UNITED STATES
SECURITIES AND EXCHANGE COMMISSION
Washington, D.C. 20549
FORM 20-F
| ¨ | REGISTRATION STATEMENT PURSUANT TO SECTION 12(b) OR (g) OF THE SECURITIES EXCHANGE ACT OF 1934 |
OR
| x | ANNUAL REPORT PURSUANT TO SECTION 13 OR 15(d) OF THE SECURITIES EXCHANGE ACT OF 1934
for the fiscal year ended December 31, 2016 |
| OR |
| ¨ | TRANSITION REPORT PURSUANT TO SECTION 13 OR 15(d) OF THE SECURITIES EXCHANGE ACT OF 1934
For the transition period from ________________ to ________________ |
OR
| ¨ | SHELL COMPANY REPORT PURSUANT TO SECTION 13 OR 15(d) OF THE SECURITIES EXCHANGE ACT OF 1934
Date of event requiring this shell company report |
Commission file number: 001-36631
GRUPO AVAL ACCIONES Y VALORES S.A.
(Exact name of Registrant as specified in its charter)
Republic of Colombia
(Jurisdiction of incorporation)
Carrera 13 No. 26A - 47
Bogotá D.C., Colombia
(Address of principal executive offices)
Jorge Adrián Rincón
Chief Legal Counsel
Grupo Aval Acciones y Valores S.A.
Carrera 13 No. 26A - 47
Bogotá D.C., Colombia
Phone: (+57 1) 241-9700
E-mail: jrincon@grupoaval.com
(Name, Telephone, E-mail and/or Facsimile number and Address of Company Contact Person)
Copies to:
Nicholas A. Kronfeld, Esq.
Davis Polk & Wardwell LLP
450 Lexington Avenue
New York, NY 10017
Phone: (212) 450-4000
Securities registered or to be registered pursuant to Section 12(b) of the Act:
None
(Title of Class)
Securities registered or to be registered pursuant to Section 12(g) of the Act:
| Title of each class | | Name of each exchange on which
registered |
| American Depositary Shares, each representing 20 preferred shares, par value Ps 1.00 per preferred share | | New York Stock Exchange |
| Preferred Shares, par value Ps 1.00 per preferred share | | New York Stock Exchange* |
* Grupo Aval Acciones y Valores S.A.’s preferred shares are not listed for trading, but are only listed in connection with the registration of the American Depositary Shares, pursuant to the requirements of the New York Stock Exchange.
Securities for which there is a reporting obligation pursuant to Section 15(d) of the Act:
None
(Title of Class)
Indicate the number of outstanding shares of each of the issuer’s classes of capital stock or common stock as of the close of business covered by the annual report.
Preferred shares: 7,043,527,332
Indicate by check mark if the registrant is a well-known seasoned issuer, as defined in Rule 405 of the Securities Act.
x Yes ¨ No
If this report is an annual or transition report, indicate by check mark if the registrant is not required to file reports pursuant to Section 13 or 15(d) of the Securities Exchange Act of 1934.
¨ Yes x No
Indicate by check mark whether the registrant (1) has filed all reports required to be filed by Section 13 or 15(d) of the Securities Exchange Act of 1934 during the preceding 12 months (or for such shorter period that the registrant was required to file such reports), and (2) has been subject to such filing requirements for the past 90 days.
x Yes ¨ No
Indicate by check mark whether the registrant has submitted electronically and posted on its corporate Web site, if any, every Interactive Data File required to be submitted and posted pursuant to Rule 405 of Regulation S-T during the preceding 12 months (or for such shorter period that the registrant was required to submit and post such files).
¨ Yes ¨ No
Indicate by check mark whether the registrant is a large accelerated filer, an accelerated filer, a non-accelerated filer, or an emerging growth company. See definition of “large accelerated filer,” “accelerated filer,” and “emerging growth company” in Rule 12b-2 of the Exchange Act. (Check one):
| Large accelerated filer x | Accelerated filer ¨ | Non-accelerated filer ¨ | Emerging growth company ¨ |
Indicate by check mark which basis of accounting the registrant has used to prepare the financial statements included in this filing:
| US GAAP ¨ | International Financial Reporting Standards as issued by the International Accounting Standards Board x | Other ¨ |
If an emerging growth company that prepares its financial statements in accordance with U.S. GAAP, indicate by check mark if the registrant has elected not to use the extended transition period for complying with any new or revised financial accounting standards† provided pursuant to Section 13(a) of the Exchange Act.
† The term “new or revised financial accounting standard” refers to any update issued by the Financial Accounting Standards Board to its Accounting Standards Codification after April 5, 2012.
If “Other” has been checked in response to the previous question indicate by check mark which financial statement item the registrant has elected to follow.
¨ Item 17 ¨ Item 18
If this is an annual report, indicate by check mark whether the registrant is a shell company (as defined in Rule 12b-2 of the Exchange Act).
¨ Yes x No
table of contents
PRESENTATION OF FINANCIAL AND OTHER INFORMATION
All references herein to “peso,” “pesos,” or “Ps” refer to the lawful currency of Colombia. All references to “U.S. dollars,” “dollars” or “U.S.$” are to United States dollars. See “Item 3. Key information—A. Selected financial and operating data—Exchange rates” for information regarding exchange rates for the Colombian currency. This annual report translates certain Colombian peso amounts into U.S. dollars at specified rates solely for the convenience of the reader. The conversion of amounts expressed in pesos as of a specified date at the then prevailing exchange rate may result in the presentation of U.S. dollar amounts that differ from U.S. dollar amounts that would have been obtained by converting Colombian pesos as of another specified date. Unless otherwise noted in this annual report, all such peso amounts have been translated at the rate of Ps 3,000.71 per U.S.$1.00, which was the representative market rate published on December 31, 2016. The representative market rate is computed and certified by the Superintendency of Finance on a daily basis and represents the weighted average of the buy/sell foreign exchange rates negotiated on the previous day by certain financial institutions authorized to engage in foreign exchange transactions. Such conversion should not be construed as a representation that the peso amounts correspond to, or have been or could be converted into, U.S. dollars at that rate or any other rate. On April 24, 2017, the representative market rate was Ps 2,868.89 per U.S.$1.00.
Definitions
In this annual report, unless otherwise indicated or the context otherwise requires, the terms:
| · | “Grupo Aval,” “we,” “us,” “our” and “our company” mean Grupo Aval Acciones y Valores S.A. and its consolidated subsidiaries; |
| · | “banks” and “our banking subsidiaries” mean Banco de Bogotá S.A., Banco de Occidente S.A., Banco Popular S.A. and Banco Comercial AV Villas S.A., and their respective consolidated subsidiaries; |
| · | “Banco de Bogotá” means Banco de Bogotá S.A. and its consolidated subsidiaries; |
| · | “Banco de Occidente” means Banco de Occidente S.A. and its consolidated subsidiaries; |
| · | “Banco Popular” means Banco Popular S.A. and its consolidated subsidiaries; |
| · | ���Banco AV Villas” means Banco Comercial AV Villas S.A. and its consolidated subsidiary; |
| · | “BAC Credomatic” or “BAC” means BAC Credomatic Inc. and its consolidated subsidiaries; |
| · | “Corficolombiana” means Corporación Financiera Colombiana S.A. and its consolidated subsidiaries; |
| · | “LB Panamá” means Leasing Bogotá S.A., Panamá and its consolidated subsidiaries; |
| · | “Porvenir” means Sociedad Administradora de Fondos de Pensiones y Cesantías Porvenir S.A. and its consolidated subsidiary; and |
| · | “Superintendency of Finance” means the Colombian Superintendency of Finance (Superintendencia Financiera de Colombia), a supervisory authority ascribed to the Colombian Ministry of Finance and Public Credit (Ministerio de Hacienda y Crédito Público), or the “Ministry of Finance,” holding the inspection, supervision and control authority over the persons or entities involved in financial activities, securities markets, insurance and any other operations related to the management, use or investment of resources collected from the public. |
In this annual report, references to “beneficial ownership” are calculated pursuant to the definition ascribed by the U.S. Securities and Exchange Commission, or the “SEC,” of beneficial ownership for foreign private issuers contained in Form 20-F. Form 20-F defines the term “beneficial owner” of securities as referring to any person who, even if not the record owner of the securities, has or shares the underlying benefits of ownership, including the power to direct the voting or the disposition of the securities or to receive the economic benefit of ownership of the securities. A person is also considered to be the “beneficial owner” of securities when such person has the right to acquire within 60 days pursuant to an option or other agreement. Beneficial owners include persons who hold their
securities through one or more trustees, brokers, agents, legal representatives or other intermediaries, or through companies in which they have a “controlling interest,” which means the direct or indirect power to direct the management and policies of the entity.
Financial statements
We are an issuer in Colombia of securities registered with the National Registry of Shares and Issuers, and in this capacity, we are subject to oversight by the Superintendency of Finance. We are not a financial institution in Colombia. We are required to comply with corporate governance and periodic reporting requirements to which all issuers are subject, but we are not supervised or regulated as a financial institution or as a holding company of banking subsidiaries and, thus, are not required to comply with the capital adequacy regulations applicable to banks and other financial institutions. All of our Colombian financial subsidiaries, including Banco de Bogotá, Banco de Occidente, Banco Popular, Banco AV Villas, Corficolombiana, Porvenir, and their respective financial subsidiaries, are entities under the direct comprehensive supervision of, and subject to inspection and surveillance as financial institutions by, the Superintendency of Finance and, in the case of BAC Credomatic, subject to inspection and surveillance as a financial institution by the relevant regulatory authorities in each country where BAC Credomatic operates.
Our consolidated financial statements at December 31, 2016 and 2015 and for the years ended December 31, 2016, 2015 and 2014 have been audited, as stated in the report appearing therein, by KPMG, and are included in this annual report and referred to as our audited consolidated financial statements. Our historical results are not necessarily indicative of results to be expected for future periods. We have prepared the audited consolidated financial statements included herein in accordance with International Financial Reporting Standards as issued by the International Accounting Standards Board (“IFRS”). Prior to January 1, 2014, our consolidated financial statements were prepared in accordance with the regulations of the Superintendency of Finance applicable to financial institutions (Resolution 3600 of 1988 and External Circular 100 of 1995) and, on issues not addressed by these regulations, generally accepted accounting principles prescribed by the Superintendency of Finance for banks operating in Colombia (which we refer to in this annual report, collectively, as “Colombian Banking GAAP”). We have included certain information prepared under Colombian Banking GAAP at and for the years ended December 31, 2013 and 2012 in “Appendix A. Selected Financial and Statistical Data Prepared under Colombian Banking GAAP” to provide information for prior years. Colombian Banking GAAP is not comparable to IFRS.
On June 21, 2016, Grupo Aval, Banco de Bogotá, Banco de Occidente and Banco Popular entered into the Amended Corficolombiana Shareholders’ Agreement to provide for Grupo Aval to directly control Corficolombiana. Prior to June 21, 2016, Banco de Bogotá, which held and continues to hold a 38.3% equity interest in Corficolombiana, controlled Corficolombiana. The amendment did not involve any modification in the equity interest held by these entities in Corficolombiana. As a result of the amended Corficolombiana Shareholders’ Agreement, Corficolombiana’s results are presented herein as a direct reporting segment of Grupo Aval and are no longer included in the Banco de Bogotá segment. Thus, the financial statements and financial information of Banco de Bogotá included herein for the years ended December 31, 2015 and 2014 have been retrospectively adjusted to reflect these revised segments.
We, and our Colombian subsidiaries, are also required to prepare consolidated financial statements for publication in Colombia under International Financial Reporting Standards as adopted by the Superintendency of Finance in accordance with Decree 1851 of 2013 and 3023 of 2013 as modified by Decrees 2420 and 2496 of 2015 (which we refer to as “Colombian IFRS”). Colombian IFRS differs from IFRS as issued by the International Accounting Standards Board (“IASB”) in certain material respects.
Colombian IFRS is based on IFRS as of December 31, 2014, and certain Colombian regulation. As a result, certain rules subsequently issued by the IASB are not applicable under Colombian IFRS and our financial statements for local purposes differ from our financial statements under IFRS in the following principal aspects:
| · | Under Colombian regulations, wealth tax, created by the Colombian congress in 2014 and to be paid by companies during 2015, 2016 and 2017, calculated based on the tax equity method can be recorded against equity reserves. However under IFRS, according to IFRIC 21, wealth tax liabilities must be recorded against the statement of income. |
| · | Under Colombian IFRS, allowances for loan losses are calculated based on specific rules of the Financial and Accounting Basic Circular (Circular Básica Contable y Financiera) issued by the Superintendency of Finance for the separate financial statements; and according to the criteria set forth in International Accounting Standard (“IAS”) 39 for consolidated financial statements. Under Colombian IFRS, the difference between both methodologies in the consolidated financial statements is recorded in other comprehensive income, whereas under IFRS, allowances for loan losses are calculated according to the criteria set forth in IAS 39 and recorded in the statement of income of each period. |
| · | Consolidated financial statements prepared under Colombian IFRS classify debt securities into one of two categories: fair value through profit or loss or amortized cost. Entities with non-controlling or non-significant influence in equity securities must record fair value changes in other comprehensive income, in accordance with the guidance set out in IFRS 9. Even though IFRS 9 will only apply in Colombia from January 1, 2018 onward, pursuant to Colombian IFRS, companies may elect to adopt IFRS 9 early. |
Non-IFRS financial measures
We have included in this annual report non-IFRS measures such as:
| · | Return on average assets, or “ROAA,” and return on average equity, or “ROAE”. |
| · | Certain constant peso figures as part of the analysis of the results of LB Panamá, which represents our main operation outside Colombia. Constant peso figures are presented to provide information on the actual performance of LB Panamá excluding the effect of the peso devaluation. The statement of financial position figures of LB Panamá are translated at the period-end rate of exchange and statement of income figures are translated at the average exchange rate prevailing during the year. |
| · | Certain figures and ratios adjusted to exclude one-off events. In particular in the case of Banco de Bogotá, certain figures and ratios have been adjusted to exclude the gain resulting from the loss of control of Corficolombiana which is a one-off event that had no effect on Grupo Aval’s consolidated results. These adjusted figures and ratios are relevant because they provide a more accurate view of the results of the segment’s recurring operations. |
These measures should not be construed as an alternative to IFRS measures and should also not be compared to similarly titled measures reported by other companies, which may evaluate such measures differently from how we do. For Non-IFRS measures to IFRS measures, see “Item 3. -Key information—A. Selected financial and operating data—Non-IFRS measures.”
Market share and other information
We obtained the market and competitive position data, including market forecasts, used throughout this annual report from market research, publicly available information and industry publications. We have presented this data on the basis of information from third-party sources that we believe are reliable, including, among others, the International Monetary Fund, or “IMF,” the Superintendency of Finance, the Colombian Stock Exchange, the Colombian National Bureau of Statistics (Departamento Administrativo Nacional de Estadística), or “DANE,” the 2010 and 2011 World Bank Development Indicators, the Economist Intelligence Unit and Euromonitor International. Industry and government publications, including those referenced herein, generally state that the information presented has been obtained from sources believed to be reliable, but that the accuracy and completeness of such information is not guaranteed. Unless otherwise indicated, gross domestic product, or “GDP,” figures with respect to Colombia in this annual report are based on the 2005 base year data series published by DANE. Although we have no reason to believe that any of this information or these reports is inaccurate in any material respect, we have not independently verified the competitive position, market share, market size, market growth or other data provided by third parties or by industry or other publications. We do not make any representation or warranty as to the accuracy of such information.
Our statement of financial position and statement of income for the periods commencing on January 1, 2014, reflects information prepared under IFRS, while comparative disclosures of our financial and operating performance from our competitors are based on unconsolidated information prepared on the basis of Colombian IFRS reported to the Superintendency of Finance. We and our banking subsidiaries also report unconsolidated financial data to the Superintendency of Finance under Colombian IFRS. Unless otherwise indicated or the context otherwise requires,
market share and other data comparing our performance to that of our competitors reflects the unconsolidated results of our banking subsidiaries, Corficolombiana, Porvenir and BAC Credomatic. “Grupo Aval aggregate” data throughout this annual report reflects the sum of the unconsolidated financial statements of our four Colombian banking subsidiaries (Banco de Bogotá, Banco de Occidente, Banco Popular and Banco AV Villas) as reported to the Superintendency of Finance under Colombian IFRS, and it is used for purposes of comparing our performance against that of our peer banks. These unconsolidated financial statements under Colombian IFRS do not reflect the consolidation of subsidiaries such as Corficolombiana, Porvenir or LB Panamá, are not intended to reflect the consolidated financial results of Grupo Aval and are not necessarily indicative of the results for any other future interim period. Except where otherwise indicated, financial and market share data pertaining to BAC Credomatic has been prepared in accordance with IFRS, unless otherwise indicated. All information regarding our market share and those of our competitors is presented on an unconsolidated basis under Colombian IFRS is based on publicly available information filed with the Superintendency of Finance. This unconsolidated information does not account for businesses of our banking subsidiaries or those of our competitors that are operated through their respective subsidiaries.
Throughout this document, unless otherwise noted, references to average statement of financial position have been calculated as follows: for 2016, we calculated our average statement of financial position based on balances at December 31, 2016, at September 30, 2016, at June 30, 2016, at March 31, 2016 and at December 31, 2015. For 2015, we calculated our average statement of financial position based on balances at December 31, 2015, at September 30, 2015, at June 30, 2015, at March 31, 2015 and at December 31, 2014. For 2014, we calculated our average statement of financial position based on balances at January 1, 2014 and at December 31, 2014. The average statement of financial position is usually calculated based on more than two periods of information considering that this methodology provides more accurate information. However, in the specific case of 2014, as a result of our first time adoption of IFRS, our average statements of financial position have been calculated based on two periods of information only.
Banks, financing companies and finance corporations are deemed credit institutions by the Superintendency of Finance and are the principal institutions authorized to accept deposits and make loans in Colombia. Banks undertake traditional deposit-taking and lending activities. Financing companies place funds in circulation by means of active credit operations, with the purpose of fostering the sale of goods and services, including the development of leasing operations. Finance corporations invest directly in the economy and thus are the only credit institutions that may invest in non-financial sectors. Banks are permitted to invest in finance corporations. See “Item 4. Information on the Company—B. Business overview—Supervision and regulation.” In Colombia, we operate four banks, one financing company and one finance corporation, and our market share is determined by comparing our banks to other banks reporting their results to the Superintendency of Finance. However, if financing companies and finance corporations are included in the calculation of market share data, our market shares would generally be lower than in a bank-only comparison, and the gaps between our market shares and those of our competitors would be smaller, but our market leadership in most market categories would be unaffected.
We consider our principal competitors in Colombia to be Bancolombia S.A., or “Bancolombia,” Banco Davivienda S.A., or “Davivienda,” and Banco Bilbao Vizcaya Argentaria Colombia S.A., or “BBVA Colombia,” which are the three leading banking groups in Colombia after Grupo Aval.
The principal competitors of Porvenir, our pension and severance fund administrator, include Administradora de Fondos de Pensiones y Cesantías Protección S.A., or “Protección,” Colfondos S.A. Pensiones y Cesantías, or “Colfondos,” and Old Mutual Administradora de Fondos de Pensiones y Cesantías S.A., or “Old Mutual,” We have included in this annual report competitive market position data for Porvenir as compared to its principal competitors. Corficolombiana, our merchant bank, is a financial corporation, and its competitors include Banca de Inversión Bancolombia S.A., J.P. Morgan Corporación Financiera S.A., BNP Paribas Colombia Corporación Financiera S.A. and Itaú BBA Colombia S.A. Corporación Financiera.
Our principal competitors in Costa Rica, El Salvador, Guatemala, Nicaragua and Panamá include Banco Industrial, Scotiabank, G&T Continental and Bancolombia.
We include certain ratios in this annual report which we believe provide investors with important information regarding our operations, such as return on average equity, or “ROAE,” return on average assets, or “ROAA,” net interest margin, and operational efficiency and asset quality indicators, among others. Certain of these ratios are also used in this annual report to compare us to our principal competitors.
Other conventions
Certain figures included in this annual report have been subject to rounding adjustments. Accordingly, figures shown as totals in certain tables may not be an arithmetic summation of the figures that precede them. References to “billions” in this annual report are to 1,000,000,000s and to “trillions” are to 1,000,000,000,000s.
“Non-controlling interest” refers to the participation of minority shareholders in Grupo Aval or our subsidiaries, as applicable.
FORWARD-LOOKING STATEMENTS
This annual report contains estimates and forward-looking statements, principally in “Item 3. Key information—D. Risk factors,” “Item 5. Operating and financial review and prospects” and “Item 4. Information on the Company—B. Business overview.” Some of the matters discussed concerning our operations and financial performance include estimates and forward-looking statements within the meaning of the Securities Act and the U.S. Securities Exchange Act of 1934, as amended, or the “Exchange Act.”
Our estimates and forward-looking statements are mainly based on our current expectations and estimates on projections of future events and trends, which affect or may affect our businesses and results of operations. Although we believe that these estimates and forward-looking statements are based upon reasonable assumptions, they are subject to several risks and uncertainties and are made in light of information currently available to us. Our estimates and forward-looking statements may be influenced by the following factors, among others:
| · | changes in Colombian, Central American, regional and international business and economic, political or other conditions; |
| · | developments affecting Colombian, Central American and international capital and financial markets; |
| · | government regulation and tax matters and developments affecting our company and industry; |
| · | declines in the oil and affiliated services sector in the Colombian and global economies; |
| · | increases in defaults by our customers; |
| · | increases in goodwill impairment losses, or other impairments; |
| · | decreases in deposits, customer loss or revenue loss; |
| · | increases in provisions for contingent liabilities; |
| · | our ability to sustain or improve our financial performance; |
| · | increases in inflation rates, particularly in Colombia and in jurisdictions in which we operate in Central America; |
| · | the level of penetration of financial products and credit in Colombia and Central America; |
| · | changes in interest rates which may, among other effects, adversely affect margins and the valuation of our treasury portfolio; |
| · | decreases in the spread between investment yields and implied interest rates in annuities; |
| · | movements in exchange rates; |
| · | competition in the banking and financial services, credit card services, insurance, asset management, pension fund administration and related industries; |
| · | adequacy of risk management procedures and credit, market and other risks of lending and investment activities; |
| · | decreases in the level of capitalization of our subsidiaries; |
| · | changes in market values of Colombian and Central American securities, particularly Colombian government securities; |
| · | adverse legal or regulatory disputes or proceedings; |
| · | successful integration and future performance of acquired businesses or assets; |
| · | natural disasters and internal security issues affecting countries where we operate; |
| · | loss of any key member of our senior management; and |
| · | other risk factors as set forth under “Item 3. Key information—D. Risk factors.” |
The words “believe,” “may,” “will,” “estimate,” “continue,” “anticipate,” “intend,” “expect” and similar words are intended to identify estimates and forward-looking statements. Estimates and forward-looking statements speak only at the date they were made, and we undertake no obligation to update or to review any estimate and/or forward-looking statement because of new information, future events or other factors. Estimates and forward-looking statements involve risks and uncertainties and are not guarantees of future performance. Our future results may differ materially from those expressed in these estimates and forward-looking statements. In light of the risks and uncertainties described above, the estimates and forward-looking statements discussed in this annual report might not occur and our future results and our performance may differ materially from those expressed in these forward-looking statements due to the factors mentioned above, among others. Because of these uncertainties, you should not make any investment decision based on these estimates and forward-looking statements.
These cautionary statements should be considered in connection with any written or oral forward-looking statements that we may issue in the future.
PART I
ITEM 1. IDENTITY OF DIRECTORS, SENIOR MANAGEMENT AND ADVISERS
| A. | Directors and senior management |
Not applicable.
Not applicable.
Not applicable.
ITEM 2. OFFER STATISTICS AND EXPECTED TIMETABLE
Not applicable.
| B. | Method and expected timetable |
Not applicable.
ITEM 3. KEY INFORMATION
| A. | Selected financial data |
The following financial data of Grupo Aval at December 31, 2016 and 2015, and for the years ended December 31, 2016, 2015 and 2014 have been derived from our audited consolidated financial statements prepared in accordance with IFRS that are included in this annual report. Our historical results are not necessarily indicative of results to be expected for future periods.
This financial data should be read in conjunction with our audited annual consolidated financial statements and the related notes, “Presentation of financial and other information” and “Item 5. Operating and financial review and prospects” included in this annual report.
Statement of income
IFRS
| | | Grupo Aval | |
| | | For the years ended December 31, | |
| | | 2016 | | | 2016 | | | 2015 | | | 2014 | |
| | | (in U.S.$ millions,
unless otherwise
indicated)(3) | | | (in Ps billions, except share and per share data) | |
| Interest income | | | 5,847.6 | | | | 17,547.0 | | | | 14,075.6 | | | | 11,421.8 | |
| Interest expense | | | (2,796.8 | ) | | | (8,392.4 | ) | | | (5,751.5 | ) | | | (4,498.7 | ) |
| Net interest income | | | 3,050.8 | | | | 9,154.6 | | | | 8,324.1 | | | | 6,923.1 | |
| Impairment loss on loans and accounts receivable | | | (1,001.2 | ) | | | (3,004.2 | ) | | | (2,127.7 | ) | | | (1,697.5 | ) |
| Impairment loss on other assets (1) | | | (39.3 | ) | | | (117.9 | ) | | | (32.2 | ) | | | (12.0 | ) |
| Recovery of charged-off assets | | | 96.8 | | | | 290.4 | | | | 219.7 | | | | 189.6 | |
| Net impairment loss on financial assets | | | (943.7 | ) | | | (2,831.7 | ) | | | (1,940.2 | ) | | | (1,519.9 | ) |
| Net income from commissions and fees | | | 1,419.5 | | | | 4,259.7 | | | | 3,662.3 | | | | 3,037.2 | |
| Net trading income | | | 241.5 | | | | 724.7 | | | | 245.2 | | | | 369.9 | |
| Other income (2) | | | 928.6 | | | | 2,786.4 | | | | 2,542.4 | | | | 2,269.0 | |
| Other expenses | | | (2,839.3 | ) | | | (8,519.8 | ) | | | (7,609.1 | ) | | | (6,273.5 | ) |
| Income before income tax expense | | | 1,857.5 | | | | 5,573.8 | | | | 5,224.7 | | | | 4,805.8 | |
| Income tax expense | | | (685.5 | ) | | | (2,056.9 | ) | | | (1,879.0 | ) | | | (1,808.3 | ) |
| Net Income | | | 1,172.0 | | | | 3,516.9 | | | | 3,345.7 | | | | 2,997.5 | |
| Net income attributable to : | | | | | | | | | | | | | | | | |
| Controlling interest | | | 713.1 | | | | 2,139.9 | | | | 2,041.4 | | | | 1,815.0 | |
| Non-controlling interest | | | 458.9 | | | | 1,377.1 | | | | 1,304.3 | | | | 1,182.5 | |
| | | | | | | | | | | | | | | | | |
| Earnings per 1,000 shares (basic and diluted earnings): | | | | | | | | | | | | | | | | |
| Common shares (in pesos) | | | - | | | | 96,039.9 | | | | 91,619.0 | | | | 86,853.8 | |
| Common shares (in U.S. dollars) (3) | | | - | | | | 32.0 | | | | 30.5 | | | | 28.9 | |
| Earnings per 1,000 shares (basic and diluted earnings): | | | | | | | | | | | | | | | | |
| Preferred shares (in pesos) | | | - | | | | 96,039.9 | | | | 91,619.0 | | | | 86,853.8 | |
| Preferred shares (in U.S. dollars) (3) | | | - | | | | 32.0 | | | | 30.5 | | | | 28.9 | |
| Dividends per 1,000 shares (4): | | | - | | | | | | | | | | | | | |
| Common and preferred shares (in pesos) | | | - | | | | 88,200.0 | | | | 58,800.0 | | | | 61,733.7 | |
| Common and preferred shares (in U.S. dollars) (3) | | | - | | | | 29.4 | | | | 19.6 | | | | 20.6 | |
| | | | - | | | | | | | | | | | | | |
| Weighted average number of shares: | | | - | | | | | | | | | | | | | |
| Outstanding common shares in thousands | | | - | | | | 15,262,660.1 | | | | 15,309,380.7 | | | | 15,406,634.6 | |
| Outstanding preferred shares in thousands | | | - | | | | 7,018,357.0 | | | | 6,971,636.5 | | | | 5,490,721.7 | |
| Outstanding common and preferred shares in thousands | | | - | | | | 22,281,017.2 | | | | 22,281,017.2 | | | | 20,897,356.4 | |
| (1) | Includes impairment loss on noncurrent assets held for sale and investments in debt and equity securities. |
| (2) | Includes net income from financial instruments designated at fair value. |
| (3) | Translated for convenience only using the representative market rate as computed and certified by the Superintendency of Finance at December 31, 2016 of Ps 3,000.71 per U.S.$1.00. |
| (4) | Until 2016, Grupo Aval declared dividends semi-annually in March (from the net income generated in the six-month period between July 1 and December 31 of the previous year) and in September (from the net income generated in the six-month period between January 1 and June 30 of the ongoing year) of each year. Beginning in March 2017, the Company will start to declare dividends on an annual basis (for the twelve-month period between January 1 and December 31 of the previous year). We do not declare dividends on a quarterly basis. Dividends per 1,000 shares figures for 2016 include dividends declared in September, 2016 from the net income generated in the six-month period ended June 30, 2016 and dividends declared in March, 2017 from the net income generated in the six-month period ended December 31, 2016, to be paid in twelve equal installments between April, 2017 and March, 2018. |
Statement of financial position
| | | Grupo Aval | |
| | | For the years ended December 31, | |
| | | 2016 | | | 2016 | | | 2015 | | | 2014 | |
| | | (in U.S.$
millions, unless
otherwise
indicated)(1) | | | (in Ps billions, except share and per share data) | |
| Assets: | | | | | | | | | | | | | | | | |
| Cash and cash equivalents | | | 7,395.9 | | | | 22,193.0 | | | | 22,285.0 | | | | 17,269.8 | |
| Financial assets held for trading through profit or losses | | | 1,530.9 | | | | 4,593.7 | | | | 5,608.2 | | | | 5,864.5 | |
| Available for sale financial assets | | | 6,129.4 | | | | 18,392.5 | | | | 19,684.9 | | | | 18,758.8 | |
| Investments held to maturity | | | 856.6 | | | | 2,570.5 | | | | 2,395.3 | | | | 2,665.8 | |
| Other financial assets at fair value through profit or loss | | | 690.7 | | | | 2,072.7 | | | | 1,891.7 | | | | 1,738.6 | |
| Loans and receivables, net | | | 50,287.7 | | | | 150,898.7 | | | | 141,827.7 | | | | 114,400.7 | |
| Other accounts receivables | | | 1,174.6 | | | | 3,524.6 | | | | 3,202.2 | | | | 2,233.4 | |
| Hedging derivatives | | | 42.8 | | | | 128.5 | | | | 33.7 | | | | 64.8 | |
| Noncurrent assets held for sale | | | 86.5 | | | | 259.5 | | | | 199.5 | | | | 211.2 | |
| Tangible assets | | | 2,186.0 | | | | 6,559.5 | | | | 6,514.0 | | | | 5,886.7 | |
| Concession arrangements rights | | | 934.9 | | | | 2,805.3 | | | | 2,390.7 | | | | 1,842.7 | |
| Goodwill | | | 2,274.4 | | | | 6,824.9 | | | | 7,056.0 | | | | 5,867.2 | |
| Other intangible assets | | | 245.0 | | | | 735.0 | | | | 612.9 | | | | 388.1 | |
| Income tax assets | | | 259.6 | | | | 779.1 | | | | 1,485.2 | | | | 440.0 | |
| Other assets(2) | | | 578.6 | | | | 1,736.1 | | | | 1,492.3 | | | | 1,209.6 | |
| Total assets | | | 74,673.6 | | | | 224,073.7 | | | | 216,679.3 | | | | 178,842.2 | |
| | | | | | | | | | | | | | | | | |
| Liabilities: | | | | | | | | | | | | | | | | |
| Derivatives instruments held for trading | | | 213.5 | | | | 640.7 | | | | 1,143.2 | | | | 1,183.1 | |
| Customer deposits | | | 47,951.0 | | | | 143,887.1 | | | | 135,954.6 | | | | 113,528.5 | |
| Interbank borrowings and overnight funds | | | 2,104.7 | | | | 6,315.7 | | | | 9,474.9 | | | | 4,964.4 | |
| Borrowings from banks and others | | | 5,967.5 | | | | 17,906.6 | | | | 18,750.6 | | | | 13,685.8 | |
| Bonds | | | 6,187.9 | | | | 18,568.2 | | | | 16,567.1 | | | | 14,130.1 | |
| Borrowings from development entities | | | 908.4 | | | | 2,725.7 | | | | 2,506.6 | | | | 2,108.5 | |
| Hedging derivatives | | | 14.5 | | | | 43.4 | | | | 337.7 | | | | 559.5 | |
| Provisions | | | 206.7 | | | | 620.4 | | | | 600.2 | | | | 744.7 | |
| Income tax liabilities | | | 550.5 | | | | 1,651.9 | | | | 1,892.1 | | | | 1,691.3 | |
| Employee benefits | | | 365.8 | | | | 1,097.6 | | | | 1,022.3 | | | | 975.7 | |
| Other liabilities | | | 1,985.3 | | | | 5,957.2 | | | | 5,523.5 | | | | 3,914.7 | |
| Total liabilities | | | 66,455.8 | | | | 199,414.5 | | | | 193,773.0 | | | | 157,486.2 | |
| | | | | | | | | | | | | | | | | |
| Equity | | | | | | | | | | | | | | | | |
| Controlling interest | | | | | | | | | | | | | | | | |
| Subscribed and paid-in capital | | | 7.4 | | | | 22.3 | | | | 22.3 | | | | 22.3 | |
| Additional paid-in capital | | | 2,768.5 | | | | 8,307.5 | | | | 8,307.8 | | | | 8,311.9 | |
| Retained earnings | | | 2,173.6 | | | | 6,522.1 | | | | 5,699.4 | | | | 4,961.5 | |
| Accumulated other comprehensive income | | | 249.8 | | | | 749.6 | | | | 538.1 | | | | 372.3 | |
| Equity attributable to controlling interest | | | 5,199.3 | | | | 15,601.6 | | | | 14,567.6 | | | | 13,668.0 | |
| Non-controlling interest | | | 3,018.5 | | | | 9,057.7 | | | | 8,338.7 | | | | 7,687.9 | |
| Total equity | | | 8,217.8 | | | | 24,659.2 | | | | 22,906.3 | | | | 21,356.0 | |
| Total liabilities and equity | | | 74,673.6 | | | | 224,073.7 | | | | 216,679.3 | | | | 178,842.2 | |
| (1) | Translated for convenience only using the representative market rate as computed and certified by the Superintendency of Finance at December 31, 2016 of Ps 3,000.71 per U.S.$1.00. |
| (2) | Includes investments in associates and joint ventures. |
Other financial and operating data
| | | Grupo Aval | |
| | | At and for the years ended December 31, | |
| | | 2016 | | | 2015 | | | 2014 | |
| | | (in percentages, unless otherwise indicated) | |
| Profitability ratios: | | | | | | | | | | | | |
| Net interest margin (1) | | | 5.4 | % | | | 5.4 | % | | | 5.4 | % |
| ROAA (2) | | | 1.6 | % | | | 1.7 | % | | | 1.8 | % |
| ROAE (3) | | | 14.3 | % | | | 14.6 | % | | | 15.2 | % |
| Efficiency ratio (4): | | | 47.3 | % | | | 47.6 | % | | | 46.2 | % |
| Capital ratios: | | | | | | | | | | | | |
| Period-end equity as a percentage of period-end total assets | | | 11.0 | % | | | 10.6 | % | | | 11.9 | % |
| Tangible equity ratio (5) | | | 7.9 | % | | | 7.3 | % | | | 8.7 | % |
| Credit quality data: | | | | | | | | | | | | |
| Charge-offs as a percentage of average gross loans (6) | | | 1.6 | % | | | 1.3 | % | | | 1.3 | % |
| Delinquency ratio (loans past due more than 30 days / total gross loans) (6) | | | 3.0 | % | | | 2.7 | % | | | 2.8 | % |
| Non-performing loans / total gross loans (6) (7) | | | 2.0 | % | | | 1.7 | % | | | 1.7 | % |
| Allowance for loans as a percentage of past due loans more than 30 days | | | 95.0 | % | | | 98.9 | % | | | 96.7 | % |
| Allowance for loans as a percentage of non-performing loans | | | 143.9 | % | | | 157.9 | % | | | 157.0 | % |
| Allowance for loans as a percentage of gross loans (6) | | | 2.8 | % | | | 2.6 | % | | | 2.7 | % |
| Operational data (in units): | | | | | | | | | | | | |
| Number of customers of the banks (8) | | | 13,883,370 | | | | 13,678,194 | | | | 12,950,374 | |
| Number of employees | | | 77,050 | | | | 76,095 | | | | 74,211 | |
| Number of branches (9) | | | 1,789 | | | | 1,785 | | | | 1,769 | |
| Number of ATMs (9) | | | 5,739 | | | | 5,623 | | | | 5,429 | |
| (1) | Net interest margin is calculated as net interest income divided by total average interest-earning assets. Average interest-earning assets for 2016 are calculated as the sum of interest-earning assets at December 31, 2016, at September 30, 2016, at June 30, 2016, at March 31, 2016 and December 31, 2015 divided by five. Average interest-earning assets for 2015 are calculated as the sum of interest-earning assets at December 31, 2015, at September 30, 2015, at June 30, 2015, at March 31, 2015 and December 31, 2014 divided by five. Average interest-earning assets for 2014 are calculated as the sum of interest-earning assets at December 31, 2014 and January 1, 2014 divided by two as there is no quarterly comparable information available for that year. If net interest margin was calculated as net interest income plus net trading income from securities held for trading through profit or loss divided by total average interest-earning assets plus investment securities held for trading through profit or loss it would be 5.6%, 5.4% and 5.5% for the years ended December 31, 2016, 2015 and 2014, respectively. |
| (2) | For the years ended December 31, 2016, 2015 and 2014, ROAA is calculated as net income divided by average assets. Average assets for 2016 are calculated as the sum of assets at December 31, 2016, at September 30, 2016, at June 30, 2016, at March 31, 2016 and December 31, 2015 divided by five. Average assets for 2015 are calculated as the sum of assets at December 31, 2015, at September 30, 2015, at June 30, 2015, at March 31, 2015 and December 31, 2014 divided by five. Average assets for 2014 are calculated as the sum of assets at December 31, 2014 and January 1, 2014 divided by two as there is no quarterly comparable information available for that year. |
| (3) | For the years ended December 31, 2016, 2015 and 2014, ROAE is calculated as net income attributable to controlling interest divided by average equity attributable to controlling interest. Average equity attributable to controlling interest for 2016 is calculated as the sum of equity attributable to controlling interest at December 31, 2016, at September 30, 2016, at June 30, 2016, at March 31, 2016 and December 31, 2015 divided by five. Average equity attributable to controlling interest for 2015 is calculated as the sum of equity attributable to controlling interest at December 31, 2015, at September 30, 2015, at June 30, 2015, at March 31, 2015 and December 31, 2014 divided by five. Average equity attributable to controlling interest for 2014 is calculated as the sum of equity attributable to controlling interest at December 31, 2014 and January 1, 2014 divided by two as there is no quarterly comparable information available for that year. |
| (4) | Efficiency ratio is calculated as personnel expenses plus administrative and other expenses divided by the sum of net interest income, net income from commissions and fees, net trading income and other income excluding other. |
| (5) | Tangible equity ratio is calculated as total equity minus intangible assets (calculated as goodwill plus other intangible assets excluding those related to concession arrangements rights) divided by total assets minus intangible assets (calculated as goodwill plus other intangible assets excluding those related to concession arrangements rights, Ps 2,805.3 billion in 2016, Ps 2,390.7 billion in 2015 and Ps 1,842.7 billion in 2014). If tangible equity ratio were calculated as total equity minus intangible assets (calculated as goodwill plus other intangible assets) divided by total assets minus intangible assets (calculated as goodwill plus other intangible assets) tangible equity ratio would be 6.7%, 6.2% and 7.8% for the years ended December 31, 2016, 2015 and 2014, respectively. See “Item 3. Key Information—A. Selected financial and operating data—Non-IFRS measures.” |
| (6) | Gross loans excludes Interbank and overnight funds |
| (7) | Non-performing loans are loans with more than 90 days past due. |
| (8) | Reflects aggregated customers of our banking subsidiaries. Customers of more than one of our banking subsidiaries and BAC Credomatic are counted separately for each banking subsidiary. |
| (9) | Reflects aggregated number of branches or ATMs of our banking subsidiaries and BAC Credomatic, as applicable, located throughout Colombia and Central America. |
Non-IFRS measures
The tables in this section and elsewhere in this annual report provide the calculation of certain Non-IFRS measures, which are used by our management to analyze the evolution and results of our company. The Non-IFRS financial measures as determined and measured by us should not be construed as an alternative to IFRS measures and should also not be compared to similarly titled measures reported by other companies. Other companies may calculate and report such measures differently.
ROAA and ROAE
ROAA, which is calculated as net income divided by average assets, provides a measure of return on assets. We believe ROAE, calculated as such, provides a measure of the total return generated from our company and our subsidiaries for shareholders.
The following table sets forth ROAA and ROAE for Grupo Aval for the indicated years.
| | | Year ended December 31, | |
| | | 2016 | | | 2015 | | | 2014 | |
| | | (in Ps billions, except percentages) | |
| Grupo Aval (consolidated): | | | | | | | | | | | | |
| Average assets(1) | | | 217,495.7 | | | | 198,184.1 | | | | 167,350.2 | |
| Average equity attributable to controlling interest (2) | | | 14,993.3 | | | | 14,019.9 | | | | 11,966.0 | |
| Net income | | | 3,516.9 | | | | 3,345.7 | | | | 2,997.5 | |
| Net income attributable to controlling interest | | | 2,139.9 | | | | 2,041.4 | | | | 1,815.0 | |
| Net income attributable to non-controlling interest | | | 1,377.1 | | | | 1,304.3 | | | | 1,182.5 | |
| ROAA(1) | | | 1.6 | % | | | 1.7 | % | | | 1.8 | % |
| ROAE(2) | | | 14.3 | % | | | 14.6 | % | | | 15.2 | % |
| Net Income attributable to non-controlling interest divided by net income | | | 39.2 | % | | | 39.0 | % | | | 39.4 | % |
| (1) | For methodology used to calculate ROAA, see note (2) to the table under “Item 3. Key Information—A. Selected financial data—Other financial and operating data.” |
| (2) | For methodology used to calculate ROAE, see note (3) to the table under “Item 3. Key Information—A. Selected financial data—Other financial and operating data.” |
The following table sets forth ROAA and ROAE of our subsidiaries for the year ended December 31, 2016.
| | | Year ended December 31, 2016 | |
| | | Banco de
Bogotá (3) | | | Banco de
Occidente | | | Banco
Popular | | | Banco
AV Villas | | | Corficolombiana | |
| | | (in Ps billions, except percentages) | | | | |
| Average assets(1) | | | 136,268.7 | | | | 35,660.8 | | | | 20,008.3 | | | | 12,040.0 | | | | 19,869.0 | |
| Average equity attributable to controlling interest (2) | | | 15,770.7 | | | | 4,181.8 | | | | 2,611.0 | | | | 1,327.9 | | | | 2,928.6 | |
| Net income | | | 2,224.0 | | | | 628.0 | | | | 181.1 | | | | 179.5 | | | | 671.3 | |
| Net income attributable to controlling interest | | | 2,038.1 | | | | 626.4 | | | | 179.9 | | | | 179.4 | | | | 294.4 | |
| Net income attributable to non-controlling interest | | | 185.9 | | | | 1.6 | | | | 1.2 | | | | 0.2 | | | | 377.0 | |
| ROAA(1) | | | 1.6 | % | | | 1.8 | % | | | 0.9 | % | | | 1.5 | % | | | 3.4 | % |
| ROAE(2) | | | 12.9 | % | | | 15.0 | % | | | 6.9 | % | | | 13.5 | % | | | 10.1 | % |
| Net Income attributable to non-controlling interest divided by net income | | | 8.4 | % | | | 0.3 | % | | | 0.6 | % | | | 0.1 | % | | | 56.2 | % |
| (1) | For methodology used to calculate ROAA, see note (2) to the table under “Item 3. Key Information—A. Selected financial data—Other financial and operating data.” |
| (2) | For methodology used to calculate ROAE, see note (3) to the table under “Item 3. Key Information—A. Selected financial data—Other financial and operating data.” |
| (3) | ROAA, ROAE and Net Income attributable to non-controlling interest divided by net income for Banco de Bogotá are adjusted to exclude the non-recurring effect of Ps 2,208.1 billion associated with the deconsolidation of Corficolombiana at Banco de Bogotá. When included ROAA, ROAE and Net Income attributable to non-controlling interest divided by net income for Banco de Bogotá would be 3.3%, 26.9% and 4.2%, respectively. |
Tangible equity ratio
The following table sets forth the tangible equity ratio of Grupo Aval and each of its business segments at December 31, 2016.
| | | | | | Grupo Aval entities | |
| | | Banco de
Bogotá | | | Banco de
Occidente | | | Banco
Popular | | | Banco
AV Villas | | | Corficolombiana | | | Grupo Aval
consolidated | |
| | | | | | (in Ps billions, except percentages) | |
| Total Equity | | | 17,238.2 | | | | 4,391.2 | | | | 2,678.9 | | | | 1,403.1 | | | | 4,899.6 | | | | 24,659.2 | |
| Total assets | | | 141,430.7 | | | | 35,568.5 | | | | 20,731.1 | | | | 12,466.6 | | | | 20,504.6 | | | | 224,073.7 | |
| Total Equity / Assets | | | 12.2 | % | | | 12.3 | % | | | 12.9 | % | | | 11.3 | % | | | 23.9 | % | | | 11.0 | % |
| Intangible assets (1) | | | 6,050.3 | | | | 169.1 | | | | 41.7 | | | | 38.8 | | | | 371.9 | | | | 7,560.0 | |
| Total Equity – Intangible assets | | | 11,187.9 | | | | 4,222.0 | | | | 2,637.3 | | | | 1,364.3 | | | | 4,527.8 | | | | 17,099.2 | |
| Total assets – Intangible assets | | | 135,380.4 | | | | 35,399.4 | | | | 20,689.5 | | | | 12,427.9 | | | | 20,132.8 | | | | 216,513.7 | |
| Tangible equity ratio (2) | | | 8.3 | % | | | 11.9 | % | | | 12.7 | % | | | 11.0 | % | | | 22.5 | % | | | 7.9 | % |
| (1) | Intangible Assets are: goodwill and other intangible assets (excluding intangible assets related to concession arrangements rights, Ps 2,805.3 for both Grupo Aval and Corficolombiana). |
| (2) | Tangible equity ratio is calculated as total equity minus intangible assets divided by total assets minus intangible assets. |
Exchange rates
The Colombian foreign exchange system allows the purchase and sale of foreign currency and the international transfer of pesos by any person or legal entity, regardless of the amount, subject to certain regulatory procedures.
The Superintendency of Finance calculates the representative market rate based on the weighted averages of the buy/sell foreign exchange rates quoted daily by certain financial institutions, including certain of our banking subsidiaries, for the purchase and sale of U.S. dollars. On April 24, 2017, the representative market rate was Ps 2,868.89 per U.S.$1.00, and on December 31, 2016, the representative market rate was Ps 3,000.71 per U.S.$1.00. The Federal Reserve Bank of New York does not report a noon buying rate for pesos/U.S. dollars.
The following table presents the monthly high and low representative market rate during the months indicated.
| Recent exchange rates of pesos per U.S. dollar | | Low | | | High | |
| Month: | | | | | | | | |
| November 2016 | | | 2,984.78 | | | | 3,187.97 | |
| December 2016 | | | 2,964.56 | | | | 3,085.60 | |
| January 2017 | | | 2,908.53 | | | | 3,000.71 | |
| February 2017 | | | 2,851.98 | | | | 2,921.90 | |
| March 2017 | | | 2,880.24 | | | | 3,004.43 | |
| April 2017 (through April 24, 2017) | | | 2,837.90 | | | | 2,885.57 | |
Source: Colombian Central Bank.
The following table presents the average pesos/U.S. dollar representative market rate for each of the five most recent years, calculated by using the average of the exchange rates on the last day of each month during the period, and the representative year-end market rate for each of the five most recent years.
Pesos/U.S.$1.00
representative market rate | | Average | | | Year-end | |
| Period: | | | | | | | | |
| 2012 | | | 1,798.23 | | | | 1,768.23 | |
| 2013 | | | 1,868.90 | | | | 1,926.83 | |
| 2014 | | | 2,000.68 | | | | 2,392.46 | |
| 2015 | | | 2,746.47 | | | | 3,149.47 | |
| 2016 | | | 3,053.42 | | | | 3,000.71 | |
Source: Colombian Central Bank.
Exchange rate fluctuation will affect the U.S. dollar value of any distributions we make with respect to our shares of preferred stock. See “—D. Risk factors—Risks relating to our preferred shares and ADSs.”
| B. | Capitalization and indebtedness |
Not applicable.
| C. | Reasons for the offer and use of proceeds |
Not applicable.
Our business, financial condition and results of operations could be materially and adversely affected if any of the risks described below occur. In such an event, the market price of our preferred shares or our American Depositary Shares, or ADSs, could decline, and you could lose all or part of your investment. We may face additional risks and uncertainties that are not presently known to us, or that we currently deem immaterial, which may also impair our business.
Risks relating to Colombia and other countries in which we operate
Adverse economic and political conditions in Colombia and other countries in which we operate, including variations in the exchange rates or downgrades in credit ratings of sovereign debt securities, may have an adverse effect on our results of operations and financial condition.
Our principal subsidiaries in Colombia are financial institutions (four commercial banks, a pension and severance fund administrator and a merchant bank), and a substantial majority of our operations, properties and customers are located in Colombia. As a consequence, our results of operations and financial condition are materially affected by economic and political conditions in Colombia.
Colombia is subject to economic, political and other uncertainties, including changes in monetary, exchange control and trade policies that could affect the overall business environment in Colombia, which would, in turn, affect our results of operations and financial condition. For example, the Central Bank of Colombia (the “Colombian Central Bank” or “Central Bank”), could sharply raise or lower interest rates, which could negatively affect our net interest income and asset quality and also restrict our growth. Extreme variations in exchange rates could also negatively affect the foreign currency positions of our borrowers. Any of these events could have an adverse effect on our results of operations and financial condition.
Decreases in the growth rate of the Colombian economy, periods of negative growth, material increases in inflation or interest rates, or high fluctuations in the exchange rate could result in lower demand for, or affect the pricing of, our services and products. Because a large percentage of the costs and expenses of our subsidiaries is fixed, we may not be able to reduce costs and expenses upon the occurrence of any of these events, in which case our profitability could be affected.
In the case of our pension and severance fund management business, economic conditions may affect the businesses and financial capacity of employers, which may result in a reduction in employee-contributor head counts or decrease the ability of employers to create new jobs or increase employee incomes.
BAC Credomatic’s results of operations and financial condition depend on economic, political and social conditions in the countries where it operates, primarily in Central America. The political, economic and social environments in such countries are affected by many different factors, including significant governmental influence over local economies, substantial fluctuations in economic growth, high levels of inflation, exchange rate movements, exchange controls or restrictions on expatriation of earnings, high domestic interest rates, drug trafficking and other forms of organized crime, wage and price controls, changes in tax policies, imposition of trade barriers, changes in the prices of commodities and unexpected changes in regulation. The results of operations and financial condition of our Central American operations could be affected by changes in economic and other policies of each country’s government, which have exercised and continue to exercise substantial influence over many aspects of the private sector, and by other social and political developments in each such country. During the past several decades, El Salvador, Guatemala, Honduras, Nicaragua and Panamá have experienced civil strife and political instability that have included a succession of regimes with differing economic policies and programs. Previous governments have imposed, among other measures, controls on prices, exchange rates, local and foreign investment and international trade, and restricted the ability of companies to dismiss employees, expropriated private sector assets and prohibited the remittance of profits to foreign investors.
Adverse economic, political and social developments in Central America may adversely affect demand for banking services and create uncertainty regarding our operating environment, which could have a material adverse effect on BAC Credomatic and, consequently, on our company. In addition, changes in political administrations may result in changes in governmental policy, which could affect BAC Credomatic and, consequently, our business.
Downgrades in credit ratings of debt securities issued or guaranteed by governments in countries in which we operate may increase our and our subsidiaries’ cost of funding or limit the ability of borrowing funds from customary sources of capital.
The Colombian and Central American economies remain vulnerable to external shocks.
A significant decline in economic growth of any of Colombia’s or Central America’s major trading partners—in particular, the United States, China, Ecuador and Venezuela—could have a material adverse effect on each country’s balance of trade and economic growth. In addition, a “contagion” effect, where an entire region or class of
investments becomes less attractive to, or subject to outflows of funds by, international investors could negatively affect Colombia or Central American countries. Lower economic growth than expected may result in asset quality deterioration and could negatively affect our business.
Pension funds, such as those managed by Porvenir, are global investors and thus are affected by regional and global economic factors. Lower economic growth of Colombia’s major trading partners or a contagion effect in the region or globally may lead to lower pension fund returns, which may in turn result in decreases in assets under management and impair our business, results of operations or financial condition. In recent years, pension fund returns have been subject to increased volatility in international financial markets. Foreign investments represented 27.0% and 27.8% of Porvenir’s total assets under management at December 31, 2016 and 2015, respectively.
Fluctuations in commodity prices and volatility in exchange rates have in the past led to a deceleration in growth. In particular, the oil industry remains an important determinant of the country’s economic growth. Substantial or extended declines in international oil prices or oil production falls may have an adverse effect on the overall performance of the Colombian economy and could have an adverse impact on the results of operations and financial condition of oil industry companies, which could have an adverse impact on our loans to oil industry companies. Our banking subsidiaries do not maintain a significant overall exposure to oil industry clients and have not been materially impacted by the decrease in international oil prices, however, continuing falling market prices, such as the one experienced during the recent year, pose significant challenges to Colombia’s near-term outlook and may impair the ability of some of the clients of our banking subsidiaries to repay their debt obligations. As of December 31, 2016, our combined exposure to the oil sector is 2.8% of the consolidated loan portfolio (including BAC and excluding contingencies and derivatives) with the principal exposure being toEmpresa Colombiana de Petróleos S.A. “Ecopetrol,” (0.8%) and to oil pipelines (1.2%) in which Ecopetrol is the majority shareholder. While the fall in international oil prices will affect Ecopetrol, the Colombian national oil company, we do not expect its credit quality to deteriorate materially. As of December 31, 2016, our exposure to oil service companies and suppliers to the oil sector (0.4% and 0.3%, respectively) is not material. While the credit quality of the companies participating in these sectors has been affected and additional allowances for loan losses will be required, we do not believe that they will materially affect our results. Although the growth of the Colombian economy is expected to gradually recover in the future, there is no guarantee that the past decade´s average growth will be maintained. A low rate of growth of the Colombian economy, a slowdown in the growth of customer demand, an increase in market competition, or changes in governmental regulations, could adversely affect the rate of growth of our loan portfolio and our risk index and, accordingly, increase our required allowances for loan losses. All of these conditions could lead to a general decrease in demand for borrowings. In addition, the effect on consumer confidence of any actual or perceived deterioration of household incomes in the Colombian or Central American economies may have a material adverse effect on our results of operations and financial condition.
Colombia has experienced and continues to experience internal security issues that have had or could have a negative effect on the Colombian economy.
Colombia has experienced internal security issues, primarily due to the activities of guerrilla groups such as the Revolutionary Armed Forces of Colombia (Fuerzas Armadas Revolucionarias de Colombia), or “FARC,” and the National Liberation Army (Ejercito de Liberación Nacional), or “ELN”, paramilitary groups and drug cartels. In remote regions of the country with minimal governmental presence, these groups have exerted influence over the local population and funded their activities by protecting, and rendering services to drug traffickers. The Colombian government reached a peace deal with the FARC in November 2016, and began negotiations with ELN in October 2016, which are ongoing. Any breakdown in peace, or renewed or continuing drug-related crime and guerilla and paramilitary activities may have a negative impact on the Colombian economy in the future. Our business or financial condition could be adversely affected by rapidly changing economic or social conditions, including the Colombian government’s response to the recently concluded peace deal with the FARC or current peace negotiations with the ELN, which may result in legislation that increases our tax burden, or that of other Colombian companies, which could, in turn, impact the overall economy, or legislation that could directly impact our business, such as those requiring more flexible credit conditions for, or the employment of, former FARC members.
Political and economic instability in the region may affect the Colombian economy and, consequently, our results of operations and financial condition.
Some of Colombia’s neighboring countries and principal trading partners, particularly Venezuela, have experienced and continue to experience periods of political and economic instability. Moreover, diplomatic relations
with Venezuela and Ecuador have from time to time been tense and affected by events surrounding the Colombian armed forces’ confrontations with FARC and ELN throughout Colombia, particularly on Colombia’s borders with each of Venezuela and Ecuador.
On November 19, 2012, the International Court of Justice placed a sizeable area of the Caribbean Sea within Nicaragua’s exclusive economic zone, which until then had been deemed by Colombia as part of its own exclusive economic zone. A worsening of diplomatic relations between Colombia and Nicaragua involving the disputed waters could result in the Nicaraguan government taking measures, or a reaction among the Nicaraguan public, which would be detrimental to Colombian-owned interests in that country, including those owned by us through BAC Credomatic.
Further economic and political instability in Colombia’s main trading partners or any future deterioration in relations with Venezuela, Ecuador, Nicaragua and other countries in the region may result in the closing of borders, the imposition of trade barriers and a breakdown of diplomatic ties, or a negative effect on Colombia’s trade balance, economy and general security situation, which may adversely affect our results of operations and financial condition.
Finally, economic conditions in the United States and the region generally may be impacted by the potential renegotiation of the North American Free Trade Agreement (“NAFTA”). This could have an indirect effect on the Colombian economy and the countries in which we operate.
Government policies and actions as well as judicial decisions in Colombia could significantly affect the local economy and, as a result, our results of operations and financial condition.
Our results of operations and financial condition may be adversely affected by changes in Colombian governmental policies and actions, and judicial decisions, involving a broad range of matters, including interest rates, exchange rates, exchange controls, inflation rates, taxation, banking and pension fund regulations and other political or economic developments affecting Colombia. The Colombian government has historically exercised substantial influence over the economy, and its policies are likely to continue to have a significant effect on Colombian companies, including us. The president of Colombia has considerable power to determine governmental policies and actions relating to the economy, and may adopt policies that could negatively affect us. Future governmental policies and actions, or judicial decisions, could adversely affect our results of operations or financial condition.
Allegations of corruption against the Colombian Government, politicians and private industry could create economic and political uncertainty.
Allegations of corruption against the Colombian Government, politicians and private industry could create economic and political uncertainty should the investigations triggered by these cases reach conclusions or result in further allegations or findings of illicit conduct committed by the accused parties. Furthermore, proven or alleged wrongdoings could have adverse effects on the political stability in Colombia and the Colombian economy. If one of our companies was found to be involved in any way in these activities, these adverse political and economic effects could result in a material adverse effect on our business, including by depressing business volumes and/or negatively affecting our reputation.
As a specific example of the situation described above, on December 21, 2016 the United States Department of Justice announced that Odebrecht S.A. (Odebrecht), a global construction conglomerate based in Brazil, had pled guilty and agreed to pay a monetary penalty to resolve charges with authorities in the United States, Brazil and Switzerland arising out of their schemes to pay approximately $800 million dollars in bribes to government officials in twelve countries around the world, including $11 million dollars in Colombia, where the company confessed to offering bribes in order to obtain infrastructure contracts including a toll road concession “Ruta del Sol Sector 2” awarded toConcesionaria Ruta del Sol S.A.S. (“Concesionaria Ruta del Sol” or “Concessionaire”)in 2009. Episol S.A., or “Episol,” a wholly-owned affiliate of Corficolombiana, is a minority (33%) non-controlling shareholder in the Concessionaire and Odebrecht is the majority controlling and operating shareholder with a participation of 62%. A third shareholder, CSS Constructores S.A., participates with 5%.
As a result of Odebrecht’s plea, Colombia’s Attorney General’s Office (Fiscalía General de la Nación) initiated an investigation that has made findings to date that, among other things, Odebrecht made campaign contributions to
both of the contending political parties in the past presidential election, an illegal act under Colombian law. Furthermore, theFiscalía General de la Nación has determined that Odebrecht effected payments directly from its Brazilian headquarters through its division of structured operations in order to obtain the abovementioned Government concession contract.
The Odebrecht scandal has also prompted additional investigations from other judicial and administrative authorities such as the Superintendency of Industry and Commerce, Superintendency of Corporations and the Superintendency of Transportation.
New or higher taxes resulting from changes in tax regulations or the interpretation thereof in Colombia and other countries in which we operate could adversely affect our results of operations and financial condition.
New tax laws and regulations, and uncertainties with respect to future tax policies, pose risks to us. In recent years, Colombian tax authorities have imposed additional taxes in a variety of areas, such as taxes on financial transactions and taxes to fund Colombia’s war against terrorism and taxes to fund post-conflict programs related to the peace negotiations with guerrilla forces. Changes in tax-related laws and regulations, and interpretations thereof, can affect tax burdens by increasing tax rates and fees, creating new taxes, limiting tax deductions, and eliminating tax-based incentives and non-taxed income. In addition, tax authorities or courts may interpret tax regulations differently than we do, which could result in tax litigation and associated costs and penalties.
Until December 31, 2016, in order to avoid double taxation, our Colombian subsidiaries usually distributed dividends from profits that had already been subject to income tax at the corporate level. These dividends were usually not taxable for Grupo Aval in Colombia, and dividends paid by Grupo Aval to its shareholders in Colombia from these sources of income also were usually not taxable, in each case provided that such profits had been taxed at the subsidiary level. However, in December 29, 2016, the Colombian government enacted a new tax reform (Law 1819) eliminating this treatment and introducing other substantial changes to the then current tax legal framework, including, pursuant to certain rules, taxation on dividends distributed to residents and non-residents from profits generated from 2017 onwards, a modified corporate income tax regime, and an increase in the Value Added Tax rate, among others. Law 1819 of 2016, also derogated Article 36-1 of the Colombian Tax Code which established that capital gains obtained in a sale of shares listed on the Colombian Stock Exchange were not subject to income tax in Colombia, provided that the shares sold by the same beneficial owner during each fiscal year did not represent more than 10% of the issued and outstanding shares of the listed company. See “Item 4. Information on the Company—B. Business overview—Supervision and regulation—Tax Reforms.”
Between 2012 and 2016, the Colombian Congress passed three tax reforms submitted by the Colombian government. The Colombian government may implement new changes in the tax rules applicable to our securities which could have a material adverse effect on our results of operations and financial condition or that may adversely affect our shareholders or holders of ADSs. ADSs do not have the same tax benefits as equity investments in Colombia. Although ADSs represent our preferred shares, they are subject to a different tax regulatory regime. Accordingly, the tax benefits applicable in Colombia to equity investments, in particular those relating to dividends and profits from sale, may not apply or apply differently in the case of our ADSs.
In addition to the tax reform approved in December 2014, the Colombian Congress enacted Law 1819 on December 29, 2016, introducing substantial changes to the then current tax legal framework, including, pursuant
to certain rules, taxation on dividends distributed to residents and non-residents from profits generated from 2017 onwards, a modified corporate income tax regime, and an increase in the Value Added Tax rate, among others.
Colombian tax haven regulations could adversely affect our results of operations and financial condition.
Decree 1966 of 2014, as amended by National Decree 2095 of 2014, put into effect article 260-7 of Colombia’s Tax Code, which regulates applicable rules for tax havens. Accordingly, a number of jurisdictions, including countries in which our banking subsidiaries operate, were either declared tax havens for Colombian tax purposes or temporarily excluded from such list subject to the completion of tax information exchange treaties within a short timeframe.
Article 260-7 of the Colombian Tax Code was recently reformed by Law 1819 of 2016. This reform establishes a new legal framework and provides criteria pursuant to which certain jurisdictions may be classified as non-cooperative jurisdictions with low or no taxation or as jurisdictions with preferential tax regimes. The new legal
framework establishes a higher tax-withholding rate on Colombian source payments to those jurisdictions and entities considered part of such a jurisdiction.
As a result, some of our clients with financial products offered by our banking subsidiaries in such jurisdictions may experience, among other effects, an increase in their withholding tax rates, transfer pricing regulation, increased likelihood of being found in violation of tax regulations by the Colombian authorities and elevated information disclosure requirements which could have a negative impact on our business, financial condition and results of operations.
As part of these discussions, Colombia and Panama signed a memorandum of understanding establishing that both countries will negotiate a treaty in order to avoid double taxation. The treaty is expected to include provisions regarding the exchange of information between Colombian and Panamanian tax authorities. In October 2016, Panama ratified to the Convention on Mutual Administrative Assistance in Tax Matters developed by the OECD as a multilateral instrument of tax cooperation to tackle tax evasion and avoidance. The convention facilitates bilateral agreements for the automatic exchange of information by participating jurisdictions. Failure to execute this treaty or the designation of Panama as a tax haven could have a negative impact on our customer base and on our business, financial condition and results of operations.
Natural disasters, acts of war or terrorism, or other external events could disrupt our businesses and affect our results of operations and financial condition.
We are exposed to natural disasters, such as earthquakes, volcanic eruptions, tornadoes, tropical storms and hurricanes. Heavy rains or abnormally low rainfall in Colombia, attributable in part to the La Niña and El Niño weather patterns, have resulted in severe flooding and mudslides and prolonged droughts in the past. These are recurring weather phenomena that may contribute to flooding, mudslides, droughts or other natural disasters on an equal or greater scale in the future. In addition to severe weather and natural disasters, acts of war or terrorism and other adverse external events could have a significant impact on our ability to conduct business and may, among other things, affect the stability of our deposit base, impair the ability of borrowers to repay outstanding loans, impair the value of collateral securing loans, cause significant property damage, cause us to incur additional expenses and/or result in loss of revenue. In the event of such circumstances, our disaster recovery plans may prove to be ineffective, which could have a material adverse effect on our ability to conduct our businesses, particularly if such an occurrence affects computer-based data processing, transmission, storage and retrieval systems or destroys customer or other data. In addition, if a significant number of our employees and senior managers were unavailable because of a natural disaster, our ability to conduct our businesses could be compromised. Natural disasters, acts of war or similar events could also result in substantial volatility in our results of operations for any fiscal quarter or year.
Risks relating to our businesses and industry
Risks relating to our banking business
A deterioration in asset quality, including the loan portfolios of our bank subsidiaries, may have an adverse effect on our results of operations and financial condition.
Changes in the financial condition or credit profiles of customers of our banking subsidiaries and increases in inflation or interest rates could have a negative effect on the quality of our banks’ loan portfolios, potentially requiring them to increase impairment loss on loan and accounts receivable or resulting in reduced profitability. In particular, the percentage of non-performing loans may increase in the future as a result of factors beyond our control, such as economic conditions and political events affecting Colombia generally or specific sectors of the economy.
A substantial number of our banks’ customers are individuals and small and medium sized enterprises, or “SMEs,” and these customers are potentially more susceptible to downturns in the economy than large corporations and high-income individuals. For example, unemployment directly affects the ability of individuals to obtain and repay consumer and residential mortgage loans. Consequently, our banking subsidiaries may experience higher levels of non-performing loans, which could result in increased impairment losses on loan and accounts receivable due to defaults by, or deterioration in the credit profiles of, individual borrowers. Non-performing loans and resulting loan losses may increase materially in the future and adversely affect our results of operations and financial condition.
Existing loan loss allowances may not be adequate to cover any increases in non-performing loans or deterioration in the credit quality of loan portfolios. As a result, our banking subsidiaries may be required to increase impairment loss on loan and accounts receivable, which may adversely affect our results of operations and financial condition.
In addition, there is no precise method for predicting loan and credit losses, such that loan loss allowances may not be sufficient to cover actual losses. If we and our banking subsidiaries are unable to manage the level of non-performing or other poor credit quality loans, our results of operations and financial condition would be materially and adversely affected.
The loan portfolios of our banking subsidiaries have grown substantially in recent years. See “Item 4. Information on the Company—B. Business overview—Selected statistical data.” As default rates generally increase with the age of loans, the level of non-performing loans may lag behind the rate of growth in loans but may increase when growth slows or the loan portfolios become more mature. As a result, historic loan loss experience may not necessarily be indicative of future loan loss experience.
Our banking subsidiaries may be unable to realize on collateral or guarantees securing loans, which may adversely affect their results of operations and financial condition.
Our banking subsidiaries make loans that are secured by collateral, including real estate and other assets that are generally located in Colombia and the countries where we operate. The value of collateral may significantly fluctuate or decline due to factors beyond the control of our subsidiaries, including, for example, prevailing economic and political conditions in the relevant jurisdiction. At December 31, 2016, 50.6% of total past due loans (including our foreign operations) were secured. An economic slowdown may lead to a downturn in the Colombian or Central American real estate markets, which may, in turn, result in declines in the value of real estate securing loans to levels below the principal balances of these loans. Any decline in the value of the collateral securing these loans or any other collateral securing these loans may result in reduced recoveries from collateral realization and have an adverse effect on our results of operations and financial condition. We may also not have sufficiently recent information on the value of collateral, which may result in an inaccurate assessment for impairment losses of our loans secured by such collateral. If this were to occur, we may need to make additional impairments to cover actual impairment losses of our loans, which may materially and adversely affect our results of operations and financial condition.
Our banking subsidiaries also make loans on the basis of guarantees from relatives, affiliates or associated persons of their principal borrowers. To the extent that guarantors encounter financial difficulties due to economic conditions, personal or business circumstances, or otherwise, the ability of our banks to enforce such guarantees may be impaired.
In addition, our banking subsidiaries may face difficulties in enforcing their rights as secured creditors against borrowers, collateral or guarantees. In particular, timing delays and procedural problems in realizing against collateral, as well as debtor-protective judicial interpretations of the law, may make it difficult to foreclose on collateral, realize against guarantees or enforce judgments in our favor, which could materially and adversely affect our results of operations and financial condition.
Colombian insolvency laws may limit the ability of our banking subsidiaries to collect on monetary obligations and enforce rights against collateral or under guarantees.
Colombian insolvency laws provide that creditors of an insolvent debtor are prohibited from initiating collection proceedings outside the bankruptcy or reorganization process of such debtor. In addition, all collection proceedings outstanding at the beginning of the bankruptcy or reorganization process must be suspended and any creditors are prevented from enforcing their rights against the collateral and other assets of the insolvent debtor.
Once a non-merchant individual has ceased paying his or her debts, such individual can initiate a voluntary insolvency proceeding before a notary public or mediator to reach an out-of-court agreement with creditors. The terms of any agreement reached with a group (two or more) of creditors that represent more than 50% of the total amount of the claims will be mandatorily applicable to all relevant creditors. The insolvency law also provides for increased debtor protections, including an automatic stay for a maximum of 90 days. A perception that loans to individuals may be difficult or impossible to recover could cause our banking subsidiaries to enhance credit requirements and result in decreased lending to individuals by making access to credit more expensive or more
onerous. In addition, increased difficulties in enforcing debt and other monetary obligations due to Colombian insolvency laws could have an adverse effect on our results of operations and financial condition.
Any failure of risk management processes, including credit and market risk, could materially and adversely affect our banking businesses, results of operations and financial condition.
Credit risk is the principal risk inherent in the business of our banks. Although we have group-wide risk management guidelines, each bank is responsible for managing its own risk. Each bank’s policies and procedures, which are designed to identify, monitor and manage risk, may prove to be insufficient. Furthermore, our banks may not be able to upgrade risk management systems on a timely basis. For example, our banks’ risk management systems utilize an internal credit rating system to assess the risk profile of each customer. As this process involves detailed analyses of the customer’s credit risk, taking into account quantitative and qualitative factors, it is necessarily subject to human error. Due to limitations in the availability of information and the developing information infrastructure in Colombia, our assessment of credit risk associated with a particular customer may not be based on complete, accurate or reliable information. Personnel of our banking subsidiaries may fail to detect risks before they occur, or may not effectively implement their risk management systems, which may increase exposure to credit risk. As a result, any failure by our banking subsidiaries to effectively implement or consistently follow or refine risk management systems may result in higher risk exposures for our banking subsidiaries, which could materially and adversely affect our results of operations and financial condition.
Declines in the value of our banks’ sovereign debt portfolios could have an adverse effect on our results of operations.
Our Colombian banks’ portfolio of securities primarily consists of sovereign bonds, mainly securities issued or guaranteed by the Colombian government. LB Panamá’s securities portfolios primarily consist of securities issued by corporate and sovereign issuers. We are exposed to significant credit, market and liquidity risks associated with sovereign debt. At December 31, 2016 and 2015, debt securities represented 10.1% and 11.3%, respectively, of our consolidated total assets; approximately 51.2% and 55.4%, respectively, of these securities were issued or backed by the Colombian government, and 9.6% and 8.2% of these securities, respectively, were issued or backed by Central American governments during each period. A significant decline in the value of these government securities could materially and adversely affect our debt securities portfolio and, consequently, our financial condition and results of operations. See “Item 4. Information on the Company—B. Business overview—Supervision and regulation—Mandatory investments.”
We are subject to market risk in our banking business.
Our bank subsidiaries are directly and indirectly affected by changes in market conditions. Market risk, or the risk that the value of assets and liabilities or revenues will be adversely affected by variation in market conditions, is inherent in the products and instruments associated with our operations, including loans, deposits, securities, bonds, long-term debt, short-term borrowings, proprietary trading in assets and liabilities and derivatives. Changes in market conditions that may affect our financial condition and results of operations include fluctuations in interest and currency exchange rates, securities prices, changes in the implied volatility of interest rates and foreign exchange rates, among others.
We are subject to counterparty risk in our banking business.
Our banks and, to a lesser extent, Corficolombiana, Porvenir and our international banking operations, are exposed to counterparty risks in addition to credit risks associated with lending activities. Counterparty risk may arise from, for example, investing in securities of third parties, entering into derivative contracts under which counterparties have obligations to make payments to us, or executing securities, futures, currency or commodity trades from proprietary trading activities that fail to settle at the required time due to non-delivery by the counterparty or systems failure by clearing agents, exchanges, clearing houses or other financial intermediaries. These risks could materially and adversely affect our results of operations and financial condition.
Our banks are subject to market and operational risks associated with derivatives transactions.
Our banks and, to a lesser extent, Corficolombiana, Porvenir and our international banking operations, enter into derivatives transactions primarily for hedging purposes and, on a limited basis, on behalf of customers. Those transactions subject us to market and operational risks, including basis risk (the risk of loss associated with
variations in the spread between the asset yield and the funding and/or hedge cost) and credit or default risk (the risk of insolvency or other inability of a counterparty to perform its obligations to us).
Market practices and documentation for derivatives transactions in Colombia and the countries where we operate, may differ from those in other countries. For example, documentation may not incorporate terms and conditions of derivatives transactions as commonly understood in other countries. In addition, the execution and performance of these transactions depend on our banks’ ability to develop adequate control and administration systems, and to hire and retain qualified personnel. Moreover, our banks’ ability to monitor and analyze these transactions depends on their information technology systems. These factors may further increase risks associated with derivatives transactions and could materially and adversely affect our results of operations and financial condition.
Our banking subsidiaries are subject to liquidity risk, which may result in increases to funding costs.
The principal sources of funding for our banking subsidiaries are savings deposits, time deposits and checking accounts, which together represented 72.0% and 69.9% of consolidated total liabilities at December 31, 2016 and 2015, respectively. Because our banking subsidiaries rely primarily on short-term deposits for funding, a sudden or unexpected shortage of funds in the banking systems in which we operate and overnight money markets may prevent our banking subsidiaries from meeting their obligations or obtaining necessary funding without incurring higher costs or selling certain assets at prices below prevailing market values, which could materially and adversely affect our results of operations and financial condition.
Default by one or more of our largest borrowers could adversely affect our results of operations and financial condition.
The aggregate outstanding loans to our banks’ ten largest borrowers represented 5.1% of our consolidated total loan portfolio at December 31, 2016. Default on loans by one or more of these borrowers may adversely affect our results of operations and financial condition.
In connection with the aforementioned Odebrecht scandal, on February 22, 2017, Colombia’s National Agency of Infrastructure (“ANI”) andConcesionaria Ruta del Sol, entered into an agreement for the termination and liquidation of Concession Contract No. 001 of 2010 regarding the construction of toll road projectRuta del Sol Sector 2. The agreement includes a formula or liquidation based on the parameters of the Public Administration’s General Contracting Statute (Law 80 of 1993), according to which, subject to compliance of certain conditions, the ANI will recognize the investments made and costs incurred byConcesionaria Ruta del Solin connection with the construction conducted during the last 7 years, net of any payments previously paid by the government to the Concessionaire, toll collections, and other sources of income associated with the project. The excess of investments and costs over payments received will be used first to repay the Concessionaire’s outstanding debt and secondly to return the shareholders’ equity in the project.
As of December 31, 2016,Concesionaria Ruta del Sol had outstanding loans in the amount of Ps 2.4 trillion (approximately U.S.$800 million) of which Ps 1.2 billion (approximately U.S.$400 million) had been granted by our banking subsidiaries. The Concessionaire is one of our ten largest borrowers. We believe that the amounts to be paid by the ANI will be sufficient to allow the full payment ofConcesionaria Ruta del Sol’s indebtedness with financial entities, including indebtedness with our banking subsidiaries. However, legal challenges to the agreed upon liquidation formula, of which none have of yet been presented, could adversely affect our results of operations and financial condition.
Electrificadora del Caribe S.A. E.S.P. (“Electricaribe”), a provider of electricity to 2.6 million individual and industrial clients in the northern region of Colombia and a 85% owned subsidiary of Gas Natural Fenosa (Spain), was intervened by the Superintendency of Public Services on November 14, 2016. Subsequently, on March 14, 2017, the Superintendency determined the liquidation of the company provided that such process included a period of temporary management to ensure uninterrupted electricity services to the company´s clients.
As of December 31, 2016,Electricaribehad outstanding loans and guarantees in the amount of Ps 1.8 trillion (U.S.$612 million) of which Ps 564 billion (U.S.$188 million) had been disbursed or issued by our banking subsidiaries and Corficolombiana. We believe that the liquidation process ofElectricaribe will result in the sale of the company’s assets as a going concern entity and therefore eventual buyers of the assets will assume all of
Electricaribe’s financial obligations. However, the liquidation process and the expected value of the assets could differ from our assumption and may adversely affect our results.
Downgrades in our long-term credit ratings or in the credit ratings of our banking subsidiaries would increase the cost of, or impair access to, funding.
Our credit ratings and those of our banking subsidiaries are an important component of our and our banking subsidiaries’ ability to obtain funding. Our banking subsidiaries’ ability to compete successfully in the marketplace for deposits depends on various factors, including their financial stability as reflected by their credit ratings. A downgrade in credit ratings may adversely affect perception of their financial stability and ability to raise deposits. On March 9, 2016, Moody’s downgraded Banco de Bogotá’s standalone baseline credit assessment to “Ba1” from “Baa3” and its long-term foreign currency subordinated debt rating to “Ba2” from “Ba1”. As a result of the downgrades on Banco de Bogotá, Moody’s also downgraded Grupo Aval’s Long term local and foreign currency issuer ratings to “Ba2” from “Ba1” and Grupo Aval Limited’s long term foreign currency issuer to “Ba2” from “Ba1”. Such ratings were assigned in consideration of the decrease in Banco de Bogotá’s adjusted capital ratio. On April 28, 2016, Fitch placed certain of our and Banco de Bogotá’s ratings on negative watch for downgrade noting a decrease in Banco de Bogotá’s capital ratios resulting from the depreciation of the Colombian peso in 2015 which boosted its U.S. dollar denominated risk-weighted assets. Fitch also reasoned that the change in our accounting standards to IFRS contributed to a decrease in the bank’s capital ratios. On June 28, 2016, Moody’s removed the negative watch on Banco de Bogotá’s and Grupo Aval’s rating but kept it under review for downgrade. Adverse changes in credit ratings could also increase the cost of funding in the capital markets or borrowing funds for our and our subsidiaries’ operations. In addition, lenders and counterparties in derivatives transactions are sensitive to the risk of a ratings downgrade. Any downgrade in our credit ratings or in any of our banking subsidiaries’ credit ratings could materially and adversely affect our results of operations and financial condition.
Our banking subsidiaries may not have the ability to attract capital necessary to maintain regulatory ratios and fund growth.
Our banking subsidiaries are subject to regulations that require them to maintain certain capital ratios. If their regulatory capital ratios decline as a result of decreases in the value of their loan portfolio or otherwise, they will be required to improve such ratios by either raising additional capital or disposing of assets. Our banking subsidiaries may need to raise additional capital in the future to obtain sufficient capital resources to maintain capital ratios and provide liquidity to meet their commitments and business needs, particularly if their asset quality or earnings were to deteriorate.
The ability to raise additional capital will depend on several things, especially conditions in the capital markets, which are outside of our and our banking subsidiaries’ control, as well as our and our banking subsidiaries’ financial performance. Adverse changes in our, and our banking subsidiaries’ credit ratings could increase the cost of funding in the capital markets. Economic conditions and the loss of confidence in financial institutions may increase cost of funds and limit access to some customary sources of capital.
We cannot provide assurances that such capital will be available on acceptable terms or at all. Any occurrence that may limit our and our banking subsidiaries’ access to the capital markets, such as a decline in the confidence of debt purchasers, depositors, or counterparties participating in the capital markets may adversely affect capital costs, ability to raise capital, and liquidity. Moreover, our banking subsidiaries may need to raise capital when many other financial institutions are also seeking to raise capital which, in turn, would require us to compete with numerous other institutions for investors. An inability to raise additional capital on acceptable terms when needed could have a materially adverse effect on our banking subsidiaries’ financial conditions and results of operations.
Our banking subsidiaries’ loan portfolios are subject to risk of prepayment, which may result in reinvestment of assets on less profitable terms.
The loan portfolios of our banking subsidiaries are subject to prepayment risk, which results from the ability of a borrower to pay a loan prior to maturity. Generally, in a declining interest rate environment, prepayment activity increases with the effect of reducing weighted average lives of interest-earning assets and adversely affecting results. Prepayment risk also has an adverse effect on credit card and collateralized mortgage obligations, since prepayments could shorten the weighted average life of these portfolios, which may result in a mismatch in funding or in reinvestment at lower yields.
The credit card industry is highly competitive and entails significant risks, including the possibility of overindebtedness of customers, which could have a material adverse effect on us.
The credit card business is subject to a number of risks and uncertainties, including the possibility of overindebtedness of our customers, despite our focus on low-risk, middle- and high-income customers.
The credit card industry is characterized by higher consumer default than other segments of the credit markets, and defaults are highly related to macroeconomic indicators that are beyond our control. Part of our current growth strategy is to increase volume and number of cards in the credit card portfolio, at the same or a higher rate than the market, which may increase our exposure to risk in our loan portfolio. If Colombian and Central American economic growth slows or declines, or if we fail to effectively analyze the creditworthiness of our customers (including by targeting certain sectors), we may be faced with unexpected losses that could have an adverse effect on our results of operations and financial condition.
Changes in banking laws and regulations in Colombia and the other countries in which we operate could adversely affect our consolidated results.
Banking and financial services laws and regulations are subject to ongoing review and revision, including changes in response to global regulatory trends. As a result, governments have been actively considering new banking laws and regulations, and reviewing and revising existing laws and regulations, particularly in relation to capital adequacy and accounting standards. In addition, various international developments, such as the adoption of risk-based capital, leverage and liquidity standards by the Basel Committee on Banking Supervision in December 2010, known as “Basel III,” will continue to impact us in the coming years. To prepare for the implementation of the Basel III accords in Colombia, the Ministry of Finance, in consultation with the Superintendency of Finance, effected an internal review of regulations applicable to financial institutions. Decree 2555 of 2010 was amended in 2012 and 2015, modifying certain capital adequacy requirements for Colombian credit institutions. Although Decree 2555 of 2010 maintained the requirement for a credit institution’s technical capital to be at least 9.0% of that institution’s total risk-weighted assets, it also introduced a new measure of “core solvency” for Common Equity Tier 1, which requires higher quality capital and is set at a minimum of 4.5% of risk-weighted assets.
Moreover, Congress enacted Law No. 1735 of 2014, created a new type of financial institution with the sole purpose of offering electronic deposits and payments (Sociedades Especializadas en Depósitos y Pagos Electrónicos or “SEDPEs”) in order to promote financial inclusion. Regulation of the operations of the SEDPEs as well as know-your-customer requirements, were included by the Colombian government in Decree 1491 of 2015. SEDPEs’ activities may create a new competitive environment that could adversely affect our consolidated results of operations.
Central America has been impacted by these regulatory changes regarding banking laws and regulations. In Honduras, the National Commission of Banks and Insurances (NCBI) has enacted a new regulation with respect to capital adequacy, capital conservation buffer and leverage requirements applicable to Honduran financial institutions, which has been effective since January 2017. Such regulation requires, among others, that in a three-year-period financial institutions maintain a capital conservation buffer ratio equivalent to three per cent (3%) above the minimum capital adequacy ratio of 10% or above the minimum capital adequacy ratio define by the NCBI for a financial institution in an individual basis. Financial institutions are also required to maintain a minimum leverage ratio of four per cent (4%). Minimum leverage ratio is calculated by dividing the primary capital (as defined in those regulations) by the sum of the total assets and the unweighted contingent assets (net of impairment, depreciation, and amortization estimates). Financial institutions with a minimum leverage ratio below such limit are required to gradually adjust it within the timeframe stated in the regulation.
During recent years, legislators in Central America have unsuccessfully attempted to enact regulation to impose maximum interest rates for all or certain types of loans. Although the scope of these legislative initiatives has varied, these initiatives have primarily focused on personal loans and, particularly, on credit card loans. The enactment of any of these bills or similar regulations in the countries where we operate could have an adverse effect on the results of the operations and financial condition in such jurisdiction.
As part of a legislative effort to narrow the current fiscal deficit the Salvadorian congress enacted Decree No. 161 in 2015, which created an annual special contribution tax applicable to large taxpayers. The special contribution tax is equal to 5% of net income, provided that it exceeds USD $500,000. This new tax took effect on November 13,
2015. The Salvadorian congress also enacted Decree No. 764 in 2014, contemplating certain tax reforms that include the introduction of a new withholding tax of 0.25% or “2.5 per 1000” on financial transactions made by check or wire transfer and on cash transactions made through the Salvadorian financial system in excess of U.S.$5,000 on a single or monthly aggregate basis. Even though Decree No. 764 exempted certain financial transactions, this new withholding tax, which has been effective since September 2014, has had an adverse in the results of our banking, credit card and brokerage operations in El Salvador. An increase in the withholding tax established by Decree No. 764 and further or similar regulation in El Salvador or elsewhere in Central America may adversely impact the result of our subsidiaries in such countries.
On December 8, 2015, the Guatemalan congress passed Decree 7 of 2015, also known as the Credit Cards Law, establishing among others, a limit in the interest rate that may be charged to cardholders.
On March 2016 the Guatemalan Constitutional Court found unconstitutional such decree. Nevertheless, the regulation of credit cards in other Central American Countries such as Honduras is been currently discussed and there is a draft bill in the congress with the purpose of regulating the interest rate and other conditions related to the issuance of credit cards.
Additionally, there have been relevant changes in Guatemala, regarding rules for collection and information on bank’s customers. First, on May 26, 2016 Decree 28 was passed to modify Article 46 of the Banks and Financial Groups Act which creates certain rules relating the collection process in order to avoid harassment by debt collectors. Such regulation may reduce the current levels of collection. Second, on July 19, 2016, the Guatemalan Congress passed Decree 37 of 2016, which modify articles 63 and 113 of the Banks and Financial Groups Act and includes new articles to the Guatemalan Tax Code regarding bank secrecy. Such change allows the Superintendency of Tax Administration of Guatemala to lift the bank secrecy and require certain customer information to banks, through a judicial procedure in which either the bank nor the customer are parties. In addition, banks will be required to comply in a short period (i.e. 8 days maximum) subject to certain sanctions.
The adoption of new laws or regulations, or changes in the interpretations or enforcement of existing laws or regulations may have an adverse effect on our results of operations and financial condition.
The adoption of new laws or regulations, or changes in the interpretations or enforcements of existing laws or regulations, may have an adverse effect on our results of operations and financial conditions. In the future, we may be subject to supervision as a bank holding company.
The Colombian government presented to the Colombian Congress a bill that sets out the principles for supervising and regulating financial conglomerates (Ley de Conglomerados Financieros). The proposal establishes the criteria forFinancial Conglomeratesas well as their controllingFinancial Holding Companies and provides the Colombian Government and Superintendence of Finance with tools to regulate and supervise financial conglomerates with respect to, capital adequacy, corporate governance standards, financial risk management and internal control framework and criteria for identifying, administering, monitoring and revealing conflicts of interest. The proposal also includes powers enabling the Superintendence to among others: require changes in the structure of the financial conglomerate when the existing structure does not allow sufficient disclosure of information and a comprehensive and consolidated supervision, the ability to conduct on-site visits and withdrawal of operating licenses.
Regulatory actions may result in fines, penalties or restrictions that could materially and adversely affect our businesses and financial performance.
Our Colombian banks, as well as Corficolombiana, Porvenir and our international banking operations, are subject to regulation and supervision by financial authorities. These regulatory authorities have broad powers to adopt regulations and other requirements affecting or restricting virtually all aspects of our subsidiaries’ organization and operations, including, for example, the imposition of anti-money laundering measures and the authority to regulate the terms and conditions of credit that can be applied by Colombian banks. Failure to comply with applicable regulations could subject our banking subsidiaries to fines or sanctions or even revocation of licenses or permits to operate. In the event that any of these subsidiaries encounters significant financial problems, are in danger of insolvency or become insolvent, or are otherwise deemed to not be viable, the financial authorities would have broad powers to intervene in our management and operations, including suspending or removing management and, in extreme circumstances, putting our banks, Corficolombiana, Porvenir and our international
banking operations, into conservatorship or receivership or taking control of our banks, Corficolombiana, Porvenir and our other subsidiaries. Grupo Aval is required, as an issuer of securities in Colombia, to submit information to the Superintendency of Finance and comply with corporate governance requirements; however, we are not regulated as a financial institution or as a bank holding company, and we are not required to comply with capital adequacy regulations applicable to banks and other financial institutions. We may, however, become subject to more stringent regulation in the event that our status as a non-financial entity is not maintained by Colombian authorities in the future.
We may face legal and other challenges to maximizing revenue from credit card fees and other fees from customers.
As part of their credit card business, our bank subsidiaries face pressures related to the fees and commissions charged to merchants (merchant discounts) and the pricing of bank interchange fees charged by issuer banks to acquiring banks. Banks and card processors in Colombia have been subject to administrative investigations regarding the fees and commissions that are charged to the merchants by the acquiring banks and in respect to the banking interchange fees.
In the past, the Superintendency of Industry and Commerce (Superintendencia de Industria y Comercio) has conducted investigations on the practices of theAsociación Gremial de Instituciones Financieras Credibanco (the Visa franchisee in Colombia) andRedeban Multicolor S.A. (theMasterCard franchisee in Colombia), the entities used by most Colombian banks to manage the credit card system in Colombia, relating to alleged price fixing schemes among Colombian banks relating to fees and commissions charged to merchants. The Superintendency of Industry and Commerce has also conducted investigations into certain Colombian banks in the past, including our Colombian banking subsidiaries, for alleged price fixing of bank interchange fees charged during the period from May 2007 to October 2008.
It is possible that similar investigations may be carried out by the relevant authorities in the future, which may result in lower fees charged to merchants and bank interchange fees, and/or lead to changes in commercial strategies that may adversely affect our results of operations and financial condition. We may also be subject to financial penalties in connection with such future investigations. In addition, fees charged for other banking services may continue to be reduced in the future as a result of regulatory measures and/or pressure from retailers and interest groups.
Failure to protect personal information could adversely affect our reputation and our business.
Our banks manage and hold confidential personal information of customers in the normal course of their banking operations. Although our banks have procedures and controls to safeguard personal information in our possession, unauthorized disclosures or unauthorized access to privileged information, fraud or interfering with regular banking and other services could subject our banks and us to legal actions, administrative sanctions and damages. Any failure to protect personal information could result in reputational damage and have an adverse effect on our results of operations and financial condition.
Risks relating to our merchant banking business
Difficult market conditions can adversely affect Corficolombiana’s business.
Corficolombiana may be adversely affected by lower than expected returns on investments, reduced opportunities to realize value from investments, and failure to find suitable investments so as to deploy capital effectively. During periods of difficult market conditions (which may span across one or more industries, sectors or geographies), portfolio companies may experience adverse operating performance, decreased revenues, financial losses, difficulty in obtaining access to financing or increased funding costs. Negative financial performance of portfolio companies may materially and adversely affect Corficolombiana’s results of operations and cash flow. If the operating performance of those portfolio companies (as well as valuation multiples) does not improve following any such downturn or other portfolio companies experience adverse operating performance, Corficolombiana may be forced to sell those assets at values that are less than projected or even at a loss. Portfolio companies may also have difficulties expanding their businesses and operations or meeting debt service and other obligations as they become due. Furthermore, negative market conditions could potentially result in a portfolio company entering bankruptcy proceedings, thereby potentially resulting in a complete loss of the investment. Although market conditions showed some signs of improvement, economic and market conditions may not continue to improve. Even
if such conditions do improve broadly and significantly over the long term, adverse conditions and/or other events in particular sectors may cause our performance to suffer further.
Corficolombiana’s due diligence process for evaluating prospective investments may not identify all risks or ensure investment returns.
Before making investments, Corficolombiana conducts due diligence that it deems reasonable and appropriate based on the facts and circumstances applicable to each investment. When conducting due diligence, it may be required to evaluate important and complex business, financial, tax, accounting, environmental and legal issues. Outside consultants, legal advisors, accountants and investment banks may be involved in the due diligence process to varying degrees depending on the type of investment, but we may be unable to engage these third parties in a timely manner, or at all. Nevertheless, the due diligence investigation carried out by Corficolombiana with respect to any investment opportunity may not reveal or highlight all relevant risks of such investment opportunity. Moreover, such an investigation will not necessarily result in the investment being successful.
A significant part of Corficolombiana’s investments are in relatively illiquid assets, and Corficolombiana may fail to realize any profits from these investments for a considerable period of time or lose some or all of the principal amount of these investments.
At December 31, 2016, 59.0% of Corficolombiana’s investments were in securities of privately held companies. There are often no readily ascertainable market prices for such securities or for those investments of Corficolombiana in listed companies with low or medium trading volumes. As a result, there may be limited or no marketability for these investments, and they may decline in value while Corficolombiana is seeking to dispose of them. Because there is significant uncertainty as to the valuation of illiquid investments, the stated values of such investments may not necessarily reflect the values that could actually be realized by Corficolombiana. In addition, in some cases, Corficolombiana may be prevented by contract from selling such securities for a period of time. Corficolombiana’s ability to dispose of investments may also be dependent on factors beyond its control. Thus, it is possible that investments in privately held companies may only be disposed of over a substantial length of time, if at all, exposing the investment returns to risks of declines in market prices during the intended disposition period. Accordingly, under certain conditions, Corficolombiana may be forced to either sell securities at lower prices than it had expected to realize or defer—potentially for a considerable period of time—sales that it had planned to make.
In connection with the aforementioned February 22, 2017 agreement for the termination and liquidation of Concession Contract No. 001 of 2010 regarding the construction of toll road projectRuta del Sol Sector 2, according to the liquidation formula the ANI will recognize the investments made and costs incurred byConcesionaria Ruta delSol in connection with the construction conducted during the last 7 years, net of any payments previously paid by the government to the Concessionaire, toll collections, and other sources of income associated with the project. The excess of investments and costs over payments received will be destined first to repay the Concessionaire’s outstanding debt and secondly to return the shareholders’ equity in the project.
As of December 31, 2016, Episol’s investment in the Concessionaire amounted to Ps 0.35 trillion (approximately U.S.$118 million). We currently estimate that the amounts to be paid by the ANI will be sufficient to only partially repay the shareholders’ equity investment in the Concessionaire. Thus, as a result of this termination and liquidation agreement, Episol registered an impairment adjustment on its investment in theConcessionaire with effect in its December 31, 2016 results in the amount of Ps 102.3 billion (approximately U.S.$34 million). Corficolombiana registered a similar impairment adjustment on its investment in Episol. Both impairments were reflected in their respective income statements of the second semester of 2016. The effect of these impairments in Aval’s income statement amounted to approximately Ps 45.5 billion (approximately U.S.$15 million).
After the mentioned impairments, as of December 31, 2016, Corficolombiana’s indirect ownership in theConcessionaire, represented 0.1% of Grupo Aval’s total consolidated assets and 1.2% of Corficolombiana’s total consolidated assets.
Corficolombiana makes minority investments in companies that it does not control.
Corficolombiana’s investments include non-controlling equity interests, and it may also dispose of a portion of its majority equity securities in portfolio companies over time in a manner that results in Corficolombiana retaining minority investments. Those investments will be subject to the risk that the company in which the investment is
made may make business, financial or management decisions with which we do not agree. Similarly, the majority stakeholders or the management of the company may take risks or otherwise act in a manner contrary to our interests. If any of the foregoing were to occur, the values of these investments could decrease or we may not be able to dispose of them, which would adversely affect Corficolombiana’s results of operations and financial condition.
Corficolombiana’s new investment projects depend on its ability to access financing.
Corficolombiana may directly, or through its operating subsidiaries, enter into new investment projects such as infrastructure projects including toll-road fourth generation concessions that require significant financing. Corficolombiana or its operating subsidiaries may experience difficulties in accessing debt and equity financing resources required to fund such projects and/or may obtain them at higher costs and/or lower tenure than initially expected. As a result, Corficolombiana’s investment objectives may attain lower returns due to higher financing costs, delays in the investment schedule or any eventual stoppage of the investment project, which could also result in the payment of penalties to its counterparties, including the government entities in the case of development of new highways and toll-roads. If Corficolombiana is unable to obtain adequate financing on terms satisfactory to it, its ability to continue to grow or support its business and respond to business challenges could be significantly limited.
Most of Corficolombiana’s investments are concentrated in five industries.
The majority of Corficolombiana’s investment portfolio was concentrated in the energy and gas, infrastructure, agribusiness, hotels division and financial services. Energy and gas and infrastructure account for 81.0% of Corficolombiana’s total investment portfolio. During periods of difficult market conditions or slowdowns in these sectors, Corficolombiana may experience decreased revenues, difficulty in obtaining access to financing and increased funding costs.
Risks relating to our pension and severance fund management business
Porvenir operates in a highly regulated market, which limits its flexibility to manage its businesses.
Porvenir’s operations are regulated by Law 100 of 1993, as amended, the Organic Statute of the Financial System (Estatuto Orgánico del Sistema Financiero), or “EOSF,” issued by the Ministry of Finance, Decree 2555 of 2010, as amended, and regulations issued by the Superintendency of Finance and, to the extent applicable, Colombian Corporation Law. These regulations limit the range of assets in which pension fund administrators, or “AFPs,” can invest and also set investment limits, depending on the type of mandatory pension or severance fund managed by each AFP. AFPs can manage four types of mandatory pension funds (i) Lower Risk Funds (“Fondo Conservador”), (ii) Mid-Risk Funds (“Fondo Moderado”), (iii) High Risk Funds (“Fondo de Mayor Riesgo”) and (iv) Planned Retirement Funds (“Fondo Especial de Retiro Programado”), and two types of severance funds (i) Short Term Funds (“Portafolio de Corto Plazo”) and (ii) Long Term Funds (“Portafolio de Largo Plazo”). In addition, each AFP is legally required to provide a minimum return on investment for each of its pension and severance funds. This minimum return is determined pursuant to specified formulas established in Decree 2555 of 2010, as amended, which vary according to the type of fund. If a fund’s return for any month is lower than the minimum return, the AFP must cover the difference within a period of five days. To do so, the AFP must first apply funds from a stabilization reserve (a portion of the AFP’s capital invested in the fund equal to 1% of the value of each pension fund under management). If the stabilization reserve is insufficient to cover the difference, the AFP must provide resources from its own capital. If the AFP does not have enough resources to cover the difference, the Superintendency of Finance may order the capitalization of the AFP. If, notwithstanding the above, an AFP fails to observe either the minimum return or the stabilization reserve requirements or fails to comply with the order of capitalization, the Superintendency of Finance may take possession (tomar posesión) of the AFP, in which case the Colombian Deposit Insurance Fund (Fondo de Garantías de Instituciones Financieras), or “FOGAFIN,” must supply funds to cover the shortfall. Although Porvenir has never failed to meet the minimum requirements, failure to do so could require us to increase our investment in Porvenir, seek capital from alternative sources or forfeit our investment, or lead to the dissolution of the AFP and the transfer of the fund to another AFP. If Porvenir is unable to fulfill the minimum return or the stabilization reserve requirements, or if new laws or decrees impose more onerous requirements, Porvenir’s business may be materially adversely affected.
On December 6, 2013, the Colombian government issued Decree 2837 of 2013 to establish a group of financial experts to discuss and review the minimum return definition methodology. The group is led by the Minister of
Finance and includes the Financial Superintendent, a representative of the Colombian Central Bank, the Director of the Unit of Financial Regulation and five financial experts appointed by the Ministry of Finance. Since there has been no definition issued by the group of financial experts, we are uncertain about the way in which the minimum return definition methodology will be changed, more onerous requirements may be imposed on Porvenir, which may materially adversely affect its business, financial condition and results of operations. In addition, there are regulatory limitations on the commissions that Porvenir may charge for its services.
In 2009, the regulatory system began to shift the management of mandatory pension funds from a single-fund pension system to a multi-funds system, allowing pension funds to be more specifically tailored to the individual needs of customers according to their risk profiles. The Colombian government has for several years now announced that it is considering presenting to the Colombian Congress a bill to amend current pension fund regulation to improve access to coverage, reduce inequality, and consolidate the financial sustainability of the system. As a result of the accession process of the Colombian government to become a member country of The Organization for Economic Co-operation and Development (OECD) further regulation amending the current pension fund regulation may be expected. The future regulation may not provide a favorable business environment and may adversely affect our results of operations and the financial condition of our pension and severance fund management business.
A significant amount of debt securities in pension and severance funds managed by our pension and severance fund businesses are issued or guaranteed by the Colombian government.
Our pension and severance fund management business, like our banks and other participants in the banking industry, is subject to the risk of loss in value of sovereign debt securities. A significant decline in the value of the securities issued or guaranteed by the Colombian government could adversely affect the debt securities portfolio of our pension and severance fund management business and, consequently, our pension and severance fund management business’s results of operations and financial condition.
Other risks relating to our businesses
We are subject to fluctuations in interest rates and other market risks, which may materially and adversely affect our results of operations and financial condition.
Market risk refers to the probability of variations in income or in the market value of assets and liabilities due to changes in markets, including variations in market rates of interest and foreign currency exchange rates. Changes in interest rates affect the following areas, among others, of our banks’ businesses: net interest income, the volume of loans originated, market value of securities holdings, asset quality, and gains from sales of loans and securities. We do not manage market risk on a group-wide basis and are not subject to regulation or supervision of market risk on a group-wide basis.
Changes in short-term interest rates may affect interest margins quickly and, therefore, net interest income, which is the most important component of our revenue. Increases in interest rates may reduce the volume of loans originated by our banking subsidiaries. Sustained high interest rates may discourage customers from borrowing and may result in increased delinquencies in outstanding loans and deterioration in the quality of assets. Increases in interest rates may reduce the value of our assets, including the financial assets of our banks, the investments of Corficolombiana and the assets managed by Porvenir. Our banking subsidiaries hold a substantial portfolio of loans and debt securities that have both fixed and floating interest rates. In addition, we may incur costs (which, in turn, will affect our results of operations) if our banking subsidiaries implement strategies to reduce future interest rate exposure. Increases in interest rates may reduce gains or require our banking subsidiaries to record losses on sales of their loans or securities.
High interest rates have historically been common in many countries in Latin America. We have regional exposure to fluctuations in interest rates. If there are significant increases in such rates in any of the countries in which BAC Credomatic operates, our operating margins may be adversely affected and our results of operations may experience significant adverse consequences.
We face exposure to fluctuations in the rate of exchange between local currencies and the U.S. dollar, particularly given the fact that the currencies in countries where we and BAC Credomatic operate have historically experienced significant devaluations and depreciations. Fluctuations in the rate of exchange rate between the value of the Colombian peso or other local currencies where we operate, and the U.S. dollar, may also negatively affect our leverage ratios as measured by regulators or by rating agencies. The types of instruments exposed to foreign
exchange rate risk include, for example, investments in foreign subsidiaries, foreign currency-denominated loans and securities, foreign currency-denominated debt and various foreign exchange derivative instruments whose values fluctuate with changes in the level or volatility of currency exchange rates or foreign interest rates.
We may be adversely affected by fluctuations between the value of the Colombian peso or other local currencies where we operate, and the U.S. dollar as a result of U.S. dollar-denominated indebtedness and as a result of our Central American operations.
We are subject to impacts on our statement of income and/or statement of financial position derived from fluctuations of the Colombian Peso, in particular, against the U.S. dollar, where most of our foreign long-term debt is denominated, and the Colombian peso, and between the U.S. dollar and each of the currencies in our Central American operations, as 36.0% of our average consolidated assets for the year ended December 31, 2016 and 39.1% of our average consolidated liabilities for the year ended December 31, 2016 are foreign currency-denominated.
On a consolidated basis we have U.S.$3.6 billion (Ps 10.8 trillion) of long-term debt denominated in U.S. dollars as of December 31, 2016. Our significant dollar-denominated investments in Central America can affect our business. Fluctuations in the exchange rate between the Colombian peso and the U.S. dollar may affect the value of these debt and investments on our statement of financial position and cause us to recognize gains or losses in our statement of income. Any substantial fluctuation in the U.S. dollar relative to the Colombian peso could affect our results of operations and our ability to meet our future payment obligations and increase or decrease the peso value of our risk-weighted assets and goodwill, thereby affecting capital ratios of our banking subsidiaries.
The exchange rate fluctuation between the Colombian peso and U.S. dollar also affects our results as the functional currency of LB Panama, which consolidates BAC Credomatic, is the U.S. Dollar. See “Item 5. Operating and financial review and prospects—Results of operations for the year ended December 31, 2016 compared to the year ended December 31, 2015—Banco de Bogotá Subsidiary Analysis—LB Panamá” for a description of the effect of such fluctuation on LB Panama’s results.
A substantial portion of BAC Credomatic’s earnings, assets and liabilities are in Costa Rican colones, Guatemalan quetzals, Honduran lempiras, Nicaraguan córdobas, Panamanian balboas and U.S. dollars. As a result, our Central American operations are subject to risks relating to foreign currency exchange rate fluctuations between these currencies and pesos. Nevertheless, as described in “Item 4. Information on the Company—B. Business overview—Central American Operations—Foreign exchange rate risk related to BAC Credomatic,” BAC Credomatic maintains a U.S. dollar net asset position, which is intended to hedge at least 60% of its shareholders’ equity against the possible devaluations and depreciations of each of these local currencies.
We are subject to trading risks with respect to our trading activities.
Our banking subsidiaries, Corficolombiana, Porvenir and our other subsidiaries engage in proprietary trading, and we derive a portion of our profits from such trading activities. As a result, any reduction in trading income could adversely affect our results of operations and financial condition. Our trading income is volatile and dependent on numerous factors beyond our control, including, among others, market trading activity, interest rates, exchange rates and general market volatility. A significant decline in our trading income, or large trading losses, could adversely affect our results of operations and financial condition.
Declines in the market price for securities could result in our recording impairment losses as well as increased unrealized losses on other securities. Losses in the Colombian equity markets could result in further losses from impairment or sale of these securities. Any significant increases in exposure to any of these non-traditional risks, or a significant increase in credit risk or bankruptcy of any of the counterparties, could materially and adversely affect our results of operations and financial condition.
Colombian law imposes limitations on interest rates, and future additional restrictions on interest rates or banking fees could negatively affect our profitability.
The Colombian Commercial Code limits the amount of interest our Colombian subsidiaries may be charged on commercial transactions, including transactions of our banking subsidiaries. In the future, regulations in Colombia could impose increased limitations regarding interest rates or banking fees. Law 1430 of December 2010, as amended, authorizes the Colombian government to impose or place limits on tariffs and fees charged by banks and other financial institutions where the government has determined that there is insufficient competition in a relevant
market. Additionally, the law requires the Superintendency of Finance to implement a monitoring scheme of the tariffs and fees charged by the financial institutions in their relevant markets and to report the results of this evaluation semi-annually to the Colombian government. The Colombian government issued Decree 4809 of 2011 and Decree 1854 of 2015, which (1) requires banks to provide each of their clients with statements of all fees charged to such clients on an annual basis, (2) sets a limit on the fees that banks may charge to their clients for withdrawals from automated teller machines of other banks and (3) establishes that transactions through the internet may not cost more than those made through other channels. Accordingly, the Superintendency of Finance has issued External Circular 012 of 2012, setting the rules and principles that must be followed by banking and financial institutions at the time of establishing, publishing and promoting their tariffs and fees. A significant portion of our banks’ revenues and operating cash flow is generated by credit services and any such increased limitations would materially and adversely affect our results of operations and financial condition.
The Colombian Central Bank may impose requirements on the ability of Colombian residents, including us, to obtain loans denominated in foreign currency.
Under Colombian exchange control requirements, the Colombian Central Bank may impose certain mandatory deposit requirements in connection with foreign currency-denominated loans obtained by Colombian residents, including us. When the Colombian peso appreciated against foreign currencies in 2008, such mandatory deposit requirement was set at 40% of the amounts to be disbursed under any credit facility denominated in a foreign currency. Future measures or requirements imposed by the Colombian Central Bank, such as mandatory deposit requirements, may adversely affect our and our clients’ ability to obtain loans in foreign currency.
We face uncertainty regarding consumer protection laws.
Law 1328 of 2009 as amended by Law 1748 of 2014, also referred to as the “financial reform law,” created a new customer protection regime with respect to financial institutions. The financial reform law provides a bill of rights for consumers of financial services and products, including the right to receive clear, complete and reliable information about the services and products offered by financial institutions. The law also contains specific obligations for financial institutions, including a duty to maintain a financial ombudsman in charge of consumer protection and procedures regulating the responsibilities and functions of the ombudsman, a duty to create a financial consumer attention center pursuant to terms set by the Superintendency of Finance, an obligation to provide services and products under the same conditions offered to the general public, and a prohibition on the inclusion of predatory or abusive clauses in contracts with consumers. Any violation of this law and its implementing regulations by our banking subsidiaries could result in monetary or administrative sanctions or restrictions on our operations.
Decree 4809 of 2011 regulates certain fees charged by Colombian financial institutions. The most salient of these regulations include a cap of 20Unidades de Valor Real or “UVR” (an inflation indexed unit) for ATM fees charged to clients for transactions conducted through ATMs owned by a third party, the requirement that ATM fees be disclosed to clients with the possibility to opt out of the transaction before it takes place, and the prohibition of charging higher fees for internet transactions than for non-internet transactions as well as charging fees for failed internet transactions. These restrictions could affect the profitability of our business by decreasing our fee income.
Law 1555 of 2012, also known as “Law 1555,” allows consumers of financial services to prepay obligations denominated in pesos owed to financial institutions, without incurring any penalty. The law also requires that financial institutions disclose the possibility of such prepayment to borrowers prior to the extension of any loan. Although this law does not apply to loans having a balance that exceeds 880 times the legal monthly minimum wages, nor to financial obligations acquired prior to its effective date (July 9, 2012), its implementation may substantially affect our banking business profits.
Additionally, on July 7, 2016 the Colombian Congress enacted Law 1793 regarding costs charged to consumers of financial entities as a result of which consumers will be able to use the total balance in their savings accounts and electronic deposits, without having the obligation to preserve a minimum amount of deposits. Moreover, financial entities will not be able to charge financial costs on savings accounts following 60 days of inactivity and will have the obligation to recognize a minimum positive rate return in savings accounts.
Our businesses face constitutional actions, class actions and other legal actions involving claims for significant monetary awards against financial institutions, which may affect our businesses.
Under the Colombian Constitution, individuals may initiate constitutional actions (acciones populares), or class actions (acciones de grupo), to protect their collective or class rights, respectively. Individuals may also initiate constitutional actions for the protection of their fundamental rights. These actions are known as tutelage actions. Colombian financial institutions, including our banking subsidiaries, Corficolombiana and Porvenir, have been, and continue to be, subject to these actions with regard to fees, financial services, mortgage lending and interest rates, the outcomes of which are uncertain. In addition, the number of such actions could increase in the future and could significantly affect our businesses.
Acquisitions and strategic partnerships may not perform in accordance with expectations, may fail to receive required regulatory approvals or may disrupt our operations and adversely affect our credit rating and profitability.
A component of our strategy is to identify and pursue growth-enhancing strategic opportunities. As part of that strategy, we have acquired interests in various financial institutions in recent years. We regularly evaluate strategic acquisitions and alliances, inside and outside of Colombia. Strategic acquisitions and alliances could expose us to risks with which we have limited or no experience, as in the case of any significant acquisition outside of Colombia. In addition, potential acquisitions in Colombia and elsewhere may be subject to regulatory approval. We may be unsuccessful in obtaining any such approval or we may not obtain approvals on terms that are acceptable for us particularly in view of our subsidiaries’ and our combined significant market share in the Colombian banking industry.
We must necessarily base any assessment of potential acquisitions and alliances on assumptions with respect to operations, profitability and other matters that may subsequently prove to be incorrect. Future acquisitions and alliances, as well as other investments, may not produce anticipated synergies or perform in accordance with our expectations and could adversely affect our operations and profitability. In addition, new demands on our existing organization and personnel resulting from the integration of new acquisitions could disrupt our operations and adversely affect our operations and profitability.
We may not be able to manage our growth successfully.
We have been expanding the scope of our operations over the past few years and we expect that this expansion will continue. As we continue to grow, we must improve our operational, technical and managerial knowledge and compliance systems in order to effectively manage our operations across the expanded group. Failure to successfully integrate, monitor and manage expanded operations could have a material adverse effect on our reputation and financial results. Our future growth will also depend on our access to internal and external financing sources. We may be unable to access such financing on commercially acceptable terms or at all.
We are subject to operational risks.
Our business depends on the ability of our banking subsidiaries to process large numbers of transactions efficiently and accurately. Operational risks and losses can result from fraud, employee error, failure to properly document transactions or to obtain proper internal authorization, failure to comply with regulatory requirements, breaches of conduct of business rules, equipment failures, natural disasters or the failure of external systems, among others. Our, and our banking subsidiaries’ currently adopted procedures may not be effective in controlling each of the operational risks faced by our banking subsidiaries.
Failure of our information systems could materially and adversely affect the effectiveness of our risk management and internal control processes as well as our results of operations and financial condition.
We and our subsidiaries are highly dependent on the ability to collect and process, on a timely basis, a large amount of financial and other information, and services and products, at a time when transaction processes have become more complex with increasing volumes. A partial or complete failure of any of these systems could materially and adversely affect our decision-making process, risk management and internal control systems as well as our ability to respond on a timely basis to changing market conditions.
In addition, our and our subsidiaries’ ability to remain competitive will depend in part on their ability to upgrade their information technology infrastructure on a timely and cost-effective basis. We and our subsidiaries must continually make significant investments and improvements in our and their information technology infrastructure in order to ensure the proper functioning of financial control, accounting and other data collection and processing systems and to remain competitive. In addition, as our banking subsidiaries open new branches and channels, they will need to improve their information technology infrastructure, including maintaining and upgrading their software and hardware systems and their back-office operations. We and our subsidiaries are currently in the process of sequentially replacing certain of our core banking systems on a bank by bank basis to converge in time to a common technology platform. If there are technological impediments, unforeseen complications, errors or breakdowns in implementing new systems, our business, financial condition or results of operations may be adversely affected.
We are subject to cyber security threats.
We and our subsidiaries rely on information systems to operate websites, process transactions, respond to customer inquiries on a timely basis and maintain cost-efficient operations. We and our subsidiaries may experience operational problems with their information systems as a result of system failures, viruses, ransomwares, computer “hackers” or other causes. Cyber security risks for financial institutions have significantly increased because of the proliferation of new technologies, the use of the Internet and telecommunications technologies to conduct financial transactions, and the increased sophistication and activities of organized crime, hackers, hacktivists, terrorists and other external parties. As we seek to further develop digital channels, the implementation of technological changes and upgrades to maintain existing systems and integrate new systems could increase our risk of cyber security attacks. Any material disruption or slowdown of our or our subsidiaries’ systems could cause information, including data related to customer requests, to be lost or to be delivered to our customers with delays or errors, which could reduce demand for their services and products and could materially and adversely affect our results of operations and financial condition.
Our policies and procedures may not be able to detect money laundering and other illegal or improper activities fully or on a timely basis, which could expose us to fines and other liabilities.
We and our subsidiaries are required to comply with applicable anti-money laundering laws, anti-terrorism financing laws and other regulations. These laws and regulations require us, among other things, to adopt and enforce “know your customer” policies and procedures and to report suspicious or large transactions to the applicable regulatory authorities. While we and our financial institutions have adopted policies and procedures aimed at detecting and preventing the use of banking networks for money laundering activities and by terrorists and terrorist-related organizations and individuals generally, such policies and procedures have in some cases only been recently adopted and may not completely eliminate instances where they may be used by other parties to engage in money laundering and other illegal or improper activities. If we or any of our subsidiaries fail to fully comply with applicable laws and regulations, the relevant government authorities to which they report have the power and authority to impose fines and other penalties. In addition, our businesses and reputation could suffer if customers use our financial institutions for money laundering or illegal or improper purposes.
Competition and consolidation in the Colombian and Central American banking and financial industry could adversely affect our market position.
We operate in a competitive market. Since the 1990s, when the Colombian financial system was deregulated, there has been an ongoing process of consolidation that has included foreign bank participants entering the Colombian market. We expect that consolidation will lead to the creation of larger local financial institutions, including additional foreign banks, presenting the risk that we could lose a portion of our market share in the industry, adversely affecting our results of operations.
Various banking institutions, which have recently been incorporated in Colombia, target the microcredit and small and medium enterprises segments. Local subsidiaries of international financial institutions, have entered the market targeting corporate clients. The businesses of these new credit institutions may affect our market position in the individual, small and medium enterprises and merchant banking segments. To a lesser extent, we also face competition from non-bank competitors, such as brokerage companies, department stores (for some credit products), leasing and factoring companies, mutual fund and pension fund management companies and insurance companies.
In addition, the pace of consolidation in the Colombian and Central American financial services industry has increased, which may also increase competition in the markets where we operate. See “Item 4. Information on the Company—B. Business overview—Competition.”
Furthermore, our banking subsidiaries may face challenges as new competitors enter the market or existing competitors may adjust their services with unique product or service offerings or approaches to providing banking services. Non-traditional providers of banking services, such as Internet based e-commerce providers, mobile telephone companies, internet search engines and crowd-funding websites may offer and/or increase their offerings of financial products and services directly to customers. Several of these competitors may have long operating histories, large customer bases, strong brand recognition and significant financial, marketing and other resources. Technological advances and heightened e-commerce activities have increased consumers’ accessibility to products and services which has in turn intensified competition among banks and nonbanks in offering loans. Existing competitors and market entrants may adopt more aggressive pricing and rates and devote more resources to technology, infrastructure and marketing. If we are unable to successfully compete with current and new competitors, or if we are unable to anticipate and adapt our offerings to changing banking industry trends, including technological changes, our business may be adversely affected.
Our ability to maintain our competitive position depends mainly on our ability to anticipate and fulfill the needs of new and current customers through the development of innovative services and products, and our ability to offer adequate services and strengthen our customer base through cross-selling. Our failure to effectively anticipate or adapt to emerging technologies or changes in customer behavior, including among younger customers, could delay or prevent our access to new digital-based markets which would in turn have an adverse effect on our competitive position and business.
Our efforts to offer new services and products may not succeed if product or market opportunities develop more slowly than expected or if the profitability of these opportunities is undermined by competitive pressures. As we expand the range of our products and services, some of which may be at an early stage of development in the Colombian and Central American market, we will be exposed to new and potentially increasingly complex risks and development expenses. Our employees and our risk management systems may not be adequate to handle such risks. In addition, the cost of developing products that are not launched is likely to affect our results of operations. Any or all of these factors, individually or collectively, could have a material adverse effect on us.
We depend on our senior management and our Board of Directors, and the loss of their services could have an adverse effect on our business.
We are highly dependent on our senior management teams and Board of Directors at both the group and subsidiary levels, all of whom possess considerable experience and expertise and have strong relationships with customers, participants of the Colombian business.
The loss of the services of any of these members of our, or our subsidiaries’, senior management and members of the Board of Directors, could have an adverse effect on our business. Accordingly, our success is dependent on appropriately managing the risks related to executing a succession plan for senior management and members of the Board of Directors on a timely basis.
We are subject to reputational risk, and our reputation also is closely tied to that of our controlling shareholder, our senior management and members of the Board of Directors, and that of our subsidiaries.
Damage to our reputation may limit our ability to attract customers, employees and investors. Harm to our reputation can arise from employee misconduct, legal and regulatory non-compliance, ethical issues, allegations of money laundering, and failing to deliver minimum standards of service and quality, among others. In particular, our success has been attributable, in part, to the high esteem in which our controlling shareholder Mr. Sarmiento Angulo, our president, Mr. Sarmiento Gutiérrez and our and our subsidiaries’ senior management and members of the Board of Directors are held in Colombia. Reputation plays an integral role in our business operations, which are based on customer confidence and trust. If the public image or reputation of any of the foregoing is damaged as a result of negative publicity or otherwise, business relationships with customers of the entire group may deteriorate, which would adversely affect our results of operations and financial condition. Any perceived or real difficulties experienced by any one of our subsidiaries would harm the reputation of Grupo Aval as a whole, which would also have an adverse effect on our results of operations and financial condition.
We are controlled by Mr. Sarmiento Angulo, whose interests could differ from the interests of other preferred shareholders and ADS holders.
Mr. Sarmiento Angulo beneficially owns 96.9% of our common shares outstanding and 43.3% of our preferred shares outstanding, as of April 24, 2017, and, accordingly, controls our group. See “Item 7. Major Shareholders and Related Party Transactions—A. Major shareholders.” The preferred shares do not have any voting rights and thus will not affect such control of our group. Mr. Sarmiento Angulo will continue to have the right to control decisions, regardless of how our minority shareholders may vote on these issues and regardless of the interests of such shareholders, including holders of ADSs and underlying preferred shares. In addition to Mr. Sarmiento Angulo’s beneficial ownership through Grupo Aval, as of April 24, 2017, he beneficially owns 8.3% of Banco de Bogotá, 13.3% of Banco de Occidente, 15.5% of Banco AV Villas, 0.8% of Banco Popular and 0.3% of Corficolombiana.
Circumstances may occur in which Mr. Sarmiento Angulo may have an interest in pursuing transactions that, in his judgment, enhance the value of his several investments in the banking sector. These transactions may not necessarily be in Grupo Aval’s interest or that of its shareholders even if holders of the ADSs or the underlying preferred shares disagree. Due to his control, Mr. Sarmiento Angulo has, and will have, the power to:
| · | elect a majority of our directors and appoint our executive officers, set our management policies and exercise overall control over our company and subsidiaries; |
| · | agree to sell or otherwise transfer his controlling stake in our company; and |
| · | determine the outcome of substantially all actions requiring shareholder approval, including transactions with related parties, corporate reorganizations, acquisitions and dispositions of assets, and dividends. |
In addition, the concentration of ownership may have the effect of delaying, preventing or deterring a change of control of our company, could deprive our shareholders of an opportunity to receive a premium for the ADSs or underlying preferred shares as part of a sale of our company and might ultimately affect the market price of the ADSs and the underlying preferred shares.
We may engage in additional transactions with our controlling shareholder in the future.
In the future we may engage, as we have done in the past, in business and financial transactions with our controlling shareholder and other shareholders that may present potential conflicts of interest between our company and these shareholders. For example, we may incur indebtedness, or acquire shares in Banco de Bogotá, Banco de Occidente, Banco Popular, Banco AV Villas and Corficolombiana that are not owned by us from entities that are beneficially owned by Mr. Sarmiento Angulo. While we believe that these transactions will be carried out on an arm’s-length basis, commercial and financial transactions between us and our controlling shareholder could create the potential for, or could result in, conflicts of interests between us and our other shareholders. To the extent that the price we pay for any assets acquired from our controlling shareholder exceeds the market value of such assets or is not as productive a use of our cash as other uses, our results of operations and financial condition could be adversely affected.
Certain risks relating to our Central American operations
We may be unsuccessful in addressing the challenges and risks presented by our operations in countries outside Colombia.
We conduct banking businesses outside our historical home market of Colombia primarily through BAC Credomatic. Our Central American operations may involve risks to which we have not previously been exposed. Some of these operations are in countries that may present different or greater risks than those in Colombia. For example, BAC Credomatic has a significant consumer finance business, including credit card operations, in the Central American countries in which it operates. At December 31, 2016, BAC Credomatic’s consumer loan portfolio totaled U.S.$5.9 billion (Ps 17.6 trillion) (including mortgages, vehicles and other personal loans), which represented 41.0% of BAC Credomatic’s total loan portfolio, and U.S$2.6 billion (Ps 7.7 trillion) in credit card loans, which represented 17.8% of BAC Credomatic’s total loan portfolio. We may face delays in payments by customers and higher delinquency rates in these countries, which could necessitate higher impairments for loan losses and, consequently, have a negative effect on our financial performance.
We depend on BAC Credomatic’s current senior management, and the loss of their services could have a material adverse effect on BAC Credomatic’s business.
We have retained the current senior management of BAC Credomatic, who have worked on average over 15 years at BAC Credomatic, and most of whom pre-date GE Capital’s 2005 investment in BAC Credomatic. The loss of services of any of BAC Credomatic’s senior officers could have an adverse effect on BAC Credomatic’s business.
Changes in credit card regulations may adversely affect BAC Credomatic’s business.
The credit card business is an important business segment for BAC Credomatic, representing 17.8% and 17.2% of its total loan portfolio for December 31, 2016 and 2015, respectively. The adoption of new laws and regulations or the revision of the current regulatory regime for credit cards in any of the jurisdictions in which BAC Credomatic operates may have an adverse effect on BAC Credomatic’s results of operations and financial condition.
BAC Credomatic and our Central American operations are subject to significant compliance risks in connection with a multi-jurisdictional regulatory regime.
BAC Credomatic’s businesses are subject to regulation under Bahamian, Costa Rican, Guatemalan, Grand Cayman, Honduran, Mexican, Nicaraguan, Panamanian, Salvadoran and U.S. federal, state and other foreign laws, regulations and policies. BAC Credomatic thus is subject to a multi-jurisdictional regulatory regime. In addition, any changes to the regulatory regime of one of the Central American countries may lead to corresponding changes to the regulatory regime of other countries in the region. BAC Credomatic’s businesses are regularly reviewed or investigated by regulators, which could lead to enforcement actions, fines and penalties or the assertion of private litigation claims and damages.
Regulation of financial institutions varies across the different Central American jurisdictions in which we operate. These differences are particularly pronounced in the assessment of credit risk and investments. These asymmetries may affect the expected results of our operations in each jurisdiction, and as a consequence could adversely affect our consolidated results of operations in Central America.
Risks relating to our preferred shares and ADSs
Exchange rate volatility may adversely affect the Colombian economy, the market price of the ADSs and the dividends payable to holders of the ADSs.
Pursuant to Colombian law, the Colombian Central Bank has the power to intervene in the exchange market in order to consolidate or dispose of international reserves, as well as to control any volatility in the exchange rate, acting through a variety of mechanisms, including discretionary ones. During recent years, the Colombian Central Bank has employed a floating exchange rate system with periodic interventions. From time to time, there have been significant fluctuations in the exchange rate between the Colombian peso and the U.S. dollar. For example, the peso appreciated 4.7% against the U.S. dollar in 2016, depreciated 31.6% in 2015, depreciated 24.2% in 2014, 9.0% in 2013 and appreciated 9.0% in 2012. Unforeseen events in international markets, fluctuations in interest rates, changes in capital flows, political developments or inflation rates may cause exchange rate instability that could, in turn, depress the value of the Colombian peso, thereby decreasing the U.S. dollar value of the dividends paid to holders of the ADSs.
Restrictions on purchasing our preferred shares may affect the market liquidity of our preferred shares and ADSs.
Under Colombian securities regulations, as a general rule, any transaction involving the sale of publicly traded shares of any Colombian company, including any sale of our preferred shares for the equivalent of 66,000 Unidades de Valor Real, or “UVRs” (approximately U.S.$5,332.7), or more, must be effected through the Colombian Stock Exchange. UVR is a Colombian inflation-adjusted monetary index calculated by the board of directors of the Colombian Central Bank and generally used for pricing home-mortgage loans (one UVR = Ps 242.5 (U.S.$0.08) and 66,000 UVRs = Ps 16,001,785.8 at December 31, 2016). Any transfer of preferred shares underlying the ADSs may be required to be sold through the Colombian Stock Exchange, which could limit their liquidity or affect their market price.
The relative illiquidity of the Colombian securities markets may impair the ability of preferred shareholders and holders of ADSs to sell preferred shares underlying the ADSs.
Our preferred shares have been listed since February 1, 2011 on the Colombian Stock Exchange, which is relatively small and illiquid compared to securities exchanges in major financial centers. In addition, a small number of issuers represents a disproportionately large percentage of the market capitalization and trading volume on the Colombian Stock Exchange. A liquid trading market for the preferred shares or ADSs may not develop on the Colombian Stock Exchange or New York Stock Exchange, respectively. A limited trading market could impair the ability of a holder of preferred shares or ADSs to sell preferred shares (in the case of an ADS holder, obtained upon withdrawal of such shares from the ADR facility) on the Colombian Stock Exchange in the amount and at the price and time desired by such holder, and could increase the volatility of the market price of the preferred shares and the ADSs.
An active market for our preferred shares and the ADSs may not continue to develop or be maintained and the market price of our preferred shares and the ADSs may fluctuate in response to numerous factors.
Prior to our initial public offering in the United States, there was no market for our ADSs. Although our ADSs have traded on the NYSE since September 23, 2014 and our preferred shares were listed on the Colombian Stock Exchange on February 1, 2011, an active public market for the ADSs or preferred shares may not continue to develop or be maintained.
The market price of the ADSs and preferred shares may fluctuate significantly in response to numerous factors, many of which are beyond our control, including actual or anticipated fluctuations in our operating results, economic downturns, political events in Colombia, Central America or other jurisdictions where we operate, developments affecting the banking industry, exchange rates, changes in financial estimates by securities analysts or our failure to perform in line with such estimates, departures of key personnel, and sales of our preferred shares in the future, including by our banking subsidiaries who may have to sell our preferred shares obtained from investors who entered into loans with them to acquire our preferred shares in our offering of 1,600 million preferred shares on May 12, 2011, or the “Preferred Shares Local Offering.” Furthermore, common shares may be converted into preferred shares on a 1-1 basis provided that our preferred shares do not exceed 50% of our total subscribed share capital. Preferred shares are available for deposit into the ADS Program.
Our banking subsidiaries extended credit disbursed through loans to finance the acquisition of preferred shares in the Preferred Shares Local Offering of which 34 loans representing Ps 131.7 billion (U.S.$43.9 million) were outstanding at December 31, 2016. The final loan will mature in 2021. Depending on the characteristics of the borrower, our banking subsidiaries may have required collateral, which may have included a pledge of the preferred shares that were subject to the financing. Such a pledge would permit our banking subsidiaries through a court procedure to seek the sale of the preferred shares if the borrower defaults. Our banking subsidiaries had, on an aggregate basis, pledges over 58,365,095 preferred shares related to loans made to third parties at December 31, 2016. All the loans are full-recourse loans. Under the terms of the pledges, each borrower is limited from selling the pledged shares until the loan is repaid. Under Colombian law, our banking subsidiaries must seek to sell any repossessed shares as banks are not permitted to hold shares issued by their parent. If changes in general economic conditions or other factors cause these borrowers to default on their loans, our subsidiaries will have to sell our preferred shares into the market, or alternatively, upon repayment of the loans, these borrowers will not be restricted from selling such shares in the market. As a result, the market price of our preferred shares and ADSs may decline.
Holders of ADSs and underlying preferred shares may face difficulties in protecting their interests because we are subject to different corporate rules and regulations than those available in other jurisdictions, and our preferred shareholders have limited rights.
Holders of ADSs will not be direct shareholders of our company and will be unable to enforce the rights of shareholders under our by-laws and Colombian law. Under Colombian law, holders of our preferred shares may have fewer rights than shareholders of a corporation incorporated in the United States. Even if a holder of ADSs surrenders its ADSs and becomes a direct shareholder, a holder of our preferred shares under Colombian law may have fewer alternatives to protect its interests relative to actions by our board of directors or executive officers, and these alternatives may be less well-defined than under the laws of those other jurisdictions.
The Colombian securities markets are not as highly regulated or supervised as the U.S. securities markets or the markets in some other jurisdictions. In addition, rules and policies against self-dealing or for preserving shareholder interests may be less well-defined and enforced in Colombia than in the United States and certain other countries, which may put holders of our preferred shares and the ADSs at a potential disadvantage. Corporate disclosures also may be less complete or informative than for a public company in the United States or in certain other countries.
Our by-laws contain an arbitration clause that provides for the exclusive jurisdiction of an arbitral tribunal to be seated at the Bogotá Chamber of Commerce. The arbitration provision provides that any conflict arising among shareholders, or between shareholders and Grupo Aval, in connection with the by-laws must be resolved by an arbitral tribunal. In addition, holders of the ADSs and our preferred shares are not entitled to vote for the election of directors or to influence our management policies. Under our by-laws and Colombian law, holders of preferred shares (and, consequently, holders of ADSs) have no voting rights in respect of preferred shares, other than in limited circumstances.
Our ability to pay dividends on the ADSs or underlying preferred shares may be limited by Colombian law and because we are a holding company dependent on dividends from subsidiaries.
Under Colombian law, a company may only distribute dividends to the extent such distribution is fully supported by accurate financial statements demonstrating the financial condition of the company. Any dividends distributed in violation of this provision may not be reclaimed from shareholders who received such payments in good faith, and any subsequent distribution of profits may be suspended. In addition, dividends may not be distributed until losses from previous fiscal years have been absorbed. Dividends must be approved at the ordinary annual shareholders’ meeting upon the recommendation of the board of directors.
Our ability to pay dividends on the preferred shares represented by ADSs will be contingent upon the financial condition of our subsidiaries. Any of our banking subsidiaries may be restricted from paying dividends to us if such subsidiary does not meet its required technical capital ratios or does not have sufficient retained earnings. In addition, we conduct substantially all of our operations through subsidiaries and are dependent on dividends from our subsidiaries to meet our obligations.
Holders of ADSs may encounter difficulties in the exercise of dividend rights and in the limited voting rights of our preferred shares.
Holders of ADSs may encounter difficulties in exercising rights with respect to the preferred shares underlying ADSs. If we make a distribution to holders of underlying shares in the form of securities, the depositary is allowed, in its discretion, to sell those securities on behalf of ADS holders and instead distribute the net proceeds to the ADS holders. Also, under some circumstances, you may not be able to exercise your limited voting rights by giving instructions to the depositary.
Our status as a foreign private issuer allows us to follow alternate standards to the corporate governance standards of the NYSE, which may limit the protections afforded to investors.
We are a “foreign private issuer” within the meaning of the NYSE corporate governance standards. Under the NYSE rules, a foreign private issuer may elect to comply with the practices of its home country and not to comply with certain corporate governance requirements applicable to U.S. companies with securities listed on the NYSE. We currently follow Colombian practices concerning corporate governance and intend to continue to do so. Accordingly, you will not have the same protections afforded to shareholders of companies that are subject to all NYSE corporate governance requirements. For example, Colombian law requires that at least 25% of our board of directors consist of “independent” directors within the meaning of Colombian law, whereas NYSE rules generally require that a majority of a domestic U.S. company’s board consist of “independent” directors within the meaning of NYSE rules. In addition, NYSE rules require non-executive directors of domestic U.S. listed companies to meet on a regular basis without management being present. There is no similar requirement under Colombian law, and our non-executive directors do not meet formally without management present. See “Item 6. Directors, senior management and employees—C. Board practices—Principal differences between Colombian and U.S. corporate governance practices.”
Preemptive rights may not be available to holders of preferred shares or ADSs.
Colombian law and our by-laws require that, whenever we issue new common shares, we must offer the holders of common shares the right to subscribe a number of shares of such class sufficient to maintain their existing percentage ownership of our aggregate share capital. On the other hand, holders of preferred shares, including holders of ADSs, are entitled to preemptive rights only when so declared at a meeting of holders of our common shares. Our common shareholders may decide not to provide for such preemptive rights. Also, U.S. holders of ADSs may not be able to exercise their preemptive rights through JPMorgan Chase Bank, N.A., which acts as ADR depositary for our ADR facility, unless a registration statement under the Securities Act is effective with respect to such rights or an exemption from the registration requirement thereunder is available. Although we are not obligated to do so, we will consider at the time of any preemptive rights offering the costs and potential liabilities associated with any such registration statement, the benefits to us from enabling the holders of the ADSs to exercise those rights and any other factors deemed appropriate at the time, and will then make a decision as to whether to file a registration statement. Accordingly, we might decide not to file a registration statement in some cases.
If holders of ADSs are unable to exercise these rights because a registration statement has not been filed and no exemption from the registration requirement under the Securities Act is available, the ADR depositary may attempt to sell the holders’ preemptive rights and distribute the net proceeds from that sale, if any, to such holders, provided that, the meeting of holders of our common shares decides that holders of preferred shares are entitled to preemptive rights. The ADR depositary, after consultation with us, will have discretion as to the procedure for making preemptive rights available to the holders of ADSs, disposing of such rights and making any proceeds available to such holders. If by the terms of any preemptive rights offering or for any other reason the ADR depositary is unable or chooses not to make those rights available to any holder of ADSs, and if it is unable or for any reason chooses not to sell those rights, the depositary may allow the rights to lapse.
Whenever the rights are sold by the ADR depositary or such rights lapse, or if the common shareholders’ meeting does not grant preemptive rights to the holders of preferred shares, the equity interests of the holders of ADSs will be proportionately diluted.
Our ability to make payments on the ADSs may be adversely affected if we become unable to convert Colombian pesos to U.S. dollars or to transfer U.S. dollars abroad.
The Colombian government does not currently restrict the ability of Colombian persons or entities to convert Colombian pesos to U.S. dollars. However, the government may impose foreign exchange controls on dividend payments and remittances of interest and principal if the foreign currency reserves of the Central Bank fall below a level equal to the value of three months of imports into Colombia. Colombian law also allows the imposition of a deposit requirement with the Central Bank in connection with any foreign exchange transaction that may increase the cost of foreign exchange transactions or limit the amount of such transactions for a particular time. No such foreign exchange controls are currently applicable. Nevertheless, such restrictions may be imposed in the future, and any such restrictions could prevent, restrict or increase the price of our access to U.S. dollars, which we need to pay our foreign currency-denominated obligations.
We are traded on more than one market and this may result in price variations; in addition, investors may not be able to easily move shares for trading between such markets.
Trading in our ADSs on the NYSE or preferred shares on the Colombian Stock Exchange take place in different currencies (U.S. dollars on the NYSE and pesos on the Colombian Stock Exchange), and at different times (resulting from different time zones, different trading days and different public holidays in the United States and Colombia). The trading prices of our shares on these two markets may differ due to these and other factors. Any decrease in the price of our preferred shares on the Colombian Stock Exchange could cause a decrease in the trading price of our ADSs on the NYSE. Investors could seek to sell or buy our shares to take advantage of any price differences between the markets through a practice referred to as arbitrage. Any arbitrage activity could create unexpected volatility in both our share prices on one exchange, and the shares available for trading on the other exchange. In addition, holders of ADSs will not be immediately able to surrender their ADSs and withdraw the underlying preferred shares for trading on the other market without effecting necessary procedures with the depositary. This could result in time delays and additional cost for holders of ADSs.
If holders of ADSs surrender their ADSs and withdraw preferred shares they may face adverse Colombian tax consequences.
Although Colombian tax law does not specifically refer to the tax consequences applicable to an ADS holder withdrawing the underlying preferred shares, we believe, based on the advice of our Colombian counsel, that such a transaction should not result in a taxable event under Colombian law in the case of non-resident entities and non-resident individuals given the nature of the transaction. Nevertheless, this issue is not free from doubt, and the Colombian tax authorities may have a different interpretation of the law and may assess taxes on the conversion of ADSs into preferred shares based upon the difference between the market value of the preferred shares and the adjusted tax basis of the ADSs. Furthermore, an investor who surrenders ADSs and withdraws preferred shares will be subject to income taxes on any gain associated with the sale of such preferred shares.
Banking regulations, accounting standards and corporate disclosure applicable to us differ from those in the United States and other countries.
Colombian banking regulations may differ in material respects from regulations applicable to banks in other countries, including those in the United States. For example, in Colombia, we are not subject to regulations applicable to financial institutions, although our banking subsidiaries, Corficolombiana, Porvenir and certain of our other subsidiaries are subject to such regulations. In addition, capital adequacy requirements for banks under Colombian regulations differ from those under U.S. regulations and may differ from those of other countries.
Colombia and other countries in which we operate have different corporate disclosure and accounting standards for our industry than those applicable in the United States. Financial reporting disclosure requirements in the jurisdictions in which we operate differ in certain significant respects from those required in the United States. There are also material differences among IFRS (as issued by the IASB) and Colombian IFRS. Accordingly, the information about us available in such jurisdictions may not be the same as the information available to holders of shares issued by a U.S. company. Furthermore, we recently began preparing our financial statements in accordance with IFRS as issued by the IASB and, as a result, some of our financial data may not be easily comparable from period to period.
Judgments of Colombian courts with respect to our preferred shares will be payable only in pesos.
If proceedings are brought in Colombian courts seeking to enforce the rights of holders of our preferred shares, we will not be required to discharge our obligations in a currency other than Colombian pesos. Under Colombian law, an obligation in Colombia to pay amounts denominated in a currency other than Colombian pesos may only be satisfied in Colombian currency at the exchange rate, as determined by the Colombian Central Bank and published by the Superintendency of Finance, also known asTasa Representativa del Mercado, in effect on the date the judgment is obtained, and such amounts are then adjusted to reflect exchange rate variations through the effective payment date. The then-prevailing exchange rate may not afford non-Colombian investors with full compensation for any claim arising out of or related to our obligations under the preferred shares, or indirectly, the ADSs.
U.S. investors in our preferred shares or the ADSs may find it difficult or impossible to enforce service of process and enforcement of judgments against us and our officers and directors.
We are incorporated under the laws of Colombia, and all of our subsidiaries are incorporated in jurisdictions outside the United States. In addition, our executive offices are located outside of the United States. All of our directors and officers reside outside of the United States, and all or a substantial portion of our assets and the assets of most of our officers and directors are, and will most likely continue to be, located outside of the United States. As a result, it may be difficult or impossible for U.S. investors to serve legal process within the United States upon us or any of these persons or to enforce a judgment against us for civil liabilities in U.S. courts. In addition, you should not assume that courts in the countries where we or our subsidiaries are incorporated or where our or our subsidiaries’ assets are located (1) would enforce judgments of U.S. courts obtained in actions against us or our subsidiaries based upon the civil liability provisions of applicable U.S. federal and state securities laws or (2) would enforce, in original actions, liabilities against us or our subsidiaries based on those laws.
There is also substantial doubt that the courts of Colombia would enter judgment in original actions brought in those courts predicated on U.S. federal or state securities laws. We have been advised by our Colombian counsel that there is no legal basis for original actions to be brought against us or our directors and executive officers in a
Colombian court predicated solely upon the provisions of the U.S. federal or state securities laws. In addition, certain remedies available under provisions of the U.S. securities laws may not be admitted or enforced by Colombian courts.
Grupo Aval’s by-laws contain an arbitration provision that provides for the exclusive jurisdiction of an arbitral tribunal to be seated at the Bogotá Chamber of Commerce. The arbitration provision provides that any conflict arising among shareholders, or between shareholders and Grupo Aval, in connection with the by-laws must be resolved by the arbitral tribunal. See “Item 4. Information on the Company—B. Business overview—Service of process and enforcement of judgments.”
ITEM 4. INFORMATION ON THE COMPANY
| A. | History and development of the company |
Our company
We are Colombia’s largest banking group based on total assets. As of December 31, 2016 we were one of the most profitable among our principal competitors in the Colombian market based on an ROAE and the most profitable in terms of ROAA, based on aggregate figures. We are also the largest banking group in Central America based on total assets as of December 31, 2016. We provide a comprehensive range of financial services and products ranging from traditional banking services, such as making loans and taking deposits, to pension and severance fund management.
As of December 31, 2016, 71.0% of our assets originated in Colombia, and 29.0% in Central America. In terms of businesses, 89.8% of our total assets were banking assets, 9.2% were assets from Corficolombiana, and 1.1% were on-balance sheet assets of our Pension Fund Manager, Porvenir. On a consolidated basis, Grupo Aval manages Ps 224.1 trillion of on-balance sheet assets, and Ps 206.4 trillion of off-balance sheet assets (assets under management).
Colombian operations
Our operations in Colombia currently consist of four commercial banks (Banco de Bogotá, Banco de Occidente, Banco Popular and Banco AV Villas), the largest merchant bank (Corficolombiana) and the largest pension and severance fund manager (Porvenir). OurRed de Grupo Aval (Grupo Aval network) is the largest combined network of ATMs and branches in Colombia and has been a key element of our competitive positioning in the Colombian market. Customers of any of our banks may access Grupo Aval’s other bank branches to carry out basic banking transactions throughout ourRed de Grupo Aval (Grupo Aval network). On June 21, 2016, Grupo Aval, Banco de Bogotá, Banco de Occidente and Banco Popular entered into the Amended shareholders’ Agreement, as a result of which Grupo Aval became the direct controlling entity of Corficolombiana.
Under our multi-brand strategy, each of our banks focuses on particular types of customers, geographic regions and products. Our banks are encouraged to compete among themselves and with other market participants, while operating within central strategic guidelines established by our management. We believe that this strategy has contributed to our strong financial performance and allowed us to provide an integrated service network to our customers. Underlying Grupo Aval’s competitive strengths are group-level policies focused on comprehensive brand management, strategic planning, general procurement, risk management, convergence of technologies and cost controls that we believe promote best practices, realization of synergies and efficiency across our subsidiaries.
On a consolidated basis in accordance with IFRS, our ROAA for the years ended December 31, 2016, 2015 and 2014 was 1.6%, 1.7% and 1.8%, respectively; our ROAE for the same periods was 14.3%, 14.6% and 15.2%, respectively; and our efficiency ratio for the same periods was 47.3%, 47.6% and 46.2%, respectively.
The following table show ROAA, ROAE, efficiency ratio and Colombian market share information of us, our Colombian banking subsidiaries and our principal competitors in accordance with Colombian IFRS on an unconsolidated basis.
| | | At and for the year ended December 31, 2016 | |
| | | Grupo Aval entities | | | | | | | | | | | | | |
| | | Banco
de
Bogotá
(5) | | | Banco de
Occidente | | | Banco
Popular | | | Banco
AV
Villas | | | Grupo
Aval
Aggregate
(1)(5) | | | Bancolombia | | | Davivienda | | | BBVA
Colombia | |
| | | (in percentages) | |
| ROAA(2) | | | 2.6 | | | | 1.6 | | | | 1.0 | | | | 1.5 | | | | 2.1 | | | | 2.2 | | | | 2.2 | | | | 1.0 | |
| ROAE(3) | | | 13.2 | | | | 13.2 | | | | 8.4 | | | | 14.5 | | | | 12.8 | | | | 14.0 | | | | 18.8 | | | | 13.4 | |
| Efficiency ratio (4) | | | 36.5 | | | | 45.5 | | | | 65.4 | | | | 55.4 | | | | 43.8 | | | | 47.5 | | | | 43.0 | | | | 49.1 | |
| Market share in Colombia: | | | | | | | | | | | | | | | | | | | | | | | | | | | | | | | | |
| Net income (6) | | | 21.9 | | | | 5.6 | | | | 2.2 | | | | 2.0 | | | | 31.7 | | | | 28.6 | | | | 16.3 | | | | 5.4 | |
| Deposits | | | 14.4 | | | | 6.1 | | | | 4.3 | | | | 2.8 | | | | 27.6 | | | | 22.9 | | | | 13.1 | | | | 11.8 | |
| Gross loans and leases | | | 12.9 | | | | 6.6 | | | | 4.1 | | | | 2.3 | | | | 25.9 | | | | 25.8 | | | | 14.2 | | | | 9.9 | |
| Assets | | | 14.6 | | | | 6.0 | | | | 3.7 | | | | 2.3 | | | | 26.6 | | | | 25.1 | | | | 13.3 | | | | 9.4 | |
| Branches | | | 12.4 | | | | 3.8 | | | | 3.9 | | | | 5.1 | | | | 25.2 | | | | 13.8 | | | | 10.4 | | | | 8.3 | |
| ATMs | | | 11.5 | | | | 2.2 | | | | 7.5 | | | | 3.8 | | | | 25.0 | | | | 28.3 | | | | 11.5 | | | | 8.8 | |
Source: Calculations for ROAA, ROAE and efficiency ratio are based on each entity’s respective unconsolidated financial statements in accordance with Colombian IFRS that are publicly available on the Superintendency of Finance website. Colombian market share information is based on unconsolidated data filed with the Superintendency of Finance, except for figures relating to branches and ATMs from Grupo Aval entities, which are derived from Grupo Aval data. Colombian market share data for Grupo Aval is based on aggregate figures. For market share information on each of our banking subsidiaries see “—B. Business overview—Our operations.”
| (1) | Ratios and market share data reflect aggregated unconsolidated data of Banco de Bogotá, Banco de Occidente, Banco Popular and Banco AV Villas. |
| (2) | ROAA is calculated as net income divided by the average of month-end total assets. |
| (3) | ROAE is calculated as net income divided by the average of month-end total equity. |
| (4) | Efficiency ratio is calculated as personnel expenses plus administration expenses divided by total income. Total income is the sum of net interest income, net fees and other services income and other income (excluding dividends and other). |
| (5) | ROAA and ROAE for Banco de Bogotá and Grupo Aval Aggregate are adjusted to exclude the non-recurring effect of Ps2,208.1 billion associated with the deconsolidation of Corficolombiana at Banco de Bogotá. When included ROAA and ROAE for Banco de Bogotá would be 5.4% and 27.3%, respectively, and for Grupo Aval Aggregate 3.6% and 22.2%, respectively. |
| (6) | Net income market shares calculated excluding the non-recurring effect of Ps 2,208.1 billion associated with the deconsolidation of Corficolombiana at Banco de Bogotá. When included market shares would be 36.7% for Banco de Bogotá, 4.6% for Banco de Occidente, 1.8% for Banco Popular, 1.6% for Banco AV Villas, 44.6% for Grupo Aval Aggregate, 23.2% for Bancolombia, 13.2% for Davivienda and 4.4% for BBVA. |
Central American operations
Through our BAC Credomatic operations, we are the largest banking group in Central America based on consolidated assets. We have a leading Central American presence with operations that are complementary to our Colombian businesses and a leading position in the consumer and credit card banking businesses in the region.
We have operations in six Central American countries (Costa Rica, El Salvador, Guatemala, Honduras, Nicaragua and Panamá) and Mexico. We are the leading credit card issuers and merchant-acquiring franchises in Central America and have the only network that processes all major credit card brands in the region. At December 31, 2016, BAC Credomatic’s credit card portfolio totaled U.S$2.6 billion (Ps 7.7 trillion), which represents a 13.2% increase from U.S.$2.3 billion at December 31, 2015 (Ps 6.8 trillion). At December 31, 2016, 78.7% of BAC Credomatic’s credit card portfolio was distributed across Costa Rica, El Salvador, Guatemala and Panamá. The remaining 21.3% was distributed among Honduras, Nicaragua and Mexico. On December 16, 2016, Credomatic de Mexico S.A. de C.V., a subsidiary of BAC International Bank, Inc., entered into an agreement with Banco Invex S.A. for the transfer of its Mexican credit card portfolio, as part of BAC International Bank, Inc.’s strategy to focus
its presence in the banking and credit card businesses in the six Central American countries. The transaction is expected to close during the first semester of 2017.
Through a network of 351 branches and 1,930 ATMs at December 31, 2016, BAC Credomatic has more than 3.2 million customers and serves a region with a total population of approximately 46.1 million at December 31, 2016. Our Central American operations represented 29.0% of our assets at December 31, 2016. For the years ended December 31, 2016, December 31, 2015 and December 31, 2014, the efficiency ratio for BAC Credomatic was 54.9%, 54.4% and 53.6%, respectively.
We continue working to improve our performance in Central America and continue to improve BAC Credomatic’s efficiency ratio. The efficiency ratio of our Colombian operations was 43.4% for the year ended December 31, 2016, while the efficiency for our Central American operations was 55.1% for the same period. We also believe we can leverage Grupo Aval’s expertise to increase BAC Credomatic’s share in corporate lending within Central America.
The following table shows the market shares of our Central American operations and that of our principal competitors in Central America.
| | | At December 31, 2016 | |
| | | BAC
Credomatic(1) | | | Banco
Industrial | | | Bancolombia
Central
America | | | G&T
Continental | | | Scotiabank
Central
America | |
| | | (in percentages) | |
| Central American market share: | | | | | | | | | | | | | | | | | | | | |
| Loans and leases, net | | | 9.7 | | | | 5.5 | | | | 9.0 | | | | 3.2 | | | | 5.0 | |
| Assets | | | 8.7 | | | | 6.4 | | | | 7.7 | | | | 3.9 | | | | 4.2 | |
| Deposits | | | 8.3 | | | | 5.8 | | | | 7.9 | | | | 4.0 | | | | 4.5 | |
| Liabilities | | | 8.5 | | | | 6.6 | | | | 7.7 | | | | 4.0 | | | | 4.3 | |
| Total equity | | | 9.9 | | | | 5.1 | | | | 8.5 | | | | 3.2 | | | | 4.0 | |
| Net income | | | 12.6 | | | | 7.6 | | | | 5.4 | | | | 3.9 | | | | 2.3 | |
Source: Calculated based on data aggregated from the local superintendencies of Costa Rica, El Salvador, Guatemala, Honduras, Nicaragua and Panamá.
| (1) | Reflects LB Panamá operations including BAC Credomatic. |
Our business strengths
We believe that we have achieved our leading positions in the Colombian and Central American financial services industry through the following competitive strengths.
Strong track record of growth and resilient profitability
We believe that our leading position in the Colombian market, cross-bank synergies, economies of scale, low-cost funding and operating efficiencies have helped us achieve stable profits. The resilience of our returns, both on our unconsolidated and consolidated financial statements results from the diversified loan portfolio provided by our multi-brand banking subsidiaries, a lower and more stable cost of funding structure and solid net provisions. Our consolidated assets have grown at a CAGR of 12.9% from January 1, 2014 to December 31, 2016. During the same period, our total liabilities have grown at a CAGR of 12.8% and our total equity has grown at a CAGR of 13.6%. We have historically accomplished our growth through organic expansion and strategic acquisitions.
Largest banking and financial services operator in most financial sectors in Colombia
We are the largest participant in the Colombian banking market, with market shares of 26.6% of total assets and 25.9% of total loans, at December 31, 2016. As of the same date we also have the largest market share of deposits, 27.6%. OurRed Grupo Aval, which is the largest ATM and banking network in the country and has been a key element of our competitive positioning in the Colombian market. At December 31, 2016, our ATMs and branches represented 25.0% and 25.2% of total ATMs and branches in Colombia, respectively.
Leading banking operations in Central America
BAC Credomatic is the leading financial group in Central America with a record of strong financial performance. Its ROAE was 18.1% for the year ended December 31, 2014, 15.5% for the year ended December 31, 2015 and 15.1% for the year ended December 31, 2016. BAC Credomatic is a full-service financial institution with one of the leading card-issuing and acquiring businesses in the region. Its Credomatic brand has key alliances with major credit card networks, such asVisa,MasterCard,American Express andDiners Club, and has the only network in the region that processes all major credit card brands. BAC Credomatic’s market share in terms of net loans varies in the different countries as follows, as of December 31, 2016: 13.4% in Costa Rica, 12.8% in El Salvador, 10.1% in Guatemala, 14.3% in Honduras, 25.9% in Nicaragua and 5.4% in Panamá. As a regional player, excluding Panamanian operations, we hold the largest share with 13.2% of the total Central American market.
Diversified and competitive sources of funding
We have access to diverse sources of funding, including deposits and debt securities placed in Colombian and international capital and credit markets, which results in a competitive cost of funding for our operations. At December 31, 2016, our market share of total customer deposits in Colombia was 27.6%, supported by a 39.6% market share in checking accounts and a 28.0% market share in savings accounts. Our consolidated deposits represented 76.0% of our total funding at December 31, 2016 compared to 74.2% at December 31, 2015, which provides us with a stable and cost-effective funding base. Furthermore, the ratio of deposits to net loans, which was 95.4% as of December 31, 2016, 95.9% as of December 31, 2015, and 99.2% as of December 31, 2014, among the best of our peers. We believe that this funding base supports our initiatives to expand our businesses.
Sound risk management
We believe we have asset quality that is superior to that of our principal competitors. In accordance with Colombian IFRS, Grupo Aval’s aggregate ratio of loans past due more than 30 days over total loans was 2.7% at December 31, 2016, the lowest among our principal competitors on an unconsolidated basis, Bancolombia’s ratio was 3.3%, Davivienda’s was 4.0% and BBVA Colombia’s was 3.2%. We have maintained our relative consolidated asset quality, as demonstrated by our ratio of non-performing loans to total loans of 2.0% at December 31, 2016 and our ratio of charge-offs to average outstanding loans of 1.6% at December 31, 2016, in accordance with IFRS. In addition, we believe that our reputation as a banking group that pursues conservative policies has allowed us to consistently retain and attract new customers. Each of our banking subsidiaries has a comprehensive risk management system, which we view as fundamental to their long-term stability and viability, which enables them to identify risks and resolve potential problems on a timely basis. In addition, we have established upward loan reporting processes, and our risk management staff meets on a weekly basis to discuss the loan portfolio, risks, opportunities and developments in the industry.
Each of our banks and Grupo Aval on an aggregate basis are well-capitalized above the minimum capital adequacy mandatory ratios as calculated under Colombian capital adequacy regulations.
Multi-brand business model
Our differentiated multi-brand business model builds on the individual strengths of our banking subsidiaries and the market-wide recognition of their brands. Each of our banks has developed a focus on particular and, to a degree, overlapping market sectors, geographic regions, services and products. We believe that this specialization has contributed to the individual success of our banks and the diversity of Grupo Aval as a whole. Our banking subsidiaries in Colombia operate as four independent banks that are encouraged to compete among themselves and with other market participants, while operating within central guidelines established by us in the areas of internal control, credit risk management, brand management, strategic planning, general procurement and information technology. These guidelines, together with group support services, are designed to allow each bank to achieve economies of scale and benefit from cross-bank synergies and group-wide best practices without inhibiting individual competition and the decision-making abilities of each bank’s management. We may, in the future, consider merging one or more of our subsidiaries in our group or additional business we may acquire if meaningful improvements in efficiencies, revenue or other benefits could be achieved.
Focus on group-wide best practices
We apply group-wide best practices and corporate policies and procedures to all of our operating subsidiaries. These practices are designed to encourage a consistent approach with respect to effective risk management, efficient use of capital, cost control, brand management, general procurement and integration of information technology. We believe that these practices have helped us achieve economies of scale and synergies to reduce operating and administrative costs. For the year ended December 31, 2016, we had a consolidated efficiency ratio of 47.3%, and our banking subsidiaries had efficiency ratios ranging from 42.9% (Banco de Occidente) to 61.9% (Banco Popular).
Experienced management teams
Our qualified and experienced management teams, both at the group and operating subsidiary levels, have played a key role in guiding our growth. Our chairman, Mr. Sarmiento Angulo, has over 60 years of business experience, including over 45 years in the banking and related financial services industry. Our president, Mr. Luis Carlos Sarmiento Gutiérrez, has over 20 years of experience in the banking and related financial services industry and over 30 years of business experience as an executive in Colombia and the United States. Our and each of our operating subsidiaries’ management teams are dedicated to formulating and executing business strategies through a culture of excellence, innovation and cooperation, which has served as our guiding vision throughout the various acquisitions and initiatives undertaken by Grupo Aval.
Our strategy
Our overall objectives are to build upon our competitive strengths to pursue opportunities for growth and to enhance our long-term financial performance. To achieve these objectives, we intend to pursue a strategy with the following key elements:
Further penetrate the Colombian market
Despite the recent slowdown in the growth of the economy driven by the drastic decline in oil prices, we believe that after the necessary fiscal adjustments, Colombia is a country with strong fundamentals and because of them, it has the ability to return to a path of higher growth rates. In such a scenario we can benefit from an increase in GDP per capita and thus in banking penetration. As part of Colombia´s leading group, and drawing upon Grupo Aval’s multi-brand business model, we believe that we are very well positioned to adjust to the current conditions and take advantage of a stronger future economy.
Continue capitalizing on synergies and improving efficiencies
We are pursuing opportunities to create synergies among Grupo Aval affiliates and at BAC Credomatic and leverage their combined strength. We intend to work with Grupo Aval on group-wide projects, mainly on digital banking and process digitalization, information technology, and procurement of goods and services, which, should allow us to achieve economies of scale by involving all of our subsidiaries under a single umbrella. We believe that these efforts have contributed and will continue to contribute to improve our efficiency.
Expand our services and products offerings and diversify our sources of income
We believe we offer the most comprehensive range of banking services and products in Colombia, and we continually seek to expand these offerings to meet evolving customer needs and enhance our profitability. We believe we can continue to capture additional revenue by (i) improving our market share in profitable segments and products where we have potential to grow organically given our existing market position (such as credit cards and mortgage loans, where we have a market share of 20.1% and 11.3% as of December 31, 2016, respectively); (ii) launching new products (such as digital accounts) to serve new segments (such as theunderbanked population);and, (iii) improving our product and service offering through their digitalization. ). In addition, we are also expanding our cross-selling efforts to our over 10.7 million banking clients and our over 11.9 million pension fund clients in Colombia as of December 31, 2016.
Furthermore, we continue to implement initiatives to increase our non-interest income, which consists primarily of net fee income and income from our non-financial operations. For the year ended December 31, 2016, net fee income accounted for 26.2% of our consolidated total income before net impairment losses. We believe we can increase non-interest income in future periods by, for example, expanding our offering of bancassurance products
(i.e., bank-offered third-party insurance products) through our distribution networks and credit card fee income by increasing credit card loan volume across all of our banks. With regards to the income from our non-financial operations, we believe that our equity investments in strategic sectors such as energy and gas, infrastructure and hotels will continue to contribute sustainable income to our bottom line.
We also continue studying initiatives to extend our banking services to under-penetrated segments of the Colombian population that have a low use or that do not currently use banking services by developing low cost products (such as“Cuentas de Ahorro de Trámite Simplificado”,or “CATS”, which are saving accounts with lighter requirements for the account opening process); cost-effective service channels, such asCorresponsales Bancariosand online/mobile banking; and risk management tools.
Further penetrate the Central American market
We plan to continue executing our multi-brand business model and maintain the BAC Credomatic brand. We intend to capitalize on the expansion of the Central American market in the current economic scenario. In order to improve operational efficiency and increase market share in key sectors, we intend to continue to share our group-wide commercial and operational standards and best practices with BAC Credomatic, while capitalizing on its regional expertise, brand recognition, customer base, and financial services and products, such as credit card issuance and merchant-acquiring businesses.
Pursue other selected acquisitions and increase our controlling interests in our subsidiaries
We have a proven track record of identifying, acquiring and integrating interests in companies we believe have strategic value to us. We are interested in expanding our businesses in Colombia and Central America and into other regions. We will continue to seek opportunities to further expand into new geographies and will evaluate potential acquisition targets that would enable us to grow and consolidate our franchise through the services and products we offer and the markets we can access. We actively consider additional strategic investments, alliances and acquisitions, principally in Colombia, Central America and other selected Latin American countries, which may materialize, if we believe they will generate value, complement our strategic goals, be accretive and will not hinder our technical capital position. We may also continue acquiring additional shares to increase our controlling interests in our banking subsidiaries as we have done in 2014, 2015 and 2016. During 2013 we expanded our operations in Central America with the acquisitions of BBVA Panamá (now merged into BAC International Bank, Inc.) and Grupo Reformador (now merged into Banco de América Central S.A. (Guatemala)) and in the Colombian Pension Fund business with the acquisition of AFP Horizonte (merged into Porvenir). During 2016, we expanded Banco Popular’s business with the acquisition of the Colombian credit card loan portfolio and users ofRipley – Compañía de Financiamiento Comercial.
Oversight
As the holding company of the group, we closely monitor the performance of our banks, Corficolombiana, Porvenir and BAC Credomatic. We actively participate in developing each banking subsidiary’s long-term business and strategic plan, and we require each of our banking subsidiaries to present to us a yearly budget and profitability targets. We develop our own independent commercial and profitability targets for each banking subsidiary before discussing and recommending any changes thereto with its management team. In addition, we make recommendations for setting the compensation of management in each of our banking subsidiaries annually, and link incentive compensation to achieving budget goals and other financial and strategic performance targets.
Our banking subsidiaries and Corficolombiana are required to report their financial and commercial performance to us on a regular basis, including monthly detailed information. We monitor the performance of our banks against their respective budgets and the performance of our competitors. This systematic control process is complemented by ad-hoc analyses of key commercial and operational drivers, such as loan growth and the loan portfolio quality of each banking subsidiary relative to the others and our competitors. When a banking subsidiary deviates from its plan or when weaknesses are identified, we meet with the respective bank’s management to discuss remedial measures and a course of action. Similarly, when a banking subsidiary finds itself in a new or unfamiliar situation, such as the mortgage and financial crisis of 1999, we provide guidance. Our senior management and management of the banking subsidiaries meet at least twice a month to discuss strategy, opportunities and current operations.
Our internal control department regularly audits our banks, Corficolombiana, Porvenir and BAC Credomatic, as well as their operating subsidiaries, to provide objective assurance to our management and board of directors regarding the effectiveness of our subsidiaries’ financial reporting and control mechanisms as well as to monitor compliance with our best practices and guidelines. Our internal control department also plays an integral part in our corporate governance. When our internal control department discovers deviations from our best practices and guidelines, we recommend remedial measures and enhance our monitoring of the respective entity.
Strategic focus
From time to time, our banks explore merger and acquisition opportunities and, as part of its equity portfolio management activities, Corficolombiana makes investments in strategic sectors. Through areas such as our vice presidency of finance and our vice presidency of strategy, we provide support to our banking subsidiary management teams in identifying opportunities, negotiating favorable outcomes and implementing acquisitions. We independently assess a prospective target’s strategic fit with the acquiring banking subsidiary and within our group as a whole. In addition, we explore new business initiatives and often recommend new product lines and services to our banks, such as bancassurance, and provide assistance to our banks in evaluating, negotiating and implementing acquisitions such as Banco de Bogotá’s acquisition of Megabanco, Banco de Occidente’s acquisition of Banco Unión, Banco Popular’s acquisition of the credit card loan book and users ofRipley – Compañía de Financiamiento Comercial and the acquisition of AFP Horizonte led by Porvenir. Our acquisitions of BAC Credomatic, BBVA Panamá (merged into BAC International Bank, Inc.) and Grupo Reformador (merged into Banco de América Central S.A. (Guatemala) reflect our approach to identifying and pursuing growth opportunities outside of our existing portfolio.
Credit risk management
Although each banking subsidiary is responsible for its credit decisions and risk management, we oversee the implementation of appropriate risk management controls at our banks and have established upward loan reporting processes. Our risk management staff meets on a weekly basis to discuss our subsidiaries’ loan portfolio, developments in the industry, risks and opportunities. For potential loan transactions that would result in an aggregated exposure to a single issuer in excess of Ps 20 billion on a consolidated basis at the group level depending on the risk rating, our risk management staff will evaluate the transaction and will often make recommendations with respect to the structure of the loan (such as tenor, guarantees, interest rates, commissions and covenants). We also coordinate loan syndication among our banks to effectively leverage the combined equity of our banks and manage any risk issues. For a discussion of our risk management guidelines, see “Item 11. Quantitative and Qualitative Disclosures About Risk—Risk management.”
Marketing and Corporate Image
Our centralized marketing strategy pursues two main objectives: to increase the competitiveness of our banks and to strengthen our corporate image. To achieve these objectives, we negotiate with third parties for the provision of certain marketing services and to design and implement advertising and marketing campaigns for certain services and products from our banking subsidiaries in Colombia. We have set up marketing guidelines and pursue communications that increase the exposure of our brands and those of our subsidiaries. Our service efforts are aimed at achieving customer and shareholder satisfaction.
Network integration
Each banking subsidiary is responsible for its information technology systems and distribution network; however, we seek to maximize the effectiveness of our distribution network and the levels of customer service and customer retention across all our banks through ourRed de Grupo Aval (Grupo Aval network), which connects all of our banks’ networks. Our network allows each of our banking subsidiaries’ customers to access basic banking services at any ATM or branch office in any of our banks. Although each banking subsidiary maintains its own information technology system, Grupo Aval works to identify potential synergies and assists in the implementation of technology and products developed at the Grupo Aval level within our banks, and the standardization of technology and processes across our banks. For example, we are developing a new technology model based on service-oriented architecture for our institutions. For a discussion of our current technology projects, see “—B. Business overview—Other corporate information—Technology.”
Digital Strategy
Each banking subsidiary is responsible for developing its own digital strategy in which they aim to digitalize, their products, channels and processes in order to achieve operational efficiency while creating better and more innovative products and services for their clients. Although each banking subsidiary develops their digital presence aligned with their own business strategy, Grupo Aval works to identify and capture potential synergies between them; and, to identify, and study, potential “white-spaces” not currently covered by our banking subsidiaries.
Our Markets
Colombia
The majority of our operations are located in Colombia, representing 67.4% and 71.1% of our net income attributable to controlling interest and gross loan portfolio, respectively, and in the six countries in Central America, representing 32.6% and 28.9% of our net income attributable to controlling interest and gross loan portfolio, respectively, in each case as of and for the year ended December 31, 2016.
In the last couple of years the Colombian financial system has proven to be resilient despite a difficult macroeconomic scenario. The decline in oil prices that began in 2014 had severe impacts on Colombia. First, as oil represented close to 50% of the exports, the decline in the price of the commodity brought with it a severe current account deficit which peaked at 7.6% in 2015. Second, the currency suffered severely taking the exchange rate from approximately Ps 1,850 per U.S. dollar to more than Ps 3,300 per U.S. dollar in February, 2016. Third, mainly driven by a pass-through effect, but also affected by a severe drought and a truckers’ strike, the inflation of the country increased from a stable 3% level to close to 9% in July 2016. Fourth, the government saw an immediate 20% revenue decline that originated from oil revenues (taxes and dividends paid by Ecopetrol) which implied a deterioration of the fiscal deficit. In order to reduce the fiscal deficit, the government passed a Fiscal Reform in December 2014 (Law 1739), and then corrected it with a “structural” reform in December 2016.To control inflation and inflation expectations, the Central Bank began to implement a contractionary monetary policy taking its intervention rate from 4.50% in 2015 to 7.75% in 2016.
Furthermore, the economy decelerated and grew at only 2.0% in 2016. With the deceleration in the economy, the financial system: (i) adjusted and decelerated loan growth; and (ii) saw some deterioration in credit quality metrics.
Banking penetration still remains low in Colombia, when compared to other countries of the region, such as Brazil and Chile. According to data from the IMF, at December 31, 2015, Colombia’s population and economy were the third and fourth largest in Latin America, respectively. According to DANE, in 2016 Colombia’s population was approximately 48.7 million people and its nominal GDP was Ps 862.7 trillion (U.S.$282.6 billion, using the average exchange rate for 2016). Colombia’s nominal GDP per capita increased from Ps 7.9 million in 2005 (U.S.$3,418 using the average exchange rate for that year) to Ps 17.7 million in 2015 (U.S.$5,797 using the average exchange rate for that year). This increase in nominal GDP per capita has allowed banks to grow at a faster pace than the economy without experiencing severe credit cycles, which suggests that there is still further room for growth.
The 2.0% GDP growth of Colombia for 2016, while low, compares favorably to other Latin American countries such as Argentina, Brazil, Chile and Perú).
Central America
Central America, a region of approximately 45.6 million people, met our expansion criteria in 2010 and is currently serving as a diversifying source of income that stabilizes any potential negative impact derived from a slower growing economy in Colombia. During 2016, Central American GDP growth was double that of Colombia partially as a result the decline in oil prices.
We continue to view this region as having organic and inorganic growth potential, supported by low banking penetration (ratio of domestic private sector credit to GDP of 53.2%) and increasing GDP per capita.
Our history
Grupo Aval Acciones y Valores S.A. is asociedad anónima, incorporated under the laws of Colombia on January 7, 1994 under the name Administraciones Bancarias S.A. On April 18, 1997, the company changed its name to Sociedad A.B. S.A., and on January 8, 1998, to Grupo Aval Acciones y Valores S.A.
Grupo Aval was created by our chairman, Mr. Sarmiento Angulo, to consolidate his interests in the Colombian financial sector. The milestones in the history of Grupo Aval are the following:
| · | Mr. Sarmiento Angulo established a real estate development firm in Bogotá in 1956, and in 1959 founded Organización Luis Carlos Sarmiento Angulo, which developed low- and middle-income housing neighborhoods in Bogotá in the 1960s and 1970s; |
| · | In 1971, Mr. Sarmiento Angulo acquired a majority stake in Banco de Occidente, and in 1972 founded Corporación de Ahorro y Vivienda Las Villas to focus on low- and middle-income mortgage financing; |
| · | In 1981, Mr. Sarmiento Angulo purchased a minority stake in Banco de Bogotá, and in 1988 he acquired a majority stake and control, consolidating a major participation in the banking system. Banco de Bogotá acquired a substantial majority of, and absorbed, Banco del Comercio in 1992; |
| · | In 1991, Banco de Bogotá and Banco de Occidente founded Porvenir as a severance fund manager, and following the creation in 1993 of the private pension fund system in Colombia, expanded the business to include pension fund management in 1994; |
| · | In 1996, Banco Popular was acquired from the Colombian government through a privatization process; |
| · | In 1997, Mr. Sarmiento Angulo acquired Corporación de Ahorro y Vivienda Ahorramas which was later merged with Corporación de Ahorro y Vivienda Las Villas in 2000 and became Banco AV Villas in 2002; |
| · | In 1998, Mr. Sarmiento Angulo contributed a majority of his direct and indirect holdings in the financial institutions to Grupo Aval. TheRed de Grupo Aval (Grupo Aval network) was also established in 1998 to provide an integrated service network of branches and ATMs; |
| · | In 1999, we conducted our initial public equity offering in Colombia and listed our common shares on the Colombian Stock Exchange under the ticker symbol “GRUPOAVAL” raising Ps 62.5 billion (U.S.$35.3 million) in gross proceeds. Grupo Aval’s initial public offering was the first large-scale equity offering of a Colombian company to the general public, which allowed several thousand investors to become our shareholders; |
| · | Corficolombiana, which was founded in 1959 as an affiliate of Banco de Bogotá, acquired and merged with several merchant banks between 1997 and 1999, including Corfitolima, Corfiprogreso, Corfes, Corfiboyacá, Corfisantander, Corfiandes and Indufinanciera. In 2005, Corfivalle, also a merchant bank merged with Corficolombiana; |
| · | In 2007, we conducted our second public offering of common shares pursuant to a preemptive rights offering in Colombia, raising Ps 372.0 billion (U.S.$210.4 million) in gross proceeds; |
| · | In 2010, we acquired BAC Credomatic from GE Consumer Finance Central Holdings Corp. and General Electric Capital Corporation; |
| · | In 2011, we registered our preferred shares with the SEC; |
| · | In 2011, we concluded our first offering of our preferred shares pursuant to a preemptive rights offering in Colombia, raising Ps 2.1 trillion (U.S.$1.1 billion) in gross proceeds; |
| · | In February 2012, we completed our first international bond offering, issuing Ps 1,083.6 billion (U.S.$600 million) at the date of the issuance of our 5.25% Senior Notes due 2017; |
| · | In September 2012, we completed our second international bond offering, issuing Ps 1,795.7 billion (U.S.$1.0 billion) at the date of the issuance of our 4.75% Senior Notes due 2022; |
| · | On April 18, 2013, we acquired Horizonte and on December 31, 2013, we completed the merger of Horizonte into Porvenir; |
| · | On December 19, 2013 and December 23, 2013, we expanded our Central America operations with the acquisitions of BBVA Panamá (merged into BAC International Bank, Inc.) and Grupo Reformador (merged into Banco de América Central S.A. (Guatemala)), respectively; |
| · | On January 17, 2014, we completed our third public offering of common shares pursuant to a preemptive rights offering, or the “Common Share Rights Offering,” raising Ps 2.4 trillion (U.S.$1.3 billion); and |
| · | In September 2014, we completed a SEC-registered initial public offering in the United States. We raised U.S.$1.3 billion in gross proceeds. Our ADSs began to trade on the New York Stock Exchange, or NYSE, under the symbol “AVAL” on September 23, 2014. |
| · | On June 21, 2016, Grupo Aval, Banco de Bogotá, Banco de Occidente, Banco Popular entered into the Amended Corficolombiana Shareholders’ Agreement to provide for Grupo Aval to directly control Corficolombiana. Prior to June 21, 2016, Banco de Bogotá, which held and continues to hold a 38.3% equity interest in Corficolombiana, controlled Corficolombiana. |
Our operations
We conduct our operations through our four banks (Banco de Bogotá, Banco de Occidente, Banco Popular and Banco AV Villas), our merchant bank (Corficolombiana), a pension and severance fund manager (Porvenir) and our Central American banking group (BAC Credomatic).
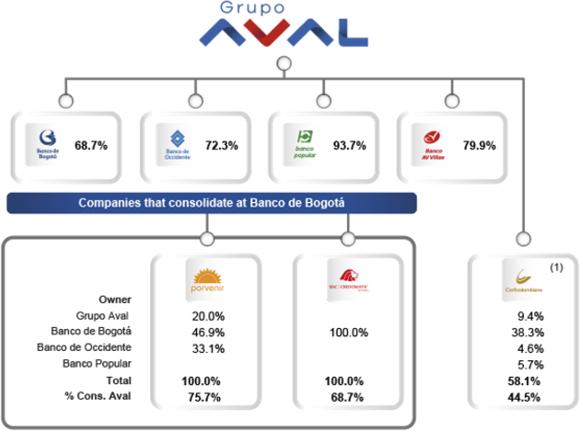
Source: Company data at December 31, 2016.
| (1) | Since June, 2016 Corficolombiana is consolidated directly by Grupo Aval and not through Banco de Bogotá. Porvenir and BAC Credomatic are subsidiaries of Banco de Bogotá, whose financial data is consolidated into Banco de Bogotá’s results. Ownership percentages shown include direct and indirect participation. |
| (2) | In addition to Mr. Sarmiento Angulo’s beneficial ownership through Grupo Aval, he beneficially owned 8.3% of Banco de Bogotá, 13.3% of Banco de Occidente, 15.5% of Banco AV Villas, 0.8% of Banco Popular and 0.3% of Corficolombiana, at April 24, 2017. |
We believe that each of our banks and Corficolombiana, as well as Porvenir and BAC Credomatic have a strong reputation in the market within their individual sectors. Each of our banks and Corficolombiana are publicly-traded on the Colombian Stock Exchange, and the remaining shares in these companies that are not beneficially owned by Mr. Sarmiento Angulo are held by non-controlling shareholders.
Colombian Banking Operations
Banco de Bogotá, founded in 1870, is Colombia’s oldest financial institution, and was the most efficient bank in the Colombian banking system in 2016 with an efficiency ratio of 36.5% on an unconsolidated basis as of December 31, 2016, in accordance with Colombian IFRS. As of the same date Banco de Bogotá had a market share of 14.4% of deposits and 12.9% of gross loans. At and for the year ended December 31, 2016, Banco de Bogotá had total assets of Ps 141.4 trillion and net income attributable to controlling interest of Ps 4.2 trillion on a consolidated basis in accordance with IFRS (of which Ps 2.2 trillion correspond to the effect of Corficolombiana’s deconsolidation). Banco de Bogotá is a full-service bank with nationwide coverage and a comprehensive portfolio of services and products, distributed through a network of 709 branches and 1,758 ATMs in Colombia at December 31, 2016. While Banco de Bogotá serves all market segments, it has a leading presence in commercial loans historically, with a particular focus on large corporations and a market share of 16.9% of commercial loans at December 31, 2016. Following its 2006 acquisition of Megabanco, Banco de Bogotá expanded its consumer banking business and now has a market share of 9.2% of consumer loans in Colombia as of December 31, 2016. In 2012, Banco de Bogotá entered the mortgage business and had a market share of 4.9% at December 31, 2016. Banco de Bogotá’s ROAE for the year ended December 31, 2016 on an unconsolidated basis, in accordance with Colombian IFRS, made it one of the most profitable banks in Colombia.
Banco de Occidente is the fifth largest bank in Colombia in loans, with a market share of 6.6% at December 31, 2016. It focuses on corporate customers, state-owned entities and retail customers and has a diversified revenue stream. For the year ended December 31, 2016, on a consolidated basis its loan portfolio was distributed as follows: approximately 33.1% in consumer and auto lending; approximately 50.5% in corporate and public sector lending; and approximately 16.4% in SMEs. Banco de Occidente had market shares of 8.0% of commercial loans and 6.3% of consumer loans at December 31, 2016.
Banco Popular is the eighth largest bank in Colombia in loans with a market share of 4.1% at December 31, 2016. Banco Popular operates primarily in the consumer and public sector businesses, with operations across all regions of Colombia. Banco Popular is a premier provider of financial solutions to government entities nationwide with a particular strength in public sector deposits and loans, and a significant part of its portfolio consists of payroll loans to pensioners and public sector employees. Banco Popular achieved better returns on its consumer loan portfolio due to its access to payroll deductions for repayment of loans, which has resulted in consumer loans with a substantially lower-risk profile for consumer loans (consumer past-due loans of 3.0% compared to a banking system average of 4.9% at December 31, 2016).
Banco AV Villas has evolved from being a traditional mortgage lender to a diversified full-service consumer bank targeting middle- and low-income customers. It is our most active bank in usage of non-traditional distribution channels (mobile banking, banking correspondents and virtual branches). Banco AV Villas has a broad service network throughout central and northern Colombia, including Bogotá. Banco AV Villas had a market share of 2.8% of deposits, 2.3% of loans, 4.2% of consumer loans and 3.4% of mortgages at December 31, 2016. During 2016,
Generally in declining interest rate scenario, consumer banks such as Banco Popular and Banco AV Villas see their net interest margin expand, while corporate banks such as Banco de Bogotá and Banco de Occidente will see their net interest margin contract.
Merchant Banking
Corficolombiana is the largest merchant bank in Colombia based on total assets as of December 31, 2016. Corficolombiana focuses on four main lines of business: (1) equity investments in strategic sectors of the Colombian economy, including, in particular, infrastructure, energy and gas, agribusiness and hospitality; (2) investment banking, including services relating to capital markets, mergers and acquisitions and project finance transactions; (3) treasury operations; and (4) financial services such as leasing, fiduciary and private banking. Corficolombiana’s ROAE was 18.9%, 16.8% and 10.0% for the years ended December 31, 2014, 2015 and 2016, respectively, based on its consolidated financial statements. Its results for 2016 were negatively affected by an impairment associated with its indirect investment in Concesionaria Ruta del Sol. For further detail see Note 14 to our audited consolidated financial statements.
Pension and Severance Fund Management Administration
Porvenir is the leading private pension and severance fund management business in Colombia, based on assets under management, with a 43.0% market share of assets under management as of December 31, 2016. Pension funds provide individual savings for retirement, while severance funds provide temporary income to employees who become unemployed. Based on unconsolidated data prepared under Colombian IFRS, at December 31, 2016, Porvenir was the most profitable and efficient pension and severance fund manager in Colombia, with an ROAE of 25.3% and an efficiency ratio of 40.8%.
Central American Operations
BAC Credomatic is the leading Central American banking group with operations in Costa Rica, El Salvador, Guatemala, Honduras, Nicaragua, Panamá and Mexico. BAC Credomatic is a full-service financial institution with one of the leading credit card issuance and merchant-acquiring franchises in Central America. It has achieved processing volumes of U.S.$17,457 million (Ps 52,383 billion) for the year ended December 31, 2016 and U.S.$15,543 million (Ps 46,640 billion) for the year ended December 31, 2015, in the merchant acquiring business,. BAC Credomatic’s ROAE was 18.1% in 2014, 15.5% in 2015 and 15.1% for the year ended December 31, 2016.
Competition
We operate in a competitive market. Our principal competitors in Colombia are Bancolombia, Davivienda, and BBVA Colombia, which are the three leading banking groups in Colombia following Grupo Aval.
We are the market leader in Colombia in terms of market share of deposits, loans and our distribution network. Despite the expansion and contraction of recent economic cycles, our banks have been among the most profitable in the banking system measured by ROAE. Recently, we have outperformed one or more of our principal competitors under key operational metrics such as the ratio of loans past due more than 30 days over gross loan portfolio and operational efficiency. We believe that these results have been achieved due to our banks’ historically strong franchises, results-oriented philosophy and the Grupo Aval multi-brand business model.
In addition to our market-leading banking business, we are also, through Porvenir, the market leader in privately managed mandatory pensions and severance funds. Porvenir also has the largest share of individual customers in the private severance fund and mandatory pension fund markets in Colombia.
Corficolombiana is the largest finance corporation in Colombia, with the largest equity portfolio primarily invested in strategic sectors of the Colombian economy: energy and gas, infrastructure, agribusiness, treasuries, hotels and financial services. Corficolombiana complements its core investment management business with treasury and investment banking operations.
Market share and other data from unconsolidated financial information
The following market share and other data comparing us and our banking subsidiaries to our competitors is based on information derived from unconsolidated financial information reported to the Superintendency of Finance by commercial banks based on Colombian IFRS.
Deposits
At December 31, 2016, we had the largest market share of total deposits in Colombia, with a market share of 27.6%. As of the same date our principal competitors—Bancolombia, Davivienda and BBVA Colombia—had market shares of 22.9%, 13.1%, and 11.8%, respectively.
The following table presents a breakdown of market share of deposits by type of deposit at December 31, 2016.
| | | At December 31, 2016 | |
| Colombian IFRS | | Grupo Aval
aggregate(1) | | | Bancolombia | | | Davivienda | | | BBVA
Colombia | | | Rest of the
Colombian
market | |
| | | (in percentages) | |
| Checking accounts | | | 39.6 | | | | 22.5 | | | | 9.2 | | | | 10.9 | | | | 17.8 | |
| Savings accounts | | | 28.0 | | | | 24.1 | | | | 14.2 | | | | 10.7 | | | | 23.0 | |
| Time deposits | | | 22.7 | | | | 21.7 | | | | 13.3 | | | | 13.3 | | | | 29.0 | |
| Total deposits | | | 27.6 | | | | 22.9 | | | | 13.1 | | | | 11.8 | | | | 24.6 | |
Source: Company calculations based on unconsolidated information published by the Superintendency of Finance.
| (1) | Grupo Aval figures reflect aggregated amounts of our banking subsidiaries. |
At December 31, 2016, deposits represented a larger share of our total funding than that of most of our principal competitor banks, and we had a higher concentration of checking accounts, which are generally source of funds with lower cost. The table below presents the total funding mix of the market at December 31, 2016.
| | | At December 31, 2016 | |
| Colombian IFRS | | Grupo Aval
aggregate(1) | | | Bancolombia | | | Davivienda | | | BBVA
Colombia | | | Rest of the
Colombian
market | |
| | | (in percentages) | |
| Funding: | | | | | | | | | | | | | | | | | | | | |
| Deposits | | | 80.8 | | | | 71.4 | | | | 73.4 | | | | 89.5 | | | | 70.7 | |
| Other funding (2) | | | 19.2 | | | | 28.6 | | | | 26.6 | | | | 10.5 | | | | 29.3 | |
| Total funding | | | 100.0 | | | | 100.0 | | | | 100.0 | | | | 100.0 | | | | 100.0 | |
| Deposits: | | | | | | | | | | | | | | | | | | | | |
| Checking accounts | | | 21.3 | | | | 14.6 | | | | 10.4 | | | | 13.7 | | | | 10.8 | |
| Savings accounts | | | 45.8 | | | | 47.6 | | | | 49.0 | | | | 41.2 | | | | 42.3 | |
| Time deposits | | | 32.9 | | | | 37.8 | | | | 40.6 | | | | 45.0 | | | | 46.9 | |
| Total deposits | | | 100.0 | | | | 100.0 | | | | 100.0 | | | | 100.0 | | | | 100.0 | |
| Average funding rate: (3) | | | | | | | | | | | | | | | | | | | | |
| Average deposit rate | | | 5.0 | | | | 4.5 | | | | 5.0 | | | | 5.7 | | | | 5.3 | |
| Average other funding rate | | | 5.5 | | | | 6.4 | | | | 6.6 | | | | 5.8 | | | | 4.8 | |
| Average total funding rate | | | 5.1 | | | | 5.1 | | | | 5.4 | | | | 5.7 | | | | 5.1 | |
Source: Company calculations based on information published by the Superintendency of Finance.
| (1) | Grupo Aval figures reflect aggregated amounts of our banking subsidiaries. |
| (2) | Other funding includes interbank borrowings and overnight funds, borrowings from banks, other long term debt and borrowings from development entities and other deposits. |
| (3) | Average balances calculated using end of month unconsolidated information for the year ended December 31, 2016. |
Loans
At December 31, 2016, we had the largest market share of total loans in Colombia, with a 25.9% market share. As of the same date, our principal competitor banks—Bancolombia, Davivienda and BBVA Colombia—had market shares of 25.8%, 14.2% and 9.9%, respectively.
The following table presents a breakdown of the market share of our loan portfolio by category at December 31, 2016.
| | | At December 31, 2016 | |
| Colombian IFRS | | Grupo Aval
aggregate(1) | | | Bancolombia | | | Davivienda | | | BBVA
Colombia | | | Rest of the
Colombian
market | |
| | | (in percentages) | |
| Commercial and leases | | | 29.2 | | | | 33.1 | | | | 12.4 | | | | 6.9 | | | | 18.3 | |
| Consumer and leases | | | 28.0 | | | | 14.5 | | | | 14.3 | | | | 13.0 | | | | 30.2 | |
| Mortgages and leases | | | 11.3 | | | | 20.9 | | | | 25.5 | | | | 19.6 | | | | 22.7 | |
| Microcredit and leases | | | 3.4 | | | | 5.8 | | | | 1.0 | | | | 0.0 | | | | 89.8 | |
| Total | | | 25.9 | | | | 25.8 | | | | 14.2 | | | | 9.9 | | | | 24.1 | |
| Source: | Company calculations based on unconsolidated information published by the Superintendency of Finance. |
| (1) | Grupo Aval figures reflect aggregated amounts of our banking subsidiaries. |
The following table shows the breakdown of our loan portfolio and that of our competitors at December 31, 2016.
| | | At December 31, 2016 | |
| Colombian IFRS | | Grupo Aval
aggregate(1) | | | Bancolombia | | | Davivienda | | | BBVA
Colombia | | | Rest of the
Colombian
market | |
| | | (in percentages) | |
| Commercial and leases | | | 65.3 | | | | 74.3 | | | | 50.7 | | | | 40.5 | | | | 44.0 | |
| Consumer and leases | | | 28.9 | | | | 15.1 | | | | 26.9 | | | | 35.1 | | | | 33.6 | |
| Mortgages and leases | | | 5.4 | | | | 10.0 | | | | 22.2 | | | | 24.4 | | | | 11.7 | |
| Microcredit and leases | | | 0.4 | | | | 0.6 | | | | 0.2 | | | | 0.0 | | | | 10.6 | |
| Total | | | 100.0 | | | | 100.0 | | | | 100.0 | | | | 100.0 | | | | 100.0 | |
| Source: | Company calculations based on unconsolidated information published by the Superintendency of Finance. |
| (1) | Grupo Aval figures reflect aggregated amounts of our banking subsidiaries. |
Loan Portfolio Quality
We believe that the credit quality of our loan portfolio compares favorably against our principal competitors. The following table presents credit quality metrics for our loan portfolio at the dates indicated.
| | | Loans past due more
than 30 days / gross
loan portfolio | | | Loans rated C, D or E
/ gross loan
portfolio(3) | | | Gross provision
expense / average
gross loan portfolio(2) | | | Allowance / loans past
due more than 30
days | |
| Colombian IFRS | | For the year ended December 31, 2016 | |
| | | (in percentages) | |
| Banco de Bogotá | | | 2.6 | | | | 4.6 | | | | 3.5 | | | | 131.8 | |
| Banco de Occidente | | | 3.0 | | | | 5.0 | | | | 4.2 | | | | 137.5 | |
| Banco Popular | | | 2.2 | | | | 2.9 | | | | 2.7 | | | | 171.5 | |
| Banco AV Villas | | | 3.5 | | | | 3.2 | | | | 4.7 | | | | 116.6 | |
| Grupo Aval aggregate(1) | | | 2.7 | | | | 4.3 | | | | 3.6 | | | | 136.8 | |
| | | | | | | | | | | | | | | | | |
| Bancolombia | | | 3.3 | | | | 5.5 | | | | 4.3 | | | | 173.3 | |
| Davivienda | | | 4.0 | | | | 3.7 | | | | 4.7 | | | | 105.3 | |
| BBVA Colombia | | | 3.2 | | | | 3.3 | | | | 3.1 | | | | 123.1 | |
| Rest of the Colombian market | | | 4.5 | | | | 6.1 | | | | 5.3 | | | | 133.6 | |
| Source: | Company calculations based on unconsolidated information published by the Superintendency of Finance. |
| (1) | Grupo Aval figures reflect aggregated amounts of our banking subsidiaries. |
| (2) | When calculated as net provision expense / average gross loan portfolio, the ratio for the year ended December 31, 2016 would be 1.9% for Banco de Bogotá, 2.3% for Banco de Occidente, 1.2% for Banco Popular, 2.6% for |
Banco AV Villas, 2.0% for Grupo Aval aggregate, 2.3% for Bancolombia, 2.9% for Davivienda, 1.7% for BBVA and 3.0% for the rest of the Colombian market.
| (3) | For further information about loan classification categories, see “Item 11. Quantitative and Qualitative disclosure about risk—Credit Classification and Provisioning.” |
Branches and ATM Network
Through our banking subsidiaries, we have the largest combined banking network in Colombia, with 1,438 branches and 3,809 ATMs at December 31, 2016. The following table presents the distribution of branches and ATMs across the market at December 31, 2016.
| | | At December 31, 2016 | |
| | | Branches | | | ATMs | |
| | | # of branches | | | Market share % | | | # of ATMs | | | Market share % | |
| Grupo Aval aggregate(1) | | | 1,438 | | | | 25.2 | % | | | 3,809 | | | | 25.0 | % |
| Bancolombia | | | 790 | | | | 13.8 | % | | | 4,307 | | | | 28.3 | % |
| Davivienda | | | 592 | | | | 10.4 | % | | | 1,745 | | | | 11.5 | % |
| BBVA Colombia | | | 477 | | | | 8.3 | % | | | 1,343 | | | | 8.8 | % |
| Rest of the Colombian market | | | 2,416 | | | | 42.3 | % | | | 4,023 | | | | 26.4 | % |
| Source: | Company calculations based on unconsolidated information published by the Superintendency of Finance, except for information for Grupo Aval which reflects aggregate data obtained from our banking subsidiaries. |
| (1) | Grupo Aval figures reflect aggregated amounts of our banking subsidiaries. |
Pension and severance fund management – Porvenir
Porvenir is the leading private pension fund manager in Colombia in terms of assets under management and has the largest share of earnings in the pension and severance fund management market in Colombia. Porvenir’s principal private competitors are other pension fund managers, including Protección, Colfondos and Old Mutual.
Porvenir also has the largest share of individual customers of privately managed mandatory pension funds and has a higher ROAE than the average of the Private Pension Fund Managers in Colombia in 2014, 2015 and 2016.
The following table presents the market shares of the main market participants with respect to assets under management and individual customers of mandatory pension funds at December 31, 2016, and net income for the year ended December 31, 2016.
| | | At and for the year ended December 31, 2015 | |
| | | Porvenir | | | Protección | | | Colfondos | | | Old Mutual | |
| | | (in percentages) | |
| Individual customers to pension funds: | | | | | | | | | | | | | | | | |
| Mandatory | | | 56.2 | | | | 30.0 | | | | 13.0 | | | | 0.7 | |
| Severance | | | 56.5 | | | | 32.6 | | | | 10.3 | | | | 0.6 | |
| Voluntary | | | 28.8 | | | | 50.7 | | | | 7.5 | | | | 13.0 | |
| Total | | | 55.6 | | | | 31.4 | | | | 12.0 | | | | 1.0 | |
| Assets under management: | | | | | | | | | | | | | | | | |
| Mandatory | | | 44.2 | | | | 36.2 | | | | 13.7 | | | | 5.9 | |
| Severance | | | 48.9 | | | | 38.0 | | | | 10.8 | | | | 2.3 | |
| Voluntary | | | 23.2 | | | | 40.8 | | | | 5.5 | | | | 30.5 | |
| Total | | | 43.0 | | | | 36.6 | | | | 13.0 | | | | 7.4 | |
| Net income: | | | 49.8 | | | | 35.9 | | | | 6.6 | | | | 7.7 | |
| Source: | Information published by the Superintendency of Finance. Information does not include data from third-party pension liability funds, which do not comprise a material portion of the market. Net income calculated under Colombian IFRS. |
Merchant banking—Corficolombiana
Corficolombiana was the largest merchant bank in Colombia in terms of assets and equity at December 31, 2016. Corficolombiana faces competition from local and global banks focused on merchant and investment banking. Bancolombia, through its subsidiary Banca de Inversión Bancolombia S.A., is Corficolombiana’s largest local competitor. On an international level, Corficolombiana faces competition from global banks with local investment banking operations. In addition, as an equity investor, Corficolombiana faces competition from other equity investors such as hedge funds, private equity firms and others.
The following table presents the market shares of Corficolombiana and its principal competitors by assets, liabilities and equity at the dates indicated at December 31, 2016.
| Colombian IFRS | | Assets | | | Liabilities | | | Equity | |
| | | (in percentages) | |
| Corficolombiana | | | 74.5 | | | | 88.2 | | | | 55.7 | |
| Banca de Inversión Bancolombia S.A. | | | 12.7 | | | | 1.6 | | | | 28.0 | |
| J.P. Morgan Corporación Financiera S.A. | | | 7.4 | | | | 7.0 | | | | 8.0 | |
| BNP Paribas Colombia Corporación Financiera S.A. | | | 2.3 | | | | 2.1 | | | | 2.5 | |
| Itaú BBA Colombia S.A. | | | 3.1 | | | | 1.1 | | | | 5.8 | |
| Source: | Information published by the Superintendency of Finance. |
Colombian banking business overview
Our differentiated multi-brand business model builds on the individual strengths of our banks and the wide recognition of their brands. Each of our banks has developed over time a focus on particular and, to a degree, overlapping market sectors, geographic regions and services and products. As a group, we are present in all banking businesses in Colombia, as shown in the following chart.
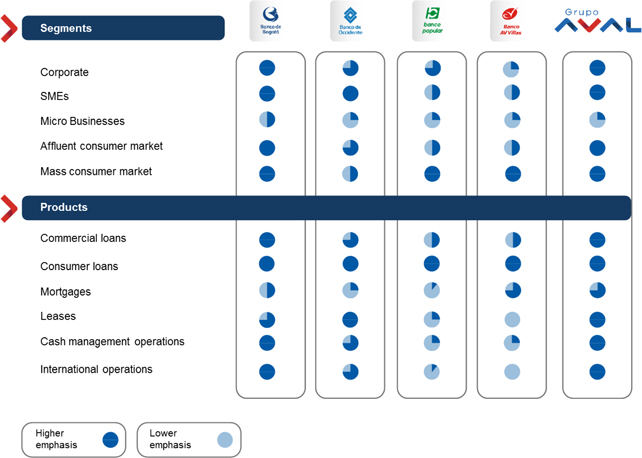
Through the subsidiaries of our banks, we also offer fiduciary, bonded warehousing and brokerage transactions, real estate escrow services, merchandise and document storage and deposit, customs agency, cargo management, surety bond and merchandise distribution services, bancassurance, payment and collection services, and provide deposit and lending operations in foreign currencies. Through Corficolombiana, we operate as a merchant and investment bank, and, through Porvenir, we participate in pension and severance fund management.
Corporate Customers
Our banks provide services and products to public and private sector customers. Our banks segment their corporate customers into separate categories based principally on their annual revenues. We believe that these customer classifications, which are specific to each bank, allow our entities to tailor their services and products to the needs of each customer classification sector.
At December 31, 2016, our banks had an aggregate of 289,800 corporate customers, which may include customer overlap among our banks, an increase of 2.7% over 282,200 corporate customers at December 31, 2015.
The following table presents the number of corporate customers that our banks served at the dates indicated.
| | | Grupo Aval | |
| | | Banco de
Bogotá | | | Banco de
Occidente | | | Banco
Popular | | | Banco AV
Villas | | | Grupo Aval
aggregate(1) | |
| | | (in thousands) | |
| Total corporate customers, as of: | | | | | | | | | | | | | | | | | | | | |
| December 31, 2016 (2) | | | 177.8 | | | | 77.3 | | | | 6.5 | | | | 28.2 | | | | 289.8 | |
| December 31, 2015 (2) | | | 173.9 | | | | 74.3 | | | | 6.2 | | | | 27.7 | | | | 282.2 | |
| (1) | Reflects aggregated amounts of our banking subsidiaries. |
| (2) | Additionally, BAC Credomatic had approximately 105,000 and 101,000 corporate customers as of December 31, 2016 and 2015, respectively. |
Individual customers
Our banks provide services and products to individuals throughout Colombia. Our banks classify their individual banking customers into separate categories based principally on income.
At December 31, 2016, our banks had a total of approximately 10,381,200 individual customers, an increase of 3.8% over approximately 10,004,800 individual customers at December 31, 2015. Customers of more than one of our banking subsidiaries are counted separately for each banking subsidiary.
The following table presents the number of individual customers that our banks served at the dates indicated.
| | | Grupo Aval | |
| | | Banco de
Bogotá | | | Banco de
Occidente | | | Banco
Popular | | | Banco AV
Villas | | | Grupo Aval
aggregate(1) | |
| | | (in thousands) | |
| Total individual customers, as of: | | | | | | | | | | | | | | | | | | | | |
| December 31, 2016 | | | 5,444.6 | | | | 635.9 | | | | 2,988.8 | | | | 1,312.0 | | | | 10,381.2 | |
| December 31, 2015 (2) | | | 5,139.7 | | | | 621.6 | | | | 2,894.7 | | | | 1,348.7 | | | | 10,004.8 | |
| (1) | Reflects aggregated amounts of our banking subsidiaries. |
| (2) | Additionally, BAC Credomatic had approximately 3,107,000 and 3,290,000 individual customers as of December 31, 2016 and 2015, respectively. |
Lending activities
In accordance with Superintendency of Finance guidelines, we classify our banks’ loans into the following categories: commercial, consumer, microcredit and mortgages.
The following table presents our gross loan portfolio at December 31, 2016 in accordance with IFRS.
| | | At December 31, 2016 | |
| | | Grupo Aval entities | | | | |
| | | Banco de
Bogotá(3) | | | Banco de
Occidente | | | Banco
Popular | | | Banco AV
Villas | | | Corficolombiana | | | Grupo Aval
consolidated(2) | |
| | | (in Ps billions) | |
| Commercial | | | 61,375.6 | | | | 19,539.1 | | | | 7,186.3 | | | | 3,134.0 | | | | 2,899.2 | | | | 93,149.2 | |
| Commercial loans | | | 58,843.6 | | | | 19,300.2 | | | | 7,120.1 | | | | 3,116.8 | | | | 2,161.9 | | | | 89,579.6 | |
| Interbank and overnight funds interbank | | | 2,532.0 | | | | 238.9 | | | | 66.3 | | | | 17.2 | | | | 737.3 | | | | 3,569.6 | |
| Consumer | | | 26,364.8 | | | | 6,893.0 | | | | 8,833.2 | | | | 4,529.6 | | | | 307.4 | | | | 46,928.0 | |
| Mortgages | | | 11,411.1 | | | | 1,014.1 | | | | 513.1 | | | | 1,744.3 | | | | 0.9 | | | | 14,683.5 | |
| Microcredit(1) | | | 389.7 | | | | - | | | | 7.9 | | | | 1.8 | | | | - | | | | 399.4 | |
| Total | | | 99,541.3 | | | | 27,446.1 | | | | 16,540.6 | | | | 9,409.7 | | | | 3,207.5 | | | | 155,160.2 | |
| Allowance for loan portfolio | | | (2,371.8 | ) | | | (872.3 | ) | | | (523.9 | ) | | | (427.8 | ) | | | (65.6 | ) | | | (4,261.4 | ) |
| Total, net | | | 97,169.5 | | | | 26,573.9 | | | | 16,016.7 | | | | 8,981.9 | | | | 3,141.9 | | | | 150,898.7 | |
| (1) | Microcredit loans are issued for the purpose of encouraging the activities of small businesses and are subject to the following requirements: the maximum amount to be lent is equal to 25 times the minimum wage (salario mínimo mensual legal vigente) without the balance of one single borrower exceeding such amount at any time, and the main source of payment for the corresponding obligation shall be the revenues obtained from the activities of the borrower’s micro business. The borrower’s outstanding indebtedness may not exceed 120 times the minimum wage. |
| (2) | Includes eliminations for intercompany or intra-group operations between Grupo Aval subsidiaries. |
| (3) | Reflects Banco de Bogotá consolidated figures which include Central American operations that accounted for Ps 44,865.2 billion (Ps 19,544.1 billion in commercial loans, Ps 16,363.5 billion in consumer loans and Ps 8,957.6 billion in mortgage loans) as of December 31, 2016. |
As of December 31, 2016, the aggregate outstanding loans to our banks’ ten largest borrowers, our 11th to 50th largest borrowers and our 51st to 160th largest borrowers, represented 5.1%,6.8% and 7.5%, respectively, of our consolidated total loan portfolio.
Commercial loans
Our commercial loan portfolio consists of general purpose loans (loans with a maturity of over one year), working capital loans (loans with a maturity of up to one year), loans funded by development banks, corporate credit cards and overdraft loans. Loans funded by development banks are loans granted to customers and focused on specific economic sectors and are funded by national or international government or government-related institutions.
The following table presents our commercial loan portfolio at December 31, 2016 in accordance with IFRS.
| | | At December 31, 2016 | |
| | | Grupo Aval entities | | | | |
| | | Banco de
Bogotá(2) | | | Banco de
Occidente | | | Banco
Popular | | | Banco AV
Villas | | | Corficolombiana | | | Grupo Aval
consolidated(1) | |
| | | (in Ps billions) | |
| General purpose loans | | | 39,922.5 | | | | 11,943.2 | | | | 5,875.6 | | | | 3,093.7 | | | | 502.0 | | | | 60,374.1 | |
| Loans funded by development banks | | | 1,528.7 | | | | 838.3 | | | | 452.9 | | | | 9.2 | | | | - | | | | 2,829.0 | |
| Working capital loans | | | 13,156.5 | | | | 1,828.6 | | | | 536.3 | | | | 3.0 | | | | - | | | | 15,524.4 | |
| Credit cards | | | 289.3 | | | | 92.3 | | | | 2.5 | | | | 1.5 | | | | - | | | | 385.5 | |
| Overdrafts | | | 416.6 | | | | 77.9 | | | | 4.7 | | | | 9.5 | | | | - | | | | 508.6 | |
| Leases | | | 3,530.2 | | | | 4,520.0 | | | | 248.1 | | | | - | | | | 1,659.9 | | | | 9,958.1 | |
| Interbank and overnight funds | | | 2,532.0 | | | | 238.9 | | | | 66.3 | | | | 17.2 | | | | 737.3 | | | | 3,569.6 | |
| Total | | | 61,375.6 | | | | 19,539.1 | | | | 7,186.3 | | | | 3,134.0 | | | | 2,899.2 | | | | 93,149.2 | |
| (1) | Includes eliminations for intercompany or intra-group operations between Grupo Aval subsidiaries. |
| (2) | Reflects Banco de Bogotá consolidated figures which include Central American operations for Ps 19,544.1 billion of commercial loans. |
Consumer loans
Our consumer loan portfolio consists of personal loans, automobile and other vehicle loans, credit cards, overdrafts, loans funded by development banks and general purpose loans. Our personal loans consist primarily of payroll loans. A payroll loan is a short- or medium-term loan, where payments are deducted directly from an employer’s salary.
The following table presents our consumer loan portfolio at December 31, 2016 in accordance with IFRS.
| | | At December 31, 2016 | |
| | | Grupo Aval entities | | | | |
| | | | Banco de
Bogotá(2) | | | Banco de
Occidente | | | Banco
Popular | | | Banco AV
Villas | | | Corficolombiana | | | Grupo Aval
consolidated (1) | |
| | | (in Ps billions) | |
| Personal loans | | | 12,437.3 | | | | 3,327.1 | | | | 8,567.8 | | | | 3,669.2 | | | | 307.0 | | | | 28,308.4 | |
| Automobile and other vehicle loans | | | 3,510.0 | | | | 2,064.3 | | | | 7.4 | | | | 154.7 | | | | - | | | | 5,736.4 | |
| Credit cards | | | 10,124.6 | | | | 1,318.7 | | | | 248.3 | | | | 704.2 | | | | - | | | | 12,395.7 | |
| Overdrafts | | | 74.9 | | | | 7.2 | | | | 0.7 | | | | 1.6 | | | | - | | | | 84.5 | |
| Loans funded by development banks | | | - | | | | - | | | | 0.0 | | | | - | | | | - | | | | 0.0 | |
| General purpose loans | | | 17.8 | | | | 162.6 | | | | 7.0 | | | | - | | | | - | | | | 187.4 | |
| Working capital loans | | | - | | | | - | | | | - | | | | - | | | | - | | | | - | |
| Leases | | | 200.1 | | | | 13.1 | | | | 2.0 | | | | - | | | | 0.4 | | | | 215.6 | |
| Total(3) | | | 26,364.8 | | | | 6,893.0 | | | | 8,833.2 | | | | 4,529.6 | | | | 307.4 | | | | 46,928.0 | |
| (1) | Includes eliminations for intercompany or intra-group operations between Grupo Aval subsidiaries. |
| (2) | Reflects Banco de Bogotá consolidated figures which include Central American operations for Ps 16,363.5 billion of consumer loans. |
| (3) | Includes microcredit loans. |
Credit cards
We provide credit card services to our bank customers in Colombia through the Visa and MasterCard networks. The following table presents the number of activated issued credit cards of our banks in Colombia at the dates indicated.
| | | Activated Issued Credit Cards | |
| Bank | | December 31,
2016 | | | December 31,
2015 | |
| Banco de Bogotá | | | 1,069,927 | | | | 956,279 | |
| Banco de Occidente | | | 609,407 | | | | 574,988 | |
| Banco Popular | | | 255,149 | | | | 86,328 | |
| Banco AV Villas | | | 416,594 | | | | 369,237 | |
| Corficolombiana | | | - | | | | - | |
| Total Colombian activated issued credit cards(1) | | | 2,351,077 | | | | 1,986,832 | |
| (1) | Additionally, BAC Credomatic had approximately 1,968,530 and 1,795,730 credit card accounts in Central America at December 31, 2016 and at December 31, 2015, respectively. See “—Central American operations—Lending activities—Credit cards.” |
Mortgages
In Colombia, Banco de Bogotá and Banco AV Villas are our main originators of loans to customers for the purchase of real estate secured by mortgages, while Banco de Occidente and Banco Popular are increasing their presence in this business. We have implemented strict underwriting standards: we do not offer mortgage loans in amounts greater than 70% of the value of the property to be purchased, and all of our mortgage loans (excluding housing leases) have maturities of between five and fifteen years. The average maturity at December 31, 2016 was
136 months. Borrowers must also meet certain minimum income levels, and payments may not exceed 30% of the borrower’s monthly income. The average maturity, for our Central American operations mortgage portfolio at December 31, 2016 was 180 months.
Deposit-taking activities
Deposits
Our banks offer traditional deposit services and products, including checking accounts, savings accounts, time deposits and other deposits. Checking accounts typically bear low or no interest. Checking accounts and savings accounts are payable on demand, although a significant portion of these accounts tend to be stable in amount over time. Time deposits typically have a maturity up to 12 months and commonly earn interest at a fixed rate.
The following table presents our deposits by product type at the dates indicated.
| | | At December 31, 2016 | |
| | | Grupo Aval entities | |
| | | Banco de
Bogotá(2) | | | Banco de
Occidente | | | Banco
Popular | | | Banco AV
Villas | | | Corficolombiana | | | Grupo Aval
consolidated(1)(2) | |
| | | (in Ps billions) | |
| Checking accounts | | | 27,025.8 | | | | 6,087.6 | | | | 1,145.0 | | | | 918.1 | | | | - | | | | 34,978.2 | |
| Savings accounts | | | 27,983.7 | | | | 8,992.8 | | | | 8,766.0 | | | | 5,628.3 | | | | 313.5 | | | | 50,573.9 | |
| Time deposits (CDs) | | | 38,444.5 | | | | 9,048.2 | | | | 4,782.5 | | | | 3,157.4 | | | | 3,516.7 | | | | 58,006.1 | |
| Other deposits | | | 222.7 | | | | 47.5 | | | | 39.8 | | | | 2.2 | | | | 16.6 | | | | 328.8 | |
| Total | | | 93,676.7 | | | | 24,176.1 | | | | 14,733.4 | | | | 9,706.1 | | | | 3,846.8 | | | | 143,887.1 | |
| (1) | Includes eliminations for intercompany or intra-group operations between Grupo Aval subsidiaries. |
| (2) | Includes Central American operations for Ps 39,893.4 billion as of December 31, 2016 (made up of by Ps 14,574.3 billion in Checking accounts, Ps 7,781.5 billion in Savings accounts, Ps 17,368.3 billion in Time Deposits, and Ps 169.3 billion in Other deposits). |
Treasury operations
Our banks’ treasury departments are responsible for managing their proprietary trading activities, liquidity and distribution of treasury services and products to customers and are focused on fixed-income securities, foreign exchange transactions and derivatives. Our banks’ proprietary trading activities include fixed income trading, derivatives and foreign exchange operations. We do not have any proprietary trading activities in equities and each of our banks have implemented trading activities policies. Our banks also accept deposits from financial institutions as part of their treasury operations. These deposits are represented by certificates of interbank deposit, or “CDIs,” and earn interest at the interbank deposit rate. Banco de Bogotá and Banco de Occidente have active treasury operations, while Banco Popular and Banco AV Villas have smaller treasury operations.
Distribution
Our banks provide services and products to their customers through our network. Each of our banks manages its own distribution network. In 1998, we created theRed de Grupo Aval (Grupo Aval network) which allows customers of any of our banks to make transfers, payments and undertake other basic banking functions in the networks of our other banks, through traditional channels and electronic networks, with results posting in real time
to the accountholder’s bank with no additional fees.Red de Grupo Aval (Grupo Aval network) services vary for each channel.
The following chart shows the distribution channels of our network in Colombia.
| Distribution Channel | | Description |
| Full-service branches | | We had 1,438 full-service branches at December 31, 2016.Red de Grupo Aval (Grupo Aval network) service points across our banks allow our bank customers to perform check cashing, deposits, savings account withdrawals, loan and credit card payments, transfers and advances at any of our branches. |
| | | |
| ATMs and electronic service points | | We had 3,809 ATMs and 45 other electronic service points (non-cash dispensing teller machines) at December 31, 2016. Through our ATMs and electronic service points, all of our bank customers can, among other services, consult their balances, execute loan and credit card payments, transfers and advances, and pay for certain third-party services where we have a payment collection agreement in place (such as utility service companies). |
| | | |
| Payment collection centers (Centros de pagos) | | We had 122 payment collection centers at December 31, 2016, which allow our customers to pay for certain third-party services where we have a payment collection agreement in place (such as utility service companies). |
| | | |
| Banking correspondents (Corresponsales bancarios) | | We had 26,438 banking correspondents at December 31, 2016. Our banks enter into agreements with various third parties, including convenience store owners, to provide all of our bank customers with certain services which can include checking and savings account withdrawals, account balance consultation, loan and credit card payments, transfers and advances, and payments for certain third-party services where we have a payment collection agreement in place with such third-party (such as utility service companies). |
| | | |
| Automated telephone banking, mobile banking and online banking | | Through our banks’ websites, mobile banking services and automated telephone banking, customers may pay loan and credit card balances, make transfers between accounts and make payments for collection agreements originated in any of our banks. |
The following map presents our banks’ points of service across the principal regions of Colombia, at December 31, 2015 and 2016.

Source: Grupo Aval
Note: Other points of service include Banking correspondents (corresponsales bancarios) or “CBs,” electronic service points (agilizadores electrónicos) and payment collection centers (centros de pago). At December 31, 2016, Banco AV Villas had closed some of its non-operational banking correspondents from their alliances withMóvil Red andRed Cerca, for strategic reasons.
The following table presents transaction volumes through our branches and ATMs at the dates indicated.
| | | Transactions at
December 31, | | | % Total Transactions at
December 31, | |
| Grupo Aval | | 2016 | | | 2015 | | | 2016 | | | 2015 | |
| | | (in thousands) | | | | |
| Branches | | | 238,268 | | | | 274,220 | | | | 26.7 | | | | 30.6 | |
| ATMs | | | 168,014 | | | | 165,534 | | | | 18.9 | | | | 18.4 | |
| Other | | | 57,608 | | | | 58,704 | | | | 6.5 | | | | 6.5 | |
| Total service points | | | 463,889 | | | | 498,457 | | | | 52.0 | | | | 55.5 | |
In addition, the following table presents transaction volumes for online banking, mobile banking and automated telephone banking channels which, pursuant to our growth strategy, are expected to grow on an annual basis relative to total transactions, at December 31, 2016 and 2015.
| | | Transactions at
December 31, | | | % of Total Transactions at
December 31, | |
| Grupo Aval | | 2016 | | | 2015 | | | 2016 | | | 2015 | |
| | | (in thousands) | |
| Online banking | | | 420,221 | | | | 385,131 | | | | 47.1 | | | | 42.9 | |
| Mobile banking | | | 2,196 | | | | 3,666 | | | | 0.2 | | | | 0.4 | |
| Automated telephone banking | | | 4,950 | | | | 10,121 | | | | 0.6 | | | | 1.1 | |
| Total | | | 427,368 | | | | 398,919 | | | | 48.0 | | | | 44.5 | |
In 2016, a total of 54.4 million messages were sent through our mobile phone banking system, an increase of approximately 27.1% as compared to 42.8 million messages in 2015.
Our call centers provide our customers with assistance relating to bank services and products, information updates, service-related complaints, payment or account linkages, and credit card blockage. Our call centers are also used for telemarketing, collection of past-due loans and customer loyalty initiatives. In 2016, the number of inbound calls to our call centers was approximately 10.1 million and the number of outbound calls was approximately 25.5 million. In 2015, the number of inbound calls to our call centers was approximately 10.7 million and the number of outbound calls was approximately 28.7 million.
Banco de Bogotá
Banco de Bogotá is Colombia’s oldest financial institution, and was the most efficient bank in the Colombian banking system with an efficiency ratio of 36.5% on an unconsolidated basis at December 31, 2016. As of the same date we had a market share of 14.4% of deposits and 12.9% of loans.
At and for the year ended December 31, 2016, Banco de Bogotá had total assets of Ps 141,430.7 billion and net income attributable to controlling interest of Ps 4,246.3 billion on a consolidated basis (of which Ps 2,208.1 billion correspond to the one-off effect associated with the deconsolidation of Corficolombiana).
Banco de Bogotá is a full-service bank with nationwide coverage and a comprehensive portfolio of services and products, distributed through a network of 709 branches and 1,758 ATMs in Colombia at December 31, 2016. While Banco de Bogotá serves all market segments, it has a leading presence in commercial loans historically, with a particular focus on large corporations and a market share of 16.9% of commercial loans at December 31, 2016. Following its 2006 acquisition of Megabanco, Banco de Bogotá expanded its consumer banking business and had a market share of 9.2% of consumer loans in Colombia December 31, 2016. In 2012, Banco de Bogotá entered the mortgage business and has a market share of 4.9% at December 31, 2016. Banco de Bogotá’s ROAE for the year ended December 31, 2016 on an unconsolidated basis made it one of the most profitable banks in Colombia.
In December 2010, Banco de Bogotá acquired BAC Credomatic. In December 2011, Banco de Bogotá completed its first international bond offering, raising U.S.$600 million (Ps 1,161.4 billion at the date of issuance). In February 2013, Banco de Bogotá completed its second international bond offering raising U.S.$500 million (Ps 892.7 billion at the date of the issuance) in subordinated notes.
On December 19, 2013, through LB Panamá, Banco de Bogotá acquired BBVA Panamá. On December 9, 2014, Banco BAC de Panamá´s operations were merged with BAC International Bank, Inc.
On December 23, 2013, through Credomatic International Corporation (a subsidiary of BAC), Banco de Bogotá acquired 100% of Grupo Financiero Reformador de Guatemala (whose subsidiaries are Banco Reformador and Transcom Bank (Barbados) Limited). On December 12, 2015, Grupo Financiero Reformador de Guatemala´s operations merged with Banco de América Central S.A. (Guatemala).
In May 2016, Banco de Bogotá completed its third international bond offering raising U.S.$600 million (Ps 1,771.6 billion at the date of the issuance) in subordinated notes, followed by a reopening in November 2016 raising an additional U.S.$500 million (Ps 1,483.3 billion at the date of the issuance).
Lending activities
The following table presents Banco de Bogotá’s consolidated loan portfolio at the dates indicated.
| | | At December 31,(1) | | | Change, December 31,
2016 vs.
December 31, 2015 | |
| | | 2016 | | | 2015(2) | | | # | | | % | |
| | | (in Ps billions) | |
| Commercial | | | 61,375.6 | | | | 59,225.0 | | | | 2,150.6 | | | | 3.6 | |
| Commercial loans | | | 58,843.6 | | | | 56,149.2 | | | | 2,694.5 | | | | 4.8 | |
| Interbank and overnight funds | | | 2,532.0 | | | | 3,075.9 | | | | (543.9 | ) | | | (17.7 | ) |
| Consumer | | | 26,364.8 | | | | 24,472.4 | | | | 1,892.4 | | | | 7.7 | |
| Mortgages | | | 11,411.1 | | | | 10,626.8 | | | | 784.4 | | | | 7.4 | |
| Microcredit | | | 389.7 | | | | 385.6 | | | | 4.1 | | | | 1.1 | |
| Total | | | 99,541.3 | | | | 94,709.9 | | | | 4,831.4 | | | | 5.1 | |
| Allowance for loan portfolio | | | (2,371.8 | ) | | | (2,096.3 | ) | | | (275.5 | ) | | | 13.1 | |
| Total, net | | | 97,169.5 | | | | 92,613.6 | | | | 4,556.0 | | | | 4.9 | |
| (1) | Reflects Banco de Bogotá consolidated figures which include Central American operations which as of December 31, 2016, accounted for Ps 44,865.2 billion of the total loan portfolio (Ps 19,544.1 billion in commercial loans, Ps 16,363.5 billion in consumer loans and Ps 8,957.6 billion in mortgage loans). As of December 31, 2015, Central American operations accounted for Ps 42,928.6 billion of the total loan portfolio (Ps 19,130.0 billion in commercial loans, Ps 15,139.0 billion in consumer loans and Ps 8,659.7 billion in mortgage loans). |
| (2) | Figures for 2015 exclude Corficolombiana. |
Deposit-taking activities
Banco de Bogotá offers customers checking accounts, savings accounts, time deposits (CDs) and other deposits as described in the table below.
The following table presents a breakdown of Banco de Bogotá’s consolidated deposits by product type at the dates indicated.
| | | At December 31,(1) | | | Change, December 31,
2016 vs.
December 31, 2015 | |
| | | 2016 | | | 2015(2) | | | # | | | % | |
| | | (in Ps billions) | |
| Checking accounts | | | 27,025.8 | | | | 24,960.5 | | | | 2,065.3 | | | | 8.3 | |
| Savings accounts | | | 27,983.7 | | | | 28,149.2 | | | | (165.5 | ) | | | (0.6 | ) |
| Time deposits | | | 38,444.5 | | | | 35,468.7 | | | | 2,975.8 | | | | 8.4 | |
| Other deposits | | | 222.7 | | | | 233.6 | | | | (10.8 | ) | | | (4.6 | ) |
| Total customer deposits | | | 93,676.7 | | | | 88,812.0 | | | | 4,864.7 | | | | 5.5 | |
| (1) | Reflects Banco de Bogotá consolidated figures which include Central American operations which as of December 31, 2016, Central American operations accounted for Ps 39,893.4 billion (Ps 14,574.3 billion in checking accounts, Ps 7,781.5 billion in savings accounts, Ps 17,368.3 billion in time deposits and 169.3 billion in other deposits). As of December 31, 2015 Central American operations accounted for Ps 39,024.7 billion (Ps 14,921.8 billion in checking accounts, Ps 7,613.2 billion in savings accounts, Ps 16,287.1 billion in time deposits and 202.6 billion in other deposits). |
| (2) | Figures for 2015 exclude Corficolombiana. |
Distribution
The following table presents Banco de Bogotá’s points of service across Colombia.
| | | At December 31, | |
| | | 2016 | | | 2015 | |
| Branches | | | 709 | | | | 711 | |
| ATMs | | | 1,758 | | | | 1,747 | |
| Other points of service | | | 7,965 | | | | 7,601 | |
| Total points of service | | | 10,432 | | | | 10,059 | |
Banco de Bogotá had a network concentration of approximately 64.5% in Colombia’s central region, of which Bogotá represents approximately 42.2% of Banco de Bogotá’s total network at December 31, 2016. Banco de Bogotá had a market share of approximately 12.4% of branches and approximately 11.5% of ATMs at December 31, 2016.
Banco de Occidente
Banco de Occidente is the fifth largest bank in Colombia, with a market share of 6.6% of loans at December 31, 2016.
Banco de Occidente focuses on corporate customers, state-owned entities and retail customers and has a diversified revenue stream. For the year ended December 31, 2016, its loan portfolio was distributed as follows: approximately 33.1% in consumer and auto lending; approximately 50.5% in corporate and public sector lending; and approximately 16.4% in SMEs. Banco de Occidente had market shares of 8.0% of commercial loans and 6.3% of consumer loans at December 31, 2016.
Banco de Occidente had a market share of approximately 11.0% of checking accounts at December 31, 2016. Additional areas of focus for future growth include credit cards, low-risk consumer loan services and products such as payroll loans and loans to government agencies. On a consolidated basis in accordance with IFRS, Banco de Occidente’s ROAE was approximately 15.0% for the year ended December 31, 2016.
Lending activities
The following table presents Banco de Occidente’s consolidated loan portfolio at the dates indicated.
| | | At December 31, | | | Change, December 31, 2016 vs.
December 31, 2015 | |
| | | 2016 | | | 2015 | | | # | | | % | |
| | | (in Ps billions, except for percentages) | |
| Commercial | | | 19,539.1 | | | | 19,324.9 | | | | 214.2 | | | | 1.1 | |
| Commercial loans | | | 19,300.2 | | | | 19,229.8 | | | | 70.4 | | | | 0.4 | |
| Interbank and overnight funds | | | 238.9 | | | | 95.1 | | | | 143.8 | | | | 151.2 | |
| Consumer | | | 6,893.0 | | | | 6,251.5 | | | | 641.5 | | | | 10.3 | |
| Mortgages | | | 1,014.1 | | | | 844.4 | | | | 169.7 | | | | 20.1 | |
| Microcredit | | | - | | | | - | | | | - | | | | - | |
| Total | | | 27,446.1 | | | | 26,420.7 | | | | 1,025.4 | | | | 3.9 | |
| Allowance for loan portfolio | | | (872.3 | ) | | | (790.3 | ) | | | (81.9 | ) | | | 10.4 | |
| Total, net | | | 26,573.9 | | | | 25,630.4 | | | | 943.5 | | | | 3.7 | |
Deposit-taking activities
Banco de Occidente has a relatively high proportion of deposits held in checking accounts. At December 31, 2016, 26.9% of Banco de Occidente’s deposits were held by customers in checking accounts, as compared to a national banking system average of approximately 14.9% at December 31, 2016.
The following table presents a breakdown of Banco de Occidente’s consolidated deposits by product type at the dates indicated.
| | | At December 31, | | | Change, December 31, 2016 vs.
December 31, 2015 | |
| | | 2016 | | | 2015 | | | # | | | % | |
| | | (in Ps billions, except for percentages) | |
| Checking accounts | | | 6,087.6 | | | | 6,341.0 | | | | (253.5 | ) | | | (4.0 | ) |
| Savings accounts | | | 8,992.8 | | | | 10,081.5 | | | | (1,088.7 | ) | | | (10.8 | ) |
| Time deposits | | | 9,048.2 | | | | 7,347.0 | | | | 1,701.2 | | | | 23.2 | |
| Other deposits(1) | | | 47.5 | | | | 121.4 | | | | (73.9 | ) | | | (60.9 | ) |
| Total | | | 24,176.1 | | | | 23,890.9 | | | | 285.2 | | | | 1.2 | |
| (1) | Includes active account portfolios, payroll accounts, funds held in trust, banks and correspondents, special deposits and temporary deposits held in connection with collection services agreements. |
Distribution
The following table presents Banco de Occidente’s points of service across in Colombia.
| | | At December 31, | |
| | | 2016 | | | 2015 | |
| Branches | | | 218 | | | | 212 | |
| ATMs | | | 339 | | | | 336 | |
| Other points of service | | | 10,198 | | | | 9,650 | |
| Total points of service | | | 10,755 | | | | 10,198 | |
Banco de Occidente had a network concentration of approximately 45.3% in Colombia’s central region, of which Bogotá represented approximately 23.0% of Banco de Occidente’s total network at December 31, 2016. Banco de Occidente is also active in the southwestern region of Colombia, in which approximately 14.4% of its distribution network is located. During 2016, Banco de Occidente opened 548 new banking correspondents. Banco de Occidente had approximately 3.8% market share of branches and approximately 2.2% market share of ATMs at December 31, 2016.
Banco Popular
Banco Popular is the eighth largest bank in Colombia in loans with a market share of 4.1% at December 31, 2016. Banco Popular operates primarily in the consumer and public sector businesses, with operations across all regions of Colombia. Banco Popular is a premier provider of financial solutions to government entities nationwide with a particular strength in public sector deposits and loans, and a significant part of its portfolio consists of payroll loans to public sector employees.
Banco Popular’s consumer loans portfolio has a substantially lower-risk profile (consumer past-due loans of 3.0% compared to a banking system average of 4.9% at December 31, 2016) due to its access to payroll deductions for repayment of loans. At December 31, 2016, on a consolidated basis, Banco Popular had total assets of Ps 20,731.1 billion, 220 branches, and net income attributable to controlling interest of Ps 179.9 billion for the year ended December 31, 2016.
Banco Popular’s focus on consumer loans and institutional customers generates a mix of broad and stable sources of revenues. On a consolidated basis, its ROAE was 6.9% as of December 31, 2016.
Banco Popular’s strategy for the future is based on four pillars: (1) strengthen its leadership in payroll loans; (2) diversify product offering, such as credit cards and mortgages; (3) further penetrating the medium-size business sector (companies with annual incomes of between Ps 2 billion and Ps 40 billion); and (4) maintaining dynamic credit origination with Grupo Aval’s other banking subsidiaries.
Lending activities
The following table presents Banco Popular’s consolidated loan portfolio at the dates indicated.
| | | At December 31, | | | Change, December 31, 2016 vs.
December 31, 2015 | |
| | | 2016 | | | 2015 | | | # | | | % | |
| | | (in Ps billions) | |
| Commercial | | | 7,186.3 | | | | 6,826.1 | | | | 360.2 | | | | 5.3 | |
| Commercial loans | | | 7,120.1 | | | | 6,826.1 | | | | 293.9 | | | | 4.3 | |
| Interbank and overnight funds | | | 66.3 | | | | 0.0 | | | | 66.2 | | | | NA | |
| Consumer | | | 8,833.2 | | | | 7,492.2 | | | | 1,341.0 | | | | 17.9 | |
| Mortgages | | | 513.1 | | | | 344.8 | | | | 168.3 | | | | 48.8 | |
| Microcredit | | | 7.9 | | | | 10.6 | | | | (2.6 | ) | | | (25.0 | ) |
| Total | | | 16,540.6 | | | | 14,673.8 | | | | 1,866.8 | | | | 12.7 | |
| Allowance for loan portfolio | | | (523.9 | ) | | | (401.1 | ) | | | (122.8 | ) | | | 30.6 | |
| Total, net | | | 16,016.7 | | | | 14,272.7 | | | | 1,744.0 | | | | 12.2 | |
Deposit-taking activities
Banco Popular generates a substantial portion of its deposits through agreements with customers pursuant to which they agree to maintain a certain level of deposits in checking and/or savings accounts in exchange for the performance of services, primarily payment and collection services. These deposits totaled Ps 5,429.9 billion, representing approximately 54.8% of total checking and savings accounts, at December 31, 2016.
The following table presents a breakdown of Banco Popular’s consolidated deposits by product type at the dates indicated.
| | | At December 31, | | | Change, December 31, 2016 vs.
December 31, 2015 | |
| | | 2016 | | | 2015 | | | # | | | % | |
| | | (in Ps billions) | |
| Checking accounts | | | 1,145.0 | | | | 1,246.1 | | | | (101.1 | ) | | | (8.1 | ) |
| Savings accounts | | | 8,766.0 | | | | 7,222.4 | | | | 1,543.6 | | | | 21.4 | |
| Time deposits | | | 4,782.5 | | | | 4,075.7 | | | | 706.9 | | | | 17.3 | |
| Other deposits | | | 39.8 | | | | 61.1 | | | | (21.3 | ) | | | (34.9 | ) |
| Total customer deposits | | | 14,733.4 | | | | 12,605.3 | | | | 2,128.1 | | | | 16.9 | |
Distribution
The following table presents Banco Popular’s points of service in Colombia.
| | | At December 31, | |
| | | 2016 | | | 2015 | |
| Branches | | | 220 | | | | 229 | |
| ATMs | | | 1,136 | | | | 1,157 | |
| Other points of service | | | 249 | | | | 266 | |
| Total points of service | | | 1,605 | | | | 1,652 | |
Banco Popular had a network concentration of approximately 49.6% in Colombia’s central region, of which Bogotá represented approximately 27.4% of Banco de Popular’s total network at December 31, 2016. Banco Popular had a market share of approximately 3.9% of branches and a market share of approximately 7.5% of ATMs at December 31, 2016.
Banco AV Villas
Banco AV Villas has evolved from being a traditional mortgage lender to a diversified full-service consumer bank targeting mass market customers. It is our most active bank in usage of non-traditional distribution channels (mobile banking, banking correspondents and virtual branches). Banco AV Villas has a broad service network throughout central and northern Colombia, including Bogotá. Banco AV Villas had a market share of 2.8% of deposits, 2.3% of loans, 4.2% of consumer loans and 3.4% of mortgages as of December 31, 2016.
As of December 31, 2016, on a consolidated basis in accordance with IFRS, Banco AV Villas had total assets of Ps 12,466.6 billion and 291 bank branches, net income attributable to controlling interest was Ps 179.4 billion, ROAE was 13.5% and efficiency ratio was 53.6%.
In the consumer segment, Banco AV Villas focuses on high-margin services and products such as general purpose loans, payroll loans and credit cards, as well as its traditional line of mortgages. It serves customers through a recently expanded sales force and through its traditional retail network, entrepreneurial business centers and instant credit offices, known as “OCIs,” where credit applicants receive the outcome of their credit application within three hours. Banco AV Villas also seeks to continue to expand in the small- and medium-size corporate segment. In order to increase transaction volume through electronic channels and improve efficiency, Banco AV Villas has developed projects, such as the Nearby Network (Red Cerca), which will allow it to increase coverage by banking correspondents and offer a wide array of services to individuals and small- and medium-size businesses through its mobile banking platform.
Lending activities
The following table presents Banco AV Villas’ consolidated loan portfolio at the dates indicated in.
| | | At December 31, | | | Change, December 31, 2016 vs.
December 31, 2015 | |
| | | 2016 | | | 2015 | | | # | | | % | |
| | | (in Ps billions) | |
| Commercial | | | 3,134.0 | | | | 3,246.7 | | | | (112.7 | ) | | | (3.5 | ) |
| Commercial loans | | | 3,116.8 | | | | 2,825.3 | | | | 291.4 | | | | 10.3 | |
| Interbank and overnight funds | | | 17.2 | | | | 421.4 | | | | (404.1 | ) | | | (95.9 | ) |
| Consumer | | | 4,529.6 | | | | 3,996.5 | | | | 533.1 | | | | 13.3 | |
| Mortgages | | | 1,744.3 | | | | 1,601.0 | | | | 143.3 | | | | 8.9 | |
| Microcredit | | | 1.8 | | | | 3.0 | | | | (1.3 | ) | | | (41.1 | ) |
| Total | | | 9,409.7 | | | | 8,847.2 | | | | 562.5 | | | | 6.4 | |
| Allowance for loan portfolio | | | (427.8 | ) | | | (392.3 | ) | | | (35.5 | ) | | | 9.1 | |
| Total, net | | | 8,981.9 | | | | 8,454.9 | | | | 526.9 | | | | 6.2 | |
Deposit-taking activities
Banco AV Villas offers customers checking accounts, savings accounts, time deposits and other deposits consisting primarily of transactional accounts. Banco AV Villas’s average savings account rate, one of the lowest in the market, is explained by a significant retail network and a low concentration of corporate and government accounts.
The following table presents a breakdown of Banco AV Villas’s consolidated deposits by product type at the dates indicated.
| | | At December 31, | | | Change, December 31, 2016 vs.
December 31, 2015 | |
| | | 2016 | | | 2015 | | | # | | | % | |
| | | (in Ps billions) | |
| Checking accounts | | | 918.1 | | | | 1,017.9 | | | | (99.8 | ) | | | (9.8 | ) |
| Savings accounts | | | 5,628.3 | | | | 5,102.1 | | | | 526.2 | | | | 10.3 | |
| Time deposits | | | 3,157.4 | | | | 2,834.1 | | | | 323.3 | | | | 11.4 | |
| Other deposits | | | 2.2 | | | | 4.5 | | | | (2.2 | ) | | | (49.8 | ) |
| Total customer deposits | | | 9,706.1 | | | | 8,958.5 | | | | 747.5 | | | | 8.3 | |
Distribution
The following table presents Banco AV Villas’ points of service in Colombia.
| | | At December 31, | |
| | | 2016 | | | 2015 | |
| Branches | | | 291 | | | | 281 | |
| ATMs | | | 576 | | | | 568 | |
| Other points of service | | | 8,193 | | | | 14,080 | |
| Total points of service | | | 9,060 | | | | 14,929 | |
Banco AV Villas had a network concentration of approximately 52.8% in Colombia’s central region, of which Bogotá represents approximately 34.2% of Banco de AV Villas’ total network at December 31, 2016. Banco AV Villas had approximately 18.9% of its network in the southwestern region at December 31, 2016. During 2016, Banco AV Villas closed 5,898 non-operational banking correspondents, including some traditional and some from its alliance with Red Cerca, due to the low levels of transactions held through these points. Banco AV Villas had a market share of approximately 5.1% of branches and a market share of approximately 3.8% of ATMs at December 31, 2016.
Corficolombiana
Corficolombiana is the largest merchant bank in Colombia based on total assets at December 31, 2016. Corficolombiana focuses on four main lines of business: (1) equity investments in strategic sectors of the Colombian economy, including, in particular, infrastructure, energy and gas, agribusiness and hospitality; (2) investment banking, including services relating to capital markets, mergers and acquisitions and project finance transactions; (3) treasury operations; and (4) financial services such as leasing, fiduciary and private banking.
Corficolombiana had total consolidated assets and shareholders’ equity attributable to controlling interest of Ps 20,504.6 billion and Ps 2,997.3 billion, respectively, at December 31, 2016 and net income attributable to controlling interest of Ps 294.4 billion for the year ended December 31, 2016 in accordance with IFRS.
Corficolombiana’s business model is based on three premises: (1) investing in businesses in strategic sectors of the Colombian economy; (2) distributing cash flows generated by its equity investment portfolio to its shareholders; and (3) acting as an investment fund and financial advisor that is listed on the Colombian Stock Exchange and regulated by the Superintendency of Finance. Corficolombiana’s equity investment strategy is to acquire and hold majority or substantial stakes in strategic businesses. These investments enable Corficolombiana to exert influence or control over these businesses’ operations and to promote revenue growth, operational efficiencies and optimization of the capital structures. Corficolombiana endeavors to achieve a balance between companies with potential to generate cash and companies with capacity to create value.
Corficolombiana’s funding strategy seeks to minimize liquidity risk by funding equity investments using its own equity, principally retained earnings. It has not sought to raise equity capital from its shareholders in the last five years.
Corficolombiana is regulated as a finance corporation by the Superintendency of Finance. Under Colombian law, a finance corporation is permitted to hold equity ownership positions in both financial and non-financial companies, unlike banks, which may only invest in financial companies. See “—Supervision and regulation.”
Equity investment portfolio
Corficolombiana primarily invests in five sectors of the Colombian economy: infrastructure; energy and gas; financial services; hotels; and agribusiness. It generally seeks to invest in businesses with leading market positions, strong cash flows and growth potential.
The following charts provide information concerning Corficolombiana’s investments in sectors of the Colombian economy at December 31, 2016, and for the year ended December 31, 2016, on an unconsolidated basis in accordance with Colombian IFRS, as the case may be.
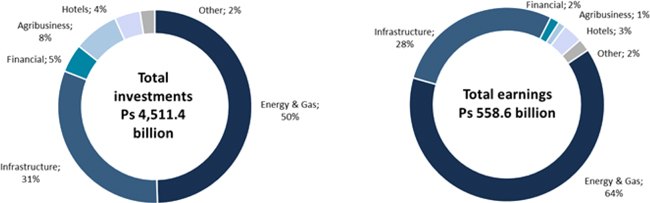
| (1) | Information prepared on an unconsolidated basis in accordance with Colombian IFRS, after provisions, fiduciary rights not included. |
| (2) | Information prepared on an unconsolidated basis in accordance with Colombian IFRS, corresponds to the sum of the net income of each of the investments, adjusted to reflect the ownership interest of Corficolombiana. |
Corficolombiana’s infrastructure investments are concentrated mainly in highway concession projects, a sector in which it is a leading private investor in Colombia. The main investments of Corficolombiana in the infrastructure sector include Proyectos de Infraestructura S.A. (Buga-Tuluá-La Paila), Concesionaria Vial de los Andes S.A.S. (Bogotá-Villavicencio), Concesiones CCFC S.A. (Fontibón-Los Alpes), Concesionaria Panamericana S.A.S. (Los Alpes-Villeta and Chuguacal-Cambao), Concesionaria Vial del Pacífico S.A.S. (Ancón Sur-Bolombolo or “Conexión Pacífico 1”), Concesionaria Nueva Vía al Mar S.A.S. (Mulaló-Loboguerrero), Concesionaria Vial Andina S.A.S. (Bogotá-Villavicencio) and Concesionaria Vial del Oriente S.A.S. (Villavicencio-Yopal). Corficolombiana’s infrastructure investments totaled Ps 1,467.4 billion after provisions at December 31, 2016 (on an unconsolidated basis). For further detail on Corficolombiana’s investment in Concesionaria Ruta del Sol S.A.S. see Note 14 to our audited consolidated financial statements.
Corficolombiana’s main investments in the energy and gas sector include Promigas S.A. E.S.P., the second largest natural gas pipeline company in Colombia, Empresa de Energía de Bogotá S.A. E.S.P, or “EEB”, an electricity and gas conglomerate, Gas Natural S.A. E.S.P., the gas distribution company for the city of Bogotá, and a majority stake in a gas distribution company in northern Peru (Gas Comprimido del Perú S.A. (Gascop)). Corficolombiana’s energy and gas investments totaled Ps 2,088.3 billion after provisions at December 31, 2016 (on an unconsolidated basis).
Corficolombiana’s principal investments in agribusiness are centered on forestry and woodworking as well as the production of palm oil, rubber, rice and cotton through Organización Pajonales, Pizano and Unipalma. Investments in this sector totaled Ps 363.7 billion after provisions at December 31, 2016 (on an unconsolidated basis).
Corficolombiana also has investments in the hospitality sector. These include majority stakes in Hoteles Estelar de Colombia S.A. and Promotora y Comercializadora Turística Santamar S.A., which totaled Ps 291.8 billion after provisions at December 31, 2016 (on an unconsolidated basis).
In the financial-services sector, Corficolombiana offers leasing, trust, brokerage and offshore banking services to third-party customers through three subsidiaries: Leasing Corficolombiana S.A., Fiduciaria Corficolombiana S.A. and Banco Corficolombiana (Panamá) S.A. Corficolombiana’s investments in these three subsidiaries totaled Ps 199.1 billion at December 31, 2016 (on an unconsolidated basis and after provisions).
Lending activities
The following table presents Corficolombiana’s consolidated loan portfolio at the dates indicated.
| | | At December 31, | | | Change, December 31, 2016 vs.
December 31, 2015 | |
| | | 2016 | | | 2015 | | | # | | | % | |
| | | (in Ps billions) | |
| Commercial | | | 2,899.2 | | | | 1,627.3 | | | | 1,272.0 | | | | 78.2 | |
| Commercial loans | | | 2,161.9 | | | | 1,103.2 | | | | 1,058.7 | | | | 96.0 | |
| Interbank and overnight funds | | | 737.3 | | | | 524.1 | | | | 213.2 | | | | 40.7 | |
| Consumer | | | 307.4 | | | | 251.5 | | | | 55.9 | | | | 22.2 | |
| Mortgages | | | 0.9 | | | | 1.1 | | | | (0.2 | ) | | | (18.7 | ) |
| Microcredit | | | - | | | | - | | | | - | | | | - | |
| Total | | | 3,207.5 | | | | 1,879.9 | | | | 1,327.6 | | | | 70.6 | |
| Allowance for loan portfolio | | | (65.6 | ) | | | (40.8 | ) | | | (24.9 | ) | | | 61.1 | |
| Total, net | | | 3,141.9 | | | | 1,839.2 | | | | 1,302.7 | | | | 70.8 | |
Deposit-taking activities
The following table presents a breakdown of Corficolombiana’s consolidated deposits by product type at the dates indicated.
| | | At December 31, | | | Change, December 31, 2016 vs.
December 31, 2015 | |
| | | 2016 | | | 2015 | | | # | | | % | |
| | | (in Ps billions) | |
| Checking accounts | | | - | | | | - | | | | - | | | | - | |
| Savings accounts | | | 313.5 | | | | 786.7 | | | | (473.1 | ) | | | (60.1 | ) |
| Time deposits | | | 3,516.7 | | | | 3,270.6 | | | | 246.0 | | | | 7.5 | |
| Other deposits | | | 16.6 | | | | 28.0 | | | | (11.4 | ) | | | (40.8 | ) |
| Total customer deposits | | | 3,846.8 | | | | 4,085.3 | | | | (238.6 | ) | | | (5.8 | ) |
Investment banking, treasury and private banking businesses
Corficolombiana’s investment banking group provides advice to third-party clients in the Colombian market covering a broad range of transactions, including, among others, capital markets, mergers and acquisitions, project finance and private banking. Corficolombiana has helped to shape the participation of the private sector in infrastructure projects, to develop the domestic capital markets and to expand the resources and operations of local companies in the region. In 2016, Corficolombiana’s investment bank helped secure financing and coordinate projects totaling Ps 11,620.5 billion.
Corficolombiana’s treasury operations are a leading participant in Colombian capital markets, both in sovereign and corporate debt securities and foreign currency denominated securities. It is also an active participant in the derivatives market, and an active market maker for Colombian sovereign debt securities. At December 31, 2016, Corficolombiana had total fixed income assets of Ps 3,062.3 billion (on a consolidated basis in accordance with IFRS).
Corficolombiana’s private banking business provides high net worth customers and companies with a wide range of investment services and products. The private banking operations had Ps 1,649.4 billion in assets under management for its customers at December 31, 2016.
Porvenir
Porvenir is the leading private AFP in Colombia, with a market share of 56.2% of mandatory pension fund individual customers and 56.5% of severance plan individual customers at December 31, 2016. See “—Competition—Pension and severance fund management – Porvenir.” Porvenir also provides voluntary pension funds and manages third-party sponsored pension funds. Pension funds provide individual savings for retirement, and severance funds provide temporary income to employees who lose their jobs. Through Gestión & Contacto, Porvenir manages social security-related information systems designed to provide employees with efficient payment solutions.
At December 31, 2016, Porvenir had Ps 110.9 trillion in total assets under management, of which Ps 84.4 trillion was managed under the privately managed mandatory pension fund, Ps 4.5 trillion was managed under the severance fund, Ps 3.4 trillion was managed under the voluntary pension fund and Ps 18.6 trillion was managed as a third-party sponsored pension liability fund.
Porvenir’s strengths include the following:
| · | Porvenir is the most profitable privately managed pension fund in Colombia, with a ROAE of 25.3%, 22.3% and 23.4% at December 31, 2016, December 31, 2015 and December 31, 2014 based on unconsolidated figures, respectively; |
| · | Porvenir has the largest and, we believe, most effective sales force in the industry with a nationwide presence. At the same time, it is the most efficient privately managed pension fund in Colombia, with an efficiency ratio of 40.8% for the year ended December 31, 2016 on an unconsolidated basis; and |
| · | Porvenir has access to Grupo Aval’s banking network. This advantage is particularly relevant in the severance market, as Grupo Aval’s banks provide financing to employers to comply with legally imposed annual severance allowance liabilities for their employees. In addition, the banks of Grupo Aval provide collection services for all of the funds administered by Porvenir. |
Business overview
The Ministry of Finance limits the range of assets in which AFPs can invest and also sets concentration limits. In addition, each AFP is required by law to provide a minimum return on investment for each of its mandatory pension and severance funds. This minimum return is determined pursuant to certain formulas established by means of Decree 2555 of 2010, which vary pursuant to the type of fund. Prior to the multi-fund scheme, the minimum return was calculated on a 36-month time horizon for mandatory pension funds and 24-month time horizon for severance funds. With the introduction of the multi-fund scheme, a new risk profile system came into effect which differentiates conservative, moderate and aggressive risk portfolios for individual clients of severance and mandatory pension funds. To adjust the minimum return of mandatory pension funds to the new risk profile portfolios, the time horizon for the minimum return will change from 36 months to a range of 36 to 60 months, depending on the risk profile of each portfolio. For severance funds, the long-term portfolio will continue to have a 24-month time horizon, and the short-term portfolio will have a three-month time horizon.
If a fund’s cumulative return for any month is lower than the minimum return, the AFP must supplement the necessary amount to cover the difference within a period of five days. To do so, the AFP must first apply funds from its “stabilization reserve,” which is a portion of the AFP’s capital invested in the fund administered by the AFP and which must represent at least 1.00% of the value of that fund. If the stabilization reserve is insufficient to cover the difference, the AFP must provide resources from its remaining capital. If the AFP does not have enough resources to cover the difference, the Superintendency of Finance may order the capitalization of the AFP. If, notwithstanding the above, an AFP fails to observe either the minimum return or the stabilization requirements or the order of capitalization, the Superintendency of Finance may take possession (tomar posesión) of the AFP, in which case FOGAFIN, the Colombian deposit insurance fund, is required to supply funds to cover the shortfall. In that event, the AFP may be dissolved and the fund transferred to another AFP. See “Item 3. Key Information—D. Risk Factors—Risks relating to our businesses and industry—Risks relating to our pension and severance fund management business.”
For the year ended December 31, 2016, 57.9% of Porvenir’s revenues were derived from mandatory pension funds, 14.0% from severance funds, 6.3% from voluntary pension funds and 1.7% from third-party sponsored pension liability funds. Porvenir derived the remaining 20.1% of its revenues from a combination of its own investment portfolio, stabilization reserves and other income.
Mandatory pension funds
Mandatory pension funds are independent trusts formed by contributions made by individual customers to the social security pension system.
At December 31, 2016, mandatory pension funds represented 76.1% of Porvenir’s assets under management and constituted its main line of business.
Contributions to these pension funds are mandatory for all employees in Colombia and are jointly funded by the employer and the employee. The base contribution rate is 16.0% (up to 18.0% for employees meeting a certain salary threshold) of an employee’s base salary, whereby the employer contributes 75.0% and the employee 25.0% of the base contribution rate. Contributions are paid on a monthly basis. Of the 16.0%-18.0% total contribution, 11.5% goes to the individual customer’s fund. The AFP retains 300 basis points (3.0%) as compensation, of which Porvenir currently pays 185 basis points (1.85%) to an insurer for life and disability coverage, to which it is required by law to subscribe. The percentage that Porvenir pays for this insurance may increase or decrease depending on market conditions and other factors. The remainder is distributed between the National Solidarity Fund (Fondo de Solidaridad Pensional), depending on the employee’s salary (up to 2.0%), and the National Minimum Pension Warranty Fund (Fondo de Garantía de Pensión Mínima) (at 1.5%).
Employees may freely select their mandatory pension fund, a private AFP of their choice or the government-sponsored defined public benefit plan, administered by Colpensiones, and can change plans after meeting minimum tenure requirements of five years to switch from the public fund to a private plan, and six months to switch between private fund providers. Whenever an employee changes from one AFP to another, his/her entire savings balance at the fund is transferred to the pension fund administered by the new AFP.
Mandatory pension funds cannot be withdrawn prematurely, and they generally expand over the individual’s working years. Porvenir is the market leader in the mandatory pension’s area, with Ps 84.4 trillion of assets under management and 7.9 million individual customers at December 31, 2016.
Severance funds
Severance funds are independent trusts formed by the accumulated severance payment allowance required by Colombian labor law. The severance payment allowance is a social benefit inuring to employees for which employers are responsible under an employment agreement. The allowance consists of the payment of one month’s salary per year of service and pro rata amounts for fractions of a year. This amount is deposited directly with the AFP by the employer.
Severance accounts represented 4.1% of Porvenir’s assets under management at December 31, 2016.
Porvenir and all other AFPs in Colombia charge a fee (per year for assets under management) of 1.0% for amounts in the mandatory investments short-term portfolio and 3.0% in the long-term portfolio.
Porvenir is the market leader in the severance area, with Ps 4.5 trillion of assets under management and 3.8 million customers at December 31, 2016.
Voluntary pension funds
Voluntary pension funds are independent trusts formed by contributions from their participants and/or sponsors and their respective yields, for the purposes of complying with one or several voluntary retirement or disability pension plans.
Voluntary pension funds represented 3.1% of Porvenir’s assets under management at December 31, 2016.
Porvenir earns annual management commissions for assets under management that range between 1.0% and 4.0%, depending on the balance of the customer and the selected portfolios (lower commissions for liquidity portfolios and higher commissions for more complex portfolios). At December 31, 2016, Porvenir had Ps 3.4 trillion of voluntary pension assets under management and approximately 167 thousand voluntary pension fund individual customers.
Third-party sponsored pension liability funds
Third-party sponsored pension liability funds represent approximately 16.8% of Porvenir’s assets under management at December 31, 2016. Third-party sponsored pension liability funds are made up of deposits from different institutions (both private and publicly owned) that require a professional institution to manage a fund that is usually created to finance particular pension regimes (i.e., pensions that are paid by the employer; before 1994, companies were allowed to establish their own internal pension systems).
Third-party sponsored pension liability funds in some cases have a minimum guaranteed return pursuant to their terms. Porvenir had Ps 18.6 trillion of such assets under management at December 31, 2016, mostly under contracts of five years. The most important of these contracts is with FONPET which is subject to renewal upon expiration in November 2017. Porvenir retains a percentage of the yearly returns of each third-party sponsored pension liability fund, and in some cases, a portion of assets under management.
Porvenir’s investments
Porvenir is required to own at least 1.00% of the funds it manages that are subject to a minimum return, known as the stabilization reserve. This stabilization reserve represents 54.6% of Porvenir’s proprietary investments. In addition, Porvenir holds voluntary investments. Revenues related to Porvenir’s stabilization reserve and its proprietary portfolio represented 14.3% and 7.2% of its total revenues at December 31, 2016 and December 31, 2015, respectively.
Distribution
Porvenir attracts new individual customers mainly through its large direct sales force (approximately 1,231 individuals) who report to six regional sales managers located in Bogotá, Antioquia, Cali, the Central region, the Coast region and the North region. At December 31, 2016, Porvenir had 54 offices, 16 service modules, 72 electronic service centers and 5 business service centers. It maintains a presence in all regions of Colombia through its service agreements with Grupo Aval’s banks.
Central American operations
BAC Credomatic is the leading financial group in Central America with a record of strong financial performance. BAC Credomatic is a full-service financial institution with one of the leading credit card-issuance and merchant-acquiring businesses in the region. BAC Credomatic offers commercial and retail banking, brokerage, insurance, pension fund management and other financial services. Its coverage extends throughout Central America with operations in Costa Rica, El Salvador, Guatemala, Honduras, Nicaragua and Panamá, as well as Mexico (with a small credit card issuing operation) and the state of Florida (with a merchant and card processing center). It also has a presence in the Bahamas, Barbados and the Cayman Islands. Its Credomatic brand has key alliances with major credit card networks, such asVisa,MasterCard,American Express andDiners Club. This section has been prepared in accordance with IFRS.
The table below shows BAC Credomatic financial data on a country-by-country basis at and for the year ended December 31, 2016.
| | | At and for the year ended December 31, 2016 | |
| | | Net income | | | Loans | | | Deposits | |
| | | (in U.S.$
millions)
(3) | | | (in Ps
billions) | | | | | | (in U.S.$
millions)
(3) | | | (in Ps
billions) | | | | | | (in U.S.$
millions)
(3) | | | (in Ps
billions) | | | | |
| Costa Rica | | | 168.4 | | | | 505.4 | | | | 54.3 | % | | | 3,952.9 | | | | 11,861.6 | | | | 27.6 | % | | | 3,537.7 | | | | 10,615.8 | | | | 26.8 | % |
| Guatemala | | | 45.9 | | | | 137.7 | | | | 14.8 | % | | | 2,538.4 | | | | 7,617.0 | | | | 17.7 | % | | | 2,200.8 | | | | 6,604.0 | | | | 16.7 | % |
| Honduras | | | 62.1 | | | | 186.4 | | | | 20.0 | % | | | 1,506.5 | | | | 4,520.5 | | | | 10.5 | % | | | 1,502.7 | | | | 4,509.1 | | | | 11.4 | % |
| Nicaragua | | | 54.4 | | | | 163.3 | | | | 17.6 | % | | | 1,231.0 | | | | 3,693.9 | | | | 8.6 | % | | | 1,206.9 | | | | 3,621.4 | | | | 9.2 | % |
| El Salvador | | | 33.9 | | | | 101.7 | | | | 10.9 | % | | | 1,443.4 | | | | 4,331.2 | | | | 10.1 | % | | | 1,307.1 | | | | 3,922.2 | | | | 9.9 | % |
| Panamá (1) | | | 53.2 | | | | 159.5 | | | | 17.1 | % | | | 3,641.7 | | | | 10,927.7 | | | | 25.4 | % | | | 3,651.3 | | | | 10,956.6 | | | | 27.7 | % |
| Mexico | | | (21.1 | ) | | | (63.3 | ) | | | -6.8 | % | | | 51.9 | | | | 155.8 | | | | 0.4 | % | | | - | | | | - | | | | 0.0 | % |
| Corporate and eliminations | | | (54.1 | ) | | | (162.4 | ) | | | -17.5 | % | | | (42.1 | ) | | | (126.4 | ) | | | -0.3 | % | | | (223.5 | ) | | | (670.5 | ) | | | -1.7 | % |
| Non-controlling interest (2) | | | (32.7 | ) | | | (98.1 | ) | | | -10.5 | % | | | - | | | | - | | | | 0.0 | % | | | - | | | | - | | | | 0.0 | % |
| Consolidated | | | 310.1 | | | | 930.4 | | | | 100.0 | % | | | 14,323.7 | | | | 42,981.3 | | | | 100.0 | % | | | 13,183.1 | | | | 39,558.5 | | | | 100.0 | % |
Source: Consolidated financial statements of BAC Credomatic’s subsidiaries in accordance with IFRS.
| (1) | Panamá loans include operations from BAC Bahamas Bank Ltd., BAC International Bank (Grand Cayman), others BAC Credomatic’s Panamá subsidiaries and certain intercompany adjustments. |
| (2) | BAC international Bank, Inc. is the controlling shareholder of the BAC Credomatic operation in Costa Rica, Guatemala, Honduras, Nicaragua, El Salvador, Panamá and México. However, non-controlling interest corresponds to the fact that Leasing Bogotá Panama, the parent company of the BAC Credomatic entities, has a direct ownership of 9.467% in BAC International Bank, Inc. |
| (3) | Translated for convenience using the representative market rate as computed and certified by the Superintendency of Finance at December 31, 2016 of Ps 3,000.71. |
The table below presents BAC Credomatic’s market share of total loans and deposits in each of its main markets at December 31, 2016.
| | | At December 31, 2016 | |
| | | Net Loans | | | Deposits | |
| Costa Rica(1) | | | 13.4 | % | | | 12.7 | % |
| El Salvador | | | 12.8 | % | | | 12.5 | % |
| Guatemala | | | 10.1 | % | | | 7.4 | % |
| Honduras | | | 14.3 | % | | | 13.4 | % |
| Nicaragua | | | 25.9 | % | | | 23.7 | % |
| Panamá | | | 5.4 | % | | | 5.4 | % |
Source: Superintendency of banks of each country and company calculations. Percentage of total loans and deposits is based on banking operations in each country, as reported to the local financial regulator, which excludes certain credit card data and offshore operations.
| (1) | Percentage calculation for Costa Rica includes state-owned banks (Banco Nacional de Costa Rica, Banco de Costa Rica, Banco Popular, Banco Hipotecario de la Vivienda and Banco Crédito Agrícola de Cartago), which at December 31, 2016 and December 31, 2015 had a 59.7% and 60.2% market share by loans, respectively, and a 61.3% and 63.0% market share by deposits, respectively. |
Lending activities
The following tables show BAC Credomatic’s gross loan portfolio at the dates indicated. BAC Credomatic’s loan portfolio consists of credit card loans, commercial loans, mortgage loans, automobile and vehicle loans and personal loans.
| | | At December 31, | |
| | | 2016 | | | 2015 | | | 2016 | | | 2015 | |
| | | (in US millions)(3) | | | (in Ps billion) | |
| Commercial loans(1) | | | 5,900.8 | | | | 5,560.1 | | | | 17,706.5 | | | | 16,684.3 | |
| Mortgage loans(2) | | | 2,982.8 | | | | 2,748.0 | | | | 8,950.4 | | | | 8,245.9 | |
| Credit card loans | | | 2,552.5 | | | | 2,255.3 | | | | 7,659.4 | | | | 6,767.5 | |
| Automobile and vehicle loans | | | 902.6 | | | | 779.5 | | | | 2,708.5 | | | | 2,338.9 | |
| Other personal loans | | | 1,985.0 | | | | 1,765.4 | | | | 5,956.5 | | | | 5,297.6 | |
| Total | | | 14,323.7 | | | | 13,108.3 | | | | 42,981.3 | | | | 39,334.3 | |
Source: Consolidated financial statements of BAC Credomatic’s subsidiaries in accordance with IFRS.
| (1) | Represents loans to businesses. |
| (2) | Includes loans measured at fair value. |
| (3) | Translated for convenience using the representative market rate as computed and certified by the Superintendency of Finance at December 31, 2016 of Ps 3,000.71. |
We believe that BAC Credomatic’s customer knowledge, coupled with a centralized risk-management structure, has benefited the quality of the loan portfolio, with an average 90 days and more past due loan ratio of 1.1% from 2012 to 2016.
Credit cards
BAC Credomatic has a leading presence in the credit card-issuing business and a significant presence in the merchant acquiring business in the region. Through its Credomatic brand, BAC Credomatic offers its customers a wide variety of credit and debit cards includingVisa,MasterCard,American Express andDiners Club, and is the only network that processes all major brands in the region. Additionally, BAC Credomatic and its customers benefit from co-branding agreements with major airlines (such as American Airlines and AviancaTACA) and major supermarkets (such as Pricesmart and Wal-Mart) present in the region. BAC Credomatic has been a member ofVisa
andMasterCard for more than 20 years, issuing both national and international credit cards. Moreover, BAC Credomatic is currently the exclusive credit card issuer and merchant acquirer ofAmerican Express in the Central American region, including Panamá.
At December 31, 2016, BAC Credomatic had approximately 4.1 million credit card and debit card accounts, of which 2.1 million were debit card accounts and 2.0 million were credit card accounts, an increase of 13.3% and 9.6% compared to December 31, 2015, respectively. For the year ended December 31, 2016, BAC Credomatic’s billed volume by its credit cardholders was U.S.$10,459.6 million (Ps 31,386.2 billion), a 13.5% increase over the U.S.$9,214.9 million (Ps 27,651.3 billion) billed volume by its credit cardholders for the year ended December 31, 2015.
At December 31, 2016, BAC Credomatic’s credit card portfolio totaled U.S.$2.6 billion (Ps 7.7 trillion) which represents a 13.2% increase from U.S.$2.3 billion (Ps 6.8 trillion) at December 31, 2015. As of the same date, 80.4% of BAC Credomatic’s credit card portfolio was distributed across Costa Rica, Honduras, Guatemala and Panamá. The remaining 19.6% was distributed among El Salvador, Nicaragua and Mexico. The following table shows the credit card portfolio breakdown by country at the dates presented.
| | | At December 31, | |
| | | 2016 | | | 2015 | |
| | | (in U.S.$
millions)(2) | | | (in Ps
billions) | | | | | | (in U.S.$
millions)(2) | | | (in Ps
billions) | | | | |
| Costa Rica | | | 775.5 | | | | 2,326.9 | | | | 30.4 | % | | | 613.4 | | | | 1,840.5 | | | | 27.2 | % |
| Guatemala | | | 407.5 | | | | 1,222.7 | | | | 16.0 | % | | | 417.0 | | | | 1,251.4 | | | | 18.5 | % |
| Honduras | | | 363.6 | | | | 1,091.2 | | | | 14.2 | % | | | 329.9 | | | | 990.0 | | | | 14.6 | % |
| Nicaragua | | | 128.8 | | | | 386.6 | | | | 5.0 | % | | | 116.4 | | | | 349.2 | | | | 5.2 | % |
| El Salvador | | | 320.0 | | | | 960.2 | | | | 12.5 | % | | | 294.7 | | | | 884.4 | | | | 13.1 | % |
| Panamá (1) | | | 505.2 | | | | 1,516.0 | | | | 19.8 | % | | | 433.0 | | | | 1,299.2 | | | | 19.2 | % |
| Mexico | | | 51.9 | | | | 155.8 | | | | 2.0 | % | | | 50.9 | | | | 152.8 | | | | 2.3 | % |
| Corporate and eliminations | | | (0.0 | ) | | | (0.0 | ) | | | 0.0 | % | | | (0.0 | ) | | | (0.0 | ) | | | 0.0 | % |
| Total | | | 2,552.5 | | | | 7,659.4 | | | | 100.0 | % | | | 2,255.3 | | | | 6,767.5 | | | | 100.0 | % |
Source: Consolidated financial statements of BAC Credomatic’s subsidiaries in accordance with IFRS.
| (1) | Panamá loans include operations from BAC Bahamas Bank Ltd., BAC International Bank (Grand Cayman), others BAC Credomatic’s Panamá subsidiaries and certain intercompany adjustments. |
| (2) | Translated for convenience using the representative market rate as computed and certified by the Superintendency of Finance at December 31, 2016 of Ps 3,000.71. |
Merchant acquiring
BAC Credomatic’s processing volume of credit and debit card transactions for the year ended December 31, 2016 of U.S.$17,456.8 million (Ps 52,382.8 billion) represented an increase of U.S.$1,914.0 million (Ps 5,743.4 billion), or 12.3%, from U.S.$15,542.8 million (Ps 46,639.4 billion) for the previous year. This increase is primarily due to a recovery in the economic activity compared to 2015 influenced by international oil prices and commodities and an increase in credit accounts. BAC Credomatic has the only network in Central America that processes all the major brands including Visa, MasterCard, American Express and Diners Club. Furthermore, BAC Credomatic has exclusive card-issuing and merchant acquiring agreements with American Express for the Central American region.
At December 31, 2016, BAC Credomatic serviced approximately 396,344 merchant locations, with 94% of credit card authorizations processed electronically through its 305,714 point-of-sale devices.
Banking
BAC Credomatic’s commercial and consumer banking divisions offer traditional banking services and products. In some jurisdictions, BAC Credomatic also offers pension plan administration, investment fund advice, financial
advisory, leasing, private banking and insurance services to its customers. Through its network and deep customer knowledge, BAC Credomatic is able to effectively offer services and solutions to its customers in addition to instant payment processing and funds transfers within the BAC Credomatic regional network.
Commercial banking
BAC Credomatic offers traditional commercial banking services and products. At December 31, 2016, 80.6% of BAC Credomatic’s commercial loan portfolio was distributed across Costa Rica, Honduras, Guatemala and Panamá. The remaining 19.5% was distributed among El Salvador, Nicaragua, Mexico, and regional offshore operations. The following table displays BAC Credomatic’s commercial loan portfolio by country at the dates presented.
| | | At December 31, | |
| | | 2016 | | | 2015 | |
| | | (in U.S.$
millions)(2) | | | (in Ps
billions) | | | | | | (in U.S.$
millions)(2) | | | (in Ps
billions) | | | | |
| Costa Rica | | | 1,212.5 | | | | 3,638.3 | | | | 20.5 | % | | | 1,124.8 | | | | 3,375.2 | | | | 20.2 | % |
| Guatemala | | | 1,442.7 | | | | 4,329.2 | | | | 24.4 | % | | | 1,380.5 | | | | 4,142.4 | | | | 24.8 | % |
| Honduras | | | 740.7 | | | | 2,222.6 | | | | 12.6 | % | | | 708.1 | | | | 2,124.7 | | | | 12.7 | % |
| Nicaragua | | | 688.9 | | | | 2,067.3 | | | | 11.7 | % | | | 634.0 | | | | 1,902.3 | | | | 11.4 | % |
| El Salvador | | | 462.3 | | | | 1,387.2 | | | | 7.8 | % | | | 402.9 | | | | 1,209.1 | | | | 7.2 | % |
| Panamá (1) | | | 1,360.7 | | | | 4,083.0 | | | | 23.1 | % | | | 1,321.1 | | | | 3,964.3 | | | | 23.8 | % |
| Mexico | | | - | | | | - | | | | 0.0 | % | | | - | | | | - | | | | 0.0 | % |
| Corporate and eliminations | | | (7.1 | ) | | | (21.3 | ) | | | -0.1 | % | | | (11.3 | ) | | | (33.8 | ) | | | -0.2 | % |
| Total | | | 5,900.8 | | | | 17,706.5 | | | | 100.0 | % | | | 5,560.1 | | | | 16,684.3 | | | | 100.0 | % |
Source: Consolidated financial statements of BAC Credomatic’s subsidiaries in accordance with IFRS.
| (1) | Panamá loans include operations from BAC Bahamas Bank Ltd., BAC International Bank (Grand Cayman), others BAC Credomatic’s Panamá subsidiaries and certain intercompany adjustments. |
| (2) | Translated for convenience using the representative market rate as computed and certified by the Superintendency of Finance at December 31, 2016 of Ps 3,000.71. |
BAC Credomatic also offers investment products, supplier and payroll ePayments, Ameritransfer (online transfer of funds among deposit accounts in BAC Credomatic’s network), online banking and foreign exchange services as part of its commercial banking platform in the region. At December 31, 2016, BAC Credomatic had more than 105,000 corporate customers, divided into three main sectors: (1) corporate, consisting of companies with over U.S.$250,000 in deposits, more than 100 employees and loans over U.S.$1,000,000, which represented 85.7% of total commercial loans; (2) midsize companies, composed of companies with deposits of U.S.$50,000 to U.S.$250,000, between 51 to 100 employees and loans between U.S.$300,000 to U.S.$1,000,000, which represented 8.5% of total commercial loans; and (3) small companies, consisting of companies with deposits of less than U.S.$50,000, fewer than 50 employees and loans under U.S.$300,000, which represented 5.8% of total commercial loans.
BAC Credomatic’s electronic transfer and payment capabilities allow corporate clients to instantly transfer funds between different commercial and consumer accounts, provided that all parties have a BAC Credomatic account. BAC Credomatic recorded over U.S.$83.1 billion (Ps 249.3 trillion) in electronic payments in 2016.
Electronic transfers are originated mainly from: (1) merchant deposit transfer payments (instant electronic payments to merchants); (2) Ameritransfer (online transfer of funds across the region); (3) supplier ePayments (instant electronic payments from merchants to suppliers); and (4) payroll ePayments (payroll payments from companies to employees). The following table breaks down BAC Credomatic’s electronic transfers by product for the dates presented.
| | | At December 31, | |
| | | 2016 | | | 2015 | | | 2016 | | | 2015 | |
| | | (in U.S.$ billions)(1) | | | (in Ps trillions) | |
| Merchant deposit transfers | | | 17.5 | | | | 15.5 | | | | 52.4 | | | | 46.6 | |
| Ameritransfer | | | 6.7 | | | | 6.3 | | | | 20.2 | | | | 18.9 | |
| Payroll ePayments | | | 6.9 | | | | 5.9 | | | | 20.7 | | | | 17.7 | |
| Supplier ePayments | | | 20.4 | | | | 16.5 | | | | 61.2 | | | | 49.5 | |
| Wire transfers | | | 31.6 | | | | 27.3 | | | | 94.9 | | | | 81.9 | |
| Total | | | 83.1 | | | | 75.1 | | | | 249.3 | | | | 214.7 | |
Source: Consolidated financial statements of BAC Credomatic’s subsidiaries in accordance with IFRS.
| (1) | Translated for convenience using the representative market rate as computed and certified by the Superintendency of Finance at December 31, 2016 of Ps 3,000.71. |
Consumer banking
At December 31, 2016, as a proportion of BAC Credomatic’s total consumer loan portfolio (which does not include credit cards), mortgage loans represented 50.8%, automobile and vehicle loans represented 15.4% and other personal loans represented 33.8%. Approximately 77.3% of the total consumer loan portfolio had a maturity greater than five years. At December 31, 2016, consumer loans amounted to U.S.$5.9 billion (Ps 17.6 trillion), a 10.9% increase over U.S.$5.3 billion (Ps 15.9 trillion) at December 31, 2015. At December 31, 2016, 81.7% of BAC Credomatic’s consumer loan portfolio was distributed across Costa Rica, Honduras, Guatemala and Panamá. The remaining 18.3% was distributed among El Salvador, Nicaragua and regional offshore operations.
The following table displays BAC Credomatic’s consumer loan portfolio by country at the dates presented.
| | | At December 31, | |
| | | 2016 | | | 2015 | |
| | | (in U.S.$
millions)(4) | | | (in Ps
billions) | | | | | | (in U.S.$
millions)(4) | | | (in Ps billions) | | | | |
| Costa Rica (1) | | | 1,965.0 | | | | 5,896.3 | | | | 33.5 | % | | | 1,835.9 | | | | 5,509.0 | | | | 34.7 | % |
| Guatemala | | | 688.2 | | | | 2,065.1 | | | | 11.7 | % | | | 575.0 | | | | 1,725.3 | | | | 10.9 | % |
| Honduras | | | 402.1 | | | | 1,206.7 | | | | 6.8 | % | | | 374.1 | | | | 1,122.5 | | | | 7.1 | % |
| Nicaragua | | | 413.2 | | | | 1,240.0 | | | | 7.0 | % | | | 366.6 | | | | 1,100.1 | | | | 6.9 | % |
| El Salvador | | | 661.1 | | | | 1,983.8 | | | | 11.3 | % | | | 581.7 | | | | 1,745.5 | | | | 11.0 | % |
| Panamá (2) | | | 1,740.9 | | | | 5,224.0 | | | | 29.7 | % | | | 1,559.6 | | | | 4,679.8 | | | | 29.5 | % |
| Mexico | | | - | | | | - | | | | 0.0 | % | | | - | | | | - | | | | 0.0 | % |
| Corporate and eliminations | | | (0.1 | ) | | | (0.4 | ) | | | 0.0 | % | | | 0.1 | | | | 0.3 | | | | 0.0 | % |
| Total (3) | | | 5,870.4 | | | | 17,615.4 | | | | 100.0 | % | | | 5,292.9 | | | | 15,882.5 | | | | 100.0 | % |
Source: Consolidated financial statements of BAC Credomatic’s subsidiaries in accordance with IFRS.
| (1) | Includes loans measured at fair value. |
| (2) | Panamá loans include operations from BAC Bahamas Bank Ltd., BAC International Bank (Grand Cayman), others BAC Credomatic’s Panamá subsidiaries and certain intercompany adjustments. |
| (3) | At December 31, 2016 and 2015, consumer loans include consumer leasing and consumer overdraft. |
| (4) | Translated for convenience using the representative market rate as computed and certified by the Superintendency of Finance at December 31, 2016 of Ps 3,000.71. |
At December 31, 2016, BAC Credomatic’s mortgage loans had an individual average mortgage loan balance of U.S.$67,633 (Ps 202.9 million) with an average loan-to-value ratio of 57.6%. Given that BAC Credomatic’s mortgage loan portfolio has no significant exposure to the higher risk sectors such as vacation homes or second-
home mortgages, it maintains a 90 days and more past due loan ratio of 1.2% and a coverage of 90 days and more past due loans of 26.6%.
Deposit activities
The following table shows BAC Credomatic’s deposit breakdown at the dates indicated. At December 31, 2016, 36.9% of BAC Credomatic’s deposit base was represented by checking deposits. Total deposits increased by 7.3% from December 31, 2015 to December 31, 2016.
| | | At December 31, | |
| | | 2016 | | | 2015 | | | 2016 | | | 2015 | |
| | | (in U.S.$ millions)(1) | | | (in Ps billions) | |
| Checking deposits | | | 4,858.9 | | | | 4,755.9 | | | | 14,580.1 | | | | 14,271.1 | |
| Savings deposits | | | 2,593.0 | | | | 2,417.3 | | | | 7,780.9 | | | | 7,253.6 | |
| Time deposits | | | 5,731.2 | | | | 5,118.2 | | | | 17,197.6 | | | | 15,358.2 | |
| Total | | | 13,183.1 | | | | 12,291.4 | | | | 39,558.5 | | | | 36,882.9 | |
Source: Consolidated financial statements of BAC Credomatic’s subsidiaries in accordance with IFRS.
| (1) | Translated for convenience using the representative market rate as computed and certified by the Superintendency of Finance at December 31, 2016 of Ps 3,000.71. |
Distribution network
BAC Credomatic serves its customers throughout Central America with a diversified distribution network that includes branches, kiosks (non-cash machines which provide online banking capabilities as well as a full keyboard), ATMs, a standardized online banking platform, call centers, and mobile phone banking. Additionally, BAC Credomatic’s strong point-of-sale presence in 396,344 merchant locations in Central America at December 31, 2016 allows clients to perform various transactions, including purchases, using credit or debit cards, payments of credit card balances and loyalty program services.
BAC Credomatic serves its clients through multiple channels to cover the needs of different customer segments across the region.
The following map shows BAC Credomatic’s branch distribution at December 31, 2015 and 2016.
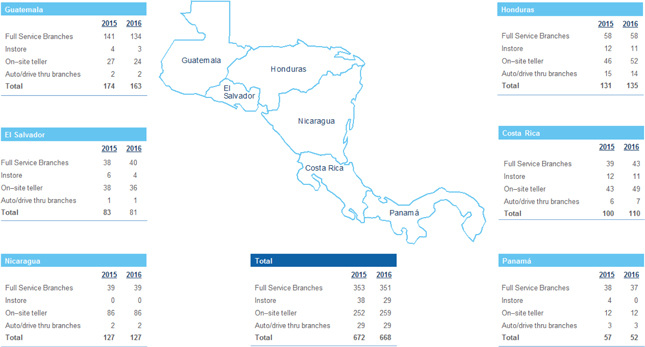
At December 31, 2016 and 2015, BAC Credomatic had a network of 1,930 and 1,815 ATMs in the region, respectively. BAC Credomatic was the first bank in Central America to offer deposit capabilities with instant credit balance through its ATMs. Additionally, BAC Credomatic has 325 self-service kiosks.
Foreign exchange rate risk related to BAC Credomatic
We are exposed to changes in the values of current holdings and future cash flows denominated in other currencies. The types of instruments exposed to foreign exchange rate risk include, for example, investments in foreign subsidiaries, foreign currency-denominated loans and securities, foreign currency-denominated debt and various foreign exchange derivative instruments whose values fluctuate with changes in the level or volatility of currency exchange rates or foreign interest rates. Hedging instruments used to mitigate this risk include currency swaps and deposits as of December 31, 2016.
The foreign exchange rate risk associated with this U.S. dollar-denominated liability is hedged with the net investment that Grupo Aval maintains in BAC Credomatic through Banco de Bogotá. The difference between the U.S. dollar-denominated debt and the net investment in BAC Credomatic (including any goodwill associated with the acquisition) may result in a net U.S. dollar asset position which Grupo Aval, through Banco de Bogotá and LB Panamá may hedge with forward contracts.
In accordance with its market risk policies, BAC Credomatic maintains a U.S. dollar net asset position (long U.S. dollar position) which is intended to hedge up to 100% of its shareholders’ equity against possible devaluations of each of the local currencies in the countries where it operates against the U.S. dollar.
Other corporate information
Technology
We continuously invest in new technology and the renewal of equipment and infrastructure in order to serve customers effectively, improve our profitability and grow our business. We believe that proper management of technology is key to the efficient management of our business. Our technology architecture focuses on our customers and supports our business model.
Our banking subsidiaries and their consolidated operations currently maintain their own technological infrastructure and software. We believe that this technology provides us with an opportunity to seek potential
additional synergies as we implement our overall technology model: assisting with the standardization and implementation of systems developed in our subsidiaries.
One of our most successful initiatives to date has been the coordination of banking branches and electronic channels within our Colombian banks through A Toda Hora, S.A., or “ATH,” the administrator of our ATMs and the transactional services that flow through theRed Grupo Aval. Although these electronic channels have been fully implemented, we plan to continue to enhance their operations with new technology, especially through internet and mobile banking. The Red de Grupo Aval coordinates connectivity between branches, technical support, webpages and transactional Internet, mobile banking, banking correspondence and payments and collections.
Our principal projects currently consist of the following:
| · | Technological architecture: We are pursuing a new technology model, which we expect will deploy new applications in different fields of business, seek to increase efficiency and enhance the competitive advantages of our entities; and |
| · | Basic software activity: We are focusing on the standardization of some processes throughout our entities, such as Core Banking, ERP, MDM and mobile banking solutions. |
| · | We incurred Ps 906.9 billion of capital expenditures relating to information technology for the year ended December 31, 2016. |
Intellectual property
We register and monitor our brands and trademarks in Colombia and abroad according to the importance of such brands and trademarks to our and our subsidiaries’ merchandising and commercial strategy. Certain of Grupo Aval’s brands and trademarks are registered in Argentina, Bolivia, Brazil, Chile, Colombia, Costa Rica, Ecuador, Guatemala, México, Nicaragua, Panamá, Paraguay, Peru, United States, Uruguay and Venezuela.
Corporate social responsibility
We coordinate with several corporate social responsibility initiatives our banks that help us maintain the strength of our image and reputation with respect to all our stakeholders.
We participate in community education and professional training programs for micro and small enterprises, and we engage in microfinance, social inclusion, cultural, sporting, human rights awareness and health projects for low-income populations throughout Colombia.
We consistently seek to improve our environmental footprint by, for example, sponsoring the “Planeta Azul” prize for the best water-conservation project, and by promoting the use of electronic means over paper.
We follow corporate human resources policies that seek employee well-being in areas such as hiring, promotion and work-related development and training. In 2016 and 2015, we spent approximately Ps 9.4 billion and Ps 8.4 billion in corporate social responsibility initiatives, respectively.
Selected statistical data
The following information is included for analytical purposes and should be read in conjunction with our consolidated financial statements included in this annual report as well as “Operating and financial review and prospects.” This information has been presented based on our financial records, which are prepared in accordance with IFRS. The selected statistical data of Grupo Aval at December 31, 2016 and 2015 and for the years ended December 31, 2016, 2015 and 2014 have been derived from our audited annual consolidated financial statements prepared in accordance with IFRS that are included in this annual report. The selected financial data at December 31, 2013 and 2012 and for the years ended December 31, 2013 and 2012 was prepared in accordance with Colombian Banking GAAP and is incorporated in this document as Appendix A. We believe that the average data set forth herein accurately reflects in all material aspects our financial condition and results of operation at the date and for the periods specified.
Distribution of assets, liabilities and equity, interest rates and interest differential
| · | Average statement of financial position has been calculated as follows: for 2016, we calculated our average statement of financial position based on balances at December 31, 2016, at September 30, 2016, at June 30, 2016, at March 31, 2016 and at December 31, 2015. For 2015, we calculated our average statement of financial position based on balances at December 31, 2015, at September 30, 2015, at June 30, 2015, at March 31, 2015 and at December 31, 2014. For 2014, we calculated our average statement of financial position based on balances at January 1, 2014 and at December 31, 2014. The average statement of financial position is usually calculated based on more than two periods of information considering that this methodology provides more accurate information. However, in the specific case of 2014, as a result of our first time adoption of IFRS, our average statements of financial position have been calculated based on two periods of information only. |
Average Statement of Financial Position
For the years ended December 31, 2016, 2015 and 2014, the following table presents:
| · | average balances for 2016 and 2015 calculated using actual balances for our assets and liabilities (based on a five period average) and for 2014 using actual balances for our assets and liabilities (based on beginning and end of year averages); |
| · | interest income earned on assets and interest paid on liabilities; and |
| · | average yield and interest rate for our interest-earning assets and interest-bearing liabilities, respectively. |
| | | Average statement of financial position and income from interest-earning and non-interest-earning
assets for the years ended December 31, | |
| | | 2016 | | | 2015 | | | 2014 | |
| | | Average
balance | | | Interest
income
earned | | | Average
yield | | | Average
balance | | | Interest
income
earned | | | Average
yield | | | Average
balance | | | Interest
income
earned | | | Average
yield | |
| | | (in Ps billions, except percentages) | |
| ASSETS | | | | | | | | | | | | | | | | | | | | | | | | | | | | | | | | | | | | |
| Interest-earning assets | | | | | | | | | | | | | | | | | | | | | | | | | | | | | | | | | | | | |
| Fixed Income Investments | | | | | | | | | | | | | | | | | | | | | | | | | | | | | | | | | | | | |
| Domestic | | | | | | | | | | | | | | | | | | | | | | | | | | | | | | | | | | | | |
| Peso-denominated | | | 12,830.2 | | | | 620.1 | | | | 4.8 | % | | | 13,987.2 | | | | 740.2 | | | | 5.3 | % | | | 13,090.0 | | | | 510.7 | | | | 3.9 | % |
| Dollar-denominated | | | 3,372.2 | | | | 85.2 | | | | 2.5 | % | | | 3,054.5 | | | | 130.1 | | | | 4.3 | % | | | 2,067.9 | | | | 52.6 | | | | 2.5 | % |
| Total domestic | | | 16,202.4 | | | | 705.3 | | | | 4.4 | % | | | 17,041.7 | | | | 870.2 | | | | 5.1 | % | | | 15,157.9 | | | | 563.3 | | | | 3.7 | % |
| Foreign | | | 4,690.4 | | | | 176.2 | | | | 3.8 | % | | | 4,396.6 | | | | 201.3 | | | | 4.6 | % | | | 3,797.2 | | | | 209.9 | | | | 5.5 | % |
| Total | | | 20,892.9 | | | | 881.5 | | | | 4.2 | % | | | 21,438.3 | | | | 1,071.5 | | | | 5.0 | % | | | 18,955.1 | | | | 773.2 | | | | 4.1 | % |
| Interbank and overnight funds | | | | | | | | | | | | | | | | | | | | | | | | | | | | | | | | | | | | |
| Domestic | | | | | | | | | | | | | | | | | | | | | | | | | | | | | | | | | | | | |
| Peso-denominated | | | 863.0 | | | | 114.7 | | | | 13.3 | % | | | 699.2 | | | | 131.9 | | | | 18.9 | % | | | 592.5 | | | | 195.6 | | | | 33.0 | % |
| Dollar-denominated | | | 1,053.5 | | | | 20.0 | | | | 1.9 | % | | | 1,278.9 | | | | 10.3 | | | | 0.8 | % | | | 640.7 | | | | 12.6 | | | | 2.0 | % |
| Total domestic | | | 1,916.5 | | | | 134.7 | | | | 7.0 | % | | | 1,978.0 | | | | 142.2 | | | | 7.2 | % | | | 1,233.2 | | | | 208.2 | | | | 16.9 | % |
| Foreign | | | 1,473.3 | | | | 51.5 | | | | 3.5 | % | | | 862.2 | | | | 49.5 | | | | 5.7 | % | | | 970.4 | | | | 34.7 | | | | 3.6 | % |
| Total | | | 3,389.8 | | | | 186.2 | | | | 5.5 | % | | | 2,840.2 | | | | 191.7 | | | | 6.8 | % | | | 2,203.6 | | | | 242.9 | | | | 11.0 | % |
| Loans and leases (1) | | | | | | | | | | | | | | | | | | | | | | | | | | | | | | | | | | | | |
| Domestic | | | | | | | | | | | | | | | | | | | | | | | | | | | | | | | | | | | | |
| Peso-denominated | | | 94,381.4 | | | | 11,605.4 | | | | 12.3 | % | | | 84,286.8 | | | | 8,812.4 | | | | 10.5 | % | | | 75,065.6 | | | | 7,739.9 | | | | 10.3 | % |
| Dollar-denominated | | | 9,237.1 | | | | 371.4 | | | | 4.0 | % | | | 10,193.3 | | | | 306.2 | | | | 3.0 | % | | | 8,100.3 | | | | 220.0 | | | | 2.7 | % |
| Total domestic | | | 103,618.5 | | | | 11,976.8 | | | | 11.6 | % | | | 94,480.2 | | | | 9,118.6 | | | | 9.7 | % | | | 83,165.9 | | | | 7,959.9 | | | | 9.6 | % |
| Foreign | | | 40,597.6 | | | | 4,502.6 | | | | 11.1 | % | | | 34,084.3 | | | | 3,693.7 | | | | 10.8 | % | | | 24,269.5 | | | | 2,445.9 | | | | 10.1 | % |
| Total | | | 144,216.1 | | | | 16,479.3 | | | | 11.4 | % | | | 128,564.4 | | | | 12,812.4 | | | | 10.0 | % | | | 107,435.4 | | | | 10,405.7 | | | | 9.7 | % |
| Loans and receivables (2) | | | | | | | | | | | | | | | | | | | | | | | | | | | | | | | | | | | | |
| Domestic | | | | | | | | | | | | | | | | | | | | | | | | | | | | | | | | | | | | |
| Peso-denominated | | | 95,244.4 | | | | 11,720.1 | | | | 12.3 | % | | | 84,986.0 | | | | 8,944.4 | | | | 10.5 | % | | | 75,658.2 | | | | 7,935.4 | | | | 10.5 | % |
| Dollar-denominated | | | 10,290.7 | | | | 391.3 | | | | 3.8 | % | | | 11,472.2 | | | | 316.5 | | | | 2.8 | % | | | 8,741.0 | | | | 232.6 | | | | 2.7 | % |
| Total domestic | | | 105,535.0 | | | | 12,111.4 | | | | 11.5 | % | | | 96,458.2 | | | | 9,260.9 | | | | 9.6 | % | | | 84,399.1 | | | | 8,168.0 | | | | 9.7 | % |
| Foreign | | | 42,070.9 | | | | 4,554.1 | | | | 10.8 | % | | | 34,946.4 | | | | 3,743.2 | | | | 10.7 | % | | | 25,239.9 | | | | 2,480.6 | | | | 9.8 | % |
| Total | | | 147,605.9 | | | | 16,665.5 | | | | 11.3 | % | | | 131,404.6 | | | | 13,004.1 | | | | 9.9 | % | | | 109,639.0 | | | | 10,648.6 | | | | 9.7 | % |
| Total interest-earning assets | | | | | | | | | | | | | | | | | | | | | | | | | | | | | | | | | | | | |
| Domestic | | | | | | | | | | | | | | | | | | | | | | | | | | | | | | | | | | | | |
| Peso-denominated | | | 108,074.6 | | | | 12,340.2 | | | | 11.4 | % | | | 98,973.2 | | | | 9,684.6 | | | | 9.8 | % | | | 88,748.2 | | | | 8,446.1 | | | | 9.5 | % |
| Dollar-denominated | | | 13,662.9 | | | | 476.5 | | | | 3.5 | % | | | 14,526.7 | | | | 446.6 | | | | 3.1 | % | | | 10,808.9 | | | | 285.2 | | | | 2.6 | % |
| Total domestic | | | 121,737.5 | | | | 12,816.7 | | | | 10.5 | % | | | 113,499.9 | | | | 10,131.1 | | | | 8.9 | % | | | 99,557.1 | | | | 8,731.3 | | | | 8.8 | % |
| Foreign | | | 46,761.3 | | | | 4,730.3 | | | | 10.1 | % | | | 39,343.0 | | | | 3,944.5 | | | | 10.0 | % | | | 29,037.0 | | | | 2,690.5 | | | | 9.3 | % |
| Total interest-earning assets | | | 168,498.8 | | | | 17,547.0 | | | | 10.4 | % | | | 152,842.9 | | | | 14,075.6 | | | | 9.2 | % | | | 128,594.1 | | | | 11,421.8 | | | | 8.9 | % |
| | | | | | | | | | | | | | | | | | | | | | | | | | | | | | | | | | | | | |
| Total non-interest-earning assets | | | 48,996.9 | | | | – | | | | – | | | | 45,341.1 | | | | – | | | | – | | | | 38,756.1 | | | | – | | | | – | |
| | | | | | | | | | | | | | | | | | | | | | | | | | | | | | | | | | | | | |
| Total interest-earning and non interest-earning assets | | | | | | | | | | | | | | | | | | | | | | | | | | | | | | | | | | | | |
| Domestic | | | | | | | | | | | | | | | | | | | | | | | | | | | | | | | | | | | | |
| Peso-denominated | | | 139,095.5 | | | | 12,340.2 | | | | 8.9 | % | | | 123,776.6 | | | | 9,684.6 | | | | 7.8 | % | | | 112,651.5 | | | | 8,446.1 | | | | 7.5 | % |
| Dollar-denominated | | | 16,427.9 | | | | 476.5 | | | | 2.9 | % | | | 20,214.3 | | | | 446.6 | | | | 2.2 | % | | | 14,397.9 | | | | 285.2 | | | | 2.0 | % |
| Total domestic | | | 155,523.4 | | | | 12,816.7 | | | | 8.2 | % | | | 143,991.0 | | | | 10,131.1 | | | | 7.0 | % | | | 127,049.4 | | | | 8,731.3 | | | | 6.9 | % |
| Foreign | | | 61,972.3 | | | | 4,730.3 | | | | 7.6 | % | | | 54,193.1 | | | | 3,944.5 | | | | 7.3 | % | | | 40,300.7 | | | | 2,690.5 | | | | 6.7 | % |
| Total assets | | | 217,495.7 | | | | 17,547.0 | | | | 8.1 | % | | | 198,184.1 | | | | 14,075.6 | | | | 7.1 | % | | | 167,350.2 | | | | 11,421.8 | | | | 6.8 | % |
| | | Average statement of financial position and income from interest-bearing and non-interest-bearing liabilities and equity
for the years ended December 31, | |
| | | 2016 | | | 2015 | | | 2014 | |
| | | Average
balance | | | Interest
expense
paid | | | Average
interest
rate | | | Average
balance | | | Interest
expense
paid | | | Average
interest
rate | | | Average
balance | | | Interest
expense
paid | | | Average
interest
rate | |
| | | (in Ps billions, except percentages) | |
| LIABILITIES AND EQUITY | | | | | | | | | | | | | | | | | | | | | | | | | | | | | | | | | | | | |
| Interest-bearing liabilities | | | | | | | | | | | | | | | | | | | | | | | | | | | | | | | | | | | | |
| Checking accounts | | | | | | | | | | | | | | | | | | | | | | | | | | | | | | | | | | | | |
| Domestic | | | | | | | | | | | | | | | | | | | | | | | | | | | | | | | | | | | | |
| Peso-denominated | | | 4,990.7 | | | | 159.6 | | | | 3.2 | % | | | 3,706.6 | | | | 108.4 | | | | 2.9 | % | | | 3,700.6 | | | | 122.4 | | | | 3.3 | % |
| Dollar-denominated | | | 924.7 | | | | 5.8 | | | | 0.6 | % | | | 1,232.6 | | | | 1.2 | | | | 0.1 | % | | | 1,180.7 | | | | 1.8 | | | | 0.2 | % |
| Total domestic | | | 5,915.3 | | | | 165.4 | | | | 2.8 | % | | | 4,939.2 | | | | 109.6 | | | | 2.2 | % | | | 4,881.3 | | | | 124.2 | | | | 2.5 | % |
| Foreign | | | 11,330.6 | | | | 93.6 | | | | 0.8 | % | | | 9,527.2 | | | | 73.6 | | | | 0.8 | % | | | 6,995.6 | | | | 47.1 | | | | 0.7 | % |
| Total | | | 17,245.9 | | | | 258.9 | | | | 1.5 | % | | | 14,466.4 | | | | 183.2 | | | | 1.3 | % | | | 11,876.9 | | | | 171.3 | | | | 1.4 | % |
| Savings accounts | | | | | | | | | | | | | | | | | | | | | | | | | | | | | | | | | | | | |
| Domestic | | | | | | | | | | | | | | | | | | | | | | | | | | | | | | | | | | | | |
| Peso-denominated | | | 41,981.0 | | | | 2,030.1 | | | | 4.8 | % | | | 40,155.0 | | | | 1,335.5 | | | | 3.3 | % | | | 37,375.5 | | | | 1,219.7 | | | | 3.3 | % |
| Dollar-denominated | | | 783.2 | | | | 3.8 | | | | 0.5 | % | | | 474.9 | | | | 3.4 | | | | 0.7 | % | | | 345.0 | | | | 3.2 | | | | 0.9 | % |
| Total domestic | | | 42,764.2 | | | | 2,033.9 | | | | 4.8 | % | | | 40,629.9 | | | | 1,338.8 | | | | 3.3 | % | | | 37,720.5 | | | | 1,222.9 | | | | 3.2 | % |
| Foreign | | | 7,481.2 | | | | 105.9 | | | | 1.4 | % | | | 6,463.2 | | | | 87.4 | | | | 1.4 | % | | | 4,623.2 | | | | 58.1 | | | | 1.3 | % |
| Total | | | 50,245.5 | | | | 2,139.8 | | | | 4.3 | % | | | 47,093.1 | | | | 1,426.2 | | | | 3.0 | % | | | 42,343.7 | | | | 1,280.9 | | | | 3.0 | % |
| Time deposits | | | | | | | | | | | | | | | | | | | | | | | | | | | | | | | | | | | | |
| Domestic | | | | | | | | | | | | | | | | | | | | | | | | | | | | | | | | | | | | |
| Peso-denominated | | | 30,102.1 | | | | 2,458.4 | | | | 8.2 | % | | | 25,164.1 | | | | 1,410.9 | | | | 5.6 | % | | | 21,566.0 | | | | 1,070.9 | | | | 5.0 | % |
| Dollar-denominated | | | 9,155.5 | | | | 150.5 | | | | 1.6 | % | | | 8,167.5 | | | | 131.2 | | | | 1.6 | % | | | 5,273.3 | | | | 94.4 | | | | 1.8 | % |
| Total domestic | | | 39,257.6 | | | | 2,609.0 | | | | 6.6 | % | | | 33,331.6 | | | | 1,542.2 | | | | 4.6 | % | | | 26,839.3 | | | | 1,165.3 | | | | 4.3 | % |
| Foreign | | | 16,164.5 | | | | 804.5 | | | | 5.0 | % | | | 14,088.5 | | | | 680.7 | | | | 4.8 | % | | | 10,712.8 | | | | 467.6 | | | | 4.4 | % |
| Total | | | 55,422.0 | | | | 3,413.5 | | | | 6.2 | % | | | 47,420.1 | | | | 2,222.8 | | | | 4.7 | % | | | 37,552.1 | | | | 1,632.9 | | | | 4.3 | % |
| Total interest bearing deposits | | | | | | | | | | | | | | | | | | | | | | | | | | | | | | | | | | | | |
| Domestic | | | | | | | | | | | | | | | | | | | | | | | | | | | | | | | | | | | | |
| Peso-denominated | | | 77,073.8 | | | | 4,648.1 | | | | 6.0 | % | | | 69,025.7 | | | | 2,854.8 | | | | 4.1 | % | | | 62,642.1 | | | | 2,413.0 | | | | 3.9 | % |
| Dollar-denominated | | | 10,863.3 | | | | 160.1 | | | | 1.5 | % | | | 9,874.9 | | | | 135.8 | | | | 1.4 | % | | | 6,799.0 | | | | 99.4 | | | | 1.5 | % |
| Total domestic | | | 87,937.1 | | | | 4,808.2 | | | | 5.5 | % | | | 78,900.7 | | | | 2,990.6 | | | | 3.8 | % | | | 69,441.1 | | | | 2,512.4 | | | | 3.6 | % |
| Foreign | | | 34,976.3 | | | | 1,004.0 | | | | 2.9 | % | | | 30,079.0 | | | | 841.7 | | | | 2.8 | % | | | 22,331.6 | | | | 572.8 | | | | 2.6 | % |
| Total | | | 122,913.4 | | | | 5,812.3 | | | | 4.7 | % | | | 108,979.7 | | | | 3,832.2 | | | | 3.5 | % | | | 91,772.7 | | | | 3,085.2 | | | | 3.4 | % |
| | | Average statement of financial position and income from interest-bearing and non-interest-bearing liabilities and equity
for the years ended December 31, | |
| | | 2016 | | | 2015 | | | 2014 | |
| | | Average
balance | | | Interest
expense
paid | | | Average
interest
rate | | | Average
balance | | | Interest
expense
paid | | | Average
interest
rate | | | Average
balance | | | Interest
expense
paid | | | Average
interest
rate | |
| | | (in Ps billions, except percentages) | |
| Interbank and overnight funds (3) | | | | | | | | | | | | | | | | | | | | | | | | | | | | | | | | | | | | |
| Domestic | | | | | | | | | | | | | | | | | | | | | | | | | | | | | | | | | | | | |
| Peso-denominated | | | 8,028.6 | | | | 462.3 | | | | 5.8 | % | | | 8,001.4 | | | | 332.3 | | | | 4.2 | % | | | 4,680.7 | | | | 175.4 | | | | 3.7 | % |
| Dollar-denominated | | | 459.7 | | | | 102.2 | | | | 22.2 | % | | | 414.2 | | | | 1.5 | | | | 0.4 | % | | | 354.0 | | | | 3.6 | | | | 1.0 | % |
| Total domestic | | | 8,488.3 | | | | 564.6 | | | | 6.7 | % | | | 8,415.6 | | | | 333.8 | | | | 4.0 | % | | | 5,034.7 | | | | 179.0 | | | | 3.6 | % |
| Foreign | | | 195.4 | | | | 5.6 | | | | 2.9 | % | | | 153.3 | | | | 6.8 | | | | 4.5 | % | | | 117.7 | | | | 6.0 | | | | 5.1 | % |
| Total | | | 8,683.6 | | | | 570.2 | | | | 6.6 | % | | | 8,568.8 | | | | 340.6 | | | | 4.0 | % | | | 5,152.4 | | | | 185.0 | | | | 3.6 | % |
| Borrowings from banks and other | | | | | | | | | | | | | | | | | | | | | | | | | | | | | | | | | | | | |
| Domestic | | | | | | | | | | | | | | | | | | | | | | | | | | | | | | | | | | | | |
| Peso-denominated | | | 4,558.2 | | | | 190.8 | | | | 4.2 | % | | | 3,457.2 | | | | 77.3 | | | | 2.2 | % | | | 3,449.2 | | | | 108.5 | | | | 3.1 | % |
| Dollar-denominated | | | 4,054.3 | | | | 62.7 | | | | 1.5 | % | | | 3,663.0 | | | | 49.2 | | | | 1.3 | % | | | 2,676.5 | | | | 28.1 | | | | 1.0 | % |
| Total domestic | | | 8,612.5 | | | | 253.6 | | | | 2.9 | % | | | 7,120.2 | | | | 126.4 | | | | 1.8 | % | | | 6,125.7 | | | | 136.6 | | | | 2.2 | % |
| Foreign | | | 11,138.7 | | | | 478.2 | | | | 4.3 | % | | | 10,522.7 | | | | 411.1 | | | | 3.9 | % | | | 8,202.4 | | | | 287.9 | | | | 3.5 | % |
| Total | | | 19,751.2 | | | | 731.7 | | | | 3.7 | % | | | 17,642.9 | | | | 537.5 | | | | 3.0 | % | | | 14,328.1 | | | | 424.4 | | | | 3.0 | % |
| Long-term debt | | | | | | | | | | | | | | | | | | | | | | | | | | | | | | | | | | | | |
| Domestic | | | | | | | | | | | | | | | | | | | | | | | | | | | | | | | | | | | | |
| Peso-denominated | | | 6,934.8 | | | | 683.4 | | | | 9.9 | % | | | 7,001.6 | | | | 592.7 | | | | 8.5 | % | | | 6,946.1 | | | | 494.3 | | | | 7.1 | % |
| Dollar-denominated | | | 8,983.5 | | | | 514.7 | | | | 5.7 | % | | | 7,383.1 | | | | 375.6 | | | | 5.1 | % | | | 5,793.2 | | | | 268.0 | | | | 4.6 | % |
| Total domestic | | | 15,918.4 | | | | 1,198.1 | | | | 7.5 | % | | | 14,384.8 | | | | 968.3 | | | | 6.7 | % | | | 12,739.4 | | | | 762.4 | | | | 6.0 | % |
| Foreign | | | 1,192.2 | | | | 80.1 | | | | 6.7 | % | | | 1,055.0 | | | | 72.8 | | | | 6.9 | % | | | 699.5 | | | | 41.8 | | | | 6.0 | % |
| Total | | | 17,110.6 | | | | 1,278.3 | | | | 7.5 | % | | | 15,439.7 | | | | 1,041.1 | | | | 6.7 | % | | | 13,438.9 | | | | 804.2 | | | | 6.0 | % |
| Total interest-bearing liabilities | | | | | | | | | | | | | | | | | | | | | | | | | | | | | | | | | | | | |
| Domestic | | | | | | | | | | | | | | | | | | | | | | | | | | | | | | | | | | | | |
| Peso-denominated | | | 96,595.4 | | | | 5,984.7 | | | | 6.2 | % | | | 87,485.9 | | | | 3,857.0 | | | | 4.4 | % | | | 77,718.2 | | | | 3,191.2 | | | | 4.1 | % |
| Dollar-denominated | | | 24,360.8 | | | | 839.8 | | | | 3.4 | % | | | 21,335.3 | | | | 562.0 | | | | 2.6 | % | | | 15,622.6 | | | | 399.1 | | | | 2.6 | % |
| Total domestic | | | 120,956.2 | | | | 6,824.5 | | | | 5.6 | % | | | 108,821.2 | | | | 4,419.1 | | | | 4.1 | % | | | 93,340.8 | | | | 3,590.3 | | | | 3.8 | % |
| Foreign | | | 47,502.6 | | | | 1,567.9 | | | | 3.3 | % | | | 41,810.0 | | | | 1,332.4 | | | | 3.2 | % | | | 31,351.2 | | | | 908.4 | | | | 2.9 | % |
| Total interest-bearing liabilities | | | 168,458.8 | | | | 8,392.4 | | | | 5.0 | % | | | 150,631.2 | | | | 5,751.5 | | | | 3.8 | % | | | 124,692.1 | | | | 4,498.7 | | | | 3.6 | % |
| | | | | | | | | | | | | | | | | | | | | | | | | | | | | | | | | | | | | |
| Total non-interest-bearing liabilities and equity | | | 49,036.9 | | | | – | | | | – | | | | 47,552.9 | | | | – | | | | – | | | | 42,658.1 | | | | – | | | | – | |
| | | | | | | | | | | | | | | | | | | | | | | | | | | | | | | | | | | | | |
| Total liabilities and equity | | | 217,495.7 | | | | 8,392.4 | | | | 3.9 | % | | | 198.184.1 | | | | 5,751.5 | | | | 2.9 | % | | | 167,350.2 | | | | 4,498.7 | | | | 2.7 | % |
| (1) | Includes an immaterial amount of interest earned on loans rated “C,” “D” and “E.” See “Item 11. Quantitative and Qualitative disclosure about risk – Credit Classification and Provisioning.” |
| (2) | Includes loans and leases and interbank and overnight funds |
| (3) | Reflects operations involving: common short-term interbank funds, repurchase transactions (repos), simultaneous operations and transactions involving the temporary transfer of securities. |
Changes in net interest income and expenses – volume and rate analysis
The following tables allocate by currency of denomination, the changes in our net interest income between the changes in average volume and changes in nominal rates for the year ended December 31, 2016 compared to the year ended December 31, 2015 and the year ended December 31, 2015 compared to the year ended December 31, 2014. Volume and rate variances have been calculated based on variances in average balances over the period and changes in nominal interest rates on average interest-earning assets and average interest-bearing liabilities. Net changes attributable to changes in both volume and interest rate have been allocated to changes in volume. You should read the following tables and the footnotes thereto in conjunction to our observations noted in “—Average statement of financial position”.
| | | 2016 - 2015
Increase (decrease)
due to changes in | | | 2015 - 2014
Increase (decrease)
due to changes in | |
| | | Volume | | | Rate | | | Net change | | | Volume | | | Rate | | | Net change | |
| | | (in Ps billions, except percentages) | |
| | | | | | | | | | | | | | | | | | | |
| Interest-earning assets: | | | | | | | | | | | | | | | | | | | | | | | | |
| | | | | | | | | | | | | | | | | | | | | | | | | |
| Fixed Income Investments | | | | | | | | | | | | | | | | | | | | | | | | |
| Domestic | | | | | | | | | | | | | | | | | | | | | | | | |
| Peso-Denominated | | | (55.9 | ) | | | (64.1 | ) | | | (120.0 | ) | | | 47.5 | | | | 182.0 | | | | 229.5 | |
| Dollar-Denominated | | | 8.0 | | | | (52.9 | ) | | | (44.9 | ) | | | 42.0 | | | | 35.5 | | | | 77.5 | |
| Total domestic | | | (47.9 | ) | | | (117.0 | ) | | | (164.9 | ) | | | 89.5 | | | | 217.5 | | | | 307.0 | |
| Foreign | | | 11.0 | | | | (36.1 | ) | | | (25.1 | ) | | | 27.4 | | | | (36.1 | ) | | | (8.7 | ) |
| Total | | | (36.9 | ) | | | (153.2 | ) | | | (190.0 | ) | | | 116.9 | | | | 181.4 | | | | 298.3 | |
| Interbank loans and overnight funds | | | | | | | | | | | | | | | | | | | | | | | | |
| Domestic | | | | | | | | | | | | | | | | | | | | | | | | |
| Peso-Denominated | | | 21.8 | | | | (39.0 | ) | | | (17.2 | ) | | | 20.1 | | | | (83.8 | ) | | | (63.6 | ) |
| Dollar-Denominated | | | (4.3 | ) | | | 13.9 | | | | 9.7 | | | | 5.1 | | | | (7.4 | ) | | | (2.3 | ) |
| Total domestic | | | 17.5 | | | | (25.1 | ) | | | (7.6 | ) | | | 25.3 | | | | (91.2 | ) | | | (65.9 | ) |
| Foreign | | | 21.4 | | | | (19.4 | ) | | | 2.0 | | | | (6.2 | ) | | | 21.0 | | | | 14.8 | |
| Total | | | 38.9 | | | | (44.4 | ) | | | (5.6 | ) | | | 19.0 | | | | (70.2 | ) | | | (51.2 | ) |
| Loans and leases (1) | | | | | | | | | | | | | | | | | | | | | | | | |
| Domestic | | | | | | | | | | | | | | | | | | | | | | | | |
| Peso-Denominated | | | 1,241.3 | | | | 1,551.7 | | | | 2,792.9 | | | | 964.1 | | | | 108.5 | | | | 1,072.6 | |
| Dollar-Denominated | | | (38.4 | ) | | | 103.6 | | | | 65.2 | | | | 62.9 | | | | 23.3 | | | | 86.2 | |
| Total domestic | | | 1,202.8 | | | | 1,655.3 | | | | 2,858.1 | | | | 1,027.0 | | | | 131.8 | | | | 1,158.8 | |
| Foreign | | | 722.4 | | | | 86.5 | | | | 808.9 | | | | 1,063.6 | | | | 184.2 | | | | 1,247.9 | |
| Total | | | 1,925.2 | | | | 1,741.8 | | | | 3,667.0 | | | | 2,090.6 | | | | 316.0 | | | | 2,406.6 | |
| | | | | | | | | | | | | | | | | | | | | | | | | |
| Total interest-earnings assets | | | | | | | | | | | | | | | | | | | | | | | | |
| Domestic | | | | | | | | | | | | | | | | | | | | | | | | |
| Peso-Denominated | | | 1,207.1 | | | | 1,448.6 | | | | 2,655.7 | | | | 1,031.7 | | | | 206.7 | | | | 1,238.4 | |
| Dollar-Denominated | | | (34.7 | ) | | | 64.6 | | | | 29.9 | | | | 110.0 | | | | 51.4 | | | | 161.4 | |
| Total domestic | | | 1,172.4 | | | | 1,513.2 | | | | 2,685.6 | | | | 1,141.7 | | | | 258.1 | | | | 1,399.8 | |
| Foreign | | | 754.8 | | | | 31.0 | | | | 785.8 | | | | 1,084.9 | | | | 169.1 | | | | 1,254.0 | |
| Total interest-earnings assets | | | 1,927.2 | | | | 1,544.2 | | | | 3,471.4 | | | | 2,226.6 | | | | 427.2 | | | | 2,653.8 | |
| | | | | | | | | | | | | | | | | | | | | | | | | |
| Interest-bearing liabilities | | | | | | | | | | | | | | | | | | | | | | | | |
| | | | | | | | | | | | | | | | | | | | | | | | | |
| Checking accounts | | | | | | | | | | | | | | | | | | | | | | | | |
| Domestic | | | | | | | | | | | | | | | | | | | | | | | | |
| Peso-Denominated | | | 41.1 | | | | 10.1 | | | | 51.2 | | | | 0.2 | | | | (14.2 | ) | | | (14.0 | ) |
| Dollar-Denominated | | | (1.9 | ) | | | 6.5 | | | | 4.6 | | | | 0.1 | | | | (0.6 | ) | | | (0.6 | ) |
| Total domestic | | | 39.1 | | | | 16.6 | | | | 55.8 | | | | 0.2 | | | | (14.8 | ) | | | (14.6 | ) |
| Foreign | | | 14.9 | | | | 5.0 | | | | 19.9 | | | | 19.6 | | | | 7.0 | | | | 26.5 | |
| Total | | | 54.0 | | | | 21.7 | | | | 75.7 | | | | 19.8 | | | | (7.9 | ) | | | 11.9 | |
| | | | | | | | | | | | | | | | | | | | | | | | | |
| Saving accounts | | | | | | | | | | | | | | | | | | | | | | | | |
| Domestic | | | | | | | | | | | | | | | | | | | | | | | | |
| Peso-Denominated | | | 88.3 | | | | 606.3 | | | | 694.6 | | | | 92.4 | | | | 23.3 | | | | 115.8 | |
| Dollar-Denominated | | | 1.5 | | | | (1.0 | ) | | | 0.4 | | | | 0.9 | | | | (0.7 | ) | | | 0.2 | |
| Total domestic | | | 89.8 | | | | 605.3 | | | | 695.1 | | | | 93.4 | | | | 22.6 | | | | 115.9 | |
| Foreign | | | 14.4 | | | | 4.1 | | | | 18.6 | | | | 24.9 | | | | 4.4 | | | | 29.3 | |
| Total | | | 104.2 | | | | 609.4 | | | | 713.7 | | | | 118.2 | | | | 27.0 | | | | 145.2 | |
| | | 2016 - 2015
Increase (decrease)
due to changes in | | | 2015 - 2014
Increase (decrease)
due to changes in | |
| | | Volume | | | Rate | | | Net change | | | Volume | | | Rate | | | Net change | |
| | | (in Ps billions, except percentages) | |
| Time deposits | | | | | | | | | | | | | | | | | | | | | | | | |
| Domestic | | | | | | | | | | | | | | | | | | | | | | | | |
| Peso-Denominated | | | 403.3 | | | | 644.2 | | | | 1,047.5 | | | | 201.7 | | | | 138.3 | | | | 340.1 | |
| Dollar-Denominated | | | 16.2 | | | | 3.1 | | | | 19.3 | | | | 46.5 | | | | (9.7 | ) | | | 36.8 | |
| Total domestic | | | 419.5 | | | | 647.2 | | | | 1,066.8 | | | | 248.2 | | | | 128.6 | | | | 376.9 | |
| Foreign | | | 103.3 | | | | 20.6 | | | | 123.9 | | | | 163.1 | | | | 49.9 | | | | 213.0 | |
| Total | | | 522.8 | | | | 667.8 | | | | 1,190.7 | | | | 411.3 | | | | 178.6 | | | | 589.9 | |
| | | | | | | | | | | | | | | | | | | | | | | | | |
| Interbank and overnight funds | | | | | | | | | | | | | | | | | | | | | | | | |
| Domestic | | | | | | | | | | | | | | | | | | | | | | | | |
| Peso-Denominated | | | 1.6 | | | | 128.5 | | | | 130.1 | | | | 137.9 | | | | 19.0 | | | | 156.9 | |
| Dollar-Denominated | | | 10.1 | | | | 90.6 | | | | 100.7 | | | | 0.2 | | | | (2.3 | ) | | | (2.1 | ) |
| Total domestic | | | 11.7 | | | | 219.1 | | | | 230.8 | | | | 138.1 | | | | 16.7 | | | | 154.8 | |
| Foreign | | | 1.2 | | | | (2.4 | ) | | | (1.2 | ) | | | 1.6 | | | | (0.7 | ) | | | 0.9 | |
| Total | | | 12.9 | | | | 216.7 | | | | 229.6 | | | | 139.7 | | | | 15.9 | | | | 155.6 | |
| | | | | | | | | | | | | | | | | | | | | | | | | |
| Borrowings from banks and other | | | | | | | | | | | | | | | | | | | | | | | | |
| Domestic | | | | | | | | | | | | | | | | | | | | | | | | |
| Peso-Denominated | | | 46.1 | | | | 67.5 | | | | 113.6 | | | | 0.2 | | | | (31.4 | ) | | | (31.2 | ) |
| Dollar-Denominated | | | 6.1 | | | | 7.5 | | | | 13.6 | | | | 13.2 | | | | 7.8 | | | | 21.1 | |
| Total domestic | | | 52.1 | | | | 75.0 | | | | 127.1 | | | | 13.4 | | | | (23.6 | ) | | | (10.1 | ) |
| Foreign | | | 26.4 | | | | 40.6 | | | | 67.0 | | | | 90.7 | | | | 32.6 | | | | 123.2 | |
| Total | | | 78.6 | | | | 115.6 | | | | 194.2 | | | | 104.1 | | | | 9.0 | | | | 113.1 | |
| | | | | | | | | | | | | | | | | | | | | | | | | |
| Long-term debt | | | | | | | | | | | | | | | | | | | | | | | | |
| Domestic | | | | | | | | | | | | | | | | | | | | | | | | |
| Peso-Denominated | | | (6.6 | ) | | | 97.3 | | | | 90.7 | | | | 4.7 | | | | 93.7 | | | | 98.4 | |
| Dollar-Denominated | | | 91.7 | | | | 47.5 | | | | 139.2 | | | | 80.9 | | | | 26.7 | | | | 107.5 | |
| Total domestic | | | 85.1 | | | | 144.7 | | | | 229.8 | | | | 85.6 | | | | 120.4 | | | | 205.9 | |
| Foreign | | | 9.2 | | | | (1.9 | ) | | | 7.3 | | | | 24.5 | | | | 6.5 | | | | 31.0 | |
| Total | | | 94.3 | | | | 142.8 | | | | 237.1 | | | | 110.1 | | | | 126.8 | | | | 236.9 | |
| | | | | | | | | | | | | | | | | | | | | | | | | |
| Total interest-bearing liabilities | | | | | | | | | | | | | | | | | | | | | | | | |
| Domestic | | | | | | | | | | | | | | | | | | | | | | | | |
| Peso-Denominated | | | 564.4 | | | | 1,563.3 | | | | 2,127.6 | | | | 430.6 | | | | 235.2 | | | | 665.9 | |
| Dollar-Denominated | | | 104.3 | | | | 173.5 | | | | 277.8 | | | | 150.5 | | | | 12.4 | | | | 162.9 | |
| Total domestic | | | 668,7 | | | | 1,736.8 | | | | 2,405.4 | | | | 581.1 | | | | 247.7 | | | | 828.8 | |
| Foreign | | | 187.9 | | | | 47.6 | | | | 235.5 | | | | 333.3 | | | | 90.7 | | | | 424.0 | |
| Total interest-bearing liabilities | | | 856.6 | | | | 1,784.4 | | | | 2,640.9 | | | | 914.4 | | | | 338.3 | | | | 1,252.7 | |
| (1) | Includes an immaterial amount of interest earned on loans rated “C,” “D” and “E.” See “Item 11. Quantitative and Qualitative disclosure about risk – Credit Classification and Provisioning.” |
Interest-earning assets – net interest margin and spread
The following table presents average balances of interest-earning assets as well as our yields on our average interest-earning assets, net interest earned, net interest margin and interest spread for the years ended December 31, 2016, 2015 and 2014.
| | | For the year ended December 31, | |
| | | 2016 | | | 2015 | | | 2014 | |
| | | (in Ps billions, except percentages) | |
| | | | | | | | | | |
| Interbank loans and overnight funds | | | | | | | | | | | | |
| Domestic | | | | | | | | | | | | |
| Peso-denominated | | | 863.0 | | | | 699.2 | | | | 592.5 | |
| Dollar-denominated | | | 1,053.5 | | | | 1,278.9 | | | | 640.7 | |
| Total Domestic | | | 1,916.5 | | | | 1,978.0 | | | | 1,233.2 | |
| Foreign | | | 1,473.3 | | | | 862.2 | | | | 970.4 | |
| Total | | | 3,389.8 | | | | 2,840.2 | | | | 2,203.6 | |
| | | | | | | | | | | | | |
| Loans and leases (1) | | | | | | | | | | | | |
| Domestic | | | | | | | | | | | | |
| Peso-denominated | | | 94,381.4 | | | | 84,286.8 | | | | 75,065.6 | |
| Foreign currency-denominated | | | 9,237.1 | | | | 10,193.3 | | | | 8,100.3 | |
| Total Domestic | | | 103,618.5 | | | | 94,480.2 | | | | 83,165.9 | |
| Foreign | | | 40,597.6 | | | | 34,084.3 | | | | 24,269.5 | |
| Total | | | 144,216.1 | | | | 128,564.4 | | | | 107,435.4 | |
| | | | | | | | | | | | | |
| Fixed Income Investments | | | | | | | | | | | | |
| Domestic | | | | | | | | | | | | |
| Peso-denominated | | | 12,830.2 | | | | 13,987.2 | | | | 13,090.0 | |
| Foreign currency-denominated | | | 3,372.2 | | | | 3,054.5 | | | | 2,067.9 | |
| Total Domestic | | | 16,202.4 | | | | 17,041.7 | | | | 15,157.9 | |
| Foreign | | | 4,690.4 | | | | 4,396.6 | | | | 3,797.2 | |
| Total | | | 20,892.9 | | | | 21,438.3 | | | | 18,955.1 | |
| | | | | | | | | | | | | |
| Total average interest-earning assets | | | | | | | | | | | | |
| Domestic | | | | | | | | | | | | |
| Peso-denominated | | | 108,074.6 | | | | 98,973.2 | | | | 88,748.2 | |
| Foreign currency-denominated | | | 13,662.9 | | | | 14,526.7 | | | | 10,808.9 | |
| Total Domestic | | | 121,737.5 | | | | 113,499.9 | | | | 99,557.1 | |
| Foreign | | | 46,761.3 | | | | 39,343.0 | | | | 29,037.0 | |
| Total | | | 168,498.8 | | | | 152,842.9 | | | | 128,594.1 | |
| Gross interest earned | | | | | | | | | | | | |
| Domestic | | | | | | | | | | | | |
| Peso-denominated | | | 12,340.2 | | | | 9,684.6 | | | | 8,446.1 | |
| Foreign currency-denominated | | | 476.5 | | | | 446.6 | | | | 285.2 | |
| Total Domestic | | | 12,816.7 | | | | 10,131.1 | | | | 8,731.3 | |
| Foreign | | | 4,730.3 | | | | 3,944.5 | | | | 2,690.5 | |
| Total | | | 17,547.0 | | | | 14,075.6 | | | | 11,421.8 | |
| | | | | | | | | | | | | |
| Net interest income (2) | | | | | | | | | | | | |
| Domestic | | | | | | | | | | | | |
| Peso-denominated | | | 6,355.5 | | | | 5,827.5 | | | | 5,255.0 | |
| Foreign currency-denominated | | | (363.3 | ) | | | (115.5 | ) | | | (114.0 | ) |
| Total Domestic | | | 5,992.2 | | | | 5,712.0 | | | | 5,141.0 | |
| Foreign | | | 3,162.4 | | | | 2,612.1 | | | | 1,782.1 | |
| Total | | | 9,154.6 | | | | 8,324.1 | | | | 6,923.1 | |
| | | | | | | | | | | | | |
| Average yield on interest-earning assets | | | | | | | | | | | | |
| Domestic | | | | | | | | | | | | |
| Peso-denominated | | | 11.4 | % | | | 9.8 | % | | | 9.5 | % |
| Foreign currency-denominated | | | 3.5 | % | | | 3.1 | % | | | 2.6 | % |
| Total Domestic | | | 10.5 | % | | | 8.9 | % | | | 8.8 | % |
| Foreign | | | 10.1 | % | | | 10.0 | % | | | 9.3 | % |
| Total | | | 10.4 | % | | | 9.2 | % | | | 8.9 | % |
| | | | | | | | | | | | | |
| Net interest margin (3) | | | | | | | | | | | | |
| Domestic | | | | | | | | | | | | |
| Peso-denominated | | | 5.9 | % | | | 5.9 | % | | | 5.9 | % |
| Foreign currency-denominated | | | (2.7 | )% | | | (0.8 | )% | | | (1.1 | )% |
| Total Domestic | | | 4.9 | % | | | 5.0 | % | | | 5.2 | % |
| | | For the year ended December 31, | |
| | | 2016 | | | 2015 | | | 2014 | |
| | | (in Ps billions, except percentages) | |
| Foreign | | | 6.8 | % | | | 6.6 | % | | | 6.1 | % |
| Total | | | 5.4 | % | | | 5.4 | % | | | 5.4 | % |
| | | | | | | | | | | | | |
| Interest spread on loans and leases (4) | | | | | | | | | | | | |
| Domestic | | | | | | | | | | | | |
| Peso-denominated | | | 6.3 | % | | | 6.3 | % | | | 6.5 | % |
| Foreign currency-denominated | | | 2.5 | % | | | 1.6 | % | | | 1.3 | % |
| Total Domestic | | | 6.1 | % | | | 5.9 | % | | | 6.0 | % |
| Foreign | | | 8.2 | % | | | 8.0 | % | | | 7.5 | % |
| Total | | | 6.7 | % | | | 6.4 | % | | | 6.3 | % |
| | | | | | | | | | | | | |
| Interest spread on total interest-earning assets (5) | | | | | | | | | | | | |
| Domestic | | | | | | | | | | | | |
| Peso-denominated | | | 6.2 | % | | | 5.4 | % | | | 5.4 | % |
| Foreign currency-denominated | | | (0.0 | )% | | | 0.4 | % | | | 0.1 | % |
| Total Domestic | | | 4.9 | % | | | 4.9 | % | | | 4.9 | % |
| Foreign | | | 6.8 | % | | | 6.8 | % | | | 6.4 | % |
| Total | | | 5.4 | % | | | 5.4 | % | | | 5.3 | % |
| (1) | Includes immaterial amount of interest earned on loans rated “C,” “D” and “E” for each year presented. |
| (2) | Net interest income is calculated as interest income less interest paid and includes accrued interest, on interbank and overnight funds. |
| (3) | Net interest margin is calculated as net interest income divided by total average interest-earning assets, determined based on monthly ending balances during the applicable period. |
| (4) | Interest spread on loans and leases is calculated as the difference between the average yield on interest-earning loans and leases and the average rate paid on interest-bearing liabilities. |
| (5) | Interest spread on total interest-earning assets is calculated as the difference between the average yield on interest-earning assets and the average rate paid on interest-bearing liabilities. |
Investment portfolio
We acquire and hold fixed income debt and equity securities for liquidity and other strategic purposes, or when required by law. In recent years, credit institutions, including our banking subsidiaries, have been required to hold certain debt securities issued by the Colombian government or government-related entities. Central Bank regulations require credit institutions to make investments in agricultural development bonds (Títulos de Desarrollo Agropecuario), or “TDAs,” issued by the Agricultural Sector Financing Fund (Fondo para el Financiamiento del Sector Agropecuario), or “Finagro.” Finagro is a development bank affiliated with the Ministry of Agriculture and finances the production and marketing activities of the agricultural and livestock sector. These securities yield below-market interest rates. The amount of these mandatory investments is calculated as a percentage of short-term deposits. Additionally our banking subsidiaries still maintain mandatory investments in reduction bonds (Títulos de Reducción de Deuda) issued by the Republic of Colombia. Under government discretion, authorities may extend the scope of current regulations or require additional disbursements on current or new mandatory investments. See “—Mandatory investments.”
The following table presents the book value of our investments in debt and equity securities, net of allowance for investment securities losses, at the dates indicated.
| | | At December 31, | |
| | | 2016 | | | 2015 | | | 2014 | |
| | | (in Ps billions) | |
| Debt securities | | | | | | | | | | | | |
| Peso-denominated | | | | | | | | | | | | |
| Securities issued or secured by the Republic of Colombia (1) | | | 10,171.7 | | | | 12,205.6 | | | | 12,869.8 | |
| Securities issued or secured by other Colombian government entities | | | 2,601.9 | | | | 2,369.6 | | | | 2,455.1 | |
| Securities issued or secured by other financial entities (2) | | | 917.6 | | | | 610.2 | | | | 651.1 | |
| Other securities (3) | | | 118.7 | | | | 158.9 | | | | 257.8 | |
| Total peso-denominated | | | 13,809.9 | | | | 15,344.3 | | | | 16,233.8 | |
| Foreign currency-denominated | | | | | | | | | | | | |
| Securities issued or secured by the Republic of Colombia (1) | | | 1,390.7 | | | | 1,347.3 | | | | 1,043.8 | |
| Securities issued or secured by foreign Central Banks | | | 613.5 | | | | 807.2 | | | | 433.3 | |
| Securities issued or secured by other Colombian government entities | | | 578.6 | | | | 513.9 | | | | 355.8 | |
| Securities issued by foreign governments | | | 2,195.6 | | | | 2,080.1 | | | | 1,593.7 | |
| Securities issued or secured by other financial entities (2) | | | 3,201.4 | | | | 3,546.2 | | | | 3,418.4 | |
| Other securities (3) | | | 787.4 | | | | 805.5 | | | | 1,119.4 | |
| Total foreign currency-denominated | | | 8,767.2 | | | | 9,100.2 | | | | 7,964.4 | |
| Total debt securities, net | | | 22,577.1 | | | | 24,444.5 | | | | 24,198.2 | |
| Equity securities, net | | | 2,477.4 | | | | 2,218.9 | | | | 2,043.1 | |
| Total investment securities, net | | | 25,054.5 | | | | 26,663.4 | | | | 26,241.3 | |
| (1) | Includes Colombian Government-issued treasuries (Títulos de Tesorería), or “TES.” |
| (2) | Reflects investments made in debt securities issued by private financial entities. |
| (3) | Reflects investments made in debt securities issued by multilateral institutions and non-financial companies. |
At December 31, 2016, 2015 and 2014, we held securities issued by foreign governments and in the principal amounts, as follows.
At
December 31, | | Issuer | | Investment amount
– book value | | | Investment amount
– book value | |
| | | | | (in Ps billions) | | | (in U.S.$ thousands) | |
| | | | | | | | | |
| 2016 | | | | | | | | | | |
| | | Argentina | | | 3.2 | | | | 1,082 | |
| | | Costa Rica | | | 951.8 | | | | 317,195 | |
| | | Mexico | | | 9.1 | | | | 3,041 | |
| | | Panamá | | | 530.1 | | | | 176.643 | |
| | | United States of America | | | 24.8 | | | | 8,267 | |
| | | El Salvador | | | 85.6 | | | | 28,535 | |
| | | Guatemala | | | 195.9 | | | | 65,277 | |
| | | Nicaragua | | | 0.9 | | | | 287 | |
| | | Honduras | | | 394.2 | | | | 131,363 | |
| | | Total 2016 | | | 2,195.6 | | | | 731,690 | |
| | | | | | | | | | | |
| 2015 | | | | | | | | | | |
| | | Brazil | | | 6.3 | | | | 2,010 | |
| | | Costa Rica | | | 846.8 | | | | 268,866 | |
| | | Mexico | | | 31.9 | | | | 10,137 | |
| | | Panamá | | | 496.5 | | | | 157,656 | |
| | | United States of America | | | 34.2 | | | | 10,827 | |
| | | El Salvador | | | 134.9 | | | | 42,829 | |
| | | Guatemala | | | 106.3 | | | | 33,765 | |
| | | Nicaragua | | | 1.5 | | | | 480 | |
| | | Honduras | | | 421.7 | | | | 133,883 | |
| | | Total 2015 | | | 2,080.1 | | | | 660,453 | |
| | | | | | | | | | | |
| 2014 | | | | | | | | | | |
| | | Brazil | | | 28.7 | | | | 11,992 | |
| | | Costa Rica | | | 565.8 | | | | 236,512 | |
| | | Mexico | | | 33.1 | | | | 13,793 | |
| | | Panamá | | | 379.9 | | | | 158,773 | |
| | | United States of America | | | 50.9 | | | | 21,277 | |
| | | El Salvador | | | 49.4 | | | | 20,647 | |
| | | Guatemala | | | 126.6 | | | | 52,928 | |
| | | Nicaragua | | | 1.7 | | | | 702 | |
| | | Honduras | | | 345.1 | | | | 144,261 | |
| | | Perú | | | 12.5 | | | | 5,240 | |
| | | Total 2014 | | | 1,593.7 | | | | 666,125 | |
Investment securities portfolio maturity
The following table summarizes the maturities and weighted average nominal yields of our debt investment securities at December 31, 2016 issued by governments or government entities.
| | | At December 31, 2016 | |
| | | Maturity less than
1 year | | | Maturity between 1
and 5 years | | | Maturity between 5
and 10 years | | | Maturity more than 10
years | | | Total | |
| | | Balance | | | Yield %
(1) | | | Balance | | | Yield %
(1) | | | Balance | | | Yield %
(1) | | | Balance | | | Yield %
(1) | | | Balance | | | Yield %
(1) | |
| | | (in Ps billions, except yields) | |
| Debt securities | | | | | | | | | | | | | | | | | | | | | | | | | | | | | | | | | | | | | | | | |
| Peso-denominated | | | | | | | | | | | | | | | | | | | | | | | | | | | | | | | | | | | | | | | | |
| Securities issued or secured by the Colombian Government | | | 946.1 | | | | 1.75 | % | | | 5,620.1 | | | | 6.13 | % | | | 3,316.0 | | | | 6.78 | % | | | 289.5 | | | | 7.25 | % | | | 10,171.7 | | | | 5.97 | % |
| Securities issued or secured by Colombian government entities | | | 2,500.3 | | | | 3.73 | % | | | 72.0 | | | | 8.83 | % | | | 29.6 | | | | 9.12 | % | | | - | | | | - | | | | 2,601.9 | | | | 3.94 | % |
| Securities issued or secured by other financial entities | | | 454.1 | | | | 8.24 | % | | | 339.2 | | | | 8.63 | % | | | 49.6 | | | | 9.90 | % | | | 74.7 | | | | 10.04 | % | | | 917.6 | | | | 8.62 | % |
| Other securities | | | 10.5 | | | | 13.41 | % | | | 38.9 | | | | 8.27 | % | | | 68.9 | | | | 6.56 | % | | | 0.4 | | | | 42.18 | % | | | 118.7 | | | | 7.85 | % |
| Total peso-denominated | | | 3,911.0 | | | | 3.80 | % | | | 6,070.2 | | | | 6.31 | % | | | 3,464.1 | | | | 6.84 | % | | | 364.6 | | | | 7.86 | % | | | 13,810.0 | | | | 5.78 | % |
| | | | | | | | | | | | | | | | | | | | | | | | | | | | | | | | | | | | | | | | | |
| Foreign currency-denominated | | | | | | | | | | | | | | | | | | | | | | | | | | | | | | | | | | | | | | | | |
| Securities issued or secured by the Colombian Government | | | 543.5 | | | | 1.18 | % | | | 729.3 | | | | 3.01 | % | | | 118.0 | | | | 3.86 | % | | | - | | | | - | | | | 1,390.7 | | | | 2.36 | % |
| Securities issued or secured by foreign Central Banks | | | 358.6 | | | | 4.22 | % | | | 254.9 | | | | 4.91 | % | | | - | | | | - | | | | - | | | | - | | | | 613.5 | | | | 4.50 | % |
| Securities issued or secured by Colombian government entities | | | - | | | | - | | | | 282.5 | | | | 3.85 | % | | | 296.0 | | | | 5.05 | % | | | - | | | | - | | | | 578.6 | | | | 4.46 | % |
| Securities issued by foreign governments | | | 754.3 | | | | 4.43 | % | | | 1,310.4 | | | | 4.56 | % | | | 130.9 | | | | 4.72 | % | | | - | | | | - | | | | 2,195.6 | | | | 4.52 | % |
| Securities issued or secured by other financial entities | | | 1,327.0 | | | | 2.06 | % | | | 1,600.8 | | | | 2.99 | % | | | 273.7 | | | | 5.13 | % | | | - | | | | - | | | | 3,201.4 | | | | 2.79 | % |
| Other securities | | | 73.6 | | | | 2.24 | % | | | 448.8 | | | | 7.23 | % | | | 247.3 | | | | 9.17 | % | | | 17.7 | | | | 5.50 | % | | | 787.4 | | | | 7.34 | % |
| Total foreign currency-denominated | | | 3,056.9 | | | | 2.75 | % | | | 4,626.7 | | | | 4.00 | % | | | 1,065.9 | | | | 5.85 | % | | | 17.7 | | | | 5.50 | % | | | 8,767.2 | | | | 3.79 | % |
| | | | | | | | | | | | | | | | | | | | | | | | | | | | | | | | | | | | | | | | | |
| Total debt securities, net | | | 6,967.9 | | | | 3.34 | % | | | 10,696.9 | | | | 5.31 | % | | | 4,530.0 | | | | 6.61 | % | | | 382.3 | | | | 7.75 | % | | | 22,577.1 | | | | 5.01 | % |
| | | | | | | | | | | | | | | | | | | | | | | | | | | | | | | | | | | | | | | | | |
| Equity securities, net | | | | | | | | | | | | | | | | | | | | | | | | | | | | | | | | | | | 2,477.4 | | | | | |
| | | | | | | | | | | | | | | | | | | | | | | | | | | | | | | | | | | | | | | | | |
| Total investment securities, net | | | | | | | | | | | | | | | | | | | | | | | | | | | | | | | | | | | 25,054.5 | | | | | |
| (1) | Yield was calculated using the internal rate of return, or “IRR,” at December 31, 2016. |
At December 31, 2016, we had the following investments in securities of issuers that exceeded 10% of our controlling equity.
| | | December 31, 2016 |
| | | Issuer | | Book value | | | Market value | |
| | | | | (in Ps billions) | |
| Securities issued or secured by the Colombian Central government | | Ministry of Finance | | | 11,562.5 | | | | 11,562.5 | |
| Securities issued or secured by Colombian government entities | | Finagro | | | 2,480.6 | | | | 2,468.4 | |
| Total | | | | | 14,043.1 | | | | 14,030.9 | |
Loan portfolio
The following table presents our loan portfolio classified into commercial, consumer, microcredit and mortgage loans for the periods indicated.
| | | At December 31, | |
| | | 2016 | | | 2015 | | | 2014 | |
| | | (in Ps billions) | |
| Domestic | | | | | | | | | | | | |
| Commercial | | | | | | | | | | | | |
| General purpose loans (1) | | | 49,412.9 | | | | 46,614.4 | | | | 40,508.2 | |
| Loans funded by development banks | | | 2,829.0 | | | | 2,514.5 | | | | 2,021.1 | |
| Working capital loans | | | 9,593.8 | | | | 10,269.9 | | | | 9,388.7 | |
| Credit cards | | | 385.5 | | | | 395.8 | | | | 395.4 | |
| Overdrafts | | | 185.4 | | | | 191.6 | | | | 175.7 | |
| Leases | | | 9,302.2 | | | | 7,824.0 | | | | 7,316.8 | |
| Interbank loans and overnight funds | | | 1,896.3 | | | | 2,557.9 | | | | 1,230.4 | |
| Total commercial | | | 73,605.1 | | | | 70,368.2 | | | | 61,036.2 | |
| | | | | | | | | | | | | |
| Consumer | | | | | | | | | | | | |
| Credit cards | | | 4,648.7 | | | | 4,063.6 | | | | 3,598.4 | |
| Personal loans | | | 22,443.9 | | | | 19,812.9 | | | | 17,457.7 | |
| Automobile and vehicle loans | | | 3,211.2 | | | | 2,940.6 | | | | 2,587.9 | |
| Overdrafts | | | 33.3 | | | | 38.0 | | | | 44.2 | |
| Loans funded by development banks | | | – | | | | 0.1 | | | | 0.1 | |
| General purpose loans | | | 187.4 | | | | 199.5 | | | | 148.7 | |
| Working capital loans | | | – | | | | 0.1 | | | | – | |
| Leases | | | 40.0 | | | | 36.8 | | | | 30.9 | |
| Total consumer | | | 30,564.5 | | | | 27,091.6 | | | | 23,867.8 | |
| | | | | | | | | | | | | |
| Mortgages | | | | | | | | | | | | |
| Mortgages | | | 4,823.8 | | | | 3,995.5 | | | | 3,015.0 | |
| Leases | | | 902.1 | | | | 762.9 | | | | 625.5 | |
| Total mortgages | | | 5,725.9 | | | | 4,758.4 | | | | 3,640.6 | |
| | | | | | | | | | | | | |
| Microcredit | | | 399.4 | | | | 399.3 | | | | 372.3 | |
| | | | | | | | | | | | | |
| Total domestic | | | 110,295.0 | | | | 102,617.4 | | | | 88,916.9 | |
| | | At December 31, | |
| | | 2016 | | | 2015 | | | 2014 | |
| | | (in Ps billions) | |
| Foreign | | | | | | | | | | | | |
| Commercial | | | | | | | | | | | | |
| General purpose loans (1) | | | 10,961.1 | | | | 11,114.1 | | | | 6,798.8 | |
| Working capital loans | | | 5,930.6 | | | | 5,512.3 | | | | 4,259.0 | |
| Overdrafts | | | 323.1 | | | | 334.0 | | | | 226.2 | |
| Leases | | | 655.9 | | | | 642.5 | | | | 432.0 | |
| Interbank loans and overnight funds | | | 1,673.3 | | | | 1,527.1 | | | | 777.1 | |
| Total commercial | | | 19,544.1 | | | | 19,130.0 | | | | 12,493.1 | |
| | | | | | | | | | | | | |
| Consumer | | | | | | | | | | | | |
| Credit cards | | | 7,747.0 | | | | 7,177.6 | | | | 4,815.0 | |
| Personal loans | | | 5,864.5 | | | | 5,461.2 | | | | 3,529.9 | |
| Automobile and vehicle loans | | | 2,525.2 | | | | 2,294.0 | | | | 1,536.2 | |
| Overdrafts | | | 51.2 | | | | 52.5 | | | | 37.0 | |
| Leases | | | 175.6 | | | | 153.6 | | | | 93.0 | |
| Total consumer | | | 16,363.5 | | | | 15,139.0 | | | | 10,011.1 | |
| | | | | | | | | | | | | |
| Mortgages | | | 8,957.6 | | | | 8,659.7 | | | | 6,137.5 | |
| Total foreign | | | 44,865.2 | | | | 42,928.6 | | | | 28,641.7 | |
| | | | | | | | | | | | | |
| Total portfolio | | | 155,160.2 | | | | 145,546.0 | | | | 117,558.5 | |
| Allowance for loan portfolio | | | (4,261.4 | ) | | | (3,718.3 | ) | | | (3,157.8 | ) |
| Total portfolio, net | | | 150,898.7 | | | | 141,827.7 | | | | 114,400.7 | |
| (1) | General purpose commercial loans primarily include short-term loans(créditos de tesorería), trade finance loans, project finance loans and loans for capital expenditures. |
We classify our loan portfolio into the categories set forth below. Leases are included as applicable in each category:
| · | Commercial loans: Commercial loans are granted to companies or individuals to carry out economic activities. |
| · | Consumer loans: Consumer loans are granted to individuals for the purchase of consumer goods or to pay for non-commercial or non-business services. |
| · | Microcredit loans: Microcredit loans are issued for the purpose of encouraging the activities of small businesses and are subject to the following requirements: the maximum amount to be lent is equal to 25 times the minimum wage (salario mínimo mensual legal vigente), or “SMMLV,” without the balance of one single borrower exceeding such amount at any time, and the main source of payment for the corresponding obligation shall be the revenues obtained from the activities of the borrower’s micro business. The borrower’s outstanding indebtedness may not exceed 120 times the SMMLV. |
| · | Mortgages: Mortgages are loans granted to individuals for the purchase of new or used housing or to build a home. In Colombia these loans include loans that are denominated in UVR or Colombian pesos, are guaranteed by a senior mortgage on the property and that are financed with a total repayment term of five to 30 years. Maturity and interest rate sensitivity of loans and leases |
The following table presents the maturities of our loan portfolio at December 31, 2016.
| | | At December 31, 2016 | |
| | | Due in one
year or less | | | Due from
one to five
years | | | Due after
five years | | | Total | |
| | | (in Ps billions) | |
| Domestic | | | | | | | | | | | | | | | | |
| Commercial | | | | | | | | | | | | | | | | |
| General purpose loans | | | 17,341.7 | | | | 23,208.4 | | | | 8,862.8 | | | | 49,412.9 | |
| Loans funded by development banks | | | 572.2 | | | | 1,461.8 | | | | 795.1 | | | | 2,829.0 | |
| Working capital loans | | | 7,929.4 | | | | 1,160.9 | | | | 503.5 | | | | 9,593.8 | |
| Credit cards | | | 226.8 | | | | 155.9 | | | | 2.8 | | | | 385.5 | |
| Overdrafts | | | 183.1 | | | | 2.3 | | | | - | | | | 185.4 | |
| Leases | | | 2,419.2 | | | | 4,104.3 | | | | 2,778.6 | | | | 9,302.2 | |
| Interbank loans and overnight funds | | | 1,896.3 | | | | - | | | | - | | | | 1,896.3 | |
| Total commercial | | | 30,568.7 | | | | 30,093.7 | | | | 12,942.7 | | | | 73,605.1 | |
| Consumer | | | | | | | | | | | | | | | | |
| Credit cards | | | 2,792.6 | | | | 1,784.1 | | | | 72.0 | | | | 4,648.7 | |
| Personal loans | | | 4,214.1 | | | | 11,205.4 | | | | 7,024.4 | | | | 22,443.9 | |
| Automobile and vehicle loans | | | 819.5 | | | | 2,181.2 | | | | 210.5 | | | | 3,211.2 | |
| Overdrafts | | | 32.7 | | | | 0.6 | | | | - | | | | 33.3 | |
| General purpose loans | | | 82.4 | | | | 103.8 | | | | 1.2 | | | | 187.4 | |
| Leases | | | 12.3 | | | | 27.2 | | | | 0.5 | | | | 40.0 | |
| Total consumer | | | 7,953.6 | | | | 15,302.3 | | | | 7,308.6 | | | | 30,564.5 | |
| Mortgages | | | | | | | | | | | | | | | | |
| Mortgages | | | 387.2 | | | | 1,293.4 | | | | 3,143.2 | | | | 4,823.8 | |
| Leases | | | 102.6 | | | | 222.5 | | | | 577.1 | | | | 902.1 | |
| Total Mortgages | | | 489.8 | | | | 1,515.9 | | | | 3,720.2 | | | | 5,725.9 | |
| Microcredit | | | 166.7 | | | | 228.4 | | | | 4.3 | | | | 399.4 | |
| Total domestic portfolio | | | 39,178.8 | | | | 47,140.3 | | | | 23,976.0 | | | | 110,295.0 | |
| Foreign | | | | | | | | | | | | | | | | |
| Commercial | | | | | | | | | | | | | | | | |
| General purpose loans | | | 1,777.2 | | | | 3,283.4 | | | | 5,900.5 | | | | 10,961.1 | |
| Working capital loans | | | 5,063.9 | | | | 764.1 | | | | 102.6 | | | | 5,930.6 | |
| Overdrafts | | | 318.3 | | | | 4.9 | | | | - | | | | 323.1 | |
| Leases | | | 35.7 | | | | 527.3 | | | | 92.9 | | | | 655.9 | |
| Interbank loans and overnight funds | | | 1,673.3 | | | | - | | | | - | | | | 1,673.3 | |
| Total commercial | | | 8,868.5 | | | | 4,579.6 | | | | 6,096.0 | | | | 19,544.1 | |
| Consumer | | | | | | | | | | | | | | | | |
| Credit cards | | | 7,012.7 | | | | 518.3 | | | | 216.0 | | | | 7,747.0 | |
| Personal loans | | | 179.5 | | | | 2,002.2 | | | | 3,682.8 | | | | 5,864.5 | |
| Automobile and vehicle loans | | | 25.3 | | | | 1,319.5 | | | | 1,180.4 | | | | 2,525.2 | |
| Overdrafts | | | 49.0 | | | | 2.1 | | | | - | | | | 51.2 | |
| Leases | | | 1.3 | | | | 87.0 | | | | 87.3 | | | | 175.6 | |
| Total consumer | | | 7,267.8 | | | | 3,929.1 | | | | 5,166.5 | | | | 16,363.5 | |
| Mortgages | | | 9.7 | | | | 145.4 | | | | 8,802.5 | | | | 8,957.6 | |
| Total foreign portfolio | | | 16,146.1 | | | | 8,654.1 | | | | 20,065.0 | | | | 44,865.2 | |
| Total loan portfolio | | | 55,324.8 | | | | 55,794.3 | | | | 44,041.0 | | | | 155,160.2 | |
The following table presents our loan portfolio due after one year and within one year or less at December 31, 2016, broken down between fixed and variable rates.
| | | At
December 31,
2016 | |
| | | (in Ps billions) | |
| Loans with maturity of one year or less | | | | |
| Variable rate: | | | | |
| Peso-denominated | | | 25,788.9 | |
| Foreign currency-denominated | | | 4,489.4 | |
| Total | | | 30,278.3 | |
| Fixed rate: | | | | |
| Peso-denominated | | | 13,324.6 | |
| Foreign currency-denominated | | | 11,722.0 | |
| Total | | | 25,046.6 | |
| Total loans with maturity of one year or less | | | 55,324.8 | |
| Loans with maturity of more than one year | | | | |
| Variable rate: | | | | |
| Peso-denominated | | | 38,485.3 | |
| Foreign currency-denominated | | | 10,968.8 | |
| Total | | | 49,454.1 | |
| Fixed rate: | | | | |
| Peso-denominated | | | 32,588.2 | |
| Foreign currency-denominated | | | 17,793.0 | |
| Total | | | 50,381.3 | |
| Total loans with maturity of more than one year | | | 99,835.3 | |
| Total loan portfolio | | | 155,160.2 | |
Loan portfolio by economic activity
The following table summarizes our loan portfolio, at the dates indicated, by the principal activity of the borrower using the International Standard Industrial Classification of All Economic Activities. Where we have not assigned a code to a borrower, classification of the relevant loan has been made based on the purpose of the loan as described by the borrower.
| | | At December 31, | |
| | | 2016 | | | % | | | 2015 | | | % | | | 2014 | | | % | |
| | | (in Ps billions, except percentages) | |
| Agricultural | | | 3,734.6 | | | | 2.4 | | | | 3,719.7 | | | | 2.6 | | | | 3,172.7 | | | | 2.7 | |
| Mining products and oil | | | 2,018.2 | | | | 1.3 | | | | 2,406.9 | | | | 1.7 | | | | 2,534.3 | | | | 2.2 | |
| Food, beverage and tobacco | | | 7,273.6 | | | | 4.7 | | | | 6,080.9 | | | | 4.2 | | | | 4,735.4 | | | | 4.0 | |
| Chemical production | | | 5,276.2 | | | | 3.4 | | | | 4,929.7 | | | | 3.4 | | | | 4,770.1 | | | | 4.1 | |
| Other industrial and manufacturing products | | | 4,576.2 | | | | 2.9 | | | | 4,311.3 | | | | 3.0 | | | | 3,751.1 | | | | 3.2 | |
| Government | | | 3,629.8 | | | | 2.3 | | | | 3,356.4 | | | | 2.3 | | | | 2,690.1 | | | | 2.3 | |
| Construction | | | 9,959.5 | | | | 6.4 | | | | 9,326.2 | | | | 6.4 | | | | 8,067.4 | | | | 6.9 | |
| Trade and tourism | | | 2,025.2 | | | | 1.3 | | | | 1,712.7 | | | | 1.2 | | | | 1,206.3 | | | | 1.0 | |
| Transportation and communications | | | 7,814.7 | | | | 5.0 | | | | 7,892.4 | | | | 5.4 | | | | 6,458.0 | | | | 5.5 | |
| Public services | | | 5,160.8 | | | | 3.3 | | | | 5,051.5 | | | | 3.5 | | | | 4,135.1 | | | | 3.5 | |
| Consumer services(1) | | | 66,157.9 | | | | 42.6 | | | | 60,374.9 | | | | 41.5 | | | | 47,133.0 | | | | 40.1 | |
| Commercial services(2) | | | 34,587.3 | | | | 22.3 | | | | 34,280.8 | | | | 23.6 | | | | 26,352.6 | | | | 22.4 | |
| Other | | | 2,946.0 | | | | 1.9 | | | | 2,102.6 | | | | 1.4 | | | | 2,552.4 | | | | 2.2 | |
| Total loan portfolio | | | 155,160.2 | | | | 100.0 | | | | 145,546.0 | | | | 100.0 | | | | 117,558.5 | | | | 100.0 | |
| (1) | Consumer services include loans to individuals, such as consumer loans (credit cards, vehicle, personal and others) and mortgage loans. |
| (2) | Commercial services include wholesale trade and retail, consulting and business support services, health and social services, moneylending and other activities. |
Credit categories
The following table presents our loan portfolio, for the purpose of credit risk evaluation, categorized in accordance with the regulations of the Superintendency of Finance, in effect at the relevant dates.
| | | Loan portfolio by type of loan | |
| | | 2016 | | | 2015 | | | 2014 | |
| | | (in Ps billions) | |
| Domestic | | | | | | | | | | | | |
| Commercial loans | | | 73,605.1 | | | | 70,368.2 | | | | 61,036.2 | |
| Commercial loans | | | 71,708.8 | | | | 67,810.2 | | | | 59,805.9 | |
| Interbank loans and overnight funds | | | 1,896.3 | | | | 2,557.9 | | | | 1,230.4 | |
| Consumer loans | | | 30,564.5 | | | | 27,091.6 | | | | 23,867.8 | |
| Microcredit loans | | | 399.4 | | | | 399.3 | | | | 372.3 | |
| Mortgages | | | 5,725.9 | | | | 4,758.4 | | | | 3,640.6 | |
| Total domestic loan portfolio | | | 110,295.0 | | | | 102,617.4 | | | | 88,916.9 | |
| Allowance for loans and financial lease losses | | | (3,642.3 | ) | | | (3,189.7 | ) | | | (2,749.9 | ) |
| Total domestic loan portfolio, net | | | 106,652.7 | | | | 99,427.7 | | | | 86,167.0 | |
| | | Loan portfolio by type of loan | |
| | | 2016 | | | 2015 | | | 2014 | |
| | | (in Ps billions) | |
| Foreign | | | | | | | | | | | | |
| Commercial loans | | | 19,544.1 | | | | 19,130.0 | | | | 12,493.1 | |
| Commercial loans | | | 17,870.7 | | | | 17,602.9 | | | | 11,716.0 | |
| Repo and interbank | | | 1,673.3 | | | | 1,527.1 | | | | 777.1 | |
| Consumer loans | | | 16,363.5 | | | | 15,139.0 | | | | 10,011.1 | |
| Mortgages | | | 8,957.6 | | | | 8,659.7 | | | | 6,137.5 | |
| Total foreign loan portfolio | | | 44,865.2 | | | | 42,928.6 | | | | 28,641.7 | |
| Allowance for loans and financial lease losses | | | (619.0 | ) | | | (528.6 | ) | | | (407.9 | ) |
| Total foreign loan portfolio, net | | | 44,246.0 | | | | 42,400.0 | | | | 28,233.8 | |
| Total loan portfolio, net | | | 150,898.7 | | | | 141,827.7 | | | | 114,400.7 | |
Risk categories
Our banks define risk classifications for loans and financial leases based on the Superintendency of Finance’s guidelines. Management at each of our bank subsidiaries assigns loans and financial leases to these categories on the basis of models developed by management and reviewed by the Superintendency of Finance. These models incorporate both subjective and objective criteria. See Note 4 to our audited consolidated financial statements.
Category A — “Normal risk”: Loans and financial leases in this category are appropriately serviced. The debtor’s financial statements or its projected cash flows, as well as all other credit information available to us, reflect adequate paying capacity.
Category B — “Acceptable risk, above normal”: Loans and financial leases in this category are acceptably serviced and guaranty-protected, but there are weaknesses which may potentially affect, on a transitory or permanent basis, the debtor’s paying capacity or its projected cash flows, to the extent that, if not timely corrected, would affect the normal collection of credit or contracts.
Category C — “Appreciable risk”: Loans and financial leases in this category have debtors with insufficient capacity to pay or relate to projects with insufficient cash flow, which may compromise the normal collection of the obligations.
Category D — “Significant risk”: Loans and financial leases in this category have the same deficiencies as loans in category C, but to a greater extent; consequently, the probability of collection is very low.
Category E — “Risk of non-recoverability”: Loans and financial leases in this category are deemed uncollectible.
The following tables present the breakdown of our loan portfolio by risk classification in effect at December 31 of each year.
| | | At December 31, | |
| | | 2016 | | | % | | | 2015 | | | % | | | 2014 | | | % | |
| | | (in Ps billions, except percentages) | |
| “A” Normal risk | | | 144,464.6 | | | | 93.1 | % | | | 136,445.6 | | | | 93.7 | % | | | 109,930.6 | | | | 93.5 | % |
| “B” Acceptable risk, above normal | | | 3,939.0 | | | | 2.5 | % | | | 3,054.9 | | | | 2.1 | % | | | 2,941.6 | | | | 2.5 | % |
| “C” Appreciable risk | | | 3,438.6 | | | | 2.2 | % | | | 3,393.2 | | | | 2.3 | % | | | 2,455.3 | | | | 2.1 | % |
| “D” Significant risk | | | 2,177.0 | | | | 1.4 | % | | | 1,662.2 | | | | 1.1 | % | | | 1,414.6 | | | | 1.2 | % |
| “E” Risk of non-recoverability | | | 1,141.0 | | | | 0.7 | % | | | 990.1 | | | | 0.7 | % | | | 816.5 | | | | 0.7 | % |
| Total loan portfolio | | | 155,160.2 | | | | 100.0 | % | | | 145,546.0 | | | | 100.0 | % | | | 117,558.5 | | | | 100.0 | % |
| Loan portfolio classified as “C,” “D” and ”E” as a percentage of total loan portfolio | | | | | | | 4.4 | | | | | | | | 4.2 | | | | | | | | 4.0 | |
Past due loans classified in Performing and Non-Performing Past Due loans
The following table presents our performing past due loans (from 31 days past due to 90 days past due) and our non-performing loans (more than 90 days past due).
| | | Past due loans | |
| | | 2016 | | | 2015 | | | 2014 | |
| | | (in Ps billions) | |
| Performing past due loans | | | | | | | | | | | | |
| Commercial loans | | | 258.5 | | | | 346.2 | | | | 303.6 | |
| Consumer loans | | | 646.2 | | | | 502.0 | | | | 460.5 | |
| Microcredit loans | | | 19.1 | | | | 16.7 | | | | 15.2 | |
| Mortgages | | | 93.7 | | | | 75.9 | | | | 59.7 | |
| Total performing Past Due loans | | | 1,017.5 | | | | 940.9 | | | | 839.0 | |
| | | | | | | | | | | | | |
| Non-Performing Past Due loans | | | | | | | | | | | | |
| Commercial loans | | | 1,483.8 | | | | 1,139.9 | | | | 987.3 | |
| Consumer loans | | | 790.8 | | | | 636.6 | | | | 585.1 | |
| Microcredit loans | | | 37.4 | | | | 28.6 | | | | 31.3 | |
| Mortgages | | | 144.1 | | | | 119.0 | | | | 102.1 | |
| Total non-performing Past Due loans | | | 2,456.1 | | | | 1,924.2 | | | | 1,705.8 | |
| Total domestic Past due loans | | | 3,473.6 | | | | 2,865.1 | | | | 2,544.8 | |
| | | | | | | | | | | | | |
| Foreign | | | | | | | | | | | | |
| Performing Past Due loans | | | | | | | | | | | | |
| Commercial loans | | | 49.3 | | | | 44.8 | | | | 97.8 | |
| Consumer loans | | | 343.2 | | | | 316.0 | | | | 224.0 | |
| Mortgages | | | 111.7 | | | | 104.6 | | | | 93.3 | |
| Total performing Past Due loans | | | 504.2 | | | | 465.4 | | | | 415.1 | |
| | | | | | | | | | | | | |
| Non-Performing Past Due loans | | | | | | | | | | | | |
| Commercial loans | | | 113.7 | | | | 100.5 | | | | 66.2 | |
| Consumer loans | | | 285.0 | | | | 228.0 | | | | 153.1 | |
| Mortgages | | | 107.2 | | | | 101.7 | | | | 86.0 | |
| Total non-performing Past Due loans | | | 505.9 | | | | 430.2 | | | | 305.2 | |
| Total foreign Past due loans | | | 1,010.1 | | | | 895.6 | | | | 720.3 | |
| Total Past Due loans | | | 4,483.7 | | | | 3,760.6 | | | | 3,265.0 | |
Past due loans classification Secured and Unsecured
The following table presents information with respect to our secured and unsecured loan portfolios 31 days past due.
| | | At December 31, | |
| | | 2016 | | | % | | | 2015 | | | % | | | 2014 | | | % | |
| | | (in Ps billions, except percentages) | |
| Secured | | | | | | | | | | | | | | | | | | | | | | | | |
| Past due 31 to 360 days | | | | | | | | | | | | | | | | | | | | | | | | |
| Commercial | | | 725.6 | | | | 0.5 | | | | 386.2 | | | | 0.3 | | | | 459.2 | | | | 0.4 | |
| Consumer | | | 483.9 | | | | 0.3 | | | | 196.4 | | | | 0.1 | | | | 158.6 | | | | 0.1 | |
| Microcredit | | | 18.4 | | | | - | | | | 9.9 | | | | - | | | | 8.5 | | | | - | |
| Mortgages | | | 337.4 | | | | 0.2 | | | | 287.9 | | | | 0.2 | | | | 244.1 | | | | 0.2 | |
| Total 31 to 360 days | | | 1,565.3 | | | | 1.0 | | | | 880.4 | | | | 0.6 | | | | 870.4 | | | | 0.8 | |
| Total past due more than 360 days | | | 705.5 | | | | 0.5 | | | | 329.1 | | | | 0.2 | | | | 264.8 | | | | 0.2 | |
| Total current | | | 64,220.0 | | | | 42.6 | | | | 58,169.0 | | | | 41.0 | | | | 45,148.9 | | | | 39.5 | |
| Total secured loan portfolio | | | 66,490.9 | | | | 44.1 | | | | 59,378.5 | | | | 41.9 | | | | 46,284.1 | | | | 40.5 | |
| Unsecured(1) | | | | | | | | | | | | | | | | | | | | | | | | |
| Past due 31 to 360 days | | | | | | | | | | | | | | | | | | | | | | | | |
| Commercial | | | 266.2 | | | | 0.2 | | | | 537.1 | | | | 0.4 | | | | 438.4 | | | | 0.4 | |
| Consumer | | | 1,407.2 | | | | 0.9 | | | | 1,332.1 | | | | 0.9 | | | | 1,118.8 | | | | 1.0 | |
| Microcredit | | | 19.7 | | | | - | | | | 19.9 | | | | - | | | | 20.3 | | | | - | |
| Total 31 to 360 days | | | 1,693.1 | | | | 1.1 | | | | 1,889.1 | | | | 1.3 | | | | 1,577.5 | | | | 1.4 | |
| Total past due more than 360 days | | | 519.7 | | | | 0.3 | | | | 662.0 | | | | 0.5 | | | | 552.3 | | | | 0.5 | |
| Total current | | | 86,456.4 | | | | 57.3 | | | | 83,616.4 | | | | 59.0 | | | | 69,144.6 | | | | 60.4 | |
| Total unsecured loan portfolio | | | 88,669.3 | | | | 58.8 | | | | 86,167.5 | | | | 60.8 | | | | 71,274.5 | | | | 62.3 | |
| Total loan portfolio, gross | | | 155,160.2 | | | | 102.8 | | | | 145,546.0 | | | | 102.6 | | | | 117,558.5 | | | | 102.8 | |
| Allowances | | | (4,261.4 | ) | | | (2.8 | ) | | | (3,718.3 | ) | | | (2.6 | ) | | | (3,157.8 | ) | | | (2.8 | ) |
| Total loan portfolio, net | | | 150,898.7 | | | | 100.0 | | | | 141,827.7 | | | | 100.0 | | | | 114,400.7 | | | | 100.0 | |
| (1) | Includes loans with personal guarantees. |
Non-performing loans, performing loans, and performing troubled debt restructured loans
Performing and non performing troubled debt restructured loans
The following table presents our performing and non-performing troubled debt restructured loan portfolio classified into domestic and foreign loans, the gross interest income that would have been recorded in the period that ended if the loans had been current in accordance with their original terms and had been outstanding throughout the period or since origination and the amount of interest income on those loans that was included in net income for the period.
| | | At and for the year ended December 31, 2016 | |
| | | Amount of loans | | | Gross interest
income | | | Interest income
included in net
income for the
period | |
| | | (in Ps billions) | |
| Domestic | | | 3,179.9 | | | | 263.3 | | | | 227.2 | |
| Foreign | | | 526.7 | | | | 81.0 | | | | 80.4 | |
| Total performing and non-performing troubled debt restructured loan portfolio | | | 3,706.6 | | | | 344.3 | | | | 307.6 | |
The following table presents a summary of our troubled debt restructured loan portfolio, classified into domestic and foreign loans.
| | | At December 31, | |
| | | 2016 | | | 2015 | | | 2014 | |
| | | (in Ps billions) | |
| Domestic | | | 3,179.9 | | | | 2,252.7 | | | | 2,046.9 | |
| Foreign | | | 526.7 | | | | 480.7 | | | | 378.3 | |
| Total performing and non-performing troubled debt restructured loan portfolio(1) | | | 3,706.6 | | | | 2,733.4 | | | | 2,425.3 | |
| (1) | Restructured loans are loans that have been modified due to an impairment of the conditions of the beneficiary. |
Movements in allowances for credit losses
Allowance for loan losses
We record allowance for loan losses in accordance with IFRS. For further information regarding the regulation and methodologies for the calculation of such allowances, see Note 11 to our audited consolidated financial statements.
The following table presents the changes in the allowance for loan and financial lease losses during the periods indicated.
| | | Year ended December 31, | |
| | | 2016 | | | 2015 | | | 2014 | |
| | | (in Ps billions) | |
| Domestic | | | | | | | | | | | | |
| Balance at beginning of period | | | 3,189.7 | | | | 2,749.9 | | | | 2,472.5 | |
| Impairment loss on loans and accounts receivable | | | 4,207.8 | | | | 3,269.7 | | | | 2,952.7 | |
| Charge-offs | | | (1,702.4 | ) | | | (1,114.8 | ) | | | (1,068.2 | ) |
| Effect of difference in exchange rate | | | (1.1 | ) | | | 1.2 | | | | 1.7 | |
| Reclassification -Securitization | | | - | | | | - | | | | 6.9 | |
| Reversals of impairment losses on loans and accounts receivable | | | (2,051.7 | ) | | | (1,716.3 | ) | | | (1,615.7 | ) |
| Balance at end of year (domestic) | | | 3,642.3 | | | | 3,189.7 | | | | 2,749.9 | |
| | | Year ended December 31, | |
| | | 2016 | | | 2015 | | | 2014 | |
| | | (in Ps billions) | |
| Foreign | | | | | | | | | | | | |
| Balance at beginning of period | | | 528.6 | | | | 407.9 | | | | 326.3 | |
| Impairment loss on loans and accounts receivable | | | 776.7 | | | | 517.7 | | | | 316.0 | |
| Charge-offs | | | (652.5 | ) | | | (521.6 | ) | | | (308.5 | ) |
| Effect of difference in exchange rate | | | (33.6 | ) | | | 124.6 | | | | 74.0 | |
| Balance at end of year (foreign) | | | 619.2 | | | | 528.6 | | | | 407.9 | |
| Balance at end of year total | | | 4,261.4 | | | | 3,718.3 | | | | 3,157.8 | |
Recoveries of charged-off loans are recorded on the statement of income of our bank subsidiaries under “recovery of charged-off assets” and are not included in impairment loss on loans and accounts receivable.
The following table presents the allocation of our allowance for loan losses by category of loan and financial lease losses.
| | | At December 31, | |
| | | 2016 | | | 2015 | | | 2014 | |
| | | (in Ps billions) | |
| Domestic | | | | | | | | | | | | |
| Commercial | | | 1,907.8 | | | | 1,754.7 | | | | 1,489.6 | |
| Consumer | | | 1,557.7 | | | | 1,296.4 | | | | 1,137.0 | |
| Microcredit | | | 63.1 | | | | 49.2 | | | | 47.8 | |
| Mortgages | | | 113.6 | | | | 89.4 | | | | 75.6 | |
| Total domestic | | | 3,642.3 | | | | 3,189.7 | | | | 2,749.9 | |
| | | | | | | | | | | | | |
| Foreign | | | | | | | | | | | | |
| Commercial | | | 120.6 | | | | 119.8 | | | | 113.3 | |
| Consumer | | | 468.6 | | | | 385.4 | | | | 270.1 | |
| Mortgages | | | 30.0 | | | | 23.4 | | | | 24.5 | |
| Total foreign | | | 619.2 | | | | 528.6 | | | | 407.9 | |
| Total allowance for loan losses | | | 4,261.4 | | | | 3,718.3 | | | | 3,157.8 | |
The following table presents the allocation of our allowance for loan losses by type of loan.
| | | At December 31, | |
| | | 2016 | | | % | | | 2015 | | | % | | | 2014 | | | % | |
| | | (in Ps billions, except percentages) | |
| Domestic | | | | | | | | | | | | | | | | | | | | | | | | |
| Commercial | | | | | | | | | | | | | | | | | | | | | | | | |
| General purpose loans | | | 1,388.3 | | | | 32.6 | | | | 1,199.5 | | | | 32.3 | | | | 1,054.3 | | | | 33.4 | |
| Loans funded by development banks | | | 53.3 | | | | 1.3 | | | | 72.6 | | | | 2.0 | | | | 60.1 | | | | 1.9 | |
| Working capital loans | | | 207.0 | | | | 4.9 | | | | 234.4 | | | | 6.3 | | | | 170.6 | | | | 5.4 | |
| Credit cards | | | 38.3 | | | | 0.9 | | | | 40.2 | | | | 1.1 | | | | 31.1 | | | | 1.0 | |
| Overdrafts | | | 11.2 | | | | 0.3 | | | | 14.4 | | | | 0.4 | | | | 15.2 | | | | 0.5 | |
| Leases | | | 209.7 | | | | 4.9 | | | | 193.7 | | | | 5.2 | | | | 158.3 | | | | 5.0 | |
| Total commercial | | | 1,907.8 | | | | 44.8 | | | | 1,754.7 | | | | 47.2 | | | | 1,489.6 | | | | 47.2 | |
| Consumer | | | | | | | | | | | | | | | | | | | | | | | | |
| Credit cards | | | 351.4 | | | | 8.2 | | | | 297.8 | | | | 8.0 | | | | 256.9 | | | | 8.1 | |
| Personal loans | | | 1,025.7 | | | | 24.1 | | | | 855.8 | | | | 23.0 | | | | 764.1 | | | | 24.2 | |
| Automobile and vehicle loans | | | 165.6 | | | | 3.9 | | | | 126.4 | | | | 3.4 | | | | 99.1 | | | | 3.1 | |
| Overdrafts | | | 3.5 | | | | 0.1 | | | | 5.5 | | | | 0.1 | | | | 6.1 | | | | 0.2 | |
| Loans funded by development banks | | | - | | | | - | | | | - | | | | - | | | | 0.1 | | | | - | |
| General purpose loans | | | 8.8 | | | | 0.2 | | | | 8.5 | | | | 0.2 | | | | 8.2 | | | | 0.3 | |
| Leases | | | 2.6 | | | | 0.1 | | | | 2.3 | | | | 0.1 | | | | 2.5 | | | | 0.1 | |
| Total consumer | | | 1,557.7 | | | | 36.6 | | | | 1,296.4 | | | | 34.9 | | | | 1,137.0 | | | | 36.0 | |
| Mortgages | | | | | | | | | | | | | | | | | | | | | | | | |
| Mortgages | | | 94.1 | | | | 2.2 | | | | 70.6 | | | | 1.9 | | | | 61.6 | | | | 2.0 | |
| Leases | | | 19.5 | | | | 0.5 | | | | 18.8 | | | | 0.5 | | | | 13.9 | | | | 0.4 | |
| Total mortgages | | | 113.6 | | | | 2.7 | | | | 89.4 | | | | 2.4 | | | | 75.6 | | | | 2.4 | |
| Microcredits | | | 63.1 | | | | 1.5 | | | | 49.2 | | | | 1.3 | | | | 47.8 | | | | 1.5 | |
| Total domestic | | | 3,642.3 | | | | 85.5 | | | | 3,189.7 | | | | 85.8 | | | | 2,749.9 | | | | 87.1 | |
| Foreign | | | | | | | | | | | | | | | | | | | | | | | | |
| Commercial | | | | | | | | | | | | | | | | | | | | | | | | |
| General purpose loans | | | 87.6 | | | | 2.1 | | | | 86.0 | | | | 2.3 | | | | 85.5 | | | | 2.7 | |
| Working capital loans | | | 27.0 | | | | 0.6 | | | | 25.9 | | | | 0.7 | | | | 20.9 | | | | 0.7 | |
| Overdrafts | | | 2.3 | | | | 0.1 | | | | 4.0 | | | | 0.1 | | | | 4.5 | | | | 0.1 | |
| Leases | | | 3.7 | | | | 0.1 | | | | 3.8 | | | | 0.1 | | | | 2.4 | | | | 0.1 | |
| Total commercial | | | 120.6 | | | | 2.8 | | | | 119.8 | | | | 3.2 | | | | 113.3 | | | | 3.6 | |
| Consumer | | | | | | | | | | | | | | | | | | | | | | | | |
| Credit cards | | | 315.9 | | | | 7.4 | | | | 262.5 | | | | 7.1 | | | | 207.4 | | | | 6.6 | |
| Personal loans | | | 136.8 | | | | 3.2 | | | | 110.8 | | | | 3.0 | | | | 52.1 | | | | 1.6 | |
| Automobile and vehicle loans | | | 8.5 | | | | 0.2 | | | | 7.5 | | | | 0.2 | | | | 6.0 | | | | 0.2 | |
| Overdrafts | | | 6.5 | | | | 0.2 | | | | 4.1 | | | | 0.1 | | | | 4.3 | | | | 0.1 | |
| Leases | | | 0.8 | | | | - | | | | 0.5 | | | | - | | | | 0.4 | | | | - | |
| Total consumer | | | 468.6 | | | | 11.0 | | | | 385.4 | | | | 10.4 | | | | 270.1 | | | | 8.6 | |
| Mortgages | | | 30.0 | | | | 0.7 | | | | 23.4 | | | | 0.6 | | | | 24.5 | | | | 0.8 | |
| Total foreign | | | 619.2 | | | | 14.5 | | | | 528.6 | | | | 14.2 | | | | 407.9 | | | | 12.9 | |
| Total allowance for loan and lease losses | | | 4,261.4 | | | | 100.0 | | | | 3,718.3 | | | | 100.0 | | | | 3,157.8 | | | | 100.0 | |
Charge-offs
The following table presents the allocation of our charge-offs by type of loan for the years indicated.
| | | Year ended December 31, | |
| | | 2016 | | | 2015 | | | 2014 | |
| | | (in Ps billions) | |
| Domestic | | | | | | | | | | | | |
| Commercial and consumer | | | | | | | | | | | | |
| General purpose loans | | | 358.6 | | | | 97.1 | | | | 147.1 | |
| Loans funded by development banks | | | 25.8 | | | | 8.8 | | | | 8.9 | |
| Working capital loans | | | 47.1 | | | | 23.6 | | | | 28.4 | |
| Credit cards | | | 345.2 | | | | 261.8 | | | | 223.6 | |
| Personal loans | | | 762.3 | | | | 550.0 | | | | 547.5 | |
| Automobile and vehicle loans | | | 61.0 | | | | 48.3 | | | | 54.5 | |
| Overdrafts | | | 12.4 | | | | 7.0 | | | | 8.7 | |
| Leases | | | 53.0 | | | | 82.8 | | | | 14.8 | |
| Total commercial and consumer | | | 1,665.4 | | | | 1,079.4 | | | | 1,033.6 | |
| Mortgages and other | | | | | | | | | | | | |
| Mortgages | | | 0.6 | | | | 0.4 | | | | 0.5 | |
| Leases | | | 0.3 | | | | 1.9 | | | | 3.6 | |
| Total Mortgages and other | | | 0.9 | | | | 2.3 | | | | 4.1 | |
| Microcredit | | | 36.2 | | | | 33.1 | | | | 30.5 | |
| Total domestic | | | 1,702.4 | | | | 1,114.8 | | | | 1,068.2 | |
| Foreign | | | | | | | | | | | | |
| Commercial and consumer | | | | | | | | | | | | |
| General purpose loans | | | 17.2 | | | | 32.7 | | | | 15.6 | |
| Working capital loans | | | 9.3 | | | | 16.2 | | | | 4.6 | |
| Credit cards | | | 402.2 | | | | 366.4 | | | | 224.6 | |
| Personal loans | | | 189.2 | | | | 68.3 | | | | 32.8 | |
| Automobile and vehicle loans | | | 11.9 | | | | 7.4 | | | | 5.6 | |
| Overdrafts | | | 14.9 | | | | 15.7 | | | | 9.6 | |
| Leases | | | 0.4 | | | | 1.2 | | | | 0.5 | |
| Total commercial and consumer | | | 645.1 | | | | 507.9 | | | | 293.3 | |
| Mortgages and other | | | 7.5 | | | | 13.7 | | | | 15.2 | |
| Total foreign | | | 652.5 | | | | 521.6 | | | | 308.5 | |
| | | | | | | | | | | | | |
| Total charge-offs | | | 2,355.0 | | | | 1,636.4 | | | | 1,376.7 | |
The ratio of charge-offs to average outstanding loans for the periods indicated were as follows.
| | | Year ended December 31, | |
| | | 2016 | | | 2015 | | | 2014 | |
| | | (in percentages) | |
| Ratio of charge-offs to average outstanding loans | | | 1.6 | % | | | 1.3 | % | | | 1.3 | % |
Loans are subject to charge-offs when all possible collection mechanisms have been exhausted and when they are one hundred percent (100%) provisioned.
Charge-offs do not, however, eliminate the obligation of our banking subsidiaries to continue to engage in collection efforts to accomplish recovery. The board of directors of each of our banks is the only administrative body with legal authority to approve charge-offs of transactions deemed uncollectible. The recovery of charged-off loans is accounted for as income in our consolidated statement of income.
Potential problem loans
In order to carefully monitor the credit risk associated with clients, we have established a committee that meets monthly to identify potential problem loans, which are then included on a watch list. In general, these are loans due by clients that could face difficulties complying with their repayment obligations, but who otherwise have had a good payment history. These potential difficulties could be related to factors such as a decline in economic activity, financial weakness or any other event that could affect the client’s business. Our banks also monitor the credit risk associated with these clients.
Separately, we also monitor loans granted by our banks to a single borrower where we have an aggregate exposure of Ps 2.0 billion or greater.
Cross-border outstanding loans and investments
We do not have any cross-border outstanding loans and investments to a borrower in any country that exceeded 0.75% of our total assets. The following table presents information with respect to our cross-border outstanding loans and investments at December 31, 2016, 2015 and 2014. See “—Loan portfolio” above for a description of cross-border outstanding by type of foreign borrower.
| | | At December 31, | |
| | | 2016 | | | 2015 | | | 2014 | |
| | | (in Ps billions) | |
| Loans | | | | | | | | | | | | |
| Commercial | | | | | | | | | | | | |
| Costa Rica | | | 3,663.7 | | | | 3,548.3 | | | | 2,304.6 | |
| El Salvador | | | 1,389.2 | | | | 1,270.6 | | | | 924.9 | |
| Guatemala | | | 4,341.6 | | | | 4,360.3 | | | | 2,813.6 | |
| Honduras | | | 2,230.6 | | | | 2,237.9 | | | | 1,484.6 | |
| Nicaragua | | | 2,145.9 | | | | 2,016.2 | | | | 1,294.2 | |
| Panamá | | | 4,099.8 | | | | 4,169.7 | | | | 2,894.0 | |
| Total Commercial | | | 17,870.8 | | | | 17,603.0 | | | | 11,715.9 | |
| | | | | | | | | | | | | |
| Consumer | | | | | | | | | | | | |
| Costa Rica | | | 2,193.0 | | | | 2,222.6 | | | | 1,395.4 | |
| El Salvador | | | 1,109.8 | | | | 937.1 | | | | 567.1 | |
| Guatemala | | | 846.4 | | | | 658.2 | | | | 381.4 | |
| Honduras | | | 495.1 | | | | 454.7 | | | | 294.2 | |
| Nicaragua | | | 846.3 | | | | 773.1 | | | | 483.2 | |
| Panamá | | | 3,125.8 | | | | 2,915.5 | | | | 2,074.0 | |
| Total Consumer | | | 8,616.4 | | | | 7,961.2 | | | | 5,195.3 | |
| | | | | | | | | | | | | |
| Mortgages | | | | | | | | | | | | |
| Costa Rica | | | 3,674.2 | | | | 3,531.1 | | | | 2,312.5 | |
| El Salvador | | | 873.9 | | | | 894.7 | | | | 652.7 | |
| Guatemala | | | 1,232.2 | | | | 1,163.5 | | | | 863.3 | |
| Honduras | | | 721.0 | | | | 732.6 | | | | 563.9 | |
| Nicaragua | | | 390.0 | | | | 378.2 | | | | 269.1 | |
| Panamá | | | 2,066.4 | | | | 1,959.5 | | | | 1,476.1 | |
| Total Mortgages | | | 8,957.7 | | | | 8,659.6 | | | | 6,137.6 | |
| | | | | | | | | | | | | |
| Credit Cards | | | | | | | | | | | | |
| Costa Rica | | | 2,370.8 | | | | 1,954.5 | | | | 1,205.1 | |
| El Salvador | | | 967.6 | | | | 938.4 | | | | 754.8 | |
| Guatemala | | | 1,233.6 | | | | 1,327.8 | | | | 894.2 | |
| Honduras | | | 1,102.2 | | | | 1,047.2 | | | | 701.3 | |
| Nicaragua | | | 390.9 | | | | 370.6 | | | | 257.0 | |
| Panamá | | | 1,526.0 | | | | 1,377.0 | | | | 872.7 | |
| Mexico | | | 155.8 | | | | 162.1 | | | | 130.7 | |
| Total Credit Cards | | | 7,746.9 | | | | 7,177.6 | | | | 4,815.8 | |
| | | At December 31, | |
| | | 2016 | | | 2015 | | | 2014 | |
| | | (in Ps billions) | |
| Total per country | | | | | | | | | |
| Costa Rica | | | 11,901.7 | | | | 11,256.5 | | | | 7,217.6 | |
| El Salvador | | | 4,340.5 | | | | 4,040.8 | | | | 2,899.5 | |
| Guatemala | | | 7,653.8 | | | | 7,509.8 | | | | 4,952.5 | |
| Honduras | | | 4,548.9 | | | | 4,472.4 | | | | 3,044.0 | |
| Nicaragua | | | 3,773.1 | | | | 3,538.1 | | | | 2,303.5 | |
| Panamá | | | 10,818.0 | | | | 10,421.7 | | | | 7,316.8 | |
| Mexico | | | 155.8 | | | | 162.1 | | | | 130.7 | |
| Total loans | | | 43,191.8 | | | | 41,401.5 | | | | 27,864.5 | |
| | | | | | | | | | | | | |
| Investments | | | | | | | | | | | | |
| Argentina | | | 3.2 | | | | - | | | | - | |
| Brazil | | | 1,149.1 | | | | 1,263.3 | | | | 1,261.4 | |
| Canada | | | - | | | | 1.7 | | | | 6.3 | |
| Chile | | | 291.6 | | | | 272.3 | | | | 488.0 | |
| Costa Rica | | | 1,143.3 | | | | 1,073.2 | | | | 1,028.0 | |
| El Salvador | | | 86.0 | | | | 153.6 | | | | 49.4 | |
| France | | | - | | | | 9.3 | | | | 20.1 | |
| Germany | | | - | | | | 9.6 | | | | 7.3 | |
| Guatemala | | | 624.1 | | | | 707.4 | | | | 386.9 | |
| Honduras | | | 425.1 | | | | 497.3 | | | | 415.1 | |
| Ireland | | | - | | | | - | | | | 2.5 | |
| Mexico | | | 46.2 | | | | 85.7 | | | | 207.9 | |
| Netherlands | | | 19.2 | | | | 16.7 | | | | 24.7 | |
| Nicaragua | | | 122.8 | | | | 129.1 | | | | 5.4 | |
| Panama | | | 666.0 | | | | 871.9 | | | | 613.5 | |
| Peru | | | 283.8 | | | | 316.0 | | | | 568.5 | |
| Spain | | | - | | | | - | | | | 28.5 | |
| Switzerland | | | 17.2 | | | | 18.6 | | | | 14.7 | |
| United Kingdom | | | 31.1 | | | | 46.4 | | | | 38.6 | |
| United States of America | | | 1,084.5 | | | | 925.3 | | | | 702.1 | |
| BAC San José Liquid Fund (BAC San José Fondo Líquido – Riesgo País Mixto) | | | 38.2 | | | | 16.8 | | | | 43.0 | |
| Inversiones Bursatiles Credom. Riesgo País Mixto | | | - | | | | 2.2 | | | | 2.4 | |
| Multilateral – Bladex (Foreign Trade Bank of Latin America) | | | 88.6 | | | | 130.9 | | | | 104.3 | |
| Multilateral – Andean Development Corporation (Corporación Andina de Fomento) | | | 3.1 | | | | 12.9 | | | | 28.5 | |
| Multilateral – Central American Bank for Economic Integration | | | 4.4 | | | | 0.3 | | | | 5.3 | |
| Total investments | | | 6,127.5 | | | | 6,560.5 | | | | 6,052.4 | |
Deposits
The principal components of our deposits are customer demand (checking and saving accounts) and time deposits. Our retail customers are the principal source of our demand and time deposits. The following table presents the composition of our deposits at December 31, 2016, 2015 and 2014.
| | | At December 31, | |
| | | 2016 | | | 2015 | | | 2014 | |
| | | (in Ps billions) | |
| Domestic | | | | | | | | | | | | |
| Interest-bearing deposits: | | | | | | | | | | | | |
| Checking accounts | | | 10,021.2 | | | | 4,237.2 | | | | 5,343.0 | |
| Time deposits | | | 40,637.8 | | | | 35,490.2 | | | | 30,242.0 | |
| Savings deposits | | | 42,792.4 | | | | 42,684.9 | | | | 36,950.4 | |
| Total | | | 93,451.4 | | | | 82,412.3 | | | | 72,535.4 | |
| Non-interest-bearing deposits: | | | | | | | | | |
| Checking accounts | | | 10,382.7 | | | | 14,271.7 | | | | 13,315.0 | |
| Other deposits (1) | | | 159.5 | | | | 245.9 | | | | 267.5 | |
| Total | | | 10,542.2 | | | | 14,517.6 | | | | 13,582.5 | |
| Total domestic deposits | | | 103,993.6 | | | | 96,929.9 | | | | 86,117.9 | |
| | | At December 31, | |
| | | 2016 | | | 2015 | | | 2014 | |
| | | (in Ps billions) | |
| Foreign | | | | | | | | | | | | |
| Interest-bearing customer deposits: | | | | | | | | | | | | |
| Checking accounts | | | 11,822.4 | | | | 12,002.2 | | | | 8,027.7 | |
| Time deposits | | | 17,368.3 | | | | 16,287.1 | | | | 11,905.9 | |
| Savings deposits | | | 7,781.5 | | | | 7,613.2 | | | | 5,303.0 | |
| Total | | | 36,972.3 | | | | 35,902.5 | | | | 25,236.6 | |
| Non-interest-bearing customer deposits: | | | | | | | | | | | | |
| Checking accounts | | | 2,751.9 | | | | 2,919.7 | | | | 2,071.0 | |
| Other deposits (1) | | | 169.3 | | | | 202.6 | | | | 103.1 | |
| Total | | | 2,921.1 | | | | 3,122.3 | | | | 2,174.0 | |
| Total foreign customer deposits | | | 39,893.4 | | | | 39,024.7 | | | | 27,410.6 | |
| Total customer deposits | | | 143,887.1 | | | | 135,954.6 | | | | 113,528.5 | |
| (1) | Consists of deposits from correspondent banks, cashier checks and collection services. |
The following table presents time deposits, by amount and maturity at December 31, 2016.
| | | At December 31, 2016 | |
| | | Peso-
denominated | | | Foreign
currency-
denominated | | | Total | |
| | | (in Ps billions) | |
| Domestic | | | | | | | | | | | | |
| Up to 3 months | | | 7,873.8 | | | | 5,567.0 | | | | 13,440.8 | |
| From 3 to 6 months | | | 3,230.4 | | | | 1,209.6 | | | | 4,440.0 | |
| From 6 to 12 months | | | 5,621.9 | | | | 1,695.8 | | | | 7,317.7 | |
| More than 12 months | | | 10,048.4 | | | | 349.1 | | | | 10,397.5 | |
| Time deposits less than U.S.$100,000 (1) | | | 4,828.1 | | | | 213.7 | | | | 5,041.8 | |
| Total domestic | | | 31,602.6 | | | | 9,035.2 | | | | 40,637.8 | |
| | | | | | | | | | | | | |
| Foreign | | | - | | | | 17,368.3 | | | | 17,368.3 | |
| Total | | | 31,602.6 | | | | 26,403.6 | | | | 58,006.1 | |
| (1) | U.S.$100,000 is the equivalent of Ps 300,071,000 (translated at the representative market rate of Ps 3,000.71 to U.S.$1.00 at December 31, 2016). |
Return on equity and assets
The following table presents certain selected financial ratios for the periods indicated.
| | | At December 31, | |
| | | 2016 | | | 2015 | | | 2014 | |
| | | (in percentages) | |
| ROAA:Return on average assets (1) | | | 1.6 | | | | 1.7 | | | | 1.8 | |
| ROAE:Return on average equity attributable to controlling interest(2) | | | 14.3 | | | | 14.6 | | | | 15.2 | |
| Average equity attributable to controlling interest as a percentage of average total assets | | | 6.9 | | | | 7.1 | | | | 7.2 | |
| Period-end equity as a percentage of period-end total assets | | | 11.0 | | | | 10.6 | | | | 11.9 | |
| Dividend payout ratio (3) | | | 91.8 | | | | 64.2 | | | | 71.1 | |
| (1) | For methodology used to calculate ROAA, see note (2) to the table under “Item 3. Key Information—A. Selected financial data—Other financial and operating data.” |
| (2) | For methodology used to calculate ROAE, see note (3) to the table under “Item 3. Key Information—A. Selected financial data—Other financial and operating data.” |
| (3) | Dividend payout ratio (dividends declared on both common and preferred shares, divided by net income). Dividends for 2016 include dividends declared in September 2016 for the six-month period ended December 31 of 2016 and dividends declared in March 2017 for the twelve-month period ended March 31 of 2017. |
Until 2016, Grupo Aval declared dividends semi-annually in March (from the net income generated in the six-month period between July 1 and December 31 of the previous year) and in September (from the net income generated in the six-month period between January 1 and June 30 of the ongoing year) of each year. Beginning in March 2017, the Company will start to declare dividends on an annual basis (for the twelve-month period between January 1 and December 31 of the previous year). We do not declare dividends on a quarterly basis. Dividends per 1,000 shares figures for 2016 include dividends declared in September 2016 from the net income generated in the six-month period ended June 30 of 2016 and dividends declared in March 2017 from the net income generated in the six-month period ended December 31 of 2016, to be paid in twelve equal installments between April 2017 and March 2018.
Short-term borrowings
The following table presents our short-term borrowings, consisting of interbank and overnight funds, for the periods indicated.
| | | At December 31, | |
| | | 2016 | | | 2015 | | | 2014 | |
| | | Amount | | | Nominal
weighted
average
rate | | | Amount | | | Nominal
weighted
average
rate | | | Amount | | | Nominal
weighted
average
rate | |
| | | (in Ps billions, except percentages) | |
| Short-term borrowings | | | | | | | | | | | | | | | | | | | | | | | | |
| Interbank borrowings and overnight funds | | | | | | | | | | | | | | | | | | | | | | | | |
| End of period | | | 6,315.7 | | | | – | | | | 9,474.9 | | | | – | | | | 4,964.4 | | | | – | |
| Average during period | | | 8,683.6 | | | | 6.6 | % | | | 8,568.8 | | | | 4.0 | % | | | 5,152.4 | | | | 3.6 | % |
| Maximum amount of borrowing at any month-end(1) | | | 9,656.7 | | | | – | | | | 9,474.9 | | | | – | | | | 4,964.4 | | | | – | |
| Interest paid during the period | | | 570.2 | | | | – | | | | 340.6 | | | | – | | | | 185.0 | | | | – | |
| (1) | As of December 2016, 2015 and 2014, accordingly. |
Supervision and regulation
Colombian Banking Regulators
Pursuant to the Colombian Constitution, the Colombian Congress has the power to prescribe the general legal framework within which the government and other authorities may regulate the financial system. The Colombian Constitution also permits the Colombian Congress to authorize government intervention in the economy by statute. The agencies vested with the authority to regulate the financial system are the Board of Directors of the Colombian Central Bank, the Colombian Ministry of Finance, the Superintendency of Finance, the Superintendency of Industry and Commerce and the Securities Market Self-Regulatory Organization.
Central Bank
The Colombian Central Bank exercises the customary functions of a central bank, including price stabilization, legal currency issuance, regulation of currency circulation, credit and exchange rate monitoring and administration of international reserves. Its Board of Directors is the regulatory authority for monetary, currency exchange and credit policies, and is responsible for the direction and execution of the Colombian Central Bank duties. The Colombian Central Bank also acts as a last resort lender to financial institutions.
Pursuant to the Colombian Constitution, the Colombian Central Bank is autonomous and independent from the government in the formulation of monetary policy and currency exchange and credit policies. Specifically, the Constitution provides administrative, technical, budgetary and legal autonomy for the Colombian Central Bank and its Board of Directors with respect to monetary, credit and foreign exchange matters. The Colombian Central Bank reports to the Colombian Congress. Its Board of Directors has seven members, one of whom is the Minister of Finance and Public Credit, one member is the General Manager of the Colombian Central Bank, and the other five members, who are full-time employees, are appointed by the President of Colombia for four-year terms that can be extended.
Ministry of Finance
The Ministry of Finance designs, coordinates, regulates and executes economic policy, seeking to create an optimal administration of public finances for the economic and social development of the country. The Ministry of Finance regulates all aspects of finance, securities and insurance activities, pursuant to powers conferred by the Colombian Constitution. As part of its duties, the Ministry of Finance issues decrees related mainly to financial, taxation, customs, public credit and budgetary matters that may affect banking transactions in Colombia. In particular, the Ministry of Finance is responsible for regulations relating to financial institutions’ capital adequacy, risk limitations, authorized transactions, disclosure of information and accounting.
According to Decree 4172 of 2011, the “Unidad Administrativa Especial, Unidad de Proyección Normativa y Estudios de Regulación Financiera,” an independent unit of the Ministry of Finance is responsible for preparing and drafting any new financial, monetary, credit, securities, foreign exchange and insurance regulation to be issued by the Colombian Government.
Superintendency of Finance
The Superintendency of Finance was created as a result of the merger between the Superintendency of Banking and the Superintendency of Securities in 2005. All of the powers and responsibilities of the former Superintendency of Banking and Superintendency of Securities were assigned to the newly created Superintendency of Finance.
The Superintendency of Finance is a technical entity affiliated with the Ministry of Finance that acts as the inspection, supervision and control authority of persons involved in financial, insurance and securities exchange activities, and any other operations related to the management, use or investment of resources collected from the public. The Superintendency of Finance is responsible for supervising the Colombian financial system with the purpose of preserving its stability and trustworthiness, as well as promoting, organizing and developing the Colombian securities market and protecting the users of financial and insurance services and investors in general.
Financial institutions must obtain the authorization of the Superintendency of Finance before commencing operations. In addition, all public offering of securities require the prior approval of the Superintendency of Finance.
Violations of the financial system rules and regulations are subject to administrative, and in some cases, criminal sanctions. The Superintendency of Finance may inspect Colombian financial institutions on a discretionary basis and has the authority to impose sanctions including admonitions, fines, removals, or administrative takeovers on such institutions and their directors and officers for violations of Colombian laws or regulations, or such financial institutions’ by-laws.
The Superintendency of Finance exerts its supervisory powers over the financial sector on a consolidated and comprehensive basis. The consolidated supervision extends to all financial institutions including banks operating in Colombia and their subsidiaries abroad, in the latter case to the extent permitted by the laws of the respective country of incorporation. For these purposes, the Superintendency of Finance has executed several memorandums of understanding with foreign financial sector regulators, including the Superintendency of Banks of Panamá, the Superintendency of the Financial System of El Salvador, the Superintendency of Banks and other Financial Institutions of Nicaragua, the Superintendency of Banks of Guatemala, and the National Commission of Banks and Insurance of Honduras. Additionally, the Superintendency of Finance is currently negotiating the execution of additional memorandums of understanding with other financial regulators to promote an exchange of information and enhance its consolidated and comprehensive supervision.
According to Decree 2555 of 2010 and External Circular 100 of 1995 (“Basic Accounting and Financial Circular,”) as amended, and in order to facilitate the Superintendency of Finance’s supervision, financial institutions are required to consolidate the results of operations of all of their subsidiaries in order to present consolidated financial statements of the controlling entity and its subsidiaries, consolidated solvency ratios and capital adequacy requirements of the group. As Grupo Aval is not regulated as a financial institution or as a holding company of banking subsidiaries, it is not required to comply with these requirements; however, all of its financial subsidiaries are required to comply.
The Superintendency of Finance may also conduct onsite inspections of Colombian financial institutions and even of their subsidiaries located abroad, in the latter case, subject to the applicable laws of the subsidiary’s country of incorporation.
According to Article 48 of Decree 2080 of 2000 (as amended by Decree 4800 of 2010), when granting authorizations relating to foreign investment transactions made by direct shareholders of Colombian financial institutions in foreign financial entities, the Superintendency of Finance must take into account the possibility of exercising comprehensive and consolidated supervision. In addition, according to Law 1328 of 2009 and Decree 2555 of 2010: (1) direct capital investments by Colombian financial institutions in foreign financial, brokerage or insurance companies, branches or agencies, require the prior authorization by the Superintendency of Finance, and (2) indirect capital investment (i.e., through a subsidiary) in foreign financial, brokerage or insurance companies, branches or agencies, require the prior authorization by the Superintendency of Finance if: (a) the initial investment equals or exceeds 10% of the investor’s paid-in capital, (b) additional investments equal or exceed 5% of the investor’s paid-in capital or (c) the financial regulatory authority of the country where the investment is to be made has not executed a memorandum of understanding with the Superintendency of Finance. Other indirect investments do not require the approval of the Superintendency of Finance but must be reported to such entity prior to the respective investment.
As an issuer of securities traded on the Colombian Stock Exchange, Grupo Aval is subject to the control of the Superintendency of Finance. Additionally, Grupo Aval’s financial and stock brokerage subsidiaries located in Colombia (including banks, finance corporations, financing companies, trust companies, managers of pensions and severance payment funds, bonded warehouses and stock brokerage firms) are each subject to the regulatory supervision of the Superintendency of Finance. The level of supervision and regulation is different, though, taking into account that Grupo Aval is not a financial institution. Grupo Aval is subject to supervision (control) as an issuer of securities traded on the Colombian Stock Exchange, while financial institutions and stock brokerage firms are subject to inspection and surveillance (inspección y vigilancia).
Fondo de Garantía de Instituciones Financieras
TheFondo de Garantía de Instituciones Financieras (“FOGAFIN”) was created pursuant to Law 117 of 1985. The primary function of FOGAFIN is to administer the deposit insurance system, with the objective of guaranteeing the deposits and savings held by the general public in Colombian financial institutions. See “—Troubled financial institutions – Deposit insurance.” The other primary purposes for which FOGAFIN was formed were to support the
banking industry, to facilitate the privatization of financial institutions by the Colombian government, and to liquidate financial institutions under receivership.
FOGAFIN has tools and mechanisms that enable it to administer and temporarily take equity stakes in troubled financial institutions in order to allow it to determine whether a financial institution is viable or requires liquidation.
Securities Market Self-Regulatory Organization
Self-regulation in the capital markets was formally introduced in Colombia by Law 964 of 2005, and the securities market self-regulatory organization (Autoregulador del Mercado de Valores de Colombia), or “SRO,” was created in June 12, 2006.
The SRO is a private entity that has the power to supervise, sanction and regulate the entities subject to self-regulation (i.e., including securities intermediaries and any entity that voluntarily submits itself to self-regulation).
The SRO’s supervisory powers entitle it to review compliance with applicable laws and regulations and impose sanctions in the case of violations. The SRO may also propose regulation aimed at various matters, including conflicts of interest and improving the integrity and quality of the capital markets.
Superintendency of Industry and Commerce
According to Law 1340 of 2009, the Superintendency of Industry and Commerce is the competent national authority for all antitrust matters in every sector of the economy, including the financial sector.
As such, the Superintendency of Industry and Commerce is responsible for advancing administrative investigations of antitrust violations by financial and non-financial corporations, and has the power to impose corresponding sanctions.
The Superintendency of Industry and Commerce is responsible for approving economic mergers, acquisitions and integrations between and among enterprises, except for mergers, acquisitions or integrations between financial entities. However, pursuant to Law 1340 of 2009, the Superintendency of Finance is the authority responsible for approving mergers, acquisitions and integrations between financial institutions. For such approvals, the Superintendency of Finance must obtain a prior written opinion by the Superintendency of Industry and Commerce.
Regulatory framework for Colombian financial institutions
Basic Framework: Decree 663 of 1993
The basic regulatory framework for the operations of the Colombian financial sector is set forth in the Financial System Organic Statute or “EOSF,” as amended by Laws 510 of 1999, 546 of 1999, 795 of 2003, 964 of 2005, 1328 of 2009 and 1555 of 2012. Decree 2555 of 2010 as well as in External Resolution 8 of 2000 (exchange control regulation statute) and External Resolution 4 of 2006 issued by the Board of Directors of the Colombian Central Bank.
The EOSF defines the structure of the Colombian financial system and establishes various business entities, including (1) credit institutions (which are further categorized into banks, finance corporations, financing companies and finance cooperatives), (2) financial services entities, (3) capitalization corporations, (4) insurance companies and (5) insurance intermediaries.
The EOSF also provides that no financial, banking or credit institution may operate in Colombia without the prior approval of the Superintendency of Finance. Subject to prior approval of the Superintendency of Finance, foreign banks may operate in Colombia through their subsidiaries established and incorporated in Colombia. Under Law 1328 of 2009, foreign banks, as of July 15, 2013, are permitted to operate through their “branches” and are not obligated to incorporate a Colombian subsidiary. Operations through these branches will be subject to prior approval by the Superintendency of Finance. Among other legal requirements, branches have to meet the same minimum capital requirements as independent entities do.
The main role of banks, finance corporations and financing companies is to receive deposits. Banks place funds back into circulation by means of loans or any active credit operation; finance corporations place funds into
circulation by means of active credit operations or investments, with the purpose of promoting the creation or expansion of enterprises; and financing companies place funds back into circulation by means of active credit operations, with the purpose of fostering the sale of consumer goods and services including leasing operations.
Each credit institution must be separately authorized by the Superintendency of Finance before it may develop and provide financial services. Furthermore, the activities of credit institutions are subject to limitations and restrictions, including limitations and restrictions relating to the extension of credit, risk concentration, investments, conditional operations, foreign currency loans and negotiations, and the administration of third-party funds. One of the principal restrictions on financial activities is that banks may not acquire or hold products, merchandise, shares of corporations, income bonds, or other similar securities, except: (1) when the bank has received those goods or securities as collateral for loans it has made or (2) with respect to shares, when they are issued by companies where banks are permitted to hold investments (mainly financial affiliates). Banks are also subject to other limitations, including limitations on lending activities.
Modifications to Framework
Laws 510 of 1999, 546 of 1999, 795 of 2003 and 1328 of 2009 have substantially modified the control, regulation and surveillance powers of the Superintendency of Finance. In addition, Law 510 of 1999 and Law 1328 of 2009 streamlined the procedures and powers for FOGAFIN.
The main purpose of Law 510 of 1999 was to increase the solvency and stability of Colombia’s financial institutions by establishing rules regarding their incorporation, as well as the permitted investments of credit institutions, insurance companies and investment companies. Law 546 of 1999 was enacted in order to regulate the system of long-term home loans.
Law 795 of 2003 was enacted with the purpose of broadening the scope of activities to be performed by financial institutions and to update Colombian regulations with the latest principles of the Basel Committee at that time. Law 795 of 2003 also increased the minimum capital requirements needed to incorporate a financial institution (see “—Minimum capital requirements”) and authorized the Superintendency of Finance to take precautionary measures with respect to financial institutions whose capital falls below certain thresholds. For example, in order to avoid a temporary taking of possession by the Superintendency of Finance, troubled financial institutions must submit a restructuring program to the Superintendency of Finance.
Law 1328 of 2009, as amended by Law 1748 of 2014, provided a new set of rights and responsibilities for customers of the financial system and a set of obligations for financial institutions, in order to minimize disputes. This law also broadened the scope of permitted business activities by regulated entities: following its adoption, banks were allowed to operate leasing businesses under certain circumstances and to extend loans to third parties so that borrowers may acquire control of other companies.
In order to implement and enforce the provisions related to Colombia’s financial system, the Superintendency of Finance has issued periodic circulars and resolutions. The External Circular 007 of 1996, as amended, consolidates all of the rules and regulations applicable to financial institutions, including rules and regulations relating to the management, operations, investments, lending activities and money laundering prevention activities of financial institutions. The Basic Accounting and Financial Circular, consolidates all of the regulations applicable to the accounting and financial rules of financial institutions. Furthermore, the Basic Accounting and Financial Circular regulates the assessment of credit institutions’ investments, risk management, financial statements, information disclosure and inter-banking credits.
Violations of Laws 510 of 1999, 546 of 1999, 795 of 2003 or 1328 of 2009, as well as of specific provisions of Decree 663 of 1993 and their relevant regulations, are subject to administrative sanctions and, in some cases, criminal sanctions.
To prepare for the implementation of the Basel III accords in Colombia, the Ministry of Finance, in consultation with the Superintendency of Finance, issued Decree 1771 of 2012 and Decree 2392 of 2015 (both amended Decree 2555 and are deemed part of it). Pursuant to these new decrees, new capital components were included within the assets to be recognized as Tier One Capital, Additional Tier One Capital and Tier Two Capital. Under Decree 2392 of 2015, credit institutions are permitted to issue debt instruments that comply with certain regulatory requirements in order to include their outstanding principal amount as a component of Tier One Capital or Tier Two Capital. These requirements include, among others, provisions of perpetuity and loss absorption mechanism for Tier One
Capital and loss absorption mechanisms for Tier Two Capital and amortization provisions in both cases. In such a case, the outstanding principal amount eligible to be included as Tier Two Capital amortizes on a straight-line, annual basis, during the five years immediately prior to their final maturity. Additionally, Decree 2392 established a transitional rule to issue debt instruments as component of Tier Two Capital meeting the requirements referred to in the preceding paragraph with the exception of the loss absorption mechanism and a special amortization rule for those debt instruments issued from December 31, 2015 to December 31, 2017 (“Transitional Tier Two Capital Instruments”). The transitional rule provides that (i) 100% of the outstanding principal amount of the Transitional Tier Two Capital Instruments that are issued from December 31, 2015 to December 31, 2017 will be eligible to be included as Tier Two Capital until December 31, 2017. Subsequently, eligibility for inclusion of these instruments as Tier Two Capital will be phased out from then on, with the base for calculation set at an amount equivalent to the outstanding principal amount of all such Transitional Tier Two Capital Instruments as of December 31, 2017 (the “Transitional Tier Two Capital Base”). Starting on January 1, 2018 and on every anniversary thereafter, the percentage of the Transitional Tier Two Capital Base eligible to be included as Tier Two Capital will decrease by 10% per year. From January 1, 2026, the Transitional Tier Two Capital Instruments will no longer be eligible to be included as a component of Tier Two Capital. Notwithstanding the foregoing, beginning on the fifth year prior to the final maturity of the Transitional Tier Two Capital Instrument, the outstanding principal amount of such instrument that will be eligible to be included as Tier Two Capital will be the lesser of (i) the amount eligible for inclusion as determined based on the immediately preceding sentences and (ii) the amount that results from amortizing the outstanding principal amount of the instrument on a straight-line, annual basis during the five years prior to its final maturity.
Key interest rates
Colombian commercial banks, finance corporations and financing companies are required to report data to the Colombian Central Bank on a weekly basis regarding the total volume (in pesos) of certificates of deposit issued during the prior week and the average interest rates paid for certificates of deposit with maturities of 90 days. Based on such reports, the Colombian Central Bank calculates the DTF rate, which is published at the beginning of the following week for use in calculating interest rates payable by financial institutions. The DTF rate is the weighted average interest rate paid by commercial banks, finance corporations and financing companies for certificates of deposit with maturities of 90 days.
The Colombian Central Bank also calculates the interbank rate (Interés Bancario de Referencia), or “IBR,” which acts as a reference of overnight, and one-month and three-month interbank loans, based on quotations submitted each business day by eight participating banks to the Colombian Central Bank. Using the median of the quotations submitted, the Colombian Central Bank calculates the overnight IBR each business day. The one-month and three-month IBRs are also calculated using the median of the quotations submitted each business day, based on the prices of interest rate swaps for each of these periods.
Article 884 of the Colombian Commercial Code provides for a limit on the amount of interest that may be charged in commercial transactions. The limit is 1.5 times the current banking interest rate (Interés Bancario Corriente), calculated as the average of the interest ordinarily charged by banks within a set period of time. The current banking interest rate is certified by the Superintendency of Finance.
Capital Adequacy Requirements
Decree 2555 of 2010 (as modified by Decree 1771 of 2012, Decree 1648 of 2014, and Decree 2392 of 2015) sets forth capital adequacy requirements for Colombian credit institutions. Since August 1, 2013, technical capital for Colombian credit institutions consist of the sum of basic capital (patrimonio básico), or primary capital (Tier I), and secondary capital (patrimonio adicional), or secondary capital (Tier II). In addition, Primary capital (Tier I) consist of the sum of ordinary basic capital (patrimonio básico ordinario), or Common Equity Tier I, and additional basic capital (patrimonio básico adicional), or Additional Tier I. Tier I and Tier II as defined herein may differ to manner in which those terms are used in other jurisdictions.
Credit institutions’ technical capital must be at least 9.0% of that institution’s total risk-weighted assets and must also comply with a measure of “core solvency” for Common Equity Tier 1, which requires higher quality capital set at a minimum of 4.5% of risk-weighted assets.
Pursuant to Decree 2555 of 2010 (as amended) the Superintendency of Finance must grant prior approval of the eligibility of a debt, equity or hybrid instruments in order to be classified as Common Equity Tier I, Additional Tier I or Tier II.
The following tables set forth the consolidated capital adequacy information under Colombian IFRS for each of our Colombian banking subsidiaries and Corficolombiana at December 31, 2016 and 2015 as calculated under the Current Definition of Technical Capital.
Banco de Bogotá
| | | At December 31, | |
| | | 2016 | | | 2015 | |
| | | (in Ps billions) | |
| Subscribed capital | | | 3 | | | | 3 | |
| Reserves and retained earnings | | | 13,915 | | | | 10,307 | |
| Non-controlling interests | | | - | | | | 1,138 | |
| Unconsolidated financial sector investments | | | (3,459 | ) | | | (33 | ) |
| | | | | | | | | |
| Plus/minus others | | | | | | | | |
| Goodwill | | | (2,635 | ) | | | (2,630 | ) |
| Foreign currency translation adjustments | | | 2,946 | | | | 3,588 | |
| Others | | | (315 | ) | | | (885 | ) |
| Primary capital (Tier I) | | | 10,456 | | | | 11,487 | |
| Reserves and retained earnings | | | 295 | | | | 568 | |
| Non-controlling interests | | | - | | | | 799 | |
| Unrealized gains/losses on debt securities available for sale(1) | | | (87 | ) | | | (392 | ) |
| Unrealized gains/losses on equity securities available for sale(1) | | | - | | | | 150 | |
| Subordinated bonds | | | 5,545 | | | | 3,905 | |
| | | | | | | | | |
| Minus: | | | | | | | | |
| Devaluations | | | - | | | | (8 | ) |
| Plus/minus others | | | 27 | | | | 23 | |
| Secondary capital (Tier II) | | | 5,780 | | | | 5,045 | |
| Technical capital | | | 16,236 | | | | 16,531 | |
| Risk-weighted assets | | | 110,307 | | | | 112,228 | |
| Value at risk | | | 579 | | | | 849 | |
| Regulatory value at risk(2) | | | 6,439 | | | | 9,432 | |
| Risk-weighted assets including regulatory value at risk | | | 116,745 | | | | 121,660 | |
| Primary capital (Tier I) to risk-weighted assets including regulatory value at risk | | | 9.0 | % | | | 9.4 | % |
| Secondary capital (Tier II) to risk-weighted assets including regulatory value at risk | | | 5.0 | % | | | 4.1 | % |
| Solvency ratio(3) | | | 13.9 | % | | | 13.6 | % |
| (1) | Unrealized gains/losses on securities available for sale do not flow through the statement of income until such securities are disposed of and the gain or loss is realized. |
| (2) | Regulatory value at risk consists of value at risk multiplied by (100/9) as required by the Superintendency of Finance. See “—Capital adequacy requirements.” |
| (3) | Solvency ratio is calculated as technical capital to risk-weighted assets including regulatory value at risk. |
Banco de Occidente
| | | At December 31, | |
| | | 2016 | | | 2015 | |
| | | (in Ps billions) | |
| Subscribed capital | | | 5 | | | | 5 | |
| Reserves and retained earnings | | | 3,304 | | | | 3,103 | |
| Non-controlling interests | | | 7 | | | | 7 | |
| Unconsolidated financial sector investments | | | (166 | ) | | | (141 | ) |
| | | | | | | | | |
| Plus/minus others: | | | | | | | | |
| Goodwill | | | - | | | | - | |
| Foreign currency translation adjustments | | | (4 | ) | | | (10 | ) |
| Others | | | (116 | ) | | | - | |
| Primary capital (Tier I) | | | 3,029 | | | | 2,964 | |
| Reserves and retained earnings | | | 37 | | | | 79 | |
| Non-controlling interests | | | 6 | | | | 3 | |
| Unrealized gains/losses on debt securities available for sale(1) | | | 1 | | | | (117 | ) |
| Unrealized gains/losses on equity securities available for sale(1) | | | 29 | | | | 48 | |
| Subordinated bonds | | | 631 | | | | 400 | |
| | | | | | | | | |
| Minus: | | | | | | | | |
| Devaluations | | | (15 | ) | | | (1 | ) |
| Plus/minus others | | | 84 | | | | 8 | |
| Secondary capital (Tier II) | | | 772 | | | | 420 | |
| Technical capital | | | 3,801 | | | | 3,384 | |
| Risk-weighted assets | | | 28,355 | | | | 29,243 | |
| Value at risk | | | 111 | | | | 144 | |
| Regulatory value at risk(2) | | | 1,233 | | | | 1,600 | |
| Risk-weighted assets including regulatory value at risk | | | 29,589 | | | | 30,843 | |
| Primary capital (Tier I) to risk-weighted assets including regulatory value at risk | | | 10.2 | % | | | 9.6 | % |
| Secondary capital (Tier II) to risk-weighted assets including regulatory value at risk | | | 2.6 | % | | | 1.4 | % |
| Solvency ratio(3) | | | 12.8 | % | | | 11.0 | % |
| (1) | Unrealized gains/losses on securities available for sale do not flow through the statement of income until such securities are disposed of and the gain or loss is realized. |
| (2) | Regulatory value at risk consists of value at risk multiplied by (100/9) as required by the Superintendency of Finance. See “—Capital adequacy requirements.” |
| (3) | Solvency ratio is calculated as technical capital to risk-weighted assets including regulatory value at risk. |
Banco Popular
| | | At December 31, | |
| | | 2016 | | | 2015 | |
| | | (in Ps billions) | |
| Subscribed capital | | | 77 | | | | 77 | |
| Reserves and retained earnings | | | 1,877 | | | | 1,752 | |
| Non-controlling interests | | | 28 | | | | 27 | |
| Unconsolidated financial sector investments | | | (185 | ) | | | (3 | ) |
| | | | | | | | | |
| Plus/minus others: | | | | | | | | |
| Goodwill | | | (42 | ) | | | (18 | ) |
| Foreign currency translation adjustments | | | - | | | | - | |
| Others | | | - | | | | - | |
| Primary capital (Tier I) | | | 1,756 | | | | 1,835 | |
| Reserves and retained earnings | | | 0 | | | | 8 | |
| Non-controlling interests | | | - | | | | - | |
| Unrealized gains/losses on debt securities available for sale(1) | | | (18 | ) | | | 88 | |
| Unrealized gains/losses on equity securities available for sale(1) | | | 6 | | | | 6 | |
| Subordinated bonds | | | 300 | | | | - | |
| | | | | | | | | |
| Minus: | | | | | | | | |
| Devaluations | | | (1 | ) | | | (0 | ) |
| Plus/minus others | | | 60 | | | | 3 | |
| Secondary capital (Tier II) | | | 347 | | | | 104 | |
| Technical capital | | | 2,103 | | | | 1,940 | |
| Risk-weighted assets | | | 17,580 | | | | 15,675 | |
| Value at risk | | | 121 | | | | 151 | |
| Regulatory value at risk(2) | | | 1,340 | | | | 1,674 | |
| Risk-weighted assets including regulatory value at risk | | | 18,920 | | | | 17,349 | |
| Primary capital (Tier I) to risk-weighted assets including regulatory value at risk | | | 9.3 | % | | | 10.6 | % |
| Secondary capital (Tier II) to risk-weighted assets including regulatory value at risk | | | 1.8 | % | | | 0.6 | % |
| Solvency ratio(3) | | | 11.1 | % | | | 11.2 | % |
| (1) | Unrealized gains/losses on securities available for sale do not flow through the statement of income until such securities are disposed of and the gain or loss is realized. |
| (2) | Regulatory value at risk consists of value at risk multiplied by (100/9) as required by the Superintendency of Finance. See “—Capital adequacy requirements.” |
| (3) | Solvency ratio is calculated as technical capital to risk-weighted assets including regulatory value at risk. |
Banco AV Villas
| | | At December 31, | |
| | | 2016 | | | 2015 | |
| | | (in Ps billions) | |
| Subscribed capital | | | 22 | | | | 22 | |
| Reserves and retained earnings | | | 996 | | | | 947 | |
| Non-controlling interests | | | - | | | | - | |
| Unconsolidated financial sector investments | | | (16 | ) | | | (17 | ) |
| | | | | | | | | |
| Plus/minus others: | | | | | | | | |
| Goodwill | | | - | | | | - | |
| Foreign currency translation adjustments | | | - | | | | - | |
| Others | | | - | | | | - | |
| Primary capital (Tier I) | | | 1,002 | | | | 953 | |
| Reserves and retained earnings | | | 119 | | | | 81 | |
| Non-controlling interests | | | - | | | | - | |
| Unrealized gains/losses on debt securities available for sale(1) | | | (20 | ) | | | (72 | ) |
| Unrealized gains/losses on equity securities available for sale(1) | | | 1 | | | | 1 | |
| Subordinated bonds | | | - | | | | - | |
| | | | | | | | | |
| Minus: | | | | | | | | |
| Devaluations | | | - | | | | - | |
| Plus/minus others | | | 17 | | | | 15 | |
| Secondary capital (Tier II) | | | 117 | | | | 26 | |
| Technical capital | | | 1,119 | | | | 979 | |
| Risk-weighted assets | | | 8,775 | | | | 7,765 | |
| Value at risk | | | 89 | | | | 110 | |
| Regulatory value at risk(2) | | | 993 | | | | 1,226 | |
| Risk-weighted assets including regulatory value at risk | | | 9,768 | | | | 8,991 | |
| Primary capital (Tier I) to risk-weighted assets including regulatory value at risk | | | 10.3 | % | | | 10.6 | % |
| Secondary capital (Tier II) to risk-weighted assets including regulatory value at risk | | | 1.2 | % | | | 0.3 | % |
| Solvency ratio(3) | | | 11.5 | % | | | 10.9 | % |
| (1) | Unrealized gains/losses on securities available for sale do not flow through the statement of income until such securities are disposed of and the gain or loss is realized. |
| (2) | Regulatory value at risk consists of value at risk multiplied by (100/9) as required by the Superintendency of Finance. See “—Capital adequacy requirements.” |
| (3) | Solvency ratio is calculated as technical capital to risk-weighted assets including regulatory value at risk. |
Corficolombiana
| | | At December 31, | |
| | | 2016 | | | 2015 | |
| | | (in Ps billions) | |
| Subscribed capital | | | 2 | | | | 2 | |
| Reserves and retained earnings | | | 2,740 | | | | 2,439 | |
| Non-controlling interests | | | - | | | | - | |
| Unconsolidated financial sector investments | | | (32 | ) | | | (38 | ) |
| | | | | | | | | |
| Plus/minus others: | | | | | | | | |
| Goodwill | | | - | | | | - | |
| Foreign currency translation adjustments | | | 10 | | | | 10 | |
| Others | | | (472 | ) | | | (142 | ) |
| Primary capital (Tier I) | | | 2,247 | | | | 2,271 | |
| Reserves and retained earnings | | | 120 | | | | 264 | |
| Non-controlling interests | | | - | | | | - | |
| Unrealized gains/losses on debt securities available for sale(1) | | | (30 | ) | | | (160 | ) |
| Unrealized gains/losses on equity securities available for sale(1) | | | 335 | | | | 318 | |
| Subordinated bonds | | | - | | | | - | |
| | | | | | | | | |
| Minus: | | | | | | | | |
| Devaluations | | | (60 | ) | | | (28 | ) |
| Plus/minus others | | | - | | | | - | |
| Secondary capital (Tier II) | | | 364 | | | | 394 | |
| Technical capital | | | 2,611 | | | | 2,665 | |
| Risk-weighted assets | | | 5,437 | | | | 6,216 | |
| Value at risk | | | 151 | | | | 276 | |
| Regulatory value at risk(2) | | | 1,677 | | | | 3,066 | |
| Risk-weighted assets including regulatory value at risk | | | 7,114 | | | | 9,282 | |
| Primary capital (Tier I) to risk-weighted assets including regulatory value at risk | | | 31.6 | % | | | 24.5 | % |
| Secondary capital (Tier II) to risk-weighted assets including regulatory value at risk | | | 5.1 | % | | | 4.2 | % |
| Solvency ratio(3) | | | 36.7 | % | | | 28.7 | % |
| (1) | Unrealized gains/losses on securities available for sale do not flow through the statement of income until such securities are disposed of and the gain or loss is realized. |
| (2) | Regulatory value at risk consists of value at risk multiplied by (100/9) as required by the Superintendency of Finance. See “—Capital adequacy requirements.” |
| (3) | Solvency ratio is calculated as technical capital to risk-weighted assets including regulatory value at risk. |
Mandatory Investments
Colombian banking institutions are required to invest in agricultural development bonds (Títulos de Desarrollo Agropecuario, or “TDAs”) issued by Finagro, a government entity, according to External Resolution 3 of 2000 of the Colombian Central Bank, as amended by External Resolution 5 of 2000, External Resolution 1 of 2002, External Resolution 2 of 2005, External Resolutions 2, 8, 9 and 17 of 2007, External Resolutions 2, 6, 8 and 14 of 2008, External Resolution 15 of 2012, External Resolution 7 of 2014 and External Resolution 19 of 2015. The Colombian Central Bank requires that each bank maintains a total investment in these bonds equal to 5.8% of its checking and savings deposits, plus 4.3% of its time deposits with a maturity of up to 18 months. Finagro may issue two different types of agricultural development bonds, Class A with an interest rate of four percentage points below the DTF rate (DTF-4) and Class B with an interest rate of two percentage points below the DTF rate (DTF-2). If the DTF interest rate falls to 4% or less, the profitability of the Class A TDAs will be 0%, and if the DTF rate falls to 2% or less, the profitability of the Class B TDAs will be 0%. Banks are required to invest 37% of the total mandatory investment in Class A TDAs and 63% in Class B TDAs; however, in accordance with the External Resolution 19 of 2015, from January 2016 to March 2016 banks are required to invest 50% of the total mandatory investment in Class A TDAs and 50% in Class B TDAs.
Until 2006, banking institutions were required to invest in debt reduction bonds (Títulos de Reducción de Deuda), issued by the Colombian government. These bonds are no longer a mandatory investment but are still outstanding in the portfolios of bank institutions until maturity.
Under government discretion, authorities may extend the scope of current regulations or require additional disbursements on current or new types of mandatory investments.
Minimum Capital Requirements
Article 80 of Decree 663 of 1993, as amended by Law 795 of 2003, establishes minimum incorporation capital requirements for different financial institutions. When a financial institution fails to comply with the minimum required capital after a cure period granted by law, the Superintendency of Finance may intervene, causing the financial institution to be liquidated, merged with another institution or its corporate form may be converted into another category of financial institution, notwithstanding the fact that the institution may be subject to fines imposed by the Superintendency of Finance.
The minimum incorporation capital requirement for banks on an unconsolidated basis for 2016 was Ps 85.2 billion. Through the date hereof, all of our banks have consistently satisfied this incorporation capital requirement.
Capital Investment Limit
All investments in subsidiaries and other authorized capital investments, other than those carried out in order to fulfill legal provisions, may not exceed 100% of the total aggregate of the capital, equity reserves and the equity reappraisal account of the respective bank, financial corporation or financing company, excluding unadjusted fixed assets and including deductions for accumulated losses.
Foreign Currency Position Requirements
According to External Resolution 9 of 2013 issued by the Board of Directors of the Colombian Central Bank, a financial institution’s foreign currency position is the difference between such institution’s foreign currency-denominated assets and liabilities (including any off-balance sheet items), realized or contingent, including those that may be sold in Colombian legal currency.
External Resolution 9 of 2013 of the Board of Directors of the Colombian Central Bank provides mandatory guidelines for foreign currency positions of financial institutions, including the following:
| · | The average of a bank’s foreign currency position for three business days cannot exceed the equivalent in foreign currency of 20.0% of the bank’s technical capital. Currency exchange intermediaries such as Banco de Bogotá are permitted to hold a three business days’ average negative foreign currency position not exceeding the equivalent in foreign currency of 5.0% of its technical capital. From July 6, 2016 and in accordance with article 1 of the External Resolution 1 of 2016, an article that will be in force on July 6, 2016, the average of a bank’s foreign currency position for three business days will not have any limits. At December 31, 2016, Banco de Bogotá, Banco de Occidente, Banco Popular and Banco AV Villas had unconsolidated foreign currency positions of U.S.$4.9 million, U.S.$2.8 million, U.S.$2.6 million and U.S.$-0.04 million, respectively, which fell within these regulatory guidelines. |
| · | Foreign currency position in cash is defined as the difference between all foreign currency-denominated assets and liabilities. A bank’s three business days’ average foreign currency position in cash cannot exceed 50.0% of the bank’s technical capital. Currency exchange intermediaries such as Banco de Bogotá are permitted to hold a three business days’ average negative foreign currency position in cash not exceeding the equivalent in foreign currency of 20.0% its technical capital. At December 31, 2016, Banco de Bogotá, Banco de Occidente, Banco Popular and Banco AV Villas had unconsolidated foreign currency positions in cash of U.S.$-243.3 million, U.S.$-9.7 million, U.S.$1.8 million and U.S.$-0.04 million, respectively, which fell within these regulatory guidelines; and |
| · | Gross position of leverage, defined as (1) the value of the rights and obligations of term contracts denominated in foreign currency, plus (2) the value of transactions denominated in foreign currency to be settled in cash within one or more days, and (3) the value of the exchange rate risk exposure associated with exchange rate options and derivatives. External Resolution 9 of 2013 (as amended by External Resolution 1 of 2016) of the Board of Directors of the Colombian Central Bank establishes that the average of a bank’s gross position of leverage for three business days cannot exceed 550.0% of the technical capital of such bank. In calculating the gross position of leverage, External Resolution 9 of 2013 of the Board of Directors of the Colombian Central Bank excludes any foreign exchange transactions that intermediaries of the FX Market perform as local suppliers of liquidity of foreign currency using the Systems of Compensation and Liquidation of Currencies when there is a breach of payment by a participant. At December 31, 2016, Banco de Bogotá, Banco de Occidente, Banco Popular and Banco AV Villas had an unconsolidated gross position of leverage of U.S.$7,209.2 million, U.S.$4,012.6 million, U.S.$10.2 million and U.S.$0.0 million, respectively, which fell within these regulatory guidelines. |
Lending Limits
Title II, Book I of Part II of Decree 2555 of 2010, provides that a financial institution may not lend, individually or in the aggregate, to a single borrower an amount in excess of 10% of their Tier 1 Capital (Patrimonio Técnico) if the only security for such operation is the borrower’s equity. Nevertheless, commercial banks can lend to a single person an amount equivalent to 25% of their Tier 1 Capital (Patrimonio Técnico), as long as such loan is secured by eligible collateral and sufficient to secure a risk exceeding 5% of such equity.
Notwithstanding the general rule set above regarding the lending limit of 10%, Decree 816 of 2014 was issued to promote the financing of fourth generation road concessions (concesiones de cuarta generación), and establishes that commercial banks can lend to a single borrower who is pursuing a fourth generation concession, a sum up to 25% of our Tier 1 Capital (Patrimonio Técnico).
Fourth generation concessions is a governmental program issued under the current administration of President Santos, through which the government plans to execute the construction of road infrastructure projects in association with private entities.
Decree 2555 of 2010 sets a maximum limit for risk concentrated in one single party, equivalent to 30% of a bank’s technical capital, the calculation of which includes loans, leasing operations and equity and debt investments.
Pursuant to Title VI, Book 36 of Part II of Decree 2555 of 2010, a bank may not make a loan to any shareholder that holds directly more than 10% of its share capital for one year after such shareholder reaches the 10% threshold. In no event may a loan to a shareholder holding, directly or indirectly, 20% or more of a bank’s share capital exceed 20% of a bank’s technical capital. In addition, no loan to a single financial institution may exceed 30% of a bank’s technical capital, with the exception of loans funded by Colombian development banks for which no limit exists.
If a financial institution exceeds these limits, the Superintendency of Finance may impose a fine equal to up to twice the amount by which any such loan exceeded the limit and, in some cases, there may be criminal sanctions. No concentration limits apply to Grupo Aval on a consolidated basis.
The Colombian Central Bank also has the authority to establish maximum limits on the interest rates that commercial banks and other financial institutions may charge on loans.
At December 31, 2016, pursuant to Decree 2555 of 2010, our banks were subject to the following lending limits for unsecured and secured loans: Banco de Bogotá’s lending limit per borrower on an unconsolidated basis was Ps 1,497.3 billion for unsecured loans and Ps 3,743.2 billion for secured loans. Banco de Occidente’s lending limit per borrower on an unconsolidated basis was Ps 378.4 billion for unsecured loans and Ps 946.0 billion for secured loans, Banco Popular’s lending limit per borrower on an unconsolidated basis was Ps 205.8 billion for unsecured loans and Ps 514.6 billion for secured loans, and Banco AV Villas’ lending limit per borrower on an unconsolidated basis was Ps 111.9 billion for unsecured loans and Ps 279.7 billion for secured loans.
Reserve Requirements
Commercial banks are required by the Board of Directors of the Colombian Central Bank to satisfy reserve requirements with respect to deposits and other cash demands. These reserves are held by the Colombian Central Bank in the form of cash deposits. According to External Resolution 11 of 2008, as amended by External Resolution 5 of 2015, the reserve requirements for Colombian banks are measured bi-weekly and the amounts depend on the class of deposits.
The reserves of credit institutions range between zero and 11.0%. For example, credit institutions must maintain reserves of 11.0% for checking accounts and savings deposits, reserves of 4.5% for term deposits with a maturity of less than 540 days, and no reserves for term deposits with a maturity of more than 540 days.
Credit institutions must maintain these reserves in their accounts at the Colombian Central Bank or in cash.
Foreign Currency Loans
Colombian residents may only obtain foreign currency loans from foreign entities that obtain a code from the Colombian Central Bank. Such code has to be requested from the foreign exchange intermediary by the resident that wishes to obtain a loan from foreign entities or foreign individuals. Foreign currency loans must be either channeled through foreign exchange intermediaries (such as Colombian financial institutions) or deposited in offshore compensation accounts (i.e., specially designated accounts at foreign banks held by Colombian residents and registered before the Colombian Central Bank).
Under regulations issued by the Colombian Central Bank, every Colombian resident and institution borrowing funds in foreign currency is generally required to post with the Colombian Central Bank non-interest—bearing deposits for a specified term; however the percentage of the required deposit is currently zero. No such deposits would be required for foreign currency loans aimed at financing Colombian investments abroad or for short-term exportation loans (provided the loan is disbursed against the funds of Banco de Comercio Exterior—Bancoldex).
In addition, pursuant to Law 9 of 1991, the Board of Directors of the Colombian Central Bank is entitled to impose conditions and limitations on the incurrence of foreign currency indebtedness in order to avoid pressure in the foreign exchange market.
Law 1607 of 2012 has established that loans obtained abroad by banks incorporated under the laws of Colombia are not considered national source income for income tax purposes.
Restrictions on Foreign Investment in Colombia
Colombia’s foreign investment statute regulates the manner in which non-residents are permitted to invest in Colombia and participate in the Colombian securities market. Among other requirements, Colombian law requires foreign investors to register certain foreign exchange transactions with the Colombian Central Bank and obtain authorization for certain types of investments. Certain foreign exchange transactions, including those between residents and non-residents, must be made through authorized foreign exchange intermediaries.
Non-residents are permitted to hold portfolio investments in Colombia, through a registered stock brokerage firm, a trust company or an investment firm. Investors would only be allowed to transfer dividends abroad after the foreign investment registration procedure with the Colombian Central Bank has been completed. The failure of a non-resident investor to report or register foreign exchange transactions with the Colombian Central Bank relating to investments in Colombia on a timely basis may prevent the investor from remitting dividends, or an investigation that may result in a fine, may be commenced.
Allowance for Loan Losses
Under Colombian IFRS, calculation of allowances for loan losses in the separate financial statements of Colombian credit institutions differs from the way in which such allowances are calculated in their consolidated financial statements. Separate financial statements of credit institutions must follow the Superintendency of Finance guidelines relating to allowances for loan losses established in the Basic Accounting and Financial Circular, which refer to the adoption by credit institutions of theSistema de Administración de Riesgo de Crédito(credit risk administration system), or “SARC,” (for its initials in Spanish).
The SARC adopted by each credit institution must contain policies and procedures defining the manner in which the institution assesses, evaluates, classifies, grades, controls and covers credit risk. Management must adopt policies and procedures to ensure adequate risk management in connection with the establishment of allowances and of lending and continuous monitoring standards.
Under the current model of allowances for loan losses for separate financial statements under Colombian IFRS, loans must be classified and graded in five different categories, from “A” to “E” as established by the Superintendency of Finance. Loans classified in category “A” are considered “normal” or “ordinary,” with a regular credit risk. Loans classified in category “B” are those considered to have an acceptable risk. In category “C,” institutions must include loans with an appreciable risk, while in category “D,” loans with a significant or material credit risk. Finally, loans that are not able to be recovered, or that have a reduced chance of being recovered, must be classified in category “E.” Each bank must follow this system.
The Superintendency of Finance’s guidelines specify the criteria for classifying loans, including type of loan (i.e., commercial, consumer, mortgage or microcredit loans), age of loan, term of default and variation of the credit risk of the debtor (by determining repayment capability and payment record). Credit institutions are also required to apply specific allowances to particular categories of loans, which are calculated as a percentage of the outstanding balance using the Superintendency of Finance´s reference model.
For mortgage loans and microcredit loans a general allowance for loan losses of 1% of the principal amount must be established for each mortgage and microcredit loan. In addition to the general allowance, individual allowances for loan losses must be established.
The following table presents the minimum individual allowance for mortgage loan losses applicable to separate financial statements of Colombian credit institutions, as established by the Superintendency of Finance.
| Credit category | | Percentage of
allowance over
the guaranteed
portion of the
loan | | | Percentage of
allowance over
the non-
guaranteed
portion of the
loan | |
| A | | | 1.0 | | | | 1.0 | |
| B | | | 3.2 | | | | 100.0 | |
| C | | | 10.0 | | | | 100.0 | |
| D | | | 20.0 | | | | 100.0 | |
| E | | | 30.0 | | | | 100.0 | |
The following table presents the minimum individual allowance for microcredit loan losses applicable to separate financial statements of Colombian credit institutions.
| Credit grade | | Minimum
Allowance
Percentage(1) | | | Minimum
Allowance
Percentage(2) | |
| A | | | 0.0 | | | | 1.0 | |
| B | | | 1.0 | | | | 2.2 | |
| C | | | 20.0 | | | | 0.0 | |
| D | | | 50.0 | | | | 0.0 | |
| E | | | 100.0 | | | | 0.0 | |
| (1) | Allowance percentage that will be applied over the balance due on the loan, after discounting the value of acceptable guarantees, taking into account the rules provided in Annex 1 of Chapter II of Basic Accounting and Financial Circular. |
| (2) | Allowance percentage that will be applied over the balance due on the loan, without discounting the value of acceptable guarantees. |
In any case, the minimum individual allowance for credit losses corresponds to the sum of:
| 1. | The allowance percentage applicable to the balance due, net of the value of acceptable guarantees; and |
| 2. | The allowance percentage applicable to the entire balance due on the loan. |
For consumer and commercial loans, Annex 3 to Chapter II of the Basic Accounting and Financial Circular issued by the Superintendency of Finance, establishes that financial institutions which provide consumer and commercial loans may prepare internal lending models which classify and qualify all consumer and commercial loans granted by said entity, in order to constitute non-performing loan allowances (that includes countercyclical parameters) reflecting the classification and qualification set in the model.
Under this regulation, each financial institution may submit its own internal models for the review (and non-objection opinion) of the Superintendency of Finance. However, if an entity does not submit such internal models or if they are objected to by the Superintendency of Finance, the reference models contained in the Basic Accounting and Financial Circular must be applied to their lending activities.
With respect to consolidated financial statements of Colombian credit institutions, the calculation of allowances for loan losses under Colombian IFRS is similar to the way in which such allowances are treated under IFRS. Consolidated financial statements of credit institutions observe the following rules with respect to allowances for loan losses:
With respect to the entire loan portfolio, in accordance with IAS 39 financial institutions must evaluate at the end of each accounting period if there exists objective evidence of the impairment of a loan measured in accordance with the amortized cost methodology. Impairment indicators include significant economic difficulties faced by the borrower, payment default and the probability that the borrower will seek protection from creditors. If impairment is determined, a loan loss provision charged to income is calculated as follows:
For loans deemed individually significant and impaired, an individual analysis is effected in accordance with IAS 39, which takes into consideration the amortization schedule, collateral and information from credit bureaus. A loan is considered impaired when based on historic and current information and events, it is concluded that a
probability exists that the lender will be unable to collect in full the amounts owed as per the loan agreement including interest and commissions. When a loan has been identified as impaired the value of the loss is measured as the difference between the book value of the loan and the present value of expected future flows (taking into consideration the condition of the borrower), discounted using the interest rate initially established on the loan, or the present value of the collateral that guarantees the loan (after deducting the estimated selling costs of the collateral) when it is concluded that the fundamental source of repayment is the sale of the collateral. For the calculation of allowances for loans considered individually significant, based on their guarantee, estimates of the fair value of such guarantee are established using independent expert appraisers.
For those loans which are not individually significant and for loans individually significant but not impaired, a collective assessment is effected, with loans grouped together by segments having similar characteristics, using statistical assessment techniques based on the analysis of historical losses to determine an estimate of percentage of losses which have been incurred in such assets as of the date of the financial statements, but which have not been identified on an individual basis.
For the calculation of incurred losses of loan portfolios analyzed collectively, statistical models are utilized which take into consideration four fundamental factors: exposure, probability of default, loss identification period and loss given default.
The calculation process includes analyses of specific, historical and subjective components. The methodologies utilized include the following elements: a) A detailed periodical analysis of the loan portfolio, b) A credit classification system by risk levels, c) A periodical review of the summary of allowances for impairment losses, d) Identification of loans to be evaluated individually due to impairment, e) Consideration of internal factors such as our size, organizational structure, loan portfolio structure, loan administration process, analysis of overdue portfolio and experiences of historical losses, f) Consideration of risks inherent to different types of loans, g) Consideration of external factors, including local, regional and national, as well as economic factors.
Public Tender Offer Rules
Pursuant to Colombian law, the acquisition of the beneficial ownership of 25.0% or more of the outstanding shares with voting rights of a listed company, or the purchase of 5.0% or more of the outstanding shares with voting rights by a shareholder or group shareholders beneficially owning 25.0% or more of such outstanding shares of a listed company, should be made pursuant to the public tender offer rules. The preferred shares offered hereby are not shares with voting rights for purposes of this requirement.
Under Article 6.15.2.1.1 of Decree 2555 of 2010, any entity or group of entities ultimately representing the same beneficial owner, directly or through one or more intermediaries, may only become the beneficial owner of more than 25.0% of the outstanding shares with voting rights of a company that is publicly traded in Colombia by making a tender offer directed to all holders of such shares of that company, following the procedures established by the Superintendency of Finance.
Moreover, any beneficial owner of more than 25.0% of the outstanding shares with voting rights of a company who wants to acquire additional shares of the company representing more than 5.0% of the company’s outstanding shares with voting rights may only do so by making a tender offer directed to all holders of such company’s shares, following the procedures established by the Colombian Superintendency of Finance.
These requirements do not need to be met in certain circumstances described in Article 6.15.2.1.2 of Decree 2555 of 2010, including: (1) if the purchase is approved by 100% of the holders of the outstanding shares of the company, (2) if the purchaser acquires the percentages indicated above through an offer in a privatization process, (3) if the company reacquires its own shares or (4) if the company issues voting shares, among others.
Sales of Publicly Traded Stock
Any transaction involving the sale of publicly traded stock of any Colombian company, including any sale of our preferred shares for the peso equivalent of 66,000 UVRs (approximately U.S.$5,332.7) or more must be effected through the Colombian Stock Exchange. At December 31, 2016, one UVR equaled Ps 242.5 and 66,000 UVRs equal Ps 16,001,786.
Intervention Powers of the Superintendency of Finance – Bankruptcy Considerations
Pursuant to Colombian banking regulations, the Superintendency of Finance has the power to intervene in the operations of a bank in order to prevent it from, or to control and reduce the effects of, a bank failure.
The Superintendency of Finance may intervene in a bank’s business: (1) prior to the liquidation of the bank, by taking precautionary measures in order to prevent the bank from being taken over by the Superintendency of Finance, or (2) to take possession of the bank to either administer the bank or order its liquidation, depending on the severity of the situation.
The purpose of taking possession is to allow the Superintendency of Finance to decide: (1) whether the entity should be liquidated, (2) whether it is possible to place it in a position to continue doing business in the ordinary course, or (3) whether other measures may be adopted to secure better conditions so that depositors, creditors and investors may obtain the full or partial payment of their credits.
If the Superintendency of Finance takes possession of a bank, FOGAFIN must appoint a special agent (who must be accepted by the Superintendency of Finance) to administer the affairs of the bank during such process and until the bank is ordered to be liquidated or the entity is reestablished to continue doing business in the ordinary course.
During the period of the Superintendency of Finance’s possession (which ends when the liquidation process begins), Colombian banking laws prevent any creditor of the bank from (1) initiating any procedure for the collection of any amount owed by the bank, (2) enforcing any judicial decision rendered against the bank to secure payment of any of its obligations, (3) placing a lien or attachment on any of the assets of the bank to secure payment of any of its obligations, or (4) making any payment, advance or compensation or assuming any obligation on behalf of the bank, with the funds or assets that may belong to it and are held by third parties, except for payments that are made by way of set-off between regulated entities of the Colombian financial and insurance systems.
In the event that the bank is liquidated, the Superintendency of Finance must, among other measures, provide that all term obligations of the bank are due and payable at the date when the order to liquidate becomes effective.
During the liquidation process bank deposits and other types of saving instruments will be excluded from the liquidation process and, claims of creditors, as a general rule, rank as follows: (i) the first class of credits includes the court expenses incurred in the interest of all creditors, wages and other obligations related with employment contracts and tax authorities’ credits regarding national and local taxes; (ii) the second class of credits comprises the credits secured by a security interest on movable assets; (iii) the third class of credits includes the credits secured by real estate collateral, such as mortgages; (iv) the fourth class of credits contains some other credits of the tax authorities against the debtor that are not included in the first class of credits and credits of suppliers of raw materials and input to the debtor; and (v) finally, the fifth class of credits includes all other credits without any priority or privilege; provided however, which among credits of the fifth class, subordinated credits shall be ranked junior to the external liabilities (pasivos externos) senior only to capital stock. Each category of creditors will collect in the order indicated above, whereby distributions in one category will be subject to completing full distribution in the prior category.
Troubled Financial Institutions – Deposit Insurance
Subject to specific limitations, FOGAFIN is authorized to provide equity and/or secured loans to troubled financial institutions and to insure deposits of commercial banks and certain other financial institutions. In 1998 and 1999, to address the adverse effects of the economic crisis, certain regulations were adopted, among others, Law 546 of 1999 (Ley de Vivienda) and Law 550 of 1999 (Ley de Reactivación Económica).
To protect the customers of commercial banks and certain financial institutions, Resolution No. 1 of 1988 of FOGAFIN, as amended by Resolutions 1, 3 and 4 of 2012, Resolution 1 of 2013, Resolutions 1, 2, 3 and 5 of 2014 and Resolution 1 of 2015, requires mandatory deposit insurance. Under this resolution, banks must pay an annual premium of 0.3% of total funds received on savings accounts, checking accounts, certificates of deposit, special savings deposits, mortgage bonds, special accounts, bank collection services and electronic deposits. If a bank is liquidated, the deposit insurance will cover the funds deposited by an individual or corporation with such bank, up to a maximum of Ps 20 million, regardless of the number of accounts held.
Anti-Money Laundering Provisions
The regulatory framework to prevent and control money laundering is contained in, among others, the EOSF, Chapter 11 of Title I of Legal Basic Circular (Circular Básica Jurídica), as amended, issued by the Superintendency of Finance, as well as Law 599 of 2000 (the Colombian Criminal Code).
Colombian laws adopt the latest guidelines related to anti-money laundering and other terrorist activities established by the Financial Action Task Force on Money Laundering, or “FATF.” Colombia, as a member of the GAFI-SUD (a FATF-style regional body) follows all of FATF’s 40 recommendations and eight special recommendations.
Anti-money laundering provisions have been complemented with provisions aimed at deterring terrorism financing. For that purpose, by means of Circular 26 of 2008 (which amended the Circular Básica Jurídica), the Superintendency of Finance has issued regulations requiring the implementation by financial institutions of a system of controls for money laundering and terrorism financing.
The requirements include “know your customer” rules and procedures to protect financial institutions from being used directly by shareholders and executives in money laundering activities, for channeling funds for terrorist activities, or for the concealment of assets from such activities; these rules and procedures set forth detailed instructions for monitoring these risks.
Chapter 13 of Title I of Legal Basic Circular, as amended, issued by the Superintendency of Finance and applicable to issuers of securities in the capital markets, provides rules and guidelines regarding the prevention of money laundering and terrorism financing.
Finally, the Colombian Criminal Code introduced criminal rules and regulations to prevent, control, detect, eliminate and prosecute all matters related to financing terrorism and money laundering. The criminal rules and regulations cover the omission of reports on cash transactions, mobilization or storage of cash, and the lack of controls.
Pension Fund Solvency Measures
On July 19, 2012, Decree 1548 of 2012 which amends Decree 2555 of 2010, introduces a new measure of solvency for pension fund administrators, which sets technical capital (patrimonio técnico) at a total of 9% of exposure to operational risk. “Exposure to operational risk” is defined as the product of multiplying 100/9 by the sum of:
| · | 16% of fee income from mandatory pension funds; |
| · | 16% of fee income from severance funds; |
| · | 0% of fee income from voluntary pension funds; and |
| · | 1/48 of all other funds managed by pension fund administrators. |
Furthermore, Decree 1895 of September 11, 2012 includes 13% of the fee income from the administration of funds belonging to theFondo Nacional de Pensiones de las Entidades Territoriales - FONPET to the sum that must be multiplied by 100/9 to determine a pension fund administrator’s “Exposure to operational risk.”
Insolvency Law
On July 12, 2012, the Colombian Congress enacted Law 1564, which provides insolvency protection for non-merchant individuals. Under the new insolvency regulation, which came into effect on October 1, 2012, once a non-merchant individual has ceased paying his or her debts, which individual can initiate a voluntary insolvency proceeding before a notary public or mediator to reach an agreement with his or her creditors. The terms of any agreement reached with two or more creditors that represent more than 50% of the total amount of the claims against such individual will be mandatorily applicable to all relevant creditors. The law also provides for increased debtor protections, including an automatic stay for a maximum of 90 days.
Prepayment of Credit Operations Without Penalty
On July 9, 2012, the Colombian Congress enacted Law 1555, allowing consumers of financial services to prepay obligations denominated in pesos owed to financial institutions, without incurring in any penalty. Law 1555 also requires that financial institutions disclose the possibility of such prepayment to borrowers prior to the extension of any loan.
Law 1555 does not apply to (i) mortgage loans, for which prepayment is always allowed according to Law 546 of 1999, (ii) loans having a balance that exceeds 880 times the legal monthly minimum wages, or (iii) to financial obligations acquired prior this law’s effective date (July 9, 2012), and for which prepayment will continue to be governed by the relevant contractual provisions, or absent an agreement by the parties, by the laws in force at the time when the relevant agreement was executed.
Data Protection Law
On October 17, 2012, Law 1581 of 2012 introduced a new data protection regime that applies to any person that administers databases in Colombia, and this Law was regulated on June 27, 2013 by Decree 1377 of 2013 and Decree 886 of 2014. Although it does not apply in its entirety to financial institutions, it provides a set of principles (legality, freedom, truth or quality, transparency, access, confidentiality, among others) that apply to us in the administration of our databases. Additionally, there is a general prohibition of transferring personal data to other countries that do not provide adequate levels of data protection according to the standards set by the Superintendency of Industry and Commerce. This prohibition does not apply to transfers of data that are inherent to banking and securities activities under the applicable law.
Regulation on Liens Over Movable Assets
On August 20, 2013, the Colombian Congress enacted Law 1676 with the purpose of increasing the public access to credit by providing a new regulation on liens over movable assets. Law 1676 introduced substantial modifications to Colombian regulation on liens over movable assets, including: (a) the creation of a single unified lien public registry, (b) the ability for creditors to directly foreclose on the secured assets for a value determined in an appraisal conducted by an independent expert appointed by the Superintendency of Companies, (c) the ability for creditors to enforce the security upon insolvency of the debtor, provided that the movable assets are not essential for the continuing of business of the insolvent debtor, and (d) an upgrade of priority upon liquidation.
Regulation on Payroll Loans
On April 27, 2012, the Colombian Congress enacted Law 1527, as amended by Law 1607 of 2012, which consolidated the then existing regulatory framework on payroll deduction loans. Under Law 1527 of 2012, payroll loans are secured by an irrevocable order or authorization from the clients to their respective employers or to the entity that pays their salary or other financial benefits arising from their employment to directly pay the loan. As opposed to the prior regulatory regime, employers may currently freely determine the financial institution granting the relevant financial product or service. Likewise, Law 1527 of 2012 provides that the employer is jointly and severally liable for the employee’s payment obligation.
Tax Reforms
Law 1607 of 2012
On December 26, 2012, the Colombian Congress enacted Law 1607, introducing a series of reforms to the Colombian tax system, which came into effect in 2013. Law 1607 of 2012 created a new income tax, denominated income tax for equality, or “CREE,” levied on the fiscal year’s gross revenues (excluding windfall amounts) less returns, rebates, and discounts; certain types of income; costs; certain deductions; and income exempt under the Andean Pact.
The CREE tax rate was initially set at 9% for the years 2013, 2014 and 2015. Subject to certain deductions, the CREE tax rate was amended in 2014 by Law 1739 of 2014, to reflect a surcharge resulting in a rate of 14% for 2015, 15% for 2016, 17% for 2017 and 18% for 2018. The CREE tax was levied on Colombian corporations and legal entities that have the obligation to file an income tax return in Colombia, such as us and our subsidiaries, as well as on foreign entities that have the obligation to file an income tax return in Colombia. Additionally, Law 1607 of 2012
reduced the general income tax rate from 33% to 25% for companies incorporated in Colombia and for the domestic source income earned by their branches and permanent establishments in Colombia.
Law 1607 of 2012 further established rules concerning the tax basis of assets and capital stock and amended prior rules to determine when dividends or share participations are not subject to tax, and also provided for a transition to IFRS. It also introduced a series of changes to the VAT rates, which positively affect our business and the business of our subsidiaries, by lowering the VAT rate from 16% to 0% on the purchase and sale of foreign currency as well as on financial derivatives and has a less favorable effect by establishing a 16% VAT rate for leasing agreements, compared to the 10% rate in force before the reform, generating higher costs for these operations.
Other reforms concerning financial institutions included the introduction of amendments to taxes on foreign capital investment portfolio income. Law 1607 of 2012 also provided that indebtedness obtained abroad by financial cooperatives, commercial finance companies, as well as certain government-owned finance agencies such as Bancoldex, Finagro and Findeter, does not generate income for Colombian tax purposes and is not deemed to be held in Colombia, as was already the case for banks and financial corporations. Furthermore, this law set forth that the returns generated by the stabilization reserve maintained by pension fund managers would be exempted from income tax, with a positive impact for Porvenir, taking into account that the stabilization reserve is equivalent to 1.00% of the funds it manages.
Finally, some rules designed for individual taxpayers, for example, the imposition of more burdensome conditions for obtaining tax deductions for contributions made to the voluntary pension funds and to the savings accounts for the promotion of construction, may also have a significant effect on the business of financial institutions. See “Item 3. Key information—A. Selected financial and operating data—Risk factors—Risks relating to Colombia and other countries in which we operate—New or higher taxes resulting from changes in tax regulations or the interpretation thereof Colombia and other countries in which we operate could adversely affect our results of operations and financial condition.”
Law 1739 of 2014
On December 23, 2014, the Congress of Colombia enacted Law 1739, which added a new net worth tax on the wealth of corporate entities, or the “Wealth Tax”, and the extra charge on the CREE as explained above. Law 1739 of 2014 introduced modifications to various aspects of tax regulation in Colombia and introduced, among other things, the Wealth Tax (Impuesto a la Riqueza) calculated over the net assets under accounting fiscal basis. During 2015, 2016 and 2017, in the case of companies resident in Colombia, and 2015, 2016, 2017 and 2018 in the case of Colombian individuals, thisImpuesto a la Riqueza, or Wealth Tax, will be calculated over net equity as determined on January 1 of each of the respective years (subject to certain exclusions such as equity investments) according to tax accounting bases at rates between 0% to 1.5%, adjusted yearly.
For Colombian IFRS accounting purposes, this new tax obligation may be recorded against retained earnings instead of net income for the respective year. Accordingly, Grupo Aval has recorded this tax obligation against retained earnings. Under IFRS this tax obligation was recorded in the income statement.
Law 1819 of 2016
In addition to the tax reforms introduced in 2012 and 2014, on December 29, 2016, the Colombian Congress enacted Law 1819, introducing substantial changes to the then current tax legal framework, including among others, the following:
| · | Taxation on Dividends:Dividends distributed from profits generated from January 1, 2017 onwards will be subject to a withholding tax as follows: |
| o | In the case of Colombian-Resident Individuals: a. No withholding tax will apply if the dividends received do not exceed 600 UVTs (equivalent to Ps 19,115,400 (U.S.$6,370.29)), b. a 5% withholding tax will apply for dividends received between 600 UVTs (defined below) and 1000 UVTs (equivalent to Ps 31,859,000 (U.S.$10,617.25)) and c. a 10% withholding tax will apply for dividends received in excess of 1000 UVTs. However, to the extent the dividend distribution is made out of profits that were not taxed at the entity level (i.e. because of the application of some tax benefit), the distribution will be subject to a 35% withholding tax. In such case, the applicable dividend tax withholding will apply to the distributed amount, net of the 35% withholding. |
| o | In the case of Non Colombian-Resident Individuals and Foreign Corporations: As a general rule, a 5% withholding tax will apply to dividends paid to Non-Colombian individuals and Foreign Corporations. However, to the extent the dividend distribution is made out of profits that were not taxed at the entity level (i.e. because of the application of some tax benefit), the distribution will be subject to a 35% withholding tax. In such case, the applicable 5% tax withholding will apply to the distributed amount, net of the 35% withholding. |
“UVT” or “Unidad de Valor Tributario” refers to a tax unit established each year by the Colombian Tax Authority (“DIAN”) for the calculation of tax returns. UVT for 2017 amounts to Ps.31,859 (U.S.$10.62).
| · | Corporate Income Tax:Law 1819 of 2016 merged the income tax for equality (or CREE, established in 2012 by Law 1607) into the general income tax, establishing a single income tax. This single income tax rate is 34% for 2017 and 33% for 2018 and thereafter. In addition, the tax reform established a surtax of 6% and 4% for 2017 and 2018, respectively, which applies on taxable income in excess of Ps800 million (approx. U.S.$266,000). This change implies that the corporate income tax rate in Colombia will decrease from 40% in 2016 and 2017 to 33% in 2019, as explained below: |
| Tax Item | | 2016 | | | 2017 | | | 2018 | | | 2019
onwards | |
| Income Tax | | | 25 | % | | | 34 | % | | | 33 | % | | | 33 | % |
| CREE | | | 9 | % | | | 0 | % | | | 0 | % | | | 0 | % |
| Surtax | | | 6 | % | | | 6 | % | | | 4 | % | | | 0 | % |
| Total Nominal Tax | | | 40 | % | | | 40 | % | | | 37 | % | | | 33 | % |
| · | Value Added Tax:The reform generally set the VAT rate at 19%, providing a 5% rate for certain goods and services. Most of the basic goods, however, were declared exempt of the VAT. |
| · | Non-cooperative jurisdictions with low or no taxation and preferential tax regimes: The reform established a new legal framework that replaces the tax havens regime, and provides that certain jurisdictions may be subject to tax haven treatment. The new legal framework establishes a higher tax-withholding rate on Colombian source payments to those jurisdictions and entities considered part of a preferential tax regime. |
| · | Controlled Foreign Companies (“ECE”): Law 1819 of 2016 establishes a Controlled Foreign Companies regime. This regime will only apply to Colombian tax residents (individuals or entities) that directly or indirectly hold a stake equal to or greater than 10% of the capital of a foreign entity or its profits. Controlled Foreign Companies include investment vehicles, such as subsidiaries, trusts, collective investments funds, and private interest foundations that comply with the conditions to be considered as related parties for transfer pricing purposes. Among others, for income tax purposes, net profits derived from passive income obtained by a Controlled Foreign Company will be recognized by Colombian taxpayers immediately in proportion equivalent to their participation in the Controlled Foreign Company’s capital or profits. |
| · | Automatic exchange of information:The reform authorizes the Colombian Tax Authorities, under certain circumstances, to collect the information necessary to comply with the automatic exchange of tax information under the international agreements. For these purposes, the beneficial owner must be an individual (not an entity) that either: (i) holds, directly or indirectly, effective control of the entity; (ii) benefits, directly or indirectly from the entity's activities or operations; or (iii) possesses, directly or indirectly, 25% or more of the entity's capital or votes. |
| · | Income tax for individuals:Law 1819 of 2016 eliminates the alternative minimum tax (IMAN) and simplified alternative and minimum tax (IMAS), returning to an ordinary income tax system and creating a new tax system in which the income received by individuals are classified according to their nature (Labor income, Pensions, Working capital, Non-labor income and Dividends and participations). The reform imposed the following income tax rates: a maximum rate of 33% on labor and pension income, a maximum rate of 35% on non-labor income and working capital categories, a rate of 35% for non-residents, a maximum rate of 10% for distributions (to tax residents) of dividends that were not taxed at a corporate level and 35% for distributions taxed at the corporate level. |
Regulatory Framework for Non-Financial Subsidiaries
All of our Colombian subsidiaries listed in Note 1 to our audited consolidated financial statements that are not part of the financial sector are governed by the laws and regulations of the Colombian Civil Code and the Colombian Code of Commerce, as well as any regulations issued by the Colombian Superintendency of Industry and Commerce and the Superintendency of Corporations or any other type of special regulations that may be applicable to corporations, and the commercial and industrial activities carried out by these subsidiaries.
Service of process and enforcement of judgments
Grupo Aval is incorporated under the laws of Colombia. All of our directors and officers reside outside the United States. Substantially all of our assets are located outside the United States, primarily in Colombia. As a result, it may not be possible, or it may be difficult, for you to effect service of process upon us or these other persons within the United States or to obtain recognition and enforcement of judgments obtained in U.S. courts against us or them, including those predicated upon the civil liability provisions of the U.S. federal securities laws or otherwise.
The Colombian Supreme Court will determine whether to recognize a U.S. judgment predicated on the U.S. securities laws through a proceeding known under Colombian law as “exequatur.” Enforcement of U.S. judgments may require a separate court procedure in Colombia. After the exequatur has been granted, if the judicial decision imposes an obligation to pay a sum of money or to comply with certain obligations, an executive judicial proceeding (proceso ejecutivo) before a local court is available. Such proceeding would follow the same rules applicable for the enforcement of local judicial decisions.
The Colombian Supreme Court will recognize a foreign judgment, without reconsideration of the merits, only if the judgment satisfies the requirements of Articles 605, 606 and 607 of Law 1564 of 2012 (Código General del Proceso), provided that the parties affected by the judgment were summoned in the exequatur proceedings in accordance with applicable rules. Law 1564 of 2012 provides that the foreign judgment will be recognized if:
| · | a treaty or convention exists between Colombia and the country where the judgment was granted relating to the recognition and enforcement of foreign judgments or, in the absence of such treaty or convention, there is reciprocity in the recognition of foreign judgments between the courts of the relevant jurisdiction and the courts of Colombia; |
| · | the foreign judgment does not refer to “in rem” rights vested in assets that were located in Colombia at the time the suit was filed in the foreign court which issued the judgment; |
| · | the foreign judgment does not contravene or conflict with Colombian laws relating to public order (i.e. provision considered to be international public policy) other than those governing judicial procedures; |
| · | the foreign judgment is final and not subject to appeal in accordance with the laws of the country in which it was obtained. The copy of the judgment provided to the Colombian Supreme Court must be authenticated and legalized by a Colombian Consul and translated into Spanish by an authorized translator, duly registered at the Ministry of Foreign Affairs; |
| · | the foreign judgment does not refer to any matter upon which Colombian courts have exclusive jurisdiction; |
| · | no proceedings are pending in Colombia with respect to the same cause of action, and no final judgment has been awarded in any proceeding in Colombia on the same subject matter and between the same parties; |
| · | in the proceedings commenced in the foreign court that issued the judgment, the defendant was served properly in accordance with the applicable laws in such jurisdiction, and was given a reasonable opportunity to defend itself against the action; and |
| · | the Colombian Supreme Court has granted exequatur upon the foreign judgment. |
The United States and Colombia do not have a bilateral treaty providing for automatic reciprocal recognition and enforcement of judgments in civil and commercial matters. The Colombian Supreme Court, which is the only Colombian court that can recognize foreign judgments, has generally accepted that reciprocity exists when it has been proven that either a U.S. court has recognized a Colombian judgment or that a U.S. court would recognize a foreign judgment, including a judgment issued by a Colombian court. However, the Colombian legal system is not based on precedents and exequatur decisions are made on a case-by-case basis.
We have appointed Banco de Bogotá S.A., New York Agency as our authorized agent upon whom process may be served in any action instituted in any U.S. federal or state court having subject matter jurisdiction in the Borough of Manhattan in New York, New York, arising out of or based upon the ADSs or the underwriting agreement related to the ADSs.
Notwithstanding the foregoing, we cannot assure you that a Colombian court would recognize or enforce a judgment issued by a state or federal court in the United States with respect to the preferred shares or ADSs based on U.S. securities laws. We have been advised by our Colombian counsel that there is no legal basis for a Colombian court to exert jurisdiction over original actions to be brought against us or our directors and executive officers predicated solely upon the provisions of U.S. securities laws. In addition, certain remedies available under U.S. securities laws may not be admitted or enforced by Colombian courts.
Grupo Aval’s articles of incorporation and by-laws contain an arbitration clause that provides for the exclusive jurisdiction of an arbitral tribunal to be seated in Bogotá, D.C., Colombia. The arbitration provision provides that any conflict arising among shareholders, or between shareholders and Grupo Aval in connection with the by-laws, must be resolved by an arbitral tribunal.
| C. | Organizational structure |
Our operations
We conduct our operations through our four banks (Banco de Bogotá, Banco de Occidente, Banco Popular and Banco AV Villas), a pension and severance fund manager (Porvenir), our merchant bank (Corficolombiana) and our Central American banking group, BAC Credomatic. For more information on our organizational structure, please see the chart presented in “Item 4. Information on the Company—B. Business overview—Our operations”.
| D. | Property, plants and equipment |
Properties
Grupo Aval does not directly own any properties at December 31, 2016. We have listed below the property holdings of each of our banking subsidiaries, Corficolombiana, Porvenir and BAC Credomatic at December 31, 2016.
| | | Number of
properties | | | Fair value | |
| | | | | | (Ps billions) | |
| Banco de Bogotá | | | 455 | | | | 543.7 | |
| Banco de Occidente | | | 174 | | | | 456.7 | |
| Banco Popular | | | 203 | | | | 418.0 | |
| Banco AV Villas | | | 132 | | | | 262.2 | |
| Corficolombiana | | | 72 | | | | 13.4 | |
| Porvenir | | | 141 | | | | 125.1 | |
| BAC Credomatic | | | 196 | | | | 581.4 | |
| Total | | | 1,373 | | | | 2,400.5 | |
ITEM 4A. UNRESOLVED STAFF COMMENTS
Not applicable.
ITEM 5. OPERATING AND FINANCIAL REVIEW AND PROSPECTS
The following discussion of our financial condition and results of operations should be read in conjunction with our consolidated financial statements at December 31, 2016 and 2015 and for the years ended December 31, 2016, 2015 and 2014, and the related notes thereto, and with the other financial information included in this annual report. The preparation of the financial statements requires the adoption of assumptions and estimates that affect the amounts recorded as assets, liabilities, revenue and expenses in the years and periods addressed and are subject to certain risks and uncertainties. Our future results may vary substantially from those indicated because of various factors that affect our business, including, among others, those identified under “Forward-Looking Statements” and “Item 3. Key Information—D. Risk factors” and other factors discussed in this annual report. Our audited consolidated financial statements at December 31, 2016 and 2015 and for the years ended December 31, 2016, 2015 and 2014 included in this annual report have been prepared in accordance with IFRS.
Principal factors affecting our financial condition and results of operations
Colombian Economic Conditions
The Colombian economy has expanded in recent years, driven by strong growth in areas such as capital investment, domestic consumption and exports. Colombian GDP grew at a CAGR of 3.7% in the five-year period ended December 31, 2016. Our operations are concentrated in Colombia, such that our results are linked to the country’s economic performance. Following the global financial crisis, GDP growth reached a peak of 6.6% in 2011, but business and consumer confidence deteriorated moderately due to global concerns related to the European debt crisis and GDP growth slowed down to 4.0% in 2012. Nonetheless, the pace of economic activity picked up the following year, partly supported by a set of countercyclical fiscal and monetary policies. The economy expanded 4.9% in 2013.
The economy continued strengthening throughout the first half of 2014, with annual growth accelerating to 5.2% compared to the first half of 2013. However, growth expectations for the second half of the year and for 2015 deteriorated due to the sharp decline in oil prices that began in August 2014. Oil accounted for more than half of Colombian exports, therefore the economy began to experience a large negative terms-of-trade shock in the following quarters. GDP growth ended up slowing to 4.4% in 2014.
Oil prices continued to drop throughout 2015, reaching levels not seen since 2004 by the end of the year and accumulating a decline of more than 70% since the beginning of the sell-off in the third quarter of 2014. Simultaneously, global financial conditions tightened considerably throughout the year, mainly due to an anticipation of the first interest rate hike by the U.S. Federal Reserve in more than nine years, which took place in December 2015, and due to increased concerns about a sharper slowdown of the Chinese economy. As a result of these large external shocks, the growth outlook for the Colombian economy deteriorated further. Actual GDP growth for 2015 was 3.1%.
In 2016, the economy felt the full effects of the large terms-of-trade shock that began in the second half of 2014 and continued its gradual adjustment, with GDP growth slowing further to 2%. Investment declined, mainly driven by the oil and mining sectors and by the effects of exchange rate depreciation on the price of imported capital goods, while the pace of government spending retrenched due to plummeting oil revenues, and that of household consumption moderated sharply due to the pass-through of exchange rate depreciation on inflation, which also led to tighter monetary policy.
For 2017, the Central Bank is expecting GDP to expand between 0.7% and 2.7%, with 2% growth as the most likely scenario, as the economy hits a trough and begins a gradual recovery.
The Colombian government presented a new tax reform in the second half of 2016, on top of the one approved in December 2014, in order to obtain additional funds and close potential deficits, especially considering the more challenging medium-term outlook for the oil sector. This tax reform, which was approved in December 2016, reduced and simplified corporate taxes. Some tax changes may affect our results of operations or financial condition in the short term but we believe they will benefit the country in the medium term.
The Colombian peso, despite showing volatility during the first half of the year, ended up only appreciating 4.7% against the U.S. dollar in 2016. We continue to be subject to impacts on our statement of income and/or statement of financial position derived from fluctuations in the rate of exchange of the Colombian peso, in particular, against the U.S. dollar, the currency in which most of our foreign long-term debt is denominated, and between the U.S. dollar and each of the currencies in our Central American operations, as 36.0% of our average consolidated assets for the year ended December 31, 2016 and 39.1% of our average consolidated liabilities for the year ended December 31, 2016 are foreign currency-denominated. On a consolidated basis, we have U.S.$3.6 million (Ps 10.8 trillion) of long-term debt denominated in U.S. dollars as of December 31, 2016.
Labor Markets
During the twelve months ended December 31, 2016, the Colombian unemployment rate increased to an annual average of 9.2% from a historic low (since the publication of employment statistics in 2001) of 8.9% at December 31, 2015, according to DANE. The participation rate (i.e., economically active population divided by working age population), a measure of labor supply, declined to an annual average of 64.5% at December 31, 2016, compared to 64.7% at December 31, 2015; while the employment rate (i.e., employed population divided by working age population), a measure of labor demand, also declined slightly to an annual average of 58.5% at December 31, 2016 from a historic high of 59% at December 31, 2015. Despite a moderate deterioration in 2016, the high employment rate is derived primarily from increased employment in the trade, construction, services and manufacturing sectors, while formal employment has increased substantially in recent years due to the reduction of labor costs enacted in the 2012 tax reform.
Interest Rates
Since the implementation of an inflation-targeting regime in 1999, the Colombian Central Bank has used its overnight lending rate as a mechanism to control inflation and inflation expectations. The following graph shows the monthly average Central Bank rate between 2010 and 2016.
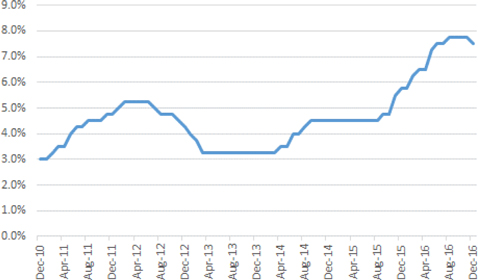
Most recently, and in order to control the inflation increase resulting from the decline in oil prices, the Central Bank increased its overnight lending rate from 4.50% to 7.75% between August 2015 and August 2016, and kept it unchanged until December 2016. After inflation began to decline, the Central Bank began to lower its rate in order to stimulate the economy. The Central Bank rate as of April 24, 2017 stands at 7.0%.
An important portion of our banking subsidiaries’ assets are linked to the DTF and the IBR rate; accordingly, changes in both rates affect our banking subsidiaries’ net interest income. The following graph shows the monthly average DTF and three-month IBR rates between 2010 and 2016:

Three-month IBR information is only available beginning in November 2012.
As seen in the graph, both the DTF and the IBR rate follow the trend of the Central Bank rate. Since the Central Bank started to hint to the market that the tightening cycle was over, both the DTF and the IBR began to anticipate the declining cycle and currently stand below the Central Bank rate.
Inflation
Lower interest rates and stable inflation generally lead to increased consumer confidence and increased consumer demand for credit. Colombian Central Bank independence, and the adoption of an inflation-targeting regime and a free-floating exchange rate regime since 1999, have contributed to declining inflation rates and increased price stability in Colombia. The inflation rate was 1.9% for 2013, the lowest annual rate since 1954, mainly due to the effects of a series of regulatory and supply shocks during the preceding 12 months. Inflation accelerated to 3.7% at December 31, 2014 as the effects of these shocks waned, coupled with stronger domestic demand throughout the first three quarters of 2014, and as the local currency depreciated substantially in the fourth quarter due to the large decline in oil prices. Inflation continued to accelerate to 6.8% at December 31, 2015 and to a 15-year high of close to 9.0% at July 31, 2016, mainly driven by the impact of El Niño weather phenomenon on food and energy prices and by the pass-through effects of a sharper exchange rate depreciation, as a result of continued weakness in oil prices and increased turmoil in global financial markets. However, the effects of exchange rate depreciation and El Niño began to fade in the second half of 2016, driving down inflation to 5.75% at December 31, 2016 and to 5.2% at February 28, 2017. The Central Bank estimates that inflation will decline further in 2017 slightly above the upper limit of its target range of 2% to 4% by the end of the year, as the effects of these supply shocks continue to wear-off, coupled with weak domestic demand. The Colombian Central Bank’s preemptive approach with respect to monetary policy has resulted in a decrease in inflation expectations in the past few years.
Credit Volumes
Credit volumes in Colombia have grown since 2005, mainly driven by the above-mentioned factors, including lower inflation rates, decreasing interest rates and consistent economic growth. At December 31, 2013, bank credit volume growth was 13.8% and 12.8% when adjusted for securitized mortgage loan data, both as reported by the Superintendency of Finance. At December 31, 2014, bank credit volume growth was 15.6% and 15.2% when adjusted for securitized mortgage loan data. At December 31, 2015, bank credit volume growth was 15.3% and 15.1% when adjusted for securitized mortgage loan data (note that as of 2015, this figure incorporates IFRS reporting). At December 31, 2016, bank credit volume growth was 12.2% and 12.1% when adjusted for securitized mortgage loan data. We believe that Colombia offers significant opportunities to expand our business due to the country’s strong economic fundamentals and low penetration rates of domestic credit to the private sector as a percentage of GDP for banking and other financial services and products in 2015 of 47.1% as compared to 67.9% for Brazil, 111.1% for Chile, 32.7% for Mexico and 37.4% for Peru, as reported in the World Bank Development Indicators.
At December 31, 2016, Colombia’s bank loans to GDP was 45.7%, showing a 157 basis points increase versus the 43.9% level in December 31, 2015.
Reserve Requirements
The Colombian Central Bank’s reserve requirements affect our banking subsidiaries’ results of operations. The raising or lowering of these requirements directly affects our banking subsidiaries’ results by increasing or decreasing the funds available for lending.
Colombian banks are required to maintain a determined level of reserves depending on the volume and mix of their deposits. These are reflected in the line item “cash and cash equivalents” on our consolidated balance sheet. During 2008, this level of cash reserves, referred to as the general minimum deposit requirement, was first increased by the Colombian Central Bank from 8.3% to 11.5% for checking accounts and savings deposits and from 2.5% to 6.0% for time deposits with maturities of up to 18 months. On October 24, 2008, it was decreased to 11.0% for checking accounts and savings deposits and 4.5% for time deposits. The reserve requirements have not changed since October 2008.
In May 2007, as a cautionary measure, the Colombian Central Bank forced banks to maintain, in addition to the general minimum deposit requirement, a marginal minimum deposit requirement of approximately 13% of total deposits that exceeded the level that each bank had at May 7, 2007. This marginal minimum deposit requirement (27% for current accounts, 12.5% for savings deposits and 5% for time deposits) was a temporary measure aimed at decreasing the level of liquidity in the market and was eliminated by the Colombian Central Bank in mid-2008. Reserve requirements have remained stable since late 2008; the Colombian Central Bank, however, has the power to modify these requirements.
Tax Policies
Changes in Colombian tax policies can significantly affect our results of operations. For 2016, the Colombian government estimates a consolidated public sector deficit of 2.4% of GDP, unchanged from 2015, and a central government deficit of 4.0% of GDP, compared to 3% of GDP in 2015, due to the ongoing decline in oil-related revenues and a further slowdown in economic activity. However, the central government deficit is expected to tighten to 3.3% of GDP in 2017 and 2.7% in 2018, as mandated by the Fiscal Rule Law.
In order to address weaknesses in fiscal accounts, the Colombian Congress enacted several laws to strengthen the fiscal regulatory regime, including the Fiscal Rule Law, along with reforms on taxes and oil and mining royalties. The improvement in the fiscal regulatory regime requires expenses to grow in line with revenues and savings from excess oil revenues, with the goal of reducing Colombian government public debt to below 30% of GDP by 2026. There can be no assurance that this goal will be achieved.
On December 29, 2016, the Congress of Colombia enacted Law 1819, a new tax reform designed to replace oil revenues and restore growth. This law reduced corporate income taxes under one unified rate, eliminated the existing wealth tax on corporate entities and introduced new taxes on dividends paid to individuals and foreign residents:
Corporate Income Tax. Until December 31, 2016, companies in Colombia had to pay an income tax rate of 25%, plus an additional income tax named “income tax for equality”, or CREE, at a rate of 9%, for a total income tax rate of 34%. The tax reform of 2014 introduced an extra charge on the CREE of 5% in 2015, 6% in 2016, 8% in 2017 and 9% in 2018, subject to certain deductions. As a result, total income tax rates increased to 39% in 2015, 40% in 2016, 42% in 2017 and 43% in 2018.
Law 1819 of 2016 eliminated the CREE and introduced a single income tax rate of 33% with a transition period during 2017 and 2018. In 2017, the income tax rate will be 34%, plus an extra charge at a marginal rate of 6% for companies whose net income exceeds Ps 800 million, for a total income tax rate of 40%. In 2018 the income tax rate falls to 33%, plus an extra charge at a marginal rate of 4% for companies whose net income also exceeds PS 800 million, for a total income tax rate of 37%. The new income tax rate will be calculated under IFRS accounting basis.
Wealth Tax (Impuesto a la Riqueza).Until December 31, 2016, a wealth tax was levied on corporate entities. During 2015, 2016 and 2017, in the case of companies, and 2015, 2016, 2017 and 2018, in the case of individuals, this Wealth Tax was calculated over net equity as of January 1st of each of the respective years (subject to certain exclusions such as equity investments), according to tax accounting basis, at rates between 0.4% and 1.5%, adjusted every year. Under Colombian IFRS, this tax obligation could be recorded against retained earnings instead of net income for the respective year. Under Full IFRS, this tax obligation impacted net income. Law 1819 eliminated this tax.
Taxes on dividends. Law 1819 introduced new taxes on dividends on ordinary and preferred shares. Payments to Colombian-resident individuals exceeding Ps 18 million will be taxed at a marginal rate of 5% and those exceeding Ps 30 million will be taxed at a marginal rate of 10%, while those to Colombian corporations will not be taxed. Payments to foreign residents, both individuals and corporations, will be taxed at a rate of 5%. Nonetheless, regarding foreign residents, if the dividend distribution is made out of profits that were not taxed at the entity level (i.e., because of the application of some tax benefit), the distribution will be subject to a 35% withholding tax. In such case, the 5% dividend tax will apply to the distributed amount, net of the 35% withholding. These taxes will be charged on net income generated from January 1, 2017 onwards.
Law 1819 also introduced other modifications to various aspects of tax regulation in Colombia, including a simplified tax code, higher VAT and consumption taxes, higher Colombian income taxes, a new, simplified tax regime for small businesses, a lower tax burden on capital, a new carbon tax on fuels, improvements in capacity and tax collection efficiency of the DIAN (local tax authority), stronger measures to fight tax evasion, and extension of the financial transactions tax beyond 2018, among others.
Central American Economic Conditions
According to the IMF, for the year ended December 31, 2016, Central America was expected to post a combined GDP of U.S.$242.3 billion, ranking as the fifth largest economy in Latin America excluding Venezuela (due to inconsistencies attributed to its multiple exchange rate regime), after Brazil (nominal GDP of U.S.$1,769.6 billion), Mexico (nominal GDP of U.S.$1,063.6 billion), Argentina (nominal GDP of U.S.$541.7 billion) and Colombia (nominal GDP of U.S.$274.1 billion).
Because BAC’s and our other Central American businesses’ operations are concentrated in Central America, their results are linked to the region’s economic performance. According to the IMF, Central America’s GDP was expected to grow 4.0% in 2016, above the expected growth rate for Colombia of 2%, and is expected to grow at an annual average rate of 4.3% between 2017 and 2019, compared to Colombia’s expected average growth rate of 3.6% during the same period. The recent stronger growth rates in Central America versus Colombia result from those countries being net importers of oil and having economies closely linked to the U.S. economy, via for example remittances. Similar to the discussion above for the Colombian economic conditions, any moderation in the Central American economy will result in a slowdown in our growth rates and could increase our delinquency ratios and provisions. We expect that weak GDP growth will slow growth of lending in our Central American operations in 2017, which will in turn limit increases in net interest income. In addition, the current decline in international oil prices and any slowdown in the Central American economy may cause a deterioration in the credit profiles of certain of our borrowers in 2017, including those in the oil and affiliated sectors, which would result in an increase in non-performing loans, a deterioration in our delinquency ratios, and increased loan loss provisions.
During the last several years, countries in Central America have increased their efforts to promote fiscal prudence and foreign investment. Countries such as Costa Rica, El Salvador, Guatemala and Nicaragua have signed agreements with the IMF under which their respective governments receive credit, subject to adopting fiscal discipline in their economic policies.
We believe that Central America offers a stable market that is expected to further converge toward an integrated economy as a result of the ongoing implementation of free trade agreements. The United States-Dominican Republic-Central America Free Trade Agreement, or “DR-CAFTA,” gradually eliminates barriers to trade and investment among Costa Rica, the Dominican Republic, El Salvador, Guatemala, Honduras, Nicaragua and the United States. The agreement allows Central American countries access to markets in the United States and establishes common regulatory standards among these countries. DR-CAFTA covers most types of trade and commercial exchange between these countries and the United States.
Critical Accounting Policies under IFRS as issued by IASB
Critical accounting policies are those policies that require us to exercise judgment or involve a higher degree of complexity in the application of the accounting policies that currently affect our financial condition and results of operations. The accounting judgments and estimates we make in these contexts require us to calculate variables and make assumptions about matters that are highly uncertain. In each case, if we had made other estimates, or if changes in the estimates occur from period to period, our financial condition and results of operations could be materially affected.
See Notes 2 and 3 to our audited consolidated financial statements for a summary of the critical accounting Judgments and Estimates and principal accounting policies and practices applicable to us. There are many other areas in which we use estimates about uncertain matters, but we believe the reasonably likely effect of changed or different estimates would not be material to our financial presentation.
Results of Operations for the Year Ended December 31, 2016 Compared to the Year Ended December 31, 2015
On June 21, 2016, Grupo Aval, Banco de Bogotá, Banco de Occidente and Banco Popular entered into the Amended Corficolombiana Shareholders’ Agreement to provide for Grupo Aval to directly control Corficolombiana. Prior to June 21, 2016, Banco de Bogotá, which held and continues to hold a 38.3% equity interest in Corficolombiana, controlled Corficolombiana. As a result of the Amended Corficolombiana Shareholders’ Agreement, Corficolombiana’s results are presented herein as a direct reporting segment of Grupo Aval and are no longer included in the Banco de Bogotá segment. The financial statements and financial information included herein for the years ended December 31, 2015 and 2014 have been retrospectively adjusted to reflect these revised segments. The change in consolidation of Corficolombiana did not have any impact on Grupo Aval’s standalone or consolidated financial statements.
Grupo Aval
Overview
The following discussion describes the main drivers of Grupo Aval’s consolidated results of operations for the year ended December 31, 2016 compared to the year ended December 31, 2015. Further detail is provided in the discussion of the results of our banking subsidiaries.
Our net income attributable to controlling interest for the year ended December 31, 2016 increased by 4.8%, or Ps 98.5 billion, to Ps 2,139.9 billion compared to the year ended December 31, 2015. Of the Ps 98.5 billion increase, Ps 123.9 billion is derived from our Central American operations, when translated to pesos (the devaluation of the average peso to dollar exchange rate accounted for Ps 59.2 billion of the increase). Our net income attributable to controlling interest from the Colombian operations decreased by Ps 25.4 billion.
The Ps 98.5 billion increase in our consolidated net income attributable to controlling interest was mainly driven by:
| (i) | a 10.0% or Ps 830.4 billion increase in net interest income. Ps 280.2 billion of such increase resulted from our Colombian operations and Ps 550.2 billion resulted from our Central American operations, when translated to pesos; |
| (ii) | a 16.3% or Ps 597.4 billion increase in net income from commissions and fees. Ps 195.6 billion of such increase resulted from our Colombian operations and Ps 401.7 billion resulting from our Central American operations, when translated to pesos; |
| (iii) | a 195.6% or Ps 479.5 billion increase in net trading income. Ps 493.2 billion of such increase resulted from our Colombian operations and was partially offset by a decrease of Ps 13.7 billion from our Central American operations, when translated to pesos; and |
| (iv) | a 9.6% or Ps 244.0 billion increase in total other income (expense). Ps 110.5 billion of such increase resulted from our Colombian operations and Ps 133.5 billion resulted from our Central American operations, when translated to pesos. |
The above-detailed increases were partially offset by:
| (i) | a 12.0% or Ps 910.7 billion increase in total other expense. Ps 333.8 billion of such increase resulted from our Colombian operations and Ps 576.8 billion resulted from our Central American operations, when translated to pesos. These increases primarily reflected a Ps 530.4 billion increase in administrative and other expenses and a Ps 419.8 billion increase in personnel expenses; |
| (ii) | a 45.9% or Ps 891.4 billion increase in net impairment loss on financial assets. Ps 617.9 billion of such increase resulted from our Colombian operations and Ps 273.6 billion resulted from our Central American operations, when translated to pesos; |
| (iii) | a 9.5% or Ps 177.9 billion increase in income tax expense. Ps 137.2 billion of such increase resulted from our Colombian operations and Ps 40.7 billion resulted from our Central American operations, when translated to pesos; and |
| (iv) | a 5.6% or Ps 72.7 billion increase in net income attributable to non-controlling interest. Ps 16.0 billion of such increase resulted from our Colombian operations and Ps 56.7 billion resulted from our Central American operations, when translated to pesos. |
The following discussion describes the main drivers of Grupo Aval’s consolidated results of operations for the year ended December 31, 2016 compared to the year ended December 31, 2015. Further detail is provided in the discussion of the results of our banking subsidiaries.
| | | Grupo Aval Consolidated | |
| | | For the year ended December 31, | | | Change December 2016 vs
December 2015 | |
| | | 2016 | | | 2015 | | | # | | | % | |
| | | (in Ps billions) | | | | | | | |
| Interest income | | | 17,547.0 | | | | 14,075.6 | | | | 3,471.4 | | | | 24.7 | |
| Interest expenses | | | (8,392.4 | ) | | | (5,751.5 | ) | | | (2,640.9 | ) | | | 45.9 | |
| Net interest income | | | 9,154.6 | | | | 8,324.1 | | | | 830.4 | | | | 10.0 | |
| Impairment loss on loans and other accounts receivable, net | | | (3,004.2 | ) | | | (2,127.7 | ) | | | (876.4 | ) | | | 41.2 | |
| Impairment loss on other assets, net | | | (117.9 | ) | | | (32.2 | ) | | | (85.8 | ) | | | 266.6 | |
| Recovery of charged-off financial assets | | | 290.4 | | | | 219.7 | | | | 70.8 | | | | 32.2 | |
| Net impairment loss | | | (2,831.7 | ) | | | (1,940.2 | ) | | | (891.4 | ) | | | 45.9 | |
| Net commission and fees income | | | 4,259.7 | | | | 3,662.3 | | | | 597.4 | | | | 16.3 | |
| Net trading income | | | 724.7 | | | | 245.2 | | | | 479.5 | | | | 195.6 | |
| Other income | | | 2,786.4 | | | | 2,542.4 | | | | 244.0 | | | | 9.6 | |
| Other expenses | | | (8,519.8 | ) | | | (7,609.1 | ) | | | (910.7 | ) | | | 12.0 | |
| Income before income tax expense | | | 5,573.8 | | | | 5,224.7 | | | | 349.2 | | | | 6.7 | |
| Income tax expense | | | (2,056.9 | ) | | | (1,879.0 | ) | | | (177.9 | ) | | | 9.5 | |
| Net Income | | | 3,516.9 | | | | 3,345.7 | | | | 171.3 | | | | 5.1 | |
| Net income attributable to: | | | | | | | | | | | | | | | | |
| Controlling interest | | | 2,139.9 | | | | 2,041.4 | | | | 98.5 | | | | 4.8 | |
| Non-controlling interest | | | 1,377.1 | | | | 1,304.3 | | | | 72.7 | | | | 5.6 | |
Net interest income
| | | Year ended December 31, | | | Change, 2016 vs. 2015 | |
| | | 2016 | | | 2015 | | | # | | | % | |
| | | (in Ps billions) | | | | | | | |
| Interest income: | | | | | | | | | | | | | | | | |
| Commercial loans and leases | | | 7,914.4 | | | | 5,768.1 | | | | 2,146.4 | | | | 37.2 | |
| Consumer loans and leases | | | 7,312.0 | | | | 6,028.2 | | | | 1,283.8 | | | | 21.3 | |
| Mortgage loans and leases | | | 1,135.9 | | | | 908.8 | | | | 227.2 | | | | 25.0 | |
| Microcredit loans and leases | | | 116.9 | | | | 107.4 | | | | 9.6 | �� | | | 8.9 | |
| Interbank and overnight funds | | | 186.2 | | | | 191.7 | | | | (5.6 | ) | | | (2.9 | ) |
| Interest on loans and leases | | | 16,665.5 | | | | 13,004.1 | | | | 3,661.4 | | | | 28.2 | |
| Interest on investments in debt securities | | | 881.5 | | | | 1,071.5 | | | | (190.0 | ) | | | (17.7 | ) |
| Total interest income | | | 17,547.0 | | | | 14,075.6 | | | | 3,471.4 | | | | 24.7 | |
| Interest expense: | | | | | | | | | | | | | | | | |
| Checking accounts | | | (258.9 | ) | | | (183.2 | ) | | | (75.7 | ) | | | 41.3 | |
| Time deposits | | | (3,413.5 | ) | | | (2,222.8 | ) | | | (1,190.7 | ) | | | 53.6 | |
| Savings deposits | | | (2,139.8 | ) | | | (1,426.2 | ) | | | (713.7 | ) | | | 50.0 | |
| Total interest expense on deposits | | | (5,812.3 | ) | | | (3,832.2 | ) | | | (1,980.0 | ) | | | 51.7 | |
| Borrowings from banks and others | | | (575.7 | ) | | | (413.8 | ) | | | (161.9 | ) | | | 39.1 | |
| Interbank and overnight funds | | | (570.2 | ) | | | (340.6 | ) | | | (229.6 | ) | | | 67.4 | |
| Bonds | | | (1,278.3 | ) | | | (1,041.1 | ) | | | (237.1 | ) | | | 22.8 | |
| Borrowings from development entities | | | (156.0 | ) | | | (123.7 | ) | | | (32.3 | ) | | | 26.1 | |
| Total interest expense | | | (8,392.4 | ) | | | (5,751.5 | ) | | | (2,640.9 | ) | | | 45.9 | |
| Net interest income | | | 9,154.6 | | | | 8,324.1 | | | | 830.4 | | | | 10.0 | |
Grupo Aval’s net interest income increased by 10.0%, or Ps 830.4 billion, to Ps 9,154.6 billion in 2016 as compared to 2015, with Ps 280.2 billion of the increase explained by the Colombian operations and Ps 550.2 billion explained by the Central American operations, when translated to pesos. The increase in net interest income was mainly due to a 24.7%, or Ps 3,471.4 billion, increase in interest income (Ps 2,685.6 billion resulting from the Colombian operations and Ps 785.8 billion resulting from the Central American operations, when translated to pesos), partially offset by a 45.9% or Ps 2,640.9 billion increase in interest expense (Ps 2,405.4 billion resulting from the Colombian operations’ and Ps 235.5 billion resulting from the Central American operations, when translated to pesos). For an analysis of the evolution of the Central American net interest income excluding the impact of the devaluation of the peso, see LB Panamá’s MD&A (“—Banco de Bogotá subsidiary analysis—LB Panamá—Net interest income”).
Total interest income for Colombia’s operations increased by 26.5% or Ps 2,685.6 billion to Ps 12,816.7 billion in 2016, driven by an increase of 30.8% or Ps 2,850.6 billion to Ps 12,111.4 billion in interest income from total loans and leases (which include interest from interbank and overnight funds). Partially offsetting this increase, was a 19.0%, or Ps 164.9 billion decrease in interest income on investments in debt securities to Ps 705.3 billion. Of the increase in interest income from total loans and leases, Ps 2,858.1 billion result from increase in interest income from loans and leases, which were partially offset by Ps 7.6 billion decrease from interbank and overnight funds.
In our Colombian operations, the increase in interest income on loans and leases of Ps 2,858.1 billion was mainly driven by a 191 basis points increase in the average yield earned on loans and leases from 9.7% in 2015 to 11.6% in 2016, which resulted in an a Ps 1,655.3 billion increase in interest income. The increase in the average yield on loans and leases was in line with a 243 basis points increase in the average Central Bank rate, from 4.67% in 2015 to 7.10% in 2016, as the Central Bank imposed a contractionary monetary policy throughout most of 2016 in order to control inflation. The average interest earning loans and leases portfolio for our Colombian operations increased 9.7% or Ps 9,138.4 billion from Ps 94,480.2 billion in 2015 to Ps 103,618.5 billion in 2016, which resulted in a Ps 1,202.8 billion increase in interest income. The growth in our Colombian operations was the result of:
| · | a 7.3% or Ps 4,724.7 billion increase in the average commercial loans and leases portfolio driven by increases in the balance of general purpose loans and financial leases, |
| · | a 13.1% or Ps 3,329.8 billion increase in the average consumer loans and leases portfolio driven by increases in the balance of personal loans, credit cards and automobile loans, and |
| · | a 25.7% or Ps 1,070.8 billion increase in the average interest-earning mortgage loans and leases portfolio. |
In our Colombian operations, interest income on interbank and overnight funds decreased by Ps 7.6 billion from Ps 142.2 billion in 2015 to Ps 134.7 billion in 2016.
Total interest income for our Central American operations, when translated to pesos, increased by 19.9% or Ps 785.8 billion to Ps 4,730.3 billion in 2016, driven by an increase of 21.7% or Ps 810.8 billion to Ps 4,554.1 billion in interest income from total loans and leases (which include interest from interbank and overnight funds), partially offset by a 12.5% or Ps 25.1 billion decrease in interest income from investments in debt securities to Ps 176.2 billion. Of the increase in interest income from total loans and leases, Ps 808.8 billion resulted from an increase in interest income from loans and leases and Ps 2.0 billion resulted from the increase in interest from interbank and overnight funds.
Our Central American operations, when translated to pesos, increased in interest income on loans and leases by Ps 808.8 billion mainly driven by a 19.1% or Ps 6,513.3 billion increase in its average interest earning loans and leases portfolio from Ps 34,084.3 billion in 2015 to Ps 40,597.6 billion in 2016, which resulted in a Ps 722.4 billion increase in interest income. The average yield earned on loans and leases increased by 25 basis points from 10.8% to 11.1%, which resulted in an additional Ps 86.5 billion increase in interest income. The devaluation of the average peso to dollar exchange rate accounted for Ps 402.3 billion of the increase in interest income on loans and leases. For an analysis of the evolution of the Central American net interest income excluding the impact of the devaluation of the peso, see LB Panamá’s MD&A (“—Banco de Bogotá subsidiary analysis—LB Panamá—Net interest income”).
In our Central American operations, when translated to pesos, interest income on interbank and overnight funds increased by Ps 2.0 billion from Ps 49.5 billion in 2015 to Ps 51.5 billion in 2016.
Grupo Aval’s consolidated yield on the loans and leases portfolio increased 146 basis points from 10.0% in 2015 to 11.4% in 2016.
Grupo Aval’s consolidated income on investments in debt securities decreased by 17.7% or Ps 190.0 billion to Ps 881.5 billion in 2016. This decrease is mainly explained by a decrease in the average yield on investment in debt securities from 5.0% in 2015 to 4.2% in 2016, which resulted in a Ps 146.1 billion decrease in income from investments in debt securities. Also contributing to the decrease was a 2.5% or Ps 545.4 billion decrease in the average balance of investment in debt securities from Ps 21,438.3 billion in 2015 to Ps 20,892.9 billion in 2016, which resulted in a Ps 43.9 billion decrease in interest income.
Total interest income on investments in debt securities for our Colombian operations decreased by 19.0% or Ps 164.9 billion to Ps 705.3 billion in 2016. This decrease is mainly explained by a decrease in the average yield on investment in debt securities from 5.1% in 2015 to 4.4% in 2016, which resulted in a Ps 110.0 billion decrease in income from investments in debt securities. The decrease in the average yield on investment in debt securities was explained by a decrease in fixed income securities rates in Colombia during 2016 due to a decrease in the interest rate on the Colombian Treasury Bond due 2026, which is a benchmark for tracking the movement of the fixed income rate. Also contributing to the decrease was a 4.9% or Ps 839.1 billion decrease in the average balance of investment in debt securities from Ps 17,041.5 billion in 2015 to Ps 16,202.4 billion in 2016, which resulted in a Ps 55.0 billion decrease in interest income.
Total interest income on investments in debt securities for our Central American operations, when translated to pesos, decreased by 12.5% or Ps 25.1 billion to Ps 176.2 billion in 2016. This decrease is mainly explained by an 82 basis points decrease in the average yield of investments in debt securities from 4.6% in 2015 to 3.8% in 2016 that resulted in a Ps 36.1 billion decrease in interest income. This decrease was partially offset by a 6.7% or Ps 293.7 billion increase in the average balance from Ps 4,396.8 billion in 2015 to Ps 4,690.4 billion in 2016, which resulted in a Ps 11.0 billion increase in interest income.
Grupo Aval’s consolidated interest expense increased by 45.9% or Ps 2,640.9 billion to Ps 8,392.4 billion in 2016. This increase was explained by a Ps 2,405.4 billion increase from our Colombian operations and a Ps 235.5 billion increase from our Central American operations, when translated to pesos.
Total interest expense for our Colombian operations increased by 54.4% to Ps 6,824.5 billion in 2016, driven by an increase of 60.8% or Ps 1,817.6 billion to Ps 4,808.2 billion in interest expense on interest-bearing deposits and by a 41.1% or Ps 587.8 billion increase to Ps 2,016.3 billion in interest expense on other funding (including
borrowings from banks and others, interbank and overnight funds, long-term debt and borrowings from development entities).
The increase of Ps 1,817.6 billion in interest expense on interest-bearing deposits for our Colombian operations was mainly driven by a 168 basis points increase in the average rate paid on interest-bearing deposits from 3.8% in 2015 to 5.5% in 2016, in line with the 243 basis points increase in the average Central Bank rate, from 4.67% in 2015 to 7.10% in 2016, which resulted in a Ps 1,274.0 billion increase in interest expense. The average balance of interest-bearing deposits increased by 11.5%, or Ps 9,036.4 billion, from Ps 78,900.7 billion in 2015 to Ps 87,937.1 billion in 2016, resulting in a Ps 543.7 billion increase in interest expense.
The Ps 587.8 billion increase in interest expense on other funding for our Colombian operations was mainly driven by a 133 basis points increase in the average rate paid on other funding, consistent with the increase in average Central Bank rate mentioned above, which resulted in a Ps 438.9 billion increase in interest expense. Also contributing to this increase was a 10.4% or Ps 3,098.6 billion increase in the average balance of other funding from Ps 29,920.5 billion in 2015 to Ps 33,019.1 billion in 2016, which resulted in a Ps 148.9 billion increase in interest expense.
Total interest expense for our Central American operations, when translated to pesos, increased by 17.7%, or Ps 235.5 billion, to Ps 1,567.9 billion in 2016, driven by an increase of 19.3%, or Ps 162.4 billion to Ps 1,004.0 billion in interest expense on interest-bearing deposits and by a 14.9%, or Ps 73.1 billion to Ps 563.9 billion increase in interest expense on other funding (including borrowings from banks and others, interbank and overnight funds, long-term debt and borrowings from development entities).
The Ps 162.4 billion increase in interest expense on interest-bearing deposits for our Central American operations was mainly driven by a 16.3%, or Ps 4,897.3 billion, increase in LB Panamá’s average interest-bearing deposits from Ps 30,079.0 billion in 2015 to Ps 34,976.3 billion in 2016, which resulted in a Ps 132.6 billion increase in interest expense. The average rate paid on interest-bearing deposits increased by 7 basis points from 2.8% in 2015 to 2.9% in 2016, resulting in a Ps 29.7 billion increase in interest expense.
The increase in interest expense on other funding for our Central American operations of Ps 73.1 billion was driven by a 6.8%, or Ps 795.4 billion, increase in LB Panamá’s average balance of other funding from Ps 11,730.9 billion in 2015 to Ps 12,526.4 billion in 2016, which resulted in a Ps 36.9 billion increase in interest expense. The average rate paid on other funding increased by 32 basis points from 4.2% in 2015 to 4.5% in 2016, which resulted in a Ps 36.3 billion increase in interest expense.
Grupo Aval’s consolidated average total interest-earning assets (calculated as (i) gross loans including interbank and overnight funds, and (ii) available for sale and held to maturity fixed income investments) increased by 10.2%, or Ps 15,655.9 billion, to Ps 168,498.8 billion in 2016 and the net interest income increased by 10.0%, or Ps 830.4 billion to Ps 9,154.6 in 2016. Grupo Aval’s consolidated net interest margin remained basically unchanged at 5.4% for both 2015 and 2016. The interest spread between the average rate on loans and leases and the average rate paid on interest-bearing deposits increased by 25 basis points from 6.4% to 6.7% over the same period. This increase was driven by a faster repricing on our loans and leases portfolio than in our interest-bearing deposits.
Net impairment loss
| | | Year ended December 31, | | | Change, 2016 vs. 2015 | |
| | | 2016 | | | 2015 | | | # | | | % | |
| | | Total
Income/Expense | | | Total
Income/Expense | | | | |
| | | (in Ps billions) | | | | | | | |
| Impairment losses: | | | | | | | | | | | | | | | | |
| Impairment loss on loans and leases, net | | | (2,673.9 | ) | | | (1,986.8 | ) | | | (687.1 | ) | | | 34.6 | |
| Impairment loss on accrued interest and other receivables, net | | | (330.3 | ) | | | (141.0 | ) | | | (189.3 | ) | | | 134.3 | |
| Impairment loss on investments in debt and equity securities | | | (80.3 | ) | | | (6.2 | ) | | | (74.1 | ) | | | 1,190.9 | |
| Impairment loss on noncurrent assets held for sale | | | (37.6 | ) | | | (26.0 | ) | | | (11.7 | ) | | | 45.0 | |
| Recovery of charged-off financial assets | | | 290.4 | | | | 219.7 | | | | 70.8 | | | | 32.2 | |
| Recovery of impairment loss on investments in debt and equity securities | | | - | | | | - | | | | - | | | | - | |
| Recovery of impairment loss on noncurrent assets held for sale | | | - | | | | - | | | | - | | | | - | |
| Net impairment loss | | | (2,831.7 | ) | | | (1,940.2 | ) | | | (891.4 | ) | | | 45.9 | |
| | | Year ended December 31, | | | Change, 2016 vs. 2015 | |
| | | 2016 | | | 2015 | | | Loans at least
91 days past due | | | Delinquency
Ratio | |
| | | Loans at least
91 days past due | | | Delinquency
Ratio (1) | | | Loans at least
91 days past due | | | Delinquency
Ratio (1) | | | # | | | % | |
| | | (in Ps billions) | | | | | | | |
| Delinquency Ratios | | | 2,962.0 | | | | 2.0 | % | | | 2,354.4 | | | | 1.7 | % | | | 607.6 | | | | 0.3 | |
| Colombian Operations | | | 2,456.1 | | | | 2.4 | % | | | 1,924.2 | | | | 2.0 | % | | | 532.0 | | | | 0.3 | |
| Commercial loans | | | 1,483.8 | | | | 2.1 | % | | | 1,139.9 | | | | 1.8 | % | | | 343.9 | | | | 0.4 | |
| Consumer loans | | | 790.8 | | | | 2.8 | % | | | 636.6 | | | | 2.5 | % | | | 154.2 | | | | 0.2 | |
| Mortgage loans | | | 144.1 | | | | 2.8 | % | | | 119.0 | | | | 2.9 | % | | | 25.1 | | | | (0.1 | ) |
| Microcredit loans | | | 37.4 | | | | 9.4 | % | | | 28.6 | | | | 7.5 | % | | | 8.7 | | | | 2.0 | |
| Central American Operations | | | 505.9 | | | | 1.2 | % | | | 430.2 | | | | 1.0 | % | | | 75.7 | | | | 0.1 | |
| Commercial loans | | | 113.7 | | | | 0.6 | % | | | 100.5 | | | | 0.6 | % | | | 13.3 | | | | 0.1 | |
| Consumer loans | | | 285.0 | | | | 1.7 | % | | | 228.0 | | | | 1.5 | % | | | 57.0 | | | | 0.2 | |
| Mortgage loans | | | 107.2 | | | | 1.2 | % | | | 101.7 | | | | 1.2 | % | | | 5.4 | | | | 0.0 | |
| Microcredit loans | | | - | | | | N.A. | | | | - | | | | N.A. | | | | - | | | | N.A. | |
| (1) | Calculated as 91 days past due loans divided by total gross loans excluding interbank and overnight funds. |
Net impairment loss for Grupo Aval’s consolidated operations increased by 45.9% or Ps 891.4 billion in 2016 as compared to 2015, with Ps 617.9 billion explained by Colombian operations and Ps 273.6 billion explained by Central American operations, when translated to pesos. The ratio of impairment loss on loans and other accounts receivable, net to average balance of loans and leases for the consolidated operations was 1.7% in 2015 and 2.1% in 2016.
The Ps 617.9 or 43.8% billion increase in net impairment loss resulting from our Colombian operations, was mainly driven by a Ps 419.9 billion increase in impairment loss on loans and leases, net, a Ps 190.1 billion increase in impairment loss on accrued interest and other receivables, net, a Ps 74.1 billion increase in impairment on investments in debt and equity securities (Ps 63.9 billion increase in the impairment of our corporate debt fixed income portfolio related to exposure to Oi S.A. and Telemar Norte Leste S.A., Ps 6.1 billion related to the impairment in Concesionaria Ruta del Sol S.A.S., and Ps 4.0 billion related to associates of Promigas, see Corficolombiana’s MD&A (“—Corficolombiana”)), and Ps 5.6 billion increase in impairment loss on noncurrent assets held for sale. These increases were partially offset by a Ps 71.8 billion increase in recoveries of charged-off assets.
The increase in impairment loss on loans and leases, net was driven by a 9.7% increase in the average balance of loans and leases and deterioration in the delinquency ratio (measured as loans 91 days past due as a percentage of total gross loans) for our Colombian operations from 2.0% in 2015 to 2.4% in 2016. The ratio of impairment loss on loans and accounts receivable, net to average balance of loans and leases was 1.7% in 2015 and 2.1% in 2016. The increase in the cost of risk was derived from the deterioration of the portfolio, which was expected to occur in a low GDP growth scenario, and some one-time provisions associated with particular clients, such as the Ps 86.1 billion provision of Pacific Exploration & Production Corp., which by itself accounted for 8 basis points of the deterioration in the cost of risk of the Colombian operations.
The Ps 273.6 billion increase in net impairment losses resulting from our Central American operations, when translated to pesos, is mainly explained by a Ps 267.3 billion increase in impairment loss on loans and leases, net and by a Ps 6.1 billion increase in impairment loss on noncurrent held for sale assets. The devaluation of the average peso to dollar exchange rate accounted for Ps 56.5 billion of the increase in net impairment losses. For an analysis of the evolution of the Central American net impairment loss on financial assets excluding the impact of the devaluation of the peso, see LB Panamá’s MD&A (“—Banco de Bogotá subsidiary analysis—LB Panamá—Impairment loss on financial assets”). The ratio of net impairment loss on loans and leases to average balance of loans and leases for our Central American operations was 1.5% in 2015 and 1.9% in 2016. The country which contributed the most to the deterioration of the credit risk was Guatemala.
Charge-offs for Grupo Aval’s consolidated operations increased by Ps 718.5 billion from Ps 1,636.4 billion in 2015 to Ps 2,355.0 billion in 2016. The ratio of charge-offs to average balance of loans and leases increased from 1.3% in 2015 to 1.6% in 2016. Charge-offs for our Colombian operations increased by Ps 587.6 billion and for our Central American operations by Ps 130.9 billion.
Grupo Aval’s consolidated coverage ratio for loans 91 days past due was 143.9% in 2016 versus 157.9% in 2015. In our Colombian operations the ratio went from 165.8% in 2015 to 148.3% in 2016, and in our Central American operations it went from 122.9% in 2015 to 122.4% in 2016.
The recovery of charged-off assets increased Ps 70.8 billion, driven by increases in the recoveries of Ps 71.8 billion from Grupo Aval’s Colombian operations. The increase was partially offset by a Ps 1.0 billion decrease in the recoveries from the Central American operations.
Net commissions and fee income
| | | Year ended December 31, | | | Change, 2016 vs. 2015 | |
| | | 2016 | | | 2015 | | | # | | | % | |
| | | (in Ps billions) | | | | | | | |
| Commissions and fee income: | | | | | | | | | | | | | | | | |
| Banking fees | | | 3,593.3 | | | | 3,095.3 | | | | 498.0 | | | | 16.1 | |
| Bonded warehouse services | | | 186.1 | | | | 167.3 | | | | 18.7 | | | | 11.2 | |
| Trust activities | | | 275.7 | | | | 233.9 | | | | 41.8 | | | | 17.9 | |
| Pension and severance fund management | | | 824.1 | | | | 787.7 | | | | 36.4 | | | | 4.6 | |
| Commission and fee income | | | 4,879.2 | | | | 4,284.2 | | | | 595.0 | | | | 13.9 | |
| Commission and fee expenses | | | (619.5 | ) | | | (621.9 | ) | | | 2.4 | | | | (0.4 | ) |
| Net commission and fee income | | | 4,259.7 | | | | 3,662.3 | | | | 597.4 | | | | 16.3 | |
Net commission and fee income for Grupo Aval’s consolidated operation increased by 16.3% or Ps 597.4 billion in 2016 as compared to 2015, with Ps 195.6 billion explained by our Colombian operations and Ps 401.7 billion explained by our Central American operations, when translated to pesos.
The 9.0% or Ps 195.6 billion increase in net commission and fee income resulting from our Colombian operations, was mainly driven by a Ps 95.0 billion increase in banking fees, a Ps 41.8 billion increase in trust activities, a Ps 30.7 billion increase in pension and severance fund management, a Ps 18.7 billion increase in bonded warehouse services, and a Ps 9.4 billion decrease in commissions and fee expenses. Such growth in net fees was aligned with growth of the balance sheet and a solid performance of our pension fund manager, Porvenir.
The 27.1% or Ps 401.7 billion increase in net commission and fee income resulting from our Central American operations, when translated to pesos, is mainly explained by a Ps 403.0 billion increase in banking fees and a Ps 5.7 billion increase in pension and severance fund management. These increases were partially offset by a Ps 7.0 billion increase in commission and fee expenses. The devaluation of the average peso to dollar exchange rate accounted for Ps 156.7 billion of the increase in net commission and fee income. For an analysis of the evolution of the Central American Net income from commissions and fees excluding the impact of the devaluation of the peso, see LB Panamá’s MD&A (“—Banco de Bogotá subsidiary analysis—LB Panamá—Net income from commissions and fees”).
Net trading income
Grupo Aval’s net trading income includes (i) net trading income from investment securities held for trading through profit or loss, which reflects the interest and gains/losses from mark-to-market valuation, in each case from equity and fixed income investment securities held for trading through profit or loss, and (ii) net trading income from derivatives, which reflects the gains/losses from mark-to-market valuation on derivatives different from that considered under hedge accounting.
During 2016, Grupo Aval’s net trading income came in at Ps 724.7 billion, Ps 479.5 billion or 195.6% higher than the Ps 245.2 billion obtained in 2015. Of such increase, Ps 493.2 billion resulted from our Colombian operations and were partially offset by a Ps 13.7 billion decrease from our Central American operations, when translated to pesos. Of the consolidated Ps 479.5 billion increase in net trading income, Ps 311.4 billion resulted from an increase in net trading income from investment securities held for trading through profit or loss and Ps 168.1 billion resulted from an increase in net trading income from derivatives.
The increase in net trading income from investment securities held for trading through profit or loss was mainly driven by an increase in the average yield which went from 3.5% in 2015 to 11.7% in 2016, resulting in a Ps 441.5 billion increase in income. The average balance of Grupo Aval’s consolidated fixed income and equity investments held for trading through profit or loss portfolio decreased by 20.7%, or Ps 1,111.3 billion, to Ps 4,224.7 billion, resulting in Ps 130.0 billion decrease in income.
For the Colombian operations, net trading income from investment securities held for trading through profit or loss increased by 109.7% or Ps 179.6 billion from Ps 163.7 billion in 2015 to Ps 343.3 billion in 2016. The increase was mainly explained by an increase in the average yield which went from 3.6% in 2015 to 8.8% in 2016, resulting in a Ps 243.8 billion increase in income. The average balance the Colombian operations fixed income and equity investments held for trading through profit or loss portfolio decreased by 15.7%, or Ps 725.7 billion, to Ps 3,885.2 billion, and resulted in Ps 64.1 billion decrease in income.
For the Central American operations, net trading income from investment securities held for trading through profit or loss increased Ps 131.8 billion from Ps 21.5 billion in 2015 to Ps 153.3 billion in 2016. The increase was mainly explained by an increase in the average yield which went from 2.9% in 2015 to 42.6% in 2016, resulting in a Ps 296.2 billion increase in income. The average balance of fixed income and equity investments held for trading through profit or loss decreased by 51.8% or Ps 385.6 billion, to Ps 359.5 billion, resulting in a Ps 164.4 billion decrease in income.
Total income from investment securities
Grupo Aval’s securities portfolio is classified in the following categories: (i) equity and fixed income investments held for trading through profit or loss (described in this section as net trading income in investment securities held for trading through profit or loss), (ii) available for sale fixed income investments and (iii) held to maturity fixed income investments (results from (ii) and (iii) are included in the net interest income as interest income from investment in debt securities). Grupo Aval manages its investment portfolio in a comprehensive and integral manner that considers individual return of each one of these three categories and the total return of the investment securities portfolio.
Total income from investment securities for Grupo Aval consolidated operation (comprised of interest income on investments in debt securities and net trading income from investment securities held for trading through profit or loss) was Ps 1,378.1 billion for 2016, 9.7% or Ps 121.4 billion higher than the Ps 1,256.7 billion for 2015. This was primarily driven by the average yield on total investment securities increasing from 4.7% in 2015 to 5.5% in 2016, generating a Ps 212.2 billion increase in interest income. Partially offsetting this increase was a Ps 1,656.8 billion decrease in the average balance of “Total Investment Securities” (calculated as (i) fixed income and equity investments held for trading through profit or loss, (ii) available for sale fixed income investments and (iii) held to maturity fixed income investments) from Ps 26,794.3 billion in 2015 to Ps 25,137.6 billion in 2016, resulting in a Ps 90.8 billion decrease in interest income.
When including the investment securities held for trading through profit or loss, Grupo Aval’s consolidated average total interest earning assets (calculated as (i) gross loans including interbank and overnight funds, (ii) available for sale and held to maturity fixed income investments, and (iii) fixed income and equity investments held for trading through profit or loss) would have increased by 9.2% or Ps 14,544.5 billion to Ps 172,743.5 billion in 2016 and the net interest income plus net trading income from investment securities held for trading would have increased by 13.4%, or Ps 1,141.9 billion to Ps 9,651.2 billion in 2016. The return over average total interest earning assets (calculated as (i) gross loans including interbank and overnight funds, (ii) available for sale and held to maturity fixed income investments, and (iii) fixed income and equity investments held for trading through profit or loss) would have increased by 21 basis points from 5.4% in 2015 to 5.6% in 2016.
Other income
| | | Year ended December 31, | | | Change, 2016 vs. 2015 | |
| | | 2016 | | | 2015 | | | # | | | % | |
| | | (in Ps billions) | | | | | | | |
| Foreign exchange gains (losses), net | | | 517.9 | | | | 457.9 | | | | 60.0 | | | | 13.1 | |
| Gains on sales of investments, net | | | 210.4 | | | | 79.2 | | | | 131.1 | | | | 165.5 | |
| Income from sales of noncurrent assets held for sale | | | 28.4 | | | | 26.2 | | | | 2.2 | | | | 8.3 | |
| Equity method | | | 140.8 | | | | 230.4 | | | | (89.6 | ) | | | (38.9 | ) |
| Dividend income | | | 28.0 | | | | 33.6 | | | | (5.6 | ) | | | (16.6 | ) |
| Gains on valuation of assets, net | | | 53.6 | | | | - | | | | 53.6 | | | | - | |
| Income from non-financial sector, net | | | 929.3 | | | | 838.6 | | | | 90.7 | | | | 10.8 | |
| Net income from financial instruments designated at fair value | | | 181.0 | | | | 153.1 | | | | 27.9 | | | | 18.2 | |
| Other | | | 697.0 | | | | 723.4 | | | | (26.3 | ) | | | (3.6 | ) |
| Total other income | | | 2,786.4 | | | | 2,542.4 | | | | 244.0 | | | | 9.6 | |
Total other income for Grupo Aval’s consolidated operation increased by 9.6% or Ps 244.0 billion in 2016 as compared to 2015, with Ps 110.5 billion explained by Colombian operations and Ps 133.5 billion explained by Central American operations, when translated to pesos.
The 4.8% or Ps 110.5 billion increase in total other income resulting from Colombian operations is mainly explained by (i) a Ps 126.0 billion increase in gains on sales of investments, net, related to the sale of Grupo Aval’s subsidiaries’ investment in CIFIN S.A., as part of a sale agreement signed with other minority shareholders to sell 100% of the company TransUnion Netherlands II B.V. CIFIN is an entity classified as a Technical and Administrative Services Company and accredited as a provider of financial, credit, commercial information and services. The financial entities selling their shares seek a strategic investor with experience and international knowledge, looking to generate added value to this company, by incorporating new knowledge, advanced technologies and better international practices in the analysis of credit information, credit risk management, and money laundering, among others; (ii) a Ps 90.7 billion increase in income from non-financial sector, net, driven by higher operating income from some of Corficolombiana’s subsidiaries such as Promigas, Hoteles Estelar and Unipalma. For an analysis of the income from the non-financial companies, equity method and dividends of Corficolombiana, see Corficolombiana’s MD&A (“—Corficolombiana—Other income (expense)”); (iii) a Ps 53.6 billion increase in gains on valuation of assets, net; and (iv) a Ps 27.9 billion increase in net income from financial instruments designated at fair value.
Partially offsetting these increases was (i) a Ps 89.6 billion decrease in income from the equity method, mainly driven by the impairment that Corficolombiana took on its indirect investment in Concesionaria Ruta del Sol for Ps 96.3 billion. For a detailed analysis of this impairment, see Note 14 to our audited consolidated financial statements; (ii) a Ps 41.3 billion decrease in foreign exchange gains (losses), net; (iii) a Ps 45.1 billion decrease in other; (iv) a Ps 6.1 billion decrease in income from sales of noncurrent assets held for sale; and (v) a Ps 5.6 billion decrease in dividend income.
The 51.4% or Ps 133.5 billion increase in total other income resulting from our Central American operations, when translated to pesos, is mainly explained by a Ps 101.3 billion increase in foreign exchange gains (losses), net, a Ps 18.7 billion increase in other income, a Ps 8.3 billion increase in income from sales of noncurrent assets held for sale, and a Ps 5.2 billion increase in gains on sales of investments, net. The devaluation of the average peso to dollar exchange rate accounted for Ps 40.7 billion of the increase in total other income. For an analysis of the evolution of our Central American total other income excluding the impact of the devaluation of the peso, see LB Panamá’s MD&A (“—Banco de Bogotá subsidiary analysis—LB Panamá—Other income (expense)”).
Other expenses
| | | Year ended December 31, | | | Change, 2016 vs. 2015 | |
| | | 2016 | | | 2015 | | | # | | | % | |
| | | (in Ps billions) | | | | | | | |
| Losses from sales of noncurrent assets held for sale | | | (7.7 | ) | | | - | | | | (7.7 | ) | | | - | |
| Personnel expenses | | | (3,531.1 | ) | | | (3,111.3 | ) | | | (419.8 | ) | | | 13.5 | |
| Salaries and employee benefits | | | (3,323.1 | ) | | | (2,945.9 | ) | | | (377.2 | ) | | | 12.8 | |
| Bonus plan payments | | | (134.8 | ) | | | (113.5 | ) | | | (21.3 | ) | | | 18.8 | |
| Termination payments | | | (73.2 | ) | | | (51.9 | ) | | | (21.3 | ) | | | 41.0 | |
| Administrative and other expenses | | | (4,141.6 | ) | | | (3,575.6 | ) | | | (566.0 | ) | | | 15.8 | |
| Depreciation and amortization | | | (471.6 | ) | | | (488.2 | ) | | | 16.6 | | | | (3.4 | ) |
| Wealth tax | | | (267.6 | ) | | | (303.2 | ) | | | 35.6 | | | | (11.7 | ) |
| Other expenses | | | (100.1 | ) | | | (130.8 | ) | | | 30.7 | | | | (23.4 | ) |
| Charitable and other donation expenses | | | (8.1 | ) | | | (9.4 | ) | | | 1.3 | | | | (13.9 | ) |
| Other | | | (92.0 | ) | | | (121.4 | ) | | | 29.4 | | | | (24.2 | ) |
| Total other expenses | | | (8,519.8 | ) | | | (7,609.1 | ) | | | (910.7 | ) | | | 12.0 | |
Total other expenses for Grupo Aval’s consolidated operation increased by 12.0% or Ps 910.7 billion in 2016 as compared to 2015, with Ps 333.8 billion explained by our Colombian operations and Ps 576.8 billion explained by our Central American operations.
The 6.7% or Ps 333.8 billion increase in total other expenses resulting from our Colombian operations is mainly explained by a Ps 208.4 billion increase in administrative and other expenses, a Ps 176.3 billion increase in personnel expenses, a Ps 6.5 billion increase in depreciation and amortization, and a Ps 4.2 billion increase in losses from sales of noncurrent assets held for sale. These increases were partially offset by a Ps 35.6 billion decrease in wealth tax and a Ps 25.9 billion decrease in other expenses.
The 21.9% or Ps 576.8 billion increase in total other expenses resulting from our Central American operations is mainly explained, when translated to pesos, by a Ps 357.6 billion increase in administrative and other expenses, a Ps 243.5 billion increase in personnel expense and a Ps 23.1 billion decrease in depreciation and amortization. The increase in Central America’s expenses is driven by a combination of organic growth and the impact of the devaluation of the peso. The devaluation of the average peso to dollar exchange rate accounted for Ps 291.6 billion of the increase in total other expenses. For an analysis of the evolution of the Central American operation’s other expenses excluding the impact of the devaluation of the peso, see LB Panamá’s MD&A (“—Banco de Bogotá subsidiary analysis—LB Panamá—Total other expenses”).
Because Grupo Aval’s personnel and administrative and other expenses increased by 14.7%, while its income increased by 15.5%, the efficiency ratio (calculated as personnel and administrative and other expenses divided by net interest income, fees and other services income, other income excluding other) improved from 47.6% in 2015 to 47.3% in 2016. The ratio of personnel and administrative and other expenses as a percentage of average assets slightly deteriorated from 3.4% in 2015 to 3.5% in 2016.
The increase in personnel expenses is driven by the increase in the headcount in Grupo Aval that occurred during the year to support the growth of the loan portfolio. The number of employees of Grupo Aval went from 76,095 employees in 2015 to 77,050 employees in 2016. Yearly salaries and employee benefits per employee increased from Ps 38.7 million in 2015 to Ps 43.1 million in 2016.
The efficiency ratio for the Colombian operations improved from 44.4% in 2015 to 43.4% in 2016. The ratio of personnel and administrative and other expenses as a percentage of average assets remained stable at 3.0% for both 2015 and 2016.
The efficiency ratio for the Central American operations, when translated to pesos, deteriorated 47 basis points from 54.7% in 2015 to 55.1% in 2016. For an analysis of the evolution of the Central American operation’s efficiency ratio excluding the impact of the devaluation of the peso, see LB Panamá’s MD&A (“—Banco de Bogotá subsidiary analysis—LB Panamá—Other expenses”).
Income tax expense
Income tax expense for Grupo Aval’s consolidated operation increased by 9.5%, or Ps 177.9 billion, to Ps 2,056.9 billion in 2016. Grupo Aval’s consolidated operation effective tax rate (calculated as income tax expense divided by income before income tax expense excluding dividends and the equity method, as both are non-taxable income, and the equity tax as it is a non-deductible expense) was 35.7% in 2015 and 36.3% in 2016. The increase in the effective tax rate was mainly driven by an increase in our Colombian operations effective tax rate which resulted from the 2014 fiscal reform implementation which took the corporate tax rate from 39% in 2015 to 40% in 2016.
Net income attributable to non-controlling interest
Net income attributable to non-controlling interest increased by 5.6%, or Ps 72.7 billion, to Ps 1,377.1 billion in 2016 as compared with 2015. The ratio of net income attributable to non-controlling interest to net income slightly increased from 39.0% in 2015 to 39.2% in 2016.
Banco de Bogotá
Overview
Banco de Bogotá’s net income attributable to controlling interest for the year ended December 31, 2016 increased by 123.0%, or Ps 2,342.3 billion, to Ps 4,246.1 billion compared to the year ended December 31, 2015. Net income attributable to controlling interest for the year ended December 31, 2016 includes Ps 2,208.1 billion of income resulting from the deconsolidation of Corficolombiana. Other components Banco de Bogotá’s net income attributable to controlling interest for the year ended December 31, 2016 increased by 7.1%, or Ps 134.2 billion compared to the year ended December 31, 2015. For further detail of the banks’ deconsolidation of Corficolombiana, please see note 14 of the Consolidated Financial Statements.
The Ps 134.2 billion increase in net income mentioned above, was driven by a 16.4% or Ps 865.4 billion increase in net interest income, a 16.3% or Ps 505.3 billion increase in net income from commissions and fees, a 10.1% or Ps 81.3 billion increase in other income (expense), and a 22.6% or Ps 64.8 billion increase in net trading income. These increases were partially offset by a 13.9% or Ps 710.2 billion increase in other expenses, a 43.4% or Ps 539.5 billion increase in net impairment loss on financial assets, a 19.4% Ps 30.2 billion increase in net income attributable to non-controlling interest, and a 9.8% or Ps 102.7 billion increase in income tax expense.
Net income attributable to controlling interest, for Banco de Bogotá’s Colombian operations, increased by Ps 2,161.9 billion as compared 2015, which includes the one-time effect of Corficolombiana. Other components of net income attributable to controlling interest for Banco de Bogotá’s Colombian operations decreased by 4.3% or Ps 46.1 billion for the year ended December 31, 2016 as compared to the year ended December 31, 2015.
The following discussion describes the principal drivers of Banco de Bogotá’s consolidated results of operations for the year ended December 31, 2016 compared to the year ended December 31, 2015. Further detail is provided in the discussion of the results of operations for LB Panamá and Porvenir.
| | | Banco de Bogotá Consolidated | |
| | | For the year ended December 31, | | | Change, December 2016 vs December
2015 | |
| | | 2016 | | | 2015 | | | # | | | % | |
| | | (in Ps billions) | | | | | | | |
| Interest income | | | 10,702.0 | | | | 8,479.2 | | | | 2,222.7 | | | | 26.2 | |
| Interest expenses | | | (4,568.5 | ) | | | (3,211.1 | ) | | | (1,357.4 | ) | | | 42.3 | |
| Net interest income | | | 6,133.5 | | | | 5,268.1 | | | | 865.4 | | | | 16.4 | |
| Impairment loss on loans and other accounts receivable, net | | | (1,897.9 | ) | | | (1,323.3 | ) | | | (574.6 | ) | | | 43.4 | |
| Impairment loss on other assets, net | | | (17.8 | ) | | | (20.9 | ) | | | 3.1 | | | | (14.7 | ) |
| Recovery of charged-off financial assets | | | 131.9 | | | | 99.9 | | | | 32.0 | | | | 32.0 | |
| Net impairment loss | | | (1,783.8 | ) | | | (1,244.3 | ) | | | (539.5 | ) | | | 43.4 | |
| Net commission and fees income | | | 3,611.1 | | | | 3,105.7 | | | | 505.3 | | | | 16.3 | |
| Net trading income | | | 351.6 | | | | 286.8 | | | | 64.8 | | | | 22.6 | |
| Other income | | | 3,095.3 | | | | 805.9 | | | | 2,289.4 | | | | 284.1 | |
| Other expenses(1) | | | (5,825.2 | ) | | | (5,115.0 | ) | | | (710.2 | ) | | | 13.9 | |
| Income before income tax expense | | | 5,582.4 | | | | 3,107.2 | | | | 2,475.2 | | | | 79.7 | |
| Income tax expense | | | (1,150.4 | ) | | | (1,047.7 | ) | | | (102.7 | ) | | | 9.8 | |
| Net Income(1) | | | 4,432.0 | | | | 2,059.6 | | | | 2,372.4 | | | | 115.2 | |
| Net income attributable to: | | | | | | | | | | | | | | | | |
| Controlling interest(1) | | | 4,246.1 | | | | 1,903.9 | | | | 2,342.3 | | | | 123.0 | |
| Non-controlling interest | | | 185.9 | | | | 155.7 | | | | 30.2 | | | | 19.4 | |
| (1) | Other income of Ps 3,095.3 billion less Ps 2,208.1 billion, for the deconsolidation effect of Corficolombiana, equals Ps 887.2 billion. Net income of Ps 4,432.0 billion less Ps 2,208.1 billion, for the deconsolidation effect of Corficolombiana, equals Ps 2,224.0 billion. Net income attributable to controlling interest of Ps 4,246.1 billion less Ps 2,208.1 billion, for the deconsolidation effect of Corficolombiana, equals Ps 2,038.1 billion. |
Net interest income
| | | Year ended December 31, | | | Change, December 2016 vs.
December 2015 | |
| | | 2016 | | | 2015 | | | # | | | % | |
| | | (in Ps billions) | | | | | | | |
| Interest income: | | | | | | | | | | | | | | | | |
| Commercial loans and leases | | | 4,852.3 | | | | 3,589.4 | | | | 1,262.9 | | | | 35.2 | |
| Consumer loans and leases | | | 4,368.6 | | | | 3,599.4 | | | | 769.2 | | | | 21.4 | |
| Mortgage loans and leases | | | 834.3 | | | | 676.8 | | | | 157.5 | | | | 23.3 | |
| Microcredit loans and leases | | | 114.8 | | | | 104.8 | | | | 10.0 | | | | 9.5 | |
| Interbank and overnight funds | | | 106.1 | | | | 76.6 | | | | 29.5 | | | | 38.5 | |
| Interest on loans and leases | | | 10,276.0 | | | | 8,047.0 | | | | 2,228.9 | | | | 27.7 | |
| Interest on investment in debt securities | | | 426.0 | | | | 432.2 | | | | (6.2 | ) | | | (1.4 | ) |
| Total interest income | | | 10,702.0 | | | | 8,479.2 | | | | 2,222.7 | | | | 26.2 | |
| Interest expense: | | | | | | | | | | | | | | | | |
| Checking accounts | | | (244.7 | ) | | | (166.8 | ) | | | (77.9 | ) | | | 46.7 | |
| Time deposits | | | (1,976.9 | ) | | | (1,446.5 | ) | | | (530.4 | ) | | | 36.7 | |
| Savings deposits | | | (1,134.0 | ) | | | (701.3 | ) | | | (432.6 | ) | | | 61.7 | |
| Total interest expense on deposits | | | (3,355.6 | ) | | | (2,314.7 | ) | | | (1,040.9 | ) | | | 45.0 | |
| Borrowings from banks and others | | | (549.0 | ) | | | (308.6 | ) | | | (240.4 | ) | | | 77.9 | |
| Interbank and overnight funds | | | (200.1 | ) | | | (110.2 | ) | | | (89.9 | ) | | | 81.5 | |
| Long-term debt (bonds) | | | (369.6 | ) | | | (392.6 | ) | | | 23.0 | | | | (5.9 | ) |
| Borrowings from development entities | | | (94.2 | ) | | | (85.0 | ) | | | (9.2 | ) | | | 10.8 | |
| Total interest expense | | | (4,568.5 | ) | | | (3,211.1 | ) | | | (1,357.4 | ) | | | 42.3 | |
| Net interest income | | | 6,133.5 | | | | 5,268.1 | | | | 865.4 | | | | 16.4 | |
Banco de Bogotá’s net interest income increased by 16.4% or Ps 865.4 billion to Ps 6,133.5 billion in 2016 as compared to 2015. The increase in net interest income was mainly due to a 26.2% or Ps 2,222.7 billion increase in interest income, partially offset by a 42.3% or Ps 1,357.4 billion increase in interest expense. Of the Ps 865.4 billion increase in net interest income, Ps 315.1 billion are explained by the bank’s Colombian operations and Ps 550.2 billion by the bank’s Central American operations, when translated to pesos. The devaluation of the average peso to dollar exchange rate accounted for Ps 281.6 billion of the increase in net interest income from the bank’s Central American operations.
Total interest income for Banco de Bogotá increased by 26.2% or Ps 2,222.7 billion to Ps 10,702.0 billion in 2016, driven by an increase of Ps 2,228.9 billion in interest income from total loans and leases (which include interest from interbank and overnight funds), offset in part by a Ps 6.2 billion decrease in interest on investments in debt securities. The Ps 2,228.9 billion increase in interest income from total loans and leases was driven by a 27.6% or Ps 2,199.5 billion increase in income from loans and leases and Ps 29.5 billion increase in income from interbank and overnight funds.
The 27.6% or Ps. 2,199.5 billion increase in interest income from loans and leases for Banco de Bogotá’s consolidated operation in 2016 as compared to 2015 was a result of a 12.6% or Ps 10,383.4 billion increase in the
average balance of loans and leases to Ps 92,483.5 billion driven by organic growth in Colombia and in Central America. The increase in the average balance resulted in a Ps 1,141.8 billion increase in interest income and a 129 basis points increase in the average yield on loans and leases from 9.7% in 2015 to 11.0% in 2016 resulted in an additional Ps 1,057.7 billion increase in interest income.
Banco de Bogotá’s consolidated interest income from investments in debt securities (which includes available for sale and held to maturity fixed income securities) slightly decreased by 1.4% or Ps 6.2 billion and it was mainly a result of a 12 basis points decrease in the average yield of investment securities from 4.2% in 2015 to 4.1% in 2016, which resulted in a Ps 12.4 billion decrease in interest income from investment securities. Partially offsetting this decrease was a 1.5% or Ps 148.9 billion increase in the average balance of investments that resulted in a Ps 6.1 billion increase in interest income.
Total interest income for Banco de Bogotá’s Colombian operations increased by 31.7% or Ps 1,437.0 billion to Ps 5,971.7 billion in 2016, driven by an increase of Ps 1,418.1 billion in interest income from total loans and leases (which include interest from interbank and overnight funds), and a Ps 18.9 billion increase in interest on investments in debt securities. The Ps 1,418.1 billion increase in interest income from total loans and leases was driven by a 32.5% or Ps 1,390.7 billion increase in income from loans and leases and Ps 27.4 billion increase in income from interbank and overnight funds.
Interest income from loans and leases for Banco de Bogotá’s Colombian operations increased by 32.5% or Ps 1,390.7 billion. This increase was driven by an increase of 202 basis points in the average yield on loans and leases from 8.9% in 2015 to 10.9% in 2016, which resulted in a Ps 967.9 billion increase in interest income. The increase in Banco de Bogotá’s average yield on loans and leases was in line with the 243 basis points increase in the average Central Bank rate, from 4.67% to 7.10%. Also contributing to the increase in interest income from loans and leases was a 8.1% or Ps 3,870.1 billion increase in their average balance to Ps 51,885.9 billion in 2016, which was mainly driven by organic growth in the commercial loans and leases portfolio and resulted in a Ps 422.7 billion increase in interest income. The growth in Banco de Bogotá’s Colombian operations was the result of:
| · | a 6.9% or Ps 2,557.5 billion increase in the average commercial loans and leases portfolio driven by increases in the balance of general purpose loans, |
| · | a 9.0% or Ps 785.0 billion increase in the average consumer loans and leases portfolio driven by increases in the balance of personal loans, credit cards and automobile loans, and |
| · | a 30.1% or Ps 509.7 billion increase in the average interest-earning mortgage loans and leases portfolio. |
Interest income on investments in debt securities for Banco de Bogotá’s Colombian operations increased by 8.2% or Ps 18.9 billion. The increase is explained by a 44 basis points increase in the average yield on investments from 4.0% in 2015 to 4.4% in 2016, which resulted in a Ps 25.3 billion increase in interest income. The average balance of investment securities decreased from Ps 5,786.5 in 2015 to Ps 5,641.7 billion in 2016, which resulted in a Ps 6.4 billion decrease in interest income.
When translated into pesos, total interest income for the Central American operations increased by 19.9% or Ps 785.5 billion, driven by an increase of Ps 810.8 billion in interest income from total loans and leases (which include interest from interbank and overnight funds), and a Ps 25.1 billion decrease in interest on investment securities. The Ps 810.8 billion increase in interest income from total loans and leases was driven by a Ps 808.8 billion increase in income from loans and leases and Ps 2.0 billion increase in income from interbank and overnight funds.
Interest income from loans and leases for Banco de Bogotá’s Central American operations increased by 21.9% or Ps 808.8 billion. The increase was mainly explained by a 19.1% or Ps 6,513.3 billion increase in average balance of loans and leases, which resulted in a Ps 722.4 billion increase in interest income. In addition, there was a 25 basis points increase in the average yield on loans and leases from 10.8% in 2015 to 11.1% in 2016, which resulted in a Ps 86.4 billion increase in interest income. The devaluation of the average peso to dollar exchange rate accounted for Ps 402.3 billion of the increase in interest income from loans and leases. For an analysis of the evolution of the Central American average yield on interest earning assets excluding the impact of the devaluation of the peso, see LB Panamá’s MD&A (“—Banco de Bogotá subsidiary analysis—LB Panamá—Net interest income”).
Interest income from investments in debt securities for Banco de Bogotá’s Central American operations decreased by 12.5%, or Ps 25.1 billion, to Ps 176.2 billion for the year ended December 31, 2016, as the result of a decrease in the average yield, from 4.6% for 2015 to 3.8% for 2016, resulting in a Ps 36.1 billion decrease in interest income. Partially offsetting this was a 6.7% or Ps 293.7 billion increase in average balance of investment in debt securities from Ps 4,396.8 billion in 2015 to Ps 4,690.4 billion in 2016, which resulted in an 11.0 billion increase in interest income.
The 42.3% or Ps 1,357.4 billion increase in total interest expense for Banco de Bogotá’s consolidated operation is explained by an increase of 89 basis points in the average cost of funding, from 3.4% in 2015 to 4.3% in 2016, which resulted in a Ps 836.9 billion increase in interest expense. The average balance of total interest-bearing liabilities increased 12.9% or Ps 12,142.9 billion to Ps 106,596.0 billion in 2016 resulting in a Ps 520.4 billion increase in interest expense. Interest expense for Banco de Bogotá’s interest-bearing deposits increased by 45.0% or Ps 1,040.9 billion to Ps 3,355.6 billion in 2016, mainly driven by a 93 basis points increase in the average cost of funds, from 3.2% in 2015 to 4.2% in 2016, which resulted in a Ps 666.8 billion increase in interest expense. Also contributing to this increase was a 12.5% or Ps 8,978.4 billion increase in the average balance of interest-bearing deposits, from Ps 71,548.5 billion in 2015 to Ps 80,526.9 billion in 2016, which resulted in a Ps 374.1 billion increase in interest expense.
Total interest expense for Banco de Bogotá’s Colombian operations increased 59.7% or Ps 1,121.8 billion, driven by a 151 basis points increase in the average cost of funding from 3.6% in 2015 to 5.1% in 2016, consistent with the increasing rate environment in Colombia, which resulted in a Ps 794.3 billion increase in interest expense. In addition, the average balance of total interest-bearing liabilities increased by 12.3% or Ps 6,450.2 billion to Ps 59,093.4 billion resulting in a Ps 327.5 billion increase in interest expense. Interest expense on interest-bearing deposits increased by 59.6% or Ps 878.6 billion to Ps 2,351.6 billion in 2016, mainly driven by a 161 basis points increase in the average cost of funds, from 3.6% in 2015 to 5.2% in 2016, which resulted in a Ps 667.9 billion increase in interest expense. Also contributing to this increase was a 9.8% or Ps 4,081.1 billion increase in the average balance of interest-bearing deposits, from Ps 41,469.5 billion in 2015 to Ps 45,550.7 billion in 2016, which resulted in a Ps 210.7 billion increase in interest expense.
Total interest expense for Central American operations, when translated into pesos, increased by 17.7% or Ps 235.5 billion, explained by a 13.6% or Ps 5,692.7 billion increase in the average balance of total interest-bearing liabilities that resulted in a Ps 187.9 billion increase in interest expense. Also contributing to the increase in interest expense was an 11 basis points increase in the average cost of funding from 3.2% to 3.3% that resulted in a Ps 47.6 billion increase in interest expense. Interest expense on interest-bearing deposits increased by 19.3% or Ps 162.4 billion to Ps 1,004.0 billion in 2016, mainly driven by an 16.3% or Ps 4,897.3 billion increase in the average balance of interest-bearing deposits, from Ps 30,079.0 billion in 2015 to Ps 34,976.3 billion in 2016, which resulted in a Ps 140.6 billion increase in interest expense. In addition, the average cost of funds increased from 2.8% in 2015 to 2.9% in 2016, resulting in a Ps 21.8 billion increase in interest expense. For an analysis of the evolution of the Central American average balance of interest bearing liabilities and its costs excluding the impact of the devaluation of the peso, see LB Panamá’s MD&A (“—Banco de Bogotá subsidiary analysis—LB Panamá—Net interest income”).
Average total interest-earning assets (calculated as (i) gross loans including interbank and overnight funds, and (ii) available for sale and held-to-maturity fixed income investments) for Banco de Bogotá’s Colombian operations increased by 7.1%, or Ps 3,872.4 billion, to Ps 58,578.4 billion for the year ended December 31, 2016, while net interest income grew by 11.9% or Ps 315.1 billion to Ps 2,971.1 billion. The above resulted in a 22 basis points increase in net interest margin from 4.9% in 2015 to 5.1% in 2016. The spread between the yield earned on loans and leases (excluding interbank and overnight funds) and the rate paid on deposits increased by 40 basis points from 5.4% in 2015 to 5.8% in 2016 as the bank’s assets reprice faster than liabilities, increasing spreads in an increasing interest rates scenario.
Average total interest-earning assets (calculated as (i) gross loans including interbank and overnight funds, and (ii) available for sale and held-to-maturity fixed income investments) for Banco de Bogotá’s Central American operations increased by 18.9%, or Ps 7,418.1 billion, to Ps 46,761.3 billion for the year ended December 31, 2016, while net interest income grew by 21.1% or Ps 550.2 billion to Ps 3,162.4 billion. The above resulted in a 12 basis points increase in net interest margin from 6.6% in 2015 to 6.8% in 2016. The spread between the yield earned on loans and leases (excluding interbank and overnight funds) and the rate paid on deposits increased 18 basis points from 8.0% in 2015 to 8.2% in 2016. For an analysis of the evolution of the Central American net interest margin,
excluding the impact of the devaluation of the peso, see LB Panamá’s MD&A (“—Banco de Bogotá subsidiary analysis—LB Panamá—Net interest income”).
Finally, Banco de Bogotá’s consolidated average total interest-earning assets (calculated as (i) gross loans including interbank and overnight funds, and (ii) available for sale and held-to-maturity fixed income investments) increased by 12.0%, or Ps 11,290.5 billion, to Ps 105,339.7 billion in 2016 and net interest income increased by 16.4%, or Ps 865.4 billion to Ps 6,133.5 billion in 2016, which resulted in a 22 basis points increase in the net interest margin from 5.6% in 2015 to 5.8% in 2016. The spread between the yield earned on loans and leases and the rate paid on deposits increased 36 basis points from 6.5% in 2015 to 6.8% in 2016.
Net impairment losses
| | | Year ended December 31, | | | Change, 2016 vs. 2015 | |
| | | 2016 | | | 2015 | | | # | | | % | |
| | | Total
Income/Expense | | | Total
Income/Expense | | | | | | | |
| | | (in Ps billions) | | | | | | | |
| Impairment losses: | | | | | | | | | | | | | | | | |
| Impairment loss on loans and leases, net | | | (1,702.2 | ) | | | (1,236.3 | ) | | | (465.9 | ) | | | 37.7 | |
| Impairment loss on accrued interest and other receivables, net | | | (195.7 | ) | | | (87.0 | ) | | | (108.7 | ) | | | 124.9 | |
| Impairment loss on investments in debt and equity securities | | | (0.0 | ) | | | (0.3 | ) | | | 0.3 | | | | (92.1 | ) |
| Impairment loss on noncurrent assets held for sale | | | (17.8 | ) | | | (20.5 | ) | | | 2.8 | | | | (13.5 | ) |
| Recovery of charged-off financial assets | | | 131.9 | | | | 99.9 | | | | 32.0 | | | | 32.0 | |
| Recovery of impairment loss on investments in debt and equity securities | | | - | | | | - | | | | - | | | | - | |
| Recovery of impairment loss on noncurrent assets held for sale | | | - | | | | - | | | | - | | | | - | |
| Net impairment losses | | | (1,783.8 | ) | | | (1,244.3 | ) | | | (539.5 | ) | | | 43.4 | |
| | | Year ended December 31, | | | Change, 2016 vs. 2015 | |
| | | 2016 | | | 2015 | | | Loans at
least 91
days past
due | | | Delinquency
Ratio | |
| | | Loans at
least 91
days past
due | | | Delinquency
Ratio (1) | | | Loans at
least 91
days past
due | | | Delinquency
Ratio (1) | | | # | | | % | |
| | | (in Ps billions) | | | | | | | |
| Delinquency Ratios | | | 1,664.2 | | | | 1.7 | % | | | 1,360.5 | | | | 1.5 | % | | | 303.7 | | | | 0.2 | |
| Colombian Operations | | | 1,158.3 | | | | 2.2 | % | | | 930.3 | | | | 1.9 | % | | | 228.0 | | | | 0.3 | |
| Commercial loans | | | 807.5 | | | | 2.0 | % | | | 619.3 | | | | 1.7 | % | | | 188.2 | | | | 0.4 | |
| Consumer loans | | | 280.6 | | | | 3.0 | % | | | 262.0 | | | | 3.0 | % | | | 18.6 | | | | (0.1 | ) |
| Mortgage loans | | | 33.5 | | | | 1.5 | % | | | 21.1 | | | | 1.2 | % | | | 12.4 | | | | 0.3 | |
| Microcredit loans | | | 36.6 | | | | 9.5 | % | | | 27.8 | | | | 7.6 | % | | | 8.8 | | | | 1.9 | |
| Central American Operations | | | 505.9 | | | | 1.2 | % | | | 430.2 | | | | 1.0 | % | | | 75.7 | | | | 0.1 | |
| Commercial loans | | | 113.7 | | | | 0.6 | % | | | 100.5 | | | | 0.6 | % | | | 13.3 | | | | 0.1 | |
| Consumer loans | | | 285.0 | | | | 1.7 | % | | | 228.0 | | | | 1.5 | % | | | 57.0 | | | | 0.2 | |
| Mortgage loans | | | 107.2 | | | | 1.2 | % | | | 101.7 | | | | 1.2 | % | | | 5.4 | | | | 0.0 | |
| Microcredit loans | | | - | | | | N.A. | | | | - | | | | N.A. | | | | N.A. | | | | N.A. | |
| (1) | Calculated as 91 days past due loans divided by total gross loans and leases (excluding interbank and overnight funds) |
Net impairment losses for Banco de Bogotá’s consolidated operations increased by 43.4% or Ps 539.5 billion in 2016 as compared to 2015, driven primarily by a 37.7% or Ps 465.9 billion increase in impairment loss on loans and
leases, net and a Ps 108.7 billion increase in impairment loss on accrued interest and other receivables, net. These increases were partially offset by a Ps 32.0 billion increase in recoveries of charged-off assets.
The increase in net impairment losses was explained by a Ps 265.9 billion increase for Banco de Bogotá’s Colombian operations and a Ps 273.6 billion increase Banco de Bogotá’s Central American operation.
Net impairment losses for Banco de Bogotá’s Colombian operations increased by 37.2% or Ps 265.9 billion from Ps 714.9 billion in 2015 to Ps 980.9 billion in 2016, mainly explained by a 27.6% or Ps 198.6 billion increase in impairment loss on loans and leases and a Ps 109.5 billion increase in impairment loss on accrued interest and other receivables, net that were partially offset by a Ps 33.0 billion increase in recoveries of charged-off assets. Delinquency ratios in Colombia presented a 30 basis points deterioration due to a 37 basis points deterioration in delinquency for commercial loans, a 5 basis points deterioration of consumer loans and a 28 basis point deterioration on mortgage loans. The ratio of net impairment loss on loan and leases to average loan and leases increased from 1.7%, in 2015 to 2.1% in 2016. The deterioration of the loan portfolio was directly associated with a low GDP growth scenario. Provision expenses for loans and leases, net was also impacted by provision expenses of some large credits, such as the Ps 86.1 billion net impairment of the loan to Pacific Exploration & Production Corp., done during the first semester of 2016 which accounted for 17 basis points of the increase in cost of risk.
When translated into pesos, net impairment losses for the Central American operations increased by 51.7% or 273.6 billion to Ps 802.9 billion in 2016. The increase is mainly explained by a Ps 267.3 billion increase in impairment loss on loans and leases. The devaluation of the average peso to dollar exchange rate accounted for Ps 56.5 billion of the increase in net impairment losses. For an analysis of the evolution of the Central American net impairment loss on financial assets, excluding the impact of the devaluation of the peso, see LB Panamá’s MD&A (“—Banco de Bogotá subsidiary analysis—LB Panamá—Impairment”). The ratio of net impairment loss on loans and leases to average loans and leases increased from 1.5% in 2015 to 1.9% in 2016, mainly driven by a slight deterioration in the credit quality of our operation in Guatemala.
Charge-offs for Banco de Bogotá’s consolidated operations increased by 43.3% or Ps 476.1 billion to Ps 1,576.8 billion in 2016 as compared to 2015, and its ratio of charge-offs to average balance of loans and leases (excluding interbank and overnight funds) ratio increased from 1.3% in 2015 to 1.7% in 2016. This ratio was also impacted by the Pacific Exploration & Production Corp. loan mentioned above, which was fully provisioned and charged-off as of June 2016, adding 9 basis points to the full-year ratio.
Banco de Bogotá’s consolidated coverage ratio for loans 91 days past due was 142.5% in 2016, with a ratio of 141.4% for its Colombian operations and 122.4% for its Central American operations. These ratios compared with 154.1%, 154.7% and 122.9% for the consolidated, Colombian and Central American operations during 2015.
The recovery of charged-off assets increased by 32.0% or Ps 32.0 billion, driven by increases of Ps 33.0 billion in the recoveries of Banco de Bogotá’s Colombian operations, which were offset by a decrease of Ps 1.0 billion in recoveries from the Central American operation.
Net commission and fee income
| | | Year ended December 31, | | | Change, 2016 vs. 2015 | |
| | | 2016 | | | 2015 | | | # | | | % | |
| | | (in Ps billions) | | | | | | | |
| Commission and fee income: | | | | | | | | | | | | | | | | |
| Banking fees | | | 2,865.5 | | | | 2,407.8 | | | | 457.7 | | | | 19.0 | |
| Bonded warehouse services | | | 123.4 | | | | 112.5 | | | | 10.9 | | | | 9.7 | |
| Trust and portfolio management activities | | | 147.5 | | | | 126.7 | | | | 20.8 | | | | 16.4 | |
| Pension and severance fund management | | | 822.3 | | | | 786.0 | | | | 36.3 | | | | 4.6 | |
| Commission and fee income | | | 3,958.7 | | | | 3,433.0 | | | | 525.7 | | | | 15.3 | |
| Commission and fee expenses | | | (347.6 | ) | | | (327.3 | ) | | | (20.4 | ) | | | 6.2 | |
| Net commission and fee income | | | 3,611.1 | | | | 3,105.7 | | | | 505.3 | | | | 16.3 | |
Net commission and fee income for Banco de Bogotá’s consolidated operation increased by 16.3% or Ps 505.3 billion in 2016 as compared to 2015, with Ps 103.6 billion resulting from Banco de Bogotá’s Colombian operations and Ps 401.7 billion resulting from Banco de Bogotá’s Central American operations.
The Ps 103.6 billion or 6.4% increase resulting from Banco de Bogotá’s Colombian operations was mainly driven by a Ps 54.7 billion or 6.3% increase in commissions from banking fees, a Ps 30.6 billion or 4.0% increase in fees from pension and severance fund management (“Banco de Bogotá subsidiary analysis—Porvenir—Net income from commissions and fees”), a Ps 20.8 billion or 16.4% increase in fees from trust and portfolio management activities and a Ps 10.9 billion or 9.7% increase in fees from bonded warehouse services. These increases were partially offset by a Ps 13.4 billion or 5.6% increase in commission and fee expenses.
Of the Ps 401.7 billion or 27.1% increase in net commission and fee income from Central American operations, Ps 403.0 billion are explained by an increase in banking fees and Ps 5.7 billion by increases in pension and severance fund management. These increases were partially offset by an increase of Ps 7.0 billion in commission and fee expenses. The devaluation of the average peso to dollar exchange rate accounted for Ps 156.7 billion of the increase in net commission and fee income. For an analysis of the evolution of the Central American net income from commissions and fees, excluding the impact of the devaluation of the peso, see LB Panamá’s MD&A (“—Banco de Bogotá subsidiary analysis—LB Panamá—Net income from commissions and fees”).
Net trading income
Banco de Bogotá’s consolidated net trading income includes (i) net trading income from investment securities held for trading through profit or loss, which reflects the interest and gains/losses from mark-to-market valuation, in each case from equity and fixed income investment securities held for trading through profit or loss, and (ii) net trading income from derivatives, which reflects the gains/losses from mark-to-market valuation on derivatives different from that considered under hedge accounting.
During 2016, Banco de Bogotá’s consolidated net trading income was Ps 351.6 billion, 22.6% or Ps 64.8 billion higher than the Ps 286.8 billion for 2015. Colombian operations accounted for a Ps 78.5 billion increase in net trading income, offset in part by a Ps 13.7 billion decrease in net trading income from the Central American operations, when translated to pesos. The Ps 64.8 billion increase in net trading income was driven by a Ps 367.0 billion increase in net trading income from investment securities held for trading through profit or loss and Ps 302.2 billion decrease in net trading income from derivatives.
Total income from valuation on trading and hedging derivatives decreased Ps 302.2 billion from Ps 340.1 billion to in 2015 to Ps 37.9 billion in 2016, driven by the appreciation of the Colombian peso during 2016.
The Ps 367.0 billion increase in net trading income from investment securities held for trading through profit or loss, for Banco de Bogotá’s consolidated operations, was mainly driven by an increase in the return from a negative 1.9% in 2015 to 14.8% in 2016, resulting in a Ps 461.4 billion increase in income. The average balance of Banco de Bogotá’s consolidated fixed income and equity investments held for trading through profit or loss decreased by 23.1%, or Ps 638.6 billion, to Ps 2,121.0 billion, and resulted in a Ps 94.4 billion decrease in income.
For the Colombian operations, net trading income from investment securities held for trading through profit or loss increased by Ps 235.1 billion to Ps 160.4 billion in 2016. This increase was mainly explained by an increase in the average return from a negative 3.7% in 2015 to 9.1% in 2016, resulting in a Ps 258.2 billion increase in income. This increase was partially offset by a decrease in the average balance of the Colombian operations’ fixed income and equity investments held for trading through profit or loss of 12.6%, or Ps 253.0 billion, to Ps 1,761.5 billion, resulting in a Ps 23.0 billion decrease in income.
For the Central America operation, when translated to pesos, net trading income from investment securities held for trading through profit or loss increased Ps 131.8 billion from Ps 21.5 billion in 2015 to Ps 153.3 billion in 2016. The increase was mainly explained by an increase in the return from 2.9% in 2015 to 42.6% in 2016, resulting in a Ps 296.2 billion increase in income. The average balance of fixed income and equity investments held for trading through profit or loss decreased by Ps 385.6 billion, to Ps 359.5 billion, resulting in a Ps 164.4 billion decrease in income. The increase in yield is primarily associated with gains on sales of fixed income investments held for trading through profit or loss.
Total income from investment securities
Banco de Bogotá’s securities portfolio is classified in the following categories: (i) equity and fixed income investments held for trading through profit or loss (described in this section as net trading income in investment securities held for trading through profit or loss), (ii) available for sale fixed income investments and (iii) held-to-
maturity fixed income investments (results from (ii) and (iii) are included in the net interest income section as interest income from investment in debt securities). Banco de Bogotá manages its investment portfolio in a comprehensive and integral manner that considers individual return of each one of these three categories and the total return of the investment securities portfolio.
Total income from investment securities for Banco de Bogotá consolidated operations (comprised of income on investment in debt securities and net trading income from investment securities held for trading through profit or loss) was Ps 739.7 billion for 2016, Ps 360.7 billion higher than the Ps 379.0 billion for 2015. This was primarily driven by an increase of 301 basis points in the average return on total investment securities from 2.9% in 2015 to 5.9% in 2016, generating a Ps 389.8 billion increase in interest income, which was partially offset by a Ps 489.7 billion decrease in the average balance of Total Investment Securities from Ps 12,942.8 billion in 2015 to Ps 12,453.1 billion in 2016, resulting in a Ps 29.1 billion decrease in interest income.
When including the investment securities held for trading through profit or loss, Banco de Bogotá’s consolidated average total interest earning assets (calculated as (i) gross loans including interbank and overnight funds, (ii) available for sale and held-to-maturity fixed income investments, and (iii) fixed income and equity investments held for trading through profit or loss) would have increased by 11.0% or Ps 10,652.0 billion to Ps 107,460.7 billion in 2016 and the net interest income plus net trading income from investment securities held for trading through profit or loss would have increased by 23.6%, or Ps 1,232.3 billion to Ps 6,447.2 billion in 2016. The return over average total interest earning assets (calculated as (i) gross loans including interbank and overnight funds, (ii) available for sale and held-to-maturity fixed income investments, and (iii) fixed income and equity investments held for trading through profit or loss) would have increased by 61 basis points from 5.4% in 2015 to 6.0% in 2016.
Other income
| | | Year ended December 31, | | | Change, 2016 vs. 2015 | |
| | | 2016 | | | 2015 | | | # | | | % | |
| | | (in Ps billions) | | | | | | | |
| Foreign exchange gains (losses), net | | | 381.3 | | | | 289.2 | | | | 92.1 | | | | 31.9 | |
| Gains on sales of investments, net | | | 84.2 | | | | 62.9 | | | | 21.3 | | | | 33.8 | |
| Income from sales of noncurrent assets held for sale | | | 14.8 | | | | 15.8 | | | | (1.0 | ) | | | (6.4 | ) |
| Equity method | | | 112.2 | | | | 176.8 | | | | (64.6 | ) | | | (36.5 | ) |
| Dividend income | | | 1.8 | | | | 2.5 | | | | (0.7 | ) | | | (29.4 | ) |
| Gain on valuation of assets, net | | | 4.8 | | | | - | | | | 4.8 | | | | - | |
| Income from non-financial sector, net | | | (102.5 | ) | | | (92.4 | ) | | | (10.1 | ) | | | 11.0 | |
| Net income from financial instruments designated at fair value | | | - | | | | - | | | | - | | | | - | |
| Other | | | 2,598.7 | | | | 351.0 | | | | 2,247.7 | | | | 640.4 | |
| Total other income | | | 3,095.3 | | | | 805.9 | | | | 2,289.4 | | | | 284.1 | |
Total other income for Banco de Bogotá’s consolidated operation increased by Ps 2,289.4 billion to Ps 3,095.3 in 2016, this increase was mainly driven by the one-time effect Ps 2,208.1 billion of income resulting from the deconsolidation of Corficolombiana, a Ps 92.1 billion increase in foreign exchange gains (losses), net, a Ps 21.3 billion increase in gains on sales of investments, net related to the sale of the bank’s investment in CIFIN to TransUnion Netherlands and a Ps 4.8 billion increase in gains on valuations of assets. These increases were partially offset by a Ps 64.6 billion decrease in equity method related to a decrease in Corficolombiana’s net income (see Corficolombiana’s MD&A (“—Corficolombiana— Other income (expense)”) and a Ps 10.1 billion
decrease in income from the non-financial sector related to higher personnel and administrative expenses in Banco de Bogotá’s subsidiary Megalinea.
Other expenses
| | | Year ended December 31, | | | Change, 2016 vs. 2015 | |
| | | 2016 | | | 2015 | | | # | | | % | |
| | | (in Ps billions) | | | | | | | |
| Losses from sales of noncurrent assets held for sale | | | (6.2 | ) | | | 0.0 | | | | (6.2 | ) | | | N.A. | |
| Personnel expenses | | | (2,466.0 | ) | | | (2,151.6 | ) | | | (314.4 | ) | | | 14.6 | |
| Salaries and employee benefits | | | (2,294.3 | ) | | | (2,013.8 | ) | | | (280.5 | ) | | | 13.9 | |
| Bonus plan payments | | | (111.9 | ) | | | (101.3 | ) | | | (10.7 | ) | | | 10.5 | |
| Termination payments | | | (59.8 | ) | | | (36.5 | ) | | | (23.2 | ) | | | 63.6 | |
| Administrative and other expenses | | | (2,790.3 | ) | | | (2,340.2 | ) | | | (450.1 | ) | | | 19.2 | |
| Depreciation and amortization | | | (352.6 | ) | | | (358.5 | ) | | | 5.9 | | | | (1.6 | ) |
| Wealth tax | | | (153.5 | ) | | | (168.7 | ) | | | 15.2 | | | | (9.0 | ) |
| Other expenses | | | (56.6 | ) | | | (95.9 | ) | | | 39.4 | | | | (41.0 | ) |
| Charitable and other donation expenses | | | (5.4 | ) | | | (4.3 | ) | | | (1.1 | ) | | | 26.3 | |
| Other | | | (51.2 | ) | | | (91.7 | ) | | | 40.5 | | | | (44.2 | ) |
| Total other expenses | | | (5,825.2 | ) | | | (5,115.0 | ) | | | (710.2 | ) | | | 13.9 | |
Total other expenses for Banco de Bogotá’s consolidated operation increased by Ps 710.2 billion, or 13.9%, in 2016 as compared to 2015. Of this increase, Ps 133.4 billion was driven by the Colombian operations and Ps 576.8 billion by Central American operations, when translated to pesos.
The Ps 133.4 billion or 5.4% increase in total other expenses resulting from Colombian operations was mainly driven by a 7.2% or Ps 92.5 billion increase in administrative and other expenses and an 8.6% or Ps 70.9 billion increase in personnel expenses. Partially offsetting this increase was a Ps 34.6 billion decrease in other expenses.
The Ps 576.8 billion increase in total other expenses resulting from Central American operations, when translated to pesos, is mainly explained by a Ps 33.9% or 357.6 billion increase in administrative and other expenses and an 18.4% or Ps 243.5 billion increase in personnel expenses, partially offset by a Ps 23.1 billion decrease in depreciation and amortization. The devaluation of the average peso to dollar exchange rate accounted for Ps 291.6 billion of the increase in total other expenses. For an analysis of the evolution of the Central American operation’s other expenses excluding the impact of the devaluation of the peso, see LB Panamá’s MD&A (“—Banco de Bogotá subsidiary analysis—LB Panamá—Other expenses”).
The increase in personnel expenses for Banco de Bogotá’s consolidated operation resulted from a 1.7% increase in headcount during the year to support the growth of the loan portfolio. The number of employees went from 46,418 employees in 2015 to 47,208 employees in 2016. Furthermore, there was a 12.6% increase in yearly salaries and employee benefits per employee (6.9% for Colombian operations and 15.4% for Central American Operations) from Ps 43.4 million in 2015 to 48.6 million in 2016. Excluding the devaluation, salaries and employee benefits per employee for Central American operations would have increased by 3.9%.
Banco de Bogotá’s consolidated operations’ efficiency ratio (calculated as personnel and administrative and other expenses divided by net interest income, fees and other services income, net trading income and other income excluding other) remained relatively stable at 49.3% in 2015 and 49.6% in 2016 (44.4% to 43.9% for Colombian operations and 54.7% to 55.1% for Central American Operations). The ratio of personnel and administrative and other expenses as a percentage of average assets increased from 3.7% in 2015 to 3.9% in 2016 (stable at 3.1% for Colombian operations and 4.4% to 4.8% for Central American Operations).
Income tax expense
Income tax expense for Banco de Bogotá’s consolidated operation increased by 9.8%, or Ps 102.7 billion, to Ps 1,150.4 billion in 2016. Banco de Bogotá’s consolidated operation effective tax rate (calculated as income tax
expense divided by income before income tax expense excluding dividends and the equity method, as both are non-taxable income, and the equity tax as it is a non-deductible expense) was 20.5% in 2016 compared to 33.8% in 2015. The decrease in the effective tax rate in 2016 was mainly explained by the one-time effect resulting from the deconsolidation of Corficolombiana which was a non-taxable income. Excluding this one-time effect, Banco de Bogotá’s effective tax rate for 2016 would have been 33.7%.
Net income attributable to non-controlling interest
Net income attributable to non-controlling interest increased by Ps 30.2 billion, to Ps 185.9 billion in 2016 as compared with Ps 155.7 billion in 2015. The ratio of net income attributable to non-controlling interest to net income was 4.2% in 2016 compared to 7.6% in 2015. The decrease was mainly explained by the one-time effect resulting from the deconsolidation of Corficolombiana. Net income less the one-time effect of the deconsolidation of Corficolombiana was Ps 2,224.0 billion, Banco de Bogotá’s ratio of net income attributable to non-controlling interest to net income less the one-time effect of the deconsolidation of Corficolombiana for 2016 would have been 8.4% (net income attributable to non-controlling interest of Ps 185.9 billion divided by net income less the one-time effect of the deconsolidation of Corficolombiana of Ps 2,224.0 billion), reflecting the improvement in Porvenir’s results and the recognition of its non-controlling interests.
Banco de Bogotá Subsidiary Analysis
Banco de Bogotá’s results of operations are significantly affected by the results of operations of its subsidiaries, Porvenir and LB Panamá. In order to fully disclose the effect of these subsidiaries on Banco de Bogotá, the following is an analysis of the results of operations of each of Porvenir and LB Panamá in the year ended December 31, 2016 compared to the year ended December 31, 2015.
Porvenir
Porvenir generates income primarily from fees on its customers’ pension contributions, which consist predominantly of monthly mandatory contributions. It also generates net interest income and net trading income, composed almost entirely of investment income from the appreciation of Porvenir’s proprietary trading portfolio, which can be divided into two components: (i) income from its stabilization reserve, which is the legally required proprietary stake (1% of assets under management) in its funds that are subject to a minimum return guarantee mainly mandatory pension and severance funds; and (ii) income from Porvenir’s investment portfolio, which includes income from fixed income securities and money market instruments. As a result, Porvenir’s revenue is mainly affected by the number of contributors, their salaries, any changes in applicable fee rates and the rate of return of its assets under management and its proprietary investment portfolio.
Net income
| | | For the year ended December 31, | | | Change, December 2016 vs December
2015 | |
| | | 2016 | | | 2015 | | | # | | | % | |
| | | (in Ps billions) | | | | | | | |
| Interest income | | | 22.0 | | | | 69.2 | | | | (47.1 | ) | | | (68.2 | ) |
| Interest expenses | | | (30.8 | ) | | | (28.1 | ) | | | (2.7 | ) | | | 9.5 | |
| Net interest income | | | (8.8 | ) | | | 41.0 | | | | (49.8 | ) | | | (121.4 | ) |
| Impairment loss on loans and other accounts receivable, net | | | 7.0 | | | | (22.9 | ) | | | 30.0 | | | | (130.7 | ) |
| Impairment loss on other assets, net | | | - | | | | - | | | | - | | | | - | |
| Recovery of charged-off financial assets | | | - | | | | - | | | | - | | | | - | |
| Net impairment loss | | | 7.0 | | | | (22.9 | ) | | | 30.0 | | | | (130.7 | ) |
| Net commission and fees income | | | 699.2 | | | | 667.3 | | | | 31.9 | | | | 4.8 | |
| Net trading income | | | 75.6 | | | | 122.1 | | | | (46.5 | ) | | | (38.1 | ) |
| Other income | | | 85.1 | | | | (73.0 | ) | | | 158.1 | | | | (216.6 | ) |
| Other expenses | | | (323.0 | ) | | | (314.8 | ) | | | (8.2 | ) | | | 2.6 | |
| Income before income tax expense | | | 535.2 | | | | 419.6 | | | | 115.6 | | | | 27.5 | |
| Income tax expense | | | (194.1 | ) | | | (165.0 | ) | | | (29.1 | ) | | | 17.6 | |
| Net Income | | | 341.1 | | | | 254.6 | | | | 86.5 | | | | 34.0 | |
| Net income attributable to: | | | | | | | | | | | | | | | | |
| Controlling interest | | | 340.4 | | | | 254.0 | | | | 86.4 | | | | 34.0 | |
| Non-controlling interest | | | 0.7 | | | | 0.6 | | | | 0.1 | | | | 18.6 | |
Porvenir’s net income attributable to controlling interest increased by 34.0%, or Ps 86.4 billion, to Ps 340.4 billion in 2016 as compared to 2015. This increase in Porvenir’s results was driven by a Ps 158.1 billion increase in total other income (expense), a Ps 31.9 billion increase in net income from commissions and fees and a Ps 30.0 billion decrease in net impairment loss on financial assets. Partially offsetting these was a Ps 49.8 billion decrease in net interest income, a Ps 46.5 billion decrease in net trading income, a Ps 29.1 billion increase in income tax expense, and a Ps 8.2 billion increase in total other expenses.
Net interest income
Net interest income decreased by Ps 49.8 billion, to a net loss of Ps 8.8 billion in 2016 as compared to 2015, mainly driven by a Ps 48.0 billion decrease in interest on investments in debt securities.
The Ps 48.0 billion decrease in interest income from investments in debt securities from Ps 63.0 billion in 2015 to 15.0 billion in 2016 was driven by a decrease in Porvenir’s rate of return on its debt securities investment portfolio from 17.6% in 2015 to 3.1% in 2016, as prevailing market conditions during the year ended December 31, 2016 were less favorable due to local and global fixed income market conditions than those prevailing during the year ended December 31, 2015, which resulted in a Ps 52.1 billion decrease in interest income. Partially offsetting this decrease was a 36.5%, or Ps 130.8 billion, increase in the average balance of fixed income investments available for sale from Ps 358.1 billion in 2015 to Ps 488.9 billion in 2016, resulting in a Ps 4.0 billion increase in interest income.
Total interest expense increased by Ps 2.7 billion from Ps 28.1 billion in 2015 to Ps 30.8 billion in 2016, due to movements in the exchange rate that impacted Porvenir’s foreign currency denominated loans.
Net impairment losses
Porvenir’s net impairment loss on financial assets decreased by Ps 30.0 billion from a net impairment loss of Ps 22.9 billion in 2015 to a net impairment recovery of Ps 7.0 billion in 2016 mainly due to a decrease in the impairment losses on “unidades negativas” (negative units), which resulted from customers switching from another pension fund manager to Porvenir. Porvenir’s impairment loss on financial assets only includes losses on accounts receivable since Porvenir does not engage in lending activities.
Net commission and fee income
| | | Year ended December 31, | | | Change, 2016 vs. 2015 | |
| | | 2016 | | | 2015 | | | # | | | % | |
| | | (in Ps billions) | | | | | | | |
| Net commission and fee income: | | | | | | | | | | | | | | | | |
| Banking fees | | | 6.3 | | | | 0.0 | | | | 6.3 | | | | N.A. | |
| Bonded warehouse services | | | - | | | | - | | | | - | | | | - | |
| Trust activities | | | - | | | | - | | | | - | | | | - | |
| Pension and severance fund management | | | 790.0 | | | | 763.1 | | | | 26.9 | | | | 3.5 | |
| Commission and fee income | | | 796.4 | | | | 763.1 | | | | 33.2 | | | | 4.4 | |
| Commission and fee expenses | | | (97.2 | ) | | | (95.9 | ) | | | (1.3 | ) | | | 1.3 | |
| Net commission and fee income | | | 699.2 | | | | 667.3 | | | | 31.9 | | | | 4.8 | |
Net commission and fee income consists primarily of commissions earned on the administration of mandatory pension funds, severance funds, voluntary pension funds and third-party liability pension funds. Porvenir’s total fees and other services income, net increased by Ps 31.9 billion, or 4.8%, to Ps 699.2 billion in 2016 as compared to Ps 667.3 billion in 2015.
Pension and severance fund management fees, which include fees from administration of mandatory, voluntary and third-party liability pension funds, and severance funds increased by Ps 26.9 billion or 3.5% to Ps 790.0 billion in 2016.
This increase was primarily driven by a Ps 12.9 billion, or 2.4%, increase in fee income from the administration of mandatory pension funds from Ps 538.4 billion in 2015 to Ps 551.3 billion in 2016. Such results are explained by an increase in the number of clients from 7.3 million as of December 31, 2015 to 7.9 million as of December 31, 2016.
Fee income from severance fund management increased by Ps 12.7 billion from Ps 127.4 billion in 2015 to Ps 140.1 billion in 2016. This increase was mainly due to an increase in the severance funds clients from 3.6 million as of December 31, 2015 to 3.8 million as of December 31, 2016.
Revenues received from the administration of third-party liability pension funds increased by Ps 2.1 billion or 25.2% from Ps 8.2 billion in 2015 to Ps 10.3 billion in 2016.
Partially offsetting these increases, was a Ps 0.7 billion decrease in fee income associated with the management of voluntary pension funds and other fees from Ps 89.2 billion in 2015 to Ps 88.5 billion in 2015.
Banking fees increased by Ps 6.3 billion from Ps 0.02 billion in 2015 to Ps 6.31 billion in 2016.
Commission and fee expenses increased by Ps 1.3 billion or 1.3%, from Ps 95.9 billion in 2015 to Ps 97.2 billion in 2016.
Net trading income
Porvenir’s net trading income includes (i) net trading income from investment securities held for trading through profit or loss, which reflects the interest and gains/losses from mark-to-market valuation, in each case from equity and fixed income investment securities held for trading through profit or loss, and (ii) net trading income from derivatives, which reflects the gains/losses from mark-to-market valuation on derivatives different from that considered under hedge accounting.
Total net trading income decreased by Ps 46.5 billion, or 38.1%, from Ps 122.1 billion in 2015 to Ps 75.6 billion in 2016, driven by a Ps 132.5 billion decrease in net trading income from derivatives, from a gain of Ps 87.3 billion in 2015 to a loss of Ps 45.2 billion in 2016. This decrease in net trading income from derivatives was driven by an appreciation of the Colombian peso during 2016 and was offset by a Ps 172.0 billion increase in foreign exchange gains (losses), net.
Net trading income from investment securities held for trading through profit or loss increased by Ps 86.0 billion from Ps 34.8 billion in 2015 to 120.8 billion in 2016. This increase was driven by an increase in their average yield from 3.4% in 2015 to 10.5% in 2016, which resulted in an increase in income of Ps 72.9 billion. Porvenir’s average balance of investment securities held for trading through profit or loss increased from Ps 1,026.1 billion in 2015 to Ps 1,150.8 billion in 2016, resulting in a Ps 13.1 billion increase in net trading income.
Total income from investment securities
Porvenir’s securities portfolio is classified in the following categories: (i) equity and fixed income investments held for trading through profit or loss (described in this section as net trading income in investment securities held for trading through profit or loss), (ii) available for sale fixed income investments and (iii) held to maturity fixed income investments (results from (ii) and (iii) are included in the net interest income section as interest income from investment in debt securities). Porvenir manages its investment portfolio in a comprehensive and integral manner that considers individual return of each one of these three categories and the total return of the investment securities portfolio.
Total income from investment securities (comprised of income on investment securities and net trading income from investment securities held for trading through profit or loss) was Ps 135.8 billion for 2016, 38.8% or Ps 38.0 billion higher than the Ps 97.8 billion for 2015. This result is mainly explained by a Ps 255.5 billion increase in the average balance of Total Investment Securities, which resulted in a Ps 21.2 billion increase in income and an increase in the average yield of total investment securities from 7.1% in 2015 to 8.3% in 2016, which resulted in a Ps 16.8 billion increase in income.
Other income
Total other income increased by Ps 158.1 billion from a loss of Ps 73.0 billion in 2015 to a gain of Ps 85.1 billion in 2016. This increase was primarily due to a Ps 172.0 billion increase in foreign exchange gains (losses), net, related to the appreciation of the Colombian peso during 2016, from a Ps 138.2 billion loss in 2015 to a Ps 33.8 billion gain in 2015. This result was partially offset by a Ps 15.3 billion decrease in other income attributable to
provisions recovered as a result of customers switching from one pension fund manager to another and recoveries of insurance claims and others.
Other expenses
| | | For the year ended December 31, | | | Change, 2016 vs. 2015 | |
| | | 2016 | | | 2015 | | | # | | | % | |
| | | (in Ps billions) | | | | | | | |
| Losses from sales of noncurrent assets held for sale | | | - | | | | - | | | | - | | | | - | |
| Personnel expenses | | | (119.4 | ) | | | (113.8 | ) | | | (5.6 | ) | | | 4.9 | |
| Salaries and employee benefits | | | (119.2 | ) | | | (112.7 | ) | | | (6.6 | ) | | | 5.8 | |
| Bonus plan payments | | | (0.1 | ) | | | (0.7 | ) | | | 0.5 | | | | (83.2 | ) |
| Termination payments | | | (0.0 | ) | | | (0.4 | ) | | | 0.4 | | | | (97.1 | ) |
| Administrative and other expenses | | | (165.8 | ) | | | (148.0 | ) | | | (17.8 | ) | | | 12.0 | |
| Depreciation and amortization | | | (20.1 | ) | | | (13.9 | ) | | | (6.3 | ) | | | 45.4 | |
| Wealth tax | | | (13.0 | ) | | | (15.2 | ) | | | 2.2 | | | | (14.5 | ) |
| Other expenses | | | (4.7 | ) | | | (24.0 | ) | | | 19.3 | | | | (80.4 | ) |
| Charitable and other donation expenses | | | - | | | | (1.3 | ) | | | 1.3 | | | | (100.0 | ) |
| Other | | | (4.7 | ) | | | (22.7 | ) | | | 18.0 | | | | (79.3 | ) |
| Total other expenses | | | (323.0 | ) | | | (314.8 | ) | | | (8.2 | ) | | | 2.6 | |
Porvenir’s total other expenses increased by Ps 8.2 billion, or 2.6% to Ps 323.0 billion in 2016 as compared to 2015. This increase was mainly driven by a Ps 17.8 billion or 12.0% increase in administrative and other expenses, a Ps 6.3 billion or 45.4% increase in depreciation and amortization costs, and a Ps 5.6 billion or 4.9% increase in personnel expenses. Partially offsetting these increases was a Ps 19.3 billion decrease in other expenses driven by the yearly update in their actuarial calculations for provisions of uncapitalized accounts (“cuentas descapitalizadas”) in 2016 and a Ps 2.2 billion decrease in wealth tax.
Porvenir’s efficiency to income ratio (calculated as personnel and administrative and other expenses divided by net income, fees and other services income, other income excluding other) improved from 37.4% in 2015 to 35.2% in 2016.
The number of employees of Porvenir increased from 2,872 in 2015 to 2,957 in 2016 and yearly salaries and employee benefits per capita increased by 2.8% from Ps 39.2 million in 2015 to Ps 40.3 million in 2016.
Income tax expense
Income tax expense increased by 17.6%, or Ps 29.1 billion, to Ps 194.1 billion in 2016 as compared to 2015. Porvenir’s effective tax rate (calculated as income tax expense divided by income before tax expense minus equity method minus dividends, plus wealth tax) improved from 38.0% in 2015 to 35.4% in 2016.
Net income attributable to non-controlling interest
Net income attributable to non-controlling interest, a non-material figure of Porvenir’s net income that reflects third party ownerships in entities consolidated by the company, increased from Ps 0.6 billion in 2015 to Ps 0.7 billion in 2016.
LB Panamá
Given that LB Panamá’s functional currency is USD, it is important to bear in mind that its consolidated results for 2016 in Colombian Pesos reflect both the entity’s performance in its functional currency and the depreciation of the average exchange rate, which was 11.2% in the year ended December 31, 2016.
The following tables present the results of LB Panamá in Colombian Pesos and also include an adjusted 2015 column in which we applied 2016 average exchange rate of Ps 3,053.42 to provide 2015 U.S. dollar translations to adjust for the impact of the devaluation of the Colombian Peso.
Net income
| | | For the year ended
December 31, | | | Change, December 2016 vs
December 2015 | | | For the year
ended
December 31, | | | Change, December
2016 vs December 2015
* | |
| | | 2016 | | | 2015 | | | # | | | % | | | 2015 (adjusted)(*) | | | # | | | % | |
| | | (in Ps billions) | | | | | | | | | | | | | | | | |
| Interest income | | | 4,730.3 | | | | 3,944.5 | | | | 785.8 | | | | 19.9 | | | | 4,374.9 | | | | 355.4 | | | | 8.1 | |
| Interest expenses | | | (1,567.9 | ) | | | (1,332.4 | ) | | | (235.5 | ) | | | 17.7 | | | | (1,481.1 | ) | | | (86.8 | ) | | | 5.9 | |
| Net interest income | | | 3,162.4 | | | | 2,612.1 | | | | 550.2 | | | | 21.1 | | | | 2,893.8 | | | | 268.6 | | | | 9.3 | |
| Impairment loss on loans and other accounts receivable, net | | | (785.2 | ) | | | (518.7 | ) | | | (266.5 | ) | | | 51.4 | | | | (574.5 | ) | | | (210.7 | ) | | | 36.7 | |
| Impairment loss on other assets, net | | | (17.8 | ) | | | (11.7 | ) | | | (6.1 | ) | | | 52.1 | | | | (12.7 | ) | | | (5.1 | ) | | | 40.0 | |
| Recovery of charged-off financial assets | | | - | | | | 1.0 | | | | (1.0 | ) | | | (100.0 | ) | | | 1.3 | | | | (1.3 | ) | | | (100.0 | ) |
| Net impairment loss | | | (802.9 | ) | | | (529.4 | ) | | | (273.6 | ) | | | 51.7 | | | | (585.9 | ) | | | (217.0 | ) | | | 37.0 | |
| Net commission and fees income | | | 1,881.5 | | | | 1,479.7 | | | | 401.7 | | | | 27.1 | | | | 1,636.5 | | | | 245.0 | | | | 15.0 | |
| Net trading income | | | 15.3 | | | | 29.1 | | | | (13.7 | ) | | | (47.3 | ) | | | 21.8 | | | | (6.5 | ) | | | (29.7 | ) |
| Other income | | | 393.4 | | | | 259.9 | | | | 133.5 | | | | 51.4 | | | | 300.6 | | | | 92.8 | | | | 30.9 | |
| Other expenses | | | (3,212.6 | ) | | | (2,635.8 | ) | | | (576.8 | ) | | | 21.9 | | | | (2,927.4 | ) | | | (285.2 | ) | | | 9.7 | |
| Income before income tax expense | | | 1,437.1 | | | | 1,215.7 | | | | 221.4 | | | | 18.2 | | | | 1,339.3 | | | | 97.7 | | | | 7.3 | |
| Income tax expense | | | (421.6 | ) | | | (380.8 | ) | | | (40.7 | ) | | | 10.7 | | | | (418.1 | ) | | | (3.5 | ) | | | 0.8 | |
| Net Income | | | 1,015.5 | | | | 834.9 | | | | 180.6 | | | | 21.6 | | | | 921.2 | | | | 94.3 | | | | 10.2 | |
| Net income attributable to: | | | | | | | | | | | | | | | | | | | | | | | | | | | | |
| Controlling interest | | | 1,015.3 | | | | 834.9 | | | | 180.4 | | | | 21.6 | | | | 921.0 | | | | 94.3 | | | | 10.2 | |
| Non-controlling interest | | | 0.2 | | | | (0.1 | ) | | | 0.3 | | | | (336.8 | ) | | | 0.2 | | | | 0.0 | | | | 10.2 | |
* 2015 figures are adjusted for the impact of the devaluation of the Colombian Peso on a line by line basis
LB Panamá mainly reflects our investment in BAC Credomatic. In addition to its investment in BAC Credomatic, which as of December 31, 2016, amounted to Ps 6,355.3 billion (U.S.$ 2,117.9 billion), as of the same date, LB Panama’s unconsolidated balance sheet carried goodwill of Ps 4,714.6 billion (U.S.$1,571.2 million) resulting from the direct acquisition the company made of BAC Credomatic and Banco BAC de Panamá. LB Panama’s unconsolidated balance sheet also includes Ps 1,504.8 billion (U.S.$501.5 million) of indebtedness. LB Panama had a fixed income portfolio of Ps 948.5 billion (U.S.$316.1 million) comprised mainly of bonds issued by Latin American sovereign and corporate issuers, acquired pursuant to Banco de Bogotá’s investment guidelines.
LB Panamá’s net income attributable to controlling interest for the year ended December 31, 2016 increased by 21.6%, or Ps 180.4 billion, to Ps 1,015.3 billion. The devaluation of the average peso to dollar exchange rate accounted for Ps 86.1 billion of the increase in net income attributable to controlling interest.
LB Panamá’s net income attributable to controlling interest in local currency for the year ended December 31, 2016 increased by 10.2%, or Ps 94.3 billion. This increase in net income was driven by a Ps 268.6 billion, or 9.3%, increase in net interest income, a Ps 245.0 billion, or 15.0%, increase in net income from commissions and fees and a Ps 92.8 billion, or 30.9%, increase in total other income (expense). These increases were partially offset by a Ps 285.2 billion, or 9.7%, increase in total other expenses, a Ps 217.0 billion, or 37.0%, increase in net impairment loss on financial assets, a Ps 6.5 billion, or 29.7%, decrease in net trading income, and a Ps 3.5 billion, or 0.8%, increase in income tax expense.
Net interest income
| | | For the year ended
December 31, | | | Change, December 2016
vs December 2015 | | | For the year
ended
December 31,
2015 | | | Change, December
2016 vs December
2015 * | |
| | | 2016 | | | 2015 | | | # | | | % | | | (adjusted)(*) | | | # | | | % | |
| | | (in Ps billions) | | | | | | | | | | | | | | | | |
| Interest income: | | | | | | | | | | | | | | | | | | | | | | | | | | | | |
| Commercial loans and leases | | | 1,094.3 | | | | 909.0 | | | | 185.3 | | | | 20.4 | | | | 1,007.2 | | | | 87.0 | | | | 8.6 | |
| Consumer loans and leases | | | 2,774.2 | | | | 2,255.7 | | | | 518.5 | | | | 23.0 | | | | 2,501.1 | | | | 273.1 | | | | 10.9 | |
| Mortgage loans and leases | | | 634.1 | | | | 529.1 | | | | 105.0 | | | | 19.8 | | | | 587.8 | | | | 46.4 | | | | 7.9 | |
| Microcredit loans and leases | | | - | | | | - | | | | - | | | | - | | | | - | | | | - | | | | - | |
| Interbank and overnight funds | | | 51.5 | | | | 49.5 | | | | 2.0 | | | | 4.1 | | | | 55.8 | | | | (4.3 | ) | | | (7.7 | ) |
| Interest on loans and leases | | | 4,554.1 | | | | 3,743.3 | | | | 810.8 | | | | 21.7 | | | | 4,151.9 | | | | 402.3 | | | | 9.7 | |
| Interest on investments in debt securities | | | 176.2 | | | | 201.3 | | | | (25.1 | ) | | | (12.5 | ) | | | 223.0 | | | | (46.8 | ) | | | (21.0 | ) |
| Total interest income | | | 4,730.3 | | | | 3,944.5 | | | | 785.8 | | | | 19.9 | | | | 4,374.9 | | | | 355.4 | | | | 8.1 | |
| Interest expense: | | | | | | | | | | | | | | | | | | | | | | | | | | | | |
| Checking accounts | | | (93.6 | ) | | | (73.6 | ) | | | (19.9 | ) | | | 27.1 | | | | (81.5 | ) | | | (12.1 | ) | | | 14.8 | |
| Time deposits | | | (804.5 | ) | | | (680.7 | ) | | | (123.9 | ) | | | 18.2 | | | | (756.8 | ) | | | (47.7 | ) | | | 6.3 | |
| Savings deposits | | | (105.9 | ) | | | (87.4 | ) | | | (18.6 | ) | | | 21.2 | | | | (96.9 | ) | | | (9.1 | ) | | | 9.4 | |
| Total interest expense on deposits | | | (1,004.0 | ) | | | (841.7 | ) | | | (162.4 | ) | | | 19.3 | | | | (935.1 | ) | | | (68.9 | ) | | | 7.4 | |
| Borrowings from banks and others | | | (478.2 | ) | | | (411.1 | ) | | | (67.0 | ) | | | 16.3 | | | | (457.6 | ) | | | (20.5 | ) | | | 4.5 | |
| Interbank and overnight funds | | | (5.6 | ) | | | (6.8 | ) | | | 1.2 | | | | (18.1 | ) | | | (7.7 | ) | | | 2.1 | | | | (27.5 | ) |
| Long-term debt (bonds) | | | (80.1 | ) | | | (72.8 | ) | | | (7.3 | ) | | | 10.1 | | | | (80.6 | ) | | | 0.5 | | | | (0.6 | ) |
| Borrowings from development entities | | | - | | | | - | | | | - | | | | - | | | | - | | | | - | | | | - | |
| Total interest expense | | | (1,567.9 | ) | | | (1,332.4 | ) | | | (235.5 | ) | | | 17.7 | | | | (1,481.1 | ) | | | (86.8 | ) | | | 5.9 | |
| Net interest income | | | 3,162.4 | | | | 2,612.1 | | | | 550.2 | | | | 21.1 | | | | 2,893.8 | | | | 268.6 | | | | 9.3 | |
* 2015 figures are adjusted for the impact of the devaluation of the Colombian Peso on a line by line basis
LB Panamá’s net interest income increased by 21.1% or Ps 550.2 billion in 2016, the devaluation of the average peso to dollar exchange rate accounted for Ps 281.6 billion of the increase in net interest income.
Net interest income in local currency increased by 9.3%, or Ps 268.6 billion, in 2016 as compared to 2015, reflecting a Ps 355.4 billion increase in total interest income offset in part by a Ps 86.8 billion increase in interest expense. The Ps 268.6 billion increase in total interest income is explained by a Ps 402.3 billion increase in interest income on total loans and leases (which includes income from interbank and overnight funds) and a Ps 46.8 billion decrease in income on investments in debt securities. The Ps 402.3 billion increase in interest income on total loans and leases was driven by a Ps 406.5 billion increase in interest income from loans and leases and a Ps 4.3 billion decrease in interest income from interbank and overnight funds.
The increase in interest income on loans and leases of Ps 406.5 billion was mainly driven by a 10.7%, or Ps 3,947.8 billion, increase in LB Panamá’s average interest-earning loan portfolio from Ps 36,812.1 billion in 2015 to Ps 40,759.9 billion in 2016, which resulted in a Ps 436.1 billion increase in interest income. The average yield earned on loans and leases showed a slight decline from 11.1% to 11.0%, which resulted in a Ps 29.6 billion decrease in interest income. The increase in interest income on loans and leases (excluding interbank and overnight funds) was driven by a Ps 273.1 billion increase in income on consumer loans and leases, a Ps 87.0 billion increase in income on commercial loans and leases and a Ps 46.4 billion increase in interest income on mortgage loans and leases.
The increase in interest earned on consumer loans and leases of Ps 273.1 billion was mainly driven by a 14.0% or Ps 1,865.5 billion increase in LB Panamá’s average consumer loans and leases portfolio from Ps 13,327.0 billion in 2015 to Ps 15,192.5 billion in 2016, which resulted in a Ps 340.6 billion increase in interest income. The increase in the average consumer loans and leases portfolio was driven by an increase in the balance of credit cards, personal loans, and automobile loans. This increase was partially offset by a 51 basis points decrease in the average yield on consumer loans and leases from 18.8% in 2015 to 18.3% in 2016, which resulted in a Ps 67.6 billion decrease in interest income.
The Ps 87.0 billion, or 8.6%, increase in interest income on commercial loans and leases was driven by a 9.3%, or Ps 1,442.5 billion, increase in LB Panamá’s average commercial loans and leases portfolio from Ps 15,535.5 billion in 2015 to Ps 16,977.9 billion in 2016, which resulted in a Ps 93.0 billion increase in interest income. This increase was partially offset by a 4 basis points decrease in the average yield on commercial loans from 6.48% in 2015 to 6.45% in 2016, which resulted in a Ps 5.9 billion decrease in interest income.
The increase in interest income on mortgage loans and leases of Ps 46.4 billion was driven by an 8.0% or Ps 639.8 billion increase in LB Panamá’s average mortgage loans and leases portfolio from Ps 7,949.7 billion in 2015 to Ps 8,589.5 billion in 2016, which resulted in a Ps 47.2 billion increase in interest income. The average yield on
mortgage loans and leases slightly decreased from 7.39% in 2015 to 7.38% in 2016, resulting in a Ps 0.9 billion decrease in interest income.
Income from interbank and overnight funds decreased by 7.7%, or Ps 4.3 billion, from Ps 55.8 billion in 2015 to Ps 51.5 billion in 2016.
The Ps 46.8 billion decrease to Ps 176.2 billion in 2016 in income on investments in debt securities is mainly explained by an 88 basis points decrease in the average yield of investments in debt securities from 4.6% in 2015 to 3.7% in 2016, which resulted in a Ps 42.6 billion decrease in interest income. The average balance of investments in debt securities decreased from Ps 4,828.3 billion in 2015 to Ps 4,714.9 billion in 2016, which resulted in Ps 4.2 billion decrease in interest income.
Total interest expense increased by 5.9% or Ps 86.8 billion in 2016 as compared to 2015, mainly driven by a 5.3%, or Ps 2,410.4 billion increase in the average balance of interest-bearing liabilities from Ps 45,263.8 billion in 2015 to Ps 47,674.2 billion in 2016, which resulted in a Ps 79.3 billion increase in interest expense. Additionally, a 2 basis points increase in the average cost of funds from 3.27% in 2015 to 3.29% in 2016, resulted in a Ps 7.5 billion increase in interest expense.
Total interest expense on interest-bearing deposits increased by 7.4% or Ps 68.9 billion mainly driven by a Ps 2,577.0 billion increase in the average balance of interest-bearing deposits from Ps 32,532.5 billion in 2015 to Ps 35,109.5 billion in 2016, which resulted in a Ps 73.7 billion decrease interest expense. Partially offsetting this increase was a 1 basis points decrease in the average rate paid on interest-bearing deposits from 2.87% in 2015 to 2.86% in 2016, which resulted in a Ps 4.8 billion decrease interest expense.
The Ps 68.9 billion increase in interest expense on interest-bearing deposits reflects a Ps 47.7 billion increase in interest expense on time deposits, a Ps 12.1 billion increase in interest expense on checking accounts and a Ps 9.1 billion increase in interest expense on savings deposits.
The increase in interest expense on time deposits of Ps 47.7 billion was mainly driven by a Ps 994.5 billion increase in the average balance of time deposits from Ps 15,237.1 in 2015 to Ps 16,231.6 billion in 2016, resulting in a Ps 49.3 billion increase in interest expense. Partially offsetting this increase was a slight decrease in the average rate paid from 4.97% in 2015 to 4.96% in 2016, which resulted in a Ps 1.6 billion decrease in interest expense.
The Ps 12.1 billion increase in interest expense on interest-bearing checking accounts was driven by an increase in the average balance of interest-bearing checking accounts from Ps 10,303.2 billion in 2015 to 11,366.3 billion in 2016, resulting in a Ps 8.7 billion increase in interest expense. Additionally, a 3 basis points increase in the average rate paid from 0.79% in 2015 to 0.82% in 2016, resulted in a Ps 3.3 billion increase in interest expense.
The increase in interest expense on savings deposits of Ps 9.1 billion was driven by a Ps 519.5 billion increase in the average balance of savings deposits to Ps 7,511.7 billion in 2016, which resulted in a Ps 7.3 billion increase in interest expense. Also contributing to the increase in interest expense was a slight increase in the average rate paid on savings deposits from 1.39% in 2015 to 1.41% in 2016, resulting in a Ps 1.7 billion increase in interest expense.
The Ps 17.9 billion increase in interest expense on other funding (includes borrowings from banks and others, interbank and overnight funds, long-term debt and borrowings from development entities) is explained by a 20 basis points increase in the average rate paid on other funding from 4.3% in 2015 to 4.5% in 2016, which resulted in a Ps 25.4 billion increase in interest expense. The average balance of other funding decreased from Ps 12,731.3 billion in 2015 to Ps 12,564.7 billion in 2016, resulting in a Ps 7.5 billion decrease in interest expense.
The Ps 17.9 billion increase in interest expense on other funding is explained by a Ps 20.5 billion increase in interest expense from borrowings from banks and others, partially offset by a Ps 2.1 billion decrease in interest expense from interbank and overnight funds and a Ps 0.5 billion decrease interest expense from long term debt.
The Ps 20.5 billion increase in interest expense from borrowings from banks and others was mainly driven by a 28 basis points increase in the average rate paid from 4.0% in 2015 to 4.3% in 2016, which resulted in a Ps 31.7 billion increase in interest expense. Partially offsetting this increase was a Ps 260.4 billion decrease in the average balance of borrowings from banks and others from Ps 11,445.6 billion in 2015 to Ps 11,185.2 billion in 2016, resulting in a Ps 11.1 billion decrease in interest expense.
Average total interest earning assets (calculated as (i) gross loans including interbank and overnight funds, and (ii) available for sale and held to maturity fixed income investments) increased by 10.3%, or Ps 4,386.1 billion, from Ps 42,567.7 billion in 2015 to Ps 46,953.8 billion in 2016 and net interest income increased by 9.3%, or Ps 268.6 billion, from Ps 2,893.8 billion to Ps 3,162.4 billion over the same period, which resulted in a 6 basis points decrease in the net interest margin from 6.8% in 2015 to 6.7% in 2016. The interest spread between the average rate on loans and leases (excluding interbank and overnight funds) and the average rate paid on deposits decreased by 7 basis points to 8.2% over the same period.
Net impairment losses
| | | For the year ended
December 31, | | | Change December 2016 vs
December 2015 | | | For the year
ended
December 31,
2015 | | | Change December 2016
vs December 2015 * | |
| | | 2016 | | | 2015 | | | # | | | % | | | (adjusted)(*) | | | # | | | % | |
| | | Total Income/
Expense | | | Total Income/
Expense | | | | | | | | | Total Income/
Expense | | | | | | | |
| | | (in Ps billions) | | | | | | | | | | | | | | | | |
| Impairment losses: | | | | | | | | | | | | | | | | | | | | | | | | | | | | |
| Impairment loss on loans and leases, net | | | (785.0 | ) | | | (517.7 | ) | | | (267.3 | ) | | | 51.6 | | | | (573.0 | ) | | | (212.0 | ) | | | 37.0 | |
| Impairment loss on accrued interest and other receivables, net | | | (0.2 | ) | | | (1.0 | ) | | | 0.8 | | | | (81.9 | ) | | | (1.5 | ) | | | 1.3 | | | | (88.4 | ) |
| Impairment loss on investments in debt and equity securities | | | - | | | | - | | | | - | | | | - | | | | - | | | | - | | | | - | |
| Impairment loss on noncurrent held for sale assets | | | (17.8 | ) | | | (11.7 | ) | | | (6.1 | ) | | | 52.1 | | | | (12.7 | ) | | | (5.1 | ) | | | 40.0 | |
| Recovery of charged-off financial assets | | | - | | | | 1.0 | | | | (1.0 | ) | | | (100.0 | ) | | | 1.3 | | | | (1.3 | ) | | | (100.0 | ) |
| Recovery of impairment loss on investment securities | | | - | | | | - | | | | - | | | | - | | | | - | | | | - | | | | - | |
| Recovery of impairment loss on noncurrent held for sale assets | | | - | | | | - | | | | - | | | | - | | | | - | | | | - | | | | - | |
| Net impairment losses | | | (802.9 | ) | | | (529.4 | ) | | | (273.6 | ) | | | 51.7 | | | | (585.9 | ) | | | (217.0 | ) | | | 37.0 | |
* 2015 figures are adjusted for the impact of the devaluation of the Colombian Peso on a line by line basis
| | | Year ended December 31, | | | | |
| | | 2016 | | | 2015 | | | Change, 2016 vs. 2015 | |
| | | Loans 91 days
past due | | | Delinquency
Ratio (1) | | | Loans 91 days
past due | | | Delinquency
Ratio (1) | | | Loans 91 days
past due | | | Delinquency
Ratio | |
| | | | | | | | | | | | | | | # | | | % | |
| | | (in Ps billions) | | | | | | | |
| Total loans and leases: | | | 505.9 | | | | 1.2 | % | | | 409.9 | | | | 1.0 | % | | | 96.0 | | | | 0.1 | |
| Commercial loans and leases | | | 113.7 | | | | 0.6 | % | | | 95.7 | | | | 0.6 | % | | | 18.0 | | | | 0.1 | |
| Consumer loans and leases | | | 285.0 | | | | 1.7 | % | | | 217.3 | | | | 1.5 | % | | | 67.7 | | | | 0.2 | |
| Mortgage loans and leases | | | 107.2 | | | | 1.2 | % | | | 96.9 | | | | 1.2 | % | | | 10.2 | | | | 0.0 | |
| Microcredit loans and leases | | | - | | | | N.A. | | | | - | | | | N.A. | | | | - | | | | N.A. | |
(1) Calculated as 91 days past due loans divided by total gross loans (excluding interbank and overnight funds)
Net impairment losses increased by 51.7% or Ps 273.6 billion in 2016 as compared to 2015, the devaluation of the average peso to dollar exchange rate accounted for Ps 56.5 billion of the increase in net impairment losses.
Net impairment losses in local currency increased by 37.0% or Ps 217.0 billion in 2016 as compared to 2015. This increase is explained by a Ps 212.0 billion increase in impairment loss on loans and leases, net and a Ps 5.1 billion increase in impairment loss on noncurrent held for sale assets.
The Ps 217.0 billion increase in impairment loss on loans and leases, net was primarily attributable to deterioration in the loan and leases portfolio, particularly the consumer loans and leases portfolio, and to the growth in the aggregate size of the loan and leases portfolio. LB Panamá’s delinquency ratio (measured as loans 91 days
past due as a percentage of total gross loans, excluding interbank and overnight funds) deteriorated by 13 basis points to 1.2% in 2016 as compared to 1.0% in 2015, mainly in Guatemala. The delinquency ratio for LB Panama’s consumer loans and leases portfolio was 1.7% in 2016, compared to 1.5% in 2015. The delinquency ratio for LB Panama’s commercial loans and leases portfolio was 0.6% for both 2015 and 2016.
The cost of risk measured as impairment loss on loans and leases, net divided by the average balance of loans and leases (excluding interbank and overnight funds) increased from 1.6% in 2015 to 1.9% in 2016. The cost of risk net of recoveries of charged-off assets, measured as impairment loss on loans and leases, net of recoveries of charged-off assets divided by the average balance of loans and leases (excluding interbank and overnight funds) was 1.9% in 2016, compared to 1.6% in 2015. The increase in cost of risk was derived from a deterioration of the loan portfolio quality metrics, mainly in Guatemala, and the strengthening of the bank’s coverage ratios over its past due loans.
Impairment losses on foreclosed assets increased by Ps 5.1 billion to Ps 17.8 billion in 2016.
Charge-offs increased from Ps 581.2 billion for the year ended December 31 2015 to Ps 652.5 billion for the year ended December 31, 2016. The ratio of charged-off assets to average loans (excluding interbank and overnight funds) remained basically unchanged at 1.6% for both 2015 and 2016. As of December 31, 2016 LB Panama’s coverage over its 91 days past due loans was 122.4%, compared to 122.8% as of December 31, 2015.
Net commission and fee income
| | | For the year ended
December 31, | | | Change, December 2016 vs
December 2015 | | | For the year
ended
December 31,
2015
(adjusted)(*) | | | Change, December 2016
vs December 2015 * | |
| | | 2016 | | | 2015 | | | # | | | % | | | | | | # | | | % | |
| | | (in Ps billions) | | | | | | | | | | | | | | | | |
| Commission and fee income: | | | | | | | | | | | | | | | | | | | | | | | | | | | | |
| Banking services | | | 1,947.4 | | | | 1,544.3 | | | | 403.0 | | | | 26.1 | | | | 1,706.1 | | | | 241.3 | | | | 14.1 | |
| Bonded warehouse services | | | - | | | | - | | | | - | | | | - | | | | - | | | | - | | | | - | |
| Trust activities | | | - | | | | - | | | | - | | | | - | | | | - | | | | - | | | | - | |
| Pension and severance fund management | | | 28.6 | | | | 22.9 | | | | 5.7 | | | | 25.0 | | | | 25.3 | | | | 3.3 | | | | 13.0 | |
| Commission and fee income | | | 1,976.0 | | | | 1,567.2 | | | | 408.7 | | | | 26.1 | | | | 1,731.4 | | | | 244.6 | | | | 14.1 | |
| Commission and fee expenses | | | (94.5 | ) | | | (87.5 | ) | | | (7.0 | ) | | | 8.0 | | | | (95.0 | ) | | | 0.5 | | | | (0.5 | ) |
| Net commission and fee expenses | | | 1,881.5 | | | | 1,479.7 | | | | 401.7 | | | | 27.1 | | | | 1,636.5 | | | | 245.0 | | | | 15.0 | |
* 2015 figures are adjusted for the impact of the devaluation of the Colombian Peso on a line by line basis
Net commission and fee income increased by 27.1% or Ps 401.7 billion in 2016 as compared to 2015, the devaluation of the average peso to dollar exchange rate accounted for Ps 156.7 billion of the increase in net commission and fee income.
Net commission and fee income in local currency increased by 15.0% or Ps 245.0 billion to Ps 1,881.5 billion in 2016 as compared to 2015. The increase is explained by a strong Ps 241.3 billion increase in commissions from banking services and a Ps 3.3 billion increase in pension and severance fund management. These increases were driven by higher credit and debit card fees and international services.
Net trading income
LB Panamá’s net trading income includes (i) net trading income from investment securities held for trading through profit or loss, which reflects the interest and gains/losses from mark-to-market valuation, in each case from equity and fixed income investment securities held for trading through profit or loss, and (ii) net trading income from derivatives, which reflects the gains/losses from mark-to-market valuation on derivatives different from that considered under hedge accounting. LB Panamá’s net trading income for 2016 was Ps 15.3 billion, Ps 13.7 billion lower than in 2015. The devaluation of the average peso to dollar exchange rate accounted for Ps 7.3 billion of the decrease in net trading income.
Total income from investment securities
LB Panamá’s securities portfolio is classified in the following categories: (i) equity and fixed income investments held for trading through profit or loss (described in this section as net trading income in investment securities held for trading through profit or loss), (ii) available for sale fixed income investments and (iii) held to maturity fixed income investments (results from (ii) and (iii) are included in the net interest income section as interest income from investment in debt securities). LB Panamá manages its investment portfolio in a comprehensive and integral manner that considers individual return of each one of these three categories and the total return of the investment securities portfolio.
Total income from investment securities (comprised of income on investments in debt securities and net trading income in investment securities held for trading through profit or loss) was Ps 329.4 billion for 2016, Ps 106.7 billion higher than in 2015. The devaluation of the average peso to dollar exchange rate accounted for Ps 8.9 billion of the increase in total income from investment securities.
Total income from investment securities in local currency increased Ps 97.8 billion in 2016. This increase was driven by an increase in the average yield on investment securities from 4.1% in 2015 to 6.5% in 2016, which resulted in a Ps 134.4 billion increase in interest expense. Partially offsetting this increase was a Ps 562.8 billion decrease in the average balance of Total Investment Securities from Ps 5,635.5 billion in 2015 to Ps 5,072.7 billion in 2016, resulting in a Ps 36.5 billion decrease in interest income.
When including the investment securities held for trading LB Panamá’s average total interest-earning assets (calculated as (i) gross loans including interbank and overnight funds, (ii) available for sale and held to maturity fixed income investments, and (iii) fixed income and equity investments held for trading through profit or loss) would have increased by 9.1%, or Ps 3,936.8 billion, from Ps 43,374.8 billion in 2015 to Ps 47,311.6 billion in 2016 and net interest income plus net trading income from investment securities held for trading increased by 14.2%, or Ps 413.3 billion from Ps 2,902.4 billion to Ps 3,315.7 billion over the same period. The return over the average total interest-earning assets (calculated as (i) gross loans including interbank and overnight funds, (ii) available for sale and held to maturity fixed income investments, and (iii) fixed income and equity investments held for trading through profit or loss) would have increased by 32 basis points from 6.7% in 2015 to 7.0% in 2016.
Other income
| | | Year ended December 31, | | | Change, 2016 vs. 2015 | | | For the year
ended
December 31,
2015 (adjusted)* | | | Change, 2016 vs. 2015 | |
| | | 2016 | | | 2015 | | | # | | | % | | | | | | # | | | % | |
| | | (in Ps billions) | | | | | | | | | | | | | | | | |
| Foreign exchange gains (losses), net | | | 321.1 | | | | 219.8 | | | | 101.3 | | | | 46.1 | | | | 238.4 | | | | 82.6 | | | | 34.6 | |
| Gains on sales of investments, net | | | 12.4 | | | | 7.3 | | | | 5.2 | | | | 71.0 | | | | 19.9 | | | | (7.5 | ) | | | (37.5 | ) |
| Income from sales of noncurrent assets held for sale | | | 12.9 | | | | 4.5 | | | | 8.3 | | | | 182.9 | | | | 11.0 | | | | 1.9 | | | | 17.2 | |
| Other | | | 47.0 | | | | 28.3 | | | | 18.7 | | | | 66.3 | | | | 31.3 | | | | 15.7 | | | | 50.3 | |
| Total other income | | | 393.4 | | | | 259.9 | | | | 133.5 | | | | 51.4 | | | | 300.6 | | | | 92.8 | | | | 30.9 | |
* 2015 figures are adjusted for the impact of the devaluation of the Colombian Peso on a line by line basis
Total other income increased by 51.4% or Ps 133.5 billion to Ps 393.4 billion in 2016, the devaluation of the average peso to dollar exchange rate accounted for Ps 40.7 billion of the increase in total other income.
Total other income in local currency increased by 30.9% or Ps 92.8 billion in 2016. The increase was mainly driven by a 34.6% or Ps 82.6 billion increase in foreign exchange gains (losses), net. This increase is explained by a depreciation of the Costa Rican Colón against the U.S. dollar.
Other expenses
| | | Year ended December 31, | | | Change, 2016 vs. 2015 | | | For the year
ended
December 31, | | | Change, 2016 vs. 2015 | |
| | | 2016 | | | 2015 | | | # | | | % | | | 2015 (adjusted)* | | | # | | | % | |
| | | (in Ps billions) | | | | | | | | | | | | | | | | |
| Losses from sales of noncurrent assets held for sale | | | (3.5 | ) | | | 0.0 | | | | (3.5 | ) | | | N.A. | | | | (5.9 | ) | | | 2.3 | | | | (39.6 | ) |
| Personnel expenses | | | (1,569.2 | ) | | | (1,325.7 | ) | | | (243.5 | ) | | | 18.4 | | | | (1,472.7 | ) | | | (96.4 | ) | | | 6.5 | |
| Salaries and employee benefits | | | (1,410.7 | ) | | | (1,199.0 | ) | | | (211.8 | ) | | | 17.7 | | | | (1,331.6 | ) | | | (79.1 | ) | | | 5.9 | |
| Bonus plan payments | | | (100.8 | ) | | | (91.6 | ) | | | (9.2 | ) | | | 10.0 | | | | (102.5 | ) | | | 1.7 | | | | (1.7 | ) |
| Termination payments | | | (57.7 | ) | | | (35.1 | ) | | | (22.5 | ) | | | 64.2 | | | | (38.6 | ) | | | (19.1 | ) | | | 49.4 | |
| Administrative and other expenses | | | (1,411.1 | ) | | | (1,053.5 | ) | | | (357.6 | ) | | | 33.9 | | | | (1,165.1 | ) | | | (245.9 | ) | | | 21.1 | |
| Depreciation and amortization | | | (199.2 | ) | | | (222.3 | ) | | | 23.1 | | | | (10.4 | ) | | | (245.8 | ) | | | 46.6 | | | | (19.0 | ) |
| Wealth tax | | | - | | | | - | | | | - | | | | - | | | | - | | | | - | | | | - | |
| Other expenses | | | (29.5 | ) | | | (34.3 | ) | | | 4.8 | | | | (13.9 | ) | | | (37.8 | ) | | | 8.2 | | | | (21.8 | ) |
| Charitable and other donation expenses | | | (5.4 | ) | | | (2.7 | ) | | | (2.7 | ) | | | 99.8 | | | | (3.0 | ) | | | (2.4 | ) | | | 78.1 | |
| Other | | | (24.2 | ) | | | (31.6 | ) | | | 7.4 | | | | (23.5 | ) | | | (34.8 | ) | | | 10.6 | | | | (30.5 | ) |
| Total other expenses | | | (3,212.6 | ) | | | (2,635.8 | ) | | | (576.8 | ) | | | 21.9 | | | | (2,927.4 | ) | | | (285.2 | ) | | | 9.7 | |
* 2015 figures are adjusted for the impact of the devaluation of the Colombian Peso on a line by line basis
Total other expenses for the year ended December 31, 2016 increased by 21.9% or Ps 576.8 billion to Ps 3,212.6 billion in 2016, the devaluation of the average peso to dollar exchange rate accounted for Ps 291.6 billion of the increase in total other expenses.
Total other expenses in local currency for the year ended December 31, 2016 increased by 9.7% or Ps 285.2 billion in 2016. This increase is mainly driven by a Ps 245.9 billion increase in administrative and other expenses and a Ps 96.4 billion increase in personnel expenses. Partially offsetting this increase was a Ps 46.6 billion decrease in depreciation and amortization and a Ps 8.2 billion decrease in other expenses.
The increase in administrative and other expenses is explained by an increase in corporate expenses, in improvements and repairs, in taxes and surcharges, in contributions and affiliations and in contributions and affiliations, among others.
The increase in personnel expenses is driven by the increase in the headcount in BAC Credomatic’s operation that occurred during the year to support the growth of the loan portfolio. The number of employees of BAC went from 24,548 employees in 2015 to 25,023 employees in 2016. Yearly salaries and employee benefits per employee increased from Ps 54.2 million in 2015 to Ps 56.4 million in 2016.
Because LB Panamá’s personnel and administrative expenses increased by 13.0% or Ps 342.4 billion, while its operational income increased by 12.1% or Ps 584.2 billion, LB Panamá’s efficiency ratio (calculated as personnel and administrative and other expenses divided by net interest income, fees and other services income, net trading income and other income excluding other) deteriorated from 54.7% in 2015 to 55.1% in 2016. The ratio of personnel expenses and administrative and other expenses as a percentage of average assets 4.5% for 2015 to 4.8% for 2016.
Income tax expense
Income tax expense for LB Panamá increased by 10.7% or Ps 40.7 billion to Ps 421.6 billion for the year ended December 31, 2016. The devaluation of the average peso to dollar exchange rate accounted for Ps 37.3 billion of the increase in income tax expense.
Income tax expense in local currency increased by 0.8% or Ps 3.5 billion to Ps 421.6 billion for the year ended December 31, 2015. LB Panamá’s effective tax rate (calculated as income tax expense divided by income before tax expense minus equity method, minus dividends) decreased from 31.2% in 2015 to 29.3% in 2016.
Net income attributable to non-controlling interest
Net income attributable to non-controlling interest in LB Panamá was Ps 0.2 billion in 2016 and accounted for only 0.02% of net income.
Banco de Occidente
Net income
| | | For the year ended December 31, | | | Change, December 2016 vs December
2015 | |
| | | 2016 | | | 2015 | | | # | | | % | |
| | | (in Ps billions) | | | | | | | |
| Interest income | | | 3,366.4 | | | | 2,650.9 | | | | 715.6 | | | | 27.0 | |
| Interest expenses | | | (1,455.4 | ) | | | (989.8 | ) | | | (465.6 | ) | | | 47.0 | |
| Net interest income | | | 1,911.1 | | | | 1,661.1 | | | | 250.0 | | | | 15.1 | |
| Impairment loss on loans and other accounts receivable, net | | | (579.5 | ) | | | (544.1 | ) | | | (35.3 | ) | | | 6.5 | |
| Impairment loss on other assets, net | | | (0.0 | ) | | | (7.0 | ) | | | 7.0 | | | | (100.0 | ) |
| Recovery of charged-off financial assets | | | 90.5 | | | | 67.5 | | | | 23.0 | | | | 34.1 | |
| Net impairment loss | | | (489.0 | ) | | | (483.6 | ) | | | (5.3 | ) | | | 1.1 | |
| Net commission and fees income | | | 292.6 | | | | 247.8 | | | | 44.8 | | | | 18.1 | |
| Net trading income | | | 40.0 | | | | 137.4 | | | | (97.4 | ) | | | (70.9 | ) |
| Other income | | | 255.9 | | | | 167.0 | | | | 88.9 | | | | 53.2 | |
| Other expenses | | | (1,150.3 | ) | | | (1,060.9 | ) | | | (89.4 | ) | | | 8.4 | |
| Income before income tax expense | | | 860.3 | | | | 668.7 | | | | 191.6 | | | | 28.6 | |
| Income tax expense | | | (232.3 | ) | | | (195.6 | ) | | | (36.7 | ) | | | 18.8 | |
| Net Income | | | 628.0 | | | | 473.1 | | | | 154.9 | | | | 32.7 | |
| Net income attributable to: | | | | | | | | | | | | | | | | |
| Controlling interest | | | 626.4 | | | | 471.8 | | | | 154.6 | | | | 32.8 | |
| Non-controlling interest | | | 1.6 | | | | 1.3 | | | | 0.3 | | | | 18.9 | |
Banco de Occidente’s net income attributable to controlling interest increased by 32.8%, or Ps 154.6 billion, to Ps 626.4 billion in 2016 as compared to Ps 471.8 billion in 2015. The increase in net income was primarily due to a Ps 250.0 billion increase in net interest income, a Ps 88.9 billion increase in other income (expense) and a Ps 44.8 billion increase in net income from commissions and fees. Partially offsetting these increases was a Ps 97.4 billion decrease in net trading income, a Ps 89.4 billion increase in total other expenses, a Ps 36.7 billion increase in income tax expense, and a Ps 5.3 billion increase in net impairment loss on financial assets.
Net interest income
| | | Year ended December 31, | | | Change, 2016 vs. 2015 | |
| | | 2016 | | | 2015 | | | # | | | % | |
| | | (in Ps billions) | | | | |
| Interest income: | | | | | | | | | | | | | | | | |
| Commercial loans and leases | | | 2,032.5 | | | | 1,438.7 | | | | 593.8 | | | | 41.3 | |
| Consumer loans and leases | | | 1,022.4 | | | | 847.6 | | | | 174.8 | | | | 20.6 | |
| Mortgage loans and leases | | | 90.2 | | | | 69.2 | | | | 21.0 | | | | 30.3 | |
| Microcredit loans and leases | | | - | | | | - | | | | - | | | | - | |
| Interbank and overnight funds | | | 7.1 | | | | 46.1 | | | | (39.0 | ) | | | (84.6 | ) |
| Interest on loans and leases | | | 3,152.3 | | | | 2,401.6 | | | | 750.6 | | | | 31.3 | |
| Interest on investments in debt securities | | | 214.2 | | | | 249.2 | | | | (35.1 | ) | | | (14.1 | ) |
| Total interest income | | | 3,366.4 | | | | 2,650.9 | | | | 715.6 | | | | 27.0 | |
| Interest expense: | | | | | | | | | | | | | | | | |
| Checking accounts | | | (12.3 | ) | | | (14.0 | ) | | | 1.7 | | | | (12.4 | ) |
| Time deposits | | | (568.7 | ) | | | (341.4 | ) | | | (227.3 | ) | | | 66.6 | |
| Savings deposits | | | (485.9 | ) | | | (362.8 | ) | | | (123.1 | ) | | | 33.9 | |
| Total interest expense on deposits | | | (1,066.9 | ) | | | (718.2 | ) | | | (348.7 | ) | | | 48.5 | |
| Borrowings from banks and others | | | (37.6 | ) | | | (25.8 | ) | | | (11.8 | ) | | | 45.6 | |
| Interbank and overnight funds | | | (39.5 | ) | | | (34.7 | ) | | | (4.9 | ) | | | 14.0 | |
| Long-term debt (bonds) | | | (263.8 | ) | | | (187.0 | ) | | | (76.8 | ) | | | 41.1 | |
| Borrowings from development entities | | | (47.6 | ) | | | (24.1 | ) | | | (23.4 | ) | | | 97.2 | |
| Total interest expense | | | (1,455.4 | ) | | | (989.8 | ) | | | (465.6 | ) | | | 47.0 | |
| Net interest income | | | 1,911.1 | | | | 1,661.1 | | | | 250.0 | | | | 15.1 | |
Banco de Occidente’s net interest income increased by 15.1%, or Ps 250.0 billion, to Ps 1,911.1 billion in 2016 as compared to 2015. This increase was primarily driven by a Ps 715.6 billion or 27.0% increase in total interest income to Ps 3,366.4 billion in 2016. The increase in total income was as a result of a 31.3%, or Ps 750.6 billion, increase in interest income on total loans and leases (which includes income from interbank and overnight funds) to Ps 3,152.3 billion and despite a 14.1%, or Ps 35.1 billion, decrease in interest on investments in debt securities to Ps 214.2 billion in 2016. The Ps 750.6 billion increase in interest income on total loans and leases was driven by a Ps 789.6 billion increase in interest income on loans and leases offset by a Ps 39.0 billion decrease in income from interbank and overnight funds. The increase in interest income was partially offset by a Ps 465.6 billion or 47.0% increase in interest expense.
The Ps 789.6 billion increase in interest income earned on loans and leases was driven by a 204 basis points increase in the average yield on loans from 9.8% in 2015 to 11.8% in 2016, which resulted in a Ps 490.8 billion increase in interest income, and a 10.5%, or Ps 2,526.0 billion, increase in Banco de Occidente’s average interest earning loan portfolio from Ps 24,060.2 billion in 2015 to Ps 26,586.2 billion in 2016, which resulted in a Ps 298.8 billion increase in interest income. The increase in the average yield on loans was in line with the 243 basis points increase in the average Central Bank rate, from 4.67% in 2015 to 7.10% in 2016. The increase in interest income on loans and leases was driven by a Ps 593.8 billion increase in income on commercial loans and leases, a Ps 174.8 billion increase in income on consumer loans and leases and a Ps 21.0 billion increase in interest income on mortgage loans and leases.
The Ps 593.8 billion, or 41.3%, increase in interest income on commercial loans and leases was driven by a 246 basis points increase in the average yield on commercial loans from 8.2% in 2015 to 10.7% in 2016, which resulted in a Ps 431.6 billion increase in interest income. Furthermore, an 8.7%, or Ps 1,522.7 billion, increase in Banco de Occidente’s average commercial loans and leases portfolio from Ps 17,560.5 billion in 2015 to Ps 19,083.2 billion in 2016, due to an increase in the balance of general purpose loans and financial leases, resulted in a Ps 162.2 billion increase in interest income.
The increase in interest earned on consumer loans and leases of Ps 174.8 billion was mainly driven by a 13.8% or Ps 796.5 billion increase in Banco de Occidente’s average consumer loans and leases portfolio from Ps 5,777.5 billion in 2015 to Ps 6,574.0 billion in 2016, which resulted in a Ps 123.9 billion increase in interest income. The increase in average consumer loans and leases portfolio was driven by an increase in the balance of personal loans and automobile loans. In addition, an 88 basis points increase in the average yield on consumer loans and leases from 14.7% in 2015 to 15.6% in 2016, which resulted in a Ps 51.0 billion increase in interest income. The increase in the average yield resulted from the increasing interest rate environment, described above.
The increase in interest income on mortgage loans and leases of Ps 21.0 billion was driven by an 28.6% or Ps 206.8 billion increase in Banco de Occidente’s average mortgage loans and leases portfolio from Ps 722.1 billion in 2015 to Ps 929.0 billion in 2016, which resulted in a Ps 20.1 billion increase in interest income. The average yield on mortgage loans and leases increased 12 basis points from 9.6% in 2015 to 9.7% in 2016, which resulted in a Ps 0.9 billion increase in interest income.
Interest earned on interbank and overnight funds decreased by Ps 39.0 billion from Ps 46.1 billion in 2015 to Ps 7.1 billion in 2016.
The Ps 35.1 billion decrease to Ps 214.2 billion in interest on investments in debt securities in 2016, is explained by a 16.1%, or Ps 832.1 billion, decrease in the average balance of available for sale and held to maturity fixed income investments from Ps 5,170.9 billion in 2015 to Ps 4,338.9 billion in 2016, which resulted in a Ps 41.1 billion decrease in interest income. Partially offsetting this decrease was a 12 basis points increase in the average yield of these investments from 4.8% in 2015 to 4.9% in 2016, which resulted in a 6.0 billion increase in interest income.
Total interest expense increased by 47.0% or Ps 465.6 billion in 2016 as compared to 2015, mainly driven by a 158 basis points increase in the average cost of funds from 4.2% in 2015 to 5.7% in 2016 which led to a Ps 374.5 billion increase in interest expense. The increase in the average cost of funds resulted also from the increasing interest
rate environment, described above. Furthermore, a 6.7%, or Ps 1,584.9 billion, increase in the average balance of interest-bearing liabilities from Ps 23,756.1 billion in 2015 to Ps 25,340.9 billion in 2016 resulted in a Ps 91.0 billion increase in interest expense.
Total interest expense for interest-bearing deposits increased 48.5%, or Ps 348.7 billion, to Ps 1,066.9 billion over the same period, mainly driven by a 156 basis points increase in the average cost of interest-bearing deposits from 3.9% in 2015 to 5.4% in 2016, resulting in a Ps 290.3 billion increase in interest expense. Also contributing to the increase in interest expense for interest-bearing deposits was a 5.8%, or Ps 1.074.9 billion, increase in the average balance of interest-bearing deposits from Ps 18,576.2 billion in 2015 to Ps 19,651.1 billion in 2016, resulting in a Ps 58.4 billion increase in interest expense.
The Ps 465.6 billion increase in total interest expense was mainly driven by a 348.7 billion increase in interest expense on interest-bearing deposits and a Ps 116.9 billion increase in interest expense on other funding. The increase in interest expense on interest-bearing deposits is explained by a Ps 227.3 billion increase in interest expense on time deposits, a Ps 123.1 billion increase in interest expense on savings deposits and by a Ps 1.7 billion decrease in interest expense on interest-bearing checking accounts. The increase in interest expense on other funding was mainly attributable to a Ps 76.8 billion increase in interest expense on long-term debt (bonds), a Ps 35.2 billion increase in interest expense on borrowings from banks and others (including borrowings from development entities) and a Ps 4.9 billion increase in interest expense on interbank and overnight funds.
The Ps 227.3 billion increase in interest expense on time deposits was mainly driven by an increase in the average interest rate paid on time deposits of 192 basis points from 4.6% in 2015 to 6.5% in 2016, which resulted in a Ps 143.4 billion increase in interest expense, and a 17.3%, or Ps 1,290.0 billion, increase in the average balance of time deposits to Ps 8,739.2 billion, which resulted in a Ps 83.9 billion increase in interest expense.
The increase in interest expense on savings deposits of Ps 123.1 billion was driven by an increase in the average rate paid on savings deposits of 130 basis points from 3.7% in 2015 to 5.0% in 2016, which resulted in a Ps 127.4 billion increase in interest expense. The average balance of savings deposits decreased by 0.9%, or Ps 86.4 billion, to Ps 9,749.6 billion resulting in a Ps 4.3 billion decrease in interest expense.
The Ps 76.8 billion increase in interest expense on long-term debt was driven by a 257 basis points increase in the average rate paid from 7.8% in 2015 to 10.3% in 2016, which resulted in a Ps 62.1 billion increase in interest expense. In addition, the average balance of long-term debt increased by 5.9%, or Ps 142.6 billion, to Ps 2,554.3 billion, which resulted in a Ps 14.7 billion increase in interest expense.
The increase in interest expense on borrowings from banks and others (including borrowings from development entities) of Ps 35.2 billion was driven by a 134 basis points increase in the average rate paid from 2.6% in 2015 to 3.9% in 2016, which resulted in a Ps 26.0 billion increase in interest expense. The average balance of these funds increase by 12.1%, or Ps 234.9 billion, to Ps 2,175.2 billion, which resulted in a Ps 9.2 billion increase in interest expense.
Average total interest earning assets (calculated as (i) gross loans including interbank and overnight funds, and (ii) available for sale and held to maturity fixed income investments) increased by 5.7%, or Ps 1,679.7 billion, from Ps 29,426.7 billion in 2015 to Ps 31,106.3 billion in 2016 and net interest income increased by 15.1%, or Ps 250.0 billion, from Ps 1,661.1 billion to Ps 1,911.1 billion over the same period, which resulted in a 50 basis points increase in the net interest margin from 5.6% in 2015 to 6.1% in 2016. The interest spread between the average rate on loans and leases and the average rate paid on deposits increased by 48 basis points from 5.9% to 6.4% over the same period. Given the fact that Banco de Occidente’s loan portfolio is comprised mainly by corporate loans, which by nature are floating-rate loans, an increasing rate scenario is NIM positive for this Bank.
Net impairment losses
| | | Year ended December 31, | | | Change, 2016 vs. 2015 | |
| | | 2016 | | | 2015 | | | # | | | % | |
| | | Total
Income/Expense | | | Total
Income/Expense | | | | |
| | | (in Ps billions) | | | | | | | |
| Impairment losses: | | | | | | | | | | | | | | | | |
| Impairment loss on loans and leases, net | | | (511.7 | ) | | | (497.4 | ) | | | (14.3 | ) | | | 2.9 | |
| Impairment loss on accrued interest and other receivables, net | | | (67.7 | ) | | | (46.7 | ) | | | (21.0 | ) | | | 45.0 | |
| Impairment loss on investments in debt and equity securities | | | - | | | | (7.0 | ) | | | 7.0 | | | | (100.0 | ) |
| Impairment loss on noncurrent held for sale assets | | | (0.0 | ) | | | - | | | | (0.0 | ) | | | - | |
| Recovery of charged-off financial assets | | | 90.5 | | | | 67.5 | | | | 23.0 | | | | 34.1 | |
| Recovery of impairment loss on investments in debt and equity securities | | | - | | | | - | | | | - | | | | - | |
| Recovery of impairment loss on noncurrent held for sale assets | | | - | | | | - | | | | - | | | | - | |
| Net impairment losses | | | (489.0 | ) | | | (483.6 | ) | | | (5.3 | ) | | | 1.1 | |
| | | Year ended December 31, | | | | |
| | | 2016 | | | 2015 | | | Change, 2016 vs. 2015 | |
| | | Loans 91 days
past due | | | Delinquency
Ratio (1) | | | Loans 91 days
past due | | | Delinquency
Ratio (1) | | | Loans 91
days past
due | | | Delinquency
Ratio | |
| | | | | | # | | | % | |
| | | (in Ps billions) | | | | | | | |
| Total loans and leases: | | | 639.3 | | | | 2.3 | % | | | 499.0 | | | | 1.9 | % | | | 140.3 | | | | 0.5 | |
| Commercial loans and leases | | | 444.0 | | | | 2.3 | % | | | 352.6 | | | | 1.8 | % | | | 91.4 | | | | 0.5 | |
| Consumer loans and leases | | | 174.0 | | | | 2.5 | % | | | 130.1 | | | | 2.1 | % | | | 43.9 | | | | 0.4 | |
| Mortgage loans and leases | | | 21.3 | | | | 2.1 | % | | | 16.3 | | | | 1.9 | % | | | 5.1 | | | | 0.2 | |
| Microcredit loans and leases | | | - | | | | N.A. | | | | - | | | | N.A. | | | | - | | | | N.A. | |
(1) Calculated as 91 days past due loans divided by total gross loans (excluding interbank and overnight funds)
Net impairment losses increased by 1.1%, or Ps 5.3 billion, in 2016 as compared to 2015. This increase was primarily driven by a Ps 21.0 billion increase in impairment loss for accrued interests and other receivables, net, and a Ps 14.3 billion increase in impairment loss on loans and leases, net. These increases were partially offset by a Ps 23.0 billion increase in recoveries of charged-off assets and a Ps 7.0 billion decrease in impairment loss on investments in debt and equity securities.
The increases in impairment loss for accrued interests and other receivables, net and in impairment loss on loans and leases, net were mainly attributable to a deterioration in the bank’s total loans and leases portfolio. Banco de Occidente’s delinquency ratio (measured as loans 91 days past due as a percentage of total gross loans excluding interbank and overnight funds) increased by 45 basis points in 2016 as compared to 2015. The delinquency ratio for the commercial loan portfolio increased by 47 basis points to 2.3% in 2016 and for the consumer loan portfolio increased by 44 basis points to 2.5% in 2016. The deterioration of the loan portfolio was directly associated with a low GDP growth scenario.
The bank’s cost of risk, measured as impairment loss on loans and leases, net divided by the average balance of loans and leases (excluding interbank and overnight funds) decreased 8 basis points from 2.3% in 2015 to 2.2% for 2016. The bank’s cost of risk net of recoveries of charged-off assets, measured as net impairment loss on loans and leases, net of recoveries of charged-off assets divided by the average balance of loans and leases (excluding interbank and overnight funds) decreased 14 basis points from 2.0% in 2015 to 1.8% for 2016.
Charge-offs increased from Ps 370.3 billion for the year ended December 31, 2015 to Ps 467.3 billion for the year ended December 31, 2016 and the ratio of charge-offs to average loans (excluding interbank and overnight funds) increased from 1.5% for the year ended December 31, 2015 to 1.8% for the year ended December 31, 2016. Since Banco de Occidente’s net impairment loss on loans and leases increased, in absolute terms, more than charge-offs, the allowance for impairment losses on loans and leases increased from Ps 790.3 billion as of December 31, 2015 to Ps 872.3 billion as of December 31, 2016. As of December 31, 2016 Banco de Occidente’s coverage over its 91 days past due loans was 136.4% versus 158.4% as of December 31, 2015.
The recovery of charged-off assets increased by 34.1% or Ps 23.0 billion, to Ps 90.5 billion. The ratio of recovered charged-off assets to average loans (excluding interbank and overnight funds) remained substantially unchanged at 0.3% in 2016 as compared to 2015.
Impairment losses on investment in debt and equity securities decreased Ps 7.0 billion in 2016. During 2015 Banco de Occidente provisioned Ps 7.0 billion given a deterioration in a particular issuer (Pacific Exploration and Production S.A.) in Occidental Bank Barbados corporate bond portfolio.
Net commission and fee income
| | | Year ended December 31, | | | Change, 2016 vs. 2015 | |
| | | 2016 | | | 2015 | | | # | | | % | |
| | | (in Ps billions) | | | | | | | |
| Commissions and fee income: | | | | | | | | | | | | | | | | |
| Banking fees | | | 339.0 | | | | 347.6 | | | | (8.6 | ) | | | (2.5 | ) |
| Bonded warehouse services | | | - | | | | - | | | | - | | | | - | |
| Trust activities | | | 53.4 | | | | 51.2 | | | | 2.2 | | | | 4.3 | |
| Pension and severance fund management | | | - | | | | - | | | | - | | | | - | |
| Commission and fee income | | | 392.4 | | | | 398.8 | | | | (6.4 | ) | | | (1.6 | ) |
| Commission and fee expenses | | | (99.8 | ) | | | (151.0 | ) | | | 51.2 | | | | (33.9 | ) |
| Net commission and fee income | | | 292.6 | | | | 247.8 | | | | 44.8 | | | | 18.1 | |
Net commission and fee income increased by 18.1% or Ps 44.8 billion to Ps 292.6 billion in 2016 as compared to 2015. This was primarily due to a 33.9%, or Ps 51.2 billion, decrease in commission and fee expenses and a 4.3%, or Ps 2.2 billion, increase in trust activities fess, offset in part by a Ps 8.6 billion decrease in banking fees.
The decrease in commission and fee expenses was partly explained by a difference in accounting of expenses for commissions and fees related with credit and debit cards, which are now netted in income from banking fees. When analyzing 2015 as presented in 2016, banking fees would have grown 31.3% and expenses 11.3%.
Net trading income
Banco de Occidente’s net trading income includes (i) net trading income from investment securities held for trading through profit or loss, which reflects the interest and gains/losses from mark-to-market valuation, in each case from equity and fixed income investment securities held for trading through profit or loss, and (ii) net trading income from derivatives, which reflects the gains/losses from mark-to-market valuation on derivatives different from that considered under hedge accounting. During 2016, the bank’s net trading income came in at Ps 40.0 billion, Ps 97.4 billion lower than the Ps 137.4 billion obtained in 2015.
Net trading income from derivatives decreased Ps 88.4 billion from a gain of Ps 111.6 billion in 2015 to a gain of Ps 23.2 billion in 2016.
Net trading income from investment securities held for trading through profit or loss decreased Ps 9.1 billion to Ps 16.8 billion in 2016. This decrease was mainly driven by a 32.4%, or Ps 217.0 billion, decrease in the average balance of Banco de Occidente’s fixed income and equity investments held for trading through profit or loss, which resulted in a Ps 8.0 billion decrease in income. Also contributing to the decrease in net trading income from investment securities held for trading through profit or loss was a decrease in the average yield from 3.9% in 2015 to 3.7% in 2015, resulting in a Ps 1.0 billion decrease in income.
Total income from investment securities
Banco de Occidente’s securities portfolio is classified in the following categories: (i) equity and fixed income investments held for trading through profit or loss (described in this section as net trading income in investment securities held for trading through profit or loss), (ii) available for sale fixed income investments and (iii) held to maturity fixed income investments (results from (ii) and (iii) are included in the net interest income section as interest income from investment in debt securities). Banco de Occidente manages its investment portfolio in a comprehensive and integral manner that considers individual return of each one of these three categories and the total return of the investment securities portfolio.
Total income from investment securities for the bank (comprised of income on investments in debt securities and net trading income in investment securities held for trading through profit or loss) was Ps 230.9 billion for 2016, 16.0% or Ps 44.1 billion lower than the Ps 275.1 billion registered during 2015. This was primarily driven by a Ps 1,049.0 billion decrease in the average balance of Total Investment Securities from Ps 5,840.6 billion in 2015 to Ps 4,791.6 billion in 2016, resulting in a Ps 50.6 billion decrease in interest income. The average yield on investment securities increased from 4.7% in 2015 to 4.8% in 2016, generating a Ps 6.4 billion increase in interest income.
When including the investment securities held for trading through profit or loss Banco de Occidente’s average total interest-earning assets (calculated as (i) gross loans including interbank and overnight funds, (ii) available for sale and held-to-maturity fixed income investments, and (iii) fixed income and equity investments held for trading through profit or loss) would have increased by 4.9% or Ps 1,462.7 billion from Ps 30,096.4 billion in 2015 to Ps 31,559.1 billion in 2016 and net interest income plus net trading income would have increased by 14.3%, or Ps 240.9 billion, from Ps 1,686.9 billion to Ps 1,927.8 billion over the same period. The return over average total interest-earning assets (calculated as (i) gross loans including interbank and overnight funds, (ii) available for sale and held-to-maturity fixed income investments, and (iii) fixed income and equity investments held for trading through profit or loss) would have increased 50 basis points from 5.6% in 2015 to 6.1% in 2016.
Other income
| | | Year ended December 31, | | | Change, 2016 vs. 2015 | |
| | | 2016 | | | 2015 | | | # | | | % | |
| | | | | | (in Ps billions) | | | | | | | |
| Foreign exchange gains (losses), net | | | 21.2 | | | | (54.0 | ) | | | 75.3 | | | | (139.3 | ) |
| Gains on sales of investments, net | | | 47.8 | | | | 0.8 | | | | 47.0 | | | | 5,982.1 | |
| Income from sales of noncurrent assets held for sale | | | 0.3 | | | | 2.8 | | | | (2.5 | ) | | | (90.6 | ) |
| Equity method | | | 117.6 | | | | 95.9 | | | | 21.7 | | | | 22.7 | |
| Dividend income | | | 21.5 | | | | 27.8 | | | | (6.3 | ) | | | (22.6 | ) |
| Gains on valuation of assets, net | | | 31.3 | | | | - | | | | 31.3 | | | | - | |
| Income from non-financial sector, net | | | (67.7 | ) | | | (45.5 | ) | | | (22.2 | ) | | | 48.8 | |
| Net income from financial instruments designated at fair value | | | - | | | | - | | | | - | | | | - | |
| Other | | | 84.0 | | | | 139.3 | | | | (55.3 | ) | | | (39.7 | ) |
| Total other income | | | 255.9 | | | | 167.0 | | | | 88.9 | | | | 53.2 | |
Total other income increased by 53.2%, or Ps 88.9 billion, to Ps 255.9 billion in 2016 as compared to 2015. This increase was mainly driven by a Ps 75.3 billion increase in foreign exchange gains (losses), net, a Ps 47.0 billion increase in gains on sales of investments, of which Ps 44.2 were related to the sale of the bank’s investment in CIFIN to TransUnion Netherlands, a Ps 31.3 billion increase in gains on valuation of assets and a Ps 21.7 billion increase in equity method contributed by Porvenir. These increases were partially offset by a Ps 55.3 billion decrease in other income, a Ps 22.2 billion decrease in income from non-financial sector, net, a Ps 6.3 billion decrease in dividend income primarily from Corficolombiana and a Ps 2.5 billion decrease in income from sales of noncurrent assets held for sale.
Other expenses
| | | Year ended December 31, | | | Change, 2016 vs. 2015 | |
| | | 2016 | | | 2015 | | | # | | | % | |
| | | (in Ps billions) | | | | | | | |
| Personnel expenses | | | (441.0 | ) | | | (400.4 | ) | | | (40.6 | ) | | | 10.1 | |
| Salaries and employee benefits | | | (430.7 | ) | | | (394.0 | ) | | | (36.7 | ) | | | 9.3 | |
| Bonus plan payments | | | (4.6 | ) | | | (4.6 | ) | | | 0.1 | | | | (1.8 | ) |
| Termination payments | | | (5.7 | ) | | | (1.8 | ) | | | (3.9 | ) | | | 212.4 | |
| Administrative and other expenses | | | (594.9 | ) | | | (542.5 | ) | | | (52.4 | ) | | | 9.7 | |
| Depreciation and amortization | | | (64.3 | ) | | | (61.4 | ) | | | (2.9 | ) | | | 4.7 | |
| Wealth tax | | | (37.3 | ) | | | (43.6 | ) | | | 6.3 | | | | (14.6 | ) |
| Other expenses | | | (12.9 | ) | | | (13.0 | ) | | | 0.1 | | | | (1.1 | ) |
| Charitable and other donation expenses | | | (0.2 | ) | | | (1.7 | ) | | | 1.5 | | | | (87.6 | ) |
| Other | | | (12.7 | ) | | | (11.3 | ) | | | (1.4 | ) | | | 12.1 | |
| Total other expenses | | | (1,150.3 | ) | | | (1,060.9 | ) | | | (89.4 | ) | | | 8.4 | |
Total other expenses increased by 8.4%, or Ps 89.4 billion to Ps 1,150.3 billion in 2016 as compared to 2015, mainly driven by an increase of Ps 52.4 billion or 9.7% increase in administrative and other expenses, a Ps 40.6 billion increase in personnel expenses, and a Ps 2.9 billion increase in depreciation and amortization. Partially offsetting these increases was a Ps 6.3 billion decrease in wealth tax.
Administrative and other expenses increased by Ps 52.4 billion to Ps 594.9 billion in 2016 from Ps 542.5 billion in 2015, mainly explained by a Ps 24.4 billion increase in service fees, a Ps 18.7 billion increase in rentals, a Ps 15.4 billion increase in taxes and surcharges, a Ps 10.8 billion increase in insurance expenses, and a Ps 6.5 billion increase in contributions and affiliations, offset in part by a Ps 24.6 billion decrease in other administrative expenses.
The Ps 40.6 billion increase in personnel expenses is explained by a Ps 36.7 billion increase in salaries and employee benefits and a Ps 3.9 billion increase in termination payments. The 9.3%, or Ps 36.7 billion, increase in salaries and employee benefits was explained by an increase in their yearly salaries and employee benefits per employee from Ps 27.0 million in 2015 to Ps 30.8 million in 2016. Banco de Occidente’s headcount decreased from 14,571 employees in 2015 to 14,003 employees in 2016.
Banco de Occidente’s efficiency ratio improved from 45.5% for 2015 to 42.9% for 2016. The ratio of personnel expenses and administrative and other expenses as a percentage of average assets slightly deteriorated from 2.8% for 2015 to 2.9% for 2016.
Income tax expense
Income tax expense for Banco de Occidente increased by Ps 36.7 billion, or 18.8%, to Ps 232.3 billion for the year ended December 31, 2016, primarily due to higher income before income tax expense. Banco de Occidente’s effective tax rate (calculated as income tax expense divided by income before tax expense minus equity method, minus dividends, plus wealth tax) decreased from 33.2% for the year ended December 31, 2015 to 30.6% for the year ended December 31, 2016. The decrease in the effective tax rate was driven by adjustments to deferred taxes arising from the most recent tax reform.
Net income attributable to non-controlling interest
Banco de Occidente’s net income attributable to non-controlling interest increased by Ps 0.3 billion to Ps 1.6 billion for the year ended December 31, 2016. Net income attributable to non-controlling interest is not a significant contributor to net income for Banco de Occidente, responsible for only 0.3% of net income for the year ended December 31, 2016.
Banco Popular
Net income
| | | Banco Popular Consolidated | |
| | | For the year ended December 31, | | | Change December 2016 vs December 2015 | |
| | | 2016 | | | 2015 | | | # | | | % | |
| | | (in Ps billions) | | | | | | | |
| Interest income | | | 2,043.7 | | | | 1,624.3 | | | | 419.5 | | | | 25.8 | |
| Interest expenses | | | (995.1 | ) | | | (583.2 | ) | | | (411.9 | ) | | | 70.6 | |
| Net interest income | | | 1,048.7 | | | | 1,041.1 | | | | 7.5 | | | | 0.7 | |
| Impairment loss on loans and other accounts receivable, net | | | (229.9 | ) | | | (63.2 | ) | | | (166.8 | ) | | | 264.0 | |
| Impairment loss on other assets, net | | | 0.0 | | | | (4.7 | ) | | | 4.7 | | | | (100.0 | ) |
| Recovery of charged-off financial assets | | | 30.8 | | | | 29.3 | | | | 1.4 | | | | 4.9 | |
| Net impairment loss | | | (199.2 | ) | | | (38.5 | ) | | | (160.6 | ) | | | 417.0 | |
| Net commission and fees income | | | 138.1 | | | | 128.6 | | | | 9.5 | | | | 7.4 | |
| Net trading income | | | 23.4 | | | | 19.0 | | | | 4.4 | | | | 23.2 | |
| Other income | | | 188.2 | | | | 178.0 | | | | 10.2 | | | | 5.7 | |
| Other expenses | | | (866.8 | ) | | | (805.9 | ) | | | (60.9 | ) | | | 7.6 | |
| Income before income tax expense | | | 332.4 | | | | 522.4 | | | | (189.9 | ) | | | (36.4 | ) |
| Income tax expense | | | (151.4 | ) | | | (173.1 | ) | | | 21.7 | | | | (12.5 | ) |
| Net Income | | | 181.1 | | | | 349.3 | | | | (168.2 | ) | | | (48.2 | ) |
| Net income attributable to: | | | | | | | | | | | | | | | | |
| Controlling interest | | | 179.9 | | | | 348.5 | | | | (168.6 | ) | | | (48.4 | ) |
| Non-controlling interest | | | 1.2 | | | | 0.8 | | | | 0.3 | | | | 43.1 | |
Banco Popular’s net income attributable to controlling interest decreased by 48.4%, or Ps 168.6 billion, to Ps 179.9 billion in 2016 as compared to Ps 348.5 billion in 2015. This decrease is attributable to a Ps 160.6 billion increase in net impairment loss on financial assets and a Ps 60.9 billion increase in other expenses. Partially offsetting the above mentioned, was a Ps 21.7 billion decrease in income tax expense, a Ps 10.2 billion increase in total other income (expenses), a Ps 9.5 billion increase in net income from commissions and fees, a Ps 7.5 billion increase in net interest income, and a Ps 4.4 billion increase in net trading income.
Net interest income
| | | Year ended December 31, | | | Change, 2016 vs. 2015 | |
| | | 2016 | | | 2015 | | | # | | | % | |
| | | (in Ps billions) | | | | |
| Interest income: | | | | | | | | | | | | | | | | |
| Commercial loans and leases | | | 661.7 | | | | 462.3 | | | | 199.4 | | | | 43.1 | |
| Consumer loans and leases | | | 1,227.1 | | | | 1,044.6 | | | | 182.5 | | | | 17.5 | |
| Mortgage loans and leases | | | 35.2 | | | | 17.1 | | | | 18.1 | | | | 105.3 | |
| Microcredit loans and leases | | | 1.6 | | | | 1.5 | | | | 0.2 | | | | 10.9 | |
| Interbank and overnight funds | | | 6.4 | | | | 10.3 | | | | (3.9 | ) | | | (38.1 | ) |
| Interest on loans and leases | | | 1,932.0 | | | | 1,535.9 | | | | 396.2 | | | | 25.8 | |
| Interest on investments in debt securities | | | 111.7 | | | | 88.4 | | | | 23.3 | | | | 26.3 | |
| Total interest income | | | 2,043.7 | | | | 1,624.3 | | | | 419.5 | | | | 25.8 | |
| Interest expense: | | | | | | | | | | | | | | | | |
| Checking accounts | | | (0.6 | ) | | | (0.8 | ) | | | 0.2 | | | | (21.4 | ) |
| Time deposits | | | (371.1 | ) | | | (143.6 | ) | | | (227.5 | ) | | | 158.4 | |
| Savings deposits | | | (407.4 | ) | | | (274.5 | ) | | | (132.9 | ) | | | 48.4 | |
| Total interest expense on deposits | | | (779.2 | ) | | | (419.0 | ) | | | (360.2 | ) | | | 86.0 | |
| Borrowings from banks and others | | | (2.5 | ) | | | (0.0 | ) | | | (2.5 | ) | | | N.A. | |
| Interbank and overnight funds | | | (67.7 | ) | | | (29.2 | ) | | | (38.5 | ) | | | 132.1 | |
| Long-term debt (bonds) | | | (138.6 | ) | | | (129.1 | ) | | | (9.6 | ) | | | 7.4 | |
| Borrowings from development entities | | | (7.0 | ) | | | (5.9 | ) | | | (1.1 | ) | | | 18.3 | |
| Total interest expense | | | (995.1 | ) | | | (583.2 | ) | | | (411.9 | ) | | | 70.6 | |
| Net interest income | | | 1,048.7 | | | | 1,041.1 | | | | 7.5 | | | | 0.7 | |
Banco Popular’s net interest income increased by 0.7%, or Ps 7.5 billion, from Ps 1,041.1 billion in 2015 to Ps 1,048.7 billion in 2016. This increase was primarily driven by a Ps 419.5 billion or 25.8% increase in total interest income that was partially offset by Ps 411.9 billion or 70.6% increase in total interest expense. The increase in total interest income is explained by a Ps 396.2 billion increase in interest income on total loans and leases (which include income from interbank and overnight funds) and a Ps 23.3 billion increase in income on investments in debt securities. The Ps 396.2 billion increase in interest income on total loans and leases was driven by an increase in interest income from loans and leases of Ps 400.1 billion to Ps 1,925.6 billion in 2016 which was partially offset by a Ps 3.9 billion decrease in income from interbank and overnight funds.
The increase in interest earned on loans and leases of Ps 400.1 billion was explained by a 13.3%, or Ps 1,842.0 billion, increase in Banco Popular’s average interest-earning loans and leases portfolio from Ps 13,825.6 billion in 2015 to Ps 15,667.6 billion in 2016, which resulted in a Ps 226.4 billion increase in interest income. Also contributing to the increase in interest earned on loans and leases was a 126 basis points increase in the average yield of loans and financial leases from 11.0% in 2015 to 12.3% in 2016, which resulted in a Ps 173.7 billion increase in interest income on loans and leases. The increase in the average yield on loans was in line with the 243 basis points increase in the average Central Bank rate, from 4.67% to 7.10%. The increase in interest income on loans and leases was driven by a Ps 199.4 billion increase in income on commercial loans and leases, a Ps 182.5 billion increase in income on consumer loans and leases and a Ps 18.1 billion increase in interest income on mortgage loans and leases.
The Ps 199.4 billion, or 43.1%, increase in interest income on commercial loans and leases was driven by a 219 basis points increase in the average yield on commercial loans from 7.2% in 2015 to 9.4% in 2016, which resulted in a Ps 140.0 billion increase in interest income. Additionally, a 9.8%, or Ps 629.0 billion, increase in Banco Popular’s average commercial loans and leases portfolio from Ps 6,387.4 billion in 2015 to Ps 7,016.4 billion in 2016 resulted in a Ps 59.3 billion increase in interest income. The increase in the average commercial loans and leases portfolio was driven by an increase in the balance of general purpose loans.
The increase in interest earned on consumer loans and leases of Ps 182.5 billion was mainly driven by a 14.7% or Ps 1,053.7 billion increase in Banco Popular’s average consumer loans and leases portfolio from Ps 7,161.0 billion in 2015 to Ps 8,214.7 billion in 2016, which resulted in a Ps 157.4 billion increase in interest income. The increase in the average consumer loans and leases portfolio was driven by an increase in personal loans, primarily consisting of payroll loans. In addition, a 35 basis points increase in the average yield on consumer loans and leases from 14.6% in 2015 to 14.9% in 2016, which resulted in a Ps 25.1 billion increase in interest income. The increase in the average yield resulted from an increasing interest rate environment, described above.
The increase in interest income on mortgage loans and leases of Ps 18.1 billion was driven by a 61.0% or Ps 161.8 billion increase in Banco Popular’s average mortgage loans and leases portfolio from Ps 265.3 billion in 2015 to Ps 427.1 billion in 2016, which resulted in a Ps 13.3 billion increase in interest income. The average yield on mortgage loans and leases increased 178 basis points from 6.5% in 2015 to 8.2% in 2016, which resulted in a Ps 4.7 billion increase in interest income.
Interest earned on interbank and overnight funds decreased by Ps 3.9 billion from Ps 10.3 billion in 2015 to Ps 6.4 billion in 2016.
The Ps 23.3 billion increase to Ps 111.7 billion in 2016 in income on investments in debt securities mainly reflects a 72 basis points increase in the yield from 5.4% in 2015 to 6.1% in 2016, which resulted in a Ps 11.9 billion increase in interest income. Furthermore, there was an 11.4%, or Ps 188.5 billion, increase in the average balance of investments in debt securities from Ps 1,651.5 billion in 2015 to Ps 1,840.0 billion in 2016, which led to a Ps 11.4 billion increase in interest income.
Total interest expense, on the other hand, increased by 70.6%, or Ps 411.9 billion, to Ps 995.1 billion in 2016 as compared to 2015, mainly driven by a 209 basis points increase in the average cost of funds from 4.4% in 2015 to 6.5% in 2016, which resulted in a Ps 273.6 billion increase in interest expense. The increase in the average cost of funds resulted from an increasing interest rate environment, described above. In addition, a 16.1%, or Ps 2,116.8 billion, increase in the average balance of interest-bearing liabilities from Ps 13,109.1 billion in 2015 to Ps 15,225.9 billion in 2016 resulted in a Ps 138.3 billion increase in interest expense. Total interest expense for interest-bearing deposits increased by Ps 360.2 billion, to Ps 779.2 billion in 2016 as compared to Ps 419.0 billion in 2015, mainly driven by a 221 basis points increase in the average cost of these funds from 4.0% in 2015 to 6.2% in 2016, resulting in a Ps 229.4 billion increase in interest expense. Furthermore, there was a 20.2%, or Ps 2,096.1 billion increase in the average balance of interest-bearing deposits from Ps 10,388.2 billion in 2015 to Ps 12,484.3 billion in 2016, which led to a Ps 130.8 billion increase in interest expense.
The Ps 360.2 billion increase in interest expense on interest-bearing deposits was mainly driven by a Ps 227.5 billion increase in interest expense on time deposits and a Ps 132.9 billion increase in interest expense on savings deposits. The Ps 51.7 billion increase in interest expense on other funding was mainly attributable to a Ps 38.5 billion increase in interest expense on interbank and overnight funds and a Ps 9.6 billion increase in interest expense on long-term debt.
The increase in interest expense on time deposits of Ps 227.5 billion was driven by a 79.2% or Ps 1,972.5 billion increase in the average balance of time deposits from Ps 2,489.9 billion in 2015 to Ps 4,462.4 billion in 2016, which resulted in a Ps 164.0 billion increase in interest expense. The average interest rate paid on time deposits increased by 255 basis points to 8.3% in 2016, which resulted in a Ps 63.4 billion increase in the interest expense.
The Ps 132.9 billion increase in interest expenses on savings deposits was due to a 161 basis points increase in the average rate paid on savings deposits to 5.1%, which resulted in a Ps 126.3 billion increase in interest expense. The average balance of savings deposits increased by 1.6%, or Ps 129.2 billion, from Ps 7,841.0 billion in 2015 to Ps 7,970.3 billion in 2016, which resulted in a Ps 6.6 billion increase in interest expense.
Interest expense on interbank and overnight funds increased by Ps 38.5 billion from Ps 29.2 billion in 2015 to Ps 67.7 billion in 2016. This increase was driven by an increase in the average balance of interbank and overnight funds from Ps 685.6 billion in 2015 to 1,026.3 in 2016, which resulted in a Ps 22.5 billion increase in interest expense. Furthermore, an increase in the average rate paid on interbank and overnight funds from 4.3% in 2015 to 6.6% in 2016, resulted in a Ps 16.1 billion increase in interest expense.
The increase in interest expense on long-term debt of Ps 9.6 billion was primarily driven by a 247 basis points increase in the average rate paid on long-term debt from 7.1% in 2015 to 9.6% in 2016, which resulted in a Ps 44.7 billion increase in interest expense. Partially offsetting this increase was a 20.2%, or Ps 366.9 billion, decrease in the average balance of long-term debt from Ps 1,813.4 billion in 2015 to Ps 1,446.5 billion in 2016, which resulted in a Ps 35.2 billion decrease in interest expense.
Average total interest earning assets (calculated as (i) gross loans including interbank and overnight funds and (ii) available for sale and held to maturity fixed income investments) increased by 13.1%, or Ps 2,033.2 billion, to Ps 17,522.0 billion in 2016 as compared to Ps 15,488.8 billion in 2015, and net interest income increased by 0.7%, or Ps 7.5 billion, from Ps 1,041.1 billion in 2015 to Ps 1,048.7 billion in 2016, which resulted in a 74 basis point decrease in the net interest margin from 6.7% in 2015 to 6.0% in 2016. This contraction of the net interest margin was expected during an increasing rate scenario as most of Banco Popular’s loan portfolio is comprised of consumer loans, by nature with fixed yields, which tend to take longer to reprice.
Interest spread between the average yield earned on loans and leases and the average rate paid on deposits decreased by 95 basis points from 7.0% in 2015 to 6.0% in 2016. As in the case of the net interest margin, the contraction of the spread between the average yield earned on loans and leases and the average rate paid on deposits was expected during an increasing rate scenario as most of Banco Popular’s loan portfolio is comprised of consumer loans, by nature with fixed yields, which tend to take longer to reprice.
Net impairment losses
| | | Year ended December 31, | | | Change, 2016 vs. 2015 | |
| | | 2016 | | | 2015 | | | # | | | % | |
| | | Total
Income/Expense | | | Total
Income/Expense | | | Total Income/Expense | |
| | | (in Ps billions) | | | | | | | |
| Impairment losses: | | | | | | | | | | | | | | | | |
| Impairment loss on loans and leases, net | | | (224.6 | ) | | | (61.3 | ) | | | (163.3 | ) | | | 266.4 | |
| Impairment loss on accrued interest and other receivables, net | | | (5.4 | ) | | | (1.9 | ) | | | (3.5 | ) | | | 185.1 | |
| Impairment loss on investments in debt and equity securities | | | - | | | | - | | | | - | | | | - | |
| Impairment loss on noncurrent held for sale assets | | | 0.0 | | | | (4.7 | ) | | | 4.7 | | | | (100.0 | ) |
| Recovery of charged-off financial assets | | | 30.8 | | | | 29.3 | | | | 1.4 | | | | 4.9 | |
| Recovery of impairment on investments in debt and equity | | | - | | | | - | | | | - | | | | - | |
| Recovery of Impairment loss on noncurrent held for sale assets | | | - | | | | - | | | | - | | | | - | |
| Net impairment losses | | | (199.2 | ) | | | (38.5 | ) | | | (160.6 | ) | | | 417.0 | |
| | | Year ended December 31, | | | | |
| | | 2016 | | | 2015 | | | Change, 2016 vs. 2015 | |
| | | Loans 91 days
past due | | | Delinquency
Ratio(1) | | | Loans 91
days past
due | | | Delinquency
Ratio(1) | | | Loans 91
days past
due | | | Delinquency
Ratio | |
| | | | | | # | | | % | |
| | | (in Ps billions) | |
| Delinquency Ratios: | | | 342.3 | | | | 2.1 | % | | | 213.2 | | | | 1.5 | % | | | 129.1 | | | | 0.6 | |
| Commercial loans and leases | | | 114.8 | | | | 1.6 | % | | | 83.6 | | | | 1.2 | % | | | 31.1 | | | | 0.4 | |
| Consumer loans and leases | | | 220.7 | | | | 2.5 | % | | | 125.5 | | | | 1.7 | % | | | 95.2 | | | | 0.8 | |
| Mortgage loans and leases | | | 6.1 | | | | 1.2 | % | | | 3.4 | | | | 1.0 | % | | | 2.7 | | | | 0.2 | |
| Microcredit loans and leases | | | 0.7 | | | | 8.5 | % | | | 0.7 | | | | 6.8 | % | | | (0.0 | ) | | | 1.7 | |
(1) Calculated as 91 days past due loans divided by total gross loans (excluding interbank and overnight funds)
Net impairment losses increased by Ps 160.6 billion, in 2016 as compared to 2015. This increase was primarily driven by a Ps 163.3 billion increase in impairment loss in loans and leases, net, and a Ps 3.5 billion increase in impairment loss on accrued interest and other receivables, net, which were partly offset by a Ps 4.7 billion decrease in impairment loss on noncurrent held for sale assets and a Ps 1.4 billion increase in recoveries of charged-off assets.
The Ps 163.3 billion increase in impairment loss on loans and leases, net was mainly driven by a 62 basis points deterioration in Banco Popular’s delinquency ratio (measured as loans 91 days past due as a percentage of total gross loans excluding interbank and overnight funds) from 1.5% in 2015 to 2.1% in 2016. Delinquency ratios for consumer loans deteriorated 82 basis points to 2.5% in 2016, commercial loans declined 39 basis points to 1.6% and mortgages did so by 21 basis points to 1.2%. The deterioration of the loan portfolio was partially a result of low GDP growth.
Also contributing to the increase in impairment loss on loans and leases, net was a base effect of lower impairment loss on loans and leases, net for 2015 resulting from an update in the probability of default parameter in the bank’s allowance evaluation models that lowered impairment losses requirements.
The bank’s cost of risk, measured as impairment loss on loans and leases divided by the average balance of loans and leases (excluding interbank and overnight funds) was 1.5% in 2016 compared to the 0.6% in 2015, adjusted for the one-time effect registered during 2015. The bank’s cost of risk net of recoveries of charged-off assets, measured as impairment loss on loans and leases, net of recoveries of charged-off assets divided by the average balance of loans and leases (excluding interbank and overnight funds) was 1.3% in 2016 and 0.4% in 2015, adjusted for the one-time effect registered during 2015.
Impairment loss on accrued interest and other receivables, net increased by Ps 3.5 billion in 2016 as compared to 2015 due to lower reversals of impairment losses of Ps 3.2 billion.
Charge-offs increased from Ps 79.0 billion for the year ended December 31, 2015 to Ps 106.4 billion for the year ended December 31, 2016. Since Banco Popular’s impairment loss on loans and leases, net increased, in absolute terms, more than charge-offs, the allowance for impairment losses of loans and leases increased from Ps 401.1 billion as of December 31, 2015 to Ps 523.9 billion as of December 31, 2016. As of December 31, 2016 Banco Popular’s coverage over its 91 days past due loans was 153.1% versus 188.1% as of December 31, 2015. The charge-offs to average loans (excluding interbank and overnight funds) slightly increased from 0.6% for 2015 to 0.7% for 2016.
The recovery of charged-off assets increased by 4.9%, or Ps 1.4 billion, to Ps 30.8 billion. The ratio of recovered charged-off assets to average loans (excluding interbank and overnight funds) remained stable at 0.2% for both years.
Impairment loss on noncurrent held for sale assets, net decreased by Ps 4.7 billion over the same period due to a recovery in foreclosed assets held by the bank in 2015.
Net commission and fee income
| | | Year ended December 31, | | | Change, 2016 vs. 2015 | |
| | | 2016 | | | 2015 | | | # | | | % | |
| | | (in Ps billions) | | | | | | | |
| Commission and fee income: | | | | | | | | | | | | | | | | |
| Banking fees | | | 134.5 | | | | 110.5 | | | | 24.0 | | | | 21.7 | |
| Bonded warehouse services | | | 64.2 | | | | 56.0 | | | | 8.2 | | | | 14.6 | |
| Trust activities | | | 21.5 | | | | 15.2 | | | | 6.3 | | | | 41.4 | |
| Pension and severance fund management | | | 1.8 | | | | 1.7 | | | | 0.1 | | | | 6.8 | |
| Commission and fee income | | | 222.0 | | | | 183.4 | | | | 38.6 | | | | 21.1 | |
| Commission and fee expenses | | | (83.9 | ) | | | (54.8 | ) | | | (29.1 | ) | | | 53.1 | |
| Net commission and fee income | | | 138.1 | | | | 128.6 | | | | 9.5 | | | | 7.4 | |
Net commission and fee income increased by 7.4%, or Ps 9.5 billion, to Ps 138.1 billion in 2016 as compared to 2015 mainly explained by a very strong Ps 24.0 billion increase in banking fees, a Ps 8.2 billion or 14.6% increase in bonded warehouse service fees and Ps 6.3 billion or 41.4% increase in trust activities fees. These increases were partially offset by a Ps 29.1 billion or 53.1% increase in expenses for commissions and fees in 2016.
The Ps 24.0 billion increase in banking fees was driven by a Ps 13.5 billion increase in banking services fees, a Ps 9.0 billion increase in credit card fees and a Ps 1.6 billion increase in checking fees.
Net trading income
Banco Popular’s net trading income includes (i) net trading income from investment securities held for trading through profit or loss, which reflects the interest and gains/losses from mark-to-market valuation, in each case from equity and fixed income investment securities held for trading through profit or loss, and (ii) net trading income from derivatives, which reflects the gains/losses from mark-to-market valuation on derivatives different from that considered under hedge accounting.
During 2016, Banco Popular’s net trading income came in at Ps 23.4 billion, 23.2%, or Ps 4.4 billion higher than the Ps 19.0 billion obtained in 2015. This increase was driven by a Ps 2.4 billion increase in net trading income from derivatives and a Ps 2.0 billion increase in net trading income from investment securities held for trading through profit or loss.
Net trading income from derivatives increased Ps 2.4 billion from a loss of Ps 0.4 billion in 2015 to a gain of Ps 2.0 billion in 2016.
The net trading income from investment securities held for trading through profit or loss increased by 10.4%, or Ps 2.0 billion, to Ps 21.5 billion in 2016. This increase in the net trading income from investment securities held for trading through profit or loss was mainly driven by an increase in yield from 4.4% in 2015 to 12.3% in 2016, which resulted in an increase in interest income of Ps 34.9 billion. In contrast, the decrease in the average balance of the bank’s investment securities held for trading through profit or loss from Ps 440.9 billion in 2015 to Ps 174.0 billion in 2016, resulted in a Ps 32.9 billion decrease in net trading income.
Total income from investment securities
Banco Popular’s securities portfolio is classified in the following categories: (i) equity and fixed income investments held for trading through profit or loss (described in this section as net trading income in investment securities held for trading through profit or loss), (ii) available for sale fixed income investments and (iii) held to maturity fixed income investments (results from (ii) and (iii) are included in the net interest income section as interest income from investment in debt securities). Banco Popular manages its investment portfolio in a comprehensive and integral manner that considers individual return of each one of these three categories and the total return of the investment securities portfolio.
Total income from investment securities for the bank (comprised of income on investments in debt securities and net trading income from investment securities held for trading through profit or loss) was Ps 133.2 billion for 2016, Ps 25.3 billion or 23.5% higher than the Ps 107.9 billion for 2015. This was primarily driven by an increase average yield of total investment securities from 5.2% in 2015 to 6.6% in 2016, resulting in a Ps 30.5 billion increase in interest income. The average balance of Total Investment Securities, however, decreased 3.7%, or Ps 78.4 billion, resulting in a Ps 5.2 billion decline in interest income.
When including investment securities held for trading through profit or loss, Banco Popular’s average total interest earning assets (calculated as (i) gross loans including interbank and overnight funds, (ii) fixed income and equity investments held for trading through profit or loss, and (iii) available for sale and held to maturity fixed income investments) would have increased by 11.1%, or Ps 1,766.3 billion, to Ps 17,696.0 billion in 2016 as compared to Ps 15,929.7 billion in 2015, and the net interest income plus net trading income from investment securities held for trading through profit or loss would have increased 0.9%, or Ps 9.5 billion, from Ps 1,060.6 billion in 2015 to Ps 1,070.1 billion in 2016. The return over average total interest earning assets (calculated as (i) gross loans including interbank and overnight funds, (ii) fixed income and equity investments held for trading through profit or loss, and (iii) available for sale and held to maturity fixed income investments) would have decreased by 61 basis points from 6.7% in 2015 to 6.0% in 2016.
Other income
| | | Year ended December 31, | | | Change, 2016 vs. 2015 | |
| | | 2016 | | | 2015 | | | # | | | % | |
| | | (in Ps billions) | | | | |
| Foreign exchanges gains (losses), net | | | 2.0 | | | | 3.9 | | | | (1.9 | ) | | | (48.3 | ) |
| Gains on sales of investments, net | | | 34.0 | | | | (0.7 | ) | | | 34.7 | | | | N.A. | |
| Income from sales of noncurrent assets held for sale | | | 0.0 | | | | 1.5 | | | | (1.4 | ) | | | (98.0 | ) |
| Equity method | | | (0.8 | ) | | | 0.8 | | | | (1.6 | ) | | | (205.9 | ) |
| Dividend income | | | 28.4 | | | | 33.5 | | | | (5.1 | ) | | | (15.3 | ) |
| Gains on valuation of assets, net | | | 5.8 | | | | - | | | | 5.8 | | | | - | |
| Income from non-financial sector, net | | | 0.2 | | | | 1.5 | | | | (1.3 | ) | | | (86.3 | ) |
| Net income from financial instruments designated at fair value | | | - | | | | - | | | | - | | | | - | |
| Other | | | 118.6 | | | | 137.7 | | | | (19.1 | ) | | | (13.9 | ) |
| Total other income | | | 188.2 | | | | 178.0 | | | | 10.2 | | | | 5.7 | |
Total other income (expense) increased by Ps 10.2 billion, or 5.7%, to Ps 188.2 billion in 2016 from Ps 178.0 billion in 2015. This increase was mainly due to a Ps 34.7 billion increase in gains on sales of investments, net related to the sale of the bank’s investment in CIFIN to TransUnion Netherlands and a Ps 5.8 billion increase in gains on valuation of assets. Partially offsetting this was a Ps 19.1 billion decrease in other income, a Ps 5.1 billion decrease in dividend income from Corficolombiana, a Ps 1.9 billion decrease in foreign exchange gains (losses), net, a Ps 1.6 billion decrease in income from equity method from ATH, a Ps 1.4 billion decrease in income from sales of noncurrent assets held for sale and a Ps 1.3 billion decrease in income from non-financial sector.
Other expenses
| | | Year ended December 31, | | | Change, 2016 vs. 2015 | |
| | | 2016 | | | 2015 | | | # | | | % | |
| | | (in Ps billions) | | | | | | | |
| Losses from sales of noncurrent assets held for sale | | | (0.0 | ) | | | - | | | | (0.0 | ) | | | - | |
| Personnel expenses | | | (314.9 | ) | | | (290.3 | ) | | | (24.6 | ) | | | 8.5 | |
| Salaries and employee benefits | | | (304.3 | ) | | | (272.6 | ) | | | (31.7 | ) | | | 11.6 | |
| Bonus plan payments | | | (4.9 | ) | | | (4.6 | ) | | | (0.3 | ) | | | 6.5 | |
| Termination payments | | | (5.7 | ) | | | (13.1 | ) | | | 7.4 | | | | (56.4 | ) |
| Administrative and other expenses | | | (477.3 | ) | | | (435.2 | ) | | | (42.1 | ) | | | 9.7 | |
| Depreciation and amortization | | | (40.4 | ) | | | (39.1 | ) | | | (1.3 | ) | | | 3.4 | |
| Wealth tax | | | (24.4 | ) | | | (30.0 | ) | | | 5.6 | | | | (18.8 | ) |
| Other expenses | | | (9.8 | ) | | | (11.2 | ) | | | 1.5 | | | | (13.2 | ) |
| Charitable and other donation expenses | | | (2.2 | ) | | | (2.4 | ) | | | 0.1 | | | | (5.8 | ) |
| Other | | | (7.5 | ) | | | (8.9 | ) | | | 1.3 | | | | (15.2 | ) |
| Total other expenses | | | (866.8 | ) | | | (805.9 | ) | | | (60.9 | ) | | | 7.6 | |
Total other expenses increased by 7.6%, or Ps 60.9 billion, in 2016 as compared to 2015, mainly driven by an increase of Ps 42.1 billion or 9.7% in administrative and other expenses and a Ps 24.6 billion or 8.5% increase in personnel expenses, offset in part by a Ps 5.6 billion decrease in wealth tax.
Administrative and other expenses increased by Ps 42.1 billion to Ps 477.3 billion in 2016 from Ps 435.2 billion in 2015, explained by a Ps 15.2 billion increase in taxes and surcharges, a Ps 12.1 billion increase in improvements and repairs, a Ps 6.4 billion increase in insurance expense, a Ps 4.4 billion increase in rentals, and a Ps 3.1 billion increase in contributions and affiliations.
The Ps 24.6 billion increase in personnel expenses was mainly driven by a Ps 31.7 billion increase in salaries and employee benefits partially offset by a Ps 7.4 billion decrease in termination payments. The Ps 31.7 billion increase in salaries and employee benefits was driven by a 7.9% increase in headcount from 7,143 to 7,707 employees between 2015 and 2016, which was accompanied with a 3.5% increase in their yearly salaries and employee benefits per employee from Ps 38.2 million in 2015 to Ps 39.5 million in 2016.
Banco Popular’s efficiency ratio deteriorated from 59.0% in 2015 to 61.9% for 2016. The ratio of personnel expenses and administrative and other expenses as a percentage of average assets remained stable at 4.0% for both 2015 and 2016.
Income tax expense
Income tax expense for Banco Popular decreased by Ps 21.7 billion, or 12.5%, to Ps 151.4 billion for the year ended December 31, 2016, primarily due to lower income before income tax expense. Banco Popular’s effective tax rate (calculated as income tax expense divided by income before tax expense minus equity method, minus dividends, plus wealth tax) increased from 33.4% for the year ended December 31, 2015 to 46.0% for the year ended December 31, 2016. This is the result of a one-time expense of Ps 23.3 billion related to an update to deferred taxes in 2016 and to a Ps 8.9 billion income in 2015 derived from the recognition of recoverable deferred tax assets not recognized in prior periods.
Net income attributable to non-controlling interest
Net income attributable to non-controlling interest increased by Ps 0.3 billion to Ps 1.2 billion for the year ended December 31, 2016. Net income attributable to non-controlling interest is not a significant contributor to net income for Banco Popular, responsible for only 0.6% of net income for the year ended December 31, 2016.
Banco AV Villas
Net income
| | | Banco AV Villas Consolidated | |
| | | For the year ended December 31, | | | Change December 2016 vs December
2015 | |
| | | 2016 | | | 2015 | | | # | | | % | |
| | | (in Ps billions) | | | | | | | |
| Interest income | | | 1,199.8 | | | | 988.9 | | | | 210.9 | | | | 21.3 | |
| Interest expenses | | | (451.2 | ) | | | (273.9 | ) | | | (177.3 | ) | | | 64.7 | |
| Net interest income | | | 748.5 | | | | 714.9 | | | | 33.6 | | | | 4.7 | |
| Impairment loss on loans and other accounts receivable, net | | | (236.4 | ) | | | (188.9 | ) | | | (47.5 | ) | | | 25.2 | |
| Impairment loss on other assets, net | | | - | | | | 0.3 | | | | (0.3 | ) | | | (100.0 | ) |
| Recovery of charged-off financial assets | | | 36.9 | | | | 22.4 | | | | 14.5 | | | | 64.4 | |
| Net impairment loss | | | (199.5 | ) | | | (166.1 | ) | | | (33.4 | ) | | | 20.1 | |
| Net commission and fees income | | | 152.2 | | | | 145.5 | | | | 6.7 | | | | 4.6 | |
| Net trading income | | | 10.1 | | | | 0.2 | | | | 10.0 | | | | 5,744.0 | |
| Other income | | | 92.9 | | | | 93.3 | | | | (0.4 | ) | | | (0.4 | ) |
| Other expenses | | | (544.7 | ) | | | (503.4 | ) | | | (41.3 | ) | | | 8.2 | |
| Income before income tax expense | | | 259.5 | | | | 284.3 | | | | (24.8 | ) | | | (8.7 | ) |
| Income tax expense | | | (80.0 | ) | | | (108.7 | ) | | | 28.7 | | | | (26.4 | ) |
| Net Income | | | 179.5 | | | | 175.6 | | | | 3.9 | | | | 2.2 | |
| Net income attributable to: | | | | | | | | | | | | | | | | |
| Controlling interest | | | 179.4 | | | | 175.6 | | | | 3.8 | | | | 2.2 | |
| Non-controlling interest | | | 0.2 | | | | 0.0 | | | | 0.1 | | | | 252.2 | |
Banco AV Villas’ net income attributable to controlling interest increased by 2.2%, or Ps 3.8 billion, to Ps 179.4 billion for the year ended December 31, 2016 as compared to Ps 175.6 billion for the year ended December 31, 2015. The increase in net income was primarily due to a Ps 33.6 billion increase in net interest income, a Ps 28.7 billion decrease in income tax expense, a Ps 10.0 billion increase in net trading income and a Ps 6.7 billion increase in net income from commissions and fees. Partially offsetting the aforementioned was a Ps 41.3 billion increase in total other expenses, a Ps 33.4 billion increase in net impairment loss on financial assets and a Ps 0.4 billion decrease in total other income (expense).
Net interest income
| | | Year ended December 31, | | | Change, 2016 vs. 2015 | |
| | | 2016 | | | 2015 | | | # | | | % | |
| | | (in Ps billions) | | | | |
| Interest income: | | | | | | | | | | | | | | | | |
| Commercial loans and leases | | | 283.9 | | | | 203.5 | | | | 80.5 | | | | 39.6 | |
| Consumer loans and leases | | | 637.8 | | | | 536.5 | | | | 101.3 | | | | 18.9 | |
| Mortgage loans and leases | | | 176.2 | | | | 145.6 | | | | 30.6 | | | | 21.0 | |
| Microcredit loans and leases | | | 0.5 | | | | 1.1 | | | | (0.5 | ) | | | (50.2 | ) |
| Interbank and overnight funds | | | 0.0 | | | | 2.4 | | | | (2.3 | ) | | | (98.1 | ) |
| Interest on loans and leases | | | 1,098.5 | | | | 889.0 | | | | 209.5 | | | | 23.6 | |
| Interest on investments in debt securities | | | 101.2 | | | | 99.8 | | | | 1.4 | | | | 1.4 | |
| Total interest income | | | 1,199.8 | | | | 988.9 | | | | 210.9 | | | | 21.3 | |
| Interest expense: | | | | | | | | | | | | | | | | |
| Checking accounts | | | (1.3 | ) | | | (1.5 | ) | | | 0.3 | | | | (16.2 | ) |
| Time deposits | | | (221.0 | ) | | | (137.3 | ) | | | (83.7 | ) | | | 61.0 | |
| Savings deposits | | | (166.3 | ) | | | (96.5 | ) | | | (69.8 | ) | | | 72.4 | |
| Total interest expense on deposits | | | (388.6 | ) | | | (235.3 | ) | | | (153.3 | ) | | | 65.2 | |
| Borrowings from banks and others | | | (1.9 | ) | | | (0.8 | ) | | | (1.1 | ) | | | 132.6 | |
| Interbank and overnight funds | | | (60.3 | ) | | | (35.8 | ) | | | (24.4 | ) | | | 68.2 | |
| Long-term debt (bonds) | | | - | | | | - | | | | - | | | | - | |
| Borrowings from development entities | | | (0.5 | ) | | | (2.0 | ) | | | 1.5 | | | | (77.0 | ) |
| Total interest expense | | | (451.2 | ) | | | (273.9 | ) | | | (177.3 | ) | | | 64.7 | |
| Net interest income | | | 748.5 | | | | 714.9 | | | | 33.6 | | | | 4.7 | |
Banco AV Villas’ net interest income increased by 4.7%, or Ps 33.6 billion, from Ps 714.9 billion in 2015 to Ps 748.5 billion in 2016. This increase was primarily driven by a Ps 210.9 billion increase in total interest income to Ps 1,199.8 billion in 2016. The increase in total income was as a result of a 23.6%, or Ps 209.5 billion, increase in interest income on total loans and leases (which includes income from interbank and overnight funds) to Ps 1,098.5 billion and a 1.4%, or Ps 1.4 billion, increase in interest on investments in debt securities to Ps 101.2
billion in 2016. The Ps 209.5 billion increase in interest income on total loans and leases was driven by an increase in interest income from loans and leases of Ps 211.9 billion to Ps 1,098.5 billion in 2016 which was partially offset by a Ps 2.3 billion decrease in income from interbank and overnight funds. The increase in interest income was partially offset by a Ps 177.3 billion increase in interest expense, mostly due to a Ps 153.3 billion increase in total interest expense on deposits.
Interest income on loans and leases increased by Ps 211.9 billion, driven by an increase in Banco AV Villas’ average interest bearing loan portfolio from Ps 7,963.4 billion in 2015 to Ps 8,902.2 billion in 2016, which resulted in a Ps 115.8 billion increase in income. Also contributing to this increase was a 121 basis points increase in the average yield on loans and leases from 11.1% in 2015 to 12.3% in 2016, which resulted in a Ps 96.0 billion increase in interest income and a 11.8%, or Ps 938.8 billion, The increase in the average yield on loans and leases was in line with the 243 basis points increase in the average Central Bank rate, from 4.67% in 2015 to 7.10% in 2016. The increase in interest income on loans and leases was driven by a Ps 101.3 billion increase in income on consumer loans and leases, a Ps 80.5 billion increase in income on commercial loans and leases and a Ps 30.6 billion increase in interest income on mortgage loans and leases.
The increase in interest earned on consumer loans and leases of Ps 101.3 billion was mainly driven by a 15.6% or Ps 566.6 billion increase in Banco Av Villas’ average consumer loans and leases portfolio from Ps 3,640.7 billion in 2015 to Ps 4,207.4 billion in 2016, which resulted in a Ps 85.9 billion increase in interest income. The increase in the average balance was driven by the growth of the credit card portfolio and the personal loan portfolio In addition, a 42 basis points increase in the average yield on consumer loans and leases from 14.7% in 2015 to 15.2% in 2016, resulted in a Ps 15.4 billion increase in interest income. The increase in the average yield resulted from an increasing interest rate environment described above.
The Ps 80.5 billion, or 39.6%, increase in interest income on commercial loans and leases was driven by a 226 basis points increase in the average yield on commercial loans from 7.1% in 2015 to 9.4% in 2016, which resulted in a Ps 64.2 billion increase in interest income. Furthermore, a 6.1%, or Ps 173.3 billion, increase in Banco AV Villas’ average commercial loans and leases portfolio from Ps 2,845.7 billion in 2015 to Ps 3,019.0 billion in 2016, resulted in a Ps 16.3 billion increase in interest income. The increase in the average commercial loans and leases portfolio was driven by an increase in the balance of general purpose loans.
The increase in interest income on mortgage loans and leases of Ps 30.6 billion was driven by an 13.7% or Ps 201.0 billion increase in Banco AV Villas’ average mortgage loans and leases portfolio from Ps 1,472.4 billion in 2015 to Ps 1,673.4 billion in 2016, which resulted in a Ps 21.2 billion increase in interest income. The average yield on mortgage loans and leases increased 64 basis points from 9.9% in 2015 to 10.5% in 2016, which resulted in a Ps 9.5 billion decrease in interest income.
Interest earned on interbank and overnight funds decreased by Ps 2.3 billion from Ps 2.37 billion in 2015 to Ps 0.04 billion in 2016.
The Ps 1.4 billion increase to Ps 101.2 billion in interest on investments in debt securities in 2016, is explained by a 56 basis points increase in the average yield of these investments from 5.0% in 2015 to 5.6% in 2016, which resulted in a Ps 11.0 billion increase in interest income. Partially offsetting this increase was an 8.7%, or Ps 172.0 billion decrease in the average balance of available for sale and held to maturity fixed income investments from Ps 1,978.6 billion in 2015 to Ps 1,806.5 billion in 2016, which resulted in a Ps 9.6 billion decrease in interest income.
Total interest expense increased by 64.7%, or Ps 177.3 billion, in 2016 as compared to 2015, mainly driven by a 161 basis point increase in the average cost of funds from 3.1% in 2015 to 4.7% in 2016, which resulted in a Ps 141.5 billion increase in interest expense. The increase in the average cost of funds resulted from the increasing interest rate environment described above. In addition, an 8.6%, or Ps 754.7 billion, increase in the average balance of interest-bearing liabilities from Ps 8,769.3 billion in 2015 to Ps 9,524.1 billion in 2016 resulted in a Ps 35.8 billion increase in interest expense. Total interest expense for interest-bearing deposits increased 65.2%, or Ps 153.3 billion over the same period, mainly driven by a 153 basis points increase in the average cost of deposits from 3.0% in 2015 to 4.6% in 2016, resulting in a Ps 118.4 billion increase in interest expense. Also contributing to the increase in interest expense for interest-bearing deposits was a Ps 762.7 billion, or 9.9%, increase in the
average balance of interest-bearing deposits from Ps 7,717.5 billion in 2015 to Ps 8,480.2 billion in 2016, which resulted in a Ps 34.9 billion increase in interest expense.
The Ps 177.3 billion increase in total interest expense was mainly driven by a 153.3 billion increase in interest expense on interest-bearing deposits and a Ps 24.0 billion increase in interest expense on other funding. The increase in interest expense on interest-bearing deposits is explained by a Ps 83.7 billion increase in interest expense on time deposits, a Ps 69.8 billion increase in interest expense on savings deposits and by a Ps 0.3 billion decrease in interest expense on interest-bearing checking accounts. The increase in interest expense on other funding was mainly attributable to a Ps 24.4 billion increase in interest expense on interbank and overnight funds and a Ps 0.5 billion decrease in interest expense on borrowings from banks and others (including borrowings from development entities).
The Ps 83.7 billion increase in interest expense on time deposits was driven by an increase in the average interest rate paid on time deposits of 204 basis points from 4.8% in 2015 to 6.9% in 2016, which resulted in a Ps 57.8 billion increase in interest expense, and a 13.3%, or Ps 376.5 billion, increase in the average balance of time deposits to Ps 3,212.7 billion, which resulted in a Ps 25.9 billion increase in interest expense.
The Ps 69.8 billion increase in interest expense on savings deposits was driven by an increase in the average rate paid on savings deposits of 120 basis points from 2.1% in 2015 to 3.3% in 2016, which resulted in a Ps 56.3 billion increase in interest expense. The average balance of savings deposits increased by 8.9%, or Ps 414.7 billion, to Ps 5,094.6 billion resulting in a Ps 13.5 billion increase in interest expense.
The increase in interest expense on interbank and overnight funds of Ps 24.4 billion was driven by an increase in the average interest rate paid from 4.2% in 2015 to 6.7% in 2016, resulting in a Ps 20.9 billion increase in interest expense. The average balance of these funds increased by 6.2%, or Ps 52.5 billion, resulting in a Ps 3.5 billion increase in interest expense.
Average total interest earning assets (calculated as (i) gross loans including interbank and overnight funds, and (ii) available for sale and held to maturity fixed income investments) increased by 6.3%, or Ps 641.3 billion from 10,223.2 billion in 2015 to Ps 10,864.5 billion in 2016 and net interest income increased by 4.7% or Ps 33.6 billion from Ps 714.9 billion to Ps 748.5 billion, over the same period, which resulted in a 10 basis points decrease in the net interest margin from 7.0% in 2015 to 6.9% in 2016. This contraction of the net interest margin was expected during an increasing rate scenario as most of Banco AV Villas’ loan portfolio is mostly comprised of consumer loans, by nature with fixed yields, which tend to take longer to reprice. The average spread between the average rate on loans and leases and the average rate paid on deposits decreased by 33 basis points from 8.1% to 7.8% over the same period.
Net impairment losses
| | | Year ended December 31, | | | Change, 2016 vs. 2015 | |
| | | 2016 | | | 2015 | | | # | | | % | |
| | | Total Income/Expense | | | Total Income/Expense | | | Total Income/Expense | |
| | | (in Ps billions) | | | | | | | |
| Impairment losses: | | | | | | | | | | | | |
| Impairment loss on loans and leases, net | | | (218.9 | ) | | | (182.1 | ) | | | (36.8 | ) | | | 20.2 | |
| Impairment loss on accrued interest and other receivables, net | | | (17.5 | ) | | | (6.8 | ) | | | (10.8 | ) | | | 158.8 | |
| Impairment loss on investments in debt and equity securities | | | - | | | | 0.3 | | | | (0.3 | ) | | | (100.0 | ) |
| Impairment loss on noncurrent held for sale assets | | | - | | | | (0.0 | ) | | | 0.0 | | | | (100.0 | ) |
| Recovery of charged-off financial assets | | | 36.9 | | | | 22.4 | | | | 14.5 | | | | 64.4 | |
| Recovery of impairment loss on investments in debt and equity securities | | | - | | | | - | | | | - | | | | - | |
| Recovery of impairment loss on noncurrent held for sale assets | | | - | | | | - | | | | - | | | | - | |
| Net impairment losses | | | (199.5 | ) | | | (166.1 | ) | | | (33.4 | ) | | | 20.1 | |
| | | Year ended December 31, | | | | |
| | | 2016 | | | 2015 | | | Change, 2016 vs. 2015 | |
| | | Loans 91 days
past due | | | Delinquency
Ratio(1) | | | Loans 91
days past due | | | Delinquency
Ratio(1) | | | Loans 91 days
past due | | | Delinquency
Ratio (1) | |
| | | | | | # | | | % | |
| | (in Ps billions) | |
| Delinquency Ratios: | | | |
| Total loans and leases | | | 261.4 | | | | 2.8 | % | | | 258.3 | | | | 3.1 | % | | | 3.0 | | | | (0.3 | ) |
| Commercial loans and leases | | | 71.9 | | | | 2.3 | % | | | 61.0 | | | | 2.2 | % | | | 10.9 | | | | 0.1 | |
| Consumer loans and leases | | | 106.2 | | | | 2.3 | % | | | 118.9 | | | | 3.0 | % | | | (12.7 | ) | | | (0.6 | ) |
| Mortgage loans and leases | | | 83.2 | | | | 4.8 | % | | | 78.3 | | | | 4.9 | % | | | 4.8 | | | | (0.1 | ) |
| Microcredit loans and leases | | | 0.1 | | | | 4.8 | % | | | 0.1 | | | | 3.5 | % | | | (0.0 | ) | | | 1.3 | |
(1) Calculated as 91 days past due loans divided by total gross loans (excluding interbank and overnight funds)
Net impairment losses increased by 20.1%, or Ps 33.4 billion, in 2016 as compared to 2015. This increase was primarily driven by a Ps 36.8 billion increase in impairment loss on loans and leases, net and a Ps 10.8 billion increase in impairment loss on accrued interest and other receivables, net, which were partially offset by a Ps 14.5 billion increase of recoveries of charged-off assets.
The increase in impairment loss on loans and leases, net of Ps 36.8 billion was primarily attributable to the requirements derived from the 11.5% growth in Banco AV Villas’ loans and leases (excluding interbank and overnight funds) during 2016 as compared to 2015. The bank’s cost of risk, measured as impairment loss on loans and leases, net divided by the average balance of loans and leases (excluding interbank and overnight funds) increased 28 basis points from 2.4% in 2015 to 2.7% for 2016. The bank’s cost of risk net of recoveries of charged-off assets, measured as net impairment loss on loans and leases, net of recoveries of charged-off assets divided by the average balance of loans and leases (excluding interbank and overnight funds), slightly increased from 2.1% in 2015 to 2.2% in 2016. Banco AV Villas’ delinquency ratio (measured as loans 91 days past due as a percentage of total gross loans excluding interbank and overnight funds) improved by 28 basis points in 2016 as compared to 2015 from 3.1% to 2.8%. The delinquency ratios for the consumer loan portfolio and the mortgage loan portfolio improved by 0.6% and 0.1%, respectively.
The increase in impairment loss for accrued interest and other receivables, net was due to an 86.6% or Ps 14.4 billion increase in gross provision expense associated with AV Villas’ accelerated growth of 34.9% in its credit card loans portfolio.
Charge-offs increased from Ps 130.1 billion for the year ended December 31, 2015 to Ps 201.0 billion for the year ended December 31, 2016 and the ratio of charge-offs to average loans (excluding interbank and overnight funds) increased from 1.6% for the year ended December 31, 2015 to 2.3% for the year ended December 31, 2016, the increase in charge-offs is mainly explained by the higher impairments and delinquencies registered during the period.
Since Banco AV Villas’ net impairment loss on loans and leases increased, in absolute terms, more than charge-offs, the allowance for loan losses increased from Ps 392.3 billion as of December 31, 2015 to Ps 427.8 billion as of December 31, 2016. As of December 31, 2016 Banco AV Villas’ coverage over its 91 days past due loans was 163.7%, compared to 151.9% as of December 31, 2015.
Net commission and fee income
| | | Year ended December 31, | | | Change, 2016 vs. 2015 | |
| | | 2016 | | | 2015 | | | # | | | % | |
| | | (in Ps billions) | | | | | | | |
| Commission and fee income | | | | | | | | | | | | | | | | |
| Banking fees | | | 250.9 | | | | 230.7 | | | | 20.3 | | | | 8.8 | |
| Bonded warehouse services | | | - | | | | - | | | | - | | | | - | |
| Trust activities | | | - | | | | - | | | | - | | | | - | |
| Pension and severance fund management | | | - | | | | - | | | | - | | | | - | |
| Commission and fee income | | | 250.9 | | | | 230.7 | | | | 20.3 | | | | 8.8 | |
| Commission and fee expenses | | | (98.7 | ) | | | (85.2 | ) | | | (13.5 | ) | | | 15.9 | |
| Net commission and fee expenses | | | 152.2 | | | | 145.5 | | | | 6.7 | | | | 4.6 | |
Net commission and fee expenses increased by 4.6%, or Ps 6.7 billion, to Ps 152.2 billion in 2016 as compared to 2015 mainly driven by an increase of Ps 20.3 billion in banking fees to Ps 250.9 billion in 2016, primarily due to a Ps 17.0 billion increase in commissions from banking services and a Ps 3.0 billion increase in branch network fees. Partially offsetting this increase was a Ps 13.5 billion increase in commission and fee expenses due to the growth in credit card loans mentioned above.
Net trading income
Banco AV Villas’ net trading income includes (i) net trading income from investment securities held for trading through profit or loss, which reflects the interest and gains/losses from mark-to-market valuation, in each case from equity and fixed income investment securities held for trading through profit or loss, and (ii) net trading income from derivatives, which reflects the gains/losses from mark-to-market valuation on derivatives different from that considered under hedge accounting. During 2016, Banco AV Villas’ net trading income increased by Ps 10.0 billion from Ps 0.2 billion in 2015 to Ps 10.1 billion in 2016, driven by a Ps 6.7 billion increase in net trading income from derivatives and a Ps 3.2 billion increase in net trading income from investment securities held for trading through profit or loss.
Net trading income from derivatives increased Ps 6.7 billion from a loss of Ps 7.4 billion in 2015 to a loss of Ps 0.7 billion in 2016.
Net trading income from investment securities held for trading through profit or loss increased by 42.8%, or Ps 3.2 billion. The increase in the net trading income from investment securities held for trading through profit or loss was mainly driven by a 43.8%, or a Ps 35.7 billion, increase in the average balance of the bank’s held for trading through profit or loss portfolio, which resulted in a Ps 3.3 billion increase in net trading income. Partially offsetting this result was a decrease in the yield from the bank’s investment securities held for trading through profit or loss from 9.3% in 2015 to 9.2% in 2016, which produced a Ps 0.1 billion decrease in interest income.
Total income from investment securities
Banco AV Villas’ securities portfolio is classified in the following categories: (i) equity and fixed income investments held for trading through profit or loss (described in this section as net trading income in investment securities held for trading through profit or loss), (ii) available for sale fixed income investments and (iii) held to maturity fixed income investments (results from (ii) and (iii) are included in the net interest income section as interest income from investment in debt securities). Banco AV Villas manages its investment portfolio in a comprehensive and integral manner that considers individual return of each one of these three categories and the total return of the investment securities portfolio.
Total income from investment securities for the bank (comprised of income on investments in debt securities and net trading income from investment securities held for trading through profit or loss) was Ps 112.0 billion for 2016, Ps 4.6 billion higher than the Ps 107.4 billion for 2015. This increase was primarily driven by a 61 basis points increase in the average yield of Total Investment Securities from 5.2% in 2015 to 5.8% in 2016, which resulted in a Ps 12.6 billion increase in interest income. Compensating this result was a 6.6%, or Ps 136.3 billion, decrease in the average balance of total investment securities, resulting in a Ps 7.9 billion decline in interest income.
When including investment securities held for trading through profit or loss, average total interest earning assets (calculated as (i) gross loans including interbank and overnight funds, (ii) fixed income and equity investments held for trading through profit or loss, and (iii) available for sale and held to maturity fixed income investments) would have increased by 6.6%, or Ps 677.1 billion, from Ps 10,304.7 billion in 2015 to Ps 10,981.8
billion in 2016, while net interest income plus net trading income would have increased by 5.1%, or Ps 36.9 billion, over the same period. The return over average total interest earning assets (calculated as (i) gross loans including interbank and overnight funds, (ii) fixed income and equity investments held for trading through profit or loss, and (iii) available for sale and held to maturity fixed income investments) would have decreased by 10 basis points from 7.0% in 2015 to 6.9% in 2016.
Other income
| | | Year ended December 31, | | | Change, 2016 vs. 2015 | |
| | | 2016 | | | 2015 | | | # | | | % | |
| | | (in Ps billions) | | | | |
| Foreign exchange gains (losses), net | | | 1.2 | | | | 6.5 | | | | (5.3 | ) | | | (81.7 | ) |
| Gains on sales of investments, net | | | 21.8 | | | | 12.1 | | | | 9.7 | | | | 80.1 | |
| Income from sales of noncurrent assets held for sale | | | 0.4 | | | | 5.4 | | | | (5.1 | ) | | | (93.4 | ) |
| Equity method | | | (1.2 | ) | | | (0.5 | ) | | | (0.7 | ) | | | 124.6 | |
| Dividend income | | | 2.9 | | | | 1.9 | | | | 1.0 | | | | 54.0 | |
| Gains on valuation of assets, net | | | 3.4 | | | | - | | | | 3.4 | | | | N.A. | |
| Income from non-financial sector, net | | | - | | | | - | | | | - | | | | - | |
| Net income from financial instruments designated at fair value | | | - | | | | - | | | | - | | | | - | |
| Other | | | 64.5 | | | | 67.9 | | | | (3.4 | ) | | | (5.0 | ) |
| Total other income | | | 92.9 | | | | 93.3 | | | | (0.4 | ) | | | (0.4 | ) |
Total other income (expense) decreased by 0.4%, or Ps 0.4 billion, to Ps 92.9 billion in 2016 as compared to 2015. This decrease was mainly driven by a Ps 5.3 billion decrease in foreign exchanges gains (losses), net, a Ps 5.1 billion decrease in income from sales of noncurrent assets held for sale, a Ps 3.4 billion decrease in other income and a Ps 0.7 billion decrease in equity method. Partially offsetting these decreases was a Ps 9.7 billion increase in gains on sales of investments, net derived from the sale of the bank’s investment in CIFIN to TransUnion Netherlands and a Ps 1.0 billion increase in dividend income.
Other expenses
| | | Year ended December 31, | | | Change, 2016 vs. 2015 | |
| | | 2016 | | | 2015 | | | # | | | % | |
| | | (in Ps billions) | | | | | | | |
| Losses from sales of noncurrent assets held for sale | | | (1.0 | ) | | | (0.0 | ) | | | (1.0 | ) | | | N.A. | |
| Personnel expenses | | | (191.2 | ) | | | (175.2 | ) | | | (16.0 | ) | | | 9.1 | |
| Salaries and employee benefits | | | (189.1 | ) | | | (174.4 | ) | | | (14.7 | ) | | | 8.4 | |
| Bonus plan payments | | | (1.6 | ) | | | (0.7 | ) | | | (0.9 | ) | | | 131.0 | |
| Termination payments | | | (0.5 | ) | | | (0.0 | ) | | | (0.4 | ) | | | N.A. | |
| Administrative and other expenses | | | (312.8 | ) | | | (288.9 | ) | | | (23.9 | ) | | | 8.3 | |
| Depreciation and amortization | | | (24.8 | ) | | | (22.6 | ) | | | (2.2 | ) | | | 9.8 | |
| Wealth tax | | | (12.0 | ) | | | (13.9 | ) | | | 1.9 | | | | (13.4 | ) |
| Other expenses | | | (3.0 | ) | | | (2.9 | ) | | | (0.1 | ) | | | 2.0 | |
| Charitable and other donation expenses | | | (0.2 | ) | | | (0.7 | ) | | | 0.5 | | | | (68.7 | ) |
| Other | | | (2.8 | ) | | | (2.3 | ) | | | (0.5 | ) | | | 23.3 | |
| Total other expenses | | | (544.7 | ) | | | (503.4 | ) | | | (41.3 | ) | | | 8.2 | |
Total other expenses for the year ended December 31, 2016 increased by 8.2%, or Ps 41.3 billion, to Ps 544.7 billion in 2016 mainly driven by a Ps 23.9 billion increase in administrative and other expenses, a Ps 16.0 billion increase in personnel expenses and a Ps 2.2 billion increase in depreciation and amortization.
Salaries and employee benefits increased by Ps 14.7 billion or 8.4% to Ps 189.1 billion. During 2016, Banco AV Villas’ headcount increased from 6,848 employees in 2015 to 7,038 in 2016, and yearly salaries and employee benefits per employee increased from Ps 25.5 million in 2015 to Ps 26.9 million in 2016.
Because Banco AV Villas’ personnel and administrative and other expenses increased by 8.6%, while its income increased by 6.0% driven by the increase in net interest income and other income (expense), Banco AV Villas’ efficiency ratio deteriorated from 52.4% to 53.6%. The ratio of personnel and administrative and other expenses as a percentage of average assets slightly deteriorated 6 basis points from 4.1% in 2015 to 4.2% in 2016.
Income tax expense
Income tax expense decreased by 26.4%, or Ps 28.7 billion, to Ps 80.0 billion for the year ended December 31, 2016. Banco AV Villas’ effective tax rate (calculated as income tax expense divided by income before tax expense minus equity method, minus dividends, plus wealth tax) decreased from 36.6% for the year ended December 31, 2015 to 29.6% for the year ended December 31, 2016. The main drivers for the decrease were a non-taxable income on the sale/valuation of investments and adjustments to deferred taxes arising from the most recent tax reform.
Net income attributable to non-controlling interest
Net income attributable to non-controlling interest increased from Ps 0.05 billion for the year ended December 31, 2015 to Ps 0.2 billion for the year ended December 31, 2016. Banco AV Villas’ net income attributable to non-controlling interest reflects ownership in ATH by other subsidiaries of Grupo Aval.
Corficolombiana
Net income
| | | For the year ended December 31, | | | Change December 2016 vs December 2015 | |
| | | 2016 | | | 2015 | | | # | | | % | |
| | | (in Ps billions) | | | | | | | |
| Interest income | | | 518.0 | | | | 334.4 | | | | 183.7 | | | | 54.9 | |
| Interest expenses | | | (947.6 | ) | | | (608.0 | ) | | | (339.6 | ) | | | 55.9 | |
| Net interest income | | | (429.6 | ) | | | (273.6 | ) | | | (156.0 | ) | | | 57.0 | |
| Impairment loss on loans and other accounts receivable, net | | | (59.2 | ) | | | (8.5 | ) | | | (50.7 | ) | | | 598.8 | |
| Impairment loss on other assets, net | | | (13.3 | ) | | | 0.0 | | | | (13.3 | ) | | | N.A. | |
| Recovery of charged-off financial assets | | | 0.4 | | | | 0.5 | | | | (0.2 | ) | | | (30.0 | ) |
| Net impairment loss | | | (72.1 | ) | | | (7.9 | ) | | | (64.2 | ) | | | 810.4 | |
| Net commission and fees income | | | 56.9 | | | | 43.3 | | | | 13.6 | | | | 31.5 | |
| Net trading income | | | 158.8 | | | | (131.2 | ) | | | 290.0 | | | | (221.1 | ) |
| Other income | | | 1,574.1 | | | | 1,628.4 | | | | (54.3 | ) | | | (3.3 | ) |
| Other expenses | | | (235.0 | ) | | | (170.4 | ) | | | (64.7 | ) | | | 37.9 | |
| Income before income tax expense | | | 1,053.1 | | | | 1,088.6 | | | | (35.6 | ) | | | (3.3 | ) |
| Income tax expense | | | (381.6 | ) | | | (330.9 | ) | | | (50.8 | ) | | | 15.3 | |
| Net Income | | | 671.4 | | | | 757.7 | | | | (86.3 | ) | | | (11.4 | ) |
| Net income attributable to: | | | | | | | | | | | | | | | | |
| Controlling interest | | | 294.5 | | | | 445.9 | | | | (151.4 | ) | | | (34.0 | ) |
| Non-controlling interest | | | 377.0 | | | | 311.8 | | | | 65.1 | | | | 20.9 | |
Corficolombiana’s net income attributable to controlling interest decreased by 34.0%, or Ps 151.4 billion to Ps 294.5 billion in 2016 as compared to 2015. Corficolombiana’s net income attributable to controlling interest for 2016 was negatively impacted as a result of an impairment adjustment on its indirect investment in Concesionaria Ruta del Sol (CRDS) for Ps 102.3 billion (Corficolombiana owns 100% of Episol S.A.S., an entity that holds a 33% minority stake in CRDS). In absence of this expense, net income attributable to controlling interest for Corficolombiana would have been Ps 396.8 billion, showing an 11.0% decline versus net income in 2015.
As explained in further detail in note 14 of Grupo Aval’s financial statements, on February 22, 2017 CRDS and Agencia Nacional de Infraestructura (ANI) signed an agreement to early terminate and liquidate the Concession Contract No. 001 of 2010 regarding Sector 2 of Ruta del Sol. After the agreement was reached and an initial value of the liquidation of the contract was agreed upon the parties, Episol S.A.S. conducted an impairment analysis on its investment in CRDS. This analysis concluded the need to record an impairment adjustment in the amount of Ps 102.3 billion, calculated by Ps 96.3 billion through the equity method line, and Ps 6.0 billion in an impairment loss on investments in debt and equity securities.
Aside from the above, Corficolombiana’s net income attributable to controlling interest decreased by an additional Ps 49.1 billion mainly due to a contraction of the net interest income and a decline in total other income (expense) explained in the next paragraphs.
Net interest income
| | | Year ended December 31, | | | Change, 2016 vs. 2015 | |
| | | 2016 | | | 2015 | | | # | | | % | |
| | | (in Ps billions) | | | | |
| Interest income: | | | | | | | | | | | | | | | | |
| Commercial loans and leases | | | 144.8 | | | | 103.5 | | | | 41.3 | | | | 39.9 | |
| Consumer loans and leases | | | 56.1 | | | | 0.1 | | | | 56.0 | | | | N.A. | |
| Mortgage loans and leases | | | - | | | | - | | | | - | | | | - | |
| Microcredit loans and leases | | | - | | | | - | | | | - | | | | - | |
| Interbank and overnight funds | | | 142.2 | | | | 80.1 | | | | 62.0 | | | | 77.4 | |
| Interest on loans and leases | | | 343.1 | | | | 183.7 | | | | 159.4 | | | | 86.7 | |
| Interest on investments in debt securities | | | 175.0 | | | | 150.7 | | | | 24.3 | | | | 16.1 | |
| Total interest income | | | 518.0 | | | | 334.4 | | | | 183.7 | | | | 54.9 | |
| Interest expense: | | | | | | | | | | | | | | | | |
| Checking accounts | | | (0.0 | ) | | | (0.0 | ) | | | (0.0 | ) | | | N.A. | |
| Time deposits | | | (291.1 | ) | | | (172.0 | ) | | | (119.1 | ) | | | 69.3 | |
| Savings deposits | | | (41.6 | ) | | | (24.9 | ) | | | (16.7 | ) | | | 67.2 | |
| Total interest expense on deposits | | | (332.7 | ) | | | (196.9 | ) | | | (135.9 | ) | | | 69.0 | |
| Borrowings from banks and others | | | (207.7 | ) | | | (68.1 | ) | | | (139.6 | ) | | | 205.1 | |
| Interbank and overnight funds | | | (205.3 | ) | | | (133.7 | ) | | | (71.6 | ) | | | 53.5 | |
| Long-term debt (bonds) | | | (195.1 | ) | | | (202.7 | ) | | | 7.6 | | | | (3.7 | ) |
| Borrowings from development entities | | | (6.7 | ) | | | (6.6 | ) | | | (0.1 | ) | | | 2.1 | |
| Total interest expense | | | (947.6 | ) | | | (608.0 | ) | | | (339.6 | ) | | | 55.9 | |
| Net interest income | | | (429.6 | ) | | | (273.6 | ) | | | (156.0 | ) | | | 57.0 | |
Corficolombiana’s net interest income recorded expenses of Ps 429.6 billion and Ps 273.6 billion in 2016 and 2015, respectively. These expenses are mainly the result of the leverage of the non-financial subsidiaries consolidated by Corficolombiana.
Corficolombiana’s consolidated non-financial subsidiaries’ (for example, Promigas and toll road concessions, among others) net interest income has been and is expected to continue to be negative in the future as these entities are leveraged and thus pay interest expenses to fund returns of assets that are not considered “interest earning assets”. The returns on those assets were registered in the other income line item.
The increase in total interest expenses of Ps 339.6 billion to Ps 947.6 billion in 2016 as compared to 2015, was the result of an increase in the average cost of funds, from 5.8% to 7.6%, in line with the increasing rate scenario seen in Colombia, and a 17.7% or Ps 1,862.6 billion increase in the average interest bearing liabilities from Ps 10,547.5 billion in 2015 to Ps 12,410.1 billion in 2016.
The cost of funds of the consolidated non-financial entities increased 147 basis points from 7.0% in 2015 to 8.5% in 2016, while the cost of funds of the consolidated financial operation of Corficolombiana increased by 206 basis points from 5.1% in 2015 to 7.1% in 2016.
Of the Ps 1,862.6 billion or 17.7% increase in the average interest bearing liabilities in Corficolombiana, Ps 981.3 billion was due to an increase in the average funding levels of the consolidated financial entities from Ps 6,711.9 billion to Ps 7,693.2 billion, and Ps 881.3 billion was due to an increase in the average funding levels of the consolidated non-financial entities from Ps 3,835.6 billion to Ps 4,716.9 billion.
The increase in the average balance of funding levels of the non-financial entities is attributable to a 35.0% or Ps 937.2 billion increase in Promigas’ average indebtedness to Ps 3,616.3 billion, related to the start of operations of the LNG regasification plant at Sociedad Portuaria del Cayao (SPEC) and the BOMT gas treatment plant project signed with Canacol during December 2016. Partially offsetting this increase was a 18.9% or Ps 94.1 billion decrease in Epiandes’ average indebtedness to Ps 406.6 billion in 2016.
Partially offsetting the increase in interest expense was a Ps 183.7 billion increase in interest income to Ps 518.0 billion in 2016 as compared to 2015. This increase was the result of: i) a 288 basis points increase in the average yield of interest earning assets, from 8.1% to 11.0% and ii) a Ps 593.2 billion increase in the average interest earning assets from Ps 4,110.9 billion in 2015 to Ps 4,704.1 billion in 2016. The increase in the average yield of interest earning assets is mainly attributable to the consolidated financial operation whose yield increased by 121 basis points from 7.5% in 2015 to 8.7% in 2016.
Of the Ps 593.2 billion or 14.4% increase in the average interest earning assets in Corficolombiana, Ps 453.0 billion was due to an increase in the average interest earning assets of the consolidated non-financial entities, and Ps 140.2 billion was due to an increase in the average interest earning assets of the consolidated financial entities.
The increase in the average balance of interest earning assets of the non-financial entities is attributable to a Ps 282.2 billion increase in Promigas’ average commercial loans related to the start of operations of the Ps 1,145.7 billion (U.S.$ 381.8) million LNG regasification plant at Sociedad Portuaria del Cayao (SPEC) and the Ps 73.7 billion (U.S.$ 24.6) million BOMT gas treatment plant project signed with Canacol during December 2016, both classified as financial leases in accordance to IAS 17. Given that the entrance of operations of both projects was during December 2016, the full year impact on interest income was not reflected in Corficolombiana’s income statement.
Starting on January 1, 2016 Promigas’ loans to customers were classified as interest earning assets and their respective interests was classified as interest income. Until December 31, 2015 they were presented as other accounts receivable and income from the non-financial sector, net respectively.
Net impairment losses
Corficolombiana’s net impairment losses increased by Ps 64.2 billion to Ps 72.1 billion in 2016 from Ps 7.9 billion in 2015. This increase was driven by i) a Ps 50.7 billion increase in impairment loss on loans and accounts receivable, net, ii) a Ps 10.9 billion increase in impairment loss on investments in debt and equity securities, iii) a Ps 2.4 billion increase in impairment loss on noncurrent assets held for sale, and iv) a Ps 0.2 billion decrease in recoveries of charged-off assets.
Of the Ps 50.7 billion increase in impairment loss on loans and accounts receivable, net, Ps 33.1 billion are attributable to the consolidated non-financial entities, mainly as a result of the reclassification of the impairment losses associated with Promigas’ loans to clients which in 2015 were classified as income from the non-financial sector, and Ps 17.6 billion to the consolidated financial entities. The increase coming from the latter is explained by i) Ps 11.1 billion on guarantees that had been granted by Corficolombiana to Electricaribe S.A. E.S.P. and that were drawn in September and December, 2016, and ii) a Ps 6.7 billion increase in impairment losses from Leasing Corficolombiana due to a deterioration of its commercial loan portfolio.
Impairment on investments for 2016 were comprised of i) Ps 6.0 billion associated to the impairment of Corficolombiana’s investment in Episol S.A.S. mentioned above ii) Ps 3.1 billion in Promigas’ associate Compañía Energética del Este, and iii) Ps 0.1 billion in Promigas’ associate Antillean Gas, both due to changes in market conditions.
Net commission and fee income
| | | Year ended December 31, | | | Change, 2016 vs. 2015 | |
| | | 2016 | | | 2015 | | | # | | | % | |
| | | (in Ps billions) | | | | | | | |
| Commission and fee income | | | | | | | | | | | | | | | | |
| Banking fees | | | 19.3 | | | | 20.4 | | | | (1.1 | ) | | | (5.5 | ) |
| Bonded warehouse services | | | - | | | | - | | | | - | | | | - | |
| Trust and portfolio management activities | | | 46.6 | | | | 40.9 | | | | 5.7 | | | | 14.0 | |
| Pension and severance fund management | | | - | | | | - | | | | - | | | | - | |
| Commission and fee income | | | 65.9 | | | | 61.3 | | | | 4.6 | | | | 7.5 | |
| Commission and fee expenses | | | (9.0 | ) | | | (18.0 | ) | | | 9.0 | | | | (50.2 | ) |
| Net commission and fee income | | | 56.9 | | | | 43.3 | | | | 13.6 | | | | 31.5 | |
Net commission and fee income increased by Ps 13.6 billion, or 31.5% to Ps 56.9 billion in 2016 as compared to Ps 43.3 billion in 2015. This increase was driven by a Ps 9.0 billion decrease in commission and fee expenses and a Ps 4.6 billion increase in commission and fee income, mainly related to trust and portfolio management activities.
Net trading income
Corficolombiana’s net trading income includes (i) net trading income from investment securities held for trading through profit or loss, that reflects the interest and gains/losses from mark-to-market valuation, in each case from equity and fixed income investment securities held for trading through profit or loss, and (ii) net trading income from derivatives, which reflects the gains/losses from mark-to-market valuation on derivatives different from that considered under hedge accounting.
Total net trading income increased by Ps 290.0 billion from a Ps 131.2 billion loss in 2015 to a Ps 158.8 billion gain in 2016, driven by a Ps 192.5 billion increase in net trading income from derivatives and a Ps 97.5 billion increase in net trading income from investment securities held for trading through profit or loss.
Net trading income from derivatives, offset in foreign exchange gains (losses), net line, increased Ps 192.5 billion from a loss of Ps 169.2 billion in 2015 to a gain of Ps 23.3 billion in 2016.
Corficolombiana’s net trading income from investment securities held for trading through profit or loss reached Ps 135.6 billion during 2016, Ps 97.5 billion higher than the Ps 38.0 billion during 2015. The Ps 97.5 billion increase in net trading income from investment securities is explained by a Ps 98.5 billion increase in income from fixed income held for trading portfolio, and a Ps 1.0 billion decrease in income from equity investment securities held for trading through profit or loss.
The increase in the net trading income from investment securities was the result of an increase in the average yield from 2.6% in 2015 to 9.4% in 2016, which resulted in an increase in income of Ps 99.2 billion. The average balance of Corficolombiana’s investment securities held for trading through profit or loss slightly decreased from Ps 1,453.4 billion in 2015 to Ps 1,435.7 billion in 2016, resulting in a Ps 1.7 billion decrease in net trading income.
Total income from investment securities
Corficolombiana’s securities portfolio is classified in the following categories: (i) equity and fixed income investments held for trading through profit or loss (described in this section as net trading income in investment securities held for trading through profit or loss), (ii) available for sale fixed income investments and (iii) held to maturity fixed income investments ((ii) and (iii) are described above in the net interest income section as interest income from investment on debt securities). Corficolombiana manages its investment portfolio in a comprehensive and integral manner that considers individual return of each one of these three categories and the total return of the investment securities portfolio.
Total income from investment securities (comprised of income on investments in debt securities and net trading income from investment securities held for trading through profit or loss) was Ps 310.5 billion for 2016, 64.6% or Ps 121.8 billion higher than the Ps 188.7 billion registered during 2015. This increase is explained by an increase in the average yield on total investment securities from 4.8% in 2015 to 7.5% in 2016, which resulted in a Ps 109.2 billion increase in income. In addition there was an increase in average balance of total investment securities (calculated as (i) fixed income and equity investments held for trading through profit or loss, (ii) available for sale fixed income investments and (iii) held to maturity fixed income investments) from Ps 3,962.7 billion in 2015 to Ps 4,131.3 billion in 2016, which resulted in a Ps 12.7 billion increase in income.
Other income
| | | Year ended December 31, | | | Change, 2016 vs. 2015 | |
| | | 2016 | | | 2015 | | | # | | | % | |
| | | (in Ps billions) | | | | |
| Foreign exchange gains (losses), net | | | (37.4 | ) | | | 191.2 | | | | (228.6 | ) | | | (119.5 | ) |
| Gains on sales of investments, net | | | 21.8 | | | | 4.1 | | | | 17.7 | | | | 428.3 | |
| Income from sales of noncurrent assets held for sale | | | 12.9 | | | | 0.7 | | | | 12.2 | | | | 1,742.9 | |
| Equity method | | | 144.5 | | | | 206.3 | | | | (61.8 | ) | | | (29.9 | ) |
| Dividend income | | | 19.9 | | | | 26.1 | | | | (6.2 | ) | | | (23.7 | ) |
| Gains on valuation of assets, net | | | 8.4 | | | | - | | | | 8.4 | | | | - | |
| Income from non-financial sector, net | | | 1,202.1 | | | | 1,031.2 | | | | 170.9 | | | | 16.6 | |
| Net income from financial instruments designated at fair value | | | 181.0 | | | | 153.0 | | | | 27.9 | | | | 18.3 | |
| Other | | | 20.8 | | | | 15.8 | | | | 5.1 | | | | 32.1 | |
| Total other income | | | 1,574.1 | | | | 1,628.4 | | | | (54.3 | ) | | | (3.3 | ) |
Total other income decreased by Ps 54.3 billion, or 3.3%, to Ps 1,574.1 billion in 2016 as compared to Ps 1,628.4 billion recorded in 2015, mainly driven by a Ps 228.6 billion decrease in foreign exchange gains (losses), net discussed above as an offset to the gain in net trading income from derivatives (the net result of these two accounts was a loss of Ps 14.1 billion in 2016 versus a gain of Ps 22.1 billion in 2015), a Ps 61.8 billion decrease in income from equity method and a Ps 6.2 billion decrease in dividend income.
Partially offsetting these decreases was a Ps 170.9 billion increase in income from non-financial sector, net due to higher operating income results in some of Corficolombiana's consolidated non-financial subsidiaries, a Ps 27.9 billion increase in net income from financial instruments designated at fair value (which are the concession arrangements rights), a Ps 17.7 billion increase in gains on sales of investments, net, a Ps 12.2 billion increase in income from sales of noncurrent assets held for sale, a Ps 8.4 increase in gains on valuation of assets, net and a Ps 5.1 billion increase in other income.
Income from non-financial sector, net increased by 16.6% or Ps 170.9 billion to Ps 1,202.1 in 2016 from Ps 1,031.2 billion in 2015. This increase was mainly driven by a higher operating income in some of Corficolombiana’s consolidated non-financial subsidiaries such as Promigas, Hoteles Estelar, Pisa and Unipalma. In 2015 income from interests and impairment losses on Promigas’ loans to clients were classified as income from the non-financial sector as explained above.
Income from the equity method, on the other hand, decreased by Ps 61.8 billion to Ps 144.5 billion in 2016 from Ps 206.3 billion in 2015. This decrease was explained by the impairment of Corficolombiana’s indirect investment in CRDS, which impacted this line in Ps 96.3 billion. Partially offsetting this decrease was a Ps 25.7 billion increase in equity method from Promigas’ associates Cálidda and Gases del Caribe.
Finally, the Ps 6.2 billion decrease in dividend income to Ps 19.9 billion in 2016 from 26.1 billion in 2015 was driven by an Ps 8.4 billion decline in dividends from Empresa de Energía de Bogotá. Other dividends recorded during the year mainly came from Gas Natural, Mineros and Sociedad Aeroportuaria de la Costa,.
The Ps 17.7 billion increase in gains on sales of investments, net to Ps 21.8 billion in 2016 from Ps 4.1 billion in 2015 was driven by the sale of Corficolombiana’s stake in CIFIN to TransUnion Netherlands for Ps 22.1 billion. For further detail of this transaction, see Note 30 to our audited consolidated financial statements.
Net income from financial instruments designated at fair value reflect the fair value of concession arrangements entered between Promigas and the Colombian Government increased by Ps 27.9 billion to Ps 181.0 billion in 2016 as compared to 2015.
Other, which mainly includes income on sales of foreclosed assets, property, plant and equipment and recoveries on other expenses, increased by Ps 5.1 billion to Ps 20.8 billion in 2016 as compared to 2015.
Other expenses
| | | Year ended December 31, | | | Change, 2016 vs. 2015 | |
| | | 2016 | | | 2015 | | | # | | | % | |
| | | (in Ps billions) | | | | | | | |
| Losses from sales of noncurrent assets held for sale | | | (0.5 | ) | | | - | | | | (0.5 | ) | | | - | |
| Personnel expenses | | | (74.1 | ) | | | (66.1 | ) | | | (7.9 | ) | | | 12.0 | |
| Salaries and employee benefits | | | (68.8 | ) | | | (63.6 | ) | | | (5.2 | ) | | | 8.1 | |
| Bonus plan payments | | | (3.7 | ) | | | (2.1 | ) | | | (1.6 | ) | | | 75.5 | |
| Termination payments | | | (1.5 | ) | | | (0.4 | ) | | | (1.1 | ) | | | 282.9 | |
| Administrative and other expenses | | | (100.8 | ) | | | (46.9 | ) | | | (53.9 | ) | | | 114.7 | |
| Depreciation and amortization | | | (4.5 | ) | | | (5.8 | ) | | | 1.3 | | | | (22.3 | ) |
| Wealth tax | | | (37.8 | ) | | | (43.9 | ) | | | 6.0 | | | | (13.8 | ) |
| Other expenses | | | (17.4 | ) | | | (7.6 | ) | | | (9.7 | ) | | | 127.8 | |
| Charitable and other donation expenses | | | (0.1 | ) | | | (0.4 | ) | | | 0.3 | | | | (84.7 | ) |
| Other | | | (17.3 | ) | | | (7.2 | ) | | | (10.1 | ) | | | 139.8 | |
| Total other expenses | | | (235.0 | ) | | | (170.4 | ) | | | (64.7 | ) | | | 37.9 | |
Corficolombiana’ s total other expenses increased by Ps 64.7 billion or 37.9% to Ps 235.0 billion in 2016 as compared to 2015. This increase was mainly driven by a Ps 53.9 billion increase in administrative and other expenses, a Ps 10.1 billion increase in other expenses, and a Ps 7.9 billion increase in personnel expenses. Partially offsetting this increase in expenses was a Ps 6.0 reduction in the wealth tax paid during 2016 when compared to 2015.
The increase in the administrative and other expenses line item was affected by a Ps 12.4 billion of expenses related to the consolidation of Casa de Bolsa S.A. starting on December 31, 2016 (previously consolidated under Banco de Bogotá), Ps 4.5 billion increase in losses on sales of property, plant and equipment and a Ps 3.4 billion increase in expenses on labor suit contingencies.
Income tax expense
Income tax expense for Corficolombiana increased by Ps 50.8 billion, or 15.3%, to Ps 381.6 billion for the year ended December 31, 2016. Corficolombiana’s effective tax rate (calculated as income tax expense divided by income before tax expense minus equity method, minus dividends, plus wealth tax) increased from 36.8% for the year ended December 31, 2015 to 41.2% for the year ended December 31, 2016.
Net income attributable to non-controlling interest
Non-controlling interest in Corficolombiana increased by 20.9%, or Ps 65.1 billion to Ps 377.0 billion in 2016 as compared to 2015. Despite the fact that total net income of Corficolombiana decreased by Ps 86.3 billion during the year, the non-controlling portion of total income increased as the entities that performed better during the year, such as Promigas and Unipalma, are not entirely owned by Corficolombiana.
Results of Operations for the Year Ended December 31, 2015 Compared to the Year Ended December 31, 2014
This analysis differs from that presented on our 2015 20F as 2015 average balances are calculated using five periods and in 2015 average balances were calculated using two periods. For more information see “Item 4. Information on the Company—B. Business Overview—Selected Statistical Data—Average statement of financial position”.
Grupo Aval
Overview
Our net income attributable to controlling interest for the year ended December 31, 2015 increased by 12.5%, or Ps 226.3 billion, to Ps 2,041.4 billion compared to the year ended December 31, 2014. Of the Ps 226.3 billion increase, Ps 96.0 billion results from the Colombian operations and Ps 130.3 billion results from the Central American operations, when translated to pesos. Excluding the effect of the devaluation of the peso, net income attributable to controlling interest from our Central American operations would have decreased by 7.4%, or Ps 46.0 billion. During 2015 the wealth tax paid affected the income statement through the administrative and other expenses line by Ps 303.2 billion (see “Item 4. Information on the Company—B. Business Overview—Supervision and Regulation—Tax Reforms”). In absence of the payment of the wealth tax, net income before tax expense would have been Ps 5,527.9 billion (Ps 722.1 billion higher than that of 2014).
The Ps 226.3 billion increase in net income attributable to controlling interest were mainly driven by:
| (i) | a 20.2%, or Ps 1,401.1 billion increase in net interest income. Ps 571.0 billion of such increase resulted from the Colombian operations and Ps 830.0 billion resulted from the Central American operations, when translated to pesos; |
| (ii) | a 20.6%, or Ps 625.1 billion increase in net income from commissions and fees. Ps 80.2 billion of such increase resulted from the Colombian operations and Ps 544.9 billion resulting from the Central American operations, when translated to pesos; and |
| (iii) | a 12.0%, or Ps 273.4 billion increase in total other income (expense). Ps 272.4 billion of such increase resulted from the Colombian operations and Ps 0.9 billion resulted from the Central American operations, when translated to pesos. |
The increases presented above were offset by:
| (i) | a 21.3%, or Ps 1,335.7 billion increase in total other expense. Ps 433.0 billion of such increase resulted from the Colombian operations and Ps 902.6 billion resulted from the Central American operations, when translated to pesos. The Colombian other expenses include a Ps 303.2 billion paid in wealth tax in 2015; |
| (ii) | a 27.7%, or Ps 420.3 billion increase in net impairment loss on financial assets. Ps 210.9 billion of such increase resulted from the Colombian operations and Ps 209.5 billion resulted from the Central American operations, when translated to pesos; |
| (iii) | a 33.7% or Ps 124.7 billion decrease in net trading income. Ps 193.5 billion of such decrease resulted from the decrease in the Colombian operations and Ps 68.8 billion increase resulted from the Central American operations, when translated to pesos; |
| (iv) | a 10.3%, or Ps 121.9 billion, increase in net income attributable to non-controlling interest of which Ps 62.5 billion resulted from the Colombian operations and Ps 59.4 billion resulted from the Central American operations, when translated to pesos; and |
| (v) | a 3.9% or Ps 70.7 billion increase in income tax expense. Income tax expense from the Central American operations, when translated to pesos, increased by Ps 143.8 billion while it decreased Ps 73.1 billion in the Colombian operations. |
The following discussion describes the main drivers of Grupo Aval’s consolidated results of operations for the year ended December 31, 2015 compared to the year ended December 31, 2014. Further detail is provided in the discussion of the results of our banking subsidiaries.
| | | Grupo Aval Consolidated | |
| | | For the year ended December 31, | | | Change December 2015 vs
December 2014 | |
| | | 2015 | | | 2014 | | | # | | | % | |
| | | (in Ps billions) | | | | | | | |
| Interest income | | | 14,075.6 | | | | 11,421.8 | | | | 2,653.8 | | | | 23.2 | |
| Interest expenses | | | (5,751.5 | ) | | | (4,498.7 | ) | | | (1,252.7 | ) | | | 27.8 | |
| Net interest income | | | 8,324.1 | | | | 6,923.1 | | | | 1,401.1 | | | | 20.2 | |
| Impairment loss on loans and other accounts receivable, net | | | (2,127.7 | ) | | | (1,697.5 | ) | | | (430.2 | ) | | | 25.3 | |
| Impairment loss on other assets, net | | | (32.2 | ) | | | (12.0 | ) | | | (20.2 | ) | | | 168.7 | |
| Recovery of charged-off financial assets | | | 219.7 | | | | 189.6 | | | | 30.1 | | | | 15.9 | |
| Net impairment loss | | | (1,940.2 | ) | | | (1,519.9 | ) | | | (420.3 | ) | | | 27.7 | |
| Net commission and fees income | | | 3,662.3 | | | | 3,037.2 | | | | 625.1 | | | | 20.6 | |
| Net trading income | | | 245.2 | | | | 369.9 | | | | (124.7 | ) | | | (33.7 | ) |
| Other income | | | 2,542.4 | | | | 2,269.0 | | | | 273.4 | | | | 12.0 | |
| Other expenses | | | (7,609.1 | ) | | | (6,273.5 | ) | | | (1,335.7 | ) | | | 21.3 | |
| Income before income tax expense | | | 5,224.7 | | | | 4,805.8 | | | | 418.9 | | | | 8.7 | |
| Income tax expense | | | (1,879.0 | ) | | | (1,808.3 | ) | | | (70.7 | ) | | | 3.9 | |
| Net Income | | | 3,345.7 | | | | 2,997.5 | | | | 348.2 | | | | 11.6 | |
| Net income attributable to: | | | | | | | | | | | | | | | | |
| Controlling interest | | | 2,041.4 | | | | 1,815.0 | | | | 226.3 | | | | 12.5 | |
| Non-controlling interest | | | 1,304.3 | | | | 1,182.5 | | | | 121.9 | | | | 10.3 | |
Net interest income
| | | Year ended December 31, | | | Change, 2015 vs. 2014 | |
| | | 2015 | | | 2014 | | | # | | | % | |
| | | (in Ps billions) | | | | |
| Interest income: | | | | | | | | | | | | | | | | |
| Commercial loans and leases | | | 5,768.1 | | | | 4,679.7 | | | | 1,088.4 | | | | 23.3 | |
| Consumer loans and leases | | | 6,028.2 | | | | 4,942.8 | | | | 1,085.4 | | | | 22.0 | |
| Mortgage loans and leases | | | 908.8 | | | | 678.5 | | | | 230.3 | | | | 33.9 | |
| Microcredit loans and leases | | | 107.4 | | | | 104.8 | | | | 2.6 | | | | 2.5 | |
| Interbank and overnight funds | | | 191.7 | | | | 242.9 | | | | (51.2 | ) | | | (21.1 | ) |
| Interest on loans and leases | | | 13,004.1 | | | | 10,648.6 | | | | 2,355.5 | | | | 22.1 | |
| Interest on investments in debt securities | | | 1,071.5 | | | | 773.2 | | | | 298.3 | | | | 38.6 | |
| Total interest income | | | 14,075.6 | | | | 11,421.8 | | | | 2,653.8 | | | | 23.2 | |
| Interest expense: | | | | | | | | | | | | | | | | |
| Checking accounts | | | (183.2 | ) | | | (171.3 | ) | | | (11.9 | ) | | | 7.0 | |
| Time deposits | | | (2,222.8 | ) | | | (1,632.9 | ) | | | (589.9 | ) | | | 36.1 | |
| Savings deposits | | | (1,426.2 | ) | | | (1,280.9 | ) | | | (145.2 | ) | | | 11.3 | |
| Total interest expense on deposits | | | (3,832.2 | ) | | | (3,085.2 | ) | | | (747.1 | ) | | | 24.2 | |
| Borrowings from banks and others | | | (413.8 | ) | | | (346.8 | ) | | | (67.0 | ) | | | 19.3 | |
| Interbank and overnight funds | | | (340.6 | ) | | | (185.0 | ) | | | (155.6 | ) | | | 84.2 | |
| Long-term debt (bonds) | | | (1,041.1 | ) | | | (804.2 | ) | | | (236.9 | ) | | | 29.5 | |
| Borrowings from development entities | | | (123.7 | ) | | | (77.6 | ) | | | (46.1 | ) | | | 59.3 | |
| Total interest expense | | | (5,751.5 | ) | | | (4,498.7 | ) | | | (1,252.7 | ) | | | 27.8 | |
| Net interest income | | | 8,324.1 | | | | 6,923.1 | | | | 1,401.1 | | | | 20.2 | |
Grupo Aval’s net interest income increased by 20.2%, or Ps 1,401.1 billion, to Ps 8,324.1 billion in 2015 as compared to 2014, with Ps 571.0 billion of the increase explained by Colombian operations and Ps 830.0 billion explained by Central American operations, when translated to pesos. The increase in net interest income was mainly due to a 23.2%, or Ps 2,653.8 billion, increase in interest income (Ps 1,399.8 billion resulting from the Colombian operations and Ps 1,254.0 billion resulting from the Central American operations, when translated to pesos), partially offset by a 27.8% or Ps 1,252.7 billion increase in interest expense (Ps 828.8 billion resulting from the Colombian operations and Ps 424.0 billion resulting from the Central American operations, when translated to pesos). For an analysis of the evolution of the Central American net interest income excluding the impact of the devaluation of the peso, see LB Panamá’s MD&A (“—Banco de Bogotá subsidiary analysis—LB Panamá—Net interest income”).
Total interest income for Colombia’s operations increased by 16.0% or Ps 1,399.8 billion to Ps 10,131.1 billion in 2015, driven by an increase of 13.4% or Ps 1,092.8 billion to Ps 9,260.8 billion in interest income from total loans and leases (which includes interest from interbank and overnight funds). Also contributing to the increase, interest income on investments in debt securities grew by 54.5% or Ps 307.0 billion to Ps 870.2 billion. Of the increase in
interest income from total loans and leases Ps 1,158.8 billion result from increase in interest income from loans and leases, which were partially offset by Ps 65.9 billion decrease from interbank and overnight funds.
For Colombia’s operations, the increase in interest income on loans and leases of Ps 1,158.8 billion was mainly driven by a 13.4% or Ps 11,314.2 billion increase in Colombia’s operations’ average interest earning loans and leases portfolio from Ps 83,165.9 billion in 2014 to Ps 94,480.2 billion in 2015, which resulted in a Ps 1,027.0 billion increase in interest income. The average yield earned on loans and leases increased 8 basis points from 9.6% to 9.7%, which resulted in an additional Ps 131.8 billion increase in interest income. The 13.6% or Ps 11,314.2 increase in Colombia’s operations’ average interest-earning loan portfolio in 2015 was driven by an increase of (i) 13.0% or Ps 7,421.4 billion, from Ps 57,116.7 billion in 2014 to Ps 64,538.1 billion in 2015 in the average interest-earning commercial loans and leases portfolio, (ii) 12.2% or Ps 2,763.7 billion, from Ps 22,632.2 billion in 2014 to Ps 25,395.9 billion in 2015 in the average interest-earning consumer loans and leases portfolio; and (iii) 36.4% or Ps 1,111.4 billion, from Ps 3,050.9 billion in 2014 to Ps 4,162.4 billion in 2015 in the average interest-earning mortgage loans and leases portfolio, in which the growth of Grupo Aval’s portfolio outpaced the growth of the Colombian market.
For Colombia’s operations, interest income on interbank and overnight funds decreased by Ps 65.9 billion from Ps 208.2 billion in 2014 to Ps 142.2 billion in 2015.
Total interest income for Central American operations, when translated to pesos, increased by 46.6% or Ps 1,254.0 billion to Ps 3,944.5 billion in 2015, driven by an increase of 50.9% or Ps 1,262.7 billion to Ps 3,743.3 billion in interest income from total loans and leases (which includes interest from interbank and overnight funds), which was partially offset by a 4.1% or Ps 8.7 billion decrease in interest income from investments in debt securities to Ps 201.3 billion. Of the increase in interest income from total loans and leases Ps 1,247.9 billion result from an increase in interest income from loans and leases and Ps 14.8 billion from the increase in interest from interbank and overnight funds.
For Central American operations, when translated to pesos, the increase in interest income on loans and leases of Ps 1,247.9 billion was mainly driven by a 40.4% or Ps 9,814.8 billion increase in LB Panamá’s average interest earning loans and leases portfolio from Ps 24,269.5 billion in 2014 to Ps 34,084.3 billion in 2015, which resulted in a Ps 1,063.6 billion increase in interest income. The average yield earned on loans and leases increased by 76 basis points from 10.1% to 10.8%, which resulted in an additional Ps 184.2 billion increase in interest income. The devaluation of the average peso to dollar exchange rate accounted for Ps 915.5 billion of the increase in interest income on loans and leases.
For Central American operations, when translated to pesos, interest income on interbank and overnight funds increased by Ps 14.8 billion from Ps 34.7 billion in 2014 to Ps 49.5 billion in 2015.
Grupo Aval’s consolidated yield on the loans and leases portfolio increased 28 basis points from 9.7% in 2014 to 10.0% in 2015.
Total interest income on investments in debt securities for Colombia’s operations increased by 54.5% or Ps 307.0 billion to Ps 870.2 billion in 2015. The increase is mainly explained by an increase in the average yield on investment in debt securities from 3.7% in 2014 to 5.1% in 2015, which resulted in a Ps 217.5 billion increase in income from investments in debt securities. Also contributing to the increase was a 12.4% or Ps 1,883.6 billion increase in the average balance of investment in debt securities from Ps 15,157.9 billion in 2014 to Ps 17,041.5 billion in 2015, which resulted in a Ps 89.5 billion increase in interest income.
Total interest income on investments in debt securities for Central American operations, when translated to pesos, decreased by 4.1% or Ps 8.7 billion to Ps 201.3 billion in 2015. This decrease is mainly explained by a 95 basis points decrease in the average yield of investments in debt securities from 5.5% in 2014 to 4.6% in 2015 that resulted in a Ps 36.1 billion decrease in interest income. The decrease was partially offset by a 15.8% or Ps 599.6 billion increase in the average balance from Ps 3,797.2 billion in 2014 to Ps 4,396.8 billion in 2015, which resulted in a Ps 27.4 billion increase in interest income.
Grupo Aval’s consolidated interest expense increased by 27.8% or Ps 1,252.7 billion. Ps 828.8 billion resulting from the Colombian operations and Ps 424.0 billion resulting from the Central American operations, when translated to pesos.
Total interest expense for Colombia’s operations increased by 23.1% to Ps 4,419.1 billion in 2015, driven by an increase of 19.0%, or Ps 478.2 billion, to Ps 2,990.6 billion in interest expense on deposits and by a 32.5% or Ps 350.6 billion increase to Ps 1,428.5 billion in interest expense on other funding (includes borrowings from banks and others, interbank and overnight funds, long-term debt and borrowings from development entities).
The increase of Ps 478.2 billion in interest expense on deposits for Colombia’s operations was mainly driven by a 13.6% or Ps 9,459.6 billion increase in the average interest-bearing deposits from Ps 69,441.1 billion in 2014 to Ps 78,900.7 billion in 2015, which resulted in a Ps 339.9 billion increase in interest expense. The average cost on interest-bearing deposits increased by 17 basis points from 3.6% in 2014 to 3.8% in 2015, which resulted in a Ps 138.3 billion increase in interest expense.
The increase of Ps 350.6 billion in interest expense on other funding for Colombia’s operations was mainly driven by a 25.2% or Ps 6,020.8 billion increase in the average other funding from Ps 23,899.7 billion in 2014 to Ps 29,920.5 billion in 2015, which resulted in a Ps 237.1 billion increase in interest expense. The average cost on other funding increased by 26 basis points from 4.5% in 2014 to 4.8% in 2015, which resulted in a Ps 113.5 billion increase in interest expense.
Total interest expense for Central American operations, when translated to pesos, increased by 46.7% or Ps 424.0 billion to Ps 1,332.4 billion in 2015, driven by an increase of 46.9% or Ps 268.9 billion to Ps 841.7 billion in interest expense on deposits and by a 46.2% or Ps 155.1 billion to Ps 490.7 billion increase in interest expense on other funding (includes borrowings from banks and others, interbank and overnight funds, long-term debt and borrowings from development entities).
The increase of Ps 268.9 billion in interest expense on deposits for Central American operations was mainly driven by a 34.7% or Ps 7,747.4 billion increase in LB Panamá’s average interest-bearing deposits from Ps 22,331.6 billion in 2014 to Ps 30,079.0 billion in 2015, which resulted in a Ps 216.8 billion increase in interest expense. The average cost on interest-bearing deposits increased by 23 basis points from 2.6% in 2014 to 2.8% in 2015, which resulted in a Ps 52.1 billion increase in interest expense.
The increase of Ps 155.1 billion in interest expense on other funding for Central American operations was mainly driven by a 30.1% or Ps 2,711.4 billion increase in LB Panamá’s average other funding from Ps 9,019.6 billion in 2014 to Ps 11,730.9 billion in 2015, which resulted in a Ps 116.8 billion increase in interest expense. The average cost on other funding increased by 46 basis points from 3.7% in 2014 to 4.2% in 2015, which resulted in a Ps 38.3 billion increase in interest expense.
Grupo Aval’s consolidated average total interest-earning assets (calculated as (i) gross loans including interbank and overnight funds, and (ii) available for sale and held to maturity fixed income investments) increased by 18.9%, or Ps 24,248.8 billion, to Ps 152,842.9 billion in 2015 and the net interest income increased by 20.2%, or Ps 1,401.1 billion to Ps 8,324.1 in 2015, which resulted in a 6 basis points increase in the net interest margin from 5.38% in 2014 to 5.45% in 2015. The interest spread between the average rate on loans and leases and the average rate paid on deposits increased by 13 basis points from 6.3% to 6.4% over the same period. The increase in the net interest margin was mainly driven by the aforementioned increase in the yield of interest-earning assets, which was partially offset by the increase in the cost of interest-bearing liabilities.
Net impairment losses
| | | Year ended December 31, | | | Change, 2015 vs. 2014 | |
| | | 2015 | | | 2014 | | | # | | | % | |
| | | Total
Income/Expense | | | Total
Income/Expense | | | | |
| | | (in Ps billions) | | | | | | | |
| Impairment losses: | | | | | | | | | | | | | | | | |
| Impairment loss on loans and leases, net | | | (1,986.8 | ) | | | (1,506.0 | ) | | | (480.8 | ) | | | 31.9 | |
| Impairment loss on accrued interest and other receivables, net | | | (141.0 | ) | | | (191.6 | ) | | | 50.6 | | | | (26.4 | ) |
| Impairment loss on investments in debt and equity securities | | | (6.2 | ) | | | (0.5 | ) | | | (5.7 | ) | | | 1,168.6 | |
| Impairment loss on noncurrent assets held for sale | | | (26.0 | ) | | | (11.5 | ) | | | (14.5 | ) | | | 126.0 | |
| Recovery of charged-off financial assets | | | 219.7 | | | | 189.6 | | | | 30.1 | | | | 15.9 | |
| Recovery of impairment loss on investments in debt and equity securities | | | 0.0 | | | | 0.0 | | | | 0.0 | | | | N.A. | |
| Recovery of impairment loss on noncurrent assets held for sale | | | 0.0 | | | | 0.0 | | | | 0.0 | | | | N.A. | |
| Net impairment losses | | | (1,940.2 | ) | | | (1,519.9 | ) | | | (420.3 | ) | | | 27.7 | |
| | | Year ended December 31, | | | | |
| | | 2015 | | | 2014 | | | Change, 2015 vs. 2014 | |
| | | Loans at
least 91
days past
due | | | Delinquency
Ratio (1) | | | Loans at
least 91
days past
due | | | Delinquency
Ratio (1) | | | Loans at
least 91 days
past due | | | Delinquency
Ratio | |
| | | | | | | | | | | | # | | | % | |
| | | (in Ps billions) | |
| Delinquency Ratios: | | | 2,354.4 | | | | 1.7 | % | | | 2,011.0 | | | | 1.7 | % | | | 343.4 | | | | (0.1 | ) |
| Colombian Operations | | | 1,924.2 | | | | 1.9 | % | | | 1,705.8 | | | | 1.9 | % | | | 218.4 | | | | 0.0 | |
| Commercial loans | | | 1,139.9 | | | | 1.7 | % | | | 987.3 | | | | 1.7 | % | | | 152.6 | | | | 0.0 | |
| Consumer loans | | | 636.6 | | | | 2.3 | % | | | 585.1 | | | | 2.5 | % | | | 51.5 | | | | (0.1 | ) |
| Mortgage loans | | | 119.0 | | | | 2.5 | % | | | 102.1 | | | | 2.8 | % | | | 17.0 | | | | (0.3 | ) |
| Microcredit loans | | | 28.6 | | | | 7.2 | % | | | 31.3 | | | | 8.4 | % | | | (2.7 | ) | | | (1.2 | ) |
| Central American Operations | | | 430.2 | | | | 1.0 | % | | | 305.2 | | | | 1.1 | % | | | 125.0 | | | | (0.1 | ) |
| Commercial loans | | | 100.5 | | | | 0.6 | % | | | 66.2 | | | | 0.6 | % | | | 34.2 | | | | 0.0 | |
| Consumer loans | | | 228.0 | | | | 1.5 | % | | | 153.1 | | | | 1.5 | % | | | 75.0 | | | | (0.0 | ) |
| Mortgage loans | | | 101.7 | | | | 1.2 | % | | | 86.0 | | | | 1.4 | % | | | 15.8 | | | | (0.2 | ) |
| Microcredit loans | | | - | | | | N.A. | | | | - | | | | N.A. | | | | - | | | | N.A. | |
| (1) | Calculated as 91 days past due loans divided by total gross loans excluding interbank and overnight funds |
Net impairment losses for Grupo Aval’s consolidated operation increased by 27.7% or Ps 420.3 billion in 2015 as compared to 2014, with Ps 210.9 billion explained by Colombian operations and Ps 209.5 billion explained by Central American operations, when translated to pesos.
The Ps 210.9 billion increase in net impairment losses resulting from Colombia’s operations, was mainly driven by a Ps 274.8 billion increase in impairment loss on loans and leases, net, a Ps 14.9 billion increase in impairment loss on noncurrent assets held for sale and a Ps 5.7 billion increase in impairment on investments in debt and equity securities. These increases were partially offset by a Ps 50.6 billion decrease in impairment loss on accrued interest and other receivables, net and a Ps 34.0 billion increase in recoveries of charged-off assets. The increase in impairment loss on loans and leases, net was driven by an increase in the average balance of loans and leases of 13.6%, as the delinquency ratio (measured as loans 91 days past due as a percentage of total gross loans) for Colombia’s operation remained stable at 1.9%. The ratio of net impairment loss on loans and leases to average balance of loans and leases remained stable at 1.7%.
The Ps 209.5 billion increase in net impairment losses resulting from Central American operations, when translated to pesos, are mainly explained by a Ps 206.0 billion increase in impairment loss on loans and leases, net and by a Ps 3.9 billion decrease in recoveries of charged-off assets. The devaluation of the average peso to dollar exchange rate accounted for Ps 125.1 billion of the increase in net impairment losses. For an analysis of the evolution of the Central American net impairment loss on financial assets excluding the impact of the devaluation of the peso, see LB Panamá’s MD&A (“—Banco de Bogotá subsidiary analysis—LB Panamá—Impairment loss on financial assets”).
Charge-offs for Grupo Aval’s consolidated operations increased by 18.9% from Ps 1,376.7 billion in 2014 to Ps 1,636.4 billion in 2015. The ratio of charge-offs to average balance of loans and leases remained stable at 1.3% for both years.
Grupo Aval’s consolidated coverage ratio for loans 91 days past due was 157.9% in 2015, with a ratio of 165.8% for its Colombian operations and 122.9% for its Central American operations.
The recovery of charged-off assets increased Ps 30.1 billion, driven by increases in the recoveries of Ps 34.0 billion from Grupo Aval’s Colombian operations. The increase was partially offset by a Ps 3.9 billion decrease in the recoveries from the Central American operations.
Net commission and fee income
| | | Year ended December 31, | | | Change, 2015 vs. 2014 | |
| | | 2015 | | | 2014 | | | # | | | % | |
| | | (in Ps billions) | | | | | | | |
| Commission and fee income: | | | | | | | | | | | | | | | | |
| Banking fees | | | 3,095.3 | | | | 2,379.8 | | | | 715.5 | | | | 30.1 | |
| Bonded warehouse services | | | 167.3 | | | | 184.6 | | | | (17.3 | ) | | | (9.4 | ) |
| Trust activities | | | 233.9 | | | | 224.0 | | | | 9.9 | | | | 4.4 | |
| Pension and severance fund management | | | 787.7 | | | | 758.4 | | | | 29.3 | | | | 3.9 | |
| Commission and fee income | | | 4,284.2 | | | | 3,546.7 | | | | 737.5 | | | | 20.8 | |
| Commission and fee expenses | | | (621.9 | ) | | | (509.5 | ) | | | (112.4 | ) | | | 22.1 | |
| Net commission and fee income | | | 3,662.3 | | | | 3,037.2 | | | | 625.1 | | | | 20.6 | |
Net commission and fee income for Grupo Aval’s consolidated operation increased by 20.6% or Ps 625.1 billion in 2015 as compared to 2014, with Ps 80.2 billion explained by Colombian operations and Ps 544.9 billion explained by Central American operations, when translated to pesos.
The 3.8% or Ps 80.2 billion increase in net commission and fee income resulting from Colombia’s operations, was mainly driven by a 10.1% or Ps 142.0 billion increase in banking fees, a 2.7% or Ps 20.0 billion increase in pension and severance fund management and a 4.4% or Ps 9.9 billion increase in trust activities. These increases were partially offset by a 16.2% or Ps 74.5 billion increase in commission and fee expenses and a 9.4% or Ps 17.3 billion decrease in bonded warehouse services. For an analysis of the evolution of the fees from pension and severance fund management, see Porvenir’s MD&A (“—Banco de Bogotá subsidiary analysis—Porvenir—Net income from commissions and fees”).
The 58.3% or Ps 544.9 billion increase in net commission and fee income resulting from Central American operations, when translated to pesos, is mainly explained by a Ps 573.5 billion increase in banking fees and a Ps 9.3 billion increase in pension and severance fund management. These increases were partially offset by a Ps 37.9 billion increase in commission and fee expenses. The devaluation of the average peso to dollar exchange rate accounted for Ps 346.6 billion of the increase in net commission and fee income. For an analysis of the evolution of the Central American Net income from commissions and fees excluding the impact of the devaluation of the peso, see LB Panamá’s MD&A (“—Banco de Bogotá subsidiary analysis—LB Panamá—Net income from commissions and fees”).
Net trading income
Grupo Aval’s net trading income includes (i) net trading income from investment securities held for trading through profit or loss, which reflects the interest and gains/losses from mark-to-market valuation, in each case from equity and fixed income investment securities held for trading through profit or loss, and (ii) net trading income from derivatives, which reflects the gains/losses from mark-to-market valuation on derivatives different from that considered under hedge accounting. During 2015, Grupo Aval’s net trading income came in at Ps 245.2 billion, 33.7% or Ps 124.7 billion lower than the Ps 369.9 billion obtained in 2014. Of such decrease Ps 193.5 billion resulted from the Colombian operations and were partially offset by a Ps 68.8 billion increase from the Central
American operations, when translated to pesos. Of the Ps 124.7 billion decrease in net trading income Ps 239.0 billion resulted from a decrease in net trading income from investment securities held for trading through profit or loss and Ps 114.3 billion resulted from an increase in net trading income from derivatives.
Net trading income from derivatives increased Ps 114.3 billion from a loss of Ps 54.3 billion to a gain of Ps 60.0 billion in 2015.
The decrease in net trading income from investment securities held for trading through profit or loss was mainly driven by a reduction in the average yield which went from 7.2% in 2014 to 3.5% in 2015, resulting in a Ps 221.4 billion decrease in income. Furthermore, the average balance of Grupo Aval’s consolidated fixed income and equity investments held for trading through profit or loss decreased by 8.7%, or Ps 509.7 billion, to Ps 5,356.0 billion, and resulted in an additional Ps 17.6 billion decrease in income.
For the Colombian operations, net trading income from investment securities held for trading through profit or loss decreased by 64.9% or Ps 303.3 billion from Ps 467.0 billion in 2014 to Ps 163.7 billion in 2015. The decrease was mainly explained by a reduction in the average yield which went from 8.4% in 2014 to 3.6% in 2015, resulting in a Ps 270.6 billion decrease in income. Furthermore, the average balance of Grupo Aval’s Colombian operations consolidated fixed income and equity investments held for trading through profit or loss decreased by 16.6%, or Ps 919.7 billion, to Ps 4,610.9 billion, and resulted in an additional Ps 32.7 billion decrease in income.
For the Central American operations, net trading income from investment securities held for trading through profit or loss increased Ps 64.3 billion from a loss of Ps 42.8 billion in 2014 to a gain of Ps 21.5 billion in 2015. The increase was mainly explained by an increase in the average yield which went from a negative of 12.8% in 2014 to 2.9% in 2015, resulting in a Ps 52.5 billion increase in income. Furthermore, there was an increase in the average balance of fixed income and equity investments held for trading through profit or loss of Ps 409.9 billion, to Ps 745.1 billion that resulted in a Ps 11.8 billion increase in income.
Total income from investment securities
Grupo Aval’s securities portfolio is classified in the following categories: (i) equity and fixed income investments held for trading through profit or loss (described in this section as net trading income in investment securities held for trading through profit or loss), (ii) available for sale fixed income investments and (iii) held to maturity fixed income investments (results from (ii) and (iii) are included in the net interest income section as interest income from investment in debt securities). Grupo Aval manages its investment portfolio in a comprehensive and integral manner that considers individual return of each one of these three categories and the total return of the investment securities portfolio.
Total income from investment securities for Grupo Aval consolidated operation (comprised of income on investments in debt securities and net trading income from investment securities held for trading through profit or loss) was Ps 1,256.7 billion for 2015, 5.0% or Ps 59.3 billion higher than the Ps 1,197.3 billion for 2014. This was primarily driven by a 8.0% or Ps 1,973.5 billion increase in the average balance of Total Investment Securities from Ps 24,820.9 billion in 2014 to Ps 26,794.3 billion in 2015, resulting in a Ps 92.6 billion increase in interest income. The average yield on total investment securities decreased from 4.8% in 2014 to 4.7% in 2015, generating a Ps 33.2 billion decrease in interest income.
When including the investment securities held for trading through profit or loss, Grupo Aval’s consolidated average total interest earning assets (calculated as (i) gross loans including interbank and overnight funds, (ii) available for sale and held to maturity fixed income investments, and (iii) fixed income and equity investments held for trading through profit or loss) would have increased by 17.7% or Ps 23,739.1 billion to Ps 158,198.9 billion in 2015 and the net interest income plus net trading income from investment securities held for trading would have increased by 15.8%, or Ps 1,162.1 billion to Ps 8,509.3 billion in 2015. The return over average total interest earning assets (calculated as (i) gross loans including interbank and overnight funds, (ii) available for sale and held to maturity fixed income investments, and (iii) fixed income and equity investments held for trading through profit or loss) would have decreased by 9 basis points from 5.5% in 2014 to 5.4% in 2015.
Other income
| | | Year ended December 31, | | | Change, 2015 vs. 2014 | |
| | | 2015 | | | 2014 | | | # | | | % | |
| | | (in Ps billions) | | | | |
| Foreign exchange gains (losses), net | | | 457.9 | | | | 487.4 | | | | (29.4 | ) | | | (6.0 | ) |
| Gains on sales of investments, net | | | 79.2 | | | | 135.1 | | | | (55.8 | ) | | | (41.3 | ) |
| Income from sales of noncurrent assets held for sale | | | 26.2 | | | | 0.0 | | | | 26.2 | | | | N.A. | |
| Equity method | | | 230.4 | | | | 121.7 | | | | 108.7 | | | | 89.3 | |
| Dividend income | | | 33.6 | | | | 136.7 | | | | (103.1 | ) | | | (75.4 | ) |
| Gains on valuation of assets, net | | | 0.0 | | | | 0.0 | | | | 0.0 | | | | N.A. | |
| Income from non-financial sector, net | | | 838.6 | | | | 655.1 | | | | 183.5 | | | | 28.0 | |
| Net income from financial instruments designated at fair value | | | 153.1 | | | | 172.9 | | | | (19.8 | ) | | | (11.4 | ) |
| Other | | | 723.4 | | | | 560.2 | | | | 163.1 | | | | 29.1 | |
| Total other income | | | 2,542.4 | | | | 2,269.0 | | | | 273.4 | | | | 12.0 | |
Total other income for Grupo Aval’s consolidated operation increased by 12.0% or Ps 273.4 billion in 2015 as compared to 2014, with Ps 272.4 billion explained by Colombian operations and Ps 0.9 billion explained by Central American operations, when translated to pesos.
The 13.6% or Ps 272.4 billion increase in total other income resulting from Colombian operations are mainly explained by a Ps 183.5 billion increase in income from non-financial sector, net, a Ps 167.3 billion increase in other (includes Ps 174.7 billion recovery of a part of 2013 and 2014 CREE surcharge provision), a Ps 108.7 billion increase in income from the equity method, and a Ps 21.7 billion increase in income from sales of noncurrent assets held for sale. These increases were partially offset by Ps 103.1 billion decrease in dividend income, a Ps 49.2 billion decrease in foreign exchange gains (losses), net, a Ps 36.6 billion decrease in gains on sales of investments, net and a Ps 19.8 billion decrease in net income from financial instruments designated at fair value. The Ps 183.5 billion increase in income from the non-financial sector, net was mainly driven by higher operating income from some of Corficolombiana’s subsidiaries such as Promigas, Hoteles Estelar and Unipalma. For an analysis of the income from the non-financial companies, equity method and dividends of Corficolombiana, see Corficolombiana MD&A (“—Corficolombiana—Other income”).
The 0.4% or Ps 0.9 billion increase in total other income resulting from Central American operations, when translated to pesos, are mainly explained by a Ps 19.7 billion increase in foreign exchange gains (losses), net and a Ps 4.5 billion increase in income from sales of noncurrent assets held for sale. These increases were partially offset by a Ps 19.2 billion decrease in gains on sales of investments, net and Ps 4.1 billion decrease in other income. The devaluation of the average peso to dollar exchange rate accounted for Ps 86.3 billion of the increase in total other income. For an analysis of the evolution of the Central American total other income excluding the impact of the devaluation of the peso, see LB Panamá’s MD&A (“—Banco de Bogotá subsidiary analysis—LB Panamá—Other income”).
Other expenses
| | | Year ended December 31, | | | Change, 2015 vs. 2014 | |
| | | 2015 | | | 2014 | | | # | | | % | |
| | | (in Ps billions) | | | | | | | |
| Losses from sales of noncurrent assets held for sale | | | (0.0 | ) | | | (34.3 | ) | | | 34.3 | | | | (100.0 | ) |
| Personnel expenses | | | (3,111.3 | ) | | | (2,508.3 | ) | | | (603.0 | ) | | | 24.0 | |
| Salaries and employee benefits | | | (2,945.9 | ) | | | (2,363.0 | ) | | | (582.9 | ) | | | 24.7 | |
| Bonus plan payments | | | (113.5 | ) | | | (113.7 | ) | | | 0.2 | | | | (0.2 | ) |
| Termination payments | | | (51.9 | ) | | | (31.6 | ) | | | (20.3 | ) | | | 64.1 | |
| Administrative and other expenses | | | (3,575.6 | ) | | | (3,057.1 | ) | | | (518.5 | ) | | | 17.0 | |
| Depreciation and amortization | | | (488.2 | ) | | | (409.5 | ) | | | (78.7 | ) | | | 19.2 | |
| Wealth tax | | | (303.2 | ) | | | 0.0 | | | | (303.2 | ) | | | N.A. | |
| Other expenses | | | (130.8 | ) | | | (264.1 | ) | | | 133.3 | | | | (50.5 | ) |
| Charitable and other donation expenses | | | (9.4 | ) | | | (10.9 | ) | | | 1.5 | | | | (13.6 | ) |
| Other | | | (121.4 | ) | | | (253.2 | ) | | | 131.9 | | | | (52.1 | ) |
| Total other expenses | | | (7,609.1 | ) | | | (6,273.5 | ) | | | (1,335.7 | ) | | | 21.3 | |
Total other expenses for Grupo Aval’s consolidated operation increased by 21.3% or Ps 1,335.7 billion in 2015 as compared to 2014, with Ps 433.0 billion explained by Colombian operations and Ps 902.6 billion explained by Central American operations.
The 9.5% or Ps 433.0 billion increase in total other expenses resulting from Colombian operations are mainly explained by Ps 303.2 billion of the wealth tax paid in 2015, Ps 158.9 billion increase in administrative and other expenses and a Ps 156.7 billion increase in personnel expenses. These increases were partially offset by a Ps 148.6 billion decrease in other expenses, a Ps 33.7 billion decrease in losses from sales of noncurrent assets held for sale and a Ps 3.5 billion decrease in depreciation and amortization. In absence of the wealth tax, total other expenses would have increased by Ps 137.9 billion or 2.2% versus 2014.
The 52.1% or Ps 902.6 billion increase in total other expenses resulting from Central American operations are mainly explained, when translated to pesos, by a Ps 446.3 billion increase in personnel expense, a Ps 359.5 billion increase in administrative and other expenses, a Ps 82.2 billion increase in depreciation and amortization and a Ps 15.3 billion increase in other expenses. The increase in Central America’s expenses is driven by a combination of organic growth and the impact of the devaluation of the peso. The devaluation of the average peso to dollar exchange rate accounted for Ps 644.5 billion of the increase in total other expenses. For an analysis of the evolution of the Central American operation’s other expenses excluding the impact of the devaluation of the peso, see LB Panamá’s MD&A (“—Banco de Bogotá subsidiary analysis—LB Panamá—Total other expenses”).
Because Grupo Aval’s personnel and administrative and other expenses increased by 20.1%, while its income increased by 16.7%, the efficiency ratio (calculated as personnel and administrative and other expenses divided by net interest income, fees and other services income, other income excluding other) deteriorated from 46.2% in 2014 to 47.6% in 2015. The ratio of personnel and administrative and other expenses as a percentage of average assets deteriorated from 3.3% in 2014 to 3.4% in 2015.
The efficiency ratio for the Colombian operations deteriorated from 43.7% in 2014 to 44.4% in 2015. The ratio of personnel and administrative and other expenses as a percentage of average assets improved 15 basis points from 3.1% in 2014 to 3.0% in 2015.
The efficiency ratio for the Central American operations, when translated to pesos, deteriorated 48 basis points from 54.2% in 2014 to 54.7% in 2015. For an analysis of the evolution of the Central American operation’s efficiency ratio excluding the impact of the devaluation of the peso, see LB Panamá’s MD&A (“—Banco de Bogotá subsidiary analysis—LB Panamá—Other expenses”).
Income tax expense
Income tax expense for Grupo Aval’s consolidated operation increased by 3.9%, or Ps 70.7 billion, to Ps 1,879.0 billion in 2015. Grupo Aval’s consolidated operation effective tax rate (calculated as income tax expense divided by income before income tax expense excluding dividends and the equity method, as both are non-taxable income, and the equity tax as it is a non-deductible expense (includes CREE reversal)) improved from 39.8% in 2014 to 35.7% in 2015. The improvement in the effective tax rate is a consequence of the greater proportional impact of the Central America segment on our net income, as Central America’s average tax rate is lower than in our Colombian operations.
Net income attributable to non-controlling interest
Net income attributable to non-controlling interest increased by 10.3%, or Ps 121.9 billion, to Ps 1,304.3 billion in 2015 as compared with 2014. The ratio of net income attributable to non-controlling interest to net income decreased from 39.4% in 2014 to 39.0% in 2015. This decrease was mainly explained by an increase in net income in subsidiaries in which Grupo Aval holds higher stake as compared to 2014.
Banco de Bogotá
Overview
The following analysis for Banco de Bogotá’s consolidated results has been restated to retroactively reflect the deconsolidation of Corficolombiana and Casa de Bolsa from the bank’s statement of financial position and statement of income, both for 2015 and 2014.
Banco de Bogotá’s net income attributable to controlling interest for the year ended December 31, 2015 increased by 22.7%, or Ps 352.4 billion, to Ps 1,903.9 billion compared to the year ended December 31, 2014. The increase in net income, was driven by a 25.0% or Ps 1,052.0 billion increase in net interest income, a 24.8% or Ps 617.4 billion increase in net income from commissions and fees, a 30.7% or Ps 189.5 billion increase in other income (expense), and a 84.9% or Ps 131.7 billion increase in net trading income. These increases were partially offset by a 33.3% or Ps 1,278.7 billion increase in other expenses, a 28.1% or Ps 273.2 billion increase in net impairment loss on financial assets, a 15.9% Ps 21.3 billion increase in net income attributable to non-controlling interest, and a 6.6% or Ps 64.9 billion increase in income tax expense.
Net income attributable to controlling interest, for Banco de Bogotá’s Colombian operations increased by 18.0% or Ps 162.7 billion to Ps 1,068.9 billion for the year ended December 31, 2015 as compared to the year ended December 31, 2014.
The following discussion describes the principal drivers of Banco de Bogotá’s consolidated results of operations for the year ended December 31, 2015 compared to the year ended December 31, 2014. Further detail is provided in the discussion of the results of operations for LB Panamá and Porvenir.
| | | Banco de Bogotá Consolidated | |
| | | For the year ended December 31, | | | Change December 2015 vs December
2014 | |
| | | 2015 | | | 2014 | | | # | | | % | |
| | | (in Ps billions) | | | | | | | |
| Interest income | | | 8,479.2 | | | | 6,561.9 | | | | 1,917.3 | | | | 29.2 | |
| Interest expenses | | | (3,211.1 | ) | | | (2,345.8 | ) | | | (865.3 | ) | | | 36.9 | |
| Net interest income | | | 5,268.1 | | | | 4,216.2 | | | | 1,052.0 | | | | 25.0 | |
| Impairment loss on loans and other accounts receivable, net | | | (1,323.3 | ) | | | (1,038.6 | ) | | | (284.7 | ) | | | 27.4 | |
| Impairment loss on other assets, net | | | (20.9 | ) | | | (11.2 | ) | | | (9.6 | ) | | | 85.5 | |
| Recovery of charged-off financial assets | | | 99.9 | | | | 78.8 | | | | 21.1 | | | | 26.8 | |
| Net impairment loss | | | (1,244.3 | ) | | | (971.1 | ) | | | (273.2 | ) | | | 28.1 | |
| Net commission and fees income | | | 3,105.7 | | | | 2,488.3 | | | | 617.4 | | | | 24.8 | |
| Net trading income | | | 286.8 | | | | 155.2 | | | | 131.7 | | | | 84.9 | |
| Other income | | | 805.9 | | | | 616.4 | | | | 189.5 | | | | 30.7 | |
| Other expenses | | | (5,115.0 | ) | | | (3,836.3 | ) | | | (1,278.7 | ) | | | 33.3 | |
| Income before income tax expense | | | 3,107.2 | | | | 2,668.6 | | | | 438.6 | | | | 16.4 | |
| Income tax expense | | | (1,047.7 | ) | | | (982.8 | ) | | | (64.9 | ) | | | 6.6 | |
| Net Income | | | 2,059.6 | | | | 1,685.8 | | | | 373.7 | | | | 22.2 | |
| Net income attributable to: | | | | | | | | | | | | | | | | |
| Controlling interest | | | 1,903.9 | | | | 1,551.4 | | | | 352.4 | | | | 22.7 | |
| Non-controlling interest | | | 155.7 | | | | 134.4 | | | | 21.3 | | | | 15.9 | |
| | | | | | | | | | | | | | | | | |
Net interest income
| | | Year ended December 31, | | | Change, 2015 vs. 2014 | |
| | | 2015 | | | 2014 | | | # | | | % | |
| | | (in Ps billions) | | | | |
| Interest income: | | | | | | | | | | | | | | | | |
| Commercial loans and leases | | | 3,589.4 | | | | 2,742.6 | | | | 846.8 | | | | 30.9 | |
| Consumer loans and leases | | | 3,599.4 | | | | 2,717.1 | | | | 882.3 | | | | 32.5 | |
| Mortgage loans and leases | | | 676.8 | | | | 462.8 | | | | 214.0 | | | | 46.2 | |
| Microcredit loans and leases | | | 104.8 | | | | 100.7 | | | | 4.1 | | | | 4.1 | |
| Interbank and overnight funds | | | 76.6 | | | | 77.9 | | | | (1.3 | ) | | | (1.7 | ) |
| Interest on loans and leases | | | 8,047.0 | | | | 6,101.2 | | | | 1,945.8 | | | | 31.9 | |
| Interest on investment in debt securities | | | 432.2 | | | | 460.7 | | | | (28.5 | ) | | | (6.2 | ) |
| Total interest income | | | 8,479.2 | | | | 6,561.9 | | | | 1,917.3 | | | | 29.2 | |
| Interest expense: | | | | | | | | | | | | | | | | |
| Checking accounts | | | (166.8 | ) | | | (148.8 | ) | | | (18.0 | ) | | | 12.1 | |
| Time deposits | | | (1,446.5 | ) | | | (1,019.7 | ) | | | (426.8 | ) | | | 41.9 | |
| Savings deposits | | | (701.3 | ) | | | (560.4 | ) | | | (140.9 | ) | | | 25.1 | |
| Total interest expense on deposits | | | (2,314.7 | ) | | | (1,728.9 | ) | | | (585.7 | ) | | | 33.9 | |
| Borrowings from banks and others | | | (308.6 | ) | | | (309.2 | ) | | | 0.6 | | | | (0.2 | ) |
| Interbank and overnight funds | | | (110.2 | ) | | | (55.8 | ) | | | (54.4 | ) | | | 97.5 | |
| Long-term debt (bonds) | | | (392.6 | ) | | | (190.2 | ) | | | (202.4 | ) | | | 106.4 | |
| Borrowings from development entities | | | (85.0 | ) | | | (61.7 | ) | | | (23.4 | ) | | | 37.9 | |
| Total interest expense | | | (3,211.1 | ) | | | (2,345.8 | ) | | | (865.3 | ) | | | 36.9 | |
| Net interest income | | | 5,268.1 | | | | 4,216.2 | | | | 1,052.0 | | | | 25.0 | |
Banco de Bogotá’s net interest income increased by 25.0% or Ps 1,052.0 billion to Ps 5,268.1 billion in 2015 as compared to 2014. The increase in net interest income was mainly due to a 29.2% or Ps 1,917.3 billion increase in interest income, partially offset by a 36.9% or Ps 865.3 billion increase in interest expense. Of the Ps 1,052.0 billion increase in net interest income, Ps 221.9 billion are explained by the bank’s Colombian operations and Ps 830.0 billion by the bank’s Central American operations, when translated to pesos. The devaluation of the average peso to dollar exchange rate accounted for Ps 613.7 billion of the increase in net interest income for Central America’s operations.
Total interest income for Banco de Bogotá increased by 29.2% or Ps 1,917.3 billion to Ps 8,479.2 billion in 2015, driven by an increase of Ps 1,945.8 billion in interest income from total loans and leases (which includes interest from interbank and overnight funds), offset in part by a Ps 28.5 billion decrease in interest on investments in debt securities. Interest income from total loans and leases was driven by a Ps 1,947.2 billion in increase in interest income from loans and financial leases partially offset by a Ps 1.3 billion decrease in interest income from interbank and overnight funds.
The 32.3% or Ps. 1,947.2 billion increase in interest income from loans and leases for Banco de Bogotá’s consolidated operation in 2015 as compared to 2014 was a result of a 25.3% or Ps 16,579.2 billion increase in the average balance of loans and leases to Ps 82,100.1 billion driven by organic growth in Colombia and in Central America. The increase in the average balance resulted in a Ps 1,609.5 billion increase in interest income and a 52 basis points increase in the average yield on loans and leases from 9.2% in 2014 to 9.7% in 2015 resulted in an additional Ps 337.6 billion increase in interest income.
Banco de Bogotá’s consolidated interest income from investments in debt securities (which includes available for sale and held to maturity fixed income securities) decreased by 6.2% or Ps 28.5 billion and it was mainly a result of a 90 basis points decrease in the average yield of investment securities from 5.1% in 2014 to 4.2% in 2015, which resulted in a Ps 80.3 billion decrease in interest income from investment securities. Partially offsetting this decrease was a 13.6% or Ps 1,219.5 billion increase in the average balance of investments that resulted in a Ps 51.8 billion increase in interest income.
Total interest income for Banco de Bogotá’s Colombian operations increased by 17.1% or Ps 663.3 billion to Ps 4,534.7 billion in 2015, driven by an increase of Ps 683.2 billion in interest income from total loans and leases (which includes interest from interbank and overnight funds), partially offset by a Ps 19.8 billion decrease in interest on investments in debt securities. The increase in interest income from total loans and leases was driven by a Ps 699.3 billion increase in interest income from loans and financial leases offset in part by a Ps 16.1 billion decrease in interest income from interbank and overnight funds.
Interest income from loans and leases for Banco de Bogotá’s Colombian operations increased by 19.5% or Ps 669.3 billion. This increase was driven by a 16.4% or Ps 6,764.4 billion increase in the average balance of loans and leases to Ps 48,015.8 billion in 2015, which was mainly driven by organic growth in the commercial loans and leases portfolio and resulted in a Ps 602.5 billion increase in interest income. In addition, a 23 basis points increase in the average yield on loans and leases from 8.7% in 2014 to 8.9% in 2015, resulted in a Ps 96.8 billion increase in interest income. The increase in Banco de Bogotá’s average yield on loans and leases was in line with the 79 basis points increase in the average Central Bank rate, from 3.88% to 4.67%.
Interest income on investments in debt securities for Banco de Bogotá’s Colombian operations decreased by 7.9% or Ps 19.8 billion. The decrease is explained by an 86 basis points decrease in the average yield on investments from 4.9% in 2014 to 4.0% in 2015, which resulted in a Ps 44.6 billion decrease in interest income. Partially offsetting the above was a 12.0% increase in the average balance of investment securities from Ps 5,166.6 billion in 2014 to Ps 5,786.5 in 2015, which resulted in a Ps 24.7 billion increase in interest income.
When translated into pesos, total interest income for the Central American operations increased by 46.6% or Ps 1,254.0 billion, driven by an increase of Ps 1,262.7 billion in interest income from total loans and leases (which includes interest from interbank and overnight funds), and a Ps 8.7 billion decrease in interest on investment securities. The increase in interest income from total loans and leases was driven by a Ps 1,247.9 billion increase in interest income from loans and financial leases and a Ps 14.8 billion increase in interest income from interbank and overnight funds.
Interest income from loans and leases for Banco de Bogotá’s Central American operations increased by 51.0% or Ps 1,247.9 billion. The increase was mainly explained by a 40.4% or Ps 9,814.8 billion increase in average balance of loans and leases, which resulted in a Ps 1,063.6 billion increase in interest income. In addition, there was a 76 basis points increase in the average yield on loans and leases from 10.1% in 2014 to 10.8% in 2015, which resulted in a Ps 184.2 billion increase in interest income. The devaluation of the average peso to dollar exchange rate accounted for Ps 915.5 billion of the increase in interest income from loans and leases. For an analysis of the evolution of the Central American average yield on interest earning assets excluding the impact of the devaluation of the peso, see LB Panamá’s MD&A (“—Banco de Bogotá subsidiary analysis—LB Panamá—Net interest income”).
Interest income from investments in debt securities for Banco de Bogotá’s Central American operations decreased by 4.1%, or Ps 8.7 billion, to Ps 201.3 billion for the year ended December 31, 2015, as the result of a decrease in the average yield, from 5.5% for 2014 to 4.6% for 2015, resulting in a Ps 36.1 billion decrease in interest income. Partially offsetting this was a 15.8% or Ps 599.6 billion increase in average balance of investment in debt securities from Ps 3,797.2 billion in 2014 to Ps 4,396.8 billion in 2015, which resulted in a 27.4 billion increase in interest income.
The 36.9% or Ps 865.3 billion increase in total interest expense for Banco de Bogotá’s consolidated operation is explained by a 27.6% or Ps 20,438.8 billion increase in the average balance of total interest-bearing liabilities increased to Ps 94,453.2 billion in 2015 resulting in a Ps 694.9 billion increase in interest expense. Also contributing to the increase was a 23 basis points increase in the average cost of funding, from 3.2% in 2014 to 3.4% in 2015, which resulted in a Ps 170.5 billion increase in interest expense. Interest expense for Banco de Bogotá’s interest-bearing deposits increased by 33.9% or Ps 585.7 billion to Ps 2,314.7 billion in 2015, mainly driven by a 24.9% or
Ps 14,254.6 billion increase in the average balance of interest-bearing deposits, from Ps 57,293.9 billion in 2014 to Ps 71,548.5 billion in 2015, which resulted in a Ps 461.2 billion increase in interest expense.
Total interest expense for Banco de Bogotá’s Colombian operations increased 30.7% or Ps 441.4 billion, driven by a 22.8% or Ps 9,778.5 billion increase in the average balance of total interest-bearing liabilities to Ps 52,643.2 billion resulting in a Ps 349.0 billion increase in interest expense. A 22 basis points increase in the average cost of funding from 3.4% in 2014 to 3.6% in 2015, consistent with the increasing rate environment in Colombia, which resulted in a Ps 92.4 billion increase in interest expense. Interest expense on interest-bearing deposits increased by 27.4% or Ps 316.9 billion to Ps 1,473.0 billion in 2015, mainly driven by an increase of 17.9% or Ps 6,305.7 billion increase in the average balance of interest-bearing deposits, from Ps 35,163.8 billion in 2014 to Ps 41,469.5 billion in 2015, which resulted in a Ps 224.0 billion increase in interest expense. In addition, a 26 basis points increase in the average cost of interest-bearing deposits, from 3.3% in 2014 to 3.6% in 2015, resulted in a Ps 92.9 billion increase in interest expense.
Total interest expense for Central American operations, when translated into pesos, increased by 46.7% or Ps 424.0 billion, explained by a 34.2% or Ps 10,660.3 billion increase in the average balance of total interest-bearing liabilities that resulted in a Ps 339.7 billion increase in interest expense. Also contributing to the increase in interest expense was a 27 basis points increase in the average cost of funding from 2.9% to 3.2% that resulted in a Ps 84.2 billion increase in interest expense. Interest expense on interest-bearing deposits increased by 46.9% or Ps 268.9 billion to Ps 841.7 billion in 2015, mainly driven by a 35.9% or Ps 7,948.9 billion increase in the average balance of interest-bearing deposits, from Ps 22,130.1 billion in 2014 to Ps 30,079.0 billion in 2015, which resulted in a Ps 222.4 billion increase in interest expense. In addition, the average cost of funds increased from 2.6% in 2014 to 2.8% in 2015, resulting in a Ps 46.4 billion increase in interest expense. For an analysis of the evolution of the Central American average balance of interest bearing liabilities and its costs excluding the impact of the devaluation of the peso, see LB Panamá’s MD&A (“—Banco de Bogotá subsidiary analysis—LB Panamá—Net interest income”).
Average total interest-earning assets (calculated as (i) gross loans including interbank and overnight funds, and (ii) available for sale and held-to-maturity fixed income investments) for Banco de Bogotá’s Colombian operations increased by 17.1%, or Ps 7,977.7 billion, to Ps 54,706.0 billion for the year ended December 31, 2015, while net interest income grew by 9.1% or Ps 221.9 billion to Ps 2,656.0 billion. The above resulted in a 35 basis points decrease in net interest margin from 5.2% in 2014 to 4.9% in 2015. The spread between the yield earned on loans and leases (excluding interbank and overnight funds) and the rate paid on deposits remained relatively stable at 5.4% for both 2014 and 2015.
Average total interest-earning assets (calculated as (i) gross loans including interbank and overnight funds, and (ii) available for sale and held-to-maturity fixed income investments) for Banco de Bogotá’s Central American operations increased by 35.5%, or Ps 10,306.2 billion, to Ps 39,343.2 billion for the year ended December 31, 2015, while net interest income grew by 46.6% or Ps 830.0 billion to Ps 2,612.1 billion. The above resulted in a 50 basis points increase in net interest margin from 6.1% in 2014 to 6.6% in 2015. The spread between the yield earned on loans and leases (excluding interbank and overnight funds) and the rate paid on deposits increased 55 basis points from 7.5% in 2014 to 8.0% in 2015. For an analysis of the evolution of the Central American net interest margin, excluding the impact of the devaluation of the peso, see LB Panamá’s MD&A (“—Banco de Bogotá subsidiary analysis—LB Panamá—Net interest income”).
Finally, Banco de Bogotá’s consolidated average total interest-earning assets (calculated as (i) gross loans including interbank and overnight funds, and (ii) available for sale and held-to-maturity fixed income investments) increased by 24.1%, or Ps 18,283.9 billion, to Ps 94,049.2 billion in 2015 and net interest income increased by 25.0%, or Ps 1,052.0 billion to Ps 5,268.1 billion in 2015, which resulted in a 4 basis points increase in the net interest margin from 5.56% in 2014 to 5.60% in 2015. The spread between the yield earned on loans and leases and the rate paid on deposits increased 30 basis points from 6.2% in 2015 to 6.5% in 2016.
Net impairment losses
| | | Year ended December 31, | | | Change, 2015 vs. 2014 | |
| | | 2015 | | | 2014 | | | # | | | % | |
| | | Total
Income/Expense | | | Total
Income/Expense | | | | | | | |
| | | (in Ps billions) | | | | | | | |
| Impairment losses: | | | | | | | | | | | | | | | | |
| Impairment loss on loans and leases, net | | | (1,236.3 | ) | | | (972.6 | ) | | | (263.7 | ) | | | 27.1 | |
| Impairment loss on accrued interest and other receivables, net | | | (87.0 | ) | | | (66.1 | ) | | | (21.0 | ) | | | 31.8 | |
| Impairment loss on investments in debt and equity securities | | | (0.3 | ) | | | (0.0 | ) | | | (0.3 | ) | | | 1,996.6 | |
| Impairment loss on noncurrent assets held for sale | | | (20.5 | ) | | | (11.2 | ) | | | (9.3 | ) | | | 82.8 | |
| Recovery of charged-off financial assets | | | 99.9 | | | | 78.8 | | | | 21.1 | | | | 26.8 | |
| Recovery of impairment loss on investments in debt and equity securities | | | - | | | | - | | | | - | | | | - | |
| Recovery of impairment loss on noncurrent assets held for sale | | | - | | | | - | | | | - | | | | - | |
| Net impairment losses | | | (1,244.3 | ) | | | (971.1 | ) | | | (273.2 | ) | | | 28.1 | |
| | | Year ended December 31, | | | | |
| | | 2015 | | | 2014 | | | Change, 2015 vs. 2014 | |
| | | Loans at
least 91
days past
due | | | Delinquency
Ratio (1) | | | Loans at
least 91
days past
due | | | Delinquency
Ratio (1) | | | Loans at
least 91 days
past due | | | Delinquency
Ratio | |
| | | | | | | | | | | | # | | | % | |
| | | (in Ps billions) | |
| Delinquency Ratios: | | | 1,360.5 | | | | 1.5 | % | | | 1,087.4 | | | | 1.5 | % | | | 273.1 | | | | 0.0 | |
| Colombian Operations | | | 930.3 | | | | 1.9 | % | | | 782.1 | | | | 1.8 | % | | | 148.1 | | | | 0.2 | |
| Commercial loans | | | 619.3 | | | | 1.7 | % | | | 486.3 | | | | 1.4 | % | | | 133.0 | | | | 0.2 | |
| Consumer loans | | | 262.0 | | | | 3.0 | % | | | 258.1 | | | | 3.1 | % | | | 4.0 | | | | (0.1 | ) |
| Mortgage loans | | | 21.1 | | | | 1.2 | % | | | 7.7 | | | | 0.5 | % | | | 13.3 | | | | 0.7 | |
| Microcredit loans | | | 27.8 | | | | 7.6 | % | | | 30.0 | | | | 8.5 | % | | | (2.2 | ) | | | (0.9 | ) |
| Central American Operations | | | 430.2 | | | | 1.0 | % | | | 305.2 | | | | 1.1 | % | | | 125.0 | | | | (0.1 | ) |
| Commercial loans | | | 100.5 | | | | 0.6 | % | | | 66.2 | | | | 0.6 | % | | | 34.2 | | | | 0.0 | |
| Consumer loans | | | 228.0 | | | | 1.5 | % | | | 153.1 | | | | 1.5 | % | | | 75.0 | | | | (0.0 | ) |
| Mortgage loans | | | 101.7 | | | | 1.2 | % | | | 86.0 | | | | 1.4 | % | | | 15.8 | | | | (0.2 | ) |
| Microcredit loans | | | - | | | | N.A. | | | | - | | | | N.A. | | | | N.A. | | | | N.A. | |
| (1) | Calculated as 91 days past due loans divided by total gross loans and leases (excluding interbank and overnight funds) |
Net impairment losses for Banco de Bogotá’s consolidated operations increased by 28.1% or Ps 273.2 billion in 2015 as compared to 2014, driven primarily by a 27.1% or Ps 263.7 billion increase in impairment loss on loans and leases, net, a Ps 21.0 billion increase in impairment loss on accrued interest and other receivables, net and a Ps 9.3 billion increase in impairment loss on noncurrent assets held for sale. These increases were partially offset by a Ps 21.1 billion increase in recoveries of charged-off assets.
The increase in impairment losses, net was explained by a Ps 63.8 billion increase for Banco de Bogotá’s Colombian operations and a Ps 209.5 billion increase Banco de Bogotá’s Central American operation.
Net impairment losses for Banco de Bogotá’s Colombian operations increased by 9.8% or Ps 63.8 billion from Ps 651.2 billion in 2014 to Ps 714.9 billion in 2015, mainly explained by a 8.7% or Ps 57.7 billion increase in impairment loss on loans and leases and a Ps 21.0 billion increase in impairment loss on accrued interest and other receivables, net that were partially offset by a Ps 25.0 billion increase in recoveries of charged-off assets. Delinquency ratios in Colombia presented a 17 basis points deterioration due to a 23 basis points deterioration in delinquency for commercial loans and a 70 basis point deterioration on mortgage loans. The ratio of net impairment loss on loans and leases to average loans and leases decreased from 1.8%, in 2014 to 1.7% in 2015.
When translated into pesos, net impairment losses for the Central American operations increased by 65.5% or 209.5 billion to Ps 529.4 billion in 2015. The increase is mainly explained by a Ps 206.0 billion increase in impairment loss on loans and leases. The devaluation of the average peso to dollar exchange rate accounted for Ps 125.1 billion of the increase in net impairment losses. For an analysis of the evolution of the Central American net impairment loss on financial assets, excluding the impact of the devaluation of the peso, see LB Panamá’s MD&A (“—Banco de Bogotá subsidiary analysis—LB Panamá—Impairment”). The ratio of net impairment loss on loans and leases to average loans and leases increased from 1.3% in 2014 to 1.5% in 2015.
Charge-offs for Banco de Bogotá’s consolidated operations increased by 27.8% or Ps 239.3 billion to Ps 1,100.7 billion in 2015 as compared to 2014, and its ratio of charge-offs to average balance of loans and leases (excluding interbank and overnight funds) ratio remained stable at 1.3% for both 2014 and 2015.
Banco de Bogotá’s consolidated coverage ratio for loans 91 days past due was 154.1% in 2015, with a ratio of 154.7% for its Colombian operations and 122.9% for its Central American operations. These ratios compared with a 159.4%, 169.5% and 133.6% for the consolidated, Colombian and Central American operations during 2014.
The recovery of charged-off assets increased by 26.8% or Ps 21.1 billion, driven by increases of Ps 25.0 billion in the recoveries of Banco de Bogotá’s Colombian operations, which were partially offset by a decrease of Ps 3.9 billion in recoveries from the Central American operation.
Net commission and fee income
| | | Year ended December 31, | | | Change, 2015 vs. 2014 | |
| | | 2015 | | | 2014 | | | # | | | % | |
| | | (in Ps billions) | | | | | | | |
| Commissions and fee income: | | | | | | | | | | | | | | | | |
| Banking fees | | | 2,407.8 | | | | 1,741.4 | | | | 666.4 | | | | 38.3 | |
| Bonded warehouse services | | | 112.5 | | | | 132.2 | | | | (19.7 | ) | | | (14.9 | ) |
| Trust activities | | | 126.7 | | | | 119.9 | | | | 6.8 | | | | 5.7 | |
| Pension and severance fund management | | | 786.0 | | | | 757.0 | | | | 29.1 | | | | 3.8 | |
| Commission and fee income | | | 3,433.0 | | | | 2,750.4 | | | | 682.6 | | | | 24.8 | |
| Commission and fee expenses | | | (327.3 | ) | | | (262.1 | ) | | | (65.1 | ) | | | 24.9 | |
| Net commission and fee income | | | 3,105.7 | | | | 2,488.3 | | | | 617.4 | | | | 24.8 | |
Net commission and fee income for Banco de Bogotá’s consolidated operation increased by 24.8% or Ps 617.4 billion in 2015 as compared to 2014, with Ps 72.5 billion resulting from Banco de Bogotá’s Colombian operations and Ps 544.9 billion resulting from Banco de Bogotá’s Central American operations.
The Ps 72.5 billion or 4.7% increase resulting from Banco de Bogotá’s Colombian operations was mainly driven by a Ps 92.9 billion or 12.1% increase in commissions from banking fees, a Ps 19.7 billion or 2.7% increase in fees from pension and severance fund management (“-Banco de Bogotá subsidiary analysis—Porvenir—Net income from commissions and fees”) and a Ps 6.8 billion or 5.7% increase in fees from trust activities. These increases were partially offset by a Ps 27.2 billion or 12.8% increase in expenses for commissions and fees and a Ps 19.7 billion or 14.9% decrease in fees from bonded warehouse services.
Of the Ps 544.9 billion or 58.3% increase in net commission and fee income from Central American operations, Ps 573.5 billion are explained by an increase in banking fees and Ps 9.3 billion by increases in pension and severance fund management. These increases were partially offset by an increase of Ps 37.9 billion in expenses for commissions and fees. The devaluation of the average peso to dollar exchange rate accounted for Ps 346.6 billion of the increase in net commission and fee income. For an analysis of the evolution of the Central American net income from commissions and fees, excluding the impact of the devaluation of the peso, see LB Panamá’s MD&A (“—Banco de Bogotá subsidiary analysis—LB Panamá—Net income from commissions and fees”).
Net trading income
Banco de Bogotá’s consolidated net trading income includes (i) net trading income from investment securities held for trading through profit or loss, which reflects the interest and gains/losses from mark-to-market valuation, in each case from equity and fixed income investment securities held for trading through profit or loss, and (ii) net trading income from derivatives, which reflects the gains/losses from mark-to-market valuation on derivatives different from that considered under hedge accounting.
During 2015, Banco de Bogotá’s consolidated net trading income was Ps 286.8 billion, 84.9% or Ps 131.7 billion higher than the Ps 155.2 billion for 2014. Colombian operations accounted for a Ps 62.8 billion increase in net trading income and Central American operations accounted for a Ps 68.8 billion increase in net trading income, when translated to pesos. The Ps 131.7 billion increase in net trading income was driven by a Ps 313.4 billion increase in net trading income from derivatives, partially offset by a Ps 181.7 billion decrease in income from investment securities held for trading through profit or loss.
Total income from valuation on trading and hedging derivatives increased by Ps 313.4 billion from Ps 26.7 billion to in 2014 to Ps 340.1 billion in 2015, driven by the strong appreciation of the Colombian peso during 2016.
The Ps 181.7 billion decrease in net trading income from investment securities held for trading through profit or loss, for Banco de Bogotá’s consolidated operations, was mainly driven by a decrease in the return from 5.1% in 2014 to a negative 1.9% in 2015, resulting in a Ps 193.4 billion decrease in income. The average balance of Banco de Bogotá’s consolidated fixed income and equity investments held for trading through profit or loss increased by 9.1%, or Ps 230.1 billion, to Ps 2,759.6 billion, and resulted in a Ps 11.7 billion increase in income.
For the Colombian operations, net trading income from investment securities held for trading through profit or loss decreased by Ps 246.0 billion to a loss of Ps 74.7 billion in 2015. This decrease was mainly explained by a decrease in the average return from 7.8% in 2014 to a negative 3.7% in 2015, resulting in a Ps 232.0 billion increase in income. The 8.2% or Ps 179.8 billion decrease in the average balance of the Colombian operations’ fixed income and equity investments held for trading through profit or loss, to Ps 2,014.4 billion, resulted in a Ps 14.0 billion decrease in income.
For the Central America operation, when translated to pesos, net trading income from investment securities held for trading through profit or loss increased Ps 64.3 billion from a loss of Ps 42.8 billion in 2014 to a gain of Ps 21.5 billion in 2016. The increase was mainly explained by an increase in the return from a negative 12.8% in 2014 to 2.9% in 2015, resulting in a Ps 52.5 billion increase in income. The average balance of fixed income and equity investments held for trading through profit or loss increased by Ps 409.9 billion, to Ps 745.1 billion, resulting in a Ps 11.8 billion increase in income.
Total income from investment securities
Banco de Bogotá’s securities portfolio is classified in the following categories: (i) equity and fixed income investments held for trading through profit or loss (described in this section as net trading income in investment securities held for trading through profit or loss), (ii) available for sale fixed income investments and (iii) held-to-maturity fixed income investments (results from (ii) and (iii) are included in the net interest income section as interest income from investment in debt securities). Banco de Bogotá manages its investment portfolio in a comprehensive and integral manner that considers individual return of each one of these three categories and the total return of the investment securities portfolio.
Total income from investment securities for Banco de Bogotá consolidated operations (comprised of income on investment in debt securities and net trading income from investment securities held for trading through profit or loss) was Ps 379.0 billion for 2015, Ps 210.2 billion lower than the Ps 589.2 billion for 2014. This was primarily
driven by an decrease of 220 basis points in the average return on total investment securities from 5.1% in 2014 to 2.9% in 2015, generating a Ps 252.7 billion decrease in interest income, which was partially offset by a Ps 1,449.6 billion increase in the average balance of Total Investment Securities from Ps 11,493.2 billion in 2014 to Ps 12,942.8 billion in 2015, resulting in a Ps 42.4 billion decrease in interest income.
When including the investment securities held for trading through profit or loss, Banco de Bogotá’s consolidated average total interest earning assets (calculated as (i) gross loans including interbank and overnight funds, (ii) available for sale and held-to-maturity fixed income investments, and (iii) fixed income and equity investments held for trading through profit or loss) would have increased by 23.6% or Ps 18,514.0 billion to Ps 96,808.7 billion in 2015 and the net interest income plus net trading income from investment securities held for trading through profit or loss would have increased by 20.0%, or Ps 870.2 billion to Ps 5,214.9 billion in 2015. The return over average total interest earning assets (calculated as (i) gross loans including interbank and overnight funds, (ii) available for sale and held-to-maturity fixed income investments, and (iii) fixed income and equity investments held for trading through profit or loss) would have decreased by 16 basis points from 5.5% in 2015 to 5.4% in 2015
Other income
| | | Year ended December 31, | | | Change, 2015 vs. 2014 | |
| | | 2015 | | | 2014 | | | # | | | % | |
| | | (in Ps billions) | | | | |
| Foreign exchange gains (losses), net | | | 289.2 | | | | 235.5 | | | | 53.7 | | | | 22.8 | |
| Gains on sales of investments, net | | | 62.9 | | | | 76.9 | | | | (13.9 | ) | | | (18.1 | ) |
| Income from sales of noncurrent assets held for sale | | | 15.8 | | | | (23.4 | ) | | | 39.2 | | | | (167.8 | ) |
| Equity method | | | 176.8 | | | | 177.1 | | | | (0.3 | ) | | | (0.1 | ) |
| Dividend income | | | 2.5 | | | | 2.4 | | | | 0.1 | | | | 5.6 | |
| Gain on valuation of biological assets, net | | | - | | | | - | | | | - | | | | - | |
| Income from non-financial sector, net | | | (92.4 | ) | | | (76.3 | ) | | | (16.1 | ) | | | 21.1 | |
| Net income from financial instruments designated at fair value | | | - | | | | - | | | | - | | | | - | |
| Other | | | 351.0 | | | | 224.2 | | | | 126.8 | | | | 56.6 | |
| Total other income | | | 805.9 | | | | 616.4 | | | | 189.5 | | | | 30.7 | |
The Ps 189.5 billion increase in total other income was mainly due to a Ps 53.7 billion increase in foreign exchange gains (losses), net, a Ps 126.8 increase in other and a Ps 39.2 billion increase in income from sales of noncurrent assets held for sale. These increases were partially offset by a Ps 16.1 billion decrease in income from the non-financial sector related to higher personnel and administrative expenses in Banco de Bogotá’s subsidiary Megalinea and a Ps 13.9 billion decrease in gains on sales of investments, net. The Ps 0.3 billion decrease in equity method was mainly related to a decrease in Corficolombiana’s net income (see Corficolombiana’s MD&A (“—Corficolombiana—Other income”) which was offset by a better performance of Pizano.
Other expenses
| | | Year ended December 31, | | | Change, 2016 vs. 2015 | |
| | | 2016 | | | 2015 | | | # | | | % | |
| | | (in Ps billions) | | | | | | | |
| Losses from sales of noncurrent assets held for sale | | | 0.0 | | | | - | | | | 0.0 | | | | - | |
| Personnel expenses | | | (2,151.6 | ) | | | (1,625.1 | ) | | | (526.5 | ) | | | 32.4 | |
| Salaries and employee benefits | | | (2,013.8 | ) | | | (1,528.0 | ) | | | (485.8 | ) | | | 31.8 | |
| Bonus plan payments | | | (101.3 | ) | | | (75.5 | ) | | | (25.8 | ) | | | 34.1 | |
| Termination payments | | | (36.5 | ) | | | (21.6 | ) | | | (14.9 | ) | | | 69.3 | |
| Administrative and other expenses | | | (2,340.2 | ) | | | (1,864.8 | ) | | | (475.5 | ) | | | 25.5 | |
| Depreciation and amortization | | | (358.5 | ) | | | (260.4 | ) | | | (98.1 | ) | | | 37.7 | |
| Wealth tax | | | (168.7 | ) | | | - | | | | (168.7 | ) | | | - | |
| Other expenses | | | (95.9 | ) | | | (86.0 | ) | | | (9.9 | ) | | | 11.6 | |
| Charitable and other donation expenses | | | (4.3 | ) | | | (3.7 | ) | | | (0.6 | ) | | | 15.3 | |
| Other | | | (91.7 | ) | | | (82.3 | ) | | | (9.4 | ) | | | 11.4 | |
| Total other expenses | | | (5,115.0 | ) | | | (3,836.3 | ) | | | (1,278.7 | ) | | | 33.3 | |
Total other expenses for Banco de Bogotá’s consolidated operation increased by Ps 1,278.7 billion, or 33.3%, in 2015 as compared to 2014. Of this increase, Ps 376.1 billion were driven by the Colombian operations and Ps 902.6 billion by Central American operations, when translated to pesos.
The Ps 376.1 billion or 17.9% increase in total other expenses resulting from Colombian operations was mainly driven a 9.9% or Ps 115.9 billion increase in administrative and other expenses and a 10.8% or Ps 80.2 billion increase in personnel expenses. Partially offsetting this increase was a Ps 5.3 billion decrease in other expenses.
The Ps 902.6 billion increase in total other expenses resulting from Central American operations, when translated to pesos, is mainly explained by a Ps 50.7% or 446.3 billion increase in personnel expenses, a 51.8% or Ps 359.5 billion increase in administrative and other expenses and a Ps 82.2 billion increase in depreciation and amortization. The devaluation of the average peso to dollar exchange rate accounted for Ps 644.5 billion of the increase in total other expenses. For an analysis of the evolution of the Central American operation’s other expenses excluding the impact of the devaluation of the peso, see LB Panamá’s MD&A (“—Banco de Bogotá subsidiary analysis—LB Panamá—Other expenses”).
The increase in personnel expenses for Banco de Bogotá’s consolidated operation resulted from a 4.3% increase in headcount during the year to support the growth of the loan portfolio. The number of employees went from 44,507 employees in 2014 to 46,418 employees in 2015. Furthermore, there was a 26.4% increase in yearly salaries and employee benefits per employee (8.7% for Colombian operations and 42.1% for Central American Operations) from Ps 34.3 million in 2014 to 43.4 million in 2015. Excluding the devaluation, salaries and employee benefits per employee for Central American operations would have increased by 3.8%.
Banco de Bogotá’s consolidated operations’ efficiency ratio (calculated as personnel and administrative and other expenses divided by net interest income, fees and other services income, net trading income and other income excluding other) deteriorated from 48.1% in 2014 to 49.3% in 2015 (44.1% to 44.4% for Colombian operations and 54.2% to 54.7% for Central American Operations). The ratio of personnel and administrative and other expenses as a percentage of average assets increased from 3.5% in 2014 to 3.7% in 2015 (3.2% to 3.1% for Colombian operations and 3.9% to 4.4% for Central American Operations).
Income tax expense
Income tax expense for Banco de Bogotá’s consolidated operation increased by 6.6%, or Ps 64.9 billion, to Ps 1,047.7 billion in 2015. Banco de Bogotá’s consolidated operation effective tax rate (calculated as income tax expense divided by income before income tax expense excluding dividends and the equity method, as both are non-taxable income, and the equity tax as it is a non-deductible expense) decreased from 39.5% in 2014 to 33.8% in 2015.
Net income attributable to non-controlling interest
Net income attributable to non-controlling interest increased by Ps 21.3 billion, to Ps 155.7 billion in 2015 as compared with Ps 134.4 billion in 2014. The ratio of net income attributable to non-controlling interest to net income decreased from 8.0% in 2014 to 7.6% in 2015.
Banco de Bogotá Subsidiary Analysis
Banco de Bogotá’s results of operations are significantly affected by the results of operations of its subsidiaries, Porvenir and LB Panamá. In order to fully disclose the effect of these subsidiaries on Banco de Bogotá, the following is an analysis of the results of operations of each of Porvenir and LB Panamá in the year ended December 31, 2015 compared to the year ended December 31, 2014.
Porvenir
Porvenir generates income primarily from fees on its customers’ pension contributions, which consist predominantly of monthly mandatory contributions. It also generates net interest income and net trading income, composed almost entirely of investment income from the appreciation of Porvenir’s proprietary trading portfolio, which can be divided into two components: (i) income from its stabilization reserve, which is the legally required proprietary stake (1% of assets under management) in its funds that are subject to a minimum return guarantee mainly mandatory pension and severance funds; and (ii) income from Porvenir’s investment portfolio, which includes income from fixed income securities and money market instruments. As a result, Porvenir’s revenue is mainly affected by the number of contributors, their salaries, any changes in applicable fee rates and the rate of return of its assets under management and its proprietary investment portfolio.
Net income
| | | For the year ended December 31, | | | Change December 2015 vs
December 2014 | |
| | | 2015 | | | 2014 | | | # | | | % | |
| | | (in Ps billions) | | | | | | | |
| Interest income | | | 69.2 | | | | 26.4 | | | | 42.7 | | | | 161.7 | |
| Interest expenses | | | (28.1 | ) | | | (20.9 | ) | | | (7.2 | ) | | | 34.7 | |
| Net interest income | | | 41.0 | | | | 5.5 | | | | 35.5 | | | | 640.3 | |
| Impairment loss on loans and other accounts receivable, net | | | (22.9 | ) | | | (29.5 | ) | | | 6.5 | | | | (22.1 | ) |
| Impairment loss on other assets, net | | | (0.0 | ) | | | (0.0 | ) | | | 0.0 | | | | N.A. | |
| Recovery of charged-off financial assets | | | 0.0 | | | | 0.0 | | | | 0.0 | | | | N.A. | |
| Net impairment loss | | | (22.9 | ) | | | (29.5 | ) | | | 6.5 | | | | (22.1 | ) |
| Net commission and fees income | | | 667.3 | | | | 652.3 | | | | 15.0 | | | | 2.3 | |
| Net trading income | | | 122.1 | | | | 147.0 | | | | (25.0 | ) | | | (17.0 | ) |
| Other income | | | (73.0 | ) | | | (51.1 | ) | | | (21.9 | ) | | | 42.8 | |
| Other expenses | | | (314.8 | ) | | | (289.3 | ) | | | (25.5 | ) | | | 8.8 | |
| Income before income tax expense | | | 419.6 | | | | 435.0 | | | | (15.4 | ) | | | (3.5 | ) |
| Income tax expense | | | (165.0 | ) | | | (152.3 | ) | | | (12.8 | ) | | | 8.4 | |
| Net Income | | | 254.6 | | | | 282.7 | | | | (28.1 | ) | | | (10.0 | ) |
| Net income attributable to: | | | | | | | | | | | | | | | | |
| Controlling interest | | | 254.0 | | | | 282.2 | | | | (28.2 | ) | | | (10.0 | ) |
| Non-controlling interest | | | 0.6 | | | | 0.6 | | | | 0.0 | | | | 4.7 | |
| | | | | | | | | | | | | | | | | |
Porvenir’s net income attributable to controlling interest decreased by 10.0%, or Ps 28.2 billion, to Ps 254.0 billion in 2015 as compared to 2014. The most significant drivers of Porvenir’s results were (i) an increase in other expenses of Ps 25.5 billion, (ii) a decrease in net trading income of Ps 25.0 billion, (iii) a decrease in other income (expense) of Ps 21.9 billion and (iv) and an increase in income tax expense of Ps 12.8 billion. These results were partially offset by (i) an increase in net interest income of Ps 35.5 billion, (ii) an increase in net income from commissions and fees of Ps 15.0 billion, and (iii) a decrease in net impairment loss on financial assets of Ps 6.5 billion. The Ps 25.5 billion increase in other expenses is mainly explained by the payment of wealth tax for Ps 15.2
billion (see “Item 4. Information on the Company—B. Business Overview—Supervision and Regulation—Tax Reforms”), an expense for Ps 20.9 billion due to the yearly update in Porvenir’s actuarial calculations for provisions of uncapitalized accounts (“cuentas descapitalizadas”), which are those accounts that show a lesser value than the amount required to fund a legal monthly minimum pension plan, partially offset by a decrease in administrative and other expenses of Ps 11.4 billion.
Net interest income
Net interest income increased by Ps 35.5 billion, to Ps 41.0 billion in 2015 as compared to 2014, mainly driven by a Ps 41.6 billion increase in interest on investments in debt securities that was partially offset by an increase in interest expense of Ps 7.2 billion in 2015.
The Ps 41.6 billion increase in interest income from investments in debt securities, from Ps 21.4 billion in 2014 to 63.0 billion in 2015, is explained by the fact that average balance of fixed income investments available for sale increased by 177.6%, or Ps 229.1 billion, from Ps 129.0 billion in 2014 to Ps 358.1 billion in 2015, which resulted in a Ps 40.3 billion increase in interest income. Porvenir’s rate of return on its debt securities investment portfolio increased from 16.6% in 2014 to 17.6% in 2015, which resulted in a Ps 1.3 billion in interest income.
Total interest expense increased by Ps 7.2 billion mainly driven by the impact of the devaluation on the U.S.$186.1 million loan taken by Porvenir to fund the acquisition of AFP Horizonte in 2013.
Net impairment losses on financial assets
Porvenir’s net impairment loss on financial assets decreased by Ps 6.5 billion, or 22.1% from Ps 29.5 billion in 2014 to Ps 22.9 billion in 2015 mainly due to a decrease in the impairment losses on “unidades negativas” (negative units), which result from customers switching from another pension fund manager to Porvenir. Porvenir’s impairment loss on financial assets only includes losses on accounts receivable since Porvenir does not engage in lending activities.
Net commission and fee income
| | | Year ended December 31, | | | Change, 2015 vs. 2014 | |
| | | 2015 | | | 2014 | | | # | | | % | |
| | | (in Ps billions) | | | | | | | |
| Net commission and fee income: | | | | | | | | | | | | | | | | |
| Banking fees | | | 0.0 | | | | 0.2 | | | | (0.2 | ) | | | (91.6 | ) |
| Bonded warehouse services | | | 0.0 | | | | 0.0 | | | | 0.0 | | | | N.A. | |
| Trust activities | | | 0.0 | | | | 0.0 | | | | 0.0 | | | | N.A. | |
| Pension and severance fund management | | | 763.1 | | | | 739.8 | | | | 23.4 | | | | 3.2 | |
| Commission and fee income | | | 763.1 | | | | 740.0 | | | | 23.1 | | | | 3.1 | |
| Commission and fee expenses | | | (95.9 | ) | | | (87.7 | ) | | | (8.2 | ) | | | 9.3 | |
| Net commission and fee income | | | 667.3 | | | | 652.3 | | | | 15.0 | | | | 2.3 | |
Net commission and fee income consists primarily of commissions earned on the administration of mandatory pension funds, severance funds, voluntary pension funds and third-party liability pension funds. Porvenir’s total fees and other services income, net increased by Ps 15.0 billion, or 2.3%, to Ps 667.3 billion in 2015 as compared to Ps 652.3 billion in 2014.
Pension and severance fund management fees, which include fees from administration of mandatory, voluntary and third-party liability pension funds, and severance funds increased by Ps 23.4 billion to Ps 763.1 billion in 2015.
This increase was primarily driven by a Ps 13.9 billion, or 2.7%, increase in fee income from the administration of mandatory pension funds from Ps 524.5 billion in 2014 to Ps 538.4 billion in 2015. Such results are explained by an increase in the number of customers from 6.8 million as of December 31, 2014 to 7.3 million as of December 31, 2015.
Fee income from severance fund management increased by Ps 13.6 billion from Ps 113.7 billion in 2014 to Ps 127.4 billion in 2015. This increase was mainly due to an increase in the severance funds customers from 3.2 million as of December 31, 2014 to 3.6 million as of December 31, 2015.
Partially offsetting these increases, was a Ps 2.9 billion decrease in revenues received from the administration of third-party liability pension funds from Ps 11.1 billion in 2014 to Ps 8.2 billion in 2015, and a Ps 1.3 billion decrease in fee income associated with the management of voluntary pension funds and other fees from Ps 90.5 billion in 2014 to Ps 89.2 billion in 2015.
Expenses for commissions and fees increased by Ps 8.2 billion, from Ps 87.7 billion in 2014 to Ps 95.9 billion in 2015, mainly driven by a higher number of social security transactions.
Net trading income
Porvenir’s net trading income includes (i) net trading income from investment securities held for trading through profit or loss, which reflects the interest and gains/losses from mark-to-market valuation, in each case from equity and fixed income investment securities held for trading through profit or loss, and (ii) net trading income from derivatives, which reflects the gains/losses from mark-to-market valuation on derivatives different from that considered under hedge accounting. Total net trading income decreased by Ps 25.0 billion from Ps 147.0 billion in 2014 to Ps 122.1 billion in 2015, driven by a Ps 55.6 billion decrease in net trading income from investment securities held for trading through profit or loss, from Ps 90.3 billion in 2014 to 34.8 billion in 2015 and a Ps 30.6 billion increase in net trading income from derivatives, from Ps 56.7 billion in 2014 to 87.3 billion in 2015.
The decrease in the net trading income from investment securities held for trading through profit or loss of Ps 55.6 billion was mainly driven by a decrease in yield from 9.3% in 2014 to 3.4% in 2015, which resulted in a decrease in income of Ps 57.4 billion. Partially offsetting this result, the average balance of Porvenir’s investment securities held for trading through profit or loss increased from Ps 970.7 billion in 2014 to Ps 1,026.1 billion in 2015, which resulted in a Ps 1.9 billion increase in net trading income.
Total income from investment securities
Porvenir’s securities portfolio is classified in the following categories: (i) equity and fixed income investments held for trading through profit or loss (described in this section as net trading income in investment securities held for trading through profit or loss), (ii) available for sale fixed income investments and (iii) held to maturity fixed income investments (results from (ii) and (iii) are included in the net interest income section as interest income from investment in debt securities). Porvenir manages its investment portfolio in a comprehensive and integral manner that considers individual return of each one of these three categories and the total return of the investment securities portfolio.
Total income from investment securities (comprised of income on investment securities and net trading income from investment securities held for trading through profit or loss) was Ps 97.8 billion for 2015, 12.5% or Ps 14.0 billion lower than the Ps 111.8 billion for 2014. This result is mainly explained by a decrease in the average yield of total investment securities from 10.2% in 2014 to 7.1% in 2015, which resulted in a Ps 34.1 billion decrease in income, partially offset by a Ps 284.5 billion increase in average balance of Total Investment Securities, resulting in a Ps 20.1 billion increase in income.
Other income
Total other income decreased by Ps 21.9 billion, or 42.8%, from a loss of Ps 51.1 billion in 2014 to a loss of Ps 73.0 billion in 2015. This decrease was primarily due to a Ps 53.9 billion decrease in foreign exchange gains (losses), net from a Ps 84.3 billion loss in 2014 to Ps 138.2 billion loss in 2015. This result was partially offset by a Ps 31.2 billion increase in other income attributable to provisions recovered as a result of customers switching from one pension fund manager to another and recoveries of insurance claims and others, and a Ps 1.1 billion increase from gains on sales of investments, net.
Other expenses
| | | For the year ended December 31, | | | Change, 2015 vs. 2014 | |
| | | 2015 | | | 2014 | | | # | | | % | |
| | | (in Ps billions) | | | | | | | |
| Losses from sales of noncurrent assets held for sale | | | (0.0 | ) | | | (0.0 | ) | | | 0.0 | | | | N.A. | |
| Personnel expenses | | | (113.8 | ) | | | (109.9 | ) | | | (3.9 | ) | | | 3.5 | |
| Salaries and employee benefits | | | (112.7 | ) | | | (106.0 | ) | | | (6.6 | ) | | | 6.3 | |
| Bonus plan payments | | | (0.7 | ) | | | (3.0 | ) | | | 2.4 | | | | (78.3 | ) |
| Termination payments | | | (0.4 | ) | | | (0.8 | ) | | | 0.4 | | | | (45.6 | ) |
| Administrative and other expenses | | | (148.0 | ) | | | (159.4 | ) | | | 11.4 | | | | (7.2 | ) |
| Depreciation and amortization | | | (13.9 | ) | | | (10.5 | ) | | | (3.4 | ) | | | 32.4 | |
| Wealth tax | | | (15.2 | ) | | | - | | | | (15.2 | ) | | | N.A. | |
| Other expenses | | | (24.0 | ) | | | (9.5 | ) | | | (14.5 | ) | | | 152.8 | |
| Charitable and other donation expenses | | | (1.3 | ) | | | (0.4 | ) | | | (0.9 | ) | | | 202.5 | |
| Other | | | (22.7 | ) | | | (9.1 | ) | | | (13.6 | ) | | | 150.4 | |
| Total other expenses | | | (314.8 | ) | | | (289.3 | ) | | | (25.5 | ) | | | 8.8 | |
Porvenir’s total other expenses increased by Ps 25.5 billion, or 8.8% to Ps 314.8 billion in 2015 as compared to 2014. This increase was mainly driven by (i) the payment of the wealth tax (Ps 15.2 billion), (ii) an increase in other expenses by Ps 14.5 billion, explained by a Ps 20.9 billion expense for the yearly update in their actuarial calculations for provisions of uncapitalized accounts (“cuentas descapitalizadas”) and a Ps 6.4 billion decrease in other expenses, and (iii) an increase in personnel expenses by Ps 6.6 billion. Partially offsetting these increases was a Ps 11.4 billion decrease in administrative and other expenses. Porvenir’s efficiency to income ratio (calculated as personnel and administrative and other expenses divided by net income, fees and other services income, other income excluding other) slightly deteriorated from 37.0% in 2014 to 37.4% in 2015.
The number of employees of Porvenir increased from 2,838 in 2014 to 2,872 in 2015. Yearly salaries and employee benefits per capita increased by 5.0% from Ps 37.4 million in 2014 to Ps 39.2 million in 2015.
Income tax expense
Income tax expense increased by 8.4%, or Ps 12.8 billion, to Ps 165.0 billion in 2015 as compared to 2014. Porvenir’s effective tax rate (calculated as income tax expense divided by income before tax expense minus equity method minus dividends, plus wealth tax) increased from 35.0% in 2014 to 38.0% in 2015, mainly driven by the CREE surcharge of 5 percentage points, as per the tax reform of December, 2014.
Net income attributable to non-controlling interest
Net income attributable to non-controlling interest remained at Ps 0.6 billion for both years 2014 and 2015.
LB Panamá
Given that LB Panamá’s functional currency is USD, it is important to bear in mind that its consolidated results for 2015 in Colombian Pesos reflect both the entity’s performance in its functional currency and the depreciation of the peso, which was 37.3% in the year ended December 31, 2015.
The following tables present the results of LB Panamá in Colombian Pesos and also include an adjusted 2014 column in which we applied 2015 average exchange rate of Ps 2,746.47 to provide 2014 U.S. dollar translations to adjust for the impact of the devaluation of the Colombian Peso.
Net income
| | | For the year ended
December 31, | | | Change December 2015
vs December 2014 | | | For the year
ended
December 31, | | | Change December
2015 vs December
2014 * | |
| | | 2015 | | | 2014 | | | # | | | % | | | 2014
(adjusted)(*) | | | # | | | % | |
| | | (in Ps billions) | | | | | | | | | | | | | | | | |
| Interest income | | | 3,944.5 | | | | 2,690.5 | | | | 1,254.0 | | | | 46.6 | | | | 3,641.8 | | | | 302.8 | | | | 8.3 | |
| Interest expenses | | | (1,332.4 | ) | | | (908.4 | ) | | | (424.0 | ) | | | 46.7 | | | | (1,246.0 | ) | | | (86.4 | ) | | | 6.9 | |
| Net interest income | | | 2,612.1 | | | | 1,782.1 | | | | 830.0 | | | | 46.6 | | | | 2,395.8 | | | | 216.3 | | | | 9.0 | |
| Impairment loss on loans and other accounts receivable, net | | | (518.7 | ) | | | (312.7 | ) | | | (206.0 | ) | | | 65.9 | | | | (433.3 | ) | | | (85.4 | ) | | | 19.7 | |
| Impairment loss on other assets, net | | | (11.7 | ) | | | (12.1 | ) | | | 0.4 | | | | (3.6 | ) | | | (17.2 | ) | | | 5.5 | | | | (32.2 | ) |
| Recovery of charged-off financial assets | | | 1.0 | | | | 4.9 | | | | (3.9 | ) | | | (79.7 | ) | | | 5.5 | | | | (4.5 | ) | | | (81.9 | ) |
| Net impairment loss | | | (529.4 | ) | | | (319.9 | ) | | | (209.5 | ) | | | 65.5 | | | | (445.0 | ) | | | (84.4 | ) | | | 19.0 | |
| Net commission and fees income | | | 1,479.7 | | | | 934.8 | | | | 544.9 | | | | 58.3 | | | | 1,281.5 | | | | 198.3 | | | | 15.5 | |
| Net trading income | | | 29.1 | | | | (39.8 | ) | | | 68.8 | | | | 173.1 | | | | 29.3 | | | | (0.2 | ) | | | (0.7 | ) |
| Other income | | | 259.9 | | | | 259.0 | | | | 0.9 | | | | 0.4 | | | | 345.3 | | | | (85.4 | ) | | | (24.7 | ) |
| Other expenses | | | (2,635.8 | ) | | | (1,733.1 | ) | | | (902.6 | ) | | | 52.1 | | | | (2,377.6 | ) | | | (258.2 | ) | | | 10.9 | |
| Income before income tax expense | | | 1,215.7 | | | | 883.1 | | | | 332.6 | | | | 37.7 | | | | 1,229.2 | | | | (13.5 | ) | | | (1.1 | ) |
| Income tax expense | | | (380.8 | ) | | | (237.1 | ) | | | (143.8 | ) | | | 60.6 | | | | (328.0 | ) | | | (52.8 | ) | | | 16.1 | |
| Net Income | | | 834.9 | | | | 646.0 | | | | 188.8 | | | | 29.2 | | | | 901.2 | | | | (66.3 | ) | | | (7.4 | ) |
| Net income attributable to: | | | | | | | | | | | | | | | | | | | | | | | | | | | | |
| Controlling interest | | | 834.9 | | | | 645.2 | | | | 189.7 | | | | 29.4 | | | | 901.9 | | | | (67.0 | ) | | | (7.4 | ) |
| Non-controlling interest | | | (0.1 | ) | | | 0.8 | | | | (0.9 | ) | | | (109.7 | ) | | | (0.7 | ) | | | 0.7 | | | | (89.3 | ) |
* 2014 figures are adjusted for the impact of the devaluation of the Colombian Peso on a line by line basis
LB Panamá mainly reflects our investment in BAC Credomatic. In addition to its investment in BAC Credomatic, which as of December 31, 2015, amounted to Ps 6,290.3 billion (U.S.$1,997.3 billion), as of the same date, LB Panamá’s unconsolidated balance sheet carried goodwill of Ps 4,087.2 billion (U.S.$1,298 million), resulting from the company’s acquisition of BAC Credomatic and Banco BAC de Panamá. LB Panamá’s unconsolidated balance sheet also includes a fixed income portfolio of Ps 1,064.3 billion (U.S.$338 million) comprised mainly of investment grade bonds issued by Latin American sovereign and corporate issuers, acquired pursuant to Banco de Bogotá’s investment guidelines. As of December 31, 2015, LB Panamá had Ps 2,288.4 billion (U.S.$727 million) of indebtedness.
LB Panamá’s net income attributable to controlling interest for the year ended December 31, 2015 increased by 29.4%, or Ps 189.7 billion, to Ps 834.9 billion. The devaluation of the average peso to dollar exchange rate accounted for Ps 256.6 billion of the increase in net income attributable to controlling interest.
LB Panamá’s net income attributable to controlling interest in local currency for the year ended December 31, 2015 decreased by 7.4%, or Ps 67.0 billion. Despite an increase of 9.0% or Ps 216.3 billion in net interest income and a 15.5% or Ps 198.3 billion increase in net income from commissions and fees, there was an 10.9% or Ps 258.2 billion increase in other expenses, a 19.0% or Ps 84.4 billion increase in net impairment loss on financial assets, a 24.7% or Ps 85.4 billion decrease in other income (expense), a 16.1% or Ps 52.8 billion increase in income tax expense and a 0.7% or Ps 0.2 billion decrease in net trading income.
Net interest income
| | | Year ended
December 31, | | | Change, 2015 vs. 2014 | | | For the year
ended
December 31, | | | Change, 2015 vs.
2014 | |
| | | 2015 | | | 2014 | | | # | | | % | | | 2014
(adjusted)* | | | # | | | % | |
| | | (in Ps billions) | | | | | | | | | | | | | | | | |
| Interest income: | | | | | | | | | | | | | | | | | | | | | | | | | | | | |
| Commercial loans and leases | | | 909.0 | | | | 615.7 | | | | 293.2 | | | | 47.6 | | | | 846.9 | | | | 62.0 | | | | 7.3 | |
| Consumer loans and leases | | | 2,255.7 | | | | 1,465.8 | | | | 789.8 | | | | 53.9 | | | | 2,014.4 | | | | 241.3 | | | | 12.0 | |
| Mortgage loans and leases | | | 529.1 | | | | 364.3 | | | | 164.8 | | | | 45.2 | | | | 500.1 | | | | 29.0 | | | | 5.8 | |
| Microcredit loans and leases | | | 0.0 | | | | 0.0 | | | | 0.0 | | | | N.A. | | | | 0.0 | | | | 0.0 | | | | N.A. | |
| Interbank and overnight funds | | | 49.5 | | | | 34.7 | | | | 14.8 | | | | 42.5 | | | | 47.1 | | | | 2.4 | | | | 5.1 | |
| Interest on loans and leases | | | 3,743.3 | | | | 2,480.6 | | | | 1,262.7 | | | | 50.9 | | | | 3,408.5 | | | | 334.8 | | | | 9.8 | |
| Interest on investments in debt securities | | | 201.3 | | | | 209.9 | | | | (8.7 | ) | | | (4.1 | ) | | | 233.3 | | | | (32.0 | ) | | | (13.7 | ) |
| Total interest income | | | 3,944.5 | | | | 2,690.5 | | | | 1,254.0 | | | | 46.6 | | | | 3,641.8 | | | | 302.8 | | | | 8.3 | |
| Interest expense: | | | | | | | | | | | | | | | | | | | | | | | | | | | | |
| Checking accounts | | | (73.6 | ) | | | (47.1 | ) | | | (26.5 | ) | | | 56.4 | | | | (64.9 | ) | | | (8.7 | ) | | | 13.4 | |
| Time deposits | | | (680.7 | ) | | | (467.6 | ) | | | (213.0 | ) | | | 45.6 | | | | (641.3 | ) | | | (39.3 | ) | | | 6.1 | |
| Savings deposits | | | (87.4 | ) | | | (58.1 | ) | | | (29.3 | ) | | | 50.5 | | | | (79.8 | ) | | | (7.6 | ) | | | 9.5 | |
| Total interest expense on deposits | | | (841.7 | ) | | | (572.8 | ) | | | (268.9 | ) | | | 46.9 | | | | (786.1 | ) | | | (55.5 | ) | | | 7.1 | |
| Borrowings from banks and others | | | (411.1 | ) | | | (287.9 | ) | | | (123.2 | ) | | | 42.8 | | | | (394.3 | ) | | | (16.8 | ) | | | 4.3 | |
| Interbank and overnight funds | | | (6.8 | ) | | | (6.0 | ) | | | (0.9 | ) | | | 14.5 | | | | (8.1 | ) | | | 1.3 | | | | (15.8 | ) |
| Long-term debt (bonds) | | | (72.8 | ) | | | (41.8 | ) | | | (31.0 | ) | | | 74.1 | | | | (57.4 | ) | | | (15.4 | ) | | | 26.7 | |
| Borrowings from development entities | | | (0.0 | ) | | | (0.0 | ) | | | (0.0 | ) | | | N.A. | | | | (0.0 | ) | | | 0.0 | | | | N.A. | |
| Total interest expense | | | (1,332.4 | ) | | | (908.4 | ) | | | (424.0 | ) | | | 46.7 | | | | (1,246.0 | ) | | | (86.4 | ) | | | 6.9 | |
| Net interest income | | | 2,612.1 | | | | 1,782.1 | | | | 830.0 | | | | 46.6 | | | | 2,395.8 | | | | 216.3 | | | | 9.0 | |
* 2014 figures are adjusted for the impact of the devaluation of the Colombian Peso on a line by line basis
LB Panamá’s net interest income increased by 46.6% or Ps 830.0 billion in 2015, the devaluation of the average peso to dollar exchange rate accounted for Ps 613.7 billion of the increase in net interest income.
LB Panamá’s net interest income in local currency increased by 9.0% or Ps 216.3 billion in 2015 as compared to 2014, reflecting a Ps 302.8 billion increase in total interest income offset in part by a Ps 86.4 billion increase in interest expense.
The Ps 216.3 billion increase in total interest income is explained by a Ps 334.8 billion increase in interest income on total loans and leases (which includes income from interbank and overnight funds) and a Ps 32.0 billion decrease in income on investments in debt securities. The increase in interest income from total loans and leases was driven by a Ps 332.3 billion increase in interest income from loans and leases and a Ps 2.4 billion increase in income from interbank and overnight funds.
The increase in interest income on loans and leases of Ps 332.3 billion was mainly driven by a 9.6% or Ps 3,399.9 billion increase in LB Panamá’s average interest-earning loan portfolio from Ps 35,237.1 billion in 2014 to Ps 38,637.1 billion in 2015, which resulted in a Ps 325.0 billion increase in income. The average rate earned on loans and leases showed a slight increase from 9.54% to 9.56%, which resulted in a Ps 7.3 billion increase in interest
income. The increase in interest earned on consumer loans and leases explains 72.6% of the total increase in interest earned on loans and leases. The increase in interest earned on consumer loans and leases of Ps 241.3 billion was mainly driven by a 12.0% or Ps 1,499.8 billion increase in LB Panamá’s average interest-earning consumer loan portfolio, credit cards and personal loans particularly, from Ps 12,487.9 billion in 2014 to Ps 13,987.7 billion in 2015, which resulted in a Ps 241.9 billion increase in income. The average yield on consumer loans remained basically unchanged at 16.1% for 2014 and 2015, which resulted in a Ps 0.5 billion decrease in interest income.
Interest income on commercial loans increased 7.3% or Ps 62.0 billion. This increase in interest earned on commercial loans and leases was driven by a 9.3% or Ps 1,391.4 billion increase in LB Panamá’s average interest earning commercial loan portfolio from Ps 14,914.3 billion in 2014 to Ps 16,305.7 billion in 2015, which resulted in a Ps 77.6 billion increase in income. This increase was partially offset by a 10 basis points decrease in the average yield on commercial loans from 5.7% in 2014 to 5.6% in 2015, which resulted in a Ps 15.5 billion decrease in interest income.
Interest income on mortgage loans increased 5.8% or Ps 29.0 billion. This increase in interest earned on mortgage loans and leases was driven by a 6.5% or Ps 508.8 billion increase in LB Panamá’s average interest earning mortgage loan portfolio from Ps 7,835.0 billion in 2014 to Ps 8,343.8 billion in 2015, which resulted in a Ps 32.3 billion increase in income. This increase was partially offset by a 4 basis points decrease in the average yield on mortgage loans from 6.4% in 2014 to 6.3% in 2015, which resulted in a Ps 3.3 billion decrease in interest income.
Income from interbank and overnight funds increased by 5.1%, or Ps 2.4 billion, from Ps 47.1 billion in 2014 to Ps 49.5 billion in 2015.
The Ps 32.0 billion decrease to Ps 201.3 billion in 2015 in income on investments in debt securities is mainly explained by a 8.3% or Ps 461.5 billion decrease in the average balance of investments in debt securities (includes fixed income available for sale and held-to-maturity) from Ps 5,529.2 billion in 2014 to Ps 5,067.7 billion in 2015, which resulted in Ps 18.3 billion decrease in interest income on investments in debt securities. In addition, there was a 25 basis points decrease in the average yield of investments from 4.2% in 2014 to 4.0% in 2015, which resulted in a Ps 13.7 billion additional decrease in interest income.
Total interest expense increased by 6.9% or Ps 86.4 billion in 2015 as compared to 2014, mainly driven by a 4.4% or Ps 1,997.4 billion increase in the average balance of interest-bearing liabilities from Ps 45,510.3 billion in 2014 to Ps 47,507.8 billion in 2015, which resulted in a Ps 56.0 billion increase in interest expense. The average cost of funds increased by 7 basis points from 2.7% in 2014 to 2.8% in 2015, which resulted in a Ps 30.4 billion increase in interest expense.
Total interest expense on interest-bearing deposits increased by 7.1% or Ps 55.5 billion mainly driven by a 5.4% or Ps 1,760.2 billion increase in the average balance of interest-bearing deposits from Ps 32,385.1 billion in 2014 to Ps 34,145.3 billion in 2015, which resulted in a Ps 43.4 billion increase interest expense. The average cost of interest-bearing deposits increased by 4 basis points from 2.4% to 2.5% in 2015, which resulted in a Ps 12.2 billion increase interest expense.
The Ps 55.5 billion increase in interest expense on deposits reflects a Ps 39.3 billion increase in interest expense on time deposits, a Ps 8.7 billion increase in interest expense on checking accounts and a Ps 7.6 billion increase in interest expense on savings deposits. The increase in time deposits explains 70.8% of the total increase in interest expense on deposits. The increase in interest expense on time deposits of Ps 39.3 billion was mainly driven by a Ps 519.4 billion increase in the average balance of time deposits from Ps 15,473.1 in 2015 to Ps 15,992.4 billion in 2015, which resulted in a Ps 22.1 billion increase in interest expense. Additionally, an 11 basis points increase in the average rate paid from 4.1% in 2014 to 4.3% in 2015, resulted in a Ps 17.2 billion increase in interest expense.
The Ps 30.9 billion increase in interest expense on other funding (includes borrowings from banks and others, interbank and overnight funds, long-term debt and borrowings from development entities) is explained by a 17 basis points increase in the average rate paid on other funding from 3.5% in 2014 to 3.7% in 2015, which resulted in a Ps 22.1 billion increase in interest expense. In addition, a Ps 237.2 billion increase in the average balance from Ps 13,125.2 billion in 2014 to Ps 13,362.5 billion in 2015 resulted in a Ps 8.7 billion increase in interest expense.
The Ps 30.9 billion increase in interest expense on other funding is explained by a Ps 16.8 billion increase in borrowings from banks and others and a Ps 15.4 billion increase in long term debt. These increases were partially offset by a Ps 1.3 billion decrease in interbank and overnight funds. The increase in borrowings from banks and
others was mainly driven by a 14 basis points increase in the average cost from 3.3% in 2014 to 3.4% in 2015, which resulted in a Ps 16.2 billion increase in interest expense. Furthermore, a Ps 16.5 billion increase in the average balance of borrowings from banks and others from Ps 11,996.5 billion in 2014 to Ps 12,013.1 billion in 2015 resulted in a Ps 0.6 billion increase in interest expense. The increase in long-term bonds was mainly driven by a Ps 186.3 billion increase in the average balance from Ps 1,008.7 billion in 2014 to Ps 1,195.0 billion in 2015, which resulted in a Ps 11.4 billion increase in interest expense. In addition, a 40 basis points increase in the average cost of long-term bonds from 5.7% in 2014 to 6.1% in 2015 resulted in a Ps 4.0 billion increase in interest expense.
Average total interest earning assets (calculated as (i) gross loans including interbank and overnight funds, and (ii) available for sale and held to maturity fixed income investments) increased by 5.8%, or Ps 2,449.1 billion, from Ps 42,228.9 billion in 2014 to Ps 44,678.0 billion in 2015 and net interest income increased by 9.0%, or Ps 216.3 billion, from Ps 2,395.8 billion to Ps 2,612.1 billion over the same period, which resulted in a 17 basis points increase in the net interest margin from 5.67% in 2014 to 5.85% in 2015. The interest spread between the average rate on loans and leases (excluding interbank and overnight funds) and the average rate paid on deposits decreased by 2 basis points to 7.1% over the same period.
Net impairment losses
| | | Year ended December
31, | | | Change, 2015 vs. 2014 | | | For the year
ended
December 31, | | | Change, 2015 vs.
2014 | |
| | | 2015 | | | 2014 | | | # | | | % | | | 2014
(adjusted)(*) | | | # | | | % | |
| | | Total
Income/
Expense | | | Total
Income/
Expense | | | | | | Total Income/
Expense | | | | |
| | | (in Ps billions) | | | | | | | | | | | | | | | | |
| Impairment losses: | | | | | | | | | | | | | | | | | | | | | | | | | | | | |
| Impairment loss on loans and leases, net | | | (517.7 | ) | | | (311.7 | ) | | | (206.0 | ) | | | 66.1 | | | | (432.0 | ) | | | (85.8 | ) | | | 19.9 | |
| Impairment loss on accrued interest and other receivables, net | | | (1.0 | ) | | | (0.9 | ) | | | (0.0 | ) | | | 2.3 | | | | (1.3 | ) | | | 0.4 | | | | (26.8 | ) |
| Impairment loss on investments in debt and equity securities | | | (0.0 | ) | | | (0.0 | ) | | | (0.0 | ) | | | (100.0 | ) | | | (0.0 | ) | | | 0.0 | | | | (100.0 | ) |
| Impairment loss on noncurrent held for sale assets | | | (11.7 | ) | | | (12.1 | ) | | | 0.4 | | | | (3.6 | ) | | | (17.2 | ) | | | 5.5 | | | | (32.2 | ) |
| Recovery of charged-off financial assets | | | 1.0 | | | | 4.9 | | | | (3.9 | ) | | | (79.7 | ) | | | 5.5 | | | | (4.5 | ) | | | (81.9 | ) |
| Recovery of impairment loss on investment securities | | | 0.0 | | | | 0.0 | | | | 0.0 | | | | N.A. | | | | 0.0 | | | | 0.0 | | | | N.A. | |
| Recovery of impairment loss on noncurrent held for sale assets | | | 0.0 | | | | 0.0 | | | | 0.0 | | | | N.A. | | | | 0.0 | | | | 0.0 | | | | N.A. | |
| Net impairment loss on financial assets | | | (529.4 | ) | | | (319.9 | ) | | | (209.5 | ) | | | 65.5 | | | | (445.0 | ) | | | (84.4 | ) | | | 19.0 | |
* 2014 figures are adjusted for the impact of the devaluation of the Colombian Peso on a line by line basis
| | | Year ended December 31, | | | | |
| | | 2015 | | | 2014 | | | Change, 2015 vs. 2014 | |
| | | Loans 91 days
past due | | | Delinquency
Ratio (1) | | | Loans 91
days past due | | | Delinquency
Ratio (1) | | | Loans 91 days
past due | | | Delinquency
Ratio | |
| | | | | | | | | | | | | | | # | | | % | |
| | | (in Ps billions) | |
| Total loans and leases: | | | 430.2 | | | | 1.0 | % | | | 401.8 | | | | 1.1 | % | | | 28.4 | | | | (0.1 | ) |
| Commercial loans and leases | | | 100.5 | | | | 0.6 | % | | | 87.2 | | | | 0.6 | % | | | 13.3 | | | | 0.0 | |
| Consumer loans and leases | | | 228.0 | | | | 1.5 | % | | | 201.5 | | | | 1.5 | % | | | 26.6 | | | | (0.0 | ) |
| Mortgage loans and leases | | | 101.7 | | | | 1.2 | % | | | 113.2 | | | | 1.4 | % | | | (11.4 | ) | | | (0.2 | ) |
| Microcredit loans and leases | | | 0.0 | | | | N.A. | | | | 0.0 | | | | N.A. | | | | 0.0 | | | | N.A. | |
(1) Calculated as 91 days past due loans divided by total gross loans (excluding interbank and overnight funds)
Net impairment losses increased by 65.5% or Ps 209.5 billion in 2015 as compared to 2014. The devaluation of the average peso to dollar exchange rate accounted for Ps 125.1 billion of the increase in net impairment losses.
Net impairment losses in local currency increased by 19.0% or Ps 84.4 billion in 2015 as compared to 2014. This increase is explained by a Ps 85.8 billion increase in impairment loss on loans and leases, net and a Ps 4.5 billion decrease in recoveries of charged off assets, and was partially offset by a Ps 5.5 billion decrease in impairment loss on noncurrent held for sale assets.
The increase in impairment loss on loans and leases, net was primarily attributable to growth in the loan portfolio and a lower level of recoveries of impairment loss. The cost of risk measured as impairment loss on loans and leases, net divided by the average balance of loans and leases (excluding interbank and overnight funds) increased slightly from 1.2% in 2014 to 1.3% in 2015. The cost of risk net of recoveries of charged-off assets, measured as impairment loss on loans and leases, net of recoveries of charged-off assets divided by the average balance of loans and leases (excluding interbank and overnight funds) was 1.3% in 2015, compared to 1.2% in 2014. LB Panamá’s delinquency ratio (measured as loans 91 days past due as a percentage of total gross loans, excluding interbank and overnight funds) improved by 6 basis points to 1.0% in 2015 as compared to 1.1% in 2014.
The decrease in impairment loss on foreclosed assets, net was primarily driven by the sale of assets located in Guatemala.
Charge-offs increased from Ps 427.4 billion for the year ended December 31 2014 to Ps 521.6 billion for the year ended December 31, 2015 and the ratio of charged-off assets to average loans (excluding interbank and overnight funds) increased from 1.2% in 2014 to 1.4% in 2015. LB Panamá’s coverage ratio over its 91 days past due loans was 122.9% as of December 31, 2015.
Net commission and fee income
| | | Year
ended December 31, | | | Change, 2015 vs. 2014 | | | For the year
ended
December 31,
2014
(adjusted)* | | | Change, 2015 vs. 2014 | |
| | | 2015 | | | 2014 | | | # | | | % | | | | | | # | | | % | |
| | | (in Ps billions) | | | | | | | | | | | | | | | | |
| Commission and fee income: | | | | | | | | | | | | | | | | | | | | | | | | | | | | |
| Banking services | | | 1,544.3 | | | | 970.8 | | | | 573.5 | | | | 59.1 | | | | 1,336.0 | | | | 208.3 | | | | 15.6 | |
| Bonded warehouse services | | | 0.0 | | | | 0.0 | | | | 0.0 | | | | N.A. | | | | 0.0 | | | | 0.0 | | | | N.A. | |
| Trust activities | | | 0.0 | | | | 0.0 | | | | 0.0 | | | | N.A. | | | | 0.0 | | | | 0.0 | | | | N.A. | |
| Pension and severance fund management | | | 22.9 | | | | 13.6 | | | | 9.3 | | | | 68.7 | | | | 18.7 | | | | 4.2 | | | | 22.5 | |
| Commission and fee income | | | 1,567.2 | | | | 984.4 | | | | 582.8 | | | | 59.2 | | | | 1,354.7 | | | | 212.5 | | | | 15.7 | |
| Commission and fee expense | | | (87.5 | ) | | | (49.5 | ) | | | (37.9 | ) | | | 76.6 | | | | (73.2 | ) | | | (14.2 | ) | | | 19.5 | |
| Net commission and fee income | | | 1,479.7 | | | | 934.8 | | | | 544.9 | | | | 58.3 | | | | 1,281.5 | | | | 198.3 | | | | 15.5 | |
* 2014 figures are adjusted for the impact of the devaluation of the Colombian Peso on a line by line basis
Net commission and fee income increased by 58.3% or Ps 544.9 billion to Ps 1,479.7 billion in 2015 as compared to 2014. The devaluation of the average peso to dollar exchange rate accounted for Ps 346.6 billion of the increase in net commission and fee income.
Net commission and fee income in local currency increased by 15.5% or Ps 198.3 billion in 2015 as compared to 2014. The increase is explained by a Ps 208.3 billion increase in commissions from banking services and a Ps 4.2 billion increase in pension and severance fund management. These increases were driven by higher credit and debit card fees and international services and were partially offset by a Ps 14.2 billion increase in expenses for commissions and fees.
Net trading income
LB Panamá’s net trading income includes (i) net trading income from investment securities held for trading through profit or loss, which reflects the interest and gains/losses from mark-to-market valuation, in each case from equity and fixed income investment securities held for trading through profit or loss, and (ii) net trading income from derivatives, which reflects the gains/losses from mark-to-market valuation on derivatives different from that considered under hedge accounting. During 2015, LB Panamá’s net trading income came in at Ps 29.1 billion, Ps 68.8 billion higher than in 2014. The devaluation of the average peso to dollar exchange rate accounted for Ps 69.0 billion of the increase in net trading income.
LB Panamá’s net trading income in local currency was Ps 0.2 billion lower in 2015 than in 2014. Of such decrease, a Ps 3.2 billion loss is the result of net trading income from investment securities held for trading through profit or loss that was partially offset by a Ps 3.0 billion increase in net trading income from derivatives.
Total income from valuation on trading and hedging derivatives increased Ps 3.0 billion from Ps 4.6 billion in 2014 to Ps 7.6 billion in 2015.
The decrease in the net trading income from investment securities held for trading through profit or loss was mainly driven by a reduction in its average yield from 5.2% in 2014 to 2.5% in 2015, resulting in a Ps 12.6 billion decrease in income. This decrease was partially offset by a 78.3% or Ps 372.1 billion increase in the average balance of LB Panamá’s equity and fixed income investments held for trading through profit or loss, which resulted in a Ps 9.4 billion increase in income.
Total income from investment securities
LB Panamá’s securities portfolio is classified in the following categories: (i) equity and fixed income investments held for trading through profit or loss (described in this section as net trading income in investment securities held for trading through profit or loss), (ii) available for sale fixed income investments and (iii) held to maturity fixed income investments (results from (ii) and (iii) are included in the net interest income section as interest income from investment in debt securities). LB Panamá manages its investment portfolio in a comprehensive and integral manner that considers individual return of each one of these three categories and the total return of the investment securities portfolio.
Total income from investment securities (comprised of income on investments in debt securities and net trading income in investment securities held for trading through profit or loss) was Ps 222.7 billion for 2015, 33.3% or Ps
55.6 billion higher than in 2014. The devaluation of the average peso to dollar exchange rate accounted for Ps 90.8 billion of the increase in total income from investment securities.
Total income from investment securities in local currency was 13.6% or Ps 35.2 billion lower than in 2014. This was primarily driven by a decrease in the average yield on investment securities from 4.3% in 2014 to 3.8% in 2015, generating a Ps 31.8 billion decrease in interest income. Additionally, a Ps 89.4 billion decrease in the average balance of Total Investment Securities from Ps 6,004.3 billion in 2014 to Ps 5,914.9 billion in 2015, resulted in a Ps 3.4 billion decrease in interest income.
When including the investment securities held for trading LB Panamá’s average total interest-earning assets (calculated as (i) gross loans including interbank and overnight funds, (ii) available for sale and held to maturity fixed income investments, and (iii) fixed income and equity investments held for trading through profit or loss) would have increased by 6.6%, or Ps 2,821.2 billion, from Ps 42,704.0 billion in 2015 to Ps 45,525.1 billion in 2014 and net interest income plus net trading income from investment securities held for trading would have increased by 8.8%, or Ps 213.2 billion from Ps 2,420.4 billion to Ps 2,633.6 billion over the same period. The return over average total interest-earning assets (calculated as (i) gross loans including interbank and overnight funds, (ii) available for sale and held to maturity fixed income investments, and (iii) fixed income and equity investments held for trading through profit or loss) would have increased by 12 basis points from 5.7% in 2014 to 5.8% in 2015.
Other income
| | | Year
ended December 31, | | | Change, 2015 vs. 2014 | | | For the year
ended
December 31,
2014
(adjusted)* | | | Change, 2015 vs.
2014 | |
| | | 2015 | | | 2014 | | | # | | | % | | | | | | # | | | % | |
| | | (in Ps billions) | | | | | | | | | | | | | | | | |
| Foreign exchange gains (losses), net | | | 219.8 | | | | 200.1 | | | | 19.7 | | | | 9.9 | | | | 277.7 | | | | (57.9 | ) | | | (20.8 | ) |
| Gains on sales of investments, net | | | 7.3 | | | | 26.5 | | | | (19.2 | ) | | | (72.6 | ) | | | 19.6 | | | | (12.3 | ) | | | (62.8 | ) |
| Income from sales of noncurrent assets held for sale | | | 4.5 | | | | 0.0 | | | | 4.5 | | | | N.A. | | | | 0.0 | | | | 4.5 | | | | N.A. | |
| Equity method | | | 0.0 | | | | 0.0 | | | | 0.0 | | | | N.A. | | | | 0.0 | | | | 0.0 | | | | N.A. | |
| Dividend income | | | 0.0 | | | | 0.0 | | | | 0.0 | | | | N.A. | | | | 0.0 | | | | 0.0 | | | | N.A. | |
| Income from non-financial sector, net | | | 0.0 | | | | 0.0 | | | | 0.0 | | | | N.A. | | | | 0.0 | | | | 0.0 | | | | N.A. | |
| Net income from financial instruments designated at fair value | | | 0.0 | | | | 0.0 | | | | 0.0 | | | | N.A. | | | | 0.0 | | | | 0.0 | | | | N.A. | |
| Other | | | 28.3 | | | | 32.4 | | | | (4.1 | ) | | | (12.8 | ) | | | 48.0 | | | | (19.7 | ) | | | (41.1 | ) |
| Total other income (expense) | | | 259.9 | | | | 259.0 | | | | 0.9 | | | | 0.4 | | | | 345.3 | | | | (85.4 | ) | | | (24.7 | ) |
* 2014 figures are adjusted for the impact of the devaluation of the Colombian Peso on a line by line basis
Total other income in local currency decreased by 0.4% or Ps 0.9 billion to Ps 259.9 billion in 2015. The devaluation of the average peso to dollar exchange rate accounted for Ps 86.3 billion of the increase in total other income.
Total other income in local currency decreased by 24.7% or Ps 85.4 billion in 2015. The decrease was mainly driven by a 20.8% or Ps 57.9 billion decrease in foreign exchange gains (losses), net. This decrease is explained by a depreciation of the Costa Rican Colón against the U.S. dollar.
Other expenses
| | | Year
ended December 31, | | | Change, 2015 vs. 2014 | | | For the year
ended
December 31, | | | Change, 2015 vs.
2014 | |
| | | 2015 | | | 2014 | | | # | | | % | | | 2014
(adjusted)* | | | # | | | % | |
| | | (in Ps billions) | | | | | | | | | | | | | | | | |
| Losses from sales of noncurrent assets held for sale | | | (0.0 | ) | | | (0.6 | ) | | | 0.6 | | | | (100.1 | ) | | | (0.0 | ) | | | (0.0 | ) | | | 551.7 | |
| Personnel expenses | | | (1,325.7 | ) | | | (879.4 | ) | | | (446.3 | ) | | | 50.7 | | | | (1,203.4 | ) | | | (122.2 | ) | | | 10.2 | |
| Salaries and employee benefits | | | (1,199.0 | ) | | | (795.4 | ) | | | (403.6 | ) | | | 50.7 | | | | (1,088.4 | ) | | | (110.6 | ) | | | 10.2 | |
| Bonus plan payments | | | (91.6 | ) | | | (64.2 | ) | | | (27.4 | ) | | | 42.8 | | | | (87.7 | ) | | | (3.9 | ) | | | 4.5 | |
| Termination payments | | | (35.1 | ) | | | (19.9 | ) | | | (15.2 | ) | | | 76.5 | | | | (27.4 | ) | | | (7.7 | ) | | | 28.3 | |
| Administrative and other expenses | | | (1,053.5 | ) | | | (693.9 | ) | | | (359.5 | ) | | | 51.8 | | | | (955.0 | ) | | | (98.4 | ) | | | 10.3 | |
| Depreciation and amortization | | | (222.3 | ) | | | (140.1 | ) | | | (82.2 | ) | | | 58.7 | | | | (192.9 | ) | | | (29.4 | ) | | | 15.2 | |
| Equity tax | | | 0.0 | | | | 0.0 | | | | 0.0 | | | | N.A. | | | | 0.0 | | | | 0.0 | | | | N.A. | |
| Other expenses | | | (34.3 | ) | | | (19.0 | ) | | | (15.3 | ) | | | 80.2 | | | | (26.2 | ) | | | (8.1 | ) | | | 31.0 | |
| Charitable and other donation expenses | | | (2.7 | ) | | | (3.2 | ) | | | 0.5 | | | | (16.0 | ) | | | (4.3 | ) | | | 1.6 | | | | (38.0 | ) |
| Other | | | (31.6 | ) | | | (15.8 | ) | | | (15.8 | ) | | | 99.7 | | | | (21.8 | ) | | | (9.8 | ) | | | 44.7 | |
| Total other expenses | | | (2,635.8 | ) | | | (1,733.1 | ) | | | (902.6 | ) | | | 52.1 | | | | (2,377.6 | ) | | | (258.2 | ) | | | 10.9 | |
* 2014 figures are adjusted for the impact of the devaluation of the Colombian Peso on a line by line basis
Total other expenses for the year ended December 31, 2015 increased by 52.1% or Ps 902.6 billion to Ps 2,635.8 billion in 2015. The devaluation of the average peso to dollar exchange rate accounted for Ps 644.5 billion of the increase in total other expenses.
Total other expenses in local currency for the year ended December 31, 2015 increased by 10.9% or Ps 258.2 billion in 2015. This increase is mainly explained by a Ps 122.2 billion increase in personnel expenses, a Ps 98.4 billion increase in administrative and other expenses, a Ps 29.4 billion increase in depreciation and amortization and a Ps 9.8 billion increase in other expenses.
The increase in personnel expenses is driven by the increase in the headcount in BAC Credomatic’s operation that occurred during the year to support the growth of the loan portfolio. The number of employees of BAC went from 23,135 employees in 2014 to 24,548 employees in 2015.
The increase in administrative and other expenses is explained by an increase in corporate expenses, and international branding fees, among others.
Because LB Panamá’s personnel and administrative expenses increased by 10.2% or Ps 220.7 billion, while its operational income increased by 8.7% or Ps 348.8 billion, LB Panamá’s efficiency ratio (calculated as personnel and administrative and other expenses divided by net interest income, fees and other services income, net trading income and other income excluding other) deteriorated slightly from 53.9% in 2014 to 54.7% in 2015.
Income tax expense
Income tax expense for LB Panamá increased by 60.6% or Ps 143.8 billion to Ps 380.8 billion for the year ended December 31, 2015. The devaluation of the average peso to dollar exchange rate accounted for Ps 91.0 billion of the increase in income tax expense
Income tax expense in local currency increased by 16.1% or Ps 52.8 billion in 2015. LB Panamá’s effective tax rate (calculated as income tax expense divided by income before tax expense minus equity method, minus dividends) increased from 26.7% in 2014 to 31.3% in 2015. The increase in the effective tax rate was mainly driven by an increase in the deferred tax rate in Guatemala.
Net income attributable to non-controlling interest
Net income attributable to non-controlling interest in LB Panamá was not material in both 2014 and 2015.
Banco de Occidente
Net income
| | | For the year ended December 31, | | | Change December 2015 vs
December 2014 | |
| | | 2015 | | | 2014 | | | # | | | % | |
| | | (in Ps billions) | | | | | | | |
| Interest income | | | 2,650.9 | | | | 2,285.6 | | | | 365.3 | | | | 16.0 | |
| Interest expenses | | | (989.8 | ) | | | (844.7 | ) | | | (145.2 | ) | | | 17.2 | |
| Net interest income | | | 1,661.1 | | | | 1,440.9 | | | | 220.1 | | | | 15.3 | |
| Impairment loss on loans and other accounts receivable, net | | | (544.1 | ) | | | (387.7 | ) | | | (156.5 | ) | | | 40.4 | |
| Impairment loss on other assets, net | | | (7.0 | ) | | | 0.0 | | | | (7.0 | ) | | | N.A. | |
| Recovery of charged-off financial assets | | | 67.5 | | | | 60.0 | | | | 7.4 | | | | 12.4 | |
| Net impairment loss | | | (483.6 | ) | | | (327.7 | ) | | | (156.0 | ) | | | 47.6 | |
| Net commission and fees income | | | 247.8 | | | | 197.5 | | | | 50.2 | | | | 25.4 | |
| Net trading income | | | 137.4 | | | | (5.6 | ) | | | 143.0 | | | | 2,546.1 | |
| Other income | | | 167.0 | | | | 869.7 | | | | (702.7 | ) | | | (80.8 | ) |
| Other expenses | | | (1,060.9 | ) | | | (955.9 | ) | | | (105.0 | ) | | | 11.0 | |
| Income before income tax expense | | | 668.7 | | | | 1,218.9 | | | | (550.2 | ) | | | (45.1 | ) |
| Income tax expense | | | (195.6 | ) | | | (206.0 | ) | | | 10.4 | | | | (5.1 | ) |
| Net Income | | | 473.1 | | | | 1,012.9 | | | | (539.8 | ) | | | (53.3 | ) |
| Net income attributable to: | | | | | | | | | | | | | | | | |
| Controlling interest | | | 471.8 | | | | 1,011.8 | | | | (540.0 | ) | | | (53.4 | ) |
| Non-controlling interest | | | 1.3 | | | | 1.1 | | | | 0.2 | | | | 21.2 | |
Banco de Occidente’s net income attributable to controlling interest decreased by 53.4%, or Ps 540.0 billion, to Ps 471.8 billion in 2015 as compared to Ps 1,011.8 billion in 2014. Despite a Ps 220.1 billion increase in net interest income, a Ps 143.0 billion increase in net trading income, a Ps 50.2 billion increase in net income from commissions and fees, and a Ps 10.4 billion reduction in income tax expense, net income decreased due to a Ps 702.7 billion decrease in other income (expense), a Ps 156.0 billion increase in net impairment loss on financial assets, a Ps 105.0 billion increase in total other expenses. The decrease in total other income (expense) is mainly attributable to a Ps 494.0 billion decrease in gains on sales of investments related to the sale of a portion of the bank’s investment in Corficolombiana at the end of 2014 (explained below), a Ps 133.2 billion decrease in foreign exchange gains (losses), net, and a Ps 65.5 billion decrease in dividends related to the Corficolombiana transaction, which affected its dividend income in 2015. The 47.6%, or Ps 156.0 billion, increase in provisions is primarily explained by a 17.5% growth of the bank’s loan portfolio and to an update of its allowance evaluation models, mainly in commercial loans, which generated Ps 49.6 billion in additional impairment losses. Finally, the increase of Ps 105.0 billion in total other expenses is partially explained by the wealth tax paid in 2015 of Ps 43.6 billion (see “Item 4. Information on the Company—B. Business Overview—Supervision and Regulation—Tax Reforms”) and to a Ps 20.6 billion increase in personnel expenses. In absence of the wealth tax and the additional impairment losses in 2015 and the effect of the Corficolombiana transaction in 2014, net income before income tax expense for 2015 and 2014 would have been Ps 761.9 billion and Ps 731.1 billion, respectively (Ps 30.0 billion or 4.1% higher than that of 2014).
Net income for 2014 was positively affected by a net gain of Ps 487.9 billion associated with the sale of 20,008,260 shares of Corficolombiana to Grupo Aval included in total other income. On December 17, 2014, Grupo Aval acquired from Banco de Occidente a 9.3% direct interest in Corficolombiana through the purchase of 20,008,260 common shares at a purchase price of Ps 38,459 per share, in line with market prices in the week prior to the sale. This positive effect was not reflected in Grupo Aval’s standalone nor consolidated financials as this was a transaction involving related parties that prior to the transaction were consolidated by Grupo Aval at book value.
This non-recurring income was described in a different manner in our prior year 20-F as it was accounted for under Colombian Banking GAAP principles, which were the applicable accounting standards at the time that this transaction took place.
Net interest income
| | | Year ended December 31, | | | Change, 2015 vs. 2014 | |
| | | 2015 | | | 2014 | | | # | | | % | |
| | | (in Ps billions) | | | | |
| Interest income: | | | | | | | | | | | | | | | | |
| Commercial loans and leases | | | 1,438.7 | | | | 1,282.2 | | | | 156.6 | | | | 12.2 | |
| Consumer loans and leases | | | 847.6 | | | | 726.9 | | | | 120.6 | | | | 16.6 | |
| Mortgage loans and leases | | | 69.2 | | | | 55.1 | | | | 14.1 | | | | 25.7 | |
| Microcredit loans and leases | | | 0.0 | | | | 0.0 | | | | 0.0 | | | | N.A. | |
| Interbank and overnight funds | | | 46.1 | | | | 42.5 | | | | 3.6 | | | | 8.4 | |
| Interest on loans and leases | | | 2,401.6 | | | | 2,106.7 | | | | 294.9 | | | | 14.0 | |
| Interest on investments in debt securities | | | 249.2 | | | | 178.9 | | | | 70.4 | | | | 39.3 | |
| Total interest income | | | 2,650.9 | | | | 2,285.6 | | | | 365.3 | | | | 16.0 | |
| Interest expense: | | | | | | | | | | | | | | | | |
| Checking accounts | | | (14.0 | ) | | | (16.0 | ) | | | 2.0 | | | | (12.3 | ) |
| Time deposits | | | (341.4 | ) | | | (281.3 | ) | | | (60.1 | ) | | | 21.4 | |
| Savings deposits | | | (362.8 | ) | | | (342.9 | ) | | | (19.9 | ) | | | 5.8 | |
| Total interest expense on deposits | | | (718.2 | ) | | | (640.2 | ) | | | (78.0 | ) | | | 12.2 | |
| Borrowings from banks and others | | | (25.8 | ) | | | (23.0 | ) | | | (2.8 | ) | | | 12.3 | |
| Interbank and overnight funds | | | (34.7 | ) | | | (7.2 | ) | | | (27.5 | ) | | | 381.5 | |
| Long-term debt (bonds) | | | (187.0 | ) | | | (148.0 | ) | | | (39.0 | ) | | | 26.4 | |
| Borrowings from development entities | | | (24.1 | ) | | | (26.3 | ) | | | 2.2 | | | | (8.3 | ) |
| Total interest expense | | | (989.8 | ) | | | (844.7 | ) | | | (145.2 | ) | | | 17.2 | |
| Net interest income | | | 1,661.1 | | | | 1,440.9 | | | | 220.1 | | | | 15.3 | |
Banco de Occidente’s net interest income increased by 15.3%, or Ps 220.1 billion, to Ps 1,661.1 billion in 2015 as compared to 2014. The increase in interest income is explained by a Ps 294.9 billion increase in income from interest on total loans and leases (which includes income from interbank and overnight funds) and a Ps 70.4 billion increase in income from investments in debt securities. The increase was partly offset by a Ps 145.2 billion increase in total interest expense in 2015 as compared to 2014. The increase in income from interest on total loans and leases was driven by a Ps 291.3 billion increase in interest income from loans and leases to Ps 2,355.5 billion in 2015 and a Ps 3.6 billion increase in interest income from interbank and overnight funds as compared to 2014.
The increase in interest earned on loans and leases of 14.1%, or Ps 291.3 billion, was mainly driven by a 11.5%, or Ps 2,483.8 billion, increase in Banco de Occidente’s average interest earning loan portfolio from Ps 21,576.4 billion in 2014 to Ps 24,060.2 billion in 2015, which resulted in a Ps 243.2 billion increase in interest income. In addition, Banco de Occidente’s average yield on loans increased by 22 basis points from 9.6% to 9.8%, resulting in a Ps 48.2 billion increase in interest income.
Income on interbank and overnight funds increased by 8.4%, or Ps 3.6 billion from Ps 42.5 billion in 2014 to Ps 46.1 billion in 2015.
Interest income on investments in debt securities increased by 39.3%, or Ps 70.4 billion, to Ps 249.2 billion for the year ended December 31, 2015, as a result of a 18.9% or Ps 823.2 billion increase in the average balance of investment in debt securities, which resulted in a Ps 39.7 billion increase in interest income. In addition, the increase in the average yield, from 4.1% for 2014 to 4.8% for 2015, resulted in a Ps 30.7 billion increase in interest income.
Total interest expense increased by 17.2% or Ps 145.2 billion in 2015 as compared to 2014, mainly driven by a 14.0%, or Ps 2,912.7 billion, increase in the average balance of interest-bearing liabilities from Ps 20,843.4 billion in 2014 to Ps 23,756.1 billion in 2015, which resulted in a Ps 121.4 billion increase in interest expense. Furthermore, an 11 basis points increase in the average cost of funds from 4.1% in 2014 to 4.2% in 2015 led to a Ps 23.8 billion increase in interest expense. Total interest expense for interest-bearing deposits increased 12.2%, or Ps 78.0 billion, to Ps 718.2 billion over the same period, mainly driven by a 12.9%, or Ps 2,122.6 billion, increase in the average balance of interest-bearing deposits from Ps 16,453.5 billion in 2014 to Ps 18,576.2 billion in 2015, resulting in a Ps 82.1 billion increase in interest expense. The average rate paid on interest-bearing deposits remained stable at 3.9% in both 2014 and 2015, which generated a Ps 4.0 billion decrease in interest expense.
The increase in total interest expense was mainly driven by a Ps 60.1 billion increase in interest expense on time deposits, a Ps 39.0 billion increase in interest expense on long-term debt, a Ps 27.5 billion increase in interest expense on interbank and overnight funds, and a Ps 19.9 billion increase in interest expense on savings deposits.
The Ps 60.1 billion increase in interest expense on time deposits was mainly driven by a 17.2%, or Ps 1,093.4 billion, increase in the average balance of time deposits from Ps 6,355.7 billion in 2014 to Ps 7,449.1 billion in 2015, which resulted in a Ps 50.1 billion increase in interest expense. Furthermore, the average rate paid on time deposits increased by 16 basis points from 4.4% in 2014 to 4.6% in 2015, resulting in a Ps 10.0 billion increase in interest expense. The cost of these funds increased mostly due to the increase in the average DTF rate from 4.07% in 2014 to 4.58% in 2015.
The increase in interest expense on long-term debt of Ps 39.0 billion was driven by a 156 basis points increase in the average rate paid from 6.2% in 2014 to 7.8% in 2015, which resulted in a Ps 37.3 billion increase in interest income. In addition, the average balance of long-term debt increased by 0.9%, or Ps 22.1 billion, to Ps 2,411.7 billion, which resulted in a Ps 1.7 billion increase in interest expense.
Interest expense on interbank and overnight funds increased by Ps 27.5 billion from Ps 7.2 billion in 2014 to Ps 34.7 billion in 2015 driven by a Ps 470.9 billion increase in the average balance of this funds to Ps 827.9 billion in 2016, which resulted in a Ps 19.7 billion increase in interest expense. The average rate paid on interbank and overnight funds increased by 217 basis points to 4.2% in 2015, resulting in a Ps 7.8 billion increase in interest expense.
The Ps 19.9 billion increase in interest expense on savings deposits was driven by a 10.4%, or Ps 923.4 billion, increase in the average balance of savings deposits from Ps 8,912.6 billion in 2014 to Ps 9,836.0 billion in 2015, which resulted in a Ps 34.1 billion increase in interest expense. Partially offsetting the increase, the average rate paid on savings deposits decreased by 16 basis points from 3.8% in 2014 to 3.7% in 2015, which resulted in a Ps 14.2 billion decrease in interest expense.
Average total interest earning assets (calculated as (i) gross loans including interbank and overnight funds, and (ii) available for sale and held to maturity fixed income investments) increased by 11.7%, or Ps 3,081.3 billion, from Ps 26,345.4 billion in 2014 to Ps 29,426.7 billion in 2015 and net interest income increased by 15.3%, or Ps 220.1 billion, from Ps 1,440.9 billion to Ps 1,661.1 billion over the same period, which resulted in a 18 basis points increase in the net interest margin from 5.47% in 2014 to 5.64% in 2015. The interest spread between the average rate on loans and leases and the average rate paid on deposits increased by 25 basis points from 5.7% to 5.9% over the same period. The increase in the net interest margin was mainly driven by the aforementioned increase in the yield of interest-earning assets, which was partially offset by the increase in the yield on interest-bearing liabilities.
Net impairment losses
| | | Year ended December 31, | | | Change, 2015 vs. 2014 | |
| | | 2015 | | | 2014 | | | # | | | % | |
| | | Total
Income/Expense | | | Total
Income/Expense | | | | | | | |
| | | (in Ps billions) | | | | | | | |
| Impairment losses: | | | | | | | | | | | | | | | | |
| Impairment loss on loans and leases, net | | | (497.4 | ) | | | (344.5 | ) | | | (152.9 | ) | | | 44.4 | |
| Impairment loss on accrued interest and other receivables, net | | | (46.7 | ) | | | (43.1 | ) | | | (3.6 | ) | | | 8.3 | |
| Impairment loss on investments in debt and equity securities | | | (7.0 | ) | | | (0.0 | ) | | | (7.0 | ) | | | N.A. | |
| Impairment loss on noncurrent held for sale assets | | | (0.0 | ) | | | (0.0 | ) | | | (0.0 | ) | | | (101.6 | ) |
| Recovery of charged-off financial assets | | | 67.5 | | | | 60.0 | | | | 7.4 | | | | 12.4 | |
| Recovery of impairment loss on investments in debt and equity securities | | | | | | | | | | | 0.0 | | | | N.A. | |
| Recovery of impairment loss on noncurrent held for sale assets | | | | | | | | | | | 0.0 | | | | N.A. | |
| Net impairment losses | | | (483.6 | ) | | | (327.7 | ) | | | (156.0 | ) | | | 47.6 | |
| | | Year ended December 31, | | | | |
| | | 2015 | | | 2014 | | | Change, 2015 vs. 2014 | |
| | | Loans 91 days
past due | | | Delinquency
Ratio (1) | | | Loans 91 days
past due | | | Delinquency
Ratio (1) | | | Loans 91
days past
due | | | Delinquency
Ratio | |
| | | | | | # | | | % | |
| | | (in Ps billions) | |
| Total loans and leases: | | | 499.0 | | | | 1.90 | % | | | 479.2 | | | | 2.14 | % | | | 19.8 | | | | (0.2 | ) |
| Commercial loans and leases | | | 352.6 | | | | 1.8 | % | | | 356.1 | | | | 2.2 | % | | | (3.5 | ) | | | (0.3 | ) |
| Consumer loans and leases | | | 130.1 | | | | 2.1 | % | | | 105.7 | | | | 2.0 | % | | | 24.4 | | | | 0.1 | |
| Mortgage loans and leases | | | 16.3 | | | | 1.9 | % | | | 17.4 | | | | 2.8 | % | | | (1.2 | ) | | | (0.9 | ) |
| Microcredit loans and leases | | | 0.0 | | | | N.A. | | | | 0.0 | | | | N.A. | | | | 0.0 | | | | N.A. | |
(1) Calculated as 91 days past due loans divided by total gross loans (excluding interbank and overnight funds)
Net impairment losses increased by 47.6%, or Ps 156.0 billion, in 2015 as compared to 2014. This increase was primarily driven by a Ps 152.9 billion increase in impairment loss on loans and leases, net, a Ps 7.0 billion increase in impairment loss on investments in debt and equity securities and a Ps 3.6 billion increase in impairment loss for accrued interests and other receivables, net. These increases were partially offset by a Ps 7.4 billion increase in recoveries of charged-off assets.
The increase in impairment loss on loans and leases, net of Ps 152.9 billion was mainly attributable to a 17.5% growth in the bank’s loans and leases portfolio and an update of Banco de Occidente’s probability of default (PD) parameter in their allowance evaluation models on February 2015, mostly in commercial loans, which in turn implied Ps 49.6 billion in additional provisions. The update led to an increase in Banco de Occidente’s coverage ratio for 91 days past due commercial loans and leases from 109.0% in 2014 to 131.0% in 2015 and one of 133.3% to 158.4% in total 91 days past due loans and leases.
Delinquency ratio (measured as loans 91 days past due as a percentage of total gross loans excluding interbank and overnight funds) decreased by 24 basis points in 2015 as compared to 2014 and the delinquency ratio for the commercial loan portfolio decreased by 34 basis points to 1.8% in 2015.
The bank’s cost of risk, measured as impairment loss on loans and leases, net divided by the average balance of loans and leases (excluding interbank and overnight funds), excluding the one-time effect of the bank’s allowance model update, increased 26 basis points from 1.8% in 2014 to 2.1% for 2015. The bank’s cost of risk net of recoveries of charged-off assets, measured as net impairment loss on loans and leases, net of recoveries of charged-
off assets divided by the average balance of loans and leases (excluding interbank and overnight funds), excluding the aforementioned one-time effect, increased from 1.5% in 2014 to 1.8% in 2015.
Charge-offs increased from Ps 303.2 billion for the year ended December 31, 2014 to Ps 370.3 billion for the year ended December 31, 2015 and the ratio of charge-offs to average loans (excluding interbank and overnight funds) increased from 1.4% for the year ended December 31, 2014 to 1.5% for the year ended December 31, 2015. Since Banco de Occidente’s net impairment loss on loans and leases increased, in absolute terms, more than charge-offs, the allowance for impairment losses on loans and leases increased from Ps 638.9 billion as of December 31, 2014 to Ps 790.3 billion as of December 31, 2015.
The recovery of charged-off assets increased by 12.4% or Ps 7.4 billion, to Ps 67.5 billion. The ratio of recovered charged-off assets to average loans (excluding interbank and overnight funds) remained substantially unchanged at 0.3% in 2015 as compared to 2014.
Impairment losses on investment in debt and equity securities were Ps 7.0 billion given a deterioration in a particular issuer (Pacific Exploration and Production S.A.) in Occidental Bank Barbados corporate bond portfolio.
Net commission and fee income
| | | Year ended December 31, | | | Change, 2015 vs. 2014 | |
| | | 2015 | | | 2014 | | | # | | | % | |
| | | (in Ps billions) | | | | | | | |
| Commissions and fee income: | | | | | | | | | | | | | | | | |
| Banking fees | | | 347.6 | | | | 278.3 | | | | 69.3 | | | | 24.9 | |
| Bonded warehouse services | | | 0.0 | | | | 0.0 | | | | 0.0 | | | | N.A. | |
| Trust activities | | | 51.2 | | | | 48.4 | | | | 2.7 | | | | 5.7 | |
| Pension and severance fund management | | | 0.0 | | | | 0.0 | | | | 0.0 | | | | N.A. | |
| Commissions and fee income | | | 398.8 | | | | 326.8 | | | | 72.0 | | | | 22.0 | |
| Commission and fee expenses | | | (151.0 | ) | | | (129.1 | ) | | | (21.8 | ) | | | 16.9 | |
| Net commission and fee income | | | 247.8 | | | | 197.6 | | | | 50.2 | | | | 25.4 | |
Net commission and fee income increased by 25.4% or Ps 50.2 billion to Ps 247.8 billion in 2015 as compared to 2014. This was primarily due to a Ps 72.0 billion increase in income from commissions and fees that was partially offset by a Ps 21.8 billion increase in expenses for commissions and fees. The performance in income from commissions and fees is mainly attributable to a Ps 69.3 billion increase in banking fees to Ps 347.6 billion in 2015, and a Ps 2.7 billion increase in trust activities. This Ps 69.3 billion increase in banking fees was principally due to a Ps 56.8 billion increase in fees from bancassurance and a Ps 19.7 billion increase commissions from credit and debit card fees. This increase was partially offset by a 16.9%, or Ps 21.8 billion, increase in expenses from commissions and fees in 2015 as compared to 2014 partly explained by (i) a Ps 8.4 billion increase in sales force incentives, and (ii) a Ps 2.6 billion increase in fees related to loan origination.
Net trading income
Banco de Occidente’s net trading income includes (i) net trading income from investment securities held for trading through profit or loss, which reflects the interest and gains/losses from mark-to-market valuation, in each case from equity and fixed income investment securities held for trading through profit or loss, and (ii) net trading income from derivatives, which reflects the gains/losses from mark-to-market valuation on derivatives different from that considered under hedge accounting. During 2015, the bank’s net trading income came in at Ps 137.4 billion during 2015, Ps 143.0 billion higher than the Ps 5.6 billion loss obtained in 2014. Of such increase, Ps 146.2 billion are the result of net trading income from derivatives that were partially offset by a Ps 3.2 billion reduction in net trading income from investment securities held for trading through profit or loss.
Net trading income from derivatives increased Ps 146.2 billion from a loss of Ps 34.6 billion in 2014 to a gain of Ps 111.6 billion in 2015.
The decrease of Ps 3.2 billion in the net trading income from our investment securities held for trading through profit or loss was mainly driven by a 26.4%, or Ps 240.4 billion decrease in the average balance of Banco de Occidente’s fixed income and equity investments held for trading through profit or loss, which resulted in a Ps 9.3 billion decrease in income. This was partially offset by an increase in the average yield from 3.2% in 2014 to 3.9% in 2015, resulting in a Ps 6.1 billion increase in income.
Total income from investment securities
Banco de Occidente’s securities portfolio is classified in the following categories: (i) equity and fixed income investments held for trading through profit or loss (described in this section as net trading income in investment securities held for trading through profit or loss), (ii) available for sale fixed income investments and (iii) held to maturity fixed income investments (results from (ii) and (iii) are included in the net interest income section as interest income from investment in debt securities). Banco de Occidente manages its investment portfolio in a comprehensive and integral manner that considers individual return of each one of these three categories and the total return of the investment securities portfolio.
Total income from investment securities for the bank (comprised of income on investments in debt securities and net trading income in investment securities held for trading through profit or loss) was Ps 275.1 billion for 2015, 32.3% or Ps 67.2 billion higher than the Ps 207.9 billion registered during 2014. This was primarily driven by an increase in the average yield on investment securities which increased from 4.0% in 2014 to 4.7% in 2015, generating a Ps 39.7 billion increase in interest income. The average balance of Total Investment Securities increased by Ps 582.9 billion from Ps 5,257.8 billion in 2014 to Ps 5,840.6 billion in 2015, resulting in a Ps 27.5 billion increase in interest income.
When including the investment securities held for trading through profit or loss Banco de Occidente’s average total interest-earning assets (calculated as (i) gross loans including interbank and overnight funds, (ii) available for sale and held-to-maturity fixed income investments, and (iii) fixed income and equity investments held for trading through profit or loss) would have increased by 10.4% or Ps 2,840.9 billion from Ps 27,255.4 billion in 2014 to Ps 30,096.4 billion in 2015 and net interest income plus net trading income would have increased by 14.8%, or Ps 216.9 billion, from Ps 1,470.0 billion to Ps 1,686.9 billion over the same period. The return over average total interest-earning assets (calculated as (i) gross loans including interbank and overnight funds, (ii) available for sale and held-to-maturity fixed income investments, and (iii) fixed income and equity investments held for trading through profit or loss) would have increased by 21 basis points from 5.4% in 2014 to 5.6% in 2015.
Other income
| | | Year ended December 31, | | | Change, 2015 vs. 2014 | |
| | | 2015 | | | 2014 | | | # | | | % | |
| | | (in Ps billions) | | | | |
| Foreign exchange gains (losses), net | | | (54.0 | ) | | | 79.2 | | | | (133.2 | ) | | | (168.3 | ) |
| Gains on sales of investments, net | | | 0.8 | | | | 494.7 | | | | (494.0 | ) | | | (99.8 | ) |
| Income from sales of noncurrent assets held for sale | | | 2.8 | | | | 0.0 | | | | 2.8 | | | | N.A. | |
| Equity method | | | 95.9 | | | | 104.7 | | | | (8.8 | ) | | | (8.4 | ) |
| Dividend income | | | 27.8 | | | | 93.3 | | | | (65.5 | ) | | | (70.2 | ) |
| Gains on valuation of assets, net | | | 0.0 | | | | 0.0 | | | | 0.0 | | | | N.A. | |
| Income from non-financial sector, net | | | (45.5 | ) | | | (36.7 | ) | | | (8.8 | ) | | | (24.1 | ) |
| Net income from financial instruments designated at fair value | | | 0.0 | | | | 0.0 | | | | 0.0 | | | | N.A. | |
| Other | | | 139.3 | | | | 134.4 | | | | 4.9 | | | | 3.6 | |
| Total other income (expense) | | | 167.0 | | | | 869.7 | | | | (702.7 | ) | | | (80.8 | ) |
Total other income (expense) decreased by 80.8%, or Ps 702.7 billion, to Ps 167.0 billion in 2015 as compared to 2014. This decrease was mainly driven by the Ps 487.9 billion total other income related to the non-recurring
Corficolombiana transaction in 2014. Of the Ps 487.9 billion, Ps 491.3 billion were recorded as gains on sales of investments resulting from the sale of a portion of its interest in Corficolombiana to Grupo Aval that were partially offset by a Ps 3.4 billion reversion of dividends that were recognized prior to the sale.
In addition, total other income (expense) decreased by Ps 133.2 billion in foreign exchange gains (losses), net, a Ps 65.5 billion decrease in dividend income, a Ps 8.8 billion decrease in the bank’s equity method and a Ps 8.8 billion decrease in income from non-financial sector, net. These were partially offset by a Ps 4.9 billion increase in other income and a Ps 2.8 billion increase in income from sales of noncurrent assets held for sale.
Dividend income decreased by Ps 65.5 billion mainly due to the impact of the sale of a part of Banco de Occidente’s investment in Corficolombiana in December 2014, which in turn led to a lower share of dividends declared in 2015 as compared to the one in 2014 and resulted in a Ps 60.8 billion decrease in dividends received from that investment.
Income from equity method decreased by Ps 8.8 billion mainly explained by a Ps 6.0 billion decrease in equity method income from Porvenir. Income from the non-financial sector, net decreased by Ps 8.8 billion due to an increase in Banco de Occidente’s subsidiary Ventas y Servicios’ personnel expenses.
The Ps 4.9 billion increase in other income is primarily explained by a Ps 67.1 billion recovery of a part of 2013 and 2014 CREE surcharge provision, partially offset by (i) a Ps 45.3 billion decrease in insurance claims, (ii) a Ps 5.7 billion decrease in recoveries of provisions from previous results, and (iii) a Ps 4.3 billion decrease in income from ATM network usage fees charged to third parties.
Other expenses
| | | Year ended December 31, | | | Change, 2015 vs. 2014 | |
| | | 2015 | | | 2014 | | | # | | | % | |
| | | (in Ps billions) | | | | | | | |
| Losses from sales of noncurrent assets held for sale | | | (0.0 | ) | | | (0.6 | ) | | | 0.6 | | | | (100.0 | ) |
| Personnel expenses | | | (400.4 | ) | | | (379.9 | ) | | | (20.6 | ) | | | 5.4 | |
| Salaries and employee benefits | | | (394.0 | ) | | | (346.0 | ) | | | (47.9 | ) | | | 13.9 | |
| Bonus plan payments | | | (4.6 | ) | | | (25.3 | ) | | | 20.7 | | | | (81.7 | ) |
| Termination payments | | | (1.8 | ) | | | (8.5 | ) | | | 6.7 | | | | (78.5 | ) |
| Administrative and other expenses | | | (542.5 | ) | | | (484.5 | ) | | | (57.9 | ) | | | 12.0 | |
| Depreciation and amortization | | | (61.4 | ) | | | (72.9 | ) | | | 11.5 | | | | (15.7 | ) |
| Wealth tax | | | (43.6 | ) | | | 0.0 | | | | (43.6 | ) | | | N.A. | |
| Other expenses | | | (13.0 | ) | | | (18.0 | ) | | | 5.0 | | | | (27.9 | ) |
| Charitable and other donation expenses | | | (1.7 | ) | | | (0.6 | ) | | | (1.1 | ) | | | 175.8 | |
| Other | | | (11.3 | ) | | | (17.4 | ) | | | 6.1 | | | | (35.1 | ) |
| Total other expenses | | | (1,060.9 | ) | | | (955.9 | ) | | | (105.0 | ) | | | 11.0 | |
Total other expenses increased by 11.0%, or Ps 105.0 billion, in 2015 as compared to 2014, mainly driven by an increase of Ps 57.9 billion in administrative and other expenses, the Ps 43.6 billion paid in wealth tax and a Ps 20.6 billion increase in personnel expenses. Partially offsetting these increases was a Ps 11.5 billion decrease in depreciation and amortization and a Ps 5.0 billion decrease in other expenses.
Administrative and other expenses increased by Ps 57.9 billion to Ps 542.5 billion in 2015 from Ps 484.5 billion in 2014, mainly explained by (i) a Ps 24.5 billion increase in office rental fees, utilities, and other administrative fees, and (ii) a Ps 22.0 billion increase in service fees.
The Ps 20.6 billion increase in personnel expenses is explained by a Ps 47.9 billion increase in salaries and employee benefits, partially offset by a Ps 20.7 reduction in bonus plan payments and a Ps 6.7 billion decrease in termination payments. The 13.9%, or Ps 47.9 billion, increase in salaries and employee benefits was explained by a 0.1% increase in headcount from 14,562 to 14,571 employees between 2014 and 2015, which was accompanied with an increase in their yearly salaries and employee benefits per employee from Ps 23.8 million in 2014 to Ps 27.0 million in 2015.
Partially offsetting these increases was a Ps 5.0 billion decrease in other expenses is mainly explained by (i) a Ps 2.3 billion reduction in loss on casualties of operational risk and (ii) a Ps 1.3 billion decrease in provisions for other assets.
Banco de Occidente’s efficiency ratio deteriorated from 36.5% for 2014 to 45.5% for 2015. The ratio of personnel expenses and administrative and other expenses as a percentage of average assets remained unchanged at 2.8% for both 2014 and 2015. When adjusting efficiency for the Corficolombiana transaction, the indicator for 2014 would have been 46.0% and the bank’s efficiency would have improved in 2015 as compared to the adjusted efficiency ratio for 2014.
Income tax expense
Income tax expense for Banco de Occidente decreased by Ps 10.4 billion, or 5.1%, to Ps 195.6 billion for the year ended December 31, 2015, primarily due to lower income before income tax expense. Banco de Occidente’s effective tax rate (calculated as income tax expense divided by income before tax expense minus equity method, minus dividends, plus wealth tax) increased from 20.2% for the year ended December 31, 2014 to 33.3% for the year ended December 31, 2015. Nonetheless, when excluding (i) the Corficolombiana effect in 2014 and (ii) the non-taxed Ps 67.1 billion recovery of a part of 2013 and 2014 CREE surcharge provision accounted for in 2015, the effective tax rates for 2014 and 2015 would have been 38.7% and 37.6%, respectively.
Net income attributable to non-controlling interest
Banco de Occidente’s net income attributable to non-controlling interest increased by Ps 0.2 billion to Ps 1.3 billion for the year ended December 31, 2015. Net income attributable to non-controlling interest is not a significant contributor to net income for Banco de Occidente, responsible for only 0.3% of net income for the year ended December 31, 2015.
Banco Popular
| | | Banco Popular Consolidated | |
| | | For the year ended December 31, | | | Change December 2015 vs
December 2014 | |
| | | 2015 | | | 2014 | | | # | | | % | |
| | | (in Ps billions) | | | | | | | |
| Interest income | | | 1,624.3 | | | | 1,525.3 | | | | 99.0 | | | | 6.5 | |
| Interest expenses | | | (583.2 | ) | | | (505.5 | ) | | | (77.7 | ) | | | 15.4 | |
| Net interest income | | | 1,041.1 | | | | 1,019.8 | | | | 21.3 | | | | 2.1 | |
| Impairment loss on loans and other accounts receivable, net | | | (63.2 | ) | | | (92.4 | ) | | | 29.2 | | | | (31.6 | ) |
| Impairment loss on other assets, net | | | (4.7 | ) | | | (0.0 | ) | | | (4.7 | ) | | | N.A. | |
| Recovery of charged-off financial assets | | | 29.3 | | | | 15.4 | | | | 13.9 | | | | 90.0 | |
| Net impairment loss | | | (38.5 | ) | | | (77.0 | ) | | | 38.4 | | | | (49.9 | ) |
| Net commission and fees income | | | 128.6 | | | | 137.6 | | | | (9.0 | ) | | | (6.6 | ) |
| Net trading income | | | 19.0 | | | | 12.9 | | | | 6.1 | | | | 46.7 | |
| Other income | | | 178.0 | | | | 183.1 | | | | (5.1 | ) | | | (2.8 | ) |
| Other expenses | | | (805.9 | ) | | | (690.7 | ) | | | (115.2 | ) | | | 16.7 | |
| Income before income tax expense | | | 522.4 | | | | 585.8 | | | | (63.5 | ) | | | (10.8 | ) |
| Income tax expense | | | (173.1 | ) | | | (196.0 | ) | | | 22.9 | | | | (11.7 | ) |
| Net Income | | | 349.3 | | | | 389.8 | | | | (40.5 | ) | | | (10.4 | ) |
| Net income attributable to: | | | | | | | | | | | | | | | | |
| Controlling interest | | | 348.5 | | | | 388.4 | | | | (39.9 | ) | | | (10.3 | ) |
| Non-controlling interest | | | 0.8 | | | | 1.4 | | | | (0.6 | ) | | | (43.6 | ) |
Banco Popular’s net income attributable to controlling interest decreased by 10.3%, or Ps 39.9 billion, to Ps 348.5 billion in 2015 as compared to Ps 388.4 billion in 2014. This decrease is attributable to a Ps 115.2 billion increase in other expenses and a Ps 9.0 billion decrease in net income from commissions and fees. Partially offsetting the above mentioned, there was a decrease of Ps 38.4 billion in net impairment loss on financial assets, a Ps 22.9 billion decrease in income tax expense and a Ps 21.3 billion increase in net interest income. The Ps 115.2 billion increase in other expenses is mainly explained by (i) the provisions demanded by the actuarial model for employee benefits (while in 2014 the model generated a Ps 28.4 billion recovery of provisions, in 2015 it demanded a provision of Ps 7.9 billion) and (ii) the wealth tax paid in 2015 of Ps 30.0 billion (see “Item 4. Information on the Company—B. Business Overview—Supervision and Regulation—Tax Reforms”). In absence of the recovery of provisions on the actuarial model for employee benefits in 2014 and the wealth tax paid in 2015, net income before income tax expense for 2015 and 2014 would have been Ps 552.4 billion and Ps 557.4 billion, respectively (Ps 5.0 billion or 0.9% lower than that of 2014).
Net interest income
| | | Year ended December 31, | | | Change, 2015 vs. 2014 | |
| | | 2015 | | | 2014 | | | # | | | % | |
| | | (in Ps billions) | | | | |
| Interest income: | | | | | | | | | | | | | | | | |
| Commercial loans and leases | | | 462.3 | | | | 399.3 | | | | 63.0 | | | | 15.8 | |
| Consumer loans and leases | | | 1,044.6 | | | | 1,000.1 | | | | 44.5 | | | | 4.4 | |
| Mortgage loans and leases | | | 17.1 | | | | 7.0 | | | | 10.1 | | | | 143.7 | |
| Microcredit loans and leases | | | 1.5 | | | | 2.0 | | | | (0.5 | ) | | | (25.7 | ) |
| Interbank and overnight funds | | | 10.3 | | | | 11.6 | | | | (1.3 | ) | | | (11.4 | ) |
| Interest on loans and leases | | | 1,535.9 | | | | 1,420.1 | | | | 115.8 | | | | 8.2 | |
| Interest on investments in debt securities | | | 88.4 | | | | 105.2 | | | | (16.8 | ) | | | (15.9 | ) |
| Total interest income | | | 1,624.3 | | | | 1,525.3 | | | | 99.0 | | | | 6.5 | |
| Interest expense: | | | | | | | | | | | | | | | | |
| Checking accounts | | | (0.8 | ) | | | (4.7 | ) | | | 3.9 | | | | (82.6 | ) |
| Time deposits | | | (143.6 | ) | | | (73.8 | ) | | | (69.8 | ) | | | 94.5 | |
| Savings deposits | | | (274.5 | ) | | | (296.4 | ) | | | 21.9 | | | | (7.4 | ) |
| Total interest expense on deposits | | | (419.0 | ) | | | (374.9 | ) | | | (44.0 | ) | | | 11.7 | |
| Borrowings from banks and others | | | (0.0 | ) | | | (0.0 | ) | | | 0.0 | | | | (394.2 | ) |
| Interbank and overnight funds | | | (29.2 | ) | | | (9.4 | ) | | | (19.8 | ) | | | 210.3 | |
| Long-term debt (bonds) | | | (129.1 | ) | | | (116.0 | ) | | | (13.1 | ) | | | 11.3 | |
| Borrowings from development entities | | | (5.9 | ) | | | (5.2 | ) | | | (0.7 | ) | | | 14.4 | |
| Total interest expense | | | (583.2 | ) | | | (505.5 | ) | | | (77.7 | ) | | | 15.4 | |
| Net interest income | | | 1,041.1 | | | | 1,019.8 | | | | 21.3 | | | | 2.1 | |
Banco Popular’s net interest income increased by 2.1%, or Ps 21.3 billion, from Ps 1,019.8 billion in 2014 to Ps 1,041.1 billion in 2015. This increase was primarily driven by a Ps 99.0 billion increase in total interest income that was partially offset by Ps 77.7 billion increase in total interest expense. The increase in total interest income is explained by a Ps 115.8 billion increase in interest income on total loans and leases (which includes income from interbank and overnight funds) that was partially offset by a Ps 16.8 billion decrease in income on investments in debt securities. The increase in interest income on total loans and leases was driven by a Ps 117.1 billion increase in interest income on loans and leases to Ps 1,525.5 billion in 2015 and was partially offset by a Ps 1.3 billion decrease in income from interbank and overnight funds.
The increase in interest earned on loans and leases (excluding interbank and overnight funds) of Ps 117.1 billion is mainly explained by a 9.4%, or Ps 1,182.3 billion, increase in Banco Popular’s average interest-earning loans and leases portfolio from Ps 12,643.4 billion in 2014 to Ps 13,825.6 billion in 2015, which resulted in a Ps 130.5 billion increase in interest income. Partially offsetting the increase was a slight decrease in the average yield of loans and financial leases from 11.1% in 2014 to 11.0% in 2015, which resulted in a Ps 13.4 billion decrease in interest income on loans and leases. The decrease in the yield was a result of (i) a competitive landscape in Colombia, in particular for payroll loans and (ii) a decrease in the banking system’s yield on consumer loans of 23 basis points from 15.9% in 2014 to 15.7% in the last months of 2015.
Interest earned on interbank and overnight funds decreased by Ps 1.3 billion from Ps 11.6 billion in 2014 to Ps 10.3 billion in 2015.
The Ps 16.8 billion decrease to Ps 88.4 billion in 2015 in income on investments in debt securities mainly reflects a 14.8%, or Ps 287.6 billion, decrease in the average balance of investments in debt securities from Ps 1,939.1 billion in 2014 to Ps 1,651.5 billion in 2015, which led to a Ps 15.4 billion decrease in interest income. Moreover, there was a 7 basis points decrease in the yield from 5.42% in 2014 to 5.35% in 2015, which resulted in a Ps 1.4 billion decrease in interest income.
Total interest expense increased by 15.4%, or Ps 77.7 billion, to Ps 583.2 billion in 2015 as compared to 2014, mainly driven by a 9.5%, or Ps 1,132.4 billion, increase in the average balance of interest-bearing liabilities from Ps 11,976.7 billion in 2014 to Ps 13,109.1 billion in 2015, which resulted in a Ps 50.4 billion increase in interest expense. In addition, a 23 basis points increase in the average cost of funds from 4.2% in 2014 to 4.4% in 2015 resulted in a Ps 27.3 billion increase in interest expense. Total interest expense for interest-bearing deposits increased by 11.7%, or Ps 44.0 billion, to Ps 419.0 billion in 2015 as compared to Ps 374.9 billion in 2014, mainly driven by a 9.6%, or Ps 910.8 billion, increase in the average balance of interest-bearing deposits from Ps 9,477.4 billion in 2014 to Ps 10,388.2 billion in 2015, which led to a Ps 36.7 billion increase in interest expense. Furthermore, there was an 8 basis points increase in the average cost of funds from 3.96% in 2014 to 4.03% in 2015, resulting in a Ps 7.3 billion increase in interest expense.
The Ps 44.0 billion increase in interest expense on interest-bearing deposits is explained by a Ps 69.8 billion increase in interest expense on time deposits, which was offset in part by a Ps 21.9 billion decrease in interest expense on savings deposits and a Ps 3.9 billion decrease in interest expense on interest-bearing checking accounts. The Ps 33.6 billion increase in interest expense on other funding was mainly attributable to a Ps 19.8 billion increase in interest expense on interbank and overnight funds and a Ps 13.1 billion increase in interest expense on long-term debt.
The increase in interest expense on time deposits of Ps 69.8 billion was mainly due to a 61.7% or Ps 949.8 billion increase in the average balance of time deposits from Ps 1,540.1 billion in 2014 to Ps 2,489.9 billion in 2015, which resulted in a Ps 54.8 billion increase in interest expense. The average interest rate paid on time deposits increased by 97 basis points to 5.8% in 2015, which resulted in a Ps 15.0 billion increase in the interest expense.
The Ps 21.9 billion decrease in interest expenses on savings deposits was due to a 29 basis points decrease in the average rate paid on savings deposits from 3.8% to 3.5%, which resulted in a Ps 22.6 billion decrease in interest expense. Partially offsetting this decrease was a 0.3%, or Ps 20.1 billion decrease in the average balance of savings deposits from Ps 7,821.0 billion in 2014 to Ps 7,841.0 billion in 2015, which resulted in a Ps 0.7 billion increase in interest expense.
The decrease in interest expense on interest-bearing checking accounts of Ps 3.9 billion was mainly attributed to a 262 basis points decrease in the interest rate paid from 4.0% in 2014 1.4% in 2015, which resulted in a Ps 3.0 billion decrease in interest expense. Moreover, the average balance of interest-bearing checking accounts decreased by 50.8%, or Ps 59.1 billion, from Ps 116.3 billion in 2014 to Ps 57.3 billion in 2015, which led to a Ps 0.8 billion decrease in interest expense. This movement in checking accounts is explained by the banks strategy to optimize deposit mix to achieve relative stability in the cost of deposits.
Interest expense on interbank and overnight funds increased by Ps 19.8 billion from Ps 9.4 billion in 2014 to Ps 29.2 billion in 2015.
The increase in interest expense on long-term debt of Ps 13.1 billion was primarily explained by a 106 basis points increase in the average rate paid on long-term debt from 6.1% in 2014 to 7.1% in 2015, which resulted in a Ps 20.2 billion increase in interest expense. Partially offsetting this increase was a 5.2%, or Ps 99.8 billion, decrease in the average balance of long-term debt from Ps 1,913.2 billion in 2014 to Ps 1,813.4 billion in 2015, which resulted in a Ps 7.1 billion decrease in interest expense.
Average total interest earning assets (calculated as (i) gross loans including interbank and overnight funds, and (ii) available for sale and held to maturity fixed income investments) increased by 6.1%, or Ps 889.0 billion, to Ps 15,448.8 billion in 2015 as compared to Ps 14,599.7 billion in 2014, and net interest income increased by 2.1%, or Ps 21.3 billion, from Ps 1,019.8 billion in 2014 to Ps 1,041.1 billion in 2015, which resulted in a 26 basis point decrease in the net interest margin from 7.0% in 2014 to 6.7% in 2015.
Interest spread between the average yield earned on loans and leases and the average rate paid on deposits decreased by 18 basis points from 7.2% in 2014 to 7.0% in 2015. The decrease in the spread between the average yield earned on loans and leases and the average rate paid on deposits was driven by the slight decrease in the yield of the loan and financial leases portfolio and by the increase in the yield paid on deposits, mainly explained by the Central Bank’s repo rate hike from 4.50% in 2014 to 5.75% in 2015, which increased the bank’s cost of funding.
Net impairment losses
| | | Year ended December 31, | | | Change, 2015 vs. 2014 | |
| | | 2015 | | | 2014 | | | # | | | % | |
| | | Total
Income/Expense | | | Total
Income/Expense | | | Total Income/Expense | |
| | | (in Ps billions) | | | | | | | |
| Impairment losses: | | | | | | | | | | | | | | | | |
| Impairment loss on loans and leases, net | | | (61.3 | ) | | | (88.4 | ) | | | 27.1 | | | | (30.7 | ) |
| Impairment loss on accrued interest and other receivables, net | | | (1.9 | ) | | | (4.0 | ) | | | 2.1 | | | | (52.8 | ) |
| Impairment loss on investments in debt and equity securities | | | 0.0 | | | | 0.0 | | | | 0.0 | | | | N.A. | |
| Impairment loss on noncurrent held for sale assets | | | (4.7 | ) | | | 0.0 | | | | (4.7 | ) | | | N.A. | |
| Recovery of charged-off financial assets | | | 29.3 | | | | 15.4 | | | | 13.9 | | | | 90.0 | |
| Recovery of impairment on investments in debt and equity | | | — | | | | — | | | | 0.0 | | | | N.A. | |
| Recovery of Impairment loss on noncurrent held for sale assets | | | — | | | | — | | | | 0.0 | | | | N.A. | |
| Net impairment losses | | | (38.5 | ) | | | (77.0 | ) | | | 38.4 | | | | (49.9 | ) |
| | | Year ended December 31, | | | | |
| | | 2015 | | | 2014 | | | Change, 2015 vs. 2014 | |
| | | Loans 91
days past due | | | Delinquency
Ratio(1) | | | Loans 91
days past
due | | | Delinquency
Ratio(1) | | | Loans
91 days
past due | | | Delinquency
Ratio | |
| | | | | | | | | | | | | | | # | | | % | |
| | | (in Ps billions) | |
| Delinquency Ratios: | | | 213.2 | | | | 1.5 | % | | | 202.5 | | | | 1.5 | % | | | 10.7 | | | | (0.1 | ) |
| Commercial loans and leases | | | 83.6 | | | | 1.2 | % | | | 78.7 | | | | 1.3 | % | | | 4.9 | | | | (0.1 | ) |
| Consumer loans and leases | | | 125.5 | | | | 1.7 | % | | | 118.8 | | | | 1.8 | % | | | 6.7 | | | | (0.1 | ) |
| Mortgage loans and leases | | | 3.4 | | | | 1.0 | % | | | 4.0 | | | | 2.0 | % | | | (0.6 | ) | | | (1.1 | ) |
| Microcredit loans and leases | | | 0.7 | | | | 6.8 | % | | | 1.0 | | | | 7.6 | % | | | (0.3 | ) | | | (0.8 | ) |
(1) Calculated as 91 days past due loans divided by total gross loans (excluding interbank and overnight funds)
Net impairment losses decreased by 49.9%, or Ps 38.4 billion, in 2015 as compared to 2014. This decrease was primarily driven by a Ps 27.1 billion decrease in impairment loss in loans and leases, net, a Ps 13.9 billion increase in recoveries of charged-off assets and a Ps 2.1 billion decrease in impairment loss on accrued interest and other receivables, net, which were partly offset by a Ps 4.7 billion increase in impairment loss on noncurrent held for sale assets.
The Ps 27.1 billion decrease in impairment loss on loans and leases, net was attributable to an improvement in Banco Popular’s delinquency ratio (measured as loans 91 days past due as a percentage of total gross loans excluding interbank and overnight funds) from 1.54% in 2014 to 1.45% in 2015 and to an update in the probability of default parameter in the bank’s allowance evaluation models that lowered impairment losses requirements in Ps 27.1 billion in the commercial segment. The bank’s cost of risk, measured as impairment loss on loans and leases divided by the average balance of loans and leases (excluding interbank and overnight funds), adjusted for the one-time effect registered during 2015 was 0.6% compared to the 0.7% in 2014. The bank’s cost of risk net of recoveries of charged-off assets, measured as impairment loss on loans and leases, net of recoveries of charged-off assets divided by the average balance of loans and leases (excluding interbank and overnight funds), adjusted for the one-time effect registered during 2015 improved from 0.6% 2014 to 0.4% in 2015.
Banco Popular’s delinquency ratio (measured as loans 91 days past due as a percentage of total gross loans excluding interbank and overnight funds) improved by 9 basis points from 1.54% in 2014 to 1.45% in 2015. Delinquency ratios for consumer loans improved 8 basis points to 1.7% in 2015, commercial loans improved 5 basis points to 1.2% and mortgages improved 107 basis points to 1.0%.
Impairment loss on accrued interest and other receivables, net decreased by 52.8%, or Ps 2.1 billion in 2015 as compared to 2014 due to higher reversals of impairment losses of Ps 1.8 billion.
Charge-offs increased from Ps 73.8 billion for the year ended December 31, 2014 to Ps 79.0 billion for the year ended December 31, 2015. Since Banco Popular’s impairment loss on loans and leases, net increased, in absolute terms, less than charge-offs, the allowance for impairment losses of loans and leases decreased from Ps 416.4 billion as of December 31, 2014 to Ps 401.1 billion as of December 31, 2015. As of December 31, 2015 Banco Popular’s coverage over its 91 days past due loans was 188.1%. The charge-offs to average loans (excluding interbank and overnight funds) ratio remained stable at 0.6% for both years.
The recovery of charged-off assets increased by 90.0%, or Ps 13.9 billion, to Ps 29.3 billion. The ratio of recovered charged-off assets to average loans (excluding interbank and overnight funds) increased by 9 basis points to 0.2% in 2015 as compared to the 0.1% in 2014.
Impairment loss on noncurrent held for sale assets, net increased by Ps 4.7 billion over the same period due to a deterioration in foreclosed assets held by the bank.
Net commission and fee income
| | | Year ended December 31, | | | Change, 2015 vs. 2014 | |
| | | 2015 | | | 2014 | | | # | | | % | |
| | | (in Ps billions) | | | | | | | |
| Commission and fee income: | | | | | | | | | | | | | | | | |
| Banking fees | | | 110.5 | | | | 107.9 | | | | 2.6 | | | | 2.4 | |
| Bonded warehouse services | | | 56.0 | | | | 53.5 | | | | 2.5 | | | | 4.7 | |
| Trust activities | | | 15.2 | | | | 18.3 | | | | (3.1 | ) | | | (17.1 | ) |
| Pension and severance fund management | | | 1.7 | | | | 0.7 | | | | 0.9 | | | | 125.0 | |
| Commission and fee income | | | 183.4 | | | | 180.5 | | | | 2.9 | | | | 1.6 | |
| Commission and fee expenses | | | (54.8 | ) | | | (42.9 | ) | | | (11.9 | ) | | | 27.7 | |
| Net commission and fee income | | | 128.6 | | | | 137.6 | | | | (9.0 | ) | | | (6.6 | ) |
Net commission and fee income decreased by 6.6%, or Ps 9.0 billion, to Ps 128.6 billion in 2015 as compared to 2014 mainly explained by a Ps 11.9 billion increase in expenses for commissions and fees, and partially offset by a Ps 2.9 billion increase in income from commissions and fees.
The Ps 2.9 billion increase income from commissions and fees is mainly attributable to a Ps 2.6 billion increase in banking fees and a Ps 2.5 billion increase in bonded warehouse services. These were offset by a Ps 3.1 billion decline in fees from trust activities and a Ps 11.9 billion increase in expenses for commissions and fees, mainly due to an increase in fees related to loan origination for Ps 7.6 billion in 2015. The increase in banking fees is mostly due to a Ps 2.7 billion increase in commissions from banking services fees, a Ps 0.4 billion increase in credit and debit card fees and a Ps 0.3 billion increase in branch network services fees. Partially offsetting these increases was a Ps 0.9 billion decrease in checking fees.
Net trading income
Banco Popular’s net trading income includes (i) net trading income from investment securities held for trading through profit or loss, which reflects the interest and gains/losses from mark-to-market valuation, in each case from equity and fixed income investment securities held for trading through profit or loss, and (ii) net trading income from derivatives, which reflects the gains/losses from mark-to-market valuation on derivatives different from that considered under hedge accounting. During 2015, Banco Popular’s net trading income came in at Ps 19.0 billion, 46.7%, or Ps 6.1 billion higher than the Ps 12.9 billion obtained in 2014. This increase was driven by a Ps 5.2 billion increase in net trading income from investment securities held for trading through profit or loss and a Ps 0.9 billion increase in net trading income from derivatives.
Net trading income from derivatives increased Ps 0.9 billion from a loss of Ps 1.3 billion in 2014 to a loss of Ps 0.4 billion in 2015.
The net trading income from investment securities held for trading through profit or loss increased by 36.4%, or Ps 5.2 billion, to Ps 19.4 billion in 2015. This increase in the net trading income from investment securities held for trading through profit or loss was mainly driven by an increase in the average balance of the bank’s investment securities held for trading through profit or loss from Ps 353.2 billion in 2014 to Ps 440.9 billion in 2015, which resulted in a Ps 3.9 billion increase in net trading income. Additionally, an increase in the average yield from 4.0% in 2014 to 4.4% in 2015, resulted in an increase in interest income of Ps 1.3 billion.
Total income from investment securities
Banco Popular’s securities portfolio is classified in the following categories (i) equity and fixed income investments held for trading through profit or loss (described in this section as net trading income in investment securities held for trading through profit or loss), (ii) available for sale fixed income investments and (iii) held to maturity fixed income investments (described above (ii) and (iii) are included in net interest income section as interest income from investment in debt securities). Banco Popular manages its investment portfolio in a comprehensive and integral manner that considers individual return of each one of these three categories and the total return of the investment securities portfolio.
Total income from investment securities for the bank (comprised of income on investments in debt securities and net trading income from investment securities held for trading through profit or loss) was Ps 107.9 billion for 2015, slightly lower than the Ps 119.4 billion for 2014. This was primarily driven by a Ps 8.7%, or Ps 200.0 billion, decrease in the average balance of Total Investment Securities, resulting in a Ps 10.3 billion decline in interest income. In addition, the average yield of total investment securities remained basically unchanged at 5.2% and resulted in a Ps 1.3 billion decrease in interest income.
When including investment securities held for trading through profit or loss Banco Popular’s average total interest earning assets (calculated as (i) gross loans including interbank and overnight funds, (ii) fixed income and
equity investments held for trading through profit or loss, and (iii) available for sale and held to maturity fixed income investments) would have increased by 6.5%, or Ps 976.7 billion, to Ps 15,929.7 billion in 2015 as compared to Ps 14,953.0 billion in 2014 and the net interest income plus net trading income from investment securities held for trading through profit or loss would have increased 2.6%, or Ps 26.5 billion, from Ps 1,034.0 billion in 2014 to Ps 1,060.6 billion in 2015. The return over average total interest earning assets (calculated as (i) gross loans including interbank and overnight funds, (ii) fixed income and equity investments held for trading through profit or loss, and (iii) available for sale and held to maturity fixed income investments) would have decreased 26 basis points from 6.9% in 2014 to 6.7% in 2015.
Other income
| | | Year ended December 31, | | | Change, 2015 vs. 2014 | |
| | | 2015 | | | 2014 | | | # | | | % | |
| | | (in Ps billions) | | | | |
| Foreign exchanges gains (losses), net | | | 3.9 | | | | 4.2 | | | | (0.4 | ) | | | (8.7 | ) |
| Gains on sales of investments, net | | | (0.7 | ) | | | 40.8 | | | | (41.5 | ) | | | (101.8 | ) |
| Income from sales of noncurrent assets held for sale | | | 1.5 | | | | 0.0 | | | | 1.5 | | | | N.A. | |
| Equity method | | | 0.8 | | | | 0.0 | | | | 0.8 | | | | N.A. | |
| Dividend income | | | 33.5 | | | | 42.1 | | | | (8.6 | ) | | | (20.4 | ) |
| Gains on valuation of assets, net | | | 0.0 | | | | 0.0 | | | | 0.0 | | | | N.A. | |
| Income from non-financial sector, net | | | 1.5 | | | | (0.1 | ) | | | 1.6 | | | | (1,394.4 | ) |
| Net income from financial instruments designated at fair value | | | 0.0 | | | | 0.0 | | | | 0.0 | | | | N.A. | |
| Other | | | 137.7 | | | | 96.1 | | | | 41.5 | | | | 43.2 | |
| Total other income (expense) | | | 178.0 | | | | 183.1 | | | | (5.1 | ) | | | (2.8 | ) |
Total other income (expense) decreased by Ps 5.1 billion, or 2.8%, to Ps 178.0 billion in 2015 from Ps 183.1 billion in 2014. This decrease was mainly due to a Ps 41.5 billion decrease in gains on sales of investments, net and a Ps 8.6 billion decrease in dividend income. Partially offsetting this decrease was a Ps 41.5 billion increase in other income, a Ps 1.6 billion increase in income from non-financial sector and a Ps 1.5 billion increase in income from sales of noncurrent assets held for sale.
The Ps 41.5 billion increase in other income is explained by: (i) a Ps 28.0 billion recovery of a portion of 2014 CREE tax expense and (ii) a Ps 13.8 billion income from sales of some secondary administrative offices in Bogotá. The Ps 1.6 billion increase in income from non-financial sector is explained due to a better performance in some of the Banco Popular’s subsidiaries. Partially offsetting the aforementioned increases was a Ps 41.5 billion decrease in gains on sales of investments, net mainly explained by market conditions and a Ps 8.6 billion decrease in dividend income mainly explained by a decrease in dividends received from Corficolombiana between 2014 and 2015.
Other expenses
| | | Year ended December 31, | | | Change, 2015 vs. 2014 | |
| | | 2015 | | | 2014 | | | # | | | % | |
| | | (in Ps billions) | | | | | | | |
| Losses from sales of noncurrent assets held for sale | | | 0.0 | | | | (8.4 | ) | | | 8.4 | | | | (100.0 | ) |
| Personnel expenses | | | (290.3 | ) | | | (238.0 | ) | | | (52.3 | ) | | | 22.0 | |
| Salaries and employee benefits | | | (272.6 | ) | | | (229.5 | ) | | | (43.1 | ) | | | 18.8 | |
| Bonus plan payments | | | (4.6 | ) | | | (7.7 | ) | | | 3.0 | | | | (39.5 | ) |
| Termination payments | | | (13.1 | ) | | | (0.9 | ) | | | (12.2 | ) | | | 1,360.1 | |
| Administrative and other expenses | | | (435.2 | ) | | | (379.5 | ) | | | (55.7 | ) | | | 14.7 | |
| Depreciation and amortization | | | (39.1 | ) | | | (44.5 | ) | | | 5.4 | | | | (12.0 | ) |
| Wealth tax | | | (30.0 | ) | | | 0.0 | | | | (30.0 | ) | | | N.A. | |
| Other expenses | | | (11.2 | ) | | | (20.3 | ) | | | 9.1 | | | | (44.6 | ) |
| Charitable and other donation expenses | | | (2.4 | ) | | | (1.7 | ) | | | (0.6 | ) | | | 38.0 | |
| Other | | | (8.9 | ) | | | (18.6 | ) | | | (9.7 | ) | | | (52.2 | ) |
| Total other expenses | | | (805.9 | ) | | | (690.7 | ) | | | 115.2 | | | | 16.7 | |
Total other expenses increased by 16.7%, or Ps 115.2 billion, in 2015 as compared to 2014, mainly driven by an increase of Ps 55.7 billion in administrative and other expenses, a Ps 52.3 billion increase in personnel expenses and the Ps 30.0 billion paid in wealth tax. Partially offsetting these increases was a Ps 9.1 billion decrease in other expenses and a Ps 5.4 billion decrease in depreciation and amortization.
Administrative and other expenses increased by Ps 55.7 billion increase to Ps 435.2 billion in 2015 from Ps 379.5 billion in 2014, explained by (i) a Ps 24.7 billion increase in outsourcing expenses, (ii) a Ps 11.8 billion increase in service fees, (iii) a Ps 8.2 billion increase in marketing expenses, (iv) a Ps 7.7 billion increase in taxes and surcharges and (v) a Ps 6.3 billion increase in improvements and repairs.
The Ps 52.3 billion increase in personnel expenses is explained by (i) the provisions demanded by the actuarial model for employment benefits in 2015 of Ps 7.9 billion, which compare to a recovery of Ps 28.4 billion during 2014 and (ii) a 0.4% increase in headcount from 7,118 to 7,143 employees between 2014 and 2015, which was accompanied with an increase in their yearly salaries and employee benefits per employee from Ps 36.2 million in 2014 to Ps 37.1 million in 2015 (excluding impacts of the actuarial model).
Partially offsetting these increases was a Ps 9.1 billion decrease in other expenses is explained by a Ps 8.4 billion reduction in provisions for risks and claims.
Banco Popular’s efficiency ratio was 59.0% for 2015 and 49.1% for 2014. Efficiency would have been 51.4% excluding the Ps 28.4 billion recovery required by the actuarial model in 2014. The ratio of personnel expenses and administrative and other expenses as a percentage of average assets deteriorated from 3.7% in 2014 to 4.0% in 2015. Efficiency measured as costs to assets would have been 3.9% when excluding the aforementioned recovery.
Income tax expense
Income tax expense for Banco Popular decreased by Ps 22.9 billion, or 11.7%, to Ps 173.1 billion for the year ended December 31, 2015, primarily due to lower income before income tax expense. Banco Popular’s effective tax rate (calculated as income tax expense divided by income before tax expense minus equity method, minus dividends, plus wealth tax) decreased from 36.0% for the year ended December 31, 2014 to 33.6% for the year ended December 31, 2015. Nevertheless, given that the Ps 28.0 billion recovery of a part of 2013 and 2014 CREE surcharge provision accounted for in 2015 was non-taxable income, the effective tax rate adjusted for this non-recurring income would have been 35.5%.
Net income attributable to non-controlling interest
Net income attributable to non-controlling interest decreased by Ps 0.6 billion to Ps 0.8 billion for the year ended December 31, 2015. Net income attributable to non-controlling interest is not a significant contributor to net income for Banco Popular, responsible for only 0.2% of net income for the year ended December 31, 2015.
Banco AV Villas
Net income
| | | Banco AV Villas Consolidated | |
| | | For the year ended December 31, | | | Change December 2015 vs December 2014 | |
| | | 2015 | | | 2014 | | | # | | | % | |
| | | (in Ps billions) | | | | | | | |
| Interest income | | | 988.9 | | | | 927.1 | | | | 61.7 | | | | 6.7 | |
| Interest expenses | | | (273.9 | ) | | | (231.6 | ) | | | (42.3 | ) | | | 18.3 | |
| Net interest income | | | 714.9 | | | | 695.5 | | | | 19.4 | | | | 2.8 | |
| Impairment loss on loans and other accounts receivable, net | | | (188.9 | ) | | | (161.2 | ) | | | (27.7 | ) | | | 17.2 | |
| Impairment loss on other assets, net | | | 0.3 | | | | 0.0 | | | | 0.3 | | | | N.A. | |
| Recovery of charged-off financial assets | | | 22.4 | | | | 34.1 | | | | (11.6 | ) | | | (34.1 | ) |
| Net impairment loss | | | (166.1 | ) | | | (127.1 | ) | | | (39.0 | ) | | | 30.7 | |
| Net commission and fees income | | | 145.5 | | | | 150.7 | | | | (5.3 | ) | | | (3.5 | ) |
| Net trading income | | | 0.2 | | | | 14.6 | | | | (14.4 | ) | | | (98.8 | ) |
| Other income | | | 93.3 | | | | 75.5 | | | | 17.9 | | | | 23.7 | |
| Other expenses | | | (503.4 | ) | | | (494.8 | ) | | | (8.7 | ) | | | 1.8 | |
| Income before income tax expense | | | 284.3 | | | | 314.4 | | | | (30.1 | ) | | | (9.6 | ) |
| Income tax expense | | | (108.7 | ) | | | (94.8 | ) | | | (13.9 | ) | | | 14.7 | |
| Net Income | | | 175.6 | | | | 219.6 | | | | (44.0 | ) | | | (20.0 | ) |
| Net income attributable to: | | | | | | | | | | | | | | | | |
| Controlling interest | | | 175.6 | | | | 219.3 | | | | (43.7 | ) | | | (19.9 | ) |
| Non-controlling interest | | | 0.0 | | | | 0.4 | | | | (0.3 | ) | | | (87.7 | ) |
Banco AV Villas’ net income attributable to controlling interest decreased by 19.9%, or Ps 43.7 billion, to Ps 175.6 billion for the year ended December 31, 2015 as compared to Ps 219.3 billion for the year ended December 31, 2014. The decrease in net income was primarily due to a Ps 39.0 billion increase in net impairment loss on financial assets, a Ps 14.4 billion decrease in net trading income, a Ps 13.9 billion increase in income tax expense, a Ps 8.7 billion increase in total other expenses and a Ps 5.3 billion decrease in net income from commissions and fees. Partially offsetting the aforementioned was a Ps 19.4 billion increase in net interest income and a Ps 17.9 billion increase in other income (expense). The increase in net impairment loss on financial assets is mainly explained by a 17.2%, or Ps 27.7 billion, increase in impairment loss on loans and accounts receivable, net derived from a 15.7% growth in the bank’s loans and leases portfolio in 2015 as compared to 2014 and by lower recoveries of charged-off assets of Ps 11.6 billion. In addition, during 2015 the wealth tax affected the statement of profit or losses through the administrative and other expenses line by Ps 13.9 billion (see “Item 4. Information on the Company—B. Business Overview—Supervision and Regulation—Tax Reforms”). In the absence of the payment of the wealth tax, net income before income tax expense for 2015 would have been Ps 298.2 billion (Ps 16.3 billion or 5.2% lower than that of 2014).
Net interest income
| | | Year ended December 31, | | | Change, 2015 vs. 2014 | |
| | | 2015 | | | 2014 | | | # | | | % | |
| | | (in Ps billions) | | | | |
| | | | | | | |
| Interest income: | | | | | | | | | | | | | | | | |
| Commercial loans and leases | | | 203.5 | | | | 176.2 | | | | 27.3 | | | | 15.5 | |
| Consumer loans and leases | | | 536.5 | | | | 498.5 | | | | 38.0 | | | | 7.6 | |
| Mortgage loans and leases | | | 145.6 | | | | 153.5 | | | | (7.9 | ) | | | (5.2 | ) |
| Microcredit loans and leases | | | 1.1 | | | | 2.1 | | | | (1.0 | ) | | | (47.7 | ) |
| Interbank and overnight funds | | | 2.4 | | | | 1.6 | | | | 0.8 | | | | 50.5 | |
| Interest on loans and leases | | | 889.0 | | | | 831.8 | | | | 57.2 | | | | 6.9 | |
| Interest on investments in debt securities | | | 99.8 | | | | 95.3 | | | | 4.5 | | | | 4.7 | |
| Total interest income | | | 988.9 | | | | 927.1 | | | | 61.7 | | | | 6.7 | |
| Interest expense: | | | | | | | | | | | | | | | | |
| Checking accounts | | | (1.5 | ) | | | (1.3 | ) | | | (0.2 | ) | | | 18.1 | |
| Time deposits | | | (137.3 | ) | | | (116.7 | ) | | | (20.6 | ) | | | 17.6 | |
| Savings deposits | | | (96.5 | ) | | | (87.4 | ) | | | (9.0 | ) | | | 10.3 | |
| Total interest expense on deposits | | | (235.3 | ) | | | (205.4 | ) | | | (29.8 | ) | | | 14.5 | |
| Borrowings from banks and others | | | (0.8 | ) | | | 0.0 | | | | (0.8 | ) | | | N.A. | |
| Interbank and overnight funds | | | (35.8 | ) | | | (23.1 | ) | | | (12.7 | ) | | | 54.9 | |
| Long-term debt (bonds) | | | 0.0 | | | | 0.0 | | | | 0.0 | | | | N.A. | |
| Borrowings from development entities | | | (2.0 | ) | | | (3.0 | ) | | | 1.0 | | | | (33.6 | ) |
| Total interest expense | | | (273.9 | ) | | | (231.6 | ) | | | (42.3 | ) | | | 18.3 | |
| Net interest income | | | 714.9 | | | | 695.5 | | | | 19.4 | | | | 2.8 | |
Banco AV Villas’ net interest income increased by 2.8%, or Ps 19.4 billion, from Ps 695.5 billion in 2014 to Ps 714.9 billion in 2015. This increase was primarily driven by a Ps 61.7 billion increase in total interest income to Ps 988.9 billion in 2015. The increase in total income was as a result of a 6.9%, or Ps 57.2 billion, increase in interest income on total loans and leases (which includes income from interbank and overnight funds) to Ps 889.0 billion and a 4.7%, or Ps 4.5 billion, increase in interest on investments in debt securities to Ps 99.8 billion in 2015. The increase in interest income on total loans and leases was driven by a Ps 56.4 billion increase in interest income from loans and leases and a Ps 0.8 billion increase in interest income from interbank and overnight funds. The increase in interest income was partially offset by a Ps 42.3 billion increase in interest expense, mostly due to a Ps 29.8 billion increase in total interest expense on deposits and a Ps 12.7 billion increase in interest expense on interbank and overnight funds.
The increase in total interest income was mainly due to the increase interest earned on loans and leases (excluding interbank and overnight funds) of Ps 56.4 billion driven by a 14.0%, or Ps 977.0 billion, increase in Banco AV Villas’ average interest bearing loan portfolio from Ps 6,986.4 billion in 2014 to Ps 7,963.4 billion in 2015, which resulted in a Ps 108.8 billion increase in income. The increase was partially offset by a 75 basis points decrease in the average yield on loans from 11.9% in 2014 to 11.1% in 2015, which resulted in a Ps 52.4 billion decrease in interest income. Despite an increase of 51 basis points in the average DTF rate, from 4.07% in 2014 to 4.58% in 2015 and a 125 basis points increase in the Central Bank’s average repo rate from 4.50% in 2014 to 5.75% in 2015, the decrease in the yield was a result of a strong competitive landscape in Colombia, particularly in consumer loans. Overall, the yield on consumer loans in the Colombian banking system decreased by 23 basis points from 15.9% in 2014 to 15.7% in 2015.
Interest earned on interbank and overnight funds increased by Ps 0.8 billion from Ps 1.6 billion in 2014 to Ps 2.4 billion in 2015.
The Ps 4.5 billion increase to Ps 99.8 billion in interest on investments in debt securities in 2015, is explained by a 10.8%, or Ps 193.0 billion increase in the average balance of available for sale and held to maturity fixed income investments from Ps 1,785.6 billion in 2014 to Ps 1,978.6 billion in 2015, which resulted in a Ps 9.7 billion increase in interest income. Partially offsetting this increase was a 29 basis points decrease in the average yield of these investments from 5.3% in 2014 to 5.0% in 2015, which resulted in a 5.2 billion decrease in interest income.
Total interest expense increased by 18.3%, or Ps 42.3 billion, in 2015 as compared to 2014, mainly driven by a 9.5%, or Ps 758.2 billion, increase in the average balance of interest-bearing liabilities from Ps 8,011.1 billion in 2014 to Ps 8,769.3 billion in 2015, which resulted in a Ps 23.7 billion increase in interest expense. In addition, a 23 basis point increase in the average cost of funds from 2.9% in 2014 to 3.1% in 2015 resulted in a Ps 18.6 billion increase in interest expense. The increase in the average cost of funds resulted from an increasing interest rate
environment, where the average DTF rate went from 4.07% in 2014 to 4.58% in 2015. Total interest expense for interest-bearing deposits increased 14.5%, or Ps 29.8 billion, over the same period, mainly driven by a Ps 490.6 billion, or 6.8%, increase in the average balance of interest-bearing deposits from Ps 7,226.9 billion in 2014 to Ps 7,717.5 billion in 2015, which resulted in a Ps 15.0 billion increase in interest expense. Also, there was a 21 basis points increase in the average cost of deposits from 2.8% in 2014 to 3.0% in 2015 which resulted in a Ps 14.9 billion increase in interest expense.
The Ps 42.3 billion increase in total interest expense was mainly driven by a 29.8 billion increase in interest expense on interest-bearing deposits and a Ps 12.5 billion increase in interest expense on other funding. The increase in interest expense on deposits is explained by a Ps 20.6 billion increase in interest expense on time deposits, a Ps 9.0 billion increase in interest expense on savings deposits and by a Ps 0.2 billion increase in interest expense on interest-bearing checking accounts. The increase in interest expense on other funding was mainly attributable to a Ps 12.7 billion increase in interest expense on interbank and overnight funds, from Ps 23.1 billion in 2014 to Ps 35.8 billion in 2015.
The Ps 20.6 billion increase in interest expense on time deposits was mainly driven by a 10.9%, or Ps 279.3 billion, increase in the average balance of time deposits to Ps 2,836.2 billion, which resulted in a Ps 13.5 billion increase in interest expense. Furthermore, the average interest rate paid on time deposits increased by 28 basis points from 4.6% in 2014 to 4.8% in 2015, which resulted in a Ps 7.1 billion increase in interest expense.
The Ps 9.0 billion increase in interest expense on savings deposits was driven by a 4.5%, or Ps 201.7 billion, increase in the average balance of savings deposits to Ps 4,679.6 billion that resulted in a Ps 4.2 billion increase in interest expense. The average rate paid on savings deposits increased by 11 basis points and from 2.0% in 2014 to 2.1% in 2015, resulting in a Ps 4.9 billion increase in interest expense.
The increase in interest expense on interbank and overnight funds of Ps 12.7 billion was driven by a 36.9%, or Ps 229.8 billion, increase in the average balance of these funds, which resulted in a Ps 9.7 billion increase in interest expense. Furthermore, an increase in the average interest rate paid from 3.7% in 2014 to 4.2% in 2015, resulted in a Ps 3.0 billion increase in interest expense.
Average total interest earning assets (calculated as (i) gross loans including interbank and overnight funds, and (ii) available for sale and held to maturity fixed income investments) increased by 14.1%, or Ps 1,263.2 billion from 8,960.0 billion in 2015 to Ps 10,223.2 billion in 2014 and net interest income increased by 2.8% or Ps 19.4 billion from Ps 695.5 billion to Ps 714.9 billion, over the same period, which resulted in a 77 basis points decrease in the net interest margin from 7.8% in 2014 to 7.0% in 2015. The average spread between the average rate on loans and leases and the average rate paid on deposits decreased by 96 basis points from 9.0% to 8.1% over the same period.
Net impairment losses
| | | Year ended December 31, | | | Change, 2015 vs. 2014 | |
| | | 2015 | | | 2014 | | | # | | | % | |
| | | Total
Income/Expense | | | Total
Income/Expense | | | Total Income/Expense | |
| | | (in Ps billions) | | | | | | | |
| Impairment losses: | | | | | | | | | | | | | | | | |
| Impairment loss on loans and leases, net | | | (182.1 | ) | | | (121.3 | ) | | | (60.8 | ) | | | 50.2 | |
| Impairment loss on accrued interest and other receivables, net | | | (6.8 | ) | | | (39.9 | ) | | | 33.1 | | | | (83.0 | ) |
| Impairment loss on investments in debt and equity securities | | | 0.3 | | | | 0.0 | | | | 0.3 | | | | N.A. | |
| Impairment loss on noncurrent held for sale assets | | | 0.0 | | | | 0.0 | | | | 0.0 | | | | N.A. | |
| Recovery of charged-off financial assets | | | 22.4 | | | | 34.1 | | | | (11.6 | ) | | | (34.1 | ) |
| Recovery of impairment loss on investments in debt and equity securities | | | – | | | | – | | | | 0.0 | | | | N.A. | |
| Recovery of impairment loss on noncurrent held for sale assets | | | – | | | | – | | | | 0.0 | | | | N.A. | |
| Net impairment loss on financial assets | | | (166.1 | ) | | | (127.1 | ) | | | (39.0 | ) | | | 30.7 | |
| | | Year ended December 31, | | | | |
| | | 2015 | | | 2014 | | | Change, 2015 vs. 2014 | |
| | | Loans 91 days
past due | | | Delinquency
Ratio(1) | | | Loans 91
days past
due | | | Delinquency
Ratio(1) | | | Loans 91
days past
due | | | Delinquency
Ratio (1) | |
| | | | | | # | | | % | |
| | | (in Ps billions) | |
| Delinquency Ratios: | | | 258.3 | | | | 3.1 | % | | | 221.4 | | | | 3.0 | % | | | 37.0 | | | | 0.0 | |
| Commercial loans and leases | | | 61.0 | | | | 2.2 | % | | | 45.6 | | | | 1.7 | % | | | 15.4 | | | | 0.4 | |
| Consumer loans and leases | | | 118.9 | | | | 3.0 | % | | | 102.5 | | | | 3.1 | % | | | 16.4 | | | | (0.1 | ) |
| Mortgage loans and leases | | | 78.3 | | | | 4.9 | % | | | 72.9 | | | | 5.4 | % | | | 5.4 | | | | (0.5 | ) |
| Microcredit loans and leases | | | 0.1 | | | | 3.5 | % | | | 0.3 | | | | 4.8 | % | | | (0.2 | ) | | | (1.3 | ) |
(1) Calculated as 91 days past due loans divided by total gross loans (excluding interbank and overnight funds)
Net impairment losses increased by 30.7%, or Ps 39.0 billion, in 2015 as compared to 2014. This increase was primarily driven by a Ps 60.8 billion increase in impairment loss on loans and leases, net and a Ps 11.6 billion decrease of recoveries of charged-off assets, which were partially offset by a Ps 33.1 billion decrease in impairment loss on accrued interest and other receivables, net.
The increase in impairment loss on loans and leases, net of Ps 60.8 billion was primarily attributable to an update in the allowance model for the consumer segment and the requirements derived from the 15.4% growth in Banco AV Villas’ loans and leases during 2015 as compared to 2014. The bank’s cost of risk, measured as impairment loss on loans and leases, net divided by the average balance of loans and leases (excluding interbank and overnight funds) increased 6 basis points from 2.3% in 2014 to 2.4% for 2015. The bank’s cost of risk net of recoveries of charged-off assets, measured as net impairment loss on loans and leases, net of recoveries of charged-off assets divided by the average balance of loans and leases (excluding interbank and overnight funds) was 2.1% in 2015 compared to the 1.8% in 2014. Banco AV Villas’ delinquency ratio (measured as loans 91 days past due as a percentage of total gross loans excluding interbank and overnight funds) slightly deteriorated as compared to 2014 from 3.04% to 3.07%. The delinquency ratios for the consumer loan portfolio and the mortgage loan portfolio improved from 3.1% to 3.0% and from 5.4% to 4.9%, respectively, while the commercial loan portfolio deteriorated from 1.7% to 2.2%.
The decrease in impairment loss for accrued interest and other receivables, net was due to a Ps 33.8 billion, or 67.1%, reduction in gross provision expense. The decrease is mainly attributable to an improvement in the bank’s mortgages delinquency metrics.
Charge-offs decreased from Ps 136.8 billion for the year ended December 31, 2014 to Ps 130.1 billion for the year ended December 31, 2015 and the ratio of charge-offs to average loans (excluding interbank and overnight funds) decreased from 2.0% for the year ended December 31, 2014 to 1.6% for the year ended December 31, 2015. Since Banco AV Villas’ net impairment loss on loans and leases increased, in absolute terms, more than charge-offs, the allowance for loan losses increased from Ps 334.3 billion as of December 31, 2014 to Ps 392.3 billion as of December 31, 2015. As of December 31, 2015 Banco AV Villas’ coverage over its 91 days past due loans was 151.9%.
Net commission and fee income
| | | Year ended December 31, | | | Change, 2015 vs. 2014 | |
| | | 2015 | | | 2014 | | | # | | | % | |
| | | (in Ps billions) | | | | | | | |
| Commission and fee income | | | | | | | | | | | | | | | | |
| Banking fees | | | 230.7 | | | | 227.0 | | | | 3.6 | | | | 1.6 | |
| Bonded warehouse services | | | 0.0 | | | | 0.0 | | | | 0.0 | | | | N.A. | |
| Trust activities | | | 0.0 | | | | 0.0 | | | | 0.0 | | | | N.A. | |
| Pension and severance fund management | | | 0.0 | | | | 0.0 | | | | 0.0 | | | | N.A. | |
| Commission and fee income | | | 230.7 | | | | 227.0 | | | | 3.6 | | | | 1.6 | |
| Commission and fee expense | | | (85.2 | ) | | | (76.3 | ) | | | (8.9 | ) | | | 11.7 | |
| Net commission and fee income | | | 145.5 | | | | 150.7 | | | | (5.3 | ) | | | (3.5 | ) |
Net commission and fee income decreased by 3.5%, or Ps 5.3 billion, to Ps 145.5 billion in 2015 as compared to 2014 mainly driven by a Ps 8.9 billion increase in expenses for commissions and fees, partially offset by a Ps 3.6 billion increase in income from commissions and fees. The increase in expenses was attributable to a higher number of transactions on third party ATM networks, while the increase of Ps 3.6 billion in banking fees to Ps 230.7 billion in 2015 was primarily due to a Ps 3.5 billion increase in commissions from banking services.
Net trading income
Banco AV Villas’ net trading income includes (i) net trading income from investment securities held for trading through profit or loss, which reflects the interest and gains/losses from mark-to-market valuation, in each case from equity and fixed income investment securities held for trading through profit or loss, and (ii) net trading income from derivatives, which reflects the gains/losses from mark-to-market valuation on derivatives different from that considered under hedge accounting. During 2015, Banco AV Villas’ net trading income decreased by Ps 14.4 billion from Ps 14.6 billion in 2014 to Ps 0.2 billion in 2015, driven by a Ps 4.6 billion decrease in net trading income from investment securities held for trading through profit or loss and a Ps 9.8 billion decrease in net trading income from derivatives.
Net trading income from derivatives decreased Ps 9.8 billion from a gain of Ps 2.4 billion in 2014 to a loss of Ps 7.4 billion in 2015.
Net trading income from investment securities held for trading through profit or loss decreased by 37.8%, or Ps 4.6 billion. The decrease in the net trading income from investment securities held for trading through profit or loss was mainly driven by an 84.5%, or a Ps 443.1 billion, decrease in the average balance of the bank’s held for trading through profit or loss portfolio, which resulted in a Ps 41.1 billion decrease in net trading income. Compensating this result was an increase in the yield from the bank’s investment securities held for trading through profit or loss from 2.3% in 2014 to 9.3% in 2015, which produced a Ps 36.5 billion increase in interest income.
Total income from investment securities
Banco AV Villas’ securities portfolio is classified in the following categories (i) equity and fixed income investments held for trading through profit or loss (described in this section as net trading income in investment securities held for trading through profit or loss), (ii) available for sale fixed income investments and (iii) held to maturity fixed income investments (described above (ii) and (iii) are included in net interest income section as interest income from investment in debt securities). Banco AV Villas manages its investment portfolio in a comprehensive and integral manner that considers individual return of each one of these three categories and the total return of the investment securities portfolio.
Total income from investment securities for the bank (comprised of income on investments in debt securities and net trading income from investment securities held for trading through profit or loss) was Ps 107.4 billion for 2015, slightly lower than the Ps 107.5 billion for 2014. This was primarily driven by a Ps 10.8%, or Ps 250.1 billion, decrease in the average balance of Total Investment Securities resulting in a Ps 13.0 billion decline in interest income. Compensating this results there was a 56 basis points increase in the average yield of total investment securities from 4.7% in 2014 to 5.2% in 2015, which resulted in a Ps 12.9 billion increase in interest income.
When including investment securities held for trading through profit or loss, average total interest earning assets (calculated as (i) gross loans including interbank and overnight funds, (ii) fixed income and equity investments held for trading through profit or loss, and (iii) available for sale and held to maturity fixed income investments) would have increased by 8.6%, or Ps 820.1 billion, from Ps 9,484.6 billion in 2014 to Ps 10,304.7 billion in 2015, while net interest income plus net trading income would have increased by 2.1%, or Ps 14.8 billion, over the same period., The return over average total interest earning assets (calculated as (i) gross loans including interbank and overnight
funds, (ii) fixed income and equity investments held for trading through profit or loss, and (iii) available for sale and held to maturity fixed income investments) would have decreased 45 basis points from 7.5% in 2014 to 7.0% in 2015.
Other income
| | | Year ended December 31, | | | Change, 2015 vs. 2014 | |
| | | 2015 | | | 2014 | | | # | | | % | |
| | | (in Ps billions) | | | | |
| Foreign exchange gains (losses), net | | | 6.5 | | | | 2.0 | | | | 4.6 | | | | 229.0 | |
| Gains on sales of investments, net | | | 12.1 | | | | 8.3 | | | | 3.8 | | | | 45.8 | |
| Income from sales of noncurrent assets held for sale | | | 5.4 | | | | 0.0 | | | | 5.4 | | | | N.A. | |
| Equity method | | | (0.5 | ) | | | 0.0 | | | | (0.5 | ) | | | N.A. | |
| Dividend income | | | 1.9 | | | | 1.1 | | | | 0.8 | | | | 69.2 | |
| Gains on valuation of assets, net | | | 0.0 | | | | 0.0 | | | | 0.0 | | | | N.A. | |
| Income from non-financial sector, net | | | 0.0 | | | | 0.0 | | | | 0.0 | | | | N.A. | |
| Net income from financial instruments designated at fair value | | | 0.0 | | | | 0.0 | | | | 0.0 | | | | N.A. | |
| Other | | | 67.9 | | | | 64.1 | | | | 3.8 | | | | 6.0 | |
| Total other income (expense) | | | 93.3 | | | | 75.5 | | | | 17.9 | | | | 23.7 | |
Total other income (expense) increased 23.7%, or Ps 17.9 billion, to Ps 93.3 billion in 2015 as compared to 2014. This increase was mainly driven by a Ps 5.4 billion increase in income from sales of noncurrent assets held for sale, a Ps 4.6 billion increase in foreign exchanges gains (losses), net, a Ps 3.8 billion increase in gains on sales of investments, net and a Ps 3.8 billion increase in others.
Other expenses
| | | Year ended December 31, | | | Change, 2015 vs. 2014 | |
| | | 2015 | | | 2014 | | | # | | | % | |
| | | (in Ps billions) | | | | | | | |
| Losses from sales of noncurrent assets held for sale | | | (0.0 | ) | | | (0.0 | ) | | | 0.0 | | | | 340.6 | |
| Personnel expenses | | | (175.2 | ) | | | (163.7 | ) | | | (11.5 | ) | | | 7.0 | |
| Salaries and employee benefits | | | (174.4 | ) | | | (161.8 | ) | | | (12.7 | ) | | | 7.8 | |
| Bonus plan payments | | | (0.7 | ) | | | (1.5 | ) | | | 0.9 | | | | (56.0 | ) |
| Termination payments | | | (0.0 | ) | | | (0.4 | ) | | | 0.3 | | | | (90.5 | ) |
| Administrative and other expenses | | | (288.9 | ) | | | (287.8 | ) | | | (1.1 | ) | | | 0.4 | |
| Depreciation and amortization | | | (22.6 | ) | | | (26.2 | ) | | | 3.7 | | | | (13.9 | ) |
| Wealth tax | | | (13.9 | ) | | | 0.0 | | | | (13.9 | ) | | | N.A. | |
| Other expenses | | | (2.9 | ) | | | (17.1 | ) | | | 14.2 | | | | (82.8 | ) |
| Charitable and other donation expenses | | | (0.7 | ) | | | (0.7 | ) | | | 0.0 | | | | 1.5 | |
| Other | | | (2.3 | ) | | | (16.4 | ) | | | 14.2 | | | | (86.2 | ) |
| Total other expenses | | | (503.4 | ) | | | (494.8 | ) | | | (8.7 | ) | | | 1.8 | |
Total other expenses for the year ended December 31, 2015 increased by 1.8%, or Ps 8.7 billion, to Ps 503.4 billion in 2015 mainly driven by a Ps 13.9 billion payment of the wealth tax paid by Banco AV Villas in 2015. Furthermore, personnel expenses increased by Ps 11.5 billion during 2015 and administrative and other expenses increased by Ps 1.1 billion. These increases were partially offset by a Ps 14.2 billion decrease in other expenses and a Ps 3.7 billion decrease in depreciation and amortization.
Salaries and employee benefits increased by Ps 12.7 billion or 7.8% to Ps 174.4 billion. During 2015 the bank negotiated its collective agreement with its union, which resulted in a Ps 3.0 billion increase in employee benefits. Banco AV Villas’ headcount decreased from 6,947 employees in 2014 to 6,848 in 2015, and yearly salaries and employee benefits per employee increased from Ps 23.3 million in 2014 to Ps 25.5 million in 2015.
Because Banco AV Villas’ personnel and administrative and other expenses increased by 2.8%, while its income increased by 1.6% driven by the increase in net interest income and other income (expense), Banco AV Villas’ efficiency ratio deteriorated from 51.8% to 52.4%. The ratio of personnel and administrative and other expenses as a percentage of average assets improved 25 basis points from 4.4% in 2014 to 4.1% in 2015.
Income tax expense
Income tax expense increased by 14.7%, or Ps 13.9 billion, to Ps 108.7 billion for the year ended December 31, 2015. Banco AV Villas’ effective tax rate (calculated as income tax expense divided by income before tax expense minus equity method, minus dividends, plus wealth tax) increased from 30.3% for the year ended December 31, 2014 to 36.6% for the year ended December 31, 2015. The increase in the effective tax rate was mainly due to the tax reform of December 2014 which generated a CREE surcharge of 5 percentage points in 2015.
Net income attributable to non-controlling interest
Net income attributable to non-controlling interest decreased from Ps 0.4 billion for the year ended December 31, 2014 to Ps 0.05 billion for the year ended December 31, 2015. Banco AV Villas’ net income attributable to non-controlling interest reflects ownership in A Toda Hora S.A. by other subsidiaries of Grupo Aval.
Corficolombiana
Net income
| | | For the year ended December 31, | | | Change December 2015 vs December
2014 | |
| | | 2015 | | | 2014 | | | # | | | % | |
| | | (in Ps billions) | | | | | | | |
| Interest income | | | 334.4 | | | | 237.1 | | | | 97.3 | | | | 41.0 | |
| Interest expenses | | | (608.0 | ) | | | (483.8 | ) | | | (124.2 | ) | | | 25.7 | |
| Net interest income | | | (273.6 | ) | | | (246.7 | ) | | | (26.9 | ) | | | (10.9 | ) |
| Impairment loss on loans and other accounts receivable, net | | | (8.5 | ) | | | (17.1 | ) | | | 8.6 | | | | (50.4 | ) |
| Impairment loss on other assets, net | | | (0.0 | ) | | | (0.7 | ) | | | 0.7 | | | | (101.0 | ) |
| Recovery of charged-off financial assets | | | 0.5 | | | | 1.3 | | | | (0.7 | ) | | | (57.8 | ) |
| Net impairment loss | | | (7.9 | ) | | | (16.5 | ) | | | 8.6 | | | | (52.1 | ) |
| Net commission and fees income | | | 43.3 | | | | 49.5 | | | | (6.2 | ) | | | (12.6 | ) |
| Net trading income | | | (131.2 | ) | | | 109.7 | | | | (240.9 | ) | | | (219.5 | ) |
| Other income | | | 1,628.4 | | | | 1,317.0 | | | | 311.5 | | | | 23.7 | |
| Other expenses | | | (170.4 | ) | | | (158.5 | ) | | | (11.9 | ) | | | 7.5 | |
| Income before income tax expense | | | 1,088.6 | | | | 1,054.5 | | | | 34.2 | | | | 3.2 | |
| Income tax expense | | | (330.9 | ) | | | (315.1 | ) | | | (15.8 | ) | | | 5.0 | |
| Net Income | | | 757.7 | | | | 739.4 | | | | 18.4 | | | | 2.5 | |
| Net income attributable to: | | | | | | | | | | | | | | | | |
| Controlling interest | | | 445.9 | | | | 479.5 | | | | (33.6 | ) | | | (7.0 | ) |
| Non-controlling interest | | | 311.8 | | | | 259.9 | | | | 52.0 | | | | 20.0 | |
Corficolombiana’s net income attributable to controlling interest decreased by 7.0%, or Ps 33.6 billion to Ps 445.9 billion in 2015 as compared to 2014. In contrast, Corficolombiana’s net income increased by Ps 18.4 billion, or 2.5% to Ps 757.7 billion in 2015 as compared to 2014. The reason why net income increased and net income attributable to controlling interest decreased is because investments in which Corficolombiana has a lower controlling ownership performed better than those in which it has a higher controlling stake. The most significant driver of the increase in net income was an increase in other income (expense) by Ps 311.5 billion mainly from higher income from non-financial sector, net.
Partially offsetting such results there was (i) a Ps 240.9 billion decrease in Corficolombiana’s net trading income, (ii) a Ps 26.9 billion decrease in net interest income (which includes the interest expenses from non-financial subsidiaries), (iii) a Ps 11.9 billion increase in other expenses mainly due to the payment of the wealth tax (Ps 43.9 billion) (See “Item 4. Information on the Company—B. Business Overview—Supervision and Regulation—Tax Reforms”), and (iv) a Ps 15.8 billion increase in income tax expense driven by the CREE surcharge of 5 percentage points, as per the tax reform of December 2014.
Net interest income
| | | Year ended December 31, | | | Change, 2015 vs. 2014 | |
| | | 2015 | | | 2014 | | | # | | | % | |
| | | (in Ps billions) | | | | |
| Interest income: | | | | | | | | | | | | | | | | |
| Commercial loans and leases | | | 103.5 | | | | 91.3 | | | | 12.2 | | | | 13.4 | |
| Consumer loans and leases | | | 0.1 | | | | 0.1 | | | | 0.0 | | | | (31.9 | ) |
| Mortgage loans and leases | | | 0.0 | | | | 0.0 | | | | 0.0 | | | | N.A. | |
| Microcredit loans and leases | | | 0.0 | | | | 0.0 | | | | 0.0 | | | | N.A. | |
| Interbank and overnight funds | | | 80.1 | | | | 118.6 | | | | (38.5 | ) | | | (32.4 | ) |
| Interest on loans and leases | | | 183.7 | | | | 210.0 | | | | (26.3 | ) | | | (12.5 | ) |
| Interest on investments in debt securities | | | 150.7 | | | | 27.1 | | | | 123.6 | | | | 456.2 | |
| Total interest income | | | 334.4 | | | | 237.1 | | | | 97.3 | | | | 41.0 | |
| Interest expense: | | | | | | | | | | | | | | | | |
| Checking accounts | | | (0.0 | ) | | | (0.5 | ) | | | 0.5 | | | | (99.7 | ) |
| Time deposits | | | (172.0 | ) | | | (152.3 | ) | | | (19.6 | ) | | | 12.9 | |
| Savings deposits | | | (24.9 | ) | | | (24.9 | ) | | | 0.0 | | | | (0.1 | ) |
| Total interest expense on deposits | | | (196.9 | ) | | | (177.7 | ) | | | (19.1 | ) | | | 10.8 | |
| Borrowings from banks and others | | | (68.1 | ) | | | (62.5 | ) | | | (5.6 | ) | | | 8.9 | |
| Interbank and overnight funds | | | (133.7 | ) | | | (90.7 | ) | | | (43.1 | ) | | | 47.5 | |
| Long-term debt (bonds) | | | (202.7 | ) | | | (146.7 | ) | | | (56.0 | ) | | | 38.1 | |
| Borrowings from development entities | | | (6.6 | ) | | | (6.1 | ) | | | (0.5 | ) | | | 8.5 | |
| Total interest expense | | | (608.0 | ) | | | (483.8 | ) | | | (124.2 | ) | | | 25.7 | |
| Net interest income | | | (273.6 | ) | | | (246.7 | ) | | | (26.9 | ) | | | 10.9 | |
Corficolombiana’s net interest income recorded a Ps 273.6 billion expense in 2015 and a Ps 246.7 billion expense in 2014. The net expense in net interest income is partially explained by the fact that Corficolombiana’s
consolidated non-financial subsidiaries interest income and interest expense are included in Corficolombiana’s net interest income, while their operating income is included in other income (expenses) as income from the non-financial sector, net. Interest expense from non-financial subsidiaries was Ps 268.8 billion in 2015 and Ps 218.4 billion in 2014, while interest income was Ps 30.6 billion in 2015 and Ps 109.8 billion in 2014. In absence of the interest income and expense from non-financial subsidiaries, net interest income would have been Ps (138.0) billion in 2014 and Ps 35.4 billion in 2015.
The decrease in net interest income by Ps 26.9 billion, is mainly explained by a Ps 124.2 billion increase in interest expense, and a Ps 38.5 billion decrease in interest on interbank and overnight funds. Partially offsetting these decreases was a Ps 123.6 billion increase in interest on investments in debt securities and a Ps 12.2 billion increase in interest income on commercial loans and leases.
The increase in total interest expenses by Ps 124.2 billion to Ps 608.0 billion in 2015 as compared to 2014, was mainly driven by a 17.2% or Ps 1,549.8 billion increase in the average balance of interest-bearing liabilities billion to Ps 10,547.5 billion in 2015 as compared to 2014, which resulted in a Ps 89.3 billion increase in interest expense. In addition, an increase in average rate paid on funding from 5.4% in 2014 to 5.8% in 2015 resulted in a Ps 34.9 billion increase in interest expense.
The Ps 124.2 billion increase in interest expenses reflected (i) a Ps 73.8 billion increase the interest expense from financial subsidiaries and (ii) a Ps 50.4 billion increase in the interest expense of non-financial subsidiaries.
The Ps 73.8 billion increase in interest expense from financial subsidiaries was mainly due to a 23.6%, or Ps 1,279.7 billion increase in the average balance of financial subsidiaries to Ps 6,711.9 billion in 2015 as compared to 2014, which resulted in a Ps 64.7 billion increase in interest expense. In addition, the average paid rate increased from 4.9% in 2014 to 5.1% in 2015, which resulted in a Ps 9.1 billion increase in interest expense. These increases are associated with a higher interest rate environment in Colombia (higher DTF and inflation in 2015 as compared to 2014).
The Ps 50.4 billion increase in interest expenses from non-financial subsidiaries was mainly due to an increase in the average paid rate from 6.1% in 2014 to 7.0% in 2015, which resulted in a Ps 31.5 billion increase in interest expense. Contributing to this result was an increase in the average balance of 7.6%, or Ps 270.1 billion to Ps 3,835.6 billion in 2015 as compared to 2014, which resulted in a Ps 18.9 billion increase in interest expense.
The increase in interest expense on long term debt by Ps 56.0 billion is mainly attributable to non-financial subsidiaries and was caused by an increase in debt associated with the needs of working capital to fund Promigas’ new infrastructure projects.
Interest expense on interbank and overnight funds increased by Ps 43.1 billion. This increase is attributable to Corficolombiana’s financial subsidiaries.
Interest earned on interbank and overnight funds decreased by Ps 38.5 billion from Ps 118.6 billion in 2014 to Ps 80.1 billion in 2015.
The aforementioned decreases were partially offset by (i) a Ps 123.6 billion increase in interest on investments in debt securities and (ii) a Ps 12.2 billion increase in interest income on commercial loans and leases.
The increase in interest income on investment in debt securities of Ps 123.6 billion was driven by Corficolombiana’s decision to increase its exposure to fixed income during 2015 after reducing it during 2014. Corficolombiana’s balances of fixed income investments, classified as available for sale and held to maturity, at December 31, 2014 and 2015 were Ps 1,690.0 billion and Ps 2,153.6 billion, respectively.
The increase in interest on commercial loans and leases of Ps 12.2 billion is explained by a higher average balance of Ps 131.2 billion from Ps 823.0 billion in 2014 to Ps 954.2 billion in 2015, which resulted in a Ps 14.2 billion increase in interest income. This increase was partially offset by a slight decrease in the average yield from 11.1% in 2014 to 10.8% in 2015, which resulted in a Ps 2.0 decrease in interest income.
Net impairment losses
Corficolombiana’s net impairment losses decreased by Ps 8.6 billion to 7.9 billion in 2015 from Ps 16.5 in 2014. This decrease was mainly driven by a Ps 5.0 billion recovery from loans and leases in Leasing Corficolombiana in 2015.
Net commission and fee income
| | | Year ended December 31, | | | Change, 2015 vs. 2014 | |
| | | 2015 | | | 2014 | | | # | | | % | |
| | | (in Ps billions) | | | | | | | |
| Commission and fee income | | | | | | | | | | | | | | | | |
| Banking fees | | | 20.4 | | | | 20.1 | | | | 0.4 | | | | 1.8 | |
| Bonded warehouse services | | | 0.0 | | | | 0.0 | | | | 0.0 | | | | N.A. | |
| Trust activities | | | 40.9 | | | | 38.0 | | | | 2.9 | | | | 7.5 | |
| Pension and severance fund management | | | 0.0 | | | | 0.0 | | | | 0.0 | | | | N.A. | |
| Commission and fee income | | | 61.3 | | | | 58.1 | | | | 3.2 | | | | 5.5 | |
| Commission and fees expense | | | (18.0 | ) | | | (8.6 | ) | | | (9.4 | ) | | | 109.8 | |
| Net commission and fee income | | | 43.3 | | | | 49.5 | | | | (6.2 | ) | | | (12.6 | ) |
Net commission and fee income decreased by Ps 6.2 billion, or 12.6% to Ps 43.3 billion in 2015 as compared to Ps 49.5 billion in 2014. This decrease is mainly attributable to a Ps 9.4 billion increase in expenses for commissions and fees partially offset by a Ps 3.2 billion increase in income from commissions and fees.
The increase in expenses for commissions and fees of Ps 9.4 billion is mainly explained by an increase in banking fees paid for the structuring and financing of investment projects.
The increase in income from commissions and fees of Ps 3.2 billion is explained by an increase of Ps 2.9 billion in income on fees from trust activities due to a better performance in Fiduciaria Corficolombiana, which increased its fee income from Ps 38.0 billion in 2014 to Ps 40.9 billion in 2015.
Net trading income
Corficolombiana’s net trading income includes (i) net trading income from investment securities held for trading through profit or loss, which reflects the interest and gains/losses from mark-to-market valuation, in each case from equity and fixed income investment securities held for trading through profit or loss, and (ii) net trading income from derivatives, which reflects the gains/losses from mark-to-market valuation on derivatives different from that considered under hedge accounting. Total net trading income decreased by Ps 240.9 billion from Ps 109.7 billion in 2014 to a loss of Ps 131.2 billion in 2015, driven by a Ps 166.0 billion decrease in net trading income from investment securities held for trading through profit or loss and a Ps 74.9 billion decrease in net trading income from derivatives.
Net trading income from derivatives decreased Ps 74.9 billion from a loss of Ps 94.3 billion in 2014 to a loss of Ps 169.2 billion in 2015.
Corficolombiana’s net trading income from investment securities held for trading through profit or loss came to Ps 38.0 billion during 2015, 81.4% or Ps 166.0 billion lower than the Ps 204.1 billion during 2014. The Ps 166.0 billion decrease in net trading income is explained by (i) a Ps 160.0 billion decrease in income from fixed income held for trading portfolio, and (ii) a Ps 6.0 billion decrease in income from equity investment securities held for trading through profit or loss.
The decrease in the net trading income from investment securities held for trading through profit or loss of Ps 166.0 billion was mainly driven by a decrease in yield from 12.9% in 2014 to 2.6% in 2015, which resulted in a decrease in income of Ps 162.6 billion. In addition, the average balance of Corficolombiana’s investment securities
held for trading through profit or loss decreased from Ps 1,584.8 billion in 2014 to Ps 1,453.4 billion in 2015, resulted in a Ps 3.4 billion decrease in net trading income.
Total income from investment securities
Corficolombiana’s securities portfolio is classified in the following categories: (i) equity and fixed income investments held for trading through profit or loss (described in this section as net trading income in investment securities held for trading through profit or loss), (ii) available for sale fixed income investments and (iii) held to maturity fixed income investments (results from (ii) and (iii) are included in the net interest income section as interest income from investment on debt securities). Corficolombiana manages its investment portfolio in a comprehensive and integral manner that considers individual return of each one of these three categories and the total return of the investment securities portfolio.
Total income from investment securities (comprised of income on investments in debt securities and net trading income from investment securities held for trading through profit or loss) was Ps 188.7 billion for 2015, 18.4% or Ps 42.5 billion lower than the Ps 231.2 billion registered during 2014. This decrease is explained by a decrease in average yield on investment securities from 6.5% in 2014 to 4.8% in 2015, which resulted in a Ps 62.7 billion decrease in income. Partially offsetting this was a 12.0% or Ps 424.7 billion increase in the average balance of Total Investment Securities from Ps 3,538.0 billion in 2014 to Ps 3,962.7 billion in 2015, which resulted in a Ps 20.2 billion increase in income.
Other income
| | | Year ended December 31, | | | Change, 2015 vs. 2014 | |
| | | 2015 | | | 2014 | | | # | | | % | |
| | | (in Ps billions) | | | | |
| Foreign exchange gains (losses), net | | | 191.2 | | | | 103.5 | | | | 87.7 | | | | 84.7 | |
| Gains on sales of investments, net | | | 4.1 | | | | 1.1 | | | | 3.1 | | | | 293.2 | |
| Income from sales of noncurrent assets held for sale | | | 0.7 | | | | 0.0 | | | | 0.7 | | | | N.A. | |
| Equity method | | | 206.3 | | | | 107.1 | | | | 99.1 | | | | 92.5 | |
| Dividend income | | | 26.1 | | | | 100.6 | | | | (74.5 | ) | | | (74.1 | ) |
| Income from non-financial sector, net | | | 1,031.1 | | | | 786.3 | | | | 244.8 | | | | 31.1 | |
| Net income from financial instruments designated at fair value | | | 153.1 | | | | 172.9 | | | | (19.8 | ) | | | (11.4 | ) |
| Other | | | 15.8 | | | | 45.4 | | | | (29.6 | ) | | | (65.2 | ) |
| Total other income (expenses) | | | 1,628.4 | | | | 1,317.0 | | | | 311.5 | | | | 23.7 | |
Total other income (expenses) increased by Ps 311.5 billion, or 23.7% to Ps 1,628.4 billion in 2015 as compared to Ps 1,317.0 billion in 2014, mainly driven by a Ps 244.8 billion increase in income from non-financial sector, net due to higher operating income in some of the Corficolombiana's non-financial subsidiaries, a Ps 99.1 billion increase in income from equity method and a Ps 87.7 billion increase in foreign exchange gains (losses), net. Partially offsetting these increases was a Ps 74.5 billion decrease in dividend income, a Ps 29.6 billion decrease in other income and a Ps 19.8 billion decrease in net income from financial instruments designated at fair value (which are the concession arrangements rights).
The income from non-financial sector, net increased by Ps 244.8 billion to Ps 1,031.1 in 2015 from Ps 786.3 billion in 2014. This increase was mainly driven by a higher operating income in some of Corficolombiana’s subsidiaries such as Promigas, Hoteles Estelar and Unipalma.
Income from equity method increased by Ps 99.1 billion, to Ps 206.3 billion in 2015 from Ps 107.1 billion in 2014. This increase is explained by (i) an increase of Ps 66.9 billion from Concesionaria Ruta del Sol, (ii) an increase of Ps 23.4 billion from Gases del Caribe and (iii) an increase of Ps 7.7 billion from Calidda S.A.
Income on foreign exchange gains (losses), net increased by Ps 87.7 billion to Ps 191.2 billion in 2015 from Ps 103.5 billion in 2104.
These increases were partially offset by a Ps 74.5 billion decrease in dividend income to Ps 26.1 billion in 2015 from Ps 100.6 billion in 2014. The decline in dividends reflects higher dividend payment during 2014 from investments such as the Empresa de Energía de Bogotá and Gas Natural by Ps 43.9 billion and Ps 7.4 billion, respectively.
Net income from financial instruments designated at fair value, which are the fair value of concessions arrangements with the Government through Promigas and its subsidiaries, decreased by Ps 19.8 billion to Ps 153.1 billion in 2015 as compared to 2014. This decrease is attributable to a change in the valuation discount rate that increased from 7.9% in 2014 to 8.8% in 2015.
Other income, which mainly includes income on sales of foreclosed assets, property, plant and equipment and recoveries on other expenses, decreased by Ps 29.6 billion in 2015 as compared to 2014.
Other expenses
| | | Year ended December 31, | | | Change, 2015 vs. 2014 | |
| | | 2015 | | | 2014 | | | # | | | % | |
| | | (in Ps billions) | | | | | | | |
| Losses from sales of noncurrent assets held for sale | | | (0.0 | ) | | | (2.0 | ) | | | 2.0 | | | | (100.0 | ) |
| Personnel expenses | | | (66.1 | ) | | | (61.1 | ) | | | (5.0 | ) | | | 8.3 | |
| Salaries and employee benefits | | | (63.6 | ) | | | (58.4 | ) | | | (5.2 | ) | | | 9.0 | |
| Bonus plan payments | | | (2.1 | ) | | | (2.5 | ) | | | 0.3 | | | | (13.8 | ) |
| Termination payments | | | (0.4 | ) | | | (0.2 | ) | | | (0.2 | ) | | | 63.3 | |
| Administrative and other expenses | | | (46.9 | ) | | | (63.8 | ) | | | 16.9 | | | | (26.5 | ) |
| Depreciation and amortization | | | (5.8 | ) | | | (4.5 | ) | | | (1.4 | ) | | | 30.4 | |
| Wealth tax | | | (43.9 | ) | | | 0.0 | | | | (43.9 | ) | | | N.A. | |
| Other expenses | | | (7.6 | ) | | | (27.2 | ) | | | 19.6 | | | | (72.0 | ) |
| Charitable and other donation expenses | | | (0.4 | ) | | | (0.4 | ) | | | 0.0 | | | | 4.3 | |
| Other | | | (7.2 | ) | | | (26.8 | ) | | | 19.6 | | | | (73.1 | ) |
| Total other expenses | | | (170.4 | ) | | | (158.5 | ) | | | (11.9 | ) | | | 7.5 | |
Corficolombiana’s total other expenses increased by Ps 11.9 billion to Ps 170.4 billion in 2015 as compared to 2014, mainly explained by the payment of the wealth tax for Ps 43.9 billion in 2015 (see “Item 4. Information on the Company—B. Business Overview—Supervision and Regulation—Tax Reforms”). Contributing to this increase was an increase in personnel expenses of Ps 5.0 billion. Partially offsetting these increases, was a Ps 19.6 billion decrease in other expenses and a Ps 16.9 billion decrease in administrative and other expenses.
The Ps 5.0 billion increase in personnel expenses is explained by a Ps 5.2 billion increase in salaries and employee benefits, by a Ps 0.2 billion increase in termination payments and by a Ps 0.3 billion decrease in bonus plan payments. The 5.2 billion increase in salaries and employee benefits was mainly due to a 3.7% increase in aggregated employees from financial subsidiaries and holding company from 946 at December 31, 2014 to 981 at December 31, 2015. Yearly salaries and employee benefits per capita went from Ps 61.7 million in 2014 to Ps 64.8 million in 2015.
Partially offsetting these increases, was a Ps 19.6 billion decrease in other expenses, which includes mainly sales of property, plants and equipment, fines and penalties derived from customers claims and others.
Income tax expense
Income tax expense increased by 5.0%, to Ps 330.9 billion in 2015 from Ps 315.1 billion in 2014, Corficolombiana’s effective tax rate (calculated as income tax expense divided income before income tax expense, minus the equity method income and dividends, plus wealth tax) remained relatively stable at 37.2% and 36.8% for 2014 and 2015, as such, the increase reflected a higher taxable net income base.
Net income attributable to non-controlling interest
Net income attributable to non-controlling interest increased by 20.0%, or Ps 52.0 billion in 2015 as compared to 2014. This increase is explained mainly by the fact that subsidiaries in which Corficolombiana holds a lower ownership, such as Promigas and Unipalma, performed better than those in which holds a higher controlling stake.
| B. | Liquidity and capital resources |
The following table sets forth our sources of funding at December 31, 2016, 2015 and 2014.
| | | At December 31, | |
| | | 2016 | | | 2015 | | | 2014 | |
| | | (in Ps billions) | |
| Liabilities and equity: | | | | | | | | | | | | |
| Derivatives held for trading | | | 640.7 | | | | 1,143.2 | | | | 1,183.1 | |
| Deposits | | | 143,887.1 | | | | 135,954.6 | | | | 113,528.5 | |
| Interbank borrowings and overnight funds | | | 6,315.7 | | | | 9,474.9 | | | | 4,964.4 | |
| Borrowings from banks and others | | | 17,906.6 | | | | 18,750.6 | | | | 13,685.8 | |
| Long-term debt (bonds) | | | 18,568.2 | | | | 16,567.1 | | | | 14,130.1 | |
| Borrowings from development entities | | | 2,725.7 | | | | 2,506.6 | | | | 2,108.5 | |
| Hedging derivatives | | | 43.4 | | | | 337.7 | | | | 559.5 | |
| Provisions | | | 620.4 | | | | 600.2 | | | | 744.7 | |
| Income tax liabilities | | | 1,651.9 | | | | 1,892.1 | | | | 1,691.3 | |
| Employee benefits | | | 1,097.6 | | | | 1,022.3 | | | | 975.7 | |
| Other liabilities | | | 5,957.2 | | | | 5,523.5 | | | | 3,914.7 | |
| Total liabilities | | | 199,414.5 | | | | 193,773.0 | | | | 157,486.2 | |
| Controlling interest | | | 15,601.6 | | | | 14,567.6 | | | | 13,668.0 | |
| Non-controlling interest | | | 9,057.7 | | | | 8,338.7 | | | | 7,687.9 | |
| Total equity | | | 24,659.2 | | | | 22,906.3 | | | | 21,356.0 | |
| Total liabilities and equity | | | 224,073.7 | | | | 216,679.3 | | | | 178,842.2 | |
Capitalization ratios
The following tables present consolidated capitalization ratios for our Colombian banking subsidiaries and Corficolombiana which are subject to capital requirements.
| | | At December 31, 2016 | |
| | | Grupo Aval entities | | | | |
| (in percentages) | | Banco de
Bogotá | | | Banco de
Occidente | | | Banco
Popular | | | Banco
AV
Villas | | | Corficolombiana | | | Grupo Aval
consolidated | |
| Tangible equity ratio(1) | | | 8.3 | % | | | 11.9 | % | | | 12.7 | % | | | 11.0 | % | | | 22.5 | % | | | 7.9 | % |
| Tier 1 ratio(2) | | | 9.0 | % | | | 10.2 | % | | | 9.3 | % | | | 10.3 | % | | | 31.6 | % | | | - | |
| Solvency ratio(3) | | | 13.9 | % | | | 12.8 | % | | | 11.1 | % | | | 11.5 | % | | | 36.7 | % | | | - | |
Source: Company calculations based on each entity’s respective financial statements for the period indicated. Tangible equity ratio is calculated under IFRS. Tier 1 ratio and solvency ratio are calculated under Colombian IFRS applicable to Consolidated Financial Statements as required by the Superintendency.
| (1) | Tangible equity ratio is calculated as total equity minus intangible assets (calculated as goodwill plus other intangible assets excluding those related to concession arrangements rights) divided by total assets minus |
intangible assets (calculated as goodwill plus other intangible assets excluding those related to concession arrangements rights). See “Item 3. Key Information—A. Selected financial and operating data—Non-IFRS measures.”
| (2) | Tier 1 ratio is calculated as primary capital divided by risk-weighted assets. |
| (3) | Solvency ratio is calculated as technical capital divided by risk-weighted assets. For a definition of technical capital, see “Item 4. Information on the Company—B. Business Overview—Supervision and regulation—Capital adequacy requirements.” The solvency ratio for Grupo Aval is calculated as the sum of technical capital of our banking subsidiaries on a consolidated basis divided by the sum of risk-weighted assets of our banking subsidiaries on a consolidated basis. |
Each of our banking subsidiaries and Corficolombiana are required by the Superintendency of Finance to maintain a solvency ratio of at least 9.0% of its total risk-weighted assets and a measure of core solvency for Tier 1, which requires higher quality capital and is set at a minimum of 4.5% of risk-weighted assets. As Grupo Aval is not regulated as a financial institution or bank holding company, it is not required to comply with capital adequacy regulations applicable to our banking subsidiaries. See “Item 4. Information on the Company—B. Business Overview—Supervision and regulation—Capital adequacy requirements.”
Funding
Our banking subsidiaries fund most of their loans with deposits. Other sources of funding include interbank borrowings and overnight funds, and borrowings from development banks and long-term bond issuances.
The following table summarizes the funding structure of our banks on a consolidated basis at the dates indicated.
| | | At December 31, | |
| | | 2016 | | | 2015 | | | 2014 | |
| | | | | | (in Ps billions) | |
| Deposits | | | 143,887.1 | | | | 135,954.6 | | | | 113,528.5 | |
| Borrowings from banks and others | | | 17,906.6 | | | | 18,750.6 | | | | 13,685.8 | |
| Interbank borrowings and overnight funds | | | 6,315.7 | | | | 9,474.9 | | | | 4,964.4 | |
| Long-term debt (bonds) | | | 18,568.2 | | | | 16,567.1 | | | | 14,130.1 | |
| Borrowings from development entities | | | 2,725.7 | | | | 2,506.6 | | | | 2,108.5 | |
| Total funding | | | 189,403.3 | | | | 183,253.9 | | | | 148,417.3 | |
In 2016, total funding increased by 3.4% percentage points from the same period in 2015 mainly as a result of an increase in deposits and long-term debt.
From year-end 2015 to year-end 2016, deposits and long-term debt as a percentage of total funding increased by 1.8 and 0.8 percentage points, respectively. Interbank and overnight funds and borrowings from banks and others decreased as a percentage of total funding by 1.8 and 0.8 percentage points, respectively.
From year-end 2014 to year-end 2015, borrowings from banks and others and Interbank borrowings and overnight funds as a percentage of total funding increased by 1.0 and 1.8 percentage points, respectively. Deposits and long-term debt decreased as a percentage of total funding by 2.3 and 0.5 percentage points, respectively.
Our Colombian funding base also benefits from the highest available local credit ratings for each of our banking subsidiaries and each of Corficolombiana and Porvenir, as assigned by BRC Investor Services S.A., an affiliate of Standard & Poor’s Investors Services LLC, or “S&P.” Banco Popular and Banco AV Villas have also achieved the highest available local credit ratings as assigned by Value and Risk Rating S.A. S.C.V. On March 9, 2016, Moody’s downgraded Banco de Bogotá’s standalone baseline credit assessment to “Ba1” from “Baa3” and its long-term foreign currency subordinated debt rating to “Ba2” from “Ba1”. As a result of the downgrades on Banco de Bogotá, Moody’s also downgraded Grupo Aval’s Long term local and foreign currency issuer ratings to “Ba2” from “Ba1” and Grupo Aval Limited’s long term foreign currency issuer to “Ba2” from “Ba1”. Such ratings were assigned in consideration of the decrease in Banco de Bogotá’s adjusted capital ratio. On April 28, 2016, Fitch placed certain of our and Banco de Bogotá’s ratings on negative watch for downgrade noting a decrease in Banco de Bogotá’s capital ratios resulting from the depreciation of the Colombian peso in 2015 which boosted its U.S. dollar denominated risk-weighted assets. Fitch also reasoned that the change in our accounting standards to IFRS contributed to a decrease in
the bank’s capital ratios. On June 28, 2016, Moody’s removed the negative watch on Banco de Bogotá’s and Grupo Aval’s rating but kept it under review for downgrade. Any adverse change in credit ratings may increase the cost of our funding. See “Item 3. Key Information—D. Risk factors—Risks relating to our businesses and industry—Risks relating to our banking business—Downgrades in our long-term credit ratings or in the credit ratings of our banking subsidiaries would increase the cost of, or impair access to, funding.”
In September 2014, we completed an SEC-registered initial public offering in the United States of 93,703,703 ADSs, each representing 20 preferred shares, raising U.S.$1.3 billion in net proceeds. In January 2014, we completed our third public offering of common shares pursuant to a preemptive rights offering in Colombia, raising Ps 2.4 trillion (U.S.$1.3 billion).
We believe that our working capital is sufficient to meet the company’s present requirements and that the current level of funding of each of our banks is adequate to support its business.
The following tables present our consolidated funding from deposits at the dates indicated.
| | | At December 31, | |
| | | 2016 | | | 2015 | | | 2014 | |
| | | (in Ps billions) | |
| Interest-bearing customer deposits: | | | | | | | | | | | | |
| Checking accounts | | | 21,843.6 | | | | 16,239.3 | | | | 13,370.7 | |
| Time deposits | | | 58,006.1 | | | | 51,777.4 | | | | 42,147.8 | |
| Savings deposits | | | 50,573.9 | | | | 50,298.1 | | | | 42,253.4 | |
| Total | | | 130,423.7 | | | | 118,314.8 | | | | 97,772.0 | |
| Non-interest-bearing customer deposits: | | | | | | | | | | | | |
| Checking accounts | | | 13,134.6 | | | | 17,191.3 | | | | 15,386.0 | |
| Other deposits | | | 328.8 | | | | 448.5 | | | | 370.5 | |
| Total | | | 13,463.4 | | | | 17,639.8 | | | | 15,756.5 | |
| Total customer deposits | | | 143,887.1 | | | | 135,954.6 | | | | 113,528.5 | |
Checking accounts. Our consolidated balance of checking accounts was Ps 34,978.2 billion at December 31, 2016, Ps 33,430.7 billion at December 31, 2015 and Ps 28,756.7 billion at December 31, 2014, representing 18.5%, 18.2% and 19.4% of total funding, respectively.
Time deposits. Our consolidated balance of time deposits was Ps 58,006.1 billion at December 31, 2016, Ps 51,777.4 billion at December 31, 2015 and Ps 42,147.8 billion at December 31, 2014, representing 30.6%, 28.3% and 28.4% of total funding, respectively.
The following table present time deposits held at December 31, 2016, by amount and maturity for deposits.
| | | At December 31, 2016 | |
| | | Peso-
denominated | | | Foreign
currency-
denominated | | | Total | |
| | | (in Ps billions) | |
| Up to 3 months | | | 7,873.8 | | | | 10,196.9 | | | | 18,070.7 | |
| From 3 to 6 months | | | 3,230.4 | | | | 3,846.5 | | | | 7,077.0 | |
| From 6 to 12 months | | | 5,621.9 | | | | 5,559.6 | | | | 11,181.5 | |
| More than 12 months | | | 10,048.4 | | | | 4,574.1 | | | | 14,622.5 | |
| Time deposits less than U.S.$100,000(1) | | | 4,828.1 | | | | 2,226.3 | | | | 7,054.4 | |
| Total | | | 31,602.6 | | | | 26,403.6 | | | | 58,006.1 | |
| (1) | Equivalent to Ps 300.1 million at the representative market rate at December 31, 2016 of Ps 3,000.71 per U.S.$1.00. |
Savings deposits. Our consolidated balance of savings deposits was Ps 50,573.9 billion at December 31, 2016, Ps 50,298.1 billion at December 31, 2015 and Ps 42,253.4 billion at December 31, 2014, representing 26.7%, 27.4% and 28.5% of total funding requirements, respectively, in each of those years.
Other deposits. Our consolidated balance of other deposits, which consist of deposits from correspondent banks, cashier checks and collection services, was Ps 328.8 billion at December 31, 2016, Ps 448.5 billion at December 31, 2015 and Ps 370.5 billion at December 31, 2014, representing 0.2%, 0.2% and 0.2%, respectively.
Interbank borrowings and overnight funds. Our consolidated balance of interbank borrowings and overnight funds was Ps 6,315.7 billion at December 31, 2016, Ps 9,474.9 billion at December 31, 2015 and Ps 4,964.4 billion at December 31, 2014, representing 3.3%, 5.2% and 3.3% of total funding requirements, respectively.
The following table sets forth our short-term borrowings consisting of interbank borrowings for the periodsindicated.
| | | At December 31, 2016 | |
| | | Amount | | | Average rate | |
| | | (in Ps billions, except percentages) | |
| Short-term borrowings | | | | | | | | |
| Interbank borrowings and overnight funds | | | | | | | | |
| End of period | | | 6,315.7 | | | | | |
| Average during period | | | 8,683.6 | | | | 6.6 | % |
| Maximum amount of borrowing at any month-end | | | 9,656.7 | | | | | |
| Interest paid during the period | | | 570.2 | | | | | |
As part of their interbank transactions, our banks maintain a portfolio of government securities and private sector liquid debt instruments used to obtain overnight funds from other financial institutions or investment funds by selling such securities and simultaneously agreeing to repurchase them. Due to the short-term nature of this source of funding, these transactions are volatile and are generally composed of Colombian government securities.
Borrowings from banks and others. Borrowings from banks are provided by correspondent banks and by governmental entities to promote lending to specific sectors of the Colombian economy. This funding, which mainly has fully matched maturities and interest rates with related loans, totaled Ps 17,906.6 billion at December 31, 2016, representing 9.5% of total funding requirements.
Bonds. We issue bonds in the Colombian and international markets. Our consolidated balance of bonds outstanding was Ps 18,568.2 billion at December 31, 2016, Ps 16,567.1 billion at December 31, 2015 and Ps 14,130.1 billion at December 31, 2014, representing 9.8%, 9.0% and 9.5% of total funding requirements, respectively. On February 1, 2012, Grupo Aval Limited issued U.S.$600.0 million (Ps 1,083.6 billion at the date of the issuance) of 5.25% Senior Notes due 2017 and on September 26, 2012, Grupo Aval Limited issued U.S.$1.0 billion (Ps 1,795.7 billion at the date of the issuance) 4.75% Senior Notes due 2022. On November 24, 2016, Grupo Aval Limited issued CPI+3.86% Senior Notes due 2026 and CPI+4.15% Senior Notes due 2036 in the Colombian market for Ps 300 billion (U.S.$94.1 million at the date of the issuance). On November 28, 2016, Grupo Aval effected the Make-whole Redemption of Grupo Aval Limited’s 5.25% Senior Notes due 2017.
The following bond issuances were placed in the market in 2016:
| Issuer (in Ps billion) | | Issuance
date | | Amount | | Expiration date | | Interest rate |
| Grupo Aval | | 2016 | | 300.0 | | November 2026 and November 2036 | | CPI+3.86%; CPI+4.15% |
| Banco de Occidente | | 2016 | | 650.0 | | October 2019 to October 2028 | | 7.85%; 7.77%; CPI + 3.9%; CPI + 4.60% |
| Banco Popular | | 2016 | | 300.0 | | October 2023 and October 2026 | | 8.10%; CPI + 4.13% |
| Promigas | | 2016 | | 400.0 | | September 2020 and September 2026 | | CPI +6.9% |
| Banco de Bogotá | | 2016 | | 3,290.7 | | May 2026 | | 6.25% |
| BAC Credomatic Honduras | | 2016 | | 4.5 | | July 2018 | | 6.00% |
| BAC Banco America Central S.A. | | 2016 | | 212.3 | | March 2017 to October 2021 | | 4.25% to 5.80% |
| BAC Credomatic de Centroamérica S.A. | | 2016 | | 34.3 | | January 2017 | | 4.50% |
| BAC Credomatic de Guatemala S.A. | | 2016 | | 528.1 | | January 2017 to October 2018 | | 4.50% to 8.50% |
Capital expenditures
Grupo Aval incurred Ps 626.7 billion of capital expenditures in property, plant and equipment in 2016, as compared to Ps 637.7 billion in 2015.
| C. | Research and development, patents and licenses, etc. |
Other than our technology program, we do not have any significant policies or projects relating to research and development, and we own no patents or licenses. See “Item 4. Information on the Company—B. Business overview—Other corporate information—Technology.”
For a discussion of trend information, see “—A. Operating results—Principal factors affecting our financial condition and results of operations.”
| E. | Off-balance sheet arrangements |
In the ordinary course of business, our bank subsidiaries have entered into various types of off-balance sheet arrangements, including credit lines, letters of credit and financial guarantees. Our bank subsidiaries utilize these instruments to meet their customers’ financing needs. The contractual amount of these instruments represents the maximum possible credit risk should the counterparty draw down the entire commitment or our bank fulfill its entire obligation under the guarantees, and the counterparty subsequently fails to perform according to the terms of the contract. Our bank subsidiaries may hold cash or other liquid collateral to support these commitments, and they generally have legal recourse to recover amounts paid but not recovered from customers under these instruments. Most of these commitments and guarantees expire undrawn. As a result, the total contractual amount of these instruments does not represent our bank subsidiaries’ future credit exposure or funding requirements. In addition, some of these commitments, primarily those related to consumer financing, are cancelable by our banks upon notice.
The following table presents the maximum potential amount of future payments under these instruments at the dates presented for Grupo Aval on a consolidated basis.
| | | At December 31, | |
| Grupo Aval | | 2016 | | | 2015 | | | 2014 | |
| | | (in Ps billions) | |
| Unused credit card limits | | | 17,383.7 | | | | 16,695.0 | | | | 11,610.6 | |
| Civil demands against our banks | | | 432.3 | | | | 516.3 | | | | 720.7 | |
| Issued and confirmed letters of credit | | | 1,084.6 | | | | 805.6 | | | | 765.8 | |
| Unused lines of credit | | | 2,720.4 | | | | 2,887.9 | | | | 3,047.3 | |
| Bank guarantees | | | 3,510.5 | | | | 2,896.5 | | | | 3,109.9 | |
| Approved credits not disbursed | | | 2,888.8 | | | | 2,339.3 | | | | 2,073.5 | |
| Other | | | 943.6 | | | | 2,364.8 | | | | 2,011.8 | |
| Total | | | 28,964.0 | | | | 28,505.5 | | | | 23,339.5 | |
| F. | Tabular disclosure of contractual obligations |
The following tables present our contractual obligations at December 31, 2016.
| | | At December 31, 2016 | |
| | | Payments due by period | |
| | | Total | | | Less than 1
year | | | 1 - 3 years | | | 3 - 5 years | | | More than 5
years | |
| | | Grupo Aval (in Ps billions) | |
| Liabilities: | | | | | | | | | | | | | | | | | | | | |
| Long-term debt obligations(1) | | | 18,568.2 | | | | 4,425.7 | | | | 1,988.5 | | | | 1,974.9 | | | | 10,179.2 | |
| Time deposits | | | 58,006.1 | | | | 41,288.1 | | | | 11,041.7 | | | | 2,457.1 | | | | 3,219.2 | |
| Long-term borrowings from banks and others | | | 17,906.6 | | | | 7,505.9 | | | | 4,461.9 | | | | 2,300.5 | | | | 3,638.3 | |
| Interbank and overnight funds | | | 6,315.7 | | | | 6,315.7 | | | | 0.0 | | | | 0.0 | | | | 0.0 | |
| Operating leases | | | 8,053.6 | | | | 8,053.6 | | | | 0.0 | | | | 0.0 | | | | 0.0 | |
| Employee benefit plans | | | 1,097.6 | | | | 416.6 | | | | 133.6 | | | | 157.6 | | | | 389.8 | |
| Total | | | 109,947.9 | | | | 68,005.7 | | | | 17,625.7 | | | | 6,890.1 | | | | 17,426.5 | |
| (1) | See Note 21 to our audited consolidated financial statements at December 31, 2016. |
ITEM 6. DIRECTORS, SENIOR MANAGEMENT AND EMPLOYEES
| A. | Directors and senior management |
Board of Directors
The Board of Directors of Grupo Aval is composed of seven principal members and seven alternate members, each of whom serves a one-year term and may be reelected indefinitely. The term for the current directors expires on March 31, 2018.
The current members of the Board of Directors were appointed at a shareholders’ meeting held on March 31, 2017. The following table presents the names of the current principal and alternate members of the board of directors.
| Board member | | Alternate |
| Luis Carlos Sarmiento Angulo | | Mauricio Cárdenas Müller |
| Alejandro Figueroa Jaramillo | | Juan María Robledo Uribe |
| Efraín Otero Álvarez | | Juan Camilo Ángel Mejía |
| Álvaro Velásquez Cock | | Ana María Cuéllar de Jaramillo |
| Julio Leonzo Álvarez Álvarez (1)(2)(3) | | Fabio Castellanos Ordóñez (2) |
| Germán Michelsen Cuéllar (1)(3) | | Gabriel Mesa Zuleta (2) |
| Esther América Paz Montoya (1)(2)(3) | | Germán Villamil Pardo (2) |
| (1) | Member of the Audit committee. |
| (2) | Independent director under Colombian requirements. |
| (3) | Independent director under SEC Audit Committee rules. |
Luis Fernando Pabón Pabón is the secretary of our board.
Biographical information of the principal members of our board of directors and the secretary of our board is set forth below. Ages of members of our board of directors throughout this annual report are as of April 24, 2017.
Luis Carlos Sarmiento Angulo, age 84, has served as the Chairman of the board of directors of Grupo Aval since 1999. Mr. Sarmiento Angulo is the founder and controlling shareholder of Grupo Aval and, since 1985, has served as a member of the board of directors of Organización Luis Carlos Sarmiento Angulo Ltda., an affiliate of our controlling shareholder. Since 2010 he has served as principal member of the Board of Directors of Casa Editorial El Tiempo and of CEET TV. He also serves as Chairman of the board of directors of the following not-for-profit entities: Fundación para el Futuro de Colombia—Colfuturo; Fundación Grupo Aval and Fundación Luis Carlos Sarmiento Angulo, through which he is sponsoring, among other initiatives, Corporación Microcrédito Aval, a microfinance not-for-profit organization. He holds a degree in Civil Engineering from Universidad Nacional de Colombia. He is the father of the President of Grupo Aval, Mr. Luis Carlos Sarmiento Gutiérrez. Mr. Sarmiento Angulo’s business address is Carrera 13 No. 26A-47, Bogotá, D.C., Colombia.
Alejandro Figueroa Jaramillo, age 75, has served as a principal member on the board of directors of Grupo Aval since 1999. Mr. Figueroa Jaramillo has been the President of Banco de Bogotá since 1988. He has been employed with Banco de Bogotá since 1973, where he also served as Executive Vice President and Vice President of Finance. He is the Chairman of the board of directors of Porvenir and has been a board member of Porvenir since 1991. He has also been a member of the board of directors of Corficolombiana since 1998 and of Fundación Grupo Aval since 2011. He previously served as Vice-Minister and Deputy Minister of Economic Development of Colombia. He holds a degree in Civil Engineering from Facultad de Minas de la Universidad Nacional in Antioquia and a Master of Arts degree and PhD candidate in Economics from Harvard University. Mr. Figueroa Jaramillo’s business address is Calle 35 No. 7-47, Bogotá, D.C., Colombia.
Efraín Otero Álvarez, age 68, has served as a principal member on the board of directors of Grupo Aval since 1999. Mr. Otero Álvarez has been the President of Banco de Occidente since 1995. He has been employed with Banco de Occidente since 1973, where he also served as Vice President of Finance and Executive Vice President. He has also served as a member of the boards of directors of Porvenir since 1995, of Corficolombiana since 1998, of Banco de Occidente—Panamá since 1996, Occidental Bank of Barbados since 2006 and of Fundación Grupo Aval
since 2011. He previously worked as an economist at Corporación Autónoma del Valle del Cauca. He holds a degree in Economics and a Master’s degree in Industrial Engineering, both from the Universidad del Valle. Mr. Otero Álvarez’s business address is Carrera 4 No. 7-61, Cali, Colombia.
Álvaro Velásquez Cock, age 77, has served as a principal member of the board of directors of Grupo Aval since 2013 and previously as an alternate member thereof since 2008. Mr. Velásquez Cock previously served as an alternate member of the board of directors of Grupo Aval since 2008. Mr. Velásquez Cock has served as advisor to Grupo Ethuss since 1994. He has acted as Dean of the Faculty of Economics of the Universidad de Antioquia, Chief of the Departamento Nacional de Estadística—DANE, President of Pedro Gómez & Cía. S.A. and as a member of the Advisory Committee of the Superintendency of Finance. He has been a member of the board of directors of Banco de Bogotá since 2001, of Banco de Bogotá—Panamá since 1984, of Corficolombiana since 1992, of Unipalma since 1996 and of BAC Credomatic entities since 2011. He holds a degree in Economics from the Universidad de Antioquia. Mr. Velásquez Cock’s business address is Calle 69 No. 9-58, Bogotá, D.C., Colombia.
Julio Leonzo Álvarez Álvarez, age 70, has served as a principal member of the board of directors of Grupo Aval since 2013. Mr. Álvarez has previously occupied several positions at Grupo Aval, including Vice President of Shared Services, and Vice President of Corporate Systems. Mr. Álvarez Álvarez has acted as President of Avianca S.A., Cervecería Unión S.A. and Pedro Gómez & Cía S.A. He has been a member of the board of directors of Porvenir since 2001 and of Banco Popular since 1996 and is a former member of the board of directors of A Toda Hora S.A.—ATH. He holds a degree in civil engineering from the Universidad Nacional de Colombia with studies in the Higher Management Program, INALDE at the Universidad de la Sabana, Postgraduate Program in Financial Management at the Universidad de Medellín, and Postgraduate Program in Statistics Applied to Engineering at the Universidad Nacional de Colombia. Mr. Álvarez Álvarez’s business address is Carrera 13 No. 26A-47, Bogotá, D.C., Colombia.
Germán Michelsen Cuéllar, age 70, has served as a principal member on the board of directors of Grupo Aval since 2017 and previously as an alternate member thereof since 2016. Mr. Michelsen Cuéllar is an independent consultant. He has been Chief Credit Officer, Vice President for the International and Treasury Division and Vicepresident of Corporate Banking of Banco de Bogotá, as well as Manager of Banco de Bogotá New York. Mr. Michelsen Cuéllar serves as member of the Board of Directors of Fiduciaria Bogotá S.A., Almaviva S.A., Hoteles Estelar S.A. and Pizano S.A. He holds a Bachelor´s degree in Economics from Universidad Javeriana, and has participated in the Senior Management Program from the Universidad de los Andes School of Business. Mr. Michelsen Cuéllar’s business address is Calle 82 # 11-37 Office 209, Bogotá, D.C., Colombia.
Esther América Paz Montoya, age 62, has served as a principal member on the board of directors of Grupo Aval since 2010, and previously as an alternate member thereof since 2005. Ms. Paz Montoya is a former President of Banco AV Villas, where she also served as Vice President of Finance and Vice President of Operations, and a former President of Ahorramás Corporación de Ahorro y Vivienda. Ms. Paz Montoya has served as a member of the board of directors of Agremiación Cívica Centro Internacional San Diego S.A. since 2009. She holds a degree in Business Administration from the Universidad del Valle and a Finance specialty from Universidad de Los Andes. Ms. Paz Montoya’s business address is Carrera 13 No. 26A-47, Bogotá, D.C., Colombia.
Biographical information of the alternate members of our board of directors is set forth below.
Mauricio Cárdenas Müller, age 47, has served as an alternate member of the board of directors of Grupo Aval since 2015. Previously, he served as a principal member on the board of directors of Grupo Aval from 2010 until 2014, and as an alternate member thereof since 2002 until 2010. Mr. Cárdenas Müller has acted as chief advisor to Luis Carlos Sarmiento Angulo since 2004. He is a member of the board of directors of Seguros Alfa S.A. and of Seguros de Vida Alfa S.A. since 2014, and previously served from 2002 until 2011. He has also served as a member of the board of directors of Fundación para el Futuro de Colombia – Colfuturo since 2007, of Porvenir since 2008, and of Casa Editorial El Tiempo since 2011. Mr. Cárdenas holds a degree in Electronic Engineering from Universidad Javeriana and a Master’s degree in Business Administration from Escuela de Dirección y Negocios de la Universidad de la Sabana – INALDE. Mr. Cárdenas Müller’s business address is Carrera 13 No. 26A–47, Bogotá, D.C., Colombia.
Juan María Robledo Uribe, age 72, has served as an alternate member on the board of directors of Grupo Aval since 2000. Mr. Robledo Uribe has acted as Executive Vice President of Banco de Bogotá from 1990 to 1992, from 1993 to 2001 and since 2003. He has been employed with Banco de Bogotá for 50 years, where he has also served
as Vice President of Banking Services and Vice President of Commercial Banking. He has been a member of the board of directors of Corficolombiana from 1993 to 2001 and since 2006, of Fidubogotá since 2007, of Porvenir since 1991 and of Fundación Grupo Aval since 2011. He holds a degree in Economics from the Universidad del Rosario. He is also the former President of Banco del Comercio (which merged with Banco de Bogotá in 1992) and of Corficolombiana from 2003 until 2005. Mr. Robledo Uribe’s business address is Calle 35 No. 7-47, Bogotá, D.C., Colombia.
Juan Camilo Ángel Mejía, age 51, has served as an alternate member on the board of directors of Grupo Aval since 2008. Mr. Ángel Mejía has been the President of Banco AV Villas since 2007, and previously acted as its Vice President of Credit and Portfolio, Vice President of Asset Regularization and Vice President of Real Estate. Previously he was an advisor in the Offerings Department of Banco Central Hipotecario and Project Manager in the Capital Markets division of Corfinsura. He has also been a member of the board of directors of Asociación Bancaria de Colombia since 2007, of Titularizadora Colombiana S.A. since 2008 and of Fundación Grupo Aval since 2011. He holds a degree in Civil Engineering from the Universidad de Medellín. Mr. Ángel Mejía’s business address is Carrera 13 No. 26A-47, Bogotá, D.C., Colombia.
Ana María Cuéllar de Jaramillo, age 63, has served as an alternate member of the board of directors of Banco de Bogotá since 2007 and also serves as a member of the board of directors of Megalínea and Biomax S.A. and of BAC Credomatic entities since 2011. Ms. Cuéllar de Jaramillo is an independent consultant who specializes in systems and procedures for financial control and has formerly served as Director of the Dirección de Impuestos y Aduanas Nacionales DIAN and in several positions in Citibank. She holds a degree in accounting from Universidad Jorge Tadeo Lozano. Ms. Cuéllar de Jaramillo’s business address is Carrera 13 No. 26A-47, Bogotá, D.C., Colombia.
Fabio Castellanos Ordóñez, age 60, has served as an alternate member of the board of directors of Grupo Aval since 2015. He is the local representative in Colombia of AMF (Ascending Markets Financial Guaranty Corporation) and has previously acted as Chief Country Officer and Executive Director of ABN-AMRO Bank (Colombia) S.A., The Royal Bank of Scotland (Colombia) S.A., Scotiabank Colombia S.A. and Vice President and Corporate Finance Executive of the Representative Office in Colombia of The Chase Manhattan Bank, N.A. Mr. Castellanos serves as member of the Board of Directors of Junior Achievement Colombia, Ignacio Gómez IHM S.A. and Corporación Umabarí. Mr. Castellanos Ordóñez’ business address is Calle 112#1-10 E, T 5, Bogotá, D.C., Colombia.
Gabriel Mesa Zuleta, age 50, has served as an alternate member on the board of directors of Grupo Aval in several instances since 2004. Mr. Mesa Zuleta has been the President of Sadinsa S.A. since 2003 and a member of the board of directors of Banco Popular since 2004, of Seguros Alfa S.A. since 2004 and of Seguros de Vida Alfa S.A. since 2004. He previously acted as Director of the Administrative Department of the President of the Republic of Colombia and as President of Empresa de Telecomunicaciones de Colombia–Telecom. He holds a law degree from the Universidad del Rosario. Mr. Mesa Zuleta’s business address is Carrera 13 No. 26–45, Bogotá, D.C., Colombia.
Germán Villamil Pardo, age 57, has served as an alternate member on the board of directors of Grupo Aval since 2010 and previously as a principal member thereof since 2006. Mr. Villamil Pardo is a partner of Gómez Pinzón Zuleta Abogados S.A. He has served as a member of the board of directors of Gómez Pinzón Zuleta Abogados S.A. since 1997 and Gómez Pinzón Zuleta Asemarcas S.A. since 2003. Mr. Villamil Pardo formerly served as a member of the board of Inversiones Inmobiliarias Arauco Alameda S.A.S and Inversiones Inmobiliarias Barranquilla Arauco S.A.S. He previously held several positions in the Ministry of Finance of Colombia as well as in Banco de la República. He holds a law degree with a specialty in tax from the Universidad de los Andes. Mr. Villamil Pardo’s business address is Calle 67 No. 7-35 Oficina 1204, Bogotá, D.C., Colombia.
Luis Fernando Pabón Pabón, age 58, has served as Secretary of the Board of Grupo Aval since 2000. Mr. Pabón Pabón formerly served as Legal Vice President of Banco de Colombia and as Legal Counsel to the President of Banco de Bogotá. He has been a member of the board of directors of Banco AV Villas since 1998, of Porvenir since 2003, of Almaviva S.A. since 2007, of Organización Luis Carlos Sarmiento Angulo Ltda. since 2006 and of Casa Editorial El Tiempo and CEET TV since 2011. He also serves as legal counsel to Organización Luis Carlos Sarmiento Angulo Ltda. Mr. Pabón Pabón holds a law degree from Universidad Javeriana and a specialization in financial law from the Universidad de los Andes. Mr. Pabón Pabón’s business address is Carrera 13 No. 26A-47, Bogotá, D.C., Colombia.
Executive officers
The executive officers of Grupo Aval are responsible for the day-to-day management of our company. Although the Presidents of Banco Popular, Corficolombiana, Porvenir and BAC Credomatic are not represented in the board of directors or in the management of Grupo Aval, they are key individuals in our group’s banking, merchant banking, pension management and Central American businesses.
The following table lists the names and positions of our executive officers and the presidents of our banking subsidiaries, Corficolombiana, Porvenir and BAC Credomatic. Certain of our executive officers are also members of the boards of directors of our subsidiaries.
| Name | | Position |
| Luis Carlos Sarmiento Gutiérrez | | President |
| Diego Fernando Solano Saravia | | Chief Financial Officer |
| Diego Rodríguez Piedrahita | | Chief Risk Management Officer |
| Carlos Ernesto Pérez Buenaventura | | Chief Strategy Officer |
| Rodolfo Vélez Borda | | Chief of Shared Services |
| Rafael Eduardo Neira Torres | | Chief of Internal Control |
| Jorge Adrián Rincón Plata | | Chief Legal Counsel |
| María Edith González Flórez | | Vice President of Accounting |
| Tatiana Uribe Benninghoff | | Vice-President of Financial Planning and Investor Relations |
| | | |
| Banco de Bogotá | | |
| Alejandro Figueroa Jaramillo | | President |
| Banco de Occidente | | |
| Efraín Otero Álvarez | | President |
| Banco Popular | | |
| Carlos Eduardo Upegui Cuartas | | President |
| Banco AV Villas | | |
| Juan Camilo Ángel Mejía | | President |
| Corficolombiana | | |
| Bernardo Noreña Ocampo | | President |
| Porvenir | | |
| Miguel Largacha Martínez | | President |
| BAC Credomatic | | |
| Rodolfo Tabash Espinach | | President |
Biographical information of our executive officers and key employees who are not directors is set forth below. Ages of our executive officers throughout this annual report are as of April 24, 2017.
Luis Carlos Sarmiento Gutiérrez, age 55, has acted as President of Grupo Aval since 2000. Mr. Sarmiento Gutiérrez acted as President of Cocelco S.A. from 1997 until 2000. Previously he served as Executive Vice President at First Bank of the Americas in New York and as an analyst and financial manager at Procter & Gamble’s corporate headquarters. He has been the Chairman of the board of directors of Banco de Bogotá since 2004 and of Corficolombiana since 2006. He holds a Bachelor of Science degree, magna cum laude, in civil engineering from the University of Miami and a Master’s degree in Business Administration with a concentration in Finance from the Johnson Graduate School of Management at Cornell University. Mr. Sarmiento Gutiérrez is the son of the Chairman of the board of directors of Grupo Aval, Mr. Sarmiento Angulo. Mr. Sarmiento Gutiérrez’s business address is Carrera 13 No. 26A-47, Bogotá, D.C., Colombia.
Diego Fernando Solano Saravia, age 51, has acted as Chief Financial Officer, and formerly as Vice President of Corporate Planning, of Grupo Aval since 2006. He previously served as associate principal at McKinsey & Co. and Corporate Vice President at Banco Santander Colombia. He holds a degree in Systems Engineering from the Universidad de los Andes and a Master’s degree in Business Administration from the Wharton School at the University of Pennsylvania. His business address is Carrera 13 No. 26A-47, Bogotá, D.C., Colombia.
Diego Rodríguez Piedrahita, age 58, has acted as Chief Risk Management Officer of Grupo Aval since 1999. Mr. Rodríguez Piedrahita previously worked at Bank of America and ING. He has been the Chairman of the board
of directors of Banco AV Villas since 2004 and has been a board member thereof since 2000. He has also been a member of the board of directors of Fidubogotá since 2000, Organización Luis Carlos Sarmiento Angulo Ltda. since 2006, Inverprogreso S.A. since 2003 and of Inversegovia S.A. since 2003. He holds a Bachelor’s degree in Business Management and a Master in Business Administration from George Washington University. Mr. Rodríguez Piedrahita’s business address is Carrera 13 No. 26A-47, Bogotá, D.C., Colombia.
Carlos Ernesto Pérez Buenaventura, age 62, has served as Chief Strategy Officer of Grupo Aval since 2012 and formerly as CEO of Barclays in Spain. Previously he was the Division Head responsible for the Retail Bank, the Pension Fund Business and the Consumer Finance Companies of Citigroup in Argentina, Chile, Uruguay and Paraguay. He also worked for Citigroup in Colombia, Ecuador and Puerto Rico. In addition he has served as Marketing and Sales Manager of Alpina S.A. (food-producing company). He has been a board member of Banco AV Villas since 2013 and of Porvenir since 2014. He holds a degree in Industrial Engineering from Universidad Javeriana and pursued graduate studies in Business Management from Universidad del Rosario. Mr. Pérez Buenaventura’s business address is Carrera 13 No. 26A-47, Bogotá, D.C., Colombia.
Rodolfo Vélez Borda, age 52, has served as Chief of Shared Services at Grupo Aval since 2012 and formerly as Vice President of Technology and Operations of Banco AV Villas and Corporación Ahorramás. He has been a member of the board of directors of Fondo de Empleados FEVI since 2012, ACH Colombia S.A. since 2006 and A Toda Hora S.A. ATH since 2005. He holds a degree in Systems Engineering from the Universidad de Los Andes, a Telecommunications specialty from the Universidad de Los Andes and a Business Management specialty from Aden Business School and MIT. Mr. Vélez Borda’s business address is Carrera 13 No. 26A-47, Bogotá, D.C., Colombia.
Rafael Eduardo Neira Torres, age 61, has acted as Chief of Internal Control of Grupo Aval since 2009. Mr. Neira Torres acted as Deputy Financial Superintendent, and formerly as Adjunct Financial Superintendent, at the Superintendency of Finance from 2006 to 2008. He previously worked as Operations Vice President at Banco Davivienda. He holds a degree in Accounting from the Universidad Jorge Tadeo Lozano and in Banking Management from the Universidad de los Andes. Mr. Neira Torres’ business address is Carrera 13 No. 26A-47, Bogotá, D.C., Colombia.
Jorge Adrián Rincón Plata, age 37, has acted as our Chief Legal Counsel since May 2012. Mr. Rincón previously served as Legal Counsel to Banco de Bogotá. He holds a degree in law from the Universidad Autónoma de Bucaramanga and a Masters in International Business Law from Queen Mary University & Westfield College, University of London. Mr. Rincón Plata’s business address is Carrera 13 No. 26A-47, Bogotá, D.C., Colombia.
María Edith González Flórez, age 58, has acted as Vice President of Accounting, and formerly as Financial and Administrative Manager, of Grupo Aval since 2004. Ms. González Flórez previously worked as Financial Manager at Cocelco S.A. and Movistar. She holds a degree in Public Accounting from the Universidad de Santiago de Cali and a Finance specialty from Universidad ICESI. Ms. González Flórez’s business address is Carrera 13 No. 26A-47, Bogotá, D.C., Colombia.
Tatiana Uribe Benninghoff, age 36, has acted as Vice-President of Financial Planning and Investor Relations since 2013 and formerly as Strategy and M&A Manager since 2012 at Grupo Aval. Previously she served as a junior advisor to the Chairman of the Board of Grupo Aval and as an Investment Bank Director at Corficolombiana S.A. She holds a degree in Finance and International Relations from the Universidad Externado de Colombia and a Master of Business Administration from the McDonough School of Business at Georgetown University where she was given the Beta Gamma Sigma award. Her business address is Carrera 13 No. 26A-47, Bogotá, D.C., Colombia.
Carlos Eduardo Upegui Cuartas, age 55, has served as President of Banco Popular since June 2014. Mr. Upegui previously served as Executive Vice-president of Banco Popular, legal representative of Ripley Compañía de Financiamiento S.A. from 2012 to 2014 and President of BCSC S.A. from 2009 to 2012. He has also served in the past as member of the Board of Directors in several financial entities including Metlife Colombia Seguros de Vida S.A., Titularizadora Colombiana S.A., Depósito Centralizado de Valores de Colombia—Deceval S.A. He holds a degree in business administration with a specialization in markets from Universidad de los Andes. His business address is Calle 17 No. 7-43, Bogotá, D.C., Colombia.
Bernardo Noreña Ocampo, age 56, has been appointed as the Chief Executive Officer of Corficolombiana effective May 16, 2016. Mr. Noreña previously worked at Citibank for 19 years where he most recently served as President of Citibank Colombia. Mr. Noreña holds a degree in Economics from Pontificia Universidad Javierana and an MBA from the University of Notre Dame. His business address is Carrera 13 No. 26-35, Bogotá, D.C., Colombia.
Miguel Largacha Martínez, age 53, has served as President of Porvenir since 2008. Mr. Largacha Martínez previously served as President of Horizonte Sociedad Administradora de Fondos de Pensiones y de Cesantías S.A., and held other positions within BBVA Colombia S.A., including Executive Vice President and Vice President of Banco Ganadero (the predecessor to BBVA Colombia S.A.) and has been a member of the board of directors of Fundación Grupo Aval since 2011. He holds a law degree from Universidad Javeriana and has further completed postgraduate studies in Financial Legislation and Executive Management at the Universidad de los Andes. His business address is Carrera 13 No. 27-75, Bogotá, D.C., Colombia.
Rodolfo Tabash Espinach, age 48, has served as Chief Executive Officer of BAC Credomatic since July, 2016. He has previous acted in several key management positions in BAC Credomatic for the past 20 years, including Country Manager for BAC International Bank and its Panamanian subsidiaries, General Manager of BAC International Bank, Regional Chief Operating Officer for BAC Credomatic's Banking Business and Commercial Banking Manager of Banco BAC San José. He is also a member of the board of directors of several BAC Credomatic subsidiaries. Mr. Tabash Espinach holds a degree in business administration from Universidad Internacional de las Américas and an MBA from INCAE. His business address is Centro Corporativo Plaza Roble, Edificio Terrazas B, Escazú, San José, Costa Rica.
Our common shareholders must approve the compensation of our board of directors at the shareholders’ ordinary meeting of every calendar year.
Each member of our board of directors, including alternates, receives a fee based on attendance at each board of directors’ session. Members of our audit committee also receive an additional fee for attending audit committee meetings.
For the April 1, 2016 to March 31, 2017 period, the board of directors’ session fee is Ps 2,150,000 per board member and the audit committee session fee is Ps 2,150,000 per board member. For the April 1, 2017 to March 31, 2018 period, the board of directors’ session fee is Ps 2,300,000 per board member and the audit committee session fee is Ps 2,300,000 per board member.
We are not required under Colombian law to publish information regarding the compensation of our individual executive officers, and we do not make this information public. Our shareholders, however, can request this information before our general shareholders’ meetings. The aggregate amount of compensation, inclusive of bonuses, which we and our subsidiaries paid to directors, alternate directors and senior executive officers was Ps $85.7 billion (U.S.$28.5 million) in 2016. We pay bonuses to our executive officers which vary according to each officer’s performance and the achievement of certain predefined goals, and, therefore, the amounts paid may vary for each officer.
We do not have, and have not had in the past, any share option plans.
Principal differences between Colombian and U.S. corporate governance practices
Grupo Aval, as a listed company that qualifies as a foreign private issuer under the NYSE listing standards in accordance with the NYSE corporate governance rules, is permitted to follow home-country practice in some circumstances in lieu of the provisions of the corporate governance rules contained in Section 303A of the NYSE Listed Company Manual that are applicable to U.S. companies. We follow corporate governance practices applicable to Colombian companies and those described in our Corporate Governance Code, which in turn follow Colombian corporate governance rules. The Corporate Governance Code is available at Grupo Aval’s website at www.grupoaval.com. Information on our website is not incorporated into this annual report.
The following is a summary of the significant differences between the corporate governance practices followed by Grupo Aval and those applicable to domestic issuers under the NYSE listing standards.
Independence of directors
Under NYSE corporate governance rules, a majority of a U.S. company’s board of directors must be composed of independent directors, although as a foreign private issuer and a company that is controlled, directly or indirectly, by Mr. Luis Carlos Sarmiento Angulo, we would not be required to comply with this rule. Law 964 of 2005 requires that our board of directors consist of five to ten members and that at least 25% of such members be independent directors, and Decree 3923 of 2006 regulates their election. “Independence” within the meaning of Law 964 of 2005 is primarily concerned with independence from management and the absence of material related-party transactions between the director and the company. See “Item 10. Additional Information—A. Share capital.” In compliance with Colombian law and our by-laws, Grupo Aval’s board of directors is composed of seven members, of which two are independent under Colombian rules. In addition, Colombian law mandates that all directors exercise independent judgment under all circumstances.
Non-executive director meetings
Pursuant to the NYSE listing standards, non-executive directors of U.S. listed companies must meet on a regular basis without management being present. Under Colombian regulations, there is no prohibition against officers being members of the board of directors, and it is our practice that each president of our banks be a member of our board of directors. The non-executive directors of Grupo Aval do not meet formally without management present.
Committees of the board of directors
Under NYSE listing standards, all U.S. companies listed on the NYSE must have an audit committee, a compensation committee and a nominating/corporate governance committee, each with a written charter addressing certain minimum specified duties, and all members of such committees must be independent. In each case, the independence of directors must be established pursuant to highly detailed rules promulgated by the NYSE and, in the case of the audit committee, the NYSE and the SEC. We have established an audit committee, a corporate matters committee and a compensation committee as further described below.
Audit committee
Our audit committee is composed of three members, appointed by the board of directors: Esther América Paz Montoya, Julio Leonzo Álvarez Álvarez and Germán Michelsen Cuellar. Julio Leonzo Álvarez Álvarez is the financial expert on the audit committee. All members of our audit committee are independent under the NYSE and SEC corporate governance rules applicable to us. Company officers are not members of the audit committee; however, the meetings and work product of the audit committee are supported by reports and presentations by company officers. Pursuant to Colombian Securities regulation (Law 964 of 2005), the audit committee has a charter approved by the board of directors, which sets forth the main aspects related to the operation of such committee, including, among others, its composition and duties. The audit committee charter addresses various corporate governance subjects. Our external auditor KPMG, as our independent registered public accounting firm, is invited to attend the meetings of the audit committee. Pursuant to Colombian law, the audit committee must meet at least quarterly.
Our audit committee advises the board of directors generally on internal control matters, and it specifically undertakes to:
| · | review financial statements prior to their submission to the board of directors and to the general shareholders’ meeting; |
| · | supervise the internal auditor to verify if its actions address the internal control needs of the company and to identify limitations with respect to its duties; |
| · | review all internal control reports of the company and supervise compliance with such reports by the company’s management; |
| · | issue its opinion on the independence of the external auditor, based on standards set forth by Colombian and U.S. regulations; |
| · | monitor the company’s levels of risk exposure at least every six months and propose mitigation measures as needed; |
| · | propose to the board of directors control systems to prevent, detect and adequately respond to the risk of fraud and improper conduct by company employees; |
| · | provide assistance to our board of directors in fulfilling its responsibilities with respect to our compliance with legal and regulatory requirements; |
| · | make recommendations to the general shareholders meeting concerning the engagement of the independent accounting firm; and |
| · | issue reports to the board of directors on matters deemed relevant. |
Corporate matters committee
Our corporate matters committee is composed of the same members as the audit committee. The corporate matters committee advises the board of directors relating to the preparation and execution of internal policies related to risk management and internal control at the holding company level and of its subsidiaries.
Compensation committee
Our compensation committee is composed of two directors: Mr. Luis Carlos Sarmiento Angulo and Mr. Julio Leonzo Álvarez Álvarez. Our Board of Directors may change the members of the committee at any time. The compensation committee advises the board on remuneration matters and specifically undertakes to (i) review the remuneration of our President and (ii) review the criteria upon which our President will determine the remuneration of our senior management and employees. Because Colombian law does not require the creation of a compensation committee, the Board of Directors has not adopted a compensation committee charter.
At December 31, 2016, on a consolidated basis, we employed approximately 77,050 individuals, with 61,037 employees, 5,085 personnel provided by staffing service companies and 10,928 outside contractors.
The following table presents the approximate breakdown of the employees, personnel provided by staffing service companies and outside contractors of our banking subsidiaries, Corficolombiana, Porvenir and Grupo Aval (unconsolidated), at December 31, 2016.
| | | Banco de
Bogotá(1)(2) | | | Banco de
Occidente(3) | | | Banco
Popular(4) | | | Banco AV
Villas(5) | | | Corficolombiana | | | Porvenir
(6) | | | BAC
Credomatic | | | Grupo Aval
(unconsolidated) | | | Total | |
| Employees | | | 12,919 | | | | 12,556 | | | | 4,399 | | | | 4,890 | | | | 786 | | | | 2,685 | | | | 22,675 | | | | 127 | | | | 61,037 | |
| Personnel provided by staffing service companies | | | 2,395 | | | | 85 | | | | 1,280 | | | | 806 | | | | 53 | | | | 46 | | | | 418 | | | | 2 | | | | 5,085 | |
| Outside contractors | | | 3,914 | | | | 1,362 | | | | 2,028 | | | | 1,342 | | | | 121 | | | | 226 | | | | 1,930 | | | | 5 | | | | 10,928 | |
| Total | | | 19,228 | | | | 14,003 | | | | 7,707 | | | | 7,038 | | | | 960 | | | | 2,957 | | | | 25,023 | | | | 134 | | | | 77,050 | |
| (1) | Excludes employees of Porvenir, BAC and their subsidiaries. |
| (2) | 51.41% (5,474) of Banco de Bogotá’s direct employees (10,648) are represented by unions and 57.24% (6,095) of such employees are covered by collective bargaining agreements that expire in August 2018. |
| (3) | 45.49% (3,742) of Banco de Occidente’s direct employees (8,226) are represented by unions and are covered by collective bargaining agreements that expire in December 2017. |
| (4) | 66.44% (2,390) of Banco Popular’s direct employees (3,597) are represented by unions and 96.16% (3,459) of such employees are covered by collective bargaining agreements that expire in December 2017. |
| (5) | 15.60% (660) of Banco AV Villas’ direct employees (4,232) are represented by unions and 85.11% (3,602) of such employees are covered by collective bargaining agreements that expire in December 2017. |
| (6) | Less than 0.2% (4) of Porvenir’s direct employees (2,501) are represented by unions. |
Mr. Sarmiento Angulo beneficially owns 96.9% of our outstanding common shares and 43.3% of our preferred shares as determined under SEC rules at April 24, 2017. See “Item 7. Major Shareholders and Related Party Transactions—A. Major shareholders.” The following table provides the names of our other directors and key executive officers who owned shares of Grupo Aval at April 24, 2017.
| Shareholder | | Common
shares | | | Percentage
of
outstanding
common
shares | | | Preferred
shares | | | Percentage of
outstanding
preferred shares | |
| Esther América Paz Montoya | | | 251,718 | | | | * | | | | 423,076 | | | | * | |
| Efraín Otero Álvarez | | | 102,729 | | | | * | | | | 300,000 | | | | * | |
| Luis Fernando Pabón Pabón | | | 78,237 | | | | * | | | | 115,384 | | | | * | |
| Gabriel Mesa Zuleta | | | 65,788 | | | | * | | | | 35,384 | | | | * | |
| Diego Fernando Solano Saravia | | | 49,586 | | | | * | | | | 152,078 | | | | * | |
| Julio Leonzo Álvarez Álvarez | | | 47,694 | | | | * | | | | - | | | | * | |
| Mauricio Cárdenas Müller | | | 40,616 | | | | * | | | | 76,923 | | | | * | |
| Germán Villamil Pardo | | | 33,058 | | | | * | | | | - | | | | * | |
| Álvaro Velásquez Cock | | | 8,264 | | | | * | | | | 11,538 | | | | * | |
| Juan Camilo Ángel Mejía | | | 7,319 | | | | * | | | | 22,666 | | | | * | |
| Rodolfo Vélez Borda | | | 7,112 | | | | * | | | | 11,538 | | | | * | |
| Miguel Largacha Martínez | | | - | | | | * | | | | 172,680 | | | | * | |
| Ana María Cuéllar de Jaramillo | | | - | | | | * | | | | 50,846 | | | | * | |
| Diego Rodríguez Piedrahita | | | - | | | | * | | | | 49,847 | | | | * | |
| Luis Carlos Sarmiento Gutiérrez | | | - | | | | * | | | | - | | | | * | |
| Alejandro Figueroa Jaramillo | | | - | | | | * | | | | - | | | | * | |
| Juan María Robledo Uribe | | | - | | | | * | | | | - | | | | * | |
| Germán Michelsen Cuéllar | | | - | | | | * | | | | - | | | | * | |
| Rafael Eduardo Neira Torres | | | - | | | | * | | | | - | | | | * | |
| Carlos Ernesto Pérez Buenaventura | | | - | | | | * | | | | - | | | | * | |
| Tatiana Uribe Benninghoff | | | - | | | | * | | | | - | | | | * | |
| María Edith González Flórez | | | - | | | | * | | | | - | | | | * | |
| Fabio Castellanos Ordóñez | | | - | | | | * | | | | - | | | | * | |
| Jorge Adrián Rincón Plata | | | - | | | | * | | | | - | | | | * | |
| Bernardo Noreña Ocampo | | | - | | | | * | | | | - | | | | * | |
| Carlos Eduardo Upegui Cuartas | | | - | | | | * | | | | - | | | | * | |
| Rodolfo Tabash Espinach | | | - | | | | * | | | | - | | | | * | |
ITEM 7. MAJOR SHAREHOLDERS AND RELATED PARTY TRANSACTIONS
Mr. Luis Carlos Sarmiento Angulo controls Grupo Aval and was the beneficial owner of 79.9% of our issued and outstanding share capital at December 31, 2016. He retained 96.9% of our voting power by virtue of his beneficial ownership of 96.9% of our outstanding common shares, and beneficially owned 43.3% of our outstanding preferred shares, as determined under SEC rules, at April 24, 2017. Beneficial ownership is defined in Form 20-F and generally includes voting or investment power over securities. Percentage of beneficial ownership is based on 22,281,017,159 of our aggregate equity securities outstanding comprising of 15,237,489,827 common shares outstanding and 7,043,527,332 preferred shares outstanding at April 24, 2017.
The principal shareholder, as a common shareholder and a preferred shareholder, does not have any different or special voting rights in comparison to any other common shareholder or preferred shareholder, respectively.
The following table sets forth information, as of December 31, 2016, regarding the beneficial ownership of our equity securities by:
| · | Mr. Sarmiento Angulo, who beneficially owns 79.9% of our outstanding equity securities; |
| · | all directors and executive officers as a group; and |
| | | At December 31, 2016 | |
| Principal beneficial owners | | Common shares | | | Percentage of
outstanding
common shares | | | Preferred shares | | | Percentage of
outstanding
preferred shares | |
| Luis Carlos Sarmiento Angulo | | | 14,758,013,849 | | | | 96.9 | % | | | 3,048,966,627 | | | | 43.3 | % |
| Other directors and officers as a group | | | 718,088 | | | | 0.0 | % | | | 1,436,959 | | | | 0.0 | % |
| Other shareholders | | | 478,757,890 | | | | 3.1 | % | | | 3,993,123,746 | | | | 56.7 | % |
| Total | | | 15,237,489,827 | | | | 100.0 | % | | | 7,043,527,332 | | | | 100.0 | % |
As of December 31, 2016, we had 34,256 holders of preferred shares registered in Colombia in addition to JPMorgan Chase Bank, N.A. as depositary of the American Depositary Receipts, or “ADRs,” evidencing ADSs. As of April 13, 2016, there were a total of 2,488 ADR holders of record and 78,427,291 ADRs outstanding, representing 1,568,545,820 preferred shares or 22.3% of outstanding preferred shares. Since some of these ADRs are held by nominees, the number of record holders may not be representative of the number of beneficial holders.
| B. | Related party transactions |
We currently engage in, and expect from time to time in the future to engage in, financial and commercial transactions with “related parties” (within the meaning of the SEC rules). Unless otherwise indicated below, such transactions are conducted on an arm’s-length basis in the ordinary course of business, on terms that would apply to transactions with third parties.
Loans or deposits involving related parties
The following chart presents outstanding amounts of related party transactions involving loans or deposits between Grupo Aval and its consolidated subsidiaries, and each of the following individuals and entities.
| | | Transactions between Grupo Aval and its subsidiaries, and | |
| | | Grupo Aval’s
directors and key
management and
their affiliates(1) | | | Close family
members of
Mr. Sarmiento
Angulo and their
affiliates | | | Mr. Sarmiento
Gutiérrez and
his affiliates | | | Mr. Sarmiento
Angulo and his
affiliates | |
| | | (in Ps billions) | |
| At December 31, 2016 | | | | | | | | | | | | | | | | |
| Outstanding loans granted by us(2) | | | 36.9 | | | | 3.9 | | | | 0.0 | | | | 3,083.8 | |
| Outstanding loans granted to us(3) | | | - | | | | - | | | | - | | | | | |
| Deposits(4) | | | 35.6 | | | | 100.8 | | | | 6.0 | | | | 3,055.8 | |
| | | | | | | | | | | | | | | | | |
| At December 31, 2015 (5) | | | | | | | | | | | | | | | | |
| Outstanding loans granted by us(2) | | | 37.5 | | | | 0.4 | | | | 0.1 | | | | 2,486.9 | |
| Outstanding loans granted to us(3) | | | - | | | | - | | | | - | | | | | |
| Deposits(4) | | | 19.6 | | | | 73.0 | | | | 0.0 | | | | 3,140.2 | |
| (1) | Excludes Mr. Sarmiento Angulo and Mr. Sarmiento Gutiérrez and their affiliates. Key management includes executive officers of Grupo Aval as well as each of the presidents of our banks, Corficolombiana, Porvenir and BAC Credomatic. |
| (2) | Figures based on disbursed loans. See “—Loans granted to related parties by our banking subsidiaries.” |
| (3) | Figures based on disbursed loans. See “—Loans granted to Grupo Aval and its subsidiaries by shareholders of Grupo Aval and their affiliates.” |
| (4) | All deposits, including time deposits and investment portfolios, of all related parties held with us are made in the ordinary course of business, held at market rates and on terms and conditions not materially different from those available to the general public. |
| (5) | In 2016, Grupo Aval conducted a scope analysis of the applicable definitions for related party transactions under IAS 24 and balances reporting for IFRS purposes. Accordingly, 2015 figures have been adjusted in this section to reflect related party transactions after the scope analysis definitions. These adjustments had no financial statement impact other than for disclosure purposes. |
For information on related party transactions in accordance with IFRS disclosure rules, see Note 35 to our audited consolidated financial statements. For the purposes of Note 35 to our audited consolidated financial statements, “related parties” includes entities and persons that must be identified as such pursuant to IAS 24. For the purposes of this section, and as required by SEC rules, “related parties” includes enterprises that control, or are under common control with Grupo Aval, associates, individuals owning directly or indirectly an interest in the voting power that gives them significant influence over Grupo Aval, close family members, key management personnel (including directors and senior management) and any enterprises in which a substantial interest in the voting power is owned, directly or indirectly, by any of the persons listed above. We determine beneficial ownership under SEC rules. See “—A. Major shareholders.”
In the past, Adminegocios & Cia S.C.A., or “Adminegocios,” an affiliate of Mr. Sarmiento, has obtained authorizations of Grupo Aval’s Board of Directors to acquire preferred shares of Grupo Aval. More recently, on December 1, 2015, Adminegocios renewed such authorization to acquire preferred shares of Grupo Aval for a period of six months and up to Ps 150.0 billion (U.S.$62.7 million). Pursuant to such authorizations, as of December 31, 2015 Adminegocios acquired 942,000 preferred shares or Ps 1.0 billion (U.S.$0.33 million) through open market transactions. No acquisition of preferred shares was effected by Adminegocios in 2016.
As of April 24, 2017, Mr. Luis Carlos Sarmiento Angulo has not acquired preferred shares. Certain members of our board of directors and key management own shares of Grupo Aval which, other than in the case of Mr. Sarmiento Angulo, were acquired in the open market or in one of our public offerings and represent less than 0.1% of our total outstanding shares.
In January 2014 we completed our Common Share Rights Offering raising Ps 2.4 trillion (U.S.$1.3 billion) through the issuance of 1,855,176,646 of common shares. Subscription of the common shares was offered with preemptive rights to the existing shareholders of the company. Shareholders subscribing a total amount under their preemptive rights were allowed to subscribe an additional amount of common shares subject to terms of the approved rules. Mr. Luis Carlos Sarmiento Angulo acquired 1,852,895,755 common shares in the offering and, as the beneficial owner of approximately 95.2% of our issued and outstanding common shares at that time, fully exercised his preemptive rights as a part of the offering on the same terms as other common shareholders.
Loans granted to Grupo Aval and its subsidiaries by shareholders of Grupo Aval and their affiliates
In the past, certain shareholders of Grupo Aval and their affiliates have granted loans to Grupo Aval and its subsidiaries on an arm’s-length basis and at market rates that are substantially consistent with interest rates and collateral that would have been available to such parties from other lenders at the time those borrowings were entered into. Such loans have been granted for general corporate purposes (including funding the acquisition of 13,726,421 mandatorily convertible bonds issued by Banco de Bogotá (converted into 29,205,152 shares of Banco de Bogotá)). Loans have been previously granted on an unsecured basis and a five-year term, with a two-year grace period. There are no outstanding loans granted to Grupo Aval by shareholders of Grupo Aval and their respective affiliates since December 20, 2013 through to April 24, 2017. The prior outstanding balance of Ps 1,373 billion (U.S.$713.7 million) relating to loans granted by Bienes y Comercio S.A., Adminegocios & Cía S.C.A. and Rendifin S.A. were fully repaid on December 18 and December 20, 2013 with proceeds from our 2014 Common Share Rights Offering (effected from December 16, 2013 to January 17, 2014).
The largest amount of loans (including guarantees) outstanding during the period from January 1, 2013 to December 31, 2016 was Ps 1,379 billion (U.S.$463.9 million).
Business and financial reasons for borrowing from entities affiliated with Mr. Sarmiento Angulo
At April 24, 2017, there are no outstanding loans from companies beneficially owned by Mr. Sarmiento Angulo. However, in the past, we have borrowed from entities beneficially owned by Mr. Sarmiento Angulo. These loans have been entered into on an arm’s-length basis with us, the holding company, at a rate substantially consistent with rates that would have been available to the holding company from other lenders at the time those borrowings
were entered into. The amount of the loans outstanding from companies beneficially owned by Mr. Sarmiento Angulo was Ps1,373 billion (U.S.$713.7 million) in 2013. Such amounts were repaid on December 18 and December 20, 2013 and there are no outstanding loans since December 20, 2013 through April 24, 2017.
In addition to the global and local bond markets, companies affiliated with our controlling shareholder are among our funding alternatives. Even though we may consider this option in the future, so far Grupo Aval has chosen not to borrow from competing banks at the holding company level considering that affiliated companies provide us with a stable source of financing at rates that are substantially consistent with rates available to us from other lenders. In addition, these loans are executed in a shorter timeframe and at lower transaction costs than if borrowed from other potential sources of funding.
Loans granted to related parties by our banking subsidiaries
Key management of Grupo Aval and our banks, and their respective affiliates, who meet our credit eligibility requirements may subscribe to loans in the ordinary course of business, on market terms and conditions available to the general public.
All outstanding loans with our related parties are made in the ordinary course of business and on terms and conditions, including interest rates and collateral, not materially different from those available to the general public and did not involve more than the normal risk of collectability or present other unfavorable features.
In connection with our Preferred Shares Local Offering, certain members of our board of directors and key management were granted loans by our banking subsidiaries for the purpose of acquiring Grupo Aval preferred shares. These loans were granted at market rates and on terms and conditions not materially different from those available to other purchasers of Grupo Aval shares.
Other transactions with Mr. Sarmiento Angulo and his affiliates
Beneficial ownership in our banking subsidiaries (outside of Grupo Aval)
In addition to his beneficial ownership in Grupo Aval, Mr. Sarmiento Angulo beneficially owns at April 24, 2017, 8.3% of Banco de Bogotá, 13.3% of Banco de Occidente, 15.5% of Banco AV Villas, 0.8% of Banco Popular, and 0.3% of Corficolombiana.
Except as stated above, Mr. Sarmiento Angulo does not have any other beneficial ownership in our banking subsidiaries. For information on the dividend history of our banking subsidiaries, see “Item 10. Additional Information—F. Dividends and paying agents—Dividend history of our banking subsidiaries.”
Insurance services
Seguros de Vida Alfa S.A., or “Vida Alfa,” a life insurance affiliate of Mr. Sarmiento Angulo, provides insurance required by law, as well as annuities, relating to the mandatory pension funds managed by Porvenir. The insurance provider is selected by Porvenir through a competitive bidding process once every four years. Premiums under this insurance policy are deducted by Porvenir from the individual customers’ account and transferred to Vida Alfa on behalf of the individual customer.
The table below presents the insurance premiums paid for the periods indicated.
| Period | | Amount | |
| | | (in Ps billions) | |
| For the year ended December 31: | | | | |
| 2016 | | | 990.2 | |
| 2015 | | | 877.6 | |
| 2014 | | | 747.8 | |
Vida Alfa also provides:
| · | life insurance, as sole provider and as co-insurer with non-affiliated insurers (pursuant to a competitive bidding process), for individual borrowers of our banking subsidiaries to cover the risk of non-payment upon death. Premiums are paid by the borrowers; and |
| · | workers compensation for all employees of Grupo Aval and its subsidiaries (except BAC Credomatic). |
Seguros Alfa S.A., or “Alfa,” a property and casualty insurance affiliate of Mr. Sarmiento Angulo, provides fire and earthquake insurance for mortgage loans granted by certain of our banks. In addition, Alfa provides surety bonds and property insurance for our subsidiaries. Our banking subsidiaries also provide insurance products affiliated with Vida Alfa and Alfa through their bancassurance lines. These transactions are conducted on an arm’s-length basis in the ordinary course of business. Alfa has in the past, but not currently, provided bankers’ blanket bond coverage to us and our subsidiaries, reinsured under prevailing market conditions, and surety bonds for Corficolombiana’s toll-road concessions.
Other
The following companies are beneficially owned by Mr. Sarmiento Angulo, and may continue to provide services to us and our subsidiaries for amounts that are immaterial: Construcciones Planificadas S.A. (office renovations), Vigía S.A. (security services), and Corporación Publicitaria (advertising).
| C. | Interests of experts and counsel |
Not applicable.
ITEM 8. FINANCIAL INFORMATION
| A. | Consolidated statements and other financial information |
Financial statements
See “Item 18. Financial Statements,” which contains our financial statements prepared in accordance with IFRS.
Legal proceedings
We, our banking subsidiaries, Corficolombiana, Porvenir and our other subsidiaries are party to lawsuits and administrative proceedings incidental to the normal course of our business.
We record contingency provisions when the risk of loss is probable, in which case, we would consider settling. In cases where we litigate a claim, we record a provision for our estimate of the probable loss based on historical data for similar claims. Due to the provisions we have established and the legal opinions we have received, we do not believe that any liabilities related to such lawsuits or proceedings will have a material adverse effect on our financial conditions or results of operations. For the years ended December 31, 2016 and 2015, we and our banking subsidiaries had recorded consolidated provisions relating to administrative fines, indemnifications and legal proceedings for a total amount of Ps 155.7 billion and Ps 148.3 billion, respectively.
Constitutional actions
We, our banking subsidiaries, Corficolombiana, Porvenir and our other subsidiaries are also party to collective or class actions (“acciones populares” or “acciones de grupo,” respectively). Collective actions are court actions where an individual seeks to protect collective rights and prevent contingent damages, obtain injunctions and damages caused by an infringement of collective rights of which the following are the most significant.
All pension and severance fund administrators in Colombia, including Porvenir, are subject to at least two class actions in which certain individuals are alleging that the pension and severance funds administrators have caused damages to their customers by (1) paying returns earned by the severance and pension funds below the minimum profitability certified by the Superintendency of Finance, and (2) making payments to its customers—under the scheduled retirement system—below the established standards. Additionally, Porvenir and certain other pension and
severance funds are subject to a constitutional action relating to charging commissions above the legally established limits for contributions to mandatory pension funds. These constitutional actions are seeking the payment of the alleged damages caused to fund managers’ customers. No provisions have been established in connection with these three constitutional actions because the amount is unquantifiable, and we consider the probability of loss to be remote.
Banco de Bogotá, Banco de Occidente Banco Popular and Corficolombiana are subject to a constitutional action filed by certain individuals on behalf of the Department of Valle del Cauca (Departamento del Valle del Cauca) against several financial institutions (including Banco de Bogotá, Banco de Occidente, Banco Popular and Corficolombiana) claiming that the Department has paid interest in a manner prohibited by law, in connection with a credit facility granted to the Department. In addition, the plaintiffs are claiming that the defendants did not pay the alleged real value of the shares of Sociedad Portuaria de Buenaventura and Empresa de Energía del Pacífico, on a sale transaction of said shares. We consider the probability of loss in connection with this constitutional action to be low (eventual) and, therefore, have not recorded any provision.
Banco AV Villas is subject to constitutional actions brought against several companies in the financial sector in Colombia in connection with the recalculation of mortgage interests that allegedly damaged several mortgage lenders. We believe that the probability of loss in connection with these constitutional actions is remote.
Other litigation
We, our banking subsidiaries, Corficolombiana, Porvenir, BAC Credomatic and our other subsidiaries are from time to time subject to claims and parties to legal proceedings incidental to the normal course of our business, including in connection with our lending activities, employees, taxation matters and other general commercial matters. Due to the inherent difficulty of predicting the outcome of legal disputes, we cannot predict the eventual outcome of these pending matters, what the timing of the ultimate resolution of these matters will be or what the eventual loss, fines or penalties related to each pending matter may be. We believe that we have recorded adequate provisions for the anticipated costs in connection with these claims and legal proceedings and believe that liabilities related to such claims and proceedings should not, in the aggregate, have a material adverse effect on our business, financial conditions, or results of operations. However, in light of the uncertainties involved in such claims and proceedings, the ultimate resolution of these matters may exceed the provisions that we have currently recorded. As a result, the outcome of a particular matter could be material to our operating results for a particular period.
Colombia’s Attorney General’s Office (Fiscalía General de la Nación) initiated an investigation in December 2016 into possible corrupt payments involving Colombian infrastructure projects and has made factual findings to date that Odebrecht S.A., a Brazilian construction conglomerate effected payments from Brazil through its division of structured operations in order to obtain several Government concession contracts, including the toll road concession “Ruta del Sol Sector 2” that was awarded toConcesionaria Ruta del Sol S.A.S., a company controlled by Odebrecht (62%), in which Episol, a subsidiary of Corficolombiana, and CSS Constructores S.A. participate with non-controlling interests of 33% and 5%, respectively.
In addition to this criminal investigation, additional proceedings have been initiated by other judicial and administrative authorities such as theTribunal Administrativo de Cundinamarca (a State Court competent on administrative law matters),Superintendencia de Industria y Comercio (Antitrust authority),Superintendencia de Sociedades (Superintendency of Corporations),Superintendencia de Puertos y Transporte (Superintendency of Transportation), and theProcuraduría General de la Nación (Country’s General Prosecutor of public servants). Additional investigations and or proceeding from different authorities claiming competence in this matter may arise. Episol and Corficolombiana have been included in some of these investigations and proceedings and may be expected to be included in additional proceedings in the future.
Under the applicable legal and contractual framework, shareholders of the Concessionaire do not have liability for the Concessionaire’s acts or the acts of other shareholders, such as the illegal acts of Odebrecht as shareholder ofConcesionaria Ruta del Sol; however, the potential outcome, duration, scope or results of the related inquiries by the relevant authorities in each of these investigations is yet unknown, and we cannot predict how these current and potential investigation or proceedings may impact our company or our subsidiaries.
A discussion of the significant changes in our business can be found under “Item 4. Information on the Company—A. History and development of the company.”
ITEM 9. THE OFFER AND LISTING
| A. | Offering and listing details |
Not applicable.
Not applicable.
Market price and volume information
Trading history of our ADSs
Our ADSs began trading on the NYSE under the symbol “AVAL” on September 23, 2014. The following table shows the quarterly range of the high and low per share closing sales price for our ADSs as reported by the NYSE.
| | | New York Stock Exchange | |
| | | High | | | Low | | | Average daily
trading volume | |
| | | (U.S.$ per ADS) | | | (in ADS) | |
| Year | | | | | | | | | | | | |
| 2014 (beginning September 23) | | | 13.78 | | | | 9.46 | | | | 1,052,705 | |
| 2015 | | | 10.69 | | | | 6.07 | | | | 354,620 | |
| 2016 | | | 8.94 | | | | 5.64 | | | | 139,553 | |
| Quarter | | | | | | | | | | | | |
| First quarter 2015 | | | 10.69 | | | | 8.50 | | | | 612,020 | |
| Second quarter 2015 | | | 10.47 | | | | 9.16 | | | | 388,918 | |
| Third quarter 2015 | | | 9.75 | | | | 6.48 | | | | 268,838 | |
| Fourth quarter 2015 | | | 8.40 | | | | 6.07 | | | | 161,305 | |
| First quarter 2016 | | | 7.73 | | | | 5.64 | | | | 116,660 | |
| Second quarter 2016 | | | 8.23 | | | | 7.26 | | | | 167,118 | |
| Third quarter 2016 | | | 8.94 | | | | 7.60 | | | | 154,796 | |
| Fourth quarter 2016 | | | 8.60 | | | | 7.28 | | | | 118,232 | |
| First quarter 2017 | | | 8.56 | | | | 7.47 | | | | 287,847 | |
| Month | | | | | | | | | | | | |
| October 2016 | | | 8.60 | | | | 8.17 | | | | 133,721 | |
| November 2016 | | | 8.21 | | | | 7.28 | | | | 110,846 | |
| December 2016 | | | 8.15 | | | | 7.69 | | | | 110,130 | |
| January 2017 | | | 8.42 | | | | 8.12 | | | | 143,012 | |
| February 2017 | | | 8.56 | | | | 7.79 | | | | 279,822 | |
| March 2017 | | | 8.17 | | | | 7.47 | | | | 420,419 | |
| April 2017 (through April 24) | | | 8.38 | | | | 8.11 | | | | 120,201 | |
Source: New York Stock Exchange.
On April 24, 2017, the last reported closing sale price on the New York Stock Exchange was U.S.$8.23 per ADS.
Trading history of our preferred shares
Our preferred shares have been listed since February 1, 2011 on the Colombian Stock Exchange under the symbol “PFAVAL” and we first issued preferred shares on May 12, 2011 at the conclusion of the Preferred Shares Local Offering. The following table presents the high and low closing sales prices for the periods indicated, and average daily trading volume for our preferred shares on the Colombian Stock Exchange.
| | | Colombian Stock Exchange | |
| | | High | | | Low | | | Average daily
trading volume | |
| | | (Ps per share) | | | (in shares) | |
| Year | | | | | | | | | | | | |
| 2011 (beginning May 12) | | | 1,320 | | | | 1,120 | | | | 3,363,366 | |
| 2012 | | | 1,325 | | | | 1,130 | | | | 3,077,023 | |
| 2013 | | | 1,435 | | | | 1,235 | | | | 4,323,943 | |
| 2014 | | | 1,455 | | | | 1,135 | | | | 6,026,633 | |
| 2015 | | | 1,285 | | | | 1,020 | | | | 5,892,746 | |
| 2016 | | | 1,280 | | | | 990 | | | | 4,253,627 | |
| Quarter | | | | | | | | | | | | |
| First quarter 2015 | | | 1,285 | | | | 1,140 | | | | 7,266,326 | |
| Second quarter 2015 | | | 1,285 | | | | 1,135 | | | | 8,559,187 | |
| Third quarter 2015 | | | 1,285 | | | | 1,055 | | | | 4,124,717 | |
| Fourth quarter 2015 | | | 1,215 | | | | 1,020 | | | | 3,775,143 | |
| First quarter 2016 | | | 1,180 | | | | 990 | | | | 3,977,552 | |
| Second quarter 2016 | | | 1,195 | | | | 1,135 | | | | 4,654,413 | |
| Third quarter 2016 | | | 1,280 | | | | 1,165 | | | | 4,413,041 | |
| Fourth quarter 2016 | | | 1,250 | | | | 1,150 | | | | 3,948,170 | |
| First quarter 2017 | | | 1,235 | | | | 1,120 | | | | 5,067,146 | |
| Month | | | | | | | | | | | | |
| October 2016 | | | 1,250 | | | | 1,210 | | | | 4,110,107 | |
| November 2016 | | | 1,240 | | | | 1,150 | | | | 3,587,620 | |
| December 2016 | | | 1,225 | | | | 1,175 | | | | 4,146,782 | |
| January 2017 | | | 1,235 | | | | 1,185 | | | | 4,010,809 | |
| February 2017 | | | 1,220 | | | | 1,135 | | | | 5,853,389 | |
| March 2017 | | | 1,175 | | | | 1,120 | | | | 5,529,450 | |
| April 2017 (through April 24) | | | 1,210 | | | | 1,170 | | | | 3,666,761 | |
Source: Colombian Stock Exchange.
On April 24, 2017, the last reported closing sale price on the Colombian Stock Exchange was Ps 1,190 per preferred share.
Trading on the Colombian Stock Exchange
The Colombian Stock Exchange is the sole trading market for our common and preferred shares. There are no official market makers or independent specialists on the Colombian Stock Exchange to assure market liquidity and, therefore, orders to buy or sell in excess of corresponding orders to sell or buy will not be executed. The aggregate equity market capitalization of the 82 companies listed on the Colombian Stock Exchange at April 24, 2017 was Ps 305.2 trillion (U.S.$106.4 billion at the representative market exchange rate of April 24, 2017). See “Item 4. Information on the Company—B. Business Overview—Industry—Colombia—Recent developments in the Colombian stock market.”
Regulation of Colombian Securities Markets
Colombian securities markets are subject to the supervision and regulation of the Superintendency of Finance, which was created in 2005 following the merger of the Superintendency of Banking and the Superintendency of Securities. The Superintendency of Finance is an independent regulatory entity ascribed to the Ministry of Finance. The Superintendency of Finance has the authority to inspect, supervise and control the financial, insurance and securities exchange sectors and any other activities related to the investment or management of public savings. Accordingly, we are subject to the control of the Superintendency of Finance as an issuer of securities, and our subsidiaries are subject to its control, supervision and regulation as financial institutions and issuers of securities. See “Item 4. Information on the Company—B. Business Overview—Supervision and regulation—Colombian banking regulators—Ministry of Finance” and “—Superintendency of Finance.”
Registration of the ADR Program and Investment in Our ADSs by Non-Residents of Colombia
The International Investment Statute of Colombia as provided by Decree 2080 of 2000, as amended, regulates the manner in which foreign investors may participate in the Colombian securities markets and undertake other types of investment, prescribes registration with the Colombian Central Bank of certain foreign exchange
transactions and specifies procedures under which certain types of foreign investments are to be authorized and administered.
The International Investment Statute provides specific procedures for the registration of ADR programs as a form of foreign portfolio investment, which is required for the acquisition of the preferred shares to be offered in the form of ADSs. In addition, a holder of our ADSs or preferred shares may under certain circumstances be required to comply directly with certain registration and other requirements under the foreign investment regulations. Under these regulations, the failure of a non-resident investor to report or register foreign exchange transactions relating to investments in Colombia with the Colombian Central Bank on a timely basis may prevent the investor from obtaining remittance payments, including for the payment of dividends, and constitute an exchange control violation and/or result in a fine.
Each individual investor who deposits preferred shares into the ADR facility in exchange for our ADSs (other than in connection with this offering) will be required, as a condition to acceptance by Fiduciaria Bogotá S.A., or “Fidubogotá,” as custodian of such deposit, to provide or cause to be provided certain information to Fidubogotá and/or the Depositary to enable it to comply with the registration requirements under the foreign investment regulations relating to foreign exchange. A holder of ADSs who withdraws preferred shares from the ADS deposit facility under certain circumstances may be required to comply directly with certain registration and other requirements under the foreign investment regulations. Under these regulations, the failure of a non-resident investor to report or register foreign exchange transactions relating to investments in Colombia with the Central Bank on a timely basis may prevent the investor from obtaining remittance payments, including for the payment of dividends, constitute an exchange control violation and/or result in a fine.
Under Colombian law, foreign investors receive the same treatment as Colombian citizens with respect to the ownership and voting of our ADSs and preferred shares. See “Item 3. Key Information—D. Risk factors—Risks relating to our preferred shares and ADSs” and “Item 4. Information on the Company—B. Business overview—Supervision and regulation—Restrictions on foreign investment in Colombia.”
Not applicable.
Not applicable.
Not applicable.
ITEM 10. ADDITIONAL INFORMATION
Not applicable.
| B. | Memorandum and articles of association |
The following is a summary of certain significant provisions of our by-laws, Colombian corporate law, the rules and regulations of the Superintendency of Finance and the Listing Rules of the Colombian Stock Exchange that pertain to our capital, management, periodical and occasional disclosures, as well as other corporate issues applicable to us. The description below includes the material provisions of our by-laws and Colombian corporate law. In Colombia, by-laws are the principal governing document of a corporation.
Our by-laws provide for an authorized share capital of 120,000,000,000 shares of par value of Ps 1.00 each, which may be either of two classes: common shares or shares with a preferred dividend, liquidation preference and no voting. At April 24, 2017, we had 15,237,489,827 common shares outstanding, and 7,043,527,332 preferred shares outstanding.
Our by-laws also provide for the conversion of common shares into preferred shares only when such conversion is approved or authorized at a general shareholders’ meeting. A shareholders’ meeting must define, in each case, the procedure to be followed for such conversion and must determine, among other matters, the maximum number or percentage of shares that may be converted. The shareholders’ meeting may also authorize the Board of Directors or the President of our Company to approve the agreements, forms and other documents to be executed in order to give effect to a conversion.
Our shareholders’ meeting held on December 7, 2010, determined that outstanding common shares may be converted into preferred shares on a 1-to-1 basis. Conversion of common shares into preferred shares may only be made once a month, provided that, as required by Colombian law and in accordance with our by-laws, our preferred shares shall not exceed 50% of our subscribed capital.
For a description of offerings of our shares see “Item 4. Information on the Company—B. Business overview—Our history.”
Voting Rights
Common Shares
The holders of common shares are entitled to vote on the basis of one vote per share on any matter subject to approval at a general shareholders’ meeting according to articles 14 through 19 of the by-laws, as amended from time to time. These general meetings may be ordinary meetings or extraordinary meetings. Ordinary general shareholders’ meetings occur twice a year, no later than the last business day of March and September, for the following purposes:
| · | to review the general situation of the Company; |
| · | to determine the general economic policy of the Company; |
| · | to consider the approval of our report for the preceding semester ending on June 30 or December 31, as applicable, including the financial statements for the above-mentioned term; |
| · | to review the report prepared by the external auditor for the preceding semester ending on June 30 or December 31; |
| · | to elect directors and the external auditor (on an annual basis); |
| · | to determine the compensation of the members of the board of directors and the external auditor (on an annual basis); and |
| · | to determine the dividend policy and the allocation of profits, if any, of the preceding semester ending on June 30 or December 31, respectively, as well as any retained earnings from six months. |
Pursuant to Law 964 of 2005, at least 25% of the members of our board of directors must be independent within the meaning of Colombian rules. A person who is an “independent director” is understood to mean a director who is not:
| · | an employee or executive officer of the issuer or any of its parent or subsidiary companies, including any person acting in such capacity during the year immediately preceding that in which they were appointed to the board, except in the case of an independent member of the board of directors being re-elected; |
| · | a shareholder, who either directly or by virtue of an agreement directs, guides or controls the majority of the entity’s voting rights or who determines the majority composition of the administrative, directing or controlling bodies of this same entity; |
| · | a partner or employee of any association or firm that provides advisory or consultancy services to the issuer or to companies belonging to the same economic group to which such issuer belongs, in the event that income obtained from such services represent for said association or firm at least twenty percent (20.0%) of its total operating income; |
| · | an employee or executive officer of a foundation, association, partnership or corporation that receives significant donations from the issuer. The term “significant donations” is quantified as twenty percent (20.0%) or more of the total amount of donations received by the respective institution; |
| · | an administrator of any entity on whose board of directors a legal representative of the issuer participates; or |
| · | a board member who receives from the issuer any kind of remuneration other than fees as a member of the board of directors, member of the audit committee or any other committee established by the board of directors. |
Pursuant to Decree 3923 of 2006, the election of independent directors must be in a ballot separate from the ballot to elect the rest of the directors, unless the reaching of the minimum number of independent directors required by law or by the by-laws is assured, or when there is only one list that includes the minimum number of independent directors required by law or by the by-laws.
Both elections are made under a proportional representation voting system named electoral quotient—”cociente electoral” (except for the elections unanimously approved by the general shareholders’ meeting). Under that system:
| · | each holder of common shares is entitled at the first annual general shareholders’ meeting to nominate candidates for the election of directors; |
| · | each nomination of one or more directors by a shareholder constitutes a list for the purposes of the election; |
| · | each list of nominees must contain a hierarchy as to the order of preference for nominees in that list to be elected; |
| · | once all lists have been nominated, holders of common shares may cast one vote for each common share held in favor of a particular list of nominees. Votes may not be cast for particular nominees in a list; they may be cast only for the entire list; |
| · | the total number of votes cast in the election is divided by the number of directors to be elected. The resulting quotient is the quota of votes necessary to elect particular directors. For each time that the number of votes cast for a list of nominees is divisible by the quota of votes, one nominee from that list is elected, in the order of the hierarchy of that list; and |
| · | when no list has enough remaining votes to satisfy the quota of votes necessary to elect a director, any remaining board seat or seats are filled by electing the highest remaining nominee from the list with the highest number of remaining votes cast until all available seats have been filled. |
There is no age limit requirement for the election or retirement of directors. No minimum number of shares is required for a director’s qualification. Directors may be removed by shareholders entitled to vote prior to the expiration of their term.
Extraordinary general shareholders’ meetings may take place when duly called for a specified purpose or purposes, or, without prior notice, when holders representing all outstanding shares entitled to vote on the issues presented are present at the meeting. Extraordinary meetings of shareholders may be called by our president, our board of directors or the certified public accountant, directly or by request of a plural number of shareholders representing no less than 25.0% of the company’s capital, in which case an announcement must be made by the board of directors, the legal representative or the certified public accountant. In addition, meetings may be called by the Superintendency of Finance, directly or by request of shareholders holding at least 15.0% of the shares outstanding. Notice of extraordinary meetings should be given at least five days in advance.
Quorum for ordinary and extraordinary general shareholders’ meetings to be convened at first call requires the presence of multiple shareholders who represent at least 50.0% plus one of the outstanding shares entitled to vote at the relevant meeting. If no quorum is present for a general shareholders’ meeting, a subsequent meeting may be called within 10 to 30 business days at which the presence of two or more shareholders entitled to vote at the relevant meeting constitutes quorum, regardless of the number of shares represented.
Notice of ordinary general meetings must be published in one newspaper of wide circulation, at least 15 business days prior to the proposed date of a general shareholders’ meeting. Notice of extraordinary general meetings, listing the matters to be addressed at such meetings, must be published in one newspaper of wide circulation, at least five calendar days prior to the proposed date of an extraordinary general shareholders’ meeting.
Except where Colombian law requires a supermajority, decisions made at a shareholders’ meeting must be approved by a majority of the shares present. Pursuant to Colombian law and/or our by-laws, special-majorities are required in the following cases:
| · | the vote of at least 70.0% of the shares present and entitled to vote at a shareholders’ meeting is required to approve the issuance of common shares not subject to preemptive rights; |
| · | the Company must distribute (1) at least 50.0% of the annual’s net profits according to Article 155 of the Colombian Code of Commerce, or (2) at least 70.0% of the annual’s net profits if the total amount segregated in the legal, statutory and other reserves exceeds the Company’s outstanding capital, according to Article 454 of the Colombian Code of Commerce; however, the vote of at least 78.0% of the shares represented and entitled to vote may approve the distribution of a lower percentage of dividends; |
| · | the vote of at least 80.0% of the shares present and entitled to vote is required to approve the payment of dividends in shares; however, according to Law 222 of 1995, if a “situation of control” exists, whereby the decision-making power is subject to the will of a person or group of persons, a company may only pay dividends by issuing shares, to the shareholders that so accept; |
| · | unanimity is required to replace a vacancy on the board of directors without applying the electoral quotient system described above; and |
| · | the vote of 70.0% of the issued and outstanding common shares and 70.0% of the outstanding and issued preferred shares is required to approve any amendment that may impair the rights of the preferred shares. |
The adoption by a shareholders’ meeting of certain corporate actions such as mergers,escisiones, and share conversions are also subject to authorization by the Superintendency of Finance.
Preferred Shares
The holders of preferred shares are not entitled to receive notice of, attend or vote at any general shareholders’ meeting of holders of common shares, except as described below.
The holders of preferred shares will be entitled to vote on the basis of one vote per share at any shareholders’ meeting, whenever a shareholder vote is required on the following matters:
| · | in the event that amendments to our by-laws may impair the conditions or rights assigned to such preferred shares and when the conversion of such shares into common shares is to be approved. In both such cases, the vote of 70.0% of the outstanding and issued common shares and preferred shares is required; and |
| · | if at the end of any six-month period, our profits are not sufficient to pay the minimum dividend on the preferred shares and the Superintendency of Finance, by its own decision or upon request of holders of at least 10.0% of preferred shares, determines that benefits were concealed or shareholders were misled with regard to benefits thereby decreasing the profits to be distributed, the Superintendency of Finance may resolve that holders of preferred shares should participate with speaking and voting rights at the general shareholders’ meeting, in the terms established by law. |
We must issue a notice of any meeting at which holders of preferred shares are entitled to vote. The notice must be published in a newspaper of wide circulation. Depending on the matters to be subjects of the shareholders meeting, notice to preferred shareholders must be delivered at least 15 business days or 5 calendar days before the meeting. Each notice must contain the following:
| · | the date of the meeting; |
| · | a description of any resolution to be proposed for adoption at the meeting on which the holders of preferred shares are entitled to vote; and |
| · | instructions for the delivery of proxies. |
Redemption
All shareholders (whether holders of common or preferred shares) have, at their option, a redemption right in the following cases:
| · | If, as a result of a merger, transformation orescisión of the Company, (a) the shareholders must assume a higher level of liability (i.e., by transforming a corporation into a partnership), or (b) the economic rights of the shareholders are impaired. In these events, the shareholders that were not present at the meeting in which the decision was taken or voted against it, may exercise the redemption right. |
| · | Pursuant to Colombian Law (Article 12 of Law 222 of 1995), the economic rights of shareholders are deemed to be impaired if: |
| · | their ownership percentage is reduced as a result of the merger, transformation orescisión of the Company; |
| · | the equity value or the par value of the shares is reduced (in the latter case, only to the extent that the reduction of the par value implies a decrease in the Company’s stock capital); and |
| · | the negotiability of the shares is restricted or diminished. |
| · | If the Company decides to withdraw the listing of its shares from a stock exchange or its registration before the National Registry of Shares and Issuers. |
The exercise of this right is regulated by Articles 15 and 16 of Law 222 of 1995. According to Article 15, within five days following notice of the exercise of this right by a shareholder, the Company must offer to the other shareholders the shares owned by the exercising shareholder. Within the following 15 days, the other shareholders may acquire the shares on a pro rata basis. If all or a part of the shares are not acquired by the other shareholders, then the Company must reacquire them to the extent there are profits or reserves built up by the Company for those purposes. If neither the shareholders nor the Company acquires all of the shares owned by the exercising shareholder, then pursuant to Article 16 of Law 222 of 1995, such exercising shareholder is entitled to the reimbursement of the capital contributions made to the Company.
In both cases, the redemption price of the shares will be established by the agreement of seller and buyer. In the absence of such agreement, the redemption price will be determined by an expert appraiser. Notwithstanding the above, the by-laws may establish other methods for determining the redemption price to be paid in the foregoing circumstances. Our current by-laws do not contemplate such other methods.
Dividends
Common Shares
Following the approval of the financial statements at a general shareholders’ meeting, shareholders may determine the allocation of distributable profits, if any, of the preceding accounting period by a resolution approved by the majority of the holders of common shares present at the ordinary general shareholders’ meeting, pursuant to the recommendation of the board of directors and management.
Under the Colombian Code of Commerce, a company must, after payment of income taxes and appropriation of legal reserves, and after off-setting losses from prior terms, distribute at least 50.0% of net profits to all shareholders, payable in cash, or as determined by the shareholders, within a period of one year following the date on which the shareholders determine the dividends. If the total amount segregated in the legal, statutory and occasional reserves of a company exceeds its outstanding capital, this percentage is increased to 70.0%. The minimum common shares dividend requirement of 50.0% or 70.0%, as the case may be, may be waived by a favorable vote of the holders of 78.0% of a company’s common shares present at the meeting, in which case the
shareholders may distribute any percentage of the net profits. The dividends may be paid in shares if such proposal is approved by representatives of eighty (80%) of the shares present at the meeting.
Under Colombian law and our by-laws, net profits obtained in each accounting period are to be allocated as follows:
| · | first, an amount equivalent to 10.0% of net profits is segregated to build a legal reserve, until that reserve is equal to at least 50.0% of our subscribed capital; |
| · | second, payment of the minimum dividend on the preferred shares; and |
| · | third, allocation of the balance of the net profits is determined by the holders of a majority of the common shares entitled to vote on the recommendation of the board of directors and the president and may, subject to further reserves required by the by-laws, be distributed as dividends. |
Under Colombian law, the dividends payable to the holders of common shares, for each common share, cannot exceed the dividends payable to holders of the preferred shares, for each preferred share. All common shares that are fully paid-in and outstanding at the time a dividend or other distribution is declared are entitled to share equally in that dividend or other distribution. Common shares that are only partially paid-in participate in a dividend or distribution in the same proportion as the shares have been paid in at the time of the dividend or distribution.
The general shareholders’ meeting may allocate a portion of the profits to, among others, welfare, education or civic services.
Preferred Shares
Holders of preferred shares are entitled to receive a minimum dividend after deducting losses affecting the capital, and deducting any amounts set aside for legal reserve, but before creating or accruing for any other reserve and before any declared dividends are paid to holders of common shares, so long as dividends have been approved by the shareholders’ meeting of Grupo Aval. Dividends to holders of common and preferred shares must be approved by the shareholders. If no dividends are declared, no holder of Grupo Aval’s preferred or common shares will be entitled to payment. The minimum dividend will be equal to Ps 1.00 in each calendar semester, so long as this value is higher than the dividend paid to the holders of common shares. If the minimum preferred dividend is not equal or higher than the per share dividend on the common shares, the minimum dividend will be equal to the dividend paid to the holders of common shares, if any.
Payment of the preferred dividend shall be made at the time and in the manner established in the general shareholders’ meeting and with the priority indicated by Colombian law.
Grupo Aval is under a “situation of control” (whereby the decision-making power is subject to the will of a person or group of persons). As a result, the Company may only pay stock dividends to the shareholders that so accept it. Those shareholders that do not accept to receive a stock dividend, are entitled to receive their dividend in cash.
For additional information regarding dividends, see “—F. Dividends and paying agents—Dividend policy of Grupo Aval.”
General Aspects Involving Dividends
The dividend periods may be different from the periods covered by the balance sheet. In the general shareholders’ meeting, shareholders will determine such dividend periods, the effective date, and the method and the place for payment of dividends.
Dividends declared on the common shares and the preferred shares will be payable to the record holders of those shares, as they are recorded on our share registry, on the appropriate dates as determined in the general shareholders’ meeting. However, in accordance with Decree 4766 of December 14, 2011 (which amended articles 2.23.1.1.4 and 2.23.1.1.5 of Decree 2555 of 2010), issued by the Ministry of Finance:
| · | companies whose shares are registered with the National Registry of Shares and Issuers must establish a period of at least three trading days between the date that they receive approval to distribute profits from the General Shareholders Assembly and the date of payment; and |
| · | the ex-dividend period (fecha ex-dividendo) is the period during which it is understood that a purchase of shares does not include the right to receive dividends. The ex-dividend date shall be set forth by stock exchanges, and it cannot be less than two trading days. According to Colombian Stock Exchange regulations, a transaction is “ex-dividend” if it takes place between the first day of dividend payment and the four trading days preceding that date. |
Liquidation Rights
We will be dissolved if certain events take place, including the following:
| · | our term of existence, as stated in our by-laws, set at May 25, 2044, expires without being extended by the shareholders prior to its expiration date; |
| · | losses cause the decrease of our shareholders’ equity below 50% of the amount of outstanding share capital, unless one or more of the corrective measures described in the Colombian Code of Commerce are adopted by the shareholders within six months; |
| · | by decision at the general shareholders’ meeting; and |
| · | in certain other events expressly provided by law and in the by-laws. |
Upon dissolution, a liquidator must be appointed by a general meeting of the shareholders to wind up the affairs of our company.
Upon liquidation, and out of the surplus assets available for distribution to shareholders, holders of fully paid preferred shares are entitled to a preference in the reimbursement of their contribution (“aporte” as provided by article 63 of Law 222 of 1995) to Grupo Aval. This reimbursement, if any, is payable in pesos before any distribution or payment may be made to holders of common shares. If, upon any liquidation, assets that are available for distribution among the holders of preferred shares are insufficient to pay in full their respective liquidation preferences, such assets will be distributed among those holders pro rata.
Subject to the preferential liquidation rights of holders of preferred shares, and provided there are still sufficient assets remaining, all fully paid common shares will be entitled to participate in any distribution upon liquidation. Partially paid common shares must participate in a distribution upon liquidation in the same proportion that those shares have been paid at the time of the distribution.
To the extent there are surplus assets available for distribution after full payment to the holders of preferred and common shares of their contribution to Grupo Aval, the surplus assets will be distributed among all holders of shares of share capital (common or preferred), pro rata, in accordance with their respective holdings of shares.
Preemptive Rights and Other Anti-Dilution Provisions
Pursuant to the Colombian Code of Commerce, we are allowed to have an outstanding amount of share capital that is less than the authorized share capital set out in our by-laws. Under our by-laws, the holders of common shares determine the amount of authorized share capital, and our board of directors has the power to (1) order the issuance and regulate the terms of subscription of common shares up to the total amount of authorized share capital, and (2) regulate the issuance of preferred shares, when expressly delegated at the general shareholders’ meeting. The issuance of preferred shares must be approved by the general shareholders’ meeting, which shall determine the nature and extent of any rights, according to our by-laws and Colombian law.
At the time of incorporation of a Colombian company, its outstanding share capital must represent at least 50% of the authorized capital. Any increases in the authorized share capital or decreases in the outstanding share capital must be approved by the majority of shareholders required to approve a general amendment to the by-laws.
Colombian law requires that, whenever we issue new common shares, we must offer to the holders of common shares the right to subscribe a number of common shares sufficient to maintain their existing ownership percentage of the aggregate share capital. These rights are preemptive rights. On the other hand, holders of preferred shares are entitled to preemptive rights only in the specific situations that the shareholders’ meeting so decides. See “Item 3. Key Information—D. Risk factors—Risks relating to our preferred shares and ADSs.”
Common shareholders at a general shareholders’ meeting may waive preemptive rights with respect to a particular capital increase by the favorable vote of at least 70.0% of the shares represented at the meeting. Preemptive rights must be exercised within the period stated in the share placement terms of the increase, which cannot be less than 15 business days following the publication of the notice of the public offer of that capital increase. From the date of the notice of the share placement terms, preemptive rights may be transferred separately from the corresponding shares.
The Superintendency of Finance will authorize a decrease in the outstanding share capital approved by the holders of common shares only if:
| · | we have no outstanding liabilities; |
| · | our creditors consent in writing; or |
| · | the outstanding share capital remaining after the reduction represents at least twice the amount of our liabilities. |
Restrictions on Purchases and Sales of Share Capital by Related Parties
Pursuant to the Colombian Code of Commerce, the members of our board of directors and certain of our principal executive officers may not, directly or indirectly, buy or sell shares of our share capital while they hold their positions, unless they obtain the prior approval of the board of directors passed with the vote of two-thirds of its members (excluding, in the case of transactions by a director, such director’s vote). Furthermore, pursuant to Article 262 of the Colombian Code of Commerce, Grupo Aval’s subsidiaries are prohibited from owning (directly or indirectly) shares of Grupo Aval.
In addition, as our shares are publicly traded on the Colombian Stock Exchange, the transfer of the shares is subject to the applicable securities regulation and the rules of the Colombian Stock Exchange.
Pursuant to Article 23 of Law 222 of 1995, the members of our board of directors and our legal representatives generally must perform their duties according to the principles of good faith, due diligence and loyalty. In particular, the directors and legal representatives must refrain from entering into any transaction (including any sale and purchase of shares) which may imply competition with the Company or a conflict of interests, unless they obtain the prior approval of the General Shareholders Meeting, which, in any case, shall only be granted if the respective transaction does not harm the Company’s interests. The Company, in the ordinary course of its business, may enter into transactions with its directors.
Under the Company’s by-laws, directors have no power to vote on compensation to themselves or any members of the Board of Directors. This task is specifically assigned to the shareholders entitled to vote.
Transfer and Registration of Shares
Grupo Aval’s common and preferred shares are listed on the Colombian Stock Exchange. According to Colombian regulations, shares listed on a stock exchange must be sold and transferred only through such exchange, unless such shares were issued outside Colombia and are transferred outside Colombia, or unless the share purchase transaction amounts to a value that is lower than the regulatory threshold of 66,000 UVRs, as required by Article 6.15.1.1.2 of Decree 2555 of 2010. In addition, among others, the following transactions are not required to be effected through the relevant stock exchange:
| · | transfers between shareholders with the same beneficial owner; |
| · | transfers of shares owned by financial institutions that are being liquidated under the control and supervision of the Superintendency of Finance; |
| · | transfers by the State; and |
| · | any other transactions as may be authorized by the Superintendency of Finance. |
Under Colombian law, shares may be traded either in physical form or electronic form. Transfers of shares are subject to a registry system which differs depending on whether the shares are evidenced in electronic form or physical form. Transfers of shares evidenced by electronic certificates must first be registered with a securities central depositary through a stockbroker. The main purpose of the securities central depositary is to receive, safe keep and manage securities certificates issued by corporations in order to keep a record of the transactions undertaken over such securities, including transfers, pledges and withdrawals. Accordingly, they are not allowed to hold, invest or otherwise use the securities held under their custody.
Transfer of shares evidenced by electronic or physical certificates, as the case may be, must be registered on the company’s share ledger. Only those holders registered on the share ledger are recognized as shareholders. Registration requires endorsement of the certificates or a written instruction from the holder. In the case of electronic certificates, the securities central depositary notifies us regarding the transfer of shares after registering it in its system.
All of our shares are currently deposited with the securities central depositary (Deceval).
LB Panamá entered into two U.S.$135.0 million, totaling U.S.$270.0 million, five-year term loans with Bancolombia and Bancolombia Miami Agency at 180 day LIBOR plus 3.125% on November 26, 2010 to finance, in part, the acquisition of BAC Credomatic.
On September 19, 2012, we entered into an indenture in connection with our issuance of U.S.$1.0 billion (Ps 1,795.7 billion at the date of the issuance) of 4.75% Senior Notes due 2022. The indenture was among us, as guarantor, Grupo Aval Limited, as Issuer, Deutsche Bank Trust Company Americas, as Trustee, Registrar, Paying Agent and Transfer Agent and Deutsche Bank Luxembourg S.A., as Luxembourg Paying Agent and Transfer Agent.
Restrictions on Foreign Investment in Colombia
Colombia’s foreign investment statute regulates the manner in which non-residents are permitted to invest in Colombia and participate in the Colombian securities market. Among other requirements, Colombian law requires foreign investors to register certain foreign exchange transactions with the Colombian Central Bank and obtain authorization for certain types of investments. Certain foreign exchange transactions, including those between residents and non-residents, must be made through authorized foreign exchange intermediaries.
Non-residents are permitted to hold portfolio investments in Colombia, through a registered stock brokerage firm, a trust company or an investment firm. Investors would only be allowed to transfer dividends abroad after the foreign investment registration procedure with the Colombian Central Bank has been completed. The failure of a non-resident investor to report or register foreign exchange transactions with the Colombian Central Bank relating to investments in Colombia on a timely basis may prevent the investor from remitting dividends, or an investigation that may result in a fine, may be commenced.
The following summary contains a description of certain Colombian and U.S. federal income tax considerations in connection with the acquisition, ownership and disposition of ADSs and preferred shares, but it does not purport to be a comprehensive description of all of the Colombian and United States tax considerations. The summary is based upon the tax laws of Colombia and regulations thereunder and on the tax laws of the United States and regulations thereunder as in effect on the date hereof, which are subject to change. A change in such laws and regulations could apply retroactively and could affect the validity of this summary.
Colombian Tax Considerations
For purposes of Colombian taxation, depending on the individual, residence consists of one of the following:
| · | Aliens: Residence is established by the continuous or discontinuous presence in the country for more than 183 days including entry and exit days, within any period of 365 consecutive calendar days. For this purpose, when the continuous or discontinuous presence in the country happens in more than one taxable year, the person would be considered as a Colombian resident for the second taxable year. |
| · | Diplomatic employees of the Colombian State and their companions: These persons are totally or partially exempted from income tax or capital gains tax in the country in which they are performing their work, according to the Vienna Conventions about diplomatic and consular relationships. |
| · | Colombian nationals: Residence is established if, during the taxable year: (i) the spouse or permanent companion or dependent children are residents in Colombia for tax purposes; or, (ii) 50% or more of their income is considered to be Colombian-source income; or, (iii) 50% or more of their assets are managed within Colombia; or, (iv) 50% or more of their assets are deemed to be possessed in Colombia; or, (v) foreign residency status has not been demonstrated as required by the Colombian Tax Authorities; or, (vi) they are tax residents in a tax haven as defined by the Colombian Government. |
For purposes of Colombian taxation, a legal entity is a resident of Colombia if the place of effective management is located in Colombia for the relevant taxable year. Legal entities organized under the laws of Colombia or whose principal place of business is located in Colombia are considered Colombian residents as well.
Pursuant to the Colombian Tax Code, resident individuals and Colombian entities are subject to Colombian taxes on income earned in Colombia and worldwide, while non-resident individuals and foreign entities are only taxed on their Colombian-source income. Foreign entities with permanent establishments or branches in Colombia are only taxed on Colombian-source income obtained through those permanent establishments or branches.
Colombian Tax Law includes a definition of permanent establishment for foreign entities or individuals that is applicable when the entity or individual performs in Colombia the activities that are described in Article 20-1 of the Colombian Tax Code. In this case, the permanent establishment is considered as a Colombian taxpayer with respect to its Colombian-source income.
Taxation of Dividends
In Colombia, according to Law 1819 of 2016, dividends received by foreign companies or other foreign entities, non-resident individuals and successors of non-residents are subject to income taxes. In this regard, payments of dividends to foreign residents, both individuals and corporations, will be taxed at a rate of 5%. Nonetheless, if the dividend distribution is made out of profits that were not taxed at the entity level (i.e. because of the application of some tax benefit), the distribution will be subject to a 35% withholding tax. In such case, the 5% dividend tax will apply to the distributed amount, net of the 35% withholding. These taxes will be charged on net income generated from January 1, 2017 onwards and will be withheld by the company paying the dividends.
Dividends paid to non-resident holders of ADSs through the depositary will be subject to income taxes and withholding in Colombia. Provided that such dividends are paid in respect of previously taxed earnings at the corporate level, the applicable withholding rate will be of 5%. In the case of dividends paid out of non-taxed earnings at the corporate level, the distribution will be subject to a 35% withholding tax. In such case, the 5% dividend tax will apply to the distributed amount, net of the 35% withholding.
As a general rule, foreign companies, foreign investment funds, and individuals that are not Colombian residents are not required by law to file an income tax return in Colombia either when the dividends received by them have been subject to withholding taxes or when dividends are paid out of profits subject to income tax at a corporate level. Nonetheless, taking into consideration that Law 1819 of 2016 was recently approved and that it has not been completely regulated, the Colombian tax authorities might eventually determine that foreign individuals and corporation to whom dividends are paid must file an income tax return.
Payments to domestic individuals exceeding 600 UVTs will be taxed at a marginal rate of 5% and those exceeding 1000 UVTs will be taxed at a marginal rate of 10%, while those to domestic corporations will not be taxed.
“UVT” or “Unidad de Valor Tributario” refers to a tax unit established each year by the Colombian Tax Authority (“DIAN”) for the calculation of tax returns. UVT for 2017 amounts to Ps.31,859 (U.S.$10.62).
Taxation of Capital Gains Derived From the Sales of ADSs
Pursuant to Article 24 of the Colombian Tax Code, gains derived by non-resident entities or non-resident individuals of Colombia from the sale of the ADSs are not subject to income, withholding, remittance or other taxes in Colombia. If the holder is a resident in Colombia, this capital gain will be taxed in Colombia according to the general tax rules.
Taxation of Capital Gains Derived From the Sales of Shares
According to Article 36-1 of the Colombian Tax Code, capital gains obtained in a sale of shares listed on the Colombian Stock Exchange are not subject to income tax in Colombia, provided that the shares sold by the same beneficial owner during each fiscal year do not represent more than 10% of the issued and outstanding shares of the listed company. The Colombian government may implement changes in the tax rules applicable to the sale of the offered securities which may adversely affect our shareholders.
ADSs do not have the same tax benefits as equity investments in Colombia. Although ADSs represent our preferred shares, they are subject to a different tax regulatory regime. Accordingly, the tax benefits applicable in Colombia to equity investments, are not applicable to ADSs.
Tax on Foreign Capital Investment Portfolio Income
The 2012 Tax Reform (see “Item 4. Information on the Company—B. Business Overview—Supervision and regulation—Regulation on Payroll Loans—Tax Reforms”) established a new tax regime for foreign capital portfolio investments. Investors will be required to pay income tax for the profits obtained in the development of their activities, regardless of the vehicle used to carry them out, pursuant to Article 18-1 of the Colombian Tax Code. The withholding rate of such tax is generally 14%; however, a 25% rate will apply to investors domiciled in a tax haven jurisdiction. Article 260-7 of Colombian Tax Code was recently modified by Law 1819 of 2016 that establishes a new legal framework and provides criteria pursuant to which certain jurisdictions may be classified as non-cooperative jurisdictions with low or no taxation or as jurisdictions with preferential tax regimes.
Payment of this tax will be accomplished through withholding that is performed on a monthly basis by the administrator of such investment portfolio, based on the profits earned by the investor during the corresponding month. When the income corresponds to dividends, the withholding will be made by the company paying the dividend at the time of payment.
As a general rule, the withholding, performed according to the rules established in the Colombian Tax Code, shall constitute a final tax and investors will not be required to file an income tax return. However, if the investor sells shares of stock that are listed on the Colombian Stock Exchange in an amount that is above the 10% limit as set forth in Article 36-1 of the Colombian Tax Code (as described in the above paragraph under “—Taxation of Capital Gains Derived from the Sales of Shares”), the investor will be required to file the corresponding income tax return, which will be filed by the administrator of the portfolio on his/her behalf. Additionally, considering that Law 1819 of 2016 was recently approved and that it has not been completely regulated, the Colombian tax authorities might eventually determine that foreign individuals and corporation to whom dividends are paid must file an income tax return.
Other Colombian Taxes
As of the date hereof, there is no income tax treaty and no inheritance or gift tax treaty in effect between Colombia and the United States. Pursuant to Articles 24 and 36-1 of the Colombian Tax Code, transfers of ADSs from non-residents or residents to non-residents of Colombia by gift or inheritance are not subject to Colombian income tax. Transfers of ADSs by gift or inheritance from residents to residents or from non-residents to residents will be subject to Colombian income tax at the income tax rate applicable for occasional gains obtained by residents
of Colombia. There are no Colombian stamp, issue, registration, transfer or similar taxes or duties payable by holders of preferred shares or ADSs.
United States Federal Income Taxation Considerations For U.S. Holders
The following is a description of the material U.S. federal income tax consequences to the U.S. Holders described below of owning and disposing of our ADSs or preferred shares, but it does not purport to be a comprehensive description of all tax considerations that may be relevant to a particular person’s decision to hold the securities. This discussion applies only to a U.S. Holder that holds our ADSs or preferred shares as capital assets for tax purposes. In addition, it does not describe all of the tax consequences that may be relevant in light of the U.S. Holder’s particular circumstances, including alternative minimum tax consequences, the potential application of certain provisions of the Internal Revenue Code of 1986, as amended (the “Code”) relating to what is known as the Medicare contribution tax, and tax consequences applicable to U.S. Holders subject to special rules, such as:
| · | certain financial institutions; |
| · | dealers in securities or currencies or traders in securities who use a mark-to-market method of tax accounting; |
| · | persons holding ADSs or preferred shares as part of a hedging transaction, straddle, wash sale, conversion transaction or integrated transaction or persons entering into a constructive sale with respect to the ADSs or preferred shares; |
| · | persons whose functional currency for U.S. federal income tax purposes is not the U.S. dollar; |
| · | entities classified as partnerships for U.S. federal income tax purposes; |
| · | tax-exempt entities, including “individual retirement accounts” or “Roth IRAs”; |
| · | persons that own or are deemed to own ten percent or more of our voting stock; |
| · | persons who acquired our ADSs or preferred shares pursuant to the exercise of an employee stock option or otherwise as compensation; or |
| · | persons holding our ADSs or preferred shares in connection with a trade or business conducted outside of the United States. |
If an entity that is classified as a partnership for U.S. federal income tax purposes holds our ADSs or preferred shares, the U.S. federal income tax treatment of a partner will generally depend on the status of the partner and the activities of the partnership. Partnerships holding our ADSs or preferred shares and partners in such partnerships should consult their tax advisers as to the particular U.S. federal income tax consequences of holding and disposing of the ADSs or preferred shares.
This discussion is based on the Code, administrative pronouncements, judicial decisions, and final, temporary and proposed Treasury regulations, all as of the date hereof, any of which is subject to change, possibly with retroactive effect. It is also based in part on representations by the depositary and assumes that each obligation under the deposit agreement and any related agreement will be performed in accordance with its terms.
A “U.S. Holder” is a beneficial owner of our ADSs or preferred shares that is for U.S. federal income tax purposes:
| · | a citizen or individual resident of the United States; |
| · | a corporation, or other entity taxable as a corporation, created or organized in or under the laws of the United States, any state therein or the District of Columbia; or |
| · | an estate or trust the income of which is subject to U.S. federal income taxation regardless of its source. |
In general, a U.S. Holder who owns ADSs will be treated as the owner of the underlying preferred shares represented by those ADSs for U.S. federal income tax purposes. Accordingly, no gain or loss will be recognized if a U.S. Holder exchanges ADSs for the underlying shares represented by those ADSs.
The U.S. Treasury has expressed concern that intermediaries in the chain of ownership between holders of ADSs and the issuer of the securities underlying the ADSs (which may include intermediaries involved in the release of American depositary shares before the underlying securities are delivered to the depositary) may be taking actions that are inconsistent with the claiming of foreign tax credits by holders of American depositary shares. These actions would also be inconsistent with the claiming of the reduced rate of tax, described below, applicable to dividends received by certain non-corporate holders. Accordingly, the creditability of Colombian taxes, and the availability of the reduced tax rate for dividends received by certain non-corporate U.S. Holders, each described below, could be affected by actions taken by such parties or intermediaries.
U.S. Holders should consult their tax advisers concerning the U.S. federal, state, local and foreign tax consequences of owning and disposing of our ADSs or preferred shares in their particular circumstances.
Taxation of Dividends
The preferred shares constitute equity of our company for U.S. federal income tax purposes. Therefore, subject to the passive foreign investment company, or “PFIC,” rules described below, distributions paid on our ADSs or preferred shares will be treated as dividends to the extent paid out of our current or accumulated earnings and profits (as determined under U.S. federal income tax principles). Because we do not maintain calculations of our earnings and profits under U.S. federal income tax principles, it is expected that distributions generally will be reported to U.S. Holders as dividends. Subject to applicable limitations (including a minimum holding period requirement) and the discussion above regarding concerns expressed by the U.S. Treasury, dividends paid to certain non-corporate U.S. Holders that constitute “qualified dividend income” will be taxable at rates applicable to long-term capital gains. Dividends paid on our ADSs will generally constitute qualified dividend income, provided the ADSs are readily tradable on an established securities market in the United States (such as the NYSE, where our ADSs are traded). It is unclear whether these reduced rates will apply to dividends paid with respect to our preferred shares that are not backed by ADSs. U.S. Holders should consult their tax advisers regarding the availability of the reduced tax rate on dividends in their particular circumstances.
The amount of a dividend will include any amounts withheld by our company in respect of Colombian taxes. The amount of the dividend will generally be treated as foreign-source dividend income to U.S. Holders and will not be eligible for the dividends-received deduction generally available to U.S. corporations under the Code. Dividends will be included in a U.S. Holder’s income on the date of the depositary’s receipt of the dividend, in the case of ADSs, or on the date actually or constructively received by the U.S. Holder, in the case of the preferred shares. The amount of any dividend income paid in Colombian pesos will be the U.S. dollar amount calculated by reference to the exchange rate in effect on the applicable date of receipt, regardless of whether the payment is in fact converted into U.S. dollars. If the dividend is converted into U.S. dollars on the applicable date of receipt, a U.S. Holder should not be required to recognize foreign currency gain or loss in respect of the dividend income. A U.S. Holder may have foreign currency gain or loss if the dividend is converted into U.S. dollars after the date of receipt.
Subject to applicable limitations (including a minimum holding period requirement), some of which vary depending upon the U.S. Holder’s circumstances, and subject to the discussion above regarding concerns expressed by the U.S. Treasury, Colombian income taxes withheld from dividends on ADSs or preferred shares will be creditable against the U.S. Holder’s U.S. federal income tax liability. In lieu of claiming a foreign tax credit, U.S. Holders may, at their election, deduct foreign taxes, including the Colombian tax, in computing their taxable income, subject to generally applicable limitations under U.S. law. An election to deduct foreign taxes instead of claiming foreign tax credits applies to all taxes paid or accrued in the taxable year to foreign countries and possessions of the United States. The rules governing foreign tax credits are complex, and U.S. Holders should consult their tax advisers regarding the creditability of foreign taxes in their particular circumstances.
Sale, Redemption or Other Taxable Disposition of ADSs or Preferred Shares
Subject to the PFIC rules described below, for U.S. federal income tax purposes, gain or loss realized on the sale, redemption or other taxable disposition of our ADSs or preferred shares will generally be capital gain or loss, and will be long-term capital gain or loss if the U.S. Holder held the ADSs or preferred shares for more than one
year. The amount of the gain or loss will equal the difference between the U.S. Holder’s tax basis in the ADSs or preferred shares disposed of and the amount realized on the disposition, in each case as determined in U.S. dollars. This gain or loss will generally be U.S.-source gain or loss for foreign tax credit purposes.
Passive Foreign Investment Company Rules
Based on proposed Treasury regulations, which are proposed to be effective for taxable years beginning after December 31, 1994, and on management estimates, we believe we were not a PFIC for U.S. federal income tax purposes for the 2016 taxable year. However, because the proposed Treasury regulations may not be finalized in their current form, because the application of the proposed regulations is not entirely clear and because the composition of our income and assets will vary over time, there can be no assurance that we were not or will not be a PFIC for any taxable year. The determination of whether we are a PFIC is made annually and is based upon the composition of our income and assets (including the income and assets of, among others, entities in which we hold at least a 25% interest) and the nature of our activities. In general, we will be a PFIC for any taxable year in which at least 75% of our gross income is passive income, or at least 50% of the value (determined on a quarterly basis) of our assets is attributable to assets that produce or are held for the production of passive income.
If we were a PFIC for any taxable year during which a U.S. Holder held our ADSs or preferred shares, any gain recognized by a U.S. Holder on a sale or other disposition of ADSs or preferred shares (including certain pledges) would be allocated ratably over the U.S. Holder’s holding period for the ADSs or preferred shares. The amounts allocated to the taxable year of the sale or other disposition and to any year before we became a PFIC would be taxed as ordinary income. The amount allocated to all other taxable years would be subject to tax at the highest rate in effect for individuals or corporations, as appropriate, for that taxable year, and an interest charge would be imposed on the tax on such amount. Further, any distribution in respect of ADSs or preferred shares in excess of 125% of the average of the annual distributions on ADSs or preferred shares received by the U.S. Holder during the preceding three years or the U.S. Holder’s holding period, whichever is shorter, would be subject to taxation in the same manner as described immediately above with respect to gains. Certain elections may be available that would result in alternative treatments (such as mark-to-market treatment) of the ADSs or preferred shares. U.S. Holders should consult their tax advisers to determine whether any of these elections would be available and, if so, what the consequences of the alternative treatments would be in their particular circumstances.
If we were a PFIC or, with respect to a particular U.S. Holder, were treated as a PFIC for the taxable year in which we paid a dividend or for r the prior taxable year, the favorable dividend rates discussed above with respect to qualified dividend income paid to non-corporate holders would not apply. In addition, if we are a PFIC for any taxable year during which a U.S. Holder owned our ADSs or preferred shares, the U.S. Holder will generally be required to file IRS Form 8621 (or any successor form) with their annual U.S. federal income tax returns, subject to certain exceptions.
Information Reporting and Backup Withholding
Payments of dividends and sales proceeds that are made within the United States or through certain U.S.- related financial intermediaries generally are subject to information reporting, and may be subject to backup withholding, unless (1) the U.S. Holder is an exempt recipient or (2) in the case of backup withholding, the U.S. Holder provides a correct taxpayer identification number and certifies that it is not subject to backup withholding. The amount of any backup withholding from a payment to a U.S. Holder will be allowed as a credit against the holder’s U.S. federal income tax liability and may entitle it to a refund, provided that the required information is timely furnished to the Internal Revenue Service.
Certain U.S. Holders who are individuals (and certain entities closely-held by individuals) may be required to report information relating to their ownership of an interest in certain foreign financial assets, including stock of a non-U.S. entity, subject to certain exceptions (including an exception for publicly traded stock and interests held in custodial accounts maintained by a U.S. financial institution). U.S. Holders are urged to consult their tax advisers regarding the effect, if any, of this requirement on the ownership and disposition of our ADSs or preferred shares.
| F. | Dividends and paying agents |
Dividend policy of Grupo Aval
The amount of dividends, if any, that we pay will be dependent, in large part, on the amount of dividends received from our subsidiaries. From 2011 to 2016, the amount of dividends that we have paid increased at a compound annual growth rate of 20.0%, mainly driven by the issuance of common and preferred shares in the past years. Until 2016, Grupo Aval declared dividends semi-annually in March and September of each year. Beginning in March 2017, the company started to declare dividends on an annual basis. Our subsidiaries declared Ps 1,687.8 billion in 2016 and Ps 1,142.3 billion in 2015 of dividends payable to us, and we declared an aggregate of Ps 1,965.2 billion in 2016 and Ps 1,310.1 billion in 2015 of dividends to our shareholders.
Unless noted otherwise, the following table presents the net profits of, and dividends declared by, each of our banks and Porvenir, and the amount of dividends that we would be entitled to receive from each of them during the periods indicated. Dividends are paid to us on a monthly basis.
| | | Dividends declared with respect to net income for the year ended December 31, | |
| | | 2016 | | | 2015 | | | 2016 | | | 2015 | | | 2016 | | | 2015 | | | 2016 | | | 2015 | | | 2016 | | | 2015 | | | 2016 | | | 2015 | | | 2016 | | | 2015 | |
| | | Banco de
Bogotá | | | Banco de
Occidente | | | Banco
Popular | | | Banco
AV Villas | | | Corficolombiana | | | Porvenir | | | Total | |
| | | | | | | | | | | | | | | | | | | | | (in Ps billions, except
percentages) | | | | | | | | | | | | | |
| Direct ownership interest held by Grupo Aval | | | 68.7 | % | | | 68.7 | % | | | 72.3 | % | | | 72.3 | % | | | 93.7 | % | | | 93.7 | % | | | 79.9 | % | | �� | 79.9 | % | | | 9.4 | % | | | 9.4 | % | | | 20.0 | % | | | 20.0 | % | | | - | | | | - | |
| Unconsolidated net profits | | | 4,235 | | | | 2,291 | | | | 530 | | | | 496 | | | | 207 | | | | 305 | | | | 187 | | | | 204 | | | | 308 | | | | 475 | | | | 355 | | | | 277 | | | | 5,822 | | | | 4,048 | |
| Dividends declared | | | 1,531 | | | | 894 | | | | 463 | | | | 290 | | | | 107 | | | | 155 | | | | 145 | | | | 93 | | | | 341 | | | | 481 | | | | 265 | | | | 264 | | | | 2,852 | | | | 2,178 | |
| Dividends contributed to Grupo Aval | | | 1,052 | | | | 615 | | | | 335 | | | | 210 | | | | 100 | | | | 146 | | | | 116 | | | | 74 | | | | 32 | | | | 45 | | | | 53 | | | | 53 | | | | 1,688 | | | | 1,142 | |
| Dividends declared by Grupo Aval | | | - | | | | - | | | | - | | | | - | | | | - | | | | - | | | | - | | | | - | | | | - | | | | - | | | | - | | | | - | | | | 1,965 | | | | 1,310 | |
Until 2016, Grupo Aval’s subsidiaries, excluding Banco Popular, declared dividends semi-annually in March and September of each year. Beginning in March 2017, they started to declare dividends on an annual basis. Banco Popular continues to declare dividends semi-annually in March and September of each year.
The allocation of our distributable profits, if any, is determined by our common shareholders following approval of our annual financial statements. Our general shareholders’ meetings generally occur in March, three months after the close of the annual period.
In the past we have paid dividends on a monthly basis. We have not, however, adopted a specific dividend policy with respect to future dividends. The amount of any distributions will depend on many factors, such as the results of operations and financial condition of our company and our subsidiaries, their cash requirements, their prospects and other factors deemed relevant by our board of directors and shareholders.
Our company pays dividends based on the results shown in our unconsolidated audited financial statements prepared under Colombian IFRS. For the years ended December 31, 2016 and 2015, net income as reported in our Colombian IFRS financial statements was Ps 2,312.4 billion, 8.1% higher and Ps 2,190.7 billion, 7.3% higher than net income as reported in our IFRS financial statements, respectively.
We expect that differences between Colombian IFRS and IFRS financial statements will continue to occur in future periods.
The amount of dividends expected from our subsidiaries will also depend on the future share ownership in our subsidiaries.
Dividend history of Grupo Aval
The following table presents the annual cash dividends paid by Grupo Aval on each share during the periods indicated.
Until 2016, Grupo Aval declared dividends semi-annually in March and September of each year. Beginning in March 2017, the company started to declare dividends on an annual basis.
| Dividends declared with respect to net income | | Cash dividends
per share | | | Cash dividends
per share | |
| | | (Ps) | | | (U.S.$) | |
| Year ended: | | | | | | | | |
| 2012 | | | 49.20 | | | | 0.021 | |
| 2013 | | | 53.10 | | | | 0.022 | |
| 2014 | | | 57.90 | | | | 0.024 | |
| 2015 | | | 58.80 | | | | 0.019 | |
| 2016 | | | 88.2 | | | | 0.029 | |
Dividend history of our banking subsidiaries
The following tables set forth the annual cash dividends paid by each of our banks on each share during the periods indicated.
Until 2016, Grupo Aval’s subsidiaries, excluding Banco Popular, declared dividends semi-annually in March and September of each year. Beginning in March 2017, they started to declare dividends on an annual basis. Banco Popular continues to declare dividends semi-annually in March and September of each year.
Banco de Bogotá
| Dividends declared with respect to net income | | Cash
dividends per
share | | | Cash
dividends
per share | |
| | | (Ps) | | | (U.S.$) | |
| Year ended: | | | | | | | | |
| 2012 | | | 2,028.00 | | | | 0.848 | |
| 2013 | | | 2,400.00 | | | | 1.003 | |
| 2014 | | | 2,520.00 | | | | 1.053 | |
| 2015 | | | 2,700.00 | | | | 0.857 | |
| 2016 | | | 4,620.00 | | | | 1,540 | |
Banco de Occidente
| Dividends declared with respect to net income | | Cash
dividends per
share | | | Cash
dividends
per share | |
| | | (Ps) | | | (U.S.$) | |
| Year ended: | | | | | | | | |
| 2012 | | | 1,452.00 | | | | 0.607 | |
| 2013 | | | 1,602.00 | | | | 0.670 | |
| 2014 | | | 1,764.00 | | | | 0.737 | |
| 2015 | | | 1,860.00 | | | | 0.591 | |
| 2016 | | | 2,970.00 | | | | 0.990 | |
Banco Popular
| Dividends declared with respect to net income | | Cash
dividends per
share | | | Cash
dividends
per share | |
| | | (Ps) | | | (U.S.$) | |
| Year ended: | | | | | | | | |
| 2012 | | | 23.28 | | | | 0.010 | |
| 2013 | | | 24.00 | | | | 0.010 | |
| 2014 | | �� | 24.00 | | | | 0.010 | |
| 2015 | | | 20.10 | | | | 0.006 | |
| 2016 | | | 13.85 | | | | 0.005 | |
Banco AV Villas
| Dividends declared with respect to net income | | Cash
dividends per
share | | | Cash
dividends
per share | |
| | | (Ps) | | | (U.S.$) | |
| Year ended: | | | | | | | | |
| 2012 | | | 345.00 | | | | 0.144 | |
| 2013 | | | 363.00 | | | | 0.152 | |
| 2014 | | | 387.00 | | | | 0.162 | |
| 2015 | | | 415.00 | | | | 0.132 | |
| 2016 | | | 645.20 | | | | 0.215 | |
Dividend history of Corficolombiana
The following tables present the annual cash dividends paid by Corficolombiana during the periods indicated.
| Dividends declared with respect to net income | | Cash
dividends per
share | | | Cash
dividends
per share | |
| | | (Ps) | | | (U.S.$) | |
| Year ended: | | | | | | | | |
| 2012 | | | 882.00 | | | | 0.369 | |
| 2013 | | | 660.00 | | | | 0.276 | |
| 2014 | | | 630.00 | | | | 0.263 | |
| 2015 | | | 666.00 | | | | 0.211 | |
| 2016 | | | 276.00 | | | | 0.092 | |
Dividend history of Porvenir
The following tables present the annual cash dividends paid by Porvenir during the periods indicated.
| Dividends declared with respect to net income | | Cash
dividends per
share | | | Cash
dividends
per share | |
| | | (Ps) | | | (U.S.$) | |
| Year ended: | | | | | | | | |
| 2012 | | | – | | | | – | |
| 2013 | | | 1,212.00 | | | | 0.507 | |
| 2014 | | | 1,320.36 | | | | 0.552 | |
| 2015 | | | 1,225.92 | | | | 0.389 | |
| 2016 | | | 1,770.00 | | | | 0.590 | |
Dividend history of BAC Credomatic
During 2016, BAC Credomatic declared U.S.$208.57 (Ps 625,846.6) of cash dividend per share.
General aspects involving dividends
The dividend periods may be different from the periods covered by the general balance sheet. At the general shareholders’ meeting, shareholders will determine such dividend periods, the effective date, the system and the place for payment of dividends.
Dividends declared on the shares of common and preferred shares will be payable to the record holders of those shares, as they are recorded on our stock registry, on the appropriate record dates as determined at the general shareholders’ meeting. However, pursuant to External Circular 13 of 1998 issued by the former Superintendency of
Securities (currently, the Superintendency of Finance), if a shareholder sells shares during the ten business days immediately preceding the payment date, dividends corresponding to those shares will be paid by us to the seller.
The vote of at least 80.0% of the shares present and entitled to vote is required to approve the payment of dividends in shares; however, according to Law 222 of 1995, if a “situation of control” exists, whereby the decision-making power is subject to the will of another person or group of persons, a company may only pay dividends by issuing shares, to the shareholders that so accept.
Not applicable.
We are subject to the informational requirements of the Exchange Act. Accordingly, we are required to file reports and other information with the SEC, including annual reports on Form 20-F and reports on Form 6-K. You may inspect and copy reports and other information filed with the SEC at the Public Reference Room at 100 F Street, N.E., Washington, D.C. 20549. Information on the operation of the Public Reference Room may be obtained by calling the SEC at 1-800-SEC-0330. In addition, the SEC maintains an internet website that contains reports and other information about issuers, like us, that file electronically with the SEC. The address of that website is www.sec.gov.
Not applicable.
ITEM 11. QUANTITATIVE AND QUALITATIVE DISCLOSURES ABOUT RISK
Risk management
The guiding principles of risk management at Grupo Aval and our banks are the following:
| · | collective decision making for commercial loans of significant amount at the board level of each of our banks; |
| · | extensive and in-depth market knowledge, the result of our market leadership and our experienced, stable and seasoned senior management; |
| · | clear top-down directives with respect to: |
| · | know-your-customer policies; and |
| · | commercial loan credit structures based on the clear identification of sources of repayment and on the cash-flow generating capacity of the borrower; |
| · | use of common credit analysis tools and loan pricing tools across all our banks; |
| · | diversification of the commercial loan portfolio with respect to industries and economic groups; |
| · | specialization in retail banking product niches; |
| · | extensive use of continuously updated rating and scoring models to ensure the growth of high-credit quality consumer loans; |
| · | use of our extensive market presence in the identification and implementation of best practices for operational risk management; and |
| · | conservative policies in terms of: |
| · | the trading portfolio composition, with a bias towards instruments with lower volatility; |
| · | proprietary trading; and |
| · | the variable remuneration of trading personnel. |
Unless otherwise indicated, risk management figures for Banco de Bogotá consolidate financial data of LB Panamá, including BAC Credomatic. BAC Credomatic has in place its own risk management controls for credit risk, market risk and operational risk.
With respect to credit risk, BAC Credomatic has a centralized structure, led by a Chief Risk Officer (CRO), who reports to the CEO. The Regional Credit Committee, whose members are the CEO, the CRO, and four members of the administration of Grupo Aval and Banco de Bogotá, is responsible for submitting credit policies and procedures at a regional level for the Board of Directors approval. This committee is responsible for monitoring of the loan portfolio. The Regional Credit Committee is also responsible for the final decision for loans which exceed the credit limits delegated to the individual countries. While local risk managers report to the local head, observance of regional policies and procedures is reported to the CRO.
With respect to market risk, BAC Credomatic has Regional Investment Policies and Regional Asset and Liability Management Policies which set out the guidelines for establishing country risk and issuer limits as well as limits on foreign currency positions and general guidelines for the administration of liquidity, interest rate and exchange-rate risks. The establishment and administration of the regional policies is the responsibility of the Regional Asset and Liability Committee, which is comprised of BAC Credomatic board members.
Daily adherence to these policies at BAC Credomatic is carried out with the investment portfolio control management module, which documents the entire investment process. The monitoring of exposures is the responsibility of the Regional Financial Director through the local assets and liabilities committees.
Operating Risk Management at BAC Credomatic is carried out using the conceptual methodology of Basel II guidelines and the elements of The Committee of Sponsoring Organizations of the Treadway Commission(COSO). A centralized operating risk management unit ensures that there are in place policies to ensure a standardized treatment of operating risks including methodologies for the timely recognition of the principal exposures, the ownership of operational risks by functional units, accountability throughout the organization and effective procedures to collect information on operational losses. The centralized operating risk committee is also responsible for putting in place an effective business continuity plan.
Credit Risk
The credit-risk management process at all our banks takes into consideration the requirements of the Superintendency of Finance, the guidelines of Grupo Aval credit-risk management and the composition of each of the banks’ loan portfolio, which, in turn, is the result of the execution of each bank’s strategy. See Note 4 to our audited consolidated financial statements.
Commercial Lending
60.0% of our total loan portfolio is composed of commercial loans to corporate and small and medium sized enterprises. However, the level of commercial loans varies in each of our banks. At December 31, 2016, the proportion of commercial loans was 61.7%, 71.2%, 43.4% and 33.1% at Banco de Bogotá, Banco de Occidente, Banco Popular and Banco AV Villas, respectively.
The credit approval process for commercial loans at each of our banks follows the policies and lending authorities established by each bank subsidiary. The highest lending authority at all banks, other than the board of directors, is the national credit committee (Comité Nacional de Crédito at Banco de Bogotá and Banco AV Villas,Comité de Crédito Dirección General at Banco de Occidente and Comité de Presidencia at Banco Popular), which has lending limits that range between Ps 3.5 billion (approximately U.S.$1.16 million) at Banco AV Villas and Ps 15.0 billion (approximately U.S.$5.0 million) at Banco de Bogotá.
Following the approval of a transaction by the national credit committee of any of our banks, information regarding the loan is sent to the Grupo Aval risk management unit if the loan would result in aggregate exposure to the borrower in excess of Ps 5.0 billion (approximately U.S.$1.66 million). The credit approval process includes the presentation to Grupo Aval´s credit committee of all potential credit exposures per client (or client´s economic
group) that, across all of our banks, represent an exposure in excess of Ps 20.0 billion (approximately U.S.$6.4 million) or is considered to be part of a vulnerable sector. Exceptions can be made depending on the risk parameters defined by Grupo Aval´s credit committee. This committee, which is composed of the vice presidents of credit of each of our banks and the risk management staff of Grupo Aval, meets on a weekly basis to discuss general developments in the industry and economy, risks and opportunities, and the structure of credit transactions, as well as to consult on and evaluate potential business opportunities. The committee consolidates requests for loans across all banks and evaluates our total exposure to potential borrowers. In each case, the committee evaluates the relevant bank’s application of its credit analysis policy and it may make recommendations with respect to the structure of the loan (such as guarantees, interest rates, commissions and covenants). The credit committee will then submit to Grupo Aval´s advisory board those transactions which represent a significant exposure or have exceptions to credit and pricing policies.
The Grupo Aval advisory board, which is chaired by the president of Grupo Aval and composed of the presidents of our banks and some vice presidents of Grupo Aval, meets two times per month to discuss the adoption of risk management policies and how to meet the needs of major corporate and institutional clients, as well as to advise the Grupo Aval banks with respect to defaults or other credit risk issues. The advisory board also evaluates transactions submitted to it by the Grupo Aval risk management committee for compliance with applicable policies and makes recommendations to the banks with respect to such loans. The boards of the banks make the ultimate decisions with respect to such loans.
In order to facilitate the analysis of commercial loans which meet the threshold and are thus reviewed by Grupo Aval, we have developed certain tools, including a standardized “proyecto de crédito,” a stand-alone document containing all of the information considered necessary for us to make a credit decision. We have also developed financial projection models and pricing models that assist us in analyzing potential loans and comparing the estimated return on a loan with that of a comparable risk-free instrument.
We seek to achieve a profitable, high-quality commercial loan portfolio and an efficient procedure for analyzing potential loans across our banks. To that end, we have established policies and procedures for the analysis and approval of potential commercial credit transactions that seek to focus lending on the following principles:
| · | borrowers whose shareholders and management are, in our opinion, of the highest integrity (taking into account not only an analysis of the borrower’s credit profile but also their reputation in the business community and other factors); |
| · | borrowers which participate in key industries; |
| · | borrowers which are leaders or major players in the industries in which they participate; |
| · | transaction structures, including covenants and guarantees, which provide adequate protection; and |
| · | pricing which compensates adequately for capital invested and the market and credit risks incurred. |
In addition, we make loans to public sector entities. For purposes of evaluating the extension of credit to public sector entities, our banks follow three criteria: (1) the loan must be used to finance an investment that has been approved by local authorities; (2) a source of repayment, primarily tax revenues, must be clearly identified; and (3) the source of repayment so identified must be pledged to secure the loan.
Consumer Lending
Consumer lending represented 30.2% of the total loan portfolio at December 31, 2016; however, the participation and specialization by product varies in each of our banks. At December 31, 2016, Banco Popular’s consumer lending represented 53.4% of the total loan portfolio and was concentrated mainly in payroll deduction loans (libranzas), a product in which it is the leader in Colombia. At Banco AV Villas and Banco de Bogotá, consumer lending represented 48.1% and 26.5% of their total loan portfolio, respectively. At Banco de Occidente, 25.1% of the total loan portfolio consisted of consumer loans, with motor vehicle financing representing 29.9% of the consumer loan portfolio.
The credit approval process for consumer loans at each of our banks follows the policies and lending authorities established by each bank. The highest consumer lending authority at all banks, other than the board of directors, is
the national consumer credit committee where the highest lending limits are Ps 3.5 billion (approximately U.S.$1.16 million).
For consumer banking, each bank has developed a business model designed to take into consideration the product offering. Banco Popular, for which payroll deduction loans represent 96.6% of the consumer loan portfolio, has developed a business model which concentrates its analysis on the credit and operational risks of the payee (the employer) supported with statistical origination and behavior models. Banco AV Villas is the bank with the most diversified consumer loan portfolio. After being exclusively a mortgage lending institution until 2000, it has developed different niches in consumer lending. The fast growth of consumer lending with above average credit quality has been the result of the development of in-house statistical origination and behavior models and the development of a multiple view vintage analysis tools, which have allowed the sale of consumer loan products to the lower income population, which is a more profitable customer segment in which relatively few banks compete. Banco de Bogotá has a full-service consumer loan portfolio of credit cards, personal loans, automobile loans and overdrafts. Banco de Occidente has become a leader in motor vehicle financing by maintaining an independent motor vehicle financing unit which has developed its own statistical models and its own origination and collection strategies.
Mortgage Lending
Mortgage lending represented 9.5% of total loan portfolio at December 31, 2016, compared to 9.2% as of December 31, 2015, with Banco AV Villas and Banco de Bogotá being the highest contributors to this increase. At Banco AV Villas mortgage lending represents 18.5% of its total loan portfolio.
At Banco de Bogotá, mortgage lending represents 11.5% of its total loan portfolio as of December 31, 2016, up from 11.1% in 2015. On the other hand in Central America, the mortgage portfolio represented 20.0% of the total loan portfolio in 2016.
In order to ensure an adequate mortgage loan portfolio quality, Banco de Bogotá and Banco AV Villas have developed statistical models for the origination and follow-up on new mortgage loans, which has resulted in a very low past due to total loan ratios for recently originated loans.
Microcredit Lending
Microcredit loans represented 0.3% of the total loan portfolio at December 31, 2016.
Credit Classification and Provisioning
Our banks continually engage in the determination of risk factors associated with their credit-related assets, through their duration, including restructurings. For such purposes, they have designed and adopted theSistema de Administración de Riesgo de Crédito (credit risk administration system), or “SARC,” (for its initials in Spanish) in accordance with Superintendency of Finance guidelines. The SARC has integrated credit policies and procedures for the administration of credit risks, models of reference for the determination and calculation of anticipated losses, allowances for coverage of credit risks and internal control procedures.
Our banks are required to classify the loan portfolio in accordance with the rules of the Superintendency of Finance, which established the following loan classification categories: “AA,” “A,” “BB,” “B,” “CC” and “Default,” depending on the strength of the credit and its past due status.
Each bank reviews outstanding loan portfolio components under the above-mentioned criteria and classifies individual loans under the risk-rating categories below on the basis of minimum objective criteria, such as balance sheet strength, profitability and cash generation capacity. The classification of new commercial loans is made on the basis of these objective criteria. The criteria are also evaluated on an ongoing basis, together with loan performance, in reviewing the classification of existing commercial loans.
| Category | | Approval | | Commercial loan portfolio | | Consumer loan portfolio |
| “AA” | | New loans with risk rating at approval of “AA” | | Outstanding loans and financial leases with past due payments not exceeding 29 days (i.e., between 0 and 29 days past due). | | Loans whose risk rating is “AA” according to the methodology of the Consumer Reference Model, |
| Category | | Approval | | Commercial loan portfolio | | Consumer loan portfolio |
| | | | | The debtor’s financial statements or its projected cash flows, as well as all other credit information available to the financial subsidiaries, reflect excellent paying capacity. | | or “MRCO,” as established by the Superintendency of Finance |
| | | | | | | |
| “A” | | New loans with risk rating at approval of “A” | | Outstanding loans and financial leases with delayed payments in excess of 30 days but not exceeding 59 days (i.e., between 30 and 59 days past due). The debtor’s financial statements or its projected cash flows, as well as all other credit information available to the financial subsidiaries, reflect appropriate paying capacity. | | Loans whose risk rating is “A” according to the methodology of the MRCO as established by the Superintendency of Finance |
| | | | | | | |
| “BB” | | New loans with risk rating at approval of “BB” | | Outstanding loans and financial leases past due more than 60 days but less than 90 days (i.e., between 60 and 89 days past due). Loans in this category are acceptably serviced and collateralized, but there are weaknesses which may potentially affect, on a transitory or permanent basis, the debtor’s ability to pay or its projected cash flows, to the extent that, if not timely corrected, would affect the normal collection of credit or contracts. | | Loans whose risk rating is “BB” according to the methodology of the MRCO as established by the Superintendency of Finance |
| | | | | | | |
| “B” | | New loans with risk rating at approval of “B” | | Outstanding loans and financial leases past due over 90 days but less than 120 days (i.e., between 90 and 119 days past due). The debtor shows insufficient paying capacity of its obligations. | | Loans whose risk rating is “B” according to the methodology of the MRCO as established by the Superintendency of Finance |
| | | | | | | |
| “CC” | | New loans with risk rating approval of “CC” | | Outstanding loans and financial lessees past due more than 120 days but less than 150 days (i.e., between 120 and 149 days past due). Loans in this category represent grave insufficiencies in the debtors’ paying capacity or in the project’s cash flow, which may compromise the normal collection of the obligations. | | Loans whose risk rating is “CC” according to the methodology of the MRCO as established by the Superintendency of Finance |
| | | | | | | |
| “Default” | | – | | Outstanding loans and financial leases past due for 150 days or more. This category is deemed uncollectible. These loans are considered in default. | | Consumer loan portfolio past due over 90 days |
For new consumer loans, the banks use their internal statistical origination models to develop an initial classification category (“AA,” “A,” “BB,” “B” and “CC”). Once the loan is disbursed, the banks use formulas provided by the Superintendency of Finance, which incorporate payment performance of the borrower to calculate a score which in turn is used to determine the loan classification.
For financial leases the risk categories are established in the same manner as commercial or consumer loans.
For separate financial statement reporting purposes under Colombian IFRS, the Superintendency requires that loans and leases be given a risk category on the scale of “A,” “B,” “C,” “D” and “E.” As a result, the risk classifications are aligned to the risk categories as follows.
| | | Risk classification |
| Risk category | | Commercial | | Consumer |
| “A” | | “AA” | | “AA” |
| | | | | “A” – between 0 and 30 days past due |
| “B” | | “A” | | “A” – more than 30 days past due |
| | | “BB” | | “BB” |
| “C” | | “B” | | “B” |
| | | “CC” | | “CC” |
| “D” | | “Default” | | “Default” – all past due loans not classified in “E” |
| “E” | | “Default” | | “Default” – past due loans with a Loss given default (LGD) of 100%(1) |
| (1) | LGD is defined as a percentage to reflect the credit loss incurred if an obligor defaults. LGD for debtors depends on the type of collateral and as a percentage would gradually increase depending on the number of days elapsed after being classified in each category. |
For our mortgage and microcredit loan portfolios the risk categories in effect at December 31, 2016, based on past due status, are as follows.
| Category | | Microcredit | | Mortgage |
| “A” Normal Risk | | In compliance or up to date and up to 30 days past due | | In compliance or up to 60 days past due |
| “B” Acceptable Risk | | Past due between 31 and 60 days | | Past due between 61 and 150 days |
| “C” Appreciable Risk | | Past due between 61 and 90 days | | Past due between 151 and 360 days |
| “D” Significant Risk | | Past due between 91 and 120 days | | Past due between 361 and 540 days |
| “E” Uncollectable | | Past due over 120 days | | Past due over 540 days |
Allowances for impairment losses
Grupo Aval´s Banks regularly revise their loan portfolio to evaluate its impairment; while determining if an impairment should be registered with charge to results of the year, management performs judgments for determining if there are observable data indicating a decrease in the estimated cash flow of the loan portfolio before the decrease in such flow may be identified for a particular loan of the portfolio.
The provision calculation process includes analyses of specific, historical and subjective components. The methodologies utilized by our banking subsidiaries include the following elements:
| · | A detailed periodical analysis of the loan portfolio. |
| · | A credit classification system by risk levels |
| · | A periodical review of the summary of allowances for impairment losses. |
| · | Identification of loans to be evaluated individually due to impairment. |
| · | Consideration of internal factors such as size, organizational structure, loan portfolio structure, loan administration process, analysis of overdue portfolio and experiences of historical losses. |
| · | Consideration of risks inherent to different types of loans. |
| · | Consideration of external factors, including local, regional and national, as well as economic factors. |
For credits individually considered as significant and impaired, the amount of the loan loss allowance is calculated using the discounted cash flow method. Management of each financial entity makes assumptions regarding the amount to be recovered for each client and the time in which such amount will be recovered. During the calculation of allowances for credits considered individually as significant and impaired, based on their guarantee, management performs estimates of the fair value of such guarantees with the aid of independent expert appraisers.
For loans not considered individually significant, or for those credits individually significant but not impaired, loan loss allowances are calculated collectively using the historical loss rate, periodically updated data reflecting current economic conditions, performance trends of the industry, geographic concentrations of debtors within each portfolio of the segment and any other pertinent information that may affect the repayment.
For quantifying losses incurred in portfolios evaluated collectively the banking subsidiaries of Grupo Aval have calculation methodologies that take into account four fundamental factors: exposure, probability of default, the period of identification of the loss and the severity.
| · | Exposure at default – “EAD” is the principal amount owed at the time of payment default of the borrower |
| · | Probability of default – “PD” is the probability that the counterpart defaults its payment obligations of capital and/or interests. The probability of default is associated to the rating/scoring or level of delinquency of the borrower. |
| · | Loss identification period (“LIP)” parameter or period of identification of the loss, is the time elapsed between the occurrence of the event which generates the loss and the time when such loss becomes evident. The LIPs analyses are carried out on the basis of homogeneous risk portfolios. |
| · | Loss given default – “LGD” o severity is the estimate of a loss in case a payment default occurs taking into consideration the guarantees and the corresponding appraisal. |
Liquidity Risk
As a holding company, Grupo Aval’s liquidity requirements are limited to dividends, debt-service payments and operational expenses. Our liquidity is derived entirely from dividends from subsidiaries, which management believes is sufficient for these purposes. Grupo Aval is not required to maintain minimum liquidity positions.
Subject to the capital requirements of each of our banks, there are no limitations on our banks’ ability to pay dividends to Grupo Aval.
Banks controlled by Grupo Aval are required to, and maintain adequate liquidity positions based on the Superintendency of Finance’s liquidity parameters, using a short-term liquidity index (Indicador de Riesgo de Liquidez), or “IRL,” that measures 7-, 15- and 30-day liquidity. This index is defined as the difference between adjusted liquid assets and net liquidity requirements. Liquid assets include total debt securities adjusted by market liquidity and exchange rate, excluding investments classified as “held to maturity” different from mandatory investments, Central Bank deposits and available cash. Net liquidity requirements are the difference between expected contractual asset and contractual and non-contractual liability cash flows. Cash flows from past due loans are not included in this calculation.
Our Colombian banking subsidiaries and Corficolombiana, in Colombia must maintain cash on hand and in restricted banks to comply with the requirements of the Central Bank of Colombia and the Superintendency of Finance. These funds are part of the reserve requirements and are calculated on the daily average of the different customer deposits. Currently, the percentage is 11% on demand and saving deposits, with the exception of time certificates of deposit under 180 days, in which case the percentage is 4.5% or 0% when they exceed that term. See additional information required by IFRS in Note 4 of our financial statements -Liquidity risk.
Our banks have adequate liquidity, as shown in the following table. The three-month cumulative liquidity gap values for our banks for year-end 2016, 2015 and 2014 and reflect unconsolidated figures for each of our banks.
| | | Year ended December 31, | |
| Three-month cumulative liquidity position | | 2016 | | | 2015 | | | 2014 | |
| | | (in Ps billions) | |
| Banco de Bogotá | | | | | | | | | | | | |
| Total assets and contingencies | | | 14,396 | | | | 16,452 | | | | 14,997 | |
| Total liabilities, equity and contingencies | | | 16,466 | | | | 14,758 | | | | 15,850 | |
| Liquidity gap | | | (2,069 | ) | | | 1,693 | | | | (852 | ) |
| Net liquid assets (NLA) | | | 3,194 | | | | 1,782 | | | | 2,678 | |
| Liquidity gap plus NLA | | | 1,125 | | | | 3,475 | | | | 1,826 | |
| Banco de Occidente | | | | | | | | | | | | |
| Total assets and contingencies | | | 9,137 | | | | 7,470 | | | | 6,219 | |
| Total liabilities, equity and contingencies | | | 6,722 | | | | 3,501 | | | | 4,896 | |
| Liquidity gap | | | 2,415 | | | | 3,970 | | | | 1,323 | |
| Net liquid assets (NLA) | | | 3,882 | | | | 2,454 | | | | 2,713 | |
| Liquidity gap plus NLA | | | 6,297 | | | | 6,424 | | | | 4,036 | |
| Banco Popular | | | | | | | | | | | | |
| Total assets and contingencies | | | 4,279 | | | | 4,362 | | | | 3,580 | |
| Total liabilities, equity and contingencies | | | 2,061 | | | | 3,158 | | | | 2,275 | |
| Liquidity gap | | | 2,218 | | | | 1,204 | | | | 1,305 | |
| Net liquid assets (NLA) | | | 2,237 | | | | 1,509 | | | | 1,219 | |
| Liquidity gap plus NLA | | | 4,456 | | | | 2,713 | | | | 2,523 | |
| Banco AV Villas | | | | | | | | | | | | |
| Total assets and contingencies | | | 2,280 | | | | 2,294 | | | | 1,726 | |
| Total liabilities, equity and contingencies | | | 4,175 | | | | 3,934 | | | | 3,581 | |
| Liquidity gap | | | (1,896 | ) | | | (1,639 | ) | | | (1,856 | ) |
| Net liquid assets (NLA) | | | 1,952 | | | | 2,124 | | | | 3,071 | |
| Liquidity gap plus NLA | | | 57 | | | | 485 | | | | 1,215 | |
| Corficolombiana | | | | | | | | | | | | |
| Total assets and contingencies | | | 2,880 | | | | 4,136 | | | | 1,135 | |
| Total liabilities, equity and contingencies | | | 3,522 | | | | 4,427 | | | | 1,326 | |
| Liquidity gap | | | (642 | ) | | | (292 | ) | | | (192 | ) |
| Net liquid assets (NLA) | | | 1,476 | | | | 1,619 | | | | 977 | |
| Liquidity gap plus NLA | | | 834 | | | | 1,327 | | | | 785 | |
The following tables show the short-term liquidity index and the IRL Ratio at December 31, 2016 and 2015 for each of our banks, expressed in Ps billions and as a percentage.
| | | At December 31, | |
| | | Banco de Bogotá | | | Banco de Occidente | | | Banco Popular | | | Corficolombiana | | | Banco AV Villas | |
| | | 2016 | | | 2015 | | | 2016 | | | 2015 | | | 2016 | | | 2015 | | | 2016 | | | 2015 | | | 2016 | | | 2015 | |
| | | (in Ps billions) | |
| IRL – 7 days | | | 8,733 | | | | 7,302 | | | | 3,453 | | | | 4,044 | | | | 2,445 | | | | 1,678 | | | | 871 | | | | 772 | | | | 1,724 | | | | 1,858 | |
| IRL – 15 days | | | 5,605 | | | | 6,391 | | | | 3,158 | | | | 3,832 | | | | 2,212 | | | | 1,463 | | | | 795 | | | | 596 | | | | 1,554 | | | | 1,697 | |
| IRL – 30 days | | | 3,786 | | | | 4,603 | | | | 2,681 | | | | 3,339 | | | | 1,576 | | | | 1,412 | | | | 691 | | | | 497 | | | | 1,330 | | | | 1,675 | |
| | | At December 31, | |
| | | Banco de Bogotá | | | Banco de Occidente | | | Banco Popular | | | Corficolombiana | | | Banco AV Villas | |
| | | 2016 | | | 2015 | | | 2016 | | | 2015 | | | 2016 | | | 2015 | | | 2016 | | | 2015 | | | 2016 | | | 2015 | |
| | | (in percentages) | |
| IRL – 7 days | | | 759 | | | | 980 | | | | 905 | | | | 1,089 | | | | 1435 | | | | 560 | | | | 244 | | | | 191 | | | | 855 | | | | 797 | |
| IRL – 15 days | | | 226 | | | | 433 | | | | 536 | | | | 717 | | | | 632 | | | | 352 | | | | 217 | | | | 158 | | | | 491 | | | | 498 | |
| IRL – 30 days | | | 160 | | | | 230 | | | | 323 | | | | 400 | | | | 250 | | | | 324 | | | | 188 | | | | 144 | | | | 314 | | | | 473 | |
Operational Risk Management
The policies with respect to operational risk at Grupo Aval and our banks are directed at complying with the guidelines established by the Superintendency of Finance (which, in turn, follow the Basel II Accord of 2004), and the U.S. Sarbanes-Oxley Act of 2002. These guidelines require that Colombian banks establish a system for the administration of operational risks (Sistema de Administración de Riesgo Operacional) which includes the identification, measurement, control and monitoring functions as well as a business continuity plan.
In order to comply with these guidelines, each of our banks established within its organizational structure an operational risk unit independent of the operational and control areas of each bank. The responsibilities of these units are the establishment and definition of policies and methodologies and the procedures for communicating within each organization all information related to operational risk. In addition to the staff of each operational risk unit, the banks have established the role of operational risk advisors, which are employees in key areas who, in addition to their functional responsibilities, are required to report events or situations which may result in operational losses. Additionally, each bank has an operational risk management committee which meets on a periodical basis to review operational risks policies and follow up on the execution of action plans.
At Grupo Aval, an operational risk management committee, composed of the heads of the operational risk units of each bank and staff of Grupo Aval risk management, was established. The principal activities of this committee, which meets on a semi-monthly basis, are as follows:
| · | advisory in the engagement of external consultants for the identification of gaps with international standards and the development of work plans to close the gaps; |
| · | coordinated analysis of norms and the impact in each of Grupo Aval’s banks; |
| · | identification and application of best practices; |
| · | identification and implementation of operational risk management tools; |
| · | unification of criteria in the search of business continuity tools; |
| · | economies of scale in the engagement of consultants and the acquisition of tools; and |
| · | coordination in the preparation of requests for proposals and the evaluation of proposals. |
We implement, from time to time, best practices that result from meetings of the Grupo Aval operational risk management committee.
Market Risk Management
Grupo Aval monitors and oversees market risk at a consolidated level through reports received from its banking subsidiaries in charge of managing their own market risk. Grupo Aval on an unconsolidated basis does not have material market risk; however, our banking subsidiaries have substantial market risk, primarily as a result of our banks’ lending, trading and investment businesses. The primary market risks to which we are exposed are interest rate risk, foreign exchange rate risk, variations in stock price risk and investment fund risk.
We are exposed to interest rate risk whenever there is a mismatch between interest-rate-sensitive assets and liabilities, subject to any hedging we have engaged in using interest rate swaps or other off-balance sheet derivative instruments. Interest rate risk arises in connection with both trading and non-trading activities.
We are exposed to foreign exchange rate risk as a result of mismatches between assets and liabilities, and off-balance sheet items denominated in different currencies. We are exposed to variations in stock price risk in connection with investments in equity securities, including our merchant banking investments. We are exposed to fund risk primarily from investments in mutual funds.
We and our banks’ respective boards of directors, through their risk management committees, are responsible for establishing policies, procedures and limits with respect to market risk. These committees also monitor overall performance in light of the risks assumed. These policies and procedures describe the control framework used by us and each of our banks to identify, measure and manage market risk exposures inherent in our and their activities. The main purpose of these policies and procedures is to set limits on risk. All risk managers within Grupo Aval must ensure that each business activity is performed in accordance with the policies established by the relevant bank. These policies and procedures are followed in market risk decision-making in all business units and activities. All of our banks have established aSistema de Administración de Riesgos de Mercado, or SARM (for its initials in Spanish), a market risk management system which meets the requirements of the Superintendency of Finance.
Each bank is responsible for setting market risk limits and monitoring market risk.
Risk management personnel at Grupo Aval and each of our banks are responsible for the following:
| · | identification, measurement and management of the market risk exposures inherent in their businesses; |
| · | analyzing exposures under stress scenarios; |
| · | confirming compliance with applicable risk management policies, reporting violations of such policies, and proposing new policies; |
| · | designing of methodologies for valuing securities and financial instruments; and |
| · | reporting daily to senior management as to the levels of market risk associated with trading instruments. |
Our banks hold trading and non-trading instruments. Trading instruments are recorded in our banks’ “treasury books” and non-trading instruments are recorded in their “banking books.”
Trading Instruments
Trading instruments include our proprietary positions in available for sale financial instruments and/or acquired to take advantage of current and/or expected differences between purchase and sale prices. As a result of trading fixed income and floating rate securities, equity securities, investment funds and foreign exchange, we and our banks are exposed to interest rate, variations in stock prices, investment fund and foreign exchange rate risks, as well as volatility risk when derivatives are used. Our banks trade foreign exchange, fixed income instruments, floating rate securities and basic derivative instruments (forwards, options, cross currency swaps and interest rate swaps).
Our banks use value at risk, or VaR, to measure their exposure to market risk in trading instruments. VaR is an estimate of the expected maximum loss in market value of a given portfolio over a time horizon at a specific confidence interval, subject to certain assumptions and limitations discussed below.
VaR models have inherent limitations, including the fact that they rely on historical data, which may not be indicative of future market conditions or trading patterns. As a result, VaR models could overestimate or underestimate the value at risk and should not be viewed as predictive of future results. Furthermore, our banks may incur losses materially in excess of the amounts indicated by the VaR models on a particular trading day or over a period of time. VaR does not calculate the greatest possible loss. In addition, VaR models are subject to the reasonable judgment of our bank’s risk management personnel.
Each bank’s board of directors, assets and liabilities committee and risk management committee establishes the maximum VaR for each type of investment and for each type of risk using their own internal VaR models as well as the Superintendency of Finance methodology, or the regulatory VaR. Our banks use VaR estimates to alert senior management whenever the statistically estimated losses in the banks’ portfolios exceed pre-established levels. Limits on VaR are used to control exposure on a portfolio-by-portfolio basis.
In order to strictly control the trading portfolios, each entity has limits for every risk factor. To determine the limits, the impact of the variation (DV01 change in monetary value caused by a variation of 1 basis point) in each risk is taken into account. These risk limits are validated through stress testing based on historical extreme scenarios.
As described below, our banks measure interest rate risk, foreign exchange risk, variations in stock price risk and investment fund risk in accordance with VaR models. We use two types of approaches to measure VaR: (1) regulatory VaR methodology and (2) internal VaR models.
| · | The regulatory VaR used in the calculation of the capital ratio (solvency ratio) follows the methodology established by the Superintendency of Finance. The Superintendency methodology is based on the Basel II model. The Superintendency of Finance has not made publicly available technical information on how it determines the volatilities used in this model, and only limited information is available. The volatilities used in the Superintendency of Finance’s model are of a magnitude similar to those observed in very high volatility or stress periods. These parameters are seldom changed by the Superintendency of Finance. See “—Regulatory VaR” below. |
| · | In addition, our banks use internal models to manage market risk. Parameters are set to adapt to the evolution of volatility of the risk factors over time using statistical methods to estimate them. Our banks generally give recent data more weight in calculations to reflect actual market conditions. The corporate governance bodies of our banks set limits based on this VaR measure in order to control the market risks. Parametric VaR and historical simulation methodologies are also used. |
Regulatory VaR
The Regulatory VaR calculation is primarily used for the Superintendency of Finance’s solvency ratio calculations.
The Superintendency of Finance methodology is based on the Basel II model. This model applies only to the banks’ investment portfolio and excludes investments classified as “held to maturity” and other specific non-trading positions included in the “Available for sale” portfolios. Total market risk is calculated on a daily basis by aggregating the VaR for each risk exposure category on a ten-day horizon using risk factors calculated in extreme market stress scenarios. VaR at month-end comprises part of the capital adequacy ratio calculation (as set forth in Decree 2555 of 2010). The Superintendency of Finance’s rules require our banks to calculate VaR for the following risk factors: interest rate risk, foreign exchange rate risk, variations in stock price risk and fund risk; correlations between risk factors are not considered. The fluctuations in the portfolio’s VaR depend on sensitivity factors determined by the Superintendency of Finance, modified duration and changes in balances outstanding. The ten-day horizon is defined as the average time in which an entity could sell a trading position i the market.
The VaR calculation for each bank is the aggregate of the VaR of the bank and its subsidiaries.
Interest Rate Risk
Our banks’ exposure to interest rate risk in their trading portfolios primarily arises from investments in securities (floating and fixed rate) and derivative instruments. In accordance with the Superintendency of Finance rules, our banks calculate interest rate risk for positions in pesos, foreign currency and UVRs separately. UVR is a Colombian inflation-adjusted monetary index calculated by the board of directors of the Colombian Central Bank
and generally used as an alternative for pricing floating rate home-mortgage loans. The interest rate risk model is designed to measure the risk of loss arising from changes in market interest rates. It includes the sum of the net short or long position in the whole trading book, a proportion of the matched positions in each time band (the “vertical disallowance”) and a proportion of the matched positions across different time bands (the “horizontal disallowance”).
A significant portion of the market risk of our banks is interest rate risk VaR as quantified in the tables below. The interest rate risk of our banks is primarily generated by long positions held in Peso-denominated Colombian government debt. Our banks have a preference for these securities as the government debt market is the largest and most developed of the local financial markets. Additionally, government debt securities support the liquidity management of our banks as they are eligible for Colombian Central Bank overnight repo funding and are classified as high-quality liquid assets. Government debt securities also carry a zero weight for capital adequacy calculations making them attractive in terms of utilization of capital. These factors provide a strong incentive for our banks to invest in government debt securities and diversify less into other debt securities that do not possess these characteristics.
Foreign Exchange Rate Risk
Our banks use a sensitivity factor to calculate the probability of losses as a result of fluctuations in currencies in which our banks hold positions. Regulatory VaR is computed daily by multiplying the net position by the maximum probable variation in the price of such positions on a ten-day horizon, determined by the Superintendency of Finance as shown in the following table.
| U.S. dollar | | | 5.5 | % |
| Euro | | | 6.0 | % |
| Other currencies | | | 8.0 | % |
Our banks’ exposure to foreign exchange rate risk arises primarily from changes to the U.S. dollar/peso exchange rate. Our banks use an approximation to estimate the risk in exchange-rate-related option positions based on delta, gamma and vega sensitivities, which is included in foreign exchange risk.
The foreign exchange rate risk VaR calculation under the standard model of the Superintendency of Finance includes both the trading and non-trading book.
Equity Price Risk
In determining regulatory VaR variations in stock price risk, certain investments are excluded: (a) equity securities in financial institutions that are supervised by the Superintendency of Finance and (b) equity securities derived from corporate restructuring processes or received as in-kind payment for non-performing loans. In addition, as part of the solvency ratio calculation, equity securities in entities supervised by the Superintendency of Finance that do not consolidate are generally deducted from primary capital. Investments in entities that consolidate but are not supervised by Superintendency of Finance (non-financial investment) are included in VaR calculations.
Variations in stock price risk in Grupo Aval come primarily from Corficolombiana’s non-financial investment portfolio.
The Superintendency of Finance’s methodology for determining VaR for variations in stock price risk outlined above results in the inclusion of Corficolombiana’s consolidated and non-consolidated equity securities in non-financial institutions.
In December 2010, the Superintendency of Finance issued a revised methodology that excludes from the VaR calculation investments that are available for sale equity securities that are acquired as strategic investments and intended to be held on a long-term horizon.
Variations in stock price risk VaR is computed daily by multiplying the net position by the maximum probable variation in the price of such positions on a ten-day horizon, determined by the Superintendency of Finance to be 14.7%. This coefficient is based on historic volatilities and is seldom adjusted.
Investment Fund Risk
Investment fund risk comes from temporary investment of cash in portfolios managed by trust companies.
Investment fund risk VaR is computed daily by multiplying the net position by the maximum probable variation in the price of such positions on a ten-day horizon, determined by the Superintendency of Finance to be 14.7%.
The following tables show the VaR calculation relating to each of the risk factors described above and based on the Superintendency of Finance Methodology (Regulatory VaR) for the years ended December 31, 2016 and 2015, for a ten-day horizon for each of our banks. The averages, minimums and maximums are determined based on end-of-the-month calculations.
Banco de Bogotá
| | | Year ended December 31, 2016 | | | At
December 31,
2015 | |
| | | Period end | | | Average | | | Maximum | | | Minimum | | | Period end | |
| | | (in Ps millions) | |
| Interest rate risk VaR | | | 346,303 | | | | 496,788 | | | | 711,827 | | | | 324,908 | | | | 394,248 | |
| Foreign exchange rate risk VaR | | | 57,160 | | | | 37,336 | | | | 57,160 | | | | 26,940 | | | | 19,926 | |
| Variations in stock price risk VaR | | | 6,002 | | | | 9,622 | | | | 15,089 | | | | 5,090 | | | | 4,068 | |
| Fund risk VaR | | | 170,020 | | | | 160,274 | | | | 170,020 | | | | 149,082 | | | | 148,232 | |
| Total market risk VaR | | | 579,486 | | | | 704,020 | | | | 909,405 | | | | 550,562 | | | | 566,474 | |
Banco de Occidente
| | | Year ended December 31, 2016 | | | At
December 31,
2015 | |
| | | Period end | | | Average | | | Maximum | | | Minimum | | | Period end | |
| | | (in Ps millions) | |
| Interest rate risk VaR | | | 137,221 | | | | 154,398 | | | | 172,552 | | | | 131,840 | | | | 168,809 | |
| Foreign exchange rate risk VaR | | | 2,029 | | | | 2,172 | | | | 3,567 | | | | 1,488 | | | | 1,811 | |
| Variations in stock price risk VaR | | | - | | | | - | | | | - | | | | - | | | | - | |
| Fund risk VaR | | | 2,545 | | | | 3,628 | | | | 3,898 | | | | 2,545 | | | | 3,567 | |
| Total market risk VaR | | | 141,794 | | | | 160,199 | | | | 177,946 | | | | 137,343 | | | | 174,187 | |
Banco Popular
| | | Year ended December 31, 2016 | | | At
December 31,
20145 | |
| | | Period end | | | Average | | | Maximum | | | Minimum | | | Period end | |
| | | (in Ps millions) | |
| Interest rate risk VaR | | | 118,920 | | | | 129,470 | | | | 149,375 | | | | 103,097 | | | | 149,206 | |
| Foreign exchange rate risk VaR | | | 273 | | | | 703 | | | | 2,551 | | | | 17 | | | | 169 | |
| Variations in stock price risk VaR | | | 764 | | | | 813 | | | | 947 | | | | 732 | | | | 723 | |
| Fund risk VaR | | | 615 | | | | 582 | | | | 683 | | | | 490 | | | | 532 | |
| Total market risk VaR | | | 120,572 | | | | 131,567 | | | | 150,964 | | | | 104,583 | | | | 150,630 | |
Banco AV Villas
| | | Year ended December 31, 2016 | | | At
December 31,
2015 | |
| | | Period end | | | Average | | | Maximum | | | Minimum | | | Period end | |
| | | (in Ps millions) | |
| Interest rate risk VaR | | | 89,268 | | | | 100,756 | | | | 113,347 | | | | 89,066 | | | | 109,999 | |
| Foreign exchange rate risk VaR | | | 7 | | | | 307 | | | | 862 | | | | - | | | | 248 | |
| Variations in stock price risk VaR | | | - | | | | - | | | | - | | | | - | | | | – | |
| Fund risk VaR | | | 126 | | | | 115 | | | | 169 | | | | 96 | | | | 135 | |
| Total market risk VaR | | | 89,402 | | | | 101,178 | | | | 114,065 | | | | 89,243 | | | | 110,382 | |
Corficolombiana
| | | Year ended December 31, 2016 | | | At
December 31,
2015 | |
| | | Period end | | | Average | | | Maximum | | | Minimum | | | Period end | |
| | | (in Ps millions) | |
| Interest rate risk VaR | | | 141,553 | | | | 219,143 | | | | 282,081 | | | | 130,771 | | | | 266,513 | |
| Foreign exchange rate risk VaR | | | 3,263 | | | | 3,799 | | | | 8,730 | | | | 1,263 | | | | 3,236 | |
| Variations in stock price risk VaR | | | 11,975 | | | | 10,608 | | | | 12,295 | | | | 8,471 | | | | 9,253 | |
| Fund risk VaR | | | 2,906 | | | | 2,140 | | | | 3,498 | | | | 373 | | | | 3,445 | |
| Total market risk VaR | | | 159,697 | | | | 235,689 | | | | 293,983 | | | | 146,966 | | | | 282,448 | |
The regulatory VaR of our banks decreased between December 31, 2015 and December 31, 2016 mainly because of reductions in the amount and duration of the local currency debt securities (primarily government securities or “TES”) portfolio. The regulatory VaR of Banco de Occidente, Banco Popular, Banco AV Villas and Corficolombiana decreased 18.6%, 20.0%, 10.9% and 43.5% respectively mainly for the reasons mentioned above.
Considerations on Equity Price Risk Regulatory VaR
As stated above, variations in equity price risk measured based on the regulatory VaR methodology include both equity securities held for trading through profit or losses and non-strategic holdings. In addition, it does not discriminate between listed and unlisted equity investments or between those which consolidate and those which do not. It focuses on investments in non-financial institutions.
Holding periods for many of Corficolombiana’s equity investments exceed ten years. Its largest investments have remained in the portfolio for several years and are intended to remain as permanent investments. At December 31, 2016 and at December 31, 2015, the investment subject to regulatory VaR were holdings in Mineros S.A. and CFC Energy Holdings SAS.
The following table breaks down our investments subject to regulatory VaR by time since initial investments at December 31, 2016 and 2015.
| | | At December 31, | |
| | | 2016 | | | 2015 | |
| | | Investment
subject to
Regulatory
VaR | | | Regulatory
VaR | | | Percentage
of
portfolio | | | Investment
subject to
Regulatory
VaR | | | Regulatory
VaR | | | Percentage
of
portfolio | |
| Less than 18 months | | | - | | | | - | | | | - | | | | – | | | | – | | | | – | |
| 18 - 36 months | | | - | | | | - | | | | - | % | | | 164 | | | | 24 | | | | 0.3 | % |
| More than 36 months | | | 60,845 | | | | 8,944 | | | | 100.0 | % | | | 59,883 | | | | 8,803 | | | | 99.7 | % |
| Total | | | 60,845 | | | | 8,944 | | | | 100.0 | % | | | 60,048 | | | | 8,827 | | | | 100.0 | % |
Non-Trading Instruments
Non-trading instruments consist primarily of loans and deposits. Our banks’ primary market risk exposure in their non-trading instruments is interest rate risk, which arises from the possibility of changes in market interest rates. Such changes in market interest rates affect our banks’ net interest income due to timing differences on the repricing of their assets and liabilities. Our banks are also affected by gaps in maturity dates and interest rates in the different asset and liability accounts.
Note 4 of our financial statements - Risk Interest Rate on the balance sheet structure shows mismatches in the repricing of our assets and liabilities by maturity bands. Also, Note 4 of our financial statement - Liquidity Risk shows an analysis of the remaining contractual maturities of our assets and liabilities.
As part of their management of interest rate risk, our banks analyze the interest rate mismatches between their interest-earning assets and their interest-earning liabilities. Our sensitivity analysis based on hypothetical changes of 50 and 100 basis point increases in interest rates would have decreased on our profit before taxes by Ps 82.2 billion and Ps 164.5 billion for the year ended December 31, 2016, respectively (Ps 67.0 billion and Ps 134.0 billion for the year ended December 31, 2015, respectively).
Additionally, Superintendency of Finance rules require our banks to measure foreign exchange rate risk VaR not only for treasury book positions but also for all assets and liabilities denominated in foreign currencies. Our non-trading instruments are exposed to foreign exchange rate risk primarily from loans and deposits denominated in dollars. This foreign exchange rate risk is monitored under the VaR methodology described above.
ITEM 12. DESCRIPTION OF SECURITIES OTHER THAN EQUITY SECURITIES
Not applicable.
Not applicable.
Not applicable.
| D. | American depositary shares |
Fees and Expenses
The depositary may charge each person to whom ADSs are issued, including, without limitation, issuances against deposits of preferred shares, issuances in respect of preferred share distributions, rights and other distributions, issuances pursuant to a share dividend or share split declared by us or issuances pursuant to a merger, exchange of securities or any other transaction or event affecting the ADSs or deposited securities, and each person surrendering ADSs for withdrawal of deposited securities in any manner permitted by the deposit agreement or whose ADRs are cancelled or reduced for any other reason, up to U.S.$5.00 for each 100 ADSs (or any portion thereof) issued, delivered, reduced, cancelled or surrendered, as the case may be. The depositary may sell (by public or private sale) sufficient securities and property received in respect of a preferred share distribution, rights and/or other distribution prior to such deposit to pay such charge.
The following additional charges will be incurred by the ADR holders, by any party depositing or withdrawing preferred shares or by any party surrendering ADSs or to whom ADSs are issued (including, without limitation, issuances pursuant to a share dividend or share split declared by our company or an exchange of securities regarding the ADRs or the deposited securities or a distribution of ADSs), whichever is applicable:
| · | a fee of U.S.$0.05 or less per ADS for any cash distribution made pursuant to the deposit agreement; |
| · | a fee of U.S.$1.50 per ADR or ADRs for transfers of ADRs; |
| · | a fee for the distribution of securities (or the sale of securities in connection with a distribution), such fee being in an amount equal to the fee for the execution and delivery of ADSs that would have been charged as a result of the deposit of such securities (treating all such securities as if they were preferred shares) but which securities or the net cash proceeds from the sale thereof are instead distributed by the depositary to those holders entitled thereto; |
| · | an aggregate fee of U.S.$0.05 per ADS per calendar year (or portion thereof) for services performed by the depositary in administering our ADR program (which fee may be charged on a periodic basis during each calendar year and shall be assessed against holders as of the record date or record dates set by the depositary during each calendar year and will be payable at the sole discretion of the depositary by billing such holders or by deducting such charge from one or more cash dividends or other cash distributions); |
| · | any other charge payable by any of the depositary, any of the depositary’s agents, including, without limitation, the custodian, or the agents of the depositary’s agents in connection with the servicing of our preferred shares or other deposited securities (which charge will be assessed against registered holders of our ADRs as of the record date or dates set by the depositary and will be payable at the sole discretion of the depositary by billing such registered holders or by deducting such charge from one or more cash dividends or other cash distributions); |
| · | stock transfer or other taxes and other governmental charges; |
| · | cable, telex and facsimile transmission and delivery charges incurred at your request in connection with the deposit or delivery of shares; |
| · | transfer or registration fees for the registration of transfer of deposited securities on any applicable register in connection with the deposit or withdrawal of deposited securities; |
| · | expenses of the depositary in connection with the conversion of foreign currency into U.S. dollars; and |
| · | such fees and expenses as are incurred by the depositary (including without limitation expenses incurred in connection with compliance with foreign exchange control regulations or any law or regulation relating to foreign investment) in delivery of deposited securities or otherwise in connection with the depositary’s or its custodian’s compliance with applicable laws, rules or regulations. |
We will pay all other charges and expenses of the depositary and any agent of the depositary (except the custodian) pursuant to agreements from time to time between us and the depositary. The charges described above may be amended from time to time.
Direct and Indirect Payments
Our depositary has agreed to reimburse us for certain expenses we incur that are related to the establishment and maintenance of the ADR program upon such terms and conditions as we and the depositary may agree from time to time. The depositary may make available to us a set amount or a portion of the depositary fees charged in respect of the ADR program or otherwise upon such terms and conditions as we and the depositary may agree from time to time.
The depositary collects fees for making distributions to investors by deducting those fees from the amounts distributed or by selling a portion of distributable property to pay the fees. The depositary may collect its annual fee for depositary services by deduction from cash distributions, by directly billing investors or by charging the book-entry system accounts of participants acting for them. The depositary will generally set off the amounts owing from distributions made to holders of ADSs. If, however, no distribution exists and payment owing is not timely received by the depositary, the depositary may refuse to provide any further services to holders that have not paid those fees and expenses owing until such fees and expenses have been paid. At the discretion of the depositary, all fees and charges owing under the deposit agreement are due in advance and/or when declared owing by the depositary. The depositary may generally refuse to provide services to any holder until the fees and expenses owing by such holder for those services or otherwise are paid.
For the year ended December 31, 2016 we received approximately U.S.$0.4 million in payments from J.P. Morgan Chase Bank, N.A. as depositary of the ADR program.
PART II
ITEM 13. DEFAULTS, DIVIDEND ARREARAGES AND DELINQUENCIES
No matters to report.
| B. | Arrears and delinquencies |
No matters to report.
ITEM 14. MATERIAL MODIFICATIONS TO THE RIGHTS OF SECURITY HOLDERS AND USE OF PROCEEDS
| A. | Material modifications to instruments |
Not applicable.
| B. | Material modifications to rights |
Not applicable.
| C. | Withdrawal or substitution of assets |
Not applicable.
| D. | Change in trustees or paying agents |
Not applicable.
Not applicable.
ITEM 15. CONTROLS AND PROCEDURES
| A. | Disclosure controls and procedures |
As of December 31, 2016, under the supervision and with the participation of our management, including our President and Chief Financial Officer, we performed an evaluation of the effectiveness of the design and operation of our disclosure controls and procedures (as defined in Rule 13a-15(e) under the Exchange Act). There are inherent limitations to the effectiveness of any disclosure controls and procedures system, including the possibility of human error and circumventing or overriding them. Even if effective, disclosure controls and procedures can provide only reasonable assurance of achieving their control objectives.
Based on such evaluation, our President and Chief Financial Officer concluded that our disclosure controls and procedures are effective to provide reasonable assurance that the information we are required to disclose in the reports we file or submit under the Exchange Act is (1) recorded, processed, summarized and reported within the time periods specified in the SEC’s rules and forms and (2) accumulated and communicated to our management to allow timely decisions regarding required disclosures.
| B. | Management’s annual report on internal control over financial reporting |
Our management is responsible for establishing and maintaining an adequate internal control over financial reporting as defined in Rule 13a-15(f) under the Exchange Act.
Our internal control over financial reporting is a process designed by, or under the supervision of, our principal executive and principal financial officers, management and other personnel, to provide reasonable assurance regarding the reliability of financial reporting and the preparation of our financial statements for external reporting
purposes, in accordance with generally accepted accounting principles. These include those policies and procedures that:
| · | pertain to the maintenance of records that, in reasonable detail, accurately and fairly reflect transactions and dispositions of our assets; |
| · | provide reasonable assurance that transactions are recorded as necessary to permit preparation of financial statements, in accordance with generally accepted accounting principles, and that receipts and expenditures are being made only in accordance with authorization of our management and directors; and |
| · | provide reasonable assurance regarding prevention or timely detection of unauthorized acquisition, use or disposition of our assets that could have a material effect on our financial statements. |
Because of its inherent limitations, internal control over financial reporting may not prevent or detect misstatements. Therefore, effective control over financial reporting cannot, and does not, provide absolute assurance of achieving our control objectives. Also, projections of, and any evaluation of effectiveness of the internal controls in future periods are subject to the risk that controls may become inadequate because of changes in conditions, or that the degree of compliance with the policies or procedures may deteriorate.
We have adapted our internal control over financial reporting based on the guidelines set by the Internal Control – Integrated Framework of the Committee of Sponsoring Organizations of the Treadway Commission (“COSO”).
Under the supervision and with the participation of our management, including our President, our Chief Financial Officer, our Chief Risk Management Officer and our Vice-President of Internal Control, we conducted an evaluation of the effectiveness of our internal control over financial reporting as of December 31, 2016, based on the guidelines set forth by the COSO 2013.
Based on this assessment, management believes that, as of December 31, 2016, its internal control over financial reporting was effective based on those criteria.
| C. | Attestation report of the registered public accounting firm |
The effectiveness of the internal control over financial reporting, as of December 31, 2016, has been audited by KPMG, an independent registered public accounting firm, which appears on page F-2.
| D. | Changes in internal control over financial reporting |
There was no change in our internal control over financial reporting that occurred during the period covered by this annual report that has materially affected, or is reasonably likely to materially affect, our internal control over financial reporting.
ITEM 16. [RESERVED]
ITEM 16A. Audit committee financial expert
The board of directors has determined that Julio Leonzo Álvarez Álvarez is an audit committee financial expert. All members of our audit committee, namely Esther América Paz Montoya, Julio Leonzo Álvarez Álvarez and Germán Michelsen Cuéllar, are independent audit committee members under the standards of the New York Stock Exchange, which applies the audit committee independence requirements of the Securities and Exchange Commission.
ITEM 16B. Code of ethics
New York Stock Exchange rules for U.S. companies require that listed companies adopt and disclose a code of business conduct and ethics for directors, officers and employees, and promptly disclose any waivers of the code for directors or executive officers. We have in place a code of ethics that applies to the Company’s officers and employees.
ITEM 16C. Principal accountant fees and services
Amounts billed by KPMG for audit and other services were as follows:
| | | 2016 | | | 2015 | |
| | | (In Ps millions) | |
| | | | |
| Audit fees | | | 24,013 | | | | 18,966 | |
| Audit-related fees | | | - | | | | - | |
| Tax fees | | | 8 | | | | 11 | |
| Other fees paid | | | 3 | | | | 308 | |
The aggregate fees billed under the caption audit fees for professional services rendered to Grupo Aval for the audit of its financial statements and for services that are normally provided to Grupo Aval, in connection with statutory or regulatory filings or engagements totaled Ps 24,013 million and Ps 18,966 million for the years 2016 and 2015, respectively.
Additionally other fees paid totaled Ps 3 million and Ps 308 million for the years ended 2016 and 2015, respectively, and tax fees paid totaled Ps 8 million and Ps11 million for the years ended 2016 and 2015, respectively.
The services commissioned from our auditors meet the independence requirements stipulated by the Board of Accountants (Junta Central de Contadores) and by SEC rules and regulations, and they did not involve the performance of any work that is incompatible with the audit function.
If we are required to engage an auditing firm for audit and audit-related services, those services have to be pre-approved by the Audit Committee.
The Audit Committee is regularly informed of all fees paid to the auditing firms by us.
ITEM 16D. Exemptions from the listing standards for audit committees
All of the members of our audit committee satisfy the independence requirements of the NYSE applicable to foreign private issuers.
ITEM 16E. Purchases of equity securities by the issuer and affiliated purchasers
Grupo Aval may repurchase its shares only with retained earnings. On the other hand, Colombian law prohibits the repurchase of shares of entities under the comprehensive supervision of, and subject to inspection and surveillance as financial institutions by, the Superintendency of Finance. As such, Banco de Bogotá, Banco de Occidente, Banco Popular, Banco AV Villas, and their respective financial subsidiaries, including Corficolombiana, Porvenir and BAC Credomatic are not permitted to repurchase their shares or Grupo Aval’s shares.
In 2016, no purchases of our preferred shares, were effected by our “affiliated purchasers” (as that term is defined in Rule 10b-18(a)(3) under the Securities Exchange Act of 1934, as amended). Grupo Aval did not effect any purchases of its preferred shares or ADSs.
ITEM 16F. Change in registrant’s certifying accountant
Not applicable.
ITEM 16G. Corporate governance
Grupo Aval, as a listed company that qualifies as a foreign private issuer under the NYSE listing standards in accordance with the NYSE corporate governance rules, is permitted to follow home-country practice in some circumstances in lieu of the provisions of the corporate governance rules contained in Section 303A of the NYSE Listed Company Manual that are applicable to U.S. companies. We follow corporate governance practices applicable to Colombian companies and those described in our Corporate Governance Code, which in turn follow Colombian corporate governance rules. The Corporate Governance Code is available at Grupo Aval’s website at www.grupoaval.com. Information on our website is not incorporated into this annual report.
The following is a summary of the significant differences between the corporate governance practices followed by Grupo Aval and those applicable to domestic issuers under the NYSE listing standards.
Independence of directors
Under NYSE corporate governance rules, a majority of a U.S. company’s board of directors must be composed of independent directors, although as a foreign private issuer and a company that is controlled, directly or indirectly, by Mr. Luis Carlos Sarmiento Angulo, we would not be required to comply with this rule. Law 964 of 2005 requires that our board of directors consist of five to ten members and that at least 25% of such members be independent directors, and Decree 3923 of 2006 regulates their election. “Independence” within the meaning of Law 964 of 2005 is primarily concerned with independence from management and the absence of material related-party transactions between the director and the company. See “Item 10. Additional Information—A. Share capital.” In compliance with Colombian law and our by-laws, Grupo Aval’s board of directors is composed of seven members, of which two are independent under Colombian rules. In addition, Colombian law mandates that all directors exercise independent judgment under all circumstances.
Non-executive director meetings
Pursuant to the NYSE listing standards, non-executive directors of U.S. listed companies must meet on a regular basis without management being present. Under Colombian regulations, there is no prohibition against officers being members of the board of directors, and it is our practice that each president of our banks be a member of our board of directors. The non-executive directors of Grupo Aval do not meet formally without management present.
Committees of the board of directors
Under NYSE listing standards, all U.S. companies listed on the NYSE must have an audit committee, a compensation committee and a nominating/corporate governance committee, each with a written charter addressing certain minimum specified duties, and all members of such committees must be independent. In each case, the independence of directors must be established pursuant to highly detailed rules promulgated by the NYSE and, in the case of the audit committee, the NYSE and the SEC. We have established an audit committee, a corporate matters committee and a compensation committee.
Shareholder approval of equity compensation plans
Under NYSE listing standards, shareholders of U.S. companies must be given the opportunity to vote on all equity compensation plans and to approve material revisions to those plans, with limited exceptions set forth in the NYSE rules. Grupo Aval and its subsidiaries currently have no equity compensation plans. Under Colombian law, shareholder approval is required for the compensation of members of the board of directors.
Shareholder approval of dividends
While NYSE corporate governance standards for U.S. companies do not require listed companies to have shareholders approve or declare dividends, in accordance with the Colombian Code of Commerce, all dividends must be approved by Grupo Aval’s shareholders.
Corporate governance guidelines
NYSE rules for U.S. companies require that listed companies adopt and disclose corporate governance guidelines. The Superintendency of Finance recommends, but does not require, that listed companies adopt corporate governance guidelines; instead, it requires an annual corporate governance survey that compares a company’s corporate governance practices to those recommended by the Superintendency of Finance, and mandates periodic disclosure thereof to the Colombian securities market information system. The annual corporate governance survey is available at Grupo Aval’s website at www.grupoaval.com.
Code of business conduct and ethics
NYSE rules for U.S. companies require that listed companies adopt and disclose a code of business conduct and ethics for directors, officers and employees, and promptly disclose any waivers of the code for directors or executive officers. Grupo Aval has in place a code of ethics that applies to the Company’s officers and employees.
Compliance with corporate governance rules
NYSE rules require the chief executive officer to certify annually that such officer is not aware of any non-compliance with NYSE corporate governance rules, and executive officers are required to promptly notify the NYSE of any material non-compliance. Companies must also submit a written affirmation annually or promptly upon the occurrence of certain changes in corporate governance. No similar requirements exist under Colombian law.
Internal audit function
NYSE rules for U.S. companies require that listed companies maintain an internal audit function to provide management and the audit committee with ongoing assessments of the company’s risk management processes and system of internal control. Grupo Aval maintains an internal auditor, and a Vice-President of Internal Control to coordinate this function at the corporate level.
ITEM 16H. Mine safety disclosure
Not applicable.
PART III
ITEM 17. Financial statements
We have responded to Item 18 in lieu of this item.
ITEM 18. Financial statements
Financial Statements are filed as part of this annual report, see page F-1.
ITEM 19. Exhibits
| 1.1 | English translation of By-laws of Grupo Aval (incorporated by reference to our Registration Statement on Form 20-F (File No. 000-54290) filed with the SEC on March 7, 2011). |
| | |
| 2.1 | Indenture among Grupo Aval Limited, as Issuer, Grupo Aval Acciones y Valores S.A., as Guarantor, Deutsche Bank Trust Company Americas, as Trustee, Registrar, Paying Agent and Transfer Agent and Deutsche Bank Luxembourg S.A., as Luxembourg Paying Agent and Transfer Agent, dated as of September 26, 2012 (incorporated by reference to our Registration Statement on Form 20-F (File No. 000-54290) filed with the SEC on April 26, 2013). |
| | |
| 2.2 | Form of Deposit Agreement among Grupo Aval, JPMorgan Chase Bank, N.A., as depositary, and the holders from time to time of American depositary shares issued thereunder, including the form of American depositary receipts (incorporated by reference to our Registration Statement on Form F-6 (File No. 333-198614) filed with the SEC on September 8, 2014). |
| | |
| 4.1 | Loan Agreement between Bancolombia S.A. and Leasing Bogotá S.A. – Panamá, dated as of November 26, 2010 (incorporated by reference to our Registration Statement on Form 20-F (File No. 000-54290) filed with the SEC on March 7, 2011). |
| | |
| 4.2 | Loan Agreement between Bancolombia S.A. and Leasing Bogotá S.A. – Panamá, dated as of November 26, 2010 (incorporated by reference to our Registration Statement on Form 20-F (File No. 000-54290) filed with the SEC on March 7, 2011). |
| | |
| 8.1 | List of subsidiaries. |
| | |
| 12.1 | Certification pursuant to section 302 of the Sarbanes-Oxley Act of 2002. |
| | |
| 12.2 | Certification pursuant to section 302 of the Sarbanes-Oxley Act of 2002. |
| | |
| 13.1 | Certification pursuant to 18 U.S.C. section 1350, as adopted pursuant to section 906 of the Sarbanes-Oxley Act of 2002. |
| | |
| 13.2 | Certification pursuant to 18 U.S.C. section 1350, as adopted pursuant to section 906 of the Sarbanes-Oxley Act of 2002. |
INDEX TO CONSOLIDATED FINANCIAL STATEMENTS
| | Page |
| Audited consolidated financial statements of Grupo Aval Acciones y Valores S.A. and its subsidiaries as of December 31, 2016 and 2015 and for each of the years ended December 31, 2016, 2015 and 2014 | |
| Report of independent registered public accounting firm | F-2 |
| Consolidated statements of financial position as of December 31, 2016 and 2015 | F-4 |
| Consolidated statements of income for the years ended as of December 31, 2016, 2015 and 2014 | F-6 |
| Consolidated statements of comprehensive income for the years ended as of December 31, 2016, 2015 and 2014 | F-7 |
| Consolidated statements of changes in equity for the years ended December 31, 2016, 2015 and 2014 | F-8 |
| Consolidated statements of cash flow for the years ended December 31, 2016, 2015 and 2014 | F-9 |
| Notes to the consolidated financial statements of Grupo Aval Acciones y Valores S.A. and its subsidiaries | F-11 |
Report of Independent Registered Public Accounting Firm
The Board of Directors and Stockholders
Grupo Aval Acciones y Valores, S.A. and Subsidiaries:
We have audited the accompanying consolidated statements of financial position of Grupo Aval Acciones y Valores S.A. and subsidiaries (“Grupo Aval”) as of December 31, 2016 and 2015, and the related consolidated statements of income, comprehensive income, changes in equity, and cash flows for each of the years in the three-year period ended December 31, 2016. We also have audited Grupo Aval’s internal control over financial reporting as of December 3l, 2016, based on criteria established inInternal Control – Integrated Framework (2013) issued by the Committee of Sponsoring Organizations of the Treadway Commission (COSO). Grupo Aval’s management is responsible for these consolidated financial statements, for maintaining effective internal control over financial reporting, and for its assessment of the effectiveness of internal control over financial reporting, included in the accompanying “Management’ s annual report on internal control over financial reporting”. Our responsibility is to express an opinion on these consolidated financial statements and an opinion on Grupo Aval 's internal control over financial reporting based on our audits.
We conducted our audits in accordance with the standards of the Public Company Accounting Oversight Board (United States). Those standards require that we plan and perform the audits to obtain reasonable assurance about whether the financial statements are free of material misstatement and whether effective internal control over financial reporting was maintained in all material respects. Our audits of the consolidated financial statements included examining, on a test basis, evidence supporting the amounts and disclosures in the financial statements, assessing the accounting principles used and significant estimates made by management, and evaluating the overall financial statement presentation. Our audit of internal control over financial reporting included obtaining an understanding of internal control over financial reporting, assessing the risk that a material weakness exists, and testing and evaluating the design and operating effectiveness of internal control based on the assessed risk. Our audits also included performing such other procedures as we considered necessary in the circumstances. We believe that our audits provide a reasonable basis for our opinions.
A company’s internal control over financial reporting is a process designed to provide reasonable assurance regarding the reliability of financial reporting and the preparation of financial statements for external purposes in accordance with generally accepted accounting principles. A company’s internal control over financial reporting includes those policies and procedures that (1) pertain to the maintenance of records that, in reasonable detail, accurately and fairly reflect the transactions and dispositions of the assets of the company; (2) provide reasonable assurance that transactions are recorded as necessary to permit preparation of financial statements in accordance with generally accepted accounting principles, and that receipts and expenditures of the company are being made only in accordance with authorizations of management and directors of the company; and (3) provide reasonable assurance regarding prevention or timely detection of unauthorized acquisition, use, or disposition of the company’s assets that could have a material effect on the financial statements.
Because of its inherent limitations, internal control over financial reporting may not prevent or detect misstatements. Also, projections of any evaluation of effectiveness to future periods are subject to the risk that controls may become inadequate because of changes in conditions, or that the degree of compliance with the policies or procedures may deteriorate.
In our opinion, the consolidated financial statements referred to above present fairly, in all material respects, the financial position of Grupo Aval Acciones y Valores, S. A. and subsidiaries as of December 31, 2016 and 2015, and the results of its operations and its cash flows for each of the years in the three-year period ended December 31, 2016, in conformity with International Financial Reporting Standards as issued by the International Accounting Standards Board. Also in our opinion, Grupo Aval maintained, in all material respects, effective internal control over financial reporting as of December 31, 2016, based on criteria established inInternal Control – Integrated Framework (2013) issued by the Committee of Sponsoring Organizations of the Treadway Commission (COSO) .
The accompanying consolidated financial statement as of and for the year ended December 31, 2016 have been translated into United States dollars solely for the convenience of the reader. We have audited the translation and, in our opinion, the consolidated financial statements expressed in Colombian pesos have been translated into United States dollars on the basis set forth in note 2.4 of the notes to the consolidated financial statements.
/s/ KPMG S.A.S.
KPMG S.A.S.
Bogotá, Colombia
April 25, 2017
Grupo Aval Acciones y Valores S.A.
Consolidated Statement of Financial Position
At December 31, 2016 and 2015
(Figures expressed in millions of Colombian pesos, except convenience translation in millions of U.S. dollars)
| | | Note | | US$ (1) | | | December 31,
2016 | | | December 31,
2015 | |
| Assets | | | | | | | | | | | | | | |
| Cash and cash equivalents | | 6 | | | 7,395.9 | | | Ps. | 22,193,004 | | | Ps. | 22,284,977 | |
| | | | | | | | | | | | | | | |
| Financial assets held for trading through profit or losses | | | | | | | | | | | | | | |
| Debt securities | | 7 | | | 781.1 | | | | 2,343,902 | | | | 3,061,916 | |
| Equity securities | | 7 | | | 582.4 | | | | 1,747,614 | | | | 1,521,265 | |
| | | | | | 1,363.5 | | | | 4,091,516 | | | | 4,583,181 | |
| Derivative instruments | | 10 | | | 167.4 | | | | 502,209 | | | | 1,024,972 | |
| | | | | | 1,530.9 | | | | 4,593,725 | | | | 5,608,153 | |
| | | | | | | | | | | | | | | |
| Available for sale financial assets: | | | | | | | | | | | | | | |
| Debt securities | | 8 | | | 5,886.2 | | | | 17,662,733 | | | | 18,987,370 | |
| Equity securities | | 8 | | | 243.2 | | | | 729,779 | | | | 697,575 | |
| | | | | | 6,129.4 | | | | 18,392,512 | | | | 19,684,945 | |
| | | | | | | | | | | | | | | |
| Investments held to maturity | | 9 | | | 856.6 | | | | 2,570,486 | | | | 2,395,280 | |
| | | | | | | | | | | | | | | |
| Other financial assets at fair value through profit or loss | | 16 | | | 690.7 | | | | 2,072,674 | | | | 1,891,692 | |
| | | | | | | | | | | | | | | |
| Loans and receivables: | | 11 | | | | | | | | | | | | |
| Commercial | | | | | 31,042.4 | | | | 93,149,211 | | | | 89,498,148 | |
| Consumer | | | | | 15,639.0 | | | | 46,927,997 | | | | 42,230,509 | |
| Mortgages | | | | | 4,893.4 | | | | 14,683,537 | | | | 13,418,079 | |
| Microcredit | | | | | 133.0 | | | | 399,431 | | | | 399,262 | |
| Allowance for impairment losses | | | | | (1,420.1 | ) | | | (4,261,444 | ) | | | (3,718,324 | ) |
| | | | | | 50,287.7 | | | | 150,898,732 | | | | 141,827,674 | |
| Other accounts receivable | | 12 | | | 1,174.6 | | | | 3,524,594 | | | | 3,202,221 | |
| Total loans and receivables | | | | | 51,462.3 | | | | 154,423,326 | | | | 145,029,895 | |
| | | | | | | | | | | | | | | |
| Hedging derivatives | | 10 | | | 42.8 | | | | 128,479 | | | | 33,690 | |
| Non-current assets held for sale | | 13 | | | 86.5 | | | | 259,527 | | | | 199,475 | |
| Investments in associates and joint ventures | | 14 | | | 382.1 | | | | 1,146,647 | | | | 927,599 | |
| | | | | | | | | | | | | | | |
| Tangible assets: | | 15 | | | | | | | | | | | | |
| Own-use property, plant and equipment net, | | | | | 1,966.6 | | | | 5,901,325 | | | | 5,735,590 | |
| Investment properties | | | | | 203.4 | | | | 610,188 | | | | 538,246 | |
| Biological assets | | | | | 16.0 | | | | 48,002 | | | | 240,212 | |
| | | | | | 2,186.0 | | | | 6,559,515 | | | | 6,514,048 | |
| | | | | | | | | | | | | | | |
| Concession arrangement rights | | 16 | | | 934.9 | | | | 2,805,314 | | | | 2,390,701 | |
| Goodwill | | 17 | | | 2,274.4 | | | | 6,824,935 | | | | 7,055,975 | |
| Other intangible assets | | 18 | | | 245.0 | | | | 735,043 | | | | 612,892 | |
| | | | | | | | | | | | | | | |
| | | | | | | | | | | | | | | |
| Income tax assets: | | 19 | | | | | | | | | | | | |
| Current | | | | | 194.6 | | | | 584,157 | | | | 564,727 | |
| Deferred | | | | | 65.0 | | | | 194,962 | | | | 920,473 | |
| | | | | | 259.6 | | | | 779,119 | | | | 1,485,200 | |
| | | | | | | | | | | | | | | |
| Other assets | | | | | 196.5 | | | | 589,415 | | | | 564,742 | |
| Total assets | | | | | 74,673.6 | | | Ps. | 224,073,721 | | | Ps. | 216,679,264 | |
The accompanying notes and appendices are an integral part of the consolidated financial statements
Grupo Aval Acciones y Valores S.A.
Consolidated Statement of Financial Position
At December 31, 2016 and 2015
(Figures expressed in millions of Colombian pesos, except convenience translation in millions of U.S. dollars)
| | | Note | | US$ (1) | | | December 31,
2016 | | | December 31,
2015 | |
| Liabilities and equity | | | | | | | | | | | | | | |
| Liabilities | | | | | | | | | | | | | | |
| Financial liabilities held for trading | | | | | | | | | | | | | | |
| Derivative instruments | | 10 | | | 213.5 | | | Ps. | 640,695 | | | Ps. | 1,143,238 | |
| | | | | | | | | | | | | | | |
| Financial liabilities at amortized cost | | | | | | | | | | | | | | |
| Customer deposits: | | 20 | | | | | | | | | | | | |
| Checking accounts | | | | | 11,656.6 | | | | 34,978,189 | | | | 33,430,665 | |
| Savings accounts | | | | | 16,854.0 | | | | 50,573,924 | | | | 50,298,080 | |
| Time deposits | | | | | 19,330.8 | | | | 58,006,144 | | | | 51,777,366 | |
| Other | | | | | 109.6 | | | | 328,798 | | | | 448,517 | |
| | | | | | 47,951.0 | | | | 143,887,055 | | | | 135,954,628 | |
| | | | | | | | | | | | | | | |
| Financial obligations | | 21 | | | | | | | | | | | | |
| Interbank borrowings and overnight funds | | | | | 2,104.7 | | | | 6,315,717 | | | | 9,474,871 | |
| Borrowings from banks and others | | | | | 5,967.5 | | | | 17,906,633 | | | | 18,750,616 | |
| Bonds | | | | | 6,187.9 | | | | 18,568,236 | | | | 16,567,123 | |
| Borrowings from development entities | | | | | 908.4 | | | | 2,725,695 | | | | 2,506,649 | |
| | | | | | 15,168.5 | | | | 45,516,281 | | | | 47,299,259 | |
| Total financial liabilities at amortized cost | | | | | 63,119.5 | | | | 189,403,336 | | | | 183,253,887 | |
| | | | | | | | | | | | | | | |
| Hedging derivatives | | 10 | | | 14.5 | | | | 43,436 | | | | 337,750 | |
| | | | | | | | | | | | | | | |
| Provisions: | | 23 | | | | | | | | | | | | |
| For legal | | | | | 51.9 | | | | 155,749 | | | | 148,313 | |
| Other | | | | | 154.8 | | | | 464,607 | | | | 451,913 | |
| | | | | | 206.7 | | | | 620,356 | | | | 600,226 | |
| | | | | | | | | | | | | | | |
| Income tax liabilities | | 19 | | | | | | | | | | | | |
| Current | | | | | 135.0 | | | | 405,081 | | | | 669,694 | |
| Deferred | | | | | 415.5 | | | | 1,246,809 | | | | 1,222,444 | |
| | | | | | 550.5 | | | | 1,651,890 | | | | 1,892,138 | |
| Employee benefits | | 22 | | | 365.8 | | | | 1,097,594 | | | | 1,022,289 | |
| Other Liabilities | | 24 | | | 1,985.3 | | | | 5,957,192 | | | | 5,523,456 | |
| Total liabilities | | | | | 66,455.8 | | | | 199,414,499 | | | | 193,772,984 | |
| | | | | | | | | | | | | | | |
| Equity | | | | | | | | | | | | | | |
| Controlling interest | | 25 | | | | | | | | | | | | |
| Subscribed and paid-in capital | | | | | 7.4 | | | | 22,281 | | | | 22,281 | |
| Additional paid-in capital | | | | | 2,768.5 | | | | 8,307,527 | | | | 8,307,765 | |
| Retained earnings | | | | | 2,173.6 | | | | 6,522,128 | | | | 5,699,446 | |
| Accumulated other comprehensive income | | | | | 249.8 | | | | 749,617 | | | | 538,129 | |
| Equity of controlling interest | | | | | 5,199.3 | | | | 15,601,553 | | | | 14,567,621 | |
| Non-controlling interest | | 26 | | | 3,018.5 | | | | 9,057,669 | | | | 8,338,659 | |
| Total equity | | | | | 8,217.8 | | | | 24,659,222 | | | | 22,906,280 | |
| Total liabilities and equity | | | | | 74,673.6 | | | Ps. | 224,073,721 | | | Ps. | 216,679,264 | |
The accompanying notes and appendices are an integral part of the consolidated financial statements
Grupo Aval Acciones y Valores S.A.
Consolidated Statement of Income
For the years ended December 31 2016, 2015 and 2014
(Figures expressed in millions of Colombian pesos, except convenience translation in millions of U.S. dollars)
| | | For the years ended |
| | | Note | | US$ (1) | | | December 31,
2016 | | | December 31,
2015 | | | December 31,
2014 | |
| Interest income | | | | | | | | | | | | | | | | | | |
| Loan portfolio | | | | | 5,553.9 | | | Ps. | 16,665,516 | | | Ps. | 13,004,102 | | | Ps. | 10,648,623 | |
| Investments in debt securities | | | | | 293.7 | | | | 881,454 | | | | 1,071,496 | | | | 773,182 | |
| | | | | | 5,847.6 | | | | 17,546,970 | | | | 14,075,598 | | | | 11,421,805 | |
| | | | | | | | | | | | | | | | | | | |
| Interest expenses | | | | | | | | | | | | | | | | | | |
| Deposits | | | | | | | | | | | | | | | | | | |
| Checking accounts | | | | | 86.3 | | | | 258,925 | | | | 183,218 | | | | 171,304 | |
| Savings accounts | | | | | 713.1 | | | | 2,139,841 | | | | 1,426,187 | | | | 1,280,940 | |
| Time deposits | | | | | 1,137.6 | | | | 3,413,489 | | | | 2,222,836 | | | | 1,632,932 | |
| | | | | | 1,937.0 | | | | 5,812,255 | | | | 3,832,241 | | | | 3,085,176 | |
| | | | | | | | | | | | | | | | | | | |
| Financial obligations | | | | | | | | | | | | | | | | | | |
| Interbank borrowings and overnight funds | | | | | 190.0 | | | | 570,184 | | | | 340,594 | | | | 184,954 | |
| Bank borrowings and others | | | | | 191.8 | | | | 575,710 | | | | 413,809 | | | | 346,787 | |
| Bonds | | | | | 426.0 | | | | 1,278,253 | | | | 1,041,105 | | | | 804,170 | |
| Borrowing from development entities | | | | | 52.0 | | | | 156,003 | | | | 123,710 | | | | 77,635 | |
| | | | | | 859.8 | | | | 2,580,150 | | | | 1,919,218 | | | | 1,413,546 | |
| Total interest expenses | | | | | 2,796.8 | | | | 8,392,405 | | | | 5,751,459 | | | | 4,498,722 | |
| | | | | | | | | | | | | | | | | | | |
| Net interest income | | | | | 3,050.8 | | | Ps. | 9,154,565 | | | Ps. | 8,324,139 | | | Ps. | 6,923,083 | |
| | | | | | | | | | | | | | | | | | | |
| Impairment losses | | | | | | | | | | | | | | | | | | |
| Loan and other accounts receivable | | | | | 1,001.2 | | | | 3,004,184 | | | | 2,127,750 | | | | 1,697,513 | |
| Other assets | | | | | 39.3 | | | | 117,947 | | | | 32,173 | | | | 11,976 | |
| Recovery of charged-off financial assets | | | | | (96.8 | ) | | | (290,444 | ) | | | (219,679 | ) | | | (189,593 | ) |
| Net impairment loss | | | | | 943.7 | | | | 2,831,687 | | | | 1,940,244 | | | | 1,519,896 | |
| Net interest income, after impairment losses | | | | | 2,107.1 | | | Ps. | 6,322,878 | | | Ps. | 6,383,895 | | | Ps. | 5,403,187 | |
| | | | | | | | | | | | | | | | | | | |
| Commission and fee income | | | | | 1,626.0 | | | | 4,879,187 | | | | 4,284,233 | | | | 3,546,685 | |
| Commission and fee expensive | | | | | (206.5 | ) | | | (619,528 | ) | | | (621,946 | ) | | | (509,529 | ) |
| Net commission and fee income | | 28 | | | 1,419.5 | | | Ps. | 4,259,659 | | | Ps. | 3,662,287 | | | Ps. | 3,037,156 | |
| Net trading income | | 29 | | | 241.5 | | | | 724,698 | | | | 245,199 | | | | 369,853 | |
| Net income from financial instruments designated at fair value | | 16 | | | 60.3 | | | | 180,982 | | | | 153,094 | | | | 172,889 | |
| | | | | | | | | | | | | | | | | | | |
| Other income | | 30 | | | 868.3 | | | | 2,605,401 | | | | 2,389,296 | | | | 2,096,148 | |
| Other expenses | | 30 | | | 2,839.3 | | | | 8,519,773 | | | | 7,609,115 | | | | 6,273,454 | |
| | | | | | | | | | | | | | | | | | | |
| Income before income tax expense | | | | | 1,857.5 | | | | 5,573,845 | | | | 5,224,656 | | | | 4,805,779 | |
| Income tax expense | | 19 | | | 685.5 | | | | 2,056,909 | | | | 1,878,970 | | | | 1,808,298 | |
| Net income for the year | | | | | 1,172.0 | | | Ps. | 3,516,936 | | | Ps. | 3,345,686 | | | Ps. | 2,997,481 | |
| | | | | | | | | | | | | | | | | | | |
| Net income for the year attributable to: | | 25 | | | | | | | | | | | | | | | | |
| Owners of the parent | | | | | 713.1 | | | | 2,139,866 | | | | 2,041,364 | | | | 1,815,016 | |
| Non-controlling interest | | | | | 458.9 | | | | 1,377,070 | | | | 1,304,322 | | | | 1,182,465 | |
| | | | | | 1,172.0 | | | Ps. | 3,516,936 | | | Ps. | 3,345,686 | | | Ps. | 2,997,481 | |
| | | | | | | | | | | | | | | | | | | |
| Earnings per share (in Colombian pesos) | | | | | | | | | 96.040 | | | | 91.619 | | | | 86.854 | |
The accompanying notes and appendices are an integral part of the consolidated financial statements
Grupo Aval Acciones y Valores S.A.
Consolidated Statement of Comprehensive Income
For the years ended December 31 2016, 2015 and 2014
(Figures expressed in millions of Colombian pesos, except convenience translation in millions of U.S. dollars)
| | | Note | | US$ (1) | | | December 31,
2016 | | | December 31,
2015 | | | December 31,
2014 | |
| Net income for the year | | | | | 1,172.0 | | | Ps. | 3,516,936 | | | Ps. | 3,345,686 | | | Ps. | 2,997,481 | |
| Other comprehensive income | | | | | | | | | | | | | | | | | | |
| Items that may be reclassified to profit or loss | | | | | | | | | | | | | | | | | | |
| Hedging of net investments in foreign operations: | | | | | | | | | | | | | | | | | | |
| Net investment in foreign subsidiaries operations | | | | | (153.8 | ) | | | (461,385 | ) | | | 2,296,707 | | | | 1,329,007 | |
| Net investment in foreign branches | | | | | (4.5 | ) | | | (13,615 | ) | | | 70,142 | | | | 37,612 | |
| Hedging derivative instrument | | | | | 97.1 | | | | 291,506 | | | | (1,683,346 | ) | | | (870,910 | ) |
| Hedging non-derivative instrument | | | | | 11.9 | | | | 35,819 | | | | (755,431 | ) | | | (483,633 | ) |
| Cash flow hedges | | | | | 6.0 | | | | 17,967 | | | | 17,500 | | | | 7,000 | |
| Foreign currency translation differences for foreign operations | | | | | (41.7 | ) | | | (125,161 | ) | | | 24,878 | | | | (9,127 | ) |
| Unrealized gains (losses) on available for sale financial assets: | | | | | | | | | | | | | | | | | | |
| Debt financial instruments | | | | | 316.0 | | | | 948,212 | | | | (922,083 | ) | | | 10,153 | |
| Equity financial instruments | | | | | 11.5 | | | | 34,509 | | | | (6,548 | ) | | | 29,029 | |
| Investments accounted by equity method | | 14 | | | (6.7 | ) | | | (20,061 | ) | | | 31,964 | | | | 54,301 | |
| Income tax | | 19 | | | (126.3 | ) | | | (378,877 | ) | | | 1,205,865 | | | | 466,565 | |
| | | | | | 109.6 | | | | 328,914 | | | | 279,648 | | | | 569,997 | |
| | | | | | | | | | | | | | | | | | | |
| Items that will not be reclassified to profit or loss the period | | | | | | | | | | | | | | | | | | |
| Actuarial gains (losses) from defined benefit pension plans | | 22 | | | (13.7 | ) | | | (41,228 | ) | | | 6,162 | | | | (9,546 | ) |
| Income tax | | 19 | | | 4.8 | | | | 14,521 | | | | (7,251 | ) | | | (1,836 | ) |
| | | | | | (8.9 | ) | | | (26,707 | ) | | | (1,089 | ) | | | (11,382 | ) |
| | | | | | | | | | | | | | | | | | | |
| Total other comprehensive income | | | | | 100.7 | | | Ps. | 302,207 | | | Ps. | 278,559 | | | Ps. | 558,615 | |
| Total comprehensive income, net of taxes | | | | | 1,272.7 | | | Ps. | 3,819,143 | | | Ps. | 3,624,245 | | | Ps. | 3,556,096 | |
| | | | | | | | | | | | | | | | | | | |
| Total comprehensive income for the year attributable to: | | | | | | | | | | | | | | | | | | |
| Owners of the parent | | | | | 783.6 | | | | 2,351,354 | | | | 2,207,165 | | | | 2,067,206 | |
| Non-controlling interest | | | | | 489.1 | | | | 1,467,789 | | | | 1,417,080 | | | | 1,488,890 | |
| | | | | | 1,272.7 | | | Ps. | 3,819,143 | | | Ps. | 3,624,245 | | | Ps. | 3,556,096 | |
The accompanying notes and appendices are an integral part of the consolidated financial statements
Grupo Aval Acciones y Valores S.A.
Consolidated Statement of Changes in Equity
For the years ended December 31, 2016, 2015 and 2014
(Figures expressed in millions of Colombian pesos, except convenience translation in millions of U.S. dollars)
| | | Subscribed
and paid-in
capital | | | Additional
paid - in
capital | | | Retained
earnings | | | Other
comprehensive
income (OCI) | | | Equity controlling
interest | | | Non-
controlling
interest | | | Total equity | |
| Balance at January 1, 2014 | | Ps. | 20,178 | | | Ps. | 5,784,518 | | | Ps. | 4,339,228 | | | Ps. | 120,138 | | | Ps. | 10,264,062 | | | Ps. | 6,575,376 | | | Ps. | 16,839,438 | |
| Issuance of shares | | | 2,103 | | | | 2,720,211 | | | | - | | | | - | | | | 2,722,314 | | | | - | | | | 2,722,314 | |
| Subsidiaries capitalizations by non-controlling interest | | | - | | | | - | | | | - | | | | - | | | | - | | | | 665,059 | | | | 665,059 | |
| Acquisition of non-controlling interest | | | - | | | | (192,851 | ) | | | - | | | | - | | | | (192,851 | ) | | | (92,729 | ) | | | (285,580 | ) |
| Dividends declared | | | - | | | | - | | | | (1,192,680 | ) | | | - | | | | (1,192,680 | ) | | | (948,639 | ) | | | (2,141,319 | ) |
| Donations | | | - | | | | - | | | | (30 | ) | | | - | | | | (30 | ) | | | (14 | ) | | | (44 | ) |
| Increase in OCI | | | - | | | | - | | | | - | | | | 252,190 | | | | 252,190 | | | | 306,425 | | | | 558,615 | |
| Net income | | | - | | | | - | | | | 1,815,016 | | | | - | | | | 1,815,016 | | | | 1,182,465 | | | | 2,997,481 | |
| Balance at December 31, 2014 | | Ps. | 22,281 | | | Ps. | 8,311,878 | | | Ps. | 4,961,534 | | | Ps. | 372,328 | | | Ps. | 13,668,021 | | | Ps. | 7,687,943 | | | Ps. | 21,355,964 | |
| Issuance of shares | | | - | | | | 33 | | | | - | | | | - | | | | 33 | | | | 112,017 | | | | 112,050 | |
| Acquisition of non-controlling interest | | | - | | | | (4,146 | ) | | | - | | | | - | | | | (4,146 | ) | | | (2,910 | ) | | | (7,056 | ) |
| Dividends declared | | | - | | | | - | | | | (1,303,440 | ) | | | - | | | | (1,303,440 | ) | | | (875,465 | ) | | | (2,178,905 | ) |
| Donations | | | - | | | | - | | | | (12 | ) | | | - | | | | (12 | ) | | | (6 | ) | | | (18 | ) |
| Increase in OCI | | | - | | | | - | | | | - | | | | 165,801 | | | | 165,801 | | | | 112,758 | | | | 278,559 | |
| Net income | | | - | | | | - | | | | 2,041,364 | | | | - | | | | 2,041,364 | | | | 1,304,322 | | | | 3,345,686 | |
| Balance at December 31, 2015 | | Ps. | 22,281 | | | Ps. | 8,307,765 | | | Ps. | 5,699,446 | | | Ps. | 538,129 | | | Ps. | 14,567,621 | | | Ps. | 8,338,659 | | | Ps. | 22,906,280 | |
| Change in accounting policies (2) | | | - | | | | - | | | | (7,061 | ) | | | - | | | | (7,061 | ) | | | (4,870 | ) | | | (11,931 | ) |
| Acquisition of non-controlling interest | | | - | | | | (238 | ) | | | - | | | | - | | | | (238 | ) | | | - | | | | (238 | ) |
| Dividends declared | | | - | | | | - | | | | (1,310,123 | ) | | | - | | | | (1,310,123 | ) | | | (743,909 | ) | | | (2,054,032 | ) |
| Increase in OCI | | | - | | | | - | | | | - | | | | 211,488 | | | | 211,488 | | | | 90,719 | | | | 302,207 | |
| Net income | | | - | | | | - | | | | 2,139,866 | | | | - | | | | 2,139,866 | | | | 1,377,070 | | | | 3,516,936 | |
| Balance at December 31, 2016 | | Ps. | 22,281 | | | Ps. | 8,307,527 | | | Ps. | 6,522,128 | | | Ps. | 749,617 | | | Ps. | 15,601,553 | | | Ps. | 9,057,669 | | | Ps. | 24,659,222 | |
| | | | | | | | | | | | | | | | | | | | | | | | | | | | | |
| US dollars (1) | | | 7.4 | | | | 2,768.5 | | | | 2,173.6 | | | | 249.8 | | | | 5,199.3 | | | | 3,018.5 | | | | 8,217.8 | |
The accompanying notes and appendices are an integral part of the consolidated financial statements
Grupo Aval Acciones y Valores S.A.
Consolidated Statement of Cash Flows
For the years ended December 31 2016, 2015 and 2014
(Figures expressed in millions of Colombian pesos, except convenience translation in millions of U.S. dollars)
| | | Note | | US$ (1) | | | December 31,
2016 | | | December 31,
2015 | | | December 31,
2014 | |
| Cash flows from operating activities: | | | | | | | | | | | | | | | | | | |
| Net income before taxes | | | | | 1,857.5 | | | Ps. | 5,573,845 | | | Ps. | 5,224,656 | | | Ps. | 4,805,779 | |
| | | | | | | | | | | | | | | | | | | |
| Reconciliation of net income before taxes and net cash provided by operating activities: | | | | | | | | | | | | | | | | | | |
| Depreciation of tangible assets | | | | | 151.9 | | | | 455,851 | | | | 391,776 | | | | 341,187 | |
| Amortization of intangible assets | | | | | 107.9 | | | | 323,677 | | | | 384,241 | | | | 287,482 | |
| Allowance for impairment of loans and receivables | | | | | 1,001.8 | | | | 3,006,191 | | | | 2,127,750 | | | | 1,723,108 | |
| Net interest Income | | | | | (3,050.8 | ) | | | (9,154,565 | ) | | | (8,324,139 | ) | | | (6,923,083 | ) |
| Gains in non-monetary transactions | | 14 | | | (65.2 | ) | | | (195,514 | ) | | | - | | | | - | |
| Impairment of investments, net | | | | | 3.3 | | | | 9,920 | | | | - | | | | - | |
| Effect for change in accounting polices | | | | | 2.1 | | | | 6,179 | | | | - | | | | - | |
| Gains (losses) on sales of non-current assets held for sale, net | | 30 | | | (6.9 | ) | | | (20,659 | ) | | | 10,350 | | | | - | |
| Gains on available for sale financial assets | | | | | (70.1 | ) | | | (210,373 | ) | | | (79,233 | ) | | | (135,060 | ) |
| Gains on sales of concession arrangement rights | | | | | 2.0 | | | | 5,992 | | | | - | | | | - | |
| Recovery of impairment loss on tangible | | 15 | | | 0.5 | | | | 1,502 | | | | (1,968 | ) | | | 2,367 | |
| Foreign exchange gains (losses) | | | | | 82.6 | | | | 247,997 | | | | (1,133,522 | ) | | | 794,282 | |
| Equity Method | | | | | (46.9 | ) | | | (140,765 | ) | | | (230,398 | ) | | | (121,725 | ) |
| Interest accrual of issued bonds outstanding | | | | | 2.1 | | | | 6,444 | | | | 23,110 | | | | 1,492 | |
| Fair value adjustments to: | | | | | | | | | | | | | | | | | | |
| Derivative financial instruments | | 29 | | | (76.0 | ) | | | (228,083 | ) | | | (74,110 | ) | | | 54,298 | |
| Investment property | | 15 | | | (17.9 | ) | | | (53,680 | ) | | | (104,768 | ) | | | (1,691 | ) |
| Biological assets | | 15 | | | (4.9 | ) | | | (14,644 | ) | | | (22,922 | ) | | | 15,332 | |
| | | | | | | | | | | | | | | | | | | |
| Changes in operating assets and liabilities: | | | | | | | | | | | | | | | | | | |
| Decrease in financial assets held for trading | | | | | 972.9 | | | | 2,919,480 | | | | 8,245,541 | | | | 4,739,902 | |
| Increase in other accounts receivable | | | | | (138.2 | ) | | | (414,734 | ) | | | (1,047,374 | ) | | | (851,165 | ) |
| Decrease in non-current assets held for sale | | | | | 8.6 | | | | 25,800 | | | | 349,371 | | | | 150,678 | |
| Increase (decrease) in derivative financial instruments | | | | | 80.4 | | | | 241,364 | | | | (152,854 | ) | | | 470,355 | |
| Increase (decrease) in other assets | | | | | 59.9 | | | | 179,830 | | | | (61,433 | ) | | | (122,358 | ) |
| Decrease in other liabilities and provisions | | | | | (127.2 | ) | | | (381,607 | ) | | | (634,729 | ) | | | (1,641,302 | ) |
| Increase in employee benefits | | | | | 15.0 | | | | 45,139 | | | | 299 | | | | 15,535 | |
| Increase in loans and receivables | | | | | (3,473.3 | ) | | | (10,422,497 | ) | | | (12,108,021 | ) | | | (12,103,696 | ) |
| Increase in customer deposits | | | | | 3,221.4 | | | | 9,666,367 | | | | 8,593,143 | | | | 11,669,882 | |
| Increase (decrease) in interbank borrowings and overnight funds | | | | | (1,134.5 | ) | | | (3,404,291 | ) | | | 4,870,580 | | | | (676,110 | ) |
| Decrease in borrowings from development entities | | | | | (1.0 | ) | | | (3,131 | ) | | | (13,327 | ) | | | (14,273 | ) |
| Increase of borrowings from banks and others | | | | | 48.9 | | | | 146,656 | | | | 1,436,109 | | | | 1,272,032 | |
| Interest received | | | | | 4,264.8 | | | | 12,797,281 | | | | 8,162,908 | | | | 6,273,252 | |
| Interest paid | | | | | (2,472.0 | ) | | | (7,417,620 | ) | | | (3,956,510 | ) | | | (3,171,086 | ) |
| Income tax, wealth tax and equity tax payments | | | | | (370.7 | ) | | | (1,112,318 | ) | | | (519,536 | ) | | | (318,806 | ) |
| Net cash provided by operating activities | | | | | 828.0 | | | Ps. | 2,485,034 | | | Ps. | 11,354,990 | | | Ps. | 6,536,608 | |
The accompanying notes and appendices are an integral part of the consolidated financial statements
Grupo Aval Acciones y Valores S.A.
Consolidated Statement of Cash Flows
For the years ended December 31 2016, 2015 and 2014
(Figures expressed in millions of Colombian pesos, except convenience translation in millions of U.S. dollars)
| | | Note | | US$ (1) | | | December 31,
2016 | | | December 31,
2015 | | | December 31,
2014 | |
| Cash flows from investing activities: | | | | | | | | | | | | | | | | | | |
| Acquisition of own - use property plant and equipment | | 15 | | | (271.5 | ) | | | (814,556 | ) | | | (920,454 | ) | | | (757,032 | ) |
| Acquisition of investment property | | 15 | | | (18.9 | ) | | | (56,610 | ) | | | (75,458 | ) | | | (88,665 | ) |
| Additions on biological assets | | 15 | | | (7.1 | ) | | | (21,432 | ) | | | (35,265 | ) | | | (26,360 | ) |
| Additions to investments in associates and joint ventures | | 14 | | | - | | | | (16 | ) | | | 11,538 | | | | (56,638 | ) |
| Additions of concession arrangement right | | 16 | | | (204.8 | ) | | | (614,514 | ) | | | (773,581 | ) | | | (240,553 | ) |
| Additions of other intangible assets | | | | | (61.2 | ) | | | (183,662 | ) | | | (353,633 | ) | | | (302,103 | ) |
| Decrease (Increase) in available for sale financial assets | | | | | 49.7 | | | | 149,072 | | | | (4,610,568 | ) | | | (3,728,262 | ) |
| Proceeds from sales of property and equipment | | 15 | | | 80.5 | | | | 241,598 | | | | 194,287 | | | | 256,125 | |
| Proceeds from sales of investment properties | | 15 | | | 20.6 | | | | 61,786 | | | | 22,945 | | | | 15,485 | |
| Proceeds from sales of biological assets | | 15 | | | 6.9 | | | | 20,670 | | | | 20,374 | | | | 9,812 | |
| Proceeds from sales of non-current assets held for sale | | | | | 50.5 | | | | 151,443 | | | | 25,456 | | | | - | |
| Proceeds from sale of investments in associates and joint ventures | | | | | - | | | | - | | | | 15,143 | | | | 232,714 | |
| Purchases of held to maturity financial assets | | | | | (889.1 | ) | | | (2,668,018 | ) | | | (3,146,729 | ) | | | (2,772,068 | ) |
| Redemption of held to maturity financial assets | | | | | 886.0 | | | | 2,658,728 | | | | 2,800,579 | | | | 3,153,398 | |
| Dividends received from investments | | | | | 41.8 | | | | 125,347 | | | | 79,259 | | | | 160,917 | |
| Acquisition of non-controlling interest | | | | | (0.9 | ) | | | (2,706 | ) | | | - | | | | - | |
| Net cash used in investing activities | | | | | (317.5 | ) | | Ps. | (952,870 | ) | | | (6,746,107 | ) | | | (4,143,230 | ) |
| | | | | | | | | | | | | | | | | | | |
| Cash flows from financing activities: | | | | | | | | | | | | | | | | | | |
| Dividends paid to parent shareholders | | | | | (420.2 | ) | | | (1,260,876 | ) | | | (1,276,544 | ) | | | (1,161,170 | ) |
| Issuance of debt securities | | | | | 1,932.9 | | | | 5,800,085 | | | | 1,158,228 | | | | 654,132 | |
| Payment of outstanding debt securities | | | | | (1,242.4 | ) | | | (3,728,199 | ) | | | (1,918,416 | ) | | | (1,159,383 | ) |
| Issuance of common shares | | | | | (0.1 | ) | | | (238 | ) | | | 112,050 | | | | 3,387,373 | |
| Non-controlling interest transactions net | | | | | (247.9 | ) | | | (743,909 | ) | | | (882,519 | ) | | | (1,234,219 | ) |
| Net cash provided by (used in) financing activities | | | | | 22.3 | | | | 66,863 | | | | (2,807,201 | ) | | | 486,733 | |
| | | | | | | | | | | | | | | | | | | |
| Effect of foreign currency changes on cash and cash equivalents | | | | | (563.5 | ) | | | (1,691,000 | ) | | | 3,213,535 | | | | (209,699 | ) |
| | | | | | | | | | | | | | | | | | | |
| (Decrease) Increase in cash and cash equivalents | | | | | (30.7 | ) | | | (91,973 | ) | | | 5,015,217 | | | | 2,670,412 | |
| | | | | | | | | | | | | | | | | | | |
| Cash and cash equivalents at beginning of year | | | | | 7,426.6 | | | Ps. | 22,284,977 | | | | 17,269,760 | | | | 14,599,348 | |
| Cash and cash equivalents at end of year | | 6 | | | 7,395.9 | | | Ps. | 22,193,004 | | | | 22,284,977 | | | | 17,269,760 | |
The accompany notes and appendices are an integral part of the consolidated financial statements
Grupo Aval Acciones y Valores S.A.
Notes to the Consolidated Financial Statement
As of December 31, 2016 and 2015 and for the years ended December 31, 2016, 2015 and 2014
(Figures expressed in millions of Colombian pesos)
NOTE 1 – REPORTING ENTITY
Grupo Aval Acciones y Valores S.A. (hereinafter the “The Group” or “Grupo Aval”) was established under Colombian laws in January 7, 1994, with its main offices and business address registered in Bogotá, D.C., Colombia. The corporate purpose of Grupo Aval is the purchase and sale of securities issued by financial and mercantile entities. Pursuant to the performance of its corporate purpose, the Group is the largest shareholder ofBanco de Bogotá S.A., Banco de Occidente S.A., Banco Popular S.A. and Banco Comercial AV Villas S.A., entities whose main purpose is to perform all transactions, operations and services inherent to the banking business, pursuant to applicable laws and regulations. Furthermore, through its direct and indirect investments inCorporación Financiera Colombiana S.A. (“Corficolombiana”) and inSociedad Administradora de Fondos de Pensiones y Cesantías Porvenir S.A. (“Porvenir”), the Group participates in investment banking activities, investments in the non-financial sector and in the management of pensions and severance funds in Colombia, respectively.
During the performance of its activities and pursuant to the corporate bylaws, Grupo Aval may (i) promote the creation of all types of companies relating to its corporate purpose; (ii) represent individuals and companies involved in similar or complementary activities; (iii) grant or receive loans with or without interest; (iv) submit its properties as collateral; (v) issue, endorse, acquire, protest, cancel, or pay bills of exchange, checks, promissory notes or any other type of financial instruments, accept or submit them as payment; (vi) acquire, sell, tax, lease or manage any kind of assets; (vii) subscribe or acquire any kind of investments and sell or otherwise dispose the same; (viii) participate in companies which pursue similar or complementary corporate interests and alienate such participations; (ix) render services in areas relating to its activities, experience and knowledge; and (x) carry out or participate, in acts and contracts relating to the aforementioned activities, for enabling the exercise of the rights and compliance of the obligations of the Company.
The duration of the Group set forth under the bylaws is until May 24, 2044, but the Company may be dissolved before such term expires, or it may be extended.
When preparing its consolidated financial statements, Grupo Aval Acciones y Valores S.A, directly consolidates the following entities:
Banco de Bogotá S.A.
Banco de Bogotá, in which Grupo Aval holds 68.74% of voting rights as of December 31, 2016, was established as a bank on November 15, 1870. The operating license was granted by the Superintendency of Finance through Resolution Number 3140 of September 24, 1993. The commercial purpose of Banco de Bogotá is to participate and perform all operations and contracts legally authorized to commercial banking, subject to the limitations and requirements set forth under Colombian laws and regulations.
The following table presents the details of Banco de Bogotá’s most significant subsidiaries which are indirectly consolidated by Grupo Aval as of December 31, 2016:
Grupo Aval Acciones y Valores S.A.
Notes to the Consolidated Financial Statement
As of December 31, 2016 and 2015 and for the years ended December 31, 2016, 2015 and 2014
(Figures expressed in millions of Colombian pesos)
| Subsidiary | | Core business | | Location | | Total % voting
rights of Grupo
Aval | | | Total % of
economic
interest of
Grupo Aval | |
| Main Local Direct Subsidiaries | | | | | | | | | | |
| Porvenir S.A. and its subsidiary | | Pension and severance funds management. | | Bogotá, Colombia | | | 100 | % | | | 75.69 | % |
| Almaviva S.A. and its subsidiary | | Logistics services. | | Bogotá, Colombia | | | 95.81 | % | | | 65.85 | % |
| Main International Direct Subsidiaries | | | | | | | | | | |
| Leasing Bogotá Panama S.A. | | Holding company.(1) | | Panamá, Republic of Panamá | | | 100 | % | | | 68.74 | % |
| Banco de Bogotá Panamá S.A. | | Commercial banking services. | | Panamá, Republic of Panamá | | | 100 | % | | | 68.74 | % |
| Main Subsidiaries with Indirect Share Interest | | | | | | | | | | |
| BAC Credomatic Inc. | | Holding Company in charge of managing the banking and related subsidiaries in Costa Rica, El Salvador, Guatemala, Honduras, Mexico, Nicaragua and Panamá, among others. (Consolidates with Leasing Bogotá Panamá S.A.). | | Panamá, Republic of Panamá | | | 100 | % | | | 68.74 | % |
| (1) | Leasing Bogotá Panamá has no restrictions for transferring dividends to Colombia. |
Banco de Occidente S.A.
Banco de Occidente S.A., wherein Grupo Aval holds 72.27% of voting rights as of December 31, 2016, was established as a banking entity on September 8, 1964, authorized to operate under the terms of the renewal resolution No. 2345 dated June 29, 1990 issued by the Superintendency of Finance.
The following table presents the details of Banco de Occidente’s most significant subsidiaries, which are indirectly consolidated by Grupo Aval, as December 31, 2016:
| Subsidiary | | Core business | | Location | | Total % voting
rights of Grupo
Aval | | | Total % of
economic
interest of
Grupo Aval | |
| Fiduciaria de Occidente S.A. | | Trust funds management. | | Bogotá, Colombia | | | 99.99 | % | | | 71.04 | % |
| Banco de Occidente (Panamá). S.A. | | Banking establishment. | | Panamá, Republic of Panamá | | | 95.00 | % | | | 68.66 | % |
| Occidental Bank Barbados Ltd. | | Banking establishment. | | Barbados | | | 100 | % | | | 72.27 | % |
Banco Popular S. A.
Banco Popular S. A., wherein Grupo Aval holds 93.74% of voting rights as of December 31, 2016, was established as a banking entity on July 5, 1950; 98% is owned by corporations and individuals, and 2% by government entities. Its commercial purpose is to participate and perform all operations and contracts legally authorized to commercial banking, subject to the limitations and requirements set forth under Colombian laws and regulations.
The following table presents the details of Banco Popular’s most significant subsidiaries, which are indirectly consolidated by Grupo Aval, as of December 31, 2016:
Grupo Aval Acciones y Valores S.A.
Notes to the Consolidated Financial Statement
As of December 31, 2016 and 2015 and for the years ended December 31, 2016, 2015 and 2014
(Figures expressed in millions of Colombian pesos)
| Subsidiary | | Core business | | Location | | Total % voting
rights of Grupo
Aval | | | Total % of
economic
interest of
Grupo Aval | |
| Fiduciaria Popular S.A. | | Trust funds management. | | Bogotá, Colombia | | | 94.85 | % | | | 88.91 | % |
| Alpopular S.A. | | Conservation and custody of documents; transportation of products at a national and international level. | | Bogotá, Colombia | | | 71.10 | % | | | 66.65 | % |
Banco Comercial AV Villas S. A.
Banco Comercial AV Villas S. A., wherein Grupo Aval holds 79.89% of voting rights as of December 31, 2016, was incorporated as a banking entity on November 24, 1972. The commercial purpose of Banco AV Villas is to participate and perform all operations and contracts legally authorized to commercial banking, subject to the limitations and requirements imposed by Colombian laws and regulations.
The following table presents the details of Banco AV Villas’ most significant subsidiary which is indirectly consolidated by Grupo Aval, as of December 31, 2016:
| Subsidiary | | Core business | | Location | | Total % voting
rights of Grupo
Aval | | | Total % of
economic
interest of
Grupo Aval | |
| A Toda Hora S.A. ATH | | ATM network services and maintenance and software development | | Bogotá, Colombia | | | 100 | % | | | 78.90 | % |
Corporación Financiera Colombiana S.A.
Until June 21, 2016, Corficolombiana was controlled by Banco de Bogotá S.A. on that same date an agreement was signed between Grupo Aval, Banco de Bogotá, Banco de Occidente and Banco Popular, whom together held at that point a combined stake in Corficolombiana of 58%, in which Grupo Aval would assume direct control of Corficolombiana. This legal reorganization had no impact on the consolidated financial statements of Grupo Aval.
Corficolombiana S.A., in which Grupo Aval holds at December 31, 2016 58.11% of voting rights, is a merchant bank authorized to operate by the Superintendency of Finance by resolution of October 18, 1961. Corficolombiana´s core business is the active management of an equity portfolio through controlling and non-controlling investments in key strategic sectors of the Colombian economy, including infrastructure, energy and gas, agriculture and hotels.
The following table presents the details of Corficolombiana´s most significant subsidiaries, which are indirectly consolidated by Grupo Aval, as of December 31, 2016:
Grupo Aval Acciones y Valores S.A.
Notes to the Consolidated Financial Statement
As of December 31, 2016 and 2015 and for the years ended December 31, 2016, 2015 and 2014
(Figures expressed in millions of Colombian pesos)
| Main Subsidiaries with Indirect Share Interest |
| Subsidiary | | Core business | | Location | | Total % voting
rights of Grupo
Aval | | | Total % of
economic
interest of
Grupo Aval | |
| Fiduciaria Corficolombiana S.A. | | Trust services | | Bogotá, Colombia | | | 100 | % | | | 44.49 | % |
| Leasing Corficolombiana S.A. | | Financial services | | Bogotá, Colombia | | | 100 | % | | | 44.49 | % |
| Banco Corficolombiana Panamá S.A. | | Banking establishment. | | Bogotá, Colombia | | | 100 | % | | | 44.49 | % |
| Casa de Bolsa S.A. | | Securities brokerage and securities funds management. | | Bogotá, Colombia | | | 97.30 | % | | | 63.71 | % |
| Hoteles Estelar S. A. | | Construction and operation of hotels, directly owned by third parties, in Colombia and abroad. | | Bogotá, Colombia | | | 84.96 | % | | | 37.80 | % |
| Estudios y Proyectos del Sol S.A.S. | | Infrastructure projects. | | Bogotá, Colombia | | | 100 | % | | | 44.49 | % |
| Pizano S.A. | | Timber production and transformation, industrial products manufacturing, construction supplies production. | | Bogotá, Colombia | | | 59.38 | % | | | 31.15 | % |
| Organización Pajonales S. A. | | Investment and promotion of agricultural, livestock, forestry and agro industrial companies. | | Bogotá, Colombia | | | 98.13 | % | | | 43.66 | % |
| Promigas S.A. E.S.P. | | Transportation and distribution of natural gas. | | Bogotá, Colombia | | | 50.23 | % | | | 22.35 | % |
| Estudios, Proyectos e Inversiones de los Andes S.A. | | Infrastructure projects. | | Bogotá, Colombia | | | 99.93 | % | | | 44.45 | % |
| Plantaciones Unipalma de los Llanos S.A | | Development, production and sale of african palm products. | | Bogotá, Colombia | | | 54.53 | % | | | 24.26 | % |
| Constructora de Infraestructura Vial S.A.S - CONINVIAL | | Road and Infrastructure concessions. | | Bogotá, Colombia | | | 60.00 | % | | | 26.69 | % |
| Surtidora de Gas del Caribe S.A. E.S.P. | | Distribution and commercialization natural gas. | | Bogotá, Colombia | | | 99.99 | % | | | 22.34 | % |
| Proyectos de Infraestructura S.A. - PISA | | Road and Infrastructure Concessions. | | Bogotá, Colombia | | | 88.25 | % | | | 39.26 | % |
Grupo Aval Limited
Grupo Aval Limited is an affiliate of Grupo Aval in Cayman Islands. It was established on December 29, 2011. Grupo Aval Limited is a limited liability company registered with the Assistant of the Registrar of Companies of Cayman Islands under registry number MC-265169, with its Main Office located in Ugland House, South Church Street, George Town, Grand Cayman KY1-1104. It was constituted as a special purpose vehicle for issuing foreign debt.
Grupo Aval International Limited
Grupo Aval International Limited is an affiliate of Grupo Aval in Cayman Islands. It was established on October 8, 2012. Grupo Aval International Limited is a limited liability company registered with the Assistant
Grupo Aval Acciones y Valores S.A.
Notes to the Consolidated Financial Statement
As of December 31, 2016 and 2015 and for the years ended December 31, 2016, 2015 and 2014
(Figures expressed in millions of Colombian pesos)
of the Registrar of Companies of Cayman Islands under registry number MC-272253, with its Main Office located in Ugland House, South Church Street, George Town, Grand Cayman KY1-1104. It was constituted as a special purpose entity for issuing foreign debt.
Between December 31, 2016 and 2015 there were no significant changes in the share interest of Grupo Aval in its subsidiaries.
Companies integrating Grupo Aval in Colombia, are subject to the following restrictions to transfer profits or perform transactions, in accordance with the legal standards in Colombia:
| · | The subsidiaries abroad of Colombia should assign 10% of its profits as legal reserves before distributing any dividends to its shareholders. |
| · | The financial companies of the Group Aval in Colombia may not make loans to other companies of the Group that exceed 10% of its regulatory capital if the loan unsecured or 25% if it is granted with an acceptable guarantee under the Superintendency of Finance rules. |
| · | Pursuant to article 2.1.2.1.8 of Decree 2555 of 2010, banks in Colombia have a lending limit of 30% of their regulatory capital with respect to loans granted to financial entities. |
The subsidiaries abroad of Grupo Aval do not have any restriction to transfer dividends to the parent company. Lending operation in general have restrictions similar to those of banks in Colombia, described above.
Grupo Aval and its subsidiaries do not face any significant restrictions on their ability to access or use assets to settle the liabilities of the group. The only restrictions faced by the Group are those mentioned earlier which establish a minimum capital reserve before any distributions can occur within the Group. There are no restrictions on the ability of the parent or the subsidiaries to transfer assets within the Group. The restrictions imposed by the Colombian government are not expected to have an impact over the ability of the Group to meet its cash obligations.
NOTE 2 – BASIS OF PREPARATION OF THE CONSOLIDATED FINANCIAL STATEMENTS AND SUMMARY OF SIGNIFICANT ACCOUNTING POLICIES
The consolidated financial statements of Grupo Aval have been prepared in accordance with International Financial Reporting Standards (IFRS´s) as issued by the International Accounting Standards Board (IASB), currently effective.
The consolidated financial statements have been prepared on the basis of historical cost basis, except for financial assets held for trading, at fair value through profit or loss and available for sale, derivative financial instruments, investment properties, assets held for sale and biological assets which are accounted for at fair value. Non-current assets held for sale which are measured at the lower value of their carrying value at the time of transfer and fair value, minus estimated costs of disposal.
The consolidated financial statements were authorized for issuance by the Audit Committee on April 21, 2017.
The main accounting policies applied in preparing the consolidated financial statements of Grupo Aval for the years ended December 31, 2016, 2015 and, 2014, are as follows:
Grupo Aval Acciones y Valores S.A.
Notes to the Consolidated Financial Statement
As of December 31, 2016 and 2015 and for the years ended December 31, 2016, 2015 and 2014
(Figures expressed in millions of Colombian pesos)
| a) | Presentation of Consolidated Financial Statements |
The consolidated financial statements are prepared as follows:
| · | The consolidated statement of financial position presents assets and liabilities based on their liquidity since it provides reliable and more relevant information. |
| · | The consolidated statements of income and other comprehensive income are presented separately in two statements. The statement of income is presented by nature, as it provides reliable and more relevant information. |
| · | The consolidated statements of cash flows are presented using the indirect method, whereby the net cash flows from operating activities are determined by reconciling income before taxes, due to the effects of the non-cash items, net changes in assets and liabilities derived from operating activities, and for any other items whose effects are not classified as investing or financing activities. Revenue and expenses due to interest received and paid form part of operating activities. |
| b) | Consolidated financial statements |
Grupo Aval prepares its consolidated financial statements with controlled entities. Grupo Aval controls an investee if it is exposed to, or has rights to, variable returns from its involvement with the investee and has the ability to affect those returns through its power over the investee. Grupo Aval reassesses whether it has control if there are changes to one or more of the elements of control. This includes circumstances in which protective rights held (e.g. those resulting from a lending relationship) become substantive and lead to the Group having power over an investee.
The financial statements of subsidiaries are included in the consolidated financial statements from the date on which control commences until the date when control ceases.
During the consolidation process, Grupo Aval combines the assets, liabilities and profits or losses of those entities under control, previously aligning the accounting policies in all the subsidiaries. Such process includes eliminating intragroup balances and transactions and any unrealized income and expenses (except for foreign currency translation gains or losses) arising from intra-group transactions. Unrealized losses are eliminated in the same way as unrealized gains but only to the extent that there is no evidence of impairment. Non-controlling interest is presented in the consolidated statement of financial position of Grupo Aval separate from that attributable to equity holders of Grupo Aval.
For consolidation purposes, the statements of financial position and income of Grupo Aval´s foreign subsidiaries are translated to Colombian pesos, as follows:
| a) | Assets and liabilities are translated at the closing rate at the reporting date; |
| b) | Income and expenses are translated at monthly average exchange rates since those averages approximate the exchange rates of each specific transaction; |
| c) | All resulting exchange differences are recognized in other comprehensive income and accumulated in the foreign currency translation reserve except to the extent that the translation difference is allocated to non-controlling interests. |
Grupo Aval Acciones y Valores S.A.
Notes to the Consolidated Financial Statement
As of December 31, 2016 and 2015 and for the years ended December 31, 2016, 2015 and 2014
(Figures expressed in millions of Colombian pesos)
| c) | Investments in associates |
Investments in companies in which Grupo Aval does not have control, but has significant influence are called “Investments in associates”. Investments in associates are accounted for under the equity method. They are presented in the statement of financial position as ”Investments in associates and joint ventures” (additionally see Note 2.1.d) “Joint arrangements”). Grupo Aval exercises significant influence over another entity if it owns, directly or indirectly, 20% or more of the voting power of the investee, unless it is clearly evidenced that such influence does not exist. Under the equity method, investments in associates are initially recognized at cost and subsequently adjusted by Grupo Aval´s share in the associates income and other comprehensive income with credit or charge to Grupo Aval’s profit or loss account and other comprehensive income, respectively of the net income, and other comprehensive income of the investee.
A joint arrangement is one in which two or more parties have joint control of the arrangement. Joint arrangements are divided into joint operations, in which the parties having joint control of the agreement have rights to the assets and obligations with respect to the liabilities relating to the agreement, and joint ventures, wherein the parties having joint control are entitled to the net assets of the agreement.
Grupo Aval recognizes joint operations in the consolidated financial statements based on their proportional and contractual participation in each of the assets, liabilities and profit or loss of the contract or entity wherein the agreement is held. In addition, Grupo Aval recognizes joint ventures by the equity method, in the same manner as investments in associates.
| 2.2 | Grupo Aval functional currency |
Grupo Aval´s management has determined the Colombian Peso as functional and presentation currency for submitting the consolidated financial statements. The foreign subsidiaries have other functional currencies, mainly the U.S. dollar.
| 2.3 | Transactions in foreign currencies |
Foreign currency transactions are translated into the functional currency of each entity at the exchange rate prevailing on the transaction date. Monetary assets and liabilities in foreign currency are translated into the functional currency using the prevailing exchange rate at the reporting date of the statement of financial position. Non-monetary assets and liabilities denominated in foreign currencies in terms of historical costs are measured using the exchange rate at the transaction date. Financial instruments measured at fair value are translated using the exchange rate from the date the fair value was determined. Profit or loss resulting from the translation process are included in the statement of income.
At December 31, 2016, and 2015, the representative market rates as computed and certified by the Superintendency of Finance (for the U.S.$ which is the most representative foreign currency for Grupo Aval´s transactions) were Ps. 3,000.71 and Ps. 3,149.47 per U.S. $1, respectively.
Grupo Aval Acciones y Valores S.A.
Notes to the Consolidated Financial Statement
As of December 31, 2016 and 2015 and for the years ended December 31, 2016, 2015 and 2014
(Figures expressed in millions of Colombian pesos)
| 2.4 | Convenience translation in to U.S. dollars |
The presentation currency of Grupo Aval´s consolidated financial statements is the Colombian Peso. The U.S. dollar amounts disclosed in the accompanying consolidated financial statements are presented solely for the convenience of the reader, dividing the Colombian peso amounts by the exchange rate of Ps. 3,000.71 per US$1.00, which is the market exchange rate at December 31, 2016, as calculated by the Central Bank of Colombia. The use of this methodology in translating Colombian pesos into U.S. dollars is referred to as the “U.S. dollar translation methodology,” and should not be construed as a representation that the Colombian peso amounts actually represent or have been, or could be converted into U.S. dollars at that or any other rate.
| 2.5 | Cash and cash equivalents |
Cash and cash equivalents include cash, bank deposits, and other short-term investments with original maturities of three months or less from the date of their acquisition that are subject to an insignificant risk of changes in their fair value and are used by the Group in the management of its short-term commitments.
A financial asset is an asset that is:
| • | An equity instrument of another entity. |
| • | A contractual right to receive cash or another financial asset from another entity or to exchange financial assets or financial liabilities with another entity under conditions that are potentially favorable to the entity, or |
| • | A contract that will or may be settled in the entity´s own equity instruments and is a non-derivative. |
For accounting purposes, financial assets are classified at initial recognition into four categories:
| · | Fair value through profit or loss: |
| (i) | Held for trading financial assets acquired to generate short-term profits or that is part of a portfolio of financial instruments managed together for that purpose. |
| (ii) | Financial assets under concessions contracts are included in this category in order to obtain more relevant information, either because this eliminates or significantly reduces recognition or measurement inconsistencies (accounting mismatches) that would otherwise arise from measuring assets or recognizing the gains or losses on them on different bases, in accordance with a documented risk management or investment strategy, and information is provided on that basis to Grupo Aval’s key management personnel. We believe this classification adequately reflects the present market expectations over future costs comprising |
Grupo Aval Acciones y Valores S.A.
Notes to the Consolidated Financial Statement
As of December 31, 2016 and 2015 and for the years ended December 31, 2016, 2015 and 2014
(Figures expressed in millions of Colombian pesos)
the amount of the concession to be negotiated with the different Colombian administration, upon the termination of the concession or its renewal.
| · | Investments held to maturity: These are debt securities with fixed or determinable payments and a fixed maturity date, which Grupo Aval intends and has the ability to hold to maturity. |
| · | Loans and receivables: These are financial assets of fixed or determinable payments that are not quoted in active markets and are not classified as either trading or available for sale. |
| · | Available for sale: These are financial assets that are designated initially as available for sale and are intended to be held for at least six months, or are those not classified as loans and receivables, or as held to maturity investments. |
Grupo Aval initially recognizes loans and advances, on the date on which they are originated. All other financial instruments (including regular-way purchases and sales of financial assets) are recognized on the trade date, which is the date on which Grupo Aval becomes a party to the contractual provisions of the instrument.
A financial asset is measured initially at fair value plus, for an item not at fair value through profit or loss, transaction costs that are directly attributable to its acquisition or issue.
Upon their initial recognition, financial assets are measured as follows:
| · | At fair value through profit or loss: are measured daily at their fair value with changes recognized in profit or loss. |
| · | Loans and receivables and investments held to maturity: are measured at their amortized cost, calculated based on the effective interest rate method, less principal repayments or installments received from debtors, minus any impairment. |
The effective interest rate method is a method of calculating the amortized cost of a financial asset and allocating the interest income or expense over the relevant period. The effective interest rate is the rate that discounts future cash payments or receipts (without consideration of future credit losses, over the expected life of the financial instrument) to the net carrying amount of the financial asset at initial recognition. In the process of calculating the effective interest rate, Grupo Aval estimates the cash flows considering the contractual terms of the financial instrument, except for future credit losses and considering the initial fair value plus transaction costs and premiums granted, minus commissions and discounts received which form integral part of the effective rate.
| - | Debt instruments are recognized at fair value. The effective interest rate method is used in order to calculate the amortized cost of the instrument to determine interest income that is recognized in profit or loss. Any changes in fair value are |
Grupo Aval Acciones y Valores S.A.
Notes to the Consolidated Financial Statement
As of December 31, 2016 and 2015 and for the years ended December 31, 2016, 2015 and 2014
(Figures expressed in millions of Colombian pesos)
recognized in other comprehensive income (OCI). Impairment losses and foreign exchange gains and losses on available for sale debt instruments are excluded from the fair value gains and losses recognized in other comprehensive income (OCI) and are recognized in profit or loss as incurred.
| - | Equity instruments available for sale are recognized at fair value, with gains or losses recognized in other comprehensive income. Dividends received from such instruments are recognized in profit or loss when Grupo Aval becomes entitled to receive the payment. Impairment losses are recognized in profit or loss when there is objective evidence that the issuer is impaired with credit to other comprehensive income. |
| - | When financial assets available for sale are sold, the accumulated values in other comprehensive income (OCI) are transferred to profit or loss. |
Upon their initial classification financial assets shall not be reclassified to other categories, except for special circumstances; in the event of such circumstances, transfers shall be accounted for as follows:
| · | From at fair value through profit or loss to other categories: those assets are recognized at their fair value. |
| · | From available for sale to held to maturity investment: the fair value immediately before the reclassification becomes the new amortized cost. In reclassification of an asset with a fixed maturity, any gain or loss previously recognized in other comprehensive income (OCI) and the difference between the newly established amortized cost and the maturity amount are both amortized over the remaining term of the financial asset under the effective interest rate method. However, any gain or loss previously recognized in other comprehensive income (OCI) is immediately reclassified from equity to profit or loss if the asset is subsequently impaired. For a financial asset with no stated maturity, any gain or loss previously recognized in other comprehensive income (OCI) is reclassified from equity to profit or loss when the financial asset is disposed of or impaired. |
| · | From held to maturity investment to available for sale: the difference between the amortized cost and fair value is recognized in other comprehensive income. |
| f) | Fair value of financial assets |
Fair value is the price to be received from the sale of an asset or paid for transferring a liability in an orderly transaction between market participants at the measurement date.
Based on that, fair value calculations of financial assets are carried out as follows:
| · | When available, Grupo Aval measures the fair value of an instrument using the quoted price in an active market for that instrument. A market is regarded as active if transactions for the asset or liability take place with sufficient frequency and volume to provide pricing information on an ongoing basis. |
Grupo Aval Acciones y Valores S.A.
Notes to the Consolidated Financial Statement
As of December 31, 2016 and 2015 and for the years ended December 31, 2016, 2015 and 2014
(Figures expressed in millions of Colombian pesos)
| · | If there is no quoted price in an active market, then Grupo Aval uses valuation techniques that maximize the use of relevant observable inputs and minimize the use of unobservable inputs. The chosen valuation technique incorporates all of the factors that market participants would take into account in pricing a transaction.(See Note 5). |
| g) | Impairment of financial assets |
Grupo Aval assesses whether there is objective evidence that a financial asset or a group of financial assets is impaired depending on its classification.
For held to maturity and loans receivables at amortized cost, objective evidence includes: significant financial difficulties of the borrower, default or delinquency by a borrower, restructuring of a loan or advance on terms that Grupo Aval would not consider otherwise, indications that a borrower or issuer will enter bankruptcy, disappearance of an active market for a security or observable data relating to a group of assets such as adverse changes in the payment status of borrowers or issuers in the group, or economic conditions that correlate with defaults. If there is objective evidence of impairment, impairment is recognized in the statement of income. The amount of the allowance is determined as follows:
| · | Grupo Aval performs an individual assessment of significant financial assets classified as held until maturity and loans and accounts receivables, analyzing the debt profile of each debtor, the guarantees granted and information provided by credit risk agencies. Financial assets are deemed impaired when based on information and current and past events it is likely that Grupo Aval may not collect all the amounts due in the original contract, including interest and fees. If a financial asset has been identified as impaired, the amount of the loss is measured as the difference between the carrying amount and the present value of the future cash flows expected pursuant to the debtor’s conditions, discounted at the original effective interest rate, or the present value of the collateral guarantee covering the asset, less the estimated costs of sale when it is determined that the most important source of collection of the loan is such guarantee. |
| · | For those financial assets which are not deemed individually as significant and for individually significant financial asset portfolios which were not determined as impaired after the individual assessment described above, Grupo Aval carries out a collective assessment of impairment. For this purpose, financial assets are grouped together into segments with similar characteristics, using statistical assessment techniques based on an analysis of historical losses to determine an estimated percentage of losses which could have been incurred in such assets as of the date of the reporting, but that have not been identified on an individual basis (See Note 4 for further details regarding the calculation of the collective allowance). |
| · | Once an allowance is recorded for a financial asset or a group of similar financial assets, due to an impairment loss, interest income of the loan continues to be recognized using the same original contractual loan interest rate applied to the carrying value of the loan. |
Impaired financial assets are written off from the consolidated statement of financial position when the recovery of any recognized amount is considered to be unlikely. Collections of financial assets after the write off are recognized in profit or loss.
Grupo Aval Acciones y Valores S.A.
Notes to the Consolidated Financial Statement
As of December 31, 2016 and 2015 and for the years ended December 31, 2016, 2015 and 2014
(Figures expressed in millions of Colombian pesos)
For available for sale debt securities, Grupo Aval assesses objective evidence for impairment following the same criteria used for loans and receivables, which could include:
| · | significant financial difficulty of the issuer or counterparty; or |
| · | breach of contract, such as a default or delinquency in interest or principal payments; or |
| · | indication that a borrower or issuer will enter bankruptcy or reorganization; or |
| · | the disappearance of an active market for that financial asset because of financial difficulties. |
For available for sale equity instruments, a significant or prolonged decline in the fair value of the security below its cost is considered to be an objective evidence of impairment.
When there is objective evidence at the date of measurement of these instruments that any excess of carrying value is due to an impairment that is other than temporary, cumulative gains or losses previously recognized in equity under “Other Comprehensive Income” are reclassified to profit or loss.
In respect of available-for-sale debt instruments, impairment losses are subsequently reversed through profit or loss if an increase in the fair value of the investment can be objectively related to an event occurring after the recognition of the impairment loss.
Impairment losses previously recognized in profit or loss are not reversed through profit or loss. Any increase in fair value subsequent to an impairment loss is recognized in equity under “Other Comprehensive Income”.
Once the impairment losses have been estimated, they are charged to profit or loss of the period and credited to an allowance sub-account in the respective financial asset category.
| h) | Troubled debt restructured loans |
Troubled debt restructured loans are those that have collection problems in which Grupo Aval grants the debtor a modification that it would not otherwise consider. These modifications generally involve interest rate reductions, extension of deadlines for payment or reductions in the balance due to a troubled debt loan.
If the terms of a financial asset are renegotiated or modified or an existing financial asset is replaced with a new one due to financial difficulties of the borrower, then an assessment is made of whether the financial asset should be derecognized. If the cash flows of the renegotiated asset are substantially different, then the contractual rights to cash flows from the original financial asset are deemed to have expired. In this case, the original financial asset is derecognized and the new financial asset is recognized at fair value. The impairment loss before an expected restructuring is measured as follows.
| · | If the expected restructuring will not result in derecognition of the existing asset, then the estimated cash flows arising from the modified financial asset are included in the measurement of the existing asset based on their expected timing and amounts are discounted at the original effective interest rate of the existing financial asset. |
Grupo Aval Acciones y Valores S.A.
Notes to the Consolidated Financial Statement
As of December 31, 2016 and 2015 and for the years ended December 31, 2016, 2015 and 2014
(Figures expressed in millions of Colombian pesos)
| · | If the expected restructuring will result in derecognition of the existing asset, then the expected fair value of the new asset is treated as the final cash flow from the existing financial asset at the time of its derecognition. This amount is discounted from the expected date of derecognition to the reporting date using the original effective interest rate of the existing financial asset. |
| i) | Transfers of financial assets |
The accounting treatment of transfers of financial assets is conditioned by the transfer of risks and rewards, associated with the asset. Those financial assets are only derecognized from the consolidated statement of financial position when the cash flows generated by the asset have been transferred or when the implicit risks and rewards have been substantially transferred to third parties. In this case, the transferred financial asset is derecognized from the consolidated statement of financial position, simultaneously recognizing any right or obligation retained or recording a profit or loss on the transfer.
It is considered that Grupo Aval has substantially transferred the risks and rewards when the transferred risks and rewards represent significantly the total risks and rewards of the transferred assets. If the risks and/or rewards associated with the financial asset transferred are substantially retained:
| · | The transferred financial asset is not derecognized from the consolidated statement of financial position and continues to be valued using the same criteria applied before the transfer; |
| · | A financial liability is recognized in an amount that equals the compensation received, which is subsequently valued at amortized cost; and |
| · | Both the income associated with the transferred financial assets (but not derecognized) as well as the expenses associated with the new financial liability will continue to be recognized in the consolidated financial statements of Grupo Aval. |
| j) | Offsetting of financial instruments in the consolidated statement of financial position |
Financial assets and liabilities are offset, and the net amount is recognized in the consolidated statement of financial position, when there is a legally enforceable right to offset recognized amounts and management intends to settle them on a net basis or to realize the asset and settle the liability simultaneously.
| k) | Repurchase agreements and reverse repurchase agreements |
Purchases of financial instruments under a non-optional resale agreement are measured at fair value and recognized as assets in the consolidated statement of financial position under Loans and advances to credit institutions – Reverse repurchase agreements or Loans and advances to customers – Reverse repurchase agreements.
The excess of the purchase prices over the resale prices is recognized as interest income over the contractual term.
Sales of financial instruments under a non-optional repurchase agreement are measured at fair value and recognized as liabilities in the consolidated statement of financial position under Deposits
Grupo Aval Acciones y Valores S.A.
Notes to the Consolidated Financial Statement
As of December 31, 2016 and 2015 and for the years ended December 31, 2016, 2015 and 2014
(Figures expressed in millions of Colombian pesos)
from the Central Bank – Repurchase agreements, Deposits from credit institutions – Repurchase agreements or Customer deposits – Repurchase agreements.
The excess of the sales prices over the repurchase prices is recognized as interest expense over the contractual term.
| 2.7 | Derecognition of financial assets |
Financial assets are derecognized from the consolidated statement of financial position only when all the risks and rewards of the asset have been substantially transferred to third parties or when the rights have been legally extinguished.
| 2.8 | Derivative financial instruments and hedging accounting |
A derivative is a financial instrument whose value changes in response to one or more variables denominated as an “underlying” (a specific interest rate, the price of a financial instrument, a listed commodity, a foreign currency exchange rate, etc.), that has an initial net investment smaller than would be required for other instruments that have a similar response to the variable and that is settled in a future date.
Grupo Aval trades in financial markets, forward contracts, future contracts, swaps and options that fulfil the definition of a derivative.
Derivative transactions are initially recognized at fair value. Subsequent changes in the fair value are recognized in profit or loss, unless the derivative instrument is designated as a hedging instrument and, in this case, the accounting criteria will depend on the nature of the hedged item, as described below:
| · | For fair value hedge of assets or liabilities and firm commitments, changes in the fair value of the derivative instrument are recognized in profit or loss, as well as any other change in the fair value of the asset, liability or firm commitment attributable to the hedge risk, |
| · | For cash flow hedge of a particular risk associated with a recognized asset or liability or a projected highly probable transaction, the effective portion of changes in the fair value of the derivative is recognized in other comprehensive income (OCI). The gain or loss relating to the portion that is not effective for hedging or that does not relate to the hedged risk is immediately recognized in profit or loss. |
The values accumulated in other comprehensive income (OCI) are transferred to profit or loss in the same period in which the hedged item is carried to profit or loss.
| · | Hedging of net investments in a foreign operation is recognized similarly to cash flow hedging: the effective portion of changes in fair value of the hedging instrument is recognized in other comprehensive income (OCI), and the ineffective portion of the changes in fair value of the derivative is recognized in profit or loss. The hedging instrument's gains or losses accumulated in equity will be recognized in profit or loss when the net investment in foreign operations is sold in whole or proportionally, if partially sold. |
At the beginning of the hedging transaction, Grupo Aval formally documents the relationship existing between the hedging instrument and the hedged item, including the risk management
Grupo Aval Acciones y Valores S.A.
Notes to the Consolidated Financial Statement
As of December 31, 2016 and 2015 and for the years ended December 31, 2016, 2015 and 2014
(Figures expressed in millions of Colombian pesos)
objective and strategy in undertaking the hedging relationship. It also documents its assessment, both initially as well as on a recurring basis, of whether the hedging relationship is highly effective in offsetting the changes in fair value or cash flows of the hedged items.
Financial assets and liabilities from transactions with derivatives are not offset in the consolidated statement of financial position. However, when there is a legal and exercisable right to offset the recognized values and intended to be settled on a net basis or to realize the assets and settle the liability simultaneously, derivatives are presented as net values in the consolidated statement of financial position.
| 2.9 | Non-current assets held for sale |
Foreclosed and non-current assets held for sale, which Grupo Aval intends to sell in a period of less than one year, and it is considered highly probable that they will be recovered primarily through sale rather than through continuing use, are recognized as "non-current assets held for sale". These assets are measured at the lower of their carrying value at the time of transfer and fair value, less estimated costs of disposal.
Financial guarantees are those contracts requiring that the issuer carries out specific payments to reimburse the creditor for losses incurred when a specific debtor defaults its payment obligation, in accordance with the original or modified conditions, of a debt instrument; regardless of its legal form.
Liabilities arising from financial guarantees are initially measured at fair value, which is generally the value of the fee received, adjusted for the directly attributable transaction costs incurred, and the initial fair value is amortized over the life of the guarantee or the commitment. The liability is subsequently carried at the higher of this amortized amount and the present value of any expected payment to settle the liability when a payment under the contract has become probable.
The provisions established over financial guarantee agreements classified as impaired, are recognized as liabilities under “Provisions – other provisions” and recognized in profit or loss.
| 2.11 | Property, plant and equipment for own use |
Property, plant and equipment include the assets, owned or under financial leases held by Grupo Aval for current or future use and which expects to be used for more than one period.
They are recognized in the consolidated statement of financial position at their acquisition or construction cost, less the corresponding accumulated depreciation and, if applicable, the estimated impairment losses resulting from comparing the carrying amount of each asset with its recoverable value.
Depreciation is calculated by applying the straight-line method over the acquisition cost of the assets, less any residual value, under the premise that the land, where the buildings and other constructions are built, have an undetermined useful life and, therefore, are not subject to depreciation.
Depreciation is estimated on a straight-line basis during the estimated useful life of the asset. The annual depreciation rates for each item of assets are:
Grupo Aval Acciones y Valores S.A.
Notes to the Consolidated Financial Statement
As of December 31, 2016 and 2015 and for the years ended December 31, 2016, 2015 and 2014
(Figures expressed in millions of Colombian pesos)
| Asset | | Useful Life |
| Own use buildings | | According to appraisals without exceeding 70 years |
| Equipment, furniture and accessories | | Between 3-10 years |
| Machinery and equipment | | Between 5-25 years |
| Computer equipment | | Between 3-12 years |
| Vehicles | | Between 5-10 years |
| Bearer plants | | Between 25-35 years |
Conservation and maintenance expenses are recognized as incurred as “Administration Expenses”. (See note 2.19 Impairment of non-financial assets).
According to the changes in accounting policies discussed in 2.15 below, the biological assets that meet the concept of a bearer plants are accounted for as property, plant and equipment.
A bearer plant is a live plant that meets the following requirements:
| a) | It is used for the manufacturing or supply of agricultural products; |
| b) | It is expected to produce for more than one period; and |
| c) | It has a remote probability of being sold as an agricultural product, except for irregular sales related to thinning and trimming. |
Bearer plants that are under the set-up and growing phase are subject to a biological transformation which should be reflected through cost accumulation until they reach their maturity level. In the case of the African oil palm once it has been introduced the maturity level corresponds to the second year, while for rubber it corresponds to the seventh year. After reaching their maturity level bearer plants are considered developed and the future economic benefits arise from the sale of the fruit produced during the life of the plant.
Bearer plants are measured at their cost less accumulated depreciation and any impairment losses. The useful life is equal to the production period of the plants. Rubber’s useful life corresponds to 35 years while African oil palm’s useful life corresponds to 25 years. The depreciation method used is the estimated production units as it accurately reflects the use of the assets. If the bearer plant is sold for timber at the end of the useful life the value received is considered the residual value of the asset.
| 2.12 | Investment properties |
Land and buildings, considered in whole or in part, that are held to earn rental income or for capital appreciation, rather than for own use or sale in the ordinary course of business. Investment properties are recognized initially at cost, including all costs associated with the transaction, and subsequently measured at fair value, with changes in fair value recognized in profit or loss.
| 2.13 | Leases – Lessor accounting |
Leases are classified as a finance or operating lease. A lease is classified as a financial lease when it substantially transfers all the risks and rewards inherent to the property. A lease is classified as operating if it does not substantially transfer all the risks and rewards inherent to the property. Lease contracts classified
Grupo Aval Acciones y Valores S.A.
Notes to the Consolidated Financial Statement
As of December 31, 2016 and 2015 and for the years ended December 31, 2016, 2015 and 2014
(Figures expressed in millions of Colombian pesos)
as financial lease are included in the consolidated statement of financial position as “Loans and receivables” and are recognized in the same way as other loans, as explained in note 2.6 above. Lease contracts classified as operating lease continue to be included as property, plant and equipment or investment property in Grupo Aval and are recognized and depreciated in the same manner as property and equipment of its own use. Revenues from payments are recognized in profit or loss of the period using the straight-line accrual method.
| 2.14 | Leases - Lessee accounting |
At their initial recognition, assets are classified as finance or operating leases, in the same way as described above.
Lease agreements classified as finance leases are included in the consolidated statement of financial position as property, plant and equipment or as investment properties, in accordance with the intention of Grupo Aval in relation to the asset, and are initially recognized in assets and in liabilities simultaneously for an amount equal to the fair value of the asset received on lease or for the present value of the minimum lease payments, if the latter is lower. The present value of the minimum lease payments is established by using the implicit interest rate in the lease contract, or if such rate is not determinable, the average interest rate of the bonds placed by Grupo Aval in the market. Any initial direct cost of the lessee is added to the recognized asset amount.
After initial recognition, these assets are accounted for in the same manner as other property, plant and equipment or investment properties. The value recognized as a liability is included as a financial liability.
Payments made under lease contracts classified as operating are recognized in the consolidated statement of income based on the straight-line basis during the lease term. Incentives received from leasing are recognized as an integral part of the total leasing payments during its term.
As of January 1, 2016, Grupo Aval changed its accounting policy regarding the measurement of biological assets related to bearer plants, according to IAS 16 amendment (property, plant and equipment) and IAS 41 (Agriculture). Based on such amendment, bearer plants could be classified as property, plant and equipment for own use and accounted for under the cost model, according to IAS 16; then, they are depreciated during the estimated life of the bearer plants by using the production units’ method. The biological product of those bearer plants (fruit) are recognized according to IAS 41, at fair value with changes in profit or loss.
Until December 31, 2015, bearer plants were recorded as biological assets at fair value with changes in fair value recognized in profit or loss. The effect of this accounting change had no material effect on Grupo Aval´s financial statements and for this reason previous financial statements were not adjusted for retrospective application.
Other biological assets, including biological assets growing in the bearer plants, are recognized both at the time of their initial recognition and at the end of reporting period at fair value less disposal cost, except for biological assets for which their fair value cannot be measured reliably; in such case they are measured at cost less accumulated depreciation and impairment loss. Gains and losses arising from the initial and subsequent recognition at fair value of the agricultural products are included in profit or loss. Costs incurred in the agricultural production process are also recognized directly in profit or loss.
Grupo Aval Acciones y Valores S.A.
Notes to the Consolidated Financial Statement
As of December 31, 2016 and 2015 and for the years ended December 31, 2016, 2015 and 2014
(Figures expressed in millions of Colombian pesos)
Fair value of biological assets is determined using valuations made by experienced internal professionals, using discounted cash flow models. The expected cash flows of the crop’s total life are determined by using the market price of the agricultural product currently in effect and the estimated productive life of plants, net of maintenance and harvest costs and of any other costs required for plant maintenance during the production period. Productive life of plants is estimated considering the age, location and type of product. Fair value of the biological assets is dependent on current market prices for each product.
| 2.16 | Business combinations and goodwill |
Business combinations are accounted for by using the “acquisition method” when control is transferred. The consideration transferred in the acquisition is generally measured at fair value, as are the identifiable net assets acquired. Any goodwill that arises is tested annually for impairment. If there are non-controlling interests during the acquisition of control of the entity, such non-controlling interests are recognized at either fair value or at the proportionate interest in the recognized amount of the identifiable net assets of the acquire. This election is allowed on a transaction by transaction basis.
Goodwill is measured as the excess of the aggregate of consideration transferred, over the amount of any interest previously acquired and the net of identifiable assets and liabilities assumed at acquisition date. Goodwill acquired in a business combination is assigned to each of the groups of cash-generating units from which a benefit is expected as a consequence of the acquisition. Goodwill is not subsequently amortized but it shall be subject to an annual assessment of impairment of the cash-generating unit to which goodwill has been assigned, from which benefits are expected deriving from the synergies of business combinations.
A loss due to impairment recognized on Goodwill cannot be reversed in subsequent periods. In addition, statement of income of the acquire in Grupo Aval´s consolidated financial statements is included from the acquisition date.
They mainly comprise software and licenses, which are initially measured at the cost incurred during the acquisition or during its internal development phase. Costs incurred during the research phase are directly recognized in profit or loss.
Development expenses which are directly attributable to design and performance of tests of software which is identifiable, unique and controlled by Grupo Aval are recognized as intangible assets, when the following conditions are met:
| · | Technically, it is possible to complete the intangible asset production so it can be available for use; |
| · | Management intends to complete the corresponding intangible asset for use; |
| · | Grupo Aval has the capacity of using the intangible asset; |
| · | It is probable that future economic benefits that are attributable to the asset will flow to the entity; |
| · | There is availability of adequate technical or financial resources or other type, for completion of development and for using the intangible asset; and |
| · | Costs attributable to intangible assets during its development phase can be estimated and measures in a reliable manner. |
Costs that are directly attributable and capitalized as part of intangible assets include expenses of personal directly involved in developing such programs and an adequate percent of overhead expenses.
Grupo Aval Acciones y Valores S.A.
Notes to the Consolidated Financial Statement
As of December 31, 2016 and 2015 and for the years ended December 31, 2016, 2015 and 2014
(Figures expressed in millions of Colombian pesos)
Expenses not fulfilling these criteria are recognized as expenses as incurred. Disbursements over intangible assets are initially recognized as expenses of the period and they will not be subsequently recognized as intangible assets.
Subsequent to their initial recognition, these assets are measured at cost less amortization, which is carried out during its estimated useful life as follows: software amortization is recognized under the straight-line method, according to the estimated useful lives. At the end of each fiscal year, Grupo Aval analyzes if there is evidence based on each CGU, both external and internal, indicating that the intangible asset is impaired. Any loss due to subsequent impairment or reversals are recognized in profit or loss; such impairment is determined by the excess of carrying amount over recoverable value.
| 2.18 | Service concession arrangements |
Concession contracts, between certain subsidiaries of Grupo Aval and the Colombian Government for construction or maintenance of infrastructure during a specific period, in which those entities receive income during the life of the contract, whether through direct payments from the Government or through tolls or fees charged to the users. Are recognized as financial assets or intangible assets.
A financial asset is recognized when pursuant to the contract conditions, it is entitled to an unconditional contractual right of receiving from the grantor entity or from the Colombian Government, cash or other financial assets due to construction services or when the Government guarantees minimum income from tolls or fees charged to the users of the concession work during the term of the concession agreement. An intangible asset is recognized when the Grupo Aval subsidiary in the concession contract does not have an unconditional right to receive cash and it has a right to charge for the use of the concession infrastructure. In some cases, contracts can contain both a financial asset and an intangible asset.
Concession arrangements are recognized as follows:
| (a) | During the construction stage of assets under concession, all estimated income for construction and upgrade services and costs associated to construction are recognized in profit or loss based on the stage of completion of the work performed. Any additional expected loss is recognized as an expense. |
| (b) | If the concession agreements or part of such are classified as a financial asset, it is recognized as loans and receivables in other accounts receivable line item in the consolidated statement of financial position, at fair value at inception and subsequently at amortized cost, with the exception of certain concession agreements in the Promigas subsidiaries which due to the condition of the contracts, are classified as other financial assets at fair value through profit or losses. |
| (c) | If concession agreements or part of such are classified as an Intangible asset, the considerations for providing construction or upgrade services are measured at fair value on initial recognition with reference to the fair value of the services provided. The fair value is the cost of the intangible assets which was subsequently amortized to profit or loss during the term of the contract. Any income received as tolls or fees before completion of the construction stage is deferred and amortized, to profit or loss during the term of the contract, starting on the date in which the asset is placed into use. Income received from tolls or fees upon construction completion and available for public service is recognized as income when effectively received. |
Grupo Aval Acciones y Valores S.A.
Notes to the Consolidated Financial Statement
As of December 31, 2016 and 2015 and for the years ended December 31, 2016, 2015 and 2014
(Figures expressed in millions of Colombian pesos)
| 2.19 | Impairment of non-financial assets |
At each reporting date, Grupo Aval reviews the carrying amounts of its non-financial assets (other than investment properties and deferred tax assets) to determine whether there is any indication of impairment. If any such indication exists, then the asset’s recoverable amount is estimated.
Goodwill is tested annually for impairment. For impairment testing, assets are grouped together into the smallest group of assets that generates cash inflows from continuing use that is largely independent of the cash inflows of other assets or CGUs. Goodwill arising from a business combination is allocated to CGUs or groups of CGUs that are expected to benefit from the synergies of the combination.
The ‘recoverable amount’ of an asset or CGU is the greater of its value in use and its fair value less costs to sell. ‘Value in use’ is based on the estimated future cash flows, discounted to their present value using a pre-tax discount rate that reflects current market assessments of the time value of money and the risks specific to the asset or CGU.
An impairment loss is recognized if the carrying amount of an asset or CGU exceeds its recoverable amount.
Grupo Aval´s corporate assets do not generate separate cash inflows and are used by more than one CGU. Corporate assets are allocated to CGUs on a reasonable and consistent basis and tested for impairment as part of the testing of the CGUs to which the corporate assets are allocated.
Impairment losses are recognized in profit or loss. They are allocated first to reduce the carrying amount of any goodwill allocated to the CGU, and then to reduce the carrying amounts of the other assets in the CGU on a pro rata basis.
An impairment loss in respect of goodwill cannot be reversed. For other assets, an impairment loss is reversed only to the extent that the asset’s carrying amount does not exceed the carrying amount that would have been determined, net of depreciation or amortization, if no impairment loss had been recognized.
| 2.20 | Financial liabilities |
A financial liability is any contractual liability of Grupo Aval to deliver cash or other financial asset to another entity or person, or to exchange financial assets or financial liabilities under potentially unfavorable conditions for Grupo Aval, or a contract, which will be terminated or could be settled using equity instruments owned by the entity. Financial liabilities are initially recognized based on their fair value, which is usually equal to the transaction value less directly attributable costs. Subsequently, such financial liabilities are measured at their amortized cost according to the effective interest rate method determined at initial recognition, and recognized in profit or loss.
Grupo Aval entities provide the following in exchange of services rendered by employees:
| a) | Short-term employee benefits |
Pursuant to the Colombian labor rules, such benefits are comprised of salaries, legal and extra-legal premiums, holidays, severance payments and payroll tax contributions to the Colombian Government
Grupo Aval Acciones y Valores S.A.
Notes to the Consolidated Financial Statement
As of December 31, 2016 and 2015 and for the years ended December 31, 2016, 2015 and 2014
(Figures expressed in millions of Colombian pesos)
agencies which are paid within the next 12 months following the end of the period. Such benefits are recognized on an accrual basis and recognized in profit or loss.
| b) | Post-employment benefits (defined benefit plans) |
These are benefits that Grupo Aval pay to its employees when they retire or upon completion of their employment period, other than indemnities. According to the Colombian labor rules, such benefits are retirement pensions which are directly assumed by the Grupo Aval's entities, pending severance payments to employees belonging to the labor regime prior to Law 50 1990 and certain extra-legal benefits or agreed in collective labor conventions.
Post-employment benefits liabilities are determined based on present value of estimated future payments, calculated based on actuarial assessments based on the projected unit of credit method, and applying actuarial assumptions about mortality rate, increase of salaries and personnel turnover, and interest rates determined with reference to bond market returns in effect at the reporting date, the Colombian Government’s bonds or high-quality business liabilities. Under the projected unit of credit method, future benefits which will be paid to employees are assigned to each accounting period in which the employee renders the service. Therefore, the corresponding expense due to these benefits recognized in profit or loss of Grupo Aval includes the present service cost assigned in the actuarial calculation plus the financial cost of calculated liabilities. Changes in liabilities due to changes in actuarial assumptions are recognized in other comprehensive income.
Changes in actuarial liabilities due to changes in employment benefits granted to employees that have a retroactive effect are recognized as an expense in the earlier of the following dates:
| · | When a modification of the granted employment benefits takes place, or |
| · | When provisions for restructuring costs are recognized by a subsidiary or a business of Grupo Aval. |
| c) | Other long-term employee benefits |
Long term benefits are different from employee short-term benefits, post-employment benefits and termination. In accordance with the collective conventions and regulations of each company of Grupo Aval, such benefits are mainly seniority bonds.
Long-term liabilities for employee benefits are determined in the same manner as post-employment benefits described in item (b) above; the only difference is that the changes in the actuarial liability due to changes in the actuarial assumptions are recognized in profit or loss.
These benefits are payments carried out by Grupo Aval entities deriving from a unilateral decision of terminating a labor contract or by a decision of the employee to accept benefits offered by an entity in exchange for terminating the employment contract. Pursuant to Colombian law, such payments correspond to compensation and other benefits that entities unilaterally decide to grant to their employees under such circumstances.
Termination benefits are recognized as a liability and in profit or loss at the earlier of the following dates:
Grupo Aval Acciones y Valores S.A.
Notes to the Consolidated Financial Statement
As of December 31, 2016 and 2015 and for the years ended December 31, 2016, 2015 and 2014
(Figures expressed in millions of Colombian pesos)
| · | When Grupo Aval formally informs to the employee about its decision of dismissal; or |
| · | When provisions for restructuring costs are recognized by a subsidiary or business of Grupo Aval. |
Income tax expenses include current and deferred tax. Tax expenses are recognized in profit or loss except for items recognized in Other Comprehensive Income or directly in equity.
The current income tax is calculated based on the tax laws in force (enacted or substantively enacted) in Colombia as of the reporting date of the consolidated financial statements or, in the country where subsidiaries of Grupo Aval are located and subject to income tax payment. Management of each subsidiary of Grupo Aval periodically assesses tax return positions with respect to situations where the applicable tax regulation is subject to interpretation and establishes provisions, when appropriate, on the basis of amounts expected to be paid to tax authorities.
Deferred taxes are recognized on temporary differences arising between the tax basis of assets and liabilities and the carrying amounts in the consolidated financial statements. However, deferred taxes are not recognized if they derive from the initial recognition of goodwill; temporary differences on the initial recognition of an asset or liability in a transaction that is not business combination and that affects neither accounting or taxable profit or loss, and temporary differences related to investments in subsidiaries, associates and joint ventures to the extent that it is probable that they will not reverse in the foreseeable future. Deferred tax is determined using enacted or substantively enacted tax rates at the reporting date.
Deferred taxes assets are only recognized to the extent it is probable that future taxable income is expected to be available to offset temporary differences.
Deferred tax liabilities that arise from taxable temporary differences are recognized in the consolidated financial statements, except for the deferred tax liabilities on investments in subsidiaries, associates and joint ventures, when the reversal of such temporary differences is controlled by Grupo Aval and it is probable the temporary difference will not reverse in the near future. Generally, Grupo Aval has the ability to control the temporary differences of investments in associates.
Current taxes are offset only when it has a legally enforceable right to offset and it intends either to settle on a net basis or to realize the asset and settle the liability simultaneously. Deferred taxes are offset when there is a legal entitlement to offset current tax assets against current tax liabilities and when the deferred tax assets and liabilities are related to income taxes levied by the same tax authority over the same taxable entity or over different entities but these entities have an intention to settle current tax liabilities and assets on a net basis or their tax assets and liabilities will be realized simultaneously for each period in which these differences reverse.
In determining the amount of current and deferred tax, Grupo Aval considers the impact of uncertain tax exposures on current tax liabilities, including whether additional taxes and interest may be due. This assessment relies on estimates and assumptions and may involve a series of judgements about future events. New information may become available that causes Grupo Aval to change its judgement regarding the adequacy of existing tax liabilities; such changes to tax liabilities would impact tax expense in the period in which, such a determination is made.
Grupo Aval Acciones y Valores S.A.
Notes to the Consolidated Financial Statement
As of December 31, 2016 and 2015 and for the years ended December 31, 2016, 2015 and 2014
(Figures expressed in millions of Colombian pesos)
| 2.23 | Non-income taxes (Levies) |
Levies are recognized as liabilities when Grupo Aval has accomplished the activities on which taxes must be paid, according to legislation in effect.
A wealth tax was created by the Colombian Congress in late 2014, which is calculated over the equity of companies in Colombia, determined under fiscal rules as of January 1, 2014, for every year from 2015 through 2017, and is recognized on an annual basis as a liability when incurred and charged to profit or loss.
Provisions for environmental dismantling and recovery, restructuring costs and legal claims are recognized when Grupo Aval faces a present legal or constructive obligation as a result of past events, and it is probable that an outflow of economic benefits will be required to settle the obligation. Restructuring provisions include penalties due to cancelation of leases and employee dismissal payments.
Provisions are measured at the present value of outflows expected to be necessary to settle the obligation, using a discount rate before taxes, reflecting the assessments of the time value of money of the current market as well as the specific risks of the obligation. The subsequent increase of the provision due to the unwinding of the discount rate is recognized as a finance expense.
| 2.25 | Non-voting rights of preferred shares |
Preferred shares represent partial ownership and do not enjoy any of the voting rights of common shares.
Interest income and expense are recognized in profit or loss using the effective interest method. The ‘effective interest rate’ is the rate that discounts the estimated future cash payments and receipts through the expected life of the financial asset or financial liability (or, where appropriate, a shorter period) to the carrying amount of the financial asset or financial liability. When calculating the effective interest rate, the Group estimates future cash flows considering all contractual terms of the financial instrument, but not future credit losses.
The calculation of the effective interest rate includes transaction costs and fees and points paid or received that are an integral part of the effective interest rate. Transaction costs include incremental costs that are directly attributable to the acquisition or issue of a financial asset or financial liability.
Interest income and expense presented in the statement of profit or loss:
| (i) | interest on financial assets and financial liabilities measured at amortized cost calculated on an effective interest basis; |
| (ii) | interest on available-for-sale debt securities calculated on an effective interest basis; |
Grupo Aval Acciones y Valores S.A.
Notes to the Consolidated Financial Statement
As of December 31, 2016 and 2015 and for the years ended December 31, 2016, 2015 and 2014
(Figures expressed in millions of Colombian pesos)
Interest income and expense on all trading assets and liabilities are considered to be incidental to Grupo Aval’s trading operations and are presented together with all other changes in the fair value of trading assets and liabilities in net trading income.
Fair value changes on other derivatives held for risk management purposes, and other financial assets and financial liabilities carried at FVTPL, are presented in net income from other financial instruments at FVTPL in the statement of profit or loss and OCI.
‘Net trading income’ comprises gains less losses related to trading assets and liabilities, and includes all realized and unrealized fair value changes, interest, dividends and foreign exchange differences.
| • | Revenue from commissions and fees |
Commissions and fees are recognized as revenue in profit or loss as follows:
| i. | Commissions for banking services: when services are rendered; |
| ii. | The commissions on credit cards are booked and amortized on a straightline basis during the estimated useful life of the product and; |
| iii. | The commissions and fees incurred on the granting of new loans are deferred and recognized in profit or loss during the life of the loans, net of incurred cost, using the effective interest rate method. |
| • | Revenue from services and sales of goods |
Revenues are measured at fair value of the consideration received or receivable, and represent amounts to be collected for the delivered goods or rendered services, net of discounts, returns, and the value added tax.
Grupo Aval recognizes revenues when the amount thereof can be measured in a reliable manner, when it is likely that future economic benefits will flow to the entity and when the specific criteria for each activity of the entities of Grupo Aval have been fulfilled a follows:
Grupo Aval renders services regarding several activities. Revenue from services is recognized in the period when the service is provided. The services are rendered, with reference to the completion stage of the specific transaction and assessed on the basis of the real service provided, as a proportion of all of the services that will be rendered. When the services are rendered through an undetermined number of acts, throughout a specific period of time, income is recognized on a straight line basis throughout the period.
| • | Customer loyalty programs |
Financial entities and hotels of Grupo Aval manage several loyalty programs in which the customers accumulate points for their purchases, being entitled to redeem such points for prizes in accordance
Grupo Aval Acciones y Valores S.A.
Notes to the Consolidated Financial Statement
As of December 31, 2016 and 2015 and for the years ended December 31, 2016, 2015 and 2014
(Figures expressed in millions of Colombian pesos)
with the policies and the prize plan in force as of the redemption date. Reward points are recognized as an identifiable component separate from income for the service rendered, at their fair value. Income in loyalty programs is deferred and recognized in profit or loss when the entity has fulfilled its obligations to supply the products under the terms of the program or when it is no longer probable that the points under the program will be redeemed.
Sale of goods
Revenue from the sale of goods from the non-financial sector is recognized when the risks and returns of the product are transferred to the buyer.
Earnings per share is calculated by dividing the net income for the period attributable to Grupo Aval's shareholders by the weighted average number of common and preferred shares outstanding during the period given that preferred shares are entitled to the same dividends as common shares (see note 25). Diluted earnings per share are determined the same way, on the basis of net profit, but the weighted average number of shares outstanding is adjusted to account for the potential dilutive effect of stock options. Grupo Aval does not have financial instruments with potential voting rights. As a consequence, basic and diluted earnings per share are the same.
An operating segment is a component of an entity which:
| a) | Contracts business activities from which it can obtain revenue and incur expenses (including revenue and expenses from transactions with other components of the same entity); |
| b) | Its operating profit or losses are regularly revised by the chief operating decision maker, who decides on the resources allocation to the segment and assesses its performance; and |
| c) | For which discrete financial information is available. |
Grupo Aval discloses information separately for each identified operating segment, exceeding the minimum quantitative thresholds of a segment:
| a) | Reported revenue from the ordinary activities, including revenue from external customers and as well as revenue or transfers inter-segments, which are equal or greater than 10 per cent of the revenue of combined ordinary activities, internal and external, of all operating segments. |
| b) | The amount of the reported net income is, in absolute terms, equal to or greater than 10 per cent of the amount greater of: (i) the combined reported net income of all the segments of the operation which have not incurred losses; and (ii) the reported combined loss of all segments of the operation which incurred losses. |
| c) | Its assets are equal to or greater than 10 percent of the combined assets of all segments of the operation. |
Grupo Aval Acciones y Valores S.A.
Notes to the Consolidated Financial Statement
As of December 31, 2016 and 2015 and for the years ended December 31, 2016, 2015 and 2014
(Figures expressed in millions of Colombian pesos)
The information regarding other activities of the business of operation segments that do not have to be reported is combined and disclosed within the category “Others.”
In the current year, Grupo Aval has applied a number of new or revised International Accounting Standards (hereinafter, IAS), or IFRS issued by the IASB that are mandatorily effective for the accounting period beginning on January 1, 2016.
Annual Improvements to IFRS 2012 – 2014 Cycle
(Effective for annual periods beginning on or after January 1, 2016)
| Standard | Subject of amendment | Details |
| | | |
IFRS 5 Non-current Assets Held for Sale and Discontinued Operations | Changes in methods of disposal | The amendment introduces specific guidance in IFRS 5 for when an entity reclassifies an asset (or disposal group) from held for sale to held for distribution to owners (or vice versa), or when held-for-distribution accounting is discontinued. |
IFRS 7 Financial Instruments: Disclosure | Servicing contracts | The amendments provide additional guidance to clarify whether a servicing contract constitutes continuing involvement in a transferred asset for the purposes of the disclosures required in relation to transferred assets. |
| | | |
| | Applicability of the amendments to IFRS 7 on offsetting disclosure to condensed interim financial statements | Amendments to IFRS 7 were made to remove uncertainty as to whether the disclosure requirements on offsetting financial assets and financial liabilities (introduced in December 2011 and effective for periods beginning on or after January 1, 2013) should be included in condensed interim financial statements, and if so, whether in all condensed interim financial statements after January 1, 2013 or only in the first year. |
IAS 19 Employee Benefits | Discount rate: regional market issue | The amendments to IAS 19 clarify that the high-quality corporate bonds used to estimate the discount rate for post- |
Grupo Aval Acciones y Valores S.A.
Notes to the Consolidated Financial Statement
As of December 31, 2016 and 2015 and for the years ended December 31, 2016, 2015 and 2014
(Figures expressed in millions of Colombian pesos)
| | | employment benefits should be issued in the same currency as the benefits to be paid. |
| | | |
IAS 34 Interim financial reporting | Disclosures of information included “elsewhere in the financial report” | The amendments clarify the requirements relating to information required by IAS 34 that is presented elsewhere within the interim financial report but outside the interim financial statements. |
Amendments to IFRS 11 Accounting for Acquisitions of Interests in Joint Operations
(Effective for annual periods beginning on or after January 1, 2016)
The amendments to IFRS 11 provide guidance on how to account for the acquisition of an interest in a joint operation in which the activities constitute a business as defined in IFRS 3Business Combinations.
Amendments to IAS 1 Disclosure Initiative
(Effective for annual periods beginning on or after January 1, 2016)
The amendments were a response to comments that there were difficulties in applying the concept of materiality in practice as the wording of some of the requirements in IAS 1 had in some cases been read to prevent the use of judgment.
Amendments to IAS 16 and IAS 38 Clarification of Acceptable Methods of Depreciation and Amortization
(Effective for annual periods beginning on or after January 1, 2016)
The amendments to IAS 16 prohibit entities from using a revenue-based depreciation method for items of property, plant and equipment. The amendments to IAS 38 introduce a rebuttable presumption that revenue is not an appropriate basis for amortization of an intangible asset. This presumption can only be rebutted under the following two limited circumstances:
| a) | when the intangible asset is expressed as a measure of revenue; or |
| b) | when it can be demonstrated that revenue and consumption of the economic benefits of the intangible asset are highly correlated. |
The amendments apply prospectively. Currently, Grupo Aval uses the straight-line method for depreciation and amortization for its tangible and intangible assets, respectively. Management believes that the straight-line method is the most appropriate method to reflect the consumption of economic benefits inherent in the respective assets and accordingly, the application of this amendment has had no impact on the amounts recognized in Grupo Aval’s consolidated financial statements.
Amendments to IAS 16 and IAS 41 Agriculture: Bearer Plants
(Effective for annual periods beginning on or after January 1, 2016)
The amendments to IAS 16 and IAS 41 define a bearer plant and require biological assets that meet the definition of a bearer plant to be accounted for as property, plant and equipment in accordance with IAS 16, instead of IAS 41. In terms of the amendments, bearer plants can be measured using either the cost model or the revaluation model set out in IAS 16.
The produce growing on bearer plants continues to be accounted for in accordance with IAS 41.
Grupo Aval Acciones y Valores S.A.
Notes to the Consolidated Financial Statement
As of December 31, 2016 and 2015 and for the years ended December 31, 2016, 2015 and 2014
(Figures expressed in millions of Colombian pesos)
The amendments apply retrospectively. The application of this amendment has had no significant impact on the amounts recognized in Grupo Aval’s consolidated financial statements. For more information, refer to Note 15.
Amendments to IAS 27 Equity Method in Separate Financial Statements
(Effective for annual periods beginning on or after January 1, 2016)
The amendments to IAS 27 focus on separate financial statements and allow the use of the equity method in such statements. Specifically, the amendments allow an entity to account for investments in subsidiaries, joint ventures and associates in its separate financial statements:
| · | in accordance with IFRS 9Financial Instruments (or IAS 39Financial Instruments: Recognition and Measurement for entities that have not yet adopted IFRS 9); or |
| · | using the equity method as described in IAS 28Investments in Associates and Joint Ventures. |
The amendments apply retrospectively.
Amendments to IFRS 10, IFRS 12 and IAS 28 Investment Entities: Applying the Consolidation Exception
(Effective for annual periods beginning on or after January 1, 2016)
The amendments to IFRS 10, IFRS 12 and IAS 28 clarify that the exemption from preparing consolidated financial statements is available to a parent entity that is a subsidiary of an investment entity, even if the investment entity measures all its subsidiaries at fair value in accordance with IFRS 10. Consequential amendments have also been made to IAS 28 to clarify that the exemption from applying the equity method is also applicable to an investor in an associate or joint venture if that investor is a subsidiary of an investment entity that measures all its subsidiaries at fair value.
The amendments apply retrospectively.
Below is a list of the new and amended standards that have been issued by the IASB and are effective for annual periods starting on or after January 1, 2017. Management is in the process of assessing the potential impact of these pronouncements on Grupo Aval consolidated financial statements.
| Forthcoming requirements. | | Title of the Standard | | Effective for
Annual Periods
Beginning on or After |
| Amendments to IAS 7 (*) | | Disclosure Initiative | | January 1, 2017 |
| Amendments to IAS 12 (*) | | Recognition of Deferred Tax Assets for Unrealized Losses | | January 1, 2017 |
| IFRS 15 | | Revenue from Contracts with Customers | | January 1, 2018 |
| IFRS 9 | | Financial Instruments | | January 1, 2018 |
| IFRS 16 | | Leases | | January 1, 2019 |
| Amendments to IFRS 10 and IAS 28 | | Sale or Contribution of Assets between an Investor and its Associate or Joint Venture | | Postponed |
(*) No significant impact on Grupo Aval´s financial information is expected from these amendments.
Grupo Aval Acciones y Valores S.A.
Notes to the Consolidated Financial Statement
As of December 31, 2016 and 2015 and for the years ended December 31, 2016, 2015 and 2014
(Figures expressed in millions of Colombian pesos)
IFRS 9 Financial Instruments and associated amendments to various other standards:IFRS 9 replaces the multiple classification and measurement models in IAS 39Financial instruments: Recognition andmeasurement with a single model that has initially only two classification categories: amortized cost and fair value.
Phase 1: Classification and measurement of financial assets and financial liabilities
Classification of debt assets will be driven by the entity’s business model for managing the financial assets and the contractual cash flow characteristics of the financial assets. A debt instrument is measured at amortized cost if: a) the objective of the business model is to hold the financial asset for the collection of the contractual cash flows, and b) the contractual cash flows under the instrument solely represent payments of principal and interest.
All other debt and equity instruments, including investments in complex debt instruments and equity investments, must be recognized at fair value.
All fair value movements on financial assets are taken through the statement of profit or loss, except for debt and equity investments that are not held for trading, which may be recorded in the Other Comprehensive Income (without subsequent recycling to profit or loss).
For financial liabilities that are measured under the fair value option entities will need to recognize the part of the fair value change that is due to changes in the their own credit risk in other comprehensive income rather than profit or loss.
As stated through the document, Grupo Aval is organized into five segments comprised by four banks and their subsidiaries within and outside Colombia, and Corficolombiana has merchant bank. The banking business of the Group is focused on commercial and consumer portfolios and we have not a history of operating any complex financial products. As part of our implementation strategy, our main goal has been to achieve, among the different segments and subsidiaries, a homogeneous application of the classification of financial instruments of the portfolios established under IFRS 9 and, in order to do so; we have developed a standardized process and guidelines, for a homogeneous analysis to the extent possible.
Grupo Aval as a holding entity and through its banking subsidiaries and Corficolombiana, is currently in the process of implementing an analysis of its portfolios using the abovementioned common guidelines in order to assess, identify and classify financial instruments into their corresponding portfolio under IFRS 9.
Therefore, in accordance to the status of the project and remaining phases to be completed, Grupo Aval would expect the following:
| • | Financial assets classified as loans under IAS 39 will generally continue to be classified into amortized cost. |
| • | Available for sale debt instruments will likely continue to be classified at either fair value with changes presented in other comprehensive income or at amortized cost. |
| • | Available for sale equity instruments will be classified at fair value with changes in profit or loss, unless Grupo Aval concludes irrevocably, to present them at fair value with changes presented in other comprehensive income. |
In the case of financial liabilities, the classification and measurement criteria defined under IAS 39 will remain without major differences under IFRS 9.
Grupo Aval Acciones y Valores S.A.
Notes to the Consolidated Financial Statement
As of December 31, 2016 and 2015 and for the years ended December 31, 2016, 2015 and 2014
(Figures expressed in millions of Colombian pesos)
Phase 2: Impairment methodology
A new expected credit loss (ECL) model, which involves a three-stage approach whereby financial assets move through the three stages as their credit quality changes. The stage dictates how an entity measures impairment losses and applies the effective interest rate method. A simplified approach is permitted for financial assets that do not have a significant financing component (eg trade receivables) the 3 stages are as follow:
First stage: On initial recognition, entities will record a provision equal to the 12 month ECL (or lifetime ECL for trade receivables), unless the assets are considered credit impaired.
In estimating the parameters used in the expected loss calculation (Exposure at Default (EAD), “Probability of Default” (PD), “Loss Given Default” (LGD) and discount rate), Grupo Aval leverages its experience of developing internal models for calculating parameters for regulatory and management purposes.
The definition of default is consistent with the definition of default currently used by Grupo Aval. IFRS 9 does not define default, but contains a rebuttable presumption that default has occurred when an exposure is greater than 90 days past due.
Use of present, past and future information: both the measurement and the classification of the expected credit losses require a high degree of judgment and estimations that must consider information about past events and current conditions as well as forecasts of future events. In this regard, our estimations of expected losses consider multiple macroeconomic scenarios which probability will be assessed considering past event, the current situation and future trends of macroeconomic factors such as gross domestic product (GDP) and unemployment rate. All these concepts will be the input to assess the significant increases in credit risk, as well as utilizing PD estimations.
Second stage: In this stage assets with significant increase in credit rise since initial recognition a provision will record equal to the lifetime ECL. interest income for this loan effective interest income are recorded also on gross carry amount.
Third stage: This stage loans are classified are credit impairment assets and the provision will be record in the lifetime ECL. Interest income are recorded on loans carrying amount net of credit allowance
Phase 3: Hedge accounting
The new hedge accounting rules (released in December 2013) align hedge accounting more closely with common risk management practices. The new standard also introduces expanded disclosure requirements and changes in presentation.
Grupo Aval is in the process of evaluating the effects of IFRS 9 application. Once completed, management will communicate the expected impact once a reliable estimation can be made. IFRS 9 application could represent a loan impairment increase and a higher volatility in Grupo Aval future results.
IFRS 15 Revenue from Contracts with Customers
(Effective for annual periods beginning on or after January 1, 2018)
Grupo Aval Acciones y Valores S.A.
Notes to the Consolidated Financial Statement
As of December 31, 2016 and 2015 and for the years ended December 31, 2016, 2015 and 2014
(Figures expressed in millions of Colombian pesos)
In May 2014, IFRS 15 was issued, which establishes a single comprehensive model for entities to use in accounting for revenue arising from contracts with customers. IFRS 15 will supersede the following revenue Standards and Interpretations upon its effective date:
| · | IAS 18 Revenue; |
| · | IAS 11 Construction Contracts; |
| · | IFRIC 13 Customer Loyalty Programmes; |
| · | IFRIC 15 Agreements for the Construction of Real Estate; |
| · | IFRIC 18 Transfers of Assets from Customers; and |
| · | SIC 31 Revenue-Barter Transactions Involving Advertising Services. |
Under IFRS 15, a customer of an entity is a party that has contracted with the entity to obtain goods or services that are an output of the entity’s ordinary activities in exchange for consideration. Unlike the scope of IAS 18, the recognition and measurement of interest income and dividend income from debt and equity investments are no longer within the scope of IFRS 15. Instead, they are within the scope of IFRS 9 Financial Instruments, as they will likely be adopted at the same date.
As mentioned above, the new revenue Standard has a single model to deal with revenue from contracts with customers. Its core principle is that an entity should recognize revenue to depict the transfer of promised goods or services to customers in an amount that reflects the consideration to which the entity expects to be entitled in exchange for those goods or services.
The new revenue Standard introduces a five-step approach to revenue recognition and measurement:
| · | Step 1: Identify the contract with a customer. |
| · | Step 2: Identify the performance obligations in the contract. |
| · | Step 3: Determine the transaction price. |
| · | Step 4: Allocate the transaction price to the performance obligations in the contract. |
| · | Step 5: Recognize revenue when (or as) the entity satisfies a performance obligation. |
Far more prescriptive guidance has been introduced by the new revenue Standard:
| · | Whether or not a contract (or a combination of contracts) contains more than one promised good or service, and if so, when and how the promised goods or services should be unbundled. |
| · | Whether the transaction price allocated to each performance obligation should be recognized as revenue over time or at a point in time. Under IFRS 15, an entity recognizes revenue when a performance obligation is satisfied, which is when “control” of the goods or services underlying the particular performance obligation is transferred to the customer. Unlike IAS 18, the new Standard does not include separate guidance for “sales of goods” and “provision of services”; rather, the new Standard requires entities to assess whether revenue should be recognized over time or at a particular point in time regardless of whether revenue relates to “sales of goods” or “provision of services”. |
| · | When the transaction price includes a variable consideration element, how it will affect the amount and timing of revenue to be recognized. The concept of variable consideration is broad; a transaction price is considered variable due to discounts, rebates, refunds, credits, price concessions, incentives, performance bonuses, penalties and contingency arrangements. The new Standard introduces a high hurdle for variable consideration to be recognized as revenue – that is, only to the extent that it is highly probable that a significant reversal in the amount of cumulative revenue recognized will not occur when the uncertainty associated with the variable consideration is subsequently resolved. |
| · | When costs incurred to obtain a contract and costs to fulfill a contract can be recognized as an asset. |
Grupo Aval Acciones y Valores S.A.
Notes to the Consolidated Financial Statement
As of December 31, 2016 and 2015 and for the years ended December 31, 2016, 2015 and 2014
(Figures expressed in millions of Colombian pesos)
| · | Extensive disclosures are required by the new Standard. |
| · | In April 2016, the IASB issued Clarifications to IFRS 15 in response to feedback received by the IASB/FASB Joint Transition Resource Group for Revenue Recognition, which was formed to address potential issues associated with the implementation of IFRS 15 and the US GAAP equivalent, ASC topic 606. The Clarifications to IFRS 15 clarified the following areas: |
| · | Identifying performance obligations: by providing illustrative factors for consideration in assessing whether the promised goods or services are distinct; |
| · | Principal versus agent considerations: by clarifying that an entity should assess whether it is a principal or agent for each distinct good or service promised to the customer, and by amending and reframing the indicators to assess whether an entity is a principal or agent; and |
| · | Licensing application guidance: in determining whether the license grants customers a right to use the underlying intellectual property (IP) (which would result in point time revenue recognition) or a right to access the IP (which would result in revenue recognition over time), an entity is required to determine whether (i) its ongoing activities are expected to significantly change the form or the functionality of the IP or (ii) the ability of the customer to obtain benefit from the IP is substantially derived from or dependent upon those activities. |
IFRS 15, together with the clarifications thereto issued in April 2016, is effective for reporting periods beginning on or after January 1, 2018 The Clarification to IFRS 15 also introduces additional practical expedients for entities transitioning to IFRS 15 on (i) contract modifications that occurred prior to the beginning of the earliest period presented and (ii) contracts that were completed at the beginning of the earliest period presented.
Grupo Aval management anticipates that the application of IFRS 15 may have a non-material impact on the amounts reported and disclosures made in the consolidated financial statements. However, it is not practicable to provide a reasonable estimate of the effect of IFRS 15 until it is performed a detailed review.
IFRS 16 Leases
(Effective for annual periods beginning on or after January 1, 2019)
IFRS 16 provides a comprehensive model for the identification of lease arrangements and their treatment in the financial statements of both lessees and lessors. It will supersede the following lease Standard and Interpretations upon its effective date:
| · | IFRS 16 Leases; |
| · | IFRIC 4 Determining whether an Arrangement contains a Lease; |
| · | SIC-15 Operating Leases – Incentives; and |
| · | SIC-27 Evaluating the Substance of Transactions Involving the Legal Form of a Lease. |
Identification of a Lease
IFRS 16 applies a control model to the identification of leases, distinguishing between leases and service contracts on the basis of whether there is an identified asset controlled by the customer. Control is considered to exist if the customer has:
| · | The right to obtain substantially all of the economic benefits from the use of an identified asset; and |
| · | The right to direct the use of that asset. |
The Standard provides detailed guidance to determine whether those conditions are met, including instances where the supplier has substantive substitution rights, and where the relevant decisions about how and for what purpose the asset is used are predetermined.
Grupo Aval Acciones y Valores S.A.
Notes to the Consolidated Financial Statement
As of December 31, 2016 and 2015 and for the years ended December 31, 2016, 2015 and 2014
(Figures expressed in millions of Colombian pesos)
Lease accounting
IFRS 16 introduces significant changes to lessee accounting: it removes the distinction between operating and finance leases under IAS 17 and requires a lessee to recognize a right-of-use asset and a lease liability at lease commencement for all leases, except for short-term leases and leases of low value assets.
The right-of-use asset is initially measured at cost and subsequently measured at cost (subject to certain exceptions) less accumulated depreciation and impairment losses, adjusted for any remeasurement of the lease liability.
The lease liability is initially measured at the present value of the lease payments that are not paid at that date. Subsequently, the lease liability is adjusted for interest and lease payments, as well as the impact of lease modifications, amongst others.
If a lessee elects not to apply the general requirements of IFRS 16 to short-term leases (i.e. one that does not include a purchase option and has a lease term at commencement date of 12 months or less) and leases of low value assets, the lessee should recognize the lease payments associated with those leases as an expense on either a straight-line basis over the lease term or another systematic basis, similar to the current accounting for operating leases.
Lessor accounting
In contrast to lessee accounting, the IFRS 16 lessor accounting requirements remain largely unchanged from IAS 17, which continue to require a lessor to classify a lease either as an operating lease or a finance lease. In addition, IFRS 16 also provides guidance on the accounting for sale and leaseback transactions. Extensive disclosure are also required.
IFRS 16 is effective for reporting periods beginning on or after January 1, 2019 with early application permitted for entities that apply IFRS 15 at or before the date of initial application of IFRS 16. A lessee can apply IFRS 16 either by a full retrospective approach or a modified retrospective approach. If the latter approach is selected, an entity is not required to restate the comparative information and the cumulative effect of initially applying IFRS 16 must be presented as an adjustment to opening retained earnings (or other component of equity as appropriate).
Grupo Aval management anticipates that the application of IFRS 16 could have material impact on the amounts reported, ratios, debt levels reported and disclosures made in the consolidated financial statements. However, it is not practicable to provide a reasonable estimate of the effect of IFRS 16 until detailed review is performed by Grupo Aval.
NOTE 3 – JUDGEMENTS AND CRITICAL ACCOUNTING ESTIMATES IN APPLYING ACCOUNTING POLICIES
Grupo Aval’s management makes estimates and assumptions that affect the amounts recognized in the consolidated financial statements and the carrying value of the assets and liabilities within the fiscal year. The judgments and estimates are continuously evaluated and are based on the experience of management and other factors, including the occurrence of future events that are believed as reasonable under the current circumstances. Management also makes certain judgments besides those which involve estimates during the process of applying accounting policies. These judgments that have the most significant effects on the amounts recognized in the consolidated financial statements and the estimates that may cause an
Grupo Aval Acciones y Valores S.A.
Notes to the Consolidated Financial Statement
As of December 31, 2016 and 2015 and for the years ended December 31, 2016, 2015 and 2014
(Figures expressed in millions of Colombian pesos)
important adjustment to the value in the carrying value of assets and liabilities in the following year include the following:
Held-to-maturity financial assets. Management applies judgment in assessing whether financial assets can be categorized as held-to-maturity. In particular (a) its intention and ability to hold the assets to maturity and (b) whether the assets are quoted in an active market. If Grupo Aval fails to keep these investments to maturity other than in certain specific circumstances – for example, selling an insignificant amount close to maturity – it will be required to reclassify the entire class as available-for-sale. The investments would, therefore, be measured at fair value rather than amortized cost. If the entire class of held-to-maturity investments is reclassified, the carrying amount in 2016 would decrease by Ps. 12,153 thousand (2015 increase: of Ps. 18,387) with a corresponding entry in other comprehensive income.
Impairment of available-for-sale financial assets. In making this judgment, Grupo Aval, among other factors, considers the volatility in the security price. In addition, impairment may be appropriate when there is evidence of changes in technology or a deterioration in the financial health of the investee, industry and sector performance, or operating or financing cash flows. Had all the declines in fair value below cost been considered significant or prolonged, Grupo Aval would record an additional impairment loss of Ps. 471,619 (2015: Ps. 892,405 and 2014: Ps.3,678), which would be reclassified from other comprehensive income to profit or loss for the year.
Loan impairment allowance:Grupo Aval regularly revises its loan portfolio to evaluate its impairment. In determining if an impairment should be registered through profit or loss for the year, management determines if there are observable data indicating a decrease in the estimated cash flow of the loan portfolio, before the decrease in such flow may be identified for a particular loan of the portfolio.
The process used to calculate the provision includes an analysis of specific, historical and subjective components. The methods used by Grupo Aval include the following:
| · | A regular detailed analysis of the loan portfolio. |
| · | A system for classifying loans according to risk levels. |
| · | A regular review of the summary of loan-loss provisions. |
| · | Identification of loans to be assessed individually for impairment. |
| · | Consideration of internal factors such as our size, organizational structure, the structure of the loan portfolio, the loan management process, a trend analysis of non-performing loans and historical loss experiences. |
| · | Consideration of the risks inherent in different types of loans. |
| · | Consideration of external factors - local, regional and national - as well as economic factors. |
Main sources of uncertainty in loan impairment calculations:
In the process of calculating impairment for loans deemed individually significant, based on the discounted cash flow method, Grupo Aval´s management makes assumptions as to the amount to be recovered from each customer and when it will be recovered. Any change in this estimate can generate significant changes in the value of the provision that is established. In calculating provisions for loans considered to be individually significant, based on their collateral, management estimates the fair value of the collateral with the help of independent appraisals. In turn, any variation in the price ultimately obtained in recovering the collateral can prompt significant changes in the value of the allowances.
In the process of calculating the collective impairments allowances for loans management focuses on loans that are not considered individually significant or loans that are individually significant but that have not
Grupo Aval Acciones y Valores S.A.
Notes to the Consolidated Financial Statement
As of December 31, 2016 and 2015 and for the years ended December 31, 2016, 2015 and 2014
(Figures expressed in millions of Colombian pesos)
been previously impaired. The historic loss rates used in the process are regularly updated to include the most recent data that reflects current economic conditions, trends in industry performance, geographic concentrations or concentrations of borrowers within each portfolio segment, and any other relevant information that could affect the estimation of loan impairment provisions. Many factors can affect estimates of the provisions for losses on loans granted by Grupo Aval, including volatility in the probability of impairment, migration and estimates of the severity of the losses.
To quantify the losses incurred in collectively assessed portfolios, Grupo Aval has calculation methods that take into account four main factors: exposure at default, probability of default, the loss identification period and the loss given default as explained below. For such purposes, loans are considered in default when they are past due for more than 90 days , restructured loans due to financial problems for the debtors, clients in bankruptcy and clients included in credit risk categories D or E, according to internal credit risk evaluation models.
| · | Exposure at default (EAD) is the amount of risk incurred at the time of counterparty defaults. |
| · | Probability of default (PD) is the possibility the counterparty will default on its obligations to pay capital and/or interest. The probability of default is associated with the rating/scoring or the level of default of each counterpart/transaction. In the specific case of loan default, the assigned PD is 100%. |
| · | The loss identification period (LIP) refers to the time elapsed between the occurrence of the event that generates an incurred loss and the time that loss becomes clearly evident at the individual level. LIPs are analyzed based on loans with similar risk. |
| · | Loss given default (LGD) is the estimated loss in the event of default. It depends mainly on the characteristics of the counterparty and the valuation of the collateral associated with the transaction. |
The following table shows a sensitivity analysis of the most important variables affecting the calculation of the provision for loan portfolio impairment:
| December 31, 2016 |
| | | Sensitivity | | | Increase | | | Decrease | |
| Loans assessed individually: | | | | | | | | | | | | |
| Probability of default on estimated future cash flows | | | 10 | % | | | 325,866 | | | | (191,518 | ) |
| Loans assessed collectively: | | | | | | | | | | | | |
| Probability of default | | | 10 | % | | | 176,162 | | | | (218,154 | ) |
| Severity of the estimated loss | | | 10 | % | | | 199,130 | | | | (234,327 | ) |
| Loss identification period | | | 1 month | | | | 189,434 | | | | (178,529 | ) |
| December 31, 2015 |
| | | Sensitivity | | | Increase | | | Decrease | |
| Loans assessed individually: | | | | | | | | | | | | |
| Probability of default on estimated future cash flows | | | 10 | % | | | 225,292 | | | | (196,350 | ) |
| Loans assessed collectively: | | | | | | | | | | | | |
| Probability of default | | | 10 | % | | | 115,401 | | | | (157,465 | ) |
| Severity of the estimated loss | | | 10 | % | | | 146,631 | | | | (163,341 | ) |
| Loss identification period | | | 1 month | | | | 87,869 | | | | (102,626 | ) |
| December 31, 2014 |
| | | Sensitivity | | | Increase | | | Decrease | |
| Loans assessed individually: | | | | | | | | | | | | |
| Probability of default on estimated future cash flows | | | 10 | % | | | 149,764 | | | | (95,768 | ) |
| Loans assessed collectively: | | | | | | | | | | | | |
| Probability of default | | | 10 | % | | | 75,642 | | | | (93,925 | ) |
| Severity of the estimated loss | | | 10 | % | | | 112,729 | | | | (145,428 | ) |
| Loss identification period | | | 1 month | | | | 256,558 | | | | (10,417 | ) |
Grupo Aval Acciones y Valores S.A.
Notes to the Consolidated Financial Statement
As of December 31, 2016 and 2015 and for the years ended December 31, 2016, 2015 and 2014
(Figures expressed in millions of Colombian pesos)
Deferred Income Tax: Grupo Aval assess the realization of the deferred income tax asset throughout time. The deferred tax asset represents the recoverable income taxes through future deductions from taxable income and they are recognized in the financial position statement. The deferred tax assets are recoverable to the extent that the realization of the related tax benefits is likely. Future tax revenues and the amount of the tax benefits that are probable in the future are based on medium-term plans prepared by management. The business plan is based on management´s expectations which are believed to be reasonable under the current circumstances. Management based their financial and tax projections for each company and at the consolidated level on a project constant growth, adjusted for inflation, of 3% for the following 5 years.
As of December 30, 2016 and December 31, 2015 Grupo Aval’s management estimates that the deferred income tax asset would be recoverable according to the estimates of future taxable income. Deferred tax liabilities have not been recognized on income from its subsidiaries in which Grupo Aval has no to repatriate in the near future, Grupo Aval controls the dividend policies of the subsidiaries and has no intent to repatriate dividends or sell the related investments in the near future. See Note 19.
Fair value of Biological Assets: The fair value for biological assets, which Grupo Aval owns through long-term crops is determined based on appraisals prepared internally by each entity and internal experts in the development of such crops and preparation of valuation models. Due to the nature of such crops and the lack of comparable market data, the fair value of these assets is determined based on models of discounted cash flow of future net cash flows of each crop. The valuation takes into account the estimated future harvest yields, current prices of such products and the estimated future costs during development, maintenance and future harvest costs, discounted at the risk-free interest rates adjusted by risk premiums which are required in such circumstances. Note 15 discusses the main assumptions used in the determination of the fair value of biological assets as well as a sensitivity analysis.
Fair value of investment properties:The Group determines the fair value of investment properties based on appraisal reports prepared by third party independent real estate appraisers in accordance with international valuation standards on the basis of comparable prices in the local market or of net cash inflows discounted to present value using a discounted cash flow method. The valuations are made on the basis of estimated future cash flows supported by existing leases or other contracts, current market rents of similar properties in similar locations and conditions, related property operating expenses and discount rates that reflect market assessments of the uncertainty in the amount and timing of the cash flows. The best evidence to support the fair value for investment properties are the current prices in an active market for similar investment properties.
Goodwill Impairment: Annually, Grupo Aval conducts an evaluation of goodwill impairment recorded in their financial statements. The assessment is based on market values of stocks of banks listed in Stock Exchanges and based on studies carried out for these entities that are not quoted on the Colombia Stock Exchange. These studies are based on the valuation of the business lines that are related with goodwill, through the discounted cash flow method. The analysis takes into account factors such as: the economic situation of the country and the sector in which Grupo Aval operates, historical financial information, projected growth of revenues and costs of Grupo Aval during the next five years and subsequent perpetual growth, profits capitalization indices which are all discounted at the risk free interest rates adjusted by risk premiums which are required under the circumstances. Note 17 includes the main assumptions used in these assessments and a sensitivity analysis.
Provision for contingencies: Grupo Aval evaluates and records an estimate for contingencies, in order to cover possible losses due to the labor cases, civil and commercial lawsuits, and tax objections or other issues.
Grupo Aval Acciones y Valores S.A.
Notes to the Consolidated Financial Statement
As of December 31, 2016 and 2015 and for the years ended December 31, 2016, 2015 and 2014
(Figures expressed in millions of Colombian pesos)
The contingencies are based on the opinion of the external legal counsel and/or in-house lawyers, when they consider the loss to be probable and it can be reasonably quantified. Given the nature of many claims, cases and/or processes, in some opportunities it is not possible to carry out an accurate forecast or to quantify the amount of loss in a reasonable manner. Consequently, the actual amount of disbursements effectively paid for claims, cases and/or processes is different from the initial estimated and provisioned amounts and the differences are recognized when they are identified.
Post-employment Plan: Measurement of the pension obligation, costs and liabilities depends on a variety of long-term premises determined on actuarial bases. The assumptions for the pension obligation, includes an estimate of the present value of projected future pension payments for the participants of the plan and, the likelihood of potential future events, such as increases in the urban minimum wage and demographic experience. These premises may have an effect on the amount of future contributions if there are any variations, and also on the service cost recognize in the income statement.
The discount rate allows for the calculation of future cash flows at the present value as of the date of measurement. Grupo Aval determines a long-term rate representing the market rate of high quality fixed-income investments or for government bonds denominated in Colombian Pesos, the currency in which the benefit will be paid. They also consider the opportunity and the amount of payments of future benefits, for which the Bank has selected the government bonds. Grupo Aval uses other key premises for assessing actuarial liabilities, which are calculated based on the specific experience of Grupo Aval combined with published statistics and market indicators (see Note 22, which describes the most important assumptions used in the actuarial calculations and the corresponding sensitivity analysis).
NOTE 4 – RISK MANAGEMENT
Grupo Aval and its subsidiaries in the financial sector such as Banco de Bogotá, Banco de Occidente, Banco AV Villas, Banco Popular and Corficolombiana manage risk pursuant to the applicable regulations in each country where the operate and according to Grupo Aval’s internal policies.
Even though Grupo Aval´s non-financial sector subsidiaries are less exposed to certain financial risks, they are still exposed to adverse changes in the prices of their products and to operational, compliance and legal risks.
A detailed summary of the main risks Grupo Aval could be subject or exposed to as follows: financial, non-financial and cross-group risks. These risks are described in accordance to the analysis made by the Group:
Financial risks
Credit risk: risk of incurring in a financial loss as a result of failure of the debtors to meet their contractual obligations in financial transactions.
Market risk: risk derived from changes in market variables that could affect the value of the portfolios.
Liquidity risk: risk related to the inability to fulfill obligations with customers, financial market counterparties, lenders, suppliers, authorities or other stakeholders, or complying with those obligations at an excessive cost.
Regulatory and capital management risks include: risk related to banking subsidiaries and management of capital requirements and adequacy.
Grupo Aval Acciones y Valores S.A.
Notes to the Consolidated Financial Statement
As of December 31, 2016 and 2015 and for the years ended December 31, 2016, 2015 and 2014
(Figures expressed in millions of Colombian pesos)
Non-financial risks
Operational risk: risk to incur losses due to failure on day to day processes, individuals, operating systems supporting the business, or external events.
Conduct risk: risk derived from inappropriate practices in the dealings with customers, and the treatment of products offered to each particular customer and the adequacy thereof.
Compliance and legal risk: risk arising from non-compliance with the legal framework, internal rules or the requirements of regulators and supervisors.
Cross-group risks:
Reputational risk: risk of deterioration or damage in the perception of Grupo Aval and its subsidiaries by media, public opinion, customers, investors and other key players in the market.
Strategic risk: risk resulting from changes in Grupo Aval’s strategy or business plan due to changes in general business conditions and risk associated with strategic decisions, such as investments. Strategic risk also includes the risk of poor implementation of decisions and lack of capacity to respond to changes in the business environment.
Objective and general guidelines
Grupo Aval's objective is to maximize long term returns for its investors, through proper risk management. The guiding principles of risk management of Grupo Aval are as follows:
| a) | Make risk management a part of every institutional process. |
| b) | Collective decision making for commercial lending of significant amounts at the Board of Directors. |
| c) | Extensive and in-depth market knowledge, as a result of our leadership and our experienced, stable and seasoned senior management. |
| d) | Clear risk management policies based on a top-down approach with respect to: |
| · | Compliance with know-your-customer policies. |
| · | Commercial loans credit structure based on a clear identification of sources of repayment and of cash flow generating capacity of the borrower. |
| e) | Use common credit analysis tools and loan pricing tools across Grupo Aval's subsidiaries. |
| f) | Diversification of the commercial loan portfolio with respect to industries and economic groups. |
| g) | Specialization in consumer product niches. |
| h) | Extensive use of continuously updated scoring models to ensure quality growth of consumer loans. |
| i) | Conservative policies in terms of: |
| · | Trading portfolio composition with bias towards lower volatility instruments. |
| · | Proprietary trading, and |
| · | The variable compensation for the trading staff. |
Risk management
Grupo Aval´s risk management is based on the principles indicated in the section above and they are transmitted to all banking subsidiaries and business units. The risk management strategy is supported by the following guidelines:
Grupo Aval Acciones y Valores S.A.
Notes to the Consolidated Financial Statement
As of December 31, 2016 and 2015 and for the years ended December 31, 2016, 2015 and 2014
(Figures expressed in millions of Colombian pesos)
| a) | In all of Grupo Aval’s banking subsidiaries the risk function is independent of the business units. The segregation of functions between the business areas and the risk areas in charge of risk acceptance, measurement analysis, control and reporting provides sufficient independence and autonomy for proper risk control. |
| b) | The decision making process at the banking subsidiaries requires that transactions of significant amounts are sent to decision centers such as risk committees. The frequency of meetings of these committees assures a high degree of agility regarding the resolution of proposals and continuous participation of senior management for administering the different risks. |
| c) | Grupo Aval has detailed manuals and policies for risk management. The business and risk groups of Grupo Aval hold regular orientation meetings based on approaches to risk that are consistent with the Group´s risk culture. |
| d) | Grupo Aval has implemented a risk limit system that is updated on a regular basis to address new conditions in the markets and the risks to which they are exposed. |
| e) | There are adequate information systems to monitor risk exposure on a daily basis, to ensure compliance with limits approval and, if necessary, to implement proper corrective actions. |
| f) | Key risks are analyzed on a regular basis, and not only when risks materialize or when problems occur during the normal course of business. |
| g) | Grupo Aval offers adequate, permanent training courses on risk culture. These courses are given at every level within the organization. |
| h) | A risk culture integrated throughout the organization, consisting on a series of attitudes, values, skills and guidelines to action. |
Corporate structure of the risk function
Governance of the risk function seeks to ensure that risk decisions are taken appropriately and efficiently and that risks are effectively controlled. The goal is to guarantee that risks are managed in accordance with the guidelines set forth by Grupo Aval. The corporate structure for risk management at the banking subsidiaries is comprised of the following, top-level risk governance bodies:
| · | Board of Directors |
| · | Risk committees |
| · | Risks vice-presidency |
| · | Risk management administrative processes |
| · | Internal Auditing Department |
Responsibility for the control and management of risk and, in particular, for the setting of the Group's risk tone rests ultimately with the Board of Directors of Grupo Aval. The Board has the powers to delegate to the various committees. The Board is supported by a comprehensive structure of risk management committees among the different banks and the Integrated Risk Management Committee.
Board of directors
The boards of directors for the banking subsidiaries of Grupo Aval are responsible for adopting the following decisions, among others, with respect to the proper organization of each entity’s risk management system:
| · | Define and approve the general policies and strategies related to the internal control system for risk management. |
| · | Approve the entity’s policies in relation to the management of different risks. |
Grupo Aval Acciones y Valores S.A.
Notes to the Consolidated Financial Statement
As of December 31, 2016 and 2015 and for the years ended December 31, 2016, 2015 and 2014
(Figures expressed in millions of Colombian pesos)
| · | Approve trading and counterparty limits, according to defined attributions. |
| · | Approve exposure and limits for different types of risks. |
| · | Approve different procedures and methodologies for risk management. |
| · | Ensuring the assignment of the human resources and physical and technical resources required for effective risk management. |
| · | Setting forth the responsibility and attributes assigned to the different positions and areas in charge of risk management. |
| · | Creating and defining the functions of the committees that are needed to ensure the proper organization, control and monitoring of operations that generate risk exposure. |
| · | Approve internal control systems for risk management. |
| · | Require management of the Grupo Aval subsidiaries to submit periodic reports on the levels of exposure to several risks. |
| · | Evaluate recommendations and corrective actions proposed for risk management processes. |
| · | Require a variety of periodic reports from management on the levels of exposure to different risks. |
| · | Conduct monitoring and follow-up at regular board meetings, based on periodic risk-management reports submitted by the Audit Committee on measures taken to control or mitigate the more relevant risks. |
| · | Approve the nature and scope of the strategic business and markets in which each subsidiary will operate. |
The Board of Directors is the body responsible for establishing and annually updating the Group’s risk appetite or tone, monitoring its actual risk profile and ensuring consistency between the two. The risk appetite is determined both for the Group as a whole and for each of the main business segments using a corporate methodology adapted to the circumstances of each business segment. The Board of Directors is responsible for approving the respective risk appetite/tone proposals once the Group has validated them.
Risk appetite is defined at the Group level as the amount and type of risk that it considers reasonable to assume in implementing its business strategy in order to ensure that it can continue to operate normally if unexpected events occur. To this end, adverse scenarios are taken into account, which might have an adverse impact on its subsidiaries’ levels of capital or liquidity, its profits and/or its share price.
Risk committees
Grupo Aval´s financial subsidiaries have, among others, committees for credit risk and treasury risk integrated by members of the Board of Directors which periodically discuss, measure, control and analyze the credit risk management system (SARC for its initials in Spanish) and the market risk management systems (SARM for its initials in Spanish). Grupo Aval’s financial subsidiaries also have an asset-liability committee (ALCO) which makes decisions regarding asset and liability management and evaluates de effectiveness of the liquidity risk management system (SARL for is initials in Spanish). The analysis and follow-up of the operating risk management system and the management of the business continuity plan (SARO-PCN for its initials in Spanish) is carried out by management and the Audit Committee. Compliance of legal risks is monitored by the General Secretaries of each bank. The functions of these committees include, among others, the following:
| 1. | Proposing to the Board of Directors adequate policies for managing the risks that concern each committee and the applicable business processes and methodologies. |
Grupo Aval Acciones y Valores S.A.
Notes to the Consolidated Financial Statement
As of December 31, 2016 and 2015 and for the years ended December 31, 2016, 2015 and 2014
(Figures expressed in millions of Colombian pesos)
| 2. | Review systematically the entity’s exposure to risks and take the corrective action if necessary. |
| 3. | Ensuring that actions of each business unit in relation to risk management are consistent with previous defined levels of risk appetite. |
| 4. | Approve the decisions that are within the attributes established for each committee by the Board of Directors. |
| I. | Integrated risk management committee |
The objective of this committee is to establish policies, procedures and strategies for comprehensive management with respect to credit, market, liquidity, operational, money laundering and terrorism financing risks. Its main duties involve:
| · | Measuring the entity’s comprehensive risk profile. |
| · | Designing systems to monitor and follow up on levels of exposure to the different risks the entity faces. |
| · | Reviewing and proposing to the Board of Directors the level of tolerance and degree of exposure to risk the entity is willing to assume in the course of its business. This implies evaluating alternatives to align risk appetite in the various risk management systems. |
| · | Assessing the inherent risks involved in entering new markets, products, segments and countries, among others. |
| II. | Credit and treasury risk committee |
The purpose of this committee is to discuss, measure, control and analyze the credit risk and the market risk management systems (SARC and SARM for their initials in Spanish). Its primary duties involve:
| · | Monitoring the credit and treasury risk profile to ensure the level of risk remains within established parameters, pursuant to the entities risk limits and policies. |
| · | Evaluating incursion into new markets and new products. |
| · | Assessing policies, strategies and rules of procedure in commercial activities with respect to both treasury and credit. |
| · | Ensuring that risk management and measurement methodologies are appropriate, given the characteristics and activities of the entity. |
| III. | Assets and liabilities committee |
The objective of this committee is to support senior management by establishing risk policies, limits and systems to monitor and measure the effectiveness of the liquidity risk management systems (SARL for its initial in Spanish):
| · | Establishing adequate procedures and mechanisms for liquidity risk management. |
| · | Monitoring liquidity risk exposure reports. |
| · | Identify the origin of risk exposure through sensitivity analysis, in order to assess the probability of lower returns for the entity or assess the necessity of new liquidity resources. |
Grupo Aval Acciones y Valores S.A.
Notes to the Consolidated Financial Statement
As of December 31, 2016 and 2015 and for the years ended December 31, 2016, 2015 and 2014
(Figures expressed in millions of Colombian pesos)
The Audit Committee´s principal objective is to evaluate and monitor the Internal Control System.
The following are the description of the functions for this committee:
| · | Proposing for approval of the Board of Directors the structure, procedures and methodologies required for the operation of the Internal Control System. |
| · | Assessing the structure of the internal control of the entity, in order to establish if the procedures are designed reasonably to protect its assets, as well as those of third parties under its administration and custody. Understand if there are existing controls to verify that transactions are being properly authorized and registered. For such purpose, the areas in charge of the administration of the various systems of risk, the Statutory Auditor and the Internal Auditor submit the established periodical reports to the Committee as well as other reports that the members of the Committee may require. |
| · | Performing a follow-up of risk exposure levels taking into account the consequences for the entity and the measures adopted for their control or mitigation. |
Risk vice presidency
The Risk Vice-Presidency is the head of the Group's risk function and participates in various committees including the Board of Directors. Below is a detailed breakdown of its functions:
| 1. | Oversee adequate compliance of the policies and procedures established by the Board of Directors and the various committees for risk management. |
| 2. | Designing methodologies and procedures to be followed by the administration for risk management. |
| 3. | Establishing ongoing monitoring procedures to allow timely identification of any deviation relating to compliance of the policies established for risk management. |
| 4. | Preparing timely reports for the different risk committees, the Board of Directors of each bank and for the government entities in charge of control and supervision of financial institutions in connection with compliance of risk policies. |
Administrative processes of risk management
Each banking subsidiary of Grupo Aval has well defined structures and procedures, including manuals on administrative processes to be followed for managing different risks. The entities use the different technological tools, for the analysis, monitoring and control of the various risks.
Internal audit
The Internal audit units at each bank are run independently from the administration. In the course of performing their functions, they carry out periodic independent compliance assessments of risk management policies and procedures. Reports are submitted directly to the risk committees and audit committees, which are responsible for the follow-up with the Bank’s administration regarding the corrective measures to be taken. Additionally, at the holding company there is a senior vicepresident-corporate controller who oversees the meetings of the audit committees of the most significant subsidiaries. The area he leads carry on periodic of Grupo Aval´s subsidiaries to monitor the compliance with risk management
Grupo Aval Acciones y Valores S.A.
Notes to the Consolidated Financial Statement
As of December 31, 2016 and 2015 and for the years ended December 31, 2016, 2015 and 2014
(Figures expressed in millions of Colombian pesos)
policies. The corresponding reports are presented directly to senior management at each of the subsidiaries and to the corresponding audit committees including the audit committee of the holding company.
Grupo BAC Credomatic
Grupo BAC Credomatic (hereinafter referred to as BAC), whose main operations are located in Central America, is consolidated as part the parent company Banco de Bogotá through its subsidiary Leasing Bogotá Panamá. BAC has its own policies, functions and risk management procedures, subject to approval by Banco de Bogotá.
Risk management and periodic risk surveillance are carried out through the following bodies of corporate governance which were, established both at a regional level as well as in the countries where Grupo BAC Credomatic operates: Committee of Integral Risk Management, Committee of Assets and Liabilities (ALCO), Committee of Compliance, Credit Committee, Investment Committee and Audit Committee.
Regarding credit risk management, BAC has a centralized structure, led by a Chief Risk Officer (CRO), who reports to the CEO. The Regional Credit Committee, whose members include the CEO, the CRO, and four members of the administration of Grupo Aval and Banco de Bogota, is responsible for submitting credit policies and procedures at a regional level for the Board of Directors approval. This committee is responsible for monitoring the loan portfolio. The regional credit committee is also responsible for the final decision on loans, which exceed the credit limits delegated to the individual countries. While local risk managers report to the local head, observance of regional policies and procedures is reported to the CRO.
With regard to market risk, BAC manages an investment policy and asset and liability policy at a regional level, setting guidelines for establishing country and counterparty risk limits, as well as limits to foreign currency positions and guidelines for liquidity risk management, interest rate and exchange rate risks. The Regional Committee of Assets and Liabilities, which is integrated by members of the Board of Directors of BAC, is responsible for the establishment of regional risk management policies.
Grupo Aval is comprised primarily by entities of the financial sector that are exposed to various financial, operating, reputational and legal risks.
Financial risks include credit and market risks and liquidity risks from its composition of assets and liabilities, as they are affected by changes in interest rates, exchange rates and liquidity.
The entities of Grupo Aval which have businesses in economic sectors other than the financial sector, commonly referred in Colombia as the “Non-financial sector”, are less exposed to financial risks but are still exposed to adverse variations in the prices of its products. This occurs in companies in the agricultural-business. Subsidiaries which operate in different economic sectors are exposed fundamentally to operational and legal risks.
Below is an analysis of each of the aforementioned risks in order of importance, on the basis that such risks are managed separately by each of the banking subsidiaries of Grupo Aval. Unless otherwise indicated, Banco de Bogotá consolidates the risk information of Grupo BAC Credomatic.
Control environment
The risk management model has a control environment that ensures the appropriate control for all risks and provides an integrated view thereof. This control is performed at all of the Group's business segments and
Grupo Aval Acciones y Valores S.A.
Notes to the Consolidated Financial Statement
As of December 31, 2016 and 2015 and for the years ended December 31, 2016, 2015 and 2014
(Figures expressed in millions of Colombian pesos)
for each type of risk in order to ensure that the Group's exposures and overall risk profile are within the framework of the mandates established by both the Board of Directors and the regulators. The main elements ensuring effective control are:
| - | The allocation of responsibilities in risk-generating functions through decision-making and the due control of their activity. |
| - | Specialized control of each risk factor. |
| - | The supervision and aggregate integration of all risks. |
| - | The assessment of control mechanisms. |
| - | Independent assessment by internal audit. |
| 4.1.1 | Consolidated credit risk exposure |
Grupo Aval´s banking subsidiaries are exposed to credit risk, consisting of the risk of incurring in a financial loss as a result of the failure of the debtor to meet its contractual obligations in financial transactions on a timely and complete manner. Exposure to credit risk for Grupo Aval and its subsidiaries is also incurred as a result of credit activities and transactions with counterparties.
The maximum exposure to credit risk of Grupo Aval, at a consolidated level is reflected in the carrying value of financial assets in the statement of financial position of Grupo Aval as of December 31, 2016 and 2015 as follows:
| Account | | December 31,
2016 | | | December 31,
2015 | |
| Assets | | | | | | | | |
| Cash and cash equivalents (**) | | Ps. | 17,294,457 | | | Ps. | 17,847,913 | |
| | | | | | | | | |
| Financial assets held for trading | | | 2,343,902 | | | | 3,061,916 | |
| Financial instruments available for sale | | | 17,662,733 | | | | 18,987,370 | |
| Financial instruments held to maturity | | | 2,570,486 | | | | 2,395,280 | |
| Other financial assets at fair value through profit or loss | | | 2,072,674 | | | | 1,891,692 | |
| Derivatives instruments | | | 502,209 | | | | 1,024,972 | |
| Hedging derivatives | | | 128,479 | | | | 33,690 | |
| Loans and receivables | | | | | | | | |
| Commercial | | | 93,149,211 | | | | 89,498,148 | |
| Consumer | | | 46,927,997 | | | | 42,230,509 | |
| Mortgage | | | 14,683,537 | | | | 13,418,079 | |
| Microcredit | | | 399,431 | | | | 399,262 | |
| Other accounts receivable | | | 3,719,672 | | | | 3,396,671 | |
| Total financial assets with credit risk | | Ps. | 201,454,788 | | | Ps. | 194,185,502 | |
| Financial instruments with credit risk outside of the statement of financial position at its nominal value | | | | | | | | |
| Financial guarantees and letters of credit | | | 3,513,700 | | | | 3,834,571 | |
| Credit commitments | | | 23,734,857 | | | | 22,756,133 | |
| Total exposure to credit risk outside of the statement of financial position | | Ps. | 27,248,557 | | | Ps. | 26,590,704 | |
| Total maximum exposure to credit risk | | Ps. | 228,703,345 | | | Ps. | 220,776,206 | |
(**) Not including funds guarded by the entity (cash, tellers, vaults), because there is no credit risk regarding Grupo Aval entities.
For guarantees and commitments to extend the credit amounts, the maximum exposure credit risk is the amount of the commitment. Credit risk is mitigated by guarantees and collaterals as described below.
Grupo Aval Acciones y Valores S.A.
Notes to the Consolidated Financial Statement
As of December 31, 2016 and 2015 and for the years ended December 31, 2016, 2015 and 2014
(Figures expressed in millions of Colombian pesos)
| 4.1.2 | Mitigation of credit risk, collaterals and other credit risk enhancements |
The exposure to credit risk for each of Grupo Aval´s banking subsidiaries is reduced by collaterals and other credit enhancements. The existence of guarantees can be a necessary measure but not a determinant for the approval of a credit. Credit risk policies of Grupo Aval require an evaluation of the debtor’s payment capacity based on the debtor´s ability to generate the resources needed for the timely and complete payment of its obligations.
Credit risk management is organized into three different levels at the banking subsidiaries of Grupo Aval:
| · | Analysis of credit risk: For commercial lending it is based on tools for the individual evaluation of credits based on payment capacity based on cash generation, and credit rating models based on the historical and projected financial condition and on the payment history of the debtor with the financial sector. For consumer lending (including mortgages and auto financing), scoring models are based on socio demographic variables and payment history. |
| · | Establishment of guarantees with appropriate debt coverage in accordance with the credit policies of each bank. Guarantees include mortgages on real estate, pledge on assets, including cash deposits and investments. |
| · | Evaluation of the liquidity of the guarantees received. |
The methods used for the evaluation of guarantees are aligned with the market practices and include the use of independent real estate appraisers, the market value of securities or the valuation of companies issuing the securities. All guarantees must be legally evaluated and drafted following the parameters of applicable legal regulations.
| 4.1.2.1 | Credit risk parameters |
At the banking subsidiaries level, the assessment of customers or transactions using rating or scoring systems constitutes a judgment of their credit quality, which is quantified through the Probability of Default (PD).
In addition to customer assessment, the quantification of credit risk requires the estimation of other parameters, such as Exposure at Default (EAD) and the percentage of EAD that will not be recovered (Loss Given Default - LGD). Therefore, other relevant factors are taken into account in estimating the risk involved in transactions, such as the quantification of off-balance-sheet risk, which depends on the type of product, the Loss Identification Period (LIP) or the analysis of expected recoveries, which is related to the guarantees provided and other characteristics of the transaction such as product type, term, etc.
These factors are the main credit risk parameters. Their combination is used in the calculation of the incurred loss or expected loss. This loss is considered an additional cost of the activity, which is reflected in the risk premium.
Regarding portfolios for which limited internal default experience information exists, such as banks or sovereign risk, estimates of the risk parameters (PD, LGD and EAD) are based on alternative sources such as market prices or studies conducted by external agencies gathering the shared experience of a sufficient number of entities.
Grupo Aval Acciones y Valores S.A.
Notes to the Consolidated Financial Statement
As of December 31, 2016 and 2015 and for the years ended December 31, 2016, 2015 and 2014
(Figures expressed in millions of Colombian pesos)
For all other portfolios, parameter estimates are based on the Group internal experience. The PD is calculated by observing the cases of new arrears in relation to the non-default population in a previous observation point.
The LGD calculation is based on the observation of the recoveries of loans in default, taking into account not only the income and expenses associated with the recovery process, but also the timing when the income and expenses take place.
EAD is estimated by comparing the use of committed facilities at the time of default and their use under normal (performing) circumstances, to identify the actual use of the facilities at the time of default.
Grupo Aval Acciones y Valores S.A.
Notes to the Consolidated Financial Statement
As of December 31, 2016 and 2015 and for the years ended December 31, 2016, 2015 and 2014
(Figures expressed in millions of Colombian pesos)
As of December 31, 2016 and 2015, the following chart shows the detail of the credit portfolio per type of guarantees received as support of credits issued by Grupo Aval at a consolidated level:
| December 31, 2016 | | Commercial | | | Consumer | | | Mortgages | | | Microcredit | | | Finance
Leases (1) | | | Total | |
| Unsecured credits | | Ps. | 48,792,810 | | | Ps. | 39,358,447 | | | Ps. | 204,690 | | | Ps. | 270,340 | | | Ps. | 42,966 | | | Ps. | 88,669,253 | |
| Loans secured by other banks | | | 413,049 | | | | 3,145 | | | | - | | | | - | | | | 4,779 | | | | 420,973 | |
| Collateralized credits: | | | | | | | | | | | | | | | | | | | | | | | | |
| Mortgages | | | 3,907,080 | | | | 78,728 | | | | 13,125,629 | | | | 6,494 | | | | 105,501 | | | | 17,223,432 | |
| Other real estate | | | 9,207,647 | | | | 1,136,153 | | | | 879 | | | | 186 | | | | 785,872 | | | | 11,130,737 | |
| Investments in equity instruments | | | 503,141 | | | | 1,779 | | | | - | | | | - | | | | - | | | | 504,920 | |
| Deposits in cash or cash equivalents | | | 2,797,882 | | | | 187,740 | | | | 22,159 | | | | 113,269 | | | | 7,170 | | | | 3,128,220 | |
| Leased machineries and vehicles | | | - | | | | - | | | | - | | | | - | | | | 7,996,135 | | | | 7,996,135 | |
| Fiduciary agreements, stand by letters and guarantee funds | | | 6,994,810 | | | | 3,211 | | | | 3,637 | | | | 7,503 | | | | 342,970 | | | | 7,352,131 | |
| Pledged income | | | 3,054,764 | | | | 450 | | | | 103 | | | | - | | | | 19,987 | | | | 3,075,304 | |
| Pledges | | | 3,882,928 | | | | 5,567,107 | | | | 1,586 | | | | 1,639 | | | | 2,768 | | | | 9,456,028 | |
| Other assets | | | 3,637,005 | | | | 375,629 | | | | 422,750 | | | | - | | | | 1,767,659 | | | | 6,203,043 | |
| Total gross credit portfolio | | Ps. | 83,191,116 | | | Ps. | 46,712,389 | | | Ps. | 13,781,433 | | | Ps. | 399,431 | | | Ps. | 11,075,807 | | | Ps. | 155,160,176 | |
| December 31, 2015 | | Commercial | | | Consumer | | | Mortgages | | | Microcredit | | | Finance
Leases (1) | | | Total | |
| Unsecured credits | | Ps. | 50,400,859 | | | Ps. | 35,443,855 | | | Ps. | 4,590 | | | Ps. | 270,667 | | | Ps. | 47,544 | | | Ps. | 86,167,515 | |
| Loans secured by other banks | | | 580,478 | | | | 7,148 | | | | - | | | | - | | | | 1,994 | | | | 589,620 | |
| Collateralized credits: | | | | | | | | | | | | | | | | | | | | | | | | |
| Mortgages | | | 3,613,658 | | | | 72,563 | | | | 12,430,089 | | | | 8,133 | | | | 89,265 | | | | 16,213,708 | |
| Other real estate | | | 8,418,562 | | | | 988,860 | | | | - | | | | 321 | | | | 587,543 | | | | 9,995,286 | |
| Investments in equity instruments | | | 377,493 | | | | 9,721 | | | | - | | | | - | | | | - | | | | 387,214 | |
| Deposits in cash or cash equivalents | | | 2,914,240 | | | | 161,739 | | | | 1,826 | | | | 115,088 | | | | 11,381 | | | | 3,204,274 | |
| Leased machineries and vehicles | | | - | | | | - | | | | - | | | | - | | | | 4,901,847 | | | | 4,901,847 | |
| Fiduciary agreements, stand by letters and guarantee funds | | | 6,935,239 | | | | 1,872 | | | | - | | | | 3,537 | | | | 345,501 | | | | 7,286,149 | |
| Pledged income | | | 2,752,201 | | | | - | | | | - | | | | - | | | | 19,327 | | | | 2,771,528 | |
| Pledges | | | 1,063,276 | | | | 2,771,769 | | | | 1,201 | | | | 1,516 | | | | 25,425 | | | | 3,863,187 | |
| Other assets | | | 4,142,317 | | | | 2,416,038 | | | | 217,476 | | | | - | | | | 3,389,839 | | | | 10,165,670 | |
| Total gross credit portfolio | | Ps. | 81,198,323 | | | Ps. | 41,873,565 | | | Ps. | 12,655,182 | | | Ps. | 399,262 | | | Ps. | 9,419,666 | | | Ps. | 145,545,998 | |
Grupo Aval Acciones y Valores S.A.
Notes to the Consolidated Financial Statement
As of December 31, 2016 and 2015 and for the years ended December 31, 2016, 2015 and 2014
(Figures expressed in millions of Colombian pesos)
| 4.1.3 | Policies to prevent excessive credit-risk concentration |
In order to prevent excessive concentrations of credit risk at an individual, economic group, country or economic sectors level, each bank of Grupo Aval maintains updated indices to limit concentration. The exposure limit by a banking subsidiary of Grupo Aval to an individual client or economic group depends on the risk profile of the client (or economic group), the nature of the risk of the debtor and the experience of each banking subsidiary in a specific market or sector.
Concentration risk control is key to the risk management process. The Group continuously monitors the degree of credit risk concentration by sector and customer group.
In order to avoid credit risk concentration at the Group level management relies on the Risk Vice-Presidency, which consolidates, and monitors the credit risk exposures of all banks, to determine the maximum levels of concentration.
Pursuant to Colombian regulations, banks in Colombia cannot grant unsecured loan to a borrower, which on a combined basis exceed 10% of its regulatory capital calculated according to the regulations of the Superintendency of Finance. Loans maybe more than 10% of the regulatory capital of the bank when they are secured by acceptable guarantees.
The detail of credit risk at the level of Grupo Aval in the different geographic areas determined according to the domicile of the debtor, without considering the recorded loan loss impairment provisions as of December 31, 2016 and 2015 is as follows.
| December 31, 2016 | | Commercial | | | Consumer | | | Mortgages | | | Microcredit | | | Finance Leases (1) | | | Total | |
| Colombia | | Ps. | 58,561,329 | | | Ps. | 30,523,917 | | | Ps. | 4,822,806 | | | Ps. | 399,431 | | | Ps. | 10,244,275 | | | Ps. | 104,551,758 | |
| Panamá | | | 5,305,839 | | | | 4,650,419 | | | | 2,067,375 | | | | - | | | | 127,976 | | | | 12,151,609 | |
| United States | | | 4,212,510 | | | | 436 | | | | 16 | | | | - | | | | - | | | | 4,212,962 | |
| Costa Rica | | | 3,341,255 | | | | 4,390,441 | | | | 3,674,158 | | | | - | | | | 665,281 | | | | 12,071,135 | |
| Nicaragua | | | 2,241,090 | | | | 1,237,205 | | | | 390,003 | | | | - | | | | 7,164 | | | | 3,875,462 | |
| Honduras | | | 2,398,364 | | | | 1,597,280 | | | | 720,987 | | | | - | | | | 3,867 | | | | 4,720,498 | |
| El Salvador | | | 1,565,481 | | | | 2,076,588 | | | | 873,870 | | | | - | | | | 11,977 | | | | 4,527,916 | |
| Guatemala | | | 4,691,911 | | | | 2,080,065 | | | | 1,232,218 | | | | - | | | | 15,267 | | | | 8,019,461 | |
| Other countries | | | 873,337 | | | | 156,038 | | | | - | | | | - | | | | - | | | | 1,029,375 | |
| Total gross credit portfolio | | Ps. | 83,191,116 | | | Ps. | 46,712,389 | | | Ps. | 13,781,433 | | | Ps. | 399,431 | | | Ps. | 11,075,807 | | | Ps. | 155,160,176 | |
| December 31, 2015 | | Commercial | | | Consumer | | | Mortgages | | | Microcredit | | | Finance Leases (1) | | | Total | |
| Colombia | | Ps. | 56,538,501 | | | Ps. | 26,887,977 | | | Ps. | 3,994,491 | | | Ps. | 399,262 | | | Ps. | 8,623,573 | | | Ps. | 96,443,804 | |
| Panamá | | | 4,993,312 | | | | 4,289,764 | | | | 1,960,577 | | | | - | | | | 134,017 | | | | 11,377,670 | |
| United States | | | 4,510,600 | | | | 139 | | | | - | | | | - | | | | - | | | | 4,510,739 | |
Grupo Aval Acciones y Valores S.A.
Notes to the Consolidated Financial Statement
As of December 31, 2016 and 2015 and for the years ended December 31, 2016, 2015 and 2014
(Figures expressed in millions of Colombian pesos)
| December 31, 2015 | | Commercial | | | Consumer | | | Mortgages | | | Microcredit | | | Finance Leases (1) | | | Total | |
| Costa Rica | | | 3,636,836 | | | | 4,027,535 | | | | 3,531,120 | | | | - | | | | 619,956 | | | | 11,815,447 | |
| Nicaragua | | | 2,052,071 | | | | 1,143,589 | | | | 378,184 | | | | - | | | | 9,224 | | | | 3,583,068 | |
| Honduras | | | 2,416,153 | | | | 1,501,950 | | | | 732,553 | | | | - | | | | 3,591 | | | | 4,654,247 | |
| El Salvador | | | 1,513,091 | | | | 1,874,399 | | | | 894,710 | | | | - | | | | 17,122 | | | | 4,299,322 | |
| Guatemala | | | 4,688,278 | | | | 1,986,054 | | | | 1,163,547 | | | | - | | | | 12,183 | | | | 7,850,062 | |
| Other countries | | | 849,481 | | | | 162,158 | | | | - | | | | - | | | | - | | | | 1,011,639 | |
| Total gross credit portfolio | | Ps. | 81,198,323 | | | Ps. | 41,873,565 | | | Ps. | 12,655,182 | | | Ps. | 399,262 | | | Ps. | 9,419,666 | | | Ps. | 145,545,998 | |
Below is the credit portfolio distribution of Grupo Aval by economic sector as of December 31, 2016 and 2015:
| Sector | | December 31, 2016 | | | | % | | December 31, 2015 | | | | % |
| Agricultural | | Ps. | 3,734,625 | | | | 2 | % | | Ps. | 3,719,743 | | | | 3 | % |
| Mining products and oil | | | 2,018,219 | | | | 1 | % | | | 2,406,910 | | | | 2 | % |
| Food, beverage and tobacco | | | 7,273,602 | | | | 5 | % | | | 6,080,892 | | | | 4 | % |
| Chemical production | | | 5,276,248 | | | | 4 | % | | | 4,929,694 | | | | 3 | % |
| Other industrial and manufacturing products | | �� | 4,576,173 | | | | 3 | % | | | 4,311,334 | | | | 3 | % |
| Government | | | 3,629,849 | | | | 2 | % | | | 3,356,442 | | | | 2 | % |
| Construction | | | 9,959,536 | | | | 7 | % | | | 9,326,175 | | | | 7 | % |
| Trade and tourism | | | 2,025,206 | | | | 1 | % | | | 1,712,694 | | | | 1 | % |
| Transportation and communications | | | 7,814,741 | | | | 5 | % | | | 7,892,375 | | | | 5 | % |
| Public services | | | 5,160,778 | | | | 3 | % | | | 5,051,470 | | | | 3 | % |
| Consumer services | | | 66,157,872 | | | | 43 | % | | | 60,374,860 | | | | 41 | % |
| Commercial services | | | 34,587,323 | | | | 22 | % | | | 34,280,784 | | | | 24 | % |
| Other | | | 2,946,004 | | | | 2 | % | | | 2,102,625 | | | | 2 | % |
| Total of each economic sector | | Ps. | 155,160,176 | | | | 100 | % | | Ps. | 145,545,998 | | | | 100 | % |
Grupo Aval Acciones y Valores S.A.
Notes to the Consolidated Financial Statement
As of December 31, 2016 and 2015 and for the years ended December 31, 2016, 2015 and 2014
(Figures expressed in millions of Colombian pesos)
As a general rule, Grupo Aval considers sovereign risk to be the risk assumed in transactions with the Central Banks (including the mandatory deposits) in which the Group operates, the issuer risk of the Colombian Government and the risk arising from transactions with public entities that have the following features: their funds are obtained only from fiscal income; they are legally recognized as entities directly included in the government sector; and their activities are of a non-commercial nature.
Sovereign risk exposure arises mainly from Grupo Aval’s obligations to maintain certain mandatory deposits in the Central Banks in which the Group operates and from the fixed-income portfolios held as part of the on-balance-sheet structural interest rate risk management strategy and in the trading books of the treasury department. The vast majorities of these exposures are taken in pesos and are financed through peso denominated repurchase agreements or customer deposits.
As of December 31, 2016 and 2015, the investment portfolio of financial assets in debt instruments is comprised mainly of securities issued and guaranteed by entities of the Republic of Colombia, which represent 65.02% and 67.22%, respectively of the total portfolio.
Below is the detail of Grupo Aval’s sovereign debt portfolio issued by Central Governments per country:
| | | December 31, 2016 | | | December 31, 2015 | |
| | | | | | % | | | | | | % | |
| Investment grade (1) | | | | | | | | | | | | | | | | |
| Colombia | | Ps. | 11,562,492 | | | | 84.04 | % | | Ps. | 13,552,937 | | | | 86.69 | % |
| Panamá | | | 530,055 | | | | 3.85 | % | | | 496,534 | | | | 3.18 | % |
| USA | | | 24,808 | | | | 0.18 | % | | | 34,098 | | | | 0.22 | % |
| Mexico | | | 9,126 | | | | 0.07 | % | | | 31,925 | | | | 0.20 | % |
| Brazil (*) | | | - | | | | 0.00 | % | | | 6,329 | | | | 0.04 | % |
| | | Ps. | 12,126,481 | | | | 88.14 | % | | Ps. | 14,121,823 | | | | 90.33 | % |
| Speculative (2) | | | | | | | | | | | | | | | | |
| Argentina | | | 3,246 | | | | 0.02 | % | | | - | | | | 0.00 | % |
| Costa Rica | | | 951,809 | | | | 6.92 | % | | | 846,786 | | | | 5.42 | % |
| Honduras | | | 394,184 | | | | 2.87 | % | | | 421,660 | | | | 2.70 | % |
| El Salvador | | | 85,626 | | | | 0.62 | % | | | 134,888 | | | | 0.86 | % |
| Guatemala | | | 195,876 | | | | 1.42 | % | | | 106,343 | | | | 0.68 | % |
| Nicaragua | | | 863 | | | | 0.01 | % | | | 1,513 | | | | 0.01 | % |
| | | Ps. | 1,631,604 | | | | 11.86 | % | | Ps. | 1,511,190 | | | | 9.67 | % |
| | | Ps. | 13,758,085 | | | | 100.00 | % | | Ps. | 15,633,013 | | | | 100.00 | % |
Below is the detail of Grupo Aval’s sovereign debt portfolio issued by Central Banks per country:
| | | December 31, 2016 | | | December 31, 2015 | |
| | | | | | % | | | | | | % | |
| Speculative (2) | | | | | | | | | | | | | | | | |
| Costa Rica | | Ps. | 124,695 | | | | 20.33 | % | | Ps. | 96,000 | | | | 11.89 | % |
| Honduras | | | 30,891 | | | | 5.04 | % | | | 75,686 | | | | 9.38 | % |
| Guatemala | | | 335,900 | | | | 54.76 | % | | | 507,980 | | | | 62.93 | % |
| Nicaragua | | | 121,971 | | | | 19.87 | % | | | 127,552 | | | | 15.80 | % |
| | | Ps. | 613,457 | | | | 100.00 | % | | | 807,218 | | | | 100.00 | % |
| Total sovereign risk | | Ps. | 14,371,542 | | | | | | | | 16,440,231 | | | | | |
Grupo Aval Acciones y Valores S.A.
Notes to the Consolidated Financial Statement
As of December 31, 2016 and 2015 and for the years ended December 31, 2016, 2015 and 2014
(Figures expressed in millions of Colombian pesos)
| (1) | Investment grade includes the risk rating of Fitch Ratings Colombia S.A. o F1+ to F3, BRC of Colombia from BRC 1+ to BRC 3 and Standard & Poor’s from A1 to A3. |
| (2) | Speculative or non-investment grade level includes the risk rating of Fitch Ratings Colombia S.A. from B to E, BRC de Colombia from BRC 4 to BRC 6 and Standard & Poor’s from B1 to D. |
(*) In February 2016 Standard & Poor's and Moody’s downgraded securities issued by the Government of Brazil.
| 4.1.5 | Loan and counterparty approval process |
Each of Grupo Aval´s banking subsidiaries assumes the credit risk for both: the credit activity itself, which includes commercial, consumer, residential mortgage and microcredit credit operations; and treasury activities, including interbank loans, investment portfolio management, derivatives and foreign currency trading activities, among others. Despite being independent businesses, the nature of insolvency risk of the borrower or counterparty is equivalent and therefore the criteria in which they are evaluated is similar.
The principles and rules for credit management and credit risk for each bank are contained in the credit manual, both for traditional banking activity and treasury activity. Evaluation criteria to measure credit risk follows the principal instructions set forth by the Treasury and Credit Risk Committees.
The maximum authority regarding credits is the Board of Directors for each bank, which orients the general policy and has the capacity to grant the highest levels of credits allowed. In the normal banking operation, authorizations for approval of loans and lines of credit depend on the amounts, credit quality, tenor and guarantees offered by the client. The Board of Directors of each bank has delegated part of its credit authorities to different committees and executives who process the credit requests and are responsible for the analysis and follow-up.
Regarding the operations for treasury activities, the Board of Directors approves the lines of credit for counterparts. Risk control is carried out through essentially three mechanisms: annual approval of lines of credit and daily control, quarterly solvency evaluations for issuers and a report on concentrations for each client or economic group.
Additionally, for the approval of credits certain considerations are taken into account, including but not limited to the probability of default, counterpart lines of credit, and recovery percentage of guarantees received, tenor and concentration by economic sector.
Each bank has a Credit Risk Management System (SARC), which is administered by the credit vice-presidency, and includes, among others, the design, implementation and evaluation of policies and risk mechanisms defined by the Credit and Treasury Risk Committee and the Board of Directors. The operation of the SARC has resulted in the integration of risk measurement tools into the credit approval process in each of the banking subsidiaries.
Each banking subsidiary, has at least two models for evaluating credit risk for the approval of consumer loans (including mortgage loans and auto loans): the financial ratings model, statistical models based on financial information of the client, which are used in the approval process and for the management and follow-up of the portfolio. The second model is based on the client´s financial ratings and its historical payment behavior with the bank, used in the process of client rating.
| 4.1.6 | The credit-risk monitoring process and credit rating of the loan portfolio |
The monitoring process and follow-up of credit risk of each bank is carried out in several steps including the follow-up and management of daily collections based on overdue portfolio analysis by ages, risk level rating, permanent follow-up of high risk clients, restructuring processes of operations and the receipt of goods received as payment.
Grupo Aval Acciones y Valores S.A.
Notes to the Consolidated Financial Statement
As of December 31, 2016 and 2015 and for the years ended December 31, 2016, 2015 and 2014
(Figures expressed in millions of Colombian pesos)
On a daily basis, banks generate a list of past due loans and based on such analysis, different bank personnel carries out collection procedures by telephone calls, emails, or written collection.
As of December 31, 2016 and 2015, a summary of the overdue portfolio by days past due is as follows:
| | Arrears but not impaired | | |
| December 31, 2016 | | From 1 to
30 days | | | From 31
to 60 days | | | From 61
to 90 days | | | Total in
arrears but
not
impaired | | | Total in
arrears
impaired | |
| | | | | | | | | | | | | | | | |
| Commercial | | Ps. | 995,491 | | | Ps. | 142,565 | | | Ps. | 98,294 | | | Ps. | 1,236,350 | | | Ps. | 1,408,893 | |
| Consumer | | | 1,839,650 | | | | 620,555 | | | | 367,153 | | | | 2,827,358 | | | | 1,074,417 | |
| Mortgage | | | 541,366 | | | | 127,768 | | | | 61,980 | | | | 731,114 | | | | 230,901 | |
| Microcredit | | | 48,305 | | | | 10,766 | | | | 8,364 | | | | 67,435 | | | | 37,381 | |
| Finance Leases (1) | | | 575,400 | | | | 54,770 | | | | 29,476 | | | | 659,646 | | | | 210,499 | |
| Total loan portfolio value | | Ps. | 4,000,212 | | | Ps. | 956,424 | | | Ps. | 565,267 | | | Ps. | 5,521,903 | | | Ps. | 2,962,091 | |
| | Arrears but not impaired | | |
| December 31, 2015 | | From 1 to
30 days | | | From 31 to
60 days | | | From 61
to 90
days | | | Total in
arrears but
not
impaired | | | Total in
arrears
impaired | |
| | | | | | | | | | | | | | | | |
| Commercial | | Ps. | 914,365 | | | Ps. | 119,563 | | | Ps. | 194,219 | | | Ps. | 1,228,147 | | | Ps. | 1,095,866 | |
| Consumer | | | 1,702,285 | | | | 504,925 | | | | 311,997 | | | | 2,519,207 | | | | 863,377 | |
| Mortgage | | | 406,398 | | | | 108,712 | | | | 44,828 | | | | 559,938 | | | | 204,481 | |
| Microcredit | | | 48,088 | | | | 10,490 | | | | 6,245 | | | | 64,823 | | | | 28,644 | |
| Finance Leases (1) | | | 424,220 | | | | 77,654 | | | | 27,555 | | | | 529,429 | | | | 162,000 | |
| Total loan portfolio value | | Ps. | 3,495,356 | | | Ps. | 821,344 | | | Ps. | 584,844 | | | Ps. | 4,901,544 | | | Ps. | 2,354,368 | |
On a quarterly basis each bank evaluates, the commercial portfolio by economic sectors, where macro-sectors are evaluated with the purpose of monitoring the concentration per economic sector and the risk level of each.
Every six-months each bank carries out an individual analysis of the credit risk with current balances greater than Ps. 2,000 based on updated financial information of the client, payment record, guarantees received and credit bureau reports; based on the information, clients are classified by risk level: Category A-Normal, B-Subnormal, C-Deficient, D-Doubtful recovery and E- Unrecoverable. Each of the risk categories is explained as follows:
Category A — “Normal risk”: Loans and finance leases in this category are appropriately serviced. The debtor’s financial statements or its projected cash flows, as well as all other credit information available to us, reflect adequate paying capacity.
Category B — “Acceptable risk, above normal”: Loans and finance leases in this category are adequately serviced and protected. But there are weaknesses which may potentially affect, on a transitory or permanent basis, the debtor’s paying capacity or its projected cash flows, to the extent that, if not timely corrected, would affect the collection of the credits as contracted.
Grupo Aval Acciones y Valores S.A.
Notes to the Consolidated Financial Statement
As of December 31, 2016 and 2015 and for the years ended December 31, 2016, 2015 and 2014
(Figures expressed in millions of Colombian pesos)
Category C — “Appreciable risk”: Loans and finance leases in this category have debtors with insufficient paying capacity or relate to projects with insufficient cash flow, which may compromise the normal collection of the obligations.
Category D — “Significant risk”: Loans and finance leases in this category have the same deficiencies as loans in category C, but to a larger extent. Consequently, the probability of collection is highly doubtful.
Category E — “Risk of nonrecoverability”: Loans and finance leases in this category are deemed uncollectible.
For mortgage and microcredits, the previous classification by risk levels is carried out monthly considering the number of days past due.
The credit risk exposure is administered through a periodic analysis of the ability of the borrowers or potential borrowers to determine the repayment capacity of capital and interests. The credit risk exposure is also mitigated partly by obtaining collateral, corporate and personal guarantees.
As of December 31, 2016 and 2015, the following is a summary of the portfolio credit by risk level rating.
| | | December 31, 2016 | | | December 31, 2015 | |
| Commercial | | | | | | | | |
| “A” Normal Risk | | Ps. | 77,930,507 | | | Ps. | 77,019,400 | |
| “B” Acceptable Risk | | | 1,996,137 | | | | 1,557,891 | |
| “C” Appreciable Risk | | | 1,818,112 | | | | 1,478,481 | |
| “D” Significant Risk | | | 910,746 | | | | 677,531 | |
| “E” Risk of nonrecoverability | | | 535,614 | | | | 465,020 | |
| | | | 83,191,116 | | | | 81,198,323 | |
| Consumer | | | | | | | | |
| “A” Normal Risk | | | 42,956,173 | | | | 38,677,100 | |
| “B” Acceptable Risk | | | 1,240,377 | | | | 884,980 | |
| “C” Appreciable Risk | | | 1,169,752 | | | | 1,208,570 | |
| “D” Significant Risk | | | 984,334 | | | | 777,826 | |
| “E” Risk of nonrecoverability | | | 361,753 | | | | 325,089 | |
| | | | 46,712,389 | | | | 41,873,565 | |
| Microcredit | | | | | | | | |
| “A” Normal Risk | | | 337,391 | | | | 350,289 | |
| “B” Acceptable Risk | | | 11,687 | | | | 11,242 | |
| “C” Appreciable Risk | | | 9,432 | | | | 6,449 | |
| “D” Significant Risk | | | 7,523 | | | | 4,876 | |
| “E” Risk of nonrecoverability | | | 33,398 | | | | 26,406 | |
| | | | 399,431 | | | | 399,262 | |
| Mortgage | | | | | | | | |
| “A” Normal Risk | | | 13,104,010 | | | | 11,813,074 | |
| “B” Acceptable Risk | | | 247,334 | | | | 203,381 | |
| “C” Appreciable Risk | | | 234,954 | | | | 476,890 | |
| “D” Significant Risk | | | 62,383 | | | | 39,554 | |
| “E” Risk of nonrecoverability | | | 132,752 | | | | 122,283 | |
| | | | 13,781,433 | | | | 12,655,182 | |
| Financial leasing | | | | | | | | |
| “A” Normal Risk | | | 10,136,530 | | | | 8,585,748 | |
| “B” Acceptable Risk | | | 443,437 | | | | 397,389 | |
Grupo Aval Acciones y Valores S.A.
Notes to the Consolidated Financial Statement
As of December 31, 2016 and 2015 and for the years ended December 31, 2016, 2015 and 2014
(Figures expressed in millions of Colombian pesos)
| | | December 31, 2016 | | | December 31, 2015 | |
| “C” Appreciable Risk | | | 206,397 | | | | 222,813 | |
| “D” Significant Risk | | | 211,983 | | | | 162,413 | |
| “E” Risk of nonrecoverability | | | 77,460 | | | | 51,303 | |
| Financial leasing portfolio gross balance | | Ps. | 11,075,807 | | | Ps. | 9,419,666 | |
| Gross balance of financial assets per credit portfolio | | Ps. | 155,160,176 | | | Ps. | 145,545,998 | |
Based on the foregoing classifications, each bank prepares a list of clients who potentially could have an important impact on the financial results and assigns the staff to monitor each customer individually. This process includes to work together to find solutions that will enable the debtor to meet its obligations.
| 4.1.7 | Troubled debt restructuring business process. |
Each banking subsidiary of Grupo Aval periodically carries out, at the request of the client, restructurings of obligations which have become troubled. Such restructurings generally consist of extensions of tenors, decrease of interest rates, partial write-off of indebtedness or payment with assets of the debtor or guarantor.
The Group follows definitions and policies in this management process, so that it is performed in accordance with the best practices and in compliance with regulatory requirements. In connection to this, Grupo Aval has a detailed policy with regard to the aforementioned transactions.
The objective of granting such restructurings is to provide the client with a viable alternative to meet its obligations to the bank and to adapt to changing conditions.
When a credit is restructured due to a debtor´s financial difficulties, the debt is flagged within the records of each bank as a restructured credit in accordance with the regulations of the Superintendency of Finance. The restructuring process has a negative impact on the debtor’s rating, which can only be improved when the client has complied during a prudent period with the terms of the restructurings, its financial condition has improved or when sufficient additional guarantees have been obtained.
Restructured loans are included for impairment evaluation and determination of provisions: however, the marking of a credit as restructured does not necessarily imply its rating is impaired, because in most cases new guarantees are obtained supporting the obligation.
The following is the balance of restructured loans as of December 31, 2016 and 2015:
| Restructured loans | | December 31, 2016 | | | December 31, 2015 | |
| | | | | | | |
| Local | | Ps. | 3,179,875 | | | Ps. | 2,252,697 | |
| Foreign | | | 526,703 | | | | 480,742 | |
| Total restructured | | Ps. | 3,706,578 | | | Ps. | 2,733,439 | |
| 4.1.8 | Foreclosed assets business process |
When persuasive collection processes or credit restructurings are not effective, a legal proceeding is carried out or an agreement is reached with the client for the receipt of assets as payment. Each bank has clearly established
Grupo Aval Acciones y Valores S.A.
Notes to the Consolidated Financial Statement
As of December 31, 2016 and 2015 and for the years ended December 31, 2016, 2015 and 2014
(Figures expressed in millions of Colombian pesos)
policies for receiving assets and has a separate department specialized in the management of these cases the receipt of assets and eventual sale.
During the years ended December 31, 2016, 2015 and 2014, the following is the total of foreclosed assets received and sold during such periods:
| | | December 31, 2016 | | | December 31, 2015 | | | December 31, 2014 | |
| | | | | | | | | | |
| Foreclosed assets received | | Ps. | 220,400 | | | Ps. | 60,315 | | | Ps. | 152,806 | |
| Foreclosed assets sold | | | 44,677 | | | | 60,544 | | | | 47,970 | |
| 4.1.9 | Credit worthiness of financial assets (excluding loan portfolio) |
The following breakdown of the different financial assets excluding loan portfolio, credit risk level and type of issuer is based on the rating issued by the independent credit rating agency, a financial asset is considered investment grade if its credit rating is BBB- or higher by Standard & Poor's, or Baa3 or higher by Moody's, or F3 or higher by Fitch Ratings Colombia S.A, or BRC3 or higher by BRC of Colombia and a financial asset is considered speculative or non-investment grade if its credit rating is BB or lower by Standard & Poor's, or Ba or lower by Moody's, or B or lower by Fitch Ratings Colombia S.A, or BRC4 or lower by BRC of Colombia.
| a) | Cash and cash equivalents |
| | | December 31, 2016 | | | December 31, 2015 | |
| Investment grade | | Ps. | 10,978,574 | | | Ps. | 11,270,588 | |
| Central Bank | | | 3,598,126 | | | | 4,437,063 | |
| Financial entities | | | 7,338,920 | | | | 6,694,196 | |
| Others | | | 41,528 | | | | 139,329 | |
| Speculative grade | | | 5,887,086 | | | | 5,583,674 | |
| Central Bank | | | 5,381,681 | | | | 5,153,234 | |
| Financial entities | | | 505,405 | | | | 430,440 | |
| Others | | | - | | | | - | |
| Without grade or not available | | | 428,797 | | | | 594,447 | |
| Central Bank | | | 1,724 | | | | 5,116 | |
| Financial entities | | | 426,826 | | | | 588,559 | |
| Others | | | 247 | | | | 772 | |
| Cash and cash equivalent with third | | Ps. | 17,294,457 | | | Ps. | 17,448,709 | |
| Cash held by entity (**) | | | 4,898,547 | | | | 4,836,268 | |
| Total | | Ps. | 22,193,004 | | | Ps. | 22,284,977 | |
(**) Cash held by Bank guarded in vaults, ATMs and cash.
Grupo Aval Acciones y Valores S.A.
Notes to the Consolidated Financial Statement
As of December 31, 2016 and 2015 and for the years ended December 31, 2016, 2015 and 2014
(Figures expressed in millions of Colombian pesos)
| b) | Held for trading investments |
Debt securities
| | | December 31, 2016 | | | December 31, 2015 | |
| Investment grade | | | | | | | | |
| Sovereign (*) | | Ps. | 985,455 | | | Ps. | 1,497,577 | |
| Other Public Entities(**) | | | 79,789 | | | | 58,127 | |
| Corporate | | | 84,880 | | | | 88,373 | |
| Financial Entities | | | 959,085 | | | | 702,689 | |
| Multilaterals | | | - | | | | 9,566 | |
| Total investment grade | | Ps. | 2,109,209 | | | Ps. | 2,356,332 | |
| Speculative grade | | | | | | | | |
| Sovereign(*) | | Ps. | 88,095 | | | Ps. | 84,912 | |
| Central Banks | | | 74,727 | | | | 518,242 | |
| Corporate | | | - | | | | 15,945 | |
| Financial Entities | | | 71,871 | | | | 86,485 | |
| Total Speculative grade | | Ps. | 234,693 | | | Ps. | 705,584 | |
| | | Ps. | 2,343,902 | | | Ps. | 3,061,916 | |
(*) A sovereign credit rating considers the risk of Treasury issuer or similar agency (government debt portfolio).
(**) Derived from operations with government entities; including public administrations in general (plus regional and local).
| c) | Available for sale financial assets |
Debt Securities
| | | December 31, 2016 | | | December 31, 2015 | |
| Investment grade | | | | | | | | |
| Sovereign(*) | | Ps. | 11,115,044 | | | Ps. | 12,566,278 | |
| Other Public Entities(**) | | | 569,312 | | | | 558,516 | |
| Corporate | | | 341,099 | | | | 610,682 | |
| Financial Entities | | | 2,149,641 | | | | 3,147,886 | |
| Multilaterals | | | 93,069 | | | | 2,004 | |
| Total investment grade | | | 14,268,165 | | | | 16,885,366 | |
| Speculative grade | | | | | | | | |
| Sovereign(*) | | | 1,543,509 | | | | 1,426,278 | |
| Central Banks | | | 538,731 | | | | 288,975 | |
| Other Public Entities(**) | | | - | | | | 272 | |
| Corporate | | | 366,482 | | | | 189,332 | |
| Financial Entities | | | 822,729 | | | | 118,021 | |
| Total Speculative grade | | | 3,271,451 | | | | 2,022,878 | |
| Without Grade or Not available | | | | | | | | |
| Corporate | | | 82,663 | | | | 38,257 | |
| Financial Entities | | | 15,705 | | | | 40,869 | |
| Total Without Grade or Not available | | | 98,368 | | | | 79,126 | |
| Default (***) | | | | | | | | |
| Corporate | | | 24,749 | | | | - | |
| Total Default | | | 24,749 | | | | - | |
| | | Ps. | 17,662,733 | | | Ps. | 18,987,370 | |
Grupo Aval Acciones y Valores S.A.
Notes to the Consolidated Financial Statement
As of December 31, 2016 and 2015 and for the years ended December 31, 2016, 2015 and 2014
(Figures expressed in millions of Colombian pesos)
(*) A sovereign credit rating considers the risk of Treasury issuer or similar agency (government debt portfolio).
(**) Derived from operations with government entities; including public administrations in general (plus regional and local).
(***)Includes investments in the Brazilian Telecommunications Company OI S.A. And its subsidiary Telemar Norte Leste S.A., which requested to avail themselves of the judicial protection law after declaring bankruptcy on June 20, 2016.
| d) | Held to maturity investments |
| | | December 31, 2016 | | | December 31, 2015 | |
| Investment Grade | | | | | | | | |
| Sovereign(*) | | Ps. | 25,981 | | | Ps. | 57,970 | |
| Other Public Entities(**) | | | 2,484,078 | | | | 2,274,456 | |
| Corporate | | | 1,541 | | | | - | |
| Multilaterals | | | 58,886 | | | | 1,614 | |
| Total investment Grade | | | 2,570,486 | | | | 2,334,040 | |
| Speculative | | | | | | | | |
| Corporate | | | - | | | | 8,319 | |
| Financial Entities | | | - | | | | 52,921 | |
| Total Speculative | | | - | | | | 61,240 | |
| Total | | Ps. | 2,570,486 | | | Ps. | 2,395,280 | |
(*) A sovereign credit rating considers the risk of Treasury issuer or similar agency (government debt portfolio).
(**)Derived from operations with government entities; including public administrations in general (plus regional and local).
| e) | Derivative instruments and hedging derivatives |
The details of credit rating determined by independent credit rating agents of counterparties in trading asset derivative instruments and hedging derivative instruments are as follows.
| Credit Worthiness | | December 31, 2016 | | | December 31, 2015 | |
| Investment Grade | | Ps. | 528,823 | | | Ps. | 679,660 | |
| Speculative | | | 248 | | | | 29,280 | |
| Without Grade or not available | | | 101,617 | | | | 349,722 | |
| Total | | Ps. | 630,688 | | | Ps. | 1,058,662 | |
Grupo Aval´s financial subsidiaries, namely Banco de Bogotá, Banco de Occidente, Banco Popular, Banco AV Villas, Corficolombiana, AFP Porvenir and the trust companies (Fiduciaries) of the Banks and Corficolombiana actively participate in money markets, foreign exchange markets and capital markets both for their book (for balance sheet risk management and trading) and to provide services to their customers. This is done subject to established policies and risk levels. In that regard, they manage different financial asset portfolios within the allowed limits and risk levels.
Market risk arises from open positions of Grupo Aval´s financial subsidiaries in debt security investment portfolios, derivatives and equity instruments. These risks are created by changes in factors such as interest rates, inflation, foreign currency exchange rates, share prices, credit margins of instruments and their volatility, as well as the liquidity in the markets where Grupo Aval operates.
Grupo Aval Acciones y Valores S.A.
Notes to the Consolidated Financial Statement
As of December 31, 2016 and 2015 and for the years ended December 31, 2016, 2015 and 2014
(Figures expressed in millions of Colombian pesos)
For purposes of our analysis, we have segmented market risk into two categories; trading book risk due to changes in interest rates and exchange rates, and the price risks of investments in equity securities and mutual funds.
| 4.2.1 | Market risk exposure |
Grupo Aval´s financial subsidiaries trade financial instruments for various reasons. The following are the main ones.
| · | To offer products tailored to specific customer needs. Some of these products are designed to hedge the financial risks of customers. |
| · | To take advantage of arbitrage among different yield curves, assets and markets, and to obtain returns with an adequate use of capital. |
| · | To hedge asset and liability risk positions on proprietary positions, to act on behalf of customers or to take advantage of arbitrage opportunities mainly in foreign exchange and interest rates in both local and foreign markets. |
In carrying out these operations, Grupo Aval´s financial subsidiaries take risks, within a set of predetermined limits. These risks are mitigated with the use of derivative products and other financial instruments.
The following is a breakdown of Grupo Aval’s financial assets and liabilities exposed to trading risk held at December 31, 2016 and 2015.
| Account | | December 31, 2016 | | | December 31, 2015 | |
| Financial assets | | | | | | | | |
| Debt financial assets | | | | | | | | |
| Trading | | Ps. | 2,343,902 | | | Ps. | 3,061,916 | |
| Available for sale | | | 17,662,733 | | | | 18,987,370 | |
| Total | | Ps. | 20,006,635 | | | Ps. | 22,049,286 | |
| Derivative instruments | | Ps. | 502,209 | | | Ps. | 1,024,972 | |
| Hedging derivatives | | | 128,479 | | | | 33,690 | |
| | | | 630,688 | | | | 1,058,662 | |
| Total financial assets | | Ps. | 20,637,323 | | | Ps. | 23,107,948 | |
| Liabilities | | | | | | | | |
| Derivative instruments | | | 640,695 | | | | 1,143,238 | |
| Hedging derivatives | | | 43,436 | | | | 337,750 | |
| Total financial liabilities | | | 684,131 | | | | 1,480,988 | |
| Net position | | Ps. | 19,953,192 | | | Ps. | 21,626,960 | |
| 4.2.1.1 | Description of objectives, policies and processes to manage trading risk |
The financial subsidiaries of Grupo Aval participate in money markets, foreign exchange markets and capital markets to meet their needs and those of their customers, pursuant to established policies and risk levels. In this respect, they manage different portfolios of financial assets within the limits and risk levels allowed.
The risks assumed in transactions related to the trading or treasury book are consistent with Grupo Aval’s overall business strategy and its risk appetite; which is based on the market depth for each instrument, its impact on risk-weighted assets and regulatory capital, the profit budget established for each business unit, and the balance sheet structure.
Grupo Aval Acciones y Valores S.A.
Notes to the Consolidated Financial Statement
As of December 31, 2016 and 2015 and for the years ended December 31, 2016, 2015 and 2014
(Figures expressed in millions of Colombian pesos)
Business strategies are established on the basis of approved limits, in an effort to balance the risk / return relationship. Moreover, there is a structure of limits consistent with Grupo Aval’s general philosophy and is based on capital levels, earnings performance and risk tolerance.
The Market Risk Management System (SARM in Spanish) allows Grupo Aval´s financial subsidiaries to identify, measure, control and monitor the market risk they are exposed to in carrying out their operations.
There are several scenarios in which Grupo Aval is exposed to trading risks.
·Interest Rate
Grupo Aval's portfolios are exposed to interest-rate risk when a change in the market value of asset positions due to a change in interest rates does not match the change in the market value of the liability positions, and this difference is not offset by a change in the market value of other instruments. Additionally, there is interest rate risk when the future margin of open transactions depends on interest rates.
·Foreign Exchange
Grupo Aval's portfolios are exposed to foreign exchange currency risk when the current value of the asset positions in each currency is not equivalent to the current value of the liability positions in the same currency, and the difference is not offset by other instruments. There is foreign exchange risk when positions are taken in derivative products where the underlying asset is exposed to exchange risk and the sensitivity of the value to variations in exchange rates has not been eliminated. Positions that have interest rate risk in currencies other than the functional currency can generate profits or losses because of the difference in the value of asset positions and the value of liability positions in a given currency. There is also foreign exchange risk when the margin of a transaction depends directly on exchange rates.
·Equity Price Risk and Mutual Fund Risk
Grupo Aval´s financial subsidiaries are exposed to equity price risk in investments. Particularly, Porvenir S. A. is required to directly invest on severance and mandatory pensions funds managed for it set in equity for a total amount of 1% of the assets of these funds, according to Colombian rules. The Group’s subsidiaries are also exposed to mutual fund risk in short term investments in money market or mutual funds.
Senior management and the boards of directors of Grupo Aval and its financial subsidiaries play an active role in managing and controlling risk. Senior management analyses the corresponding proposal and participates a number of committees that comprehensively monitor - both technically and fundamentally - the different variables that influence domestic and foreign markets. This process is intended to support strategic decisions.
Analyzing and monitoring the risks that Grupo Aval´s financial subsidiaries take in their operations is essential for decision making and to assess potential effects on profit or loss. An ongoing analysis of macroeconomic conditions is necessary in order to achieve an ideal combination of risk, return and liquidity.
Grupo Aval Acciones y Valores S.A.
Notes to the Consolidated Financial Statement
As of December 31, 2016 and 2015 and for the years ended December 31, 2016, 2015 and 2014
(Figures expressed in millions of Colombian pesos)
The risks assumed in financial operations are reflected in a limit structure that includes different types of instruments, specific trading strategies, the markets depth in which Grupo Aval´s financial subsidiaries operate, the impact on risk-weighted assets and regulatory capital, as well as the balance sheet structure.
These limits are monitored at least an a monthly basis and reported weekly to the Board of Directors of Grupo Aval´s financial subsidiaries.
In order to minimize interest rate and exchange rate risks in specific positions and transactions, Grupo Aval´s financial subsidiaries manage hedging strategies by taking positions in derivative instruments such as non-deliverable forwards (NDF) related to TES (local currency public debt) securities, money market transactions and foreign exchange forwards.
| 4.2.1.3 | Methods used to measure market risk |
Trading risks are quantified through the use of value-at-risk models (internal and standard), and measurements are done according to historical simulation methods. The Boards of Directors for Grupo Aval´s financial subsidiaries approve a framework of limits based on the value-at-risk related to the annual budget.
VaR is an estimate of the expected maximum loss in market value of a given portfolio over a time horizon at a specific confidence interval, subject to certain assumptions and limitations. VaR models have inherent limitations, partially because they rely on historical data, which may not be an indicative of future market conditions. VaR models could overestimate or underestimate the value at risk if market conditions vary significantly and they do not calculate the greatest possible loss.
Market risk is calculated on a daily basis by aggregating the VaR for each risk exposure category on a ten day horizon using risk factors calculated in extreme market stress scenarios. The VaR is calculated for the four risk factors mentioned below. Correlations between the risk factors are not considered. The sensitivity factors used in the VaR calculations are those determined by the Superintendency of Finance and the ten day horizon is defined as the average time in which an entity could sell a trading position in the market.
Grupo Aval´s financial subsidiaries hold trading and non-trading instruments. Trading instruments are recorded in our banks’ “treasury books” and non-trading instruments are recorded in their “banking books.”
Grupo Aval´s financial subsidiaries use the regulatory VaR to measure, control and manage market interest rate risk in the treasury book and a foreign exchange risk in both the treasury book and the banking book, as required by the Superintendency of Finance. The sum of the risk exposures by risk type constitutes the regulatory VaR. Each risk exposure is measured on a daily and monthly basis. Currently, asset and liability positions of the treasury books are classified according to their duration, to the type of instruments and to the currency. Net foreign currency positions are measured by currency both in the banking book and the treasury book, in accordance to the standard model determined by the Superintendency of Finance.
Grupo Aval´s financial subsidiaries also have parametric and non-parametric models based on the value-at-risk (VaR) method designed for internal management. These models enhance market-risk management by identifying and analyzing variations in risk factors (interest rates, exchange rates and price indexes) with respect to the value of the different instruments that constitute the portfolios. JP Morgan Risk Metrics and the historical simulation method are two examples of such models.
With the use of these methods profit and capital at risk projections have improved resource allocation among the different business units. The methods also allow comparisons of activities in different markets and
Grupo Aval Acciones y Valores S.A.
Notes to the Consolidated Financial Statement
As of December 31, 2016 and 2015 and for the years ended December 31, 2016, 2015 and 2014
(Figures expressed in millions of Colombian pesos)
identification of the riskiest positions in treasury activities. These tools are also used to determine limits on traders’ positions and to review positions and strategies rapidly in response to changes in market conditions.
The methods used to measure VaR are assessed regularly and back-tested to check their efficiency. In addition, Grupo Aval´s financial subsidiaries have tools to carry out portfolio stress and/or sensitivity tests, using extreme scenario simulations. Additionally, there are limits according to the "risk type" associated with each of the instruments comprising the different portfolios. These limits are related to sensitivity or impact on the value of the portfolio as a result of fluctuations of specific risk factors such as: interest rate (Rho), exchange rate (Delta) and volatility (Vega).
Grupo Aval´s financial subsidiaries have counterparty and trading limits for each trader for the different trading platforms in the markets where they operate. These limits are controlled daily by the back and middle offices of each entity. Trading limits for individual traders are assigned based upon the individual´s level in the organization, market and trading experience and product and portfolio management knowledge.
There is also a process to monitor the prices of fixed-income bonds issued abroad published by Infovalmer the local investment price provider. It is used daily to identify significant differences in prices among those provided by Infovalmer and those observed on the Bloomberg platform. This process provides feedback to Infovalmer.
In addition, fixed income bonds are subject to a qualitative liquidity analysis to determine the market depth for this type of instruments.
Finally, the daily transaction monitoring process includes controlling different aspects of trading, such as terms of negotiation, non-conventional or off-market transactions, and related party transactions.
According to the regulatory model, the market value-at-risk (VaR) for Grupo Aval´s financial subsidiaries consolidated at their level at December 31, 2016 and 2015 was as follows:
| | | December 31, 2016 | | | December 31, 2015 | |
| Bank | | Value | | | Basis points of
regulatory capital | | | Value | | | Basis points of
regulatory capital | |
| Banco Bogotá | | | 579,486 | | | | 81 | | | | 566,474 | | | | 68 | |
| Banco de Occidente | | | 141,794 | | | | 56 | | | | 174,187 | | | | 60 | |
| Banco Popular | | | 120,572 | | | | 85 | | | | 150,630 | | | | 119 | |
| Banco AV Villas | | | 89,402 | | | | 130 | | | | 110,382 | | | | 172 | |
| Corficolombiana | | | 159,697 | | | | 11 | | | | 282.448 | | | | 21 | |
The following tables show the VaR calculation relating to each of the risk factors described above and based on the Superintendency of Finance Methodology (Regulatory VaR) for the years ended December 31, 2016 and 2015, for a ten-day horizon for each of our Colombian banking subsidiaries (including Corficolombiana) . The averages, minimums and maximums are determined based on end-of-the-month calculations.
Grupo Aval Acciones y Valores S.A.
Notes to the Consolidated Financial Statement
As of December 31, 2016 and 2015 and for the years ended December 31, 2016, 2015 and 2014
(Figures expressed in millions of Colombian pesos)
Banco de Bogotá S.A.
| Maximum, Minimum and Average VaR Values |
| December 31, 2016 |
| | | Minimum | | | Average | | | Maximum | | | Period end | |
| Interest rate | | | 324,908 | | | | 496,788 | | | | 711,827 | | | | 346,303 | |
| Exchange rate | | | 26,940 | | | | 37,336 | | | | 57,160 | | | | 57,160 | |
| Shares | | | 5,090 | | | | 9,622 | | | | 15,089 | | | | 6,002 | |
| Mutual funds | | | 149,082 | | | | 160,274 | | | | 170,020 | | | | 170,020 | |
| VaR Portfolio | | | 550,562 | | | | 704,020 | | | | 909,405 | | | | 579,486 | |
| Maximum, Minimum and Average VaR Values |
| December 31, 2015 |
| | | Minimum | | | Average | | | Maximum | | | Period end | |
| Interest rate | | | 394,248 | | | | 430,186 | | | | 466,030 | | | | 394,248 | |
| Exchange rate | | | 6,840 | | | | 29,827 | | | | 60,756 | | | | 19,926 | |
| Shares | | | 2,443 | | | | 3,510 | | | | 4,374 | | | | 4,068 | |
| Mutual funds | | | 143,731 | | | | 146,807 | | | | 149,519 | | | | 148,232 | |
| VaR Portfolio | | | 566,474 | | | | 610,330 | | | | 671,850 | | | | 566,474 | |
Banco de Bogotá´s market risk weighted assets remained on average around 5.5 % of the total risk-weighted assets during the year ended December 31, 2016 and 5.4% for the year ended December 31, 2015.
Banco de Occidente S.A.
| Maximum, Minimum and Average VaR Values |
| December 31, 2016 |
| | | Minimum | | | Average | | | Maximum | | | Period end | |
| Interest rate | | | 131,840 | | | | 154,398 | | | | 172,552 | | | | 137,221 | |
| Exchange rate | | | 1,488 | | | | 2,172 | | | | 3,567 | | | | 2,029 | |
| Shares | | | - | | | | - | | | | - | | | | - | |
| Mutual funds | | | 2,545 | | | | 3,628 | | | | 3,898 | | | | 2,545 | |
| VaR Portfolio | | | 137,343 | | | | 160,199 | | | | 177,946 | | | | 141,794 | |
| Maximum, Minimum and Average VaR Values |
| December 31, 2015 |
| | | Minimum | | | Average | | | Maximum | | | Period end | |
| Interest rate | | | 168,809 | | | | 212,241 | | | | 255,956 | | | | 168,809 | |
| Exchange rate | | | 928 | | | | 2,173 | | | | 3,648 | | | | 1,811 | |
| Shares | | | - | | | | - | | | | - | | | | - | |
| Mutual funds | | | 3,026 | | | | 3,490 | | | | 3,575 | | | | 3,567 | |
| VaR Portfolio | | | 174,168 | | | | 217,904 | | | | 262,386 | | | | 174,187 | |
Banco de Occidente´s market risk weighted assets remained on average around 4.2 % of the total risk-weighted assets during the year ended December 31, 2016 and 5.2% for the year ended December 31, 2015.
Grupo Aval Acciones y Valores S.A.
Notes to the Consolidated Financial Statement
As of December 31, 2016 and 2015 and for the years ended December 31, 2016, 2015 and 2014
(Figures expressed in millions of Colombian pesos)
Banco Popular S.A
| Maximum, Minimum and Average VaR Values |
| December 31, 2016 |
| | | Minimum | | | Average | | | Maximum | | | Period end | |
| Interest rate | | | 103,097 | | | | 129,470 | | | | 149,375 | | | | 118,920 | |
| Exchange rate | | | 17 | | | | 703 | | | | 2,551 | | | | 273 | |
| Shares | | | 732 | | | | 813 | | | | 947 | | | | 764 | |
| Mutual funds | | | 490 | | | | 582 | | | | 683 | | | | 615 | |
| VaR Portfolio | | | 104,583 | | | | 131,567 | | | | 150,964 | | | | 120,572 | |
| Maximum, Minimum and Average VaR Values |
| December 31, 2015 |
| | | Minimum | | | Average | | | Maximum | | | Period end | |
| Interest rate | | | 130,954 | | | | 142,941 | | | | 153,197 | | | | 149,206 | |
| Exchange rate | | | 11 | | | | 225 | | | | 564 | | | | 169 | |
| Shares | | | 720 | | | | 722 | | | | 724 | | | | 723 | |
| Mutual funds | | | 547 | | | | 556 | | | | 623 | | | | 532 | |
| VaR Portfolio | | | 131,536 | | | | 144,444 | | | | 155,108 | | | | 150,630 | |
Banco Popular´s market risk weighted assets remained on average around 7.1 % of the total risk-weighted assets during the year ended December 31, 2016 and 9.6% for the year ended December 31, 2015.
Banco Comercial AV Villas S.A
| Maximum, Minimum and Average VaR Values |
| December 31, 2016 |
| | | Minimum | | | Average | | | Maximum | | | Period end | |
| Interest rate | | | 89,066 | | | | 100,756 | | | | 113,347 | | | | 89,268 | |
| Exchange rate | | | 0,3 | | | | 307 | | | | 862 | | | | 7 | |
| Shares | | | - | | | | - | | | | - | | | | - | |
| Mutual funds | | | 96 | | | | 115 | | | | 169 | | | | 126 | |
| VaR Portfolio | | | 89,243 | | | | 101,178 | | | | 114,065 | | | | 89,402 | |
| Maximum, Minimum and Average VaR Values |
| December 31, 2015 |
| | | Minimum | | | Average | | | Maximum | | | Period end | |
| Interest rate | | | 67,118 | | | | 120,884 | | | | 138,761 | | | | 109,999 | |
| Exchange rate | | | 0.4 | | | | 37 | | | | 395 | | | | 248 | |
Grupo Aval Acciones y Valores S.A.
Notes to the Consolidated Financial Statement
As of December 31, 2016 and 2015 and for the years ended December 31, 2016, 2015 and 2014
(Figures expressed in millions of Colombian pesos)
| Maximum, Minimum and Average VaR Values |
| December 31, 2015 |
| | | Minimum | | | Average | | | Maximum | | | Period end | |
| Shares | | | - | | | | - | | | | - | | | | - | |
| Mutual funds | | | 77 | | | | 276 | | | | 710 | | | | 135 | |
| VaR Portfolio | | | 67,609 | | | | 121,197 | | | | 138,975 | | | | 110,382 | |
Banco AV Villas´market risk weighted assets remained on average around 10.2 % of the total risk-weighted assets during the year ended December 31, 2016 and 13.6% for the year ended December 31, 2015.
Corficolombiana S.A.
| Maximum, Minimum and Average VaR Values |
| December 31, 2016 |
| | | Minimum | | | Average | | | Maximum | | | Period end | |
| Interest rate | | | 130,771 | | | | 219,143 | | | | 282,081 | | | | 141,553 | |
| Exchange rate | | | 1,263 | | | | 3,799 | | | | 8,730 | | | | 3,263 | |
| Shares | | | 8,471 | | | | 10,608 | | | | 12,295 | | | | 11,975 | |
| Mutual funds | | | 373 | | | | 2,140 | | | | 3,498 | | | | 2,906 | |
| VaR Portfolio | | | 146,966 | | | | 235,689 | | | | 293,983 | | | | 159,697 | |
| Maximum, Minimum and Average VaR Values |
| December 31, 2015 |
| | | Minimum | | | Average | | | Maximum | | | Period end | |
| Interest rate | | | 228,837 | | | | 274,744 | | | | 366,521 | | | | 266,513 | |
| Exchange rate | | | 1,360 | | | | 4,106 | | | | 7,560 | | | | 3,236 | |
| Shares | | | 5,951 | | | | 6,655 | | | | 9,253 | | | | 9,253 | |
| Mutual funds | | | 3,171 | | | | 16,920 | | | | 50,822 | | | | 3,445 | |
| VaR Portfolio | | | 278,535 | | | | 302,426 | | | | 383,049 | | | | 282,448 | |
Corficolombiana´s market risk weighted assets remained on average around 23.6 % of the total risk-weighted assets during the year ended December 31, 2016 and 33% on the year ended December 31, 2015.
4.2.1.4 Investment price risk in equity instruments
Equity investments
Through Grupo Aval´s subsidiary Corficolombiana the Group, is exposed to financial asset price risk in equity instruments, due to volatility in their market price.
At December 31, 2016 and 2015, Corficolombiana and its subsidiaries were exposed to financial asset price risk in equity instruments listed on the stock exchanges as follows: Gas Natural ESP, Bolsa de Valores de Colombia, Empresa
Grupo Aval Acciones y Valores S.A.
Notes to the Consolidated Financial Statement
As of December 31, 2016 and 2015 and for the years ended December 31, 2016, 2015 and 2014
(Figures expressed in millions of Colombian pesos)
de Energía de Bogotá, Mineros S.A., Bladex S.A. Clase E. If the share prices of these securities would have been 1% higher or lower at December 31, 2015, the lesser or greater impact on the Corporation’s Other Comprehensive Income (OCI) would be Ps. 6,510 before taxes during the year ended on December 31, 2016 (Ps. 6,902 for the year ended on December 31, 2015 and Ps. 6,962 before taxes during the year ended on December 31, 2014).
| 4.3 | Structural foreign exchange risk |
Grupo Aval ´s financial subsidiaries have agencies and subsidiaries offshore and have assets and liabilities in foreign currencies and thus are exposed to changes in the exchange rates, primarily the United States dollar and the Euro. Foreign exchange risk is present when there are assets and liabilities denominated in foreign currency, when investments are made in subsidiaries and branches abroad, in loan portfolios, and obligations in foreign currency, There is also foreign exchange risk in foreign currency off balance sheet transactions.
Banks in Colombia are authorized by the country’s central bank (Banco de la República) to trade currencies and to maintain balances in foreign currency in accounts abroad. Colombia law allows to the Banks to maintain a net daily asset or liability position in foreign currency, determined as the difference in foreign currency denominated rights and foreign currency denominated obligations including both on and off balance sheet positions. The average of this difference over three business days cannot exceed twenty percent (20%) of the entity´s regulatory capital. The three business day average in foreign currency can be negative without exceeding five percent (5%) of regulatory capital expressed in U.S. dollars.
There is also a limit to the spot position. This position is determined by the difference between foreign currency-denominated assets and liabilities, excluding derivatives and specific investments. The three-business-day average of the spot foreign currency position cannot exceed fifty percent (50%) of the entity's regulatory capital and it cannot be negative.
In addition, there are limits to the gross leverage position, which are defined as the sum of the rights and obligations in foreign exchange futures contracts, foreign exchange spot transactions maturing in the range of T + 1 day and T + 3 days, and other foreign exchange derivatives. The three business-day average of the gross leverage position cannot exceed five hundred and fifty percent (550%) of the entity's regulatory capital.
The maximum and minimum total foreign currency position and the spot foreign currency position are determined according to each entities´ regulatory capital. The regulatory capital that is used is that of the last business day of the prior month at the exchange rate set by the Superintendency of Finance at the end of the previous month.
A substantial amount of Grupo Aval's foreign currency assets and liabilities are in U.S. dollars. Details on the assets and liabilities in foreign currency held by Grupo Aval at December 31, 2016 and 2015 are shown below:
December 31, 2016
| Account | | U.S. dollars
(Millions) | | | Euros (Millions) | | | Other currencies
converted to U.S.
dollars (Millions) | | | Total in Colombian
pesos (Millions) | |
| Financial assets | | | | | | | | | | | | | | | | |
| Cash and cash equivalents | | | 3,898 | | | | 69 | | | | 940 | | | | 14,694,459 | |
| Investments in debt securities held for trading | | | 172 | | | | - | | | | - | | | | 516,926 | |
| Investments in securities available for sale | | | 2,741 | | | | - | | | | - | | | | 8,224,549 | |
| Investments in debt securities held to maturity | | | 9 | | | | - | | | | - | | | | 25,693 | |
| Trading derivatives | | | 128 | | | | - | | | | 26 | | | | 462,278 | |
| Loan portfolio financial assets at amortized cost | | | 14,149 | | | | - | | | | 4,682 | | | | 56,505,459 | |
| Other accounts receivable | | | 318 | | | | - | | | | - | | | | 955,677 | |
| Hedge derivatives | | | 43 | | | | - | | | | - | | | | 128,479 | |
Grupo Aval Acciones y Valores S.A.
Notes to the Consolidated Financial Statement
As of December 31, 2016 and 2015 and for the years ended December 31, 2016, 2015 and 2014
(Figures expressed in millions of Colombian pesos)
| Account | | U.S. dollars
(Millions) | | | Euros (Millions) | | | Other currencies
converted to U.S.
dollars (Millions) | | | Total in Colombian
pesos (Millions) | |
| Total financial assets | | | 21,458 | | | | 69 | | | | 5,648 | | | | 81,513,520 | |
| Account | | U.S. dollars
(Millions) | | | Euros (Millions) | | | Other currencies
converted to U.S.
dollars (Millions) | | | Total in Colombian
pesos (Millions) | |
| Financial liabilities | | | | | | | | | | | | | | | | |
| Trading derivatives | | | 134 | | | | - | | | | 70 | | | | 613,376 | |
| Customer deposits | | | 13,214 | | | | 58 | | | | 4,405 | | | | 53,014,364 | |
| Financial obligations | | | 9,219 | | | | - | | | | - | | | | 27,664,167 | |
| Accounts payable | | | 1 | | | | - | | | | - | | | | 4,234 | |
| Hedge derivatives | | | 14 | | | | - | | | | - | | | | 43,436 | |
| Total financial liabilities | | | 22,582 | | | | 58 | | | | 4,475 | | | | 81,339,577 | |
| Net financial asset (liability) position | | | (1,124 | ) | | | 11 | | | | 1,173 | | | | 173,943 | |
December 31, 2015
| Account | | U.S. dollars
(Millions) | | | Euros
(Millions) | | | Other currencies converted
to U.S. dollars (Millions) | | | Total in Colombian
pesos (Millions) | |
| Financial assets | | | | | | | | | | | | | | | | |
| Cash and cash equivalents | | | 3,502 | | | | 45 | | | | 907 | | | | 14,039,490 | |
| Investments in debt securities held for trading | | | 141 | | | | - | | | | 177 | | | | 999,728 | |
| Investments in securities available for sale | | | 2,230 | | | | 1 | | | | 329 | | | | 8,059,671 | |
| Investments in debt securities held to maturity | | | 13 | | | | - | | | | - | | | | 40,819 | |
| Trading derivatives | | | 248 | | | | 35 | | | | - | | | | 900,106 | |
| Loan portfolio financial assets at amortized cost | | | 13,590 | | | | 2 | | | | 3,601 | | | | 54,147,890 | |
| Other accounts receivable | | | 1,951 | | | | 14 | | | | 94 | | | | 6,490,126 | |
| Hedge derivatives | | | 11 | | | | - | | | | - | | | | 33,690 | |
| Total financial assets | | | 21,686 | | | | 97 | | | | 5,108 | | | | 84,711,520 | |
| Account | | U.S. dollars
(Millions) | | | Euros
(Millions) | | | Other currencies converted
to U.S. dollars (Millions) | | | Total in Colombian
pesos (Millions) | |
| Financial liabilities | | | | | | | | | | | | | | | | |
| Trading derivatives | | | 284 | | | | 3 | | | | - | | | | 904,309 | |
| Customer deposits | | | 12,316 | | | | 37 | | | | 4,056 | | | | 51,691,158 | |
| Financial obligations | | | 8,042 | | | | 55 | | | | 571 | | | | 27,315,034 | |
| Accounts payable | | | - | | | | - | | | | - | | | | 548 | |
| Hedge derivatives | | | 103 | | | | - | | | | - | | | | 323,172 | |
| Total financial liabilities | | | 20,745 | | | | 95 | | | | 4,627 | | | | 80,234,221 | |
| Net financial asset (liability) position | | | 941 | | | | 2 | | | | 481 | | | | 4,477,299 | |
Grupo Aval’s financial subsidiaries hedge their foreign exchange exposure using derivatives, especially forwards. The net foreign currency position of each subsidiary is monitored on a daily basis.
Grupo Aval has a number of investments in foreign subsidiaries and branches whose net assets are exposed to foreign exchange risk because of the translation of gains or losses for the purpose of consolidating their financial statements. The exposure arising from net assets in foreign operations is hedged primarily with financial obligations, bonds issued to the market and foreign exchange derivative instruments.
Had the peso value of the U.S. dollar increased by Ps. 10 Colombian pesos per U.S. dollar at December 31, 2016, Grupo Aval’s equity would have decrease by Ps. 8,184 (Ps.1,598 increase in the year ended at December 31, 2015).
Grupo Aval Acciones y Valores S.A.
Notes to the Consolidated Financial Statement
As of December 31, 2016 and 2015 and for the years ended December 31, 2016, 2015 and 2014
(Figures expressed in millions of Colombian pesos)
The foreign exchange effect on profit before taxes, Grupo Aval would have led to a decrease of Ps. 13,640 in the year ended December 31, 2016, (Ps.2,620 increase in the year ended at December 31, 2015).
| 4.4 | Structural interest rate risk |
Grupo Aval´s financial subsidiaries are exposed to fluctuations in market interest rates that impact their financial positions and cash flows. They monitor their interest rate risk on a daily basis and set limits to the asset and liability mismatches when they are repriced.
Grupo Aval´s banks analyze their interest rate exposure in a dynamic way. Scenario modelling considers renewal of existing positions, financing alternatives and hedges. Considering these scenarios, the banks calculate the profit and loss impact for a given change in interest rates.
The following table shows interest rates exposure for assets and liabilities, as a result of repricing, at December 31, 2016 and 2015. In this table, fixed rate instruments are classified according to the maturity date and floating rate instruments are classified according to the repricing date.
December 31, 2016
| Assets | | Less than
one month | | | From one
to six
months | | | From six
to twelve
months | | | More than a
year | | | Non-interest | | | Total | |
| | | | | | | | | | | | | | | | | | | |
| Cash and cash equivalents | | Ps. | 885,572 | | | Ps. | - | | | Ps. | - | | | Ps. | - | | | Ps. | 21,307,432 | | | Ps. | 22,193,004 | |
| Debt securities held for trading | | | 584,277 | | | | 354,424 | | | | 249,249 | | | | 1,155,952 | | | | - | | | | 2,343,902 | |
| Debt securities available for sale | | | 97,048 | | | | 151,277 | | | | 5,882,444 | | | | 11,531,964 | | | | - | | | | 17,662,733 | |
| Debt securities held to maturity | | | 51,042 | | | | 2,488,507 | | | | 25,693 | | | | 5,244 | | | | - | | | | 2,570,486 | |
| Service concession arrangements | | | - | | | | - | | | | - | | | | 2,072,674 | | | | - | | | | 2,072,674 | |
| Commercial loans and leases | | | 19,446,228 | | | | 54,284,920 | | | | 4,799,382 | | | | 14,618,681 | | | | - | | | | 93,149,211 | |
| Consumer loans and leases | | | 4,060,610 | | | | 8,528,968 | | | | 1,387,001 | | | | 32,951,418 | | | | - | | | | 46,927,997 | |
| Mortgages and housing leases | | | 3,896,339 | | | | 423,374 | | | | 105,437 | | | | 10,258,387 | | | | - | | | | 14,683,537 | |
| Microcredit loans and leases | | | 3,183 | | | | 18,536 | | | | 34,455 | | | | 343,257 | | | | - | | | | 399,431 | |
| Other accounts receivable | | | - | | | | - | | | | - | | | | 440,275 | | | | 3,279,397 | | | | 3,719,672 | |
| Total Assets | | Ps. | 29,024,299 | | | Ps. | 66,250,006 | | | Ps. | 12,483,661 | | | Ps. | 73,377,852 | | | Ps. | 24,586,829 | | | Ps. | 205,722,647 | |
Grupo Aval Acciones y Valores S.A.
Notes to the Consolidated Financial Statement
As of December 31, 2016 and 2015 and for the years ended December 31, 2016, 2015 and 2014
(Figures expressed in millions of Colombian pesos)
| Liabilities | | Less than
one month | | | From one
to six
months | | | From six
to twelve
months | | | More than a
year | | | Non-interest | | | Total | |
| | | | | | | | | | | | | | | | | | | |
| Checking accounts | | Ps. | 21,843,630 | | | Ps. | - | | | Ps. | - | | | Ps. | - | | | Ps. | 13,134,559 | | | Ps. | 34,978,189 | |
| Time deposits | | | 9,250,329 | | | | 23,292,407 | | | | 10,725,534 | | | | 14,737,874 | | | | - | | | | 58,006,144 | |
| Saving deposits | | | 50,573,924 | | | | - | | | | - | | | | - | | | | - | | | | 50,573,924 | |
| Other deposits | | | - | | | | - | | | | - | | | | - | | | | 328,798 | | | | 328,798 | |
| Interbank and overnight funds | | | 6,171,336 | | | | 144,381 | | | | - | | | | - | | | | - | | | | 6,315,717 | |
| Borrowing from banks and other | | | 2,636,761 | | | | 5,724,376 | | | | 1,961,526 | | | | 7,583,970 | | | | - | | | | 17,906,633 | |
| Long-term debt | | | 2,463,493 | | | | 4,715,900 | | | | 753,451 | | | | 10,635,392 | | | | - | | | | 18,568,236 | |
| Borrowing from development entities | | | 448,532 | | | | 1,289,977 | | | | 173,197 | | | | 813,989 | | | | - | | | | 2,725,695 | |
| Total Liabilities | | Ps. | 93,388,005 | | | Ps. | 35,167,041 | | | Ps. | 13,613,708 | | | Ps. | 33,771,225 | | | Ps. | 13,463,357 | | | Ps. | 189,403,336 | |
December 31, 2015
| Assets | | Less than
one month | | | From one
to six
months | | | From six
to twelve
months | | | More than a
year | | | Non-interest | | | Total | |
| | | | | | | | | | | | | | | | | | | |
| Cash and cash equivalents | | Ps. | 2,345,232 | | | Ps. | - | | | Ps. | - | | | Ps. | - | | | Ps. | 19,939,745 | | | Ps. | 22,284,977 | |
| Debt securities held for trading | | | 11,891 | | | | 44,348 | | | | 166,265 | | | | 2,839,412 | | | | - | | | | 3,061,916 | |
| Debt securities available for sale | | | 51,985 | | | | 167,929 | | | | 4,314,529 | �� | | | 14,452,927 | | | | - | | | | 18,987,370 | |
| Debt securities held to maturity | | | 33,480 | | | | 2,065,464 | | | | 264,775 | | | | 31,561 | | | | - | | | | 2,395,280 | |
| Service concession arrangements | | | - | | | | - | | | | - | | | | 1,891,692 | | | | - | | | | 1,891,692 | |
| Commercial loans and leases | | | 18,519,813 | | | | 52,755,681 | | | | 3,460,470 | | | | 14,762,184 | | | | - | | | | 89,498,148 | |
| Consumer loans and leases | | | 1,522,497 | | | | 6,045,366 | | | | 2,368,871 | | | | 32,293,775 | | | | - | | | | 42,230,509 | |
| Mortgages and housing leases | | | 3,645,448 | | | | 219,614 | | | | 276,023 | | | | 9,276,994 | | | | - | | | | 13,418,079 | |
| Microcredit loans and leases | | | 280 | | | | 8,613 | | | | 49,560 | | | | 340,809 | | | | - | | | | 399,262 | |
| Other accounts receivable | | | - | | | | - | | | | - | | | | 42,864 | | | | 3,353,807 | | | | 3,396,671 | |
| Total Assets | | Ps. | 26,130,626 | | | Ps. | 61,307,015 | | | Ps. | 10,900,493 | | | Ps. | 75,932,218 | | | Ps. | 23,293,552 | | | Ps. | 197,563,904 | |
Grupo Aval Acciones y Valores S.A.
Notes to the Consolidated Financial Statement
As of December 31, 2016 and 2015 and for the years ended December 31, 2016, 2015 and 2014
(Figures expressed in millions of Colombian pesos)
| Liabilities | | Less than
one month | | | From one
to six
months | | | From six
to twelve
months | | | More than a
year | | | Non-interest | | | Total | |
| | | | | | | | | | | | | | | | | | | |
| Checking accounts | | | 16,239,339 | | | | - | | | | - | | | | - | | | | 17,191,326 | | | | 33,430,665 | |
| Time deposits | | | 10,268,170 | | | | 20,684,957 | | | | 10,308,182 | | | | 10,516,057 | | | | - | | | | 51,777,366 | |
| Saving deposits | | | 50,298,080 | | | | - | | | | - | | | | - | | | | - | | | | 50,298,080 | |
| Other deposits | | | - | | | | - | | | | - | | | | - | | | | 448,517 | | | | 448,517 | |
| Interbank and overnight funds | | | 9,207,789 | | | | 267,082 | | | | - | | | | - | | | | - | | | | 9,474,871 | |
| Borrowing from banks and other | | | 2,127,910 | | | | 9,193,102 | | | | 2,855,241 | | | | 4,574,363 | | | | - | | | | 18,750,616 | |
| Long-term debt | | | 1,168,285 | | | | 3,665,358 | | | | 336,605 | | | | 11,396,875 | | | | - | | | | 16,567,123 | |
| Borrowing from development entities | | | 779,240 | | | | 1,659,598 | | | | 45,171 | | | | 22,640 | | | | - | | | | 2,506,649 | |
| Total Liabilities | | Ps. | 90,088,813 | | | Ps. | 35,470,097 | | | Ps. | 13,545,199 | | | Ps. | 26,509,935 | | | Ps. | 17,639,843 | | | Ps. | 183,253,887 | |
During the year ended on December 31, 2016, a 50 basis points increase in interest rates, with all the other variables constant, Grupo Aval´s revenue from interest earning financial assets would have increased by Ps. 849,370 and the expense from interest bearing financial liabilities would have increased by Ps. 931,643. A 100 basis points increase in interest rates would have increased revenues from by Ps. 1,698,740 and expenses by Ps. 1,863,286. A 50 or 100 basis point reduction in interest rates would have decreased income and expenses by the same amounts.
For the year ended on December 31, 2015, a 50 basis points increase in interest rates, with all the other variables constant, Grupo Aval´s revenue from interest earning financial assets would have increased by Ps. 762,178 and the expense from interest bearing financial liabilities would have increased by Ps. 829,178. A 100 basis points increase in interest rates would have increased revenues from by Ps. 1,524,356 and expenses by Ps. 1,658,356. A 50 or 100 basis point reduction in interest rates would have decreased income and expenses by the same amounts.
The following is a breakdown of interest bearing assets and liabilities, by interest rate type and by maturity, at December 31, 2016 and 2015.
December 31, 2016
| | | Under one year | | | Over one year | | | | | | | |
| Assets | | Variable | | | Fixed | | | Variable | | | Fixed | | | Non-interest | | | Total | |
| Cash and cash equivalents | | Ps. | - | | | Ps. | 885,572 | | | Ps. | - | | | Ps. | - | | | Ps. | 21,307,432 | | | Ps. | 22,193,004 | |
| Debt securities held for trading | | | 203,422 | | | | 799,566 | | | | 256,467 | | | | 1,084,447 | | | | - | | | | 2,343,902 | |
| Debt securities available for sale | | | 76,170 | | | | 3,323,386 | | | | 179,413 | | | | 14,083,764 | | | | - | | | | 17,662,733 | |
| Debt securities held to maturity | | | 2,486,514 | | | | 78,860 | | | | 3,928 | | | | 1,184 | | | | - | | | | 2,570,486 | |
| Service concession arrangements | | | - | | | | - | | | | 2,072,674 | | | | - | | | | - | | | | 2,072,674 | |
| Commercial loans and leases | | | 28,138,078 | | | | 12,039,918 | | | | 40,904,474 | | | | 12,066,741 | | | | - | | | | 93,149,211 | |
| Consumer loans and leases | | | 413,928 | | | | 12,779,524 | | | | 2,001,963 | | | | 31,732,582 | | | | - | | | | 46,927,997 | |
| Mortgages and housing leases | | | 83,339 | | | | 324,246 | | | | 5,363,330 | | | | 8,912,622 | | | | - | | | | 14,683,537 | |
| Microcredit loans and leases | | | 9,958 | | | | 156,761 | | | | 6,903 | | | | 225,809 | | | | - | | | | 399,431 | |
| Other accounts receivable | | | - | | | | - | | | | 440,275 | | | | - | | | | 3,279,397 | | | | 3,719,672 | |
| Total Assets | | | 31,411,409 | | | | 30,387,833 | | | | 51,229,427 | | | | 68,107,149 | | | | 24,586,829 | | | | 205,722,647 | |
Grupo Aval Acciones y Valores S.A.
Notes to the Consolidated Financial Statement
As of December 31, 2016 and 2015 and for the years ended December 31, 2016, 2015 and 2014
(Figures expressed in millions of Colombian pesos)
| | | Under one year | | | Over one year | | | | | | | |
| Liabilities | | Variable | | | Fixed | | | Variable | | | Fixed | | | Non-interest | | | Total | |
| Checking accounts | | Ps. | - | | | Ps. | 21,843,630 | | | Ps. | - | | | Ps. | - | | | Ps. | 13,134,559 | | | Ps. | 34,978,189 | |
| Time deposits | | | 13,079,866 | | | | 29,792,727 | | | | 6,057,772 | | | | 9,075,779 | | | | - | | | | 58,006,144 | |
| Saving deposits | | | 70,783 | | | | 50,234,077 | | | | - | | | | 269,064 | | | | - | | | | 50,573,924 | |
| Other deposits | | | - | | | | - | | | | - | | | | - | | | | 328,798 | | | | 328,798 | |
| Interbank and overnight funds | | | 712,355 | | | | 5,603,362 | | | | - | | | | - | | | | - | | | | 6,315,717 | |
| Borrowing from banks and other | | | 3,187,556 | | | | 5,173,581 | | | | 4,458,094 | | | | 5,087,402 | | | | - | | | | 17,906,633 | |
| Long-term debt | | | 1,314,956 | | | | 4,234,039 | | | | 4,737,643 | | | | 8,281,598 | | | | - | | | | 18,568,236 | |
| Borrowing from development entities | | | 529,843 | | | | - | | | | 2,195,852 | | | | - | | | | - | | | | 2,725,695 | |
| Total Liabilities | | | 18,895,359 | | | | 116,881,416 | | | | 17,449,361 | | | | 22,713,843 | | | | 13,463,357 | | | | 189,403,336 | |
December 31, 2015
| | | Under one year | | | Over one year | | | | | | | |
| Assets | | Variable | | | Fixed | | | Variable | | | Fixed | | | Non-interest | | | Total | |
| Cash and cash equivalents | | Ps. | - | | | Ps. | 2,345,232 | | | Ps. | - | | | Ps. | - | | | Ps. | 19,939,745 | | | Ps. | 22,284,977 | |
| Debt securities held for trading | | | 25,867 | | | | 715,848 | | | | 150,169 | | | | 2,170,032 | | | | - | | | | 3,061,916 | |
| Debt securities available for sale | | | 50,347 | | | | 1,927,304 | | | | 876,471 | | | | 16,133,248 | | | | - | | | | 18,987,370 | |
| Debt securities held to maturity | | | 2,039,315 | | | | 346,869 | | | | 1,740 | | | | 7,356 | | | | - | | | | 2,395,280 | |
| Service concession arrangements | | | - | | | | - | | | | 1,891,692 | | | | - | | | | - | | | | 1,891,692 | |
| Commercial loans and leases | | | 28,517,374 | | | | 13,483,063 | | | | 36,977,021 | | | | 10,520,690 | | | | - | | | | 89,498,148 | |
| Consumer loans and leases | | | 717,953 | | | | 13,765,526 | | | | 3,640,010 | | | | 24,107,020 | | | | - | | | | 42,230,509 | |
| Mortgages and housing leases | | | 11,437 | | | | 488,377 | | | | 3,930,524 | | | | 8,987,741 | | | | - | | | | 13,418,079 | |
| Microcredit loans and leases | | | 1,972 | | | | 178,039 | | | | 5,998 | | | | 213,253 | | | | - | | | | 399,262 | |
| Other accounts receivable | | | - | | | | - | | | | 42,864 | | | | - | | | | 3,353,807 | | | | 3,396,671 | |
| Total Assets | | | 31,364,265 | | | | 33,250,258 | | | | 47,516,489 | | | | 62,139,340 | | | | 23,293,552 | | | | 197,563,904 | |
Grupo Aval Acciones y Valores S.A.
Notes to the Consolidated Financial Statement
As of December 31, 2016 and 2015 and for the years ended December 31, 2016, 2015 and 2014
(Figures expressed in millions of Colombian pesos)
| | | Under one year | | | Over one year | | | | | | | |
| Liabilities | | Variable | | | Fixed | | | Variable | | | Fixed | | | Non-interest | | | Total | |
| Checking accounts | | Ps. | - | | | Ps. | 16,239,339 | | | Ps. | - | | | Ps. | - | | | Ps. | 17,191,326 | | | Ps. | 33,430,665 | |
| Time deposits | | | 11,811,239 | | | | 28,242,830 | | | | 6,892,867 | | | | 4,830,430 | | | | - | | | | 51,777,366 | |
| Saving deposits | | | 25,919 | | | | 50,272,161 | | | | - | | | | - | | | | - | | | | 50,298,080 | |
| Other deposits | | | - | | | | - | | | | - | | | | - | | | | 448,517 | | | | 448,517 | |
| Interbank and overnight funds | | | - | | | | 9,474,871 | | | | - | | | | - | | | | - | | | | 9,474,871 | |
| Borrowing from banks and other | | | 3,108,030 | | | | 4,541,631 | | | | 5,719,763 | | | | 5,381,192 | | | | - | | | | 18,750,616 | |
| Long-term debt | | | 626,379 | | | | 784,858 | | | | 5,050,759 | | | | 10,105,127 | | | | - | | | | 16,567,123 | |
| Borrowing from development entities | | | 132,962 | | | | 11,949 | | | | 2,340,016 | | | | 21,722 | | | | - | | | | 2,506,649 | |
| Total Liabilities | | | 15,704,529 | | | | 109,567,639 | | | | 20,003,405 | | | | 20,338,471 | | | | 17,639,843 | | | | 183,253,887 | |
Liquidity risk management has always been a basic element of the Group business strategy and a fundamental cornerstone, together with capital, on which the strength of its balance sheet rests. Liquidity risk is related to the inability of Grupo Aval´s financial subsidiaries to fulfill their obligations with customers, financial market counterparties, lenders, suppliers, authorities or other stake holders at any given moment, in any currency and in any location. Each entity reviews its available resources on a daily basis in order to control its liquidity risk.
Grupo Aval´s financial subsidiaries manage liquidity risk according to the standard model established by the Superintendency of Finance and to the general rules of liquidity risk management. This is done by adopting the basic principles of the Liquidity Risk Management Systems (SARL in Spanish), which sets the minimum reasonable parameters that the entities must monitor in their operations to effectively manage liquidity risk.
Grupo Aval is responsible for covering the liquidity needs arising from its current and future activity. The Group will either take deposits from its customers in its area of influence, or by resorting to the wholesale markets where it operates. In addition, this funding structure benefits from the advantages of having a commercial banking model,
Grupo Aval Acciones y Valores S.A.
Notes to the Consolidated Financial Statement
As of December 31, 2016 and 2015 and for the years ended December 31, 2016, 2015 and 2014
(Figures expressed in millions of Colombian pesos)
with the focus on retail customers and a high level of efficiency. As a result, Grupo Aval has a considerable capacity to attract stable deposits, as well as a significant issue capacity in the wholesale markets.
To measure liquidity risk, a liquidity risk indicator (LRI) is calculated weekly for periods of 7, 15 and 30 days, as established by the Superintendency of Finance’s standard model.
Grupo Aval´s financial subsidiaries assess the volatility of deposits, debt levels, the asset and liability structure, the liquidity of different asset types, the availability of lines of credit and the effectiveness of asset and liability management. The objective is to have adequate liquidity to manage possible stress scenarios.
The quantification of money market funding is an integral part of the liquidity measurement carried out by each entity. Based on statistical analysis, primary and secondary sources of liquidity are identified in order to ensure funding stability and diversification, and to minimize concentration. Funds are assigned to the different business lines according to the budget and the nature and depth of the markets.
Resource availability is monitored on a daily basis, not only to meet reserve requirements, but also to forecast and/or anticipate potential changes in the entities´ liquidity risk profile and make the appropriate changes in strategy. The banks have liquidity warning indicators to analyze the current situation and to implement the adequate strategy. These indicators include the LRI, deposit concentration levels and use of the Central Bank's discount window.
Senior management of Grupo Aval´s financial subsidiaries monitor the institutions’ liquidity situation and make the necessary decisions in the asset and liability committees. These committees analyze the high-quality liquid assets that must be maintained, tolerance in liquidity management or minimum liquidity levels, the strategies for granting loans and obtaining funds; policies regarding placement of excess liquidity, changes in the characteristics of new and existing products, diversification of funding sources to prevent deposit concentration, hedging strategies; the entities´ income statement, and changes in the balance sheet structure.
Banks in Colombia and other countries must maintain cash on hand and in Central Bank deposits in order to comply with reserve requirements. The reserve requirement calculation is based upon the daily average of the different types of deposits on a biweekly basis. Grupo Aval´s Banks and financial subsidiaries have always met their reserve requirements. Details on the requested percentage in each country are shown below:
| Requested Percentage |
| Country | | Details | | % | |
| Colombia | | Checking account and Savings accounts | | | 11% | |
| | | Time deposits < 18 months | | | 4.5% | |
| Guatemala | | Deposits and Capital raising | | | 11.6% | |
| | | 1st Demand deposits | | | 25% | |
| El Salvador | | 2nd Demand deposits | | | 25% | |
| | | 3rd Debt securities | | | 50% | |
| | | Demand deposits | | | 12% | |
| Honduras | | Mandatory investment in local currency | | | 5% | |
| | | Mandatory investment in foreign currency | | | 12% | |
| Nicaragua | | Daily, Liabilities in local and foreign currency | | | 12% | |
| | | Biweekly, Liabilities in local and foreign currency | | | 14% | |
| Costa Rica | | Deposits in local and foreign currency | | | 15% | |
| | | Capital raising in local and foreign currency | | | 15% | |
Grupo Aval Acciones y Valores S.A.
Notes to the Consolidated Financial Statement
As of December 31, 2016 and 2015 and for the years ended December 31, 2016, 2015 and 2014
(Figures expressed in millions of Colombian pesos)
The following is a breakdown by time bands of the Liquid Assets and the LRI – Liquidity Risk Indicator for the specified time band; reflect unconsolidated figures for each of our banks at December 31, 2016 and 2015.
December 31, 2016
| Bank | | Liquid assets available
at the end of the year
(1) | | | After 1 to 7 days
(2) | | | After 8 to 15 days
(2) | | | After 16 to 30
days (2) | | | After 31 to 90 days
(2) | |
| Banco de Bogotá | | | 10,058,552 | | | | 8,732,532 | | | | 5,604,879 | | | | 3,786,496 | | | | (2,999,598 | ) |
| Banco Occidente | | | 3,882,343 | | | | 3,453,308 | | | | 3,158,023 | | | | 2,638,916 | | | | 1,081,962 | |
| Banco Popular | | | 2,628,298 | | | | 2,445,146 | | | | 2,212,315 | | | | 1,511,457 | | | | (212,024 | ) |
| Banco AV Villas | | | 1,952,334 | | | | 1,723,991 | | | | 1,554,462 | | | | 1,206,529 | | | | 56,614 | |
| Corficolombiana | | | 1,475,836 | | | | 871,378 | | | | 795,495 | | | | 490,178 | | | | (187,120 | ) |
December 31, 2015
| Bank | | Liquid assets available
at the end of the year
(1) | | | After 1 to 7 days
(2) | | | After 8 to 15 days
(2) | | | After 16 to 30
days (2) | | | After 31 to 90 days
(2) | |
| Banco de Bogotá | | | 8,131,840 | | | | 7,301,750 | | | | 6,391,286 | | | | 5,216,459 | | | | (2,655,421 | ) |
| Banco Occidente | | | 4,453,199 | | | | 4,044,406 | | | | 3,831,863 | | | | 3,747,533 | | | | 1,005,251 | |
| Banco Popular | | | 2,043,060 | | | | 1,678,428 | | | | 1,462,554 | | | | 1,357,190 | | | | 112,105 | |
| Banco AV Villas | | | 2,124,199 | | | | 1,857,759 | | | | 1,697,483 | | | | 1,640,919 | | | | 484,801 | |
| Corficolombiana | | | 1,678,778 | | | | 772,276 | | | | 596,202 | | | | 322,385 | | | | 61,678 | |
(1) Liquid assets are the sum of the assets that are readily convertible to cash. These assets include cash on hand and bank deposits including Central Bank deposits, securities or coupons that have been transferred to the entity in money market transactions and have not been used in borrowing operations in the money market. It also includes investments in debt securities recorded at fair value, investments in mutual funds with no withdrawal restrictions, and debt securities carried at amortized cost, provided they are legally required or “mandatory” investments, subscribed in the primary market and that can be used for money market operations. The value of the liquid assets mentioned above, is calculated at the fair value market price on the date of the assessment.
(2) This amount is the remaining value of the liquid assets in the specified time period, or the LRI, that is calculated as the difference among the liquid assets and the liquidity requirement. The liquidity requirement is the difference of contractual cash inflows and contractual and non-contractual cash outflows during the period according to the LRI methodology.
The liquidity calculations described above assume normal liquidity conditions, according to the contractual flows and historical experience of each Bank. In extreme liquidity events caused by unusual deposit withdrawals, the Banks have contingency plans that include available credit lines with other financial institutions and access to special lines of credit with Colombia´s Central Bank, in accordance with current regulations. These lines of credit are granted when required and are collateralized by Colombian government securities and by a portfolio of high quality loans, as
Grupo Aval Acciones y Valores S.A.
Notes to the Consolidated Financial Statement
As of December 31, 2016 and 2015 and for the years ended December 31, 2016, 2015 and 2014
(Figures expressed in millions of Colombian pesos)
specified in the Central Bank regulations. Grupo Aval´s Banks and its financial subsidiaries did not access the Central Bank special lines of credit during the years ended at December 31, 2016 and 2015.
The following is a breakdown by contractual undiscounted cash flows of the financial assets and liabilities including projected contractual interest receivable and payable at December 31, 2016 and 2015.
December 31, 2016
| Assets | | Less than
one month | | | From one
to six
months | | | From six
to twelve
months | | | More than a
year | | | Non -
Sensitive | | | Total | |
| | | | | | | | | | | | | | | | | | | |
| Cash and cash equivalents | | Ps. | - | | | Ps. | - | | | Ps. | - | | | Ps. | - | | | Ps. | 23,431,502 | | | Ps. | 23,431,502 | |
| Investments in debt securities held for trading | | | 820,683 | | | | 541,799 | | | | 331,319 | | | | 1,078,497 | | | | - | | | | 2,772,298 | |
| Investments in securities available for sale | | | 944,879 | | | | 1,531,453 | | | | 1,506,568 | | | | 16,979,066 | | | | - | | | | 20,961,966 | |
| Investments in debt securities held to maturity | | | 529,014 | | | | 880,233 | | | | 1,219,842 | | | | 17,888 | | | | - | | | | 2,646,977 | |
| Commercial loans and leases | | | 11,627,160 | | | | 22,248,731 | | | | 14,210,565 | | | | 56,169,672 | | | | - | | | | 104,256,128 | |
| Consumer loans and leases | | | 5,039,323 | | | | 10,345,530 | | | | 6,034,277 | | | | 35,590,184 | | | | - | | | | 57,009,314 | |
| Mortgages and housing leases | | | 146,691 | | | | 727,017 | | | | 846,720 | | | | 23,968,085 | | | | - | | | | 25,688,513 | |
| Microcredit loans and leases | | | 39,582 | | | | 116,175 | | | | 129,340 | | | | 263,682 | | | | - | | | | 548,779 | |
| Other accounts receivable | | | 783,812 | | | | 222,986 | | | | 747,269 | | | | 11,981 | | | | - | | | | 1,766,048 | |
| Trading derivatives | | | 377,946 | | | | 85,736 | | | | 18,311 | | | | 14,186 | | | | - | | | | 496,179 | |
| Hedging derivatives | | | 123,672 | | | | 3,540 | | | | 4,607 | | | | - | | | | - | | | | 131,819 | |
| Other assets | | | - | | | | - | | | | - | | | | - | | | | 589,415 | | | | 589,415 | |
| Total Assets | | Ps. | 20,432,762 | | | Ps. | 36,703,200 | | | Ps. | 25,048,818 | | | Ps. | 134,093,241 | | | Ps. | 24,020,917 | | | Ps. | 240,298,938 | |
| Liabilities | | Less than
one month | | | From one
to six
months | | | From six
to twelve
months | | | More than a
year | | | Non –
Sensitive | | | Total | |
| | | | | | | | | | | | | | | | | | | |
| Trading derivatives | | Ps. | 406,656 | | | Ps. | 164,753 | | | Ps. | 85,827 | | | Ps. | 86,295 | | | Ps. | - | | | Ps. | 743,531 | |
| Checking accounts | | | 35,176,430 | | | | - | | | | - | | | | - | | | | - | | | | 35,176,430 | |
| Time deposits | | | 9,280,758 | | | | 24,443,943 | | | | 12,490,712 | | | | 15,013,753 | | | | - | | | | 61,229,166 | |
| Saving deposits | | | 51,684,382 | | | | - | | | | - | | | | - | | | | - | | | | 51,684,382 | |
| Other deposits | | | 309,940 | | | | 2,292 | | | | 16,584 | | | | - | | | | - | | | | 328,816 | |
| Interbank and overnight funds | | | 5,877,059 | | | | 476,679 | | | | - | | | | - | | | | - | | | | 6,353,738 | |
| Borrowing from banks and other | | | 1,279,413 | | | | 5,799,940 | | | | 4,459,671 | | | | 11,584,008 | | | | - | | | | 23,123,032 | |
| Long-term debt | | | 2,166,658 | | | | 1,233,436 | | | | 1,241,972 | | | | 14,775,950 | | | | - | | | | 19,418,016 | |
| Borrowing from development entities | | | 28,507 | | | | 251,343 | | | | 244,463 | | | | 3,105,206 | | | | - | | | | 3,629,519 | |
| Hedging derivatives | | | 44,650 | | | | 684 | | | | 942 | | | | - | | | | - | | | | 46,276 | |
| Other Liabilities | | | - | | | | - | | | | - | | | | - | | | | 5,957,192 | | | | 5,957,192 | |
| Total Liabilities | | Ps. | 106,254,453 | | | Ps. | 32,373,070 | | | Ps. | 18,540,171 | | | Ps. | 44,565,212 | | | Ps. | 5,957,192 | | | Ps. | 207,690,098 | |
Grupo Aval Acciones y Valores S.A.
Notes to the Consolidated Financial Statement
As of December 31, 2016 and 2015 and for the years ended December 31, 2016, 2015 and 2014
(Figures expressed in millions of Colombian pesos)
December 31, 2015
| Assets | | Less than
one month | | | From one
to six
months | | | From six
to twelve
months | | | More than
a year | | | Non -
Sensitive | | | Total | |
| | | | | | | | | | | | | | | | | | | |
| Cash and cash equivalents | | Ps. | - | | | Ps. | - | | | Ps. | - | | | Ps. | - | | | Ps. | 24,275,310 | | | Ps. | 24,275,310 | |
| Investments in debt securities held for trading | | | 3,903,330 | | | | 135,941 | | | | 146,002 | | | | 444,124 | | | | | | | | 4,629,397 | |
| Investments in securities available for sale | | | 3,450,273 | | | | 1,028,061 | | | | 1,182,466 | | | | 19,542,450 | | | | | | | | 25,203,250 | |
| Investments in debt securities held to maturity | | | 507,493 | | | | 973,544 | | | | 997,615 | | | | 90,367 | | | | | | | | 2,569,019 | |
| Commercial loans and leases | | | 10,206,035 | | | | 21,034,550 | | | | 12,508,288 | | | | 57,001,664 | | | | | | | | 100,750,537 | |
| Consumer loans and leases | | | 5,040,393 | | | | 10,366,531 | | | | 5,443,561 | | | | 33,587,192 | | | | | | | | 54,437,677 | |
| Mortgages and housing leases | | | 105,964 | | | | 508,189 | | | | 694,755 | | | | 21,483,370 | | | | | | | | 22,792,278 | |
| Microcredit loans and leases | | | 24,161 | | | | 115,922 | | | | 123,728 | | | | 285,489 | | | | | | | | 549,300 | |
| Other accounts receivable | | | 168,352 | | | | - | | | | - | | | | 3,143,340 | | | | | | | | 3,311,692 | |
| Trading derivatives | | | 1,020,953 | | | | 176,115 | | | | 52,883 | | | | 8,634 | | | | | | | | 1,258,585 | |
| Hedging derivatives | | | 41,474 | | | | - | | | | - | | | | - | | | | | | | | 41,474 | |
| Other assets | | | | | | | | | | | | | | | | | | | 564,742 | | | | 564,742 | |
| Total Assets | | Ps. | 24,468,428 | | | Ps. | 34,338,853 | | | Ps. | 21,149,298 | | | Ps. | 135,586,630 | | | Ps. | 24,840,052 | | | Ps. | 240,383,261 | |
| Liabilities | | Less than
one month | | | From one
to six
months | | | From six
to twelve
months | | | More than
a year | | | Non -
Sensitive | | | Total | |
| | | | | | | | | | | | | | | | | | | |
| Trading derivatives | | Ps. | 1,367,046 | | | Ps. | 124,009 | | | Ps. | 25,134 | | | Ps. | 14,510 | | | Ps. | | | | Ps. | 1,530,699 | |
| Checking accounts | | | 33,482,918 | | | | - | | | | - | | | | - | | | | | | | | 33,482,918 | |
| Time deposits | | | 6,797,848 | | | | 21,879,832 | | | | 12,001,500 | | | | 17,985,340 | | | | | | | | 58,664,520 | |
| Saving deposits | | | 51,357,997 | | | | - | | | | - | | | | - | | | | | | | | 51,357,997 | |
| Other deposits | | | 448,529 | | | | - | | | | - | | | | - | | | | | | | | 448,529 | |
| Interbank and overnight funds | | | 12,193,375 | | | | 499,187 | | | | - | | | | - | | | | | | | | 12,692,562 | |
| Borrowing from banks and other | | | 1,650,555 | | | | 5,298,723 | | | | 4,822,033 | | | | 16,595,855 | | | | | | | | 28,367,166 | |
| Long-term debt | | | 126,963 | | | | 1,071,954 | | | | 829,833 | | | | 13,507,848 | | | | | | | | 15,536,598 | |
| Borrowing from development entities | | | 29,530 | | | | 194,304 | | | | 284,475 | | | | 2,746,223 | | | | | | | | 3,254,532 | |
| Hedging derivatives | | | 351,559 | | | | - | | | | - | | | | - | | | | | | | | 351,559 | |
| Other Liabilities | | | | | | | | | | | | | | | | | | | 5,523,456 | | | | 5,523,456 | |
| Total Liabilities | | Ps. | 107,806,320 | | | Ps. | 29,068,009 | | | Ps. | 17,962,975 | | | Ps. | 50,849,776 | | | Ps. | 5,523,456 | | | Ps. | 211,210,536 | |
| 4.6 | Regulatory capital management |
Grupo Aval is not subject to requirements of minimum capital, consequently, regulatory capital management of Grupo Aval focuses on complying with requirements at the financial subsidiaries level, pursuant to the rules established under Colombian law and regulation or under the laws and regulation of the jurisdictions where the subsidiaries operate.
Banks and financial corporations are subject to a “Total Solvency Risk Ratio” (Total Regulatory Capital/Risk Weighted Assets) of at least 9% and a “Basic Solvency Risk Ratio” (Basic Ordinary Regulatory Capital/Risk Weighted Assets) of at least 4.5%.
Grupo Aval Acciones y Valores S.A.
Notes to the Consolidated Financial Statement
As of December 31, 2016 and 2015 and for the years ended December 31, 2016, 2015 and 2014
(Figures expressed in millions of Colombian pesos)
As of December 31, 2016 and 2015, all of Grupo Aval´s financial subsidiaries comply with minimum regulatory capital requirements.
Following is the detail of the calculation of the minimum regulatory capital, required for the entities regulated by Superintendency of Finance:
| Regulatory Capital | | December 31, 2016 | |
| | | Banco de Bogotá | | | Banco de
Occidente | | | Banco Popular | | | Banco AV
Villas | | | Corficolombiana | |
| Regulatory Capital | | | 16,236,204 | | | | 3,801,455 | | | | 2,103,019 | | | | 1,119,136 | | | | 2,611,410 | |
| Basic ordinary equity | | | 10,456,131 | | | | 3,029,445 | | | | 1,756,321 | | | | 1,002,396 | | | | 2,247,231 | |
| Basic additional equity | | | 5,780,073 | | | | 772,010 | | | | 346,698 | | | | 116,740 | | | | 364,179 | |
| Market Risk | | | 6,438,729 | | | | 1,233,358 | | | | 1,339,691 | | | | 993,172 | | | | 1,676,891 | |
| Total assets weighted by risk | | | 116,745,434 | | | | 29,588,532 | | | | 18,919,825 | | | | 9,768,306 | | | | 7,114,069 | |
| Total solvency risk index. | | | 13.91% | | | | 12.85% | | | | 11.12% | | | | 11.46% | | | | 36.71% | |
| Basic solvency risk index. | | | 8.96% | | | | 10.24% | | | | 9.28% | | | | 10.26% | | | | 31.59% | |
| Regulatory Capital | | December 31, 2015 | |
| | | Banco de Bogotá | | | Banco de
Occidente | | | Banco Popular | | | Banco AV
Villas | | | Corficolombiana | |
| Regulatory Capital | | | 13,608,494 | | | | 3,384,279 | | | | 1,939,682 | | | | 978,823 | | | | 2,665,473 | |
| Basic ordinary equity | | | 9,378,213 | | | | 2,964,006 | | | | 1,835,310 | | | | 953,143 | | | | 2,270,874 | |
| Basic additional equity | | | 4,230,281 | | | | 420,274 | | | | 104,372 | | | | 25,680 | | | | 394,599 | |
| Market Risk | | | 6,294,154 | | | | 1,599,787 | | | | 1,673,661 | | | | 1,226,157 | | | | 3,066,419 | |
| Total assets weighted by risk | | | 115,559,828 | | | | 30,842,695 | | | | 17,348,913 | | | | 8,991,409 | | | | 9,281,978 | |
| Total solvency risk index. | | | 11.78% | | | | 10.97% | | | | 11.18% | | | | 10.89% | | | | 28.72% | |
| Basic solvency risk index. | | | 8.12% | | | | 9.61% | | | | 10.58% | | | | 10.60% | | | | 24.46% | |
Definition and objectives
Grupo Aval defines operational (OR) risk as “the risk of incurring losses due to failure on day to day processes, individual operations, systems supporting the business or external events".
Operational risk is inherent in all products, activities, processes and systems, and is generated in all business and support areas. Accordingly, all employees are responsible for managing and controlling the risks arising in their area of activity.
The aim pursued by the Group in operational risk control and management is primarily to identify, measure/assess, control/mitigate and report on this risk.
Grupo Aval’s priority, therefore, is to identify and mitigate any clusters of operational risk, irrespective of whether or not they have given rise to any losses. Measurement of this risk also contributes to the establishment of priorities in operational risk management.
Grupo Aval Acciones y Valores S.A.
Notes to the Consolidated Financial Statement
As of December 31, 2016 and 2015 and for the years ended December 31, 2016, 2015 and 2014
(Figures expressed in millions of Colombian pesos)
| 4.7.1 | Risk identification, measurement and assessment model |
In order to identify, measure and assess operational risk, the Group defined a set of quantitative and qualitative techniques/tools that are combined to perform a diagnosis, based on the identified risks, and obtain a valuation, through the measurement/assessment of the business unit.
The quantitative analysis of this risk is carried out mainly using tools that record and quantify the potential level of losses associated with operational risk events.
The tools defined for the qualitative analysis aim to assess aspects (coverage/exposure) linked to the risk profile, thereby making it possible to capture the control environment in place.
The model requires the Group to monitor the mitigation measures established in response to the main sources of risk, which were identified through an analysis of the tools used in managing operational risk, and as a result of the organizational model and the preventive implementation of operational risk management and control policies and procedures.
The most significant mitigation measures have focused on the improvement of security for customers in their day-to-day transactions, the management of external fraud, the ongoing improvement of processes and technology, on taking steps to ensure that products are sold and services are provided in an appropriate manner.
In 2016, Grupo Aval continued to devote its full attention to cyber-security related risks, which affect all types of companies and institutions, including those in the financial sector. This situation, which is generating awareness among entities and regulators, is prompting the adoption of preventive measures in order to be prepared for cyber-attacks.
Grupo Aval has a business continuity management system to ensure the continuity of the business processes in the event of a disaster or serious incident.
| 4.8 | Compliance and conduct risk |
| 4.8.1 | Scope, mission, definitions and objective |
The compliance function encompasses all matters relating to regulatory compliance, the prevention of money laundering and terrorist financing, product governance, consumer protection and reputational risk.
To this end, the compliance function promotes adherence by Grupo Aval´s subsidiaries to the rules, oversight requirements, principles and values of good conduct by establishing standards, holding debates and providing advice and information in the interest of employees, customers, shareholders and other stakeholders.
Based on the current arrangement of the Group's three lines of defense, the compliance function is a second-line control function with access to the Board of Directors and its committees through the Chief of Internal Control, who
Grupo Aval Acciones y Valores S.A.
Notes to the Consolidated Financial Statement
As of December 31, 2016 and 2015 and for the years ended December 31, 2016, 2015 and 2014
(Figures expressed in millions of Colombian pesos)
has access to these bodies on a regular and independent basis. This structure is in line with banking regulatory requirements and supervisory expectations. Compliance risks are defined as including the following:
Compliance risk: risk arising from non-compliance with the legal framework, internal rules or the requirements of regulators and supervisors.
Conduct risk: risk derived from inappropriate practices in the dealings with customers, and the treatment and products offered to each particular customer and the adequacy thereof.
Reputational risk: risk of deterioration or damage in the perception of Grupo Aval and its subsidiaries by media, public opinion, customers, investors and other key players in the market.
The Group's objective regarding compliance and conduct risk is to minimize the likelihood of non-compliance and irregularities occurring and to ensure that, should they ultimately occur, they are promptly identified, assessed, reported and resolved.
The Board of Directors is responsible, as part of its general supervisory function, for approving the appointment of the person responsible for the compliance function, as well as for its framework and its development policies. In addition, the Board of Directors is in charge of the Group's general code of conduct and the frameworks developed by the compliance function.
The person responsible for the compliance function reports to the Audit Committee on a quarterly basis.
It is worth mentioning the appropriate coordination is in place with the operational risk function, which compiles the various loss events arising from compliance and conduct risks and reports them to the Audit Committee of Board of Directors and its committees, after combining all of the Group´s risks.
Grupo Aval´s Legal Division supports operational risk management in its particular area of expertise. Specifically, this division defines and institutes the necessary procedures to adequately control the legal risks inherent in banking operations, making sure these controls meet legal standards and are properly documented. It also analyzes and drafts contracts for operations carried out by the different business units.
As to the legal situation of each subsidiary the legal division ensures, the respective contingencies have been provisioned appropriately and whenever required. In accordance with IAS 37 on the subject of provisions, Grupo Aval has assessed the claims filed against it, based on the analysis and opinions of the lawyers in charge.
With regard to copyrights, each subsidiary in Grupo Aval uses only software or licenses that have been acquired legally and allows only officially approved software to be used on its computers.
Details of the suits filed against Grupo Aval are provided in Note 23 and 27 to the financial statements.
Grupo Aval Acciones y Valores S.A.
Notes to the Consolidated Financial Statement
As of December 31, 2016 and 2015 and for the years ended December 31, 2016, 2015 and 2014
(Figures expressed in millions of Colombian pesos)
NOTE 5 – ESTIMATIONS OF FAIR VALUE
The fair value of the financial assets and liabilities traded in active markets (such as financial assets in debt securities, equity certificates and derivatives actively listed in stock exchanges or interbank markets) is based on dirty prices supplied by a price vendor.
An active market is a market wherein transactions for assets or liabilities are carried out with sufficient frequency and volume in order toprovide price information on an ongoing basis. A dirty price is that which includes accrued and pending interest on the security, as from the date of issuance or last payment of interest, until the date in which the purchase and sale operation is due. The fair value of financial assets and liabilities that are not traded in an active market is determined through appraisal techniques determined by the price supplier or by the management of Grupo Aval’s entities. Appraisal techniques used for non-standardized financial instruments such as options, foreign exchange swaps and derivatives of the over-the-counter market include the use of interest rates or currencies assessment curves built by providers and extrapolated to the specific conditions of the instrument that is appraised, discounted cash flow analysis, options pricing models and other valuation techniques commonly used by market participants who rely mostly on market data and the least possible on specific data of entities.
Grupo Aval may use models developed internally for financial instruments with no active markets. These models are usually based on valuation techniques and methods generally standardized in the financial sector. The valuation models are mainly used for appraising equity financial equity instruments not listed on the stock exchange, debt certificates and other debt instruments for which the markets were or have been inactive during the financial period. Some inputs of these models may not be observable in the market and are therefore estimated based on assumptions.
The output of a model is always an estimate or approximation of a value that cannot be determined with certainty, and the valuation techniques used may not fully reflect all the factors relevant to the positions of Grupo Aval. Therefore, the appraisals are adjusted, if necessary, to allow additional factors, including country risk, liquidity risks and counterpart risks.
The fair value hierarchy has the following levels:
| · | Level 1 inputs are quoted prices (unadjusted) in active markets for assets or liabilities identical to those which the entity can access as of the date of measurement. |
| · | Level 2 inputs are inputs different than quoted prices included in Level 1 that are observable for the asset or liability, whether directly or indirectly in non-active markets. |
| · | Level 3 inputs are unobservable inputs for the asset or liability. |
The level in the fair value hierarchy within which fair value measurement is classified in whole is determined based on the input of the lowest level that is most significant for measuring its total fair value. For such purpose, the relevance of an input is assessed in connection with the measurement of the total fair value. Financial instruments that are listed in markets that are not deemed active, but which are valued based in accordance with quoted market prices, quotes from price vendors or alternative price sources supported by observable inputs, are classified in Level 2.
If a fair value measurement uses observable inputs that require significant adjustments based on unobservable inputs, this measurement is classified Level 3. The assessment of the importance of a particular input to the measurement of fair value in whole requires judgment, taking into account specific factors of the asset or liability.
Determining what is deemed as 'observable' requires a significant judgment by Grupo Aval. Grupo Aval considers as observable data the market data, which is already available, distributed or updated by the price suppliers, which are
Grupo Aval Acciones y Valores S.A.
Notes to the Consolidated Financial Statement
As of December 31, 2016 and 2015 and for the years ended December 31, 2016, 2015 and 2014
(Figures expressed in millions of Colombian pesos)
reliable and verifiable, with no property rights, and provided by independent sources which are actively involved in the reference market.
| 5.1 | Measurements of fair value on a recurring basis |
Measurements of fair value on a recurring basis are those, which IFRS accounting standards require or allow in financial position statement at the end of each accounting period.
The following table presents an analysis, within the hierarchy of fair value, of Grupo Aval´s assets and liabilities (by class), measured at fair value as of December 31, 2016 and 2015 on a recurring basis.
December 31, 2016
| | | Level 1 | | | Level 2 | | | Level 3 | | | Total | |
| Assets | | | | | | | | | | | | | | | | |
| | | | | | | | | | | | | | | | | |
| Trading debt securities | | | | | | | | | | | | | | | | |
| In Colombian Pesos | | | | | | | | | | | | | | | | |
| Securities issued or secured by Colombian Government | | Ps. | 887,218 | | | Ps. | 78,521 | | | Ps. | - | | | Ps. | 965,739 | |
| Securities issued or secured by other entities of the Colombian Government | | | - | | | | 38,400 | | | | - | | | | 38,400 | |
| Securities issued or secured by other financial entities | | | - | | | | 737,884 | | | | - | | | | 737,884 | |
| Securities issued or secured by entities of the Non-financial sector | | | - | | | | 18,657 | | | | - | | | | 18,657 | |
| Other | | | - | | | | 54,085 | | | | 12,210 | | | | 66,295 | |
| | | | | | | | | | | | | | | | | |
| In Foreign Currency | | | | | | | | | | | | | | | | |
| Securities issued or secured by Colombian Government | | | - | | | | 19,716 | | | | - | | | | 19,716 | |
| Securities issued or secured by other entities of the Colombian Government | | | 330 | | | | 20,747 | | | | - | | | | 21,077 | |
| Securities issued or secured by foreign Governments | | | - | | | | 88,095 | | | | - | | | | 88,095 | |
| Securities issued or secured by central banks | | | - | | | | 74,727 | | | | - | | | | 74,727 | |
| Securities issued or secured by other financial entities | | | - | | | | 313,129 | | | | - | | | | 313,129 | |
| Other | | | - | | | | 183 | | | | - | | | | 183 | |
| Total trading debt securities | | Ps. | 887,548 | | | Ps. | 1,444,144 | | | Ps. | 12,210 | | | Ps. | 2,343,902 | |
| Investments in debt securities available for sale | | | | | | | | | | | | | | | | |
| In Colombian Pesos | | | | | | | | | | | | | | | | |
| Securities issued or secured by the Colombian Government | | | 8,281,946 | | | | 922,232 | | | | - | | | | 9,204,178 | |
| Securities issued or secured by other entities of the Colombian Government | | | - | | | | 79,435 | | | | - | | | | 79,435 | |
| Securities issued or secured by other financial entities | | | - | | | | 120,795 | | | | - | | | | 120,795 | |
| Securities issued or secured by entities of the Non-financial sector | | | - | | | | 17,923 | | | | - | | | | 17,923 | |
| Other | | | - | | | | 685 | | | | 15,167 | | | | 15,852 | |
Grupo Aval Acciones y Valores S.A.
Notes to the Consolidated Financial Statement
As of December 31, 2016 and 2015 and for the years ended December 31, 2016, 2015 and 2014
(Figures expressed in millions of Colombian pesos)
| | | Level 1 | | | Level 2 | | | Level 3 | | | Total | |
| In Foreign Currency | | | | | | | | | | | | | | | | |
| Securities issued or secured by Colombian Government | | | - | | | | 1,371,029 | | | | - | | | | 1,371,029 | |
| Securities issued or secured by other entities of the Colombian Government | | | 22,550 | | | | 467,327 | | | | - | | | | 489,877 | |
| Securities issued or secured by foreign Governments | | | - | | | | 2,083,345 | | | | - | | | | 2,083,345 | |
| Securities issued or secured by central banks | | | - | | | | 538,731 | | | | - | | | | 538,731 | |
| Securities issued or secured by other financial entities | | | 375,798 | | | | 2,580,127 | | | | - | | | | 2,955,925 | |
| Securities issued or secured by entities of the Non-financial sector | | | 80,638 | | | | 500,152 | | | | - | | | | 580,790 | |
| Other | | | - | | | | 204,853 | | | | - | | | | 204,853 | |
| Total investments in debt securities available for sale | | Ps. | 8,760,932 | | | Ps. | 8,886,634 | | | Ps. | 15,167 | | | Ps. | 17,662,733 | |
| Total investments in debt securities | | Ps. | 9,648,480 | | | Ps. | 10,330,778 | | | Ps. | 27,377 | | | Ps. | 20,006,635 | |
| | | | | | | | | | | | | | | | | |
| Equity securities | | | | | | | | | | | | | | | | |
| Trading equity securities | | | 3,233 | | | | 1,744,381 | | | | - | | | | 1,747,614 | |
| Investments in equity securities available for sale | | | 655,096 | | | | 74,683 | | | | - | | | | 729,779 | |
| Total equity securities | | Ps. | 658,329 | | | Ps. | 1,819,064 | | | Ps. | - | | | Ps. | 2,477,393 | |
| | | | | | | | | | | | | | | | | |
| Trading Derivatives | | | | | | | | | | | | | | | | |
| Currency Forward | | | - | | | | 391,370 | | | | - | | | | 391,370 | |
| Interest Rate Swap | | | - | | | | 39,780 | | | | - | | | | 39,780 | |
| Currency Swap | | | - | | | | 44,594 | | | | - | | | | 44,594 | |
| Currency Options | | | - | | | | 26,313 | | | | - | | | | 26,313 | |
| Interest Rate Options | | | - | | | | 152 | | | | - | | | | 152 | |
| Total trading derivatives | | Ps. | - | | | Ps. | 502,209 | | | Ps. | - | | | Ps. | 502,209 | |
| Hedging Derivatives | | | | | | | | | | | | | | | | |
| Currency Forward | | | - | | | | 128,479 | | | | - | | | | 128,479 | |
| Total hedging derivatives | | Ps. | - | | | Ps. | 128,479 | | | Ps. | - | | | Ps. | 128,479 | |
| Financial assets designated at fair value | | | | | | | | | | | | | | | | |
| Financial assets in concession contracts | | | - | | | | - | | | | 2,072,674 | | | | 2,072,674 | |
| Total financial assets designated at fair value | | Ps. | - | | | Ps. | - | | | Ps. | 2,072,674 | | | Ps. | 2,072,674 | |
| Non- financial assets | | | | | | | | | | | | | | | | |
| Biological assets | | | - | | | | - | | | | 48,002 | | | | 48,002 | |
| Investment properties | | | - | | | | - | | | | 610,188 | | | | 610,188 | |
| Total non- financial assets | | Ps. | - | | | Ps. | - | | | Ps. | 658,190 | | | Ps. | 658,190 | |
| Total assets at fair value on recurring basis | | Ps. | 10,306,809 | | | Ps. | 12,780,530 | | | Ps. | 2,758,241 | | | Ps. | 25,845,580 | |
| | | | | | | | | | | | | | | | | |
| Liabilities | | | | | | | | | | | | | | | | |
| Trading Derivatives | | | | | | | | | | | | | | | | |
| Currency Forward | | | - | | | | 408,903 | | | | - | | | | 408,903 | |
| Securities Forward | | | - | | | | 1,492 | | | | - | | | | 1,492 | |
| Interest Rate Swap | | | - | | | | 25,827 | | | | - | | | | 25,827 | |
| Currency Swap | | | - | | | | 164,906 | | | | - | | | | 164,906 | |
| Currency Options | | | - | | | | 39,567 | | | | - | | | | 39,567 | |
| Total trading derivatives | | Ps. | - | | | Ps. | 640,695 | | | Ps. | - | | | Ps. | 640,695 | |
| Hedging Derivatives | | | | | | | | | | | | | | | | |
| Currency Forward | | | - | | | | 43,436 | | | | - | | | | 43,436 | |
| Total hedging derivatives | | Ps. | - | | | Ps. | 43,436 | | | Ps. | - | | | Ps. | 43,436 | |
| Total liabilities at fair value on recurring basis | | Ps. | - | | | Ps. | 684,131 | | | Ps. | - | | | Ps. | 684,131 | |
Grupo Aval Acciones y Valores S.A.
Notes to the Consolidated Financial Statement
As of December 31, 2016 and 2015 and for the years ended December 31, 2016, 2015 and 2014
(Figures expressed in millions of Colombian pesos)
December 31, 2015
| | | Level 1 | | | Level 2 | | | Level 3 | | | Total | |
| Assets | | | | | | | | | | | | | | | | |
| | | | | | | | | | | | | | | | | |
| Trading debt securities | | | | | | | | | | | | | | | | |
| In Colombian Pesos | | | | | | | | | | | | | | | | |
| Securities issued or secured by Colombian Government | | Ps. | 734,028 | | | Ps. | 762,006 | | | Ps. | - | | | Ps. | 1,496,034 | |
| Securities issued or secured by other entities of the Colombian Government | | | - | | | | 28,420 | | | | - | | | | 28,420 | |
| Securities issued or secured by other financial entities | | | - | | | | 433,650 | | | | - | | | | 433,650 | |
| Securities issued or secured by entities of the Non-financial sector | | | - | | | | 20,513 | | | | - | | | | 20,513 | |
| Other | | | - | | | | 72,111 | | | | 11,460 | | | | 83,571 | |
| | | | | | | | | | | | | | | | | |
| In Foreign Currency | | | | | | | | | | | | | | | | |
| Securities issued or secured by other entities of the Colombian Government | | | 335 | | | | 21,854 | | | | - | | | | 22,189 | |
| Securities issued or secured by foreign Governments | | | 1,543 | | | | 84,912 | | | | - | | | | 86,455 | |
| Securities issued or secured by central banks | | | - | | | | 518,242 | | | | - | | | | 518,242 | |
| Securities issued or secured by other financial entities | | | - | | | | 363,042 | | | | - | | | | 363,042 | |
| Securities issued or secured by entities of the Non-financial sector | | | - | | | | 189 | | | | - | | | | 189 | |
| Other | | | - | | | | 9,611 | | | | - | | | | 9,611 | |
| Total trading debt securities | | Ps. | 735,906 | | | Ps. | 2,314,550 | | | Ps. | 11,460 | | | Ps. | 3,061,916 | |
| Investments in debt securities available for sale | | | | | | | | | | | | | | | | |
| In Colombian Pesos | | | | | | | | | | | | | | | | |
| Securities issued or secured by the Colombian Government | | | 7,666,596 | | | | 3,016,856 | | | | - | | | | 10,683,452 | |
| Securities issued or secured by other entities of the Colombian Government | | | - | | | | 66,766 | | | | - | | | | 66,766 | |
| Securities issued or secured by other financial entities | | | - | | | | 123,655 | | | | - | | | | 123,655 | |
| Securities issued or secured by entities of the Non-financial sector | | | - | | | | 17,699 | | | | - | | | | 17,699 | |
| Other | | | - | | | | 11,510 | | | | 24,617 | | | | 36,127 | |
| | | | | | | | | | | | | | | | | |
| In Foreign Currency | | | | | | | | | | | | | | | | |
| Securities issued or secured by Colombian Government | | | - | | | | 1,347,348 | | | | - | | | | 1,347,348 | |
| Securities issued or secured by other entities of the Colombian Government | | | 44,034 | | | | 447,717 | | | | - | | | | 491,751 | |
| Securities issued or secured by foreign Governments | | | - | | | | 1,961,755 | | | | - | | | | 1,961,755 | |
| Securities issued or secured by central banks | | | - | | | | 288,975 | | | | - | | | | 288,975 | |
| Securities issued or secured by other financial entities | | | 341,578 | | | | 2,841,543 | | | | - | | | | 3,183,121 | |
| Securities issued or secured by entities of the Non-financial sector | | | 71,215 | | | | 694,485 | | | | - | | | | 765,700 | |
| Other | | | - | | | | 21,021 | | | | - | | | | 21,021 | |
| Total investments in debt securities available for sale | | Ps. | 8,123,423 | | | Ps. | 10,839,330 | | | Ps. | 24,617 | | | Ps. | 18,987,370 | |
| Total investments in debt securities | | Ps. | 8,859,329 | | | Ps. | 13,153,880 | | | Ps. | 36,077 | | | Ps. | 22,049,286 | |
Grupo Aval Acciones y Valores S.A.
Notes to the Consolidated Financial Statement
As of December 31, 2016 and 2015 and for the years ended December 31, 2016, 2015 and 2014
(Figures expressed in millions of Colombian pesos)
| | | Level 1 | | | Level 2 | | | Level 3 | | | Total | |
| Equity securities | | | | | | | | | | | | | | | | |
| Trading equity securities | | | - | | | | 1,521,265 | | | | - | | | | 1,521,265 | |
| Investments in equity securities available for sale | | | 620,212 | | | | 77,363 | | | | - | | | | 697,575 | |
| Total equity securities | | Ps. | 620,212 | | | Ps. | 1,598,628 | | | Ps. | - | | | Ps. | 2,218,840 | |
| | | | | | | | | | | | | | | | | |
Trading Derivatives | | | | | | | | | | | | | | | | |
| Currency Forward | | | - | | | | 780,150 | | | | - | | | | 780,150 | |
| Securities Forward | | | - | | | | 575 | | | | - | | | | 575 | |
| Interest Rate Swap | | | - | | | | 51,865 | | | | - | | | | 51,865 | |
| Currency Swap | | | - | | | | 53,550 | | | | - | | | | 53,550 | |
| Other Swaps | | | - | | | | 72,426 | | | | - | | | | 72,426 | |
| Currency Futures | | | 2,376 | | | | - | | | | - | | | | 2,376 | |
| Currency Options | | | - | | | | 64,030 | | | | - | | | | 64,030 | |
| Total trading derivatives | | Ps. | 2,376 | | | Ps. | 1,022,596 | | | Ps. | - | | | Ps. | 1,024,972 | |
| Hedging Derivatives | | | | | | | | | | | | | | | | |
| Currency Forward | | | - | | | | 33,690 | | | | - | | | | 33,690 | |
| Total hedging derivatives | | Ps. | - | | | Ps. | 33,690 | | | Ps. | - | | | Ps. | 33,690 | |
| Financial assets designated at fair value | | | | | | | | | | | | | | | | |
| Financial assets in concession contracts | | | - | | | | - | | | | 1,891,692 | | | | 1,891,692 | |
| Total financial assets designated at fair value | | Ps. | - | | | Ps. | - | | | Ps. | 1,891,692 | | | Ps. | 1,891,692 | |
| Non- financial assets | | | | | | | | | | | | | | | | |
| Biological assets | | | - | | | | - | | | | 240,212 | | | | 240,212 | |
| Investment properties | | | - | | | | - | | | | 538,246 | | | | 538,246 | |
| Total non- financial assets | | Ps. | - | | | Ps. | - | | | Ps. | 778,458 | | | Ps. | 778,458 | |
| Total assets at fair value on recurring basis | | Ps. | 9,481,917 | | | Ps. | 15,808,794 | | | Ps. | 2,706,227 | | | Ps. | 27,996,938 | |
| | | | | | | | | | | | | | | | | |
| Liabilities | | | | | | | | | | | | | | | | |
| Trading Derivatives | | | | | | | | | | | | | | | | |
| Currency Forward | | | - | | | | 656,624 | | | | - | | | | 656,624 | |
| Securities Forward | | | - | | | | 5,365 | | | | - | | | | 5,365 | |
| Interest Rate Swap | | | - | | | | 222,171 | | | | - | | | | 222,171 | |
| Currency Swap | | | - | | | | 47,390 | | | | - | | | | 47,390 | |
| Other Swaps | | | - | | | | 186,174 | | | | - | | | | 186,174 | |
| Currency Options | | | - | | | | 25,514 | | | | - | | | | 25,514 | |
| Total trading derivatives | | Ps. | - | | | Ps. | 1,143,238 | | | Ps. | - | | | Ps. | 1,143,238 | |
| Hedging Derivatives | | | | | | | | | | | | | | | | |
| Currency Forward | | | - | | | | 323,172 | | | | - | | | | 323,172 | |
| Securities Forward | | | - | | | | 13,343 | | | | - | | | | 13,343 | |
| Interest Rate Swap | | | - | | | | 1,235 | | | | - | | | | 1,235 | |
| Total hedging derivatives | | Ps. | - | | | Ps. | 337,750 | | | Ps. | - | | | Ps. | 337,750 | |
| Total liabilities at fair value on recurring basis | | Ps. | - | | | Ps. | 1,480,988 | | | Ps. | - | | | Ps. | 1,480,988 | |
| 5.2 | Items measurements at fair value on a non-recurring basis |
Grupo Aval is required, on a nonrecurring basis to adjust the carrying value of certain assets and liabilities or provide valuation allowances. These assets or liabilities primarily include impaired collateralized loans and non-current assets held for sale. The fair value of these assets which are classified as Level 3 are determined using pricing models, discounted cash flow methodologies, a current replacement cost or similar techniques, using internal models or external experts with sufficient experience and knowledge of the real estate market or of assets being appraised.
Grupo Aval Acciones y Valores S.A.
Notes to the Consolidated Financial Statement
As of December 31, 2016 and 2015 and for the years ended December 31, 2016, 2015 and 2014
(Figures expressed in millions of Colombian pesos)
Generally, these appraisals are carried out by references to market data or based on the replacement cost, when sufficient market data is lacking.
The following table present the company’s assets and liabilities, classified within the fair value hierarchy, which are measured on a nonrecurring basis as of December 31, 2016 and 2015 at fair value less cost of sale:
| December 31, 2016 | | | | | | | | | | | | |
| | | | | | | | | | | | | |
| | | Level 1 | | | Level 2 | | | Level 3 | | | Total | |
| | | | | | | | | | | | | |
| Impaired collateralized loans | | Ps. | - | | | Ps. | - | | | Ps. | 657,080 | | | Ps. | 657,080 | |
| Non- current assets held for sale | | | - | | | | - | | | | 259,528 | | | | 259,528 | |
| | | Ps. | - | | | Ps. | - | | | Ps. | 916,608 | | | Ps. | 916,608 | |
December 31, 2015
| | | Level 1 | | | Level 2 | | | Level 3 | | | Total | |
| | | | | | | | | | | | | |
| Impaired collateralized loans | | Ps. | - | | | Ps. | - | | | Ps. | 605,358 | | | Ps. | 605,358 | |
| Non- current assets held for sale | | | - | | | | - | | | | 198,881 | | | | 198,881 | |
| | | Ps. | - | | | Ps. | - | | | Ps. | 804,239 | | | Ps. | 804,239 | |
| 5.3 | Fair value determination |
Grupo Aval determined Level 1 financial instruments as those traded in an active market. Their fair value was established according to quoted prices (unadjusted) supplied by the price vendor, which are determines the same through weighted averages of transactions carried out during the trading day.
Grupo Aval defined Level 2 financial instruments as those traded in non-active market, the following table provides information about valuation techniques and significant inputs when measuring assets and liabilities.
| | | Valuation technique | | Significant inputs (1) |
| ASSETS | | | | |
| Investments in debt securities at fair value | | | | |
| In Colombian Pesos | | | | |
| Securities issued or secured by the Colombian Government | | Discounted cash flow | | Estimated Prices (2) |
| Securities issued or secured by Colombian government entities | | Discounted cash flow | | Estimated Prices (2) |
| Securities issued or secured by other financial entities | | Discounted cash flow | | Estimated Prices (2) Yield and Margin |
| Securities issued or secured by non-financial sector entities | | Discounted cash flow | | Estimated Prices (2) |
| Other | | Discounted cash flow | | Estimated Prices (2) Yield and Margin |
| | | | | |
| In Foreign Currency | | | | |
| Securities issued or secured by the Colombian Government | | Market Price | | Quoted Prices Estimated Prices (2) |
| Securities issued or secured by Colombian government entities | | Discounted cash flow | | Estimated Prices (2) |
| Securities issued or secured by foreign governments | | - Internal Model - Market Price | | - Discounted cash flows using yields from similar securities outstanding |
Grupo Aval Acciones y Valores S.A.
Notes to the Consolidated Financial Statement
As of December 31, 2016 and 2015 and for the years ended December 31, 2016, 2015 and 2014
(Figures expressed in millions of Colombian pesos)
| | | Valuation technique | | Significant inputs (1) |
| | | | | - Market Price or price calculated based on benchmarks set by price providers methodologies - Bloomberg Generic / Bloomberg Valuation |
| Securities issued or secured by Central Banks | | - Internal Model - Market Price | | - Discounted cash flows using yields from similar securities outstanding - Market Price or price calculated based on benchmarks set by price providers methodologies |
| Securities issued or secured by other financial entities | | - Discounted cash flow - Internal Model - Market Price | | - Estimated Prices (2) - Quoted Price or price calculated based on benchmarks set by price providers methodologies - Bloomberg Generic / Bloomberg Valuation |
| Securities issued or secured by non-financial sector entities | | - Market Price | | - Average Price - Quoted Price - Bloomberg Generic |
| Other | | - Discounted cash flow - Internal Model - Market Price | | - Estimated Prices (2) - Theoretical Price Mutual Funds which by the end of the month capitalize or pay interests - Quoted Price |
| | | | | |
| Equity securities | | | | |
| Corporate Stock | | Market Price | | Estimated Prices (2) |
| Investment Funds | | Market Price | | Market value of underlying assets discounted of management and administrative fees |
| Pension and severance funds (3) | | Market Price | | Market value of underlying assets discounted of management and administrative fees |
| | | | | |
| Trading Derivatives | | | | |
| Foreign Currency Forward | | Discounted cash flow | | - Underlying asset price - Currency curve by underlying asset - Forward Exchange rates curve of the operation’s currency - Implicit curves of Exchange rates forwards - Swap curves by underlying asset - Implicit volatilities matrixes and curves |
| Debt securities Forward | | |
| Interest rate Swap | | |
| Cross Currency Swap | | |
| Swap (others) | | |
| Currency Options | | |
| | | | | |
| Hedging Derivatives | | | | |
| Currency Forward | | Discounted cash flow | | Curves by currency |
| | | | | |
| LIABILITIES | | | | |
| Derivatives held for trading | | | | |
| Foreign Currency Forward | | Discounted cash flow | | - Underlying asset price - Currency curve by underlying asset - Forward Exchange rates curve of the operation’s currency - Implicit curves of exchange rates forwards - Swap curves by underlying asset - Implicit volatilities matrixes and curves |
| Debt securities Forward | | |
| Interest rate Swap | | |
| Currency Swap | | |
| Swap (others) | | |
| Currency Options | | |
| | | | | |
| Hedging Derivatives | | | | |
| Foreign Currency Forward | | | | - Underlying asset price |
| Interest rate Forward | | Discounted cash flow | | - Currency curve by underlying asset |
Grupo Aval Acciones y Valores S.A.
Notes to the Consolidated Financial Statement
As of December 31, 2016 and 2015 and for the years ended December 31, 2016, 2015 and 2014
(Figures expressed in millions of Colombian pesos)
| | | Valuation technique | | Significant inputs (1) |
| Interest rate Swap | | | | - Forward Exchange rates curve of the operation’s currency - Implicit curves of Exchange rates forwards - Swap curves by underlying asset - Implicit volatilities matrixes and curves |
| (1) | Supplied by the price vendor |
| (2) | Estimated Price: A valuation model is made by the price vendor when it is not able to supply quoted prices (unadjusted) for each security. This model is the basis for the construction of the valuation margin of the securities that is represented on the assigned curve or reference rate. This margin remains constant on the assigned curve or reference rate when calculating the theoretical valuation price. |
| (3) | The subsidiary Porvenir S. A. according to Colombian rules is required to invest to 1% of its total assets under management from severance and mandatory pension funds. |
The following table provides information about valuation techniques and significant unobservable inputs when measuring Level 3 assets and liabilities at recurrent fair value.
| | | Valuation technique | | Significant inputs |
| ASSETS | | | | |
| Investments in debt securities at fair value | | | | |
| In Colombian Pesos | | | | |
| Other | | Discounted cash flow | | Projected payments flow of mortgage securitizations (1) |
| | | | | |
| Other financial assets | | | | |
| Assets under concession contracts | | Discounted cash flow | | - Free-cash flow from concession contracts - Concession contract’s maturity period - Perpetuity value of the year “n” free-cash flow - Present value of the discounted residual value at WACC. - Financial income: annual adjustment of the financial asset’s value. The detail of valuation process for financial assets in concession arrangements are outlined in (2) |
| | | | | |
| Non-financial assets | | | | |
| Biological assets | | Discounted cash flow | | The processes used to collect data and determine the fair value of biological assets are described in (3). |
| Investment properties | | Discounted cash flow | | The processes used to collect data and determine the fair value of investment properties are described in (4) |
| (1) | Mortgage-backed securities |
Titularizadora Colombiana S.A. issued mortgage securitizations and provides valuation under 3 scenarios for the investors’ information purposes. These scenarios are based on projections that, consider different prepayment and delinquency assumptions. The following table shows the sensitivity analysis of this fair value under three different scenarios.
Grupo Aval Acciones y Valores S.A.
Notes to the Consolidated Financial Statement
As of December 31, 2016 and 2015 and for the years ended December 31, 2016, 2015 and 2014
(Figures expressed in millions of Colombian pesos)
| December 2016 | |
| Baseline scenario (i) | | | Favorable scenario (ii) | | | Unfavorable scenario (iii) | |
| Ps. | 27,377 | | | Ps. | 302 | | | Ps. | (343 | ) |
| December 2015 | |
| Baseline scenario (i) | | | Favorable scenario (ii) | | | Unfavorable scenario (iii) | |
| Ps. | 36,077 | | | Ps. | 303 | | | Ps. | (492 | ) |
| (i) | Fair value as of December 31, 2016 and 2015 calculated based on baseline valuation scenario, which considers a 12-month Moving Average Prepayment parameter of between 12.4% and 15.8% and 12.3% and 16.0% respectively, and 1 Time Delinquency Curve. |
| (ii) | Pre-payment of 10% and 1 time delinquency curve |
| (iii) | Pre-payment of 20% and 1 time delinquency curve |
| (2) | Financial assets under concession contracts |
Promigas and subsidiaries, designated at fair value the financial assets under concession contracts, the method of discounted cash flows was used to determine the fair value.
The assumptions in the calculation of the financial asset were:
| · | Financial assets are calculated taking into account the expiration date of each concession contract. |
| · | The calculation was carried out in proportion to the expiration of each of the concession contracts in force. |
| · | Only the operational cash flows of these assets under concession were taken into account. |
The components of the calculations are as follows:
| · | Free cash flow generated solely by assets under concession. |
| · | Expiration period of the concession. |
| · | Amount in-perpetuity of the Free Cash Flow (FCF) of the year, estimated factoring a growth in the residual amount between 3% and 1% each year, as of December 31, 2016 and 2015. |
| · | Current amount of the residual amount Weighted Average Cost of Capital (WACC), estimated taking into account an interest rate between 9.05% and 8.54% each year, as of December 31, 2016 and 2015. |
| · | Financial Income: Annual adjustment of the amount of the financial asset to WACC (*). |
(*) Nominal WACC calculated under the Capital Asset Pricing Model (CAPM) methodology for each, updated annually. The following variables were used for determining the WACC:
| · | Beta Unlevered USA (Oil/Gas Distribution): Damodaran. [Betaunlevered 0.69] |
| · | Risk Free Rate, Source: Geometric Average 10 years of American bonds “T-Bonds”. |
| · | Marker Return, Source: Geometric Average 10 years Damodaran “Stocks” USA, between years 2006 and 2015. |
| · | Market Premium: Market Return – Risk Free Rate |
| · | Country Risk Premium: Average last 5 years EMBI (Difference between 10 year Colombian sovereign bonds and 10 year “T-Bonds”). Damodaran |
| · | Emerging Market: Equity Premium Emerging countries (Lambda - Damodaran) |
Grupo Aval Acciones y Valores S.A.
Notes to the Consolidated Financial Statement
As of December 31, 2016 and 2015 and for the years ended December 31, 2016, 2015 and 2014
(Figures expressed in millions of Colombian pesos)
Sensitivity analysis
The following table includes a sensitivity analysis of the assumptions used by Promigas and its subsidiaries in the calculation of fair value of unconditional transfer rights of gas pipelines to Government entities at the expiration date of the contracts.
| Variable | | +100 bps | | | -100 bps | |
| WACC | | Ps. | (534,128 | ) | | Ps. | 810,001 | |
| Growth rate | | | 434,225 | | | | (293,491 | ) |
Fair value of Grupo Aval subsidiary’s “biological assets”, which correspond to agricultural activities related to biological assets (animals or plants), is estimated based on internal reports by the companies which own such assets. Fair value of biological assets is determined using valuations performed by experienced internal professionals, using discounted cash flow models for biological assets. Since no comparable market exist for the biological assets, given their nature, their fair value is defined using discounted cash flows models of each biological asset, considering estimated future quantities of crops, prices, harvesting costs, and maintenance and crop yields, among others, discounted using a discount rate based on a risk-free rate adjusted by appropriate risk premium. See note 15.
The main assumptions used for determining the fair value of the principal biological assets are the following:
1. Biological assets growing in rubber crops
The price of natural rubber was forecasted based on the average of the last 3 years of the TSR20 per ton since year 2014 and average with the future prices of the next 3 months (USD $1,816.6 as of December 31, 2016 and USD$2.136 as of December 31, 2015), in order to reflect the behavior of the commodity for an entire economic cycle. In the forecast, the price is adjusted annually with the expected US inflation rate.
Yield per hectare:Based on the crop composition and the planting year of the different clones, we forecasted a stepwise yield per hectare starting in year 7 after the plantation and stabilizing after year 10
| | | Tons of rubber per
hectare per year: | |
| Year 7 | | | 0.60 | |
| Year 8 | | | 0.90 | |
| Year 9 | | | 1.40 | |
| Year 10 and on | | | 1.80 | |
Costs and administrative expenses:Costs are forecasted considering the different activities incurred during the life of a rubber project. A cost per hectare is forecasted for every key activity such as crop establishment, maintenance of immature plant and maintenance and harvest of a mature plant.
Discount rate:Based on the data for the“Farming/Agriculture” sector of Damodaran Online’s Global Markets database, a cost of equity of 14.20% was defined. Additionally, a cost of debt of 6.47% net of tax shield was defined based on existing debt market conditions. Based on the latter, the discount rate, or WACC, was determined at 11.29%.
Grupo Aval Acciones y Valores S.A.
Notes to the Consolidated Financial Statement
As of December 31, 2016 and 2015 and for the years ended December 31, 2016, 2015 and 2014
(Figures expressed in millions of Colombian pesos)
| 2. | Biological assets growing in African palm crops: |
The price of African palm (USD $606.20 per ton) was forecasted based on the average price of palm oil since 2015, in order to reflect the behavior of the commodity for an entire economic cycle. In the forecast, the price is adjusted annually with the expected US inflation rate.
The source of information for international prices for Colombia’s market are the following:
| a. | Crude palm oil: BURSA MALAYSIA DERIVATIVES (BMD) – Crude Palm Oil Futures (FCPO) – Third Position. It is a relevant international market prices, of easy public access, and is provided by transparent and objective source. |
| b. | For the price forecast, available future prices (FCPO) were also used. |
Yield per hectare:Based on the crop composition and the re-planting year of the crops, which started in 2006, we forecasted a stepwise yield per hectare for each plantation as follows:
| Year | | Tons of fresh fruit per
hectare | |
| 0 to 3 | | | - | |
| 4 | | | 4.25 | |
| 5 | | | 9.91 | |
| 6 | | | 11.73 | |
| 7 | | | 21.58 | |
| 7 to 18 | | | 21.80 | |
| More than 18 | | | 36.10 | |
| Weighted average | | | 17.56 | |
Extraction rate:The oil extraction rate (OER) is a factor that defines the amount of crude palm oil that is produced. The OER varies depending on the age of the plantation, and was forecasted based on the following table:
| Year | | Extraction Rate
(%) | |
| 0 to 3 | | | 19 | |
| 4 | | | 23 | |
| 5 | | | 23 | |
| 6 | | | 23 | |
| 7 | | | 23 | |
| 7 to 18 | | | 23 | |
| More than 18 | | | 21 | |
| Weighted average | | | 22.14 | |
Grupo Aval Acciones y Valores S.A.
Notes to the Consolidated Financial Statement
As of December 31, 2016 and 2015 and for the years ended December 31, 2016, 2015 and 2014
(Figures expressed in millions of Colombian pesos)
Costs and administrative expenses:The cost forecast considers the different activities that are incurred during the life of an African palm crop. A cost per hectare is forecasted for every key activity such as crop establishment, maintenance and exploitation, harvest and transport.
Discount rate:Based on the data for the“Farming/Agriculture” sector of Damodaran Online’s Global Markets database, a cost of equity of 14.31% was defined. Additionally, a cost of debt of 7.11% net of tax shield was defined based on existing debt market conditions. Based on the latter, the discount rate, or WACC, was determined at 11.60%.
Sensitivity analysis of this fair value
As a result of its investment in Corficolombiana, Grupo Aval´s assets include certain biological assets, primary it is exposed to African palm oil and rubber. Grupo Aval does not produce African palm oil from Malaysia, nor does it sell its product on the Rotterdam market. However, Grupo Aval has knowledge the price of African palm oil and rubber is highly correlated to the price of palm oil traded at both those markets.
If the average price of technically specified rubber (TSR20) and crude palm oil (CPO) had been 5% higher or lower in 2016 and 2015, with all other variables remaining constant and excluding the effect of hedging activities, Grupo Aval’s profits for the period, before taxes, would have been the following, including only the produce growing on bearer plants in accordance with IAS 41.
Rubber Plantations
| | | TSR20 reference
price USD/ton | | | Change in fiscal
year-end price | | | Value of the
biological asset | | | Effect on profits
before taxes | |
| | | 1,907 | | | | 5 | % | | | 15,628 | | | | 679 | |
| Dec-16 | | | 1,817 | | | | - | | | | 14,606 | | | | 503 | |
| | | | 1,726 | | | | (5 | )% | | | 13,584 | | | | 327 | |
| | | 1,907 | | | | 5 | % | | | 6,207 | | | | 7,664 | |
| Dec-15 | | | 1,817 | | | | - | | | | 5,706 | | | | 7,667 | |
| | | | 1,726 | | | | (5 | )% | | | 5,205 | | | | 6,630 | |
African Palm Plantations
| | | CPO reference price
USD/ton | | | Change in fiscal year-
end price | | | Value of the biological
asset | | | Effect on profits before
taxes | |
| | | 637 | | | | 5 | % | | | 23,109 | | | | 486 | |
| Dec-16 | | | 606 | | | | - | | | | 21,597 | | | | 360 | |
| | | | 576 | | | | (5 | )% | | | 20,085 | | | | 234 | |
| | | 637 | | | | 5 | % | | | 20,506 | | | | 4,058 | |
| Dec-15 | | | 606 | | | | - | | | | 18,461 | | | | 2,013 | |
| | | | 576 | | | | (5 | )% | | | 16,417 | | | | (31 | ) |
The fair value of biological assets also is affected by different circumstances in the market, such as the climate, lack of rainfall, natural disasters and plagues. The subsidiaries that manage biological assets have taken all the necessary precautions to reduce these risks from an operational standpoint.
Grupo Aval Acciones y Valores S.A.
Notes to the Consolidated Financial Statement
As of December 31, 2016 and 2015 and for the years ended December 31, 2016, 2015 and 2014
(Figures expressed in millions of Colombian pesos)
Investment properties are recognized at fair value, based on a valuation made at each year-end period, using an independent expert appraisal. White in Colombia, the frequency of transactions in the real state sector is low compared to other move developed markets; however, management believes there are enough references to assess the fair value of investment properties of Grupo Aval and its subsidiaries based on comparable market transactions.
Fire-salesare excluded from the comparable transactions used to estimate the fair-value of investment properties. Management has reviewed the main assumptions used by the independent external appraisers (such as inflation, interest rates, etc.) and believes those are consistent with market conditions at each end of period. However, management believes that the estimation of the fair value of investment properties depends on significant judgement from the independent expert appraisers, and, as such, there could be a significant probability that the actual price of sale of a property differs from its fair value.
| 5.4 | Transfers between level 1 and level 2 of the fair value hierarchy |
The following table summarize the transfer of fair value between level 1 and 2 during the years 2016 and 2015, in general, transfers between Level 1 and Level 2 in the investment portfolios are due, fundamentally, to changes in the liquidity levels of the securities in the markets.
| | | December 31, 2016 | | | December 31, 2015 | |
| | | Transfers between: | | | Transfers between: | |
| | | Level 2 to 1 | | | Level 1 to 2 | | | Level 2 to 1 | | | Level 1 to 2 | |
| Trading debt securities | | | | | | | | | | | | | | | | |
| In Colombian Pesos | | | | | | | | | | | | | | | | |
| Securities issued or secured by Colombian Government | | Ps. | 963,794 | | | Ps. | 208,526 | | | Ps. | 1,293,020 | | | Ps. | 1,319,221 | |
| Securities issued or secured by other financial entities | | | - | | | | - | | | | 6,162 | | | | - | |
| | | Ps. | 963,794 | | | Ps. | 208,526 | | | Ps. | 1,299,182 | | | Ps. | 1,319,221 | |
| In Foreign Currency | | | | | | | | | | | | | | | | |
| Securities issued or secured by other entities of the Colombian Government | | Ps. | - | | | Ps. | - | | | Ps. | - | | | Ps. | 129,624 | |
| Securities issued or secured by foreign Governments | | | - | | | | - | | | | 62,556 | | | | - | |
| Securities issued or secured by central banks | | | - | | | | - | | | | 23,669 | | | | - | |
| Securities issued or secured by other financial entities | | | - | | | | 1,547 | | | | 187,418 | | | | 250,345 | |
| Securities issued or secured by entities of the Non-financial sector | | | - | | | | - | | | | 140,695 | | | | 164,009 | |
| Other | | | - | | | | - | | | | 11,248 | | | | - | |
| | | Ps. | - | | | Ps. | 1,547 | | | Ps. | 425,586 | | | Ps. | 543,978 | |
| | | Ps. | 963,794 | | | Ps. | 210,073 | | | Ps. | 1,724,768 | | | Ps. | 1,863,199 | |
There were no transfers of fair values to or from level 3.
5.5 Reconciliation Level 3 of the fair value hierarchy
The reconciliation of the balances at the beginning of the period to the closing balances with the fair value measurements classified at Level 3 is shows in the following table.
| | | Financial assets
in debt
securities | | | Equity
instruments | | | Financial assets in
concession
arrangements | | | Biological
assets | | | Investment
properties | |
| January 1, 2014 | | Ps. | 62,477 | | | Ps. | - | | | Ps. | 1,565,709 | | | Ps. | 201,183 | | | Ps. | 319,744 | |
| Valuation adjustment with an effect on income | | | (897 | ) | | | - | | | | 172,889 | | | | (15,332 | ) | | | 13,657 | |
Grupo Aval Acciones y Valores S.A.
Notes to the Consolidated Financial Statement
As of December 31, 2016 and 2015 and for the years ended December 31, 2016, 2015 and 2014
(Figures expressed in millions of Colombian pesos)
| | | Financial assets
in debt
securities | | | Equity
instruments | | | Financial assets in
concession
arrangements | | | Biological
assets | | | Investment
properties | |
| Valuation adjustments with an effect on OCI | | | (4,037 | ) | | | - | | | | - | | | | - | | | | - | |
| Additions | | | - | | | | - | | | | - | | | | 26.360 | | | | 88,666 | |
| Sales/disposals | | | (20,722 | ) | | | - | | | | - | | | | (9,812 | ) | | | (55,324 | ) |
| December 31, 2014 | | Ps. | 36,821 | | | Ps. | - | | | Ps. | 1,738,598 | | | Ps. | 202,399 | | | Ps. | 366,742 | |
| Valuation adjustment with an effect on income | | | 2,892 | | | | - | | | | 153,094 | | | | 22,922 | | | | 104,769 | |
| Valuation adjustments with an effect on OCI | | | (3,636 | ) | | | - | | | | - | | | | - | | | | - | |
| Additions | | | - | | | | - | | | | - | | | | 35,265 | | | | 89,679 | |
| Sales/disposals | | Ps. | - | | | Ps. | - | | | Ps. | - | | | Ps. | (20,374 | ) | | Ps. | (22,944 | ) |
| December 31, 2015 | | Ps. | 36,077 | | | Ps. | - | | | Ps. | 1,891,692 | | | Ps. | 240,212 | | | Ps. | 538,246 | |
| Valuation adjustment with an effect on income | | | 750 | | | | - | | | | 180,982 | | | | 14,644 | | | | 53,680 | |
| Valuation adjustments with an effect on OCI | | | (9,450 | ) | | | - | | | | - | | | | - | | | | - | |
| Reclassification of bearer plants balance | | | - | | | | - | | | | - | | | | (188,177 | ) | | | - | |
| Effects of amendments in accounting policies of bearer plants. | | | - | | | | - | | | | - | | | | (18,108 | ) | | | - | |
| Transfers to non-current assets held for sale | | | - | | | | - | | | | - | | | | - | | | | 11,319 | |
| Reclassification | | | - | | | | - | | | | - | | | | (1,331 | ) | | | (2,539 | ) |
| Additions | | | - | | | | - | | | | - | | | | 21,432 | | | | 71,268 | |
| Sales/disposals | | Ps. | - | | | Ps. | - | | | Ps. | - | | | Ps. | (20,670 | ) | | Ps. | (61,786 | ) |
| December 31, 2016 | | Ps. | 27,377 | | | Ps. | - | | | Ps. | 2,072,674 | | | Ps. | 48,002 | | | Ps. | 610,188 | |
5.6 Fair Value of financial assets and liabilities recognized at amortized cost
The following table shows a summary of financial assets and liabilities accounted at amortized cost and valued at fair value only for purposes of this disclosure, as of December 31, 2016 and 2015.
| | | December 31, 2016 | | | December 31, 2015 | |
| | | Carrying
Amount | | | Fair Value
Estimate | | | Carrying
Amount | | | Fair Value
Estimate | |
| Assets | | | | | | | | | | | | | | | | |
| Investments in fixed income held to maturity (1) | | | 2,570,486 | | | | 2,558,333 | | | | 2,395,280 | | | | 2,385,777 | |
| Credit portfolio at amortized cost (2) | | | 150,898,732 | | | | 159,917,633 | | | | 141,827,674 | | | | 145,622,905 | |
| Total financial assets | | Ps. | 153,469,218 | | | Ps. | 162,475,966 | | | Ps. | 144,222,954 | | | Ps. | 148,008,682 | |
| | | | | | | | | | | | | | | | | |
| Liabilities | | | | | | | | | | | | | | | | |
| Customer deposits (3) | | | 143,887,055 | | | | 146,778,588 | | | | 135,954,628 | | | | 144,385,126 | |
| Financial Liabilities (4) | | | 45,516,281 | | | | 46,545,065 | | | | 47,299,259 | | | | 47,171,475 | |
| Total financial Liabilities | | Ps. | 189,403,336 | | | Ps. | 193,323,653 | | | Ps. | 183,253,887 | | | Ps. | 191,556,601 | |
| (1) | Financial assets held to maturity |
Grupo Aval Acciones y Valores S.A.
Notes to the Consolidated Financial Statement
As of December 31, 2016 and 2015 and for the years ended December 31, 2016, 2015 and 2014
(Figures expressed in millions of Colombian pesos)
Fair value of fixed income investments at amortized cost was determined using the dirty price given by the price supplier, securities in an active market and with a market price for the day of the valuation are classified as level 1, securities with no active market and/or with an estimated price (present value of the flows of a security, discounted with the reference rate and the corresponding margin) given by the supplier are classified as level 2.
| (2) | Credit portfolio at amortized cost |
For credit portfolio at amortized cost it fair value was determined using discounted of cash flows models at the interest rates offered by banks for granting new loans, taking into account the credit risk and its maturity; the process of valuation is deemed as level 3.
The fair value of demand deposits is equal to their carrying value. For fixed-term deposits with maturities of less than 180 days, its fair value is deemed equal to its carrying value. For fixed-term deposits with maturities of more than 180 days, its fair value was estimated using the carrying discounted cash flow models to the interest rates offered by banks in accordance with their maturity. It is considered that this is a level 2 valuation.
For financial liabilities and other short-term liabilities, the carrying value was considered as its fair value. The fair value of long-term financial liabilities was determined using the discounted cash flow model at interest rates free of risk adjusted by risk premiums of each entity. The fair value of outstanding bonds is determined according to quoted prices or estimated prices supplied by the price vendor. It is considered that this is a level 2 valuation.
NOTE 6 – CASH AND CASH EQUIVALENTS
Balances of cash and cash equivalents comprise the following as of December 31, 2016 and 2015:
| | | December 31, 2016 | | | December 31, 2015 | |
| In Colombian Pesos | | | | | | | | |
| Cash | | Ps. | 3,476,270 | | | Ps. | 3,410,446 | |
| In the Colombian Central Bank | | | 3,598,125 | | | | 4,437,063 | |
| Bank and other financial entities on demand | | | 380,610 | | | | 304,140 | |
| Clearing | | | 2,435 | | | | 5,945 | |
| Investments in debt securities maturing in under three months | | | 41,064 | | | | 85,697 | |
| Restricted cash(1) | | | 41 | | | | 14,790 | |
| | | Ps. | 7,498,545 | | | Ps. | 8,258,081 | |
| In foreign currency | | | | | | | | |
| Cash | | | 1,422,278 | | | | 1,479,396 | |
| Bank and other financial entities on demand | | | 13,268,996 | | | | 12,547,500 | |
| Restricted cash(2) | | | 3,185 | | | | - | |
| | | Ps. | 14,694,459 | | | Ps. | 14,026,896 | |
| Total cash and cash equivalents | | Ps. | 22,193,004 | | | Ps. | 22,284,977 | |
(1)Grupo Aval has restricted cash related to the collection of tolls on concessions and legal reserve.
(2)Grupo Aval has restricted cash related to deposits in guarantee for Banco Corficolombiana Panamá S.A. and Gas Comprimido del Perú S.A.
Grupo Aval´s banking subsidiaries had cash reserves to comply with the mandatory amount for time deposits, checking account and savings accounts for Ps. 7,151,365 and Ps. 7,156,874 at December 31, 2016 and 2015, respectively.
Grupo Aval Acciones y Valores S.A.
Notes to the Consolidated Financial Statement
As of December 31, 2016 and 2015 and for the years ended December 31, 2016, 2015 and 2014
(Figures expressed in millions of Colombian pesos)
NOTE 7 – FINANCIAL ASSETS HELD FOR TRADING THROUGH PROFIT OR LOSSES
The balance of financial assets held for trading comprises the following as of December 31, 2016 and 2015:
| | | December
31, 2016 | | | December 31,
2015 | |
| Debt securities | | | | | | | | |
| In Colombian Pesos | | | | | | | | |
| Securities issued or secured by Colombian Government | | Ps. | 965,739 | | | Ps. | 1,496,034 | |
| Securities issued or secured by other Colombian Government entities | | | 38,400 | | | | 28,420 | |
| Securities issued or secured by other financial entities | | | 737,884 | | | | 433,650 | |
| Securities issued or secured by Non-financial sector entities | | | 18,657 | | | | 20,513 | |
| Others | | | 66,296 | | | | 83,571 | |
| | | Ps. | 1,826,976 | | | Ps. | 2,062,188 | |
| | | | | | | | | |
| In foreign currency | | | | | | | | |
| Securities issued or secured by Colombian Government | | | 19,716 | | | | - | |
| Securities issued or secured by other Colombian Government entities | | | 21,076 | | | | 22,189 | |
| Securities issued or secured by Foreign Governments | | | 88,095 | | | | 86,455 | |
| Securities issued or secured by Central Banks | | | 74,727 | | | | 518,242 | |
| Securities issued or secured by other financial entities | | | 313,129 | | | | 363,042 | |
| Securities issued or secured by Non-financial sector entities | | | - | | | | 189 | |
| Others | | | 183 | | | | 9,611 | |
| | | Ps. | 516,926 | | | Ps. | 999,728 | |
| Total trading debt securities | | Ps. | 2,343,902 | | | Ps. | 3,061,916 | |
| | | | | | | | | |
| Equity securities | | | | | | | | |
| | | | | | | | | |
| In Colombian Pesos | | | | | | | | |
| Corporate Stock | | Ps. | 3,233 | | | Ps. | 52 | |
| Investment Funds | | | 644,063 | | | | 506,382 | |
| Pension and severance funds (1) | | | 1,100,318 | | | | 1,014,831 | |
| Total Equity Securities | | Ps. | 1,747,614 | | | Ps. | 1,521,265 | |
| Total Trading Securities | | Ps. | 4,091,516 | | | Ps. | 4,583,181 | |
| (1) | The subsidiary Porvenir S. A. according to Colombian rules is required to directly invest on severance and mandatory pensions funds managed for it set in equity for a total amount of 1% of the assets of these funds. |
For the years ended December 31, 2016, 2015 and 2014 dividends from these equity investments were recognized in the consolidated statement of income, their value was Ps. 28,027, Ps. 33,611 and Ps. 136,684 respectively.
Grupo Aval Acciones y Valores S.A.
Notes to the Consolidated Financial Statement
As of December 31, 2016 and 2015 and for the years ended December 31, 2016, 2015 and 2014
(Figures expressed in millions of Colombian pesos)
The following is a list of financial assets held for trading that are being used as collateral in repo operations, pledged as collateral of transactions with financial instruments, or pledged to third parties as collateral to secure financial obligations with other banks (See note 21).
| | | December 31,
2016 | | | December 31,
2015 | |
| Pledged in money market operations | | | | | | | | |
| Securities issued or secured by Central Banks | | Ps. | 5,611 | | | Ps. | - | |
| Securities issued or secured by Foreign Governments | | | 50,831 | | | | 60,706 | |
| Securities issued or secured by Colombian Government | | | 562,986 | | | | 1,030,728 | |
| Securities issued or secured by other financial entities | | | 9,693 | | | | - | |
| | | Ps. | 629,121 | | | Ps. | 1,091,434 | |
| Pledged as collateral on operations with derivative instruments | | | | | | | | |
| Securities issued or secured by Colombian Government | | Ps. | - | | | Ps. | 9,196 | |
| | | | - | | | | 9,196 | |
| | | Ps. | 629,121 | | | Ps. | 1,100,630 | |
NOTE 8 – AVAILABLE FOR SALE FINANCIAL ASSETS
The following is the balance of financial assets available for sale at December 31, 2016 and 2015.
December 31, 2016
| | | Cost | | | Unrealized
Gain | | | Unrealized
Losses (*) | | | Fair Value | |
| Available for sale securities | | | | | | | | | | | | | | | | |
| Debt Securities | | | | | | | | | | | | | | | | |
| | | | | | | | | | | | | | | | | |
| In Colombian Pesos | | | | | | | | | | | | | | | | |
| Securities issued or secured by Colombian Government | | Ps. | 9,371,078 | | | Ps. | 16,622 | | | Ps. | (183,521 | ) | | Ps. | 9,204,179 | |
| Securities issued or secured by other Colombian Government entities | | | 83,582 | | | | 386 | | | | (4,533 | ) | | | 79,435 | |
| Securities issued or secured by other financial entities | | | 116,683 | | | | 4,317 | | | | (205 | ) | | | 120,795 | |
| Securities issued or secured by Non-financial sector entities | | | 18,390 | | | | - | | | | (467 | ) | | | 17,923 | |
| Others | | | 15,820 | | | | 33 | | | | (1 | ) | | | 15,852 | |
| | | Ps. | 9,605,553 | | | Ps. | 21,358 | | | Ps. | (188,727 | ) | | Ps. | 9,438,184 | |
| | | | | | | | | | | | | | | | | |
| In foreign currency | | | | | | | | | | | | | | | | |
| Securities issued or secured by Colombian Government | | | 1,368,836 | | | | 7,018 | | | | (4,825 | ) | | | 1,371,029 | |
| Securities issued or secured by other Colombian Government entities | | | 496,223 | | | | 1,843 | | | | (8,189 | ) | | | 489,877 | |
| Securities issued or secured by Foreign Governments | | | 2,082,953 | | | | 13,400 | | | | (13,008 | ) | | | 2,083,345 | |
| Securities issued or secured by Central Banks | | | 539,393 | | | | 596 | | | | (1,258 | ) | | | 538,731 | |
Grupo Aval Acciones y Valores S.A.
Notes to the Consolidated Financial Statement
As of December 31, 2016 and 2015 and for the years ended December 31, 2016, 2015 and 2014
(Figures expressed in millions of Colombian pesos)
| | | Cost | | | Unrealized
Gain | | | Unrealized
Losses (*) | | | Fair Value | |
| Securities issued or secured by other financial entities | | | 2,978,145 | | | | 6,045 | | | | (28,266 | ) | | | 2,955,924 | |
| Securities issued or secured by Non-financial sector entities (**) | | | 658,703 | | | | 10,779 | | | | (88,692 | ) | | | 580,790 | |
| Others | | | 205,143 | | | | 1,486 | | | | (1,776 | ) | | | 204,853 | |
| | | Ps. | 8,329,396 | | | Ps. | 41,167 | | | Ps. | (146,014 | ) | | Ps. | 8,224,549 | |
| Total Debt Securities | | Ps. | 17,934,949 | | | Ps. | 62,525 | | | Ps. | (334,741 | ) | | Ps. | 17,662,733 | |
| | | | | | | | | | | | | | | | | |
| Equity Instruments | | | | | | | | | | | | | | | | |
| | | | | | | | | | | | | | | | | |
| In Colombian Pesos | | | | | | | | | | | | | | | | |
| Corporate Stock | | Ps. | 239,502 | | | Ps. | 485,935 | | | Ps. | (82 | ) | | Ps. | 725,355 | |
| | | | | | | | | | | | | | | | | |
| In foreign currency | | | | | | | | | | | | | | | | |
| Corporate Stock | | | 393 | | | | 4,031 | | | | - | | | | 4,424 | |
| Total Equity Securities | | Ps. | 239,895 | | | Ps. | 489,966 | | | Ps. | (82 | ) | | Ps. | 729,779 | |
| Total investments available for sale and unrealized gain (loss) in Other comprehensive income | | Ps. | 18,174,844 | | | Ps. | 552,491 | | | Ps. | (334,823 | ) | | Ps. | 18,392,512 | |
| (*) | Unrealized losses correspond to changes in fair value that reflect market conditions such as variations in interest rates and other economic conditions from the country where the investment is issued. After Grupo Aval objectively evaluated each securities’ issuer, it was concluded that only the securities from two issuers were classified as impaired and realized the impairment in statement of profit or loss. |
| (**) | Cost includes Ps. 72,110 for impairment recognized in statement of income in impairment loss on financial asset line from the debt investment securities issued by OI S.A. and Telemar Norte Leste S.A., after OI S.A. and subsidiaries filed for bankruptcy protection on June 20, 2016. |
December 31, 2015
| | | Cost | | | Unrealized
Gain | | | Unrealized
Losses (*) | | | Fair Value | |
| Available for sale securities | | | | | | | | | | | | | | | | |
| Debt Securities | | | | | | | | | | | | | | | | |
| | | | | | | | | | | | | | | | | |
| In Colombian Pesos | | | | | | | | | | | | | | | | |
| Securities issued or secured by Colombian Government | | Ps. | 11,452,129 | | | Ps. | 6,589 | | | Ps. | (775,266 | ) | | Ps. | 10,683,452 | |
| Securities issued or secured by other Colombian Government entities | | | 73,206 | | | | - | | | | (6,440 | ) | | | 66,766 | |
| Securities issued or secured by other financial entities | | | 128,831 | | | | - | | | | (5,176 | ) | | | 123,655 | |
| Securities issued or secured by Non-financial sector entities | | | 18,768 | | | | 43 | | | | (1,112 | ) | | | 17,699 | |
| Others | | | 36,461 | | | | 144 | | | | (478 | ) | | | 36,127 | |
| | | Ps. | 11,709,395 | | | Ps. | 6,776 | | | Ps. | (788,472 | ) | | Ps. | 10,927,699 | |
| | | | | | | | | | | | | | | | | |
| In foreign currency | | | | | | | | | | | | | | | | |
| Securities issued or secured by Colombian Government | | | 1,372,060 | | | | 186 | | | | (24,898 | ) | | | 1,347,348 | |
| Securities issued or secured by other Colombian Government entities | | | 532,198 | | | | 197 | | | | (40,644 | ) | | | 491,751 | |
Grupo Aval Acciones y Valores S.A.
Notes to the Consolidated Financial Statement
As of December 31, 2016 and 2015 and for the years ended December 31, 2016, 2015 and 2014
(Figures expressed in millions of Colombian pesos)
| | | Cost | | | Unrealized
Gain | | | Unrealized
Losses (*) | | | Fair Value | |
| Securities issued or secured by Foreign Governments | | | 1,958,416 | | | | 18,839 | | | | (15,500 | ) | | | 1,961,755 | |
| Securities issued or secured by Central Banks | | | 288,757 | | | | 1,454 | | | | (1,236 | ) | | | 288,975 | |
| Securities issued or secured by other financial entities | | | 3,291,024 | | | | 1,238 | | | | (109,141 | ) | | | 3,183,121 | |
| Securities issued or secured by Non-financial sector entities (**) | | | 1,034,967 | | | | 171 | | | | (269,438 | ) | | | 765,700 | |
| Others | | | 20,981 | | | | 40 | | | | - | | | | 21,021 | |
| | | Ps. | 8,498,403 | | | Ps. | 22,125 | | | Ps. | (460,857 | ) | | Ps. | 8,059,671 | |
| Total Debt Securities | | Ps. | 20,207,798 | | | Ps. | 28,901 | | | Ps. | (1,249,329 | ) | | Ps. | 18,987,370 | |
| | | | | | | | | | | | | | | | | |
| Equity Instruments | | | | | | | | | | | | | | | | |
| | | | | | | | | | | | | | | | | |
| In Colombian Pesos | | | | | | | | | | | | | | | | |
| Corporate Stock | | Ps. | 241,943 | | | Ps. | 456,688 | | | Ps. | (1,568 | ) | | Ps. | 697,063 | |
| | | | | | | | | | | | | | | | | |
| In foreign currency | | | | | | | | | | | | | | | | |
| Corporate Stock | | | 257 | | | | 255 | | | | - | | | | 512 | |
| Total Equity Securities | | Ps. | 242,200 | | | Ps. | 456,943 | | | Ps. | (1,568 | ) | | Ps. | 697,575 | |
| Total investments available for sale and unrealized gain (loss) in Other comprehensive income | | Ps. | 20,449,998 | | | Ps. | 485,844 | | | Ps. | (1,250,897 | ) | | Ps. | 19,684,945 | |
| (*) | Unrealized losses correspond to changes in fair value that reflect market conditions such as variations in interest rates and other economic conditions from the country where the investment is issued. After Grupo Aval objectively evaluated each securities’ issuer, it was concluded that only the securities from one issuer were classified as impaired. |
| (**) | Cost includes Ps. 6,799 for impairment recognized in statement of income in impairment loss on financial asset line from the debt investment securities issued by Pacific Rubiales Energy Corp. |
The details of equity instruments available for sale as of December 31, 2016 and 2015 are as follows.
| Entity (*) | | December 31,
2016 | | | December 31,
2015 | |
| Empresa de Energía de Bogotá S.A. E.S.P. | | Ps. | 592,142 | | | Ps. | 562,699 | |
| Gas Natural S.A. ESP | | | 74,624 | | | | 74,624 | |
| Mineros S.A. | | | 42,913 | | | | 41,236 | |
| Bolsa de Valores de Colombia S.A. | | | 15,603 | | | | 12,224 | |
| Master Card | | | 3,874 | | | | 3,874 | |
| Others | | | 623 | | | | 2,918 | |
| Total | | Ps. | 729,779 | | | Ps. | 697,575 | |
(*) Financial assets in equity Instruments at fair value with adjustments to Other comprehensive income (OCI), have been designated taking into account that those represent strategic investments for Grupo Aval and therefore, they are not expected to be sold in a foreseeable future.
The following is a list of financial investment debt securities available for sale that are being used as collateral in repo operations, pledged as collateral in transactions with financial instruments, or pledged to third parties as collateral to secure financial obligations with other banks (See note 21).
Grupo Aval Acciones y Valores S.A.
Notes to the Consolidated Financial Statement
As of December 31, 2016 and 2015 and for the years ended December 31, 2016, 2015 and 2014
(Figures expressed in millions of Colombian pesos)
| | | December 31, 2016 | | | December 31, 2015 | |
| Pledged in money market operations | | | | | | | | |
| Securities issued or secured by Foreign Governments | | Ps. | 299,560 | | | Ps. | 106,976 | |
| Securities issued or secured by Colombian Government | | | 4,174,184 | | | | 7,177,234 | |
| Securities issued or secured by Non-financial sector entities | | | 3,020 | | | | 44,920 | |
| Securities issued or secured by other Colombian Government entities | | | 83,076 | | | | 69,656 | |
| Securities issued or secured by other financial entities | | | 35,809 | | | | 37,606 | |
| Others | | | 39,335 | | | | - | |
| | | Ps. | 4,634,984 | | | Ps. | 7,436,392 | |
| Pledged as collateral in operations with derivative instruments | | | | | | | | |
| Securities issued or secured by Colombian Government | | | 151,343 | | | | 174,971 | |
| | | Ps. | 151,343 | | | Ps. | 174,971 | |
| Pledged as collateral of Financial Liabilities (*) | | | | | | | | |
| Securities issued or secured by Foreign Governments | | Ps. | - | | | Ps. | 52,679 | |
| Securities issued or secured by Colombian Government | | | - | | | | 38,420 | |
| Securities issued or secured by Non-financial sector entities | | | - | | | | 504,973 | |
| Securities issued or secured by other Colombian Government entities | | | - | | | | 142,433 | |
| Securities issued or secured by other financial entities | | | - | | | | 382,921 | |
| Others | | | - | | | | - | |
| | | Ps. | - | | | Ps. | 1,121,426 | |
| | | Ps. | 4,786,327 | | | Ps. | 8,732,789 | |
(*) On December 31, 2015 includes debt securities pledged as collateral of a financial obligation between Leasing Bogotá Panamá and Deutsche Bank, during 2016 this financial obligation was cancelled.
A summary of the debt financial assets available for sale per maturity dates is as follows:
| | | December 31, 2016 | | | December 31, 2015 | |
| Fair Value | | | | | | | | |
| Up to 1 month | | Ps. | 881,951 | | | Ps. | 190,796 | |
| More than 1 month and no more than 3 months | | | 313,386 | | | | 298,309 | |
| More than 3 months and no more than 1 year | | | 2,204,219 | | | | 1,485,344 | |
| More than 1 year and no more than 5 years | | | 9,544,836 | | | | 10,221,753 | |
| More than 5 years and no more than 10 years | | | 4,345,791 | | | | 5,787,910 | |
| More than 10 years | | | 372,550 | | | | 1,003,258 | |
| | | Ps. | 17,662,733 | | | Ps. | 18,987,370 | |
| | | | | | | | | |
| Cost | | | | | | | | |
| Up to 1 month | | Ps. | 880,907 | | | Ps. | 190,761 | |
| More than 1 month and no more than 3 months | | | 313,048 | | | | 298,135 | |
| More than 3 months and no more than 1 year | | | 2,199,014 | | | | 1,484,726 | |
| More than 1 year and no more than 5 years | | | 9,669,504 | | | | 10,630,122 | |
| More than 5 years and no more than 10 years | | | 4,483,043 | | | | 6,458,596 | |
| More than 10 years | | | 389,433 | | | | 1,145,458 | |
| | | Ps. | 17,934,949 | | | Ps. | 20,207,798 | |
Grupo Aval Acciones y Valores S.A.
Notes to the Consolidated Financial Statement
As of December 31, 2016 and 2015 and for the years ended December 31, 2016, 2015 and 2014
(Figures expressed in millions of Colombian pesos)
NOTE 9 – HELD-TO-MATURITY INVESTMENTS
The breakdown of held to maturity investments as of December 31, 2016 and 2015 as follows:
| | | December 31, 2016 | | | December 31, 2015 | |
| Debt securities | | | | | | | | |
| In Colombian Pesos | | | | | | | | |
| Securities issued or secured by Colombian Government | | Ps. | 1,829 | | | Ps. | 26,104 | |
| Securities issued or secured by other Colombian Government entities | | | 2,484,078 | | | | 2,274,456 | |
| Securities issued or secured by other financial entities | | | 58,887 | | | | 52,921 | |
| Others | | | - | | | | 980 | |
| | | Ps. | 2,544,794 | | | Ps. | 2,354,461 | |
| In foreign currency | | | | | | | | |
| Securities issued or secured by Foreign Governments | | | 24,152 | | | | 31,866 | |
| Others | | | 1,540 | | | | 8,953 | |
| | | Ps. | 25,692 | | | Ps. | 40,819 | |
| Total held-to-maturity | | Ps. | 2,570,486 | | | Ps. | 2,395,280 | |
As of December 31, 2016 and 2015 there are no held to maturity securities given in collateral of financial liabilities.
The following is the summary of the financial assets held to maturity by maturity dates:
| | | December 31, 2016 | | | December 31, 2015 | |
| | | | | | | |
| Up to 1 month | | Ps. | 695,201 | | | Ps. | 793,573 | |
| More than 1 month and no more than 3 months | | | 27,608 | | | | 38,856 | |
| More than 3 months and no more than 1 year | | | 1,842,566 | | | | 1,558,344 | |
| More than 1 year and no more than 5 years | | | 4,938 | | | | 4,334 | |
| More than 5 years and no more than 10 years | | | - | | | | - | |
| More than 10 years | | | 173 | | | | 173 | |
| | | Ps. | 2,570,486 | | | Ps. | 2,395,280 | |
NOTE 10 – DERIVATIVE INSTRUMENTS AND HEDGE ACCOUNTING
| 10.1 | Derivative instruments |
The table below shows fair values at the end of the period of forward contracts, futures and swaps of interest rate and foreign currency with which Grupo Aval is committed:
Derivative financial instruments for trading comprise the following:
| | | December 31, 2016 | | | December 31, 2015 | |
| Item | | Notional Amount | | | Fair Value | | | Notional Amount | | | Fair Value | |
| Assets | | | | | | | | | | | | | | | | |
| Forward contracts | | | | | | | | | | | | | | | | |
| Foreign currency to buy | | Ps. | 5,255,735 | | | Ps. | 118,568 | | | Ps. | 7,031,432 | | | Ps. | 582,470 | |
| Foreign currency to sell | | | 10,206,225 | | | | 272,803 | | | | 5,166,566 | | | | 197,680 | |
| Debt securities to buy | | | - | | | | - | | | | 15,000 | | | | 152 | |
| Debt securities to sell | | | - | | | | - | | | | 149,000 | | | | 423 | |
| Subtotal | | Ps. | 15,461,960 | | | Ps. | 391,371 | | | Ps. | 12,361,998 | | | Ps. | 780,725 | |
Grupo Aval Acciones y Valores S.A.
Notes to the Consolidated Financial Statement
As of December 31, 2016 and 2015 and for the years ended December 31, 2016, 2015 and 2014
(Figures expressed in millions of Colombian pesos)
| | | December 31, 2016 | | | December 31, 2015 | |
| Item | | Notional Amount | | | Fair Value | | | Notional Amount | | | Fair Value | |
| Swap | | | | | | | | | | | | | | | | |
| Cross currency | | | 1,288,048 | | | | 44,593 | | | | 189,783 | | | | 53,550 | |
| Interest rate | | | 6,021,481 | | | | 39,780 | | | | 2,916,028 | | | | 51,865 | |
| Others | | | - | | | | - | | | | 1,235,710 | | | | 72,426 | |
| Subtotal | | Ps. | 7,309,529 | | | Ps. | 84,373 | | | Ps. | 4,341,521 | | | Ps. | 177,841 | |
| Futures Contracts | | | | | | | | | | | | | | | | |
| Foreign currency to buy | | | 1,069,003 | | | | - | | | | 1,566,861 | | | | 2,328 | |
| Foreign currency to sell | | | 1,198,784 | | | | - | | | | 541,757 | | | | 48 | |
| Others | | | - | | | | - | | | | 11,981 | | | | - | |
| Subtotal | | Ps. | 2,267,787 | | | Ps. | - | | | Ps. | 2,120,599 | | | Ps. | 2,376 | |
| Options Contracts | | | | | | | | | | | | | | | | |
| Foreign currency to buy | | | 563,522 | | | | 10,769 | | | | 813,484 | | | | 64,030 | |
| Interest rate to buy | | | 31,550 | | | | 152 | | | | - | | | | - | |
| Debt securities to buy | | | 739,512 | | | | 15,544 | | | | - | | | | - | |
| Subtotal | | | 1,334,584 | | | | 26,465 | | | | 813,484 | | | | 64,030 | |
| Total Assets | | Ps. | 26,373,860 | | | Ps. | 502,209 | | | Ps. | 19,637,602 | | | Ps. | 1,024,972 | |
| | | | | | | | | | | | | | | | | |
| Liabilities | | | | | | | | | | | | | | | | |
| Forward contracts | | | | | | | | | | | | | | | | |
| Foreign currency to buy | | Ps. | 9,286,812 | | | Ps. | 247,967 | | | Ps. | 4,205,443 | | | Ps. | 163,770 | |
| Sale of Foreign currency | | | 7,039,126 | | | | 160,936 | | | | 6,918,144 | | | | 492,854 | |
| Debt securities to sell | | | 597,500 | | | | 1,492 | | | | 800,500 | | | | 5,365 | |
| Subtotal | | Ps. | 16,923,438 | | | Ps. | 410,395 | | | Ps. | 11,924,087 | | | Ps. | 661,989 | |
| Swap | | | | | | | | | | | | | | | | |
| Cross currency | | | 1,771,324 | | | | 164,906 | | | | 514,326 | | | | 222,171 | |
| Interest rate | | | 4,210,766 | | | | 25,827 | | | | 3,216,413 | | | | 47,390 | |
| Others | | | - | | | | - | | | | 1,263,540 | | | | 186,174 | |
| Subtotal | | Ps. | 5,982,090 | | | Ps. | 190,733 | | | Ps. | 4,994,279 | | | Ps. | 455,735 | |
| Futures Contracts | | | | | | | | | | | | | | | | |
| Foreign currency to buy | | | 1,995,604 | | | | - | | | | 653,515 | | | | - | |
| Foreign currency to sell | | | 409,747 | | | | - | | | | 1,949,522 | | | | - | |
| Subtotal | | Ps. | 2,405,351 | | | Ps. | - | | | Ps. | 2,603,037 | | | Ps. | - | |
| Options Contracts | | | | | | | | | | | | | | | | |
| Foreign currency to buy | | | - | | | | - | | | | 341,477 | | | | 15,900 | |
| Foreign currency to sell | | | 447,818 | | | | 19,960 | | | | 353,592 | | | | 9,614 | |
| Debt securities to sell | | | 556,310 | | | | 19,607 | | | | - | | | | - | |
| Subtotal | | | 1,004,128 | | | | 39,567 | | | | 695,069 | | | | 25,514 | |
| Total Liabilities | | | 26,315,007 | | | | 640,695 | | | | 20,216,472 | | | | 1,143,238 | |
| Net position | | Ps. | 58,853 | | | Ps. | (138,486 | ) | | Ps. | (578,870 | ) | | Ps. | (118,266 | ) |
Derivative Financial Instruments for hedging purposes comprise the following:
| | | December 31, 2016 | | | December 31, 2015 | |
| Item | | Notional Amount | | | Fair Value | | | Notional Amount | | | Fair Value | |
| Assets | | | | | | | | | | | | | | | | |
| Forward contracts | | | | | | | | | | | | | | | | |
| Foreign currency to buy | | Ps. | 474,412 | | | Ps. | 3,914 | | | Ps. | 119,721 | | | Ps. | 4,929 | |
| Foreign currency to sell | | | 3,735,363 | | | | 124,565 | | | | 897,506 | | | | 28,761 | |
Grupo Aval Acciones y Valores S.A.
Notes to the Consolidated Financial Statement
As of December 31, 2016 and 2015 and for the years ended December 31, 2016, 2015 and 2014
(Figures expressed in millions of Colombian pesos)
| | | December 31, 2016 | | | December 31, 2015 | |
| Item | | Notional Amount | | | Fair Value | | | Notional Amount | | | Fair Value | |
| Subtotal | | Ps. | 4,209,775 | | | Ps. | 128,479 | | | Ps. | 1,017,227 | | | Ps. | 33,690 | |
| Futures Contracts | | | | | | | | | | | | | | | | |
| Foreign currency to buy | | | 150,036 | | | | - | | | | - | | | | - | |
| Foreign currency to sell | | | 973,730 | | | | - | | | | - | | | | - | |
| Subtotal | | | 1,123,766 | | | | - | | | | - | | | | - | |
| Total Assets | | Ps. | 5,333,541 | | | Ps. | 128,479 | | | Ps. | 1,017,227 | | | Ps. | 33,690 | |
| | | | | | | | | | | | | | | | | |
| Liabilities | | | | | | | | | | | | | | | | |
| Forward contracts | | | | | | | | | | | | | | | | |
| Foreign currency to buy | | | 967,702 | | | | 28,297 | | | | 573,296 | | | | 29,061 | |
| Foreign currency to sell | | | 1,536,849 | | | | 15,139 | | | | 3,566,547 | | | | 294,111 | |
| Interest rate to sell | | | - | | | | - | | | | 752,823 | | | | 13,343 | |
| Subtotal | | Ps. | 2,504,551 | | | Ps. | 43,436 | | | Ps. | 4,892,666 | | | Ps. | 336,515 | |
| Swap | | | | | | | | | | | | | | | | |
| Interest rate | | | - | | | | - | | | | 79,174 | | | | 1,235 | |
| Subtotal | | Ps. | - | | | Ps. | - | | | Ps. | 79,174 | | | Ps. | 1,235 | |
| Future Contracts | | | | | | | | | | | | | | | | |
| Foreign currency to buy | | | 363,086 | | | | - | | | | - | | | | - | |
| Foreign currency to sell | | | 190,545 | | | | - | | | | - | | | | - | |
| Subtotal | | Ps. | 553,631 | | | Ps. | - | | | Ps. | - | | | Ps. | - | |
| Total Liabilities | | Ps. | 3,058,182 | | | Ps. | 43,436 | | | Ps. | 4,971,840 | | | Ps. | 337,750 | |
| Net position | | Ps. | 2,275,359 | | | Ps. | 85,043 | | | Ps. | (3,954,613 | ) | | Ps. | (304,060 | ) |
Derivative instruments contracted by Grupo Aval or its consolidated entities are generally traded in either the domestic financial markets or in over the counter international markets. Derivative instruments have a net favorable condition (asset) or a net unfavorable condition (liability) as a result of fluctuations in exchange rates, in interest rates or other variables relating to market conditions. As a result, the aggregate amount of fair values of the assets and liabilities in derivative instruments may vary significantly from time to time.
According to risk management policies, Grupo Aval uses hedge accounting to manage foreign exchange risk in investment in foreign operations and in forecasted transactions of its subsidiary Promigas, as follows:
| 10.2.1 | Hedges of net investment in foreign operations |
Banco de Bogotá and Banco de Occidente have foreign investments in subsidiaries, which are exposed to foreign exchange risk as those foreign investments are expressed in US dollars and the functional currency of Grupo Aval is the Colombian peso.
The purpose of hedge accounting is to mitigate and offset any adverse changes that might occur given the fluctuation between the Colombian Peso and the functional currency of such investments. The impacts of those movements are reflected in the cumulative translation adjustment in other comprehensive income of the consolidated financial statements.
Grupo Aval Acciones y Valores S.A.
Notes to the Consolidated Financial Statement
As of December 31, 2016 and 2015 and for the years ended December 31, 2016, 2015 and 2014
(Figures expressed in millions of Colombian pesos)
To cover this risk, Grupo Aval hedges its exposure through foreign currency financial liabilities expressed in U.S. dollars and forward contracts for the sale of U.S. dollars, as permitted under IAS 39.
Changes in the fluctuation of the Colombian peso against the U.S. dollar are as follows:
| Date | | Value of US 1 | | | Variation | |
| December 31, 2014 | | | 2,392.46 | | | | 465.63 | |
| December 31, 2015 | | | 3,149.47 | | | | 757.01 | |
| December 31, 2016 | | | 3,000.71 | | | | (148.76 | ) |
According to information described above, the following table contains details of hedging operations carried out to cover foreign denominated equity investments. The analysis is presented gross of taxes:
December 31, 2016
| | | Thousands of USD | | | Ps. millions | |
| Detail of investment | | Investment
amount | | | Amount of
hedge by
financial
liabilities in
foreign
currency | | | Amount of
hedge by
forward
contracts | | | Cumulative
translation
adjustment
of the
investments | | | Exchange
difference of
financial
liabilities | | | Exchange
difference in
forward
contracts | | | Net OCI
account | |
| Leasing Bogotá Panamá | | | 3,436,658 | | | | (2,074,100 | ) | | | (1,346,889 | ) | | | 3,115,527 | | | | (1,080,737 | ) | | | (2,171,234 | ) | | | (136,444 | ) |
| Other subsidiaries and branches Banco de Bogotá (*) | | | 100,827 | | | | - | | | | (100,260 | ) | | | 94,139 | | | | - | | | | (91,517 | ) | | | 2,622 | |
| Occidental Bank Barbados | | | 25,401 | | | | (25,401 | ) | | | - | | | | 19,176 | | | | (19,176 | ) | | | - | | | | - | |
| Banco de Occidente Panamá | | | 21,699 | | | | (21,699 | ) | | | - | | | | 29,627 | | | | (29,627 | ) | | | - | | | | - | |
| Total | | | 3,584,585 | | | | (2,121,200 | ) | | | (1,447,149 | ) | | | 3,258,469 | | | | (1,129,540 | ) | | | (2,262,751 | ) | | | (133,822 | ) |
(*) Includes Banco de Bogotá Panamá, Banco de Bogotá Finance, Ficentro and contributions of foreign branches in Miami, New York and Nassau.
December 31, 2015
| | | Thousands of USD | | | Ps. millions | |
| Detail of investment | | Investment
amount(*) | | | Amount of
hedge by
financial
liabilities in
foreign
currency | | | Amount of
hedge by
forward
contracts | | | Cumulative
translation
adjustment
of the
investments | | | Exchange
difference of
financial
liabilities | | | Exchange
difference in
forward
contracts | | | Net OCI
account | |
| Leasing Bogotá Panamá | | | 2,664,626 | | | | (993,000 | ) | | | (1,680,981 | ) | | | 3,600,733 | | | | (1,214,082 | ) | | | (2,449,638 | ) | | | (62,987 | ) |
| Other subsidiaries and branches Banco de Bogotá (**) | | | 87,363 | | | | - | | | | (88,448 | ) | | | 107,754 | | | | - | | | | (104,619 | ) | | | 3,134 | |
| Occidental Bank Barbados | | | 18,222 | | | | 18,222 | | | | - | | | | 9,843 | | | | (9,843 | ) | | | - | | | | - | |
| Banco de Occidente Panamá | | | 28,231 | | | | 28,231 | | | | - | | | | 15,139 | | | | (15,139 | ) | | | - | | | | - | |
| Total | | | 2,798,442 | | | | (946,547 | ) | | | (1,769,429 | ) | | | 3,733,469 | | | | (1,239,064 | ) | | | (2,554,257 | ) | | | (59,853 | ) |
(*) Includes only exposure hedged under hedge accounting.
(**) Includes Banco de Bogotá Panamá, Banco Bogotá Finance, Ficentro and contributions of foreign branches in Miami, New York and Nassau.
Grupo Aval Acciones y Valores S.A.
Notes to the Consolidated Financial Statement
As of December 31, 2016 and 2015 and for the years ended December 31, 2016, 2015 and 2014
(Figures expressed in millions of Colombian pesos)
| 10.2.2 | Hedging with forward contracts |
Forward contracts to sell U.S. dollars have been taken to hedge part of the net foreign investment that Banco de Bogotá has in Leasing Bogotá Panamá and others foreign subsidiaries. The forward contracts were executed with counterparties from the financial sector and the hedge was documented as a "dynamic hedging strategy," where new forward contracts are signed simultaneously as the previous ones expire. According to IAS 39, changes in the fair value of derivatives due to changes in the peso/U.S. dollar exchange rate are registered under “Other Comprehensive Income” in equity and the ineffective part is recognized in the statement of income for the period
| 10.2.3 | Hedging with debt in foreign currency in U.S. dollars |
Debt financial instruments that are not derivatives can be designated as hedging instruments of changes in foreign currency exchange rates. According to this rule Banco de Bogotá and Banco de Occidente designed debt in U.S. dollar as hedging instruments of their foreign subsidiaries as follows:
| · | Bonds issued by Banco de Bogotá in the international market were designated as hedging instruments of the investment of Leasing Bogotá Panamá amounting US$2,074 million in 2016 and US$993 million in 2015. |
| · | Other financial liabilities amounting $46 million as December 31, 2016 (US$546 million as of December 31, 2015) were used to hedge part of the net foreign investment that Banco de Bogotá has in Leasing Bogotá Panamá and other foreign subsidiaries and in that Banco de Occidente has in foreign subsidiaries as part of a hedging strategy, by which when some obligations expire, new obligations will be designated to replace them. |
| · | Between December 21, 2015 and November 2, 2016, financial liabilities designated as hedging instruments described above included an intra-group liability amounting to US$500 million that Banco de Bogotá had as a hedging instrument of its investment in Leasing Bogotá Panamá. This operation was eliminated in the consolidation process of Grupo Aval and was excluded of the foreign investment hedge accounting. |
Starting May 1st and up to November 2nd, 2016 Grupo Aval designated financial assets in foreign debt securities amounting to US$500 million as cash flow hedge, the foreign exchange differences of this intra-group liability were not eliminated in the consolidation process and recorded in Other Comprehensive Income in the amount of Ps. 73,705. This value would be realized in the future as income only when the investment in Leasing Bogotá Panamá is sold.
| · | On November 2nd, 2016 Banco de Bogotá cancelled the intragroup liability amounting to US$500 million which was replaced in the foreign investment hedge accounting with other obligations in foreign currency with third parties. |
| 10.2.4 | Hedging of forecasted transactions |
In the ordinary course of its operations Promigas S.A. and its subsidiaries receive income in U.S. Dollars derived from the transportation of gas in their gas pipelines.
Grupo Aval Acciones y Valores S.A.
Notes to the Consolidated Financial Statement
As of December 31, 2016 and 2015 and for the years ended December 31, 2016, 2015 and 2014
(Figures expressed in millions of Colombian pesos)
To hedge the exchange risk arising in future transactions of highly probable gas transportation income, Promigas and its subsidiaries entered into forward contracts for the sale of U.S. dollars with financial entities different from the ones consolidated into Grupo Aval.
During the years ended at December 31, 2016, 2015 and 2014, an exchange difference recognized under “Other Comprehensive Income” as a result of cash flow hedge accounting of income from these highly probable transactions, was reclassified to the statement of income in the amounts of Ps. 5,037, Ps. (16,542) and Ps. (8,837).
The following is the summary of open cash flow hedge in Promigas and subsidiaries:
| | | December 31, 2016 | | | December 31, 2015 | |
| Amount hedging U.S. dollars | | | 142,731 | | | | 210,553 | |
| Notional amount contracts forward U.S. dollars | | | 99,912 | | | | 153,559 | |
| % hedged | | | 70 | % | | | 73 | % |
| Fair value in Colombian pesos | | | 4,824 | | | | (8,349 | ) |
| # of contracts | | | 892 | | | | 1,078 | |
The movement of the OCI account related to cash flow hedges in Colombian pesos during the years ended on December 31, 2016, 2015 and 2014 is as follows:
| | | December 31,
2016 | | | December 31,
2015 | | | December 31,
2014 | |
| Balance at the beginning of the year | | | (11,757 | ) | | | (26,790 | ) | | | 1,081 | |
| Changes in the fair value of the hedge forward contracts | | | 12,930 | | | | 31,575 | | | | (19,034 | ) |
| Transferred to profit or loss | | | 5,037 | | | | (16,542 | ) | | | (8,837 | ) |
| Balance at the end of the year | | Ps. | 6,210 | | | Ps. | (11,757 | ) | | Ps. | (26,790 | ) |
| 10.2.5 | Testing of hedge effectiveness |
IAS 39 considers hedging as highly effective if at the beginning and in subsequent periods, the hedging is highly effective at offsetting changes in fair value or in cash flows attributable to the risk hedged during the period for which the hedging has been designated and that the effectiveness of the hedging is in a range between 80% and 125%. Such effectiveness is assessed by Grupo Aval‘s entities at least quarterly and at the end of each accounting period.
Grupo Aval has documented the hedging effectiveness of its foreign currency denominated investments in based on the portion of the net investment hedged at the beginning of the hedging relationship. Since the net balance of these investments fluctuates during the year, Grupo Aval evaluates the hedging relationship on a daily basis as well as the result of the testing of hedge effectiveness as follows:
| 10.2.6 | Hedge effectiveness with forward contracts |
Grupo Aval applies the method of the forward rate used in forward contracts to evaluate the hedge effectiveness; for such purpose, Grupo Aval measures the hedge ineffectiveness comparing the value of current forward contracts, which serve as hedge the change in the value of a hypothetical derivative with the same maturity.
Grupo Aval Acciones y Valores S.A.
Notes to the Consolidated Financial Statement
As of December 31, 2016 and 2015 and for the years ended December 31, 2016, 2015 and 2014
(Figures expressed in millions of Colombian pesos)
| 10.2.7 | Hedge effectiveness with debt instruments in foreign currency |
For debt in foreign currency designated as a hedging instrument, the gain or loss arising from the conversion of the debt to Colombian Pesos is based on the current exchange rate between the U.S. dollar and the Colombian Peso, which is the functional currency of Grupo Aval. If the notional amount of the hedging instrument exactly matches with the portion of the hedged investment in foreign operations, no ineffectiveness is registered in the statement of income.
NOTE 11 – LOANS AND RECEIVABLES
Financial assets at amortized cost on the statement of financial position are classified as commercial, consumer, residential, and microcredit. Due to the significance of the financial leasing portfolio for Grupo Aval, these credits are also presented in all the tables in the note of credit risks for disclosure purposes:
December 31, 2016
| Modality | | Balance in Statement of
financial position | | | Leasing
presentation
adjustment | | | Balance according to
disclosure | |
| Commercial | | Ps. | 93,149,211 | | | Ps. | (9,958,095 | ) | | Ps. | 83,191,116 | |
| Consumer | | | 46,927,997 | | | | (215,608 | ) | | | 46,712,389 | |
| Residential mortgage | | | 14,683,537 | | | | (902,104 | ) | | | 13,781,433 | |
| Microcredit | | | 399,431 | | | | - | | | | 399,431 | |
| Financial Leasing | | | - | | | | 11,075,807 | | | | 11,075,807 | |
| Total portfolio | | Ps. | 155,160,176 | | | Ps. | - | | | Ps. | 155,160,176 | |
December 31, 2015
| Modality | | Balance in Statement of
financial position | | | Leasing
presentation
adjustment | | | Balance according to
disclosure | |
| Commercial | | Ps. | 89,498,148 | | | Ps. | (8,299,825 | ) | | Ps. | 81,198,323 | |
| Consumer | | | 42,230,509 | | | | (356,944 | ) | | | 41,873,565 | |
| Residential mortgage | | | 13,418,079 | | | | (762,897 | ) | | | 12,655,182 | |
| Microcredit | | | 399,262 | | | | - | | | | 399,262 | |
| Financial Leasing | | | - | | | | 9,419,666 | | | | 9,419,666 | |
| Total portfolio | | Ps. | 145,545,998 | | | Ps. | - | | | Ps. | 145,545,998 | |
| 11.1. | Credit portfolio by modality |
The distribution of the credit portfolio of Grupo Aval by modality is shown as follows:
| | | December 31, 2016 | | | December 31, 2015 | |
| General purpose loans | | Ps. | 60,561,432 | | | Ps. | 57,927,976 | |
| Personal loans | | | 28,308,406 | | | | 25,274,165 | |
| Working capital loans | | | 15,524,372 | | | | 15,782,240 | |
Grupo Aval Acciones y Valores S.A.
Notes to the Consolidated Financial Statement
As of December 31, 2016 and 2015 and for the years ended December 31, 2016, 2015 and 2014
(Figures expressed in millions of Colombian pesos)
| | | December 31, 2016 | | | December 31, 2015 | |
| Mortgages | | | 13,781,433 | | | | 12,655,182 | |
| Credit Cards | | | 12,781,182 | | | | 11,637,092 | |
| Commercial financial leases | | | 9,958,096 | | | | 8,466,509 | |
| Consumer financial leases | | | 215,608 | | | | 190,330 | |
| Automobile and vehicle loans | | | 5,736,357 | | | | 5,234,613 | |
| Interbank and overnight funds | | | 3,569,587 | | | | 4,084,982 | |
| Loans funded by development banks (*) | | | 2,829,091 | | | | 2,514,608 | |
| Housing leases | | | 902,104 | | | | 762,897 | |
| Overdrafts | | | 593,077 | | | | 616,142 | |
| Microcredit | | | 399,431 | | | | 399,262 | |
| Gross balance of Financial Assets of credit portfolio | | | 155,160,176 | | | | 145,545,998 | |
| Allowance for impairment of financial assets from the loan portfolio | | | (4,261,444 | ) | | | (3,718,324 | ) |
| Net balance of Financial Assets to credit portfolio | | Ps. | 150,898,732 | | | Ps. | 141,827,674 | |
(*) As of December 31, 2016 and 2015 these loans and receivables were given as guarantee of financial obligations with development entities (See Note 21.3).
Grupo Aval Acciones y Valores S.A.
Notes to the Consolidated Financial Statement
As of December 31, 2016 and 2015 and for the years ended December 31, 2016, 2015 and 2014
(Figures expressed in millions of Colombian pesos)
| 11.2. | Loans impairment provision |
The movement of the impairment provision of the financial assets of the credit portfolio during the years ended December 31, 2016 and 2015 is as follows
| | | Commercial | | | Consumer | | | Mortgage | | | Microcredit | | | Financial
Leasing | | | Total | |
| Balance as of January 1, 2014 | | | 1,328,697 | | | | 1,258,679 | | | | 36,077 | | | | 44,010 | | | | 131,335 | | | | 2,798,798 | |
| Allowance of the period charged against to profit or loss | | | 1,227,758 | | | | 1,812,327 | | | | 59,972 | | | | 41,642 | | | | 127,044 | | | | 3,268,743 | |
| Recovery of provisions with partial payment to profit or loss | | | (648,822 | ) | | | (842,624 | ) | | | (24,261 | ) | | | (16,998 | ) | | | (82,965 | ) | | | (1,615,670 | ) |
| Charge-offs of the period | | | (219,773 | ) | | | (1,091,833 | ) | | | (15,669 | ) | | | (30,521 | ) | | | (18,898 | ) | | | (1,376,694 | ) |
| Exchange differences | | | (239,089 | ) | | | 268,194 | | | | 7,704 | | | | 9,675 | | | | 29,256 | | | | 75,740 | |
| Recovery of provisions for securitizations | | | - | | | | - | | | | 6,886 | | | | - | | | | - | | | | 6,886 | |
| Balance as of December 31, 2014 | | Ps. | 1,448,771 | | | Ps. | 1,404,743 | | | Ps. | 70,709 | | | Ps. | 47,808 | | | Ps. | 185,772 | | | Ps. | 3,157,803 | |
| Allowance of the period charged against to profit or loss | | | 1,310,679 | | | | 2,182,141 | | | | 42,313 | | | | 37,506 | | | | 214,797 | | | | 3,787,436 | |
| Recovery of provisions with partial payment to profit or loss | | | (663,931 | ) | | | (916,030 | ) | | | (24,797 | ) | | | (14,505 | ) | | | (97,012 | ) | | | (1,716,275 | ) |
| Charge-offs of the period | | | (198,727 | ) | | | (1,304,058 | ) | | | (14,160 | ) | | | (33,096 | ) | | | (86,405 | ) | | | (1,636,446 | ) |
| Exchange differences | | | (217,563 | ) | | | 312,351 | | | | 21,037 | | | | 11,493 | | | | (1,512 | ) | | | 125,806 | |
| Balance as of December 31, 2015 | | Ps. | 1,679,229 | | | Ps. | 1,679,147 | | | Ps. | 95,102 | | | Ps. | 49,206 | | | Ps. | 215,640 | | | Ps. | 3,718,324 | |
| Allowance of the period charged against to profit or loss | | | 1,522,077 | | | | 3,088,950 | | | | 75,059 | | | | 72,917 | | | | 225,498 | | | | 4,984,501 | |
| Recovery of provisions with partial payment to profit or loss | | | (857,465 | ) | | | (976,258 | ) | | | (37,863 | ) | | | (18,119 | ) | | | (162,033 | ) | | | (2,051,738 | ) |
| Charge-offs of the period | | | (495,326 | ) | | | (1,759,896 | ) | | | (15,828 | ) | | | (28,703 | ) | | | (55,234 | ) | | | (2,354,987 | ) |
| Exchange differences | | | (33,571 | ) | | | (9,118 | ) | | | 7,630 | | | | (12,164 | ) | | | 12,567 | | | | (34,656 | ) |
| Balance as of December 31, 2016 | | Ps. | 1,814,944 | | | Ps. | 2,022,825 | | | Ps. | 124,100 | | | Ps. | 63,137 | | | Ps. | 236,438 | | | Ps. | 4,261,444 | |
| 11.3. | Credit Portfolio assessed collectively and individually |
The detailed information of credit risk impairment provisions accrued as of December 31, 2016 and 2015, taking into account how they were determined individually for loans above of Ps. 2,000 and collectively for other credits. Loans individually assessed for impairment lower than Ps. 2,000 are considered in the allowances for each type of credit.
December 31, 2016
| Impairment provision: | | Commercial | | | Consumer | | | Mortgage | | | Microcredit | | | Financial
Leasing | | | Total | |
| Loans assessed individually | | Ps. | 724,522 | | | Ps. | 47 | | | Ps. | 827 | | | Ps. | - | | | Ps. | 74,098 | | | Ps. | 799,494 | |
| Loans assessed collectively | | | 1,090,422 | | | | 2,022,778 | | | | 123,273 | | | | 63,137 | | | | 162,340 | | | | 3,461,950 | |
| Total impairment provision | | Ps. | 1,814,944 | | | Ps. | 2,022,825 | | | Ps. | 124,100 | | | Ps | 63,137 | | | Ps. | 236,438 | | | Ps. | 4,261,444 | |
Grupo Aval Acciones y Valores S.A.
Notes to the Consolidated Financial Statement
As of December 31, 2016 and 2015 and for the years ended December 31, 2016, 2015 and 2014
(Figures expressed in millions of Colombian pesos)
Gross balance of financial assets for credit
portfolio: | | Commercial | | | Consumer | | | Mortgage | | | Microcredit | | | Financial
Leasing | | | Total | |
| Loans assessed individually (1) | | Ps. | 48,565,393 | | | Ps. | 92,410 | | | Ps. | 8,506 | | | Ps. | - | | | Ps. | 5,113,843 | | | Ps. | 53,780,152 | |
| Loans assessed collectively | | | 34,625,723 | | | | 46,619,979 | | | | 13,772,927 | | | | 399,431 | | | | 5,961,964 | | | | 101,380,024 | |
| Total gross investment value of portfolio | | Ps. | 83,191,116 | | | Ps. | 46,712,389 | | | Ps. | 13,781,433 | | | Ps. | 399,431 | | | Ps. | 11,075,807 | | | Ps. | 155,160,176 | |
| (1) | Loans individually evaluated for impairment that are not considered impaired, additionally are evaluated collectively for impairment according to historical losses experience adjusted to reflect current economic conditions. |
December 31, 2015
| Impairment provision: | | Commercial | | | Consumer | | | Mortgage | | | Microcredit | | | Financial
Leasing | | | Total | |
| Loans assessed individually | | Ps. | 743,211 | | | Ps. | 558 | | | Ps. | 9 | | | Ps. | - | | | Ps. | 65,219 | | | Ps. | 808,997 | |
| Loans assessed collectively | | | 936,018 | | | | 1,678,589 | | | | 95,093 | | | | 49,206 | | | | 150,421 | | | | 2,909,327 | |
| Total impairment provision | | Ps. | 1,679,229 | | | Ps. | 1,679,147 | | | Ps. | 95,102 | | | Ps. | 49,206 | | | Ps. | 215,640 | | | Ps. | 3,718,324 | |
Gross balance of financial assets for credit
portfolio: | | Commercial | | | Consumer | | | Mortgage | | | Microcredit | | | Financial
Leasing | | | Total | |
| Loans assessed individually (1) | | Ps. | 45,208,957 | | | Ps. | 95,018 | | | Ps. | 8,731 | | | Ps. | - | | | Ps. | 4,669,142 | | | Ps. | 49,981,848 | |
| Loans assessed collectively | | | 35,989,366 | | | | 41,778,547 | | | | 12,646,451 | | | | 399,262 | | | | 4,750,524 | | | | 95,564,150 | |
| Total gross investment value of portfolio | | Ps. | 81,198,323 | | | Ps. | 41,873,565 | | | Ps. | 12,655,182 | | | Ps. | 399,262 | | | Ps. | 9,419,666 | | | Ps. | 145,545,998 | |
| (1) | Loans individually evaluated for impairment that are not considered impaired, additionally are evaluated collectively for impairment according to historical losses experience adjusted to reflect current economic conditions. |
Grupo Aval Acciones y Valores S.A.
Notes to the Consolidated Financial Statement
As of December 31, 2016 and 2015 and for the years ended December 31, 2016, 2015 and 2014
(Figures expressed in millions of Colombian pesos)
11.4 Portfolio of loans assessed individually for impairment
The detailed information as of December 31, 2016 and 2015 is as follows
| December 31, 2016 |
| | | Gross Amount
Registered | | | Collateral
Guarantees | | | Allowance
Recognized | |
| | | | | | | | | | |
| Without recognized provision | | | | | | | | | | | | |
| Commercial | | Ps. | 262,831 | | | Ps. | 208,604 | | | Ps. | - | |
| Financial Leasing | | | 138,513 | | | | 484,339 | | | | - | |
| Subtotal | | Ps. | 401,344 | | | Ps. | 692,943 | | | Ps. | - | |
| | | | | | | | | | | | | |
| With recognized provision | | | | | | | | | | | | |
| Commercial | | Ps. | 3,156,154 | | | Ps. | 221,203 | | | Ps. | 724,522 | |
| Consumer | | | 141 | | | | - | | | | 47 | |
| Residential Mortgage | | | 1,907 | | | | - | | | | 827 | |
| Financial Leasing | | | 327,755 | | | | 165,221 | | | | 74,098 | |
| Subtotal | | Ps. | 3,485,957 | | | Ps. | 386,424 | | | Ps. | 799,494 | |
| Totals | | | | | | | | | | | | |
| Commercial | | | 3,418,985 | | | | 429,807 | | | | 724,522 | |
| Consumer | | | 141 | | | | - | | | | 47 | |
| Residential Mortgage | | | 1,907 | | | | - | | | | 827 | |
| Financial Leasing | | | 466,268 | | | | 649,560 | | | | 74,098 | |
| Total | | Ps. | 3,887,301 | | | Ps. | 1,079,367 | | | Ps. | 799,494 | |
| December 31, 2015 |
| | | Gross Amount
Registered | | | Collateral
Guarantees | | | Allowance
Recognized | |
| | | | | | | | | | |
| Without recognized provision | | | | | | | | | | | | |
| Commercial | | Ps. | 237,460 | | | Ps. | 216,428 | | | Ps. | - | |
| Financial Leasing | | | 126,115 | | | | 216,021 | | | | - | |
| Subtotal | | Ps. | 363,575 | | | Ps. | 432,449 | | | Ps. | - | |
| | | | | | | | | | | | | |
| With recognized provision | | | | | | | | | | | | |
| Commercial | | Ps. | 2,442,599 | | | Ps. | 480,001 | | | Ps. | 743,211 | |
| Consumer | | | 227 | | | | 41 | | | | 558 | |
| Residential Mortgage | | | 2,230 | | | | - | | | | 9 | |
| Financial Leasing | | | 275,225 | | | | 126,633 | | | | 65,219 | |
| Subtotal | | Ps. | 2,720,281 | | | Ps. | 606,675 | | | Ps. | 808,997 | |
| Totals | | | | | | | | | | | | |
| Commercial | | | 2,680,059 | | | | 696,429 | | | | 743,211 | |
| Consumer | | | 227 | | | | 41 | | | | 558 | |
| Residential Mortgage | | | 2,230 | | | | - | | | | 9 | |
| Microcredit | | | - | | | | - | | | | - | |
| Financial Leasing | | | 401,340 | | | | 342,654 | | | | 65,219 | |
| Total | | Ps. | 3,083,856 | | | Ps. | 1,039,124 | | | Ps. | 808,997 | |
Grupo Aval Acciones y Valores S.A.
Notes to the Consolidated Financial Statement
As of December 31, 2016 and 2015 and for the years ended December 31, 2016, 2015 and 2014
(Figures expressed in millions of Colombian pesos)
The difference between the value of the loan and the guarantees disclosed on the table above correspond to unsecured loans valued with the discounted cash flow method. When using this method it is implied that it is possible for the customer to make future payments.
| 11.5. | Loans portfolio by maturity |
The distribution of loans portfolio of Grupo Aval by maturity period is as follows:
December 31, 2016
| | | Up to 1
year | | | From 1 to 3
years | | | From 3 to
5 years | | | More than
5 years | | | Total | |
| Commercial | | Ps. | 36,982,196 | | | Ps. | 19,083,900 | | | Ps. | 10,957,767 | | | Ps. | 16,167,253 | | | Ps. | 83,191,116 | |
| Consumer | | | 15,207,864 | | | | 10,928,357 | | | | 8,188,856 | | | | 12,387,312 | | | | 46,712,389 | |
| Residential Mortgage | | | 396,964 | | | | 706,364 | | | | 732,454 | | | | 11,945,651 | | | | 13,781,433 | |
| Microcredit | | | 166,719 | | | | 208,759 | | | | 19,610 | | | | 4,343 | | | | 399,431 | |
| Financial Leasing | | | 2,571,103 | | | | 2,775,490 | | | | 2,192,804 | | | | 3,536,410 | | | | 11,075,807 | |
| Total gross credit portfolio | | Ps. | 55,324,846 | | | Ps. | 33,702,870 | | | Ps. | 22,091,491 | | | Ps. | 44,040,969 | | | Ps. | 155,160,176 | |
December 31, 2015
| | | Up to 1
year | | | From 1 to 3
years | | | From 3 to
5 years | | | More than
5 years | | | Total | |
| Commercial | | Ps. | 39,751,789 | | | Ps. | 17,267,985 | | | Ps. | 10,380,273 | | | Ps. | 13,798,276 | | | Ps. | 81,198,323 | |
| Consumer | | | 14,337,485 | | | | 9,659,282 | | | | 7,365,624 | | | | 10,511,174 | | | | 41,873,565 | |
| Residential Mortgage | | | 338,562 | | | | 595,255 | | | | 629,464 | | | | 11,091,901 | | | | 12,655,182 | |
| Microcredit | | | 201,441 | | | | 181,383 | | | | 16,157 | | | | 281 | | | | 399,262 | |
| Financial Leasing | | | 2,535,719 | | | | 2,774,432 | | | | 1,913,695 | | | | 2,195,820 | | | | 9,419,666 | |
| Total gross credit portfolio | | Ps. | 57,164,996 | | | Ps. | 30,478,337 | | | Ps. | 20,305,213 | | | Ps. | 37,597,452 | | | Ps. | 145,545,998 | |
| 11.6. | Loans portfolio by currency |
The classification of loan portfolio by type of currency is as follows:
| December 31, 2016 |
| | | Colombian Pesos | | | Foreign Currency | | | Total | |
| Commercial | | Ps. | 54,026,331 | | | Ps. | 29,164,785 | | | Ps. | 83,191,116 | |
| Consumer | | | 30,452,658 | | | | 16,259,731 | | | | 46,712,389 | |
| Residential Mortgage | | | 4,822,806 | | | | 8,958,627 | | | | 13,781,433 | |
| Microcredit | | | 399,431 | | | | - | | | | 399,431 | |
| Financial Leasing | | | 8,953,491 | | | | 2,122,316 | | | | 11,075,807 | |
| Total gross credit portfolio | | Ps. | 98,654,717 | | | Ps. | 56,505,459 | | | Ps. | 155,160,176 | |
| December 31, 2015 |
| | | Colombian Pesos | | | Foreign Currency | | | Total | |
| Commercial | | Ps. | 51,627,093 | | | Ps. | 29,571,230 | | | Ps. | 81,198,323 | |
| Consumer | | | 26,836,344 | | | | 15,037,221 | | | | 41,873,565 | |
| Residential Mortgage | | | 3,994,468 | | | | 8,660,714 | | | | 12,655,182 | |
| Microcredit | | | 399,262 | | | | - | | | | 399,262 | |
| Financial Leasing | | | 8,540,941 | | | | 878,725 | | | | 9,419,666 | |
| Total gross credit portfolio | | Ps. | 91,398,108 | | | Ps. | 54,147,890 | | | Ps. | 145,545,998 | |
Grupo Aval Acciones y Valores S.A.
Notes to the Consolidated Financial Statement
As of December 31, 2016 and 2015 and for the years ended December 31, 2016, 2015 and 2014
(Figures expressed in millions of Colombian pesos)
| 11.7. | Financial leasing portfolio |
As of December 31, 2016 and 2015 the following table shows the reconciliation between gross investment in financial leasing and the present value of minimum payments to be received in these dates:
| | | December 31,
2016 | | | December 31,
2015 | |
| Total gross rent payments receivable | | Ps. | 17,071,858 | | | Ps. | 12,558,960 | |
| Less amounts representing running costs (such as taxes, maintenance, insurances ,etc.,) | | | (2,527 | ) | | | (2,130 | ) |
| Plus Estimated residual amount of assets given for rental (without guarantee) | | | 21,162 | | | | 28,927 | |
| Gross investment in contracts of financial leasing | | | 17,090,493 | | | | 12,585,757 | |
| Lessunrealized financial income | | | (6,014,686 | ) | | | (3,166,091 | ) |
| Net investment in contracts of financial leasing | | | 11,075,807 | | | | 9,419,666 | |
| Impairment of net investment in financial leasing | | Ps. | (236,438 | ) | | Ps. | (215,640 | ) |
The detailed information of gross investment and net investment in financial leasing contracts receivable as of December 31, 2016 and 2015 in each period is as follows:
| December 31, 2016 |
| | | Gross investment | | | Net investment | |
| Up to 1 year | | Ps. | 2,711,147 | | | Ps. | 2,128,441 | |
| From 1 to 5 years | | | 6,375,267 | | | | 4,798,364 | |
| More than 5 years | | | 8,004,079 | | | | 4,149,002 | |
| Total | | Ps. | 17,090,493 | | | Ps. | 11,075,807 | |
| December 31, 2015 |
| | | Gross investment | | | Net investment | |
| Up to 1 year | | Ps. | 2,758,966 | | | Ps. | 2,258,621 | |
| From 1 to 5 years | | | 5,850,421 | | | | 4,279,489 | |
| More than 5 years | | | 3,976,370 | | | | 2,881,556 | |
| Total | | Ps. | 12,585,757 | | | Ps. | 9,419,666 | |
The banks of Grupo Aval grant loans through the modality of financial leasing mainly for the financing of vehicles and computer equipment, generally with terms between 36 and 60 months with an purchase option, machinery and equipment with terms of 60 to 120 months with a purchase option at the end of the contract and for housing leasing with terms of 120 to 240 months transferring the asset at the end of the contract. All these leasing contracts are granted at current market interest rates at inception.
Grupo Aval Acciones y Valores S.A.
Notes to the Consolidated Financial Statement
As of December 31, 2016 and 2015 and for the years ended December 31, 2016, 2015 and 2014
(Figures expressed in millions of Colombian pesos)
NOTE 12 – OTHER ACCOUNTS RECEIVABLES
The detailed information of other accounts receivables as of December 31, 2016 and 2015 is as follows:
| Detail | | December
31, 2016 | | | December
31, 2015 | |
| Accounts receivables for goods and services sales in non-financial sector companies | | Ps. | 1,066,628 | | | Ps. | 993,919 | |
| Fees, services and advances | | | 272,488 | | | | 4,897 | |
| Payment in advance | | | 262,473 | | | | 171,251 | |
| Credit card compensations and network compensation | | | 249,430 | | | | 263,552 | |
| Dormant customer deposits ICETEX (1) | | | 237,034 | | | | - | |
| Receivables from associates and joint ventures | | | 230,950 | | | | 87,875 | |
| Financial assets in concession contract at amortized cost ( See note 16) | | | 203,241 | | | | 42,864 | |
| Debtors | | | 178,785 | | | | 259,644 | |
| Diverse | | | 176,472 | | | | 92,462 | |
| Transfers in process | | | 166,153 | | | | 131,075 | |
| Collateral on derivatives | | | 138,520 | | | | 623,518 | |
| Commissions | | | 131,867 | | | | 63,763 | |
| Transfers to the National Treasury | | | 52,351 | | | | 48,085 | |
| Storage services | | | 41,282 | | | | 37,598 | |
| Payment in advance to supplier's contract | | | 39,309 | | | | 137,386 | |
| Quota shares retirement pensions | | | 30,396 | | | | 30,659 | |
| Claims to insurance companies | | | 19,201 | | | | 38,455 | |
| Dividends | | | 16,263 | | | | 14,662 | |
| Deductible taxes | | | 15,611 | | | | 98,752 | |
| Promissory sellers | | | 11,661 | | | | 32,731 | |
| Payment in advance for industry and trade taxes | | | 11,553 | | | | 10,379 | |
| Others | | | 168,004 | | | | 213,144 | |
| Gross balance of other accounts receivable | | Ps. | 3,719,672 | | | Ps. | 3,396,671 | |
| Impairment allowance | | Ps. | (195,078 | ) | | Ps. | (194,450 | ) |
| Net Other accounts receivable | | Ps. | 3,524,594 | | | Ps. | 3,202,221 | |
(1) According to Law 1777 of 2016, financial institutions in Colombia since August 1, 2016, must transfer cash from clients’ dormant deposits to a special fund as a loan to a Government entity denominated “ICETEX”, and classified as “Other accounts receivable” given it is permanently deemed refundable by any particular client. This Fund is responsible for managing the monies with the commitment to return them at the time the account holder requests them. Dormant client’s deposits are accounts of savings or current accounts that exceed the 322 UVR (Real Value Units) equivalent to Ps. 78,069 pesos, on which no deposit, withdrawal, transfer or, in general, debit or credit movements have been made during an uninterrupted period of three years. An account may cease to be considered dormant when the owner makes use of it.
The movements of allowance for the years ended December 31, 2016, 2015 and 2014 is as follows:
| | | December 31,
2016 | | | December 31,
2015 | | | December 31,
2014 | |
| Balance at the beginning of the year | | Ps. | 194,450 | | | Ps. | 222,385 | | | Ps. | 171,185 | |
| Provision charged to profit or loss | | | 105,942 | | | | 96,775 | | | | 99,120 | |
| Recovery from other accounts receivable | | | (32,514 | ) | | | (40,185 | ) | | | (35,970 | ) |
| Charge-offs | | | (72,120 | ) | | | (85,880 | ) | | | (44,536 | ) |
| Exchange gains in foreign currency | | | (680 | ) | | | 1,355 | | | | 32,586 | |
| Balance at the end of the year | | Ps. | 195,078 | | | Ps. | 194,450 | | | Ps. | 222,385 | |
Grupo Aval Acciones y Valores S.A.
Notes to the Consolidated Financial Statement
As of December 31, 2016 and 2015 and for the years ended December 31, 2016, 2015 and 2014
(Figures expressed in millions of Colombian pesos)
NOTE 13 – NON-CURRENT ASSETS HELD FOR SALE
The movement of the non-current assets held for sale during the years ended December 31, 2016, 2015 and 2014 is as follows:
| | | December 31,
2016 | | | December 31,
2015 | | | December 31,
2014 | |
| Balance at the beginning of the year | | Ps. | 199,475 | | | Ps. | 211,247 | | | Ps. | 303,721 | |
| Additional increases during the year | | | 236,632 | | | | 93,698 | | | | 71,848 | |
| Assets sold | | | (130,784 | ) | | | (104,940 | ) | | | (207,587 | ) |
| Charged-offs | | | - | | | | (5,786 | ) | | | (7,176 | ) |
| Impairment | | | (34,572 | ) | | | (12,159 | ) | | | (14,693 | ) |
| Reclassifications | | | (5,631 | ) | | | (24,901 | ) | | | 38,113 | |
| Exchange gains in foreign currency | | | (5,593 | ) | | | 42,316 | | | | 27,021 | |
| Balance at year end balance | | Ps. | 259,527 | | | Ps. | 199,475 | | | Ps. | 211,247 | |
Following is the detail of the non-current assets held for sale:
| | | December 31,
2016 | | | December 31,
2015 | |
| Foreclosed assets | | | | | | | | |
| Movable property | | Ps. | 103,569 | | | Ps. | 38,173 | |
| Residential real estate | | | 36,368 | | | | 43,815 | |
| Other real estate | | | 38,080 | | | | 45,474 | |
| | | Ps. | 178,017 | | | Ps. | 127,462 | |
| Assets received from leasing agreements | | | | | | | | |
| Machinery and equipment | | | 25,035 | | | | 3,599 | |
| Vehicles | | | 6,320 | | | | 6,909 | |
| Real estate | | | 27,208 | | | | - | |
| | | Ps. | 58,563 | | | Ps. | 10,508 | |
| Other non-current assets held for sale | | | | | | | | |
| Lands | | | 8,396 | | | | 21,354 | |
| Real estate | | | - | | | | 15,712 | |
| Other | | | 14,551 | | | | 24,439 | |
| | | | 22,947 | | | | 61,505 | |
| Balance at the end of the year | | Ps. | 259,527 | | | Ps. | 199,475 | |
Following is the detail of the associated liabilities with groups of assets held for sale:
| | | December 31, 2016 | | | December 31, 2015 | |
| Commercial accounts payable | | Ps. | 13,884 | | | Ps. | 7,125 | |
| Total | | Ps. | 13,884 | | | Ps. | 7,125 | |
Non-current assets held for sale are primarily assets received through foreclosure from assets pledged as loan collateral. Accordingly, Grupo Aval intention is to sell them immediately, and it has departments, processes and special sales programs for that purpose. Foreclosed assets are either sold for cash or financing for their sale is provided to potential buyers under normal market conditions. These are expected to be sold within a period of 12 months subsequent to their classification as assets held for sale. There are options contracts in place for some of
Grupo Aval Acciones y Valores S.A.
Notes to the Consolidated Financial Statement
As of December 31, 2016 and 2015 and for the years ended December 31, 2016, 2015 and 2014
(Figures expressed in millions of Colombian pesos)
these assets. Note 4.1 on credit risk contains information on assets received through foreclosure and sold during the period. During the years ended on December 31, 2016, 2015 and 2014, there were no changes in plans for the disposal of non-current assets held for sale.
NOTE 14 – INVESTMENTS IN ASSOCIATES AND JOINT VENTURES
The detail of the investments in associates and joint ventures is as follows:
| | | December 31,
2016 | | | December 31,
2015 | |
| Associates | | Ps. | 865,410 | | | Ps. | 645,377 | |
| Joint ventures | | | 281,237 | | | | 282,222 | |
| Total | | Ps. | 1,146,647 | | | Ps. | 927,599 | |
The following table shows the balances of each investment in associates and joint ventures as of December 31, 2016 and 2015, Grupo Aval voting right percentage in those entities:
| | | December 31, 2016 | | | December 31, 2015 | |
| | | Proportion of
ownership
interest | | | Book
value | | | Proportion of
ownership
interest | | | Book
value | |
| Associates | | | | | | | | | | | | | | | | |
| A.C.H Colombia S.A. | | | 34 | % | | Ps. | 10,467 | | | | 34 | % | | Ps. | 9,888 | |
| Redeban Multicolor S.A. | | | 20 | % | | | 18,421 | | | | 20 | % | | | 16,822 | |
| Credibanco S.A.(*) | | | 25 | % | | | 192,893 | | | | 0 | % | | | - | |
| Aerocali S.A. | | | 50 | % | | | 24,971 | | | | 50 | % | | | 23,165 | |
| Colombiana de Extrusión S.A. Extrucol | | | 25 | % | | | 11,354 | | | | 25 | % | | | 10,294 | |
| Concesionaria Tibitoc S.A. | | | 33 | % | | | 20,209 | | | | 33 | % | | | 19,112 | |
| Metrex S.A. | | | 14 | % | | | 2,239 | | | | 14 | % | | | 2,324 | |
| C.I. Acepalma S.A. (**) | | | 11 | % | | | 4,367 | | | | 11 | % | | | 3,385 | |
| Gases del Caribe S.A. E.S.P. | | | 31 | % | | | 218,432 | | | | 31 | % | | | 201,762 | |
| Calidda S.A. | | | 40 | % | | | 354,822 | | | | 40 | % | | | 348,141 | |
| Antillean Gas, Ltd. | | | 20 | % | | | - | | | | 20 | % | | | 968 | |
| Complejo Energético del Este SA | | | 17 | % | | | - | | | | 17 | % | | | 3,059 | |
| Concentra Inteligencia en Energía S.A.S. | | | 24 | % | | | 557 | | | | 24 | % | | | 386 | |
| Energía Eficiente S.A. | | | 39 | % | | | 6,678 | | | | 39 | % | | | 6,071 | |
| | | | | | | Ps. | 865,410 | | | | | | | Ps. | 645,377 | |
Grupo Aval Acciones y Valores S.A.
Notes to the Consolidated Financial Statement
As of December 31, 2016 and 2015 and for the years ended December 31, 2016, 2015 and 2014
(Figures expressed in millions of Colombian pesos)
| | | December 31, 2016 | | | December 31, 2015 | |
| | | Proportion of
ownership
interest | | | Book
value | | | Proportion of
ownership
interest | | | Book value | |
Joint ventures related to infrastructure projects | | | | | | | | | | | | | | | | |
| Cfc Sk Eldorado Latam Advisory Company S.A.S. (1) | | | 50 | % | | | 258 | | | | 50 | % | | | 100 | |
| Cfc Sk El Dorado Latam Management Company Ltd (1) | | | 50 | % | | | 2,993 | | | | 50 | % | | | 1,726 | |
| Cfc Sk El Dorado Latam Capital Partner Ltd (1) | | | 50 | % | | | 472 | | | | 50 | % | | | 161 | |
| Cfc Sk El Dorado Latam Fund L.P. (1) | | | 50 | % | | | 12,395 | | | | 50 | % | | | 1,866 | |
| Concesionaria Ruta Del Sol S.A.S. (2) | | | 33 | % | | | 252,474 | | | | 33 | % | | | 258,365 | |
| Concesionaria Vial Del Pacífico S.A.S.(3) | | | 50 | % | | | 1,479 | | | | 50 | % | | | 1,594 | |
| Concesionaria Nueva Vía Al Mar S.A.S.(4) | | | 60 | % | | | 11,166 | | | | 60 | % | | | 9,323 | |
| Others | | | | | | | - | | | | | | | | 9,087 | |
| | | | | | | Ps. | 281,237 | | | | | | | Ps. | 282,222 | |
(*) Since November 30, 2016, Grupo Aval has significant influence on Credibanco. Credibanco’s General Shareholders Meeting agreed to transform the society from a non-profit organization to a Limited Liability Company, which is now accounted for as an associate.
(**) Grupo Aval has significant influence over C.I. Acepalma S.A. due to its participation in the Board of Directors.
Associates and Joint ventures are domiciled in Colombia and Peru.
The main corporate purpose of Grupo Aval´s associates is described as follows:
| | Associate | | Corporate purpose |
| 1 | A.C.H. Colombia S.A. | | Financial transactions |
| 2 | Redeban Multicolor S.A. | | Payment processing |
| 3 | Aerocali S.A. | | Projects in airport infrastructure |
| 4 | Colombiana de Extrusión S.A. - Extrucol | | Networks and infrastructure |
| 5 | Concesionaria Tibitoc S.A. | | Infrastructure projects |
| 6 | Metrex S.A. | | Manufacture and commercialization of industrial equipment |
| 7 | C.I. Acepalma S.A. | | Oil palm farming and subproducts |
| 8 | Gases del Caribe S.A. E.S.P. | | Gas distribution |
| 9 | Calidda S.A. | | Gas distribution |
| 10 | Antillean Gas, Ltd. | | Regasification of natural gas |
| 11 | Complejo Energético del Este S.A. | | Gas distribution |
| 12 | Concentra Inteligencia en Energía S.A.S. | | Gas distribution |
| 13 | Energía Eficiente S.A. | | Gas distribution |
| 14 | Credibanco S.A. | | Payment processing |
Below is the detail of the corporate purpose of the material joint ventures in concession agreements:
| (1) | Different joint businesses executed by Grupo Aval’s subsidiaries with specific destinations wherein the joint business solely assumes responsibilities of means and not of results, not requiring significant equity resources from Grupo Aval. |
| (2) | Through Episol S.A.S., a 100% owned subsidiary of Corficolombiana, Grupo Aval owns a non-controlling 33% investment in Concesionaria Ruta del Sol. The controlling owner of Concesionaria Ruta del Sol S.A.S. is Odebrecht S.A. through two subsidiaries which are Norberto Odebrecht Construction Company S.A. and Odebrecht Latinvest S.A.S., a firm that is currently under investigation in multiple jurisdictions in connection with their public confession about the payment of bribes and other malpractices done in multiple countries, Colombia being one of them. After Colombian authorities (Fiscalía General de la Nación) confirmed that the confession was |
Grupo Aval Acciones y Valores S.A.
Notes to the Consolidated Financial Statement
As of December 31, 2016 and 2015 and for the years ended December 31, 2016, 2015 and 2014
(Figures expressed in millions of Colombian pesos)
true, and that approximately US$ 11 million in bribes were paid by Odebrecht S.A. between 2009 and 2014, the Government entered into an agreement with Concesionaria Ruta del Sol to early terminate the concession agreement (Contrato de Concesión 001 de 2010). This agreement was signed on February 22nd, 2017 and was further amended on March 27th, 2017. Under this agreement, both parties (the concessionaire in which Corficolombiana holds a minority interest, and the government) agreed to an early termination of the contract and to a liquidation formula and procedure. Based on the liquidation formula included in the agreement and the estimated value of the liquidation, the balance of loans that Concesionaria Ruta del Sol owes to the banks owned by Grupo Aval (Ps. 1.2 billion or US$ 400 million) is expected to be fully recovered between 2017 and 2021. On the other hand, the estimated value of the liquidation suggests that only a portion of the equity investment of Episol in Concesionaria Ruta del Sol will be recovered. As a consequence, 30% of the value of the investment was impaired in December, 2016, equivalent to Ps. 102,000 million. This figure affected Corficolombiana’s net income and impacted the attributable net income of Grupo Aval by Ps. 45,000 million.
| (3) | This joint venture agreement is in charge the construction and operation of Project Autopista Conexión Pacífico1 (Contrato VJ-VE-IP-LP-007-2013) between Bolombolo - Camilo C - Primavera - Ancón Sur, connecting Medellín with the Cauca River Valley in Colombia. This concession contract was signed on September 15, 2014 and have an estimated time of construction of 5 years. |
Currently the Project is under development of its pre-construction phase comprising the presentation of studies and designs for the future operational Start-up of the road construction.
| (4) | This joint agreement has the purpose of constructing a road project in Valle del Cauca, through a concession contract entered into by the joint venture between Episol S.A. and Iridium Colombia Concesiones Viarias S.A.S. and the Colombian Government in January 22, 2015 comprising a construction stage ending in 5 years. |
As of December 31, 2016 and 2015 Grupo Aval did not have any contingent assets for income receivable, deriving from a contractual difference with any concession different than a tariff acknowledgement. Neither did it have any contingent liabilities for sanctions or fines imposed by the Government during the performance of concession contracts due to potential contractual breaches.
The movement of investments in associates and joint ventures accounts is shown below for the years ended at December 31, 2016, 2015 and 2014:
Associates
| | | December 31,
2016 | | | December 31,
2015 | | | December 31,
2014 | |
| Balance at the beginning of the year | | Ps. | 645,377 | | | Ps. | 540,082 | | | Ps. | 437,127 | |
| Acquisitions | | | 16 | | | | - | | | | - | |
| Gain in non-monetary transactions (*) | | | 195,514 | | | | - | | | | - | |
| Participation in the profit or loss of the period | | | 147,867 | | | | 121,563 | | | | 72,555 | |
| Participation in Other Comprehensive Income | | | (17,949 | ) | | | 30,426 | | | | 54,301 | |
| Dividends received | | | (96,375 | ) | | | (39,188 | ) | | | (24,233 | ) |
| Capitalization reductions | | | (4,746 | ) | | | | | | | | |
| Allowance for Impairment | | | (4,027 | ) | | | - | | | | - | |
| Transfers / Reclassification | | | - | | | | (6,524 | ) | | | - | |
| Exchange difference | | | (267 | ) | | | (982 | ) | | | 332 | |
| Year-end balance | | Ps. | 865,410 | | | Ps. | 645,377 | | | Ps. | 540,082 | |
(*) Since November 30, 2016, Grupo Aval has significant influence on Credibanco. On August 26, 2016 Credibanco’s General Shareholders Meeting agreed to transform the society from a non-profit organization to a Limited Liability Company, which is now accounted for as an associate.
Grupo Aval Acciones y Valores S.A.
Notes to the Consolidated Financial Statement
As of December 31, 2016 and 2015 and for the years ended December 31, 2016, 2015 and 2014
(Figures expressed in millions of Colombian pesos)
Joint ventures
| | | December 31,
2016 | | | December 31,
2015 | | | December
31, 2014 | |
| Balance at the beginning of the year | | Ps. | 282,222 | | | Ps. | 177,103 | | | Ps. | 127,680 | |
| Participation in the period profit or loss | | | (7,102 | ) | | | 108,835 | | | | 49,170 | |
| Participation in Other Comprehensive Income | | | (2,112 | ) | | | 1,538 | | | | - | |
| Dividends received | | | - | | | | (6,460 | ) | | | - | |
| Capitalization | | | 17,282 | | | | - | | | | - | |
| Allowance for Impairment | | | (5,892 | ) | | | - | | | | - | |
| Transfers / Reclassification | | | (3,569 | ) | | | 1,206 | | | | 253 | |
| Exchange difference | | | 408 | | | | - | | | | - | |
| Year-end balance | | Ps. | 281,237 | | | Ps. | 282,222 | | | Ps. | 177,103 | |
The condensed financial information of the associates and joint ventures is as follows:
Associates
December 31, 2016
| | | Assets | | | Liabilities | | | Equity | | | Income | | | Expenses | | | Net
income | |
| A.C.H. Colombia S.A. | | Ps. | 48,243 | | | Ps. | 17,282 | | | Ps. | 30,961 | | | Ps. | 59,991 | | | Ps. | 47,275 | | | Ps. | 12,716 | |
| Redeban Multicolor S.A. | | | 161,093 | | | | 69,912 | | | | 91,181 | | | | 132,626 | | | | 127,020 | | | | 5,606 | |
| Credibanco S.A. | | | 365,559 | | | | 212,085 | | | | 153,474 | | | | 203,214 | | | | 184,342 | | | | 18,872 | |
| Aerocali S.A. | | | 146,783 | | | | 96,841 | | | | 49,942 | | | | 130,743 | | | | 104,850 | | | | 25,893 | |
| Colombiana de Extrusión S.A. Extrucol | | | 59,338 | | | | 20,148 | | | | 39,190 | | | | 79,876 | | | | 67,585 | | | | 4,560 | |
| Concesionaria Tibitoc S.A. | | | 88,521 | | | | 27,894 | | | | 60,627 | | | | 53,212 | | | | 37,063 | | | | 16,149 | |
| Metrex S.A. | | | 28,604 | | | | 16,162 | | | | 12,442 | | | | 43,997 | | | | 41,058 | | | | 2,939 | |
| C.I. Acepalma | | | 211,211 | | | | 172,455 | | | | 38,756 | | | | 652,528 | | | | 645,524 | | | | 7,004 | |
| Gases del Caribe S.A. | | | 2,197,142 | | | | 1,460,303 | | | | 736,838 | | | | 1,818,142 | | | | 1,627,786 | | | | 190,356 | |
| Cálidda S.A. | | | 2,230,186 | | | | 1,343,129 | | | | 887,057 | | | | 1,630,979 | | | | 1,462,514 | | | | 168,465 | |
| Concentra Inteligencia en energía S.A.S | | | 2,092 | | | | 165 | | | | 1,927 | | | | 1,670 | | | | 1,196 | | | | 474 | |
| Energía Eficiente S.A. | | | 41,643 | | | | 25,045 | | | | 16,598 | | | | 500,311 | | | | 491,584 | | | | 8,728 | |
| | | Ps. | 5,580,415 | | | Ps. | 3,461,421 | | | Ps. | 2,118,993 | | | Ps. | 5,307,289 | | | Ps. | 4,837,797 | | | Ps. | 461,762 | |
December 31, 2015
| | | Assets | | | Liabilities | | | Equity | | | Income | | | Expenses | | | Net
income | |
| A.C.H. Colombia S.A. | | Ps. | 40,143 | | | Ps. | 10,736 | | | Ps. | 29,407 | | | Ps. | 51,039 | | | Ps. | 37,099 | | | Ps. | 8,668 | |
| Redeban Multicolor S.A. | | | 137,129 | | | | 49,133 | | | | 87,996 | | | | 139,048 | | | | 123,182 | | | | 8,484 | |
| Aerocali S.A. | | | 103,382 | | | | 57,052 | | | | 46,330 | | | | 123,168 | | | | 101,986 | | | | 21,182 | |
| Colombiana de Extrusión S.A. Extrucol | | | 57,785 | | | | 18,920 | | | | 38,865 | | | | 83,543 | | | | 78,991 | | | | 4,552 | |
| Concesionaria Tibitoc S.A. | | | 89,676 | | | | 32,341 | | | | 57,336 | | | | 23,000 | | | | 17,046 | | | | 5,953 | |
| Metrex S.A. | | | 33,162 | | | | 20,249 | | | | 12,913 | | | | 49,554 | | | | 45,933 | | | | 3,621 | |
| C.I. Acepalma S.A. | | | 193,390 | | | | 150,747 | | | | 42,643 | | | | 583,989 | | | | 572,002 | | | | 11,987 | |
| Gases del Caribe S.A. | | | 2,030,925 | | | | 1,283,395 | | | | 747,529 | | | | 1,176,513 | | | | 1,003,084 | | | | 173,429 | |
| Cálidda S.A. | | | 2,314,330 | | | | 1,443,974 | | | | 870,356 | | | | 1,420,166 | | | | 1,331,308 | | | | 88,858 | |
| Concentra Inteligencia en Energía S.A.S. | | | 1,634 | | | | 155 | | | | 1,479 | | | | 1,581 | | | | 1,618 | | | | (36 | ) |
| Energía Eficiente S.A. | | | 53,406 | | | | 36,624 | | | | 16,782 | | | | 220,177 | | | | 212,617 | | | | 7,560 | |
| | | Ps. | 5,054,962 | | | Ps. | 3,103,326 | | | Ps. | 1,951,636 | | | Ps. | 3,871,778 | | | Ps. | 3,524,866 | | | Ps. | 334,258 | |
Grupo Aval Acciones y Valores S.A.
Notes to the Consolidated Financial Statement
As of December 31, 2016 and 2015 and for the years ended December 31, 2016, 2015 and 2014
(Figures expressed in millions of Colombian pesos)
Joint ventures
December 31, 2016
| | | Assets | | | Liabilities | | | Equity | | | Income | | | Expenses | | | Net
income | |
| CFC SK Eldorado Latam Advisory Company S.A.S | | | 1,015 | | | | 499 | | | | 516 | | | | 2,637 | | | | 2,265 | | | | 372 | |
| Cfc Sk Eldorado Latam Management Company Ltd. | | | 6,026 | | | | 39 | | | | 5,987 | | | | 3,003 | | | | 381 | | | | 2,622 | |
| Cfc Sk Eldorado Latam Capital Partners, Ltd. | | | 960 | | | | 15 | | | | 945 | | | | (20 | ) | | | 152 | | | | (172 | ) |
| Cfc Sk Eldorado Latam Fund L.P. | | | 37,545 | | | | 12,582 | | | | 24,963 | | | | 1,953 | | | | 9,655 | | | | (7,702 | ) |
| Concesionaria Ruta del Sol S.A. (*) | | | 3,653,227 | | | | 2,578,230 | | | | 1,074,997 | | | | 1,499,983 | | | | 1,207,910 | | | | 292,073 | |
| Concesionaria Vial del Pacífico S.A.S. | | | 246,184 | | | | 243,221 | | | | 2,963 | | | | 61,275 | | | | 61,506 | | | | (231 | ) |
| Concesionaria Nueva Vía al Mar S.A.S. | | | 122,884 | | | | 104,274 | | | | 18,610 | | | | 27,408 | | | | 24,337 | | | | 3,071 | |
| | | Ps. | 4,067,841 | | | Ps. | 2,938,860 | | | Ps. | 1,128,981 | | | Ps. | 1,596,239 | | | Ps. | 1,306,206 | | | Ps | 290,033 | |
December 31, 2015
| | | Assets | | | Liabilities | | | Equity | | | Income | | | Expenses | | | Net
income | |
| CFC SK Eldorado Latam Advisory Company S.A.S | | | 538 | | | | 339 | | | | 199 | | | | 1,330 | | | | 1,132 | | | | 197 | |
| Cfc Sk Eldorado Latam Management Company Ltd. | | | 3,488 | | | | 47 | | | | 3,441 | | | | 4,062 | | | | 202 | | | | 3,860 | |
| Cfc Sk Eldorado Latam Capital Partners, Ltd. | | | 116 | | | | 17 | | | | 100 | | | | (13 | ) | | | 120 | | | | (133 | ) |
| Cfc Sk Eldorado Latam Fund L.P. | | | 787 | | | | 166 | | | | 621 | | | | - | | | | 3,521 | | | | (3,521 | ) |
| Concesionaria Ruta del Sol S.A. | | | 3,113,070 | | | | 2,330,145 | | | | 782,925 | | | | 1,224,050 | | | | 933,261 | | | | 290,788 | |
| Concesionaria Vial del Pacífico | | | 109,626 | | | | 106,431 | | | | 3,195 | | | | 55,242 | | | | 54,095 | | | | 1,147 | |
| Concesionaria Nueva Vía al Mar | | | 61,734 | | | | 46,195 | | | | 15,539 | | | | 48,358 | | | | 46,819 | | | | 1,539 | |
| | | Ps. | 3,289,359 | | | Ps. | 2,483,340 | | | Ps. | 806,020 | | | Ps. | 1,333,029 | | | Ps. | 1,039,150 | | | Ps. | 293,877 | |
(*) See Note 14 (2).
Grupo Aval Acciones y Valores S.A.
Notes to the Consolidated Financial Statement
As of December 31, 2016 and 2015 and for the years ended December 31, 2016, 2015 and 2014
(Figures expressed in millions of Colombian pesos)
NOTE 15 – TANGIBLE ASSETS
The movement of carrying value amounts of tangible assets accounts during the periods ended on December 31, 2016, 2015 and 2014 is as follows:
| | | For own
use | | | Given in
operating
leases | | | Investment
properties | | | Biological
assets at fair
value | | | Total | |
| Cost | | | | | | | | | | | | | | | | | | | | |
| Balance as of January 1, 2014 | | Ps. | 6,088,077 | | | Ps. | 20,037 | | | Ps. | 319,744 | | | Ps. | 201,183 | | | Ps. | 6,629,041 | |
| Purchases or capitalized expenses | | | 756,355 | | | | 677 | | | | 88,665 | | | | 26,360 | | | | 872,057 | |
| Withdrawals / Sales | | | (337,632 | ) | | | (3,603 | ) | | | (15,485 | ) | | | (9,812 | ) | | | (366,532 | ) |
| Changes in fair value | | | - | | | | - | | | | 1,691 | | | | (15,332 | ) | | | (13,641 | ) |
| Transfers to non-current assets held for sale | | | (1,517 | ) | | | - | | | | (39,839 | ) | | | - | | | | (41,356 | ) |
| Adjustments for exchange differences | | | 253,457 | | | | - | | | | 11,966 | | | | - | | | | 265,423 | |
| Balance as of December 31, 2014 | | Ps. | 6,758,740 | | | Ps. | 17,111 | | | Ps. | 366,742 | | | Ps. | 202,399 | | | Ps. | 7,344,992 | |
| Purchases or capitalized expenses | | | 919,335 | | | | 1,119 | | | | 75,458 | | | | 35,265 | | | | 1,031,177 | |
| Withdrawals / Sales | | | (349,056 | ) | | | (7,739 | ) | | | (22,945 | ) | | | (20,374 | ) | | | (400,114 | ) |
| Changes in fair value | | | - | | | | - | | | | 104,769 | | | | 22,922 | | | | 127,691 | |
| Transfers to non-current assets held for sale | | | 15,498 | | | | - | | | | 14,222 | | | | - | | | | 29,720 | |
| Adjustments for exchange differences | | | 625,076 | | | | - | | | | - | | | | - | | | | 625,076 | |
| Balance as of December 31, 2015 | | | 7,969,593 | | | | 10,491 | | | | 538,246 | | | | 240,212 | | | | 8,758,542 | |
| Reclassification of bearer plants balance (*) | | | 188,177 | | | | - | | | | - | | | | (188,177 | ) | | | - | |
| Effects of amendments in accounting policies of bearer plants. | | | 29 | | | | - | | | | - | | | | (18,108 | ) | | | (18,079 | ) |
| Purchases or capitalized expenses | | | 814,194 | | | | 362 | (1) | | | 71,268 | | | | 21,432 | | | | 907,256 | |
| Withdrawals / Sales | | | (367,987 | ) | | | (3,806 | ) | | | (61,786 | ) | | | (20,670 | ) | | | (454,249 | ) |
| Changes in fair value | | | - | | | | - | | | | 53,680 | | | | 14,644 | | | | 68,324 | |
| Transfers to non-current assets held for sale | | | (18,704 | ) | | | - | | | | 11,319 | | | | - | | | | (7,385 | ) |
| Adjustments for exchange differences | | | (138,320 | ) | | | - | | | | - | | | | - | | | | (138,320 | ) |
| Reclassification | | | (58,046 | ) | | | - | | | | (2,539 | ) | | | (1,331 | ) | | | (61,916 | ) |
| Balance as of December 31, 2016 | | | 8,388,936 | | | | 7,047 | | | | 610,188 | | | | 48,002 | | | | 9,054,173 | |
| | | | | | | | | | | | | | | | | | | | | |
| Accumulated Depreciation: | | | | | | | | | | | | | | | | | | | | |
| | | | | | | | | | | | | | | | | | | | | |
| Balance January 1, 2014 | | | (1,157,527 | ) | | | (3,156 | ) | | | - | | | | - | | | | (1,160,683 | ) |
| Depreciation of the year charged against profit or loss | | | (332,770 | ) | | | (8,417 | ) | | | - | | | | - | | | | (341,187 | ) |
| Withdrawals / Sales | | | 82,774 | | | | 2,336 | | | | - | | | | - | | | | 85,110 | |
| Transfers to non-current assets held for sale | | | 27,181 | | | | - | | | | - | | | | - | | | | 27,181 | |
| Adjustments for exchange differences | | | (65,628 | ) | | | - | | | | - | | | | - | | | | (65,628 | ) |
| Balance December 31, 2014 | | | (1,445,970 | ) | | | (9,237 | ) | | | - | | | | - | | | | (1,455,207 | ) |
| Depreciation of the year charged against profit or loss | | | (388,271 | ) | | | (3,505 | ) | | | - | | | | - | | | | (391,776 | ) |
| Withdrawals / Sales | | | 156,830 | | | | 5,678 | | | | - | | | | - | | | | 162,508 | |
| Transfers to non-current assets held for sale | | | (364,282 | ) | | | - | | | | - | | | | - | | | | (364,282 | ) |
| Adjustments for exchange differences | | | (194,653 | ) | | | - | | | | - | | | | - | | | | (194,653 | ) |
| Balance December 31, 2015 | | | (2,236,346 | ) | | | (7,064 | ) | | | - | | | | - | | | | (2,243,410 | ) |
| IAS 41 Adoption Effect – agriculture | | | (29 | ) | | | | | | | | | | | | | | | (29 | ) |
| Depreciation of the year charged against profit or loss | | | (454,620 | ) | | | (1,232 | ) | | | - | | | | - | | | | (455,852 | ) |
| Withdrawals / Sales | | | 126,782 | | | | 3,413 | | | | - | | | | - | | | | 130,195 | |
Grupo Aval Acciones y Valores S.A.
Notes to the Consolidated Financial Statement
As of December 31, 2016 and 2015 and for the years ended December 31, 2016, 2015 and 2014
(Figures expressed in millions of Colombian pesos)
| | | For own
use | | | Given in
operating
leases | | | Investment
properties | | | Biological
assets at fair
value | | | Total | |
| Transfers to non-current assets held for sale | | | 10,781 | | | | - | | | | - | | | | - | | | | 10,781 | |
| Adjustments for exchange differences | | | 71,582 | | | | - | | | | - | | | | - | | | | 71,582 | |
| Reclassification | | | (5,338 | ) | | | - | | | | - | | | | - | | | | (5,338 | ) |
| Balance December 31, 2016 | | | (2,487,188 | ) | | | (4,883 | ) | | | - | | | | - | | | | (2,492,071 | ) |
| | | | | | | | | | | | | | | | | | | | |
| Impairment losses: | | | | | | | | | | | | | | | | | | | | |
| | | | | | | | | | | | | | | | | | | | | |
| Balance as of January 1, 2014 | | | - | | | | (686 | ) | | | - | | | | - | | | | (686 | ) |
| Year impairment charge | | | (2,726 | ) | | | 360 | | | | - | | | | - | | | | (2,366 | ) |
| Balance as of December 31, | | | (2,726 | ) | | | (326 | ) | | | - | | | | - | | | | (3,052 | ) |
| Year impairment charge | | | 1,709 | | | | 259 | | | | - | | | | - | | | | 1,968 | |
| Balance as of December 31, 2015 | | | (1,017 | ) | | | (67 | ) | | | - | | | | - | | | | (1,084 | ) |
| Year impairment charge | | | (1,482 | ) | | | (21 | ) | | | - | | | | - | | | | (1,503 | ) |
| Balance as of December 31, 2016 | | | (2,499 | ) | | | (88 | ) | | | - | | | | - | | | | (2,587 | ) |
| | | | | | | | | | | | | | | | | | | | | |
| Tangible Assets, net: | | | | | | | | | | | | | | | | | | | | |
| | | | | | | | | | | | | | | | | | | | | |
| Balance as of December 31, 2014 | | Ps. | 5,310,044 | | | Ps. | 7,548 | | | Ps. | 366,742 | | | Ps. | 202,399 | | | Ps. | 5,886,733 | |
| Balance as of December 31, 2015 | | Ps. | 5,732,230 | | | Ps. | 3,360 | | | Ps. | 538,246 | | | Ps. | 240,212 | | | Ps. | 6,514,048 | |
| Balance as of December 31, 2016 | | Ps. | 5,899,249 | | | Ps. | 2,076 | | | Ps. | 610,188 | | | Ps. | 48,002 | | | Ps. | 6,559,515 | |
| | | | | | | | | | | | | | | | | | | | | |
| (*) See note 2.15 | | | | | | | | | | | | | | | | | | | | |
(1) The total of purchases of investment properties, includes Ps. 14,658 of assets received in total or partial settlement of the payment obligations of debtors.
| 15.1. | Properties, plant and equipment for own use |
Following is the detail of the balance as of December 31, 2016 and 2015, by type of property, plant and equipment for own use:
| | | Cost | | | Accumulated
depreciation | | | Impairment
loss | | | Carrying
amount | |
| December 31, 2016 | | | | | | | | | | | | | | | | |
| Land | | Ps. | 1,010,753 | | | Ps. | - | | | Ps. | (1,452 | ) | | Ps. | 1,009,301 | |
| Buildings | | | 2,598,571 | | | | (396,015 | ) | | | (213 | ) | | | 2,202,343 | |
| Office equipment and accessories | | | 939,344 | | | | (600,743 | ) | | | (72 | ) | | | 338,529 | |
| Information technology equipment | | | 1,555,655 | | | | (1,086,475 | ) | | | - | | | | 469,180 | |
| Vehicles | | | 130,493 | | | | (69,282 | ) | | | - | | | | 61,211 | |
| Equipment and machinery | | | 1,352,413 | | | | (150,677 | ) | | | (762 | ) | | | 1,200,974 | |
| Silos | | | 8,613 | | | | (4,445 | ) | | | - | | | | 4,168 | |
| Warehouses | | | 43,457 | | | | (24,819 | ) | | | - | | | | 18,638 | |
| Advanced payments for the acquisition of plant property and equipment | | | 17,455 | | | | - | | | | - | | | | 17,455 | |
| Improvements in leaseholds properties | | | 307,289 | | | | (152,067 | ) | | | - | | | | 155,222 | |
| Construction in progress | | | 225,803 | | | | - | | | | - | | | | 225,803 | |
| Bearer plants | | | 199,090 | | | | (2,665 | ) | | | - | | | | 196,425 | |
| Balance as of December 31, 2016 | | Ps. | 8,388,936 | | | Ps. | (2,487,188 | ) | | Ps. | (2,499 | ) | | Ps. | 5,899,249 | |
Grupo Aval Acciones y Valores S.A.
Notes to the Consolidated Financial Statement
As of December 31, 2016 and 2015 and for the years ended December 31, 2016, 2015 and 2014
(Figures expressed in millions of Colombian pesos)
| | | Cost | | | Accumulated
depreciation | | | Impairment
loss | | | Carrying
amount | |
| December 31, 2015 | | | | | | | | | | | | | | | | |
| Land | | Ps. | 968,408 | | | Ps. | - | | | Ps. | (52 | ) | | Ps. | 968,356 | |
| Buildings | | | 2,544,274 | | | | (294,208 | ) | | | (213 | ) | | | 2,249,853 | |
| Office equipment and accessories | | | 916,756 | | | | (564,718 | ) | | | - | | | | 352,038 | |
| Information technology equipment | | | 1,461,335 | | | | (1,013,594 | ) | | | - | | | | 447,741 | |
| Vehicles | | | 83,577 | | | | (36,849 | ) | | | - | | | | 46,728 | |
| Equipment and machinery | | | 1,271,277 | | | | (163,819 | ) | | | (694 | ) | | | 1,106,764 | |
| Silos | | | 8,613 | | | | (4,359 | ) | | | (58 | ) | | | 4,196 | |
| Warehouses | | | 43,435 | | | | (23,905 | ) | | | - | | | | 19,530 | |
| Advanced payments for the acquisition of plant property and equipment | | | 24,044 | | | | - | | | | - | | | | 24,044 | |
| Improvements in leaseholds properties | | | 284,081 | | | | (134,891 | ) | | | - | | | | 149,190 | |
| Construction in progress | | | 363,790 | | | | - | | | | - | | | | 363,790 | |
| Balance as of December 31, 2015 | | Ps. | 7,969,590 | | | Ps. | (2,236,343 | ) | | Ps. | (1,017 | ) | | Ps. | 5,732,230 | |
| 15.2 | Properties, plant and equipment given in operating lease: |
Following is the detail of the balance as of December 31, 2016 and 2015, by type of property, plant and equipment given in operating lease:
| | | Cost | | | Accumulated
impairment | | | Impairment
loss | | | Carrying
amount | |
| December 31, 2016 | | | | | | | | | | | | | | | | |
| Equipment, furniture and office equipment | | Ps. | 264 | | | Ps. | (264 | ) | | Ps. | - | | | Ps. | - | |
| Computing equipment | | | 1,838 | | | | (1,799 | ) | | | (1 | ) | | | 38 | |
| Vehicles | | | 3,876 | | | | (1,968 | ) | | | - | | | | 1,908 | |
| Mobilization equipment and machinery | | | 1,069 | | | | (939 | ) | | | - | | | | 130 | |
| Balance as of December 31, 2016 | | Ps. | 7,047 | | | Ps. | (4,970 | ) | | Ps. | (1 | ) | | Ps. | 2,076 | |
| | | | | | | | | | | | | |
| December 31, 2015 | | | | | | | | | | | | | | | | |
| Equipment, furniture and office equipment | | Ps. | 302 | | | Ps. | (280 | ) | | Ps. | (8 | ) | | Ps. | 14 | |
| Computing equipment | | | 4,686 | | | | (3,975 | ) | | | (59 | ) | | | 652 | |
| Vehicles | | | 4,284 | | | | (1,880 | ) | | | - | | | | 2,404 | |
| Mobilization equipment and machinery | | | 1,219 | | | | (929 | ) | | | - | | | | 290 | |
| Balance as of December 31, 2015 | | Ps. | 10,491 | | | Ps. | (7,064 | ) | | Ps. | (67 | ) | | Ps. | 3,360 | |
Below is a summary of the minimum lease payments to be received in the next years based on assets given in operating lease to December 31, 2016 and 2015:
| | | December 31,
2016 | | | December 31,
2015 | |
| Less than a year | | Ps. | 1,937 | | | Ps. | 2,344 | |
| More than a year, less than 5 | | | 1,170 | | | | 1,491 | |
| Total | | Ps. | 3,107 | | | Ps. | 3,835 | |
Grupo Aval Acciones y Valores S.A.
Notes to the Consolidated Financial Statement
As of December 31, 2016 and 2015 and for the years ended December 31, 2016, 2015 and 2014
(Figures expressed in millions of Colombian pesos)
Below is the detail of the movement in fair value of biological assets as of December 31, 2016, 2015 and 2014:
| | | December 31,
2016 | | | December 31,
2015 | | | December 31,
2014 | |
| | | | | | | | | | |
| Balance at the beginning of the year | | Ps. | 240,212 | | | Ps. | 202,399 | | | Ps. | 201,183 | |
| Reclassification of balance from bearer plants (*) | | | (188,177 | ) | | | - | | | | - | |
| NIC 41 Adoption– agriculture (*) | | | (18,108 | ) | | | - | | | | - | |
| Purchases or capitalized expenses (net) | | | 21,432 | | | | 35,265 | | | | 26,360 | |
| Withdrawals / Sales (net) | | | (20,670 | ) | | | (20,374 | ) | | | (9,812 | ) |
| Reclassification inventories | | | (1,331 | ) | | | - | | | | - | |
| Changes in fair value | | | 14,644 | | | | 22,922 | | | | (15,332 | ) |
| Year end balance | | Ps. | 48,002 | | | Ps. | 240,212 | | | Ps. | 202,399 | |
| | | | | | | | | | | | | |
| (*) See note 2.15 | | | | | | | | | | | | |
Following is the detail of the biological assets by type of asset:
| | | December 31,
2016 | | | December 31,
2015 | |
| African palm | | | | | | | | |
| In production (at fair value) | | Ps. | - | | | Ps. | 81,916 | |
| In growth (cost) | | | 22,814 | | | | 2,775 | |
| Rubber plantations | | | | | | | | |
| In production (at fair value) | | | - | | | | 118,169 | |
| In growth (cost) | | | 14,605 | | | | 27,561 | |
| Other at fair value(*) | | | 10,583 | | | | 9,791 | |
| Total | | Ps. | 48,002 | | | Ps. | 240,212 | |
| | | | | | | | | |
| (*)Includes short-term crops, livestock and fish farming. | | | | | | | | |
The aforementioned amounts are not subject to any limitations or restrictions.
During the years ended on December 31, 2016, 2015 and 2014, Grupo Aval recorded in its statement of income and cost and expenses as follows:
| | | December 31,
2016 | | | December 31,
2015 | | | December 31,
2014 | |
| Sales of biological goods | | Ps. | 39,032 | | | Ps. | 46,458 | | | Ps. | 35,511 | |
| Changes in fair value of biological assets | | | 14,644 | | | | 22,922 | | | | (15,332 | ) |
| Subtotal | | | 53,676 | | | | 69,380 | | | | 20,179 | |
| Costs and expenses | | | (27,067 | ) | | | (37,045 | ) | | | (28,247 | ) |
| Depreciation of bearer plants | | | (2,665 | ) | | | - | | | | - | |
| General administration costs and sales | | | (4,379 | ) | | | (2,866 | ) | | | (5,760 | ) |
| Financial costs | | | (2,285 | ) | | | (278 | ) | | | (3,372 | ) |
| Subtotal | | | (36,396 | ) | | | (40,189 | ) | | | (37,379 | ) |
| Total net income | | Ps. | 17,280 | | | Ps. | 29,191 | | | Ps. | (17,200 | ) |
Grupo Aval Acciones y Valores S.A.
Notes to the Consolidated Financial Statement
As of December 31, 2016 and 2015 and for the years ended December 31, 2016, 2015 and 2014
(Figures expressed in millions of Colombian pesos)
| 15.4 | Investment properties |
The following table summarize investment properties as of December 31, 2016 and 2015:
| December 31, 2016 | | Cost | | | Accumulated adjustments
to fair value | | | Carrying amount | |
| Land | | Ps. | 328,785 | | | Ps. | 66,592 | | | Ps. | 395,377 | |
| Buildings | | | 186,720 | | | | 28,091 | | | | 214,811 | |
| Balance as of December 31, 2016 | | Ps. | 515,505 | | | Ps. | 94,683 | | | Ps. | 610,188 | |
| December 31, 2015 | | Cost | | | Accumulated
adjustments to fair value | | | Carrying amount | |
| Land | | Ps. | 344,313 | | | Ps. | 30,041 | | | Ps. | 374,354 | |
| Buildings | | | 140,165 | | | | 23,727 | | | | 163,892 | |
| Balance as of December 31, 2015 | | Ps. | 484,478 | | | Ps. | 53,768 | | | Ps. | 538,246 | |
The following table reflects the net rents derived from investments properties recognized in the consolidated statement of income during the years ended on December 31, 2016, 2015 and 2014:
| | | December 31,
2016 | | | December 31,
2015 | | | December 31,
2014 | |
| Income from rents | | Ps. | 5,183 | | | Ps. | 6,986 | | | Ps. | 4,751 | |
| Direct operating expenses deriving from property investments which create income from rent | | | (321 | ) | | | (1,798 | ) | | | (112 | ) |
| Direct operating expenses deriving from property investments which do not create income from rent | | | (1,328 | ) | | | (762 | ) | | | (1,013 | ) |
| Net rents from investment properties | | Ps. | 3,534 | | | Ps. | 4,426 | | | Ps. | 3,626 | |
Grupo Aval Acciones y Valores S.A.
Notes to the Consolidated Financial Statement
As of December 31, 2016 and 2015 and for the years ended December 31, 2016, 2015 and 2014
(Figures expressed in millions of Colombian pesos)
NOTE 16 – CONCESSION ARRANGEMENTS RIGHTS
Under IFRIC 12, the concession arrangements between several of Grupo Aval’s subsidiaries and the Colombian Government for a number of infrastructure projects are classified as financial and intangible assets.
| 16.1. | Financial assets in concession arrangements |
The following table shows the changes in the financial assets in concession arrangements registered for Grupo Aval’s subsidiaries in the years ended at December 31, 2016, 2015 and 2014:
| | | At fair value | | | At amortized cost | | | Total | |
| Balance at January 1, 2014 | | Ps. | 1,565,709 | | | Ps. | 184,227 | | | Ps. | 1,749,936 | |
| Additions or new concession arrangements | | | - | | | | 322,386 | | | | 322,386 | |
| Collections during the year | | | - | | | | (422,960 | ) | | | (422,960 | ) |
| Adjustment to fair value credited to income | | | 172,889 | | | | - | | | | 172,889 | |
| Accrued interest | | | - | | | | 35,684 | | | | 35,684 | |
| Balance at December 31, 2014 | | Ps. | 1,738,598 | | | Ps. | 119,337 | | | Ps. | 1,857,935 | |
| Additions or new concession arrangements | | | - | | | | 369,983 | | | | 369,983 | |
| Collections during the year | | | - | | | | (400,703 | ) | | | (400,703 | ) |
| Adjustment to fair value credited to income | | | 153,094 | | | | - | | | | 153,094 | |
| Changes in accounting estimates (1) | | | - | | | | (111,432 | ) | | | (111,432 | ) |
| Accrued interest | | | - | | | | 65,679 | | | | 65,679 | |
| Balance at December 31, 2015 | | Ps. | 1,891,692 | | | Ps. | 42,864 | | | Ps. | 1,934,556 | |
| Additions or new concession arrangements | | | - | | | | 408,040 | | | | 408,040 | |
| Collections during the year | | | - | | | | (327,607 | ) | | | (327,607 | ) |
| Adjustment to fair value credited to income | | | 180,982 | | | | - | | | | 180,982 | |
| Accrued interest | | | - | | | | 79,944 | | | | 79,944 | |
| Balance at December 31, 2016 | | Ps. | 2,072,674 | | | Ps. | 203,241 | | | Ps. | 2,275,915 | |
| (1) | During 2015, the subsidiaries Estudios, Proyectos e Inversiones de los Andes S.A. and Proyectos de Infraestructura S.A. reassessed the allocation of the fair value of two mixed concession contracts, between the financial asset and the intangible asset that arise from the contract, as a result of clarifications made to the contracts due to requirements for additional work. As a result, it was determined to perform an adjustment to their carrying amount by a reclassification of the amount of Ps. 111,432 from the financial assets at amortized cost included in other accounts receivable, to intangible assets. |
| 16.2. | Intangible assets in concession arrangements |
The following table shows the movement in the main concession agreements recognized for Grupo Aval’s subsidiaries under intangible assets during the years ended at December 31, 2016, 2015 and 2014:
| | | Promigas
S.A. | | | Concesionaria Vial
de los Andes S.A. | | | Proyectos de
infraestructura
S.A. – PISA | | | Estudios y
proyectos del
sol S.A.S –
EPISOL | | | Total | |
| Cost | | | | | | | | | | | | | | | | | | | | |
| | | | | | | | | | | | | | | | | | | | | |
| Balance as of December 31, 2014 | | Ps. | 1,389,660 | | | Ps. | 278,295 | | | Ps. | 259,382 | | | Ps. | 72,391 | | | Ps. | 1,999,728 | |
| Additions | | | 494,815 | | | | 147,689 | | | | 16,902 | | | | - | | | | 659,406 | |
Grupo Aval Acciones y Valores S.A.
Notes to the Consolidated Financial Statement
As of December 31, 2016 and 2015 and for the years ended December 31, 2016, 2015 and 2014
(Figures expressed in millions of Colombian pesos)
| | | Promigas
S.A. | | | Concesionaria Vial
de los Andes S.A. | | | Proyectos de
infraestructura
S.A. – PISA | | | Estudios y
proyectos del
sol S.A.S –
EPISOL | | | Total | |
| Reclassification - Change in estimate | | | - | | | | 128,053 | | | | (13,878 | ) | | | - | | | | 114,175 | |
| Balance as of December 31, 2015 | | Ps. | 1,884,475 | | | Ps. | 554,037 | | | Ps. | 262,406 | | | Ps. | 72,391 | | | Ps. | 2,773,309 | |
| Additions | | | 423,553 | | | | 96,604 | | | | 11,152 | | | | 83,205 | | | | 614,514 | |
| Reclassification - Change in estimate | | | 61,902 | | | | - | | | | 2 | | | | 1 | | | | 61,905 | |
| Balance as of December 31, 2016 | | Ps. | 2,369,930 | | | Ps. | 650,641 | | | Ps. | 273,560 | | | Ps. | 155,597 | | | Ps. | 3,449,728 | |
| | | | | | | | | | | | | | | | | | | | | |
| Accumulated Amortization | | | | | | | | | | | | | | | | | | | | |
| | | | | | | | | | | | | | | | | | | | | |
| Balance as of December 31, 2014 | | Ps. | (52,735 | ) | | Ps. | (93,643 | ) | | Ps. | (9,057 | ) | | Ps. | (1,556 | ) | | Ps. | (156,991 | ) |
| Amortization of the year | | | (97,008 | ) | | | (117,014 | ) | | | (9,914 | ) | | | (1,681 | ) | | | (225,617 | ) |
| Balance as of December 31, 2015 | | Ps. | (149,743 | ) | | Ps. | (210,657 | ) | | Ps. | (18,971 | ) | | Ps. | (3,237 | ) | | Ps. | (382,608 | ) |
| Amortization of the year | | | (101,986 | ) | | | (148,749 | ) | | | (9,487 | ) | | | (1,584 | ) | | | (261,806 | ) |
| Balance as of December 31, 2016 | | Ps. | (251,729 | ) | | Ps. | (359,406 | ) | | Ps. | (28,458 | ) | | Ps. | (4,821 | ) | | Ps. | (644,414 | ) |
| | | | | | | | | | | | | | | | | | | | | |
| Net balance | | | | | | | | | | | | | | | | | | | | |
| | | | | | | | | | | | | | | | | | | | | |
| Balance as of December 31, 2014 | | Ps. | 1,336,925 | | | Ps. | 184,652 | | | Ps. | 250,325 | | | Ps. | 70,835 | | | Ps. | 1,842,737 | |
| Cost | | | 1,884,475 | | | | 554,037 | | | | 262,406 | | | | 72,391 | | | | 2,773,309 | |
| Accumulated amortization | | | (149,743 | ) | | | (210,657 | ) | | | (18,971 | ) | | | (3,237 | ) | | | (382,608 | ) |
| Balance as of December 31, 2015 | | Ps. | 1,734,732 | | | Ps. | 343,380 | | | Ps. | 243,435 | | | Ps. | 69,154 | | | Ps. | 2,390,701 | |
| Cost | | | 2,369,930 | | | | 650,641 | | | | 273,560 | | | | 155,597 | | | | 3,449,728 | |
| Accumulated amortization | | | (251,729 | ) | | | (359,406 | ) | | | (28,458 | ) | | | (4,821 | ) | | | (644,414 | ) |
| Balance as of December 31, 2016 | | Ps. | 2,118,201 | | | Ps. | 291,235 | | | Ps. | 245,102 | | | Ps. | 150,776 | | | Ps. | 2,805,314 | |
Grupo Aval Acciones y Valores S.A.
Notes to the Consolidated Financial Statement
As of December 31, 2016 and 2015 and for the years ended December 31, 2016, 2015 and 2014
(Figures expressed in millions of Colombian pesos)
The following is the activity of income and costs incurred in the construction stage on concession arrangements:
| | | Promigas S.A.
and
subsidiaries | | | Concesionaria
Vial de los
Andes S.A. | | | Proyectos de
Infraestructura
S.A. | | | Estudios y
proyectos del
sol S.A.S.
Episol | | | Total | |
| Accumulated income capitalized as intangible or financial assets, recorded in the income statement | | | | | | | | | | | | | | | | | | | | |
| Balance at January 1, 2014 | | Ps. | - | | | Ps. | - | | | Ps. | - | | | Ps. | - | | | Ps. | - | |
| Construction income during the year | | | 91,809 | | | | 394,153 | | | | - | | | | 10,385 | | | | 496,347 | |
| Accumulated financial income during the year | | | - | | | | 34,011 | | | | - | | | | 1,674 | | | | 35,685 | |
| Balance at December 31, 2014 | | Ps. | 91,809 | | | Ps. | 428,164 | | | Ps. | - | | | Ps. | 12,059 | | | Ps. | 532,032 | |
| Construction income during the year | | | 39,259 | | | | 480,901 | | | | 13,874 | | | | 52,797 | | | | 586,831 | |
| Accumulated financial income during the year | | | 35,863 | | | | 63,562 | | | | - | | | | 1,222 | | | | 100,647 | |
| Balance at December 31, 2015 | | Ps. | 75,122 | | | Ps. | 544,463 | | | Ps. | 13,874 | | | Ps. | 54,019 | | | Ps. | 687,478 | |
| Construction income during the year | | | 583,018 | | | | 334,761 | | | | 77,466 | | | | 209,625 | | | | 1,204,870 | |
| Accumulated financial income during the year | | | 180,983 | | | | 68,237 | | | | - | | | | 11,708 | | | | 260,894 | |
| Balance at December 31, 2016 | | Ps. | 763,971 | | | Ps. | 402,998 | | | Ps. | 77,466 | | | Ps. | 221,333 | | | Ps. | 1,465,768 | |
| | | | | | | | | | | | | | | | | | | | | |
| Accumulated costs incurred in the concession, recorded in the Income statement | | | | | | | | | | | | | | | | | | | | |
| Balance at January 1, 2014 | | Ps. | - | | | Ps. | - | | | Ps. | - | | | Ps. | - | | | Ps. | - | |
| Construction costs incurred during the year | | | 91,809 | | | | 394,153 | | | | - | | | | 10,676 | | | | 496,638 | |
| Financial costs incurred during the year | | | - | | | | - | | | | - | | | | 8,061 | | | | 8,061 | |
| Balance at December 31, 2014 | | Ps. | 91,809 | | | Ps. | 394,153 | | | Ps. | - | | | Ps. | 18,737 | | | Ps. | 504,699 | |
| Construction costs incurred during the year | | | 39,259 | | | | 480,901 | | | | 13,874 | | | | 45,112 | | | | 579,146 | |
| Financial costs incurred during the year | | | 35,863 | | | | 18,814 | | | | - | | | | 7,676 | | | | 62,353 | |
| Balance at December 31, 2015 | | Ps. | 75,122 | | | Ps. | 499,715 | | | Ps. | 13,874 | | | Ps. | 52,788 | | | Ps. | 641,499 | |
| Construction costs incurred during the year | | | 583,018 | | | | 334,761 | | | | 77,466 | | | | 155,409 | | | | 1,150,654 | |
| Financial costs incurred during the year | | | 2,398 | | | | 37,794 | | | | - | | | | 14,490 | | | | 54,682 | |
| Balance at December 31, 2016 | | Ps. | 585,416 | | | Ps. | 372,555 | | | Ps. | 77,466 | | | Ps. | 169,899 | | | Ps. | 1,205,336 | |
PROMIGAS S.A. and Subsidiaries
Promigas and its subsidiaries have executed several concession agreements with entities of the Colombian Government for the construction, operation and maintenance of gas pipelines in Colombia, entered into during the years 1996 to 2010, which are currently in operational stage. For the construction service, Promigas and its subsidiaries receive rates fixed by the Colombian government for gas transportation in periods between 30 and 50 years and whose contracts comprise the unconditional transfer of the concession gas, at the end of the contract, to Colombian Government entities for their fair value, or otherwise, obtaining successive extensions for 20 additional years, but in any case, always at the end of the each extension period the gas pipelines subject matter of the concession are transferred to the Colombian Government at their fair value.
Due to the foregoing, for purposes of IFRS Interpretations Committee (IFRIC) 12, the aforementioned contracts have been classified as mixed contracts: as intangible assets in the part corresponding to the remuneration for the gas transportation rates and as a financial asset in the part corresponding to the unconditional right at the end of the contract to transfer the assets subject matter of the concession to the Colombian Government, at their fair value.
In addition to the foregoing, Promigas and its subsidiaries have executed other concession contracts entered into with the Colombian Government for the construction, operation and maintenance of gas pipelines in terms of duration of between 30 and 50 years during which, as remuneration for the construction of such gas pipelines, receiving the rates regulated by the Colombian Government, but at the end of the contract the assets subject matter of the concession are transferred to the Colombian Government entities, without any consideration; due to the aforementioned, such contracts have been classified under IFRIC 12 as intangible assets.
Grupo Aval Acciones y Valores S.A.
Notes to the Consolidated Financial Statement
As of December 31, 2016 and 2015 and for the years ended December 31, 2016, 2015 and 2014
(Figures expressed in millions of Colombian pesos)
Concesionaria Vial de los Andes S.A. (“Coviandes”)
Coviandes has a concession contract with the Colombian Government to carry on the studies, final designs, rehabilitation and construction works, operation and maintenance of the road denominated Sector Bogotá -Puente Real and maintenance and operation of Sector Puente Real to Villavicencio in Colombia. Coviandes began the concession contract No. 444 on August 2, 1994 with the National Road Institute (INVIAS, for its Spanish acronym Instituto Nacional de Vías), which has been modified by acts signed by the participants and the addition No. 1 dated January 22, 2010. On December 29, 2003, INVIAS ceded the forementioned contract to the National Infraestructure Agency (ANI, for its Spanish acronym Agencia Nacional de Infraestructura) through the other No. 43 and the addition No. 1 to said contract. The term for the execution of the missing designs and the works object of addition No. 1 is eight years counted from the act of initiation of the construction stage and complying whit the schedule defined in addition No. 1 and are expected to culminate in 2017. For purposes of IFRIC 12 the concession contract has been deemed as a mixed contract including a financial asset for minimum payments guaranteed by the Colombian Government recognized at amortized cost and an intangible asset for the amount collected through tolls.
As of December 31, 2016 the subsidiary has satisfactorily complied with the terms of the agreement. It is expected that the amount registered in books as intangible assets will be totally recoverable with future revenues.
Proyecto de Infraestructura S.A. (“PISA”)
Pisa has a concession agreement entered into with the Valle del Cauca department, Colombia, executed on December 30, 1993 during a term of fifteen (15) years and subsequently extended for 20 years in 1996, for the construction and maintenance of a new road, improvement and maintenance of the existing lane of the road Buga - Tulua - La Paila in Colombia. For purposes of IFRIC 12 the concession contract has been deemed as an intangible asset. As of December 31, 2016 the subsidiary has satisfactorily complied with the terms of the agreement. It is expected that the amount registered in books will be totally recoverable with the revenues of future tolls.
Concesiones CCFC S.A. is a subsidiary of PISA, which is executing a concession contract entered into with the National Road Institute (INVIAS, for its Spanish acronym Instituto Nacional de Vías) on June 30, 1995, whose purpose is to develop, under the concession system, the studies and final designs, rehabilitation and construction works, operation and maintenance of the road Bogotá (Fontibon) – Facatativa – Los Alpes, in the Department of Cundinamarca, Colombia, expiring on march 2024. For purposes of IFRIC 12 the concession contract has been deemed as an intangible asset. As of December 31, 2016 the subsidiaries have satisfactorily complied with the terms of the agreement and based on impairment assessments carried out, it is expected that the amount registered in books will be totally recoverable with the revenues from future tolls.
Estudios y proyectos del sol S.A.S. Episol
Concesionaria Panamericana S.A.S., in the normal course of the business the company has executed a concession contract with the Department of Cundinamarca, Colombia on December 16, 1997, where in the Concessionaire binds itself to perform under the Concession system, the studies, final designs, rehabilitation and construction works, operation and maintenance of the project Road Corridor of Central West Cundinamarca (“Corredor Vial del Centro Occidente de Cundinamarca”) in Colombia.
For purposes of IFRIC 12 the concession contract has been classified as an intangible asset. As of December 31, 2016 the subsidiary has satisfactorily complied with the terms of the agreement and based on impairment assessments carried out, it is expected that the amount registered in books will be totally recoverable with future revenues.
Grupo Aval Acciones y Valores S.A.
Notes to the Consolidated Financial Statement
As of December 31, 2016 and 2015 and for the years ended December 31, 2016, 2015 and 2014
(Figures expressed in millions of Colombian pesos)
Concesionaria Vial Andina S.A.S. COVIANDINA S.A.S., in development of its object has a concession contract No 005 of June 9, 2015 under the scheme of private partnership of the private initiative in the terminals of law 1508 of 2012, has the purpose of granting a concession. In accordance with the provisions of this contract, the Concessionaire, at its own risk, carries out studies and designs, financing, construction, operation, maintenance, social, property and environmental management of a new road between Chirajara and Intersection Founders, maintenance and operation of the entire Bogota - Villavicencio corridor.
NOTE 17 – GOODWILL
Following is the movement of goodwill account during the years ended December 31, 2016 and 2015:
| | | December 31,
2016 | | | December 31,
2015 | |
| | | | | | | |
| Balance at the beginning of the year | | Ps. | 7,055,975 | | | Ps. | 5,867,232 | |
| Additions / Purchases (*) | | | 2,805 | | | | - | |
| Foreign exchange adjustment | | | (233,845 | ) | | | 1,188,743 | |
| Balance at the end of the year | | Ps. | 6,824,935 | | | Ps. | 7,055,975 | |
(*) Credomatic International Corporation a subsidiary of Leasing Bogotá Panamá acquired 100% of the outstanding shares issued by COINCA Corporation Inc (COINCA) and Medios de Pago MP S.A. located in Costa Rica. The business acquisition generated Goodwill of Ps. 2,805 which was recorded by Grupo Aval in the first quarter of 2016.
The following is the detail of goodwill assigned by cash generating units (CGU) representing the lowest identifiable level within Grupo Aval and monitored by management, in addition those are not greater than the identified business’ segments:
| December 31, 2016 |
| CGU | | Goodwill
carrying
amount | | | CGU Book
Value | | | CGU
Recoverable
amount | | | Excess | |
| Leasing Bogotá Panamá | | Ps. | 4,714,617 | | | Ps. | 10,428,240 | | | Ps. | 14,362,910 | | | Ps. | 3,934,670 | |
| Inside Banco de Bogotá S.A. (Megabanco) | | | 465,905 | | | | 5,579,593 | | | | 9,976,659 | | | | 4,397,066 | |
| Promigas S.A. and Subsidiaries | | | 169,687 | | | | 2,785,270 | | | | 7,089,387 | | | | 4,304,117 | |
| Concesionaria Panamericana S.A.S. | | | 119,916 | | | | 35,585 | | | | 370,248 | | | | 334,663 | |
| Hoteles Estelar S.A. | | | 6,661 | | | | 90,794 | | | | 97,956 | | | | 7,162 | |
| Inside Banco de Occidente S.A. (Banco Unión y Aliadas) | | | 22,724 | | | | 41,935 | | | | 454,906 | | | | 412,971 | |
| Banco Popular S.A. | | | 358,401 | | | | 2,624,196 | | | | 3,541,307 | | | | 917,111 | |
| Banco de Bogotá S.A. | | | 301,222 | | | | 10,331,548 | | | | 13,708,171 | | | | 3,376,623 | |
| Banco de Occidente S.A. | | | 127,571 | | | | 3,089,717 | | | | 4,168,844 | | | | 1,079,127 | |
| Pensiones y Cesantías Porvenir S.A. | | | 538,231 | | | | 2,433,816 | | | | 9,187,043 | | | | 6,753,227 | |
| | | | 6,824,935 | | | | | | | | | | | | | |
Grupo Aval Acciones y Valores S.A.
Notes to the Consolidated Financial Statement
As of December 31, 2016 and 2015 and for the years ended December 31, 2016, 2015 and 2014
(Figures expressed in millions of Colombian pesos)
| December 31, 2015 |
| CGU | | Goodwill
carrying
amount | | | CGU Book
Value | | | CGU
Recoverable
amount | | | Excess | |
| Leasing Bogotá Panamá | | Ps. | 4,945,657 | | | Ps. | 10,035,197 | | | Ps. | 15,190,545 | | | Ps. | 5,155,348 | |
| Inside Banco de Bogotá S.A. (Megabanco) | | | 465,905 | | | | 5,502,572 | | | | 9,479,653 | | | | 3,977,081 | |
| Promigas S.A. and Subsidiaries | | | 169,687 | | | | 2,850,171 | | | | 6,596,642 | | | | 3,746,471 | |
| Consecionaria Panamericana S.A.S. | | | 119,916 | | | | 33,785 | | | | 191,645 | | | | 157,860 | |
| Hoteles Estelar S.A. | | | 6,661 | | | | 47,747 | | | | 56,342 | | | | 8,595 | |
| Inside Banco de Occidente S.A. (Banco Union y Aliadas) | | | 22,724 | | | | 41,935 | | | | 457,455 | | | | 415,520 | |
| Banco Popular S.A. | | | 358,401 | | | | 2,288,327 | | | | 3,577,290 | | | | 1,288,963 | |
| Banco de Bogotá S.A. | | | 301,222 | | | | 10,837,872 | | | | 13,548,774 | | | | 2,710,902 | |
| Banco de Occidente S.A. | | | 127,571 | | | | 3,049,161 | | | | 4,303,771 | | | | 1,254,610 | |
| Pensiones y Cesantías Porvenir S.A. | | | 538,231 | | | | 2,123,705 | | | | 7,705,649 | | | | 5,581,944 | |
| | | | 7,055,975 | | | | | | | | | | | | | |
The excess (impairment) is calculated by the difference between the CGU recoverable amounts as explained below of the most significant goodwill’s recorded in Grupo Aval representing more than Ps. 200,000.
The recoverable amount of each cash generating unit was determined based on market values of banks, listed in stock exchanges and a recoverable amount is determined by a study for those not listed in stock exchanges. Such calculations used cash flow projections approved by management, covering periods from 5 to 20 years. Cash flows subsequent to these periods were extrapolated using estimated growth rates for such flows, not exceeding the average of the economic sector where the cash generating unit operates.
Below is explanation of the most significant Goodwill carrying amounts, representing more than 80% of the Goodwill balance detailed above, originated in the business acquisitions of Leasing Bogotá Panamá, CGU of Banco de Bogotá (Megabanco), Porvenir, Banco de Bogotá and Banco Popular:
Leasing Bogotá S.A. Panamá
On December 9, 2010, Banco de Bogotá S.A. acquired control of BAC Credomatic Inc (BAC COM) through its subsidiary Leasing Bogotá S.A. Panamá (LBP), which is the Panamanian company that executed the purchase agreement. BAC Credomatic Inc. (BAC COM), a company incorporated to do business under the laws of the British Virgin Islands, is the owner of Banco BAC International Bank, Inc. and the operations of BAC Credomatic Inc. (BAC) in Central America.
With the acquisition of BAC COM, through LBP, BAC's corporate structure now is controlled by Banco de Bogotá S.A., which is controlled, in turn, by Grupo Aval. Goodwill was generated and recognized as a result of that operation. Banco de Bogotá was authorized by Superintendency of Finance to make this acquisition, through its subsidiary Leasing Bogotá Panamá, as indicated in Official Notice 2010073017- 048 dated December 3, 2010.
Afterwards, ninety-eight point ninety-two percent (98.92%) of the shares of Banco Bilbao Vizcaya Argentaria S.A. Panamá (BBVA Panamá, now BAC de Panamá) were acquired by Banco de Bogotá, through its subsidiary Leasing Bogotá Panamá, under authorization from Superintendency of Finance, as per Official Notice 2013072962-052 dated December 12, 2013.
Grupo Aval Acciones y Valores S.A.
Notes to the Consolidated Financial Statement
As of December 31, 2016 and 2015 and for the years ended December 31, 2016, 2015 and 2014
(Figures expressed in millions of Colombian pesos)
Finally, one hundred percent (100.00%) of the shares of Banco Reformador de Guatemala and of Transcom Bank Limited in Barbados were acquired, and both banks were stated as Grupo Financiero Reformador de Guatemala. The Superintendency of Finance authorized Banco de Bogotá to acquire these banks, through its subsidiaries Credomatic International Corporation and BAC Credomatic Inc., as per Official Notice 2013068082-062 dated December 3, 2013.
Until December 31, 2015, an independent impairment test was performed individually for the goodwill generated through these acquisitions (BAC COM, BBVA Panamá, Reformer and Transcom). Starting January 1, 2016 and after multiple mergers, for the purpose of assessing impairment of the goodwills generated, Banco de Bogotá started a general impairment test at that level.
The latest valuation update for the groups of cash generating units to which this goodwill was allocated was done by an external adviser in January 2017, based on the financial statements of BAC Credomatic at November 30, 2016. The conclusion was that there are no situations that imply a possible impairment, given that the recoverable amount for Ps. 14,362,910 exceeds the book value for Ps. 10,428,240 of the groups of cash generating units that have goodwill allocated.
The following table shows the averages of the primary premises used in the reports on impairment of the cash-generating units with allocated goodwill, based on the impairment assessments done on the indicated dates.
| December 31, 2016 |
| | | 2017 | | | 2018 | | | 2019 | | | 2020 | | | 2021 | |
| Lending rate on the loan portfolio and investments | | | 10.8 | % | | | 10.8 | % | | | 10.8 | % | | | 10.8 | % | | | 10.9 | % |
| Borrowing rate | | | 3.0 | % | | | 3.0 | % | | | 3.0 | % | | | 3.0 | % | | | 3.0 | % |
| Growth in income from commissions | | | 3.9 | % | | | 5.6 | % | | | 6.6 | % | | | 5.7 | % | | | 6.5 | % |
| Growth in expenses | | | 5.8 | % | | | 7.4 | % | | | 7.1 | % | | | 6.8 | % | | | 6.2 | % |
| Discount rate after taxes | | | 13.2 | % | | | | | | | | | | | | | | | | |
| Growth rate after ten years | | | 3.0 | % | | | | | | | | | | | | | | | | |
| December 31, 2015 |
| | | 2016 | | | 2017 | | | 2018 | | | 2019 | | | 2020 | |
| Lending rate on the loan portfolio and investments | | | 14.4 | % | | | 14.6 | % | | | 14.8 | % | | | 15.0 | % | | | 15.1 | % |
| Borrowing rate | | | 3.4 | % | | | 3.5 | % | | | 3.6 | % | | | 3.6 | % | | | 3.7 | % |
| Growth in income from commissions | | | 15.1 | % | | | 14.0 | % | | | 12.0 | % | | | 10.5 | % | | | 8.1 | % |
| Growth in expenses | | | 9.8 | % | | | 11.9 | % | | | 10.0 | % | | | 8.2 | % | | | 6.4 | % |
| Discount rate after taxes | | | 12.5 | % | | | | | | | | | | | | | | | | |
| Growth rate after ten years | | | 3.5 | % | | | | | | | | | | | | | | | | |
A 10-year projection was made to evaluate goodwill impairment, considering the business will have matured and the flow of funds will have stabilized once this period has elapsed. In turn, macroeconomic assumptions as well as those for BAC Credomatic’s business in each of the countries where it operates were used for the projection, so as to reflect the reality that each market provides to the CGUs as a whole. The averages of the main premises used are listed in the foregoing tables, including the variables for all the countries where BAC Credomatic operates. The following is description of that process.
| • | Lending rates on loans and investments were projected based on historical data and on the expectations of management in each of the countries where BAC Credomatic operates, considering the competitiveness of the different services in their respective markets and the growth strategies for each segment. The projection on US Federal Reserve rates was taken into account as well, since these rates serve as a basis for international banking rates. |
Grupo Aval Acciones y Valores S.A.
Notes to the Consolidated Financial Statement
As of December 31, 2016 and 2015 and for the years ended December 31, 2016, 2015 and 2014
(Figures expressed in millions of Colombian pesos)
| • | Growth in commissions was projected considering the increase in the commercial loan portfolios, as well as more competitive markets over the projected timeline. For this reason, BAC Credomatic is expected to reduce this revenue gradually, so as to improve its competitiveness in the market and the cost of its services in all the countries where it operates, with the exception of Mexico. In the case of Mexico, the operation is solely a credit card business and the account only includes revenue derived from this particular portfolio. Therefore, its projection contemplates growth based on higher billing associated with the credit card portfolio. |
| • | Although the functional or reporting currency of the business is that of each country in the region where BAC subsidiaries operate, the future flows of funds have been converted into nominal U.S. dollars in each projected period, discounted at a nominal rate in U.S. dollars, net of income tax, estimated as "Ke". A discount rate in U.S. dollars is used, given that a consistent discount rate in the respective local currencies cannot be estimated because of the lack of necessary data. |
| • | The discount rate has been estimated in light of the risk profile of each of the markets where BAC operates. |
| • | To estimate the terminal value, the normalized flow of funds, adjusted according to expectations for its growth, was projected in perpetuity. This projection does not exceed the average long-term rate of growth for the economies in each of the countries where BAC operates. Consequently, an annual growth rate of 3% was estimated for the long term. |
| • | The discount rate after taxes used to discount the dividend flows reflects the specific risks relative to the CGU and the markets where BAC Credomatic operates, as mentioned earlier. Had the estimated 13.2% discount rate been 0.5% higher than the estimated rate; that is, 13.7%, it would not have been necessary to reduce the book value of goodwill, since the vale-in-use of the cash-generating units to which the goodwill was allocated would be Ps. 13,514,221, still exceeding book value as of December 31, 2016 which corresponds to Ps. 10,428,240. |
Cash-generating units inside Banco de Bogotá
Goodwill was generated in 2006 with the acquisition of 94.99% of the shares of Banco de Crédito y Desarrollo Social – MEGABANCO S.A. and later merged with Banco de Bogotá. This operation was authorized by the Office of the Superintendent of Finance of Colombia in Resolution No. 917 dated June 2, 2006.
That goodwill was allocated to the groups of cash-generating units inside Banco de Bogotá involved in the following lines of business:
| | | Share (%) | | | Value | |
| | | | | | | |
| Commercial | | | 32.7 | % | | | 152,539 | |
| Consumer | | | 30.8 | % | | | 143,287 | |
| Payroll installment loans | | | 27.0 | % | | | 125,934 | |
| Vehicles | | | 6.7 | % | | | 31,304 | |
| Microcredit | | | 2.8 | % | | | 12,841 | |
| Total | | | 100.0 | % | | | 465,905 | |
Grupo Aval Acciones y Valores S.A.
Notes to the Consolidated Financial Statement
As of December 31, 2016 and 2015 and for the years ended December 31, 2016, 2015 and 2014
(Figures expressed in millions of Colombian pesos)
The latest valuation update for the business lines of the groups of cash-generating units to which this goodwill was allocated, was done by an external adviser. This valuation was conducted on January 2017 and is based on Banco de Bogotá´s financial statements at November 30, 2016. Due to the merger of Banco de Bogotá with the acquired company, no triggering events was detected. The recoverable value exceeds the book value as of December 31, 2016 by Ps. 5,579,593.
The following table shows the main premises used in the latest impairment tests of the groups of cash-generating units with allocated goodwill. These were performed in December 2016 and December 2015
| December 31, 2016 |
| | | 2017 | | | 2018 | | | 2019 | | | 2020 | | | 2021 | |
| Lending rate on the loan portfolio and investments | | | 10.5 | % | | | 10.0 | % | | | 9.6 | % | | | 9.2 | % | | | 9.0 | % |
| Borrowing rate | | | 4.7 | % | | | 4.1 | % | | | 3.7 | % | | | 3.2 | % | | | 3.2 | % |
| Growth in income from commissions | | | 17.2 | % | | | 21.3 | % | | | 12.2 | % | | | 12.2 | % | | | 15.6 | % |
| Growth in expenses | | | 7.0 | % | | | 10.8 | % | | | 10.8 | % | | | 11.0 | % | | | 12.7 | % |
| Inflation | | | 4.1 | % | | | 3.0 | % | | | 3.1 | % | | | 3.0 | % | | | 3.0 | % |
| Discount rate after taxes | | | 15.7 | % | | | | | | | | | | | | | | | | |
| Growth rate after ten years | | | 3.0 | % | | | | | | | | | | | | | | | | |
| December 31, 2015 |
| | | 2016 | | | 2017 | | | 2018 | | | 2019 | | | 2020 | |
| Lending rate on the loan portfolio and investments | | | 10.7 | % | | | 10.7 | % | | | 11.0 | % | | | 11.2 | % | | | 11.2 | % |
| Borrowing rate | | | 4.1 | % | | | 3.8 | % | | | 3.7 | % | | | 3.6 | % | | | 3.6 | % |
| Growth in income from commissions | | | 26.7 | % | | | 25.0 | % | | | 12.3 | % | | | 12.4 | % | | | 15.1 | % |
| Growth in expenses | | | 32.6 | % | | | 12.7 | % | | | 15.0 | % | | | 16.9 | % | | | 15.4 | % |
| Inflation | | | 5.0 | % | | | 3.6 | % | | | 3.0 | % | | | 3.0 | % | | | 3.0 | % |
| Discount rate after taxes | | | 13.9 | % | | | | | | | | | | | | | | | | |
| Growth rate after ten years | | | 3.0 | % | | | | | | | | | | | | | | | | |
A 10-year projection was made to estimate goodwill, based on macroeconomic assumptions and those related to the businesses listed in the foregoing tables.
The following is a description of that process.
| - | The lending rates on loans and investments were projected based on the Group past earnings and the projected DTF rate. |
| - | The borrowing rates were projected based on the Group historical earnings and the influence the DTF could have on these rates. |
| - | Estimated growth in commissions and expenses is based on the growth in loans and other operations estimated by the company. |
| - | The rate of inflation used in the projections is based on reports from outside sources, such as the International Monetary Fund, and on documents from experts, such as the projections in Latin focus and others, |
| - | The growth rate used for the terminal value was 3.0%, which is the rate used in the most recent studies. |
Grupo Aval Acciones y Valores S.A.
Notes to the Consolidated Financial Statement
As of December 31, 2016 and 2015 and for the years ended December 31, 2016, 2015 and 2014
(Figures expressed in millions of Colombian pesos)
The discount rate after taxes used to discount dividend flows reflects the specific risks relative to each cash-generating unit. If the 15.7% estimated discount rate had been 0.5% higher than the rate estimated in the independent studies, the book value of goodwill would not have to be reduced, since the fair value of the groups of cash-generating units with this sensitivity would be Ps. 9,467,010, which is well above the book value of Ps. 5,579,593 as of December 31, 2016.
| · | Sociedad Administradora de Fondos de Pensiones y Cesantías Porvenir S.A. |
After the acquisition, Porvenir absorbed AFP Horizonte Pensiones y Cesantías S.A. and the goodwill in question was allocated to the groups of cash-generating units that together make up Porvenir later that same year.
The latest valuation update of the groups of cash-generating units that comprise Porvenir was done by an external adviser based on Porvenir’s financial statements at December 31, 2016, no triggering events were detected, given that the recoverable value exceeds book value as of December 31, 2016 Ps. 2,433,816.
The following are the main premises used in the impairment test reports taken as the basis for impairment testing on the dates listed:
| December 31, 2016 |
| | | 2017 | | | 2018 | | | 2019 | | | 2020 | | | 2021 | |
| Interest rate on investments | | | 6.5 | % | | | 5.9 | % | | | 6.2 | % | | | 6.2 | % | | | 6.2 | % |
| Borrowing rate | | | 6.3 | % | | | 6.3 | % | | | 6.3 | % | | | 6.3 | % | | | 6.3 | % |
| Growth in income from commissions | | | 6.9 | % | | | 12.7 | % | | | 7.2 | % | | | 7.1 | % | | | 6.9 | % |
| Growth in expenses | | | 3.5 | % | | | 13.2 | % | | | 5.3 | % | | | 6.5 | % | | | 5.9 | % |
| Inflation | | | 3.7 | % | | | 3.0 | % | | | 3.1 | % | | | 3.0 | % | | | 3.0 | % |
| Discount interest rate after taxes | | | 12.9 | % | | | | | | | | | | | | | | | | |
| Growth rate after five years | | | 4.0 | % | | | | | | | | | | | | | | | | |
| December 31, 2015 |
| | | 2016 | | | 2017 | | | 2018 | | | 2019 | | | 2020 | |
| Lending interest rate on investments | | | 5.4 | % | | | 5.4 | % | | | 5.4 | % | | | 5.6 | % | | | 5.7 | % |
| Borrowing rate | | | 6.1 | % | | | 5.9 | % | | | 5.9 | % | | | 5.9 | % | | | 5.9 | % |
| Growth in income from commissions | | | 6.6 | % | | | 7.9 | % | | | 7.1 | % | | | 7.0 | % | | | 6.9 | % |
| Growth in expenses | | | (3.0 | )% | | | 7.4 | % | | | 5.1 | % | | | 6.2 | % | | | 5.6 | % |
| Inflation | | | 5.0 | % | | | 3.4 | % | | | 3.0 | % | | | 3.0 | % | | | 3.0 | % |
| Discount interest rate after taxes | | | 13.5 | % | | | | | | | | | | | | | | | | |
| Growth rate after five years | | | 4.0 | % | | | | | | | | | | | | | | | | |
A 20-year projection was made to estimate goodwill based on macroeconomic assumptions and those related to the business of AFP Horizonte Pensiones y Cesantías, as indicated in the foregoing tables. The following is a description of that process.
| • | Rates investments and borrowing rates were projected using historical data on the business. |
| • | The estimated increases in commissions and expenses are based on business growth and other transactions estimated by the Group. |
Grupo Aval Acciones y Valores S.A.
Notes to the Consolidated Financial Statement
As of December 31, 2016 and 2015 and for the years ended December 31, 2016, 2015 and 2014
(Figures expressed in millions of Colombian pesos)
| • | The inflation rate used in the projections was taken from several domestic and international sources, such as the International Monetary Fund and the Central Bank of Colombia |
| • | Finally, the growth rate used for the terminal value was 4.0%, which is the rate used in the most recent studies. |
The discount interest rate after taxes that was used to discount dividend flows reflects the specific risks relative to each cash-generating unit. If the estimated discount rate of 12.9% had been 0.5% higher than the estimated rate in the valuation done by outside experts, there would be no need to reduce the book value of goodwill. Since the fair value of the groups of cash-generating units to which the goodwill was allocated would be Ps. 8,604,140 and exceeds their book value of Ps. 2,433,816.
Banco de Bogotá and Banco Popular
The recoverable amount of cash-generating units was determined based on the market values since these Banks are public. At December 31, 2016 and 2015 the value of shares in stock market from these Banks was as follows:
| | | Number of shares | | | Stock-market value
in Colombian pesos | | | Market
value | | | Carrying amount
including goodwill | | | Excess
(impairment) | |
| December 31, 2016 | | | | | | | | | | | | | | | | | | | | |
| Banco Bogotá | | | 227,710,487 | | | | 60,200 | | | | 13,708,171 | | | | 10,331,548 | | | | 3,376,623 | |
| Banco Popular | | | 7,241,936,738 | | | | 489 | | | | 3,541,307 | | | | 2,624,196 | | | | 917,111 | |
| | | | | | | | | | | | | | | | | | | | | |
| December 31, 2015 | | | | | | | | | | | | | | | | | | | | |
| Banco Bogotá | | | 227,710,487 | | | | 59,500 | | | | 13,548,774 | | | | 10,837,872 | | | | 2,710,903 | |
| Banco Popular | | | 7,241,476,738 | | | | 494 | | | | 3,577,290 | | | | 2,288,327 | | | | 1,288,963 | |
As a result of the stock-market values of these entities, we concluded was not necessary to create any provision for impairment corresponding to goodwill at December 31, 2016 or 2015.
NOTE 18 – OTHER INTANGIBLE ASSETS
Below is the detail of the balances of other intangible assets as of December 31, 2016 and 2015
| December 31, 2016 | | | |
| | | | |
| | | Cost | | | Accumulated
amortization | | | Impairment
loss | | | Amount in
books | |
| | | | | | | | | | | | | |
| Software and information technology applications purchased | | Ps. | 649,053 | | | Ps. | (208,485 | ) | | Ps. | - | | | Ps. | 440,568 | |
| Other intangibles assets | | | 404,799 | | | | (110,324 | ) | | | - | | | | 294,475 | |
| Balance as of December 31, 2016 | | Ps. | 1,053,852 | | | Ps. | (318,809 | ) | | Ps. | - | | | Ps. | 735,043 | |
Grupo Aval Acciones y Valores S.A.
Notes to the Consolidated Financial Statement
As of December 31, 2016 and 2015 and for the years ended December 31, 2016, 2015 and 2014
(Figures expressed in millions of Colombian pesos)
| December 31, 2015 | | | |
| | | | |
| | | Cost | | | Accumulated
amortization | | | Impairment
loss | | | Amount in
books | |
| | | | | | | | | | | | | |
| Software and information technology applications purchased | | Ps. | 643,782 | | | Ps. | (212,620 | ) | | Ps. | - | | | Ps. | 431,162 | |
| Other intangibles assets | | | 226,408 | | | | (44,678 | ) | | | - | | | | 181,730 | |
| Balance as of December 31, 2015 | | Ps. | 870,190 | | | Ps. | (257,298 | ) | | Ps. | - | | | Ps. | 612,892 | |
NOTE 19 – INCOME TAX
| 19.1. | Expense components for income tax: |
The expense for income tax for the years ended on December 31, 2016, 2015 and 2014 are comprised by the following:
| | | December 31,
2016 | | | December 31,
2015 | | | December 31,
2014 | |
| Current period income tax | | Ps. | 1,264,066 | | | Ps. | 1,190,949 | | | Ps. | 1,224,812 | |
| CREE tax | | | 295,324 | | | | 356,475 | | | | 422,838 | |
| CREE surcharge | | | 193,425 | | | | 200,965 | | | | - | |
| Subtotal current period taxes | | | 1,752,815 | | | | 1,748,389 | | | | 1,647,650 | |
| Previous period adjustments | | | (13,440 | ) | | | (19,282 | ) | | | (25,131 | ) |
| Adjustment due to uncertain tax positions in previous periods | | | (31,067 | ) | | | 3,542 | | | | (10,312 | ) |
| Deferred taxes | | | 348,601 | | | | 146,321 | | | | 196,091 | |
| Total | | Ps. | 2,056,909 | | | Ps. | 1,878,970 | | | Ps. | 1,808,298 | |
| 19.2 | Reconciliation of the nominal tax rate and the effective tax rate: |
The following are the current basic tax rules over income tax:
In Colombia
Colombian regulation for income tax and related taxes applicable for 2014, 2015 and 2016 include the following:
| · | Taxable income will be subject to an income tax rate of 25% and an additional corporate income tax rate denominated CREE at 9% and a further surcharge of 5% for 2015 and 6% for 2016 for a total income tax rate of 34% in 2014, 39% in 2015 and 40% in 2016. |
| · | Non ordinary income on the sale or disposal of non-current assets held for more than two years is taxed at 10%. |
| · | The taxable income for income tax and CREE may not be less than 3% of each of our tax-declaring companies’ net equity at the end of the preceding year. When the taxable income is less than such percentage, the difference, known as “presumptive income”, is deductible from taxable income over a period of five years. |
Grupo Aval Acciones y Valores S.A.
Notes to the Consolidated Financial Statement
As of December 31, 2016 and 2015 and for the years ended December 31, 2016, 2015 and 2014
(Figures expressed in millions of Colombian pesos)
| · | Tax losses incurred since 2007, fiscally adjusted for inflation, may be offset with future taxable income at any time, for both income tax and CREE. |
| · | Corporate income tax returns filed up to December 31, 2016 are protected by statute of limitations by the tax authorities two years after the date of filing, unless the Group offset loss carry forwards, in which case the return is protected by statute of limitations five years after the date of filing. |
In December 2016 Colombia Congress issued a new tax reform (Law 1819), which amongst other things, contains the following regulations over income taxes for 2017 and subsequent years:
| · | Taxable income will be subject to a corporate tax rate of 34% in 2017; and at 33% in 2018 and subsequent years. Plus and additional tax surcharge of 6% in 2017 and 4% in 2018 for those companies with taxable incomes exceeding Ps. 800. |
| · | Corporate income tax returns are protected by the statute of limitations by tax authorities three years after the filing date, however if the Group’s tax return is offset with loss carry forward, this term is six years. |
| · | Loss carry forwards incurred prior to 2017 continue to be deductible on the same terms that applied for 2016, but they may not be fiscally adjusted by inflation. Loss carry forwards incurred from 2017 and on may be offset against company taxable income over the next twelve years. |
| · | Non ordinary income on the sale or disposal of non-current assets held for more than two years continue taxed at the rate of 10%. |
| · | The taxable income of the companies may not be lower than 3.5% of fiscal equity at the end of the preceding year; and, as before, if the taxable income is lower than that base, the difference may be deducted from taxable income within five years of its occurrence, as “excess of presumptive income”. |
In other countries
Given that our subsidiary Leasing Bogotá Panamá has an international license it is subject to an income tax rate of 0%. The subsidiaries in Guatemala are taxed at a rate of 25%; the subsidiaries in El Salvador, Honduras, Costa Rica, and Mexico are taxed at a rate of 30% and the subsidiaries with a local license in Panamá are taxed at a rate of 25%.
Below is the detailed reconciliation between total expected income tax expenses of Grupo Aval calculated at the applicable enacted tax rate of 40% and effective income tax rate recognized in the statement of income for the years ended on December 31, 2016, 2015 and 2014:
| | | Years ended on: | |
| | | December
31, 2016 | | | December
31, 2015 | | | December
31, 2014 | |
| Profit before income tax | | Ps. | 5,573,845 | | | Ps. | 5,224,656 | | | Ps. | 4,805,779 | |
| Enacted tax rate in Colombia | | | 40 | % | | | 39 | % | | | 34 | % |
| Theoretical income tax expense | | | 2,229,538 | | | | 2,037,616 | | | | 1,633,965 | |
| Non deductible expenses | | | 339,803 | | | | 298,773 | | | | 329,943 | |
| Tax losses considered non recoverable for income tax purpose | | | 140,904 | | | | - | | | | - | |
| Presumptive income considered non recoverable for income tax purpose | | | 45,385 | | | | 28,954 | | | | (1,709 | ) |
Grupo Aval Acciones y Valores S.A.
Notes to the Consolidated Financial Statement
As of December 31, 2016 and 2015 and for the years ended December 31, 2016, 2015 and 2014
(Figures expressed in millions of Colombian pesos)
| | | Years ended on: | |
| | | December
31, 2016 | | | December
31, 2015 | | | December
31, 2014 | |
| Wealth tax and equity tax | | | 107,051 | | | | 118,245 | | | | 30,994 | |
| Nontaxable dividends | | | (15,655 | ) | | | (47,883 | ) | | | (33,505 | ) |
| Nontaxable income under equity method in associates | | | (56,306 | ) | | | (91,572 | ) | | | (20,678 | ) |
| Profit (loss) in sales or appraisal of investment | | | (71,669 | ) | | | (7,697 | ) | | | (2,255 | ) |
| Nontaxable Interest income | | | (150,714 | ) | | | (61,561 | ) | | | (59,452 | ) |
| Other nontaxable income | | | (83,742 | ) | | | (75,171 | ) | | | (54,120 | ) |
| Revenues taxable by different tax rate | | | (14,983 | ) | | | (5,602 | ) | | | 104 | |
| Expenses deductibles at different tax rate | | | (4,679 | ) | | | 6,971 | | | | 3,445 | |
| Tax benefits in the acquisition of property and equipment | | | (66,245 | ) | | | (67,574 | ) | | | (31,952 | ) |
| Profits ( losses) Subsidiary in tax free countries or with different tax rate | | | (143,109 | ) | | | (66,729 | ) | | | 15,239 | |
| Benefit from changes in tax rates | | | (96,232 | ) | | | (71,962 | ) | | | (31,501 | ) |
| Expenses considered non recoverable for deferred income tax purposes | | | 1,465 | | | | 11,598 | | | | - | |
| Prior period adjustments | | | (13,440 | ) | | | (44,581 | ) | | | 4,264 | |
| Adjustments due to uncertain tax positions in prior periods | | | (31,067 | ) | | | 28,374 | | | | (8,504 | ) |
| Other concepts | | | (59,396 | ) | | | (111,229 | ) | | | 34,020 | |
| Total tax expense of the year | | Ps. | 2,056,909 | | | Ps. | 1,878,970 | | | Ps. | 1,808,298 | |
| Effective income tax rate | | | 36.90 | % | | | 35.96 | % | | | 37.63 | % |
| 19.3 | Tax losses and excess of presumptive income: |
As of December 31, 2016, and 2015, following table shows the detail of the tax loss carry forward in excess of minimum presumptive income of the entities of Grupo Aval over which deferred income tax assets have not been recognized.
| | | December
31, 2016 | | | December
31, 2015 | |
| Tax losses expiring on: | | | | | | | | |
| | | | | | | | | |
| December 31, 2017 | | | - | | | | 1,772 | |
| December 31, 2018 | | | - | | | | 169 | |
| December 31, 2019 | | | - | | | | 243 | |
| Without expiration date | | | 397,869 | | | | 78,292 | |
| Subtotal | | | 397,869 | | | | 80,476 | |
| | | | | | | | | |
| Surplus of presumptive income expiring on: | | | | | | | | |
| December 31, 2016 | | | - | | | | 1,070 | |
| December 31, 2017 | | | 4,508 | | | | 1,622 | |
| December 31, 2018 | | | 43,307 | | | | 7,141 | |
| December 31, 2019 | | | 83,871 | | | | 77,056 | |
| December 31, 2020 | | | 54,150 | | | | 44,252 | |
| December 31, 2021 | | | 49,600 | | | | - | |
| Subtotal | | | 235,436 | | | | 131,141 | |
| Total | | Ps. | 633,305 | | | Ps. | 211,617 | |
Grupo Aval Acciones y Valores S.A.
Notes to the Consolidated Financial Statement
As of December 31, 2016 and 2015 and for the years ended December 31, 2016, 2015 and 2014
(Figures expressed in millions of Colombian pesos)
| 19.4 | Deferred taxes related to subsidiaries, associates and joint ventures: |
In accordance with IFRS 12, Grupo Aval did not account for deferred tax liabilities arising from temporary differences on investments in subsidiaries, associates or joint ventures given that: i) the Group has control over its subsidiaries and, therefore, it has the ability to decide on the reversion of such temporary differences; and ii) the Group does not have the intention of their realization in the medium term. As such, it is highly likely these temporary differences will not reverse in the near future. AS of December 31, 2016 and 2015 the Group did not account for deferred tax liabilities related with the temporary differences on investments for an amount of Ps. 17,073,013 and Ps. 16,714,818 respectively.
| 19.5 | Deferred taxes by type of temporary difference: |
The differences between the carrying value of the assets and liabilities and their tax bases give rise to the following temporary differences which result in deferred income taxes, calculated and recorded in the years ended on December 31, 2016, 2015 and 2014, based on current tax regulations as references for the years wherein such temporary differences will be reverted:
Year ended on December 31, 2016
| | | Balance as of
December 31,
2015 | | | Credited
(charged) to
profit or loss | | | Credited
(charged)
to OCI | | | Reclassifications | | | Balance as of
December 31,
2016 | |
| Deferred tax assets | | | | | | | | | | | | | | | | | | | | |
| Debt securities at fair value | | | 290,465 | | | | (5,459 | ) | | | (212,090 | ) | | | (10,289 | ) | | | 62,627 | |
| Equity securities at fair value | | | 323 | | | | (26,416 | ) | | | 27,676 | | | | - | | | | 1,583 | |
| Derivative instruments | | | 518,992 | | | | (223,831 | ) | | | (165,894 | ) | | | (50,527 | ) | | | 78,740 | |
| Accounts receivable | | | 7,852 | | | | 8,426 | | | | - | | | | - | | | | 16,278 | |
| Differences between the accounting and tax bases of loans and receivables | | | 5,652 | | | | 362 | | | | - | | | | - | | | | 6,014 | |
| Allowance for impairment on loans and receivables | | | 96,054 | | | | 9,679 | | | | - | | | | (160 | ) | | | 105,573 | |
| Allowance for other accounts receivable | | | 18,119 | | | | (11,900 | ) | | | - | | | | - | | | | 6,219 | |
| Financial assets in concession contracts | | | 12,096 | | | | 13,741 | | | | - | | | | - | | | | 25,837 | |
| Differences between accounting and tax basis of foreclosed assets | | | 13,326 | | | | (8,480 | ) | | | - | | | | - | | | | 4,846 | |
| Differences between accounting and tax basis of the cost in property, plant and equipment | | | 58,505 | | | | 237,739 | | | | - | | | | 25 | | | | 296,269 | |
| Differences between accounting and tax basis of accumulated of depreciation of property, plant and equipment | | | 5,415 | | | | 284 | | | | - | | | | - | | | | 5,699 | |
| Biological assets | | | 369 | | | | (268 | ) | | | - | | | | - | | | | 101 | |
| Differences between accounting and tax basis of deferred charges and of intangible assets | | | 77,055 | | | | 37,167 | | | | - | | | | (405 | ) | | | 113,817 | |
| Tax losses carry forward | | | 527,153 | | | | (140,623 | ) | | | - | | | | (675 | ) | | | 385,855 | |
| Surplus of presumptive income | | | 166,116 | | | | (146,636 | ) | | | - | | | | - | | | | 19,480 | |
| Provisions | | | 146,578 | | | | 60,716 | | | | 5,706 | | | | (305 | ) | | | 212,695 | |
| Employee benefits | | | 101,224 | | | | (5,718 | ) | | | 8,677 | | | | 423 | | | | 104,606 | |
| Goodwill | | | 6,947 | | | | (6,947 | ) | | | - | | | | - | | | | - | |
| Deferred income | | | 35,857 | | | | 77,523 | | | | - | | | | - | | | | 113,380 | |
| Lease agreements | | | 8,414 | | | | 746 | | | | - | | | | - | | | | 9.160 | |
| Other | | | 174,966 | | | | (107,102 | ) | | | - | | | | 1,158 | | | | 69,022 | |
| Subtotal | | | 2,271,478 | | | | (236,997 | ) | | | (335,925 | ) | | | (60,755 | ) | | | 1,637,801 | |
| | | | | | | | | | | | | | | | | | | | | |
| Differed tax liabilities | | | | | | | | | | | | | | | | | | | | |
| Debt securities at fair value | | | (19,943 | ) | | | 44,338 | | | | (51,673 | ) | | | - | | | | (27,278 | ) |
Grupo Aval Acciones y Valores S.A.
Notes to the Consolidated Financial Statement
As of December 31, 2016 and 2015 and for the years ended December 31, 2016, 2015 and 2014
(Figures expressed in millions of Colombian pesos)
| | | Balance as of
December 31,
2015 | | | Credited
(charged) to
profit or loss | | | Credited
(charged)
to OCI | | | Reclassifications | | | Balance as of
December 31,
2016 | |
| Equity securities at fair value | | | (104,317 | ) | | | (9,072 | ) | | | 13,059 | | | | (154 | ) | | | (100,484 | ) |
| Derivative instruments | | | (333,317 | ) | | | 240,468 | | | | (21,586 | ) | | | 46,461 | | | | (67,974 | ) |
| Accounts receivable | | | - | | | | (260,621 | ) | | | - | | | | - | | | | (260,621 | ) |
| Differences between the accounting and tax bases of loans and receivables | | | (238,492 | ) | | | (30,255 | ) | | | - | | | | - | | | | (268,747 | ) |
| Allowance for impairment on loans and receivables | | | (227,336 | ) | | | (48,449 | ) | | | - | | | | - | | | | (275,785 | ) |
| Differences between accounting and tax basis of foreclosed assets | | | (83,774 | ) | | | 36,991 | | | | - | | | | - | | | | (46,783 | ) |
| Provision for foreclosed assets | | | (15,198 | ) | | | (22,600 | ) | | | - | | | | - | | | | (37,798 | ) |
| Differences between the accounting and tax base for property plant and equipment costs | | | (355,478 | ) | | | (44,865 | ) | | | - | | | | 163 | | | | (400,180 | ) |
| Differences between accounting and tax basis of accumulated of depreciation of property, plant and equipment | | | (227,591 | ) | | | 18,114 | | | | - | | | | (72 | ) | | | (209,549 | ) |
| Differences between accounting and tax basis of deferred charges and of intangible assets | | | (60,003 | ) | | | (595 | ) | | | - | | | | - | | | | (60,598 | ) |
| Unrealized profits of foreign subsidiaries | | | (38,209 | ) | | | 16,180 | | | | - | | | | - | | | | (22,029 | ) |
| Provisions | | | (1,961 | ) | | | 1,490 | | | | - | | | | - | | | | (471 | ) |
| Goodwill | | | (42,822 | ) | | | (43,214 | ) | | | - | | | | - | | | | (86,036 | ) |
| Other | | | (152,824 | ) | | | 85,669 | | | | - | | | | 1,755 | | | | (65,400 | ) |
| Deferred Income | | | (26,940 | ) | | | (7,673 | ) | | | - | | | | - | | | | (34,613 | ) |
| Financial assets in concession arrangements | | | (627,666 | ) | | | (90,830 | ) | | | - | | | | - | | | | (718,496 | ) |
| Biological assets | | | (17,578 | ) | | | 3,320 | | | | - | | | | 7,452 | | | | (6,806 | ) |
| Subtotal | | | (2,573,449 | ) | | | (111,604 | ) | | | (60,200 | ) | | | 55,605 | | | | (2,689,648 | ) |
| Net | | | (301,971 | ) | | | (348,601 | ) | | | (396,125 | ) | | | (5,150 | ) | | | (1,051,847 | ) |
Year ended on December 31, 2015
| | | Balance as of
December 31,
2014 | | | Credited
(charged) to
profit or loss | | | Credited
(charged)
to OCI | | | Reclassifications | | | Balance as of
December 31,
2015 | |
| Deferred tax assets | | | | | | | | | | | | | | | | | | | | |
| Debt securities at fair value | | | 17,317 | | | | 240,415 | | | | 263,532 | | | | (230,799 | ) | | | 290,465 | |
| Equity securities at fair value | | | 7,505 | | | | (1,082 | ) | | | - | | | | (6,100 | ) | | | 323 | |
| Derivatives instruments | | | 555,521 | | | | (159,875 | ) | | | (19,044 | ) | | | 142,390 | | | | 518,992 | |
| Differences between the accounting and tax bases of the loans and receivables | | | 30,998 | | | | (26,337 | ) | | | - | | | | 991 | | | | 5,652 | |
| Account receivable | | | - | | | | 7,852 | | | | - | | | | - | | | | 7,852 | |
| Allowance for impairment on loans and receivables | | | 102,662 | | | | 12,503 | | | | - | | | | (19,111 | ) | | | 96,054 | |
| Allowance for other accounts receivable | | | 1,897 | | | | (1,730 | ) | | | - | | | | 17,952 | | | | 18,119 | |
| Financial asset in concession contracts | | | 11,341 | | | | 588 | | | | - | | | | 167 | | | | 12,096 | |
| Differences between accounting and tax basis of goods received as payment | | | 30,180 | | | | (16,854 | ) | | | - | | | | - | | | | 13,326 | |
| Differences between accounting and tax basis of the cost in property, plant and equipment | | | 39,561 | | | | 21,074 | | | | - | | | | (2,130 | ) | | | 58,505 | |
| Differences between accounting and tax basis of accumulated of depreciation of property, plant and equipment | | | 6,938 | | | | (1,526 | ) | | | - | | | | 3 | | | | 5,415 | |
| Biological assets | | | 4,580 | | | | (4,211 | ) | | | - | | | | - | | | | 369 | |
| Differences between accounting and tax basis of deferred charges of intangible assets | | | 59,354 | | | | 17,701 | | | | - | | | | - | | | | 77,055 | |
| Tax losses carry forward | | | 45,601 | | | | 3,020 | | | | 478,532 | | | | - | | | | 527,153 | |
| Surplus of presumptive income | | | 16,147 | | | | (13,249 | ) | | | 163,218 | | | | - | | | | 166,116 | |
| Provisions | | | 126,762 | | | | 23,070 | | | | - | | | | (3,254 | ) | | | 146,578 | |
| Employee benefits | | | 104,872 | | | | 3,927 | | | | (7,251 | ) | | | (324 | ) | | | 101,224 | |
| Goodwill | | | 6,947 | | | | - | | | | - | | | | - | | | | 6,947 | |
| Deferred Income | | | 8,092 | | | | 30,574 | | | | - | | | | (2,809 | ) | | | 35,857 | |
Grupo Aval Acciones y Valores S.A.
Notes to the Consolidated Financial Statement
As of December 31, 2016 and 2015 and for the years ended December 31, 2016, 2015 and 2014
(Figures expressed in millions of Colombian pesos)
| | | Balance as of
December 31,
2014 | | | Credited
(charged) to
profit or loss | | | Credited
(charged)
to OCI | | | Reclassifications | | | Balance as of
December 31,
2015 | |
| Lease agreements | | | 7,315 | | | | 1,099 | | | | - | | | | - | | | | 8,414 | |
| Other | | | 180,108 | | | | (68,038 | ) | | | - | | | | 62,896 | | | | 174,966 | |
| Subtotal | | | 1,363,698 | | | | 68,921 | | | | 878,987 | | | | (40,128 | ) | | | 2,271,478 | |
| | | | | | | | | | | | | | | | | | | | | |
| Differed tax liabilities | | | | | | | | | | | | | | | | | | | | |
| Debt securities at fair value | | | 9,509 | | | | (243,790 | ) | | | - | | | | 214,338 | | | | (19,943 | ) |
| Equity securities at fair value | | | (103,469 | ) | | | 103 | | | | - | | | | (951 | ) | | | (104,317 | ) |
| Derivatives instruments | | | (346,677 | ) | | | 149,307 | | | | - | | | | (135,947 | ) | | | (333,317 | ) |
| Differences between the accounting and tax bases of the loans and receivables | | | (77,205 | ) | | | (27,030 | ) | | | - | | | | (134,257 | ) | | | (238,492 | ) |
| Allowance for impairment on loans and receivables | | | (366,953 | ) | | | 5,457 | | | | - | | | | 134,160 | | | | (227,336 | ) |
| Differences between the accounting and tax base of goods received as payment | | | (60,587 | ) | | | (44,414 | ) | | | - | | | | 21,227 | | | | (83,774 | ) |
| Provision for goods received as payment | | | (10,070 | ) | | | (5,151 | ) | | | - | | | | 23 | | | | (15,198 | ) |
| Differences between the accounting and tax base for property plant and equipment costs | | | (453,088 | ) | | | 98,866 | | | | - | | | | (1,256 | ) | | | (355,478 | ) |
| Differences between accounting and tax basis of accumulated of depreciation of property, plant and equipment | | | (207,123 | ) | | | (23,775 | ) | | | - | | | | 3,307 | | | | (227,591 | ) |
| Differences between accounting and tax basis of deferred charges of intangible assets | | | (33,639 | ) | | | (26,364 | ) | | | - | | | | - | | | | (60,003 | ) |
| Profits not carried as investments in subsidiaries | | | (17,974 | ) | | | (20,235 | ) | | | - | | | | - | | | | (38,209 | ) |
| Provisions | | | (24,468 | ) | | | 18,448 | | | | - | | | | 4,059 | | | | (1,961 | ) |
| Goodwill | | | (23,166 | ) | | | (19,656 | ) | | | - | | | | - | | | | (42,822 | ) |
| Other | | | (137,604 | ) | | | 81,121 | | | | - | | | | (96,341 | ) | | | (152,824 | ) |
| Accumulative translation adjustment in foreign operations | | | (22,661 | ) | | | (7,088 | ) | | | - | | | | 2,809 | | | | (26,940 | ) |
| Financial and intangible assets in concession contracts | | | (484,105 | ) | | | (143,561 | ) | | | - | | | | - | | | | (627,666 | ) |
| Biological assets | | | (10,098 | ) | | | (7,480 | ) | | | - | | | | - | | | | (17,578 | ) |
| Subtotal | | | (2,369,378 | ) | | | (215,242 | ) | | | - | | | | 11,171 | | | | (2,573,449 | ) |
| Total | | | (1,005,680 | ) | | | (146,321 | ) | | | 878,987 | | | | (28,957 | ) | | | (301,971 | ) |
Year ended on December 31, 2014
| | | Balance as of
January 1,
2014 | | | Credited
(charged) to
profit or loss | | | Credited
(charged)
to OCI | | | Reclassifications | | | Balance as of
December 31,
2014 | |
| Deferred tax assets | | | | | | | | | | | | | | | | | | | | |
| Debt securities at fair value | | | 15,923 | | | | (2,438 | ) | | | 5,289 | | | | (7,951 | ) | | | 10,823 | |
| Equity securities at fair value | | | 9,656 | | | | (10,248 | ) | | | 8,097 | | | | - | | | | 7,505 | |
| Derivatives instruments | | | 60,741 | | | | 200,171 | | | | 294,302 | | | | 307 | | | | 555,521 | |
| Differences between the accounting and tax bases of the loans and receivables | | | 25,687 | | | | 5,311 | | | | - | | | | - | | | | 30,998 | |
| Allowance for impairment on loans and receivables | | | 81,389 | | | | 21,273 | | | | - | | | | - | | | | 102,662 | |
| Allowance for other accounts receivable | | | 240 | | | | 1,657 | | | | - | | | | - | | | | 1,897 | |
| Financial asset in concession contracts | | | 16,573 | | | | (5,232 | ) | | | - | | | | - | | | | 11,341 | |
| Differences between accounting and tax basis of goods received as payment | | | 14,177 | | | | 16,003 | | | | - | | | | - | | | | 30,180 | |
| Differences between accounting and tax basis of the cost in property, plant and equipment | | | 53,740 | | | | (14,179 | ) | | | - | | | | - | | | | 39,561 | |
| Differences between accounting and tax basis of accumulated of depreciation of property, plant and equipment | | | 2,795 | | | | 4,143 | | | | - | | | | - | | | | 6,938 | |
| Biological assets | | | 55 | | | | 4,525 | | | | - | | | | - | | | | 4,580 | |
| Differences between accounting and tax basis of deferred charges of intangible assets | | | 46,788 | | | | 12,682 | | | | - | | | | (116 | ) | | | 59,354 | |
Grupo Aval Acciones y Valores S.A.
Notes to the Consolidated Financial Statement
As of December 31, 2016 and 2015 and for the years ended December 31, 2016, 2015 and 2014
(Figures expressed in millions of Colombian pesos)
| | | Balance as of
January 1,
2014 | | | Credited
(charged) to
profit or loss | | | Credited
(charged)
to OCI | | | Reclassifications | | | Balance as of
December 31,
2014 | |
| Losses carry forward | | | 52,058 | | | | (6,457 | ) | | | - | | | | - | | | | 45,601 | |
| Surplus of presumptive income | | | 38,625 | | | | (20,835 | ) | | | - | | | | (1,643 | ) | | | 16,147 | |
| Provisions | | | 115,222 | | | | 12,481 | | | | - | | | | (941 | ) | | | 126,762 | |
| Employees benefits | | | 102,848 | | | | 3,860 | | | | (1,836 | ) | | | - | | | | 104,872 | |
| Goodwill | | | 7,470 | | | | (523 | ) | | | - | | | | - | | | | 6,947 | |
| Unrealized gains in debt financial instruments | | | 3,471 | | | | 3,023 | | | | - | | | | - | | | | 6,494 | |
| Deferred income | | | 2,218 | | | | 5,874 | | | | - | | | | - | | | | 8,092 | |
| Lease agreements | | | 5,437 | | | | 1,878 | | | | - | | | | - | | | | 7,315 | |
| Other | | | 144,746 | | | | 35,282 | | | | - | | | | 80 | | | | 180,108 | |
| Subtotal | | | 799,859 | | | | 268,251 | | | | 305,852 | | | | (10,264 | ) | | | 1,363,698 | |
| | | | | | | | | | | | | | | | | | | | | |
| Deferred tax liabilities | | | | | | | | | | | | | | | | | | | | |
| Debt securities at fair value | | | (105,382 | ) | | | 114,891 | | | | - | | | | - | | | | 9,509 | |
| Equity securities at fair value | | | (26,921 | ) | | | (60,774 | ) | | | - | | | | (15,774 | ) | | | (103,469 | ) |
| Derivatives instruments | | | (48,782 | ) | | | (193,181 | ) | | | - | | | | (104,714 | ) | | | (346,677 | ) |
| Differences between the accounting and tax bases of the loans and receivables | | | (58,572 | ) | | | (18,646 | ) | | | - | | | | 13 | | | | (77,205 | ) |
| Allowance for impairment on loans and receivables | | | (237,404 | ) | | | (131,625 | ) | | | - | | | | 2,076 | | | | (366,953 | ) |
| Differences between the accounting and tax base of goods received as payment | | | (31,930 | ) | | | (28,657 | ) | | | - | | | | - | | | | (60,587 | ) |
| Provision for goods received as payment | | | (145,403 | ) | | | 135,333 | | | | - | | | | - | | | | (10,070 | ) |
| Differences between the accounting and tax base for property plant and equipment costs | | | (341,554 | ) | | | (111,534 | ) | | | - | | | | - | | | | (453,088 | ) |
| Differences between accounting and tax basis of accumulated of depreciation of property, plant and equipment | | | (174,039 | ) | | | (33,084 | ) | | | - | | | | - | | | | (207,123 | ) |
| Differences between accounting and tax basis of deferred charges of intangible assets | | | (2,116 | ) | | | (31,523 | ) | | | - | | | | - | | | | (33,639 | ) |
| Profits not carried as investments in subsidiaries | | | (2,653 | ) | | | (15,321 | ) | | | - | | | | - | | | | (17,974 | ) |
| Provisions | | | (2,110 | ) | | | (22,358 | ) | | | - | | | | - | | | | (24,468 | ) |
| Goodwill | | | (7,726 | ) | | | (15,440 | ) | | | - | | | | - | | | | (23,166 | ) |
| Other | | | (69,049 | ) | | | (68,732 | ) | | | - | | | | 177 | | | | (137,604 | ) |
| Deferred Income | | | (4,978 | ) | | | (17,683 | ) | | | - | | | | - | | | | (22,661 | ) |
| Financial and intangible assets in concession contracts | | | (513,659 | ) | | | 29,554 | | | | - | | | | - | | | | (484,105 | ) |
| Biological assets | | | (14,536 | ) | | | 4,438 | | | | - | | | | - | | | | (10,098 | ) |
| Subtotal | | | (1,786,814 | ) | | | (464,342 | ) | | | - | | | | (118,222 | ) | | | (2,369,378 | ) |
| Total | | | (986,955 | ) | | | (196,091 | ) | | | 305,852 | | | | (128,486 | ) | | | (1,005,680 | ) |
The Group offsets deferred tax assets and liabilities by entity and tax authority, considering the application of the tax regulations in Colombia and other countries in which there is a legal right to offset tax assets and liabilities and other requirements set forth in IAS 12, according to the following breakdown:
| December 31, 2016 | | Gross Deferred
tax amounts | | | Offset
Reclassification | | | Balances on
Statement of
financial position | |
| Deferred tax asset | | Ps. | 1,637,801 | | | Ps. | (1,442,839 | ) | | Ps. | 194,962 | |
| Deferred tax liability | | | (2,689,648 | ) | | | 1,442,839 | | | | (1,246,809 | ) |
| Net | | Ps. | (1,051,847 | ) | | Ps. | - | | | Ps. | (1,051,847 | ) |
| December 31, 2015 | | Gross Deferred
tax amounts | | | Offset
Reclassification | | | Balances on
Statement of financial position | |
| Deferred tax asset | | Ps. | 2,271,478 | | | Ps. | (1,351,005 | ) | | Ps. | 920,473 | |
| Deferred tax liability | | | (2,573,449 | ) | | | 1,351,005 | | | | (1,222,444 | ) |
| Net | | Ps. | (301,971 | ) | | Ps. | - | | | Ps. | (301,971 | ) |
Grupo Aval Acciones y Valores S.A.
Notes to the Consolidated Financial Statement
As of December 31, 2016 and 2015 and for the years ended December 31, 2016, 2015 and 2014
(Figures expressed in millions of Colombian pesos)
| 19.6 | Effect of the current and deferred income taxes in each component of other comprehensive income in equity: |
The effects of the current and deferred income taxes in each component of Other Comprehensive Income for the years ended on December 31, 2016, 2015 and 2014 are detailed below:
| | | December 31, 2016 | |
| | | Amount
before taxes | | | Current
tax
expense
(Income) | | | Deferred
tax
expense
(income) | | | Net | |
| Foreign currency translation of net investments in foreign operations | | Ps. | (586,546 | ) | | Ps. | 8,204 | | | Ps. | - | | | Ps. | (578,342 | ) |
| Exchange differences from hedging derivatives in foreign currency | | | 291,506 | | | | 47,419 | | | | (187,480 | ) | | | 151,446 | |
| Exchange differences from hedging financial liabilities in foreign currency | | | 35,819 | | | | (23,854 | ) | | | - | | | | 11,965 | |
| Cash Flow hedging | | | 17,967 | | | | - | | | | - | | | | 17,967 | |
| Investment accounted by equity method | | | (20,061 | ) | | | - | | | | - | | | | (20,061 | ) |
| Equity financial instruments | | | 34,509 | | | | - | | | | 40,735 | | | | 75,244 | |
| Debt financial instruments | | | 948,212 | | | | - | | | | (263,763 | ) | | | 684,449 | |
| Foreign currency translation of net investment in foreign branches | | | (13,615 | ) | | | - | | | | - | | | | (13,615 | ) |
| Actuarial gains (losses) from defined benefit pension plans | | | (41,228 | ) | | | - | | | | 14,383 | | | | (26,845 | ) |
| Total “other comprehensive income” during the period | | Ps. | 666,563 | | | Ps. | 31,767 | | | Ps. | (396,125 | ) | | Ps. | 302,207 | |
| | | December 31, 2015 | |
| | | Amount
before taxes | | | Current
tax
expense
(Income) | | | Deferred
tax expense
(income) | | | Net | |
| Foreign currency translation of net investments in foreign operations | | Ps. | 2,321,586 | | | Ps. | - | | | Ps. | - | | | Ps. | 2,321,586 | |
| Exchange differences from hedging derivatives in foreign currency | | | (1,683,347 | ) | | | 89,960 | | | | 629,531 | | | | (963,856 | ) |
| Exchange differences from hedging financial liabilities in foreign currency | | | (755,431 | ) | | | 267,528 | | | | - | | | | (487,903 | ) |
| Cash Flow hedging | | | 17,500 | | | | - | | | | (6,825 | ) | | | 10,675 | |
| Investment accounted by equity method | | | 31,964 | | | | - | | | | - | | | | 31,964 | |
| Equity financial instruments | | | (6,548 | ) | | | - | | | | - | | | | (6,548 | ) |
| Debt financial instruments | | | (922,083 | ) | | | - | | | | 263,532 | | | | (658,551 | ) |
| Foreign currency translation of net investment in foreign branches | | | 70,142 | | | | (37,862 | ) | | | - | | | | 32,280 | |
| Actuarial gains (losses) from defined benefit pension plans | | | 6,162 | | | | - | | | | (7,251 | ) | | | (1,089 | ) |
| Total “other comprehensive income” during the period | | Ps. | (920,055 | ) | | Ps. | 319,626 | | | Ps. | 878,987 | | | Ps. | 278,559 | |
| | | December 31, 2014 | |
| | | Amount
before
taxes | | | Current tax
expense
(income) | | | Deferred tax
expense
(income) | | | Net | |
| Foreign currency translation of net investments in foreign operations | | Ps. | 1,319,880 | | | Ps. | - | | | Ps. | - | | | Ps. | 1,319,880 | |
| Exchange differences from hedging derivatives in foreign currency | | | (870,910 | ) | | | 1,671 | | | | 294,302 | | | | (574,937 | ) |
| Exchange differences from hedging financial liabilities in foreign currency | | | (483,633 | ) | | | 157,206 | | | | - | | | | (326,427 | ) |
| Cash Flow hedging | | | 7,000 | | | | - | | | | - | | | | 7,000 | |
Grupo Aval Acciones y Valores S.A.
Notes to the Consolidated Financial Statement
As of December 31, 2016 and 2015 and for the years ended December 31, 2016, 2015 and 2014
(Figures expressed in millions of Colombian pesos)
| | | December 31, 2014 | |
| | | Amount
before
taxes | | | Current tax
expense
(income) | | | Deferred tax
expense
(income) | | | Net | |
| Investment accounted by equity method | | | 54,301 | | | | - | | | | - | | | | 54,301 | |
| Equity financial instruments | | | 29,029 | | | | - | | | | 8,097 | | | | 37,126 | |
| Debt financial instruments | | | 10,153 | | | | - | | | | 5,289 | | | | 15,442 | |
| Foreign currency translation of net investment in foreign branches | | | 37,612 | | | | - | | | | - | | | | 37,612 | |
| Actuarial gains (losses) from defined benefit pension plans | | | (9,546 | ) | | | - | | | | (1,836 | ) | | | (11,382 | ) |
| Total “other comprehensive income” during the period | | Ps. | 93,886 | | | Ps. | 158,877 | | | Ps. | 305,852 | | | Ps. | 558,615 | |
| 19.7 | Uncertainties in open tax positions |
As of December 31, 2016, December 31, 2015 and December 31, 2014, Grupo Aval recognized tax uncertainty liabilities for Ps. 106, 032, Ps. 147,467 and Ps. 116,126 respectively. Uncertainties on open tax positions of the four banks of Grupo Aval are as follows:
| Bank | | December 31, 2016 | | | December 31, 2015 | | | December 31, 2014 | |
| Bogotá | | Ps. | 66,428 | | | Ps. | 105,557 | | | Ps. | 70,138 | |
| Occidente | | | 32,210 | | | | 25,058 | | | | 21,735 | |
| Popular | | | 338 | | | | 1,867 | | | | 3,986 | |
| Villas | | | 7,056 | | | | 14,863 | | | | 20,267 | |
| Corficolombiana | | | - | | | | 122 | | | | - | |
| Total | | Ps. | 106,032 | | | Ps. | 147,467 | | | Ps. | 116,126 | |
Penalties and interests are accumulated and recognized as income tax expense.
The roll forward of tax uncertainties during the years ended on December 31, 2016, 2015 and 2014 is as follows:
| | | December 31,
2016 | | | December 31,
2015 | | | December 31,
2014 | |
| Balance at the beginning of the year | | Ps. | 147,467 | | | Ps. | 116,126 | | | Ps. | 124,630 | |
| Provisions increase during the period | | | 31,039 | | | | 30,191 | | | | 24,922 | |
| Provisions used | | | (1,867 | ) | | | (1,145 | ) | | | (3,851 | ) |
| Amounts reversed due to provisions not used | | | (73,085 | ) | | | (25,259 | ) | | | (40,859 | ) |
| Financial cost | | | 12,475 | | | | 7,541 | | | | 1,815 | |
| Foreign currency effects | | | (9,998 | ) | | | 20,013 | | | | 9,469 | |
| Balance at the end of the year | | Ps. | 106,032 | | | Ps. | 147,467 | | | Ps. | 116,126 | |
The balance as of December 31, 2016, 2015 and 2014 is expected to be completely used or released once the inspection rights from the tax authorities regarding tax returns expire, as follows:
| Year | | December 31,
2016 | | | December 31,
2015 | | | December 31,
2014 | |
| 2015 | | | - | | | | - | | | | 40,319 | |
| 2016 | | | - | | | | 19,566 | | | | 31,125 | |
| 2017 | | | 9,027 | | | | 27,630 | | | | 16,705 | |
| 2018 | | | 10.794 | | | | 32,104 | | | | 14,834 | |
| 2019 | | | 16,612 | | | | 18,437 | | | | 13,143 | |
| 2020 | | | 22,427 | | | | 18,223 | | | | - | |
Grupo Aval Acciones y Valores S.A.
Notes to the Consolidated Financial Statement
As of December 31, 2016 and 2015 and for the years ended December 31, 2016, 2015 and 2014
(Figures expressed in millions of Colombian pesos)
| Year | | December 31,
2016 | | | December 31,
2015 | | | December 31,
2014 | |
| 2021 | | | 26,108 | | | | 19,527 | | | | - | |
| 2022 | | | 19,681 | | | | 11,980 | | | | - | |
| 2023 | | | 1,382 | | | | - | | | | - | |
| Total | | Ps. | 106,032 | | | Ps. | 147,467 | | | Ps. | 116,126 | |
NOTE 20 – CUSTOMER DEPOSITS
Following is a detail of the balances of the deposits received from Grupo Aval´s customer:
| Detail | | December 31, 2016 | | | December 31, 2015 | |
| | | | | | | |
| Demand | | | | | | | | |
| Current accounts | | Ps. | 34,978,189 | | | Ps. | 33,430,665 | |
| Savings accounts | | | 50,573,924 | | | | 50,298,080 | |
| Other funds on demand | | | 328,798 | | | | 448,517 | |
| | | | 85,880,911 | | | | 84,177,262 | |
| Term | | | | | | | | |
| Fixed term deposit certificates | | | 58,006,144 | | | | 51,777,366 | |
| Total Deposits | | | 143,887,055 | | | | 135,954,628 | |
| | | | | | | | | |
| Per currency | | | | | | | | |
| In Colombian Pesos | | | 85,735,406 | | | | 79,375,266 | |
| In foreign currency | | | 58,151,649 | | | | 56,579,362 | |
| Total per currency | | Ps. | 143,887,055 | | | Ps. | 135,954,628 | |
The detail of the maturities of term deposits in force as of December 31, 2016 is as follows:
| Year | | 2016 | |
| | | | |
| 2017 | | Ps. | 43,934,517 | |
| 2018 | | | 8,117,371 | |
| 2019 | | | 1,352,756 | |
| 2020 | | | 2,311,485 | |
| After 2021 | | | 2,290,015 | |
| Total | | Ps. | 58,006,144 | |
A summary of the effective interest rates which are accrued on customer deposits is as follows:
| December 31, 2016 |
| Deposits |
| | | in Colombian Pesos | | | In foreign currency | |
| Rate |
| | | Minimum | | | Maximum | | | Minimum | | | Maximum | |
| | | % | | | % | | | % | | | % | |
| Checking accounts | | | 0.53 | % | | | 8.54 | % | | | 0.10 | % | | | 4.08 | % |
| Saving accounts | | | 0.01 | % | | | 8.75 | % | | | 0.05 | % | | | 4.08 | % |
| Fixed term deposit certificates | | | 0.05 | % | | | 12.64 | % | | | 0.05 | % | | | 13.04 | % |
Grupo Aval Acciones y Valores S.A.
Notes to the Consolidated Financial Statement
As of December 31, 2016 and 2015 and for the years ended December 31, 2016, 2015 and 2014
(Figures expressed in millions of Colombian pesos)
| December 31, 2015 |
| Deposits |
| | | in Colombian Pesos | | | In foreign currency | |
| Rate |
| | | Minimum | | | Maximum | | | Minimum | | | Maximum | |
| | | % | | | % | | | % | | | % | |
| Checking accounts | | | 0.94 | % | | | 6.93 | % | | | 0.10 | % | | | 3.75 | % |
| Saving accounts | | | 0.05 | % | | | 6.50 | % | | | 0.25 | % | | | 3.75 | % |
| Fixed term deposit certificates | | | 0.05 | % | | | 11.50 | % | | | 0.10 | % | | | 13.04 | % |
Following is the detail of the concentration of deposits received from customers per economic sector:
| | | December 31, 2016 | | | December 31, 2015 | |
| | | Amount | | | % | | | Amount | | | % | |
| Individuals | | | 36,983,897 | | | | 26 | % | | | 30,776,375 | | | | 25 | % |
| Commerce | | | 20,717,015 | | | | 14 | % | | | 22,870,892 | | | | 18 | % |
| Government and Colombian Government Entities | | | 14,879,219 | | | | 11 | % | | | 14,978,309 | | | | 11 | % |
| Manufacturing | | | 7,902,332 | | | | 5 | % | | | 9,320,103 | | | | 6 | % |
| Real Estate | | | 7,078,922 | | | | 5 | % | | | 6,644,027 | | | | 5 | % |
| Colombian Municipalities | | | 3,289,615 | | | | 2 | % | | | 3,817,802 | | | | 3 | % |
| Agriculture and livestock | | | 3,241,177 | | | | 2 | % | | | 2,464,855 | | | | 2 | % |
| Foreign Governments | | | 1,048,947 | | | | 1 | % | | | 1,372,452 | | | | 1 | % |
| Other(1) | | | 48,745,931 | | | | 34 | % | | | 43,709,813 | | | | 29 | % |
| Total | | | 143,887,055 | | | | 100 | % | | | 135,954,628 | | | | 100 | % |
| (1) | December 31, 2016, includes deposits from the financial sector of Ps. 6,099,784, education entities of Ps. 210,856 and from services sector of Ps. 8,592,255. |
NOTE 21 – FINANCIAL OBLIGATIONS
| 21.1. | Financial Obligations |
Following is the summary of the financial obligations of Grupo Aval as of December 31, 2016 and 2015:
| | | December
31, 2016 | | | December
31, 2015 | |
| | | | | | | |
| Local Currency | | | | | | | | |
| Interbank funds | | | | | | | | |
| Overnight funds | | Ps. | 2,075 | | | Ps. | 2,838 | |
| Interbank funds purchased | | | 1,366,757 | | | | 557,721 | |
| Commitments to transfer open and closed repo operations | | | 1,259,676 | | | | 2,120,225 | |
Grupo Aval Acciones y Valores S.A.
Notes to the Consolidated Financial Statement
As of December 31, 2016 and 2015 and for the years ended December 31, 2016, 2015 and 2014
(Figures expressed in millions of Colombian pesos)
| | | December
31, 2016 | | | December
31, 2015 | |
| Commitments to transfer simultaneous operations | | | 2,436,838 | | | | 5,881,795 | |
| Commitments originated in short positions simultaneous operations | | | 538,016 | | | | 295,689 | |
| Total interbank funds | | Ps. | 5,603,362 | | | Ps. | 8,858,268 | |
| Borrowings | | | 2,084,988 | | | | 1,743,818 | |
| Letters of credit | | | 3,509 | | | | 3,709 | |
| Bankers´ acceptances | | | 517 | | | | - | |
| Total loans banks | | Ps. | 2,089,014 | | | Ps. | 1,747,527 | |
| | | | | | | | | |
Foreign currency | | | | | | | | |
| Interbank funds | | | | | | | | |
| Overnight funds | | | 3,498 | | | | 77,931 | |
| Interbank funds purchased | | | 309,924 | | | | 263,798 | |
| Commitments to transfer open and closed repo operations | | | 398,933 | | | | 274,874 | |
| Total interbank funds | | Ps. | 712,355 | | | Ps. | 616,603 | |
| Borrowings | | | 15,086,112 | | | | 16,180,100 | |
| Letters of credit | | | 6,976 | | | | 10,271 | |
| Bankers´ acceptances | | | 724,531 | | | | 812,718 | |
| Total loans banks | | Ps. | 15,817,619 | | | Ps. | 17,003,089 | |
| Total financial obligations | | Ps. | 24,222,350 | | | Ps. | 28,225,487 | |
| Short term obligations | | Ps. | 13,593,308 | | | Ps. | 9,474,871 | |
| Long term obligations | | Ps. | 10,629,042 | | | Ps. | 18,750,616 | |
As of December 31, 2016, short-term obligations associated with simultaneous and repo operations for an amount of Ps. 2,436,838, guaranteed with investments for an amount of Ps.5,264,105 and as of December 31, 2015 Ps. 5,881,795 were guaranteed with investments for an amount of Ps. 8,527,826.
| 21.2 | Financial Obligations from issued bonds |
The different entities from Grupo Aval are authorized by Superintendency of Finance and by the regulatory entities abroad where Grupo Aval operates, for issuing or placing either bonds or general guarantee bonds. The bonds issued by Grupo Aval and its banking subsidiaries are non-guaranteed.
a) The detail of liabilities as of December 31, 2016 and 2015, by issue date and maturity date was as follows
| Issuer | | Issue Date | | December
31, 2016 | | | December
31, 2015 | | | Maturity Date | | Interest Rate |
| Peso denominated | | | | | | | | | | | | | | |
| Banco de Bogotá S.A. | | 23/02/2010 | | | 248,234 | | | | 236,761 | | | Between 23/02/2017 and 23/02/2020 | | CPI + 5.33% + 7% UVR + 5.29% UVR + 5.45% |
| Banco de Occidente | | Between 25/08/2008 and 26/10/2016 | | | 2,811,593 | | | | 2,620,716 | | | Between 22/09/2016 and 26/10/2028 | | CPI + 2.89% – 7.00%
IBR 1.30 %– 2.04%. Between 6.00% y
7.85% |
| Corporación Financiera Colombiana S.A. | | Between 23/07/2009 and 11/03/2015 | | | 2,356,272 | | | | 2,001,397 | | | Between 23/07/2016 and 12/02/2033 | | CPI + 2.55% – 5.99%
DTF E.A; Between 12.87% y 15.38% |
Grupo Aval Acciones y Valores S.A.
Notes to the Consolidated Financial Statement
As of December 31, 2016 and 2015 and for the years ended December 31, 2016, 2015 and 2014
(Figures expressed in millions of Colombian pesos)
| Issuer | | Issue Date | | December
31, 2016 | | | December
31, 2015 | | | Maturity Date | | Interest Rate |
| Banco Popular | | Between 25/02/2012 and 12/10/2016 | | Ps. | 1,620,504 | | | Ps. | 1,489,748 | | | Between 25/01/2017 and 26/02/2026 | | Fixed rate 5.67% y 8.10%; CPI +2.44% -3.90%
IBR +1.35%; Fix 5.67% y 8.10% |
| | | | | | | | | | | | | | | |
Grupo Aval Acciones y Valores | | 01/12/2009 and 24/11/2016 | | Ps. | 704,726 | | | Ps. | 523,159 | | | Between 3/12/2019 and 24/11/2036 | | CPI + 4.15% to 5.20% |
| Peso denominated Total | | | | Ps. | 7,741,329 | | | Ps. | 6,871,781 | | | | | |
| | | | | | | | | | | | | | | |
| Foreign Currency | | | | | | | | | | | | | | |
Banco de Bogotá S.A. Bajo regla144A. | | Between 19/12/2011 and 04/11/2016 | | | 6,656,720 | | | | 3,397,308 | | | Between 15/01/2017 and 12/05/2026 | | 5.00% and 6.25% |
| | | | | | | | | | | | | | | |
| BAC Credomatic | | | | | | | | | | | | | | |
| El Salvador | | Between 06/02/2012 and 30/06/2016 | | | 552,861 | | | | 531,295 | | | Between 01/01/2017 and 28/10/2021 | | Between 4.25% and 5.80% |
| Guatemala | | Between 05/01/2015 and 28/12/2016 | | | 543,441 | | | | 539,820 | | | Between 03/01/2017 and 30/10/2018 | | Between 4.50% and 8.50% |
| Honduras | | Between 23/07/2013 and 09/05/2016 | | | 68,929 | | | | 150,574 | | | Between 15/05/2017 and 23/07/2018 | | Between 5.50% and 10.50% |
| Nicaragua | | Between 24/01/2014 and 02/02/2015 | | | 12,040 | | | | 15,335 | | | 06/11/2017 | | 5.25% |
| BAC Credomatic Total | | | | Ps. | 1,177,271 | | | Ps. | 1,237,024 | | | | | |
| Banco Bogotá Total | | | | Ps. | 7,833,991 | | | Ps. | 4,634,332 | | | | | |
| | | | | | | | | | | | | | | |
| Grupo Aval Limited | | 19/09/2012 | | | 2,992,916 | | | | 5,061,010 | | | 19/09/2022 | | 4.75% |
| Foreign Currency Total | | | | Ps. | 10,826,907 | | | Ps. | 9,695,342 | | | | | |
| Total of Bonds | | | | Ps. | 18,568,236 | | | Ps. | 16,567,123 | | | | | |
Future maturities of bonds as of December 31, 2016 are as follows:
| Year | | 2016 | |
| 2017 | | Ps. | 4,234,038 | |
| 2018 | | | 674,110 | |
| 2019 | | | 1,364,855 | |
| 2020 | | | 1,252,384 | |
| After 2021 | | | 11,042,849 | |
| Total | | Ps. | 18,568,236 | |
Grupo Aval Acciones y Valores S.A.
Notes to the Consolidated Financial Statement
As of December 31, 2016 and 2015 and for the years ended December 31, 2016, 2015 and 2014
(Figures expressed in millions of Colombian pesos)
| 21.3 | Borrowings from development entities |
The Colombian Government has established certain credit programs for promoting the development of specific sectors of the economy, including foreign trade, agriculture, tourism, housing construction and other industries. The programs are managed by many entities of the Government such as Banco de Comercio Exterior (“BANCOLDEX”), Fondo para el Financimiento del Sector Agropecuario (“FINAGRO”) and Financiera del Desarrollo Territorial (“FINDETER”).
The details of the borrowings from these entities as of December 31, 2016 and 2015 and are as follows:
| | | Interest rates in force at
cutoff Rate | | December 31,
2016 | | | December 31,
2015 | |
| | | | | | | | | |
| Banco de Comercio Exterior - “BANCOLDEX” | | Between 0.40% - 21.38% | | Ps. | 736,721 | | | Ps. | 821,723 | |
| Fondo para el Financiamiento del Sector Agropecuario - “FINAGRO” | | Between 0.50% - 14.63% | | | 337,649 | | | | 353,238 | |
| Financiera de Desarrollo Territorial “FINDETER” | | Between 2.84% - 12.81% | | | 1,651,325 | | | | 1,331,688 | |
| Total | | | | Ps. | 2,725,695 | | | Ps. | 2,506,649 | |
Details showing the maturities of the financial obligations with development entities as for December 31, 2016 are as follows:
| Year | | 2016 | |
| | | | |
| 2017 | | Ps. | 529,843 | |
| 2018 | | | 462,109 | |
| 2019 | | | 417,488 | |
| 2020 | | | 320,872 | |
| After 2021 | | | 995,383 | |
| Total | | Ps. | 2,725,695 | |
NOTE 22 – EMPLOYEE BENEFITS
According to Colombian and other countries labor legislation wherein Grupo Aval has subsidiaries and pursuant to labor conventions and labor collective agreements entered into with employees, employees of Grupo Aval have short term benefits such as: salaries, holidays, legal and extralegal premiums, severances and interests on severances, long term benefits such as seniority bonds premiums and medical aids, post-employment benefits and retirement benefits such as: severance payments to employees that continue with labor regime before Law 50 of 1990 and legal and extralegal retirement pensions. Compensation for key personnel of the management includes salaries, benefits different than cash and contributions. (See note 35).
Through personnel benefits plans, Grupo Aval is exposed to several risks (interest rates and operating), which are intended to be minimized by applying the risk management policies and procedures defined in Note 4 above.
Grupo Aval Acciones y Valores S.A.
Notes to the Consolidated Financial Statement
As of December 31, 2016 and 2015 and for the years ended December 31, 2016, 2015 and 2014
(Figures expressed in millions of Colombian pesos)
The detail of the balance liabilities for employee benefits as of December 31, 2016 and 2015 is as follows:
| | | December 31, 2016 | | | December 31, 2015 | |
| Short term | | Ps. | 397,460 | | | Ps. | 378,622 | |
| Post-employment | | | 509,022 | | | | 436,696 | |
| Long term | | | 191,112 | | | | 206,971 | |
| Total | | Ps. | 1,097,594 | | | Ps. | 1,022,289 | |
22.1 Post-employment benefits
| · | In Colombia, when employees retire after completing certain years and time of service, retirement pensions are assumed by public or private pension funds based on defined contribution plans, to which entities and employees contribute monthly defined amounts by law for being entitled to the pension at the time of retirement. However, for some employees hired by Grupo Aval entities prior to 1968 that have fulfilled the requirements of age and years of service the pensions are directly assumed by some of the entities of Grupo Aval. |
| · | Certain employees hired by entities of Grupo Aval before 1990 are entitled to receive a compensation corresponding to the last month of salary multiplied by each year of service. |
| · | Some subsidiaries have labor conventions or pay extra-legal premiums to employees retiring in compliance with the required age and time of service, when they start enjoying the pension granted by the pension funds. |
Post-employment and long-term benefits movements during the years ended at December 31, 2016, 2015 and 2014 are as follows:
| | | Post-Employment benefits | | | Long-term Benefits | |
| | | December
31, 2016 | | | December
31, 2015 | | | December
31, 2014 | | | December
31, 2016 | | | December
31, 2015 | | | December
31, 2014 | |
| Balance at the beginning of the year | | Ps. | 436,696 | | | Ps. | 442,258 | | | Ps. | 467,665 | | | Ps. | 206,971 | | | Ps. | 188,522 | | | Ps. | 202,442 | |
| Costs incurred during period | | | 3,006 | | | | 2,158 | | | | 4,072 | | | | 19,243 | | | | 16,745 | | | | 16,257 | |
| Interests Cost | | | 69,348 | | | | 31,338 | | | | 35,301 | | | | (20,274 | ) | | | 11,975 | | | | 16,463 | |
| Past Service Costs | | | - | | | | 2,712 | | | | (1,448 | ) | | | - | | | | 2,711 | | | | - | |
| | | | 509,050 | | | | 478,466 | | | | 505,590 | | | | 205,940 | | | | 219,953 | | | | 235,162 | |
| | | | | | | | | | | | | | | | | | | | | | | | | |
| Changes in actuarial assumptions from changes in demographic assumptions. | | | (1,232 | ) | | | 7,171 | | | | (5,416 | ) | | | (6,456 | ) | | | (2,162 | ) | | | (3,022 | ) |
| Changes in actuarial assumptions from changes in financial assumptions. | | | 42,460 | | | | (1,009 | ) | | | (4,130 | ) | | | 18,845 | | | | 7,515 | | | | (12,727 | ) |
| | | | 41,228 | | | | 6,162 | | | | (9,546 | ) | | | 12,389 | | | | 5,353 | | | | (15,749 | ) |
| | | | | | | | | | | | | | | | | | | | | | | | | |
| Exchange differences | | | 6,083 | | | | (27 | ) | | | (814 | ) | | | - | | | | 8,236 | | | | 4,170 | |
| Payments to employees | | | (47,339 | ) | | | (47,905 | ) | | | (52,972 | ) | | | (27,217 | ) | | | (26,571 | ) | | | (23,325 | ) |
| (Gains) / (Losses) for direct arrangements with employees | | | - | | | | - | | | | - | | | | - | | | | - | | | | (11,736 | ) |
| Balance at the end of the year | | Ps. | 509,022 | | | Ps. | 436,696 | | | Ps. | 442,258 | | | Ps. | 191,112 | | | Ps. | 206,971 | | | Ps. | 188,522 | |
Grupo Aval Acciones y Valores S.A.
Notes to the Consolidated Financial Statement
As of December 31, 2016 and 2015 and for the years ended December 31, 2016, 2015 and 2014
(Figures expressed in millions of Colombian pesos)
The variables used to calculate the obligation projected for different post-employment benefits employees are shown as follows:
| | | December 31,
2016 | | | December 31,
2015 | |
| Discount interest rate | | | 7.23 | % | | | 7.76 | % |
| Inflation rate | | | 3.50 | % | | | 3.50 | % |
| Salary growth rate | | | 3.50 | % | | | 3.50 | % |
| Pension growth rate | | | 3.50 | % | | | 4.80 | % |
Employee´s life expectation is calculated based on the mortality tables published by the Superintendency of Finance, which are based on mortality experiences provided to the Superintendency by several insurance companies operating in Colombia.
The sensitivity analysis for post-employment liabilities due to defined benefits plans to different actuarial and financial variables is shown below, maintaining other variables at constant values:
| | | Change in the variable | | | Variable Increase | | | Variable Decrease | |
| Discount interest | | | 0.50 | % | | | 7.73 | % | | | 6.73 | % |
| Salaries growth rate | | | 0.50 | % | | | 4.00 | % | | | 3.00 | % |
| Retirement growth rate | | | 0.50 | % | | | 4.00 | % | | | 3.00 | % |
Projected future benefit payments, reflecting services, as the case may be, are expected to be paid as follows:
| 2016 |
| Year | | Payments for Post-
Employment | | | Payments for Long-
term Benefits | |
| 2017 | | | 47,377 | | | | 23,400 | |
| 2018 | | | 43,742 | | | | 28,930 | |
| 2019 | | | 43,011 | | | | 29,014 | |
| 2020 | | | 43,216 | | | | 32,869 | |
| 2021 | | | 43,052 | | | | 26,280 | |
| Years 2022–2026 | | | 231,126 | | | | 126,052 | |
22.2 Long Term Employee Benefits
Grupo Aval grants its employees extra-legal long term premiums during the working life depending on number of years of service, five, ten, fifteen, or twenty years etc., calculated as days of salary per year of work.
Some pensioners receive payments relating to medical treatments, hospitalization and surgery from Grupo Aval. Grupo Aval has recognized the liabilities corresponding to these benefits, based on the same actuarial calculations carried out under the same parameters of retirement benefits.
Grupo Aval Acciones y Valores S.A.
Notes to the Consolidated Financial Statement
As of December 31, 2016 and 2015 and for the years ended December 31, 2016, 2015 and 2014
(Figures expressed in millions of Colombian pesos)
NOTE 23 – PROVISIONS FOR LEGAL AND OTHERS
The movement of provisions during the years ended on December 31, 2016, 2015 and 2014 are as follows:
| | | For Legal | | | Other Provisions | | | Total Provisions | |
| Balance as of January 1, 2014 | | Ps. | 135,771 | | | Ps. | 613,239 | | | Ps. | 749,010 | |
| Provisions increase during the period | | | 93,533 | | | | 80,373 | | | | 173,906 | |
| Use of provisions | | | (22,752 | ) | | | (132,140 | ) | | | (154,892 | ) |
| Amounts reversed due to provisions not utilized | | | (20,280 | ) | | | (16,576 | ) | | | (36,856 | ) |
| Financial cost | | | - | | | | 131 | | | | 131 | |
| Variations in exchange in foreign currency | | | - | | | | 14,398 | | | | 14,398 | |
| Reclassification | | | (616 | ) | | | (428 | ) | | | (1,044 | ) |
| Balance as of December 31, 2014 | | Ps. | 185,656 | | | Ps. | 558,997 | | | Ps. | 744,653 | |
| Provisions increase during the period | | | 13,405 | | | | 72,032 | | | | 85,437 | |
| Use of provisions | | | (27,816 | ) | | | (60,085 | ) | | | (87,901 | ) |
| Amounts reversed due to provisions not utilized | | | (22,932 | ) | | | (21,033 | ) | | | (43,965 | ) |
| Financial cost | | | - | | | | (1,284 | ) | | | (1,284 | ) |
| Variations in exchange in foreign currency | | | - | | | | 195 | | | | 195 | |
| Reclassification | | | - | | | | (96,909 | ) | | | (96,909 | ) |
| Balance as of December 31, 2015 | | Ps. | 148,313 | | | Ps. | 451,913 | | | Ps. | 600,226 | |
| Provisions increase during the period | | | 32,402 | | | | 363,211 | | | | 395,613 | |
| Provisions utilization | | | (13,143 | ) | | | (322,117 | ) | | | (335,260 | ) |
| Amounts reversed due to provisions not utilized | | | (12,938 | ) | | | (27,724 | ) | | | (40,662 | ) |
| Reclassification | | | 1,115 | | | | (676 | ) | | | 439 | |
| Balance as of December 31, 2016 | | Ps. | 155,749 | | | Ps. | 464,607 | | | Ps. | 620,356 | |
PROVISIONS FOR LEGAL
| · | Administrative Processes |
As of December 31, 2016 and 2015 there were administrative proceedings for Ps. 30,852 and Ps. 44,056, for litigation, mainly due to the alleged breach of contract for building the Gibraltar-Bucaramanga pipeline -amounting to Ps. 25,622- by Promigas. This process is currently in the State Council, before which an appeal was filed for annulment of the Arbitral Award rendered by the Arbitration Tribunal.
As of December 31, 2016 and 2015 there were labor proceedings for Ps. 42,943 and Ps. 57,355 includes labor suits, indemnities for ex-employees against of several subsidiaries of Grupo Aval and pensions claims (survivor pensions, invalidity pensions, seniority pensions, return of balances, etc.) in Porvenir, the time expected for resolution is uncertain due to the fact that each proceeding is based on different instances.
As of December 31, 2016 and2015 there were other legal proceedings for Ps. 81,954 and Ps. 46,918, client indemnities, complaints, client disbursements to clients for amounts not covered by insurance, legal costs, among others, including Hoteles Estelar proceeding declaring the violation of rights due to the use of public space in Cartagena. The time expected for resolution is uncertain since each case is subject to studies for assessment and analysis by experts in charge.
Grupo Aval Acciones y Valores S.A.
Notes to the Consolidated Financial Statement
As of December 31, 2016 and 2015 and for the years ended December 31, 2016, 2015 and 2014
(Figures expressed in millions of Colombian pesos)
OTHER PROVISIONS
As of December 31, 2016 and 2015 other provisions amounting Ps. 464,607 and Ps. 451,913 are mainly comprised by a provision of Corficolombiana affiliates for Ps. 155,124 and Ps. 152,616, associated with the maintenance, restoration and rehabilitation of constructions and buildings, dismantling of assets, professional fees relating to development of concession contracts. Additionally, this caption includes a provision of Porvenir subsidiary for individual savings accounts shortfalls of people, which their retirement pensions are covered by the mandatory fund denominated “Fondo de Pensiones Obligatorias Especial Porvenir del Retiro Programado” managed by Porvenir, pursuant to legal provisions in force requiring they should be assumed by the pensions fund manager. This provision is calculated in accordance with projections performed based on actuarial assumptions that show some people with limited resources in the Fund will not cover their future pension payments. The provisions for this matter at December 31, 2016 and 2015 amounted Ps. 173,541 and Ps. 159,130, respectively, were derived from the business combination of Porvenir with other fund manager named Horizonte, in the past years.
NOTE 24 – ACCOUNTS PAYABLE AND OTHER LIABILITIES
Accounts payable and other liabilities comprise the following:
| Items | | December 31,
2016 | | | December 31,
2015 | |
| Suppliers and services payable | | Ps. | 1,600,673 | | | Ps. | 1,449,674 | |
| Cashier checks | | | 802,270 | | | | 786,215 | |
| Other liabilities | | | 651,506 | | | | 606,596 | |
| Dividends payable | | | 644,733 | | | | 595,605 | |
| Non-financial liabilities | | | 580,842 | | | | 545,996 | |
| Withholdings taxes and labor contributions | | | 496,437 | | | | 537,329 | |
| Collection on behalf of third parties | | | 256,035 | | | | 108,497 | |
| Collection service | | | 235,325 | | | | 105,390 | |
| Commissions and fees | | | 197,322 | | | | 371,314 | |
| Affiliate establishments | | | 194,221 | | | | 122,364 | |
| Tax levies | | | 72,790 | | | | 70,844 | |
| Financial transactions tax | | | 42,110 | | | | 31,534 | |
| Checks drawn and not paid | | | 41,093 | | | | 64,684 | |
| Insurance payables | | | 29,962 | | | | 2,081 | |
| Frozen accounts | | | 28,649 | | | | 27,073 | |
| Contributions and affiliations | | | 28,380 | | | | 21,872 | |
| Promissory buyers | | | 27,819 | | | | 42,249 | |
| Profit on sale of assets | | | 8,688 | | | | 6,671 | |
| Cash surplus | | | 8,081 | | | | 7,684 | |
| Leases | | | 8,054 | | | | 17,850 | |
| Compensation to customers | | | 1,151 | | | | 811 | |
| Deferred credits | | | 1,051 | | | | 1,123 | |
| | | Ps. | 5,957,192 | | | Ps. | 5,523,456 | |
Grupo Aval Acciones y Valores S.A.
Notes to the Consolidated Financial Statement
As of December 31, 2016 and 2015 and for the years ended December 31, 2016, 2015 and 2014
(Figures expressed in millions of Colombian pesos)
NOTE 25 – CONTROLLING INTEREST EQUITY
Authorized, issued and outstanding shares as of December 31, 2016 and 2015 consisted of the following:
| | | December 31, | | | December 31, | |
| | | 2016 | | | 2015 | |
| Authorized shares | | | 120,000,000,000 | | | | 120,000,000,000 | |
| | | | | | | | | |
| Subscribed fully paid shares | | | 22,281,017,159 | | | | 22,281,017,159 | |
| Subscribed but pending to be paid shares | | | | | | | | |
| Total outstanding shares | | | 22,281,017,159 | | | | 22,281,017,159 | |
| | | | | | | | | |
| The outstanding shares are as follows: | | | | | | | | |
| Common voting shares(1) | | | 15,254,876,823 | | | | 15,266,963,659 | |
| Preferred non-voting shares(1) (2) | | | 7,026,140,336 | | | | 7,014,053,500 | |
(1) Since 2011, Grupo Aval allows its shareholders to convert their common shares into preferred shares. For the years ended December 31, 2016 and 2015, 12,086,836 and 107,993,330 common shares were converted into preferred shares, respectively. Preferred shares have the right to receive a preferential minimum dividend of one Colombian peso (Ps. 1) per semester per share. This preferential minimum dividend is only applicable when dividends declared for common shares are less than one Colombian peso (Ps. 1). Preferential minimum dividends are not cumulative.
(2) Between September 23, 2014 and October 02, 2014, Grupo Aval issued through the New York Stock Exchange an aggregate of 1,874,074,060 preferred shares, equivalent to 93,703,703 ADRs at a price of U.S. $13.5 per ADS, raising U.S.$1.3 billion (Ps 2.4 trillion at the date of issuance). The sale of these shares generated an increase of Ps. 2,425,060 million in capital, Ps 1,874 million in subscribed capital and Ps. 2,423,186 in additional paid-in capital, for Grupo Aval.
Our by-laws provide for two classes of shares: common shares and shares with a preferred dividend, liquidation preference and no voting power (except in limited and extraordinary circumstances). Holders of preferred shares are entitled to receive a minimum dividend after deducting losses affecting the capital, and deducting any amounts set aside for legal reserve, but before creating or accruing for any other reserve and before any declared dividends are paid to holders of common shares. Dividends to holders of common shares must be approved by the shareholders. If no dividends are declared, no holder of Grupo Aval’s preferred or common shares will be entitled to payment. The minimum dividend will be equal to Ps 1.00 in each calendar semester, so long as this value is higher than the dividend paid to the holders of common shares. If the minimum preferred dividend is not equal or higher than the per share dividend on the common shares, the minimum dividend will be equal to the dividend paid to the holders of common shares, if any.
Appropriated retained earnings
As of December 31, 2016, and December 31, 2015 the appropriation of retained earnings, based on an unconsolidated basis under Colombian IFRS, is as follows:
| | | December 31, 2016 | | | December 31, 2015 | |
| Legal reserve | | Ps. | 11,140 | | | Ps. | 11,140 | |
| Statutory and voluntary reserves | | | 5,591,387 | | | | 5,012,799 | |
| | | Ps. | 5,602,527 | | | Ps. | 5,023,939 | |
Grupo Aval Acciones y Valores S.A.
Notes to the Consolidated Financial Statement
As of December 31, 2016 and 2015 and for the years ended December 31, 2016, 2015 and 2014
(Figures expressed in millions of Colombian pesos)
Legal Reserve
Pursuant to legal provisions in force, Grupo Aval and its subsidiaries in Colombia shall create a legal reserve through the appropriation of ten percent (10%) of the net profits of each year up to an amount equal to fifty percent (50%) of the subscribed capital stock. This reserve may be reduced below fifty percent (50%) of the subscribed capital stock to stem losses in excess of retained earnings. The legal reserve cannot be less than the percentage aforementioned except to cover losses in excess of retained earnings.
Statutory and Voluntary Reserves
The Statutory and voluntary reserves are determined during the Shareholders Meetings.
Declared Dividends
The dividends are decreed and paid to shareholders based on unconsolidated net income under Colombian IFRS for the immediately preceding semester:
| | | June 30, 2016 | | | December 31, 2015 | |
| Net income for the periods ended in June 30, 2016 and December 31, 2015. | | | 1,258,835 | | | | 1,086,061 | |
| Cash dividends declared | | Ps | 29.40 per share payable in six (6) installments of P.s. 4.90 per share between October 2016 and March 2017 (based on profits from the first half of 2016) | | | Ps | 29.40 per share payable in six (6) installments of P.s. 4.90 per share between April 2016 and September 2016 (based on profits from the second half of 2015) | |
| Ordinary shares outstanding | | | 15,258,916,143 | | | | 15,265,983,336 | |
| Preferred shares outstanding | | | 7,022,101,016 | | | | 7,015,033,823 | |
| Total outstanding shares | | | 22,281,017,159 | | | | 22,281,017,159 | |
| Total dividends declared | | | 655,062 | | | | 655,062 | |
On October 25, 2016, The General Meeting of Shareholders of Grupo Aval approved the amendment of the Company's by-laws in order to present the financial statements of the Company on an annualized basis for the period between the 1st of January and the 31st of December of each year. Prior to such amendment, the Company's bylaws specified the semi-annual presentation of financial statements for the periods from January 1st to June 30th and July 1st to December 31st of each year.
Earning per share
| a) | Basic earning per share |
Grupo Aval calculates basic earning per share by dividing net income for the year attributable to ordinary shareholders of Grupo Aval parent company by the weighted average number of shares outstanding during the year.
The following table summarizes the earning per share for the year ended as of December 31, 2016, 2015 and 2014:
Grupo Aval Acciones y Valores S.A.
Notes to the Consolidated Financial Statement
As of December 31, 2016 and 2015 and for the years ended December 31, 2016, 2015 and 2014
(Figures expressed in millions of Colombian pesos)
| | | December 31,
2016 | | | December 31,
2015 | | | December 31,
2014 | |
| Net income for the year | | Ps. | 3,516,936 | | | Ps. | 3,345,686 | | | Ps. | 2,997,481 | |
| Less: participation of non- controlling interests | | | (1,377,070 | ) | | | (1,304,322 | ) | | | (1,182,465 | ) |
| Net income attributable to controlling interest | | | 2,139,866 | | | | 2,041,364 | | | | 1,815,016 | |
| Less: preferred dividends declared | | | - | | | | - | | | | - | |
| Less: Allocation of undistributed earnings to preferred stockholders (1)(2) | | | (674,042 | ) | | | (638,734 | ) | | | (476,890 | ) |
| Net Income allocated to common shareholders for basic and diluted EPS | | Ps. | 1,465,824 | | | Ps. | 1,402,630 | | | Ps. | 1,338,126 | |
| Weighted average number of common shares outstanding used in basic EPS calculation (2) | | | 15,262,660,115 | | | | 15,309,380,685 | | | | 15,406,634,618 | |
| Basic and Diluted earnings per share to common shareholders (pesos) | | | 96.040 | | | | 91.619 | | | | 86.854 | |
| Basic and Diluted earnings per ADS in pesos (3) | | | 1,920.80 | | | | 1,832.38 | | | | 1,737.08 | |
(1) Based on a weighted average of 7,018,357,044 preferred shares for 2016, 6,971,636,474 preferred shares for 2015 and 5,490,721,740 preferred shares for 2014
(2) Averages based on an end of month number of preferred or common shares
(3) Each ADS represents 20 preferred shares
NOTE 26 – NON- CONTROLLING INTEREST
The following table includes financial information regarding each subsidiary of Grupo Aval that has significant non-controlling interests at December 31, 2016 and 2015:
| December 31, 2016 |
| Entity | | Country | | Non-controlling
Interest | | | Interest in the
equity | | | Interest in net
income | | | Dividends paid to
non-controlling
interest in the
year | |
| | | | | | | | | | | | | | | |
| Corporación Financiera Colombiana S.A. | | Colombia | | | 55.51 | % | | | 3,154,158 | | | | 590,036 | | | | (294,376 | ) |
| Banco Bogotá S.A. | | Colombia | | | 31.26 | % | | | 4,882,747 | | | | 685,073 | | | | (332,460 | ) |
| Banco de Occidente S.A. | | Colombia | | | 27.73 | % | | | 568,263 | | | | 53,256 | | | | (83,166 | ) |
| Banco Popular S.A. | | Colombia | | | 6.26 | % | | | 165,150 | | | | 12,347 | | | | (9,529 | ) |
| Banco Comercial AV Villas S.A. | | Colombia | | | 20.13 | % | | | 287,351 | | | | 36,358 | | | | (7,668 | ) |
| | | | | | Total | | | Ps. | 9,057,669 | | | Ps. | 1,377,070 | | | Ps. | (727,199 | ) |
Grupo Aval Acciones y Valores S.A.
Notes to the Consolidated Financial Statement
As of December 31, 2016 and 2015 and for the years ended December 31, 2016, 2015 and 2014
(Figures expressed in millions of Colombian pesos)
| December 31, 2015 |
| Entity | | Country | | Non-controlling
Interest | | | Interest in the
equity | | | Interest in net
income | | | Dividends paid to
non-controlling
interest in the
year | |
| Corporación Financiera Colombiana S.A. | | Colombia | | | 55.51 | % | | | 2,167,900 | | | | 500,546 | | | | (276,284 | ) |
| Banco Bogotá S.A. | | Colombia | | | 31.26 | % | | | 5,201,638 | | | | 681,822 | | | | (267,414 | ) |
| Banco de Occidente S.A. | | Colombia | | | 27.73 | % | | | 550,813 | | | | 62,871 | | | | (77,863 | ) |
| Banco Popular S.A. | | Colombia | | | 6.27 | % | | | 161,784 | | | | 23,671 | | | | (11,471 | ) |
| Banco Comercial AV Villas S.A. | | Colombia | | | 20.14 | % | | | 256,524 | | | | 35,412 | | | | (18,172 | ) |
| | | | | | Total | | | Ps. | 8,338,659 | | | Ps. | 1,304,322 | | | Ps. | (651,204 | ) |
The following table includes information regarding each subsidiary of Grupo Aval that has significant non- controlling interests to December 31, 2016 and 2015:
| December 31, 2016 |
| Entity | | Assets | | | Liabilities | | | Total
Income | | | Net
Income | | | OCI | | | Cash Flow from
operating
activities | |
| Corporación Financiera Colombiana S.A. | | | 20,504,644 | | | | 15,604,999 | | | | 2,135,834 | | | | 671,336 | | | | 537,304 | | | | (284,837 | ) |
| Banco Bogotá S.A. (*) | | | 141,430,749 | | | | 124,192,566 | | | | 18,141,612 | | | | 4,432,026 | | | | 970,007 | | | | 3,084,460 | |
| Banco de Occidente S.A. | | | 35,568,507 | | | | 31,177,321 | | | | 4,054,750 | | | | 627,993 | | | | 242,389 | | | | 147,776 | |
| Banco Popular S.A. | | | 20,731,144 | | | | 18,052,231 | | | | 2,478,501 | | | | 181,075 | | | | 278,374 | | | | (342,446 | ) |
| Banco Comercial AV Villas S.A. | | | 12,466,634 | | | | 11,063,550 | | | | 1,554,428 | | | | 179,550 | | | | (19,599 | ) | | | 343,303 | |
(*) includes Ps 2,208.1 billion of income resulting from the deconsolidation of Corporación Financiera Colombiana S.A.
| December 31, 2015 |
| Entity | | Assets | | | Liabilities | | | Total
Income | | | Net
Income | | | OCI | | | Cash Flow from
operating
activities | |
| Corporación Financiera Colombiana S.A. | | | 19,816,332 | | | | 15,301,384 | | | | 5,987,726 | | | | 757,747 | | | | (45,934 | ) | | | 3,063,646 | |
| Banco Bogotá S.A. (*) | | | 152,269,264 | | | | 134,835,648 | | | | 14,781,592 | | | | 2,639,101 | | | | 1,159,159 | | | | 2,382,188 | |
| Banco de Occidente S.A. | | | 35,649,865 | | | | 31,614,619 | | | | 3,217,800 | | | | 473,101 | | | | 189,285 | | | | (63,217 | ) |
| Banco Popular S.A. | | | 19,109,384 | | | | 16,542,041 | | | | 2,007,817 | | | | 349,292 | | | | 231,168 | | | | 1,157,301 | |
| Banco Comercial AV Villas S.A. | | | 11,547,162 | | | | 10,281,490 | | | | 1,320,720 | | | | 175,602 | | | | (60,985 | ) | | | 40,564 | |
(*) Does not reflect the deconsolidation of Corporación Financiera Colombiana S.A.
Grupo Aval Acciones y Valores S.A.
Notes to the Consolidated Financial Statement
As of December 31, 2016 and 2015 and for the years ended December 31, 2016, 2015 and 2014
(Figures expressed in millions of Colombian pesos)
NOTE 27 – COMMITMENTS AND CONTINGENCIES
Credit Commitments
As part of us operations, Grupo Aval grants guarantees and letters of credit to its customers wherein Grupo Aval financial subsidiaries are irrevocably committed to make payments to third parties when customers do not comply with their obligations with such third parties, with the same credit risk as of the financial assets by loans portfolios and letters of credit disbursement are subject to the same policies for approval of disbursements of loans regarding client’ credit risk and guarantees required according to the circumstances of each client.
The commitments for credit extension represent unused portions of authorizations to grant loans, use of credit cards, overdraft quotas and letters of credit. With respect to credit risk over commitments to extend credit lines, Grupo Aval is potentially exposed to losses in an amount equal to the total amount of unused commitments, if the unused amount were to be withdrawn in whole. However, the amount of the loss is less that the total amount of commitments unused, since most commitments to extend credits are contingent once the customer maintains the specific of credit risk standards.
Grupo Aval monitors maturity terms of commitments regarding credit quotas, because long-term commitments have a higher credit risk than short-term commitments.
Pending unused credit lines and guarantees do not necessarily represent future cash out flows, because such quotas may expire and not be used whole or in part.
Following is the detail of the guarantees, letters of credit and credit commitments on non-used credit lines as of December 31, 2016 and 2015.
Commitments in unused lines of credit
| | | December 31, 2016 | | | December 31, 2015 | |
| | | Notional
Amount | | | Fair
Value | | | Notional
Amount | | | Fair
Value | |
| Guarantees | | Ps. | 3,510,546 | | | Ps. | 61,030 | | | Ps. | 3,834,571 | | | Ps. | 37,813 | |
| Unused letters of credit | | | 1,084,589 | | | | 4,569 | | | | 943,558 | | | | 10,219 | |
| Unused limits of overdrafts | | | 128,621 | | | | - | | | | 254,991 | | | | - | |
| Unused credit card limits | | | 17,383,743 | | | | - | | | | 16,697,120 | | | | - | |
| Other | | | 5,480,222 | | | | - | | | | 4,860,464 | | | | - | |
| Total | | Ps. | 27,587,721 | | | Ps. | 65,599 | | | Ps. | 26,590,704 | | | Ps. | 48,032 | |
Following is the detail of the credit commitments by type of currency:
| | | December 31,
2016 | | | December 31,
2015 | |
| Colombian Pesos | | Ps. | 13,608,215 | | | Ps. | 12,347,135 | |
| U.S. dollars | | | 13,626,359 | | | | 13,869,051 | |
| Euro | | | 37,263 | | | | 76,708 | |
| Other | | | 315,884 | | | | 297,810 | |
| Total | | Ps. | 27,587,721 | | | Ps. | 26,590,704 | |
Grupo Aval Acciones y Valores S.A.
Notes to the Consolidated Financial Statement
As of December 31, 2016 and 2015 and for the years ended December 31, 2016, 2015 and 2014
(Figures expressed in millions of Colombian pesos)
Capital Expenses Commitments
As of December 31, 2016 Grupo Aval had contractual disbursement commitments of capital expenditures for Ps. 62,885.
Operating Lease Commitments
During the development of its operations, Grupo Aval executes contracts in order to receive property, plant and equipment in operating leasing, as well as certain intangibles; following is the detail of rent payment commitments of operating leasing in the forthcoming years:
| | | December 31,
2016 | | | December 31,
2015 | |
| Up to one year | | Ps. | 200,796 | | | Ps. | 142,727 | |
| Greater than one year and up to five years | | | 544,148 | | | | 467,902 | |
| More than five years | | | 309,696 | | | | 208,160 | |
| Total | | Ps. | 1,054,640 | | | Ps. | 818,789 | |
Contingencies
As of December 31, 2016 and 2015, Grupo was party to administrative and legal proceedings as defendant; the claims of the proceedings were assessed based on analyses and opinions of responsible lawyers. The following legal contingencies were determined:
Labor Proceedings
As of December 31, 2016 and 2015, labor complaints had been recognized for Ps. 30,358 and Ps.103,347 respectively. Historically, the majority of these proceedings have been resolved in favor of Grupo Aval.
Civil Proceedings
As of December 31, 2016 and 2015, the result of the assessment of the claims of legal proceedings for civil suits, not including those with remote probability, reached an amount of Ps. 432,334 and Ps. 563,889 respectively.
Administrative Proceedings and Other Proceedings
Claims relating to administrative and legal proceedings having a tax character, initiated by tax authorities of national and local orders, establish sanctions in some cases wherein Grupo Aval would incur in development of its activity as National and Territorial tax collector; other proceedings relate to greater taxes in its capacity as tax payer. As of December 31, 2016 and 2015, the amount of the claims reached the sum of Ps. 42,723 and Ps.171,013 respectively.
Grupo Aval Acciones y Valores S.A.
Notes to the Consolidated Financial Statement
As of December 31, 2016 and 2015 and for the years ended December 31, 2016, 2015 and 2014
(Figures expressed in millions of Colombian pesos)
NOTE 28 – INCOME (EXPENSES) COMMISSIONS AND FEES
Below is a detail of the expenses for commissions and fees for the years ended as of December 31, 2016, 2015 and 2014:
| Income from commissions and fees | | December 31,
2016 | | | December 31,
2015 | | | December 31,
2014 | |
| Commissions on banking services | | Ps. | 2,436,692 | | | Ps. | 1,751,527 | | | Ps. | 1,381,493 | |
| Fees on credit cards | | | 1,034,763 | | | | 1,223,189 | | | | 888,437 | |
| Pension and severance fund management | | | 824,089 | | | | 787,692 | | | | 758,364 | |
| Trust activities | | | 275,719 | | | | 233,892 | | | | 223,950 | |
| Storage services | | | 186,068 | | | | 167,323 | | | | 184,596 | |
| Commissions on drafts, checks and checkbooks | | | 67,832 | | | | 71,294 | | | | 66,090 | |
| Office network services | | | 43,508 | | | | 39,709 | | | | 43,755 | |
| Other commissions | | | 10,516 | | | | 9,607 | | | | - | |
| Total | | Ps. | 4,879,187 | | | Ps. | 4,284,233 | | | Ps. | 3,546,685 | |
| Commissions and Fees Expenses | | December 31,
2016 | | | December 31,
2015 | | | December 31,
2014 | |
| Banking Services | | Ps. | (318,672 | ) | | Ps. | (288,303 | ) | | Ps. | (221,289 | ) |
| Sales and Services Commissions | | | (99,659 | ) | | | (90,202 | ) | | | (97,579 | ) |
| Affiliations to Pension Funds | | | (68,454 | ) | | | (67,854 | ) | | | (67,283 | ) |
| Offices Network Services | | | (33,404 | ) | | | (34,437 | ) | | | (30,731 | ) |
| Information Processing Services of Operators | | | (20,963 | ) | | | (18,273 | ) | | | (16,634 | ) |
| Collection Service of Contributions to Financial Entities | | | (6,084 | ) | | | (4,962 | ) | | | (5,295 | ) |
| Fiduciary Businesses | | | (256 | ) | | | (238 | ) | | | (1,921 | ) |
| Banks Guarantees | | | (87 | ) | | | (131 | ) | | | (245 | ) |
| Credit Cards | | | (14 | ) | | | (110 | ) | | | (35 | ) |
| Other | | | (71,935 | ) | | | (117,436 | ) | | | (68,517 | ) |
| Total | | Ps. | (619,528 | ) | | Ps. | (621,946 | ) | | Ps. | (509,529 | ) |
Grupo Aval Acciones y Valores S.A.
Notes to the Consolidated Financial Statement
As of December 31, 2016 and 2015 and for the years ended December 31, 2016, 2015 and 2014
(Figures expressed in millions of Colombian pesos)
NOTE 29–NET TRADING INCOME
Income from client driven trading activities primarily conducted in markets, including foreign Exchange, Credit, Rates and Equities trading.
| | | December
31, 2016 | | | December
31, 2015 | | | December
31, 2014 | |
| Trading investment income (1) | | | | | | | | | | | | |
| Fixed income securities | | Ps. | 369,184 | | | Ps. | 143,179 | | | Ps. | 334,740 | |
| Equities | | | 127,431 | | | | 41,997 | | | | 89,411 | |
| | | Ps. | 496,615 | | | Ps. | 185,176 | | | Ps. | 424,151 | |
| Derivatives income | | | | | | | | | | | | |
| Net income (loss) on financial derivatives (2) | | Ps. | 10,593 | | | Ps. | (156,820 | ) | | | (321,639 | ) |
| Other trading income (3) | | | 217,490 | | | | 216,843 | | | | 267,341 | |
| | | Ps. | 228,083 | | | Ps. | 60,023 | | | Ps. | (54,298 | ) |
| | | | | | | | | | | | | |
| Total | | Ps. | 724,698 | | | Ps. | 245,199 | | | Ps. | 369,853 | |
| (1) | Includes net trading income from investment securities held for trading, that reflects the interest from investment in debt securities, gains/losses from mark-to-market valuation from investment in equity and debt securities and net income from trading activities. |
| (2) | Includes net trading income from derivatives, which reflects the gains/losses from mark-to-market valuation on trading derivatives. |
| (3) | Includes gains/losses from: (i) Net changes in the valuation of hedging derivatives from mark-to-market valuations from unhedged, (ii) the ineffective portion of the hedge, (iii) Transfers of due hedging derivatives from OCI to the statement of income. |
NOTE 30 – OTHER INCOME AND EXPENSE
Below is a detail of the general administrative expenses in the years ending as of December 31, 2016, December 31, 2015 and December 31, 2014:
| Other income | | December 31,
2016 | | | December 31,
2015 | | | December 31,
2014 | |
| | | | | | | | | | |
| Foreign exchange gains (losses), net | | Ps. | 517,902 | | | Ps. | 457,904 | | | Ps. | 487,353 | |
| Net gain on sale of investments (*) | | | 210,373 | | | | 79,233 | | | | 135,060 | |
| Gain (loss) on the sale of non-current assets held for sale | | | 28,392 | | | | 26,211 | | | | - | |
| Equity method (**) | | | 140,765 | | | | 230,398 | | | | 121,725 | |
| Dividends | | | 28,027 | | | | 33,611 | | | | 136,684 | |
| Income from non-financial sector | | | 929,294 | | | | 838,578 | | | | 655,092 | |
| Other operating income (***) | | | 750,648 | | | | 723,361 | | | | 560,234 | |
| | | Ps. | 2,605,401 | | | Ps. | 2,389,296 | | | Ps. | 2,096,148 | |
Grupo Aval Acciones y Valores S.A.
Notes to the Consolidated Financial Statement
As of December 31, 2016 and 2015 and for the years ended December 31, 2016, 2015 and 2014
(Figures expressed in millions of Colombian pesos)
(*) Ps. 126.0 billion increase in gains on sales of investments, net, related to the sale of Grupo Aval’s subsidiaries’ investment in CIFIN S.A. (classified as other assets) between February and May 2016, as part of a sale agreement signed with other minority shareholders to sell 100% of the company TransUnion Netherlands II B.V. CIFIN is an entity classified as a Technical and Administrative Services Company and accredited as a provider of financial, credit, commercial information and services. The financial entities selling their shares sought a strategic investor with experience and international knowledge, looking to generate added value to this company, by incorporating new knowledge, advanced technologies and better international practices in the analysis of credit information, credit risk management, and money laundering, among others.
(**) See note 14
(***) Since November 30, 2016, Grupo Aval has significant influence on Credibanco. Credibanco’s General Shareholders Meeting agreed to transform the society from a non-profit organization to a Limited Liability Company, which is now accounted for as an associate, generating a gain in non-monetary transactions.
| Other Expense | | December 31,
2016 | | | December 31,
2015 | | | December 31,
2014 | |
| Personnel expenses | | Ps. | 3,531,087 | | | Ps. | 3,111,306 | | | Ps. | 2,508,344 | |
| Taxes and fees | | | 633,260 | | | | 557,046 | | | | 477,001 | |
| Depreciation and amortization | | | 471,608 | | | | 488,212 | | | | 409,498 | |
| Leases | | | 440,777 | | | | 396,922 | | | | 320,122 | |
| Affiliation contributions and transfers | | | 428,581 | | | | 349,961 | | | | 259,636 | |
| Consulting, auditing and other fees | | | 355,590 | | | | 282,181 | | | | 225,731 | |
| Advertising services | | | 344,423 | | | | 299,281 | | | | 248,247 | |
| Maintenance and repairs | | | 317,170 | | | | 209,804 | | | | 156,873 | |
| Insurance | | | 316,852 | | | | 282,452 | | | | 245,092 | |
| Warehouse services | | | 288,491 | | | | 276,343 | | | | 246,224 | |
| Wealth tax (*) | | | 267,627 | | | | 303,193 | | | | - | |
| Temporary services | | | 184,330 | | | | 131,236 | | | | 143,504 | |
| Transportation services | | | 160,002 | | | | 150,866 | | | | 121,958 | |
| Cleaning and security services | | | 138,693 | | | | 135,299 | | | | 124,348 | |
| Electronic data processing | | | 81,682 | | | | 66,813 | | | | 64,862 | |
| Adaptation and installation | | | 67,938 | | | | 57,566 | | | | 55,529 | |
| Travel expenses | | | 54,275 | | | | 49,876 | | | | 37,788 | |
| Supplies and stationary | | | 23,722 | | | | 44,514 | | | | 65,658 | |
| Loss on sales of non-current assets held for sale | | | 7,733 | | | | - | | | | 34,350 | |
| Other | | | 405,932 | | | | 416,244 | | | | 528,689 | |
| | | Ps. | 8,519,773 | | | Ps. | 7,609,115 | | | Ps. | 6,273,454 | |
(*) Grupo Aval and its subsidiaries in Colombia are liable for wealth tax during the period from 2015 to 2017. This levy on wealth tax was establish in Colombia during 2014 according to fiscal laws and is calculated on the companies equity determined under fiscal rules at January 1, 2015, 2016 and 2017. The wealth tax is charged at progressive rates, depending on the amount of equity. These rates fluctuate between 0.20% and 1.15% in 2015, 0.15% and 1% in 2016, and 0.05% and 0.40% in 2017. During the year ended at December 31, 2016, Grupo Aval and its subsidiaries in Colombia paid Ps. 267,627 in tax, recorded in income statement.
Grupo Aval Acciones y Valores S.A.
Notes to the Consolidated Financial Statement
As of December 31, 2016 and 2015 and for the years ended December 31, 2016, 2015 and 2014
(Figures expressed in millions of Colombian pesos)
NOTE 31 – ANALYSIS OF OPERATING SEGMENTS
Operating segments are components of Grupo Aval responsible for developing commercial activities that can generate incomes or incur expenses and whose operating profit or loss are regularly reviewed by the Board of Directors of Grupo Aval, and for which financial information is available:
Until June 20, 2016, Grupo Aval was organized into four business segments, however, due to the legal reorganization explained in Note 1, the information provided to the Board of Directors has been updated and adjusted as requested to present five segments considering Corficolombiana as an additional reportable segment.
| 31.1 | Description of products and services from which each reportable segment derives its income |
Grupo Aval is organized into five business segments comprised by the four main financial entities (see note 1) of Grupo Aval: Banco de Bogotá, Banco de Occidente, Banco AV Villas, Banco Popular and Corficolombiana. All these banks and Corficolombiana, provide services relating to banking activity in Colombia and others countries in commercial, consumer, mortgage housing and microcredit banking. Corficolombiana´s core business is the active management of an equity portfolio.
| 31.2 | Factors used by management to identify reportable segments |
Operating segments identified above are based on the strategic organization of Grupo Aval in order to serve different sectors of the economy in Colombia.
| 31.3 | Measurement of the net income, and assets and liabilities of operating segments |
The Board of Directors of Grupo Aval revises the financial information of each of its operating segments and assesses the performance of each segment based on the income statement of each of them and on certain credit risk indicators, as described in note 2.26.
Following is the detail of the reportable financial information under IFRS summarized for each segment as of December 31, 2016, 2015 and 2014:
Grupo Aval Acciones y Valores S.A.
Notes to the Consolidated Financial Statement
As of December 31, 2016 and 2015 and for the years ended December 31, 2016, 2015 and 2014
(Figures expressed in millions of Colombian pesos)
Statement of Financial Position
December 31, 2016
| | | Banco
Bogotá S.A. | | | Banco de
Occidente S.A. | | | Banco
Popular S.A. | | | Banco AV
Villas S.A. | | | Corficolombiana
S.A. | | | Other (2) | | | Eliminations | | | Total | |
| Assets | | | | | | | | | | | | | | | | | | | | | | | | | | | | | | | | |
| Financial assets held for trading | | Ps. | 2,179,411 | | | Ps. | 645,607 | | | Ps. | 228,176 | | | Ps. | 182,936 | | | Ps. | 1,499,533 | | | Ps. | 834,148 | | | Ps. | (976,086 | ) | | Ps. | 4,593,725 | |
| Financial assets available for sale | | | 9,157,156 | | | | 3,991,626 | | | | 2,046,466 | | | | 1,478,433 | | | | 2,773,149 | | | | - | | | | (1,054,318 | ) | | | 18,392,512 | |
| Financial assets in debt securities held to maturity | | | 1,256,607 | | | | 542,008 | | | | 409,131 | | | | 250,980 | | | | 111,760 | | | | - | | | | - | | | | 2,570,486 | |
| Investments in associates | | | 3,354,551 | | | | 570,782 | | | | 9,103 | | | | - | | | | 932,586 | | | | 7,031,632 | | | | (10,752,007 | ) | | | 1,146,647 | |
| Loans and receivables | | | 97,169,521 | | | | 26,573,862 | | | | 16,016,683 | | | | 8,981,858 | | | | 3,141,864 | | | | 2,201,828 | | | | (3,186,884 | ) | | | 150,898,732 | |
| Other Assets | | | 28,313,503 | | | | 3,244,622 | | | | 2,021,585 | | | | 1,572,427 | | | | 12,045,752 | | | | 1,188,070 | | | | (1,914,340 | ) | | | 46,471,619 | |
| Total Assets | | Ps. | 141,430,749 | | | Ps. | 35,568,507 | | | Ps. | 20,731,144 | | | Ps. | 12,466,634 | | | Ps. | 20,504,644 | | | Ps. | 11,255,678 | | | Ps. | (17,883,635 | ) | | Ps. | 224,073,721 | |
| Liabilities | | | | | | | | | | | | | | | | | | | | | | | | | | | | | | | | |
| Customer Deposits | | | 93,676,674 | | | | 24,176,056 | | | | 14,733,350 | | | | 9,706,084 | | | | 3,846,793 | | | | - | | | | (2,251,902 | ) | | | 143,887,055 | |
| Financial Obligations | | | 25,863,311 | | | | 5,504,607 | | | | 2,451,314 | | | | 975,300 | | | | 9,288,278 | | | | 4,811,942 | | | | (3,378,471 | ) | | | 45,516,281 | |
| Other Liabilities | | | 4,652,581 | | | | 1,496,658 | | | | 867,567 | | | | 382,166 | | | | 2,469,928 | | | | 602,907 | | | | (460,644 | ) | | | 10,011,163 | |
| Total Liabilities | | Ps. | 124,192,566 | | | Ps. | 31,177,321 | | | Ps. | 18,052,231 | | | Ps. | 11,063,550 | | | Ps. | 15,604,999 | | | Ps. | 5,414,849 | | | Ps. | (6,091,017 | ) | | Ps. | 199,414,499 | |
Statement of Income year ended 2016
| | | Banco
Bogotá S.A.
(1) | | | Banco de
Occidente
S.A. | | | Banco
Popular
S.A. | | | Banco AV
Villas S.A. | | | Corficolombiana
S.A. | | | Other (2) | | | Eliminations
(1) | | | Total | |
| External Income | | | | | | | | | | | | | | | | | | | | | | | | | | | | | | | | |
| Financial Income | | Ps. | 10,481,965 | | | Ps. | 3,363,556 | | | Ps. | 2,042,878 | | | Ps. | 1,193,544 | | | Ps. | 442,398 | | | Ps. | 22,629 | | | Ps. | - | | | Ps. | 17,546,970 | |
| Fees and Commissions | | | 3,957,774 | | | | 387,986 | | | | 219,717 | | | | 237,762 | | | | 63,763 | | | | 12,185 | | | | - | | | | 4,879,187 | |
| Participation in profit or loss associates and joint business | | | (4,275 | ) | | | (484 | ) | | | 388 | | | | 729 | | | | 144,407 | | | | - | | | | - | | | | 140,765 | |
| Dividends | | | 1,779 | | | | 1,150 | | | | 3,112 | | | | 2,941 | | | | 18,973 | | | | 72 | | | | | | | | 28,027 | |
| Other Operating Income | | | 1,336,184 | | | | 93,860 | | | | 183,931 | | | | 99,701 | | | | 1,647,967 | | | | (19,355 | ) | | | - | | | | 3,342,288 | |
| | | Ps. | 15,773,427 | | | Ps. | 3,846,068 | | | Ps. | 2,450,026 | | | Ps. | 1,534,677 | | | Ps. | 2,317,508 | | | Ps. | 15,531 | | | Ps. | - | | | Ps. | 25,937,237 | |
| | | | | | | | | | | | | | | | | | | | | | | | | | | | | | | | | |
| Intersegment Income | | | | | | | | | | | | | | | | | | | | | | | | | | | | | | | | |
| Financial Incomes | | Ps. | 219,995 | | | Ps. | 2,893 | | | Ps. | 848 | | | Ps. | 6,223 | | | Ps. | 75,641 | | | Ps. | 201,737 | | | Ps. | (507,337 | ) | | Ps. | - | |
| Fees and Commissions | | | 900 | | | | 4,386 | | | | 2,282 | | | | 13,170 | | | | 2,115 | | | | 62,313 | | | | (85,166 | ) | | | - | |
| Participation in profit or loss associates and joint business | | | 116,488 | | | | 118,109 | | | | (1,206 | ) | | | (1,923 | ) | | | 100 | | | | - | | | | (231,568 | ) | | | - | |
| Dividends | | | - | | | | 20,336 | | | | 25,293 | | | | - | | | | 944 | | | | 1,158,177 | | | | (1,204,750 | ) | | | - | |
| Other Operating Income | | | 1,996,738 | | | | 62,959 | | | | 115 | | | | 1,610 | | | | (79,493 | ) | | | 189,234 | | | | (2,171,163 | ) | | | - | |
| | | | 2,334,121 | | | | 208,683 | | | | 27,332 | | | | 19,080 | | | | (693 | ) | | | 1,611,461 | | | | (4,199,984 | ) | | | - | |
| Total income | | Ps. | 18,107,548 | | | Ps. | 4,054,751 | | | Ps. | 2,477,358 | | | Ps. | 1,553,757 | | | Ps. | 2,316,815 | | | Ps. | 1,626,992 | | | Ps. | (4,199,984 | ) | | Ps. | 25,937,237 | |
| | | | | | | | | | | | | | | | | | | | | | | | | | | | | | | | | |
| Expenses | | | | | | | | | | | | | | | | | | | | | | | | | | | | | | | | |
| Financial Expenses | | Ps. | 4,568,469 | | | Ps. | 1,455,388 | | | Ps. | 995,070 | | | Ps. | 451,224 | | | Ps. | 947,603 | | | Ps. | 379,835 | | | Ps. | (405,185 | ) | | Ps. | 8,392,404 | |
| Provision for financial assets impairment | | | 1,897,902 | | | | 579,471 | | | | 229,948 | | | | 236,434 | | | | 59,176 | | | | - | | | | 1,253 | | | | 3,004,184 | |
| Depreciations and amortizations | | | 352,619 | | | | 64,252 | | | | 40,449 | | | | 24,787 | | | | 4,513 | | | | 577 | | | | (15,588 | ) | | | 471,609 | |
| Commissions and fees paid | | | 347,612 | | | | 99,804 | | | | 83,857 | | | | 98,738 | | | | 8,970 | | | | 410 | | | | (19,863 | ) | | | 619,528 | |
| Administrative Expenses | | | 2,943,832 | | | | 632,153 | | | | 501,664 | | | | 324,787 | | | | 138,626 | | | | 63,014 | | | | (194,877 | ) | | | 4,409,199 | |
| Other Operating | | | 2,414,695 | | | | 363,398 | | | | 293,930 | | | | 158,243 | | | | 104,944 | | | | 38,396 | | | | 92,862 | | | | 3,466,468 | |
| Income Tax | | | 1,150,393 | | | | 232,292 | | | | 151,365 | | | | 79,994 | | | | 381,647 | | | | 2,967 | | | | 58,251 | | | | 2,056,909 | |
| Total Expenses | | | 13,675,522 | | | | 3,426,758 | | | | 2,296,283 | | | | 1,374,207 | | | | 1,645,479 | | | | 485,199 | | | | (483,147 | ) | | | 22,420,301 | |
| Net Profit | | Ps. | 4,432,026 | | | Ps. | 627,993 | | | Ps. | 181,075 | | | Ps. | 179,550 | | | Ps. | 671,336 | | | Ps. | 1,141,793 | | | Ps. | (3,716,837 | ) | | Ps. | 3,516,936 | |
| | | | | | | | | | | | | | | | | | | | | | | | | | | | | | | | | |
| Controlling interest | | Ps. | 4,246,148 | | | Ps. | 626,393 | | | Ps. | 179,923 | | | Ps. | 179,389 | | | Ps. | 294,371 | | | Ps. | 1,141,793 | | | Ps. | (4,528,151 | ) | | Ps. | 2,139,866 | |
| Non-controlling interest | | Ps. | 185,878 | | | Ps. | 1,600 | | | Ps. | 1,152 | | | Ps. | 161 | | | Ps. | 376,964 | | | Ps. | - | | | Ps. | 811,314 | | | Ps. | 1,377,070 | |
(1) Includes Ps. 2,208,053 of income resulting from the deconsolidation of Corficolombiana.
(2) Includes Grupo Aval, Grupo Aval Limited and Grupo Aval International Limited.
Grupo Aval Acciones y Valores S.A.
Notes to the Consolidated Financial Statement
As of December 31, 2016 and 2015 and for the years ended December 31, 2016, 2015 and 2014
(Figures expressed in millions of Colombian pesos)
Statement of Financial Position
December 31, 2015
| | | Banco
Bogotá S.A. | | | Banco de
Occidente
S.A. | | | Banco
Popular
S.A. | | | Banco AV
Villas S.A. | | | Corficolombiana
S.A. | | | Other (1) | | | Eliminations | | | Total | |
| Assets | | | | | | | | | | | | | | | | | | | | | | | | | | | | | | | | |
| Financial assets held for trading | | Ps. | 2,679,167 | | | Ps. | 732,059 | | | Ps. | 274,480 | | | Ps. | 41,893 | | | Ps. | 1,907,725 | | | Ps. | 1,276,389 | | | Ps. | (1,303,560 | ) | | Ps. | 5,608,153 | |
| Financial assets available for sale | | | 9,090,584 | | | | 4,535,446 | | | | 2,001,344 | | | | 1,578,296 | | | | 3,538,517 | | | | (100,258 | ) | | | (958,984 | ) | | | 19,684,945 | |
| Financial assets in debt securities held to maturity | | | 1,126,973 | | | | 525,366 | | | | 374,197 | | | | 255,820 | | | | 112,944 | | | | (20 | ) | | | - | | | | 2,395,280 | |
| Investments in associates | | | 3,325,480 | | | | 557,384 | | | | 9,718 | | | | 313 | | | | 924,400 | | | | 18,508,858 | | | | (22,398,554 | ) | | | 927,599 | |
| Loans and receivables | | | 92,613,576 | | | | 25,630,385 | | | | 14,272,660 | | | | 8,454,946 | | | | 1,513,036 | | | | - | | | | (656,929 | ) | | | 141,827,674 | |
| Other Assets | | | 28,281,451 | | | | 3,669,226 | | | | 2,176,985 | | | | 1,215,894 | | | | 11,515,149 | | | | 6,450,574 | | | | (7,073,666 | ) | | | 46,235,613 | |
| Total Assets | | Ps. | 137,117,231 | | | Ps. | 35,649,866 | | | Ps. | 19,109,384 | | | Ps. | 11,547,162 | | | Ps. | 19,511,771 | | | Ps. | 26,135,543 | | | Ps. | (32,391,693 | ) | | Ps. | 216,679,264 | |
| Liabilities | | | | | | | | | | | | | | | | | | | | | | | | | | | | | | | | |
| Customer Deposits | | | 88,811,951 | | | | 23,890,877 | | | | 12,605,267 | | | | 8,958,536 | | | | 4,085,344 | | | | (5,500 | ) | | | (2,391,847 | ) | | | 135,954,628 | |
| Financial Obligations | | | 27,184,011 | | | | 6,147,535 | | | | 3,060,906 | | | | 936,021 | | | | 8,230,470 | | | | 7,851,942 | | | | (6,111,626 | ) | | | 47,299,259 | |
| Other Liabilities | | | 4,847,777 | | | | 1,576,206 | | | | 875,868 | | | | 386,933 | | | | 2,691,214 | | | | 429,307 | | | | (288,208 | ) | | | 10,519,097 | |
| Total Liabilities | | Ps. | 120,843,739 | | | Ps. | 31,614,618 | | | Ps. | 16,542,041 | | | Ps. | 10,281,490 | | | Ps. | 15,007,028 | | | Ps. | 8,275,749 | | | Ps. | (8,791,681 | ) | | Ps. | 193,772,984 | |
Statement of Income year ended 2015
| | | Banco Bogotá
S.A. | | | Banco de
Occidente
S.A | | | Banco
Popular S.A. | | | Banco Av
villas S.A. | | | Corficolombiana
S.A. | | | Other (1) | | | Eliminations | | | Total | |
| External Income | | | | | | | | | | | | | | | | | | | | | | | | | | | | | | | | |
| Financial Incomes | | Ps. | 8,511,620 | | | Ps. | 2,648,326 | | | Ps. | 1,623,643 | | | Ps. | 986,384 | | | Ps. | 304,109 | | | Ps. | 1,517 | | | Ps. | - | | | Ps. | 14,075,599 | |
| Fees and Commissions | | | 3,432,512 | | | | 394,039 | | | | 180,302 | | | | 218,769 | | | | 58,610 | | | | - | | | | - | | | | 4,284,232 | |
Grupo Aval Acciones y Valores S.A.
Notes to the Consolidated Financial Statement
As of December 31, 2016 and 2015 and for the years ended December 31, 2016, 2015 and 2014
(Figures expressed in millions of Colombian pesos)
| | | Banco Bogotá
S.A. | | | Banco de
Occidente
S.A | | | Banco
Popular S.A. | | | Banco Av
villas S.A. | | | Corficolombiana
S.A. | | | Other (1) | | | Eliminations | | | Total | |
| Participation in profit or loss associates and joint business | | | 178,243 | | | | 20,674 | | | | 2,002 | | | | 1,523 | | | | 27,956 | | | | - | | | | - | | | | 230,398 | |
| Dividends | | | 416 | | | | 2,638 | | | | 2,534 | | | | 1,909 | | | | 26,113 | | | | - | | | | - | | | | 33,610 | |
| Other Operating Incomes | | | 706,302 | | | | 105,337 | | | | 162,605 | | | | 90,644 | | | | 1,263,449 | | | | 195,244 | | | | - | | | | 2,523,581 | |
| | | Ps. | 12,829,093 | | | Ps. | 3,171,014 | | | Ps. | 1,971,086 | | | Ps. | 1,299,229 | | | Ps. | 1,680,237 | | | Ps. | 196,761 | | | Ps. | - | | | Ps. | 21,147,420 | |
| | | | | | | | | | | | | | | | | | | | | | | | | | | | | | | | | |
| Intersegment income | | | | | | | | | | | | | | | | | | | | | | | | | | | | | | | | |
| Financial Incomes | | Ps. | (32,382 | ) | | Ps. | 2,570 | | | Ps. | 633 | | | Ps. | 2,467 | | | Ps. | 30,274 | | | Ps. | 134,872 | | | Ps. | (138,434 | ) | | Ps. | - | |
| Fees and Commissions | | | 471 | | | | 4,752 | | | | 3,091 | | | | 11,895 | | | | 2,693 | | | | 57,472 | | | | (80,374 | ) | | | - | |
| Participation in profit or loss associates and joint business | | | (1,439 | ) | | | 75,227 | | | | (1,229 | ) | | | (2,055 | ) | | | 178,305 | | | | 912,105 | | | | (1,160,914 | ) | | | - | |
| Dividends | | | 2,105 | | | | 25,127 | | | | 30,989 | | | | - | | | | - | | | | 579,731 | | | | (637,952 | ) | | | - | |
| Other Operating Incomes | | | 207,102 | | | | 75,435 | | | | 148 | | | | 1,493 | | | | 1,482 | | | | (412,878 | ) | | | 127,218 | | | | - | |
| Total Segments income | | Ps. | 175,857 | | | Ps. | 183,111 | | | Ps. | 33,632 | | | Ps. | 13,800 | | | Ps. | 212,754 | | | Ps. | 1,271,302 | | | Ps. | (1,890,456 | ) | | Ps. | - | |
| Total income | | | 13,004,950 | | | | 3,354,125 | | | | 2,004,718 | | | | 1,313,029 | | | | 1,892,991 | | | | 1,468,063 | | | | (1,890,456 | ) | | | 21,147,420 | |
| | | Banco Bogotá
S.A. | | | Banco de
Occidente
S.A | | | Banco
Popular S.A. | | | Banco Av
villas S.A. | | | Corficolombiana
S.A. | | | Other (1) | | | Eliminations | | | Total | |
| Expenses | | | | | | | | | | | | | | | | | | | | | | | | | | | | | | | | |
| Financial Expenses | | Ps. | 3,211,116 | | | Ps. | 989,836 | | | Ps. | 583,151 | | | Ps. | 273,944 | | | Ps. | 607,989 | | | Ps. | 291,290 | | | Ps. | (205,868 | ) | | Ps. | 5,751,458 | |
| Provision for financial assets impairment | | | 1,323,338 | | | | 544,143 | | | | 63,180 | | | | 188,895 | | | | 8,468 | | | | - | | | | (274 | ) | | | 2,127,750 | |
| Depreciations and amortizations | | | 358,517 | | | | 61,396 | | | | 39,130 | | | | 22,571 | | | | 5,810 | | | | 788 | | | | - | | | | 488,212 | |
| Commissions and fees paid | | | 327,250 | | | | 151,038 | | | | 54,774 | | | | 85,195 | | | | 18,013 | | | | 508 | | | | (14,832 | ) | | | 621,946 | |
| Administrative Expenses | | | 2,508,967 | | | | 586,050 | | | | 465,226 | | | | 302,765 | | | | 90,812 | | | | 52,102 | | | | (127,136 | ) | | | 3,878,786 | |
| Other Expenses | | | 2,168,528 | | | | 352,957 | | | | 276,905 | | | | 155,355 | | | | 73,262 | | | | 27,781 | | | | (175 | ) | | | 3,054,613 | |
| Income Tax | | | 1,047,656 | | | | 195,606 | | | | 173,060 | | | | 108,704 | | | | 330,889 | | | | 3,221 | | | | 19,834 | | | | 1,878,970 | |
| Total Expenses | | | 10,945,372 | | | | 2,881,026 | | | | 1,655,426 | | | | 1,137,429 | | | | 1,135,243 | | | | 375,690 | | | | (328,451 | ) | | | 17,801,735 | |
| Net Profit | | Ps. | 2,059,578 | | | Ps. | 473,099 | | | Ps. | 349,292 | | | Ps. | 175,600 | | | Ps. | 757,748 | | | Ps. | 1,092,373 | | | Ps. | (1,562,005 | ) | | Ps. | 3,345,685 | |
| | | | | | | | | | | | | | | | | | | | | | | | | | | | | | | | | |
| Controlling interest | | Ps. | 1,903,866 | | | Ps. | 471,754 | | | Ps. | 348,487 | | | Ps. | 175,554 | | | Ps. | 445,899 | | | Ps. | 1,092,373 | | | Ps. | (2,396,570 | ) | | Ps. | 2,041,363 | |
| Non-controlling interest | | Ps. | 155,712 | | | Ps. | 1,345 | | | Ps. | 805 | | | Ps. | 46 | | | Ps. | 311,849 | | | Ps. | - | | | Ps. | 834,565 | | | Ps. | 1,304,322 | |
(1) Includes Grupo Aval, Grupo Aval Limited and Grupo Aval International Limited.
Grupo Aval Acciones y Valores S.A.
Notes to the Consolidated Financial Statement
As of December 31, 2016 and 2015 and for the years ended December 31, 2016, 2015 and 2014
(Figures expressed in millions of Colombian pesos)
Statement of Income year ended 2014
| | | Banco
Bogotá
S.A. | | | Banco de
Occidente
S.A. | | | Banco
Popular
S.A. | | | Banco AV
Villas S.A. | | | Corficolombiana
S.A. | | | Other (1) | | | Eliminations | | | Total | |
| External Income | | | | | | | | | | | | | | | | | | | | | | | | | | | | | | | | |
| Financial Income | | Ps. | 6,460,023 | | | Ps. | 2,282,635 | | | Ps. | 1,524,132 | | | Ps. | 923,953 | | | Ps. | 237,103 | | | Ps. | (6,042 | ) | | Ps. | - | | | Ps. | 11,421,804 | |
| Fees and Commissions | | | 2,770,236 | | | | 322,642 | | | | 177,085 | | | | 218,631 | | | | 58,092 | | | | - | | | | - | | | | 3,546,686 | |
| Participation in profit or loss associates and joint business | | | 177,465 | | | | 12,909 | | | | 514 | | | | 662 | | | | (69,825 | ) | | | - | | | | - | | | | 121,725 | |
| Dividends | | | 322 | | | | 15,492 | | | | 2,983 | | | | 1,128 | | | | 100,649 | | | | 16,109 | | | | - | | | | 136,683 | |
| Other Operating Income | | | 751,392 | | | | 146,784 | | | | 153,744 | | | | 84,498 | | | | 1,218,912 | | | | 25,152 | | | | - | | | | 2,380,482 | |
| | | Ps. | 10,159,438 | | | Ps. | 2,780,462 | | | Ps. | 1,858,458 | | | Ps. | 1,228,872 | | | Ps. | 1,544,931 | | | Ps. | 35,219 | | | Ps. | - | | | Ps. | 17,607,380 | |
| | | | | | | | | | | | | | | | | | | | | | | | | | | | | | | | | |
| Intersegment Income | | | | | | | | | | | | | | | | | | | | | | | | | | | | | | | | |
| Financial Incomes | | Ps. | 102,954 | | | Ps. | 2,978 | | | Ps. | 1,138 | | | Ps. | 3,164 | | | Ps. | - | | | Ps. | 99,911 | | | Ps. | (210,145 | ) | | Ps. | - | |
| Fees and Commissions | | | 172 | | | | 4,125 | | | | 3,438 | | | | 8,393 | | | | - | | | | 55,845 | | | | (71,973 | ) | | | - | |
| Participation in profit or loss associates and joint business | | | (607 | ) | | | 91,835 | | | | (514 | ) | | | (662 | ) | | | 176,966 | | | | 2,315,779 | | | | (2,582,797 | ) | | | - | |
| Dividends | | | 2,504 | | | | 77,784 | | | | 39,111 | | | | - | | | | - | | | | 20,583 | | | | (139,982 | ) | | | - | |
| Other Operating Income | | | (130,014 | ) | | | 519,255 | | | | 227 | | | | 4,424 | | | | - | | | | 224,642 | | | | (618,534 | ) | | | - | |
| | | | (24,991 | ) | | | 695,977 | | | | 43,400 | | | | 15,319 | | | | 176,966 | | | | 2,716,760 | | | | (3,623,431 | ) | | | - | |
| Total income | | Ps. | 10,134,447 | | | Ps. | 3,476,439 | | | Ps. | 1,901,858 | | | Ps. | 1,244,191 | | | Ps. | 1,721,897 | | | Ps. | 2,751,979 | | | Ps. | (3,623,431 | ) | | Ps. | 17,607,380 | |
| | | | | | | | | | | | | | | | | | | | | | | | | | | | | | | | | |
| Expenses | | | | | | | | | | | | | | | | | | | | | | | | | | | | | | | | |
| Financial Expenses | | Ps. | 2,346,465 | | | Ps. | 844,672 | | | Ps. | 505,487 | | | Ps. | 231,610 | | | Ps. | 483,767 | | | Ps. | 223,159 | | | Ps. | (136,438 | ) | | Ps. | 4,498,722 | |
| Provision for financial assets impairment | | | 1,039,147 | | | | 387,681 | | | | 92,404 | | | | 161,203 | | | | 17,078 | | | | - | | | | - | | | | 1,697,513 | |
| Depreciations and amortizations | | | 261,259 | | | | 72,864 | | | | 44,485 | | | | 26,227 | | | | 4,455 | | | | 208 | | | | - | | | | 409,498 | |
| Commissions and fees paid | | | 264,677 | | | | 129,239 | | | | 42,881 | | | | 76,275 | | | | 8,587 | | | | 641 | | | | (12,771 | ) | | | 509,529 | |
| Administrative Expenses | | | 1,872,472 | | | | 484,522 | | | | 379,523 | | | | 287,783 | | | | 63,795 | | | | 56,203 | | | | (87,174 | ) | | | 3,057,124 | |
| Other Operating | | | 1,681,031 | | | | 338,531 | | | | 251,253 | | | | 146,683 | | | | 89,732 | | | | 120,442 | | | | 1,543 | | | | 2,629,215 | |
| Income Tax | | | 983,072 | | | | 206,034 | | | | 196,005 | | | | 94,787 | | | | 315,122 | | | | 13,278 | | | | - | | | | 1,808,298 | |
| Total Expenses | | | 8,448,123 | | | | 2,463,543 | | | | 1,512,038 | | | | 1,024,568 | | | | 982,536 | | | | 413,931 | | | | (234,840 | ) | | | 14,609,899 | |
| Net Profit | | Ps. | 1,686,324 | | | Ps. | 1,012,896 | | | Ps. | 389,820 | | | Ps. | 219,623 | | | Ps. | 739,361 | | | Ps. | 2,338,048 | | | Ps. | (3,3388,591 | ) | | Ps. | 2,997,481 | |
| | | | | | | | | | | | | | | | | | | | | | | | | | | | | | | | | |
| Controlling interest | | Ps. | 1,551,348 | | | Ps. | 1,011,786 | | | Ps. | 388,392 | | | Ps. | 219,251 | | | Ps. | 479,481 | | | Ps. | 2,338,048 | | | Ps. | (4,173,289 | ) | | Ps. | 1,815,017 | |
| Non-controlling interest | | Ps. | 134,976 | | | Ps. | 1,110 | | | Ps. | 1,428 | | | Ps. | 372 | | | Ps. | 259,880 | | | Ps. | - | | | Ps. | 784,698 | | | Ps. | 1,182,464 | |
(1) Includes Grupo Aval, Grupo Aval Limited and Grupo Aval International Limited.
Grupo Aval Acciones y Valores S.A.
Notes to the Consolidated Financial Statement
As of December 31, 2016 and 2015 and for the years ended December 31, 2016, 2015 and 2014
(Figures expressed in millions of Colombian pesos)
Main eliminations of total income, expenses, assets and liabilities between segments with the corresponding consolidated entries at the level of Grupo Aval are:
| · | Loans with financial obligations of entities mainly from non-financial sector. |
| · | Investments in term deposits and outstanding bonds of in other segments. |
| · | Investments in subsidiaries elimination and record of non- controlling interests. |
| · | Expenses and incomes for commissions. |
| 31.5 | Analysis of Revenues by Products and Services |
Grupo Aval’s revenues are analyzed by products and services, in the statement of income.
Grupo Aval’s revenues for each individual country for which revenues are significant, are the following during the years ended as of December 31, 2016, December 31, 2015 and December 31, 2014:
| | | December 31,
2016 | | | December 31,
2015 | | | December 31,
2014 | |
| Colombia | | Ps. | 18,548,029 | | | Ps. | 15,749,570 | | | Ps. | 13,926,362 | |
| Panamá | | | 1,333,843 | | | | 1,293,132 | | | | 653,664 | |
| Costa Rica | | | 2,598,446 | | | | 1,778,560 | | | | 1,211,551 | |
| Guatemala | | | 1,084,436 | | | | 1,027,948 | | | | 605,644 | |
| Other countries | | | 2,372,483 | | | | 1,298,225 | | | | 1,210,159 | |
| Total Consolidated Revenues | | Ps. | 25,937,237 | | | Ps. | 21,147,435 | | | Ps. | 17,607,380 | |
The foregoing analysis is based on the customer's domicile. Income from off- shore entities of Colombian customers are reported as income from Colombia. The revenues include income for interests, fees, commissions and other operating income.
| 31.7 | Non-current assets by Country |
Grupo Aval’s non-current assets for each individual country for which noncurrent assets are significant, are the following during the years ended as of December 31, 2016 and December 31, 2015:
December 31, 2016
| | | Own – use Property, plant and
equipment, net | | | (*) Intangible assets | |
| Colombia | | Ps. | 4,702,347 | | | Ps. | 5,496,699 | |
| Panamá | | | 208,727 | | | | 3,681,756 | |
| Costa Rica | | | 376,984 | | | | 113,009 | |
| Guatemala | | | 97,798 | | | | 14,110 | |
| Other countries | | | 513,393 | | | | 1,059,718 | |
| Total | | Ps. | 5,899,249 | | | Ps. | 10,365,292 | |
(*) see the notes 16 through 18.
Grupo Aval Acciones y Valores S.A.
Notes to the Consolidated Financial Statement
As of December 31, 2016 and 2015 and for the years ended December 31, 2016, 2015 and 2014
(Figures expressed in millions of Colombian pesos)
December 31, 2015
| | | Own – use Property, plant and
equipment, net | | | (*) Intangible assets | |
| Colombia | | Ps. | 4,575,795 | | | Ps. | 4,958,791 | |
| Panamá | | | 202,153 | | | | 3,951,630 | |
| Costa Rica | | | 384,485 | | | | 52,377 | |
| Guatemala | | | 105,648 | | | | 8,449 | |
| Other countries | | | 467,509 | | | | 1,088,321 | |
| Total | | Ps. | 5,735,590 | | | Ps. | 10,059,568 | |
(*) see the note from 16 to 18.
During the year ended December 31, 2016, 2015 and 2014, Grupo Aval’s reported no concentration of revenue in customers with more than a 10% share of revenue from ordinary activities.
NOTE 32 – OFFSET OF FINANCIAL ASSETS WITH FINANCIAL LIABILITIES
Following is a detail of the financial instruments subject to offset contractually required as of December 31, 2016 and 2015:
December 31, 2016
| | | Gross
Amounts of | | | Gross
Amonts
Offset in the | | | Net Amounts
of Assets
Presented in
the | | | Gross Amounts Not
Offset in the Consolidated
Balance Sheet | | | | |
| | | Recognized
Assets | | | Consolidated
Balance Sheet | | | Consoliated
Balance Sheet | | | Financial
Instruments | | | Collateral Received | | | Net
Exposure | |
| Offsetting assets | | | | | | | | | | | | | | | | | | | | | | | | |
| Derivatives | | Ps. | 864,460 | | | Ps. | (233,772 | ) | | Ps. | 630,688 | | | Ps. | (4,890 | ) | | Ps. | (40,241 | ) | | Ps. | 585,557 | |
| Repurchase agreements | | | 711,950 | | | | - | | | | 711,950 | | | | (671,028 | ) | | | - | | | | 40,922 | |
| Total | | Ps. | 1,576,410 | | | Ps. | (233,772 | ) | | Ps. | 1,342,638 | | | Ps. | (675,918 | ) | | Ps. | (40,241 | ) | | Ps. | 626,479 | |
| | | Gross
Amounts of | | | Gross
Amounts
Offset in the | | | Net Amounts
of Liabilities
Presented in
the | | | Gross Amounts Not
Offset in the Consolidated
Balance Sheet | | | | |
| | | Recognized
Liabilities | | | Consolidated
Balance Sheet | | | Consolidated
Balance Sheet | | | Financial
Instruments | | | Collateral
Received | | | Net
Exposure | |
| | | | | | | | | | | | | | | | | | | |
| Offsetting liabilities | | | | | | | | | | | | | | | | | | | | | | | | |
| Derivatives | | | 942,258 | | | | (258,127 | ) | | | 684,131 | | | | (51,030 | ) | | | (90,228 | ) | | | 542,873 | |
| Repurchase agreements | | | 5,457,370 | | | | - | | | | 5,457,370 | | | | (5,264,105 | ) | | | - | | | | 193,265 | |
| Total | | Ps. | 6,399,628 | | | Ps. | (258,127 | ) | | Ps. | 6,141,501 | | | Ps. | (5,315,135 | ) | | Ps. | (90,228 | ) | | Ps. | 736,138 | |
Grupo Aval Acciones y Valores S.A.
Notes to the Consolidated Financial Statement
As of December 31, 2016 and 2015 and for the years ended December 31, 2016, 2015 and 2014
(Figures expressed in millions of Colombian pesos)
December 31, 2015
| | | Gross
Amounts of | | | Gross
Amonts
Offset in the | | | Net Amounts
of Assets
Presented in
the | | | Gross Amounts Not
Offset in the Consolidated
Balance Sheet | | | | |
| | | Recognized
Assets | | | Consolidated
Balance Sheet | | | Consoliated
Balance Sheet | | | Financial
Instruments | | | Collateral Received | | | Net
Exposure | |
| Offsetting assets | | | | | | | | | | | | | | | | | | | | | | | | |
| Derivatives | | Ps. | 1,225,158 | | | Ps. | (160,383 | ) | | Ps. | 1,064,775 | | | Ps. | - | | | Ps. | (15,212 | ) | | Ps. | 1,049,563 | |
| Repurchase agreements | | | 560,943 | | | | - | | | | 560,943 | | | | (464,765 | ) | | | - | | | | 96,178 | |
| Total | | Ps. | 1,786,101 | | | Ps. | (160,383 | ) | | Ps. | 1,625,718 | | | Ps. | (464,765 | ) | | Ps. | (15,212 | ) | | Ps. | 1,145,741 | |
| | | Gross
Amounts of | | | Gross
Amonts
Offset in the | | | Net Amounts
of Assets
Presented in
the | | | Gross Amounts Not
Offset in the Consolidated
Balance Sheet | | | | |
| | | Recognized
Assets | | | Consolidated
Balance Sheet | | | Consoliated
Balance Sheet | | | Financial
Instruments | | | Collateral Received | | | Net
Exposure | |
| | | | | | | | | | | | | | | | | | | |
| Offsetting liabilities | | | | | | | | | | | | | | | | | | | | | | | | |
| Derivatives | | | 1,999,924 | | | | (518,468 | ) | | | 1,481,456 | | | | - | | | | (351,540 | ) | | | 1,129,916 | |
| Repurchase agreements | | | 8,572,582 | | | | - | | | | 8,572,582 | | | | (8,527,826 | ) | | | - | | | | 44,756 | |
| Total | | Ps. | 10,572,506 | | | Ps. | (518,468 | ) | | Ps. | 10,054,038 | | | Ps. | (8,527,826 | ) | | Ps. | (351,540 | ) | | Ps. | 1,174,672 | |
NOTE 33 – UNCONSOLIDATED STRUCTURED ENTITIES
The term "unconsolidated structured entities" refers to all structured entities that are not controlled by Grupo Aval. Grupo Aval enters into transactions with unconsolidated structured entities in the normal course of business to facilitate customer transactions and for specific investment opportunities.
The table below shows the total assets of unconsolidated structured entities in which Grupo Aval had an interest at the reporting date and its maximum exposure to loss in relation to those interests.
Nature and risks associated with Grupo Aval’s interests in unconsolidated structured entities
| December 31, 2016 | | Securitizations | | | Grupo
Aval’s managed
funds | | | Total | |
| | | | | | | | | | |
| Grupo Aval’s interest-assets | | | | | | | | | | | | |
| Investments at fair value through profit or loss | | Ps. | 27,377 | | | Ps. | 2,719,217 | | | Ps. | 2,746,594 | |
| Other account receivables | | | - | | | | 45,489 | | | | 45,489 | |
| Total assets in relation to the Grupo Aval’s interests in the unconsolidated structured entities | | | 27,377 | | | | 2,764,706 | | | | 2,792,083 | |
| Grupo Aval’s maximum exposure | | Ps. | 27,377 | | | Ps. | 2,764,706 | | | Ps. | 2,792,083 | |
Grupo Aval Acciones y Valores S.A.
Notes to the Consolidated Financial Statement
As of December 31, 2016 and 2015 and for the years ended December 31, 2016, 2015 and 2014
(Figures expressed in millions of Colombian pesos)
| December 31, 2015 | | Securitizations | | | Grupo
Aval’s managed
funds | | | Total | |
| Grupo Aval’s interest-assets | | | | | | | | | | | | |
| Investments at fair value through profit or loss | | Ps. | 38,975 | | | Ps. | 944,656 | | | Ps. | 983,631 | |
| Other account receivables | | | - | | | | 36,928 | | | | 36,928 | |
| Total assets in relation to the Grupo Aval’s interests in the unconsolidated structured entities | | | 38,975 | | | | 981,584 | | | | 1,020,559 | |
| Grupo Aval’s maximum exposure | | Ps. | 38,975 | | | Ps. | 981,584 | | | Ps. | 1,020,559 | |
Grupo Aval invests in asset-backed securities issued by securitization entities for which underlying assets are mortgages granted by financial institutions. Grupo Aval does not have a significant exposure to sub-prime securities. The asset-backed securities are denominated in local market TIPS and accounted for as investment at fair value through profit or loss. These asset-backed securities have different maturities and are generally classified by credit ratings. Also, Grupo Aval retains beneficial interests in the form of servicing fees on the securitized receivable and manages funds.
In the normal course of operations, Grupo Aval has trust companies that manage collective investment funds and assets of third parties whose the managing trustees receive commissions. Additionally Grupo Aval has the subsidiary Fondo de Pensiones y Cesantias Porvenir S. A. which according to Colombian rules is required to directly invest on severance and mandatory pensions funds managed for it set in equity for a total amount of 1% of the assets of these funds. For management services provided by the trust and Porvenir, commissions vary according to the conditions of each fund or asset managed are received.
The obligations of these entities in the administration of these assets are of means and do not guarantee the results. The maximum exposure risk of loss is determined by the possible failures in the administration of the funds by the amount of the returns that manages and the return of the results of assets the clients.
Grupo Aval Acciones y Valores S.A.
Notes to the Consolidated Financial Statement
As of December 31, 2016 and 2015 and for the years ended December 31, 2016, 2015 and 2014
(Figures expressed in millions of Colombian pesos)
NOTE 34 - TRANSFERS OF FINANCIAL ASSETS
Grupo Aval enters into transactions in the normal course of business by which it transfers financial assets to third parties. Depending on the circumstances, these transfers may either result in these financial assets being derecognized or continuing to be recognized.
| A. | Transferred financial assets not qualifying for full derecognition |
| i. | Sale and repurchase agreements |
Sales and repurchase agreements are transactions in which Grupo Aval sells security and simultaneously agrees to repurchase it (or an asset that is substantially the same) at a fixed price on a future date. Grupo Aval continues to recognize the securities in their entirety in the statement of financial position because it retains substantially all of the risks and rewards of ownership. The cash consideration received is recognized as a financial asset and a financial liability is recognized for the obligation to pay the repurchase price. Because Grupo Aval sells the contractual rights to the cash flows of the securities, it does not have the ability to use the transferred assets during the term of the arrangement. As of December 31, 2016, the financial investments debt securities available for sale that are being used as collateral in repo operations amounted Ps. 4,634,984 (December 31, 2015 Ps. 7,436,392) see Note 8, and financial assets held for trading that are being used as collateral in repo operations amounted Ps. 629,121 (December 31, 2016 Ps. 1,091,434) See Note 7.
As of December 31, 2016 and 2015 Grupo Aval has not recorded securities lending.
| B. | Transfer of financial assets that are derecognized in their entirety. |
Certain securitization transactions undertaken by Grupo Aval result in the derecognizing transferred assets in their entirety. This is the case when Grupo Aval transfers substantially all of the risks and rewards of ownership of financial assets to unconsolidated securitization vehicle and retains a relatively small interest in the vehicle or a service arrangement in respect of the transferred financial assets. If the financial assets are derecognized in the entirety, then the interest in unconsolidated securitization vehicles that Grupo Aval receives as part of the transfer and the service arrangement represent continuing involvement with those assets.
During the years ended at December 31, 2016, 2015 and 2014, Grupo Aval did not transfer financial assets to special purpose vehicles. However before 2014, a subsidiary bank made a transfer of mortgage loans to unconsolidated special purpose vehicles as the bank did not have control over them. In the securitization process, Grupo Aval received investment securities as payment for the transferred assets classified as investments at fair value adjusted in profit or loss at December 31, 2016, 2015 and 2014. At present, the subsidiary bank collects the accounts receivable transferred to the vehicle, and such collected amounts are immediately transferred to the special purpose vehicle in charge of such accounts. For collecting the payments, Grupo Aval receives 1% as commission fee based on the collected
Grupo Aval Acciones y Valores S.A.
Notes to the Consolidated Financial Statement
As of December 31, 2016 and 2015 and for the years ended December 31, 2016, 2015 and 2014
(Figures expressed in millions of Colombian pesos)
accounts receivable. A loss can potentially occur if the costs incurred in the execution of the collecting service exceed the commission fee revenue received.
The table below explain in detail the assets at December 31, 2016, 2015 and 2014 that represent the continuing involvement of Grupo Aval with the accounts receivable transferred and revenue obtained during the collecting process of such loans.
| At the end of the year | | December 31,
2016 | | | December 31,
2015 | | | December 31,
2014 | |
| Financial assets (1) | | Ps. | 27,377 | | | Ps. | 38,975 | | | Ps. | 52,808 | |
| Income for commission and fees | | Ps. | 96 | | | Ps. | 359 | | | Ps. | 560 | |
| (1) | Include investments held for trading through profit or loss and available for sale |
The financial assets held for trading through profit or loss securities in the special purpose vehicle which managed the loans and receivables represents Grupo Aval´s maximum exposure to loss from its continuing involvement in the form of notes issued by unconsolidated securitization vehicles is their carrying amount.
NOTE 35 – RELATED PARTIES
Grupo Aval has implemented IAS 24 in order to identify the persons and entities that must treated as a related party for the preparation of its consolidated financial statements.
To verify the correct identification of relationships and transaction with related parties, the Group has established a specific writtenProcedure for the Identification and Disclosure of Balances and Transactions with Related Parties. Such procedure is communicated and made available to our personnel through the Group’s intranet. In application of this procedure, our members of the board of directors and our key management personnel are periodically required to identify close family members and entities over which such persons have significant influence. Such process is conducted by means of a written request containing the criteria that such person must consider in order to provide information on close family members and entities that must be disclosed as their related parties.
In addition, Grupo Aval Vice-Presidency of Accounting Consolidation periodically performs an evaluation of its controlling and non-controlling investments in other entities to identify if such entities should be treated as a related entity pursuant to IAS 24.
In October 28, 2015, Grupo Aval’s board of directors approved aReference Framework for Institutional Relations applicable to Grupo Aval and its subsidiaries. Among other things, such framework established guidelines for intragroup operations oriented to regulate this type of transactions and to generate an adequate balance between the best interests of Grupo Aval at a consolidated level and that of the minority shareholders of the entities forming part of Grupo Aval and/or its subsidiaries. The following are some of the guidelines included in the abovementioned corporate framework:
| · | Grupo Aval and its subsidiaries shall permanently carry out the registration of the operations performed with related parties, identifying the type of operation, its purpose, economic conditions and authorizations received when applicable. |
Grupo Aval Acciones y Valores S.A.
Notes to the Consolidated Financial Statement
As of December 31, 2016 and 2015 and for the years ended December 31, 2016, 2015 and 2014
(Figures expressed in millions of Colombian pesos)
| · | Grupo Aval and its subsidiaries shall establish limits of indebtedness or exposure and perform constant monitoring of the intragroup operations, complying for such purpose with the restrictions set forth under applicable regulations. |
| · | All intragroup operations shall be fully identified by accounting areas of the respective entities. |
| · | Authorization levels are defined within the governance and control structure, assigned as may be deemed adequate as a function of the magnitude and type of transaction, keeping the evidence of such authorizations. |
Grupo Aval Acciones y Valores S.A.
Notes to the Consolidated Financial Statement
As of December 31, 2016 and 2015 and for the years ended December 31, 2016, 2015 and 2014
(Figures expressed in millions of Colombian pesos)
| · | It should be verified that related party transactions are carried out for a good and valuable consideration, at market conditions, maintaining a financial equilibrium in the relationships between the entities participating in the operation. |
ThisReference Framework for Institutional Relations was also submitted to the consideration and approval of the Board of Directors of our subsidiaries and has been made available in the web sites of Grupo Aval and its subsidiaries.
In 2016, Grupo Aval conducted a scope analysis of the applicable definitions for related party transactions under IAS 24 and balances reporting for IFRS purposes. Accordingly, figures for 2015 have been re-expressed in this section reflecting related party transactions after the scope analysis definitions. This changes had no financial statement impact other than for disclosure purposes.
In consideration of the foregoing, balances as of December 31, 2016 and 2015, with related parties, are included on the following tables:
| | | Individuals | | | Entity | |
| December 31, 2016 | | Mr.
Sarmiento
Angulo
and
relatives | | | Key
management
personnel
and their
affiliates | | | Associates
and joint
arrangements | | | Entities
controlled by
individuals | | | Entities with
significant
influence by
individuals | |
| | | | | | | | | | | | | | | | |
| Assets | | | | | | | | | | | | | | | | | | | | |
| Cash and equivalents | | Ps. | - | | | Ps. | - | | | Ps. | - | | | Ps. | - | | | Ps. | - | |
| Financial assets in investments | | | - | | | | - | | | | 157,427 | | | | - | | | | - | |
| Financial assets in credit operations | | | 3,897 | | | | 9,520 | | | | 1,809,972 | | | | 1,276,534 | | | | 24,695 | |
| Accounts receivable | | | 3 | | | | 28 | | | | 157,725 | | | | 8,781 | | | | 125,532 | |
| Other assets | | | - | | | | 1 | | | | 41,168 | | | | 30,068 | | | | - | |
| | | | | | | | | | | | | | | | | | | | | |
| Liabilities | | | | | | | | | | | | | | | | | | | | |
| Deposits | | Ps. | 100,787 | | | Ps. | 39,431 | | | Ps. | 2,610,620 | | | Ps. | 446,802 | | | Ps. | 588 | |
| Accounts payable | | | 73 | | | | 582 | | | | 16,215 | | | | 641,363 | | | | 37,831 | |
| Financial obligations | | | 3 | | | | 308 | | | | 9,445 | | | | - | | | | - | |
| Other liabilities | | | - | | | | - | | | | 1,984 | | | | 3,982 | | | | - | |
Grupo Aval Acciones y Valores S.A.
Notes to the Consolidated Financial Statement
As of December 31, 2016 and 2015 and for the years ended December 31, 2016, 2015 and 2014
(Figures expressed in millions of Colombian pesos)
| | | Individuals | | | Entity | |
| December 31, 2015 | | Mr.
Sarmiento
Angulo and
relatives | | | Key management
personnel and
their affiliates | | | Associates and
joint
arrangements | | | Entities controlled
by individuals | | | Entities with
significant
influence by
individuals | |
| | | | | | | | | | | | | | | | |
| Assets | | | | | | | | | | | | | | | | | | | | |
| Cash and equivalents | | Ps. | - | | | Ps. | - | | | Ps. | 59 | | | Ps. | - | | | Ps. | - | |
| Financial assets in investments | | | - | | | | - | | | | 891,187 | | | | - | | | | - | |
| Financial assets in credit operations | | | 361 | | | | 9,806 | | | | 1,540,511 | | | | 949,347 | | | | 24,784 | |
| Accounts receivable | | | 1 | | | | 32 | | | | 107,542 | | | | 6,758 | | | | 10,549 | |
| Other assets | | | - | | | | - | | | | 44,899 | | | | 32,768 | | | | - | |
| | | | | | | | | | | | | | | | | | | | | |
| Liabilities | | | | | | | | | | | | | | | | | | | | |
| Deposits | | Ps. | 73,039 | | | Ps. | 16,678 | | | Ps. | 2,493,494 | | | Ps. | 640,864 | | | Ps. | 8,829 | |
| Accounts payable | | | 75 | | | | 55 | | | | 20,744 | | | | 720,611 | | | | 3 | |
| Financial obligations | | | - | | | | 31 | | | | 9,333 | | | | - | | | | - | |
| Other liabilities | | | - | | | | - | | | | 2,947 | | | | 258 | | | | - | |
The transactions during the years ended as of December 31, 2016 and 2015 with related parties comprise:
Grupo Aval Acciones y Valores S.A.
Notes to the Consolidated Financial Statement
As of December 31, 2016 and 2015 and for the years ended December 31, 2016, 2015 and 2014
(Figures expressed in millions of Colombian pesos)
| | | Individuals | | | Entity | |
| December 31, 2016 | | Mr.
Sarmiento
Angulo and
relatives | | | Key management
personnel and their
affiliates | | | Associates and
joint
arrangements | | | Entities controlled
by individuals | | | Entities with
significant
influence by
individuals | |
| | | | | | | | | | | | | | | | |
| Income | | | | | | | | | | | | | | | | | | | | |
| Interest income | | Ps. | 28 | | | | 321 | | | | 81,646 | | | | 64,299 | | | | 789 | |
| Fee income and commissions | | | 4 | | | | 28 | | | | 12,717 | | | | 33,659 | | | | - | |
| Leases | | | - | | | | - | | | | 66 | | | | 290 | | | | 30 | |
| Other income | | | 440 | | | | - | | | | 171,405 | | | | 2,957 | | | | 9,915 | |
| | | | | | | | | | | | | | | | | | | | | |
| Expenses | | | | | | | | | | | | | | | | | | | | |
| Financial expenses | | | 84 | | | | 656 | | | | 88,800 | | | | 19,064 | | | | - | |
| Fee expenses and commissions | | | 333 | | | | 931 | | | | 15,451 | | | | 2,674 | | | | 143 | |
| Operating expenses | | | - | | | | 5,588 | | | | 75 | | | | 2,060 | | | | 1 | |
| Other expenses | | | 11 | | | | 1,390 | | | | 193,762 | | | | 15,159 | | | | 811 | |
| | | Individuals | | | Entity | |
| December 31, 2015 | | Mr.
Sarmiento
Angulo and
relatives | | | Key management
personnel and their
affiliates | | | Associates and
joint
arrangements | | | Entities controlled
by individuals | | | Entities with
significant
influence by
individuals | |
| | | | | | | | | | | | | | | | |
| Income | | | | | | | | | | | | | | | | | | | | |
| Interest income | | Ps. | 84 | | | | 379 | | | | 66,562 | | | | 23,506 | | | | 1,122 | |
| Fee income and commissions | | | 3 | | | | 28 | | | | 6,471 | | | | 26,775 | | | | - | |
| Leases | | | - | | | | - | | | | 278 | | | | 262 | | | | 19 | |
| Other income | | | 2 | | | | 80 | | | | 190,571 | | | | 2,423 | | | | 5,786 | |
| | | | | | | | | | | | | | | | | | | | | |
| Expenses | | | | | | | | | | | | | | | | | | | | |
| Financial expenses | | | 163 | | | | 209 | | | | 324 | | | | 18,001 | | | | - | |
| Fee expenses and commissions | | | 2 | | | | 1,327 | | | | 13,597 | | | | 1,227 | | | | 8 | |
| Operating expenses | | | - | | | | 8,288 | | | | 114 | | | | 1,963 | | | | - | |
| | | | | | | | | | | | | | | | |
| Other expenses | | | 5 | | | | 154 | | | | 71,759 | | | | 27,916 | | | | 60 | |
Grupo Aval Acciones y Valores S.A.
Notes to the Consolidated Financial Statement
As of December 31, 2016 and 2015 and for the years ended December 31, 2016, 2015 and 2014
(Figures expressed in millions of Colombian pesos)
Outstanding amounts are not guaranteed and shall be liquidated in cash. Guarantees have not been granted or received. No expense has been recognized during the current period nor in previous periods with respect to uncollectable or accounts of doubtful collection relating to amounts in debt by related parties.
| b. | Compensation of Key Management Personnel |
The compensation received by the key personnel of the management comprises the following:
| | | Years ended as of | |
| Items | | December
31, 2016 | | | December
31, 2015 | | | December
31, 2014 | |
| Salaries | | Ps. | 15,731 | | | Ps. | 14,271 | | | Ps. | 14,246 | |
| Short term benefits for employees | | | 10,664 | | | | 12,282 | | | | 10,515 | |
| Total | | Ps. | 26,395 | | | Ps. | 26,553 | | | Ps. | 24,761 | |
Transactions with our related parties correspond primarily to normal course of banking business activities effected in market conditions. Such transactions include demand and saving deposits, time deposits, commercial, consumer and mortgage loans, financial leases, payment of dividends and or interest. Our subsidiaries may eventually enter into operations among themselves inherent to their financial activities, including credit operations, foreign exchange intermediation operations and stock market brokerage although eliminated in consolidated in financial statement. For the purpose of conducting intragroup operations relating to financial services and products offered, our subsidiaries must strictly comply at all times with applicable regulations, as well as with policies and procedures of Grupo Aval (such as the Reference Framework for Institutional Relations) regulating these types of operations. Particularly regarding the establishment of counterparty limits, applicable exposure limits per type of operation and the obligation of performing such operations under prevailing market and economic terms and conditions, as well as the need of performing disclosures to the market through mechanisms established for said purpose, such as their inclusion in the financial statements and publishing relevant information, as the case may be.
Grupo Aval Acciones y Valores S.A.
Notes to the Consolidated Financial Statement
As of December 31, 2016 and 2015 and for the years ended December 31, 2016, 2015 and 2014
(Figures expressed in millions of Colombian pesos)
NOTE 36 – SUBSEQUENT EVENTS
At the General Meeting of Shareholders that took place on March 31st, 2017, it was declared a dividend of Ps. 4.90 per month for the preferred and common shares, during period of twelve-month between April, 2017 and March 2018, for a total dividend of Ps. 1,310,124 according to the following:
| Net income for the six-month period ended December 31, 2016 included in the unconsolidated financial statements of Grupo Aval | | | 1,053,594 | |
| Occasional reserve release at the disposal of the General Meeting of Shareholders | | | 5,591,387 | |
| Total Income available for disposal of the General Meeting of Shareholders | | | 6,644,981 | |
| | | | | |
| Cash Dividends | | | Ps. 58.80 per share payable in twelve monthly installments of Ps.4.90 per share, from April, 2017 to March, 2018. | |
| Ordinary shares outstanding | | | 15,240,124,702 | |
| Preferred shares outstanding | | | 7,040,892,457 | |
| Total shares outstanding | | | 22,281,017,159 | |
| Total dividends declared | | Ps. | 1,310,124 | |
| | | | | |
| To Occasional reserve at the disposal of General Meeting of Shareholders | | | 5,334,857 | |
In a meeting held on March 31th 2017, Grupo Aval’s Board of Directors approved the presentation of the consolidated financial statements under Colombian IFRS and the accompanying notes for the period ended December 31, 2016, for consideration of the General Meeting of Shareholders.
NOTE 37 – PARENT COMPANY INFORMATION
Condensed Unconsolidated Statement of financial positions
Following are the condensed separate statement of financial position and statement of income of Grupo Aval Acciones y Valores S.A., at December 31, 2016, and 2015 and statement of cash flows for the fiscal year ended December 31, 2016 and 2015.
Condensed separate Statement of Financial Position
| | | December 31, | |
| | | 2016 | | | 2015 | |
| Current Assets | | | | | | | | |
| Cash and cash equivalents | | Ps. | 47,280 | | | Ps. | 12,164 | |
| Trading securities | | | 4,980 | | | | 4,456 | |
| Accounts receivable from related parties | | | 260,445 | | | | 251,321 | |
| Other assets | | | 17,759 | | | | 14,713 | |
| Total current assets | | Ps. | 330,464 | | | Ps. | 282,654 | |
Grupo Aval Acciones y Valores S.A.
Notes to the Consolidated Financial Statement
As of December 31, 2016 and 2015 and for the years ended December 31, 2016, 2015 and 2014
(Figures expressed in millions of Colombian pesos)
| | | December 31, | |
| | | 2016 | | | 2015 | |
| Non-current Assets | | | | | | | | |
| Investments in subsidiaries | | | 17,529,893 | | | | 16,584,183 | |
| Property and equipment | | | 3,170 | | | | 3,294 | |
| Other assets | | | - | | | | 41 | |
| Total non-current assets | | Ps. | 17,533,063 | | | Ps. | 16,587,518 | |
| | | | | | | | | |
| Total assets | | Ps. | 17,863,527 | | | Ps. | 16,870,172 | |
| | | | | | | | | |
| Current liabilities | | | | | | | | |
| Borrowings at amortized cost | | | 370,349 | | | | 3,696 | |
| Outstanding bonds at amortized cost | | | 6,701 | | | | 119,079 | |
| Accounts payable | | | 430,279 | | | | 428,021 | |
| Other non-financial liabilities | | | 1,234 | | | | 1,244 | |
| Total current liabilities | | Ps. | 808,563 | | | Ps. | 552,040 | |
| | | | | | | | | |
| Long-term liabilities | | | | | | | | |
| Borrowings at amortized cost | | | 365,605 | | | | 514,322 | |
| Outstanding bonds | | | 704,080 | | | | 404,080 | |
| Total non-current liabilities | | Ps. | 1,069,685 | | | Ps. | 918,402 | |
| | | | | | | | | |
| Total liabilities | | Ps. | 1,878,248 | | | Ps. | 1,470,442 | |
| | | | | | | | | |
| Equity | | | | | | | | |
| Shareholders’ equity | | | 15,985,279 | | | | 15,399,730 | |
| | | | | | | | | |
| Total liabilities and shareholders’ equity | | Ps. | 17,863,527 | | | Ps. | 16,870,172 | |
| Condensed separate Statement of Income | | December 31,
2016 | | | December 31,
2015 | | | December 31,
2014 | |
| | | | | | | | | | |
| Operating revenue | | | | | | | | | | | | |
| Equity method income, net | | | 2,330,814 | | | | 2,331,965 | | | | 2,272,478 | |
| Other revenue from ordinary activities | | | 77,387 | | | | 75,262 | | | | 113,962 | |
| Total operating revenue | | Ps. | 2,408,201 | | | Ps. | 2,407,227 | | | Ps. | 2,386,440 | |
| | | | | | | | | | | | | |
| Expenses, net | | | | | | | | | | | | |
| Administrative expenses | | | 98,130 | | | | 79,908 | | | | 84,288 | |
| Other expenses | | | 168 | | | | 337 | | | | 783 | |
| (Losses) Gains from exchange differences | | | (1,085 | ) | | | (29,760 | ) | | | 114,006 | |
| Operating income | | Ps. | 2,308,818 | | | Ps. | 2,297,222 | | | Ps. | 2,415,375 | |
| | | | | | | | | | | | | |
| Financial expenses | | | 125,585 | | | | 68,512 | | | | 150,020 | |
| | | | | | | | | | | | | |
| Earnings before taxes | | | 2,183,233 | | | | 2,228,710 | | | | 2,265,355 | |
| Income tax expense | | | 5,620 | | | | 6,571 | | | | 15,737 | |
| Net income | | Ps. | 2,177,613 | | | Ps. | 2,222,139 | | | Ps. | 2,249,618 | |
Grupo Aval Acciones y Valores S.A.
Notes to the Consolidated Financial Statement
As of December 31, 2016 and 2015 and for the years ended December 31, 2016, 2015 and 2014
(Figures expressed in millions of Colombian pesos)
| Condensed separate Cash flow | | December 31,
2016 | | | December 31,
2015 | | | December 31,
2014 | |
| | | | | | | | | | |
| Net income | | Ps. | 2,177,613 | | | Ps. | 2,222,139 | | | Ps. | 2,249,618 | |
| Adjustments to reconcile net income to net cash used by operating activities | | | (1,726,296 | ) | | | (1,470,593 | ) | | | (1,681,323 | ) |
| Net cash provided by operating activities | | | 451,317 | | | | 751,546 | | | | 568,295 | |
| Net cash provided (used in) by investing activities | | | (55,374 | ) | | | 192,801 | | | | (2,342,535 | ) |
| Net cash (used in) provided by financing activities | | | (360,827 | ) | | | (974,642 | ) | | | 980,866 | |
| Increase (decrease) in cash and cash equivalents | | | 35,116 | | | | (30,295 | ) | | | (793,374 | ) |
| Cash and cash equivalents at beginning of year | | | 12,164 | | | | 42,459 | | | | 835,833 | |
| Cash and cash equivalents at end of year | | Ps. | 47,280 | | | Ps. | 12,164 | | | Ps. | 42,459 | |
Basis for presenting and summary of significant accounting policies
The attached separated financial statement of Grupo Aval have been prepared in accordance with the International Financial Reporting Standards (IFRS) issued by the International Accounting Standards Board (IASB), and their interpretations from the International Financial Reporting Standards Committee (IFRIC), currently in force and on the basis of historic cost, except for financial assets at fair value through profit or losses.
Certain information and footnote disclosures normally included in financial statements prepared in accordance with IFRS have been condensed or omitted.
According to Colombian Laws, the separated financial statements prepared on half year basis under partial IFRS in force as of December 31, 2013 are the basis for distribution of dividends.
The separated financial statements of Grupo Aval have been prepared using the same IFRS basis and principles that Grupo Aval used to prepare it consolidated financial statements described in Note 2, except as provided below for its investments in subsidiaries.
Commitments and contingencies
In the normal course of business, certain subsidiaries of Grupo Aval are defendants in various tax and legal proceedings. Grupo Aval is not aware of any pending legal proceedings which could have a significant effect on its financial position or the results of its operations.
Investment in subsidiaries companies
Based on the IAS 27, when an entity prepares separate financial statements it shall account for investments in subsidiaries either: a) at cost or b) at fair value, in accordance with IAS 39 or c) using the equity method. Based on that Grupo Aval accounts its investments in subsidiaries using the equity method.
Grupo Aval Acciones y Valores S.A.
Notes to the Consolidated Financial Statement
As of December 31, 2016 and 2015 and for the years ended December 31, 2016, 2015 and 2014
(Figures expressed in millions of Colombian pesos)
The equity method is an accounting method according to which the investment is initially recorded at cost, and they are periodically adjusted due to changes in the interest of the parent company over the net assets of the subsidiaries. Grupo Aval records on the result of the period its participation in the profit or loss of the subsidiaries, and in OCI its participation in the “Other comprehensive income account” of the subsidiary. In applying equity method Grupo Aval uses the subsidiaries consolidated financial statements at the end of the period prepared under IFRS.
Gain and losses resulting from transactions between Grupo Aval and its subsidiaries are recognized in the Grupo Aval´s financial statement only to the extent of Grupo Aval interest in the subsidiaries, unless the transaction provides evidence of an impairment in the book value of transferred assets.
Additionally, in a business combination process, to acquire some subsidiaries any difference between the cost of investment and Grupo Aval’s share on the net fair value of the subsidiary identifiable acquired assets and assumed liabilities is accounted as follows:
Goodwill relating to the acquisition is included in the carrying amount of the investment. Bonds at Amortization of goodwill is not permitted.
Appropriate adjustment to Grupo Aval share of the subsidiary after acquisition are made to account for example for depreciation of assets acquired in the business combination process based on their fair value at the acquisition date and for the impairment losses in such assets.
Investment in Subsidiaries
Investment in subsidiaries as of December 31, 2016 and 2015 comprise the following:
| | | December 31, 2016 | | | December 31, 2015 | |
| Subsidiary | | % of
participation in
voting rights | | | Book
Value | | | % of
participation in
voting rights | | | Book
Value | |
| | | | | | | | | | | | | |
| Banco de Bogotá S.A. | | | 68.74 | % | | Ps. | 10,331,548 | | | | 68.74 | % | | Ps. | 10,692,187 | |
| Banco de Occidente S.A. | | | 72.27 | % | | | 3,089,717 | | | | 72.27 | % | | | 1,926,842 | |
| Banco Comercial AV Villas S.A. | | | 79.87 | % | | | 1,139,881 | | | | 79.87 | % | | | 1,055,501 | |
| Banco Popular S.A. | | | 93.74 | % | | | 2,624,196 | | | | 93.74 | % | | | 2,149,689 | |
| Corporación Financiera Colombiana S.A. | | | 44.49 | % | | | 472,466 | | | | 44.42 | % | | | 501,271 | |
| Sociedad Administradora de Fondos de Pensiones y Cesantías Porvenir S.A. | | | 75.69 | % | | | 341,112 | | | | 75.69 | % | | | 752,302 | |
| Grupo Aval Limited | | | 100.00 | % | | | (316,553 | ) | | | 100.00 | % | | | (319,207 | ) |
| Grupo Aval International Limited | | | 100.00 | % | | | (152,474 | ) | | | 100.00 | % | | | (174,402 | ) |
| | | | | | | Ps. | 17,529,893 | | | | | | | Ps. | 16,584,183 | |
Grupo Aval Acciones y Valores S.A.
Notes to the Consolidated Financial Statement
As of December 31, 2016 and 2015 and for the years ended December 31, 2016, 2015 and 2014
(Figures expressed in millions of Colombian pesos)
Bonds at December 31, 2016 and 2015 comprise the following:
| | | | | | | | | | Amounts outstanding | |
| Issuance date | | Traches | | | Maturity | | Coupon rate | | 2016 | | | 2015 | |
| | | | | | | | | | | | | | |
| November, 2016 | | Ps. | 93,000 | | | November, 2026 | | IPC + 3.86% | | Ps. | 93,000 | | | Ps. | - | |
| November, 2016 | | | 207,000 | | | November, 2036 | | IPC + 4.15% | | | 207,000 | | | | - | |
| December, 2009 | | | 114,670 | | | December, 2016 | | IPC + 4.49% | | | - | | | | 114,670 | |
| December, 2009 | | | 279,560 | | | December, 2019 | | IPC + 4.84% | | | 279,560 | | | | 279,560 | |
| December, 2009 | | | 124,520 | | | December, 2024 | | IPC + 5.20% | | | 124,520 | | | | 124,520 | |
| Total Bonds | | Ps. | 818,750 | | | | | | | Ps. | 704,080 | | | Ps. | 518,750 | |
The scheduled maturities of bonds as of December 31, 2016 are as follows
| Period | | Amount | |
| 2019 and thereafter | | | 704,080 | |
| Total | | Ps. | 704,080 | |
APPENDIX A. SELECTED FINANCIAL AND STATISTICAL DATA PREPARED UNDER COLOMBIAN BANKING GAAP
Included below is selected financial and statistical data for Grupo Aval that has been derived from audited financial statements at and for the years ended December 31, 2013 and 2012, prepared in accordance with the regulations of the Superintendency of Finance applicable to financial institutions (Resolution 3600 of 1988 and External Circular 100 of 1995) and, on issues not addressed by these regulations, generally accepted accounting principles prescribed by the Superintendency of Finance for banks operating in Colombia, consistently applied, together with such regulations, on the issue date (which we refer to in this document, collectively, as “Colombian Banking GAAP.”) The audited consolidated financial statements included elsewhere in this document have been prepared in accordance with International Financial Reporting Standards as issued by the International Accounting Standards Board (“IFRS”). Colombian Banking GAAP differs in certain material respects from IFRS. Reconciliations and descriptions of the effect of the transition from Colombian Banking GAAP to IFRS are provided in Note 38 to our audited consolidated financial statements included in our annual report on Form 20-F from the previous year. For further information about the preparation of our financial data, please see “Presentation of financial and other information” and “Item 3. Key information—Selected financial and operating data—Non-IFRS measures reconciliation.”
This appendix reflects our policies in force on or prior to December 31, 2013.
Statement of income data
| | | Grupo Aval | |
| | | For the year ended December
31, | |
| | | 2013 | | | 2012 | |
| | | (In Ps billions, except share and
per share data) | |
| Colombian Banking GAAP | | | | | | | | |
| Operating income: | | | | | | | | |
| Net interest income | | | 6,981.0 | | | | 6,310.3 | |
| Provisions for loan and financial lease losses, accrued interest and other receivables, net | | | (1,417.4 | ) | | | (1,041.8 | ) |
| Recovery of charged-off assets | | | 148.2 | | | | 142.7 | |
| Provision (recovery) for investment securities, foreclosed assets and other assets | | | (25.0 | ) | | | (18.2 | ) |
| Total (provisions) reversals, net | | | (1,294.2 | ) | | | (917.3 | ) |
| Total fees and other services income, net | | | 2,814.4 | | | | 2,382.0 | |
| Total other operating income | | | 1,317.4 | | | | 885.7 | |
| Total operating income | | | 9,818.5 | | | | 8,660.6 | |
| Total operating expenses | | | (6,028.1 | ) | | | (5,299.5 | ) |
| Net operating income | | | 3,790.4 | | | | 3,361.1 | |
| Non-operating income (expense): | | | | | | | | |
| Other income | | | 453.4 | | | | 618.5 | |
| Other expense | | | (217.2 | ) | | | (170.4 | ) |
| Total non-operating income (expense), net | | | 236.1 | | | | 448.1 | |
| Income before income tax expense and non-controlling interest | | | 4,026.6 | | | | 3,809.2 | |
| Income tax expense | | | (1,414.7 | ) | | | (1,371.7 | ) |
| Income before non-controlling interest | | | 2,611.9 | | | | 2,437.4 | |
| Non-controlling interest | | | (1,011.4 | ) | | | (911.1 | ) |
| Net income attributable to Grupo Aval shareholders | | | 1,600.5 | | | | 1,526.4 | |
| | | | | | | | | |
| Earnings per 1,000 shares (basic and diluted earnings): | | | | | | | | |
| Common and preferred shares (in pesos) | | | 86,013.9 | | | | 82,277.2 | |
| Common and preferred shares (in U.S. dollars) (1) | | | 44.6 | | | | 46.5 | |
| | | Grupo Aval | |
| | | For the year ended December
31, | |
| | | 2013 | | | 2012 | |
| | | (In Ps billions, except share and
per share data) | |
| Dividends per 1,000 shares (2): | | | | | | |
| Common and preferred shares (in pesos) | | | 55,632.9 | | | | 49,200.0 | |
| Common and preferred shares (in U.S. dollars) (1) | | | 28.9 | | | | 27.8 | |
| Weighted average number of common and preferred fully paid shares outstanding (basic and diluted): | | | | | | | | |
| Outstanding shares | | | 18,607,487.3 | | | | 18,551,766.5 | |
| U.S. GAAP (3) | | | | | | | | |
| Provision for loans, leases and other receivables | | | (1,113.5 | ) | | | (971.7 | ) |
| Net income attributable to controlling interest under U.S. GAAP | | | 1,632.5 | | | | 1,564.5 | |
| Basic and diluted net income per 1,000 shares | | | | | | | | |
| Outstanding shares (pesos) | | | 87,731.9 | | | | 84,330.3 | |
| Outstanding shares (U.S. dollars) (1) | | | 45.5 | | | | 47.7 | |
| (1) | Translated for convenience using the representative market rate as computed and certified by the Superintendency of Finance of Ps 1,768.23 and Ps 1,926.83, per U.S.$1.00 at 2012 and 2013, respectively. |
| (2) | Dividends are declared semi-annually in March (for the six-month period ended December 31 of the previous year) and September (for the six-month period ended June 30 of the current year) of each year. We do not declare dividends on a quarterly basis. |
| (3) | See Note 38 to our audited consolidated financial statements included in our annual report on Form 20-F from the previous year for reconciliations to U.S. GAAP. |
Balance sheet data
| | | Grupo Aval | |
| | | At December 31, | |
| | | 2013 | | | 2012 | |
| | | (In Ps billions, except per share
data) | |
| Colombian Banking GAAP | | | | | | | | |
| Assets: | | | | | | | | |
| Total cash and cash equivalents | | | 16,096.6 | | | | 13,398.9 | |
| Total investment securities, net | | | 27,298.6 | | | | 23,295.8 | |
| Total loans and financial leases, net | | | 93,440.8 | | | | 77,483.8 | |
| Total interest accrued on loans and financial leases, net | | | 735.2 | | | | 716.0 | |
| Bankers’ acceptances, spot transactions and derivatives | | | 411.9 | | | | 454.3 | |
| Accounts receivable, net | | | 1,765.6 | | | | 1,800.9 | |
| Property, plant and equipment, net | | | 2,044.8 | | | | 1,794.9 | |
| Operating leases, net | | | 439.2 | | | | 375.7 | |
| Foreclosed assets, net | | | 109.2 | | | | 92.0 | |
| Prepaid expenses and deferred charges | | | 2,239.7 | | | | 1,961.7 | |
| Goodwill, net (1) | | | 4,968.0 | | | | 2,842.5 | |
| Other assets, net | | | 1,323.9 | | | | 1,128.6 | |
| Reappraisal of assets | | | 3,413.7 | | | | 2,317.8 | |
| Total assets | | | 154,287.4 | | | | 127,663.0 | |
| | | Grupo Aval | |
| | | At December 31, | |
| | | 2013 | | | 2012 | |
| | | (In Ps billions, except per share
data) | |
| Liabilities: | | | | | | | | |
| Total deposits | | | 101,190.4 | | | | 81,463.3 | |
| Bankers’ acceptances and derivatives financial instruments | | | 447.3 | | | | 410.0 | |
| Interbank borrowings and overnight funds | | | 5,123.6 | | | | 5,156.5 | |
| Borrowings from banks and others | | | 11,954.1 | | | | 10,380.9 | |
| Accounts payable | | | 2,867.7 | | | | 3,005.3 | |
| Accrued interest payable | | | 509.2 | | | | 474.8 | |
| Other liabilities | | | 2,221.7 | | | | 1,700.6 | |
| Long-term debt (bonds) | | | 11,179.7 | | | | 9,769.0 | |
| Estimated liabilities | | | 593.3 | | | | 811.7 | |
| Non-controlling interest | | | 6,472.2 | | | | 5,407.7 | |
| Total liabilities | | | 142,559.2 | | | | 118,579.9 | |
| Shareholders’ equity: | | | | | | | | |
| Subscribed and paid-in capital: | | | | | | | | |
| Common shares | | | 20.2 | | | | 18.6 | |
| Additional paid-in capital | | | 5,784.5 | | | | 3,671.7 | |
| Retained earnings: | | | | | | | | |
| Appropriated | | | 3,574.8 | | | | 2,911.3 | |
| Unappropriated | | | 765.6 | | | | 804.9 | |
| Equity surplus: | | | | | | | | |
| Equity inflation adjustments | | | 652.2 | | | | 654.6 | |
| Unrealized gains (losses) on investment securities available for sale | | | (523.6 | ) | | | 78.2 | |
| Reappraisal of assets | | | 1,454.5 | | | | 943.8 | |
| Total shareholders’ equity | | | 11,728.2 | | | | 9,083.1 | |
| Total liabilities and shareholders’ equity | | | 154,287.4 | | | | 127,663.0 | |
| | | | | | | | | |
| U.S. GAAP (2) | | | | | | | | |
| Loans | | | 93,924.4 | | | | 78,333.3 | |
| Financial leases | | | 8,103.4 | | | | 7,650.7 | |
| Total loans and financial leases | | | 102,027.8 | | | | 85,984.0 | |
| Allowance for loans, lease losses and other receivables losses | | | (2,615.7 | ) | | | (2,350.4 | ) |
| Total loans and financial leases, net | | | 99,412.0 | | | | 83,633.6 | |
| Controlling interest shareholders’ equity under U.S. GAAP | | | 9,536.5 | | | | 7,426.2 | |
| Controlling interest shareholders’ equity under U.S. GAAP per 1,000 shares (U.S. dollars and Ps) | | | 512,510.6 | | | | 400,297.5 | |
| (1) | Goodwill attributable to Grupo Aval’s shareholders was Ps 3,617.4 billion and Ps 1,943.4 billion at December 31, 2013 and 2012, respectively. Our attributable tangible equity (calculated as total shareholders’ equity minus goodwill attributable to Grupo Aval) was Ps 8,110.8 billion and Ps 7,139.7 billion at December 31, 2013 and 2012, respectively. |
| (2) | See Note 38 to our audited consolidated financial statements included in our annual report on Form 20-F from the previous year for reconciliations to U.S. GAAP. |
Other financial and operating data
| | | Grupo Aval | |
| | | At and for the year ended
December 31, | |
| Colombian Banking GAAP | | 2013 | | | 2012 | |
| | | (in percentages, unless
otherwise indicated) | |
| Profitability ratios: | | | | | | | | |
| Net interest margin (1) | | | 6.2 | | | | 6.5 | |
| ROAA (2) | | | 1.9 | | | | 2.0 | |
| ROAE (3) | | | 17.1 | | | | 17.7 | |
| Efficiency ratio: | | | | | | | | |
| Operating expenses before depreciation and amortization / total operating income before net provisions | | | 50.4 | | | | 51.3 | |
| Capital ratios: | | | | | | | | |
| Period-end shareholders’ equity and non-controlling interest as a percentage of period-end total assets | | | 11.8 | | | | 11.4 | |
| Tangible equity ratio (4) | | | 8.9 | | | | 9.3 | |
| Credit quality data: | | | | | | | | |
| Non-performing loans as a percentage of total loans (5) | | | 1.8 | | | | 1.6 | |
| Delinquency ratio loans past due more than 30 days | | | 2.4 | | | | 2.3 | |
| “C,” “D” and “E” loans as a percentage of total loans | | | 3.5 | | | | 3.3 | |
| Allowance for loans as a percentage of non-performing loans | | | 179.3 | | | | 194.3 | |
| Allowance for loans as a percentage of past due loans | | | 133.3 | | | | 139.2 | |
| Allowance for loans as a percentage of “C,” “D” and “E” loans | | | 90.4 | | | | 95.6 | |
| Allowance for loans as a percentage of total loans | | | 3.2 | | | | 3.2 | |
| Operational data (in units): | | | | | | | | |
| Number of customers of the banks (6) | | | 11,661,279 | | | | 10,345,695 | |
| Number of employees | | | 66,865 | | | | 59,406 | |
| Number of branches (7) | | | 1,721 | | | | 1,545 | |
| Number of ATMs (7) | | | 5,179 | | | | 4,328 | |
| (1) | Net interest margin is calculated as net interest income divided by total average interest-earning assets. |
| (2) | For the years ended December 31, ROAA is calculated as income before non-controlling interest divided by average assets (the sum of total assets at December 31 of the fiscal year and total assets at December 31 of the previous fiscal year, divided by two). |
If average assets were calculated using monthly consolidated information, rather than the average at the beginning and end of an annual period, our ROAA would be: 1.9% and 2.1% for the periods ended December 31, 2013 and 2012, respectively.
| (3) | For the years ended December 31, ROAE is calculated as net income divided by average shareholders’ equity (shareholders’ equity at the end of the period plus shareholder’ equity at the end of the prior period, divided by two). |
If average shareholders’ equity were calculated using monthly consolidated information, rather than the average at the beginning and end of such period, our ROAE would be as follows: 17.3%, and 17.8% for the periods ended December 31, 2013 and 2012, respectively.
| (4) | Tangible equity ratio is calculated as shareholders’ equity plus non-controlling interest minus goodwill, divided by total assets minus goodwill. |
| (5) | Non-performing loans, include microcredit loans that are past due more than 30 days, mortgage and consumer loans that are past due more than 60 days and commercial loans that are past due more than 90 days. Each category includes financial leases. |
| (6) | Reflects aggregated customers of our banking subsidiaries. Customers of more than one of our banking subsidiaries and BAC Credomatic are counted separately for each banking subsidiary. |
| (7) | Reflects aggregated number of branches or ATMs of our banking subsidiaries and BAC Credomatic, as applicable, located throughout Colombia and Central America. |
Average balance sheet
For the years ended December 31, 2013 and 2012, the following table presents:
| · | average balances calculated using actual month-end balances for our assets and liabilities (based on non-consolidated monthly amounts for a 13-month period and the last day of the prior year, adjusted for consolidation by the addition or subtraction of, as applicable, average balances for the three respective semi-annual periods); |
| · | interest income earned on assets and interest paid on liabilities; and |
| · | average yield and interest rate for our interest-earning assets and interest-bearing liabilities, respectively. |
The interest rate subtotals are based on the weighted average of the average peso-denominated and foreign currency-denominated (principally U.S. dollars) balances.
| | | Average balance sheet and income from interest-earning assets for the years
ended December 31, | |
| | | 2013 | | | 2012 | |
| | | Average
balance | | | Interest
income
earned | | | Average
yield | | | Average
balance | | | Interest
income
earned | | | Average
yield | |
| | | (in Ps billions, except percentages) | |
| Assets | | | | | | | | | | | | | | | | | | | | | | | | |
| Interest-earning assets | | | | | | | | | | | | | | | | | | | | | | | | |
| Interbank and overnight funds | | | | | | | | | | | | | | | | | | | | | | | | |
| Domestic | | | | | | | | | | | | | | | | | | | | | | | | |
| Peso-denominated | | | 1,347.8 | | | | 110.9 | | | | 8.2 | % | | | 1,451.4 | | | | 167.9 | | | | 11.6 | % |
| Foreign currency-denominated | | | 661.3 | | | | 48.8 | | | | 7.4 | % | | | 839.0 | | | | 10.6 | | | | 1.3 | % |
| Total domestic | | | 2,009.2 | | | | 159.7 | | | | 7.9 | % | | | 2,290.4 | | | | 178.6 | | | | 7.8 | % |
| Foreign | | | 770.5 | | | | 30.5 | | | | 4.0 | % | | | 801.8 | | | | 28.3 | | | | 3.5 | % |
| Total | | | 2,779.7 | | | | 190.1 | | | | 6.8 | % | | | 3,092.3 | | | | 206.8 | | | | 6.7 | % |
| Investment securities (1) | | | | | | | | | | | | | | | | | | | | | | | | |
| Domestic | | | | | | | | | | | | | | | | | | | | | | | | |
| Peso-denominated | | | 19,343.8 | | | | 1,077.0 | | | | 5.6 | % | | | 16,559.8 | | | | 1,145.6 | | | | 6.9 | % |
| Foreign currency-denominated | | | 2,310.9 | | | | 62.0 | | | | 2.7 | % | | | 3,101.4 | | | | 87.4 | | | | 2.8 | % |
| Total domestic | | | 21,654.7 | | | | 1,139.0 | | | | 5.3 | % | | | 19,661.2 | | | | 1,233.0 | | | | 6.3 | % |
| Foreign | | | 3,319.9 | | | | 167.9 | | | | 5.1 | % | | | 1,802.1 | | | | 66.0 | | | | 3.7 | % |
| Total | | | 24,974.6 | | | | 1,306.9 | | | | 5.2 | % | | | 21,463.3 | | | | 1,299.0 | | | | 6.1 | % |
Loans and financial
leases (2) | | | | | | | | | | | | | | | | | | | | | | | | |
| Domestic | | | | | | | | | | | | | | | | | | | | | | | | |
| Peso-denominated | | | 63,179.1 | | | | 7,310.5 | | | | 11.6 | % | | | 56,742.4 | | | | 7,052.0 | | | | 12.4 | % |
| Foreign currency-denominated | | | 6,433.3 | | | | 184.0 | | | | 2.9 | % | | | 4,850.8 | | | | 170.2 | | | | 3.5 | % |
| Total domestic | | | 69,612.5 | | | | 7,494.4 | | | | 10.8 | % | | | 61,593.2 | | | | 7,222.2 | | | | 11.7 | % |
| Foreign | | | 14,337.7 | | | | 1,791.9 | | | | 12.5 | % | | | 11,465.8 | | | | 1,476.9 | | | | 12.9 | % |
| Total | | | 83,950.2 | | | | 9,286.3 | | | | 11.1 | % | | | 73,059.0 | | | | 8,699.2 | | | | 11.9 | % |
| Total interest-earning assets | | | | | | | | | | | | | | | | | | | | | | | | |
| Domestic | | | | | | | | | | | | | | | | | | | | | | | | |
| Peso-denominated | | | 83,870.7 | | | | 8,498.3 | | | | 10.1 | % | | | 74,753.6 | | | | 8,365.6 | | | | 11.2 | % |
| Foreign currency-denominated | | | 9,405.6 | | | | 294.8 | | | | 3.1 | % | | | 8,791.2 | | | | 268.2 | | | | 3.1 | % |
| Total domestic | | | 93,276.3 | | | | 8,793.1 | | | | 9.4 | % | | | 83,544.8 | | | | 8,633.8 | | | | 10.3 | % |
| Foreign | | | 18,428.1 | | | | 1,990.3 | | | | 10.8 | % | | | 14,069.7 | | | | 1,571.2 | | | | 11.2 | % |
| Total interest-earning assets | | | 111,704.4 | | | | 10,783.4 | | | | 9.7 | % | | | 97,614.5 | | | | 10,205.0 | | | | 10.5 | % |
| Non-interest-earning assets | | | | | | | | | | | | | | | | | | | | | | | | |
| Cash and due from banks | | | | | | | | | | | | | | | | | | | | | | | | |
| Domestic | | | | | | | | | | | | | | | | | | | | | | | | |
| Peso-denominated | | | 5,955.2 | | | | – | | | | – | | | | 3,821.4 | | | | – | | | | – | |
| Foreign currency-denominated | | | 1,088.0 | | | | – | | | | – | | | | 1,265.9 | | | | – | | | | – | |
| Total domestic | | | 7,043.2 | | | | – | | | | – | | | | 5,087.3 | | | | – | | | | – | |
| Foreign | | | 3,649.9 | | | | – | | | | – | | | | 2,931.1 | | | | – | | | | – | |
| Total | | | 10,693.1 | | | | – | | | | – | | | | 8,018.4 | | | | – | | | | – | |
| Allowance for loan and financial lease losses | | | | | | | | | | | | | | | | | | | | | | | | |
| Domestic | | | | | | | | | | | | | | | | | | | | | | | | |
| Peso-denominated | | | (2,492.4 | ) | | | – | | | | – | | | | (2,192.4 | ) | | | – | | | | – | |
| Foreign currency-denominated | | | (26.8 | ) | | | – | | | | – | | | | (16.6 | ) | | | – | | | | – | |
| Total domestic | | | (2,519.2 | ) | | | – | | | | – | | | | (2,209.0 | ) | | | – | | | | – | |
| | | Average balance sheet and income from interest-earning assets for the years
ended December 31, | |
| | | 2013 | | | 2012 | |
| | | Average
balance | | | Interest
income
earned | | | Average
yield | | | Average
balance | | | Interest
income
earned | | | Average
yield | |
| | | (in Ps billions, except percentages) | |
| Foreign | | | (265.2 | ) | | | – | | | | – | | | | (199.9 | ) | | | – | | | | – | |
| Total | | | (2,784.4 | ) | | | – | | | | – | | | | (2,408.9 | ) | | | – | | | | – | |
| Non-performing past due loans (3) | | | | | | | | | | | | | | | | | | | | | | | | |
| Domestic | | | | | | | | | | | | | | | | | | | | | | | | |
| Peso-denominated | | | 1,226.3 | | | | – | | | | – | | | | 991.3 | | | | – | | | | – | |
| Foreign currency-denominated | | | 5.9 | | | | – | | | | – | | | | 4.3 | | | | – | | | | – | |
| Total domestic | | | 1,232.2 | | | | – | | | | – | | | | 995.6 | | | | – | | | | – | |
| Foreign | | | 243.8 | | | | – | | | | – | | | | 236.6 | | | | – | | | | – | |
| Total | | | 1,476.0 | | | | – | | | | – | | | | 1,232.2 | | | | – | | | | – | |
| Bankers’ acceptances, spot transactions and derivatives | | | | | | | | | | | | | | | | | | | | | | | | |
| Domestic | | | | | | | | | | | | | | | | | | | | | | | | |
| Peso-denominated | | | 139.7 | | | | – | | | | – | | | | 3,997.6 | | | | – | | | | – | |
| Foreign currency-denominated | | | 234.6 | | | | – | | | | – | | | | (3,626.6 | ) | | | – | | | | – | |
| Total domestic | | | 374.3 | | | | – | | | | – | | | | 370.9 | | | | – | | | | – | |
| Foreign | | | 15.8 | | | | – | | | | – | | | | 14.6 | | | | – | | | | – | |
| Total | | | 390.1 | | | | – | | | | – | | | | 385.5 | | | | – | | | | – | |
| Accounts receivable, net | | | | | | | | | | | | | | | | | | | | | | | | |
| Domestic | | | | | | | | | | | | | | | | | | | | | | | | |
| Peso-denominated | | | 2,001.2 | | | | – | | | | – | | | | 1,488.1 | | | | – | | | | – | |
| Foreign currency-denominated | | | 237.7 | | | | – | | | | – | | | | 66.9 | | | | – | | | | – | |
| Total domestic | | | 2,238.9 | | | | – | | | | – | | | | 1,555.0 | | | | – | | | | – | |
| Foreign | | | 326.1 | | | | – | | | | – | | | | 259.1 | | | | – | | | | – | |
| Total | | | 2,565.0 | | | | – | | | | – | | | | 1,814.0 | | | | – | | | | – | |
| Foreclosed assets, net | | | | | | | | | | | | | | | | | | | | | | | | |
| Domestic | | | | | | | | | | | | | | | | | | | | | | | | |
| Peso-denominated | | | 63.5 | | | | – | | | | – | | | | 57.6 | | | | – | | | | – | |
| Foreign currency-denominated | | | – | | | | – | | | | – | | | | – | | | | – | | | | – | |
| Total domestic | | | 63.5 | | | | – | | | | – | | | | 57.6 | | | | – | | | | – | |
| Foreign | | | 22.5 | | | | – | | | | – | | | | 25.2 | | | | – | | | | – | |
| Total | | | 86.0 | | | | – | | | | – | | | | 82.8 | | | | – | | | | – | |
| Property, plant and equipment, net | | | | | | | | | | | | | | | | | | | | | | | | |
| Domestic | | | | | | | | | | | | | | | | | | | | | | | | |
| Peso-denominated | | | 1,873.4 | | | | – | | | | – | | | | 1,816.2 | | | | – | | | | – | |
| Foreign currency-denominated | | | 72.2 | | | | – | | | | – | | | | 35.6 | | | | – | | | | – | |
| Total domestic | | | 1,945.6 | | | | – | | | | – | | | | 1,851.8 | | | | – | | | | – | |
| Foreign | | | 333.8 | | | | – | | | | – | | | | 298.7 | | | | – | | | | – | |
| Total | | | 2,279.4 | | | | – | | | | – | | | | 2,150.5 | | | | – | | | | – | |
| Other assets net | | | | | | | | | | | | | | | | | | | | | | | | |
| Domestic | | | | | | | | | | | | | | | | | | | | | | | | |
| Peso-denominated | | | 7,632.6 | | | | – | | | | – | | | | 6,730.8 | | | | – | | | | – | |
| Foreign currency-denominated | | | 81.4 | | | | – | | | | – | | | | 362.3 | | | | – | | | | – | |
| Total domestic | | | 7,714.0 | | | | – | | | | – | | | | 7,093.2 | | | | – | | | | – | |
| Foreign | | | 2,371.5 | | | | – | | | | – | | | | 2,227.7 | | | | – | | | | – | |
| Total | | | 10,085.5 | | | | – | | | | – | | | | 9,320.8 | | | | – | | | | – | |
| | | Average balance sheet and income from interest-earning assets for the years
ended December 31, | |
| | | 2013 | | | 2012 | |
| | | Average
balance | | | Interest
income
earned | | | Average
yield | | | Average
balance | | | Interest
income
earned | | | Average
yield | |
| | | (in Ps billions, except percentages) | |
| Total non-interest-earning assets | | | | | | | | | | | | | | | | | | | | | | | | |
| Domestic | | | | | | | | | | | | | | | | | | | | | | | | |
| Peso-denominated | | | 16,399.4 | | | | – | | | | – | | | | 16,710.6 | | | | – | | | | – | |
| Foreign currency-denominated | | | 1,693.1 | | | | – | | | | – | | | | (1,908.3 | ) | | | – | | | | – | |
| Total domestic | | | 18,092.6 | | | | – | | | | – | | | | 14,802.4 | | | | – | | | | – | |
| Foreign | | | 6,698.1 | | | | – | | | | – | | | | 5,793.1 | | | | – | | | | – | |
| Total non-interest-earning assets | | | 24,790.7 | | | | – | | | | – | | | | 20,595.4 | | | | – | | | | – | |
| | | | | | | | | | | | | | | | | | | | | | | | | |
| Total interest and non-interest-earning assets | | | | | | | | | | | | | | | | | | | | | | | | |
| Domestic | | | | | | | | | | | | | | | | | | | | | | | | |
| Peso-denominated | | | 100,270.2 | | | | 8,498.3 | | | | 8.5 | % | | | 91,464.2 | | | | 8,365.6 | | | | 9.1 | % |
| Foreign currency-denominated | | | 11,098.7 | | | | 294.8 | | | | 2.7 | % | | | 6,883.0 | | | | 268.2 | | | | 3.9 | % |
| Total domestic | | | 111,368.9 | | | | 8,793.1 | | | | 7.9 | % | | | 98,347.2 | | | | 8,633.8 | | | | 8.8 | % |
| Foreign | | | 25,126.3 | | | | 1,990.3 | | | | 7.9 | % | | | 19,862.8 | | | | 1,571.2 | | | | 7.9 | % |
| Total assets | | | 136,495.1 | | | | 10,783.4 | | | | 7.9 | % | | | 118,210.0 | | | | 10,205.0 | | | | 8.6 | % |
| | | Average balance sheet and income from interest–bearing liabilities for years
ended December 31, | |
| | | 2013 | | | 2012 | |
| | | Average
balance | | | Interest
expense
paid | | | Average
interest
rate | | | Average
balance | | | Interest
expense
paid | | | Average
interest
rate | |
| | | (in Ps billions, except percentages) | |
| Liabilities and shareholders’ equity | | | | | | | | | | | | | | | | | | | | | | | | |
| Interest-bearing liabilities | | | | | | | | | | | | | | | | | | | | | | | | |
| Checking accounts | | | | | | | | | | | | | | | | | | | | | | | | |
| Domestic | | | | | | | | | | | | | | | | | | | | | | | | |
| Peso-denominated | | | 3,766.3 | | | | 111.9 | | | | 3.0 | % | | | 2,737.3 | | | | 123.8 | | | | 4.5 | % |
| Foreign currency-denominated | | | 267.6 | | | | 0.7 | | | | 0.3 | % | | | 868.9 | | | | 5.2 | | | | 0.6 | % |
| Total domestic | | | 4,033.9 | | | | 112.6 | | | | 2.8 | % | | | 3,606.2 | | | | 129.0 | | | | 3.6 | % |
| Foreign | | | 4,837.6 | | | | 35.4 | | | | 0.7 | % | | | 4,305.6 | | | | 30.2 | | | | 0.7 | % |
| Total | | | 8,871.6 | | | | 148.0 | | | | 1.7 | % | | | 7,911.8 | | | | 159.2 | | | | 2.0 | % |
| Savings deposits | | | | | | | | | | | | | | | | | | | | | | | | |
| Domestic | | | | | | | | | | | | | | | | | | | | | | | | |
| Peso-denominated | | | 33,975.5 | | | | 1,054.0 | | | | 3.1 | % | | | 26,489.8 | | | | 1,059.3 | | | | 4.0 | % |
| Foreign currency-denominated | | | 359.2 | | | | 2.5 | | | | 0.7 | % | | | 470.5 | | | | 3.4 | | | | 0.7 | % |
| Total domestic | | | 34,334.8 | | | | 1,056.5 | | | | 3.1 | % | | | 26,960.3 | | | | 1,062.8 | | | | 3.9 | % |
| Foreign | | | 2,983.8 | | | | 36.6 | | | | 1.2 | % | | | 2,463.4 | | | | 31.3 | | | | 1.3 | % |
| Total | | | 37,318.6 | | | | 1,093.0 | | | | 2.9 | % | | | 29,423.8 | | | | 1,094.0 | | | | 3.7 | % |
| Time deposits | | | | | | | | | | | | | | | | | | | | | | | | |
| Domestic | | | | | | | | | | | | | | | | | | | | | | | | |
| Peso-denominated | | | 19,270.3 | | | | 1,009.0 | | | | 5.2 | % | | | 17,718.2 | | | | 1,108.1 | | | | 6.3 | % |
| Foreign currency-denominated | | | 3,956.1 | | | | 74.0 | | | | 1.9 | % | | | 3,495.3 | | | | 73.4 | | | | 2.1 | % |
| Total domestic | | | 23,226.4 | | | | 1,083.0 | | | | 4.7 | % | | | 21,213.5 | | | | 1,181.5 | | | | 5.6 | % |
| Foreign | | | 5,845.6 | | | | 300.8 | | | | 5.1 | % | | | 4,628.7 | | | | 214.5 | | | | 4.6 | % |
| Total | | | 29,072.1 | | | | 1,383.8 | | | | 4.8 | % | | | 25,842.3 | | | | 1,396.1 | | | | 5.4 | % |
| | | Average balance sheet and income from interest–bearing liabilities for years
ended December 31, | |
| | | 2013 | | | 2012 | |
| | | Average
balance | | | Interest
expense
paid | | | Average
interest
rate | | | Average
balance | | | Interest
expense
paid | | | Average
interest
rate | |
| | | (in Ps billions, except percentages) | |
| Interbank borrowings and overnight funds (4) | | | | | | | | | | | | | | | | | | | | | | | | |
| Domestic | | | | | | | | | | | | | | | | | | | | | | | | |
| Peso-denominated | | | 5,263.0 | | | | 146.1 | | | | 2.8 | % | | | 4,878.1 | | | �� | 219.5 | | | | 4.5 | % |
| Foreign currency-denominated | | | 254.3 | | | | 10.8 | | | | 4.3 | % | | | 302.9 | | | | 2.9 | | | | 1.0 | % |
| Total domestic | | | 5,517.2 | | | | 157.0 | | | | 2.8 | % | | | 5,181.0 | | | | 222.4 | | | | 4.3 | % |
| Foreign | | | 71.2 | | | | 3.8 | | | | 5.4 | % | | | 88.7 | | | | 5.9 | | | | 6.7 | % |
| Total | | | 5,588.4 | | | | 160.8 | | | | 2.9 | % | | | 5,269.7 | | | | 228.3 | | | | 4.3 | % |
| Borrowings from banks and others (5) | | | | | | | | | | | | | | | | | | | | | | | | |
| Domestic | | | | | | | | | | | | | | | | | | | | | | | | |
| Peso-denominated | | | 4,129.0 | | | | 227.7 | | | | 5.5 | % | | | 3,899.2 | | | | 298.0 | | | | 7.6 | % |
| Foreign currency-denominated | | | 2,346.6 | | | | 30.6 | | | | 1.3 | % | | | 2,864.9 | | | | 53.9 | | | | 1.9 | % |
| Total domestic | | | 6,475.6 | | | | 258.3 | | | | 4.0 | % | | | 6,764.1 | | | | 351.9 | | | | 5.2 | % |
| Foreign | | | 3,900.3 | | | | 137.3 | | | | 3.5 | % | | | 3,201.0 | | | | 121.5 | | | | 3.8 | % |
| Total | | | 10,376.0 | | | | 395.6 | | | | 3.8 | % | | | 9,965.1 | | | | 473.4 | | | | 4.8 | % |
| Bonds | | | | | | | | | | | | | | | | | | | | | | | | |
| Domestic | | | | | | | | | | | | | | | | | | | | | | | | |
| Peso-denominated | | | 5,709.0 | | | | 343.7 | | | | 6.0 | % | | | 5,403.1 | | | | 393.7 | | | | 7.3 | % |
| Foreign currency-denominated | | | 4,837.3 | | | | 245.6 | | | | 5.1 | % | | | 2,550.1 | | | | 129.5 | | | | 5.1 | % |
| Total domestic | | | 10,546.3 | | | | 589.3 | | | | 5.6 | % | | | 7,953.2 | | | | 523.2 | | | | 6.6 | % |
| Foreign | | | 466.7 | | | | 31.9 | | | | 6.8 | % | | | 316.6 | | | | 20.5 | | | | 6.5 | % |
| Total | | | 11,013.0 | | | | 621.1 | | | | 5.6 | % | | | 8,269.8 | | | | 543.7 | | | | 6.6 | % |
| Total interest-bearing liabilities | | | | | | | | | | | | | | | | | | | | | | | | |
| Domestic | | | | | | | | | | | | | | | | | | | | | | | | |
| Peso-denominated | | | 72,113.1 | | | | 2,892.5 | | | | 4.0 | % | | | 61,125.7 | | | | 3,202.3 | | | | 5.2 | % |
| Foreign currency-denominated | | | 12,021.2 | | | | 364.1 | | | | 3.0 | % | | | 10,552.7 | | | | 268.4 | | | | 2.5 | % |
| Total domestic | | | 84,134.3 | | | | 3,256.6 | | | | 3.9 | % | | | 71,678.4 | | | | 3,470.7 | | | | 4.8 | % |
| Foreign | | | 18,105.3 | | | | 545.8 | | | | 3.0 | % | | | 15,004.0 | | | | 423.9 | | | | 2.8 | % |
| Total | | | 102,239.6 | | | | 3,802.4 | | | | 3.7 | % | | | 86,682.4 | | | | 3,894.7 | | | | 4.5 | % |
| | | | | | | | | | | | | | | | | | | | | | | | | |
| Total non-interest-bearing liabilities and shareholders’ equity | | | 34,255.5 | | | | – | | | | – | | | | 31,527.6 | | | | – | | | | – | |
| | | | | | | | | | | | | | | | | | | | | | | | | |
| Total liabilities and shareholders’ equity | | | 136,495.1 | | | | 3,802.4 | | | | 2.8 | % | | | 118,210.0 | | | | 3,894.7 | | | | 3.3 | % |
| (1) | Includes available for sale securities, in which yields are based on historical cost balances. |
| (2) | Includes an immaterial amount of interest earned on loans rated “C,” “D” and “E.” |
| (3) | Loans past due more than 90 days for commercial loans, more than 60 days for consumer loans, more than 30 days for microcredit loans, more than 60 days for mortgages, more than 90 days for commercial financial leases and more than 60 days for consumer financial leases. |
| (4) | Reflects operations involving: common short-term interbank funds, repurchase transactions (repos), simultaneous operations and transactions involving the temporary transfer of securities. |
| (5) | Reflects loans made by other financial institutions including development banks and international correspondent banks. |
Changes in net interest income and expenses – volume and rate analysis
The following tables allocate by currency of denomination, changes in our net interest income to changes in average volume, changes in nominal rates and the net change caused by changes in both average volume and nominal rates for the year ended December 31, 2013 compared to the year ended December 31, 2012. Volume and rate variances have been calculated based on variances in average balances over the period and changes in nominal interest rates on average interest-earning assets and average interest-bearing liabilities. Net changes attributable to changes in both volume and interest rate have been allocated to changes in volume.
| | | 2013 – 2012
Increase (decrease)
due to changes in | |
| | | Volume | | | Rate | | | Net
change | |
| | | (in Ps billions) | |
| Interest-earning assets | | | | | | | | | | | | |
| Interbank and overnight funds | | | | | | | | | | | | |
| Domestic | | | | | | | | | | | | |
| Peso-denominated | | | (8.5 | ) | | | (48.5 | ) | | | (57.0 | ) |
| Foreign currency-denominated | | | (13.1 | ) | | | 51.3 | | | | 38.1 | |
| Total domestic | | | (21.6 | ) | | | 2.7 | | | | (18.9 | ) |
| Investment securities | | | | | | | | | | | | |
| Domestic | | | | | | | | | | | | |
| Peso-denominated | | | 155.0 | | | | (223.6 | ) | | | (68.6 | ) |
| Foreign currency-denominated | | | (21.2 | ) | | | (4.2 | ) | | | (25.4 | ) |
| Total domestic | | | 133.8 | | | | (227.8 | ) | | | (94.0 | ) |
| Loans and financial leases (1) | | | | | | | | | | | | |
| Domestic | | | | | | | | | | | | |
| Peso-denominated | | | 744.8 | | | | (486.4 | ) | | | 258.4 | |
| Foreign currency-denominated | | | 45.3 | | | | (31.5 | ) | | | 13.8 | |
| Total domestic | | | 790.1 | | | | (517.9 | ) | | | 272.2 | |
| Total interest-earning assets | | | | | | | | | | | | |
| Domestic | | | | | | | | | | | | |
| Peso-denominated | | | 891.3 | | | | (758.5 | ) | | | 132.8 | |
| Foreign currency-denominated | | | 10.9 | | | | 15.6 | | | | 26.5 | |
| Total domestic | | | 902.2 | | | | (742.9 | ) | | | 159.3 | |
| Foreign | | | – | | | | – | | | | 419.1 | |
| Total interest-earning assets | | | 1,333.1 | | | | (754.7 | ) | | | 578.4 | |
| | | 2013 – 2012
Increase (decrease)
due to changes in | |
| | | Volume | | | Rate | | | Net
change | |
| | | (in Ps billions) | |
| Interest-bearing liabilities | | | | | | | | | | | | |
| Checking accounts | | | | | | | | | | | | |
| Domestic | | | | | | | | | | | | |
| Peso-denominated | | | 30.6 | | | | (42.4 | ) | | | (11.8 | ) |
| Foreign currency-denominated | | | (1.5 | ) | | | (3.0 | ) | | | (4.6 | ) |
| Total domestic | | | 29.1 | | | | (45.5 | ) | | | (16.4 | ) |
| Savings deposits | | | | | | | | | | | | |
| Domestic | | | | | | | | | | | | |
| | | 2013 – 2012
Increase (decrease)
due to changes in | |
| | | Volume | | | Rate | | | Net
change | |
| | | (in Ps billions) | |
| Peso-denominated | | | 232.2 | | | | (237.6 | ) | | | (5.4 | ) |
| Foreign currency-denominated | | | (0.8 | ) | | | (0.1 | ) | | | (0.9 | ) |
| Total domestic | | | 231.4 | | | | (237.7 | ) | | | (6.3 | ) |
| Time deposits | | | | | | | | | | | | |
| Domestic | | | | | | | | | | | | |
| Peso-denominated | | | 81.3 | | | | (180.4 | ) | | | (99.1 | ) |
| Foreign currency-denominated | | | 8.6 | | | | (8.1 | ) | | | 0.6 | |
| Total domestic | | | 89.9 | | | | (188.4 | ) | | | (98.5 | ) |
| Interbank borrowings and overnight funds | | | | | | | | | | | | |
| Domestic | | | | | | | | | | | | |
| Peso-denominated | | | 10.7 | | | | (84.0 | ) | | | (73.3 | ) |
| Foreign currency-denominated | | | (2.1 | ) | | | 10.0 | | | | 7.9 | |
| Total domestic | | | 8.6 | | | | (74.0 | ) | | | (65.4 | ) |
| Borrowings from banks and others | | | | | | | | | | | | |
| Domestic | | | | | | | | | | | | |
| Peso-denominated | | | 12.7 | | | | (82.9 | ) | | | (70.2 | ) |
| Foreign currency-denominated | | | (6.8 | ) | | | (16.6 | ) | | | (23.3 | ) |
| Total domestic | | | 5.9 | | | | (99.5 | ) | | | (93.5 | ) |
| Long-term debt (bonds) | | | | | | | | | | | | |
| Domestic | | | | | | | | | | | | |
| Peso-denominated | | | 18.4 | | | | (68.3 | ) | | | (49.9 | ) |
| Foreign currency-denominated | | | 116.1 | | | | (0.1 | ) | | | 116.0 | |
| Total domestic | | | 134.5 | | | | (68.4 | ) | | | 66.1 | |
| Total interest-bearing liabilities | | | | | | | | | | | | |
| Domestic | | | | | | | | | | | | |
| Peso-denominated | | | 385.8 | | | | (695.7 | ) | | | (309.8 | ) |
| Foreign currency-denominated | | | 113.6 | | | | (17.9 | ) | | | 95.7 | |
| Total domestic | | | 499.4 | | | | (713.6 | ) | | | (214.1 | ) |
| Foreign | | | – | | | | – | | | | 121.9 | |
| Total interest-bearing liabilities | | | 583.7 | | | | (675.9 | ) | | | (92.3 | ) |
| (1) | Includes an immaterial amount of interest earned on loans rated “C,” “D” and “E.” |
Interest-earning assets – net interest margin and spread
The following table presents average balances of interest-earning assets as well as our yields on our average interest-earning assets, net interest earned, net interest margin and interest spread for the years ended December 31, 2013 and 2012.
| | | For the year ended December
31, | |
| | | 2013 | | | 2012 | |
| | | (in Ps billions, except
percentages) | |
| Interbank and overnight funds | | | | | | | | |
| Domestic | | | | | | | | |
| Peso-denominated | | | 1,347.8 | | | | 1,451.4 | |
| Foreign currency-denominated | | | 661.3 | | | | 839.0 | |
| Total Domestic | | | 2,009.2 | | | | 2,290.4 | |
| Foreign | | | 770.5 | | | | 801.8 | |
| Total | | | 2,779.7 | | | | 3,092.3 | |
| Investment securities | | | | | | | | |
| Domestic | | | | | | | | |
| Peso-denominated | | | 19,343.8 | | | | 16,559.8 | |
| Foreign currency-denominated | | | 2,310.9 | | | | 3,101.4 | |
| Total Domestic | | | 21,654.7 | | | | 19,661.2 | |
| Foreign | | | 3,319.9 | | | | 1,802.1 | |
| Total | | | 24,974.6 | | | | 21,463.3 | |
| Loans and financial leases (1) | | | | | | | | |
| Domestic | | | | | | | | |
| Peso-denominated | | | 63,179.1 | | | | 56,742.4 | |
| Foreign currency-denominated | | | 6,433.3 | | | | 4,850.8 | |
| Total Domestic | | | 69,612.5 | | | | 61,593.2 | |
| Foreign | | | 14,337.7 | | | | 11,465.8 | |
| Total | | | 83,950.2 | | | | 73,059.0 | |
| Other interest-earning assets | | | | | | | | |
| Domestic | | | | | | | | |
| Peso-denominated | | | – | | | | – | |
| Foreign currency-denominated | | | – | | | | – | |
| Total Domestic | | | – | | | | – | |
| Foreign | | | – | | | | – | |
| Total | | | – | | | | – | |
| Total average interest-earning assets | | | | | | | | |
| Domestic | | | | | | | | |
| Peso-denominated | | | 83,870.7 | | | | 74,753.6 | |
| Foreign currency-denominated | | | 9,405.6 | | | | 8,791.2 | |
| Total Domestic | | | 93,276.3 | | | | 83,544.8 | |
| Foreign | | | 18,428.1 | | | | 14,069.7 | |
| Total | | | 111,704.4 | | | | 97,614.5 | |
| Net interest earned (2) | | | | | | | | |
| Domestic | | | | | | | | |
| Peso-denominated | | | 5,605.9 | | | | 5,163.3 | |
| Foreign currency-denominated | | | (69.4 | ) | | | (0.2 | ) |
| Total Domestic | | | 5,536.5 | | | | 5,163.0 | |
| Foreign | | | 1,444.5 | | | | 1,147.3 | |
| Total | | | 6,981.0 | | | | 6,310.3 | |
| Average yield on interest-earning assets | | | | | | | | |
| Domestic | | | | | | | | |
| Peso-denominated | | | 10.1 | % | | | 11.2 | % |
| Foreign currency-denominated | | | 3.1 | % | | | 3.1 | % |
| Total Domestic | | | 9.4 | % | | | 10.3 | % |
| Foreign | | | 10.8 | % | | | 11.2 | % |
| Total | | | 9.7 | % | | | 10.5 | % |
| | | For the year ended December
31, | |
| | | 2013 | | | 2012 | |
| | | (in Ps billions, except
percentages) | |
| Net interest margin (3) | | | | | | | | |
| Domestic | | | | | | | | |
| Peso-denominated | | | 6.7 | % | | | 6.9 | % |
| Foreign currency-denominated | | | (0.7 | )% | | | – | |
| Total Domestic | | | 5.9 | % | | | 6.2 | % |
| Foreign | | | 7.8 | % | | | 8.2 | % |
| Total | | | 6.2 | % | | | 6.5 | % |
| Interest spread on loans and financial leases (4) | | | | | | | | |
| Domestic | | | | | | | | |
| Peso-denominated | | | 7.6 | % | | | 7.2 | % |
| Foreign currency-denominated | | | (0.2 | )% | | | 1.0 | % |
| Total Domestic | | | 6.9 | % | | | 6.9 | % |
| Foreign | | | 9.5 | % | | | 10.1 | % |
| Total | | | 7.3 | % | | | 7.4 | % |
| Interest spread on total interest-earning assets (5) | | | | | | | | |
| Domestic | | | | | | | | |
| Peso-denominated | | | 6.1 | % | | | 6.0 | % |
| Foreign currency-denominated | | | 0.1 | % | | | 0.5 | % |
| Total Domestic | | | 5.6 | % | | | 5.5 | % |
| Foreign | | | 7.8 | % | | | 8.3 | % |
| Total | | | 5.9 | % | | | 6.0 | % |
| (1) | Includes an immaterial amount of interest earned on loans rated “C,” “D” and “E.” |
| (2) | Net interest earned is calculated as interest income less interest paid and includes accrued interest, valuation adjustments and gains (losses) realized on debt and equity securities that are accounted for as “available for sale,” gains (losses) on repurchase transactions (repos), gains (losses) realized on the sale of debt securities, and mark-to-market gains (losses) on trading securities portfolio. |
| (3) | Net interest margin is calculated as net interest income divided by total average interest-earning assets, determined based on monthly ending balances during the applicable period. |
| (4) | Interest spread on loans and financial leases is calculated as the difference between the average yield on interest-earning loans and financial leases and the average rate paid on interest-bearing liabilities. |
| (5) | Interest spread on total interest-earning assets is calculated as the difference between the average yield on interest-earning assets and the average rate paid on interest-bearing liabilities. |
Investment portfolio
We acquire and hold fixed income debt and equity securities for liquidity and other strategic purposes, or when required by law. In recent years, credit institutions, including our banking subsidiaries, have been required to hold certain debt securities issued by the Colombian government or government-related entities. Central Bank regulations require credit institutions to make investments in agricultural development bonds (Títulos de Desarrollo Agropecuario), or “TDAs,” issued by the Agricultural Sector Financing Fund (Fondo para el Financiamiento del Sector Agropecuario), or “Finagro.” Finagro is a development bank affiliated with the Ministry of Agriculture and finances the production and marketing activities of the agricultural and livestock sector. These securities yield below-market interest rates. The amount of these mandatory investments are calculated as a percentage of short-term deposits. Additionally our banking subsidiaries still maintain mandatory investments in reduction bonds (Títulos de Reducción de Deuda) issued by the Republic of Colombia. Under government discretion, authorities may extend the scope of current regulations or require additional disbursements on current or new mandatory investments. See “—Mandatory investments.”
The Superintendency of Finance requires investments to be classified as “trading,” “available for sale” or “held to maturity.” Trading investments are investments acquired primarily to obtain profits from fluctuations in short-term prices and are recorded at fair value. The difference between current and previous fair value is added to, or subtracted from, the value of the investment and credited or charged to earnings. “Available for sale” investments are those investments that we intend, and are able, to hold for at least six months and are recorded on the balance sheet at fair value with changes to the values of these securities recorded in a separate equity account labeled as “unrealized gains and losses”; when a portion of the gains or losses is realized, such amount is transferred to the consolidated income statement. “Held to maturity” investments are investments acquired and that we intend, and are able, to hold until maturity, and are recorded at amortized cost.
The following table presents the book value of our investments in debt securities and equity securities, net of allowance for investment securities losses, at the dates indicated.
| | | At December 31, | |
| | | 2013 | | | 2012 | |
| | | (in Ps billions) | |
| Debt securities | | | | | | | | |
| Peso-denominated | | | | | | | | |
| Securities issued or secured by the Colombian Government (1) | | | 13,525.5 | | | | 10,930.9 | |
| Securities issued or secured by the Colombian Central Bank | | | – | | | | – | |
| Securities issued or secured by other Colombian government entities | | | 2,650.8 | | | | 2,408.4 | |
| Securities issued or secured by other financial entities (2) | | | 555.2 | | | | 387.1 | |
| Other securities (3) | | | 265.9 | | | | 442.7 | |
| Total peso-denominated | | | 16,997.4 | | | | 14,169.0 | |
| Foreign currency-denominated | | | | | | | | |
| Securities issued or secured by the Colombian Government (1) | | | 718.5 | | | | 537.4 | |
| Securities issued or secured by other Colombian government entities | | | 252.6 | | | | 221.7 | |
| Securities issued by foreign governments | | | 1,327.7 | | | | 1,069.9 | |
| Securities issued or secured by other financial entities (2) | | | 3,085.5 | | | | 2,425.9 | |
| Other securities (3) | | | 1,190.3 | | | | 1,290.1 | |
| Total foreign currency-denominated | | | 6,574.7 | | | | 5,545.0 | |
| | | | | | | | | |
| Total debt securities, net | | | 23,572.1 | | | | 19,714.0 | |
| | | | | | | | | |
| Equity securities, net | | | 3,726.5 | | | | 3,581.8 | |
| | | | | | | | | |
| Total investment securities, net | | | 27,298.6 | | | | 23,295.8 | |
| (1) | Includes Colombian Government-issued treasuries (Títulos de Tesorería), or “TESs.” |
| (2) | Reflects investments made in debt securities issued by private financial entities. |
| (3) | Reflects investments made in debt securities issued by multilateral institutions and non-financial companies. |
At December 31, 2013 and 2012, we held securities issued by foreign governments and in the principal amounts, as follows.
At
December
31, | | Issuer | | Investment
amount – book
value | | | Investment
amount – book
value | |
| | | | | (in Ps billions) | | | (in U.S.$
thousands) | |
| 2013 | | | | | | | | | | |
| | | Brazil | | | 23.3 | | | | 12,090 | |
| | | Costa Rica | | | 450.5 | | | | 233,788 | |
| | | Mexico | | | 24.0 | | | | 12,464 | |
| | | Panama | | | 141.0 | | | | 73,161 | |
| | | United States of America | | | 40.9 | | | | 21,223 | |
| | | El Salvador | | | 115.4 | | | | 59,893 | |
| | | Chile | | | – | | | | – | |
| | | Guatemala | | | 291.8 | | | | 151,418 | |
| | | Barbados | | | 4.3 | | | | 2,246 | |
| | | Nicaragua | | | 1.9 | | | | 991 | |
| | | Perú | | | 19.8 | | | | 10,257 | |
| | | Honduras | | | 214.9 | | | | 111,553 | |
| | | Total 2013 | | | 1,327.8 | | | | 689,085 | |
| | | | | | | | | | | |
| 2012 | | | | | | | | | | |
| | | Brazil | | | 20.4 | | | | 11,525 | |
| | | Costa Rica | | | 572.2 | | | | 323,600 | |
| | | Mexico | | | 9.4 | | | | 5,307 | |
| | | Panama | | | 204.4 | | | | 115,613 | |
| | | United States of America | | | 14.7 | | | | 8,334 | |
| | | El Salvador | | | 47.8 | | | | 27,046 | |
| | | Chile | | | 9.6 | | | | 5,439 | |
| | | Guatemala | | | 61.7 | | | | 34,897 | |
| | | Nicaragua | | | 1.8 | | | | 1,024 | |
| | | Honduras | | | 127.9 | | | | 72,305 | |
| | | Total 2012 | | | 1,069.9 | | | | 605,090 | |
Loan portfolio
The following table presents our loan portfolio classified into commercial, consumer, microcredit, financial leases and mortgage loans for the periods indicated.
| | | At December 31, | |
| | | 2013 | | | 2012 | |
| | | (in Ps billions) | |
| Domestic | | | | | | | | |
| Commercial | | | | | | | | |
| General purpose loans (1) | | | 35,442.9 | | | | 29,971.2 | |
| Loans funded by development banks | | | 1,658.4 | | | | 1,661.9 | |
| Working capital loans | | | 8,773.8 | | | | 9,149.6 | |
| Credit cards | | | 315.3 | | | | 242.6 | |
| Overdrafts | | | 152.9 | | | | 194.9 | |
| Total commercial | | | 46,343.3 | | | | 41,220.2 | |
| | | | | | | | | |
| Consumer | | | | | | | | |
| Credit cards | | | 2,983.3 | | | | 2,289.7 | |
| Personal loans | | | 15,357.2 | | | | 14,202.8 | |
| Automobile and vehicle loans | | | 2,133.2 | | | | 1,935.3 | |
| Overdrafts | | | 44.9 | | | | 53.6 | |
| Loans funded by development banks | | | 0.2 | | | | 0.2 | |
| General purpose loans | | | 151.6 | | | | 157.9 | |
| Working capital loans | | | – | | | | 1.4 | |
| Total consumer | | | 20,670.5 | | | | 18,640.8 | |
| | | | | | | | | |
| Microcredit | | | 341.9 | | | | 290.9 | |
| Mortgages | | | 1,879.9 | | | | 1,073.3 | |
| Financial leases | | | 6,624.1 | | | | 6,223.9 | |
| Total domestic | | | 75,859.7 | | | | 67,449.2 | |
| | | | | | | | | |
| Foreign | | | | | | | | |
| Commercial | | | | | | | | |
| General purpose loans (1) | | | 4,090.0 | | | | 2,285.6 | |
| Loans funded by development banks | | | – | | | | – | |
| Working capital loans | | | 4,227.5 | | | | 1,959.3 | |
| Credit cards | | | – | | | | – | |
| Overdrafts | | | 194.8 | | | | 49.1 | |
| Total commercial | | | 8,512.3 | | | | 4,294.0 | |
| | | | | | | | | |
| Consumer | | | | | | | | |
| Credit cards | | | 3,814.6 | | | | 3,066.8 | |
| Personal loans | | | 2,165.9 | | | | 757.3 | |
| Automobile and vehicle loans | | | 1,123.9 | | | | 892.8 | |
| Overdrafts | | | 26.4 | | | | 22.4 | |
| Loans funded by development banks | | | – | | | | – | |
| General purpose loans | | | – | | | | – | |
| Working capital loans | | | – | | | | – | |
| Total consumer | | | 7,130.8 | | | | 4,739.4 | |
| | | | | | | | | |
| Microcredit | | | – | | | | – | |
| Mortgages | | | 4,640.2 | | | | 3,275.0 | |
| Financial leases | | | 370.8 | | | | 271.8 | |
| Total foreign | | | 20,654.2 | | | | 12,580.2 | |
| | | At December 31, | |
| | | 2013 | | | 2012 | |
| | | (in Ps billions) | |
| Total portfolio | | | 96,513.8 | | | | 80,029.4 | |
| Allowance for loan portfolio | | | (3,073.0 | ) | | | (2,545.6 | ) |
| Total portfolio, net | | | 93,440.8 | | | | 77,483.8 | |
| (1) | General purpose commercial loans primarily include short-term loans (créditos de tesorería), trade finance loans, project finance loans and loans for capital expenditures. |
Loan portfolio by economic activity
The following table summarizes our loan portfolio, at the dates indicated, by the principal activity of the borrower using the International Standard Industrial Classification of All Economic Activities. Where we have not assigned a code to a borrower, classification of the relevant loan has been made based on the purpose of the loan as described by the borrower.
| | | At December 31, | |
| | | 2013 | | | % | | | 2012 | | | % | |
| | | (in Ps billions, except percentages) | |
| Agricultural | | | 2,817.2 | | | | 2.9 | | | | 2,050.6 | | | | 2.6 | |
| Mining products and oil | | | 2,198.4 | | | | 2.3 | | | | 1,747.2 | | | | 2.2 | |
| Food, beverage and tobacco | | | 4,239.4 | | | | 4.4 | | | | 2,755.3 | | | | 3.4 | |
| Chemical production | | | 3,872.3 | | | | 4.0 | | | | 3,744.1 | | | | 4.7 | |
| Other industrial and manufacturing products | | | 3,424.4 | | | | 3.5 | | | | 3,173.6 | | | | 4.0 | |
| Government | | | 2,669.8 | | | | 2.8 | | | | 2,332.0 | | | | 2.9 | |
| Construction | | | 7,072.2 | | | | 7.3 | | | | 5,885.8 | | | | 7.4 | |
| Trade and tourism | | | 1,198.9 | | | | 1.2 | | | | 992.5 | | | | 1.2 | |
| Transportation and communications | | | 5,509.7 | | | | 5.7 | | | | 5,271.4 | | | | 6.6 | |
| Public services | | | 3,194.4 | | | | 3.3 | | | | 3,016.5 | | | | 3.8 | |
| Consumer services(1) | | | 37,144.1 | | | | 38.5 | | | | 27,804.3 | | | | 34.7 | |
| Commercial services(2) | | | 20,366.6 | | | | 21.1 | | | | 20,024.3 | | | | 25.0 | |
| Other | | | 2,806.3 | | | | 2.9 | | | | 1,231.7 | | | | 1.5 | |
| Total loan portfolio | | | 96,513.8 | | | | 100.0 | | | | 80,029.4 | | | | 100.0 | |
| (1) | Consumer services include loans to individuals, such as consumer loans (credit cards, vehicle, personal and others) and mortgage loans. |
| (2) | Commercial services include wholesale trade and retail, consulting and business support services, health and social services, moneylending and other activities. |
Credit categories
The following table presents our loan portfolio, for the purpose of credit risk evaluation, categorized in accordance with the regulations of the Superintendency of Finance, in effect at the relevant dates.
| | | Loan portfolio by type of loan | |
| | | At December 31, | |
| Domestic | | 2013 | | | 2012 | |
| | | (in Ps billions) | |
| Commercial loans | | | 46,343.3 | | | | 41,220.2 | |
| Consumer loans | | | 20,670.5 | | | | 18,640.8 | |
| Microcredit loans | | | 341.9 | | | | 290.9 | |
| Mortgages | | | 1,879.9 | | | | 1,073.3 | |
| Financial leases | | | 6,624.1 | | | | 6,223.9 | |
| Total domestic loan portfolio | | | 75,859.7 | | | | 67,449.2 | |
| | | Loan portfolio by type of loan | |
| | | At December 31, | |
| Domestic | | 2013 | | | 2012 | |
| | | (in Ps billions) | |
| Allowance for loans and financial lease losses | | | (2,653.0 | ) | | | (2,332.8 | ) |
| Total domestic loan portfolio, net | | | 73,206.7 | | | | 65,116.3 | |
| | | Loan portfolio by type of loan | |
| | | At December 31, | |
| Foreign | | 2013 | | | 2012 | |
| | | (in Ps billions) | | | | |
| Commercial loans | | | 8,512.3 | | | | 4,294.0 | |
| Consumer loans | | | 7,130.8 | | | | 4,739.4 | |
| Microcredit loans | | | – | | | | – | |
| Mortgages | | | 4,640.2 | | | | 3,275.0 | |
| Financial leases | | | 370.8 | | | | 271.8 | |
| Total foreign loan portfolio | | | 20,654.2 | | | | 12,580.2 | |
| Allowance for loans and financial lease losses | | | (420.1 | ) | | | (212.7 | ) |
| Total foreign loan portfolio, net | | | 20,234.1 | | | | 12,367.5 | |
| Total loan portfolio, net | | | 93,440.8 | | | | 77,483.8 | |
Risk categories
The following tables use the Superintendency of Finance minimum risk classifications for loans and financial leases as they were in force on or prior to December 31, 2013. For those periods, management assigns loans and financial leases to these classifications on the basis of models developed by management and reviewed by the Superintendency of Finance. These models incorporate both subjective and objective criteria.
Category A — “Normal risk”: Loans and financial leases in this category are appropriately serviced. The debtor’s financial statements or its projected cash flows, as well as all other credit information available to us, reflect adequate paying capacity.
Category B — “Acceptable risk, above normal”: Loans and financial leases in this category are acceptably serviced and guaranty-protected, but there are weaknesses which may potentially affect, on a transitory or permanent basis, the debtor’s paying capacity or its projected cash flows, to the extent that, if not timely corrected, would affect the normal collection of credit or contracts.
Category C — “Appreciable risk”: Loans and financial leases in this category have debtors with insufficient paying capacity or relate to projects with insufficient cash flow, which may compromise the normal collection of the obligations.
Category D — “Significant risk”: Loans and financial leases in this category have the same deficiencies as loans in category C, but to a larger extent; consequently, the probability of collection is highly doubtful.
Category E — “Risk of non-recoverability”: Loans and financial leases in this category are deemed uncollectible.
The following table presents the breakdown of our loan portfolio by risk classification in effect at December 31 of each year.
| | | At December 31, | |
| Domestic | | 2013 | | | % | | | 2012 | | | % | |
| | | (in Ps billions, except percentages) | |
| “A” Normal risk | | | 71,502.4 | | | | 94.3 | | | | 63,505.4 | | | | 94.2 | |
| “B” Acceptable risk, above normal | | | 1,916.3 | | | | 2.5 | | | | 1,834.6 | | | | 2.7 | |
| “C” Appreciable risk | | | 990.7 | | | | 1.3 | | | | 863.3 | | | | 1.3 | |
| | | At December 31, | |
| Domestic | | 2013 | | | % | | | 2012 | | | % | |
| | | (in Ps billions, except percentages) | |
| “D” Significant risk | | | 931.4 | | | | 1.2 | | | | 837.9 | | | | 1.2 | |
| “E” Risk of non-recoverability | | | 518.9 | | | | 0.7 | | | | 408.0 | | | | 0.6 | |
| Total domestic loan portfolio | | | 75,859.7 | | | | 100.0 | | | | 67,449.2 | | | | 100.0 | |
| Loan portfolio classified as “C,” “D” and “E” as a percentage of total loan portfolio | | | 3.2 | | | | – | | | | 3.1 | | | | – | |
| | | At December 31, | |
| Foreign | | 2013 | | | % | | | 2012 | | | % | |
| | | (in Ps billions, except percentages) | |
| “A” Normal risk | | | 18,963.7 | | | | 91.8 | | | | 11,753.7 | | | | 93.4 | |
| “B” Acceptable risk, above normal | | | 733.4 | | | | 3.6 | | | | 272.4 | | | | 2.2 | |
| “C” Appreciable risk | | | 712.6 | | | | 3.5 | | | | 430.6 | | | | 3.4 | |
| “D” Significant risk | | | 125.1 | | | | 0.6 | | | | 75.5 | | | | 0.6 | |
| “E” Risk of non-recoverability | | | 119.3 | | | | 0.6 | | | | 47.9 | | | | 0.4 | |
| Total foreign loan portfolio | | | 20,654.2 | | | | 100.0 | | | | 12,580.2 | | | | 100.0 | |
| Loan portfolio classified as “C,” “D” and “E” as a percentage of total loan portfolio | | | 4.6 | | | | – | | | | 4.4 | | | | – | |
| Total loan portfolio | | | 96,513.8 | | | | 100.0 | | | | 80,029.4 | | | | 100.0 | |
Suspension of accruals
The Superintendency of Finance mandates that interest, UVRs, lease payments and other items of income cease to be accrued in our statement of income and begin to be recorded in memorandum accounts until any payment is collected, once a loan or financial lease is in arrears for more than 90 days for commercial loans or financial leases, 60 days for mortgage and consumer loans or financial leases and 30 days for microcredit loans.
Interest paid on non-accrued loans is recorded as “interest on loans” on our statement of income.
The following table presents the breakdown of our past due loans by type of loan in accordance with the criteria of the Superintendency of Finance in effect at December 31 of each year.
| | | At December 31, | |
| | | 2013 | | | % | | | 2012 | | | % | |
| | | (in Ps billions, except percentages) | |
| Domestic | | | | | | | | | | | | | | | | |
| Performing past due loans: (1) | | | | | | | | | | | | | | | | |
| Commercial loans past due from 31 to 90 days | | | 125.7 | | | | 7.1 | | | | 128.1 | | | | 8.4 | |
| Consumer loans past due from 31 to 60 days | | | 234.7 | | | | 13.3 | | | | 233.0 | | | | 15.3 | |
| Microcredit loans past due up to 30 days | | | 0.3 | | | | – | | | | 0.4 | | | | – | |
| Mortgage loans past due from 31 to 60 days | | | 20.3 | | | | 1.2 | | | | 18.5 | | | | 1.2 | |
| Financial leases past due from 31 to 60/90 days (2) | | | 58.1 | | | | 3.3 | | | | 63.0 | | | | 4.1 | |
| Total domestic performing past due loan portfolio | | | 439.1 | | | | 24.9 | | | | 443.0 | | | | 29.0 | |
| | | At December 31, | |
| | | 2013 | | | % | | | 2012 | | | % | |
| | | (in Ps billions, except percentages) | �� |
| Non-performing past due loans: | | | | | | | | | | | | | | | | |
| Commercial loans past due more than 90 days | | | 500.0 | | | | 28.3 | | | | 410.9 | | | | 26.9 | |
| Consumer loans past due more than 60 days | | | 641.8 | | | | 36.4 | | | | 511.2 | | | | 33.5 | |
| Microcredit loans past due more than 30 days | | | 32.2 | | | | 1.8 | | | | 32.2 | | | | 2.1 | |
| Mortgage loans past due more than 60 days | | | 41.0 | | | | 2.3 | | | | 45.2 | | | | 3.0 | |
| Financial leases past due more than 60/90 days | | | 110.6 | | | | 6.3 | | | | 85.2 | | | | 5.6 | |
| Total domestic non-performing past due loan portfolio | | | 1,325.6 | | | | 75.1 | | | | 1,084.6 | | | | 71.0 | |
| | | | | | | | | | | | | | | | | |
| Total domestic past due loan portfolio | | | 1,764.7 | | | | 100.0 | | | | 1,527.5 | | | | 100.0 | |
| | | | | | | | | | | | | | | | | |
| Total non-performing past due loan portfolio | | | 1,325.6 | | | | – | | | | 1,084.6 | | | | – | |
| Foreclosed assets | | | 189.9 | | | | – | | | | 190.9 | | | | – | |
| Other accounts receivable more than 180 days past due | | | 40.0 | | | | – | | | | 33.2 | | | | – | |
| Total domestic non-performing assets | | | 1,555.5 | | | | – | | | | 1,308.7 | | | | – | |
| | | | | | | | | | | | | | | | | |
| Allowance for loan and financial lease losses | | | 2,653.0 | | | | – | | | | 2,332.8 | | | | – | |
| Allowance for estimated losses on foreclosed assets | | | 128.2 | | | | – | | | | 120.9 | | | | – | |
| Allowance for accounts receivable and accrued interest losses | | | 84.4 | | | | – | | | | 77.2 | | | | – | |
| | | | | | | | | | | | | | | | | |
| Loans and financial leases at least 31 days past due as a percentage of total loans | | | 2.3 | % | | | – | | | | 2.3 | % | | | – | |
| Allowance for loan and financial lease losses as a percentage of loans at least 31 days past due | | | 150.3 | % | | | – | | | | 152.7 | % | | | – | |
| Allowance for loan and financial lease losses as a percentage of loans classified as “C,” “D” and “E” | | | 108.7 | % | | | – | | | | 110.6 | % | | | – | |
| Percentage of performing loans and financial leases to total loans and financial leases | | | 98.3 | % | | | – | | | | 98.4 | % | | | – | |
| | | | | | | | | | | | | | | | | |
| Foreign | | | | | | | | | | | | | | | | |
| Performing past due loans: (1) | | | | | | | | | | | | | | | | |
| Commercial loans past due from 31 days to 90 days | | | 47.9 | | | | 8.9 | | | | 22.6 | | | | 7.5 | |
| Consumer loans past due loans from 31 days to 60 days | | | 102.8 | | | | 19.0 | | | | 51.4 | | | | 17.1 | |
| Microcredit loans past due up to 30 days | | | – | | | | – | | | | – | | | | – | |
| Mortgage loans past due from 31 days to 60 days | | | – | | | | – | | | | – | | | | – | |
| Financial leases past due from 31 days to 60/90 days (2) | | | 1.4 | | | | 0.3 | | | | 0.8 | | | | 0.3 | |
| Total foreign performing past due loan portfolio | | | 152.1 | | | | 28.1 | | | | 74.9 | | | | 24.9 | |
| | | At December 31, | |
| | | 2013 | | | % | | | 2012 | | | % | |
| | | (in Ps billions, except percentages) | |
| Non-performing past due loans: | | | | | | | | | | | | | | | | |
| Commercial loans past due more than 90 days | | | 44.0 | | | | 8.2 | | | | 51.3 | | | | 17.1 | |
| Consumer loans past due more than 60 days | | | 174.8 | | | | 32.4 | | | | 93.9 | | | | 31.2 | |
| Microcredit loans past due more than 30 days | | | – | | | | – | | | | – | | | | – | |
| Mortgage loans past due more than 60 days | | | 168.6 | | | | 31.2 | | | | 80.2 | | | | 26.6 | |
| Financial leases past due more than 60/90 days | | | 0.8 | | | | 0.1 | | | | 0.6 | | | | 0.2 | |
| Total foreign non-performing past due loan portfolio | | | 388.2 | | | | 71.9 | | | | 225.9 | | | | 75.1 | |
| | | | | | | | | | | | | | | | | |
| Total foreign past due loan portfolio | | | 540.3 | | | | 100.0 | | | | 300.8 | | | | 100.0 | |
| | | | | | | | | | | | | | | | | |
| Total non-performing past due loan portfolio | | | 388.2 | | | | – | | | | 225.9 | | | | – | |
| Foreclosed assets | | | 88.1 | | | | – | | | | 43.2 | | | | – | |
| Other accounts receivable more than 180 days past due | | | – | | | | – | | | | – | | | | – | |
| Total foreign non-performing assets | | | 476.3 | | | | – | | | | 269.1 | | | | – | |
| | | | | | | | | | | | | | | | | |
| Allowance for loan and financial lease losses | | | 420.1 | | | | – | | | | 212.7 | | | | – | |
| Allowance for estimated losses on foreclosed assets | | | 40.5 | | | | – | | | | 21.2 | | | | – | |
| Allowance for accounts receivable and accrued interest losses | | | – | | | | – | | | | – | | | | – | |
| Loans and financial leases at least 31 days past due as a percentage of total loans | | | 2.6 | % | | | – | | | | 2.4 | % | | | – | |
| Allowance for loan and financial lease losses as a percentage of loans at least 31 days past due | | | 77.8 | % | | | – | | | | 70.7 | % | | | – | |
| Allowance for loan and financial lease losses as a percentage of loans classified as “C,” “D” and “E” | | | 43.9 | % | | | – | | | | 38.4 | % | | | – | |
| Percentage of performing loans and financial leases to total loans and financial leases | | | 98.1 | % | | | – | | | | 98.2 | % | | | – | |
| (1) | Performing past due loans are loans upon which interest has not been received for the periods indicated; however, we continue to recognize income. Once interest is unpaid on accrual loans for greater than the amount of days specified in the respective line item above, the loan is classified as non-performing. |
| (2) | Includes commercial and consumer financial leases. |
The following table presents the breakdown of our non-performing past due loans by type of loan in accordance with the criteria of the Superintendency of Finance for domestic and foreign loans at the periods indicated.
| | | At December 31, | |
| | | 2013 | | | 2012 | |
| | | (in Ps billions) | |
| Domestic | | | | | | | | |
| Non-performing past due loans: | | | | | | | | |
| Commercial loans past due more than 90 days | | | 500.0 | | | | 410.2 | |
| Consumer loans past due more than 60 days | | | 641.8 | | | | 511.2 | |
| Microcredit loans past due more than 30 days | | | 32.2 | | | | 32.2 | |
| Mortgage loans past due more than 60 days | | | 41.0 | | | | 45.2 | |
| Financial leases past due more than 60 days | | | 110.6 | | | | 85.2 | |
| Total domestic non-performing past due loan portfolio | | | 1,325.6 | | | | 1,083.9 | |
| Foreign | | | | | | | | |
| Non-performing past due loans: | | | | | | | | |
| Commercial loans past due more than 90 days | | | 44.0 | | | | 51.9 | |
| Consumer loans past due more than 60 days | | | 174.8 | | | | 93.9 | |
| Microcredit loans past due more than 30 days | | | – | | | | – | |
| Mortgage loans past due more than 60 days | | | 168.6 | | | | 80.2 | |
| Financial leases past due more than 60/90 days | | | 0.8 | | | | 0.6 | |
| Total foreign non-performing past due loan portfolio | | | 388.2 | | | | 226.5 | |
| Total domestic and foreign non-performing past due loan portfolio | | | 1,713.8 | | | | 1,310.5 | |
The following table presents our past due loan portfolio by type of loan.
| | | At December 31, | |
| | | 2013 | | | % | | | 2012 | | | % | |
| | | (in Ps billions, except percentages) | |
| | | | | | | | | | | | | |
| Commercial | | | | | | | | | | | | | | | | |
| General purpose loans | | | 494.5 | | | | 21.5 | | | | 442.9 | | | | 24.2 | |
| Loans funded by development banks | | | 42.4 | | | | 1.8 | | | | 41.2 | | | | 2.3 | |
| Working capital loans | | | 141.3 | | | | 6.1 | | | | 64.5 | | | | 3.5 | |
| Credit cards | | | 22.3 | | | | 1.0 | | | | 15.4 | | | | 0.8 | |
| Overdrafts | | | 17.2 | | | | 0.7 | | | | 48.9 | | | | 2.7 | |
| Total commercial | | | 717.6 | | | | 31.1 | | | | 612.9 | | | | 33.5 | |
| | | | | | | | | | | | | | | | | |
| Consumer | | | | | | | | | | | | | | | | |
| Credit cards | | | 353.9 | | | | 15.4 | | | | 243.1 | | | | 13.3 | |
| Personal loans | | | 657.4 | | | | 28.5 | | | | 511.5 | | | | 28.0 | |
| Automobile and vehicle loans | | | 131.2 | | | | 5.7 | | | | 115.9 | | | | 6.3 | |
| Overdrafts | | | 6.2 | | | | 0.3 | | | | 12.2 | | | | 0.7 | |
| Loans funded by development banks | | | 0.1 | | | | – | | | | 0.1 | | | | – | |
| General purpose loans | | | 5.2 | | | | 0.2 | | | | 6.8 | | | | 0.4 | |
| Working capital loans | | | – | | | | – | | | | – | | | | – | |
| Total consumer | | | 1,154.0 | | | | 50.1 | | | | 889.4 | | | | 48.6 | |
| | | | | | | | | | | | | | | | | |
| Microcredit | | | 32.5 | | | | 1.4 | | | | 32.6 | | | | 1.8 | |
| Mortgages | | | 229.9 | | | | 10.0 | | | | 143.9 | | | | 7.9 | |
| Financial leases | | | 170.9 | | | | 7.4 | | | | 149.5 | | | | 8.2 | |
| Total past due loan portfolio | | | 2,305.0 | | | | 100.0 | | | | 1,828.3 | | | | 100.0 | |
The following table presents information with respect to our secured and unsecured loan portfolios at least 31 days past due.
| | | At December 31, | |
| | | 2013 | | | % | | | 2012 | | | % | |
| | | (in Ps billions, except percentages) | |
| Secured | | | | | | | | | | | | | | | | |
| Past due 31 to 360 days | | | | | | | | | | | | | | | | |
| Commercial | | | 214.8 | | | | 0.2 | | | | 197.5 | | | | 0.3 | |
| Consumer | | | 137.8 | | | | 0.1 | | | | 114.0 | | | | 0.1 | |
| Microcredit | | | 21.1 | | | | – | | | | 21.0 | | | | 0.0 | |
| Mortgages | | | 186.6 | | | | 0.2 | | | | 124.3 | | | | 0.2 | |
| Financial leases | | | 141.2 | | | | 0.2 | | | | 114.7 | | | | 0.1 | |
| Total 31 to 360 days | | | 701.5 | | | | 0.8 | | | | 571.5 | | | | 0.7 | |
| Total loans past due more than 360 days | | | 155.6 | | | | 0.2 | | | | 115.9 | | | | 0.1 | |
| Total current | | | 30,399.6 | | | | 32.5 | | | | 25,754.3 | | | | 33.2 | |
| Total secured loan portfolio | | | 31,256.7 | | | | 33.5 | | | | 26,441.7 | | | | 34.1 | |
| | | | | | | | | | | | | | | | | |
| Unsecured (1) | | | | | | | | | | | | | | | | |
| Past due 31 to 360 days | | | | | | | | | | | | | | | | |
| Commercial | | | 277.9 | | | | 0.3 | | | | 198.4 | | | | 0.3 | |
| Consumer | | | 951.9 | | | | 1.0 | | | | 712.3 | | | | 0.9 | |
| Microcredit | | | 9.6 | | | | – | | | | 10.6 | | | | – | |
| Mortgages | | | – | | | | – | | | | – | | | | – | |
| Financial leases | | | – | | | | – | | | | – | | | | – | |
| Total 31 to 360 days | | | 1,239.4 | | | | 1.3 | | | | 921.2 | | | | 1.2 | |
| Total loans past due more than 360 days | | | 208.5 | | | | 0.2 | | | | 219.7 | | | | 0.3 | |
| Total current | | | 63,809.2 | | | | 68.3 | | | | 52,446.7 | | | | 67.7 | |
| Total unsecured loan portfolio | | | 65,257.1 | | | | 69.8 | | | | 53,587.6 | | | | 69.2 | |
| Total loan portfolio, gross | | | 96,513.8 | | | | 103.3 | | | | 80,029.4 | | | | 103.3 | |
| Allowances | | | (3,073.0 | ) | | | (3.3 | ) | | | (2,545.6 | ) | | | (3.3 | ) |
| Total loan portfolio, net | | | 93,440.8 | | | | 100.0 | | | | 77,483.8 | | | | 100.0 | |
| (1) | Includes loans with personal guarantees. |
Non-performing loans, performing loans, and performing troubled debt restructured loans
Performing troubled debt restructured loans
The following table presents a summary of our troubled debt restructured loan portfolio, classified into domestic and foreign loans, accounted for on a performing basis in accordance with the criteria of the Superintendency of Finance in effect at the end of each period.
| | | At December 31, | |
| | | 2013 | | | 2012 | |
| | | (in Ps billions) | |
| Domestic | | | 903.2 | | | | 919.3 | |
| Foreign | | | 243.3 | | | | 134.4 | |
| Total performing troubled debt restructured loan portfolio(1) | | | 1,146.5 | | | | 1,053.7 | |
| (1) | Restructured loans are loans that have been modified due to an impairment of the conditions of the beneficiary. |
Movements in allowances for credit losses
Allowance for loan and financial lease losses
The following tables present the changes in the allowance for loan and financial lease losses during the periods indicated.
| | | Year ended December 31, | |
| | | 2013 | | | 2012 | |
| | | (in Ps billions) | |
| Domestic | | | | | | | | |
| Balance at beginning of period | | | 2,332.8 | | | | 2,093.0 | |
| Increase in allowance through business combinations | | | – | | | | 11.6 | |
| Allowance for financial leasing reclassification | | | – | | | | – | |
| Provisions for loan losses | | | 2,544.8 | | | | 2,092.9 | |
| Charge-offs | | | (755.1 | ) | | | (586.4 | ) |
| Effect of difference in exchange rate | | | 1.5 | | | | (1.2 | ) |
| Reclassification – securitization | | | (0.3 | ) | | | (1.0 | ) |
| Reversals of provisions | | | (1,470.8 | ) | | | (1,276.1 | ) |
| Balance at end of year (domestic) | | | 2,653.0 | | | | 2,332.8 | |
| | | Year ended December 31, | |
| | | 2013 | | | 2012 | |
| | | (in Ps billions) | |
| Foreign | | | | | | | | |
| Balance at beginning of period | | | 212.7 | | | | 213.5 | |
| Increase in allowance through business combinations(1) | | | 120.1 | | | | – | |
| Allowance for financial leasing reclassification | | | – | | | | – | |
| Provisions for loan losses | | | 255.3 | | | | 170.7 | |
| Charge-offs | | | (175.1 | ) | | | (126.7 | ) |
| Effect of difference in exchange rate | | | 22.7 | | | | (20.6 | ) |
| Reclassification – securitization | | | – | | | | – | |
| Reversals of provisions | | | (15.6 | ) | | | (24.1 | ) |
| Balance at end of year (foreign) | | | 420.1 | | | | 212.7 | |
| Balance at end of year total (2) | | | 3,073.0 | | | | 2,545.6 | |
| (1) | In 2013 it reflects the Central American Acquisitions by Banco de Bogotá of (i) a 98.92% equity interest in Banco BAC de Panamá on December 19, 2013 through its subsidiary LB Panamá and (ii) 100.00% equity interest in Grupo Financiero Reformador de Guatemala on December 23, 2013 through its indirect subsidiary Credomatic International Corporation (a subsidiary of LB Panamá). |
| (2) | The allowance balance for accrued interest receivable, which is not included in this item, amounted to Ps 84.4 billion and Ps 77.2 billion for the years ended December 31, 2013 and 2012, respectively. |
The following table presents the allocation of our allowance for loan losses by category of loan and financial lease losses.
| | | At December 31, | |
| | | 2013 | | | 2012 | |
| | | (in Ps billions) | |
| Domestic | | | | | | | | |
| Commercial | | | 1,218.9 | | | | 1,100.6 | |
| Consumer | | | 1,154.1 | | | | 991.2 | |
| Microcredit | | | 24.1 | | | | 21.6 | |
| Mortgages | | | 24.7 | | | | 18.9 | |
| Financial leases | | | 209.7 | | | | 187.7 | |
| | | At December 31, | |
| | | 2013 | | | 2012 | |
| | | (in Ps billions) | |
| General (1) | | | 21.5 | | | | 12.7 | |
| Total domestic | | | 2,653.0 | | | | 2,332.8 | |
| Foreign | | | | | | | | |
| Commercial | | | 136.9 | | | | 64.4 | |
| Consumer | | | 248.8 | | | | 133.7 | |
| Microcredit | | | – | | | | – | |
| Mortgages | | | 31.9 | | | | 12.9 | |
| Financial leases | | | 2.5 | | | | 1.8 | |
| General (1) | | | – | | | | – | |
| Total foreign | | | 420.1 | | | | 212.7 | |
| Total allowance for loan and financial lease losses | | | 3,073.0 | | | | 2,545.6 | |
| (1) | Our banking subsidiaries adopted the Commercial Reference Model (July 2007) and the Consumer Reference Model (July 2008) issued by the Superintendency of Finance. Notwithstanding the elimination of the general allowance for loan losses dictated by these models, this did not result in a decrease in the total amount of allowances, as allowances for individual loans increased. |
The following table presents the allocation of our allowance for loans and financial lease losses by type of loan.
| | | At December 31, | |
| | | 2013 | | | % | | | 2012 | | | % | |
| | | (in Ps billions, except percentages) | |
| Domestic | | | | | | | | | | | | | | | | |
| Commercial | | | | | | | | | | | | | | | | |
| General purpose loans | | | 932.4 | | | | 30.3 | | | | 840.0 | | | | 33.0 | |
| Loans funded by development banks | | | 56.6 | | | | 1.8 | | | | 50.4 | | | | 2.0 | |
| Working capital loans | | | 196.4 | | | | 6.4 | | | | 182.9 | | | | 7.2 | |
| Credit cards | | | 23.0 | | | | 0.7 | | | | 16.7 | | | | 0.7 | |
| Overdrafts | | | 10.6 | | | | 0.3 | | | | 10.6 | | | | 0.4 | |
| Total commercial | | | 1,218.9 | | | | 39.7 | | | | 1,100.6 | | | | 43.2 | |
| Consumer | | | | | | | | | | | | | | | | |
| Credit cards | | | 193.7 | | | | 6.3 | | | | 148.0 | | | | 5.8 | |
| Personal loans | | | 844.7 | | | | 27.5 | | | | 741.1 | | | | 29.1 | |
| Automobile and vehicle loans | | | 100.2 | | | | 3.3 | | | | 85.8 | | | | 3.4 | |
| Overdrafts | | | 5.1 | | | | 0.2 | | | | 5.2 | | | | 0.2 | |
| Loans funded by development banks | | | 0.1 | | | | – | | | | 0.1 | | | | – | |
| General purpose loans | | | 10.3 | | | | 0.3 | | | | 11.0 | | | | 0.4 | |
| Working capital loans | | | – | | | | – | | | | 0.1 | | | | – | |
| Total consumer | | | 1,154.1 | | | | 37.6 | | | | 991.2 | | | | 38.9 | |
| Microcredit | | | 24.1 | | | | 0.8 | | | | 21.6 | | | | 0.8 | |
| Mortgages | | | 24.7 | | | | 0.8 | | | | 18.9 | | | | 0.7 | |
| Financial leases | | | 209.7 | | | | 6.8 | | | | 187.7 | | | | 7.4 | |
| General | | | 21.5 | | | | 0.7 | | | | 12.7 | | | | 0.5 | |
| Total domestic | | | 2,653.0 | | | | 86.3 | | | | 2,332.8 | | | | 91.6 | |
| Foreign | | | | | | | | | | | | | | | | |
| Commercial | | | | | | | | | | | | | | | | |
| General purpose loans | | | 75.8 | | | | 2.5 | | | | 47.9 | | | | 1.9 | |
| Loans funded by development banks | | | – | | | | – | | | | – | | | | – | |
| Working capital loans | | | 56.4 | | | | 1.8 | | | | 14.4 | | | | 0.6 | |
| Credit cards | | | – | | | | – | | | | – | | | | – | |
| Overdrafts | | | 4.7 | | | | 0.2 | | | | 2.0 | | | | 0.1 | |
| Total commercial | | | 136.9 | | | | 4.5 | | | | 64.4 | | | | 2.5 | |
| | | At December 31, | |
| | | 2013 | | | % | | | 2012 | | | % | |
| | | (in Ps billions, except percentages) | |
| Consumer | | | | | | | | | | | | | | | | |
| Credit cards | | | 166.0 | | | | 5.4 | | | | 117.9 | | | | 4.6 | |
| Personal loans | | | 72.0 | | | | 2.3 | | | | 8.0 | | | | 0.3 | |
| Automobile and vehicle loans | | | 7.5 | | | | 0.2 | | | | 3.8 | | | | 0.1 | |
| Overdrafts | | | 3.4 | | | | 0.1 | | | | 4.0 | | | | 0.2 | |
| Loans funded by development banks | | | – | | | | – | | | | – | | | | – | |
| General purpose loans | | | – | | | | – | | | | – | | | | – | |
| Working capital loans | | | – | | | | – | | | | – | | | | – | |
| Total consumer | | | 248.8 | | | | 8.1 | | | | 133.7 | | | | 5.3 | |
| Microcredit | | | – | | | | – | | | | – | | | | – | |
| Mortgages | | | 31.9 | | | | 1.0 | | | | 12.9 | | | | 0.5 | |
| Financial leases | | | 2.5 | | | | 0.1 | | | | 1.8 | | | | 0.1 | |
| General | | | – | | | | – | | | | – | | | | – | |
| Total foreign | | | 420.1 | | | | 13.7 | | | | 212.7 | | | | 8.4 | |
| Total allowance for loan and financial lease losses | | | 3,073.0 | | | | 100.0 | | | | 2,545.6 | | | | 100.0 | |
Charge-offs
The following table presents the allocation of our charge-offs by type of loan for the years indicated.
| | | Year ended
December 31, | |
| | | 2013 | | | 2012 | |
| | | (in Ps billions) | |
| Domestic | | | | | | | | |
| Commercial and consumer | | | | | | | | |
| General purpose loans | | | 93.8 | | | | 106.4 | |
| Loans funded by development banks | | | 6.5 | | | | 4.6 | |
| Working capital loans | | | 18.8 | | | | 5.1 | |
| Credit cards | | | 153.6 | | | | 108.7 | |
| Personal loans | | | 389.9 | | | | 283.4 | |
| Automobile and vehicle loans | | | 47.3 | | | | 36.0 | |
| Overdrafts | | | 6.4 | | | | 7.6 | |
| Total commercial and consumer | | | 716.3 | | | | 551.6 | |
| Microcredit | | | 20.0 | | | | 12.6 | |
| Mortgages and other | | | 0.1 | | | | 0.4 | |
| Financial leases | | | 18.8 | | | | 21.7 | |
| Total domestic | | | 755.1 | | | | 586.4 | |
| Foreign | | | | | | | | |
| Commercial and consumer | | | | | | | | |
| General purpose loans | | | 0.8 | | | | 6.3 | |
| Loans funded by development banks | | | – | | | | – | |
| Working capital loans | | | 0.5 | | | | 2.5 | |
| Credit cards | | | 146.6 | | | | 97.9 | |
| Personal loans | | | 12.7 | | | | 6.2 | |
| Automobile and vehicle loans | | | 2.4 | | | | 1.9 | |
| Overdrafts | | | 7.6 | | | | 5.0 | |
| Total commercial and consumer | | | 170.7 | | | | 119.9 | |
| Microcredit | | | – | | | | – | |
| Mortgages and other | | | 4.5 | | | | 5.5 | |
| Financial leases | | | (0.1 | ) | | | 1.3 | |
| Total foreign | | | 175.1 | | | | 126.7 | |
| | | Year ended
December 31, | |
| | | 2013 | | | 2012 | |
| | | (in Ps billions) | |
| | | | |
| Total charge-offs | | | 930.2 | | | | 713.2 | |
The ratio of charge-offs to average outstanding loans for the periods indicated was as follows.
| | | Year ended December
31, | |
| | | 2013 | | | 2012 | |
| | | (in percentages) | |
| Ratio of charge-offs to average outstanding loans | | | 1.1 | % | | | 1.0 | % |
Cross-border outstanding loans and investments
We do not have any cross-border outstanding loans and investments to a borrower in any country that exceeded 0.75% of our total assets. The following table presents information with respect to our cross-border outstanding loans and investments, at December 31, 2013 and 2012. See “—Loan portfolio” above for a description of cross-border outstanding by type of foreign borrower.
| | | At December 31, | |
| | | 2013 | | | 2012 | |
| | | (in Ps billions) | |
| Loans | | | | | | | | |
| Commercial | | | | | | | | |
| Costa Rica | | | 1,412.9 | | | | 1,081.9 | |
| El Salvador | | | 717.7 | | | | 540.7 | |
| Guatemala | | | 2,294.5 | | | | 466.4 | |
| Honduras | | | 1,154.5 | | | | 910.3 | |
| Nicaragua | | | 956.8 | | | | 778.3 | |
| Panama | | | 714.1 | | | | 545.0 | |
| Consumer | | | | | | | | |
| Costa Rica | | | 569.4 | | | | 457.9 | |
| El Salvador | | | 285.8 | | | | 210.8 | |
| Guatemala | | | 261.4 | | | | 99.6 | |
| Honduras | | | 211.4 | | | | 134.1 | |
| Nicaragua | | | 320.1 | | | | 172.3 | |
| Panama | | | 769.3 | | | | 597.9 | |
| Financial Leases | | | | | | | | |
| Costa Rica | | | 288.9 | | | | 222.3 | |
| El Salvador | | | 13.3 | | | | 13.7 | |
| Guatemala | | | 6.4 | | | | 0.1 | |
| Honduras | | | 1.2 | | | | 0.7 | |
| Nicaragua | | | 4.6 | | | | 2.4 | |
| Panama | | | 49.6 | | | | 32.7 | |
| Mortgages | | | | | | | | |
| Costa Rica | | | 1,654.8 | | | | 1,280.0 | |
| El Salvador | | | 510.4 | | | | 468.1 | |
| Guatemala | | | 686.9 | | | | 461.3 | |
| Honduras | | | 447.6 | | | | 436.6 | |
| Nicaragua | | | 211.4 | | | | 170.2 | |
| Panama | | | 535.8 | | | | 458.9 | |
| Credit Cards | | | | | | | | |
| Costa Rica | | | 1,304.9 | | | | 990.3 | |
| El Salvador | | | 548.8 | | | | 427.0 | |
| | | At December 31, | |
| | | 2013 | | | 2012 | |
| | | (in Ps billions) | |
| Guatemala | | | 608.3 | | | | 440.7 | |
| Honduras | | | 495.3 | | | | 464.2 | |
| Nicaragua | | | 190.0 | | | | 208.1 | |
| Panama | | | 516.9 | | | | 418.9 | |
| Unearned Income | | | | | | | | |
| Costa Rica | | | – | | | | – | |
| El Salvador | | | – | | | | – | |
| Guatemala | | | – | | | | – | |
| Honduras | | | – | | | | – | |
| Nicaragua | | | – | | | | – | |
| Panama | | | – | | | | – | |
| Total per country | | | | | | | | |
| Costa Rica | | | 5,230.9 | | | | 4,032.5 | |
| El Salvador | | | 2,076.1 | | | | 1,660.2 | |
| Guatemala | | | 3,857.5 | | | | 1,468.2 | |
| Honduras | | | 2,310.1 | | | | 1,946.0 | |
| Nicaragua | | | 1,683.0 | | | | 1,331.2 | |
| Panama | | | 2,585.8 | | | | 2,053.3 | |
| Investments | | | | | | | | |
| Australia | | | 0.6 | | | | 3.9 | |
| Brazil | | | 890.8 | | | | 498.5 | |
| British Virgin Islands | | | – | | | | 46.9 | |
| Barbados | | | 4.3 | | | | – | |
| Canada | | | 9.0 | | | | 2.2 | |
| Cayman Islands | | | 53.2 | | | | 383.1 | |
| Chile | | | 345.6 | | | | 322.9 | |
| Costa Rica | | | 755.1 | | | | 712.8 | |
| El Salvador | | | 117.9 | | | | 59.1 | |
| France | | | 1.3 | | | | 5.3 | |
| Germany | | | 24.0 | | | | 10.5 | |
| Guatemala | | | 462.5 | | | | 218.8 | |
| Honduras | | | 261.9 | | | | 374.8 | |
| Ireland | | | 2.0 | | | | – | |
| Luxembourg | | | 1.2 | | | | – | |
| Mexico | | | 132.3 | | | | 116.6 | |
| Netherlands | | | – | | | | 23.2 | |
| Nicaragua | | | 4.8 | | | | 11.3 | |
| Panama | | | 333.0 | | | | 393.8 | |
| Peru | | | 483.2 | | | | 287.0 | |
| Spain | | | 12.1 | | | | 5.3 | |
| United Kingdom | | | 15.7 | | | | 10.7 | |
| United States of America | | | 749.0 | | | | 497.3 | |
| BAC San José Liquid Fund (BAC San José Fondo líquido – Riesgo País Mixto) | | | 27.4 | | | | 5.0 | |
| Multilateral – Bank Information Center (Centro de información sobre la banca) | | | – | | | | – | |
| Inversiones Bursatiles Credom. Riesgo País Mixto | | | 1.9 | | | | – | |
| Multilateral – Bladex (Foreign Trade Bank of Latin America) | | | 78.8 | | | | – | |
| Multilateral – Andean Development Corporation (Corporación Andina de Fomento) | | | 2.0 | | | | 3.7 | |
| Multilateral – Central American Bank for Economic Integration | | | 39.2 | | | | 56.4 | |
| Multilateral – Latin America Reserve Fund (Fondo Latinoamericano de Reservas) | | | – | | | | – | |
| Total investments | | | 4,808.8 | | | | 4,142.3 | |
Deposits
The principal components of our deposits are customer demand (checking and saving accounts) and time deposits. Our retail customers are the principal source of our demand and time deposits. The following table presents the composition of our deposits at December 31, 2013 and 2012.
| | | At December 31, | |
| | | 2013 | | | 2012 | |
| | | (in Ps billions) | |
| Domestic | | | | | | | | |
| Interest-bearing deposits: | | | | | | | | |
| Checking accounts | | | 4,344.7 | | | | 3,809.5 | |
| Time deposits | | | 23,308.2 | | | | 21,868.2 | |
| Savings deposits | | | 38,536.2 | | | | 30,976.5 | |
| Total | | | 66,189.1 | | | | 56,654.1 | |
| Non-interest-bearing deposits: | | | | | | | | |
| Checking accounts | | | 12,907.7 | | | | 11,011.1 | |
| Other deposits (1) | | | 895.4 | | | | 730.0 | |
| Total | | | 13,803.1 | | | | 11,741.1 | |
| Total domestic deposits | | | 79,992.2 | | | | 68,395.2 | |
| | | At December 31, | |
| | | 2013 | | | 2012 | |
| | | (in Ps billions) | |
| Foreign | | | | | | | | |
| Interest-bearing deposits: | | | | | | | | |
| Checking accounts | | | 5,983.4 | | | | 4,440.1 | |
| Time deposits | | | 9,431.1 | | | | 4,996.8 | |
| Savings deposits | | | 3,943.4 | | | | 2,569.5 | |
| Total | | | 19,357.8 | | | | 12,006.4 | |
| Non-interest-bearing deposits: | | | | | | | | |
| Checking accounts | | | 1,647.9 | | | | 841.7 | |
| Other deposits (1) | | | 192.5 | | | | 220.0 | |
| Total | | | 1,840.4 | | | | 1,061.7 | |
| Total foreign deposits | | | 21,198.2 | | | | 13,068.1 | |
| Total deposits | | | 101,190.4 | | | | 81,463.3 | |
| (1) | Consists of deposits from correspondent banks, cashier checks and collection services. |
Return on equity and assets
The following table presents certain selected financial ratios for the periods indicated.
| | | At December 31, | |
| | | 2013 | | | 2012 | |
| | | (in percentages) | |
| ROAA:Return on average assets (1) | | | 1.9 | | | | 2.0 | |
| ROAE:Return on average shareholders’ equity (2) | | | 17.1 | | | | 17.7 | |
| Average shareholders’ equity as a percentage of average total assets | | | 6.9 | | | | 7.3 | |
| Period-end shareholders’ equity and non-controlling interest as a percentage of period-end total assets | | | 11.8 | | | | 11.4 | |
| Dividend payout ratio (3) | | | 64.7 | | | | 59.8 | |
Source: Company calculations based on Grupo Aval data.
| (1) | For methodology used to calculate ROAA, see note (2) to the table under “Item 3. Key Information—A. Selected financial data—Other financial and operating data.” |
| (2) | For methodology used to calculate ROAE, see note (3) to the table under “Item 3. Key Information—A. Selected financial data—Other financial and operating data.” |
| (3) | Dividend payout ratio (dividends declared on both common and preferred shares, divided by net income). |
Short-term borrowings
The following table presents our short-term borrowings, consisting of interbank and overnight funds, for the periods indicated.
| | | At December 31, | |
| | | 2013 | | | 2012 | |
| | | Amount | | | Nominal
rate | | | Amount | | | Nominal
rate | |
| | | (in Ps billions, except percentages) | |
| Short-term borrowings | | | | | | | | | | | | | | | | |
| Interbank borrowings and overnight funds | | | | | | | | | | | | | | | | |
| End of period | | | 5,123.6 | | | | – | | | | 5,156.5 | | | | – | |
| Average during period | | | 5,588.4 | | | | 2.9 | % | | | 5,269.7 | | | | 4.3 | % |
| Maximum amount of borrowing at any month-end | | | 7,004.7 | | | | – | | | | 8,323.7 | | | | – | |
| Interest paid during the period | | | 160.8 | | | | – | | | | 228.3 | | | | – | |
SIGNATURES
The registrant hereby certifies that it meets all of the requirements for filing on Form 20-F and that it has duly caused and authorized the undersigned to sign this annual report on its behalf.
| | Grupo Aval Acciones y Valores S.A. |
| | | |
| | By: | /s/ Luis Carlos Sarmiento Gutiérrez |
| | | Name: | Luis Carlos Sarmiento Gutiérrez |
| | | Title: | President |
Date: April 27, 2017