


MainGate MLP Fund
Class A (AMLPX)
Class C (MLCPX)
Class I (IMLPX)
6075 Poplar Avenue, Suite 720 | Memphis, TN 38119 | 855.MLP.FUND (855.657.3863) | www.maingatefunds.com
Annual Report
November 30, 2021
annual report 2021 • 3
Table of Contents
MainGate mlp fund
Dear Shareholder,
The MainGate MLP Fund (“Fund”) had the following average annual total returns for its fiscal year ended November 30, 2021 compared to the S&P 500 Index and the Alerian MLP Total Return Index.
| | Inception
Date | | 1
Year | | 5
Year | | 10
Year | | Since
Inception |
| MainGate MLP Fund – Class A without load | 2/17/11 | | 42.66% | | -4.45% | | 0.74% | | 0.76% |
| MainGate MLP Fund – Class A with 5.75% maximum front-end load | 2/17/11 | | 34.41% | | -5.57% | | 0.14% | | 0.20% |
| MainGate MLP Fund – Class I | 2/17/11 | | 42.82% | | -4.24% | | 0.97% | | 1.00% |
| S&P 500 Index | 2/17/11 | | 27.92% | | 17.90% | | 16.16% | | 14.31% |
| Alerian MLP Total Return Index | 2/17/11 | | 38.75% | | -2.55% | | -0.05% | | 0.16% |
| MainGate MLP Fund – Class C without load | 3/31/14 | | 41.02% | | -5.22% | | –– | | -4.98% |
| MainGate MLP Fund – Class C with 1.00% Contingent Deferred Sales Charge | 3/31/14 | | 40.02% | | -5.22% | | –– | | -4.98% |
| S&P 500 Index | 3/31/14 | | 27.92% | | 17.90% | | –– | | 14.54% |
| Alerian MLP Total Return Index | 3/31/14 | | 38.75% | | -2.55% | | –– | | -4.71% |
Expense Ratios (Gross/Net): A Shares = 1.73%/1.73% | C Shares = 2.47%/2.47% | I Shares = 1.47%/1.47%. Net expense ratios represent the percentages paid by investors and reflect a 0.00% deferred income tax expense which represents the performance impact of accrued deferred tax liabilities across the Fund, not individual share classes, for the fiscal year ended November 30, 2021 (the Fund did not have a current tax expense or benefit due to a valuation allowance). The Fund’s adviser has contractually agreed to cap the Fund’s total annual operating expenses (excluding brokerage fees and commissions; Class A 12b-1 fees; borrowing costs; taxes, such as Deferred Income Tax Expense; and extraordinary expenses) at 1.50% through March 31, 2023. The performance data shown For Class C with load reflects the Class C maximum deferred sales charge of 1.00%. Deferred income tax expense/(benefit) represents an estimate of the Fund’s potential tax expense/(benefit) if it were to recognize the unrealized gains/(losses) in the portfolio. An estimate of deferred income tax expense/(benefit) depends upon the Fund’s net investment income/(loss) and realized and unrealized gains/(losses) on its portfolio, which may vary greatly on a daily, monthly and annual basis depending on the nature of the Fund’s investments and their performance. An estimate of deferred income tax expenses/(benefit) cannot be reliably predicted from year to year.
The performance data quoted represents past performance. Past performance is no guarantee of future results. The investment return and the principal value of an investment will fluctuate and shares, when redeemed, may be worth more or less than their original cost. Current performance may be lower or higher than the information quoted. To obtain performance information current to the most recent month-end please call 855.MLP.FUND (855.657.3863). Performance data shown for Class A shares with load reflects the maximum sales charge of 5.75%. Performance data shown for Class C shares with load reflects the maximum deferred sales charge of 1.00%. Performance data shown for Class I shares does not reflect the deduction of a sales load or fee. Performance data shown “Without Load” does not reflect the deduction of the sales load or fee. If reflected, the load or fee would reduce the performance quoted.
annual report 2021 • 5
2022 Outlook: How it started/How it’s going.
Happy New Year! Midstream’s +40.2% performance, as measured by the Alerian MLP TR Index (AMZX)1, represented one of the strongest returns across asset categories in 2021. However, the return was only partially a mean reversion story as much more of the return was driven by fundamentals. As we’ll discuss in the Valuation2 section, our research indicates a favorable setup for attractive returns in 2022 as well.
Many of you have seen the “how it started/how’s it going” memes that began circulating as we settled into a pandemic lifestyle. Most of these memes focused on the negative: worsening conditions, dishevelment, apathy, or worse. However, in Energy, and specifically in Midstream, the improvement seen throughout 2021 and going into 2022 is distinctly positive and, in our opinion, mostly overlooked by general market participants. Why the optimism? See below:
| • | Growth: There was a 720 basis point (bps) positive change to analyst expectations for the AMZX distributable cash flow (DCF)3 per unit growth rate for 2021 rising from (1.7%) to +5.5%. And, if 2022 is to be similar to 2021, the initial estimated DCF/unit growth of 4.6% is likely understated. |
| • | Equity Repurchase Activity: At the beginning of 2021, Midstream companies had $8.5 billion of authorizations and $1.6 billion had been executed on since July 2017, though only a modest amount of that was during 2020. Total buyback authorizations increased to $10.5 billion during the year, and on a reported quarter basis, we have seen $1.3 billion executed upon in increasing amounts culminating most recently in 3Q21 with total announced repurchases reaching $733 million (56% of the total). As we’ll discuss in the Valuation section, we expect to see another high amount for the 4Q21 period and throughout 2022. |
| • | Inflation: At the end of the 2020, consumer price index (CPI)4 rate was 1.4%. Although expectations were for it to modestly increase as the economy re-opened, market participants at that time likely would have been shocked to see the December 2021 release be reported at 6.8%. Likewise, the producer price index-finished goods (PPI-FG) finished 2020 at negative 1.4% and was annualizing at +13.3% in the November 2021 release. Given the inflation pass-through mechanisms within the majority of Midstream contracts, these higher gauges should at least neutralize cost increases and, in many cases, provide tailwinds for 2022 and 2023. |
| • | Gas Demand: We estimate natural gas demand grew 3.5%, supported by stable baseload demand as well as liquefied natural gas (LNG) exports reaching record levels of 12.4 billion cubic feet per day (Bcf/d) as demand from foreign buyers remains robust. |
| • | Crude Oil: Due to the effects of the pandemic both crude production and global demand suffered. We forecast U.S. crude supply will have grown 7.3% to 11.8 million barrels per day (MMBpd) (exit rate) when 2021 is finalized, and expect modest growth in 2022. While moderately positive for assets transporting and storing crude oil, we view this as medium-term bullish for prices as they will have to stay high to incentivize global production to meet a world that still demands more crude oil. |
| • | Energy Transition: Midstream companies announced over 40 projects, initiatives, certifications, alliances, etc. since March 31, 2021 related to the Energy Transition. It is clear to us that Midstream infrastructure is here to play a critical role in the long process of transitioning and cleaning the sources for North American energy demand. |
(1) Alerian MLP Index: A capitalization-weighted index of the most prominent energy Master Limited Partnerships. Visit http://www.alerian.com/indices/amz-index for more information, including performance. You cannot invest directly in an index. (2) Valuation: The process of determining the current worth of an asset or a company. (3) Distributable Cash Flow: Measured as earnings before interest, taxes, depreciation and amortization (EBITDA) available to pay unitholders after reserving for maintenance capital expenditures and payment of interest expense. (4) Consumer Price Index (CPI): A measure that examines the weighted average of prices of a basket of consumer goods and services, such as transportation, food and medical care.
6 | MainGate mlp fund
Valuation & Capital Allocation
Valuation
Continuing the theme above, the price to DCF/unit (P/DCF)5 for the AMZX at 12/31/21 was 4.9x vs. 4.6x at 12/31/20. If 2021 were solely a mean reversion story, then that would’ve implied a +6.5% return vs. the +40.2% return actually registered. Breaking it down further, we estimate the components of the +40.2% return were:
| • | 9.7% of yield6 (average for the year), |
| • | 6.5% of mean reversion, and |
| • | 24.0% of fundamental growth |
This sector is not just about being “cheap” vs. the long-term P/DCF averages of 10.0x (since 2008) and 7.3x (since 2016). There are solid fundamental improvements occurring that we believe should sustainably move prices higher. Given the re-emerging growth narrative and the further assuagement of the “terminal value” narrative, one could make the argument that Midstream is cheaper now than it was a year ago.
Alerian Weighted P/DCF
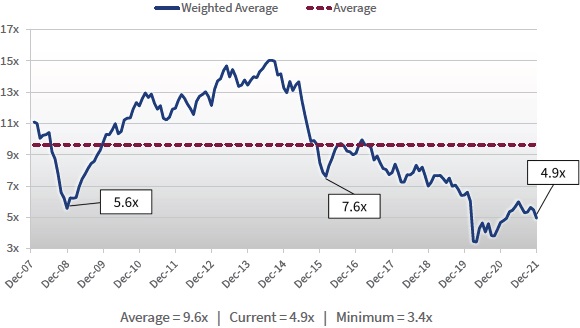
Bloomberg, LP, CCM 12/31/21
(5) Price to Distributable Cash Flow (P/DCF): Market cap of the MLP divided by a full year of distributable cash flow, which is measured as earnings before interest, taxes, depreciation and amortization (EBITDA) available to pay unit holders after reserving for maintenance capital expenditures and payment of interest expense. (6) Yield: Refers to the interest or dividends received from a security and is usually expressed annually as a percentage based on the investment’s cost, its current market value or its face value.
annual report 2021 • 7
We think the 2022e 4.6% DCF/unit growth for the AMZX is understated not just because analysts remain conservative in their estimates (volumes, inflation tailwinds, and other factors), but because it doesn’t appear they’re factoring much, if any, benefit from share/unit count reductions, which would also be a growth tailwind for per unit economics. Refreshing our years-long rhetorical question “what else are they going to do with all the cash flow7”, 2022 is shaping up to be a very strong year for free cash flow (FCF)8 generation due to the increasing cash flow from operations (CFFO) and a modest outlook for capital expenditures (“capex”).
As we expressed in earlier newsletters, 2021 and 2022 were/are expected to be “catch-up” years for both supply and demand driven projects due to the initial volumetric growth projections being disrupted by economic ramifications from the pandemic. Therefore, Midstream capex needs are not substantial in the near term, and the majority of the capex for 2022 should be known at this point. Wells Fargo Securities predicts $21 billion versus $22 billion in 2021, the majority of which is directed toward low capital, quick turn-around, high return projects which could also boost 2022 and 2023 operating cash flow higher than current consensus estimates. Furthermore, for a more long-term view of “how it started/how it’s going”, Wells also points out for the prior 5 years (2016-2020) industry capex averaged 65% of EBITDA9, whereas the 2021 forecast of $22 billion only represents 28% of earnings before interest, taxes, depreciation and amortization (EBITDA), and the forecast for the forward 5 years (2022-2027) is 24%, heavily dominated by regulatory spending in Canada10.
It strikes us as funny for all the focus the past 12-18 months on debt to EBITDA (D/EBITDA)11 leverage, it hardly warrants a discussion beyond this paragraph. The short answer is, by and large, leverage is at or below corporate targets with the AMZX index registering at 3.6x, down from 3.9x (hardly danger levels) this time last year.
Capex is low. Leverage is in check. The AMZX boasts a FCF yield of 17.9% currently, which is also well above peer asset classes, and if you simply take out the current 8.2% yield, there is simplistically 8-10% of cash flow that could be available for return of capital12 activity in 2022.
Estimated Free Cash Flow Yield

Bloomberg, LP. at 12/31/21. Using Bloomberg definition of Free Cash Flow to Equity of cash flow from operations (CFFO)
less capex. BPMP has no consensus estimate; therefore we use CCM’s estimate.
(7) Cash Flow: A measurement of the cash generating capability of a company by adding non-cash charges (e.g. depreciation) and interest expense to pretax income. (8) Free Cash Flow: A measure of financial performance calculated as operating cash flow minus capital expenditures. (9) Earnings Before Interest, Taxes, Depreciation and Amortization (EBITDA): Essentially net income with interest, taxes, depreciation, and amortization added back to it; can be used to analyze and compare profitability between companies and industries because it eliminates the effects of financing and accounting decisions. (10) Wells Fargo Securities, “Weekender: Midstream Capex Trends in Perspective”, 1/7/22. (11) Debt to EBITDA: A measurement of leverage, calculated as a company’s interest-bearing liabilities minus cash or cash equivalents, divided by its Earnings Before Interest, Taxes, Depreciation and Amortization (EBITDA). (12) Return on Invested Capital: A return from an investment that is not considered income.
8 | MainGate mlp fund
Distribution Growth
In addition to equity repurchase programs, it’s time to re-introduce the subject of income growth. With the substantial FCF available to management teams we expect an increased amount will be used for distribution and dividend increases in 2022 — something else that is rarely discussed even by industry pundits. Management teams who took the hard but necessary steps to reduce payouts to investors in 2020 to manage their debt profiles, have seen faster improvements in their business models which has accelerated their timelines to reaching leverage targets. On 11/4/21, Targa Resources Corp. (TRGP, $56.40) announced its intention to raise the 2022 annual dividend from $0.35 to $1.40, and we believe, based on additional company commentary, we could see similar step-ups from several companies within our portfolio. For other companies where distributions and dividends were not reduced, we expect to see modest upticks in the growth rate for 2022.
Energy Transition Spending
Expectations for 2022 Energy Transition spending are that it will begin in earnest, but remain low relative to the capital spending of $21 billion for traditional fuels. We do think a lot of the planning stage work will be discussed in 2022, which will begin to reflect the spending needs for 2023 and beyond. Bloomberg New Energy Finance expects global annual spending on Energy Transition could rise from $1.8 trillion per year in 2021 to $3.1-5.8 trillion per year in 205113. It is inconceivable that Midstream infrastructure will not be needed and used in this transition whether it be new or repurposed assets, thus providing an additional long-term avenue for growth. Our team has done a substantial amount of research into this area, and if learning more about this important multi-decade investment period is of interest please reach out to your Chickasaw representative.
Portfolio Update
Recognizing the improvement in conditions described above, the recent changes made to the portfolio during 4Q21 are intended to deliberately emphasize that we believe this is a growth portfolio. The portfolio is positioned and over-weighted towards companies with an inexpensive valuation, a good outlook for growth, and D/EBITDA in a position of strength. We believe these companies have the ability to use capital allocation resources towards shareholder-enhancing returns primarily through buybacks, modest distribution growth, and potential one-time distribution step-ups. And these thoughts remain supported not just through fundamental data, but through continued, in-person discussions with corporate decision makers whose near-term philosophies align with our own.
(13) BloombergNEF, “New Energy Outlook 2021”, July 2021.
annual report 2021 • 9
Fund Flow Update
Fund flows remained challenged during 2021 with net passive inflows of only $61 million and net active outflows of ($1.9) billion. December was a bit perplexing with net outflows across both passive and active totaling ($254) million after a net combined inflow of $111 million the previous two months of the quarter. And all of this stands in contrast to the positive total return performance for the AMZX for December and all of 2021.
Monthly Midstream Fund Flows
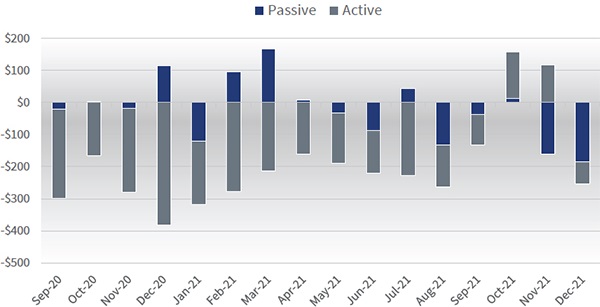
Morningstar 12/31/21
Preferring to stick with the glass half-full perspective, we offer a few thoughts. Clearly someone was buying, which would likely pin the answer on the generalist investor whom we would guess was more the macro/technical trader over the human allocator. Also, could 2021 have been the final throes of those who “kept the faith” in 2021 but weren’t prepared to stay committed long-term due to the prior years’ volatility?
Given that we thought 2021 was a great set-up for increased allocation to the space and yet, to the contrary, fund flows were uncooperative we have a hard time calling the direction. But some potential tailwinds for 2022 include:
| • | Increased conversations with generalist allocators who recognize the stability of the cash flow, the prospects for modest growth, and the role Midstream is prepared to play in the Energy Transition. They were already attracted to the inexpensive nature of the asset class, and the relatively higher income potential. |
| • | Improved macro sentiment regarding the Energy Transition, as Europe, the U.S., and other countries and regions are showing that the transition will take longer, and there is no green switch to flip. And the increased perspective of Midstream’s growth role in the transition should help investors zero in on this asset class within the broad Energy complex. |
| • | Potential corporate support for equity trading through increased repurchase activity. |
10 | MainGate mlp fund
In the context of the broader investment case for Energy, Citi’s Head of Equity Trading Strategy recently noted Energy as a sector is expected to contribute ~6% of the S&P 500’s14 total 2022e profit, yet it’s only 2.8% of the index’s market capitalization15. Something has to give; we obviously just don’t know when. As one of our astute relationships remarked, the behavior recently has been “voting, not investing”.
Inflation Update
Inflation remains a dominant market narrative. We’ll note the chart below of annual Federal Energy Regulatory Commission (FERC) tariff adjustments based on the PPI-FG index16, which continued to climb higher with November’s reported data.
FERC Tariff Adjustments
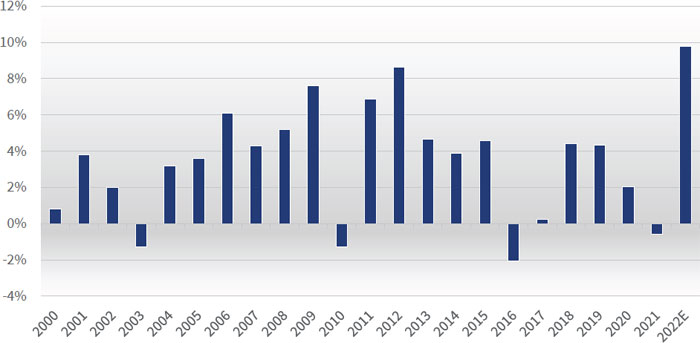
U.S. Bureau of Labor Statistics
Additional Risks
Beyond just taking a more moderate perspective of the positive factors described above, there remain a few additional risks. Of course, rolling waves of new variants have made it difficult to position for long-term investing trends for the past two years given the newness of this macro overhang. Our only retort would be most of the extrapolated concerns have been relatively short-term in hindsight, and Midstream infrastructure should retain its defensive and new growth opportunity characteristics as market participants and the general population seem determined to trudge on.
We would also remind investors we’re in a mid-year election cycle in 2022, which has occasionally raised some issues that could present concerns. However, Energy in general withstood the best punch the new Administration could throw at it during 2021, and the mood of the U.S. seems to be shifting much more politically neutral and desires less than the progressive agenda previously laid forth. We think it’s more likely we see sentiment return to normal as opposed to the “fix everything now” rhetoric from 2020 and 2021.
(14) S&P 500: A free-float capitalization-weighted index published since 1957 of the prices of 500 large-cap common stocks actively traded in the United States. (15) Citi Equity Trading Strategy, “What’s Happening Tomorrow?”, 1/4/22. (16) The Producer Price Index, (PPI-FG) program measures the average change over time in the selling prices received by domestic producers for their output. The prices included in the PPI are from the first commercial transaction for many products and some services. Finished Goods (FG) refers to the products in a manufacturer’s inventory that are completed and are awaiting to be sold.
annual report 2021 • 11
Fuels Fundamentals
Our thoughts for a constructive commodity price and volume backdrop have been well-articulated. We believe any worries about volumes in the near to medium term are misplaced, and long-term volume concerns have greatly subsided in the past year as discussed in the Valuation section above. Instead, we thought we would drop some “nuggets” to help to explain the broader picture for traditional fuels.
Natural Gas Baseload Growth
The conversation regarding the risk to oil/gasoline from electric vehicles (EVs) is becoming more balanced, as many market participants understand that while EVs could replace internal combustion engines (ICE) in developed countries over time, the growth in traditional fuel demand from emerging economies will keep oil growth healthy.
While the growth in EVs is a positive for natural gas demand, a point acknowledged by many, we’re not sure it’s been grasped on an individual level. Taking California as an example, they estimate the total load for the state’s 670,000 EV and Plug-In Hybrid EVs (PHEVs) would create a total demand of 4,670 megawatts, or 6,970 watts of load per vehicle, a figure that is lower due to the mix of PHEVs in the equation17. To fully charge each one of the average vehicles, typically 2-3 times per week, it’s the equivalent of adding to each home either:
California’s stated goal is to require all vehicle sales to be zero-emission by 2035. Maybe this is why Governor Newsom recognized the potential for fuel source dislocation and signed into law Senate Bill 423 which declared natural gas to be Zero-Carbon18? It’s probably also the reason why the EU, which is dealing with its own energy crisis, has moderated its stance by including natural gas (and nuclear) as “green”19. How quickly the sentiment towards natural gas has reversed.
Non-Organization for Economic
Co-operation and Development
Energy Consumption by Region 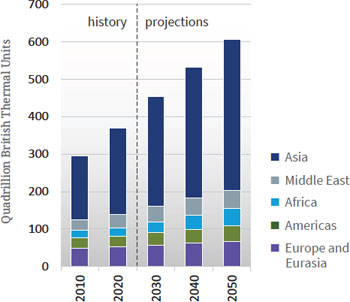
| Organization for Economic
Co-operation and Development
Energy Consumption by Region 
|
IEO2021 Release, CSIS, October 6, 2021
(17) LA Times, “Will California Have Enough Electricity for All It’s EVs? Yes—But It Will Take Work”, October 1, 2020. (18) California State Senate Bill 423, September 23, 2021. (19) CNBC, “EU’s Plan to Include Gas and Nuclear in ‘Green’ Ranking Leaves Investors Confused”, 1/6/22.
12 | MainGate mlp fund
Dislocations in Oil Inventories
Our weekly monitoring shows every single product in the Department of Energy’s (DOE) weekly report is at or below the 5 year-low, thus demonstrating the demand recovery that has occurred in excess of returns from production.
U.S. Total Petroleum Inventory

U.S. Department of Energy
It’s also pretty well reported in the Media that the rhetoric from the White House regarding gasoline prices being too high was not something the Administration had much control over. One of the available tools the Administration used was to release barrels from the Strategic Petroleum Reserve (SPR). However, the SPR was already at 2002 lows before the DOE released the first barrels. Once barrels were released, of the 32 million barrels (MMBbls) offered for sale, the DOE only received offers for 4.8 MMBbls. There were a reported 18 MMBbls that subsequently went on sale but they appear to be just a one year pull forward of an already Congressionally mandated release. So that is 22.8 MMBbls actual vs 50 MMBbls planned and only 4.8 MMBbls truly incremental. The market quickly absorbed the additional sale and the price of crude oil has recovered the levels seen prior to the Administration remarks. We’ll also ask the same question you’re probably thinking: “is it a good policy to be at historic lows with our National oil inventories?”
U.S. Strategic Petroleum Reserve Inventory

U.S. Department of Energy
annual report 2021 • 13
Shifting the lens to a global perspective, Rystad Energy reported only 4.7 billion barrels of new oil inventory were discovered in 2021, which is the lowest level seen since 1946. The investor push for higher cash returns, and corporate strategies focused on the Energy Transition and lower-emission fuels are seen as the major contributors to this lackluster development year20.
This is also well explained by the chart from JP Morgan Asset Management below:
Global Fossil Fuel Use vs Energy Capital Spending

J.P.Morgan, “Eye on the Market Outlook 2022”, January 1, 2022
Lastly, if/when production falls short for either short or longer periods of time, OPEC+22 will have a harder time filling the incremental barrels needed as spare capacity within the group continues to move back to historical lows of ~2 MMBpd23.
OPEC+ Spare Capacity
Morgan Stanley Research, “The Oil Manual”, January 6, 2022
(20) Hart Energy, “Global Oil, Gas Discoveries Plummet to Lowest in Decades”, 12/22/21. (21) The exajoule (EJ) is equal to one quintillion (1018) joules. The joule is a derived unit of energy in the International System of Units. (22) OPEC+ is a loosely affiliated entity consisting of the countries that are members of the Organization of the Petroleum Exporting Countries (OPEC), plus several of the world’s major non-OPEC oil-exporting nations, most notably Russia, with the goal of exerting a degree of control over the price of crude oil. (23) Morgan Stanley, “Is the Oil Market Heading for a Triple Deficit”, 1/7/22.
14 | MainGate mlp fund
Conclusion
We begin 2022 as optimistic as we have ever been regarding the potential for Midstream to exhibit strong returns. Positive drivers are firmly in place, and it doesn’t take a lot of movement from a sentiment, trading and liquidity perspective to help valuations for the sector to normalize.
As always, thank you to our investors and we look forward to connecting with you this year regarding this and other exciting research and initiatives on which we are working.
| Sincerely, | |
 |  |
| Geoffrey P. Mavar, Chairman | Matthew G. Mead, CEO |
Past performance is not a guarantee of future results.
Opinions expressed are those of Chickasaw Capital Management, LLC and are subject to change, are not guaranteed, and should not be considered investment advice.
The information contained in this report is authorized for use when preceded or accompanied by a prospectus.
Mutual fund investing involves risk. Principal loss is possible. The Fund is nondiversified, meaning it may concentrate its assets in fewer individual holdings than a diversified fund. Therefore, the Fund is more exposed to individual security price volatility than a diversified fund. The Fund invests in Master Limited Partnerships (MLPs) which concentrate investments in the energy sector and are subject to the risks of energy prices and demand and the volatility of commodity investments. Damage to facilities and infrastructure of MLPs may significantly affect the value of an investment and may incur environmental costs and liabilities due to the nature of their business. MLPs are subject to significant regulation and may be adversely affected by changes in the regulatory environment. Investments in smaller companies involve additional risks, such as limited liquidity and greater volatility. Investments in foreign securities involve greater volatility and political, economic and currency risks and differences in accounting methods. MLPs are subject to certain risks inherent in the structure of MLPs, including complex tax structure risks, limited ability for election or removal of management, limited voting rights, potential dependence on parent companies or sponsors for revenues to satisfy obligations, and potential conflicts of interest between partners, members and affiliates.
References to market or composite indices, benchmarks or other measures of relative market performance over a specified period of time (each, an “index”) are provided for your information only. Reference to this index does not imply that the portfolio will achieve returns, volatility or other results similar to the index. The composition of the index may not reflect the manner in which a portfolio is constructed in relation to expected or achieved returns, portfolio guidelines, restrictions, sectors, correlations, concentrations, volatility or tracking error targets, all of which are subject to change over time. Indices are unmanaged. The figures for the indices do not reflect the deduction of any fees or expenses which would reduce returns. Investors cannot invest directly in indices.
The Alerian MLP Index is a composite of the most prominent energy Master Limited Partnerships that provides investors with an unbiased, comprehensive benchmark for this emerging asset class. The index, which is calculated using a float-adjusted, capitalization-weighted methodology, is disseminated real-time on a price-return basis (NYSE: AMZ), and the corresponding total-return index is disseminated daily (NYSE: AMZX). Relevant data points such as dividend yield are also published daily. For index values, constituents, and announcements regarding constituent changes, please visit www.alerian.com.
“Alerian MLP Index”, “Alerian MLP Total Return Index”, “AMZ” and “AMZX” are servicemarks of GKD Index Partners, LLC d/b/a Alerian (“Alerian”) and their use is granted under a license from Alerian. Alerian does not guarantee the accuracy and/or completeness of the Alerian MLP Index or any data included therein and Alerian shall have no liability for any errors, omissions, interruptions or defects therein. Alerian makes no warranty, express or implied, representations or promises, as to results to be obtained by Licensee, or any other person or entity from the use of the Alerian MLP Index or any data included therein. Alerian makes no express or implied warranties, representations or promises, regarding the originality, merchantability, suitability, non-infringement, or fitness for a particular purpose or use with respect to the Alerian MLP Index or any data included therein. Without limiting any of the foregoing, in no event shall Alerian have any liability for any indirect, special, incidental, or consequential damages (including lost profits), arising out of the Alerian MLP Index or any data included therein, even if notified of the possibility of such damages.
The Energy MLP Classification Standard (“EMCS”) was developed by and is the exclusive property (and a service mark) of GKD Index Partners, LLC d/b/a Alerian (“Alerian”) and its use is granted under a license from Alerian. Alerian makes no warranties, express or implied, or representations with respect to such standard or classification (or the results to be obtained by the use thereof), and hereby expressly disclaims all warranties of originality, accuracy, completeness, merchantability, suitability, non-infringement, or fitness for a particular purpose with respect to any such standard or classification. No warranty is given that the standard or classification will conform to any description thereof or be free of omissions, errors, interruptions, or defects. Without limiting any of the foregoing, in no event shall Alerian have any liability for any indirect, special, incidental, or consequential damages (including lost profits), arising out of any such standard or classification, even if notified of the possibility of such damages.
DJIA Total Return Index tracks the total return of The Dow Jones Industrial Average, a price-weighted average of 30 significant stocks traded on the New York Stock Exchange and the Nasdaq. Dividends are reinvested. The DJIA was invented by Charles Dow back in 1896.
NASDAQ is a market-capitalization weighted index of the more than 3,000 common equities listed on the Nasdaq stock exchange. The types of securities in the index include American depositary receipts, common stocks, real estate investment trusts (REITs) and tracking stocks. The index includes all Nasdaq listed stocks that are not derivatives, preferred shares, funds, exchange-traded funds (ETFs) or debentures.
The NYSE FANG+ Index is an equal-dollar weighted index designed to represent a segment of the technology and consumer discretionary sectors consisting of highly-traded growth stocks of technology and tech-enabled companies such as Facebook, Apple, Amazon, Netflix, and Alphabet’s Google.
annual report 2021 • 15
S&P 500 Total Return Index tracks the total return of the S&P 500 Index, an index of 500 stocks chosen for market size, liquidity and industry grouping, among other factors. Dividends are reinvested. The S&P 500 is designed to be a leading indicator of U.S. equities and is meant to reflect the risk/ return characteristics of the large cap universe.
The S&P 500® Industrials Index comprises those companies included in the S&P 500 that are classified as members of the GICS® industrials sector.
The S&P 500® Materials Index comprises those companies included in the S&P 500 that are classified as members of the GICS® materials sector.
The S&P 500® Real Estate Index comprises those companies included in the S&P 500 that are classified as members of the GICS® real estate sector.
The S&P 500® Utilities Index comprises those companies included in the S&P 500 that are classified as members of the GICS® utilities sector.
The S&P 500® Information Technology Index comprises those companies included in the S&P 500 that are classified as members of the GICS® information technology sector.
Cash Flow from Operations (CFFO) indicates the amount of money a company brings in from its ongoing, regular business activities, such as manufacturing and selling goods or providing a service to customers.
CPI (Consumer Price Index) is a measure of prices paid by consumers for a market basket of consumer goods and services. The yearly (or monthly) growth rates represent the inflation rate.
Distributable Cash Flow (DCF) is calculated as net income plus depreciation and other noncash items, less maintenance capital expenditure requirements. Distributable cash flow (DCF) data is CCM calculated consensus of Wall Street estimates. The estimated consensus weighted average distributable cash flow (DCF) per unit growth rate for the AMZ and our Model Portfolio incorporates market expectations by using the average annual growth rate using rolling-forward 24-month data. DCF growth rate is not a forecast of the portfolio’s future performance. DCF growth rate for the portfolio’s holdings does not guarantee a corresponding increase in the market value of the holding or the portfolio.
Distribution Coverage Ratio is calculated as cash available to limited partners divided by cash distributed to limited partners. It gives an indication of an MLP’s ability to make dividend payments to limited partner investors from operating cash flows. MLPs with a coverage ratio of in excess of 1.0 times are able to meet their dividend payments without external financing.
Distributions are quarterly payments, similar to dividends, made to Limited Partner (LP) and General Partner (GP) investors. These amounts are set by the GP and are supported by an MLP’s operating cash flows.
EBITDA is earnings before interest rates taxes depreciation and amortization.
Free Cash Flow (FCF) is a measure of financial performance calculated as operating cash flow minus capital expenditures.
Growth CapEx or Growth Capital Expenditures refers to the aggregate of all capital expenditures undertaken to further growth prospects and/or expand operations and excludes any maintenance and regulatory capital expenditures.
Leverage is net debt divided by EBITDA.
OPEC+ is a loosely affiliated entity consisting of the countries that are members of the Organization of the Petroleum Exporting Countries (OPEC), plus several of the world’s major non-OPEC oil-exporting nations, most notably Russia, with the goal of exerting a degree of control over the price of crude oil.
PPI (Producer Price Index) is a measure of the change in the price of goods as they leave their place of production.
Terminal Value is the value of an asset, business or project in perpetuity beyond a set forecast period for which future cash flows are estimated.
West Texas Intermediate (WTI), also known as Texas light sweet, is a grade of crude oil used as a benchmark in oil pricing. This grade is described as light because of its relatively low density, and sweet because of its low sulfur content. It is the underlying commodity of Chicago Mercantile Exchange’s oil futures contracts.
Yield refers to the cash dividend or distribution divided by the share or unit price at a particular point in time.
This material is provided for informational and educational purposes only and should not be construed as investment advice or an offer or solicitation to buy or sell any security, product or service.
Fund holdings and sector allocations are subject to change at any time and should not be considered a recommendation to buy or sell any security. Please refer to the schedule of investments for a complete listing of Fund holdings.
The Fund does not receive the same tax benefits of a direct investment in an MLP.
The Fund is subject to U.S. federal income tax on its taxable income at rates applicable to corporations (currently at a rate of 21%) as well as state and local income taxes.
The Fund accrues deferred income taxes for future tax liabilities associated with the portion of MLP distributions considered to be a tax-deferred return of capital and for any net operating gains as well as capital appreciation of its investments. This deferred tax liability is reflected in the daily NAV and as a result the Fund’s after-tax performance could differ significantly from the underlying assets even if the pre-tax performance is closely tracked.
The potential tax benefits from investing in MLPs depend on MLPs being treated as partnerships for federal income tax purposes.
If the MLP is deemed to be a corporation then its income would be subject to federal taxation, reducing the amount of cash available for distribution to the Fund which could result in a reduction of the Fund’s value.
The MainGate MLP Fund is distributed by Quasar Distributors, LLC.
16 | MainGate mlp fund
Hypothetical Growth of a $10,000 Investment | unaudited
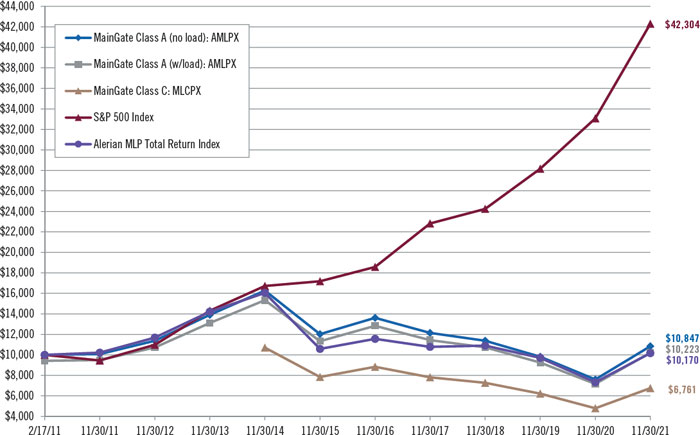
This chart illustrates the performance of a hypothetical $10,000 investment made in each share class as of its inception date (2/17/11 for Class A and 3/31/14 for Class C). Assumes reinvestment of dividends and capital gains. This chart does not imply any future performance.
Hypothetical Growth of a $1,000,000 Investment | unaudited
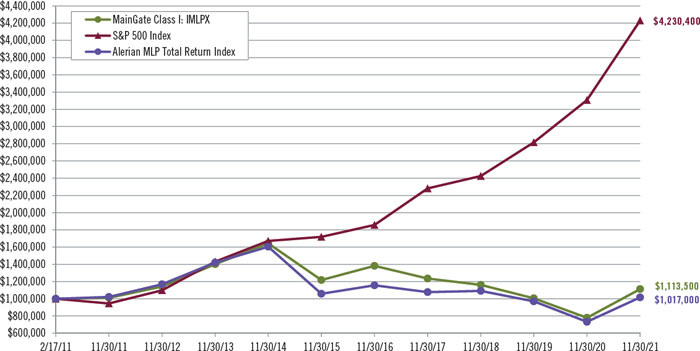
This chart illustrates the performance of a hypothetical $1,000,000 investment made in Class I shares as of their inception date (2/17/11). Assumes reinvestment of dividends and capital gains. This chart does not imply any future performance.
annual report 2021 • 17
Average Annual Returns | November 30, 2021 | unaudited
| | 1 Year | | 5 Year | | Since Inception | | Inception Date | |
| Class A (without sales load) | 42.66% | | -4.45% | | 0.76% | | 2/17/11 |
| Class A (with sales load) | 34.41% | | -5.57% | | 0.20% | | 2/17/11 | |
| Class C | 41.02% | | -5.22% | | -4.98% | | 3/31/14 | |
| Class C (with CDSC) | 40.02% | | -5.22% | | -4.98% | | 3/31/14 | |
| Class I | 42.82% | | -4.24% | | 1.00% | | 2/17/11 | |
| S&P 500 Index | 27.92% | | 17.90% | | 14.31% | | 2/17/11 | |
| S&P 500 Index | 27.92% | | 17.90% | | 14.54% | | 3/31/14 | |
| Alerian MLP Total Return Index | 38.75% | | -2.55% | | 0.16% | | 2/17/11 | |
| Alerian MLP Total Return Index | 38.75% | | -2.55% | | -4.71% | | 3/31/14 | |
Performance data quoted represents past performance; past performance does not guarantee future results. The investment return and principal value of an investment will fluctuate so that an investor’s shares, when redeemed, may be worth more or less than their original cost. Current performance of the Fund may be lower or higher than the performance quoted. Performance data current to the most recent month end may be obtained by calling 855.MLP.FUND (855.657.3863) or by visiting www.maingatefunds.com.
Class A (with sales load) performance reflects the maximum sales charge of 5.75%. Class C (with CDSC) performance reflects the 1.00% contingent deferred sales charge. Class I is not subject to a sales charge or CDSC.
The S&P 500 Index is a broad based unmanaged index of 500 stocks, which is widely recognized as representative of the equity market in general.
The Alerian MLP Total Return Index is a capped, float-adjusted, capitaliziation-weighted index, whose constituents earn the majority of their cash flow from midstream activities involving energy commodities.
You cannot invest directly in an index.
The graph and table do not reflect the deduction of taxes that a shareholder would pay on Fund distributions or the redemption of the Fund shares.
18 | MainGate mlp fund
Expense Example | unaudited
As a shareholder of the Fund, you incur two types of costs: (1) transaction costs, including sales charges (loads) on purchase payments, reinvested dividends, or other distributions; and exchange fees; and (2) ongoing costs, including management fees; distribution and/or service (12b-1) fees; and other Fund expenses. This example is intended to help you understand your ongoing costs (in dollars) of investing in the Fund and to compare these costs with the ongoing costs of investing in other mutual funds. The example is based on an investment of $1,000 invested at the beginning of the period and held for the six-month period from June 1, 2021 to November 30, 2021.
Actual Expenses
For each class, the first line of the table below provides information about actual account values and actual expenses. You may use the information in this line, together with the amount you invested, to estimate the expenses that you paid over the period. Simply divide your account value by $1,000 (for example, an $8,600 account value divided by $1,000 = 8.6), then multiply the result by the number in the first line under the heading entitled “Expenses Paid During Period” to estimate the expenses you paid on your account during this period.
Hypothetical Example for Comparison Purposes
For each class, the second line of the table below provides information about hypothetical account values and hypothetical expenses based on the Fund’s actual expense ratio and an assumed rate of return of 5% per year before expenses, which is not the Fund’s actual return. The hypothetical account values and expenses may not be used to estimate the actual ending account balance or expense you paid for the period. You may use this information to compare the ongoing costs of investing in the Fund and other funds. To do so, compare this 5% hypothetical example with the 5% hypothetical examples that appear in the shareholder reports of the other funds.
Please note that the expenses shown in the table are meant to highlight your ongoing costs only and do not reflect any transactional costs, such as sales charges (loads) or exchange fees. Therefore, the second line of the table for each class is useful in comparing ongoing costs only, and will not help you determine the relative total costs of owning different funds. In addition, if transaction costs were included, your costs would have been higher.
| | Beginning
Account Value
(6/01/21) | | Ending
Account Value
(11/30/21) | | Expenses Paid
During Period(1)
(6/01/21 – 11/30/21) | | Net Annualized
Expense Ratio(2) |
Class A Actual | $1,000.00 | | $1,006.92 | | $8.41 | | 1.68% |
Class A Hypothetical (5% return before expenses) | $1,000.00 | | $1,016.55 | | $8.45 | | 1.68% |
| Class C Actual | $1,000.00 | | $997.88 | | $12.10 | | 2.43% |
Class C Hypothetical (5% return before expenses) | $1,000.00 | | $1,012.81 | | $12.19 | | 2.43% |
| Class I Actual | $1,000.00 | | $1,007.57 | | $7.16 | | 1.43% |
Class I Hypothetical (5% return before expenses) | $1,000.00 | | $1,017.80 | | $7.19 | | 1.43% |
| (1) | Expenses are equal to the Fund’s annualized expense ratio multiplied by the average account value over the period, multiplied by 182 days (the number of days in the most recent period)/365 days (to reflect the period), for Class A, Class C and Class I. |
| (2) | Annualized expense ratio excludes current and deferred income and franchise tax expense. |
annual report 2021 • 19
Allocation of Portfolio Assets
November 30, 2021 | unaudited
(expressed as a percentage of total investments)
| ■ | Crude/Refined Products Pipelines and Storage* | 41.3% |
| ■ | Natural Gas/Natural Gas Liquid Pipelines and Storage* | 23.7% |
| ■ | Natural Gas Gathering/Processing* | 35.0% |

*Master Limited Partnerships and Related Companies
Schedule of Investments | November 30, 2021
| Master Limited Partnerships and Related Companies - 99.2%(1) | Shares | | Fair Value |
| Crude/Refined Products Pipelines and Storage - 41.0%(1) | | | |
| Canada - 0.5%(1) | | | |
| Enbridge, Inc. | 90,000 | | $3,378,600 |
| United States - 40.5%(1) | | | |
| BP Midstream Partners, L.P. | 400,000 | | 5,148,000 |
| Genesis Energy, L.P. | 1,800,000 | | 18,162,000 |
| Magellan Midstream Partners, L.P. | 1,300,000 | | 60,294,000 |
| MPLX, L.P. | 3,250,000 | | 95,257,500 |
| Phillips 66 Partners, L.P. | 720,000 | | 24,796,800 |
| Plains All American Pipeline, L.P. | 3,800,000 | | 35,340,000 |
| Plains GP Holdings, L.P. | 3,900,000 | | 39,000,000 |
| Shell Midstream Partners, L.P. | 1,680,000 | | 19,152,000 |
| | | | 297,150,300 |
| Total Crude/Refined Products Pipelines and Storage | | | 300,528,900 |
| | | | |
| Natural Gas/Natural Gas Liquid Pipelines and Storage - 23.5%(1) | | | |
| Canada - 0.4%(1) | | | |
| TC Energy Corporation | 70,000 | | 3,283,700 |
| United States - 23.1%(1) | | | |
| Energy Transfer, L.P. | 9,400,000 | | 79,148,000 |
| Enterprise Products Partners, L.P. | 2,900,000 | | 62,031,000 |
| Kinder Morgan, Inc. | 457,000 | | 7,065,220 |
| Williams Companies, Inc. | 787,000 | | 21,083,730 |
| | | | 169,327,950 |
| Total Natural Gas/Natural Gas Liquid Pipelines and Storage | | | 172,611,650 |
| | | | |
| Natural Gas Gathering/Processing - 34.7%(1) | | | |
| United States - 34.7%(1) | | | |
| Antero Midstream Corporation | 725,000 | | 7,039,750 |
| Crestwood Equity Partners, L.P. | 750,000 | | 19,170,000 |
| DCP Midstream, L.P. | 1,025,000 | | 26,988,250 |
| Enlink Midstream, LLC | 8,000,000 | | 52,080,000 |
| Targa Resources Corporation | 1,400,000 | | 72,282,000 |
| Western Midstream Partners, L.P. | 4,000,000 | | 76,920,000 |
| Total Natural Gas Gathering/Processing | | | 254,480,000 |
| | | | |
| Total Master Limited Partnerships and Related Companies (Cost $471,938,796) | | | 727,620,550 |
| Total Investments - 99.2% (Cost $471,938,796)(1) | | | 727,620,550 |
| Other Assets in Excess of Liabilities - 0.8%(1) | | | 5,596,636 |
| Net Assets - 100.0%(1) | | | $733,217,186 |
| (1) | Calculated as a percentage of net assets. |
| 20 | MainGate mlp fund | The accompanying notes are an integral part of the financial statements. | |
Statement of Assets and Liabilities
November 30, 2021
| Assets | |
| Investments at fair value (cost $471,938,796) | $727,620,550 |
| Cash(1) | 28,775,114 |
| Receivable for Fund shares sold | 489,651 |
| Dividends receivable | 149,743 |
| Prepaid expenses | 85,252 |
| Total assets | 757,120,310 |
| Liabilities | |
| Payable for Fund shares redeemed | 22,592,509 |
| Payable to Adviser | 839,995 |
| Payable for 12b-1 distribution fee | 53,346 |
| Payable to Trustees | 24,000 |
| Payable to Custodian | 9,423 |
| Accrued expenses and other liabilities | 383,851 |
| Total liabilities | 23,903,124 |
| | |
| Net assets | $733,217,186 |
| | |
| Net Assets Consist of | |
| Additional paid-in capital | $1,207,682,682 |
| Total distributable earnings, net of deferred taxes | (474,465,496) |
| Net assets | $733,217,186 |
| (1) | The Fund maintains cash in bank accounts which, at times, may exceed United States Federally insured limits. |
Unlimited shares authorized, no par value | Class A | Class C | Class I |
| Net assets | $30,569,903 | $17,119,406 | $685,527,877 |
| Shares issued and outstanding | 5,940,903 | 3,550,283 | 127,637,632 |
| Net asset value, redemption price and minimum offering price per share | $5.15 | $4.82 | $5.37 |
| Maximum offering price per share ($5.15/0.9425) | $5.46 | NA | NA |
Statement of Operations
Year Ended November 30, 2021
| Investment Income | |
| Distributions received from master limited partnerships | $52,529,635 |
Less: return of capital on distributions from master limited partnerships | (52,529,635) |
Distribution income received in excess of return of capital from master limited partnerships | — |
| Dividends from common stock(2,3) | 1,981,094 |
| Total Investment Income | 1,981,094 |
| (2) | The return of capital amount from C-Corporations was $6,875,347. (See Note 2) |
| (3) | Net of foreign withholding tax of $91,013. |
| Expenses | |
| Advisory fees | 10,244,087 |
| Administrator fees | 502,866 |
| Transfer agent expense | 196,094 |
| Insurance expense | 185,941 |
| Franchise tax expense | 149,925 |
| Professional fees | 132,712 |
| Reports to shareholders | 126,403 |
| Registration fees | 110,985 |
| Trustees’ fees | 96,000 |
| Compliance fees | 64,874 |
| Custodian fees and expenses | 51,811 |
| Fund accounting fees | 1,001 |
| 12b-1 distribution fee - Class A | 80,681 |
| 12b-1 distribution fee - Class C | 184,060 |
| Other expenses | 439 |
| Total Expenses | 12,127,879 |
| Net Investment Loss, before taxes | (10,146,785) |
| Current and deferred tax benefit/(expense)(4) | — |
| Net Investment Loss, net of taxes | (10,146,785) |
| | |
| Realized and Unrealized Gain/(Loss) on Investments | |
| Net realized loss on investments, before taxes | (18,854,705) |
| Current and deferred tax benefit/(expense)(4) | — |
| Net realized loss on investments, net of taxes | (18,854,705) |
| Net change in unrealized appreciation/depreciation on investments, before taxes | 317,060,430 |
| Deferred tax benefit/(expense)(4) | — |
| Net change in unrealized appreciation/depreciation on investments, net of taxes | 317,060,430 |
| Net Realized and Unrealized Gain/(Loss) on Investments | 298,205,725 |
| Increase in Net Assets Resulting from Operations | $288,058,940 |
| (4) | Any tax benefit/(expense) was fully offset by a valuation allowance recorded as of November 30, 2021. |
| | The accompanying notes are an integral part of the financial statements. | annual report 2021 • 21 |
Statements of Changes in Net Assets
| Operations | |
| | Year Ended November 30, 2021 | Year Ended November 30, 2020 |
| Net investment loss, net of deferred tax benefit/(expense) | $(10,146,785) | $(9,454,024) |
| Net realized loss on investments, net of deferred tax benefit/(expense) | (18,854,705) | (177,024,312) |
| Net change in unrealized appreciation/depreciation on investments, net of deferred tax benefit/(expense) | 317,060,430 | (38,350,092) |
| Increase/(Decrease) in net assets resulting from operations | 288,058,940 | (224,828,428) |
| | | |
Dividends and Distributions to Class A Shareholders | | |
| Net investment income | (385,041) | — |
| Return of capital | (2,181,901) | (3,885,742) |
| Dividends and Distributions to Class C Shareholders | | |
| Net investment income | (233,611) | — |
| Return of capital | (1,323,793) | (2,331,384) |
| Dividends and Distributions to Class I Shareholders | | |
| Net investment income | (8,832,111) | — |
| Return of capital | (50,048,630) | (83,310,078) |
| Total dividends and distributions to Fund shareholders | (63,005,087) | (89,527,204) |
| | | |
Capital Share Transactions (Note 8) | | |
| Proceeds from shareholder subscriptions | 139,804,363 | 687,002,918 |
| Dividend reinvestments | 51,077,187 | 75,024,609 |
| Payments for redemptions | (475,247,699) | (717,093,632) |
| Increase/(Decrease) in net assets from capital share transactions | (284,366,149) | 44,933,895 |
| Total decrease in net assets | (59,312,296) | (269,421,737) |
| | | |
Net Assets | | |
| Beginning of Year | 792,529,482 | 1,061,951,219 |
| End of Year | $733,217,186 | $792,529,482 |
| 22 | MainGate mlp fund | The accompanying notes are an integral part of the financial statements. | |
Financial Highlights: Class A Shares
| Per Share Data(1) | Year Ended
November 30,
2021 | Year Ended
November 30,
2020 | Year Ended
November 30,
2019 | Year Ended
November 30,
2018 | Year Ended
November 30,
2017 |
| Net Asset Value, beginning of year | $3.91 | $5.65 | $7.17 | $8.25 | $9.89 |
| Income from Investment Operations | | | | | |
| Net investment loss(2) | (0.07) | (0.06) | (0.05) | (0.09) | (0.11) |
| Net realized and unrealized gain (loss) on investments | 1.71 | (1.22) | (0.84) | (0.36) | (0.90) |
| Total increase (decrease) from investment operations | 1.64 | (1.28) | (0.89) | (0.45) | (1.01) |
| Less Distributions to Shareholders | | | | | |
| Net investment income | (0.06) | — | — | — | — |
| Return of capital | (0.34) | (0.46) | (0.63) | (0.63) | (0.63) |
| Total distributions to shareholders | (0.40) | (0.46) | (0.63) | (0.63) | (0.63) |
| Net Asset Value, end of year | $5.15 | $3.91 | $5.65 | $7.17 | $8.25 |
| Total Investment Return | 42.66% | (22.61)% | (13.71)% | (6.24)% | (10.86)% |
| Supplemental Data and Ratios | | | | | |
| Net assets, end of year | $30,569,903 | $28,693,359 | $60,839,754 | $93,423,336 | $140,857,758 |
| Ratio of Expenses to Average Net Assets(3,4) | | | | | |
| Net deferred income and franchise tax (benefit) expense | 0.02% | 0.01% | 0.01% | 0.00%‡ | 0.01% |
| Expenses (excluding net deferred income and franchise tax (benefit) expense) before (waiver) recoupment | 1.68% | 1.72% | 1.69% | 1.66% | 1.65% |
| Expenses (excluding net deferred income and franchise tax (benefit) expense) after (waiver) recoupment | 1.68% | 1.72% | 1.69% | 1.66% | 1.65% |
| Expenses (including net deferred income and franchise tax (benefit) expense) before (waiver) recoupment | 1.70% | 1.73% | 1.70% | 1.66% | 1.66% |
| Net Fund Expenses(3,4) | 1.70% | 1.73% | 1.70% | 1.66% | 1.66% |
| Ratio of Net Investment Income (Loss) to Average Net Assets(3,4) | | | | | |
| Net investment income (loss) (excluding net deferred tax benefit and franchise tax benefit (expense)) before waiver (recoupment) | (1.44)% | (1.32)% | (0.71)% | (1.05)% | (1.11)% |
| Net investment income (loss) (excluding net deferred tax benefit and franchise tax benefit (expense)) after waiver (recoupment) | (1.44)% | (1.32)% | (0.71)% | (1.05)% | (1.11)% |
| Net investment income (loss) (including net deferred tax benefit and franchise tax benefit (expense)) before waiver (recoupment) | (1.46)% | (1.33)% | (0.72)% | (1.05)% | (1.12)% |
| Net Investment Income (Loss)(3,4) | (1.46)% | (1.33)% | (0.72)% | (1.05)% | (1.12)% |
| Portfolio turnover rate(5) | 20.80% | 36.65% | 66.39% | 44.57% | 19.35% |
‡ Less than 0.01%.
(1) Information presented relates to a share of Class A for the entire year. (2) Calculated using average shares outstanding method. (3) For the year ended November 30, 2021, the Fund accrued $149,925 in franchise tax expense, of which $5,904 is attributable to Class A. For the year ended November 30, 2020, the Fund accrued $87,319 in franchise tax expense, of which $3,733 is attributable to Class A. For the year ended November 30, 2019, the Fund accrued $85,100 in franchise tax expense, of which $5,253 is attributable to Class A. For the year ended November 30, 2018, the Fund accrued $26,903 in franchise tax expense, of which $1,982 is attributable to Class A. For the year ended November 30, 2017, the Fund accrued $148,000 in franchise tax expense, of which $14,756 is attributable to Class A. (4) The Fund did not accrue a deferred tax expense or benefit. (5) Portfolio turnover is calculated on the basis of the Fund as a whole without distinguishing between the classes of shares issued.
| | The accompanying notes are an integral part of the financial statements. | annual report 2021 • 23 |
Financial Highlights: Class C Shares
| Per Share Data(1) | Year Ended
November 30,
2021 | Year Ended
November 30,
2020 | Year Ended
November 30,
2019 | Year Ended
November 30,
2018 | Year Ended
November 30,
2017 |
| Net Asset Value, beginning of year | $3.72 | $5.43 | $6.97 | $8.09 | $9.78 |
| Income from Investment Operations | | | | | |
| Net investment loss(2) | (0.10) | (0.08) | (0.10) | (0.14) | (0.17) |
| Net realized and unrealized gain (loss) on investments | 1.60 | (1.17) | (0.81) | (0.35) | (0.89) |
| Total increase (decrease) from investment operations | 1.50 | (1.25) | (0.91) | (0.49) | (1.06) |
| Less Distributions to Shareholders | | | | | |
| Net investment income | (0.06) | — | — | — | — |
| Return of capital | (0.34) | (0.46) | (0.63) | (0.63) | (0.63) |
| Total distributions to shareholders | (0.40) | (0.46) | (0.63) | (0.63) | (0.63) |
| Net Asset Value, end of year | $4.82 | $3.72 | $5.43 | $6.97 | $8.09 |
| Total Investment Return | 41.02% | (22.99)% | (14.42)% | (6.88)% | (11.51)% |
| Supplemental Data and Ratios | | | | | |
| Net assets, end of year | $17,119,406 | $16,108,024 | $33,310,916 | $52,049,211 | $62,803,141 |
| Ratio of Expenses to Average Net Assets(3,4) | | | | | |
| Net deferred income and franchise tax (benefit) expense | 0.02% | 0.01% | 0.01% | 0.00%‡ | 0.01% |
| Expenses (excluding net deferred income and franchise tax (benefit) expense) before (waiver) recoupment | 2.43% | 2.46% | 2.44% | 2.41% | 2.40% |
| Expenses (excluding net deferred income and franchise tax (benefit) expense) after (waiver) recoupment | 2.43% | 2.46% | 2.44% | 2.41% | 2.40% |
| Expenses (including net deferred income and franchise tax (benefit) expense) before (waiver) recoupment | 2.45% | 2.47% | 2.45% | 2.41% | 2.41% |
| Net Fund Expenses(3,4) | 2.45% | 2.47% | 2.45% | 2.41% | 2.41% |
| Ratio of Net Investment Income (Loss) to Average Net Assets(3,4) | | | | | |
| Net investment income (loss) (excluding net deferred tax benefit and franchise tax benefit (expense)) before waiver (recoupment) | (2.19)% | (2.06)% | (1.46)% | (1.80)% | (1.86)% |
| Net investment income (loss) (excluding net deferred tax benefit and franchise tax benefit (expense)) after waiver (recoupment) | (2.19)% | (2.06)% | (1.46)% | (1.80)% | (1.86)% |
| Net investment income (loss) (including net deferred tax benefit and franchise tax benefit (expense)) before waiver (recoupment) | (2.21)% | (2.07)% | (1.47)% | (1.80)% | (1.87)% |
| Net Investment Income (Loss)(3,4) | (2.21)% | (2.07)% | (1.47)% | (1.80)% | (1.87)% |
| Portfolio turnover rate(5) | 20.80% | 36.65% | 66.39% | 44.57% | 19.35% |
‡ Less than 0.01%.
(1) Information presented relates to a share of Class C for the entire year. (2) Calculated using average shares outstanding method. (3) For the year ended November 30, 2021, the Fund accrued $149,925 in franchise tax expense, of which $3,367 is attributable to Class C. For the year ended November 30, 2020, the Fund accrued $87,319 in franchise tax expense, of which $2,149 is attributable to Class C. For the year ended November 30, 2019, the Fund accrued $85,100 in franchise tax expense, of which $2,996 is attributable to Class C. For the year ended November 30, 2018, the Fund accrued $26,903 in franchise tax expense, of which $1,007 is attributable to Class C. For the year ended November 30, 2017, the Fund accrued $148,000 in franchise tax expense, of which $5,467 is attributable to Class C. (4) The Fund did not accrue a deferred tax expense or benefit. (5) Portfolio turnover is calculated on the basis of the Fund as a whole without distinguishing between the classes of shares issued.
| 24 | MainGate mlp fund | The accompanying notes are an integral part of the financial statements. | |
Financial Highlights: Class I Shares
| Per Share Data(1) | Year Ended
November 30,
2021 | Year Ended
November 30,
2020 | Year Ended
November 30,
2019 | Year Ended
November 30,
2018 | Year Ended
November 30,
2017 |
| Net Asset Value, beginning of year | $4.06 | $5.83 | $7.36 | $8.43 | $10.07 |
| Income from Investment Operations | | | | | |
| Net investment loss(2) | (0.06) | (0.05) | (0.03) | (0.07) | (0.08) |
| Net realized and unrealized gain (loss) on investments | 1.77 | (1.26) | (0.87) | (0.37) | (0.93) |
| Total increase (decrease) from investment operations | 1.71 | (1.31) | (0.90) | (0.44) | (1.01) |
| Less Distributions to Shareholders | | | | | |
| Net investment income | (0.06) | — | — | — | — |
| Return of capital | (0.34) | (0.46) | (0.63) | (0.63) | (0.63) |
| Total distributions to shareholders | (0.40) | (0.46) | (0.63) | (0.63) | (0.63) |
| Net Asset Value, end of year | $5.37 | $4.06 | $5.83 | $7.36 | $8.43 |
| Total Investment Return | 42.82% | (22.42)% | (13.48)% | (5.98)% | (10.66)% |
| Supplemental Data and Ratios | | | | | |
| Net assets, end of year | $685,527,877 | $747,728,099 | $967,800,549 | $1,220,133,792 | $1,403,597,144 |
| Ratio of Expenses to Average Net Assets (3,4) | | | | | |
| Net deferred income and franchise tax (benefit) expense | 0.02% | 0.01% | 0.01% | 0.00%‡ | 0.01% |
| Expenses (excluding net deferred income and franchise tax (benefit) expense) before (waiver) recoupment | 1.43% | 1.46% | 1.44% | 1.41% | 1.40% |
| Expenses (excluding net deferred income and franchise tax (benefit) expense) after (waiver) recoupment | 1.43% | 1.46% | 1.44% | 1.41% | 1.40% |
| Expenses (including net deferred income and franchise tax (benefit) expense) before (waiver) recoupment | 1.45% | 1.47% | 1.45% | 1.41% | 1.41% |
| Net Fund Expenses(3,4) | 1.45% | 1.47% | 1.45% | 1.41% | 1.41% |
| Ratio of Net Investment Income (Loss) to Average Net Assets(3,4) | | | | | |
| Net investment income (loss) (excluding net deferred tax benefit and franchise tax benefit (expense)) before waiver (recoupment) | (1.19)% | (1.07)% | (0.46)% | (0.80)% | (0.86)% |
| Net investment income (loss) (excluding net deferred tax benefit and franchise tax benefit (expense)) after waiver (recoupment) | (1.19)% | (1.07)% | (0.46)% | (0.80)% | (0.86)% |
| Net investment income (loss) (including net deferred tax benefit and franchise tax benefit (expense)) before waiver (recoupment) | (1.21)% | (1.08)% | (0.47)% | (0.80)% | (0.87)% |
| Net Investment Income (Loss)(3,4) | (1.21)% | (1.08)% | (0.47)% | (0.80)% | (0.87)% |
| Portfolio turnover rate(5) | 20.80% | 36.65% | 66.39% | 44.57% | 19.35% |
‡ Less than 0.01%.
(1) Information presented relates to a share of Class I for the entire year. (2) Calculated using average shares outstanding method. (3) For the year ended November 30, 2021, the Fund accrued $149,925 in franchise tax expense, of which $140,654 is attributable to Class I. For the year ended November 30, 2020, the Fund accrued $87,319 in franchise tax expense, of which $81,437 is attributable to Class I. For the year ended November 30, 2019, the Fund accrued $85,100 in franchise tax expense, of which $76,851 is attributable to Class I. For the year ended November 30, 2018, the Fund accrued $26,903 in franchise tax expense, of which $23,914 is attributable to Class I. For the year ended November 30, 2017, the Fund accrued $148,000 in franchise tax expense, of which $127,777 is attributable to Class I. (4) The Fund did not accrue a deferred tax expense or benefit. (5) Portfolio turnover is calculated on the basis of the Fund as a whole without distinguishing between the classes of shares issued.
| | The accompanying notes are an integral part of the financial statements. | annual report 2021 • 25 |
Notes to Financial Statements
November 30, 2021
1. Organization
MainGate MLP Fund (the “Fund”), a series of MainGate Trust (the “Trust”), is registered under the Investment Company Act of 1940 as an open-end, non-diversified investment company. The Trust was established under the laws of Delaware by an Agreement and Declaration of Trust dated November 3, 2010. The Fund’s investment objective is total return. Class A and Class I commenced operations on February 17, 2011. Class C commenced operations on March 31, 2014.
The Fund offers three classes of shares: Class A, Class C and Class I. Depending on the size of the initial purchase, Class A shares are subject to a maximum 5.75% front-end sales charge or a 1.00% contingent deferred sales charge if shares are redeemed within 18 months. Class C shares have no front-end sales charge, but are subject to a 1.00% contingent deferred sales charge within 12 months of redemption. Class I shares have no sales charge. Class A shareholders pay Rule 12b-1 fees at the annual rate of 0.25% of average daily net assets. Class C shareholders pay Rule 12b-1 fees at the annual rate of 1.00% of average daily net assets. For the year ended November 30, 2021, contingent deferred sales charges of $- and $1,078 were incurred by Class A and Class C shareholders, respectively.
The Fund is an investment company and accordingly follows the investment company accounting and reporting guidance of the Financial Accounting Standards Board (FASB) Accounting Standards Board Codification Topic 946 Financial Services—Investment Companies.
2. Significant Accounting Policies
A. Use of Estimates. The preparation of financial statements in conformity with accounting principles generally accepted in the United States of America requires management to make estimates and assumptions that affect the reported amount of assets and liabilities and disclosure of contingent assets and liabilities at the date of the financial statements and the recognition of distribution income and the reported amounts of increases and decreases in net assets from operations during the reporting period. Actual results could differ from those estimates.
B. Investment Valuation. The Fund uses the following valuation methods to determine fair value as either current market value for investments for which market quotations are available, or if not available, a fair value, as determined in good faith pursuant to such policies and procedures as may be approved by the Trust’s Board of Trustees (“Board of Trustees”) from time to time. The valuation of the portfolio securities of the Fund currently includes the following processes:
| • | Equity Securities: Securities listed on a securities exchange or an automated quotation system for which quotations are readily available, including securities traded over the counter, will be valued at the last quoted sale price on the principal exchange on which they are traded on the valuation date (or at approximately 4:00 p.m. Eastern Time if a security’s principal exchange is normally open at that time), or, if there is no such reported sale on the valuation date, at the most recent quoted bid price. |
| • | Fixed Income Securities: Debt and fixed income securities will be priced by independent, third-party pricing agents approved by the Board of Trustees. These third-party pricing agents will employ methodologies that they believe are appropriate, including actual market transactions, broker-dealer supplied valuations, matrix pricing, or other electronic data processing techniques. These techniques generally consider such factors as security prices, yields, maturities, call features, ratings and developments relating to specific securities in arriving at valuations. Debt obligations with remaining maturities of sixty days or less will be valued at their amortized cost, which approximates fair market value. |
| • | Foreign Securities: Foreign securities are often principally traded on markets that close at different hours than U.S. markets. Such securities will be valued at their most recent closing prices on the relevant principal exchange even if the close of that exchange is earlier than the time of the Fund’s net asset value (“NAV”) calculation. However, securities traded in foreign markets which remain open as of the time of the NAV calculation will be valued at the most recent sales price as of the time of the NAV calculation. In addition, prices for certain foreign securities may be obtained from the Fund’s approved pricing sources. The Adviser also monitors for the occurrence of significant events that may cast doubts on the reliability of previously obtained market prices for foreign securities held by the Fund. The prices for foreign securities will be reported in local currency and converted to U.S. dollars using currency exchange rates. Exchange rates will be provided daily by recognized independent pricing agents. The exchange rates used for the conversion will be captured as of the London close each day. |
C. Security Transactions, Investment Income and Expenses. Security transactions are accounted for on the date the securities are purchased or sold (trade date). Realized gains and losses are reported on a specific identified cost basis. Interest income is recognized on the accrual basis, including amortization of premiums and accretion of discounts. Distributions are recorded on the ex-dividend date. Distributions received from the Fund’s investments in master limited partnerships (“MLPs”), including MLP general partnership interests, generally are comprised of ordinary income and return of capital. Withholding taxes on foreign dividends have been provided for in accordance with the Fund’s understanding of the applicable country’s tax rules and regulations.
| 26 | MainGate mlp fund | The accompanying notes are an integral part of the financial statements. |
For financial statement purposes, the Fund uses return of capital and income estimates to allocate the distribution income received. Such estimates are based on historical information available from each MLP and other industry sources. These estimates may subsequently be revised based on information received from MLPs after their tax reporting periods are concluded, as the actual character of these distributions is not known until after the fiscal year end of the Fund.
The Fund estimates the allocation of investment income and return of capital for the distributions received from MLPs within the Statement of Operations. For the year ended November 30, 2021, the Fund has estimated approximately 100% of the distributions from MLPs taxed as partnerships to be return of capital. Distributions from common stocks may also include income and return of capital. The Fund records the character of distributions received during the year based on estimates available. The characterization of distributions received by the Fund may be subsequently revised based on the information received from the MLPs and common stock after their tax reporting periods conclude.
Expenses are recorded on the accrual basis.
D. Dividends and Distributions to Shareholders. The Fund intends to make quarterly distributions from net income, which include the amount received as cash distributions from MLPs and common stock dividends. These activities will be reported in the Statements of Changes in Net Assets.
Dividends and distributions to shareholders are recorded on the ex-dividend date. The character of dividends and distributions to shareholders made during the period may differ from their ultimate characterization for federal income tax purposes. For the year ended November 30, 2021, the Fund’s dividends and distributions were expected to be comprised of 85% return of capital and 15% income. The tax character of distributions paid for the year ended November 30, 2021, will be determined in early 2022.
E. Federal Income Taxation. The Fund, taxed as a corporation, is obligated to pay federal and state income tax on its taxable income. Currently, the federal income tax rate for a corporation is 21%.
The Fund invests its assets primarily in MLPs, which generally are treated as partnerships for federal income tax purposes. As a limited partner in the MLPs, the Fund reports its allocable share of the MLP’s taxable income in computing its own taxable income. The Fund’s tax expense or benefit is included in the Statement of Operations based on the component of income or gains (losses) to which such expense or benefit relates. Deferred income taxes reflect the net tax effects of temporary differences between the carrying amounts of assets and liabilities for financial reporting purposes and the amounts used for income tax purposes. A valuation allowance is recognized if, based on the weight of available evidence, it is more likely than not that some portion or all of the deferred income tax asset will not be realized.
The Fund’s policy is to classify interest and penalties associated with underpayment of federal and state income taxes as an income tax expense on the Statement of Operations. For the year ended November 30, 2021, the Fund did not have interest or penalties associated with underpayment of income taxes.
F. Indemnifications. Under the Fund’s organizational documents, its officers and trustees are indemnified against certain liabilities arising out of the performance of their duties to the Fund. In addition, in the normal course of business, the Fund may enter into contracts that provide general indemnification to other parties. The Fund’s maximum exposure under these arrangements is unknown, as this would involve future claims that may be made against the Fund that have not yet occurred, and may not occur. However, the Fund has not had prior claims or losses pursuant to these contracts.
3. Fair Value Measurements
Various inputs that are used in determining the fair value of the Fund’s investments are summarized in the three broad levels listed below:
| • | Level 1: unadjusted quoted prices in active markets for identical securities that the Fund has the ability to access |
| • | Level 2: other significant observable inputs (including quoted prices for similar securities, interest rates, prepayment speeds, credit risk, etc.) |
| • | Level 3: significant unobservable inputs (including the Fund’s own assumptions in determining the fair value of investments) |
The inputs or methodology used for valuing securities are not necessarily an indication of the risk associated with investing in those securities.
These inputs are summarized in the three broad levels that follow.
annual report 2021 • 27
| | | Fair Value Measurements at Reporting Date Using: |
| | | |
| Description | Fair Value at
November 30, 2021 | Quoted Prices in Active
Markets for Identical
Assets (Level 1) | Significant Other
Observable
Inputs (Level 2) | Significant
Unobservable
Inputs (Level 3) |
| Equity Securities |
| Master Limited Partnerships and and Related Companies(1) | $727,620,550 | $727,620,550 | $ — | $ — |
| Total | $727,620,550 | $727,620,550 | $ — | $ — |
| (1) | All other industry classifications are identified in the Schedule of Investments. |
4. Concentration Risk
The Fund seeks to achieve its investment objective by investing, under normal market conditions, at least 80% of its net assets (plus any borrowings for investment purposes) in MLP interests under normal circumstances as determined in the prospectus.
5. Agreements and Related Party Transactions
The Trust has entered into an Investment Advisory Agreement (the “Agreement”) with Chickasaw Capital Management, LLC (the “Adviser”). Under the terms of the Agreement, the Fund pays the Adviser a fee, payable at the end of each calendar month, at an annual rate equal to 1.25% of the average daily net assets of the Fund.
The Adviser has agreed to waive its advisory fee and/or reimburse certain operating expenses of the Fund, until at least March 31, 2023, but only to the extent necessary so that the Fund’s total annual expenses, excluding brokerage fees and commissions; borrowing costs (such as (a) interest and (b) dividend expenses on securities sold short); taxes, including deferred income tax expense/(benefit) and franchise taxes; any indirect expenses, such as acquired fund fees and expenses; Class A 12b-1 fees, Class C 12b-1 fees, and extraordinary expenses, do not exceed 1.50% of the average daily net assets of each class of the Fund. Any payment by the Adviser of the Fund’s operating, organizational and offering expenses are subject to repayment by the Fund in the three fiscal years following the fiscal year in which the payment was made; provided that the Fund is able to make the repayment without exceeding the 1.50% expense limitation.
Waived fees and reimbursed Fund expenses, including prior year expenses, are subject to potential recoupment by year of expiration. During the year ended November 30, 2021, the Fund did not waive or recoup expenses. At November 30, 2021, there were no prior year amounts subject to potential recoupment.
Certain Trustees and Officers of the Trust/Fund are also Officers of the Adviser or Vigilant Compliance, LLC (“Vigilant”).
The Fund has engaged Vigilant to provide compliance services including the appointment of the Fund’s Chief Compliance Officer. Effective October 1, 2015, the Fund pays Vigilant a monthly fee of $4,728 for net assets up to $1.7 billion, $5,228 for net assets between $1.7 billion and $2.0 billion, $5,728 for net assets between $2.0 billion and $2.5 billion, and $6,000 for net assets above $2.5 billion with each rate subject to a 2% annual increase.
Quasar Distributors, LLC (“Quasar”), a wholly owned broker-dealer subsidiary of Foreside Financial Group, LLC (“Foreside”), serves as the Fund’s distributor. On July 7, 2021, Foreside announced that it had entered into a definitive purchase and sale agreement with Genstar Capital (“Genstar”) such that Genstar would acquire a majority stake in Foreside. The transaction closed on September 30, 2021. The Fund’s Board of Trustees approved Quasar to remain the Fund’s distributor at its July 19, 2021 meeting. The Fund has adopted a plan of distribution under Rule 12b-1 of the 1940 Act applicable to Class A and Class C shares. Class A shareholders pay Rule 12b-1 fees at the annual rate of 0.25% of average daily net assets. Class C shareholders pay Rule 12b-1 fees at the annual rate of 1.00% of average daily net assets. For the year ended November 30, 2021, 12b-1 distribution expenses of $80,681 and $184,060 were accrued by Class A and Class C shares, respectively.
The Fund reimbursed the Advisor for fees paid to financial intermediaries such as banks, broker-dealers, financial advisors or other financial institutions for sub-transfer agency, sub-administration and other services that the financial intermediaries provided to their clients. The financial intermediaries are the record owners of the Fund on the Fund’s records through omnibus accounts, other group accounts, retirement plans or accounts traded through registered securities clearing agents. These fees are fees that the Fund is obligated to pay to such intermediaries, and the fees may vary based on, for example, the nature of services provided. The fees paid to such intermediaries by the Fund is only a portion of the full fee that is paid to the intermediaries, and the Advisor is obligated to pay the remaining amount. These amounts are included within 12b-1 distribution fees on the Statement of Operations.
28 | MainGate mlp fund
The Fund has engaged U.S. Bancorp Fund Services, LLC d/b/a U.S. Bank Global Fund Services (“Fund Services”) to provide administration and accounting services to the Fund. The Fund pays Fund Services a monthly fee computed at an annual rate of 0.10% of the first $75,000,000 of the Fund’s average daily net assets, 0.08% on the next $250,000,000 of average daily net assets and 0.05% on the balance of the Fund’s average daily net assets, with a minimum annual fee of $64,000 plus $12,000 per share class fee, imposed upon the Fund reaching certain asset levels.
Fund Services serves as the Fund’s transfer agent, dividend paying agent, and agent for the automatic dividend reinvestment plan. The Fund pays the transfer agent a $45,000 flat fee, imposed upon the Fund reaching certain asset levels, plus transaction and other out-of-pocket charges.
U.S. Bank, N.A. serves as the Fund’s custodian. The Fund pays the custodian a monthly fee computed at an annual rate of 0.0075% of the first $250 million of market value and 0.0050% of the balance, with a minimum annual fee of $4,800, imposed upon Fund reaching certain asset levels, plus transaction and other out-of-pocket charges.
6. Income Taxes
Deferred income taxes reflect the net tax effects of temporary differences between the carrying amounts of assets and liabilities for financial reporting purposes and the amounts used for income tax purposes. Such temporary differences are principally: (i) taxes on unrealized gains/(losses), which are attributable to the temporary difference between fair market value and tax basis, (ii) the net tax effects of temporary differences between the carrying amounts of assets and liabilities for financial reporting and income tax purposes and (iii) the net tax benefit of accumulated net operating losses and capital loss carryforwards. Deferred tax assets and liabilities are measured using effective tax rates expected to apply to taxable income in the years such temporary differences are realized or otherwise settled. To the extent the Fund has a deferred tax asset, consideration is given to whether or not a valuation allowance is required. A valuation allowance is required if, based on the evaluation criterion provided by ASC 740, Income Taxes (ASC 740), it is more likely-than-not some portion or all of the deferred tax asset will not be realized. Among the factors considered in assessing the Fund’s valuation allowance are: the nature, frequency and severity of current and cumulative losses, forecasts of future profitability, the duration of the statutory carryforward periods, significant redemptions, and the associated risks that operating and capital loss carryforwards may expire unused.
At November 30, 2021, the Fund determined a valuation allowance was required.
Changes to the factors considered in assessing the Fund’s valuation allowance may result in the Fund revising its position as to the recoverability of its deferred tax assets which may result in a change to the valuation allowance at a later date and could have a material impact on the Fund’s net asset value and results of operations in the period it is recorded.
Components of the Fund’s deferred tax assets and liabilities as of November 30, 2021, are as follows:
Deferred tax assets:
| Net operating loss carryforward (tax basis) | $52,965,622 |
| Capital loss carryforward (tax basis) | 76,891,960 |
| Other | 2,495 |
| Total deferred tax asset | 129,860,077 |
| Valuation allowance | (84,250,770) |
| Less: Deferred tax liabilities: |
| Unrealized gains on investment securities (tax basis) – net | 45,609,307 |
| Net deferred tax asset | $— |
The net operating loss carryforward is available to offset future taxable income. The Fund has the following net operating loss and capital loss carryforward amounts:
| Fiscal Year Ended Net Operating Loss | Amount | Expiration |
| | | |
| November 30, 2015 | $10,794,764 | November 30, 2035 |
| November 30, 2016 | 62,681,569 | November 30, 2036 |
| November 30, 2017 | 77,956,625 | November 30, 2037 |
| November 30, 2018 | 46,816,412 | November 30, 2038 |
| November 30, 2020 | 23,244,346 | Indefinite |
| November 30, 2021 | 10,762,407 | Indefinite |
| Total Fiscal Year Ended Net Operating Loss | $232,256,123 | |
| Fiscal Year Ended Net Capital Loss | Amount | Expiration |
| | | |
| November 30, 2017 | $18,645,662 | November 30, 2022 |
| November 30, 2018 | 13,056,608 | November 30, 2023 |
| November 30, 2019 | 146,554,196 | November 30, 2024 |
| November 30, 2020 | 160,284,519 | November 30, 2025 |
| Total Fiscal Year Ended Net Capital Loss | $338,540,985 | |
During the year ended November 30, 2021, the Fund utilized $24,225,189 of capital loss carry forwards.
annual report 2021 • 29
For corporations, capital losses can only be used to offset capital gains and cannot be used to offset ordinary income. The capital loss may be carried forward for 5 years and, accordingly, would begin to expire as of November 30, 2022. The net operating loss prior to the Tax Cuts and Jobs Act (“TCJA”) can be carried forward for 20 years and, accordingly, would begin to expire as of November 30, 2035. Any net operating losses arising in tax years beginning after December 31, 2017 will have an indefinite carry forward period. The TCJA also established a limitation for any net operating losses generated in tax years beginning after December 31, 2017 to the lesser of the aggregate of available net operating losses or 80% of taxable income before any net operating losses utilization. On March 27, 2020 the Coronavirus Aid, Relief, and Economic Stability Act (CARES Act) was signed into law. The CARES Act delays the application of the 80% net operating loss limitation to tax years ending November 30, 2022 and beyond.
Total income tax expense (current and deferred) differs from the amount computed by applying the federal statutory income tax rate of 21% to net investment income (loss) and realized and unrealized gains (losses) on investments before taxes for the year ended November 30, 2021, as follows:
| Total Tax Expense (Benefit) | Amount | Rate |
| Tax Expense (Benefit) at Statutory Rates | $60,492,377 | 21.00% |
| State Income Tax Expense (Benefit) (Net of Federal Benefit) | 4,933,724 | 1.71% |
| Tax Expense (Benefit) on Permanent Items(1) | (318,147) | (0.11)% |
| Provision to Return Adjustment | 56,406 | 0.02% |
| Change in State Rate | 466,210 | 0.16% |
| Capital Loss Carry Forward Expiration | 27,721,651 | 9.62% |
| Change in Valuation Allowance | (93,352,221) | (32.41)% |
| Total Tax Expense (Benefit) | — | 0.00% |
(1) Permanent Items are made up of dividends received deductions, non-deductible expenses from K-1s, and tax exempt income from K-1s.
At November 30, 2021, the Fund did not have a current tax expense or benefit due to the use of a valuation allowance.
At November 30, 2021, the tax cost basis of investments was $526,814,262 and gross unrealized appreciation and depreciation of investments for federal income tax purposes were as follows:
| Gross unrealized appreciation | $244,101,545 |
| Gross unrealized depreciation | (43,295,257) |
| Net unrealized appreciation | $200,806,288 |
The differences between book-basis and tax-basis unrealized appreciation (depreciation) are primarily due to timing differences of income recognition from the Fund’s MLP investments and wash sales on security transactions.
The Fund recognizes the tax benefits of uncertain tax positions only where the position is “more likely than not” to be sustained assuming examination by tax authorities. Management has analyzed the Fund’s tax positions, and has concluded that no liability for unrecognized tax benefits should be recorded related to uncertain tax positions taken on U.S. tax returns and state tax returns filed or expected to be filed since inception of the Fund. No income tax returns are currently under examination. The tax years since 2018 remain subject to examination by the tax authorities in the United States. Due to the nature of the Fund’s investments, the Fund may be required to file income tax returns in several states. The Fund is not aware of any tax positions for which it is reasonably possible that the total amounts of unrecognized tax benefits will change materially in the next 12 months.
7. Investment Transactions
For the year ended November 30, 2021, the Fund purchased (at cost) and sold securities (proceeds) in the amount of $163,078,144 and $457,766,741 (excluding short-term securities), respectively.
30 | MainGate mlp fund
8. Share Transactions
Transactions of shares of the Fund were as follows:
| | Year Ended November 30, 2021 | Year Ended November 30, 2020 |
| Class A Shares | Amount | Shares | Amount | Shares |
| Sold | $2,819,037 | 578,401 | $10,233,488 | 2,591,548 |
| Dividends Reinvested | 2,163,880 | 437,998 | 3,132,301 | 765,526 |
| Redeemed | (11,627,502) | (2,407,559) | (29,822,750) | (6,795,337) |
| Net Decrease | $(6,644,585) | (1,391,160) | $(16,456,961) | (3,438,263) |
| | Year Ended November 30, 2021 | Year Ended November 30, 2020 |
| Class C Shares | Amount | Shares | Amount | Shares |
| Sold | $802,078 | 186,428 | $1,876,508 | 403,978 |
| Dividends Reinvested | 1,287,797 | 276,686 | 1,961,446 | 499,151 |
| Redeemed | (5,706,264) | (1,248,560) | (11,102,286) | (2,699,961) |
| Net Decrease | $(3,616,389) | (785,446) | $(7,264,332) | (1,796,832) |
| | Year Ended November 30, 2021 | Year Ended November 30, 2020 |
| Class I Shares | Amount | Shares | Amount | Shares |
| Sold | $136,183,248 | 26,584,269 | $674,892,922 | 158,647,941 |
| Dividends Reinvested | 47,625,510 | 9,345,027 | 69,930,862 | 17,091,869 |
| Redeemed | (457,913,933) | (92,328,898) | (676,168,596) | (157,742,884) |
| Net Increase/(Decrease) | $(274,105,175) | (56,399,602) | $68,655,188 | 17,996,926 |
9. Risk Factors
The global outbreak of COVID-19 has disrupted economic markets and the prolonged economic impact is uncertain. The operational and financial performance of the issuers of securities in which the Fund invests depends on future developments, including the duration and spread of the outbreak, and such uncertainty may in turn impact the value of the Fund’s investments. COVID-19 has had a material adverse effect on global, national and local economies, which could impact MLPs and midstream companies in which the Fund invests as a result of lower energy prices and an uncertain outlook, which could limit production growth and drive increased credit risk for MLP counterparties.
10. Subsequent Events
The Fund has adopted standards which establish general standards of accounting for disclosure of events that occur after the Statement of Assets and Liabilities date, but before the financial statements are issued. The Fund has performed an evaluation of subsequent events through the date the financial statements were issued.
On January 14, 2022 the Fund declared a distribution payable of $0.100 per share, to Class A shareholders, Class C shareholders, and Class I shareholders of record on January 14, 2022, and payable on January 19, 2022.
annual report 2021 • 31
Report of Independent Registered
Public Accounting Firm
To the Shareholders of MainGate MLP Fund and
Board of Trustees of MainGate Trust
Opinion on the Financial Statements
We have audited the accompanying statement of assets and liabilities, including the schedule of investments, of MainGate Trust comprising MainGate MLP Fund (the “Fund”) as of November 30, 2021, the related statement of operations for the year then ended, the statements of changes in net assets for each of the two years in the period then ended, the related notes, and the financial highlights for each of the five years in the period then ended (collectively referred to as the “financial statements”). In our opinion, the financial statements present fairly, in all material respects, the financial position of the Fund as of November 30, 2021, the results of its operations for the year then ended, the changes in net assets for each of the two years in the period then ended, and the financial highlights for each of the five years in the period then ended, in conformity with accounting principles generally accepted in the United States of America.
Basis for Opinion
These financial statements are the responsibility of the Fund’s management. Our responsibility is to express an opinion on the Fund’s financial statements based on our audits. We are a public accounting firm registered with the Public Company Accounting Oversight Board (United States) (“PCAOB”) and are required to be independent with respect to the Fund in accordance with the U.S. federal securities laws and the applicable rules and regulations of the Securities and Exchange Commission and the PCAOB.
We conducted our audits in accordance with the standards of the PCAOB. Those standards require that we plan and perform the audit to obtain reasonable assurance about whether the financial statements are free of material misstatement whether due to error or fraud.
Our audits included performing procedures to assess the risks of material misstatement of the financial statements, whether due to error or fraud, and performing procedures that respond to those risks. Such procedures included examining, on a test basis, evidence regarding the amounts and disclosures in the financial statements. Our procedures included confirmation of securities owned as of November 30, 2021, by correspondence with the custodian. Our audits also included evaluating the accounting principles used and significant estimates made by management, as well as evaluating the overall presentation of the financial statements. We believe that our audits provide a reasonable basis for our opinion.
We have served as the Fund’s auditor since 2011.

COHEN & COMPANY, LTD.
Milwaukee, Wisconsin
January 28, 2022
32 | MainGate mlp fund
Trustees & Officers
November 30, 2021 | unaudited
Set forth below is information with respect to each of the Trustees and Officers of the Fund, including their principal occupation during the past five years. The business address of the Fund, its Trustees and Officers is 6075 Poplar Ave., Suite 720, Memphis, TN 38119.
| Name and Age | | Position(s) with Trust,
Term of Office and Length
of Time Served | | Principal Occupation(s)
During Past
Five Years | | Number of Portfolios
in Fund Complex
Overseen by Trustee | | Other Directorships
Held by Trustee During
Past Five Years |
| Independent Trustees | | | | | |
Robert A. Reed
Age: 55 | | Lead Independent Trustee since January 2011 | | President, CEO and founder, ABC Polymer Industries, LLC since 1994 | | 1 | | Director, Oakworth Capital Bank since 2008; Director, Robert E. Reed Gastrointestinal Oncology Research Foundation, 2001-present; Member of the Young Presidents Organization International, 2010; Member, Society of International Business Fellows, 1999-present |
Darrison N. Wharton
Age: 50 | | Independent Trustee since January 2011 | | Vice President and Client Advocate, Willis Towers Watson/Willis of Tennessee, Inc. in Memphis, TN since 2005 | | 1 | | Board member, Goodwill Club of the Boys and Girls Clubs of Greater Memphis since 2009; President, Phoenix Club, a non-profit group dedicated to raising money for the Boys and Girls Clubs of Greater Memphis from 2006-2007 |
David C. Burns, CPA
Age: 60 | | Independent Trustee and Chairman of the Audit Committee since January 2011 | | Partner and cofounder, Cross Keys Capital, LLC since 2004; Managing Director and Principal, Sundial Group, LLC since April 2012 | | 1 | | Board member, Ryan Taylor & Co. since 2002; Board member, The Haven since 2007; Board member, Mountainside Holdings since 2011 |
Marshall K. Gramm
Age: 48 | | Independent Trustee since January 2011 | | Associate Professor of Economics, Rhodes College, 2006-present | | 1 | | None |
Barry A. Samuels, CPA
Age: 56 | | Independent Trustee since January 2011 | | Private investor, 2009 to present; Director-Private Wealth Management, Deutsche Bank, 2003 to 2009 | | 1 | | None |
Moss W. Davis
Age: 59 | | Independent Trustee and Chairman of the Pricing Committee since January 2011 | | Vice President-Southeast Region and Head of Atlanta Office, RCG Global Services, Inc., 2020 to present; Principal, Collective Insights Consulting, 2018 to 2020; Managing Director and head of Atlanta, GA office, Midtown Consulting Group, 2012 to 2018; President and Founder, Fairview Consulting Group, 2008 to 2012; Vice President, Experient Group, Consulting and Staffing Firm, 2005 to 2008 | | 1 | | None |
| Interested Trustees and Officers | | | | | |
Matthew G. Mead(1)
Age: 54 | | Interested Trustee, President and Chief Executive Officer since January 2011 | | Principal, Chickasaw Capital Management, LLC since 2003; President, Chickasaw Securities | | 1 | | Director, Oakworth Capital Bank; Director, AGRI, Inc. |
Geoffrey Mavar(1)
Age: 59 | | Chairman of the Board, Interested Trustee, Treasurer and Chief Financial Officer since January 2011 | | Principal, Chickasaw Capital Management, LLC since 2003; Secretary, Chickasaw Securities | | 1 | | None |
Gerard Scarpati
Age: 66 | | Chief Compliance Officer since April 2013 | | Compliance Director, Vigilant Compliance, LLC, 2010 to present; Independent Consultant to the Securities Industry, 2004 to 2010 | | 1 | | None |
Salvatore Faia
Age: 59 | | Assistant Compliance Officer since April 2013; Chief Compliance Officer from January 2011 to April 2013 | | President, Vigilant Compliance, LLC Chairman, ELP Growth and Income Mutual Fund since 2017; Director since 2005 President, RBB Fund, Inc. Mutual Fund since 2009 | | 1 | | Trustee, EIP Growth & Income Fund |
(1) This person’s status as an “interested” Trustee arises from his affiliation with the Adviser.
annual report 2021 • 33
Additional Information | unaudited
November 30, 2021
Trustee and Officer Compensation
The Fund does not compensate any of its trustees who are interested persons nor any of its officers. For the year ended November 30, 2021, the aggregate compensation paid by the Fund to the independent trustees was $96,000. The Fund did not pay any special compensation to any of its trustees or officers. The Fund’s Statement of Additional Information includes additional information about the trustees and is available on the Fund’s Web site at www.maingatefunds.com or the SEC’s Web site at www.sec.gov.
Cautionary Note Regarding
Forward-Looking Statements
This report contains “forward-looking statements” as defined under the U.S. federal securities laws. Generally, the words “believe,” “expect,” “intend,” “estimate,” “anticipate,” “project,” “will” and similar expressions identify forward-looking statements, which generally are not historical in nature. Forward-looking statements are subject to certain risks and uncertainties that could cause actual results to materially differ from the Fund’s historical experience and its present expectations or projections indicated in any forward-looking statements. These risks include, but are not limited to, changes in economic and political conditions; regulatory and legal changes; MLP industry risk; concentration risk; energy sector risk; commodities risk; MLP and other tax risks, such as deferred tax assets and liabilities risk; and other risks discussed in the Fund’s filings with the SEC. You should not place undue reliance on forward-looking statements, which speak only as of the date they are made. The Fund undertakes no obligation to update or revise any forward-looking statements made herein. There is no assurance that the Fund’s investment objectives will be attained.
Proxy Voting Policies
A description of the policies and procedures that the Fund uses to determine how to vote proxies relating to portfolio securities owned by the Fund and information regarding how the Fund voted proxies relating to the portfolio of securities during the most recent 12-month period ended June 30 is available to shareholders without charge by visiting the SEC’s Web site at www.sec.gov.
Portfolio Holdings Disclosure
The Fund files its complete schedule of portfolio holdings for the first and third quarters of each fiscal year with the SEC on Part F of Form N-PORT. The Fund’s Part F of Form N-PORT and statement of additional information are available without charge by visiting the SEC’s Web site at www.sec.gov. In addition, you may review and copy the Fund’s Part F of Form N-PORT at the SEC’s Public Reference Room in Washington D.C. You may obtain information on the operation of the Public Reference Room by calling (800) SEC-0330.
Householding
In an effort to decrease costs, the Fund intends to reduce the number of duplicate prospectuses, annual and semi-annual reports, proxy statements and other similar documents you receive by sending only one copy of each to those addresses shared by two or more accounts and to shareholders that the Transfer Agent reasonably believes are from the same family or household. Once implemented, if you would like to discontinue householding for your accounts, please call toll-free at 855.MLP.FUND (855.657.3863) to request individual copies of these documents. Once the Transfer Agent receives notice to stop householding, the Transfer Agent will begin sending individual copies thirty days after receiving your request. This policy does not apply to account statements.
34 | MainGate mlp fund
Privacy Policy
The following is a description of the Fund’s policies regarding disclosure of nonpublic personal information that you provide to the Fund or that the Fund collects from other sources. In the event that you hold shares of the Fund through a broker-dealer or other financial intermediary, the privacy policy of your financial intermediary would govern how your nonpublic personal information would be shared with nonaffiliated third parties.
Categories of Information the Fund Collects. The Fund collects the following nonpublic personal information about you:
| • | Information the Fund receives from you on applications or other forms, correspondence, or conversations (such as your name, address, phone number, social security number, and date of birth); and | |
| • | Information about your transactions with the Fund, its affiliates, or others (such as your account number and balance, payment history, cost basis information, and other financial information). | |
Categories of Information the Fund Discloses. The Fund does not disclose any nonpublic personal information about its current or former shareholders to unaffiliated third parties, except as required or permitted by law. The Fund is permitted by law to disclose all of the information it collects, as described above, to service providers (such as the Fund’s custodian, administrator, transfer agent, accountant and legal counsel) to process your transactions and otherwise provide services to you.
Confidentiality and Security. The Fund restricts access to your nonpublic personal information to those persons who require such information to provide products or services to you. The Fund maintains physical, electronic, and procedural safeguards that comply with federal standards to guard your nonpublic personal information.
Disposal of Information. The Fund, through its transfer agent, has taken steps to reasonably ensure that the privacy of your nonpublic personal information is maintained at all times, including in connection with the disposal of information that is no longer required to be maintained by the Fund. Such steps shall include, whenever possible, shredding paper documents and records prior to disposal, requiring off-site storage vendors to shred documents maintained in such locations prior to disposal, and erasing and/or obliterating any data contained on electronic media in such a manner that the information can no longer be read or reconstructed.
annual report 2021 • 35
Fund Service Providers
November 30, 2021
Board of Trustees
Geoffrey P. Mavar*, Chairman of the Board
Robert A. Reed, Lead Independent Trustee
David C. Burns, Independent Trustee
Moss W. Davis, Independent Trustee
Marshall K. Gramm, Independent Trustee
Matthew G. Mead*, Interested Trustee
Barry A. Samuels, Independent Trustee
Darrison N. Wharton, Independent Trustee
Officers
Matthew G. Mead*, President and Chief Executive Officer
Geoffrey P. Mavar*, Treasurer and Chief Financial Officer
Gerard Scarpati, Chief Compliance Officer
Andrew E. Garrett*, Secretary
Investment Adviser
Chickasaw Capital Management, LLC
6075 Poplar Avenue, Suite 720, Memphis, TN 38119
Distributor
Quasar Distributors, LLC
111 East Kilbourn Avenue, Suite 2200, Milwaukee, WI 53202
Custodian
U.S. Bank, N.A.
1555 North River Center Drive, Suite 302, Milwaukee, WI 53212
Transfer Agent
U.S. Bancorp Fund Services, LLC
615 East Michigan Street, 3rd Floor, Milwaukee, WI 53202
Administrator
U.S. Bancorp Fund Services, LLC
d/b/a U.S. Bank Global Fund Services
811 East Wisconsin Avenue, 8th Floor, Milwaukee, WI 53202
Legal Counsel
Bryan Cave Leighton Paisner LLP
One Metropolitan Square, St. Louis, MO 63102
Independent Registered Public Accounting Firm
Cohen & Company, Ltd.
342 North Water Street, Suite 830, Milwaukee, WI 53202
*Employed by Chickasaw Capital Management, LLC.
36 | MainGate mlp fund
Notes
annual report 2021 • 37
Notes
38 | MainGate mlp fund
Notes
annual report 2021 • 39

| Mutual fund investing involves risk. Principal loss is possible. | Must be preceded or accompanied by a prospectus. |
| | |
| BACK COVER | NOT PART OF REPORT | Quasar Distributors, LLC, distributor. |
The registrant has adopted a code of ethics that applies to the registrant’s principal executive officer and principal financial officer. The registrant has not made any substantive amendments to its code of ethics during the period covered by this report. The registrant has not granted any waivers from any provisions of the code of ethics during the period covered by this report.
The registrant undertakes to provide to any person without charge, upon request, a copy of its code of ethics by mail when they call the registrant at 1-855-657-3863.
The registrant’s board of trustees has determined that there is at least one audit committee financial expert serving on its audit committee. Mr. David Burns is the “audit committee financial expert” and is considered to be “independent” as each term is defined in Item 3 of Form N‑CSR.
The registrant has engaged its principal accountant to perform audit services, audit-related services, tax services and other services during the past two fiscal years. “Audit services” refer to performing an audit of the registrant's annual financial statements or services that are normally provided by the accountant in connection with statutory and regulatory filings or engagements for those fiscal years. “Audit-related services” refer to the assurance and related services by the principal accountant that are reasonably related to the performance of the audit. “Tax services” refer to professional services rendered by the principal accountant for tax compliance, tax advice, and tax planning. There were no “Other services” provided by the principal accountant. The following table details the aggregate fees billed or expected to be billed for each of the last two fiscal years for audit fees, audit-related fees, tax fees and other fees by the principal accountant.
(e) The audit committee has adopted pre-approval policies and procedures that require the audit committee to pre‑approve all audit and non‑audit services of the registrant, including services provided to any entity affiliated with the registrant.
(f) All of the principal accountant’s hours spent on auditing the registrant’s financial statements were attributed to work performed by full‑time permanent employees of the principal accountant. (If more than 50 percent of the accountant’s hours were spent to audit the registrant's financial statements for the most recent fiscal year, state how many hours were attributed to work performed by persons other than the principal accountant's full-time, permanent employees.)
(h)The audit committee of the board of trustees/directors has considered whether the provision of non-audit services that were rendered to the registrant's investment adviser is compatible with maintaining the principal accountant's independence and has concluded that the provision of such non-audit services by the accountant has not compromised the accountant’s independence.
(i) Not applicable.
(j) Not applicable.
Not applicable to registrants who are not listed issuers (as defined in Rule 10A-3 under the Securities Exchange Act of 1934).
Not applicable to open-end investment companies.
Not applicable to open-end investment companies.
Not applicable to open-end investment companies.
Not Applicable.
Not applicable to open-end investment companies.
Pursuant to the requirements of the Securities Exchange Act of 1934 and the Investment Company Act of 1940, the registrant has duly caused this report to be signed on its behalf by the undersigned, thereunto duly authorized.
Matthew G. Mead, President & Chief Executive Officer
Pursuant to the requirements of the Securities Exchange Act of 1934 and the Investment Company Act of 1940, this report has been signed below by the following persons on behalf of the registrant and in the capacities and on the dates indicated.
Matthew G. Mead, President & Chief Executive Officer
Geoffrey P. Mavar, Treasurer & Chief Financial Officer