
MainGate MLP Fund
Class A (AMLPX)
Class C (MLCPX)
Class I (IMLPX)
6075 Poplar Avenue, Suite 720 | Memphis, TN 38119 | 855.MLP.FUND (855.657.3863) | www.maingatefunds.com
Annual Report
November 30, 2024
UNITED STATES
SECURITIES AND EXCHANGE COMMISSION
Washington, D.C. 20549
FORM N-CSR
CERTIFIED SHAREHOLDER REPORT OF REGISTERED
MANAGEMENT INVESTMENT COMPANIES
Investment Company Act file number 811-22492
MainGate Trust
(Exact name of registrant as specified in charter)
6075 Poplar Ave., Suite 720, Memphis, TN 38119
(Address of principal executive offices) (Zip code)
Geoffrey P. Mavar
6075 Poplar Ave., Suite 720, Memphis, TN 38119
(Name and address of agent for service)
(901) 537-1866
Registrant’s telephone number, including area code
Date of fiscal year end: November 30
Date of reporting period: November 30, 2024
Item 1. Reports to Stockholders.
| (a) |
 | MainGate MLP Fund |  |
| Class A | AMLPX | ||
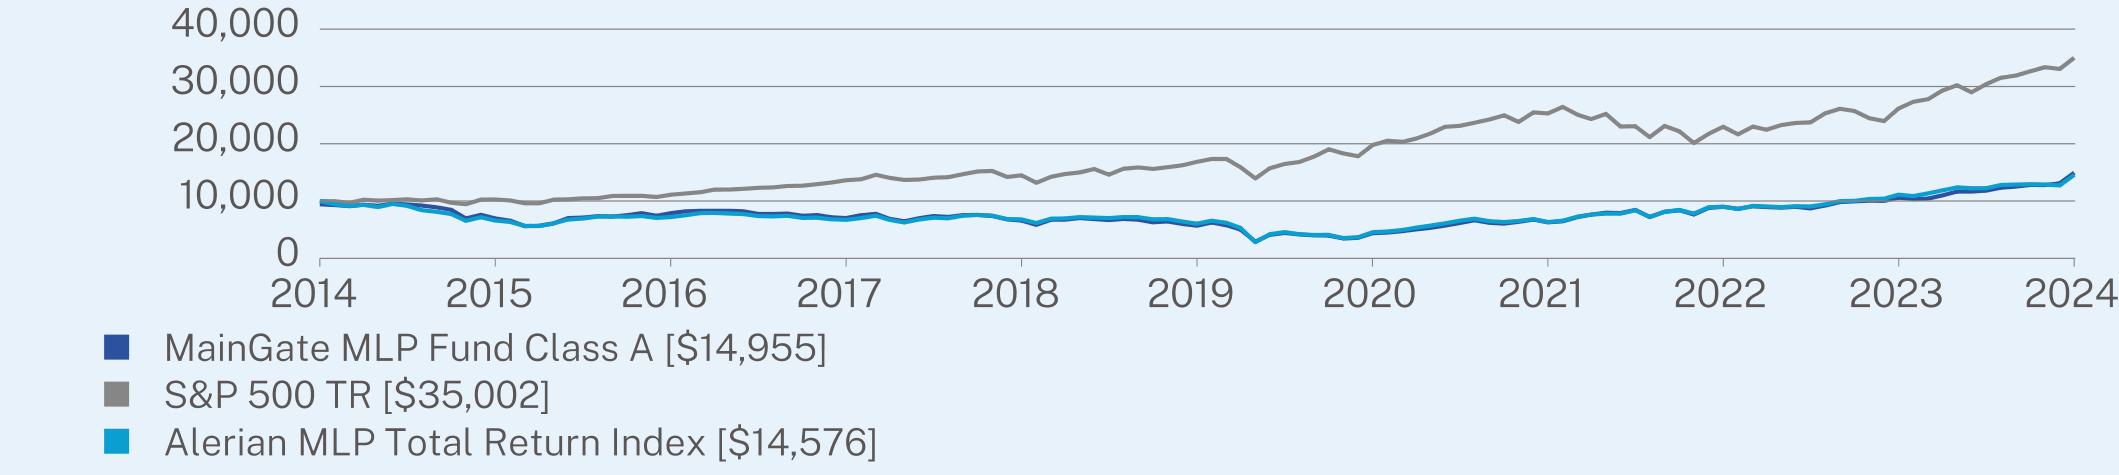
| Annual Shareholder Report | November 30, 2024 |
Class Name | Costs of a $10,000 investment | Costs paid as a percentage of a $10,000 investment |
| Class A | $208 | 1.72% |
1 Year | 5 Year | 10 Year | |
Class A (without sales charge) | 41.29 | 21.33 | 4.73 |
Class A (with sales charge) | 33.15 | 19.92 | 4.11 |
S&P 500 TR | 33.89 | 15.77 | 13.35 |
Alerian MLP Total Return Index | 31.13 | 19.23 | 3.84 |
| * | The Fund’s past performance is not a good predictor of how the Fund will perform in the future. The graph and table do not reflect the deduction of taxes that a shareholder would pay on Fund distributions or redemption of Fund shares. |
| MainGate MLP Fund | PAGE 1 | TSR-AR-560599102 |
Net Assets | $933,310,871 |
Number of Holdings | 18 |
Net Advisory Fee | $9,969,728 |
Portfolio Turnover | 15% |
Top 10 Issuers | (%) |
Energy Transfer, L.P. | 13.70% |
ONEOK, Inc. | 12.30% |
MPLX, L.P. | 12.20% |
Targa Resources Corp. | 12.10% |
Western Midstream Partners, L.P. | 11.60% |
Enterprise Products Partners, L.P. | 7.60% |
EnLink Midstream, LLC | 6.20% |
Plains GP Holdings, L.P. | 5.10% |
Williams Companies, Inc. | 4.30% |
Cheniere Energy, Inc. | 4.10% |

| MainGate MLP Fund | PAGE 2 | TSR-AR-560599102 |
 | MainGate MLP Fund |  |
| Class C | MLCPX | ||
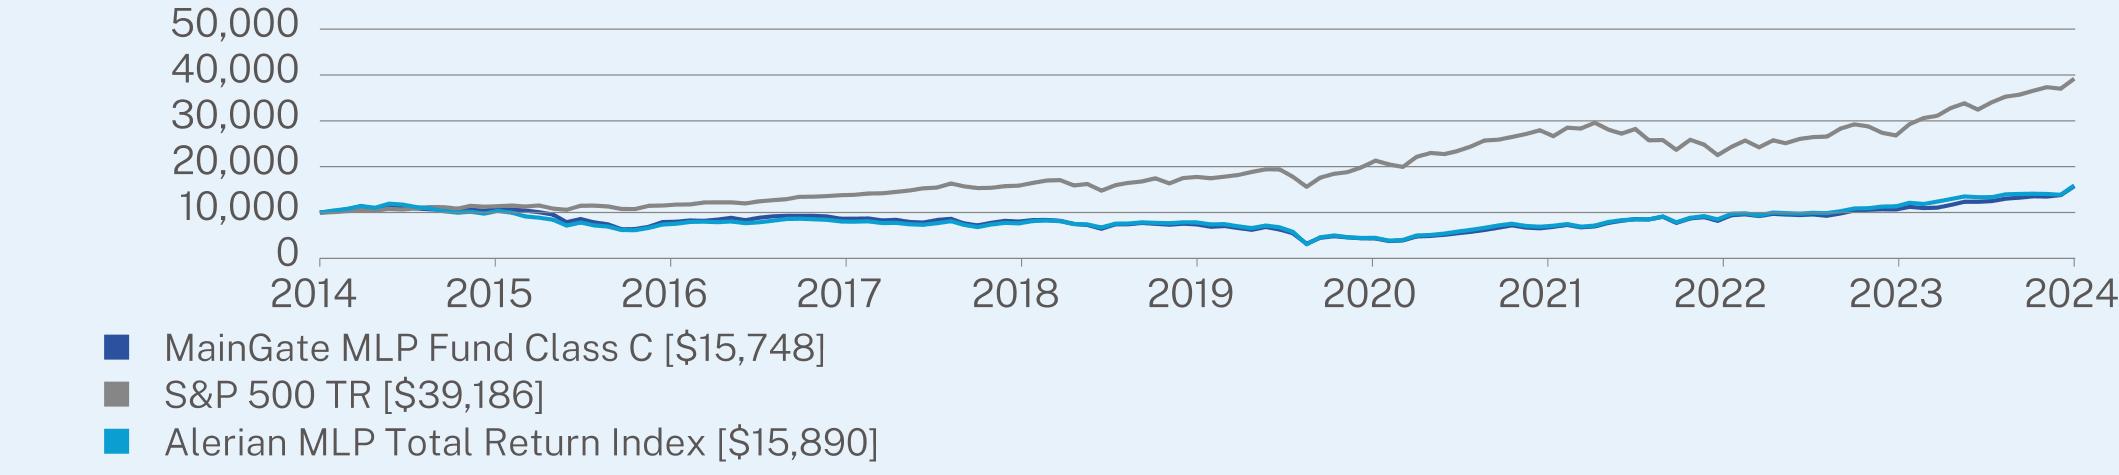
| Annual Shareholder Report | November 30, 2024 |
Class Name | Costs of a $10,000 investment | Costs paid as a percentage of a $10,000 investment |
| Class C | $297 | 2.47% |
1 Year | 5 Year | 10 Year | |
Class C (without sales charge) | 40.15 | 20.39 | 3.93 |
Class C (with sales charge) | 39.15 | 20.39 | 3.93 |
S&P 500 TR | 33.89 | 15.77 | 13.35 |
Alerian MLP Total Return Index | 31.13 | 19.23 | 3.84 |
| * | The Fund’s past performance is not a good predictor of how the Fund will perform in the future. The graph and table do not reflect the deduction of taxes that a shareholder would pay on Fund distributions or redemption of Fund shares. |
| MainGate MLP Fund | PAGE 1 | TSR-AR-560599300 |
Net Assets | $933,310,871 |
Number of Holdings | 18 |
Net Advisory Fee | $9,969,728 |
Portfolio Turnover | 15% |
Top 10 Issuers | (%) |
Energy Transfer, L.P. | 13.70% |
ONEOK, Inc. | 12.30% |
MPLX, L.P. | 12.20% |
Targa Resources Corp. | 12.10% |
Western Midstream Partners, L.P. | 11.60% |
Enterprise Products Partners, L.P. | 7.60% |
EnLink Midstream, LLC | 6.20% |
Plains GP Holdings, L.P. | 5.10% |
Williams Companies, Inc. | 4.30% |
Cheniere Energy, Inc. | 4.10% |

| MainGate MLP Fund | PAGE 2 | TSR-AR-560599300 |
 | MainGate MLP Fund |  |
| Class I | IMLPX | ||
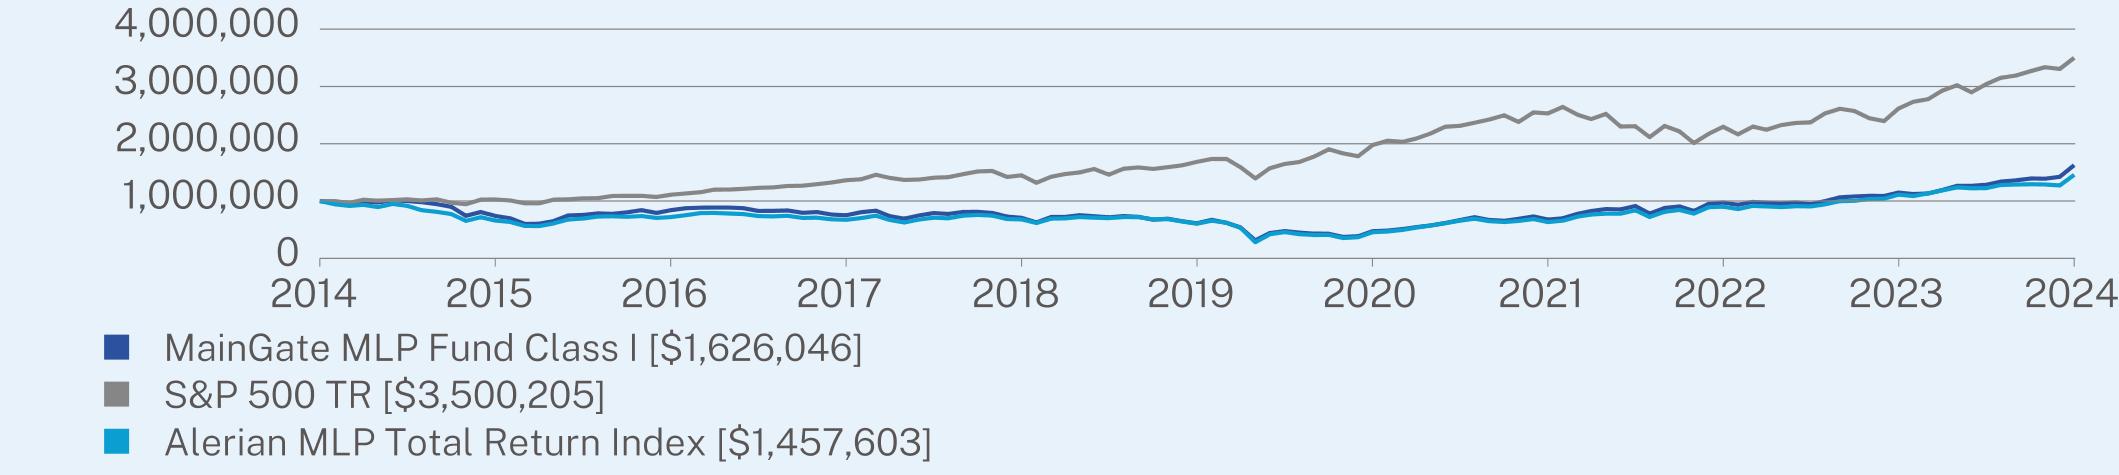
| Annual Shareholder Report | November 30, 2024 |
Class Name | Costs of a $10,000 investment | Costs paid as a percentage of a $10,000 investment |
| Class I | $178 | 1.47% |
1 Year | 5 Year | 10 Year | |
Class I (without sales charge) | 41.62 | 21.61 | 4.98 |
S&P 500 TR | 33.89 | 15.77 | 13.35 |
Alerian MLP Total Return Index | 31.13 | 19.23 | 3.84 |
| * | The Fund’s past performance is not a good predictor of how the Fund will perform in the future. The graph and table do not reflect the deduction of taxes that a shareholder would pay on Fund distributions or redemption of Fund shares. |
| MainGate MLP Fund | PAGE 1 | TSR-AR-560599201 |
Net Assets | $933,310,871 |
Number of Holdings | 18 |
Net Advisory Fee | $9,969,728 |
Portfolio Turnover | 15% |
Top 10 Issuers | (%) |
Energy Transfer, L.P. | 13.70% |
ONEOK, Inc. | 12.30% |
MPLX, L.P. | 12.20% |
Targa Resources Corp. | 12.10% |
Western Midstream Partners, L.P. | 11.60% |
Enterprise Products Partners, L.P. | 7.60% |
EnLink Midstream, LLC | 6.20% |
Plains GP Holdings, L.P. | 5.10% |
Williams Companies, Inc. | 4.30% |
Cheniere Energy, Inc. | 4.10% |

| MainGate MLP Fund | PAGE 2 | TSR-AR-560599201 |
| (b) | Not applicable. |
Item 2. Code of Ethics.
The registrant has adopted a code of ethics that applies to the registrant’s principal executive officer and principal financial officer. The registrant has not made any substantive amendments to its code of ethics during the period covered by this report. The registrant has not granted any waivers from any provisions of the code of ethics during the period covered by this report.
The registrant undertakes to provide to any person without charge, upon request, a copy of its code of ethics by mail when they call the registrant at 1-855-657-3863.
Item 3. Audit Committee Financial Expert.
The registrant’s board of trustees has determined that there is at least one audit committee financial expert serving on its audit committee. Mr. David Burns is the “audit committee financial expert” and is considered to be “independent” as each term is defined in Item 3 of Form N-CSR.
Item 4. Principal Accountant Fees and Services.
The registrant has engaged its principal accountant to perform audit services, audit-related services, tax services and other services during the past two fiscal years. “Audit fees” refer to performing an audit of the registrant’s annual financial statements or services that are normally provided by the accountant in connection with statutory and regulatory filings or engagements for those fiscal years. “Audit-related fees” refer to the assurance and related services by the principal accountant that are reasonably related to the performance of the audit. “Tax fees” refer to professional services rendered by the principal accountant for the preparation of U.S. Tax Returns and Taxable Income calculations. “All other fees” refer to other services provided by the principal accountant not reported in (a) through (c) below. The following table details the aggregate fees billed or expected to be billed for each of the last two fiscal years for audit fees, audit-related fees, tax fees and other fees by the principal accountant.
| FYE 11/30/2024 | FYE 11/30/2023 | |
| (a) Audit Fees | $109,500 | $104,601 |
| (b) Audit-Related Fees | None | None |
| (c) Tax Fees | 6,820 | 6,820 |
| (d) All Other Fees | None | None |
| (e) | (1) The audit committee has adopted pre-approval policies and procedures that require the audit committee to pre-approve all audit and non-audit services of the registrant, including services provided to any entity affiliated with the registrant. |
(2) 0% of the audit-related fees, tax fees and other fees listed in Table 1 were approved by the Registrant’s Audit Committee pursuant to the “de minimis” exception of Rule 2-01(c)(7)(i)(C) of Regulation S-X.
| (f) | Not applicable. |
| (g) | The following table indicates the non-audit fees billed or expected to be billed by the registrant’s accountant for services to the registrant and to the registrant’s investment adviser (and any other controlling entity, etc.—not sub-adviser) for the last two years. |
| Non-Audit Related Fees | FYE 11/30/2024 | FYE 11/30/2023 |
| Registrant | $6,820 | $6,820 |
| Registrant’s Investment Adviser | None | None |
| (h) | The audit committee of the board of trustees has considered whether the provision of non-audit services that were rendered to the registrant’s investment adviser is compatible with maintaining the principal accountant’s independence and has concluded that the provision of such non-audit services by the accountant has not compromised the accountant’s independence. |
| (i) | Not applicable. |
| (j) | Not applicable. |
Item 5. Audit Committee of Listed Registrants.
Not applicable to registrants who are not listed issuers (as defined in Rule 10A-3 under the Securities Exchange Act of 1934).
Item 6. Investments.
| (a) | Schedule of Investments is included within the financial statements filed under Item 7 of this Form. |
| (b) | Not Applicable. |
Item 7. Financial Statements and Financial Highlights for Open-End Management Investment Companies.
| (a) |
Shares/Units | Fair Value | |||||
MASTER LIMITED PARTNERSHIPS AND RELATED COMMON STOCKS - 108.7% | ||||||
Crude/Refined Products Pipelines and Storage - 25.8% | ||||||
Canada - 0.3% | ||||||
Enbridge, Inc. | 70,000 | $3,036,600 | ||||
United States - 25.5% | ||||||
Genesis Energy, L.P. | 1,670,000 | 20,006,600 | ||||
MPLX, L.P. | 2,400,000 | 123,984,000 | ||||
Phillips 66 | 60,000 | 8,038,800 | ||||
Plains All American Pipeline, L.P. | 1,800,000 | 33,606,000 | ||||
Plains GP Holdings, L.P. | 2,593,000 | 51,911,860 | ||||
237,547,260 | ||||||
Total Crude/Refined Products Pipelines and Storage | 240,583,860 | |||||
Natural Gas Gathering/Processing - 34.8% | ||||||
United States - 34.8% | ||||||
Antero Midstream Corp. | 300,000 | 4,791,000 | ||||
EnLink Midstream, LLC. | 3,900,000 | 62,439,000 | ||||
Kinetik Holdings, Inc. | 292,000 | 17,233,840 | ||||
Targa Resources Corp. | 600,000 | 122,580,000 | ||||
Western Midstream Partners, L.P. | 2,900,000 | 118,059,000 | ||||
Total Natural Gas Gathering/Processing | 325,102,840 | |||||
Natural Gas/Natural Gas Liquid Pipelines and Storage - 48.1% | ||||||
United States - 48.1% | ||||||
Cheniere Energy, Inc. | 185,000 | 41,441,850 | ||||
DT Midstream, Inc. | 100,000 | 10,612,000 | ||||
Energy Transfer, L.P. | 7,000,000 | 139,020,000 | ||||
Enterprise Products Partners, L.P. | 2,250,000 | 77,467,500 | ||||
Kinder Morgan, Inc. | 400,000 | 11,308,000 | ||||
ONEOK, Inc. | 1,100,000 | 124,960,000 | ||||
Williams Companies, Inc. | 752,000 | 44,007,040 | ||||
Total Natural Gas/Natural Gas Liquid Pipelines and Storage | 448,816,390 | |||||
TOTAL MASTER LIMITED PARTNERSHIPS AND RELATED COMMON STOCKS | ||||||
(Cost $315,323,602) | 1,014,503,090 | |||||
TOTAL INVESTMENTS - 108.7% (Cost $315,323,602) | $1,014,503,090 | |||||
Liabilities in Excess of Other Assets - (8.7)% | (81,192,219) | |||||
TOTAL NET ASSETS - 100.0% | $933,310,871 | |||||
1 |
ASSETS | |||
Investments at fair value (cost $315,323,602) | $1,014,503,090 | ||
Cash | 7,231,438 | ||
Receivable for Fund shares sold | 555,889 | ||
Dividends receivable | 171,354 | ||
Prepaid expenses | 105,254 | ||
Total assets | 1,022,567,025 | ||
LIABILITIES | |||
Deferred tax liability | 87,854,492 | ||
Payable for Fund shares redeemed | 47,749 | ||
Payable to Adviser(1) | 897,696 | ||
Payable for 12b-1 distribution fee(1) | 52,142 | ||
Payable to Trustees | 24,000 | ||
Payable to Custodian(1) | 7,964 | ||
Accrued expenses and other liabilities | 372,111 | ||
Total liabilities | 89,256,154 | ||
NET ASSETS | $933,310,871 | ||
Net Assets Consist of | |||
Paid-in capital | $800,486,791 | ||
Total distributable earnings, net of deferred taxes | 132,824,080 | ||
Net assets | $933,310,871 | ||
(1) | Agreements and Related Party Transactions (See Note 4) |
Unlimited shares authorized, no par value | Class A | Class C | Class I | ||||||
Net assets | $50,067,940 | $22,211,019 | $861,031,912 | ||||||
Shares issued and outstanding | 4,853,458 | 2,384,967 | 78,696,933 | ||||||
Net asset value, redemption price and minimum offering price per share | $10.32 | $9.31 | $10.94 | ||||||
Maximum offering price per share (Net asset value/0.9425) | $10.95 | N/A | N/A | ||||||
2 |
Investment Income | |||
Distributions received from master limited partnerships | $36,877,875 | ||
Less: return of capital on distributions from master limited partnerships(1) | (33,086,441) | ||
Distribution income received in excess of return of capital from master limited partnerships | 3,791,434 | ||
Dividends from common stock(2,3) | 7,204,886 | ||
Total Investment Income | 10,996,320 | ||
Expenses | |||
Advisory fees(4) | 9,882,321 | ||
Administrator fees(4) | 547,349 | ||
Professional fees | 227,258 | ||
Insurance expense | 247,095 | ||
Transfer agent expense(4) | 200,326 | ||
Reports to shareholders | 137,998 | ||
Trustees’ fees | 96,000 | ||
Compliance fees | 70,408 | ||
Registration fees | 49,439 | ||
Custodian fees and expenses(4) | 48,287 | ||
Fund accounting fees(4) | 861 | ||
12b-1 distribution fee - Class A(4) | 106,145 | ||
12b-1 distribution fee - Class C(4) | 197,999 | ||
Miscellaneous expense | 6,830 | ||
Total Expenses before expense recoupment | 11,818,316 | ||
Previously waived expenses recouped by Adviser | 87,407 | ||
Total Expenses after expense recoupment | 11,905,723 | ||
Net Investment income/(loss), before taxes | (909,403) | ||
Current and deferred tax benefit | 194,158 | ||
Net Investment income/(loss), net of taxes | (715,245) | ||
Net Realized and Unrealized Gain/(Loss) on Investments | |||
Net realized gain/(loss) on investments, before taxes | 163,292,246 | ||
Current and deferred tax expense | (34,862,895) | ||
Net realized gain/(loss) on investments, net of taxes | 128,429,351 | ||
Net change in unrealized appreciation/(depreciation) on investments, before taxes | 198,236,568 | ||
Deferred tax expense | (42,324,342) | ||
Net change in unrealized appreciation/(depreciation) on investments, net of taxes | 155,912,226 | ||
Net Realized and Unrealized Gain/(Loss) on Investments | 284,341,577 | ||
Increase/(Decrease) in Net Assets Resulting from Operations | $283,626,332 | ||
(1) | During the year ended November 30, 2024, the Fund reallocated the amount of the return of capital recognized based on the 2023 tax reporting information received. The impact of this adjustment is a decrease to return of capital by 3,791,434. |
(2) | The return of capital amount from C-Corporations was $5,174,185. (See Note 2) |
(3) | Net of foreign withholding tax of $29,055. |
(4) | Agreements and Related Party Transactions (See Note 4) |
3 |
Year Ended November 30, 2024 | Year Ended November 30, 2023 | |||||
INCREASE/(DECREASE) IN NET ASSETS RESULTING FROM OPERATIONS | ||||||
Net investment income/(loss), net of taxes | $(715,245) | $(4,397,544) | ||||
Net realized gain/(loss) on investments, net of taxes | 128,429,351 | 114,612,206 | ||||
Net change in unrealized appreciation/(depreciation) on investments, net of taxes | 155,912,226 | 14,847,681 | ||||
Increase/(Decrease) in Net Assets Resulting from Operations | 283,626,332 | 125,062,343 | ||||
Distributions to Class A Shareholders | ||||||
From distributable earnings | (2,164,212) | (2,034,827) | ||||
From tax return of capital | — | — | ||||
Distributions to Class C Shareholders | ||||||
From distributable earnings | (1,110,124) | (1,199,306) | ||||
From tax return of capital | — | — | ||||
Distributions to Class I Shareholders | ||||||
From distributable earnings | (34,980,460) | (39,228,668) | ||||
From tax return of capital | — | — | ||||
Total distributions to Fund shareholders | (38,254,796) | (42,462,801) | ||||
Capital Share Transactions (Note 7) | ||||||
Proceeds from shareholder subscriptions | 77,813,161 | 53,799,248 | ||||
Shares issued as reinvestment of distributions | 30,522,866 | 34,286,057 | ||||
Payments for redemptions | (217,982,089) | (211,373,631) | ||||
Decrease in net assets from capital share transactions | (109,646,062) | (123,288,326) | ||||
Total increase/(decrease) in net assets | 135,725,474 | (40,688,784) | ||||
NET ASSETS | ||||||
Beginning of year | 797,585,397 | 838,274,181 | ||||
End of year | $933,310,871 | $797,585,397 | ||||
4 |
Year Ended November 30, | |||||||||||||||
2024 | 2023 | 2022 | 2021 | 2020 | |||||||||||
Per Share Data(1) | |||||||||||||||
Net Asset Value, beginning of year | $7.69 | $6.92 | $5.15 | $3.91 | $5.65 | ||||||||||
Income from Investment Operations | |||||||||||||||
Net investment gain (loss)(2) | (0.03) | (0.05) | (0.04) | (0.07) | (0.06) | ||||||||||
Net realized and unrealized gain (loss) on investments | 3.09 | 1.22 | 2.21 | 1.71 | (1.22) | ||||||||||
Total increase (decrease) from investment operations | 3.06 | 1.17 | 2.17 | 1.64 | (1.28) | ||||||||||
Less Distributions to Shareholders | |||||||||||||||
From distributable earnings | (0.43) | (0.40) | (0.06) | (0.06) | — | ||||||||||
From tax return of capital | — | — | (0.34) | (0.34) | (0.46) | ||||||||||
Total distributions to shareholders | (0.43) | (0.40) | (0.40) | (0.40) | (0.46) | ||||||||||
Net Asset Value, end of year | $10.32 | $7.69 | $6.92 | $5.15 | $3.91 | ||||||||||
Total Investment Return (excludes front-end sales load) | 41.29% | 17.62% | 43.28% | 42.66% | (22.61)% | ||||||||||
Supplemental Data and Ratios | |||||||||||||||
Net assets, end of year (millions) | $50 | $39 | $36 | $31 | $29 | ||||||||||
Ratio of Expenses to Average Net Assets(3,4) | |||||||||||||||
Net deferred federal income and state tax (benefit) expense (“taxes”) | 9.74% | 1.41% | 0.00%‡ | 0.02% | 0.01% | ||||||||||
Expenses (excluding taxes) before (waiver) recoupment | 1.71% | 1.75% | 1.69% | 1.68% | 1.72% | ||||||||||
Expenses (excluding taxes) after (waiver) recoupment | 1.72% | 1.74% | 1.69% | 1.68% | 1.72% | ||||||||||
Expenses (including taxes) before (waiver) recoupment | 11.45% | 3.15% | 1.69% | 1.70% | 1.73% | ||||||||||
Expenses (including taxes) after (waiver) recoupment | 11.46% | 3.14% | 1.69% | 1.70% | 1.73% | ||||||||||
Ratio of Net Investment Income (Loss) to Average Net Assets(3,4) | |||||||||||||||
Net investment income (loss) (excluding taxes applied to net investment income (loss)) before waiver (recoupment) | (0.32)% | (0.82)% | (0.67)% | (1.44)% | (1.32)% | ||||||||||
Net investment income (loss) (excluding taxes applied to net investment income (loss)) after waiver (recoupment) | (0.33)% | (0.81)% | (0.67)% | (1.44)% | (1.32)% | ||||||||||
Net investment income (loss) (including taxes applied to net investment income (loss)) before waiver (recoupment) | (0.29)% | (0.79)% | (0.67)% | (1.46)% | (1.33)% | ||||||||||
Net Investment Income (Loss) including taxes, after (waiver) recoupment | (0.30)% | (0.78)% | (0.67)% | (1.46)% | (1.33)% | ||||||||||
Portfolio turnover rate(5) | 15.31% | 8.27% | 3.26% | 20.80% | 36.65% | ||||||||||
‡ | Less than 0.01%. |
(1) | Information presented relates to a share of Class A for the entire period. |
(2) | Calculated using average shares outstanding method. |
(3) | The Fund has not accrued any state tax expense for periods beginning after November 30, 2022. |
(4) | For the year ended November 30, 2024, the Fund accrued $76,993,079 in net deferred tax expense, of which $4,134,878 is attributable to Class A. |
(5) | Portfolio turnover is calculated on the basis of the Fund as a whole without distinguishing between the classes of shares issued. |
5 |
Year Ended November 30, | |||||||||||||||
2024 | 2023 | 2022 | 2021 | 2020 | |||||||||||
Per Share Data(1) | |||||||||||||||
Net Asset Value, beginning of year | $7.03 | $6.40 | $4.82 | $3.72 | $5.43 | ||||||||||
Income from Investment Operations | |||||||||||||||
Net investment gain (loss)(2) | (0.08) | (0.10) | (0.08) | (0.10) | (0.08) | ||||||||||
Net realized and unrealized gain (loss) on investments | 2.79 | 1.13 | 2.06 | 1.60 | (1.17) | ||||||||||
Total increase (decrease) from investment operations | 2.71 | 1.03 | 1.98 | 1.50 | (1.25) | ||||||||||
Less Distributions to Shareholders | |||||||||||||||
From distributable earnings | (0.43) | (0.40) | (0.06) | (0.06) | — | ||||||||||
From tax return of capital | — | — | (0.34) | (0.34) | (0.46) | ||||||||||
Total distributions to shareholders | (0.43) | (0.40) | (0.40) | (0.40) | (0.46) | ||||||||||
Net Asset Value, end of year | $9.31 | $7.03 | $6.40 | $4.82 | $3.72 | ||||||||||
Total Investment Return (excludes contingent deferred sales charge) | 40.15% | 16.83% | 42.25% | 41.02% | (22.99)% | ||||||||||
Supplemental Data and Ratios | |||||||||||||||
Net assets, end of year (millions) | $22 | $21 | $20 | $17 | $16 | ||||||||||
Ratio of Expenses to Average Net Assets(3,4) | |||||||||||||||
Net deferred federal income and state tax (benefit) expense (“taxes”) | 9.74% | 1.41% | 0.00%‡ | 0.02% | 0.01% | ||||||||||
Expenses (excluding taxes) before (waiver) recoupment | 2.46% | 2.50% | 2.44% | 2.43% | 2.46% | ||||||||||
Expenses (excluding taxes) after (waiver) recoupment | 2.47% | 2.49% | 2.44% | 2.43% | 2.46% | ||||||||||
Expenses (including taxes) before (waiver) recoupment | 12.20% | 3.90% | 2.44% | 2.45% | 2.47% | ||||||||||
Expenses (including taxes) after (waiver) recoupment | 12.21% | 3.89% | 2.44% | 2.45% | 2.47% | ||||||||||
Ratio of Net Investment Income (Loss) to Average Net Assets(3,4) | |||||||||||||||
Net investment income (loss) (excluding taxes applied to net investment income (loss)) before waiver (recoupment) | (1.07)% | (1.57)% | (1.42)% | (2.19)% | (2.06)% | ||||||||||
Net investment income (loss) (excluding taxes applied to net investment income (loss)) after waiver (recoupment) | (1.08)% | (1.56)% | (1.42)% | (2.19)% | (2.06)% | ||||||||||
Net investment income (loss) (including taxes applied to net investment income (loss)) before waiver (recoupment) | (1.04)% | (1.54)% | (1.42)% | (2.21)% | (2.07)% | ||||||||||
Net Investment Income (Loss) including taxes, after (waiver) recoupment | (1.05)% | (1.53)% | (1.42)% | (2.21)% | (2.07)% | ||||||||||
Portfolio turnover rate(5) | 15.31% | 8.27% | 3.26% | 20.80% | 36.65% | ||||||||||
‡ | Less than 0.01%. |
(1) | Information presented relates to a share of Class C for the entire period. |
(2) | Calculated using average shares outstanding method. |
(3) | The Fund has not accrued any state tax expense for periods beginning after November 30, 2022. |
(4) | For the year ended November 30, 2024, the Fund accrued $76,993,079 in net deferred tax expense, of which $1,928,263 is attributable to Class C. |
(5) | Portfolio turnover is calculated on the basis of the Fund as a whole without distinguishing between the classes of shares issued. |
6 |
Year Ended November 30, | |||||||||||||||
2024 | 2023 | 2022 | 2021 | 2020 | |||||||||||
Per Share Data(1) | |||||||||||||||
Net Asset Value, beginning of year | $8.11 | $7.26 | $5.37 | $4.06 | $5.83 | ||||||||||
Income from Investment Operations | |||||||||||||||
Net investment gain (loss)(2) | —◊ | (0.04) | (0.03) | (0.06) | (0.05) | ||||||||||
Net realized and unrealized gain (loss) on investments | 3.26 | 1.29 | 2.32 | 1.77 | (1.26) | ||||||||||
Total increase (decrease) from investment operations | 3.26 | 1.25 | 2.29 | 1.71 | (1.31) | ||||||||||
Less Distributions to Shareholders | |||||||||||||||
From distributable earnings | (0.43) | (0.40) | (0.06) | (0.06) | — | ||||||||||
From tax return of capital | — | — | (0.34) | (0.34) | (0.46) | ||||||||||
Total distributions to shareholders | (0.43) | (0.40) | (0.40) | (0.40) | (0.46) | ||||||||||
Net Asset Value, end of year | $10.94 | $8.11 | $7.26 | $5.37 | $4.06 | ||||||||||
Total Investment Return | 41.62 % | 17.90 % | 43.74 % | 42.82 % | (22.42)% | ||||||||||
Supplemental Data and Ratios | |||||||||||||||
Net assets, end of year (millions) | $861 | $738 | $782 | $686 | $748 | ||||||||||
Ratio of Expenses to Average Net Assets(3,4) | |||||||||||||||
Net deferred federal income and state tax (benefit) expense (“taxes”) | 9.74% | 1.41 % | 0.00 %‡ | 0.02 % | 0.01 % | ||||||||||
Expenses (excluding taxes) before (waiver) recoupment | 1.46 % | 1.50 % | 1.44 % | 1.43 % | 1.46 % | ||||||||||
Expenses (excluding taxes) after (waiver) recoupment | 1.47 % | 1.49 % | 1.44 % | 1.43 % | 1.46 % | ||||||||||
Expenses (including taxes) before (waiver) recoupment | 11.20% | 2.90 % | 1.44 % | 1.45 % | 1.47 % | ||||||||||
Expenses (including taxes) after (waiver) recoupment | 11.21% | 2.89 % | 1.44 % | 1.45 % | 1.47 % | ||||||||||
Ratio of Net Investment Income (Loss) to Average Net Assets(3,4) | |||||||||||||||
Net investment income (loss) (excluding taxes applied to net investment income (loss)) before waiver (recoupment) | (0.07)% | (0.57)% | (0.42)% | (1.19)% | (1.07)% | ||||||||||
Net investment income (loss) (excluding taxes applied to net investment income (loss)) after waiver (recoupment) | (0.08)% | (0.56)% | (0.42)% | (1.19)% | (1.07)% | ||||||||||
Net investment income (loss) (including taxes applied to net investment income (loss)) before waiver (recoupment) | (0.04)% | (0.54)% | (0.42)% | (1.21)% | (1.08)% | ||||||||||
Net Investment Income (Loss) including taxes, after (waiver) recoupment | (0.05)% | (0.53)% | (0.42)% | (1.21)% | (1.08)% | ||||||||||
Portfolio turnover rate(5) | 15.31 % | 8.27 % | 3.26 % | 20.80 % | 36.65% | ||||||||||
◊ | Per share amount is less than $0.005. |
‡ | Less than 0.01%. |
(1) | Information presented relates to a share of Class I for the entire period. |
(2) | Calculated using average shares outstanding method. |
(3) | The Fund has not accrued any state tax expense for periods beginning after November 30, 2022. |
(4) | For the year ended November 30, 2024, the Fund accrued $76,993,079 in net deferred tax expense, of which $70,929,938 is attributable to Class I. |
(5) | Portfolio turnover is calculated on the basis of the Fund as a whole without distinguishing between the classes of shares issued. |
7 |
| A. | Use of Estimates. The preparation of financial statements in conformity with accounting principles generally accepted in the United States of America requires management to make estimates and assumptions that affect the reported amount of assets and liabilities and disclosure of contingent assets and liabilities at the date of the financial statements and the recognition of distribution income and the reported amounts of increases and decreases in net assets from operations during the reporting period. Actual results could differ from those estimates. |
| B. | Investment Valuation. Fund investments are recognized at fair value, and subsequent changes in fair value are recognized in unrealized appreciation/(depreciation) on investments in the Statement of Operations. The Fund uses the following valuation methods to determine fair value as either current market value for investments for which market quotations are available, or if not available, a fair value, as determined in good faith pursuant to such policies and procedures as may be approved by the Trust’s Board of Trustees (“Board of Trustees”) from time to time. The valuation of the portfolio securities of the Fund currently includes the following processes: |
| • | Equity Securities: Securities listed on a securities exchange or an automated quotation system for which quotations are readily available, including securities traded over the counter, will be valued at the last quoted sale price on the principal exchange on which they are traded on the valuation date (or at approximately 4:00 p.m. Eastern Time if a security’s principal exchange is normally open at that time), or, if there is no such reported sale on the valuation date, at the most recent quoted bid price. |
| • | Fixed Income Securities: Debt and fixed income securities will be priced by independent, third-party pricing agents approved by the Board of Trustees. These third-party pricing agents will employ methodologies that they believe are appropriate, including actual market transactions, broker-dealer supplied valuations, matrix pricing, or other electronic data processing techniques. These techniques generally consider such factors as security prices, yields, maturities, call features, ratings and developments relating to specific securities in arriving at valuations. Debt obligations with remaining maturities of sixty days or less will be valued at their amortized cost, which approximates fair market value. |
| • | Foreign Securities: Foreign securities are often principally traded on markets that close at different hours than U.S. markets. Such securities will be valued at their most recent closing prices on the relevant principal exchange even if the close of that exchange is earlier than the time of the Fund’s net asset value (“NAV”) calculation. However, securities traded in foreign markets which remain open as of the time of the NAV calculation will be valued at the most recent sales price as of the time of the NAV calculation. In addition, prices for certain foreign securities may be obtained from the Fund’s approved pricing sources. Chickasaw Capital Management, LLC (the “Adviser”) also monitors for the occurrence of significant events that may cast doubts on the reliability of previously obtained market prices for foreign securities held by the Fund. The |
8 |
| C. | Security Transactions, Investment Income and Expenses. Security transactions are accounted for on a trade date basis. Realized gains and losses are reported on a specific identified cost basis. Interest income is recognized on the accrual basis. Distributions and dividends are recorded on the ex-dividend date. Distributions received from the Fund’s investments in master limited partnerships (“MLPs”), including MLP general partnership interests, generally are comprised of ordinary income and return of capital. Withholding taxes on foreign dividends have been provided for in accordance with the Fund’s understanding of the applicable country’s tax rules and regulations. |
| D. | Dividends and Distributions to Shareholders. The Fund makes distributions to its shareholders each fiscal quarter at a rate that is approximately equal to the distributions the Fund receives from the MLPs and other securities in which it invests. To permit the Fund to maintain more stable quarterly distributions, the distribution for any particular quarterly period may be more or less than the amount of total distributable earnings actually earned by the Fund. |
| E. | Federal Income Taxation. The Fund, taxed as a corporation, is obligated to pay federal and state income tax on its taxable income. Currently, the federal income tax rate for a corporation is 21%. |
9 |
| F. | Indemnifications. Under the Fund’s organizational documents, its officers and trustees are indemnified against certain liabilities arising out of the performance of their duties to the Fund. In addition, in the normal course of business, the Fund may enter into contracts that provide general indemnification to other parties. The Fund’s maximum exposure under these arrangements is unknown, as this would involve future claims that may be made against the Fund that have not yet occurred, and may not occur. However, the Fund has not had prior claims or losses pursuant to these contracts. |
| G. | Cash. Cash consists of deposits held with a bank. The Fund maintains cash in bank accounts which, at times, may exceed United States federally insured limits. |
| Level 1 – | Unadjusted quoted prices in active markets for identical securities that the Fund has the ability to access |
| Level 2 – | Other significant observable inputs (including quoted prices for similar securities, interest rates, prepayment speeds, credit risk, etc.) |
| Level 3 – | Significant unobservable inputs (including the Fund’s own assumptions in determining the fair value of investments) |
Description | Fair Value at November 30, 2024 | Quoted Prices in Active Markets for Identical Assets (Level 1) | Significant Other Observable Inputs (Level 2) | Significant Unobservable Inputs (Level 3) | ||||||||
Equity Securities | ||||||||||||
Master Limited Partnerships and Related Common Stocks(1) | $1,014,503,090 | $1,014,503,090 | $— | $— | ||||||||
Total | $1,014,503,090 | $1,014,503,090 | $— | $— | ||||||||
(1) | All other industry classifications are identified in the Schedule of Investments. |
10 |
11 |
Net operating loss carryforward (tax basis) | $44,530,515 | ||
Capital loss carryforward (tax basis) | 20,780,931 | ||
Valuation allowance | — | ||
Other. | (43,518) | ||
Total deferred tax asset | 65,267,928 | ||
Unrealized gains on investment securities (tax basis) – net | (153,122,420) | ||
Net deferred tax liability | $(87,854,492) | ||
Fiscal Year Ended Net Operating Loss Carryforwards | Amount | Expiration | ||||
November 30, 2016 | $26,030,332 | November 30, 2036 | ||||
November 30, 2017 | 77,956,625 | November 30, 2037 | ||||
November 30, 2018 | 46,816,412 | November 30, 2038 | ||||
November 30, 2020 | 23,244,346 | Indefinite | ||||
November 30, 2021 | 21,504,332 | Indefinite | ||||
Total Net Operating Loss Carryforwards | $195,552,047 | |||||
Fiscal Year Ended Net Capital Loss Carryforwards | Amount | Expiration | ||||
November 30, 2020 | $96,456,991 | November 30, 2025 | ||||
Total Net Capital Loss Carryforwards | $96,456,991 | |||||
12 |
Total Tax Expense (Benefit) | Amount | Rate | ||||
Tax Expense (Benefit) at Statutory Rates . | $75,730,076 | 21.00% | ||||
State Income Tax Expense (Benefit) (Net of Federal Benefit) . | 1,962,658 | 0.54% | ||||
Tax Expense (Benefit) on Permanent Items(1) . | (710,892) | (0.20)% | ||||
Provision to Return Adjustment . . | 293,483 | 0.08% | ||||
Change in State Rate . | (282,246) | (0.08)% | ||||
Change in Valuation Allowance(2). | — | 0.00% | ||||
Total Tax Expense (Benefit) . | $76,993,079 | 21.34% | ||||
(1) | Permanent Items are made up of dividends received deductions, non-deductible expenses from K-1s, and tax exempt income from K-1s. |
(2) | As of November 30, 2024, the Fund had unrealized gains in excess of the Fund’s deferred tax assets; therefore, the Fund determined the deferred tax assets were realizable and a valuation allowance was not needed. |
Gross unrealized appreciation | $710,734,579 | ||
Gross unrealized depreciation | — | ||
Net unrealized appreciation | $710,734,579 | ||
13 |
Year Ended November 30, 2024 | Year Ended November 30, 2023 | |||||||||||
Amount | Shares | Amount | Shares | |||||||||
Class A Shares | ||||||||||||
Sold | $6,648,948 | 813,816 | $6,019,771 | 857,278 | ||||||||
Dividends Reinvested | 1,788,459 | 215,475 | 1,665,697 | 238,207 | ||||||||
Redeemed | (10,639,384) | (1,263,663) | (8,576,928) | (1,227,636) | ||||||||
Net Decrease | $(2,201,977) | (234,372) | $(891,460) | (132,151) | ||||||||
Class C Shares | ||||||||||||
Sold | $391,742 | 49,881 | $1,629,130 | 254,787 | ||||||||
Dividends Reinvested | 955,595 | 127,352 | 1,010,552 | 157,045 | ||||||||
Redeemed | (5,410,480) | (729,298) | (3,809,872) | (594,741) | ||||||||
Net Decrease | $(4,063,143) | (552,065) | $(1,170,190) | (182,909) | ||||||||
Class I Shares | ||||||||||||
Sold | $70,772,471 | 7,937,179 | $46,150,347 | 6,398,248 | ||||||||
Dividends Reinvested | 27,778,812 | 3,177,007 | 31,609,808 | 4,304,165 | ||||||||
Redeemed | (201,932,225) | (23,341,036) | (198,986,831) | (27,525,979) | ||||||||
Net Decrease | $(103,380,942) | (12,226,850) | $(121,226,676) | (16,823,566) | ||||||||
14 |
15 |

16 |
| (b) | Financial Highlights are included within the financial statements filed under Item 7 of this Form. |
Item 8. Changes in and Disagreements with Accountants for Open-End Management Investment Companies.
There were no changes in or disagreements with accountants during the period covered by this report.
Item 9. Proxy Disclosures for Open-End Management Investment Companies.
There were no matters submitted to a vote of shareholders during the period covered by this report.
Item 10. Remuneration Paid to Directors, Officers, and Others of Open-End Management Investment Companies.
See Item 7(a).
Item 11. Statement Regarding Basis for Approval of Investment Advisory Contract.
Not applicable.
Item 12. Disclosure of Proxy-Voting Policies and Procedures for Closed-End Management Investment Companies.
Not applicable to open-end management investment companies.
Item 13. Portfolio Managers of Closed-End Management Investment Companies.
Not applicable to open-end management investment companies.
Item 14. Purchases of Equity Securities by Closed-End Management Investment Company and Affiliated Purchasers.
Not applicable to open-end management investment companies.
Item 15. Submission of Matters to a Vote of Security Holders.
Not applicable.
Item 16. Controls and Procedures.
| (a) | The Registrant’s Principal Executive Officer and the Registrant’s Principal Financial Officer have reviewed the Registrant’s disclosure controls and procedures (as defined in Rule 30a-3(c) under the Investment Company Act of 1940 (the “Act”)) as of a date within 90 days of the filing of this report, as required by Rule 30a-3(b) under the Act and Rules 13a-15(b) or 15d-15(b) under the Securities Exchange Act of 1934. Based on their review, such officers have concluded that the disclosure controls and procedures are effective in ensuring that information required to be disclosed in this report is appropriately recorded, processed, summarized and reported and made known to them by others within the Registrant and by the Registrant’s service provider. |
| (b) | Management concluded there were no changes in the Registrant’s internal control over financial reporting (as defined in Rule 30a-3(d) under the Act) that occurred during the period covered by this report that have materially affected, or are reasonably likely to materially affect, the Registrant’s internal control over financial reporting. |
Item 17. Disclosure of Securities Lending Activities for Closed-End Management Investment Companies.
Not applicable to open-end management investment companies.
Item 18. Recovery of Erroneously Awarded Compensation.
Not applicable.
Item 19. Exhibits.
(2) Any policy required by the listing standards adopted pursuant to Rule 10D-1 under the Exchange Act (17 CFR 240.10D-1) by the registered national securities exchange or registered national securities association upon which the registrant’s securities are listed. Not applicable.
(4) Any written solicitation to purchase securities under Rule 23c-1 under the Act sent or given during the period covered by the report by or on behalf of the registrant to 10 or more persons. Not applicable.
(5) Change in the registrant’s independent public accountant. Provide the information called for by Item 4 of Form 8-K under the Exchange Act (17 CFR 249.308). Unless otherwise specified by Item 4, or related to and necessary for a complete understanding of information not previously disclosed, the information should relate to events occurring during the reporting period. Not applicable to open-end investment management companies.
| (b) | Certifications pursuant to Section 906 of the Sarbanes-Oxley Act of 2002. Furnished herewith. |
SIGNATURES
Pursuant to the requirements of the Securities Exchange Act of 1934 and the Investment Company Act of 1940, the registrant has duly caused this report to be signed on its behalf by the undersigned, thereunto duly authorized.
| (Registrant) MainGate Trust |
| By (Signature and Title) | /s/ Matthew G. Mead | ||
| Matthew G. Mead, Principal Executive Officer |
| Date | 2/3/2025 |
Pursuant to the requirements of the Securities Exchange Act of 1934 and the Investment Company Act of 1940, this report has been signed below by the following persons on behalf of the registrant and in the capacities and on the dates indicated.
| By (Signature and Title) | /s/ Matthew G. Mead | ||
| Matthew G. Mead, Principal Executive Officer |
| Date | 2/3/2025 |
| By (Signature and Title) | /s/ Geoffrey P. Mavar | ||
| Geoffrey P. Mavar, Principal Financial Officer |
| Date | 2/3/2025 |