UNITED STATES
SECURITIES AND EXCHANGE COMMISSION
Washington, D.C. 20549
FORM 10-Q
x QUARTERLY REPORT PURSUANT TO SECTION 13 OR 15(D) OF THE SECURITIES EXCHANGE ACT OF 1934
For the quarterly period ended September 30, 2013
or
o TRANSITION REPORT PURSUANT TO SECTION 13 OR 15(D) OF THE SECURITIES EXCHANGE ACT OF 1934
For the transition period from: _____________ to _____________
Commission file number: 333-178624
DNA PRECIOUS METALS, INC.
(Exact name of Registrant as Specified in its Charter)
| Nevada | | 37-1640902 |
(State or other jurisdiction
of Incorporation) | | (I.R.S. Employer
Identification No.) |
9125 rue Pascal Gagnon, Suite 204, Saint Leonard, Quebec, Canada HIP IZ4
| |
| (ADDRESS OF PRINCIPAL EXECUTIVE OFFICES) |
| |
| (REGISTRANT’S TELEPHONE NUMBER) |
| |
| (FORMER NAME OR FORMER ADDRESS, IF CHANGES SINCE LAST REPORT) |
All correspondence to:
Tony J. Giuliano, CFO
DNA Precious Metals, Inc.
9125 Pascal Gagnon, Suite 204
Saint Leonard, Quebec, Canada H1P 1Z4
Office: (514) 852-2111
Fax: (514) 852-2221
Email: tony.giuliano@dnapreciousmetals.com
| Title of each class | | Name of each exchange on which registered |
| | | |
| Common Stock, $0.001 par value | | None |
Indicate by check mark if the registrant is a well-known seasoned issuer, as defined in Rule 405 of the Securities Act o Yes x No
Indicate by check mark if the registrant is not required to file reports pursuant to Section 13 or Section 15(d) of the Exchange Act from their obligations under those Sections. o Yes x No
Indicate by check mark whether the registrant (1) has filed all reports required to be filed by Section 13 or 15(d) of the Securities Exchange Act of 1934 during the preceding 12 months (or for such shorter period that the registrant was required to file such reports), and (2) has been subject to such filing requirements for the past 90 days. x Yes o No
Indicate by check mark whether the registrant has submitted electronically and posted on its corporate Web site, if any, every Interactive Data File required to be submitted and posted pursuant to Rule 405 of Regulation S-T (§ 232.405 of this chapter) during the preceding 12 months (or for such shorter period that the registrant was required to submit and post such files). x Yes o No
Indicate by check mark if disclosure of delinquent filers pursuant to Item 405 of Regulation S-K (§ 229.405 of this chapter) is not contained herein, and will not be contained, to the best of registrant’s knowledge, in definitive proxy or information statements incorporated by reference in Part III of this Form 10-Q or any amendment to this Form 10-Q.
o
Indicate by check mark whether the registrant is a large accelerated filer, an accelerated filer, a non-accelerated filer, or a smaller reporting company. See the definitions of "large accelerated filer," "accelerated filer" and "smaller reporting company" in Rule 12b-2 of the Exchange Act.
Large Accelerated Filer o | Non-accelerated Filer o |
Accelerated Filer o | Smaller Reporting Company x |
Indicate by check mark whether the registrant is a shell company (as defined in Rule 12b-2 of the Act). oYes x No
The aggregate market value of the voting and non-voting common equity held by non-affiliates of the registrant computed by reference to the price at which the common equity was last sold, or the average bid and asked price for such common equity, as of the last business day of the registrant's most recently completed second fiscal quarter was approximately $30,514,332 (based on a quoted price of $.569 per common stock share at the close of business on October 17, 2013).
APPLICABLE ONLY TO ISSUERS INVOLVED IN BANKRUPTCY
PROCEEDINGS DURING THE PRECEDING FIVE YEARS:
Indicate by check mark whether the registrant has filed all documents and reports required to be filed by Section 12, 13 or 15(d) of the Securities Exchange Act of 1934 subsequent to the distribution of securities under a plan confirmed by a court.
o Yes o No
APPLICABLE ONLY TO CORPORATE ISSUERS
Indicate the number of shares outstanding of each of the issuer's classes of common stock as of the latest practicable date: 90,628,000 of common stock, $0.001 par value, as of September 30, 2013.
DOCUMENTS INCORPORATED BY REFERENCE
None.
References to DNA Precious Metals, Inc., a Nevada corporation, are referred to herein as “we”, “our” or “us”, unless the context provides for otherwise.
DNA Precious Metals, Inc.
(An Exploration Stage Company)
TABLE OF CONTENTS
| PART I - FINANCIAL INFORMATION | Page |
| 1 |
| 2 |
| 3 |
| 4 |
| 5 |
| 21 |
| 39 |
| 39 |
| | |
| | |
| PART II - OTHER INFORMATION | |
| 40 |
| 40 |
| 40 |
| 40 |
| 42 |
| 42 |
| 42 |
| 43 |
The consolidated financial statements are unaudited. However, management of registrant believes that all necessary adjustments, including normal recurring adjustments, have been reflected to present fairly the financial position of registrant as at September 30, 2013 and the results of its operations for the nine and three month periods ended September 30, 2013 and 2012 and changes in its cash position for the nine month periods ended September 30, 2013 and 2012 and for the period from inception (June 2, 2006) through September 30, 2013.
MEASUREMENTS AND GLOSSARY
Conversion Table
For ease of reference in reviewing our business, we are providing you with conversion information and abbreviations:
| 1 acre | | = 0.4047 hectare | | 1 mile | | = 1.6093 kilometers |
| 1 foot | | = 0.3048 meter | | 1 troy ounce | | = 31.1035 grams |
| 1 gram per metric ton | | = 0.0292 troy ounce/ short ton | | 1 square mile | | = 2.59 square kilometers |
| 1 short ton (2000 pounds) | | = 0.9072 ton | | 1 square kilometer | | = 100 hectares |
| 1 ton | | = 1,000 kg or 2,204.6 lbs | | 1 kilogram | | = 2.204 pounds or 32.151 troy oz |
| 1 hectare | | = 10,000 square meters | | 1 hectare | | = 2.471 acres |
The following abbreviations may be used herein:
| Au | | = gold | | m2 | | = square meter |
| G | | = gram | | m3 | | = cubic meter |
| g/t | | = grams per ton | | Mg | | = milligram |
| Ha | | = hectare | | mg/m3 | | = milligrams per cubic meter |
| Km | | = kilometer | | T or t | | = ton |
| Km2 | | = square kilometers | | Oz | | = troy ounce |
| Kg | | = kilogram | | Ppb | | = parts per billion |
| M | | = meter | | Ma | | = million years |
Mining Terms
The following mining terms are used throughout this filing:
| | a) | SEC Industry Guide 7 Definitions |
| exploration stage | An “exploration stage” prospect, which is not in either the development or production stage. |
| development stage | A “development stage” project is one which there is ongoing preparation of an established commercially mineable deposit for its extraction but which is not yet in production. This stage occurs after completion of a feasibility study. |
| | |
mineralized material | The term “mineralized material” refers to material that is not included in the reserve as it does not meet all of the criteria for adequate demonstration for economic or legal extraction. |
| | |
| probable reserve | The term “probable reserve” refers to reserves for which quantity and grade and/or quality are computed from information similar to that used for proven (measured) reserves, but the sites for inspection, sampling, and measurement are farther apart or are otherwise less adequately spaced. The degree of assurance, although lower than that for proven reserves, is high enough to assume continuity between points of observation. |
| production stage | A “production stage” project is actively engaged in the process of extraction and beneficiation of mineral reserves to produce a marketable metal or mineral product. |
| | |
| proven reserve | The term “proven reserve” refers to reserves for which (a) quantity is computed from dimensions revealed in outcrops, trenches, workings or drill holes; grade and/or quality are computed from the results of detailed sampling and (b) the sites for inspection, sampling and measurement are spaced so closely and the geologic character is so well defined that size, shape, depth and mineral content of reserves are well-established. |
| | |
| Reserve | The term “reserve” refers to that part of a mineral deposit, which could be economically and legally extracted or produced at the time of the reserve determination. Reserves must be supported by a feasibility study done to bankable standards that demonstrates the economic extraction (“bankable standards” implies that the confidence attached to the costs and achievements developed in the study is sufficient for the project to be eligible for external debt financing). A reserve includes adjustments to the in-situ tons and grade to include diluting materials and allowances for losses that might occur when the material is mined. |
| alteration | Any change in the mineral composition of a rock brought about by physical or chemical means. |
| | |
| assay | A measure of the valuable mineral content. |
| | |
| dip | The angle that a structural surface, a bedding or fault plane, makes with the horizontal, measured perpendicular to the strike of the structure. |
| | |
| disseminated | Where minerals occur as scattered particles in the rock. |
| | |
| fault | A surface or zone of rock fracture along which there has been displacement. |
| | |
feasibility study | A comprehensive study of a mineral deposit in which all geological, engineering, legal, operating, economic, social, environmental and other relevant factors are considered in sufficient detail that it could reasonably serve as the basis for a final decision by a financial institution to finance the development of the deposit for mineral production. |
| | |
| formation | A distinct layer of sedimentary rock of similar composition. |
| geochemistry | The study of the distribution and amounts of the chemical elements in minerals, ores, rocks, solids, water and the atmosphere. |
| | |
| geophysics | The study of the mechanical, electrical and magnetic properties of the earth’s crust. |
| | |
geophysical surveys | A survey method used primarily in the mining industry as an exploration tool, applying the methods of physics and engineering to the earth’s surface. |
| geotechnical | The study of ground stability. |
| | |
| grade | Quantity of metal per unit weight of host rock. |
| heap leach | A mineral processing method involving the crushing and stacking of an ore on an impermeable liner upon which solutions are sprayed to dissolve metals i.e. gold, copper, etc.; the solutions containing the metals are then collected and treated to recover the metals. |
| host rock | The rock in which a mineral or an ore body may be contained. |
| | |
| in-situ | In its natural position. |
| | |
| lithology | The character of the rock described in terms of its structure, color, mineral composition, grain size and arrangement of tits component parts, all those visible features that in the aggregate impart individuality to the rock. |
| | |
mapped or geological mapping | The recording of geologic information including rock units and the occurrence of structural features and mineral deposits on maps. |
| | |
| mineral | A naturally occurring inorganic crystalline material having a definite chemical composition. |
| | |
| mineralization | A natural accumulation or concentration in rocks or soil of one or more potentially economic minerals, also the process by which minerals are introduced or concentrated in a rock. |
| | |
| outcrop | That part of a geologic formation or structure that appears at the surface of the earth. |
| | |
open pit or open cut | Surface mining in which the ore is extracted from a pit or quarry, the geometry of the pit may vary with the characteristics of the ore body. |
| | |
| ore | Mineral bearing rock that can be mined and treated profitably under current or immediately foreseeable economic conditions. |
| | |
| ore body | A mostly solid and fairly continuous mass of mineralization estimated to be economically mineable. |
| | |
| ore grade | The average weight of the valuable metal or mineral contained in a specific weight of ore i.e. grams per ton of ore. |
| | |
| oxide | Gold bearing ore, which results from the oxidation of near surface sulfide ore. |
| | |
preliminary assessment | A study that includes an economic analysis of the potential viability of Mineral Resources taken at an early stage of the project prior to the completion of a preliminary feasibility study. |
| QA/QC | Quality Assurance/Quality Control is the process of controlling and assuring data quality for assays and other exploration and mining data. |
| | |
| quartz | A mineral composed of silicon dioxide, SiO2 (silica). |
| rock | Indurated naturally occurring mineral matter of various compositions. |
| | |
sampling analytical variance/ precision | An estimate of the total error induced by sampling, sample preparation and analysis. |
| | |
| sediment | Particles transported by water, wind or ice. |
| | |
sedimentary rock | Rock formed at the earth’s surface from solid particles, whether mineral or organic, which have been moved from their position of origin and re-deposited. |
| strike | The direction or trend that a structural surface, e.g. a bedding or fault plane, takes as it intersects the horizontal. |
| | |
| strip | To remove overburden in order to expose ore. |
| | |
| tailings | The residue from an ore crushing plant. |
| | |
| orphan site | Tailings residues from former mining operations that the Quebec government has taken responsibility for remediation / restoration. |
CAUTIONARY STATEMENT REGARDING FORWARD-LOOKING STATEMENTS
Certain statements in this quarterly report on Form 10-Q contain or may contain forward-looking statements that are subject to known and unknown risks, uncertainties and other factors which may cause actual results, performance or achievements to be materially different from any future results, performance or achievements expressed or implied by such forward-looking statements. Generally, the words “believes”, “anticipates,” “may,” “will,” “should,” “expect,” “intend,” “estimate,” “continue,” and similar expressions or comparable terminology are intended to identify forward-looking statements which include, but are not limited to, statements concerning the our expectations regarding our working capital requirements, financing requirements, business prospects, and other statements of expectations, beliefs, future plans and strategies, anticipated events or trends, and similar expressions concerning matters that are not historical facts. These forward-looking statements were based on various factors and were derived utilizing numerous assumptions and other factors that could cause our actual results to differ materially from those in the forward-looking statements. These factors include, but are not limited to, economic, political and market conditions and fluctuations, government and industry regulation, interest rate risk, U.S. and global competition, and other factors. Most of these factors are difficult to predict accurately and are generally beyond our control. You should consider all of the material risks in connection with any forward-looking statements that may be made herein. Readers are cautioned not to place undue reliance on these forward-looking statements, which speak only as of the date of this report. Readers should carefully review this quarterly report in its entirety, including but not limited to our financial statements and the notes thereto. Except for our ongoing obligations to disclose material information under the federal securities laws, we undertake no obligation to release publicly any revisions to any forward-looking statements, to report events or to report the occurrence of unanticipated events.
PART 1I - FINANCIAL INFORMATION
DNA PRECIOUS METALS, INC.
(AN EXPLORATION STAGE COMPANY)
INDEX TO CONDENSED CONSOLIDATED FINANCIAL STATEMENTS
(Unaudited)
| Condensed Consolidated Financial Statements: | |
| 2 |
| 3 |
| 4 |
| 5 |
| DNA PRECIOUS METALS, INC. |
| (AN EXPLORATION STAGE COMPANY) |
|
| SEPTEMBER 30, 2013 AND DECEMBER 31, 2012 |
| (in United States dollars) |
| |
| | | (Unaudited) | | | | |
| | | SEPTEMBER 30, | | | DECEMBER 31, | |
| | | 2013 | | | 2012 | |
| ASSETS | | | | | | |
| | | | | | | |
| CURRENT ASSETS | | | | | | |
| Cash | | $ | 271,251 | | | $ | 598,938 | |
| Prepaid expenses and deposits | | | 156,021 | | | | 4,422 | |
| Sales tax receivable | | | 13,948 | | | | 62,436 | |
| Total current assets | | | 441,220 | | | | 665,796 | |
| | | | | | | | | |
| Fixed assets, net | | | 1,259,745 | | | | 1,318,343 | |
| | | | | | | | | |
| Other Asset | | | | | | | | |
| Mining rights | | | 15,000 | | | | 15,000 | |
| | | | | | | | | |
| TOTAL ASSETS | | $ | 1,715,965 | | | $ | 1,999,139 | |
| | | | | | | | | |
| | | | | | | | | |
| LIABILITIES AND STOCKHOLDERS' EQUITY (DEFICIT) | | | | | | | | |
| | | | | | | | | |
| CURRENT LIABILITIES | | | | | | | | |
| Accounts payable and accrued expenses | | $ | 96,106 | | | $ | 141,220 | |
| Liability for stock to be issued | | | 10,000 | | | | 232,000 | |
| Total current liabilities | | | 106,106 | | | | 373,220 | |
| | | | | | | | | |
| LONG TERM LIABILITIES | | | | | | | | |
| Promissory note | | | - | | | | 502,550 | |
| | | | | | | | | |
| TOTAL LIABILITIES | | | 106,106 | | | | 875,770 | |
| | | | | | | | | |
| STOCKHOLDERS' EQUITY (DEFICIT) | | | | | | | | |
| Preferred stock, $0.001 par value, 10,000,000 shares authorized | | | | | | | | |
| Nil shares issued and outstanding | | | - | | | | - | |
| Common stock, $0.001 par value, 150,000,000 shares authorized | | | | | | | | |
| 90,628,000 and 83,024,000 shares issued and outstanding, respectively | | | 90,628 | | | | 83,024 | |
| Additional paid in capital | | | 5,544,850 | | | | 2,800,976 | |
| Deferred compensation | | | (375,000 | ) | | | - | |
| Deficits accumulated during the exploration stage | | | (3,642,109 | ) | | | (1,773,047 | ) |
| Accumulated other comprehensive income (loss) | | | (8,510 | ) | | | 12,416 | |
| Total stockholders' equity (deficit) | | | 1,609,859 | | | | 1,123,369 | |
| | | | | | | | | |
| TOTAL LIABILITIES AND STOCKHOLDERS' EQUITY (DEFICIT) | | $ | 1,715,965 | | | $ | 1,999,139 | |
The accompanying notes are an integral part of these condensed consolidated financial statements.
| DNA PRECIOUS METALS, INC. |
| (AN EXPLORATION STAGE COMPANY) |
|
| FOR THE NINE AND THREE MONTHS ENDED SEPTEMBER 30, 2013 AND 2012 |
| AND THE PERIOD JUNE 2, 2006 (INCEPTION)THROUGH SEPTEMBER 30, 2013 |
| (in United States dollars) |
| (Unaudited) |
| |
| | | | | | | | | | | | | | | JUNE 2, 2006 | |
| | | NINE MONTHS ENDED | | | THREE MONTHS ENDED | | | (INCEPTION) | |
| | | SEPTEMBER 30, | | | SEPTEMBER 30, | | | THROUGH | |
| | | 2013 | | | 2012 | | | 2013 | | | 2012 | | | SEPTEMBER 30, 2013 | |
| | | | | | | | | | | | | | | | |
| REVENUE | | $ | - | | | $ | - | | | $ | - | | | $ | - | | | $ | - | |
| | | | | | | | | | | | | | | | | | | | | |
| COST OF REVENUES | | | - | | | | - | | | | - | | | | - | | | | - | |
| | | | | | | | | | | | | | | | | | | | | |
| GROSS PROFIT | | | - | | | | - | | | | - | | | | - | | | | - | |
| | | | | | | | | | | | | | | | | | | | | |
| OPERATING EXPENSES | | | | | | | | | | | | | | | | | | | | |
| Engineering costs | | | 49,522 | | | | 195,422 | | | | 7,571 | | | | 71,257 | | | | 833,889 | |
| Salaries and related expenses | | | 364,343 | | | | 145,327 | | | | 115,655 | | | | 47,700 | | | | 966,204 | |
| Shares and options issued as compensation | | | 896,928 | | | | - | | | | 209,428 | | | | - | | | | 896,928 | |
| Professional fees | | | 249,524 | | | | 134,067 | | | | 55,555 | | | | 49,123 | | | | 586,262 | |
| Rent | | | 30,690 | | | | 12,099 | | | | 9,725 | | | | 4,213 | | | | 66,378 | |
| Depreciation | | | 6,556 | | | | - | | | | 2,213 | | | | 0 | | | | 7,248 | |
| General and administrative | | | 256,015 | | | | 58,134 | | | | 78,382 | | | | 9,440 | | | | 367,950 | |
| Total operating expenses | | | 1,853,578 | | | | 545,049 | | | | 478,529 | | | | 181,733 | | | | 3,724,859 | |
| | | | | | | | | | | | | | | | | | | | | |
| OTHER (INCOME) EXPENSE | | | | | | | | | | | | | | | | | | | | |
| Interest expense, net | | | 1,579 | | | | 6,964 | | | | 410 | | | | 6,964 | | | | 11,629 | |
| Loss on conversion of promissory note | | | 125,000 | | | | - | | | | - | | | | - | | | | 125,000 | |
| Exploration tax credits | | | (111,095 | ) | | | - | | | | (111,095 | ) | | | - | | | | (219,379 | ) |
| Total other (income) expense | | | 15,484 | | | | 6,964 | | | | (110,685 | ) | | | 6,964 | | | | (82,750 | ) |
| | | | | | | | | | | | | | | | | | | | | |
| NET LOSS | | | (1,869,062 | ) | | | (552,013 | ) | | | (367,844 | ) | | | (188,697 | ) | | | (3,642,109 | ) |
| | | | | | | | | | | | | | | | | | | | | |
| | | | | | | | | | | | | | | | | | | | | |
| WEIGHTED AVERAGE NUMBER OF SHARES OUTSTANDING | | | 89,069,040 | | | | 76,193,547 | | | | 90,191,030 | | | | 76,378,609 | | | | 54,371,585 | |
| | | | | | | | | | | | | | | | | | | | | |
| NET LOSS PER SHARE | | $ | (0.02 | ) | | $ | (0.01 | ) | | $ | (0.00 | ) | | $ | (0.00 | ) | | $ | (0.07 | ) |
| | | | | | | | | | | | | | | | | | | | | |
| COMPREHENSIVE LOSS | | | | | | | | | | | | | | | | | | | | |
| Net loss | | $ | (1,869,062 | ) | | $ | (552,013 | ) | | $ | (367,844 | ) | | $ | (188,697 | ) | | $ | (3,642,109 | ) |
| Currency translation adjustment | | | (20,926 | ) | | | 9,250 | | | | 1,122 | | | | (8,333 | ) | | | (8,510 | ) |
| Total comprehensive loss | | | (1,889,988 | ) | | | (542,763 | ) | | | (366,722 | ) | | | (197,030 | ) | | | (3,650,619 | ) |
The accompanying notes are an integral part of these condensed consolidated financial statements.
| DNA PRECIOUS METALS, INC. |
| (AN EXPLORATION STAGE COMPANY) |
|
| FOR THE NINE MONTHS ENDED SEPTEMBER 30, 2013 AND 2012 |
| AND THE PERIOD JUNE 2, 2006 (INCEPTION) THROUGH SEPTEMBER 30, 2013 |
| (in United States dollars) |
| (Unaudited) |
| |
| | | | | | | | | JUNE 2, 2006 | |
| | | NINE MONTHS ENDED | | | (INCEPTION) | |
| | | SEPTEMBER 30, | | | THROUGH | |
| | | 2013 | | | 2012 | | | SEPTEMBER 30, 2013 | |
| CASH FLOWS FROM OPERATING ACTIVITIES: | | | | | | | | | |
| Net loss for the period | | $ | (1,869,062 | ) | | $ | (552,013 | ) | | $ | (3,642,109 | ) |
| | | | | | | | | | | | | |
| Adjustments to reconcile net (loss) | | | | | | | | | | | | |
| to net cash (used in) operating activities: | | | | | | | | | | | | |
| Depreciation | | | 6,556 | | | | - | | | | 7,248 | |
| Shares and options issued for compensation | | | 896,928 | | | | - | | | | 896,928 | |
| Loss on conversion of promissory note | | | 125,000 | | | | | | | | 125,000 | |
| Common shares issued for services | | | 126,000 | | | | - | | | | 534,000 | |
| | | | | | | | | | | | | |
| Change in assets and liabilities | | | | | | | | | | | | |
| (Increase) decrease in prepaid expenses and deposits | | | (62,457 | ) | | | - | | | | (74,012 | ) |
| (Increase) decrease in sales tax receivable | | | 46,650 | | | | - | | | | (15,786 | ) |
| Increase (decrease) in accounts payable and accrued expenses | | | (47,889 | ) | | | 311,879 | | | | 100,586 | |
| Total adjustments | | | 1,090,788 | | | | 311,879 | | | | 1,573,964 | |
| Net cash (used in) operating activities | | | (778,274 | ) | | | (240,134 | ) | | | (2,068,145 | ) |
| | | | | | | | | | | | | |
| CASH FLOWS FROM INVESTING ACTIVITIES: | | | | | | | | | | | | |
| Acquisition of fixed assets | | | (48,468 | ) | | | (745,372 | ) | | | (1,357,295 | ) |
| Net cash (used in) investing activities | | | (48,468 | ) | | | (745,372 | ) | | | (1,357,295 | ) |
| | | | | | | | | | | | | |
| CASH FLOWS FROM FINANCING ACTIVITIES: | | | | | | | | | | | | |
| Proceeds received from promissory note | | | - | | | | 203,320 | | | | 491,650 | |
| Cash received for common stock and liability for stock to be issued | | | 504,000 | | | | 946,000 | | | | 3,197,000 | |
| Net cash provided by financing activities | | | 504,000 | | | | 1,149,320 | | | | 3,688,650 | |
| | | | | | | | | | | | | |
| Effect of foreign currency | | | (4,945 | ) | | | 24,762 | | | | 8,041 | |
| | | | | | | | | | | | | |
| NET INCREASE (DECREASE) IN CASH AND CASH EQUIVALENTS | | | (327,687 | ) | | | 188,576 | | | | 271,251 | |
| | | | | | | | | | | | | |
| CASH AND CASH EQUIVALENTS - BEGINNING OF PERIOD | | | 598,938 | | | | 556,674 | | | | - | |
| | | | | | | | | | | | | |
| CASH AND CASH EQUIVALENTS - END OF PERIOD | | $ | 271,251 | | | $ | 745,250 | | | $ | 271,251 | |
| | | | | | | | | | | | | |
| | | | | | | | | | | | | |
| SUPPLEMENTAL NON-CASH INVESTING AND FINANCING ACTIVITIES: | | | | | | | | | |
| Common stock issued for subscriptions receivable | | $ | - | | | $ | - | | | $ | - | |
| | | | | | | | | | | | | |
| SUPPLEMENTAL CASH FLOW INFORMATION: | | | | | | | | | | | | |
| Cash paid during the period for: | | | | | | | | | | | | |
| Interest | | | 1,579 | | | | 6,964 | | | | 11,629 | |
| Income taxes | | | - | | | | - | | | | - | |
| | | | | | | | | | | | | |
| SUPPLEMENTAL NON-CASH ACTIVITY: | | | | | | | | | | | | |
| Common stock issued for mining rights | | | - | | | | - | | | | 15,000 | |
| Conversion of promissory note to common stock | | | 627,550 | | | | - | | | | 627,550 | |
| Deferred compensation for common stock | | | 875,000 | | | | - | | | | 875,000 | |
The accompanying notes are an integral part of these condensed consolidated financial statements.
DNA PRECIOUS METALS, INC.
(An Exploration Stage Company)
SEPTEMBER 30, 2013 AND 2012
(Unaudited)
| NOTE 1- | ORGANIZATION AND BASIS OF PRESENTATION |
The unaudited consolidated financial statements included herein have been prepared, without audit, pursuant to the rules and regulations of the Securities and Exchange Commission (“SEC”). Certain information and footnote disclosures normally included in financial statements prepared in accordance with accounting principles generally accepted in the United States of America have been condensed or omitted pursuant to such rules and regulations, although the Company believes that the disclosures are adequate to make the information presented not misleading. It is suggested that these condensed consolidated financial statements be read in conjunction with the December 31, 2012 audited financial statements and the accompanying notes thereto. While management believes the procedures followed in preparing these condensed consolidated financial statements are reasonable, the accuracy of the amounts are in some respects dependent upon the facts that will exist, and procedures that will be accomplished by the Company later in the year.
On June 2, 2006, Celtic Capital, Inc. was incorporated in the State of Nevada. On October 20, 2008, Celtic Capital, Inc. changed its name to Entertainment Educational Arts Inc. On May 12, 2010, the Company changed its name to DNA Precious Metals, Inc. (the “Company”). On October 29, 2010, the Company formed DNA Canada Inc., a Canadian federally incorporated company, as a wholly-owned subsidiary. The Company will operate all of its exploration operations through this Canadian entity.
The Company is an exploration stage company that is in the business of identifying mineral claim rights in Canada and the United States. The Company has conducted minimal business to date.
The Company’s primary goal is to identify and acquire premium gold (Au) and silver (Ag) properties to create an international mining company. The mineralized properties that the Company will focus on acquiring, will have easy accessibility, transportation infrastructures in place on the property and most importantly, will have the potential to be brought into production quickly.
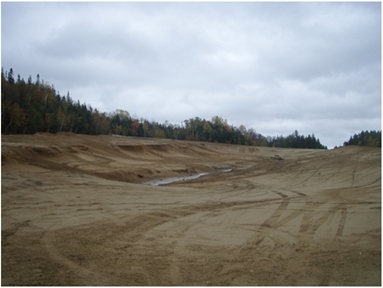
The Company acquired 10 mining claims in the Montauban Mining Project located in the Montauban and Chavigny townships near Grondines-West in the Portneuf County of Quebec, Canada (the “Property”). Presently, the Company is working on the construction of a processing mill and build-out of the infrastructure.
Going Concern
The condensed consolidated financial statements have been prepared on a going concern basis. The going concern basis of presentation assumes that the Company will continue in operation for the foreseeable future and be able to realize its assets and discharge its liabilities and commitments in the normal course of business. The Company has not generated revenues since inception and has generated losses totaling $1,869,062 and $552,013 for the nine months ended September 30, 2013 and 2012, respectively, and losses of $3,642,109 since the Company’s inception on June 2, 2006. The Company has had very little operating history to date.
DNA PRECIOUS METALS, INC.
(An Exploration Stage Company)
NOTES TO CONDENSED CONSOLIDATED FINANCIAL STATEMENTS
SEPTEMBER 30, 2013 AND 2012
(Unaudited)
The Company’s continuation as a going concern is dependent upon, amongst other things, continued financial support from its shareholders, attaining a satisfactory revenue level, attainment of profitable operations and the generation of cash from operations and the ability to secure new financing arrangements and new capital to carry out its business plan. These matters are dependent on a number of items outside of the Company’s control and there exists material uncertainties that may cast significant doubt about the Company’s ability to continue as a going concern.
The Company can give no assurance that it will achieve profitability or be capable of sustaining profitable operations. These consolidated financial statements do not include any adjustments relating to the recoverability and classification of the carrying amounts of assets or the amount and classification of liabilities that might result if the Company is unable to continue as a going concern. These factors raise substantial doubt regarding the ability of the Company to continue as a going concern.
The Company raised $110,000 from the sale of 440,000 shares of common stock in August and September 2013 (40,000 shares which were issued in October 2013), and from September 2012 to January 2013, raised $2,357,000 of capital through the subscription of 9,428,000 shares in an S-1 registration statement. The Company also raised, from June to December 2011, $670,000 of capital through the subscription of 3,350,000 private placement shares. The funds raised from the private and public offerings were used to further the Company’s business plan while the most recent public raise was used for the construction of a processing mill and build-out of the infrastructure.
During the fourth quarter of fiscal 2012, the Company commenced construction on the processing mill in which mining operations will be conducted. The structure of the mill was completed in the first quarter of fiscal 2013 but is not as yet in service pending acquisition of mill processing equipment.
Effective July 1, 2009, the Company adopted the Financial Accounting Standards Board (“FASB”) Accounting Standards Codification (“ASC”) 105-10, Generally Accepted Accounting Principles – Overall (“ASC 105-10”). ASC 105-10 establishes the FASB Accounting Standards Codification (the “Codification”) as the source of authoritative accounting principles recognized by the FASB to be applied by nongovernmental entities in the preparation of financial statements in conformity with U.S. GAAP. Rules and interpretive releases of the SEC under authority of federal securities laws are also sources of authoritative U.S. GAAP for Securities and Exchange Commission (“SEC”) registrants.
DNA PRECIOUS METALS, INC.
(An Exploration Stage Company)
NOTES TO CONDENSED CONSOLIDATED FINANCIAL STATEMENTS
SEPTEMBER 30, 2013 AND 2012
(Unaudited)
All guidance contained in the Codification carries an equal level of authority. The Codification superseded all existing non-SEC accounting and reporting standards. All other non-grandfathered, non-SEC accounting literature not included in the Codification is non-authoritative. The FASB will not issue new standards in the form of Statements, FASB Positions or Emerging Issue Task Force Abstracts. Instead, it will issue Accounting Standards Updates (“ASUs”). The FASB will not consider ASUs as authoritative in their own right. ASUs will serve only to update the Codification, provide background information about the guidance and provide the bases for conclusions on the change(s) in the Codification. References made to FASB guidance throughout this document have been updated for the Codification.
| NOTE 2- | SUMMARY OF SIGNIFICANT ACCOUNTING POLICIES |
Exploration Stage Company
The Company is an exploration stage company as defined in ASC 915. The Company has made significant capital investments on a processing mill and related infrastructure pertaining to a mining site described earlier. The construction of the processing mill structure was commenced in the fourth quarter of fiscal 2012 and completed in the first quarter of fiscal 2013. Also, significant infrastructure work related to the processing mill has been completed.
Presently, the infrastructure construction includes the foundation, a 16,000 sq./ft. steel structure building and water and power supply installations. The Company has completed all the access infrastructural work to the future site where the milling facilities will be located.
On September 14, 2012, the Company received the Certificate of Authorization, from the Quebec Provincial Government, to process the mining residues on the Montauban Mine Property. The Certificate of Authorization issued to the Company allows for the
construction and installation of equipment facilities to recuperate mica (muscovite) and the precious metals from the mining residues (tailings) located on the property.
Consequently, the primary objective will be to recuperate the mica and precious metals from the mining residues. The recuperation of the precious metals from the mining residues will be less expensive than traditional mining operations primarily because the mining residues have already been crushed and grinded by prior mining companies.
Use of Estimates
The preparation of financial statements in conformity with accounting principles generally accepted in the United States of America requires management to make estimates and assumptions that affect the reported amounts of assets and liabilities and disclosures of contingent assets and liabilities at the date of the financial statements and the reported amounts of revenue and expenses during the reporting period. Actual results could differ from those estimates.
DNA PRECIOUS METALS, INC.
(An Exploration Stage Company)
NOTES TO CONDENSED CONSOLIDATED FINANCIAL STATEMENTS
SEPTEMBER 30, 2013 AND 2012
(Unaudited)
Principles of Consolidation
The condensed consolidated financial statements include the accounts of the Company and its wholly-owned subsidiary, DNA Canada Inc. All intercompany transactions and accounts have been eliminated on consolidation.
Currency Translation
The Company’s functional is the Canadian dollar and its reporting currency is the United States dollar. Transactions denominated in the functional currency are converted into United States dollars using the exchange rate in effect at the date of the transaction or the average rate for the period in the case of revenue and expense transactions. Monetary assets and liabilities are re-valued into the reporting currency at each balance sheet date using the exchange rate in effect at the balance sheet date, with any resulting exchange gains or losses being credited or charged to accumulated other comprehensive income (loss). Non-monetary assets and liabilities are recorded in the reporting currency using the exchange rate in effect at the date of the transaction and are not revalued for subsequent changes in exchange rates.
Stock Options-Based Compensation
The Company estimates the fair value of stock options-based payment awards made to officers and directors related to the Company’s stock incentive plan, on the date of grant using an option-pricing model. The value of the portion of the award that is ultimately expected to vest is recognized as an expense ratably over the requisite service periods. The Company uses the Black-Scholes option pricing model to determine the fair value of the stock-based compensation that it grants to officers and directors. The Company is required to make certain assumptions in connection with this determination, the most important of which involves the calculation of volatility with respect to the price of its common stock. The computation of volatility is intended to produce a volatility value that is representative of the Company’s expectations about the future volatility of the price of its common stock over an expected term. The Company used an estimate of its future share price to determine volatility and cannot predict how the price of its common shares of common stock will react on the open market in the future. Shares of the Company commenced trading on September 16, 2013. As a result, the volatility value that the Company calculated may differ from the future volatility of the price of its shares of common stock.
Upon the exercise of stock options, any consideration received and the amounts previously recorded under stock-based compensation are credited to share capital. Upon the issuance of shares resulting from share awards, amounts previously recorded under stock options-based compensation are credited to share capital.
DNA PRECIOUS METALS, INC.
(An Exploration Stage Company)
NOTES TO CONDENSED CONSOLIDATED FINANCIAL STATEMENTS
SEPTEMBER 30, 2013 AND 2012
(Unaudited)
Comprehensive Income (Loss)
The Company adopted ASC 220-10, “Reporting Comprehensive Income,” (formerly SFAS No. 130). ASC 220-10 requires the reporting of comprehensive income in addition to net income from operations.
Comprehensive income is a more inclusive financial reporting methodology that includes disclosure of information that historically has not been recognized in the calculation of net income.
Cash and Cash Equivalents
The Company considers all highly liquid debt instruments and other short-term investments with maturity of three months or less, when purchased, to be cash equivalents.
The Company maintains cash and cash equivalent balances at one major Canadian bank.
Exploration Tax Credits
The Company is entitled to certain exploration tax credits for the exploration expenditures they have incurred from the Canadian federal government and the government of the Province of Quebec. Some of the tax credits available from the Province of Quebec are in the form of cash. Qualifying expenditures include exploration costs and salaries to conduct the activities of the Company. During the year ended December 31, 2012, the Company received $108,284 in tax credits for qualifying expenditures through October 28, 2011. During the nine months ended September 30, 2013, the Company received $111,095 in tax credits for expenditures through October 28, 2012. The Company has also applied for additional tax credits for the period from October 29, 2012 to December 31, 2012. The Company’s policy is to record the tax credits when received rather than applied for. Research tax credits must be reviewed and approved by the tax authorities and it is possible that the amounts granted will differ from the amounts applied for.
Fixed Assets
Fixed assets are stated at cost, less accumulated depreciation. Depreciation will be provided using the straight-line method over the estimated useful lives of the related assets when those assets are placed into service. Costs of maintenance and repairs will be charged to expense as incurred.
DNA PRECIOUS METALS, INC.
(An Exploration Stage Company)
NOTES TO CONDENSED CONSOLIDATED FINANCIAL STATEMENTS
SEPTEMBER 30, 2013 AND 2012
(Unaudited)
Trade and Other Payables
Trade and other payables and accrued liabilities are obligations to pay for goods or services that have been acquired in the normal course of business. Trade and other payables and accrued liabilities are classified as current liabilities if payment is due within one year or less. If not, they are presented as non-current liabilities.
Recoverability of Long-Lived Assets
Although the Company does not have any long-lived assets at this point, for any long-lived assets acquired in the future, the Company will review their recoverability on a periodic basis whenever events and changes in circumstances have occurred which may indicate a possible impairment. The assessment for potential impairment will be based primarily on the Company’s ability to recover the carrying value of its long-lived assets from expected future cash flows from its operations on an undiscounted basis. If such assets are determined to be impaired, the impairment recognized is the amount by which the carrying value of the assets exceeds the fair value of the assets. Fixed assets to be disposed of by sale will be carried at the lower of the then current carrying value or fair value less estimated costs to sell.
Fair Value of Financial Instruments
The carrying amount reported in the condensed consolidated balance sheets for cash and cash equivalents, accounts payable, and accrued expenses approximate fair value because of the immediate or short-term maturity of these financial instruments. The Company does not utilize derivative instruments.
DNA PRECIOUS METALS, INC.
(An Exploration Stage Company)
NOTES TO CONDENSED CONSOLIDATED FINANCIAL STATEMENTS
SEPTEMBER 30, 2013 AND 2012
(Unaudited)
Income Taxes
The Company uses the liability method of accounting for income taxes under which deferred tax assets and liabilities are recognized for the estimated future tax consequences attributable to differences between the financial statement carrying amounts of existing assets and liabilities and their respective tax bases and operating loss and tax credit carryforwards. Deferred tax assets and liabilities are measured using enacted or substantially enacted tax rates in effect for the year in which those temporary differences are expected to be recovered or settled. The effect on deferred tax assets and liabilities of a change in tax rates is recognized as part of the provision for income taxes in the period that includes the enactment date. Deferred tax liabilities are always provided for in full. Deferred tax assets are recognized to the extent that it is probable that they will be able to be utilized against future taxable income. Deferred tax assets and liabilities are offset only when the Company has a right and intention to set off current tax assets and liabilities from the same taxation authority. Valuation allowances are established, when necessary, to reduce deferred tax assets to amounts that are expected to be realized.
Revenue Recognition
The Company will generate revenues from the sale of precious metals mined from its Property. Revenue from the sale of precious metals, namely gold, silver and mica, will be recognized upon delivery of the precious metals, collection is probable, the fee is fixed or determinable and the Company has transferred to the buyer the significant risks and rewards of ownership of the precious metals supplied. Significant risks and rewards are generally considered to be transferred to the buyer when the customer has taken undisputed delivery of the precious metals.
Loss Per Share of Common Stock
Basic net loss per share (“Basic EPS”) is computed by dividing net loss available to common shareholders by the weighted average number of common shares outstanding for the period.
Diluted earnings per share is computed by dividing adjusted net income available to common shareholders by the weighted average number of common shares outstanding adjusted for the effects of all dilutive common share issuances. Dilutive common share issuances shall be deemed to have been converted into ordinary shares at the beginning of the period.
For the purpose of calculating diluted earnings per share, the Company shall assume the exercise of dilutive stock options and warrants. The assumed proceeds from these instruments shall be regarded as having been received from the issue of common shares at the average market price of common shares during the period. Dilutive common share issuances are not included in the computation of diluted earnings per share when the Company reports a loss because to do so would be anti-dilutive for the periods presented. The following is a reconciliation of the computation for basic and diluted EPS:
DNA PRECIOUS METALS, INC.
(An Exploration Stage Company)
NOTES TO CONDENSED CONSOLIDATED FINANCIAL STATEMENTS
SEPTEMBER 30, 2013 AND 2012
(Unaudited)
| | | | | | | | | | | | | | | June 2, 2006 | |
| | | | | | | | | | | | | | | (Inception) | |
| | | Nine Months Ended | | | Three Months Ended | | | Through | |
| | | September 30, | | | September 30, | | | September 30, | | | September 30, | | | September 30, | |
| | | 2013 | | | 2012 | | | 2013 | | | 2012 | | | 2013 | |
| | | | | | | | | | | | | | | | |
| Net income (loss) | | $ | (1,869,062 | ) | | $ | (552,013 | ) | | $ | (367,844 | ) | | $ | (188,697 | ) | | $ | (3,642,109 | ) |
| | | | | | | | | | | | | | | | | | | | | |
| Weighted-average common shares | | | | | | | | | | | | | | | | | | | | |
| outstanding (Basic) | | | 89,069,040 | | | | 76,193,547 | | | | 90,191,030 | | | | 76,378,609 | | | | 54,371,585 | |
| | | | | | | | | | | | | | | | | | | | | |
| | | | | | | | | | | | | | | | | | | | | |
| Weighted-average common shares | | | | | | | | | | | | | | | | | | | | |
| Equivalent | | | | | | | | | | | | | | | | | | | | |
| Stock options | | | 1,333,000 | | | | - | | | | 1,333,000 | | | | - | | | | - | |
| Warrants | | | - | | | | - | | | | - | | | | - | | | | - | |
| | | | | | | | | | | | | | | | | | | | | |
| | | | | | | | | | | | | | | | | | | | | |
| Weighted-average common shares | | | | | | | | | | | | | | | | | | | | |
| outstanding (Diluted) | | | 90,402,040 | | | | 76,193,547 | | | | 91,524,030 | | | | 76,378,609 | | | | 54,371,585 | |
Uncertainty in Income Taxes
Under ASC 740-10-25 recognition and measurement of uncertain income tax positions is required using a “more-likely-than-not” approach. Management evaluates their tax positions on an annual and quarterly basis, and has determined that as of September 30, 2013, no additional accrual for income taxes is necessary.
The Company has performed a review of its material tax positions. During the nine months ended September 30, 2013, the Company did not recognize any amounts for interest and penalties with respect to any unrecognized tax benefits.
DNA PRECIOUS METALS, INC.
(An Exploration Stage Company)
NOTES TO CONDENSED CONSOLIDATED FINANCIAL STATEMENTS
SEPTEMBER 30, 2013 AND 2012
(Unaudited)
Recent Issued Accounting Standards
In May 2011, FASB issued Accounting Standards Update (ASU) No. 2011-04, Amendments to Achieve Common Fair Value Measurement and Disclosure Requirements in U.S. GAAP and IFRSs. FASB ASU 2011-04 amends and clarifies the measurement and disclosure requirements of FASB ASC 820 resulting in common requirements for measuring fair value and for disclosing information about fair value measurements, clarification of how to apply existing fair value measurement and disclosure requirements, and changes to certain principles and requirements for measuring fair value and disclosing information about fair value measurements. The new requirements are effective for fiscal years beginning after December 15, 2011. The Company plans to adopt this amended guidance on October 1, 2012 and at this time does not anticipate that it will have a material impact on the Company’s results of operations, cash flows or financial position.
In June 2011, FASB issued ASU No. 2011-05, Presentation of Comprehensive Income, which amends the disclosure and presentation requirements of Comprehensive Income. Specifically, FASB ASU No. 2011-05 requires that all non-owner changes in stockholders’ equity be presented either in 1) a single continuous statement of comprehensive income or 2) two separate but consecutive statements, in which the first statement presents total net income and its components, and the second statement presents total other comprehensive income and its components. These new presentation requirements, as currently set forth, are effective for the Company beginning October 1, 2012, with early adoption permitted. The Company plans to adopt this amended guidance on October 1, 2012 and at this time does not anticipate that it will have a material impact on the Company’s results of operations, cash flows or financial position.
In September 2011, FASB issued ASU 2011-08, Testing Goodwill for Impairment, which amended goodwill impairment guidance to provide an option for entities to first assess qualitative factors to determine whether the existence of events or circumstances leads to a determination that it is more likely than not that the fair value of a reporting unit is less than its carrying amount. After assessing the totality of events and circumstances, if an entity determines that it is not more likely than not that the fair value of a reporting unit is less than its carrying amount, performance of the two-step impairment test is no longer required. This guidance is effective for annual and interim goodwill impairment tests performed for fiscal years beginning after December 15, 2011, with early adoption permitted. Adoption of this guidance is not expected to have any impact on the Company’s results of operations, cash flows or financial position.
In July 2012, the FASB issued ASU 2012-02, Intangibles – Goodwill and Other (Topic 350): Testing Indefinite-Lived Intangible Assets for Impairment, on testing for indefinite-lived intangible assets for impairment. The new guidance provides an entity to simplify the testing for a drop in value of intangible assets such as trademarks, patents, and distribution rights. The amended standard reduces the cost of accounting for indefinite-lived intangible assets, especially in cases where the likelihood of impairment is low. The changes permit businesses and other organizations to first use subjective criteria to determine if an intangible asset has lost value. The amendments to U.S. GAAP will be effective for fiscal years starting after September 15, 2012. The Company’s adoption of this accounting guidance does not have a material impact on the consolidated financial statements and related disclosures.
DNA PRECIOUS METALS, INC.
(An Exploration Stage Company)
NOTES TO CONDENSED CONSOLIDATED FINANCIAL STATEMENTS
SEPTEMBER 30, 2013 AND 2012
(Unaudited)
There were other updates recently issued, most of which represented technical corrections to the accounting literature or application to specific industries and are not expected to have a material impact on the Company’s financial position, results of operations or cash flows.
| NOTE 3- | STOCKHOLDERS’ EQUITY (DEFICIT) |
Preferred Stock
The Company was established on June 2, 2006 with 10,000,000 shares of preferred stock authorized with a par value of $0.001. The Company has not issued any preferred stock.
Common Stock
The Company was established on June 2, 2006 with 100,000,000 shares of common stock authorized with a par value of $0.001. On December 8, 2011, the Company amended the authorized stock to 150,000,000 shares.
At incorporation, the Company issued 40,000,000 shares of common stock to the Company’s founders at par value of $40,000 for services rendered by the founder.
In November 2010, the Company issued 20,000,000 shares of common stock for $60,000 to investors ($0.003 per share – 33 investors).
In 2011, the Company issued:
| | · | 5,000,000 shares of common stock on June 9, 2011 to acquire mining rights at a value of $15,000 which represented a per share value of $0.003 which was the price used in the November 2010 private placement. There was no change in the valuation of the Company from November 2010 to June 2011, therefore the same price was used; |
| | · | 5,000,000 shares of common stock on June 13, 2011 to board members for services at a value of $15,000 which represented a per share value of $0.003 which was the price used in the November 2010 private placement. There was no change in the valuation of the Company from November 2010 to June 2011, therefore the same price was used; |
| | · | 1,000,000 shares of common stock on June 13, 2011 for payment of interest on the promissory note of $3,000 which represented a per share value of $0.003 which was the price used in the November 2010 private placement. There was no change in the valuation of the Company from November 2010 to June 2011, therefore the same price was used; |
DNA PRECIOUS METALS, INC.
(An Exploration Stage Company)
NOTES TO CONDENSED CONSOLIDATED FINANCIAL STATEMENTS
SEPTEMBER 30, 2013 AND 2012
(Unaudited)
| | · | 3,350,000 shares of common stock from June 27, 2011 through October 20, 2011 for cash under a private placement. The Company issued the private placement at $0.20 per share to reflect the recent activity. There was no independent valuation report. The Company raised $670,000 for the shares of common stock. |
| | · | 1,500,000 shares of common stock on September 19, 2011 under employment agreements for a value of $300,000. The $0.20 value is the same value the Company used in raising funds under their private placement, and there were no changes to that value; and |
| | · | 250,000 shares of common stock on October 20, 2011 to a consultant who assisted on the engineering of the building for a value of $0.20 per share amounting to $50,000. The $0.20 value is the same value the Company used in raising funds under their private placement, and there were no changes to that value |
The methodologies, approaches and assumptions that the Company used are consistent with the American Institute of Certified Public Accountants, “Practice Guide on Valuation of Privately-Held Company Equity Securities Issued as Compensation”, considering numerous objective and subjective factors to determine common stock fair market value at each issuance date, including but not limited to the following factors: (a) arm’s length private transactions; (b) shares issued for cash as a basis to determine the value for shares issued for services to non-related third parties; and (c) fair value of service provided to non-related third parties as a basis to determine value per share. With respect to the sale of the securities identified above, the Company has relied on the exemption provisions of Section 4(2), Regulation S or Section 3(a) 10 of the Securities Act of 1933, as amended. The sale was made to a sophisticated or accredited investor, as defined in Rule 502, or were issued pursuant to a specific exemption.
In 2012, the Company issued:
| | · | 6,924,000 shares of common stock from September 1, 2012 to December 31, 2012 for $1,731,000 through an S-1 registration statement at $0.25 per share. |
In 2013, the Company issued:
| | · | 1,576,000 shares of common stock from January 1, 2013 to February 28, 2013 for $394,000 through an S-1 registration statement at $0.25 per share. The shares were issued to thirteen different shareholders. |
| | · | 928,000 shares of common stock to nine different shareholders who purchased $232,000 through an S-1 registration statement at $0.25 per share at the end of December 2012. These shares were reflected as a liability for stock to be issued at December 31, 2012. The balance as of March 31, 2013 is $0. |
| | · | 2,500,000 shares of common stock on March 4, 2013 pursuant to an executed agreement with 754 2542 Canada Inc. to convert all amounts owing them, CDN$500,000 face value of the promissory note at $0.20 per share. The original promissory note executed between the parties was dated May 13, 2011. |
DNA PRECIOUS METALS, INC.
(An Exploration Stage Company)
NOTES TO CONDENSED CONSOLIDATED FINANCIAL STATEMENTS
SEPTEMBER 30, 2013 AND 2012
(Unaudited)
| | · | 5,000,000 shares of common stock on March 15, 2013 to new Officers of the Company, pursuant to employment agreements, for value at $0.25 per share representing a total compensation expense of $1,250,000. 2,000,000 shares, valued at $500,000, vest immediately and 3,000,000 shares, valued at $750,000, vest quarterly over one year and are reflected as deferred compensation. |
| | · | 1,500,000 shares of common stock were cancelled on March 28, 2013. |
| | · | 200,000 shares of common stock pursuant to legal services rendered and 200,000 shares of common stock for investor relations valued at $126,000. |
| | · | 1,700,000 shares of common stock were cancelled on June 11, 2013. |
| | · | 440,000 shares of common stock from August 30, 2013 through September 30, 2013 for cash under a private placement. The Company issued the private placement at $0.25 per share to reflect the recent activity. The Company raised $110,000 for the shares of common stock. 40,000 of these shares, or $10,000, have not been issued and are reflected as a liability for stock to be issued on the condensed consolidated balance sheet as at September 30, 2013. |
As of September 30, 2013, the Company has 90,628,000 shares of common stock issued and outstanding.
Stock Options
On August 12, 2013, the Company approved and enacted the 2013 Stock Incentive Plan (the “Plan”). Under the 2013 Stock Incentive Plan, the Company may grant options or share awards to its full-time employees, executive officers, directors and consultants up to a maximum of 8,000,000 common shares. Under the Plan, the exercise price of each option has been established at $0.25. Stock options vest as stipulated in the stock option agreement and their maximum term is 8 years.
The following table summarizes information about the Company’s stock options:
| | | September 30, 2013 | |
| | | | | | Weigthed | |
| | | | | | average | |
| | | Number of | | | exercise | |
| | | options | | | price | |
| | | | | | | |
| Options outstanding, beginning of period | | | - | | | $ | - | |
| Granted | | | 1,333,000 | | | | 0.25 | |
| Expired | | | - | | | | - | |
| Forfeited | | | - | | | | - | |
| | | | | | | | | |
| | | | 1,333,000 | | | | 0.25 | |
DNA PRECIOUS METALS, INC.
(An Exploration Stage Company)
NOTES TO CONDENSED CONSOLIDATED FINANCIAL STATEMENTS
SEPTEMBER 30, 2013 AND 2012
(Unaudited)
The following table summarizes the ranges of exercise prices of outstanding and exercisable options held by officers and directors as of September 30, 2013:
| | September 30, 2013 | | September 30, 2013 |
| | Options Outstanding | | Options Exercisable |
| | | Weigthed | Weigthed | | | Weigthed | Weigthed |
| | | average | average | | | average | average |
| | Number of | remaining | exercise | | Number of | remaining | exercise |
| | options | life (years) | price | | options | life (years) | price |
| | | | | | | | | | |
| $0.25 | 1,333,000 | 7.88 | $ | 0.25 | | 166,500 | 7.88 | $ | 0.25 |
Stock options-based compensation expense included in the condensed consolidated statements of operations and comprehensive loss for the nine months ended September 30, 2013 and 2012 was $21,928 and $0, respectively, and for the three months ended September 30, 2013 and 2012 was $21,928 and $0, respectively.
Warrants
As of September 30, 2013, the Company has not issued any warrants.
Fixed assets consist of the following as of September 30, 2013 and December 31, 2012:
Estimated Useful Lives | | | | | (Unaudited) June 30, | | | December 31, | |
| | | (Years) | | | 2013 | | | 2012 | |
| Building | | 15 | | | $ | 1,085,663 | | | $ | 1,154,284 | |
| Land | | | | | | 93,953 | | | | 93,953 | |
| Computers | | 5 | | | | 4,424 | | | | 2,556 | |
| Office Equipment | | 5 | | | | 14,711 | | | | - | |
| Mill Equipment | | 5 | | | | 43,115 | | | | 43,115 | |
| Vehicle | | 5 | | | | 25,127 | | | | 25,127 | |
| Subtotal | | | | | | 1,266,993 | | | | 1,319,035 | |
| Less: accumulated depreciation | | | | | | (7,248 | ) | | | (692 | ) |
| Fixed assets, net | | | | | $ | 1,259,745 | | | $ | 1,318,343 | |
As of September 30, 2013, only the computers, office equipment and vehicle have been placed into service. Depreciation for the nine months ended September 30, 2013 and 2012 was $6,556 and $0, respectively, and for the three months ended September 30, 2013 and 2012 was $2,213 and $0, respectively.
DNA PRECIOUS METALS, INC.
(An Exploration Stage Company)
NOTES TO CONDENSED CONSOLIDATED FINANCIAL STATEMENTS
SEPTEMBER 30, 2013 AND 2012
(Unaudited)
| NOTE 5- | PROVISION FOR INCOME TAXES |
As of September 30, 2013, there is no provision for income taxes, current or deferred.
| Net operating losses | | $ | 979,727 | |
| Valuation allowance | | | (979,727 | ) |
| | | $ | - | |
At September 30, 2013, the Company had a net operating loss carry forward in the amount of $3,642,109, available to offset future taxable income through 2033. The Company has established a valuation allowance equal to the full amount of the deferred tax assets due to the uncertainty of the utilization of the operating losses in future periods.
A reconciliation of the Company’s effective tax rate as a percentage of income before taxes and the federal statutory rate for the nine and three month periods ended September 30, 2013 and 2012 is summarized below:
| | | | |
| Federal statutory rate | | (26.9)% | |
| State income taxes, net of federal benefits | | 0.0 | |
| Valuation allowance | | 26.9 | |
| | | 0% | |
NOTE 6- PROMISSORY NOTE
The Company entered into a promissory note with an investor on May 13, 2011 in the amount of CDN$500,000 that matures on May 31, 2014. The note had a default interest rate of 5% per annum should repayment not occur by the maturity date and the Company be in default of the promissory note agreement. In connection with the promissory note, the Company issued 1,000,000 shares of stock valued at CDN$3,000 in June 2011 for prepaid interest.
On March 4, 2013, 754 2542 Canada Inc. executed an agreement with the Company whereby 754 2542 Canada Inc. agreed to accept 2,500,000 shares of common stock in satisfaction of all amounts due and owing 754 2542 Canada Inc. pursuant to the promissory note executed between the parties on May 13, 2011. As a result, the promissory note has been converted, and the Company recorded a loss on conversion of this note of $125,000 in the condensed consolidated statement of operations.
DNA PRECIOUS METALS, INC.
(An Exploration Stage Company)
NOTES TO CONDENSED CONSOLIDATED FINANCIAL STATEMENTS
SEPTEMBER 30, 2013 AND 2012
(Unaudited)
On August 3, 2012, the Company entered into a promissory note with a non-related individual in the amount of CDN$200,000 maturing on November 16, 2014. The note bears interest at 12% per annum. The lender retained the first $7,000 for interest at closing thereby funding the Company net proceeds of $193,000. The note was repaid in full on November 30, 2012.
NOTE 7- COMMITMENTS
The Company had the following financial commitments, represented by rent agreements, as at September 30, 2013:
| | | Year ending December 31, | |
| 2013 | | $ | 9,600 | |
| 2014 | | | 35,804 | |
| 2015 | | | 22,818 | |
| 2016 | | | 22,818 | |
| 2017 | | | 22,818 | |
| | | $ | 113,858 | |
| NOTE 8- | FAIR VALUE MEASUREMENTS |
The Company adopted certain provisions of ASC Topic 820. ASC 820 defines fair value, provides a consistent framework for measuring fair value under generally accepted accounting principles and expands fair value financial statement disclosure requirements. ASC 820’s valuation techniques are based on observable and unobservable inputs. Observable inputs reflect readily obtainable data from independent sources, while unobservable inputs reflect our market assumptions. ASC 820 classifies these inputs into the following hierarchy:
Level 1 inputs: Quoted prices for identical instruments in active markets.
Level 2 inputs: Quoted prices for similar instruments in active markets; quoted prices for identical or similar instruments in markets that are not active; and model-derived valuations whose inputs are observable or whose significant value drivers are observable.
Level 3 inputs: Instruments with primarily unobservable value drivers.
The following table represents the fair value hierarchy for those financial assets and liabilities measured at fair value on a recurring basis as of September 30, 2013:
| | | Level 1 | | | Level 2 | | | Level 3 | | | Total | |
| Cash and cash equivalents | | $ | 271,251 | | | | - | | | | - | | | $ | 271,251 | |
DNA PRECIOUS METALS, INC.
(An Exploration Stage Company)
NOTES TO CONDENSED CONSOLIDATED FINANCIAL STATEMENTS
SEPTEMBER 30, 2013 AND 2012
(Unaudited)
Certain comparative figures have been reclassified to conform to the current presentation.
Subsequent to September 30, 2013, the Company received cash under a private placement in the amount of $442,000. The Company issued the private placement at $0.25 per share which will represent the issuance of 1,768,000 common shares. The common shares were issued in October 2013.
On October 15, 2013, the Company entered into a binding agreement for the asset acquisition of an undivided one hundred percent (100%) interest in certain mineral interests, specifically Bail Minier BM 748 and Concession Miniere CM 410, Province of Quebec, including claims, rights, concessions and leases. The purchase price was CDN.$50,000 and 1,000,000 common shares of the Company. The common shares for the acquisition will be valued at their fair market value at the close of business on October 15, 2013, which was $0.59 per share or $590,000.
The following Management’s Discussion and Analysis of Financial Condition and Results of Operations discusses significant factors that have affected our financial position and operations during the nine and three month periods ended September 30, 2013 and 2012. This discussion also includes events that occurred after the end of the last fiscal year end and contains both historical and forward-looking statements.
When used in this discussion, the words “expect(s)”, “feel(s)”,”believe(s)”, “will”, “may”, “anticipate(s)” “intend(s)” and similar expressions are intended to identify forward-looking statements. Such statements are subject to certain risks and uncertainties, which could cause actual results to differ materially from those projected.
Background
We are a Nevada corporation organized on June 2, 2006. We were originally incorporated under the name, Celtic Capital, Inc. On October 20, 2008, we changed our name to Entertainment Education Arts, Inc. On May 12, 2010, we changed our name to DNA Precious Metals, Inc. to accurately reflect our new business plan.
Our Business
We are an exploration stage mining company initially involved in the business of processing tailings from previously extracted ore. Our Montauban Mining Project is located in the Montauban and Chavigny townships near Grondines-West in Portneauf County, Quebec, Canada (the “Property”). Our business objective is to identify proven reserves of gold, silver and other base metals, construct a mill, build out the Property’s infrastructure and place the mine into production. The Property does not contain any known ore reserves according to the definition of ore reserves under Industry Guide 7 promulgated by the Securities and Exchange Commission (“SEC”) as well as various SEC mining related leases. Further work is required on the Property before a final determination may be made regarding the economic and legal feasibility of a mining venture relative to the Property. There is no assurance that a commercially viable deposit will be proven through our exploration efforts. The funds we spend on our properties may be unsuccessful in measuring ore reserves that meet SEC guidelines.
THE PROPERTY
On June 9, 2011, we acquired the Montauban Property from Company 9215-8062 Quebec Inc. in exchange for the issuance of 5,000,000 restricted common stock shares. The previous claim owner, Rocmec Mining Inc., exchanged its ten claims to Forage Magma Inc. for drilling equipment. Soon thereafter, Forage Magma Inc. sold those claims to 9215-8062 Quebec Inc. The ten claims were registered in the Quebec Government files directly from Forage Magma to 9215-8062 Quebec Inc.
No royalty payments are due in connection with the acquisition of the mining claims. We have paid the administrative fees of the mining claims in Quebec through June 30, 2013, after which we will be required to pay, every two years, $452 in administrative fees for all of the mining claims.
We are also required to allocate resources to each of the claims. The Quebec Ministry of Resources requires us to incur $19,750 in expenses directly related to the development of our mining claims.
We currently have a credit of approximately $76,800, which we can allocate amongst the ten mining claims. The credit is attributable to work that we have already completed on several of the mining claims.
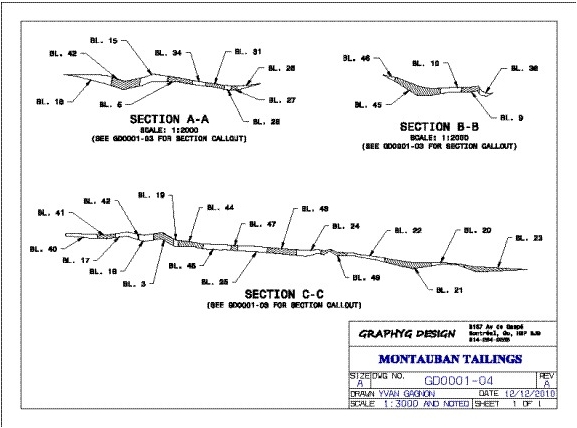
MINING HISTORY
The Montauban Tailings under study, known as the “recent tailings”, were produced by Anacon Lead Mines Ltd. between 1948 and 1955 and are situated within one kilometer northwest of the village of Montauban. Reported production from this period amounted to over 87 million pounds of zinc, 34 million pounds of lead, close to 17,000 ounces of gold and over 2.6 million ounces of silver, extracted from a total of 1,375,371 tons of processed ore.
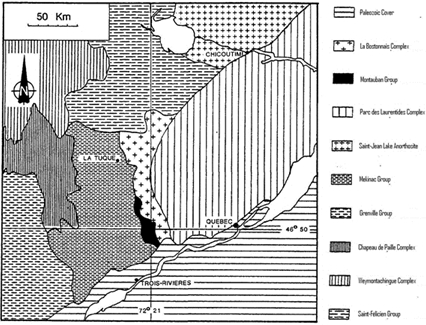
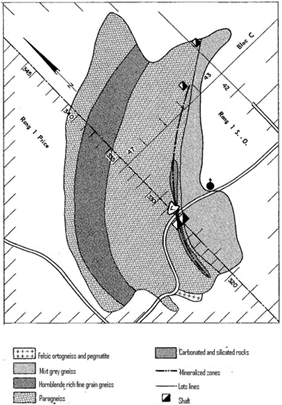
GEOLOGY
Regional geology is mostly comprised of three main rock groups: the basement crust, the supracrustal rocks and the intrusive rocks, respectively, identified as the Mekinac Group, the Montauban Group and the La Bostonnais Complex. The Montauban Deposit is a three-kilometer long mineralized formation with a geology that is fairly complex being located within an extensively folded sequence of amphibolite facies rocks that are sandwiched between intrusions of granodioritic to gabbroic composition. In the mine area, these metamorphic rocks strike roughly North-South and dip ±60° to the East.
DRILLING SUMMARY
A systematical sampling program was developed to provide an accurate and homogeneous grid of data to estimate the Montauban Tailings potential. A 24 holes percussion drilling campaign was performed totaling 143.1 meters. This percussion drilling campaign was completing the previous 25 earlier drilled holes. A total of 49 holes, totaling 302.3 meters of drilling, were completed. No proven or indicated reserves were identified.
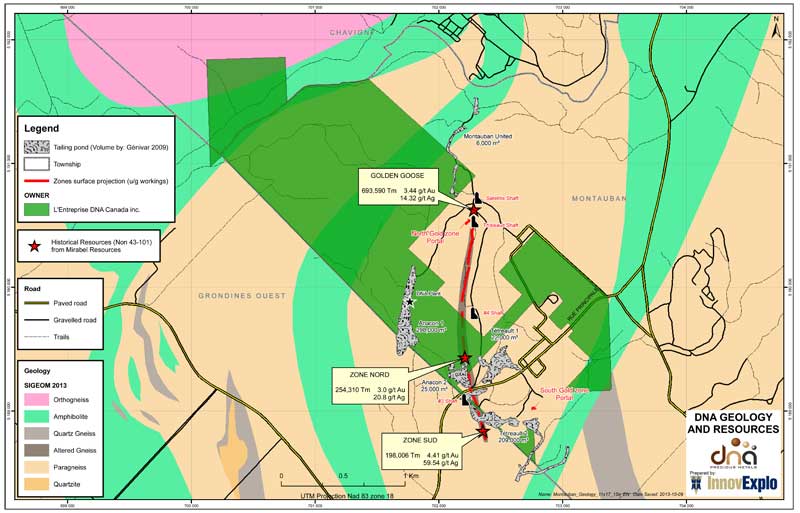
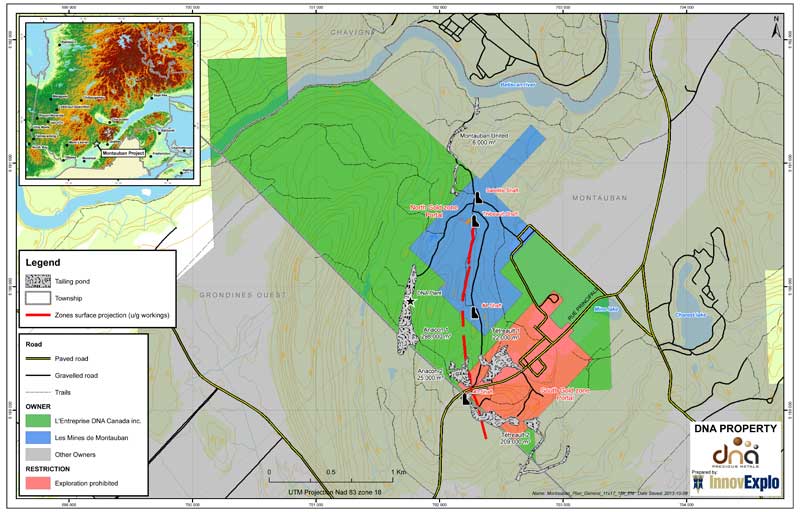
PROPERTY DESCRIPTION AND LOCATION
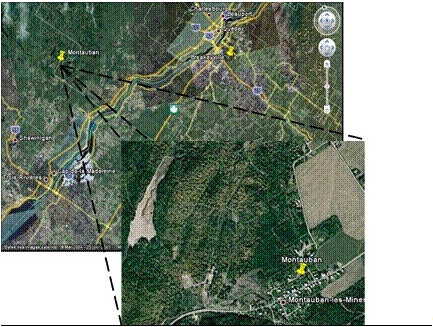
The Montauban Property is composed of 10 mining claims totaling 340.36 hectares located in the Montauban-les-Mines sector of the Notre-Dame-de-Montauban municipality, in the Montauban Township, Portneuf County, Province of Quebec. The property is located 120 km east of Quebec City and 80 km north of Trois-Rivières. The Montauban Tailings are located one kilometer west of Montauban-les-Mines with multiple land accesses. Manpower, water and electric power are easily available within the very same distance.
Figure I: Montauban Property Location Map
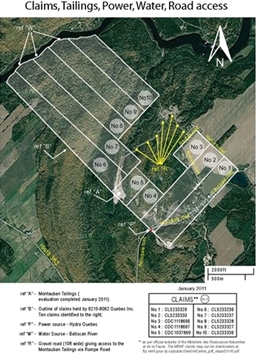
Pertinent data concerning the claims are presented in table I, these coming from the Quebec Government GESTIM website.
Table I: List of Claims
| Claim # | Range | Lot | Area |
| 1037669 | 1 | 42 | 12.55 |
| 1118666 | 1 | 41 | 11.49 |
| 1118667 | 1 | 41 | 12.32 |
| 5233236 | 1 | 47 | 46.40 |
| 5233237 | 1 | 46 | 48.80 |
| 5233327 | 1 | 44 | 44.20 |
| 5233328 | 1 | 45 | 43.30 |
| 5233329 | 1 | 39 | 40.50 |
| 5233330 | 1 | 40 | 40.50 |
| 5233336 | 1 | 43 | 40.30 |
| Total | | | 340.36 |
Figure II: Claim Reference Map
The Montauban Tailings are actually under the Quebec Provincial government responsibility since the site was declared orphan, as such, there. There are no environmental liabilities as such. However, we are required to obtain necessary permits from the government authorities to realize any further field work having an impact on the environment, especially if remobilization of tailings is considered, as these are considered by the government authorities as toxic wastes.
ACCESS, CLIMATE, LOCAL INFRASTRUCTURES AND PHYSIOGRAPHY
The Montauban Municipality is accessible by route 363 from highway 40 linking Quebec City (120 km to the east) and Trois-Rivières (80 km to the southeast). Access to railway is also available less than 10 km to the northeast in Notre-Dame-des-Anges. The Montauban Tailings are located one kilometer west of Montauban-les-Mines with multiple land accesses.
From 1971 to 2000, Environment Canada Statistics reports daily average temperature of 18.8 °C in July and -14.2 °C for January. The extreme minimum temperature registered was of -45°C (February 23, 1972) and the extreme maximum temperature reached 36.7°C (August 1, 1975). The snow cover spreads from November to April, February being the month with the most important snow accumulation. The average yearly precipitation is 1138.8 mm, including rainfall (878.7 mm) and snowfall (260.2 mm). This data was collected at the Lac aux Sables station about 10 km to the northwest of Montauban.
Manpower, water and electric power are easily available within one-kilometer distance from the Montauban-les-Mines village. The region is rural, most of the farmers growing potatoes and corn. The equipment and personnel specialized in quarries are available within a 30 km radius from the Montauban Tailings in the surrounding municipalities (Notre-Dame-de-Montauban, St-Ubalde, Lac-aux-Sables, St-Casimir, St-Marc-des-Carrières and Ste-Thècle).
Argilitic and sandy plateaus forming the foothills of the Laurentides characterize the area’s physiography. The Montauban Property is limited to the North West by the Batiscan River which is the main effluent in the area draining most of the Property towards the south to the St-Lawrence River. The topography consists of numerous small hills reaching an altitude of up to 220 m above the sea level from the valleys standing in average at 160 m elevation.
HISTORY
The mining history of the area began in 1910 with the discovery of the Pb-Zn Montauban Deposit by Mr. Elzéar Gauthier. The exploitation of the numerous base metal zones of the Montauban Mine were performed over the years by a series of successive owners: Mr. E. Gauthier (1910-1911), Mr. P. Tétreault (1911-1914), the Weedon Mining Company (1914-1915), the Zinc Company Ltd. (1915-1921), the Tetreault Estate (1921-1924), the British Metal Corporation (1925-1929), the Tetreault Estate (1929-1937), the Siscoe Metals Ltd./War Time Metals Corporation (1942-1944), Anacon Lead Mines Ltd. (1948-1956) and the Ghysleau Mining Corporation Ltd. (1957-1966). In 1966, most of the installations were decommissioned, and the mining rights on the Anacon Property expired in 1972.
In 1974, Muscocho Exploration Ltd. acquired the mining rights and performed over the following years numerous exploration programs leading to the definition of sufficient gold resources to start commercial gold production in 1983. The mine did produce gold and silver up to 1990 when production was stopped due to ore exhaustion. Over its production period, Muscocho processed 813,632 tonnes of ore producing 92,553 oz of gold and 323,376 oz of silver.
In 1981, a systematic sampling program was performed by Boville Resources Ltd. to evaluate the quantity and quality of mine tailings at Montauban-les-Mines, those tailings being the first period of exploitation between 1914 and 1944 located south of the access road to Montauban-les-Mines (Depatie (1982).
In 1999, Mirabel Resources Inc. performed a soil survey, a mag-VLF survey, some trenching and 18 diamond drill holes mostly on the south zone. In 2000-2001, more trenching and 17 short diamond drill holes were done on the north zone.
In 2003, Mirabel Resources Inc. performed limited gravimetrical tests on 4 samples equally split between core samples from former diamond drill holes and tailing samples of the “old tailings” taken close by the access road to Montauban-les-Mines (Bernard (2003)). The results showed that the gravimetric method gave good recoveries for the tailing samples but nothing significant for the rock samples.
The Montauban Tailings under study, known as the “recent tailings”, are located close to one kilometer north west of the Montauban village itself and that were produced from 1948 to 1955 by Anacon Lead Mines Ltd. Reported production from this period amounts to over 87 million pounds of zinc, 34 million pounds of lead, close to 17,000 ounces of gold and over 2.6 million ounces of silver, extracted from a total of 1,375,371 tons of ore processed.
The foregoing information pertaining to “ACCESS, CLIMATE, LOCAL INFRASTRUCTURES AND PHYSIOGRAPHY” and “HISTORY” were obtained from governmental and other publicly available sources.
GEOLOGY
Regional geology consists of three main rock groups: the basement crust, the supracrustal rocks and the intrusive rocks which were respectively identified as the Mekinac Group, the Montauban Group and the La Bostonnais Complex
The La Bostonnais Complex borders the Montauban Group to the East, an intrusive rocks complex formed of basic, tonalitic and felsic igneous rocks. To the West, the Montauban Group is in contact with the Mekinac Group mostly composed of charnockitic migmatites.
The Montauban deposit is distributed within numerous different zones along the strike length of the mineralization, from South to North we have the zones: South, Tétreault, A, C, North and Montauban. All zones are zinc bearing with the exception of the South and North zones which are gold bearing.
MONTAUBAN TAILINGS
The Montauban Tailings are covering a total area of 53,093 m² and amounts to a total volume of 250,750 m³. Since this volume is composed of tailings and that the water table is located within most of the blocks derived from each hole, the specific gravity of the material had to be evaluated to estimate the tonnage that is present on site. The estimation of the specific gravity was performed on the last drilling campaign 24 holes since no recovery evaluation is available from the first drilling campaign. Recovery of tailings in the sampling process averaged about 76% from the last percussion drilling campaign. Recoveries were ranging from 40 to 100 %, the lowest values being associated to the high water content of the deepest samples, the water table being at a depth of about 4.6 m (15 ft) within the pile of tailings. The averaged recovery was in the order of 81% (68 samples) for the upper portion of the tailings and it dropped to below 64% (27 samples) for the deeper portion (below the water table). The specific gravity is then estimated to be 1.71 g/cm³.
Montauban Tailings Hole Location Plan
The above graph shows the typical sections of the Montauban Tailings where it is clear that the drainage is towards the North (to the right on section C-C). It is also clear that the thickness is variable but not so thick compared to the value that should be reached if the whole production was to be still onsite. About 1.2 million tons were produced in the past; such a tonnage should be averaging over 13 meters in the Tailings pile. It is clear on site that an important fraction of the tailings was washed away through drainage.
Montauban Tailings Typical Sections
Figure X: Montauban Tailings View Looking South
A total of 49 blocks were defined from the two previous percussion-drilling campaigns. The drilling pattern is essentially regular with a hole each and every 30 meters on average. The block volumes were calculated with the help of the computer-modeling program that defined one polygon for each and every hole drilled. The perimeter of the tailings was mapped with the help of a GPS device, this perimeter is the limit where the surface meshing of the holes’ collars meets the meshing of the bottom of the holes. The block size is fairly regular averaging 8,740 tons, the smallest block being # 26 at 1,342 tons and the biggest one being # 21 at 24,334 tons.
To these metals one should add the mica content of the Montauban Tailings, the mica being mostly composed of the phlogopite type with some muscovite and minor amounts of biotite. The mica content is estimated to be at least 10 % of the total volume. The mica is an industrial mineral that is valued according to market conditions.
DRILLING RESULTS
The distribution of metals within the tailings is not homogeneous. It was demonstrated with the 49 holes drilled on the Montauban Tailings that recoveries dropped from 81 to less than 64 % below the 4,6 m (15 ft) horizon, which is more or less the location of the water table within the Tailings. The impact is seen on metal content when gold is 67 % richer over this horizon, silver is up 73 %, Copper also up 63 %, and the winner being lead with a jump of 149 %. The only one being evenly distributed is the zinc.
Example of Block 15 Showing Richer Upper Portion of Montauban Tailings
MILL CONSTRUCTION
We are constructing a mill to process mining residues. Our focus will be to produce gold and silver concentrate in addition to a saleable mica product. By extracting mica and producing the gold and silver concentrate, we will reduce the sulphide content of the tailings and thus lower the environmental cost for the closure at the end of the operation.
Presently, there are no similar mills in the area surrounding our mining claims. The plan for the on-site mill facility is to initially construct with gravity separation equipment, consisting of spiral classifiers and Nelson concentrators in addition to other equipment. Test work to date has indicated that this configuration will effectively segregate the mica and produce a gold/silver concentrate. There is a risk that the plant as currently built will not effectively separate the values as designed and planned. There is also a risk that the process being used is not ideal or optimal and that a different process may enhance or increase recovery of values. We intend to continue testing to improve the recuperation and extraction process. We have incorporated flexibility into our mill building design to allow for alternative/additional precious metal extraction processes to be installed. Initial testing results indicate that recovery of mica, gold and silver is possible but the economic feasibility has not been shown and there is the associated risk that the operation as planned will not be profitable either with respect to our own mining operations or refining tailings or other mining concentrates from other mining companies in close proximity to our operations.
Before gold and silver can be extracted from the tailings, the mica content must be removed. If we are able to produce a mica concentrate which corresponds to market standards, we will have an additional revenue stream with little incremental costs. There is a risk that there is no market for the mica product to be produced.
To keep expenditures as low as possible, we will use refurbished milling equipment where possible. Our larger expenses include the mill building, electrical distribution, pumps, pipe valves, spiral classifiers, Nelson concentrators, table separator, trommel, loader and a conveyor.
Special attention will be devoted to the potential of the surrounding area to produce more tailings, whether from the S-W extension of the actual deposit onto the adjoining property, or from the zone North of the access road (former exploitation), or again from the old tailings (on the Excel adjoining property). All these tailings will have to be neutralized in order to permanently close the site. The actual gross problematic is in the hands of the Quebec Provincial government and it is highly probable that they would be interested in ruling it out with the least amount of expenses as possible. It should also be noted that the Quebec Provincial government files are reporting that more than 2 million tonnes of tailings are located in numerous piles in the surroundings of the Montauban village.
We anticipate that the mill will be able to process 1,000 tons per day. By constructing our own mill, we will be able to reduce transportation costs.
With the exception of the actual presence of tailings in Montauban, no environmental problems are reported for the Montauban tailings.
PROPERTY DEVELOPMENT
In the first quarter of 2013, we completed construction of all access roads to and from the new milling facility. The hydroelectric power source to the milling facility totaling 1.3 kilometers has been completed. The main power line consists of 2,500 amperes total output power and has been brought inside the newly erected 16,000 sq./ft steel structure building.
We have hired 9216-9499 Quebec Inc. as the electrical contractor. In addition to the main power source line already completed, 9216-9499 Quebec Inc. has been hired to do all the electrical work inside the milling facility including the wiring of the entire building, installation of heating and air conditioning system, lighting supply, ventilation system installation and complete electrical set-up of all milling equipment. The contract price is $285,000CAD (approximately $279,300 U.S. based on an exchange ratio of $.98). 9216-9499 Quebec Inc., has received a retainer of $100,000 CAD ($98,000 U.S.) and has begun the preliminary work. The work is expected to be completed in the winter of 2013-2014. At that time, all of the milling processing equipment is expected to be in place and ready for preliminary processing of the mining residues.
DNA hired Deschesnes Construction and Demolition to complete the civil construction of the steel structure building. The total contract price was $470,000CAD (approximately $460,600 U.S.). This work was completed during the winter of 2012-2013.
Also included in the price of the civil construction of the steel structure building is various equipment including lighting fixtures, a 2,000 amperes electrical breaker system, heating system, air conditioning system, and back-up generator. This equipment will be installed by the electrical contractor and is included in the contract price.
We have purchased the Humphey Spirals necessary for the production of the mica product. In total, 128 spirals were purchased and are presently stored in three 40-foot containers. This equipment is necessary as a first step in the recovery of precious metals as it will remove all the mica material through gravity separation. The successful extraction process of the gold and silver from the mining residues can only be obtained after the mica is removed from the mining residues.
SUBSEQUENT EVENTS
Subsequent to September 30, 2013, the Company received cash under a private placement in the amount of $442,000. The Company issued the private placement at $0.25 per share which will represent the issuance of 1,768,000 common shares. The common shares were issued in October 2013.
On October 15, 2013, the Company entered into a binding agreement for the asset acquisition of an undivided one hundred percent (100%) interest in certain mineral interests, specifically Bail Minier BM 748 and Concession Miniere CM 410, Province of Quebec, including claims, rights, concessions and leases. The purchase price was CDN.$50,000 and 1,000,000 common shares of the Company. The common shares for the acquisition will be valued at their fair market value at the close of business on October 15, 2013, which was $0.59 per share or $590,000.
Geology Map
Property Map
PLAN OF OPERATIONS
We are an exploratory stage mining company initially involved in the business of processing tailings from previously extracted ore. We have not commenced mining operations or generated revenues from our business operations. If we are unable to obtain financing to meet our cash needs, we may be unable to fully implement our business plan. If we raise less than the desirable amount of financing, it may take longer to commence fully operational mining operations and achieve profitable operations. We currently do not have a commitment for additional debt or equity funding.
There is no historical mining information about us upon which to base an evaluation of our performance. We are in start-up operations and have no revenues. We cannot guarantee we will be successful in our business operations. Our business is subject to risks inherent in the establishment of a mining property, including limited capital resources and possible cost overruns due to price and cost increases in services and products related to exploration and mining operations.
Accomplishments in Plan of Operations
Our specific goal is to profitably mine the Property, Anacon. We have secured the necessary permitting, erected a 16,000 sq./ft building, purchased required equipment, hired engineers and contractors, built out most of the non-building infrastructure and are currently seeking additional financing to complete the necessary infrastructure expenditures and acquire the milling equipment to become fully operational. Once the infrastructure is completed and the milling equipment is acquired, we intend to begin extraction of gold, silver and other base metals in an economically efficient and profitable manner.
In the spring 2013, we requested authorization for a change in permitted treatment activities to accommodate a cyanide circuit for Anacon. This application is under review.
Following an economic analysis of the project, our management made an assessment of the feasibility of the Anacon project and made a decision to commercially extract the gold, silver and other base metals located on the Property.
We prepared a proposal to the Ministry of Natural Resources and Wildlife in Quebec to correct the environmental problems caused by the presence of tailings from previous operations on additional nearby tailings sites, Montauban United and Tetrault 1 & 2. These additional resource residues sites will increase the mine life, if the project goes into production.
Our Plan of Operations Going Forward
We will need production financing, including working capital requirements, of $6 million to commence production.
Subject to financing production and obtaining final permits, we are on track to purchase equipment for the plant in the fourth quarter of 2013 and first quarter of 2014 and begin production of gold and silver from Anacon in the second quarter of 2014.
We will also further define further the local potential of other resources such as additional tailings and/or underground resources underneath the Property or close-by in the Montauban area.
Comparison of Operating Results for the Nine and Three Months Ended September 30, 2013 and 2012 and from June 2, 2006 (Inception) to September 30, 2013.
Nine and Three Months Ended September 30, 2013 and 2012:
We have not generated revenues from operations and do not anticipate generating any revenues from operations until we have obtained additional debt or equity financing to complete the infrastructure of the mill site and acquire milling equipment essential to the processing of gold, silver and other base metals located on the Montauban Property. There are no assurances that we will obtain the needed financing or in the amount we need to conduct our processing activities. We completed a 16,000-sq./ft. building for mill processing during the nine-month period ended September 30, 2013.
The condensed consolidated financial statements for the nine month period ended September 30, 2013, included in this report, reflect total operations and other expenses of $1,869,062, representing an increase of $1,317,049 compared to the nine month period ended September 30, 2012 when total operations and other expenses were $552,013. The increase is mainly attributable to higher wages and related expenses of $1,115,944, expenses of which are primarily attributable to additional salaries for new management and to the fair value cost of common shares granted to our new President/ Chief Executive Officer, Vice-President, Operations and Chief Financial Officer upon our hiring them on March 15, 2013.
The condensed consolidated financial statements for the three month period ended September 30, 2013, included in this report, reflect total operations and other expenses of $443,844, representing an increase of $255,147 compared to the three month period ended September 30, 2012 when total operations and other expenses were $188,697. The increase is mainly attributable to higher wages and related expenses of $277,383, expenses of which are primarily attributable to additional salaries for new management and to the fair value cost of common shares granted to our new President/Chief Executive Officer, Vice-President, Operations and Chief Financial Officer upon our hiring them on March 15, 2013.
We also recognized a loss on conversion of the promissory note of $125,000 during the three month period ended March 31, 2013.
We had engineering costs of $49,522 for the nine month period ended September 30, 2013, representing a decrease of $145,900 compared to the nine month period ended September 30, 2012 when engineering costs were $195,422. We had engineering costs of $7,571 for the three month period ended September 30, 2013, representing an increase of $63,686 compared to the three month period ended September 30, 2012 when engineering costs were negative $71,257. The primary reason for the decline in engineering costs for the nine month ended September 30, 2013 compared to the nine months ended September 30, 2012 is attributable to the substantial mining studies and preliminary drilling costs incurred in the previous year, representing the early part of the project. Later engineering related expenses were deferred pending issuance of the issuance of the Certificate of Authorization. On September 14, 2012, the Ministry of Durable Development of the Environmental Parks (“MDDEP”) for the Quebec Provincial government issued us a Certificate of Authorization. The Certificate of Authorization allows us to begin the treatment of the mining residues of Anacon, which is situated on the Property. With the issuance of the Certificate of Authorization, we accelerated the build-out of the mill site building and related infrastructure and will, upon obtaining additional financing, proceed with the installation of a custom designed milling circuit for the treatment of the mining residues. In the first quarter of fiscal 2013, we requested authorization for a change in Certificate of Authorization as it relates to the treatment activities to accommodate a cyanide circuit for Anacon. This application is under review. With the pending issuance of the updated Certificate of Authorization, we expect engineering and related expenses to increase thereafter.
Professional fees increased from $134,067 for the nine month period ended September 30, 2012 to $249,524 for the nine month period ended September 30, 2013, an increase of $115,457. Professional fees increased from $49,123 for the three-month period ended September 30, 2012 to $55,555 for the three-month period ended September 30, 2013, an increase of $6,432. These increases are primarily attributable to the costs incurred in connection with the filing of our Registration Statement and ongoing reporting obligations.
From June 2, 2006 (Inception) Through September 30, 2013:
Since our inception on June 2, 2006, our expenses totaled $3,642,109 consisting primarily of $833,889 in engineering costs, $1,863,132 in wages and related expenses and $586,262 in professional fees.
Source of Funds
We will require additional debt or equity funding to complete the mill and the infrastructure to otherwise conduct operations. We filed a registration statement with the Securities and Exchange Commission offering 12 million shares of our common stock at $.25 per share. As of September 30, 2013, we sold a total of 9,428,000 shares of our common stock from the registration statement and secured $2,357,000 in financing. In the third quarter of 2013, we raised $110,000 from equity securities private placements and an additional $442,000 subsequent to September 30, 2013 from equity securities private placements. Prior to the effective date of the Registration Statement, we secured funding through the sales of both debt and equity securities in the form of private placements.
We will require additional funding to complete construction of the mill and complete the build- out of the infrastructure. On a going forward basis, there can be no assurance that we will be able to secure additional capital. Until such time as we can fully implement our business plan, it is unlikely that we will be able to reverse our continuing losses in which case you may lose your entire investment.
Liquidity and Capital Resources
Assets and Liabilities
As of September 30, 2013, we had current assets represented by cash totaling $271,251, prepaid expenses and supplier deposits totaling $156,021 and sales tax receivable totaling $13,948. Current assets as of September 30, 2013 totaled $441,220. We also had fixed assets as of September 30, 2013 totaling $1,259,745 and mining claims totaling $15,000. Total assets as of September 30, 2013 were $1,715,965. This compares to our assets at December 31, 2012, which totaled $1,999,139, when we had cash totaling $598,938, prepaid expenses and supplier deposits totaling $4,422, sales tax receivable totaling $62,436, fixed assets totaling $1,318,343 and mining claims totaling $15,000. Total assets as of June 30, 2012 were $395,730. The primary reason for the significant increase in our assets is attributable to our capital raise in which we used investor funds to invest in our mining project. This is mostly reflected in the cost of fixed assets, which increased, by $992,864 between September 30, 2012 and September 30, 2013.
Current liabilities, represented by accounts payable and accrued expenses of $96,106 and liability for stock to be issued of $10,000, totaled $106,106 as of September 30, 2013. There were no long-term liabilities. Current liabilities at December 31, 2012 totaled $373,220 which included a liability of $232,000 for stock to be issued. Our sole long-term liability as of December 31, 2012 was the promissory note totaling $502,550, which was converted during the three-month period ended March 31, 2013. The liability for stock to be issued of $232,000 was also issued during the three month period ended March 31, 2013. Accounts payable and accrued liabilities decreased by $45,114 from $141,220 as of December 31, 2012 to $96,106 as of September 30, 2013 and is mainly attributable to reductions in amounts owed to suppliers and contractors for work completed at the mill site.
We have a working capital surplus of $335,114 as of September 30, 2013 as compared to a working capital surplus of $292,576 as of December 31, 2012, representing an increase of $42,538. This increase is mainly attributable to an increase in prepaid expenses and supplier deposits of $151,599, a decrease in liability for stock to be issued of $222,000 and offset by a decrease in cash of $327,687 as of September 30, 2013. We have invested most of our funds to complete the infrastructure, purchase equipment and commence construction on the mill.
As of September 30, 2013, the cost of fixed assets totaled $1,266,993 and consisted of the mill building at a cost value of $1,085,663, land at a cost value of $93,953, mill equipment at a cost value of $43,115, computer equipment at a cost of $4,424, office equipment at a cost value of $14,711 and a vehicle at a cost value of $25,127. As of September 30, 2013, net fixed assets totaled $1,259,745. As of December 31, 2012, the cost of fixed assets and net fixed assets totaled $1,318,343 and consisted of the mill building at a cost value of $1,154,284, land at a cost value of $93,953, mill equipment at a cost value of $43,115, computer equipment at a cost value of $1,864 and a vehicle at a cost value $25,127.
As of September 30, 2013, we had an accumulated deficit totaling $3,642,109 as compared to $1,773,047 as of December 31, 2012. The $1,869,062 increase in the accumulated deficit is attributable to the loss recorded for the nine months ended September 30, 2013.
The success of our mining operations business and the ability to continue as a going concern will be dependent upon our ability to obtain additional and adequate financing to commence profitable commercial activities in the extraction of gold, silver and other base metals and meet anticipated performance specifications on a continuous and long term commercial basis.
Going Concern
Our consolidated financial statements have been prepared on a going concern basis. The going concern basis of presentation assumes that we will continue in operation for the foreseeable future and be able to realize assets and discharge its liabilities and commitments in the normal course of business. We have not generated revenues since our inception and we have generated losses totaling $797,126 and $918,390 for the years ended December 31, 2012 and 2011, respectively, losses totaling $1,869,062 and $552,013 for the nine months ended September 30, 2013 and 2012, respectively, and losses of $3,642,109 since our inception on June 2, 2006. We have had very little operating history to date.
Our continuation as a going concern is dependent upon, amongst other things, continued financial support from our shareholders, attaining a satisfactory revenue level, attainment of profitable operations and the generation of cash from operations and the ability to secure new financing arrangements and new capital to carry out our business plan. These matters are dependent on a number of items outside of our control and there exists material uncertainties that may cast significant doubt about our ability to continue as a going concern. There are no assurances that we will achieve profitability or be capable of sustaining profitable operations. Our consolidated financial statements do not include any adjustments relating to the recoverability and classification of the carrying amounts of assets or the amount and classification of liabilities that might result if we are unable to continue as a going concern. These factors raise substantial doubt regarding our ability to continue as a going concern.
Off-Balance Sheet Arrangements
We are not currently a party to, or otherwise involved with, any off-balance sheet arrangements that have or are reasonably likely to have a current or future material effect on our financial condition, changes in financial condition, revenues or expenses, results of operations, liquidity, capital expenditures or capital resources.
Foreign Currency Exchange Rate Risk
We hold cash balances in both U.S. and Canadian dollars. We transact most of our financing in U.S. dollars and operational business in Canadian dollars. Some of our operational expenses denominated in Canadian dollars include building costs, labor costs and materials and supplies. As a result, currency exchange fluctuations may impact our operating costs. We do not manage our foreign currency exchange rate risk through the use of financial or derivative instruments, forward contracts or hedging activities.
In general, we do not believe that any weakening or strengthening of the U.S. dollar as compared to the Canadian dollar will have a positive or adverse material effect on our results of operations.
Interest Rate Risk
Our investment policy for our cash and cash equivalents is focused on the preservation of capital and supporting our liquidity requirements. We do not use interest rate derivative instruments to manage exposure to interest rate changes. We do not believe that interest rate fluctuations will have any effect on our results of operations.
Cyber-security Risk
We do not believe that we are subject to any undue cyber-security risk that may have an adverse material effect on our results of operations.
| | (a) | Evaluation of Disclosure Controls and Procedures |
Our management, with the participation of our President & Chief Executive Officer and our Chief Financial Officer, evaluated the effectiveness of the design and operation of our disclosure controls and procedures (as defined in Rules 13a-15(e) and 15d-15(e) under the Exchange Act) and determined that our disclosure controls and procedures were effective as of the end of the period covered by this Quarterly Report on Form 10-Q. The evaluation considered the procedures designed to ensure that the information required to be disclosed by us in reports filed or submitted under the Exchange Act is recorded, processed, summarized and reported within the time periods specified in the SEC’s rules and forms and communicated to our management as appropriate to allow timely decisions regarding required disclosure.
| | (b) | Changes in Internal Control over Financial Reporting |
During the period covered by this Quarterly Report on Form 10-Q, there was no change in our internal control over financial reporting (as such term is defined in Rules 13a-15(d) and 13d-15(d) under the Exchange Act) that has materially affected, or is reasonably likely to materially affect, our internal control over financial reporting.
| | (c) | Inherent Limitations of Disclosure Controls and Internal Controls over Financial Reporting |
Because of its inherent limitations, internal controls over financial reporting may not prevent or detect misstatements. Projections of any evaluation or effectiveness to future periods are subject to risks that controls may become inadequate because of changes in conditions, or that the degree of compliance with the policies or procedures may deteriorate.
PART III - OTHER INFORMATION
None.
As a Smaller Reporting Company, we are not required to include risk factors in our Forms 10-Q. Nonetheless, the reader may review the risk factors included in our most recent Form 10-K for the fiscal year ended December 31, 2012 that was filed with the SEC on March 13, 2013.
None.
We have issued shares of our common stock for services rendered, capital formation and corporate acquisitions. We relied on the exemption provisions of Section 4(2) of the Securities Act. We have also offered shares pursuant to the exemption provisions of Regulation S.
In May 2010, we issued to 28 purchasers residing in Canada an aggregate of 18,000,000 shares of our common stock at a purchase price of $.003 per share for a total of $54,000. Those shares were issued in transactions which qualify for that exemption from the registration and prospectus delivery requirements of the Securities Act of 1933, as amended (“Securities Act”), as specified by the provisions of Regulation S. Accordingly, none of those purchasers are U.S. persons as that term is defined in Regulation S. No underwriters were used, thus no commissions or other remuneration was paid. The securities were sold in an offshore transaction relying on Rule 903 of Regulation S of the Securities Act. We, any distributor, any of their respective affiliates or any person acting on behalf of any of the foregoing made no directed selling efforts in the United States. We are subject to Category 3 of Rule 903 of Regulation S and accordingly we implemented the offering restrictions required by Category 3 of Rule 903 of Regulations S by including a legend on all offering materials and documents which stated that the shares have not been registered under the Securities Act and may not be offered or sold in the United States or to US persons unless the shares are registered under the Securities Act, or an exemption from the registration requirements of the Securities Act is available.
In June 2010, we offered and sold to 5 United States purchasers 2,000,000 shares of our common stock at a purchase price of $.003 per share for a total of $6,000. The transactions did not involve a public offering of our securities and, therefore, were exempt from the registration and prospectus delivery requirements of the Securities Act pursuant to the provisions of Section 4(2) of the Securities Act. In connection with the offer and sale of those 2,000,000 shares, no general solicitation or advertising was used. The purchasers had pre-existing relationships with us on the dates we sold the 2,000,000 shares to them. No commission was paid in connection with the offer and sale of these 2,000,000 shares.
In 2011, we: (a) issued 5,000,000 common stock shares to acquire mining rights at a value of $15,000; (b) issued 5,000,000 shares of common stock to board members for services at a value of $15,000; (c) issued 1,000,000 shares of common stock for payment of interest on the promissory note of $3,000; (d) sold 3,350,000 common stock shares in a private placement of our securities totaling $670,000; (e) issued 1,500,000 common stock shares as consideration in employment agreements valued at $1,500,000; and (f) issued 250,000 common stock shares valued at $50,000 for engineering services. We relied on the exemption provisions of Securities Act Section 4(2) in issuing these securities.
With respect to the sale of the securities identified above, we relied on the exemption provisions of Section 4(2), Regulation S or Section 3(a) 10 of the Securities Act, as amended.
At all relevant times, the securities were offered subject to the following terms and conditions:
| | · | The sale was made to a sophisticated or accredited investor, as defined in Rule 502 or were issued pursuant to a specific exemption; |
| | · | We gave the purchaser the opportunity to ask questions and receive answers concerning the terms and conditions of the offering and to obtain any additional information which we possessed or could acquire without unreasonable effort or expense that is necessary to verify the accuracy of information furnished; |
| | · | At a reasonable time prior to the sale of securities, we advised the purchaser of the limitations on resale in the manner contained in Rule 502(d)2; and |
| | · | Neither we nor any person acting on our behalf sold the securities by any form of general solicitation or general advertising. |
There were no sales of unregistered securities in 2012. During the fiscal year ended December 31, 2012, we sold a total of 7,852,000 shares of our registered common stock for $1,963,000 with 6,924,000 of these shares being issued during the year ended December 31, 2012 and the remaining 928,000 shares were issued in during the three month period ended March 31, 2013. Also during the three month period ended March 31, 2013, we sold an additional 1,576,000 shares of our registered common stock for $394,000 and issued the shares during the three month period ended March 31, 2013. We used the proceeds from the sale of the 9,428,000 shares in 2012 and 2013 for working capital purposes including but not limited to the mill site building, infrastructure build-out, purchase of machines and equipment, wages and professional fees.
During the three months ended September 30, 2013, we sold 440,000 shares of our unregistered stock for $110,000. 400,000 of the shares were issued during the three months ended September 30, 2013 and the remaining 40,000 shares were issued in October 2013. Subsequent to September 30, 2013, we sold 1,768,000 shares of our unregistered stock for $442,000. The 1,768,000 shares were also issued in October 2013.
None.
Inapplicable. We have no operational mines, in production or otherwise. We are subject to certain mining rules and regulations as promulgated by the Quebec Provincial government and other local municipalities and we have never been cited for any mining violations.
On March 15, 2013, our Board of Directors accepted the resignations of our officers and directors at the time nominated and accepted the nomination of the following new Directors and Officers:
| | a) | Ronald K. Mann – President/Chief Executive Officer/Director |
| | b) | James Chandik – Executive Vice-President/Chief Operating Officer/Director |
| | c) | Yves Gagnon – Vice President of Operations/Director |
| | d) | Tony J. Giuliano – Chief Financial Officer/Director |
On August 12, 2013, our Board of Directors accepted the resignations of directors at the time, with the exception of Ronald K. Mann, and nominated and accepted the nomination of the following new Directors:
| | a) | G.E.(Ted) Creber, Q.C. – Director |
Ronald K. Mann, President and Chief Executive Officer, was appointed Chairman of the Board of Directors.
On August 12, 2013, our Board of Directors approved and enacted the 2013 Stock Incentive Plan (the “Plan”). Under the 2013 Stock Incentive Plan, the Company may grant options or share awards to its full-time employees, executive officers, directors and consultants up to a maximum of 8,000,000 common shares. Under the Plan, the exercise price of each option has been established at $0.25. Stock options vest as stipulated in the stock option agreement and their maximum term is 8 years.
| Exhibit No. | | Description |
| | | |
| 31.1 | | Rule 13a-14(a)/15d14(a) Certifications of Mark Holbrook Chief Executive Officer and Director (attached hereto) |
| | | |
| 31.2 | | Rule 13a-14(a)/15d14(a) Certifications of Cora J. Holbrook, the CFO (attached hereto) |
| | | |
| 32.1 | | Section 1350 Certifications of Mark Holbrook, the President, Chief Executive Officer and Director (attached hereto) |
| | | |
| 32.2 | | Section 1350 Certifications Cora Holbrook (attached hereto) |
| | | |
| 101.INS** | | XBRL INSTANCE DOCUMENT |
| | | |
| 101.SCH** | | XBRL TAXONOMY EXTENSION SCHEMA |
| | | |
| 101.CAL** | | XBRL TAXONOMY EXTENSION CALCULATION LINKBASE |
| | | |
| 101.DEF** | | XBRL TAXONOMY EXTENSION DEFINITION LINKBASE |
| | | |
| 101.LAB** | | XBRL TAXONOMY EXTENSION LABEL LINKBASE |
| | | |
| 101.PRE** | | XBRL TAXONOMY EXTENSION PRESENTATION LINKBASE |
_____________
** XBRL (Extensible Business Reporting Language) information is furnished and not filed or a part of a registration statement or prospectus for purposes of Sections 11 or 12 of the Securities Act of 1933, as amended, is deemed not filed for purposes of Section 18 of the Securities Exchange Act of 1934, as amended, and otherwise is not subject to liability under these sections.
Pursuant to the requirements of the Securities Exchange Act of 1934, the registrant has caused this report to be been signed on its behalf by the undersigned thereunto duly authorized.
| | DNA Precious Metals, Inc. | |
| | | | |
| | | | |
| Date: October 30, 2013 | By: | /s/ Ronald K. Mann | |
| | | Ronald K. Mann, President & Chief Executive Officer | |
| | | | |
| | | | |
| Date: October 30, 2013 | By: | /s/ Tony J. Giuliano | |
| | | Tony J. Giuliano, Chief Financial Officer | |
| | | | |