UNITED STATES
SECURITIES AND EXCHANGE COMMISSION
Washington, D.C. 20549
FORM N-CSR
CERTIFIED SHAREHOLDER REPORT OF REGISTERED
MANAGEMENT INVESTMENT COMPANIES
Investment Company Act file number 811-22509
LoCorr Investment Trust
(Exact name of registrant as specified in charter)
261 School Avenue, 4th Floor
Excelsior, MN 55331
(Address of principal executive offices) (Zip code)
CT Corporation System
1300 East Ninth Street
Cleveland, OH 44114
(Name and address of agent for service)
952.767.2920
Registrant's telephone number, including area code
Date of fiscal year end: December 31, 2011
Date of reporting period: June 30, 2011
Item 1. Reports to Stockholders.

| Letter to Shareholders |
| |
| The LoCorr Managed Futures Strategy Fund (the “Fund”) commenced operations on March 22, 2011. The Fund was created to provide investors with access to a managed futures strategy in a mutual fund structure. Historically, managed futures have not been highly correlated to the stock or bond markets; meaning their returns over the long term have typically been independent of the returns of stocks and bonds. A critical component of risk management is utilizing assets that are not highly correlated with each other. As Nobel Prize winner and pioneer of Modern Portfolio Theory, Harry Markowitz, once said: “To reduce risk, it is necessary to avoid a portfolio whose securities are all highly correlated with each other.” As the LoCorr name implies, the Fund is designed to have low correlation to stocks and bonds and thus, provide the potential for enhanced returns, increased diversification and reduced risk. |
| |
| The Fund’s primary investment objective is capital appreciation in rising and falling equity markets. The Fund attempts to achieve its investment objective by investing in two primary strategies – a Managed Futures strategy and a Fixed Income strategy. |
| |
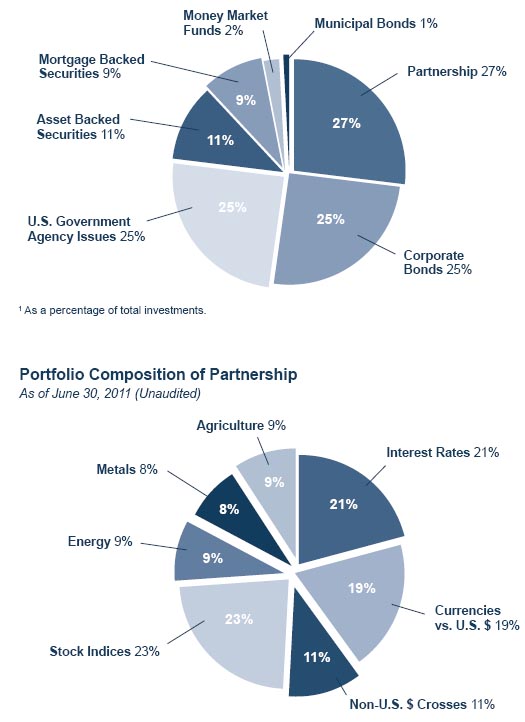
| Managed Futures Strategy The Fund invests up to 25% of its total assets into a portfolio of globally diversified managed futures positions. The Fund uses Millburn Ridgefield Corporation (“Millburn”) to execute its Managed Futures strategy. Millburn was founded in 1971 and manages over $2 billion in assets. The Fund invests in Millburn’s Diversified Program (“MDP”), a commodity pool which commenced operations in 1977. MDP systematically invests in about 120 futures markets with long and short positions in sectors such as currencies, interest rates, stock indices and commodities (agricultural, energy and metals). During periods of market volatility, MDP and the Fund both systematically employ risk management strategies in an effort to reduce exposure. |
| |
| During the period of March 22, 2011 through June 30, 2011, the Fund’s Managed Futures strategy registered a decline of approximately 5%. The Fund experienced losses from positions in stock indices, energy, metals and agricultural commodity futures that outdistanced the gains from currency and interest rate positions. |
| |
| Numerous events around the world (such as the global debt concerns and the crisis in Japan) contributed to a worsening growth outlook. Manufacturing, housing and employment showed weakness worldwide. Growth-oriented trades produced early gains until market sentiment toward these “risk-on” positions deteriorated during May and June. These factors undermined the long equity and commodity trades in the Managed Futures strategy. Against this background, long equity positions were significantly reduced and in some cases closed or reversed to short positions. |
| A steadying US dollar, slowing growth and diminishing industrial activity led to losses in long positions in energy, metals and agricultural commodities. The Fund’s interest rate trades were profitable with our long positions. With the Fund’s currency positions, our U.S. dollar trading was profitable while our non-dollar trades were not. |
| |
| Fixed Income Strategy The Fund invests most of its remaining assets in a Fixed Income strategy comprised of investment grade corporate and government agency securities. Nuveen Asset Management (“Nuveen”) is the sub-adviser for this strategy. Nuveen manages over $100 billion in assets, including about $3 billion in the Fixed Income strategy that is most similar to the one used by the Fund. |
| |
| Nuveen set out to create a short duration, high quality Fixed Income portfolio during this cycle of historically low interest rates. The Fixed Income portfolio has been positioned for a modest ongoing economic recovery with the flexibility to reposition if market or economic circumstances warrant. During this period, the Fund has been underweighting government securities and overweighting corporate bonds because of the relatively strong corporate fundamentals, earnings and balance sheets along with their attractive valuations compared to Treasuries. Performance for the Fixed Income strategy, for the period of March 22, 2011 through June 30, 2011, was positive although slightly behind its benchmark due to our shorter duration during a period of falling rates. Corporate bonds underperformed Treasuries as the global economy showed signs of weakness during the period. |
| |
Thank you for investing in LoCorr Funds. The opinions expressed in the letter are those of the fund manager, are subject to change, are not guaranteed and should not be considered a recommendation to buy or sell any security. Must be preceded or accompanied by a prospectus. Correlation measures how much the returns of two investments move together over time. Duration is a commonly used measure of the potential volatility of the price of the debt security, or the aggregate market value of a portfolio of debt securities, prior to maturity. Securities with a longer duration generally have more volatile prices than securities of comparable quality with a shorter duration. |
| |
| Mutual fund investing involves risk. Principal loss is possible. The Fund is non-diversified, meaning it may concentrate its assets in fewer individual holdings than a diversified fund. Therefore, the Fund is more exposed to individual stock volatility than a diversified fund. The Fund invests in foreign investments and foreign currencies which involve greater volatility and political, economic and currency risks and differences in accounting methods. The Fund may make short sales of securities, which involves the risk that losses may exceed the original amount invested. Investing in commodities may subject the Fund to greater risks and volatility as commodity prices may be influenced by a variety of factors including unfavorable weather, environmental factors, and changes in government regulations. The Fund may invest in derivative securities, which derive their performance from the performance of an underlying asset, index, interest rate or currency exchange rate. Derivatives can be volatile and involve various types and degrees of risks, and, depending upon the characteristics of a particular derivative, suddenly can become illiquid. Investments in debt securities typically decrease in value when interest rates rise. This risk is usually greater for longer-term debt securities. Investments in Asset Backed, Mortgage Backed, and Collateralized Mortgage Backed Securities include additional risks that investors should be aware of such as credit risk, prepayment risk, possible illiquidity and default, as well as increased susceptibility to adverse economic developments. Diversification does not assure a profit nor protect against loss in a declining market. Past performance is not a guarantee of future results. The LoCorr Managed Futures Strategy Fund is distributed by Quasar Distributors, LLC. |
| Fund Performance | | |
| | | |
| Average Annual Rate of Return | | |
| For the period ended June 30, 2011 (Unaudited) | | |
| | | |
| | | Since |
| | 3 Month | Inception |
| LoCorr Managed Futures Strategy Fund - Class A | -4.60% | -4.60%1 |
| LoCorr Managed Futures Strategy Fund - Class C | -4.80% | -4.80%2 |
| LoCorr Managed Futures Strategy Fund - Class I | -4.50% | -4.50%2 |
| Barclay CTA Index | -1.40% | -1.40%3 |
| S&P 500 Index | 0.10% | 2.61%4 |
| | | |
| Performance data represents past performance; past performance does not guarantee future results. Performance data excludes the effect of applicable sales charges. The investment return and principal value of an investment will fluctuate so that an investor’s shares, when redeemed, may be worth more or less than their original cost. Current performance of the Fund may be lower or higher than the performance quoted. Performance data current to the most recent month end may be obtained by calling 1.855.LCFUNDS, or visiting www.LoCorrFunds.com. |
| |
| |
| |
| |
| |
| |
| The S&P 500 Index is an unmanaged capitalization-weighted index of 500 stocks designed to measure performance of the broad domestic economy through changes in the aggregate market value of the 500 stocks which represent all major industries. The Barclay CTA Index is a leading industry benchmark of representative performance of commodity trading advisors. One cannot invest directly in an index. 1 Not annualized. Class A commenced operations on March 22, 2011. 2 Not annualized. Class C and Class I commenced operations on March 24, 2011. 3 Not annualized. Since inception returns as of March 31, 2011. 4 Not annualized. Since inception return as of March 22, 2011. |
4 ● PORTFOLIO COMPOSITION |
| Composition of Partnership reflects aggregate of margin used infutures contracts and sectors held within managed futures securities and do not include fixed income securities, cash, or cash equivalents. Sector allocations and positions held may vary depending on market conditions and may not be representative of the partnerships’s current or future allocations. Portfolio positions are subject to change and should not be considered investment advice. |
SCHEDULE OF INVESTMENTS ● 5 |
| Consolidated Schedule of Investments | | | |
| June 30, 2011 (Unaudited) | | | | | |
| | Principal Amount | | | Value |
| ASSET BACKED SECURITIES - 10.28% | | | | | |
| American Express Credit Account Master Trust, | | | | | |
| 1.437%, 3/15/2017 (a) | $ | 150,000 | | $ | 154,533 |
| Atlantic City Electric Transition Funding LLC, | | | | | |
| 4.910%, 7/20/2017 | | 195,480 | | | 210,250 |
| Bank of America Auto Trust,1.310%, 7/15/2014 | | 185,000 | | | 186,203 |
| Capital Auto Receivables Asset Trust, 5.300%, 5/15/2014 | | 156,086 | | | 158,856 |
| Capital One Multi-Asset Execution Trust, 5.050%, 2/15/2016 | | 250,000 | | | 268,815 |
| Chase Issuance Trust | | | | | |
| 5.120%, 10/15/2014 | | 210,000 | | | 222,332 |
| 4.650%, 3/15/2015 | | 200,000 | | | 213,417 |
| Detroit Edison Securitization Funding LLC, 6.420%, 3/1/2015 | | 150,000 | | | 158,282 |
| Discover Card Master Trust, 5.650%, 12/15/2015 | | 150,000 | | | 163,970 |
| Ford Credit Auto Lease Trust, 0.740%, 9/15/2013 | | 250,000 | | | 250,000 |
| Ford Credit Auto Owner Trust, 4.430%, 11/15/2014 | | 175,000 | | | 184,908 |
| GE Capital Credit Card Master Note Trust, 0.737%, 1/15/2017 (a) | | 250,000 | | | 251,347 |
| Honda Auto Receivables Owners Trust, 0.570%, 7/18/2013 | | 200,000 | | | 200,000 |
| Hyundai Auto Receivables Trust, 0.590%, 3/15/2014 | | 250,000 | | | 249,966 |
| PSE&G Transition Funding LLC, 6.610%, 6/15/2015 | | 194,876 | | | 207,498 |
| Santander Drive Auto Receivables Trust, 1.280%, 1/15/2015 | | 250,000 | | | 250,342 |
| Toyota Auto Receivables Owners Trust, 1.040%, 2/18/2014 | | 220,000 | | | 221,005 |
| TOTAL ASSET BACKED SECURITIES (Cost $3,550,715) | | | | | 3,551,724 |
| | | | | | |
| CORPORATE BONDS - 23.79% | | | | | |
| Finance and Insurance - 11.45% | | | | | |
| American Express Credit Corp., 7.300%, 8/20/2013 | | 200,000 | | | 222,598 |
| Bank of America Corp., 4.500%, 4/1/2015 | | 200,000 | | | 209,100 |
| Barclays Bank PLC, 2.375%, 1/13/2014 (b) | | 250,000 | | | 252,969 |
| BB&T Corp., 5.700%, 4/30/2014 | | 150,000 | | | 166,473 |
| BP Capital Markets PLC, 0.850%, 3/11/2014 (a)(b) | | 200,000 | | | 200,980 |
| Capital One Bank USA NA, 6.500%, 6/13/2013 | | 250,000 | | | 272,681 |
| Caterpillar Financial Services Corp., 4.900%, 8/15/2013 | | 250,000 | | | 269,225 |
| Citigroup, Inc. | | | | | |
| 6.375%, 8/12/2014 | | 200,000 | | | 221,145 |
| 4.587%, 12/15/2015 | | 65,000 | | | 68,354 |
| Credit Suisse, 5.500%, 5/1/2014 (b) | | 150,000 | | | 164,752 |
| Deutsche Bank AG, 3.875%, 8/18/2014 (b) | | 150,000 | | | 157,664 |
| Fifth Third Bancorp, 6.250%, 5/1/2013 | | 200,000 | | | 216,534 |
| General Electric Capital Corp., 3.750%, 11/14/2014 | | 65,000 | | | 68,803 |
| Goldman Sachs Group, Inc., 3.700%, 8/1/2015 | | 205,000 | | | 208,745 |
| JPMorgan Chase & Co., 5.125%, 9/15/2014 | | 250,000 | | | 270,162 |
| Morgan Stanley, 5.300%, 3/1/2013 | | 200,000 | | | 211,462 |
| National Rural Utilities Cooperative Finance Corp., 1.900%, 11/1/2015 200,000 | | | | | 197,156 |
| PNC Funding Corp., 3.625%, 2/8/2015 | | 200,000 | | | 210,651 |
| Prudential Financial, Inc., 2.750%, 1/14/2013 | | 175,000 | | | 178,584 |
| Wells Fargo & Co., 3.750%, 10/1/2014 | | 175,000 | | | 184,434 |
| | | | | | 3,952,472 |
| The accompanying notes are an integral part of these financial statements. | | | | | |
6 ● SCHEDULE OF INVESTMENTS (UNAUDITED) (CONTINUED) |
| | Principal Amount | | | Value |
| Information - 5.08% | | | | | |
| AT&T, Inc., 2.500%, 8/15/2015 | $ | 180,000 | | $ | 182,342 |
| Comcast Corp., 5.300%, 1/15/2014 | | 150,000 | | | 164,502 |
| Deutsche Telekom International Finance BV, 5.875%, 8/20/2013 (b) | | 150,000 | | | 164,167 |
| DIRECTV Holdings LLC/ DIRECTV Financing Co., Inc., | | | | | |
| 3.550%, 3/15/2015 | | 250,000 | | | 261,202 |
| News America, Inc., 5.300%, 12/15/2014 | | 250,000 | | | 278,674 |
| Telefonica Emisiones SAU, 2.582%, 4/26/2013 (b) | | 200,000 | | | 202,069 |
| Time Warner Cable, Inc., 8.250%, 2/14/2014 | | 200,000 | | | 232,630 |
| Verizon Communications, Inc., 5.250%, 4/15/2013 | | 250,000 | | | 268,435 |
| | | | | | 1,754,021 |
| Management of Companies and Enterprises - 0.52% | | | | | |
| Ingersoll-Rand Global Holding Co., Ltd., 9.500%, 4/15/2014 (b) | | 150,000 | | | 180,112 |
| Manufacturing - 5.52% | | | | | |
| ArcelorMittal, 3.750%, 3/1/2016 (b) | | 40,000 | | | 40,447 |
| Cisco Systems, Inc., 1.625%, 3/14/2014 | | 200,000 | | | 201,952 |
| ConocoPhillips, 4.750%, 2/1/2014 | | 250,000 | | | 272,786 |
| Covidien International Finance SA, 1.875%, 6/15/2013 (b) | | 250,000 | | | 254,268 |
| Dow Chemical Co., 2.500%, 2/15/2016 | | 150,000 | | | 148,919 |
| Kraft Foods, Inc., 6.000%, 2/11/2013 | | 200,000 | | | 215,654 |
| Merck & Co., Inc., 2.250%, 1/15/2016 | | 150,000 | | | 150,538 |
| Teva Pharmaceutical Finance III BV, 1.700%, 3/21/2014 | | 200,000 | | | 201,109 |
| Total Capital SA, 2.300%, 3/15/2016 (b) | | 150,000 | | | 149,885 |
| Wyeth, 5.500%, 3/15/2013 (a) | | 250,000 | | | 269,701 |
| | | | | | 1,905,259 |
| Retail Trade - 0.31% | | | | | |
| Viacom, Inc., 4.375%, 9/15/2014 | | 100,000 | | | 107,402 |
| Utilities - 0.91% | | | | | |
| Commonwealth Edison Co., 1.625%, 1/15/2014 | | 150,000 | | | 151,058 |
| MidAmerican Energy Co., 4.650%, 10/1/2014 | | 150,000 | | | 164,419 |
| | | | | | 315,477 |
| TOTAL CORPORATE BONDS (Cost $8,237,410) | | | | | 8,214,743 |
| | | | | | |
| MORTGAGE BACKED SECURITIES - 8.42% | | | | | |
| Fannie Mae Pool | | | | | |
| 3.500%, 2/1/2021 | | 261,069 | | | 271,935 |
| 3.500%, 6/1/2021 | | 346,879 | | | 361,315 |
| Freddie Mac REMICS, 2.500%, 2/15/2026 | | 246,168 | | | 250,717 |
| Greenwich Cap Commercial Funding Corp., 5.736%, 12/10/2049 | | 250,000 | | | 268,263 |
| GS Mortgage Securities Corp. II, 5.800%, 8/10/2045 (a) | | 250,000 | | | 268,400 |
| JP Morgan Chase Commercial Mortgage Securities Corp., | | | | | |
| 5.447%, 6/12/2047 | | 235,000 | | | 246,831 |
| Morgan Stanley Capital I, 4.970%, 12/15/2041 | | 390,000 | | | 415,162 |
| NCUA Guaranteed Notes | | | | | |
| 0.555%, 11/6/2017 (a) | | 242,913 | | | 242,989 |
| 0.635%, 1/8/2020 (a) | | 152,003 | | | 152,074 |
| 0.585%, 2/6/2020 (a) | | 181,590 | | | 181,590 |
| 0.635%, 10/7/2020 (a) | | 245,432 | | | 245,893 |
| TOTAL MORTGAGE BACKED SECURITIES (Cost $2,906,863) | | | | | 2,905,169 |
| | | | | | |
| The accompanying notes are an integral part of these financial statements. | | | | | |
SCHEDULE OF INVESTMENTS (UNAUDITED) (CONTINUED) ● 7 |
| | Principal Amount | | | Value |
| MUNICIPAL BONDS - 0.58% | | | | | |
| Louisiana Local Government Environmental Facilities & | | | | | |
Community Development Authority 1.520%, 2/1/2018 | $ | 200,000 | | $ | 200,900 |
| TOTAL MUNICIPAL BONDS (Cost $201,213) | | | | | 200,900 |
| | | | | | |
| U.S. GOVERNMENT AGENCY ISSUES - 23.07% | | | | | |
| Federal Farm Credit Bank, 1.625%, 11/19/2014 | | 250,000 | | | 253,676 |
| Federal Home Loan Banks | | | | | |
| 1.750%, 8/22/2012 | | 250,000 | | | 253,974 |
| 1.625%, 11/21/2012 | | 250,000 | | | 254,260 |
| 1.500%, 1/16/2013 | | 250,000 | | | 254,063 |
| 1.625%, 3/20/2013 | | 250,000 | | | 254,987 |
| 3.625%, 5/29/2013 | | 500,000 | | | 529,670 |
| 1.875%, 6/21/2013 | | 125,000 | | | 128,357 |
| Federal Home Loan Mortgage Corp. | | | | | |
| 4.625%, 10/25/2012 | | 100,000 | | | 105,617 |
| 0.375%, 11/30/2012 | | 125,000 | | | 124,975 |
| 0.625%, 12/28/2012 | | 650,000 | | | 652,176 |
| 4.500%, 1/15/2013 | | 250,000 | | | 265,668 |
| 0.750%, 3/28/2013 | | 125,000 | | | 125,642 |
| 1.625%, 4/15/2013 | | 250,000 | | | 255,162 |
| 3.500%, 5/29/2013 | | 100,000 | | | 105,756 |
| 4.500%, 7/15/2013 | | 100,000 | | | 108,123 |
| 4.125%, 9/27/2013 | | 250,000 | | | 269,494 |
| 0.875%, 10/28/2013 | | 250,000 | | | 251,151 |
| 4.500%, 1/15/2014 | | 100,000 | | | 109,347 |
| 2.500%, 4/23/2014 | | 250,000 | | | 261,078 |
| 1.000%, 7/30/2014 | | 500,000 | | | 499,396 |
| 2.875%, 2/9/2015 | | 125,000 | | | 131,627 |
| Federal National Mortgage Association | | | | | |
| 1.125%, 7/30/2012 | | 100,000 | | | 100,844 |
| 0.625%, 9/24/2012 | | 250,000 | | | 250,956 |
| 4.750%, 11/19/2012 | | 250,000 | | | 265,041 |
| 0.375%, 12/28/2012 | | 250,000 | | | 250,057 |
| 1.750%, 2/22/2013 | | 100,000 | | | 102,085 |
| 0.750%, 2/26/2013 | | 125,000 | | | 125,646 |
| 3.250%, 4/9/2013 | | 500,000 | | | 525,220 |
| 0.500%, 8/9/2013 | | 650,000 | | | 649,171 |
| 1.250%, 8/20/2013 | | 250,000 | | | 253,418 |
| 0.750%, 12/18/2013 | | 250,000 | | | 249,964 |
| TOTAL U.S. GOVERNMENT AGENCY ISSUES (Cost $7,941,157) | | | | | 7,966,601 |
| | | | | | |
| PARTNERSHIP - 25.25% | | Shares | | | |
| Millburn Diversified Plus LP (d)(e) | | 10,885 | | | 8,718,710 |
| TOTAL PARTNERSHIP (Cost $9,633,000) | | | | | 8,718,710 |
| | | | | | |
| MONEY MARKET FUNDS - 2.06% | | | | | |
| Fidelity Institutional Money Market Portfolio - Class I, 0.13% (c) | | 710,552 | | | 710,552 |
| TOTAL MONEY MARKET FUNDS (Cost $710,552) | | | | | 710,552 |
| | | | | | |
TOTAL INVESTMENTS (Cost $33,180,910) -93.45% | | | | $ | 32,268,399 |
| Other Assets in Excess of Liabilities - 6.55% | | | | | 2,260,933 |
| TOTAL NET ASSETS - 100.00% | | | | $ | 34,529,332 |
(a) Variable rate security. The rate reported is the rate in effect as of June 30, 2011. (b) Foreign issued security. (c) The rate quoted is the annualized seven-day effective yield as of June 30, 2011. (d) This investment is a holding of LCMFS Fund Limited. See Note 2. (e) Non-income producing security. |
| | | | | | |
| The accompanying notes are an integral part of these financial statements. | |
| Consolidated Statement of Assets & Liabilities |
| June 30, 2011 (Unaudited) | | |
| | | |
| Assets | | |
| Investments, at value (cost $33,180,910) | $ | 32,268,399 |
| Cash | | 2,341,755 |
| Receivable for Fund shares sold | | 1,137,236 |
| Interest receivable | | 147,022 |
| Deferred offering costs | | 24,284 |
| Prepaid expenses and other assets | | 19,268 |
| Total Assets | $ | 35,937,964 |
| Liabilities | | |
| Payable for securities purchased | $ | 1,324,525 |
| Payable for Fund shares redeemed | | 7,074 |
| Accrued management fees | | 16,148 |
| Accrued Trustees’ fees | | 7,042 |
| Accrued Rule 12b-1 fees | | 12,879 |
| Accrued expenses and other liabilities | | 40,964 |
| Total Liabilities | $ | 1,408,632 |
| NET ASSETS | $ | 34,529,332 |
| Net Assets Consist of: | | |
| Paid-in capital | $ | 35,508,824 |
| Accumulated net investment loss | | (63,060) |
| Accumulated net realized loss on investments | | (3,921) |
| Net unrealized depreciation of investments | | (912,511) |
| NET ASSETS | $ | 34,529,332 |
| Class A Shares | | |
| Net assets | $ | 11,226,563 |
| Shares issued and outstanding (unlimited shares authorized) | | 1,176,778 |
| Net asset value, redemption, and minimum offering price per share | $ | 9.54 |
| Maximum offering price per share ($9.54/0.9425) | $ | 10.12 |
| Class C Shares | | |
| Net assets | $ | 10,058,218 |
| Shares issued and outstanding (unlimited shares authorized) | | 1,056,223 |
| Net asset value, redemption, and offering price per share | $ | 9.52 |
| Class I Shares | | |
| Net assets | $ | 13,244,551 |
| Shares issued and outstanding (unlimited shares authorized) | | 1,387,441 |
| Net asset value, redemption, and offering price per share | $ | 9.55 |
| | | |
| | | |
| The accompanying notes are an integral part of these financial statements. | | |
| Consolidated Statement of Operations | | |
| June 30, 2011* (Unaudited) | | |
| | | |
| Investment Income | | |
| Interest | $ | 23,582 |
| Total Investment Income | | 23,582 |
| Expenses | | |
| Management fees (Note 4) | | 56,798 |
| Fund administration fees | | 13,085 |
| Fund accounting fees | | 11,371 |
| Trustees’ fees | | 7,042 |
| Transfer agent fees and expenses | | 19,367 |
| Custodian fees | | 1,915 |
| Registration expenses | | 6,465 |
| Rule 12b-1 fees - Class A (Note 4) | | 3,420 |
| Rule 12b-1 fees - Class I (Note 4) | | 9,462 |
| Insurance expenses | | 2,468 |
| Legal and audit fees | | 13,275 |
| Printing and mailing expenses | | 6,162 |
| Organizational expenses | | 61,420 |
| Offering costs and expenses | | 9,110 |
| Other expenses | | 4,107 |
| Total expenses before reimbursements | | 225,467 |
| Less expense waiver and reimbursement by Adviser | | (138,825) |
| Net Expenses | | 86,642 |
| Net Investment Loss | | (63,060 |
| Realized and Unrealized Gain (Loss) on Investments | | |
| Net realized loss on investments | | (3,921) |
| Net change in unrealized depreciation of investments | | (912,511) |
| Net realized and unrealized loss on investments | | (916,432) |
| Net Decrease in Net Assets From Operations | $ | (979,492) |
| | | |
| | | |
| Period from March 22, 2011 (commencement of operations) through June 30, 2011. | | |
| | | |
| | | |
| | | |
| | | |
| | | |
| The accompanying notes are an integral part of these financial statements. | | |
10 ● FINANCIAL STATEMENTS |
| Consolidated Statement of Changes | | |
| in Net Assets | | |
| June 30, 2011* (Unaudited) | | |
| | | |
| Operations | | |
| Net investment loss | $ | (63,060) |
| Net realized loss on investments | | (3,921) |
| Net change in unrealized depreciation of investments | | (912,511) |
| Decrease in Net Assets From Operations | | (979,492) |
| Capital Transactions (Note 5) | | |
| Proceeds from shares sold | | 35,543,347 |
| Reinvestment of distributions | | - |
| Cost of shares redeemed | | (134,579) |
| Redemption fees | | 56 |
| Increase in Net Assets From Capital Trasactions | | 35,408,824 |
| Total Increase in Net Assets | | 34,429,332 |
| Net Assets | | |
| Beginning of period | | 100,000 |
| End of period (including accumulated net investment loss of $63,060) | $ | 34,529,332 |
| | | |
| * Period from March 22, 2011 (commencement of operations) through June 30, 2011. | | |
| | | |
| | | |
| | | |
| | | |
| | | |
| | | |
| The accompanying notes are an integral part of these financial Statements. | | |
FINANCIAL HIGHLIGHTS ● 11 |
| LoCorr Managed Futures Strategy Fund-Class A | | |
| Consolidated Financial Highlights | | |
| Selected Data and Ratios (for a share outstanding throughout the period) | |
March 22, 20111 through June 30, 20112 (Unaudited) | | |
| | | |
| Per Share | | |
| Net asset value, beginning of period | $ | 10.00 |
| Income (loss) from investment operations: | | |
Net investment income (loss)3 | | (0.04) |
| Net realized and unrealized gain (loss) | | (0.42) |
| Total from Investment Operations | | (0.46) |
| Distributions to shareholders from: | | |
| Net investment income | | - |
| Net realized gains on investments sold | | - |
| Total Distributions | | - |
| Net Asset Value, End of Period | $ | 9.54 |
Total Investment Return4 | | (4.60) % |
| Net Assets, End of Period, in Thousands | $ | 11,227 |
| Ratios/Supplemental Data: | | |
| Ratio of expenses to average net assets: | | |
Before expense reimbursement or recovery5 | | 7.76 % |
After expense reimbursement or recovery5 | | 2.20 % |
| Ratio of net investment income (loss) to average net assets: | | |
Before expense reimbursement or recovery5,6 | | (7.14) % |
After expense reimbursement or recovery5,6 | | (1.58) % |
| Portfolio turnover rate | | 21.91 % |
| | | |
| | | |
| | | |
| 1 Commencement of share class operations. | | |
| 2 For the period ended June 30, 2011, all ratios have been annualized except total investment return and portfolio turnover. | | |
| 3 Net investment income per share is based on average shares outstanding. | | |
| 4 Total return excludes the effect of applicable sales charges. | | |
| 5 Does not include the expenses of other investment companies or partnerships in which the Fund invests. | | |
| 6 Recognition of net investment income by the Fund is affected by the timing and declaration of dividends by the underlying investment companies or partnerships in which the Fund invests. |
| | | |
| The accompanying notes are an integral part of these financial statements. | | |
12 ● FINANCIAL HIGHLIGHTS |
| LoCorr Managed Futures Strategy Fund-Class C | | |
| Consolidated Financial Highlights | | |
| Selected Data and Ratios (for a share outstanding throughout the period) | |
March 24, 20111 through June 30, 20112 (Unaudited) | | |
| | | |
| Per Share | | |
| Net asset value, beginning of period | $ | 10.00 |
| Income (loss) from investment operations: | | |
Net investment income (loss)3 | | (0.06) |
| Net realized and unrealized gain (loss) | | (0.42) |
| Total from Investment Operations | | (0.48) |
| Distributions to shareholders from: | | |
| Net investment income | | - |
| Net realized gains on investments sold | | - |
| Total Distributions | | - |
| Net Asset Value, End of Period | $ | 9.52 |
Total Investment Return4 | | (4.80) % |
| Net Assets, End of Period, in Thousands | $ | 10,058 |
| Ratios/Supplemental Data: | | |
| Ratio of expenses to average net assets: | | |
Before expense reimbursement or recovery5 | | 5.54 % |
After expense reimbursement or recovery5 | | 2.95 % |
| Ratio of net investment income (loss) to average net assets: | | |
Before expense reimbursement or recovery5,6 | | (4.92) % |
After expense reimbursement or recovery5,6 | | (2.33) % |
| Portfolio turnover rate | | 21.91 % |
| | | |
| | | |
| 1 Commencement of share class operations. | | |
| 2 For the period ended June 30, 2011, all ratios have been annualized except total investment return and portfolio turnover. | | |
| 3 Net investment income per share is based on average shares outstanding. | | |
| 4 Total return excludes the effect of applicable sales charges. | | |
| 5 Does not include the expenses of other investment companies or partnerships in which the Fund invests. | | |
6 Recognition of net investment income by the Fund is affected by the timing and declaration of dividends by the underlying investment companies or partnerships in which the Fund invests. |
| | | |
| | | |
| The accompanying notes are an integral part of these financial statements. | | |
FINANCIAL HIGHLIGHTS ● 13 |
| LoCorr Managed Futures Strategy Fund-Class I | | |
| Consolidated Financial Highlights | | |
| Selected Data and Ratios (for a share outstanding throughout the period) | |
March 24, 20111 through June 30, 20112 (Unaudited) | | |
| | | |
| Per Share | | |
| Net asset value, beginning of period | $ | 10.00 |
| Income (loss) from investment operations: | | |
Net investment income (loss)3 | | (0.03) |
| Net realized and unrealized gain (loss) | | (0.42) |
| Total from Investment Operations | | (0.45) |
| Distributions to shareholders from: | | |
| Net investment income | | - |
| Net realized gains on investments sold | | - |
| Total Distributions | | - |
| Net Asset Value, End of Period | $ | 9.55 |
Total Investment Return4 | | (4.50) % |
| Net Assets, End of Period, in Thousands | $ | 13,245 |
| Ratios/Supplemental Data: | | |
| Ratio of expenses to average net assets: | | |
Before expense reimbursement or recovery5 | | 4.54 % |
After expense reimbursement or recovery5 | | 1.95 % |
| Ratio of net investment income (loss) to average net assets: | | |
Before expense reimbursement or recovery5,6 | | (3.92) % |
After expense reimbursement or recovery5,6 | | (1.33) % |
| Portfolio turnover rate | | 21.91 % |
| | | |
| | | |
| | | |
| 1 Commencement of share class operations. | | |
| 2 For the period ended June 30, 2011, all ratios have been annualized except total investment return and portfolio turnover. | | |
| 3 Net investment income per share is based on average shares outstanding. | | |
| 4 Total return excludes the effect of applicable sales charges. | | |
| 5 Does not include the expenses of other investment companies or partnerships in which the Fund invests. | | |
| 6 Recognition of net investment income by the Fund is affected by the timing and declaration of dividends by the underlying investment companies or partnerships in which the Fund invests. |
| | | |
| The accompanying notes are an integral part of these financial statements. | | |
14 ● NOTES TO FINANCIAL STATEMENTS |
| Notes to the Consolidated Financial Statements |
| June 30, 2011 (Unaudited) |
| | |
| 1. | Organization |
| | |
LoCorr Managed Futures Strategy Fund (the “Fund”), a series of LoCorr Investment Trust, was formed as an Ohio business trust on November 15, 2010, and is a non-diversified, open-end management investment company under the InvestmentCompany Act of 1940, as amended. The Fund’s primary investment objective is capital appreciation in rising and falling equity markets with managing volatility as a secondary objective. The Fund intends to utilize a wholly-owned subsidiary, LCMFS Fund Limited (the “Subsidiary” and “LCMFS”), a company incorporated under the laws of the Cayman Islands, to invest in line with its investment objective. The Fund currently offers three classes of shares, Class A, Class C and Class I shares. Each share class represents an interest in the same assets of the Fund, has the same rights and is identical in all material respects except that (i) Class A shares have a maximum front end sales load of 5.75% and maximum deferred sales charge of 1.00% and Class C shares have a maximum deferred sales charge of 1.00%, (ii) Class A shares have a 12b-1 fee of 0.25% and Class C shares have a 12b-1 fee of 1.00%; (iii) certain other class-specific expenses will be borne solely by the class to which such expenses are attributable and (iv) each class will have exclusive voting rights with respect to matters relating to its own distribution arrangements. Class A commenced operations on March 22, 2011 and Class C and Class I commenced operations on March 24, 2011. |
| |
| The Fund may issue an unlimited number of shares of beneficial interest, with no par value. All shares of the Fund have equal rights and privileges, except as to class-specific rights and privileges described above. |
| | |
| 2. | Significant Accounting Policies |
| | |
Investment Valuation The net asset value (“NAV”) and offering price (NAV plus any applicable sales charges) of each class of shares is determined at 4:00 p.m. (Eastern Time) on each day the New York Stock Exchange (“NYSE”) is open for business. |
| |
| Generally, the Fund’s investments are valued each day at the last quoted sales price on each investment’s primary exchange. Investments traded or dealt in upon one or more exchanges (whether domestic or foreign) for which market quotations are readily available and not subject to restrictions against resale shall be valued at the last quoted sales price on the primary exchange or, in the absence of a sale on the primary exchange, at the last bid on the primary exchange. Investments primarily traded in the National Association of Securities Dealers’ Automated Quotation System (“NASDAQ”) National Market System for which market quotations are readily available shall be valued using the NASDAQ Official Closing Price. If market quotations are not readily available, investments will be valued at their fair value as determined in good faith by LoCorr Fund Management, LLC (the “Adviser”) in accordance with procedures approved by the Board of Trustees (the “Board”) and evaluated by the Board as to the reliability of the fair value method used. In these cases, the Fund’s NAV will reflect certain portfolio investments’ fair value rather than their market price. Fair value pricing involves subjective judgments and it is possible that the fair value determined for an investment is materially different than the value that could be realized upon the sale of that investment. The fair value prices can differ from market prices when they become available or when a price becomes available. |
NOTES TO FINANCIAL STATEMENTS (UNAUDITED) (CONTINUED) ● 15 |
| The Fund may use independent pricing services to assist in calculating the value of the Fund’s investments. In addition, market prices for foreign investments are not determined at the same time of day as the NAV for the Fund. Because the Fund may invest in underlying funds which hold portfolio investments primarily listed on foreign exchanges, and these exchanges may trade on weekends or other days when the underlying funds do not price their shares, the value of some of the Fund’s portfolio investments may change on days when you may not be able to buy or sell Fund shares. In computing the NAV, the Fund values foreign investments held by the Fund at the latest closing price on the exchange in which they are traded immediately prior to closing of the NYSE. Prices of foreign investments quoted in foreign currencies are translated into U.S. dollars at current rates. If events materially affecting the value of an investment in the Fund’s portfolio, particularly foreign investments, occur after the close of trading on a foreign market but before the Fund prices its shares, the investment will be valued at fair value. |
| |
| Fixed income securities are valued by an independent pricing service. If the Adviser decides that a price provided by the independent pricing service does not accurately reflect the fair value of a security, then the security will be valued at the fair value as determined in good faith by the Adviser in accordance with procedures approved by the Board and evaluated by the Board as to the reliability of the fair value method used. Short-term investments in fixed income securities with maturities of less than 60 days when acquired, or which subsequently are within 60 days of maturity, are valued using the amortized cost method of valuation. |
| |
| The investment in the partnership is valued by the partnership each day that the NYSE is open for business based on the price of the Subsidiary’s units held in the partnership. The number of units owned by the Subsidiary and the unit prices are provided to the Adviser each day that the NYSE is open for business directly from the partnership. |
| |
| With respect to any portion of the Fund’s assets that are invested in one or more open-end management investment companies registered under the 1940 Act, the Fund’s net asset value is calculated based upon the net asset values of those open-end management investment companies, and the prospectuses for these companies explain the circumstances under which those companies will use fair value pricing and the effects of using fair value pricing. |
16 ● NOTES TO FINANCIAL STATEMENTS (UNAUDITED) (CONTINUED) |
| The Fund has adopted authoritative fair valuation accounting standards which establish a definition of fair value and set out a hierarchy for measuring fair value. These standards require additional disclosures about the various inputs and valuation techniques used to develop the measurements of fair value and changes in valuation techniques and related inputs during the period. These inputs are summarized in three broad levels listed below: |
| | |
| Level 1 – Unadjusted quoted prices in active markets for identical assets or liabilities that the Fund has the ability to access. |
| | |
| Level 2 – Observable inputs other than quoted prices included in Level 1 that are observable for the asset or liability, either directly or indirectly. These inputs may include quoted prices for the identical instrument on an inactive market, prices for similar instruments, interest rates, prepayment speeds, credit risk, yield curves, default rates and similar data. |
| | |
| Level 3 –Unobservable inputs for the asset or liability, to the extent relevant observable inputs are not available, representing the Fund’s own assumptions about the assumptions a market participant would use in valuing the asset or liability, and would be based on the best information available. |
| | |
| The following table summarizes the Fund’s investments as of June 30, 2011: |
| Security Classification | Level 1 | Level 2 | Level 3 |
| Asset Backed Securities | $ | - | $ 3,551,724 | $ | - |
| Corporate Bonds | | - | 8,214,743 | | - |
| Mortgage Backed Securities | | - | 2,905,169 | | - |
| Municipal Bonds | | - | 200,900 | | - |
| U.S. Government Agency Issues | | - | 7,966,601 | | - |
| Partnerships | | - | 8,718,710 | | - |
| Money Market Funds | | 710,552 | - | | - |
| Total | $ | 710,552 | $31,557,847 | $ | - |
| See the Consolidated Schedule of Investments for the investments detailed by industry classification. |
| |
| There were no transfers between levels during the period. Transfers between levels are recognized at the end of the reporting period. |
| |
| In May 2011, the Financial Accounting Standards Board issued Accounting Standards Update (“ASU”) No. 2011-04 “Amendments to Achieve Common Fair Value Measurement and Disclosure Requirements in U.S. GAAP and IFRSs.” ASU No. 2011-04 requires additional disclosures regarding fair value measurements. Effective for fiscal years beginning after December 15, 2011, and for interim periods within those fiscal years, entities will need to disclose the following: |
NOTES TO FINANCIAL STATEMENTS (UNAUDITED) (CONTINUED) ● 17 |
| ● | The amounts of any transfers between Level 1 and Level 2 and the reasons for those transfers, and |
| |
| ● | For Level 3 fair value measurements, quantitative information about the significant unobservable inputs used, a description of the entity’s valuation processes, and a narrative description of the sensitivity of the fair value measurement to changes in the unobservable inputs and the interrelationship between inputs. |
| |
| Management is currently evaluating the impact ASU No. 2011-04 will have on the Fund’s financial statement disclosures. |
| |
LCMFS Fund Limited (LCMFS) The consolidated financial statements of the Fund include LCMFS Fund Limited, a wholly-owned and controlled subsidiary in which the Fund will invest up to 25% of its total assets (measured at the time of purchase). The Subsidiary acts as an investment vehicle in order to enter into certain investments consistent with the investment objectives and policies specified in the Prospectus and Statement of Additional Information. There were no inter-company eliminations. As of June 30, 2011 there were no assets or liabilities of the Subsidiary other than the investment in the Underlying Funds. |
| |
| LCMFS invests in the global derivatives markets through the use of one or more proprietary global macro trading programs (“global macro programs”), which are often labeled “managed futures” programs. Global macro programs attempt to earn profits in a variety of markets by employing long and short trading algorithms applied to futures, options, forward contracts, and other derivative instruments. It is anticipated that the global macro programs used by LCMFS will be tied to a variety of global markets for currencies, interest rates, stock market indices, energy resources, metals and agricultural products. LCMFS’s investment in a global macro program may be through investment in one or more unaffiliated private investment vehicles or unaffiliated commodity pools (“unaffiliated trading companies”) advised by one or more commodity trading advisors or “CTAs” registered with the U.S. Commodity Futures Trading Commission. The Fund or LCMFS do not consolidate assets, liabilities, capital or operations of the trading companies into their financial statements. Rather, LCMFS is separately presented as an investment in the Fund’s consolidated portfolio of investments. Income, gains and unrealized appreciation or depreciation on the investments in LCMFS are recorded in the Fund’s consolidated statement of assets and liabilities and the Fund’s consolidated statement of operations. |
| |
| In accordance with its investment objectives and through its exposure to the aforementioned global macro programs, the Fund may have increased or decreased exposure to one or more of the following risk factors described below: |
| |
| Commodity Risk. Commodity risk relates to the change in value of commodities or commodity indexes as they relate to increases or decreases in the commodities market. Commodities are physical assets that have tangible properties. Examples of these types of assets are crude oil, heating oil, metals, livestock, and agricultural products. |
18 ● NOTES TO FINANCIAL STATEMENTS (UNAUDITED) (CONTINUED) |
| Credit Risk. Credit risk relates to the ability of the issuer to meet interest and principal payments, or both, as they come due. In general, lower-grade, higher-yield bonds are subject to credit risk to a greater extent than lower-yield, higher-quality bonds. |
| |
| Equity Risk. Equity risk relates to the change in value of equity securities as they relate to increases or decreases in the general market. |
| |
| Foreign Exchange Rate Risk. Foreign exchange rate risk relates to the change in the U.S. dollar value of a security held that is denominated in a foreign currency. The U.S. dollar value of a foreign currency denominated security will decrease as the dollar appreciates against the currency, while the U.S. dollar value will increase as the dollar depreciates against the currency. |
| |
| Interest Rate Risk. Interest rate risk refers to the fluctuations in value of fixed-income securities resulting from the inverse relationship between price and yield. For example, an increase in general interest rates will tend to reduce the market value of already issued fixed-income investments, and a declinein general interest rates will tend to increase their value. In addition, debt securities with longer maturities, which tend to have higher yields, are subject to potentially greater fluctuations in value from changes in interest rates than obligations with shorter maturities. |
| |
| Volatility Risk. Volatility risk refers to the magnitude of the movement, but not the direction of the movement, in a financial instrument’s price over a defined time period. Large increases or decreases in a financial instrument’s price over a relative time period typically indicate greater volatility risk, while small increases or decreases in its price typically indicate lower volatility risk. |
| |
| Please refer to the Fund’s prospectus for a full listing of risks associated with these investments. |
| |
| For tax purposes, LCMFS is an exempted Cayman investment company. LCMFS has received an undertaking from the Government of the Cayman Islands exempting it from all local income, profits, and capital gains taxes. No such taxes are levied in the Cayman Islands at the present time. For U.S. income tax purposes, LCMFS is a controlled foreign corporation (“CFC”) and as such is not subject to U.S. income tax. However, as a wholly-owned CFC, LCMFS’s net income and capital gain, to the extent of its earnings and profits, will be included each year in the Fund’s investment company taxable income. |
| |
| Federal Income Taxes The Fund intends to qualify as a regulated investment company pursuant to Subchapter M of the Internal Revenue Code. The Fund intends to distribute substantially all of its investment company net taxable income and net capital gains to shareholders. Therefore, no federal income tax provision is required. |
| |
| As of June 30, 2011 the Fund did not have any tax positions that did not meet the “more-likely-than-not” threshold of being sustained by applicable tax authority. The Fund recognizes interest and penalties, if any, related to unrecognized tax benefits on uncertain tax position income tax expense in the consolidated statement of operations. During the period, the Fund did not incur any interest or penalties. Generally, tax authorities can examine all the tax returns filed for the last three years. |
NOTES TO FINANCIAL STATEMENTS (UNAUDITED) (CONTINUED) ● 19 |
| The Regulated Investment Company Modernization Act of 2010 (the ‘‘Act’’) was enacted on December 22, 2010. The Act makes changes to several tax rules impacting the Fund. In general, the provisions of the Act will be effective for the Fund’s fiscal period ending December 31, 2011. Relevant information regarding the impact of the Act on the Fund, if any, will be contained within the annual report for the fiscal period ending December 31, 2011. |
| |
| Use of Estimates The preparation of financial statements in conformity with accounting principles generally accepted in the United States of America requires management to make estimates and assumptions that affect the reported amount of assets and liabilities, disclosure of contingent assets and liabilities at the date of the financial statements and the reported revenues and expenses during the reporting period. Actual results could differ from those estimates. |
| |
| Indemnifications In the normal course of business, the Fund enters into contracts that contain general indemnifications to other parties. The Fund’s maximum exposure under these contracts is unknown as this would involve future claims that may be made against the Fund that have not yet occurred. However, based on experience, the Fund expects the risk of loss to be remote. |
| |
| Subsidiary and Basis for Consolidation The Fund may invest up to 25% of its total assets in a CFC, which acts as an investment vehicle in order to effect certain investments consistent with the Fund’s investment objectives and policies. |
| |
| Security Transactions and Investment Income Security transactions are recorded on trade date. Realized gains and losses on sales of investments are calculated on the specifically identified cost basis of the securities. Dividend income, less foreign taxes withheld, if any, are recorded on the ex-dividend date. Interest income is recognized on the accrual basis. Market discounts, premiums and original issue discounts on fixed-income securities are amortized daily over the expected life of the security using the effective yield method. |
| |
| Allocation of Income and Expenses Net investment income, other than class specific expenses, and realized and unrealized gains and losses are allocated daily to each class of shares based upon the relative net asset value of outstanding shares of each class of shares at the beginning of the day (after adjusting for the current capital shares activity of the respective class). |
20 ● NOTES TO FINANCIAL STATEMENTS (UNAUDITED) (CONTINUED) |
Distributions to Shareholders Shareholder transactions are recorded on trade date. Dividends from net investment income are declared and paid at least annually by the Fund. Distributions of net realized capital gains, if any, are declared and paid at least annually. Distributions to shareholders are recorded on the ex-dividend date. The character of distributions made during the year from the net investment income or net realized gains may differ from the characterization for federal income tax purposes due to the difference in the recognition of income, expense and gain items for financial statement and tax purposes. |
| |
| Subsequent Events Management has evaluated events and transactions for potential recognition or disclosure through the date the financial statements were issued. There were no subsequent events to report that would have a material impact on the Fund’s Consolidated Financial Statements and Notes to the Consolidated Financial Statements. |
| | |
| 3. | Investment Transactions |
| Purchases and sales of investment securities, excluding short-term securities and U.S. government obligations, during the period from March 22, 2011 through June 30, 2011 were $27,634,061 and $3,076,763, respectively. Purchases and sales of government securities during the period from March 22, 2011 through June 30, 2011 aggregated $7,956,574 and $0, respectively. |
| | |
| 4. | Management Fees and Other Transactions with Affiliates |
| The Fund has a Management Agreement with the Adviser, with whom certain officers and Trustees of the Fund are affiliated, to furnish investment advisory services to the Fund. Pursuant to the Management Agreement between the Fund and the Adviser, the Adviser is entitled to receive, on a monthly basis, an annual advisory fee equal to 1.50% of the Fund’s average daily net assets. Pursuant to a sub-advisory agreement between the Adviser and Nuveen Asset Management, LLC (“Sub-Adviser”), the Sub-Adviser is entitled to receive, on a monthly basis, an annual sub-advisory fee on the fixed income portion of the Fund’s average daily net assets up to 0.18%. The Sub-Adviser is paid by the Adviser, not the Fund. |
| | |
| The Fund’s Adviser has contractually agreed to waive management fees and/or reimburse the Fund for expenses it incurs, until at least April 30, 2012, but only to the extent necessary to maintain the Fund’s total annual operating expenses after fee waiver and/or reimbursement (excluding taxes, interest, brokerage commissions, expenses incurred in connection with any merger or reorganization, indirect expenses, expenses of other investment companies in which the Fund may invest, or extraordinary expenses such as litigation) at 2.20%, 2.95% and 1.95% of the average daily net assets of Class A, Class C and Class I shares, respectively. Any waiver or reimbursement is subject to repayment by the Fund within the three fiscal years following the fiscal year in which the expenses occurred, if the Fund is able to make the repayment without exceeding its current expense limitations and the repayment is approved by the Board of Trustees. The organizational and offering costs are subject to repayment by the Fund. During the period ended June 30, 2011, the Adviser waived and reimbursed $138,825 of its fees. |
NOTES TO FINANCIAL STATEMENTS (UNAUDITED) (CONTINUED) ● 21 |
| The Fund has entered into a 12b-1 distribution agreement with Quasar Distributors, LLC (“Quasar”). Class A and Class C shareholders pay Rule 12b-1 fees to Quasar at the annual rate of 0.25% and 1.00%, respectively, of average daily net assets. Class I shareholders pay no 12b-1 fees. |
| | |
| 5. | Fund Shares |
| At June 30, 2011, there were an unlimited number of shares of beneficial interest authorized. The following table summarizes the activity in shares and dollar amounts applicable to each class of the Fund: |
| LoCorr Managed Futures Strategy Fund – Class A |
For the Period Ended June 30, 20111 | |
| | Shares | Amount |
| Shares sold | 1,167,651 | $11,457,049 |
| Shares redeemed | (873) | (8,352) |
| | 1,166,778 | $11,448,697 |
| Beginning shares | 10,000 | |
| Ending shares | 1,176,778 | |
| LoCorr Managed Futures Strategy Fund – Class C |
For the Period Ended June 30, 20112 | |
| | Shares | Amount |
| Shares sold | 1,057,467 | $10,305,910 |
| Shares redeemed | (1,244) | (11,924) |
| | 1,056,223 | $10,293,986 |
| Beginning shares | - | |
| Ending shares | 1,056,223 | |
| | | |
| LoCorr Managed Futures Strategy Fund – Class I |
For the Period Ended June 30, 20112 | |
| | Shares | Amount |
| Shares sold | 1,399,228 | $13,780,388 |
| Shares redeemed | (11,787) | (114,247) |
| | 1,387,441 | $13,666,141 |
| Beginning shares | - | |
| Ending shares | 1,387,441 | |
| | | |
| 1Class A commenced operations on March 22, 2011. | | |
| 2Class C and Class I commenced operations on March 24, 2011. | | |
| Expense Example |
| June 30, 2011 (Unaudited) |
| |
| As a shareholder of a mutual fund, you incur two types of costs: (1) transaction costs, including sales charges (loads) on purchase payments; redemption fees; and (2) ongoing costs, including management fees; distribution and/or service (12b-1) fees and other Fund expenses. |
| |
| This Example is intended to help you understand your ongoing costs (in dollars) of investing in each Fund and to compare these costs with the ongoing costs of investing in other mutual funds. The Example is based on an investment of $1,000 invested at the beginning of the period and held for the entire period (March 22, 2011 through June 30, 2011 for Class A and March 24, 2011 through June 30, 2011 for Class C and Class I). |
| |
| Actual Expenses The actual return columns in the following table provide information about account values based on actual returns and actual expenses. You may use the information in these columns, together with the amount you invested, to estimate the expenses that you paid over the period. Simply divide your account value by $1,000 (for example, an $8,600 account value divided by $1,000 = 8.6), then multiply the result by the number in the first line under the heading entitled “Expenses Paid During Period” to estimate the expenses you paid on your account during this period. The only transaction fees you may be required to pay are for outgoing wire transfers, returned checks and stop payment orders at prevailing rates charged by U.S. Bancorp Fund Services, LLC, the Fund’s transfer agent. These fees are assessed on all accounts, as applicable. If you request that a redemption be made by wire transfer, currently the Fund’s transfer agent charges a $15.00 fee. The Fund’s transfer agent charges a transaction fee of $25.00 on returned checks and stop payment orders. If you paid a transaction fee, you would add the fee amount to the expenses paid on your account this period to obtain your total expenses paid. |
| |
| Hypothetical Example for Comparison Purposes The hypothetical return columns in the following table provide information about hypothetical account values and hypothetical expenses based on a Fund’s actual expense ratio and an assumed rate of return of 5% per year before expenses, which is not a Fund’s actual return. The hypothetical account values and expenses may not be used to estimate the actual ending account balance or expenses you paid for the period. You may use this information to compare the ongoing costs of investing in the Fund and other funds. To do so, compare this 5% hypothetical example with the 5% hypothetical examples that appear in the shareholder reports of the other funds. A transaction fee of $15.00 may be assessed on outgoing wire transfers and a transaction fee of $25.00 may be assessed on returned checks and stop payment orders. To include this fee in the calculation, you would add the estimated transaction fee to the hypothetical expenses shown in the table. Please note that the expenses shown in the table are meant to highlight your ongoing costs only and do not reflect the transaction fees discussed above. Therefore, those columns are useful in comparing ongoing costs only, and will not help you determine the relative total costs of owning different funds. In addition, if these transactional costs were included, your costs would have been higher. |
EXPENSE EXAMPLE (UNAUDITED) (CONTINUED) ● 23 |
| Actual vs. Hypothetical Returns | | |
| For the Period Ended June 30, 2011 (Unaudited) | |
| | Fund’s | Beginning | Ending | Expenses |
| | Annualized | Account | Account | Paid |
| | Expense | Value1 | Value | During |
| | Ratio | | 6/30/11 | Period2 |
| LoCorr Managed Futures Strategy Fund – Class A | |
| Actual | 2.20% | $1,000.00 | $954.00 | $5.892 |
| Hypothetical | 2.20% | $1,000.00 | $1,013.88 | $10.993 |
| LoCorr Managed Futures Strategy Fund – Class C | |
| Actual | 2.95% | $1,000.00 | $952.00 | $7.732 |
| Hypothetical | 2.95% | $1,000.00 | $1,010.17 | $14.703 |
| LoCorr Managed Futures Strategy Fund – Class I | |
| Actual | 1.95% | $1,000.00 | $955.00 | $5.122 |
| Hypothetical | 1.95% | $1,000.00 | $1,015.12 | $9.743 |
| 1 | Commencement of operations for Class A shares 3/2211; Class C and I shares 3/24/11. |
| 2 | Expenses are equal to the Fund’s annualized expense ratio multiplied by the average account value over the period, multiplied by 100 days for Class A and 98 days for Class C and Class I and divided by 365 to reflect the period of March 22, 2011 through June 30, 2011 for Class A and March 24, 2011 through June 30, 2011 for Class C and Class I. |
| 3 | Expenses are equal to the Fund’s annualized expense ratio multiplied by the average account value over the period, multiplied by 181 days and divided by 365 to reflect the one-half year period. |
24 ● SUPPLEMENTAL INFORMATION |
| Approval of Advisory Agreement |
| June 30, 2011 (Unaudited) |
| |
| In connection with a regular meeting held on January 24, 2011 (the “Meeting”), the Board of Trustees (the “Board” or “Trustees”) of LoCorr Investment Trust (the “Trust”), including a majority of the Trustees who are not interested persons of the Trust or interested persons to the investment management agreement (the “Independent Trustees”), discussed the approval of an investment management agreement (the “Management Agreement”) between LoCorr Fund Management, LLC (the “Adviser”) and the Trust, on behalf of LoCorr Managed Futures Strategy Fund (the “Fund”). The Trustees reviewed a memorandum from Thompson Hine LLP (“Fund counsel”) entitled “Duties of Trustees with Respect to Approval of Investment Advisory Contracts,” which had been provided to them prior to the meeting. They discussed with Fund counsel that in fulfilling their responsibilities to the Fund and its shareholders, the Trustees must apply their business judgment of whether the overall arrangements provided under the terms of the investment management contract are reasonable for the Fund. They also discussed factors the Trustees should consider in evaluating an investment management contract, which include, but are not limited to: the investment performance of the Fund and other accounts managed by the Adviser; the nature, extent and quality of the services to be provided by the Adviser to the Fund; the costs of the services to be provided and the profits to be realized by the Adviser and its affiliates from the relationship with the Fund; the extent to which economies of scale will be realized as the Fund grows; and whether the fee levels reflect these economies of scale to the benefit of shareholders. |
| |
The Trustees reviewed the Adviser’s responses to an investment adviser questionnaire and the proposed Management Agreement between the Trust and LoCorr, copies of which had previously been supplied to the Trustees for their review. As to the Adviser’s qualifications, the Trustees reviewed a copy of the Adviser’s registration statement on Form ADV (Parts I and II). As to the nature, extent and quality of the services to be provided by the Adviser to the Fund, the Trustees considered that, under the terms of the Management Agreement, the Adviser would, subject to the supervision of the Board, provide or arrange to be provided to the Fund such investment advice as the Adviser in its discretion deems advisable and will furnish or arrange to be furnished a continuous investment program for the Fund, consistent with the Fund’s investment objective and policies. The Adviser will determine or arrange for others to determine the securities to be purchased for the Fund, the portfolio securities to be held or sold by the Fund and the portion of the Fund’s assets to be invested, subject always to the Fund’s investment objective, policies and restrictions, as each of the same shall be in effect, and subject further to such policies and instructions as the Board may establish. The Adviser will furnish such information or analyses to the Trust as the Board may request or as the Adviser deems desirable. The Adviser also will advise and assist the officers of the Trust in taking such steps as are necessary or appropriate to carry out the decisions of the Board and the appropriate committees of the Board regarding the conduct of the business of the Trust. The Adviser may delegate any of the responsibilities, rights or duties described above, provided the Adviser notifies the Trust and agrees that such delegation does not relieve the Adviser from any liability thereunder. The Trustees concluded that, overall, they were satisfied with the nature, extent and quality of the services to be provided to the Fund under the Management Agreement. |
SUPPLEMENTAL INFORMATION (UNAUDITED) (CONTINUED) ● 25 |
| As to the costs of the services to be provided and the profits to be realized by the Adviser, the Trustees reviewed the Adviser’s estimates of its profitability and its financial condition. The Trustees noted that the Adviser expected net losses during the first year of operations and continuing losses should the Fund fail to attract sufficient assets. The Board also discussed whether the Adviser’s parent company would further capitalize the Adviser if necessary. Fund counsel then discussed the proposed expense limitation agreement and explained that the Adviser has agreed to cap the Fund’s expenses at 1.95%, excluding certain expense items and excluding the Fund’s 12b-1 fees. Based on their review, the Trustees concluded that they were satisfied that the Adviser’s expected level of profitability from its relationship with the Fund was not excessive. |
| |
| As to comparative fees and expenses, the Trustees considered the management fee to the Adviser and total expense ratio to be paid by Fund shareholders and compared those fees to the Fund’s peer group and considered them to be within the range of the peer group. The Trustees also considered the Adviser’s agreement to waive fees or reimburse expenses to the extent that the Fund’s total operating expenses exceeded certain limits. The Trustees concluded that the Fund’s management fee was acceptable in light of the quality of services the Fund expected to receive from the Adviser. As to economies of scale, the Trustees noted that the Management Agreement does not contain breakpoints that reduce the fee rate on assets above specified levels. The Trustees agreed that breakpoints may be an appropriate way for LoCorr to share its economies of scale with a Fund and its shareholders if it experiences a substantial growth in assets. However, the Trustees recognized that that Fund had not yet commenced operations and that the management agreements with competitor funds do not always contain breakpoints. Consequently, the Trustees concluded that the absence of breakpoints was acceptable under the circumstances. |
| |
| Having received and reviewed information from the Adviser as the Board believed to be reasonably necessary, the Trustees, including the Independent Trustees, unanimously approved the Management Agreement. |
| |
| Consideration and Approval of Sub-Advisory Agreement. Fund Counsel noted that the same factors that the Board considered with respect to the approval of the Management Agreement would apply to its consideration of the Sub-Advisory Agreement. The Trustees reviewed the responses to an investment adviser questionnaire from Nuveen Asset Management, LLC (“Nuveen” or the “Sub-Adviser”) and the proposed Sub-Advisory Agreement between the Sub-Adviser and the Trust, copies of which had previously been supplied to the Trustees for their review. As to Nuveen’s business and the qualifications of its personnel, the Trustees reviewed a copy of Nuveen’s adviser registration statement on Form ADV (Parts I and II). Next, the Trustees discussed the experience of Chris J. Neuharth, CFA, the portfolio manager, noting his many years of experience as a portfolio manager with a predecessor to Nuveen. Additionally, the Trustees noted that Nuveen is not affiliated with the transfer agent or custodian and therefore does not derive any benefits from the relationships those parties have with the Trust. |
26 ● SUPPLEMENTAL INFORMATION (UNAUDITED) (CONTINUED) |
| As to the nature, extent and quality of the services to be provided by Nuveen to the Fund, the Trustees considered that, under the terms of the Sub-Advisory Agreement, the Sub-Adviser would, subject to the supervision of the Board of Trustees of the Trust, provide or arrange to be provided to the Fund such investment advice as the Sub-Adviser in its discretion deems advisable and will furnish or arrange to be furnished a continuous investment program for the portion of the Fund’s assets for which it is responsible, consistent with the Fund’s investment objective and policies. The Trustees noted that Nuveen had adopted a compliance program to monitor and review investment decisions and to prevent and detect violations of the Fund’s investment policies and limitations, as well as federal securities laws. Additionally, they noted that Nuveen has adequate resources to access the necessary research and noted the portfolio manager’s prior experience. The Trustees concluded that, overall, they were satisfied with the nature, extent and quality of the services to be provided to the Fund under the Sub-Advisory Agreement. |
| |
| As to the costs of the services to be provided and the profits to be realized by Nuveen, the Trustees reviewed Nuveen’s estimates of its profitability and its financial condition. They noted that under the Sub-Advisory Agreement, Nuveen will receive minimum annual revenue of $45,000 from the Adviser and that the costs incurred for the services Nuveen provides will vary based on the size of the Fund. The Board noted that the fees received by Nuveen will not have an impact on the Fund’s management fee or expense ratio. Based on their review, the Trustees concluded that they were satisfied that Nuveen’s expected level of profitability from its relationship with the Fund was not excessive. As to comparative fees and expenses, the Trustees considered the management fee to be paid to Nuveen and compared those fees to management fees paid by other accounts managed by Nuveen. The Trustees noted that the minimum annual fee under the Sub-Advisory Agreement was lower than the minimum fee charged to some of Nuveen’s other clients. The Trustees concluded that the sub-advisory fee was acceptable in light of the quality of services the Fund expected to receive from Nuveen and the level of fees paid by Nuveen’s other clients. As to economies of scale, the Trustees noted that the Sub-Advisory Agreement contains breakpoints that reduce the fee rate on assets above specified levels. The Trustees agreed that breakpoints may be an appropriate way for Nuveen to share its economies of scale if the Fund experiences a substantial growth in assets and that if breakpoints were achieved, these benefits to the Adviser would be considered by the Board when the Adviser’s contract is renewed and fees are again examined. |
| |
| Having received and reviewed information from Nuveen as the Board believed to be reasonably necessary, the Trustees, including the Independent Trustees, unanimously approved the Sub-Advisory Agreement. |
| Notice of Privacy Policy & Practices |
| Your privacy is important to us. The Fund is committed to maintaining the confidentiality, integrity, and security of your personal information. When you provide personal information, the Fund believes that you should be aware of policies to protect the confidentiality of that information. |
| |
| The Fund collects the following nonpublic personal information about you: |
| |
| ● | Information we receive from you on or in applications or other forms, correspondence, or conversations, including, but not limited to, your name, address, phone number, social security number, assets, income, and date of birth; and |
| |
| ● | Information about your transactions with us, our affiliates, orothers, including, but not limited to, your account number and balance, payments history, parties to transactions, cost basis information, and other financial information. |
| |
| The Fund does not disclose any nonpublic personal information about our current or former shareholders to affiliated or nonaffiliated third parties, except as permitted by law. For example, the Fund is permitted by law to disclose all of the information we collect, as described above, to our transfer agent to process your transactions. Furthermore, the Fund restricts access to your nonpublic personal information to those persons who require such information to provide products or services to you. The Fund maintains physical, electronic, and procedural safeguards that comply with applicable federal and state standards to guard your nonpublic personal information. |
| |
| In the event that you hold shares of the Fund through a financial intermediary, including, but not limited to, a broker-dealer, bank, or trust company, the privacy policy of your financial intermediary would govern how your nonpublic personal information would be shared with affiliated or non-affiliated third parties. |
28 ● QUARTERLY PORTFOLIO HOLDINGS / PROXY |
| Quarterly Form N-Q Portfolio Schedule |
| |
| The Fund files its complete schedule of portfolio holdings withthe Securities and Exchange Commissions (“SEC”) for the first and third quarters of each fiscal year on Form N-Q. The Fund’s Forms N-Q are available on the SEC’s website at http://www.sec.gov. The Funds Forms N-Q may be reviewed and copied at the SEC’s Public Reference Room in Washington, D.C. Information on the operation of the SEC’s Public Reference Room may be obtained by calling 1-800-SEC-0330. Additionally, you may obtain copies of Forms N-Q from the Fund upon request by calling 1-855-523-8637. |
| |
| Proxy Voting Policies, Procedures & Record |
| |
| You may obtain a description of the Fund’s (1) proxy voting policies, (2) proxy voting procedures and (3) information regarding how the Fund voted any proxies related to portfolio securities during the most recent 12-month period ended June 30 for which an SEC filing has been made, without charge, upon request by contacting the Fund directly at 1-855-523-8637, or on the EDGAR Database on the SEC’s website (http://www.sec.gov). |
Investment Adviser
LoCorr Fund Management, LLC
261 School Avenue, 4th Floor
Excelsior, MN 55331
Administrator, Fund Accountant and Transfer Agent
U.S. Bancorp Fund Services, LLC
615 East Michigan Street
Milwaukee, WI 53202
Custodian
U.S. Bank, N.A. Custody Operations
1555 North RiverCenter Drive, Suite 302
Milwaukee, WI 53212
Independent Registered Public Accounting Firm
Cohen Fund Audit Services, Ltd.
800 Westpoint Pkwy, Suite 1100
Westlake, OH 44145
Fund Counsel
Thompson Hine, LLP
312 Walnut Street, 14th floor
Cincinnati, OH 45202
Distributor
Quasar Distributors, LLC
615 East Michigan Street
Milwaukee, Wisconsin 53202
Item 2. Code of Ethics.
Not applicable for semi-annual reports.
Item 3. Audit Committee Financial Expert.
Not applicable for semi-annual reports.
Item 4. Principal Accountant Fees and Services.
Not applicable for semi-annual reports.
Item 5. Audit Committee of Listed Registrants.
Not applicable to registrant.
Item 6. Investments.
| (a) | Schedule of Investments is included as part of the report to shareholders filed under Item 1 of this Form |
Item 7. Disclosure of Proxy Voting Policies and Procedures for Closed-End Management Investment Companies.
Not applicable to open-end investment companies.
Item 8. Portfolio Managers of Closed-End Management Investment Companies.
Not applicable to open-end investment companies.
Item 9. Purchases of Equity Securities by Closed-End Management Investment Company and Affiliated Purchasers.
Not applicable to open-end investment companies.
Item 10. Submission of Matters to a Vote of Security Holders.
There has been no material change to the procedures by which shareholders may recommend nominees to the registrant’s board of directors.
Item 11. Controls and Procedures.
| (a) | The Registrant’s Principal Executive Officer and Principal Financial Officer have reviewed the Registrant's disclosure controls and procedures (as defined in Rule 30a-3(c) under the Investment Company Act of 1940 (the “Act”)) as of a date within 90 days of the filing of this report, as required by Rule 30a-3(b) under the Act and Rules 13a-15(b) or 15d-15(b) under the Securities Exchange Act of 1934. Based on their review, such officers have concluded that the disclosure controls and procedures are effective in ensuring that information required to be disclosed in this report is appropriately recorded, processed, summarized and reported and made known to them by others within the Registrant and by the Registrant’s service provider. |
| (b) | There were no changes in the Registrant's internal control over financial reporting (as defined in Rule 30a-3(d) under the Act) that occurred during the second fiscal quarter of the period covered by this report that has materially affected, or is reasonably likely to materially affect, the Registrant's internal control over financial reporting. |
Item 12. Exhibits.
| (a) | (1) Any code of ethics or amendment thereto, that is the subject of the disclosure required by Item 2, to the extent that the registrant intends to satisfy Item 2 requirements through filing an exhibit. |
Not applicable to semi-annual report.
(2) A separate certification for each principal executive and principal financial officer pursuant to Section 302 of the Sarbanes-Oxley Act of 2002.
Filed herewith.
(3) Any written solicitation to purchase securities under Rule 23c-1 under the Act sent or given during the period covered by the report by or on behalf of the registrant to 10 or more persons.
Not applicable to registrant.
| (b) | Certifications pursuant to Section 906 of the Sarbanes-Oxley Act of 2002. |
Filed herewith.
SIGNATURES
Pursuant to the requirements of the Securities Exchange Act of 1934 and the Investment Company Act of 1940, the registrant has duly caused this report to be signed on its behalf by the undersigned, thereunto duly authorized.
(Registrant) LoCorr Investment Trust
By (Signature and Title)* /s/ Kevin Kinzie
Kevin Kinzie, President
Principal Executive Officer
Date 9/1/11
Pursuant to the requirements of the Securities Exchange Act of 1934 and the Investment Company Act of 1940, this report has been signed below by the following persons on behalf of the registrant and in the capacities and on the dates indicated.
By (Signature and Title)* /s/ Kevin Kinzie
Kevin Kinzie, President
Principal Executive Officer
Date 9/1/11
By (Signature and Title)* /s/ Jon Essen
Jon Essen, Treasurer
Principal Financial Officer
Date 9/1/11
* Print the name and title of each signing officer under his or her signature.