Washington, D.C. 20549
Item 1. Reports to Stockholders.
Looking ahead, we don’t expect to make significant changes to portfolio structure; the current slow growth environment should result in continued highly accommodative policy that should be supportive for the assets held in the portfolio. Also, our interest rate strategy will also remain fairly close to the benchmark unless a catalyst develops to spark a large move in rates in the future.
LoCorr Long/Short Commodities Strategy Fund
The LoCorr Long/Short Commodities Strategy Fund (the “Long/Short Commodities Fund”) commenced operations on January 1, 2012. The Long/Short Commodities Fund was created to provide investors with access to a commodities futures strategy in a mutual fund structure. Historically, investors have accessed exposure to commodities in long-only fund, funds that rely on commodity price increases to generate commodity returns. Of course, commodity prices don’t always appreciate and occasionally experience sharp declines. LoCorr’s Long/Short Commodity Fund has the ability to profit while commodity prices increase or decrease. The Long/Short Commodities Fund’s primary investment objective is capital appreciation in rising and falling commodities markets. The Long/Short Commodities Fund attempts to achieve its investment objective by investing in two primary strategies – a Commodities strategy and a Fixed Income strategy.
Commodities Strategy
The Long/Short Commodities Fund invests up to 25% of its total assets into a portfolio of globally diversified commodity futures positions. The Long/Short Commodities Fund uses Millburn Ridgefield Corporation (“Millburn”) to execute its commodities strategy. Millburn was founded in 1971 and manages about $1.9 billion in assets. The Long/Short Commodities Fund utilizes Millburn’s Commodity Program (“Milcom”), a commodity pool which commenced operations in 2005. Milcom systematically invests in about 50 futures markets with long and short positions in sectors such as energy, metals, grains, livestock, softs and lumber. The Long/Short Commodities Fund registered a loss during the first half of 2012. Losses were sustained in trading all sectors: energy, grain, metals, soft commodities, and livestock. Metal prices were volatile during the period and produced some of the largest losses during the period. Energy trading was unprofitable with a profit on short natural gas positions failing to fully offset the losses on long heating oil and gas oil positions, and trading of crude oil.
Prospects of bumper crops early in 2012 were supplanted by the reality of a severe drought in the U.S. by mid-May, and short corn, wheat, soybean, soybean oil, and oat trades produced losses and were reversed to long trades. Long European rapeseed and milling wheat positions were quite profitable, lowering the overall grain sector loss. Trading of livestock was unprofitable.
Turning to soft commodities, short cocoa trades were unprofitable as hot, dry weather hit the Ivory Coast and raised fears that an expected bumper crop might face significant damage. Trading of palm oil, Robusta coffee and sugar were also unprofitable. Meanwhile, a short Arabica coffee trade produced a profit as expectations of a bumper Brazilian harvest pushed Arabica to its lowest price in 18 months in late March. A short cotton trade was profitable as the Chinese growth outlook dimmed, and a long orange juice trade was profitable early in the period.
6 ● SHAREHOLDER LETTER
Fixed Income Strategy
Since inception, the fixed income portfolio sub-advised by Galliard Capital Management has outperformed the benchmark, the Barclays Capital 1-5 Year Government/Credit Index, by 12 basis points before fees (0.27% versus 0.15%). Outperformance was driven by allocations to short corporate bonds, asset-backed securities and Agency hybrid mortgage-backed securities, which performed better than like-duration Treasuries. Additionally, the portfolio overweight in intermediate maturity securities enhanced returns, as interest rates in this portion of the yield curve rallied to record lows near the end of the second quarter. Looking ahead, we will continue to invest cash flows in high-quality fixed income assets when they offer compelling relative value. This includes U.S. Government-backed issues, including Agency mortgage-backed securities, corporate bonds, short maturity AAA-rated asset-backed securities, and short maturity AAA-rated commercial mortgage-backed securities. Portfolio duration will likely be kept neutral to slightly short of the benchmark duration.
Thank you for investing in LoCorr Funds.
Basis Point - a unit that is equal to 1/100th of 1% and is used to denote the change in a financial instrument. Correlation measures how much the returns of two investments move together over time Duration is a commonly used measure of the potential volatility of the price of the debt security, or the aggregate market value of a portfolio of debt securities, prior to maturity. Securities with a longer duration generally have more volatile prices than securities of comparable quality with a shorter duration.
The Barclays Capital U.S. 1-5 Year Government/Credit Bond Index includes all medium and larger issues of U.S. government, investment-grade corporate, and investment-grade international dollar-denominated bonds that have maturities of between 1 and 5 years. One cannot invest directly in an index.
The opinions expressed in the letter are those of the fund manager, are subject to change, are not guaranteed and should not be considered a recommendation to buy or sell any security. Must be preceded or accompanied by a prospectus. Fund holdings and sector allocation are subject to change and should not be considered a recommendation to buy or sell any security. For a complete list of fund holdings please refer to the Schedule of Investments included in this report.
Mutual fund investing involves risk. Principal loss is possible. The Funds are non-diversified, meaning they may concentrate their assets in fewer individual holdings than a diversified fund. Therefore, the Funds are more exposed to individual stock volatility than a diversified fund. The Funds invest in foreign investments and foreign currencies which involve greater volatility and political, economic and currency risks and differences in accounting methods. The Funds may make short sales of securities, which involves the risk that losses may exceed the original amount invested. Investing in commodities may subject the Funds to greater risks and volatility as commodity prices may be influenced by a variety of factors including unfavorable weather, environmental factors, and changes in government regulations. The Funds may invest in derivative securities, which derive their performance from the performance of an underlying asset, index, interest rate or currency exchange rate. Derivatives can be volatile and involve various types and degrees of risks, and, depending upon the characteristics of a particular derivative, suddenly can become illiquid. Investments in debt securities typically decrease in value when interest rates rise. This risk is usually greater for longer-term debt securities. Investments in Asset Backed, Mortgage Backed, and Collateralized Mortgage Backed Securities include additional risks that investors should be aware of such as credit risk, prepayment risk, possible illiquidity and default, as well as increased susceptibility to adverse economic developments. Diversification does not assure a profit nor protect against loss in a declining market.
Past performance is not a guarantee of future results.
The LoCorr Managed Futures Strategy Fund and LoCorr Long/Short Commodities Strategy Fund are distributed by Quasar Distributors, LLC.
FUND PERFORMANCE ● 7
LoCorr Managed Futures Strategy Fund
| Average Annual Rate of Return | | | | |
| For the period ended June 30, 2012 (Unaudited) | | | | |
| | Inception | | | Since |
| | Date | 6 Month | 1 Year | Inception1 |
| LoCorr Managed Futures Strategy Fund - | 3/22/11 | -5.68% | -7.76% | -9.55% |
| Class A (without maximum load) | | | | |
| LoCorr Managed Futures Strategy Fund - | 3/22/11 | -11.11% | -13.04% | -13.66% |
| Class A (with maximum load) | | | | |
| LoCorr Managed Futures Strategy Fund - | 3/24/11 | -6.03% | -8.40% | -10.24% |
| Class C (without maximum load) | | | | |
| LoCorr Managed Futures Strategy Fund - | 3/24/11 | -5.56% | -7.54% | -9.34% |
| Class I | | | | |
| Barclay CTA Index | | -0.31% | -1.32% | -2.83%2 |
| S&P 500 Index | | 9.49% | 5.45% | 5.39%3 |
This chart illustrates the performance of a hypothetical $100,000 investment made in the Fund since inception. Assumes reinvestment of dividends and capital gains, but does not reflect the effect of any applicable sales charge or redemption fees. This chart does not imply any future performance.
Performance data represents past performance; past performance does not guarantee future results. The investment return and principal value of an investment will fluctuate so that an investor’s shares, when redeemed, may be worth more or less than their original cost. Current performance of the Fund may be lower or higher than the performance quoted. Performance data current to the most recent month end may be obtained by calling 1.855.LCFUNDS, or visiting www.LoCorrFunds.com.
Performance data shown reflects the Class A maximum sales charge of 5.75% and reflects the Class C Contingent Deferred Sales Charge (CDSC) of 1.00%. Performance of the Class A without load does not reflect the deduction of the sales load or fee. If reflected, the load or fee would reduce the performance quoted.
The Fund imposes a 1.00% redemption fee on shares held for less than 30 days. Performance data does not reflect the redemption fee. If it had, return would be reduced.
The S&P 500 Index is an unmanaged capitalization-weighted index of 500 stocks designed to measure performance of the broad domestic economy through changes in the aggregate market value of the 500 stocks which represent all major industries.
The Barclay CTA Index is a leading industry benchmark of representative performance of commodity trading advisors. One cannot invest directly in an index.
1 Annualized.
2 Since inception return as of March 31, 2011.
3 Since inception return as of March 24, 2011.
8 ● FUND PERFORMANCE
LoCorr Long/Short Commodities Strategy Fund
| Average Annual Rate of Return | | | | |
| For the period ended June 30, 2012 (Unaudited) | | | | |
| | Inception | | | Since |
| | Date | 3 Month | 6 Month | Inception1 |
| LoCorr Long/Short Commodities Strategy | 1/1/12 | -4.83% | -5.50% | -5.50% |
| Fund - Class A (without maximum load) | | | | |
| LoCorr Long/Short Commodities Strategy | 1/1/12 | -10.34% | -10.93% | -10.93% |
| Fund - Class A (with maximum load) | | | | |
| LoCorr Long/Short Commodities Strategy | 1/1/12 | -4.96% | -6.10% | -6.10% |
| Fund - Class C (without maximum load) | | | | |
| LoCorr Long/Short Commodities Strategy | 1/1/12 | -4.73% | -5.40% | -5.40% |
| Fund - Class I | | | | |
| Barclay CTA Index | | 0.32% | -0.31% | -0.31%2 |
| S&P 500 Index | | -2.75% | 9.49% | 9.49%2 |
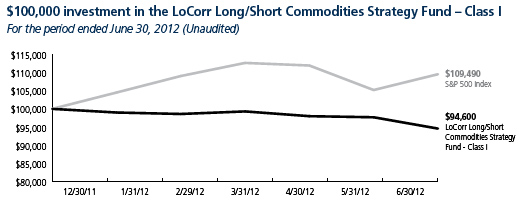
This chart illustrates the performance of a hypothetical $100,000 investment made in the Fund since inception. Assumes reinvestment of dividends and capital gains, but does not reflect the effect of any applicable sales charge or redemption fees. This chart does not imply any future performance.
Performance data represents past performance; past performance does not guarantee future results. The investment return and principal value of an investment will fluctuate so that an investor’s shares, when redeemed, may be worth more or less than their original cost. Current performance of the Fund may be lower or higher than the performance quoted. Performance data current to the most recent month end may be obtained by calling 1.855.LCFUNDS, or visiting www.LoCorrFunds.com.
Performance data shown reflects the Class A maximum sales charge of 5.75% and reflects the Class C Contingent Deferred Sales Charge (CDSC) of 1.00%. Performance of the Class A without load does not reflect the deduction of the sales load or fee. If reflected, the load or fee would reduce the performance quoted.
The Fund imposes a 1.00% redemption fee on shares held for less than 30 days. Performance data does not reflect the redemption fee. If it had, return would be reduced.
The S&P 500 Index is an unmanaged capitalization-weighted index of 500 stocks designed to measure performance of the broad domestic economy through changes in the aggregate market value of the 500 stocks which represent all major industries.
The Barclay CTA Index is a leading industry benchmark of representative performance of commodity trading advisors. One cannot invest directly in an index.
1 Not annualized.
2 Since inception returns as of January 1, 2012.
PORTFOLIO COMPOSITION ● 9
10 ● CONSOLIDATED SCHEDULE OF INVESTMENTS
| LoCorr Managed Futures Strategy Fund | | | | | | |
| Consolidated Schedule of Investments | | | | |
| June 30, 2012 (Unaudited) | | | | | | |
| | | Principal Amount | | | Value | |
| ASSET BACKED SECURITIES - 12.12% | | | | | | |
| AEP Texas Central Transition Funding, LLC, 0.880%, 12/1/2018 | | $ | 1,000,000 | | | $ | 1,002,722 | |
| AH Mortgage Advance Trust | | | | | | | | |
| 2.230%, 5/10/2043 (Acquired 05/03/2012 and 6/04/2012, | | | | | | | | |
| Cost $849,553) (a) | | | 850,000 | | | | 847,609 | |
| 3.370%, 5/10/2043 (Acquired 12/27/2011, Cost $748,594) (a) | | | 750,000 | | | | 758,775 | |
| 3.270%, 9/15/2043 (Acquired 05/09/2012, Cost $502,468) (a)(b) | | | 500,000 | | | | 505,570 | |
| 3.720%, 3/13/2044 (Acquired 01/20/2012, Cost $499,988) (a)(b) | | | 500,000 | | | | 501,250 | |
| Ally Auto Receivables Trust | | | | | | | | |
| 2.300%, 12/15/2014 | | | 1,100,000 | | | | 1,121,255 | |
| 0.700%, 1/15/2015 | | | 1,500,000 | | | | 1,501,403 | |
| 1.180%, 4/15/2015 | | | 400,000 | | | | 402,136 | |
| American Express Credit Account Master Trust, 1.499%, 3/15/2017 | | | 150,000 | | | | 153,772 | |
| AmeriCredit Automobile Receivables Trust | | | | | | | | |
| 0.840%, 6/9/2014 | | | 129,231 | | | | 129,272 | |
| 0.920%, 3/9/2015 | | | 821,708 | | | | 823,163 | |
| Atlantic City Electric Transition Funding, LLC, 4.910%, 7/20/2017 | | | 151,002 | | | | 159,969 | |
| BA Credit Card Trust, 0.309%, 9/15/2016 | | | 1,000,000 | | | | 998,944 | |
| Bank of America Auto Trust, 1.310%, 7/15/2014 | | | 68,839 | | | | 69,029 | |
| BMW Vehicle Owner Trust, 0.630%, 2/25/2014 | | | 707,423 | | | | 707,905 | |
| Cabela’s Master Credit Card Trust, 1.630%, 2/18/2020 | | | | | | | | |
| (Acquired 05/08/2012, Cost $755,950) (a) | | | 750,000 | | | | 759,212 | |
| Capital One Multi-Asset Execution Trust | | | | | | | | |
| 4.700%, 6/15/2015 | | | 750,000 | | | | 754,038 | |
| 0.768%, 10/15/2015 | | | 350,000 | | | | 350,333 | |
| 0.309%, 1/15/2016 | | | 355,000 | | | | 354,817 | |
| 5.050%, 2/15/2016 | | | 880,000 | | | | 910,713 | |
| CenterPoint Energy Transition Bond Co., LLC | | | | | | | | |
| 0.901%, 4/15/2018 | | | 1,250,000 | | | | 1,256,766 | |
| 3.460%, 8/15/2019 | | | 600,000 | | | | 659,114 | |
| Chase Issuance Trust | | | | | | | | |
| 5.120%, 10/15/2014 | | | 210,000 | | | | 212,944 | |
| 4.650%, 3/15/2015 | | | 900,000 | | | | 926,706 | |
| 0.790%, 6/15/2017 | | | 2,250,000 | | | | 2,250,995 | |
| Citibank Credit Card Issuance Trust, 2.250%, 12/23/2014 | | | 1,000,000 | | | | 1,008,906 | |
| Citibank Omni Master Trust, 3.350%, 8/15/2016 | | | | | | | | |
| (Acquired 09/22/2011 and 11/25/2011, Cost $1,002,651) (a) | | | 1,000,000 | | | | 1,003,652 | |
| CitiFinancial Auto Issuance Trust, 3.150%, 8/15/2016 | | | | | | | | |
| (Acquired 12/14/2011, Cost $1,014,541) (a) | | | 1,000,000 | | | | 1,012,838 | |
| Detroit Edison Securitization Funding, LLC, 6.420%, 3/1/2015 | | | 77,340 | | | | 79,325 | |
| Discover Card Master Trust | | | | | | | | |
| 0.808%, 6/15/2015 | | | 200,000 | | | | 200,288 | |
| 0.899%, 9/15/2015 | | | 214,000 | | | | 214,814 | |
| 0.459%, 11/16/2015 | | | 320,000 | | | | 320,453 | |
| 5.650%, 12/15/2015 | | | 870,000 | | | | 912,984 | |
| 0.459%, 3/15/2017 | | | 1,000,000 | | | | 1,001,775 | |
| 0.810%, 8/15/2017 | | | 700,000 | | | | 700,902 | |
| | | | | | | | | |
| The accompanying notes are an integral part of these consolidated financial statements. | | | | | |
CONSOLIDATED SCHEDULE OF INVESTM ENTS (CONTINUED) ● 11
| | | Principal Amount | | | Value | |
| DT Auto Owner Trust, 1.400%, 8/15/2014 | | | | | | |
| (Acquired 11/02/2011 and 02/17/2012, Cost $739,246) (a) | | $ | 738,970 | | | $ | 739,832 | |
| Entergy Louisiana Investment Recovery Funding I, LLC, 2.040%, 9/1/2023 | | | 940,490 | | | | 966,665 | |
| Ford Credit Auto Lease Trust | | | | | | | | |
| 0.910%, 7/15/2013 (Acquired 11/28/2011, Cost $180,389) (a) | | | 180,377 | | | | 180,449 | |
| 0.740%, 9/15/2013 | | | 329,396 | | | | 329,656 | |
| Ford Credit Auto Owner Trust | | | | | | | | |
| 6.070%, 5/15/2014 | | | 167,955 | | | | 171,231 | |
| 4.500%, 7/15/2014 | | | 346,964 | | | | 353,531 | |
| 4.430%, 11/15/2014 | | | 174,098 | | | | 178,309 | |
| FPL Recovery Funding, LLC., 5.044%, 8/1/2015 | | | 233,047 | | | | 239,003 | |
| GE Capital Credit Card Master Note Trust, 0.799%, 1/15/2017 | | | 250,000 | | | | 251,444 | |
| Gracechurch Card Funding PLC, 0.949%, 2/15/2017 | | | | | | | | |
| (Acquired 03/02/2012, Cost $1,250,000) (a)(b) | | | 1,250,000 | | | | 1,249,671 | |
| Honda Auto Receivables Owner Trust, 0.570%, 7/18/2013 | | | 84,104 | | | | 84,120 | |
| Hyundai Auto Receivables Trust, 0.590%, 3/17/2014 | | | 381,740 | | | | 381,855 | |
| Nissan Auto Lease Trust | | | | | | | | |
| 0.700%, 1/15/2014 | | | 472,453 | | | | 472,529 | |
| 1.270%, 10/15/2016 | | | 350,000 | | | | 352,062 | |
| Ocwen Advance Receivables Backed Notes, 4.140%, 7/15/2023 | | | | | | | | |
| (Acquired 10/05/2011, Cost $502,869) (a)(b) | | | 500,000 | | | | 500,625 | |
| Porsche Financial Auto Securitization Trust, 1.190%, 12/17/2018 | | | | | | | | |
| (Acquired 12/13/2011, Cost $753,153) (a) | | | 750,000 | | | | 756,046 | |
| PSE&G Transition Funding LLC, 6.610%, 6/15/2015 | | | 402,115 | | | | 416,036 | |
| Santander Drive Auto Receivables Trust | | | | | | | | |
| 0.950%, 8/15/2013 | | | 18,300 | | | | 18,302 | |
| 1.310%, 2/17/2014 (Acquired 06/06/2012, Cost $1,001,342) (a) | | | 1,000,000 | | | | 1,001,417 | |
| 1.110%, 8/15/2014 | | | 744,041 | | | | 745,666 | |
| 1.280%, 1/15/2015 | | | 500,000 | | | | 502,141 | |
| SMART Trust, 1.099%, 10/14/2014 | | | | | | | | |
| (Acquired 03/14/2012 and 06/27/2012, Cost $1,661,449) (a)(b) | | | 1,657,988 | | | | 1,660,929 | |
| Toyota Auto Receivables Owner Trust, 1.040%, 2/18/2014 | | | 101,661 | | | | 101,846 | |
| United States Small Business Administration, 5.725%, 9/10/2018 | | | 264,203 | | | | 294,183 | |
| Volkswagen Auto Lease Trust, 0.990%, 11/20/2013 | | | 276,099 | | | | 276,497 | |
| World Omni Auto Receivables Trust | | | | | | | | |
| 5.120%, 5/15/2014 | | | 139,042 | | | | 141,338 | |
| 2.210%, 5/15/2015 | | | 820,000 | | | | 831,658 | |
| TOTAL ASSET BACKED SECURITIES (Cost $37,671,536) | | | | | | | 37,771,390 | |
| | | | | | | | | |
| CORPORATE BONDS - 29.00% | | | | | | | | |
| Administrative and Support and Waste Management and | | | | | | | | |
| Remediation Services - 0.46% | | | | | | | | |
| Tyco International Finance SA, 3.375%, 10/15/2015 (b) | | | 1,000,000 | | | | 1,077,934 | |
| Waste Management, Inc., 2.600%, 9/1/2016 | | | 340,000 | | | | 348,899 | |
| | | | | | | | 1,426,833 | |
| Arts, Entertainment, and Recreation - 0.10% | | | | | | | | |
| Walt Disney Co., 4.500%, 12/15/2013 | | | 300,000 | | | | 317,625 | |
| | | | | | | | | |
| Construction - 0.35% | | | | | | | | |
| Transocean, Inc., 5.050%, 12/15/2016 (b) | | | 1,000,000 | | | | 1,084,644 | |
| | | | | | | | | |
| | | | | | | | | |
| The accompanying notes are an integral part of these consolidated financial statements. | | | | | | | | |
12 ● CONSOLIDATED SCHEDULE OF INVESTMENTS (CONTINUED)
| | | Principal Amount | | | Value | |
| Finance and Insurance - 13.72% | | | | | | |
| Aflac, Inc., 3.450%, 8/15/2015 | | $ | 600,000 | | | $ | 638,558 | |
| Allstate Corp., 6.200%, 5/16/2014 | | | 200,000 | | | | 219,994 | |
| Allstate Life Global Funding Trusts, 5.375%, 4/30/2013 | | | 300,000 | | | | 312,124 | |
| American Express Credit Corp. | | | | | | | | |
| 7.300%, 8/20/2013 | | | 500,000 | | | | 534,580 | |
| 1.750%, 6/12/2015 | | | 480,000 | | | | 485,452 | |
| American International Group, Inc., 4.250%, 9/15/2014 | | | 1,020,000 | | | | 1,057,057 | |
| Australia & New Zealand Banking Group, Ltd., 2.400%, 11/23/2016 | | | | | | | | |
| (Acquired 11/15/2011, Cost $995,930) (a)(b) | | | 1,000,000 | | | | 1,023,911 | |
| Bank of America Corp., 4.500%, 4/1/2015 | | | 3,165,000 | | | | 3,262,365 | |
| Bank of Montreal, 1.300%, 10/31/2014 | | | | | | | | |
| (Acquired 10/26/2011, Cost $819,787) (a)(b) | | | 820,000 | | | | 831,095 | |
| Barclays Bank PLC, 5.000%, 9/22/2016 (b) | | | 1,000,000 | | | | 1,085,960 | |
| BAT International Finance PLC, 2.125%, 6/7/2017 | | | | | | | | |
| (Acquired 06/06/2012, Cost $995,160) (a)(b) | | | 1,000,000 | | | | 998,683 | |
| BB&T Corp., 5.700%, 4/30/2014 | | | 650,000 | | | | 705,354 | |
| Berkshire Hathaway, Inc., 2.200%, 8/15/2016 | | | 860,000 | | | | 894,709 | |
| BP Capital Markets PLC, 1.068%, 3/11/2014 (b)(c) | | | 300,000 | | | | 302,077 | |
| Capital One Bank USA NA, 6.500%, 6/13/2013 | | | 500,000 | | | | 524,029 | |
| Capital One Financial Corp., 2.125%, 7/15/2014 | | | 800,000 | | | | 806,810 | |
| Caterpillar Financial Services Corp., 1.100%, 5/29/2015 | | | 950,000 | | | | 955,316 | |
| Citigroup, Inc. | | | | | | | | |
| 4.587%, 12/15/2015 | | | 1,965,000 | | | | 2,055,539 | |
| 6.125%, 11/21/2017 | | | 1,000,000 | | | | 1,107,923 | |
| Cooperatieve Centrale Raiffeisen-Boerenleenbank BA, | | | | | | | | |
| 3.375%, 1/19/2017 (b) | | | 1,000,000 | | | | 1,029,187 | |
| Credit Suisse, 5.500%, 5/1/2014 (b) | | | 455,000 | | | | 482,366 | |
| Daimler Finance North America, LLC, 2.300%, 1/9/2015 | | | | | | | | |
| (Acquired 01/04/2012 and 04/10/2012, Cost $1,008,234) (a) | | | 1,000,000 | | | | 1,020,288 | |
| Deutsche Bank AG, 3.875%, 8/18/2014 (b) | | | 465,000 | | | | 484,120 | |
| Fifth Third Bancorp | | | | | | | | |
| 6.250%, 5/1/2013 | | | 200,000 | | | | 208,306 | |
| 3.625%, 1/25/2016 | | | 255,000 | | | | 268,963 | |
| General Electric Capital Corp. | | | | | | | | |
| 2.100%, 1/7/2014 | | | 615,000 | | | | 624,565 | |
| 3.750%, 11/14/2014 | | | 965,000 | | | | 1,013,137 | |
| Goldman Sachs Group, Inc. | | | | | | | | |
| 1.466%, 2/7/2014 (c) | | | 300,000 | | | | 296,415 | |
| 3.700%, 8/1/2015 | | | 2,580,000 | | | | 2,602,800 | |
| Hartford Financial Services Group, Inc., 4.000%, 3/30/2015 | | | 1,000,000 | | | | 1,048,768 | |
| ING Bank NV, 3.750%, 3/7/2017 | | | | | | | | |
| (Acquired 02/29/2012, Cost $746,145) (a)(b) | | | 750,000 | | | | 746,482 | |
| John Deere Capital Corp., 0.875%, 4/17/2015 | | | 1,000,000 | | | | 1,001,123 | |
| JPMorgan Chase & Co., 1.252%, 1/24/2014 (c) | | | 265,000 | | | | 265,687 | |
| JPMorgan Chase & Co., 5.150%, 10/1/2015 | | | 1,495,000 | | | | 1,604,243 | |
| KeyCorp, 3.750%, 8/13/2015 | | | 350,000 | | | | 370,585 | |
| Metropolitan Life Global Funding I, 5.125%, 4/10/2013 | | | | | | | | |
| (Acquired 12/29/2011, Cost $513,788) (a) | | | 500,000 | | | | 516,535 | |
| Morgan Stanley, 4.100%, 1/26/2015 | | | 1,565,000 | | | | 1,556,186 | |
| National Rural Utilities Cooperative Finance Corp., 1.900%, 11/1/2015 | | | 500,000 | | | | 512,120 | |
| Nordea Bank AB, 2.250%, 3/20/2015 | | | | | | | | |
| (Acquired 04/10/2012, Cost $502,355) (a)(b) | | | 500,000 | | | | 501,804 | |
| PNC Funding Corp., 3.625%, 2/8/2015 | | | 500,000 | | | | 531,056 | |
| The accompanying notes are an integral part of these consolidated financial statements. | | |
CONSOLIDATED SCHEDULE OF INVESTMENTS (CONTINUED) ●13
| | | Principal Amount | | | Value | |
| Private Export Funding Corp. | | | | | | |
| 4.550%, 5/15/2015 | | $ | 750,000 | | | $ | 835,686 | |
| 1.375%, 2/15/2017 | | | 780,000 | | | | 791,913 | |
| Prudential Covered Trust 2012-1, 2.997%, 9/30/2015 | | | | | | | | |
| (Acquired 03/27/2012 and 04/19/2012, Cost $1,335,645) (a) | | | 1,330,000 | | | | 1,351,059 | |
| SABMiller Holdings, Inc., 1.850%, 1/15/2015 | | | | | | | | |
| (Acquired 01/10/2012 and 01/30/2012, Cost $740,191) (a) | | | 735,000 | | | | 745,497 | |
| Simon Property Group LP, 4.200%, 2/1/2015 | | | 295,000 | | | | 311,008 | |
| Toyota Motor Credit Corp., 1.750%, 5/22/2017 | | | 790,000 | | | | 796,401 | |
| Ventas Realty LP / Ventas Capital Corp., 3.125%, 11/30/2015 | | | 1,000,000 | | | | 1,018,088 | |
| Vornado Realty LP, 4.250%, 4/1/2015 | | | 815,000 | | | | 859,506 | |
| Wells Fargo & Co. | | | | | | | | |
| 3.750%, 10/1/2014 | | | 500,000 | | | | 527,894 | |
| 3.676%, 6/15/2016 (c) | | | 1,000,000 | | | | 1,064,400 | |
| | | | | | | | 42,787,724 | |
| Information - 2.24% | | | | | | | | |
| AT&T, Inc., 2.500%, 8/15/2015 | | | 870,000 | | | | 905,679 | |
| Deutsche Telekom International Finance BV, 5.875%, 8/20/2013 (b) | | | 320,000 | | | | 337,048 | |
| DIRECTV Holdings LLC / DIRECTV Financing Co., Inc., 3.550%, 3/15/2015 | | | 500,000 | | | | 526,499 | |
| NBCUniversal Media, LLC., 3.650%, 4/30/2015 | | | 1,000,000 | | | | 1,062,432 | |
| News America, Inc., 5.300%, 12/15/2014 | | | 700,000 | | | | 767,219 | |
| Qwest Corp., 7.500%, 10/1/2014 | | | 300,000 | | | | 334,423 | |
| Telefonica Emisiones SAU, 4.949%, 1/15/2015 (b) | | | 1,000,000 | | | | 945,407 | |
| Time Warner Cable, Inc., 8.250%, 2/14/2014 | | | 400,000 | | | | 445,353 | |
| Verizon Communications, Inc., 5.250%, 4/15/2013 | | | 500,000 | | | | 518,053 | |
| Vodafone Group PLC, 5.000%, 9/15/2015 (b) | | | 330,000 | | | | 369,135 | |
| Xstrata Finance Canada, Ltd., 3.600%, 1/15/2017 | | | | | | | | |
| (Acquired 02/14/2012, Cost $783,190) (a)(b) | | | 750,000 | | | | 772,407 | |
| | | | | | | | 6,983,655 | |
| Management of Companies and Enterprises - 0.51% | | | | | | | | |
| BHP Billiton Finance USA, Ltd., 1.000%, 2/24/2015 (b) | | | 1,000,000 | | | | 1,001,712 | |
| Ingersoll-Rand Global Holding Co., Ltd., 9.500%, 4/15/2014 (b) | | | 500,000 | | | | 568,310 | |
| | | | | | | | 1,570,002 | |
| Manufacturing - 6.60% | | | | | | | | |
| Anheuser-Busch Cos, LLC, 5.050%, 10/15/2016 | | | 500,000 | | | | 569,902 | |
| ArcelorMittal | | | | | | | | |
| 3.750%, 2/25/2015 (b) | | | 505,000 | | | | 511,910 | |
| 3.750%, 3/1/2016 (b) | | | 850,000 | | | | 844,155 | |
| Cameron International Corp., 1.600%, 4/30/2015 | | | 1,000,000 | | | | 1,000,711 | |
| Cisco Systems, Inc., 1.625%, 3/14/2014 | | | 725,000 | | | | 738,770 | |
| ConAgra Foods, Inc., 5.875%, 4/15/2014 | | | 1,135,000 | | | | 1,225,601 | |
| ConocoPhillips, 4.750%, 2/1/2014 | | | 530,000 | | | | 562,933 | |
| Covidien International Finance SA, 1.350%, 5/29/2015 (b) | | | 1,000,000 | | | | 1,001,299 | |
| Dow Chemical Co., 2.500%, 2/15/2016 | | | 300,000 | | | | 308,146 | |
| Dr. Pepper Snapple Group, Inc., 2.900%, 1/15/2016 | | | 1,000,000 | | | | 1,047,189 | |
| Eastman Chemical Co., 2.400%, 6/1/2017 | | | 1,000,000 | | | | 1,010,594 | |
| Genentech, Inc., 4.750%, 7/15/2015 | | | 300,000 | | | | 331,535 | |
| General Mills, Inc., 1.550%, 5/16/2014 | | | 500,000 | | | | 507,240 | |
| Hershey Co., 1.500%, 11/1/2016 | | | 1,000,000 | | | | 1,008,332 | |
| Hewlett-Packard Co., 3.000%, 9/15/2016 | | | 1,000,000 | | | | 1,028,585 | |
| The accompanying notes are an integral part of these consolidated financial statements. |
14 ● CONSOLIDATED SCHEDULE OF INVESTMENTS (CONTINUED)
| | | Principal Amount | | | Value | |
| Intel Corp., 1.950%, 10/1/2016 | | $ | 750,000 | | | $ | 777,244 | |
| International Business Machines Corp., 0.875%, 10/31/2014 | | | 800,000 | | | | 803,841 | |
| Kraft Foods, Inc., 6.500%, 8/11/2017 | | | 740,000 | | | | 897,832 | |
| Medtronic, Inc., 3.000%, 3/15/2015 | | | 450,000 | | | | 477,526 | |
| Merck & Co., Inc., 2.250%, 1/15/2016 | | | 300,000 | | | | 313,275 | |
| Novartis Capital Corp., 2.900%, 4/24/2015 | | | 335,000 | | | | 354,414 | |
| Procter & Gamble Co., 1.450%, 8/15/2016 | | | 800,000 | | | | 815,405 | |
| St. Jude Medical, Inc., 3.750%, 7/15/2014 | | | 500,000 | | | | 526,332 | |
| Teva Pharmaceutical Finance III BV, 1.700%, 3/21/2014 (b) | | | 450,000 | | | | 456,367 | |
| Thermo Fisher Scientific, Inc., 2.250%, 8/15/2016 | | | 1,150,000 | | | | 1,189,331 | |
| Total Capital SA, 2.300%, 3/15/2016 (b) | | | 350,000 | | | | 363,341 | |
| Tyco Electronics Group SA, 1.600%, 2/3/2015 (b) | | | 335,000 | | | | 336,401 | |
| Viacom, Inc., 4.375%, 9/15/2014 | | | 200,000 | | | | 214,088 | |
| Volkswagen International Finance NV, 1.625%, 3/22/2015 | | | | | | | | |
| (Acquired 03/19/2012, Cost $782,739) (a)(b) | | | 785,000 | | | | 787,719 | |
| Wyeth, LLC | | | | | | | | |
| 5.500%, 3/15/2013 (c) | | | 250,000 | | | | 258,880 | |
| 5.500%, 2/1/2014 | | | 300,000 | | | | 322,888 | |
| | | | | | | | 20,591,786 | |
| Mining, Quarrying, and Oil and Gas Extraction - 1.87% | | | | | | | | |
| Anadarko Petroleum Corp., 6.375%, 9/15/2017 | | | 1,000,000 | | | | 1,161,634 | |
| Canadian Oil Sands, Ltd., 5.800%, 8/15/2013 | | | | | | | | |
| (Acquired 01/25/2012, Cost $455,716) (a)(b) | | | 435,000 | | | | 453,939 | |
| Encana Corp., 4.750%, 10/15/2013 (b) | | | 500,000 | | | | 520,376 | |
| Ensco PLC, 3.250%, 3/15/2016 (b) | | | 750,000 | | | | 787,563 | |
| Freeport-McMoRan Copper & Gold, Inc., 1.400%, 2/13/2015 | | | 415,000 | | | | 413,583 | |
| Noble Holding International, Ltd., 3.450%, 8/1/2015 (b) | | | 750,000 | | | | 789,488 | |
| Occidental Petroleum Corp., 1.500%, 2/15/2018 | | | 425,000 | | | | 426,324 | |
| Petrobras International Finance Co. - Pifco, 2.875%, 2/6/2015 (b) | | | 830,000 | | | | 842,450 | |
| Rio Tinto Finance USA, Ltd., 8.950%, 5/1/2014 (b) | | | 350,000 | | | | 399,657 | |
| | | | | | | | 5,795,014 | |
| Professional, Scientific, and Technical Services - 0.64% | | | | | | | | |
| Asciano Finance, Ltd., 3.125%, 9/23/2015 | | | | | | | | |
| (Acquired 05/24/2012, Cost $998,750) (a)(b) | | | 1,000,000 | | | | 995,237 | |
| Vivendi SA, 2.400%, 4/10/2015 | | | | | | | | |
| (Acquired 04/03/2012 and 04/10/2012, Cost $1,002,555) (a)(b) | | | 1,000,000 | | | | 990,096 | |
| | | | | | | | 1,985,333 | |
| Real Estate and Rental and Leasing - 0.29% | | | | | | | | |
| Penske Truck Leasing Co. LP / PTL Finance Corp., 3.125%, 5/11/2015 | | | | | | | | |
| (Acquired 05/14/2012, Cost $908,403) (a) | | | 900,000 | | | | 905,382 | |
| Retail Trade - 1.12% | | | | | | | | |
| DIRECTV Holdings LLC / DIRECTV Financing Co., Inc., 3.125%, 2/15/2016 | | | 500,000 | | | | 520,899 | |
| Express Scripts Holding Co., 3.500%, 11/15/2016 | | | | | | | | |
| (Acquired 6/27/2012, Cost $1,057,030) (a) | | | 1,000,000 | | | | 1,052,864 | |
| Home Depot, Inc., 5.400%, 3/1/2016 | | | 500,000 | | | | 576,412 | |
| Phillips 66, 2.950%, 5/1/2017 (Acquired 03/07/2012, Cost $999,820) (a) | | | 1,000,000 | | | | 1,027,568 | |
| Target Corp., 4.000%, 6/15/2013 | | | 300,000 | | | | 309,342 | |
| | | | | | | | 3,487,085 | |
| Transportation and Warehousing - 0.17% | | | | | | | | |
| United Parcel Service, Inc., 3.875%, 4/1/2014 | | | 500,000 | | | | 527,536 | |
| The accompanying notes are an integral part of these consolidated financial statements. | | |
CONSOLIDATED SCHEDULE OF INVESTMENTS ( CONTINUED) ● 15
| | | Principal Amount | | | Value | |
| Utilities - 0.93% | | | | | | |
| Commonwealth Edison Co., 1.625%, 1/15/2014 | | $ | 300,000 | | | $ | 304,044 | |
| Duke Energy Corp., 3.950%, 9/15/2014 | | | 400,000 | | | | 424,591 | |
| McDonald’s Corp., 1.875%, 5/29/2019 | | | 1,000,000 | | | | 997,740 | |
| MidAmerican Energy Co., 4.650%, 10/1/2014 | | | 150,000 | | | | 162,034 | |
| Sempra Energy, 2.300%, 4/1/2017 | | | 1,000,000 | | | | 1,024,847 | |
| | | | | | | | 2,913,256 | |
| | | | | | | | | |
| TOTAL CORPORATE BONDS (Cost $89,701,562) | | | | | | | 90,375,895 | |
| | | | | | | | | |
| MORTGAGE BACKED SECURITIES - 14.21% | | | | | | | | |
| Bear Stearns Commercial Mortgage Securities | | | | | | | | |
| 5.718%, 9/11/2038 | | | 1,235,000 | | | | 1,402,858 | |
| 5.405%, 12/11/2040 | | | 250,000 | | | | 279,364 | |
| Citigroup/Deutsche Bank Commercial Mortgage Trust, | | | | | | | | |
| 5.219%, 7/15/2044 | | | 255,000 | | | | 283,770 | |
| Commercial Mortgage Pass Through Certificates, 1.156%, 12/10/2044 | | | 951,665 | | | | 954,847 | |
| DBUBS Mortgage Trust, 3.642%, 8/10/2044 | | | 1,990,000 | | | | 2,145,057 | |
| Extended Stay America Trust, 2.951%, 11/5/2027 | | | | | | | | |
| (Acquired 11/03/2011 and 06/27/2012, Cost $1,332,605) (a) | | | 1,324,687 | | | | 1,334,574 | |
| Fannie Mae Pool | | | | | | | | |
| 4.553%, 6/1/2013 | | | 961,189 | | | | 973,040 | |
| 2.670%, 1/1/2016 | | | 390,855 | | | | 401,477 | |
| 3.500%, 2/1/2021 | | | 204,459 | | | | 216,200 | |
| 3.500%, 6/1/2021 | | | 267,152 | | | | 282,493 | |
| 3.000%, 8/1/2021 | | | 755,815 | | | | 796,619 | |
| 3.000%, 9/1/2021 | | | 827,966 | | | | 872,665 | |
| 3.000%, 11/1/2021 | | | 1,557,963 | | | | 1,642,073 | |
| 3.500%, 12/1/2025 | | | 1,177,420 | | | | 1,245,401 | |
| 4.000%, 3/1/2026 | | | 731,609 | | | | 778,982 | |
| 3.500%, 7/1/2026 | | | 628,201 | | | | 664,472 | |
| 3.500%, 7/1/2026 | | | 574,377 | | | | 607,540 | |
| 3.500%, 9/1/2026 | | | 1,072,034 | | | | 1,133,930 | |
| 3.000%, 10/1/2026 | | | 264,707 | | | | 277,678 | |
| Fannie Mae-Aces, 3.400%, 7/25/2019 | | | 823,827 | | | | 878,796 | |
| FDIC Structured Sale Guaranteed Notes | | | | | | | | |
| 0.720%, 12/4/2020 (Acquired 02/24/2012, Cost $872,364) (a) | | | 866,470 | | | | 872,427 | |
| 3.250%, 4/25/2038 (Acquired 03/01/2012, Cost $1,193,732) (a) | | | 1,166,140 | | | | 1,193,836 | |
| 0.795%, 2/25/2048 (Acquired 11/18/2011, Cost $988,959) (a) | | | 990,507 | | | | 991,196 | |
| FDIC Trust | | | | | | | | |
| 1.840%, 4/25/2031 (Acquired 06/06/2012, Cost $889,019) (a) | | | 882,447 | | | | 893,253 | |
| 0.841%, 5/25/2035 (Acquired 05/10/2012, Cost $1,939,752) (a) | | | 1,939,751 | | | | 1,939,518 | |
| FHLMC Multifamily Structured Pass Through Certificates | | | | | | | | |
| 1.873%, 1/25/2018 | | | 722,540 | | | | 740,858 | |
| 1.560%, 10/25/2018 | | | 1,750,000 | | | | 1,778,473 | |
| Fosse Master Issuer PLC, 1.855%, 10/18/2054 | | | | | | | | |
| (Acquired 09/30/2011 and 06/27/2102, Cost $1,502,195) (a)(b) | | | 1,500,000 | | | | 1,508,233 | |
| Freddie Mac REMICS, 2.500%, 2/15/2026 | | | 142,233 | | | | 146,105 | |
| Greenwich Capital Commercial Funding Corp., 5.736%, 12/10/2049 | | | 250,000 | | | | 277,038 | |
| GS Mortgage Securities Corp. II | | | | | | | | |
| 4.751%, 7/10/2039 | | | 250,000 | | | | 269,890 | |
| 3.849%, 12/10/2043 (Acquired 04/11/2012, Cost $1,546,142) (a) | | | 1,444,659 | | | | 1,554,063 | |
| 2.999%, 8/10/2044 | | | 1,715,000 | | | | 1,808,044 | |
| The accompanying notes are an integral part of these consolidated financial statements. |
16 ● CONSOLIDATED SCHEDULE OF INVESTMENTS (CONTINUED)
| | | Principal Amount | | | Value | |
| Holmes Master Issuer PLC, 2.105%, 10/15/2054 | | | | | | |
| (Acquired 01/18/2012, Cost $1,000,000) (a)(b) | | $ | 1,000,000 | | | $ | 1,007,634 | |
| JP Morgan Chase Commercial Mortgage Securities Corp. | | | | | | | | |
| 3.853%, 6/15/2043 (Acquired 12/30/2011, Cost $1,537,986) (a) | | | 1,466,061 | | | | 1,557,858 | |
| 2.749%, 11/15/2043 (Acquired 11/01/2011, Cost $915,501) (a) | | | 905,625 | | | | 936,235 | |
| 5.195%, 12/15/2044 | | | 250,000 | | | | 279,680 | |
| 1.875%, 2/15/2046 (Acquired 09/20/2011, Cost $813,903) (a) | | | 809,291 | | | | 816,497 | |
| 5.447%, 6/12/2047 | | | 1,029,916 | | | | 1,085,925 | |
| 5.794%, 2/12/2051 | | | 1,400,000 | | | | 1,618,389 | |
| Morgan Stanley Capital I, Inc. | | | | | | | | |
| 4.970%, 12/15/2041 | | | 390,000 | | | | 407,467 | |
| 6.278%, 1/11/2043 | | | 250,000 | | | | 299,954 | |
| 3.884%, 9/15/2047 | | | | | | | | |
| (Acquired 09/20/2011 and 06/28/2012, Cost $2,284,207) (a) | | | 2,150,000 | | | | 2,312,495 | |
| 2.178%, 7/15/2049 | | | 1,104,599 | | | | 1,131,251 | |
| NCUA Guaranteed Notes | | | | | | | | |
| 0.616%, 11/6/2017 | | | 184,594 | | | | 184,651 | |
| 0.696%, 1/8/2020 | | | 134,824 | | | | 135,120 | |
| 0.646%, 2/6/2020 | | | 159,130 | | | | 159,204 | |
| 0.696%, 10/7/2020 | | | 198,113 | | | | 198,515 | |
| WIMC Capital Trust, 4.549%, 10/16/2050 | | | | | | | | |
| (Acquired 06/21/2012, Cost $999,990) (a) | | | 1,000,000 | | | | 1,002,188 | |
| | | | | | | | | |
| TOTAL MORTGAGE BACKED SECURITIES (Cost $43,848,617) | | | | | | | 44,277,833 | |
| | | | | | | | | |
| MUNICIPAL BONDS - 1.82% | | | | | | | | |
| Louisiana Local Government Environmental Facilities & | | | | | | | | |
| Community Development Authority, 1.520%, 2/1/2018 | | | 557,417 | | | | 562,963 | |
| Metropolitan Council of Minneapolis, 1.200%, 9/1/2017 | | | 2,020,000 | | | | 1,994,669 | |
| Port of Seattle, WA, 0.883%, 11/1/2013 | | | 1,500,000 | | | | 1,502,610 | |
| State of Ohio, 3.328%, 8/1/2017 | | | 1,500,000 | | | | 1,647,345 | |
| | | | | | | | | |
| TOTAL MUNICIPAL BONDS (Cost $5,749,741) | | | | | | | 5,707,587 | |
| | | | | | | | | |
| FOREIGN GOVERNMENT BONDS - 0.76% | | | | | | | | |
| Hydro Quebec, 2.000%, 6/30/2016 (b) | | | 900,000 | | | | 931,755 | |
| Province of Ontario Canada, 2.950%, 2/5/2015 (b) | | | 380,000 | | | | 400,907 | |
| Province of Ontario Canada, 1.600%, 9/21/2016 (b) | | | 1,000,000 | | | | 1,018,019 | |
| | | | | | | | | |
| TOTAL FOREIGN GOVERNMENT BONDS (Cost $2,315,446) | | | | | | | 2,350,681 | |
| | | | | | | | | |
| U.S. GOVERNMENT AGENCY ISSUES - 13.10% | | | | | | | | |
| Federal Farm Credit Banks, 1.625%, 11/19/2014 | | | 250,000 | | | | 257,381 | |
| Federal Home Loan Banks | | | | | | | | |
| 1.750%, 8/22/2012 | | | 250,000 | | | | 250,555 | |
| 1.625%, 11/21/2012 | | | 250,000 | | | | 251,423 | |
| 1.500%, 1/16/2013 | | | 250,000 | | | | 251,668 | |
| 1.625%, 3/20/2013 | | | 250,000 | | | | 252,441 | |
| 3.625%, 5/29/2013 | | | 500,000 | | | | 515,254 | |
| 1.875%, 6/21/2013 | | | 125,000 | | | | 126,957 | |
| 0.500%, 8/28/2013 | | | 1,500,000 | | | | 1,503,580 | |
| 5.250%, 9/13/2013 | | | 2,000,000 | | | | 2,117,492 | |
| 0.375%, 11/27/2013 | | | 6,500,000 | | | | 6,504,290 | |
| The accompanying notes are an integral part of these consolidated financial statements. |
CONSOLIDATED SCHEDULE OF INVESTMENTS ( CONTINUED) ● 17
| | | Principal Amount | | | Value | |
| Federal Home Loan Mortgage Corp. | | | | | | |
| 4.625%, 10/25/2012 | | $ | 100,000 | | | $ | 101,413 | |
| 0.375%, 11/30/2012 | | | 125,000 | | | | 125,145 | |
| 4.500%, 1/15/2013 | | | 250,000 | | | | 255,704 | |
| 0.750%, 3/28/2013 | | | 125,000 | | | | 125,452 | |
| 1.625%, 4/15/2013 | | | 250,000 | | | | 252,678 | |
| 3.500%, 5/29/2013 | | | 1,100,000 | | | | 1,132,516 | |
| 4.500%, 7/15/2013 | | | 100,000 | | | | 104,411 | |
| 4.125%, 9/27/2013 | | | 250,000 | | | | 261,854 | |
| 0.875%, 10/28/2013 | | | 3,650,000 | | | | 3,677,203 | |
| 4.500%, 1/15/2014 | | | 100,000 | | | | 106,343 | |
| 2.500%, 4/23/2014 | | | 250,000 | | | | 259,736 | |
| 1.000%, 7/30/2014 | | | 500,000 | | | | 506,166 | |
| 1.000%, 8/27/2014 | | | 3,000,000 | | | | 3,040,770 | |
| 2.875%, 2/9/2015 | | | 125,000 | | | | 132,706 | |
| 1.750%, 9/10/2015 | | | 1,000,000 | | | | 1,037,375 | |
| 2.000%, 8/25/2016 | | | 1,500,000 | | | | 1,576,144 | |
| 1.500%, 9/21/2016 | | | 750,000 | | | | 751,543 | |
| 1.000%, 3/8/2017 | | | 6,000,000 | | | | 6,032,454 | |
| Federal National Mortgage Association | | | | | | | | |
| 1.125%, 7/30/2012 | | | 100,000 | | | | 100,076 | |
| 0.625%, 9/24/2012 | | | 250,000 | | | | 250,299 | |
| 4.750%, 11/19/2012 | | | 250,000 | | | | 254,373 | |
| 0.375%, 12/28/2012 | | | 250,000 | | | | 250,288 | |
| 1.750%, 2/22/2013 | | | 100,000 | | | | 100,925 | |
| 0.750%, 2/26/2013 | | | 125,000 | | | | 125,397 | |
| 1.250%, 8/20/2013 | | | 250,000 | | | | 252,636 | |
| 0.750%, 12/18/2013 | | | 250,000 | | | | 251,652 | |
| 2.500%, 5/15/2014 | | | 1,500,000 | | | | 1,559,535 | |
| 0.625%, 10/30/2014 | | | 1,060,000 | | | | 1,064,692 | |
| 0.750%, 12/19/2014 | | | 3,500,000 | | | | 3,525,221 | |
| 2.375%, 7/28/2015 | | | 1,000,000 | | | | 1,055,202 | |
| 1.250%, 9/28/2016 | | | 525,000 | | | | 534,168 | |
| | | | | | | | | |
| TOTAL U.S. GOVERNMENT AGENCY ISSUES (Cost $40,636,182) | | | | 40,835,118 | |
| | | | | | | | | |
| U.S. TREASURY OBLIGATIONS - 17.47% | | | | | | | | |
| U.S. Treasury Bills | | | | | | | | |
| 0.100%, 9/28/2016 (d)(e) | | | 5,000 | | | | 5,000 | |
| 0.070%, 9/28/2016 (d)(e) | | | 10,000 | | | | 9,999 | |
| U.S. Treasury Notes | | | | | | | | |
| 0.375%, 08/31/2012 (e) | | | 14,140,000 | | | | 14,146,080 | |
| 4.250%, 09/30/2012 (e) | | | 12,600,000 | | | | 12,727,474 | |
| 0.500%, 11/30/2012 (e) | | | 12,640,000 | | | | 12,656,786 | |
| 0.625%, 02/28/2013 (e) | | | 14,850,000 | | | | 14,892,932 | |
| | | | | | | | | |
| TOTAL U.S. TREASURY OBLIGATIONS (Cost $54,440,816) | | | | 54,438,271 | |
The accompanying notes are an integral part of these consolidated financial statements.
18 ● CONSOLIDATED SCHEDULE OF INVESTMENTS (CONTINUED)
| MONEY MARKET FUNDS - 3.21% | | Shares | | | Value | |
| Fidelity Institutional Money Market Portfolio - Class I , 0.18% (f) | | | 10,002,403 | | | $ | 10,002,403 | |
| | | | | | | | | |
| TOTAL MONEY MARKET FUNDS (Cost $10,002,403) | | | | | | | 10,002,403 | |
| | | | | | | | | |
| TOTAL INVESTMENTS (Cost $284,366,303) - 91.69% | | | | | | | 285,759,178 | |
| Other Assets in Excess of Liabilities - 8.31% | | | | | | | 25,902,314 | |
| TOTAL NET ASSETS - 100.00% | | | | | | $ | 311,661,492 | |
(a) Restricted security as defined in Rule 144(a) under the Securities Act of 1933 and determined to be liquid. Purchased in a private placement transaction; resale to the public may require registration or may extend only to qualified institutional buyers. At June 30, 2012, the fair value of these securities total $44,118,448 which represents 14.16% of total net assets.
(b) Foreign issued security.
(c) Variable rate security. The rate reported is the rate in effect as of June 30, 2012.
(d) Zero coupon bond. The rate quoted is the effective yield as of June 30, 2012.
(e) These securities are pledged as collateral for the trading of futures contracts.
(f) The rate quoted is the annualized seven-day effective yield as of June 30, 2012.
CONSOLIDATED SCHEDULE OF FUTURES CONTRACTS ● 19
| LoCorr Managed Futures Strategy Fund | | | | | | | | |
| Consolidated Schedule of Futures Contracts | |
| June 30, 2012 (Unaudited) | | | | | | | | | | |
| | | | | | | | | | Unrealized | |
| | | Contracts | | Expiration | | Notional | | | Appreciation/ | |
| | | | | Date | | Amount | | | (Depreciation) | |
| LONG FUTURES CONTRACTS | | | | | | | | | | |
| 90 Day Australian Bank Bill Future | | | 39 | | Dec 2012 | | $ | 39,619,499 | | | $ | (14,466 | ) |
| 90 Day Australian Bank Bill Future | | | 96 | | Mar 2013 | | | 97,536,856 | | | | (23,811 | ) |
| 90 Day Sterling Future | | | 453 | | Mar 2013 | | | 88,053,378 | | | | 100,292 | |
| 90 Day Sterling Future | | | 695 | | Jun 2013 | | | 135,106,537 | | | | 233,101 | |
| 2 Year Euro Schatz Future | | | 1,407 | | Sep 2012 | | | 196,743,185 | | | | (281,796 | ) |
| 2 Year US Treasury Note Future | | | 1,992 | | Sep 2012 | | | 438,613,699 | | | | (393,424 | ) |
| 3 Year Australian Bond Future | | | 339 | | Sep 2012 | | | 38,301,994 | | | | (116,673 | ) |
| 3 Month Canadian Bankers Acceptance Future | | | 23 | | Dec 2012 | | | 5,581,132 | | | | (565 | ) |
| 3 Month Euroswiss Future | | | 29 | | Dec 2012 | | | 7,639,941 | | | | (4,925 | ) |
| 3 Month Euro Euribor Future | | | 782 | | Mar 2013 | | | 246,181,062 | | | | 185,412 | |
| 3 Month Euro Euribor Future | | | 732 | | Jun 2013 | | | 230,382,688 | | | | 239,164 | |
| 3 Month Eurodollar Future | | | 867 | | Jun 2013 | | | 215,557,875 | | | | 127,425 | |
| 5 Year Euro Bobl Future | | | 429 | | Sep 2012 | | | 68,345,748 | | | | (709,162 | ) |
| 5 Year US Treasury Note Future | | | 1,121 | | Sep 2012 | | | 138,969,025 | | | | (109,485 | ) |
| 5 Year US Treasury Note Future* | | | 16 | | Sep 2012 | | | 1,986,875 | | | | 4,400 | |
| 10 Year Australian Bond Future | | | 97 | | Sep 2012 | | | 12,455,379 | | | | (34,024 | ) |
| 10 Year Canadian Bond Future | | | 390 | | Sep 2012 | | | 53,035,556 | | | | 352,952 | |
| 10 Year Euro Bund Future | | | 131 | | Sep 2012 | | | 23,358,517 | | | | (424,601 | ) |
| 10 Year US Treasury Note Future | | | 499 | | Sep 2012 | | | 66,554,125 | | | | (124,125 | ) |
| 30 Year Euro Buxl Future | | | 31 | | Sep 2012 | | | 5,136,851 | | | | (323,032 | ) |
| Brent Crude Oil Future | | | 13 | | Aug 2012 | | | 1,271,400 | | | | 93,200 | |
| Brent Crude Oil Future | | | 72 | | Oct 2012 | | | 7,038,000 | | | | 235,400 | |
| CAC 40 10 Future | | | 76 | | Jul 2012 | | | 3,070,008 | | | | 141,490 | |
| CME 3 Month Eurodollar Future | | | 151 | | Mar 2013 | | | 37,551,813 | | | | (3,888 | ) |
| Corn Future | | | 144 | | Dec 2012 | | | 4,570,200 | | | | 38,413 | |
| Crude Oil Future | | | 259 | | Sep 2012 | | | 22,110,830 | | | | 745,290 | |
| Euro-BTP Italian Bond Future | | | 31 | | Sep 2012 | | | 3,941,104 | | | | 95,685 | |
| FTSE 100 Index Future | | | 73 | | Sep 2012 | | | 6,314,373 | | | | 55,363 | |
| FTSE/JSE Top 40 Index Future | | | 386 | | Sep 2012 | | | 13,950,857 | | | | (279,664 | ) |
| Gilt Future | | | 145 | | Sep 2012 | | | 27,048,832 | | | | (112,935 | ) |
| Gold Future | | | 32 | | Aug 2012 | | | 5,133,440 | | | | 48,000 | |
| Japanese Government 10-year Future | | | 88 | | Sep 2012 | | | 158,187,527 | | | | 115,594 | |
| LME Aluminum Future | | | 48 | | Sep 2012 | | | 2,291,400 | | | | (15,088 | ) |
| LME Lead Future | | | 7 | | Sep 2012 | | | 325,413 | | | | (8,344 | ) |
| LME Nickel Future | | | 14 | | Sep 2012 | | | 1,405,236 | | | | (3,048 | ) |
| LME TIN Future | | | 3 | | Sep 2012 | | | 281,715 | | | | (12,600 | ) |
| LME ZINC Future | | | 16 | | Sep 2012 | | | 751,800 | | | | 10,538 | |
| Mexico Bolsa Index Future | | | 27 | | Sep 2012 | | | 818,722 | | | | 36,783 | |
| Mini DJIA Future | | | 35 | | Sep 2012 | | | 2,242,800 | | | | 12,225 | |
| NASDAQ 100 E-Mini Future | | | 150 | | Sep 2012 | | | 7,837,500 | | | | 115,120 | |
| Nikkei 225 Index Future | | | 30 | | Sep 2012 | | | 1,684,181 | | | | 32,401 | |
| OMX 30 Index Future | | | 124 | | Jul 2012 | | | 1,844,104 | | | | 71,678 | |
| S&P 500 E-Mini Future | | | 47 | | Sep 2012 | | | 3,191,888 | | | | 42,750 | |
| SET 50 Index Future | | | 42 | | Sep 2012 | | | 1,076,052 | | | | 25,538 | |
| The accompanying notes are an integral part of these consolidated financial statements. | |
20 ● CONSOLIDATED SCHEDULE OF FUTURES CONTRACTS (CONTINUED)
| | | | | | | | | | Unrealized | |
| | | Contracts | | Expiration | | Notional | | | Appreciation/ | |
| | | | | Date | | Amount | | | (Depreciation) | |
| Soybean Future | | | 83 | | Nov 2012 | | $ | 5,925,163 | | | $ | 81,113 | |
| Soybean Future | | | 129 | | Dec 2012 | | | 5,328,990 | | | | 238,700 | |
| Topix Index Future | | | 52 | | Sep 2012 | | | 5,002,565 | | | | 105,336 | |
| U.S. Long Bond Future | | | 187 | | Sep 2012 | | | 27,670,166 | | | | (258,219 | ) |
| Wheat Future | | | 12 | | Dec 2012 | | | 466,050 | | | | (2,563 | ) |
| | | | | | | | | | | | | | |
| Total Long Futures Contracts | | | | | | | $ | 2,467,492,051 | | | $ | 326,925 | |
| | | | | | | | | | | | | | |
| | | | | | | | | | | | | | |
| | | | | | | | | | | | | | |
| | | | | | | | | | | | | | |
| | | | | | | | | | | | | | |
| | | | | | | | | | | | Unrealized | |
| | | Contracts | | Expiration | | Notional | | | Appreciation/ | |
| | | | | | Date | | Amount | | | (Depreciation) | |
| SHORT FUTURES CONTRACTS | | | | | | | | | | | | | |
| Amsterdam Index Future | | | (30 | ) | Jul 2012 | | | (2,332,954 | ) | | $ | (100,316 | ) |
| Cocoa Future | | | (136 | ) | Sep 2012 | | | (3,115,760 | ) | | | (78,270 | ) |
| Coffee Future | | | (81 | ) | Sep 2012 | | | (5,185,013 | ) | | | (450,544 | ) |
| Copper Future | | | (58 | ) | Sep 2012 | | | (5,069,925 | ) | | | (277,163 | ) |
| Corn Future | | | (31 | ) | Sep 2012 | | | (974,175 | ) | | | (84,338 | ) |
| Cotton Future | | | (119 | ) | Dec 2012 | | | (4,244,135 | ) | | | (105,980 | ) |
| Crude Oil Future | | | (108 | ) | Aug 2012 | | | (10,562,400 | ) | | | (405,160 | ) |
| Crude Oil Future | | | (346 | ) | Aug 2012 | | | (29,396,160 | ) | | | (1,113,130 | ) |
| Crude Oil Future | | | (36 | ) | Sep 2012 | | | (3,073,320 | ) | | | (97,200 | ) |
| Crude Oil Future | | | (113 | ) | Sep 2012 | | | (11,060,440 | ) | | | (477,680 | ) |
| Crude Oil Future | | | (25 | ) | Feb 2013 | | | (2,189,000 | ) | | | (76,940 | ) |
| DAX Index Future | | | (5 | ) | Sep 2012 | | | (1,014,221 | ) | | | (11,136 | ) |
| FTSE/MIB Index Future | | | (33 | ) | Sep 2012 | | | (2,985,118 | ) | | | (238,155 | ) |
| Gas Oil Future | | | (38 | ) | Aug 2012 | | | (3,204,350 | ) | | | (109,275 | ) |
| Gas Oil Future | | | (121 | ) | Jul 2012 | | | (10,266,850 | ) | | | (397,750 | ) |
| Hang Seng Index Future | | | (7 | ) | Jul 2012 | | | (877,442 | ) | | | (21,584 | ) |
| Hard Red Winter Wheat Future | | | (18 | ) | Dec 2012 | | | (700,650 | ) | | | (80,263 | ) |
| Heating Oil Future | | | (27 | ) | Sep 2012 | | | (3,074,954 | ) | | | (78,687 | ) |
| Heating Oil Future | | | (102 | ) | Aug 2012 | | | (11,609,212 | ) | | | (433,486 | ) |
| H-Shares Index Future | | | (63 | ) | Jul 2012 | | | (3,872,357 | ) | | | (36,846 | ) |
| Ibex 35 Index Future | | | (31 | ) | Jul 2012 | | | (2,740,609 | ) | | | (147,480 | ) |
| ISE 30 Futures | | | (49 | ) | Aug 2012 | | | (207,813 | ) | | | (5,398 | ) |
| KOSPI 200 Index Future | | | (31 | ) | Sep 2012 | | | (3,325,053 | ) | | | 51,927 | |
| Lean Hogs Future | | | (47 | ) | Aug 2012 | | | (1,781,770 | ) | | | (130,810 | ) |
| Live Cattle Future | | | (109 | ) | Aug 2012 | | | (5,251,620 | ) | | | (55,810 | ) |
| LME Aluminum Future | | | (261 | ) | Sep 2012 | | | (12,459,488 | ) | | | 655,956 | |
| LME Copper Future | | | (28 | ) | Sep 2012 | | | (5,382,650 | ) | | | (102,575 | ) |
| LME Lead Future | | | (133 | ) | Sep 2012 | | | (6,182,838 | ) | | | 169,700 | |
| LME Nickel Future | | | (64 | ) | Sep 2012 | | | (6,423,936 | ) | | | (15,078 | ) |
| LME Tin Future | | | (12 | ) | Sep 2012 | | | (1,126,860 | ) | | | 26,420 | |
| LME Zinc Future | | | (230 | ) | Sep 2012 | | | (10,807,125 | ) | | | (52,900 | ) |
| MSCI Singapore Index Future | | | (6 | ) | Jul 2012 | | | (314,600 | ) | | | (8,526 | ) |
| MSCI Taiwan Index Future | | | (34 | ) | Jul 2012 | | | (861,560 | ) | | | (26,580 | ) |
| Natural Gas Future | | | (3 | ) | Sep 2012 | | | (84,990 | ) | | | (1,320 | ) |
| Natural Gas Future | | | (34 | ) | Aug 2012 | | | (960,160 | ) | | | (32,970 | ) |
| The accompanying notes are an integral part of these consolidated financial statements. | |
CONSOLIDATED SCHEDULE OF FUTURE S CONTRACTS (CONTINUED) ● 21
| | | | | | | | | | Unrealized | |
| | | Contracts | | Expiration | | Notional | | | Appreciation/ | |
| | | | | Date | | Amount | | | (Depreciation) | |
| Natural Gas Future | | | (63 | ) | Oct 2012 | | $ | (1,812,510 | ) | | $ | (185,020 | ) |
| Natural Gas Future | | | (63 | ) | Nov 2012 | | | (1,947,330 | ) | | | (210,690 | ) |
| Palladium Future | | | (33 | ) | Sep 2012 | | | (1,929,015 | ) | | | 51,095 | |
| Platinum Future | | | (58 | ) | Oct 2012 | | | (4,211,960 | ) | | | (52,305 | ) |
| RBOB Gasoline Future | | | (9 | ) | Aug 2012 | | | (994,820 | ) | | | (58,766 | ) |
| RBOB Gasoline Future | | | (8 | ) | Sep 2012 | | | (859,320 | ) | | | (35,196 | ) |
| Rubber Future | | | (39 | ) | Dec 2012 | | | (574,742 | ) | | | - | |
| Russell 200 Mini Future | | | (49 | ) | Sep 2012 | | | (3,906,280 | ) | | | (133,010 | ) |
| S&P/TSX 60 Index Future | | | (67 | ) | Sep 2012 | | | (8,694,667 | ) | | | (152,130 | ) |
| SGX CNX Nifty Index Future | | | (221 | ) | Jul 2012 | | | (2,340,169 | ) | | | (82,672 | ) |
| Silver Future | | | (15 | ) | Sep 2012 | | | (2,070,900 | ) | | | (5,175 | ) |
| Soybean Oil Future | | | (119 | ) | Dec 2012 | | | (3,789,912 | ) | | | (195,840 | ) |
| SPI 200 Index Future | | | (14 | ) | Sep 2012 | | | (1,453,318 | ) | | | (12,026 | ) |
| STOXX 50 Index Future | | | (10 | ) | Sep 2012 | | | (285,371 | ) | | | 1,519 | |
| Sugar #11 Future | | | (219 | ) | Oct 2012 | | | (5,153,333 | ) | | | (395,304 | ) |
| TAIEX Bank and Insurance Future | | | (36 | ) | Jul 2012 | | | (914,064 | ) | | | (1,205 | ) |
| Taiex Electronics Future | | | (8 | ) | Jul 2012 | | | (288,519 | ) | | | (4,725 | ) |
| Taiwan Stock Exchange Future | | | (25 | ) | Jul 2012 | | | (1,190,229 | ) | | | (15,192 | ) |
| VIX Future | | | (81 | ) | Jul 2012 | | | (1,579,500 | ) | | | 194,450 | |
| | | | | | | | | | | | | | |
| Total Short Futures Contracts | | | | | | | $ | (216,715,467 | ) | | $ | (5,641,539 | ) |
| Total Futures Contracts | | | | | | | $ | 2,250,776,584 | | | $ | (5,314,614 | ) |
* Long futures contract held by LoCorr Managed Futures Strategy Fund. The total balance of unrealized depreciation on futures contracts held by Millburn Diversified Plus L.P. is $(5,319,014).
The accompanying notes are an integral part of these consolidated financial statements.
22 ● CONSOLIDATED SCHEDULE OF FORWARD CURRENCY CONTRACTS
| LoCorr Managed Futures Strategy Fund | | | | | | | | |
| Consolidated Schedule of Forward Currency Contracts | |
| June 30, 2012 (Unaudited) | | | | | | | | | | |
| | | | | | | | | | | | | |
| LONG FORWARD CURRENCY CONTRACTS | | | | | | | | |
| Expiration | | Currency Purchased | | Notional Value | | | | |
| Date | Description | Currency | | Amount | | Currency | | Amount | | | Fair Value | |
| Sept 2012 | AUD/CHF | AUD | | 19,570,000 | | CHF | | | (19,887,243 | ) | | | $219,613 | |
| Sept 2012 | AUD/EUR | AUD | | 20,857,311 | | EUR | | | (21,195,422 | ) | | | 235,570 | |
| Sept 2012 | AUD/GBP | AUD | | 12,215,839 | | GBP | | | (12,413,866 | ) | | | 193,293 | |
| Sept 2012 | AUD/USD | AUD | | 15,870,000 | | USD | | | (16,127,263 | ) | | | 434,811 | |
| Sept 2012 | BRL/USD | BRL | | 4,020,000 | | USD | | | (1,969,621 | ) | | | 54,184 | |
| Sept 2012 | CAD/USD | CAD | | 9,400,000 | | USD | | | (9,220,369 | ) | | | 24,733 | |
| Sept 2012 | CHF/AUD | CHF | | 2,588,856 | | AUD | | | (2,733,242 | ) | | | 5,690 | |
| Sept 2012 | CHF/NO | CHF | | 3,790,000 | | NO | | | (4,001,377 | ) | | | 62,996 | |
| Sept 2012 | CHF/USD | CHF | | 18,310,000 | | USD | | | (19,331,189 | ) | | | 41,567 | |
| Sept 2012 | CLP/USD | CLP | | 1,456,000,000 | | USD | | | (2,874,743 | ) | | | 34,378 | |
| Sept 2012 | COP/USD | COP | | 20,180,000,000 | | USD | | | (11,166,791 | ) | | | 222,223 | |
| Sept 2012 | CZK/USD | CZK | | 42,950,000 | | USD | | | (2,130,145 | ) | | | 28,617 | |
| Sept 2012 | EUR/AUD | EUR | | 2,270,000 | | AUD | | | (2,874,772 | ) | | | 2,081 | |
| Sept 2012 | EUR/CZK | EUR | | 4,020,000 | | CZK | | | (5,091,005 | ) | | | 82,023 | |
| Sept 2012 | EUR/NO | EUR | | 1,900,000 | | NO | | | (2,406,196 | ) | | | 1,742 | |
| Sept 2012 | EUR/PLN | EUR | | 8,640,000 | | PLN | | | (10,941,862 | ) | | | 212,275 | |
| Sept 2012 | EUR/RON | EUR | | 7,220,000 | | RON | | | (9,143,546 | ) | | | 63,270 | |
| Sept 2012 | EUR/SEK | EUR | | 1,880,000 | | SEK | | | (2,380,868 | ) | | | 1,724 | |
| Sept 2012 | EUR/TRY | EUR | | 600,000 | | TRY | | | (759,852 | ) | | | 550 | |
| Sept 2012 | EUR/USD | EUR | | 74,920,000 | | USD | | | (94,880,124 | ) | | | 592,971 | |
| Sept 2012 | GBP/AUD | GBP | | 1,730,000 | | AUD | | | (2,713,085 | ) | | | 3,652 | |
| Sept 2012 | GBP/USD | GBP | | 8,170,000 | | USD | | | (12,812,661 | ) | | | 99,681 | |
| Sept 2012 | HUF/EUR | HUF | | 1,256,680,200 | | EUR | | | (5,502,208 | ) | | | 135,266 | |
| Sept 2012 | IDR/USD | IDR | | 308,000,000 | | USD | | | (32,464 | ) | | | 179 | |
| Sept 2012 | ILS/USD | ILS | | 890,000 | | USD | | | (226,893 | ) | | | 873 | |
| Sept 2012 | JPY/USD | JPY | | 3,612,000,000 | | USD | | | (45,280,731 | ) | | | (193,673 | ) |
| Sept 2012 | KRW/USD | KRW | | 1,828,000,000 | | USD | | | (1,592,473 | ) | | | 19,082 | |
| Sept 2012 | MXN/USD | MXN | | 69,530,000 | | USD | | | (5,158,948 | ) | | | 23,167 | |
| Sept 2012 | MYR/USD | MYR | | 630,000 | | USD | | | (198,720 | ) | | | 1,752 | |
| Sept 2012 | NO/CHF | NO | | 143,062,848 | | CHF | | | (23,935,318 | ) | | | 434,157 | |
| Sept 2012 | NO/EUR | NO | | 110,644,776 | | EUR | | | (18,511,570 | ) | | | 279,017 | |
| Sept 2012 | NO/USD | NO | | 80,990,000 | | USD | | | (13,550,138 | ) | | | 6,374 | |
| Sept 2012 | NZD/USD | NZD | | 14,040,000 | | USD | | | (11,196,302 | ) | | | 201,549 | |
| Sept 2012 | PHP/USD | PHP | | 136,090,000 | | USD | | | (3,231,927 | ) | | | 47,248 | |
| Sept 2012 | PLN/EUR | PLN | | 30,792,009 | | EUR | | | (9,132,928 | ) | | | 124,460 | |
| Sept 2012 | PLN/USD | PLN | | 7,480,000 | | USD | | | (2,218,572 | ) | | | 34,820 | |
| Sept 2012 | RON/EUR | RON | | 12,079,050 | | EUR | | | (3,400,580 | ) | | | 17,220 | |
| Sept 2012 | RUB/USD | RUB | | 11,310,000 | | USD | | | (344,254 | ) | | | (1,269 | ) |
| Sept 2012 | SEK/EUR | SEK | | 128,154,768 | | EUR | | | (18,461,063 | ) | | | 346,001 | |
| Sept 2012 | SEK/USD | SEK | | 103,800,000 | | USD | | | (14,952,688 | ) | | | 152,273 | |
| Sept 2012 | SGD/USD | SGD | | 5,260,000 | | USD | | | (4,151,354 | ) | | | 30,249 | |
| Sept 2012 | TRY/EUR | TRY | | 51,615,244 | | EUR | | | (28,073,935 | ) | | | 102,950 | |
| Sept 2012 | TRY/USD | TRY | | 13,790,000 | | USD | | | (7,500,489 | ) | | | 117,034 | |
| | | | | | | | | | | | | | | |
| The accompanying notes are an integral part of these consolidated financial statements. | |
CONSOLIDATED SCHEDULE OF FORWAR D CURRENCY CONTRACTS ( CONTINUED) ● 23
| Expiration | | Currency Purchased | | Notional Value | | | | |
| Date | Description | Currency | Amount | | Currency | | Amount | | | Fair Value | |
| Sept 2012 | USD/BRL | USD | | 9,985,329 | | BRL | | | (9,985,329 | ) | | | - | |
| Sept 2012 | USD/CAD | USD | | 12,276,729 | | CAD | | | (12,276,729 | ) | | | - | |
| Sept 2012 | USD/CHF | USD | | 33,794,920 | | CHF | | | (33,794,920 | ) | | | - | |
| Sept 2012 | USD/CLP | USD | | 12,384,250 | | CLP | | | (12,384,250 | ) | | | - | |
| Sept 2012 | USD/COP | USD | | 1,489,297 | | COP | | | (1,489,297 | ) | | | - | |
| Sept 2012 | USD/CZK | USD | | 4,429,327 | | CZK | | | (4,429,327 | ) | | | - | |
| Sept 2012 | USD/EUR | USD | | 111,111,759 | | EUR | | | (111,111,759 | ) | | | - | |
| Sept 2012 | USD/GBP | USD | | 11,353,910 | | GBP | | | (11,353,910 | ) | | | - | |
| Sept 2012 | USD/IDR | USD | | 1,805,296 | | IDR | | | (1,805,296 | ) | | | - | |
| Sept 2012 | USD/ILS | USD | | 14,607,990 | | ILS | | | (14,607,990 | ) | | | - | |
| Sept 2012 | USD/INR | USD | | 6,067,118 | | INR | | | (6,067,118 | ) | | | - | |
| Sept 2012 | USD/JPY | USD | | 60,169,035 | | JPY | | | (60,169,035 | ) | | | - | |
| Sept 2012 | USD/KRW | USD | | 16,908,397 | | KRW | | | (16,908,397 | ) | | | - | |
| Sept 2012 | USD/MXN | USD | | 9,794,698 | | MXN | | | (9,794,698 | ) | | | - | |
| Sept 2012 | USD/MYR | USD | | 973,573 | | MYR | | | (973,573 | ) | | | - | |
| Sept 2012 | USD/NO | USD | | 15,644,391 | | NO | | | (15,644,391 | ) | | | - | |
| Sept 2012 | USD/NZD | USD | | 6,076,536 | | NZD | | | (6,076,536 | ) | | | - | |
| Sept 2012 | USD/PHP | USD | | 842,536 | | PHP | | | (842,536 | ) | | | - | |
| Sept 2012 | USD/PLN | USD | | 3,639,685 | | PLN | | | (3,639,685 | ) | | | - | |
| Sept 2012 | USD/RUB | USD | | 3,245,469 | | RUB | | | (3,245,469 | ) | | | - | |
| Sept 2012 | USD/SEK | USD | | 15,374,068 | | SEK | | | (15,374,068 | ) | | | - | |
| Sept 2012 | USD/SGD | USD | | 5,747,740 | | SGD | | | (5,747,740 | ) | | | - | |
| Sept 2012 | USD/ZAR | USD | | 7,869,395 | | ZAR | | | (7,869,395 | ) | | | - | |
| Sept 2012 | ZAR/EUR | ZAR | | 58,067,617 | | EUR | | | (7,023,787 | ) | | | 61,586 | |
| Sept 2012 | ZAR/USD | ZAR | | 28,530,000 | | USD | | | (3,450,954 | ) | | | 30,670 | |
| Total Long Forward Currency Contracts | | | | | | | | $ | 4,588,629 | |
| | | | | | | | | | | | | | | |
| SHORT FORWARD CURRENCY CONTRACTS | | | | | | | | |
| Expiration | | Currency Purchased | | Notional Value | | | | |
| Date | Description | Currency | | Amount | | Currency | | Amount | | | Fair Value | |
| Sept 2012 | AUD/CHF | AUD | | (2,690,000 | ) | CHF | | | 2,733,607 | | | $ | (6,055 | ) |
| Sept 2012 | AUD/EUR | AUD | | (2,828,874 | ) | EUR | | | 2,874,732 | | | | (2,042 | ) |
| Sept 2012 | AUD/GBP | AUD | | (2,669,909 | ) | GBP | | | 2,713,190 | | | | (3,757 | ) |
| Sept 2012 | AUD/USD | AUD | | (6,410,000 | ) | USD | | | 6,513,910 | | | | (109,140 | ) |
| Sept 2012 | BRL/USD | BRL | | (20,580,000 | ) | USD | | | 10,083,284 | | | | (97,955 | ) |
| Sept 2012 | CAD/USD | CAD | | (12,630,000 | ) | USD | | | 12,388,644 | | | | (111,915 | ) |
| Sept 2012 | CHF/AUD | CHF | | (18,539,381 | ) | AUD | | | 19,573,363 | | | | 94,267 | |
| Sept 2012 | CHF/NO | CHF | | (22,500,000 | ) | NO | | | 23,754,875 | | | | (253,714 | ) |
| Sept 2012 | CHF/USD | CHF | | (32,410,000 | ) | USD | | | 34,217,578 | | | | (422,657 | ) |
| Sept 2012 | CLP/USD | CLP | | (6,526,500,000 | ) | USD | | | 12,885,997 | | | | (501,747 | ) |
| Sept 2012 | COP/USD | COP | | (2,677,000,000 | ) | USD | | | 1,481,343 | | | | 7,953 | |
| Sept 2012 | CZK/EUR | CZK | | (103,798,930 | ) | EUR | | | 5,148,003 | | | | (139,021 | ) |
| Sept 2012 | CZK/USD | CZK | | (92,140,000 | ) | USD | | | 4,569,768 | | | | (140,441 | ) |
| Sept 2012 | EUR/AUD | EUR | | (16,490,000 | ) | AUD | | | 20,883,252 | | | | 76,599 | |
| Sept 2012 | EUR/HUF | EUR | | (4,220,000 | ) | HUF | | | 5,344,289 | | | | 22,653 | |
| Sept 2012 | EUR/NO | EUR | | (14,500,000 | ) | NO | | | 18,363,078 | | | | (130,525 | ) |
| Sept 2012 | EUR/PLN | EUR | | (7,120,000 | ) | PLN | | | 9,016,904 | | | | (8,437 | ) |
| The accompanying notes are an integral part of these consolidated financial statements. | |
24 ● CONSOLIDATED SCHEDULE OF FORWARD CURRENCY CONTRACTS (CONTINUED)
| Expiration | Currency Purchased | | Notional Value | | | | |
| Date | Description | Currency | | Amount | | Currency | | Amount | | | Fair Value | |
| Sept 2012 | EUR/RON | EUR | | (2,690,000 | ) | RON | | | 3,406,668 | | | $ | (23,308 | ) |
| Sept 2012 | EUR/SEK | EUR | | (14,370,000 | ) | SEK | | | 18,198,443 | | | | (83,381 | ) |
| Sept 2012 | EUR/TRY | EUR | | (21,960,000 | ) | TRY | | | 27,810,565 | | | | 160,420 | |
| Sept 2012 | EUR/USD | EUR | | (88,600,000 | ) | USD | | | 112,204,738 | | | | (1,092,980 | ) |
| Sept 2012 | EUR/ZAR | EUR | | (5,490,000 | ) | ZAR | | | 6,952,641 | | | | 9,560 | |
| Sept 2012 | GBP/AUD | GBP | | (7,780,000 | ) | AUD | | | 12,201,041 | | | | 19,532 | |
| Sept 2012 | GBP/USD | GBP | | (7,320,000 | ) | USD | | | 11,479,643 | | | | (125,732 | ) |
| Sept 2012 | IDR/USD | IDR | | (17,437,000,000 | ) | USD | | | 1,837,911 | | | | (32,615 | ) |
| Sept 2012 | ILS/USD | ILS | | (57,210,000 | ) | USD | | | 14,584,900 | | | | 23,089 | |
| Sept 2012 | INR/USD | INR | | (342,810,000 | ) | USD | | | 6,076,970 | | | | (9,852 | ) |
| Sept 2012 | JPY/USD | JPY | | (4,764,000,000 | ) | USD | | | 59,722,426 | | | | 446,609 | |
| Sept 2012 | KRW/USD | KRW | | (19,935,000,000 | ) | USD | | | 17,366,495 | | | | (458,098 | ) |
| Sept 2012 | MXN/USD | MXN | | (141,710,000 | ) | USD | | | 10,514,518 | | | | (719,821 | ) |
| Sept 2012 | MYR/USD | MYR | | (3,090,000 | ) | USD | | | 974,673 | | | | (1,099 | ) |
| Sept 2012 | NO/CHF | NO | | (23,955,958 | ) | CHF | | | 4,007,983 | | | | (69,602 | ) |
| Sept 2012 | NO/EUR | NO | | (14,366,470 | ) | EUR | | | 2,403,601 | | | | 853 | |
| Sept 2012 | NO/USD | NO | | (95,490,000 | ) | USD | | | 15,976,080 | | | | (331,689 | ) |
| Sept 2012 | NZD/USD | NZD | | (7,730,000 | ) | USD | | | 6,164,346 | | | | (87,809 | ) |
| Sept 2012 | PHP/USD | PHP | | (36,010,000 | ) | USD | | | 855,182 | | | | (12,646 | ) |
| Sept 2012 | PLN/EUR | PLN | | (38,635,002 | ) | EUR | | | 11,459,164 | | | | (729,577 | ) |
| Sept 2012 | PLN/USD | PLN | | (13,170,000 | ) | USD | | | 3,906,230 | | | | (266,545 | ) |
| Sept 2012 | RON/EUR | RON | | (32,621,404 | ) | EUR | | | 9,183,809 | | | | (103,533 | ) |
| Sept 2012 | RUB/USD | RUB | | (111,410,000 | ) | USD | | | 3,391,100 | | | | (145,630 | ) |
| Sept 2012 | SEK/EUR | SEK | | (16,519,466 | ) | EUR | | | 2,379,677 | | | | (532 | ) |
| Sept 2012 | SEK/USD | SEK | | (111,350,000 | ) | USD | | | 16,040,288 | | | | (666,219 | ) |
| Sept 2012 | SGD/USD | SGD | | (7,390,000 | ) | USD | | | 5,832,416 | | | | (84,675 | ) |
| Sept 2012 | TRY/EUR | TRY | | (1,399,350 | ) | EUR | | | 761,117 | | | | (1,816 | ) |
| Sept 2012 | USD/AUD | USD | | (15,692,453 | ) | AUD | | | 15,692,453 | | | | - | |
| Sept 2012 | USD/BRL | USD | | (1,915,437 | ) | BRL | | | 1,915,437 | | | | - | |
| Sept 2012 | USD/CAD | USD | | (9,195,635 | ) | CAD | | | 9,195,635 | | | | - | |
| Sept 2012 | USD/CHF | USD | | (19,289,622 | ) | CHF | | | 19,289,622 | | | | - | |
| Sept 2012 | USD/CLP | USD | | (2,840,365 | ) | CLP | | | 2,840,365 | | | | - | |
| Sept 2012 | USD/COP | USD | | (10,944,568 | ) | COP | | | 10,944,568 | | | | - | |
| Sept 2012 | USD/CZK | USD | | (2,101,528 | ) | CZK | | | 2,101,528 | | | | - | |
| Sept 2012 | USD/EUR | USD | | (94,287,153 | ) | EUR | | | 94,287,153 | | | | - | |
| Sept 2012 | USD/GBP | USD | | (12,712,980 | ) | GBP | | | 12,712,980 | | | | - | |
| Sept 2012 | USD/IDR | USD | | (32,285 | ) | IDR | | | 32,285 | | | | - | |
| Sept 2012 | USD/ILS | USD | | (226,020 | ) | ILS | | | 226,020 | | | | - | |
| Sept 2012 | USD/JPY | USD | | (45,474,404 | ) | JPY | | | 45,474,404 | | | | - | |
| Sept 2012 | USD/KRW | USD | | (1,573,391 | ) | KRW | | | 1,573,391 | | | | - | |
| Sept 2012 | USD/MXN | USD | | (5,135,781 | ) | MXN | | | 5,135,781 | | | | - | |
| Sept 2012 | USD/MYR | USD | | (196,967 | ) | MYR | | | 196,967 | | | | - | |
| Sept 2012 | USD/NO | USD | | (13,543,765 | ) | NO | | | 13,543,765 | | | | - | |
| Sept 2012 | USD/NZD | USD | | (10,994,753 | ) | NZD | | | 10,994,753 | | | | - | |
| Sept 2012 | USD/PHP | USD | | (3,184,680 | ) | PHP | | | 3,184,680 | | | | - | |
| Sept 2012 | USD/PLN | USD | | (2,183,752 | ) | PLN | | | 2,183,752 | | | | - | |
| Sept 2012 | USD/RUB | USD | | (345,523 | ) | RUB | | | 345,523 | | | | - | |
| Sept 2012 | USD/SEK | USD | | (14,800,415 | ) | SEK | | | 14,800,415 | | | | - | |
| Sept 2012 | USD/SGD | USD | | (4,121,105 | ) | SGD | | | 4,121,105 | | | | - | |
| | | | | | | | | | | | | | | |
| The accompanying notes are an integral part of these consolidated financial statements. | |
CONSOLIDATED SCHEDULE OF FORWARD CURRENCY CONTRACTS (CONTINUED) ● 25
| Expiration | Currency Purchased | Notional Value | | |
| Date | Description | Currency | Amount | Currency | Amount | Fair Value |
| Sept 2012 | USD/TRY | USD | (7,383,455) | TRY | 7,383,455 | | |
| Sept 2012 | USD/ZAR | USD | (3,420,284) | ZAR | 3,420,284 | | - |
| Sept 2012 | ZAR/USD | ZAR | (68,820,000) | USD | 8,324,382 | | (454,987) |
| Total Short Forward Currency Contracts | | | | $(6,568,017) |
| | | | | | | | |
| Total Forward Currency Contracts | | | | | $(1,979,388) |
| | | Currency | | Currency | | Currency |
| | Currency | Descriptions | Currency | Descriptions | Currency | Descriptions |
| | AUD | Australian dollar | IDR | Indoneasian rupiah | PLN | Polish zloty |
| | BRL | Brazil real | ILS | Isreali shekel | RON | Romanian leu |
| | CAD | Canadian dollar | INR | Indian rupee | RUB | Russian ruble |
| | CHF | Swiss franc | JPY | Japanese yen | SEK | Swedish krona |
| | CLP | Chilean peso | KRW | Korean won | SGD | Singapore dollar |
| | COP | Colombian peso | MXN | Mexican peso | TRY | Turkish lira |
| | CZK | Czech koruna | MYR | Malaysian ringgit | USD | United States dollar |
| | EUR | Euro | NO | Norwegian krone | ZAR | South African rand |
| | GBP | British pound | NZD | New Zealand dollar | | |
| | HUF | Hungarian forint | PHP | Philippine peso | | |
The accompanying notes are an integral part of these consolidated financial statements.
26 ● PORTFOLIO COMPOSITION
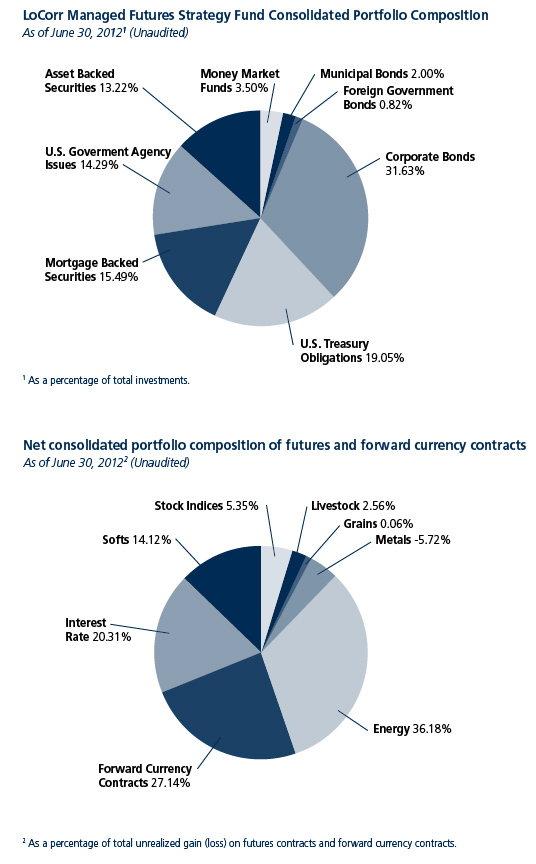
2 As a percentage of total unrealized gain (loss) on futures contracts and forward currency contracts held by Millburn Commodity Plus L.P.
The accompanying notes are an integral part of these consolidated financial statements.
CONSOLIDATED SCHEDULE OF INVESTMENTS ● 27
| LoCorr Long/Short Commodities Strategy Fund | | | | | | |
| Consolidated Schedule of Investments | | | | | | |
| June 30, 2012 (Unaudited) | | | | | | |
| | | Principal Amount | | | Value | |
| ASSET BACKED SECURITIES - 1.96% | | | | | | |
| AmeriCredit Automobile Receivables Trust, 0.710%, 12/8/2015 | | $ | 25,000 | | | $ | 25,000 | |
| Bank of America Auto Trust, 0.780%, 6/15/2016 | | | 10,000 | | | | 10,022 | |
| CNH Equipment Trust, 0.860%, 9/15/2017 | | | 15,000 | | | | 15,017 | |
| GE Equipment Small Ticket LLC, 1.040%, 9/21/2015 | | | | | | | | |
| (Acquired on 5/22/2012, Cost $14,997) (a) | | | 15,000 | | | | 15,026 | |
| Navistar Financial Corp. Owner Trust, 0.850%, 3/18/2015 | | | | | | | | |
| (Acquired on 6/20/2012, Cost $25,000) (a) | | | 25,000 | | | | 24,992 | |
| Santander Drive Auto Receivables Trust, 0.790%, 8/17/2015 | | | 25,000 | | | | 24,993 | |
| TOTAL ASSET BACKED SECURITIES (Cost $114,993) | | | | | | | 115,050 | |
| | | | | | | | | |
| | | | | | | | | |
| CORPORATE BONDS - 6.21% | | | | | | | | |
| Construction - 0.26% | | | | | | | | |
| ABB Treasury Center USA, Inc., 2.500%, 6/15/2016 | | | | | | | | |
| (Acquired on 6/19/2012, Cost $15,513) (a) | | | 15,000 | | | | 15,514 | |
| Finance and Insurance - 2.34% | | | | | | | | |
| American Express Credit Corp., 2.800%, 9/19/2016 | | | 10,000 | | | | 10,432 | |
| Berkshire Hathaway Finance Corp., 1.600%, 5/15/2017 | | | 10,000 | | | | 10,070 | |
| Boston Properties LP, 5.000%, 6/1/2015 | | | 10,000 | | | | 10,865 | |
| Caterpillar Financial Services Corp., 1.100%, 5/29/2015 | | | 10,000 | | | | 10,056 | |
| Dragon 2012 LLC, 1.972%, 3/12/2024 | | | 25,000 | | | | 24,901 | |
| Helios Leasing I LLC, 2.018%, 5/29/2024 | | | 25,000 | | | | 24,967 | |
| John Deere Capital Corp., 0.950%, 6/29/2015 | | | 15,000 | | | | 15,025 | |
| PNC Funding Corp., 2.700%, 9/19/2016 | | | 10,000 | | | | 10,364 | |
| Toyota Motor Credit Corp., 2.050%, 1/12/2017 | | | 10,000 | | | | 10,221 | |
| Vornado Realty LP, 4.250%, 4/1/2015 | | | 10,000 | | | | 10,546 | |
| | | | | | | | 137,447 | |
| Information - 0.32% | | | | | | | | |
| AT&T, Inc., 1.700%, 6/1/2017 | | | 10,000 | | | | 10,046 | |
| Comcast Corp., 4.950%, 6/15/2016 | | | 8,000 | | | | 8,981 | |
| | | | | | | | 19,027 | |
| Management of Companies and Enterprises - 0.19% | | | | | | | | |
| BAE Systems Holdings, Inc., 5.200%, 8/15/2015 | | | | | | | | |
| (Acquired on 6/4/2012, Cost $10,873) (a) | | | 10,000 | | | | 10,880 | |
| Manufacturing - 1.29% | | | | | | | | |
| Baxter International, Inc., 1.850%, 1/15/2017 | | | 10,000 | | | | 10,218 | |
| Covidien International Finance SA, 1.350%, 5/29/2015 (b) | | | 7,000 | | | | 7,009 | |
| Kellogg Co., 1.750%, 5/17/2017 | | | 10,000 | | | | 9,999 | |
| Kraft Foods Group, Inc., 1.625%, 6/4/2015 | | | | | | | | |
| (Acquired on 5/30/2012, Cost $9,974) (a) | | | 10,000 | | | | 10,106 | |
| Lockheed Martin Corp., 2.125%, 9/15/2016 | | | 10,000 | | | | 10,236 | |
| Parker Hannifin Corp., 5.500%, 5/15/2018 | | | 10,000 | | | | 11,956 | |
| Thermo Fisher Scientific, Inc., 5.000%, 6/1/2015 | | | 10,000 | | | | 11,167 | |
| United Technologies Corp., 1.200%, 6/1/2015 | | | 5,000 | | | | 5,058 | |
| | | | | | | | 75,749 | |
| The accompanying notes are an integral part of these consolidated financial statements. | | |
28 ● CONSOLIDATED SCHEDULE OF INVESTMENTS (CONTINUED)
| | | Principal Amount | | | Value | |
| Mining, Quarrying, and Oil and Gas Extraction - 0.60% | | | | | | |
| Devon Energy Corp., 1.875%, 5/15/2017 | | $ | 10,000 | | | $ | 10,002 | |
| Rio Tinto Finance USA PLC, 2.000%, 3/22/2017 (b) | | | 10,000 | | | | 10,194 | |
| Total Capital International SA, 1.550%, 6/28/2017 (b) | | | 15,000 | | | | 15,035 | |
| | | | | | | | 35,231 | |
| Transportation & Warehousing - 0.43% | | | | | | | | |
| VRG Linhas Aereas SA, 1.000%, 6/30/2014 (b) | | | 25,000 | | | | 24,995 | |
| Utilities - 0.78% | | | | | | | | |
| McDonald’s Corp., 5.800%, 10/15/2017 | | | 10,000 | | | | 12,145 | |
| Southern California Edison Co., 4.650%, 4/1/2015 | | | 15,000 | | | | 16,410 | |
| Wisconsin Electric Power Co., 6.250%, 12/1/2015 | | | 15,000 | | | | 17,517 | |
| | | | | | | | 46,072 | |
| TOTAL CORPORATE BONDS (Cost $364,450) | | | | | | | 364,915 | |
| | | | | | | | | |
| MORTGAGE BACKED SECURITIES - 5.38% | | | | | | | | |
| Banc of America Merrill Lynch Commercial Mortgage, Inc., | | | | | | | | |
| 5.727%, 5/10/2045 | | | 20,000 | | | | 22,801 | |
| Bear Stearns Commercial Mortgage Securities, 5.537%, 10/12/2041 | | | 25,000 | | | | 28,567 | |
| Credit Suisse Mortgage Capital Certificates, 5.416%, 2/15/2039 | | | 10,000 | | | | 11,176 | |
| Fannie Mae Pool | | | | | | | | |
| 1.490%, 6/1/2017 | | | 25,000 | | | | 25,245 | |
| 3.000%, 4/1/2027 | | | 19,791 | | | | 20,770 | |
| 3.000%, 4/1/2027 | | | 9,899 | | | | 10,389 | |
| FHLMC Multifamily Structured Pass Through Certificates | | | | | | | | |
| 2.130%, 1/25/2019 | | | 30,000 | | | | 30,598 | |
| 2.086%, 3/25/2019 | | | 25,000 | | | | 25,533 | |
| Freddie Mac Gold Pool | | | | | | | | |
| 3.000%, 4/1/2027 | | | 4,953 | | | | 5,190 | |
| 3.000%, 4/1/2027 | | | 19,736 | | | | 20,760 | |
| 3.000%, 4/1/2027 | | | 14,852 | | | | 15,632 | |
| 3.000%, 5/1/2027 | | | 24,894 | | | | 26,255 | |
| LB-UBS Commercial Mortgage Trust, 5.372%, 9/15/2039 | | | 15,000 | | | | 17,039 | |
| Morgan Stanley Capital I, Inc., 5.162%, 10/12/2052 | | | 25,000 | | | | 27,860 | |
| Temporary Deal Collateral Strip Interest Series KL-UF89 , 4.530%, 8/1/2062 | | | 25,000 | | | | 27,825 | |
| TOTAL MORTGAGE BACKED SECURITIES (Cost $314,160) | | | | | | | 315,640 | |
| | | | | | | | | |
| MUNICIPAL BONDS - 3.34% | | | | | | | | |
| City of Columbus, OH., 4.090%, 7/1/2017 | | | 25,000 | | | | 27,974 | |
| City of El Paso, TX., 3.610%, 8/15/2014 | | | 50,000 | | | | 52,968 | |
| Massachusetts Health & Educational Facilities Authority, 5.260%, 10/1/2018 | | | 60,000 | | | | 72,059 | |
| State of Washington, 3.040%, 2/1/2017 | | | 40,000 | | | | 42,837 | |
| TOTAL MUNICIPAL BONDS (Cost $195,292) | | | | | | | 195,838 | |
| | | | | | | | | |
| FOREIGN GOVERNMENT BONDS - 0.43% | | | | | | | | |
| Petroleos Mexicanos, 2.000%, 12/20/2022 (b) | | | 25,000 | | | | 25,048 | |
| TOTAL FOREIGN GOVERNMENT BONDS (Cost $25,000) | | | | | | | 25,048 | |
| | | | | | | | | |
| | | | | | | | | |
| | | | | | | | | |
| The accompanying notes are an integral part of these consolidated financial statements. | | | | | | | | |
CONSOLIDATED SCHEDULE OF INVESTMENTS ( CONTINUED) ● 29
| | | Principal Amount | | | Value | |
| U.S. GOVERNMENT AGENCY ISSUES - 44.30% | | | | | | |
| Dus 5-4 1/2 Full Io, 1.500%, 7/1/2042 (c) | | $ | 35,000 | | | $ | 35,335 | |
| Federal Home Loan Banks | | | | | | | | |
| 0.375%, 1/29/2014 | | | 325,000 | | | | 325,126 | |
| 1.375%, 5/28/2014 | | | 275,000 | | | | 280,564 | |
| Federal Home Loan Mortgage Corp | | | | | | | | |
| 1.625%, 4/15/2013 | | | 195,000 | | | | 197,089 | |
| 0.500%, 4/17/2015 | | | 375,000 | | | | 375,023 | |
| 1.250%, 5/12/2017 | | | 195,000 | | | | 197,577 | |
| 1.000%, 7/28/2017 | | | 75,000 | | | | 74,961 | |
| 2.160%, 7/1/2042 (c) | | | 20,000 | | | | 20,760 | |
| 2.350%, 7/1/2042 (c) | | | 25,000 | | | | 26,013 | |
| 2.430%, 7/1/2042 (c) | | | 25,000 | | | | 26,080 | |
| 2.550%, 7/1/2042 (c) | | | 25,000 | | | | 26,153 | |
| 2.160%, 9/1/2042 (c) | | | 25,000 | | | | 25,753 | |
| Federal National Mortgage Association | | | | | | | | |
| 0.500%, 8/9/2013 | | | 200,000 | | | | 200,477 | |
| 2.750%, 3/13/2014 | | | 240,000 | | | | 249,737 | |
| 0.500%, 5/27/2015 | | | 425,000 | | | | 424,690 | |
| 0.500%, 7/2/2015 | | | 35,000 | | | | 34,957 | |
| 2.380%, 1/1/2030 (c) | | | 25,000 | | | | 25,815 | |
| 2.300%, 9/1/2042 (c) | | | 25,000 | | | | 25,783 | |
| Ginnie Mae II Pool, 5.306%, 7/20/2060 | | | 25,922 | | | | 29,456 | |
| TOTAL U.S. GOVERNMENT AGENCY ISSUES (Cost $2,596,320) | | | | 2,601,349 | |
| | | | | | | | | |
| U.S. TREASURY OBLIGATION - 1.18% | | | | | | | | |
| United States Treasury Inflation Indexed Bonds, 0.125%, 4/15/2017 | | | 65,846 | | | | 69,508 | |
| TOTAL U.S. TREASURY OBLIGATION (Cost $69,853) | | | | | | | 69,508 | |
| | | | | | | | | |
| PARTNERSHIP - 21.62% | | Shares | | | | | |
| Millburn Commodities Plus LP (d)(e) | | | 1,594 | | | | 1,269,763 | |
| TOTAL PARTNERSHIP (Cost $1,491,700) | | | | | | | 1,269,763 | |
| | | | | | | | | |
| MONEY MARKET FUNDS - 14.25% | | | | | | | | |
| Fidelity Institutional Money Market Portfolio - Class I , 0.18% (f) | | | 836,609 | | | | 836,609 | |
| TOTAL MONEY MARKET FUNDS (Cost $836,609) | | | | | | | 836,609 | |
| | | | | | | | | |
TOTAL INVESTMENTS (Cost $6,008,377) - 98.67% | | | | | | | 5,793,720 | |
| Other Assets in Excess of Liabilities - 1.33% | | | | | | | 77,973 | |
| TOTAL NET ASSETS - 100.00% | | | | | | $ | 5,871,693 | |
(a) Restricted security as defined in Rule 144(a) under the Securities Act of 1933 and determined to be liquid. Purchased in a private placement transaction; resale to the public may require registration or may extend only to qualified institutional buyers. At June 30, 2012, the fair value of these securities total $76,518 which represents 1.30% of total net assets.
(b) Foreign issued security.
(c) When-issued security. As of June 30, 2012, these securities represented $211,692 or 3.61% of total net assets.
(d) This investment is a holding of LCLSCS Fund Limited. See Note 1.
(e) Non-income producing security.
(f) The rate quoted is the annualized seven-day effective yield as of June 30, 2012.
The accompanying notes are an integral part of these consolidated financial statements.
30 ● CONSOLIDATED FINANCIAL STATEMENTS
| LoCorr Managed Futures Strategy Fund | | | |
| Consolidated Statement of Assets & Liabilities | | | |
| June 30, 2012 (Unaudited) | | | |
| | | | |
| Assets | | | |
| Investments, at value (cost $284,366,303) | | $ | 285,759,178 | |
| Cash | | | 35,544,233 | |
| Receivable for Fund shares sold | | | 5,087,587 | |
| Receivables for securities sold | | | 2,284,056 | |
| Interest receivable | | | 1,360,012 | |
| Unrealized gain on futures contracts | | | 4,730,029 | |
| Unrealized gain on forward currency contracts | | | 5,645,107 | |
| Prepaid expenses and other assets | | | 108,779 | |
| Total Assets | | $ | 340,518,981 | |
| Liabilities | | | | |
| Cash overdraft denominated in foreign currencies (cost $519,494) | | | $523,161 | |
| Payable for securities purchased | | | 9,218,661 | |
| Payable for Fund shares redeemed | | | 191,971 | |
| Payable for variation margin on futures | | | 3,375 | |
| Accrued management fees | | | 861,133 | |
| Accrued Trustees’ fees | | | 14,723 | |
| Accrued Rule 12b-1 fees | | | 215,890 | |
| Unrealized loss on futures contracts | | | 10,049,043 | |
| Unrealized gain on forward currency contracts | | | 7,624,495 | |
| Accrued expenses and other liabilities | | | 155,037 | |
| Total Liabilities | | $ | 28,857,489 | |
| Net Assets | | $ | 311,661,492 | |
| Net Assets Consist of: | | | | |
| Paid-in capital | | $ | 327,302,021 | |
| Accumulated net investment loss | | | (10,859,067 | ) |
| Accumulated net realized gain on investments | | | (1,351,582 | ) |
| Net unrealized appreciation of investments | | | 1,392,875 | |
| Net unrealized depreciation of futures contracts | | | (5,314,614 | ) |
| Net unrealized depreciation of forward currency contracts | | | (1,979,388 | ) |
| Controlling interest of the Fund | | | 309,190,245 | |
| Non-controlling interest | | | 2,471,247 | |
| NET ASSETS | | $ | 311,661,492 | |
Class A Shares 1 | | | | |
| Net assets | | $ | 129,615,366 | |
| Shares issued and outstanding (unlimited shares authorized) | | | 14,727,390 | |
| Net asset value, redemption, and minimum offering price per share (a)(b) | | $ | 8.80 | |
| Maximum offering price per share ($8.80/0.9425) (c) | | $ | 9.34 | |
Class C Shares 1 | | | | |
| Net assets | | $ | 57,405,468 | |
| Shares issued and outstanding (unlimited shares authorized) | | | 6,583,311 | |
| Net asset value, redemption, and offering price per share (a)(b) | | $ | 8.72 | |
Class I Shares 1 | | | | |
| Net assets | | $ | 122,169,411 | |
| Shares issued and outstanding (unlimited shares authorized) | | | 13,835,946 | |
| Net asset value, redemption, and offering price per share (b) | | $ | 8.83 | |
| | | | | |
| The accompanying notes are an integral part of these consolidated financial statements. | | |
CONSOLIDATED FINANCIAL STATEMENTS ● 31
| LoCorr Managed Futures Strategy Fund | | | |
| Consolidated Statement of Operations | | | |
| Six Months Ended June 30, 2012 (Unaudited) | | | |
| | | | |
| Investment Income | | | |
| Interest | | $ | 2,069,449 | |
| Total Investment Income | | | 2,069,449 | |
| Expenses | | | | |
| Management fees (Note 5) | | | 2,917,345 | |
| Fund administration fees | | | 88,574 | |
| Fund accounting fees | | | 55,319 | |
| Trustees’ fees | | | 36,703 | |
| Transfer agent fees and expenses | | | 173,634 | |
| Custodian fees | | | 5,528 | |
| Registration expenses | | | 49,971 | |
| Rule 12b-1 fees - Class A (Note 5) | | | 120,563 | |
| Rule 12b-1 fees - Class C (Note 5) | | | 229,934 | |
| Legal and audit fees | | | 53,126 | |
| Printing and mailing expenses | | | 14,160 | |
| Offering costs and expenses | | | 10,650 | |
| Other expenses | | | 271,474 | |
| Total expenses before interest expense and reimbursements | | | 4,026,981 | |
| Interest expense | | | 403,954 | |
| Plus expense recoupment by Adviser | | | 142,490 | |
| Net Expenses | | | 4,573,425 | |
| Net Investment Loss | | | (2,503,976 | ) |
| Realized and Unrealized Gain (Loss) on Investments | | | | |
| Net realized gain on investments | | | 192,854 | |
| Net realized gain on futures contracts | | | 821,113 | |
| Net realized loss on forward currency contracts | | | (2,321,418 | ) |
| Net change in unrealized appreciation of investments and foreign currency | | | 1,426,936 | |
| Net change in unrealized depreciation of futures contracts | | | (7,358,667 | ) |
| Net change in unrealized depreciation of forward currency contracts | | | (3,091,920 | ) |
| Net realized and unrealized loss on investments, futures contracts and | | | | |
| forward currency contracts | | | (10,331,102 | ) |
Net Decrease in Net Assets From Operations 2 | | $ | (12,835,078 | ) |
| 1 | Share class information on the consolidated statement of assets and liabilities does not include non-controlling interest. |
(a) A 1.00% contingent deferred sales charge may apply to redemptions made within twelve months of purchase. The contingent deferred sales charge only applies to Class A share purchases of $1 million or more.
(b) Redemptions made within 30 days of purchase may be assessed a redemptions fee of 1.00%.
(c) On investments of $25,000 or more, the offering price is reduced.
| 2 | Net decrease in net assets from operations attributable to the controlling interest and non-controlling interest was $(12,452,500) and $(382,578), respectively. |
The accompanying notes are an integral part of these consolidated financial statements.
32 ● CONSOLIDATED FINANCIAL STATEMENTS
| LoCorr Managed Futures Strategy Fund | | | | | | |
| Consolidated Statements of Changes in Net Assets | | | |
| | | | | | | |
| | | Six Months Ended | | | Period Ended | |
| | | June 30, 2012 | | | December 31, 2011* | |
| | | (Unaudited) | | | | |
| Operations | | | | | | |
| Net investment loss | | $ | (2,503,976 | ) | | $ | (1,842,028 | ) |
| Net realized gain loss on investments,futures contracts and | | | | | | | | |
| forward currency contracts | | | (1,307,451 | ) | | | (7,310,185 | ) |
| Net change in unrealized appreciation (depreciation) of | | | | | | | | |
| investments, futures contracts and forward | | | | | | | | |
| currency contracts | | | (9,023,651 | ) | | | 3,122,524 | |
| Decrease in Net Assets From Operations | | | (12,835,078 | ) | | | (6,029,689 | ) |
| | | | | | | | | |
| Capital Transactions (Note 6) - Controlling Interest | | | | | | | | |
| Proceeds from shares sold | | | 153,622,240 | | | | 212,354,656 | |
| Reinvestment of distributions | | | - | | | | - | |
| Cost of shares redeemed | | | (33,827,800 | ) | | | (6,052,572 | ) |
| Redemption Fees | | | 9,616 | | | | 4,925 | |
| Increase in Net Assets From Capital Transactions - | | | | | | | | |
| Controlling Interest | | | 119,804,056 | | | | 206,307,009 | |
| | | | | | | | | |
| Capital Transactions - Non-controlling Interest | | | | | | | | |
| Proceeds from Contributions | | | 1,796,099 | | | | 3,385,500 | |
| Withdrawals | | | (66,405 | ) | | | (800,000 | ) |
| Total Increase in Net Assets From Capital | | | | | | | | |
| Transactions - Non-controlling interest | | | 1,729,694 | | | | 2,585,500 | |
| Total Increase in Net Assets | | | 108,698,672 | | | | 202,862,820 | |
| | | | | | | | | |
| Net Assets | | | | | | | | |
| Beginning of period | | | 202,962,820 | | | | 100,000 | |
| End of period (including accumulated net investment | | | | | | | | |
| loss of $10,859,067 and $8,355,091, respectively) | | $ | 311,661,492 | | | $ | 202,962,820 | |
| | | | | | | | | |
| * Period from March 22, 2011 (commencement of operations) through December 31, 2011 | | |
The accompanying notes are an integral part of these consolidated financial statements.
CONSOLIDATED FINANCIAL HIGHLIGHTS ● 33
| LoCorr Managed Futures Strategy Fund - Class A | | | | | | |
| Consolidated Financial Highlights | | | | |
| Selected Data and Ratios (for a share outstanding throughout the period) do not include | |
| non-controlling interest | | | | | | |
| | | | | | Period from | |
| | | Six Months | | | March 22, 20111 | |
| | | Ended | | | through | |
| | | June 30, 20122 | | | December 31, 20112 | |
| | | (Unaudited) | | | | |
| Per Share | | | | | | |
| Net asset value, beginning of period | | $ | 9.33 | | | $ | 10.00 | |
| Income (loss) from investment operations: | | | | | | | | |
Net investment income (loss)3 | | | (0.09 | ) | | | (0.22 | ) |
| Net realized and unrealized gain (loss) | | | (0.44 | ) | | | (0.45 | ) |
| Total from Investment Operations | | | (0.53 | ) | | | (0.67 | ) |
| Distributions to shareholders from: | | | | | | | | |
| Net investment income | | | - | | | | - | |
| Net realized gains on investments sold | | | - | | | | - | |
| Total Distributions | | | - | | | | - | |
Redemption Fees4 | | | - | | | | - | |
| Net Asset Value, End of Period | | $ | 8.80 | | | $ | 9.33 | |
Total Investment Return5 | | | -5.68 | % | | | -6.70 | % |
| Net Assets, End of Period, in Thousands | | $ | 129,615 | | | $ | 71,532 | |
| Ratios/Supplemental Data: | | | | | | | | |
| Ratio of expenses to average net assets: | | | | | | | | |
Before expense reimbursement or recovery6 | | | 3.47 | % | | | 4.15 | % |
After expense reimbursement or recovery6 | | | 3.59 | % | | | 3.93 | % |
| Ratio of net investment income (loss) to average net assets: | | | | | |
| Before expense reimbursement or recovery | | | (1.83 | ) % | | | (3.18 | ) % |
| After expense reimbursement or recovery | | | (1.95 | ) % | | | (2.96 | ) % |
| Portfolio turnover rate | | | 12.63 | % | | | 18.22 | % |
| 1 | Commencement of share class operations. |
| 2 | All ratios have been annualized except total investment return and portfolio turnover. |
| 3 | Net investment income per share is based on average shares outstanding. |
| 4 | Amount represents less than $0.005 per share. |
| 5 | Total return excludes the effect of applicable sales charges. |
6 The ratio of expenses to average net assets included interest expense on short positions. The before expense reimbursement and after expense reimbursement ratio excluding interest on short positions were 3.16% and 3.28% respectively, for the six month period ended June 30, 2012 and 4.15% and 3.93% respectively, for the period ended December 31, 2011.
The accompanying notes are an integral part of these consolidated financial statements.
34 ● CONSOLIDATED FINANCIAL HIGHLIGHTS
| LoCorr Managed Futures Strategy Fund - Class C | | | | | | |
| Consolidated Financial Highlights | | | | |
| Selected Data and Ratios (for a share outstanding throughout the period) do not include | |
| non-controlling interest | | | | | | |
| | | | | | Period from | |
| | | Six Months | | | March 24, 20111 | |
| | | Ended | | | through | |
| | | June 30, 20122 | | | December 31, 20112 | |
| | | (Unaudited) | | | | |
| Per Share | | | | | | |
| Net asset value, beginning of period | | $ | 9.28 | | | $ | 10.00 | |
| Income (loss) from investment operations: | | | | | | | | |
Net investment income (loss)3 | | | (0.12 | ) | | | (0.27 | ) |
| Net realized and unrealized gain (loss) | | | (0.44 | ) | | | (0.45 | ) |
| Total from Investment Operations | | | (0.56 | ) | | | (0.72 | ) |
| Distributions to shareholders from: | | | | | | | | |
| Net investment income | | | - | | | | - | |
| Net realized gains on investments sold | | | - | | | | - | |
| Total Distributions | | | - | | | | - | |
Redemption Fees4 | | | - | | | | - | |
| Net Asset Value, End of Period | | $ | 8.72 | | | $ | 9.28 | |
Total Investment Return5 | | | -6.03 | % | | | -7.20 | % |
| Net Assets, End of Period, in Thousands | | $ | 57,405 | | | $ | 38,055 | |
| Ratios/Supplemental Data: | | | | | | | | |
| Ratio of expenses to average net assets: | | | | | | | | |
Before expense reimbursement or recovery6 | | | 4.22 | % | | | 4.89 | % |
After expense reimbursement or recovery6 | | | 4.34 | % | | | 4.68 | % |
| Ratio of net investment income (loss) to average net assets: | | | | | | | | |
| Before expense reimbursement or recovery | | | (2.58 | ) % | | | (3.92 | ) % |
| After expense reimbursement or recovery | | | (2.70 | ) % | | | (3.71 | ) % |
| Portfolio turnover rate | | | 12.63 | % | | | 18.22 | % |
1 Commencement of share class operations.
| 2 | All ratios have been annualized except total investment return and portfolio turnover. |
| 3 | Net investment income per share is based on average shares outstanding. |
| 4 | Amount represents less than $0.005 per share. |
| 5 | Total return excludes the effect of applicable sales charges. |
6 The ratio of expenses to average net assets included interest expense on short positions. The before expense reimbursement and after expense reimbursement ratio excluding interest on short positions were 3.91% and 4.03% respectively, for the six month period ended June 30, 2012 and 4.89% and 4.68% respectively, for the period ended December 31, 2011.
The accompanying notes are an integral part of these consolidated financial statements.
CONSOLIDATED FINANCIAL HIGHLIGHTS ● 35
| LoCorr Managed Futures Strategy Fund - Class I | | | | | | |
| Consolidated Financial Highlights | | | | |
| Selected Data and Ratios (for a share outstanding throughout the period) do not include | |
| non-controlling interest | | | | | | |
| | | | | | Period from | |
| | | Six Months | | | March 24, 20111 | |
| | | Ended | | | through | |
| | | June 30, 20122 | | | December 31, 20112 | |
| | | (Unaudited) | | | | |
| Per Share | | | | | | |
| Net asset value, beginning of period | | $ | 9.35 | | | $ | 10.00 | |
| Income (loss) from investment operations: | | | | | | | | |
Net investment income (loss)3 | | | (0.08 | ) | | | (0.20 | ) |
| Net realized and unrealized gain (loss) | | | (0.44 | ) | | | (0.45 | ) |
| Total from Investment Operations | | | (0.52 | ) | | | (0.65 | ) |
| Distributions to shareholders from: | | | | | | | | |
| Net investment income | | | - | | | | - | |
Net realized gains on investments sold | | | - | | | | - | |
| Total Distributions | | | - | | | | - | |
Redemption Fees4 | | | - | | | | - | |
| Net Asset Value, End of Period | | $ | 8.83 | | | $ | 9.35 | |
Total Investment Return5 | | | -5.56 | % | | | -6.50 | % |
| Net Assets, End of Period, in Thousands | | $ | 122,169 | | | $ | 91,161 | |
| Ratios/Supplemental Data: | | | | | | | | |
| Ratio of expenses to average net assets: | | | | | | | | |
Before expense reimbursement or recovery6 | | | 3.22 | % | | | 3.89 | % |
After expense reimbursement or recovery6 | | | 3.34 | % | | | 3.68 | % |
| Ratio of net investment income (loss) to average net assets: | | | | | | | | |
| Before expense reimbursement or recovery | | | (1.58 | ) % | | | (2.92 | ) % |
| After expense reimbursement or recovery | | | (1.70 | ) % | | | (2.71 | ) % |
| Portfolio turnover rate | | | 12.63 | % | | | 18.22 | % |
| 1 | Commencement of share class operations. |
| 2 | All ratios have been annualized except total investment return and portfolio turnover. |
| 3 | Net investment income per share is based on average shares outstanding. |
| 4 | Amount represents less than $0.005 per share. |
| 5 | Total return excludes the effect of applicable sales charges. |
6 The ratio of expenses to average net assets included interest expense on short positions. The before expense reimbursement and after expense reimbursement ratio excluding interest on short positions were 2.91% and 3.03% respectively, for the six month period ended June 30, 2012 and 3.89% and 3.68% respectively, for the period ended December 31, 2011.
The accompanying notes are an integral part of these consolidated financial statements.
36 ● CONSOLIDATED FINANCIAL STATEMENTS
| LoCorr Long/Short Commodities Strategy Fund | | | |
| Consolidated Statement of Assets & Liabilities | |
| June 30, 2012 (Unaudited) | | | |
| | | | |
| Assets | | | |
| Investments, at value (cost $6,008,377) | | $ | 5,793,720 | |
| Cash | | | 323,000 | |
| Receivable for Fund shares sold | | | 132,506 | |
| Interest receivable | | | 10,121 | |
| Total Assets | | $ | 6,259,347 | |
| | | | | |
| Liabilities | | | | |
| Payable for securities purchased | | $ | 306,105 | |
| Payable for Fund shares redeemed | | | 9,261 | |
| Accrued management fees | | | 4,424 | |
| Accrued Trustees’ fees | | | 3,843 | |
| Accrued Rule 12b-1 fees | | | 1,743 | |
| Accrued expenses and other liabilities | | | 62,278 | |
| Total Liabilities | | | $387,654 | |
| Net Assets | | $ | 5,871,693 | |
| | | | | |
| Net Assets Consist of: | | | | |
| Paid-in capital | | $ | 6,101,837 | |
| Accumulated net investment loss | | | (18,326 | ) |
| Accumulated net realized gain on investments | | | 2,839 | |
| Net unrealized depreciation of investments | | | (214,657 | ) |
| NET ASSETS | | $ | 5,871,693 | |
| | | | | |
| Class A Shares | | | | |
| Net assets | | $ | 1,917,176 | |
| Shares issued and outstanding (unlimited shares authorized) | | | 202,827 | |
| Net asset value, redemption, and minimum offering price per share (a)(b) | | $ | 9.45 | |
| Maximum offering price per share ($9.45/0.9425) (c) | | $ | 10.03 | |
| | | | | |
| Class C Shares | | | | |
| Net assets | | $ | 481,621 | |
| Shares issued and outstanding (unlimited shares authorized) | | | 51,286 | |
| Net asset value, redemption, and offering price per share (a)(b) | | $ | 9.39 | |
| | | | | |
| Class I Shares | | | | |
| Net assets | | $ | 3,472,896 | |
| Shares issued and outstanding (unlimited shares authorized) | | | 367,193 | |
| Net asset value, redemption, and offering price per share (b) | | $ | 9.46 | |
(a) A 1.00% contingent deferred sales charge may apply to redemptions made within twelve months of purchase. The contingent deferred sales charge only applies to Class A share purchases of $1 million or more.
(b) Redemptions made within 30 days of purchase may be assessed a redemption fee of 1.00%.
(c) On investments of $25,000 or more, the offering price is reduced.
The accompanying notes are an integral part of these consolidated financial statements.
CONSOLIDATED FINANCIAL STATEMENTS ● 37
| LoCorr Long/Short Commodities Strategy Fund | | | |
| Consolidated Statement of Operations | | | |
| Six Months Ended June 30, 2012 (Unaudited) | | | |
| | | | |
| Investment Income | | | |
| Interest | | $ | 4,461 | |
| Total Investment Income | | | 4,461 | |
| | | | | |
| Expenses | | | | |
| Management fees (Note 5) | | | 15,884 | |
| Fund administration fees | | | 25,460 | |
| Fund accounting fees | | | 22,377 | |
| Trustees’ fees | | | 4,578 | |
| Transfer agent fees and expenses | | | 23,146 | |
| Custodian fees | | | 3,066 | |
| Registration expenses | | | 11,931 | |
| Rule 12b-1 fees - Class A (Note 5) | | | 863 | |
| Rule 12b-1 fees - Class C (Note 5) | | | 1,283 | |
| Insurance expenses | | | 1,705 | |
| Legal and audit fees | | | 41,280 | |
| Printing and mailing expenses | | | 12,499 | |
| Other expenses | | | 2,426 | |
| Total expenses before reimbursements | | | 166,498 | |
| Less expense reimbursement by Adviser | | | (143,711 | ) |
| Net Expenses | | | 22,787 | |
| Net Investment Loss | | | (18,326 | ) |
| | | | | |
| Realized and Unrealized Gain (Loss) on Investments | | | | |
| Net realized gain on investments | | | 2,839 | |
| Net change in unrealized depreciation of investments | | | (214,657 | ) |
| Net realized and unrealized loss on investments | | | (211,818 | ) |
| | | | | |
| Net Decrease in Net Assets From Operations | | $ | (230,144 | ) |
The accompanying notes are an integral part of these consolidated financial statements.
38 ● CONSOLIDATED FINANCIAL STATEMENTS
| LoCorr Long/Short Commodities Strategy Fund | | | |
| Consolidated Statement of Changes in Net Assets | |
| | | | |
| | | Six Months Ended | |
| | | June 30, 2012 | |
| | | (Unaudited) | |
| Operations | | | |
| Net investment loss | | $ | (18,326 | ) |
| Net realized gain on investments | | | 2,839 | |
| Net change in unrealized depreciation of investments | | | (214,657 | ) |
| Decrease in Net Assets From Operations | | | (230,144 | ) |
| | | | | |
| Capital Transactions (Note 6) | | | | |
| Proceeds from shares sold | | | 6,204,015 | |
| Reinvestment of distributions | | | - | |
| Cost of shares redeemed | | | (102,234 | ) |
| Redemption Fees | | | 56 | |
| Increase in Net Assets From Capital Transactions | | | 6,101,837 | |
| Total Increase in Net Assets | | | 5,871,693 | |
| | | | | |
| Net Assets | | | | |
| Beginning of period | | | - | |
| End of period (including accumulated net investment loss of $18,326) | | $ | 5,871,693 | |
| | | | | |
The accompanying notes are an integral part of these consolidated financial statements.
CONSOLIDATED FINANCIAL HIGHLIGHTS ● 39
| LoCorr Long/Short Commodities Strategy Fund | | | | | | | |
| Consolidated Financial Highlights | | | | | | | |
| Selected Data and Ratios (for a share outstanding throughout the period). | | | | |
Six Months Ended June 30, 20121 (Unaudited) | | | | | | | | | |
| | | Class A | | | Class C | | | Class I | |
| Per Share | | | | | | | | | |
| Net asset value, beginning of period | | $ | 10.00 | | | $ | 10.00 | | | $ | 10.00 | |
| | | | | | | | | | | | | |
| Income (loss) from investment operations: | | | | | | | | | | | | |
Net investment income (loss)2,3 | | | (0.09 | ) | | | (0.12 | ) | | | (0.07 | ) |
| Net realized and unrealized gain (loss) | | | (0.46 | ) | | | (0.49 | ) | | | (0.47 | ) |
| | | | | | | | | | | | | |
| Total from Investment Operations | | | (0.55 | ) | | | (0.61 | ) | | | (0.54 | ) |
| | | | | | | | | | | | | |
| Distributions to shareholders from: | | | | | | | | | | | | |
| Net investment income | | | - | | | | - | | | | - | |
| Net realized gains on investments sold | | | - | | | | - | | | | - | |
| Total Distributions | | | - | | | | - | | | | - | |
| | | | | | | | | | | | | |
| Redemption fees | | | 0.00 | 4 | | | - | | | | 0.00 | 4 |
| | | | | | | | | | | | | |
| Net Asset Value, End of Period | | $ | 9.45 | | | $ | 9.39 | | | $ | 9.46 | |
| | | | | | | | | | | | | |
| | | | | | | | | | | | | |
Total Investment Return5 | | | -5.50 | % | | | -6.10 | % | | | -5.40 | % |
| | | | | | | | | | | | | |
| | | | | | | | | | | | | |
| | | | | | | | | | | | | |
| Net Assets, End of Period, in Thousands | | $ | 1,917 | | | $ | 482 | | | $ | 3,473 | |
| | | | | | | | | | | | | |
| Ratios/Supplemental Data: | | | | | | | | | | | | |
| Ratio of expenses to average net assets: | | | | | | | | | | | | |
Before expense reimbursement6 | | | 15.77 | % | | | 16.52 | % | | | 15.52 | % |
After expense reimbursement6 | | | 2.20 | % | | | 2.95 | % | | | 1.95 | % |
| Ratio of net investment income (loss) to | | | | | | | | | | | | |
| average net assets: | | | | | | | | | | | | |
Before expense reimbursement3 | | | (15.35 | ) % | | | (16.10 | ) % | | | (15.10 | ) % |
After expense reimbursement3 | | | (1.78 | ) % | | | (2.53 | ) % | | | (1.53 | ) % |
| Portfolio turnover rate | | | 10.74 | % | | | 10.74 | % | | | 10.74 | % |
1 | For the period ended June 30, 2012, all ratios have been annualized except total investment return and portfolio turnover. |
| 2 | Net investment income per share is based on average shares outstanding. |
3 | Recognition of net investment income by the Fund is affected by the timing of net investment income from the Partnership in which the Fund invests. The ratio does not include the net investment income of the Partnership in which the Fund invests. |
| 4 | Amount represents less than $0.005 per share. |
| 5 | Total return excludes the effect of applicable sales charges. |
| 6 | Does not include expenses of the Partnership in which the Fund invests. |
The accompanying notes are an integral part of these consolidated financial statements.
40 ● NOTES TO CONSOLIDATED FINANCIAL STATEMENTS (UNAUDITED)
LoCorr Investment Trust
Notes to the Consolidated Financial Statements
June 30, 2012 (Unaudited)
1. Organization
LoCorr Investment Trust (the “Trust”), an Ohio business trust, was formed on November 15, 2010 and is a non-diversified, open-end management investment company under the Investment Company Act of 1940, as amended. The LoCorr Managed Futures Strategy Fund and the LoCorr Long/Short Commodities Strategy Fund (individually a “Fund” and collectively the “Funds”) are series within the Trust. The LoCorr Managed Futures Strategy Fund’s primary investment objective is capital appreciation in rising and falling equity markets with managing volatility as a secondary objective. The LoCorr Long/Short Commodities Strategy Fund’s primary objective is capital appreciation in rising and falling commodities markets with managing volatility as a secondary objective. In order to achieve its investment objectives, each Fund will invest up to 25% of its total assets (measured at the time of purchase) in wholly-owned subsidiaries, LCMFS Fund Limited (“LCMFS”) and LCLSCS Fund Limited (“LCLSCS”), companies incorporated under the laws of the Cayman Islands. As of June 30, 2012, the fair value of LoCorr Managed Futures Strategy Fund’s investment in LCMFS was $71,399,212 (representing 22.91% of the LoCorr Managed Futures Strategy Fund’s consolidated net assets) and the fair value of LoCorr Long/Short Commodities Strategy Fund’s investment in LCLSCS was $1,269,763 (representing 21.63% of the LoCorr Long/Short Commodities Strategy Fund’s consolidated net assets). LCMFS and LCLSCS act as investment vehicles in order to enter into certain investments for the Funds consistent with their investment objectives and policies specified in the Prospectus and Statement of Additional Information.
As of June 30, 2012, LCMFS has a 96.65% ownership in Millburn Diversified Plus L.P. (“MD Plus”) and LCLSCS has a 45.54% ownership in Millburn Commodity Plus L.P. (“MC Plus”)(collectively the “Partnerships”). MD Plus and MC Plus are limited partnerships that were organized on February 14, 2011 and December 16, 2011, respectively, under the Delaware Revised Uniform Limited Partnership Act and commenced operations on March 24, 2011 and December 30, 2011, respectively. The Partnerships engage in speculative trading of futures and forward currency contracts. The General Partner of the Partnerships is Millburn Ridgefield Corporation (the “General Partner”).
The consolidated financial statements of the LoCorr Managed Futures Strategy Fund include the financial statements of LCMFS. In addition, because LCMFS has a controlling interest (greater than 50% but less than 100%) in MD Plus, the financial results of MD Plus as of and for the period ended June 30, 2012 have also been consolidated with the financial statements of LCMFS. All intercompany balances, revenues, and expenses have been eliminated in consolidation. LoCorr Managed Futures Strategy Fund, LCMFS and MD Plus are collectively referred to as the Fund throughout these consolidated financial statements. The LoCorr Long/Short Commodities Strategy Fund’s consolidated financial statements include the financial statements of LCLSCS, however they do not include the financial statements of MC Plus since LCLSCS does not have a controlling interest in MC Plus as of June 30, 2012.
NOTES TO CONSOLIDATED FINANCIAL STATEMENTS (UNAUDITED) (CONTINUED) ● 41
Non-controlling interest is the portion of equity ownership in MD Plus not attributable to the Fund. Non-controlling interest represents additional, non-related partners in MD Plus and for the LoCorr Managed Futures Strategy Fund it was equal to 3.35% of MD Plus’ net assets and 0.79% of the Fund’s consolidated net assets as of June 30, 2012.
The Funds currently offer three classes of shares, Class A, Class C and Class I shares. Each share class represents an interest in the same assets of the Fund, has the same rights and is identical in all material respects except that (i) Class A shares have a maximum front end sales load of 5.75% and maximum deferred sales charge of 1.00% and Class C shares have a maximum deferred sales charge of 1.00%, (ii) Class A shares have a 12b-1 fee of 0.25% and Class C shares have a 12b-1 fee of 1.00%; (iii) certain other class-specific expenses will be borne solely by the class to which such expenses are attributable and (iv) each class will have exclusive voting rights with respect to matters relating to its own distribution arrangements. All classes are subject to a 1.00% redemption fee on redemptions made within 30 days of the original purchase. The LoCorr Managed Futures Strategy Fund Class A commenced operations on March 22, 2011 and Class C and Class I commenced operations on March 24, 2011. All three classes of the LoCorr Long/Short Commodities Strategy Fund commenced operations on January 1, 2012.
The Funds may issue an unlimited number of shares of beneficial interest, with no par value. All shares of the Funds have equal rights and privileges, except as to class-specific rights and privileges described above.
2. Significant Accounting Policies
Investment Valuation
The Funds have adopted authoritative fair valuation accounting standards which establish a definition of fair value and set out a hierarchy for measuring fair value. These standards require additional disclosures about the various inputs and valuation techniques used to develop the measurements of fair value and changes in valuation techniques and related inputs during the period. These inputs are summarized in three broad levels listed below:
Level 1 – Unadjusted quoted prices in active markets for identical assets or liabilities that the Fund has the ability to access.
Level 2 – Observable inputs other than quoted prices included in Level 1 that are observable for the asset or liability, either directly or indirectly. These inputs may include quoted prices for the identical instrument on an inactive market, prices for similar instruments, interest rates, prepayment speeds, credit risk, yield curves, default rates and similar data.
Level 3 – Unobservable inputs for the asset or liability, to the extent relevant observable inputs are not available, representing the Funds’ own assumptions about the assumptions a market participant would use in valuing the asset or liability, and would be based on the best information available.
Generally, the Funds’ investments are valued each day at the last quoted sales price on each investment’s primary exchange. Investments traded or dealt in upon one or more exchanges (whether domestic or foreign) for which market quotations are readily available and not subject to restrictions against resale shall be valued at the last quoted sales price on the primary exchange or, in the absence of a sale on the primary exchange, at the last bid on the primary exchange. Investments primarily traded in the National Association of Securities Dealers’ Automated Quotation System (“NASDAQ”) National Market System for which market quotations are readily available shall be valued using the NASDAQ Official Closing Price. If market quotations are not readily available, investments will be valued at their fair value as determined in good faith by LoCorr Fund Management, LLC (the “Adviser”) in accordance with procedures approved by the Board of Trustees (the “Board”) and evaluated by the Board as to the reliability of the fair value method used. In these cases, each Fund’s net asset value (“NAV”) will reflect certain portfolio investments’ fair value rather than their market price. Fair value pricing involves subjective judgments and it is possible that the fair value determined for an investment is materially different than the value that could be realized upon the sale of that investment. The fair value prices can differ from market prices when they become available or when a price becomes available.
42 ● NOTES TO CONSOLI DATED FI NANCIAL STATEMENT S (UNAUDI TED) (CONTINUED)
The Funds may use independent pricing services to assist in calculating the value of the Funds’ investments. In addition, market prices for foreign investments are not determined at the same time of day as the NAV for the Funds. Because the Funds may invest in underlying funds which hold portfolio investments primarily listed on foreign exchanges, and these exchanges may trade on weekends or other days when the underlying funds do not price their shares, the value of some of the Funds’ portfolio investments may change on days when you may not be able to buy or sell the Funds’ shares. In computing the NAV, the Funds value foreign investments held by the Funds at the latest closing price on the exchange in which they are traded immediately prior to closing of the NYSE. Prices of foreign investments quoted in foreign currencies are translated into U.S. dollars at current rates. If events materially affecting the value of an investment in the Funds’ portfolio, particularly foreign investments, occur after the close of trading on a foreign market but before the Funds price their shares, the investment will be valued at fair value.
Fixed income securities are valued using an evaluated price supplied by an independent pricing service. Inputs used by the pricing service for U.S. government and treasury securities are normally valued using a model that incorporates market observable data such as reported sales of similar securities, broker dealer quotes, yields, bids, offers, and reference data. Agency issued debt securities, foreign issued bonds and municipal bonds are generally valued in a manner similar to U.S. government securities. Evaluations for corporate bonds are typically based on valuation methodologies such as market pricing and other analytical pricing models as well as market transactions and dealer quotations based on observable inputs. Fixed income securities are generally categorized in level 1 or level 2 of the fair value hierarchy depending on inputs used and market activity levels for specific securities.
The fair value of asset backed securities and mortgage backed securities is estimated on models that consider the estimated cash flows of each tranche of the entity, establish a benchmark yield, and develop an estimated tranche-specific spread to the benchmark yield based on the unique attributes of the tranche. Additional inputs such as creditworthiness of the underlying collateral and quotes from outside brokers for the same or similar issuance may also be considered in the development of fair value. Asset backed and mortgage backed securities are generally categorized in level 2 of the fair value hierarchy. Short-term investments in fixed income securities with maturities of less than 60 days when acquired, or which subsequently are within 60 days of maturity, are valued using an amortized cost method of valuation, and are categorized level 2.
NOTES TO CONSOLIDATED FINANCIAL STATEMENTS (UNAUDITED) (CONTINUED) ● 43
With respect to any portion of the Funds’ assets that are invested in one or more open-end management investment companies, including money market funds, registered under the 1940 Act, the Fund’s net asset value is calculated based upon the net asset values of those open-end management investment companies, and the prospectuses for these companies explain the circumstances under which those companies will use fair value pricing and the effects of using fair value pricing.
Futures contracts are stated at fair value using the primary exchange’s closing (settlement) price, and are categorized in level 1. Forward currency contracts are stated at fair value using spot currency rates and are adjusted for the time value of money (forward points) and contractual prices of the underlying financial instruments. Forward currency contracts are generally categorized in level 2.
The investment in the partnerships by the Funds are valued at their fair value. The unitized net asset value of each partnership is provided daily by the general partner via their independent administrator as of the fair value measurement date without adjustment. The Adviser has determined that the general partner and independent administrator has an effective process and related internal controls in place to estimate the fair value of the investments that are included in the net asset value calculation of the partnerships.
The following table summarizes the LoCorr Managed Futures Strategy Fund’s consolidated investments as of June 30, 2012:
| Security Classification | | Level 1 | | | Level 2 | | | Level 3 | |
| Investments | | | | | | | | | |
| Asset Backed Securities | | $ | - | | | $ | 37,771,390 | | | | $ - | |
| Corporate Bonds | | | - | | | | 90,375,895 | | | | - | |
| Mortgage Backed Securities | | | - | | | | 44,277,833 | | | | - | |
| Municipal Bonds | | | - | | | | 5,707,587 | | | | - | |
| Foreign Government Bonds | | | - | | | | 2,350,681 | | | | - | |
| U.S. Government Agency Issues | | | - | | | | 40,835,118 | | | | - | |
| U.S. Treasury Obligations | | | 54,438,271 | | | | - | | | | - | |
| Money Market Funds | | | 10,002,403 | | | | - | | | | - | |
| Total Investments | | $ | 64,440,674 | | | $ | 221,318,504 | | | | $ - | |
| | | | | | | | | | | | | |
| Futures Contracts | | | | | | | | | | | | |
| Long Futures Contracts | | | $326,925 | | | | $ - | | | | $ - | |
| Short Futures Contracts | | | (5,641,539 | ) | | | - | | | | - | |
| Total Futures Contracts | | $ | (5,314,614 | ) | | | $ - | | | | $ - | |
| Forward Currency Contracts | | | | | | | | | | | | |
| Long Forward Currency Contracts | | | $ - | | | $ | 4,588,629 | | | | $ - | |
| Short Forward Currency Contracts | | | - | | | | (6,568,017 | ) | | | - | |
| Total Forward Currency Contracts | | | $ - | | | $ | (1,979,388 | ) | | | $ - | |
44 ● NOTES TO CONSOLIDATED FINANCIAL STATEMENTS (UNAUDITED) (CONTINUED)
The following table summarizes the LoCorr Long/Short Commodities Strategy Fund’s consolidated investments as of June 30, 2012:
| Security Classification | | Level 1 | | | Level 2 | | | Level 3 | |
| Investments | | | | | | | | | |
| Asset Backed Securities | | $ | - | | | $ | 115,050 | | | | $ - | |
| Corporate Bonds | | | - | | | | 364,915 | | | | - | |
| Mortgage Backed Securities | | | - | | | | 315,640 | | | | - | |
| Municipal Bonds | | | - | | | | 195,838 | | | | - | |
| Foreign Government Bonds | | | - | | | | 25,048 | | | | - | |
| U.S. Government Agency Issues | | | - | | | | 2,601,349 | | | | - | |
| U.S. Treasury Obligations | | | 69,508 | | | | - | | | | - | |
| Partnership | | | - | | | | 1,269,763 | | | | - | |
| Money Market Funds | | | 836,609 | | | | - | | | | - | |
| Total Investments | | $ | 906,117 | | | $ | 4,887,603 | | | | $ - | |
See the consolidated schedules of investments for the investments detailed by industry classification. The Funds did not hold any level 3 assets during the period. There were no transfers between levels during the period. Transfers between levels are recognized at the end of the reporting period.
Federal Income Taxes
The Funds intend to qualify as a regulated investment company pursuant to Subchapter M of the Internal Revenue Code. Each Fund intends to distribute substantially all of its investment company net taxable income and net capital gains to shareholders. Therefore, no federal income tax provision is required. As of and during the period ended June 30, 2012 the Funds did not have any tax positions that did not meet the “more-likely-than-not” threshold of being sustained by applicable tax authorities. The Funds recognize interest and penalties, if any, related to unrecognized tax benefits on uncertain tax position income tax expense in the statements of operations. During the period, the Funds did not incur any interest or penalties. Generally, tax authorities can examine all the tax returns filed for the last three years. For tax purposes, LCMFS and LCLSCS are exempted Cayman investment companies. LCMFS and LCLSCS have received an undertaking from the Government of the Cayman Islands exempting them from all local income, profits, and capital gains taxes. No such taxes are levied in the Cayman Islands at the present time. For U.S. income tax purposes, LCMFS and LCLSCS are controlled foreign corporations (“CFC’s”) and as such are not subject to U.S. income tax. However, as a wholly-owned CFC, LCMFS’s and LCLSCS’s net income and capital gain, to the extent of its earnings and profits, will be included each year in the Funds’ investment company taxable income.
Use of Estimates
The preparation of financial statements in conformity with accounting principles generally accepted in the United States of America requires management to make estimates and assumptions that affect the reported amount of assets and liabilities, disclosure of contingent assets and liabilities at the date of the financial statements and the reported revenues and expenses during the reporting period. Actual results could differ from those estimates.
NOTES TO CONSOLIDATED FINANCIAL STATEMENTS (UNAUDITED) (CONTINUED) ● 45
Indemnifications
In the normal course of business, the Funds enter into contracts that contain general indemnifications to other parties. The Funds’ maximum exposure under these contracts is unknown as this would involve future claims that may be made against the Funds that have not yet occurred. However, based on experience, the Funds expect the risk of loss to be remote.
Security Transactions and Investment Income
Security transactions are recorded on trade date. Realized gains and losses on sales of investments are calculated on the specifically identified cost basis of the securities. Dividend income, less foreign taxes withheld, if any, are recorded on the ex-dividend date. Interest income is recognized on the accrual basis. Market discounts, premiums and original issue discounts on fixed-income securities are amortized daily over the expected life of the security using the effective yield method.
Allocation of Income and Expenses
Net investment income, other than class specific expenses, and realized and unrealized gains and losses are allocated daily to each class of shares based upon the relative net asset value of outstanding shares of each class of shares at the beginning of the day (after adjusting for the current capital shares activity of the respective class).
Distributions to Shareholders
Shareholder transactions are recorded on trade date. Dividends from net investment income are declared and paid at least annually by the Funds. Distribution of net realized capital gains, if any, are declared and paid at least annually. Distributions to shareholders are recorded on the ex-dividend date. The character of distributions made during the year from the net investment income or net realized gains may differ from the characterization for federal income tax purposes due to the difference in the recognition of income, expense and gain items for financial statement and tax purposes. There were no distributions paid during the six months ended June 30, 2012.
Distributable Earnings and Investment Transactions
Net investment income and net realized gains (losses) may differ for financial reporting and tax purposes because of temporary or permanent book/tax differences. To the extent these differences are permanent, reclassifications are made to the appropriate equity accounts in the period that the difference arises.
Additionally, U.S. generally accepted accounting principles require that certain components of net assets relating to permanent differences be reclassified between financial and tax reporting. These reclassifications have no effect on net assets or net asset value per share.
Foreign Securities and Currency
Investment securities and other assets and liabilities denominated in foreign currencies are translated into U.S. dollar amounts at the date of valuation. Purchases and sales of investment securities and income and expense items denominated in foreign currencies are translated into U.S. dollar amounts on the respective dates of such transactions.
The Funds do not isolate that portion of the results of operations resulting from changes in foreign exchange rates on investments from the fluctuations arising from changes in market prices of securities held. Such fluctuations are included with the net realized and unrealized gain or loss from investments.
46 ● NOTES TO CONSOLIDATED FINANCIAL STATEMENTS (UNAUDITED) (CONTINUED)
Reported net realized foreign exchange gains or losses arise from sales of foreign currencies, currency gains or losses realized between the trade and settlement dates on securities transactions, and the difference between the amounts of dividends, interest, and foreign withholding taxes recorded on the Funds’ books and the U.S. dollar equivalent of the amounts actually received or paid. Net unrealized foreign exchange gains and losses arise from changes in the fair values of assets and liabilities, other than investments in securities at period end, resulting from changes in exchange rates.
Futures Contracts
Gains or losses are realized when contracts are liquidated. The Funds present unrealized gains and unrealized losses on open futures contracts (the difference between the contract trade price and quoted market price) as a gross amount in the statements of assets and liabilities. However, the futures broker has the right of offset. The Funds elected not to net broker cash with cash deficit at broker, denominated in foreign currencies even though a right of offset exists for these amounts. Any change in net unrealized gain or loss is reported in the statement of operations. Brokerage commissions on open futures contracts are charged to expense when paid.
Forward Currency Contracts
Gains or losses are realized when foreign currency contracts are liquidated. The Funds present the aggregate gross unrealized gains and losses with an interbank market maker as a gross amount in the statement of assets and liabilities. However, the interbank market maker has the individual right of offset. The unrealized gains or losses on open forward currency contracts are the difference between contract trade price and market price. Any change in net unrealized gain or loss is reported in the statements of operations.
Deposits with Broker
The Funds deposit funds with J.P Morgan Securities LLC, and Citigroup Global Markets, Inc., subject to Commodity Futures Trading Commission regulations and various exchange and broker requirements. Margin requirements are satisfied by the deposit of U.S. government securities and cash with such brokers. Accordingly, assets used to meet margin and other broker or regulatory requirements are partially restricted. Each Fund earns or pays interest on its assets deposited with, or borrowed from, the brokers.
Market and Credit Risks
Futures transactions of the Funds are cleared by J.P. Morgan Securities LLC and Citigroup Global Markets, Inc., pursuant to customer agreements. For all forward currency transactions, the Funds utilize one interbank market maker, Barclays Bank PLC. The Funds engage in the speculative trading of U.S. and foreign futures and forward currency contracts (collectively, derivatives).
The Funds are exposed to both market risk, which is the risk arising from changes in the fair value of the contracts, and credit risk, which is the risk of failure by another party to perform according to the terms of a contract.
Purchase and sale of futures contracts requires margin deposits with the broker. Additional deposits may be necessary for any loss on contract value. The Commodity Exchange Act requires a broker to segregate all customer transactions and assets from such broker’s proprietary activities. A customer’s cash and other property (for example, U.S. government securities) deposited with a broker are considered commingled with all other customer funds subject to the broker’s segregation requirements. In the event of a broker’s insolvency, recovery may be limited to a pro rata share of segregated funds available. It is possible that the recovered amount could be less than total cash and other property deposited.
The Funds have a substantial portion of its assets on deposit with financial institutions in connection with their trading of forward currency contracts and their cash management activities. Assets deposited with financial institutions in connection with their trading of forward currency contracts and their cash management activities. Assets deposited with financial institutions in connection with the Funds’ trading of forward currency contracts are partially restricted due to deposit or margin requirements. As forward currency contracts are traded in unregulated markets between principals, the Funds assume the risk of loss from counterparty non-performance. At June 30, 2012, the LoCorr Managed Futures Strategy Fund had U.S. government securities on deposit with Barclays Capital (Barclays), HSBC Bank USA, N.A. (HSBC) and J.P. Morgan Securities LLC (J.P. Morgan), in the amount of $54,423,272. In the event of insolvency of Barclays, HSBC and/or J.P. Morgan, none of these assets would be subject to claims of other bank customers or the bank’s creditors. Accordingly, a bank failure should have no adverse effect on the Funds’ custodial account as the assets in the account would remain property of the Funds.
For derivatives, risks arise from changes in the fair value of the contracts. Theoretically, the Funds are exposed to a market risk equal to the notional contract value of futures and forward currency contracts purchased and unlimited liability on such contracts sold short.
The Funds also engage in investing its assets in U.S. government securities. Risks arise from investments in U.S. government securities due to possible market illiquidity. U.S. government securities are also sensitive to changes in interest rates and economic conditions.
The Funds have established procedures to actively monitor market risk and minimize credit risk, although there can be no assurance that it will, in fact, succeed in doing so.
NOTES TO CONSOLIDATED FINANCIAL STATEMENTS (UNAUDITED) (CONTINUED) ● 47
3. Derivatives
The Funds may invest in derivatives in order to hedge against market movements while liquidating certain positions and buying other securities or as substitutes for securities.
The Funds’ market risk related to its derivatives trading is influenced by a wide variety of factors, including the level and volatility of interest rates, exchange rates, weather, supply and demand of commodities, the market value of futures and forward currency contracts, the diversification effects among the Funds’ open positions and the liquidity of the markets in which they trade.
The Funds engage in the speculative trading of futures and forward currency contracts. The Managed Futures Strategy Fund trades futures contracts on interest rates, commodities, currencies, metals, energies, livestock and stock indices. The Long/Short Commodities Strategy Fund trades futures contracts on commodities, metals, energies and livestock indices. The following were the primary trading risk exposures of the Funds at June 30, 2012, by market sector:
Agricultural (grains, livestock and softs). The Funds’ primary exposure is to agricultural price movements which are often directly affected by severe or unexpected weather conditions.
48 ● NOTES TO CONSOLIDATED FINANCIAL STATEMENTS (UNAUDITED) (CONTINUED)
Currencies. Exchange rate risk is a principal market exposure of the Funds. The Funds’ currency exposure is to exchange rate fluctuations, primarily fluctuations which disrupt the historical pricing relationships
between different currencies and currency pairs. The fluctuations are influenced by interest rate changes as well as political and general economic conditions. The Funds trade in a large number of currencies including cross-rates – e.g., positions between two currencies other than the U.S. dollar.
Energy. The Funds’ primary energy market exposure is to gas and oil price movements, often resulting from political developments in the Middle East and economic conditions worldwide. Energy prices are volatile and substantial profits and losses have been and are expected to continue to be experienced in this market.
Interest rates. Interest rate movements directly affect the price of the sovereign bond futures positions held by the Funds and indirectly the value of its stock index currency positions. Interest rate movements in one country as well as relative interest rate movements between countries may materially impact the Funds’ profitability. The Funds’ primary interest rate exposure is to interest rate fluctuations in countries or regions including Australia, Canada, Japan, Switzerland, the United Kingdom, the United States and the Eurozone. However, the Funds also may take positions in futures contracts on the government debt of other nations. The Funds anticipate that interest rates in these industrialized countries or areas, both long-term and short-term, will remain a primary market exposure of the Fund for the foreseeable future.
Metals. The Funds’ metals market exposure is to fluctuations in the price of aluminum, copper, gold, lead, nickel, palladium, tin, silver and zinc.
Stock index. The Funds’ equity exposure, through stock index futures, is to equity price risk in the major industrialized countries as well as other countries.
The Funds have adopted authoritative standards regarding disclosure about derivatives and hedging activities and how they affect the Funds’ statements of asset and liabilities and statements of operations. Fair value of futures contracts in an asset position are recorded in the statements of assets and liabilities as Net unrealized gain on futures, Payable for variation margin on futures, and Net unrealized appreciation on futures. Fair value of forward currency contracts in an asset position are recorded in the statements of assets and liabilities as Net unrealized gain on forward currency contracts and Net unrealized appreciation on forward currency contracts.
Since the derivatives held long or short are for speculative trading purposes, the derivative instruments are not designated as hedging instruments. Accordingly, all realized gains and losses, as well as any change in net unrealized gains or losses on open contracts from the preceding period, are recognized as part of realized and unrealized gain (loss) in the statements of operations.
The following table presents the fair value of consolidated open futures and forward currency contracts for the LoCorr Managed Futures Strategy Fund, held long or sold short, at June 30, 2012.
NOTES TO CONSOLIDATED FINANCIAL STATEMENTS (UNAUDITED) (CONTINUED) ● 49
| June 30, 2012 | | | | | | | | |
| | Fair Value – | | Fair Value – | | |
| | Long Positions | | Short Positions | | Net Unrealized |
| Futures | | | | | | | | Gain (Loss) on |
| Contracts | Assets | | Liabilities | | Assets | | Liabilities | Open Positions |
| Energy | $ 1,073,890 | | | | | | $ (3,713,270) | $ (2,639,380) |
| Grains | 358,225 | | (2,563) | | - | | (360,440) | (4,778) |
| Interest Rate | 1,454,025 | | (2,935,131) | | - | | - | (1,481,106) |
| Livestock | - | | - | | - | | (186,620) | (186,620) |
| Metals | 58,537 | | (39,079) | | 903,171 | | (505,195) | 417,434 |
| Softs | - | | - | | - | | (1,030,098) | (1,030,098) |
| Stock Index | 638,685 | | (279,664) | | 247,896 | | (996,983) | (390,066) |
| Total Futures | | | | | | | | |
| Contracts | 3,583,362 | | (3,256,437) | | 1,151,067 | | (6,792,606) | (5,314,614) |
| Forward | | | | | | | | |
| Currency | | | | | | | | |
| Contracts | 4,783,572 | | (194,943) | | 861,535 | | (7,429,552) | (1,979,388) |
| Total Futures | | | | | | | | |
| and Forward | | | | | | | | |
| Currency | | | | | | | | |
| Contracts | $ 8,366,934 | | $ (3,451,380) | | $ 2,012,602 | | $ (14,222,158) | $ (7,294,002) |
| | | | | | | | | |
| Six Months Ended June 30, 2012 | | | | | | |
| | | | Gain (Loss) from Trading | | |
| | | | | | Change in | | Number of |
| Futures Contracts | | | Realized | | Unrealized | | Contracts Closed |
| Currency | | | | | $ | - | | 1,095 |
| Energy | | | 1,002,729 | | (2,969,636) | | 13,436 |
| Grains | | | (1,302,233) | | 435,615 | | 6,818 |
| Interest Rate | | | 7,775,358 | | (3,672,904) | | 45,416 |
| Livestock | | | (130,640) | | (183,640) | | 309 |
| Metals | | | (2,009,065) | | 513,497 | | 4,839 |
| Softs | | | 2,784,195 | | (1,268,561) | | 2,085 |
| Stock Index | | | (7,262,539) | | (213,038) | | 4,114,194 |
| Total Futures Contracts | | 821,113 | | (7,358,667) | | 4,188,192 |
| Forward Currency Contracts | | (2,321,418) | | (3,091,920) | | |
The average monthly notional amount of long and short futures and forward currency contracts during the period ended June 30, 2012 for the LoCorr Managed Futures Strategy Fund were as follows:
| | Average Monthly | Notional Amount |
| | Long Derivatives | Short Derivatives |
| Futures Contracts | $1,963,946,247 | $(187,650,195) |
| Forward Currency Contracts | 1,074,140,329 | (1,117,853,426) |
Please refer to the Funds’ prospectus for a full listing of risks associated with these investments
4. Investment Transactions
Purchases and sales of investment securities, excluding short-term securities and U.S. government obligations, during the six months ended June 30, 2012, were $138,564,386 and $24,275,858, respectively, for the LoCorr Managed Futures Strategy Fund and were $2,507,258 and $837, respectively, for the LoCorr Long/Short Commodities Strategy Fund. Purchases and sales of government securities during the six months ended June 30, 2012 aggregated $9,028,384 and $5,880,679, respectively, for the LoCorr Managed Futures Strategy Fund and aggregated $2,847,080 and $182,047, respectively, for the LoCorr Long/Short Commodities Strategy Fund.
50 ● NOTES TO CONSOLIDATED FINANCIAL STATEMENTS (UNAUDITED) (CONTINUED)
5. Management Fees and Other Transactions with Affiliates
The Funds have a Management Agreement with the Adviser, with whom certain officers and Trustees of the Funds are affiliated, to furnish investment advisory services to the Funds. Pursuant to a Management Agreement between the Funds and the Adviser, the Adviser is entitled to receive, on a monthly basis, an annual advisory fee equal to 1.50% of the Funds’ average daily net assets. Pursuant to a sub-advisory agreement between the Adviser and Nuveen Asset Management, LLC and Galliard Capital Management, Inc. (individually a “Sub-Adviser” and collectively the “Sub-Advisers”), the Sub-Advisers are entitled to receive, on a monthly basis, an annual sub-advisory fee on the fixed income portion of the Funds’ average daily net assets up to 0.18% based on the balance of sub-advised assets. The Sub-Advisers are paid by the Adviser, not the Funds. As of June 30, 2012, the LoCorr Managed Futures Strategy Fund and the LoCorr Long/Short Commodities Strategy Fund incurred $1,870,824 and $15,884, respectively, in advisory fees and owed the Adviser $424,128 and $4,424, respectively.
The Funds’ Adviser has contractually agreed to waive management fees and/or reimburse the Funds for expenses it incurs but only to the extent necessary to maintain the Funds’ total annual operating expenses after fee waiver and/or reimbursement (excluding taxes, interest, brokerage commissions, expenses incurred in connection with any merger or reorganization, indirect expenses, expenses of other investment companies in which the Funds may invest, or extraordinary expenses such as litigation) at 2.20%, 2.95% and 1.95% of the average daily net assets of Class A, Class C and Class I shares, respectively. Management excludes the expenses of the Partnership from the calculation described previously. Any waiver or reimbursement is subject to repayment by the Funds within the three fiscal years following the fiscal year in which the expenses occurred, if the Funds are able to make the repayment without exceeding their current expense limitations and the repayment is approved by the Board of Trustees. During the six months ended June 30, 2012, the Adviser recovered $142,490 of its fees related to the LoCorr Managed Futures Strategy Fund. As of June 30, 2012, the LoCorr Managed Futures Strategy Fund had $30,651 in waived fees remaining, which are subject to repayment on or before December 31, 2014. The Adviser waived $15,884 of its fees and reimbursed $127,827 of expenses related to the LoCorr Long/Short Commodities Strategy Fund, which are subject to repayment on or before December 31, 2015.
The Limited Partnership Agreements of the Partnerships provide that the General Partner receives a monthly management fee (accrued daily) in respect of each Limited Partner in an amount ranging from 1/12 of 0% to 1/12 of 2% of the Target Trading Level of such Limited Partner’s capital account at the beginning of the month prorated for partial months and adjusted for daily subscriptions and withdrawals (the “Management Fee”). The Management Fee is paid to the General Partner in arrears as of each month-end and is calculated prior to reduction for any withdrawals, profits and losses during the month, any accrued Profit Share (as defined below) or the Management Fee then being calculated. As of June 30, 2012, the General Partner was paid $1,046,521 in Management Fees, and was owed $437,005 from MD Plus.
NOTES TO CONSOLIDATED FINANCIAL STATEMENTS (UNAUDITED) (CONTINUED) ● 51
“Target Trading Level,” for purposes of calculating Management Fees, means four times the net asset value of such Limited Partner’s capital account at the beginning of the month, adjusted for subscriptions and withdrawals during the month, irrespective of any day-to-day changes in the actual trading level of each Partnership or intra-month profit of loss attributable to a Limited Partner’s capital account. Since the Management Fee is based on the Target Trading Level, as described above, and not net assets or the level at which each Partnership’s assets may actually be traded at any particular time, a 2% per annum Management Fee on the Target Trading Level calculates to an annualized 8% per annum Management Fee based on the Partnerships’ beginning of the month net assets, prorated for partial months and adjusted for daily subscriptions and withdrawals.
The Partnership Agreements provide that the General Partner is allocated a profit share of allocation ranging from 0% to 17.5% of Trading Profits (as defined in the Limited Partnership Agreements) that is deducted from the Limited Partners’ capital accounts and added to the General Partner’s capital account. However, for Limited Partners’ withdrawals during the period, the General Partner profit share allocation calculation shall be computed as though the withdrawal date was at the end of the period. For the six months ended June 30, 2012, there was no profit share allocation.
The General Partner may waive, reduce or rebate its management fee or profit share allocation (or adjust the frequency of the profit share allocation) in respect of any Limited Partner without entitling any other Limited Partner to a similar waiver, reduction, rebate or adjustment.
The LoCorr Managed Futures Strategy Fund and MD Plus have management fees that are consolidated on the statement of operations and financial highlights as of the period ended June 30, 2012. The LoCorr Long/Short Commodities Strategy Fund and MC Plus did not consolidate its management fees as of the period ended June 30, 2012.
The Funds have entered into a 12b-1 distribution agreement with Quasar Distributors, LLC (“Quasar”). Class A and Class C shareholders pay Rule 12b-1 fees to Quasar at the annual rate of 0.25% and 1.00%, respectively, of average daily net assets. Class I shareholders pay no 12b-1 fees.
6. Fund Shares
At June 30, 2012, there were an unlimited number of shares of beneficial interest authorized. The following table summarizes the activity in shares and dollar amounts applicable to each class of the Funds:
| LoCorr Managed Futures Strategy Fund – Class A | | | |
| | For the Six Months Ended | | For the Period Ended |
| | June 30, 2012 | | December 31, 20111 |
| | Shares | Amount | | Shares | Amount |
| Shares sold | 8,328,708 | $ 71,194,873 | | 7,989,613 | $76,312,992 |
| Shares redeemed | (1,265,892) | (10,509,715) | | (335,039) | (3,147,306) |
| Redemption Fees | - | 1,561 | | - | 2,847 |
| | 7,062,816 | $ 60,686,719 | | 7,654,574 | $73,168,533 |
| Beginning shares | 7,664,574 | | | 10,000 | |
| Ending shares | 14,727,390 | | | 7,664,574 | |
52 ● NOTES TO CONSOLIDATED FINANCIAL STATEMENTS (UNAUDITED) (CONTINUED)
| LoCorr Managed Futures Strategy Fund – Class C | | | |
| | For the Six Months Ended | | For the Period Ended |
| | June 30, 2012 | | December 31, 20112 |
| | Shares | Amount | | Shares | Amount |
| Shares sold | 2,769,054 | $24,608,227 | | 4,158,458 | $39,851,440 |
| Shares redeemed | (285,876) | (2,529,927) | | (58,325) | (550,168) |
| Redemption Fees | - | 3 | | - | 119 |
| | 2,483,178 | $22,078,303 | | 4,100,133 | $39,301,391 |
| Beginning shares | 4,100,133 | | | - | |
| Ending shares | 6,583,311 | | | 4,100,133 | |
| | | | | | |
| LoCorr Managed Futures Strategy Fund – Class I | | | |
| | For the Six Months Ended | | For the Period Ended |
| | June 30, 2012 | | December 31, 20112 |
| | Shares | Amount | | Shares | Amount |
| Shares sold | 6,425,069 | $57,819,140 | | 9,998,312 | $96,190,224 |
| Shares redeemed | (2,338,509) | (20,788,158) | | (248,926) | (2,355,098) |
| Redemption Fees | - | 8,052 | | - | 1,959 |
| | 4,086,560 | $37,039,034 | | 9,749,386 | $93,837,085 |
| Beginning shares | 9,749,386 | | | - | |
| Ending shares | 13,835,946 | | | 9,749,386 | |
1 Class A commenced operations on March 22, 2011. | | | | |
2 Class C and Class I commenced operations on March 24, 2011. | | | |
| | | | | | |
| LoCorr Long/Short Commodities Strategy Fund – Class A | |
| | | | | For the Six Months Ended June 30, 2012 |
| | | | | Shares | Amount |
| Shares sold | | | | 204,504 | $2,004,493 |
| Shares redeemed | | | | (1,677) | (16,451) |
| Redemption Fees | | | | - | 22 |
| | | | | 202,827 | $1,988,064 |
| Beginning shares | | | | - | |
| Ending shares | | | | 202,827 | |
| | | | | | |
| LoCorr Long/Short Commodities Strategy Fund – Class C | |
| | | | | For the Six Months Ended June 30, 2012 |
| | | | | Shares | Amount |
| Shares sold | | | | 51,286 | $502,741 |
| Shares redeemed | | | | - | - |
| Redemption Fees | | | | - | - |
| | | | | 51,286 | $502,741 |
| Beginning shares | | | | - | |
| Ending shares | | | | 51,286 | |
| | | | | | |
| LoCorr Long/Short Commodities Strategy Fund – Class I | |
| | | | | For the Six Months Ended June 30, 2012 |
| | | | | Shares | Amount |
| Shares sold | | | | 376,020 | $3,696,781 |
| Shares redeemed | | | | (8,827) | (85,783) |
| Redemption Fees | | | | - | 34 |
| | | | | 367,193 | $3,611,032 |
| Beginning shares | | | | - | |
| Ending shares | | | | 367,193 | |
NOTES TO CONSOLIDATED FINANCIALS TATEMENTS (UNAUDITED) (CONTINUED) ● 53
| 7. Federal Tax Information | | | |
| At December 31, 2011, the components of accumulated earnings (losses) on a tax basis | |
| were as follows: | | | |
| | LoCorr Managed Futures | |
| | Strategy Fund | |
| Cost of investments | | $ | 194,591,885 | |
| Gross unrealized appreciation | | $ | 378,696 | |
| Gross unrealized depreciation | | | (412,757 | ) |
| Net unrealized depreciation | | $ | (34,061 | ) |
| Undistributed ordinary income | | $ | - | |
| Undistributed long-term capital gains | | | - | |
| Total distributable earnings | | $ | - | |
| Other accumulated losses | | $ | (5,242,637 | ) |
| Total accumulated losses | | $ | (5,276,698 | ) |
The Funds are permitted to carry forward capital losses incurred. Additionally, capital loss carryforwards will retain their character as either short-term or long-term capital losses. As of December 31, 2011 the LoCorr Managed Futures Strategy Fund had post-enactment short-term capital loss carryforwards equal to $16,167.
The LoCorr Managed Futures Strategy Fund intends to defer and treat $32,362 of post-October losses incurred during the fiscal year ended December 31, 2011 as arising in the fiscal year ending December 31, 2012.
Difference between book and tax components of distributable earnings are related to differing treatment of income and expenses from LCMFS.
8. New Accounting Pronouncement
In December 2011, the FASB issued ASU No. 2011-11 “Disclosures about Offsetting Assets and Liabilities.” ASU 2011-11 requires disclosures to make financial statements that are prepared under U.S. GAAP more comparable to those prepared under IFRS. The new disclosure requirements mandate that entities disclose both gross and net information about instruments and transactions eligible for offset in the Statements of Assets & Liabilities as well as instruments and transactions subject to an agreement similar to a master netting arrangement. In addition, ASU 2011-11 requires disclosure of collateral received and posted in connection with master netting agreements or similar arrangements. New disclosures are required for annual reporting periods beginning on or after January 1, 2013, and interim periods within those annual periods.
Management is currently evaluating the impact ASU No. 2011-04 and ASU No. 2011-11 will have on the Funds’ financial statements and disclosures.
54 ● EXPENSE EXAMPLE (UNAUDITED)
Consolidated Expense Example Excluding Non-Controlling Interest
June 30, 2012 (Unaudited)
As a shareholder of a mutual fund, you incur two types of costs: (1) transaction costs, including sales charges (loads) on purchase payments; redemption fees; and (2) ongoing costs, including management fees; distribution and/or service (12b-1) fees and other Fund expenses.
This Example is intended to help you understand your ongoing costs (in dollars) of investing in each of the Funds and to compare these costs with the ongoing costs of investing in other mutual funds. The Example is based on an investment of $1,000 invested at the beginning of the period and held for the entire period (January 1, 2012 through June 30, 2012).
Actual Expenses
The actual return columns in the following table provide information about account values based on actual returns and actual expenses. You may use the information in these columns, together with the amount you invested, to estimate the expenses that you paid over the period. Simply divide your account value by $1,000 (for example, an $8,600 account value divided by $1,000 = 8.6), then multiply the result by the number in the first line under the heading entitled “Expenses Paid During Period” to estimate the expenses you paid on your account during this period. The only transaction fees you may be required to pay are for outgoing wire transfers, returned checks and stop payment orders at prevailing rates charged by U.S. Bancorp Fund Services, LLC, the Funds’ transfer agent. These fees are assessed on all accounts, as applicable. If you request that a redemption be made by wire transfer, currently the Funds’ transfer agent charges a $15.00 fee. The Funds’ transfer agent charges a transaction fee of $25.00 on returned checks and stop payment orders. If you paid a transaction fee, you would add the fee amount to the expenses paid on your account this period to obtain your total expenses paid.
Hypothetical Example for Comparison Purposes
The hypothetical return columns in the following table provide information about hypothetical account values and hypothetical expenses based on the Funds’ actual expense ratio and an assumed rate of return of 5% per year before expenses, which is not the Funds’ actual return. The hypothetical account values and expenses may not be used to estimate the actual ending account balance or expenses you paid for the period. You may use this information to compare the ongoing costs of investing in the Funds and other funds. To do so, compare this 5% hypothetical example with the 5% hypothetical examples that appear in the shareholder reports of the other funds. A transaction fee of $15.00 may be assessed on outgoing wire transfers and a transaction fee of $25.00 may be assessed on returned checks and stop payment orders. To include this fee in the calculation, you would add the estimated transaction fee to the hypothetical expenses shown in the table. Please note that the expenses shown in the table are meant to highlight your ongoing costs only and do not reflect the transaction fees discussed above. Therefore, those columns are useful in comparing ongoing costs only, and will not help you determine the relative total costs of owning different funds. In addition, if these transactional costs were included, your costs would have been higher.
EXPENSE EXAMPLE (UNAUDITED) (CONTINUED) ● 55
| Actual vs. Hypothetical Returns | | | |
| For the Six Months Ended June 30, 2012 (Unaudited) | | |
| | | | | |
| | Fund’s | Beginning | Ending | Consolidated |
| | Annualized | Account Value | Account Value | Expenses |
| | Consolidated | 1/1/2012 | 6/30/2012 | Paid During |
| | Expense Ratio1 | | | Period1,2 |
| LoCorr Managed Futures Strategy Fund – Class A | | |
| Actual | 3.59% | $1,000.00 | $943.20 | $17.34 |
Hypothetical3 | 3.59% | $1,000.00 | $1,007.01 | $17.91 |
| LoCorr Managed Futures Strategy Fund – Class C | | |
| Actual | 4.34% | $1,000.00 | $939.70 | $20.93 |
Hypothetical3 | 4.34% | $1,000.00 | $1,003.28 | $21.62 |
| LoCorr Managed Futures Strategy Fund – Class I | | |
| Actual | 3.34% | $1,000.00 | $944.40 | $16.15 |
Hypothetical3 | 3.34% | $1,000.00 | $1,008.25 | $16.68 |
1Consolidated expenses ratios and consolidated expenses does not include non-controlling interest.
2 Expenses are equal to the Fund’s annualized expense ratio multiplied by the average account value over the period, multiplied by 182 days and divided by 366 to reflect the period of January 1, 2012 through June 30, 2012.
3Hypothetical assumes a 5% return.
| | Fund’s | Beginning | Ending | Consolidated |
| | Annualized | Account Value | Account Value | Expenses Paid |
| | Consolidated | 1/1/2012 | 6/30/2012 | During Period1 |
| | Expense Ratio | | | |
| LoCorr Long/Short Commodities Strategy Fund – Class A | |
| Actual | 2.20% | $1,000.00 | $945.00 | $10.64 |
Hypothetical2 | 2.20% | $1,000.00 | $1,013.93 | $11.02 |
| LoCorr Long/Short Commodities Strategy Fund – Class C | |
| Actual | 2.95% | $1,000.00 | $939.00 | $14.22 |
Hypothetical2 | 2.95% | $1,000.00 | $1,010.20 | $14.74 |
| LoCorr Long/Short Commodities Strategy Fund – Class I | |
| Actual | 1.95% | $1,000.00 | $946.00 | $9.43 |
Hypothetical2 | 1.95% | $1,000.00 | $1,015.17 | $9.77 |
1 Consolidated expenses are equal to the Fund’s annualized expense ratio multiplied by the average account value over the period, multiplied by 182 days and divided by 366 to reflect the period of January 1, 2012 through June 30, 2012.
2 Hypothetical assumes a 5% return.
56 ● SUPPLEMENTAL INFORMATION (CONTINUED)
LoCorr Long/Short Commodities Strategy Fund
June 30, 2012 (Unaudited)
Approval of Advisory Agreement – LoCorr Long/Short Commodities Strategy Fund
In connection with a regular meeting held on December 23, 2011 (the “Meeting”), the Board of Trustees (the “Board” or “Trustees”) of LoCorr Investment Trust (the “Trust”), including a majority of the Trustees who are not interested persons of the Trust or interested persons to the investment management agreement (the “Independent Trustees”), discussed the approval of an investment management agreement (the “Management Agreement”) between LoCorr Fund Management, LLC (the “Adviser”) and the Trust, on behalf of LoCorr Long/Short Commodities Strategy Fund (the “Fund”). The Trustees reviewed a memorandum from Thompson Hine LLP (“Fund counsel”) entitled “Duties of Trustees with Respect to Approval of Investment Advisory Contracts,” which had been provided to them prior to the meeting. They discussed with Fund counsel that in fulfilling their responsibilities to the Fund and its shareholders, the Trustees must apply their business judgment of whether the overall arrangements provided under the terms of the investment management contract are reasonable for the Fund. They also discussed specific factors the Trustees should consider in evaluating an investment management contract, which include, but are not limited to: the investment performance of the Fund and other accounts managed by the Adviser; the nature, extent and quality of the services to be provided by the Adviser to the Fund; the costs of the services to be provided and the profits to be realized by the Adviser and its affiliates from the relationship with the Fund; the extent to which economies of scale will be realized as the Fund grows; and whether the fee levels reflect these economies of scale to the benefit of shareholders.
The Trustees reviewed the Adviser’s responses to an investment adviser questionnaire and the proposed Management Agreement between the Trust and LoCorr, copies of which had previously been supplied to the Trustees for their review. As to the Adviser’s qualifications, the Trustees reviewed a copy of the Adviser’s registration statement on Form ADV (Parts I and II). As to the nature, extent and quality of the services to be provided by the Adviser to the Fund, the Trustees considered that, under the terms of the Management Agreement, the Adviser would, subject to the supervision of the Board, provide or arrange to be provided to the Fund such investment advice as the Adviser in its discretion deems advisable and will furnish or arrange to be furnished a continuous investment program for the Fund, consistent with the Fund’s investment objective and policies. The Adviser will determine or arrange for others to determine the securities to be purchased for the Fund, the portfolio securities to be held or sold by the Fund and the portion of the Fund’s assets to be invested, subject always to the Fund’s investment objective, policies and restrictions, as each of the same shall be in effect, and subject further to such policies and instructions as the Board may establish. The Adviser will furnish such information or analyses to the Trust as the Board may request or as the Adviser deems desirable. The Adviser also will advise and assist the officers of the Trust in taking such steps as are necessary or appropriate to carry out the decisions of the Board and the appropriate committees of the Board regarding the conduct of the business of the Trust. The Adviser may delegate any of the responsibilities, rights or duties described above, provided the Adviser notifies the Trust and agrees that such delegation does not relieve the Adviser from any liability thereunder. The Trustees concluded that, overall, they were satisfied with the nature, extent and quality of the services to be provided to the Fund under the Management Agreement.
SUPPLEMENTAL INFORMATION (CONTINUED) ● 57
As to the costs of the services to be provided and the profits to be realized by the Adviser, the Trustees reviewed the Adviser’s estimates of its profitability and its financial condition. The Trustees noted that the Adviser expected net losses during the first year of operations and continuing losses should the Fund fail to attract sufficient assets. The Board also discussed whether the Adviser’s parent company would further capitalize the Adviser if necessary. Fund counsel then discussed the proposed expense limitation agreement and explained that the Adviser has agreed to cap the Fund’s expenses at 1.95%, excluding certain expense items and excluding the Fund’s 12b-1 fees. Based on their review, the Trustees concluded that they were satisfied that the Adviser’s expected level of profitability from its relationship with the Fund was not excessive.
As to comparative fees and expenses, the Trustees considered the management fee to the Adviser and total expense ratio to be paid by Fund shareholders and compared those fees to the Fund’s peer group and considered them to be within the range of the peer group. The Trustees also considered the Adviser’s agreement to waive fees or reimburse expenses to the extent that Fund’s total operating expenses exceeded certain limits. The Trustees concluded that the Fund’s management fee was acceptable in light of the quality of services the Fund expected to receive from the Adviser. As to economies of scale, the Trustees noted that the Management Agreement does not contain breakpoints that reduce the fee rate on assets above specified levels. The Trustees agreed that breakpoints may be an appropriate way for LoCorr to share its economies of scale with a Fund and its shareholders if it experiences a substantial growth in assets. However, the Trustees recognized that that Fund had not yet commenced operations and that the management agreements with competitor funds do not always contain breakpoints. Consequently, the Trustees concluded that the absence of breakpoints was acceptable under the circumstances. Having received and reviewed information from the Adviser as the Board believed to be reasonably necessary, the Trustees, including the Independent Trustees, unanimously approved the Management Agreement.
Consideration and Approval of Sub-Advisory Agreement
Fund Counsel noted that the same factors that the Board considered with respect to the approval of the Management Agreement would apply to its consideration of the Sub-Advisory Agreement. The Trustees reviewed the responses to an investment adviser questionnaire from Galliard Capital Management, LLC (“Galliard” or the “Sub-Adviser”) and the proposed Sub-Advisory Agreement between the Sub-Adviser and the Trust, copies of which had previously been supplied to the Trustees for their review. As to Galliard’s business and the qualifications of its personnel, the Trustees reviewed a copy of Galliard’s adviser registration statement on Form ADV (Parts I and II). Next, the Trustees discussed the experience of Andrea Johnson, CFA, the portfolio manager, noting her years of experience as a portfolio manager with Galliard. Additionally, the Trustees noted that Galliard is not affiliated with the transfer agent or custodian and therefore does not derive any benefits from the relationships those parties have with the Trust. As to the nature, extent and quality of the services to be provided by Galliard to the Fund, the Trustees considered that, under the terms of the Sub-Advisory Agreement, the Sub-Adviser would, subject to the supervision of the Board of Trustees of the Trust, provide or arrange to be provided to the Fund such investment advice as the Sub-Adviser in its discretion deems advisable and will furnish or arrange to be furnished a continuous investment program for the portion of the Fund’s assets for which it is responsible, consistent with the Fund’s investment objective and policies. The Trustees noted that Galliard had adopted a compliance program to monitor and review investment decisions and to prevent and detect violations of the Fund’s investment policies and limitations, as well as federal securities laws. Additionally, they noted that Galliard has adequate resources to access the necessary research and noted the portfolio manager’s prior experience. The Trustees concluded that, overall, they were satisfied with the nature, extent and quality of the services to be provided to the Fund under the Sub-Advisory Agreement.
58 ● SUPPLEMENTAL INFORMATION (CONTINUED)
As to the costs of the services to be provided and the profits to be realized by Galliard, the Trustees reviewed Galliard’s estimates of its profitability and its financial condition. They noted that under the Sub-Advisory Agreement, Galliard will receive minimum annual revenue of $45,000 from the Adviser and that the costs incurred for the services Galliard provides will vary based on the size of the Fund. The Board noted that the fees received by Galliard will not have an impact on the Fund’s management fee or expense ratio. Based on their review, the Trustees concluded that they were satisfied that Galliard’s expected level of profitability from its relationship with the Fund was not excessive. As to comparative fees and expenses, the Trustees considered the management fee to be paid to Galliard and compared those fees to management fees paid by other accounts managed by Galliard. The Trustees concluded that the sub-advisory fee was acceptable in light of the quality of services the Fund expected to receive from Galliard and the level of fees paid by Galliard’s other clients. As to economies of scale, the Trustees noted that the Sub-Advisory Agreement contains breakpoints that reduce the fee rate on assets above specified levels. The Trustees agreed that breakpoints may be an appropriate way for Galliard to share its economies of scale if the Fund experiences a substantial growth in assets and that if breakpoints were achieved, these benefits to the Adviser would be considered by the Board when the Adviser’s contract is renewed and fees are again examined.
Having received and reviewed information from Galliard as the Board believed to be reasonably necessary, the Trustees, including the Independent Trustees, unanimously approved the Sub-Advisory Agreement.
PRIVACY POLICY ● 59
Notice of Privacy Policy & Practices
(Unaudited)
Your privacy is important to us. The Funds are committed to maintaining the confidentiality, integrity, and security of your personal information. When you provide personal information, the Funds believe that you should be aware of policies to protect the confidentiality of that information. The Funds collect the following nonpublic personal information about you:
| ● | Information we receive from you on or in applications or other forms, correspondence, or conversations, including, but not limited to, your name, address, phone number, social security number, assets, income, and date of birth; and |
| ● | Information about your transactions with us, our affiliates, or others, including, but not limited to, your account number and balance, payments history, parties to transactions, cost basis information, and other financial information. |
The Funds do not disclose any nonpublic personal information about our current or former shareholders to affiliated or nonaffiliated third parties, except as permitted by law. For example, the Funds are permitted by law to disclose all of the information we collect, as described above, to our transfer agent to process your transactions. Furthermore, the Funds restrict access to your nonpublic personal information to those persons who require such information to provide products or services to you. The Funds maintain physical, electronic, and procedural safeguards that comply with applicable federal and state standards to guard your nonpublic personal information.
In the event that you hold shares of the Funds through a financial intermediary, including, but not limited to, a broker-dealer, bank, or trust company, the privacy policy of your financial intermediary would govern how your nonpublic personal information would be shared with affiliated or non-affiliated third parties.
60 ● QUARTERLY PORTFOLIO HOLDINGS/PROXY
Quarterly Form N-Q Portfolio Schedule
(Unaudited)
The Funds file their complete schedule of portfolio holdings with the Securities and Exchange Commission (“SEC”) for the first and third quarters of each fiscal year on Form N-Q. The Funds’ Forms N-Q are available on the SEC’s website at http://www.sec. gov. The Funds’ Forms N-Q may be reviewed and copied at the SEC’s Public Reference Room in Washington, D.C. Information on the operation of the SEC’s Public Reference Room may be obtained by calling 1-800-SEC-0330. Additionally, you may obtain copies of Forms N-Q from the Funds upon request by calling 1-855-523-8637.
Proxy voting Policies, Procedures and Record
(Unaudited)
You may obtain a description of the Funds’ (1) proxy voting policies, (2) proxy voting procedures and (3) information regarding how the Funds voted any proxies related to portfolio securities during the most recent 12-month period ended June 30 for which an SEC filing has been made, without charge, upon request by contacting the Funds directly at 1-855-523-8637, or on the EDGAR Database on the SEC’s website (http:// www.sec.gov).
CONTACT INFORMATION ● 61
Investment Adviser
LoCorr Fund Management, LLC 261 School Avenue, 4th Floor Excelsior, MN 55331
Administrator, Fund Accountant and Transfer Agent
U.S. Bancorp Fund Services, LLC 615 East Michigan Street Milwaukee, WI 53202
Custodian
U.S. Bank, N.A. Custody Operations
1555 North RiverCenter Drive, Suite 302 Milwaukee, WI 53212
Independent Registered Public Accounting Firm
Cohen Fund Audit Services, Ltd. 800 Westpoint Pkwy, Suite 1100 Westlake, OH 44145
Fund Counsel
Thompson Hine, LLP
312 Walnut Street, 14th Floor Cincinnati, OH 45202
Distributor
Quasar Distributors, LLC 615 East Michigan Street Milwaukee, Wisconsin 53202
This page left intentionally blank.
This page left intentionally blank.
Item 2. Code of Ethics.
Not applicable for semi-annual reports.
Item 3. Audit Committee Financial Expert.
Not applicable for semi-annual reports.
Item 4. Principal Accountant Fees and Services.
Not applicable for semi-annual reports.
Item 5. Audit Committee of Listed Registrants.
Not applicable to registrant.
Item 6. Investments.
Item 7. Disclosure of Proxy Voting Policies and Procedures for Closed-End Management Investment Companies.
Not applicable to open-end investment companies.
Item 8. Portfolio Managers of Closed-End Management Investment Companies.
Not applicable to open-end investment companies.
Item 9. Purchases of Equity Securities by Closed-End Management Investment Company and Affiliated Purchasers.
Not applicable to open-end investment companies.
Item 10. Submission of Matters to a Vote of Security Holders.
There has been no material change to the procedures by which shareholders may recommend nominees to the registrant’s board of directors.
Item 11. Controls and Procedures.
Not applicable to semi-annual report.
Filed herewith.
Filed herewith.
Pursuant to the requirements of the Securities Exchange Act of 1934 and the Investment Company Act of 1940, the registrant has duly caused this report to be signed on its behalf by the undersigned, thereunto duly authorized.
Pursuant to the requirements of the Securities Exchange Act of 1934 and the Investment Company Act of 1940, this report has been signed below by the following persons on behalf of the registrant and in the capacities and on the dates indicated.
* Print the name and title of each signing officer under his or her signature.