As filed with the Securities and Exchange Commission on September 3, 2015
UNITED STATES
SECURITIES AND EXCHANGE COMMISSION
Washington, D.C. 20549
FORM N-CSR
CERTIFIED SHAREHOLDER REPORT OF REGISTERED
MANAGEMENT INVESTMENT COMPANIES
Investment Company Act file number 811-22509
LoCorr Investment Trust
(Exact name of registrant as specified in charter)
261 School Avenue, 4th Floor
Excelsior, MN 55331
(Address of principal executive offices) (Zip code)
CT Corporation System
1300 East Ninth Street
Cleveland, OH 44114
(Name and address of agent for service)
952.767.2920
Registrant's telephone number, including area code
Date of fiscal year end: December 31
Date of reporting period: June 30, 2015
Item 1. Reports to Stockholders.
Letter to Shareholders
LoCorr Funds seek to provide investments that, over time, will have low correlation to traditional asset classes such as stocks and bonds. We believe that adding low correlating investments to portfolios can significantly reduce the overall portfolio risk while enhancing returns. Correlation measures the degree to which the returns of two investments move together over time. LoCorr offers products that provide the potential for positive returns in rising or falling markets and are designed to resist correlation with traditional stock, bond and commodity investments. In this report, LoCorr Funds are reporting on six mutual funds: LoCorr Managed Futures Strategy Fund, LoCorr Long/Short Commodities Strategy Fund, LoCorr Multi-Strategy Fund, LoCorr Market Trend Fund, LoCorr Long/Short Equity Fund and LoCorr Spectrum Income Fund (collectively, the “Funds”).
LoCorr Managed Futures Strategy Fund
The LoCorr Managed Futures Strategy Fund (the “Managed Futures Fund” or the “Fund”) seeks capital appreciation as its primary investment objective with managing volatility as a secondary objective. The Managed Futures Fund attempts to achieve its objective by investing in two main strategies – a Managed Futures Strategy and a Fixed Income Strategy.
The Managed Futures Fund invests up to 25% of its total assets into a portfolio of globally diversified managed futures positions. The Fund accesses the returns of certain trading programs of Millburn Ridgefield Corporation (“Millburn”), Crabel Capital Management, LLC (“Crabel”) and Graham Capital Management, LLC (“Graham”) via its investment in a total return swap agreement. The Fund uses Millburn, Crabel and Graham to execute its Managed Futures Strategy. Millburn was founded in 1971 and manages about $1.5 billion in assets. Crabel was founded in 1992 and manages about $2 billion in assets. Graham was founded in 1994 and manages about $9.9 billion in assets. The Managed Futures Fund accesses returns generated by Millburn’s Diversified Program (“MDP”), a commodity pool which commenced operations in 1977. MDP systematically invests in about 120 futures markets with long and short positions in sectors such as currencies, interest rates, stock indices and commodities (agricultural, energy and metals). The Fund also accesses returns generated by Crabel’s Multi-Product program, a short-term trend following strategy that commenced trading in March 1998. Crabel’s program was added in 2013 to complement Millburn’s longer-term trend strategy in an attempt to improve the Fund’s risk-adjusted returns. Finally, the Fund accesses returns generated by Graham’s Tactical Trend program, a systematic trend strategy that commenced trading in 2006. Graham’s program was added in 2014 to complement the other strategies in the Fund in an attempt to improve the Fund’s risk-adjusted returns. Overall, the Fund’s Class I shares declined 1.63% during the six months ended June 30, 2015.
Managed Futures Strategy
The Managed Futures Strategy lost 1.27% during the first half of 2015 as solid gains from the first quarter were more than offset by losses in the second quarter. Strong gains from Graham during the period were not enough to counterbalance the losses incurred by Millburn and Crabel. Several profitable trades from early in the year proved unprofitable during the second quarter. Overall, losses from trading energy, currency and grain futures slightly outdistanced the gains from long equity, interest rate, and metal futures positions.
Solid first quarter performance was led by gains from trading of financial markets—interest rate and equity futures, and currency forwards. Commodity futures trading was nearly flat as losses from trading grain futures were countered by gains from trading soft, metal and livestock futures.
The European Central Bank’s historic quantitative easing (“QE”) announcement, several easing moves by the People’s Bank of China and more than 20 other official interest rate reductions led to sharp gains on long positions in various interest rate futures across the yield curve.
The more accommodative monetary policy environment and some improvement in growth indicators for Europe led to gains on long positions in many global equity futures trades. Meanwhile, U.S. equity futures, after reaching record levels, stagnated in the wake of the stronger dollar, disappointing earnings reports, and a first quarter growth slowdown.
Currency markets were volatile during the quarter, although a solid U.S. economic outlook and generally higher relative interest rates, underpinned the U.S. dollar.
Still, a tentative Russia/ Ukraine ceasefire and temporary bouts of sanity around the Greek crisis periodically took some steam out of the dollar. Overall, long dollar positions versus the euro and several other currencies were profitable.
Grain prices recovered a bit after the USDA projected a reduction in planting acreage for the current crop year. Consequently, short wheat positions, and to a lesser extent trading of corn, soybeans, soybean meal and bean oil produced minor losses. Coffee and sugar prices continued to fall and short positions in both were profitable. A short hog trade was marginally positive. Energy and metal trading were nearly flat.
The Fund sustained a loss as a number of profitable, consensus trades from the first quarter proved unprofitable in Q2. Generally long positions in interest rate futures, equity futures, and U.S. dollar forwards and short euro currency trades were unprofitable. Short energy futures trades were unprofitable as well. On the other hand, trading of metal futures was profitable, while trading of soft and agricultural commodities was nearly flat.
The sanguine attitude toward Greece from the first quarter became a Q2 ebb and flow of meetings, proposals, information and recriminations around the Greek Crisis, culminating in the imposition of capital controls; a week-long bank holiday; and a nationwide referendum that rattled equity, bond and currency markets. The U.S. economy rebounded from its poor first quarter showing, although inflation and wages did not register unequivocal improvements. Consequently, the on-again, off-again prospects for a Federal Reserve rate increase added to market anxiety. Finally, uncertainty about China’s growth prospects were compounded late in the period by the sudden, precipitous collapse in Chinese equity markets.
Several note and bond futures, which had risen precipitously in the wake of the European Central Bank’s QE program, reversed course abruptly, driving rates sharply higher as analysts questioned the extraordinarily low levels they had reached, particularly as European Union (“EU”) economic data was improving and the Greek situation seemed to defy solution. Consequently, long positions in certain note and bond futures were unprofitable. Though the path was not a straight line (partly due to reduced global bond market liquidity), better U.S. economic news pushed U.S. interest rates higher, producing losses from long positions in U.S. note and bond futures.
The path of equity prices during the quarter was uneven across time and markets. Equity futures were buffeted in a positive way by improving economic data from the U.S. and Europe, and in a negative way by the unfolding Greek tragedy; by economic growth concerns and wild swings in equity markets in China that prompted a Bank of China rate cut; and by worries about the timing of possible Fed rate increases. In the end, the negative influences carried the day and long positions in many equity futures posted losses.
Currency trading was also volatile during the second quarter. In April and early May, the poor U.S. Q1 GDP report raised the likelihood that an anticipated Federal Reserve interest rate increase would be delayed. Consequently, long dollar positions registered losses and were reduced or reversed. Later on, the dollar steadied as U.S. economic data recovered and as the situations in China and Greece deteriorated. On balance, trading the U.S. dollar was unprofitable. Short euro trades versus several currencies were also unprofitable.
Energy prices moved higher in April amid signs of a growth improvement in Europe and a weakening dollar. Consequently, short positions in crude oil, crude oil products and natural gas generated losses and were scaled back. Predominantly short positions in metals were profitable, particularly in May and June, as China’s slowdown and equity turmoil led to reduced demand and some increased supplies on world markets.
Grain prices, which have been falling rather persistently, rose somewhat late in the period as heavy rains in the U.S. threatened to delay harvests of some crops and planting of others. Consequently, losses on short corn and wheat positions outdistanced the gains from long soybean and soybean meal trades.
Fixed Income Strategy
The Managed Futures Fund invests most of its remaining assets in a Fixed Income Strategy comprised of short to intermediate term investment grade corporate and government agency securities. Nuveen Asset Management (“Nuveen”) is the sub-adviser for this strategy – a shorter duration, high quality portfolio. Nuveen manages over $137 billion in assets.
The U.S. economy started 2015 on a weak note as it was held back by severe winter weather, soft global growth, a rising dollar and the West Coast port strikes. Subsequent data has been more encouraging and in line with real growth of around 2.5% for Q2 and U.S. employment growth has remained solid. Global growth has been mixed; while economies in Europe and Japan have responded to stimulus and have surprised on the upside, Chinese growth has weakened and dragged down commodity economies with it. At the same time, fears of a disorderly Greek exit from the Eurozone resulted in heightened market volatility towards the end of the second quarter.
Monetary policy has remained a major focus for the markets in 2015. While the European Central Bank eased policy by embarking on another round of QE, softer U.S. data resulted in the market dialing back its expectations of Federal Reserve Bank tightening this year. With expectations for Fed rate hikes being pushed into late 2015, U.S. interest rates, though certainly volatile within the reporting period, were little changed from year end. Over the reporting period short to intermediate rates were basically unchanged while long rates were 20-40 basis points higher.
With economic data coming in weaker than expected and uncertainty around China and Greece impacting investor sentiment, risk premiums were pushed wider as a record amount of corporate bond issuance weighed down the credit sector. Shorter maturity investment grade credit spreads widened during Q2. Securitized sectors fared better, with spreads being little changed in 2015; both traditional consumer related asset backed securities (“ABS”) and commercial mortgage backed securities (“CMBS”) had solid performance as these sectors benefited from relatively stable credit fundamentals.
Entering 2015, the portfolio themes for the fixed income portions of the Funds generally revolved around moderate economic expansion and a gradual normalization of monetary policy by the Fed. We have been looking for short to intermediate term rates to rise as the timeline for Fed tightening drew nearer and we have been positioning the duration, or interest rate sensitivity, for the fixed income portion of the Funds aggressively short to their benchmarks. Additionally, given our reasonably constructive views of credit fundamentals and domestic growth, the portfolios have emphasized owning non-government securities such as high grade corporate bonds and high quality short duration securitized products in varying degrees in the Funds. While our sector strategy was a modest boost to returns, our duration strategy was a meaningful drag on performance in the first half of the year. Though rates were basically unchanged across the short end of the curve, 3 to 5 year Treasuries outperformed 2 year Treasuries due to higher income and strong curve roll down. Given that the Funds owned more securities towards the short end of this maturity range, performance was negatively impacted.
Looking ahead, we think the U.S. economy will continue to expand at a moderate pace. Consumer spending should be a stable driver of growth in the second half of the year due to ongoing gains in employment and income and strong household balance sheets. The housing market has shown broad based strength and will likely continue to be supportive of growth, both directly and indirectly. Manufacturing surveys have been solid. The softer dollar and stabilization of global growth should support trade while business spending should move higher over the balance of the year. While core inflation could drift higher over the balance of the year, it should remain below the Fed’s target of 2% well into 2016. We believe the Fed will be comfortable enough with the outlooks for growth and inflation to begin raising rates later this year to begin what we think will be a very gradual and shallow tightening cycle. Given our commitment to being properly positioned as the Fed tightening cycle unfolds, while seeking higher returns than cash, we are currently comfortable retaining a defensive duration strategy.
The fixed income component of the Managed Futures Fund portfolio is managed against the Barclay’s 1-5 Year Government/Credit Index. Returns for this portion of the portfolio were 0.71% compared to 0.94% for the benchmark for the first half of 2015. The duration of the fixed income component of the Fund was managed between 1.30 and 1.50 years compared to about 2.7 years for the benchmark. The decision to manage portfolio duration defensively accounted for our underperformance versus the benchmark. With respect to our sector exposure, given increased idiosyncratic risk in the corporate sector, we maintained a smaller than normal exposure of about 35% to investment grade corporate bonds. Alternatively, we maintained higher weights in the ABS and CMBS sectors as we saw better fundamentals and technical measures in these sectors. Our sector allocation was beneficial to performance as ABS and CMBS both performed better than corporate and government securities.
LoCorr Long/Short Commodities Strategy Fund
The LoCorr Long/Short Commodities Strategy Fund (the “Long/Short Commodities Fund” or the “Fund”) provides investors with access to a commodities futures strategy in a mutual fund structure. Historically, investors have primarily accessed exposure to long-only commodities that rely on rising commodity prices to generate positive returns. Of course, commodity prices don’t always appreciate and occasionally experience sharp declines. The Long/Short Commodities Fund has the ability to profit while commodity prices increase or decrease. The Long/Short Commodities Fund’s primary investment objective is capital appreciation in rising and falling commodities markets. The Long/Short Commodities Fund attempts to achieve its investment objective by investing in two primary strategies – a Commodities Strategy and a Fixed Income Strategy. Overall, the Fund’s Class I shares were up 4.54% for the reporting period.
Commodity Strategy
The Fund accesses, via a total return swap agreement, the returns of Millburn’s Commodity Program (“Milcom”), which began trading in 2005. Milcom systematically invests in about 50 futures markets with long and short positions in sectors such as energy, metals, livestock, grains and softs and lumber.
The Program was profitable in the first half of 2015, the result of gains from relative value “spread” trading in all sectors, and from outright directional trading of metal futures, soft commodities and livestock. Outright trading of grains and energy futures was unprofitable through June.
Energy prices were volatile, with prices rising towards the end of the first half of 2015. The erratic movements in price resulted from the push-and-pull of global excess production, rising inventories and the threat of more supply from Iran, Iraq and Libya, on the one hand; and periodic supply disruptions in Libya and Iraq, the boiling cauldron of Middle East conflict, and some improving economic data from Europe, on the other. Short positions in crude oil, heating oil, London gas oil and natural gas generated losses, but spread trading of Brent crude, heating oil and London gas oil were solidly profitable and scaled back most of the losses.
Trading metals was profitable in the first half of 2015. Gains came from short positions in aluminum, tin, palladium and silver as China’s slowdown and equity turmoil led to reduced demand and some increased supplies on world markets. Increased palladium and platinum production from South Africa also weighed on prices. Gold produced a small gain over this period, while spread trading of copper produced a sizable gain. Meanwhile, a sharp swing in the price of zinc in the wake mine closures in Australia and Ireland led to a loss.
Persistently strong supplies and crop outlooks led to lower sugar and coffee prices and, hence, profits on short positions. Reduced supply from Ghana underpinned cocoa’s price gains and, as a result, a position in cocoa was profitable. Positions in rubber were also profitable. Trading of crude palm oil and cotton futures was unprofitable, while spread trading of cotton, sugar, coffee and cocoa added to profits.
Grain prices, which had been falling rather persistently, rose somewhat late in the period as heavy rains in the U.S. threatened to delay harvests of some crops and planting of others. Consequently, losses on short corn and wheat positions slightly outweighed the gains from long soybean, soybean meal and rapeseed trades. Spread trading of wheat, soybeans and soy meal were quite profitable.
Finally, a short hog trade and spread trading of livestock, especially live cattle, were profitable, and well outdistanced the fractional loss from outright trading of live cattle.
Fixed Income Strategy
The Fund invests most of its remaining assets in a Fixed Income Strategy comprised of short to intermediate term investment grade corporate and government agency securities. Nuveen is the sub-adviser for this strategy – a shorter duration, high quality portfolio.
The fixed income component of the Long/Short Commodities Fund portfolio is managed against the Barclay’s 1-5 Year Government/Credit Index. Returns for this portion of the portfolio were 0.48% compared to 0.94% for the benchmark during the reporting period. Given our strong bias to be defensive on duration and to maintain a large liquidity buffer in the portfolio, our duration was managed between 1.10 and 1.50 years during 2015, compared to about 2.7 years for the benchmark. This defensive duration strategy accounted for most of the underperformance versus the benchmark this year. Sector-wise, the portfolio has been positioned with a bias for liquidity, with roughly a 40% allocation to short duration government securities and with roughly 15-20% each in investment grade corporate bonds, asset backed securities, and commercial mortgage securities. While the focus on liquidity served the Fund well during the reporting period, the liquidity profile of the portfolio curtailed income generation.
LoCorr Multi-Strategy Fund
The LoCorr Multi-Strategy Fund (the “Multi-Strategy Fund” or the “Fund”) commenced operations in early April 2015. The Fund’s objective is capital appreciation and it invests in securities that are expected to produce a competitive level of current income. The Fund was launched in part due to demand for a Fund that would include a variety of our alternative investment strategies into one investment. Currently, the Fund invests in the following strategies: Income Strategy, Long/Short Equity Strategy, Managed Futures Strategy and Commodities Strategy. Due to the recent launch of the Fund the following commentary focuses on the second quarter of 2015. For the period April 6, 2015 (inception date of Fund) to June 30, 2015, the Fund’s cumulative Class I shares declined 7.91%.
Income Strategy
The Fund’s Income Strategy, sub-advised by TFMS in a similar strategy as used in Spectrum Income Fund, struggled in the second quarter, with a cumulative total return of -6.20% since the Fund’s inception. Please refer to the commentary above in the Spectrum Income Fund’s Income Strategy to learn more about current portfolio positioning and market outlook.
Long/Short Equity Strategy
The Fund’s Long/Short Equity Strategy, sub-advised by Billings in a similar strategy as used in Long/Short Equity Fund, produced a cumulative since inception total return of +4.00%. Please refer to Billings’ commentary above in the Long/Short Equity Fund to learn more about current portfolio positioning and market outlook.
Managed Futures Strategy
The Fund’s Managed Futures Strategy is managed by Graham in a similar strategy as used in Market Trend Fund. The second quarter was characterized by increased market volatility that underscored the vulnerability of global markets to headline risk. The escalation of the Greek debt crisis and meltdown in Chinese equities raised questions as to the U.S. Federal Reserve’s ability to increase interest rates in the near-term in light of the global backdrop. As a result, bond and equity prices were volatile while the U.S. dollar was mixed versus its major counterparts. The greenback advanced more than 10% versus the New Zealand dollar and 2% versus the Japanese yen, while the major European currencies strengthened versus the U.S. dollar. A number of commodity markets saw significant price moves during the quarter, with wheat rallying more than 20% and crude oil advancing by 25%.
The Fund’s Managed Futures Strategy recorded a net loss during the second quarter. Losses resulted from positions in fixed income, particularly on the long end of the yield curve in the U.S., Europe and Australia as bond prices fell during the period. Losses also resulted from positions in commodities, most notably in grains as wheat, corn and soybean prices rallied on the back of excessive rain in the Midwestern U.S. In metals, the Fund recorded losses from positions in copper and silver. The Fund posted profits from long positions in Asian equity indices, particularly the Hang Seng, with smaller gains in the Nikkei and TOPIX. Additional gains resulted from positions in the Japanese yen, euro, New Zealand dollar, and Mexican peso versus the U.S. dollar.
Commodities Strategy
The Fund’s Commodities Strategy is managed by Millburn in a similar strategy as used in Long/Short Commodities Fund.
The commodity portfolio was profitable during the period as gains from outright trading of metals and broad-based spread trading profits outdistanced sizable losses from outright energy trading. Outright trading of soft and agricultural commodities was fractionally profitable as well.
Energy prices moved higher in April amid signs of a growth improvement in Europe and a weakening dollar. Consequently, short positions were scaled back as crude oil, heating oil, London gas oil and natural gas generated losses. Energy spread trading, especially of WTI crude, was profitable, as was a long position in Tokyo gasoline.
Short positions in aluminum, copper, palladium, platinum and silver were profitable, particularly in May and June, as China’s slowdown and equity turmoil led to reduced demand and some increased supplies on world markets. Increased palladium and platinum production from South Africa also weighed on prices. Spread trading of copper produced a small gain. Meanwhile, a sharp swing in the price of zinc in the wake of mine closures in Australia and Ireland led to a loss on a long position. Trading of gold was also unprofitable.
Grain prices, which have been falling rather persistently, rose somewhat late in the period as heavy rains in the U.S. threatened to delay harvests of some crops and planting of others. Consequently, losses on short corn and wheat positions substantially reduced the gains from long soybean, soybean meal and rapeseed trades. Spread trading of soybeans and soy meal were quite profitable.
The gains from long cocoa positions and a short Arabica coffee trade slightly outweighed the losses on a short sugar position and trading of crude palm oil. Reduced supply from Ghana underpinned cocoa’s price gains. Spread trading of cotton, sugar and coffee added to profits. Finally, outright and spread trading of livestock was profitable.
LoCorr Market Trend Fund
The LoCorr Market Trend Fund (the “Market Trend Fund” or the “Fund”) was created to provide investors with access to a trend following futures strategy with one of the world’s most prominent managers in this space—Graham Capital Management. Graham was founded in 1994 and manages about $9.9 billion in assets. The Fund seeks capital appreciation as its primary investment objective with managing volatility as a secondary objective. The Market Trend Fund attempts to achieve its objective by investing in two main strategies – a Market Trend Strategy and a Fixed Income Strategy. During this six month period, the Fund posted strong gains, up 8.73% for the Class I shares.
Market Trend Strategy
Graham serves as sub-adviser of the Fund’s primary investment strategy. The Market Trend Strategy is managed similarly to Graham’s Tactical Trend program, a systematic trend strategy that commenced trading in 2006.
The first half of 2015 was characterized by an ongoing focus on central bank policy and an increasingly clouded macroeconomic environment. While the U.S. economy showed overall signs of improvement (despite a poor, weather impacted Q1), concerns mounted in Q2 over Greece and the Chinese economy and stock market.
In currencies, despite reversals during the period, the U.S. dollar advanced on balance versus the majority of its global counterparts during the first half. The euro remained under pressure and reached multi-year lows in Q1 versus the greenback following the European Central Bank stimulus measures and amidst the escalating debt crisis in Greece. Meanwhile, commodity currencies including the New Zealand, Australian and Canadian dollars were impacted by China fears and slowing domestic economy, and declined between 6% and 15%. Meanwhile, the Japanese yen declined by a more modest 2% versus the U.S. dollar.
U.S. equities fluctuated during the period with the S&P 500 Total Return Index (“S&P 500”) finishing the half virtually flat while the NASDAQ advanced more than 5% on support for tech stocks. Notwithstanding a massive price reversal in Chinese equities late in the second quarter, Asian equities advanced on balance with the Nikkei reaching multi-year highs. Likewise, larger-than-expected stimulus measures in Europe pushed benchmark indices higher. In fixed income, bond prices were volatile and sold off in the second quarter.
In commodities, volatility persisted throughout the first half. Wheat prices experienced sharp swings and experienced gains on balance after rallying nearly 30% during the month of June. Gold prices dropped as inflation fears abated and the dollar rallied, while crude oil reversed its dramatic decline from 2014, advancing nearly 12% during the period.
As mentioned, the Fund posted strong gains during the period, but it is also important to note that the Fund held onto most year-to-date profits during a volatile second quarter that led to losses for many peers. In currencies, the Fund benefitted from a long bias in the U.S. dollar as the greenback advanced versus its major counterparts, primarily the euro and New Zealand, Canadian and Australian dollars. Additional profits resulted from long positions in global equities, particularly in Asian and European benchmark indices as equity markets rallied. The strategy recorded gains in fixed income, most notably from U.K. and European bonds as well as U.S. short rates. In a volatile commodity market, losses were experienced from positions in grains, metals, and crude oil amidst sharp price reversals during the period.
Fixed Income Strategy
The Fund invests most of its remaining assets in a Fixed Income Strategy comprised of primarily government securities and very highly rated corporate fixed income of shorter durations. Nuveen is the sub-adviser for this strategy – a shorter duration, high quality portfolio.
The fixed income portion of LoCorr Market Trend is a very short duration portfolio of the highest credit quality and is managed against the Barclay’s 1-3 Year Government Bond Index. Returns for the fixed income portion of the portfolio were 0.40% versus 0.69% for the benchmark for the six month period ended June 30, 2015. Given our view for a mid-year Fed tightening, we began 2015 managing the portfolio with a duration of about 1.15 vs. 1.90 for the benchmark. As our policy views evolved towards less tightening in 2015, we found opportunities to move the duration out to about 1.50 years, which is roughly where portfolio duration was as of June 30. The portfolio’s defensive interest rate strategy accounted for the underperformance relative to the benchmark during the reporting period. The Fund maintained about 28% of fixed income assets in high quality securities such as ABS, corporates, and covered bonds; this helped performance modestly as each of these sectors posted better returns than Treasuries during the time period.
LoCorr Long/Short Equity Fund
The LoCorr Long/Short Equity Fund (the “Long/Short Equity Fund” or the “Fund”) seeks long-term capital appreciation with reduced volatility compared to traditional broad-based equity market indices as a secondary objective. Consistent with the “low correlation” our LoCorr Fund family seeks, long/short equity funds have the ability to provide positive returns when equity markets are rising, yet they can provide downside protection when equity prices are declining.
The Fund currently uses two sub-advisers—Billings Capital Management (“Billings”) and Millennium Asset Management (“Millennium”). Billings’ strategy is based on a value-oriented, fundamental, bottom-up long/short equity approach. They seek to maximize absolute returns, exceeding the S&P 500 index over the long term. Relative value drives the selection process for both long and short positions. The Fund invests with Billings based on a strategy they have managed since 2008 with their current firm and for many years prior to that at a different firm. With a focus on mid to large cap stocks, this strategy is expected to provide further diversification in the Fund. Millennium focuses on small and micro-cap stocks as the core long holdings. Millennium will also look to short individual stocks and hold bear Exchange Traded Funds (“ETFs”) to seek to mitigate volatility and to profit when prices decline. Millennium was founded in 1999 and the Fund invests based on a strategy of theirs that commenced trading in 2000. Overall, the Fund’s Class I shares gained 7.73% in the first six months of 2015.
BILLINGS
Half way through 2015 U.S. equity markets, specifically the S&P 500, appears to be range bound, with one half of the months positive and one half negative, netting out to a modest 1.23% gain year-to-date. After three consecutive years of double digit positive returns, it appears this may be the year that upsets that trend. Domestic economic data has painted a mixed picture with positive signs in new home sales and construction, and modestly improving employment numbers. On the flip side, consumer spending hasn’t increased as quickly as anticipated and manufacturing data and business investment were both weaker than expected. Add to that several headline scares around Fed policy, Greece, slower growth in China, an oil prices shock and a strengthening dollar. Clearly a lot of uncertainty, and uncertainty in itself is the likely cause for market gyrations. The bond market has also taken a pause and is nearly flat year-to-date.
Somewhat like 2014, breadth of returns remains wide. So far in 2015, many developed non-U.S. markets and emerging markets are outperforming the S&P 500. Within the U.S., mid and small caps lead the charge relative to larger cap indices like the Dow Jones and the S&P 500.
Despite having our largest exposure to the financial sector, which has been nearly flat on the year, the majority of the stocks in our portfolio performed well and have been rewarded with price movements to match. Financial holdings have been the largest contributor of our +14.5% total return so far this year. During the period, there was a slight reduction in net long exposure. Our market cap exposure has decreased in the large and small cap space and increased in mid caps. This is a result of the opportunities we have found this year through our fundamental bottom-up analysis and not a result of a macro or tactical view. Intuitively this makes sense: as markets enter the range of fair value (which is where we believe we are today) opportunities should be more available in underfollowed or misunderstood businesses which are more common in mid and small cap companies.
Our perspective is that U.S. markets are in the range of fair value and investors should have expectations in line with that. Markets should be in this range more often than not with massive under or over valuations occurring far less frequently. We maintain our sanguine view on U.S. equity markets (and the economy for that matter) into the foreseeable future. There are many positives factors which lead us to believe that markets can maintain their natural tailwind but with long term return expectations slightly below their historical results. Our objective is to provide attractive risk-adjusted returns and to outperform the broader index. We believe that even in fairly valued markets we can achieve our goal through a concentrated portfolio of companies with proven business models that create competitive advantages and enter a position at an attractive price relative to intrinsic value. Granted, in fairly valued markets it is harder to find business that meets quantitative and qualitative dynamics we demand in conjunction with attractive pricing. But, by maintaining a concentrated portfolio with 3-5 year outlooks, we are left with an investment team that can dedicate the time and effort to a rigorous research process. We acknowledge that there will be short term spats of volatility along the way, but it is in those moments that we are afforded a unique opportunity to invest at more attractive prices than previously offered. To be successful, our strategy requires dedication to, and a combination of, continual research, continual monitoring and patience.
MILLENNIUM
The broader equity market indexes have been relatively flat during the first half of 2015, driven by a slowly expanding U.S. economy and concerns over the impact of slowing economic growth outside the U.S.. The European Union continues to struggle with anemic growth and the potential exit of Greece from the EU. Growth in China has slowed down and there are concerns as to when it will improve.
The U.S. economy is leading the world in economic growth. Small cap companies, which in aggregate serve a more domestic market compared to large cap names, have received increased investor attention in the first half of 2015 compared to larger cap companies. Although small cap indexes have outperformed the broader equity market in the first half of 2015, they have also been more volatile. Corrective market pressures during the period were more severe for the small cap companies.
In Q1 2015, the Russell 2000 was up 4.32%, while the S&P 500 was up 0.95%. The Millennium portfolio corrected more than the small cap indexes in Q1 2015, and was -2.26% in Q1 2015. During Q2 2015, the Millennium portfolio rebounded strongly, with a 7.58% return compared to 0.42% for the Russell 2000 and 0.28% for the S&P 500. For the first half of 2015 performance, the Millennium portfolio was +5.14% compared to +4.75% for the Russell 2000 and +1.23% for the S&P 500.
LoCorr Spectrum Income Fund
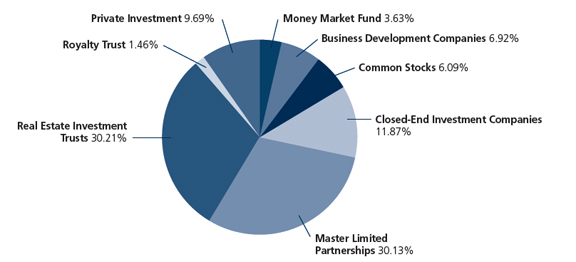
The LoCorr Spectrum Income Fund (the “Spectrum Income Fund” or the “Fund”) launched in 2014 with the objective of current income with capital appreciation as a secondary objective. The Fund is designed to fit within the “low correlation” of the LoCorr Fund family by seeking to provide relatively high levels of income with low correlation to the bond market.
The Fund uses two strategies to attempt to achieve its objective – an Income Strategy and a Loan Investment Strategy. The Fund’s sub-adviser of the Income Strategy is Trust and Fiduciary Management Services (“TFMS”). TFMS invests in pass-through securities to seek high current income, much of which the Fund distributes monthly to investors. Overall, the Fund’s Class I shares were up 2.45% during the six months ended June 30, 2015.
Income Strategy
At mid-year an economic and investing perspective may be needed. The U.S. economy grew over 3% a year in the two decades from 1986 to 2006. The average growth rate over the past eight years has been just 1.2% annually. This year’s GDP growth rate started below this average, but is expected to improve in the second half due to lower gasoline prices, catch-up capital spending by corporations, better employment numbers, and a moderate uptick in the housing market. The investment world has, in addition, been affected by an unusual dose of geopolitics and international market dynamics. Both the Greece/Euro situation and the massive correction of Chinese equities with Beijing’s recent intervention in market activities have brought into question the level of international economic expansion.
Frequent headlines about Federal Reserve policy and interest rate forecasts influence market behavior. The S&P 500 index including dividends is up 1.23% through mid-year with the Dow Jones Industrials at nearly breakeven level while the NASDAQ is up around 5%. European indexes have been up in the high single digit range because of a long waited return to positive economic growth after years of recessionary conditions. On the Fed front, rates have been very low for more than six years and evidence suggests that the Central Bank will raise rates in a deliberate and gradual manner and monitor the impact on the economy as we approach year-end. Keep in mind that the length of the current interest rate policy has produced real economic distortions that usually are not healthy for long-term growth.
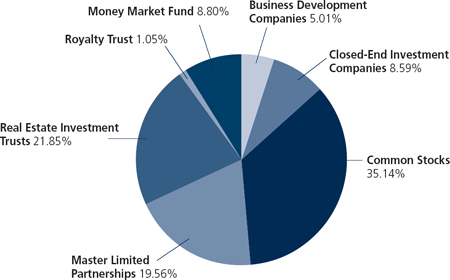
Because of strong headwind factors, Real Estate Investment Trusts (“REITs”) and Master Limited Partnerships (“MLPs”) have been under market pressure. We believe that fundamentals remain positive in these sectors at these price levels, and distributions remain strongly covered with several potential increases as 2015 progresses. We continue to fine tune our Agency Mortgage Backed Securities selections to emphasize shorter-term maturities and less leveraged portfolios. Commercial Mortgage REIT selections continue to perform well within their fundamental business models. We may see value producing assets in the commercial equity REITs spun out to shareholders by year-end. Business Development Corporations (“BDCs”) have now shown stabilization and a moderate upward trend after a period of correction primarily based on energy sector worries. Not reflecting good fundamentals in other areas, these worries brought the group to trade below book value for a time. These valuations have prompted a strong and meaningful amount of insider buying which has validated our confidence in the high income producing fundamentals. Refiners, shippers, and select special situations remain strong.
Asset classes that are sensitive to interest rates and commodities were impacted negatively in the first half of 2015, especially the second quarter of the year. As always, factors both real and sentiment-related were evident. Inflation as measured by the Consumer Price Index (“CPI”) is still benign. The Federal Reserve’s target of 2% inflation rate may be reached sometime in the future, possibly 2016-2017.
The Bloomberg Commodities Index recently dropped to a 13-year low, lower than after the banking meltdown of 2008 and the Eurozone crisis of 2012. From oil to copper to sugar, iron ore to palladium, almost nothing has escaped price weakness in this year’s worst performing asset class. Weak international economies, especially China, share the blame but there are global supply factors causing weakness too. This has exacerbated commodity price erosion and contributed greatly to negative market sentiment. Natural gas has been the rare exception as its price has remained in a tight range because of worldwide demand and domestic electric power switching from traditional coal generation to gas-fired plants. We are closely monitoring opportunities to find bargains in this area as the correction unfolds.
With regard to interest rates, we fully expect the Fed to increase rates at some time this year and we believe that the general level of interest rates will reflect the beginning of a Federal Reserve’s normalization process rather than a major tightening to slow down inflationary rates and credit expansion in the broader U.S. economy. Consumers are continuing to deleverage their household balance sheets by paying down debt more regularly than they have in more than a decade. Home foreclosures are also at a 10-year low. This coupled with cautious underwriting of loans and stricter banking and lending regulation have improved credit conditions and directly moderated the demand for money. Strong cash flow from pass-through entities and regular C corporations have taken lessened corporate demands for capital. With this backdrop, the Fed can now begin the process of adjusting its balance sheet. As this plays out, yield competition from fixed income products for income investors may be muted going forward.
The LoCorr Spectrum Income Fund Class I shares for the six months ended June 30, 2015 was up 2.45%, giving up more than half of its first quarter gain as the result of the investment headwinds and concerns discussed above. The yields of the portfolio holdings have been steady.
Loan Investment Strategy
The Loan Investment Strategy is designed to invest in secured real estate loans that provide the Fund with the potential to enhance yield, reduce volatility and provide the portfolio benefits of lower correlation to stocks and bonds. The Fund’s Loan Investment Strategy is based on its investment in a pool of secured real estate loans managed and administered by Terra Capital Partners (“Terra”), which was founded in 2002. During the period, this investment has generated a steady source of high income and helped dampen the Fund’s volatility while producing positive returns.
Thank you for investing in LoCorr Funds.
It is not possible to invest directly into an index.
Correlation measures how much the returns of two investments move together over time. Duration is a commonly used measure of the potential volatility of the price of the debt security, or the aggregate market value of a portfolio of debt securities, prior to maturity. Securities with a longer duration generally have more volatile prices than securities of comparable quality with a shorter duration. Market cap refers to the size of companies held based on the value of all outstanding shares. Basis Points (bps) - A unit that is equal to 1/100th of 1%, and is used to denote the change in a financial instrument. The basis point is commonly used for calculating changes in interest rates, equity indexes and the yield of a fixed-income security. Book Value (BV) - the net asset value of a company, calculated by subtracting total liabilities from total assets.
S&P 500 Total Return Index is a capitalization weighted unmanaged benchmark index that includes the stocks of 500 large capitalization companies in major industries. This total return index includes net dividends and is calculated by adding an indexed dividend return to the index price change for a given period. Russell 2000 Index measures the performance of approximately 2,000 small-cap companies in the Russell 3000 Index, which is made up of 3,000 of the biggest U.S. stocks. The Russell 2000 serves as a benchmark for small-cap stocks in the United States. Barclays Capital 1-5 Year Government/Credit Index is an unmanaged index considered representative of performance of short-term U.S. corporate bonds and U.S. government bonds with maturities from one to five years. NASDAQ is a computerized system that facilitates trading and provides price quotations on more than 5,000 of the more actively traded over the counter stocks. Nikkei Index is a stock market index for the Tokyo Stock Exchange (TSE). It is a price-weighted index, and the components are reviewed once a year. Currently, the Nikkei is the most widely quoted average of Japanese equities, similar to the Dow Jones Industrial Average. Barclays 1-3 Year Government Bond Index is a broad measure of the performance of short-term government bonds. Please note an investor cannot invest directly in an index. Dow Jones Industrial Average (DJIA) is a price-weighted average of 30 significant stocks traded on the New York Stock Exchange and the Nasdaq. Consumer Price Index measures the variation in prices paid by typical consumers for retail goods and other items.
The opinions expressed in the letter are those of the Fund manager, are subject to change, are not guaranteed and should not be considered investment advice.
Must be preceded or accompanied by a prospectus.
Fund holdings and sector allocation are subject to change and should not be considered a recommendation to buy or sell any security. For a complete list of Fund holdings please refer to the Schedule of Investments included in this report.
Mutual fund investing involves risk. Principal loss is possible. The LoCorr Managed Futures Strategy Fund is a diversified fund. The LoCorr Long/ Short Commodities Strategy Fund, the LoCorr Multi-Strategy Fund, the LoCorr Market Trend Fund, the LoCorr Long/Short Equity Fund and the LoCorr Spectrum Income Fund are each non-diversified funds, meaning they may invest their assets in fewer individual holdings than a diversified fund. Therefore, the Funds are more exposed to individual stock volatility than a diversified fund. The Funds invest in foreign investments and foreign currencies which involve greater volatility and political, economic and currency risks and differences in accounting methods. The Funds may make short sales of securities, which involves the risk that losses may exceed the original amount invested. Investing in commodities may subject the Funds to greater risks and volatility as commodity prices may be influenced by a variety of factors including unfavorable weather, environmental factors, and changes in government regulations. The Funds may invest in derivative securities, which derive their performance from the performance of an underlying asset, index, interest rate or currency exchange rate. Derivatives can be volatile and involve various types and degrees of risks, and, depending upon the characteristics of a particular derivative, suddenly can become illiquid. Investments in debt securities typically decrease in value when interest rates rise. This risk is usually greater for longer-term debt securities. Investments in Asset Backed, Mortgage Backed, and Collateralized Mortgage Backed Securities include additional risks that investors should be aware of such as credit risk, prepayment risk, possible illiquidity and default, as well as increased susceptibility to adverse economic developments.
Diversification does not assure a profit nor protect against loss in a declining market.
Past performance is not a guarantee of future results.
Derivative contracts ordinarily have leverage inherent in their terms which can magnify a Fund’s potential for gains or losses through increased long and short position exposure. A Fund may access derivatives via a swap agreement. A risk of a swap agreement is the risk that the counterparty to the agreement will default on its obligation to pay the Fund.
A Fund will incur a loss as a result of a short position if the price of the short position instrument increases in value between the date of the short position sale and the date on which an offsetting position is purchased.
Investments in small - and medium-capitalization companies involve additional risks such as limited liquidity and greater volatility. Investments in lower rated and non-rated securities presents a greater risk of loss to principal and interest than higher-rated securities. ETF investments are subject to investment advisory and other expenses, which will be indirectly paid by the Fund. As a result, the cost of investing in the Fund will be higher than the cost of investing directly in ETFs and may be higher than other mutual funds that invest directly in stocks and bonds. ETFs are subject to specific risks, depending on the nature of the ETF.
A Fund’s portfolio will be significantly impacted by the performance of the real estate market generally, and a Fund may be exposed to greater risk and experience higher volatility than would a more economically diversified portfolio. Property values may fall due to increasing vacancies or declining rents resulting from economic, legal, cultural, or technological developments. Investments in Limited Partnerships (including master limited partnerships) involve risks different from those of investing in common stock including risks related to limited control and limited rights to vote on matters affecting the Limited Partnership, risks related to potential conflicts of interest between the Limited Partnership and the Limited Partnership’s general partner, cash flow risks, dilution risks and risks related to the general partner’s limited call right. Underlying Funds are subject to management and other expenses, which will be indirectly paid by a Fund.
The LoCorr Managed Futures Strategy Fund, LoCorr Long/Short Commodities Strategy Fund, LoCorr Multi-Strategy Fund, LoCorr Market Trend Fund, LoCorr Long/ Short Equity Fund, and the LoCorr Spectrum Income Fund are distributed by Quasar Distributors, LLC.
LoCorr Managed Futures Strategy Fund
Rate of Return — For the period ended June 30, 2015 (Unaudited)
| | | | | | | | | |
| | | Inception Date | | 6 Month | | 1 Year | | Average Annual Since Inception |
| LoCorr Managed Futures Strategy Fund - Class A (without maximum load) | | 3/22/11 | | -1.88% | | 2.93% | | -1.47% |
| LoCorr Managed Futures Strategy Fund - Class A (with maximum load) | | 3/22/11 | | -7.53% | | -3.03% | | -2.83% |
| LoCorr Managed Futures Strategy Fund - Class C | | 3/24/11 | | -3.15% | | 1.30% | | -2.20% |
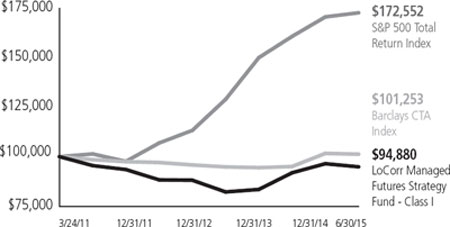
| LoCorr Managed Futures Strategy Fund - Class I | | 3/24/11 | | -1.63% | | 3.27% | | -1.22% |
| S&P 500 Total Return Index | | | | 1.23% | | 7.42% | | 13.63%1 |
| Barclays CTA Index | | | | -0.38% | | 6.54% | | 0.30%2 |
$100,000 investment in the LoCorr Managed Futures Strategy Fund – Class I
For the period ended June 30, 2015 (Unaudited)
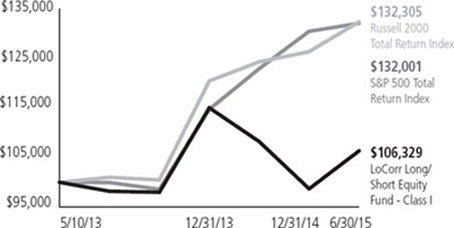
This chart illustrates the performance of a hypothetical $100,000 investment made in the Fund since inception. Assumes reinvestment of dividends and capital gains, but does not reflect the effect of any applicable sales charge or redemption fees. This chart does not imply any future performance. Performance will vary from class to class based on differences in class-specific expenses and sales charges. The returns do not reflect the deduction of taxes that a shareholder would pay on Fund distributions or the redemption of Fund shares.
Performance data represents past performance; past performance does not guarantee future results. The investment return and principal value of an investment will fluctuate so that an investor’s shares, when redeemed, may be worth more or less than their original cost. Current performance of the Fund may be lower or higher than the performance quoted. Performance data current to the most recent month end may be obtained by calling 1.855.LCFUNDS, or visiting www.LoCorrFunds.com.
Performance data shown reflects the Class A maximum sales charge of 5.75% and reflects the Class C Contingent Deferred Sales Charge (CDSC) of 1.00%. Performance of the Class A without load does not reflect the deduction of the sales load or fee. If reflected, the load or fee would reduce the performance quoted.
The Fund imposes a 1.00% redemption fee on shares held for less than 30 days. Performance data does not reflect the redemption fee. If it had, return would be reduced.
Per the fee table in the Fund’s May 1, 2015 prospectus, the Fund’s annual operating expense ratio is 2.62%, 3.37% and 2.37% for Class A, Class C and Class I shares, respectively.
The S&P 500 Total Return Index is an unmanaged capitalization-weighted index of 500 stocks designed to measure performance of the broad domestic economy through changes in the aggregate market value of the 500 stocks which represent all major industries. The Barclays CTA Index is a leading industry benchmark of representative performance of commodity trading advisors.
One cannot invest directly in an index.
1 Since inception return as of March 24, 2011.
2 Since inception return as of March 31, 2011.
| |
| LoCorr Long/Short Commodities Strategy Fund |
| |
Rate of Return — For the period ended June 30, 2015 (Unaudited) |
| | | Inception Date | | 6 Month | | 1 Year | | Average Annual Since Inception1 |
| LoCorr Long/Short Commodities Strategy Fund - Class A (without maximum load) | | 1/1/12 | | 4.45% | | 15.32% | | -0.64% |
| LoCorr Long/Short Commodities Strategy Fund - Class A (with maximum load) | | 1/1/12 | | -1.55% | | 8.66% | | -2.30% |
| LoCorr Long/Short Commodities Strategy Fund - Class C | | 1/1/12 | | 2.95% | | 13.13% | | -1.50% |
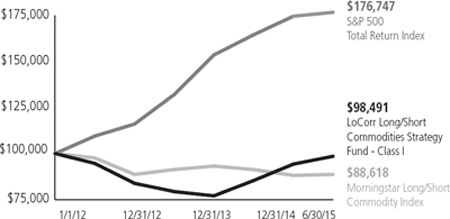
| LoCorr Long/Short Commodities Strategy Fund - Class I | | 1/1/12 | | 4.54% | | 15.46% | | -0.43% |
| S&P 500 Total Return Index | | | | 1.23% | | 7.42% | | 17.66% |
| Morningstar Long/Short Commodity Index | | | | 0.56% | | -2.88% | | -3.38% |
$100,000 investment in the LoCorr Long/Short Commodities Strategy Fund – Class I
For the period ended June 30, 2015 (Unaudited)
This chart illustrates the performance of a hypothetical $100,000 investment made in the Fund since inception. Assumes reinvestment of dividends and capital gains, but does not reflect the effect of any applicable sales charge or redemption fees. This chart does not imply any future performance. Performance will vary from class to class based on differences in class-specific expenses and sales charges. The returns do not reflect the deduction of taxes that a shareholder would pay on Fund distributions or the redemption of Fund shares.
Performance data represents past performance; past performance does not guarantee future results. The investment return and principal value of an investment will fluctuate so that an investor’s shares, when redeemed, may be worth more or less than their original cost. Current performance of the Fund may be lower or higher than the performance quoted. Performance data current to the most recent month end may be obtained by calling 1.855.LCFUNDS, or visiting www.LoCorrFunds.com.
Performance data shown reflects the Class A maximum sales charge of 5.75% and reflects the Class C Contingent Deferred Sales Charge (CDSC) of 1.00%. Performance of the Class A without load does not reflect the deduction of the sales load or fee. If reflected, the load or fee would reduce the performance quoted.
The Fund imposes a 1.00% redemption fee on shares held for less than 30 days. Performance data does not reflect the redemption fee. If it had, return would be reduced.
Per the fee table in the Fund’s May 1, 2015 prospectus, the Fund’s annual operating expense ratio, before fee waivers is 3.53%, 4.28% and 3.28% for Class A, Class C and Class I shares, respectively.
The S&P 500 Total Return Index is an unmanaged capitalization-weighted index of 500 stocks designed to measure performance of the broad domestic economy through changes in the aggregate market value of the 500 stocks which represent all major industries. The Morningstar Long/Short Commodity Index is a fully collateralized commodity futures index that uses the momentum rule to determine if each commodity is held long, short, or flat.
One cannot invest directly in an index.
1 Since inception returns as of January 1, 2012.
LoCorr Multi-Strategy Fund
Rate of Return — For the period ended June 30, 2015 (Unaudited)
| | | | | | | |
| | | Inception Date | | 1 Month | | Since Inception1 |
| LoCorr Multi-Strategy Fund - Class A (without maximum load) | | 4/6/15 | | -4.34% | | -7.95% |
| LoCorr Multi-Strategy Fund - Class A (with maximum load) | | 4/6/15 | | -9.88% | | -13.24% |
| LoCorr Multi-Strategy Fund - Class C | | 4/6/15 | | -5.37% | | -9.09% |
| LoCorr Multi-Strategy Fund - Class I | | 4/6/15 | | -4.32% | | -7.91% |
| S&P 500 Total Return Index | | | | -1.94% | | -0.35% |
| Morningstar Multialternative Category | | | | -1.64% | | -1.64% |
$100,000 investment in the LoCorr Multi-Strategy Fund - Class I
For the period ended June 30, 2015 (Unaudited)
This chart illustrates the performance of a hypothetical $100,000 investment made in the Fund since inception. Assumes reinvestment of dividends and capital gains, but does not reflect the effect of any applicable sales charge or redemption fees. This chart does not imply any future performance. Performance will vary from class to class based on differences in class-specific expenses and sales charges. The returns do not reflect the deduction of taxes that a shareholder would pay on Fund distributions or the redemption of Fund shares.
Performance data represents past performance; past performance does not guarantee future results. The investment return and principal value of an investment will fluctuate so that an investor’s shares, when redeemed, may be worth more or less than their original cost. Current performance of the Fund may be lower or higher than the performance quoted. Performance data current to the most recent month end may be obtained by calling 1.855.LCFUNDS, or visiting www.LoCorrFunds.com.
Performance data shown reflects the Class A maximum sales charge of 5.75% and reflects the Class C Contingent Deferred Sales Charge (CDSC) of 1.00%. Performance of the Class A without load does not reflect the deduction of the sales load or fee. If reflected, the load or fee would reduce the performance quoted.
The Fund imposes a 1.00% redemption fee on shares held for less than 30 days. Performance data does not reflect the redemption fee. If it had, return would be reduced.
Per the fee table in the Fund’s May 1, 2015 prospectus, the Fund’s annual operating expense ratio, before fee waivers is 3.14%, 3.89% and 2.89% for Class A, Class C and Class I shares, respectively.
The S&P 500 Total Return Index is an unmanaged capitalization-weighted index of 500 stocks designed to measure performance of the broad domestic economy through changes in the aggregate market value of the 500 stocks which represent all major industries. The funds in the Morningstar Multialternative Category use a combination of alternative strategies. Funds in this category have a majority of their assets exposed to alternative strategies and include both funds with static allocations to alternative strategies and funds tactically allocating among alternative strategies and asset classes.
One cannot invest directly in an index.
1 Cumulative total return since inception as of April 6, 2015.
Rate of Return — For the period ended June 30, 2015 (Unaudited)
| | | | | | | | | |
| | | Inception Date | | 6 Month | | 1 Year | | Average Annual Since Inception1 |
| LoCorr Market Trend Fund - Class A (without maximum load) | | 7/1/14 | | 8.57% | | 28.91% | | 28.91% |
| LoCorr Market Trend Fund - Class A (with maximum load) | | 7/1/14 | | 2.31% | | 21.50% | | 21.50% |
| LoCorr Market Trend Fund - Class C | | 7/1/14 | | 7.15% | | 26.93% | | 26.93% |
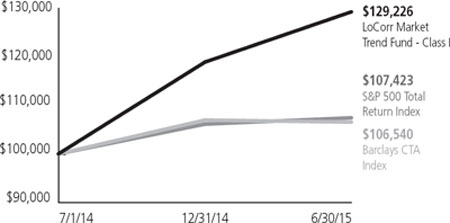
| LoCorr Market Trend Fund - Class I | | 7/1/14 | | 8.73% | | 29.26% | | 29.26% |
| S&P 500 Total Return Index | | | | 1.23% | | 7.42% | | 7.42% |
| Barclays CTA Index | | | | -0.38% | | 6.54% | | 6.54% |
$100,000 investment in the LoCorr Market Trend Fund - Class I
For the period ended June 30, 2015 (Unaudited)
This chart illustrates the performance of a hypothetical $100,000 investment made in the Fund since inception. Assumes reinvestment of dividends and capital gains, but does not reflect the effect of any applicable sales charge or redemption fees. This chart does not imply any future performance. Performance will vary from class to class based on differences in class-specific expenses and sales charges. The returns do not reflect the deduction of taxes that a shareholder would pay on Fund distributions or the redemption of Fund shares.
Performance data represents past performance; past performance does not guarantee future results. The investment return and principal value of an investment will fluctuate so that an investor’s shares, when redeemed, may be worth more or less than their original cost. Current performance of the Fund may be lower or higher than the performance quoted. Performance data current to the most recent month end may be obtained by calling 1.855.LCFUNDS, or visiting www.LoCorrFunds.com.
Performance data shown reflects the Class A maximum sales charge of 5.75% and reflects the Class C Contingent Deferred Sales Charge (CDSC) of 1.00%. Performance of the Class A without load does not reflect the deduction of the sales load or fee. If reflected, the load or fee would reduce the performance quoted.
The Fund imposes a 1.00% redemption fee on shares held for less than 30 days. Performance data does not reflect the redemption fee. If it had, return would be reduced.
Per the fee table in the Fund’s May 1, 2015 prospectus, the Fund’s annual operating expense ratio, before fee waivers is 3.70%, 4.45% and 3.45% for Class A, Class C and Class I shares, respectively.
The S&P 500 Total Return Index is an unmanaged capitalization-weighted index of 500 stocks designed to measure performance of the broad domestic economy through changes in the aggregate market value of the 500 stocks which represent all major industries. The Barclays CTA Index is a leading industry benchmark of representative performance of commodity trading advisors.
One cannot invest directly in an index.
1 Since inception return as of July 1, 2014.
LoCorr Long/Short Equity Fund
Rate of Return — For the period ended June 30, 2015 (Unaudited)
| | | | | | | | | |
| | | Inception Date | | 6 Month | | 1 Year | | Average Annual Since Inception1 |
| LoCorr Long/Short Equity Fund - Class A (without maximum load) | | 5/10/13 | | 7.66% | | -1.92% | | 2.68% |
| LoCorr Long/Short Equity Fund - Class A (with maximum load) | | 5/10/13 | | 1.44% | | -7.57% | | -0.12% |
| LoCorr Long/Short Equity Fund - Class C | | 5/10/13 | | 6.14% | | -3.75% | | 1.86% |
| LoCorr Long/Short Equity Fund - Class I | | 5/10/13 | | 7.73% | | -1.73% | | 2.91% |
| S&P 500 Total Return Index | | | | 1.23% | | 7.42% | | 13.85% |
| Russell 2000 Total Return Index | | | | 4.75% | | 6.49% | | 13.98% |
$100,000 investment in the LoCorr Long/Short Equity Fund - Class I
For the period ended June 30, 2015 (Unaudited)
This chart illustrates the performance of a hypothetical $100,000 investment made in the Fund since inception. Assumes reinvestment of dividends and capital gains, but does not reflect the effect of any applicable sales charge or redemption fees. This chart does not imply any future performance. Performance will vary from class to class based on differences in class-specific expenses and sales charges. The returns do not reflect the deduction of taxes that a shareholder would pay on Fund distributions or the redemption of Fund shares.
Performance data represents past performance; past performance does not guarantee future results. The investment return and principal value of an investment will fluctuate so that an investor’s shares, when redeemed, may be worth more or less than their original cost. Current performance of the Fund may be lower or higher than the performance quoted. Performance data current to the most recent month end may be obtained by calling 1.855.LCFUNDS, or visiting www.LoCorrFunds.com.
Performance data shown reflects the Class A maximum sales charge of 5.75% and reflects the Class C Contingent Deferred Sales Charge (CDSC) of 1.00%. Performance of the Class A without load does not reflect the deduction of the sales load or fee. If reflected, the load or fee would reduce the performance quoted.
The Fund imposes a 1.00% redemption fee on shares held for less than 30 days. Performance data does not reflect the redemption fee. If it had, return would be reduced.
Per the fee table in the Fund’s May 1, 2015 prospectus, the Fund’s annual operating expense ratio before fee waivers is 3.61%, 4.36% and 3.36% for Class A, Class C and Class I shares, respectively.
The S&P 500 Total Return Index is an unmanaged capitalization-weighted index of 500 stocks designed to measure performance of the broad domestic economy through changes in the aggregate market value of the 500 stocks which represent all major industries. The Russell 2000 Total Return Index measures the performance of the small-cap segment of the U.S. equity universe.
One cannot invest directly in an index.
1 Since inception returns as of May 10, 2013.
| |
| LoCorr Spectrum Income Fund |
Rate of Return — For the period ended June 30, 2015 (Unaudited)
| | | | | | | | | |
| | | Inception Date | | 6 Month | | 1 Year | | Average Annual Since Inception1 |
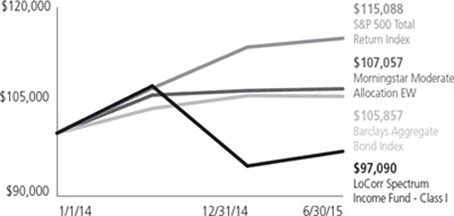
| LoCorr Spectrum Income Fund - Class A (without maximum load) | | 1/1/14 | | 2.31% | | -9.92% | | -2.19% |
| LoCorr Spectrum Income Fund - Class A (with maximum load) | | 1/1/14 | | -3.60% | | -15.10% | | -5.99% |
| LoCorr Spectrum Income Fund - Class C | | 1/1/14 | | 1.03% | | -11.38% | | -2.89% |
| LoCorr Spectrum Income Fund - Class I | | 1/1/14 | | 2.45% | | -9.68% | | -1.95% |
| S&P 500 Total Return Index | | | | 1.23% | | 7.42% | | 9.85% |
| Morningstar Moderate Allocation EW | | | | 0.75% | | 2.20% | | 5.07% |
| Barclays Aggregate Bond Index | | | | -0.10% | | 1.86% | | 3.88% |
$100,000 investment in the LoCorr Spectrum Income Fund - Class I
For the period ended June 30, 2015 (Unaudited)
This chart illustrates the performance of a hypothetical $100,000 investment made in the Fund since inception. Assumes reinvestment of dividends and capital gains, but does not reflect the effect of any applicable sales charge or redemption fees. This chart does not imply any future performance. Performance will vary from class to class based on differences in class-specific expenses and sales charges. The returns do not reflect the deduction of taxes that a shareholder would pay on Fund distributions or the redemption of Fund shares.
Performance data represents past performance; past performance does not guarantee future results. The investment return and principal value of an investment will fluctuate so that an investor’s shares, when redeemed, may be worth more or less than their original cost. Current performance of the Fund may be lower or higher than the performance quoted. Performance data current to the most recent month end may be obtained by calling 1.855.LCFUNDS, or visiting www.LoCorrFunds.com.
Performance data shown reflects the Class A maximum sales charge of 5.75% and reflects the Class C Contingent Deferred Sales Charge (CDSC) of 1.00%. Performance of the Class A without load does not reflect the deduction of the sales load or fee. If reflected, the load or fee would reduce the performance quoted.
The Fund imposes a 2.00% redemption fee on shares held for less than 60 days. Performance data does not reflect the redemption fee. If it had, return would be reduced.
Per the fee table in the Fund’s May 1, 2015 prospectus, the Fund’s annual operating expense ratio, before fee waivers is 3.37%, 4.12% and 3.12% for Class A, Class C and Class I shares, respectively.
The S&P 500 Total Return Index is an unmanaged capitalization-weighted index of 500 stocks designed to measure performance of the broad domestic economy through changes in the aggregate market value of the 500 stocks which represent all major industries. The Barclays Aggregate Bond Index is a long term, market capitalization-weighted index used to represent investment grade bonds being traded in the United States. The Morningstar Moderate Allocation portfolios seek to provide both capital appreciation and income by investing in three major areas: stocks, bonds and cash. Equal weighting (EW) gives each fund in the data set the same weight, regardless of assets.
One cannot invest directly in an index.
1 Since inception returns as of January 1, 2014.
| | |
| | LoCorr Managed Futures Strategy Fund - Consolidated Schedule of Investments | 15 |
| | |
LoCorr Managed Futures Strategy Fund
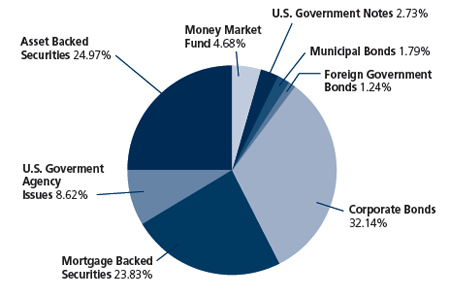
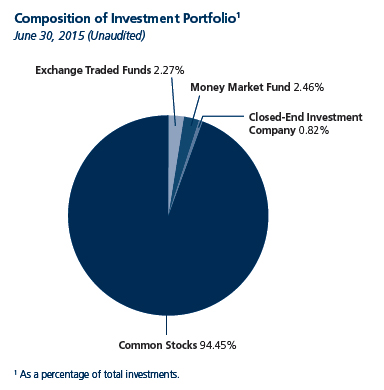
Composition of Consolidated Investment Portfolio1
June 30, 2015 (Unaudited)
1 As a percentage of total investments.
Consolidated Schedule of Investments
June 30, 2015 (Unaudited)
| | | | | | | | | | | | |
| | | Maturity Date | | Coupon Rate | | Principal Amount | | | Value | |
| ASSET BACKED SECURITIES: 22.59% | | | | | | | | | | | |
| 321 Henderson Receivables I LLC, 2004-A A1 (Acquired 02/08/2013, Cost, $385,002) (a)(c) | | 09/15/2045 | | 0.54 | % | | $ | 404,467 | | | $ | 400,192 | |
| 321 Henderson Receivables II LLC, 2006-1 (Acquired 03/30/2015, Cost, $2,873,630) (a)(c) | | 03/15/2041 | | 0.39 | % | | | 2,915,079 | | | | 2,857,299 | |
| Ally Auto Receivables Trust | | | | | | | | | | | | | |
| Series 2013-2 A3 | | 01/16/2018 | | 0.79 | % | | | 1,080,598 | | | | 1,081,140 | |
| Series 2013-1 A4 | | 02/15/2018 | | 0.84 | % | | | 1,100,000 | | | | 1,099,424 | |
| American Express Credit Account Master Trust, 2012-2 A | | 03/15/2018 | | 0.68 | % | | | 2,500,000 | | | | 2,500,445 | |
| American Homes 4 Rent 2014-SFR1 A (Acquired 05/13/2014 and 10/08/2014, Cost, $3,755,614) (a)(c) | | 06/17/2031 | | 1.25 | % | | | 3,761,627 | | | | 3,749,255 | |
| AmeriCredit Automobile Receivables Trust, 2014-2 A2A | | 10/10/2017 | | 0.54 | % | | | 934,995 | | | | 934,528 | |
| Atlantic City Electric Transition Funding LLC | | | | | | | | | | | | | |
| Series 2002-1 A3 | | 07/20/2017 | | 4.91 | % | | | 1,869 | | | | 1,873 | |
| Series 2003-1 A3 | | 10/20/2020 | | 5.05 | % | | | 922,876 | | | | 981,117 | |
| BA Credit Card Trust, 2014-A3 A (c) | | 01/15/2020 | | 0.47 | % | | | 4,040,000 | | | | 4,037,451 | |
| Bank of The West Auto Trust, 2014-1 A2 (Acquired 11/05/2014, Cost, $3,215,671) (a) | | 07/17/2017 | | 0.69 | % | | | 3,215,896 | | | | 3,216,890 | |
| Cabela’s Master Credit Card Trust | | | | | | | | | | | | | |
| Series 2010-2A A2 (Acquired 12/27/2012, 02/08/2013 and 05/07/2015, Cost, $2,777,668) (a)(c) | | 09/15/2018 | | 0.89 | % | | | 2,775,000 | | | | 2,777,670 | |
| Series 2012-1A A1 (Acquired 05/08/2012, 07/23/2012 and 05/06/2015, Cost, $3,616,103) (a) | | 02/18/2020 | | 1.63 | % | | | 3,590,000 | | | | 3,620,856 | |
| California Republic Auto Receivables Trust Series 2012-1 A (Acquired 12/03/2014, Cost, $201,301) (a) | | 08/15/2017 | | 1.18 | % | | | 201,121 | | | | 201,368 | |
| Series Trust 2013-2 A2 | | 03/15/2019 | | 1.23 | % | | | 1,466,783 | | | | 1,470,173 | |
| Series Trust 2015-1 A3 | | 04/15/2019 | | 1.33 | % | | | 2,500,000 | | | | 2,506,548 | |
| Capital Auto Receivables Asset Trust 2013-1 A4 | | 01/22/2018 | | 0.97 | % | | | 1,901,000 | | | | 1,902,405 | |
| Capital One Multi-Asset Execution Trust | | | | | | | | | | | | | |
| Series 2006-A11 (c) | | 06/15/2019 | | 0.27 | % | | | 3,500,000 | | | | 3,492,650 | |
| Series 2007-A2 (c) | | 12/16/2019 | | 0.26 | % | | | 3,500,000 | | | | 3,487,998 | |
| Carfinance Capital Auto Trust 2013-1 A (Acquired 05/21/2013, Cost, $24,997) (a) | | 07/17/2017 | | 1.65 | % | | | 24,998 | | | | 25,005 | |
| CenterPoint Energy Restoration Bond Co. LLC, 2009-1 A2 (Acquired 08/25/2011, 05/10/2013, 05/15/2013, 04/07/2015 and 06/11/2015, Cost, $3,468,442) (a) | | 08/15/2019 | | 3.46 | % | | | 3,358,837 | | | | 3,469,914 | |
| CenterPoint Energy Transition Bond Co. IV LLC, 2012-1A1 | | 04/15/2018 | | 0.90 | % | | | 1,421,674 | | | | 1,422,053 | |
| Chase Issuance Trust | | | | | | | | | | | | | |
| Series 2007-A2 A (c) | | 04/15/2019 | | 0.24 | % | | | 3,500,000 | | | | 3,485,839 | |
| Series 2013-A3 A3 (c) | | 04/15/2020 | | 0.46 | % | | | 234,000 | | | | 233,643 | |
The accompanying notes are an integral part of these consolidated financial statements.
| | |
16 | LoCorr Managed Futures Strategy Fund - Consolidated Schedule of Investments (continued) | |
| | |
| | | Maturity Date | | Coupon Rate | | Principal Amount | | | Value | |
ASSET BACKED SECURITIES (continued) | | | | | | | | | | | |
| Citibank Credit Card Issuance Trust | | | | | | | | | | | |
| Series 2013-A12 (c) | | 11/07/2018 | | 0.51 | % | | $ | 1,000,000 | | | $ | 999,497 | |
| Series 2007-A8 | | 09/20/2019 | | 5.65 | % | | | 3,500,000 | | | | 3,829,854 | |
| Colony American Homes | | | | | | | | | | | | | |
| Series 2014-1A A (Acquired 04/02/2014 and 12/02/2014, Cost, $3,139,642) (a)(c) | | 05/17/2031 | | 1.40 | % | | | 3,147,439 | | | | 3,130,477 | |
| Series 2015-1 C C (Acquired 05/27/2015, Cost, $1,940,000) (a)(c) | | 07/19/2032 | | 2.14 | % | | | 1,940,000 | | | | 1,931,144 | |
| Consumers 2014 Securitization Funding LLC, 2014-A A1 | | 11/01/2020 | | 1.33 | % | | | 1,960,604 | | | | 1,960,144 | |
| Discover Card Execution Note Trust, 2013-A1 (c) | | 08/17/2020 | | 0.49 | % | | | 3,300,000 | | | | 3,299,465 | |
| Dryrock Issuance Trust, 2012-2 A | | 08/15/2018 | | 0.64 | % | | | 1,500,000 | | | | 1,500,231 | |
| Entergy Arkansas Restoration Funding LLC, 2010-A A1 | | 08/01/2021 | | 2.30 | % | | | 1,768,544 | | | | 1,803,553 | |
| Entergy Gulf States Reconstruction Funding 1 LLC, 2007-A A2 | | 10/01/2018 | | 5.79 | % | | | 761,136 | | | | 805,924 | |
| Fifth Third Auto Trust | | | | | | | | | | | | | |
| Series 2014-3 A2B (c) | | 05/15/2017 | | 0.41 | % | | | 4,256,405 | | | | 4,256,745 | |
| Series 2013-A B | | 04/15/2019 | | 1.21 | % | | | 1,500,000 | | | | 1,504,659 | |
| Ford Credit Auto Owner Trust, 2013-B A3 | | 10/15/2017 | | 0.57 | % | | | 1,611,862 | | | | 1,611,388 | |
| HLSS Servicer Advance Receivables Backed Notes | | | | | | | | | | | | | |
| Series 2013-T1 A2 (Acquired 03/05/2015, Cost, $149,250) (a) | | 01/16/2046 | | 1.50 | % | | | 150,000 | | | | 149,850 | |
| Series 2013-T1 D2 (Acquired 01/16/2013 and 06/30/2015, Cost, $3,560,878) (a) | | 01/16/2046 | | 3.23 | % | | | 3,560,000 | | | | 3,563,560 | |
| Series 2013-T5 FLT (Acquired 06/01/2015, Cost, $2,004,338) (a) | | 08/15/2046 | | 1.98 | % | | | 2,000,000 | | | | 1,998,000 | |
| Series 2013-T7 A7 (Acquired 03/28/2014, 03/05/2015 and 05/12/2015, Cost, $879,287) (a) | | 11/15/2046 | | 1.98 | % | | | 883,000 | | | | 878,585 | |
| Honda Auto Receivables Owner Trust, 2012-4 A4 | | 12/18/2018 | | 0.66 | % | | | 3,262,000 | | | | 3,263,448 | |
| Huntington Auto Trust, 2015-1 | | 09/16/2019 | | 1.24 | % | | | 4,700,000 | | | | 4,692,776 | |
| Hyundai Auto Receivables Trust, 2012-C A3 | | 04/17/2017 | | 0.53 | % | | | 353,250 | | | | 353,350 | |
| Invitation Homes 2013-SFR1 Trust, A (Acquired 11/05/2013 and 10/24/2014, Cost, $4,141,145) (a)(c) | | 12/17/2030 | | 1.40 | % | | | 4,140,402 | | | | 4,122,979 | |
| Invitation Homes 2014-SFR2 Trust, A (Acquired 08/04/2014 and 05/06/2015, Cost, $3,800,000) (a)(c) | | 09/18/2031 | | 1.28 | % | | | 3,800,000 | | | | 3,761,449 | |
| John Deere Owner Trust, 2015-A A3 | | 06/17/2019 | | 1.32 | % | | | 1,500,000 | | | | 1,504,602 | |
| Ohio Phase-In-Recovery Funding LLC, 2013-1 A1 | | 07/01/2018 | | 0.96 | % | | | 2,417,978 | | | | 2,418,827 | |
| Santander Drive Auto Receivables Trust | | | | | | | | | | | | | |
| Series 2014-2 A2A | | 07/17/2017 | | 0.54 | % | | | 298,329 | | | | 298,208 | |
| Series 2014-3 A3 | | 07/16/2018 | | 0.81 | % | | | 2,710,000 | | | | 2,708,480 | |
| Series 2015-3 | | 09/17/2018 | | 1.02 | % | | | 5,600,000 | | | | 5,603,416 | |
| SMART Trust/Australia, 2012-2USA A3B (Acquired 02/08/2013, Cost, $196,215) (a)(b)(c) | | 10/14/2016 | | 1.14 | % | | | 195,970 | | | | 196,158 | |
| SWAY Residential Trust, 2014-1 A (Acquired 12/04/2014, Cost, $3,501,699) (a)(c) | | 01/20/2032 | | 1.49 | % | | | 3,519,113 | | | | 3,519,113 | |
| TCF Auto Receivables Owner Trust | | | | | | | | | | | | | |
| Series 2014-1A A2 (Acquired 02/26/2015, Cost, $1,275,417) (a) | | 05/15/2017 | | 0.59 | % | | | 1,276,015 | | | | 1,275,823 | |
| Series 2015-1A A2 (Acquired 06/03/2015, Cost, $2,999,827) (a) | | 08/15/2018 | | 1.02 | % | | | 3,000,000 | | | | 3,001,005 | |
| United States Small Business Administration, 2008-10B 1 | | 09/10/2018 | | 5.73 | % | | | 24,981 | | | | 26,035 | |
| TOTAL ASSET BACKED SECURITIES (Cost $118,933,696) | | | | | | | | | | | | 118,924,481 | |
| | | | | | | | | | | | | | |
| CORPORATE BONDS: 29.08% | | | | | | | | | | | | | |
| Administrative and Support and Waste Management and Remediation Services: 0.80% | | | | | | | | | | | | | |
| Glencore Finance (Canada) Ltd. (Acquired 02/14/2012 and 03/12/2013, Cost, $1,785,407) (a)(b) | | 01/15/2017 | | 3.60 | % | | | 1,750,000 | | | | 1,796,242 | |
| Mastercard, Inc. | | 04/01/2019 | | 2.00 | % | | | 1,165,000 | | | | 1,168,891 | |
| Synchrony Financial | | 08/15/2017 | | 1.88 | % | | | 1,250,000 | | | | 1,249,483 | |
| | | | | | | | | | | | | 4,214,616 | |
| | | | | | | | | | | | | | |
| Finance and Insurance: 12.22% | | | | | | | | | | | | | |
| Aetna Inc. | | 11/15/2017 | | 1.50 | % | | | 1,500,000 | | | | 1,503,693 | |
| Aflac Inc. | | 02/15/2017 | | 2.65 | % | | | 1,750,000 | | | | 1,791,213 | |
| American Express Co. | | 05/22/2018 | | 1.55 | % | | | 2,500,000 | | | | 2,481,077 | |
| Anthem, Inc. | | 01/15/2018 | | 1.88 | % | | | 1,250,000 | | | | 1,247,824 | |
| Bank of America Corp. | | 05/01/2018 | | 5.65 | % | | | 4,570,000 | | | | 5,020,182 | |
| Bank of Montreal (Acquired 12/04/2014, Cost, $2,029,909) (a)(b) | | 01/30/2017 | | 1.95 | % | | | 2,000,000 | | | | 2,031,712 | |
| Barclays Bank PLC (b) | | 09/22/2016 | | 5.00 | % | | | 1,000,000 | | | | 1,046,593 | |
| Berkshire Hathaway Inc. | | 08/15/2016 | | 2.20 | % | | | 860,000 | | | | 874,073 | |
| BNP Paribas (b) | | 08/20/2018 | | 2.70 | % | | | 1,750,000 | | | | 1,790,836 | |
| Capital One Financial Corp. | | 09/01/2016 | | 6.15 | % | | | 1,000,000 | | | | 1,055,486 | |
| Charles Schwab Corp./The | | 03/10/2018 | | 1.50 | % | | | 2,050,000 | | | | 2,052,023 | |
| Citigroup, Inc. | | 11/21/2017 | | 6.13 | % | | | 4,465,000 | | | | 4,911,375 | |
| Credit Agricole SA (Acquired 10/01/2012, Cost, $1,502,322) (a)(b) | | 10/01/2017 | | 3.00 | % | | | 1,500,000 | | | | 1,547,892 | |
| Deutsche Bank Aktiengesellschaft (b) | | 02/13/2019 | | 2.50 | % | | | 1,060,000 | | | | 1,065,390 | |
The accompanying notes are an integral part of these consolidated financial statements.
| | |
| | LoCorr Managed Futures Strategy Fund - Consolidated Schedule of Investments (continued) | 17 |
| | |
| | | | | | | | | | | | |
| | | Maturity Date | | Coupon Rate | | Principal Amount | | | Value | |
CORPORATE BONDS (continued) | | | | | | | | | | | |
| Fifth Third Bancorp | | 06/01/2018 | | 4.50 | % | | $ | 1,000,000 | | | $ | 1,059,219 | |
| Ford Motor Credit Company LLC | | 01/17/2017 | | 1.50 | % | | | 1,500,000 | | | | 1,498,274 | |
| General Electric Capital Corp. | | 04/27/2017 | | 2.30 | % | | | 235,000 | | | | 239,589 | |
| General Electric Capital Corp. | | 05/01/2018 | | 5.63 | % | | | 3,085,000 | | | | 3,414,549 | |
| Goldman Sachs Group, Inc./The | | 04/01/2018 | | 6.15 | % | | | 4,135,000 | | | | 4,597,624 | |
| Heineken N.V. (Acquired 10/02/2012 and 05/06/2015, Cost, $3,002,848) (a)(b) | | 10/01/2017 | | 1.40 | % | | | 3,000,000 | | | | 3,000,330 | |
| ING Bank N.V. (Acquired 02/29/2012 and 10/23/2012, Cost, $1,513,884) (a)(b) | | 03/07/2017 | | 3.75 | % | | | 1,500,000 | | | | 1,558,551 | |
| JPMorgan Chase & Co. | | 01/15/2018 | | 6.00 | % | | | 3,115,000 | | | | 3,431,160 | |
| Keycorp | | 12/13/2018 | | 2.30 | % | | | 1,170,000 | | | | 1,180,345 | |
| Morgan Stanley (c) | | 10/18/2016 | | 0.73 | % | | | 1,000,000 | | | | 998,715 | |
| Morgan Stanley | | 12/28/2017 | | 5.95 | % | | | 1,565,000 | | | | 1,720,271 | |
| Nomura Holdings, Inc. (b) | | 09/13/2016 | | 2.00 | % | | | 1,250,000 | | | | 1,259,107 | |
| Nordea Bank AB (Acquired 02/12/2013, Cost, $1,024,648) (a)(b) | | 03/20/2017 | | 3.13 | % | | | 1,000,000 | | | | 1,032,138 | |
| Prudential Financial Inc. | | 06/15/2019 | | 7.38 | % | | | 1,400,000 | | | | 1,659,928 | |
| Rabobank Nederland (b) | | 01/19/2017 | | 3.38 | % | | | 1,000,000 | | | | 1,032,930 | |
| Realty Income Corp. | | 01/31/2018 | | 2.00 | % | | | 1,750,000 | | | | 1,762,462 | |
| Toyota Motor Credit Corp. | | 05/22/2017 | | 1.75 | % | | | 1,290,000 | | | | 1,307,834 | |
| UBS AG (b) | | 12/20/2017 | | 5.88 | % | | | 872,000 | | | | 959,303 | |
| UnitedHealth Group Incorporated | | 12/15/2017 | | 1.40 | % | | | 445,000 | | | | 444,204 | |
| Voya Financial Inc. | | 02/15/2018 | | 2.90 | % | | | 1,000,000 | | | | 1,026,196 | |
| Wells Fargo & Co. | | 01/16/2018 | | 1.50 | % | | | 2,725,000 | | | | 2,719,888 | |
| | | | | | | | | | | | | 64,321,986 | |
| | | | | | | | | | | | | | |
| Health Care and Social Assistance: 0.36% | | | | | | | | | | | | | |
| Catholic Health Initiatives | | 11/01/2017 | | 1.60 | % | | | 1,900,000 | | | | 1,897,196 | |
| | | | | | | | | | | | | | |
| Information: 3.29% | | | | | | | | | | | | | |
| America Movil, S.A.B. de C.V. (b) | | 09/08/2016 | | 2.38 | % | | | 1,500,000 | | | | 1,518,930 | |
| AT&T Inc. | | 03/11/2019 | | 2.30 | % | | | 1,985,000 | | | | 1,986,600 | |
| CA, Inc. | | 08/15/2018 | | 2.88 | % | | | 1,500,000 | | | | 1,530,087 | |
| CBS Corp. | | 07/01/2017 | | 1.95 | % | | | 1,000,000 | | | | 1,009,136 | |
| Comcast Corp. | | 02/15/2018 | | 5.88 | % | | | 1,500,000 | | | | 1,664,536 | |
| DIRECTV Holdings LLC / DIRECTV Financing Co., Inc. | | 03/15/2017 | | 2.40 | % | | | 1,500,000 | | | | 1,519,813 | |
| Discovery Communications LLC | | 08/15/2019 | | 5.63 | % | | | 1,250,000 | | | | 1,397,698 | |
| Oracle Corp. | | 04/15/2018 | | 5.75 | % | | | 1,500,000 | | | | 1,668,874 | |
| Symantec Corp. | | 06/15/2017 | | 2.75 | % | | | 1,000,000 | | | | 1,012,359 | |
| Total System Services, Inc. | | 06/01/2018 | | 2.38 | % | | | 1,000,000 | | | | 997,179 | |
| Verizon Communications, Inc. | | 09/14/2018 | | 3.65 | % | | | 1,400,000 | | | | 1,472,502 | |
| Vodafone Group Plc. (b) | | 02/19/2018 | | 1.50 | % | | | 1,575,000 | | | | 1,548,419 | |
| | | | | | | | | | | | | 17,326,133 | |
| | | | | | | | | | | | | | |
| Manufacturing: 5.84% | | | | | | | | | | | | | |
| Abbvie, Inc. | | 05/14/2018 | | 1.80 | % | | | 1,450,000 | | | | 1,445,738 | |
| Anheuser-Busch InBev Finance Inc. | | 01/17/2018 | | 1.25 | % | | | 1,500,000 | | | | 1,495,131 | |
| Apple Inc. (c) | | 05/05/2017 | | 0.35 | % | | | 2,920,000 | | | | 2,920,394 | |
| Becton, Dickinson and Company | | 12/15/2017 | | 1.80 | % | | | 2,135,000 | | | | 2,135,260 | |
| Cisco Systems, Inc. | | 06/15/2018 | | 1.65 | % | | | 1,710,000 | | | | 1,716,076 | |
| Dow Chemical Co./The | | 05/15/2018 | | 5.70 | % | | | 1,215,000 | | | | 1,344,763 | |
| Eastman Chemical Co. | | 06/01/2017 | | 2.40 | % | | | 2,000,000 | | | | 2,032,928 | |
| Ecolab Inc. | | 12/08/2017 | | 1.45 | % | | | 1,500,000 | | | | 1,486,734 | |
| EMC Corp. | | 06/01/2018 | | 1.88 | % | | | 1,750,000 | | | | 1,753,392 | |
| Hershey Co./The | | 11/01/2016 | | 1.50 | % | | | 1,000,000 | | | | 1,010,624 | |
| HJ Heinz Co. (Acquired 06/23/2015, Cost, $1,497,000) (a) | | 07/02/2018 | | 2.00 | % | | | 1,500,000 | | | | 1,499,526 | |
| Johnson Controls, Inc. | | 11/02/2017 | | 1.40 | % | | | 1,255,000 | | | | 1,250,147 | |
| Lorillard Tobacco Co. | | 08/21/2017 | | 2.30 | % | | | 1,500,000 | | | | 1,505,268 | |
| Merck & Co Inc. | | 05/18/2018 | | 1.30 | % | | | 1,580,000 | | | | 1,573,762 | |
| Qualcomm, Inc. | | 05/18/2018 | | 1.40 | % | | | 2,050,000 | | | | 2,043,635 | |
| Sherwin-Williams Co./The | | 12/15/2017 | | 1.35 | % | | | 1,640,000 | | | | 1,634,516 | |
| Suncor Energy, Inc. (b) | | 06/01/2018 | | 6.10 | % | | | 1,170,000 | | | | 1,304,744 | |
| Thermo Fisher Scientific, Inc. | | 02/01/2017 | | 1.30 | % | | | 565,000 | | | | 564,062 | |
| Tyco Electronics Group S.A. (b) | | 12/17/2018 | | 2.38 | % | | | 1,000,000 | | | | 1,011,298 | |
| Zoetis, Inc. | | 02/01/2018 | | 1.88 | % | | | 1,000,000 | | | | 997,229 | |
| | | | | | | | | | | | | 30,725,227 | |
The accompanying notes are an integral part of these consolidated financial statements.
| | |
18 | LoCorr Managed Futures Strategy Fund - Consolidated Schedule of Investments (continued) | |
| | |
| | | | | | | | | | | | |
| | | Maturity Date | | Coupon Rate | | Principal Amount | | | Value | |
CORPORATE BONDS (continued) | | | | | | | | | | | |
| Mining, Quarrying, and Oil and Gas Extraction: 1.96% | | | | | | | | | | | |
| Anadarko Petroleum Corp. | | 09/15/2017 | | 6.38 | % | | $ | 2,000,000 | | | $ | 2,194,808 | |
| BHP Billiton Finance (USA) Ltd. (b) | | 02/24/2017 | | 1.63 | % | | | 1,015,000 | | | | 1,024,180 | |
| Nabors Industries, Inc. | | 02/15/2018 | | 6.15 | % | | | 1,000,000 | | | | 1,079,840 | |
| Occidental Petroleum Corp. | | 02/15/2018 | | 1.50 | % | | | 425,000 | | | | 423,529 | |
| Phillips 66 | | 05/01/2017 | | 2.95 | % | | | 1,500,000 | | | | 1,541,812 | |
| Rio Tinto Finance (USA) PLC (b) | | 08/21/2017 | | 1.63 | % | | | 1,505,000 | | | | 1,506,060 | |
| Sinopec Group Overseas Development (2014) Ltd. (Acquired 04/02/2014, | | | | | | | | | | | | | |
| Cost, $1,500,000) (a)(b)(c) | | 04/10/2017 | | 1.05 | % | | | 1,500,000 | | | | 1,498,147 | |
| Teck Resources Ltd. (b) | | 08/15/2017 | | 3.85 | % | | | 1,000,000 | | | | 1,031,187 | |
| | | | | | | | | | | | | 10,299,563 | |
| | | | | | | | | | | | | | |
| Real Estate and Rental and Leasing: 0.49% | | | | | | | | | | | | | |
| Health Care REIT, Inc. | | 04/01/2019 | | 4.13 | % | | | 1,500,000 | | | | 1,587,714 | |
| Ventas Realty LP / Ventas Capital Corp. | | 02/15/2018 | | 2.00 | % | | | 1,000,000 | | | | 1,006,124 | |
| | | | | | | | | | | | | 2,593,838 | |
| | | | | | | | | | | | | | |
| Retail Trade: 1.76% | | | | | | | | | | | | | |
| Amazon.com, Inc. | | 11/29/2017 | | 1.20 | % | | | 1,250,000 | | | | 1,244,277 | |
| AutoZone, Inc. | | 06/15/2016 | | 6.95 | % | | | 2,000,000 | | | | 2,110,518 | |
| BP Capital Markets (b) | | 09/26/2018 | | 2.24 | % | | | 1,000,000 | | | | 1,014,490 | |
| CVS Health Corp. | | 12/05/2018 | | 2.25 | % | | | 2,115,000 | | | | 2,141,112 | |
| Macy’s Retail Holdings, Inc. | | 12/01/2016 | | 5.90 | % | | | 1,500,000 | | | | 1,598,171 | |
| Walgreens Boots Alliance Inc. | | 11/17/2017 | | 1.75 | % | | | 1,150,000 | | | | 1,154,518 | |
| | | | | | | | | | | | | 9,263,086 | |
| | | | | | | | | | | | | | |
| Transportation and Warehousing: 0.33% | | | | | | | | | | | | | |
| Carnival Corp. (b) | | 12/15/2017 | | 1.88 | % | | | 775,000 | | | | 778,236 | |
| Spectra Energy Partners, LP | | 09/25/2018 | | 2.95 | % | | | 915,000 | | | | 935,791 | |
| | | | | | | | | | | | | 1,714,027 | |
| | | | | | | | | | | | | | |
| Utilities: 0.89% | | | | | | | | | | | | | |
| Exelon Generation Co., LLC | | 10/01/2019 | | 5.20 | % | | | 2,000,000 | | | | 2,199,612 | |
| Sempra Energy | | 04/01/2017 | | 2.30 | % | | | 1,000,000 | | | | 1,014,710 | |
| Southern Power Co. | | 06/01/2018 | | 1.50 | % | | | 1,500,000 | | | | 1,491,276 | |
| | | | | | | | | | | | | 4,705,598 | |
| | | | | | | | | | | | | | |
| Wholesale Trade: 1.14% | | | | | | | | | | | | | |
| B.A.T. International Finance P.L.C. (Acquired 06/06/2012, Cost, $995,160) (a)(b) | | 06/07/2017 | | 2.13 | % | | | 1,000,000 | | | | 1,011,535 | |
| Cardinal Health, Inc. | | 11/15/2019 | | 2.40 | % | | | 1,500,000 | | | | 1,487,897 | |
| McKesson Corporation | | 03/10/2017 | | 1.29 | % | | | 1,500,000 | | | | 1,497,813 | |
| Samsung Electronics America, Inc. (Acquired 04/18/2013, Cost, $2,016,552) (a) | | 04/10/2017 | | 1.75 | % | | | 2,000,000 | | | | 2,012,844 | |
| | | | | | | | | | | | | 6,010,089 | |
| TOTAL CORPORATE BONDS (Cost $152,732,229) | | | | | | | | | | | | 153,071,359 | |
| | | | | | | | | | | | | | |
| FOREIGN GOVERNMENT BONDS: 1.12% | | | | | | | | | | | | | |
| European Investment Bank (b) | | 03/15/2018 | | 1.00 | % | | | 3,500,000 | | | | 3,492,590 | |
| European Investment Bank (b) | | 08/15/2018 | | 1.13 | % | | | 2,400,000 | | | | 2,392,577 | |
| TOTAL FOREIGN GOVERNMENT BONDS (Cost $5,868,114) | | | | | | | | | | | | 5,885,167 | |
| | | | | | | | | | | | | | |
| MORTGAGE BACKED SECURITIES: 21.56% | | | | | | | | | | | | | |
| American Tower Trust I, 2013-1-2 (Acquired 03/06/2013, Cost, $1,830,000) (a) | | 03/15/2043 | | 1.55 | % | | | 1,830,000 | | | | 1,820,802 | |
| BXHTL Mortgage Trust, 2015-JWRZ (Acquired 06/19/2015, Cost, $1,583,488) (a)(c) | | 05/15/2029 | | 1.43 | % | | | 1,585,000 | | | | 1,583,488 | |
| CD 2005-CD1 Commercial Mortgage Trust, 2005-CD1 A4 (c) | | 07/15/2044 | | 5.38 | % | | | 120,111 | | | | 120,205 | |
| CD 2007-CD5 Mortgage Trust, A4 (c) | | 11/15/2044 | | 5.89 | % | | | 2,627,549 | | | | 2,828,714 | |
| COMM 2012-CCRE2 Mortgage Trust, 2012-CR2 A1 | | 08/15/2045 | | 0.82 | % | | | 1,281,370 | | | | 1,279,484 | |
| COMM 2012-CCRE4 Mortgage Trust, 2012-CR4 A2 | | 10/17/2045 | | 1.80 | % | | | 2,500,000 | | | | 2,514,368 | |
| Commercial Mortgage Trust, 2007-GG11 A4 | | 12/10/2049 | | 5.74 | % | | | 1,250,000 | | | | 1,326,593 | |
| CSMC Series, 2014-ICE A (Acquired 10/07/2014, Cost, $3,583,455) (a)(c) | | 04/15/2027 | | 0.98 | % | | | 3,580,000 | | | | 3,570,842 | |
| CSMC Trust | | | | | | | | | | | | | |
| Series 2013-6 1A1 (Acquired 07/24/2013, Cost, $2,346,528) (a)(c) | | 07/25/2028 | | 2.50 | % | | | 2,404,383 | | | | 2,391,421 | |
| Series 2015-2 (Acquired 04/30/2015, Cost, $2,942,551) (a) | | 02/25/2045 | | 3.00 | % | | | 2,896,633 | | | | 2,920,010 | |
| DBUBS 2011-LC3 Mortgage Trust, A2 | | 08/10/2044 | | 3.64 | % | | | 1,854,436 | | | | 1,887,432 | |
The accompanying notes are an integral part of these consolidated financial statements.
| | |
| | LoCorr Managed Futures Strategy Fund - Consolidated Schedule of Investments (continued) | 19 |
| | |
| | | Maturity Date | | Coupon Rate | | Principal Amount | | | Value | |
MORTGAGE BACKED SECURITIES (continued) | | | | | | | | | | | |
| Fannie Mae-Aces | | | | | | | | | | | |
| Series 2014-M13 ASQ2 | | 11/25/2017 | | 1.64 | % | | $ | 2,625,256 | | | $ | 2,653,837 | |
| Series 2015-M1 ASQ2 | | 02/25/2018 | | 1.63 | % | | | 715,000 | | | | 722,751 | |
| Series 2015-M7 ASQ2 | | 04/25/2018 | | 1.55 | % | | | 2,500,000 | | | | 2,518,652 | |
| Series 2013-M13 FA (c) | | 05/25/2018 | | 0.54 | % | | | 1,292,119 | | | | 1,294,229 | |
| Fannie Mae Connecticut Avenue Securities | | | | | | | | | | | | | |
| Series 2014-C02 1M1 (c) | | 05/25/2024 | | 1.13 | % | | | 3,175,135 | | | | 3,150,312 | |
| Series 2014-C03 1M1 (c) | | 07/25/2024 | | 1.39 | % | | | 3,408,441 | | | | 3,405,942 | |
| Fannie Mae Pool | | 02/01/2021 | | 3.50 | % | | | 77,228 | | | | 81,469 | |
| Fannie Mae Pool | | 06/01/2021 | | 3.50 | % | | | 102,219 | | | | 107,832 | |
| Fannie Mae Pool | | 08/01/2021 | | 3.00 | % | | | 274,851 | | | | 285,967 | |
| Fannie Mae Pool | | 09/01/2021 | | 3.00 | % | | | 335,197 | | | | 348,786 | |
| Fannie Mae Pool | | 11/01/2021 | | 3.00 | % | | | 641,766 | | | | 667,884 | |
| Fannie Mae Pool | | 12/01/2025 | | 3.50 | % | | | 474,038 | | | | 501,233 | |
| Fannie Mae Pool | | 09/01/2026 | | 3.50 | % | | | 455,434 | | | | 481,462 | |
| Fannie Mae Pool (c) | | 10/01/2033 | | 2.40 | % | | | 1,087,520 | | | | 1,159,001 | |
| FDIC Commercial Mortgage Trust, 2012-C1 A (Acquired 05/10/2012, Cost, $25,359) (a)(c) | | 05/25/2035 | | 0.84 | % | | | 25,359 | | | | 25,369 | |
| FDIC Guaranteed Notes Trust | | | | | | | | | | | | | |
| Series 2010-S4 A (Acquired 02/24/2012, Cost, $647,260) (a)(c) | | 12/04/2020 | | 0.90 | % | | | 645,768 | | | | 649,739 | |
| Series 2010-S1 2A (Acquired 03/01/2012, Cost, $646,640) (a) | | 04/25/2038 | | 3.25 | % | | | 638,722 | | | | 654,993 | |
| Series 2010-S1 1A (Acquired 11/18/2011, Cost, $263,887) (a)(c) | | 02/25/2048 | | 0.73 | % | | | 264,300 | | | | 264,383 | |
| FHLMC Multifamily Structured Pass Through Certificates | | | | | | | | | | | | | |
| Series K501 A1 | | 06/25/2016 | | 1.34 | % | | | 4,009 | | | | 4,007 | |
| Series K501 A2 | | 11/25/2016 | | 1.66 | % | | | 700,000 | | | | 706,163 | |
| Series K703 A1 | | 01/25/2018 | | 1.87 | % | | | 122,766 | | | | 123,349 | |
| Series K709 A1 | | 10/25/2018 | | 1.56 | % | | | 1,168,373 | | | | 1,175,523 | |
| Freddie Mac REMICS | | | | | | | | | | | | | |
| Series 3855 HE | | 02/15/2026 | | 2.50 | % | | | 34,634 | | | | 35,237 | |
| Series 4181 PF (c) | | 11/15/2042 | | 0.44 | % | | | 2,503,265 | | | | 2,502,644 | |
| Freddie Mac Structured Agency Credit Risk Debt Notes | | | | | | | | | | | | | |
| Series 2013-DN2 M1 (c) | | 11/25/2023 | | 1.63 | % | | | 3,040,453 | | | | 3,044,418 | |
| Series 2014-DN2 M1 (c) | | 04/25/2024 | | 1.04 | % | | | 1,821,398 | | | | 1,818,554 | |
| Series 2014-HQ2 M1 (c) | | 09/25/2024 | | 1.64 | % | | | 2,629,225 | | | | 2,639,400 | |
| FREMF Mortgage Trust | | | | | | | | | | | | | |
| Series 2012-KF01 (Acquired 02/02/2015, Cost, $3,052,037) (a)(c) | | 10/25/2044 | | 2.78 | % | | | 3,000,000 | | | | 3,058,212 | |
| Series 2012-K708 (Acquired 02/03/2015, Cost, $3,395,390) (a)(c) | | 02/25/2045 | | 3.89 | % | | | 3,250,000 | | | | 3,372,811 | |
| Series 2013-K502 (Acquired 05/06/2015, Cost, $2,915,317) (a)(c) | | 03/25/2045 | | 2.83 | % | | | 2,875,000 | | | | 2,912,844 | |
| Series 2013-KF02 (Acquired 11/01/2013, Cost, $689,889) (a)(c) | | 12/25/2045 | | 3.18 | % | | | 689,889 | | | | 710,145 | |
| GAHR Commercial Mortgage Trust, 2015-NRF AFL1 (Acquired 05/07/2015, | | | | | | | | | | | | | |
| Cost, $2,879,129) (a)(c) | | 12/15/2034 | | 1.48 | % | | | 2,870,000 | | | | 2,869,567 | |
| GS Mortgage Securities Trust | | | | | | | | | | | | | |
| Series 2014-GSFL A (Acquired 08/06/2014, Cost, $2,000,000) (a)(c) | | 07/15/2031 | | 1.18 | % | | | 2,000,000 | | | | 1,996,446 | |
| Series 2010-C2 A1 (Acquired 04/11/2012, Cost, $1,293,015) (a) | | 12/10/2043 | | 3.85 | % | | | 1,227,675 | | | | 1,249,397 | |
| Series 2011-GC5 A2 | | 08/10/2044 | | 3.00 | % | | | 3,715,000 | | | | 3,779,544 | |
| Series 2007-GG10 A4 (c) | | 08/10/2045 | | 5.79 | % | | | 5,476,930 | | | | 5,844,733 | |
| JPMBB Commercial Mortgage Securities Trust, 2014-C25 A1 | | 11/18/2047 | | 1.52 | % | | | 4,669,633 | | | | 4,659,145 | |
| JPMorgan Chase Commercial Mortgage Securities Trust | | | | | | | | | | | | | |
| Series 2010-C1 A1 (Acquired 12/30/2011, Cost, $52,290) (a) | | 06/15/2043 | | 3.85 | % | | | 50,421 | | | | 50,379 | |
| Series 2005-LDP5 A4 (c) | | 12/15/2044 | | 5.41 | % | | | 131,049 | | | | 131,343 | |
| Series 2011-C3, A3 (Acquired 04/17/2015, Cost, $2,696,653) (a) | | 02/16/2046 | | 4.39 | % | | | 2,500,000 | | | | 2,662,742 | |
| Series 2007-CIBC20 A4 (c) | | 02/12/2051 | | 5.79 | % | | | 1,256,059 | | | | 1,345,954 | |
| NCUA Guaranteed Notes Trust | | | | | | | | | | | | | |
| Series 2010-R2 1A (c) | | 11/06/2017 | | 0.56 | % | | | 2,553,708 | | | | 2,558,545 | |
| Series 2011-R1 1A (c) | | 01/08/2020 | | 0.63 | % | | | 86,567 | | | | 86,999 | |
| Series 2011-R2 1A (c) | | 02/06/2020 | | 0.59 | % | | | 2,360,551 | | | | 2,367,444 | |
| Series 2011-R3 1A (c) | | 03/11/2020 | | 0.59 | % | | | 2,654,553 | | | | 2,662,671 | |
| Series 2010-R1 1A (c) | | 10/07/2020 | | 0.63 | % | | | 275,080 | | | | 276,478 | |
| Series 2010-C1 APT | | 10/29/2020 | | 2.65 | % | | | 3,647,456 | | | | 3,721,328 | |
New Residential Mortgage Loan Trust, 2015-1 (Acquired 06/23/2015, Cost, $1,228,943) (a)(c) | | 05/28/2052 | | 3.75 | % | | | 1,200,000 | | | | 1,228,981 | |
| SBA Tower Trust, 2012-1 (Acquired 06/12/2014 and 09/03/2014, Cost, $1,606,295) (a) | | 12/15/2042 | | 2.93 | % | | | 1,562,000 | | | | 1,585,060 | |
| Sequoia Mortgage Trust, 2015-3 (Acquired 06/19/2015, Cost, $1,520,476) (a)(c) | | 07/25/2045 | | 3.50 | % | | | 1,500,000 | | | | 1,520,508 | |
| Silverstone Master Issuer PLC, 2015-1 (Acquired 02/13/2015, Cost, $2,000,000) (a)(b)(c) | | 01/21/2070 | | 0.32 | % | | | 2,000,000 | | | | 2,006,576 | |
| Springleaf Mortgage Loan Trust | | | | | | | | | | | | | |
| Series 2013-3A A (Acquired 10/04/2013, Cost, $1,464,214) (a)(c) | | 09/25/2057 | | 1.87 | % | | | 1,464,408 | | | | 1,460,909 | |
| Series 2013-1A A (Acquired 04/03/2013, Cost, $1,258,866) (a)(c) | | 06/25/2058 | | 1.27 | % | | | 1,258,966 | | | | 1,257,417 | |
| Series 2012-3A A (Acquired 10/18/2012, Cost, $359,517) (a)(c) | | 12/25/2059 | | 1.57 | % | | | 359,564 | | | | 360,275 | |
The accompanying notes are an integral part of these consolidated financial statements.
| | |
20 | LoCorr Managed Futures Strategy Fund - Consolidated Schedule of Investments (continued) | |
| | |
| | | | | | | | | | | | |
| | | Maturity Date | | Coupon Rate | | Principal Amount | | | Value | |
MORTGAGE BACKED SECURITIES (continued) | | | | | | | | | | | |
| UBS-Citigroup Commercial Mortgage Trust 2011-C1, A2 | | 01/12/2045 | | 2.80 | % | | $ | 4,000,000 | | | $ | 4,078,588 | |
| WIMC Capital Trust, 2012-A A1 (Acquired 06/21/2012, Cost, $415,953) (a) | | 10/16/2050 | | 4.55 | % | | | 415,957 | | | | 419,274 | |
| TOTAL MORTGAGE BACKED SECURITIES (Cost $113,750,639) | | | | | | | | | | | | 113,500,810 | |
| | | | | | | | | | | | | | |
| MUNICIPAL BONDS: 1.62% | | | | | | | | | | | | | |
| County of Hamilton OH Sewer System Revenue | | 12/01/2016 | | 1.23 | % | | | 825,000 | | | | 830,131 | |
| Louisiana Local Government Environmental Facilities & Community Development Authority | | 02/01/2018 | | 1.52 | % | | | 320,664 | | | | 321,279 | |
| Louisiana Local Government Environmental Facilities & Community Development Authority | | 02/01/2021 | | 3.22 | % | | | 850,000 | | | | 879,742 | |
| Metropolitan Council, (Minneapolis - St. Paul Metropolitan Area), State of Minnesota | | 09/01/2017 | | 1.20 | % | | | 2,020,000 | | | | 2,029,353 | |
| Metropolitan Government of Nashville & Davidson County TN | | 07/01/2017 | | 1.21 | % | | | 1,500,000 | | | | 1,498,530 | |
| St. Paul Housing & Redevelopment Authority | | 07/01/2018 | | 1.84 | % | | | 1,385,000 | | | | 1,380,845 | |
| State of Ohio | | 08/01/2017 | | 3.33 | % | | | 1,500,000 | | | | 1,566,240 | |
| TOTAL MUNICIPAL BONDS (Cost $8,504,786) | | | | | | | | | | | | 8,506,120 | |
| | | | | | | | | | | | | | |
| U.S. GOVERNMENT AGENCY ISSUES: 7.32% | | | | | | | | | | | | | |
| Federal Home Loan Banks | | 09/02/2015 | | 0.13 | % | | | 5,000,000 | | | | 5,000,045 | |
| Federal Home Loan Banks | | 12/09/2016 | | 1.63 | % | | | 4,000,000 | | | | 4,061,160 | |
| Federal Home Loan Banks | | 12/16/2016 | | 4.75 | % | | | 5,000,000 | | | | 5,297,315 | |
| Federal Home Loan Banks | | 03/10/2017 | | 0.88 | % | | | 3,000,000 | | | | 3,010,176 | |
| Federal Home Loan Mortgage Corp. | | 09/10/2015 | | 1.75 | % | | | 1,000,000 | | | | 1,003,056 | |
| Federal Home Loan Mortgage Corp. | | 08/25/2016 | | 2.00 | % | | | 5,000,000 | | | | 5,088,615 | |
| Federal National Mortgage Association | | 03/30/2016 | | 0.50 | % | | | 10,000,000 | | | | 10,013,870 | |
| Federal National Mortgage Association | | 11/15/2016 | | 1.38 | % | | | 5,000,000 | | | | 5,058,800 | |
| TOTAL U.S. GOVERNMENT AGENCY ISSUES (Cost $38,494,599) | | | | | | | | | | | | 38,533,037 | |
| | | | | | | | | | | | | | |
| U.S. GOVERNMENT NOTES: 2.47% | | | | | | | | | | | | | |
| United States Treasury Note | | 12/15/2015 | | 0.25 | % | | | 4,000,000 | | | | 4,002,500 | |
| United States Treasury Note | | 04/30/2017 | | 0.50 | % | | | 9,000,000 | | | | 8,985,231 | |
| TOTAL U.S. GOVERNMENT NOTES (Cost $12,979,320) | | | | | | | | | | | | 12,987,731 | |
| | | | | | | | | | | | | | |
| | | | | | | | | | | | | | |
| SHORT TERM INVESTMENTS: 4.71% | | | | | | | | | | | | | |
| U.S. GOVERNMENT AGENCY ISSUE: 0.47% | | | | | | | | | | | | | |
| Federal Home Loan Banks | | 09/25/2015 | | 0.20 | % | | | 2,500,000 | | | | 2,500,525 | |
| TOTAL U.S. GOVERNMENT AGENCY ISSUE | | | | | | | | | | | | 2,500,525 | |
| | | | | | | | Shares | | | | | |
| MONEY MARKET FUND: 4.24% | | | | | | | | | | | | |
| Fidelity Institutional Money Market Portfolio - Class I, 0.10% (d)(e)(f) | | | | | | | | 22,300,963 | | | | 22,300,963 | |
| TOTAL MONEY MARKET FUND | | | | | | | | | | | | 22,300,963 | |
| TOTAL SHORT TERM INVESTMENTS (Cost $24,800,947) | | | | | | | | | | | | 24,801,488 | |
| | | | | | | | | | | | | | |
| TOTAL INVESTMENTS (Cost $476,064,330): 90.47% | | | | | | | | | | | | 476,210,193 | |
| Other Assets in Excess of Liabilities: 9.53% (f) | | | | | | | | | | | | 50,148,168 | |
| TOTAL NET ASSETS: 100.00% | | | | | | | | | | | $ | 526,358,361 | |
(a) Restricted security as defined in Rule 144(a) under the Securities Act of 1933 and determined to be liquid. Purchased in a private placement transaction; resale to the public may require registration or may extend only to qualified institutional buyers. At June 30, 2015, the value of these securities total $107,438,099 which represents 20.41% of total net assets.
(b) Foreign issued security.
(c) Variable rate security. The rate reported is the rate in effect as of June 30, 2015.
(d) The rate quoted is the annualized seven-day effective yield as of June 30, 2015.
(e) All or a portion of this security is held by LCMFS Fund Limited. See Note 1.
(f) Includes assets pledged as collateral for swap contracts. See Note 2.
The accompanying notes are an integral part of these consolidated financial statements.
| | |
| | LoCorr Managed Futures Strategy Fund - Consolidated Schedule of Swap Contracts | 21 |
| | |
Consolidated Schedule of Swap Contracts
June 30, 2015 (Unaudited)
LONG TOTAL RETURN SWAP CONTRACTS
This investment is a holding of LCMFS Fund Limited. See Note 1.
| | | | | | | | | | |
| Termination Date | | Reference Index | | Notional | | | Unrealized
Appreciation
(Depreciation)* | | Counterparty |
| 12/20/17 | | LoCorr Managed Futures Index^ | | $ | 536,519,768 | | | $ | (42,869,132) | | Deutsche Bank AG |
^ Comprised of a proprietary basket of Commodity Trading Advisor’s (“CTA”) Programs investing in various futures, forwards, and currency derivative contracts and other similar investments. See Notes 2 and 3.
*Unrealized depreciation is a payable on the Fund’s consolidated statement of assets and liabilities.
The accompanying notes are an integral part of these consolidated financial statements.
| | |
22 | LoCorr Long/Short Commodities Strategy Fund - Consolidated Schedule of Investments | |
| | |
LoCorr Long/Short Commodities Strategy Fund
Composition of Consolidated Investment Portfolio1
June 30, 2015 (Unaudited)
1 As a percentage of total investments.
| Consolidated Schedule of Investments |
| June 30, 2015 (Unaudited) |
| | | | | | | | | | | | |
| | | Maturity Date | | Coupon Rate | | Principal Amount | | | Value | |
| ASSET BACKED SECURITIES: 15.98% | | | | | | | | | | | |
| American Express Credit Account Master Trust | | | | | | | | | | | |
| Series 2012-1 A (c) | | 01/15/2020 | | 0.45 | % | | $ | 200,000 | | | $ | 200,040 | |
| Series 2013-2 A (c) | | 05/17/2021 | | 0.61 | % | | | 200,000 | | | | 200,397 | |
| AmeriCredit Automobile Receivables Trust | | | | | | | | | | | | | |
| Series 2012-4 A3 | | 06/08/2017 | | 0.67 | % | | | 3,506 | | | | 3,506 | |
| Series 2013-1 A3 | | 10/10/2017 | | 0.61 | % | | | 15,071 | | | | 15,070 | |
| Series 2013-5 A3 | | 09/10/2018 | | 0.90 | % | | | 265,000 | | | | 264,986 | |
| BA Credit Card Trust, 2014-A3 A (c) | | 01/15/2020 | | 0.47 | % | | | 250,000 | | | | 249,842 | |
| Bank of The West Auto Trust, 2014-1 A2 (Acquired 11/05/2014 and 03/19/2015, Cost, $279,571) (a) | | 07/17/2017 | | 0.69 | % | | | 279,643 | | | | 279,730 | |
| California Republic Auto Receivables Trust 2013-2, A2 | | 03/15/2019 | | 1.23 | % | | | 232,193 | | | | 232,730 | |
| Capital Auto Receivables Asset Trust/Ally 2013-1, A-4 | | 01/22/2018 | | 0.97 | % | | | 100,000 | | | | 100,074 | |
| Capital One Multi-Asset Execution Trust | | | | | | | | | | | | | |
| Series 2006-A11 (c) | | 06/17/2019 | | 0.27 | % | | | 100,000 | | | | 99,790 | |
| Series 2007-A2 (c) | | 12/16/2019 | | 0.26 | % | | | 250,000 | | | | 249,143 | |
| CenterPoint Energy Restoration Bond Co. LLC, 2009-1 A2 (Acquired 04/07/2015, | | | | | | | | | | | | | |
| Cost, $276,988) (a) | | 08/15/2019 | | 3.46 | % | | | 267,578 | | | | 276,427 | |
| CenterPoint Energy Transition Bond Co. II LLC, A4 | | 08/01/2019 | | 5.17 | % | | | 302,408 | | | | 314,320 | |
| CenterPoint Energy Transition Bond Co. IV LLC, A1 | | 04/15/2018 | | 0.90 | % | | | 148,260 | | | | 148,300 | |
| Chase Issuance Trust, 2013-A3 (c) | | 04/15/2020 | | 0.46 | % | | | 300,000 | | | | 299,542 | |
| Citibank Credit Card Issuance Trust, 2013-A11(c) | | 02/07/2018 | | 0.42 | % | | | 100,000 | | | | 100,019 | |
| CNH Equipment Trust | | | | | | | | | | | | | |
| Series 2012-B A3 | | 09/15/2017 | | 0.86 | % | | | 479 | | | | 479 | |
| Series 2012-C A3 | | 12/15/2017 | | 0.57 | % | | | 8,662 | | | | 8,663 | |
| Series 2012-D A3 | | 04/16/2018 | | 0.65 | % | | | 22,113 | | | | 22,095 | |
| Colony American Homes | | | | | | | | | | | | | |
| Series 2014-1A A (Acquired 04/02/2014 and 12/02/2014, Cost, $487,339) (a)(c) | | 05/17/2031 | | 1.40 | % | | | 488,733 | | | | 486,099 | |
| Series 2015-1C C (Acquired 05/27/2015, Cost, $100,000) (a)(c) | | 07/19/2032 | | 2.14 | % | | | 100,000 | | | | 99,543 | |
| Discover Card Execution Note Trust | | | | | | | | | | | | | |
| Series 2010-A2 (c) | | 03/15/2018 | | 0.76 | % | | | 100,000 | | | | 100,068 | |
| Series 2013-A1 (c) | | 08/17/2020 | | 0.49 | % | | | 200,000 | | | | 199,968 | |
The accompanying notes are an integral part of these consolidated financial statements.
| | |
| | LoCorr Long/Short Commodities Strategy Fund - Consolidated Schedule of Investments (continued) | 23 |
| | |
| | | | | | | | | | | | |
| | | Maturity Date | | Coupon Rate | | Principal Amount | | | Value | |
ASSET BACKED SECURITIES (continued) | | | | | | | | | | | |
| Fifth Third Auto Trust | | | | | | | | | | | |
| Series 2014-3 A2B (c) | | 05/15/2017 | | 0.41 | % | | $ | 85,128 | | | $ | 85,135 | |
| Series 2013-A A3 | | 09/15/2017 | | 0.61 | % | | | 34,188 | | | | 34,191 | |
| GE Equipment Midticket LLC, 2012-1 A3 | | 05/23/2016 | | 0.60 | % | | | 229 | | | | 229 | |
| Honda Auto Receivables Owner Trust, 2012-4 A3 | | 08/18/2016 | | 0.52 | % | | | 4,870 | | | | 4,870 | |
| Huntington Auto Trust 2015-1 | | 09/16/2019 | | 1.24 | % | | | 250,000 | | | | 249,616 | |
| Invitation Homes 2014-SFR2 Trust, A (Acquired 08/04/2014 and 05/06/2015, Cost, $200,000) (a)(c) | | 09/18/2031 | | 1.28 | % | | | 200,000 | | | | 197,971 | |
| John Deere Owner Trust, 2013-A A3 | | 03/15/2017 | | 0.60 | % | | | 24,452 | | | | 24,448 | |
| Ohio Phase-In-Recovery Funding LLC, 2013-1 A1 | | 07/01/2018 | | 0.96 | % | | | 196,052 | | | | 196,121 | |
| Santander Drive Auto Receivables Trust | | | | | | | | | | | | | |
| Series 2014-2 A2A | | 07/17/2017 | | 0.54 | % | | | 119,332 | | | | 119,283 | |
| Series 2013-2 A3 | | 09/15/2017 | | 0.70 | % | | | 5,198 | | | | 5,197 | |
| Small Business Administration Participation Certificates, 2012-20K 1 | | 11/01/2032 | | 2.09 | % | | | 20,890 | | | | 20,513 | |
| TCF Auto Receivables Owner Trust, 2015-1A A2(Acquired 06/03/2015, Cost, $139,992) (a) | | 08/15/2018 | | 1.02 | % | | | 140,000 | | | | 140,047 | |
| World Omni Auto Receivables Trust | | | | | | | | | | | | | |
| Series 2012-A A3 | | 02/15/2017 | | 0.64 | % | | | 2,324 | | | | 2,324 | |
| Series 2012-B A3 | | 06/15/2017 | | 0.61 | % | | | 7,072 | | | | 7,073 | |
| TOTAL ASSET BACKED SECURITIES (Cost $5,045,439) | | | | | | | | | | | | 5,037,849 | |
| | | | | | | | | | | | | | |
| CORPORATE BONDS: 20.60% | | | | | | | | | | | | | |
| Administrative and Support and Waste Management and Remediation Services: 0.56% | | | | | | | | | | | | | |
| Glencore Finance (Canada) Ltd. (Acquired 04/07/2014, Cost, $26,403) (a)(b) | | 11/15/2016 | | 5.80 | % | | | 25,000 | | | | 26,314 | |
| Mastercard, Inc. | | 04/01/2019 | | 2.00 | % | | | 50,000 | | | | 50,167 | |
| Synchrony Financial | | 08/15/2017 | | 1.88 | % | | | 60,000 | | | | 59,975 | |
| Waste Management, Inc. | | 09/01/2016 | | 2.60 | % | | | 40,000 | | | | 40,701 | |
| | | | | | | | | | | | | 177,157 | |
| | | | | | | | | | | | | | |
| Finance and Insurance: 10.10% | | | | | | | | | | | | | |
| Aetna Inc. | | 11/15/2017 | | 1.50 | % | | | 45,000 | | | | 45,111 | |
| Aflac Inc. | | 02/15/2017 | | 2.65 | % | | | 85,000 | | | | 87,002 | |
| American Express Co. | | 05/22/2018 | | 1.55 | % | | | 45,000 | | | | 44,659 | |
| Bank of America Corp. | | 05/01/2018 | | 5.65 | % | | | 225,000 | | | | 247,164 | |
| Bank of Montreal (Acquired 12/04/2014, Cost, $91,346) (a)(b) | | 01/30/2017 | | 1.95 | % | | | 90,000 | | | | 91,427 | |
| Barclays Bank PLC (b) | | 09/22/2016 | | 5.00 | % | | | 55,000 | | | | 57,563 | |
| BB&T Corp. | | 01/12/2018 | | 1.45 | % | | | 80,000 | | | | 79,664 | |
| Berkshire Hathaway Inc. | | 08/15/2016 | | 2.20 | % | | | 35,000 | | | | 35,573 | |
| BNP Paribas (b) | | 08/20/2018 | | 2.70 | % | | | 75,000 | | | | 76,750 | |
| Capital One Financial Corp. | | 09/01/2016 | | 6.15 | % | | | 25,000 | | | | 26,387 | |
| Caterpillar Financial Services Corp. | | 09/06/2018 | | 2.45 | % | | | 25,000 | | | | 25,575 | |
| Charles Schwab Corp./The | | 03/10/2018 | | 1.50 | % | | | 110,000 | | | | 110,109 | |
| Citigroup, Inc. | | 11/21/2017 | | 6.13 | % | | | 230,000 | | | | 252,994 | |
| Deutsche Bank Aktiengesellschaft (b) | | 02/13/2019 | | 2.50 | % | | | 30,000 | | | | 30,152 | |
| Dragon 2012 LLC | | 03/12/2024 | | 1.97 | % | | | 19,176 | | | | 19,088 | |
| Fifth Third Bancorp | | 06/01/2018 | | 4.50 | % | | | 55,000 | | | | 58,257 | |
| Ford Motor Credit Company LLC | | 01/17/2017 | | 1.50 | % | | | 70,000 | | | | 69,919 | |
| General Electric Capital Corp. | | 05/01/2018 | | 5.63 | % | | | 175,000 | | | | 193,694 | |
| Goldman Sachs Group, Inc./The | | 04/01/2018 | | 6.15 | % | | | 220,000 | | | | 244,614 | |
| Helios Leasing I LLC | | 05/29/2024 | | 2.02 | % | | | 19,299 | | | | 19,230 | |
| Helios Leasing I LLC | | 07/24/2024 | | 1.73 | % | | | 19,762 | | | | 19,437 | |
| Helios Leasing I LLC | | 09/28/2024 | | 1.56 | % | | | 20,191 | | | | 19,654 | |
| John Deere Capital Corp. | | 04/13/2017 | | 5.50 | % | | | 50,000 | | | | 54,011 | |
| JPMorgan Chase & Co. | | 01/15/2018 | | 6.00 | % | | | 160,000 | | | | 176,239 | |
| KeyBank National Association | | 11/01/2017 | | 5.70 | % | | | 27,000 | | | | 29,339 | |
| Morgan Stanley | | 03/22/2017 | | 4.75 | % | | | 55,000 | | | | 58,022 | |
| Morgan Stanley | | 12/28/2017 | | 5.95 | % | | | 90,000 | | | | 98,929 | |
| MSN 41079 and 41084 Ltd. (b) | | 07/13/2024 | | 1.72 | % | | | 19,750 | | | | 19,408 | |
| Nomura Holdings, Inc. (b) | | 09/13/2016 | | 2.00 | % | | | 30,000 | | | | 30,219 | |
| Phoenix 2012 LLC | | 07/03/2024 | | 1.61 | % | | | 20,000 | | | | 19,574 | |
| PNC Funding Corp. | | 09/19/2016 | | 2.70 | % | | | 55,000 | | | | 55,955 | |
| Prudential Financial Inc. | | 06/15/2019 | | 7.38 | % | | | 50,000 | | | | 59,283 | |
| Rabobank Nederland (b) | | 01/19/2017 | | 3.38 | % | | | 40,000 | | | | 41,317 | |
| Realty Income Corp. | | 01/31/2018 | | 2.00 | % | | | 75,000 | | | | 75,534 | |
| Safina Ltd. (b) | | 01/15/2022 | | 1.55 | % | | | 18,039 | | | | 17,924 | |
The accompanying notes are an integral part of these consolidated financial statements.
| | |
24 | LoCorr Long/Short Commodities Strategy Fund - Consolidated Schedule of Investments (continued) | |
| | |
| | | | | | | | | | | | |
| | | Maturity Date | | Coupon Rate | | Principal Amount | | | Value | |
CORPORATE BONDS (continued) | | | | | | | | | | | |
| State Street Bank & Trust Co. | | 10/15/2018 | | 5.25 | % | | $ | 20,000 | | | $ | 22,139 | |
| Tagua Leasing LLC | | 11/16/2024 | | 1.58 | % | | | 20,203 | | | | 19,677 | |
| Toronto-Dominion Bank/The (Acquired 12/04/2014, Cost, $100,970) (a)(b) | | 09/14/2016 | | 1.63 | % | | | 100,000 | | | | 101,012 | |
| Toyota Motor Credit Corp. | | 01/12/2017 | | 2.05 | % | | | 10,000 | | | | 10,158 | |
| Toyota Motor Credit Corp. | | 05/22/2017 | | 1.75 | % | | | 30,000 | | | | 30,415 | |
| Travelers Companies, Inc./The | | 12/01/2015 | | 5.50 | % | | | 16,000 | | | | 16,323 | |
| UBS AG (b) | | 12/20/2017 | | 5.88 | % | | | 50,000 | | | | 55,006 | |
| UnitedHealth Group Incorporated | | 12/15/2017 | | 1.40 | % | | | 50,000 | | | | 49,911 | |
| WellPoint, Inc. | | 01/15/2018 | | 1.88 | % | | | 65,000 | | | | 64,887 | |
| Wells Fargo & Co. | | 01/16/2018 | | 1.50 | % | | | 140,000 | | | | 139,737 | |
| Westpac Banking Corp. (b) | | 08/14/2017 | | 2.00 | % | | | 85,000 | | | | 86,180 | |
| | | | | | | | | | | | | 3,185,222 | |
| | | | | | | | | | | | | | |
| Information: 2.58% | | | | | | | | | | | | | |
| America Movil, S.A.B. de C.V. (b) | | 09/08/2016 | | 2.38 | % | | | 65,000 | | | | 65,820 | |
| AT&T Inc. | | 06/01/2017 | | 1.70 | % | | | 40,000 | | | | 40,153 | |
| AT&T Inc. | | 03/11/2019 | | 2.30 | % | | | 55,000 | | | | 55,044 | |
| CA, Inc. | | 08/15/2018 | | 2.88 | % | | | 75,000 | | | | 76,504 | |
| CBS Corp. | | 07/01/2017 | | 1.95 | % | | | 40,000 | | | | 40,366 | |
| Comcast Corp. | | 02/15/2018 | | 5.88 | % | | | 80,000 | | | | 88,775 | |
| DIRECTV Holdings LLC / DIRECTV Financing Co., Inc. | | 03/15/2017 | | 2.40 | % | | | 75,000 | | | | 75,991 | |
| Discovery Communications LLC | | 08/15/2019 | | 5.63 | % | | | 45,000 | | | | 50,317 | |
| Oracle Corp. | | 04/15/2018 | | 5.75 | % | | | 70,000 | | | | 77,881 | |
| Symantec Corp. | | 06/15/2017 | | 2.75 | % | | | 65,000 | | | | 65,804 | |
| Total System Services, Inc. | | 06/01/2018 | | 2.38 | % | | | 45,000 | | | | 44,873 | |
| Verizon Communications, Inc. | | 09/14/2018 | | 3.65 | % | | | 60,000 | | | | 63,107 | |
| Vodafone Group Plc. (b) | | 02/19/2018 | | 1.50 | % | | | 70,000 | | | | 68,819 | |
| | | | | | | | | | | | | 813,454 | |
| | | | | | | | | | | | | | |
| Manufacturing: 4.30% | | | | | | | | | | | | | |
| AbbVie Inc. | | 11/06/2015 | | 1.20 | % | | | 20,000 | | | | 20,018 | |
| AbbVie Inc. | | 05/14/2018 | | 1.80 | % | | | 50,000 | | | | 49,853 | |
| Anheuser-Busch InBev Finance Inc. | | 01/17/2018 | | 1.25 | % | | | 65,000 | | | | 64,789 | |
| Anheuser-Busch InBev Worldwide Inc. | | 07/15/2015 | | 0.80 | % | | | 15,000 | | | | 15,002 | |
| Apple Inc. (c) | | 05/05/2017 | | 0.35 | % | | | 75,000 | | | | 75,010 | |
| Apple Inc. | | 05/06/2019 | | 2.10 | % | | | 60,000 | | | | 60,604 | |
| Becton, Dickinson and Company | | 12/15/2017 | | 1.80 | % | | | 50,000 | | | | 50,006 | |
| Chevron Corp. | | 12/05/2017 | | 1.10 | % | | | 10,000 | | | | 9,957 | |
| Cisco Systems, Inc. | | 06/15/2018 | | 1.65 | % | | | 75,000 | | | | 75,267 | |
| Dow Chemical Co. | | 05/15/2018 | | 5.70 | % | | | 55,000 | | | | 60,874 | |
| Eastman Chemical Co. | | 06/01/2017 | | 2.40 | % | | | 30,000 | | | | 30,494 | |
| Ecolab Inc. | | 12/08/2016 | | 3.00 | % | | | 30,000 | | | | 30,701 | |
| Ecolab Inc. | | 12/08/2017 | | 1.45 | % | | | 40,000 | | | | 39,646 | |
| EMC Corp. | | 06/01/2018 | | 1.88 | % | | | 85,000 | | | | 85,165 | |
| Hewlett-Packard Co. | | 09/15/2016 | | 3.00 | % | | | 75,000 | | | | 76,524 | |
| HJ Heinz Co (Acquired 06/23/2015, Cost, $59,880) (a) | | 07/02/2018 | | 2.00 | % | | | 60,000 | | | | 59,981 | |
| Intel Corp. | | 12/15/2017 | | 1.35 | % | | | 75,000 | | | | 74,973 | |
| Johnson Controls, Inc. | | 11/02/2017 | | 1.40 | % | | | 50,000 | | | | 49,807 | |
| Kraft Foods Group, Inc. | | 06/05/2017 | | 2.25 | % | | | 30,000 | | | | 30,409 | |
| Merck & Co Inc. | | 05/18/2018 | | 1.30 | % | | | 70,000 | | | | 69,724 | |
| Qualcomm, Inc. | | 05/18/2018 | | 1.40 | % | | | 90,000 | | | | 89,721 | |
| Sherwin-Williams Co./The | | 12/15/2017 | | 1.35 | % | | | 65,000 | | | | 64,783 | |
| Suncor Energy, Inc. (b) | | 06/01/2018 | | 6.10 | % | | | 50,000 | | | | 55,758 | |
| Thermo Fisher Scientific Inc. | | 02/01/2017 | | 1.30 | % | | | 10,000 | | | | 9,983 | |
| Tyco Electronics Group S.A. (b) | | 12/17/2018 | | 2.38 | % | | | 30,000 | | | | 30,339 | |
| United Technologies Corp. | | 06/01/2017 | | 1.80 | % | | | 30,000 | | | | 30,437 | |
| Zoetis, Inc. | | 02/01/2018 | | 1.88 | % | | | 45,000 | | | | 44,875 | |
| | | | | | | | | | | | | 1,354,700 | |
| | | | | | | | | | | | | | |
| Mining, Quarrying, and Oil and Gas Extraction: 0.92% | | | | | | | | | | | | | |
| BHP Billiton Finance (USA) Ltd. (b) | | 02/24/2017 | | 1.63 | % | | | 35,000 | | | | 35,317 | |
| Nabors Industries, Inc. | | 02/15/2018 | | 6.15 | % | | | 20,000 | | | | 21,597 | |
| Phillips 66 | | 05/01/2017 | | 2.95 | % | | | 85,000 | | | | 87,369 | |
| Rio Tinto Finance (USA) PLC (b) | | 03/22/2017 | | 2.00 | % | | | 65,000 | | | | 65,753 | |
The accompanying notes are an integral part of these consolidated financial statements.
| | |
| | LoCorr Long/Short Commodities Strategy Fund - Consolidated Schedule of Investments (continued) | 25 |
| | |
| | | | | | | | | | | | |
| | | Maturity Date | | Coupon Rate | | Principal Amount | | | Value | |
CORPORATE BONDS (continued) | | | | | | | | | | | |
| Rio Tinto Finance (USA) PLC (b) | | 08/21/2017 | | 1.63 | % | | $ | 15,000 | | | $ | 15,010 | |
| Total Capital International (b) | | 06/28/2017 | | 1.55 | % | | | 65,000 | | | | 65,603 | |
| | | | | | | | | | | | | 290,649 | |
| Professional, Scientific, and Technical Services: 0.05% | | | | | | | | | | | | | |
| ABB Treasury Center (USA), Inc. (Acquired 06/19/2012, Cost, $15,127) (a) | | 06/15/2016 | | 2.50 | % | | | 15,000 | | | | 15,198 | |
| | | | | | | | | | | | | | |
| Real Estate and Rental and Leasing: 0.26% | | | | | | | | | | | | | |
| Health Care REIT, Inc. | | 04/01/2019 | | 4.13 | % | | | 35,000 | | | | 37,047 | |
| Ventas Realty LP / Ventas Capital Corp. | | 02/15/2018 | | 2.00 | % | | | 45,000 | | | | 45,275 | |
| | | | | | | | | | | | | 82,322 | |
| Retail Trade: 0.83% | | | | | | | | | | | | | |
| Amazon.com, Inc. | | 11/29/2017 | | 1.20 | % | | | 70,000 | | | | 69,680 | |
| BP Capital Markets (b) | | 05/05/2017 | | 1.85 | % | | | 20,000 | | | | 20,244 | |
| CVS Health Corp. | | 12/05/2018 | | 2.25 | % | | | 15,000 | | | | 15,185 | |
| Macy’s Retail Holdings, Inc. | | 12/01/2016 | | 5.90 | % | | | 100,000 | | | | 106,545 | |
| Walgreens Boots Alliance Inc. | | 11/17/2017 | | 1.75 | % | | | 48,000 | | | | 48,189 | |
| | | | | | | | | | | | | 259,843 | |
| Transportation and Warehousing: 0.29% | | | | | | | | | | | | | |
| Carnival Corp. (b) | | 12/15/2017 | | 1.88 | % | | | 40,000 | | | | 40,167 | |
| Spectra Energy Partners, LP | | 09/25/2018 | | 2.95 | % | | | 50,000 | | | | 51,136 | |
| | | | | | | | | | | | | 91,303 | |
| Utilities: 0.27% | | | | | | | | | | | | | |
| Sempra Energy | | 04/01/2017 | | 2.30 | % | | | 25,000 | | | | 25,368 | |
| Southern Power Co. | | 06/01/2018 | | 1.50 | % | | | 60,000 | | | | 59,651 | |
| | | | | | | | | | | | | 85,019 | |
| Wholesale Trade: 0.44% | | | | | | | | | | | | | |
| Cardinal Health, Inc. | | 11/15/2019 | | 2.40 | % | | | 60,000 | | | | 59,516 | |
| McKesson Corporation | | 03/10/2017 | | 1.29 | % | | | 80,000 | | | | 79,883 | |
| | | | | | | | | | | | | 139,399 | |
| TOTAL CORPORATE BONDS (Cost $6,509,214) | | | | | | | | | | | | 6,494,266 | |
| | | | | | | | | | | | | | |
| FOREIGN GOVERNMENT BONDS: 0.95% | | | | | | | | | | | | | |
| European Investment Bank (b) | | 03/15/2018 | | 1.00 | % | | | 180,000 | | | | 179,619 | |
| European Investment Bank (b) | | 08/15/2018 | | 1.13 | % | | | 100,000 | | | | 99,691 | |
| Petroleos Mexicanos (b) | | 12/20/2022 | | 2.00 | % | | | 18,750 | | | | 18,796 | |
| TOTAL FOREIGN GOVERNMENT BONDS (Cost $297,172) | | | | | | | | | | | | 298,106 | |
| | | | | | | | | | | | | | |
| MORTGAGE BACKED SECURITIES: 16.83% | | | | | | | | | | | | | |
| Banc of America Commercial Mortgage Trust, 2006-2 A4 (c) | | 05/10/2045 | | 5.92 | % | | | 20,000 | | | | 20,332 | |
| Bear Stearns Commercial Mortgage Securities Trust | | | | | | | | | | | | | |
| Series 2006-PWR12 A4 (c) | | 09/11/2038 | | 5.89 | % | | | 19,098 | | | | 19,582 | |
| Series 2006-PWR14 A4 | | 12/11/2038 | | 5.20 | % | | | 25,000 | | | | 26,077 | |
| Series 2006-TOP24 A4 | | 10/12/2041 | | 5.54 | % | | | 22,605 | | | | 23,489 | |
| Citigroup Commercial Mortgage Trust, 2006-C5 A4 | | 10/18/2049 | | 5.43 | % | | | 35,000 | | | | 36,426 | |
| Commercial Mortgage Pass-Through Certificates, 2012-CRE3 A1 | | 10/17/2045 | | 0.67 | % | | | 12,411 | | | | 12,378 | |
| Commercial Mortgage Trust, 2007-GG9 | | 03/10/2039 | | 5.44 | % | | | 208,504 | | | | 219,208 | |
| Credit Suisse Commercial Mortgage Trust, 2006-C1 A4 (c) | | 02/15/2039 | | 5.61 | % | | | 9,053 | | | | 9,122 | |
| CSMC Series, 2014-ICE A(Acquired 10/07/2014, Cost, $420,407) (a)(c) | | 04/15/2027 | | 0.98 | % | | | 420,000 | | | | 418,926 | |
| CSMC Trust 2015-2 (Acquired 04/30/2015, Cost, $135,451) (a) | | 02/25/2045 | | 3.00 | % | | | 133,337 | | | | 134,413 | |
| Fannie Mae-Aces | | | | | | | | | | | | | |
| Series 2012-M17 ASQ2 | | 11/25/2015 | | 0.95 | % | | | 30,213 | | | | 30,221 | |
| Series 2013-M3 ASQ2 | | 02/25/2016 | | 1.08 | % | | | 199,835 | | | | 200,190 | |
| Series 2013-M1 ASQ2 | | 11/25/2016 | | 1.07 | % | | | 52,062 | | | | 52,254 | |
| Series 2014-M13 ASQ2 | | 11/25/2017 | | 1.64 | % | | | 486,159 | | | | 491,451 | |
| Series 2013-M7 ASQ2 | | 03/25/2018 | | 1.23 | % | | | 92,234 | | | | 92,481 | |
| Series 2014-M8 FA (c) | | 05/25/2018 | | 0.45 | % | | | 241,030 | | | | 241,440 | |
| Series 2014-M10 ASQ2 (c) | | 09/25/2019 | | 2.17 | % | | | 270,000 | | | | 274,142 | |
| Fannie Mae Connecticut Avenue Securities, 2014-C02 1M1 (c) | | 05/25/2024 | | 1.13 | % | | | 200,450 | | | | 198,883 | |
| Fannie Mae Pool | | 07/01/2017 | | 1.50 | % | | | 35,000 | | | | 35,351 | |
| FHLMC Multifamily Structured Pass Through Certificates | | | | | | | | | | | | | |
| Series K701 A2 (c) | | 11/25/2017 | | 3.88 | % | | | 50,000 | | | | 52,798 | |
| Series K708 A2 | | 01/25/2019 | | 2.13 | % | | | 30,000 | | | | 30,567 | |
| Series K709 A2 | | 03/25/2019 | | 2.09 | % | | | 25,000 | | | | 25,428 | |
| Series KF01 A (c) | | 04/25/2019 | | 0.53 | % | | | 14,987 | | | | 14,926 | |
| Series K710 A2 | | 05/25/2019 | | 1.88 | % | | | 50,000 | | | | 50,447 | |
The accompanying notes are an integral part of these consolidated financial statements.
| | |
| 26 | LoCorr Long/Short Commodities Strategy Fund - Consolidated Schedule of Investments (continued) | |
| | |
| | | | | | | | | | | | |
| | | Maturity Date | | Coupon Rate | | Principal Amount | | | Value | |
MORTGAGE BACKED SECURITIES (continued) | | | | | | | | | | | |
| Freddie Mac Structured Agency Credit Risk Debt Notes, 2013-DN2 M1 (c) | | 11/25/2023 | | 1.63 | % | | $ | 202,697 | | | $ | 202,961 | |
FREMF 2013-K502 Mortgage Trust, 2013-K502 (Acquired 05/06/2015,Cost, $126,753) (a)(c) | | 03/25/2045 | | 2.83 | % | | | 125,000 | | | | 126,645 | |
| FREMF Mortgage Trust | | | | | | | | | | | | | |
| Series 2012-KF01 (Acquired 04/06/2015, Cost, $153,648) (a)(c) | | 10/25/2044 | | 2.78 | % | | | 150,000 | | | | 152,911 | |
| Series 2012-K708 (Acquired 04/21/2015, Cost, $157,368) (a)(c) | | 02/25/2045 | | 3.89 | % | | | 150,000 | | | | 155,668 | |
| Series 2013-KF02 (Acquired 04/06/2015, Cost, $108,873) (a)(c) | | 12/25/2045 | | 3.18 | % | | | 105,783 | | | | 108,889 | |
| GAHR Commercial Mortgage Trust 2015-NRF, AFL1 (Acquired 05/07/2015, Cost, $130,414) (a)(c) | | 12/15/2034 | | 1.48 | % | | | 130,000 | | | | 129,980 | |
| GS Mortgage Securities Trust | | | | | | | | | | | | | |
| Series 2014-GSFL A (Acquired 08/06/2014, Cost, $100,000) (a)(c) | | 07/15/2031 | | 1.18 | % | | | 100,000 | | | | 99,822 | |
| Series 2006-GG8 A4 | | 11/10/2039 | | 5.56 | % | | | 22,566 | | | | 23,394 | |
| Series 2011-GC5 A2 | | 08/10/2044 | | 3.00 | % | | | 180,000 | | | | 183,127 | |
| Series 2007-GG10 A4 (c) | | 08/10/2045 | | 5.79 | % | | | 179,571 | | | | 191,631 | |
| JP Morgan Chase Commercial Mortgage Securities Trust | | | | | | | | | | | | | |
| Series 2006-LDP6 A4 (c) | | 04/15/2043 | | 5.48 | % | | | 25,318 | | | | 25,684 | |
| Series 2006-LDP7 A4 (c) | | 04/15/2045 | | 6.06 | % | | | 23,057 | | | | 23,582 | |
| Series 2012-C8 ASB | | 10/17/2045 | | 2.38 | % | | | 50,000 | | | | 50,108 | |
| Series 2007-CIBC20 A4 (c) | | 02/12/2051 | | 5.79 | % | | | 201,867 | | | | 216,314 | |
| JPMBB Commercial Mortgage Securities Trust, 2014-C25 A1 | | 11/15/2047 | | 1.52 | % | | | 354,892 | | | | 354,095 | |
| LB Commercial Mortgage Trust, 2007-C3 A4B | | 07/15/2044 | | 5.52 | % | | | 34,538 | | | | 36,657 | |
| LB-UBS Commercial Mortgage Trust, 2006-C6 A4 | | 09/15/2039 | | 5.37 | % | | | 40,000 | | | | 41,497 | |
| Morgan Stanley Bank of America Merrill Lynch Trust, 2012-C6 A1 | | 11/17/2045 | | 0.66 | % | | | 11,958 | | | | 11,936 | |
| Morgan Stanley Capital I Trust | | | | | | | | | | | | | |
| Series 2006-IQ12 A4 | | 12/15/2043 | | 5.33 | % | | | 22,588 | | | | 23,496 | |
| Series 2006-TOP21 A4 (c) | | 10/12/2052 | | 5.16 | % | | | 24,571 | | | | 24,682 | |
| SBA Tower Trust, 2012-1 (Acquired 09/03/2014, Cost, $40,875) (a) | | 12/15/2042 | | 2.93 | % | | | 40,000 | | | | 40,591 | |
| Sequoia Mortgage Trust 2015-3, 2015-3 (Acquired 06/19/2015, Cost, $167,252) (a)(c) | | 07/25/2045 | | 3.50 | % | | | 165,000 | | | | 167,256 | |
| UBS-Citigroup Commercial Mortgage Trust 2011-C1, A2 | | 01/12/2045 | | 2.80 | % | | | 200,000 | | | | 203,930 | |
| TOTAL MORTGAGE BACKED SECURITIES (Cost $5,314,805) | | | | | | | | | | | | 5,305,388 | |
| | | | | | | | | | | | | | |
| MUNICIPAL BONDS: 1.72% | | | | | | | | | | | | | |
| City of Huntsville, AL | | 09/01/2016 | | 2.41 | % | | | 40,000 | | | | 40,578 | |
| City of Lubbock, TX | | 02/15/2018 | | 4.44 | % | | | 25,000 | | | | 26,923 | |
| City of Rochester, MN | | 02/01/2016 | | 2.25 | % | | | 25,000 | | | | 25,078 | |
| County of Berks, PA | | 11/15/2016 | | 1.01 | % | | | 25,000 | | | | 24,940 | |
| County of Forsyth, NC | | 04/01/2020 | | 3.55 | % | | | 30,000 | | | | 31,751 | |
| Denton Independent School District | | 08/15/2015 | | 2.00 | % | | | 40,000 | | | | 40,078 | |
| Maricopa County School District No. 28 Kyrene Elementary | | 07/01/2019 | | 5.38 | % | | | 15,000 | | | | 16,900 | |
| Rosemount-Apple Valley-Eagan Independent School District No. 196 | | 02/01/2019 | | 5.00 | % | | | 25,000 | | | | 27,788 | |
| St Paul Housing & Redevelopment Authority | | 07/01/2018 | | 1.84 | % | | | 60,000 | | | | 59,820 | |
| State of Hawaii | | 02/01/2017 | | 3.73 | % | | | 25,000 | | | | 26,011 | |
| State of Mississippi | | 11/01/2017 | | 1.35 | % | | | 30,000 | | | | 30,081 | |
| State of Ohio | | 04/01/2018 | | 3.66 | % | | | 45,000 | | | | 47,926 | |
| State of Tennessee | | 05/01/2017 | | 3.82 | % | | | 25,000 | | | | 26,262 | |
| State of Texas | | 10/01/2017 | | 2.50 | % | | | 25,000 | | | | 25,585 | |
| State of Washington | | 02/01/2017 | | 3.04 | % | | | 40,000 | | | | 41,400 | |
| University of Texas System | | 08/15/2018 | | 3.81 | % | | | 25,000 | | | | 26,751 | |
| Virginia College Building Authority | | 02/01/2016 | | 2.40 | % | | | 25,000 | | | | 25,300 | |
| TOTAL MUNICIPAL BONDS (Cost $540,942) | | | | | | | | | | | | 543,172 | |
| | | | | | | | | | | | | | |
| U.S. GOVERNMENT AGENCY ISSUES: 4.32% | | | | | | | | | | | | | |
| Federal Farm Credit Banks | | 03/03/2017 | | 0.65 | % | | | 500,000 | | | | 499,873 | |
| Federal Home Loan Banks | | 03/24/2017 | | 0.75 | % | | | 100,000 | | | | 100,145 | |
| Federal Home Loan Mortgage Corp. | | 11/28/2016 | | 0.60 | % | | | 500,000 | | | | 500,567 | |
| Federal National Mortgage Association | | 11/15/2016 | | 1.38 | % | | | 150,000 | | | | 151,764 | |
| Ginnie Mae II Pool | | 07/20/2060 | | 5.31 | % | | | 25,261 | | | | 27,440 | |
| Ginnie Mae II Pool | | 07/20/2062 | | 4.56 | % | | | 24,215 | | | | 26,298 | |
| Ginnie Mae II Pool | | 08/20/2062 | | 4.12 | % | | | 51,212 | | | | 54,954 | |
| TOTAL U.S. GOVERNMENT AGENCY ISSUES (Cost $1,360,687) | | | | | | | | | | | | 1,361,041 | |
The accompanying notes are an integral part of these consolidated financial statements.
| | |
| | LoCorr Long/Short Commodities Strategy Fund - Consolidated Schedule of Investments (continued) | 27 |
| | |
| | | | | | | | | | | | | | |
| | | Maturity Date | | Coupon Rate | | Principal Amount | | | Value | |
| SHORT TERM INVESTMENTS: 13.34% | | | | | | | | | | | | | |
| U.S. GOVERNMENT AGENCY ISSUES: 4.60% | | | | | | | | | | | | | |
| Federal Farm Credit Banks | | 07/30/2015 | | 0.35 | % | | $ | 500,000 | | | $ | 500,105 | |
| Federal Home Loan Banks | | 08/06/2015 | | 0.13 | % | | | 500,000 | | | | 500,022 | |
| Federal Home Loan Banks | | 11/20/2015 | | 0.50 | % | | | 450,000 | | | | 450,548 | |
| TOTAL U.S. GOVERNMENT AGENCY ISSUES | | | | | | | | | | | | 1,450,675 | |
| | | | | | | | | | | | | | |
| | | | | | | | | Shares | | | | | |
| MONEY MARKET FUND: 8.74% | | | | | | | | | | | | | |
| Fidelity Institutional Money Market Portfolio - Class I, 0.10% (d)(e)(f) | | | | | | | | 2,756,999 | | | | 2,756,999 | |
| TOTAL MONEY MARKET FUND | | | | | | | | | | | | 2,756,999 | |
| TOTAL SHORT TERM INVESTMENTS (Cost $4,207,586) | | | | | | | | | | | | 4,207,674 | |
| | | | | | | | | | | | | | |
| TOTAL INVESTMENTS (Cost $23,275,845): 73.74% | | | | | | | | | | | | 23,247,496 | |
| Other Assets in Excess of Liabilities: 26.26% (f) | | | | | | | | | | | | 8,280,194 | |
| TOTAL NET ASSETS: 100.00% | | | | | | | | | | | $ | 31,527,690 | |
(a) Restricted security as defined in Rule 144(a) under the Securities Act of 1933 and determined to be liquid. Purchased in a private placement transaction; resale to the public may require registration or may extend only to qualified institutional buyers. At June 30, 2015, the value of these securities total $3,308,850 which represents 10.50% of total net assets.
(b) Foreign issued security.
(c) Variable rate security. The rate reported is the rate in effect as of June 30, 2015.
(d) The rate quoted is the annualized seven-day effective yield as of June 30, 2015.
(e) All or a portion of this security is held by LCLSCS Fund Limited. See Note 1.
(f) Includes assets pledged as collateral for swap contracts. See Note 2.
The accompanying notes are an integral part of these consolidated financial statements.
| | |
28 | LoCorr Long/Short Commodities Strategy Fund - Consolidated Schedule of Swap Contracts | |
| | |
Consolidated Schedule of Swap Contracts
June 30, 2015 (Unaudited)
LONG TOTAL RETURN SWAP CONTRACTS
This investment is a holding of LCLSCS Fund Limited. See Note 1.
| | | | | | | | | | | |
| Termination Date | | Reference Index | Notional | | | Unrealized Appreciation (Depreciation)* | | | Counterparty |
| 12/20/17 | | LoCorr Commodities Index^ | | $ | 26,099,999 | | | $ | (4,899,992 | ) | | Deutsche Bank AG |
^ Comprised of a proprietary basket of Commodity Trading Advisor’s (“CTA”) Programs investing in various futures, forwards, and currency derivative contracts and other similar investments. See Notes 2 and 3.
*Unrealized depreciation is a payable on the Fund’s consolidated statement of assets and liabilities.
The accompanying notes are an integral part of these consolidated financial statements.
| | |
| | LoCorr Multi-Strategy Fund - Consolidated Schedule of Investments | 29 |
| | |
LoCorr Multi-Strategy Fund
Composition of Consolidated Investment Portfolio1
June 30, 2015 (Unaudited)
1 As a percentage of total investments.
Consolidated Schedule of Investments
June 30, 2015 (Unaudited)
| | | Shares | | | Value | |
| BUSINESS DEVELOPMENT COMPANIES: 4.21% | | | | | | |
| Finance and Insurance: 4.21% | | | | | | |
| Ares Capital Corporation | | | 28,825 | | | $ | 474,460 | |
| Fifth Street Finance Corp. | | | 20,325 | | | | 133,129 | |
| Prospect Capital Corporation | | | 26,825 | | | | 197,700 | |
| TOTAL BUSINESS DEVELOPMENT COMPANIES (Cost $850,519) | | | | | | | 805,289 | |
| | | | | | | | | |
| CLOSED-END INVESTMENT COMPANIES: 7.22% | | | | | | | | |
| Finance and Insurance: 7.22% | | | | | | | | |
| Avenue Income Credit Strategies Fund | | | 8,275 | | | | 117,588 | |
| BlackRock Corporate High Yield Fund Inc. | | | 15,185 | | | | 163,846 | |
| First Trust Intermediate Duration Preferred & Income Fund | | | 5,160 | | | | 111,146 | |
| Invesco Dynamic Credit Opportunities Fund | | | 9,650 | | | | 112,037 | |
| Medley Capital Corp. | | | 12,185 | | | | 108,568 | |
| NexPoint Credit Strategies Fund | | | 21,700 | | | | 159,061 | |
| Nuveen Preferred Income Opportunities Fund | | | 25,475 | | | | 233,351 | |
| Stone Harbor Emerging Markets Income Fund | | | 5,830 | | | | 87,625 | |
| Western Asset Emerging Markets Income Fund Inc. | | | 9,725 | | | | 104,349 | |
| Western Asset Global High Income Fund Inc. | | | 7,700 | | | | 183,018 | |
| TOTAL CLOSED-END INVESTMENT COMPANIES (Cost $1,455,059) | | | | | | | 1,380,589 | |
| | | | | | | | | |
| COMMON STOCKS: 29.55% | | | | | | | | |
| Accommodation and Food Services: 2.78% | | | | | | | | |
| Diamond Resorts International, Inc. (a) | | | 16,855 | | | | 531,775 | |
| | | | | | | | | |
| Construction: 7.31% | | | | | | | | |
| Century Communities Inc. (a) | | | 19,072 | | | | 383,920 | |
| MasTec, Inc. (a) | | | 51,038 | | | | 1,014,125 | |
| | | | | | | | 1,398,045 | |
The accompanying notes are an integral part of these consolidated financial statements.
| | |
30 | LoCorr Multi-Strategy Fund - Consolidated Schedule of Investments (continued) | |
| | |
| | | Shares | | | Value | |
COMMON STOCKS (continued) | | | | | | |
| Finance and Insurance: 9.25% | | | | | | |
| American Express Co. | | | 3,982 | | | $ | 309,481 | |
| Apollo Global Management, LLC | | | 10,275 | | | | 227,591 | |
| Credit Acceptance Corporation (a) | | | 3,141 | | | | 773,251 | |
| JPMorgan Chase & Co. | | | 3,387 | | | | 229,503 | |
| Wells Fargo & Company | | | 4,061 | | | | 228,391 | |
| | | | | | | | 1,768,217 | |
| | | | | | | | | |
| Information: 4.97% | | | | | | | | |
| Frontier Communications Corporation | | | 27,575 | | | | 136,496 | |
| Nexstar Broadcasting Group, Inc. | | | 5,303 | | | | 296,968 | |
| Sinclair Broadcast Group, Inc. | | | 18,530 | | | | 517,172 | |
| | | | | | | | 950,636 | |
| | | | | | | | | |
| Manufacturing: 2.25% | | | | | | | | |
| General Motors Company | | | 6,366 | | | | 212,179 | |
| Tenneco Inc. (a) | | | 3,784 | | | | 217,353 | |
| | | | | | | | 429,532 | |
| | | | | | | | | |
| Transportation and Warehousing: 2.99% | | | | | | | | |
| Ship Finance International Limited (b) | | | 29,825 | | | | 486,744 | |
| Student Transportation Inc. (b) | | | 18,355 | | | | 84,800 | |
| | | | | | | | 571,544 | |
| TOTAL COMMON STOCKS (Cost $5,614,861) | | | | | | | 5,649,749 | |
| | | | | | | | | |
| | | Units | | | | | |
| MASTER LIMITED PARTNERSHIPS: 16.44% | | | | | | | | |
| Finance and Insurance: 2.63% | | | | | | | | |
| KKR & Co. L.P. | | | 22,050 | | | | 503,843 | |
| | | | | | | | | |
| Manufacturing: 7.15% | | | | | | | | |
| Calumet Specialty Products Partners, L.P. | | | 17,500 | | | | 445,550 | |
| CVR Partners, LP | | | 13,350 | | | | 168,611 | |
| CVR Refining, LP | | | 10,505 | | | | 192,241 | |
| Northern Tier Energy LP | | | 8,070 | | | | 191,824 | |
| Terra Nitrogen Company, L.P. | | | 3,045 | | | | 368,719 | |
| | | | | | | | 1,366,945 | |
| | | | | | | | | |
| Mining, Quarrying, and Oil and Gas Extraction: 2.08% | | | | | | | | |
| Memorial Production Partners, LP | | | 12,610 | | | | 187,258 | |
| Vanguard Natural Resources, LLC | | | 14,060 | | | | 209,916 | |
| | | | | | | | 397,174 | |
| | | | | | | | | |
| Other Services (except Public Administration): 1.48% | | | | | | | | |
| StoneMor Partners L.P. | | | 9,410 | | | | 283,711 | |
| | | | | | | | | |
| Transportation and Warehousing: 1.06% | | | | | | | | |
| Navios Maritime Partners L.P. (b) | | | 19,000 | | | | 203,300 | |
| | | | | | | | | |
| Wholesale Trade: 2.04% | | | | | | | | |
| Martin Midstream Partners L.P. | | | 12,575 | | | | 389,322 | |
| TOTAL MASTER LIMITED PARTNERSHIPS (Cost $3,326,152) | | | | | | | 3,144,295 | |
| | | | | | | | | |
| | | Shares | | | | | |
| REAL ESTATE INVESTMENT TRUSTS: 18.38% | | | | | | | | |
| Finance and Insurance: 8.93% | | | | | | | | |
| American Capital Mortgage Investment Corp. | | | 13,025 | | | | 208,270 | |
| Apollo Commercial Real Estate Finance, Inc. | | | 26,350 | | | | 432,930 | |
| Invesco Mortgage Capital Inc. | | | 13,725 | | | | 196,542 | |
| NorthStar Realty Finance Corp. | | | 26,200 | | | | 416,580 | |
| Starwood Property Trust, Inc. | | | 20,975 | | | | 452,431 | |
| | | | | | | | 1,706,753 | |
The accompanying notes are an integral part of these consolidated financial statements.
| | |
| | LoCorr Multi-Strategy Fund - Consolidated Schedule of Investments (continued) and Consolidated Schedule of Securities Sold Short | 31 |
| | |
| | | | | | | |
| | | Shares | | | Value | |
REAL ESTATE INVESTMENT TRUSTS (continued) | | | | | | |
| Real Estate and Rental and Leasing: 9.45% | | | | | | |
| American Realty Capital Properties, Inc. | | | 26,225 | | | $ | 213,209 | |
| Capstead Mortgage Corporation | | | 17,500 | | | | 194,250 | |
| EPR Properties | | | 3,855 | | | | 211,177 | |
| Hospitality Properties Trust | | | 14,425 | | | | 415,729 | |
| New Residential Investment Corp. | | | 18,925 | | | | 288,417 | |
| Senior Housing Properties Trust | | | 10,475 | | | | 183,836 | |
| STAG Industrial, Inc. | | | 10,225 | | | | 204,500 | |
| Whitestone REIT | | | 7,340 | | | | 95,567 | |
| | | | | | | | 1,806,685 | |
| TOTAL REAL ESTATE INVESTMENT TRUSTS (Cost $3,859,743) | | | | | | | 3,513,438 | |
| | | | | | | | | |
| ROYALTY TRUST: 0.89% | | | | | | | | |
| Manufacturing: 0.89% | | | | | | | | |
| BP Prudhoe Bay Royalty Trust | | | 2,750 | | | | 169,703 | |
| TOTAL ROYALTY TRUST (Cost $179,163) | | | | | | | 169,703 | |
| | | | | | | | | |
| SHORT TERM INVESTMENT: 7.40% | | | | | | | | |
| MONEY MARKET FUND: 7.40% | | | | | | | | |
| Fidelity Institutional Money Market Portfolio - Class I, 0.10% (c) | | | 1,415,533 | | | | 1,415,533 | |
| TOTAL MONEY MARKET FUND | | | | | | | 1,415,533 | |
| TOTAL SHORT TERM INVESTMENT (Cost $1,415,533) | | | | | | | 1,415,533 | |
| | | | | | | | | |
| TOTAL INVESTMENTS (Cost $16,701,030): 84.09% | | | | | | | 16,078,596 | |
| Other Assets in Excess of Liabilities, 15.91% | | | | | | | 3,041,280 | |
| TOTAL NET ASSETS, 100.00% | | | | | | $ | 19,119,876 | |
(a) Non-dividend income producing security.
(b) Foreign issued security.
(c) The rate quoted is the annualized seven-day effective yield as of June 30, 2015.
| Consolidated Schedule of Securities Sold Short | | | | | | |
| June 30, 2015 (Unaudited) | | | | | | |
| | | | | | | |
| | | Shares | | | Value | |
| COMMON STOCK: (1.17)% | | | | | | |
| Other Services (except Public Administration): (1.17)% | | | | | | |
Regis Corp.(a) | | | (14,145 | ) | | $ | (222,925 | ) |
| TOTAL COMMON STOCK (Proceeds $232,330) | | | | | | $ | (222,925 | ) |
(a) Non-dividend expense producing security.
Percentages are stated as a percent of net assets.
The accompanying notes are an integral part of these consolidated financial statements.
| | |
32 | LoCorr Multi-Strategy Fund - Consolidated Schedule of Swap Contracts | |
| | |
Consolidated Schedule of Swap Contracts
June 30, 2015 (Unaudited)
LONG TOTAL RETURN SWAP CONTRACTS
This investment is a holding of LCMSF Fund Limited. See Note 1.
| | | | | | | | | | |
| Termination Date | | Reference Index | | Notional | | | Unrealized Appreciation (Depreciation)* | | Counterparty |
| 04/14/20 | | LoCorr Multi-Strategy Index^ | | $ | 18,082,500 | | | $ | (662,563 | ) | Deutsche Bank AG |
^Comprised of a proprietary basket of Commodity Trading Advisor’s (“CTA”) Programs investing in various futures, forwards, and currency derivative contracts and other similar investments. See Notes 2 and 3.
*Unrealized depreciation is a payable on the Fund’s consolidated statement of assets and liabilities.
The accompanying notes are an integral part of these consolidated financial statements.
| | |
| | LoCorr Market Trend Fund - Consolidated Schedule of Investments | 33 |
| | |
LoCorr Market Trend Fund
Composition of Consolidated Investment Portfolio1
June 30, 2015 (Unaudited)
1 As a percentage of total investments.
Consolidated Schedule of Investments
June 30, 2015 (Unaudited)
| | | Maturity Date | | Coupon Rate | | Principal Amount | | | Value | |
| ASSET BACKED SECURITIES: 19.55% | | | | | | | | | | | |
| AEP Texas Central Transition Funding III LLC, 2012-1 A1 | | 12/01/2018 | | 0.88 | % | | $ | 312,422 | | | $ | 311,959 | |
| AEP Texas Central Transition Funding LLC, 2002-1 A5 | | 01/15/2017 | | 6.25 | % | | | 970,668 | | | | 988,465 | |
| Ally Auto Receivables Trust | | | | | | | | | | | | | |
| Series 2012-4 A3 | | 01/17/2017 | | 0.59 | % | | | 330,270 | | | | 330,317 | |
| Series 2012-4 A4 | | 10/16/2017 | | 0.80 | % | | | 2,500,000 | | | | 2,502,445 | |
| Series 2013-2 A3 | | 01/16/2018 | | 0.79 | % | | | 1,627,406 | | | | 1,628,223 | |
| Series 2013-1 A4 | | 02/15/2018 | | 0.84 | % | | | 3,750,000 | | | | 3,748,035 | |
| American Express Credit Account Master Trust | | | | | | | | | | | | | |
| Series 2012-3A (c) | | 03/15/2018 | | 0.33 | % | | | 250,000 | | | | 250,000 | |
| Series 2012-1 A (c) | | 01/15/2020 | | 0.45 | % | | | 1,590,000 | | | | 1,590,315 | |
| AmeriCredit Automobile Receivables Trust | | | | | | | | | | | | | |
| Series 2014-1 A2 | | 07/10/2017 | | 0.57 | % | | | 352,984 | | | | 352,875 | |
| Series 2014-2 A2A | | 10/10/2017 | | 0.54 | % | | | 813,039 | | | | 812,633 | |
| Series 2012-4 A2A | | 04/09/2018 | | 0.72 | % | | | 965,982 | | | | 964,267 | |
| Series 2013-3 A3 | | 04/09/2018 | | 0.92 | % | | | 1,356,293 | | | | 1,356,936 | |
| BA Credit Card Trust, 2014-A2 A (c) | | 09/16/2019 | | 0.45 | % | | | 3,000,000 | | | | 2,996,697 | |
| Bank of The West Auto Trust, 2014-1 A2 (Acquired 11/05/2014, 01/14/2015, 02/26/2015 and 03/25/2015, Cost, $1,672,600) (a) | | 07/17/2017 | | 0.69 | % | | | 1,673,198 | | | | 1,673,715 | |
| Barclays Dryrock Issuance Trust, 2013-1 A (c) | | 07/16/2018 | | 0.52 | % | | | 440,000 | | | | 440,085 | |
| Cabela’s Credit Card Master Note Trust | | | | | | | | | | | | | |
| Series 2011-2A A2 (Acquired 10/08/2014, Cost, $200,681) (a)(c) | | 06/17/2019 | | 0.78 | % | | | 200,000 | | | | 200,413 | |
| Series 2012-1A A2 (Acquired 02/27/2015 and 05/19/2015, Cost, $1,730,067) (a)(c) | | 02/18/2020 | | 0.71 | % | | | 1,725,000 | | | | 1,728,812 | |
| Series 2014-1 A (c) | | 03/16/2020 | | 0.52 | % | | | 3,220,000 | | | | 3,221,127 | |
| California Republic Auto Receivables Trust | | | | | | | | | | | | | |
| Series 2012-1 A (Acquired 02/26/2015 and 06/23/2015, Cost, $578,057) (a) | | 08/15/2017 | | 1.18 | % | | | 577,463 | | | | 578,173 | |
| Series 2013-2 A2 | | 03/15/2019 | | 1.23 | % | | | 3,554,825 | | | | 3,563,040 | |
| Series 2015-1 A3 | | 04/15/2019 | | 1.33 | % | | | 750,000 | | | | 751,964 | |
| Capital Auto Receivables Asset Trust 2013-1, A-4 | | 01/22/2018 | | 0.97 | % | | | 2,000,000 | | | | 2,001,478 | |
| Capital One Multi-Asset Execution Trust | | | | | | | | | | | | | |
| Series 2006-A11 (c) | | 06/15/2019 | | 0.27 | % | | | 1,400,000 | | | | 1,397,060 | |
| Series 2007-A2 (c) | | 12/16/2019 | | 0.26 | % | | | 2,300,000 | | | | 2,292,113 | |
| Series 2007-A7 | | 07/15/2020 | | 5.75 | % | | | 1,850,000 | | | | 2,028,668 | |
| CarMax Auto Owner Trust | | | | | | | | | | | | | |
| Series 2012-3 A3 | | 07/17/2017 | | 0.52 | % | | | 390,609 | | | | 390,521 | |
| Series 2013-1 A3 | | 10/16/2017 | | 0.60 | % | | | 1,270,773 | | | | 1,269,863 | |
The accompanying notes are an integral part of these consolidated financial statements.
| | |
34 | LoCorr Market Trend Fund - Consolidated Schedule of Investments (continued) | |
| | |
| | | Maturity Date | | Coupon Rate | | Principal Amount | | | Value | |
ASSET BACKED SECURITIES (continued) | | | | | | | | | | | |
| CenterPoint Energy Restoration Bond Co. LLC, 2009-1 A2 (Acquired 04/07/2015 and 06/11/2015, Cost, $1,608,745) (a) | | 08/15/2019 | | 3.46 | % | | $ | 1,556,819 | | | $ | 1,608,303 | |
| CenterPoint Energy Transition Bond Co. II LLC, A4 | | 08/01/2019 | | 5.17 | % | | | 930,861 | | | | 967,529 | |
| CenterPoint Energy Transition Bond Co. IV LLC, A1 | | 04/15/2018 | | 0.90 | % | | | 2,428,219 | | | | 2,428,867 | |
| Chase Issuance Trust | | | | | | | | | | | | | |
| Series 2014-A3 (c) | | 05/15/2018 | | 0.38 | % | | | 150,000 | | | | 149,894 | |
| Series 2007-A3 | | 04/15/2019 | | 5.23 | % | | | 1,615,000 | | | | 1,724,366 | |
| Series 2014-A7 | | 11/15/2019 | | 1.38 | % | | | 3,395,000 | | | | 3,402,058 | |
| Citibank Credit Card Issuance Trust | | | | | | | | | | | | | |
| Series 2005-A9 | | 11/20/2017 | | 5.10 | % | | | 1,900,000 | | | | 1,934,048 | |
| Series 2013-A11 (c) | | 02/07/2018 | | 0.42 | % | | | 375,000 | | | | 375,073 | |
| Series 2014-A9 (c) | | 11/23/2018 | | 0.43 | % | | | 645,000 | | | | 644,681 | |
| Series 2007-A8 | | 09/20/2019 | | 5.65 | % | | | 2,500,000 | | | | 2,735,610 | |
| Discover Card Execution Note Trust | | | | | | | | | | | | | |
| Series 2013-A3 (c) | | 10/15/2018 | | 0.36 | % | | | 800,000 | | | | 800,157 | |
| Series 2007-A1 | | 03/16/2020 | | 5.65 | % | | | 2,500,000 | | | | 2,738,130 | |
| Entergy Gulf States Reconstruction Funding 1 LLC, 2007-A A2 | | 10/01/2018 | | 5.79 | % | | | 898,141 | | | | 950,991 | |
| Entergy Texas Restoration Funding LLC, 2009-A A2 | | 08/01/2019 | | 3.65 | % | | | 586,356 | | | | 607,184 | |
| Fifth Third Auto Trust, 2014-3 A2B (c) | | 05/15/2017 | | 0.41 | % | | | 553,333 | | | | 553,377 | |
| Ford Credit Auto Owner Trust, 2013-B A3 | | 10/15/2017 | | 0.57 | % | | | 80,593 | | | | 80,569 | |
| Huntington Auto Trust, 2015-1 | | 09/16/2019 | | 1.24 | % | | | 3,000,000 | | | | 2,995,389 | |
| Hyundai Auto Receivables Trust | | | | | | | | | | | | | |
| Series 2014-A A2 | | 01/16/2017 | | 0.46 | % | | | 231,933 | | | | 231,886 | |
| Series 2012-B A4 | | 03/15/2018 | | 0.81 | % | | | 2,410,276 | | | | 2,410,149 | |
| John Deere Owner Trust, 2015-A A3 | | 06/17/2019 | | 1.32 | % | | | 1,500,000 | | | | 1,504,602 | |
| Ohio Phase-In-Recovery Funding LLC, 2013-1 A1 | | 07/01/2018 | | 0.96 | % | | | 2,777,408 | | | | 2,778,383 | |
| Santander Drive Auto Receivables Trust | | | | | | | | | | | | | |
| Series 2013-2 A3 | | 09/15/2017 | | 0.70 | % | | | 500,453 | | | | 500,375 | |
| Series 2013-3 A3 | | 10/16/2017 | | 0.70 | % | | | 393,930 | | | | 393,869 | |
| Series 2014-2 A3 | | 04/16/2018 | | 0.80 | % | | | 2,490,000 | | | | 2,490,321 | |
| SMART ABS Series Trust | | | | | | | | | | | | | |
| Series 2013-2US A3A | | 01/14/2017 | | 0.83 | % | | | 2,274,957 | | | | 2,274,957 | |
| Series 2015-1US A2A | | 08/14/2017 | | 0.99 | % | | | 3,610,000 | | | | 3,612,422 | |
| TCF Auto Receivables Owner Trust, 2015-1A A2 (Acquired 06/03/2015, Cost, $1,859,893) (a) | | 08/15/2018 | | 1.02 | % | | | 1,860,000 | | | | 1,860,623 | |
| TCF Auto Receivables Owner Trust 2014-1A A2 (Acquired 02/25/2015 and 06/10/2015, Cost, $779,568) (a) | | 05/15/2017 | | 0.59 | % | | | 779,943 | | | | 779,825 | |
| USAA Auto Owner Trust, 2014-1 A3 | | 12/15/2017 | | 0.58 | % | | | 500,000 | | | | 499,990 | |
| World Omni Auto Receivables Trust | | | | | | | | | | | | | |
| Series 2012-A A3 | | 02/15/2017 | | 0.64 | % | | | 179,944 | | | | 179,944 | |
| Series 2013-A A3 | | 04/16/2018 | | 0.64 | % | | | 1,093,785 | | | | 1,092,846 | |
| TOTAL ASSET BACKED SECURITIES (Cost $84,686,889) | | | | | | | | | | | | 84,676,617 | |
| | | | | | | | | | | | | | |
| CORPORATE BONDS: 2.66% | | | | | | | | | | | | | |
| Finance and Insurance: 1.87% | | | | | | | | | | | | | |
| Bank of Montreal (Acquired 12/04/2014, 04/29/2015 and 06/18/2015, Cost, $3,049,027) (a)(b) | | 01/30/2017 | | 1.95 | % | | | 3,000,000 | | | | 3,047,568 | |
| Bank of Nova Scotia/The (Acquired 01/13/2015 and 04/29/2015, Cost, $1,522,927) (a)(b) | | 08/03/2016 | | 2.15 | % | | | 1,500,000 | | | | 1,523,473 | |
| Canadian Imperial Bank of Commerce/Canada (Acquired 01/14/2015, Cost, $506,647) (a)(b) | | 01/27/2016 | | 2.75 | % | | | 500,000 | | | | 506,250 | |
| Toronto-Dominion Bank/The (Acquired 12/04/2014, 04/29/2015 and 6/15/2015 Cost, $3,031,571) (a)(b) | | 09/14/2016 | | 1.63 | % | | | 3,000,000 | | | | 3,030,363 | |
| | | | | | | | | | | | | 8,107,654 | |
| | | | | | | | | | | | | | |
Information: 0.38% | | | | | | | | | | | | | |
| Microsoft Corporation | | 11/15/2017 | | 0.88 | % | | | 110,000 | | | | 109,757 | |
| Microsoft Corporation | | 12/06/2018 | | 1.63 | % | | | 1,500,000 | | | | 1,512,924 | |
| | | | | | | | | | | | | 1,622,681 | |
| | | | | | | | | | | | | | |
| Manufacturing: 0.41% | | | | | | | | | | | | | |
| Johnson & Johnson | | 07/15/2018 | | 5.15 | % | | | 1,595,000 | | | | 1,772,251 | |
| TOTAL CORPORATE BONDS (Cost $11,516,397) | | | | | | | | | | | | 11,502,586 | |
The accompanying notes are an integral part of these consolidated financial statements.
| | |
| | LoCorr Market Trend Fund - Consolidated Schedule of Investments (continued) | 35 |
| | |
| | | Maturity Date | | Coupon Rate | | Principal Amount | | | Value | |
| FOREIGN GOVERNMENT BONDS: 2.42% | | | | | | | | | | | |
| Finance and Insurance: 1.15% | | | | | | | | | | | |
| European Investment Bank (b) | | 03/15/2016 | | 2.25 | % | | $ | 500,000 | | | $ | 506,590 | |
| European Investment Bank (b) | | 03/15/2018 | | 1.00 | % | | | 1,000,000 | | | | 997,883 | |
| European Investment Bank (b) | | 05/15/2018 | | 1.25 | % | | | 1,000,000 | | | | 1,002,806 | |
| European Investment Bank (b) | | 08/15/2018 | | 1.13 | % | | | 2,500,000 | | | | 2,492,268 | |
| | | | | | | | | | | | | 4,999,547 | |
| | | | | | | | | | | | | | |
| Public Administration: 1.27% | | | | | | | | | | | | | |
| International Bank for Reconstruction & Development (b) | | 03/15/2016 | | 2.13 | % | | | 500,000 | | | | 506,465 | |
| International Bank for Reconstruction & Development (b) | | 11/15/2017 | | 1.00 | % | | | 5,000,000 | | | | 5,004,170 | |
| | | | | | | | | | | | | 5,510,635 | |
| TOTAL FOREIGN GOVERNMENT BONDS (Cost $10,501,766) | | | | | | | | | | | | 10,510,182 | |
| | | | | | | | | | | | | | |
| MORTGAGE BACKED SECURITIES: 12.27% | | | | | | | | | | | | | |
| Fannie Mae-Aces | | | | | | | | | | | | | |
| Series 2013-M3 ASQ2 | | 02/25/2016 | | 1.08 | % | | | 681,661 | | | | 682,870 | |
| Series 2014-M5 FA (c) | | 01/25/2017 | | 0.56 | % | | | 3,397,692 | | | | 3,400,574 | |
| Series 2012-M13 ASQ2 | | 08/25/2017 | | 1.25 | % | | | 2,143,717 | | | | 2,154,483 | |
| Series 2014-M13 ASQ2 | | 11/25/2017 | | 1.64 | % | | | 291,695 | | | | 294,871 | |
| Series 2014-M6 FA (c) | | 12/25/2017 | | 0.49 | % | | | 2,193,012 | | | | 2,195,586 | |
| Series 2015-M1 ASQ2 | | 02/25/2018 | | 1.63 | % | | | 1,500,000 | | | | 1,516,260 | |
| Series 2015-M7 | | 04/25/2018 | | 1.55 | % | | | 2,500,000 | | | | 2,518,652 | |
| Series 2014-M8 FA (c) | | 05/25/2018 | | 0.45 | % | | | 2,820,046 | | | | 2,824,852 | |
| Series 2013-M13 FA (c) | | 05/25/2018 | | 0.54 | % | | | 3,156,244 | | | | 3,161,398 | |
| Series 2013-M14 FA (c) | | 08/25/2018 | | 0.53 | % | | | 1,704,154 | | | | 1,707,032 | |
| Series 2009-M2 A3 | | 01/25/2019 | | 4.00 | % | | | 3,000,000 | | | | 3,228,270 | |
| Series 2014-M10 ASQ2 (c) | | 09/25/2019 | | 2.17 | % | | | 3,000,000 | | | | 3,046,023 | |
| Fannie Mae Pool | | 04/01/2017 | | 1.92 | % | | | 2,500,000 | | | | 2,536,916 | |
| FHLMC Multifamily Structured Pass Through Certificates | | | | | | | | | | | | | |
| Series K501 A2 | | 11/25/2016 | | 1.66 | % | | | 2,510,000 | | | | 2,532,098 | |
| Series K502 A2 | | 08/25/2017 | | 1.43 | % | | | 200,000 | | | | 201,544 | |
| Series K703 A2 | | 05/25/2018 | | 2.70 | % | | | 7,000,000 | | | | 7,259,794 | |
| Series K705 A2 | | 09/25/2018 | | 2.30 | % | | | 4,000,000 | | | | 4,102,744 | |
| Series K709 A1 | | 10/25/2018 | | 1.56 | % | | | 500,731 | | | | 503,795 | |
| Series K706 A2 | | 10/25/2018 | | 2.32 | % | | | 4,875,000 | | | | 5,003,086 | |
| Series K708 A2 | | 01/25/2019 | | 2.13 | % | | | 1,400,000 | | | | 1,426,442 | |
| Series K006 A1 | | 07/25/2019 | | 3.40 | % | | | 2,746,906 | | | | 2,868,937 | |
| TOTAL MORTGAGE BACKED SECURITIES (Cost $53,106,875) | | | | | | | | | | | | 53,166,227 | |
| | | | | | | | | | | | | | |
| | | | | | | | | | | | | | |
| U.S. GOVERNMENT AGENCY ISSUES: 42.08% | | | | | | | | | | | | | |
| Finance and Insurance: 42.05% | | | | | | | | | | | | | |
| Federal Farm Credit Banks Funding Corporation | | 03/01/2016 | | 0.41 | % | | | 500,000 | | | | 500,827 | |
| Federal Farm Credit Banks Funding Corporation | | 03/28/2016 | | 1.05 | % | | | 2,000,000 | | | | 2,011,234 | |
| Federal Farm Credit Banks Funding Corporation | | 04/18/2016 | | 0.45 | % | | | 3,000,000 | | | | 3,003,063 | |
| Federal Farm Credit Banks Funding Corporation | | 05/16/2016 | | 0.40 | % | | | 355,000 | | | | 355,647 | |
| Federal Farm Credit Banks Funding Corporation | | 07/25/2016 | | 0.50 | % | | | 2,000,000 | | | | 2,005,114 | |
| Federal Farm Credit Banks Funding Corporation | | 08/25/2016 | | 5.13 | % | | | 1,000,000 | | | | 1,053,522 | |
| Federal Farm Credit Banks Funding Corporation | | 10/03/2016 | | 0.57 | % | | | 5,000,000 | | | | 5,006,570 | |
| Federal Farm Credit Banks Funding Corporation | | 11/14/2016 | | 0.60 | % | | | 1,000,000 | | | | 1,000,706 | |
| Federal Farm Credit Banks Funding Corporation | | 12/15/2016 | | 0.72 | % | | | 2,465,000 | | | | 2,468,838 | |
| Federal Farm Credit Banks Funding Corporation | | 03/03/2017 | | 0.65 | % | | | 2,500,000 | | | | 2,499,363 | |
| Federal Home Loan Banks | | 12/11/2015 | | 1.38 | % | | | 1,000,000 | | | | 1,005,173 | |
| Federal Home Loan Banks | | 05/18/2016 | | 5.38 | % | | | 1,000,000 | | | | 1,043,896 | |
| Federal Home Loan Banks | | 06/24/2016 | | 0.38 | % | | | 10,500,000 | | | | 10,499,286 | |
| Federal Home Loan Banks | | 07/22/2016 | | 0.80 | % | | | 500,000 | | | | 502,973 | |
| Federal Home Loan Banks | | 09/09/2016 | | 2.00 | % | | | 3,500,000 | | | | 3,563,255 | |
| Federal Home Loan Banks | | 09/28/2016 | | 0.50 | % | | | 6,500,000 | | | | 6,501,541 | |
| Federal Home Loan Banks | | 10/14/2016 | | 0.63 | % | | | 4,500,000 | | | | 4,506,025 | |
| Federal Home Loan Banks | | 11/23/2016 | | 0.63 | % | | | 7,470,000 | | | | 7,474,527 | |
| Federal Home Loan Banks | | 12/29/2016 | | 0.70 | % | | | 500,000 | | | | 501,868 | |
| Federal Home Loan Banks | | 02/24/2017 | | 0.70 | % | | | 5,000,000 | | | | 5,009,480 | |
| Federal Home Loan Banks | | 03/10/2017 | | 0.88 | % | | | 8,000,000 | | | | 8,027,136 | |
| Federal Home Loan Banks | | 06/09/2017 | | 1.00 | % | | | 5,000,000 | | | | 5,022,375 | |
| Federal Home Loan Banks | | 12/08/2017 | | 1.13 | % | | | 5,000,000 | | | | 5,021,010 | |
The accompanying notes are an integral part of these consolidated financial statements.
| | |
36 | LoCorr Market Trend Fund - Consolidated Schedule of Investments (continued) | |
| | |
| | | Maturity Date | | Coupon Rate | | Principal Amount | | | Value | |
U.S. GOVERNMENT AGENCY ISSUES (continued) | | | | | | | | | | | |
| Federal Home Loan Banks | | 12/08/2017 | | 2.13 | % | | $ | 5,000,000 | | | $ | 5,142,000 | |
| Federal Home Loan Mortgage Corp. | | 04/18/2016 | | 5.25 | % | | | 900,000 | | | | 935,347 | |
| Federal Home Loan Mortgage Corp. | | 05/13/2016 | | 0.50 | % | | | 5,000,000 | | | | 5,006,805 | |
| Federal Home Loan Mortgage Corp. | | 10/18/2016 | | 5.13 | % | | | 1,000,000 | | | | 1,061,131 | |
| Federal Home Loan Mortgage Corp. | | 11/01/2016 | | 0.63 | % | | | 8,250,000 | | | | 8,265,675 | |
| Federal Home Loan Mortgage Corp. | | 11/28/2016 | | 0.60 | % | | | 2,000,000 | | | | 2,002,270 | |
| Federal Home Loan Mortgage Corp. | | 01/27/2017 | | 0.50 | % | | | 5,000,000 | | | | 4,994,130 | |
| Federal Home Loan Mortgage Corp. | | 03/08/2017 | | 1.00 | % | | | 7,000,000 | | | | 7,044,093 | |
| Federal Home Loan Mortgage Corp. | | 06/29/2017 | | 1.00 | % | | | 5,000,000 | | | | 5,027,435 | |
| Federal Home Loan Mortgage Corp. | | 07/14/2017 | | 0.75 | % | | | 12,500,000 | | | | 12,499,725 | |
| Federal Home Loan Mortgage Corp. | | 07/25/2017 | | 1.00 | % | | | 5,000,000 | | | | 5,018,865 | |
| Federal National Mortgage Association | | 03/08/2016 | | 2.00 | % | | | 1,500,000 | | | | 1,517,600 | |
| Federal National Mortgage Association | | 03/15/2016 | | 2.25 | % | | | 8,000,000 | | | | 8,110,680 | |
| Federal National Mortgage Association | | 03/30/2016 | | 0.50 | % | | | 6,250,000 | | | | 6,258,669 | |
| Federal National Mortgage Association | | 08/26/2016 | | 0.63 | % | | | 7,000,000 | | | | 7,016,877 | |
| Federal National Mortgage Association | | 11/15/2016 | | 1.38 | % | | | 13,500,000 | | | | 13,658,760 | |
| Federal National Mortgage Association | | 04/20/2017 | | 0.75 | % | | | 5,000,000 | | | | 5,006,005 | |
| Federal National Mortgage Association | | 09/27/2017 | | 1.00 | % | | | 5,000,000 | | | | 5,019,040 | |
| | | | | | | | | | | | | 182,168,536 | |
| | | | | | | | | | | | | | |
| Utilities: 0.03% | | | | | | | | | | | | | |
| Tennessee Valley Authority | | 12/15/2016 | | 4.88 | % | | | 145,000 | | | | 153,737 | |
| TOTAL U.S. GOVERNMENT AGENCY ISSUES (Cost $182,275,876) | | | | | | | | | | | | 182,322,273 | |
| | | | | | | | | | | | | | |
| U.S. GOVERNMENT NOTES: 3.54% | | | | | | | | | | | | | |
| United States Treasury Note | | 02/15/2016 | | 4.50 | % | | | 3,000,000 | | | | 3,080,859 | |
| United States Treasury Note | | 03/31/2016 | | 0.38 | % | | | 2,000,000 | | | | 2,002,032 | |
| United States Treasury Note | | 04/30/2016 | | 0.38 | % | | | 1,750,000 | | | | 1,751,230 | |
| United States Treasury Note | | 05/31/2016 | | 1.75 | % | | | 1,000,000 | | | | 1,013,047 | |
| United States Treasury Note | | 01/31/2017 | | 0.50 | % | | | 7,500,000 | | | | 7,497,660 | |
| TOTAL U.S. GOVERNMENT NOTES (Cost $15,332,767) | | | | | | | | | | | | 15,344,828 | |
| | | | | | | | | | | | | | |
| SHORT TERM INVESTMENTS: 8.55% | | | | | | | | | | | | | |
| U.S. GOVERNMENT AGENCY ISSUES: 0.23% | | | | | | | | | | | | | |
| Federal Farm Credit Banks Funding Corporation | | 10/15/2015 | | 0.42 | % | | | 1,000,000 | | | | 1,000,748 | |
| TOTAL U.S. GOVERNMENT AGENCY ISSUES | | | | | | | | | | | | 1,000,748 | |
| | | | | | | | | | | | | | |
| | | | | | | | Shares | | | | | |
| MONEY MARKET FUND: 8.32% | | | | | | | | | | | | | |
| Fidelity Institutional Money Market Portfolio - Class I, 0.10% (d)(e)(f) | | | | | | | | 36,042,158 | | | | 36,042,158 | |
| TOTAL MONEY MARKET FUND | | | | | | | | | | | | 36,042,158 | |
| TOTAL SHORT TERM INVESTMENTS (Cost $37,042,729) | | | | | | | | | | | | 37,042,906 | |
| | | | | | | | | | | | | | |
| TOTAL INVESTMENTS (Cost $394,463,299): 91.07% | | | | | | | | | | | | 394,565,619 | |
| Other Assets in Excess of Liabilities: 8.93% (f) | | | | | | | | | | | | 38,668,342 | |
| TOTAL NET ASSETS: 100.00% | | | | | | | | | | | $ | 433,233,961 | |
(a) Restricted security as defined in Rule 144(a) under the Securities Act of 1933 and determined to be liquid. Purchased in a private placement transaction; resale to the public may require registration or may extend only to qualified institutional buyers. At June 30, 2015, the value of these securities total $16,537,518, which represents 3.82% of total net assets.
(b) Foreign issued security.
(c) Variable rate security. The rate reported is the rate in effect as of June 30, 2015.
(d) The rate quoted is the annualized seven-day effective yield as of June 30, 2015.
(e) All or a portion of this security is held by LCMT Fund Limited. See Note 1.
(f) Includes assets pledged as collateral for derivative contracts. See Note 2.
The accompanying notes are an integral part of these consolidated financial statements.
| | |
| | LoCorr Market Trend Fund - Consolidated Schedule of Open Forward Currency Contracts | 37 |
| | |
LoCorr Market Trend Fund
Consolidated Schedule of Open Forward Currency Contracts(a)
June 30, 2015 (Unaudited)
| | | | | | | | | | | | | | | | | | | | |
| | | | | | | Currency to be Received | | Currency to be Delivered | | | | | | | |
| | | Notional Amount | | Forward Settlement Date | | Curr Abbr. | | U.S. $ Value at June 30, 2015 | | Curr Abbr. | | U.S. Value on Origination Date | | | Unrealized Appreciation | | | Unrealized (Depreciation) | |
| | | | | | | | | | | | | | | | | | | | |
| Purchase Contracts: | | | | | | | | | | | | | | | | | | | |
| | | $ | 18,425,000 | | 09/18/2015 | | AUD | | $ | 14,152,900 | | USD | | $ | 14,202,672 | | | $ | — | | | $ | (49,772 | ) |
| | | | 72,854,000 | | 09/18/2015 | | CAD | | | 58,266,419 | | USD | | | 59,147,672 | | | | — | | | | (881,253 | ) |
| | | | 46,303,000 | | 09/18/2015 | | CHF | | | 49,681,863 | | USD | | | 49,601,846 | | | | 80,017 | | | | — | |
| | | | 10,137,000 | | 09/18/2015 | | EUR | | | 11,314,268 | | USD | | | 11,391,771 | | | | — | | | | (77,503 | ) |
| | | | 35,687,000 | | 09/18/2015 | | GBP | | | 56,040,410 | | USD | | | 56,147,110 | | | | — | | | | (106,700 | ) |
| | | | 3,487,675,000 | | 09/18/2015 | | JPY | | | 28,528,845 | | USD | | | 28,230,126 | | | | 298,719 | | | | — | |
| | | | 1,000 | | 09/18/2015 | | MXN | | | 63 | | USD | | | 65 | | | | — | | | | (2 | ) |
| | | | 1,276,000 | | 09/18/2015 | | NZD | | | 858,707 | | USD | | | 875,177 | | | | — | | | | (16,470 | ) |
| Total Purchase Contracts | | | | | | | | | | 218,843,475 | | | | | 219,596,439 | | | | 378,736 | | | | (1,131,700 | ) |
| | | | | | | | | | | | | | | | | | | | | | | | | |
| Sale Contracts: | | | | | | | | | | | | | | | | | | | | | | | | |
| | | $ | 48,261,000 | | 09/18/2015 | | USD | | $ | (37,070,996 | ) | AUD | | $ | (37,040,234 | ) | | $ | — | | | $ | (30,762 | ) |
| | | | 29,022,000 | | 09/18/2015 | | USD | | | (23,210,915 | ) | CAD | | | (23,557,114 | ) | | | 346,199 | | | | — | |
| | | | 1,726,000 | | 09/18/2015 | | USD | | | (1,851,951 | ) | CHF | | | (1,877,527 | ) | | | 25,576 | | | | — | |
| | | | 14,489,000 | | 09/18/2015 | | USD | | | (16,171,691 | ) | EUR | | | (16,424,884 | ) | | | 253,193 | | | | — | |
| | | | 15,870,000 | | 09/18/2015 | | USD | | | (24,921,156 | ) | GBP | | | (24,589,756 | ) | | | — | | | | (331,400 | ) |
| | | | 5,163,262,000 | | 09/18/2015 | | USD | | | (42,234,984 | ) | JPY | | | (41,842,822 | ) | | | — | | | | (392,162 | ) |
| | | | 1,076,803,000 | | 09/18/2015 | | USD | | | (68,118,245 | ) | MXN | | | (69,117,996 | ) | | | 999,751 | | | | — | |
| | | | 102,503,000 | | 09/18/2015 | | USD | | | (68,981,228 | ) | NZD | | | (70,925,381 | ) | | | 1,944,153 | | | | — | |
| Total Sale Contracts | | | | | | | (282,561,166 | ) | | | | (285,375,714 | ) | | | 3,568,872 | | | | (754,324 | ) |
| Total Net Forward Currency Contracts | | | | | | $ | (63,717,691 | ) | | | $ | (65,779,275 | ) | | | 3,947,608 | | | $ | (1,886,024 | ) |
| Net Unrealized Appreciation | | | | | | | | | | | | | | | $ | 2,061,584 | | | | | |
(a) Bank of America Merrill Lynch is the counterparty for all open forward currency exchange contracts held by the Fund as of June 30, 2015.
Currency abbreviations:
| AUD | AUSTRALIAN DOLLAR |
| CAD | CANADIAN DOLLAR |
| CHF | SWISS FRANC |
| EUR | EURO |
| GBP | BRITISH POUND |
| JPY | JAPANESE YEN |
| MXN | MEXICAN PESO |
| NZD | NEW ZEALAND DOLLAR |
| USD | U.S. DOLLAR |
The accompanying notes are an integral part of these consolidated financial statements.
| | |
38 | LoCorr Market Trend Fund - Consolidated Schedule of Open Futures Contracts | |
| | |
LoCorr Market Trend Fund
Consolidated Schedule of Open Futures Contracts
June 30, 2015 (Unaudited)
| | | | | | | | | | | | | | |
| | | | | | | | | | | | | | |
| Description | | Notional Amount | | | Number of Contracts Purchased (Sold) | | Settlement Month-Year | | Unrealized Appreciation | | | Unrealized (Depreciation) | |
| | | | | | | | | | | | | | |
| Purchase Contracts: | | | | | | | | | | | | | |
| 3 Mo Euro Euribor | | $ | 798,032,728 | | | | 2,866 | | Dec-16 | | $ | — | | | $ | (22,270 | ) |
| 90 Day Eurodollar | | | 686,711,375 | | | | 2,785 | | Dec-16 | | | 278,219 | | | | — | |
| Brent Crude (a) | | | 12,336,460 | | | | 194 | | Jul-15 | | | — | | | | (107,512 | ) |
| Cac 40 10 Euro | | | 21,131,508 | | | | 396 | | Jul-15 | | | — | | | | (127,374 | ) |
| Can 10Yr Bond | | | 57,838,271 | | | | 516 | | Sep-15 | | | 444,716 | | | | — | |
| Dow Jones Industrial Average Mini E-Cbot | | | 54,671,760 | | | | 624 | | Sep-15 | | | — | | | | (576,236 | ) |
| Euro Stoxx 50 | | | 30,683,360 | | | | 801 | | Sep-15 | | | — | | | | (80,878 | ) |
| Euro-Bobl | | | 53,017,748 | | | | 367 | | Sep-15 | | | 92,320 | | | | — | |
| Euro-Bond | | | 31,349,640 | | | | 185 | | Sep-15 | | | 224,115 | | | | — | |
| Gasoline Rbob (a) | | | 6,627,760 | | | | 77 | | Aug-15 | | | 160,709 | | | | — | |
| Hang Seng Index | | | 31,945,585 | | | | 189 | | Jul-15 | | | — | | | | (1,109,550 | ) |
| Nasdaq 100 E-Mini | | | 16,595,145 | | | | 189 | | Sep-15 | | | — | | | | (276,573 | ) |
| Nikkei 225 (Sgx) | | | 44,265,474 | | | | 534 | | Sep-15 | | | 126,784 | | | | — | |
| Russell 2000 Mini | | | 54,392,400 | | | | 435 | | Sep-15 | | | — | | | | (415,720 | ) |
| S&P 500 E-Mini | | | 14,997,120 | | | | 146 | | Sep-15 | | | — | | | | (199,733 | ) |
| Tokyo Price Index | | | 44,764,309 | | | | 336 | | Sep-15 | | | — | | | | (240,369 | ) |
| Total Purchase Contracts | | | | | | | | | | | | 1,326,863 | | | | (3,156,215 | ) |
| | | | | | | | | | | | | | | | | | |
| Sale Contracts: | | | | | | | | | | | | | | | | | |
| 90 Day Sterling | | $ | 447,673,642 | | | | (2,311 | ) | Dec-16 | | $ | 159,066 | | | $ | — | |
| Aust 10Y Bond | | | 73,160,747 | | | | (757 | ) | Sep-15 | | | — | | | | (176,078 | ) |
| Coffee ‘C’ (a) | | | 16,036,950 | | | | (323 | ) | Sep-15 | | | — | | | | (61,923 | ) |
| Dax Index | | | 18,397,567 | | | | (60 | ) | Sep-15 | | | 307,295 | | | | — | |
| Ftse 100 Index | | | 28,978,317 | | | | (284 | ) | Sep-15 | | | 773,874 | | | | — | |
| Lme Copper (a) | | | 9,365,281 | | | | (65 | ) | Sep-15 | | | 8,461 | | | | — | |
| Lme Zinc (a) | | | 1,299,025 | | | | (26 | ) | Sep-15 | | | 3,294 | | | | — | |
| Long Gilt | | | 61,098,108 | | | | (336 | ) | Sep-15 | | | 382,150 | | | | — | |
| Natural Gas (a) | | | 2,690,400 | | | | (95 | ) | Aug-15 | | | — | | | | (4,340 | ) |
| Silver (a) | | | 20,099,490 | | | | (258 | ) | Sep-15 | | | 681,043 | | | | — | |
| U.S. Long Bond (Cbt) | | | 53,247,844 | | | | (353 | ) | Sep-15 | | | — | | | | (165,470 | ) |
| Wheat (a) | | | 18,597,800 | | | | (598 | ) | Dec-15 | | | — | | | | (2,567,297 | ) |
| Total Sale Contracts | | | | | | | | | | | | 2,315,183 | | | | (2,975,108 | ) |
| Total Net Futures Contracts | | | | | | | | | | | $ | 3,642,046 | | | $ | (6,131,323 | ) |
| Net Unrealized Depreciation | | | | | | | | | | | | | | | $ | (2,489,277 | ) |
(a) Contract held by LCMT Fund Limited. See Note 1.
The accompanying notes are an integral part of these consolidated financial statements.
| | |
| | LoCorr Long/Short Equity Fund - Schedule of Investments | 39 |
| | |
LoCorr Long/Short Equity Fund
Composition of Investment Portfolio1
June 30, 2015 (Unaudited)
Schedule of Investments
June 30, 2015 (Unaudited)
| | | | | | | | | |
| | | | Shares | | | Value | |
| CLOSED-END INVESTMENT COMPANY: 0.82% | | | | | | | | |
| Management of Companies and Enterprises: 0.82% | | | | | | | | |
| Newtek Business Services Corp. (c) | | | 17,293 | | | $ | 306,432 | |
| TOTAL CLOSED-END INVESTMENT COMPANY (Cost $280,776) | | | | | | | 306,432 | |
| | | | | | | | | |
| COMMON STOCKS: 94.35% | | | | | | | | |
| Accommodation and Food Services: 7.06% | | | | | | | | |
| Diamond Resorts International, Inc. (a) | | | 83,569 | | | | 2,636,602 | |
| | | | | | | | | |
| Administrative and Support and Waste Management and Remediation Services: 0.82% | | | | | | | | |
| Hudson Technologies, Inc. (a) | | | 88,000 | | | | 307,120 | |
| | | | | | | | | |
| Construction: 18.56% | | | | | | | | |
| Century Communities, Inc. (a) | | | 94,562 | | | | 1,903,533 | |
| MasTec, Inc. (a) | | | 253,050 | | | | 5,028,104 | |
| | | | | | | | 6,931,637 | |
| Finance and Insurance: 29.58% | | | | | | | | |
| American Express Co. | | | 19,700 | | | | 1,531,084 | |
| Atlas Financial Holdings, Inc. (a)(b)(c) | | | 15,000 | | | | 297,450 | |
| BofI Holding, Inc. (a)(c) | | | 7,000 | | | | 739,970 | |
| Credit Acceptance Corporation (a) | | | 15,455 | | | | 3,804,712 | |
| Customers Bancorp, Inc. (a) | | | 20,000 | | | | 537,800 | |
| Essent Group Ltd. (a)(b) | | | 12,500 | | | | 341,875 | |
| JMP Group LLC (c) | | | 43,840 | | | | 341,952 | |
| JPMorgan Chase & Co. | | | 16,796 | | | | 1,138,097 | |
| Molina Healthcare, Inc. (a) | | | 9,000 | | | | 632,700 | |
| Noah Holdings Limited - ADR (a)(b) | | | 18,100 | | | | 547,163 | |
| Wells Fargo & Company | | | 20,132 | | | | 1,132,224 | |
| | | | | | | | 11,045,027 | |
| | | | | | | | | |
| Industrials: 0.33% | | | | | | | | |
| Aceto Corporation | | | 5,000 | | | | 123,150 | |
The accompanying notes are an integral part of these financial statements.
| | |
40 | LoCorr Long/Short Equity Fund - Schedule of Investments (continued) | |
| | |
| | | | | | | | | |
| | | | Shares | | | Value | |
COMMON STOCKS (continued) | | | | | | | | |
| Information: 13.87% | | | | | | | | |
| Luxoft Holding, Inc. (a)(b) | | | 5,000 | | | $ | 282,750 | |
| Neustar, Inc. (a) | | | 10,000 | | | | 292,100 | |
| Nexstar Broadcasting Group, Inc. | | | 26,093 | | | | 1,461,208 | |
| Power Solutions International, Inc. (a)(c) | | | 2,000 | | | | 108,040 | |
| Salem Media Group, Inc. | | | 33,392 | | | | 211,371 | |
| Sinclair Broadcast Group, Inc. | | | 91,198 | | | | 2,545,336 | |
| Tableau Software, Inc. (a) | | | 2,400 | | | | 276,720 | |
| | | | | | | | 5,177,525 | |
| | | | | | | | | |
| Manufacturing: 17.83% | | | | | | | | |
| Acme United Corporation | | | 6,000 | | | | 108,600 | |
| Akorn, Inc. (a)(c) | | | 2,000 | | | | 87,320 | |
| Ambarella, Inc. (a)(b) | | | 1,000 | | | | 102,690 | |
| Ani Pharmaceuticals, Inc. (a) | | | 6,000 | | | | 372,300 | |
| Balchem Corporation | | | 4,000 | | | | 222,880 | |
| Biolase, Inc. (a)(e) | | | 0 | | | | 0 | |
| DTS, Inc. (a)(c) | | | 10,000 | | | | 304,900 | |
| General Motors Company | | | 31,335 | | | | 1,044,396 | |
| Innospec, Inc. | | | 14,000 | | | | 630,560 | |
| Integrated Device Technology, Inc. (a)(c) | | | 15,000 | | | | 325,500 | |
| Microsemi Corporation (a)(c) | | | 12,000 | | | | 419,400 | |
| Patrick Industries, Inc. (a) | | | 15,000 | | | | 570,750 | |
| Skechers U.S.A., Inc. (a)(c) | | | 1,300 | | | | 142,727 | |
| SolarEdge Technologies, Inc. (a) | | | 10,500 | | | | 381,675 | |
| Sparton Corporation (a)(c) | | | 8,000 | | | | 218,560 | |
| Super Micro Computer, Inc. (a) | | | 12,000 | | | | 354,960 | |
| TASER International, Inc. (a)(c) | | | 9,000 | | | | 299,790 | |
| Tenneco Inc. (a) | | | 18,623 | | | | 1,069,705 | |
| | | | | | | | 6,656,713 | |
| | | | | | | | | |
| Mining, Quarrying, and Oil and Gas Extraction: 0.40% | | | | | | | | |
| Trecora Resources (a)(c) | | | 10,000 | | | | 151,000 | |
| | | | | | | | | |
| Professional, Scientific, and Technical Services: 4.53% | | | | | | | | |
| Cambrex Corporation (a)(c) | | | 6,000 | | | | 263,640 | |
| Cimpress N.V. (a)(b)(c) | | | 3,500 | | | | 294,560 | |
| Echo Global Logistics, Inc. (a) | | | 10,000 | | | | 326,600 | |
| Enanta Pharmaceuticals, Inc. (a) | | | 4,500 | | | | 202,455 | |
| Gigamon Inc. (a) | | | 11,000 | | | | 362,890 | |
| VASCO Data Security International, Inc. (a) | | | 8,000 | | | | 241,520 | |
| | | | | | | | 1,691,665 | |
| | | | | | | | | |
| Real Estate and Rental and Leasing: 1.00% | | | | | | | | |
| Global Ship Lease, Inc. (a)(b) | | | 20,000 | | | | 115,800 | |
| New Home Company Inc./The (a) | | | 15,000 | | | | 258,450 | |
| | | | | | | | 374,250 | |
| Wholesale Trade: 0.37% | | | | | | | | |
| Paycom Software, Inc. (a) | | | 4,000 | | | | 136,600 | |
| TOTAL COMMON STOCKS (Cost $31,345,294) | | | | | | | 35,231,289 | |
| | | | | | | | | |
| EXCHANGE TRADED FUNDS: 2.27% | | | | | | | | |
| Direxion Daily 20 Year Plus Treasury Bear 3X Shares (a) | | | 5,000 | | | | 170,650 | |
| Direxion Daily Small Cap Bear 3X Shares (a) | | | 70,000 | | | | 676,200 | |
| TOTAL EXCHANGE TRADED FUNDS (Cost $827,999) | | | | | | | 846,850 | |
The accompanying notes are an integral part of these financial statements.
| | |
| | LoCorr Long/Short Equity Fund - Schedule of Investments (continued) | 41 |
| | |
| | | | | | | |
| | | Shares | | | Value | |
| SHORT-TERM INVESTMENT: 2.46% | | | | | | |
| MONEY MARKET FUND: 2.46% | | | | | | |
| Fidelity Institutional Money Market Portfolio - Class I, 0.10% (c)(d) | | | 917,572 | | | $ | 917,572 | |
| TOTAL MONEY MARKET FUND (Cost $917,572) | | | | | | | 917,572 | |
| TOTAL SHORT-TERM INVESTMENT (Cost $917,572) | | | | | | | 917,572 | |
| | | | | | | | | |
| TOTAL INVESTMENTS (Cost $33,371,641): 99.90% | | | | | | | 37,302,143 | |
| Other Assets in Excess of Liabilities: 0.10% | | | | | | | 38,777 | |
| TOTAL NET ASSETS: 100.00% | | | | | | $ | 37,340,920 | |
ADR American Depository Receipt
(a) Non-income producing security.
(b) Foreign issued security.
(c) This security or a portion of this security is pledged to cover short positions. See Note 2.
(d) The rate quoted is the annualized seven-day effective yield as of June 30, 2015.
(e) Represents a fractional holding.
The accompanying notes are an integral part of these financial statements.
| | |
42 | LoCorr Long/Short Equity Fund - Schedule of Securities Sold Short | |
| | |
Schedule of Securities Sold Short
June 30, 2015 (Unaudited)
| | | | | | | |
| | | Shares | | | Value | |
| COMMON STOCKS: (9.74)% | | | | | | |
| Finance and Insurance: (0.61)% | | | | | | |
| Charles Schwab Corp./The | | | (7,000 | ) | | $ | (228,550 | ) |
| | | | | | | | | |
| Information: (1.05)% | | | | | | | | |
| Cogent Communications Holdings, Inc. | | | (7,000 | ) | | | (236,880 | ) |
| Pandora Media, Inc. (a) | | | (10,000 | ) | | | (155,400 | ) |
| | | | | | | | (392,280 | ) |
| Management of Companies and Enterprises: (0.85)% | | | | | | | | |
| Echostar Corporation (a) | | | (6,500 | ) | | | (316,420 | ) |
| | | | | | | | | |
| Manufacturing: (2.83)% | | | | | | | | |
| Callaway Golf Company | | | (35,000 | ) | | | (312,900 | ) |
| First Solar, Inc. (a) | | | (3,500 | ) | | | (164,430 | ) |
| Movado Group, Inc. | | | (5,000 | ) | | | (135,800 | ) |
| Sunpower Corporation (a) | | | (4,000 | ) | | | (113,640 | ) |
| SuperCom Ltd. (a)(b) | | | (5,000 | ) | | | (63,400 | ) |
| Tesla Motors, Inc. (a) | | | (1,000 | ) | | | (268,260 | ) |
| | | | | | | | (1,058,430 | ) |
| Mining, Quarrying, and Oil and Gas Extraction: (0.54)% | | | | | | | | |
| Gulfport Energy Corporation (a) | | | (5,000 | ) | | | (201,250 | ) |
| | | | | | | | | |
| Other Services (except Public Administration): (2.96)% | | | | | | | | |
| Regis Corp. (a) | | | (70,031 | ) | | | (1,103,689 | ) |
| | | | | | | | | |
| Retail Trade: (0.90)% | | | | | | | | |
| Nordstrom, Inc. | | | (4,500 | ) | | | (335,250 | ) |
| TOTAL COMMON STOCKS (Proceeds $3,699,995) | | | | | | | (3,635,869 | ) |
| | | | | | | | | |
| EXCHANGE TRADED FUND: (0.37)% | | | | | | | | |
| SPDR S&P Oil & Gas Exploration & Production ETF | | | (3,000 | ) | | | (139,980 | ) |
| TOTAL EXCHANGE TRADED FUND (Proceeds $139,437) | | | | | | | (139,980 | ) |
| TOTAL SECURITIES SOLD SHORT (Proceeds $3,839,432): (10.11)% | | | | | | $ | (3,775,849 | ) |
(a) Non-dividend expense producing security.
(b) Foreign issued security.
Percentages are stated as a percent of net assets.
The accompanying notes are an integral part of these financial statements.
| | |
| | LoCorr Spectrum Income Fund - Schedule of Investments | 43 |
| | |
LoCorr Spectrum Income Fund
Composition of Investment Portfolio1
June 30, 2015 (Unaudited)
1 As a percentage of total investments.
Schedule of Investments
June 30, 2015 (Unaudited)
| | | | | | | |
| | | Shares | | | Value | |
| BUSINESS DEVELOPMENT COMPANIES: 6.90% | | | | | | |
| Finance and Insurance: 6.90% | | | | | | |
| Ares Capital Corporation | | | 291,120 | | | $ | 4,791,835 | |
| Fifth Street Finance Corp. | | | 205,245 | | | | 1,344,355 | |
| Prospect Capital Corporation | | | 270,880 | | | | 1,996,386 | |
TOTAL BUSINESS DEVELOPMENT COMPANIES (Cost $9,527,978) | | | | | | | 8,132,576 | |
| | | | | | | | | |
| CLOSED-END INVESTMENT COMPANIES: 11.83% | | | | | | | | |
| Finance and Insurance: 11.83% | | | | | | | | |
| Avenue Income Credit Strategies Fund | | | 83,560 | | | | 1,187,388 | |
| BlackRock Corporate High Yield Fund Inc. | | | 153,395 | | | | 1,655,132 | |
| First Trust Intermediate Duration Preferred & Income Fund | | | 52,135 | | | | 1,122,988 | |
| Invesco Dynamic Credit Opportunities Fund | | | 97,455 | | | | 1,131,453 | |
| Medley Capital Corp. | | | 123,100 | | | | 1,096,821 | |
| NexPoint Credit Strategies Fund | | | 219,255 | | | | 1,607,139 | |
| Nuveen Preferred Income Opportunities Fund | | | 257,315 | | | | 2,357,005 | |
| Stone Harbor Emerging Markets Income Fund | | | 58,885 | | | | 885,042 | |
| Western Asset Emerging Markets Income Fund Inc. | | | 98,140 | | | | 1,053,042 | |
| Western Asset Global High Income Fund Inc. | | | 178,810 | | | | 1,848,895 | |
| TOTAL CLOSED-END INVESTMENT COMPANIES (Cost $16,208,040) | | | | | | | 13,944,905 | |
| | | | | | | | | |
| COMMON STOCKS: 6.07% | | | | | | | | |
| Information: 1.17% | | | | | | | | |
| Frontier Communications Corporation | | | 278,535 | | | | 1,378,748 | |
| | | | | | | | | |
| Transportation and Warehousing: 4.90% | | | | | | | | |
| Ship Finance International Limited (a) | | | 301,230 | | | | 4,916,074 | |
| Student Transportation Inc. (a) | | | 185,385 | | | | 856,479 | |
| | | | | | | | 5,772,553 | |
| TOTAL COMMON STOCKS (Cost $7,905,381) | | | | | | | 7,151,301 | |
| | | | | | | | | |
| | | Units | | | | | |
| MASTER LIMITED PARTNERSHIPS: 30.02% | | | | | | | | |
| Finance and Insurance: 6.27% | | | | | | | | |
| Apollo Global Management, LLC | | | 103,640 | | | | 2,295,626 | |
| KKR & Co. L.P. | | | 222,600 | | | | 5,086,410 | |
| | | | | | | | 7,382,036 | |
The accompanying notes are an integral part of these financial statements.
| | |
44 | LoCorr Spectrum Income Fund - Schedule of Investments (continued) | |
| | |
| | | | | | | | | | |
| | | | | | Shares | | | Value | |
MASTER LIMITED PARTNERSHIPS (continued) | | | | | | | | | |
| Manufacturing: 12.38% | | | | | | | | | |
| Calumet Specialty Products Partners, L.P. | | | | | | 185,715 | | | $ | 4,728,304 | |
| CVR Partners, LP | | | | | | 141,660 | | | | 1,789,166 | |
| CVR Refining, LP | | | | | | 111,135 | | | | 2,033,770 | |
| Northern Tier Energy LP | | | | | | 89,270 | | | | 2,121,948 | |
| Terra Nitrogen Company, L.P. | | | | | | 32,330 | | | | 3,914,840 | |
| | | | | | | | | | | 14,588,028 | |
| Mining, Quarrying, and Oil and Gas Extraction: 3.58% | | | | | | | | | | | |
| Memorial Production Partners, LP | | | | | | 133,785 | | | | 1,986,707 | |
| Vanguard Natural Resources, LLC | | | | | | 149,200 | | | | 2,227,556 | |
| | | | | | | | | | | 4,214,263 | |
| | | | | | | | | | | | |
| Other Services (except Public Administration): 2.55% | | | | | | | | | | | |
| StoneMor Partners L.P. | | | | | | 99,835 | | | | 3,010,025 | |
| | | | | | | | | | | | |
| Transportation and Warehousing: 1.74% | | | | | | | | | | | |
| Navios Maritime Partners L.P. (a) | | | | | | 191,915 | | | | 2,053,491 | |
| | | | | | | | | | | | |
| Wholesale Trade: 3.50% | | | | | | | | | | | |
| Martin Midstream Partners L.P. | | | | | | 133,340 | | | | 4,128,206 | |
| TOTAL MASTER LIMITED PARTNERSHIPS (Cost $38,834,498) | | | | | | | | | | 35,376,049 | |
| | | | | | | | | | | | |
| | | | | | | | | | | |
| PRIVATE INVESTMENT: 9.65% | Preferred Return | | | Units ($) | | | | | |
| Finance and Insurance: 9.65% | | | | | | | | | | | |
| Terra Secured Income Fund 5, LLC (b) | | | 8.50 | % | | $ | 12,340,000 | | | | 11,373,928 | |
| TOTAL PRIVATE INVESTMENT (Cost $10,682,711) | | | | | | | | | | | 11,373,928 | |
| | | | | | | | | | | | | |
| | | | | | | Shares | | | | | |
| REAL ESTATE INVESTMENT TRUSTS: 30.11% | | | | | | | | | | | | |
| Finance and Insurance: 14.63% | | | | | | | | | | | | |
| American Capital Mortgage Investment Corp. | | | | | | | 131,505 | | | | 2,102,765 | |
| Apollo Commercial Real Estate Finance, Inc. | | | | | | | 265,940 | | | | 4,369,394 | |
| Invesco Mortgage Capital Inc. | | | | | | | 138,475 | | | | 1,982,962 | |
| NorthStar Realty Finance Corp. | | | | | | | 264,630 | | | | 4,207,617 | |
| Starwood Property Trust, Inc. | | | | | | | 211,765 | | | | 4,567,771 | |
| | | | | | | | | | | | 17,230,509 | |
| Real Estate and Rental and Leasing: 15.48% | | | | | | | | | | | | |
| American Realty Capital Properties, Inc. | | | | | | | 264,810 | | | | 2,152,905 | |
| Capstead Mortgage Corporation | | | | | | | 176,650 | | | | 1,960,815 | |
| EPR Properties | | | | | | | 38,915 | | | | 2,131,764 | |
| Hospitality Properties Trust | | | | | | | 145,675 | | | | 4,198,353 | |
| New Residential Investment Corp. | | | | | | | 191,170 | | | | 2,913,431 | |
| Senior Housing Properties Trust | | | | | | | 105,800 | | | | 1,856,790 | |
| STAG Industrial, Inc. | | | | | | | 103,190 | | | | 2,063,800 | |
| Whitestone REIT | | | | | | | 74,145 | | | | 965,368 | |
| | | | | | | | | | | | 18,243,226 | |
| TOTAL REAL ESTATE INVESTMENT TRUSTS (Cost $39,027,054) | | | | | | | | | | | 35,473,735 | |
| | | | | | | | | | | | | |
| ROYALTY TRUST: 1.46% | | | | | | | | | | | | |
| Manufacturing: 1.46% | | | | | | | | | | | | |
| BP Prudhoe Bay Royalty Trust | | | | | | | 27,800 | | | | 1,715,538 | |
| TOTAL ROYALTY TRUST (Cost $2,454,948) | | | | | | | | | | | 1,715,538 | |
| | | | | | | | | | | | | |
| SHORT TERM INVESTMENT: 3.62% | | | | | | | | | | | | |
| MONEY MARKET FUND: 3.62% | | | | | | | | | | | | |
| Fidelity Institutional Money Market Portfolio - Class I, 0.10% (c) | | | | | | | 4,259,283 | | | | 4,259,283 | |
| TOTAL MONEY MARKET FUND (Cost $4,259,283) | | | | | | | | | | | 4,259,283 | |
| TOTAL SHORT TERM INVESTMENT (Cost $4,259,283) | | | | | | | | | | | | |
| | | | | | | | | | | | | |
| TOTAL INVESTMENTS (Cost $128,899,893): 99.66% | | | | | | | | | | | 117,427,315 | |
| Other Assets in Excess of Liabilities: 0.34% | | | | | | | | | | | 405,960 | |
| TOTAL NET ASSETS: 100.00% | | | | | | | | | | $ | 117,833,275 | |
(a) Foreign issued security.
(b) Deemed to be illiquid. At June 30, 2015, the value of these securities total $11,373,928 which represents 9.65% of total net assets.
(c) The rate quoted is the annualized seven-day effective yield as of June 30, 2015.
The accompanying notes are an integral part of these financial statements.
| | |
LoCorr Managed Futures Strategy Fund, LoCorr Long/Short Commodities Strategy Fund, LoCorr Multi-Strategy Fund
and LoCorr Market Trend Fund - Consolidated Statements of Assets & Liabilities | | 45 |
Consolidated Statements of Assets & Liabilities
June 30, 2015 (Unaudited)
| | | | | | | | | | | | | |
| | | LoCorr Managed Futures Strategy Fund | | | LoCorr Long/Short Commodities Strategy Fund | | | LoCorr Multi-Strategy Fund | | | LoCorr Market Trend Fund | |
| Assets | | | | | | | | | | | | |
| Investments, at value (Cost $476,064,330, $23,275,845, $16,701,030 and $394,463,299, respectively) | | $ | 476,210,193 | | | $ | 23,247,496 | | | $ | 16,078,596 | | | $ | 394,565,619 | |
| Cash | | | 14,710 | | | | — | | | | 10,686 | | | | 3,787,062 | |
| Foreign currency, at value (Cost $1,150,617) | | | — | | | | — | | | | — | | | | 1,150,617 | |
| Receivable for Fund shares sold | | | 1,274,478 | | | | 113,548 | | | | 254,568 | | | | 14,219,672 | |
| Receivable from Adviser (Note 5) | | | — | | | | — | | | | 14,371 | | | | — | |
| Dividend and interest receivable | | | 1,570,433 | | | | 74,765 | | | | 53,232 | | | | 821,715 | |
| Receivable for variation margin on futures contracts | | | — | | | | — | | | | — | | | | 1,134,784 | |
| Deferred offering costs (Note 2) | | | — | | | | — | | | | 49,723 | | | | — | |
| Deposits with broker for derivative instruments (Note 2) | | | 101,000,010 | | | | 9,435,010 | | | | 3,616,500 | | | | 32,654,084 | |
| Deposits with broker for securities sold short (Note 2) | | | — | | | | — | | | | 348,486 | | | | — | |
| Unrealized appreciation on forward currency contracts (Note 2) | | | — | | | | — | | | | — | | | | 3,947,608 | |
| Advance receipt on swap contracts | | | — | | | | 3,728,823 | | | | — | | | | — | |
| Prepaid expenses and other assets | | | 70,696 | | | | 28,994 | | | | 3,023 | | | | 70,312 | |
| Total Assets | | | 580,140,520 | | | | 36,628,636 | | | | 20,429,185 | | | | 452,351,473 | |
| | | | | | | | | | | | | | | | | |
| Liabilities | | | | | | | | | | | | | | | | |
| Securities sold short, at value (proceeds $232,330) | | $ | — | | | $ | — | | | $ | 222,925 | | | $ | — | |
| Payable for Fund shares redeemed | | | 3,050,345 | | | | 18,008 | | | | 27 | | | | 194,014 | |
| Payable for securities purchased | | | 4,313,170 | | | | 59,880 | | | | 368,217 | | | | 16,350,437 | |
| Payable for distributions | | | — | | | | — | | | | 14,317 | | | | — | |
| Payable to custodian | | | — | | | | 492 | | | | — | | | | — | |
| Accrued management fees (Note 5) | | | 655,813 | | | | 21,401 | | | | — | | | | 478,079 | |
| Accrued Trustees’ fees | | | 10,723 | | | | 334 | | | | 420 | | | | 2,792 | |
| Accrued Rule 12b-1 fees | | | 69,262 | | | | 47,616 | | | | 5,164 | | | | 128,970 | |
| Unrealized depreciation on swap contracts (Note 1) | | | 42,869,132 | | | | 4,899,992 | | | | 662,563 | | | | — | |
| Unrealized depreciation on forward currency contracts (Note 2) | | | — | | | | — | | | | — | | | | 1,886,024 | |
| Advance payment on swap contracts | | | 2,660,742 | | | | — | | | | — | | | | — | |
| Accrued expenses and other liabilities | | | 152,972 | | | | 53,223 | | | | 35,676 | | | | 77,196 | |
| Total Liabilities | | | 53,782,159 | | | | 5,100,946 | | | | 1,309,309 | | | | 19,117,512 | |
| Net Assets | | $ | 526,358,361 | | | $ | 31,527,690 | | | $ | 19,119,876 | | | $ | 433,233,961 | |
| | | | | | | | | | | | | | | | | |
| Net Assets Consist of: | | | | | | | | | | | | | | | | |
| Paid-in capital | | $ | 520,788,605 | | | $ | 32,002,810 | | | $ | 20,404,601 | | | $ | 428,022,449 | |
| Accumulated net investment loss | | | (2,743,348 | ) | | | (223,539 | ) | | | — | | | | (1,603,941 | ) |
| Accumulated distributions in excess of net investment income | | | — | | | | — | | | | (29,934 | ) | | | — | |
| Accumulated undistributed net realized gain | | | 51,036,373 | | | | 4,676,760 | | | | 20,801 | | | | 7,140,826 | |
| Net unrealized appreciation (depreciation) of: | | | | | | | | | | | | | | | | |
| Investments | | | 145,863 | | | | (28,349 | ) | | | (622,434 | ) | | | 102,320 | |
| Securities sold short | | | — | | | | — | | | | 9,405 | | | | — | |
| Swap contracts | | | (42,869,132 | ) | | | (4,899,992 | ) | | | (662,563 | ) | | | — | |
| Forward currency contracts | | | — | | | | — | | | | — | | | | 2,061,584 | |
| Futures contracts | | | — | | | | — | | | | — | | | | (2,489,277 | ) |
| NET ASSETS | | $ | 526,358,361 | | | $ | 31,527,690 | | | $ | 19,119,876 | | | $ | 433,233,961 | |
| | | | | | | | | | | | | | | | | |
| Class A Shares | | | | | | | | | | | | | | | | |
| Net assets | | $ | 221,221,908 | | | $ | $15,826,875 | | | $ | 1,859,571 | | | $ | 84,706,701 | |
| Shares issued and outstanding (unlimited shares authorized, no par value) | | | 26,492,866 | | | | 1,774,971 | | | | 203,045 | | | | 6,821,851 | |
| Net asset value, redemption, and minimum offering price per share (a)(b) | | | $8.35 | | | | $8.92 | | | | $9.16 | | | | $12.42 | |
| Maximum offering price per share ($8.35/0.9425), ($8.92/0.9425) ($9.16/0.9425) ($12.42/0.9425) (c) | | | $8.86 | | | | $9.46 | | | | $9.72 | | | | $13.18 | |
| | | | | | | | | | | | | | | | | |
| Class C Shares | | | | | | | | | | | | | | | | |
| Net assets | | $ | $98,847,820 | | | $ | $3,071,794 | | | $ | 4,680,894 | | | $ | 53,177,885 | |
| Shares issued and outstanding (unlimited shares authorized, no par value) | | | 12,178,139 | | | | 353,289 | | | | 511,389 | | | | 4,309,757 | |
| Net asset value, redemption, and offering price per share (a)(b) | | | $8.12 | | | | $8.69 | | | | $9.15 | | | | $12.34 | |
| | | | | | | | | | | | | | | | | |
| Class I Shares | | | | | | | | | | | | | | | | |
| Net assets | | $ | 206,288,633 | | | $ | 12,629,021 | | | $ | 12,579,411 | | | $ | 295,349,375 | |
| Shares issued and outstanding (unlimited shares authorized, no par value) | | | 24,478,289 | | | | 1,406,573 | | | | 1,373,216 | | | | 23,731,631 | |
| Net asset value, redemption, and offering price per share (b) | | | $8.43 | | | | $8.98 | | | | $9.16 | | | | $12.45 | |
| (a) A 1.00% contingent deferred sales charge may apply to redemptions made within twelve months of purchase. |
| The contingent deferred sales charge only applies to Class A share purchases of $1 million or more. |
| (b) Redemptions made within 30 days of purchase may be assessed a redemption fee of 1.00%. |
| (c) On investments of $25,000 or more, the offering price is reduced. |
The accompanying notes are an integral part of these consolidated financial statements.
| | |
46 | LoCorr Long/Short Equity Fund and LoCorr Spectrum Income Fund - Statements of Assets & Liabilities | |
| | |
Statements of Assets & Liabilities
June 30, 2015 (Unaudited)
| | | | | | | |
| | | LoCorr Long/Short Equity Fund | | | LoCorr Spectrum Income Fund | |
| | | | | | | |
| Assets | | | | | | |
| Investments, at value (Cost $33,371,641 and $128,899,893, respectively) | | $ | 37,302,143 | | | $ | 117,427,315 | |
| Cash | | | — | | | | 37,033 | |
| Receivable for Fund shares sold | | | 51,394 | | | | 422,984 | |
| Receivable for securities sold | | | 1,362,748 | | | | — | |
| Dividends, interest and other receivables | | | 16,315 | | | | 665,694 | |
| Deposits with broker for securities sold short (Note 2) | | | 3,745,571 | | | | — | |
| Prepaid expenses and other assets | | | 33,273 | | | | 41,822 | |
| Total Assets | | | 42,511,444 | | | | 118,594,848 | |
| | | | | | | | | |
| Liabilities | | | | | | | | |
| Securities sold short, at value (proceeds $3,839,432) | | $ | 3,775,849 | | | $ | — | |
| Payable for Fund shares redeemed | | | 262,467 | | | | 323,271 | |
| Payable for securities purchased | | | 860,507 | | | | — | |
| Payable for distributions | | | — | | | | 135,327 | |
| Payable to custodian | | | 123,942 | | | | — | |
| Accrued management fees (Note 5) | | | 67,537 | | | | 142,396 | |
| Accrued Trustees’ fees | | | 1,154 | | | | 1,713 | |
| Accrued Rule 12b-1 fees | | | 27,216 | | | | 110,747 | |
| Accrued expenses and other liabilities | | | 51,852 | | | | 48,119 | |
| Total Liabilities | | | 5,170,524 | | | | 761,573 | |
| Net Assets | | $ | 37,340,920 | | | $ | 117,833,275 | |
| | | | | | | | | |
| Net Assets Consist of: | | | | | | | | |
| Paid-in capital | | $ | 37,868,183 | | | $ | 132,122,436 | |
| Accumulated net investment loss | | | (533,160 | ) | | | — | |
| Accumulated distributions in excess of net investment income | | | — | | | | (206,941 | ) |
| Accumulated net realized loss | | | (3,988,188 | ) | | | (2,609,642 | ) |
| Net unrealized appreciation (depreciation) of: | | | | | | | | |
| Investments | | | 3,930,502 | | | | (11,472,578 | ) |
| Securities sold short | | | 63,583 | | | | — | |
| NET ASSETS | | $ | 37,340,920 | | | $ | 117,833,275 | |
| | | | | | | | | |
| Class A Shares | | | | | | | | |
| Net assets | | $ | 15,879,957 | | | $ | 43,338,877 | |
| Shares issued and outstanding (unlimited shares authorized, no par value) | | | 1,507,242 | | | | 4,867,786 | |
| Net asset value, redemption, and minimum offering price per share (a) | | | $10.54 | (b) | | | $8.90 | (c) |
| Maximum offering price per share ($10.54/0.9425) ($8.90/0.9425) (d) | | | $11.18 | | | | $9.44 | |
| | | | | | | | | |
| Class C Shares | | | | | | | | |
| Net assets | | $ | 9,511,749 | | | $ | 33,933,831 | |
| Shares issued and outstanding (unlimited shares authorized, no par value) | | | 917,816 | | | | 3,813,493 | |
| Net asset value, redemption, and offering price per share (a) | | | $10.36 | (b) | | | $8.90 | (c) |
| | | | | | | | | |
| Class I Shares | | | | | | | | |
| Net assets | | $ | 11,949,214 | | | $ | 40,560,567 | |
| Shares issued and outstanding (unlimited shares authorized, no par value) | | | 1,128,168 | | | | 4,554,896 | |
| Net asset value, redemption, and offering price per share | | | $10.59 | (b) | | | $8.90 | (c) |
| (a) A 1.00% contingent deferred sales charge may apply to redemptions made within twelve months of purchase. |
| The contingent deferred sales charge only applies to Class A share purchases of $1 million or more. |
| (b) Redemptions made within 30 days of purchase may be assessed a redemption fee of 1.00%. |
| (c) Redemptions made within 60 days of purchase may be assessed a redemption fee of 2.00%. |
| (d) On investments of $25,000 or more, the offering price is reduced. |
The accompanying notes are an integral part of these financial statements.
| | |
| LoCorr Managed Futures Strategy Fund, LoCorr Long/Short Commodities Strategy Fund, LoCorr Multi-Strategy Fund and LoCorr Market Trend Fund - Consolidated Statements of Operations | | 47 |
Consolidated Statements of Operations
| | | | | | | | | | | | | |
| | | Six Months Ended
June 30, 2015 (Unaudited) | | | Period from April 6, 2015
(commencement of operations)
through June 30, 2015
(Unaudited) | | | Six Months Ended June 30, 2015 (Unaudited) | |
| | | LoCorr
Managed Futures
Strategy Fund | | | LoCorr
Long/Short Commodities
Strategy Fund | | | LoCorr Multi-Strategy Fund | | | LoCorr Market Trend Fund | |
| | | | | | | | | | | | | |
| Investment Income | | | | | | | | | | | | |
Dividend and interest income(a) | | $ | 2,689,787 | | | $ | 127,103 | | | $ | 128,545 | | | $ | 450,941 | |
| Distributions received from master limited partnerships (“MLP”) interests | | | — | | | | — | | | | 58,013 | | | | — | |
| Less: return of capital on distributions from MLP interests (Note 2) | | | — | | | | — | | | | (58,013 | ) | | | — | |
| Other income | | | 658 | | | | — | | | | — | | | | — | |
| Total Investment Income | | | 2,690,445 | | | | 127,103 | | | | 128,545 | | | | 450,941 | |
| | | | | | | | | | | | | | | | | |
| Expenses | | | | | | | | | | | | | | | | |
| Management fees (Note 5) | | | 3,929,748 | | | | 274,259 | | | | 57,557 | | | | 1,587,520 | |
| Fund administration fees | | | 87,823 | | | | 21,782 | | | | 10,254 | | | | 36,506 | |
| Fund accounting fees | | | 103,685 | | | | 39,159 | | | | 10,232 | | | | 42,530 | |
| Trustees’ fees | | | 25,786 | | | | 1,624 | | | | 420 | | | | 6,282 | |
| Transfer agent fees and expenses | | | 376,385 | | | | 46,365 | | | | 10,748 | | | | 108,315 | |
| Custodian fees | | | 10,726 | | | | 5,161 | | | | 2,081 | | | | 3,786 | |
| Registration expenses | | | 46,056 | | | | 25,886 | | | | 12,039 | | | | 23,876 | |
| Rule 12b-1 fees - Class A (Note 5) | | | 279,569 | | | | 26,908 | | | | 729 | | | | 63,293 | |
| Rule 12b-1 fees - Class C (Note 5) | | | 495,312 | | | | 14,650 | | | | 4,435 | | | | 127,815 | |
| Legal and audit fees | | | 28,621 | | | | 19,287 | | | | 13,150 | | | | 18,621 | |
| Printing and mailing expenses | | | 35,910 | | | | 4,239 | | | | 610 | | | | 19,375 | |
| Offering costs (Note 2) | | | — | | | | — | | | | 15,042 | | | | 36,544 | |
| Organizational costs (Note 2) | | | — | | | | — | | | | 15,167 | | | | — | |
| Other expenses | | | 14,172 | | | | 1,587 | | | | 276 | | | | 2,161 | |
| Total expenses before interest expense | | | 5,433,793 | | | | 480,907 | | | | 152,740 | | | | 2,076,624 | |
| Dividend and interest expense on securities sold short (See Note 2) | | | — | | | | — | | | | 49 | | | | 55 | |
| Interest expense on credit line (Note 8) | | | — | | | | 15 | | | | — | | | | — | |
| Total expenses before recovery (reimbursement) | | | 5,433,793 | | | | 480,922 | | | | 152,789 | | | | 2,076,679 | |
| Recovery to (Reimbursement from) Adviser (Note 5) | | | — | | | | (82,813 | ) | | | (80,481 | ) | | | 143,030 | |
| Net Expenses | | | 5,433,793 | | | | 398,109 | | | | 72,308 | | | | 2,219,709 | |
| Net Investment Income (Loss) | | | (2,743,348 | ) | | | (271,006 | ) | | | 56,237 | | | | (1,768,768 | ) |
| | |
| Realized and Unrealized Gain (Loss) on Investments, Securities Sold Short, Swap Contracts, Forward Currency Contracts, Futures Contracts and Foreign Currency Translation: | |
| Net realized gain (loss) on: | | | | | | | | | | | | | | | | |
| Investments | | | 20,931 | | | | (23,182 | ) | | | 20,802 | | | | 4,633 | |
| Swap contracts | | | 51,032,621 | | | | 4,770,487 | | | | — | | | | — | |
| Forward currency contracts | | | — | | | | — | | | | — | | | | 6,751,748 | |
| Futures contracts | | | — | | | | — | | | | — | | | | (470,790 | ) |
| Foreign currency translation | | | — | | | | — | | | | (1 | ) | | | 15,642 | |
| Net change in unrealized appreciation (depreciation) on: | | | | | | | | | | | | | | | | |
| Investments | | | 40,002 | | | | 42,680 | | | | (622,434 | ) | | | 134,935 | |
| Securities sold short | | | — | | | | — | | | | 9,405 | | | | — | |
| Swap contracts | | | (59,717,185 | ) | | | (2,974,837 | ) | | | (662,563 | ) | | | — | |
| Forward currency contracts | | | — | | | | — | | | | — | | | | 1,648,027 | |
| Futures contracts | | | — | | | | — | | | | — | | | | (3,949,347 | ) |
| Net realized and unrealized gain (loss) | | | (8,623,631 | ) | | | 1,815,148 | | | | (1,254,791 | ) | | | 4,134,848 | |
| Net Increase (Decrease) in Net Assets From Operations | | $ | (11,366,979 | ) | | $ | 1,544,142 | | | $ | (1,198,554 | ) | | $ | 2,366,080 | |
| (a) Net of foreign tax withheld of $135, $34, $244 and $23, respectively. |
The accompanying notes are an integral part of these consolidated financial statements.
| | |
48 | LoCorr Long/Short Equity and LoCorr Spectrum Income Fund - Statements of Operations | |
| | |
Statements of Operations
Six Months Ended June 30, 2015 (Unaudited)
| | | | | | | |
| | | LoCorr Long/Short Equity Fund | | | LoCorr Spectrum Income Fund | |
| Investment Income | | | | | | |
Dividend and interest income(a) | | $ | 151,740 | | | $ | 4,137,818 | |
| Distributions received from master limited partnership (“MLP”) interests | | | 9,619 | | | | 1,539,392 | |
| Less: return of capital on distributions from MLP interests (Note 2) | | | (9,619 | ) | | | (1,539,392 | ) |
| Total Investment Income | | | 151,740 | | | | 4,137,818 | |
| | | | | | | | | |
| Expenses | | | | | | | | |
| Management fees (Note 5) | | | 475,741 | | | | 720,706 | |
| Fund administration fees | | | 21,951 | | | | 28,819 | |
| Fund accounting fees | | | 21,742 | | | | 26,638 | |
| Trustees’ fees | | | 2,375 | | | | 4,748 | |
| Transfer agent fees and expenses | | | 47,944 | | | | 77,086 | |
| Custodian fees | | | 5,105 | | | | 2,417 | |
| Registration expenses | | | 24,075 | | | | 24,240 | |
| Rule 12b-1 fees - Class A (Note 5) | | | 19,723 | | | | 53,532 | |
| Rule 12b-1 fees - Class C (Note 5) | | | 55,453 | | | | 153,704 | |
| Legal and audit fees | | | 13,421 | | | | 18,784 | |
| Printing and mailing expenses | | | 6,850 | | | | 4,916 | |
| Other expenses | | | 2,919 | | | | 2,312 | |
| Total expenses before dividend and interest expense | | | 697,299 | | | | 1,117,902 | |
| Dividend and interest expense on securities sold short (See Note 2) | | | 42,906 | | | | — | |
| Interest expense on credit line (Note 8) | | | 3,696 | | | | 1,286 | |
| Total expenses before recovery (reimbursement) | | | 743,901 | | | | 1,119,188 | |
| Recovery to (Reimbursement from) Adviser (Note 5) | | | (59,001 | ) | | | 87,235 | |
| Net Expenses | | | 684,900 | | | | 1,206,423 | |
| Net Investment Income (Loss) | | | (533,160 | ) | | | 2,931,395 | |
| | | | | | | | | |
| Realized and Unrealized Gain (Loss) on Investments, Securities Sold Short and Foreign Currency Translation: | | | | | | | | |
| Net realized gain (loss) on: | | | | | | | | |
| Investments | | | 1,837,720 | | | | 142,374 | |
| Securities sold short | | | (217,684 | ) | | | — | |
| Foreign currency translation | | | — | | | | (143 | ) |
| Net change in unrealized appreciation (depreciation) on: | | | | | | | | |
| Investments | | | 1,564,914 | | | | (1,857,565 | ) |
| Securities sold short | | | 135,134 | | | | — | |
| Net realized and unrealized gain (loss) | | | 3,320,084 | | | | (1,715,334 | ) |
| Net Increase in Net Assets From Operations | | $ | 2,786,924 | | | $ | 1,216,061 | |
| (a) Net of issuance fees and/or foreign tax withheld of $347 and $5,588, respectively. |
The accompanying notes are an integral part of these financial statements.
| | |
| | LoCorr Managed Futures Strategy Fund - Consolidated Statements of Changes in Net Assets | 49 |
| | |
LoCorr Managed Futures Strategy Fund
Consolidated Statements of Changes in Net Assets
| | | | | | | | | | |
| | | Six Months Ended
June 30, 2015 (Unaudited) | | Year Ended
December 31, 2014 | |
| | | | | | | | | | |
| Operations | | | | | | | | | |
| Net investment loss | | | $ | (2,743,348 | ) | | | $ | (4,018,359 | ) | |
| Net realized gain on investments and swap contracts | | | | 51,053,552 | | | | | 1,135,537 | | |
| Net change in unrealized appreciation (depreciation) of investments and swap contracts | | | | (59,677,183 | ) | | | | 57,786,972 | | |
| Increase (Decrease) in Net Assets From Operations | | | | (11,366,979 | ) | | | | 54,904,150 | | |
| | | | | | | | | | | | |
| Distributions to Shareholders From | | | | | | | | | | | |
| Net investment income: | | | | | | | | | | | |
| Class A | | | | — | | | | | (22,591,169 | ) | |
| Class C | | | | — | | | | | (9,858,197 | ) | |
| Class I | | | | — | | | | | (20,118,881 | ) | |
| Net realized gain: | | | | | | | | | | | |
| Class A | | | | — | | | | | (177,091 | ) | |
| Class C | | | | — | | | | | (81,762 | ) | |
| Class I | | | | — | | | | | (154,423 | ) | |
| Total Distributions to Shareholders | | | | — | | | | | (52,981,523 | ) | |
| | | | | | | | | | | | |
Capital Transactions (Note 6) | | | | | | | | | | | |
| Proceeds from shares sold | | | | 125,263,436 | | | | | 246,619,230 | | |
| Reinvestment of distributions | | | | — | | | | | 45,334,085 | | |
| Cost of shares redeemed | | | | (78,450,406 | ) | | | | (174,009,967 | ) | |
| Redemption fees | | | | 5,794 | | | | | 24,729 | | |
| Increase in Net Assets From Capital Transactions | | | | 46,818,824 | | | | | 117,968,077 | | |
| | | | | | | | | | | | |
| Total Increase in Net Assets | | | | 35,451,845 | | | | | 119,890,704 | | |
| | | | | | | | | | | | |
| Net Assets | | | | | | | | | | | |
| Beginning of period | | | | 490,906,516 | | | | | 371,015,812 | | |
| End of period (including accumulated net investment income (loss) of $(2,743,348) and $0, respectively) | | | $ | 526,358,361 | | | | $ | 490,906,516 | | |
The accompanying notes are an integral part of these consolidated financial statements.
| | |
50 | LoCorr Long/Short Commodities Strategy Fund - Consolidated Statements of Changes in Net Assets | |
| | |
LoCorr Long/Short Commodities Strategy Fund
Consolidated Statements of Changes in Net Assets
| | | | | | | | | | |
| | | Six Months Ended
June 30, 2015 (Unaudited) | | Year Ended
December 31, 2014 | |
| | | | | | | | | | |
| Operations | | | | | | | | | |
| Net investment loss | | | $ | (271,006 | ) | | | $ | (434,332 | ) | |
| Net realized gain on investments and swap contracts | | | | 4,747,305 | | | | | 5,475,762 | | |
| Net change in unrealized depreciation of investments and swap contracts | | | | (2,932,157 | ) | | | | (1,097,072 | ) | |
| Increase in Net Assets From Operations | | | | 1,544,142 | | | | | 3,944,358 | | |
| | | | | | | | | | | | |
| Distributions to Shareholders From | | | | | | | | | | | |
| Net investment income: | | | | | | | | | | | |
| Class A | | | | — | | | | | (4,370,892 | ) | |
| Class C | | | | — | | | | | (198,919 | ) | |
| Class I | | | | — | | | | | (986,117 | ) | |
| Total Distributions to Shareholders | | | | — | | | | | (5,555,928 | ) | |
| | | | | | | | | | | | |
Capital Transactions (Note 6) | | | | | | | | | | | |
| Proceeds from shares sold | | | | 12,095,089 | | | | | 61,824,488 | | |
| Reinvestment of distributions | | | | — | | | | | 5,432,471 | | |
| Cost of shares redeemed | | | | (41,266,293 | ) | | | | (17,301,505 | ) | |
| Redemption fees | | | | 1,351 | | | | | 1,528 | | |
| Increase (Decrease) in Net Assets From Capital Transactions | | | | (29,169,853 | ) | | | | 49,956,982 | | |
| | | | | | | | | | | | |
| Total Increase (Decrease) in Net Assets | | | | (27,625,711 | ) | | | | 48,345,412 | | |
| | | | | | | | | | | | |
| Net Assets | | | | | | | | | | | |
| Beginning of period | | | | 59,153,401 | | | | | 10,807,989 | | |
| End of period (including accumulated net investment income (loss) of $(223,539) and $47,467, respectively) | | | $ | 31,527,690 | | | | $ | 59,153,401 | | |
The accompanying notes are an integral part of these consolidated financial statements.
| | |
| | LoCorr Multi-Strategy Fund - Consolidated Statement of Changes in Net Assets | 51 |
| | |
LoCorr Multi-Strategy Fund
Consolidated Statement of Changes in Net Assets
| | | | | | |
| | | Period from April 6, 2015
(commencement of operations)
through
June 30, 2015 (Unaudited) | |
| | | | | | |
| Operations | | | | | |
| Net investment income | | | $ | 56,237 | | |
| Net realized gain on investments and foreign currency translation | | | | 20,801 | | |
| Net change in unrealized depreciation of investments, securities sold short and swap contracts | | | | (1,275,592 | ) | |
| Decrease in Net Assets From Operations | | | | (1,198,554 | ) | |
| | | | | | | |
| Distributions to Shareholders From | | | | | | |
| Net investment income: | | | | | | |
| Class A | | | | (7,667 | ) | |
| Class C | | | | (13,187 | ) | |
| Class I | | | | (65,317 | ) | |
| Total Distributions to Shareholders | | | | (86,171 | ) | |
| | | | | | | |
Capital Transactions (Note 6) | | | | | | |
| Proceeds from shares sold | | | | 20,346,559 | | |
| Reinvestment of distributions | | | | 58,069 | | |
| Cost of shares redeemed | | | | (27 | ) | |
| Redemption fees | | | | — | | |
| Increase in Net Assets From Capital Transactions | | | | 20,404,601 | | |
| | | | | | | |
| Total Increase in Net Assets | | | | 19,119,876 | | |
| | | | | | | |
| Net Assets | | | | | | |
| Beginning of period | | | | — | | |
| End of period (including accumulated distributions in excess of net investment income of $29,934) | | | $ | 19,119,876 | | |
The accompanying notes are an integral part of these consolidated financial statements.
| | |
52 | LoCorr Market Trend Fund - Consolidated Statements of Changes in Net Assets | |
| | |
LoCorr Market Trend Fund
Consolidated Statements of Changes in Net Assets
| | | | | | | | | | |
| | | Six Months Ended
June 30, 2015 (Unaudited) | | Period from July 1, 2014
(commencement of operations)
through
December 31, 2014 | |
| | | | | | | | | | |
| Operations | | | | | | | | | |
| Net investment loss | | | $ | (1,768,768 | ) | | | $ | (192,710 | ) | |
| Net realized gain on investments, forward currency contracts, futures contracts and foreign currency translation | | | | 6,301,233 | | | | | 3,306,313 | | |
| Net change in unrealized appreciation (depreciation) of investments, forward currency contracts and futures contracts | | | | (2,166,385 | ) | | | | 1,841,012 | | |
| Increase in Net Assets From Operations | | | | 2,366,080 | | | | | 4,954,615 | | |
| | | | | | | | | | | | |
| Distributions to Shareholders From | | | | | | | | | | | |
| Net investment income: | | | | | | | | | | | |
| Class A | | | | — | | | | | (281,419 | ) | |
| Class C | | | | — | | | | | (134,709 | ) | |
| Class I | | | | — | | | | | (860,029 | ) | |
| Net realized gain: | | | | | | | | | | | |
| Class A | | | | — | | | | | (203,792 | ) | |
| Class C | | | | — | | | | | (103,703 | ) | |
| Class I | | | | — | | | | | (613,333 | ) | |
| Total Distributions to Shareholders | | | | — | | | | | (2,196,985 | ) | |
| | | | | | | | | | | | |
Capital Transactions (Note 6) | | | | | | | | | | | |
| Proceeds from shares sold | | | | 391,611,584 | | | | | 56,201,611 | | |
| Reinvestment of distributions | | | | — | | | | | 1,998,424 | | |
| Cost of shares redeemed | | | | (21,226,322 | ) | | | | (481,368 | ) | |
| Redemption fees | | | | 4,914 | | | | | 1,408 | | |
| Increase in Net Assets From Capital Transactions | | | | 370,390,176 | | | | | 57,720,075 | | |
| | | | | | | | | | | | |
| Total Increase in Net Assets | | | | 372,756,256 | | | | | 60,477,705 | | |
| | | | | | | | | | | | |
| Net Assets | | | | | | | | | | | |
| Beginning of period | | | | 60,477,705 | | | | | — | | |
| End of period (including accumulated net investment income (loss) of $(1,603,941) and $164,827, respectively) | | | $ | 433,233,961 | | | | $ | 60,477,705 | | |
The accompanying notes are an integral part of these consolidated financial statements.
| | |
| LoCorr Long/Short Equity Fund - Statements of Changes in Net Assets | | 53 |
| | |
LoCorr Long/Short Equity Fund
Statements of Changes in Net Assets
| | | | | | | | | | | |
| | | Six Months Ended June 30, 2015 (Unaudited) | | Year Ended December 31, 2014 | |
| | | | | | | | | | | |
| Operations | | | | | | | | | | |
| Net investment loss | | | $ | (533,160 | ) | | | | $ | (1,131,444 | ) | |
Net realized gain (loss) on investments and securities sold short | | | | 1,620,036 | | | | | | (5,380,860 | ) | |
| Net change in unrealized appreciation (depreciation) of investments and securities sold short | | | | 1,700,048 | | | | | | (1,145,545 | ) | |
| Increase (Decrease) in Net Assets From Operations | | | | 2,786,924 | | | | | | (7,657,849 | ) | |
| | | | | | | | | | | | | |
| Distributions to Shareholders From | | | | | | | | | | | | |
| Net realized gain: | | | | | | | | | | | | |
| Class A | | | | — | | | | | | (70,089 | ) | |
| Class C | | | | — | | | | | | (49,882 | ) | |
| Class I | | | | — | | | | | | (49,706 | ) | |
| Total Distributions to Shareholders | | | | — | | | | | | (169,677 | ) | |
| | | | | | | | | | | | | |
Capital Transactions (Note 6) | | | | | | | | | | | | |
| Proceeds from shares sold | | | | 6,579,615 | | | | | | 41,083,555 | | |
| Reinvestment of distributions | | | | — | | | | | | 151,442 | | |
| Cost of shares redeemed | | | | (13,662,192 | ) | | | | | (33,834,867 | ) | |
| Redemption fees | | | | 102 | | | | | | 3,575 | | |
| Increase (Decrease) in Net Assets From Capital Transactions | | | | (7,082,475 | ) | | | | | 7,403,705 | | |
| | | | | | | | | | | | | |
| Total Decrease in Net Assets | | | | (4,295,551 | ) | | | | | (423,821 | ) | |
| | | | | | | | | | | | | |
| Net Assets | | | | | | | | | | | | |
| Beginning of period | | | | 41,636,471 | | | | | | 42,060,292 | | |
| End of period (including accumulated net investment income (loss) of $(533,160) and $0, respectively) | | | $ | 37,340,920 | | | | | $ | 41,636,471 | | |
The accompanying notes are an integral part of these financial statements.
| | |
54 | | LoCorr Spectrum Income Fund - Statements of Changes in Net Assets |
| | |
LoCorr Spectrum Income Fund
Statements of Changes in Net Assets
| | | | | | | | | | | | | |
| | | Six Months Ended June 30, 2015 (Unaudited) | | Year Ended December 31, 2014 | |
| | | | | | | | | | | | | |
| Operations | | | | | | | | | | | | |
| Net investment income | | | $ | 2,931,395 | | | | | $ | 2,361,119 | | |
| Net realized gain (loss) on investments and foreign currency translation | | | | 142,231 | | | | | | (2,730,887 | ) | |
| Net change in unrealized depreciation of investments | | | | (1,857,565 | ) | | | | | (9,463,570 | ) | |
| Increase (Decrease) in Net Assets From Operations | | | | 1,216,061 | | | | | | (9,833,338 | ) | |
| | | | | | | | | | | | | |
| Distributions to Shareholders From | | | | | | | | | | | | |
| Net investment income: | | | | | | | | | | | | |
| Class A | | | | (1,337,042 | ) | | | | | (963,509 | ) | |
| Class C | | | | (846,833 | ) | | | | | (507,139 | ) | |
| Class I | | | | (1,223,187 | ) | | | | | (912,226 | ) | |
| Return of capital: | | | | | | | | | | | | |
| Class A | | | | — | | | | | | (443,908 | ) | |
| Class C | | | | — | | | | | | (233,650 | ) | |
| Class I | | | | — | | | | | | (420,282 | ) | |
| Total Distributions to Shareholders | | | | (3,407,062 | ) | | | | | (3,480,714 | ) | |
| | | | | | | | | | | | | |
Capital Transactions (Note 6) | | | | | | | | | | | | |
| Proceeds from shares sold | | | | 39,528,517 | | | | | | 124,120,006 | | |
| Reinvestment of distributions | | | | 2,373,770 | | | | | | 2,216,013 | | |
| Cost of shares redeemed | | | | (15,948,507 | ) | | | | | (18,977,948 | ) | |
| Redemption fees | | | | 7,563 | | | | | | 18,914 | | |
| Increase in Net Assets From Capital Transactions | | | | 25,961,343 | | | | | | 107,376,985 | | |
| | | | | | | | | | | | | |
| Total Increase in Net Assets | | | | 23,770,342 | | | | | | 94,062,933 | | |
| | | | | | | | | | | | | |
| Net Assets | | | | | | | | | | | | |
| Beginning of period | | | | 94,062,933 | | | | | | — | | |
| End of period (including accumulated distributions in excess of net investment of income of $206,941 and net investment income of $60,996, respectively) | | | $ | 117,833,275 | | | | | $ | 94,062,933 | | |
The accompanying notes are an integral part of these financial statements.
| | |
| LoCorr Spectrum Income Fund - Statement of Cash Flows | | 55 |
| | |
LoCorr Spectrum Income Fund
Statement of Cash Flows
| | | | | | |
| | | | |
| | | | | | |
| Cash Flows from Operating Activities | | | | | |
| Increase in net assets from operations | | | $ | 1,216,061 | | |
| Adjustments to reconcile net increase in net assets resulting from operations to net cash used in operating activities: | | | | | | |
| Purchases of investments | | | | (35,692,233 | ) | |
| Sales of investments | | | | 11,728,604 | | |
| Purchases of short term investments, net | | | | 735,753 | | |
| Net realized gain on investments | | | | (142,374 | ) | |
| Return of capital on distributions from investments | | | | 1,733,440 | | |
| Net change in unrealized depreciation on investments | | | | 1,857,565 | | |
| | | | | | | |
| Dividends, interest and other receivables | | | | (34,953 | ) | |
| Prepaid expenses and other assets | | | | (19,135 | ) | |
| Payable for securities purchased | | | | (1,385,388 | ) | |
| Payable to custodian | | | | (87,409 | ) | |
| Other payables | | | | 1,046 | | |
| Accrued management fees | | | | 54,539 | | |
| Accrued Trustees’ fees | | | | (438 | ) | |
| Accrued Rule 12b-1 fees | | | | 23,429 | | |
| Accrued expenses and other liabilities | | | | (27,719 | ) | |
| Net cash used in operating activities | | | | (20,039,212 | ) | |
| | | | | | | |
| Cash Flows from Financing Activities | | | | | | |
| Proceeds from shares sold, net of receivable for Fund shares sold | | | | 39,826,983 | | |
| Distributions paid in cash | | | | (1,080,871 | ) | |
| Cost of shares redeemed, net of payable for Fund shares redeemed | | | | (18,677,430 | ) | |
| Redemption fees | | | | 7,563 | | |
| Net cash from financing activities | | | | 20,076,245 | | |
| Net change in cash | | | | 37,033 | | |
| Cash at beginning of period | | | | — | | |
| Cash at end of period | | | $ | 37,033 | | |
Supplemental disclosure of cash flow information:
Non-cash financing activities not included herein consist of reinvestment of dividends of $2,373,770.
Cash paid during the period for interest of $1,192.
The accompanying notes are an integral part of these financial statements.
| | |
56 | | LoCorr Managed Futures Strategy Fund - Consolidated Financial Highlights - Class A |
| | |
LoCorr Managed Futures Strategy Fund - Class A
Consolidated Financial Highlights
Selected Data and Ratios (for a share outstanding throughout the period)
| | | | | | | | | | | | | | | | | | |
| | | Six Months Ended June 30, 2015(a) (Unaudited) | | | Year Ended December 31, 2014 | | Year Ended December 31, 2013 | | Year Ended December 31, 2012(b) | | | Period from March 22, 2011 (commencement of operations) through December 31, 2011(a), (b) | |
| | | | | | | | | | | | | | |
| Per Share | | | | | | | | | | | | | |
| Net asset value, beginning of period | | $ | 8.51 | | | | $ | 8.28 | | | | $ | 8.77 | | | $ | 9.33 | | | $ | 10.00 | |
| | | | | | | | | | | | | | | | | | | | | | | |
| Income (loss) from investment operations: | | | | | | | | | | | | | | | | | | | | | | |
Net investment income (loss)(c) | | | (0.04 | ) | | | | (0.08 | ) | | | | (0.07 | ) | | | (0.24 | ) | | | (0.22 | ) |
| Net realized and unrealized gain (loss) | | | (0.12 | ) | | | | 1.36 | | | | | (0.41 | ) | | | (0.32 | ) | | | (0.45 | ) |
| Total from Investment Operations | | | (0.16 | ) | | | | 1.28 | | | | | (0.48 | ) | | | (0.56 | ) | | | (0.67 | ) |
| | | | | | | | | | | | | | | | | | | | | | | |
| Distributions to shareholders from: | | | | | | | | | | | | | | | | | | | | | | |
| Net investment income | | | — | | | | | (1.04 | ) | | | | — | | | | — | | | | — | |
| Net realized gains on investments and swap contracts | | | — | | | | | (0.01 | ) | | | | (0.01 | ) | | | (0.00 | )(d) | | | — | |
| Total Distributions | | | — | | | | | (1.05 | ) | | | | (0.01 | ) | | | (0.00 | ) | | | — | |
| | | | | | | | | | | | | | | | | | | | | | | |
Redemption Fees(d) | | | 0.00 | | | | | 0.00 | | | | | 0.00 | | | | 0.00 | | | | 0.00 | |
| | | | | | | | | | | | | | | | | | | | | | | |
| Net Asset Value, End of Period | | $ | 8.35 | | | | $ | 8.51 | | | | $ | 8.28 | | | $ | 8.77 | | | $ | 9.33 | |
| | | | | | | | | | | | | | | | | | | | | | | |
Total Investment Return(e) | | | (1.88 | )% | | | | 15.42 | % | | | | (5.53 | )% | | | (5.98 | )% | | | (6.70 | )% |
| | | | | | | | | | | | | | | | | | | | | | | |
| Net Assets, End of Period, in Thousands | | $ | 221,222 | | | | $ | 206,931 | | | | $ | 195,046 | | | $ | 182,457 | | | $ | 71,532 | |
| | | | | | | | | | | | | | | | | | | | | | | |
| Ratios/Supplemental Data: | | | | | | | | | | | | | | | | | | | | | | |
| Ratio of expenses to average net assets: | | | | | | | | | | | | | | | | | | | | | | |
| Before expense reimbursement or recovery | | | 2.02 | %(f) | | | | 2.11 | %(f) | | | | 2.08 | %(f) | | | 3.95 | %(f),(g) | | | 4.15 | %(g) |
| After expense reimbursement or recovery | | | 2.02 | %(f) | | | | 2.11 | %(f) | | | | 2.08 | %(f) | | | 4.00 | %(f),(g) | | | 3.93 | %(g) |
| Ratio of net investment income (loss) to average net assets: | | | | | | | | | | | | | | | | | | | | | | |
| Before expense reimbursement or recovery | | | (1.00 | )%(f) | | | | (0.94 | )%(f) | | | | (0.87 | )%(f) | | | (2.60 | )%(f),(h) | | | (3.18 | )%(h) |
| After expense reimbursement or recovery | | | (1.00 | )%(f) | | | | (0.94 | )%(f) | | | | (0.87 | )%(f) | | | (2.65 | )%(f),(h) | | | (2.96 | )%(h) |
| | | | | | | | | | | | | | | | | | | | | | | |
Portfolio turnover rate(i) | | | 19 | % | | | | 57 | % | | | | 46 | % | | | 46 | % | | | 18 | % |
(a) All ratios have been annualized except total investment return and portfolio turnover.
(b) Selected data and ratios (for a share outstanding throughout the period) do not include non-controlling interest.
(c) Net investment income (loss) per share is based on average shares outstanding.
(d) Amount represents less than $0.005 per share.
(e) Total investment return excludes the effect of applicable sales charges.
(f) Ratios do not include the income and expenses of the CTAs included in the swap.
(g) For the year ended December 31, 2012 and period from March 22, 2011 through December 31, 2011, the ratios include 1.88% and 1.73%, respectively, of expenses attributable to the Partnership. See Note 1.
(h) For the year ended December 31, 2012 and period from March 22, 2011 through December 31, 2011, the ratios include (1.63)% and (1.71)%, respectively, of net investment losses attributable to the Partnership. See Note 1.
(i) Portfolio turnover rate is calculated on the basis of the Fund as a whole without distinguishing between classes of shares issued.
The accompanying notes are an integral part of these consolidated financial statements.
| | |
| LoCorr Managed Futures Strategy Fund - Consolidated Financial Highlights - Class C | | 57 |
| | |
LoCorr Managed Futures Strategy Fund - Class C
Consolidated Financial Highlights
Selected Data and Ratios (for a share outstanding throughout the period)
| | | | | �� | | | | | | | | | | | | | |
| | | Six Months Ended June 30, 2015(a) (Unaudited) | | | Year Ended December 31, 2014 | | Year Ended December 31, 2013 | | Year Ended December 31, 2012(b) | | | Period from March 24, 2011 (commencement of operations) through December 31, 2011(a), (b) | |
| | | | | | | | | | | | | | | | | | |
| Per Share | | | | | | | | | | | | | | | | | |
| Net asset value, beginning of period | | $ | 8.30 | | | | $ | 8.12 | | | | $ | 8.65 | | | $ | 9.28 | | | $ | 10.00 | |
| | | | | | | | | | | | | | | | | | | | | | | |
| Income (loss) from investment operations: | | | | | | | | | | | | | | | | | | | | | | |
Net investment income (loss)(c) | | | (0.07 | ) | | | | (0.15 | ) | | | | (0.14 | ) | | | (0.30 | ) | | | (0.27 | ) |
| Net realized and unrealized gain (loss) | | | (0.11 | ) | | | | 1.33 | | | | | (0.38 | ) | | | (0.33 | ) | | | (0.45 | ) |
| Total from Investment Operations | | | (0.18 | ) | | | | 1.18 | | | | | (0.52 | ) | | | (0.63 | ) | | | (0.72 | ) |
| | | | | | | | | | | | | | | | | | | | | | | |
| Distributions to shareholders from: | | | | | | | | | | | | | | | | | | | | | | |
| Net investment income | | | — | | | | | (0.99 | ) | | | | — | | | | — | | | | — | |
| Net realized gains on investments and swap contracts | | | — | | | | | (0.01 | ) | | | | (0.01 | ) | | | (0.00 | ) (d) | | | — | |
| Total Distributions | | | — | | | | | (1.00 | ) | | | | (0.01 | ) | | | (0.00 | ) | | | — | |
| | | | | | | | | | | | | | | | | | | | | | | |
Redemption Fees(d) | | | 0.00 | | | | | 0.00 | | | | | 0.00 | | | | 0.00 | | | | 0.00 | |
| | | | | | | | | | | | | | | | | | | | | | | |
| Net Asset Value, End of Period | | $ | 8.12 | | | | $ | 8.30 | | | | $ | 8.12 | | | $ | 8.65 | | | $ | 9.28 | |
| | | | | | | | | | | | | | | | | | | | | | | |
Total Investment Return(e) | | | (2.17 | )% | | | | 14.39 | % | | | | (6.07 | )% | | | (6.77 | )% | | | (7.20 | )% |
| | | | | | | | | | | | | | | | | | | | | | | |
| Net Assets, End of Period, in Thousands | | $ | 98,848 | | | | $ | 93,924 | | | | $ | 73,691 | | | $ | 76,979 | | | $ | 38,055 | |
| | | | | | | | | | | | | | | | | | | | | | | |
| Ratios/Supplemental Data: | | | | | | | | | | | | | | | | | | | | | | |
| Ratio of expenses to average net assets: | | | | | | | | | | | | | | | | | | | | | | |
| Before expense reimbursement or recovery | | | 2.77 | %(f) | | | | 2.86 | %(f) | | | | 2.83 | %(f) | | | 4.70 | %(f),(g) | | | 4.89 | %(g) |
| After expense reimbursement or recovery | | | 2.77 | %(f) | | | | 2.86 | %(f) | | | | 2.83 | %(f) | | | 4.75 | %(f),(g) | | | 4.68 | %(g) |
| Ratio of net investment income (loss) to average net assets: | | | | | | | | | | | | | | | | | | | | | | |
| Before expense reimbursement or recovery | | | (1.75 | )%(f) | | | | (1.69 | ) %(f) | | | | (1.62 | )%(f) | | | (3.35 | )%(f),(h) | | | (3.92 | )%(h) |
| After expense reimbursement or recovery | | | (1.75 | )%(f) | | | | (1.69 | )%(f) | | | | (1.62 | )%(f) | | | (3.40 | )%(f),(h) | | | (3.71 | )%(h) |
| | | | | | | | | | | | | | | | | | | | | | | |
Portfolio turnover rate(i) | | | 19 | % | | | | 57 | % | | | | 46 | % | | | 46 | % | | | 18 | % |
(a) All ratios have been annualized except total investment return and portfolio turnover.
(b) Selected data and ratios (for a share outstanding throughout the period) do not include non-controlling interest.
(c) Net investment income (loss) per share is based on average shares outstanding.
(d) Amount represents less than $0.005 per share.
(e) Total investment return excludes the effect of applicable sales charges.
(f) Ratios do not include the income and expenses of the CTAs included in the swap.
(g) For the year ended December 31, 2012 and period from March 24, 2011 through December 31, 2011, the ratios include 1.88% and 1.73%, respectively, of expenses attributable to the Partnership. See Note 1.
(h) For the year ended December 31, 2012 and period from March 24, 2011 through December 31, 2011, the ratios include (1.63)% and (1.71)%, respectively, of net investment losses attributable to the Partnership. See Note 1.
(i) Portfolio turnover rate is calculated on the basis of the Fund as a whole without distinguishing between classes of shares issued.
The accompanying notes are an integral part of these consolidated financial statements.
| | |
58 | | LoCorr Managed Futures Strategy Fund - Consolidated Financial Highlights - Class I |
| | |
LoCorr Managed Futures Strategy Fund - Class I
Consolidated Financial Highlights
Selected Data and Ratios (for a share outstanding throughout the period)
| | | | | | | | | | | | | | | | | | |
| | | Six Months Ended June 30, 2015(a) (Unaudited) | | | Year Ended December 31, 2014 | | Year Ended December 31, 2013 | | Year Ended December 31, 2012(b) | | | Period from March 24, 2011 (commencement of operations) through December 31, 2011(a), (b) | |
| | | | | | | | | | | | | | | | | | |
| Per Share | | | | | | | | | | | | | | | | | |
| Net asset value, beginning of period | | $ | 8.57 | | | | $ | 8.34 | | | | $ | 8.81 | | | $ | 9.35 | | | $ | 10.00 | |
| | | | | | | | | | | | | | | | | | | | | | | |
| Income (loss) from investment operations: | | | | | | | | | | | | | | | | | | | | | | |
Net investment income (loss)(c) | | | (0.03 | ) | | | | (0.06 | ) | | | | (0.05 | ) | | | (0.22 | ) | | | (0.20 | ) |
| Net realized and unrealized gain (loss) | | | (0.11 | ) | | | | 1.36 | | | | | (0.41 | ) | | | (0.32 | ) | | | (0.45 | ) |
| Total from Investment Operations | | | (0.14 | ) | | | | 1.30 | | | | | (0.46 | ) | | | (0.54 | ) | | | (0.65 | ) |
| | | | | | | | | | | | | | | | | | | | | | | |
| Distributions to shareholders from: | | | | | | | | | | | | | | | | | | | | | | |
| Net investment income | | | — | | | | | (1.06 | ) | | | | — | | | | — | | | | — | |
| Net realized gains on investments and swap contracts | | | — | | | | | (0.01 | ) | | | | (0.01 | ) | | | (0.00 | )(d) | | | — | |
| Total Distributions | | | — | | | | | (1.07 | ) | | | | (0.01 | ) | | | (0.00 | ) | | | — | |
| | | | | | | | | | | | | | | | | | | | | | | |
Redemption Fees(d) | | | 0.00 | | | | | 0.00 | | | | | 0.00 | | | | 0.00 | | | | 0.00 | |
| | | | | | | | | | | | | | | | | | | | | | | |
| Net Asset Value, End of Period | | $ | 8.43 | | | | $ | 8.57 | | | | $ | 8.34 | | | $ | 8.81 | | | $ | 9.35 | |
| | | | | | | | | | | | | | | | | | | | | | | |
| Total Investment Return | | | (1.63 | )% | | | | 15.56 | % | | | | (5.28 | )% | | | (5.75 | )% | | | (6.50 | )% |
| | | | | | | | | | | | | | | | | | | | | | | |
| Net Assets, End of Period, in Thousands | | $ | 206,288 | | | | $ | 190,052 | | | | $ | 102,279 | | | $ | 138,096 | | | $ | 91,161 | |
| | | | | | | | | | | | | | | | | | | | | | | |
| Ratios/Supplemental Data: | | | | | | | | | | | | | | | | | | | | | | |
| Ratio of expenses to average net assets: | | | | | | | | | | | | | | | | | | | | | | |
| Before expense reimbursement or recovery | | | 1.77 | %(e) | | | | 1.86 | %(e) | | | | 1.83 | %(e) | | | 3.70 | %(e),(f) | | | 3.89 | %(f) |
| After expense reimbursement or recovery | | | 1.77 | %(e) | | | | 1.86 | %(e) | | | | 1.83 | %(e) | | | 3.75 | %(e),(f) | | | 3.68 | %(f) |
| Ratio of net investment income (loss) to average net assets: | | | | | | | | | | | | | | | | | | | | | | |
| Before expense reimbursement or recovery | | | (0.75 | )%(e) | | | | (0.69 | )%(e) | | | | (0.62 | )%(e) | | | (2.35 | )%(e),(g) | | | (2.92 | )%(g) |
| After expense reimbursement or recovery | | | (0.75 | )%(e) | | | | (0.69 | )%(e) | | | | (0.62 | )%(e) | | | (2.40 | )%(e),(g) | | | (2.71 | )%(g) |
| | | | | | | | | | | | | | | | | | | | | | | |
Portfolio turnover rate(h) | | | 19 | % | | | | 57 | % | | | | 46 | % | | | 46 | % | | | 18 | % |
(a) All ratios have been annualized except total investment return and portfolio turnover.
(b) Selected data and ratios (for a share outstanding throughout the period) do not include non-controlling interest.
(c) Net investment income (loss) per share is based on average shares outstanding.
(d) Amount represents less than $0.005 per share.
(e) Ratios do not include the income and expenses of the CTAs included in the swap.
(f) For the year ended December 31, 2012 and period from March 24, 2011 through December 31, 2011, the ratios include 1.88% and 1.73%, respectively, of expenses attributable to the Partnership. See Note 1.
(g) For the year ended December 31, 2012 and period from March 24, 2011 through December 31, 2011, the ratios include (1.63)% and (1.71)%, respectively, of net investment losses attributable to the Partnership. See Note 1.
(h) Portfolio turnover rate is calculated on the basis of the Fund as a whole without distinguishing between classes of shares issued.
The accompanying notes are an integral part of these consolidated financial statements.
| | |
| LoCorr Long/Short Commodities Strategy Fund - Consolidated Financial Highlights - Class A | | 59 |
| | |
LoCorr Long/Short Commodities Strategy Fund - Class A
Consolidated Financial Highlights
Selected Data and Ratios (for a share outstanding throughout the period)
| | | | | | | | | | | | | |
| | | Six Months Ended June 30, 2015 (a) (Unaudited) | | | Year Ended December 31, 2014 | | | Year Ended December 31, 2013 | | | Year Ended December 31, 2012 | |
| | | | | | | | | | | | | |
| Per Share | | | | | | | | | | | | |
| Net asset value, beginning of period | | $ | 8.54 | | | $ | 7.67 | | | $ | 8.37 | | | $ | 10.00 | |
| | | | | | | | | | | | | | | | | |
| Income (loss) from investment operations: | | | | | | | | | | | | | | | | |
Net investment income (loss)(b) | | | (0.06 | ) | | | (0.14 | ) | | | (0.12 | ) | | | (0.17 | ) |
| Net realized and unrealized gain (loss) | | | 0.44 | | | | 1.85 | | | | (0.58 | ) | | | (1.46 | ) |
| Total from Investment Operations | | | 0.38 | | | | 1.71 | | | | (0.70 | ) | | | (1.63 | ) |
| | | | | | | | | | | | | | | | | |
| Distributions to shareholders from: | | | | | | | | | | | | | | | | |
| Net investment income | | | — | | | | (0.84 | ) | | | — | | | | — | |
| Total Distributions | | | — | | | | (0.84 | ) | | | — | | | | — | |
| | | | | | | | | | | | | | | | | |
Redemption Fees(c) | | | 0.00 | | | | 0.00 | | | | 0.00 | | | | 0.00 | |
| | | | | | | | | | | | | | | | | |
| Net Asset Value, End of Period | | $ | 8.92 | | | $ | 8.54 | | | $ | 7.67 | | | $ | 8.37 | |
| | | | | | | | | | | | | | | | | |
Total Investment Return(d) | | | 4.45 | % | | | 22.07 | % | | | (8.36 | )% | | | (16.30 | )% |
| | | | | | | | | | | | | | | | | |
| Net Assets, End of Period, in Thousands | | $ | 15,827 | | | $ | 43,345 | | | $ | 3,653 | | | $ | 3,213 | |
| | | | | | | | | | | | | | | | | |
Ratios/Supplemental Data:(e) | | | | | | | | | | | | | | | | |
| Ratio of expenses to average net assets: | | | | | | | | | | | | | | | | |
| Before expense reimbursement or recovery | | | 2.65 | %(f) | | | 3.01 | %(f) | | | 4.18 | % | | | 6.12 | % |
| After expense reimbursement or recovery | | | 2.20 | %(f) | | | 2.20 | %(f) | | | 2.20 | % | | | 2.20 | % |
| Ratio of net investment income (loss) to average net assets: | | | | | | | | | | | | | | | | |
| Before expense reimbursement or recovery | | | (1.95 | )% | | | (2.39 | )% | | | (3.46 | )% | | | (5.82 | )% |
| After expense reimbursement or recovery | | | (1.50 | )% | | | (1.58 | )% | | | (1.48 | )% | | | (1.90 | )% |
| | | | | | | | | | | | | | | | | |
Portfolio turnover rate(g) | | | 83 | % | | | 55 | % | | | 59 | % | | | 60 | % |
(a) All ratios have been annualized except total investment return and portfolio turnover.
(b) Net investment income (loss) per share is based on average shares outstanding.
(c) Amount represents less than $0.005 per share.
(d) Total return excludes the effect of applicable sales charges.
(e) Ratios do not include the income and expenses of the CTAs included in the swap.
(f) Includes interest expense on line of credit of 0.00% for the six months ended June 30, 2015 and 0.00% for the year ended December 31, 2014.
(g) Portfolio turnover rate is calculated on the basis of the Fund as a whole without distinguishing between classes of shares issued.
The accompanying notes are an integral part of these consolidated financial statements.
| | |
60 | | LoCorr Long/Short Commodities Strategy Fund - Consolidated Financial Highlights - Class C |
| | |
LoCorr Long/Short Commodities Strategy Fund - Class C
Consolidated Financial Highlights
Selected Data and Ratios (for a share outstanding throughout the period)
| | | | | | | | | | | | | |
| | | Six Months Ended June 30, 2015 (a) (Unaudited) | | | Year Ended December 31, 2014 | | | Year Ended December 31, 2013 | | | Year Ended December 31, 2012 | |
| | | | | | | | | | | | | |
| Per Share | | | | | | | | | | | | |
| Net asset value, beginning of period | | $ | 8.36 | | | $ | 7.54 | | | $ | 8.29 | | | $ | 10.00 | |
| | | | | | | | | | | | | | | | | |
| Income (loss) from investment operations: | | | | | | | | | | | | | | | | |
Net investment income (loss)(b) | | | (0.09 | ) | | | (0.20 | ) | | | (0.17 | ) | | | (0.24 | ) |
| Net realized and unrealized gain (loss) | | | 0.42 | | | | 1.80 | | | | (0.58 | ) | | | (1.47 | ) |
| Total from Investment Operations | | | 0.33 | | | | 1.60 | | | | (0.75 | ) | | | (1.71 | ) |
| | | | | | | | | | | | | | | | | |
| Distributions to shareholders from: | | | | | | | | | | | | | | | | |
| Net investment income | | | — | | | | (0.78 | ) | | | — | | | | — | |
| Total Distributions | | | — | | | | (0.78 | ) | | | — | | | | — | |
| | | | | | | | | | | | | | | | | |
| Redemption Fees | | | — | | | | — | | | | — | | | | 0.00 | (c) |
| | | | | | | | | | | | | | | | | |
| Net Asset Value, End of Period | | $ | 8.69 | | | $ | 8.36 | | | $ | 7.54 | | | $ | 8.29 | |
| | | | | | | | | | | | | | | | | |
Total Investment Return(d) | | | 3.95 | % | | | 21.01 | % | | | (9.05 | )% | | | (17.10 | )% |
| | | | | | | | | | | | | | | | | |
| Net Assets, End of Period, in Thousands | | $ | 3,072 | | | $ | 2,983 | | | $ | 1,653 | | | $ | 1,605 | |
| | | | | | | | | | | | | | | | | |
Ratios/Supplemental Data:(e) | | | | | | | | | | | | | | | | |
| Ratio of expenses to average net assets: | | | | | | | | | | | | | | | | |
| Before expense reimbursement or recovery | | | 3.40 | %(f) | | | 3.76 | %(f) | | | 4.93 | % | | | 6.87 | % |
| After expense reimbursement or recovery | | | 2.95 | %(f) | | | 2.95 | %(f) | | | 2.95 | % | | | 2.95 | % |
| Ratio of net investment income (loss) to average net assets: | | | | | | | | | | | | | | | | |
| Before expense reimbursement or recovery | | | (2.70 | )% | | | (3.14 | )% | | | (4.21 | )% | | | (6.57 | )% |
| After expense reimbursement or recovery | | | (2.25 | )% | | | (2.33 | )% | | | (2.23 | )% | | | (2.65 | )% |
| | | | | | | | | | | | | | | | | |
Portfolio turnover rate(g) | | | 83 | % | | | 55 | % | | | 59 | % | | | 60 | % |
(a) All ratios have been annualized except total investment return and portfolio turnover.
(b) Net investment income (loss) per share is based on average shares outstanding.
(c) Amount represents less than $0.005 per share.
(d) Total return excludes the effect of applicable sales charges.
(e) Ratios do not include the income and expenses of the CTAs included in the swap.
(f) Includes interest expense on line of credit of 0.00% for the six months ended June 30, 2015 and 0.00% for the year ended December 31, 2014.
(g) Portfolio turnover rate is calculated on the basis of the Fund as a whole without distinguishing between classes of shares issued.
The accompanying notes are an integral part of these consolidated financial statements.
| | |
| LoCorr Long/Short Commodities Strategy Fund - Consolidated Financial Highlights - Class I | | 61 |
| | |
LoCorr Long/Short Commodities Strategy Fund - Class I
Consolidated Financial Highlights
Selected Data and Ratios (for a share outstanding throughout the period)
| | | | | | | | | | | | | |
| | | Six Months Ended June 30, 2015 (a) (Unaudited) | | | Year Ended December 31, 2014 | | | Year Ended December 31, 2013 | | | Year Ended December 31, 2012 | |
| | | | | | | | | | | | | |
| Per Share | | | | | | | | | | | | |
| Net asset value, beginning of period | | $ | 8.59 | | | $ | 7.70 | | | $ | 8.38 | | | $ | 10.00 | |
| | | | | | | | | | | | | | | | | |
| Income (loss) from investment operations: | | | | | | | | | | | | | | | | |
Net investment income (loss)(b) | | | (0.05 | ) | | | (0.12 | ) | | | (0.10 | ) | | | (0.15 | ) |
| Net realized and unrealized gain (loss) | | | 0.44 | | | | 1.86 | | | | (0.58 | ) | | | (1.47 | ) |
| Total from Investment Operations | | | 0.39 | | | | 1.74 | | | | (0.68 | ) | | | (1.62 | ) |
| | | | | | | | | | | | | | | | | |
| Distributions to shareholders from: | | | | | | | | | | | | | | | | |
| Net investment income | | | — | | | | (0.85 | ) | | | — | | | | — | |
| Total Distributions | | | — | | | | (0.85 | ) | | | — | | | | — | |
| | | | | | | | | | | | | | | | | |
Redemption Fees(c) | | | 0.00 | | | | 0.00 | | | | 0.00 | | | | 0.00 | |
| | | | | | | | | | | | | | | | | |
| Net Asset Value, End of Period | | $ | 8.98 | | | $ | 8.59 | | | $ | 7.70 | | | $ | 8.38 | |
| | | | | | | | | | | | | | | | | |
| Total Investment Return | | | 4.54 | % | | | 22.36 | % | | | (8.11 | )% | | | (16.20 | )% |
| | | | | | | | | | | | | | | | | |
| Net Assets, End of Period, in Thousands | | $ | 12,629 | | | $ | 12,825 | | | $ | 5,502 | | | $ | 6,373 | |
| | | | | | | | | | | | | | | | | |
Ratios/Supplemental Data:(d) | | | | | | | | | | | | | | | | |
| Ratio of expenses to average net assets: | | | | | | | | | | | | | | | | |
| Before expense reimbursement or recovery | | | 2.40 | %(e) | | | 2.76 | %(e) | | | 3.93 | % | | | 5.87 | % |
| After expense reimbursement or recovery | | | 1.95 | %(e) | | | 1.95 | %(e) | | | 1.95 | % | | | 1.95 | % |
| Ratio of net investment income (loss) to average net assets: | | | | | | | | | | | | | | | | |
| Before expense reimbursement or recovery | | | (1.70 | )% | | | (2.14 | )% | | | (3.21 | )% | | | (5.57 | )% |
| After expense reimbursement or recovery | | | (1.25 | )% | | | (1.33 | )% | | | (1.23 | )% | | | (1.65 | )% |
| | | | | | | | | | | | | | | | | |
Portfolio turnover rate(f) | | | 83 | % | | | 55 | % | | | 59 | % | | | 60 | % |
(a) All ratios have been annualized except total investment return and portfolio turnover.
(b) Net investment income (loss) per share is based on average shares outstanding.
(c) Amount represents less than $0.005 per share.
(d) Ratios do not include the income and expenses of the CTAs included in the swap.
(e) Includes interest expense on line of credit of 0.00% for the six months ended June 30, 2015 and 0.00% for the year ended December 31, 2014.
(f) Portfolio turnover rate is calculated on the basis of the Fund as a whole without distinguishing between classes of shares issued.
The accompanying notes are an integral part of these consolidated financial statements.
| | |
62 | | LoCorr Multi-Strategy Fund - Consolidated Financial Highlights - Class A |
| | |
LoCorr Multi-Strategy Fund - Class A
Consolidated Financial Highlights
Selected Data and Ratios (for a share outstanding throughout the period)
| | | Period from April 6, 2015
(commencement of operations)
through
June 30, 2015 (a)
(Unaudited) |
| | | | | |
| Per Share | | | | |
| Net asset value, beginning of period | | | $ | 10.00 | |
| | | | | | |
| Income (loss) from investment operations: | | | | | |
Net investment income (loss)(b) | | | | 0.04 | |
| Net realized and unrealized gain (loss) | | | | (0.83 | ) |
| Total from Investment Operations | | | | (0.79 | ) |
| | | | | | |
| Distributions to shareholders from: | | | | | |
| Net investment income | | | | (0.05 | ) |
| Total Distributions | | | | (0.05 | ) |
| | | | | | |
| Redemption Fees | | | | — | |
| | | | | | |
| Net Asset Value, End of Period | | | $ | 9.16 | |
| | | | | | |
Total Investment Return(c) | | | | (7.95 | )% |
| | | | | | |
| Net Assets, End of Period, in Thousands | | | $ | 1,860 | |
| | | | | | |
Ratios/Supplemental Data:(d)(e) | | | | | |
| Ratio of expenses to average net assets: | | | | | |
Before expense reimbursement or recovery(f) | | | | 4.74 | % |
After expense reimbursement or recovery(f) | | | | 2.29 | % |
| Ratio of net investment income (loss) to average net assets: | | | | | |
| Before expense reimbursement or recovery | | | | (0.83 | )% |
| After expense reimbursement or recovery | | | | 1.62 | % |
| | | | | | |
Portfolio turnover rate(g) | | | | 8 | % |
| (a) | All ratios have been annualized except total investment return and portfolio turnover. |
| (b) | Net investment income (loss) per share is based on average shares outstanding. |
| (c) | Total return excludes the effect of applicable sales charges. |
| (d) | Ratios do not include the income and expenses of the CTAs included in the swap. |
| (e) | Ratios do not include the expenses of the investment companies in which the Fund invests. |
| (f) | Includes dividend and interest expense on securities sold short of 0.00% for the period from April 6, 2015 through June 30, 2015. |
| (g) | Portfolio turnover rate is calculated on the basis of the Fund as a whole without distinguishing between classes of shares issued. The portfolio turnover rate excludes purchases and sales of short positions as the Adviser does not intend to hold the short positions for more than one year. |
The accompanying notes are an integral part of these consolidated financial statements.
| |
LoCorr Multi-Strategy Fund - Consolidated Financial Highlights - Class C | 63 |
| |
LoCorr Multi-Strategy Fund - Class C
Consolidated Financial Highlights
Selected Data and Ratios (for a share outstanding throughout the period)
| | | Period from April 6, 2015 (commencement of operations)
through
June 30, 2015 (a) (Unaudited) |
| | | | | |
| Per Share | | | | |
| Net asset value, beginning of period | | | $ | 10.00 | |
| | | | | | |
| Income (loss) from investment operations: | | | | | |
Net investment income (loss)(b) | | | | 0.02 | |
| Net realized and unrealized gain (loss) | | | | (0.84 | ) |
| Total from Investment Operations | | | | (0.82 | ) |
| | | | | | |
| Distributions to shareholders from: | | | | | |
| Net investment income | | | | (0.03 | ) |
| Total Distributions | | | | (0.03 | ) |
| | | | | | |
| Redemption Fees | | | | — | |
| | | | | | |
| Net Asset Value, End of Period | | | $ | 9.15 | |
| | | | | | |
Total Investment Return(c) | | | | (8.17 | )% |
| | | | | | |
| Net Assets, End of Period, in Thousands | | | $ | 4,681 | |
| | | | | | |
Ratios/Supplemental Data:(d)(e) | | | | | |
| Ratio of expenses to average net assets: | | | | | |
Before expense reimbursement or recovery(f) | | | | 5.49 | % |
After expense reimbursement or recovery(f) | | | | 3.04 | % |
| Ratio of net investment income (loss) to average net assets: | | | | | |
| Before expense reimbursement or recovery | | | | (1.58 | ) % |
| After expense reimbursement or recovery | | | | 0.87 | % |
| | | | | | |
Portfolio turnover rate(g) | | | | 8 | % |
| (a) | All ratios have been annualized except total investment return and portfolio turnover. |
| (b) | Net investment income (loss) per share is based on average shares outstanding. |
| (c) | Total return excludes the effect of applicable sales charges. |
| (d) | Ratios do not include the income and expenses of the CTAs included in the swap. |
| (e) | Ratios do not include the expenses of the investment companies in which the Fund invests. |
| (f) | Includes dividend and interest expense on securities sold short of 0.00% for the period from April 6, 2015 through June 30, 2015. |
| (g) | Portfolio turnover rate is calculated on the basis of the Fund as a whole without distinguishing between classes of shares issued. The portfolio turnover rate excludes purchases and sales of short positions as the Adviser does not intend to hold the short positions for more than one year. |
The accompanying notes are an integral part of these consolidated financial statements.
| | |
64 | LoCorr Multi-Strategy Fund - Consolidated Financial Highlights - Class I | |
| | |
LoCorr Multi-Strategy Fund - Class I
Consolidated Financial Highlights
Selected Data and Ratios (for a share outstanding throughout the period)
| | | Period from April 6, 2015 (commencement of operations)
through June 30, 2015 (a) (Unaudited) |
| | | | | |
| Per Share | | | | |
| Net asset value, beginning of period | | | $ | 10.00 | |
| | | | | | |
| Income (loss) from investment operations: | | | | | |
Net investment income (loss)(b) | | | | 0.04 | |
| Net realized and unrealized gain (loss) | | | | (0.83 | ) |
| Total from Investment Operations | | | | (0.79 | ) |
| | | | | | |
| Distributions to shareholders from: | | | | | |
| Net investment income | | | | (0.05 | ) |
| Total Distributions | | | | (0.05 | ) |
| | | | | | |
| Redemption Fees | | | | — | |
| | | | | | |
| Net Asset Value, End of Period | | | $ | 9.16 | |
| | | | | | |
| Total Investment Return | | | | (7.91 | )% |
| | | | | | |
| Net Assets, End of Period, in Thousands | | | $ | 12,579 | |
| | | | | | |
Ratios/Supplemental Data:(c)(d) | | | | | |
| Ratio of expenses to average net assets: | | | | | |
Before expense reimbursement or recovery(e) | | | | 4.49 | % |
After expense reimbursement or recovery(e) | | | | 2.04 | % |
| Ratio of net investment income (loss) to average net assets: | | | | | |
| Before expense reimbursement or recovery | | | | (0.58 | )% |
| After expense reimbursement or recovery | | | | 1.87 | % |
| | | | | | |
Portfolio turnover rate(f) | | | | 8 | % |
| (a) | All ratios have been annualized except total investment return and portfolio turnover. |
| (b) | Net investment income (loss) per share is based on average shares outstanding. |
| (c) | Ratios do not include the income and expenses of the CTAs included in the swap. |
| (d) | Ratios do not include the expenses of the investment companies in which the Fund invests. |
| (e) | Includes dividend and interest expense on securities sold short of 0.00% for the period from April 6, 2015 through June 30, 2015. |
| (f) | Portfolio turnover rate is calculated on the basis of the Fund as a whole without distinguishing between classes of shares issued. The portfolio turnover rate excludes purchases and sales of short positions as the Adviser does not intend to hold the short positions for more than one year. |
The accompanying notes are an integral part of these consolidated financial statements.
| | |
| | LoCorr Market Trend Fund - Consolidated Financial Highlights - Class A | 65 |
| | |
LoCorr Market Trend Fund - Class A
Consolidated Financial Highlights
Selected Data and Ratios (for a share outstanding throughout the period)
| | | Six Months Ended
June 30, 2015(a)
(Unaudited) | | Period from July 1, 2014 (commencement of operations)
through
December 31, 2014(a) |
| | | | | | | | | |
| Per Share | | | | | | | | |
| Net asset value, beginning of period | | | $ | 11.44 | | | | $ | 10.00 | |
| | | | | | | | | | | |
| Income (loss) from investment operations: | | | | | | | | | | |
Net investment income (loss)(b) | | | | (0.11 | ) | | | | (0.12 | ) |
| Net realized and unrealized gain (loss) | | | | 1.09 | | | | | 1.99 | |
| Total from Investment Operations | | | | 0.98 | | | | | 1.87 | |
| | | | | | | | | | | |
| Distributions to shareholders from: | | | | | | | | | | |
| Net investment income | | | | — | | | | | (0.25 | ) |
Net realized gains on investments, forward currency contracts, futures contracts and foreign currency translation | | | | — | | | | | (0.18 | ) |
| Total Distributions | | | | — | | | | | (0.43 | ) |
| | | | | | | | | | | |
Redemption Fees(c) | | | | 0.00 | | | | | 0.00 | |
| | | | | | | | | | | |
| Net Asset Value, End of Period | | | $ | 12.42 | | | | $ | 11.44 | |
| | | | | | | | | | | |
Total Investment Return(d) | | | | 8.57 | % | | | | 18.74 | % |
| | | | | | | | | | | |
| Net Assets, End of Period, in Thousands | | | $ | 84,707 | | | | $ | 13,337 | |
| | | | | | | | | | | |
| Ratios/Supplemental Data: | | | | | | | | | | |
| Ratio of expenses to average net assets: | | | | | | | | | | |
| Before expense reimbursement or recovery | | | | 2.03 | % | | | | 3.64 | % |
| After expense reimbursement or recovery | | | | 2.16 | % | | | | 2.20 | % |
| Ratio of net investment income (loss) to average net assets: | | | | | | | | | | |
| Before expense reimbursement or recovery | | | | (1.61 | ) % | | | | (3.48 | )% |
| After expense reimbursement or recovery | | | | (1.74 | ) % | | | | (2.04 | )% |
| | | | | | | | | | | |
Portfolio turnover rate(e) | | | | 10 | % | | | | 6 | % |
| (a) | All ratios have been annualized except total investment return and portfolio turnover. |
| (b) | Net investment income (loss) per share is based on average shares outstanding. |
| (c) | Amount represents less than $0.005 per share. |
| (d) | Total return excludes the effect of applicable sales charges. |
| (e) | Portfolio turnover rate is calculated on the basis of the Fund as a whole without distinguishing between classes of shares issued. |
The accompanying notes are an integral part of these consolidated financial statements.
| |
66 | LoCorr Market Trend Fund - Consolidated Financial Highlights - Class C |
| |
LoCorr Market Trend Fund - Class C
Consolidated Financial Highlights
Selected Data and Ratios (for a share outstanding throughout the period)
| | | Six Months Ended
June 30, 2015(a)
(Unaudited) | | Period from July 1, 2014
(commencement of operations)
through
December 31, 2014(a) |
| | | | | | | | | |
| Per Share | | | | | | | | |
| Net asset value, beginning of period | | | $ | 11.41 | | | | $ | 10.00 | |
| | | | | | | | | | | |
| Income (loss) from investment operations: | | | | | | | | | | |
Net investment income (loss)(b) | | | | (0.15 | ) | | | | (0.16 | ) |
| Net realized and unrealized gain (loss) | | | | 1.08 | | | | | 1.99 | |
| Total from Investment Operations | | | | 0.93 | | | | | 1.83 | |
| | | | | | | | | | | |
| Distributions to shareholders from: | | | | | | | | | | |
| Net investment income | | | | — | | | | | (0.24 | ) |
Net realized gains on investments, forward currency contracts, futures contracts and foreign currency translation | | | | — | | | | | (0.18 | ) |
| Total Distributions | | | | — | | | | | (0.42 | ) |
| | | | | | | | | | | |
Redemption Fees(c) | | | | 0.00 | | | | | 0.00 | |
| | | | | | | | | | | |
| Net Asset Value, End of Period | | | $ | 12.34 | | | | $ | 11.41 | |
| | | | | | | | | | | |
Total Investment Return(d) | | | | 8.15 | % | | | | 18.29 | % |
| | | | | | | | | | | |
| Net Assets, End of Period, in Thousands | | | $ | 53,178 | | | | $ | 6,949 | |
| | | | | | | | | | | |
| Ratios/Supplemental Data: | | | | | | | | | | |
| Ratio of expenses to average net assets: | | | | | | | | | | |
| Before expense reimbursement or recovery | | | | 2.78 | % | | | | 4.39 | % |
| After expense reimbursement or recovery | | | | 2.91 | % | | | | 2.95 | % |
| Ratio of net investment income (loss) to average net assets: | | | | | | | | | | |
| Before expense reimbursement or recovery | | | | (2.36 | ) % | | | | (4.23 | )% |
| After expense reimbursement or recovery | | | | (2.49 | ) % | | | | (2.79 | )% |
| | | | | | | | | | | |
Portfolio turnover rate(e) | | | | 10 | % | | | | 6 | % |
| (a) | All ratios have been annualized except total investment return and portfolio turnover. |
| (b) | Net investment income (loss) per share is based on average shares outstanding. |
| (c) | Amount represents less than $0.005 per share. |
| (d) | Total return excludes the effect of applicable sales charges. |
| (e) | Portfolio turnover rate is calculated on the basis of the Fund as a whole without distinguishing between classes of shares issued. |
The accompanying notes are an integral part of these consolidated financial statements.
| | |
| | LoCorr Market Trend Fund - Consolidated Financial Highlights - Class I | 67 |
| | |
LoCorr Market Trend Fund - Class I
Consolidated Financial Highlights
Selected Data and Ratios (for a share outstanding throughout the period)
| | | Six Months Ended
June 30, 2015(a)
(Unaudited) | | Period from July 1, 2014
(commencement of operations)
through
December 31, 2014(a) |
| | | | | | | | | |
| Per Share | | | | | | | | |
| Net asset value, beginning of period | | | $ | 11.45 | | | | $ | 10.00 | |
| | | | | | | | | | | |
| Income (loss) from investment operations: | | | | | | | | | | |
Net investment income (loss)(b) | | | | (0.09 | ) | | | | (0.10 | ) |
| Net realized and unrealized gain (loss) | | | | 1.09 | | | | | 1.99 | |
| Total from Investment Operations | | | | 1.00 | | | | | 1.89 | |
| | | | | | | | | | | |
| Distributions to shareholders from: | | | | | | | | | | |
| Net investment income | | | | — | | | | | (0.26 | ) |
Net realized gains on investments, forward currency contracts, futures contracts and foreign currency translation | | | | — | | | | | (0.18 | ) |
| Total Distributions | | | | — | | | | | (0.44 | ) |
| | | | | | | | | | | |
Redemption Fees(c) | | | | 0.00 | | | | | 0.00 | |
| | | | | | | | | | | |
| Net Asset Value, End of Period | | | $ | 12.45 | | | | $ | 11.45 | |
| | | | | | | | | | | |
| Total Investment Return | | | | 8.73 | % | | | | 18.88 | % |
| | | | | | | | | | | |
| Net Assets, End of Period, in Thousands | | | $ | 295,349 | | | | $ | 40,192 | |
| | | | | | | | | | | |
| Ratios/Supplemental Data: | | | | | | | | | | |
| Ratio of expenses to average net assets: | | | | | | | | | | |
| Before expense reimbursement or recovery | | | | 1.78 | % | | | | 3.39 | % |
| After expense reimbursement or recovery | | | | 1.91 | % | | | | 1.95 | % |
| Ratio of net investment income (loss) to average net assets: | | | | | | | | | | |
| Before expense reimbursement or recovery | | | | (1.36 | ) % | | | | (3.23 | )% |
| After expense reimbursement or recovery | | | | (1.49 | ) % | | | | (1.79 | )% |
| | | | | | | | | | | |
Portfolio turnover rate(d) | | | | 10 | % | | | | 6 | % |
| (a) | All ratios have been annualized except total investment return and portfolio turnover. |
| (b) | Net investment income (loss) per share is based on average shares outstanding. |
| (c) | Amount represents less than $0.005 per share. |
| (d) | Portfolio turnover rate is calculated on the basis of the Fund as a whole without distinguishing between classes of shares issued. |
The accompanying notes are an integral part of these consolidated financial statements.
| | |
68 | LoCorr Long/Short Equity Fund - Financial Highlights - Class A | |
| | |
LoCorr Long/Short Equity Fund - Class A
Financial Highlights
Selected Data and Ratios (for a share outstanding throughout the period)
| | | Six Months Ended
June 30, 2015 (a) (Unaudited) | | Year Ended
December 31, 2014 | | Period from May 10, 2013
(commencement of operations)
through
December 31, 2013(a) |
| | | | | | | | | | | | | |
| Per Share | | | | | | | | | | | | |
| Net asset value, beginning of period | | | $ | 9.80 | | | | $ | 11.48 | | | | $ | 10.00 | |
| | | | | | | | | | | | | | | | |
| Income (loss) from investment operations: | | | | | | | | | | | | | | | |
Net investment income (loss)(b) | | | | (0.13 | ) | | | | (0.22 | ) | | | | (0.13 | ) |
| Net realized and unrealized gain (loss) | | | | 0.87 | | | | | (1.42 | ) | | | | 1.61 | |
| Total from Investment Operations | | | | 0.74 | | | | | (1.64 | ) | | | | 1.48 | |
| | | | | | | | | | | | | | | | |
| Distributions to shareholders from: | | | | | | | | | | | | | | | |
| Net realized gains on investments and securities sold short | | | | — | | | | | (0.04 | ) | | | | — | |
| Total Distributions | | | | — | | | | | (0.04 | ) | | | | — | |
| | | | | | | | | | | | | | | | |
Redemption Fees(c) | | | | 0.00 | | | | | 0.00 | | | | | 0.00 | |
| | | | | | | | | | | | | | | | |
| Net Asset Value, End of Period | | | $ | 10.54 | | | | $ | 9.80 | | | | $ | 11.48 | |
| | | | | | | | | | | | | | | | |
Total Investment Return(d) | | | | 7.66 | % | | | | (14.37 | ) % | | | | 14.80 | % |
| | | | | | | | | | | | | | | | |
| Net Assets, End of Period, in Thousands | | | $ | 15,880 | | | | $ | 17,174 | | | | $ | 21,256 | |
| | | | | | | | | | | | | | | | |
| Ratios/Supplemental Data: | | | | | | | | | | | | | | | |
| Ratio of expenses to average net assets: | | | | | | | | | | | | | | | |
| Before expense reimbursement or recovery | | | | 3.69 | % | | | | 3.55 | % | | | | 5.05 | % |
| After expense reimbursement or recovery | | | | 3.39 | % | | | | 3.30 | % | | | | 3.26 | % |
| | | | | | | | | | | | | | | | |
Ratio of expenses to average net assets (excluding dividend and interest expense on securities sold short and interest expense on line of credit): | | | | | | | | | | | | | | | |
| Before expense reimbursement or recovery | | | | 3.45 | % | | | | 3.40 | % | | | | 4.94 | % |
| After expense reimbursement or recovery | | | | 3.15 | % | | | | 3.15 | % | | | | 3.15 | % |
| | | | | | | | | | | | | | | | |
| Ratio of net investment income (loss) to average net assets: | | | | | | | | | | | | | | | |
| Before expense reimbursement or recovery | | | | (2.91 | ) % | | | | (2.41 | ) % | | | | (3.64 | )% |
| After expense reimbursement or recovery | | | | (2.61 | ) % | | | | (2.16 | ) % | | | | (1.85 | )% |
| | | | | | | | | | | | | | | | |
Portfolio turnover rate(e) | | | | 118 | % | | | | 256 | % | | | | 66 | % |
| (a) | All ratios have been annualized except total investment return and portfolio turnover. |
| (b) | Net investment income (loss) per share is based on average shares outstanding. |
| (c) | Amount represents less than $0.005 per share. |
| (d) | Total return excludes the effect of applicable sales charges. |
| (e) | Portfolio turnover rate is calculated on the basis of the Fund as a whole without distinguishing between classes of shares issued. The portfolio turnover rate excludes purchases and sales of short positions as the Adviser does not intend to hold the short positions for more than one year. |
The accompanying notes are an integral part of these financial statements.
| | |
| | LoCorr Long/Short Equity Fund - Financial Highlights - Class C | 69 |
| | |
LoCorr Long/Short Equity Fund - Class C
Financial Highlights
Selected Data and Ratios (for a share outstanding throughout the period)
| | | Six Months Ended
June 30, 2015 (a) (Unaudited) | | Year Ended
December 31, 2014 | | Period from May 10, 2013
(commencement of operations)
through
December 31, 2013(a) |
| | | | | | | | | | | | | |
| Per Share | | | | | | | | | | | | |
| Net asset value, beginning of period | | | $ | 9.67 | | | | $ | 11.42 | | | | $ | 10.00 | |
| | | | | | | | | | | | | | | | |
| Income (loss) from investment operations: | | | | | | | | | | | | | | | |
Net investment income (loss)(b) | | | | (0.16 | ) | | | | (0.29 | ) | | | | (0.18 | ) |
| Net realized and unrealized gain (loss) | | | | 0.85 | | | | | (1.42 | ) | | | | 1.60 | |
| Total from Investment Operations | | | | 0.69 | | | | | (1.71 | ) | | | | 1.42 | |
| | | | | | | | | | | | | | | | |
| Distributions to shareholders from: | | | | | | | | | | | | | | | |
| Net realized gains on investments and securities sold short | | | | — | | | | | (0.04 | ) | | | | — | |
| Total Distributions | | | | — | | | | | (0.04 | ) | | | | — | |
| | | | | | | | | | | | | | | | |
| Redemption Fees | | | | 0.00 | (c) | | | | 0.00 | (c) | | | | — | |
| | | | | | | | | | | | | | | | |
| Net Asset Value, End of Period | | | $ | 10.36 | | | | $ | 9.67 | | | | $ | 11.42 | |
| | | | | | | | | | | | | | | | |
Total Investment Return(d) | | | | 7.14 | % | | | | (14.98 | ) % | | | | 14.20 | % |
| | | | | | | | | | | | | | | | |
| Net Assets, End of Period, in Thousands | | | $ | 9,512 | | | | $ | 12,158 | | | | $ | 8,443 | |
| | | | | | | | | | | | | | | | |
| Ratios/Supplemental Data: | | | | | | | | | | | | | | | |
| Ratio of expenses to average net assets: | | | | | | | | | | | | | | | |
| Before expense reimbursement or recovery | | | | 4.44 | % | | | | 4.30 | % | | | | 5.80 | % |
| After expense reimbursement or recovery | | | | 4.14 | % | | | | 4.05 | % | | | | 4.01 | % |
| | | | | | | | | | | | | | | | |
Ratio of expenses to average net assets (excluding dividend and interest expense on securities sold short and interest expense on line of credit): | | | | | | | | | | | | | | | |
| Before expense reimbursement or recovery | | | | 4.20 | % | | | | 4.15 | % | | | | 5.69 | % |
| After expense reimbursement or recovery | | | | 3.90 | % | | | | 3.90 | % | | | | 3.90 | % |
| | | | | | | | | | | | | | | | |
| Ratio of net investment income (loss) to average net assets: | | | | | | | | | | | | | | | |
| Before expense reimbursement or recovery | | | | (3.66 | ) % | | | | (3.16 | ) % | | | | (4.39 | )% |
| After expense reimbursement or recovery | | | | (3.36 | ) % | | | | (2.91 | ) % | | | | (2.60 | )% |
| | | | | | | | | | | | | | | | |
Portfolio turnover rate(e) | | | | 118 | % | | | | 256 | % | | | | 66 | % |
| (a) | All ratios have been annualized except total investment return and portfolio turnover. |
| (b) | Net investment income (loss) per share is based on average shares outstanding. |
| (c) | Amount represents less than $0.005 per share. |
| (d) | Total return excludes the effect of applicable sales charges. |
| (e) | Portfolio turnover rate is calculated on the basis of the Fund as a whole without distinguishing between classes of shares issued. The portfolio turnover rate excludes purchases and sales of short positions as the Adviser does not intend to hold the short positions for more than one year. |
The accompanying notes are an integral part of these financial statements.
| |
70 | LoCorr Long/Short Equity Fund - Financial Highlights - Class I |
| |
LoCorr Long/Short Equity Fund - Class I
Financial Highlights
Selected Data and Ratios (for a share outstanding throughout the period)
| | | Six Months Ended
June 30, 2015 (a) (Unaudited) | | Year Ended
December 31, 2014 | | Period from May 10, 2013
(commencement of operations)
through
December 31, 2013(a) |
| | | | | | | | | | | | | |
| Per Share | | | | | | | | | | | | |
| Net asset value, beginning of period | | | $ | 9.84 | | | | $ | 11.50 | | | | $ | 10.00 | |
| | | | | | | | | | | | | | | | |
| Income (loss) from investment operations: | | | | | | | | | | | | | | | |
Net investment income (loss)(b) | | | | (0.12 | ) | | | | (0.20 | ) | | | | (0.11 | ) |
| Net realized and unrealized gain (loss) | | | | 0.87 | | | | | (1.42 | ) | | | | 1.61 | |
| Total from Investment Operations | | | | 0.75 | | | | | (1.62 | ) | | | | 1.50 | |
| | | | | | | | | | | | | | | | |
| Distributions to shareholders from: | | | | | | | | | | | | | | | |
| Net realized gains on investments and securities sold short | | | | — | | | | | (0.04 | ) | | | | — | |
| Total Distributions | | | | — | | | | | (0.04 | ) | | | | — | |
| | | | | | | | | | | | | | | | |
Redemption Fees(c) | | | | 0.00 | | | | | 0.00 | | | | | 0.00 | |
| | | | | | | | | | | | | | | | |
| Net Asset Value, End of Period | | | $ | 10.59 | | | | $ | 9.84 | | | | $ | 11.50 | |
| | | | | | | | | | | | | | | | |
| Total Investment Return | | | | 7.73 | % | | | | (14.18 | ) % | | | | 15.00 | % |
| | | | | | | | | | | | | | | | |
| Net Assets, End of Period, in Thousands | | | $ | 11,949 | | | | $ | 12,304 | | | | $ | 12,361 | |
| | | | | | | | | | | | | | | | |
| Ratios/Supplemental Data: | | | | | | | | | | | | | | | |
| Ratio of expenses to average net assets: | | | | | | | | | | | | | | | |
| Before expense reimbursement or recovery | | | | 3.44 | % | | | | 3.30 | % | | | | 4.80 | % |
| After expense reimbursement or recovery | | | | 3.14 | % | | | | 3.05 | % | | | | 3.01 | % |
| | | | | | | | | | | | | | | | |
Ratio of expenses to average net assets (excluding dividend and interest expense on securities sold short and interest expense on line of credit): | | | | | | | | | | | | | | | |
| Before expense reimbursement or recovery | | | | 3.20 | % | | | | 3.15 | % | | | | 4.69 | % |
| After expense reimbursement or recovery | | | | 2.90 | % | | | | 2.90 | % | | | | 2.90 | % |
| | | | | | | | | | | | | | | | |
| Ratio of net investment income (loss) to average net assets: | | | | | | | | | | | | | | | |
| Before expense reimbursement or recovery | | | | (2.66 | ) % | | | | (2.16 | ) % | | | | (3.39 | )% |
| After expense reimbursement or recovery | | | | (2.36 | ) % | | | | (1.91 | ) % | | | | (1.60 | )% |
| | | | | | | | | | | | | | | | |
Portfolio turnover rate(d) | | | | 118 | % | | | | 256 | % | | | | 66 | % |
| (a) | All ratios have been annualized except total investment return and portfolio turnover. |
| (b) | Net investment income (loss) per share is based on average shares outstanding. |
| (c) | Amount represents less than $0.005 per share. |
| (d) | Portfolio turnover rate is calculated on the basis of the Fund as a whole without distinguishing between classes of shares issued. The portfolio turnover rate excludes purchases and sales of short positions as the Adviser does not intend to hold the short positions for more than one year. |
The accompanying notes are an integral part of these financial statements.
| | |
| | LoCorr Spectrum Income Fund - Financial Highlights - Class A | 71 |
| | |
LoCorr Spectrum Income Fund - Class A
Financial Highlights
Selected Data and Ratios (for a share outstanding throughout the period)
| | | Six Months Ended
June 30, 2015(a)
(Unaudited) | | Year Ended
December 31, 2014 |
| | | | | | | | | |
| Per Share | | | | | | | | |
| Net asset value, beginning of period | | | $ | 8.97 | | | | $ | 10.00 | |
| | | | | | | | | | | |
| Income (loss) from investment operations: | | | | | | | | | | |
Net investment income (loss)(b) | | | | 0.25 | | | | | 0.41 | |
| Net realized and unrealized gain (loss) | | | | (0.03 | ) | | | | (0.91 | ) |
| Total from Investment Operations | | | | 0.22 | | | | | (0.50 | ) |
| | | | | | | | | | | |
| Distributions to shareholders from: | | | | | | | | | | |
| Net investment income | | | | (0.29 | ) | | | | (0.36 | ) |
| Return of capital | | | | — | | | | | (0.17 | ) |
| Total Distributions | | | | (0.29 | ) | | | | (0.53 | ) |
| | | | | | | | | | | |
Redemption Fees(c) | | | | 0.00 | | | | | 0.00 | |
| | | | | | | | | | | |
| Net Asset Value, End of Period | | | $ | 8.90 | | | | $ | 8.97 | |
| | | | | | | | | | | |
Total Investment Return(d) | | | | 2.31 | % | | | | (5.45 | )% |
| | | | | | | | | | | |
| Net Assets, End of Period, in Thousands | | | $ | 43,339 | | | | $ | 37,425 | |
| | | | | | | | | | | |
Ratios/Supplemental Data:(e) | | | | | | | | | | |
| Ratio of expenses to average net assets: | | | | | | | | | | |
| Before expense reimbursement or recovery | | | | 1.89 | %(f) | | | | 2.28 | % |
| After expense reimbursement or recovery | | | | 2.05 | %(f) | | | | 2.05 | % |
| Ratio of net investment income (loss) to average net assets: | | | | | | | | | | |
| Before expense reimbursement or recovery | | | | 5.57 | % | | | | 3.88 | % |
| After expense reimbursement or recovery | | | | 5.41 | % | | | | 4.11 | % |
| | | | | | | | | | | |
Portfolio turnover rate(g) | | | | 11 | % | | | | 43 | % |
| (a) | All ratios have been annualized except total investment return and portfolio turnover. |
| (b) | Net investment income (loss) per share is based on average shares outstanding. |
| (c) | Amount represents less than $0.005 per share. |
| (d) | Total return excludes the effect of applicable sales charges. |
| (e) | Ratios do not include the expenses of the investment companies in which the Fund invests. |
| (f) | Includes interest expense on line of credit of 0.00% for the six months ended June 30, 2015. |
| (g) | Portfolio turnover rate is calculated on the basis of the Fund as a whole without distinguishing between classes of shares issued. |
The accompanying notes are an integral part of these financial statements.
| |
72 | LoCorr Spectrum Income Fund - Financial Highlights - Class C |
| |
LoCorr Spectrum Income Fund - Class C
Financial Highlights
Selected Data and Ratios (for a share outstanding throughout the period)
| | | Six Months Ended
June 30, 2015(a)
(Unaudited) | | Year Ended
December 31, 2014 |
| | | | | | | | | |
| Per Share | | | | | | | | |
| Net asset value, beginning of period | | | $ | 8.96 | | | | $ | 10.00 | |
| | | | | | | | | | | |
| Income (loss) from investment operations: | | | | | | | | | | |
Net investment income (loss)(b) | | | | 0.22 | | | | | 0.33 | |
| Net realized and unrealized gain (loss) | | | | (0.03 | ) | | | | (0.91 | ) |
| Total from Investment Operations | | | | 0.19 | | | | | (0.58 | ) |
| | | | | | | | | | | |
| Distributions to shareholders from: | | | | | | | | | | |
| Net investment income | | | | (0.25 | ) | | | | (0.31 | ) |
| Return of capital | | | | — | | | | | (0.15 | ) |
| Total Distributions | | | | (0.25 | ) | | | | (0.46 | ) |
| | | | | | | | | | | |
Redemption Fees(c) | | | | 0.00 | | | | | 0.00 | |
| | | | | | | | | | | |
| Net Asset Value, End of Period | | | $ | 8.90 | | | | $ | 8.96 | |
| | | | | | | | | | | |
Total Investment Return(d) | | | | 2.02 | % | | | | (6.19 | )% |
| | | | | | | | | | | |
| Net Assets, End of Period, in Thousands | | | $ | 33,934 | | | | $ | 25,210 | |
| | | | | | | | | | | |
Ratios/Supplemental Data:(e) | | | | | | | | | | |
| Ratio of expenses to average net assets: | | | | | | | | | | |
| Before expense reimbursement or recovery | | | | 2.64 | %(f) | | | | 3.03 | % |
| After expense reimbursement or recovery | | | | 2.80 | %(f) | | | | 2.80 | % |
| Ratio of net investment income (loss) to average net assets: | | | | | | | | | | |
| Before expense reimbursement or recovery | | | | 4.82 | % | | | | 3.13 | % |
| After expense reimbursement or recovery | | | | 4.66 | % | | | | 3.36 | % |
| | | | | | | | | | | |
Portfolio turnover rate(g) | | | | 11 | % | | | | 43 | % |
| (a) | All ratios have been annualized except total investment return and portfolio turnover. |
| (b) | Net investment income (loss) per share is based on average shares outstanding. |
| (c) | Amount represents less than $0.005 per share. |
| (d) | Total return excludes the effect of applicable sales charges. |
| (e) | Ratios do not include the expenses of the investment companies in which the Fund invests. |
| (f) | Includes interest expense on line of credit of 0.00% for the six months ended June 30, 2015. |
| (g) | Portfolio turnover rate is calculated on the basis of the Fund as a whole without distinguishing between classes of shares issued. |
The accompanying notes are an integral part of these financial statements.
| | |
| | LoCorr Spectrum Income Fund - Financial Highlights - Class I | 73 |
| | |
LoCorr Spectrum Income Fund - Class I
Financial Highlights
Selected Data and Ratios (for a share outstanding throughout the period)
| | | Six Months Ended
June 30, 2015(a)
(Unaudited) | | Year Ended
December 31, 2014 |
| | | | | | | | | |
| Per Share | | | | | | | | |
| Net asset value, beginning of period | | | $ | 8.97 | | | | $ | 10.00 | |
| | | | | | | | | | | |
| Income (loss) from investment operations: | | | | | | | | | | |
Net investment income (loss)(b) | | | | 0.26 | | | | | 0.43 | |
| Net realized and unrealized gain (loss) | | | | (0.03 | ) | | | | (0.91 | ) |
| Total from Investment Operations | | | | 0.23 | | | | | (0.48 | ) |
| | | | | | | | | | | |
| Distributions to shareholders from: | | | | | | | | | | |
| Net investment income | | | | (0.30 | ) | | | | (0.38 | ) |
| Return of capital | | | | — | | | | | (0.17 | ) |
| Total Distributions | | | | (0.30 | ) | | | | (0.55 | ) |
| | | | | | | | | | | |
Redemption Fees(c) | | | | 0.00 | | | | | 0.00 | |
| | | | | | | | | | | |
| Net Asset Value, End of Period | | | $ | 8.90 | | | | $ | 8.97 | |
| | | | | | | | | | | |
| Total Investment Return | | | | 2.45 | % | | | | (5.23 | )% |
| | | | | | | | | | | |
| Net Assets, End of Period, in Thousands | | | $ | 40,560 | | | | $ | 31,428 | |
| | | | | | | | | | | |
Ratios/Supplemental Data:(d) | | | | | | | | | | |
| Ratio of expenses to average net assets: | | | | | | | | | | |
| Before expense reimbursement or recovery | | | | 1.64 | %(e) | | | | 2.03 | % |
| After expense reimbursement or recovery | | | | 1.80 | %(e) | | | | 1.80 | % |
| Ratio of net investment income (loss) to average net assets: | | | | | | | | | | |
| Before expense reimbursement or recovery | | | | 5.82 | % | | | | 4.13 | % |
| After expense reimbursement or recovery | | | | 5.66 | % | | | | 4.36 | % |
| | | | | | | | | | | |
Portfolio turnover rate(f) | | | | 11 | % | | | | 43 | % |
| (a) | All ratios have been annualized except total investment return and portfolio turnover. |
| (b) | Net investment income (loss) per share is based on average shares outstanding. |
| (c) | Amount represents less than $0.005 per share. |
| (d) | Ratios do not include the expenses of the investment companies in which the Fund invests. |
| (e) | Includes interest expense on line of credit of 0.00% for the six months ended June 30, 2015. |
| (f) | Portfolio turnover rate is calculated on the basis of the Fund as a whole without distinguishing between classes of shares issued. |
The accompanying notes are an integral part of these financial statements.
74 | | LoCorr Managed Futures Strategy Fund, LoCorr Long/Short Commodities Strategy Fund, LoCorr Multi-Strategy Fund and LoCorr Market Trend Fund - Notes to Consolidated Financial Statements / LoCorr Long/Short Equity Fund and LoCorr Spectrum Income Fund - Notes to Financial Statements |
LoCorr Investment Trust
Notes
June 30, 2015 (Unaudited)
1. Organization
LoCorr Investment Trust (the “Trust”), an Ohio business trust, was formed on November 15, 2010 and is an open-end management investment company registered under the Investment Company Act of 1940, as amended (“1940 Act”). The LoCorr Managed Futures Strategy Fund, LoCorr Long/Short Commodities Strategy Fund, LoCorr Multi-Strategy Fund, LoCorr Market Trend Fund, LoCorr Long/Short Equity Fund and the LoCorr Spectrum Income Fund (individually a “Fund” and collectively the “Funds”) are series within the Trust. The LoCorr Long/Short Commodities Strategy Fund, the LoCorr Multi-Strategy Fund, the LoCorr Market Trend Fund, the LoCorr Long/Short Equity Fund and the LoCorr Spectrum Income Fund are each non-diversified funds and the LoCorr Managed Futures Strategy Fund is a diversified fund.
The LoCorr Managed Futures Strategy Fund’s primary investment objective is capital appreciation in rising and falling equity markets with managing volatility as a secondary objective.
The LoCorr Long/Short Commodities Strategy Fund’s primary investment objective is capital appreciation in rising and falling commodities markets with managing volatility as a secondary objective.
The LoCorr Multi-Strategy Fund’s investment objective is capital appreciation.
The LoCorr Market Trend Fund’s primary investment objective is capital appreciation in rising and falling equity markets with managing volatility as a secondary objective.
The LoCorr Long/Short Equity Fund’s primary investment objective is long-term capital appreciation with reduced volatility compared to traditional broad-based equity market indices as a secondary objective.
The LoCorr Spectrum Income Fund’s primary investment objective is current income with capital appreciation as a secondary objective.
In order to achieve their investment objectives, the LoCorr Managed Futures Strategy Fund, the LoCorr Long/Short Commodities Strategy Fund, the LoCorr Multi-Strategy Fund and the LoCorr Market Trend Fund each invest up to 25% of their total assets (measured at the time of purchase) in wholly-owned subsidiaries, LCMFS Fund Limited (“LCMFS”), LCLSCS Fund Limited (“LCLSCS”), LCMSF Fund Limited (“LCMSF”) and LCMT Fund Limited (“LCMT”), respectively; each company incorporated under the laws of the Cayman Islands. LCMFS, LCLSCS, LCMSF and LCMT act as investment vehicles in order to enter into certain investments for the LoCorr Managed Futures Strategy Fund, the LoCorr Long/Short Commodity Strategy Fund, the LoCorr Multi-Strategy Fund and the LoCorr Market Trend Fund, respectively, consistent with their investment objectives and policies specified in the Prospectus and Statement of Additional Information.
At June 30, 2015, each Fund’s investment in LCMFS, LCLSCS, LCMSF and LCMT represented 10.91%, 27.49%, 16.10% and 1.47% of the total assets of LoCorr Managed Futures Strategy Fund, LoCorr Long/Short Commodities Strategy Fund, LoCorr Multi-Strategy Fund and LoCorr Market Trend Fund, respectively. At June 30, 2015, the LoCorr Long/Short Commodities Strategy Fund’s investment in LCLSCS exceeded the 25% of total assets limit, however, the Fund was deemed to be in compliance pursuant to acceptable regulatory exceptions. See Note 2.
The consolidated financial statements of the LoCorr Managed Futures Strategy Fund, LoCorr Long/Short Commodities Strategy Fund, LoCorr Multi-Strategy Fund and the LoCorr Market Trend Fund each include the investment activity and financial statements of LCMFS, LCLSCS, LCMSF and LCMT, respectively. All intercompany accounts and transactions have been eliminated in consolidation. Because each Fund may invest a substantial portion of its assets in its respective subsidiary, the Fund may be considered to be investing indirectly in some of those investments through its subsidiary. For that reason, references to the Fund may also include its subsidiary. The subsidiary will be subject to the same investment restrictions and limitations, and follow the same compliance policies and procedures, as the Fund when viewed on a consolidated basis. The Fund and its subsidiary are each a “commodity pool” under the U.S. Commodity Exchange Act and LoCorr Fund Management, LLC (the “Adviser” or “Management”) is a “commodity pool operator” registered with and regulated by the Commodity Futures Trading Commission (“CFTC”). As a result, additional CFTC-mandated disclosure, reporting and recordkeeping obligations apply with respect to each Fund and its respective subsidiary under CFTC and the U.S. Securities and Exchange Commission (the “SEC”) harmonized regulations.
At June 30, 2015, the only investment held by LCMFS, LCLSCS and LCMSF are swap contracts, for which the notional amount was $536,519,768, $26,099,999 and $18,082,500, respectively. At June 30, 2015, LCMFS, LCLSCS and LCMSF reported unrealized depreciation on swap contracts of $42,869,132, $4,899,992 and $662,563, respectively. In addition, LCMFS, LCLSCS and LCMSF hold cash and cash equivalents as collateral on the swap contracts.
At June 30, 2015, investments held by LCMT include open futures contracts and other investments intended to serve as margin or collateral for futures positions. At June 30, 2015, the notional amount of long and short open futures contracts held by LCMT were $18,964,220 and $68,088,946, respectively. At June 30, 2015, the net unrealized appreciation on the long open futures contracts reported by LCMT was $53,197 and the net unrealized depreciation on the short open futures contracts reported by LCMT was $1,940,762.
During the year ended December 31, 2012, LCMFS had a controlling ownership interest in Millburn Diversified Plus L.P. (the “Partnership”), a limited partnership organized on February 14, 2011, under the Delaware Revised Uniform Limited Partnership Act, which commenced operations on March 24, 2011. The Partnership engaged in speculative trading of futures and forward currency contracts. Similarly, LCLSCS had an investment in a partnership during the year ended December 31, 2012, however, based on the ownership percentage held during the year ended December 31, 2012, LCLSCS was not considered to have a controlling interest in that entity. The General Partner of the Partnership was Millburn Ridgefield Corporation (the “General Partner”). LCMFS and LCLSCS had fully redeemed out of their positions held in the partnerships as of December 20, 2012, and as a result, LCMFS no longer consolidated the Partnership, and its assets, liabilities, and related non-controlling interest are no longer included in the LoCorr Managed Futures Strategy Fund’s financial statements. As of December 20, 2012, there was no gain or loss on the redemption and deconsolidation because the investment in the Partnership was carried at fair value on a daily basis by LCMFS.
| LoCorr Managed Futures Strategy Fund, LoCorr Long/Short Commodities Strategy Fund, LoCorr Multi-Strategy Fund and LoCorr Market Trend Fund - Notes to Consolidated Financial Statements / LoCorr Long/Short Equity Fund and LoCorr Spectrum Income Fund - Notes to Financial Statements (continued) | | 75 |
Because LCMFS had a controlling interest (greater than 50% but less than 100%) in the Partnership for the period January 1, 2012 through December 20, 2012, the financial activity of the Partnership for that period ended December 20, 2012, has also been consolidated with the financial statements of LCMFS. All intercompany balances, revenues, and expenses have been eliminated in consolidation. LoCorr Managed Futures Strategy Fund, LCMFS and the Partnership are collectively referred to as the LoCorr Managed Futures Strategy Fund throughout these consolidated financial statements.
Non-controlling interest is the portion of equity ownership in the Partnership not attributable to the LoCorr Managed Futures Strategy Fund. Non-controlling interest represents additional, non-related partners in the Partnership and was equal to 2.20% of the Partnership’s net assets prior to LCMFS having fully redeemed its holding of the Partnership.
The Funds currently offer three classes of shares: Class A, Class C and Class I shares. Each share class represents an interest in the same assets of the Fund, has the same rights and is identical in all material respects except that (i) Class A shares have a maximum front end sales load of 5.75% and maximum deferred sales charge of 1.00% and Class C shares have a maximum deferred sales charge of 1.00%, (ii) Class A shares have a 12b-1 fee of 0.25% and Class C shares have a 12b-1 fee of 1.00%; (iii) certain other class-specific expenses will be borne solely by the class to which such expenses are attributable and (iv) each class will have exclusive voting rights with respect to matters relating to its own distribution arrangements.
With respect to the LoCorr Managed Futures Strategy Fund, the LoCorr Long/Short Commodities Strategy Fund, the LoCorr Multi-Strategy Fund, the LoCorr Market Trend Fund and the LoCorr Long/Short Equity Fund, all classes are subject to a 1.00% redemption fee on redemptions made within 30 days of the original purchase. All classes with respect to the LoCorr Spectrum Income Fund are subject to a 2.00% redemption fee on redemptions made within 60 days of the original purchase.
The following table presents the class-specific commencement of operations dates for each of the Funds:
| | | | | | | |
| | | Commencement of Operations |
| | | Class A | | Class C | | Class I |
| LoCorr Managed Futures Strategy Fund | | March 22, 2011 | | March 24, 2011 | | March 24, 2011 |
| LoCorr Long/Short Commodities Strategy Fund | | January 1, 2012 | | January 1, 2012 | | January 1, 2012 |
| LoCorr Long/Short Equity Fund | | May 10, 2013 | | May 10, 2013 | | May 10, 2013 |
| LoCorr Spectrum Income Fund | | January 1, 2014 | | January 1, 2014 | | January 1, 2014 |
| LoCorr Market Trend Fund | | July 1, 2014 | | July 1, 2014 | | July 1, 2014 |
| LoCorr Multi-Strategy Fund | | April 6, 2015 | | April 6, 2015 | | April 6, 2015 |
The Funds may issue an unlimited number of shares of beneficial interest, with no par value. All shares of the Funds have equal rights and privileges, except as to class-specific rights and privileges described above.
2. Significant Accounting Policies
The following is a summary of significant accounting policies consistently followed by the Funds in the preparation of the consolidated financial statements. These policies are in conformity with generally accepted accounting principles in the United States of America (“GAAP”).
Investment Valuation
The Funds follow fair valuation accounting standards which establish a definition of fair value and set out a hierarchy for measuring fair value. These standards require additional disclosures about the various inputs and valuation techniques used to develop the measurements of fair value and changes in valuation techniques and related inputs during the period. These inputs are summarized in three broad levels listed below:
Level 1 – Unadjusted quoted prices in active markets for identical assets or liabilities that the Funds have the ability to access.
Level 2 – Observable inputs other than quoted prices included in Level 1 that are observable for the asset or liability, either directly or indirectly. These inputs may include quoted prices for the identical instrument on an inactive market, prices for similar instruments, interest rates, prepayment speeds, credit risk, yield curves, default rates and similar data.
Level 3 – Unobservable inputs for the asset or liability, to the extent relevant observable inputs are not available; representing the Funds’ own assumptions about the assumptions a market participant would use in valuing the asset or liability, and would be based on the best information available.
Generally, the Funds’ investments are valued each day at the last quoted sales price on each investment’s primary exchange. Investments traded or dealt in upon one or more exchanges (whether domestic or foreign) for which market quotations are readily available and not subject to restrictions against resale shall be valued at the last quoted sales price on the primary exchange or, in the absence of a sale on the primary exchange, at the last bid on the primary exchange. Investments primarily traded in the National Association of Securities Dealers’ Automated Quotation System (“NASDAQ”) National Market System for which market quotations are readily available shall be valued using the NASDAQ Official Closing Price.
76 | | LoCorr Managed Futures Strategy Fund, LoCorr Long/Short Commodities Strategy Fund, LoCorr Multi-Strategy Fund and LoCorr Market Trend Fund - Notes to Consolidated Financial Statements / LoCorr Long/Short Equity Fund and LoCorr Spectrum Income Fund - Notes to Financial Statements (continued) |
The Funds may use independent pricing services to assist in calculating the value of the Funds’ investments. In addition, market prices for foreign investments are not determined at the same time of day as the net asset value (“NAV”) for the Funds. Because the Funds may invest in portfolio investments primarily listed on foreign exchanges, and these exchanges may trade on weekends or other days when the Funds do not price their shares, the value of some of the Funds’ portfolio investments may change on days when you may not be able to buy or sell the Funds’ shares. In computing the NAV, the Funds value foreign investments held by the Funds at the latest closing price on the exchange in which they are traded immediately prior to closing of the NYSE. Prices of foreign investments quoted in foreign currencies are translated into U.S. dollars at current rates. If events materially affecting the value of an investment in the Funds’ portfolio, particularly foreign investments, occur after the close of trading on a foreign market but before the Funds price their shares, the investment will be valued at fair value.
Fixed income securities and certificates of deposit with maturities more than 60 days when acquired generally are valued using an evaluated price supplied by an independent pricing service. Inputs used by the pricing service for U.S. government and treasury securities are normally valued using a model that incorporates market observable data such as reported sales of similar securities, broker dealer quotes, yields, bids, offers, and reference data. Agency issued debt securities, foreign issued bonds and municipal bonds are generally valued in a manner similar to U.S. government securities. Evaluations for corporate bonds are typically based on valuation methodologies such as market pricing and other analytical pricing models as well as market transactions and dealer quotations based on observable inputs. Fixed income securities are generally categorized in Level 1 or Level 2 of the fair value hierarchy depending on inputs used and market activity levels for specific securities.
The fair value of asset backed securities and mortgage backed securities is estimated on models that consider the estimated cash flows of each tranche of the entity, establish a benchmark yield, and develop an estimated tranche-specific spread to the benchmark yield based on the unique attributes of the tranche. Additional inputs such as creditworthiness of the underlying collateral and quotes from outside brokers for the same or similar issuance may also be considered in the development of fair value. Asset backed and mortgage backed securities are generally categorized in Level 2 of the fair value hierarchy.
Short-term investments in fixed income securities and certificates of deposit with maturities of less than 60 days when acquired, or which subsequently are within 60 days of maturity, are valued using an amortized cost method of valuation, and are generally categorized in Level 2.
Equity securities, including common stocks, preferred stocks, securities convertible into common stocks, such as convertible bonds, warrants, rights, options, master limited partnership (“MLP”) interests, real estate investment trusts (“REITs”), business development companies and royalty trusts, generally are valued by using market quotations, but may be valued on the basis of prices furnished by a pricing service when the Adviser believes such prices accurately reflect the fair market value of such securities. MLP interests are limited partnerships, the interests in which (known as “units”) typically trade publicly, like stock. Master limited partnerships are also called publicly traded partnerships and public limited partnerships. Securities that are traded on any stock exchange or on the NASDAQ over-the-counter market are generally valued by the pricing service at the last quoted sale price. Lacking a last sale price, an equity security is generally valued by the pricing service at its last bid price. Equity securities are generally categorized in Level 1 or Level 2 of the fair value hierarchy depending on inputs used and market activity levels for specific securities.
With respect to any portion of the Funds’ assets that are invested in one or more open-end management investment companies, including money market funds, registered under the 1940 Act, the Funds’ net asset value is calculated based upon the net asset values of those open-end management investment companies, and the prospectuses for these companies explain the circumstances under which those companies will use fair value pricing and the effects of using fair value pricing.
The Funds generally will purchase shares of closed-end investment companies only in the secondary market. The shares of many closed-end investment companies, after their initial public offering, frequently trade at a price per share that is less than the net asset value per share, the difference representing the “market discount” of such shares. This market discount may be due in part to the investment objective of long-term appreciation, which is sought by many closed-end investment companies, as well as to the fact that the shares of closed-end investment companies are not redeemable by the holder upon demand to the issuer at the next determined net asset value but rather are subject to the principles of supply and demand in the secondary market. A relative lack of secondary market purchasers of closed-end investment company shares also may contribute to such shares trading at a discount to their net asset value. Closed-end investment companies are generally categorized in Level 1 or Level 2 of the fair value hierarchy depending on inputs used and market activity levels for specific securities.
The Funds may invest in Exchange Traded Funds (“ETFs”). ETFs are passive funds that track their related index and have the flexibility of trading like a security. They are managed by professionals and provide the investor with diversification, cost and tax efficiency, liquidity, marginability, are useful for hedging, have the ability to go long and short, and some provide quarterly dividends. Additionally, some ETFs are unit investment trusts (“UITs”), which are unmanaged portfolios overseen by trustees. ETFs generally have two markets. The primary market is where institutions swap “creation units” in block-multiples of shares, typically 25,000 or 50,000, for in-kind securities and cash in the form of dividends. The secondary market is where individual investors can trade as little as a single share during trading hours on the exchange. This is different from open-ended mutual funds that are traded after hours once the NAV is calculated. ETFs share many similar risks with open-end and closed-end funds. ETFs are generally categorized in Level 1 of the fair value hierarchy.
The Funds may invest in ETFs and other investment companies that hold a portfolio of foreign securities. Investing in securities of foreign companies and countries involves certain considerations and risks that are not typically associated with investing in U.S. government securities and securities of domestic companies. There may be less publicly available information about a foreign issuer than a domestic one, and foreign companies are not generally subject to uniform accounting, auditing and financial standards and requirements comparable to those applicable to U.S. companies. There may also be less government supervision and regulation of foreign securities exchanges, brokers and listed companies than exists in the United States.
| LoCorr Managed Futures Strategy Fund, LoCorr Long/Short Commodities Strategy Fund, LoCorr Multi-Strategy Fund and LoCorr Market Trend Fund - Notes to Consolidated Financial Statements / LoCorr Long/Short Equity Fund and LoCorr Spectrum Income Fund - Notes to Financial Statements (continued) | | 77 |
Interest and dividends paid by foreign issuers may be subject to withholding and other foreign taxes, which may decrease the net return on such investments as compared to dividends and interest paid to the Fund by domestic companies or the U.S. government. There may be the possibility of expropriations, seizure or nationalization of foreign deposits, confiscatory taxation, political, economic or social instability or diplomatic developments that could affect assets of the Fund held in foreign countries. Finally, the establishment of exchange controls or other foreign governmental laws or restrictions could adversely affect the payment of obligations.
The Funds may invest in sponsored and unsponsored American Depositary Receipts (“ADRs”), which are receipts issued by an American bank or trust company evidencing ownership of underlying securities issued by a foreign issuer. ADRs, in registered form, are designed for use in U.S. securities markets. Unsponsored ADRs may be created without the participation of the foreign issuer. Holders of unsponsored ADRs generally bear all the costs of the ADR facility, whereas foreign issuers typically bear certain costs in a sponsored ADR. The bank or trust company depositary of an unsponsored ADR may be under no obligation to distribute shareholder communications received from the foreign issuer or to pass through voting rights. ADRs are generally categorized in Level 1 or Level 2 of the fair value hierarchy depending on inputs used and market activity levels for specific securities.
Over-the-counter financial derivative instruments, such as forward currency contracts, futures contracts, or swap agreements, derive their value from underlying asset prices, indices, reference rates, and other inputs or a combination of these factors. These contracts are normally valued on the basis of broker-dealer quotations or a pricing service at the settlement price determined by the relevant exchange. Depending on the product and the terms of the transaction, the value of the derivative contracts can be estimated by a pricing service provider using a series of techniques, including simulation pricing models. The pricing models use inputs that are observed from actively quoted markets such as issuer details, indices, spreads, interest rates, curves, dividends and exchange rates.
Forward currency contracts represent the purchase or sale of a specific quantity of a foreign currency at the current or spot price, with delivery and settlement at a specified future date. Forward currency contracts are presented at fair value using spot currency rates and are adjusted for the time value of money (forward points) and contractual prices of the underlying financial instruments. Forward currency contracts are generally categorized in Level 2.
Futures contracts are carried at fair value using the primary exchange’s closing (settlement) price, and are generally categorized in Level 1.
Total return swap contracts are stated at fair value daily based on the fair value of the underlying futures and forward currency contracts constituting the contract’s stated index, taking into account any fees and expenses associated with the swap agreement. Total return swap contracts are generally categorized in Level 2.
If market quotations are not readily available, investments will be valued at their fair value as determined in good faith by the Adviser in accordance with procedures approved by the Board of Trustees (the “Board”) and evaluated by the Board as to the reliability of the fair value method used. In these cases, a Fund’s NAV will reflect certain portfolio investments’ fair value rather than their market price. Fair value pricing involves subjective judgments and it is possible that the fair value determined for an investment is materially different than the value that could be realized upon the sale of that investment. The fair value prices can differ from market prices when they become available or when a price becomes available.
Fair value determinations are required for the following securities:
| | ● | securities for which market quotations are not readily available at the valuation time on a particular business day (including without limitation securities for which there is a short and temporary lapse in the provision of a price by the regular pricing source); |
| | | |
| | ● | securities for which, in the opinion of the Adviser/relevant Sub-Adviser, the prices or values available do not represent the fair value of the instrument, based upon factors that may include, but are not limited to, the following: the availability of only a bid price or an ask price; the spread between bid and ask prices; the frequency of sales; the thinness of the market; the size of reported trades; and actions of the securities markets or regulators, such as the suspension or limitation of trading; |
| | | |
| | ● | securities determined to be illiquid in accordance with the Trust’s Liquidity Procedures; and |
| | | |
| | ● | securities with respect to which an event that will affect the value thereof has occurred subsequent to the determination by the Adviser/relevant Sub-Adviser of the closing prices reported on the principal exchange on which the securities are traded, but prior to the relevant Fund’s calculation of its NAV. |
| | | |
| | ● | For any open-end mutual funds that do not provide timely NAV information, the Adviser/relevant Sub-Adviser shall evaluate those ‘similar’ funds and determine which are most appropriate based on funds having similar benchmarks or similar objectives. The Adviser/relevant Sub-Adviser shall then calculate the NAV percentage move of those ‘similar’ funds for the day to create an aggregate average percentage move, which it shall use to calculate the price movement for the day of the Fund at issue. For closed-end funds, the aforementioned practice shall be utilized, in addition to monitoring secondary market activity during the day. |
Performing Fair Value Pricing
The Adviser considers all appropriate factors relevant to the value of securities for which market quotations are not readily available. No single standard for determining fair value can be established, since fair value depends upon the circumstances of each individual case. As a general principle, the current fair value of an issue of securities being valued by the Adviser would appear to be the amount that the owner might reasonably expect to receive for them upon their current sale. Methods that are in accord with this principle may, for example, be based on:
| | ● | a multiple of earnings; |
| | | |
| | ● | a discount from market of a similar freely traded security (including a derivative security or a basket of securities traded on other markets, exchanges or among dealers); or |
| | | |
| | ● | yield to maturity with respect to debt issues, or a combination of these and other methods. |
78 | | LoCorr Managed Futures Strategy Fund, LoCorr Long/Short Commodities Strategy Fund, LoCorr Multi-Strategy Fund and LoCorr Market Trend Fund - Notes to Consolidated Financial Statements / LoCorr Long/Short Equity Fund and LoCorr Spectrum Income Fund - Notes to Financial Statements (continued) |
Fair value determinations are not based on what the Adviser believes that a buyer may pay at a later time, such as when market conditions change or when the market ultimately recognizes a security’s true value as perceived by the Adviser. Similarly, bonds and other instruments may not be fair valued at par based on the expectation that the Fund will hold the investment until maturity.
Some of the general factors that the Adviser considers in determining a valuation method for an individual issue of securities include, but shall not be limited to:
| | ● | the fundamental analytical data relating to the investment; |
| | | |
| | ● | the nature and duration of restrictions (if any) on disposition of the securities; |
| | | |
| | ● | evaluation of the forces that influence the market in which these securities are purchased or sold; |
| | | |
| | ● | changes in interest rates; |
| | | |
| | ● | government (domestic or foreign) actions or pronouncements; and |
| | | |
| | ● | other news events. |
With respect to securities traded on foreign markets, the Adviser considers the value of foreign securities traded on other foreign markets, ADR trading, closed-end fund trading, foreign currency exchange activity and the trading prices of financial products that are tied to baskets of foreign securities, such as WEBS.
Among the more specific factors that the Funds’ Adviser considers (if applicable) in determining a valuation method for an individual issue of securities are:
| | ● | type of security; |
| | | |
| | ● | financial statements of the issuer; |
| | | |
| | ● | cost at date of purchase; |
| | | |
| | ● | size of holding; |
| | | |
| | ● | discount from market value of unrestricted securities of the same class at time of purchase; |
| | | |
| | ● | special reports prepared by analysts; |
| | | |
| | ● | information as to any transactions or offers with respect to the security; |
| | | |
| | ● | existence of merger proposals or tender offers affecting the securities; |
| | | |
| | ● | price and extent of public trading in similar securities of the issuer or comparable companies; and |
| | | |
| | ● | other relevant matters. |
As a general matter, the Funds’ Adviser will value the portfolio security or other asset primarily by reference to the public market if there is a public market for securities of the same class or similar securities; primarily by reference to private transactions if public market reference is not available and private transaction reports are available; and primarily by use of one or more analytical methods or models if public and private market references are not available or not reliable. The Adviser will use cost only if no better method of valuation is available.
The Adviser regularly evaluates whether its pricing methodologies continue to result in values that the Fund might reasonably expect to receive upon a current sale. In order to do this, the Adviser compares its fair value prices with values that are available from other sources (if there are any). The next actual sales price of a security might be one such source. However, the next-day opening prices or next actual sales prices for a security may differ from the fair value of that security as of the time for NAV calculation, given the subjectivity inherent in fair valuation and the fact that events could occur after NAV calculation. Thus, discrepancies between fair values and next-day opening prices or next actual sales prices may occur on a regular and recurring basis. These discrepancies do not necessarily indicate that the Adviser’s fair value methodology is inappropriate. Nonetheless, systematic comparisons of fair values to the next-day opening prices or next actual sales prices are useful to assist the Adviser with ongoing monitoring and evaluation of the appropriateness of its fair value methodologies.
The above guidance does not purport to delineate all factors that may be considered. The Adviser takes into consideration all indications of value available to it in determining the fair value assigned to a particular security.
The fair value of the LoCorr Spectrum Income Fund’s investment in Terra Secured Income Fund 5, LLC (“Terra”) is based on the Adviser’s analysis of certain existing data to determine the significance and character of inputs used to determine value. These inputs include, but are not limited to, financial statements (audited and unaudited) of Terra and the value used by other investors in Terra. Management also engaged a third party appraisal firm to review the valuation process used by Terra and the Adviser in determining the value of the investment. Changes to the fair value of this investment would result from changes to the underlying financial performance of Terra or other market factors, such as adverse changes to the financial condition of Terra, its borrowers or the secured assets as well as the deterioration of real estate market or general economic conditions. Terra is a private investment, limited liability company formed to originate, fund and structure real estate-related loans, including mezzanine loans, first and second mortgage loans, subordinated mortgage loans, bridge loans, preferred equity investments and other loans related to high quality commercial real estate in the United States. Units invested with Terra are not registered with the SEC under the Securities Act of 1933, as amended (the “Securities Act”) or the securities agency of any state. The units were offered in reliance upon an exemption from the registration provisions of the Securities Act and state securities laws applicable only to offers and sales to investors meeting the suitability requirements set forth herein. Due to lack of market activity and observable inputs, the LoCorr Spectrum Income Fund’s investment in Terra is categorized in Level 3 of the fair value hierarchy.
LoCorr Managed Futures Strategy Fund, LoCorr Long/Short Commodities Strategy Fund, LoCorr Multi-Strategy Fund and LoCorr Market Trend Fund - Notes
to Consolidated Financial Statements / LoCorr Long/Short Equity Fund and LoCorr Spectrum Income Fund - Notes to Financial Statements (continued) | | 79 |
The following table summarizes LoCorr Managed Futures Strategy Fund’s consolidated investments and swap contracts as of June 30, 2015:
| | | | | | | | | | | | | |
| Security Classification | | Level 1 | | | Level 2 | | | Level 3 | | | Total | |
| Investments | | | | | | | | | | | | |
| Asset Backed Securities | | $ | — | | | $ | 118,924,481 | | | $ | — | | | $ | 118,924,481 | |
| Corporate Bonds | | | — | | | | 153,071,359 | | | | — | | | | 153,071,359 | |
| Foreign Government Bonds | | | — | | | | 5,885,167 | | | | — | | | | 5,885,167 | |
| Mortgage Backed Securities | | | — | | | | 113,500,810 | | | | — | | | | 113,500,810 | |
| Municipal Bonds | | | — | | | | 8,506,120 | | | | — | | | | 8,506,120 | |
| U.S. Government Agency Issues | | | — | | | | 38,533,037 | | | | — | | | | 38,533,037 | |
| U.S. Government Notes | | | — | | | | 12,987,731 | | | | — | | | | 12,987,731 | |
| Short Term Investments | | | 22,300,963 | | | | 2,500,525 | | | | — | | | | 24,801,488 | |
| Total Investments | | $ | 22,300,963 | | | $ | 453,909,230 | | | $ | — | | | $ | 476,210,193 | |
| | | | | | | | | | | | | | | | | |
Swap Contracts* | | | | | | | | | | | | | | | | |
| Long Total Return Swap Contracts | | $ | — | | | $ | (42,869,132 | ) | | $ | — | | | $ | (42,869,132 | ) |
| Total Swap Contracts | | $ | — | | | $ | (42,869,132 | ) | | $ | — | | | $ | (42,869,132 | ) |
See the Fund’s consolidated schedule of investments for the investments detailed by industry classification.
*Swap contracts are derivative instruments not reflected in the Fund’s consolidated schedule of investments. The fair value of the Fund’s investment in swap contracts represents the net unrealized depreciation at June 30, 2015.
The LoCorr Managed Futures Strategy Fund did not hold any Level 3 assets during the period.
The following table summarizes LoCorr Long/Short Commodities Strategy Fund’s consolidated investments and swap contracts as of June 30, 2015:
| | | | | | | | | | | | | |
| Security Classification | | Level 1 | | | Level 2 | | | Level 3 | | | Total | |
| Investments | | | | | | | | | | | | |
| Asset Backed Securities | | $ | — | | | $ | 5,037,849 | | | $ | — | | | $ | 5,037,849 | |
| Corporate Bonds | | | — | | | | 6,494,266 | | | | — | | | | 6,494,266 | |
| Foreign Government Bonds | | | — | | | | 298,106 | | | | — | | | | 298,106 | |
| Mortgage Backed Securities | | | — | | | | 5,305,388 | | | | — | | | | 5,305,388 | |
| Municipal Bonds | | | — | | | | 543,172 | | | | — | | | | 543,172 | |
| U.S. Government Agency Issues | | | — | | | | 1,361,041 | | | | — | | | | 1,361,041 | |
| Short Term Investments | | | 2,756,999 | | | | 1,450,675 | | | | — | | | | 4,207,674 | |
| Total Investments | | $ | 2,756,999 | | | $ | 20,490,497 | | | $ | — | | | $ | 23,247,496 | |
| | | | | | | | | | | | | | | | | |
Swap Contracts* | | | | | | | | | | | | | | | | |
| Long Total Return Swap Contracts | | $ | — | | | $ | (4,899,992 | ) | | $ | — | | | $ | (4,899,992 | ) |
| Total Swap Contracts | | $ | — | | | $ | (4,899,992 | ) | | $ | — | | | $ | (4,899,992 | ) |
See the Fund’s consolidated schedule of investments for the investments detailed by industry classification.
*Swap contracts are derivative instruments not reflected in the Fund’s consolidated schedule of investments. The fair value of the Fund’s investment in swap contracts represents the net unrealized depreciation at June 30, 2015.
The LoCorr Long/Short Commodities Strategy Fund did not hold any Level 3 assets during the period.
80 | | LoCorr Managed Futures Strategy Fund, LoCorr Long/Short Commodities Strategy Fund, LoCorr Multi-Strategy Fund and LoCorr Market Trend Fund - Notes
to Consolidated Financial Statements / LoCorr Long/Short Equity Fund and LoCorr Spectrum Income Fund - Notes to Financial Statements (continued) |
The following table summarizes LoCorr Multi-Strategy Fund’s consolidated investments, securities sold short and swap contracts as of June 30, 2015:
| | | | | | | | | | | | | |
| Security Classification | | Level 1 | | | Level 2 | | | Level 3 | | | Total | |
| Investments | | | | | | | | | | | | |
| Business Development Companies | | $ | 805,289 | | | $ | — | | | $ | — | | | $ | 805,289 | |
| Closed-End Investment Companies | | | 1,380,589 | | | | — | | | | — | | | | 1,380,589 | |
| Common Stocks | | | 5,649,749 | | | | — | | | | — | | | | 5,649,749 | |
| Master Limited Partnerships | | | 3,144,295 | | | | — | | | | — | | | | 3,144,295 | |
| Real Estate Investment Trusts | | | 3,513,438 | | | | — | | | | — | | | | 3,513,438 | |
| Royalty Trust | | | 169,703 | | | | — | | | | — | | | | 169,703 | |
| Short Term Investment | | | 1,415,533 | | | | — | | | | — | | | | 1,415,533 | |
| Total Investments | | $ | 16,078,596 | | | $ | — | | | $ | — | | | $ | 16,078,596 | |
| Securities Sold Short | | | | | | | | | | | | | | | | |
| Common Stock | | $ | (222,925 | ) | | $ | — | | | $ | — | | | $ | (222,925 | ) |
| Total Securities Sold Short | | $ | (222,925 | ) | | $ | — | | | $ | — | | | $ | (222,925 | ) |
| | | | | | | | | | | | | | | | | |
Swap Contracts* | | | | | | | | | | | | | | | | |
| Long Total Return Swap Contracts | | $ | — | | | $ | (662,563 | ) | | $ | — | | | $ | (662,563 | ) |
| Total Swap Contracts | | $ | — | | | $ | (662,563 | ) | | $ | — | | | $ | (662,563 | ) |
See the Fund’s consolidated schedule of investments and securities sold short for the investments detailed by industry classification.
*Swap contracts are derivative instruments not reflected in the Fund’s consolidated schedule of investments. The fair value of the Fund’s investment in swap contracts represents the net unrealized depreciation at June 30, 2015.
The LoCorr Multi-Strategy Fund did not hold any Level 3 assets during the period.
The following table summarizes LoCorr Market Trend Fund’s consolidated investments and other financial instruments as of June 30, 2015:
| | | | | | | | | | | | | |
| Security Classification | | Level 1 | | | Level 2 | | | Level 3 | | | Total | |
| Investments | | | | | | | | | | | | |
| Asset Backed Securities | | $ | — | | | $ | 84,676,617 | | | $ | — | | | $ | 84,676,617 | |
| Corporate Bonds | | | — | | | | 11,502,586 | | | | — | | | | 11,502,586 | |
| Foreign Government Bonds | | | — | | | | 10,510,182 | | | | — | | | | 10,510,182 | |
| Mortgage Backed Securities | | | — | | | | 53,166,227 | | | | — | | | | 53,166,227 | |
| U.S. Government Agency Issues | | | — | | | | 182,322,273 | | | | — | | | | 182,322,273 | |
| U.S. Government Notes | | | — | | | | 15,344,828 | | | | — | | | | 15,344,828 | |
| Short Term Investments | | | 36,042,158 | | | | 1,000,748 | | | | — | | | | 37,042,906 | |
| Total Investments | | $ | 36,042,158 | | | $ | 358,523,461 | | | $ | — | | | $ | 394,565,619 | |
| | | | | | | | | | | | | | | | | |
Other Financial Instruments* | | | | | | | | | | | | | | | | |
| Forward Currency Contracts | | | | | | | | | | | | | | | | |
| Long Forward Currency Contracts | | $ | — | | | $ | (752,964 | ) | | $ | — | | | $ | (752,964 | ) |
| Short Forward Currency Contracts | | | — | | | | 2,814,548 | | | | — | | | | 2,814,548 | |
| Total Forward Currency Contracts | | | — | | | | 2,061,584 | | | | — | | | | 2,061,584 | |
| Futures Contracts | | | | | | | | | | | | | | | | |
| Long Futures Contracts | | | (1,829,352 | ) | | | — | | | | — | | | | (1,829,352 | ) |
| Short Futures Contracts | | | (659,925 | ) | | | — | | | | — | | | | (659,925 | ) |
| Total Futures Contracts | | | (2,489,277 | ) | | | — | | | | — | | | | (2,489,277 | ) |
| Total Other Financial Instruments | | $ | (2,489,277 | ) | | $ | 2,061,584 | | | $ | — | | | $ | (427,693 | ) |
See the Fund’s consolidated schedule of investments for the investments detailed by industry classification.
*Other financial instruments include forward currency contracts and futures contracts which are not included in the Fund’s consolidated schedule of investments. The fair value of the Fund’s other financial instruments represent the net unrealized appreciation (depreciation) at June 30, 2015.
The LoCorr Market Trend Fund did not hold any Level 3 assets during the period.
The following table summarizes LoCorr Long/Short Equity Fund’s investments and securities sold short as of June 30, 2015:
| | | | | | | | | | | | | |
| Security Classification | | Level 1 | | | Level 2 | | | Level 3 | | | Total | |
| Investments | | | | | | | | | | | | |
| Closed-End Investment Company | | $ | 306,432 | | | $ | — | | | $ | — | | | $ | 306,432 | |
| Common Stocks | | | 35,231,289 | | | | — | | | | — | | | | 35,231,289 | |
| Exchange Traded Funds | | | 846,850 | | | | — | | | | — | | | | 846,850 | |
| Short Term Investment | | | 917,572 | | | | — | | | | — | | | | 917,572 | |
| Total Investments | | $ | 37,302,143 | | | $ | — | | | $ | — | | | $ | 37,302,143 | |
| | | | | | | | | | | | | | | | | |
| Securities Sold Short | | | | | | | | | | | | | | | | |
| Common Stocks | | $ | (3,635,869 | ) | | $ | — | | | $ | — | | | $ | (3,635,869 | ) |
| Exchange Traded Fund | | | (139,980 | ) | | | — | | | | — | | | | (139,980 | ) |
| Total Securities Sold Short | | $ | (3,775,849 | ) | | $ | — | | | $ | — | | | $ | (3,775,849 | ) |
See the Fund’s schedule of investments and schedule of securities sold short for detail by industry classification.
LoCorr Managed Futures Strategy Fund, LoCorr Long/Short Commodities Strategy Fund, LoCorr Multi-Strategy Fund and LoCorr Market Trend Fund - Notes
to Consolidated Financial Statements / LoCorr Long/Short Equity Fund and LoCorr Spectrum Income Fund - Notes to Financial Statements (continued) | | 81 |
The following table summarizes the LoCorr Long/Short Equity Fund’s transfers between levels of the fair value hierarchy:
| | | | | | | | | |
| Security Classification | | Level 1 | | | Level 2 | | | |
| Common Stocks | | | | | | | | |
| Transfers In | | $ | 108,600 | | | $ | — | | | |
| Transfers Out | | | — | | | | (108,600 | ) | | |
| Net Transfers In and/or Out | | $ | 108,600 | | | $ | (108,600 | ) | | |
The Fund held one common stock classified as Level 2 of the Fair Value Hierarchy at March 31, 2015, which is now classified as Level 1 at June 30, 2015.
The LoCorr Long/Short Equity Fund did not hold any Level 3 assets during the period.
The following table summarizes LoCorr Spectrum Income Fund’s investments as of June 30, 2015:
| | | | | | | | | | | | | |
| Security Classification | | Level 1 | | | Level 2 | | | Level 3 | | | Total | |
| Investments | | | | | | | | | | | | |
| Business Development Companies | | $ | 8,132,576 | | | $ | — | | | $ | — | | | $ | 8,132,576 | |
| Closed-End Investment Companies | | | 13,944,905 | | | | — | | | | — | | | | 13,944,905 | |
| Common Stocks | | | 7,151,301 | | | | — | | | | — | | | | 7,151,301 | |
| Master Limited Partnerships | | | 35,376,049 | | | | — | | | | — | | | | 35,376,049 | |
| Private Investment | | | — | | | | — | | | | 11,373,928 | | | | 11,373,928 | |
| Real Estate Investment Trusts | | | 35,473,735 | | | | — | | | | — | | | | 35,473,735 | |
| Royalty Trust | | | 1,715,538 | | | | — | | | | — | | | | 1,715,538 | |
| Short Term Investment | | | 4,259,283 | | | | — | | | | — | | | | 4,259,283 | |
| Total Investments | | $ | 106,053,387 | | | $ | — | | | $ | 11,373,928 | | | $ | 117,427,315 | |
See the Fund’s schedule of investments for detail by industry classification.
The following is a reconciliation of the beginning and ending balances for assets measured at fair value using significant unobservable inputs (Level 3) during the period ended June 30, 2015:
| | | Investments | |
| | | in Securities, | |
| Level 3 Reconciliation Disclosure | | at fair value | |
| Balance, December 31, 2014 | | $ | 11,251,542 | |
| Purchases | | | — | |
| (Sales) | | | — | |
| Return of capital distributions | | | (194,048 | ) |
| Realized gain (loss) | | | — | |
| Change in net unrealized gain (loss) | | | 316,434 | |
| Transfer into Level 3 | | | — | |
| Transfer out of Level 3 | | | — | |
| Balance, June 30, 2015 | | $ | 11,373,928 | |
| | | | | |
| Net change in unrealized gains relating to Level 3 investments still held at June 30, 2015 | | $ | 316,434 | |
Quantitative Information about Level 3 Fair Value Measurements held in the LoCorr Spectrum Income Fund:
| | | | | | | |
| Type of Security | Valuation Technique | Unobservable Input | Range | | Fair Value at June 30, 2015 | |
| Private Investment | See note below | Subscription Price $50,000 per unit | Unchanged | | $ | 11,373,928 | |
Note: Management’s fair valuation is based on the issuer’s financial statements and other data, as well as other trades in this security as noted above. See additional detail related to these considerations in the Investment Valuation disclosures. The purchase discount on LoCorr Spectrum Income Fund’s investment in Terra is accreted on a straight-line basis over a period of five years, and is presented as part of unrealized appreciation for financial reporting purposes.
Transfers between levels are recognized at the end of the quarterly reporting period.
82 | | LoCorr Managed Futures Strategy Fund, LoCorr Long/Short Commodities Strategy Fund, LoCorr Multi-Strategy Fund and LoCorr Market Trend Fund - Notes
to Consolidated Financial Statements / LoCorr Long/Short Equity Fund and LoCorr Spectrum Income Fund - Notes to Financial Statements (continued) |
Deferred Offering Costs
Offering Costs are accounted for as a deferred charge until operations begin and thereafter amortized to expense over twelve months on a straight-line basis. For the LoCorr Multi-Strategy Fund and the LoCorr Market Trend Fund, these costs consisted of legal fees pertaining to preparing the Fund’s initial registration statement, printing costs, and SEC and state registration fees. For the period from April 6, 2015 (commencement of operations) through June 30, 2015, the LoCorr Multi-Strategy Fund amortized $15,042 in deferred offering costs. At June 30, 2015, the remaining cumulative balance of unamortized offering costs for the LoCorr Multi-Strategy Fund amounted to $49,723. For the six months ended June 30, 2015, the LoCorr Market Trend Fund amortized $36,544 in deferred offering costs. At June 30, 2015, the LoCorr Market Trend Fund fully amortized all of its deferred offering costs.
Organizational Costs
Organizational costs in connection with the organization of the Funds are expensed as incurred. For the period from April 6, 2015 (commencement of operations) through June 30, 2015, the LoCorr Multi-Strategy Fund expensed $15,167 in organizational costs associated with the legal fees related to the Fund’s formation and incorporation of business.
Federal Income Taxes
The Funds intend to qualify as regulated investment companies pursuant to Subchapter M of the Internal Revenue Code of 1986, as amended. The Funds intend to distribute substantially all of their investment company net taxable income and net capital gains to shareholders. Therefore, no federal income tax provision is required.
As of and during the period ended June 30, 2015, the Funds did not have any tax positions that did not meet the “more-likely-than-not” threshold of being sustained by applicable tax authorities. The Funds recognize interest and penalties, if any, related to unrecognized tax benefits on uncertain tax positions as interest or other expense in the statements of operations. During the period ended June 30, 2015, the Funds did not incur any interest or penalties. Generally, tax authorities can examine all the tax returns filed for the last three open tax years.
For tax purposes, LCMFS, LCLSCS, LCMSF and LCMT are exempted Cayman Islands investment companies. LCMFS, LCLSCS, LCMSF and LCMT have each received an undertaking from the Government of the Cayman Islands exempting them from all local income, profits, and capital gains taxes. No such taxes are levied in the Cayman Islands at the present time. For U.S. income tax purposes, LCMFS, LCLSCS, LCMSF and LCMT are controlled foreign corporations (“CFCs”) and as such are not subject to U.S. income tax. However, as a wholly-owned CFC, the net income and capital gain of each CFC, to the extent of its earnings and profits, will be included each year in the respective Funds’ investment company taxable income.
Use of Estimates
The preparation of consolidated financial statements in conformity with GAAP requires management to make estimates and assumptions that affect the reported amounts of assets and liabilities, disclosure of contingent assets and liabilities at the date of the financial statements and the reported revenues and expenses during the reporting period. Actual results could differ from those estimates.
Indemnifications
In the normal course of business, the Funds enter into contracts that contain general indemnifications to other parties. The Funds’ maximum exposure under these contracts is unknown as this would involve future claims that may be made against the Funds that have not yet occurred. However, based on experience, the Funds expect the risk of loss to be remote.
Security Transactions and Investment Income
Security transactions are recorded on trade date. Generally, realized gains and losses on sales of investments are calculated on the specifically identified cost basis of the securities.
Each Fund may invest up to 15% of its net assets in illiquid securities. Illiquid securities may include securities subject to contractual or legal restrictions on resale (e.g., because they have not been registered under the Securities Act) and securities that are otherwise not readily marketable (e.g., because trading in the security is suspended or because market makers do not exist or will not entertain bids or offers). Securities that have not been registered under the Securities Act are referred to as private investments or restricted securities and are purchased directly from the issuer or in the secondary market. Foreign securities that are freely tradable in their principal markets are not considered to be illiquid. Under guidelines adopted by the Trust’s Board, the Adviser of the Fund may determine that particular Rule 144(a) securities, and commercial paper issued in reliance on the private placement exemption from registration afforded by Section 4(a)(2) of the Securities Act, are liquid even though they are not registered. At June 30, 2015, the Adviser deemed all of the restricted securities held in the LoCorr Managed Futures Strategy Fund, the LoCorr Long/Short Commodities Strategy Fund and the LoCorr Market Trend Fund to be liquid. There were no illiquid or restricted securities held in the LoCorr Multi-Strategy Fund or the LoCorr Long/Short Equity Fund at June 30, 2015. The LoCorr Spectrum Income Fund’s investment in Terra was deemed by the Adviser to be illiquid at June 30, 2015 and represented 9.65% of the Fund’s net assets. The private placement memorandum of Terra specifies that it will continue in existence until December 31, 2023, unless terminated sooner.
Dividend income, less foreign taxes withheld, if any, are recorded on the ex-dividend date.
Distributions received from the investments in MLP interests, REITs, private investments and royalty trusts generally are comprised of ordinary income, capital gains and return of capital. For financial statement purposes, the Funds use estimates to characterize these distributions received as return of capital, capital gains or ordinary income. Such estimates are based on historical information available from each MLP, REIT, private investment or royalty trust and other industry sources. These estimates may subsequently be revised based on information received from the MLP, REIT, private investment or royalty trust after their tax reporting periods are concluded, as the actual character of these distributions is not known until after the fiscal year end of the Funds. The distributions received from the MLP, REIT, private investment and royalty trust securities that have been classified as income and capital gains are included in investment income and net realized gain (loss) on investments, respectively, on the statement of operations. The distributions received that are classified as return of capital reduce the cost of investments on the statement of assets and liabilities. For the period ended June 30, 2015, the Funds estimated that 100% of the MLP distributions received would be treated as return of capital. For the period ended June 30, 2015, approximately 63% of the total distributions received from Terra are estimated to be interest income, and the remaining 37% were treated as return of capital.
LoCorr Managed Futures Strategy Fund, LoCorr Long/Short Commodities Strategy Fund, LoCorr Multi-Strategy Fund and LoCorr Market Trend Fund - Notes
to Consolidated Financial Statements / LoCorr Long/Short Equity Fund and LoCorr Spectrum Income Fund - Notes to Financial Statements (continued) | | 83 |
Interest income and expense are recognized on the accrual basis. Market discounts, premiums and original issue discounts on fixed-income securities are amortized daily over the expected life of the security using the effective yield method.
Allocation of Income and Expenses
Net investment income, other than class specific expenses, and realized and unrealized gains and losses are allocated daily to each class of shares based upon the relative net asset value of outstanding shares of each class of shares at the beginning of the day (after adjusting for the current capital shares activity of the respective class). Expenses associated with a specific Fund in the Trust are charged to that Fund. Common expenses are typically allocated based upon the relative net assets of each Fund, or by other equitable means.
Distributions to Shareholders
Shareholder transactions are recorded on trade date. Dividends from net investment income are declared and paid at least annually by the Funds. Distribution of net realized capital gains, if any, are declared and paid at least annually. Distributions to shareholders are recorded on the ex-dividend date. The character of distributions made during the periods from net investment income or net realized gains may differ from the characterization for federal income tax purposes due to the difference in the recognition of income, expense and gain items for financial statement and tax purposes.
Beginning in May 2015, dividends for the LoCorr Multi-Strategy Fund are distributed monthly. In 2015, the dividends for the LoCorr Spectrum Income Fund are distributed monthly. The estimated characterization of the distributions paid will be either a qualified dividend or return of capital. This estimate is based on each Fund’s operating results during the period. It is anticipated that a significant portion of the distributions of the Funds’ investments in MLP and certain investments in REIT and royalty trusts will be comprised of return of capital as a result of the tax character of cash distributions made by each Fund’s investments. The actual characterization of the distributions made during the period will not be determined until after the end of the fiscal year.
The estimated tax character of distributions paid during the periods was as follows:
| | | | | | | | | | |
| | | Period Ended June 30, 2015(a) | |
| Fund | | Ordinary Income | | | Long-Term Capital Gains | | | Return of Capital | |
| LoCorr Multi-Strategy Fund | | $ | 86,171 | | | $ | — | | | $ | — | |
| LoCorr Spectrum Income Fund | �� | | 3,407,062 | | | | — | | | | — | |
(a) For the period from April 6, 2015 (commencement of operations) through June 30, 2015 for the LoCorr Multi-Strategy Fund and for the six months ended June 30, 2015 for the LoCorr Spectrum Income Fund.
| | | Period Ended December 31, 2014(a) | |
| Fund | | Ordinary Income | | | Long-Term Capital Gains | | | Return of Capital | |
| LoCorr Managed Futures Strategy Fund | | $ | 52,568,247 | | | $ | 413,276 | | | $ | — | |
| LoCorr Long/Short Commodities Strategy Fund | | | 5,555,928 | | | | — | | | | — | |
| LoCorr Market Trend Fund | | | 1,644,488 | | | | 552,497 | | | | — | |
| LoCorr Long/Short Equity Fund | | | 169,677 | | | | — | | | | — | |
| LoCorr Spectrum Income Fund | | | 2,382,874 | | | | — | | | | 1,097,840 | |
(a) For the year ended December 31, 2014 for the LoCorr Managed Futures Strategy Fund, the LoCorr Long/Short Commodities Strategy Fund, the LoCorr Long/Short Equity Fund and the LoCorr Spectrum Income Fund and for the period from July 1, 2014 (commencement of operations) through December 31, 2014 for the LoCorr Market Trend Fund.
Distributable Earnings and Investment Transactions
Net investment income and net realized gains (losses) may differ for financial reporting and tax purposes because of temporary or permanent book/tax differences. To the extent these differences are permanent; reclassifications are made to the appropriate equity accounts in the period that the difference arises.
Additionally, U.S. generally accepted accounting principles require that certain components of net assets relating to permanent differences be reclassified between financial and tax reporting. These reclassifications have no effect on net assets or net asset value per share.
Foreign Securities and Currency
Investment securities and other assets and liabilities denominated in foreign currencies are translated into U.S. dollar amounts at the date of valuation. Purchases and sales of investment securities and income and expense items denominated in foreign currencies are translated into U.S. dollar amounts on the respective dates of such transactions.
84 | | LoCorr Managed Futures Strategy Fund, LoCorr Long/Short Commodities Strategy Fund, LoCorr Multi-Strategy Fund and LoCorr Market Trend Fund - Notes
to Consolidated Financial Statements / LoCorr Long/Short Equity Fund and LoCorr Spectrum Income Fund - Notes to Financial Statements (continued) |
The Funds do not isolate that portion of the results of operations resulting from changes in foreign exchange rates on investments from the fluctuations arising from changes in market prices of securities held. Such fluctuations are included with the net realized and unrealized gain or loss from investments.
Reported net realized foreign exchange gains or losses arise from sales of foreign currencies, currency gains or losses realized between the trade and settlement dates on securities transactions, and the difference between the amounts of dividends, interest, and foreign withholding taxes recorded on the Funds’ books and the U.S. dollar equivalent of the amounts actually received or paid. Net unrealized foreign exchange gains and losses arise from changes in the fair values of assets and liabilities, other than investments in securities at period end, resulting from changes in exchange rates.
Forward Currency Contracts
Gains or losses are realized when foreign currency contracts are liquidated. Any change in net unrealized gain or loss is reported in the statement of operations.
Futures Contracts
Gains or losses are realized when contracts are liquidated. Any change in net unrealized gain or loss is reported in the statement of operations. Brokerage commissions on open futures contracts are charged to expense when paid.
Total Return Swap Contracts
The Funds may enter into total return swap agreements. A total return swap entered into by the Funds is a derivative contract that transfers the market risk of underlying portfolios of futures and forward currency contracts (considered the “index” within each total return swap contract) between counterparties. The “notional amount” of each total return swap agreement is the agreed upon amount or value of the index used for calculating the returns that the parties to a swap agreement have agreed to exchange. The total return swaps are marked to market daily and any change is recorded in unrealized gain/loss on the consolidated statement of operations based on the value of the index on which the total return swap is referenced, as defined within the total return swap agreement between the counterparties. The composition of the index may vary based on how the underlying portfolio of futures and forward currency contracts is traded. A Fund’s obligation under a total return swap agreement, including any related fees, offset against amounts owed to the Fund in the case of positive performance, will be covered by designating liquid assets on the Fund’s books and records (see the consolidated statement of assets and liabilities for deposits with broker for derivative instruments). Gains or losses will be realized when the total return swap contracts are liquidated and will be presented as net realized gain or loss on swap contracts on the consolidated statements of operations. In addition, changes in notional value and any cash holding adjustments, which represent voluntary realizations by a Fund of swap value at any point in time, are also presented as net realized gain or loss on swap contracts on the consolidated statements of operations. A corresponding asset or liability for “advance receipt on swap contracts” or “advance payment on swap contracts”, respectively, is recorded on the consolidated statements of assets and liabilities for the gain or loss realized on changes in notional value. Total return swaps outstanding at period end, if any, are listed after the Funds’ consolidated schedules of investments.
Short Sales
The Funds may sell securities short. A short sale is a transaction in which the Fund sells a security it does not own or have the right to acquire (or that it owns but does not wish to deliver) in anticipation that the market price of that security will decline.
When the Fund makes a short sale, the broker-dealer through which the short sale is made must borrow the security sold short and deliver it to the party purchasing the security. The Fund is required to make a margin deposit in connection with such short sales; the Fund may have to pay a fee to borrow particular securities and will often be obligated to pay over any dividends and accrued interest on borrowed securities.
If the price of the security sold short increases between the time of the short sale and the time the Fund covers its short position, the Fund will incur a loss; conversely, if the price declines, the Fund will realize a capital gain. A gain, limited to the price at which the Fund sold the security short, or a loss, unlimited in size, will be recognized upon the close of a short sale. Any gain will be decreased, and any loss increased, by the transaction costs described above. The successful use of short selling may be adversely affected by imperfect correlation between movements in the price of the security sold short and the securities being hedged. Gains or losses from closed positions of securities sold short are presented as net realized gain or loss on securities sold short on the statement of operations.
In addition, the Fund is required to pay the lender any dividends declared on short positions. Dividends declared on open short positions are recorded on ex-date and shown as an expense for financial reporting purposes. To borrow the security, the Fund also may be required to pay fees, which is shown as an expense for financial reporting purposes.
To the extent the Fund sells securities short, it will provide collateral to the broker-dealer and (except in the case of short sales “against the box”) will maintain additional asset coverage in the form of cash, U.S. government securities or other liquid securities with its custodian in a segregated account in an amount at least equal to the difference between the current fair value of the securities sold short and any amounts required to be deposited as collateral with the selling broker (not including the proceeds of the short sale). A short sale is “against the box” to the extent the Fund contemporaneously owns, or has the right to obtain at no added cost, securities identical to those sold short. Short sales are collateralized by cash deposits with the counterparty broker and pledged securities held at the custodian, U.S. Bank, N.A. (“U.S. Bank”). The collateral required is determined daily by reference to the fair value of the short positions.
Deposits with Broker
Forward Currency and Futures Contracts
When trading derivative instruments, such as forward or futures contracts, the Fund is only required to post initial or variation margin with the exchange or clearing broker. The use of margin in trading these instruments has the effect of creating leverage, which can expose the Fund to substantial gains or losses occurring from relatively small price changes in the value of the underlying instrument and can increase the volatility of the Fund’s returns. Volatility is a statistical measure of the dispersion of returns of an investment, where higher volatility generally indicates greater risk. At June 30, 2015, the LoCorr Market Trend Fund pledged $3,460,000 in cash and cash equivalents with Bank of America Merrill Lynch for its investment in forward currency contracts.
LoCorr Managed Futures Strategy Fund, LoCorr Long/Short Commodities Strategy Fund, LoCorr Multi-Strategy Fund and LoCorr Market Trend Fund - Notes
to Consolidated Financial Statements / LoCorr Long/Short Equity Fund and LoCorr Spectrum Income Fund - Notes to Financial Statements (continued) | | 85 |
Upon entering into a futures contract, and to maintain the Fund’s open positions in futures contracts, the Fund would be required to deposit with its custodian or futures broker in a segregated account in the name of the futures broker an amount of cash, U.S. government securities, suitable money market instruments, or other liquid securities, known as “initial margin.” The margin required for a particular futures contract is set by the exchange on which the contract is traded, and may be significantly modified from time to time by the exchange during the term of the contract. Futures contracts are customarily purchased and sold on margins that may range upward from less than 5% of the value of the contract being traded.
At June 30, 2015, the LoCorr Market Trend Fund and LCMT, collectively, had $32,654,084 in cash and cash equivalents on deposit with broker for derivative instruments and is presented on the Fund’s consolidated statement of assets and liabilities. In addition, LCMT pledged securities with a fair value of $348,642 as collateral for derivative instruments.
If the price of an open futures contract changes (by increase in underlying instrument or index in the case of a sale or by decrease in the case of a purchase) so that the loss on the futures contract reaches a point at which the margin on deposit does not satisfy margin requirements, the broker will require an increase in the margin. However, if the value of a position increases because of favorable price changes in the futures contract so that the margin deposit exceeds the required margin, the broker will pay the excess to the Fund.
These subsequent payments, called “variation margin,” to and from the futures broker, are made on a daily basis as the price of the underlying assets fluctuate making the long and short positions in the futures contract more or less valuable, a process known as “marking to the market.” The Fund expects to earn interest income on any margin deposits.
Swap Contracts
LCMFS, LCLSCS and LCMSF have a substantial portion of their assets on deposit with Deutsche Bank in connection with their trading of swap contracts. Assets deposited with Deutsche Bank in connection with the trading of swap contracts for LCMFS, LCLSCS and LCMSF are partially restricted due to deposit requirements. At June 30, 2015, the LoCorr Managed Futures Strategy Fund, the LoCorr Long/Short Commodities Strategy Fund and the LoCorr Multi-Strategy Fund had cash and cash equivalents on deposit with Deutsche Bank in the amount of $101,000,010, $9,435,010 and $3,616,500, respectively, which have been presented on the consolidated statements of assets and liabilities for each Fund. In addition, at June 30, 2015, the LCMFS, LCLSCS and LCMSF pledged securities with a fair value of $2,869,771, $461,350 and $200,010, respectively, as collateral for swap contracts. Risks arise from the possible inability of the counterparty to meet the term of its contract and may increase if the counterparty’s financial condition worsens.
Securities Sold Short
At June 30, 2015, the LoCorr Long/Short Equity Fund had cash on deposit with the broker-dealer in the amount of $3,745,571 and pledged securities with a fair value of $3,654,435.
Market and Credit Risks
The Funds may engage in the speculative trading of U.S. and foreign futures, forward currency and swap contracts (collectively, derivatives). The Funds are exposed to both market risk, which is the risk arising from changes in the fair value of the contracts, and credit risk, which is the risk of failure by another party to perform according to the terms of a contract.
Purchase and sale of futures contracts requires margin deposits with the broker. Additional deposits may be necessary for any loss on contract value. The Commodity Exchange Act requires a broker to segregate all customer transactions and assets from such broker’s proprietary activities. A customer’s cash and other property (for example, U.S. government securities) deposited with a broker are considered commingled with all other customer funds subject to the broker’s segregation requirements. In the event of a broker’s insolvency, recovery may be limited to a pro rata share of segregated funds available. It is possible that the recovered amount could be less than total cash and other property deposited.
For derivatives, risks arise from changes in the fair value of the contracts. Theoretically, the Funds are exposed to a market risk equal to the notional contract value of swap, futures and forward currency contracts purchased and unlimited liability on such contracts sold short.
The Funds also engage in investing its assets in U.S. government securities. Risks arise from investments in U.S. government securities due to possible market illiquidity. U.S. government securities are also sensitive to changes in interest rates and economic conditions.
The Funds have established procedures to actively monitor market risk and minimize credit risk, although there can be no assurance that they will, in fact, succeed in doing so.
3. Derivative and Other Financial Instruments
The Funds may invest in derivatives such as futures, forward currency, and swap contracts, in order to hedge against market movements while liquidating certain positions and buying other securities or as substitutes for securities, as well as for speculative purposes to gain exposure to such market movements.
The Funds’ market risk related to its derivatives trading is influenced by a wide variety of factors, including the level and volatility of interest rates, exchange rates, weather, supply and demand of commodities, the market value of futures and forward currency contracts, the diversification effects among the Funds’ open positions and the liquidity of the markets in which they trade.
The following are the primary trading risk exposures by market sector of the Funds as encompassed in the total return swap contracts:
Agricultural (grains, livestock and softs). The Funds’ primary exposure is to agricultural price movements which are often directly affected by severe or unexpected weather conditions.
86 | | LoCorr Managed Futures Strategy Fund, LoCorr Long/Short Commodities Strategy Fund, LoCorr Multi-Strategy Fund and LoCorr Market Trend Fund - Notes
to Consolidated Financial Statements / LoCorr Long/Short Equity Fund and LoCorr Spectrum Income Fund - Notes to Financial Statements (continued) |
Currencies. Exchange rate risk is a principal market exposure of the Funds. The Funds’ currency exposure is to exchange rate fluctuations, primarily fluctuations which disrupt the historical pricing relationships between different currencies and currency pairs. The fluctuations are influenced by interest rate changes as well as political and general economic conditions. The Funds trade in a large number of currencies including cross-rates – e.g., positions between two currencies other than the U.S. dollar.
Energy. The Funds’ primary energy market exposure is to gas and oil price movements, often resulting from political developments in the Middle East and economic conditions worldwide. Energy prices are volatile and substantial profits and losses have been and are expected to continue to be experienced in this market.
Interest rates. Interest rate movements directly affect the price of the sovereign bond futures positions held by the Funds and indirectly the value of its stock index currency positions. Interest rate movements in one country as well as relative interest rate movements between countries may materially impact the Funds’ profitability. The Funds’ primary interest rate exposure is to interest rate fluctuations in countries or regions including Australia, Canada, Japan, Switzerland, the United Kingdom, the United States and the Eurozone. However, the Funds also may take positions in futures contracts on the government debt of other nations. The Funds anticipate that interest rates in these industrialized countries or areas, both long-term and short-term, will remain a primary market exposure of the Funds for the foreseeable future.
Metals. The Funds’ metals market exposure is to fluctuations in the price of aluminum, copper, gold, lead, nickel, palladium, tin, silver and zinc.
Stock index. The Funds’ equity exposure, through stock index futures, is to equity price risk in the major industrialized countries as well as other countries.
At June 30, 2015, the LoCorr Managed Futures Strategy Fund, the LoCorr Long/Short Commodities Strategy Fund and the LoCorr Multi-Strategy Fund held swap contracts which are not subject to a master netting arrangement. As the tables below illustrate, no positions are netted in these consolidated financial statements.
| | | | | | | | | | | | | | | | | | | |
| LoCorr Managed Futures Strategy Fund - June 30, 2015 | |
| Liabilities: | | | | | | | | | | | | | | | | | | |
| | | | | | | | | | | | Gross Amounts not offset in the Consolidated Statement of Assets & Liabilities | | | | |
| Description | | Gross Amounts of Recognized Liabilities | | | Gross Amounts Offset in the Consolidated Statement of Assets & Liabilities | | | Net Amounts Presented in the Consolidated Statement of Assets & Liabilities | | | Financial Instruments | | | Collateral Received (Pledged) | | | Net Amount | |
Swap Contracts* | | $ | 45,529,874 | | | $ | — | | | $ | 45,529,874 | | | $ | — | | | $ | (45,529,874 | ) | | $ | — | |
| Total | | $ | 45,529,874 | | | $ | — | | | $ | 45,529,874 | | | $ | — | | | $ | (45,529,874 | ) | | $ | — | |
*Includes advance payment on swap contracts.
| | | | | | | | | | | | | | | | | | | |
| LoCorr Long/Short Commodities Strategy Fund - June 30, 2015 | |
| Liabilities: | | | | | | | | | | | | | | | | | | |
| | | | | | | | | | | | Gross Amounts not offset in the Consolidated Statement of Assets & Liabilities | | | | |
| Description | | Gross Amounts of Recognized Liabilities | | | Gross Amounts Offset in the Consolidated Statement of Assets & Liabilities | | | Net Amounts Presented in the Consolidated Statement of Assets & Liabilities | | | Financial Instruments | | | Collateral Received (Pledged) | | | Net Amount | |
| Swap Contracts | | $ | 4,899,992 | | | $ | — | | | $ | 4,899,992 | | | $ | — | | | $ | (4,899,992 | ) | | $ | — | |
| Total | | $ | 4,899,992 | | | $ | — | | | $ | 4,899,992 | | | $ | — | | | $ | (4,899,992 | ) | | $ | — | |
| | | | | | | | | | | | | | | | | | | |
| LoCorr Multi-Strategy Fund - June 30, 2015 | |
| Liabilities: | | | | | | | | | | | | | | | | | | |
| | | | | | | | | | | | Gross Amounts not offset in the Consolidated Statement of Assets & Liabilities | | | | |
| Description | | Gross Amounts of Recognized Liabilities | | | Gross Amounts Offset in the Consolidated Statement of Assets & Liabilities | | | Net Amounts Presented in the Consolidated Statement of Assets & Liabilities | | | Financial Instruments | | | Collateral Received (Pledged) | | | Net Amount | |
| Swap Contracts | | $ | 662,563 | | | $ | — | | | $ | 662,563 | | | $ | — | | | $ | (662,563 | ) | | $ | — | |
| Total | | $ | 662,563 | | | $ | — | | | $ | 662,563 | | | $ | — | | | $ | (662,563 | ) | | $ | — | |
LoCorr Managed Futures Strategy Fund, LoCorr Long/Short Commodities Strategy Fund, LoCorr Multi-Strategy Fund and LoCorr Market Trend Fund - Notes
to Consolidated Financial Statements / LoCorr Long/Short Equity Fund and LoCorr Spectrum Income Fund - Notes to Financial Statements (continued) | | 87 |
At June 30, 2015, the LoCorr Market Trend Fund held derivative and other financial instruments which are not subject to a master netting arrangement.
| | | | | | | | | | | | | | | | | | | |
| LoCorr Market Trend Fund - June 30, 2015 | |
| Assets: | | | | | | | | | | | | | | | | | | |
| | | | | | | | | | | | Gross Amounts not offset in the Consolidated Statement of Assets & Liabilities | | | | |
| Description | | Gross Amounts of Recognized Assets | | | Gross Amounts Offset in the Consolidated Statement of Assets & Liabilities | | | Net Amounts Presented in the Consolidated Statement of Assets & Liabilities | | | Financial Instruments | | | Collateral Pledged (Received) | | | Net Amount | |
| Forward Currency Contracts | | $ | 3,947,608 | | | $ | — | | | $ | 3,947,608 | | | $ | — | | | $ | — | | | $ | 3,947,608 | |
| Futures Contracts | | | 1,134,784 | | | | — | | | | 1,134,784 | | | | — | | | | — | | | | 1,134,784 | |
| Total | | $ | 5,082,392 | | | $ | — | | | $ | 5,082,392 | | | $ | — | | | $ | — | | | $ | 5,082,392 | |
| | | | | | | | | | | | | | | | | | | |
| Liabilities: | | | | | | | | | | | | | | | | | | |
| | | | | | | | | | | | Gross Amounts not offset in the Consolidated Statement of Assets & Liabilities | | | | |
| Description | | Gross Amounts of Recognized Liabilities | | | Gross Amounts Offset in the Consolidated Statement of Assets & Liabilities | | | Net Amounts Presented in the Consolidated Statement of Assets & Liabilities | | | Financial Instruments | | | Collateral Received (Pledged) | | | Net Amount | |
| Forward Currency Contracts | | $ | 1,886,024 | | | $ | — | | | $ | 1,886,024 | | | $ | — | | | $ | (1,886,024 | ) | | $ | — | |
| Total | | $ | 1,886,024 | | | $ | — | | | $ | 1,886,024 | | | $ | — | | | $ | (1,886,024 | ) | | $ | — | |
The Funds have adopted authoritative standards regarding disclosure about derivatives and hedging activities and how they affect the Funds’ consolidated statements of asset and liabilities and statements of operations. Fair value of swap contracts are recorded in the consolidated statements of assets and liabilities as net unrealized gain on swap contracts or net unrealized loss on swap contracts and net unrealized appreciation of swap contracts or net unrealized depreciation of swap contracts.
Since the derivatives held long or short are for speculative trading purposes, the derivative instruments are not designated as hedging instruments. Accordingly, all realized gains and losses, as well as any change in net unrealized gains or losses on open contracts from the preceding period, are recognized as part of realized and unrealized gain (loss) in the consolidated statements of operations.
The following table presents the fair value of consolidated open swap contracts for the LoCorr Managed Futures Strategy Fund, the LoCorr Long/ Short Commodities Strategy Fund and the LoCorr Multi-Strategy Fund at June 30, 2015, as presented on each Fund’s consolidated statements of assets and liabilities.
| | | | | | | | | | |
| | | | | | Net Unrealized | |
| | | | | | | | | Gain (Loss) on | |
| | | Fair Value | | | Open | |
| Derivatives not accounted for as hedging instruments | | Assets | | | Liabilities | | | Positions | |
| LoCorr Managed Futures Strategy Fund | | | | | | | | | |
| Long Total Return Swap Contracts | | | | | | | | | |
| LoCorr Managed Futures Index | | $ | — | | | $ | 42,869,132 | | | $ | (42,869,132 | ) |
| | | | | | | | | | | | | |
| LoCorr Long/Short Commodities Strategy Fund | | | | | | | | | | | | |
| Long Total Return Swap Contracts | | | | | | | | | | | | |
| LoCorr Commodities Index | | $ | — | | | $ | 4,899,992 | | | $ | (4,899,992 | ) |
| | | | | | | | | | | | | |
| LoCorr Multi-Strategy Fund | | | | | | | | | | | | |
| Long Total Return Swap Contracts | | | | | | | | | | | | |
| LoCorr Multi-Strategy Index | | $ | — | | | $ | 662,563 | | | $ | (662,563 | ) |
88 | | LoCorr Managed Futures Strategy Fund, LoCorr Long/Short Commodities Strategy Fund, LoCorr Multi-Strategy Fund and LoCorr Market Trend Fund - Notes
to Consolidated Financial Statements / LoCorr Long/Short Equity Fund and LoCorr Spectrum Income Fund - Notes to Financial Statements (continued) |
The following table presents the fair value of consolidated derivative instruments for the LoCorr Market Trend Fund at June 30, 2015 as presented on the Fund’s consolidated statement of assets and liabilities:
| | | | | | | | | | |
| | | | | | | | | Net Unrealized | |
| | | | | | Gain (Loss) on | |
| | | Fair Value | | | Open | |
| Derivatives not accounted for as hedging instruments | | Assets | | | Liabilities | | | Positions | |
| LoCorr Market Trend Fund | | | | | | | | | |
Forward Currency Contracts(a) | | | | | | | | | |
| Long | | $ | 378,736 | | | $ | 1,131,700 | | | $ | (752,964 | ) |
| Short | | | 3,568,872 | | | | 754,324 | | | | 2,814,548 | |
| Total Forward Currency Contracts | | | 3,947,608 | | | | 1,886,024 | | | | 2,061,584 | |
| | | | | | | | | | | | | |
Futures Contracts(b) | | | | | | | | | | | | |
| Long Contracts | | | | | | | | | | | | |
| Commodity | | | 160,709 | | | | 107,512 | | | | 53,197 | |
| Equity | | | 126,784 | | | | 2,899,059 | | | | (2,772,275 | ) |
| Interest Rate | | | 1,039,370 | | | | 149,644 | | | | 889,726 | |
| Total Long Contracts | | | 1,326,863 | | | | 3,156,215 | | | | (1,829,352 | ) |
| | | | | | | | | | | | | |
| Short Contracts | | | | | | | | | | | | |
| Commodity | | | 692,798 | | | | 2,633,560 | | | | (1,940,762 | ) |
| Equity | | | 1,081,169 | | | | — | | | | 1,081,169 | |
| Interest Rate | | | 541,216 | | | | 341,548 | | | | 199,668 | |
| Total Short Contracts | | | 2,315,183 | | | | 2,975,108 | | | | (659,925 | ) |
| Total Futures Contracts | | | 3,642,046 | | | | 6,131,323 | | | | (2,489,277 | ) |
| | | | | | | | | | | | | |
| Total | | $ | 7,589,654 | | | $ | 8,017,347 | | | $ | (427,693 | ) |
(a) Unrealized appreciation on forward currency contracts is a receivable and unrealized depreciation on forward currency contracts is a payable on the Fund’s consolidated statement of assets and liabilities.
(b) Reflects the cumulative unrealized appreciation (depreciation) of futures contracts as reported in the Fund’s consolidated schedule of open futures contracts. Only the current day variation margin for futures contracts is separately reported within the Fund’s consolidated statement of assets and liabilities.
The following table presents the trading results of the derivative trading and information related to volume for the six months ended June 30, 2015 for the LoCorr Managed Futures Strategy Fund, the LoCorr Long/Short Commodities Strategy Fund and the LoCorr Market Trend Fund and for the period from April 6, 2015 (commencement of operations) through June 30, 2015 for the LoCorr Multi-Strategy Fund. The below captions of “Net Realized” and “Net Change in Unrealized” correspond to the captions in the Fund’s consolidated statement of operations.
| | | Gain (Loss) from Trading | | | | | |
| Fund and Type of Derivative Instrument | | Net Realized | | | Net Change in Unrealized | | | | | |
| LoCorr Managed Futures Strategy Fund | | | | | | | | | | |
| Swap Contracts | | $ | 51,032,621 | | | $ | (59,717,185 | ) | | | | |
| | | | | | | | | | | | | |
| LoCorr Long/Short Commodities Strategy Fund | | | | | | | | | | | | |
| Swap Contracts | | $ | 4,770,487 | | | $ | (2,974,837 | ) | | | | |
| | | | | | | | | | | | | |
| LoCorr Multi-Strategy Fund | | | | | | | | | | | | |
| Swap Contracts | | $ | — | | | $ | (662,563 | ) | | | | |
| | | | | | | | | | | | | |
| LoCorr Market Trend Fund | | | | | | | | | | | | |
| Forward Currency Contracts | | $ | 6,751,748 | | | $ | 1,648,027 | | | | | |
| Futures Contracts | | | | | | | | | | | | |
| Commodity | | | (1,979,383 | ) | | | (2,585,500 | ) | | | | |
| Equity | | | 5,495,815 | | | | (1,739,860 | ) | | | | |
| Interest rate | | | (3,987,222 | ) | | | 376,013 | | | | | |
| Total Futures Contracts | | | (470,790 | ) | | | (3,949,347 | ) | | | | |
| Total Forward Currency Contracts and Futures Contracts | | $ | 6,280,958 | | | $ | (2,301,320 | ) | | | | |
LoCorr Managed Futures Strategy Fund, LoCorr Long/Short Commodities Strategy Fund, LoCorr Multi-Strategy Fund and LoCorr Market Trend Fund - Notes
to Consolidated Financial Statements / LoCorr Long/Short Equity Fund and LoCorr Spectrum Income Fund - Notes to Financial Statements (continued) | | 89 |
The average monthly notional amount is shown as an indicator of volume. The average monthly notional amounts during the period were:
| | | Average Notional Amount(a) | |
| Fund and Type of Derivative Instrument | | Long Contracts | | | Short Contracts | |
| LoCorr Managed Futures Strategy Fund | | | | | | |
| Swap Contracts | | $ | 517,948,339 | | | $ | — | |
| | | | | | | | | |
| LoCorr Long/Short Commodities Strategy Fund | | | | | | | | |
| Swap Contracts | | $ | 35,514,285 | | | $ | — | |
| | | | | | | | | |
| LoCorr Multi-Strategy Fund | | | | | | | | |
| Swap Contracts | | $ | 15,858,971 | | | $ | — | |
| | | | | | | | | |
| LoCorr Market Trend Fund | | | | | | | | |
| Forward Currency Contracts | | $ | 4,030,358,917 | | | $ | 6,346,649,718 | |
| Futures Contracts | | | 1,473,117,723 | | | | 170,069,154 | |
(a) During the six months ended June 30, 2015 for the LoCorr Managed Futures Strategy Fund, the LoCorr Long/Short Commodities Strategy Fund and the LoCorr Market Trend Fund and for the period from April 6, 2015 (commencement of operations) through June 30, 2015 for the LoCorr Multi-Strategy Fund.
Please refer to the Funds’ prospectus for a full listing of risks associated with these investments.
4. Investment Transactions
The cost of security purchases and proceeds from security sales, excluding U.S. Government obligations, short-term investments, derivative instruments, short sales and purchases to cover short sales for the period ended June 30, 2015(a) were as follows:
| | | | | | | |
| Fund | | Purchases | | | Sales | |
| LoCorr Managed Futures Strategy Fund | | $ | 175,163,669 | | | $ | 56,057,740 | |
| LoCorr Long/Short Commodities Strategy Fund | | | 17,022,859 | | | | 35,108,295 | |
| LoCorr Multi-Strategy Fund | | | 16,363,877 | | | | 1,041,164 | |
| LoCorr Market Trend Fund | | | 332,130,622 | | | | 13,999,010 | |
| LoCorr Long/Short Equity Fund | | | 44,074,055 | | | | 52,066,150 | |
| LoCorr Spectrum Income Fund | | | 35,692,233 | | | | 11,728,604 | |
Purchases and sales of U.S. Government obligations for the period ended June 30, 2015(a) were as follows:
| | | | | | | |
| Fund | | Purchases | | | Sales | |
| LoCorr Managed Futures Strategy Fund | | $ | 25,447,852 | | | $ | 19,484,177 | |
| LoCorr Long/Short Commodities Strategy Fund | | | 1,018,281 | | | | 1,020,773 | |
| LoCorr Multi-Strategy Fund | | | — | | | | — | |
| LoCorr Market Trend Fund | | | 18,422,217 | | | | 3,026,309 | |
| LoCorr Long/Short Equity Fund | | | — | | | | — | |
| LoCorr Spectrum Income Fund | | | — | | | | — | |
(a) For the six months ended June 30, 2015 for the LoCorr Managed Futures Strategy Fund, the LoCorr Long/Short Commodities Strategy Fund, the LoCorr Market Trend Fund, the LoCorr Long/Short Equity Fund and the LoCorr Spectrum Income Fund and for the period from April 6, 2015 (commencement of operations) through June 30, 2015 for the LoCorr Multi-Strategy Fund.
90 | | LoCorr Managed Futures Strategy Fund, LoCorr Long/Short Commodities Strategy Fund, LoCorr Multi-Strategy Fund and LoCorr Market Trend Fund - Notes to Consolidated Financial Statements / LoCorr Long/Short Equity Fund and LoCorr Spectrum Income Fund - Notes to Financial Statements (continued) |
5. Management Fees and Other Transactions with Affiliates
Manangement Agreement
The Trust has a Management Agreement with the Adviser, with whom certain officers and Trustees of the Funds are affiliated, to furnish investment advisory services to the Funds. Pursuant to the Management Agreement effective April 11, 2014, the Adviser is entitled to receive a fee, in accordance with the Incremental Advisory Fee schedule below based on each of the LoCorr Managed Futures Strategy Fund and the LoCorr Long/Short Commodities Strategy Fund’s average daily net assets.
| | | | |
Net Assets per Fund for each of the
LoCorr Managed Futures Strategy Fund and the
LoCorr Long/Short Commodities Strategy Fund | | Incremental*
Advisory Fee | |
| $0.0 – $0.5 billion | | | 1.50% | |
| $0.5 – $1.0 billion | | | 1.40% | |
| $1.0 – $1.5 billion | | | 1.30% | |
| $1.5 – $2.0 billion | | | 1.20% | |
| $2.0 – $2.5 billion | | | 1.10% | |
| Over $2.5 billion | | | 1.00% | |
*Incremental advisory fee represents the fees paid on net assets at the related net asset level. For example, with $3 billion in net assets in a Fund, the Adviser would earn 1.50% on the first $500 million, plus 1.40% on the next $500 million, plus 1.30% on the next $500 million, plus 1.20% on the next $500 million, plus 1.10% on the next $500 million, plus 1.00% on the final $500 million.
In addition, pursuant to the Management Agreement, the Adviser is entitled to receive a fee as follows:
| | | | |
| Fund | | Annual Advisory Fee as a Percentage
of the Average Daily
Net Assets of the Fund |
| LoCorr Multi-Strategy Fund | | | 1.75 | % |
| LoCorr Market Trend Fund | | | 1.50 | % |
| LoCorr Long/Short Equity Fund | | | 2.45 | % |
| LoCorr Spectrum Income Fund | | | 1.30 | % |
For the period ended June 30, 2015, the Funds reported the following in regards to management fees:
| | | | | | | |
| | | Management Fees | | (Accrued
Management Fees) /
Receivable from Adviser |
| Fund | | For the Period Ended
June 30, 2015 (a) | |
June 30, 2015 |
| LoCorr Managed Futures Strategy Fund | | $ | 3,929,748 | | | $ | (655,813 | ) |
| LoCorr Long/Short Commodities Strategy Fund | | | 274,259 | | | | (21,401 | ) |
| LoCorr Multi-Strategy Fund | | | 57,557 | | | | 14,371 | |
| LoCorr Market Trend Fund | | | 1,587,520 | | | | (478,079 | ) |
| LoCorr Long/Short Equity Fund | | | 475,741 | | | | (67,537 | ) |
| LoCorr Spectrum Income Fund | | | 720,706 | | | | (142,396 | ) |
(a) For the six months ended June 30, 2015 for the LoCorr Managed Futures Strategy Fund, the LoCorr Long/Short Commodities Strategy Fund, the LoCorr Market Trend Fund, the LoCorr Long/Short Equity Fund and the LoCorr Spectrum Income Fund and for the period from April 6, 2015 (commencement of operations) through June 30, 2015 for the LoCorr Multi-Strategy Fund.
Sub-Advisory Agreements
Pursuant to a sub-advisory agreement between the Adviser and Nuveen Asset Management, LLC (“Nuveen”) related to the LoCorr Managed Futures Strategy Fund, the LoCorr Long/Short Commodities Strategy Fund and the LoCorr Market Trend Fund, Nuveen is entitled to receive a monthly fee at an annual rate equal to 0.18% of the average daily net assets of the first $50 million of sub-advised assets, 0.14% of the average daily net assets of the next $50 million of sub-advised assets, 0.10% of the average daily net assets of the next $200 million of sub-advised assets, 0.07% of the average daily net assets of the next $700 million of sub-advised assets, and 0.05% of the average daily net assets in excess of $1 billion of sub-advised assets. The minimum aggregate annual fee payable by the Adviser to Nuveen is $45,000.
Pursuant to the sub-advisory agreements between the Adviser and Graham Capital Management, L.P. (“Graham”) related to the LoCorr Market Trend Fund and its wholly-owned and controlled subsidiary, LCMT, Graham is entitled to receive as full compensation a monthly fee at an annual rate of up to 1.10% of the average daily net asset value of the trading size of the sub-advised assets. However, to the extent that Graham invests in the Fund, its fee may be higher. The sub-advisory fee will differ depending on Graham’s relationship to the underlying investor and its involvement with due diligence and other factors. It is likely that Graham will manage a portion of the Fund’s assets subject to payment by the Adviser at varying fee amounts. The Adviser agrees to provide sufficient information to the sub-adviser to support the Adviser’s determination of the amount payable. The Adviser may pay the sub-adviser both fees for the pertinent sub-advised assets. In no event will the Adviser and sub-adviser have a combined fee in excess of 1.50% per annum. Any additional fee paid to the sub-adviser will be directly offset by the amount of the fee retained by the Adviser. This fee for each month will be paid to the sub-adviser during the succeeding month.
| | |
| LoCorr Managed Futures Strategy Fund, LoCorr Long/Short Commodities Strategy Fund, LoCorr Multi-Strategy Fund and LoCorr Market Trend Fund - Notes to Consolidated Financial Statements / LoCorr Long/Short Equity Fund and LoCorr Spectrum Income Fund - Notes to Financial Statements (continued) | | 91 |
Pursuant to a sub-advisory agreement between the Adviser and Millennium Asset Management, L.L.C. (“Millennium”) related to the LoCorr Long/Short Equity Fund, Millennium is entitled to receive a monthly fee at an annual rate equal to 1.25% of the first $10 million of the average daily net assets of the sub-advised assets and 1.00% of the average daily net assets of the sub-advised assets over $10 million.
Pursuant to a sub-advisory agreement between the Adviser and Billings Capital Management, LLC (“Billings”) related to the Trust, the Adviser will pay to the Sub-Adviser as compensation therefor a monthly fee at an annual rate equal to 1.70% of the first $50 million of the average daily net asset value of the Sub-Advised Assets, plus 1.50% of the next $50 million of the average daily net asset value of the Sub-Advised Assets plus 1.30% of the average daily net asset value of the Sub-Advised Assets over $100 million. Pertaining to Section 7 of the agreement, “Sub-Advised Assets” shall refer to the assets assigned by the Adviser to the Sub-Adviser for LoCorr Long/Short Equity Fund, LoCorr Multi-Strategy Fund and any other Fund within the Trust. The Sub-Advised Assets within the Trust are aggregated in determining the appropriate fee level(s) to be used in the fee calculation. The Sub-Adviser agrees to manage at least $200 million in the Funds’ Sub-Advised Assets and may increase this amount upon mutual consent of all parties.
Pursuant to the sub-advisory agreement between the Adviser and Trust & Fiduciary Management Services, Inc. (“TFMS”) related to the aggregate sub-advised assets of all of the Funds in the Trust, TFMS is entitled to receive a fee, on a monthly basis, in accordance with the Annual Fee Rate schedule shown below:
| | | | |
Average Daily Net Asset Value
of the Sub-Advised Assets of
the Funds in the Trust | | Annual Fee Rate |
| $0 – $100 million | | | 0.400 | % |
| $100 – $200 million | | | 0.375 | % |
| $200 – $300 million | �� | | 0.350 | % |
| $300 – $400 million | | | 0.325 | % |
| Over $400 million | | | 0.300 | % |
During the period ended June 30, 2015, TFMS provided sub-advisory services to the LoCorr Multi-Strategy Fund and the LoCorr Spectrum Income Fund.
For the services provided and the expenses borne pursuant to this Agreement, the Adviser will pay to the Sub-Adviser, as further described in the table above, as full compensation therefor. The monthly fee is based on an annual rate of the average daily net assets of the Sub-Advised Assets.
The Adviser is solely responsible for the payment of the Sub-Adviser’s fees, and the Sub-Adviser agrees not to seek payment of its fees from the Trust or the Funds.
Expense Limitation Agreement
The Funds’ Adviser has contractually agreed to waive management fees and/or reimburse the Funds for expenses it incurs but only to the extent necessary to maintain the Funds’ total annual operating expenses after fee waiver and/or reimbursement (excluding any Rule 12b-1 distribution and/or servicing fees, taxes, interest, brokerage commissions, expenses incurred in connection with any merger or reorganization, dividend expenses on short sales, swap fees, indirect expenses, expenses of other investment companies in which the Funds may invest, or extraordinary expenses such as litigation and inclusive of organizational costs incurred prior to the commencement of operations) at the percentages listed below:
| | | | | | |
| Fund | | Expense Limit as a
Percentage of the
Average Daily Net
Assets of the Fund | | Effective Period Through |
| LoCorr Managed Futures Strategy Fund | | | 1.95 | % | | April 30, 2016 |
| LoCorr Long/Short Commodities Strategy Fund | | | 1.95 | % | | April 30, 2016 |
| LoCorr Multi-Strategy Fund | | | 2.04 | % | | April 30, 2016 |
| LoCorr Market Trend Fund | | | 1.95 | % | | April 30, 2016 |
| LoCorr Long/Short Equity Fund | | | 2.90 | % | | April 30, 2016 |
| LoCorr Spectrum Income Fund | | | 1.80 | % | | April 30, 2016 |
Any waiver or reimbursement is subject to repayment by the respective Fund within the three fiscal years following the fiscal year in which the expenses occurred, if the Fund is able to make the repayment without exceeding its current expense limitations and the repayment is approved by the Board of Trustees. The organizational and offering costs are subject to repayment by the Funds.
92 | | LoCorr Managed Futures Strategy Fund, LoCorr Long/Short Commodities Strategy Fund, LoCorr Multi-Strategy Fund and LoCorr Market Trend Fund - Notes to Consolidated Financial Statements / LoCorr Long/Short Equity Fund and LoCorr Spectrum Income Fund - Notes to Financial Statements (continued) |
The total amounts of management fees waived and/or expenses reimbursed which are subject to recovery, and their related expiration date are as follows:
| LoCorr Long/Short Commodities Strategy Fund | | | | | | | | | | |
| | | | | | | | | | | | | | | | | | | |
| | | Fees (Waived) or Expenses (Borne) by Adviser Subject to Recovery | | | Recovery to Adviser Six Months Ended June 30, 2015 | | | | | | Subject to Recovery on or before Fiscal Year Ending
December 31, | |
| Period | | Management Fees | | | Other Expenses | | | Total | | | | | Remaining Available Subject to Recovery | | | |
| Six Months Ended June 30, 2015 | | $ | (82,813 | ) | | $ | — | | | $ | (82,813 | ) | | $ | — | | | $ | (82,813 | ) | | | 2018 | |
| Year Ended December 31, 2014 | | | (226,735 | ) | | | — | | | | (226,735 | ) | | | — | | | | (226,735 | ) | | | 2017 | |
| Year Ended December 31, 2013 | | | (171,188 | ) | | | (54,559 | ) | | | (225,747 | ) | | | — | | | | (225,747 | ) | | | 2016 | |
| Year Ended December 31, 2012 | | | (80,503 | ) | | | (129,605 | ) | | | (210,108 | ) | | | — | | | | (210,108 | ) | | | 2015 | |
| Total | | | (561,239 | ) | | | (184,164 | ) | | | (745,403 | ) | | | — | | | | (745,403 | ) | | | | |
| LoCorr Multi-Strategy Fund | | | | | | | | | | | | | | | | | | |
| | | | | | | | | | | | | | | | | | | |
| | | Fees (Waived) or Expenses (Borne) by Adviser Subject to Recovery | | | Recovery to Adviser Period Ended
June 30, 2015* | | | | | | Subject to Recovery on or before Fiscal Year Ending
December 31, | |
| Period | | Management Fees | | | Other Expenses | | | Total | | | | | Remaining Available Subject to Recovery | | | |
Period Ended June 30, 2015* | | $ | (57,557 | ) | | $ | (22,924 | ) | | $ | (80,481 | ) | | $ | — | | | $ | (80,481 | ) | | | 2018 | |
| Total | | | (57,557 | ) | | | (22,924 | ) | | | (80,481 | ) | | | — | | | | (80,481 | ) | | | | |
*Period from April 6, 2015 (commencement of operations) through June 30, 2015.
| LoCorr Market Trend Fund | | | | | | | | | | | | | | | | | | |
| | | | | | | | | | | | | | | | | | | |
| | | Fees (Waived) or Expenses (Borne) by Adviser Subject to Recovery | | | Recovery to Adviser Six Months Ended June 30, 2015 | | | | | | Subject to Recovery on or before Fiscal Year Ending
December 31, | |
| Period | | Management Fees | | | Other Expenses | | | Total | | | | | Remaining Available Subject to Recovery | | | |
Period Ended December 31, 2014* | | $ | (143,030 | ) | | $ | — | | | $ | (143,030 | ) | | $ | 143,030 | | | $ | — | | | | 2017 | |
| Total | | | (143,030 | ) | | | — | | | | (143,030 | ) | | | 143,030 | | | | — | | | | | |
*Period from July 1, 2014 (commencement of operations) through December 31, 2014.
| LoCorr Long/Short Equity Fund | | | | | | | | | | | | | | | | | | |
| | | | | | | | | | | | | | | | | | | |
| | | Fees (Waived) or Expenses (Borne) by Adviser Subject to Recovery | | | Recovery to Adviser Six Months Ended June 30, 2015 | | | | | | Subject to Recovery on or before Fiscal Year Ending
December 31, | |
| Period | | Management Fees | | | Other Expenses | | | Total | | | | | Remaining Available Subject to Recovery | | | |
| Six Months Ended June 30, 2015 | | $ | (59,001 | ) | | $ | — | | | $ | (59,001 | ) | | $ | — | | | $ | (59,001 | ) | | | 2018 | |
| Year Ended December 31, 2014 | | | (122,831 | ) | | | — | | | | (122,831 | ) | | | — | | | | (122,831 | ) | | | 2017 | |
Period Ended December 31, 2013* | | | (140,599 | ) | | | — | | | | (140,599 | ) | | | — | | | | (140,599 | ) | | | 2016 | |
| Total | | | (322,431 | ) | | | — | | | | (322,431 | ) | | | — | | | | (322,431 | ) | | | | |
*Period from May 10, 2013 (commencement of operations) through December 31, 2013.
| LoCorr Spectrum Income Fund | | | | | | | | | | | | | | | | | | |
| | | | | | | | | | | | | | | | | | | |
| | | Fees (Waived) or Expenses (Borne) by Adviser Subject to Recovery | | | Recovery to Adviser Six Months Ended June 30, 2015 | | | | | | Subject to Recovery on or before Fiscal Year Ending
December 31, | |
| Period | | Management Fees | | | Other Expenses | | | Total | | | | | Remaining Available Subject to Recovery | | | |
| Year Ended December 31, 2014 | | $ | (132,869 | ) | | $ | — | | | $ | (132,869 | ) | | $ | 87,235 | | | $ | (45,634 | ) | | | 2017 | |
| Total | | | (132,869 | ) | | | — | | | | (132,869 | ) | | | 87,235 | | | | (45,634 | ) | | | | |
At June 30, 2015, there were no fees subject to recovery for the LoCorr Managed Futures Strategy Fund.
The Funds have entered into a 12b-1 distribution agreement with Quasar Distributors, LLC (“Quasar”). Class A and Class C shareholders pay Rule 12b-1 fees to Quasar at the annual rate of 0.25% and 1.00%, respectively, of average daily net assets. Class I shareholders pay no 12b-1 fees.
| | |
LoCorr Managed Futures Strategy Fund, LoCorr Long/Short Commodities Strategy Fund, LoCorr Multi-Strategy Fund and LoCorr Market Trend Fund - Notes to Consolidated Financial Statements / LoCorr Long/Short Equity Fund and LoCorr Spectrum Income Fund - Notes to Financial Statements (continued) | | 93 |
6. Fund Shares
At June 30, 2015, there were an unlimited number of shares of beneficial interest authorized. The following table summarizes the activity in shares and dollar amounts applicable to each class of the Funds:
| LoCorr Managed Futures Strategy Fund – Class A | | | | | | | | | | |
| | | For the Six Months Ended June 30, 2015 | | | For the Year Ended December 31, 2014 | |
| | | Shares | | | Amount | | | Shares | | | Amount | |
| Shares Sold | | | 5,537,250 | | | $ | 48,202,436 | | | | 9,075,320 | | | $ | 80,698,695 | |
| Dividends Reinvested | | | — | | | | — | | | | 2,278,102 | | | | 19,454,988 | |
| Shares Redeemed | | | (3,369,974 | ) | | | (29,164,536 | ) | | | (10,570,526 | ) | | | (92,993,732 | ) |
| Redemption Fees | | | — | | | | 1,076 | | | | — | | | | 10,951 | |
| | | | 2,167,276 | | | $ | 19,038,976 | | | | 782,896 | | | $ | 7,170,902 | |
| Beginning Shares | | | 24,325,590 | | | | | | | | 23,542,694 | | | | | |
| Ending Shares | | | 26,492,866 | | | | | | | | 24,325,590 | | | | | |
| LoCorr Managed Futures Strategy Fund – Class C | | | | | | | | | | | | | |
| | | For the Six Months Ended June 30, 2015 | | | For the Year Ended December 31, 2014 | |
| | | Shares | | | Amount | | | Shares | | | Amount | |
| Shares Sold | | | 2,130,077 | | | $ | 18,082,212 | | | | 3,629,307 | | | $ | 31,696,190 | |
| Dividends Reinvested | | | — | | | | — | | | | 1,113,439 | | | | 9,286,080 | |
| Shares Redeemed | | | (1,268,187 | ) | | | (10,688,219 | ) | | | (2,506,615 | ) | | | (21,310,340 | ) |
| Redemption Fees | | | — | | | | 255 | | | | — | | | | 597 | |
| | | | 861,890 | | | $ | 7,394,248 | | | | 2,236,131 | | | $ | 19,672,527 | |
| Beginning Shares | | | 11,316,249 | | | | | | | | 9,080,118 | | | | | |
| Ending Shares | | | 12,178,139 | | | | | | | | 11,316,249 | | | | | |
| LoCorr Managed Futures Strategy Fund – Class I | | | | | | | | | | | | | |
| | | For the Six Months Ended June 30, 2015 | | | For the Year Ended December 31, 2014 | |
| | | Shares | | | Amount | | | Shares | | | Amount | |
| Shares Sold | | | 6,744,269 | | | $ | 58,978,788 | | | | 14,790,210 | | | $ | 134,224,345 | |
| Dividends Reinvested | | | — | | | | — | | | | 1,927,180 | | | | 16,593,017 | |
| Shares Redeemed | | | (4,429,771 | ) | | | (38,597,651 | ) | | | (6,813,241 | ) | | | (59,705,895 | ) |
| Redemption Fees | | | — | | | | 4,463 | | | | — | | | | 13,181 | |
| | | | 2,314,498 | | | $ | 20,385,600 | | | | 9,904,149 | | | $ | 91,124,648 | |
| Beginning Shares | | | 22,163,791 | | | | | | | | 12,259,642 | | | | | |
| Ending Shares | | | 24,478,289 | | | | | | | | 22,163,791 | | | | | |
| LoCorr Managed Futures Strategy Fund | | | | | | | | | | | | | |
| Total Net Increase | | | | | | $ | 46,818,824 | | | | | | | $ | 117,968,077 | |
| LoCorr Long/Short Commodities Strategy Fund – Class A | | | | | | | | | | | | | |
| | | For the Six Months Ended June 30, 2015 | | | For the Year Ended December 31, 2014 | |
| | | Shares | | | Amount | | | Shares | | | Amount | |
| Shares Sold | | | 756,674 | | | $ | 6,540,475 | | | | 5,384,775 | | | $ | 48,541,702 | |
| Dividends Reinvested | | | — | | | | — | | | | 493,118 | | | | 4,290,126 | |
| Shares Redeemed | | | (4,054,503 | ) | | | (34,957,345 | ) | | | (1,281,113 | ) | | | (11,117,228 | ) |
| Redemption Fees | | | — | | | | 839 | | | | — | | | | 1,279 | |
| | | | (3,297,829 | ) | | $ | (28,416,031 | ) | | | 4,596,780 | | | $ | 41,715,879 | |
| Beginning Shares | | | 5,072,800 | | | | | | | | 476,020 | | | | | |
| Ending Shares | | | 1,774,971 | | | | | | | | 5,072,800 | | | | | |
| LoCorr Long/Short Commodities Strategy Fund – Class C | | | | | | | | | | | | | |
| | | For the Six Months Ended June 30, 2015 | | | For the Year Ended December 31, 2014 | |
| | | Shares | | | Amount | | | Shares | | | Amount | |
| Shares Sold | | | 48,144 | | | $ | 412,242 | | | | 196,491 | | | $ | 1,692,395 | |
| Dividends Reinvested | | | — | | | | — | | | | 22,725 | | | | 193,620 | |
| Shares Redeemed | | | (51,602 | ) | | | (435,847 | ) | | | (81,685 | ) | | | (656,781 | ) |
| Redemption Fees | | | — | | | | — | | | | — | | | | — | |
| | | | (3,458 | ) | | $ | (23,605 | ) | | | 137,531 | | | $ | 1,229,234 | |
| Beginning Shares | | | 356,747 | | | | | | | | 219,216 | | | | | |
| Ending Shares | | | 353,289 | | | | | | | | 356,747 | | | | | |
| LoCorr Long/Short Commodities Strategy Fund – Class I | | | | | | | | | | | | | |
| | | For the Six Months Ended June 30, 2015 | | | For the Year Ended December 31, 2014 | |
| | | Shares | | | Amount | | | Shares | | | Amount | |
| Shares Sold | | | 589,148 | | | $ | 5,142,372 | | | | 1,311,420 | | | $ | 11,590,391 | |
| Dividends Reinvested | | | — | | | | — | | | | 108,426 | | | | 948,725 | |
| Shares Redeemed | | | (675,109 | ) | | | (5,873,101 | ) | | | (641,482 | ) | | | (5,527,496 | ) |
| Redemption Fees | | | — | | | | 512 | | | | — | | | | 249 | |
| | | | (85,961 | ) | | $ | (730,217 | ) | | | 778,364 | | | $ | 7,011,869 | |
| Beginning Shares | | | 1,492,534 | | | | | | | | 714,170 | | | | | |
| Ending Shares | | | 1,406,573 | | | | | | | | 1,492,534 | | | | | |
| | | | | | | | | | | | | | | | | |
| LoCorr Long/Short Commodities Strategy Fund Fund | | | | | | | | | | | | | |
| Total Net Increase (Decrease) | | | | | | $ | (29,169,853 | ) | | | | | | $ | 49,956,982 | |
94 | | LoCorr Managed Futures Strategy Fund, LoCorr Long/Short Commodities Strategy Fund, LoCorr Multi-Strategy Fund and LoCorr Market Trend Fund - Notes to Consolidated Financial Statements / LoCorr Long/Short Equity Fund and LoCorr Spectrum Income Fund - Notes to Financial Statements (continued) |
| | | | | | | |
| LoCorr Multi-Strategy Fund - Class A | | | | | | |
| | | For the Period Ended June 30, 2015(a) | |
| | | Shares | | | Amount | |
| Shares Sold | | | 202,252 | | | $ | 1,974,335 | |
| Dividends Reinvested | | | 793 | | | | 7,402 | |
| Shares Redeemed | | | — | | | | — | |
| Redemption Fees | | | — | | | | — | |
| | | | 203,045 | | | $ | 1,981,737 | |
| Beginning Shares | | | — | | | | | |
| Ending Shares | | | 203,045 | | | | | |
| | | | | | | | | |
| LoCorr Multi-Strategy Fund - Class C | | | | | | | | |
| | | For the Period Ended June 30, 2015(a) | |
| | | Shares | | | Amount | |
| Shares Sold | | | 509,982 | | | $ | 4,835,251 | |
| Dividends Reinvested | | | 1,410 | | | | 13,112 | |
| Shares Redeemed | | | (3 | ) | | | (27 | ) |
| Redemption Fees | | | — | | | | — | |
| | | | 511,389 | | | $ | 4,848,336 | |
| Beginning Shares | | | — | | | | | |
| Ending Shares | | | 511,389 | | | | | |
| | | | | | | | | |
| LoCorr Multi-Strategy Fund - Class I | | | | | | | | |
| | | For the Period Ended June 30, 2015(a) | |
| | | Shares | | | Amount | |
| Shares Sold | | | 1,369,203 | | | $ | 13,536,973 | |
| Dividends Reinvested | | | 4,013 | | | | 37,555 | |
| Shares Redeemed | | | — | | | | — | |
| Redemption Fees | | | — | | | | — | |
| | | | 1,373,216 | | | $ | 13,574,528 | |
| Beginning Shares | | | — | | | | | |
| Ending Shares | | | 1,373,216 | | | | | |
| | | | | | | | | |
| LoCorr Multi-Strategy Fund | | | | | | | | |
| Total Net Increase | | | | | | $ | 20,404,601 | |
(a) Class A, Class C and Class I shares of the LoCorr Multi-Strategy Fund commenced operations on April 6, 2015.
| | | | | | | | | | | | | |
| LoCorr Market Trend Fund - Class A | | | | | | | | | | | | |
| | | For the Six Months Ended June 30, 2015 | | | For the Period Ended December 31, 2014(a) | |
| | | Shares | | | Amount | | | Shares | | | Amount | |
| Shares Sold | | | 6,057,848 | | | $ | 75,781,471 | | | | 1,140,203 | | | $ | 12,638,973 | |
| Dividends Reinvested | | | — | | | | — | | | | 38,866 | | | | 444,627 | |
| Shares Redeemed | | | (401,992 | ) | | | (4,984,439 | ) | | | (13,074 | ) | | | (144,143 | ) |
| Redemption Fees | | | — | | | | 2,484 | | | | — | | | | 97 | |
| | | | 5,655,856 | | | $ | 70,799,516 | | | | 1,165,995 | | | $ | 12,939,554 | |
| Beginning Shares | | | 1,165,995 | | | | | | | | — | | | | | |
| Ending Shares | | | 6,821,851 | | | | | | | | 1,165,995 | | | | | |
| | | | | | | | | | | | | | | | | |
| LoCorr Market Trend Fund - Class C | | | | | | | | | | | | | | | | |
| | | For the Six Months Ended June 30, 2015 | | | For the Period Ended December 31, 2014(a) | |
| | | Shares | | | Amount | | | Shares | | | Amount | |
| Shares Sold | | | 3,737,646 | | | $ | 46,781,589 | | | | 589,942 | | | $ | 6,399,896 | |
| Dividends Reinvested | | | — | | | | — | | | | 19,209 | | | | 219,169 | |
| Shares Redeemed | | | (37,006 | ) | | | (458,150 | ) | | | (34 | ) | | | (375 | ) |
| Redemption Fees | | | — | | | | 113 | | | | — | | | | 4 | |
| | | | 3,700,640 | | | $ | 46,323,552 | | | | 609,117 | | | $ | 6,618,694 | |
| Beginning Shares | | | 609,117 | | | | | | | | — | | | | | |
| Ending Shares | | | 4,309,757 | | | | | | | | 609,117 | | | | | |
| | | | | | | | | | | | | | | | |
| LoCorr Market Trend Fund - Class I | | | | | | | | | | | | | | | | |
| | | For the Six Months Ended June 30, 2015 | | | For the Period Ended December 31, 2014(a) | |
| | | Shares | | | Amount | | | Shares | | | Amount | |
| Shares Sold | | | 21,477,409 | | | $ | 269,048,524 | | | | 3,422,289 | | | $ | 37,162,742 | |
| Dividends Reinvested | | | — | | | | — | | | | 116,561 | | | | 1,334,628 | |
| Shares Redeemed | | | (1,255,250 | ) | | | (15,783,733 | ) | | | (29,378 | ) | | | (336,850 | ) |
| Redemption Fees | | | — | | | | 2,317 | | | | — | | | | 1,307 | |
| | | | 20,222,159 | | | $ | 253,267,108 | | | | 3,509,472 | | | $ | 38,161,827 | |
| Beginning Shares | | | 3,509,472 | | | | | | | | — | | | | | |
| Ending Shares | | | 23,731,631 | | | | | | | | 3,509,472 | | | | | |
| | | | | | | | | | | | | | | | | |
| LoCorr Market Trend Fund | | | | | | | | | | | | | | | | |
| Total Net Increase | | | | | | $ | 370,390,176 | | | | | | | $ | 57,720,075 | |
(a) Class A, Class C and Class I shares of the LoCorr Market Trend Fund commenced operations on July 1, 2014.
| LoCorr Managed Futures Strategy Fund, LoCorr Long/Short Commodities Strategy Fund, LoCorr Multi-Strategy Fund and LoCorr Market Trend Fund - Notes to Consolidated Financial Statements / LoCorr Long/Short Equity Fund and LoCorr Spectrum Income Fund - Notes to Financial Statements (continued) | | 95 |
| | | | | | | | | | | | | |
| LoCorr Long/Short Equity Fund – Class A | | | | | | | | | | | | |
| | | For the Six Months Ended June 30, 2015 | | | For the Year Ended December 31, 2014 | |
| | | Shares | | | Amount | | | Shares | | | Amount | |
| Shares Sold | | | 280,325 | | | $ | 2,870,267 | | | | 1,404,936 | | | $ | 14,534,404 | |
| Dividends Reinvested | | | — | | | | — | | | | 6,351 | | | | 62,174 | |
| Shares Redeemed | | | (526,111 | ) | | | (5,274,821 | ) | | | (1,509,894 | ) | | | (15,298,824 | ) |
| Redemption Fees | | | — | | | | 52 | | | | — | | | | 1,736 | |
| | | | (245,786 | ) | | $ | (2,404,502 | ) | | | (98,607 | ) | | $ | (700,510 | ) |
| Beginning Shares | | | 1,753,028 | | | | | | | | 1,851,635 | | | | | |
| Ending Shares | | | 1,507,242 | | | | | | | | 1,753,028 | | | | | |
| | | | | | | | | | | | | | | | | |
| LoCorr Long/Short Equity Fund – Class C | | | | | | | | | | | | | | | | |
| | | For the Six Months Ended June 30, 2015 | | | For the Year Ended December 31, 2014 | |
| | | Shares | | | Amount | | | Shares | | | Amount | |
| Shares Sold | | | 99,385 | | | $ | 949,628 | | | | 948,844 | | | $ | 9,918,172 | |
| Dividends Reinvested | | | — | | | | — | | | | 4,865 | | | | 47,048 | |
| Shares Redeemed | | | (438,498 | ) | | | (4,352,967 | ) | | | (436,057 | ) | | | (4,341,537 | ) |
| Redemption Fees | | | — | | | | 4 | | | | — | | | | 730 | |
| | | | (339,113 | ) | | $ | (3,403,335 | ) | | | 517,652 | | | $ | 5,624,413 | |
| Beginning Shares | | | 1,256,929 | | | | | | | | 739,277 | | | | | |
| Ending Shares | | | 917,816 | | | | | | | | 1,256,929 | | | | | |
| | | | | | | | | | | | | | | | | |
| LoCorr Long/Short Equity Fund – Class I | | | | | | | | | | | | | | | | |
| | | For the Six Months Ended June 30, 2015 | | | For the Year Ended December 31, 2014 | |
| | | Shares | | | Amount | | | Shares | | | Amount | |
| Shares Sold | | | 282,991 | | | $ | 2,759,720 | | | | 1,591,039 | | | $ | 16,630,979 | |
| Dividends Reinvested | | | — | | | | — | | | | 4,295 | | | | 42,220 | |
| Shares Redeemed | | | (405,640 | ) | | | (4,034,404 | ) | | | (1,419,669 | ) | | | (14,194,506 | ) |
| Redemption Fees | | | — | | | | 46 | | | | — | | | | 1,109 | |
| | | | (122,649 | ) | | $ | (1,274,638 | ) | | | 175,665 | | | $ | 2,479,802 | |
| Beginning Shares | | | 1,250,817 | | | | | | | | 1,075,152 | | | | | |
| Ending Shares | | | 1,128,168 | | | | | | | | 1,250,817 | | | | | |
| | | | | | | | | | | | | | | | | |
| LoCorr Long/Short Equity Fund | | | | | | | | | | | | | | | | |
| Total Net Increase (Decrease) | | | | | | $ | (7,082,475 | ) | | | | | | $ | 7,403,705 | |
| | | | | | | | | | | | | | | | |
| | | | | | | | | | | | | | | | | |
| LoCorr Spectrum Income Fund – Class A | | | | | | | | | | | | | | | | |
| | | For the Six Months Ended June 30, 2015 | | | For the Year Ended December 31, 2014 | |
| | | Shares | | | Amount | | | Shares | | | Amount | |
| Shares Sold | | | 1,274,421 | | | $ | 12,034,248 | | | | 4,706,973 | | | $ | 47,619,090 | |
| Dividends Reinvested | | | 92,634 | | | | 863,569 | | | | 82,891 | | | | 817,475 | |
| Shares Redeemed | | | (673,204 | ) | | | (6,323,652 | ) | | | (615,929 | ) | | | (5,744,702 | ) |
| Redemption Fees | | | — | | | | 1,850 | | | | — | | | | 5,368 | |
| | | | 693,851 | | | $ | 6,576,015 | | | | 4,173,935 | | | $ | 42,697,231 | |
| Beginning Shares | | | 4,173,935 | | | | | | | | — | | | | | |
| Ending Shares | | | 4,867,786 | | | | | | | | 4,173,935 | | | | | |
| | | | | | | | | | | | | | | | | |
| LoCorr Spectrum Income Fund – Class C | | | | | | | | | | | | | | | | |
| | | For the Six Months Ended June 30, 2015 | | | For the Year Ended December 31, 2014 | |
| | | Shares | | | Amount | | | Shares | | | Amount | |
| Shares Sold | | | 1,291,788 | | | $ | 12,157,060 | | | | 2,916,738 | | | $ | 29,471,751 | |
| Dividends Reinvested | | | 66,812 | | | | 622,347 | | | | 52,035 | | | | 511,280 | |
| Shares Redeemed | | | (359,122 | ) | | | (3,363,624 | ) | | | (154,758 | ) | | | (1,456,007 | ) |
| Redemption Fees | | | — | | | | 1,979 | | | | — | | | | 3,926 | |
| | | | 999,478 | | | $ | 9,417,762 | | | | 2,814,015 | | | $ | 28,530,950 | |
| Beginning Shares | | | 2,814,015 | | | | | | | | — | | | | | |
| Ending Shares | | | 3,813,493 | | | | | | | | 2,814,015 | | | | | |
| | | | | | | | | | | | | | | | | |
| LoCorr Spectrum Income Fund – Class I | | | | | | | | | | | | | | | | |
| | | For the Six Months Ended June 30, 2015 | | | For the Year Ended December 31, 2014 | |
| | | Shares | | | Amount | | | Shares | | | Amount | |
| Shares Sold | | | 1,627,224 | | | $ | 15,337,209 | | | | 4,658,456 | | | $ | 47,029,165 | |
| Dividends Reinvested | | | 95,109 | | | | 887,854 | | | | 89,822 | | | | 887,258 | |
| Shares Redeemed | | | (671,907 | ) | | | (6,261,231 | ) | | | (1,243,808 | ) | | | (11,777,239 | ) |
| Redemption Fees | | | — | | | | 3,734 | | | | — | | | | 9,620 | |
| | | | 1,050,426 | | | $ | 9,967,566 | | | | 3,504,470 | | | $ | 36,148,804 | |
| Beginning Shares | | | 3,504,470 | | | | | | | | — | | | | | |
| Ending Shares | | | 4,554,896 | | | | | | | | 3,504,470 | | | | | |
| | | | | | | | | | | | | | | | | |
| LoCorr Spectrum Income Fund | | | | | | | | | | | | | | | | |
| Total Net Increase | | | | | | $ | 25,961,343 | | | | | | | $ | 107,376,985 | |
96 | | LoCorr Managed Futures Strategy Fund, LoCorr Long/Short Commodities Strategy Fund, LoCorr Multi-Strategy Fund and LoCorr Market Trend Fund - Notes
to Consolidated Financial Statements / LoCorr Long/Short Equity Fund and LoCorr Spectrum Income Fund - Notes to Financial Statements (continued) |
7. Federal Tax Information
At December 31, 2014, the components of accumulated earnings (losses) on a tax basis were as follows:
| | | | | | | | | | | | | | | | |
| | | LoCorr Managed Futures Strategy Fund | | | LoCorr Long/Short Commodities Strategy Fund | | | LoCorr Market Trend Fund | | | LoCorr Long/Short Equity Fund | | | LoCorr Spectrum Income Fund | |
| | | Year Ended December 31, 2014 | | | Year Ended December 31, 2014 | | | Period from July 1, 2014(a) through December 31, 2014 | | | Year Ended December 31, 2014 | | | Year Ended December 31, 2014 | |
| Tax cost of investments | | $ | 375,878,875 | | | $ | 45,411,187 | | | $ | 50,611,396 | | | $ | 40,358,218 | | | $ | 107,121,771 | |
| | | | | | | | | | | | | | | | | | | | | |
| Gross unrealized appreciation | | | 1,122,356 | | | | 2,184,550 | | | | 126,128 | | | | 3,416,739 | | | | 2,100,755 | |
| Gross unrealized depreciation | | | (1,016,495 | ) | | | (2,255,598 | ) | | | (158,743 | ) | | | (1,571,170 | ) | | | (11,574,456 | ) |
| Net unrealized appreciation (depreciation) | | | 105,861 | | | | (71,048 | ) | | | (32,615 | ) | | | 1,845,569 | | | | (9,473,701 | ) |
| | | | | | | | | | | | | | | | | | | | | |
| Undistributed ordinary income | | | — | | | | 47,467 | | | | 1,239,303 | | | | — | | | | — | |
| Undistributed long-term capital gains | | | — | | | | — | | | | 960,116 | | | | — | | | | — | |
| Total distributable earnings | | $ | — | | | $ | 47,467 | | | $ | 2,199,419 | | | $ | — | | | $ | — | |
| | | | | | | | | | | | | | | | | | | | | |
| Other accumulated earnings (losses) | | $ | 16,830,874 | | | $ | (1,995,681 | ) | | $ | 678,628 | | | $ | (5,159,756 | ) | | $ | (2,624,459 | ) |
| Total accumulated earnings (losses) | | $ | 16,936,735 | | | $ | (2,019,262 | ) | | $ | 2,845,432 | | | $ | (3,314,187 | ) | | $ | (12,098,160 | ) |
(a) Commencement of operations.
Undistributed income or net realized gains for financial statement purposes may differ from amounts recognized for federal income tax purposes due to differences in the recognition and characterization of income, expense and capital gain items. The difference between book-basis and tax-basis unrealized appreciation (depreciation) is primarily attributable to the tax deferral of losses on wash sales and other temporary differences.
Under the current tax law, capital losses realized after October 31 may be deferred and treated as occurring on the first day of the following fiscal year. As presented in the table below, the following Funds elected to defer capital losses for the year ended December 31, 2014.
| | | | | | | |
| | | Post October Loss Deferral | | | Late Year Loss Deferral | |
| LoCorr Managed Futures Strategy Fund | | $ | 17,179 | | | $ | — | |
| LoCorr Long/Short Commodities Strategy Fund | | | 5,820 | | | | — | |
| LoCorr Long/Short Equity Fund | | | 1,114,373 | | | | — | |
| LoCorr Spectrum Income Fund | | | 1,631,575 | | | | 366 | |
At December 31, 2014, accumulated net realized capital loss carryovers, if any, and the year(s) in which the capital loss carryovers expire were:
| | | | | | | | | |
| | | Capital Loss Carryover | | | Year of |
| | | Short-Term | | | Long-Term | | | Expiration |
| LoCorr Long/Short Commodities Strategy Fund | | $ | 45,451 | | | $ | 19,255 | | | Indefinitely |
| LoCorr Long/Short Equity Fund | | | 3,561,750 | | | | 350,288 | | | Indefinitely |
| LoCorr Spectrum Income Fund | | | 991,849 | | | | — | | | Indefinitely |
During the year ended December 31, 2014, none of the Funds utilized capital loss carryovers.
8. Line of Credit
On March 17, 2014, the Trust entered into an unsecured, uncommitted Loan Agreement (“Line of Credit” or “LOC”) with U.S. Bank not individually but as an umbrella facility on behalf of the LoCorr Managed Futures Strategy Fund, the LoCorr Long/Short Commodities Strategy Fund, the LoCorr Long/Short Equity Fund and the LoCorr Spectrum Income Fund. On September 10, 2014, the LOC was amended to include the LoCorr Market Trend Fund and on March 15, 2015, the LOC was amended to include the LoCorr Multi-Strategy Fund. The LOC expires on March 14, 2016. The LOC was established to provide the Funds a temporary short-term liquidity source, subject to certain restrictions and the right of setoff on the Fund’s assets, to meet unanticipated redemptions. Under terms of the LOC, borrowings for each Fund are limited to the lesser of one-third of the total assets (including the amount borrowed) of the respective Fund, 5% of the gross assets of the respective Fund or $32 million in the aggregate for all of the Funds under this agreement. U.S. Bank charges an interest rate per annum equal to the Prime Rate (weighted average of 3.25% for the first six months of 2015). For the six months ended June 30, 2015, the LoCorr Long/Short Commodities Strategy Fund, the LoCorr Long/Short Equity Fund and the LoCorr Spectrum Income Fund incurred interest charges of $15, $3,696 and $1,286, respectively, on average daily loan balances of $923, $226,320 and $72,972, respectively. The maximum amount borrowed during the six months ended June 30, 2015 for the LoCorr Long/Short Commodities Strategy Fund was $167,000 on February 24, 2015. The maximum amount borrowed during the six months ended June 30, 2015 for the LoCorr Long/Short Equity Fund was $1,522,000 on February 24, 2015. The maximum amount borrowed during the six months ended June 30, 2015 for the LoCorr Spectrum Income Fund was $1,251,000 on January 15, 2015. The LoCorr Managed Futures Strategy Fund, the LoCorr Market Trend Fund and the LoCorr Multi-Strategy Fund did not borrow from the LOC during the period ended June 30, 2015. At June 30, 2015, the Funds did not have any outstanding borrowings.
| | |
LoCorr Managed Futures Strategy Fund, LoCorr Long/Short Commodities Strategy Fund, LoCorr Multi-Strategy Fund and LoCorr Market Trend Fund - Notes
to Consolidated Financial Statements / LoCorr Long/Short Equity Fund and LoCorr Spectrum Income Fund - Notes to Financial Statements (continued) | | 97 |
9. Subsequent Events
In preparing the financial statements, the Adviser has evaluated events after June 30, 2015.
LoCorr Multi-Strategy Fund
The LoCorr Multi-Strategy Fund declared the following ordinary income distributions:
| | | | | | | | | | | | | |
| Dividend Declaration | | | Shareholder of | | Distribution Amount per Share Class | |
Date (a) | | | Record Date | | Class A | | | Class C | | | Class I | |
| | | | | | | | | | | | | |
| July 31, 2015 | | | July 30, 2015 | | $ | 0.02292 | | | $ | 0.01667 | | | $ | 0.02500 | |
(a) Ex-Date, reinvest date and payable date.
LoCorr Spectrum Income Fund
The LoCorr Spectrum Income Fund declared the following ordinary income distributions:
| | | | | | | | | | | | | |
| Dividend Declaration | | | Shareholder of | | Distribution Amount per Share Class | |
Date (a) | | | Record Date | | Class A | | | Class C | | | Class I | |
| | | | | | | | | | | | | |
| July 31, 2015 | | | July 30, 2015 | | $ | 0.0479 | | | $ | 0.0417 | | | $ | 0.0500 | |
(a) Ex-Date, reinvest date and payable date.
The estimated characterization of the distributions paid will be either a qualified dividend or return of capital. See Note 2 for additional information.
At an in-person meeting of the Board of Trustees held July 15, 2015, the Board of Trustees approved Kettle Hill Capital Management, LLC to serve as sub-adviser to the LoCorr Long/Short Equity Fund.
There were no additional subsequent events since June 30, 2015 through the date the financial statements were issued that would require adjustment to or additional disclosure in these financial statements.
| | |
98 | LoCorr Investment Trust - Expense Example (Unaudited) | |
| | |
Expense Example
June 30, 2015 (Unaudited)
As a shareholder of a mutual fund, you incur two types of costs: (1) transaction costs, including sales charges (loads) on purchase payments; redemption fees; and (2) ongoing costs, including management fees; distribution and/or service (12b-1) fees and other Fund expenses.
This Example is intended to help you understand your ongoing costs (in dollars) of investing in each of the Funds and to compare these costs with the ongoing costs of investing in other mutual funds. For the LoCorr Managed Futures Strategy Fund, the LoCorr Long/Short Commodities Strategy Fund, the LoCorr Market Trend Fund, the LoCorr Long/Short Equity Fund and the LoCorr Spectrum Income Fund, the Expense Example is based on an investment of $1,000 invested at the beginning of the period and held for the entire period (January 1, 2015 through June 30, 2015). For the LoCorr Multi-Strategy Fund, the Expense Example is based on an investment of $1,000 at the date of the Fund’s inception and held for the entire period (April 6, 2015 (commencement of operations) through June 30, 2015).
Actual Expenses
The actual return rows in the following table provide information about account values based on actual returns and actual expenses. You may use the information in these columns, together with the amount you invested, to estimate the expenses that you paid over the period. Simply divide your account value by $1,000 (for example, an $8,600 account value divided by $1,000 = 8.6), then multiply the result by the number in the first line under the heading entitled “Expenses Paid During Period” to estimate the expenses you paid on your account during this period. The only transaction fees you may be required to pay are for outgoing wire transfers, returned checks and stop payment orders at prevailing rates charged by U.S. Bancorp Fund Services, LLC, the Funds’ transfer agent. These fees are assessed on all accounts, as applicable. If you request that a redemption be made by wire transfer, currently the Funds’ transfer agent charges a $15.00 fee. The Funds’ transfer agent charges a transaction fee of $25.00 on returned checks and stop payment orders. If you paid a transaction fee, you would add the fee amount to the expenses paid on your account this period to obtain your total expenses paid.
Hypothetical Example for Comparison Purposes
The hypothetical return rows in the following table provide information about hypothetical account values and hypothetical expenses based on the Funds’ actual expense ratio and an assumed rate of return of 5% per year before expenses, which is not the Funds’ actual return. The hypothetical account values and expenses may not be used to estimate the actual ending account balance or expenses you paid for the period. You may use this information to compare the ongoing costs of investing in the Funds and other funds. To do so, compare this 5% hypothetical example with the 5% hypothetical examples that appear in the shareholder reports of the other funds. A transaction fee of $15.00 may be assessed on outgoing wire transfers and a transaction fee of $25.00 may be assessed on returned checks and stop payment orders. To include this fee in the calculation, you would add the estimated transaction fee to the hypothetical expenses shown in the table. Please note that the expenses shown in the table are meant to highlight your ongoing costs only and do not reflect the transaction fees discussed above. Therefore, those columns are useful in comparing ongoing costs only, and will not help you determine the relative total costs of owning different funds. In addition, if these transactional costs were included, your costs would have been higher.
Actual vs. Hypothetical Returns
Actual vs. Hypothetical returns for the Six Months Ended June 30, 2015 (Unaudited)
| | | | | | | | | | | | | |
Fund’s Annualized Consolidated Expense Ratio | | | Beginning Value January 1, 2015 | | | Ending Account Value June 30, 2015 | | | Consolidated Expenses Paid During Period1 | |
| LoCorr Managed Futures Strategy Fund – Class A | |
| Actual | | | 2.02 | % | | | $1,000.00 | | | | $981.20 | | | | $9.92 | |
Hypothetical2 | | | 2.02 | % | | | $1,000.00 | | | | $1,014.78 | | | | $10.09 | |
| LoCorr Managed Futures Strategy Fund – Class C | |
| Actual | | | 2.77 | % | | | $1,000.00 | | | | $978.30 | | | | $13.59 | |
Hypothetical2 | | | 2.77 | % | | | $1,000.00 | | | | $1,011.06 | | | | $13.81 | |
| LoCorr Managed Futures Strategy Fund – Class I | |
| Actual | | | 1.77 | % | | | $1,000.00 | | | | $983.70 | | | | $8.71 | |
Hypothetical2 | | | 1.77 | % | | | $1,000.00 | | | | $1,016.02 | | | | $8.85 | |
1 Consolidated expenses are equal to the Fund’s annualized expense ratio multiplied by the average account value over the period, multiplied by 181 days and divided by 365 to reflect the period of January 1, 2015 through June 30, 2015.
2 Hypothetical assumes a 5% return.
| | |
| | LoCorr Investment Trust - Expense Example (Unaudited) (continued) | 99 |
| | |
Actual vs. Hypothetical returns for the Six Months Ended June 30, 2015 (Unaudited)
| | | | | | | | | | | | | |
Fund’s Annualized Consolidated Expense Ratio | | | Beginning Value January 1, 2015 | | | Ending Account Value June 30, 2015 | | | Consolidated Expenses Paid During Period1 | |
| LoCorr Long/Short Commodities Strategy Fund – Class A | |
| Actual | | | 2.20 | % | | | $1,000.00 | | | | $1,044.50 | | | | $11.15 | |
Hypothetical2 | | | 2.20 | % | | | $1,000.00 | | | | $1,013.89 | | | | $10.99 | |
| LoCorr Long/Short Commodities Strategy Fund – Class C | |
| Actual | | | 2.95 | % | | | $1,000.00 | | | | $1,039.50 | | | | $14.92 | |
Hypothetical2 | | | 2.95 | % | | | $1,000.00 | | | | $1,010.17 | | | | $14.70 | |
| LoCorr Long/Short Commodities Strategy Fund – Class I | |
| Actual | | | 1.95 | % | | | $1,000.00 | | | | $1,045.40 | | | | $9.89 | |
Hypothetical2 | | | 1.95 | % | | | $1,000.00 | | | | $1,015.13 | | | | $9.74 | |
1 Consolidated expenses are equal to the Fund’s annualized expense ratio multiplied by the average account value over the period, multiplied by 181 days and divided by 365 to reflect the period of January 1, 2015 through June 30, 2015.
2 Hypothetical assumes a 5% return.
Actual vs. Hypothetical returns for the Period from April 6, 2015¹ through June 30, 2015 (Unaudited)
| | | | | | | | | | | | | |
Fund’s Annualized Consolidated Expense Ratio | | | Beginning Value April 6, 20151 | | | Ending Account Value June 30, 2015 | | Consolidated Expenses Paid During Period2 | |
| LoCorr Multi-Strategy Fund – Class A | |
| Actual | | | 2.29 | % | | | $1,000.00 | | | | $920.50 | | | $5.12 | |
Hypothetical3 | | | 2.29 | % | | | $1,000.00 | | | | $1,006.31 | | | $5.35 | |
| LoCorr Multi-Strategy Fund – Class C | |
| Actual | | | 3.04 | % | | | $1,000.00 | | | | $918.30 | | | $6.79 | |
Hypothetical3 | | | 3.04 | % | | | $1,000.00 | | | | $1,004.56 | | | $7.10 | |
| LoCorr Multi-Strategy Fund – Class I | |
| Actual | | | 2.04 | % | | | $1,000.00 | | | | $920.90 | | | $4.56 | |
Hypothetical3 | | | 2.04 | % | | | $1,000.00 | | | | $1,006.89 | | | $4.77 | |
1 Commencement of operations.
2 Consolidated expenses are equal to the Fund’s annualized expense ratio multiplied by the average account value over the period, multiplied by 85 days and divided by 365 to reflect the period of April 6, 2015 (commencement of operations) through June 30, 2015.
3 Hypothetical assumes a 5% return.
Actual vs. Hypothetical returns for the Six Months Ended June 30, 2015 (Unaudited)
| | | | | | | | | | | | | |
Fund’s Annualized Consolidated Expense Ratio | | | Beginning Value January 1, 2015 | | | Ending Account Value June 30, 2015 | | | Consolidated Expenses Paid During Period1 | |
| LoCorr Market Trend Fund – Class A | |
| Actual | | | 2.16 | % | | | $1,000.00 | | | | $1,085.70 | | | | $11.17 | |
Hypothetical2 | | | 2.16 | % | | | $1,000.00 | | | | $1,014.08 | | | | $10.79 | |
| LoCorr Market Trend Fund – Class C | |
| Actual | | | 2.91 | % | | | $1,000.00 | | | | $1,081.50 | | | | $15.02 | |
Hypothetical2 | | | 2.91 | % | | | $1,000.00 | | | | $1,010.36 | | | | $14.51 | |
| LoCorr Market Trend Fund – Class I | |
| Actual | | | 1.91 | % | | | $1,000.00 | | | | $1,087.30 | | | | $9.88 | |
Hypothetical2 | | | 1.91 | % | | | $1,000.00 | | | | $1,015.32 | | | | $9.54 | |
1 Consolidated expenses are equal to the Fund’s annualized expense ratio multiplied by the average account value over the period, multiplied by 181 days and divided by 365 to reflect the period of January 1, 2015 through June 30, 2015.
2 Hypothetical assumes a 5% return.
| | |
100 | LoCorr Investment Trust - Expense Example (Unaudited) (continued) | |
| | |
Actual vs. Hypothetical returns for the Six Months Ended June 30, 2015 (Unaudited)
| | | | | | | | | | | | | |
Fund’s Annualized Expense Ratio | | | Beginning Value January 1, 2015 | | | Ending Account Value June 30, 2015 | | | Expenses Paid During Period1 | |
| LoCorr Long/Short Equity Fund – Class A | |
Actual2 | | | 3.39 | % | | | $1,000.00 | | | | $1,076.60 | | | | $17.45 | |
Hypothetical2, 3 | | | 3.39 | % | | | $1,000.00 | | | | $1,007.98 | | | | $16.88 | |
| LoCorr Long/Short Equity Fund – Class C | |
Actual2 | | | 4.14 | % | | | $1,000.00 | | | | $1,071.40 | | | | $21.26 | |
Hypothetical2, 3 | | | 4.14 | % | | | $1,000.00 | | | | $1,004.27 | | | | $20.57 | |
| LoCorr Long/Short Equity Fund – Class I | |
Actual2 | | | 3.14 | % | | | $1,000.00 | | | | $1,077.30 | | | | $16.17 | |
Hypothetical2, 3 | | | 3.14 | % | | | $1,000.00 | | | | $1,009.22 | | | | $15.64 | |
1 Expenses are equal to the Fund’s annualized expense ratio multiplied by the average account value over the period, multiplied by 181 days and divided by 365 to reflect the period of January 1, 2015 through June 30, 2015.
2 Includes 0.24% of dividend and interest expense on securities sold short and interest expense on credit line.
3 Hypothetical assumes a 5% return.
Actual vs. Hypothetical returns for the Six Months Ended June 30, 2015 (Unaudited)
| | | | | | | | | | | | | |
Fund’s Annualized Expense Ratio | | | Beginning Value January 1, 2015 | | | Ending Account Value June 30, 2015 | | | Expenses Paid During Period1 | |
| LoCorr Spectrum Income Fund – Class A | |
| Actual | | | 2.05 | % | | | $1,000.00 | | | | $1,023.10 | | | | $10.28 | |
Hypothetical2 | | | 2.05 | % | | | $1,000.00 | | | | $1,014.63 | | | | $10.24 | |
| LoCorr Spectrum Income Fund – Class C | |
| Actual | | | 2.80 | % | | | $1,000.00 | | | | $1,020.20 | | | | $14.03 | |
Hypothetical2 | | | 2.80 | % | | | $1,000.00 | | | | $1,010.91 | | | | $13.96 | |
| LoCorr Spectrum Income Fund – Class I | |
| Actual | | | 1.80 | % | | | $1,000.00 | | | | $1,024.50 | | | | $9.04 | |
Hypothetical2 | | | 1.80 | % | | | $1,000.00 | | | | $1,015.87 | | | | $9.00 | |
1 Expenses are equal to the Fund’s annualized expense ratio multiplied by the average account value over the period, multiplied by 181 days and divided by 365 to reflect the period of January 1, 2015 through June 30, 2015.
2 Hypothetical assumes a 5% return.
| | |
| | Approval of Advisory Agreements (Unaudited) | 101 |
| | |
LoCorr Investment Trust
June 30, 2015 (Unaudited)
Approval of Advisory Agreement
In connection with a regular meeting held on February 24, 2015 (the “Meeting”), the Board of Trustees (the “Board” or “Trustees”) of LoCorr Investment Trust (the “Trust”), including a majority of the Trustees who are not interested persons of the Trust or interested persons to the investment management agreement (the “Independent Trustees”), discussed the review and renewal of the Investment Advisory Agreement (the “Management Agreement”) between LoCorr Fund Management, LLC (the “Adviser”) and the Trust, with respect to the LoCorr Managed Futures Strategy Fund (“LCMFS Fund”), LoCorr Long/Short Commodities Strategy Fund (“LCLSCS Fund”), LoCorr Long/Short Equity Fund (“LCLSE Fund”), LoCorr Spectrum Income Fund (“LCSI Fund”) and approval of the Management Agreement with respect to the LoCorr Multi-Strategy Fund (“LCMS Fund”) (each a “Fund”, collectively, the “Funds”).
The Trustees reviewed a memorandum which had been provided to them prior to the Meeting from Thompson Hine LLP (“Legal Counsel”) entitled “Duties of Trustees with Respect to Approval and Renewal of Investment Advisory and Sub-Advisory Contracts”. Legal Counsel emphasized that the Trustees must apply their business judgment to the question of whether the overall arrangements provided under the terms of the Management Agreement are reasonable business arrangements for the Funds.
The Board considered the nature, extent and quality of services to be provided by the Adviser to the Funds. The Board noted that the Adviser furnishes a continuous investment program and compliance program for the LCMFS, LCLSCS, LCLSE and LCSI Funds and would also do so for the LCMS Fund. After a discussion, the Board concluded that the Adviser is well-staffed, has sufficient resources and offers experienced personnel and investment expertise.
The Board discussed the performance of the Funds and their relative benchmarks. with respect to the LCMFS Fund, the Board noted that one-year performance was significantly higher than the Morningstar Category Average and peer group average while the since inception performance did slightly lag both averages.. The Board reviewed the one year and since inception returns for the LCLSCS Fund also noted that the Fund performed better than its peer group and Morningstar Category one-year returns and that they were pleased with the Fund’s improved performance. The Board reviewed and discussed the performance of the LCLSE Fund and lagged behind the Morningstar Category average and peer group average. The Trustees also discussed that the Adviser has taken steps to improve performance by reallocating the Fund’s assets. The Board reviewed and discussed the performance of the LCSI Fund, noting that the one-year return lagged behind the Morningstar Category average but outperformed the peer group average and further noted that Adviser would continue to monitor the returns of each of the Fund’s strategies and would reallocate between them as appropriate. The Board also concluded that they believed that the Adviser’s performance with respect to the LMS Fund would be satisfactory.
The Board reviewed and discussed the costs of services provided and profits to be realized by the Adviser. The Board noted that the advisory fees for each of the Funds was above the average for each of their respective Morningstar categories but were within the reasonable range for fees for each Fund’s category. The Board also noted the expense limitation in place for each of the Funds as well as the Adviser’s level of profitability. The Board concluded that the cost of services provided and profitability to be realized by the Adviser was within the range of reasonableness and that the Adviser has sufficient resources to fulfill its obligations to the Trust.
The Board considered the economies of scale to be realized by the shareholders of the Funds. The Board noted the breakpoints of the new incremental fee schedule that had been implemented. With respect to the LCMS Fund, the Board agreed to discuss future breakpoints after the Fund had sufficient operating history to consider.
Having received and reviewed information from the Adviser as the Board believed to be reasonably necessary, the Trustees, including the Independent Trustees, concluded that the advisory fee structure is fair and reasonable and that renewal of the Management Agreement with respect to the LCMFS, LCLSCS, LCLSE and LCSI Funds and approval with respect to the LCMS Fund was in the best interests of the Trust and each Fund’s shareholders, and unanimously approved or renewed the Management Agreement between the Adviser and the Funds.
Consideration and Approval of Sub-Advisory Agreements
Nuveen Asset Management, LLC
In connection with the regular meeting held on February 24, 2015, the Board discussed the sub-advisory agreement (the “Sub-Advisory Agreement”) between the Adviser and Nuveen Asset Management, LLC (“Nuveen”) with respect to the LCMFS and LCLSCS Funds. Legal Counsel noted that the same factors that the Board considered with respect to the renewal of the LCMFS and LCLSCS Management Agreement would apply to its consideration of each of the Sub-Advisory Agreements. The Board noted that Nuveen’s performance for its allocation of the LCMFS and LCLSCS Funds either outperformed or was in line with the benchmark on a one-year and since inception basis. The Board also considered and discussed the services provided and the qualifications of Nuveen’s investment professionals involved with managing the LCMFS and LCLSCS Funds. The Board reviewed the responses provided by Nuveen in its sub-adviser questionnaire. The Board noted the many years of experience of the key personnel involved as well as Nuveen’s depth of investment capabilities and compliance procedures. The Board further noted that the personnel involved with managing the LCMFS and LCLSCS Funds and concluded that Nuveen is well-staffed and has provided high quality services with respect to the LCMFS and LCLSCS Funds. The Board reviewed the fees paid to Nuveen and Nuveen’s profits to be realized for providing services to the Funds. The Board noted that Nuveen’s level of profitability with respect to the Funds as well as the fees paid to it by the Adviser. After a discussion, the Board concluded that the fees paid to Nuveen and its profitability were reasonable in light of the services provided. Having received and reviewed information from Nuveen as the Board believed to be reasonably necessary, the Trustees, including the Independent Trustees, concluded that the sub-advisory fee structure is fair and reasonable and that renewal of the Sub-Advisory Agreement with respect to the LCMFS and LCLSCS Funds was in the best interests of the Trust and each Fund’s shareholders, and unanimously approved the renewal of the Sub-Advisory Agreements with Nuveen for the LCMFS Fund and LCLSCS Fund, respectively.
| | |
102 | Approval of Advisory Agreements (Unaudited) | |
| | |
Trust & Fiduciary Management Systems, Inc.
In connection with the regular meeting held on February 24, 2015, the Board discussed the renewal of the sub-advisory agreement (the “Sub-Advisory Agreement”) between the Adviser and Trust & Fiduciary Management Systems, Inc. (“TFMS”) with respect to the LCSI Fund and the approval of the Sub-Advisory Agreement between the Adviser and TFMS with respect to the LCMS Fund. The Board reviewed and discussed the nature, extent and quality of the services to be provided by TFMS and noted that the qualifications of the applicable investment personnel as well as TFMS’s approach to risk management and compliance. The Board concluded that it was satisfied with the nature, extent and quality of the services to be provided by TFMS with respect to the LCSI Fund and concluded that it would provide similar services to the LCMS Fund. The Board noted that TFMS’s performance had outperformed its peer group but lagged its benchmark and further noted the Adviser’s satisfaction with the performance of TFMS. After a discussion, the Board deemed TFMS’s performance to be satisfactory with respect to the LCSI Fund and agreed that it expected TFMS to provide similar satisfactory performance with respect to the LCMS Fund. The Trustees discussed the costs of services provided and to be provided by TFMS to the LCSI Fund and LCMS Fund, respectively. The Board noted that TFMS was not profitable with respect to LCSI Fund and did not expect to be profitable with respect to the LCMS Fund based on the LCMS Fund’s expected level of assets. The Board concluded that the sub-advisory fees to be paid to TFMS by the Adviser for the Funds were reasonable in light of the services to be provided under the Sub-Advisory agreements. Having received and reviewed information from TFMS as the Board believed to be reasonably necessary, the Trustees, including the Independent Trustees, concluded that the sub-advisory fee structure is fair and reasonable and that the renewal of the Sub-Advisory Agreement with respect to the LCSI Fund and approval with respect to the LCMS Fund was in the best interests of the Trust and each Fund’s shareholders, and unanimously renewed or approved the Sub-Advisory Agreements with TFMS.
Billings Capital Management, LLC
In connection with the regular meeting held on February 24, 2015, the Board discussed the proposed sub-advisory agreement (the “Sub-Advisory Agreement”) between the Adviser and Billings Capital Management, LLC (“Billings”) with respect to the LCMS Fund. The Board reviewed the responsibilities of Billings’s key individuals, noting the experience of these individuals as well as their experience in sub-advising the LCLSE Fund. The Trustees further noted that Billings will provide fundamental research, security selection and trade execution for the long/short equity portion of the LCMS Fund’s portfolio as well as compliance services to assure assets are managed within the Fund’s investment restrictions. The Board concluded that it was satisfied with the nature, extent and quality of the services to be provided by Billings with respect to the LCMS Fund. The Board reviewed the investment performance of Billings’s long/short equity strategy, which the Board noted is a reasonable substitute for the LCMS Fund, since the LCMS Fund has no performance history. The Trustees noted the one-year and five-year returns are reasonably similar to the returns of the strategy’s benchmark and that since inception return of the strategy has strongly outperformed the benchmark. After a discussion, the Board concluded that it expects the performance of Billings to be satisfactory. The Board then considered the costs of services provided and profits to be realized by Billings. The Board noted the expected profitability of Billings with respect to its management of the LCMS Fund’s portfolio. The Board concluded, based on the consideration of all the factors in their totality, that the Sub-Advisory Agreement, including the sub-advisory fees, was fair and reasonable. The Board, therefore, determined that the approval of the Sub-Advisory Agreement between the Adviser and Billings would be in the best interest of the LCMS Fund and its shareholders.
Millennium Asset Management, L.L.C.
In connection with the regular meeting held on February 24, 2015, the Board discussed the renewal of the sub-advisory agreement (the “Sub-Advisory Agreement”) between the Adviser and Millennium Asset Management, L.L.C. (“Millennium”) with respect to the LCLSE Fund. The Board reviewed the responsibilities of Millennium’s key individuals, noted the many years of experience for the portfolio manager and other personnel and a depth of investment capabilities. The Trustees further noted that Millennium provides fundamental long/short equity research, security selection and trade execution for LCLSE Fund’s portfolio as well as compliance services to assure assets are managed within the Fund’s investment restrictions. The Board concluded that it was satisfied with the nature, extent and quality of the services to be provided by Millennium with respect to the Fund. The Board noted that Millennium’s performance for the one year and since inception periods lagged Millennium’s strategy benchmark for the one year period but outpaced the since inception return of the benchmark. After a discussion, the Trustees agreed that Millennium’s performance was satisfactory. After reviewing the sub-advisory fee paid to Millennium by the Adviser and its level of profitability with respect to subadvising the Fund, the Board concluded that the fees paid to Millennium and its profitability were reasonable in light of the services provided. Having received and reviewed information from Millennium as the Board believed to be reasonably necessary, the Trustees, including the Independent Trustees, concluded that the sub-advisory fee structure is fair and reasonable and that the renewal of the Sub-Advisory Agreement with respect to the LCLSE Fund was in the best interests of the Trust and the Fund’s shareholders, and unanimously renewed the Sub-Advisory Agreements with Millennium.
| | |
| | Notice of Privacy Policy & Practices/Quarterly Portfolio Holdings/Proxy (Unaudited) | 103 |
| | |
Notice of Privacy Policy & Practices
(Unaudited)
Your privacy is important to us. The Funds are committed to maintaining the confidentiality, integrity, and security of your personal information. When you provide personal information, the Funds believe that you should be aware of policies to protect the confidentiality of that information.
The Funds collect the following nonpublic personal information about you:
| ● | Information we receive from you on or in applications or other forms, correspondence, or conversations, including, but not limited to, your name, address, phone number, social security number, assets, income, and date of birth; and |
| | |
| ● | Information about your transactions with us, our affiliates, or others, including, but not limited to, your account number and balance, payments history, parties to transactions, cost basis information, and other financial information. |
The Funds do not disclose any nonpublic personal information about our current or former shareholders to affiliated or nonaffiliated third parties, except as permitted by law. For example, the Funds are permitted by law to disclose all of the information we collect, as described above, to our transfer agent to process your transactions. Furthermore, the Funds restrict access to your nonpublic personal information to those persons who require such information to provide products or services to you. The Funds maintain physical, electronic, and procedural safeguards that comply with applicable federal and state standards to guard your nonpublic personal information.
In the event that you hold shares of the Funds through a financial intermediary, including, but not limited to, a broker-dealer, bank, or trust company, the privacy policy of your financial intermediary would govern how your nonpublic personal information would be shared with affiliated or non-affiliated third parties.
Quarterly Form N-Q portfolio schedule
(Unaudited)
The Funds file their complete schedule of portfolio holdings with the Securities and Exchange Commission (“SEC”) for the first and third quarters of each fiscal year on Form N-Q. The Funds’ Forms N-Q are available on the SEC’s website at http://www.sec.gov. The Funds’ Forms N-Q may be reviewed and copied at the SEC’s Public Reference Room in Washington, D.C. Information on the operation of the SEC’s Public Reference Room may be obtained by calling 1-800-SEC-0330. Additionally, you may obtain copies of Forms N-Q from the Funds upon request by calling 1-855-523-8637.
Proxy voting policies, procedures and record
(Unaudited)
You may obtain a description of the Funds’ (1) proxy voting policies, (2) proxy voting procedures and (3) information regarding how the Funds voted any proxies related to portfolio securities during the most recent 12-month period ended December 31 for which an SEC filing has been made, without charge, upon request by contacting the Funds directly at 1-855-523-8637, or on the EDGAR Database on the SEC’s website (http:// www.sec.gov).
This page left intentionally blank.
This page left intentionally blank.
This page left intentionally blank.

Item 2. Code of Ethics.
Not applicable for semi-annual reports.
Item 3. Audit Committee Financial Expert.
Not applicable for semi-annual reports.
Item 4. Principal Accountant Fees and Services.
Not applicable for semi-annual reports.
Item 5. Audit Committee of Listed Registrants.
Not applicable to registrants who are not listed issuers (as defined in Rule 10A-3 under the Securities Exchange Act of 1934).
Item 6. Investments.
| (a) | Schedule of Investments is included as part of the report to shareholders filed under Item 1 of this Form. |
Item 7. Disclosure of Proxy Voting Policies and Procedures for Closed-End Management Investment Companies.
Not applicable to open-end investment companies.
Item 8. Portfolio Managers of Closed-End Management Investment Companies.
Not applicable to open-end investment companies.
Item 9. Purchases of Equity Securities by Closed-End Management Investment Company and Affiliated Purchasers.
Not applicable to open-end investment companies.
Item 10. Submission of Matters to a Vote of Security Holders.
There have been no material changes to the procedures by which shareholders may recommend nominees to the registrant’s Board of Trustees.
Item 11. Controls and Procedures.
| (a) | The registrant’s President and Treasurer have reviewed the registrant's disclosure controls and procedures (as defined in Rule 30a-3(c) under the Investment Company Act of 1940 (the “Act”)) as of a date within 90 days of the filing of this report, as required by Rule 30a-3(b) under the Act and Rules 13a-15(b) or 15d-15(b) under the Securities Exchange Act of 1934. Based on their review, such officers have concluded that the disclosure controls and procedures are effective in ensuring that information required to be disclosed in this report is appropriately recorded, processed, summarized and reported and made known to them by others within the registrant and by the registrant’s service provider. |
| (b) | There were no changes in the registrant's internal control over financial reporting (as defined in Rule 30a-3(d) under the Act) that occurred during the second fiscal quarter of the period covered by this report that has materially affected, or is reasonably likely to materially affect, the registrant's internal control over financial reporting. |
Item 12. Exhibits.
| (a) | (1) Any code of ethics or amendment thereto, that is the subject of the disclosure required by Item 2, to the extent that the registrant intends to satisfy Item 2 requirements through filing an exhibit. |
Not applicable for semi-annual reports.
(2) A separate certification for each principal executive and principal financial officer pursuant to Section 302 of the Sarbanes-Oxley Act of 2002.
Filed herewith.
(3) Any written solicitation to purchase securities under Rule 23c-1 under the Act sent or given during the period covered by the report by or on behalf of the registrant to 10 or more persons.
Not applicable to open-end investment companies.
| (b) | Certifications pursuant to Section 906 of the Sarbanes-Oxley Act of 2002. |
Furnished herewith.
SIGNATURES
Pursuant to the requirements of the Securities Exchange Act of 1934 and the Investment Company Act of 1940, the registrant has duly caused this report to be signed on its behalf by the undersigned, thereunto duly authorized.
(Registrant) LoCorr Investment Trust
By (Signature and Title) /s/ Kevin Kinzie
Kevin Kinzie, President
Date 8/28/15
Pursuant to the requirements of the Securities Exchange Act of 1934 and the Investment Company Act of 1940, this report has been signed below by the following persons on behalf of the registrant and in the capacities and on the dates indicated.
By (Signature and Title) /s/ Kevin Kinzie
Kevin Kinzie, President
Date 8/28/15
By (Signature and Title) /s/ Jon Essen
Jon Essen, Treasurer
Date 8/28/15