As filed with the Securities and Exchange Commission on August 31, 2017
UNITED STATES
SECURITIES AND EXCHANGE COMMISSION
Washington, D.C. 20549
FORM N-CSR
CERTIFIED SHAREHOLDER REPORT OF REGISTERED
MANAGEMENT INVESTMENT COMPANIES
Investment Company Act file number 811-22509
LoCorr Investment Trust
(Exact name of registrant as specified in charter)
261 School Avenue, 4th Floor
Excelsior, MN 55331
(Address of principal executive offices) (Zip code)
CT Corporation System
1300 East Ninth Street
Cleveland, OH 44114
(Name and address of agent for service)
952.767.2920
Registrant's telephone number, including area code
Date of fiscal year end: December 31
Date of reporting period: June 30, 2017
Item 1. Reports to Stockholders.
Letter to Shareholders
LoCorr Funds seek to provide investments that, over time, will have low correlation to traditional asset classes such as stocks and bonds. We believe that adding low correlating investments to portfolios can significantly reduce the overall portfolio risk while enhancing returns. Correlation measures the degree to which the returns of two investments move together over time. LoCorr offers products that provide the potential for positive returns in rising or falling markets and are designed to resist correlation with traditional stock, bond and commodity investments. In this report, LoCorr Funds are reporting on six mutual funds: LoCorr Macro Strategies Fund (formerly LoCorr Managed Futures Strategy Fund), LoCorr Long/Short Commodities Strategy Fund, LoCorr Multi-Strategy Fund, LoCorr Market Trend Fund, LoCorr Dynamic Equity Fund (formerly LoCorr Long/Short Equity Fund) and LoCorr Spectrum Income Fund (collectively, the “Funds”).
LoCorr Macro Strategies Fund
The LoCorr Macro Strategies Fund (the “Macro Strategies Fund” or the “Fund”) seeks capital appreciation as its primary investment objective with managing volatility as a secondary objective. The Macro Strategies Fund attempts to achieve its objective by investing in two main strategies – a Managed Futures Strategy and a Fixed Income Strategy.
The Fund invests up to 25% of its total assets into a portfolio of globally diversified managed futures positions. The Fund employs three sub-advisers to manage the managed futures portion of the Fund: Millburn Ridgefield Corporation (“Millburn”), Graham Capital Management, LLC (“Graham”), and Revolution Capital Management (“Revolution”). Millburn traces its roots back to 1971 and manages $4.5 billion in assets. Graham was founded in 1994 and manages $14.0 billion in assets. Revolution was founded in 2004 and manages $581 million in assets.
Millburn manages a portfolio for the Fund that is similar to its Millburn Diversified Program which commenced operations in 1977. Millburn invests in a diversified portfolio of global futures contracts by combining non-traditional and trend-following strategies in a systematic multi-factor approach. Graham manages a portfolio for the Fund that is similar to its Tactical Trend strategy, a systematic medium- to long-term trend following program that commenced trading in 2006. Revolution manages a strategy for the Fund that is similar to its Alpha Program that has been available in a managed account program since 2007. Revolution employs a short- to medium-term pattern recognition strategy that incorporates trend reversion and counter-trend signals.
Overall, the Fund’s Class I shares declined -2.66% during the semi-annual period ended June 30, 2017 versus a -1.67% decline for the Barclays CTA Index. Returns for the period were driven primarily by profitable trading in Equities that was offset by losses from positions in Foreign Currencies, Interest Rates, and Commodities. During the semi-annual period, Millburn generated slightly positive returns for the Fund while Graham and Revolution had negative returns.
At the end of 2016, many expected an improved trading environment for managed futures strategies. The new administration’s plans for regulatory rollbacks, tax cuts, and infrastructure spending, combined with more-ominous intimations of border taxes and trade-agreement re-negotiations, appeared to all but ensure a more-uncertain and hence more-volatile market regime for 2017 that might create tradeable opportunities.
Six months into 2017, however, market volatility has in fact been extremely compressed, with the majority of sectors outside of Equities having experienced range-bound behavior that seems more pronounced than at any time in the recent past. While the economy has maintained its slow but steady momentum in terms of moderate job gains, low unemployment, and ~2% Gross Domestic Product (“GDP”) growth, the Trump administration has not made significant tangible progress on the myriad of promises made during and just after the election campaign. This lack of progress, accompanied by a slowly-tightening Fed, and more hawkish rhetoric from a number of central banks globally has led to aimless, range-bound markets across most asset classes that have exhibited a propensity for sharp and sudden reversals. Conditions that have challenged many managed futures managers.
Managed Futures Strategy
Commodities
Similar to 2016, Commodity markets were generally difficult for many Commodity Trading Advisors (“CTAs”) during the first half of 2017 as commodities generally traded within a range and experienced multiple, punctuated reversals which tended to whipsaw the managers trading signals and resulted in unprofitable trading opportunities. The largest losses in Commodities were from Energy trading followed by Precious Metals, while positions in Base Metals were profitable. With oil prices moving lower during the first two months of the year, short Energy positions were hurt in March by a substantial rally as Brent Crude prices reversed and moved from approximately $51/barrel to just over $57/barrel by the second week of April before reversing course again. With gold and silver prices generally range-bound and prone to reversals during the period, Precious Metal positions fluctuated between long and short at inopportune times, leading to losses. Long Base Metal positions benefitted from rising prices early in the year.
Equity Indices
The Fund enjoyed substantial positive returns from long positions in U.S., European, and Asian Equity Indices which benefitted from the upward move in global equity prices during the semi-annual period. The MSCI ACWI - All Country World Index, a proxy for global equity returns, gained +9.28% during the first six months of 2017. Both developed and emerging market equities generally advanced as confidence in global economic growth improved and investors generally ignored the increasing dysfunction in the U.S. political landscape as well as geopolitical tension.
Foreign Currencies
Trading in Foreign Currency markets was unprofitable during the period as investor sentiment regarding the U.S. dollar oscillated during the first half of the year. The U.S. dollar, which had risen sharply during 2016’s fourth quarter, was volatile and weakened during the first three months of 2017 as the difficult reality of governing diminished the election euphoria for the Trump Administration. During the second quarter, Foreign Currency trading remained volatile as the U.S. dollar, buffeted by conflicting influences, declined markedly in a saw-toothed pattern during the quarter. On the one hand, persistent increases in the official interest rate by the Federal Reserve were supportive of the dollar. On the other hand, the fact that growth in Europe and Asia was accelerating while growth in the U.S. remained tepid, and that politics in the U.S. was growing more toxic while the political outlook in Europe had improved significantly, weighed on the greenback. Finally, hawkish comments by European and Canadian central bank leaders in June contributed to a sell-off in the U.S. dollar late in the quarter. Overall, positioning in Foreign Currencies vacillated between short and long relative to the U.S. dollar over the course of the semi-annual period.
Interest Rates
Trading in Interest Rates was unprofitable for the Fund during the first six months of 2017, with positions in Long/Intermediate Rates accounting for the bulk of the losses. While the Fed raised official rates twice during the year, the losses were primarily attributable to long global bond positions that were hurt in June following comments made by European Central Bank (“ECB”) President Mario Draghi, Mark Carney from the Bank of England, and Stephen Poloz from the Bank of Canada at a conference in Sintra, Portugal that suggested global growth was strengthening and the era of quantitative easing was coming to an end. This sparked a late June spike in bond yields, both domestic and foreign, which hurt long positions.
Outlook
Despite the negative returns during the first half of 2017, we continue to believe the Macro Strategies Fund has demonstrated an ability to perform in a variety of market environments as the underlying sub-advisers employ varied and differentiated investment strategies. Due to the diversified and complementary nature of this multi-manager fund, we expect it to generate “smoother” and less volatile returns than single manager peers with the potential to excel in a variety of market conditions.
While the placid, low-volatility regime that we are experiencing has been generally problematic for directional managed-futures strategies, it is possible the very setting that will allow for potentially-profitable trends when the next unforeseen shock erupts. While the timing of this is certainly unknown, history suggests that market volatility could eventually increase markedly and correspondingly provide improved profit opportunities. During the second half of 2017, there are a number of factors that could potentially create more volatility and dispersion that the Fund could capture including the gradual easing of easy global monetary policy, the political landscape both in the U.S. and abroad, am equity market that could run out of steam, as well as ongoing geopolitical tensions.
Fixed Income Strategy
The Macro Strategies Fund invests most of its remaining assets in a fixed income strategy comprised of short to intermediate term investment grade corporate and government agency securities. Nuveen Asset Management (“Nuveen”) is the sub-adviser for this strategy and manages a shorter duration, high quality portfolio.
The fixed income component of the Fund is managed against the Barclay’s 1-5 Government Credit Index. Returns for the fixed income portion of the portfolio were +1.13%, even with the benchmark in the first half of 2017. The duration of the portfolio was managed between 1.8 and 2.0 years during the period compared to about 2.7 years for the benchmark. Our decision to position the Fund’s duration defensively over the time period was a positive contributor versus the benchmark, however, our curve positioning was a moderate detractor. Sector-wise, the Fund was positioned with between a 40%-45% weighting to investment grade corporate bonds along with a 35% aggregate weighting to high quality, short duration securitized instruments. The Fund’s corporate bond issuer exposure was well diversified with modest overweight in both financials and industrials. Given strong returns for non-government securities, our sector strategy was beneficial to investment returns during the reporting period.
While first-quarter U.S. GDP growth was relatively sluggish at 1.4%, most estimates for second quarter are coming in stronger at slightly higher than 2%. Despite some softness in economic data and weaker inflation, Federal Reserve (“Fed”) policymakers voted in June to raise the federal funds rate by 0.25% for the fourth time since December 2015. The increase was widely anticipated given that the U.S. unemployment rate dropped to a 16-year low of 4.3% in May. Inflation continued to stay below the Fed’s unofficial 2% target during the quarter, pressured in part by sagging energy and commodity prices. At the June meeting, the Fed also kept its guidance in place for gradual rate hikes, while signaling its intent to begin slowly shrinking its balance sheet sometime later this year by reducing its holdings of U.S. Treasuries and mortgage-backed securities.
With volatility low and financial markets stable, risk assets enjoyed a strong start to the year as both fundamentals and technicals remained supportive. Equities posted solid gains and credit spreads tightened over the quarter to levels not seen since mid-2014. After a dramatic rise in the short end of the Treasury curve at the end of 2016, rates slowly drifted up during the first half the year as the Federal Reserve continued along the path of policy normalization. However, longer dated Treasury rates fell over this period as inflation slowed and growth lagged expectations causing the curve to flatten.
Investment-grade credit spreads tightened given continued stable fundamentals and strong foreign demand. Investment-grade corporate bonds performed well during a period of low volatility and a continued search for yield. Short Treasury rates rose slowly during the period as the fed raised rates twice during the period, with expectations of a third later in the year. Rates for 2 Year Treasury increased by approximately 20 basis points, while the 5 Year Treasury fell modestly as the curve flattened.
Securitized sectors spread tightened during the first half of the year. Short-duration residential mortgage-backed securities (“MBS”) outperformed based on continued strong fundamentals and saw significant spread compression. The commercial mortgage-backed securities (“CMBS”) sector performed well during the period as supply remained light and demand was aided by reinvestments needs from investors as pre-crisis bonds matured. The sector finished the period with positive excess returns versus Treasuries. Traditional consumer asset-backed securities (“ABS”) posted a positive excess return versus Treasuries for the period. Healthy consumer credit metrics and low volatility provided the basis for the outperformance.
LoCorr Long/Short Commodities Strategy Fund
The LoCorr Long/Short Commodities Strategy Fund(the “Long/Short Commodities Fund” or the “Fund”) provides investors with access to a commodities futures strategy in a mutual fund structure. Historically, investors have primarily accessed exposure to long-only commodities that rely on rising commodity prices to generate positive returns. The Long/Short Commodities Fund has shown the ability to profit while commodity prices increase or decrease. The Long/Short Commodities Fund’s primary investment objective is capital appreciation in rising and falling commodities markets. The Fund attempts to achieve its investment objective by investing in two primary strategies – a Commodities Strategy and a Fixed Income Strategy.
The Fund accesses, via a total return swap agreement, the returns of Millburn’s Commodity Program (“Milcom”), which began trading in 2005 and the returns of J E Moody & Company Commodity Relative Value Program (“JEM CRV”), which began trading in 2006. Milcom employs a systematic trading strategy that takes outright long/short positions and calendar spread positions across 40+ commodity futures markets. JEM CRV employs a market neutral, systematic trading strategy that invests in calendar spread positions across 20+ commodity markets.
The Fund’s Class I shares declined -2.92% during the semi-annual period ended June 30, 2017. While performance during the first quarter was positive, returns slipped during April and May causing performance over the period to fall into negative territory. Overall during the period, directional trading detracted from trading, particularly in Energy and Grains. This was partially offset by solid contributions from calendar spread trading where Energy and Livestock positions performed best.
Commodities Strategy
Energy
Trading in Energy markets was unprofitable during the semi-annual period, as losses during the second quarter offset small gains from the first three months of the year. Losses from directional trading more than offset solid gains from calendar spread trading during the semi-annual period. Overall during the period, energy prices were range-bound, but exhibited sizable swings within that range, conditions that were challenging for the Fund and led to inopportune shifts in positioning from long to short. Losses from short positions in oil-based markets late in the quarter were particularly acute as oil prices rallied sharply following unexpectedly hawkish comments by ECB President Draghi and reports that eased investor minds regarding excess production.
Grains
Positions in Grains were unprofitable during the period as directional and calendar spread trading both experienced losses, particularly during the second quarter. During the last three months of the period, short positions in Kansas City wheat, milling wheat, corn, soybean and canola were unprofitable as a drought in the U.S. high plains region, reduced wheat plantings in Canada, and a falling dollar underpinned a rally in prices. In addition, earlier in the quarter long soybean and soybean meal positions were unprofitable in April and May.
Metals
Trading in Metals was profitable during the period, attributable to solid gains from directional positions. Early in the year, with confidence in global economic growth increasing and worries about mine closures and Chinese supply cuts, industrial metals prices rose, generating gains from long aluminum, zinc, copper, and palladium positions. Later during the first quarter, however, as political and geopolitical tensions arose, industrial metals prices eased back, reducing the earlier gains from these positions. Trading in silver was particularly profitable during the period, particularly early in the second quarter when short positions benefitted from sliding prices.
Softs & Livestock
Trading in Softs was profitable during the period due to gains from both directional and calendar spread trading. Short positions in coffee and sugar were the largest contributors, partially offset by small losses in crude palm oil. Livestock positions were also profitable during the period, attributable to strong gains from calendar spread trading in lean hogs and live cattle. Lean hog spread positions benefited from rising pork supplies and increasing demand spurred by lower prices early in the year. Live cattle spread positions profited from large supplies as feed remained cheap for livestock producers.
Outlook
Millburn - As we peer into the second half of 2017, market participants will have to adjust to several developments that are likely to influence financial and commodity market price action. Currently, monetary policy globally remains accommodative, however there are strong indications that major central banks will gradually begin reducing the level of that accommodation in coming quarters. Energy prices, after plumbing the year’s lows in June, recovered as U.S. shale production seems to have leveled off recently; U.S. inventories have fallen; and, as the Organization of Petroleum Exporting Countries (“OPEC”) seeks to enforce renewed discipline. The increasingly toxic political environment in Washington has dampened expectations for passage of any significant policy initiatives from the Trump Administration and the Republican Congress. In the Fall, the 19th National Congress of the Communist Party of China will be held in Beijing, and the party delegates at the congress will elect the new leadership of the Communist Party of China. For these reasons, Millburn continues to see opportunities for the portfolio going forward, including opportunities with the potential to profit when market conditions for traditional equity and bond investments decline.
JE Moody - We continue to find a diverse set of opportunities across the markets, with primary benefits coming from Meats and Energies. We expect opportunities across these markets to continue. Our ongoing research has yielded enhancements to our models which are generally increasing our exposure to a wider set of markets at any given time with more efficient capturing of the opportunities, which we believe may enhance returns going forward.
Fixed Income Strategy
The Long/Short Commodities Fund invests most of its remaining assets in a Fixed Income Strategy comprised of short to intermediate term investment grade corporate and government agency securities. Nuveen is the sub-adviser for this strategy and manages a shorter duration, high quality portfolio.
The fixed income component of the Fund is managed against the Barclay’s 1-5 Government Credit Index. Returns for the fixed income portion of the portfolio were +1.19% compared to +1.13% for the benchmark in the first half of 2017. The duration of the fixed income component of the fund was managed between 1.8 and 2.0 years during the period compared to about 2.7 years for the benchmark. The sub-adviser’s decision to position the Fund’s duration defensively over the period accounted for the outperformance versus the benchmark, while the portfolio’s curve positioning was a detractor. Approximately 40-45% of the portfolio’s exposure was in investment grade corporate bonds and about 35% in securitized product. Within the corporate sector, we continue to focus on diversifying issuer exposure and maintaining above market weights to both Industrials and Financials issuers.
LoCorr Multi-Strategy Fund
TheLoCorr Multi-Strategy Fund (the “Multi-Strategy Fund” or the “Fund”) objective is capital appreciation and it invests in securities that are expected to produce a competitive level of current income. The Fund was launched in part due to demand for a Fund that would include a variety of our alternative investment strategies into one investment. Currently, the Fund’s exposure is allocated approximately equally between an equity-oriented portfolio and a managed futures driven portfolio. The equity-oriented allocation is comprised of an income-oriented strategy and a long/short strategy while the managed futures allocation is comprised of a diversified multi-asset trend-following futures strategy and a long/short commodity strategy.
Portfolio Update
For the semi-annual period ended June 30, 2017, the Fund’s Class I shares declined -1.74%. During the period, the Fund benefited from strong aggregate contributions from its equity-oriented manager allocation, led by positive returns from the income strategy while the long/short equity portfolio was slightly in the red. The allocation to managed futures detracted from returns during the period, as both the diversified futures portfolio and the long/short commodity portfolio had slightly negative returns.
Income Strategy
The income portfolio is sub-advised by Trust and Fiduciary Income Partners, Inc. (“TFIP”) which has managed a similar strategy, through a predecessor firm since 2001. The TFIP portfolio produced solid gains during the semi-annual period as strength from the portfolio’s position in asset management holdings, mortgage REITs, and credit sensitive holdings such as Bank Loan Funds and BDCs were positive, offsetting losses from mid-stream MLPs that sold-off in sympathy with the price of oil. TFIP’s portfolio continued to generate income for the Fund which distributed a consistent distribution per month throughout the period. Please refer to the commentary below for the Spectrum Income Fund’s Income Strategy to learn more about current portfolio positioning and market outlook.
Long/Short Equity Strategy
The long/short equity portfolio is sub-advised by Billings Capital Management (“Billings”) which has managed a similar strategy since the firm’s inception in early 2008. The Billings portfolio had slight losses during the period due to modestly negative returns by both the long and short book. In the long book, the underperformance by smaller cap securities and of value versus growth created a significant headwind for Billings. Holdings in the Financial Services and Industrial sector performed well, but were not able to offset losses from the Consumer Cyclical sector. In the Consumer Cyclical sector, retail positions were particularly weak though one of the holdings in this sector was sold by the sub-adviser. On the short side, gains from the Consumer Cyclical sector were not enough to offset weakness from a position in the Basic Materials sector.
Commodities Strategy
The Fund accesses the returns of the Millburn Commodity Program (“Milcom”) which it has traded since 2005. During the semi-annual period, the Milcom portion of the Fund produced negative returns as losses from directional trading more than offset positive contributions from calendar spread trading. Specifically, losses from outright/directional trading of Energy, Grain and Livestock futures were larger than the profits from outright trading of Metal and Soft commodity futures, and from Energy spread trading. The overall environment for systematic trading strategies like that employed by the Fund was challenging as it was marked by fairly range-bound markets that experienced sharp and frequent reversals.
Diversified Managed Futures Strategy
The Fund accesses the returns of Graham’s Tactical Trend strategy (“Graham”), which the manager has traded since 2006. During the semi-annual period, the Graham portion of the Fund had modest losses as gains came from long position in Equity markets were offset by losses in Commodity, Foreign Currency, and Interest Rate positions. Please refer to the commentary below for the Market Trend Fund to learn more about current portfolio positioning and market outlook.
Outlook
We continue to believe a high conviction approach that utilizes a select number of complementary managers, each of which has successfully executed similar strategies to the underlying portfolios in the Fund since at least 2008, may produce attractive risk-adjusted returns in the future. While the environment has been challenging for the managed futures portion of the Fund, we believe in the Fund’s potential to perform to our expectations. Further, though market participants appear to continue to be complacent with respect to risk, we expect volatility to return to equity markets in the future. Historically, managed futures have performed quite well during extended periods of weakness in equities and could provide ballast for the Fund if the market were to correct.
LoCorr Market Trend Fund
The LoCorr Market Trend Fund (the “Market Trend Fund” or the “Fund”) was created to provide investors with access to a trend following futures strategy managed by what we believe to be one of the leading managers in this space—Graham Capital Management. Graham was founded in 1994 and manages approximately $14 billion in assets. The Market Trend Strategy is managed similarly to Graham’s Tactical Trend program, a systematic medium- to long-term trend following strategy that commenced trading in 2006. The Fund seeks capital appreciation as its primary investment objective with managing volatility as a secondary objective. The Market Trend Fund attempts to achieve its objective by investing in two main strategies – a Market Trend Strategy and a Fixed Income Strategy.
The Fund’s Class I shares declined -3.18% during the semi-annual period ended June 30, 2017 versus a -1.67% decline for the Barclay’s CTA Index and a -5.80% decline for the SG Trend Index, which track the largest trend following CTAs. The first half of 2017 has proven difficult from a macro trading perspective as the environment has been broadly characterized by few sustained macro themes and price reversals across a number of sectors. Strong themes that began to emerge toward the end of 2016 have been tested throughout the year as markets adjust to political tensions in the U.S. and abroad. Despite valuation concerns, equities have trended higher during 2017 and produced opportunities that the Fund has captured. Fixed income and Foreign Currency markets have been more challenging as these markets have traded in narrow, trendless price ranges. Similarly, commodity markets have exhibited few directional opportunities as periods of low volatility have been frequently upended by short-term price fluctuations. Overall, the Fund’s largest gains came from long position in Equity markets that were offset by losses in Commodity, Foreign Currency, and Interest Rate positions.
Market Trend Strategy
Commodities
The Fund experienced losses from trading in the Commodities market with the largest detractors from positions in Energy and Precious Metals. Overall, commodity markets traded in a range and/or exhibited frequent and sharp reversals which challenged the strategy. Through much of the first quarter, long Energy positions were hurt as energy prices drifted lower. As positioning shifted short in response to the downward trending markets, the Fund was hurt when oil prices reversed course sharply from mid-March to early April before reversing again. Long positions in natural gas also hurt the Fund in the first quarter as prices fell due to mild weather. Profitable trading from a short position in Energy during the second quarter was not enough to offset the aforementioned weakness. In Precious Metals, a short position in gold during early 2017 was unprofitable as gold prices rallied, recouping some of the commodity’s losses experienced in late 2016 following the U.S. presidential election when expectations for growth surged. Trading in Base Metals contributed positively to returns, particularly from long positions in aluminum during the first quarter.
Equity Indices
The Fund was able to capture the strong trending activity in Equities during the semi-annual period. Long positions in U.S., Asia, and Europe benefitted from the march upward in global equity markets. The S&P 500 Index, for example, rose +9.34% during the first six months of 2017 and has now risen for seven consecutive quarters. While trading in U.S. markets was particularly profitable, substantial gains were also made in the other regions during the period.
Foreign Currencies
The largest losses during the period came from trading in Foreign Currency markets as investor sentiment regarding the U.S. dollar oscillated during the first half of the year. Overall, positioning in Foreign Currencies shifted between short and long relative to the U.S. dollar over the course of the semi-annual period. Trading in the Japanese Yen was unprofitable during the period as the Yen experienced multiple reversals versus the U.S. dollar as numerous factors including tension in North Korea, economic activity, and Bank of Japan (“BOJ”) dovish policy shifted sentiment toward the currency. This environment proved challenging for Graham’s trend following models to navigate and led to positioning that shifted inopportunely between long and short. A short position in the British Pound was also unprofitable as the currency reversed its downward trend, soaring to six-month highs following Prime Minister Theresa May’s call for a snap election in June. Trading in the Australian and Canadian Dollar was also unprofitable.
Interest Rates
Trading in Interest Rates was unprofitable for the Fund during the first six months of 2017, with positions in Long/Intermediate Rates accounting for the bulk of the losses. While the Fed raised official rates twice during the year, the losses were primarily attributable to long global bond positions that were hurt in June following comments made by ECB President Mario Draghi, Mark Carney from the Bank of England, and Stephen Poloz from the Bank of Canada at a conference in Sintra, Portugal that suggested global growth was strengthening and the era of quantitative easing was coming to an end. This sparked a late June spike in bond yields, both domestic and foreign, which hurt long positions, particularly in Canadian, US, European and UK positions.
Outlook
As we enter the third quarter, the primary focus of macro markets is on the timing and scope of monetary policy normalization across major economies. While global central bankers have expressed confidence in their inflation outlooks, continued weaker-than-expected inflation data, tighter financial conditions (from higher bond yields and potentially weaker equity prices) and ongoing geopolitical tensions have the potential to slow this process. All the while, the strained political environment in the U.S. may challenge some of the pro-growth optimism witnessed early in the year. The unfolding of a new monetary regime, and the potential for policy mistakes, may present trading opportunities in the second half of 2017 and beyond.
Fixed Income Strategy
The fixed income portion of the Fund is sub-advised by Nuveen and is relatively conservatively managed as a short duration portfolio of the highest credit quality. It is managed against the Barclay’s 1-3 Year Government Index and focuses primarily on U.S. Treasuries and U.S. Government securities, but can own up to 30% in aggregate in corporate, municipal, and asset backed securities of the highest credit quality. Returns for the fixed income portion of the portfolio were 0.60% compared to 0.48% for the benchmark in the first half of 2017. Nuveen’s defensive interest rate strategy accounted for a portion of the outperformance relative to the index as the duration of the portfolio was positioned shorter than the benchmark by between .30 and .40 years over the first half of 2017. Nuveen’s curve positioning was a slight detractor to performance. The portfolio generally held about 25% in non-government securities during the time frame; this was a boost to performance as these securities outperformed government securities. The portfolio also held about 10% of U.S. Agency multifamily mortgage-backed securities (“MBS”) in the first half of 2017; these securities also outperformed similar duration government securities and were beneficial to performance. As of June 30, 2017, portfolio duration was 1.6 years compared to 1.87 years for the benchmark and about 72% of the portfolio was in U.S. government debt with the remainder in AAA rated non-government securities.
LoCorr Dynamic Equity Fund
TheLoCorr Dynamic Equity Fund(the “Dynamic Equity Fund” or the “Fund”) seeks long-term capital appreciation with reduced volatility compared to traditional broad-based equity market indices as a secondary objective. Consistent with the “low correlation” our LoCorr Fund family seeks, Dynamic Equity Funds have shown the ability to provide positive returns when equity markets are rising, yet they offer the potential for downside protection when equity prices are falling.
The Fund employs two sub-advisers—Billings and Kettle Hill Capital Management (“Kettle Hill”). Billings’ strategy is based on a value-oriented, fundamental, bottom-up long/short equity approach. This manager seeks to maximize absolute returns, exceeding the S&P 500 index over the long term. The sub-portfolio managed by Billings is similar to a strategy that this manager has executed since its inception in 2008. Kettle Hill seeks to earn superior returns over an investment cycle while focusing on capital preservation and downside volatility. The manager’s investment process combines bottom-up, fundamental analysis with a top-down opportunistic overlay. Investing primarily in small cap securities, Kettle Hill targets a conservative net exposure to the market. The sub-portfolio managed by Kettle Hill is similar to a strategy that this manager has executed since its inception in 2003.
Market Commentary
Despite a less accommodative Federal Reserve (i.e. rising interest rates and shrinking balance sheet), terrorist attacks in Europe, and political stalemates in the U.S., the market seemed to take everything in stride during the first half of 2017. The S&P 500 finished the semi-annual period up +9.34%, including dividends, and has not had a down month so far this year. Technology stocks have been the strongest performers thus far this year, primarily driven by the FAANG stocks (Facebook, Amazon, Apple, Netflix, and Google/Alphabet).
While S&P 500 returns were up nearly 10%, there was a significant disparity between the performance of large and small cap issues, as well as value versus growth stocks. With growth stocks dramatically outperforming value stocks thus far in 2017 (Russell 1000 Growth up +13.99% vs. Russell 1000 Value up +4.66%) and large cap stocks (Russell 1000 Index up +9.27%) outperforming small cap stocks (Russell 2000 Index up +4.99%), the Fund has faced considerable head winds this year from its value and small-to-mid capitalization market bias.
Portfolio Update
After a strong 2016, the LoCorr Dynamic Equity Fund declined -0.49% (Class I shares) versus a gain of 9.34% for the S&P 500 Index and +4.31% for the Morningstar Long/Short Equity Category during the semi-annual period. The Fund benefited from positive absolute returns from its long positions while short positions detracted. During the period, Kettle Hill generated positive absolute returns while Billings portfolio was down slightly. Net exposure for the Fund ended the period at 41%.
In the Fund’s long book, strong gains came from the Technology sector while positions in Financial Services, Communication Service, and Industrials also contributed positively. In the Technology sector, a number of software positions generated sizable gains for the portfolio. Five9 Inc., a cloud-based contact center software provider, rose sharply, benefitting from consolidation and a favorable Q1 earnings report. In the Financial sector, Credit Acceptance Corp, a niche provider of auto dealership financing, was a strong performer during the period. Better-than-expected fourth quarter 2016 and Q1 2017 earnings helped propel the stock higher. Finally, Mastec Inc., a holding in the engineering & construction industry, continued to recover from its 2014 swoon, reaching valuation levels that caused the sub-adviser to exit the position. Offsetting some of these gains were losses in the Consumer Cyclical sector and, to a lesser extent, positions in Energy. In the Consumer Cyclical sector, holdings in two specialty retailers, Signet Jewelers Limited and Tailored Brands Inc., fell as these companies were caught in the broad-based sell-off that plagued the retail sector during the period. The position in Tailored Brands Inc. was exited.
On the short side of the book, positions in the Consumer Cyclical sector were the strongest contributors while holdings in the Energy, Industrial, and Financial sectors also benefited the Fund. In the Consumer Cyclical sector, an operator of hair salons was a substantial winner as the company’s growth struggles continued. Offsetting these gains, were losses concentrated in the Technology and Basic Materials sectors. A company involved in the production and sale of commercial construction material in the Basic Materials sector and, in the Technology sector, positions in an electronic gaming company and security platform provider were the largest detractors.
Outlook
Billings - Given the strong performance in 1st half 2017, it becomes incredibly difficult to prognosticate about the remainder of the year (not that any 6-month period is easy to predict). One thing that we believe will occur is the return of volatility, which does not have to mean a large market drawdown, but rather a larger bifurcation between sectors; market caps; healthy companies and weak companies; growth and value. It is still too early to know the effects of Trump’s protectionist policies and the outcome of Brexit. Overall, we are encouraged as we continue to find very attractive long and short opportunities.
We have held a cash balance between 20-30% for most of 2017; which we believe will be a benefit at some point. We have many names in the cue and are patiently waiting for slightly better pricing before entering them.
Kettle Hill- There has been much discussion within the financial media about risk in the market. Since all of these factors are common knowledge, we do not believe we have a significantly differentiated market view at this time. That said, we aim to continue to play defense with a well-curated short book. We will wait for better opportunities to tactically increase (or decrease) long exposure, depending on the opportunity set. Overall, we remain encouraged by the alpha-generating potential in the portfolio and believe we are prepared to manage through any potential increase in equity market volatility going forward.
We are quite excited about a number of themes in the portfolio including: golf, video games, software as a service, waste management, and internet companies that we feel have created massive scale, network effects and competitive moats, but have only recently begun monetizing their user bases. On the short side, we find opportunities in capital equipment for semiconductors and other technology component manufacturing that are trading at peak multiples on peak earnings. We are also short high valuation consumer stocks that are losing market share. We have a long-term secular short thesis on energy, predicated on potential technological disruption from electric vehicles.
LoCorr Spectrum Income Fund
The LoCorr Spectrum Income Fund (the “Spectrum Income Fund” or the “Fund”) has an objective of current income with capital appreciation as a secondary objective. The Fund is designed to fit within the “low correlation” of the LoCorr Fund family by seeking to provide relatively high levels of income with low correlation to the bond market. The Fund is sub-advised by Trust and Fiduciary Income Partners (“TFIP”). TFIP invests in pass-through securities to seek high current income, much of which the Fund distributes monthly to investors.
Spectrum Income Fund produced consistent income and solid total return for the first half of 2017, somewhat divided between a strong first quarter and a relatively quiescent second. Overall, the Fund’s Class I shares gained +2.85% during the semi-annual period ended June 30, 2017 due primarily to profits from positions in Investment Managers, Mortgage Real Estate Investment Trusts (“Mortgage REITs”), and Closed-End Funds (“CEFs”). The largest detractors during the period were positions in Preferred Stocks and Master Limited Partnerships (“MLPs”).
Market Commentary
Markets and news headlines in the first half of 2017 were significantly influenced by the new administration in Washington and the policies, or lack thereof, that were enacted. This produced stronger performance by economically sensitive holdings in the first quarter, followed by subsiding optimism in the second. Overall market volatility remained muted as the major global central banks continued their broadly accommodative policies, though with signs beginning to emerge that their largesse would not be unending. In the U. S., the Federal Reserve raised rates twice and gave clear guidance that it would begin to unwind its balance sheet.
TFIP continues to see fundamental strength in the reflation theme, understood as increasing economic output both at home and abroad--but without meaningful inflation in consumer price indexes, wages, or commodities. The most significant market condition affecting the portfolio was the decline in oil prices which, despite OPEC assurances of extended production control, continued through June. Although the spot oil futures price is volatile and has little relation to the longer-term prices at which physical markets clear, it can exert significant short-term influence on market sentiment. In this case, it was a factor in depressing portfolio holdings in US midstream pipelines, despite the fact that these companies are benefiting from increasing volumes of U.S. oil and gas production and exports.
Portfolio Update
Asset management companies, trading primarily as Publicly Traded Partnerships (“PTPs”), benefited from still “easy” money provided by the central banks’ gradual withdrawal of monetary accommodation combined with robust public markets which allowed them to sell private equity investments at attractive prices. Mortgage REITs had a strong first half although they corrected in anticipation of the Fed rate hike in June. TFIP took advantage of the strength in some of the Mortgage REIT holdings to lighten up prior to the rate driven “June swoon.” Credit sensitive holdings such as Bank Loan Funds and BDC’s appreciated modestly. The weakest group in the first half of 2017 were holdings in the midstream oil and gas space. Midstream MLPs have become highly correlated with the price of crude oil despite the fact that, as mentioned above, they are benefiting from increasing volumes of U.S. oil and gas production and exports. Despite the oil induced volatility, TFIP continues to see value in midstream MLP’s that have exposure to targeted areas like the Permian Basin. As this is written, the oil price and pipelines have rallied from June lows and TFIP believes that stable, moderate oil prices will be sufficient to rekindle investor interest in this sector.
New investment themes that the investment team acted upon during the first half of the year included renewable energy, Liquid Natural Gas (“LNG”) transportation, and emerging market debt. After monitoring the renewables sector for a long time, TFIP began to see signs that, if properly located in appropriately sunny and/or windy areas and relatively close to population centers, renewable energy can become competitive with, if not cheaper than, traditional sources of energy on a stand-alone basis. TFIP added to its LNG transportation and infrastructure theme with the proceeds from the sale of most of the Fund’s traditional and crude tanker shipping positions. The projected growth of LNG, especially to Asia, is compelling and, in the investment team’s view, in its infancy. A third new theme added in the first half was a set of closed end funds holding emerging market debt. After a period in which emerging markets investments were out of favor, the global reflationary trends have strengthened to the point that growth and credit quality in these areas of the world are sufficient to justify a modest allocation.
Sales during the first quarter included a number of individual issues which reached price targets, justifying profit taking, and various holdings where fundamentals failed to meet expectations. The latter included a few items positions highly levered to oil and fertilizer prices. TFIP also decided to sell most of the Fund’s traditional and crude oil tanker positions because the anticipated recovery in tanker rates was taking longer than expected.
Outlook
TFIP is optimistic about what the balance of 2017 may bring for the portfolio. The portfolio is positioned in anticipation of further economic growth (but not price inflation) and the investment team sees every sign of a benign environment for the operations of the Fund’s holdings. The portfolio is diversified across many sectors and, in the manager’s view, valuations remain extremely attractive.
Thank you for investing in the LoCorr Funds
The S&P 500 Index is a broad based unmanaged index of 500 stocks, which is widely recognized as representative of the equity market in general. Barclays 1-5 Year Government Credit Index-The Barclays U.S. Government/Credit 1-5 Year Index is an index of all investment grade bonds with maturities of more than one year and less than 5 years. Barclays 1-3 Year Government Bond Index-The Barclays U.S. 1-3 Year Government/Credit Bond Index is a part of the Barclays U.S. Government/Credit Bond Index. It includes Treasury and agency securities (U.S. Government Bond Index) and publicly issued U.S. corporate and foreign debentures and secured notes (U.S. Credit Bond Index). The bonds in the index are investment-grade with a maturity between one and three years. Morningstar Global Long/Short Equity Index uses historical fund data dating back to the fund’s inception. Funds that have been liquidated or merged are included in analysis. The inception of the index is determined by the date at which the benchmark obtains five or more constituents, without falling below two constituents going forward. It includes funds with exposure to long and short positions in global equities or derivatives and is equally weighted. Barclays CTA Index is an unweighted index which attempts to measure the performance of the Commodity Trading Advisor (“CTA”) industry. The Index measures the combined performance of all CTAs reporting to Barclay Trading Group who have more than 4 years past performance. Fees and transaction costs are reflected. MSCI ACWI - All Country World Index is a market capitalization weighted index designed to provide a broad measure of equity-market performance throughout the world. The MSCI ACWI is maintained by Morgan Stanley Capital International, and is comprised of stocks from both developed and emerging markets. SG CTA Trend Sub-Index is a subset of the SG CTA Index, and follows traders of trend following methodologies. The SG CTA Index is equal weighted, calculates the daily rate of return for a pool of CTAs selected from the larger managers that are open to new investment. Russell 1000 Growth Index refers to a composite that includes large and mid-cap companies located in the United States that also exhibit a growth probability. The Russell 1000 Growth is published and maintained by FTSE Russell. Russell 1000 Value Index refers to a composite of large and mid-cap companies located in the United States that also exhibit a value probability. The Russell 1000 Value is published and maintained by FTSE Russell. Russell 1000 Index is a stock market index that represents the highest-ranking 1,000 stocks in the Russell 3000 Index, which represents about 90% of the total market capitalization of that index. Russell 2000 Index measures the performance of approximately 2,000 small-cap companies in the Russell 3000 Index, which is made up of 3,000 of the biggest U.S. stocks. The Russell 2000 serves as a benchmark for small-cap stocks in the United States. One cannot invest directly in an index.
Fund holdings and sector allocations are subject to change and are not recommendations to buy or sell any security.
Alpha is an annualized return measure of how much better or worse a fund’s performance is relative to an index of funds in the same category, after allowing for differences in risk. Basis point (bp) is a unit equal to 1/100th of 1% and is used to denote the change in a financial instrument. Correlation measures how much the returns of two investments move together over time.
Duration is a commonly used measure of the potential volatility of the price of a debt security, or the aggregate market value of a portfolio of debt securities, prior to maturity. Securities with a longer duration generally have more volatile prices than securities of comparable quality with a shorter duration.
Investment Grade-Investment Grade refers to bonds that are rated BBB or higher. Bond ratings are grades given to bonds that indicate their credit quality as determined by private independent rating services such as Standard & Poor’s, Moody’s and Fitch. These firms evaluate a bond issuer’s financial strength, or its ability to pay a bond’s principal and interest in a timely fashion. Ratings are expressed as letters ranging from ‘AAA’, which is the highest grade, to ‘D’, which is the lowest grade.
Spread is the percentage point difference between yields of various classes of bonds compared to treasury bonds.
Yield Curve is a line that plots the interest rates, at a set point in time, of bonds having equal credit quality, but differing maturity dates. The most frequently reported yield curve compares the three-month, two-year, five-year and 30-year U.S. Treasury debt. The curve is used to predict changes in economic output and growth.
Must be preceded or accompanied by a prospectus.
Opinions expressed are those of the Investment Manager and are subject to change, are not guaranteed and should not be considered investment advice.
Earnings growth is not representative of the Funds’ future performance.
Past performance is not a guarantee of future results.
Diversification does not assure a profit nor protect against loss in a declining market.
Mutual fund investing involves risk. Principal loss is possible. The LoCorr Macro Strategies Fund and the LoCorr Spectrum Income Fund are each a diversified fund. The LoCorr Long/Short Commodities Strategy Fund, the LoCorr Multi-Strategy Fund, the LoCorr Market Trend Fund and the LoCorr Dynamic Equity Fund are each non-diversified funds, meaning they may invest their assets in fewer individual holdings than a diversified fund. Therefore, those Funds are more exposed to individual stock volatility than a diversified fund. The Funds invest in foreign investments and foreign currencies which involve greater volatility and political, economic and currency risks and differences in accounting methods. The Funds may make short sales of securities, which involves the risk that losses may exceed the original amount invested. Investing in commodities may subject the Funds to greater risks and volatility as commodity prices may be influenced by a variety of factors including unfavorable weather, environmental factors, and changes in government regulations. The Funds may invest in derivative securities, which derive their performance from the performance of an underlying asset, index, interest rate or currency exchange rate. Derivatives can be volatile and involve various types and degrees of risks, and, depending upon the characteristics of a particular derivative, suddenly can become illiquid. Investments in debt securities typically decrease in value when interest rates rise. This risk is usually greater for longer-term debt securities. Investments in Asset Backed, Mortgage Backed, and Collateralized Mortgage Backed Securities include additional risks that investors should be aware of such as credit risk, prepayment risk, possible illiquidity and default, as well as increased susceptibility to adverse economic developments. Investments in Real Estate Investment Trusts (REITs) involve additional risks such as declines in the value of real estate and increased susceptibility to adverse economic or regulatory developments.
Derivative contracts ordinarily have leverage inherent in their terms which can magnify a Fund’s potential for gains or losses through increased long and short position exposure. A Fund may access derivatives via a swap agreement. A risk of a swap agreement is the risk that the counterparty to the agreement will default on its obligation to pay the Fund.
A Fund will incur a loss as a result of a short position if the price of the short position instrument increases in value between the date of the short position sale and the date on which an offsetting position is purchased.
Investments in small- and medium-capitalization companies involve additional risks such as limited liquidity and greater volatility. Investments in lower rated and non-rated securities presents a greater risk of loss to principal and interest than higher-rated securities. ETF investments are subject to investment advisory and other expenses, which will be indirectly paid by the Fund. As a result, the cost of investing in the Fund will be higher than the cost of investing directly in ETFs and may be higher than other mutual funds that invest directly in stocks and bonds. ETFs are subject to specific risks, depending on the nature of the ETF.
A Fund’s portfolio will be significantly impacted by the performance of the real estate market generally, and a Fund may be exposed to greater risk and experience higher volatility than would a more economically diversified portfolio. Property values may fall due to increasing vacancies or declining rents resulting from economic, legal, cultural, or technological developments. Investments in Limited Partnerships (including master limited partnerships) involve risks different from those of investing in common stock including risks related to limited control and limited rights to vote on matters affecting the Limited Partnership, risks related to potential conflicts of interest between the Limited Partnership and the Limited Partnership’s general partner, cash flow risks, dilution risks and risks related to the general partner’s limited call right. Underlying Funds are subject to management and other expenses, which will be indirectly paid by a Fund.
The LoCorr Macro Strategies Fund, LoCorr Long/Short Commodities Strategy Fund, LoCorr Multi-Strategy Fund, LoCorr Market Trend Fund, LoCorr Dynamic Equity Fund, and the LoCorr Spectrum Income Fund are distributed by Quasar Distributors, LLC.
LoCorr Macro Strategies Fund
Rate of Return — For the period ended June 30, 2017 (Unaudited)
| | Inception | | | | Average Annual |
| | Date | 6 Month | 1 Year | 5 Year | Since Inception |
| LoCorr Macro Strategies Fund - Class A (without maximum load) | 3/22/11 | -2.80% | -7.23% | 3.05% | 0.36% |
| LoCorr Macro Strategies Fund - Class A (with maximum load) | 3/22/11 | -8.35% | -12.55% | 1.83% | -0.59% |
| LoCorr Macro Strategies Fund - Class C | 3/24/11 | -4.10% | -8.79% | 2.28% | -0.39% |
| LoCorr Macro Strategies Fund - Class I | 3/24/11 | -2.66% | -6.95% | 3.31% | 0.61% |
| S&P 500 Total Return Index | | 9.34% | 17.90% | 14.63% | 12.70%1 |
| Barclays CTA Index | | -1.67% | -4.46% | 0.06% | -0.61%2 |
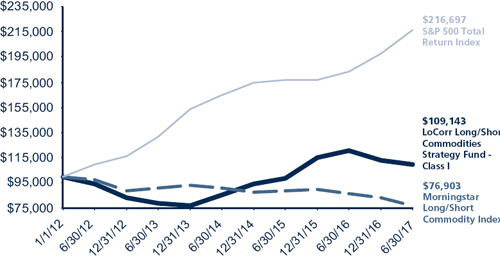
$100,000 investment in the LoCorr Macro Strategies Fund – Class I
For the period ended June 30, 2017 (Unaudited)
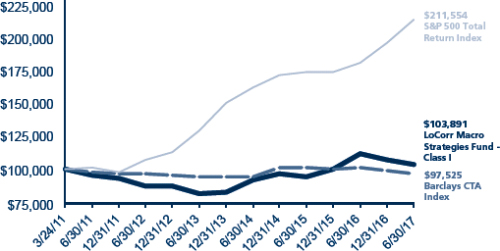
This chart illustrates the performance of a hypothetical $100,000 investment made in the Fund since inception. Assumes reinvestment of distributions, but does not reflect the effect of any applicable sales charge or redemption fees. This chart does not imply any future performance. Performance will vary from class to class based on differences in class-specific expenses and sales charges. The returns do not reflect the deduction of taxes that a shareholder would pay on Fund distributions or the redemption of Fund shares.
Performance data represents past performance; past performance does not guarantee future results. The investment return and principal value of an investment will fluctuate so that an investor’s shares, when redeemed, may be worth more or less than their original cost. Current performance of the Fund may be lower or higher than the performance quoted. Performance data current to the most recent month end may be obtained by calling 1.855.LCFUNDS, or visiting www.LoCorrFunds.com.
Performance data shown reflects the Class A maximum sales charge of 5.75% and reflects the Class C Contingent Deferred Sales Charge (CDSC) of 1.00%. Performance of the Class A without load does not reflect the deduction of the sales load or fee. If reflected, the load or fee would reduce the performance quoted.
The returns reflect the actual performance for each period and do not include the impact on trades executed on the last business day of the period that were recorded on the first business day of the next period.
Per the fee table in the Fund’s May 1, 2017 prospectus, the Fund’s annual operating expense ratio is 2.31%, 3.06% and 2.06% for Class A, Class C and Class I shares, respectively.
The S&P 500 Total Return Index is an unmanaged capitalization-weighted index of 500 stocks designed to measure performance of the broad domestic economy through changes in the aggregate market value of the 500 stocks which represent all major industries.
The Barclays CTA Index is a leading industry benchmark of representative performance of commodity trading advisors.
One cannot invest directly in an index.
1 Since inception return as of March 24, 2011.
2 Since inception return as of March 31, 2011.
LoCorr Long/Short Commodities Strategy Fund
Rate of Return — For the period ended June 30, 2017 (Unaudited)
| | Inception | | | | Average Annual |
| | Date | 6 Month | 1 Year | 5 Year | Since Inception1 |
| LoCorr Long/Short Commodities Strategy Fund - Class A (without maximum load) | 1/1/12 | -3.05% | -9.93% | 2.66% | 1.36% |
| LoCorr Long/Short Commodities Strategy Fund - Class A (with maximum load) | 1/1/12 | -8.63% | -15.11% | 1.44% | 0.28% |
| LoCorr Long/Short Commodities Strategy Fund - Class C | 1/1/12 | -4.43% | -11.39% | 1.88% | 0.55% |
| LoCorr Long/Short Commodities Strategy Fund - Class I | 1/1/12 | -2.92% | -9.58% | 2.90% | 1.60% |
| S&P 500 Total Return Index | | 9.34% | 17.90% | 14.63% | 15.09% |
| Morningstar Long/Short Commodity Index | | -7.51% | -11.16% | -4.65% | -4.66% |
$100,000 investment in the LoCorr Long/Short Commodities Strategy Fund – Class I
For the period ended June 30, 2017 (Unaudited)
This chart illustrates the performance of a hypothetical $100,000 investment made in the Fund since inception. Assumes reinvestment of distributions, but does not reflect the effect of any applicable sales charge or redemption fees. This chart does not imply any future performance. Performance will vary from class to class based on differences in class-specific expenses and sales charges. The returns do not reflect the deduction of taxes that a shareholder would pay on Fund distributions or the redemption of Fund shares.
Performance data represents past performance; past performance does not guarantee future results. The investment return and principal value of an investment will fluctuate so that an investor’s shares, when redeemed, may be worth more or less than their original cost. Current performance of the Fund may be lower or higher than the performance quoted. Performance data current to the most recent month end may be obtained by calling 1.855.LCFUNDS, or visiting www.LoCorrFunds.com.
Performance data shown reflects the Class A maximum sales charge of 5.75% and reflects the Class C Contingent Deferred Sales Charge (CDSC) of 1.00%. Performance of the Class A without load does not reflect the deduction of the sales load or fee. If reflected, the load or fee would reduce the performance quoted.
The returns reflect the actual performance for each period and do not include the impact on trades executed on the last business day of the period that were recorded on the first business day of the next period.
Per the fee table in the Fund’s May 1, 2017 prospectus, the Fund’s annual operating expense ratio, before fee waivers is 2.73%, 3.48% and 2.48% for Class A, Class C and Class I shares, respectively.
The S&P 500 Total Return Index is an unmanaged capitalization-weighted index of 500 stocks designed to measure performance of the broad domestic economy through changes in the aggregate market value of the 500 stocks which represent all major industries.
The Morningstar Long/Short Commodity Index is a fully collateralized commodity futures index that uses the momentum rule to determine if each commodity is held long, short, or flat.
One cannot invest directly in an index.
1 Since inception returns as of January 1, 2012.
LoCorr Multi-Strategy Fund
Rate of Return — For the period ended June 30, 2017 (Unaudited)
| | Inception | | | Average Annual |
| | Date | 6 Month | 1 Year | Since Inception1 |
| LoCorr Multi-Strategy Fund - Class A (without maximum load) | 4/6/15 | -1.89% | -3.69% | -7.30% |
| LoCorr Multi-Strategy Fund - Class A (with maximum load) | 4/6/15 | -7.56% | -9.17% | -9.72% |
| LoCorr Multi-Strategy Fund - Class C | 4/6/15 | -3.07% | -5.37% | -8.00% |
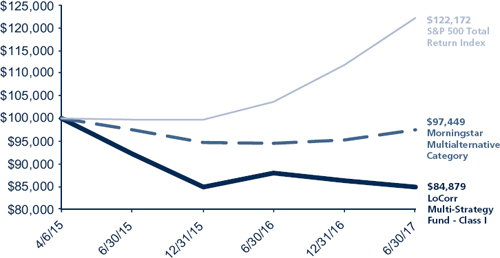
| LoCorr Multi-Strategy Fund - Class I | 4/6/15 | -1.74% | -3.40% | -7.08% |
| S&P 500 Total Return Index | | 9.34% | 17.90% | 9.38% |
| Morningstar Multialternative Category | | 2.31% | 3.11% | -0.75% |
$100,000 investment in the LoCorr Multi-Strategy Fund - Class I
For the period ended June 30, 2017 (Unaudited)
This chart illustrates the performance of a hypothetical $100,000 investment made in the Fund since inception. Assumes reinvestment of distributions, but does not reflect the effect of any applicable sales charge or redemption fees. This chart does not imply any future performance. Performance will vary from class to class based on differences in class-specific expenses and sales charges. The returns do not reflect the deduction of taxes that a shareholder would pay on Fund distributions or the redemption of Fund shares.
Performance data represents past performance; past performance does not guarantee future results. The investment return and principal value of an investment will fluctuate so that an investor’s shares, when redeemed, may be worth more or less than their original cost. Current performance of the Fund may be lower or higher than the performance quoted. Performance data current to the most recent month end may be obtained by calling 1.855.LCFUNDS, or visiting www.LoCorrFunds.com.
Performance data shown reflects the Class A maximum sales charge of 5.75% and reflects the Class C Contingent Deferred Sales Charge (CDSC) of 1.00%. Performance of the Class A without load does not reflect the deduction of the sales load or fee. If reflected, the load or fee would reduce the performance quoted.
The returns reflect the actual performance for each period and do not include the impact on trades executed on the last business day of the period that were recorded on the first business day of the next period.
Per the fee table in the Fund’s May 1, 2017 prospectus, the Fund’s annual operating expense ratio, before fee waivers is 3.97%, 4.72% and 3.72% for Class A, Class C and Class I shares, respectively.
The S&P 500 Total Return Index is an unmanaged capitalization-weighted index of 500 stocks designed to measure performance of the broad domestic economy through changes in the aggregate market value of the 500 stocks which represent all major industries.
The funds in the Morningstar Multialternative Category use a combination of alternative strategies. Funds in this category have a majority of their assets exposed to alternative strategies and include both funds with static allocations to alternative strategies and funds tactically allocating among alternative strategies and asset classes.
One cannot invest directly in an index.
1 Since inception return as of April 6, 2015.
LoCorr Market Trend Fund
Rate of Return — For the period ended June 30, 2017 (Unaudited)
| | | | | Average Annual |
| | Inception Date | 6 Month | 1 Year | Since Inception1 |
| LoCorr Market Trend Fund - Class A (without maximum load) | 7/1/14 | -3.38% | -15.10% | 3.06% |
| LoCorr Market Trend Fund - Class A (with maximum load) | 7/1/14 | -8.94% | -19.97% | 1.05% |
| LoCorr Market Trend Fund - Class C | 7/1/14 | -4.67% | -16.58% | 2.28% |
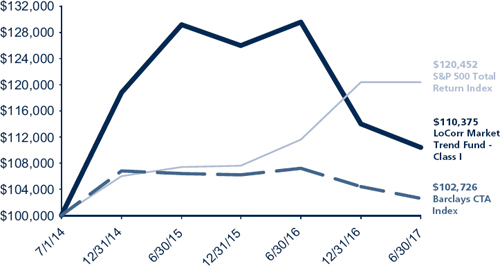
| LoCorr Market Trend Fund - Class I | 7/1/14 | -3.18% | -14.85% | 3.35% |
| S&P 500 Total Return Index | | 9.34% | 17.90% | 9.61% |
| Barclays CTA Index | | -1.67% | -4.46% | 0.79% |
$100,000 investment in the LoCorr Market Trend Fund - Class I
For the period ended June 30, 2017 (Unaudited)
This chart illustrates the performance of a hypothetical $100,000 investment made in the Fund since inception. Assumes reinvestment of distributions, but does not reflect the effect of any applicable sales charge or redemption fees. This chart does not imply any future performance. Performance will vary from class to class based on differences in class-specific expenses and sales charges. The returns do not reflect the deduction of taxes that a shareholder would pay on Fund distributions or the redemption of Fund shares.
Performance data represents past performance; past performance does not guarantee future results. The investment return and principal value of an investment will fluctuate so that an investor’s shares, when redeemed, may be worth more or less than their original cost. Current performance of the Fund may be lower or higher than the performance quoted.
Performance data current to the most recent month end may be obtained by calling 1.855.LCFUNDS, or visiting www.LoCorrFunds.com. Performance data shown reflects the Class A maximum sales charge of 5.75% and reflects the Class C Contingent Deferred Sales Charge (CDSC) of 1.00%. Performance of the Class A without load does not reflect the deduction of the sales load or fee. If reflected, the load or fee would reduce the performance quoted.
The returns reflect the actual performance for each period and do not include the impact on trades executed on the last business day of the period that were recorded on the first business day of the next period.
Per the fee table in the Fund’s May 1, 2017 prospectus, the Fund’s annual operating expense ratio is 2.03%, 2.78% and 1.78% for Class A, Class C and Class I shares, respectively.
The S&P 500 Total Return Index is an unmanaged capitalization-weighted index of 500 stocks designed to measure performance of the broad domestic economy through changes in the aggregate market value of the 500 stocks which represent all major industries.
The Barclays CTA Index is a leading industry benchmark of representative performance of commodity trading advisors.
One cannot invest directly in an index.
1 Since inception return as of July 1, 2014.
LoCorr Dynamic Equity Fund
Rate of Return — For the period ended June 30, 2017 (Unaudited)
| | | | | Average Annual |
| | Inception Date | 6 Month | 1 Year | Since Inception1 |
| LoCorr Dynamic Equity Fund - Class A (without maximum load) | 5/10/13 | -0.58% | 17.78% | 4.58% |
| LoCorr Dynamic Equity Fund - Class A (with maximum load) | 5/10/13 | -6.33% | 11.02% | 3.10% |
| LoCorr Dynamic Equity Fund - Class C | 5/10/13 | -1.93% | 15.92% | 3.77% |
| LoCorr Dynamic Equity Fund - Class I | 5/10/13 | -0.49% | 18.03% | 4.84% |
| S&P 500 Total Return Index | | 9.34% | 17.90% | 12.33% |
| Morningstar Long/Short Equity Fund Index | | 4.31% | 8.36% | 3.39% |
$100,000 investment in the LoCorr Dynamic Equity Fund - Class I
For the period ended June 30, 2017 (Unaudited)
This chart illustrates the performance of a hypothetical $100,000 investment made in the Fund since inception. Assumes reinvestment of distributions, but does not reflect the effect of any applicable sales charge or redemption fees. This chart does not imply any future performance. Performance will vary from class to class based on differences in class-specific expenses and sales charges. The returns do not reflect the deduction of taxes that a shareholder would pay on Fund distributions or the redemption of Fund shares.
Performance data represents past performance; past performance does not guarantee future results. The investment return and principal value of an investment will fluctuate so that an investor’s shares, when redeemed, may be worth more or less than their original cost. Current performance of the Fund may be lower or higher than the performance quoted. Performance data current to the most recent month end may be obtained by calling 1.855.LCFUNDS, or visiting www.LoCorrFunds.com.
Performance data shown reflects the Class A maximum sales charge of 5.75% and reflects the Class C Contingent Deferred Sales Charge (CDSC) of 1.00%. Performance of the Class A without load does not reflect the deduction of the sales load or fee. If reflected, the load or fee would reduce the performance quoted.
The returns reflect the actual performance for each period and do not include the impact on trades executed on the last business day of the period that were recorded on the first business day of the next period.
Per the fee table in the Fund’s May 1, 2017 prospectus, the Fund’s annual operating expense ratio, before fee waivers is 3.80%, 4.55% and 3.55% for Class A, Class C and Class I shares, respectively.
The S&P 500 Total Return Index is an unmanaged capitalization-weighted index of 500 stocks designed to measure performance of the broad domestic economy through changes in the aggregate market value of the 500 stocks which represent all major industries.
The funds in the Morningstar Long/Short Equity Fund Index category hold sizeable stakes in both long and short positions in equities and related derivatives. At least 75% of the assets are in equity securities or derivatives.
One cannot invest directly in an index.
1 Since inception returns as of May 10, 2013.
LoCorr Spectrum Income Fund
Rate of Return — For the period ended June 30, 2017 (Unaudited)
| | | | | Average Annual |
| | Inception Date | 6 Month | 1 Year | Since Inception1 |
| LoCorr Spectrum Income Fund - Class A (without maximum load) | 1/1/14 | 2.69% | 5.19% | -1.19% |
| LoCorr Spectrum Income Fund - Class A (with maximum load) | 1/1/14 | -3.22% | -0.91% | -2.85% |
| LoCorr Spectrum Income Fund - Class C | 1/1/14 | 1.20% | 3.33% | -1.95% |
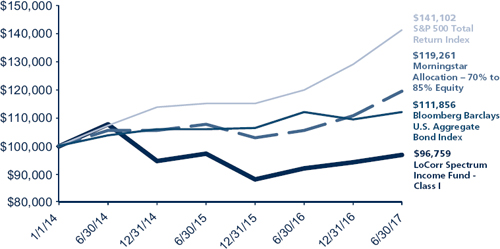
| LoCorr Spectrum Income Fund - Class I | 1/1/14 | 2.85% | 5.40% | -0.94% |
| S&P 500 Total Return Index | | 9.34% | 17.90% | 10.35% |
| Morningstar Allocation - 70% to 85% Equity | | 7.73% | 13.15% | 5.09% |
| Bloomberg Barclays U.S. Aggregate Bond Index | | 2.27% | -0.31% | 3.26% |
$100,000 investment in the
LoCorr Spectrum Income Fund - Class I
For the period ended June 30, 2017 (Unaudited)
This chart illustrates the performance of a hypothetical $100,000 investment made in the Fund since inception. Assumes reinvestment of distributions, but does not reflect the effect of any applicable sales charge or redemption fees. This chart does not imply any future performance. Performance will vary from class to class based on differences in class-specific expenses and sales charges. The returns do not reflect the deduction of taxes that a shareholder would pay on Fund distributions or the redemption of Fund shares.
Performance data represents past performance; past performance does not guarantee future results. The investment return and principal value of an investment will fluctuate so that an investor’s shares, when redeemed, may be worth more or less than their original cost. Current performance of the Fund may be lower or higher than the performance quoted. Performance data current to the most recent month end may be obtained by calling 1.855.LCFUNDS, or visiting www.LoCorrFunds.com.
Performance data shown reflects the Class A maximum sales charge of 5.75% and reflects the Class C Contingent Deferred Sales Charge (CDSC) of 1.00%. Performance of the Class A without load does not reflect the deduction of the sales load or fee. If reflected, the load or fee would reduce the performance quoted.
The returns reflect the actual performance for each period and do not include the impact on trades executed on the last business day of the period that were recorded on the first business day of the next period.
The Fund imposes a 2.00% redemption fee on shares held for less than 60 days. Performance data does not reflect the redemption fee. If it had, return would be reduced.
Per the fee table in the Fund’s May 1, 2016 prospectus, the Fund’s annual operating expense ratio, before fee recoveries is 3.06%, 3.81% and 2.81% for Class A, Class C and Class I shares, respectively.
The S&P 500 Total Return Index is an unmanaged capitalization-weighted index of 500 stocks designed to measure performance of the broad domestic economy through changes in the aggregate market value of the 500 stocks which represent all major industries.
The Bloomberg Barclays U.S. Aggregate Bond Index is a long term, market capitalization-weighted index used to represent investment grade bonds being traded in the United States.
The Morningstar Allocation – 70% to 85% Equity portfolios seek to provide both income and capital appreciation by investing in multiple asset classes, including stocks, bonds and cash. These portfolios are dominated by domestic holdings and have equity expenses between 70% and 85%.
One cannot invest directly in an index.
1 Since inception returns as of January 1, 2014.
| |
|
LoCorr Macro Strategies Fund - Consolidated Schedule of Investments | 15 |
| |
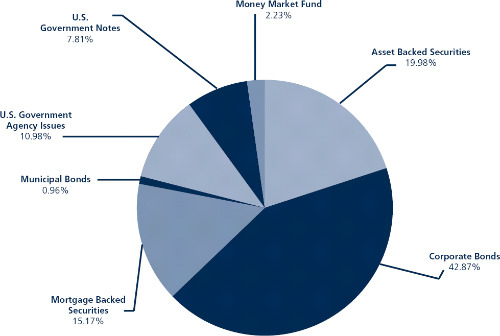
LoCorr Macro Strategies Fund
Composition of Consolidated Investment Portfolio1
June 30, 2017 (Unaudited)
1 As a percentage of total investments.
Consolidated Schedule of Investments
June 30, 2017 (Unaudited)
| | | Maturity Date | | Coupon Rate | | Principal Amount | | Value |
| ASSET BACKED SECURITIES: 17.42% | | | | | | | | | | |
| 321 Henderson Receivables I LLC | | | | | | | | | | |
Series 2006-1A A1 (Acquired 03/30/2015, Cost, $1,427,033) (a)(c) | | 03/15/2041 | | 1.36% | | $ | 1,447,616 | | $ | 1,409,418 |
Series 2006-4A A1 (Acquired 07/19/2016, Cost, $1,729,398) (a)(c) | | 12/15/2041 | | 1.36% | | | 1,788,791 | | | 1,744,416 |
Series 2004-A A1 (Acquired 02/08/2013, Cost, $230,004) (a)(c) | | 09/15/2045 | | 1.51% | | | 241,633 | | | 234,781 |
| Ally Auto Receivables Trust, 2015-1 A3 | | 09/16/2019 | | 1.39% | | | 2,682,602 | | | 2,681,806 |
AmeriCredit Automobile Receivables, 2016-1 A2A (c) | | 06/10/2019 | | 1.52% | | | 1,806,320 | | | 1,806,432 |
| Atlantic City Electric Transition Funding LLC, 2003-1 A3 | | 10/20/2020 | | 5.05% | | | 416,092 | | | 423,433 |
| BA Credit Card Trust | | | | | | | | | | |
Series 2014-3A A (c) | | 01/15/2020 | | 1.45% | | | 2,040,000 | | | 2,040,678 |
Series 2015-1A A (c) | | 06/15/2020 | | 1.49% | | | 3,975,000 | | | 3,981,338 |
Cabela’s Credit Card Master Note Trust, 2013-2A A2 (Acquired 05/24/2016 through 08/12/2016, Cost, $3,883,520) (a)(c) | | 08/16/2021 | | 1.08% | | | 3,885,000 | | | 3,905,001 |
| California Republic Auto Receivables Trust | | | | | | | | | | |
| Series 2013-2 A2 | | 03/15/2019 | | 1.23% | | | 136,403 | | | 136,342 |
| Series 2015-2 A2 | | 03/15/2019 | | 1.34% | | | 1,426,572 | | | 1,426,145 |
| Series 2015-1 A3 | | 04/15/2019 | | 1.33% | | | 232,566 | | | 232,539 |
| Series 2017-1 A2 | | 11/15/2019 | | 1.55% | | | 3,095,000 | | | 3,094,231 |
| Capital Auto Receivables Asset Trust, 2015-2 A2 | | 09/20/2018 | | 1.39% | | | 410,988 | | | 410,982 |
Capital One Multi-Asset Execution Trust, 2014-3A (c) | | 01/18/2022 | | 1.54% | | | 3,060,000 | | | 3,073,108 |
| CarMax Auto Owner Trust, 2017-1 | | 02/18/2020 | | 1.54% | | | 4,439,000 | | | 4,438,458 |
| CenterPoint Energy Restoration Bond Co. LLC, 2009-1 A2 | | 08/15/2019 | | 3.46% | | | 1,184,731 | | | 1,194,352 |
| Chase Issuance Trust | | | | | | | | | | |
Series 2013-A3 (c) | | 04/15/2020 | | 1.44% | | | 5,750,000 | | | 5,758,255 |
Series 2013-9A (c) | | 11/16/2020 | | 1.58% | | | 5,200,000 | | | 5,222,099 |
| Series 2012-A4 | | 08/16/2021 | | 1.58% | | | 4,115,000 | | | 4,102,354 |
Chrysler Capital Auto Receivables Trust, 2015-B A3 (Acquired 02/10/2017 through 05/25/2017, Cost, $4,787,235) (a) | | 03/16/2020 | | 1.91% | | | 4,776,021 | | | 4,784,810 |
| Citibank Credit Card Issuance Trust | | | | | | | | | | |
| Series 2007-A8 | | 09/20/2019 | | 5.65% | | | 4,650,000 | | | 4,691,060 |
| Series 2016-A2 | | 11/20/2023 | | 2.19% | | | 6,730,000 | | | 6,753,776 |
The accompanying notes are an integral part of these consolidated financial statements.
| |
|
16 | LoCorr Macro Strategies Fund - Consolidated Schedule of Investments (continued) |
| |
| | | Maturity Date | | Coupon Rate | | Principal Amount | | Value |
ASSET BACKED SECURITIES (continued) | | | | | | | | | | |
| Colony American Homes | | | | | | | | | | |
Series 2014-A1 (Acquired 04/02/2014 through 09/21/2016, Cost, $4,629,213) (a)(c) | | 05/17/2031 | | 2.36% | | $ | 4,635,284 | | $ | 4,660,644 |
Series 2015-C1 (Acquired 05/27/2015, Cost, $1,940,000) (a)(c) | | 07/17/2032 | | 3.12% | | | 1,940,000 | | | 1,945,681 |
Series 2015-A1 (Acquired 01/06/2017, Cost, $3,905,272) (a)(c) | | 07/19/2032 | | 2.37% | | | 3,903,542 | | | 3,909,320 |
Colony Starwood Homes, 2016-A1 (Acquired 05/25/2017, Cost, $3,670,446) (a)(c) | | 07/19/2033 | | 2.71% | | | 3,619,779 | | | 3,670,233 |
| Consumers 2014 Securitization Funding LLC, 2014-A A1 | | 11/01/2020 | | 1.33% | | | 1,087,504 | | | 1,078,701 |
Discover Card Execution Note Trust, 2013-A1 (c) | | 08/17/2020 | | 1.46% | | | 5,400,000 | | | 5,406,398 |
| Entergy Arkansas Restoration Funding LLC, 2010-A A1 | | 08/01/2021 | | 2.30% | | | 3,998,695 | | | 4,017,465 |
| Entergy Gulf States Reconstruction Funding 1 LLC, 2007-A A2 | | 10/01/2018 | | 5.79% | | | 118,883 | | | 119,344 |
| Ford Credit Auto Owner Trust | | | | | | | | | | |
Series 2014-REV1 A (Acquired 05/01/2017, Cost, $5,468,726) (a) | | 11/15/2025 | | 2.26% | | | 5,420,000 | | | 5,469,736 |
Series 2016-REV1 A (Acquired 11/22/2016, Cost, $2,164,958) (a) | | 08/15/2027 | | 2.31% | | | 2,150,000 | | | 2,161,443 |
GM Financial Consumer Automobile, 2017-1A A2A (Acquired 04/03/2017 through 05/31/2017, Cost, $5,644,627) (a) | | 03/16/2020 | | 1.51% | | | 5,645,000 | | | 5,643,549 |
| Honda Auto Receivables Owner Trust | | | | | | | | | | |
| Series 2017-1 A3 | | 07/22/2019 | | 1.42% | | | 3,200,000 | | | 3,199,677 |
| Series 2016-1 A3 | | 12/18/2019 | | 1.22% | | | 7,110,000 | | | 7,091,639 |
| Huntington Auto Trust, 2015-1 A3 | | 09/16/2019 | | 1.24% | | | 3,230,780 | | | 3,228,478 |
| Invitation Homes Trust | | | | | | | | | | |
Series 2014-SFR2 A (Acquired 08/04/2014 through 05/06/2015, Cost, $3,627,283) (a)(c) | | 09/18/2031 | | 2.31% | | | 3,627,283 | | | 3,634,092 |
Series 2015-SFR1 A (Acquired 03/23/2017, Cost, $3,629,612) (a)(c) | | 03/18/2032 | | 2.66% | | | 3,610,539 | | | 3,642,801 |
Series 2015-SFR3 A (Acquired 02/21/2017, Cost, $3,925,917) (a)(c) | | 08/19/2032 | | 2.51% | | | 3,906,009 | | | 3,923,821 |
| Ocwen Master Advance Receivables Trust | | | | | | | | | | |
Series 2015-T3 AT3 (Acquired 11/06/2015, Cost, $1,549,987) (a) | | 11/15/2047 | | 3.21% | | | 1,550,000 | | | 1,546,345 |
Series 2016-T2 AT2 (Acquired 08/03/2016, Cost, $3,189,997) (a) | | 08/16/2049 | | 2.72% | | | 3,190,000 | | | 3,178,784 |
| Ohio Phase-In-Recovery Funding LLC, 2013-1 A1 | | 07/01/2018 | | 0.96% | | | 416,877 | | | 416,870 |
OneMain Direct Auto Receivables Trust, 2016 A1 (Acquired 11/09/2016 through 03/27/2017, Cost, $1,255,156) (a) | | 01/15/2021 | | 2.04% | | | 1,252,896 | | | 1,254,295 |
| Santander Drive Auto Receivables Trust, 2017-2 | | 03/16/2020 | | 1.60% | | | 4,750,000 | | | 4,747,815 |
SMB Private Education Loan Trust, 2017-A (Acquired 01/31/2017 through 03/20/2017, Cost, $3,644,408) (a)(c) | | 06/17/2024 | | 1.61% | | | 3,644,219 | | | 3,649,199 |
SoFi Professional Loan Program LLC, 2015-C A2 (Acquired 07/29/2015, Cost, $1,650,760)(a) | | 08/25/2033 | | 2.51% | | | 1,659,873 | | | 1,662,263 |
SPS Servicer Advance Receivables Trust, 2016-T1 A-T1 (Acquired 11/16/2016, Cost, $2,999,736) (a) | | 11/16/2048 | | 2.53% | | | 3,000,000 | | | 2,973,852 |
SWAY Residential Trust, 2014-1 A (Acquired 12/04/2014 through 02/02/2016, Cost, $74,887) (a)(c) | | 01/20/2032 | | 2.51% | | | 75,292 | | | 75,291 |
| Synchrony Credit Card Master Note Trust | | | | | | | | | | |
| Series 2014-1 A | | 11/15/2020 | | 1.61% | | | 2,935,000 | | | 2,936,672 |
| Series 2015-3 A | | 09/15/2021 | | 1.74% | | | 4,000,000 | | | 4,002,748 |
| Series 2017-1 | | 06/15/2023 | | 1.93% | | | 3,140,000 | | | 3,129,675 |
| TCF Auto Receivables Owner Trust | | | | | | | | | | |
Series 2015-1A A3 (Acquired 09/19/2016, Cost, $997,777) (a) | | 12/16/2019 | | 1.49% | | | 997,133 | | | 996,602 |
Series 2016-1A A3 (Acquired 03/29/2017 through 06/05/2017, Cost, $2,163,522) (a) | | 04/15/2021 | | 1.71% | | | 2,172,000 | | | 2,164,986 |
Series 2016-PT1 A (Acquired 03/28/2017 through 05/03/2017, Cost, $3,608,411) (a) | | 06/15/2022 | | 1.93% | | | 3,610,369 | | | 3,607,010 |
| United States Small Business Administration, 2008-10B 1 | | 09/10/2018 | | 5.73% | | | 18,716 | | | 19,192 |
Verizon Owner Trust, 2017-2A A (Acquired 06/13/2017, Cost, $4,299,341) (a) | | 12/20/2021 | | 1.92% | | | 4,300,000 | | | 4,299,341 |
| Volkswagen Auto Loan Enhanced Trust, 2014-1 A3 | | 10/22/2018 | | 0.91% | | | 163,184 | | | 163,091 |
| World Omni Auto Receivables Trust, 2017-A | | 08/17/2020 | | 1.50% | | | 5,000,000 | | | 4,997,349 |
| TOTAL ASSET BACKED SECURITIES (Cost $172,201,614) | | | | | | | | | | 172,170,216 |
| | | | | | | | | | | |
| CORPORATE BONDS: 37.39% | | | | | | | | | | |
| Finance and Insurance: 14.74% | | | | | | | | | | |
| Aflac, Inc. | | 03/16/2020 | | 2.40% | | | 2,835,000 | | | 2,864,960 |
| American Express Co. | | 05/22/2018 | | 1.55% | | | 2,500,000 | | | 2,499,338 |
| American Express Credit Corp. | | 10/30/2019 | | 1.70% | | | 2,000,000 | | | 1,989,220 |
| American International Group, Inc. | | 08/15/2020 | | 3.38% | | | 3,000,000 | | | 3,104,385 |
| Bank of America Corp. | | 05/01/2018 | | 5.65% | | | 5,715,000 | | | 5,894,468 |
The accompanying notes are an integral part of these consolidated financial statements.
| |
|
LoCorr Macro Strategies Fund - Consolidated Schedule of Investments (continued) | 17 |
| |
|
| | | Maturity Date | | Coupon Rate | | Principal Amount | | | Value |
CORPORATE BONDS (continued) | | | | | | | | | | |
| Bank of America Corp. | | 05/13/2021 | | 5.00% | | $ | 3,950,000 | | $ | 4,309,956 |
Bank of Montreal (b) | | 07/18/2019 | | 1.50% | | | 1,875,000 | | | 1,857,388 |
| BB&T Corp. | | 01/15/2020 | | 2.45% | | | 3,410,000 | | | 3,448,093 |
| Berkshire Hathaway Finance Corp. | | 08/15/2018 | | 2.00% | | | 1,330,000 | | | 1,336,403 |
| Berkshire Hathaway Finance Corp. | | 01/15/2021 | | 4.25% | | | 1,500,000 | | | 1,614,822 |
BNP Paribas (b) | | 08/20/2018 | | 2.70% | | | 3,125,000 | | | 3,160,459 |
| Capital One Financial Corp. | | 04/24/2019 | | 2.45% | | | 2,562,000 | | | 2,575,702 |
| Capital One Financial Corp. | | 05/12/2020 | | 2.50% | | | 1,700,000 | | | 1,707,364 |
| Caterpillar Financial Services Corp. | | 03/05/2020 | | 2.00% | | | 2,000,000 | | | 1,998,432 |
| Charles Schwab Corp./The | | 03/10/2018 | | 1.50% | | | 2,050,000 | | | 2,050,570 |
| Chubb INA Holdings, Inc. | | 11/03/2020 | | 2.30% | | | 2,500,000 | | | 2,514,255 |
| Citigroup, Inc. | | 07/30/2018 | | 2.15% | | | 4,175,000 | | | 4,188,126 |
| Citigroup, Inc. | | 01/14/2022 | | 4.50% | | | 1,195,000 | | | 1,284,993 |
| Citizens Bank NA | | 03/14/2019 | | 2.50% | | | 2,725,000 | | | 2,744,972 |
Cooperatieve Rabobank UA (b) | | 01/14/2019 | | 2.25% | | | 2,000,000 | | | 2,012,780 |
| Fifth Third Bancorp | | 06/01/2018 | | 4.50% | | | 1,300,000 | | | 1,330,953 |
| Fifth Third Bancorp | | 07/27/2020 | | 2.88% | | | 1,965,000 | | | 2,005,833 |
| Goldman Sachs Group, Inc./The | | 04/25/2019 | | 2.00% | | | 2,000,000 | | | 1,999,132 |
| Goldman Sachs Group, Inc./The | | 09/15/2020 | | 2.75% | | | 4,135,000 | | | 4,184,818 |
| Goldman Sachs Group, Inc./The | | 02/25/2021 | | 2.88% | | | 3,420,000 | | | 3,456,662 |
| Hartford Financial Services Group, Inc./The | | 03/30/2020 | | 5.50% | | | 2,775,000 | | | 3,015,459 |
HSBC Holdings PLC (b) | | 04/05/2021 | | 5.10% | | | 2,390,000 | | | 2,598,415 |
| HSBC USA, Inc. | | 08/07/2020 | | 2.75% | | | 2,040,000 | | | 2,073,350 |
ING Bank NV (Acquired 03/15/2016 through 10/11/2016, Cost, $2,508,210) (a)(b) | | 03/22/2019 | | 2.30% | | | 2,500,000 | | | 2,511,845 |
| John Deere Capital Corp. | | 06/22/2020 | | 1.95% | | | 2,490,000 | | | 2,496,489 |
| JPMorgan Chase & Co. | | 03/22/2019 | | 1.85% | | | 4,115,000 | | | 4,110,671 |
| JPMorgan Chase & Co. | | 01/23/2020 | | 2.25% | | | 7,875,000 | | | 7,899,428 |
| Keycorp | | 12/13/2018 | | 2.30% | | | 2,170,000 | | | 2,181,727 |
| Lincoln National Corp. | | 02/15/2020 | | 6.25% | | | 1,155,000 | | | 1,266,917 |
| Marsh & McLennan Cos, Inc. | | 07/15/2021 | | 4.80% | | | 2,000,000 | | | 2,174,334 |
Metropolitan Life Global Funding (Acquired 06/16/2016 through 08/10/2016, Cost, $2,020,218) (a) | | 04/14/2020 | | 2.00% | | | 2,000,000 | | | 1,994,530 |
| Morgan Stanley | | 07/24/2020 | | 5.50% | | | 7,405,000 | | | 8,084,875 |
Nomura Holdings, Inc. (b) | | 03/19/2019 | | 2.75% | | | 1,560,000 | | | 1,575,611 |
| PNC Bank NA | | 10/18/2019 | | 2.40% | | | 2,500,000 | | | 2,523,525 |
Pricoa Global Funding I (Acquired 09/14/2015, Cost, $1,849,186) (a) | | 09/21/2018 | | 1.90% | | | 1,850,000 | | | 1,853,077 |
Principal Life Global Funding II (Acquired 11/17/2015, Cost, $2,009,363) (a) | | 10/15/2018 | | 2.25% | | | 2,000,000 | | | 2,011,858 |
| Prudential Financial, Inc. | | 06/15/2019 | | 7.38% | | | 1,400,000 | | | 1,543,171 |
Santander UK PLC (b) | | 08/23/2018 | | 3.05% | | | 1,505,000 | | | 1,523,856 |
Societe Generale SA (Acquired 04/04/2016, Cost, $1,498,875) (a)(b) | | 04/08/2021 | | 2.50% | | | 1,500,000 | | | 1,504,101 |
| State Street Corp. | | 08/18/2020 | | 2.55% | | | 2,500,000 | | | 2,546,945 |
| SunTrust Banks, Inc. | | 03/03/2021 | | 2.90% | | | 2,500,000 | | | 2,538,103 |
Teva Pharmaceutical Finance Netherlands III BV (b) | | 07/19/2019 | | 1.70% | | | 2,210,000 | | | 2,190,227 |
| Travelers Co’s Inc./The | | 11/01/2020 | | 3.90% | | | 2,490,000 | | | 2,629,169 |
Trinity Acquisition PLC (b) | | 09/15/2021 | | 3.50% | | | 3,045,000 | | | 3,118,168 |
UBS AG (b) | | 03/26/2020 | | 2.35% | | | 2,000,000 | | | 2,011,872 |
| UnitedHealth Group, Inc. | | 10/15/2020 | | 3.88% | | | 2,280,000 | | | 2,400,270 |
| Wells Fargo & Co. | | 04/22/2019 | | 2.13% | | | 2,790,000 | | | 2,804,539 |
| Wells Fargo & Co. | | 07/22/2020 | | 2.60% | | | 2,725,000 | | | 2,763,417 |
Westpac Banking Corp. (b) | | 11/19/2019 | | 4.88% | | | 3,345,000 | | | 3,562,070 |
| | | | | | | | | | | 145,642,103 |
| Information: 4.83% | | | | | | | | | | |
| 21st Century Fox America, Inc. | | 02/15/2021 | | 4.50% | | | 2,500,000 | | | 2,678,997 |
America Movil SAB de CV (b) | | 03/30/2020 | | 5.00% | | | 3,075,000 | | | 3,303,196 |
| AT&T, Inc. | | 03/11/2019 | | 2.30% | | | 5,790,000 | | | 5,824,340 |
| CBS Corp. | | 04/15/2020 | | 5.75% | | | 1,645,000 | | | 1,799,426 |
The accompanying notes are an integral part of these consolidated financial statements.
| |
|
18 | LoCorr Macro Strategies Fund - Consolidated Schedule of Investments (continued) |
| |
| | | Maturity Date | | Coupon Rate | | Principal Amount | | | Value |
CORPORATE BONDS (continued) | | | | | | | | | | |
| Charter Communications Operating LLC/Charter Communications Operating Capital | | 07/23/2020 | | 3.58% | | $ | 3,500,000 | | $ | 3,616,813 |
Deutsche Telekom International Finance BV (b) | | 07/08/2019 | | 6.00% | | | 3,000,000 | | | 3,233,157 |
| Discovery Communications LLC | | 06/01/2020 | | 5.05% | | | 2,150,000 | | | 2,300,113 |
| Hewlett Packard Enterprise Co. | | 10/05/2018 | | 2.85% | | | 2,250,000 | | | 2,269,251 |
| Microsoft Corp. | | 02/06/2020 | | 1.85% | | | 2,640,000 | | | 2,646,729 |
| Oracle Corp. | | 07/15/2020 | | 3.88% | | | 2,750,000 | | | 2,906,173 |
Orange SA (b) | | 11/03/2019 | | 1.63% | | | 2,000,000 | | | 1,982,558 |
Rogers Communications, Inc. (b) | | 08/15/2018 | | 6.80% | | | 2,000,000 | | | 2,109,794 |
| Verizon Communications, Inc. | | 09/14/2018 | | 3.65% | | | 4,365,000 | | | 4,461,737 |
| Visa, Inc. | | 12/14/2020 | | 2.20% | | | 4,235,000 | | | 4,270,409 |
Vodafone Group PLC (b) | | 03/16/2021 | | 4.38% | | | 4,025,000 | | | 4,290,980 |
| | | | | | | | | | | 47,693,673 |
| Manufacturing: 8.68% | | | | | | | | | | |
| Abbott Laboratories | | 11/30/2021 | | 2.90% | | | 2,270,000 | | | 2,295,356 |
| AbbVie, Inc. | | 05/14/2020 | | 2.50% | | | 1,845,000 | | | 1,866,389 |
AerCap Ireland Capital Ltd./AerCap Global Aviation Trust (b) | | 05/15/2019 | | 3.75% | | | 3,500,000 | | | 3,594,959 |
| Altria Group, Inc. | | 01/14/2020 | | 2.63% | | | 2,000,000 | | | 2,031,004 |
| Anheuser-Busch InBev Finance, Inc. | | 02/01/2021 | | 2.65% | | | 3,875,000 | | | 3,926,956 |
| Apple, Inc. | | 05/06/2019 | | 2.10% | | | 1,910,000 | | | 1,927,906 |
| Apple, Inc. | | 02/23/2021 | | 2.25% | | | 3,175,000 | | | 3,196,044 |
| Archer-Daniels-Midland Co. | | 03/01/2021 | | 4.48% | | | 2,000,000 | | | 2,162,048 |
| Bunge Ltd. Finance Corp. | | 11/24/2020 | | 3.50% | | | 2,410,000 | | | 2,470,756 |
| Celgene Corp. | | 08/15/2018 | | 2.13% | | | 2,870,000 | | | 2,881,087 |
| Chevron Corp. | | 03/03/2020 | | 1.96% | | | 2,280,000 | | | 2,286,915 |
| Corning, Inc. | | 08/15/2020 | | 4.25% | | | 2,000,000 | | | 2,108,134 |
Daimler Finance North America LLC (Acquired 09/19/2016, Cost, $2,289,566) (a) | | 07/05/2019 | | 1.50% | | | 2,300,000 | | | 2,278,099 |
| Dr. Pepper Snapple Group, Inc. | | 11/15/2021 | | 2.53% | | | 3,670,000 | | | 3,668,202 |
| Eastman Chemical Co. | | 01/15/2020 | | 2.70% | | | 2,000,000 | | | 2,026,356 |
| General Electric Capital Corp. | | 05/01/2018 | | 5.63% | | | 3,085,000 | | | 3,190,146 |
| General Electric Capital Corp. | | 08/07/2019 | | 6.00% | | | 3,565,000 | | | 3,874,456 |
Heineken NV (Acquired 06/27/2017, Cost, $3,131,090) (a)(b) | | 04/01/2022 | | 3.40% | | | 3,000,000 | | | 3,116,628 |
Ingersoll-Rand Luxembourg Finance SA (b) | | 05/01/2020 | | 2.63% | | | 2,600,000 | | | 2,625,717 |
| Intel Corp. | | 07/29/2020 | | 2.45% | | | 3,500,000 | | | 3,559,108 |
| Kraft Heinz Foods Co. | | 07/02/2018 | | 2.00% | | | 1,500,000 | | | 1,503,798 |
| Kraft Heinz Foods Co. | | 07/02/2020 | | 2.80% | | | 2,135,000 | | | 2,166,935 |
| L3 Technologies, Inc. | | 02/15/2021 | | 4.95% | | | 2,525,000 | | | 2,722,162 |
| Merck & Co., Inc. | | 05/18/2018 | | 1.30% | | | 1,580,000 | | | 1,578,341 |
| Newell Brands, Inc. | | 03/29/2019 | | 2.60% | | | 2,927,000 | | | 2,955,538 |
| PepsiCo, Inc. | | 10/14/2020 | | 2.15% | | | 2,400,000 | | | 2,415,310 |
| Philip Morris International, Inc. | | 02/25/2019 | | 1.38% | | | 2,250,000 | | | 2,235,263 |
| QUALCOMM, Inc. | | 05/20/2020 | | 2.10% | | | 2,515,000 | | | 2,526,496 |
| Reynolds American, Inc. | | 06/12/2020 | | 3.25% | | | 3,965,000 | | | 4,082,118 |
| Rockwell Collins, Inc. | | 07/15/2019 | | 1.95% | | | 2,220,000 | | | 2,223,257 |
Siemens Financieringsmaatschappij NV (Acquired 09/06/2016 through 12/15/2016, Cost, $3,245,796) (a)(b) | | 09/13/2019 | | 1.30% | | | 3,270,000 | | | 3,229,671 |
| Tyson Foods, Inc. | | 08/15/2019 | | 2.65% | | | 3,000,000 | | | 3,037,827 |
| | | | | | | | | | | 85,762,982 |
| Mining, Quarrying, and Oil and Gas Extraction: 0.57% | | | | | | | | | | |
| ConocoPhillips Co. | | 03/15/2021 | | 4.20% | | | 2,000,000 | | | 2,120,490 |
| Occidental Petroleum Corp. | | 02/15/2018 | | 1.50% | | | 425,000 | | | 424,544 |
Total Capital International SA (b) | | 01/10/2019 | | 2.13% | | | 3,000,000 | | | 3,021,072 |
| | | | | | | | | | | 5,566,106 |
| Professional, Scientific, and Technical Services: 0.85% | | | | | | | | | | |
| Biogen, Inc. | | 09/15/2020 | | 2.90% | | | 2,250,000 | | | 2,295,103 |
| eBay, Inc. | | 08/01/2019 | | 2.20% | | | 2,520,000 | | | 2,530,095 |
| International Business Machines Corp. | | 05/17/2019 | | 1.80% | | | 3,590,000 | | | 3,598,401 |
| | | | | | | | | | | 8,423,599 |
The accompanying notes are an integral part of these consolidated financial statements.
| |
|
LoCorr Macro Strategies Fund - Consolidated Schedule of Investments (continued) | 19 |
| |
|
| | | Maturity Date | | Coupon Rate | | Principal Amount | | Value |
CORPORATE BONDS (continued) | | | | | | | | | | |
| Real Estate and Rental and Leasing: 1.58% | | | | | | | | | | |
| Air Lease Corp. | | 06/01/2021 | | 3.38% | | $ | 3,150,000 | | $ | 3,233,610 |
| Ford Motor Credit Company LLC | | 11/04/2019 | | 2.60% | | | 4,000,000 | | | 4,026,588 |
| General Motors Financial Co., Inc. | | 05/09/2019 | | 2.40% | | | 2,170,000 | | | 2,175,805 |
| National Rural Utilities Cooperative Finance Corp. | | 02/01/2019 | | 2.15% | | | 2,000,000 | | | 2,012,130 |
| Toyota Motor Credit Corp. | | 10/24/2018 | | 2.00% | | | 2,030,000 | | | 2,041,021 |
| Toyota Motor Credit Corp. | | 09/15/2021 | | 3.40% | | | 2,055,000 | | | 2,147,502 |
| | | | | | | | | | | 15,636,656 |
| Retail Trade: 2.58% | | | | | | | | | | |
| Amazon.com, Inc. | | 12/05/2019 | | 2.60% | | | 4,305,000 | | | 4,386,072 |
BP Capital Markets PLC (b) | | 09/26/2018 | | 2.24% | | | 1,000,000 | | | 1,005,705 |
BP Capital Markets PLC (b) | | 01/15/2020 | | 2.52% | | | 1,905,000 | | | 1,931,531 |
| CVS Health Corp. | | 12/05/2018 | | 2.25% | | | 2,115,000 | | | 2,128,079 |
| CVS Health Corp. | | 07/20/2020 | | 2.80% | | | 2,390,000 | | | 2,433,254 |
| Home Depot, Inc./The | | 06/15/2019 | | 2.00% | | | 3,930,000 | | | 3,957,494 |
Hyundai Capital America (Acquired 12/02/2016, Cost, $2,539,096) (a) | | 03/18/2021 | | 3.00% | | | 2,535,000 | | | 2,549,242 |
| Kroger Co./The | | 09/30/2019 | | 1.50% | | | 2,000,000 | | | 1,970,310 |
| Lowe’s Co’s, Inc. | | 04/15/2021 | | 3.75% | | | 2,000,000 | | | 2,111,646 |
| Walgreens Boots Alliance, Inc. | | 11/18/2019 | | 2.70% | | | 3,000,000 | | | 3,047,130 |
| | | | | | | | | | | 25,520,463 |
| Transportation and Warehousing: 0.33% | | | | | | | | | | |
Carnival Corp. (b) | | 10/15/2020 | | 3.95% | | | 2,225,000 | | | 2,355,269 |
| Spectra Energy Partners, LP | | 09/25/2018 | | 2.95% | | | 915,000 | | | 925,303 |
| | | | | | | | | | | 3,280,572 |
| Utilities: 1.78% | | | | | | | | | | |
| Dominion Resources, Inc. | | 08/15/2019 | | 1.60% | | | 2,305,000 | | | 2,285,476 |
| Duke Energy Corp. | | 09/15/2019 | | 5.05% | | | 2,000,000 | | | 2,128,660 |
| Exelon Generation Co., LLC | | 10/01/2019 | | 5.20% | | | 2,000,000 | | | 2,124,316 |
| Exelon Generation Co., LLC | | 01/15/2020 | | 2.95% | | | 2,135,000 | | | 2,167,928 |
| NextEra Energy Capital Holdings, Inc. | | 03/01/2019 | | 6.00% | | | 2,000,000 | | | 2,127,184 |
| Northern States Power Co. | | 08/15/2020 | | 2.20% | | | 2,000,000 | | | 2,005,114 |
| PG&E Corp. | | 03/01/2019 | | 2.40% | | | 2,260,000 | | | 2,271,090 |
| Sempra Energy | | 03/15/2020 | | 2.40% | | | 2,475,000 | | | 2,486,113 |
| | | | | | | | | | | 17,595,881 |
| Wholesale Trade: 1.45% | | | | | | | | | | |
| Cardinal Health, Inc. | | 11/15/2019 | | 2.40% | | | 3,500,000 | | | 3,519,957 |
LyondellBasell Industries NV (b) | | 04/15/2019 | | 5.00% | | | 3,002,000 | | | 3,138,414 |
| McKesson Corp. | | 03/15/2019 | | 2.28% | | | 2,120,000 | | | 2,132,160 |
| Sherwin-Williams Co./The | | 05/15/2020 | | 2.25% | | | 2,255,000 | | | 2,260,045 |
| Sysco Corp. | | 10/01/2020 | | 2.60% | | | 3,195,000 | | | 3,234,570 |
| | | | | | | | | | | 14,285,146 |
| TOTAL CORPORATE BONDS (Cost $369,181,569) | | | | | | | | | | 369,407,181 |
| | | | | | | | | | | |
| MORTGAGE BACKED SECURITIES: 13.23% | | | | | | | | | | |
BXHTL Mortgage Trust, 2015-JWRZ A (Acquired 06/19/2015 through 11/15/2016, Cost, $4,571,492) (a)(c) | | 05/15/2029 | | 2.39% | | | 4,585,000 | | | 4,590,752 |
CD Mortgage Trust, 2007-CD5 A4 (c) | | 11/15/2044 | | 5.89% | | | 231,826 | | | 232,019 |
| Citigroup Commercial Mortgage Trust, 2016-GC37 A1 | | 04/12/2049 | | 1.64% | | | 3,171,718 | | | 3,146,794 |
Cold Storage Trust, 2017-ICE3 (Acquired 04/20/2017, Cost, $3,775,000) (a)(c) | | 04/15/2036 | | 2.16% | | | 3,775,000 | | | 3,779,676 |
| Commercial Mortgage Trust | | | | | | | | | | |
Series 2012-CR4 A2 (c) | | 10/17/2045 | | 1.80% | | | 2,369,366 | | | 2,369,645 |
| Series 2007-GG11 A4 | | 12/10/2049 | | 5.74% | | | 512,645 | | | 512,257 |
| CSMC Trust | | | | | | | | | | |
Series 2013-6 1A1 (Acquired 07/24/2013, Cost, $1,618,120) (a)(c) | | 07/25/2028 | | 2.50% | | | 1,658,016 | | | 1,632,433 |
Series 2015-2 A2 (Acquired 04/30/2015, Cost, $1,356,261) (a) | | 02/25/2045 | | 3.00% | | | 1,342,098 | | | 1,341,783 |
Series 2017-HL1 (Acquired 06/26/2017, Cost, $3,580,348) (a) | | 06/25/2047 | | 3.50% | | | 3,500,000 | | | 3,580,391 |
The accompanying notes are an integral part of these consolidated financial statements.
| | | |
| | | |
| 20 | | | LoCorr Macro Strategies Fund - Consolidated Schedule of Investments (continued) |
| | | |
| | Maturity Date | | Coupon Rate | | Principal Amount | | | Value |
MORTGAGE BACKED SECURITIES (continued) | | | | | | | | | | |
| Fannie Mae Aces | | | | | | | | | | |
| Series 2014-M13 ASQ2 | 11/25/2017 | | 1.64% | | $ | 412,774 | | | $ | 412,494 |
| Series 2015-M1 ASQ2 | 02/25/2018 | | 1.63% | | | 447,580 | | | | 447,380 |
| Series 2015-M7 ASQ2 | 04/25/2018 | | 1.55% | | | 2,324,605 | | | | 2,322,119 |
Series 2013-M13 FA (c) | 05/25/2018 | | 1.57% | | | 868,929 | | | | 869,703 |
Series 2013-M14 FA (c) | 08/25/2018 | | 1.57% | | | 2,349,002 | | | | 2,353,222 |
| Fannie Mae Connecticut Avenue Securities | | | | | | | | | | |
Series 2016-C03 2M1 (c) | 10/25/2028 | | 3.42% | | | 1,873,315 | | | | 1,900,643 |
Series 2017-C01 1M1 (c) | 07/25/2029 | | 2.52% | | | 2,922,686 | | | | 2,953,734 |
Series 2017-C02 2M1 (c) | 09/25/2029 | | 2.37% | | | 2,650,977 | | | | 2,674,654 |
Series 2017-C03 1M1 (c) | 10/25/2029 | | 2.17% | | | 1,692,339 | | | | 1,700,662 |
| Fannie Mae Pool | 02/01/2021 | | 3.50% | | | 33,345 | | | | 34,716 |
| Fannie Mae Pool | 08/01/2021 | | 3.00% | | | 127,507 | | | | 130,958 |
| Fannie Mae Pool | 09/01/2021 | | 3.00% | | | 157,077 | | | | 161,329 |
| Fannie Mae Pool | 11/01/2021 | | 3.00% | | | 307,908 | | | | 316,242 |
| Fannie Mae Pool | 12/01/2025 | | 3.50% | | | 293,005 | | | | 305,052 |
| Fannie Mae Pool | 09/01/2026 | | 3.50% | | | 275,130 | | | | 286,443 |
| FDIC Guaranteed Notes Trust | | | | | | | | | | |
Series 2010-S4 A (Acquired 02/24/2012, Cost, $475,697) (a)(c) | 12/04/2020 | | 1.71% | | | 475,406 | | | | 475,728 |
Series 2010-S1 2A (Acquired 03/01/2012, Cost, $350,103) (a) | 04/25/2038 | | 3.25% | | | 347,426 | | | | 349,604 |
| FHLMC Multifamily Structured Pass Through Certificates | | | | | | | | | | |
| Series K-702 A2 | 02/25/2018 | | 3.15% | | | 4,766,752 | | | | 4,800,386 |
| Series K-709 A1 | 10/25/2018 | | 1.56% | | | 473,373 | | | | 473,337 |
Series K-LH1 A (c) | 11/25/2022 | | 1.76% | | | 3,245,000 | | | | 3,257,201 |
| Series 3855 HE | 02/15/2026 | | 2.50% | | | 14,518 | | | | 14,561 |
Series 4181 PF (c) | 11/15/2042 | | 1.41% | | | 1,530,219 | | | | 1,524,870 |
| Freddie Mac Structured Agency Credit Risk Debt Notes | | | | | | | | | | |
Series 2013-DN2 M1 (c) | 11/27/2023 | | 2.67% | | | 704,048 | | | | 707,192 |
Series 2014-HQ2 M1 (c) | 09/25/2024 | | 2.67% | | | 335,722 | | | | 336,653 |
Series 2016-DNA2 M1 (c) | 10/25/2028 | | 1.69% | | | 721,521 | | | | 723,489 |
| FREMF Mortgage Trust | | | | | | | | | | |
Series 2011-K702 B (Acquired 06/16/2016 through 01/20/2017, Cost, $5,767,798) (a)(c) | 04/25/2044 | | 4.93% | | | 5,595,000 | | | | 5,684,815 |
Series 2012-K708 B (Acquired 02/03/2015, Cost, $3,369,565) (a)(c) | 02/25/2045 | | 3.88% | | | 3,250,000 | | | | 3,323,819 |
Series 2013-K502 B (Acquired 05/06/2015, Cost, $2,907,766) (a)(c) | 03/25/2045 | | 2.50% | | | 2,875,000 | | | | 2,871,429 |
Series 2013-K712 B (Acquired 01/20/2017 through 02/08/2017, Cost, $3,987,320) (a)(c) | 05/25/2045 | | 3.48% | | | 3,905,000 | | | | 3,995,924 |
Series 2013-KF02 B (Acquired 11/01/2013 through 03/23/2017, Cost, $1,288,194) (a)(c) | 12/25/2045 | | 4.00% | | | 1,276,481 | | | | 1,297,432 |
Series 2011-K13 B (Acquired 05/25/2017, Cost, $4,887,830) (a)(c) | 01/25/2048 | | 4.77% | | | 4,565,000 | | | | 4,878,572 |
Series 2011-K10 B (Acquired 11/22/2016, Cost, $2,366,827) (a)(c) | 11/25/2049 | | 4.79% | | | 2,220,000 | | | | 2,352,334 |
| GAHR Commercial Mortgage Trust, 2015-NRF AFL1 (Acquired 05/07/2015, | | | | | | | | | | |
Cost, $526,310) (a)(c) | 12/15/2034 | | 2.29% | | | 525,344 | | | | 526,123 |
| GP Portfolio Trust, 2014-GPP A (Acquired 09/01/2016 through 05/24/2017, | | | | | | | | | | |
Cost, $5,528,731) (a)(c) | 02/16/2027 | | 2.36% | | | 5,516,756 | | | | 5,532,402 |
| GS Mortgage Securities Trust | | | | | | | | | | |
Series 2014-GSFL A (Acquired 08/06/2014, Cost, $1,000) (a)(c) | 07/15/2031 | | 2.16% | | | 1,000 | | | | 999 |
Series 2010-C2 A1 (Acquired 04/11/2012, Cost, $157,359) (a) | 12/10/2043 | | 3.85% | | | 150,753 | | | | 154,935 |
| JP Morgan Mortgage Trust | | | | | | | | | | |
Series 2016-1 A5 (Acquired 06/09/2016, Cost, $1,484,897) (a) | 05/25/2046 | | 3.50% | | | 1,447,550 | | | | 1,474,466 |
Series 2017-1 (Acquired 02/17/2017, Cost, $3,654,301) (a) | 01/25/2047 | | 3.50% | | | 3,577,012 | | | | 3,655,164 |
Series 2017-2 (Acquired 05/22/2017, Cost, $4,226,960) (a) | 05/25/2047 | | 3.50% | | | 4,127,180 | | | | 4,215,296 |
| JPMorgan Chase Commercial Mortgage Securities Trust | | | | | | | | | | |
Series 2010-C2 A3 (Acquired 06/05/2017, Cost, $4,581,690) (a) | 11/15/2043 | | 4.07% | | | 4,350,000 | | | | 4,562,431 |
Series 2011-C3 A3 (Acquired 04/17/2015, Cost, $2,275,630) (a) | 02/16/2046 | | 4.39% | | | 2,135,376 | | | | 2,168,328 |
| MASTR Asset Securitization Trust, 2004-1 4A1 | 02/25/2019 | | 4.50% | | | 62,194 | | | | 62,352 |
| Morgan Stanley Capital I Trust, 2007-IQ16 4A | 12/12/2049 | | 5.81% | | | 864,830 | | | | 867,348 |
The accompanying notes are an integral part of these consolidated financial statements.
| | | |
| | | |
| LoCorr Macro Strategies Fund - Consolidated Schedule of Investments (continued) | | | 21 |
| | | |
| | | Maturity Date | | Coupon Rate | | Principal Amount | | | Value |
MORTGAGE BACKED SECURITIES (continued) | | | | | | | | | | | |
| NCUA Guaranteed Notes Trust | | | | | | | | | | | |
Series 2011-R2 1A (c) | | 02/06/2020 | | 1.48% | | $ | 2,169,497 | | | $ | 2,173,495 |
Series 2011-R3 1A (c) | | 04/09/2020 | | 1.52% | | | 1,600,725 | | | | 1,600,448 |
Series 2010-R1 1A (c) | | 10/07/2020 | | 1.53% | | | 168,148 | | | | 168,375 |
| New Residential Mortgage Loan Trust | | | | | | | | | | | |
Series 2015-1A A3 (Acquired 06/23/2015 through 04/19/2016, Cost, $1,661,448) (a) | | 05/28/2052 | | 3.75% | | | 1,627,665 | | | | 1,671,339 |
Series 2014-2A A3 (Acquired 02/18/2016, Cost, $1,568,396) (a)(c) | | 05/25/2054 | | 3.75% | | | 1,534,566 | | | | 1,566,434 |
Series 2016-1A A1 (Acquired 03/29/2016 through 06/20/2017, Cost, $3,172,308) (a) | | 03/25/2056 | | 3.75% | | | 3,078,315 | | | | 3,155,748 |
Series 2017-1A A1 (Acquired 03/06/2017, Cost, $3,752,124) (a) | | 02/25/2057 | | 4.00% | | | 3,647,606 | | | | 3,792,181 |
Series 2017-2A A3 (Acquired 04/19/2017, Cost, $4,409,008) (a)(c) | | 03/25/2057 | | 4.00% | | | 4,242,045 | | | | 4,416,881 |
Series 2017-3A A1 (Acquired 06/05/2017, Cost, $2,394,981) (a) | | 04/25/2057 | | 4.00% | | | 2,300,000 | | | | 2,388,845 |
Opteum Mortgage Acceptance Corp., 2005-1 M3 (c) | | 02/25/2035 | | 2.07% | | | 1,062,697 | | | | 1,061,633 |
Sequoia Mortgage Trust, 2015-3 A4 (Acquired 06/19/2015, Cost, $969,766) (a)(c) | | 07/25/2045 | | 3.50% | | | 959,863 | | | | 974,711 |
VNDO Mortgage Trust, 2013-PENN (Acquired 06/05/2017, Cost, $4,413,947) (a) | | 12/13/2029 | | 3.81% | | | 4,185,000 | | | | 4,383,736 |
| Wells Fargo Commercial Mortgage Trust, 2015-LC22 A1 | | 09/17/2058 | | 1.64% | | | 4,647,875 | | | | 4,635,932 |
| WFRBS Commercial Mortgage Trust, 2012-C8 A2 | | 08/17/2045 | | 1.88% | | | 352,248 | | | | 352,032 |
WIMC Capital Trust, 2012-A A1 (Acquired 06/21/2012, Cost, $82,601) (a) | | 10/16/2050 | | 4.55% | | | 82,602 | | | | 82,654 |
| TOTAL MORTGAGE BACKED SECURITIES (Cost $130,981,149) | | | | | | | | | | | 130,766,735 |
| | | | | | | | | | | | |
| MUNICIPAL BONDS: 0.84% | | | | | | | | | | | |
| Louisiana Local Government Environmental Facilities & Community Development Authority | | 02/01/2021 | | 3.22% | | | 483,208 | | | | 486,890 |
| Metropolitan Council, (Minneapolis - St. Paul Metropolitan Area), State of Minnesota | | 09/01/2017 | | 1.20% | | | 2,020,000 | | | | 2,019,899 |
| Metropolitan Government of Nashville & Davidson County TN | | 07/01/2017 | | 1.21% | | | 1,500,000 | | | | 1,500,000 |
| North Carolina Eastern Municipal Power Agency | | 07/01/2018 | | 2.00% | | | 1,385,000 | | | | 1,390,360 |
| St. Paul Housing & Redevelopment Authority | | 07/01/2018 | | 1.84% | | | 1,385,000 | | | | 1,387,452 |
| State of Ohio | | 08/01/2017 | | 3.33% | | | 1,500,000 | | | | 1,502,235 |
| TOTAL MUNICIPAL BONDS (Cost $8,288,902) | | | | | | | | | | | 8,286,836 |
| | | | | | | | | | | | |
| U.S. GOVERNMENT AGENCY ISSUES: 9.58% | | | | | | | | | | | |
| Federal Farm Credit Banks | | 09/27/2019 | | 1.55% | | | 4,000,000 | | | | 3,995,640 |
| Federal Farm Credit Banks | | 10/21/2019 | | 1.44% | | | 8,500,000 | | | | 8,482,413 |
| Federal Farm Credit Banks | | 04/13/2020 | | 1.55% | | | 16,775,000 | | | | 16,735,277 |
| Federal Farm Credit Banks | | 05/08/2020 | | 1.55% | | | 17,800,000 | | | | 17,749,768 |
| Federal Home Loan Banks | | 05/28/2019 | | 1.38% | | | 2,985,000 | | | | 2,981,806 |
| Federal Home Loan Banks | | 06/12/2020 | | 1.75% | | | 10,000,000 | | | | 10,033,970 |
| Federal Home Loan Mortgage Corp. | | 01/17/2020 | | 1.50% | | | 2,085,000 | | | | 2,083,249 |
| Federal Home Loan Mortgage Corp. | | 04/20/2020 | | 1.38% | | | 8,500,000 | | | | 8,449,723 |
| Federal National Mortgage Association | | 02/26/2019 | | 1.00% | | | 10,000,000 | | | | 9,933,250 |
| Federal National Mortgage Association | | 08/02/2019 | | 0.88% | | | 5,925,000 | | | | 5,853,770 |
| Federal National Mortgage Association | | 10/24/2019 | | 1.00% | | | 6,900,000 | | | | 6,823,555 |
| Federal National Mortgage Association | | 02/28/2020 | | 1.50% | | | 1,500,00 | | | | 1,496,068 |
| TOTAL U.S. GOVERNMENT AGENCY ISSUES (Cost $94,971,761) | | | | | | | | | | | 94,618,489 |
| | | | | | | | | | | | |
| U.S. GOVERNMENT NOTES: 6.81% | | | | | | | | | | | |
| United States Treasury Note | | 03/15/2018 | | 1.00% | | | 1,500,000 | | | | 1,497,480 |
| United States Treasury Note | | 05/31/2018 | | 2.38% | | | 16,800,000 | | | | 16,961,431 |
| United States Treasury Note | | 07/15/2018 | | 0.88% | | | 15,000,000 | | | | 14,934,375 |
| United States Treasury Note | | 12/15/2019 | | 1.38% | | | 8,155,000 | | | | 8,137,801 |
| United States Treasury Note | | 09/30/2020 | | 1.38% | | | 2,340,000 | | | | 2,322,633 |
| United States Treasury Note | | 04/30/2021 | | 1.38% | | | 5,320,000 | | | | 5,252,048 |
| United States Treasury Note | | 04/30/2022 | | 1.88% | | | 7,000,000 | | | | 6,998,635 |
| United States Treasury Note | | 05/31/2022 | | 1.75% | | | 6,700,000 | | | | 6,660,745 |
| United States Treasury Note | | 05/31/2022 | | 1.88% | | | 4,500,000 | | | | 4,499,824 |
| TOTAL U.S. GOVERNMENT NOTES (Cost $67,477,808) | | | | | | | | | | | 67,264,972 |
The accompanying notes are an integral part of these consolidated financial statements.
| | | |
| | | |
| 22 | | | LoCorr Macro Strategies Fund - Consolidated Schedule of Investments (continued) |
| | | |
| | Shares | | | Value |
| SHORT TERM INVESTMENT: 1.95% | | | | |
| MONEY MARKET FUND: 1.95% | | | | |
| STIT-Government & Agency Portfolio, Institutional Class, 0.89% (d)(e) | 19,255,770 | | | 19,255,770 |
| TOTAL MONEY MARKET FUND (Cost $19,255,770) | | | | 19,255,770 |
| TOTAL SHORT TERM INVESTMENT (Cost $19,255,770) | | | | 19,255,770 |
| | | | | |
| TOTAL INVESTMENTS (Cost $862,358,573): 87.22% | | | | 861,770,199 |
| Other Assets in Excess of Liabilities: 12.78% (f) | | | | 126,317,778 |
| TOTAL NET ASSETS: 100.00% | | | $ | 988,087,977 |
| (a) | Restricted security as defined in Rule 144(a) under the Securities Act of 1933 and determined to be liquid. Purchased in a private placement transaction; resale to the public may require registration or may extend only to qualified institutional buyers. At June 30, 2017, the value of these securities total $182,074,130 which represents 18.43% of total net assets. |
| (b) | Foreign issued security. |
| (c) | Variable rate security. The rate reported is the rate in effect as of June 30, 2017. |
| (d) | The rate quoted is the annualized seven-day effective yield as of June 30, 2017. |
| (e) | All or a portion of this security is held by LCMFS Fund Limited and pledged as collateral for derivative contracts. |
| (f) | Includes assets pledged as collateral for derivative contracts. |
The accompanying notes are an integral part of these consolidated financial statements.
| | |
| |
LoCorr Macro Strategies Fund - Consolidated Schedule of Open Forward Currency Contracts | | 23 |
| |
LoCorr Macro Strategies Fund
Consolidated Schedule of Open Forward Currency Contracts
June 30, 2017 (Unaudited)
| | | | | | | | Currency to be Received | | Currency to be Delivered | | | | | | | | | |
| | | Notional
Amount | | Counter-
party | Forward
Settlement Date | Curr
Abbr. | | U.S. $ Value at
June 30, 2017 | | Curr
Abbr. | | U.S. $ Value on
Origination Date | | | | Unrealized
Appreciation | | | | Unrealized
(Depreciation) | |
| | | | | | | | | | | | | | | | | | | | | | | | | |
| Purchase Contracts: | | | | | | | | | | | | | | | | | | | | | |
| | | $ | 9,579,992 | | DB | 07/19/2017 | AUD | | $ | 9,681,770 | | USD | | $ | 9,579,992 | | | $ | 101,778 | | | $ | — | |
| | | | 90,448,044 | | BAML | 09/22/2017 | AUD | | | 91,692,637 | | USD | | | 90,448,044 | | | | 1,244,593 | | | | — | |
| | | | 16,131,227 | | DB | 07/19/2017 | BRL | | | 16,087,594 | | USD | | | 16,131,227 | | | | — | | | | (43,633) | |
| | | | 63,034,362 | | DB | 07/19/2017 | CAD | | | 64,106,176 | | USD | | | 63,034,362 | | | | 1,071,814 | | | | — | |
| | | | 96,175,214 | | BAML | 09/22/2017 | CAD | | | 97,530,937 | | USD | | | 96,175,214 | | | | 1,355,723 | | | | — | |
| | | | 35,208,171 | | DB | 07/19/2017 | CHF | | | 35,565,721 | | USD | | | 35,208,171 | | | | 357,550 | | | | — | |
| | | | 59,411,777 | | BAML | 09/22/2017 | CHF | | | 59,725,892 | | USD | | | 59,411,777 | | | | 314,115 | | | | — | |
| | | | 358,658 | | DB | 07/19/2017 | CLP | | | 356,826 | | USD | | | 358,658 | | | | — | | | | (1,832) | |
| | | | 1,049,114 | | DB | 07/19/2017 | COP | | | 1,030,893 | | USD | | | 1,049,114 | | | | — | | | | (18,221) | |
| | | | 23,077,452 | | DB | 07/19/2017 | EUR | | | 23,450,126 | | NOK | | | 23,077,452 | | | | 372,674 | | | | — | |
| | | | 5,829,180 | | DB | 07/19/2017 | EUR | | | 5,956,858 | | PLN | | | 5,829,180 | | | | 127,678 | | | | — | |
| | | | 27,140,275 | | DB | 07/19/2017 | EUR | | | 27,623,356 | | SEK | | | 27,140,275 | | | | 483,081 | | | | — | |
| | | | 6,139,037 | | DB | 07/19/2017 | EUR | | | 6,139,794 | | TRY | | | 6,139,037 | | | | 757 | | | | — | |
| | | | 45,540,169 | | DB | 07/19/2017 | EUR | | | 46,271,409 | | USD | | | 45,540,169 | | | | 731,240 | | | | — | |
| | | | 100,388,809 | | BAML | 09/22/2017 | EUR | | | 101,969,261 | | USD | | | 100,388,809 | | | | 1,580,452 | | | | — | |
| | | | 25,381,950 | | DB | 07/19/2017 | GBP | | | 25,948,586 | | USD | | | 25,381,950 | | | | 566,636 | | | | — | |
| | | | 99,929,025 | | BAML | 09/22/2017 | GBP | | | 100,403,258 | | USD | | | 99,929,025 | | | | 474,233 | | | | — | |
| | | | 1,315,990 | | DB | 07/19/2017 | ILS | | | 1,316,786 | | USD | | | 1,315,990 | | | | 796 | | | | — | |
| | | | 6,418,838 | | DB | 07/19/2017 | INR | | | 6,399,173 | | USD | | | 6,418,838 | | | | — | | | | (19,665) | |
| | | | 36,910,581 | | DB | 07/19/2017 | JPY | | | 36,439,557 | | USD | | | 36,910,581 | | | | — | | | | (471,024) | |
| | | | 25,024,083 | | BAML | 09/22/2017 | JPY | | | 24,404,601 | | USD | | | 25,024,083 | | | | — | | | | (619,482) | |
| | | | 5,644,902 | | DB | 07/19/2017 | KRW | | | 5,572,532 | | USD | | | 5,644,902 | | | | — | | | | (72,370) | |
| | | | 16,632,438 | | DB | 07/19/2017 | MXN | | | 16,610,688 | | USD | | | 16,632,438 | | | | — | | | | (21,750) | |
| | | | 24,701,204 | | BAML | 09/22/2017 | MXN | | | 24,771,208 | | USD | | | 24,701,204 | | | | 70,004 | | | | — | |
| | | | 15,488,011 | | DB | 07/19/2017 | NOK | | | 15,707,484 | | EUR | | | 15,488,011 | | | | 219,473 | | | | — | |
| | | | 5,314,629 | | DB | 07/19/2017 | NOK | | | 5,409,137 | | USD | | | 5,314,629 | | | | 94,508 | | | | — | |
| | | | 23,327,347 | | DB | 07/19/2017 | NZD | | | 23,551,156 | | USD | | | 23,327,347 | | | | 223,809 | | | | — | |
| | | | 45,217,547 | | BAML | 09/22/2017 | NZD | | | 46,004,015 | | USD | | | 45,217,547 | | | | 786,468 | | | | — | |
| | | | 9,243,381 | | DB | 07/19/2017 | PLN | | | 9,342,663 | | EUR | | | 9,243,381 | | | | 99,282 | | | | — | |
| | | | 593,520 | | DB | 07/19/2017 | PLN | | | 593,630 | | USD | | | 593,520 | | | | 110 | | | | — | |
| | | | 5,771,259 | | DB | 07/19/2017 | RUB | | | 5,616,101 | | USD | | | 5,771,259 | | | | — | | | | (155,158) | |
| | | | 6,492,057 | | DB | 07/19/2017 | SEK | | | 6,713,477 | | EUR | | | 6,492,057 | | | | 221,420 | | | | — | |
| | | | 9,652,628 | | DB | 07/19/2017 | SEK | | | 9,869,171 | | USD | | | 9,652,628 | | | | 216,543 | | | | — | |
| | | | 4,379,599 | | DB | 07/19/2017 | SGD | | | 4,395,709 | | USD | | | 4,379,599 | | | | 16,110 | | | | — | |
| | | | 11,460,678 | | DB | 07/19/2017 | TRY | | | 11,398,931 | | EUR | | | 11,460,678 | | | | — | | | | (61,747) | |
| | | | 8,984,599 | | DB | 07/19/2017 | TRY | | | 9,022,416 | | USD | | | 8,984,599 | | | | 37,817 | | | | — | |
| | | | 7,979,934 | | DB | 07/19/2017 | ZAR | | | 7,869,919 | | USD | | | 7,979,934 | | | | — | | | | (110,015) | |
| Total Purchase Contracts | | | | | | | 984,549,448 | | | | | 975,375,681 | | | | 10,768,664 | | | | (1,594,897) | |
| Sale Contracts: | | | | | | | | | | | | | | | | | | | | | |
| | | $ | 11,877,854 | | DB | 07/19/2017 | USD | | $ | (12,048,425) | | AUD | | $ | (11,877,854) | | | $ | — | | | $ | (170,571) | |
| | | | 66,374,365 | | BAML | 09/22/2017 | USD | | | (67,449,486) | | AUD | | | (66,374,365) | | | | — | | | | (1,075,121) | |
| | | | 6,363,770 | | DB | 07/19/2017 | USD | | | (6,383,346) | | BRL | | | (6,363,770) | | | | — | | | | (19,576) | |
| | | | 72,148,625 | | DB | 07/19/2017 | USD | | | (74,613,109) | | CAD | | | (72,148,625) | | | | — | | | | (2,464,484) | |
| | | | 80,102,432 | | BAML | 09/22/2017 | USD | | | (83,315,445) | | CAD | | | (80,102,432) | | | | — | | | | (3,213,013) | |
| | | | 33,517,954 | | DB | 07/19/2017 | USD | | | (33,780,126) | | CHF | | | (33,517,954) | | | | — | | | | (262,172) | |
| | | | 4,539,301 | | BAML | 09/22/2017 | USD | | | (4,557,275) | | CHF | | | (4,539,301) | | | | — | | | | (17,974) | |
| | | | 231,055 | | DB | 07/19/2017 | USD | | | (231,861) | | CLP | | | (231,055) | | | | — | | | | (806) | |
| | | | 2,377,628 | | DB | 07/19/2017 | USD | | | (2,370,956) | | COP | | | (2,377,628) | | | | 6,672 | | | | — | |
| | | | 15,488,011 | | DB | 07/19/2017 | NOK | | | (15,766,808) | | EUR | | | (15,488,011) | | | | — | | | | (278,797) | |
| | | | 9,243,381 | | DB | 07/19/2017 | PLN | | | (9,409,777) | | EUR | | | (9,243,381) | | | | — | | | | (166,396) | |
| | | | 6,492,057 | | DB | 07/19/2017 | SEK | | | (6,631,435) | | EUR | | | (6,492,057) | | | | — | | | | (139,378) | |
| | | | 11,460,678 | | DB | 07/19/2017 | TRY | | | (11,536,410) | | EUR | | | (11,460,678) | | | | — | | | | (75,732) | |
| | | | 21,411,980 | | DB | 07/19/2017 | USD | | | (21,860,868) | | EUR | | | (21,411,980) | | | | — | | | | (448,888) | |
| | | | 12,563,452 | | BAML | 09/22/2017 | USD | | | (12,696,249) | | EUR | | | (12,563,452) | | | | — | | | | (132,797) | |
| | | | 29,077,116 | | DB | 07/19/2017 | USD | | | (29,610,842) | | GBP | | | (29,077,116) | | | | — | | | | (533,726) | |
| | | | 68,495,444 | | BAML | 09/22/2017 | USD | | | (69,947,320) | | GBP | | | (68,495,444) | | | | — | | | | (1,451,876) | |
The accompanying notes are an integral part of these consolidated financial statements.
| | |
| | |
24 | | LoCorr Macro Strategies Fund - Consolidated Schedule of Open Forward Currency Contracts (continued) |
| | |
| | | | | | | | Currency to be Received | | Currency to be Delivered | | | | | | | | | |
| | | | Notional | | Counter- | Forward | Curr | | U.S. $ Value at | | Curr | | U.S. $ Value on | | | | Unrealized | | | | Unrealized | |
| | | | Amount | | party | Settlement Date | Abbr. | | June 30, 2017 | | Abbr. | | Origination Date | | | | Appreciation | | | | (Depreciation) | |
| | | | | | | | | | | | | | | | | | | | | | | | | |
| Sale Contracts (continued) | | | | | | | | | | | | | | | | | |
| | | $ | 5,039,083 | | DB | 07/19/2017 | USD | | $ | (5,086,409) | | ILS | | $ | (5,039,083) | | | $ | — | | | $ | (47,326) | |
| | | | 654,324 | | DB | 07/19/2017 | USD | | | (655,780) | | INR | | | (654,324) | | | | — | | | | (1,456) | |
| | | | 33,441,566 | | DB | 07/19/2017 | USD | | | (32,853,442) | | JPY | | | (33,441,566) | | | | 588,124 | | | | — | |
| | | | 62,849,004 | | BAML | 09/22/2017 | USD | | | (61,892,326) | | JPY | | | (62,849,004) | | | | 956,678 | | | | — | |
| | | | 15,388,312 | | DB | 07/19/2017 | USD | | | (15,168,407) | | KRW | | | (15,388,312) | | | | 219,905 | | | | — | |
| | | | 5,438,124 | | DB | 07/19/2017 | USD | | | (5,390,441) | | MXN | | | (5,438,124) | | | | 47,683 | | | | — | |
| | | | 1,901,272 | | BAML | 09/22/2017 | USD | | | (1,889,921) | | MXN | | | (1,901,272) | | | | 11,351 | | | | — | |
| | | | 23,077,452 | | DB | 07/19/2017 | EUR | | | (23,309,683) | | NOK | | | (23,077,452) | | | | — | | | | (232,231) | |
| | | | 8,966,428 | | DB | 07/19/2017 | USD | | | (9,096,314) | | NOK | | | (8,966,428) | | | | — | | | | (129,886) | |
| | | | 31,902,775 | | DB | 07/19/2017 | USD | | | (32,466,165) | | NZD | | | (31,902,775) | | | | — | | | | (563,390) | |
| | | | 14,964,189 | | BAML | 09/22/2017 | USD | | | (15,209,559) | | NZD | | | (14,964,189) | | | | — | | | | (245,370) | |
| | | | 5,829,180 | | DB | 07/19/2017 | EUR | | | (5,944,043) | | PLN | | | (5,829,180) | | | | — | | | | (114,863) | |
| | | | 7,634,593 | | DB | 07/19/2017 | USD | | | (7,765,759) | | PLN | | | (7,634,593) | | | | — | | | | (131,166) | |
| | | | 2,685,009 | | DB | 07/19/2017 | USD | | | (2,680,220) | | RUB | | | (2,685,009) | | | | 4,789 | | | | — | |
| | | | 27,140,275 | | DB | 07/19/2017 | EUR | | | (27,991,050) | | SEK | | | (27,140,275) | | | | — | | | | (850,775) | |
| | | | 5,028,771 | | DB | 07/19/2017 | USD | | | (5,220,382) | | SEK | | | (5,028,771) | | | | — | | | | (191,611) | |
| | | | 6,170,474 | | DB | 07/19/2017 | USD | | | (6,212,118) | | SGD | | | (6,170,474) | | | | — | | | | (41,644) | |
| | | | 6,139,037 | | DB | 07/19/2017 | EUR | | | (6,136,871) | | TRY | | | (6,139,037) | | | | 2,166 | | | | — | |
| | | | 169,635 | | DB | 07/19/2017 | USD | | | (169,594) | | TRY | | | (169,635) | | | | 41 | | | | — | |
| | | | 361,088 | | DB | 07/19/2017 | USD | | | (358,001) | | ZAR | | | (361,088) | | | | 3,087 | | | | — | |
| Total Sale Contracts | | | | (727,706,223) | | | | | (716,545,694) | | | | 1,840,496 | | | | (13,001,025) | |
| Total Forward Currency Contracts | | | $ | 256,843,225 | | | | $ | 258,829,987 | | | $ | 12,609,160 | | | $ | (14,595,922) | |
| Net Unrealized Depreciation | | | | | | | | | | | | | | | | $ | (1,986,762) | |
Counterparty: |
| BAML | Bank of America Merrill Lynch |
| DB | Deutsche Bank |
Currency abbreviations: | | COP | COLOMBIAN PESO | | KRW | SOUTH KOREAN WON | | SEK | SWEDISH KRONA |
| AUD | AUSTRALIAN DOLLAR | | EUR | EURO | | MXN | MEXICAN PESO | | SGD | SINGAPORE DOLLAR |
| BRL | BRAZILIAN REAL | | GBP | BRITISH POUND | | NOK | NORWEGIAN KRONE | | TRY | TURKISH LIRA |
| CAD | CANADIAN DOLLAR | | ILS | ISRAELI NEW SHEQEL | | NZD | NEW ZEALAND DOLLAR | | USD | U.S. DOLLAR |
| CHF | SWISS FRANC | | INR | INDIAN RUPEE | | PLN | POLISH ZLOTY | | ZAR | SOUTH AFRICAN RAND |
| CLP | CHILEAN PESO | | JPY | JAPANESE YEN | | RUB | RUSSIAN RUBLE | | | |
The accompanying notes are an integral part of these consolidated financial statements.
| | |
| |
LoCorr Macro Strategies Fund - Consolidated Schedule of Open Futures Contracts | | 25 |
| |
LoCorr Macro Strategies Fund
Consolidated Schedule of Open Futures Contracts
June 30, 2017 (Unaudited)
| | | | | | | | | | | | | | | | | |
| | | | | | | Number of Contracts | | | Settlement | | | Unrealized | | | Unrealized | |
| Description | | | Notional Amount | | | Purchased (Sold) | | | Month-Year | | | Appreciation | | | (Depreciation) | |
| Purchase Contracts: | | | | | | | | | | | | | | | | |
| 3 Mo Euro Euribor | | $ | 182,908,833 | | | 640 | | | Dec-18 | | $ | — | | $ | (149,368 | ) |
| 90 Day Euro | | | 44,298,000 | | | 180 | | | Mar-18 | | | — | | | (34,749 | ) |
| 90 Day Euro | | | 19,673,000 | | | 80 | | | Jun-18 | | | — | | | (8,888 | ) |
| 90 Day Euro | | | 44,967,675 | | | 183 | | | Sep-18 | | | — | | | (22,254 | ) |
| 90 Day Euro | | | 551,393,000 | | | 2,246 | | | Dec-18 | | | — | | | (286,754 | ) |
| 90 Day Euro | | | 16,930,013 | | | 69 | | | Mar-19 | | | — | | | (12,332 | ) |
| 90 Day Euro | | | 14,957,963 | | | 61 | | | Jun-19 | | | — | | | (6,743 | ) |
| 90 Day Euro | | | 24,752,575 | | | 101 | | | Sep-19 | | | — | | | (17,987 | ) |
| 90 Day Sterling | | | 272,055,993 | | | 1,684 | | | Dec-18 | | | — | | | (708,977 | ) |
Aluminum (a)(b) | | | 24,761,550 | | | 516 | | | Sep-17 | | | — | | | (350,081 | ) |
| Amsterdam Exchange Index | | | 13,421,203 | | | 116 | | | Jul-17 | | | — | | | (412,350 | ) |
| Australian 10 Yr Bond | | | 112,860,246 | | | 1,136 | | | Sep-17 | | | — | | | (1,710,263 | ) |
| Australian 3 Yr Bond | | | 76,891,333 | | | 896 | | | Sep-17 | | | — | | | (472,949 | ) |
| Australian Dollar | | | 1,918,750 | | | 25 | | | Sep-17 | | | 22,705 | | | — | |
| British Pound | | | 8,886,906 | | | 109 | | | Sep-17 | | | 18,451 | | | — | |
| CAC 40 10 Euro Index | | | 29,452,863 | | | 504 | | | Jul-17 | | | — | | | (714,246 | ) |
| Canadian 10 Yr Bond | | | 103,396,591 | | | 954 | | | Sep-17 | | | — | | | (3,197,849 | ) |
| Canadian Dollar | | | 5,406,800 | | | 70 | | | Sep-17 | | | 27,763 | | | — | |
Cocoa (a) | | | 174,600 | | | 9 | | | Sep-17 | | | 1,857 | | | — | |
Copper (a)(b) | | | 36,978,056 | | | 249 | | | Sep-17 | | | 1,132,414 | | | — | |
Copper (NYCOM) (a) | | | 6,845,275 | | | 101 | | | Sep-17 | | | 51,349 | | | — | |
| DAX Index | | | 47,138,909 | | | 134 | | | Sep-17 | | | — | | | (1,508,934 | ) |
| Dow Jones Industrial Average Mini E-Cbot Index | | | 71,994,000 | | | 676 | | | Sep-17 | | | 318,167 | | | — | |
| Euro | | | 28,524,163 | | | 199 | | | Sep-17 | | | 45,643 | | | — | |
| Euro-Bobl | | | 104,994,173 | | | 698 | | | Sep-17 | | | — | | | (954,869 | ) |
| Euro-BTP | | | 54,794,413 | | | 355 | | | Sep-17 | | | — | | | (184,840 | ) |
| Euro-Bund | | | 41,413,163 | | | 224 | | | Sep-17 | | | — | | | (786,044 | ) |
| Euro-Buxl 30 Yr Bond | | | 12,513,238 | | | 67 | | | Sep-17 | | | — | | | (417,088 | ) |
| Euro-OAT | | | 87,337,187 | | | 515 | | | Sep-17 | | | — | | | (1,047,266 | ) |
| Euro-Schatz | | | 88,658,313 | | | 694 | | | Sep-17 | | | — | | | (241,093 | ) |
| Euro-Stoxx 50 Index | | | 63,640,082 | | | 1,624 | | | Sep-17 | | | — | | | (1,990,120 | ) |
| FTSE 100 Index | | | 51,598,733 | | | 547 | | | Sep-17 | | | — | | | (1,204,270 | ) |
Gold (a) | | | 5,838,810 | | | 47 | | | Aug-17 | | | — | | | (190,377 | ) |
| Hang Seng Index | | | 49,318,824 | | | 301 | | | Jul-17 | | | — | | | (170,496 | ) |
| H-Shares Index | | | 7,116,632 | | | 109 | | | Jul-17 | | | — | | | (88,523 | ) |
| IBEX 35 Index | | | 5,823,710 | | | 49 | | | Jul-17 | | | — | | | (131,015 | ) |
Lead (a)(b) | | | 1,318,906 | | | 23 | | | Sep-17 | | | 65,127 | | | — | |
Live Cattle (a) | | | 2,232,960 | | | 48 | | | Aug-17 | | | — | | | (25,828 | ) |
| Long Gilt | | | 152,100,991 | | | 930 | | | Sep-17 | | | — | | | (2,560,560 | ) |
| MSCI Taiwan Index | | | 3,197,990 | | | 83 | | | Jul-17 | | | — | | | (43,927 | ) |
| Nasdaq 100 E-Mini Index | | | 27,359,310 | | | 242 | | | Sep-17 | | | — | | | (516,981 | ) |
Nickel (a)(b) | | | 1,689,750 | | | 30 | | | Sep-17 | | | 22,471 | | | — | |
| Nikkei 225 Index (OSE) | | | 27,945,232 | | | 157 | | | Sep-17 | | | 7,958 | | | — | |
| Nikkei 225 Index (SGX) | | | 14,492,110 | | | 163 | | | Sep-17 | | | — | | | (13,465 | ) |
| Russell 2000 Mini Index | | | 32,599,615 | | | 461 | | | Sep-17 | | | — | | | (42,471 | ) |
| S&P/TSX 60 Index | | | 6,445,466 | | | 47 | | | Sep-17 | | | — | | | (50,326 | ) |
| S&P500 E-Mini Index | | | 105,551,240 | | | 872 | | | Sep-17 | | | — | | | (511,496 | ) |
| SPI 200 Index | | | 5,644,354 | | | 52 | | | Sep-17 | | | — | | | (50,276 | ) |
The accompanying notes are an integral part of these consolidated financial statements.
| | |
| | |
| 26 | | LoCorr Macro Strategies Fund - Consolidated Schedule of Open Futures Contracts (continued) |
| | |
| | | | | | | | | | | | | | |
| Description | | Notional Amount | | | Number of Contracts
Purchased (Sold) | | Settlement
Month-Year | | Unrealized
Appreciation | | | Unrealized
(Depreciation) | |
| | | | | | | | | | | | | | |
Purchase Contracts (continued) | | | | | | | | | | | | | |
| Swiss Franc | | $ | 3,667,300 | | | 28 | | Sep-17 | | $ | — | | | $ | (2,016 | ) |
| Tokyo Price Index | | | 33,526,650 | | | 234 | | Sep-17 | | | 137,309 | | | | — | |
| U.S. 10 Yr Note | | | 218,173,313 | | | 1,738 | | Sep-17 | | | — | | | | (907,542 | ) |
| U.S. 2 Yr Note | | | 273,810,581 | | | 1,267 | | Sep-17 | | | — | | | | (217,476 | ) |
| U.S. 5 Yr Note | | | 315,800,316 | | | 2,680 | | Sep-17 | | | — | | | | (761,455 | ) |
| U.S. Long Bond | | | 157,837,063 | | | 1,027 | | Sep-17 | | | — | | | | (1,205,544 | ) |
| U.S. Ultra Bond | | | 26,705,875 | | | 161 | | Sep-17 | | | — | | | | (251,995 | ) |
Wheat (a) | | | 184,100 | | | 7 | | Sep-17 | | | 232 | | | | — | |
Zinc (a)(b) | | | 15,801,000 | | | 229 | | Sep-17 | | | 561,509 | | | | — | |
| Total Purchase Contracts | | | | | | | | | | | 2,412,955 | | | | (24,182,083 | ) |
| | | | | | | | | | | | | | | | | |
| Sales Contracts: | | | | | | | | | | | | | | | | |
| 10 Yr Mini JGB | | $ | 1,869,944 | | | (14) | | Sep-17 | | $ | 6,322 | | | $ | — | |
| 90 Day Euro | | | 4,419,000 | | | (18) | | Dec-18 | | | 2,631 | | | | — | |
Aluminum (a)(b) | | | 5,902,463 | | | (123) | | Sep-17 | | | — | | | | (52,165 | ) |
Brent Crude (a) | | | 76,959,060 | | | (1,578) | | Jul-17 | | | — | | | | (2,518,520 | ) |
Brent Crude (a) | | | 3,530,880 | | | (72) | | Aug-17 | | | — | | | | (144,694 | ) |
Brent Crude (a) | | | 1,233,250 | | | (25) | | Sep-17 | | | — | | | | (32,243 | ) |
Brent Crude (a) | | | 545,490 | | | (11) | | Oct-17 | | | — | | | | (38,117 | ) |
| CBOE Volatility Index | | | 1,528,300 | | | (124) | | Jul-17 | | | — | | | | (31,713 | ) |
Cocoa (a) | | | 5,541,626 | | | (279) | | Sep-17 | | | 15,877 | | | | — | |
Coffee (a) | | | 7,494,863 | | | (159) | | Sep-17 | | | 353,633 | | | | — | |
Copper (a)(b) | | | 27,028,138 | | | (182) | | Sep-17 | | | — | | | | (1,419,395 | ) |
Corn (a) | | | 14,602,000 | | | (745) | | Dec-17 | | | — | | | | (203,595 | ) |
Cotton No.2 (a) | | | 1,268,915 | | | (37) | | Dec-17 | | | 5,843 | | | | — | |
| DAX Index | | | 703,566 | | | (2) | | Sep-17 | | | 6,594 | | | | — | |
| Dollar | | | 20,897,201 | | | (219) | | Sep-17 | | | 268,592 | | | | — | |
| Euro-Bobl | | | 30,535,555 | | | (203) | | Sep-17 | | | 65,640 | | | | — | |
| Euro-Bund | | | 46,220,047 | | | (250) | | Sep-17 | | | 193,269 | | | | — | |
| Euro-Schatz | | | 215,130,548 | | | (1,684) | | Sep-17 | | | 238,273 | | | | — | |
| FTSE/JSE Top 40 Index | | | 3,352,166 | | | (96) | | Sep-17 | | | — | | | | (22,376 | ) |
Gasoline RBOB (a) | | | 28,545,355 | | | (449) | | Jul-17 | | | — | | | | (214,335 | ) |
Gasoline RBOB (a) | | | 2,902,637 | | | (46) | | Aug-17 | | | — | | | | (74,758 | ) |
Gasoline RBOB (a) | | | 650,496 | | | (11) | | Sep-17 | | | — | | | | (24,725 | ) |
Gold (a) | | | 11,429,160 | | | (92) | | Aug-17 | | | 107,672 | | | | — | |
Hard Red Wheat (a) | | | 6,592,275 | | | (249) | | Sep-17 | | | — | | | | (915,105 | ) |
Heating Oil (a) | | | 43,665,430 | | | (701) | | Jul-17 | | | — | | | | (1,045,726 | ) |
Heating Oil (a) | | | 3,130,470 | | | (50) | | Aug-17 | | | — | | | | (107,551 | ) |
Heating Oil (a) | | | 503,664 | | | (8) | | Sep-17 | | | — | | | | (16,160 | ) |
| Japanese 10 Yr Bond | | | 4,003,823 | | | (3) | | Sep-17 | | | 16,085 | | | | — | |
| Japanese Yen | | | 3,564,000 | | | (32) | | Sep-17 | | | 26,235 | | | | — | |
| KOSPI 200 Index | | | 4,854,237 | | | (71) | | Sep-17 | | | — | | | | (11,588 | ) |
Lead (a)(b) | | | 1,318,906 | | | (23) | | Sep-17 | | | — | | | | (95,754 | ) |
Lean Hogs (a) | | | 804,000 | | | (24) | | Aug-17 | | | — | | | | (24,919 | ) |
| Long Gilt | | | 11,284,912 | | | (69) | | Sep-17 | | | 35,081 | | | | — | |
Low Sulphur Gasoil (a) | | | 11,554,000 | | | (265) | | Aug-17 | | | — | | | | (123,477 | ) |
Low Sulphur Gasoil (a) | | | 1,704,300 | | | (39) | | Sep-17 | | | 11,049 | | | | — | |
Low Sulphur Gasoil (a) | | | 702,800 | | | (16) | | Oct-17 | | | — | | | | (1,621 | ) |
Natural Gas (a) | | | 15,933,750 | | | (525) | | Jul-17 | | | 12,181 | | | | — | |
Natural Gas (a) | | | 2,818,830 | | | (93) | | Aug-17 | | | — | | | | (62,825 | ) |
Natural Gas (a) | | | 1,590,160 | | | (52) | | Sep-17 | | | — | | | | (31,428 | ) |
Natural Gas (a) | | | 342,980 | | | (11) | | Oct-17 | | | — | | | | (8,531 | ) |
The accompanying notes are an integral part of these consolidated financial statements.
| | |
| |
LoCorr Macro Strategies Fund - Consolidated Schedule of Open Futures Contracts (continued) | | 27 |
| |
| | | | | | | | | | | | | | |
| Description | | Notional Amount | | | Number of Contracts
Purchased (Sold) | | Settlement
Month-Year | | Unrealized
Appreciation | | | Unrealized
(Depreciation) | |
| | | | | | | | | | | | | | |
Sales Contracts (continued) | | | | | | | | | | | | | |
Nickel (a)(b) | | $ | 1,915,050 | | | (34) | | Sep-17 | | $ | — | | | $ | (79,674 | ) |
Platinum (a) | | | 185,280 | | | (4) | | Oct-17 | | | — | | | | (1,083 | ) |
| SGX Nifty 50 Index | | | 1,085,109 | | | (57) | | Jul-17 | | | 14,438 | | | | — | |
Silver (a) | | | 16,793,270 | | | (202) | | Sep-17 | | | — | | | | (23,477 | ) |
Soybean (a) | | | 31,077,113 | | | (651) | | Nov-17 | | | — | | | | (955,858 | ) |
Soybean Meal (a) | | | 4,916,960 | | | (158) | | Dec-17 | | | — | | | | (86,504 | ) |
Soybean Oil (a) | | | 6,921,384 | | | (346) | | Dec-17 | | | — | | | | (287,530 | ) |
Sugar (a) | | | 18,003,821 | | | (1,164) | | Sep-17 | | | 323,250 | | | | — | |
Wheat (a) | | | 6,185,750 | | | (227) | | Dec-17 | | | — | | | | (894,712 | ) |
Wti Crude (a) | | | 106,490,520 | | | (2,313) | | Jul-17 | | | — | | | | (1,977,101 | ) |
Wti Crude (a) | | | 3,518,040 | | | (76) | | Aug-17 | | | 14,577 | | | | — | |
Wti Crude (a) | | | 1,069,730 | | | (23) | | Sep-17 | | | 10,317 | | | | — | |
Wti Crude (a) | | | 561,240 | | | (12) | | Oct-17 | | | 4,587 | | | | — | |
Zinc (a)(b) | | | 9,798,000 | | | (142) | | Sep-17 | | | — | | | | (734,522 | ) |
| Total Sale Contracts | | | | | | | | | | | 1,732,146 | | | | (12,261,782 | ) |
| Total Futures Contracts | | | | | | | | | | $ | 4,145,101 | | | $ | (36,443,865 | ) |
| Net Unrealized Depreciation | | | | | | | | | | | | | | $ | (32,298,764 | ) |
| (a) | Contract held by LCMFS Fund Limited. |
| (b) | London Metal Exchange (“LME”) futures contracts settle on their respective maturity date. The unrealized appreciation on these contracts is a receivable for unsettled open futures contracts and the unrealized depreciation is a payable for unsettled open futures contracts on the Fund’s consolidated statement of assets and liabilities. See Notes 2 & 3. |
The accompanying notes are an integral part of these consolidated financial statements.
| |
| |
28 | LoCorr Long/Short Commodities Strategy Fund - Consolidated Schedule of Investments |
| |
LoCorr Long/Short Commodities Strategy Fund
Composition of Consolidated Investment Portfolio1
June 30, 2017 (Unaudited)
1As a percentage of total investments.
Consolidated Schedule of Investments
June 30, 2017 (Unaudited)
| | | Maturity Date | | Coupon Rate | | Principal Amount | | | Value | |
| ASSET BACKED SECURITIES: 16.54% | | | | | | | | | | | |
321 Henderson Receivables I LLC, 2006-4A A1 (Acquired 07/19/2016, Cost, $347,139) (a)(c) | | 12/15/2041 | | 1.36% | | $ | 359,060 | | $ | 350,153 | |
| AEP Texas Central Transition Funding II LLC, 2006-2 A4 | | 01/01/2020 | | 5.17% | | | 606,199 | | | 611,789 | |
| American Express Credit Account Master Trust | | | | | | | | | | | |
Series 2013-2 A (c) | | 05/17/2021 | | 1.58% | | | 995,000 | | | 999,054 | |
| Series 2017-1 A | | 09/15/2022 | | 1.93% | | | 365,000 | | | 365,811 | |
| California Republic Auto Receivables Trust | | | | | | | | | | | |
| Series 2013-2 A2 | | 03/15/2019 | | 1.23% | | | 34,759 | | | 34,743 | |
| Series 2016-2 A2 | | 03/15/2019 | | 1.34% | | | 222,902 | | | 222,835 | |
| Series 2015-1 A3 | | 04/15/2019 | | 1.33% | | | 74,421 | | | 74,412 | |
Series 2015-4 A3 (Acquired 09/02/2016, Cost, $257,740) (a) | | 01/15/2020 | | 2.04% | | | 256,667 | | | 257,164 | |
| Capital One Multi-Asset Execution Trust | | | | | | | | | | | |
| Series 2015-1A | | 01/15/2021 | | 1.39% | | | 850,000 | | | 849,623 | |
| Series 2015-5A | | 05/17/2021 | | 1.60% | | | 565,000 | | | 565,320 | |
| CenterPoint Energy Restoration Bond Co. LLC, 2009-1 A2 | | 08/15/2019 | | 3.46% | | | 94,380 | | | 95,147 | |
| CenterPoint Energy Transition Bond Co. II LLC, 2005-A A4 | | 08/01/2019 | | 5.17% | | | 18,392 | | | 18,449 | |
Chase Issuance Trust, 2013-A3 (c) | | 04/15/2020 | | 1.44% | | | 545,000 | | | 545,782 | |
| Chrysler Capital Auto Receivables Trust, 2015-B A3 | | | | | | | | | | | |
(Acquired 02/10/2017 through 03/01/2017, Cost, $657,899) (a) | | 03/16/2020 | | 1.91% | | | 656,279 | | | 657,487 | |
Citibank Credit Card Issuance Trust, 2013-A7 (c) | | 09/10/2020 | | 1.55% | | | 905,000 | | | 908,386 | |
| Colony American Homes | | | | | | | | | | | |
Series 2014-1A A (Acquired 04/02/2014 through 05/09/2016, Cost, $641,032) (a)(c) | | 05/17/2031 | | 2.36% | | | 643,789 | | | 647,312 | |
Series 2015-1A C (Acquired 05/27/2015 through 04/19/2016, Cost, $457,498) (a)(c) | | 07/17/2032 | | 3.12% | | | 470,000 | | | 471,376 | |
Countrywide Asset-Backed Certificates, 2004-AB1 (c) | | 11/25/2034 | | 2.19% | | | 626,170 | | | 623,399 | |
| Discover Card Execution Note Trust, 2012-A6 | | 01/18/2022 | | 1.67% | | | 900,000 | | | 898,803 | |
| Entergy Arkansas Restoration Funding LLC, 2010-A A1 | | 08/01/2021 | | 2.30% | | | 258,403 | | | 259,616 | |
The accompanying notes are an integral part of these consolidated financial statements.
| |
| |
LoCorr Long/Short Commodities Strategy Fund - Consolidated Schedule of Investments (continued) | 29 |
| |
| | | Maturity Date | | Coupon Rate | | Principal Amount | | | Value | |
ASSET BACKED SECURITIES (continued) | | | | | | | | | | | |
| Ford Credit Auto Owner Trust | | | | | | | | | | | |
Series 2014-REV1 A (Acquired 05/01/2017, Cost, $585,214) (a) | | 11/15/2025 | | 2.26% | | $ | 580,000 | | $ | 585,322 | |
Series 2016-REV1 A (Acquired 11/22/2016, Cost, $372,574) (a) | | 08/15/2027 | | 2.31% | | | 370,000 | | | 371,969 | |
GM Financial Consumer Automobile, 2017-1A A2A (Acquired 04/03/2017, Cost, $354,980) (a) | | 03/16/2020 | | 1.51% | | | 355,000 | | | 354,909 | |
Green Tree Agency Advance Funding Trust, 2016-T1 (Acquired 09/28/2016, Cost, $499,999) (a) | | 10/15/2048 | | 2.38% | | | 500,000 | | | 497,930 | |
| Huntington Auto Trust, 2015-1 A3 | | 09/16/2019 | | 1.24% | | | 123,595 | | | 123,507 | |
| Hyundai Auto Receivables Trust, 2013-C A4 | | 03/15/2019 | | 1.55% | | | 107,202 | | | 107,215 | |
| Invitation Homes Trust | | | | | | | | | | | |
Series 2014-SFR2 A (Acquired 03/03/2016, Cost, $580,326) (a)(c) | | 09/18/2031 | | 2.31% | | | 596,593 | | | 597,712 | |
Series 2015-SFR3 A (Acquired 02/21/2017, Cost, $475,723) (a)(c) | | 08/19/2032 | | 2.51% | | | 473,311 | | | 475,469 | |
| Ocwen Master Advance Receivables Trust | | | | | | | | | | | |
Series 2015-T3 AT3 (Acquired 11/06/2015 through 01/05/2017, Cost, $221,999) (a) | | 11/15/2047 | | 3.21% | | | 222,000 | | | 221,477 | |
Series 2016-T2 AT2 (Acquired 08/03/2016, Cost, $624,999) (a) | | 08/16/2049 | | 2.72% | | | 625,000 | | | 622,803 | |
| Ohio Phase-In-Recovery Funding LLC, 2013-1 A1 | | 07/01/2018 | | 0.96% | | | 63,984 | | | 63,982 | |
OneMain Direct Auto Receivables Trust, 2016 A1 (Acquired 11/09/2016 through 03/27/2017, Cost, $225,423) (a) | | 01/15/2021 | | 2.04% | | | 225,017 | | | 225,268 | |
| Small Business Administration Participation Certificates, 2012-20K 1 | | 11/01/2032 | | 2.09% | | | 16,514 | | | 16,232 | |
SMB Private Education Loan Trust, 2017-A (Acquired 01/31/2017, Cost, $360,417) (a)(c) | | 06/17/2024 | | 1.61% | | | 360,417 | | | 360,910 | |
SoFi Professional Loan Program LLC, 2015-C A2 (Acquired 07/29/2015 through 02/14/2017, Cost, $303,705) (a) | | 08/25/2033 | | 2.51% | | | 304,764 | | | 305,202 | |
SPS Servicer Advance Receivables Trust, 2016-T1 A-T1 (Acquired 11/16/2016, Cost, $499,956) (a) | | 11/16/2048 | | 2.53% | | | 500,000 | | | 495,642 | |
SWAY Residential Trust, 2014-1 A (Acquired 02/02/2016 through 04/04/2016, Cost, $15,112) (a)(c) | | 01/20/2032 | | 2.51% | | | 15,366 | | | 15,366 | |
| Synchrony Credit Card Master Note Trust, 2017-1 | | 06/15/2023 | | 1.93% | | | 285,000 | | | 284,063 | |
| TCF Auto Receivables Owner Trust | | | | | | | | | | | |
Series 2016-1A A3 (Acquired 09/14/2016, Cost, $599,901) (a) | | 04/15/2021 | | 1.71% | | | 600,000 | | | 598,062 | |
Series 2016-PT1 A (Acquired 02/01/2017, Cost, $572,971) (a) | | 06/15/2022 | | 1.93% | | | 574,745 | | | 574,209 | |
Verizon Owner Trust, 2017-2A A (Acquired 06/13/2017, Cost, $404,938) (a) | | 12/20/2021 | | 1.92% | | | 405,000 | | | 404,937 | |
| Volkswagen Auto Loan Enhanced Trust, 2014-1 A3 | | 10/22/2018 | | 0.91% | | | 51,622 | | | 51,592 | |
| World Omni Auto Receivables Trust, 2014-A A3 | | 04/15/2019 | | 0.94% | | | 27,350 | | | 27,333 | |
| TOTAL ASSET BACKED SECURITIES (Cost $16,803,541) | | | | | | | | | | 16,837,772 | |
| | | | | | | | | | | | |
| CORPORATE BONDS: 34.74% | | | | | | | | | | | |
| Administrative and Support and Waste Management and Remediation Services: 0.01% | | | | | | | | | |
Safina Ltd. (b) | | 01/15/2022 | | 1.55% | | | 12,788 | | | 12,625 | |
| | | | | | | | | | | | |
| Finance and Insurance: 13.97% | | | | | | | | | | | |
| Aflac, Inc. | | 03/16/2020 | | 2.40% | | | 340,000 | | | 343,593 | |
| American Express Co. | | 05/22/2018 | | 1.55% | | | 405,000 | | | 404,893 | |
| American International Group, Inc. | | 08/15/2020 | | 3.38% | | | 330,000 | | | 341,482 | |
| Bank of America Corp. | | 05/01/2018 | | 5.65% | | | 1,075,000 | | | 1,108,758 | |
Bank of Montreal (b) | | 07/18/2019 | | 1.50% | | | 255,000 | | | 252,605 | |
| BB&T Corp. | | 01/15/2020 | | 2.45% | | | 435,000 | | | 439,859 | |
| Berkshire Hathaway Finance Corp. | | 08/15/2018 | | 2.00% | | | 175,000 | | | 175,842 | |
| Berkshire Hathaway Finance Corp. | | 01/15/2021 | | 4.25% | | | 250,000 | | | 269,137 | |
BNP Paribas (b) | | 08/20/2018 | | 2.70% | | | 285,000 | | | 288,234 | |
| Capital One Financial Corp. | | 04/24/2019 | | 2.45% | | | 125,000 | | | 125,669 | |
| Capital One Financial Corp. | | 05/12/2020 | | 2.50% | | | 90,000 | | | 90,390 | |
| Charles Schwab Corp./The | | 03/10/2018 | | 1.50% | | | 290,000 | | | 290,081 | |
| Chubb INA Holdings, Inc. | | 11/03/2020 | | 2.30% | | | 350,000 | | | 351,996 | |
| Citigroup, Inc. | | 07/30/2018 | | 2.15% | | | 585,000 | | | 586,839 | |
| Citizens Bank NA | | 03/14/2019 | | 2.50% | | | 315,000 | | | 317,309 | |
Cooperatieve Rabobank UA (b) | | 01/14/2019 | | 2.25% | | | 250,000 | | | 251,598 | |
| Dragon 2012 LLC | | 03/12/2024 | | 1.97% | | | 15,091 | | | 14,936 | |
The accompanying notes are an integral part of these consolidated financial statements.
| |
| |
30 | LoCorr Long/Short Commodities Strategy Fund - Consolidated Schedule of Investments (continued) |
| |
| | | Maturity Date | | Coupon Rate | | Principal Amount | | | Value | |
CORPORATE BONDS (continued) | | | | | | | | | | | |
| Fifth Third Bancorp | | 07/27/2020 | | 2.88% | | $ | 350,000 | | $ | 357,273 | |
| Goldman Sachs Group, Inc./The | | 09/15/2020 | | 2.75% | | | 250,000 | | | 253,012 | |
| Goldman Sachs Group, Inc./The | | 02/25/2021 | | 2.88% | | | 535,000 | | | 540,735 | |
| Hartford Financial Services Group, Inc./The | | 03/30/2020 | | 5.50% | | | 250,000 | | | 271,663 | |
HSBC Holdings PLC (b) | | 04/05/2021 | | 5.10% | | | 215,000 | | | 233,749 | |
ING Bank NV (Acquired 03/15/2016, Cost, $399,884) (a)(b) | | 03/22/2019 | | 2.30% | | | 400,000 | | | 401,895 | |
| John Deere Capital Corp. | | 06/22/2020 | | 1.95% | | | 230,000 | | | 230,599 | |
| JPMorgan Chase & Co. | | 03/22/2019 | | 1.85% | | | 130,000 | | | 129,863 | |
| JPMorgan Chase & Co. | | 01/23/2020 | | 2.25% | | | 685,000 | | | 687,125 | |
| Keycorp | | 12/13/2018 | | 2.30% | | | 250,000 | | | 251,351 | |
| Lincoln National Corp. | | 02/15/2020 | | 6.25% | | | 180,000 | | | 197,442 | |
Metropolitan Life Global Funding (Acquired 06/16/2016, Cost, $352,553) (a) | | 04/14/2020 | | 2.00% | | | 350,000 | | | 349,043 | |
| Morgan Stanley | | 07/24/2020 | | 5.50% | | | 845,000 | | | 922,582 | |
MSN 41079 and 41084 Ltd. (b) | | 07/13/2024 | | 1.72% | | | 15,761 | | | 15,431 | |
Nomura Holdings, Inc. (b) | | 03/19/2019 | | 2.75% | | | 90,000 | | | 90,901 | |
| Phoenix 2012 LLC | | 07/03/2024 | | 1.61% | | | 15,879 | | | 15,516 | |
| PNC Bank NA | | 10/18/2019 | | 2.40% | | | 305,000 | | | 307,870 | |
Pricoa Global Funding I (Acquired 09/14/2015, Cost, $149,934) (a) | | 09/21/2018 | | 1.90% | | | 150,000 | | | 150,249 | |
Principal Life Global Funding II (Acquired 11/17/2015 through 02/25/2016, Cost, $336,978) (a) | | 10/15/2018 | | 2.25% | | | 335,000 | | | 336,986 | |
| Prudential Financial, Inc. | | 06/15/2019 | | 7.38% | | | 215,000 | | | 236,987 | |
Santander UK PLC (b) | | 08/23/2018 | | 3.05% | | | 245,000 | | | 248,070 | |
Societe Generale SA (Acquired 04/04/2016, Cost, $299,775) (a)(b) | | 04/08/2021 | | 2.50% | | | 300,000 | | | 300,820 | |
| State Street Corp. | | 08/18/2020 | | 2.55% | | | 305,000 | | | 310,727 | |
| SunTrust Banks, Inc. | | 03/03/2021 | | 2.90% | | | 265,000 | | | 269,039 | |
| Tagua Leasing LLC | | 11/16/2024 | | 1.58% | | | 16,216 | | | 15,771 | |
Teva Pharmaceutical Finance Netherlands III BV (b) | | 07/19/2019 | | 1.70% | | | 310,000 | | | 307,226 | |
Trinity Acquisition PLC (b) | | 09/15/2021 | | 3.50% | | | 335,000 | | | 343,050 | |
| UnitedHealth Group, Inc. | | 10/15/2020 | | 3.88% | | | 195,000 | | | 205,286 | |
| Wells Fargo & Co. | | 04/22/2019 | | 2.13% | | | 375,000 | | | 376,954 | |
| Wells Fargo & Co. | | 07/22/2020 | | 2.60% | | | 210,000 | | | 212,961 | |
| | | | | | | | | | | 14,223,397 | |
| Information: 4.89% | | | | | | | | | | | |
| 21st Century Fox America, Inc. | | 02/15/2021 | | 4.50% | | | 300,000 | | | 321,480 | |
America Movil SAB de CV (b) | | 03/30/2020 | | 5.00% | | | 320,000 | | | 343,747 | |
| AT&T, Inc. | | 03/11/2019 | | 2.30% | | | 700,000 | | | 704,152 | |
| CBS Corp. | | 04/15/2020 | | 5.75% | | | 250,000 | | | 273,469 | |
| Charter Communications Operating LLC/Charter Communications Operating Capital | | 07/23/2020 | | 3.58% | | | 400,000 | | | 413,350 | |
Deutsche Telekom International Finance BV (b) | | 07/08/2019 | | 6.00% | | | 225,000 | | | 242,487 | |
| Discovery Communications LLC | | 06/01/2020 | | 5.05% | | | 240,000 | | | 256,757 | |
| Hewlett Packard Enterprise Co. | | 10/05/2018 | | 2.85% | | | 297,000 | | | 299,541 | |
| Oracle Corp. | | 01/15/2019 | | 2.38% | | | 165,000 | | | 166,899 | |
Orange SA (b) | | 11/03/2019 | | 1.63% | | | 390,000 | | | 386,599 | |
Rogers Communications, Inc. (b) | | 08/15/2018 | | 6.80% | | | 295,000 | | | 311,195 | |
| Verizon Communications, Inc. | | 09/14/2018 | | 3.65% | | | 320,000 | | | 327,092 | |
| Visa, Inc. | | 12/14/2020 | | 2.20% | | | 460,000 | | | 463,846 | |
Vodafone Group PLC (b) | | 03/16/2021 | | 4.38% | | | 435,000 | | | 463,746 | |
| | | | | | | | | | | 4,974,360 | |
| Manufacturing: 7.85% | | | | | | | | | | | |
| Abbott Laboratories | | 11/30/2021 | | 2.90% | | | 345,000 | | | 348,854 | |
| AbbVie, Inc. | | 05/14/2020 | | 2.50% | | | 240,000 | | | 242,782 | |
AerCap Ireland Capital Ltd./AerCap Global Aviation Trust (b) | | 05/15/2019 | | 3.75% | | | 450,000 | | | 462,209 | |
| Altria Group, Inc. | | 01/14/2020 | | 2.63% | | | 295,000 | | | 299,573 | |
| Anheuser-Busch InBev Finance, Inc. | | 02/01/2021 | | 2.65% | | | 300,000 | | | 304,022 | |
| Apple, Inc. | | 05/06/2019 | | 2.10% | | | 250,000 | | | 252,344 | |
| Archer-Daniels-Midland Co. | | 03/01/2021 | | 4.48% | | | 270,000 | | | 291,876 | |
The accompanying notes are an integral part of these consolidated financial statements.
| |
| |
LoCorr Long/Short Commodities Strategy Fund - Consolidated Schedule of Investments (continued) | 31 |
| |
| | | Maturity Date | Coupon Rate | | Principal Amount | | Value | |
CORPORATE BONDS (continued) | | | | | | | | |
| Bunge Ltd. Finance Corp. | | 11/24/2020 | | 3.50% | | $ | 295,000 | | $ | 302,437 | |
| Celgene Corp. | | 08/15/2018 | | 2.13% | | | 305,000 | | | 306,178 | |
| Chevron Corp. | | 03/03/2020 | | 1.96% | | | 195,000 | | | 195,591 | |
Daimler Finance North America LLC (Acquired 12/14/2016, Cost, $187,697) (a) | | 07/05/2019 | | 1.50% | | | 190,000 | | | 188,191 | |
| Dr. Pepper Snapple Group, Inc. | | 11/15/2021 | | 2.53% | | | 330,000 | | | 329,838 | |
| Eastman Chemical Co. | | 01/15/2020 | | 2.70% | | | 250,000 | | | 253,295 | |
| General Electric Capital Corp. | | 05/01/2018 | | 5.63% | | | 165,000 | | | 170,624 | |
| General Electric Capital Corp. | | 08/07/2019 | | 6.00% | | | 410,000 | | | 445,590 | |
Heineken NV (Acquired 06/27/2017, Cost, $292,235) (a)(b) | | 04/01/2022 | | 3.40% | | | 280,000 | | | 290,885 | |
Ingersoll-Rand Luxembourg Finance SA (b) | | 05/01/2020 | | 2.63% | | | 340,000 | | | 343,363 | |
| Kraft Heinz Foods Co. | | 07/02/2018 | | 2.00% | | | 215,000 | | | 215,544 | |
| L3 Technologies, Inc. | | 02/15/2021 | | 4.95% | | | 230,000 | | | 247,959 | |
| Merck & Co., Inc. | | 05/18/2018 | | 1.30% | | | 210,000 | | | 209,780 | |
| Newell Brands, Inc. | | 03/29/2019 | | 2.60% | | | 315,000 | | | 318,071 | |
| PepsiCo, Inc. | | 10/14/2020 | | 2.15% | | | 450,000 | | | 452,871 | |
| Philip Morris International, Inc. | | 02/25/2019 | | 1.38% | | | 240,000 | | | 238,428 | |
| QUALCOMM, Inc. | | 05/20/2020 | | 2.10% | | | 260,000 | | | 261,188 | |
| Reynolds American, Inc. | | 06/12/2020 | | 3.25% | | | 335,000 | | | 344,895 | |
| Rockwell Collins, Inc. | | 07/15/2019 | | 1.95% | | | 245,000 | | | 245,359 | |
Siemens Financieringsmaatschappij NV (Acquired 09/14/2016, Cost, $249,135) (a)(b) | | 09/13/2019 | | 1.30% | | | 250,000 | | | 246,917 | |
| Tyson Foods, Inc. | | 08/15/2019 | | 2.65% | | | 185,000 | | | 187,333 | |
| | | | | | | | | | | 7,995,997 | |
| Mining, Quarrying, and Oil and Gas Extraction: 0.61% | | | | | | | | | | | |
| ConocoPhillips Co. | | 03/15/2021 | | 4.20% | | | 310,000 | | | 328,676 | |
Total Capital International SA (b) | | 01/10/2019 | | 2.13% | | | 290,000 | | | 292,037 | |
| | | | | | | | | | | 620,713 | |
| Professional, Scientific, and Technical Services: 0.77% | | | | | | | | | | | |
| Biogen, Inc. | | 09/15/2020 | | 2.90% | | | 300,000 | | | 306,014 | |
| eBay, Inc. | | 08/01/2019 | | 2.20% | | | 230,000 | | | 230,921 | |
| International Business Machines Corp. | | 05/17/2019 | | 1.80% | | | 250,000 | | | 250,585 | |
| | | | | | | | | | | 787,520 | |
| Real Estate and Rental and Leasing: 1.55% | | | | | | | | | | | |
| Air Lease Corp. | | 06/01/2021 | | 3.38% | | | 350,000 | | | 359,290 | |
| Ford Motor Credit Company LLC | | 11/04/2019 | | 2.60% | | | 255,000 | | | 256,695 | |
| General Motors Financial Co., Inc. | | 05/09/2019 | | 2.40% | | | 310,000 | | | 310,829 | |
| Helios Leasing I LLC | | 05/29/2024 | | 2.02% | | | 15,305 | | | 15,164 | |
| Helios Leasing I LLC | | 07/24/2024 | | 1.73% | | | 15,778 | | | 15,460 | |
| Helios Leasing I LLC | | 09/28/2024 | | 1.56% | | | 15,690 | | | 15,229 | |
| National Rural Utilities Cooperative Finance Corp. | | 02/01/2019 | | 2.15% | | | 350,000 | | | 352,123 | |
| Toyota Motor Credit Corp. | | 10/24/2018 | | 2.00% | | | 250,000 | | | 251,357 | |
| | | | | | | | | | | 1,576,147 | |
| Retail Trade: 1.61% | | | | | | | | | | | |
BP Capital Markets PLC (b) | | 09/26/2018 | | 2.24% | | | 250,000 | | | 251,426 | |
| CVS Health Corp. | | 12/05/2018 | | 2.25% | | | 260,000 | | | 261,608 | |
| Home Depot, Inc./The | | 06/15/2019 | | 2.00% | | | 305,000 | | | 307,134 | |
Hyundai Capital America (Acquired 12/02/2016, Cost, $310,501) (a) | | 03/18/2021 | | 3.00% | | | 310,000 | | | 311,742 | |
| Kroger Co./The | | 09/30/2019 | | 1.50% | | | 245,000 | | | 241,363 | |
| Walgreens Boots Alliance, Inc. | | 11/18/2019 | | 2.70% | | | 260,000 | | | 264,085 | |
| | | | | | | | | | | 1,637,358 | |
| Transportation and Warehousing: 0.37% | | | | | | | | | | | |
Carnival Corp. (b) | | 10/15/2020 | | 3.95% | | | 350,000 | | | 370,492 | |
| | | | | | | | | | | | |
| Utilities: 2.02% | | | | | | | | | | | |
| Dominion Resources, Inc. | | 08/15/2019 | | 1.60% | | | 360,000 | | | 356,951 | |
| Duke Energy Corp. | | 09/15/2019 | | 5.05% | | | 220,000 | | | 234,153 | |
| Exelon Generation Co., LLC | | 10/01/2019 | | 5.20% | | | 265,000 | | | 281,472 | |
The accompanying notes are an integral part of these consolidated financial statements.
| |
| |
32 | LoCorr Long/Short Commodities Strategy Fund - Consolidated Schedule of Investments (continued) |
| |
| | | Maturity Date | Coupon Rate | | Principal Amount | | Value | |
CORPORATE BONDS (continued) | | | | | | | | |
| NextEra Energy Capital Holdings, Inc. | | 03/01/2019 | | 6.00% | | $ | 230,000 | | $ | 244,626 | |
| Northern States Power Co. | | 08/15/2020 | | 2.20% | | | 345,000 | | | 345,882 | |
| PG&E Corp. | | 03/01/2019 | | 2.40% | | | 285,000 | | | 286,399 | |
| Sempra Energy | | 03/15/2020 | | 2.40% | | | 305,000 | | | 306,369 | |
| | | | | | | | | | | 2,055,852 | |
| Wholesale Trade: 1.09% | | | | | | | | | | | |
| Cardinal Health, Inc. | | 11/15/2019 | | 2.40% | | | 255,000 | | | 256,454 | |
LyondellBasell Industries NV (b) | | 04/15/2019 | | 5.00% | | | 146,000 | | | 152,634 | |
| McKesson Corp. | | 03/15/2019 | | 2.28% | | | 245,000 | | | 246,405 | |
| Sherwin-Williams Co./The | | 05/15/2020 | | 2.25% | | | 230,000 | | | 230,515 | |
| Sysco Corp. | | 10/01/2020 | | 2.60% | | | 225,000 | | | 227,787 | |
| | | | | | | | | | | 1,113,795 | |
| TOTAL CORPORATE BONDS (Cost $35,386,356) | | | | | | | | | | 35,368,256 | |
| | | | | | | | | | | | |
| FOREIGN GOVERNMENT BOND: 0.01% | | | | | | | | | | | |
Petroleos Mexicanos (b) | | 12/20/2022 | | 2.00% | | | 13,750 | | | 13,663 | |
| TOTAL FOREIGN GOVERNMENT BOND (Cost $13,750) | | | | | | | | | | 13,663 | |
| | | | | | | | | | | | |
| MORTGAGE BACKED SECURITIES: 11.39% | | | | | | | | | | | |
Agate Bay Mortgage Trust, 2016-3 A5 (Acquired 08/08/2016, Cost, $490,462) (a)(c) | | 08/25/2046 | | 3.50% | | | 479,144 | | | 489,224 | |
BXHTL Mortgage Trust, 2015-JWRZ A (Acquired 03/10/2016, Cost, $734,063) (a)(c) | | 05/15/2029 | | 2.39% | | | 750,000 | | | 750,941 | |
| Citigroup Commercial Mortgage Trust, 2016-GC37 A1 | | 04/12/2049 | | 1.64% | | | 588,316 | | | 583,693 | |
Citigroup Mortgage Loan Trust, Inc., 2004-HE1 A (Acquired 12/20/2016, Cost, $264,500) (a)(c) | | 09/25/2033 | | 1.55% | | | 269,898 | | | 269,300 | |
| Commercial Mortgage Trust | | | | | | | | | | | |
Series 2012-CR4 A2 (c) | | 10/17/2045 | | 1.80% | | | 189,549 | | | 189,572 | |
| Series 2007-GG11 A4 | | 12/10/2049 | | 5.74% | | | 67,900 | | | 67,849 | |
CSMC Trust, 2015-2 A2 (Acquired 04/30/2015, Cost, $62,431) (a)(c) | | 02/25/2045 | | 3.00% | | | 61,779 | | | 61,765 | |
| Fannie Mae Aces | | | | | | | | | | | |
| Series 2014-M13 ASQ2 | | 11/25/2017 | | 1.64% | | | 76,440 | | | 76,388 | |
| Series 2012-M9 ASQ2 | | 12/25/2017 | | 1.51% | | | 111,809 | | | 111,728 | |
| Series 2015-M1 ASQ2 | | 02/25/2018 | | 1.63% | | | 228,485 | | | 228,383 | |
| Series 2013-M7 ASQ2 | | 03/25/2018 | | 1.23% | | | 16,999 | | | 16,920 | |
Series 2014-M8 FA (c) | | 05/25/2018 | | 1.29% | | | 62,527 | | | 62,525 | |
Series 2014-M10 ASQ2 (c) | | 09/25/2019 | | 2.17% | | | 270,000 | | | 272,198 | |
Series 2010-M3 A3 (c) | | 03/25/2020 | | 4.33% | | | 297,550 | | | 314,042 | |
| Fannie Mae Connecticut Avenue Securities | | | | | | | | | | | |
Series 2015-C03 2M1 (c) | | 07/25/2025 | | 2.72% | | | 30,811 | | | 30,846 | |
Series 2017-C02 2M1 (c) | | 09/25/2029 | | 2.37% | | | 319,099 | | | 321,949 | |
| FHLMC Multifamily Structured Pass Through Certificates | | | | | | | | | | | |
Series K-701 A2 (c) | | 11/25/2017 | | 3.88% | | | 44,011 | | | 44,136 | |
Series K-705 A2 (c) | | 09/25/2018 | | 2.30% | | | 285,000 | | | 287,137 | |
| Series K-708 A2 | | 01/25/2019 | | 2.13% | | | 29,467 | | | 29,650 | |
| Series K-709 A2 | | 03/25/2019 | | 2.09% | | | 25,000 | | | 25,161 | |
| Series K-710 A2 | | 05/25/2019 | | 1.88% | | | 50,000 | | | 50,177 | |
| Freddie Mac Structured Agency Credit Risk Debt Notes | | | | | | | | | | | |
Series 2013-DN2 M1 (c) | | 11/27/2023 | | 2.67% | | | 46,937 | | | 47,146 | |
Series 2016-DNA2 M1 (c) | | 10/25/2028 | | 1.69% | | | 180,380 | | | 180,872 | |
| FREMF Mortgage Trust | | | | | | | | | | | |
Series 2011-K704 B (Acquired 03/01/2016, Cost, $412,402) (a)(c) | | 10/25/2030 | | 4.69% | | | 400,000 | | | 409,390 | |
Series 2011-K702 B (Acquired 06/16/2016 through 01/20/2017, Cost, $740,150) (a)(c) | | 04/25/2044 | | 4.93% | | | 715,000 | | | 726,478 | |
Series 2012-K708 B (Acquired 04/21/2015, Cost, $156,059) (a)(c) | | 02/25/2045 | | 3.88% | | | 150,000 | | | 153,407 | |
Series 2013-K502 B (Acquired 05/06/2015, Cost, $126,424) (a)(c) | | 03/25/2045 | | 2.50% | | | 125,000 | | | 124,845 | |
Series 2013-K712 B (Acquired 01/20/2017, Cost, $408,073) (a)(c) | | 05/25/2045 | | 3.48% | | | 400,000 | | | 409,314 | |
Series 2013-KF02 B (Acquired 04/06/2015, Cost, $46,929) (a)(c) | | 12/25/2045 | | 4.00% | | | 45,874 | | | 46,626 | |
Series 2011-K13 B (Acquired 05/25/2017, Cost, $246,265) (a)(c) | | 01/25/2048 | | 4.77% | | | 230,000 | | | 245,799 | |
Series 2011-K10 B (Acquired 11/22/2016, Cost, $411,529) (a)(c) | | 11/25/2049 | | 4.79% | | | 386,000 | | | 409,010 | |
The accompanying notes are an integral part of these consolidated financial statements.
| |
| |
LoCorr Long/Short Commodities Strategy Fund - Consolidated Schedule of Investments (continued) | 33 |
| |
| | | Maturity Date | | Coupon Rate | | Principal Amount | | Value | |
MORTGAGE BACKED SECURITIES(continued) | | | | | | | | | |
GAHR Commercial Mortgage Trust, 2015-NRF AFL1 (Acquired 05/07/2015 through 08/04/2016, Cost, $68,001) (a)(c) | | 12/15/2034 | | 2.29% | | $ | 67,727 | | $ | 67,828 | |
GP Portfolio Trust, 2014-GPP A (Acquired 04/29/2016, Cost, $220,639) (a)(c) | | 02/16/2027 | | 2.36% | | | 221,957 | | | 222,586 | |
GS Mortgage Securities Trust, 2014-GSFL A (Acquired 08/06/2014, Cost, $50) (a)(c) | | 07/15/2031 | | 2.16% | | | 50 | | | 50 | |
JP Morgan Mortgage Trust, 2016-1 A5 (Acquired 06/09/2016, Cost, $296,979) (a)(c) | | 05/25/2046 | | 3.50% | | | 289,510 | | | 294,893 | |
| JPMBB Commercial Mortgage Securities Trust, 2013-C12 A2 | | 07/17/2045 | | 2.42% | | | 160,994 | | | 161,878 | |
| JPMorgan Chase Commercial Mortgage Securities Trust | | | | | | | | | | | |
Series 2010-C2 A2 (Acquired 01/26/2016, Cost, $200,911) (a) | | 11/18/2043 | | 3.62% | | | 195,693 | | | 196,934 | |
| Series 2012-C8 ASB | | 10/17/2045 | | 2.38% | | | 50,000 | | | 50,356 | |
Series 2011-C3 A3 (Acquired 08/26/2015 through 03/03/2016, Cost, $669,212) (a) | | 02/16/2046 | | 4.39% | | | 640,613 | | | 650,498 | |
| MASTR Asset Securitization Trust, 2004-1 4A1 | | 02/25/2019 | | 4.50% | | | 42,405 | | | 42,513 | |
| New Residential Mortgage Loan Trust | | | | | | | | | | | |
Series 2015-1A A3 (Acquired 03/09/2016 through 04/19/2016, Cost, $341,033) (a)(c) | | 05/28/2052 | | 3.75% | | | 334,276 | | | 343,245 | |
Series 2014-2A A3 (Acquired 02/18/2016, Cost, $226,550) (a)(c) | | 05/25/2054 | | 3.75% | | | 221,636 | | | 226,239 | |
Series 2016-1A A1 (Acquired 03/29/2016 through 06/20/2017, Cost, $507,141) (a)(c) | | 03/25/2056 | | 3.75% | | | 492,674 | | | 505,067 | |
Series 2017-1A A1 (Acquired 03/06/2017, Cost, $450,065) (a)(c) | | 02/25/2057 | | 4.00% | | | 437,528 | | | 454,870 | |
Opteum Mortgage Acceptance Corp., 2005-1 M3 (c) | | 02/25/2035 | | 2.07% | | | 151,814 | | | 151,662 | |
RBSSP Resecuritization Trust, 2009-7 (Acquired 12/14/2016, Cost, $328,919) (a)(c) | | 06/26/2037 | | 1.40% | | | 340,408 | | | 329,011 | |
Sequoia Mortgage Trust, 2015-3 A4 (Acquired 06/19/2015, Cost, $106,685) (a)(c) | | 07/25/2045 | | 3.50% | | | 105,585 | | | 107,218 | |
VNDO Mortgage Trust, 2013-PENN (Acquired 06/21/2017, Cost, $131,458) (a) | | 12/13/2029 | | 3.81% | | | 125,000 | | | 130,936 | |
Vornado DP LLC Trust, 2010-VN0 A1 (Acquired 03/01/2016, Cost, $376,391) (a) | | 09/14/2028 | | 2.97% | | | 369,574 | | | 375,844 | |
| Wells Fargo Commercial Mortgage Trust | | | | | | | | | | | |
| Series 2015-C26 A1 | | 02/18/2048 | | 1.45% | | | 66,465 | | | 66,198 | |
| Series 2015-LC22 A1 | | 09/17/2058 | | 1.64% | | | 169,014 | | | 168,579 | |
| WFRBS Commercial Mortgage Trust, 2012-C8 A2 | | 08/17/2045 | | 1.88% | | | 14,845 | | | 14,836 | |
| TOTAL MORTGAGE BACKED SECURITIES (Cost $11,610,131) | | | | | | | | | | 11,597,712 | |
| | | | | | | | | | | | |
| MUNICIPAL BONDS: 0.34% | | | | | | | | | | | |
| City of Lubbock, TX | | 02/15/2018 | | 4.44% | | | 25,000 | | | 25,445 | |
| County of Forsyth, NC | | 04/01/2020 | | 3.55% | | | 30,000 | | | 31,314 | |
| Maricopa County School District No. 28 Kyrene Elementary | | 07/01/2019 | | 5.38% | | | 15,000 | | | 16,096 | |
| North Carolina Eastern Municipal Power Agency | | 07/01/2018 | | 2.00% | | | 60,000 | | | 60,232 | |
| Rosemount-Apple Valley-Eagan Independent School District No. 196 | | 02/01/2019 | | 5.00% | | | 25,000 | | | 26,367 | |
| St. Paul Housing & Redevelopment Authority | | 07/01/2018 | | 1.84% | | | 60,000 | | | 60,106 | |
| State of Mississippi | | 11/01/2017 | | 1.35% | | | 30,000 | | | 30,016 | |
| State of Ohio | | 04/01/2018 | | 3.66% | | | 45,000 | | | 45,750 | |
| State of Texas | | 10/01/2017 | | 2.50% | | | 25,000 | | | 25,060 | |
| University of Texas System | | 08/15/2018 | | 3.81% | | | 25,000 | | | 25,633 | |
| TOTAL MUNICIPAL BONDS (Cost $344,702) | | | | | | | | | | 346,019 | |
| | | | | | | | | | | | |
| U.S. GOVERNMENT AGENCY ISSUES: 14.67% | | | | | | | | | | | |
| Federal Farm Credit Banks | | 10/21/2019 | | 1.44% | | | 1,000,000 | | | 997,931 | |
| Federal Farm Credit Banks | | 05/08/2020 | | 1.55% | | | 1,000,000 | | | 997,178 | |
| Federal Home Loan Banks | | 03/18/2019 | | 1.38% | | | 1,335,000 | | | 1,334,415 | |
| Federal Home Loan Banks | | 08/05/2019 | | 0.88% | | | 1,500,000 | | | 1,481,666 | |
| Federal Home Loan Banks | | 06/12/2020 | | 1.75% | | | 1,000,000 | | | 1,003,397 | |
| Federal Home Loan Mortgage Corp. | | 07/19/2019 | | 0.88% | | | 2,515,000 | | | 2,485,029 | |
| Federal Home Loan Mortgage Corp. | | 04/20/2020 | | 1.38% | | | 915,000 | | | 909,588 | |
| Federal National Mortgage Association | | 08/02/2019 | | 0.88% | | | 1,170,000 | | | 1,155,934 | |
| Federal National Mortgage Association | | 08/28/2019 | | 1.00% | | | 2,140,000 | | | 2,119,092 | |
| Federal National Mortgage Association | | 10/24/2019 | | 1.00% | | | 1,165,000 | | | 1,152,093 | |
| Federal National Mortgage Association | | 02/28/2020 | | 1.50% | | | 1,220,000 | | | 1,216,802 | |
Ginnie Mae II Pool (c) | | 07/20/2060 | | 5.31% | | | 16,747 | | | 17,403 | |
Ginnie Mae II Pool (c) | | 07/20/2062 | | 4.56% | | | 21,786 | | | 22,559 | |
Ginnie Mae II Pool (c) | | 08/20/2062 | | 4.10% | | | 43,380 | | | 44,797 | |
| TOTAL U.S. GOVERNMENT AGENCY ISSUES (Cost $15,026,890) | | | | | | | | | | 14,937,884 | |
The accompanying notes are an integral part of these consolidated financial statements.
| |
| |
34 | LoCorr Long/Short Commodities Strategy Fund - Consolidated Schedule of Investments (continued) |
| |
| | | Maturity Date | Coupon Rate | | Principal Amount | | Value | |
| U.S. GOVERNMENT NOTES: 4.08% | | | | | | | | |
| United States Treasury Note | | 03/15/2018 | | 1.00% | | $ | 1,380,000 | | $ | 1,377,682 | |
| United States Treasury Note | | 01/31/2020 | | 1.25% | | | 1,000,000 | | | 993,867 | |
| United States Treasury Note | | 04/30/2022 | | 1.75% | | | 745,000 | | | 740,722 | |
| United States Treasury Note | | 04/30/2022 | | 1.88% | | | 420,000 | | | 419,918 | |
| United States Treasury Note | | 05/31/2022 | | 1.88% | | | 625,000 | | | 624,976 | |
| TOTAL U.S. GOVERNMENT NOTES (Cost $4,170,934) | | | | | | | | | | 4,157,165 | |
| SHORT TERM INVESTMENT: 3.72% | | | | | | | | | | | |
| MONEY MARKET FUND: 3.72% | | | | | | Shares | | | | |
STIT-Government & Agency Portfolio, 0.89% (d)(e) | | | | | | | 3,782,080 | | | 3,782,080 | |
| TOTAL MONEY MARKET FUND (Cost $3,782,080) | | | | | | | | | | 3,782,080 | |
| TOTAL SHORT TERM INVESTMENT (Cost $3,782,080) | | | | | | | | | | 3,782,080 | |
| | | | | | | | | | | | |
| TOTAL INVESTMENTS (Cost $87,138,384): 85.49% | | | | | | | | | | 87,040,551 | |
Other Assets in Excess of Liabilities: 14.51% (f) | | | | | | | | | | 14,775,751 | |
| TOTAL NET ASSETS: 100.00% | | | | | | | | | $ | 101,816,302 | |
| (a) | Restricted security as defined in Rule 144(a) under the Securities Act of 1933 and determined to be liquid. Purchased in a private placement transaction; resale to the public may require registration or may extend only to qualified institutional buyers. At June 30, 2017, the value of these securities total $19,668,725 which represents 19.32% of total net assets. |
| (b) | Foreign issued security. |
| (c) | Variable rate security. The rate reported is the rate in effect as of June 30, 2017. |
| (d) | The rate quoted is the annualized seven-day effective yield as of June 30, 2017. |
| (e) | All or a portion of this security is held by LCLSCS Fund Limited and pledged as collateral for swap contracts. |
| (f) | Includes assets pledged as collateral for swap contracts. |
The accompanying notes are an integral part of these consolidated financial statements.
| |
| |
LoCorr Long/Short Commodities Strategy Fund - Consolidated Schedule of Swap Contracts | 35 |
| |
Consolidated Schedule of Swap Contracts
June 30, 2017 (Unaudited)
LONG TOTAL RETURN SWAP CONTRACTS
This investment is a holding of LCLSCS Fund Limited. See Note 1.
| | | | | | | Unrealized | | |
| | | | | | | Appreciation | | |
| Termination Date | Reference Index | | Notional | | | (Depreciation)* | | Counterparty |
| 12/20/2017 | LoCorr Commodities Index^ | | $ | 100,100,000 | | | $ | (21,655,240 | ) | Deutsche Bank AG |
^ | Comprised of a proprietary basket of Commodity Trading Advisor’s (“CTA”) Programs investing in various futures, forwards, and currency derivative contracts and other similar investments. See Notes 2 & 3. |
| * | Unrealized depreciation is a payable on the Fund’s consolidated statement of assets and liabilities. |
The accompanying notes are an integral part of these consolidated financial statements.
| | | |
| | | |
| 36 | | | LoCorr Multi-Strategy Fund - Consolidated Schedule of Investments |
| | | |
LoCorr Multi-Strategy Fund
Composition of Consolidated Investment Portfolio1
June 30, 2017 (Unaudited)
1 As a percentage of total investments.
Consolidated Schedule of Investments
June 30, 2017 (Unaudited)
| | | | Shares | | | Value | |
| BUSINESS DEVELOPMENT COMPANIES: 3.86% | | | | | | | |
| Apollo Investment Corp. | | | 68,290 | | $ | 436,373 | |
| Ares Capital Corp. | | | 39,013 | | | 639,033 | |
| Hercules Capital, Inc. | | | 33,807 | | | 447,605 | |
| TOTAL BUSINESS DEVELOPMENT COMPANIES (Cost $1,491,248) | | | | | | 1,523,011 | |
| | | | | | | | |
| CLOSED-END INVESTMENT COMPANIES: 7.74% | | | | | | | |
| AllianceBernstein Global High Income Fund, Inc. | | | 34,630 | | | 448,112 | |
| AllianzGI Convertible & Income Fund II | | | 76,831 | | | 477,889 | |
| Invesco Dynamic Credit Opportunities Fund | | | 50,690 | | | 608,787 | |
| Nuveen Credit Strategies Income Fund | | | 50,617 | | | 435,812 | |
| PIMCO Dynamic Credit and Mortgage Income Fund | | | 19,980 | | | 445,954 | |
| Western Asset Global High Income Fund, Inc. | | | 63,368 | | | 637,482 | |
| TOTAL CLOSED-END INVESTMENT COMPANIES (Cost $2,917,792) | | | | | | 3,054,036 | |
| | | | | | | | |
| COMMON STOCKS: 30.47% | | | | | | | |
| Finance and Insurance: 7.80% | | | | | | | |
| Artisan Partners Asset Management, Inc. | | | 13,816 | | | 424,151 | |
Credit Acceptance Corp. (a) | | | 10,310 | | | 2,651,114 | |
| | | | | | | 3,075,265 | |
| Information: 6.89% | | | | | | | |
| CenturyLink, Inc. | | | 8,418 | | | 201,022 | |
Gogo, Inc. (a) | | | 155,886 | | | 1,797,366 | |
| Nexstar Broadcasting Group, Inc. | | | 9,877 | | | 590,645 | |
| Sinclair Broadcast Group, Inc. | | | 3,955 | | | 130,119 | |
| | | | | | | 2,719,152 | |
The accompanying notes are an integral part of these consolidated financial statements.
| | | |
| | | |
| LoCorr Multi-Strategy Fund - Consolidated Schedule of Investments (continued) | | | 37 |
| | | |
| | | | Shares | | | Value | |
COMMON STOCKS (continued) | | | | | | | |
| Manufacturing: 4.04% | | | | | | | |
| Lear Corp. | | | 3,390 | | $ | 481,651 | |
| Tenneco, Inc. | | | 19,195 | | | 1,110,047 | |
| | | | | | | 1,591,698 | |
| Mining, Quarrying, and Oil and Gas Extraction: 2.35% | | | | | | | |
| EnLink Midstream LLC | | | 23,287 | | | 409,851 | |
| Pattern Energy Group, Inc. | | | 21,751 | | | 518,544 | |
| | | | | | | 928,395 | |
| Professional, Scientific, and Technical Services: 0.54% | | | | | | | |
| National CineMedia, Inc. | | | 28,514 | | | 211,574 | |
| | | | | | | | |
| Real Estate and Rental and Leasing: 1.78% | | | | | | | |
AerCap Holdings NV (a)(b) | | | 15,141 | | | 702,997 | |
| | | | | | | | |
| Retail Trade: 3.06% | | | | | | | |
Signet Jewelers Ltd. (b) | | | 19,094 | | | 1,207,504 | |
| | | | | | | | |
| Transportation and Warehousing: 3.46% | | | | | | | |
Euronav NV (b) | | | 19,574 | | | 154,635 | |
GasLog Partners LP (b) | | | 12,980 | | | 293,997 | |
Golar LNG Partners LP (b) | | | 18,793 | | | 377,175 | |
Hoegh LNG Partners LP (b) | | | 10,303 | | | 197,302 | |
| Targa Resources Corp. | | | 7,566 | | | 341,983 | |
| | | | | | | 1,365,092 | |
| Utilities: 0.55% | | | | | | | |
| NRG Yield, Inc. | | | 12,316 | | | 216,762 | |
| TOTAL COMMON STOCKS (Cost $10,809,787) | | | | | | 12,018,439 | |
| | | | | | | | |
| CONVERTIBLE PREFERRED STOCKS: 2.52% | | | | | | | |
| Information: 0.19% | | | | | | | |
| Frontier Communications Corp., 11.125% | | | 2,502 | | | 73,659 | |
| | | | | | | | |
| Utilities: 2.33% | | | | | | | |
| Kinder Morgan, Inc., 9.750% | | | 20,979 | | | 920,559 | |
| TOTAL CONVERTIBLE PREFERRED STOCKS (Cost $1,077,768) | | | | | | 994,218 | |
| | | | | | | | |
| MASTER LIMITED PARTNERSHIPS: 14.80% | | | Units | | | | |
| Finance and Insurance: 1.00% | | | | | | | |
| AllianceBernstein Holding LP | | | 16,710 | | | 395,191 | |
| | | | | | | | |
| Manufacturing: 1.54% | | | | | | | |
| Alon USA Partners, LP | | | 19,502 | | | 204,381 | |
| MPLX LP | | | 12,026 | | | 401,668 | |
| | | | | | | 606,049 | |
| Mining, Quarrying, and Oil and Gas Extraction: 2.16% | | | | | | | |
| Enterprise Products Partners LP | | | 15,933 | | | 431,466 | |
| SunCoke Energy Partners LP | | | 23,951 | | | 420,340 | |
| | | | | | | 851,806 | |
| Other Services (except Public Administration): 1.51% | | | | | | | |
| StoneMor Partners LP | | | 62,744 | | | 592,931 | |
| | | | | | | | |
| Real Estate and Rental and Leasing: 2.20% | | | | | | | |
| Fortress Transportation & Infrastructure Investors LLC | | | 30,106 | | | 479,890 | |
| Icahn Enterprises LP | | | 7,530 | | | 389,000 | |
| | | | | | | 868,890 | |
| Retail Trade: 3.19% | | | | | | | |
| Crestwood Equity Partners LP | | | 28,087 | | | 660,044 | |
| Global Partners LP | | | 33,198 | | | 599,224 | |
| | | | | | 1,259,268 | |
The accompanying notes are an integral part of these consolidated financial statements.
| | | |
| | | |
| 38 | | | LoCorr Multi-Strategy Fund - Consolidated Schedule of Investments (continued) |
| | | |
| | | | Units | | | Value | |
MASTER LIMITED PARTNERSHIPS (continued) | | | | | | | |
| Transportation and Warehousing: 2.71% | | | | | | | |
| Energy Transfer Partners LP | | | 31,837 | | $ | 649,146 | |
| Summit Midstream Partners LP | | | 18,493 | | | 418,866 | |
| | | | | | | 1,068,012 | |
| Wholesale Trade: 0.49% | | | | | | | |
| Martin Midstream Partners LP | | | 11,090 | | | 194,630 | |
| TOTAL MASTER LIMITED PARTNERSHIPS (Cost $5,823,051) | | | | | | 5,836,777 | |
| | | | | | | | |
| PREFERRED STOCKS: 1.03% | | | Shares | | | | |
| Real Estate and Rental and Leasing: 1.03% | | | | | | | |
| Digital Realty Trust, Inc. - REIT, 7.375% | | | 14,838 | | | 407,006 | |
| TOTAL PREFERRED STOCKS (Cost $396,630) | | | | | | 407,006 | |
| | | | | | | | |
| PUBLICLY TRADED PARTNERSHIPS: 4.94% | | | Units | | | | |
| Apollo Global Management LLC | | | 8,110 | | | 214,509 | |
| Ares Management LP | | | 18,395 | | | 331,110 | |
| Blackstone Group LP/The | | | 19,857 | | | 662,231 | |
| Carlyle Group LP/The | | | 25,073 | | | 495,192 | |
| Oaktree Capital Group LLC | | | 5,277 | | | 245,908 | |
| TOTAL PUBLICLY TRADED PARTNERSHIPS (Cost $1,633,008) | | | | | | 1,948,950 | |
| | | | Shares | | | | |
| REAL ESTATE INVESTMENT TRUSTS: 9.58% | | | | | | | |
| Administrative and Support and Waste Management and Remediation Services: 1.00% | | | | | | | |
| Ladder Capital Corp. | | | 29,424 | | | 394,576 | |
| | | | | | | | |
| Finance and Insurance: 3.88% | | | | | | | |
| AGNC Investment Corp. | | | 9,876 | | | 210,260 | |
| Apollo Commercial Real Estate Finance, Inc. | | | 23,478 | | | 435,517 | |
| Hannon Armstrong Sustainable Infrastructure Capital, Inc. | | | 11,324 | | | 258,980 | |
| Starwood Property Trust, Inc. | | | 27,883 | | | 624,300 | |
| | | | | | | 1,529,057 | |
| Real Estate and Rental and Leasing: 4.18% | | | | | | | |
| Annaly Capital Management, Inc. | | | 17,350 | | | 209,068 | |
| Hospitality Properties Trust | | | 20,021 | | | 583,612 | |
| LaSalle Hotel Properties | | | 6,861 | | | 204,458 | |
| Two Harbors Investment Corp. | | | 23,045 | | | 228,376 | |
| Uniti Group, Inc. | | | 16,865 | | | 423,986 | |
| | | | | | | 1,649,500 | |
| Transportation and Warehousing: 0.52% | | | | | | | |
| Iron Mountain, Inc. | | | 6,015 | | | 206,675 | |
| TOTAL REAL ESTATE INVESTMENT TRUSTS (Cost $3,591,128) | | | | | | 3,779,808 | |
| | | | | | | | |
| SHORT TERM INVESTMENT: 8.78% | | | | | | | |
| MONEY MARKET FUND: 8.78% | | | | | | | |
STIT-Government & Agency Portfolio, Institutional Class, 0.89% (c)(d) | | | 3,463,402 | | | 3,463,402 | |
| TOTAL MONEY MARKET FUND (Cost $3,463,402) | | | | | | 3,463,402 | |
| TOTAL SHORT TERM INVESTMENT (Cost $3,463,402) | | | | | | 3,463,402 | |
| | | | | | | | |
| TOTAL INVESTMENTS (Cost $31,203,814): 83.72% | | | | | | 33,025,647 | |
Other Assets in Excess of Liabilities: 16.28% (e) | | | | | | 6,423,216 | |
| TOTAL NET ASSETS: 100.00% | | | | | $ | 39,448,863 | |
(a) Non-dividend income producing security.
(b) Foreign issued security.
(c) The rate quoted is the annualized seven-day effective yield as of June 30, 2017.
(d) All or a portion of this security is held by LCMSF Fund Limited and pledged as collateral for swap contracts.
(e) Includes assets pledged as collateral for swap contracts.
The accompanying notes are an integral part of these consolidated financial statements.
| | | |
| | | |
| LoCorr Multi-Strategy Fund - Consolidated Schedule of Securities Sold Short | | | 39 |
| | | |
Consolidated Schedule of Securities Sold Short
June 30, 2017 (Unaudited)
| | | | Shares | | | Value | |
| COMMON STOCKS: (3.09)% | | | | | | | |
| Manufacturing: (1.68)% | | | | | | | |
| Owens Corning | | | (9,925 | ) | $ | (664,181) | |
| | | | | | | | |
| Other Services (except Public Administration): (0.74)% | | | | | | | |
| Regis Corp. (a) | | | (28,436 | ) | | (292,038) | |
| | | | | | | | |
| Retail Trade: (0.67)% | | | | | | | |
| Tiffany & Co. | | | (2,812 | ) | | (263,962) | |
| TOTAL COMMON STOCKS (Proceeds $1,194,647) | | | | | | (1,220,181) | |
| TOTAL SECURITIES SOLD SHORT (Proceeds $1,194,647) | | | | | $ | (1,220,181) | |
(a) Non-dividend expense producing security.
Percentages are stated as a percent of net assets.
The accompanying notes are an integral part of these consolidated financial statements.
| | | |
| | | |
| 40 | | | LoCorr Multi-Strategy Fund - Consolidated Schedule of Swap Contracts |
| | | |
Consolidated Schedule of Swap Contracts
June 30, 2017 (Unaudited)
LONG TOTAL RETURN SWAP CONTRACTS
This investment is a holding of LCMSF Fund Limited. See Note 1.
| Termination Date | Reference Index | Notional | Unrealized
Appreciation
(Depreciation)* | Counterparty |
| 04/14/2020 | LoCorr Multi-Strategy Index^ | $41,101,783 | $(4,272,107) | Deutsche Bank AG |
| ^ | Comprised of a proprietary basket of Commodity Trading Advisor’s (“CTA”) Programs investing in various futures, forwards, and currency derivative contracts and other similar investments. See Notes 2 & 3. |
| * | Unrealized depreciation is a payable on the Fund’s consolidated statement of assets and liabilities. |
The accompanying notes are an integral part of these consolidated financial statements.
| |
| |
LoCorr Market Trend Fund - Consolidated Schedule of Investments | 41 |
| |
LoCorr Market Trend Fund
Composition of Consolidated Investment Portfolio1
June 30, 2017 (Unaudited)
1 As a percentage of total investments.
Consolidated Schedule of Investments
June 30, 2017 (Unaudited)
| | Maturity Date | Coupon Rate | | | Principal Amount | | | Value |
| ASSET BACKED SECURITIES: 20.34% | | | | | | | | |
| AEP Texas Central Transition Funding II LLC, 2006-2 A4 | 01/01/2020 | 5.17% | | $ | 2,006,761 | | $ | 2,025,265 |
| AEP Texas Central Transition Funding III LLC, 2012-1 A1 | 12/01/2018 | 0.88% | | | 394,759 | | | 393,870 |
| Ally Auto Receivables Trust, 2014-2 A3 | 04/15/2019 | 1.25% | | | 2,341,280 | | | 2,340,610 |
| American Express Credit Account Master Trust | | | | | | | | |
| Series 2014-4 A | 06/15/2020 | 1.43% | | | 7,500,000 | | | 7,501,477 |
| Series 2017-1 A | 09/15/2022 | 1.93% | | | 5,840,000 | | | 5,852,978 |
| AmeriCredit Automobile Receivables Trust, 2016-3 A2A | 11/08/2019 | 1.37% | | | 4,426,768 | | | 4,424,521 |
BA Credit Card Trust, 2014-3A A (c) | 01/15/2020 | 1.45% | | | 7,990,000 | | | 7,992,656 |
| California Republic Auto Receivables Trust | | | | | | | | |
| Series 2013-2 A2 | 03/15/2019 | 1.23% | | | 634,983 | | | 634,700 |
| Series 2015-1 A3 | 04/15/2019 | 1.33% | | | 89,305 | | | 89,295 |
Series 2015-4 A3 (Acquired 02/16/2017, Cost, $5,147,372) (a) | 01/15/2020 | 2.04% | | | 5,133,331 | | | 5,143,273 |
| Capital Auto Receivables Asset Trust, 2016-1 A2A | 11/20/2018 | 1.50% | | | 1,470,098 | | | 1,470,122 |
| Capital One Multi-Asset Execution Trust | | | | | | | | |
Series 2015-A6 (c) | 06/15/2020 | 1.53% | | | 5,575,000 | | | 5,577,067 |
| Series 2015-5A | 05/17/2021 | 1.60% | | | 4,455,000 | | | 4,457,525 |
| CarMax Auto Owner Trust, 2015-3 A3 | 05/15/2020 | 1.63% | | | 5,854,000 | | | 5,856,121 |
| CenterPoint Energy Restoration Bond Co. LLC, 2009-1 A2 | 08/15/2019 | 3.46% | | | 2,090,782 | | | 2,107,762 |
| CenterPoint Energy Transition Bond Co. II LLC, 2005-A A4 | 08/01/2019 | 5.17% | | | 127,431 | | | 127,826 |
| Chase Issuance Trust | | | | | | | | |
| Series 2015-A5 | 04/15/2020 | 1.36% | | | 6,250,000 | | | 6,244,624 |
Series 2013-9A (c) | 11/16/2020 | 1.58% | | | 2,768,841 | | | 2,780,608 |
Chrysler Capital Auto Receivables Trust, 2016-B A2 (Acquired 10/26/2016 through 02/23/2017, Cost, $7,030,854) (a) | 01/15/2020 | 1.36% | | | 7,033,104 | | | 7,024,670 |
| Citibank Credit Card Issuance Trust | | | | | | | | |
| Series 2008-A1 | 02/07/2020 | 5.35% | | | 4,270,000 | | | 4,366,243 |
| Series 2017-A2 | 01/19/2021 | 1.74% | | | 5,085,000 | | | 5,091,489 |
The accompanying notes are an integral part of these consolidated financial statements.
| |
| |
42 | LoCorr Market Trend Fund - Consolidated Schedule of Investments (continued) |
| |
| | Maturity Date | Coupon Rate | | | Principal Amount | | | Value |
ASSET BACKED SECURITIES (continued) | | | | | | | | |
| Discover Card Execution Note Trust | | | | | | | | |
| Series 2007-A1 | 03/16/2020 | 5.65% | | $ | 8,000,000 | | $ | 8,070,918 |
| Series 2012-A6 | 01/18/2022 | 1.67% | | | 4,500,000 | | | 4,494,015 |
| Entergy Gulf States Reconstruction Funding 1 LLC, 2007-A A2 | 10/01/2018 | 5.79% | | | 863,963 | | | 867,315 |
| Entergy Texas Restoration Funding LLC, 2009-A A2 | 08/01/2019 | 3.65% | | | 376,482 | | | 379,834 |
| Ford Credit Auto Owner Trust, 2016-A A2A | 12/15/2018 | 1.12% | | | 1,257,920 | | | 1,257,405 |
| GM Financial Automobile Leasing Trust, 2016-1 A3 | 06/20/2019 | 1.64% | | | 5,000,000 | | | 5,001,717 |
GM Financial Consumer Automobile, 2017-1A A2A (Acquired 05/31/2017, Cost, $3,999,688) (a) | 03/16/2020 | 1.51% | | | 4,000,000 | | | 3,998,972 |
| Honda Auto Receivables Owner Trust | | | | | | | | |
| Series 2017-1 A3 | 07/22/2019 | 1.42% | | | 5,445,000 | | | 5,444,451 |
| Series 2016-1 A3 | 12/18/2019 | 1.22% | | | 6,000,000 | | | 5,984,506 |
| Huntington Auto Trust, 2015-1 A3 | 09/16/2019 | 1.24% | | | 4,513,699 | | | 4,510,482 |
| Hyundai Auto Receivables Trust, 2014-B A3 | 12/17/2018 | 0.90% | | | 577,318 | | | 577,101 |
| Nissan Auto Receivables Owner Trust, 2015-C | 05/15/2020 | 1.37% | | | 5,510,000 | | | 5,500,403 |
| Ohio Phase-In-Recovery Funding LLC, 2013-1 A1 | 07/01/2018 | 0.96% | | | 1,514,933 | | | 1,514,907 |
| Santander Drive Auto Receivables Trust, 2016-2 A2A | 07/15/2019 | 1.38% | | | 1,046,711 | | | 1,046,533 |
Susquehanna Auto Receivables Trust, 2014-1 (Acquired 05/22/2017, Cost, $5,505,970) (a) | 08/15/2019 | 1.43% | | | 5,505,587 | | | 5,504,851 |
| Synchrony Credit Card Master Note Trust | | | | | | | | |
| Series 2014-1 A | 11/15/2020 | 1.61% | | | 9,300,000 | | | 9,305,296 |
| Series 2017-1 | 06/15/2023 | 1.93% | | | 2,225,000 | | | 2,217,684 |
TCF Auto Receivables Owner Trust, 2016-1A A3 (Acquired 09/14/2016, Cost, $6,998,850) (a) | 04/15/2021 | 1.71% | | | 7,000,000 | | | 6,977,396 |
Verizon Owner Trust, 2017-2A A (Acquired 06/13/2017, Cost, $3,144,518) (a) | 12/20/2021 | 1.92% | | | 3,145,000 | | | 3,144,518 |
| Volkswagen Auto Loan Enhanced Trust, 2014-1 A3 | 10/22/2018 | 0.91% | | | 262,127 | | | 261,978 |
| TOTAL ASSET BACKED SECURITIES (Cost $157,686,683) | | | | | | | | 157,562,984 |
| | | | | | | | | |
| CORPORATE BOND: 0.21% | | | | | | | | |
| Manufacturing: 0.21% | | | | | | | | |
| Johnson & Johnson | 07/15/2018 | 5.15% | | | 1,595,000 | | | 1,654,353 |
| TOTAL CORPORATE BOND (Cost $1,659,347) | | | | | | | | 1,654,353 |
| | | | | | | | | |
| FOREIGN GOVERNMENT BONDS: 1.87% | | | | | | | | |
European Investment Bank (b) | 03/15/2018 | 1.00% | | | 6,000,000 | | | 5,985,330 |
European Investment Bank (b) | 05/15/2018 | 1.25% | | | 1,000,000 | | | 999,019 |
European Investment Bank (b) | 08/15/2018 | 1.13% | | | 2,500,000 | | | 2,491,410 |
International Bank for Reconstruction & Development (b) | 11/15/2017 | 1.00% | | | 5,000,000 | | | 4,997,980 |
| TOTAL FOREIGN GOVERNMENT BONDS (Cost $14,477,320) | | | | | | | | 14,473,739 |
| | | | | | | | | |
| MORTGAGE BACKED SECURITIES: 7.68% | | | | | | | | |
| Fannie Mae Aces | | | | | | | | |
| Series 2012-M13 ASQ2 | 08/25/2017 | 1.25% | | | 127,572 | | | 127,446 |
| Series 2014-M13 ASQ2 | 11/25/2017 | 1.64% | | | 1,344,574 | | | 1,343,662 |
Series 2014-M6 FA (c) | 12/25/2017 | 1.28% | | | 215,992 | | | 215,910 |
| Series 2015-M1 ASQ2 | 02/25/2018 | 1.63% | | | 3,653,258 | | | 3,651,621 |
| Series 2015-M7 ASQ2 | 04/25/2018 | 1.55% | | | 3,463,661 | | | 3,459,957 |
Series 2014-M8 FA (c) | 05/25/2018 | 1.29% | | | 731,560 | | | 731,542 |
Series 2013-M13 FA (c) | 05/25/2018 | 1.57% | | | 2,122,521 | | | 2,124,412 |
Series 2013-M14 FA (c) | 08/25/2018 | 1.57% | | | 1,229,823 | | | 1,232,032 |
| Series 2009-M2 A3 | 01/25/2019 | 4.00% | | | 2,032,591 | | | 2,092,631 |
Series 2014-M10 ASQ2 (c) | 09/25/2019 | 2.17% | | | 4,880,000 | | | 4,919,728 |
| Series 2010-M1 A2 | 09/25/2019 | 4.45% | | | 3,179,119 | | | 3,325,993 |
Series 2010-M3 A3 (c) | 03/25/2020 | 4.33% | | | 3,050,317 | | | 3,219,378 |
| FHLMC Multifamily Structured Pass Through Certificates | | | | | | | | |
Series K-701 A2 (c) | 11/25/2017 | 3.88% | | | 4,401,137 | | | 4,413,613 |
| Series K-703 A2 | 05/25/2018 | 2.70% | | | 3,912,966 | | | 3,943,608 |
Series K-705 A2 (c) | 09/25/2018 | 2.30% | | | 4,000,000 | | | 4,029,986 |
| Series K-708 A2 | 01/25/2019 | 2.13% | | | 1,375,118 | | | 1,383,675 |
The accompanying notes are an integral part of these consolidated financial statements.
| |
| |
LoCorr Market Trend Fund - Consolidated Schedule of Investments (continued) | 43 |
| |
| | Maturity Date | Coupon Rate | | | Principal Amount | | | Value |
MORTGAGE BACKED SECURITIES (continued) | | | | | | | | |
FHLMC Multifamily Structured Pass Through Certificates (continued) | | | | | | | | |
| Series K006 A1 | 07/25/2019 | 3.40% | | $ | 1,235,215 | | $ | 1,259,910 |
| Series K-504 A1 | 10/25/2019 | 1.68% | | | 5,347,922 | | | 5,348,352 |
FREMF Multifamily Aggregation Risk Transfer Trust, 2017-KT01 A (c) | 02/25/2020 | 1.35% | | | 5,890,000 | | | 5,905,492 |
NCUA Guaranteed Notes Trust, 2010-R1 1A (c) | 10/07/2020 | 1.53% | | | 6,725,906 | | | 6,734,991 |
| TOTAL MORTGAGE BACKED SECURITIES (Cost $59,200,562) | | | | | | | | 59,463,939 |
| | | | | | | | | |
| U.S. GOVERNMENT AGENCY ISSUES: 44.42% | | | | | | | | |
| Federal Farm Credit Banks | 09/14/2018 | 0.88% | | | 22,000,000 | | | 21,878,120 |
| Federal Farm Credit Banks | 09/27/2019 | 1.55% | | | 13,000,000 | | | 12,985,830 |
| Federal Farm Credit Banks | 10/21/2019 | 1.44% | | | 13,200,000 | | | 13,172,689 |
| Federal Farm Credit Banks | 05/08/2020 | 1.55% | | | 18,590,000 | | | 18,537,539 |
| Federal Home Loan Banks | 03/18/2019 | 1.38% | | | 6,500,000 | | | 6,497,153 |
| Federal Home Loan Banks | 05/28/2019 | 1.38% | | | 9,535,000 | | | 9,524,798 |
| Federal Home Loan Banks | 06/14/2019 | 1.63% | | | 20,000,000 | | | 20,067,980 |
| Federal Home Loan Banks | 08/05/2019 | 0.88% | | | 5,055,000 | | | 4,993,213 |
| Federal Home Loan Banks | 06/12/2020 | 1.75% | | | 13,150,000 | | | 13,194,671 |
| Federal Home Loan Mortgage Corp. | 10/12/2018 | 0.88% | | | 17,210,000 | | | 17,105,088 |
| Federal Home Loan Mortgage Corp. | 04/15/2019 | 1.13% | | | 22,000,000 | | | 21,901,154 |
| Federal Home Loan Mortgage Corp. | 07/19/2019 | 0.88% | | | 25,440,000 | | | 25,136,832 |
| Federal Home Loan Mortgage Corp. | 01/17/2020 | 1.50% | | | 26,185,000 | | | 26,163,005 |
| Federal Home Loan Mortgage Corp. | 04/20/2020 | 1.38% | | | 6,800,000 | | | 6,759,778 |
| Federal National Mortgage Association | 02/26/2019 | 1.00% | | | 42,000,000 | | | 41,719,650 |
| Federal National Mortgage Association | 08/02/2019 | 0.88% | | | 21,000,000 | | | 20,747,538 |
| Federal National Mortgage Association | 08/28/2019 | 1.00% | | | 21,610,000 | | | 21,398,870 |
| Federal National Mortgage Association | 10/24/2019 | 1.00% | | | 22,545,000 | | | 22,295,224 |
| Federal National Mortgage Association | 11/26/2019 | 1.75% | | | 8,495,000 | | | 8,542,088 |
| Federal National Mortgage Association | 02/28/2020 | 1.50% | | | 11,560,000 | | | 11,529,701 |
TOTAL U.S. GOVERNMENT AGENCY ISSUES (Cost $345,861,409) | | | | | | | | 344,150,921 |
| | | | | | | | | |
| U.S. GOVERNMENT NOTES: 6.47% | | | | | | | | |
| United States Treasury Note | 02/15/2019 | 0.75% | | | 10,500,000 | | | 10,398,696 |
| United States Treasury Note | 08/15/2019 | 0.75% | | | 5,000,000 | | | 4,932,030 |
| United States Treasury Note | 01/31/2020 | 1.25% | | | 10,000,000 | | | 9,938,670 |
| United States Treasury Note | 05/15/2020 | 1.50% | | | 6,000,000 | | | 5,993,202 |
| United States Treasury Note | 06/30/2020 | 1.63% | | | 6,000,000 | | | 6,010,548 |
| United States Treasury Note | 08/31/2020 | 1.38% | | | 12,950,000 | | | 12,858,949 |
| TOTAL U.S. GOVERNMENT NOTES (Cost $50,243,269) | | | | | | | | 50,132,095 |
| | | | | | | | | |
| SHORT TERM INVESTMENT: 4.15% | | | | | | | | |
| MONEY MARKET FUND: 4.15% | | | | | Shares | | | |
STIT-Government & Agency Portfolio, 0.89% (d)(e) | | | | | 32,142,971 | | | 32,142,971 |
| TOTAL MONEY MARKET FUND (Cost $32,142,971) | | | | | | | | 32,142,971 |
| TOTAL SHORT TERM INVESTMENT (Cost $32,142,971) | | | | | | | | 32,142,971 |
| | | | | | | | | |
| TOTAL INVESTMENTS (Cost $661,271,560): 85.14% | | | | | | | | 659,581,002 |
Other Assets in Excess of Liabilities: 14.86% (f) | | | | | | | | 115,125,481 |
| TOTAL NET ASSETS: 100.00% | | | | | | | $ | 774,706,483 |
| (a) | Restricted security as defined in Rule 144(a) under the Securities Act of 1933 and determined to be liquid. Purchased in a private placement transaction; resale to the public may require registration or may extend only to qualified institutional buyers. At June 30, 2017, the value of these securities total $31,793,680 which represents 4.10% of total net assets. |
| (b) | Foreign issued security. |
| (c) | Variable rate security. The rate reported is the rate in effect as of June 30, 2017. |
| (d) | The rate quoted is the annualized seven-day effective yield as of June 30, 2017. |
| (e) | All or a portion of this security is held by LCMT Fund Limited and pledged as collateral for derivative contracts. |
| (f) | Includes assets pledged as collateral for derivative contracts. |
The accompanying notes are an integral part of these consolidated financial statements.
| |
| |
44 | LoCorr Market Trend Fund - Consolidated Schedule of Open Forward Currency Contracts |
| |
LoCorr Market Trend Fund
Consolidated Schedule of Open Forward Currency Contracts(a)
June 30, 2017 (Unaudited)
| | | | | | Currency to be Received | | | Currency to be Delivered | | | | | | |
| | | Notional
Amount | | Forward
Settlement Date | | Curr
Abbr. | | | U.S. $ Value at
June 30, 2017 | | | Curr
Abbr. | | | U.S. $ Value on
Origination Date | | | Unrealized
Appreciation | | | Unrealized
(Depreciation) |
| | | | | | | | | | | | | | | | | | | | | | |
| Purchase Contracts: | | | | | | | | | | | | | | | | | | | | | |
| | $ | 213,395,826 | | 09/22/2017 | | AUD | | $ | 216,334,183 | | | USD | | $ | 213,395,826 | | $ | 2,938,357 | | $ | — |
| | | 226,841,950 | | 09/22/2017 | | CAD | | | 230,062,406 | | | USD | | | 226,841,950 | | | 3,220,456 | | | — |
| | | 139,518,279 | | 09/22/2017 | | CHF | | | 140,251,038 | | | USD | | | 139,518,279 | | | 732,759 | | | — |
| | | 233,997,216 | | 09/22/2017 | | EUR | | | 237,669,746 | | | USD | | | 233,997,216 | | | 3,672,530 | | | — |
| | | 235,289,221 | | 09/22/2017 | | GBP | | | 236,399,821 | | | USD | | | 235,289,221 | | | 1,110,600 | | | — |
| | | 59,188,101 | | 09/22/2017 | | JPY | | | 57,727,553 | | | USD | | | 59,188,101 | | | — | | | (1,460,548) |
| | | 58,001,038 | | 09/22/2017 | | MXN | | | 58,169,434 | | | USD | | | 58,001,038 | | | 168,396 | | | — |
| | | 105,864,826 | | 09/22/2017 | | NZD | | | 107,709,260 | | | USD | | | 105,864,826 | | | 1,844,434 | | | — |
| Total Purchase Contracts | | | | | | | | | 1,284,323,441 | | | | | | 1,272,096,457 | | | 13,687,532 | | | (1,460,548) |
| | | | | | | | | | | | | | | | | | | | | | |
| Sale Contracts: | | | | | | | | | | | | | | | | | | | | | |
| | $ | 156,703,437 | | 09/22/2017 | | USD | | $ | (159,238,862) | | | AUD | | $ | (156,703,437) | | $ | — | | $ | (2,535,425) |
| | | 189,005,825 | | 09/22/2017 | | USD | | | (196,583,031) | | | CAD | | | (189,005,825) | | | — | | | (7,577,206) |
| | | 10,284,893 | | 09/22/2017 | | USD | | | (10,324,651) | | | CHF | | | (10,284,893) | | | — | | | (39,758) |
| | | 27,160,968 | | 09/22/2017 | | USD | | | (27,424,403) | | | EUR | | | (27,160,968) | | | — | | | (263,435) |
| | | 161,254,164 | | 09/22/2017 | | USD | | | (164,673,881) | | | GBP | | | (161,254,164) | | | — | | | (3,419,717) |
| | | 148,267,537 | | 09/22/2017 | | USD | | | (146,014,071) | | | JPY | | | (148,267,537) | | | 2,253,466 | | | — |
| | | 4,302,295 | | 09/22/2017 | | USD | | | (4,282,223) | | | MXN | | | (4,302,295) | | | 20,072 | | | — |
| | | 34,616,169 | | 09/22/2017 | | USD | | | (35,186,556) | | | NZD | | | (34,616,169) | | | — | | | (570,387) |
| Total Sale Contracts | | | | | (743,727,678) | | | | | | (731,595,288) | | | 2,273,538 | | | (14,405,928) |
| Total Forward Currency Contracts | | | | $ | 540,595,763 | | | | | $ | 540,501,169 | | $ | 15,961,070 | | $ | (15,866,476) |
| Net Unrealized Appreciation | | | | | | | | | | | | | $ | 94,594 | | | |
Currency abbreviations:
(a) Bank of America Merrill Lynch is the counterparty for all open forward currency exchange contracts held by the Fund as of June 30, 2017.
The accompanying notes are an integral part of these consolidated financial statements.
| |
| |
LoCorr Market Trend Fund - Consolidated Schedule of Open Futures Contracts | 45 |
| |
LoCorr Market Trend Fund
Consolidated Schedule of Open Futures Contracts
June 30, 2017 (Unaudited)
| | | | | | | | | | | |
| | | | | Number of Contracts | | Settlement | | Unrealized | | Unrealized |
| Description | | Notional Amount | | Purchased (Sold) | | Month-Year | | Appreciation | | (Depreciation) |
| Purchase Contracts: | | | | | | | | | | | | | | | | | | | |
| 3 Mo Euro Euribor | | $ | 430,693,144 | | | | 1,507 | | | Dec-18 | | | $ | — | | | $ | (350,985 | ) |
| 90 Day Euro | | | 1,298,449,500 | | | | 5,289 | | | Dec-18 | | | | — | | | | (670,990 | ) |
| 90 Day Sterling | | | 640,559,389 | | | | 3,965 | | | Dec-18 | | | | — | | | | (1,750,916 | ) |
Aluminum (a)(b) | | | 48,035,488 | | | | 1,001 | | | Sep-17 | | | | — | | | | (937,359 | ) |
| Australian 10 Yr Bond | | | 131,537,821 | | | | 1,324 | | | Sep-17 | | | | — | | | | (2,073,835 | ) |
| CAC 40 10 Euro Index | | | 34,770,741 | | | | 595 | | | Jul-17 | | | | — | | | | (881,340 | ) |
| Canadian 10 Yr Bond | | | 214,813,464 | | | | 1,982 | | | Sep-17 | | | | — | | | | (6,836,023 | ) |
Copper (a)(b) | | | 52,719,719 | | | | 355 | | | Sep-17 | | | | 1,347,650 | | | | — | |
| DAX Index | | | 64,024,488 | | | | 182 | | | Sep-17 | | | | — | | | | (2,247,247 | ) |
| Dow Jones Industrial Average Mini E-Cbot Index | | | 111,505,500 | | | | 1,047 | | | Sep-17 | | | | 809,756 | | | | — | |
| Euro-Bobl | | | 42,870,114 | | | | 285 | | | Sep-17 | | | | — | | | | (436,107 | ) |
| Euro-Stoxx 50 Index | | | 87,936,177 | | | | 2,244 | | | Sep-17 | | | | — | | | | (2,945,198 | ) |
| FTSE 100 Index | | | 103,197,465 | | | | 1,094 | | | Sep-17 | | | | — | | | | (2,640,817 | ) |
Gold (a) | | | 13,789,530 | | | | 111 | | | Aug-17 | | | | — | | | | (450,177 | ) |
| Hang Seng Index | | | 59,805,218 | | | | 365 | | | Jul-17 | | | | — | | | | (161,066 | ) |
| Long Gilt | | | 216,539,477 | | | | 1,324 | | | Sep-17 | | | | — | | | | (3,287,454 | ) |
| Nasdaq 100 E-Mini Index | | | 25,098,210 | | | | 222 | | | Sep-17 | | | | — | | | | (1,033,337 | ) |
| Nikkei 225 Index | | | 64,968,215 | | | | 365 | | | Sep-17 | | | | 15,676 | | | | — | |
| Russell 2000 Mini Index | | | 52,682,675 | | | | 745 | | | Sep-17 | | | | — | | | | (18,155 | ) |
| S&P500 E-Mini Index | | | 121,892,315 | | | | 1,007 | | | Sep-17 | | | | — | | | | (521,722 | ) |
| Tokyo Price Index | | | 61,322,249 | | | | 428 | | | Sep-17 | | | | 395,967 | | | | — | |
| U.S. 10 Yr Note | | | 295,626,094 | | | | 2,355 | | | Sep-17 | | | | — | | | | (689,630 | ) |
| U.S. 2 Yr Note | | | 399,370,127 | | | | 1,848 | | | Sep-17 | | | | — | | | | (323,149 | ) |
| U.S. 5 Yr Note | | | 424,209,377 | | | | 3,600 | | | Sep-17 | | | | — | | | | (601,762 | ) |
| U.S. Long Bond | | | 145,081,000 | | | | 944 | | | Sep-17 | | | | — | | | | (468,002 | ) |
Zinc (a)(b) | | | 23,460,000 | | | | 340 | | | Sep-17 | | | | 718,894 | | | | — | |
| Total Purchase Contracts | | | | | | | | | | | | | | 3,287,943 | | | | (29,325,271 | ) |
| | | | | | | | | | | | | | | | | | | | |
| Sales Contracts: | | | | | | | | | | | | | | | | | | | |
| 10 Yr Mini JGB | | $ | 1,736,377 | | | | (13) | | | Sep-17 | | | $ | 3,913 | | | $ | — | |
Aluminum (a)(b) | | | 3,503,088 | | | | (73) | | | Sep-17 | | | | — | | | | (31,920 | ) |
Brent Crude (a) | | | 30,188,630 | | | | (619) | | | Jul-17 | | | | — | | | | (1,011,394 | ) |
Cocoa (a) | | | 13,069,499 | | | | (658) | | | Sep-17 | | | | 35,011 | | | | — | |
Coffee (a) | | | 13,104,225 | | | | (278) | | | Sep-17 | | | | 786,338 | | | | — | |
Copper (a)(b) | | | 33,859,425 | | | | (228) | | | Sep-17 | | | | — | | | | (1,784,658 | ) |
Corn (a) | | | 11,034,800 | | | | (563) | | | Dec-17 | | | | — | | | | (58,297 | ) |
Cotton No.2 (a) | | | 548,720 | | | | (16) | | | Dec-17 | | | | — | | | | (5,141 | ) |
| Dollar | | | 49,141,820 | | | | (515) | | | Sep-17 | | | | 632,012 | | | | — | |
| Euro-Bund | | | 51,396,692 | | | | (278) | | | Sep-17 | | | | 178,317 | | | | — | |
| Euro-Schatz | | | 506,527,686 | | | | (3,965) | | | Sep-17 | | | | 560,713 | | | | — | |
Gasoline RBOB (a) | | | 46,410,042 | | | | (730) | | | Jul-17 | | | | 455,380 | | | | — | |
Hard Red Wheat (a) | | | 13,449,300 | | | | (508) | | | Sep-17 | | | | — | | | | (1,972,505 | ) |
Heating Oil (a) | | | 48,897,807 | | | | (785) | | | Jul-17 | | | | — | | | | (586,089 | ) |
| Japanese 10 Yr Bond | | | 12,011,469 | | | | (9) | | | Sep-17 | | | | 48,611 | | | | — | |
Low Sulphur Gasoil (a) | | | 14,867,600 | | | | (341) | | | Aug-17 | | | | — | | | | (259,924 | ) |
Natural Gas (a) | | | 21,184,300 | | | | (698) | | | Jul-17 | | | | 127,681 | | | | — | |
Silver (a) | | | 34,916,700 | | | | (420) | | | Sep-17 | | | | — | | | | (82,568 | ) |
Soybean (a) | | | 31,411,275 | | | | (658) | | | Nov-17 | | | | — | | | | (911,447 | ) |
Soybean Meal (a) | | | 10,362,960 | | | | (333) | | | Dec-17 | | | | — | | | | (151,499 | ) |
Soybean Oil (a) | | | 9,521,904 | | | | (476) | | | Dec-17 | | | | — | | | | (492,774 | ) |
Sugar (a) | | | 10,177,418 | | | | (658) | | | Sep-17 | | | | 1,038,157 | | | | — | |
Wheat (a) | | | 13,625,000 | | | | (500) | | | Dec-17 | | | | — | | | | (2,022,410 | ) |
Wti Crude (a) | | | 44,889,000 | | | | (975) | | | Jul-17 | | | | 1,600,576 | | | | — | |
Zinc (a)(b) | | | 13,593,000 | | | | (197) | | | Sep-17 | | | | — | | | | (1,037,567 | ) |
| Total Sale Contracts | | | | | | | | | | | | | | 5,466,709 | | | | (10,408,193 | ) |
| Total Futures Contracts | | | | | | | | | | | | | $ | 8,754,652 | | | $ | (39,733,464 | ) |
| Net Unrealized Depreciation | | | | | | | | | | | | | | | | | $ | (30,978,812 | ) |
| (a) | Contract held by LCMT Fund Limited. |
| (b) | London Metal Exchange (“LME”) futures contracts settle on their respective maturity date. The unrealized appreciation on these contracts is a receivable for unsettled open futures contracts and the unrealized depreciation is a payable for unsettled open futures contracts on the Fund’s consolidated statement of assets and liabilities. See Notes 2 & 3. |
The accompanying notes are an integral part of these consolidated financial statements.
| |
| |
46 | LoCorr Dynamic Equity Fund - Schedule of Investments |
| |
LoCorr Dynamic Equity Fund
Composition of Investment Portfolio1
June 30, 2017 (Unaudited)
1 As a percentage of total investments.
Composition of Common Stock Portfolio1
June 30, 2017 (Unaudited)
1 As a percentage of total common stocks.
Schedule of Investments
June 30, 2017 (Unaudited)
| | | Shares | | | Value | |
| COMMON STOCKS: 61.28% | | | | | | |
| Accommodation and Food Services: 0.48% | | | | | | |
| Extended Stay America, Inc. | | | 20,119 | | | $ | 389,504 | |
| | | | | | | | | |
| Administrative and Support and Waste Management and Remediation Services: 2.39% | | | | | | | | |
Casella Waste Systems, Inc. (a) | | | 50,162 | | | | 823,158 | |
Cision Ltd. (a) | | | 28,030 | | | | 288,429 | |
TripAdvisor, Inc. (a) | | | 21,132 | | | | 807,242 | |
| | | | | | | | 1,918,829 | |
| Construction: 0.43% | | | | | | | | |
| Lennar Corp. | | | 7,742 | | | | 348,158 | |
| | | | | | | | | |
| Energy: 1.03% | | | | | | | | |
Petrofac Ltd. (b) | | | 143,745 | | | | 827,519 | |
| | | | | | | | | |
| Finance and Insurance: 8.72% | | | | | | | | |
Aspen Insurance Holdings Ltd. (b) | | | 15,842 | | | | 789,724 | |
Credit Acceptance Corp. (a) | | | 23,452 | | | | 6,030,447 | |
| Drive Shack, Inc. | | | 60,725 | | | | 191,284 | |
| | | | | | | | 7,011,455 | |
| Information: 19.38% | | | | | | | | |
Cincinnati Bell, Inc. (a) | | | 31,235 | | | | 610,640 | |
Gogo, Inc. (a) | | | 682,164 | | | | 7,865,351 | |
Houghton Mifflin Harcourt Co. (a) | | | 80,232 | | | | 986,854 | |
Internap Corp. (a) | | | 9,456 | | | | 34,704 | |
Lumos Networks Corp. (a) | | | 10,218 | | | | 182,596 | |
Madison Square Garden Co./The (a) | | | 4,120 | | | | 811,228 | |
Match Group, Inc. (a) | | | 85,238 | | | | 1,481,436 | |
| Nexstar Broadcasting Group, Inc. | | | 33,372 | | | | 1,995,646 | |
NII Holdings, Inc. (a) | | | 132,820 | | | | 106,787 | |
| Sinclair Broadcast Group, Inc. | | | 10,323 | | | | 339,627 | |
Twilio, Inc. (a) | | | 25,838 | | | | 752,144 | |
Zayo Group Holdings, Inc. (a) | | | 13,064 | | | | 403,678 | |
| | | | | | | | 15,570,691 | |
The accompanying notes are an integral part of these financial statements.
| |
| |
LoCorr Dynamic Equity Fund - Schedule of Investments (continued) | 47 |
| |
| | | Shares | | | Value | |
COMMON STOCKS (continued) | | | | | | |
| Manufacturing: 14.52% | | | | | | |
AK Steel Holding Corp. (a) | | | 155,493 | | | $ | 1,021,589 | |
| Callaway Golf Co. | | | 78,541 | | | | 1,003,754 | |
| Commercial Metals Co. | | | 20,747 | | | | 403,114 | |
Harmonic, Inc. (a) | | | 18,012 | | | | 94,563 | |
Immersion Corp. (a) | | | 16,150 | | | | 146,642 | |
| Lear Corp. | | | 15,252 | | | | 2,167,004 | |
Manitowoc Co., Inc./The (a) | | | 65,641 | | | | 394,502 | |
Nintendo Co. Ltd. - ADR (a)(b) | | | 29,227 | | | | 1,222,273 | |
| Olympic Steel, Inc. | | | 11,297 | | | | 220,066 | |
QuickLogic Corp. (a) | | | 55,581 | | | | 81,148 | |
| Steel Dynamics, Inc. | | | 11,793 | | | | 422,307 | |
| Tenneco, Inc. | | | 67,772 | | | | 3,919,255 | |
| United States Steel Corp. | | | 18,374 | | | | 406,800 | |
Zynga, Inc. (a) | | | 45,730 | | | | 166,457 | |
| | | | | | | | 11,669,474 | |
| Professional, Scientific, and Technical Services: 0.96% | | | | | | | | |
Instructure, Inc. (a) | | | | | | | | |
| | | | 26,159 | | | | 771,691 | |
| Real Estate and Rental and Leasing: 3.91% | | | | | | | | |
AerCap Holdings NV (a)(b) | | | | | | | | |
| | | | 67,608 | | | | 3,139,039 | |
| Retail Trade: 8.23% | | | | | | | | |
Etsy, Inc. (a) | | | 51,412 | | | | 771,180 | |
MobileIron, Inc. (a) | | | 69,747 | | | | 421,969 | |
Signet Jewelers Ltd. (b) | | | 83,333 | | | | 5,269,979 | |
Straight Path Communications, Inc. (a) | | | 838 | | | | 150,547 | |
| | | | | | | | 6,613,675 | |
| Transportation and Warehousing: 1.23% | | | | | | | | |
JetBlue Airways Corp. (a) | | | 43,398 | | | | 990,776 | |
| TOTAL COMMON STOCKS (Cost $44,675,055) | | | | | | | 49,250,811 | |
| | | | | | | | | |
| REAL ESTATE INVESTMENT TRUSTS: 1.02% | | | | | | | | |
| Gaming and Leisure Properties, Inc. | | | 11,549 | | | | 435,051 | |
| STORE Capital Corp. | | | 17,006 | | | | 381,785 | |
| TOTAL REAL ESTATE INVESTMENT TRUSTS (Cost $753,514) | | | | | | | 816,836 | |
| SHORT TERM INVESTMENTS: 33.05% | | | | | | | | | | |
| U.S. TREASURY BILL: 7.44% | Maturity Date | | Coupon | | Principal Amount | | | | |
United States Treasury Bill (c) | 11/09/17 | | | 1.03 | %(d) | | $ 6,000,000 | | | | 5,977,416 | |
| TOTAL U.S. TREASURY BILL (Cost $5,983,625) | | | | | | | | | | | | 5,977,416 | |
| MONEY MARKET FUND: 25.61% | | Shares | | | | |
STIT-Government & Agency Portfolio, 0.89% (e) | | | 20,577,791 | | | | 20,577,791 | |
| TOTAL MONEY MARKET FUND (Cost $20,577,791) | | | | | | | 20,577,791 | |
| TOTAL SHORT TERM INVESTMENTS (Cost $26,561,416) | | | | | | | 26,555,207 | |
| | | | | | | | | |
| TOTAL INVESTMENTS (Cost $71,989,985): 95.35% | | | | | | | 76,622,854 | |
Other Assets in Excess of Liabilities: 4.65% (f) | | | | | | | 3,738,313 | |
| TOTAL NET ASSETS: 100.00% | | | | | | $ | 80,361,167 | |
ADR American Depository Receipt.
(a) Non-dividend income producing security.
(b) Foreign issued security.
(c) This security or a portion of this security is pledged to cover short positions. See Note 2.
(d) Effective yield as of June 30, 2017.
(e) The rate quoted is the annualized seven-day effective yield as of June 30, 2017.
(f) Includes assets pledged as collateral for securities sold short.
The accompanying notes are an integral part of these financial statements.
| |
| |
48 | LoCorr Dynamic Equity Fund - Schedule of Securities Sold Short |
| |
Schedule of Securities Sold Short
June 30, 2017 (Unaudited)
| | | Shares | | | Value | |
| COMMON STOCKS: (21.23)% | | | | | | |
| Accommodation and Food Services: (0.67)% | | | | | | |
Restaurant Brands International, Inc. (b) | | | (8,559 | ) | | $ | (535,280 | ) |
| | | | | | | | | |
| Construction: (0.52)% | | | | | | | | |
| Lennar Corp. | | | (7,742 | ) | | | (412,803 | ) |
| | | | | | | | | |
| Consumer Discretionary: (1.82)% | | | | | | | | |
adidas AG (b) | | | (3,139 | ) | | | (601,420 | ) |
Bayerische Motoren Werke (b) | | | (4,621 | ) | | | (428,987 | ) |
Daimler (b) | | | (5,955 | ) | | | (431,012 | ) |
| | | | | | | | (1,461,419 | ) |
| Finance and Insurance: (1.25)% | | | | | | | | |
| Allstate Corp./The | | | (2,487 | ) | | | (219,950 | ) |
| Evercore Partners, Inc. | | | (8,204 | ) | | | (578,382 | ) |
| Progressive Corp./The | | | (4,627 | ) | | | (204,004 | ) |
| | | | | | | | (1,002,336 | ) |
| Information: (1.82)% | | | | | | | | |
Bankrate, Inc.(a) | | | (17,917 | ) | | | (230,233 | ) |
Boingo Wireless, Inc. (a) | | | (4,400 | ) | | | (65,824 | ) |
Cornerstone OnDemand, Inc. (a) | | | (13,353 | ) | | | (477,370 | ) |
Qualys, Inc. (a) | | | (7,147 | ) | | | (291,598 | ) |
Vonage Holdings Corp. (a) | | | (61,000 | ) | | | (398,940 | ) |
| | | | | | | | (1,463,965 | ) |
| Management of Companies and Enterprises: (0.25)% | | | | | | | | |
Echostar Corp. (a) | | | (3,343 | ) | | | (202,920 | ) |
| | | | | | | | | |
| Manufacturing: (8.05)% | | | | | | | | |
| Acushnet Holdings Corp. | | | (3,302 | ) | | | (65,512 | ) |
| Allison Transmission Holdings, Inc. | | | (13,163 | ) | | | (493,744 | ) |
Canada Goose Holdings, Inc. (a)(b) | | | (28,434 | ) | | | (561,572 | ) |
| Cummins, Inc. | | | (1,898 | ) | | | (307,894 | ) |
| Dr Pepper Snapple Group, Inc. | | | (6,424 | ) | | | (585,291 | ) |
| MKS Instruments, Inc. | | | (2,829 | ) | | | (190,392 | ) |
NETGEAR, Inc. (a) | | | (13,375 | ) | | | (576,463 | ) |
| Owens Corning | | | (33,229 | ) | | | (2,223,684 | ) |
| PACCAR, Inc. | | | (4,723 | ) | | | (311,907 | ) |
| Snyder’s-Lance, Inc. | | | (10,511 | ) | | | (363,891 | ) |
TreeHouse Foods, Inc. (a) | | | (4,853 | ) | | | (396,442 | ) |
Ultra Clean Holdings, Inc. (a) | | | (10,155 | ) | | | (190,406 | ) |
Universal Electronics, Inc. (a) | | | (2,970 | ) | | | (198,545 | ) |
| | | | | | | | (6,465,743 | ) |
| Mining, Quarrying, and Oil and Gas Extraction: (0.70)% | | | | | | | | |
Schlumberger Ltd. (b) | | | (8,585 | ) | | | (565,236 | ) |
| | | | | | | | | |
| Other Services (except Public Administration): (1.22)% | | | | | | | | |
Regis Corp. (a) | | | (95,486 | ) | | | (980,641 | ) |
| | | | | | | | | |
| Professional, Scientific, and Technical Services: (1.19)% | | | | | | | | |
| FactSet Research Systems, Inc. | | | (3,645 | ) | | | (605,726 | ) |
MoneyGram International, Inc. (a) | | | (11,550 | ) | | | (199,238 | ) |
Okta, Inc. (a) | | | (6,707 | ) | | | (152,920 | ) |
| | | | | | | | (957,884 | ) |
| Software: (0.28)% | | | | | | | | |
Constellation Software, Inc. (b) | | | (433 | ) | | | (226,520 | ) |
| | | | | | | | | |
The accompanying notes are an integral part of these financial statements.
| |
| |
LoCorr Dynamic Equity Fund - Schedule of Securities Sold Short (continued) | 49 |
| |
| | | Shares | | | Value | |
COMMON STOCKS (continued) | | | | | | |
| Real Estate and Rental and Leasing: (0.76)% | | | | | | |
| AMERCO | | | (1,676 | ) | | $ | (613,517 | ) |
| | | | | | | | | |
| Retail Trade: (2.08)% | | | | | | | | |
GrubHub, Inc. (a) | | | (11,516 | ) | | | (502,097 | ) |
| Tiffany & Co. | | | (12,477 | ) | | | (1,171,215 | ) |
| | | | | | | | (1,673,312 | ) |
| Wholesale Trade: (0.62)% | | | | | | | | |
| Patterson Cos., Inc. | | | (10,595 | ) | | | (497,435 | ) |
| TOTAL COMMON STOCKS (Proceeds $17,054,307) | | | | | | | (17,059,011 | ) |
| | | | | | | | | |
| EXCHANGE TRADED FUNDS: (2.52)% | | | | | | | | |
| iShares iBoxx $ High Yield Corporate Bond | | | (4,533 | ) | | | (400,672 | ) |
| iShares Russell 2000 | | | (2,794 | ) | | | (393,730 | ) |
| iShares US Telecommunications | | | (13,718 | ) | | | (442,543 | ) |
| Powershares QQQ Trust Series 1 | | | (2,857 | ) | | | (393,237 | ) |
| SPDR S&P500 Trust | | | (1,635 | ) | | | (395,343 | ) |
| TOTAL EXCHANGE TRADED FUNDS (Proceeds $2,034,826) | | | | | | | (2,025,525 | ) |
| TOTAL SECURITIES SOLD SHORT (Proceeds $19,089,133): (23.75)% | | | | | | $ | (19,084,536 | ) |
(a) Non-dividend expense producing security.
(b) Foreign issued security.
Percentages are stated as a percent of net assets.
The accompanying notes are an integral part of these financial statements.
|
|
50 | LoCorr Spectrum Income Fund - Schedule of Investments |
|
LoCorr Spectrum Income Fund
Composition of Investment Portfolio1
June 30, 2017 (Unaudited)
1 As a percentage of total investments.
Schedule of Investments
June 30, 2017 (Unaudited)
| | | Shares | | | Value | |
| BUSINESS DEVELOPMENT COMPANIES: 6.77% | | | | | | |
| Apollo Investment Corp. | | | 341,831 | | | $ | 2,184,300 | |
| Ares Capital Corp. | | | 194,944 | | | | 3,193,183 | |
| Hercules Capital, Inc. | | | 168,910 | | | | 2,236,368 | |
| TOTAL BUSINESS DEVELOPMENT COMPANIES (Cost $7,526,081) | | | | | | | 7,613,851 | |
| | | | | | | | | |
| CLOSED-END INVESTMENT COMPANIES: 13.60% | | | | | | | | |
| AllianceBernstein Global High Income Fund, Inc. | | | 172,699 | | | | 2,234,725 | |
| AllianzGI Convertible & Income Fund II | | | 384,292 | | | | 2,390,296 | |
| Invesco Dynamic Credit Opportunities Fund | | | 253,555 | | | | 3,045,195 | |
| Nuveen Credit Strategies Income Fund | | | 253,233 | | | | 2,180,336 | |
| PIMCO Dynamic Credit and Mortgage Income Fund | | | 100,056 | | | | 2,233,250 | |
| Western Asset Global High Income Fund, Inc. | | | 319,326 | | | | 3,212,420 | |
| TOTAL CLOSED-END INVESTMENT COMPANIES (Cost $14,523,051) | | | | | | | 15,296,222 | |
| | | | | | | | | |
| COMMON STOCKS: 14.88% | | | | | | | | |
| Finance and Insurance: 1.89% | | | | | | | | |
| Artisan Partners Asset Management, Inc. | | | 69,138 | | | | 2,122,537 | |
| | | | | | | | | |
| Information: 0.89% | | | | | | | | |
| CenturyLink, Inc. | | | 42,063 | | | | 1,004,464 | |
| | | | | | | | | |
| Mining, Quarrying, and Oil and Gas Extraction: 4.12% | | | | | | | | |
| EnLink Midstream LLC | | | 115,924 | | | | 2,040,262 | |
| Pattern Energy Group, Inc. | | | 108,900 | | | | 2,596,176 | |
| | | | | | | | 4,636,438 | |
| Professional, Scientific, and Technical Services: 0.94% | | | | | | | | |
| National CineMedia, Inc. | | | 142,568 | | | | 1,057,855 | |
The accompanying notes are an integral part of these financial statements.
|
|
LoCorr Spectrum Income Fund - Schedule of Investments (continued) | 51 |
|
| | | Shares | | | Value | |
COMMON STOCKS (continued) | | | | | | |
| Transportation and Warehousing: 6.08% | | | | | | |
Euronav NV (a) | | | 93,585 | | | $ | 739,321 | |
GasLog Partners LP (a) | | | 65,166 | | | | 1,476,010 | |
Golar LNG Partners LP (a) | | | 94,466 | | | | 1,895,933 | |
Hoegh LNG Partners LP (a) | | | 52,338 | | | | 1,002,273 | |
| Targa Resources Corp. | | | 37,863 | | | | 1,711,408 | |
| | | | | | | | 6,824,945 | |
| Utilities: 0.96% | | | | | | | | |
| NRG Yield, Inc. | | | 61,644 | | | | 1,084,934 | |
| TOTAL COMMON STOCKS (Cost $17,076,819) | | | | | | | 16,731,173 | |
| | | | | | | | | |
| CONVERTIBLE PREFERRED STOCKS: 4.42% | | | | | | | | |
| Information: 0.33% | | | | | | | | |
| Frontier Communications Corp., 11.125% | | | 12,528 | | | | 368,824 | |
| | | | | | | | | |
| Utilities: 4.09% | | | | | | | | |
| Kinder Morgan, Inc., 9.750% | | | 104,870 | | | | 4,601,696 | |
| TOTAL CONVERTIBLE PREFERRED STOCKS (Cost $5,369,354) | | | | | | | 4,970,520 | |
| | | | | | | | | |
| MASTER LIMITED PARTNERSHIPS: 25.68% | | Units | | | | | |
| Finance and Insurance: 1.68% | | | | | | | | |
| AllianceBernstein Holding LP | | | 79,878 | | | | 1,889,115 | |
| | | | | | | | | |
| Manufacturing: 2.69% | | | | | | | | |
| Alon USA Partners, LP | | | 97,510 | | | | 1,021,905 | |
| MPLX LP | | | 60,093 | | | | 2,007,106 | |
| | | | | | | | 3,029,011 | |
| Mining, Quarrying, and Oil and Gas Extraction: 3.79% | | | | | | | | |
| Enterprise Products Partners LP | | | 79,638 | | | | 2,156,597 | |
| SunCoke Energy Partners LP | | | 120,281 | | | | 2,110,931 | |
| | | | | | | | 4,267,528 | |
| Other Services (except Public Administration): 2.52% | | | | | | | | |
| StoneMor Partners LP | | | 300,096 | | | | 2,835,907 | |
| | | | | | | | | |
| Real Estate and Rental and Leasing: 3.87% | | | | | | | | |
| Fortress Transportation & Infrastructure Investors LLC | | | 150,529 | | | | 2,399,432 | |
| Icahn Enterprises LP | | | 37,712 | | | | 1,948,202 | |
| | | | | | | | 4,347,634 | |
| Retail Trade: 5.52% | | | | | | | | |
| Crestwood Equity Partners LP | | | 135,991 | | | | 3,195,788 | |
| Global Partners LP | | | 165,991 | | | | 2,996,138 | |
| | | | | | | | 6,191,926 | |
| Transportation and Warehousing: 4.74% | | | | | | | | |
| Energy Transfer Partners LP | | | 159,184 | | | | 3,245,762 | |
| Summit Midstream Partners LP | | | 92,251 | | | | 2,089,485 | |
| | | | | | | | 5,335,247 | |
| Wholesale Trade: 0.87% | | | | | | | | |
| Martin Midstream Partners LP | | | 55,565 | | | | 975,166 | |
| TOTAL MASTER LIMITED PARTNERSHIPS (Cost $28,566,831) | | | | | | | 28,871,534 | |
| | | | | | | | | |
| PREFERRED STOCK: 1.83% | | Shares | | | | | |
| Real Estate and Rental and Leasing: 1.83% | | | | | | | | |
| Digital Realty Trust, Inc. - REIT, 7.375% | | | 74,980 | | | | 2,056,701 | |
| TOTAL PREFERRED STOCK (Cost $1,999,559) | | | | | | | 2,056,701 | |
The accompanying notes are an integral part of these financial statements.
|
|
52 | LoCorr Spectrum Income Fund - Schedule of Investments (continued) |
|
| | | Units | | | Value | |
| PUBLICLY TRADED PARTNERSHIPS: 8.67% | | | | | | |
| Apollo Global Management LLC | | | 40,569 | | | $ | 1,073,050 | |
| Ares Management LP | | | 91,975 | | | | 1,655,550 | |
| Blackstone Group LP/The | | | 99,316 | | | | 3,312,189 | |
| Carlyle Group LP/The | | | 125,691 | | | | 2,482,397 | |
| Oaktree Capital Group LLC | | | 26,383 | | | | 1,229,448 | |
| TOTAL PUBLICLY TRADED PARTNERSHIPS (Cost $8,082,692) | | | | | | | 9,752,634 | |
| | | Shares | | | | | |
| REAL ESTATE INVESTMENT TRUSTS: 16.83% | | | | | | | | |
| Administrative and Support and Waste Management and Remediation Services: 1.77% | | | | | | | | |
| Ladder Capital Corp. | | | 148,379 | | | | 1,989,762 | |
| | | | | | | | | |
| Finance and Insurance: 6.80% | | | | | | | | |
| AGNC Investment Corp. | | | 49,387 | | | | 1,051,449 | |
| Apollo Commercial Real Estate Finance, Inc. | | | 117,327 | | | | 2,176,416 | |
| Hannon Armstrong Sustainable Infrastructure Capital, Inc. | | | 56,682 | | | | 1,296,317 | |
| Starwood Property Trust, Inc. | | | 139,384 | | | | 3,120,808 | |
| | | | | | | | 7,644,990 | |
| Real Estate and Rental and Leasing: 7.34% | | | | | | | | |
| Annaly Capital Management, Inc. | | | 86,760 | | | | 1,045,458 | |
| Hospitality Properties Trust | | | 100,141 | | | | 2,919,110 | |
| LaSalle Hotel Properties | | | 34,313 | | | | 1,022,528 | |
| Two Harbors Investment Corp. | | | 116,276 | | | | 1,152,295 | |
| Uniti Group, Inc. | | | 84,376 | | | | 2,121,213 | |
| | | | | | | | 8,260,604 | |
| Transportation and Warehousing: 0.92% | | | | | | | | |
| Iron Mountain, Inc. | | | 30,077 | | | | 1,033,446 | |
| TOTAL REAL ESTATE INVESTMENT TRUSTS (Cost $18,394,971) | | | | | | | 18,928,802 | |
| | | | | | | | | |
| SHORT TERM INVESTMENT: 8.64% | | | | | | | | |
| MONEY MARKET FUND: 8.64% | | | | | | | | |
STIT-Government & Agency Portfolio, Institutional Class, 0.89% (b) | | | 9,719,966 | | | | 9,719,966 | |
| TOTAL MONEY MARKET FUND (Cost $9,719,966) | | | | | | | 9,719,966 | |
| TOTAL SHORT TERM INVESTMENT (Cost $9,719,966) | | | | | | | 9,719,966 | |
| | | | | | | | | |
| TOTAL INVESTMENTS (Cost $111,259,324): 101.32% | | | | | | | 113,941,403 | |
| Liabilities in Excess of Other Assets: (1.32)% | | | | | | | (1,485,546 | ) |
| TOTAL NET ASSETS: 100.00% | | | | | | $ | 112,455,857 | |
| (a) | Foreign issued security. |
| (b) | The rate quoted is the annualized seven-day effective yield as of June 30, 2017. |
With the exception of short-term investments, all securities held are dividend income producing.
The accompanying notes are an integral part of these financial statements.
| | |
| | |
LoCorr Macro Strategies Fund, LoCorr Long/Short Commodities Strategy Fund, LoCorr Multi-Strategy Fund and
LoCorr Market Trend Fund - Consolidated Statements of Assets & Liabilities | | 53 |
| | |
Consolidated Statements of Assets & Liabilities
June 30, 2017 (Unaudited)
| | | | | | LoCorr | | | | | | | |
| | | | | | Long/Short | | | LoCorr | | | LoCorr | |
| | | LoCorr Macro | | | Commodities | | | Multi-Strategy | | | Market Trend | |
| | | Strategies Fund | | | Strategy Fund | | | Fund | | | Fund | |
| Assets | | | | | | | | | | | | |
| Investments, at value (Cost $862,358,573, $87,138,384, $31,203,814 | | | | | | | | | | | | |
| and $661,271,560, respectively) | | $ | 861,770,199 | | | $ | 87,040,551 | | | $ | 33,025,647 | | | $ | 659,581,002 | |
| Cash (Note 2) | | | 17,330,000 | | | | — | | | | — | | | | 29,130,000 | |
| Receivable for Fund shares sold | | | 4,472,170 | | | | 412,652 | | | | 138,059 | | | | 3,047,657 | |
| Receivable for securities sold | | | 26,920,432 | | | | 471,628 | | | | — | | | | 8,535,819 | |
| Dividends and interest receivable | | | 4,172,557 | | | | 423,582 | | | | 100,952 | | | | 1,822,147 | |
| Receivable for unsettled open futures contracts | | | 1,781,521 | | | | — | | | | — | | | | 2,066,544 | |
| Deposits with broker for derivative instruments (Note 2) | | | 99,606,247 | | | | 23,609,819 | | | | 11,413,357 | | | | 96,511,940 | |
| Deposits with broker for securities sold short (Note 2) | | | — | | | | — | | | | 1,798,711 | | | | — | |
| Unrealized appreciation on forward currency contracts (Note 2) | | | 12,609,160 | | | | — | | | | — | | | | 15,961,070 | |
| Advance receipt on swap contracts | | | — | | | | 12,036,526 | | | | — | | | | — | |
| Prepaid expenses and other assets | | | 190,496 | | | | 43,677 | | | | 28,154 | | | | 94,290 | |
| Total Assets | | | 1,028,852,782 | | | | 124,038,435 | | | | 46,504,880 | | | | 816,750,469 | |
| | | | | | | | | | | | | | | | | |
| Liabilities | | | | | | | | | | | | | | | | |
| Securities sold short, at value (Proceeds, $0, $0, $1,194,647 and $0, respectively) | | $ | — | | | $ | — | | | $ | 1,220,181 | | | $ | — | |
| Payable for Fund shares redeemed | | | 4,966,084 | | | | 255,585 | | | | 10,543 | | | | 3,653,463 | |
| Payable for securities purchased | | | 8,632 | | | | — | | | | 343,565 | | | | — | |
| Payable for unsettled open futures contracts | | | 2,731,591 | | | | — | | | | — | | | | 3,791,504 | |
| Payable for variation margin on futures contracts | | | 16,674,446 | | | | — | | | | — | | | | 16,739,299 | |
| Accrued management fees (Note 5) | | | 1,465,961 | | | | 115,594 | | | | 42,625 | | | | 1,022,320 | |
| Accrued Trustees' fees | | | 15,382 | | | | 2,567 | | | | 738 | | | | 26,722 | |
| Accrued Rule 12b-1 fees | | | — | | | | 89,347 | | | | 19,104 | | | | 181,719 | |
| Unrealized depreciation on swap contracts (Note 1) | | | — | | | | 21,655,240 | | | | 4,272,107 | | | | — | |
| Unrealized depreciation on forward currency contracts (Note 2) | | | 14,595,922 | | | | — | | | | — | | | | 15,866,476 | |
| Advance payment on swap contracts | | | — | | | | — | | | | 1,085,749 | | | | — | |
| Accrued expenses and other liabilities | | | 306,787 | | | | 103,800 | | | | 61,405 | | | | 762,483 | |
| Total Liabilities | | | 40,764,805 | | | | 22,222,133 | | | | 7,056,017 | | | | 42,043,986 | |
| | | | | | | | | | | | | | | | | |
| Net Assets | | $ | 988,087,977 | | | $ | 101,816,302 | | | $ | 39,448,863 | | | $ | 774,706,483 | |
| | | | | | | | | | | | | | | | | |
| Net Assets Consist of: | | | | | | | | | | | | | | | | |
| Paid-in capital | | $ | 1,001,402,295 | | | $ | 124,658,983 | | | $ | 43,245,119 | | | $ | 836,687,178 | |
| Accumulated net investment loss | | | (3,883,819 | ) | | | (187,882 | ) | | | (676,681 | ) | | | (4,910,225 | ) |
| Accumulated net realized gain (loss) | | | 25,618,716 | | | | (901,726 | ) | | | (643,767 | ) | | | (24,495,694 | ) |
| Net unrealized appreciation (depreciation) of: | | | | | | | | | | | | | | | | |
| Investments | | | (588,374 | ) | | | (97,833 | ) | | | 1,821,833 | | | | (1,690,558 | ) |
| Securities sold short | | | — | | | | — | | | | (25,534 | ) | | | — | |
| Swap contracts | | | — | | | | (21,655,240 | ) | | | (4,272,107 | ) | | | — | |
| Forward currency contracts | | | (1,986,762 | ) | | | — | | | | — | | | | 94,594 | |
| Futures contracts | | | (32,298,764 | ) | | | — | | | | — | | | | (30,978,812 | ) |
| Foreign currency translation | | | (175,315 | ) | | | — | | | | — | | | | — | |
| NET ASSETS | | $ | 988,087,977 | | | $ | 101,816,302 | | | $ | 39,448,863 | | | $ | 774,706,483 | |
| | | | | | | | | | | | | | | | | |
| Class A Shares | | | | | | | | | | | | | | | | |
| Net assets | | $ | 103,042,831 | | | $ | 27,929,540 | | | $ | 18,447,294 | | | $ | 76,633,134 | |
| Shares issued and outstanding (unlimited shares authorized, no par value) | | | 11,874,973 | | | | 3,140,338 | | | | 2,346,995 | | | | 7,436,422 | |
Net asset value, redemption, and minimum offering price per share (a) | | | $8.68 | | | | $8.89 | | | | $7.86 | | | | $10.31 | |
| Maximum offering price per share | | | | | | | | | | | | | | | | |
($8.68/0.9425), ($8.89/0.9425), ($7.86/0.9425), ($10.31/0.9425) (b) | | | $9.21 | | | | $9.43 | | | | $8.34 | | | | $10.94 | |
| | | | | | | | | | | | | | | | | |
| Class C Shares | | | | | | | | | | | | | | | | |
| Net assets | | $ | 103,667,788 | | | $ | 5,745,780 | | | $ | 3,045,266 | | | $ | 56,598,552 | |
| Shares issued and outstanding (unlimited shares authorized, no par value) | | | 12,397,645 | | | | 664,218 | | | | 386,702 | | | | 5,573,156 | |
Net asset value, redemption, and offering price per share (a) | | | $8.36 | | | | $8.65 | | | | $7.87 | | | | $10.16 | |
| | | | | | | | | | | | | | | | | |
| Class I Shares | | | | | | | | | | | | | | | | |
| Net assets | | $ | 781,377,358 | | | $ | 68,140,982 | | | $ | 17,956,303 | | | $ | 641,474,797 | |
| Shares issued and outstanding (unlimited shares authorized, no par value) | | | 88,877,233 | | | | 7,596,710 | | | | 2,288,385 | | | | 61,992,092 | |
| Net asset value, redemption, and offering price per share | | | $8.79 | | | | $8.97 | | | | $7.85 | | | | $10.35 | |
| (a) | A 1.00% contingent deferred sales charge may apply to redemptions made within twelve months of purchase. The contingent deferred sales charge only applies to Class A share purchases of $1 million or more. |
| (b) | On investments of $25,000 or more, the offering price is reduced. |
The accompanying notes are an integral part of these consolidated financial statements.
| |
| |
54 | LoCorr Dynamic Equity Fund and LoCorr Spectrum Income Fund - Statements of Assets & Liabilities |
| |
Statements of Assets & Liabilities
June 30, 2017 (Unaudited)
| | | LoCorr | | | LoCorr | |
| | | Dynamic Equity | | | Spectrum | |
| | | Fund | | | Income Fund | |
| | | | | | | |
| Assets | | | | | | |
| Investments, at value (Cost $71,989,985 and $111,259,324, respectively) | | $ | 76,622,854 | | | $ | 113,941,403 | |
| Cash (Note 2) | | | 2,100,000 | | | | — | |
| Receivable for Fund shares sold | | | 162,376 | | | | 467,974 | |
| Receivable for securities sold | | | 8,044,917 | | | | — | |
| Dividend and interest receivable | | | 22,379 | | | | 500,755 | |
| Deposits with broker for securities sold short (Note 2) | | | 22,146,996 | | | | — | |
| Prepaid expenses and other assets | | | 49,788 | | | | 30,297 | |
| Total Assets | | | 109,149,310 | | | | 114,940,429 | |
| | | | | | | | | |
| Liabilities | | | | | | | | |
| Securities sold short, at value (proceeds $19,089,133 and $0, respectively) | | $ | 19,084,536 | | | $ | — | |
| Payable for Fund shares redeemed | | | 387,546 | | | | 240,843 | |
| Payable for securities purchased | | | 9,058,756 | | | | 1,719,725 | |
| Accrued management fees (Note 5) | | | 162,604 | | | | 118,694 | |
| Accrued Trustees' fees | | | 1,758 | | | | 1,835 | |
| Accrued Rule 12b-1 fees | | | 26,645 | | | | 83,512 | |
| Accrued expenses and other liabilities | | | 66,298 | | | | 319,963 | |
| Total Liabilities | | | 28,788,143 | | | | 2,484,572 | |
| | | | | | | | | |
| Net Assets | | $ | 80,361,167 | | | $ | 112,455,857 | |
| | | | | | | | | |
| Net Assets Consist of: | | | | | | | | |
| Paid-in capital | | $ | 72,533,611 | | | $ | 138,915,344 | |
| Accumulated net investment loss | | | (1,104,390 | ) | | | (3,973,726 | ) |
| Accumulated undistributed net realized gain (loss) | | | 4,295,854 | | | | (25,167,840 | ) |
| Net unrealized appreciation (depreciation) of: | | | | | | | | |
| Investments | | | 4,632,869 | | | | 2,682,079 | |
| Securities sold short | | | 4,597 | | | | — | |
| Foreign currency translation | | | (1,374 | ) | | | — | |
| NET ASSETS | | $ | 80,361,167 | | | $ | 112,455,857 | |
| | | | | | | | | |
| Class A Shares | | | | | | | | |
| Net assets | | $ | 18,056,840 | | | $ | 34,849,286 | |
| Shares issued and outstanding (unlimited shares authorized, no par value) | | | 1,506,828 | | | | 4,576,014 | |
Net asset value, redemption, and minimum offering price per share (a) | | | $11.98 | | | | $7.62 | (b) |
Maximum offering price per share ($11.98/0.9425), ($7.62/0.9425) (c) | | | $12.71 | | | | $8.08 | |
| | | | | | | | | |
| Class C Shares | | | | | | | | |
| Net assets | | $ | 11,751,137 | | | $ | 25,662,351 | |
| Shares issued and outstanding (unlimited shares authorized, no par value) | | | 1,012,209 | | | | 3,357,881 | |
Net asset value, redemption, and offering price per share (a) | | | $11.61 | | | | $7.64 | (b) |
| | | | | | | | | |
| Class I Shares | | | | | | | | |
| Net assets | | $ | 50,553,190 | | | $ | 51,944,220 | |
| Shares issued and outstanding (unlimited shares authorized, no par value) | | | 4,174,718 | | | | 6,825,405 | |
| Net asset value, redemption, and offering price per share | | | $12.11 | | | | $7.61 | (b) |
| (a) | A 1.00% contingent deferred sales charge may apply to redemptions made within twelve months of purchase. The contingent deferred sales charge only applies to Class A share purchases of $1 million or more. |
| (b) | Redemptions made within 60 days of purchase may be assessed a redemption fee of 2.00%. |
| (c) | On investments of $25,000 or more, the offering price is reduced. |
The accompanying notes are an integral part of these financial statements.
| | |
| | |
LoCorr Macro Strategies Fund, LoCorr Long/Short Commodities Strategy Fund, LoCorr Multi-Strategy Fund and LoCorr Market Trend Fund - Consolidated Statements of Operations | | 55 |
| |
Consolidated Statements of Operations
Six Months Ended June 30, 2017 (Unaudited)
| | | LoCorr Macro Strategies Fund | | LoCorr
Long/Short
Commodities
Strategy Fund | | LoCorr
Multi-Strategy
Fund | | LoCorr
Market Trend
Fund | |
| | | | | | | | | | | | | | |
| Investment Income | | | | | | | | | | | | | |
Dividend and interest income (a) | | $ | 6,832,415 | | $ | 959,250 | | $ | 594,404 | | $ | 4,273,878 | |
| Distributions received from master limited partnership (“MLP”) interests | | | — | | | — | | | 409,371 | | | — | |
| Less: return of capital on distributions from MLP interests (Note 2) | | | — | | | — | | | (409,371) | | | — | |
| Total Investment Income | | | 6,832,415 | | | 959,250 | | | 594,404 | | | 4,273,878 | |
| | | | | | | | | | | | | | |
| Expenses | | | | | | | | | | | | | |
| Management fees (Note 5) | | | 8,759,693 | | | 841,516 | | | 340,084 | | | 6,736,744 | |
| Fund administration fees | | | 144,044 | | | 34,045 | | | 21,949 | | | 183,975 | |
| Fund accounting fees | | | 178,994 | | | 52,986 | | | 21,937 | | | 189,192 | |
| Trustees’ fees | | | 32,258 | | | 4,717 | | | 1,483 | | | 45,169 | |
| Transfer agent fees and expenses | | | 734,795 | | | 135,405 | | | 42,819 | | | 889,474 | |
| Custodian fees | | | 32,956 | | | 5,853 | | | 3,361 | | | 25,421 | |
| Registration expenses | | | 77,139 | | | 41,162 | | | 22,066 | | | 62,316 | |
| Rule 12b-1 fees - Class A (Note 5) | | | 220,730 | | | 38,748 | | | 23,084 | | | 132,349 | |
| Rule 12b-1 fees - Class C (Note 5) | | | 552,305 | | | 30,958 | | | 17,053 | | | 362,096 | |
| Legal and audit fees | | | 27,998 | | | 16,309 | | | 18,044 | | | 33,283 | |
| Printing and mailing expenses | | | 49,976 | | | 11,128 | | | 7,087 | | | 83,517 | |
| Other expenses | | | 5,626 | | | 2,267 | | | 1,694 | | | 10,170 | |
| Total expenses before dividend expense | | | 10,816,514 | | | 1,215,094 | | | 520,661 | | | 8,753,706 | |
| Dividend expense on securities sold short (Note 2) | | | — | | | — | | | 3,391 | | | — | |
| Total expenses before reimbursement | | | 10,816,514 | | | 1,215,094 | | | 524,052 | | | 8,753,706 | |
| Reimbursement from Adviser (Note 5) | | | (100,280 | ) | | (51,417 | ) | | (84,082 | ) | | — | |
| Net Expenses | | | 10,716,234 | | | 1,163,677 | | | 439,970 | | | 8,753,706 | |
| Net Investment Income (Loss) | | | (3,883,819 | ) | | (204,427 | ) | | 154,434 | | | (4,479,828 | ) |
| |
| Realized and Unrealized Gain (Loss) on Investments, Securities Sold Short, Swap Contracts, Forward Currency Contracts, Futures Contracts and Foreign Currency Translation: | | | | | | | |
| Net realized gain (loss) on: | | | | | | | | | | | | | |
| Investments | | | (1,661,194 | ) | | (199,027 | ) | | 497,308 | | | (1,060,432 | ) |
| Securities sold short | | | — | | | — | | | — | | | — | |
| Swap contracts | | | — | | | (390,927 | ) | | (520,886 | ) | | — | |
| Forward currency contracts | | | (18,996,692 | ) | | — | | | — | | | (39,137,223 | ) |
| Futures contracts | | | 36,039,367 | | | — | | | — | | | 60,313,278 | |
| Foreign currency translation | | | 167,351 | | | — | | | — | | | (78,265 | ) |
| Net change in unrealized appreciation (depreciation) on: | | | | | | | | | | | | | |
| Investments | | | 4,178,579 | | | 402,427 | | | (281,994 | ) | | 1,112,484 | |
| Securities sold short | | | — | | | — | | | (34,319 | ) | | — | |
| Swap contracts | | | — | | | (2,664,290 | ) | | (567,752 | ) | | — | |
| Forward currency contracts | | | (4,843,392 | ) | | — | | | — | | | (3,755,285 | ) |
| Futures contracts | | | (37,703,694 | ) | | — | | | — | | | (40,506,568 | ) |
| Foreign currency translation | | | (158,925 | ) | | — | | | — | | | — | |
| Net realized and unrealized loss | | | (22,978,600 | ) | | (2,851,817 | ) | | (907,643 | ) | | (23,112,011 | ) |
| Net Decrease in Net Assets From Operations | | $ | (26,862,419 | ) | $ | (3,056,244 | ) | $ | (753,209 | ) | $ | (27,591,839 | ) |
(a) Net of foreign tax withheld of $0 ,$0, $646 and $0, respectively.
The accompanying notes are an integral part of these consolidated financial statements.
| |
| |
56 | LoCorr Dynamic Equity Fund and LoCorr Spectrum Income Fund - Statements of Operations |
| |
Statements of Operations
Six Months Ended June 30, 2017 (Unaudited)
| | | LoCorr Dynamic
Equity Fund | | LoCorr
Spectrum
Income Fund | |
| | | | | | | | |
| Investment Income | | | | | | | |
Dividend and interest income (a) | | $ | 324,761 | | $ | 2,770,807 | |
| Distributions received from master limited partnership (“MLP”) interests | | | — | | | 1,963,661 | |
| Less: return of capital on distributions from MLP interests (Note 2) | | | — | | | (1,963,661 | ) |
| Total Investment Income | | | 324,761 | | | 2,770,807 | |
| | | | | | | | |
| Expenses | | | | | | | |
| Management fees (Note 5) | | | 1,049,737 | | | 716,339 | |
| Fund administration fees | | | 25,308 | | | 29,861 | |
| Fund accounting fees | | | 25,364 | | | 31,562 | |
| Trustees’ fees | | | 3,185 | | | 3,813 | |
| Transfer agent fees and expenses | | | 81,428 | | | 88,326 | |
| Custodian fees | | | 16,138 | | | 4,963 | |
| Registration expenses | | | 25,183 | | | 26,684 | |
| Rule 12b-1 fees - Class A (Note 5) | | | 28,867 | | | 42,687 | |
| Rule 12b-1 fees - Class C (Note 5) | | | 59,003 | | | 129,204 | |
| Legal and audit fees | | | 9,430 | | | 16,623 | |
| Printing and mailing expenses | | | 3,118 | | | 21,741 | |
| Other expenses | | | 1,779 | | | 2,925 | |
| Total expense before dividend and interest expense | | | 1,328,540 | | | 1,114,728 | |
| Dividend expense on securities sold short (Note 2) | | | 95,140 | | | — | |
| Interest expense | | | 3,595 | | | — | |
| Total expenses before recovery | | | 1,427,275 | | | 1,114,728 | |
| Recovery to Adviser (Note 5) | | | 1,876 | | | 39,116 | |
| Net Expenses | | | 1,429,151 | | | 1,153,844 | |
| Net Investment Income (Loss) | | | (1,104,390 | ) | | 1,616,963 | |
| | | | | | | | |
| Realized and Unrealized Gain (Loss) on Investments, Securities Sold Short and Foreign Currency Translation: | | | | | | | |
| Net realized gain (loss) on: | | | | | | | |
| Investments | | | 4,349,485 | | | (2,189,089 | ) |
| Securities sold short | | | (769,609 | ) | | — | |
| Foreign currency translation | | | 12 | | | — | |
| Net change in unrealized appreciation (depreciation) on: | | | | | | | |
| Investments | | | (2,619,292 | ) | | 3,347,222 | |
| Securities sold short | | | (465,418 | ) | | — | |
| Foreign currency translation | | | (1,374 | ) | | — | |
| Net realized and unrealized gain | | | 493,804 | | | 1,158,133 | |
| Net Increase (Decrease) in Net Assets From Operations | | $ | (610,586 | ) | $ | 2,775,096 | |
(a) Net of foreign tax withheld of $170 and $3,088, respectively.
The accompanying notes are an integral part of these financial statements.
|
| |
LoCorr Macro Strategies Fund - Consolidated Statements of Changes in Net Assets | 57 |
| |
LoCorr Macro Strategies Fund
Consolidated Statements of Changes in Net Assets
| | | Six Months Ended
June 30, 2017
(Unaudited) | | Year Ended
December 31, 2016 | |
| | | | | | | | |
| Operations | | | | | | | |
| Net investment loss | | $ | (3,883,819 | ) | $ | (6,632,771 | ) |
| Net realized gain on investments, swap contracts, forward currency contracts, futures contracts and foreign currency translation | | | 15,548,832 | | | 16,256,745 | |
| Net change in unrealized appreciation (depreciation) of investments, swap contracts, forward currency contracts, futures contracts and foreign currency translation | | | (38,527,432 | ) | | 19,033,766 | |
| Increase (Decrease) in Net Assets From Operations | | | (26,862,419 | ) | | 28,657,740 | |
| | | | | | | | |
| Distributions to Shareholders From | | | | | | | |
| Net investment income: | | | | | | | |
| Class I | | | — | | | (24,016 | ) |
| Net realized gain: | | | | | | | |
| Class A | | | — | | | (5,711,451 | ) |
| Class C | | | — | | | (2,291,477 | ) |
| Class I | | | — | | | (8,002,729 | ) |
| Total Distributions to Shareholders | | | — | | | (16,029,673 | ) |
| | | | | | | | |
| Capital Transactions (Note 6) | | | | | | | |
| Proceeds from shares sold | | | 554,755,047 | | | 538,774,369 | |
| Reinvestment of distributions | | | — | | | 14,146,054 | |
| Cost of shares redeemed | | | (422,476,650 | ) | | (203,375,297 | ) |
| Redemption fees | | | 11,727 | | | 22,168 | |
| Increase in Net Assets From Capital Transactions | | | 132,290,124 | | | 349,567,294 | |
| | | | | | | | |
| Total Increase in Net Assets | | | 105,427,705 | | | 362,195,361 | |
| | | | | | | | |
| Net Assets | | | | | | | |
| Beginning of period | | | 882,660,272 | | | 520,464,911 | |
| End of period (including accumulated net investment loss of $3,883,819 and $0, respectively) | | $ | 988,087,977 | | $ | 882,660,272 | |
The accompanying notes are an integral part of these consolidated financial statements.
| |
| |
| 58 | LoCorr Long/Short Commodities Strategy Fund - Consolidated Statements of Changes in Net Assets |
| |
LoCorr Long/Short Commodities Strategy Fund
Consolidated Statements of Changes in Net Assets
| | | Six Months Ended
June 30, 2017
(Unaudited) | | Year Ended
December 31, 2016 | |
| | | | | | | | |
| Operations | | | | | | | |
| Net investment loss | | $ | (204,427 | ) | $ | (1,147,060 | ) |
| Net realized gain (loss) on investments and swap contracts | | | (589,954 | ) | | 8,624,839 | |
| Net change in unrealized depreciation of investments and swap contracts | | | (2,261,863 | ) | | (16,234,076 | ) |
| Decrease in Net Assets From Operations | | | (3,056,244 | ) | | (8,756,297 | ) |
| | | | | | | | |
| Distributions to Shareholders From | | | | | | | |
| Net investment income: | | | | | | | |
| Class A | | | — | | | (1,090,668 | ) |
| Class C | | | — | | | (185,406 | ) |
| Class I | | | — | | | (2,898,594 | ) |
| Total Distributions to Shareholders | | | — | | | (4,174,668 | ) |
| | | | | | | | |
| Capital Transactions (Note 6) | | | | | | | |
| Proceeds from shares sold | | | 24,157,017 | | | 184,501,674 | |
| Reinvestment of distributions | | | — | | | 3,318,366 | |
| Cost of shares redeemed | | | (42,731,974 | ) | | (111,389,429 | ) |
| Redemption fees | | | 108 | | | 26,941 | |
| Increase (Decrease) in Net Assets From Capital Transactions | | | (18,574,849 | ) | | 76,457,552 | |
| | | | | | | | |
| Total Increase (Decrease) in Net Assets | | | (21,631,093 | ) | | 63,526,587 | |
| | | | | | | | |
| Net Assets | | | | | | | |
| Beginning of period | | | 123,447,395 | | | 59,920,808 | |
| End of period (including accumulated net investment income (loss) of $(187,882) and $16,545, respectively) | | $ | 101,816,302 | | $ | 123,447,395 | |
The accompanying notes are an integral part of these consolidated financial statements.
| |
| |
LoCorr Multi-Strategy Fund - Consolidated Statements of Changes in Net Asset | 59 |
| |
LoCorr Multi-Strategy Fund
Consolidated Statements of Changes in Net Assets
| | | Six Months Ended | | | | |
| | | June 30, 2017 | | | Year Ended | |
| | | (Unaudited) | | | December 31, 2016 | |
| | | | | | | |
| Operations | | | | | | |
| Net investment income | | $ | 154,434 | | | $ | 324,370 | |
| Net realized loss on investments, securities sold short and swap contracts | | | (23,578 | ) | | | (139,905 | ) |
Net change in unrealized appreciation (depreciation) of investments, securities sold short
and swap contracts | | | (884,065 | ) | | | 363,071 | |
| Increase (Decrease) in Net Assets From Operations | | | (753,209 | ) | | | 547,536 | |
| | | | | | | | | |
| Distributions to Shareholders From | | | | | | | | |
| Net investment income: | | | | | | | | |
| Class A | | | (319,957 | ) | | | (154,251 | ) |
| Class C | | | (41,850 | ) | | | (33,115 | ) |
| Class I | | | (319,368 | ) | | | (199,550 | ) |
| Return of capital: | | | | | | | | |
| Class A | | | — | | | | (341,141 | ) |
| Class C | | | — | | | | (73,235 | ) |
| Class I | | | — | | | | (441,323 | ) |
| Total Distributions to Shareholders | | | (681,175 | ) | | | (1,242,615 | ) |
| | | | | | | | | |
| Capital Transactions (Note 6) | | | | | | | | |
| Proceeds from shares sold | | | 7,304,203 | | | | 21,301,189 | |
| Reinvestment of distributions | | | 586,829 | | | | 1,018,144 | |
| Cost of shares redeemed | | | (6,341,017 | ) | | | (16,445,492 | ) |
| Redemption fees | | | 2 | | | | 238 | |
| Increase in Net Assets From Capital Transactions | | | 1,550,017 | | | | 5,874,079 | |
| | | | | | | | | |
| Total Increase in Net Assets | | | 115,633 | | | | 5,179,000 | |
| | | | | | | | | |
| Net Assets | | | | | | | | |
| Beginning of period | | | 39,333,230 | | | | 34,154,230 | |
| End of period (including accumulated net investment loss of $676,681 and $149,940, respectively) | | $ | 39,448,863 | | | $ | 39,333,230 | |
The accompanying notes are an integral part of these consolidated financial statements.
| |
| |
60 | LoCorr Market Trend Fund - Consolidated Statements of Changes in Net Assets |
| |
LoCorr Market Trend Fund
Consolidated Statements of Changes in Net Assets
| | | Six Months Ended | | | | |
| | | June 30, 2017 | | | Year Ended | |
| | | (Unaudited) | | | December 31, 2016 | |
| | | | | | | |
| Operations | | | | | | |
| Net investment loss | | $ | (4,479,828 | ) | | $ | (14,352,202 | ) |
Net realized gain (loss) on investments, forward currency contracts, futures contracts and foreign currency translation | | | 20,037,358 | | | | (147,332,298 | ) |
Net change in unrealized appreciation (depreciation) of investments, forward currency contracts, futures contracts and foreign currency translation | | | (43,149,369 | ) | | | 7,238,768 | |
| Decrease in Net Assets From Operations | | | (27,591,839 | ) | | | (154,445,732 | ) |
| | | | | | | | | |
| Distributions to Shareholders From | | | | | | | | |
| Net investment income: | | | | | | | | |
| Class A | | | — | | | | (2,324,469 | ) |
| Class C | | | — | | | | (1,348,021 | ) |
| Class I | | | — | | | | (16,192,350 | ) |
| Total Distributions to Shareholders | | | — | | | | (19,864,840 | ) |
| | | | | | | | | |
| Capital Transactions (Note 6) | | | | | | | | |
| Proceeds from shares sold | | | 192,518,899 | | | | 1,129,819,283 | |
| Reinvestment of distributions | | | — | | | | 18,880,713 | |
| Cost of shares redeemed | | | (410,671,389 | ) | | | (854,994,134 | ) |
| Redemption fees | | | 5,881 | | | | 31,875 | |
| Increase (Decrease) in Net Assets From Capital Transactions | | | (218,146,609 | ) | | | 293,737,737 | |
| | | | | | | | | |
| Total Increase (Decrease) in Net Assets | | | (245,738,448 | ) | | | 119,427,165 | |
| | | | | | | | | |
| Net Assets | | | | | | | | |
| Beginning of period | | | 1,020,444,931 | | | | 901,017,766 | |
| End of period (including accumulated net investment loss of $4,910,225 and $430,397, respectively) | | $ | 774,706,483 | | | $ | 1,020,444,931 | |
The accompanying notes are an integral part of these consolidated financial statements.
| |
| |
LoCorr Dynamic Equity Fund - Statements of Changes in Net Assets | 61 |
| |
LoCorr Dynamic Equity Fund
Statements of Changes in Net Assets
| | | Six Months Ended | | | | |
| | | June 30, 2017 | | | Year Ended | |
| | | (Unaudited) | | | December 31, 2016 | |
| | | | | | | |
| Operations | | | | | | |
| Net investment loss | | $ | (1,104,390 | ) | | $ | (1,250,712 | ) |
| Net realized gain on investments, securities sold short and foreign currency translation | | | 3,579,888 | | | | 4,557,685 | |
Net change in unrealized appreciation (depreciation) of investments, securities sold short and foreign currency translation | | | (3,086,084 | ) | | | 6,734,680 | |
| Increase (Decrease) in Net Assets From Operations | | | (610,586 | ) | | | 10,041,653 | |
| | | | | | | | | |
| Capital Transactions (Note 6) | | | | | | | | |
| Proceeds from shares sold | | | 39,451,640 | | | | 59,597,625 | |
| Cost of shares redeemed | | | (42,758,927 | ) | | | (15,637,868 | ) |
| Redemption fees | | | 2,283 | | | | 2,152 | |
| Increase (Decrease) in Net Assets From Capital Transactions | | | (3,305,004 | ) | | | 43,961,909 | |
| | | | | | | | | |
| Total Increase (Decrease) in Net Assets | | | (3,915,590 | ) | | | 54,003,562 | |
| | | | | | | | | |
| Net Assets | | | | | | | | |
| Beginning of period | | | 84,276,757 | | | | 30,273,195 | |
| End of period (including accumulated net investment loss of $1,104,390 and $0, respectively) | | $ | 80,361,167 | | | $ | 84,276,757 | |
The accompanying notes are an integral part of these financial statements.
| |
| |
62 | LoCorr Spectrum Income Fund - Statements of Changes in Net Assets |
| |
LoCorr Spectrum Income Fund
Statements of Changes in Net Assets
| | | Six Months Ended | | | | |
| | | June 30, 2017 | | | Year Ended | |
| | | (Unaudited) | | | December 31, 2016 | |
| | | | | | | |
| Operations | | | | | | |
| Net investment income | | $ | 1,616,963 | | | $ | 3,408,203 | |
| Net realized loss on investments and foreign currency translation | | | (2,189,089 | ) | | | (4,887,348 | ) |
| Net change in unrealized appreciation of investments | | | 3,347,222 | | | | 6,426,460 | |
| Increase in Net Assets From Operations | | | 2,775,096 | | | | 4,947,315 | |
| | | | | | | | | |
| Distributions to Shareholders from | | | | | | | | |
| Net investment income: | | | | | | | | |
| Class A | | | (1,279,731 | ) | | | (1,640,399 | ) |
| Class C | | | (834,062 | ) | | | (1,132,883 | ) |
| Class I | | | (1,968,556 | ) | | | (1,733,891 | ) |
| Return of capital: | | | | | | | | |
| Class A | | | — | | | | (869,438 | ) |
| Class C | | | — | | | | (600,446 | ) |
| Class I | | | — | | | | (918,989 | ) |
| Total Distributions to Shareholders | | | (4,082,349 | ) | | | (6,896,046 | ) |
| | | | | | | | | |
| Capital Transactions (Note 6) | | | | | | | | |
| Proceeds from shares sold | | | 22,465,977 | | | | 51,290,652 | |
| Reinvestment of distributions | | | 2,725,823 | | | | 5,104,992 | |
| Cost of shares redeemed | | | (17,212,776 | ) | | | (41,752,967 | ) |
| Redemption fees | | | 15,684 | | | | 8,855 | |
| Increase in Net Assets From Capital Transactions | | | 7,994,708 | | | | 14,651,532 | |
| | | | | | | | | |
| Total Increase in Net Assets | | | 6,687,455 | | | | 12,702,801 | |
| | | | | | | | | |
| Net Assets | | | | | | | | |
| Beginning of period | | | 105,768,402 | | | | 93,065,601 | |
| End of period (including accumulated net investment loss of $3,973,726 and $1,508,340, respectively) | | $ | 112,455,857 | | | $ | 105,768,402 | |
The accompanying notes are an integral part of these financial statements.
| |
| |
LoCorr Macro Strategies Fund - Consolidated Financial Highlights - Class A | 63 |
| |
LoCorr Macro Strategies Fund - Class A
Consolidated Financial Highlights
Selected Data and Ratios (for a share outstanding throughout the period)
| | | | | | |
| | | | | | |
| | | Six Months Ended
June 30, 2017 (a) | | Year Ended December 31, |
| | | (Unaudited) | | 2016 | | | 2015 | | | 2014 | | | 2013 | | | 2012(b) | |
| | | | | | | | | | | | | | | | | | | |
| Per Share | | | | | | | | | | | | | | | | | | |
| Net asset value, beginning of period | | $ | 8.91 | | | $ | 8.54 | | | $ | 8.51 | | | $ | 8.28 | | | $ | 8.77 | | | $ | 9.33 | |
| | | | | | | | | | | | | | | | | | | | | | | | | |
| Income (loss) from investment operations: | | | | | | | | | | | | | | | | | | | | | | | | |
Net investment income (loss)(c) | | | (0.04) | | | | (0.09) | | | | (0.08) | | | | (0.08) | | | | (0.07) | | | | (0.24) | |
| Net realized and unrealized gain (loss) | | | (0.19) | | | | 0.64 | | | | 0.36 | | | | 1.36 | | | | (0.41) | | | | (0.32) | |
| Total from Investment Operations | | | (0.23) | | | | 0.55 | | | | 0.28 | | | | 1.28 | | | | (0.48) | | | | (0.56) | |
| | | | | | | | | | | | | | | | | | | | | | | | | |
| Distributions to shareholders from: | | | | | | | | | | | | | | | | | | | | | | | | |
| Net investment income | | | — | | | | — | | | | (0.25) | | | | (1.04) | | | | — | | | | — | |
| Net realized gains | | | — | | | | (0.18) | | | | — | | | | (0.01) | | | | (0.01) | | | | (0.00) | (d) |
| Total Distributions | | | — | | | | (0.18) | | | | (0.25) | | | | (1.05) | | | | (0.01) | | | | (0.00) | |
| | | | | | | | | | | | | | | | | | | | | | | | | |
Redemption Fees(d) | | | 0.00 | | | | 0.00 | | | | 0.00 | | | | 0.00 | | | | 0.00 | | | | 0.00 | |
| | | | | | | | | | | | | | | | | | | | | | | | | |
| Net Asset Value, End of Period | | $ | 8.68 | | | $ | 8.91 | | | $ | 8.54 | | | $ | 8.51 | | | $ | 8.28 | | | $ | 8.77 | |
| | | | | | | | | | | | | | | | | | | | | | | | | |
Total Investment Return(e) | | | (2.58) | % | | | 6.39 | % | | | 3.27 | % | | | 15.42 | % | | | (5.53) | % | | | (5.98) | % |
| | | | | | | | | | | | | | | | | | | | | | | | | |
| Net Assets, End of Period, in Thousands | | $ | 103,043 | | | $ | 297,844 | | | $ | 229,427 | | | $ | 206,931 | | | $ | 195,046 | | | $ | 182,457 | |
| | | | | | | | | | | | | | | | | | | | | | | | | |
| Ratios/Supplemental Data: | | | | | | | | | | | | | | | | | | | | | | | | |
| Ratio of expenses to average net assets: | | | | | | | | | | | | | | | | | | | | | | | | |
| Before expense reimbursement or recovery | | | 2.33 | % | | | 2.34 | %(f)(g) | | | 2.06 | %(f)(g) | | | 2.11 | %(f) | | | 2.08 | %(f) | | | 3.95 | %(f)(h) |
| After expense reimbursement or recovery | | | 2.31 | % | | | 2.34 | %(f)(g) | | | 2.06 | %(f)(g) | | | 2.11 | %(f) | | | 2.08 | %(f) | | | 4.00 | %(f)(h) |
| | | | | | | | | | | | | | | | | | | | | | | | | |
| Ratio of net investment income (loss) to average net assets: | | | | | | | | | | | | | | | | | | | | | | | | |
| Before expense reimbursement or recovery | | | (0.91) | % | | | (0.96) | %(f) | | | (0.90) | %(f) | | | (0.94) | %(f) | | | (0.87) | %(f) | | | (2.60) | %(f)(i) |
| After expense reimbursement or recovery | | | (0.89) | % | | | (0.96) | %(f) | | | (0.90) | %(f) | | | (0.94) | %(f) | | | (0.87) | %(f) | | | (2.65) | %(f)(i) |
| | | | | | | | | | | | | | | | | | | | | | | | | |
Portfolio turnover rate(j) | | | 45 | % | | | 62 | % | | | 53 | % | | | 57 | % | | | 46 | % | | | 46 | % |
(a) All ratios have been annualized except total investment return and portfolio turnover.
(b) Selected data and ratios (for a share outstanding throughout the period) do not include non-controlling interest.
(c) Net investment income (loss) per share is based on average shares outstanding.
(d) Amount represents less than $0.005 per share.
(e) Total investment return excludes the effect of applicable sales charges.
(f) Ratios do not include the income and expenses of the CTAs included in the swap.
(g) Includes interest expense of 0.01% and 0.00% for the years ended December 31, 2016 and 2015, respectively.
(h) For the year ended December 31, 2012 the ratios include 1.88% of expenses attributable to the Partnership. See Note 1.
(i) For the year ended December 31, 2012 the ratios include (1.63)% of net investment losses attributable to the Partnership. See Note 1.
(j) Portfolio turnover rate is calculated on the basis of the Fund as a whole without distinguishing between classes of shares issued. Consists of long-term investments only; excludes derivative instruments.
The accompanying notes are an integral part of these consolidated financial statements.
| |
| |
64 | LoCorr Macro Strategies Fund - Consolidated Financial Highlights - Class C |
| |
LoCorr Macro Strategies Fund - Class C
Consolidated Financial Highlights
Selected Data and Ratios (for a share outstanding throughout the period)
| | | | | | |
| | | | | | |
| | | Six Months Ended
June 30, 2017 (a) | | | Year Ended December 31, |
| | | (Unaudited) | | | 2016 | | | 2015 | | | 2014 | | | 2013 | | | 2012(b) | |
| | | | | | | | | | | | | | | | | | | |
| Per Share | | | | | | | | | | | | | | | | | | |
| Net asset value, beginning of period | | $ | 8.62 | | | $ | 8.32 | | | $ | 8.30 | | | $ | 8.12 | | | $ | 8.65 | | | $ | 9.28 | |
| | | | | | | | | | | | | | | | | | | | | | | | | |
| Income (loss) from investment operations: | | | | | | | | | | | | | | | | | | | | | | | | |
Net investment income (loss)(c) | | | (0.07) | | | | (0.15) | | | | (0.14) | | | | (0.15) | | | | (0.14) | | | | (0.30) | |
| Net realized and unrealized gain (loss) | | | (0.19) | | | | 0.63 | | | | 0.35 | | | | 1.33 | | | | (0.38) | | | | (0.33) | |
| Total from Investment Operations | | | (0.26) | | | | 0.48 | | | | 0.21 | | | | 1.18 | | | | (0.52) | | | | (0.63) | |
| | | | | | | | | | | | | | | | | | | | | | | | | |
| Distributions to shareholders from: | | | | | | | | | | | | | | | | | | | | | | | | |
| Net investment income | | | — | | | | — | | | | (0.19) | | | | (0.99) | | | | — | | | | — | |
| Net realized gains | | | — | | | | (0.18) | | | | — | | | | (0.01) | | | | (0.01) | | | | (0.00) | (d) |
| Total Distributions | | | — | | | | (0.18) | | | | (0.19) | | | | (1.00) | | | | (0.01) | | | | (0.00) | |
| | | | | | | | | | | | | | | | | | | | | | | | | |
Redemption Fees(d) | | | 0.00 | | | | 0.00 | | | | 0.00 | | | | 0.00 | | | | 0.00 | | | | 0.00 | |
| | | | | | | | | | | | | | | | | | | | | | | | | |
| Net Asset Value, End of Period | | $ | 8.36 | | | $ | 8.62 | | | $ | 8.32 | | | $ | 8.30 | | | $ | 8.12 | | | $ | 8.65 | |
| | | | | | | | | | | | | | | | | | | | | | | | | |
Total Investment Return(e) | | | (3.02) | % | | | 5.72 | % | | | 2.51 | % | | | 14.39 | % | | | (6.07) | % | | | (6.77) | % |
| | | | | | | | | | | | | | | | | | | | | | | | | |
| Net Assets, End of Period, in Thousands | | $ | 103,668 | | | $ | 113,814 | | | $ | 98,729 | | | $ | 93,924 | | | $ | 73,691 | | | $ | 76,979 | |
| | | | | | | | | | | | | | | | | | | | | | | | | |
| Ratios/Supplemental Data: | | | | | | | | | | | | | | | | | | | | | | | | |
| Ratio of expenses to average net assets: | | | | | | | | | | | | | | | | | | | | | | | | |
| Before expense reimbursement or recovery | | | 3.08 | % | | | 3.09 | %(f)(g) | | | 2.81 | %(f)(g) | | | 2.86 | %(f) | | | 2.83 | %(f) | | | 4.70 | %(f)(h) |
| After expense reimbursement or recovery | | | 3.06 | % | | | 3.09 | %(f)(g) | | | 2.81 | %(f)(g) | | | 2.86 | %(f) | | | 2.83 | %(f) | | | 4.75 | %(f)(h) |
| | | | | | | | | | | | | | | | | | | | | | | | | |
| Ratio of net investment income (loss) to average net assets: | | | | | | | | | | | | | | | | | | | | | | | | |
| Before expense reimbursement or recovery | | | (1.66) | % | | | (1.71) | %(f) | | | (1.65) | %(f) | | | (1.69) | %(f) | | | (1.62) | %(f) | | | (3.35) | %(f)(i) |
| After expense reimbursement or recovery | | | (1.64) | % | | | (1.71) | %(f) | | | (1.65) | %(f) | | | (1.69) | %(f) | | | (1.62) | %(f) | | | (3.40) | %(f)(i) |
| | | | | | | | | | | | | | | | | | | | | | | | | |
Portfolio turnover rate(j) | | | 45 | % | | | 62 | % | | | 53 | % | | | 57 | % | | | 46 | % | | | 46 | % |
(a) All ratios have been annualized except total investment return and portfolio turnover.
(b) Selected data and ratios (for a share outstanding throughout the period) do not include non-controlling interest.
(c) Net investment income (loss) per share is based on average shares outstanding.
(d) Amount represents less than $0.005 per share.
(e) Total investment return excludes the effect of applicable sales charges.
(f) Ratios do not include the income and expenses of the CTAs included in the swap.
(g) Includes interest expense of 0.01% and 0.00% for the years ended December 31, 2016 and 2015, respectively.
(h) For the year ended December 31, 2012 the ratios include 1.88% of expenses attributable to the Partnership. See Note 1.
(i) For the year ended December 31, 2012 the ratios include (1.63)% of net investment losses attributable to the Partnership. See Note 1.
(j) Portfolio turnover rate is calculated on the basis of the Fund as a whole without distinguishing between classes of shares issued. Consists of long-term investments only; excludes derivative instruments.
The accompanying notes are an integral part of these consolidated financial statements.
| |
| |
LoCorr Macro Strategies Fund - Consolidated Financial Highlights - Class I | 65 |
| |
LoCorr Macro Strategies Fund - Class I
Consolidated Financial Highlights
Selected Data and Ratios (for a share outstanding throughout the period)
| | | | | | | |
| | | | | | | |
| | | Six Months Ended
June 30, 2017 (a) | | | Year Ended December 31, | |
| | | (Unaudited) | | | 2016 | | | 2015 | | | 2014 | | | 2013 | | | 2012(b) | |
| | | | | | | | | | | | | | | | | | | |
| Per Share | | | | | | | | | | | | | | | | | | |
| Net asset value, beginning of period | | $ | 9.01 | | | $ | 8.62 | | | $ | 8.57 | | | $ | 8.34 | | | $ | 8.81 | | | $ | 9.35 | |
| | | | | | | | | | | | | | | | | | | | | | | | | |
| Income (loss) from investment operations: | | | | | | | | | | | | | | | | | | | | | | | | |
Net investment income (loss)(c) | | | (0.03) | | | | (0.07) | | | | (0.06) | | | | (0.06) | | | | (0.05) | | | | (0.22) | |
| Net realized and unrealized gain (loss) | | | (0.19) | | | | 0.64 | | | | 0.38 | | | | 1.36 | | | | (0.41) | | | | (0.32) | |
| Total from Investment Operations | | | (0.22) | | | | 0.57 | | | | 0.32 | | | | 1.30 | | | | (0.46) | | | | (0.54) | |
| | | | | | | | | | | | | | | | | | | | | | | | | |
| Distributions to shareholders from: | | | | | | | | | | | | | | | | | | | | | | | | |
| Net investment income | | | — | | | | (0.00) | (d) | | | (0.27) | | | | (1.06) | | | | — | | | | — | |
| Net realized gains | | | — | | | | (0.18) | | | | — | | | | (0.01) | | | | (0.01) | | | | (0.00) | (d) |
| Total Distributions | | | — | | | | (0.18) | | | | (0.27) | | | | (1.07) | | | | (0.01) | | | | (0.00) | |
| | | | | | | | | | | | | | | | | | | | | | | | | |
Redemption Fees(d) | | | 0.00 | | | | 0.00 | | | | 0.00 | | | | 0.00 | | | | 0.00 | | | | 0.00 | |
| | | | | | | | | | | | | | | | | | | | | | | | | |
| Net Asset Value, End of Period | | $ | 8.79 | | | $ | 9.01 | | | $ | 8.62 | | | $ | 8.57 | | | $ | 8.34 | | | $ | 8.81 | |
| | | | | | | | | | | | | | | | | | | | | | | | | |
| Total Investment Return | | | (2.44) | % | | | 6.57 | % | | | 3.72 | % | | | 15.56 | % | | | (5.28) | % | | | (5.75) | % |
| | | | | | | | | | | | | | | | | | | | | | | | | |
| Net Assets, End of Period, in Thousands | | $ | 781,377 | | | $ | 471,002 | | | $ | 192,309 | | | $ | 190,052 | | | $ | 102,279 | | | $ | 138,096 | |
| | | | | | | | | | | | | | | | | | | | | | | | | |
| Ratios/Supplemental Data: | | | | | | | | | | | | | | | | | | | | | | | | |
| Ratio of expenses to average net assets: | | | | | | | | | | | | | | | | | | | | | | | | |
| Before expense reimbursement or recovery | | | 2.08 | % | | | 2.09 | %(e)(f) | | | 1.81 | %(e)(f) | | | 1.86 | %(e) | | | 1.83 | %(e) | | | 3.70 | %(e)(g) |
| After expense reimbursement or recovery | | | 2.06 | % | | | 2.09 | %(e)(f) | | | 1.81 | %(e)(f) | | | 1.86 | %(e) | | | 1.83 | %(e) | | | 3.75 | %(e)(g) |
| | | | | | | | | | | | | | | | | | | | | | | | | |
| Ratio of net investment income (loss) to average net assets: | | | | | | | | | | | | | | | | | | | | | | | | |
| Before expense reimbursement or recovery | | | (0.66) | % | | | (0.71) | %(e) | | | (0.65) | %(e) | | | (0.69) | %(e) | | | (0.62) | %(e) | | | (2.35) | %(e)(h) |
| After expense reimbursement or recovery | | | (0.64) | % | | | (0.71) | %(e) | | | (0.65) | %(e) | | | (0.69) | %(e) | | | (0.62) | %(e) | | | (2.40) | %(e)(h) |
| | | | | | | | | | | | | | | | | | | | | | | | | |
Portfolio turnover rate(i) | | | 45 | % | | | 62 | % | | | 53 | % | | | 57 | % | | | 46 | % | | | 46 | % |
(a) All ratios have been annualized except total investment return and portfolio turnover.
(b) Selected data and ratios (for a share outstanding throughout the period) do not include non-controlling interest.
(c) Net investment income (loss) per share is based on average shares outstanding.
(d) Amount represents less than $0.005 per share.
(e) Ratios do not include the income and expenses of the CTAs included in the swap.
(f) Includes interest expense of 0.01% and 0.00% for the years ended December 31, 2016 and 2015, respectively.
(g) For the year ended December 31, 2012 the ratios include 1.88% of expenses attributable to the Partnership. See Note 1.
(h) For the year ended December 31, 2012 the ratios include (1.63)% of net investment losses attributable to the Partnership. See Note 1.
(i) Portfolio turnover rate is calculated on the basis of the Fund as a whole without distinguishing between classes of shares issued. Consists of long-term investments only; excludes derivative instruments.
The accompanying notes are an integral part of these consolidated financial statements.
| |
| |
66 | LoCorr Long/Short Commodities Strategy Fund - Consolidated Financial Highlights - Class A |
| |
LoCorr Long/Short Commodities Strategy Fund - Class A
Consolidated Financial Highlights
Selected Data and Ratios (for a share outstanding throughout the period)
| | | | | | | |
| | | | | | | |
| | | Six Months Ended
June 30, 2017 (a) | | | Year Ended December 31, | |
| | | (Unaudited) | | | 2016 | | | 2015 | | | 2014 | | | 2013 | | | 2012 | |
| | | | | | | | | | | | | | | | | | | |
| Per Share | | | | | | | | | | | | | | | | | | |
| Net asset value, beginning of period | | $ | 9.17 | | | $ | 9.72 | | | $ | 8.54 | | | $ | 7.67 | | | $ | 8.37 | | | $ | 10.00 | |
| | | | | | | | | | | | | | | | | | | | | | | | | |
| Income (loss) from investment operations: | | | | | | | | | | | | | | | | | | | | | | | | |
Net investment income (loss)(b) | | | (0.02) | | | | (0.10) | | | | (0.13) | | | | (0.14) | | | | (0.12) | | | | (0.17) | |
| Net realized and unrealized gain (loss) | | | (0.26) | | | | (0.18) | | | | 2.02 | | | | 1.85 | | | | (0.58) | | | | (1.46) | |
| Total from Investment Operations | | | (0.28) | | | | (0.28) | | | | 1.89 | | | | 1.71 | | | | (0.70) | | | | (1.63) | |
| | | | | | | | | | | | | | | | | | | | | | | | | |
| Distributions to shareholders from: | | | | | | | | | | | | | | | | | | | | | | | | |
| Net investment income | | | — | | | | (0.27) | | | | (0.71) | | | | (0.84) | | | | — | | | | — | |
| Total Distributions | | | — | | | | (0.27) | | | | (0.71) | | | | (0.84) | | | | — | | | | — | |
| | | | | | | | | | | | | | | | | | | | | | | | | |
Redemption Fees(c) | | | 0.00 | | | | 0.00 | | | | 0.00 | | | | 0.00 | | | | 0.00 | | | | 0.00 | |
| | | | | | | | | | | | | | | | | | | | | | | | | |
| Net Asset Value, End of Period | | $ | 8.89 | | | $ | 9.17 | | | $ | 9.72 | | | $ | 8.54 | | | $ | 7.67 | | | $ | 8.37 | |
| | | | | | | | | | | | | | | | | | | | | | | | | |
Total Investment Return(d) | | | (3.05) | % | | | (2.98) | % | | | 22.34 | % | | | 22.07 | % | | | (8.36) | % | | | (16.30) | % |
| | | | | | | | | | | | | | | | | | | | | | | | | |
| Net Assets, End of Period, in Thousands | | $ | 27,929 | | | $ | 34,860 | | | $ | 24,425 | | | $ | 43,345 | | | $ | 3,653 | | | $ | 3,213 | |
| | | | | | | | | | | | | | | | | | | | | | | | | |
Ratios/Supplemental Data:(e) | | | | | | | | | | | | | | | | | | | | | | | | |
| Ratio of expenses to average net assets: | | | | | | | | | | | | | | | | | | | | | | | | |
| Before expense reimbursement or recovery | | | 2.29 | % | | | 2.22 | %(f) | | | 2.59 | %(f) | | | 3.01 | %(f) | | | 4.18 | % | | | 6.12 | % |
| After expense reimbursement or recovery | | | 2.20 | % | | | 2.20 | %(f) | | | 2.20 | %(f) | | | 2.20 | %(f) | | | 2.20 | % | | | 2.20 | % |
| | | | | | | | | | | | | | | | | | | | | | | | | |
| Ratio of net investment income (loss) to average net assets: | | | | | | | | | | | | | | | | | | | | | | | | |
| Before expense reimbursement or recovery | | | (0.58) | % | | | (0.99) | % | | | (1.79) | % | | | (2.39) | % | | | (3.46) | % | | | (5.82) | % |
| After expense reimbursement or recovery | | | (0.49) | % | | | (0.97) | % | | | (1.40) | % | | | (1.58) | % | | | (1.48) | % | | | (1.90) | % |
| | | | | | | | | | | | | | | | | | | | | | | | | |
Portfolio turnover rate(g) | | | 37 | % | | | 105 | % | | | 164 | % | | | 55 | % | | | 59 | % | | | 60 | % |
(a) All ratios have been annualized except total investment return and portfolio turnover.
(b) Net investment income (loss) per share is based on average shares outstanding.
(c) Amount represents less than $0.005 per share.
(d) Total investment return excludes the effect of applicable sales charges.
(e) Ratios do not include the income and expenses of the CTAs included in the swap.
(f) Includes interest expense on line of credit of 0.00%, 0.00% and 0.00% for the years ended December 31, 2016, 2015 and 2014, respectively.
(g) Portfolio turnover rate is calculated on the basis of the Fund as a whole without distinguishing between classes of shares issued. Consists of long-term investments only; excludes derivative instruments.
The accompanying notes are an integral part of these consolidated financial statements.
| |
| |
LoCorr Long/Short Commodities Strategy Fund - Consolidated Financial Highlights - Class C | 67 |
| |
LoCorr Long/Short Commodities Strategy Fund - Class C
Consolidated Financial Highlights
Selected Data and Ratios (for a share outstanding throughout the period)
| | | | | | | | | | | | | | | | | | | |
| | | Six Months Ended | | | | | | | | | | | | | | | | |
| | | June 30, 2017 (a) | | | Year Ended December 31, | |
| | | (Unaudited) | | | 2016 | | | 2015 | | | 2014 | | | 2013 | | | 2012 | |
| | | | | | | | | | | | | | | | | | | |
| Per Share | | | | | | | | | | | | | | | | | | |
| Net asset value, beginning of period | | $ | 8.95 | | | $ | 9.51 | | | $ | 8.36 | | | $ | 7.54 | | | $ | 8.29 | | | $ | 10.00 | |
| | | | | | | | | | | | | | | | | | | | | | | | | |
| Income (loss) from investment operations: | | | | | | | | | | | | | | | | | | | | | | | | |
Net investment income (loss)(b) | | | (0.06) | | | | (0.17) | | | | (0.19) | | | | (0.20) | | | | (0.17) | | | | (0.24) | |
| Net realized and unrealized gain (loss) | | | (0.24) | | | | (0.18) | | | | 1.96 | | | | 1.80 | | | | (0.58) | | | | (1.47) | |
| Total from Investment Operations | | | (0.30) | | | | (0.35) | | | | 1.77 | | | | 1.60 | | | | (0.75) | | | | (1.71) | |
| | | | | | | | | | | | | | | | | | | | | | | | | |
| Distributions to shareholders from: | | | | | | | | | | | | | | | | | | | | | | | | |
| Net investment income | | | — | | | | (0.21) | | | | (0.62) | | | | (0.78) | | | | — | | | | — | |
| Total Distributions | | | — | | | | (0.21) | | | | (0.62) | | | | (0.78) | | | | — | | | | — | |
| | | | | | | | | | | | | | | | | | | | | | | | | |
| Redemption Fees | | | 0.00 | (c) | | | 0.00 | (c) | | | — | | | | — | | | | — | | | | 0.00 | (c) |
| | | | | | | | | | | | | | | | | | | | | | | | | |
| Net Asset Value, End of Period | | $ | 8.65 | | | $ | 8.95 | | | $ | 9.51 | | | $ | 8.36 | | | $ | 7.54 | | | $ | 8.29 | |
| | | | | | | | | | | | | | | | | | | | | | | | | |
Total Investment Return(d) | | | (3.35) | % | | | (3.72) | % | | | 21.39 | % | | | 21.01 | % | | | (9.05) | % | | | (17.10) | % |
| | | | | | | | | | | | | | | | | | | | | | | | | |
| Net Assets, End of Period, in Thousands | | $ | 5,746 | | | $ | 7,383 | | | $ | 4,330 | | | $ | 2,983 | | | $ | 1,653 | | | $ | 1,605 | |
| | | | | | | | | | | | | | | | | | | | | | | | | |
Ratios/Supplemental Data:(e) | | | | | | | | | | | | | | | | | | | | | | | | |
| Ratio of expenses to average net assets: | | | | | | | | | | | | | | | | | | | | | | | | |
| Before expense reimbursement or recovery | | | 3.04 | % | | | 2.97 | %(f) | | | 3.34 | %(f) | | | 3.76 | %(f) | | | 4.93 | % | | | 6.87 | % |
| After expense reimbursement or recovery | | | 2.95 | % | | | 2.95 | %(f) | | | 2.95 | %(f) | | | 2.95 | %(f) | | | 2.95 | % | | | 2.95 | % |
| | | | | | | | | | | | | | | | | | | | | | | | | |
| Ratio of net investment income (loss) to average net assets: | | | | | | | | | | | | | | | | | | | | | | | | |
| Before expense reimbursement or recovery | | | (1.33) | % | | | (1.74) | % | | | (2.54) | % | | | (3.14) | % | | | (4.21) | % | | | (6.57) | % |
| After expense reimbursement or recovery | | | (1.24) | % | | | (1.72) | % | | | (2.15) | % | | | (2.33) | % | | | (2.23) | % | | | (2.65) | % |
| | | | | | | | | | | | | | | | | | | | | | | | | |
Portfolio turnover rate(g) | | | 37 | % | | | 105 | % | | | 164 | % | | | 55 | % | | | 59 | % | | | 60 | % |
| (a) | All ratios have been annualized except total investment return and portfolio turnover. |
| (b) | Net investment income (loss) per share is based on average shares outstanding. |
| (c) | Amount represents less than $0.005 per share. |
| (d) | Total investment return excludes the effect of applicable sales charges. |
| (e) | Ratios do not include the income and expenses of the CTAs included in the swap. |
| (f) | Includes interest expense on line of credit of 0.00%, 0.00% and 0.00% for the years ended December 31, 2016, 2015 and 2014, respectively. |
| (g) | Portfolio turnover rate is calculated on the basis of the Fund as a whole without distinguishing between classes of shares issued. Consists of long-term investments only; excludes derivative instruments. |
The accompanying notes are an integral part of these consolidated financial statements.
| |
| |
68 | LoCorr Long/Short Commodities Strategy Fund - Consolidated Financial Highlights - Class I |
| |
LoCorr Long/Short Commodities Strategy Fund - Class I
Consolidated Financial Highlights
Selected Data and Ratios (for a share outstanding throughout the period)
| | | | | | | | | | | | | | | | | | | |
| | | Six Months Ended | | | | | | | | | | | | | | | | |
| | | June 30, 2017 (a) | | | Year Ended December 31, | |
| | | (Unaudited) | | | 2016 | | | 2015 | | | 2014 | | | 2013 | | | 2012 | |
| | | | | | | | | | | | | | | | | | | |
| Per Share | | | | | | | | | | | | | | | | | | |
| Net asset value, beginning of period | | $ | 9.24 | | | $ | 9.79 | | | $ | 8.59 | | | $ | 7.70 | | | $ | 8.38 | | | $ | 10.00 | |
| | | | | | | | | | | | | | | | | | | | | | | | | |
| Income (loss) from investment operations: | | | | | | | | | | | | | | | | | | | | | | | | |
Net investment income (loss)(b) | | | (0.01) | | | | (0.07) | | | | (0.11) | | | | (0.12) | | | | (0.10) | | | | (0.15) | |
| Net realized and unrealized gain (loss) | | | (0.26) | | | | (0.18) | | | | 2.03 | | | | 1.86 | | | | (0.58) | | | | (1.47) | |
| Total from Investment Operations | | | (0.27) | | | | (0.25) | | | | 1.92 | | | | 1.74 | | | | (0.68) | | | | (1.62) | |
| | | | | | | | | | | | | | | | | | | | | | | | | |
| Distributions to shareholders from: | | | | | | | | | | | | | | | | | | | | | | | | |
| Net investment income | | | — | | | | (0.30) | | | | (0.72) | | | | (0.85) | | | | — | | | | — | |
| Total Distributions | | | — | | | | (0.30) | | | | (0.72) | | | | (0.85) | | | | — | | | | — | |
| | | | | | | | | | | | | | | | | | | | | | | | | |
| Redemption Fees | | | — | | | | 0.00 | (c) | | | 0.00 | (c) | | | 0.00 | (c) | | | 0.00 | (c) | | | 0.00 | (c) |
| | | | | | | | | | | | | | | | | | | | | | | | | |
| Net Asset Value, End of Period | | $ | 8.97 | | | $ | 9.24 | | | $ | 9.79 | | | $ | 8.59 | | | $ | 7.70 | | | $ | 8.38 | |
| | | | | | | | | | | | | | | | | | | | | | | | | |
| Total Investment Return | | | (2.92) | % | | | (2.67) | % | | | 22.61 | % | | | 22.36 | % | | | (8.11) | % | | | (16.20) | % |
| | | | | | | | | | | | | | | | | | | | | | | | | |
| Net Assets, End of Period, in Thousands | | $ | 68,141 | | | $ | 81,204 | | | $ | 31,166 | | | $ | 12,825 | | | $ | 5,502 | | | $ | 6,373 | |
| | | | | | | | | | | | | | | | | | | | | | | | | |
Ratios/Supplemental Data:(d) | | | | | | | | | | | | | | | | | | | | | | | | |
| Ratio of expenses to average net assets: | | | | | | | | | | | | | | | | | | | | | | | | |
| Before expense reimbursement or recovery | | | 2.04 | % | | | 1.97 | %(e) | | | 2.34 | %(e) | | | 2.76 | %(e) | | | 3.93 | % | | | 5.87 | % |
| After expense reimbursement or recovery | | | 1.95 | % | | | 1.95 | %(e) | | | 1.95 | %(e) | | | 1.95 | %(e) | | | 1.95 | % | | | 1.95 | % |
| | | | | | | | | | | | | | | | | | | | | | | | | |
| Ratio of net investment income (loss) to average net assets: | | | | | | | | | | | | | | | | | | | | | | | | |
| Before expense reimbursement or recovery | | | (0.33) | % | | | (0.74) | % | | | (1.54) | % | | | (2.14) | % | | | (3.21) | % | | | (5.57) | % |
| After expense reimbursement or recovery | | | (0.24) | % | | | (0.72) | % | | | (1.15) | % | | | (1.33) | % | | | (1.23) | % | | | (1.65) | % |
| | | | | | | | | | | | | | | | | | | | | | | | | |
Portfolio turnover rate(f) | | | 37 | % | | | 105 | % | | | 164 | % | | | 55 | % | | | 59 | % | | | 60 | % |
| (a) | All ratios have been annualized except total investment return and portfolio turnover. |
| (b) | Net investment income (loss) per share is based on average shares outstanding. |
| (c) | Amount represents less than $0.005 per share. |
| (d) | Ratios do not include the income and expenses of the CTAs included in the swap. |
| (e) | Includes interest expense on line of credit of 0.00%, 0.00% and 0.00% for the years ended December 31, 2016, 2015 and 2014, respectively. |
| (f) | Portfolio turnover rate is calculated on the basis of the Fund as a whole without distinguishing between classes of shares issued. Consists of long-term investments only; excludes derivative instruments. |
The accompanying notes are an integral part of these consolidated financial statements.
| |
| |
LoCorr Multi-Strategy Fund - Consolidated Financial Highlights - Class A | 69 |
| |
LoCorr Multi-Strategy Fund - Class A
Consolidated Financial Highlights
Selected Data and Ratios (for a share outstanding throughout the period)
| | | | | | | | | | | | |
| | | Six Months Ended
June 30, 2017 (a)
(Unaudited) | | Year Ended
December 31, 2016 | | Period from April 6, 2015
(commencement of operations)
through
December 31, 2015 (a) | |
| | | | | | | | | | | | |
| Per Share | | | | | | | | | | | |
| Net asset value, beginning of period | | $ | 8.15 | | | $ | 8.31 | | | | $ | 10.00 | | |
| | | | | | | | | | | | | | | |
| Income (loss) from investment operations: | | | | | | | | | | | | | | |
Net investment income (loss)(b) | | | 0.03 | | | | 0.06 | | | | | 0.07 | | |
| Net realized and unrealized gain (loss) | | | (0.18) | | | | 0.06 | (c) | | | | (1.58) | | |
| Total from Investment Operations | | | (0.15) | | | | 0.12 | | | | | (1.51) | | |
| | | | | | | | | | | | | | | |
| Distributions to shareholders from: | | | | | | | | | | | | | | |
| Net investment income | | | (0.14) | | | | (0.09) | | | | | (0.09) | | |
| Return of capital | | | — | | | | (0.19) | | | | | (0.09) | | |
| Total Distributions | | | (0.14) | | | | (0.28) | | | | | (0.18) | | |
| | | | | | | | | | | | | | | |
| Redemption Fees | | | — | | | | 0.00 | (d) | | | | 0.00 | (d) | |
| | | | | | | | | | | | | | | |
| Net Asset Value, End of Period | | $ | 7.86 | | | $ | 8.15 | | | | $ | 8.31 | | |
| | | | | | | | | | | | | | | |
Total Investment Return(e) | | | (1.89) | % | | | 1.41 | % | | | | (15.14) | % | |
| | | | | | | | | | | | | | | |
| Net Assets, End of Period, in Thousands | | $ | 18,447 | | | $ | 17,149 | | | | $ | 12,102 | | |
| | | | | | | | | | | | | | | |
Ratios/Supplemental Data:(f)(g) | | | | | | | | | | | | | | |
| Ratio of expenses to average net assets: | | | | | | | | | | | | | | |
| Before expense reimbursement or recovery | | | 2.74 | % | | | 2.84 | % | | | | 3.44 | % | |
| After expense reimbursement or recovery | | | 2.31 | % | | | 2.34 | % | | | | 2.30 | % | |
| | | | | | | | | | | | | | | |
| Ratio of expenses to average net assets (excluding dividend and interest expense): | | | | | | | | | | | | | | |
| Before expense reimbursement or recovery | | | 2.72 | % | | | 2.79 | % | | | | 3.43 | % | |
| After expense reimbursement or recovery | | | 2.29 | % | | | 2.29 | % | | | | 2.29 | % | |
| | | | | | | | | | | | | | | |
| Ratio of net investment income (loss) to average net assets: | | | | | | | | | | | | | | |
| Before expense reimbursement or recovery | | | 0.32 | % | | | 0.36 | % | | | | (0.04) | % | |
| After expense reimbursement or recovery | | | 0.75 | % | | | 0.86 | % | | | | 1.10 | % | |
| | | | | | | | | | | | | | | |
Portfolio turnover rate(h) | | | 44 | % | | | 95 | % | | | | 38 | % | |
| (a) | All ratios have been annualized except total investment return and portfolio turnover. |
| (b) | Net investment income (loss) per share is based on average shares outstanding. |
| (c) | Realized and unrealized gains and losses in this caption are balancing amounts necessary to reconcile the change in net asset value per share for the period, and may not reconcile with the Fund’s consolidated statement of operations due to share transactions for the period. |
| (d) | Amount represents less than $0.005 per share. |
| (e) | Total investment return excludes the effect of applicable sales charges. |
| (f) | Ratios do not include the income and expenses of the CTAs included in the swap. |
| (g) | Ratios do not include investment companies in which the Fund invests. |
| (h) | Portfolio turnover rate is calculated on the basis of the Fund as a whole without distinguishing between classes of shares issued. Consists of long-term investments only; excludes securities sold short and swap transactions. |
The accompanying notes are an integral part of these consolidated financial statements.
| |
| |
70 | LoCorr Multi-Strategy Fund - Consolidated Financial Highlights - Class C |
| |
LoCorr Multi-Strategy Fund - Class C
Consolidated Financial Highlights
Selected Data and Ratios (for a share outstanding throughout the period)
| | | | | | | | | |
| | | Six Months Ended
June 30, 2017 (a)
(Unaudited) | | Year Ended
December 31, 2016 | | | Period from April 6, 2015
(commencement of operations)
through
December 31, 2015 (a) | |
| | | | | | | | | | | | |
| Per Share | | | | | | | | | | | |
| Net asset value, beginning of period | | $ | 8.15 | | | $ | 8.31 | | | | $ | 10.00 | | |
| | | | | | | | | | | | | | | |
| Income (loss) from investment operations: | | | | | | | | | | | | | | |
Net investment income (loss)(b) | | | 0.00 | (d) | | | 0.01 | | | | | 0.02 | | |
| Net realized and unrealized gain (loss) | | | (0.18) | | | | 0.03 | (c) | | | | (1.58) | | |
| Total from Investment Operations | | | (0.18) | | | | 0.04 | | | | | (1.56) | | |
| | | | | | | | | | | | | | | |
| Distributions to shareholders from: | | | | | | | | | | | | | | |
| Net investment income | | | (0.10) | | | | (0.06) | | | | | (0.06) | | |
| Return of capital | | | — | | | | (0.14) | | | | | (0.07) | | |
| Total Distributions | | | (0.10) | | | | (0.20) | | | | | (0.13) | | |
| | | | | | | | | | | | | | | |
| Redemption Fees | | | — | | | | 0.00 | (d) | | | | 0.00 | (d) | |
| | | | | | | | | | | | | | | |
| Net Asset Value, End of Period | | $ | 7.87 | | | $ | 8.15 | | | | $ | 8.31 | | |
| | | | | | | | | | | | | | | |
Total Investment Return(e) | | | (2.23) | % | | | 0.49 | % | | | | (15.62) | % | |
| | | | | | | | | | | | | | | |
| Net Assets, End of Period, in Thousands | | $ | 3,045 | | | $ | 3,899 | | | | $ | 5,490 | | |
| | | | | | | | | | | | | | | |
Ratios/Supplemental Data:(f)(g) | | | | | | | | | | | | | | |
| Ratio of expenses to average net assets: | | | | | | | | | | | | | | |
| Before expense reimbursement or recovery | | | 3.49 | % | | | 3.59 | % | | | | 4.19 | % | |
| After expense reimbursement or recovery | | | 3.06 | % | | | 3.09 | % | | | | 3.05 | % | |
| | | | | | | | | | | | | | | |
| Ratio of expenses to average net assets (excluding dividend and interest expense): | | | | | | | | | | | | | | |
| Before expense reimbursement or recovery | | | 3.47 | % | | | 3.54 | % | | | | 4.18 | % | |
| After expense reimbursement or recovery | | | 3.04 | % | | | 3.04 | % | | | | 3.04 | % | |
| | | | | | | | | | | | | | | |
| Ratio of net investment income (loss) to average net assets: | | | | | | | | | | | | | | |
| Before expense reimbursement or recovery | | | (0.43) | % | | | (0.39) | % | | | | (0.79) | % | |
| After expense reimbursement or recovery | | | 0.00 | % | | | 0.11 | % | | | | 0.35 | % | |
| | | | | | | | | | | | | | | |
Portfolio turnover rate(h) | | | 44 | % | | | 95 | % | | | | 38 | % | |
| (a) | All ratios have been annualized except total investment return and portfolio turnover. |
| (b) | Net investment income (loss) per share is based on average shares outstanding. |
| (c) | Realized and unrealized gains and losses in this caption are balancing amounts necessary to reconcile the change in net asset value per share for the period, and may not reconcile with the Fund’s consolidated statement of operations due to share transactions for the period. |
| (d) | Amount represents less than $0.005 per share. |
| (e) | Total investment return excludes the effect of applicable sales charges. |
| (f) | Ratios do not include the income and expenses of the CTAs included in the swap. |
| (g) | Ratios do not include investment companies in which the Fund invests. |
| (h) | Portfolio turnover rate is calculated on the basis of the Fund as a whole without distinguishing between classes of shares issued. Consists of long-term investments only; excludes securities sold short and swap transactions. |
The accompanying notes are an integral part of these consolidated financial statements.
| |
| |
LoCorr Multi-Strategy Fund - Consolidated Financial Highlights - Class I | 71 |
| |
LoCorr Multi-Strategy Fund - Class I
Consolidated Financial Highlights
Selected Data and Ratios (for a share outstanding throughout the period)
| | | | | | | | | | |
| | | Six Months Ended
June 30, 2017 (a)
(Unaudited) | | Year Ended
December 31, 2016 | | | Period from April 6, 2015
(commencement of operations)
through
December 31, 2015 (a) | |
| | | | | | | | | | | |
| Per Share | | | | | | | | | | |
| Net asset value, beginning of period | | $ | 8.14 | | | $ | 8.31 | | | | $ | 10.00 | | |
| | | | | | | | | | | | | | | |
| Income (loss) from investment operations: | | | | | | | | | | | | | | |
Net investment income (loss)(b) | | | 0.04 | | | | 0.10 | | | | | 0.09 | | |
| Net realized and unrealized gain (loss) | | | (0.18 | ) | | | 0.03 | (c) | | | | (1.58 | ) | |
| Total from Investment Operations | | | (0.14 | ) | | | 0.13 | | | | | (1.49 | ) | |
| | | | | | | | | | | | | | | |
| Distributions to shareholders from: | | | | | | | | | | | | | | |
| Net investment income | | | (0.15 | ) | | | (0.09 | ) | | | | (0.10 | ) | |
| Return of capital | | | — | | | | (0.21 | ) | | | | (0.10 | ) | |
| Total Distributions | | | (0.15 | ) | | | (0.30 | ) | | | | (0.20 | ) | |
| | | | | | | | | | | | | | | |
Redemption Fees(d) | | | 0.00 | | | | 0.00 | | | | | 0.00 | | |
| | | | | | | | | | | | | | | |
| Net Asset Value, End of Period | | $ | 7.85 | | | $ | 8.14 | | | | $ | 8.31 | | |
| | | | | | | | | | | | | | | |
| Total Investment Return | | | (1.74 | )% | | | 1.60 | % | | | | (14.98 | )% | |
| | | | | | | | | | | | | | | |
| Net Assets, End of Period, in Thousands | | $ | 17,957 | | | $ | 18,285 | | | | $ | 16,562 | | |
| | | | | | | | | | | | | | | |
Ratios/Supplemental Data:(e)(f) | | | | | | | | | | | | | | |
| Ratio of expenses to average net assets: | | | | | | | | | | | | | | |
| Before expense reimbursement or recovery | | | 2.49 | % | | | 2.59 | % | | | | 3.19 | % | |
| After expense reimbursement or recovery | | | 2.06 | % | | | 2.09 | % | | | | 2.05 | % | |
| | | | | | | | | | | | | | | |
| Ratio of expenses to average net assets (excluding dividend and interest expense): | | | | | | | | | | | | | | |
| Before expense reimbursement or recovery | | | 2.47 | % | | | 2.54 | % | | | | 3.18 | % | |
| After expense reimbursement or recovery | | | 2.04 | % | | | 2.04 | % | | | | 2.04 | % | |
| | | | | | | | | | | | | | | |
| Ratio of net investment income (loss) to average net assets: | | | | | | | | | | | | | | |
| Before expense reimbursement or recovery | | | 0.57 | % | | | 0.61 | % | | | | 0.21 | % | |
| After expense reimbursement or recovery | | | 1.00 | % | | | 1.11 | % | | | | 1.35 | % | |
| | | | | | | | | | | | | | | |
Portfolio turnover rate(g) | | | 44 | % | | | 95 | % | | | | 38 | % | |
| (a) | All ratios have been annualized except total investment return and portfolio turnover. |
| (b) | Net investment income (loss) per share is based on average shares outstanding. |
| (c) | Realized and unrealized gains and losses in this caption are balancing amounts necessary to reconcile the change in net asset value per share for the period, and may not reconcile with the Fund’s consolidated statement of operations due to share transactions for the period. |
| (d) | Amount represents less than $0.005 per share. |
| (e) | Ratios do not include the income and expenses of the CTAs included in the swap. |
| (f) | Ratios do not include investment companies in which the Fund invests. |
| (g) | Portfolio turnover rate is calculated on the basis of the Fund as a whole without distinguishing between classes of shares issued. Consists of long-term investments only excludes securities sold short and swap transactions. |
The accompanying notes are an integral part of these consolidated financial statements.
| |
| |
| 72 | LoCorr Market Trend Fund - Consolidated Financial Highlights - Class A |
| |
LoCorr Market Trend Fund - Class A
Consolidated Financial Highlights
Selected Data and Ratios (for a share outstanding throughout the period)
| | | | | | | | | | | | | | | | | | Period from July 1, 2014 | |
| | | Six Months Ended | | | | | | | | | | | | | (commencement of operations) | |
| | | June 30, 2017 (a) | | | Year Ended December 31, | | | through | |
| | | (Unaudited) | | | 2016 | | | 2015 | | | December 31, 2014 (a) | |
| | | | | | | | | | | | | | | | | | | | | |
| Per Share | | | | | | | | | | | | | | | | | | | | | | | | |
| Net asset value, beginning of period | | | $ | 10.65 | | | | | $ | 12.00 | | | | | $ | 11.44 | | | | | $ | 10.00 | | |
| | | | | | | | | | | | | | | | | | | | | | | | | |
| Income (loss) from investment operations: | | | | | | | | | | | | | | | | | | | | | | | | |
| Net investment income (loss)(b) | | | | (0.06 | ) | | | | | (0.15 | ) | | | | | (0.19 | ) | | | | | (0.12 | ) | |
| Net realized and unrealized gain (loss) | | | | (0.28 | ) | | | | | (1.01 | ) | | | | | 0.84 | (c) | | | | | 1.99 | | |
| Total from Investment Operations | | | | (0.34 | ) | | | | | (1.16 | ) | | | | | 0.65 | | | | | | 1.87 | | |
| | | | | | | | | | | | | | | | | | | | | | | | | |
| Distributions to shareholders from: | | | | | | | | | | | | | | | | | | | | | | | | |
| Net investment income | | | | — | | | | | | (0.19 | ) | | | | | (0.07 | ) | | | | | (0.25 | ) | |
| Net realized gains | | | | — | | | | | | — | | | | | | (0.02 | ) | | | | | (0.18 | ) | |
| Total Distributions | | | | — | | | | | | (0.19 | ) | | | | | (0.09 | ) | | | | | (0.43 | ) | |
| | | | | | | | | | | | | | | | | | | | | | | | | |
| Redemption Fees(d) | | | | 0.00 | | | | | | 0.00 | | | | | | 0.00 | | | | | | 0.00 | | |
| | | | | | | | | | | | | | | | | | | | | | | | | |
| Net Asset Value, End of Period | | | $ | 10.31 | | | | | $ | 10.65 | | | | | $ | 12.00 | | | | | $ | 11.44 | | |
| | | | | | | | | | | | | | | | | | | | | | | | | |
| Total Investment Return(e) | | | | (3.19 | )% | | | | | (9.71 | )% | | | | | 5.68 | % | | | | | 18.74 | % | |
| | | | | | | | | | | | | | | | | | | | | | | | | |
| Net Assets, End of Period, in Thousands | | | $ | 76,633 | | | | | $ | 133,146 | | | | | $ | 110,324 | | | | | $ | 13,337 | | |
| | | | | | | | | | | | | | | | | | | | | | | | | |
| Ratios/Supplemental Data: | | | | | | | | | | | | | | | | | | | | | | | | |
| Ratio of expenses to average net assets: | | | | | | | | | | | | | | | | | | | | | | | | |
| Before expense reimbursement or recovery | | | | 2.09 | % | | | | | 2.02 | %(f) | | | | | 2.03 | % | | | | | 3.64 | % | |
| After expense reimbursement or recovery | | | | 2.09 | % | | | | | 2.02 | %(f) | | | | | 2.06 | % | | | | | 2.20 | % | |
| | | | | | | | | | | | | | | | | | | | | | | | | |
| Ratio of net investment income (loss) to average net assets: | | | | | | | | | | | | | | | | | | | | | | | | |
| Before expense reimbursement or recovery | | | | (1.14 | )% | | | | | (1.24 | )% | | | | | (1.49 | )% | | | | | (3.48 | )% | |
| After expense reimbursement or recovery | | | | (1.14 | )% | | | | | (1.24 | )% | | | | | (1.52 | )% | | | | | (2.04 | )% | |
| | | | | | | | | | | | | | | | | | | | | | | | | |
| Portfolio turnover rate(g) | | | | 46 | % | | | | | 83 | % | | | | | 27 | % | | | | | 6 | % | |
(a) | All ratios have been annualized except total investment return and portfolio turnover. |
(b) | Net investment income (loss) per share is based on average shares outstanding. |
(c) | Realized and unrealized gains and losses per share in this caption are balancing amounts necessary to reconcile the change in net asset value per share for the period, and may not reconcile with the Fund’s consolidated statement of operations due to share transactions for the period. |
(d) | Amount represents less than $0.005 per share. |
(e) | Total investment return excludes the effect of applicable sales charges. |
(f) | Includes 0.00% of interest expense for the year ended December 31, 2016. |
(g) | Portfolio turnover rate is calculated on the basis of the Fund as a whole without distinguishing between classes of shares issued. Consists of long-term investments only; excludes derivative instruments. |
The accompanying notes are an integral part of these consolidated financial statements.
| |
| |
LoCorr Market Trend Fund - Consolidated Financial Highlights - Class C | 73 |
| |
LoCorr Market Trend Fund - Class C
Consolidated Financial Highlights
Selected Data and Ratios (for a share outstanding throughout the period)
| | | | | | | | | | | | | | | | | | Period from July 1, 2014 | |
| | | Six Months Ended | | | | | | | | | | | | | (commencement of operations) | |
| | | June 30, 2017 (a) | | | Year Ended December 31, | | | through | |
| | | (Unaudited) | | | 2016 | | | 2015 | | | December 31, 2014 (a) | |
| | | | | | | | | | | | | | | | | | | | | |
| Per Share | | | | | | | | | | | | | | | | | | | | | | | | |
| Net asset value, beginning of period | | | $ | 10.53 | | | | | $ | 11.92 | | | | | $ | 11.41 | | | | | $ | 10.00 | | |
| | | | | | | | | | | | | | | | | | | | | | | | | |
| Income (loss) from investment operations: | | | | | | | | | | | | | | | | | | | | | | | | |
| Net investment income (loss)(b) | | | | (0.10) | | | | | | (0.23) | | | | | | (0.28) | | | | | | (0.16) | | |
| Net realized and unrealized gain (loss) | | | | (0.27) | | | | | | (1.01) | | | | | | 0.84) | (c) | | | | | 1.99 | | |
| Total from Investment Operations | | | | (0.37) | | | | | | (1.24) | | | | | | 0.56 | | | | | | 1.83 | | |
| | | | | | | | | | | | | | | | | | | | | | | | | |
| Distributions to shareholders from: | | | | | | | | | | | | | | | | | | | | | | | | |
| Net investment income | | | | — | | | | | | (0.15) | | | | | | (0.03) | | | | | | (0.24) | | |
| Net realized gains | | | | — | | | | | | — | | | | | | (0.02) | | | | | | (0.18) | | |
| Total Distributions | | | | — | | | | | | (0.15) | | | | | | (0.05) | | | | | | (0.42) | | |
| | | | | | | | | | | | | | | | | | | | | | | | | |
| Redemption Fees(d) | | | | 0.00 | | | | | | 0.00 | | | | | | 0.00 | | | | | | 0.00 | | |
| | | | | | | | | | | | | | | | | | | | | | | | | |
| Net Asset Value, End of Period | | | $ | 10.16 | | | | | $ | 10.53 | | | | | $ | 11.92 | | | | | $ | 11.41 | | |
| | | | | | | | | | | | | | | | | | | | | | | | | |
| Total Investment Return(e) | | | | (3.51) | % | | | | | (10.45) | % | | | | | 4.90 | % | | | | | 18.29 | % | |
| | | | | | | | | | | | | | | | | | | | | | | | | |
| Net Assets, End of Period, in Thousands | | | $ | 56,598 | | | | | $ | 89,454 | | | | | $ | 94,707 | | | | | $ | 6,949 | | |
| | | | | | | | | | | | | | | | | | | | | | | | | |
| Ratios/Supplemental Data: | | | | | | | | | | | | | | | | | | | | | | | | |
| Ratio of expenses to average net assets: | | | | | | | | | | | | | | | | | | | | | | | | |
| Before expense reimbursement or recovery | | | | 2.84 | % | | | | | 2.77 | %(f) | | | | | 2.78 | % | | | | | 4.39 | % | |
| After expense reimbursement or recovery | | | | 2.84 | % | | | | | 2.77 | %(f) | | | | | 2.81 | % | | | | | 2.95 | % | |
| | | | | | | | | | | | | | | | | | | | | | | | | |
| Ratio of net investment income (loss) to average net assets: | | | | | | | | | | | | | | | | | | | | | | | | |
| Before expense reimbursement or recovery | | | | (1.89) | % | | | | | (1.99) | % | | | | | (2.24) | % | | | | | (4.23) | % | |
| After expense reimbursement or recovery | | | | (1.89) | % | | | | | (1.99) | % | | | | | (2.27) | % | | | | | (2.79) | % | |
| | | | | | | | | | | | | | | | | | | | | | | | | |
| Portfolio turnover rate(g) | | | | 46 | % | | | | | 83 | % | | | | | 27 | % | | | | | 6 | % | |
(a) | All ratios have been annualized except total investment return and portfolio turnover. |
(b) | Net investment income (loss) per share is based on average shares outstanding. |
(c) | Realized and unrealized gains and losses per share in this caption are balancing amounts necessary to reconcile the change in net asset value per share for the period, and may not reconcile with the Fund’s consolidated statement of operations due to share transactions for the period. |
(d) | Amount represents less than $0.005 per share. |
(e) | Total investment return excludes the effect of applicable sales charges. |
(f) | Includes 0.00% of interest expense for the year ended December 31, 2016. |
(g) | Portfolio turnover rate is calculated on the basis of the Fund as a whole without distinguishing between classes of shares issued. Consists of long-term investments only; excludes derivative instruments. |
The accompanying notes are an integral part of these consolidated financial statements.
| |
| |
74 | LoCorr Market Trend Fund - Consolidated Financial Highlights - Class I |
| |
LoCorr Market Trend Fund - Class I
Consolidated Financial Highlights
Selected Data and Ratios (for a share outstanding throughout the period)
| | | | | | | | | | | | | | | | | Period from July 1, 2014 | |
| | | Six Months Ended | | | | | | | | | | | | (commencement of operations) | |
| | | June 30, 2017 (a) | | Year Ended December 31, | | | through | |
| | | (Unaudited) | | | 2016 | | | | | 2015 | | | | December 31, 2014 (a) | |
| | | | | | | | | | | | | | | | | | | | |
| Per Share | | | | | | | | | | | | | | | | | | | | | | | |
| Net asset value, beginning of period | | | $ | 10.68 | | | | $ | 12.02 | | | | | $ | 11.45 | | | | | $ | 10.00 | | |
| | | | | | | | | | | | | | | | | | | | | | | | |
| Income (loss) from investment operations: | | | | | | | | | | | | | | | | | | | | | | | |
| Net investment income (loss)(b) | | | | (0.05) | | | | | (0.12) | | | | | | (0.16) | | | | | | (0.10) | | |
| Net realized and unrealized gain (loss) | | | | (0.28) | | | | | (1.02) | | | | | | 0.84 | (c) | | | | | 1.99 | | |
| Total from Investment Operations | | | | (0.33) | | | | | (1.14) | | | | | | 0.68 | | | | | | 1.89 | | |
| | | | | | | | | | | | | | | | | | | | | | | | |
| Distributions to shareholders from: | | | | | | | | | | | | | | | | | | | | | | | |
| Net investment income | | | | — | | | | | (0.20) | | | | | | (0.09 | ) | | | | | (0.26) | | |
| Net realized gains | | | | — | | | | | — | | | | | | (0.02 | ) | | | | | (0.18) | | |
| Total Distributions | | | | — | | | | | (0.20) | | | | | | (0.11 | ) | | | | | (0.44) | | |
| | | | | | | | | | | | | | | | | | | | | | | | |
| Redemption Fees(d) | | | | 0.00 | | | | | 0.00 | | | | | | 0.00 | | | | | | 0.00 | | |
| | | | | | | | | | | | | | | | | | | | | | | | |
| Net Asset Value, End of Period | | | $ | 10.35 | | | | $ | 10.68 | | | | | $ | 12.02 | | | | | $ | 11.45 | | |
| | | | | | | | | | | | | | | | | | | | | | | | |
| Total Investment Return | | | | (3.09) | % | | | | (9.49) | % | | | | | 5.96 | % | | | | | 18.88 | % | |
| | | | | | | | | | | | | | | | | | | | | | | | |
| Net Assets, End of Period, in Thousands | | | $ | 641,475 | | | | $ | 797,845 | | | | | $ | 695,987 | | | | | $ | 40,192 | | |
| | | | | | | | | | | | | | | | | | | | | | | | |
| Ratios/Supplemental Data: | | | | | | | | | | | | | | | | | | | | | | | |
| Ratio of expenses to average net assets: | | | | | | | | | | | | | | | | | | | | | | | |
| Before expense reimbursement or recovery | | | | 1.84 | % | | | | 1.77 | %(e) | | | | | 1.78 | % | | | | | 3.39 | % | |
| After expense reimbursement or recovery | | | | 1.84 | % | | | | 1.77 | %(e) | | | | | 1.81 | % | | | | | 1.95 | % | |
| | | | | | | | | | | | | | | | | | | | | | | | |
| Ratio of net investment income (loss) to average net assets: | | | | | | | | | | | | | | | | | | | | | | | |
| Before expense reimbursement or recovery | | | | (0.89) | % | | | | (0.99) | % | | | | | (1.24) | % | | | | | (3.23) | % | |
| After expense reimbursement or recovery | | | | (0.89) | % | | | | (0.99) | % | | | | | (1.27) | % | | | | | (1.79) | % | |
| | | | | | | | | | | | | | | | | | | | | | | | |
| Portfolio turnover rate(f) | | | | 46 | % | | | | 83 | % | | | | | 27 | % | | | | | 6 | % | |
(a) | All ratios have been annualized except total investment return and portfolio turnover. |
(b) | Net investment income (loss) per share is based on average shares outstanding. |
(c) | Realized and unrealized gains and losses per share in this caption are balancing amounts necessary to reconcile the change in net asset value per share for the period, and may not reconcile with the Fund’s consolidated statement of operations due to share transactions for the period. |
(d) | Amount represents less than $0.005 per share. |
(e) | Includes 0.00% of interest expense for the year ended December 31, 2016. |
(f) | Portfolio turnover rate is calculated on the basis of the Fund as a whole without distinguishing between classes of shares issued. Consists of long-term investments only; excludes derivative instruments. |
The accompanying notes are an integral part of these consolidated financial statements.
| |
| |
LoCorr Dynamic Equity Fund - Financial Highlights - Class A | 75 |
| |
LoCorr Dynamic Equity Fund - Class A
Financial Highlights
Selected Data and Ratios (for a share outstanding throughout the period)
| | | | | | | | | | | | | | | | | | Period from May 10, | |
| | | Six Months Ended | | | | | | | | | | | | | 2013 (commencement of | |
| | | June 30, 2017 (a) | | Year Ended December 31, | | | operations) through | |
| | | (Unaudited) | | | 2016 | | | 2015 | | | 2014 | | | | December 31, 2013 (a) | |
| | | | | | | | | | | | | | | | | | | | | |
| Per Share | | | | | | | | | | | | | | | | | | | | | | | | | |
| Net asset value, beginning of period | | | $ | 12.06 | | | | $ | 9.64 | | | $ | 9.80 | | | $ | 11.48 | | | | | $ | 10.00 | | |
| | | | | | | | | | | | | | | | | | | | | | | | | | |
| Income (loss) from investment operations: | | | | | | | | | | | | | | | | | | | | | | | | | |
| Net investment income (loss)(b) | | | | (0.15) | | | | | (0.32) | | | | (0.27) | | | | (0.22) | | | | | | (0.13) | | |
| Net realized and unrealized gain (loss) | | | | 0.07 | | | | | 2.74 | | | | 0.11 | | | | (1.42) | | | | | | 1.61 | | |
| Total from Investment Operations | | | | (0.08) | | | | | 2.42 | | | | (0.16) | | | | (1.64) | | | | | | 1.48 | | |
| | | | | | | | | | | | | | | | | | | | | | | | | | |
| Distributions to shareholders from: | | | | | | | | | | | | | | | | | | | | | | | | | |
| Net realized gains | | | | — | | | | | — | | | | — | | | | (0.04) | | | | | | — | | |
| Total Distributions | | | | — | | | | | — | | | | — | | | | (0.04) | | | | | | — | | |
| | | | | | | | | | | | | | | | | | | | | | | | | | |
| Redemption Fees(c) | | | | 0.00 | | | | | 0.00 | | | | 0.00 | | | | 0.00 | | | | | | 0.00 | | |
| | | | | | | | | | | | | | | | | | | | | | | | | | |
| Net Asset Value, End of Period | | | $ | 11.98 | | | | $ | 12.06 | | | $ | 9.64 | | | $ | 9.80 | | | | | $ | 11.48 | | |
| | | | | | | | | | | | | | | | | | | | | | | | | | |
| Total Investment Return(d) | | | | (0.66) | % | | | | 25.10 | % | | | (1.53) | % | | | (14.37) | % | | | | | 14.80 | % | |
| | | | | | | | | | | | | | | | | | | | | | | | | | |
| Net Assets, End of Period, in Thousands | | | $ | 18,057 | | | | $ | 28,243 | | | $ | 12,446 | | | $ | 17,174 | | | | | $ | 21,256 | | |
| | | | | | | | | | | | | | | | | | | | | | | | | | |
| Ratios/Supplemental Data: | | | | | | | | | | | | | | | | | | | | | | | | | |
| Ratio of expenses to average net assets: | | | | | | | | | | | | | | | | | | | | | | | | | |
| Before expense reimbursement or recovery | | | | 3.38 | % | | | | 3.74 | % | | | 3.72 | % | | | 3.55 | % | | | | | 5.05 | % | |
| After expense reimbursement or recovery | | | | 3.38 | % | | | | 3.49 | % | | | 3.35 | % | | | 3.30 | % | | | | | 3.26 | % | |
| | | | | | | | | | | | | | | | | | | | | | | | | | |
| Ratio of expenses to average net assets (excluding dividend and interest expense): | | | | | | | | | | | | | | | | | | | | | | | | | |
| Before expense reimbursement or recovery | | | | 3.15 | % | | | | 3.40 | % | | | 3.52 | % | | | 3.40 | % | | | | | 4.94 | % | |
| After expense reimbursement or recovery | | | | 3.15 | % | | | | 3.15 | % | | | 3.15 | % | | | 3.15 | % | | | | | 3.15 | % | |
| | | | | | | | | | | | | | | | | | | | | | | | | | |
| Ratio of net investment income (loss) to average net assets: | | | | | | | | | | | | | | | | | | | | | | | | | |
| Before expense reimbursement or recovery | | | | (2.62) | % | | | | (3.23) | % | | | (3.06) | % | | | (2.41) | % | | | | | (3.64) | % | |
| After expense reimbursement or recovery | | | | (2.62) | % | | | | (2.98) | % | | | (2.69) | % | | | (2.16) | % | | | | | (1.85) | % | |
| | | | | | | | | | | | | | | | | | | | | | | | | | |
| Portfolio turnover rate(e) | | | | 216 | % | | | | 343 | % | | | 269 | % | | | 256 | % | | | | | 66 | % | |
(a) | All ratios have been annualized except total investment return and portfolio turnover. |
(b) | Net investment income (loss) per share is based on average shares outstanding. |
(c) | Amount represents less than $0.005 per share. |
(d) | Total investment return excludes the effect of applicable sales charges. |
(e) | Portfolio turnover rate is calculated on the basis of the Fund as a whole without distinguishing between classes of shares issued. Consists of long-term investments only; excludes securities sold short. |
The accompanying notes are an integral part of these financial statements.
| |
| |
76 | LoCorr Dynamic Equity Fund - Financial Highlights - Class C |
| |
LoCorr Dynamic Equity Fund - Class C
Financial Highlights
Selected Data and Ratios (for a share outstanding throughout the period)
| | | | | | | | | | | | | | | | | | Period from May 10, | |
| | | Six Months Ended | | | | | | | | | | | | | | 2013 (commencement of | |
| | | June 30, 2017 (a) | | | Year Ended December 31, | | | operations) through | |
| | | (Unaudited) | | | | 2016 | | | 2015 | | | 2014 | | | | December 31, 2013 (a) | |
| | | | | | | | | | | | | | | | | | | | | |
| Per Share | | | | | | | | | | | | | | | | | | | | | | | | | |
| Net asset value, beginning of period | | | $ | 11.73 | | | | $ | 9.45 | | | $ | 9.67 | | | $ | 11.42 | | | | | $ | 10.00 | | |
| | | | | | | | | | | | | | | | | | | | | | | | | | |
| Income (loss) from investment operations: | | | | | | | | | | | | | | | | | | | | | | | | | |
| Net investment income (loss)(b) | | | | (0.19) | | | | | (0.38) | | | | (0.33) | | | | (0.29) | | | | | | (0.18) | | |
| Net realized and unrealized gain (loss) | | | | 0.07 | | | | | 2.66 | | | | 0.11 | | | | (1.42) | | | | | | 1.60 | | |
| Total from Investment Operations | | | | (0.12) | | | | | 2.28 | | | | (0.22 | ) | | | (1.71) | | | | | | 1.42 | | |
| | | | | | | | | | | | | | | | | | | | | | | | | | |
| Distributions to shareholders from: | | | | | | | | | | | | | | | | | | | | | | | | | |
| Net realized gains | | | | — | | | | | — | | | | — | | | | (0.04) | | | | | | — | | |
| Total Distributions | | | | — | | | | | — | | | | — | | | | (0.04) | | | | | | — | | |
| | | | | | | | | | | | | | | | | | | | | | | | | | |
| Redemption Fees | | | | 0.00 | (c) | | | | 0.00 | (c) | | | 0.00 | (c) | | | 0.00 | (c) | | | | | — | | |
| | | | | | | | | | | | | | | | | | | | | | | | | | |
| Net Asset Value, End of Period | | | $ | 11.61 | | | | $ | 11.73 | | | $ | 9.45 | | | $ | 9.67 | | | | | $ | 11.42 | | |
| | | | | | | | | | | | | | | | | | | | | | | | | | |
| Total Investment Return(d) | | | | (1.02) | % | | | | 24.13 | % | | | (2.28) | % | | | (14.98) | % | | | | | 14.20 | % | |
| | | | | | | | | | | | | | | | | | | | | | | | | | |
| Net Assets, End of Period, in Thousands | | | $ | 11,751 | | | | $ | 11,218 | | | $ | 7,837 | | | $ | 12,158 | | | | | $ | 8,443 | | |
| | | | | | | | | | | | | | | | | | | | | | | | | | |
| Ratios/Supplemental Data: | | | | | | | | | | | | | | | | | | | | | | | | | |
| Ratio of expenses to average net assets: | | | | | | | | | | | | | | | | | | | | | | | | | |
| Before expense reimbursement or recovery | | | | 4.13 | % | | | | 4.49 | % | | | 4.47 | % | | | 4.30 | % | | | | | 5.80 | % | |
| After expense reimbursement or recovery | | | | 4.13 | % | | | | 4.24 | % | | | 4.10 | % | | | 4.05 | % | | | | | 4.01 | % | |
| | | | | | | | | | | | | | | | | | | | | | | | | | |
Ratio of expenses to average net assets (excluding dividend
and interest expense): | | | | | | | | | | | | | | | | | | | | | | | | | |
| Before expense reimbursement or recovery | | | | 3.90 | % | | | | 4.15 | % | | | 4.27 | % | | | 4.15 | % | | | | | 5.69 | % | |
| After expense reimbursement or recovery | | | | 3.90 | % | | | | 3.90 | % | | | 3.90 | % | | | 3.90 | % | | | | | 3.90 | % | |
| | | | | | | | | | | | | | | | | | | | | | | | | | |
| Ratio of net investment income (loss) to average net assets: | | | | | | | | | | | | | | | | | | | | | | | | | |
| Before expense reimbursement or recovery | | | | (3.37) | % | | | | (3.98) | % | | | (3.81) | % | | | (3.16) | % | | | | | (4.39) | % | |
| After expense reimbursement or recovery | | | | (3.37) | % | | | | (3.73) | % | | | (3.44) | % | | | (2.91) | % | | | | | (2.60) | % | |
| | | | | | | | | | | | | | | | | | | | | | | | | | |
Portfolio turnover rate(e) | | | | 216 | % | | | | 343 | % | | | 269 | % | | | 256 | % | | | | | 66 | % | |
(a) | All ratios have been annualized except total investment return and portfolio turnover. |
(b) | Net investment income (loss) per share is based on average shares outstanding. |
(c) | Amount represents less than $0.005 per share. |
(d) | Total investment return excludes the effect of applicable sales charges. |
(e) | Portfolio turnover rate is calculated on the basis of the Fund as a whole without distinguishing between classes of shares issued. Consists of long-term investments only; excludes securities sold short. |
The accompanying notes are an integral part of these financial statements.
| |
| |
LoCorr Dynamic Equity Fund - Financial Highlights - Class I | 77 |
| |
LoCorr Dynamic Equity Fund - Class I
Financial Highlights
Selected Data and Ratios (for a share outstanding throughout the period)
| | | | | | | | | | | | | | | Period from May 10, |
| | | Six Months Ended | | | | | | | | | | | | 2013 (commencement of |
| | | June 30, 2017 (a) | | | Year Ended December 31, | | | operations) through |
| | | (Unaudited) | | | 2016 | | | 2015 | | | 2014 | | | December 31, 2013(a)(a) |
| | | | | | | | | | | | | | | | |
| Per Share | | | | | | | | | | | | | | | |
| Net asset value, beginning of period | | $ | 12.17 | | | $ | 9.71 | | | $ | 9.84 | | | $ | 11.50 | | | $ | 10.00 | |
| | | | | | | | | | | | | | | | | | | | | |
| Income (loss) from investment operations: | | | | | | | | | | | | | | | | | | | | |
Net investment income (loss)(b) | | | (0.14) | | | | (0.30) | | | | (0.24) | | | | (0.20) | | | | (0.11) | |
| Net realized and unrealized gain (loss) | | | 0.08 | | | | 2.76 | | | | 0.11 | | | | (1.42) | | | | 1.61 | |
| Total from Investment Operations | | | (0.06) | | | | 2.46 | | | | (0.13) | | | | (1.62) | | | | 1.50 | |
| | | | | | | | | | | | | | | | | | | | | |
| Distributions to shareholders from: | | | | | | | | | | | | | | | | | | | | |
| Net realized gains | | | — | | | | — | | | | — | | | | (0.04) | | | | — | |
| Total Distributions | | | — | | | | — | | | | — | | | | (0.04) | | | | — | |
| | | | | | | | | | | | | | | | | | | | | |
Redemption Fees(c) | | | 0.00 | | | | 0.00 | | | | 0.00 | | | | 0.00 | | | | 0.00 | |
| | | | | | | | | | | | | | | | | | | | | |
| Net Asset Value, End of Period | | $ | 12.11 | | | $ | 12.17 | | | $ | 9.71 | | | $ | 9.84 | | | $ | 11.50 | |
| | | | | | | | | | | | | | | | | | | | | |
| Total Investment Return | | | (0.49) | % | | | 25.33 | % | | | (1.22) | % | | | (14.18) | % | | | 15.00 | % |
| | | | | | | | | | | | | | | | | | | | | |
| Net Assets, End of Period, in Thousands | | $ | 50,553 | | | $ | 44,816 | | | $ | 9,990 | | | $ | 12,304 | | | $ | 12,361 | |
| | | | | | | | | | | | | | | | | | | | | |
| Ratios/Supplemental Data: | | | | | | | | | | | | | | | | | | | | |
| Ratio of expenses to average net assets: | | | | | | | | | | | | | | | | | | | | |
| Before expense reimbursement or recovery | | | 3.13 | % | | | 3.49 | % | | | 3.47 | % | | | 3.30 | % | | | 4.80 | % |
| After expense reimbursement or recovery | | | 3.13 | % | | | 3.24 | % | | | 3.10 | % | | | 3.05 | % | | | 3.01 | % |
| | | | | | | | | | | | | | | | | | | | | |
| Ratio of expenses to average net assets (excluding dividend and interest expense): | | | | | | | |
| Before expense reimbursement or recovery | | | 2.90 | % | | | 3.15 | % | | | 3.27 | % | | | 3.15 | % | | | 4.69 | % |
| After expense reimbursement or recovery | | | 2.90 | % | | | 2.90 | % | | | 2.90 | % | | | 2.90 | % | | | 2.90 | % |
| | | | | | | | | | | | | | | | | | | | | |
| Ratio of net investment income (loss) to average net assets: | | | | | | | | | | | | | | | | | | | | |
| Before expense reimbursement or recovery | | | (2.37) | % | | | (2.98) | % | | | (2.81) | % | | | (2.16) | % | | | (3.39) | % |
| After expense reimbursement or recovery | | | (2.37) | % | | | (2.73) | % | | | (2.44) | % | | | (1.91) | % | | | (1.60) | % |
| | | | | | | | | | | | | | | | | | | | | |
Portfolio turnover rate(d) | | | 216 | % | | | 343 | % | | | 269 | % | | | 256 | % | | | 66 | % |
| (a) | All ratios have been annualized except total investment return and portfolio turnover. |
| (b) | Net investment income (loss) per share is based on average shares outstanding. |
| (c) | Amount represents less than $0.005 per share. |
| (d) | Portfolio turnover rate is calculated on the basis of the Fund as a whole without distinguishing between classes of shares issued. Consists of long-term investments only; excludes securities sold short. |
The accompanying notes are an integral part of these financial statements.
| |
| |
78 | LoCorr Spectrum Income Fund - Financial Highlights - Class A |
| |
LoCorr Spectrum Income Fund - Class A
Financial Highlights
Selected Data and Ratios (for a share outstanding throughout the period)
| | | Six Months Ended | | | | | | | | | | |
| | | June 30, 2017(a) | | | Year Ended December 31, |
| | | (Unaudited) | | | 2016 | | | 2015 | | | 2014 |
| | | | | | | | | | | | | |
| Per Share | | | | | | | | | | | | |
| Net asset value, beginning of period | | $ | 7.70 | | | $ | 7.78 | | | $ | 8.97 | | | $ | 10.00 | |
| | | | | | | | | | | | | | | | | |
| Income (loss) from investment operations: | | | | | | | | | | | | | | | | |
Net investment income (loss)(b) | | | 0.12 | | | | 0.29 | | | | 0.38 | | | | 0.41 | |
| Net realized and unrealized gain (loss) | | | 0.09 | | | | 0.20 | | | | (1.00) | | | | (0.91) | |
| Total from Investment Operations | | | 0.21 | | | | 0.49 | | | | (0.62) | | | | (0.50) | |
| | | | | | | | | | | | | | | | | |
| Distributions to shareholders from: | | | | | | | | | | | | | | | | |
| Net investment income | | | (0.29) | | | | (0.37) | | | | (0.39) | | | | (0.36) | |
| Return of capital | | | — | | | | (0.20) | | | | (0.18) | | | | (0.17) | |
| Total Distributions | | | (0.29) | | | | (0.57) | | | | (0.57) | | | | (0.53) | |
| | | | | | | | | | | | | | | | | |
Redemption Fees(c) | | | 0.00 | | | | 0.00 | | | | 0.00 | | | | 0.00 | |
| | | | | | | | | | | | | | | | | |
| Net Asset Value, End of Period | | $ | 7.62 | | | $ | 7.70 | | | $ | 7.78 | | | $ | 8.97 | |
| | | | | | | | | | | | | | | | | |
Total Investment Return(d) | | | 2.69 | % | | | 6.64 | % | | | (7.36) | % | | | (5.45) | % |
| | | | | | | | | | | | | | | | | |
| Net Assets, End of Period, in Thousands | | $ | 34,849 | | | $ | 33,032 | | | $ | 36,957 | | | $ | 37,425 | |
| | | | | | | | | | | | | | | | | |
Ratios/Supplemental Data:(e) | | | | | | | | | | | | | | | | |
| Ratio of expenses to average net assets: | | | | | | | | | | | | | | | | |
| Before expense reimbursement or recovery | | | 1.96 | % | | | 2.02 | % | | | 1.99 | %(f) | | | 2.28 | %(f) |
| After expense reimbursement or recovery | | | 2.03 | % | | | 2.05 | % | | | 2.05 | %(f) | | | 2.05 | %(f) |
| | | | | | | | | | | | | | | | | |
| Ratio of net investment income (loss) to average net assets: | | | | | | | | | | | | | | | | |
| Before expense reimbursement or recovery | | | 3.07 | % | | | 3.81 | % | | | 4.41 | % | | | 3.88 | % |
| After expense reimbursement or recovery | | | 3.00 | % | | | 3.78 | % | | | 4.35 | % | | | 4.11 | % |
| | | | | | | | | | | | | | | | | |
Portfolio turnover rate(g) | | | 38 | % | | | 92 | % | | | 54 | % | | | 43 | % |
| (a) | All ratios have been annualized except total investment return and portfolio turnover. |
| (b) | Net investment income (loss) per share is based on average shares outstanding. |
| (c) | Amount represents less than $0.005 per share. |
| (d) | Total investment return excludes the effect of applicable sales charges. |
| (e) | Ratios do not include the expenses of the investment companies in which the Fund invests. |
| (f) | Includes interest expense on line of credit of 0.00% and 0.00% for the years ended December 31, 2015 and 2014, respectively. |
| (g) | Portfolio turnover rate is calculated on the basis of the Fund as a whole without distinguishing between classes of shares issued. |
The accompanying notes are an integral part of these financial statements.
| |
| |
LoCorr Spectrum Income Fund - Financial Highlights - Class C | 79 |
| |
LoCorr Spectrum Income Fund - Class C
Financial Highlights
Selected Data and Ratios (for a share outstanding throughout the period)
| | | Six Months Ended | | | | | | | | | | |
| | | June 30, 2017(a) | | | Year Ended December 31, |
| | | (Unaudited) | | | 2016 | | | 2015 | | | 2014 | |
| | | | | | | | | | | | | |
| Per Share | | | | | | | | | | | | |
| Net asset value, beginning of period | | $ | 7.72 | | | $ | 7.78 | | | $ | 8.96 | | | $ | 10.00 | |
| | | | | | | | | | | | | | | | | |
| Income (loss) from investment operations: | | | | | | | | | | | | | | | | |
Net investment income (loss)(b) | | | 0.09 | | | | 0.23 | | | | 0.32 | | | | 0.33 | |
| Net realized and unrealized gain (loss) | | | 0.08 | | | | 0.21 | | | | (1.00) | | | | (0.91) | |
| Total from Investment Operations | | | 0.17 | | | | 0.44 | | | | (0.68) | | | | (0.58) | |
| | | | | | | | | | | | | | | | | |
| Distributions to shareholders from: | | | | | | | | | | | | | | | | |
| Net investment income | | | (0.25) | | | | (0.33) | | | | (0.34) | | | | (0.31) | |
| Return of capital | | | — | | | | (0.17) | | | | (0.16) | | | | (0.15) | |
| Total Distributions | | | (0.25) | | | | (0.50) | | | | (0.50) | | | | (0.46) | |
| | | | | | | | | | | | | | | | | |
Redemption Fees(c) | | | 0.00 | | | | 0.00 | | | | 0.00 | | | | 0.00 | |
| | | | | | | | | | | | | | | | | |
| Net Asset Value, End of Period | | $ | 7.64 | | | $ | 7.72 | | | $ | 7.78 | | | $ | 8.96 | |
| | | | | | | | | | | | | | | | | |
Total Investment Return(d) | | | 2.19 | % | | | 5.88 | % | | | (8.05) | % | | | (6.19) | % |
| | | | | | | | | | | | | | | | | |
| Net Assets, End of Period, in Thousands | | $ | 25,663 | | | $ | 25,898 | | | $ | 27,817 | | | $ | 25,210 | |
| | | | | | | | | | | | | | | | | |
Ratios/Supplemental Data:(e) | | | | | | | | | | | | | | | | |
| Ratio of expenses to average net assets: | | | | | | | | | | | | | | | | |
| Before expense reimbursement or recovery | | | 2.71 | % | | | 2.77 | % | | | 2.74 | %(f) | | | 3.03 | %(f) |
| After expense reimbursement or recovery | | | 2.78 | % | | | 2.80 | % | | | 2.80 | %(f) | | | 2.80 | %(f) |
| | | | | | | | | | | | | | | | | |
| Ratio of net investment income (loss) to average net assets: | | | | | | | | | | | | | | | | |
| Before expense reimbursement or recovery | | | 2.32 | % | | | 3.06 | % | | | 3.66 | % | | | 3.13 | % |
| After expense reimbursement or recovery | | | 2.25 | % | | | 3.03 | % | | | 3.60 | % | | | 3.36 | % |
| | | | | | | | | | | | | | | | | |
Portfolio turnover rate(g) | | | 38 | % | | | 92 | % | | | 54 | % | | | 43 | % |
| (a) | All ratios have been annualized except total investment return and portfolio turnover. |
| (b) | Net investment income (loss) per share is based on average shares outstanding. |
| (c) | Amount represents less than $0.005 per share. |
| (d) | Total investment return excludes the effect of applicable sales charges. |
| (e) | Ratios do not include the expenses of the investment companies in which the Fund invests. |
| (f) | Includes interest expense on line of credit of 0.00% and 0.00% for the years ended December 31, 2015 and 2014, respectively. |
| (g) | Portfolio turnover rate is calculated on the basis of the Fund as a whole without distinguishing between classes of shares issued. |
The accompanying notes are an integral part of these financial statements.
| |
| |
80 | LoCorr Spectrum Income Fund - Financial Highlights - Class I |
| |
LoCorr Spectrum Income Fund - Class I
Financial Highlights
Selected Data and Ratios (for a share outstanding throughout the period)
| | | Six Months Ended | | | | | | | | | | |
| | | June 30, 2017(a) | | | Year Ended December 31, |
| | | (Unaudited) | | | 2016 | | | 2015 | | | 2014 | |
| | | | | | | | | | | | | |
| Per Share | | | | | | | | | | | | |
| Net asset value, beginning of period | | $ | 7.69 | | | $ | 7.78 | | | $ | 8.97 | | | $ | 10.00 | |
| | | | | | | | | | | | | | | | | |
| Income (loss) from investment operations: | | | | | | | | | | | | | | | | |
Net investment income (loss)(b) | | | 0.13 | | | | 0.31 | | | | 0.41 | | | | 0.43 | |
| Net realized and unrealized gain (loss) | | | 0.09 | | | | 0.20 | | | | (1.00) | | | | (0.91) | |
| Total from Investment Operations | | | 0.22 | | | | 0.51 | | | | (0.59) | | | | (0.48) | |
| | | | | | | | | | | | | | | | | |
| Distributions to shareholders from: | | | | | | | | | | | | | | | | |
| Net investment income | | | (0.30) | | | | (0.39) | | | | (0.41) | | | | (0.38) | |
| Return of capital | | | — | | | | (0.21) | | | | (0.19) | | | | (0.17) | |
| Total Distributions | | | (0.30) | | | | (0.60) | | | | (0.60) | | | | (0.55) | |
| | | | | | | | | | | | | | | | | |
Redemption Fees(c) | | | 0.00 | | | | 0.00 | | | | 0.00 | | | | 0.00 | |
| | | | | | | | | | | | | | | | | |
| Net Asset Value, End of Period | | $ | 7.61 | | | $ | 7.69 | | | $ | 7.78 | | | $ | 8.97 | |
| | | | | | | | | | | | | | | | | |
| Total Investment Return | | | 2.85 | % | | | 6.85 | % | | | (7.10) | % | | | (5.23) | % |
| | | | | | | | | | | | | | | | | |
| Net Assets, End of Period, in Thousands | | $ | 51,944 | | | $ | 46,838 | | | $ | 28,292 | | | $ | 31,428 | |
| | | | | | | | | | | | | | | | | |
Ratios/Supplemental Data:(d) | | | | | | | | | | | | | | | | |
| Ratio of expenses to average net assets: | | | | | | | | | | | | | | | | |
| Before expense reimbursement or recovery | | | 1.71 | % | | | 1.77 | % | | | 1.74 | %(e) | | | 2.03 | %(e) |
| After expense reimbursement or recovery | | | 1.78 | % | | | 1.80 | % | | | 1.80 | %(e) | | | 1.80 | %(e) |
| | | | | | | | | | | | | | | | | |
| Ratio of net investment income (loss) to average net assets: | | | | | | | | | | | | | | | | |
| Before expense reimbursement or recovery | | | 3.32 | % | | | 4.06 | % | | | 4.66 | % | | | 4.13 | % |
| After expense reimbursement or recovery | | | 3.25 | % | | | 4.03 | % | | | 4.60 | % | | | 4.36 | % |
| | | | | | | | | | | | | | | | | |
Portfolio turnover rate(f) | | | 38 | % | | | 92 | % | | | 54 | % | | | 43 | % |
| (a) | All ratios have been annualized except total investment return and portfolio turnover. |
| (b) | Net investment income (loss) per share is based on average shares outstanding. |
| (c) | Amount represents less than $0.005 per share. |
| (d) | Ratios do not include the expenses of the investment companies in which the Fund invests. |
| (e) | Includes interest expense on line of credit of 0.00% and 0.00% for the years ended December 31, 2015 and 2014, respectively. |
| (f) | Portfolio turnover rate is calculated on the basis of the Fund as a whole without distinguishing between classes of shares issued. |
The accompanying notes are an integral part of these financial statements.
| | | |
| | | |
LoCorr Macro Strategies Fund, LoCorr Long/Short Commodities Strategy Fund, LoCorr Multi-Strategy Fund, and LoCorr Market Trend Fund – Notes to Consolidated Financial Statements / LoCorr Dynamic Equity Fund and LoCorr Spectrum Income Fund – Notes to Financial Statements | | | 81 |
| | | |
LoCorr Investment Trust
Notes
June 30, 2017
1. Organization
LoCorr Investment Trust (the “Trust”), an Ohio business trust, was formed on November 15, 2010 and is an open-end management investment company registered under the Investment Company Act of 1940, as amended (“1940 Act”). Each Fund is an investment company and accordingly follows the investment company accounting and reporting guidance of the Financial Accounting Standards Board (“FASB”) Accounting Standards Codification (“ASC”) Topic 946, Financial Services - Investment Companies. The LoCorr Macro Strategies Fund (formerly known as the LoCorr Managed Futures Strategy Fund), LoCorr Long/Short Commodities Strategy Fund, LoCorr Multi-Strategy Fund, LoCorr Market Trend Fund, LoCorr Dynamic Equity Fund (formerly known as the LoCorr Long/Short Equity Fund) and the LoCorr Spectrum Income Fund (individually a “Fund” and collectively the “Funds”) are series within the Trust. The LoCorr Long/Short Commodities Strategy Fund, the LoCorr Multi-Strategy Fund, the LoCorr Market Trend Fund and the LoCorr Dynamic Equity Fund are each non-diversified funds. The LoCorr Macro Strategies Fund and the LoCorr Spectrum Income Fund are each diversified funds.
The LoCorr Macro Strategies Fund’s primary investment objective is capital appreciation in rising and falling equity markets with managing volatility as a secondary objective.
The LoCorr Long/Short Commodities Strategy Fund’s primary investment objective is capital appreciation in rising and falling commodities markets with managing volatility as a secondary objective.
The LoCorr Multi-Strategy Fund’s investment objective is capital appreciation.
The LoCorr Market Trend Fund’s primary investment objective is capital appreciation in rising and falling equity markets with managing volatility as a secondary objective.
The LoCorr Dynamic Equity Fund’s primary investment objective is long-term capital appreciation with reduced volatility compared to traditional broad-based equity market indices as a secondary objective.
The LoCorr Spectrum Income Fund’s primary investment objective is current income with capital appreciation as a secondary objective.
Wholly-owned and Controlled Subsidiaries
In order to achieve their investment objectives, the LoCorr Macro Strategies Fund, the LoCorr Long/Short Commodities Strategy Fund, the LoCorr Multi-Strategy Fund and the LoCorr Market Trend Fund each invest up to 25% of their total assets (measured at the time of purchase) in wholly-owned subsidiaries, LCMFS Fund Limited (“LCMFS”), LCLSCS Fund Limited (“LCLSCS”), LCMSF Fund Limited (“LCMSF”) and LCMT Fund Limited (“LCMT”), respectively; each company incorporated under the laws of the Cayman Islands. LCMFS, LCLSCS, LCMSF and LCMT act as investment vehicles in order to enter into certain investments for the LoCorr Macro Strategies Fund, the LoCorr Long/Short Commodities Strategy Fund, the LoCorr Multi-Strategy Fund and the LoCorr Market Trend Fund, respectively, consistent with their investment objectives and policies specified in the Prospectus and Statement of Additional Information.
At June 30, 2017, investments in LCMFS, LCLSCS, LCMSF and LCMT represented 2.04%, 14.20%, 15.86% and 2.80% of the total net assets of LoCorr Macro Strategies Fund, LoCorr Long/Short Commodities Strategy Fund, LoCorr Multi-Strategy Fund and LoCorr Market Trend Fund, respectively. See Note 2.
The consolidated financial statements of the LoCorr Macro Strategies Fund, LoCorr Long/Short Commodities Strategy Fund, LoCorr Multi-Strategy Fund and the LoCorr Market Trend Fund each include the investment activity and financial statements of LCMFS, LCLSCS, LCMSF and LCMT, respectively. All intercompany accounts and transactions have been eliminated in consolidation. Because each Fund may invest a substantial portion of its assets in its respective subsidiary, the Fund may be considered to be investing indirectly in some of those investments through its subsidiary. For that reason, references to the Fund may also encompass its subsidiary. The subsidiary will be subject to the same investment restrictions and limitations, and follow the same compliance policies and procedures, as the Fund when viewed on a consolidated basis. Each Fund and its subsidiary are a “commodity pool” under the U.S. Commodity Exchange Act and LoCorr Fund Management, LLC (the “Adviser” or “Management”) is a “commodity pool operator” registered with and regulated by the Commodity Futures Trading Commission (“CFTC”). As a result, additional CFTC-mandated disclosure, reporting and recordkeeping obligations apply with respect to each Fund and its respective subsidiary under CFTC and the U.S. Securities and Exchange Commission (the “SEC”) harmonized regulations.
At June 30, 2017, the only investment held by LCLSCS and LCMSF are swap contracts, for which the notional amount was $100,100,000 and $41,101,783, respectively. At June 30, 2017, LCLSCS and LCMSF reported unrealized depreciation on swap contracts of $21,655,240 and $4,272,107, respectively. In addition, LCLSCS and LCMSF hold cash and cash equivalents as collateral on the swap contracts.
At June 30, 2017, investments held by LCMFS and LCMT include open futures contracts and other investments intended to serve as margin or collateral for futures positions. At June 30, 2017, LCMFS held long open futures contracts with a total notional amount of $95,825,008 and net unrealized appreciation of $1,268,673 and short open futures contracts with a total notional amount of $485,732,054 and net unrealized depreciation of $11,337,119. At June 30, 2017, LCMT held long open futures contracts with a total notional amount of $138,004,736 and net unrealized appreciation of $679,008 and short open futures contracts with a total notional amount of $418,614,692 and net unrealized depreciation of $6,365,050.
| | |
| | |
82 | | LoCorr Macro Strategies Fund, LoCorr Long/Short Commodities Strategy Fund, LoCorr Multi-Strategy Fund, and LoCorr Market Trend Fund – Notes to Consolidated Financial Statements / LoCorr Dynamic Equity Fund and LoCorr Spectrum Income Fund – Notes to Financial Statements (continued) |
| | |
Partnership Interest
During the year ended December 31, 2012, LCMFS had a controlling ownership interest in Millburn Diversified Plus L.P. (the “Partnership”), a limited partnership organized on February 14, 2011, under the Delaware Revised Uniform Limited Partnership Act, which commenced operations on March 24, 2011. The Partnership engaged in speculative trading of futures and forward currency contracts. Similarly, LCLSCS had an investment in a partnership during the year ended December 31, 2012; however, based on the ownership percentage held during the year ended December 31, 2012, LCLSCS was not considered to have a controlling interest in that entity. The General Partner of the Partnership was Millburn Ridgefield Corporation (the “General Partner”). LCMFS and LCLSCS had fully redeemed out of their positions held in the partnerships as of December 20, 2012, and as a result, LCMFS no longer consolidated the Partnership, and its assets, liabilities, and related non-controlling interest were no longer included in the LoCorr Macro Strategies Fund’s financial statements. As of December 20, 2012, there was no gain or loss on the redemption and deconsolidation because the investment in the Partnership was carried at fair value on a daily basis by LCMFS.
Because LCMFS had a controlling interest (greater than 50% but less than 100%) in the Partnership for the period January 1, 2012 through December 20, 2012, the financial activity of the Partnership for that period ended December 20, 2012, was also consolidated with the financial statements of LCMFS. All intercompany balances, revenues and expenses have been eliminated in consolidation. LoCorr Macro Strategies Fund, LCMFS and the Partnership are collectively referred to as the LoCorr Macro Strategies Fund throughout these consolidated financial statements.
Non-controlling interest is the portion of equity ownership in the Partnership not attributable to the LoCorr Macro Strategies Fund. Non-controlling interest represents additional, non-related partners in the Partnership and was equal to 2.20% of the Partnership’s net assets prior to LCMFS having fully redeemed its holding of the Partnership.
Share Classes
The Funds currently offer three classes of shares: Class A, Class C and Class I shares. Each share class represents an interest in the same assets of the Fund, has the same rights and is identical in all material respects except that (i) Class A shares have a maximum front end sales load of 5.75% and maximum deferred sales charge of 1.00% and Class C shares have a maximum deferred sales charge of 1.00%, (ii) Class A shares have a 12b-1 fee of 0.25% and Class C shares have a 12b-1 fee of 1.00%; (iii) certain other class-specific expenses will be borne solely by the class to which such expenses are attributable and (iv) each class will have exclusive voting rights with respect to matters relating to its own distribution arrangements.
All classes with respect to the LoCorr Spectrum Income Fund are subject to a 2.00% redemption fee on redemptions made within 60 days of the original purchase. As of May 1, 2017, none of the other Funds are subject to a redemption fee. Prior to May 1, 2017, all share classes of the LoCorr Macro Strategies Fund, the LoCorr Long/Short Commodities Strategy Fund, the LoCorr Dynamic Equity Fund, the LoCorr Market Trend Fund and the LoCorr Multi-Strategy Fund were subject to a 1.00% redemption fee on redemptions made within 30 days of the original purchase.
The following table presents the class-specific commencement of operations dates for each of the Funds:
| | Commencement of Operations |
| | Class A | | Class C | | Class I |
| LoCorr Macro Strategies Fund | March 22, 2011 | | March 24, 2011 | | March 24, 2011 |
| LoCorr Long/Short Commodities Strategy Fund | January 1, 2012 | | January 1, 2012 | | January 1, 2012 |
| LoCorr Dynamic Equity Fund | May 10, 2013 | | May 10, 2013 | | May 10, 2013 |
| LoCorr Spectrum Income Fund | January 1, 2014 | | January 1, 2014 | | January 1, 2014 |
| LoCorr Market Trend Fund | July 1, 2014 | | July 1, 2014 | | July 1, 2014 |
| LoCorr Multi-Strategy Fund | April 6, 2015 | | April 6, 2015 | | April 6, 2015 |
The Funds may issue an unlimited number of shares of beneficial interest, with no par value. All shares of the Funds have equal rights and privileges, except as to class-specific rights and privileges described above.
2. Significant Accounting Policies
The following is a summary of significant accounting policies consistently followed by the Funds in the preparation of the consolidated financial statements. These policies are in conformity with generally accepted accounting principles in the United States of America (“GAAP”).
Investment Valuation
The Funds follow fair valuation accounting standards in accordance with FASB ASC Topic 820, Fair Value Measurement, which establish a definition of fair value and set out a hierarchy for measuring fair value. These standards require additional disclosures about the various inputs and valuation techniques used to develop the measurements of fair value and changes in valuation techniques and related inputs during the period. These inputs are summarized in three broad levels listed below:
Level 1 – Unadjusted quoted prices in active markets for identical assets or liabilities that the Funds have the ability to access.
Level 2 – Observable inputs other than quoted prices included in Level 1 that are observable for the asset or liability, either directly or indirectly. These inputs may include quoted prices for the identical instrument on an inactive market, prices for similar instruments, interest rates, prepayment speeds, credit risk, yield curves, default rates and similar data.
Level 3 – Unobservable inputs for the asset or liability, to the extent relevant observable inputs are not available; representing the Funds’ own assumptions about the assumptions a market participant would use in valuing the asset or liability, and would be based on the best information available.
| | | |
| | | |
LoCorr Macro Strategies Fund, LoCorr Long/Short Commodities Strategy Fund, LoCorr Multi-Strategy Fund, and LoCorr Market Trend Fund – Notes to Consolidated Financial Statements / LoCorr Dynamic Equity Fund and LoCorr Spectrum Income Fund – Notes to Financial Statements | | | 83 |
| | | |
Generally, the Funds’ investments are valued each day at the last quoted sales price on each investment’s primary exchange. Investments traded or dealt in upon one or more exchanges (whether domestic or foreign) for which market quotations are readily available and not subject to restrictions against resale shall be valued at the last quoted sales price on the primary exchange or, in the absence of a sale on the primary exchange, at the last bid on the primary exchange. Investments primarily traded in the National Association of Securities Dealers’ Automated Quotation System (“NASDAQ”) National Market System for which market quotations are readily available shall be valued using the NASDAQ Official Closing Price.
The Funds may use independent pricing services to assist in calculating the value of the Funds’ investments. In addition, market prices for foreign investments are not determined at the same time of day as the net asset value (“NAV”) for the Funds. Because the Funds may invest in portfolio investments primarily listed on foreign exchanges and these exchanges may trade on weekends or other days when the Funds do not price their shares, the value of some of the Funds’ portfolio investments may change on days when you may not be able to buy or sell the Funds’ shares. In computing the NAV, the Funds value foreign investments held by the Funds at the latest closing price on the exchange in which they are traded immediately prior to closing of the NYSE. Prices of foreign investments quoted in foreign currencies are translated into U.S. dollars at current rates. If events materially affecting the value of an investment in the Funds’ portfolio, particularly foreign investments, occur after the close of trading on a foreign market but before the Funds price their shares, the investment will be valued at fair value.
American Depositary Receipts
The Funds may invest in sponsored and unsponsored American Depositary Receipts (“ADRs”), which are receipts issued by an American bank or trust company evidencing ownership of underlying securities issued by a foreign issuer. ADRs, in registered form, are designed for use in U.S. securities markets. Unsponsored ADRs may be created without the participation of the foreign issuer. Holders of unsponsored ADRs generally bear all the costs of the ADR facility, whereas foreign issuers typically bear certain costs in a sponsored ADR. The bank or trust company depositary of an unsponsored ADR may be under no obligation to distribute shareholder communications received from the foreign issuer or to pass through voting rights. ADRs are generally categorized in Level 1 or Level 2 of the fair value hierarchy depending on inputs used and market activity levels for specific securities.
Equity Securities
Equity securities, including common stocks, preferred stocks, securities convertible into common stocks, such as convertible bonds, warrants, rights, options, master limited partnership (“MLP”) interests, real estate investment trusts (“REITs”), business development companies and royalty trusts are generally valued by using market quotations, but may be valued on the basis of prices furnished by a pricing service when the Adviser believes such prices accurately reflect the fair market value of such securities. MLP interests are limited partnerships, the interests in which (known as “units”) typically trade publicly, like stock. MLPs are also called publicly traded partnerships and public limited partnerships. Securities that are traded on any stock exchange or on the NASDAQ over-the-counter market are generally valued by the pricing service at the last quoted sale price. Lacking a last sale price, an equity security is generally valued by the pricing service at its last bid price. Equity securities are generally categorized in Level 1 or Level 2 of the fair value hierarchy depending on inputs used and market activity levels for specific securities.
Exchange Traded Funds
The Funds may invest in Exchange Traded Funds (“ETFs”). They are managed by professionals and provide the investor with diversification, cost and tax efficiency, liquidity, marginability, usability for hedging, the ability to go long and short, and (for some ETFs) the provision of periodic distributions. Additionally, some ETFs are unit investment trusts (“UITs”), which are unmanaged portfolios overseen by trustees. ETFs generally have two markets. The primary market is where institutions swap “creation units” in block-multiples of shares, typically 25,000 or 50,000, for in-kind securities and cash in the form of dividends. The secondary market is where individual investors can trade as little as a single share during trading hours on the exchange. This is different from open-ended mutual funds that are traded after hours once the NAV is calculated. ETFs share many similar risks with open-end and closed-end funds. ETFs are generally categorized in Level 1 of the fair value hierarchy.
The Funds may invest in ETFs and other investment companies that hold a portfolio of foreign securities. Investing in securities of foreign companies and countries involves certain considerations and risks that are not typically associated with investing in U.S. government securities and securities of domestic companies. There may be less publicly available information about a foreign issuer than a domestic one, and foreign companies are not generally subject to uniform accounting, auditing and financial standards and requirements comparable to those applicable to U.S. companies. There may also be less government supervision and regulation of foreign securities exchanges, brokers and listed companies than exists in the United States. Interest and dividends paid by foreign issuers may be subject to withholding and other foreign taxes, which may decrease the net return on such investments as compared to dividends and interest paid to the Funds by domestic companies or the U.S. government. There may be the possibility of expropriations, seizure or nationalization of foreign deposits, confiscatory taxation, political, economic or social instability, or diplomatic developments that could affect assets of the Funds held in foreign countries. Finally, the establishment of exchange controls or other foreign governmental laws or restrictions could adversely affect the payment of obligations.
Fixed Income Securities
Fixed income securities and certificates of deposit with maturities more than 60 days when acquired generally are valued using an evaluated price supplied by an independent pricing service. Inputs used by the pricing service for U.S. government and treasury securities are normally valued using a model that incorporates market observable data such as reported sales of similar securities, broker dealer quotes, yields, bids, offers and reference data. Agency issued debt securities, foreign issued bonds and municipal bonds are generally valued in a manner similar to U.S. government securities. Evaluations for corporate bonds are typically based on valuation methodologies such as market pricing and other analytical pricing models as well as market transactions and dealer quotations based on observable inputs. Fixed income securities are generally categorized in Level 1 or Level 2 of the fair value hierarchy depending on inputs used and market activity levels for specific securities.
The fair value of asset backed securities and mortgage backed securities is estimated on models that consider the estimated cash flows of each tranche of the entity, establish a benchmark yield, and develop an estimated tranche-specific spread to the benchmark yield based on the unique attributes of the tranche. Additional inputs such as creditworthiness of the underlying collateral and quotes from outside brokers for the same or similar issuance may also be considered in the development of fair value. Asset backed and mortgage backed securities are generally categorized in Level 2 of the fair value hierarchy.
Short-term investments in fixed income securities and certificates of deposit with maturities of less than 60 days when acquired, or which subsequently are within 60 days of maturity, are valued using an amortized cost method of valuation, and are generally categorized in Level 2.
| | |
| 84 | | LoCorr Macro Strategies Fund, LoCorr Long/Short Commodities Strategy Fund, LoCorr Multi-Strategy Fund, and LoCorr Market Trend Fund – Notes to Consolidated Financial Statements / LoCorr Dynamic Equity Fund and LoCorr Spectrum Income Fund – Notes to Financial Statements (continued) |
| | |
Investment Companies
With respect to any portion of the Funds’ assets that are invested in one or more open-end management investment companies, including money market funds, registered under the 1940 Act, the Funds’ net asset value is calculated based upon the net asset values of those open-end management investment companies, and the prospectuses for these companies explain the circumstances under which those companies will use fair value pricing and the effects of using fair value pricing.
The Funds generally will purchase shares of closed-end investment companies only in the secondary market. The shares of many closed-end investment companies, after their initial public offering, frequently trade at a price per share that is less than the net asset value per share, the difference representing the “market discount” of such shares. This market discount may be due in part to the investment objective of long-term appreciation, which is sought by many closed-end investment companies, as well as to the fact that the shares of closed-end investment companies are not redeemable by the holder upon demand to the issuer at the next determined net asset value but rather are subject to the principles of supply and demand in the secondary market. A relative lack of secondary market purchasers of closed-end investment company shares also may contribute to such shares trading at a discount to their net asset value. Closed-end investment companies are generally categorized in Level 1 or Level 2 of the fair value hierarchy depending on inputs used and market activity levels for specific securities.
Over-the-counter Financial Derivative Instruments
Over-the-counter financial derivative instruments, such as forward currency contracts, futures contracts, or swap agreements, derive their value from underlying asset prices, indices, reference rates and other inputs or a combination of these factors. These contracts are normally valued on the basis of broker-dealer quotations or a pricing service at the settlement price determined by the relevant exchange. Depending on the product and the terms of the transaction, the value of the derivative contracts can be estimated by a pricing service provider using a series of techniques, including simulation pricing models. The pricing models use inputs that are observed from actively quoted markets such as issuer details, indices, spreads, interest rates, curves, dividends and exchange rates.
Forward currency contracts represent the purchase or sale of a specific quantity of a foreign currency at the current or spot price, with delivery and settlement at a specified future date. Forward currency contracts are presented at fair value using spot currency rates and are adjusted for the time value of money (forward points) and contractual prices of the underlying financial instruments. Forward currency contracts are generally categorized in Level 2.
Futures contracts are carried at fair value using the primary exchange’s closing (settlement) price, and are generally categorized in Level 1.
Total return swap contracts are stated at fair value daily based on the fair value of the underlying futures and forward currency contracts constituting the contract’s stated index, taking into account any fees and expenses associated with the swap agreement. Total return swap contracts are generally categorized in Level 2.
Fair Value Pricing
If market quotations are not readily available, investments will be valued at their fair value as determined in good faith by the Adviser in accordance with procedures approved by the Board of Trustees (the “Board”) and evaluated by the Board as to the reliability of the fair value method used. In these cases, a Fund’s NAV will reflect certain portfolio investments’ fair value rather than their market price. Fair value pricing involves subjective judgments and it is possible that the fair value determined for an investment is materially different than the value that could be realized upon the sale of that investment. The fair value prices can differ from market prices when they become available or when a price becomes available.
Fair value determinations are required for the following securities:
| ● | securities for which market quotations are not readily available at the valuation time on a particular business day (including without limitation securities for which there is a short and temporary lapse in the provision of a price by the regular pricing source); |
| ● | securities for which market quotations are not readily available at the valuation time on a particular business day (including without limitation securities for which there is a short and temporary lapse in the provision of a price by the regular pricing source); |
| ● | securities determined to be illiquid in accordance with the Trust’s Liquidity Procedures; and |
| ● | securities with respect to which an event that will affect the value thereof has occurred subsequent to the determination by the Adviser/relevant Sub-Adviser of the closing prices reported on the principal exchange on which the securities are traded, but prior to the relevant Fund’s calculation of its NAV. |
| ● | For any open-end mutual funds that do not provide timely NAV information, the Adviser/relevant Sub-Adviser shall evaluate those ‘similar’ funds and determine which are most appropriate based on funds having similar benchmarks or similar objectives. The Adviser/relevant Sub-Adviser shall then calculate the NAV percentage move of those ‘similar’ funds for the day to create an aggregate average percentage move, which it shall use to calculate the price movement for the day of the Fund at issue. For closed-end funds, the aforementioned practice shall be utilized, in addition to monitoring secondary market activity during the day. |
| | |
| LoCorr Macro Strategies Fund, LoCorr Long/Short Commodities Strategy Fund, LoCorr Multi-Strategy Fund, and LoCorr Market Trend Fund – Notes to Consolidated Financial Statements / LoCorr Dynamic Equity Fund and LoCorr Spectrum Income Fund – Notes to Financial Statements | | 85 |
| | |
Performing Fair Value Pricing
The Adviser considers all appropriate factors relevant to the value of securities for which market quotations are not readily available. No single standard for determining fair value can be established, since fair value depends upon the circumstances of each individual case. As a general principle, the current fair value of an issue of securities being valued by the Adviser would appear to be the amount that the owner might reasonably expect to receive for them upon their current sale. Methods that are in accord with this principle may, for example, be based on:
| ● | a discount from market of a similar freely traded security (including a derivative security or a basket of securities traded on other markets, exchanges or among dealers); or |
| ● | yield to maturity with respect to debt issues, or a combination of these and other methods. |
Fair value determinations are not based on what the Adviser believes that a buyer may pay at a later time, such as when market conditions change or when the market ultimately recognizes a security’s true value as perceived by the Adviser. Similarly, bonds and other instruments may not be fair valued at par based on the expectation that the Funds will hold the investment until maturity.
Some of the general factors that the Adviser considers in determining a valuation method for an individual issue of securities include, but shall not be limited to:
| ● | the fundamental analytical data relating to the investment; |
| ● | the nature and duration of restrictions (if any) on disposition of the securities; |
| ● | evaluation of the forces that influence the market in which these securities are purchased or sold; |
| ● | changes in interest rates; |
| ● | government (domestic or foreign) actions or pronouncements; and |
With respect to securities traded on foreign markets, the Adviser considers the value of foreign securities traded on other foreign markets, ADR trading, closed-end fund trading, foreign currency exchange activity and the trading prices of financial products that are tied to baskets of foreign securities, such as WEBS.
Among the more specific factors that the Funds’ Adviser considers (if applicable) in determining a valuation method for an individual issue of securities are:
| ● | financial statements of the issuer; |
| ● | cost at date of purchase; |
| ● | discount from market value of unrestricted securities of the same class at time of purchase; |
| ● | special reports prepared by analysts; |
| ● | information as to any transactions or offers with respect to the security; |
| ● | existence of merger proposals or tender offers affecting the securities; |
| ● | price and extent of public trading in similar securities of the issuer or comparable companies; and |
As a general matter, the Funds’ Adviser will value the portfolio security or other asset primarily by reference to the public market if there is a public market for securities of the same class or similar securities; primarily by reference to private transactions if public market reference is not available and private transaction reports are available; and primarily by use of one or more analytical methods or models if public and private market references are not available or not reliable. The Adviser will use cost only if no better method of valuation is available.
The Adviser regularly evaluates whether its pricing methodologies continue to result in values that the Funds might reasonably expect to receive upon a current sale. In order to do this, the Adviser compares its fair value prices with values that are available from other sources (if there are any). The next actual sales price of a security might be one such source. However, the next-day opening prices or next actual sales prices for a security may differ from the fair value of that security as of the time for NAV calculation, given the subjectivity inherent in fair valuation and the fact that events could occur after NAV calculation. Thus, discrepancies between fair values and next-day opening prices or next actual sales prices may occur on a regular and recurring basis. These discrepancies do not necessarily indicate that the Adviser’s fair value methodology is inappropriate. Nonetheless, systematic comparisons of fair values to the next-day opening prices or next actual sales prices are useful to assist the Adviser with ongoing monitoring and evaluation of the appropriateness of its fair value methodologies.
The above guidance does not purport to delineate all factors that may be considered. The Adviser takes into consideration all indications of value available to it in determining the fair value assigned to a particular security.
| | |
| | |
| 86 | | LoCorr Macro Strategies Fund, LoCorr Long/Short Commodities Strategy Fund, LoCorr Multi-Strategy Fund, and LoCorr Market Trend Fund – Notes to Consolidated Financial Statements / LoCorr Dynamic Equity Fund and LoCorr Spectrum Income Fund – Notes to Financial Statements (continued) |
| | |
The following table summarizes LoCorr Macro Strategies Fund’s consolidated investments and other financial instruments as of June 30, 2017:
| Security Classification | | Level 1 | | | Level 2 | | | Level 3 | | | Total | |
| Investments | | | | | | | | | | | | |
| Asset Backed Securities | | $ | — | | | $ | 172,170,216 | | | $ | — | | | $ | 172,170,216 | |
| Corporate Bonds | | | — | | | | 369,407,181 | | | | — | | | | 369,407,181 | |
| Mortgage Backed Securities | | | — | | | | 130,766,735 | | | | — | | | | 130,766,735 | |
| Municipal Bonds | | | — | | | | 8,286,836 | | | | — | | | | 8,286,836 | |
| U.S. Government Agency Issues | | | — | | | | 94,618,489 | | | | — | | | | 94,618,489 | |
| U.S. Government Notes | | | — | | | | 67,264,972 | | | | — | | | | 67,264,972 | |
| Short Term Investment | | | 19,255,770 | | | | — | | | | — | | | | 19,255,770 | |
| Total Investments | | $ | 19,255,770 | | | $ | 842,514,429 | | | $ | — | | | $ | 861,770,199 | |
| | | | | | | | | | | | | | | | | |
| Other Financial Instruments* | | | | | | | | | | | | | | | | |
| Forward Currency Contracts | | | | | | | | | | | | | | | | |
| Long | | $ | — | | | $ | 9,173,767 | | | $ | — | | | $ | 9,173,767 | |
| Short | | | — | | | | (11,160,529) | | | | — | | | | (11,160,529) | |
| Total Forward Currency Contracts | | | — | | | | (1,986,762) | | | | — | | | | (1,986,762) | |
| Futures Contracts | | | | | | | | | | | | | | | | |
| Long | | | (21,769,128) | | | | — | | | | — | | | | (21,769,128) | |
| Short | | | (10,529,636) | | | | — | | | | — | | | | (10,529,636) | |
| Total Futures Contracts | | | (32,298,764) | | | | — | | | | — | | | | (32,298,764) | |
| Total Other Financial Instruments | | $ | (32,298,764) | | | $ | (1,986,762) | | | $ | — | | | $ | (34,285,526) | |
See the Fund’s consolidated schedule of investments for the investments detailed by industry classification.
*Other financial instruments include forward currency contracts and futures contracts which are not included in the Fund’s consolidated schedule of investments. The fair value of the Fund’s other financial instruments represent the net unrealized appreciation (depreciation) at June 30, 2017.
The LoCorr Macro Strategies Fund did not hold any Level 3 assets during the period.
The following table summarizes LoCorr Long/Short Commodities Strategy Fund’s consolidated investments and swap contracts as of June 30, 2017:
| Security Classification | | Level 1 | | | Level 2 | | | Level 3 | | | Total | |
| Investments | | | | | | | | | | | | |
| Asset Backed Securities | | $ | — | | | $ | 16,837,772 | | | $ | — | | | $ | 16,837,772 | |
| Corporate Bonds | | | — | | | | 35,368,256 | | | | — | | | | 35,368,256 | |
| Foreign Government Bond | | | — | | | | 13,663 | | | | — | | | | 13,663 | |
| Mortgage Backed Securities | | | — | | | | 11,597,712 | | | | — | | | | 11,597,712 | |
| Municipal Bonds | | | — | | | | 346,019 | | | | — | | | | 346,019 | |
| U.S. Government Agency Issues | | | — | | | | 14,937,884 | | | | — | | | | 14,937,884 | |
| U.S. Government Notes | | | — | | | | 4,157,165 | | | | — | | | | 4,157,165 | |
| Short Term Investment | | | 3,782,080 | | | | — | | | | — | | | | 3,782,080 | |
| Total Investments | | $ | 3,782,080 | | | $ | 83,258,471 | | | $ | — | | | $ | 87,040,551 | |
| | | | | | | | | | | | | | | | | |
| Swap Contracts* | | | | | | | | | | | | | | | | |
| Long Total Return Swap Contracts | | $ | — | | | $ | (21,655,240) | | | $ | — | | | $ | (21,655,240) | |
| Total Swap Contracts | | $ | — | | | $ | (21,655,240) | | | $ | — | | | $ | (21,655,240) | |
See the Fund’s consolidated schedule of investments for the investments detailed by industry classification.
*Swap contracts are derivative instruments not reflected in the Fund’s consolidated schedule of investments. The fair value of the Fund’s investment in swap contracts represents the net unrealized depreciation at June 30, 2017.
The LoCorr Long/Short Commodities Strategy Fund did not hold any Level 3 assets during the period.
| |
| | |
| LoCorr Macro Strategies Fund, LoCorr Long/Short Commodities Strategy Fund, LoCorr Multi-Strategy Fund, and LoCorr Market Trend Fund – Notes to Consolidated Financial Statements / LoCorr Dynamic Equity Fund and LoCorr Spectrum Income Fund – Notes to Financial Statements | | 87 |
| | |
The following table summarizes LoCorr Multi-Strategy Fund’s consolidated investments, securities sold short and swap contracts as of June 30, 2017:
| Security Classification | | Level 1 | | | Level 2 | | | Level 3 | | | Total | |
| Investments | | | | | | | | | | | | |
| Business Development Companies | | $ | 1,523,011 | | | $ | — | | | $ | — | | | $ | 1,523,011 | |
| Closed-End Investment Companies | | | 3,054,036 | | | | — | | | | — | | | | 3,054,036 | |
| Common Stocks | | | 12,018,439 | | | | — | | | | — | | | | 12,018,439 | |
| Convertible Preferred Stocks | | | 994,218 | | | | — | | | | — | | | | 994,218 | |
| Master Limited Partnerships | | | 5,836,777 | | | | — | | | | — | | | | 5,836,777 | |
| Preferred Stock | | | 407,006 | | | | — | | | | — | | | | 407,006 | |
| Publicly Traded Partnerships | | | 1,948,950 | | | | — | | | | — | | | | 1,948,950 | |
| Real Estate Investment Trusts | | | 3,779,808 | | | | — | | | | — | | | | 3,779,808 | |
| Short Term Investment | | | 3,463,402 | | | | — | | | | — | | | | 3,463,402 | |
| Total Investments | | $ | 33,025,647 | | | $ | — | | | $ | — | | | $ | 33,025,647 | |
| | | | | | | | | | | | | | | | | |
| Securities Sold Short | | | | | | | | | | | | | | | | |
| Common Stocks | | $ | (1,220,181) | | | $ | — | | | $ | — | | | $ | (1,220,181) | |
| Total Securities Sold Short | | $ | (1,220,181) | | | $ | — | | | $ | — | | | $ | (1,220,181) | |
| | | | | | | | | | | | | | | | | |
| Swap Contracts* | | | | | | | | | | | | | | | | |
| Long Total Return Swap Contracts | | $ | — | | | $ | (4,272,107) | | | $ | — | | | $ | (4,272,107) | |
| Total Swap Contracts | | $ | — | | | $ | (4,272,107) | | | $ | — | | | $ | (4,272,107) | |
See the Fund’s consolidated schedule of investments and schedule of securities sold short for the investments detailed by industry classification.
*Swap contracts are derivative instruments not reflected in the Fund’s consolidated schedule of investments. The fair value of the Fund’s investment in swap contracts represents the net unrealized depreciation at June 30, 2017.
The LoCorr Multi-Strategy Fund did not hold any Level 3 assets during the period.
The following table summarizes LoCorr Market Trend Fund’s consolidated investments and other financial instruments as of June 30, 2017:
| Security Classification | | Level 1 | | | Level 2 | | | Level 3 | | | Total | |
| Investments | | | | | | | | | | | | |
| Asset Backed Securities | | $ | — | | | $ | 157,562,984 | | | $ | — | | | $ | 157,562,984 | |
| Corporate Bond | | | — | | | | 1,654,353 | | | | — | | | | 1,654,353 | |
| Foreign Government Bonds | | | — | | | | 14,473,739 | | | | — | | | | 14,473,739 | |
| Mortgage Backed Securities | | | — | | | | 59,463,939 | | | | — | | | | 59,463,939 | |
| U.S. Government Agency Issues | | | — | | | | 344,150,921 | | | | — | | | | 344,150,921 | |
| U.S. Government Notes | | | — | | | | 50,132,095 | | | | — | | | | 50,132,095 | |
| Short Term Investment | | | 32,142,971 | | | | — | | | | — | | | | 32,142,971 | |
| Total Investments | | $ | 32,142,971 | | | $ | 627,438,031 | | | $ | — | | | $ | 659,581,002 | |
| | | | | | | | | | | | | | | | | |
| Other Financial Instruments* | | | | | | | | | | | | | | | | |
| Forward Currency Contracts | | | | | | | | | | | | | | | | |
| Long | | $ | — | | | $ | 12,226,984 | | | $ | — | | | $ | 12,226,984 | |
| Short | | | — | | | | (12,132,390) | | | | — | | | | (12,132,390) | |
| Total Forward Currency Contracts | | | — | | | | 94,594 | | | | — | | | | 94,594 | |
| Futures Contracts | | | | | | | | | | | | | | | | |
| Long | | | (26,037,328) | | | | — | | | | — | | | | (26,037,328) | |
| Short | | | (4,941,484) | | | | — | | | | — | | | | (4,941,484) | |
| Total Futures Contracts | | | (30,978,812) | | | | — | | | | — | | | | (30,978,812) | |
| Total Other Financial Instruments | | $ | (30,978,812) | | | $ | 94,594 | | | $ | — | | | $ | (30,884,218) | |
See the Fund’s consolidated schedule of investments for the investments detailed by industry classification.
*Other financial instruments include forward currency contracts and futures contracts which are not included in the Fund’s consolidated schedule of investments. The fair value of the Fund’s other financial instruments represent the net unrealized appreciation (depreciation) at June 30, 2017.
The LoCorr Market Trend Fund did not hold any Level 3 assets during the period.
| | |
| | |
| 88 | | LoCorr Macro Strategies Fund, LoCorr Long/Short Commodities Strategy Fund, LoCorr Multi-Strategy Fund, and LoCorr Market Trend Fund – Notes to Consolidated Financial Statements / LoCorr Dynamic Equity Fund and LoCorr Spectrum Income Fund – Notes to Financial Statements (continued) |
| | |
The following table summarizes LoCorr Dynamic Equity Fund’s investments and securities sold short as of June 30, 2017:
| Security Classification | | Level 1 | | | Level 2 | | | Level 3 | | | Total | |
| Investments | | | | | | | | | | | | |
| Common Stocks | | $ | 49,250,811 | | | $ | — | | | $ | — | | | $ | 49,250,811 | |
| Real Estate Investment Trusts | | | 816,836 | | | | — | | | | — | | | | 816,836 | |
| Short Term Investments | | | 20,577,791 | | | | 5,977,416 | | | | — | | | | 26,555,207 | |
| Total Investments | | $ | 70,645,438 | | | $ | 5,977,416 | | | $ | — | | | $ | 76,622,854 | |
| | | | | | | | | | | | | | | | | |
| Securities Sold Short | | | | | | | | | | | | | | | | |
| Common Stocks | | $ | (17,059,011) | | | $ | — | | | $ | — | | | $ | (17,059,011) | |
| Exchange Traded Funds | | | (2,025,525) | | | | — | | | | — | | | | (2,025,525) | |
| Total Securities Sold Short | | $ | (19,084,536) | | | $ | — | | | $ | — | | | $ | (19,084,536) | |
See the Fund’s schedule of investments and schedule of securities sold short for detail by industry classification.
The LoCorr Dynamic Equity Fund did not hold any Level 3 assets during the period.
The following table summarizes LoCorr Spectrum Income Fund’s investments as of June 30, 2017:
| Security Classification | | Level 1 | | | Level 2 | | | Level 3 | | | Total | |
| Investments | | | | | | | | | | | | |
| Business Development Companies | | $ | 7,613,851 | | | $ | — | | | $ | — | | | $ | 7,613,851 | |
| Closed-End Investment Companies | | | 15,296,222 | | | | — | | | | — | | | | 15,296,222 | |
| Common Stocks | | | 16,731,173 | | | | — | | | | — | | | | 16,731,173 | |
| Convertible Preferred Stocks | | | 4,970,520 | | | | — | | | | — | | | | 4,970,520 | |
| Master Limited Partnerships | | | 28,871,534 | | | | — | | | | — | | | | 28,871,534 | |
| Preferred Stock | | | 2,056,701 | | | | — | | | | — | | | | 2,056,701 | |
| Publicly Traded Partnerships | | | 9,752,634 | | | | — | | | | — | | | | 9,752,634 | |
| Real Estate Investment Trusts | | | 18,928,802 | | | | — | | | | — | | | | 18,928,802 | |
| Short Term Investment | | | 9,719,966 | | | | — | | | | — | | | | 9,719,966 | |
| Total Investments | | $ | 113,941,403 | | | $ | — | | | $ | — | | | $ | 113,941,403 | |
See the Fund’s schedule of investments for detail by industry classification.
The LoCorr Spectrum Income Fund did not hold any Level 3 assets during the period.
For each of the Funds, there were no transfers between levels during the period. Transfers between levels are recognized at the end of the reporting period.
The LoCorr Funds did not hold any Level 3 assets as of June 30, 2017.
| | |
LoCorr Macro Strategies Fund, LoCorr Long/Short Commodities Strategy Fund, LoCorr Multi-Strategy Fund, and LoCorr Market Trend Fund – Notes to
Consolidated Financial Statements / LoCorr Dynamic Equity Fund and LoCorr Spectrum Income Fund – Notes to Financial Statements | | 89 |
| | |
Allocation of Income and Expenses
Net investment income, other than class specific expenses, and realized and unrealized gains and losses are allocated daily to each class of shares based upon the relative net asset value of outstanding shares of each class of shares at the beginning of the day (after adjusting for the current capital shares activity of the respective class). Expenses associated with a specific Fund in the Trust are charged to that Fund. Common expenses are typically allocated based upon the relative net assets of each Fund, or by other equitable means.
Deposits with Broker
Forward Currency and Futures Contracts
When trading derivative instruments, such as forward or futures contracts, a Fund is only required to post initial or variation margin with the exchange or clearing broker. The use of margin in trading these instruments has the effect of creating leverage, which can expose the Fund to substantial gains or losses occurring from relatively small price changes in the value of the underlying instrument and can increase the volatility of the Fund’s returns. Volatility is a statistical measure of the dispersion of returns of an investment, where higher volatility generally indicates greater risk. At June 30, 2017, the LoCorr Macro Strategies Fund and the LoCorr Market Trend Fund pledged cash and cash equivalents at U.S. Bank, N.A. (“U.S. Bank”) of $17,330,000 and $29,130,000, respectively, with Bank of America Merrill Lynch for each Fund’s investment in forward currency contracts.
Upon entering into a futures contract, and to maintain the Fund’s open positions in futures contracts, the Fund is required to deposit with its custodian or futures broker in a segregated account in the name of the futures broker an amount of cash, U.S. government securities, suitable money market instruments, or other liquid securities, known as “initial margin.” The margin required for a particular futures contract is set by the exchange on which the contract is traded, and may be significantly modified from time to time by the exchange during the term of the contract. Futures contracts are customarily purchased and sold on margins that may range upward from less than 5% of the value of the contract being traded.
At June 30, 2017, the LoCorr Macro Strategies Fund and LCMFS, collectively, had $99,606,247 in cash and cash equivalents on deposit with the broker for derivative instruments which is presented on the Fund’s consolidated statement of assets and liabilities. In addition, LCMFS pledged securities with a fair value of $11,663 as collateral for derivative instruments.
At June 30, 2017, the LoCorr Market Trend Fund and LCMT, collectively, had $96,511,940 in cash and cash equivalents (including foreign currency) on deposit with the broker for derivative instruments which is presented on the Fund’s consolidated statement of assets and liabilities. In addition, LCMT pledged securities with a fair value of $352,546 as collateral for derivative instruments.
If the price of an open futures contract changes (by increase in underlying instrument or index in the case of a sale or by decrease in the case of a purchase) so that the loss on the futures contract reaches a point at which the margin on deposit does not satisfy margin requirements, the broker will require an increase in the margin. However, if the value of a position increases because of favorable price changes in the futures contract so that the margin deposit exceeds the required margin, the broker will pay the excess to the Fund.
These subsequent payments, called “variation margin,” to and from the futures broker (with the exception of futures contracts traded on the London Metal Exchange (“LME”)), are made on a daily basis as the price of the underlying assets fluctuate making the long and short positions in the futures contract more or less valuable, a process known as “marking to the market”. The variation margin on LME futures contracts do not settle daily, but rather settle at their respective maturity dates. At period end, the unrealized appreciation and depreciation on LME futures contracts is shown as receivable for unsettled open futures contracts and payable for unsettled open futures contracts, respectively, on the Fund’s consolidated statements of assets and liabilities. The Funds expect to earn interest income on any margin deposits.
Securities Sold Short
At June 30, 2017, the LoCorr Multi-Strategy Fund and the LoCorr Dynamic Equity Fund had cash on deposit with the broker-dealer in the amount of $1,798,711 and $22,146,996, respectively. In addition, at June 30, 2017, the LoCorr Dynamic Equity Fund pledged cash and securities with a fair value of $2,100,000 and $5,977,416, respectively, as collateral for securities sold short.
Swap Contracts
LCLSCS and LCMSF have a substantial portion of their assets on deposit with Deutsche Bank in connection with their trading of swap contracts. Assets deposited with Deutsche Bank in connection with the trading of swap contracts for LCLSCS and LCMSF are partially restricted due to deposit requirements. At June 30, 2017, the LoCorr Long/Short Commodities Strategy Fund and the LoCorr Multi-Strategy Fund had cash and cash equivalents on deposit with Deutsche Bank in the amount of $23,609,819 and $11,413,357, respectively, which have been presented on the consolidated statements of assets and liabilities for each Fund. In addition, at June 30, 2017, the LCLSCS and LCMSF pledged securities with a fair value of $464,214 and $201,200, respectively, as collateral for swap contracts. Risks arise from the possible inability of the counterparty to meet the term of its contract and may increase if the counterparty’s financial condition worsens.
Distributable Earnings and Investment Transactions
Net investment income and net realized gains (losses) may differ for financial reporting and tax purposes because of temporary or permanent book/tax differences. To the extent these differences are permanent; reclassifications are made to the appropriate equity accounts in the period that the difference arises.
Additionally, GAAP requires that certain components of net assets relating to permanent differences be reclassified between financial and tax reporting. These reclassifications have no effect on net assets or net asset value per share. See Note 7.
Distributions to Shareholders
Shareholder transactions are recorded on trade date. Dividends from net investment income are declared and paid at least annually by the Funds. Distribution of net realized capital gains, if any, are declared and paid at least annually. Distributions to shareholders are recorded on the ex-dividend date. The character of distributions made during the periods from net investment income or net realized gains may differ from the characterization for federal income tax purposes due to the difference in the recognition of income, expense and gain items for financial statement and tax purposes.
| | |
90 | | LoCorr Macro Strategies Fund, LoCorr Long/Short Commodities Strategy Fund, LoCorr Multi-Strategy Fund, and LoCorr Market Trend Fund – Notes to
Consolidated Financial Statements / LoCorr Dynamic Equity Fund and LoCorr Spectrum Income Fund – Notes to Financial Statements (continued) |
| | |
In 2017, the dividends for the LoCorr Multi-Strategy Fund and the LoCorr Spectrum Income Fund were distributed monthly. The estimated characterization of the distributions paid will be an ordinary dividend, qualified dividend or return of capital. This estimate is based on each Fund’s operating results during the period. It is anticipated that a significant portion of the distributions of the Funds’ investments in MLP and certain investments in REITs and royalty trusts will be comprised of return of capital as a result of the tax character of cash distributions made by each Fund’s investments. The actual characterization of the distributions made during the period is not determined until after the end of the fiscal year.
The tax character of distributions paid during the periods was as follows:
| | | | | | | | | |
| | | Six Months Ended June 30, 2017 | |
| Fund | | Ordinary
Income | | | Long-Term
Capital Gains | | | Return of
Capital | |
| LoCorr Multi-Strategy Fund | | $ | 681,175 | | | $ | — | | | $ | — | |
| LoCorr Spectrum Income Fund | | | 4,082,349 | | | | — | | | | — | |
| | | | | | | |
| | | Year Ended December 31, 2016 | |
| Fund | | Ordinary
Income | | | Long-Term
Capital Gains | | | Return of
Capital | |
| LoCorr Macro Strategies Fund | | $ | 3,094,731 | | | $ | 12,934,942 | | | $ | — | |
| LoCorr Long/Short Commodities Strategy Fund | | | 4,174,668 | | | | — | | | | — | |
| LoCorr Multi-Strategy Fund | | | 386,916 | | | | — | | | | 855,699 | |
| LoCorr Market Trend Fund | | | 19,864,840 | | | | — | | | | — | |
| LoCorr Spectrum Income Fund | | | 4,507,173 | | | | — | | | | 2,388,873 | |
Federal Income Taxes
The Funds intend to qualify as regulated investment companies pursuant to Subchapter M of the Internal Revenue Code of 1986, as amended. The Funds intend to distribute substantially all of their investment company net taxable income and net capital gains to shareholders. Therefore, no federal income tax provision is required.
As of and during the six months ended June 30, 2017, the Funds did not have any tax positions that did not meet the “more-likely-than-not” threshold of being sustained by applicable tax authorities. The Funds recognize interest and penalties, if any, related to unrecognized tax benefits on uncertain tax positions as interest or other expense in the statements of operations. During the six months ended June 30, 2017, the Funds did not incur any interest or penalties.
For tax purposes, LCMFS, LCLSCS, LCMSF and LCMT are exempted Cayman Islands investment companies. LCMFS, LCLSCS, LCMSF and LCMT have each received an undertaking from the Government of the Cayman Islands exempting them from all local income, profits, and capital gains taxes. No such taxes are levied in the Cayman Islands at the present time. For U.S. income tax purposes, LCMFS, LCLSCS, LCMSF, and LCMT are controlled foreign corporations (“CFCs”) and as such are not subject to U.S. income tax. However, as a wholly-owned CFC, the net income and capital gain of each CFC, to the extent of its earnings and profits, will be included each year in the respective Funds’ investment company taxable income.
Foreign Securities and Currency
Investment securities and other assets and liabilities denominated in foreign currencies are translated into U.S. dollar amounts at the date of valuation. Purchases and sales of investment securities and income and expense items denominated in foreign currencies are translated into U.S. dollar amounts on the respective dates of such transactions.
The Funds do not isolate that portion of the results of operations resulting from changes in foreign exchange rates on investments from the fluctuations arising from changes in market prices of securities held. Such fluctuations are included with the net realized and unrealized gain or loss from investments.
Reported net realized foreign exchange gains or losses arise from sales of foreign currencies, currency gains or losses realized between the trade and settlement dates on securities transactions, and the difference between the amounts of dividends, interest, and foreign withholding taxes recorded on the Funds’ books and the U.S. dollar equivalent of the amounts actually received or paid. Net unrealized foreign exchange gains and losses arise from changes in the fair values of assets and liabilities, other than investments in securities at period end, resulting from changes in exchange rates.
Forward Currency Contracts
Gains or losses are realized when foreign currency contracts are liquidated. Any change in net unrealized gain or loss is reported in the statement of operations.
| | |
LoCorr Macro Strategies Fund, LoCorr Long/Short Commodities Strategy Fund, LoCorr Multi-Strategy Fund, and LoCorr Market Trend Fund – Notes to
Consolidated Financial Statements / LoCorr Dynamic Equity Fund and LoCorr Spectrum Income Fund – Notes to Financial Statements | | 91 |
| | |
Futures Contracts
A futures contract provides for the future sale by one party and purchase by another party of a specified amount of a specific financial instrument (e.g., units of a stock index) for a specified price, date, time and place designated at the time the contract is made. Brokerage fees are incurred when a futures contract is bought or sold and margin deposits must be maintained. Entering into a contract to buy is commonly referred to as buying or purchasing a contract or holding a long position. Entering into a contract to sell is commonly referred to as selling a contract or holding a short position.
Unlike when a Fund purchases or sells a security, no price would be paid or received by the Fund upon the purchase or sale of a futures contract.
Although certain futures contracts, by their terms, require actual future delivery of and payment for the underlying instruments, in practice most futures contracts are usually closed out before the delivery date. Gains or losses are realized when contracts are liquidated. Closing out an open futures contract purchase or sale is affected by entering into an offsetting futures contract sale or purchase, respectively, for the same aggregate amount of the identical underlying instrument or index and the same delivery date. If the offsetting purchase price is less than the original sale price, the Fund realizes a gain; if it is more, the Fund realizes a loss. Conversely, if the offsetting sale price is more than the original purchase price, the Fund realizes a gain; if it is less, the Fund realizes a loss.
The transaction costs must also be included in these calculations. There can be no assurance, however, that a Fund will be able to enter into an offsetting transaction with respect to a particular futures contract at a particular time. If a Fund is not able to enter into an offsetting transaction, the Fund will continue to be required to maintain the margin deposits on the futures contract.
Any change in net unrealized gain or loss is reported in the statements of operations.
Indemnifications
In the normal course of business, the Funds enter into contracts that contain general indemnifications to other parties. The Funds’ maximum exposure under these contracts is unknown as this would involve future claims that may be made against the Funds that have not yet occurred. However, based on experience, the Funds expect the risk of loss to be remote.
Market and Credit Risks
The Funds may engage in the speculative trading of U.S. and foreign futures, forward currency and swap contracts (collectively, “derivatives”). The Funds are exposed to both market risk, which is the risk arising from changes in the fair value of the contracts and credit risk, which is the risk of failure by another party to perform according to the terms of a contract.
Purchase and sale of futures contracts requires margin deposits with the broker. Additional deposits may be necessary for any loss on contract value. The Commodity Exchange Act requires a broker to segregate all customer transactions and assets from such broker’s proprietary activities. A customer’s cash and other property (for example, U.S. government securities) deposited with a broker are considered commingled with all other customer funds subject to the broker’s segregation requirements. In the event of a broker’s insolvency, recovery may be limited to a pro rata share of segregated funds available. It is possible that the recovered amount could be less than total cash and other property deposited.
For derivatives, risks arise from changes in the fair value of the contracts. Theoretically, the Funds are exposed to a market risk equal to the notional contract value of swap, futures and forward currency contracts purchased and unlimited liability on such contracts sold short.
The Funds also engage in investing its assets in U.S. government securities. Risks arise from investments in U.S. government securities due to possible market illiquidity. U.S. government securities are also sensitive to changes in interest rates and economic conditions.
The Funds have established procedures to actively monitor market risk and minimize credit risk, although there can be no assurance that they will, in fact, succeed in doing so.
New Accounting Pronouncements and/or SEC Regulatory Updates
In October 2016, the SEC adopted new rules and amended existing rules (together, “final rules”) intended to modernize the reporting and disclosure of information by registered investment companies. In part, the final rules amend Regulation S-X and require standardized, enhanced disclosure about derivatives in investment company financial statements, as well as other amendments. The compliance date for the amendments to Regulation S-X is August 1, 2017. Management is currently evaluating the impact that the adoption of the amendments to Regulation S-X will have on the financial statements and related disclosures.
Options on Securities
The Funds may purchase and write (i.e., sell) put and call options. Such options may relate to particular securities or stock indices, and may or may not be listed on a domestic or foreign securities exchange and may or may not be issued by the Options Clearing Corporation. Option trading is a highly specialized activity that entails greater than ordinary investment risk. Options may be more volatile than the underlying instruments, and therefore, on a percentage basis, an investment in options may be subject to greater fluctuation than an investment in the underlying instruments themselves.
A call option for a particular security gives the purchaser of the option the right to buy, and the writer (seller) the obligation to sell, the underlying security at the stated exercise price at any time prior to the expiration of the option, regardless of the market price of the security. The premium paid to the writer is in consideration for undertaking the obligation under the option contract. A put option for a particular security gives the purchaser the right to sell the security at the stated exercise price at any time prior to the expiration date of the option, regardless of the market price of the security.
| | |
92 | | LoCorr Macro Strategies Fund, LoCorr Long/Short Commodities Strategy Fund, LoCorr Multi-Strategy Fund, and LoCorr Market Trend Fund – Notes to
Consolidated Financial Statements / LoCorr Dynamic Equity Fund and LoCorr Spectrum Income Fund – Notes to Financial Statements (continued) |
| | |
A Fund’s obligation to sell an instrument subject to a call option written by it, or to purchase an instrument subject to a put option written by it, may be terminated prior to the expiration date of the option by the Fund’s execution of a closing purchase transaction, which is effected by purchasing on an exchange an option of the same series (i.e., same underlying instrument, exercise price and expiration date) as the option previously written. A closing purchase transaction will ordinarily be effected to realize a profit on an outstanding option, to prevent an underlying instrument from being called, to permit the sale of the underlying instrument or to permit the writing of a new option containing different terms on such underlying instrument. The cost of such a liquidation purchase plus transactions costs may be greater than the premium received upon the original option, in which event the Fund will have incurred a loss in the transaction. There is no assurance that a liquid secondary market will exist for any particular option. An option writer unable to effect a closing purchase transaction will not be able to sell the underlying instrument or liquidate the assets held in a segregated account, as described below, until the option expires or the optioned instrument is delivered upon exercise. In such circumstances, the writer will be subject to the risk of market decline or appreciation in the instrument during such period.
If an option purchased by a Fund expires unexercised, the Fund realizes a loss equal to the premium paid. If a Fund enters into a closing sale transaction on an option purchased by it, the Fund will realize a gain if the premium received by the Fund on the closing transaction is more than the premium paid to purchase the option or a loss if it is less. If an option written by a Fund expires on the stipulated expiration date or if the Fund enters into a closing purchase transaction, it will realize a gain (or loss if the cost of a closing purchase transaction exceeds the net premium received when the option is sold). If an option written by the Fund is exercised, the proceeds of the sale will be increased by the net premium originally received and the Fund will realize a gain or loss.
Security Transactions and Investment Income
Security transactions are recorded on trade date. Generally, realized gains and losses on sales of investments are calculated on the specifically identified cost basis of the securities.
In accordance with the investment restrictions outlined within the Funds’ respective prospectuses, each Fund may invest up to 15% of its net assets in illiquid securities. Illiquid securities may include securities subject to contractual or legal restrictions on resale (e.g., because they have not been registered under the Securities Act) and securities that are otherwise not readily marketable (e.g., because trading in the security is suspended or because market makers do not exist or will not entertain bids or offers). Securities that have not been registered under the Securities Act are referred to as private investments or restricted securities and are purchased directly from the issuer or in the secondary market. Foreign securities that are freely tradable in their principal markets are not considered to be illiquid. Under guidelines adopted by the Trust’s Board, the Adviser of the Funds may determine that particular Rule 144(a) securities, and commercial paper issued in reliance on the private placement exemption from registration afforded by Section 4(a)(2) of the Securities Act, are liquid even though they are not registered. At June 30, 2017, the Adviser deemed all of the restricted securities held in the LoCorr Macro Strategies Fund, the LoCorr Long/Short Commodities Strategy Fund and the LoCorr Market Trend Fund to be liquid. At June 30, 2017, there were no illiquid or restricted securities held in the LoCorr Multi-Strategy Fund, the LoCorr Dynamic Equity Fund or the LoCorr Spectrum Income Fund.
Dividend income, less foreign taxes withheld, if any, are recorded on the ex-dividend date.
Distributions received from the investments in MLP interests, REITs, private investments and royalty trusts generally are comprised of ordinary income, capital gains and return of capital. For financial statement purposes, the Funds use estimates to characterize these distributions received as return of capital, capital gains or ordinary income. Such estimates are based on historical information available from each MLP, REIT, private investment or royalty trust and other industry sources. These estimates may subsequently be revised based on information received from the MLP, REIT, private investment or royalty trust after their tax reporting periods are concluded, as the actual character of these distributions is not known until after the fiscal year end of the Funds. The distributions received from the MLP, REIT, private investment and royalty trust securities that have been classified as income and capital gains are included in investment income and net realized gain (loss) on investments, respectively, on the statement of operations. The distributions received that are classified as return of capital reduce the cost of investments on the statements of assets and liabilities. For the six months ended June 30, 2017, the Funds estimated that 100% of the MLP distributions received would be treated as return of capital.
Interest income and expense are recognized on the accrual basis. Market discounts, premiums and original issue discounts on fixed-income securities are amortized daily over the expected life of the security using the effective yield method.
Short Sales
The Funds may sell securities short. A short sale is a transaction in which a Fund sells a security it does not own or have the right to acquire (or that it owns but does not wish to deliver) in anticipation that the market price of that security will decline.
When a Fund makes a short sale, the broker-dealer through which the short sale is made must borrow the security sold short and deliver it to the party purchasing the security. The Funds are required to make a margin deposit in connection with such short sales; the Funds may have to pay a fee to borrow particular securities and will often be obligated to pay over any dividends and accrued interest on borrowed securities.
If the price of the security sold short increases between the time of the short sale and the time a Fund covers its short position, the Fund will incur a loss; conversely, if the price declines, the Fund will realize a gain. A gain, limited to the price at which the Fund sold the security short, or a loss, unlimited in size, will be recognized upon the close of a short sale. Any gain will be decreased, and any loss increased, by the transaction costs described above. The successful use of short selling may be adversely affected by imperfect correlation between movements in the price of the security sold short and the securities being hedged. Gains or losses from closed positions of securities sold short are presented as net realized gain or loss on securities sold short on the statements of operations.
In addition, the Funds are required to pay the lender any dividends declared on short positions. Dividends declared on open short positions are recorded on ex-date and shown as an expense for financial reporting purposes. To borrow the security, the Funds also may be required to pay fees, which are shown as an expense for financial reporting purposes.
| | |
LoCorr Macro Strategies Fund, LoCorr Long/Short Commodities Strategy Fund, LoCorr Multi-Strategy Fund, and LoCorr Market Trend Fund – Notes to
Consolidated Financial Statements / LoCorr Dynamic Equity Fund and LoCorr Spectrum Income Fund – Notes to Financial Statements | | 93 |
| | |
To the extent the Funds sell securities short, it will provide collateral to the broker-dealer and (except in the case of short sales “against the box”) will maintain additional asset coverage in the form of cash, U.S. government securities or other liquid securities with its custodian in a segregated account in an amount at least equal to the difference between the current fair value of the securities sold short and any amounts required to be deposited as collateral with the selling broker (not including the proceeds of the short sale). A short sale is “against the box” to the extent the Funds contemporaneously own, or have the right to obtain at no added cost, securities identical to those sold short. Short sales are collateralized by cash deposits with the counterparty broker and pledged securities held at the custodian, U.S. Bank. The collateral required is determined daily by reference to the fair value of the short positions.
Total Return Swap Contracts
The Funds may enter into total return swap agreements. A total return swap entered into by the Funds is a derivative contract that transfers the market risk of underlying portfolios of futures and forward currency contracts (considered the “index” within each total return swap contract) between counterparties. The “notional amount” of each total return swap agreement is the agreed upon amount or value of the index used for calculating the returns that the parties to a swap agreement have agreed to exchange. The total return swaps are marked to market daily and any change is recorded in unrealized gain/loss on the consolidated statement of operations based on the value of the index on which the total return swap is referenced, as defined within the total return swap agreement between the counterparties. The composition of the index may vary based on how the underlying portfolio of futures and forward currency contracts is traded. A Fund’s obligation under a total return swap agreement, including any related fees, offset against amounts owed to the Fund in the case of positive performance, will be covered by designating liquid assets on the Fund’s books and records (see the consolidated statement of assets and liabilities for deposits with broker for derivative instruments). Gains or losses will be realized when the total return swap contracts are liquidated and will be presented as net realized gain or loss on swap contracts on the consolidated statements of operations. In addition, changes in notional value and any cash holding adjustments, which represent voluntary realizations by a Fund of swap value at any point in time, are also presented as net realized gain or loss on swap contracts on the consolidated statements of operations. A corresponding asset or liability for “advance receipt on swap contracts” or “advance payment on swap contracts”, respectively, is recorded on the consolidated statements of assets and liabilities for the gain or loss realized on changes in notional value. Total return swaps outstanding at period end, if any, are listed after the Funds’ consolidated schedules of investments.
Use of Estimates
The preparation of consolidated financial statements in conformity with GAAP requires management to make estimates and assumptions that affect the reported amounts of assets and liabilities, disclosure of contingent assets and liabilities at the date of the financial statements and the reported revenues and expenses during the reporting period. Actual results could differ from those estimates.
Warrants
The Funds may invest in warrants. Warrants are options to purchase common stock at a specific price (usually at a premium above the market value of the optioned common stock at issuance) valid for a specific period of time. Warrants may have a life ranging from less than one year to twenty years, or they may be perpetual. However, most warrants have expiration dates after which they are worthless. In addition, a warrant is worthless if the market price of the common stock does not exceed the warrant’s exercise price during the life of the warrant. Warrants have no voting rights, pay no dividends and have no rights with respect to the assets of the corporation issuing them. The percentage increase or decrease in the market price of the warrant may tend to be greater than the percentage increase or decrease in the market price of the optioned common stock.
3. Derivative and Other Financial Instruments
The Funds may invest in derivatives such as futures, forward currency and swap contracts, in order to hedge against market movements while liquidating certain positions and buying other securities or as substitutes for securities, as well as for speculative purposes to gain exposure to such market movements.
The Funds’ market risk related to their derivatives trading is influenced by a wide variety of factors, including the level and volatility of interest rates, exchange rates, weather, supply and demand of commodities, the market value of futures and forward currency contracts, the diversification effects among the Funds’ open positions, and the liquidity of the markets in which they trade.
The following are the primary trading risk exposures by market sector of the Funds as encompassed in the total return swap contracts:
Agricultural (grains, livestock and softs). The Funds’ primary exposure is to agricultural price movements which are often directly affected by severe or unexpected weather conditions.
Currencies. Exchange rate risk is a principal market exposure of the Funds. The Funds’ currency exposure is to exchange rate fluctuations, primarily fluctuations which disrupt the historical pricing relationships between different currencies and currency pairs. The fluctuations are influenced by interest rate changes as well as political and general economic conditions. The Funds trade in a large number of currencies including cross-rates – e.g., positions between two currencies other than the U.S. dollar.
Energy. The Funds’ primary energy market exposure is to gas and oil price movements, often resulting from political developments in the Middle East and economic conditions worldwide. Energy prices are volatile and substantial profits and losses have been and are expected to continue to be experienced in this market.
Interest rates. Interest rate movements directly affect the price of the sovereign bond futures positions held by the Funds and indirectly the value of its stock index currency positions. Interest rate movements in one country as well as relative interest rate movements between countries may materially impact the Funds’ profitability. The Funds’ primary interest rate exposure is to interest rate fluctuations in countries or regions including Australia, Canada, Japan, Switzerland, the United Kingdom, the United States and the Eurozone. However, the Funds also may take positions in futures contracts on the government debt of other nations. The Funds anticipate that interest rates in these industrialized countries or areas, both long-term and short-term, will remain a primary market exposure of the Funds for the foreseeable future.
| | |
94 | | LoCorr Macro Strategies Fund, LoCorr Long/Short Commodities Strategy Fund, LoCorr Multi-Strategy Fund, and LoCorr Market Trend Fund – Notes to
Consolidated Financial Statements / LoCorr Dynamic Equity Fund and LoCorr Spectrum Income Fund – Notes to Financial Statements (continued) |
| | |
Metals. The Funds’ metals market exposure is to fluctuations in the price of aluminum, copper, gold, lead, nickel, palladium, tin, silver and zinc.
Stock index. The Funds’ equity exposure, through stock index futures, is to equity price risk in the major industrialized countries as well as other countries.
At June 30, 2017, the LoCorr Macro Strategies Fund, the LoCorr Long/Short Commodities Strategy Fund, the LoCorr Multi-Strategy Fund and the LoCorr Market Trend Fund held derivative and other financial instruments which are not subject to a master netting arrangement. As the tables below illustrate, no positions are netted in these consolidated financial statements.
| LoCorr Macro Strategies Fund - June 30, 2017 | | | | | | | | | | | | | | | | |
| Assets: | | | | | | | | | | Gross Amounts not offset in the
Consolidated Statement of Assets & Liabilities | | | | |
| Description | | Gross Amounts of
Recognized Assets | | Gross Amounts
Offset in the
Consolidated
Statement of
Assets & Liabilities | | Net Amounts
Presented in the
Consolidated
Statement of
Assets & Liabilities | | Financial
Instruments | | | Collateral Pledged
(Received) | | | Net Amount | |
| Forward currency contracts | | $ | 12,609,160 | | | $ | — | | | $ | 12,609,160 | | | $ | — | | | $ | — | | | $ | 12,609,160 | |
| Futures contracts | | | 1,781,521 | | | | — | | | | 1,781,521 | | | | — | | | | — | | | | 1,781,521 | |
| Total | | $ | 14,390,681 | | | $ | — | | | $ | 14,390,681 | | | $ | — | | | $ | — | | | $ | 14,390,681 | |
| | | | | | | | | | | | | | | | | | | |
| Liabilities: | | | | | | | | | | | | | Gross Amounts not offset in the
Consolidated Statement of Assets & Liabilities | | | | | |
| Description | | Gross Amounts
of Recognized
Liabilities | | Gross Amounts
Offset in the
Consolidated
Statement of
Assets & Liabilities | | Net Amounts
Presented in the
Consolidated
Statement of
Assets & Liabilities | | Financial
Instruments | | | Collateral Received
(Pledged) | | Net Amount | |
| Forward currency contracts | | $ | 14,595,922 | | | $ | — | | | $ | 14,595,922 | | | $ | — | | | $ | (14,595,922 | ) | | $ | — | |
| Futures contracts | | | 19,406,037 | | | | — | | | | 19,406,037 | | | | — | | | | (19,406,037 | ) | | | — | |
| Total | | $ | 34,001,959 | | | $ | — | | | $ | 34,001,959 | | | $ | — | | | $ | (34,001,959 | ) | | $ | — | |
| | | | | | | | | | | | | | | | | | | | | | | | | |
| LoCorr Long/Short Commodities Strategy Fund - June 30, 2017 | | | | | | | | | | | | | | | | | | | | |
| Liabilities: | | | | | | | | | | | | | Gross Amounts not offset in the
Consolidated Statement of Assets & Liabilities | | | | | |
| Description | | Gross Amounts
of Recognized
Liabilities | | Gross Amounts
Offset in the
Consolidated
Statement of
Assets & Liabilities | | Net Amounts
Presented in the
Consolidated
Statement of
Assets & Liabilities | | Financial
Instruments | | | Collateral Received
(Pledged) | | | Net Amount | |
| Swap Contracts | | $ | 21,655,240 | | | $ | — | | | $ | 21,655,240 | | | $ | — | | | $ | (21,655,240 | ) | | $ | — | |
| Total | | $ | 21,655,240 | | | $ | — | | | $ | 21,655,240 | | | $ | — | | | $ | (21,655,240 | ) | | $ | — | |
| | | | | | | | | | | | | | | | | | | | | | | | | |
| LoCorr Multi-Strategy Fund - June 30, 2017 | | | | | | | | | | | | | | | | | | | | | |
| Liabilities: | | | | | | | | | | | | | Gross Amounts not offset in the
Consolidated Statement of Assets & Liabilities | | | | | |
| Description | | Gross Amounts
of Recognized
Liabilities | | Gross Amounts
Offset in the
Consolidated
Statement of
Assets & Liabilities | | Net Amounts
Presented in the
Consolidated
Statement of
Assets & Liabilities | | Financial
Instruments | | | Collateral Received
(Pledged) | | | Net Amount | |
| Swap Contracts* | | $ | 5,357,856 | | | $ | — | | | $ | 5,357,856 | | | $ | — | | | $ | (5,357,856 | ) | | $ | — | |
| Total | | $ | 5,357,856 | | | $ | — | | | $ | 5,357,856 | | | $ | — | | | $ | (5,357,856 | ) | | $ | — | |
*Includes advance payment on swap contracts. |
| | |
LoCorr Macro Strategies Fund, LoCorr Long/Short Commodities Strategy Fund, LoCorr Multi-Strategy Fund, and LoCorr Market Trend Fund – Notes to
Consolidated Financial Statements / LoCorr Dynamic Equity Fund and LoCorr Spectrum Income Fund – Notes to Financial Statements | | 95 |
| | |
| LoCorr Market Trend Fund - June 30, 2017 | | | | | | | | | | | | | | | | |
| Assets: | | | | | | | | | | Gross Amounts not offset in the
Consolidated Statement of Assets & Liabilities | | | | |
| Description | Gross Amounts of
Recognized Assets | | Gross Amounts
Offset in the
Consolidated
Statement of
Assets & Liabilities | | Net Amounts
Presented in the
Consolidated
Statement of
Assets & Liabilities | | Financial
Instruments | | Collateral Pledged
(Received) | | Net Amount | |
| Forward currency contracts | | $ | 15,961,070 | | | $ | — | | | $ | 15,961,070 | | | $ | — | | | $ | — | | | $ | 15,961,070 | |
| Futures contracts | | | 2,066,544 | | | | — | | | | 2,066,544 | | | | — | | | | — | | | | 2,066,544 | |
| Total | | $ | 18,027,614 | | | $ | — | | | $ | 18,027,614 | | | $ | — | | | $ | — | | | $ | 18,027,614 | |
| | | | | | | | | | | | | | | | | | | | | | |
| Liabilities: | | | | | | | | | | | | | Gross Amounts not offset in the
Consolidated Statement of Assets & Liabilities | | | | | |
| Description | Gross Amounts
of Recognized
Liabilities | | Gross Amounts
Offset in the
Consolidated
Statement of
Assets & Liabilities | | Net Amounts
Presented in the
Consolidated
Statement of
Assets & Liabilities | | Financial
Instruments | | Collateral Received
(Pledged) | | Net Amount | |
| Forward currency contracts | | $ | 15,866,476 | | | $ | — | | | $ | 15,866,476 | | | $ | — | | | $ | (15,866,476 | ) | | $ | — | |
| Futures contracts | | | 20,530,803 | | | | — | | | | 20,530,803 | | | | — | | | | (20,530,803 | ) | | | — | |
| Total | | $ | 36,397,279 | | | $ | — | | | $ | 36,397,279 | | | $ | — | | | $ | (36,397,279 | ) | | $ | — | |
The Funds have adopted authoritative standards regarding disclosure about derivatives and hedging activities and how they affect the Funds’ consolidated statements of assets and liabilities and consolidated statements of operations. Fair value of swap contracts are recorded in the consolidated statements of assets and liabilities as net unrealized gain on swap contracts or net unrealized loss on swap contracts and net unrealized appreciation of swap contracts or net unrealized depreciation of swap contracts.
Since the derivatives held long or short are for speculative trading purposes, the derivative instruments are not designated as hedging instruments. Accordingly, all realized gains and losses, as well as any change in net unrealized gains or losses on open contracts from the preceding period, are recognized as part of realized and unrealized gain (loss) in the consolidated statements of operations.
The following table presents the fair value of consolidated derivative instruments for the LoCorr Macro Strategies Fund, the LoCorr Long/Short Commodities Strategy Fund, the LoCorr Multi-Strategy Fund and the LoCorr Market Trend Fund as of June 30, 2017 as presented on the Funds’ consolidated statements of assets and liabilities:
| | | | | | | | | | |
| | | | | | | | | Net Unrealized | |
| | | | | | | | | Gain (Loss) on | |
| | | Fair Value | | | Open | |
| Derivatives Not Accounted for as Hedging Instruments | | Assets | | | Liabilities | | | Positions | |
| LoCorr Macro Strategies Fund | | | | | | | | | |
Forward Currency Contracts(a) | | | | | | | | | |
| Long | | $ | 10,768,664 | | | $ | 1,594,897 | | | $ | 9,173,767 | |
| Short | | | 1,840,496 | | | | 13,001,025 | | | | (11,160,529) | |
| Total Forward Currency Contracts | | | 12,609,160 | | | | 14,595,922 | | | | (1,986,762) | |
| | | | | | | | | | | | | |
Futures Contracts(b) | | | | | | | | | | | | |
| Long Contracts | | | | | | | | | | | | |
| Commodity | | | 1,834,959 | | | | 566,286 | | | | 1,268,673 | |
| Equity | | | 463,434 | | | | 7,448,896 | | | | (6,985,462) | |
| Foreign exchange | | | 114,562 | | | | 2,016 | | | | 112,546 | |
| Interest rate | | | — | | | | 16,164,885 | | | | (16,164,885) | |
| Total Long Contracts | | | 2,412,955 | | | | 24,182,083 | | | | (21,769,128) | |
| | | | | | | | | | | | | |
| Short Contracts | | | | | | | | | | | | |
| Commodity | | | 858,986 | | | | 12,196,105 | | | | (11,337,119) | |
| Equity | | | 21,032 | | | | 65,677 | | | | (44,645) | |
| Foreign exchange | | | 294,827 | | | | — | | | | 294,827 | |
| Interest rate | | | 557,301 | | | | — | | | | 557,301 | |
| Total Short Contracts | | | 1,732,146 | | | | 12,261,782 | | | | (10,529,636) | |
| Total Futures Contracts | | | 4,145,101 | | | | 36,443,865 | | | | (32,298,764) | |
| Total Forward Currency Contracts and Futures Contracts | | $ | 16,754,261 | | | $ | 51,039,787 | | | $ | (34,285,526) | |
| | |
| | |
| 96 | | LoCorr Macro Strategies Fund, LoCorr Long/Short Commodities Strategy Fund, LoCorr Multi-Strategy Fund, and LoCorr Market Trend Fund – Notes to
Consolidated Financial Statements / LoCorr Dynamic Equity Fund and LoCorr Spectrum Income Fund – Notes to Financial Statements (continued) |
| | |
| | | | | | | | | Net Unrealized | |
| | | | | | | | | Gain (Loss) on | |
| | | Fair Value | | | Open | |
| Derivatives Not Accounted for as Hedging Instruments | | Assets | | | Liabilities | | | Positions | |
| LoCorr Long/Short Commodities Strategy Fund | | | | | | | | | |
| Long Total Return Swap Contracts | | | | | | | | | |
| LoCorr Commodities Index | | $ | — | | | $ | 21,655,240 | | | $ | (21,655,240) | |
| | | | | | | | | | | | | |
| LoCorr Multi-Strategy Fund | | | | | | | | | | | | |
| Long Total Return Swap Contracts | | | | | | | | | | | | |
| LoCorr Multi-Strategy Index | | $ | — | | | $ | 4,272,107 | | | $ | (4,272,107) | |
| | | | | | | | | | | | | |
| LoCorr Market Trend Fund | | | | | | | | | | | | |
Forward Currency Contracts(a) | | | | | | | | | | | | |
| Long | | $ | 13,687,532 | | | $ | 1,460,548 | | | $ | 12,226,984 | |
| Short | | | 2,273,538 | | | | 14,405,928 | | | | (12,132,390) | |
| Total Forward Currency Contracts | | | 15,961,070 | | | | 15,866,476 | | | | 94,594 | |
| | | | | | | | | | | | | |
Futures Contracts(b) | | | | | | | | | | | | |
| Long Contracts | | | | | | | | | | | | |
| Commodity | | | 2,066,544 | | | | 1,387,536 | | | | 679,008 | |
| Equity | | | 1,221,399 | | | | 10,448,882 | | | | (9,227,483) | |
| Interest rate | | | — | | | | 17,488,853 | | | | (17,488,853) | |
| Total Long Contracts | | | 3,287,943 | | | | 29,325,271 | | | | (26,037,328) | |
| | | | | | | | | | | | | |
| Short Contracts | | | | | | | | | | | | |
| Commodity | | | 4,043,143 | | | | 10,408,193 | | | | (6,365,050) | |
| Foreign exchange | | | 632,012 | | | | — | | | | 632,012 | |
| Interest rate | | | 791,554 | | | | — | | | | 791,554 | |
| Total Short Contracts | | | 5,466,709 | | | | 10,408,193 | | | | (4,941,484) | |
| Total Futures Contracts | | | 8,754,652 | | | | 39,733,464 | | | | (30,978,812) | |
| Total Forward Currency Contracts and Futures Contracts | | $ | 24,715,722 | | | $ | 55,599,940 | | | $ | (30,884,218) | |
(a) Unrealized appreciation on forward currency contracts is a receivable and unrealized depreciation on forward currency contracts is a payable on the Fund’s consolidated statement of assets and liabilities.
(b) Reflects the cumulative unrealized appreciation (depreciation) of futures contracts as reported in the Fund’s consolidated schedule of open futures contracts. Only the current day variation margin for futures contracts is separately reported within the Fund’s consolidated statement of assets and liabilities.
The following table presents the results of the derivative trading and information related to volume for the six months ended June 30, 2017 for the LoCorr Macro Strategies Fund, the LoCorr Long/Short Commodities Strategy Fund, the LoCorr Multi-Strategy Fund and the LoCorr Market Trend Fund. The below captions of “Net Realized” and “Net Change in Unrealized” correspond to the captions in each Fund’s consolidated statement of operations.
| | | Gain (Loss) from Trading | |
| | | | | | Net Change | |
| Fund and Type of Derivative Instrument | | Net Realized | | | in Unrealized | |
| LoCorr Macro Strategies Fund | | | | | | |
| Forward Currency Contracts | | $ | (18,996,692) | | | $ | (4,843,392) | |
| Futures Contracts | | | | | | | | |
| Commodity | | | (30,299,496) | | | | (9,491,119) | |
| Equity | | | 70,217,364 | | | | (8,587,978) | |
| Foreign exchange | | | 1,742,692 | | | | 319,748 | |
| Interest rate | | | (5,621,193) | | | | (19,944,345) | |
| Total Futures Contracts | | | 36,039,367 | | | | (37,703,694) | |
| Total Forward Currency Contracts and Futures Contracts | | $ | 17,042,675 | | | $ | (42,547,086) | |
| LoCorr Long/Short Commodities Strategy Fund | | | | | | | | |
| Swap Contracts | | $ | (390,927) | | | $ | (2,664,290) | |
| | | |
| | | |
LoCorr Macro Strategies Fund, LoCorr Long/Short Commodities Strategy Fund, LoCorr Multi-Strategy Fund, and LoCorr Market Trend Fund – Notes to
Consolidated Financial Statements / LoCorr Dynamic Equity Fund and LoCorr Spectrum Income Fund – Notes to Financial Statements | | | 97 |
| | | |
| | | Gain (Loss) from Trading | |
| | | | | | Net Change | |
| Fund and Type of Derivative Instrument | | Net Realized | | | in Unrealized | |
| LoCorr Multi-Strategy Fund | | | | | | |
| Swap Contracts | | $ | (520,886) | | | $ | (567,752) | |
| | | | | | | | | |
| LoCorr Market Trend Fund | | | | | | | | |
| Forward Currency Contracts | | $ | (39,137,223) | | | $ | (3,755,285) | |
| Futures Contracts | | | | | | | | |
| Commodity | | | (25,317,267) | | | | (4,607,511) | |
| Equity | | | 91,622,249 | | | | (12,338,591) | |
| Foreign exchange | | | (585,206) | | | | 256,124 | |
| Interest rate | | | (5,406,498) | | | | (23,816,590) | |
| Total Futures Contracts | | | 60,313,278 | | | | (40,506,568) | |
| Total Forward Currency Contracts and Futures Contracts | | $ | 21,176,055 | | | $ | (44,261,853) | |
The average monthly notional amount is shown as an indicator of volume. The average monthly notional amounts during the six months ended June 30, 2017 were:
| | | Average Notional Amount | |
| | | Long Contracts | | | Short Contracts | |
| LoCorr Macro Strategies Fund | | | | | | |
| Forward Currency Contracts | | $ | 763,935,570 | | | $ | 801,152,953 | |
| Futures Contracts | | | 3,046,971,469 | | | | 1,282,284,423 | |
| | | | | | | | | |
| LoCorr Long/Short Commodities Strategy Fund | | | | | | | | |
| Swap Contracts | | $ | 109,885,714 | | | $ | — | |
| | | | | | | | | |
| LoCorr Multi-Strategy Fund | | | | | | | | |
| Swap Contracts | | $ | 41,479,233 | | | $ | — | |
| | | | | | | | | |
| LoCorr Market Trend Fund | | | | | | | | |
| Forward Currency Contracts | | $ | 1,284,281,777 | | | $ | 1,290,936,877 | |
| Futures Contracts | | | 3,904,603,097 | | | | 3,180,750,974 | |
The commodity-related future contracts reported in the tables in Note 3 represent balances and activity of each Fund’s respective wholly-owned and controlled subsidiary. See Note 2.
Please refer to the Funds’ prospectus for a full listing of risks associated with these investments.
4. Investment Transactions
The cost of security purchases and proceeds from security sales, excluding short-term investments, derivative instruments, short sales and purchases to cover short sales for the six months ended June 30, 2017 were as follows:
| | | U.S. Government Obligations | | | All Other | |
| | | Purchases | | | Sales | | | Purchases | | | Sales | |
| | | | | | | | | | | | | | | | | |
| LoCorr Macro Strategies Fund | | $ | 42,313,730 | | | $ | 71,803,913 | | | $ | 414,369,149 | | | $ | 287,565,521 | |
| LoCorr Long/Short Commodities Strategy Fund | | | 6,047,085 | | | | 5,845,904 | | | | 26,999,150 | | | | 44,729,285 | |
| LoCorr Multi-Strategy Fund | | | — | | | | — | | | | 13,268,445 | | | | 12,832,828 | |
| LoCorr Market Trend Fund | | | 64,655,312 | | | | 84,488,670 | | | | 261,196,144 | | | | 457,113,448 | |
| LoCorr Dynamic Equity Fund | | | — | | | | — | | | | 108,978,805 | | | | 110,067,327 | |
| LoCorr Spectrum Income Fund | | | — | | | | — | | | | 46,342,168 | | | | 39,009,048 | |
| | |
| | |
98 | | LoCorr Macro Strategies Fund, LoCorr Long/Short Commodities Strategy Fund, LoCorr Multi-Strategy Fund, and LoCorr Market Trend Fund – Notes to
Consolidated Financial Statements / LoCorr Dynamic Equity Fund and LoCorr Spectrum Income Fund – Notes to Financial Statements (continued) |
| | |
5. Management Fees and Other Transactions with Affiliates
Management Agreement
The Trust has a Management Agreement with the Adviser, with whom certain officers and Trustees of the Funds are affiliated, to furnish investment advisory services to the Funds. Pursuant to the Amendment to the Management Agreement, the Adviser is entitled to receive a fee as follows:
| | Annual Advisory Fee as a Percentage |
| Fund | of the Average Daily Net Assets of the Fund |
| | |
| LoCorr Macro Strategies Fund | 1.75%* |
| LoCorr Multi-Strategy Fund | 1.75% |
| LoCorr Market Trend Fund | 1.50% |
| LoCorr Dynamic Equity Fund | 2.45% |
| LoCorr Spectrum Income Fund | 1.30% |
*Effective May 1, 2017, the Trustees of the LoCorr Macro Strategies Fund approved an amended Management Agreement pursuant to which the Adviser receives a rate of 1.75% of the Fund’s average daily net assets. Prior to May 1, 2017, the Adviser received a rate of 1.85% of the Fund’s average daily net assets.
Pursuant to the Amendment to the Management Agreement, the Adviser is entitled to receive a fee, in accordance with the Incremental Advisory Fee schedule below based on the LoCorr Long/Short Commodities Strategy Fund’s average daily net assets.
| | |
| Net Assets for the LoCorr Long/Short | Incremental** |
| Commodities Strategy Fund | Advisory Fee |
| $0.0 - $0.5 billion | 1.50% |
| $0.5 - $1.0 billion | 1.40% |
| $1.0 - $1.5 billion | 1.30% |
| $1.5 - $2.0 billion | 1.20% |
| $2.0 - $2.5 billion | 1.10% |
| Over $2.5 billion | 1.00% |
**Incremental advisory fee represents the fees paid on net assets at the related net asset level. For example, with $3 billion in net assets in a Fund, the Adviser would earn 1.50% on the first $500 million, plus 1.40% on the next $500 million, plus 1.30% on the next $500 million, plus 1.20% on the next $500 million, plus 1.10% on the next $500 million, plus 1.00% on the final $500 million.
As of and for the six months ended June 30, 2017, the Funds reported the following in regards to management fees:
| | | | | | Accrued |
| | | Management Fees | | Management Fees |
| | | For the Six Months Ended | | as of |
| Fund | | June 30, 2017 | | June 30, 2017 |
| LoCorr Macro Strategies Fund* | | $ | 8,759,693 | | | $ | 1,465,961 | |
| LoCorr Long/Short Commodities Strategy Fund | | | 841,516 | | | | 115,594 | |
| LoCorr Multi-Strategy Fund | | | 340,084 | | | | 42,625 | |
| LoCorr Market Trend Fund | | | 6,736,744 | | | | 1,022,320 | |
| LoCorr Dynamic Equity Fund | | | 1,049,737 | | | | 162,604 | |
| LoCorr Spectrum Income Fund | | | 716,339 | | | | 118,694 | |
*Effective May 1, 2017, the Trustees approved an amended Management Agreement in which the Adviser receives a rate of 1.75% of the Fund’s average daily net assets. Prior to May 1, 2017, the Adviser received a rate of 1.85% of the Fund’s average daily net assets.
Sub-Advisory Agreements
Sub-advisory services are provided to the Funds, pursuant to agreements between the Adviser and the below listed sub-advisers. Under the terms of these sub-advisory agreements, the Adviser compensates the sub-advisers based on the portion of each Fund’s average daily net assets which they have been allocated to manage.
| LoCorr Macro Strategies Fund: | LoCorr Market Trend Fund: |
| Graham Capital Management, L.P. | Graham Capital Management, L.P. |
| Millburn Ridgefield Corporation | Nuveen Asset Management, LLC |
| Nuveen Asset Management, LLC | |
| Revolution Capital Management LLC | LoCorr Dynamic Equity Fund: |
| | Billings Capital Management LLC |
| LoCorr Long/Short Commodities Strategy Fund: | Kettle Hill Capital Management, LLC |
| Nuveen Asset Management, LLC | |
| | LoCorr Spectrum Income Fund: |
| LoCorr Multi-Strategy Fund: | Trust & Fiduciary Income Partners, LLC |
| Billings Capital Management LLC | |
| Trust & Fiduciary Income Partners, LLC | |
The Adviser is solely responsible for the payment of the sub-adviser’s fees, and the sub-adviser agrees not to seek payment of its fees from the Trust or the Funds.
| | |
| | |
LoCorr Macro Strategies Fund, LoCorr Long/Short Commodities Strategy Fund, LoCorr Multi-Strategy Fund, and LoCorr Market Trend Fund – Notes to
Consolidated Financial Statements / LoCorr Dynamic Equity Fund and LoCorr Spectrum Income Fund – Notes to Financial Statements | | 99 |
| | |
Expense Limitation Agreement
The Funds’ Adviser has contractually agreed to waive management fees and/or reimburse the Funds for expenses they incur, but only to the extent necessary to maintain the Funds’ total annual operating expenses after fee waiver and/or reimbursement (excluding any Rule 12b-1 distribution and/or servicing fees, taxes, interest, brokerage commissions, expenses incurred in connection with any merger or reorganization, dividend expenses on short sales, swap fees, indirect expenses, expenses of other investment companies in which the Funds may invest, or extraordinary expenses such as litigation expenses and inclusive of offering and organizational costs incurred prior to the commencement of operations) at the percentages listed below:
| | Expense Limit as a Percentage of the | |
| Fund | Average Daily Net Assets of the Fund | Effective Period Through |
| LoCorr Macro Strategies Fund | 1.99%* | April 30, 2018 |
| LoCorr Long/Short Commodities Strategy Fund | 1.95% | April 30, 2018 |
| LoCorr Multi-Strategy Fund | 2.04% | April 30, 2018 |
| LoCorr Market Trend Fund | 1.95% | April 30, 2018 |
| LoCorr Dynamic Equity Fund | 2.90% | April 30, 2018 |
| LoCorr Spectrum Income Fund | 1.80% | April 30, 2018 |
*In conjunction with the amended management agreement approved on May 1, 2017, the expense limitation has been decreased to 1.99% of the average daily net assets of the Fund. Prior to May 1, 2017, the expense limitation was 2.25% of the average daily net assets of the Fund.
Any waiver or reimbursement is subject to repayment by the respective Fund within the three fiscal years following the fiscal year in which the expenses occurred, if the Fund is able to make the repayment without exceeding its current expense limitations and the repayment is approved by the Board of Trustees. The organizational and offering costs are subject to repayment by the Funds.
The total amounts of management fees waived and/or expenses reimbursed which are subject to recovery, and their related expiration date are as follows:
LoCorr Macro Strategies Fund | | | | | | | | | | | | | | | | | | | | | | |
| | | | | | | | | | | | | | | | | | | | | | | | Subject to | |
| | | Fees (Waived) or Expenses (Borne) | | | Recovery to Adviser | | | Remaining | | | Recovery on or | |
| | | by Adviser Subject to Recovery | | | Six Months | | | Year Ended | | | Available | | | Before Fiscal | |
| | | Management | | | Other | | | | | | Ended June | | | December 31, | | | Subject to | | | Year Ending | |
| Period | | Fees | | | Expenses | | | Total | | | 30, 2017 | | | | 2016 | | | | 2015 | | | Recovery | | | December 31, | |
| Six Months Ended June 30, 2017 | | $ | (100,280 | ) | | $ | — | | | $ | (100,280 | ) | | $ | — | | | $ | — | | | $ | — | | | $ | (100,280 | ) | | | 2020 | |
| Total | | $ | (100,280 | ) | | $ | — | | | $ | (100,280 | ) | | $ | — | | | $ | — | | | $ | — | | | $ | (100,280 | ) | | | | |
| LoCorr Long/Short Commodities Strategy Fund | | | | | | | | | | | | | | | | | | | |
| | | | | | | | | | | | | | | | | | | | | | | | Subject to | |
| | | Fees (Waived) or Expenses (Borne) | | | Recovery to Adviser | | | Remaining | | | Recovery on or | |
| | | by Adviser Subject to Recovery | | | Six Months | | | Year Ended | | | Available | | | Before Fiscal | |
| | | Management | | | Other | | | | | | Ended June | | | December 31, | | | Subject to | | | Year Ending | |
| Period | | Fees | | | Expenses | | | Total | | | 30, 2017 | | | | 2016 | | | | 2015 | | | Recovery | | | December 31, | |
| Six Months Ended June 30, 2017 | | $ | (51,417 | ) | | $ | — | | | $ | (51,417 | ) | | $ | — | | | $ | — | | | $ | — | | | $ | (51,417 | ) | | | 2020 | |
| Year Ended December 31, 2016 | | | (21,779 | ) | | | — | | | | (21,779 | ) | | | — | | | | — | | | | — | | | | (21,779 | ) | | | 2019 | |
| Year Ended December 31, 2015 | | | (154,527 | ) | | | — | | | | (154,527 | ) | | | — | | | | — | | | | — | | | | (154,527 | ) | | | 2018 | |
| Year Ended December 31, 2014 | | | (226,735 | ) | | | — | | | | (226,735 | ) | | | — | | | | — | | | | — | | | | (226,735 | ) | | | 2017 | |
| Total | | $ | (454,458 | ) | | $ | — | | | $ | (454,458 | ) | | $ | — | | | $ | — | | | $ | — | | | $ | (454,458 | ) | | | | |
| LoCorr Multi-Strategy Fund | | | | | | | | | | | | | | | | | | | |
| | | | | | | | | | | | | | | | | | | | | | | | Subject to | |
| | | Fees (Waived) or Expenses (Borne) | | | Recovery to Adviser | | | Remaining | | | Recovery on or | |
| | | by Adviser Subject to Recovery | | | Six Months | | | Year Ended | | | Available | | | Before Fiscal | |
| | | Management | | | Other | | | | | | Ended June | | | December 31, | | | Subject to | | | Year Ending | |
| Period | | Fees | | | Expenses | | | Total | | | 30, 2017 | | | | 2016 | | | | 2015 | | | Recovery | | | December 31, | |
| Six Months Ended June 30, 2017 | | $ | (84,082 | ) | | $ | — | | | $ | (84,082 | ) | | $ | — | | | $ | — | | | $ | — | | | $ | (84,082 | ) | | | 2020 | |
| Year Ended December 31, 2016 | | | (181,466 | ) | | | — | | | | (181,466 | ) | | | — | | | | — | | | | — | | | | (181,466 | ) | | | 2019 | |
| Period Ended December 31, 2015* | | | (195,479 | ) | | | — | | | | (195,479 | ) | | | — | | | | — | | | | — | | | | (195,479 | ) | | | 2018 | |
| Total | | $ | (461,027 | ) | | $ | — | | | $ | (461,027 | ) | | $ | — | | | $ | — | | | $ | — | | | $ | (461,027 | ) | | | | |
*Period from April 6, 2015 (commencement of operations) through December 31, 2015.
| LoCorr Dynamic Equity Fund | | | | | | | | | | | | | | | | | | |
| | | | | | | | | | | | | | | | | | | | | | | | Subject to | |
| | | Fees (Waived) or Expenses (Borne) | | | Recovery to Adviser | | | Remaining | | | Recovery on or | |
| | | by Adviser Subject to Recovery | | | Six Months | | | Year Ended | | | Available | | | Before Fiscal | |
| | | Management | | | Other | | | | | | Ended June | | | December 31, | | | Subject to | | | Year Ending | |
| Period | | Fees | | | Expenses | | | Total | | | 30, 2017 | | | | 2016 | | | | 2015 | | | Recovery | | | December 31, | |
| Six Months Ended June 30, 2017 | | $ | — | | | $ | — | | | $ | — | | | $ | — | | | $ | — | | | $ | — | | | $ | — | | | | 2020 | |
| Year Ended December 31, 2016 | | | (102,813 | ) | | | — | | | | (102,813 | ) | | | — | | | | — | | | | — | | | | (102,813 | ) | | | 2019 | |
| Year Ended December 31, 2015 | | | (132,040 | ) | | | — | | | | (132,040 | ) | | | — | | | | — | | | | — | | | | (132,040 | ) | | | 2018 | |
| Year Ended December 31, 2014 | | | (122,831 | ) | | | — | | | | (122,831 | ) | | | 1,876 | | | | — | | | | — | | | | (120,955 | ) | | | 2017 | |
| Total | | $ | (357,684 | ) | | $ | — | | | $ | (357,684 | ) | | $ | 1,876 | | | $ | — | | | $ | — | | | $ | (355,808 | ) | | | | |
| | |
| | |
| 100 | | LoCorr Macro Strategies Fund, LoCorr Long/Short Commodities Strategy Fund, LoCorr Multi-Strategy Fund, and LoCorr Market Trend Fund – Notes to Consolidated Financial Statements / LoCorr Dynamic Equity Fund and LoCorr Spectrum Income Fund – Notes to Financial Statements (continued) |
| | |
| LoCorr Spectrum Income Fund | | | | | | | | | | | | | | | | | | | |
| | | | | | | | | | | | | | | | | | | | | | | | Subject to | |
| | | Fees (Waived) or Expenses (Borne) | | | Recovery to Adviser | | | Remaining | | | Recovery on or | |
| | | by Adviser Subject to Recovery | | | Six Months | | | Year Ended | | | Available | | | Before Fiscal | |
| | | Management | | | Other | | | | | | Ended June | | | December 31, | | | Subject to | | | Year Ending | |
| Period | | Fees | | | Expenses | | | Total | | | 30, 2017 | | | | 2016 | | | | 2015 | | | Recovery | | | December 31, | |
| Six Months Ended June 30, 2017 | | $ | — | | | $ | — | | | $ | — | | | $ | — | | | $ | — | | | $ | — | | | $ | — | | | | 2020 | |
| Year Ended December 31, 2016 | | | — | | | | — | | | | — | | | | — | | | | — | | | | — | | | | — | | | | 2019 | |
| Year Ended December 31, 2015 | | | — | | | | — | | | | — | | | | — | | | | — | | | | — | | | | — | | | | 2018 | |
| Year Ended December 31, 2014 | | | (132,869) | | | | — | | | | (132,869) | | | | 39,116 | | | | 26,753 | | | | 67,000 | | | | — | | | | 2017 | |
| Total | | $ | (132,869) | | | $ | — | | | $ | (132,869) | | | $ | 39,116 | | | $ | 26,753 | | | $ | 67,000 | | | $ | — | | | | | |
At June 30, 2017, there were no fees subject to recovery for the LoCorr Market Trend Fund.
Rule 12b-1 Distribution Agreement
The Funds have entered into a Rule 12b-1 distribution agreement with Quasar Distributors, LLC (“Quasar”). Class A shareholders pay distribution expenses to Quasar at the annual rate of 0.25% of the Fund’s average daily net assets. Class C shareholders pay to Quasar an annual rate of 1.00%, which is comprised of 0.75% in distribution expenses and 0.25% in service fees, of the Fund’s average daily net assets. Class I shareholders pay no 12b-1 fees.
6. Fund Shares
At June 30, 2017, there were an unlimited number of shares of beneficial interest authorized. The following table summarizes the activity in shares and dollar amounts applicable to each class of the Funds:
| LoCorr Macro Strategies Fund – Class A | | | | | | | | | | | | |
| | | For the Six Months Ended June 30, 2017 | | | For the Year Ended December 31, 2016 | |
| | | Shares | | | Amount | | | Shares | | | Amount | |
| Shares Sold | | | 3,963,460 | | | $ | 35,643,075 | | | | 16,961,784 | | | $ | 155,903,603 | |
| Dividends Reinvested | | | — | | | | — | | | | 551,098 | | | | 4,910,284 | |
| Shares Redeemed | | | (25,500,705) | | | | (231,224,921) | | | | (10,956,643) | | | | (99,832,561) | |
| Redemption Fees | | | — | | | | 382 | | | | — | | | | 2,040 | |
| | | | (21,537,245) | | | $ | (195,581,464) | | | | 6,556,239 | | | $ | 60,983,366 | |
| Beginning Shares | | | 33,412,218 | | | | | | | | 26,855,979 | | | | | |
| Ending Shares | | | 11,874,973 | | | | | | | | 33,412,218 | | | | | |
| | | | | | | | | | | | | | | | | |
| LoCorr Macro Strategies Fund – Class C | | | | | | | | | | | | | | | | |
| | | For the Six Months Ended June 30, 2017 | | | For the Year Ended December 31, 2016 | |
| | | Shares | | | Amount | | | Shares | | | Amount | |
| Shares Sold | | | 1,392,453 | | | $ | 12,074,789 | | | | 3,540,006 | | | $ | 31,741,634 | |
| Dividends Reinvested | | | — | | | | — | | | | 256,145 | | | | 2,207,972 | |
| Shares Redeemed | | | (2,205,742) | | | | (19,139,514) | | | | (2,445,483) | | | | (21,620,670) | |
| Redemption Fees | | | — | | | | 680 | | | | — | | | | 289 | |
| | | | (813,289) | | | $ | (7,064,045) | | | | 1,350,668 | | | $ | 12,329,225 | |
| Beginning Shares | | | 13,210,934 | | | | | | | | 11,860,266 | | | | | |
| Ending Shares | | | 12,397,645 | | | | | | | | 13,210,934 | | | | | |
| | | | | | | | | | | | | | | | | |
| LoCorr Macro Strategies Fund – Class I | | | | | | | | | | | | | | | | |
| | | For the Six Months Ended June 30, 2017 | | | For the Year Ended December 31, 2016 | |
| | | Shares | | | Amount | | | Shares | | | Amount | |
| Shares Sold | | | 55,502,595 | | | $ | 507,037,183 | | | | 38,061,171 | | | $ | 351,129,132 | |
| Dividends Reinvested | | | — | | | | — | | | | 779,989 | | | | 7,027,798 | |
| Shares Redeemed | | | (18,880,783) | | | | (172,112,215) | | | | (8,907,973) | | | | (81,922,066) | |
| Redemption Fees | | | — | | | | 10,665 | | | | — | | | | 19,839 | |
| | | | 36,621,812 | | | $ | 334,935,633 | | | | 29,933,187 | | | $ | 276,254,703 | |
| Beginning Shares | | | 52,255,421 | | | | | | | | 22,322,234 | | | | | |
| Ending Shares | | | 88,877,233 | | | | | | | | 52,255,421 | | | | | |
| LoCorr Macro Strategies Fund | | | | | | | | | | | | | | | | |
| Total Net Increase | | | | | | $ | 132,290,124 | | | | | | | $ | 349,567,294 | |
| | |
| | |
LoCorr Macro Strategies Fund, LoCorr Long/Short Commodities Strategy Fund, LoCorr Multi-Strategy Fund, and LoCorr Market Trend Fund – Notes to Consolidated Financial Statements / LoCorr Dynamic Equity Fund and LoCorr Spectrum Income Fund – Notes to Financial Statements | | 101 |
| | |
| LoCorr Long/Short Commodities Strategy Fund — Class A | | | | | | | | | | |
| | | For the Six Months Ended June 30, 2017 | | | For the Year Ended December 31, 2016 | |
| | | Shares | | | Amount | | | Shares | | | Amount | |
| Shares Sold | | | 456,800 | | | $ | 4,205,480 | | | | 5,519,830 | | | $ | 56,215,085 | |
| Dividends Reinvested | | | — | | | | — | | | | 90,271 | | | | 850,348 | |
| Shares Redeemed | | | (1,117,206) | | | | (10,296,190) | | | | (4,322,845) | | | | (43,063,779) | |
| Redemption Fees | | | — | | | | 74 | | | | — | | | | 5,787 | |
| | | | (660,406) | | | $ | (6,090,636) | | | | 1,287,256 | | | $ | 14,007,441 | |
| Beginning Shares | | | 3,800,744 | | | | | | | | 2,513,488 | | | | | |
| Ending Shares | | | 3,140,338 | | | | | | | | 3,800,744 | | | | | |
| | | | | | | | | | | | | | |
| LoCorr Long/Short Commodities Strategy Fund — Class C | | | | | | | | | | | | | |
| | | For the Six Months Ended June 30, 2017 | | | For the Year Ended December 31, 2016 | |
| | | Shares | | | Amount | | | Shares | | | Amount | |
| Shares Sold | | | 154,050 | | | $ | 1,346,316 | | | | 600,272 | | | $ | 5,936,288 | |
| Dividends Reinvested | | | — | | | | — | | | | 19,301 | | | | 177,569 | |
| Shares Redeemed | | | (314,285) | | | | (2,817,149) | | | | (250,419) | | | | (2,413,789) | |
| Redemption Fees | | | — | | | | 34 | | | | — | | | | 383 | |
| | | | (160,235) | | | $ | (1,470,799) | | | | 369,154 | | | $ | 3,700,451 | |
| Beginning Shares | | | 824,453 | | | | | | | | 455,299 | | | | | |
| Ending Shares | | | 664,218 | | | | | | | | 824,453 | | | | | |
| | | | | | | | | | | | | | | | | |
| LoCorr Long/Short Commodities Strategy Fund – Class I | | | | | | | | | | | | | |
| | | For the Six Months Ended June 30, 2017 | | | For the Year Ended December 31, 2016 | |
| | | Shares | | | Amount | | | Shares | | | Amount | |
| Shares Sold | | | 2,004,092 | | | $ | 18,605,221 | | | | 11,982,802 | | | $ | 122,350,301 | |
| Dividends Reinvested | | | — | | | | — | | | | 241,354 | | | | 2,290,449 | |
| Shares Redeemed | | | (3,196,956) | | | | (29,618,635) | | | | (6,618,317) | | | | (65,911,861) | |
| Redemption Fees | | | — | | | | — | | | | — | | | | 20,771 | |
| | | | (1,192,864) | | | $ | (11,013,414) | | | | 5,605,839 | | | $ | 58,749,660 | |
| Beginning Shares | | | 8,789,574 | | | | | | | | 3,183,735 | | | | | |
| Ending Shares | | | 7,596,710 | | | | | | | | 8,789,574 | | | | | |
| LoCorr Long/Short Commodities Strategy Fund | | | | | | | | | | | | | |
| Total Net Increase (Decrease) | | | | | | $ | (18,574,849) | | | | | | | $ | 76,457,552 | |
| | | | | | | | | | | | | | | | | |
| LoCorr Multi-Strategy Fund – Class A | | | | | | | | | | | | | | | | |
| | | For the Six Months Ended June 30, 2017 | | | For the Year Ended December 31, 2016 | |
| | | Shares | | | Amount | | | Shares | | | Amount | |
| Shares Sold | | | 456,643 | | | $ | 3,719,367 | | | | 1,331,325 | | | $ | 10,927,197 | |
| Dividends Reinvested | | | 32,937 | | | | 264,191 | | | | 48,692 | | | | 399,332 | |
| Shares Redeemed | | | (247,750) | | | | (1,991,711) | | | | (730,590) | | | | (6,017,250) | |
| Redemption Fees | | | — | | | | — | | | | — | | | | 177 | |
| | | | 241,830 | | | $ | 1,991,847 | | | | 649,427 | | | $ | 5,309,456 | |
| Beginning Shares | | | 2,105,165 | | | | | | | | 1,455,738 | | | | | |
| Ending Shares | | | 2,346,995 | | | | | | | | 2,105,165 | | | | | |
| | | | | | | | | | | | | | | | | |
| LoCorr Multi-Strategy Fund – Class C | | | | | | | | | | | | | | | | |
| | | For the Six Months Ended June 30, 2017 | | | For the Year Ended December 31, 2016 | |
| | | Shares | | | Amount | | | Shares | | | Amount | |
| Shares Sold | | | 44,839 | | | $ | 363,001 | | | | 187,751 | | | $ | 1,553,343 | |
| Dividends Reinvested | | | 4,965 | | | | 39,916 | | | | 12,332 | | | | 100,963 | |
| Shares Redeemed | | | (141,292) | | | | (1,145,564) | | | | (382,843) | | | | (3,106,550) | |
| Redemption Fees | | | — | | | | — | | | | — | | | | 4 | |
| | | | (91,488) | | | $ | (742,647) | | | | (182,760) | | | $ | (1,452,240) | |
| Beginning Shares | | | 478,190 | | | | | | | | 660,950 | | | | | |
| Ending Shares | | | 386,702 | | | | | | | | 478,190 | | | | | |
| | | | | | | | | | | | | | | | | |
| LoCorr Multi-Strategy Fund – Class I | | | | | | | | | | | | | | | | |
| | | For the Six Months Ended June 30, 2017 | | | For the Year Ended December 31, 2016 | |
| | | Shares | | | Amount | | | Shares | | | Amount | |
| Shares Sold | | | 397,891 | | | $ | 3,221,835 | | | | 1,079,642 | | | $ | 8,820,649 | |
| Dividends Reinvested | | | 35,288 | | | | 282,722 | | | | 63,201 | | | | 517,849 | |
| Shares Redeemed | | | (392,458) | | | | (3,203,742) | | | | (889,163) | | | | (7,321,692) | |
| Redemption Fees | | | — | | | | 2 | | | | — | | | | 57 | |
| | | | 40,721 | | | $ | 300,817 | | | | 253,680 | | | $ | 2,016,863 | |
| Beginning Shares | | | 2,247,664 | | | | | | | | 1,993,984 | | | | | |
| Ending Shares | | | 2,288,385 | | | | | | | | 2,247,664 | | | | | |
| LoCorr Multi-Strategy Fund | | | | | | | | | | | | | | | | |
| Total Net Increase | | | | | | $ | 1,550,017 | | | | | | | $ | 5,874,079 | |
| | |
| | |
| 102 | | LoCorr Macro Strategies Fund, LoCorr Long/Short Commodities Strategy Fund, LoCorr Multi-Strategy Fund, and LoCorr Market Trend Fund – Notes to Consolidated Financial Statements / LoCorr Dynamic Equity Fund and LoCorr Spectrum Income Fund – Notes to Financial Statements (continued) |
| | |
| LoCorr Market Trend Fund – Class A | | | | | | | | | | | | |
| | | For the Six Months Ended June 30, 2017 | | | For the Year Ended December 31, 2016 | |
| | | Shares | | | Amount | | | Shares | | | Amount | |
| Shares Sold | | | 1,046,499 | | | $ | 11,179,440 | | | | 11,027,256 | | | $ | 134,082,733 | |
| Dividends Reinvested | | | — | | | | — | | | | 196,345 | | | | 2,120,523 | |
| Shares Redeemed | | | (6,115,189) | | | | (64,686,824) | | | | (7,913,099) | | | | (91,798,608) | |
| Redemption Fees | | | — | | | | 784 | | | | — | | | | 7,807 | |
| | | | (5,068,690) | | | $ | (53,506,600) | | | | 3,310,502 | | | $ | 44,412,455 | |
| Beginning Shares | | | 12,505,112 | | | | | | | | 9,194,610 | | | | | |
| Ending Shares | | | 7,436,422 | | | | | | | | 12,505,112 | | | | | |
| | | | | | | | | | | | | | | | | |
| LoCorr Market Trend Fund – Class C | | | | | | | | | | | | | | | | |
| | | For the Six Months Ended June 30, 2017 | | | For the Year Ended December 31, 2016 | |
| | | Shares | | | Amount | | | Shares | | | Amount | |
| Shares Sold | | | 219,862 | | | $ | 2,315,028 | | | | 4,790,065 | | | $ | 57,543,161 | |
| Dividends Reinvested | | | — | | | | — | | | | 123,161 | | | | 1,316,592 | |
| Shares Redeemed | | | (3,140,151) | | | | (32,848,573) | | | | (4,366,738) | | | | (49,694,049) | |
| Redemption Fees | | | — | | | | 6 | | | | — | | | | 1,131 | |
| | | | (2,920,289) | | | $ | (30,533,539) | | | | 546,488 | | | $ | 9,166,835 | |
| Beginning Shares | | | 8,493,445 | | | | | | | | 7,946,957 | | | | | |
| Ending Shares | | | 5,573,156 | | | | | | | | 8,493,445 | | | | | |
| | | | | | | | | | | | | | | | | |
| LoCorr Market Trend Fund – Class I | | | | | | | | | | | | | | | | |
| | | For the Six Months Ended June 30, 2017 | | | For the Year Ended December 31, 2016 | |
| | | Shares | | | Amount | | | Shares | | | Amount | |
| Shares Sold | | | 16,741,390 | | | $ | 179,024,431 | | | | 77,618,009 | | | $ | 938,193,389 | |
| Dividends Reinvested | | | — | | | | — | | | | 1,426,002 | | | | 15,443,598 | |
| Shares Redeemed | | | (29,466,451) | | | | (313,135,992) | | | | (62,230,774) | | | | (713,501,477) | |
| Redemption Fees | | | — | | | | 5,091 | | | | — | | | | 22,937 | |
| | | | (12,725,061) | | | $ | (134,106,470) | | | | 16,813,237 | | | $ | 240,158,447 | |
| Beginning Shares | | | 74,717,153 | | | | | | | | 57,903,916 | | | | | |
| Ending Shares | | | 61,992,092 | | | | | | | | 74,717,153 | | | | | |
| LoCorr Market Trend Fund | | | | | | | | | | | | | | | | |
| Total Net Increase (Decrease) | | | | | | $ | (218,146,609) | | | | | | | $ | 293,737,737 | |
| | | | | | | | | | | | | | | | | |
| LoCorr Dynamic Equity Fund - Class A | | | | | | | | | | | | | |
| | | For the Six Months Ended June 30, 2017 | | | For the Year Ended December 31, 2016 | |
| | | Shares | | | Amount | | | Shares | | | Amount | |
| Shares Sold | | | 835,336 | | | $ | 9,959,598 | | | | 1,619,380 | | | $ | 18,187,352 | |
| Shares Redeemed | | | (1,670,516) | | | | (19,930,961) | | | | (568,057) | | | | (6,110,231) | |
| Redemption Fees | | | — | | | | 1,548 | | | | — | | | | 398 | |
| | | | (835,180) | | | $ | (9,969,815) | | | | 1,051,323 | | | $ | 12,077,519 | |
| Beginning Shares | | | 2,342,008 | | | | | | | | 1,290,685 | | | | | |
| Ending Shares | | | 1,506,828 | | | | | | | | 2,342,008 | | | | | |
| | | | | | | | | | | | | | | | | |
| LoCorr Dynamic Equity Fund – Class C | | | | | | | | | | | | | |
| | | For the Six Months Ended June 30, 2017 | | | For the Year Ended December 31, 2016 | |
| | | Shares | | | Amount | | | Shares | | | Amount | |
| Shares Sold | | | 293,216 | | | $ | 3,381,186 | | | | 442,691 | | | $ | 4,787,011 | |
| Shares Redeemed | | | (237,676) | | | | (2,727,948) | | | | (315,415) | | | | (3,114,307) | |
| Redemption Fees | | | — | | | | 121 | | | | — | | | | 33 | |
| | | | 55,540 | | | $ | 653,359 | | | | 127,276 | | | $ | 1,672,737 | |
| Beginning Shares | | | 956,669 | | | | | | | | 829,393 | | | | | |
| Ending Shares | | | 1,012,209 | | | | | | | | 956,669 | | | | | |
| | | | | | | | | | | | | | | | | |
| LoCorr Dynamic Equity Fund – Class I | | | | | | | | | | | | | |
| | | For the Six Months Ended June 30, 2017 | | | For the Year Ended December 31, 2016 | |
| | | Shares | | | Amount | | | Shares | | | Amount | |
| Shares Sold | | | 2,169,901 | | | $ | 26,110,856 | | | | 3,239,660 | | | $ | 36,623,262 | |
| Shares Redeemed | | | (1,677,330) | | | | (20,100,018) | | | | (586,786) | | | | (6,413,330) | |
| Redemption Fees | | | — | | | | 614 | | | | — | | | | 1,721 | |
| | | | 492,571 | | | $ | 6,011,452 | | | | 2,652,874 | | | $ | 30,211,653 | |
| Beginning Shares | | | 3,682,147 | | | | | | | | 1,029,273 | | | | | |
| Ending Shares | | | 4,174,718 | | | | | | | | 3,682,147 | | | | | |
| LoCorr Dynamic Equity Fund | | | | | | | | | | | | | | | | |
| Total Net Increase (Decrease) | | | | | | $ | (3,305,004) | | | | | | | $ | 43,961,909 | |
| | |
| | |
LoCorr Macro Strategies Fund, LoCorr Long/Short Commodities Strategy Fund, LoCorr Multi-Strategy Fund, and LoCorr Market Trend Fund – Notes to Consolidated Financial Statements / LoCorr Dynamic Equity Fund and LoCorr Spectrum Income Fund – Notes to Financial Statements | | 103 |
| | |
| LoCorr Spectrum Income Fund – Class A | | | | | | | | | | | | |
| | | For the Six Months Ended June 30, 2017 | | | For the Year Ended December 31, 2016 | |
| | | Shares | | | Amount | | | Shares | | | Amount | |
| Shares Sold | | | 801,139 | | | $ | 6,216,263 | | | | 1,632,393 | | | $ | 12,699,250 | |
| Dividends Reinvested | | | 106,007 | | | | 821,873 | | | | 235,964 | | | | 1,810,640 | |
| Shares Redeemed | | | (622,551) | | | | (4,837,178) | | | | (2,326,814) | | | | (17,742,010) | |
| Redemption Fees | | | — | | | | 606 | | | | — | | | | 2,666 | |
| | | | 284,595 | | | $ | 2,201,564 | | | | (458,457) | | | $ | (3,229,454) | |
| Beginning Shares | | | 4,291,419 | | | | | | | | 4,749,876 | | | | | |
| Ending Shares | | | 4,576,014 | | | | | | | | 4,291,419 | | | | | |
| | | | | | | | | | | | | | | | | |
| LoCorr Spectrum Income Fund – Class C | | | | | | | | | | | | | | | | |
| | | For the Six Months Ended June 30, 2017 | | | For the Year Ended December 31, 2016 | |
| | | Shares | | | Amount | | | Shares | | | Amount | |
| Shares Sold | | | 414,741 | | | $ | 3,241,136 | | | | 740,640 | | | $ | 5,722,907 | |
| Dividends Reinvested | | | 89,742 | | | | 698,018 | | | | 189,715 | | | | 1,459,221 | |
| Shares Redeemed | | | (503,234) | | | | (3,926,339) | | | | (1,148,184) | | | | (8,758,530) | |
| Redemption Fees | | | — | | | | 263 | | | | – | | | | 384 | |
| | | | 1,249 | | | $ | 13,078 | | | | (217,829) | | | $ | (1,576,018) | |
| Beginning Shares | | | 3,356,632 | | | | | | | | 3,574,461 | | | | | |
| Ending Shares | | | 3,357,881 | | | | | | | | 3,356,632 | | | | | |
| | | | | | | | | | | | | | | | | |
| LoCorr Spectrum Income Fund – Class I | | | | | | | | | | | | | | | | |
| | | For the Six Months Ended June 30, 2017 | | | For the Year Ended December 31, 2016 | |
| | | Shares | | | Amount | | | Shares | | | Amount | |
| Shares Sold | | | 1,668,437 | | | $ | 13,008,578 | | | | 4,225,921 | | | $ | 32,868,495 | |
| Dividends Reinvested | | | 155,671 | | | | 1,205,932 | | | | 238,899 | | | | 1,835,131 | |
| Shares Redeemed | | | (1,087,210) | | | | (8,449,259) | | | | (2,012,132) | | | | (15,252,427) | |
| Redemption Fees | | | — | | | | 14,815 | | | | – | | | | 5,805 | |
| | | | 736,898 | | | $ | 5,780,066 | | | | 2,452,688 | | | $ | 19,457,004 | |
| Beginning Shares | | | 6,088,507 | | | | | | | | 3,635,819 | | | | | |
| Ending Shares | | | 6,825,405 | | | | | | | | 6,088,507 | | | | | |
| LoCorr Spectrum Income Fund | | | | | | | | | | | | | | | | |
| Total Net Increase | | | | | | $ | 7,994,708 | | | | | | | $ | 14,651,532 | |
7. Federal Tax Information
As of December 31, 2016, the components of accumulated earnings (losses) for income tax purposes were as follows:
| | | LoCorr | | | LoCorr Long/Short | | | LoCorr | |
| | | Macro Strategies | | | Commodities Strategy | | | Multi Strategy | |
| | | Fund | | | Fund | | | Fund | |
| Tax cost of investments | | $ | 792,214,600 | | | $ | 106,286,260 | | | $ | 32,225,286 | |
| | | | | | | | | | | | | |
| Gross unrealized appreciation | | | 10,067,249 | | | | 232,856 | | | | 3,633,468 | |
| Gross unrealized depreciation | | | (14,834,202) | | | | (738,665 | ) | | | (1,447,748 | ) |
| Net unrealized appreciation (depreciation) | | | (4,766,953) | | | | (505,809 | ) | | | 2,185,720 | |
| Undistributed ordinary income | | | 6,860,245 | | | | 16,544 | | | | — | |
| Undistributed long-term capital gains | | | 12,048,528 | | | | — | | | | — | |
| Total distributable earnings | | $ | 18,908,773 | | | $ | 16,544 | | | $ | — | |
| Other accumulated losses | | $ | (593,719) | | | $ | (19,297,172 | ) | | $ | (4,547,592 | ) |
| Total accumulated earnings (losses) | | $ | 13,548,101 | | | $ | (19,786,437 | ) | | $ | (2,361,872 | ) |
| | | | | | | | | | | | | |
| | | LoCorr Market | | | LoCorr Dynamic | | | LoCorr Spectrum | |
| | | Trend Fund | | | Equity Fund | | | Income Fund | |
| Tax cost of investments | | $ | 862,859,636 | | | $ | 74,238,974 | | | $ | 105,887,430 | |
| | | | | | | | | | | | | |
| Gross unrealized appreciation | | | 17,902,555 | | | | 8,517,417 | | | | 6,011,112 | |
| Gross unrealized depreciation | | | (20,705,597) | | | | (1,791,087 | ) | | | (6,663,343 | ) |
| Net unrealized appreciation (depreciation) | | | (2,803,042) | | | | 6,726,330 | | | | (652,231 | ) |
| Undistributed ordinary income | | | — | | | | — | | | | — | |
| Undistributed long-term capital gains | | | — | | | | 1,592,481 | | | | — | |
| Total distributable earnings | | $ | — | | | $ | 1,592,481 | | | $ | — | |
| Other accumulated earnings (losses) | | $ | (31,585,814) | | | $ | 119,331 | | | $ | (24,500,003 | ) |
| Total accumulated earnings (losses) | | $ | (34,388,856) | | | $ | 8,438,142 | | | $ | (25,152,234 | ) |
| | |
| | |
| 104 | | LoCorr Macro Strategies Fund, LoCorr Long/Short Commodities Strategy Fund, LoCorr Multi-Strategy Fund, and LoCorr Market Trend Fund – Notes to Consolidated Financial Statements / LoCorr Dynamic Equity Fund and LoCorr Spectrum Income Fund – Notes to Financial Statements (continued) |
| | |
Undistributed income or net realized gains for financial statement purposes may differ from amounts recognized for federal income tax purposes due to differences in the recognition and characterization of income, expense and capital gain items. The difference between book-basis and tax-basis unrealized appreciation is attributed primarily to the tax deferral of losses on wash sales and other temporary differences.
Under the current tax law, capital losses realized after October 31 may be deferred and treated as occurring on the first day of the following fiscal year. As presented in the table below, the following Funds elected to defer capital losses for the fiscal year ended December 31, 2016:
| | | Post October | | | Late Year | |
| | | Loss Deferral | | | Loss Deferral | |
| LoCorr Multi-Strategy Fund | | $ | — | | | $ | 3,716 | |
| LoCorr Market Trend Fund | | | — | | | | 411,429 | |
| LoCorr Spectrum Income Fund | | | — | | | | 130,394 | |
At December 31, 2016, accumulated net realized capital loss carryovers, if any, and the year(s) in which the capital loss carryovers expire were:
| | | Capital Loss Carryover | | Year of |
| | | Short-Term | | | Long-Term | | Expiration |
| LoCorr Long/Short Commodities Strategy Fund | | $ | 221,117 | | | $ | 85,106 | | Indefinitely |
| LoCorr Multi-Strategy Fund | | | 839,325 | | | | — | | Indefinitely |
| LoCorr Market Trend Fund | | | 1,566,125 | | | | 28,510,761 | | Indefinitely |
| LoCorr Spectrum Income Fund | | | 6,775,222 | | | | 17,593,814 | | Indefinitely |
During the fiscal year ended December 31, 2016, the LoCorr Macro Strategies Fund, the LoCorr Multi-Strategy Fund, the LoCorr Market Trend Fund and the LoCorr Dynamic Equity Fund utilized unlimited capital loss carryovers of $541,149, $442,465, $15,549,259 and $3,606,067, respectively. The LoCorr Long/Short Commodities Strategy Fund and the LoCorr Spectrum Income Fund did not utilize any capital loss carryovers during the fiscal year ended December 31, 2016.
8. Line of Credit
The Trust entered into an unsecured, uncommitted Loan Agreement (“Line of Credit” or “LOC”) with U.S. Bank not individually but as an umbrella facility on behalf of the Funds in the Trust. The LOC expires on March 12, 2018. The LOC was established to provide the Funds a temporary short-term liquidity source, subject to certain restrictions, covenants and the right of setoff on the Funds’ assets, to meet unanticipated redemptions. Under terms of the LOC, borrowings for each Fund are limited to the lesser of one-third of the total unencumbered assets (including the amount borrowed) of the respective Fund, 5% of the gross assets of the respective Fund or $50 million in the aggregate for all of the Funds under this agreement.
The Funds did not utilize the Line of Credit during the six months ended June 30, 2017.
9. Subsequent Events
In preparing the financial statements, the Adviser has evaluated events after June 30, 2017.
Declaration of Dividends
The LoCorr Multi-Strategy Fund declared the following ordinary income distributions:
| Dividend Declaration | | Shareholder of | | Distribution Amount per Share Class | |
Date (a) | | Record Date | | Class A | | | Class C | | | Class I | |
| July 31, 2017 | | July 28, 2017 | | $0.02292 | | | $0.01667 | | | $0.02500 | |
(a) Ex-date, reinvest date and payable date.
| | |
| LoCorr Macro Strategies Fund, LoCorr Long/Short Commodities Strategy Fund, LoCorr Multi-Strategy Fund, and LoCorr Market Trend Fund – Notes to Consolidated Financial Statements / LoCorr Dynamic Equity Fund and LoCorr Spectrum Income Fund – Notes to Financial Statements | | 105 |
| | |
The LoCorr Spectrum Income Fund declared the following ordinary income distributions:
| Dividend Declaration | | Shareholder of | | Distribution Amount per Share Class |
Date (a) | | Record Date | | Class A | | Class C | | Class I |
| July 31, 2017 | | July 28, 2017 | | $0.04790 | | $0.04170 | | $0.05000 |
(a) Ex-date, reinvest date and payable date.
The estimated characterization of the distributions paid will be an ordinary dividend, qualified dividend or return of capital. See Note 2 for additional information.
Class T shares
Post-Effective Amendment No. 35 to the Trust’s registration statement on Form N-1A was filed on August 10, 2017 for initial registration of Class T shares for each of the six Funds in the Trust.
Sub-adviser approval
At the Trust’s regular quarterly meeting of the Board of Trustees (the “Board”) held November 21, 2016, the Board approved Kettle Hill Capital Management, LLC to serve as an additional sub-adviser to the LoCorr Multi-Strategy Fund. As of the date of this filing, the effective date has not yet been determined. The Fund’s portfolio is currently sub-advised by Billings Capital Management LLC and Trust & Fiduciary Income Partners, LLC. See Note 5.
There were no additional subsequent events since June 30, 2017 through the date the financial statements were issued that would require adjustments to or additional disclosure in these financial statements.
| | |
| | |
| 106 | | LoCorr Investment Trust - Expense Example (Unaudited) |
| | |
Expense Example
June 30, 2017 (Unaudited)
As a shareholder of a mutual fund, you incur two types of costs: (1) transaction costs, including sales charges (loads) on purchase payments; redemption fees; and (2) ongoing costs, including management fees; distribution and/or service (12b-1) fees and other Fund expenses.
This Example is intended to help you understand your ongoing costs (in dollars) of investing in each of the Funds and to compare these costs with the ongoing costs of investing in other mutual funds. The Example is based on an investment of $1,000 invested at the beginning of the period and held for the entire period (January 1, 2017 through June 30, 2017).
Actual Expenses
The actual return columns in the following table provide information about account values based on actual returns and actual expenses. You may use the information in these columns, together with the amount you invested, to estimate the expenses that you paid over the period. Simply divide your account value by $1,000 (for example, an $8,600 account value divided by $1,000 = 8.6), then multiply the result by the number in the first line under the heading entitled “Expenses Paid During Period” to estimate the expenses you paid on your account during this period. The only transaction fees you may be required to pay are for outgoing wire transfers, returned checks and stop payment orders at prevailing rates charged by U.S. Bancorp Fund Services, LLC, the Funds’ transfer agent. These fees are assessed on all accounts, as applicable. If you request that a redemption be made by wire transfer, currently the Funds’ transfer agent charges a $15.00 fee. The Funds’ transfer agent charges a transaction fee of $25.00 on returned checks and stop payment orders. If you paid a transaction fee, you would add the fee amount to the expenses paid on your account this period to obtain your total expenses paid.
Hypothetical Example for Comparison Purposes
The hypothetical return columns in the following table provide information about hypothetical account values and hypothetical expenses based on the Funds’ actual expense ratio and an assumed rate of return of 5% per year before expenses, which is not the Funds’ actual return. The hypothetical account values and expenses may not be used to estimate the actual ending account balance or expenses you paid for the period. You may use this information to compare the ongoing costs of investing in the Funds and other funds. To do so, compare this 5% hypothetical example with the 5% hypothetical examples that appear in the shareholder reports of the other funds. A transaction fee of $15.00 may be assessed on outgoing wire transfers and a transaction fee of $25.00 may be assessed on returned checks and stop payment orders. To include this fee in the calculation, you would add the estimated transaction fee to the hypothetical expenses shown in the table. Please note that the expenses shown in the table are meant to highlight your ongoing costs only and do not reflect the transaction fees discussed above. Therefore, those columns are useful in comparing ongoing costs only, and will not help you determine the relative total costs of owning different funds. In addition, if these transactional costs were included, your costs would have been higher.
| | |
| | |
| LoCorr Investment Trust - Expense Example (Unaudited) (continued) | | 107 |
| | |
Actual vs Hypothetical Returns
Actual vs. Hypothetical returns for the Six Months Ended June 30, 2017 (Unaudited)
| | | | | Actual | | Hypothetical
(5% gross annual return) |
| | Class | Fund’s
Annualized
Expense Ratio 1, 2 | Beginning
Account Value
January 01, 2017 | Ending
Account Value
June 30, 2017 | Expenses
Paid During
Period1, 2, 3 | | Ending
Account Value
June 30, 2017 | Expenses
Paid During
Period1, 2, 3 |
| | | | | | | | | |
LoCorr Macro Strategies Fund | | | | |
| | A | 2.31% | $1,000.00 | $972.00 | $11.29 | | $1,013.34 | $11.53 |
| | C | 3.06% | $1,000.00 | $968.70 | $14.94 | | $1,009.62 | $15.25 |
| | I | 2.06% | $1,000.00 | $973.40 | $10.08 | | $1,014.58 | $10.29 |
| | | | | | | | | |
LoCorr Long/Short Commodities Strategy Fund | | | | |
| | A | 2.20% | $1,000.00 | $969.50 | $10.74 | | $1,013.88 | $10.99 |
| | C | 2.95% | $1,000.00 | $965.40 | $14.38 | | $1,010.17 | $14.70 |
| | I | 1.95% | $1,000.00 | $970.80 | $9.53 | | $1,015.12 | $9.74 |
| | | | | | | | | |
LoCorr Multi-Strategy Fund | | | | |
| | A | 2.31% | $1,000.00 | $981.10 | $11.35 | | $1,013.34 | $11.53 |
| | C | 3.06% | $1,000.00 | $979.00 | $15.01 | | $1,009.62 | $15.25 |
| | I | 2.06% | $1,000.00 | $982.60 | $10.13 | | $1,014.58 | $10.29 |
| | | | | | | | | |
LoCorr Market Trend Fund | | | | |
| | A | 2.09% | $1,000.00 | $966.20 | $10.19 | | $1,014.43 | $10.44 |
| | C | 2.84% | $1,000.00 | $963.00 | $13.82 | | $1,010.71 | $14.16 |
| | I | 1.84% | $1,000.00 | $968.20 | $8.98 | | $1,015.67 | $9.20 |
| | | | | | | | | |
LoCorr Dynamic Equity Fund | | | | |
| | A | 3.38% | $1,000.00 | $994.20 | $16.71 | | $1,008.03 | $16.83 |
| | C | 4.13% | $1,000.00 | $990.60 | $20.38 | | $1,004.31 | $20.52 |
| | I | 3.13% | $1,000.00 | $995.10 | $15.48 | | $1,009.27 | $15.59 |
| | | | | | | | | |
LoCorr Spectrum Income Fund | | | | |
| | A | 2.03% | $1,000.00 | $1,026.90 | $10.20 | | $1,014.73 | $10.14 |
| | C | 2.78% | $1,000.00 | $1,021.90 | $13.94 | | $1,011.01 | $13.86 |
| | I | 1.78% | $1,000.00 | $1,028.50 | $8.95 | | $1,015.97 | $8.90 |
| 1 | Includes dividend and/or interest expense of 0.00%, 0.00%, 0.02%, 0.00%, 0.23% and 0.00% for the LoCorr Macro Strategies Fund, the LoCorr Long/Short Commodities Strategy Fund, the LoCorr Multi-Strategy Fund, the LoCorr Market Trend Fund, the LoCorr Dynamic Equity Fund and the LoCorr Spectrum Income Fund, respectively. |
| 2 | Includes expenses of the wholly-owned and controlled Cayman Islands subsidiaries for the LoCorr Macro Strategies Fund, the LoCorr Long/Short Commodities Strategy Fund, the LoCorr Multi-Strategy Fund and the LoCorr Market Trend Fund. |
| 3 | Expenses Paid During Period are equal to the net annualized expense ratio for the class, multiplied by the average account value over the period, multiplied by 181/365 (to reflect the one-half year period). |
| |
| |
108 | Approval of Advisory Agreements (Unaudited) |
| |
LoCorr Investment Trust
June 30, 2017 (Unaudited)
Review of Management and Sub-Advisory Agreements
Approval of Advisory Agreement
The Board considered the nature, extent and quality of services to be provided by LoCorr Fund Management, LLC (the “Adviser”) to the LoCorr Macro Strategies Fund (the “Macro Fund”), the LoCorr Long/Short Commodities Strategy Fund (the “LLSCS Fund”), the LoCorr Dynamic Equity Fund (the “LDE Fund”), the LoCorr Spectrum Income Fund (the “LSI Fund”) and the LoCorr Multi-Strategy Fund (the “LMS Fund”) and reviewed the 15(c) responses for each, which included a review of the key personnel of the Adviser. The Trustees noted that the Adviser has furnished and will continue to furnish a continuous investment program for the Macro Fund, the LLSCS Fund, the LDE Fund, the LSI Fund and the LMS Fund consistent with each Fund’s investment objective and policies and regulatory restrictions. The Adviser provides sub-adviser research, oversight of trade execution and settlement support in determining the securities to be purchased, held and sold for the Funds. The Adviser also provides, and will provide, overall portfolio and risk management consistent each Fund’s investment strategy. The Trustees also noted that the Adviser executes a compliance program to monitor and review investment decisions and to prevent and detect violations of each Fund’s investment policies and limitations, as well as federal securities laws. The Adviser also furnishes such reports, evaluations, information or analyses to the Trust as the Board of Trustees of the Trust may request from time to time. Counsel and a representative from the Adviser discussed the Adviser’s financial statements with the Trustees. The Trustees noted that, based on their review of the Adviser’s financial statements and discussions with the Adviser, its financial position was strong and stable and that the Adviser has sufficient resources to perform its obligations to all of the Funds.
The Trust’s CCO discussed the Trust’s compliance policies and noted that the Adviser reported no material compliance issues. Counsel noted for the Board that the Adviser has adopted a code of ethics as required under Rule 17j-1 of the 1940 Act. After a discussion, the Board concluded that the Adviser has compliance policies and procedures in place in order to perform its duties under the renewed management agreements for the Funds.
Counsel stated that there had not been any recent examinations of the Adviser by any regulatory authorities. A representative of the Adviser discussed changes in personnel at the Adviser including additional compliance staff. The Board concluded that the Adviser is appropriately staffed and offers a tremendous depth of experienced personnel and investment expertise and has provided, and is expected to continue to provide, high quality services to the Funds.
Counsel noted for the Trustees that the Adviser continued to carry Errors & Omissions and Directors and Officers (“E&O/D&O”) insurance coverage at an appropriate level of coverage. The Trustees discussed the level of insurance coverage with representatives of the Adviser. A representative of the Adviser stated that the Adviser would continue to evaluate the level of insurance coverage with its insurance broker.
The Board reviewed and discussed the performance of the Macro Fund, noting that the one-year and since inception returns of the Macro Fund. Management noted that the one-year and since inception performance was significantly higher than the Morningstar Category Average and peer group average. The Trustees noted they were pleased with the Fund’s one-year and since inception performance. A discussion ensued regarding performance of the Fund’s managed futures subadvisers. Management reminded the Trustees that the remainder of the Macro Fund’s assets is allocated to the fixed income strategy managed by Nuveen.
The Trustees directed their attention to the investment performance of the LLSCS Fund, noting one-year and three year annualized returns. The Trustees compared the Fund’s one-year return of the LLSCS Fund to its peer group and Morningstar Category Average reported returns. The Trustees further noted the LLSCS Fund slightly lagged the Barclay CTA Index for the one-year period. A representative of the Adviser noted that there are just a few long/short commodity managed funds and therefore, the peer group universe is quite small. He also stated that the Fund does not engage in any financial, index or currency futures like many of the funds in the Morningstar Category do. After a discussion, the Trustees concluded that they were overall satisfied with the Fund’s performance and that the one-year performance was not unreasonable.
The Trustees then reviewed and discussed the performance of the LDE Fund, noting that the one-year and since inception returns of the LDE Fund which were significantly higher than the Morningstar Category average and peer group average for the same periods. Management discussed the Fund’s recent performance and its bounce back from the prior year, noting the individual efforts of the Fund’s subadvisers. After a discussion, the Board concluded that the Fund’s performance was excellent.
The Board reviewed and discussed the performance of the LSI Fund, noting that the one-year and since inception returns of the LSI Fund which lagged behind the Morningstar Category average but outperformed the peer group average. A representative of the Adviser’s discussed the Fund’s positive performance but noted that it lagged the peer group and Morningstar Category average returns for the one year period. He also discussed the difficulty in identifying an appropriate peer group for the LSI Fund and that the Fund’s current Morningstar category was not necessarily the best fit. After a discussion, the Board concluded that the LSI Fund’s performance was satisfactory.
The Board then reviewed the performance of the LMS Fund. Counsel noted for the Board the Fund’s one-year return was better than the peer groups’ and the Morningstar category returns. A representative of the Adviser reminded the Trustees that the Fund used two sub-advisers and accessed the returns of other advisers through total return swap positions. The representative went on to discuss that the returns of the Fund’s income strategy and long short equity strategy had performed particularly well during the past year. The Board noted their satisfaction in the recent performance of the Fund and concluded that the Fund’s performance was reasonable.
| |
| |
Approval of Advisory Agreements (Unaudited) (continued) | 109 |
| |
The Board then reviewed and discussed the costs of services provided and profits to be realized by the Adviser with respect to the Funds.
The Trustees noted that the management fee for the Macro Fund was above the average of its peer group and Morningstar Category, however, was below the high end range of management fees reported for the Macro Fund’s peer group and Morningstar Category Average. A representative of the Adviser pointed out that one peer fund continued to be a peer group outlier. The Board also noted that the Adviser had paid and would continue to pay Nuveen’s subadvisory fee, rather than the Fund. After a discussion, the Board agreed that the Macro Fund’s management fee was reasonable.
The Trustees then considered that the management fee for the LLSCS Fund was above the average of its peer group and Morningstar Category, but was well below the high end range of management fees reported for the LLSCS Fund’s Morningstar Category Average. Counsel noted for the Trustees that the management fee was within the range of advisory fees for the peer group. A representative of the Adviser again reminded the Board that, due to the investment strategies of the LLSCS Fund, it is difficult to find a large number of peers but did state that the Adviser was able to identify additional peer funds for review. After a discussion, the Board concluded that the expense ratio of the LLSCS Fund was within the range of reasonableness.
Counsel directed the Board to review the management fee for the LDE Fund, noting for the Board that it was above the average of its peer group and Morningstar Category, which was above the high end range of management fees for the LDE Fund’s peer group but was within the range for the Morningstar Category. A representative of the Adviser reminded the Trustees that many funds in the Morningstar Category were single manager funds while the Adviser engages and pays multiple subadvisers. The Trustees also noted that the LDE Fund’s net expense ratio was below the high end ranges of the LDE Fund’s peer group and Morningstar Category. After a discussion, the Board agreed that the LDE Fund’s management fee was reasonable.
The Trustees noted that the LSI Fund’s management fee was above the averages for the LSI Fund’s peer group and Morningstar Category. A representative of the Adviser indicated that it was difficult to identify a worthwhile peer group for the LSI Fund and that the peer group only consisted of three other funds. Counsel and the Adviser’s representative discussed the Fund’s unique strategy and the fact that it was not likely a good fit for its current Morningstar category. The Board reviewed the LSI Fund’s expense ratio was above the average expense ratio for the Morningstar Category but below the high range of the Morningstar Category. After a discussion, the Board agreed that the expense ratio of the LSI Fund was not excessive.
The Trustees then discussed the management fee for the LMS Fund. They noted that the management fee was above the averages for the peer group and Morningstar category but noted that the fee was within the ranges for both. A representative of the Adviser stated that the Fund was a multi-manager fund while many in the peer group were single manager funds. The Trustees again reviewed the Fund’s various strategies and subadvisers. After a discussion, the Trustees decided that the fee was reasonable.
The Board considered all of these factors with regards to the renewal of the expense limitation agreements with the Adviser for an additional one-year period for the Macro Fund, LLSCS Fund, LDE Fund, LSI Fund and LMS Fund.
The Board reviewed the profit analysis of the Adviser with respect to the Macro Fund and considered that the Adviser’s profits from the advisory agreement, net of sub-advisory fees and overhead. The Board also considered and agreed that the Adviser’s total net profits related to the Macro Fund was reasonable.
Next, Counsel directed the Board’s attention to the profitability of the Adviser with respect to the LLSCS Fund. Counsel noted that the Adviser’s net profits with respect to the LLSCS Fund, which the Board agreed was reasonable.
The Board then reviewed the profitability of the Adviser with respect to the LDE Fund. Counsel pointed out to the Board that the Adviser had a small total net profit margin. The Board concluded that the Adviser’s profits with respect to the LDE Fund were not excessive.
Counsel directed the Board’s attention to the profitability of the Adviser with respect to the LSI Fund. The Board noted that the Adviser showed a net profit and agreed that the Adviser’s total net profits were reasonable.
The Board then considered the Adviser’s profitability with respect to the LMS Fund. Counsel stated that the Adviser has indicated that it had made a small net profit with respect to its management of the Fund in the past year. The Board agreed that this profit were reasonable.
The Board considered the economies of scale to be realized by the shareholders of the Macro Fund, LLSCS Fund, LDE Fund and LSI Fund, noting that the management fee for the LLSCS Fund reflects an incremental fee schedule which includes breakpoints.
Approval of Sub-Advisory Agreements
Nuveen Asset Management, LLC (“Nuveen”), Sub-Adviser (Macro Fund, LLSCS Fund and LMT Fund)
The Board then reviewed the nature, extent and quality of services provided by Nuveen for the fixed income strategies in the Macro Fund, the LLSCS Fund and the LMT Fund. The Board discussed Nuveen’s key individuals, noted many years of experience and a depth of investment capabilities. The Trustees further noted that Nuveen provides and will provide credit research, security selection, trade execution and compliance monitoring for the fixed income portion of the portfolios of the Macro Fund, LLSCS Fund and LMT Fund. The CCO noted that there had not been any changes with respect to the Nuveen personnel providing services to the Funds.
|
| |
110 | Approval of Advisory Agreements (Unaudited) (continued) |
| |
Counsel indicated that Nuveen reported no material compliance or regulatory agency issues in the past 36 months but noted that Nuveen did respond to a sweep letter from the SEC related to its high yield bond funds. Counsel stated that Nuveen reported no material litigation that would impact its ability to provide services to the Funds.
The Board concluded that, based on the revenue from its assets under management, Nuveen has adequate resources available to continue to provide satisfactory services to the Funds.
Next, the Trustees discussed the investment performance for Nuveen, noting the one-year and since inception returns for the Funds. The Trustees compared Nuveen’s reported returns to its benchmark one-year and since inception returns and noted that the reported performance returns for the Macro Fund were impressive compared to its respective benchmark returns. A representative of the Adviser discussed the overall relationship with Nuveen and the minor differences in Nuveen’s approach to managing its sleeve of each Fund. After a discussion, the Board noted it was pleased with Nuveen’s performance with respect to Macro Fund, the LLSCS Fund and the LMT Fund and deemed Nuveen’s performance to be satisfactory.
The Trustees discussed the costs of services provided by Nuveen to the Macro Fund, LLSCS Fund and LMT Fund, and noted that Nuveen is not profitable with regard to subadvising the Funds. The Board concluded that the sub-advisory fees to be paid to Nuveen by the Adviser were reasonable in light of the services to be provided under the sub-advisory agreements.
Trust & Fiduciary Income Partners, LLC (“TFIP”), Sub-Adviser (LSI Fund and LMS Fund)
The Board considered the nature, extent and quality of services provided or to be provided by TFIP for the income strategies for the LSI Fund and the LMS Fund. Counsel directed the Board’s attention to the 15(c) responses for TFIP. The CCO reminded the Trustees that noted that TFIP was now a subsidiary under Bramshill Investments LLC. The Board reviewed the responsibilities of TFIP’s key individuals, noted the years of experience for the portfolio manager and a depth of investment capabilities. The Trustees further noted that TFIP provides quantitative research, security selection and trade execution for the income portion of the LSI and LMS Fund’s portfolios and that TFIP was now operating under the compliance policies and procedures of Bramshill in providing compliance oversight for its allocation of the Funds.
Counsel stated that TFIP reported no material compliance issues in the past 36 months. The Board concluded that TFIP was well-suited to perform the services as sub-adviser to the LSI and LMS Funds.
Counsel stated that TFIP carries a sufficient E&O/D&O policy. The Board concluded that, based on the revenue from its assets under management, TFIP has appropriate resources available and sufficient insurance coverage. The Board concluded that TFIP is well-staffed and has a depth of experienced personnel and fixed income investment expertise and has provided high quality services.
Next, Counsel turned the Board’s attention to the performance information for TFIP with respect to the LSI Fund and the LMS Fund. The Board noted that TFIP’s performance exceeded the Fund’s benchmark and the sub-adviser’s selected benchmark. A representative of the Adviser discusses TFIP’s recent strong performance and stated that the Adviser was overall very satisfied with the performance of TFIP. After a discussion, the Board deemed TFIP’s performance was satisfactory.
The Trustees discussed the costs of services provided and to be provided by TFIP to the LSI Fund and LMS Fund. The Board noted that TFIP was slightly profitable with respect to the LSI Fund or the LMS Fund. Counsel directed the Trustees’ attention to the materials for TFIP which indicated that TFIP’s subadvisory fee was favorable in comparison to fees it charges to other clients. The Board concluded that the sub-advisory fees to be paid to TFIP by the Adviser were reasonable in light of the services to be provided under the sub-advisory agreements.
Billings Capital Management, LLC (“Billings”), Sub-Adviser (LDE Fund and LMS Fund)
The Board then considered the nature, extent and quality of services to be provided by Billings for the LDE Fund and the LMS Fund. The Board reviewed the responsibilities of Billings’s key individuals, noting the experience of these individuals as well as their experience in sub-advising the long/short equity strategies for the Funds. The CCO discussed that Billings provides fundamental research, security selection and trade execution for the LDE and LMS Fund’s portfolio as well as compliance services to assure assets are managed within each Fund’s investment restrictions.
Counsel stated that Billings did not report any material compliance issues in the past 36 months. Counsel also indicated that Billings did not have any recent regulatory examinations, material compliance issues or material litigations in the past 36 months.
The Trustees noted that Billings carries an appropriate E&O/D&O policy. The Board concluded that, based on the revenue from its assets under management, Billings has adequate resources available to provide services to the Funds.
Counsel directed the Board’s attention the investment performance of Billings’s long/short equity strategy for the Funds. Billings’s long/short equity strategy reported one-year and since inception average annual returns that significantly outperformed the Funds’ benchmarks. The Trustees concluded they were very satisfied with the performance of Billings and expected Billings to continue to deliver strong performance for the Funds.
The Board then reviewed the cost of services and profitability of Billings with respect to the Funds. Counsel noted that Billings was not profitable with respect to its relationship with the LDE Fund and was just slightly profitable with respect to the LMS Fund. After a discussion, the Board concluded that Billings’s fees and profitability were not excessive.
| |
| |
Approval of Advisory Agreements (Unaudited) (continued) | 111 |
| |
Review of Management and Sub-Advisory Agreements
Approval of Advisory Agreement
The Board considered the nature, extent and quality of services to be provided by the Adviser to the LoCorr Market Trend Fund (the “LMT Fund’) and LCMT Fund Limited and reviewed the 15(c) responses, which included a review of the key personnel of the Adviser. The Trustees noted that the Adviser has overseen the investment program for the LMT Fund consistent with its investment objective, policies and regulatory restrictions since the Fund’s inception and that the Adviser evaluates and manages the LMT Fund’s sub-advisers. Counsel directed the Trustees to the Adviser’s financial statements which a representative of the Adviser discussed with the Trustees. The Trustees noted that, based on their review of the Adviser’s financial statements and representations from the Adviser that its financial position remains sound, the Adviser has sufficient resources to perform its obligations to the LMT Fund.
Counsel discussed that there were no material compliance issues or litigations since the most recent renewal of the advisory agreement for the LMT Fund. Counsel also noted that that the Adviser continue to maintain a sufficient level of insurance.
After a discussion, the Board concluded that the Adviser is well staffed and provides valuable investment expertise and oversight of the LMT Fund and is expected to continue to provide, high quality services.
Counsel then reviewed the Fund’s performance with the Trustees, noting that the Fund had lagged its peer group average, benchmark index and Morningstar category for the 1 year period. The Trustees discussed the Fund’s strong since-inception performance, noting that it had outperformed its peer group average, benchmark index and Morningstar category for that period. A representative of the Adviser stated that the Adviser continued to be satisfied with the performance of the LMT Fund’s two subadvisers. After a discussion, the Trustees agreed that the Fund’s performance was reasonable.
Counsel then directed the Trustees to the Adviser’s responses to its advisory fee and its profitability with respect to the LMT Fund. Counsel noted that the investment advisory fee was slightly above the peer group and Morningstar category averages but within the ranges for each. Counsel discussed the peer group and noted the differences between the LMT Fund and some of its peers. A representative of the Adviser discussed that several peer group funds do not directly engage their subadvisers but rather seek exposure through a swap. Counsel then discussed the Adviser’s profitability with respect to the LMT Fund, noting its profitability margin. After a discussion, the Board concluded that the LMT Fund’s advisory fee and the Adviser’s profitability with respect to the LMT Fund were not unreasonable.
Having requested and received such information from the Adviser as the Trustees believed to be reasonably necessary to evaluate the terms of the Advisory Agreement, and as assisted by the advice of Counsel, the Trustees concluded that the fee structure is reasonable and that approval of the Advisory Agreement is in the best interests of the LMT Fund and its shareholders.
Approval of Sub-Advisory Agreement
Graham Capital Management, L.P. (“Graham”), Sub-Adviser (LMT Fund & LCMT Fund Limited)
The Board then reviewed the nature, extent and quality of services provided by Graham. Counsel reviewed the individuals responsible for providing services to the Fund and confirmed with the Adviser that there had been no material changes in the subadviser’s personnel. Counsel discussed Graham’s market trend strategy and its compliance program. Counsel stated that Graham did not have any recent compliance, litigation or regulatory issues. Counsel then reviewed Graham’s insurance coverage for the Board.
The Board then reviewed Graham’s performance for the LMT Fund. The Trustees agreed that they were satisfied with the overall performance of Graham.
The Trustees noted that the subadvisory fee was favorable in comparison to the Graham’s fee for other accounts. Counsel directed the Trustees to the Graham’s profitability chart and reviewed Graham’s profitability with respect to the LMT Fund. The Trustees agreed that the subadvisory fee and Graham’s profitability with respect to the LMT Fund was reasonable.
Having requested and received such information from Graham as the Trustees believed to be reasonably necessary to evaluate the terms of the subadvisory agreement, and as assisted by the advice of Counsel, the Trustees concluded that the fee structure is reasonable and that approval of the subadvisory agreement with Graham for the LMT Fund is in the best interests of the Fund and its shareholders.
| | |
| | |
| 112 | | Notice of Privacy Policy & Practices/Quarterly Portfolio Holdings/Proxy (Unaudited) |
| | |
Notice of Privacy Policy & Practices
(Unaudited)
Your privacy is important to us. The Funds are committed to maintaining the confidentiality, integrity, and security of your personal information. When you provide personal information, the Funds believe that you should be aware of policies to protect the confidentiality of that information.
The Funds collect the following nonpublic personal information about you:
| · | Information we receive from you on or in applications or other forms, correspondence, or conversations, including, but not limited to, your name, address, phone number, social security number, assets, income and date of birth; and |
| · | Information about your transactions with us, our affiliates, or others, including, but not limited to, your account number and balance, payments history, parties to transactions, cost basis information and other financial information. |
The Funds do not disclose any nonpublic personal information about our current or former shareholders to affiliated or nonaffiliated third parties, except as permitted by law. For example, the Funds are permitted by law to disclose all of the information we collect, as described above, to our transfer agent to process your transactions. Furthermore, the Funds restrict access to your nonpublic personal information to those persons who require such information to provide products or services to you. The Funds maintain physical, electronic and procedural safeguards that comply with applicable federal and state standards to guard your nonpublic personal information.
In the event that you hold shares of the Funds through a financial intermediary, including, but not limited to, a broker-dealer, bank, or trust company, the privacy policy of your financial intermediary would govern how your nonpublic personal information would be shared with affiliated or non-affiliated third parties.
Quarterly Form N-Q portfolio schedule
(Unaudited)
The Funds file their complete schedule of portfolio holdings with the Securities and Exchange Commission (“SEC”) for the first and third quarters of each fiscal year on Form N-Q. The Funds’ Forms N-Q are available on the SEC’s website at http://www.sec.gov. The Funds’ Forms N-Q may be reviewed and copied at the SEC’s Public Reference Room in Washington, D.C. Information on the operation of the SEC’s Public Reference Room may be obtained by calling 1-800-SEC-0330. Additionally, you may obtain copies of Forms N-Q from the Funds upon request by calling 1-855-523-8637.
Proxy voting policies, procedures and record
(Unaudited)
You may obtain a description of the Funds’ (1) proxy voting policies, (2) proxy voting procedures and (3) information regarding how the Funds voted any proxies related to portfolio securities during the most recent 12-month period ended June 30 for which an SEC filing has been made, without charge, upon request by contacting the Funds directly at 1-855-523-8637, or on the EDGAR Database on the SEC’s website (http:// www.sec.gov).
| |
| |
Independent Trustees/Interested Trustees and Officers | 113 |
| |
The Statement of Additional Information includes additional information about the Independent Trustees/Interested Trustees and Officers and is available, without charge, by calling 1-855-523-8637.
| Independent Trustees | | | | |
Name, Address
and Year of Birth | Position/Term
of Office1 | Principal Occupation
During the Past 5 Years | Number of Portfolios
in Fund Complex2
Overseen by Trustee | Other Directorships
held by Trustee
During the Past
5 Years |
Gary Jarrett
Year of Birth: 1954 | Trustee/May 2016 to present | Chief Executive Officer, Black River Asset Management LLC, investment subsidiary of Cargill, Inc., June 2002 to August 2015. | 6 | None |
James W. Morton
Year of Birth: 1939 | Trustee/January 2011 to present | Chairman of the Board, Fidelity Bank (community bank), 2008 to 2015, President 1978 to 2008. | 6 | None |
Mark Thompson
Year of Birth: 1959 | Trustee/December 2011 to present | Chairman and Chief Manager,Riverbridge Partners, LLC(investment management), 1987 to present. | 6 | None |
Ronald A. Tschetter
Year of Birth: 1941 | Trustee/January 2011 to present | Mr. Tschetter is presently retired from his principal occupation; Director of the U.S. Peace Corps, September 2006 to January 2009. | 6 | None |
| Interested Trustees and Officers | | | |
Name, Address
and Year of Birth | Position/Term
of Office1 | Principal Occupation
During the Past 5 Years | Number of Portfolios
in Fund Complex2
Overseen by Trustee | Other Directorships
held by Trustee
During the Past
5 Years |
Jon C. Essen3
Year of Birth: 1963 | Treasurer, Secretary, Chief Compliance Officer/January 2011 to present; Trustee/November, 2010 to present | Chief Financial Officer and Chief Compliance Officer of LoCorr Fund Management, LLC, (2010-present), Chief Operating Officer (2010-2016); Senior Vice President, Chief Financial Officer, and Registered Representative of LoCorr Distributors, LLC (broker/dealer), April 2008 to present, and Chief Operating Officer, April 2008 to January 2016. | 6 | None |
Kevin M. Kinzie4
Year of Birth: 1956 | President, Trustee/ January 2011 to present | Chief Executive Officer of LoCorr Fund Management, LLC, November 2010 to present; President and Chief Executive Officer of LoCorr Distributors, LLC (broker/dealer), March 2002 to present. | 6 | None |
1 The term of office for each Trustee listed above will continue indefinitely.
2 The term “Fund Complex” refers to the LoCorr Investment Trust.
3 Mr. Essen is an interested Trustee because he is an officer of the Funds’ Adviser.
4 Mr. Kinzie is an interested Trustee because he is an officer and indirect controlling interest holder of the Funds’ Adviser.
This page left intentionally blank.

Item 2. Code of Ethics.
Not applicable for semi-annual reports.
Item 3. Audit Committee Financial Expert.
Not applicable for semi-annual reports.
Item 4. Principal Accountant Fees and Services.
Not applicable for semi-annual reports.
Item 5. Audit Committee of Listed Registrants.
Not applicable to registrants who are not listed issuers (as defined in Rule 10A-3 under the Securities Exchange Act of 1934).
Item 6. Investments.
| (a) | Schedule of Investments is included as part of the report to shareholders filed under Item 1 of this Form. |
Item 7. Disclosure of Proxy Voting Policies and Procedures for Closed-End Management Investment Companies.
Not applicable to open-end investment companies.
Item 8. Portfolio Managers of Closed-End Management Investment Companies.
Not applicable to open-end investment companies.
Item 9. Purchases of Equity Securities by Closed‑End Management Investment Company and Affiliated Purchasers.
Not applicable to open-end investment companies.
Item 10. Submission of Matters to a Vote of Security Holders.
There have been no material changes to the procedures by which shareholders may recommend nominees to the registrant's Board of Trustees.
Item 11. Controls and Procedures.
| (a) | The registrant's President and Treasurer have reviewed the registrant's disclosure controls and procedures (as defined in Rule 30a-3(c) under the Investment Company Act of 1940 (the "Act")) as of a date within 90 days of the filing of this report, as required by Rule 30a-3(b) under the Act and Rules 13a-15(b) or 15d‑15(b) under the Securities Exchange Act of 1934. Based on their review, such officers have concluded that the disclosure controls and procedures are effective in ensuring that information required to be disclosed in this report is appropriately recorded, processed, summarized and reported and made known to them by others within the registrant and by the registrant's service provider. |
| (b) | There were no changes in the registrant's internal control over financial reporting (as defined in Rule 30a-3(d) under the Act) that occurred during the second fiscal quarter of the period covered by this report that has materially affected, or is reasonably likely to materially affect, the registrant's internal control over financial reporting. |
Item 12. Exhibits.
| (a) | (1) Any code of ethics or amendment thereto, that is the subject of the disclosure required by Item 2, to the extent that the registrant intends to satisfy Item 2 requirements through filing an exhibit. |
Not applicable for semi-annual reports.
(2) A separate certification for each principal executive and principal financial officer pursuant to Section 302 of the Sarbanes-Oxley Act of 2002.
Filed herewith.
(3) Any written solicitation to purchase securities under Rule 23c‑1 under the Act sent or given during the period covered by the report by or on behalf of the registrant to 10 or more persons.
Not applicable to open-end investment companies.
| (b) | Certifications pursuant to Section 906 of the Sarbanes‑Oxley Act of 2002. |
Furnished herewith.
SIGNATURES
Pursuant to the requirements of the Securities Exchange Act of 1934 and the Investment Company Act of 1940, the registrant has duly caused this report to be signed on its behalf by the undersigned, thereunto duly authorized.
(Registrant) LoCorr Investment Trust
By (Signature and Title) /s/ Kevin Kinzie
Kevin Kinzie, President
Date 8/28/17
Pursuant to the requirements of the Securities Exchange Act of 1934 and the Investment Company Act of 1940, this report has been signed below by the following persons on behalf of the registrant and in the capacities and on the dates indicated.
By (Signature and Title) /s/ Kevin Kinzie
Kevin Kinzie, President
Date 8/28/17
By (Signature and Title) /s/ Jon Essen
Jon Essen, Treasurer
Date 8/28/17