Letter to Shareholders
LoCorr Funds seek to provide investments that, over time, will have low correlation to traditional asset classes such as stocks and bonds. We believe that adding low correlating investments to portfolios can significantly reduce the overall portfolio risk while enhancing returns. Correlation measures the degree to which the returns of two investments move together over time. LoCorr offers products that are designed to generate returns independent of traditional stock, bond and commodity investments. In this report, LoCorr Funds are reporting on five mutual funds: LoCorr Macro Strategies Fund, LoCorr Long/Short Commodities Strategy Fund, LoCorr Market Trend Fund, LoCorr Dynamic Equity Fund and LoCorr Spectrum Income Fund (collectively, the “Funds”).
LoCorr Macro Strategies Fund
The LoCorr Macro Strategies Fund (the “Fund”) seeks capital appreciation as its primary investment objective with managing volatility as a secondary objective. The Fund attempts to achieve its objective by investing in two main strategies - a Managed Futures Strategy and a Fixed Income Strategy.
The Fund employs three sub-advisers to manage the Managed Futures Strategy of the Fund: Millburn Ridgefield (“Millburn”), Graham Capital Management (“Graham”), and Revolution Capital Management (“Revolution”). Millburn traces its roots back to 1971 and manages approximately $6.2 billion in assets. Graham was founded in 1994 and manages about $13.1 billion in assets. Revolution was founded in 2004 and manages approximately $470 million in assets.
Millburn manages a portfolio for the Fund that is similar to its Millburn Diversified Program which commenced operations in 1977. Millburn invests in a diversified portfolio of global futures contracts by combining non-traditional and trend-following strategies in a systematic multi-factor approach. Graham manages a portfolio for the Fund that is similar to its Tactical Trend strategy, a systematic medium- to long-term trend following program that commenced trading in 2006. Revolution manages a strategy for the Fund that is similar to its Alpha Program that has been available in a managed account program since 2007. Revolution employs a short- to mediumterm pattern recognition strategy that incorporates trend reversion and counter-trend signals.
Performance Summary
For the six months ended June 30th 2019, the Macro Strategies Fund Class I returned +7.19% versus +1.24% for the ICE BofAML 3M U.S. Treasury Note Index and +3.72% for the Barclay’s CTA Index. The Fund outperformed the Morningstar US Fund Managed Futures category
which gained +3.64% during the period. Overall, we are pleased with both the Fund’s absolute returns as well as its performance versus peers during the period.
The Fund benefitted from its allocation to Graham Capital, whose trend following approach generated the largest gains during the period. Revolution Capital’s short-term program also excelled, generating positive returns during the first half of the year. Millburn Ridgefield, whose machine-learning based, multi-factor model has been the Fund’s strongest contributor the past couple of years, had slightly negative returns during the period. We are encouraged by the results for the Fund and believe the complementary nature of the sub-advisers has the potential to deliver favorable, risk adjustment return. By sector, trading in Fixed Income was the standout contributor during the first half of the year with smaller gains from Equities. Trading in Commodities generated the largest losses during the semi-annual period, most notably in Energy. Trading in Foreign Currency also detracted from the Fund’s returns. The target allocation to each sub-adviser remained unchanged versus the prior year:
• Millburn Ridgefield: 40%
• Graham Capital Management: 40%
• Revolution Capital Management: 20%
Managed Futures Strategy
Equity Indices
Equities got off to a roaring start in 2019, recovering from their late 2018 swoon that saw the S&P 500 Index reach bear market territory (a decline of at least -20%) intra-day on December 24th. Despite the continuing U.S./China trade war, Brexit uncertainty, and slowing economic growth, a shift in central bank posture buoyed the markets during the first six months of 2019. The MSCI World Index, a proxy for global equities, finished the semi-annual period with a staggering gain of +17.38%.
The first quarter was marked by strong gains for equity markets as the shift in Federal Reserve tone to a more accommodative posture encouraged risk taking. These conditions persisted through April, but markets sold-off sharply in May as growth expectations continued to falter and no end seemed in sight for the U.S./China trade dispute. With increasing expectations that the Fed would cut rates in response to stronger signs of deterioration in the economy, the market caught a bid in June as investors seemed to take the perspective that bad news is good news…. that rate cuts will be able to re-invigorate growth and extend the long-lived bull market. The latest forecast from the Atlanta Fed calls for Q2 U.S. GDP growth of 1.3%, down considerably from the final Q1 2019 reading of 3.1% growth. As a result of this economic sluggishness, the Federal Reserve is now generally expected to cut rates by 0.25% at its July meeting.
Trading in Equity Indices was profitable during the first six months of 2019 as long positions benefitted from the strong upward move in global stocks. Following the nearly 20% decline in the S&P 500 TR Index in the last few months of 2018, the Fund entered the new year with short positions but, later in January, this shifted to long as the recovery gathered steam. Overall, the Fund was positioned long across U.S., Europe, and Asia for most of the semi-annual period. The largest contributions stemmed from long positions in the U.S. with modest contributions from European positions. Trading in Asia was slightly unprofitable. The largest individual market contributors included the Dow Futures E-Mini and the NASDAQ 100 E-Mini while trading in the Russell 2000 E-Mini generated the largest losses.
Fixed Income
After a controversial rate hike decision in December that caused a market panic, the Fed seemed to blink first as it quickly changed its tune, providing much more dovish comments and coming to the rescue of falling asset prices. After peaking in November at 3.24%, the U.S. 10-year Treasury ended the semi-annual period at approximately 2% leading to strong returns in the bond market, as measured by the Bloomberg Barclays U.S. Aggregate Bond Index which returned +6.11%. During the period, the U.S. 10-year and 3-month treasury note yields inverted, which has typically been a strong indication of an impending recession. Bond yields outside the U.S. also fell as the global economy softened. The German 10-year Bund rate fell into negative yield territory and the Japanese 10-Year Government Bond (10-Year JGB) yield also moved lower and remains negative. According to estimates, approximately $12 trillion in government debt globally carries negative yields.
Trading in Fixed Income was the most profitable sector for the Fund during the semi-annual period as the Fund’s long positions benefitted from the sizable and consistent fall in rates. While the bulk of the gains were generated in the long end of the curve, trading in the short end also generated gains. Geographically, the bulk of the gains stemmed from trading in Europe with U.S. markets also highly profitable. Long positions in the Euro Bund, T-Bond (U.S. 30-year Treasury) and U.S. 5-year Treasury generated the largest gains. While all three subadvisers were able to take advantage of opportunities in this sector, given the magnitude and duration of the move in rates, the Fund’s trend following component was particularly profitable.
Foreign Currencies
The U.S. Dollar Currency Index (“DXY”), a proxy for the U.S. dollar (“USD”) versus a basket of major currencies, was little changed during the semi-annual period though it experienced choppy upward drift through late May before falling in a similar choppy fashion in June. These frequent reversals generally created challenging conditions for the sub-advisers. In the first quarter, the upward move was prompted by stronger U.S. economic growth relative to the rest of the world, particularly Europe, as well as looser monetary policy from other central banks. As the Fed’s shift down the path towards rate cuts continued into June and U.S. growth expectations continued to ratchet lower, the greenback weakened. Overall, as these views shifted throughout the period along with other concerns including trade tariffs and Brexit, foreign currency markets were whipsawed within a relatively tight band.
Trading in Foreign Currencies (“FX”) was unprofitable during the semi-annual period due to modest losses in both the first and second quarter. Though the Fund was short overall in FX versus the USD for most of the period, the DXY was relatively unchanged. At the individual currency level, however, some short positions were hurt by strengthening versus the dollar. Short positions in the Canadian dollar created the largest drag on returns, at least partially attributable to that currency rallying versus the USD as the Canadian economy rebounded following a few quarters of stagnant growth. With Brexit uncertainty and UK Prime Minister Theresa May indicating her intent to step down, the British Pound moved higher during the first few months of the period which also hurt short positions.
Commodities
The ongoing U.S/China trade dispute made trading conditions in Commodities challenging during the semi-annual period. Given the size of the Chinese economy and its insatiable appetite for commodities, their importance in the supply/demand equation cannot be understated. For example, the U.S. accounts for approximately 10% of global copper demand which pales in comparison to China which represents roughly half of total global demand. Thus, the effect of the U.S./China tariffs in Metal and Agricultural markets is particularly significant.
Energy markets moved sharply higher during the semi-annual period, rallying alongside equities through April as global supply tightened, before retracing part of their gains as economic concerns continued to deteriorate. In Metals, gold prices moved higher, most notably late in the period on the softening economic growth and inflation outlook. Copper prices began the year in a bullish fashion, rallying on supply disruptions before U.S/China trade concerns caused prices to move lower in the second quarter. After Grain prices declined in the first quarter, due largely to U.S./China trade tariffs and oversupplied conditions, a very rainy Spring in the Midwest caused many U.S. farmers to delay plantings leading to sizable gains in wheat and corn prices during the second quarter.
Trading in Commodities generated the largest losses for the Fund during the semi-annual period, due primarily to losses in Energy. Trading in Base Metals was also slightly unprofitable while trading in Precious Metals was marginally profitable. In Energy, the bulk of the losses occurred during the first quarter. While exposure shifted long later in the quarter, short positions during January in oil and oil-derived product were hurt by the rapid recovery in prices. Overall in the semi-annual period, the Fund’s largest losses in Energy were from trading in WTI and London Gas Oil. In Metals, long positions in gold during the month of June benefitted as expectations for lower interest rates and geopolitical concerns drove the commodity higher. These gains were offset by losses in Base Metals, particularly copper and zinc while trading in silver was also unprofitable. Trading in Agricultural commodities was not a significant factor during the period.
Outlook
Many of the same geopolitical concerns that existed entering 2019 remain outstanding issues at the mid-point of the year: Chinese/U.S. trade war, Brexit resolution, Federal Reserve policy shift, Iran, wealth inequality, etc. Although market volatility remains muted overall, we’ve seen episodic surges over the past year and a half and believe we are returning to more normal market conditions by historical standards.
In this type of environment, we believe the potential benefit of using diversifying strategies that exhibit low correlation to traditional stocks and bonds is particularly important. We are optimistic that this dynamic will create a more favorable environment for managed futures strategies going forward.
We are pleased with the Fund’s performance which delivered solid positive absolute returns during the semi-annual period. In our view, the high conviction, multi-manager structure that combines complementary investment strategies will help the Fund navigate markets in a smoother and less volatile fashion than peers. We remain highly confident in the ability of the Fund to provide positive absolute returns and compelling diversification for investors.
Fixed Income Strategy
The Macro Strategies Fund invests most of its remaining assets in a Fixed Income Strategy comprised of short to intermediate term investment grade corporate and government agency securities. Nuveen Asset Management (“Nuveen”) is the sub-adviser for this strategy and manages a shorter duration, high quality portfolio.
The fixed income component of the Fund is managed against the Barclay’s 1-5 Government/Credit Index. Returns for the fixed income portion of the Fund were +3.70% compared to +3.56% for the benchmark in the first half of 2019. The duration of the fixed income component was managed between 2.3 and 2.6 years during the period compared to about 2.6 years for the benchmark. Nuveen’s decision to position duration defensively over the time period was a detractor versus the benchmark. Curve position didn’t have any meaningful impact on performance. Sector-wise, the portfolio was positioned with between a 31% - 34% weighting to investment grade corporate bonds along with 35% aggregate weighting to high quality, short duration securitized instruments. Corporate bond issuer exposure was well diversified with modest overweights to both Financials and Industrials. Given that spreads for non-government securities tightened, Nuveen’s sector strategy was a contributor to investment returns during the reporting period.
U.S economic activity remained resilient on a relative basis during the period, as a tight labor market and wages near cycle highs continued to support consumer spending. Activity outside the U.S. remained sluggish, reflecting trade concerns and prompting global central banks to become more accommodative. The Fed signaled a patient pause early in the year, while preparing markets for an interest rate cut near the end of the second quarter in response to the global economic downshift and a benign inflation environment.
Market volatility waned during the period as global central banks shifted to a more accommodative stance. Risk assets retraced most of the sell-off that occurred late in 2018, supported by easing financial conditions. Rates were meaningfully lower as the Fed signaled its intention to provide accommodation and the market pricing reflected the likelihood of two to three rate cuts by the end of the year. The 2-Year U.S. Treasury fell 73 basis points, while the 10-Year U.S. Treasury fell 67 basis points, causing the curve to steepen modestly.
Investment-grade credit spreads tightened significantly during the first half of the year, reversing the sell-off during the fourth quarter of 2018. Aided by the move lower in Treasury yields, investment-grade credit generated their strongest first-half return since 1995. Lower issuance and dovish monetary policy provided a catalyst for positive excess return versus Treasuries during the period.
Short-duration residential mortgage-backed securities (“MBS”) outperformed based on continued strong fundamentals and saw tighter spreads during the period. Housing price appreciation remains positive, albeit at lower levels than the prior three years. The commercial mortgage-backed securities (“CMBS”) sector performed well as lighter supply was met with strong investor demand. Traditional consumer asset-backed securities (“ABS”) had strong performance during the period. Strong job growth and rising wages were supportive of consumer credit metrics. All securitized sectors had positive excess returns versus Treasuries during the first half of the year.
Nuveen expects slower U.S. and global growth, which leaves the economy more vulnerable to negative shocks that may arise. The Fed’s reversal in policy and significantly lower rates stabilized financial conditions and provided support to risk assets. The team at Nuveen expects the Fed to cut rates at least once during the second half of the year, but may fall short of market expectations of two to three cuts. The manager expects largely range-bound yields for the remainder of the year. Given this outlook on the Fed and expectations for incoming economic data, Nuveen expects to manage the Funds’ duration mostly neutral versus the benchmark.
LoCorr Long/Short Commodities Strategy Fund
The LoCorr Long/Short Commodities Strategy Fund (the “Long/Short Commodities Fund” or the “Fund”) provides investors with access to a Commodities Futures Strategy in a mutual fund structure. Historically, investors have primarily accessed exposure to long-only commodities that rely on rising commodity prices to generate positive returns. Of course, commodity prices don’t always appreciate and occasionally experience sharp declines, as was seen most recently in the fourth quarter of 2018 when oil prices collapsed. The Long/Short Commodities Fund has the potential to profit while commodity prices increase or decrease which we believe differentiates it from most commodity-oriented mutual funds. The Fund’s primary investment objective is capital appreciation in rising and falling commodities markets. The Fund attempts to achieve its investment objective by investing in two primary strategies - a Commodities Strategy and a Fixed Income Strategy.
The Fund accesses, via a total return swap agreement, the returns of Millburn’s Commodity Program (“MILCOM”), which began trading in 2005; the returns of J E Moody & Company Commodity Relative Value Program (“JEM CRV”), which began trading in 2006; and the returns of First Quadrant’s Commodities Long/Short strategy (“FQ”), which began trading in 2010. MILCOM employs a systematic trading strategy that takes outright long/short positions and relative value spread positions across 40+ commodity futures markets. JEM CRV employs a market neutral, systematic trading strategy that invests in relative value calendar spread positions across 20+ commodity markets. FQ employs a systematic long/short directional strategy that attempts to capture commercial market participant behavior across 20+ commodity markets. First Quadrant was added to the Fund at the end of March.
Following its +15.40% return in 2018 (in comparison to the ICE BofAML T-Bill Index return of 1.94% in 2018), the Fund’s Class I shares were flat 0.00% during the semi-annual period ended June 28th 2019 versus the +5.06% return for the Bloomberg Commodity Total Return Index and the +1.24% gain for the ICE BofAML T-Bill Index (see page 14). During the period, MILCOM had positive returns while JEM CRV and FQ performance was negative. The largest gains for the six-month period were from trading in Livestock with smaller gains in Grains and Softs. Trading in Energy was unprofitable with smaller losses in Metals.
Overall, conditions in the commodity markets were challenging, at least in part attributable to the ongoing U.S/China trade dispute. Given the size of the Chinese economy and its insatiable appetite for commodities, their importance in the supply/demand equation for commodities cannot be understated. For example, the U.S. accounts for approximately 10% of global copper demand which pales in comparison to China which represents roughly half of total global demand. As U.S./China trade negotiations intensified, investors focused on the political uncertainty and its impact on global growth, causing price movement to deviate from fundamentally-driven views.
Performance data quoted represents past performance. Past performance does not guarantee future results. The investment return and principal value will fluctuate so that an investor’s shares, when redeemed, may be worth more or less than the original cost. Current performance may be lower or higher than the performance data quoted. To obtain performance through the most recent month end, call 855-523-8637 or visit www.LoCorrFunds.com.
Commodities Strategy
Energy
Following its epic collapse in the latter months of 2018, oil prices rocketed higher through late April. West Texas Intermediate crude (“WTI”), a proxy for oil prices, moved from the mid-$40 per barrel at the end of 2018 to $66 on April 22nd. The rally was primarily attributable to production cuts from the Organization of the Petroleum Exporting Countries (“OPEC”)’s decision to cut production by approximately 1.2 million barrels per day, U.S. sanctions on Iran and Venezuela, and rebounding from over-sold conditions in late 2018. Other oil-related commodities like Reformulated Blendstock for Oxygenate Blending gasoline (“RBOB”) and heating oil also rallied sharply during this period. Oil prices retreated until mid-June as global economic growth concerns and an escalation in the China/U.S. trade dispute. Overall, for the semi-annual period, oil and oil-derived product like RBOB gasoline increased sharply while natural gas prices weakened.
Energy trading was unprofitable for the Fund during the first half of 2019, though losses were relatively modest. The losses stemmed from short positions in January as oil and oil-related commodities rallied sharply off their December 2018 lows. The Fund was profitable in Energy over the rest of the semi-annual period, but it was not enough to offset those January losses. Relative value trading generated solid profitability over the six-month period, but it was more than offset by losses from the directional long/short positions. Short positions in WTI and Brent crude generated the largest losses while trading in RBOB was a notable positive contributor.
Metals
While Base Metal prices were weak in 2018 on trade war fears, as optimism for a U.S./China trade agreement improved, prices moved higher during the first few months of 2019. As those same U.S./China trade concerns escalated during the period, Base Metal prices began to weaken, given China’s importance as a consumer of these commodities. Copper prices plunged from late April until early June with similar weakness in other industrial-oriented commodities. Precious Metal prices surged during the second half of the period as gold prices reached their highest level since 2012. Gold’s breakout came on the heels of dovish central bank sentiment and geopolitical tension which has tended to be bullish for the commodity.
Trading in Metals was slightly unprofitable during the semi-annual period, due primarily to long positions in May. During the period, relative value trading was a neutral from a contribution perspective while directional trading had losses. The largest losses were from long positions in copper which were hurt in May by escalating U.S/China tariff concerns which weighed on prices despite numerous fundamental supply disruptions that seemed bullish for the commodity. A short position in aluminum partially offset those losses as prices also tumbled on the ongoing tariff issue, as well as broader excess supply concern for that commodity. Long positions in palladium were profitable as prices surged to an all-time high.
Agricultural
In Grains, U.S./China tariff concerns and oversupplied conditions led to softness during the first few months of the year. This reversed course during May as prices surged in crops like wheat, corn, and soybean due to flooding in the U.S. grain belt which impacted the planting season. In Softs, cocoa prices moved higher on constrained supplies and the imposition of a price floor at $2,600 per metric ton by the Ivory Coast and Ghana, which are leading producers of that commodity. In Livestock, the price of lean hogs skyrocketed as Asia, the world’s largest consumer of pork, has been experiencing an outbreak of African Swine Flu, prompting more demand for U.S. lean hogs. On the other hand, live cattle prices were down by double digit.
Overall, the Fund had small gains trading Agricultural commodities during the semi-annual period led by profitable positions in Livestock which were partially offset by small losses in Grains. Softs did not have a significant effect on performance during the period. In Livestock, long positions and calendar spreading trading in lean hogs was the most notable contributor, partially offset by losses from calendar spread trading in live cattle. In Grains, trading in soybean during the second quarter created the largest losses that were partially offset by gains from wheat.
Outlook
We believe the Fund may be highly attractive to investors seeking solutions that are generally uncorrelated to most investment strategies and asset classes, or for investors that are seeking alternatives in the commodity market. Commodity markets are characterized by high volatility and subject to sizable drawdowns as we saw in 2018. This volatility also creates tremendous opportunities. The underlying managers have the ability to take both long and short directional positions (benefit from commodities moving up or down), as well as to trade along the forward curve (relative value calendar spread trading) to capture this diverse and robust set of opportunities over time. Finally, the Fund’s multi-manager approach has the potential to smooth the ride for investors as the underlying managers tend to zig and zag at different times which may help reduce volatility and limit drawdowns. We remain confident in the outlook for the Fund and the underlying managers and strategies.
Fixed Income Strategy
The Managed Futures Fund invests most of its remaining assets in a Fixed Income Strategy comprised of short to intermediate term investment grade corporate and government agency securities. Nuveen Asset Management (“Nuveen”) is the sub-adviser for this strategy and manages a shorter duration, high quality portfolio.
The fixed income component of the Fund is managed against the Barclay’s 1-5 Government Credit Index. Returns for the fixed income portion of the portfolio were +3.75% compared to +3.56% for the benchmark in the first half of 2019. The duration of the fixed income allocation was managed between 2.3 and 2.6 compared to about 2.6 years for the benchmark. Nuveen’s decision to position the Fund’s duration defensively over the time period was a detractor versus the benchmark. Curve position didn’t have any meaningful impact on performance. Sector-wise, the Fund was positioned with between a 31% - 34% weighting to investment grade corporate bonds along with 35% aggregate weighting to high quality, short duration securitized instruments. The fund’s corporate bond issuer exposure was well diversified with modest overweights to both financials and industrials. Given that spreads for non-government securities tightened, Nuveen’s sector strategy was a contributor to investment returns during the reporting period.
LoCorr Market Trend Fund
The LoCorr Market Trend Fund (the “Market Trend Fund” or the “Fund”) was created to provide investors with access to a trend following futures strategy managed by one of the leading managers in this space—Graham Capital Management. Graham was founded in 1994 and manages approximately $13.8 billion in assets. The Market Trend Strategy is managed similarly to Graham’s Tactical Trend program, a systematic medium- to long-term trend following strategy that commenced trading in 2006. The Fund seeks capital appreciation as its primary investment objective with managing volatility as a secondary objective. The Fund attempts to achieve its objective by investing in two main strategies - a Managed Futures Strategy and a Fixed Income Strategy.
The Fund’s Class I shares gained +11.88% during the semi-annual period ended June 28th 2019, well ahead of the +1.24% return for the ICE BofAML T-Bill Index and the +7.43% return for the SG Trend Index. After a challenging 2018, trend following strategies have fared considerably better through the first six months of 2019 as strong trending activity emerged in fixed income and, to a lesser extent, equities. While the Fund benefitted from this improved backdrop, we are pleased with its outperformance versus the Index. During the period, the primary driver of the Fund’s double-digit returns was from trading in Fixed Income markets while trading in Equities was also profitable. Commodities trading was unprofitable, particularly in Energy, while FX trading experienced modest losses.
Market Trend Strategy
Equity Indices
Equities got off to a roaring start in 2019, reversing course from their late 2018 swoon that saw the S&P 500 Index reach bear market territory (a decline of at least -20%) intra-day on December 24th. Despite the continuing U.S./China trade war, Brexit uncertainty, and slowing economic growth, a shift in central bank posture buoyed the markets causing equity markets to trend higher during the first six months of 2019. The MSCI World Index, a proxy for global equities, finished the semi-annual period with a staggering gain of +17.38%.
The first quarter was marked by strong gains for equity markets as the shift in Federal Reserve tone to a more accommodative posture encouraged risk taking. These conditions persisted through April, but markets sold-off sharply in May as growth expectations continued to falter and no end seemed in sight for the U.S./China trade dispute. With increasing expectations that the Fed would cut rates in response to stronger signs of deterioration in the economy, the market caught a bid in June as investors seemed to take the perspective that bad news is good news…. that rate cuts will be able to re-invigorate growth and extend the long-lived bull market. The latest forecast from the Atlanta Fed calls for Q2 U.S. GDP growth of 1.3%, down considerably from the final Q1 2019 reading of 3.1% growth. As a result of this economic sluggishness, the Federal Reserve is now generally expected to cut rates by 0.25% at its July meeting.
Trading in Equities was profitable during the semi-annual period as long positions benefitted from the upward trending activity in global equity markets. While the Fund was still positioned short Equities entering 2019, positioning shifted long as the rally persisted. While long positions were hurt by the sharp May equity sell-off, the recovery in June enabled the Fund to post healthy gains from trading in this sector for the period. Long positions in the U.S. and Europe were profitable with strong gains from positions in the NASDAQ 100 E-Mini and the Euro Stoxx 50. Trading in Asia was unprofitable due to losses from long positions during the May risk-off period.
Fixed Income
After a controversial rate hike decision in December that caused a market panic, the Fed seemed to blink first as it quickly changed its tune, providing much more dovish comments and coming to the rescue of falling asset prices. After peaking in November at 3.24%, the U.S. 10-year Treasury ended the semi-annual period at approximately 2%, exhibiting very strong trending activity and strong returns in the bond market, as measured by the Bloomberg Barclays U.S. Aggregate Bond Index which returned +6.11%. During the period, the U.S. 10-year and 3-month treasury note yields inverted, which has typically been a strong indication of an impending recession. Bond yields outside the U.S. also fell as the global economy softened. The German 10-year Bund rate fell into negative yield territory and the Japanese 10-Year Government Bond (10-Year JGB) yield also moved lower and remains negative. According to estimates, approximately $12 trillion in government debt globally carries negative yields.
Trading in Fixed Income generated double-digit returns during the period, as long positions benefitted from the strong trending activity in the sector as rates continued to fall. While the bulk of the gains were generated in the long end of the curve, trading in the short end also generated profits. Geographically, the bulk of the return was from long positions in North America, though trading in Europe and Asia was also profitable. Long positions in U.S. Treasury contracts were the largest contributors with nicely profitable positions in the Australian 10-Year and Eurodollar.
Foreign Currencies
The U.S. Dollar Currency Index (“DXY”), a proxy for the U.S. dollar (“USD”) versus a basket of major currencies, was little changed during the semi-annual period though it experienced choppy upward drift through late May before falling in a similar choppy fashion in June. These frequent reversals generally created less than optimal market conditions for Graham’s trend-following strategy. In the first quarter, the upward move was prompted by stronger U.S. economic growth relative to the rest of the world, particularly Europe, as well as looser monetary policy from other central banks. As the Fed’s shift down the path towards rate cuts continued into June and U.S. growth expectations continued to ratchet lower, the greenback weakened. Overall, as these views shifted throughout the period along with other concerns including trade tariffs and Brexit, foreign currency markets were whipsawed within a relatively tight band.
Trading in Foreign Currencies (“FX”) was unprofitable during the semi-annual period as losses in the second quarter offset small gains from trading in the first three months of the year. Though the size of the position varied, the Fund was short overall in FX versus the USD throughout the semi-annual period. At the individual currency level, however, some short positions were hurt by strengthening versus the dollar. While positioning fluctuated, short positions in the British Pound were hurt as the currency moved higher versus the USD early in the year due to Brexit uncertainty and UK Prime Minister Theresa May indicating her intent to step down.
Commodities
The ongoing U.S/China trade dispute made trading conditions in Commodities challenging during the semi-annual period. Given the size of the Chinese economy and its insatiable appetite for commodities, their importance in the supply/demand equation cannot be understated. For example, the U.S. accounts for approximately 10% of global copper demand which pales in comparison to China which represents roughly half of total global demand. Thus, the effect of the U.S./China tariffs in Metal and Agricultural markets is particularly significant.
Energy markets moved sharply higher during the semi-annual period, rallying alongside equities through April as global supply tightened, before retracing part of their gains as economic conditions continued to deteriorate. In Metals, gold prices moved higher, most notably late in the period on the softening economic growth and inflation outlook. Copper prices began the year in a bullish fashion, rallying on supply disruptions before U.S/China trade concerns caused prices to move lower in the second quarter. After Grain prices declined in the first quarter, due largely to U.S./China trade tariffs and oversupplied conditions, a very rainy Spring in the Midwest caused many U.S. farmers to delay plantings leading to sizable gains in wheat and corn prices during the second quarter.
Trading in Commodities generated the largest losses for the Fund during the semi-annual period, led by unprofitable positions in Energy. With oil markets reversing course from their dramatic fourth quarter 2018 sell-off, the Fund’s short positions were hurt during the first few months of the year as oil prices surged higher. While positioning shifted long over the course of the semi-annual period, the reversals in the Energy market proved difficult to navigate. Trading in Metals was also unprofitable due primarily to losses in Base Metals including zinc and copper while trading in Precious Metals was marginally unprofitable. Trading in Agricultural commodities was also marginally unprofitable as those markets experienced sizable reversals.
Outlook
Many of the same geopolitical concerns that existed entering 2019 remain outstanding issues at the mid-point of the year: Chinese/U.S. trade war, Brexit resolution, Federal Reserve policy shift, Iran, wealth inequality, etc. Although market volatility remains muted overall, we’ve seen episodic surges over the past year and a half and believe we are returning to more normal market conditions by historical standards. In this type of environment, we believe the potential benefit of using diversifying strategies that exhibit low correlation to traditional stocks and bonds is particularly important. With strong trending activity in Fixed Income markets and solid trending in Equities, we are pleased with the improvement in the overall environment for trend following thus far in 2019. As we would anticipate, the Fund has participated nicely with this more favorable environment, outperforming the SG Trend Index. We remain highly confident in the ability of the Fund to provide positive absolute returns and compelling diversification for investors.
Fixed Income Strategy
The Fund invests most of its remaining assets in a high quality, short-duration fixed income portfolio comprised of primarily government securities and very highly rated corporate fixed income securities. Nuveen Asset Management (“Nuveen”) is the sub-adviser for this strategy.
The fixed income portion of the Fund is conservatively managed as a short duration portfolio of the highest credit quality. It is managed against the Barclay’s 1-3 Year Government Index and focuses primarily on U.S. Treasuries and U.S. Government securities, but can own up to 30% in aggregate in corporate, municipal, and asset-backed securities of the highest credit quality. Returns for the fixed income portion of the portfolio were +2.40% compared to +2.47% for the benchmark in the first half of 2019. Nuveen’s defensive interest rate strategy was a detractor relative to the index as the duration of the portfolio was positioned short to the benchmark by between .20 and .40 years over the first half of 2019. Curve positioning was a modest contributor to performance. The portfolio generally owned about 22-26% in non-government securities during the time frame; this was a boost to performance as these securities outperformed government securities over the period. The portfolio also held about 10-12% of U.S. Agency multifamily MBS in the first half of 2019; these securities also outperformed similar duration government securities and were beneficial to performance. As of June 30, 2019, portfolio duration was 1.64 years compared to 1.84 years for the benchmark and about 78% of the portfolio was in U.S. government debt with the remainder in AAA rated non-government securities.
LoCorr Dynamic Equity Fund
The LoCorr Dynamic Equity Fund (the “Fund”) seeks long-term capital appreciation with reduced volatility compared to traditional broadbased equity market indices as a secondary objective. Consistent with the “low correlation” our LoCorr Fund family seeks, long/short equity funds have the ability to provide positive returns when equity markets are rising, yet they offer the potential for downside risk mitigation when equity prices are falling.
The Fund employs three sub-advisers—Billings Capital Management (“Billings”), Kettle Hill Capital Management (“Kettle Hill”), and First Quadrant (“First Quadrant”). Billings’ strategy is based on a value-oriented, concentrated, fundamental, bottom-up long/short equity approach. This manager seeks to maximize absolute returns, exceeding the S&P 500 index over the long term. The sub-portfolio managed by Billings is similar to a strategy that this manager has executed since 2008 with their current firm and for many years prior to that at a different entity. Kettle Hill seeks to earn superior returns over an investment cycle while focusing on capital preservation and downside volatility. The manager’s investment process combines bottom-up, fundamental analysis with a top-down opportunistic overlay. Investing primarily in small cap securities, Kettle Hill targets a conservative net exposure to the market. The sub-portfolio managed by Kettle Hill is similar to a strategy that this manager has executed since its inception in 2003. First Quadrant was added to the portfolio in January 2019 and seeks to capture opportunity through a fundamentally-based quantitative investment process with a dynamic and tactical approach to risk management. The sub-portfolio managed by First Quadrant is similar to a global long/short strategy the manager has executed since 2016 which invests in developed international and U.S. markets utilizing a systematic multi-factor approach coupled with an active beta management approach to maximize upside opportunities while reducing downside performance.
Market Commentary
The S&P 500 TR Index soared in the first half of 2019, finishing its best six-month start to a calendar year since 1997. Investor sentiment has shifted to the positive side and all things “full speed ahead”, despite corporate earnings estimates declining and the ongoing geopolitical trade war causing some concerns throughout the second quarter. The Index closed June up nicely (up +7.05%) and finishing the first six months of 2019 on a bullish note. The Street responded positively to stimulus from the Fed Reserve and cooling U.S. China tariff conversations in the second quarter of 2019, which helped to boost the S&P 500 TR’s YTD return +18.54% through the end of June.
While the S&P 500 TR Index closed 2018 down -4.38%, the equity markets have made a strong rebound in 2019. Coming off the first negative calendar year since 2008, negative market sentiment did not persist, as investors poured back into equities after the Fed Reserve paused rate hikes as it shifted to a more dovish posture, which helped boost stocks greatly in January and February. A slight market retracement in May triggered by the short-term breakdown of trade talk between the U.S. and China was offset by a solid gain in June which was driven by a strong jobs reports and increased conviction that the Fed would reduce rates at its July meeting. Investors remain somewhat cautious, however, and continue to closely watch the Fed Reserve for clues about future monetary policies and implications on financial markets.
Portfolio Update
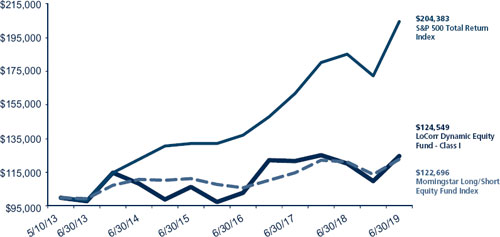
The Fund (LEQIX I share) performed alongside the broader equity markets and outperformed the Morningstar Long/Short Fund category, with the Fund closing the first half of 2019 up +13.60%. The Fund underperformed the S&P 500 TR’s phenomenal start to 2019 which was up +18.54, but outperformed the U.S. Morningstar Long/Short Fund Category which was up +7.71%. The Fund has continued to perform well in the U.S. Morningstar Long/Short Equity Category, ranking in the top 32nd percentile among 234 funds over the one-year period, in the top 34th percentile among 211 funds over the past three years, and in the 50 percentile among 155 funds over the past five years based on risk adjusted returns for the period ending 6/30/19.
The Fund’s value bias was a headwind as value stocks underperformed growth stocks which is illustrated by the Russell 1000 Value Index up +16.24% versus the Russell 1000 Growth Index up +21.49%. The Fund’s net exposure shifted throughout the first six months of the year, but closed within its typical 40-60% range, at 51% net exposure.
The Fund’s long book was a contributor to the Fund’s overall positive performance through June 2019 as it tracked alongside broader equity markets and saw strong returns from the Consumer Cyclicals, Industrials, Financials Services, and Technology sectors. Within the Consumer Cyclicals sector, Rev Group Inc. (2.68% of the Fund as of 6/30/19), a designer and manufacturer of specialty /emergency vehicles benefitted from better-than-estimated earnings along with operational improvements across all business segments, which was viewed favorably by investors. In the Industrial sector, MasTec Inc. (3.64% of the Fund as of 6/30/19), which is a leading infrastructure construction company focusing on engineering and building of communications, energy, and utilities was additive to the Fund’s long book on a strong earnings report and profitability in the company’s power generation business segment. Another contributor in the Industrials sector, Frontdoor Inc. (2.35% of the Fund as of 6/30/19), which engages in the provision of home service plans offering assistance for homeowners who require technical home repair issues, was also a contributor to the Fund. Frontdoor Inc., also posted solid earnings along with revenue growth from its home service membership which boosted investor sentiment towards the stock. The Fund also saw nominal positive performance from the Technology sector. Offsetting these gains were losses primarily in the Energy sector. Within this sector a position in Range Resources Corp. (0.26% of the Fund as of 6/30/19), a company which engages in exploration, development, and acquisition of natural gas in the U.S. was hurt by significant price declines in the natural gas markets as a glut in natural gas inventories negatively impacted the stock.
The Fund’s short book experienced losses as broader equity markets saw a significant rebound in the first half of 2019. Despite the majority of sectors in the short book finishing in negative territory, a position in the Real Estate sector helped to offset those losses as a real estate investment trust company which specializes in infrastructure in the communications industry sold off (benefitting the Fund’s short position) following news that their largest customer will file for bankruptcy. The Technology sector was the Fund’s primary detractor with nominal losses from the Consumer Cyclicals, Industrials, and Consumer Defensive sectors.
Outlook
Many of the same geopolitical concerns that existed entering 2019 remain outstanding issues at the mid-point of the year: Chinese/U.S. trade war, Brexit resolution, Federal Reserve policy shift, Iran, wealth inequality, etc. Although market volatility remains muted overall, we’ve seen episodic surges over the past year and a half and believe we are returning to more normal market conditions by historical standards. In this type of environment, a long/short equity strategy may allow for continued participation in equity markets if they rise while their hedged approach ability to benefit from stocks falling in price may potentially mitigate losses if equities were to sell off.
As we would anticipate, the Fund has participated nicely with this more favorable environment, outperforming the Morningstar Long-Short Equity Fund Category. We remain highly confident in the ability of the Fund to provide positive absolute returns and compelling diversification
for investors.
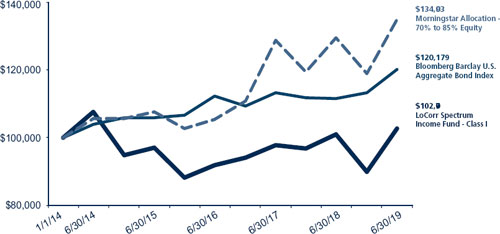
LoCorr Spectrum Income Fund
The LoCorr Spectrum Income Fund (the “Spectrum Income Fund” or the “Fund”) has an objective of current income with capital appreciation as a secondary objective. The Fund is designed to fit within the “low correlation” of the LoCorr Fund family by seeking to provide relatively high levels of income with low correlation to the bond market. The Fund’s sub-adviser is Trust and Fiduciary Income Partners (“TFIP”). TFIP invests in portfolio of pass-through securities with an integrated covered call and hedging strategy. TFIP seeks to generate high current income, much of which the Fund distributed monthly to investors.
Market Commentary
The first half of 2019 was fueled by a dramatic liquidity-driven market, which bolstered virtually all asset classes including both defensive securities and riskier assets, the latter of which recovered from their sharp declines in the fourth quarter of last year. The proximate cause of this development was the “dovish pivot” by the U.S. Federal Reserve (“Fed”) following its market-busting rate hike in December. In a series of speeches and meetings, the central bank leadership effectively admitted that they had overestimated the strength of the US economy in late 2018, revised growth projections downward, and articulated guidance which implies that rates will be lowered at their July meeting and quite possibly followed by further such actions later in the year. Other central banks generally followed the same direction, although Europe, Japan, and China had already experienced economic slowing last year and had begun their pivot well before the Fed.
In May, the upside momentum reversed as concerns mounted regarding a possible escalation in the trade conflict between the U.S. and China ahead of the G20 meeting in late June, along with increased tensions in the Middle East. As this is written, worst case fears have been allayed regarding Sino-American relations as further tariffs have been deferred by the U.S. and talks are nominally ongoing, and the Middle East is relatively quiet. Within our domestic markets, we appear to have entered a period of stasis, in which valuations of safe haven and secular growth investment continue to move higher, while securities which are strongly tied to the economic cycle languish, awaiting signs of reaccelerating economic growth. Given normal lags between Fed action and response in the real economy, it seems likely that growth in revenue and profits will be weak for at least a couple of quarters, with the market effects of these dynamics yet to be felt. At the same time, we note that no recession seems likely in the real economy, the Fed has forthrightly stated that it intends to extend the economic expansion, and unemployment and inflation remain low, so downside risks seem contained.
Steady gains in “safe haven” assets, most notably U.S. treasury bonds sent yields tumbling. All else equal, a decline in Treasury yields is supportive of the Fund, as it has the effect of increasing the difference in the yield offered by the Fund versus the risk-free yield, making our portfolio more attractive. The 3-month T-bill to 10-year Treasury note remains inverted, with the longer dated securities having a lower interest rate than the short. By the end of March, however, the 2-year to 10-year while still positively sloping, tightened to roughly 15 basis points, the narrowest spread since the 2006-2007 timeframe. Yield curve inversion has generally been interpreted as a harbinger of recession, though the Fed seems like to respond with lower rates.
Crude oil prices, which can have a significant effect on market perceptions of energy-related securities in the portfolio, ended the first half up over +28%. This gain belies the actual volatility which saw a nearly -24% selloff from intra period high to low. Slowing global growth and strong U.S. oil production offset escalating Middle East tensions and a disciplined OPEC (plus Russia) which tend to push prices higher. The investment team remains wary of a rally in crude oil prices based on supply reduction alone, and are waiting for resumption in global growth to get fully behind being bullish about a demand-led rally in the commodity. At the same time, the operating results and distributions for the energy-related holdings in the Fund are little affected by oil price fluctuations within the range that we are witnessing.
Portfolio Update
The Fund’s Class I shares gained +14.15% during the semi-annual period ending June 30th 2019, recovering from the challenging market environment in the fourth quarter of 2018 and well ahead of the +6.11% return for the Barclay’s U.S. Aggregate Bond Index. Contributions to the Fund’s strong performance were widespread, but most notably Master Limited Partnerships (“MLPs”), Publicly Traded Partnerships (“PTPs”), Closed End Funds (“CEFs”), and Business Development Companies (“BDCs”).
MLP positions were the largest contributors to the Fund’s double-digit gains. MLPs, as measured by the Alerian MLP Index, posted a total return of +16.86% during the period as investor sentiment toward the group improved with the rally in oil prices. The investment team continues to see value in mid-stream energy and believe that improving fundamentals such as leverage reduction, simplification (eliminating Incentive Distribution Rights (IDRs), conversion to C-Corps, etc.) and cash flow growth have increased distribution coverage ratios and is beginning to draw attention to the sector from generalist equity investors and thus warranted an increased exposure. Top individual performers in this sector included: Crestwood Equity Partners (3.29% of the Fund as of 6/30/19), a mid-stream MLP with organic growth in major basins that TFIP believes has a chance to grow cash flow significantly; NGL Energy Partners (1.59% of the Fund as of 6/30/19), another mid-stream MLP positions after its turnaround and balance sheet improvement bolstered the stock; and Icahn Enterprises (2.00% of the Fund as of 6/30/19), which was able to increase distributions through effective activism and use of strong market conditions to monetize some of its portfolio of operating companies.
BDCs were also strong performers during the period and have the potential catalyst that the SEC may reverse the AFFE (acquired fund fee and expense) rule, which could make this sector eligible for index inclusion and broader generalist investment. Newtek Business Services (2.44% of the Fund at 6/30/19) was a notable contributor as it indicated a distribution increase going forward. Equity Real Estate Investment Trusts (“REITs”) were also up nicely during the semi-annual period, benefiting from the Fed’s pause in raising short term interest rates. TFIP maintained total exposure to the sector, however, it increased the Fund’s allocation to healthcare and triple net lease issues and exited mall REITs. CoreSite Realty (1.09% of the Fund as of 6/30/19), a provider of data center solutions, was a steady gainer during the period while Uniti Group (0.00% of the Fund as of 6/30/19) was negatively affected by the bankruptcy filing of Windstream, its largest client, and ultimately sold from the Fund.
CEFs were strong performers for the Fund, led by double digit gains in several positions. TFIP reduced exposure to natural resources, high yield and municipal debt CEFs while maintaining positions in emerging market debt funds. Exposure was added to C-Corp holdings, most notably in renewable energy, integrated oil, mid-stream energy and consumer-related positions while reducing exposure to communications. Notable C-Corp performers included CVR Energy Inc. (1.53% of the Fund as of 6/30/19), a mid-continent refiner which benefitted from attractive crack spreads and also announced it was evaluating potential strategic alternatives, including a potential sale of the company. Consolidated Communication Holdings (0.00% of the Fund as of 6/30/19) fell sharply and was sold from the portfolio as the company opted to forgo their distribution in favor of debt reduction. Finally, PTPs have been an attractive allocation because of strong fundraising trends and the potential for C-Corp conversion.
The most significant thematic portfolio shift during the period was the initiation of a program to sell covered calls and buy index put protection. We believe this new capability will affect performance going forward by dampening some of the volatility that the portfolio occasionally experiences due to its exposure to smaller capitalization securities and perceived energy price sensitivity of some holdings.
Outlook
The portfolio management challenge for the rest of the year is to balance current economic deceleration and risk of poor operating results with the expectation of central bank ease and faster growth of the economy and operating results later in the year. Major sectors of the portfolio which have little risk of poor operating results in a weak economy include equity and mortgage REITS, as well as the renewable utility holdings. Even if the economy slows and rates decline, their value may increase with a further decline in rates. Elements of the portfolio which should benefit from a re-acceleration of the economy include asset managers and energy- and consumer-related positions, though all of these are selected to have minimal downside operating risk in any case. With trade tensions continuing to negatively impact global growth, investors have become (perhaps too) reliant on the Fed and global central banks to provide the stimulus necessary to engineer a soft landing and avoid a recession. Given these uncertainties, for the present the investment team is taking a wait and see view regarding whether and when central bank easing might be effective in reversing the decline in growth, but stand ready to adopt a more aggressive stance when their conviction increases.
Thank you for investing in the LoCorr Funds
The S&P 500 Index is a broad based unmanaged index of 500 stocks, which is widely recognized as representative of the equity market in general. Barclays 1-5 Year Government Credit Index-The Barclays U.S. Government/Credit 1-5 Year Index is an index of all investment grade bonds with maturities of more than one year and less than 5 years. Barclays 1-3 Year Government Bond Index-The Barclays U.S. 1-3 Year Government/Credit Bond Index is a part of the Barclays U.S. Government/Credit Bond Index. It includes Treasury and agency securities (U.S. Government Bond Index) and publicly issued U.S. corporate and foreign debentures and secured notes (U.S. Credit Bond Index). The bonds in the index are investment-grade with a maturity between one and three years. Nikkei is Japan’s Nikkei 225 Stock Average, commonly used to measure a price-weighted index comprised of Japan’s top 225 blue-chip companies on the Tokyo Stock Exchange. Tokyo Stock Exchange is the largest stock exchange in Japan. The exchange has more than 2,200 listed companies, making it the third-largest in the world by this measure. Morningstar Global Long/Short Equity Index uses historical fund data dating back to the fund’s inception. Funds that have been liquidated or merged are included in analysis. The inception of the index is determined by the date at which the benchmark obtains five or more constituents, without falling below two constituents going forward. It includes funds with exposure to long and short positions in global equities or derivatives and is equally weighted. One cannot invest directly in an index.
Alpha is an annualized return measure of how much better or worse a fund’s performance is relative to an index of funds in the same category, after allowing for differences in risk.
Duration is a commonly used measure of the potential volatility of the price of a debt security, or the aggregate market value of a portfolio of debt securities, prior to maturity. Securities with a longer duration generally have more volatile prices than securities of comparable quality with a shorter duration.
Investment Grade-Investment Grade refers to bonds that are rated BBB or higher. Bond ratings are grades given to bonds that indicate their credit quality as determined by private independent rating services such as Standard & Poor’s, Moody’s and Fitch. These firms evaluate a bond issuer’s financial strength, or its ability to pay a bond’s principal and interest in a timely fashion. Ratings are expressed as letters ranging from ‘AAA’, which is the highest grade, to ‘D’, which is the lowest grade.
Spread is the percentage point difference between yields of various classes of bonds compared to treasury bonds.
Yield Curve is a line that plots the interest rates, at a set point in time, of bonds having equal credit quality, but differing maturity dates. The most frequently reported yield curve compares the three-month, two-year, five-year and 30-year U.S. Treasury debt. The curve is used to predict changes in economic output and growth.
Must be preceded or accompanied by a prospectus.
Opinions expressed are those of the Investment Manager and are subject to change, are not guaranteed and should not be considered investment advice.
Earnings growth is not representative of the Funds’ future performance.
Past performance is not a guarantee of future results.
Diversification does not assure a profit nor protect against loss in a declining market.
Mutual fund investing involves risk. Principal loss is possible. The LoCorr Macro Strategies Fund, LoCorr Long/Short Commodities Strategy Fund, LoCorr Market Trend Fund and LoCorr Spectrum Income Fund are diversified funds. The LoCorr Dynamic Equity Fund is a non-diversified fund, meaning it may invest its assets in fewer individual holdings than a diversified fund. Therefore, those Funds are more exposed to individual stock volatility than a diversified fund. The Funds invest in foreign investments and foreign currencies which involve greater volatility and political, economic and currency risks and differences in accounting methods. The Funds may make short sales of securities, which involves the risk that losses may exceed the original amount invested. Investing in commodities may subject the Funds to greater risks and volatility as commodity prices may be influenced by a variety of factors including unfavorable weather, environmental factors, and changes in government regulations. The Funds may invest in derivative securities, which derive their performance from the performance of an underlying asset, index, interest rate or currency exchange rate. Derivatives can be volatile and involve various types and degrees of risks, and, depending upon the characteristics of a particular derivative, suddenly can become illiquid. Investments in debt securities typically decrease in value when interest rates rise. This risk is usually greater for longer-term debt securities. Investments in Asset Backed, Mortgage Backed, and Collateralized Mortgage Backed Securities include additional risks that investors should be aware of such as credit risk, prepayment risk, possible illiquidity and default, as well as increased susceptibility to adverse economic developments. Investments in Real Estate Investment Trusts (REITs) involve additional risks such as declines in the value of real estate and increased susceptibility to adverse economic or regulatory developments.
Derivative contracts ordinarily have leverage inherent in their terms which can magnify a Fund’s potential for gains or losses through increased long and short position exposure. A Fund may access derivatives via a swap agreement. A risk of a swap agreement is the risk that the counterparty to the agreement will default on its obligation to pay the Fund.
A Fund will incur a loss as a result of a short position if the price of the short position instrument increases in value between the date of the short position sale and the date on which an offsetting position is purchased.
Investments in small- and medium-capitalization companies involve additional risks such as limited liquidity and greater volatility. Investments in lower rated and non-rated securities presents a greater risk of loss to principal and interest than higher-rated securities. ETF investments are subject to investment advisory and other expenses, which will be indirectly paid by the Fund. As a result, the cost of investing in the Fund will be higher than the cost of investing directly in ETFs and may be higher than other mutual funds that invest directly in stocks and bonds. ETFs are subject to specific risks, depending on the nature of the ETF.
A Fund’s portfolio will be significantly impacted by the performance of the real estate market generally, and a Fund may be exposed to greater risk and experience higher volatility than would a more economically diversified portfolio. Property values may fall due to increasing vacancies or declining rents resulting from economic, legal, cultural, or technological developments. Investments in Limited Partnerships (including master limited partnerships) involve risks different from those of investing in common stock including risks related to limited control and limited rights to vote on matters affecting the Limited Partnership, risks related to potential conflicts of interest between the Limited Partnership and the Limited Partnership’s general partner, cash flow risks, dilution risks and risks related to the general partner’s limited call right. Underlying Funds are subject to management and other expenses, which will be indirectly paid by a Fund.
Definitions
BofA Merrill Lynch 3-Month T-Bill Index tracks the performance of the U.S. dollar denominated U.S. Treasury Bills publicly issued in the U.S. domestic market with a remaining term to final maturity of less than 3 months
Barclays CTA Index is an unweighted index, which attempts to measure the performance of the Commodity Trading Advisor (“CTA”) industry. The Index measures the combined performance of all CTAs reporting to Barclay Trading Group who have more than 4 years past performance. Fees and transaction costs are reflected.
MSCI World Index is a market capitalization weighted index designed to provide a broad measure of equity-market performance throughout the world.
Bloomberg Barclays U.S. Aggregate Bond Index is a broad-based bond index comprised of government, corporate, mortgage and asset-back issues rated investment grade or higher.
U.S. Dollar Index (USDX) is a measure of the value of the U.S. dollar relative to the value of a basket of currencies of the majority of the U.S.’s most significant trading partners. This index is similar to other trade-weighted indexes, which also use the exchange rates from the same major currencies.
Basis Points (bps) - A unit that is equal to 1/100th of 1% and is used to denote the change in a financial instrument. The basis point is commonly used for calculating changes in interest rates, equity indexes and the yield of a fixed-income security.
Russell 1000 Growth Index refers to a composite that includes large and mid-cap companies located in the United States that also exhibit a growth probability. The Russell 1000 Growth is published and maintained by FTSE Russell.
Russell 1000 Value Index refers to a composite of large and mid-cap companies located in the United States that also exhibit a value probability. The Russell 1000 Value is published and maintained by FTSE Russell.
Alerian MLP Index is a market-cap weighted, float-adjusted index created to provide a comprehensive benchmark for investors to track the performance of the energy MLP sector.
ICE BofA Merrill Lynch 3-Month T-Bill Index tracks the performance of the U.S. dollar denominated U.S. Treasury Bills publicly issued in the U.S. domestic market with a remaining term to final maturity of less than 3 months
SG CTA Trend Index is a subset of the SG CTA Index, and follows traders of trend following methodologies. The SG CTA Index is equal weighted, calculates the daily rate of return for a pool of CTAs selected from the larger managers that are open to new investment.
Distribution coverage ratios measure a company’s ability to service its debt and meet its financial obligations such as interests payments or dividends.
Incentive distribution rights (IDR) give a general partner an increasing share of a limited partnership’s incremental distributable cash flow. Used in master limited partnerships (MLP), IDRs outline per-unit distribution increases to the limited partners. IDRs are used to align the interests of all parties in a partnership.
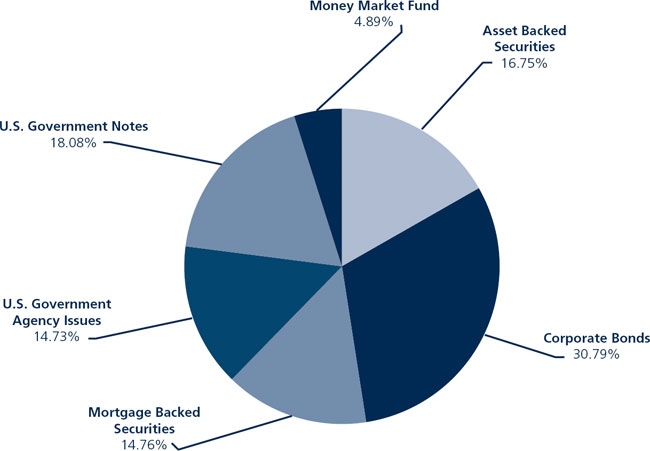
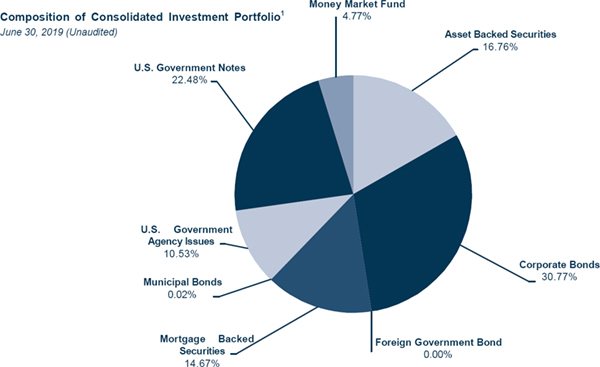
Please refer to the Schedule of Investments in this report for full holdings information. Fund holdings and sector allocations are subject to change and should not be considered recommendations to buy or sell any security
Morningstar rankings are for LEQIX only, other share classes may have different rankings. Morningstar percentile ranking is based on the fund’s total return percentile rank relative to all funds that have the same category for the same time period. The highest (or most favorable) percentile rank is 1% and the lowest (or least favorable) percentile rank is 100%. Morningstar total return includes both income and capital gains or losses and is not adjusted for sales charges or redemptions fees.
© 2019 Morningstar, Inc. All Rights Reserved. The information contained herein: (1) is proprietary to Morningstar; (2) may not be copied or distributed; and (3) is not warranted to be accurate, complete or timely. Neither Morningstar nor its content providers are responsible for any damages or losses arising from any use of this information. Past performance is no guarantee of future results.
The LoCorr Macro Strategies Fund, LoCorr Long/Short Commodities Strategy Fund, LoCorr Market Trend Fund, LoCorr Dynamic Equity Fund, and the LoCorr Spectrum Income Fund are distributed by Quasar Distributors, LLC.
LoCorr Macro Strategies Fund
Rate of Return — For the period ended June 30, 2019 (Unaudited)
| | | | Average Annual |
| | Inception Date | 6 Month | 1 Year
| 5 Year | Since Inception |
| LoCorr Macro Strategies Fund - Class A (without maximum load) | 3/22/11 | 7.04% | 6.88% | 3.71% | 1.09% |
| LoCorr Macro Strategies Fund - Class A (with maximum load) | 3/22/11 | 0.83% | 0.73% | 2.48% | 0.37% |
| LoCorr Macro Strategies Fund - Class C | 3/24/11 | 5.56% | 4.95% | 2.95% | 0.34% |
| LoCorr Macro Strategies Fund - Class I | 3/24/11 | 7.19% | 7.12% | 4.00% | 1.36% |
| Bank of America Merrill Lynch 3-Month Treasury Bill Index | | 1.24% | 2.31% | 0.87% | 0.56%1 |
| Barclay CTA Index | | 3.72% | 2.80% | 1.09% | -0.09%1 |
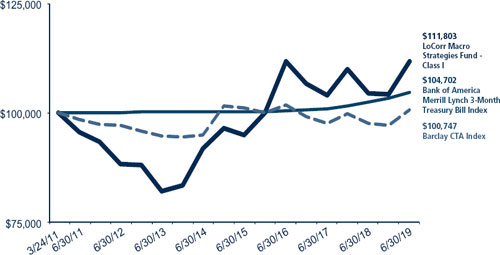
$100,000 investment in the
LoCorr Macro Strategies Fund - Class I
For the period ended June 30, 2019 (Unaudited)
This chart illustrates the performance of a hypothetical $100,000 investment made in the Fund since inception. Assumes reinvestment of distributions, but does not reflect the effect of any applicable sales charge or redemption fees. This chart does not imply any future performance. Performance will vary from class to class based on differences in class-specific expenses and sales charges. The returns do not reflect the deduction of taxes that a shareholder would pay on Fund distributions or the redemption of Fund shares.
Performance data represents past performance; past performance does not guarantee future results. The investment return and principal value of an investment will fluctuate so that an investor’s shares, when redeemed, may be worth more or less than their original cost. Current performance of the Fund may be lower or higher than the performance quoted. Performance data current to the most recent month end may be obtained by calling 1.855. LCFUNDS, or visiting www.LoCorrFunds.com.
Performance data shown reflects the Class A maximum sales charge of 5.75% and reflects the Class C Contingent Deferred Sales Charge (CDSC) of 1.00%. Performance of the Class A without load does not reflect the deduction of the sales load or fee. If reflected, the load or fee would reduce the performance quoted.
The returns reflect the actual performance for each period and do not include the impact on trades executed on the last business day of the period that were recorded on the first business day of the next period.
Per the fee table in the Fund’s March 1, 2019 prospectus, the Fund’s annual operating expense ratio is, before fee waivers 2.18%, 2.93% and 1.93% for Class A, Class C and Class I shares, respectively.
The Bank of America Merrill Lynch U.S. 3-Month Treasury Bill Index is an unmanaged index that seeks to measure the performance of U.S. Treasury bills available in the marketplace.
The Barclay CTA Index is a leading industry benchmark of representative performance of commodity trading advisors.
One cannot invest directly in an index.
1 Since inception return as of March 24, 2011.
LoCorr Long/Short Commodities Strategy Fund
Rate of Return — For the period ended June 30, 2019 (Unaudited)
| | | | Average Annual |
| | Inception Date | 6 Month | 1 Year | 5 Year | Since Inception |
| LoCorr Long/Short Commodities Strategy Fund - Class A (without maximum load) | 12/31/11 | -0.10% | 8.14% | 9.79% | 4.11% |
| LoCorr Long/Short Commodities Strategy Fund - Class A (with maximum load) | 12/31/11 | -5.81% | 1.92% | 8.49% | 3.29% |
| LoCorr Long/Short Commodities Strategy Fund - Class C | 12/31/11 | -1.52% | 6.37% | 8.92% | 3.28% |
| LoCorr Long/Short Commodities Strategy Fund - Class I | 12/31/11 | 0.00% | 8.44% | 10.06%
| 4.36% |
| Bank of America Merrill Lynch 3-Month Treasury Bill Index | | 1.24% | 2.31% | 0.87% | 0.61% |
| Morningstar Long/Short Commodity Index | | -1.76% | -9.92%
| -2.91% | -3.14% |
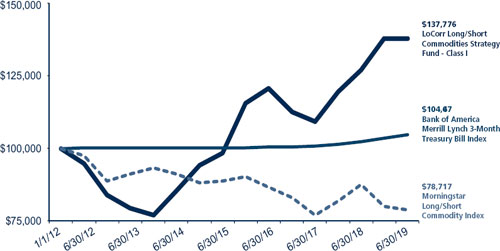
$100,000 investment in the
LoCorr Long/Short Commodities Strategy Fund - Class I
For the period ended June 30, 2019 (Unaudited)
This chart illustrates the performance of a hypothetical $100,000 investment made in the Fund since inception. Assumes reinvestment of distributions, but does not reflect the effect of any applicable sales charge or redemption fees. This chart does not imply any future performance. Performance will vary from class to class based on differences in class-specific expenses and sales charges. The returns do not reflect the deduction of taxes that a shareholder would pay on Fund distributions or the redemption of Fund shares.
Performance data represents past performance; past performance does not guarantee future results. The investment return and principal value of an investment will fluctuate so that an investor’s shares, when redeemed, may be worth more or less than their original cost. Current performance of the Fund may be lower or higher than the performance quoted. Performance data current to the most recent month end may be obtained by calling 1.855. LCFUNDS, or visiting www.LoCorrFunds.com.
Performance data shown reflects the Class A maximum sales charge of 5.75% and reflects the Class C Contingent Deferred Sales Charge (CDSC) of 1.00%. Performance of the Class A without load does not reflect the deduction of the sales load or fee. If reflected, the load or fee would reduce the performance quoted.
The returns reflect the actual performance for each period and do not include the impact on trades executed on the last business day of the period that were recorded on the first business day of the next period.
Per the fee table in the Fund’s March 1, 2019 prospectus, the Fund’s annual operating expense ratio is, before fee waivers 2.67%, 3.42% and 2.42% for Class A, Class C and Class I shares, respectively.
The Bank of America Merrill Lynch U.S. 3-Month Treasury Bill Index is an unmanaged index that seeks to measure the performance of U.S. Treasury bills available in the marketplace.
The Morningstar Long/Short Commodity Index is a fully collateralized commodity futures index that uses the momentum rule to determine if each commodity is held long, short, or flat.
One cannot invest directly in an index.
LoCorr Market Trend Fund
Rate of Return — For the period ended June 30, 2019 (Unaudited)
| |
| | Average Annual |
| | Inception
Date | 6 Month | 1 Year | 5 Year | Since Inception |
| LoCorr Market Trend Fund - Class A (without maximum load) | 6/30/14 | 11.87% | 5.13% | 2.53% | 2.53% |
| LoCorr Market Trend Fund - Class A (with maximum load) | 6/30/14 | 5.45% | -0.93% | 1.32% | 1.32% |
| LoCorr Market Trend Fund - Class C | 6/30/14 | 10.42% | 3.34% | 1.76% | 1.76% |
| LoCorr Market Trend Fund - Class I | 6/30/14 | 11.88% | 5.29% | 2.77% | 2.77% |
| Bank of America Merrill Lynch 3-Month Treasury Bill Index | | 1.24% | 2.31% | 0.87% | 0.87% |
| Barclay CTA Index | | 3.72% | 2.80% | 1.09% | 1.09% |
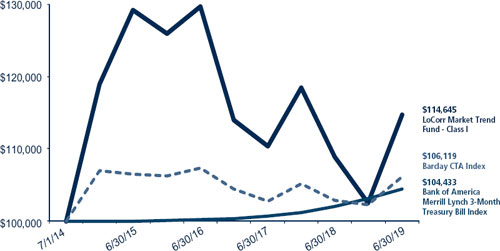
$100,000 investment in the
LoCorr Market Trend Fund - Class I
For the period ended June 30, 2019 (Unaudited)
This chart illustrates the performance of a hypothetical $100,000 investment made in the Fund since inception. Assumes reinvestment of distributions, but does not reflect the effect of any applicable sales charge or redemption fees. This chart does not imply any future performance. Performance will vary from class to class based on differences in class-specific expenses and sales charges. The returns do not reflect the deduction of taxes that a shareholder would pay on Fund distributions or the redemption of Fund shares.
Performance data represents past performance; past performance does not guarantee future results. The investment return and principal value of an investment will fluctuate so that an investor’s shares, when redeemed, may be worth more or less than their original cost. Current performance of the Fund may be lower or higher than the performance quoted. Performance data current to the most recent month end may be obtained by calling 1.855. LCFUNDS, or visiting www.LoCorrFunds.com.
Performance data shown reflects the Class A maximum sales charge of 5.75% and reflects the Class C Contingent Deferred Sales Charge (CDSC) of 1.00%. Performance of the Class A without load does not reflect the deduction of the sales load or fee. If reflected, the load or fee would reduce the performance quoted.
The returns reflect the actual performance for each period and do not include the impact on trades executed on the last business day of the period that were recorded on the first business day of the next period.
Per the fee table in the Fund’s March 1, 2019 prospectus, the Fund’s annual operating expense ratio is, before fee waivers 2.00%, 2.75% and 1.75% for Class A, Class C and Class I shares, respectively.
The Bank of America Merrill Lynch U.S. 3-Month Treasury Bill Index is an unmanaged index that seeks to measure the performance of U.S. Treasury bills available in the marketplace.
The Barclay CTA Index is a leading industry benchmark of representative performance of commodity trading advisors.
One cannot invest directly in an index.
LoCorr Dynamic Equity Fund
Rate of Return — For the period ended June 30, 2019 (Unaudited)
| | | | Average Annual |
| | Inception Date | 6 Month | 1 Year | 5 Year | Since Inception |
| LoCorr Dynamic Equity Fund - Class A (without maximum load) | 5/10/13 | 13.52% | 3.46% | 2.59% | 3.38% |
| LoCorr Dynamic Equity Fund - Class A (with maximum load) | 5/10/13 | 7.04% | -2.49% | 1.38% | 2.38% |
| LoCorr Dynamic Equity Fund - Class C | 5/10/13 | 11.99% | 1.68% | 1.81% | 2.59% |
| LoCorr Dynamic Equity Fund - Class I | 5/10/13 | 13.60% | 3.68% | 2.85% | 3.64% |
| S&P 500 Total Return Index | | 18.54% | 10.42% | 10.71% | 12.35% |
| Morningstar Long/Short Equity Fund Index | | 7.63% | 1.17% | 2.07% | 3.36% |
$100,000 investment in the
LoCorr Dynamic Equity Fund - Class I
For the period ended June 30, 2019 (Unaudited)
This chart illustrates the performance of a hypothetical $100,000 investment made in the Fund since inception. Assumes reinvestment of distributions, but does not reflect the effect of any applicable sales charge or redemption fees. This chart does not imply any future performance. Performance will vary from class to class based on differences in class-specific expenses and sales charges. The returns do not reflect the deduction of taxes that a shareholder would pay on Fund distributions or the redemption of Fund shares.
Performance data represents past performance; past performance does not guarantee future results. The investment return and principal value of an investment will fluctuate so that an investor’s shares, when redeemed, may be worth more or less than their original cost. Current performance of the Fund may be lower or higher than the performance quoted. Performance data current to the most recent month end may be obtained by calling 1.855. LCFUNDS, or visiting www.LoCorrFunds.com. Performance data shown reflects the Class A maximum sales charge of 5.75% and reflects the Class C Contingent Deferred Sales Charge (CDSC) of 1.00%. Performance of the Class A without load does not reflect the deduction of the sales load or fee. If reflected, the load or fee would reduce the performance quoted.
The returns reflect the actual performance for each period and do not include the impact on trades executed on the last business day of the period that were recorded on the first business day of the next period.
Per the fee table in the Fund’s March 1, 2019 prospectus, the Fund’s annual operating expense ratio is, before fee waivers 2.61%, 3.36% and 2.36% for Class A, Class C and Class I shares, respectively.
The S&P 500 Total Return Index is an unmanaged capitalization-weighted index of 500 stocks designed to measure performance of the broad domestic economy through changes in the aggregate market value of the 500 stocks which represent all major industries.
The Morningstar Long/Short Equity Index category holds sizeable stakes in both long and short positions in equities and related derivative. At least 75% of the assets are in equity securities or derivatives.
One cannot invest directly in an index.
LoCorr Spectrum Income Fund
Rate of Return — For the period ended June 30, 2019 (Unaudited)
| | | | Average Annual |
| | Inception Date | 6 Month | 1 Year | 5 Year | Since Inception |
| LoCorr Spectrum Income Fund - Class A (without maximum load) | 12/31/13 | 13.94% | 1.29% | -1.20% | 0.20% |
| LoCorr Spectrum Income Fund - Class A (with maximum load) | 12/31/13 | 7.42% | -4.56% | -2.36% | -0.87% |
| LoCorr Spectrum Income Fund - Class C | 12/31/13 | 12.62% | -0.23% | -1.92% | -0.54% |
| LoCorr Spectrum Income Fund - Class I | 12/31/13 | 14.15% | 1.64% | -0.91% | 0.49% |
| Bloomberg Barclay U.S. Aggregate Bond Index | | 6.11% | 7.87% | 2.95% | 3.40% |
| Morningstar Allocation - 70% to 85% Equity | | 13.49% | 4.21% | 4.98% | 5.57% |
$100,000 investment in the
LoCorr Spectrum Income Fund - Class I
For the period ended June 30, 2019 (Unaudited)
This chart illustrates the performance of a hypothetical $100,000 investment made in the Fund since inception. Assumes reinvestment of distributions, but does not reflect the effect of any applicable sales charge or redemption fees. This chart does not imply any future performance. Performance will vary from class to class based on differences in class-specific expenses and sales charges. The returns do not reflect the deduction of taxes that a shareholder would pay on Fund distributions or the redemption of Fund shares.
Performance data represents past performance; past performance does not guarantee future results. The investment return and principal value of an investment will fluctuate so that an investor’s shares, when redeemed, may be worth more or less than their original cost. Current performance of the Fund may be lower or higher than the performance quoted. Performance data current to the most recent month end may be obtained by calling 1.855. LCFUNDS, or visiting www.LoCorrFunds.com.
Performance data shown reflects the Class A maximum sales charge of 5.75% and reflects the Class C Contingent Deferred Sales Charge (CDSC) of 1.00%. Performance of the Class A without load does not reflect the deduction of the sales load or fee. If reflected, the load or fee would reduce the performance quoted.
The returns reflect the actual performance for each period and do not include the impact on trades executed on the last business day of the period that were recorded on the first business day of the next period.
Per the fee table in the Fund’s March 1, 2019 prospectus, the Fund’s annual operating expense ratio is, before fee waivers 3.54%, 4.29% and 3.29% for Class A, Class C and Class I shares, respectively.
The Bloomberg Barclay U.S. Aggregate Bond Index is a long term, market capitalization-weighted index used to represent investment grade bonds being traded in the United States.
The Morningstar Allocation - 70% to 85% Equity portfolios seek to provide both income and capital appreciation by investing in multiple asset classes, including stocks, bonds and cash. These portfolios are dominated by domestic holdings and have equity expenses between 70% and 85%.
One cannot invest directly in an index.
| | |
| | |
| LoCorr Macro Strategies Fund - Consolidated Schedule of Investments | | 17 |
| | |
LoCorr Macro Strategies Fund
Composition of Consolidated Investment Portfolio1
June 30, 2019 (Unaudited)
1 As a percentage of total investments.
Consolidated Schedule of Investments
June 30, 2019 (Unaudited)
| | |
| | |
| | |
| |
| | Maturity Date
| | Coupon Rate | | Principal Amount | | | Value | |
ASSET BACKED SECURITIES: 14.92% |
| | | | | | | | | |
| 321 Henderson Receivables I LLC | | | | | | | | | | |
Series 2006-1A A1 (1 Month LIBOR USD + 0.200%) (a)(c) | 03/15/2041 | | | 2.59 | % | | $ | 833,198 | | | $ | 820,811 | |
Series 2006-4A A1 (1 Month LIBOR USD + 0.200%) (a)(c) | 12/15/2041 | | | 2.59 | % | | | 958,807 | | | | 949,442 | |
Series 2004-A A1 (1 Month LIBOR USD + 0.350%) (a)(c) | 09/15/2045 | | | 2.74 | % | | | 133,386 | | | | 130,414 | |
| American Express Credit Account Master Trust, 2019-1 A | 10/15/2024 | | | 2.87 | % | | | 2,390,000 | | | | 2,442,921 | |
Avid Automobile Receivables Trust, 2018-1 A (a) | 08/15/2023 | | | 2.84 | % | | | 1,066,500 | | | | 1,065,080 | |
Bank of The West Auto Trust, 2017-1 A3 (a) | 01/15/2023 | | | 2.11 | % | | | 2,000,000 | | | | 1,994,263 | |
Barclays Dryrock Issuance Trust, 2017-2 A (1 Month LIBOR USD + 0.300%) (c) | 05/15/2023 | | | 2.69 | % | | | 3,225,000 | | | | 3,228,529 | |
Cabela’s Credit Card Master Note Trust, 2014-2 A (1 Month LIBOR USD + 0.450%) (c) | 07/15/2022 | | | 2.84 | % | | | 1,004,000 | | | | 1,004,126 | |
| California Republic Auto Receivables Trust, 2018-1 A3 | 08/15/2022 | | | 3.14 | % | | | 1,100,000 | | | | 1,107,792 | |
| Carmax Auto Owner Trust, 2019-1 A3 | 03/15/2024 | | | 3.05 | % | | | 2,450,000 | | | | 2,500,059 | |
| Citibank Credit Card Issuance Trust, 2018-A3 | 05/23/2025 | | | 3.29 | % | | | 3,500,000 | | | | 3,644,326 | |
Conn’s Receivables Funding LLC, 2018-A A (a) | 07/17/2023 | | | 3.25 | % | | | 947,139 | | | | 950,811 | |
DB Master Finance LLC, 2019-1A A2I (a) | 05/20/2049 | | | 3.79 | % | | | 2,015,000 | | | | 2,057,960 | |
Diamond Resorts Owner Trust, 2018-1 A (a) | 01/21/2031 | | | 3.70 | % | | | 2,364,187 | | | | 2,397,826 | |
Discover Card Execution Note Trust, 2018-2 A (1 Month LIBOR USD + 0.330%) (c) | 08/15/2025 | | | 2.72 | % | | | 2,775,000 | | | | 2,769,361 | |
Domino’s Pizza Master Issuer LLC, 2017-1A A2I (3 Month LIBOR USD + 1.250%) (a)(c) | 07/25/2047 | | | 3.83 | % | | | 1,075,838 | | | | 1,069,716 | |
| Entergy New Orleans Storm Recovery Funding LLC, 2015-1 A | 06/01/2027 | | | 2.67 | % | | | 1,107,519 | | | | 1,115,872 | |
Evergreen Credit Card Trust, 2018-2 A (1 Month LIBOR USD + 0.350%) (a)(b)(c) | 07/15/2022 | | | 2.74 | % | | | 1,975,000 | | | | 1,978,330 | |
Ford Credit Auto Owner Trust, 2016-1 A (a) | 08/15/2027 | | | 2.31 | % | | | 2,350,000 | | | | 2,357,972 | |
GLS Auto Receivables Trust, 2018-2A A (a) | 04/18/2022 | | | 3.25 | % | | | 1,196,235 | | | | 1,199,153 | |
| Honda Auto Receivables Owner Trust, 2019-1 A-3 | 03/20/2023 | | | 2.83 | % | | | 1,800,000 | | | | 1,825,882 | |
| Invitation Homes Trust | | | | | | | | | | | | | |
Series 2017-SFR2 A (1 Month LIBOR USD + 0.850%) (a)(c) | 12/19/2036 | | | 3.24 | % | | | 1,534,348 | | | | 1,524,117 | |
Series 2018-SFR2 A (1 Month LIBOR USD + 0.900%) (a)(c) | 06/18/2037 | | | 3.29 | % | | | 2,582,446 | | | | 2,576,694 | |
Series 2018-SFR3 A (1 Month LIBOR USD + 1.000%) (a)(c) | 07/17/2037 | | | 3.39 | % | | | 2,968,734 | | | | 2,960,376 | |
Series 2018-SFR4 A (1 Month LIBOR USD + 1.100%) (a)(c) | 01/19/2038 | | | 3.49 | % | | | 1,884,573 | | | | 1,894,817 | |
MVW Owner Trust, 2019-1A A (a) | 11/20/2036 | | | 2.89 | % | | | 2,050,000 | | | | 2,077,010 | |
NRZ Advance Receivables Trust, 2016-T3 AT3 (a) | 10/16/2051 | | | 2.83 | % | | | 3,210,000 | | | | 3,233,779 | |
Ocwen Master Advance Receivables Trust, 2016-T2 AT2 (a) | 08/16/2049 | | | 2.72 | % | | | 3,190,000 | | | | 3,188,749 | |
The accompanying notes are an integral part of these consolidated financial statements.
| | |
| | |
| 18 | | LoCorr Macro Strategies Fund - Consolidated Schedule of Investments (continued) |
| | |
| | Maturity Date | | Coupon Rate | | Principal Amount | | | Value | |
ASSET BACKED SECURITIES (continued) | | | | | | | | | | |
OneMain Financial Issuance Trust, 2016-2 B (a) | 03/20/2028 | | | 5.94 | % | | $ | 1,867,215 | | | $ | 1,874,430 | |
Planet Fitness Master Issuer LLC, 2018-1A A2I (a) | 09/05/2048 | | | 4.26 | % | | | 2,064,400 | | | | 2,126,724 | |
Progress Residential Trust, 2017-SFR1 A (a) | 08/17/2034 | | | 2.77 | % | | | 3,279,465 | | | | 3,300,271 | |
Prosper Marketplace Issuance Trust, 2018-1A A (a) | 06/17/2024 | | | 3.11 | % | | | 512,267 | | | | 512,557 | |
SMB Private Education Loan Trust, 2018-C A1 (1 Month LIBOR USD + 0.300%) (a)(c) | 09/15/2025 | | | 2.69 | % | | | 1,114,450 | | | | 1,114,344 | |
| SoFi Professional Loan Program LLC | | | | | | | | | | | | | |
Series 2016-C A2B (a) | 12/27/2032 | | | 2.36 | % | | | 2,170,544 | | | | 2,167,435 | |
Series 2015-C A2 (a) | 08/25/2033 | | | 2.51 | % | | | 1,051,610 | | | | 1,054,124 | |
Series 2016-A A2 (a) | 12/26/2036 | | | 2.76 | % | | | 3,058,742 | | | | 3,076,752 | |
Series 2017-C A2A (a) | 07/25/2040 | | | 1.75 | % | | | 832,186 | | | | 829,667 | |
| Synchrony Card Issuance Trust, 2018-A1 A1 | 09/15/2024 | | | 3.38 | % | | | 2,935,000 | | | | 3,011,601 | |
| Synchrony Credit Card Master Note Trust, 2018-1 A | 03/15/2024 | | | 2.97 | % | | | 3,100,000 | | | | 3,139,639 | |
| TCF Auto Receivables Owner Trust | | | | | | | | | | | | | |
Series 2016-1A A3 (a) | 04/15/2021 | | | 1.71 | % | | | 101,720 | | | | 101,662 | |
Series 2016-PT1 A (a) | 06/15/2022 | | | 1.93 | % | | | 1,038,422 | | | | 1,035,607 | |
Tricon American Homes Trust, 2017-SFR1 A (a) | 09/19/2034 | | | 2.72 | % | | | 2,833,053 | | | | 2,837,614 | |
| Verizon Owner Trust | | | | | | | | | | | | | |
Series 2018-1A A1B (1 Month LIBOR USD + 0.260%) (a)(c) | 09/20/2022 | | | 2.64 | % | | | 4,525,000 | | | | 4,522,770 | |
| Series 2018-A A1A | 04/20/2023 | | | 3.23 | % | | | 3,000,000 | | | | 3,057,786 | |
| Series 2019-B A1A | 12/20/2023 | | | 2.33 | % | | | 2,597,000 | | | | 2,604,841 | |
| TOTAL ASSET BACKED SECURITIES (Cost $89,537,908) | | | | | | | | | | | | 90,434,012 | |
| | | | | | | | | | | | | | |
| CORPORATE BONDS: 27.41% | | | | | | | | | | | | | |
| Aerospace/Defense: 0.43% | | | | | | | | | | | | | |
| L3 Technologies, Inc. | 02/15/2021 | | | 4.95 | % | | | 1,005,000 | | | | 1,038,476 | |
| United Technologies Corp. | 08/16/2023 | | | 3.65 | % | | | 1,480,000 | | | | 1,549,991 | |
| | | | | | | | | | | | | 2,588,467 | |
| Agriculture: 0.35% | | | | | | | | | | | | | |
| Altria Group, Inc. | 02/14/2024 | | | 3.80 | % | | | 2,025,000 | | | | 2,110,899 | |
| | | | | | | | | | | | | | |
| Auto Manufacturers: 0.97% | | | | | | | | | | | | | |
| American Honda Finance Corp. | 02/12/2021 | | | 2.65 | % | | | 2,020,000 | | | | 2,032,351 | |
| General Motors Financial Co., Inc. | 05/09/2023 | | | 3.70 | % | | | 2,375,000 | | | | 2,409,533 | |
Hyundai Capital America (a) | 03/18/2021 | | | 3.00 | % | | | 1,425,000 | | | | 1,432,540 | |
| | | | | | | | | | | | | 5,874,424 | |
| Banks: 10.03% | | | | | | | | | | | | | |
| Bank of America Corp. | 10/21/2022 | | | 2.50 | % | | | 6,155,000 | | | | 6,170,488 | |
| Bank of America Corp. | 01/11/2023 | | | 3.30 | % | | | 1,650,000 | | | | 1,700,781 | |
Bank of Montreal (b) | 03/26/2022 | | | 2.90 | % | | | 1,770,000 | | | | 1,797,094 | |
| Bank of New York Mellon Corp. | 02/07/2022 | | | 2.60 | % | | | 1,000,000 | | | | 1,010,089 | |
| BB&T Corp. | 12/06/2023 | | | 3.75 | % | | | 1,260,000 | | | | 1,329,824 | |
| Citigroup, Inc. | 10/26/2020 | | | 2.65 | % | | | 970,000 | | | | 973,414 | |
| Citigroup, Inc. | 01/14/2022 | | | 4.50 | % | | | 3,315,000 | | | | 3,484,689 | |
Citigroup, Inc. (3 Month LIBOR USD + 0.722%) (d) | 01/24/2023 | | | 3.14 | % | | | 2,000,000 | | | | 2,034,188 | |
Cooperatieve Rabobank UA (b) | 11/09/2022 | | | 3.95 | % | | | 2,130,000 | | | | 2,209,474 | |
Danske Bank (a)(b) | 01/12/2022 | | | 5.00 | % | | | 1,255,000 | | | | 1,312,789 | |
| Fifth Third Bancorp | 07/27/2020 | | | 2.88 | % | | | 1,965,000 | | | | 1,974,022 | |
| Goldman Sachs Group, Inc. | 02/25/2021 | | | 2.88 | % | | | 1,690,000 | | | | 1,702,137 | |
| Goldman Sachs Group, Inc. | 01/22/2023 | | | 3.63 | % | | | 2,140,000 | | | | 2,220,151 | |
| Goldman Sachs Group, Inc. | 02/23/2023 | | | 3.20 | % | | | 1,885,000 | | | | 1,929,097 | |
HSBC Holdings PLC (b) | 04/05/2021 | | | 5.10 | % | | | 2,390,000 | | | | 2,497,383 | |
| Huntington National Bank | 04/01/2022 | | | 3.13 | % | | | 1,735,000 | | | | 1,768,958 | |
| JP Morgan Chase & Co. | 09/23/2022 | | | 3.25 | % | | | 1,565,000 | | | | 1,607,772 | |
| JP Morgan Chase & Co. | 01/25/2023 | | | 3.20 | % | | | 5,705,000 | | | | 5,854,200 | |
| KeyBank NA | 02/01/2022 | | | 3.30 | % | | | 1,485,000 | | | | 1,524,047 | |
| Morgan Stanley | 07/24/2020 | | | 5.50 | % | | | 4,270,000 | | | | 4,407,656 | |
| Morgan Stanley | 01/23/2023 | | | 3.13 | % | | | 2,115,000 | | | | 2,162,729 | |
The accompanying notes are an integral part of these consolidated financial statements.
| | |
| | |
| LoCorr Macro Strategies Fund - Consolidated Schedule of Investments (continued) | | 19 |
| | |
| | Maturity Date | | Coupon Rate | | Principal Amount | | | Value | |
CORPORATE BONDS (continued) | | | | | | | | | | |
| PNC Bank NA | 01/22/2021 | | | 2.50 | % | | $ | 1,555,000 | | | $ | 1,560,202 | |
Royal Bank of Canada (b) | 04/29/2022 | | | 2.80 | % | | | 1,555,000 | | | | 1,579,506 | |
| State Street Corp. | 08/18/2020 | | | 2.55 | % | | | 1,410,000 | | | | 1,416,266 | |
| SunTrust Banks, Inc. | 03/03/2021 | | | 2.90 | % | | | 2,500,000 | | | | 2,522,495 | |
| Wells Fargo & Co. | 07/22/2020 | | | 2.60 | % | | | 2,725,000 | | | | 2,733,962 | |
| Zions Bancorp NA | 03/04/2022 | | | 3.35 | % | | | 1,295,000 | | | | 1,319,087 | |
| | | | | | | | | | | | | 60,802,500 | |
| Beverages: 0.73% | | | | | | | | | | | | | |
| Anheuser-Busch InBev Finance, Inc. | 02/01/2023 | | | 3.30 | % | | | 1,365,000 | | | | 1,408,902 | |
Heineken NV (a)(b) | 04/01/2022 | | | 3.40 | % | | | 1,425,000 | | | | 1,466,601 | |
| PepsiCo, Inc. | 03/05/2022 | | | 2.75 | % | | | 1,515,000 | | | | 1,543,172 | |
| | | | | | | | | | | | | 4,418,675 | |
| Biotechnology: 0.42% | | | | | | | | | | | | | |
| Celgene Corp. | 02/20/2023 | | | 3.25 | % | | | 2,480,000 | | | | 2,542,196 | |
| | | | | | | | | | | | | | |
| Computers: 0.25% | | | | | | | | | | | | | |
| Apple, Inc. | 02/23/2021 | | | 2.25 | % | | | 1,540,000 | | | | 1,545,501 | |
| | | | | | | | | | | | | | |
| Diversified Financial Services: 2.60% | | | | | | | | | | | | | |
AerCap Ireland Capital DAC/AerCap Global Aviation Trust Air (b) | 02/01/2022 | | | 3.95 | % | | | 1,220,000 | | | | 1,255,195 | |
| Lease Corp. | 07/03/2023 | | | 3.88 | % | | | 2,150,000 | | | | 2,240,840 | |
| American Express Co. | 05/20/2022 | | | 2.75 | % | | | 505,000 | | | | 511,167 | |
| American Express Co. | 12/02/2022 | | | 2.65 | % | | | 2,000,000 | | | | 2,021,927 | |
| Capital One Bank | 02/15/2023 | | | 3.38 | % | | | 1,700,000 | | | | 1,734,082 | |
CDP Financial, Inc.(a)(b) | 03/07/2022 | | | 2.75 | % | | | 2,190,000 | | | | 2,234,016 | |
| Charles Schwab Corp. | 01/25/2023 | | | 2.65 | % | | | 1,905,000 | | | | 1,928,696 | |
OMERS Finance Trust (a)(b) | 05/02/2024 | | | 2.50 | % | | | 1,930,000 | | | | 1,973,096 | |
| Visa, Inc. | 12/14/2022 | | | 2.80 | % | | | 1,800,000 | | | | 1,843,135 | |
| | | | | | | | | | | | | 15,742,154 | |
| Electric: 0.61% | | | | | | | | | | | | | |
| Berkshire Hathaway Energy Co. | 01/15/2021 | | | 2.38 | % | | | 2,345,000 | | | | 2,351,420 | |
| Nextera Energy Capital Holdings, Inc. | 04/01/2022 | | | 2.90 | % | | | 1,335,000 | | | | 1,358,151 | |
| | | | | | | | | | | | | 3,709,571 | |
| Environmental Control: 0.26% | | | | | | | | | | | | | |
| Waste Management, Inc. | 06/15/2024 | | | 2.95 | % | | | 1,530,000 | | | | 1,577,085 | |
| | | | | | | | | | | | | | |
| Food: 0.29% | | | | | | | | | | | | | |
| Sysco Corp. | 10/01/2020 | | | 2.60 | % | | | 1,760,000 | | | | 1,765,898 | |
| | | | | | | | | | | | | | |
| Healthcare - Products: 0.25% | | | | | | | | | | | | | |
| Abbott Laboratories | 11/30/2021 | | | 2.90 | % | | | 1,525,000 | | | | 1,550,268 | |
| | | | | | | | | | | | | | |
| Healthcare - Services: 0.24% | | | | | | | | | | | | | |
| UnitedHealth Group, Inc. | 10/15/2020 | | | 3.88 | % | | | 1,435,000 | | | | 1,458,125 | |
| | | | | | | | | | | | | | |
| Insurance: 1.45% | | | | | | | | | | | | | |
| Chubb INA Holdings,Inc. | 11/03/2020 | | | 2.30 | % | | | 1,215,000 | | | | 1,215,520 | |
| Lincoln National Corp. | 09/01/2023 | | | 4.00 | % | | | 1,500,000 | | | | 1,586,876 | |
Metropolitan Life Global Funding I (a) | 01/11/2022 | | | 3.38 | % | | | 2,070,000 | | | | 2,127,764 | |
| Prudential Financial, Inc. | 11/15/2020 | | | 4.50 | % | | | 2,000,000 | | | | 2,061,083 | |
| Unum Group | 05/15/2021 | | | 3.00 | % | | | 1,820,000 | | | | 1,829,733 | |
| | | | | | | | | | | | | 8,820,976 | |
| Machinery - Construction & Mining: 0.31% | | | | | | | | | | | | | |
| Caterpillar, Inc. | 06/26/2022 | | | 2.60 | % | | | 1,840,000 | | | | 1,858,453 | |
| | | | | | | | | | | | | | |
| Machinery - Diversified: 0.25% | | | | | | | | | | | | | |
| John Deere Capital Corp. | 01/08/2021 | | | 2.55 | % | | | 1,495,000 | | | | 1,503,862 | |
The accompanying notes are an integral part of these consolidated financial statements.
| | |
| | |
20 | | LoCorr Macro Strategies Fund - Consolidated Schedule of Investments (continued) |
| | |
| | Maturity Date | | Coupon Rate | | Principal Amount | | | Value | |
CORPORATE BONDS (continued) | | | | | | | | | | |
| Media: 1.40% | | | | | | | | | | |
| 21st Century Fox America, Inc. | 02/15/2021 | | | 4.50 | % | | $ | 2,015,000 | | | $ | 2,081,380 | |
| Comcast Corp. | 04/15/2024 | | | 3.70 | % | | | 2,925,000 | | | | 3,104,443 | |
| Discovery Communications LLC | 04/01/2023 | | | 3.25 | % | | | 2,150,000 | | | | 2,185,496 | |
Fox Corp. (a) | 01/25/2022 | | | 3.67 | % | | | 1,105,000 | | | | 1,141,925 | |
| | | | | | | | | | | | | 8,513,244 | |
| Miscellaneous Manufacturing: 0.73% | | | | | | | | | | | | | |
| General Electric Co. | 01/07/2021 | | | 4.63 | % | | | 1,345,000 | | | | 1,384,204 | |
| Ingersoll-Rand Global Holding Co. Ltd. | 06/15/2023 | | | 4.25 | % | | | 1,415,000 | | | | 1,505,470 | |
| Parker-Hannifin Corp. | 06/14/2024 | | | 2.70 | % | | | 1,540,000 | | | | 1,558,594 | |
| | | | | | | | | | | | | 4,448,268 | |
| Oil & Gas: 1.15% | | | | | | | | | | | | | |
BP Capital Markets PLC (b) | 03/11/2021 | | | 4.74 | % | | | 1,000,000 | | | | 1,040,899 | |
| Occidental Petroleum Corp. | 02/01/2021 | | | 4.10 | % | | | 1,765,000 | | | | 1,805,446 | |
Saudi Arabian Oil Co. (a)(b) | 04/16/2022 | | | 2.75 | % | | | 2,150,000 | | | | 2,169,880 | |
Total Capital International SA (b) | 06/19/2021 | | | 2.75 | % | | | 1,915,000 | | | | 1,937,083 | |
| | | | | | | | | | | | | 6,953,308 | |
| Oil & Gas Services: 0.33% | | | | | | | | | | | | | |
Schlumberger Holdings Corp. (a) | 12/21/2020 | | | 3.00 | % | | | 1,995,000 | | | | 2,011,359 | |
| | | | | | | | | | | | | | |
| Packaging & Containers: 0.27% | | | | | | | | | | | | | |
| Packaging Corp. of America | 12/15/2020 | | | 2.45 | % | | | 1,630,000 | | | | 1,628,664 | |
| | | | | | | | | | | | | | |
| Pharmaceuticals: 0.55% | | | | | | | | | | | | | |
| AbbVie, Inc. | 11/06/2022 | | | 2.90 | % | | | 1,845,000 | | | | 1,857,298 | |
| CVS Health Corp. | 07/20/2020 | | | 2.80 | % | | | 1,455,000 | | | | 1,458,718 | |
| | | | | | | | | | | | | 3,316,016 | |
| Pipelines: 0.35% | | | | | | | | | | | | | |
| Enterprise Products Operating LLC | 02/15/2021 | | | 2.80 | % | | | 2,115,000 | | | | 2,129,667 | |
| | | | | | | | | | | | | | |
| Real Estate Investment Trusts: 0.24% | | | | | | | | | | | | | |
| Alexandria Real Estate Equities, Inc. | 01/15/2024 | | | 4.00 | % | | | 1,365,000 | | | | 1,443,820 | |
| | | | | | | | | | | | | | |
| Retail: 0.26% | | | | | | | | | | | | | |
| Walmart, Inc. | 12/15/2022 | | | 2.35 | % | | | 1,545,000 | | | | 1,562,332 | |
| | | | | | | | | | | | | | |
| Software: 1.05% | | | | | | | | | | | | | |
| Fiserv, Inc. | 07/01/2024 | | | 2.75 | % | | | 1,650,000 | | | | 1,664,705 | |
| Microsoft Corp. | 02/06/2022 | | | 2.40 | % | | | 2,835,000 | | | | 2,864,768 | |
| Oracle Corp. | 10/15/2022 | | | 2.50 | % | | | 1,825,000 | | | | 1,837,891 | |
| | | | | | | | | | | | | 6,367,364 | |
| Telecommunications: 1.18% | | | | | | | | | | | | | |
| AT&T, Inc. | 02/17/2021 | | | 2.80 | % | | | 2,290,000 | | | | 2,304,341 | |
| AT&T, Inc. | 03/11/2024 | | | 3.90 | % | | | 1,470,000 | | | | 1,551,040 | |
| Verizon Communications, Inc. | 03/15/2021 | | | 3.45 | % | | | 2,200,000 | | | | 2,250,048 | |
| Verizon Communications, Inc. | 09/15/2023 | | | 5.15 | % | | | 920,000 | | | | 1,027,250 | |
| | | | | | | | | | | | | 7,132,679 | |
| Transportation: 0.46% | | | | | | | | | | | | | |
| FedEx Corp. | 01/14/2022 | | | 3.40 | % | | | 1,185,000 | | | | 1,214,892 | |
| Union Pacific Corp. | 03/01/2024 | | | 3.15 | % | | | 1,525,000 | | | | 1,572,455 | |
| | | | | | | | | | | | | 2,787,347 | |
| TOTAL CORPORATE BONDS (Cost $163,315,045) | | | | | | | | | | | | 166,163,122 | |
The accompanying notes are an integral part of these consolidated financial statements.
| | |
| | |
| LoCorr Macro Strategies Fund - Consolidated Schedule of Investments (continued) | | 21 |
| | |
| Maturity Date | | Coupon Rate | | Principal Amount | | | Value | |
| MORTGAGE BACKED SECURITIES: 13.14% | | | | | | | | | | |
BX Trust, 2018-MCSF A (1 Month LIBOR USD + 0.577%) (a)(c) | 04/16/2035 | | | 2.97 | % | | $ | 3,285,000 | | | $ | 3,280,984 | |
| Comm Mortgage Trust | | | | | | | | | | | | | |
| Series 2014-UBS2 AM | 03/12/2047 | | | 4.20 | % | | | 2,450,000 | | | | 2,588,847 | |
| Series 2014-LC17 | 10/11/2047 | | | 3.92 | % | | | 724,000 | | | | 775,898 | |
| Series 2014-CCRE21 | 12/10/2047 | | | 3.53 | % | | | 1,817,139 | | | | 1,902,605 | |
| Series 2015-CCR27 AM | 10/13/2048 | | | 3.98 | % | | | 2,000,000 | | | | 2,124,900 | |
CSMC Trust, 2017-HL2 A3 (a)(d) | 10/25/2047 | | | 3.50 | % | | | 2,752,156 | | | | 2,795,883 | |
| Fannie Mae Connecticut Avenue Securities | | | | | | | | | | | | | |
Series 2014-C02 1M2 (1 Month LIBOR USD + 2.600%) (c) | 05/28/2024 | | | 5.00 | % | | | 2,038,626 | | | | 2,106,974 | |
Series 2017-C01 1M1 (1 Month LIBOR USD + 1.300%) (c) | 07/25/2029 | | | 3.70 | % | | | 1,783,210 | | | | 1,789,318 | |
Series 2017-C02 2M1 (1 Month LIBOR USD + 1.150%) (c) | 09/25/2029 | | | 3.55 | % | | | 1,216,018 | | | | 1,219,571 | |
Series 2018-C02 2M1 (1 Month LIBOR USD + 0.650%) (c) | 08/26/2030 | | | 3.05 | % | | | 1,203,036 | | | | 1,203,452 | |
Series 2018-C05 1M1 (1 Month LIBOR USD + 0.720%) (c) | 01/27/2031 | | | 3.12 | % | | | 3,512,349 | | | | 3,513,576 | |
Series 2019-R03 1M1 (1 Month LIBOR USD + 0.750%) (a)(c) | 09/25/2031 | | | 3.15 | % | | | 1,532,201 | | | | 1,532,891 | |
Series 2019-R04 2M1 (1 Month LIBOR USD + 0.750%) (a)(c) | 06/27/2039 | | | 3.15 | % | | | 2,700,000 | | | | 2,700,000 | |
FDIC Guaranteed Notes Trust, 2010-S4 A (1 Month LIBOR USD + 0.720%) (a)(c) | 12/04/2020 | | | 3.20 | % | | | 324,732 | | | | 323,317 | |
| FHLMC Multifamily Structured Pass Through Certificates, 3855 HE | 02/15/2026 | | | 2.50 | % | | | 3,326 | | | | 3,312 | |
| Flagstar Mortgage Trust | | | | | | | | | | | | | |
Series 2017-2 A5 (a)(d) | 10/25/2047 | | | 3.50 | % | | | 3,264,873 | | | | 3,312,828 | |
Series 2018-4 A4 (a)(d) | 07/25/2048 | | | 4.00 | % | | | 2,024,924 | | | | 2,043,997 | |
| GS Mortgage Securities Trust | | | | | | | | | | | | | |
Series 2010-C2 A1 (a) | 12/10/2043 | | | 3.85 | % | | | 63,193 | | | | 63,712 | |
| Series 2015-GC28 A5 | 02/12/2048 | | | 3.76 | % | | | 1,985,000 | | | | 2,084,506 | |
| JP Morgan Chase Commercial Mortgage Securities Trust | | | | | | | | | | | | | |
Series 2018-BCON A (a) | 01/07/2031 | | | 3.73 | % | | | 3,630,000 | | | | 3,799,985 | |
Series 2010-C2 A3 (a) | 11/15/2043 | | | 4.07 | % | | | 4,084,741 | | | | 4,141,373 | |
| Series 2014-C23 ASB | 09/17/2047 | | | 3.66 | % | | | 2,950,000 | | | | 3,054,002 | |
| JP Morgan Mortgage Trust | | | | | | | | | | | | | |
Series 2016-1 A5 (a)(d) | 05/25/2046 | | | 3.50 | % | | | 965,636 | | | | 980,423 | |
Series 2018-9 A5 (a)(d) | 02/25/2049 | | | 4.00 | % | | | 1,890,227 | | | | 1,923,132 | |
Morgan Stanley Capital I Trust, 2017-CLS A (1 Month LIBOR USD + 0.700%) (a)(c) | 11/15/2034 | | | 3.09 | % | | | 2,785,000 | | | | 2,782,387 | |
| NCUA Guaranteed Notes Trust | | | | | | | | | | | | | |
Series 2011-R2 1A (1 Month LIBOR USD + 0.400%) (c) | 02/06/2020 | | | 2.82 | % | | | 1,198,147 | | | | 1,199,177 | |
Series 2011-R3 1A (1 Month LIBOR USD + 0.400%) (c) | 04/09/2020 | | | 2.81 | % | | | 769,723 | | | | 771,121 | |
Series 2010-R1 1A (1 Month LIBOR USD + 0.450%) (c) | 10/07/2020 | | | 2.87 | % | | | 84,864 | | | | 84,993 | |
| New Residential Mortgage Loan Trust | | | | | | | | | | | | | |
Series 2018-NQM1 A1 (a)(d) | 11/25/2048 | | | 3.99 | % | | | 2,869,858 | | | | 2,925,627 | |
Series 2015-1A A3 (a)(d) | 05/28/2052 | | | 3.75 | % | | | 1,027,569 | | | | 1,062,258 | |
Series 2014-2A A3 (a)(d) | 05/25/2054 | | | 3.75 | % | | | 915,087 | | | | 931,665 | |
Series 2016-1A A1 (a)(d) | 03/25/2056 | | | 3.75 | % | | | 1,896,361 | | | | 1,938,730 | |
Series 2017-1A A1 (a)(d) | 02/25/2057 | | | 4.00 | % | | | 2,502,889 | | | | 2,604,332 | |
Series 2017-2A A3 (a)(d) | 03/25/2057 | | | 4.00 | % | | | 2,657,575 | | | | 2,775,138 | |
Series 2017-3A A1 (a)(d) | 04/25/2057 | | | 4.00 | % | | | 1,923,945 | | | | 2,001,995 | |
| OBX Trust | | | | | | | | | | | | | |
Series 2018-EXP1 1A6 (a)(d) | 04/25/2048 | | | 4.50 | % | | | 1,230,059 | | | | 1,253,332 | |
Series 2018-EXP2 1A1 (a)(d) | 07/25/2058 | | | 4.00 | % | | | 2,187,819 | | | | 2,221,899 | |
Sequoia Mortgage Trust, 2018-CH4 A10 (a)(d) | 10/25/2048 | | | 4.50 | % | | | 1,605,511 | | | | 1,649,074 | |
Shellpoint Co-Originator Trust, 2017-2 A4 (a)(d) | 10/25/2047 | | | 3.50 | % | | | 1,149,744 | | | | 1,169,099 | |
Spruce Hill Mortgage Loan Trust, 2019-SH1 A1 (a)(d) | 04/29/2049 | | | 3.40 | % | | | 1,248,647 | | | | 1,260,132 | |
Verus Securitization Trust, 2018-3 A-1 (a)(d) | 10/25/2058 | | | 4.11 | % | | | 1,333,658 | | | | 1,362,661 | |
WFRBS Commercial Mortgage Trust, 2011-C3 A4 (a) | 03/17/2044 | | | 4.38 | % | | | 2,338,910 | | | | 2,410,010 | |
| TOTAL MORTGAGE BACKED SECURITIES (Cost $79,067,088) | | | | | | | | | | | | 79,669,116 | |
The accompanying notes are an integral part of these consolidated financial statements.
| | |
| | |
22 | | LoCorr Macro Strategies Fund - Consolidated Schedule of Investments (continued) |
| | |
| Maturity Date | | Coupon Rate | | Principal Amount | | | Value | |
| U.S. GOVERNMENT AGENCY ISSUES: 13.11% | | | | | | | | | | |
| Federal Farm Credit Banks | 11/27/2020 | | | 1.90 | % | | $ | 7,000,000 | | | $ | 7,001,752 | |
| Federal Farm Credit Banks | 04/05/2021 | | | 2.54 | % | | | 5,120,000 | | | | 5,178,306 | |
| Federal Farm Credit Banks | 06/26/2023 | | | 1.77 | % | | | 5,135,000 | | | | 5,118,963 | |
| Federal Farm Credit Banks | 07/17/2023 | | | 2.88 | % | | | 10,985,000 | | | | 11,400,636 | |
| Federal Home Loan Banks | 07/07/2021 | | | 1.88 | % | | | 5,200,000 | | | | 5,204,919 | |
| Federal Home Loan Banks | 06/10/2022 | | | 2.13 | % | | | 5,115,000 | | | | 5,159,506 | |
| Federal Home Loan Banks | 06/10/2022 | | | 2.75 | % | | | 6,015,000 | | | | 6,173,600 | |
| Federal Home Loan Banks | 06/09/2023 | | | 3.25 | % | | | 15,200,000 | | | | 15,998,228 | |
| Federal Home Loan Banks | 09/08/2023 | | | 3.38 | % | | | 9,000,000 | | | | 9,571,683 | |
| Federal Home Loan Mortgage Corp. | 05/29/2020 | | | 2.53 | % | | | 5,150,000 | | | | 5,151,754 | |
| Federal National Mortgage Association | 04/12/2022 | | | 2.25 | % | | | 3,500,000 | | | | 3,543,970 | |
| TOTAL U.S. GOVERNMENT AGENCY ISSUES (Cost $77,813,290) | | | | | | | | | | | | 79,503,317 | |
| | | | | | | | | | | | | | |
| U.S. GOVERNMENT NOTES: 16.10% | | | | | | | | | | | | | |
| United States Treasury Note | 02/28/2021 | | | 1.13 | % | | | 8,990,000 | | | | 8,888,512 | |
| United States Treasury Note | 05/31/2021 | | | 2.00 | % | | | 2,565,000 | | | | 2,576,022 | |
| United States Treasury Note | 01/15/2022 | | | 2.50 | % | | | 6,500,000 | | | | 6,622,891 | |
| United States Treasury Note | 10/31/2022 | | | 2.00 | % | | | 1,900,000 | | | | 1,916,625 | |
| United States Treasury Note | 11/15/2022 | | | 1.63 | % | | | 9,640,000 | | | | 9,607,992 | |
| United States Treasury Note | 09/30/2023 | | | 2.88 | % | | | 2,305,000 | | | | 2,411,336 | |
| United States Treasury Note | 12/31/2023 | | | 2.63 | % | | | 4,200,000 | | | | 4,358,156 | |
| United States Treasury Note | 01/31/2024 | | | 2.25 | % | | | 11,500,000 | | | | 11,749,315 | |
| United States Treasury Note | 02/15/2024 | | | 2.75 | % | | | 5,000,000 | | | | 5,221,094 | |
| United States Treasury Note | 02/29/2024 | | | 2.38 | % | | | 2,265,000 | | | | 2,328,792 | |
| United States Treasury Note | 03/31/2024 | | | 2.13 | % | | | 6,000,000 | | | | 6,100,313 | |
| United States Treasury Note | 04/30/2024 | | | 2.00 | % | | | 11,530,000 | | | | 11,655,659 | |
| United States Treasury Note | 05/15/2024 | | | 2.50 | % | | | 8,440,000 | | | | 8,729,795 | |
| United States Treasury Note | 12/31/2024 | | | 2.25 | % | | | 10,580,000 | | | | 10,829,622 | |
| United States Treasury Note | 02/15/2025 | | | 7.63 | % | | | 3,500,000 | | | | 4,580,625 | |
| TOTAL U.S. GOVERNMENT NOTES (Cost $95,495,750) | | | | | | | | | | | | 97,576,749 | |
| | | | | | | | | | | | | | |
| SHORT TERM INVESTMENT: 4.35% | | | | | | | | | | | | | |
| MONEY MARKET FUND: 4.35% | | | | | | | Shares | | | | | |
STIT-Government & Agency Portfolio, Institutional Class, 2.26% (e)(f)
| | | | | | | | 26,396,175 | | | | 26,396,175 | |
| TOTAL MONEY MARKET FUND (Cost $26,396,175) | | | | | | | | | | | | 26,396,175 | |
| TOTAL SHORT TERM INVESTMENT (Cost $26,396,175) | | | | | | | | | | | | 26,396,175 | |
| | | | | | | | | | | | | | |
| TOTAL INVESTMENTS (Cost $531,625,256): 89.03% | | | | | | | | | | | | 539,742,491 | |
Other Assets in Excess of Liabilities: 10.97 (g) | | | | | | | | | | | | 66,518,828 | |
| TOTAL NET ASSETS: 100.00% | | | | | | | | | | | $ | 606,261,319 | |
| (a) | Security as defined in Rule 144A under the Securities Act of 1933 and determined to be liquid. Purchased in a private placement transaction; resale to the public may require registration or may extend only to qualified institutional buyers. At June 30, 2019, the value of these securities total $130,098,111 which represents 21.46% of total net assets. |
| (b) | Foreign issued security. |
| (c) | Variable rate security based on a reference index and spread. The rate reported is the rate in effect as of June 30, 2019. |
| (d) | Variable rate security. The coupon is based on an underlying pool of loans. The rate reported is the rate in effect as of June 30, 2019. |
| (e) | The rate quoted is the annualized seven-day effective yield as of June 30, 2019. |
| (f) | A portion of this security is held by LCMFS Fund Limited and pledged as collateral for derivative contracts. |
| (g) | Includes assets pledged as collateral for derivative contracts. |
| LIBOR | London Interbank Offered Rate |
The accompanying notes are an integral part of these consolidated financial statements.
| | |
| | |
| LoCorr Macro Strategies Fund - Consolidated Schedule of Open Forward Currency Contracts | | 23 |
| | |
LoCorr Macro Strategies Fund
Consolidated Schedule of Open Forward Currency Contracts
June 30, 2019 (Unaudited)
| | | | | | | | | | Currency to be Received | | | Currency to be Delivered | | | | | | | |
Notional
Amount | | | Counter-
party | | | Forward
Settlement Date | | | Curr
Abbr. | | | U.S. $ Value at
June 30, 2019 | | | Curr Abbr. | | | U.S. $ Value on
Origination Date | | | Unrealized
Appreciation | | | Unrealized
(Depreciation) | |
| | | See key for abbreviation | | | | | | | | | | | | | | | | | | | | | | |
| Purchase Contracts: | | | | | | | | | | | | | | | | | | | | | | | | | |
| | $ | 48,142,753 | | | DB | | | 07/17/2019 | | | AUD | | $ | 48,692,370 | | | USD | | $ | 48,142,753 | | $ | 549,617 | | $ | — | |
| | | 271,144 | | | BAML | | | 09/20/2019 | | | AUD | | | 273,791 | | | USD | | | 271,144 | | | 2,647 | | | — | |
| | | 32,102,207 | | | DB | | | 07/17/2019 | | | BRL | | | 32,429,259 | | | USD | | | 32,102,207 | | | 327,052 | | | — | |
| | | 36,068,158 | | | DB | | | 07/17/2019 | | | CAD | | | 36,747,249 | | | USD | | | 36,068,158 | | | 679,091 | | | — | |
| | | 34,398,893 | | | BAML | | | 09/20/2019 | | | CAD | | | 34,522,633 | | | USD | | | 34,398,893 | | | 123,740 | | | — | |
| | | 36,678,986 | | | DB | | | 07/17/2019 | | | CHF | | | 37,006,927 | | | USD | | | 36,678,986 | | | 327,941 | | | — | |
| | | 1,672,456 | | | BAML | | | 09/20/2019 | | | CHF | | | 1,676,403 | | | USD | | | 1,672,456 | | | 3,947 | | | — | |
| | | 1,214,799 | | | DB | | | 07/17/2019 | | | CLP | | | 1,234,077 | | | USD | | | 1,214,799 | | | 19,278 | | | — | |
| | | 326,527 | | | DB | | | 07/17/2019 | | | COP | | | 326,912 | | | USD | | | 326,527 | | | 385 | | | — | |
| | | 21,540,228 | | | DB | | | 07/17/2019 | | | EUR | | | 21,719,694 | | | NOK | | | 21,540,228 | | | 179,466 | | | — | |
| | | 7,522,578 | | | DB | | | 07/17/2019 | | | EUR | | | 7,585,379 | | | PLN | | | 7,522,578 | | | 62,801 | | | — | |
| | | 22,882,381 | | | DB | | | 07/17/2019 | | | EUR | | | 23,109,208 | | | SEK | | | 22,882,381 | | | 226,827 | | | — | |
| | | 57,324,630 | | | DB | | | 07/17/2019 | | | EUR | | | 57,505,367 | | | USD | | | 57,324,630 | | | 180,737 | | | — | |
| | | 20,639,336 | | | BAML | | | 09/20/2019 | | | EUR | | | 20,685,660 | | | USD | | | 20,639,336 | | | 46,324 | | | — | |
| | | 50,113,730 | | | DB | | | 07/17/2019 | | | GBP | | | 50,047,062 | | | USD | | | 50,113,730 | | | — | | | (66,668) | |
| | | 2,244,065 | | | BAML | | | 09/20/2019 | | | GBP | | | 2,258,891 | | | USD | | | 2,244,065 | | | 14,826 | | | — | |
| | | 5,228,104 | | | DB | | | 07/17/2019 | | | ILS | | | 5,262,922 | | | USD | | | 5,228,104 | | | 34,818 | | | — | |
| | | 6,282,105 | | | DB | | | 07/17/2019 | | | INR | | | 6,330,899 | | | USD | | | 6,282,105 | | | 48,794 | | | — | |
| | | 44,547,006 | | | DB | | | 07/17/2019 | | | JPY | | | 44,607,281 | | | USD | | | 44,547,006 | | | 60,275 | | | — | |
| | | 33,508,874 | | | BAML | | | 09/20/2019 | | | JPY | | | 33,435,303 | | | USD | | | 33,508,874 | | | — | | | (73,571) | |
| | | 4,959,123 | | | DB | | | 07/17/2019 | | | KRW | | | 5,004,409 | | | USD | | | 4,959,123 | | | 45,286 | | | — | |
| | | 15,578,376 | | | DB | | | 07/17/2019 | | | MXN | | | 15,586,191 | | | USD | | | 15,578,376 | | | 7,815 | | | — | |
| | | 12,681,355 | | | BAML | | | 09/20/2019 | | | MXN | | | 12,641,609 | | | USD | | | 12,681,355 | | | — | | | (39,746) | |
| | | 28,121,543 | | | DB | | | 07/17/2019 | | | NOK | | | 28,474,965 | | | EUR | | | 28,121,543 | | | 353,422 | | | — | |
| | | 14,377,080 | | | DB | | | 07/17/2019 | | | NOK | | | 14,504,616 | | | USD | | | 14,377,080 | | | 127,536 | | | — | |
| | | 28,395,977 | | | DB | | | 07/17/2019 | | | NZD | | | 29,007,966 | | | USD | | | 28,395,977 | | | 611,989 | | | — | |
| | | 709,265 | | | BAML | | | 09/20/2019 | | | NZD | | | 723,992 | | | USD | | | 709,265 | | | 14,727 | | | — | |
| | | 10,076,736 | | | DB | | | 07/17/2019 | | | PLN | | | 10,212,181 | | | EUR | | | 10,076,736 | | | 135,445 | | | — | |
| | | 8,523,772 | | | DB | | | 07/17/2019 | | | PLN | | | 8,599,545 | | | USD | | | 8,523,772 | | | 75,773 | | | — | |
| | | 20,948,766 | | | DB | | | 07/17/2019 | | | RUB | | | 21,214,320 | | | USD | | | 20,948,766 | | | 265,554 | | | — | |
| | | 14,994,358 | | | DB | | | 07/17/2019 | | | SEK | | | 15,239,631 | | | EUR | | | 14,994,358 | | | 245,273 | | | — | |
| | | 14,728,790 | | | DB | | | 07/17/2019 | | | SEK | | | 14,875,450 | | | USD | | | 14,728,790 | | | 146,660 | | | — | |
| | | 4,629,181 | | | DB | | | 07/17/2019 | | | SGD | | | 4,650,665 | | | USD | | | 4,629,181 | | | 21,484 | | | — | |
| | | 6,266,068 | | | DB | | | 07/17/2019 | | | TRY | | | 6,321,435 | | | USD | | | 6,266,068 | | | 55,367 | | | — | |
| | | 14,435,681 | | | DB | | | 07/17/2019 | | | ZAR | | | 14,987,507 | | | USD | | | 14,435,681 | | | 551,826 | | | — | |
| Total Purchase Contracts | | | | | | | | | 667,501,769 | | | | | | 662,135,031 | | | 5,546,723 | | | (179,985) | |
Sale Contracts: | | | | | | | | | | | | | | | | | | | | | | | | | |
| | $ | 52,941,144 | | | DB | | | 07/17/2019 | | | USD | | $ | 53,778,688 | | | AUD | | $ | 52,941,144 | | $ | — | | $ | (837,544) | |
| | | 41,854,748 | | | BAML | | | 09/20/2019 | | | USD | | | 42,292,579 | | | AUD | | | 41,854,748 | | | — | | | (437,831) | |
| | | 25,145,150 | | | DB | | | 07/17/2019 | | | USD | | | 25,376,708 | | | BRL | | | 25,145,150 | | | — | | | (231,558) | |
| | | 28,129,980 | | | DB | | | 07/17/2019 | | | USD | | | 28,351,153 | | | CAD | | | 28,129,980 | | | — | | | (221,173) | |
| | | 49,831,776 | | | BAML | | | 09/20/2019 | | | USD | | | 50,570,227 | | | CAD | | | 49,831,776 | | | — | | | (738,451) | |
| | | 47,382,280 | | | DB | | | 07/17/2019 | | | USD | | | 47,967,381 | | | CHF | | | 47,382,280 | | | — | | | (585,101) | |
| | | 33,114,785 | | | BAML | | | 09/20/2019 | | | USD | | | 33,690,119 | | | CHF | | | 33,114,785 | | | — | | | (575,334) | |
| | | 1,206,914 | | | DB | | | 07/17/2019 | | | USD | | | 1,234,077 | | | CLP | | | 1,206,914 | | | — | | | (27,163) | |
| | | 82,028 | | | DB | | | 07/17/2019 | | | USD | | | 82,039 | | | COP | | | 82,028 | | | — | | | (11) | |
| | | 28,121,543 | | | DB | | | 07/17/2019 | | | NOK | | | 28,291,412 | | | EUR | | | 28,121,543 | | | — | | | (169,869) | |
| | | 10,076,735 | | | DB | | | 07/17/2019 | | | PLN | | | 10,148,006 | | | EUR | | | 10,076,735 | | | — | | | (71,271) | |
| | | 14,994,359 | | | DB | | | 07/17/2019 | | | SEK | | | 15,102,420 | | | EUR | | | 14,994,359 | | | — | | | (108,061) | |
| | | 55,854,708 | | | DB | | | 07/17/2019 | | | USD | | | 56,377,811 | | | EUR | | | 55,854,708 | | | — | | | (523,103) | |
| | | 88,760,542 | | | BAML | | | 09/20/2019 | | | USD | | | 89,189,883 | | | EUR | | | 88,760,542 | | | — | | | (429,341) | |
| | | 46,427,019 | | | DB | | | 07/17/2019 | | | USD | | | 46,729,235 | | | GBP | | | 46,427,019 | | | — | | | (302,216) | |
| | | 62,465,742 | | | BAML | | | 09/20/2019 | | | USD | | | 62,473,867 | | | GBP | | | 62,465,742 | | | — | | | (8,125) | |
| | | 3,620,357 | | | DB | | | 07/17/2019 | | | USD | | | 3,661,041 | | | ILS | | | 3,620,357 | | | — | | | (40,684) | |
| | | 3,043,470 | | | DB | | | 07/17/2019 | | | USD | | | 3,069,417 | | | INR | | | 3,043,470 | | | — | | | (25,947) | |
| | | 53,488,002 | | | DB | | | 07/17/2019 | | | USD | | | 53,664,361 | | | JPY | | | 53,488,002 | | | — | | | (176,359) | |
The accompanying notes are an integral part of these consolidated financial statements.
| | |
| | |
| 24 | | LoCorr Macro Strategies Fund - Consolidated Schedule of Open Forward Currency Contracts (continued) |
| | |
| | | | | | | | | | Currency to be Received | | | Currency to be Delivered | | | | | | | |
Notional
Amount | | | Counter-
party | | | Forward
Settlement Date | | | Curr
Abbr. | | | U.S. $ Value at
June 30, 2019 | | | Curr
Abbr. | | | U.S. $ Value on
Origination Date | | | Unrealized
Appreciation | | | Unrealized
(Depreciation) | |
| | | | | | See key for abbreviation | | | | | | | | | | | | | | | | | | | | | | |
| Sale Contracts: (continued) | | | | | | | | | | | | | | | | | | | | | | |
| | $ | 10,155,255 | | | BAML | | | 09/20/2019 | | | USD | | $ | 10,174,856 | | | JPY | | $ | 10,155,255 | | $ | — | | $ | (19,601) | |
| | | 4,884,452 | | | DB | | | 07/17/2019 | | | USD | | | 4,918,618 | | | KRW | | | 4,884,452 | | | — | | | (34,166) | |
| | | 7,529,692 | | | DB | | | 07/17/2019 | | | USD | | | 7,529,526 | | | MXN | | | 7,529,692 | | | 166 | | | — | |
| | | 10,457 | | | BAML | | | 09/20/2019 | | | USD | | | 10,426 | | | MXN | | | 10,457 | | | 31 | | | — | |
| | | 21,540,229 | | | DB | | | 07/17/2019 | | | EUR | | | 21,854,387 | | | NOK | | | 21,540,229 | | | — | | | (314,158) | |
| | | 12,448,048 | | | DB | | | 07/17/2019 | | | USD | | | 12,674,677 | | | NOK | | | 12,448,048 | | | — | | | (226,629) | |
| | | 31,455,657 | | | DB | | | 07/17/2019 | | | USD | | | 32,187,013 | | | NZD | | | 31,455,657 | | | — | | | (731,356) | |
| | | 17,109,509 | | | BAML | | | 09/20/2019 | | | USD | | | 17,469,373 | | | NZD | | | 17,109,509 | | | — | | | (359,864) | |
| | | 7,522,578 | | | DB | | | 07/17/2019 | | | EUR | | | 7,628,956 | | | PLN | | | 7,522,578 | | | — | | | (106,378) | |
| | | 4,848,618 | | | DB | | | 07/17/2019 | | | USD | | | 4,925,511 | | | PLN | | | 4,848,618 | | | — | | | (76,893) | |
| | | 12,153,381 | | | DB | | | 07/17/2019 | | | USD | | | 12,311,074 | | | RUB | | | 12,153,381 | | | — | | | (157,693) | |
| | | 22,882,381 | | | DB | | | 07/17/2019 | | | EUR | | | 23,294,001 | | | SEK | | | 22,882,381 | | | — | | | (411,620) | |
| | | 16,802,613 | | | DB | | | 07/17/2019 | | | USD | | | 17,101,429 | | | SEK | | | 16,802,613 | | | — | | | (298,816) | |
| | | 2,300,666 | | | DB | | | 07/17/2019 | | | USD | | | 2,321,636 | | | SGD | | | 2,300,666 | | | — | | | (20,970) | |
| | | 2,426,702 | | | DB | | | 07/17/2019 | | | USD | | | 2,441,441 | | | TRY | | | 2,426,702 | | | — | | | (14,739) | |
| | | 11,688,031 | | | DB | | | 07/17/2019 | | | USD | | | 12,257,160 | | | ZAR | | | 11,688,031 | | | — | | | (569,129) | |
| Total Sale Contracts | | | | | | | | | 841,150,508 | | | | | | 832,299,551 | | | 197 | |
| (8,851,154) | |
| Net Forward Currency Contracts | | | | | | | | $ | (173,648,739) |
| | | | $ | (170,164,520) | | $ | 5,546,920 | | $ | (9,031,139) | |
| Net Unrealized Depreciation | | | | | | | | | | | | | | | | | | | | $ | (3,484,219) | |
Counterparty:
| BAML | Bank of America Merrill Lynch |
| DB | Deutsche Bank |
| Currency abbreviations: | | | | |
| AUD | | AUSTRALIAN DOLLAR | | EUR | | EURO | | MXN | | MEXICAN PESO | | SGD | | SINGAPORE DOLLAR |
| BRL | | BRAZILIAN REAL | | GBP | | BRITISH POUND | | NOK | | NORWEGIAN KRONE | | TRY | | TURKISH LIRA |
| CAD | | CANADIAN DOLLAR | | ILS | | ISRAELI NEW SHEQEL | | NZD | | NEW ZEALAND DOLLAR | | USD | | U.S. DOLLAR |
| CHF | | SWISS FRANC | | INR | | INDIAN RUPEE | | PLN | | POLISH ZLOTY | | ZAR | | SOUTH AFRICAN RAND |
| CLP | | CHILEAN PESO | | JPY | | JAPANESE YEN | | RUB | | RUSSIAN RUBLE | | | | |
| COP | | COLOMBIAN PESO | | KRW | | SOUTH KOREAN WON | | SEK | | SWEDISH KRONA | | | | |
The accompanying notes are an integral part of these consolidated financial statements.
| | |
| | |
| LoCorr Macro Strategies Fund - Consolidated Schedule of Open Futures Contracts | | 25 |
| | |
LoCorr Macro Strategies Fund
Consolidated Schedule of Open Futures Contracts
June 30, 2019 (Unaudited)
| | | Number of | | | | | | Current | | | |
| | Value | |
| Description | | Contracts
Purchased (Sold) | | | Settlement
Month-Year | | | Notional
Amount | | | Value at
Trade Date | | | Unrealized
Appreciation | | | Unrealized
(Depreciation) | |
| | | | | | | | | | | | | | | | | | | |
| Purchase Contracts: | | | | | | | | | | | | | | | | | | |
| | | 10 Yr Mini JGB | | 13 | | | Sep-19 | | $ | 1,855,679 | | $ | 1,852,932 | | $ | 2,747 | | $ | — | |
| | | 90 Day Euro | | 33 | | | Mar-20 | | | 8,108,925 | | | 8,114,827 | | | — | | | (5,902) | |
| | | 90 Day Euro | | 50 | | | Jun-20 | | | 12,297,500 | | | 12,305,780 | | | — | | | (8,280) | |
| | | 90 Day Euro | | 124 | | | Sep-20 | | | 30,517,950 | | | 30,538,110 | | | — | | | (20,160) | |
| | | 90 Day Euro | | 1,391 | | | Dec-20 | | | 342,342,488 | | | 342,266,277 | | | 76,211 | | | — | |
| | | 90 Day Euro | | 172 | | | Mar-21 | | | 42,342,100 | | | 42,352,811 | | | — | | | (10,711) | |
| | | 90 Day Euro | | 164 | | | Jun-21 | | | 40,360,400 | | | 40,358,461 | | | 1,939 | | | — | |
| | | 90 Day Euro | | 173 | | | Sep-21 | | | 42,566,650 | | | 42,521,088 | | | 45,562 | | | — | |
| | | 90 Day Sterling | | 1,110 | | | Dec-20 | | | 174,849,352 | | | 174,913,098 | | | — | | | (63,746) | |
| | | Aluminum - 90 Day Settlement (a)(b) | | 1 | | | Jul-19 | | | 44,263 | | | 48,205 | | | — | | | (3,942) | |
| | | Aluminum - 90 Day Settlement (a)(b) | | 1 | | | Jul-19 | | | 44,494 | | | 47,166 | | | — | | | (2,672) | |
| | | Aluminum - 90 Day Settlement (a)(b) | | 1 | | | Jul-19 | | | 44,492 | | | 47,388 | | | — | | | (2,896) | |
| | | Aluminum - 90 Day Settlement (a)(b) | | 1 | | | Aug-19 | | | 44,734 | | | 45,724 | | | — | | | (990) | |
| | | Aluminum - 90 Day Settlement (a)(b) | | 1 | | | Aug-19 | | | 44,811 | | | 45,925 | | | — | | | (1,114) | |
| | | Aluminum - 90 Day Settlement (a)(b) | | 1 | | | Sep-19 | | | 45,000 | | | 44,362 | | | 638 | | | — | |
| | | Aluminum - 90 Day Settlement (a)(b) | | 1 | | | Sep-19 | | | 45,038 | | | 43,939 | | | 1,099 | | | — | |
| | | Aluminum - 90 Day Settlement (a)(b) | | 1 | | | Sep-19 | | | 45,036 | | | 44,580 | | | 456 | | | — | |
| | | Aluminum - 90 Day Settlement (a)(b) | | 1 | | | Sep-19 | | | 45,033 | | | 44,687 | | | 346 | | | — | |
| | | Aluminum (a)(b) | | 34 | | | Sep-19 | | | 1,530,213 | | | 1,532,648 | | | — | | | (2,435) | |
| | | Amsterdam Exchange Index | | 12 | | | Jul-19 | | | 1,530,801 | | | 1,528,574 | | | 2,227 | | | — | |
| | | Australian 10 Yr Bond | | 1,467 | | | Sep-19 | | | 147,946,307 | | | 147,680,789 | | | 265,518 | | | — | |
| | | Australian 3 Yr Bond | | 31 | | | Sep-19 | | | 2,502,756 | | | 2,502,900 | | | — | | | (144) | |
| | | Australian Dollar | | 217 | | | Sep-19 | | | 15,268,120 | | | 15,233,865 | | | 34,255 | | | — | |
| | | Brent Crude (a) | | 219 | | | Sep-19 | | | 14,178,060 | | | 13,845,560 | | | 332,500 | | | — | |
| | | Brent Crude (a) | | 6 | | | Oct-19 | | | 386,100 | | | 386,067 | | | 33 | | | — | |
| | | Brent Crude (a) | | 3 | | | Nov-19 | | | 192,210 | | | 193,104 | | | — | | | (894) | |
| | | Brent Crude (a) | | 2 | | | Dec-19 | | | 127,600 | | | 127,182 | | | 418 | | | — | |
| | | CAC 40 10 Euro Index | | 341 | | | Jul-19 | | | 21,454,271 | | | 21,324,251 | | | 130,020 | | | — | |
| | | Canadian 10 Yr Bond | | 495 | | | Sep-19 | | | 54,026,459 | | | 53,444,660 | | | 581,799 | | | — | |
| | | Canadian Dollar | | 163 | | | Sep-19 | | | 12,478,465 | | | 12,402,091 | | | 76,374 | | | — | |
| | | Cocoa (ICE) (a) | | 114 | | | Sep-19 | | | 2,613,185 | | | 2,593,490 | | | 19,695 | | | — | |
| | | Copper - 90 Day Settlement (a)(b) | | 1 | | | Jul-19 | | | 149,413 | | | 162,334 | | | — | | | (12,921) | |
| | | Copper - 90 Day Settlement (a)(b) | | 1 | | | Jul-19 | | | 149,793 | | | 162,238 | | | — | | | (12,445) | |
| | | Copper - 90 Day Settlement (a)(b) | | 1 | | | Jul-19 | | | 149,761 | | | 159,949 | | | — | | | (10,188) | |
| | | Copper - 90 Day Settlement (a)(b) | | 1 | | | Aug-19 | | | 149,847 | | | 149,069 | | | 778 | | | — | |
| | | Copper - 90 Day Settlement (a)(b) | | 1 | | | Aug-19 | | | 149,900 | | | 148,189 | | | 1,711 | | | — | |
| | | Copper - 90 Day Settlement (a)(b) | | 1 | | | Sep-19 | | | 149,953 | | | 148,215 | | | 1,738 | | | — | |
| | | Copper - 90 Day Settlement (a)(b) | | 1 | | | Sep-19 | | | 149,850 | | | 148,504 | | | 1,346 | | | — | |
| | | Copper - 90 Day Settlement (a)(b) | | 1 | | | Sep-19 | | | 149,828 | | | 150,327 | | | — | | | (499) | |
| | | Copper (a)(b) | | 19 | | | Sep-19 | | | 2,848,100 | | | 2,838,548 | | | 9,552 | | | — | |
| | | Corn (a) | | 576 | | | Dec-19 | | | 12,427,200 | | | 13,005,915 | | | — | | | (578,715) | |
| | | DAX Index | | 85 | | | Sep-19 | | | 29,933,593 | | | 29,694,058 | | | 239,535 | | | — | |
| | | Dollar | | 66 | | | Sep-19 | | | 6,313,956 | | | 6,376,175 | | | — | | | (62,219) | |
| | | Dow Jones Industrial Average Mini E-Cbot Index | | 332 | | | Sep-19 | | | 44,144,380 | | | 44,211,612 | | | — | | | (67,232) | |
| | | Euro | | 144 | | | Sep-19 | | | 20,603,700 | | | 20,582,624 | | | 21,076 | | | — | |
| | | Euro-Bobl | | 966 | | | Sep-19 | | | 147,674,107 | | | 147,232,048 | | | 442,059 | | | — | |
| | | Euro-BTP | | 58 | | | Sep-19 | | | 8,857,328 | | | 8,806,971 | | | 50,357 | | | — | |
| | | Euro-Bund | | 290 | | | Sep-19 | | | 56,962,578 | | | 56,726,213 | | | 236,365 | | | — | |
| | | Euro-Schatz | | 48 | | | Sep-19 | | | 6,128,606 | | | 6,123,841 | | | 4,765 | | | — | |
| | | Euro-Stoxx 50 Index | | 1,244 | | | Sep-19 | | | 49,028,393 | | | 48,632,120 | | | 396,273 | | | — | |
| | | FTSE 100 Index | | 429 | | | Sep-19 | | | 40,147,073 | | | 40,180,758 | | | — | | | (33,685) | |
| | | FTSE China A50 Index | | 46 | | | Jul-19 | | | 621,230 | | | 620,869 | | | 361 | | | — | |
| | | Gasoline RBOB (a) | | 95 | | | Aug-19 | | | 7,567,434 | | | 6,849,277 | | | 718,157 | | | — | |
The accompanying notes are an integral part of these consolidated financial statements.
| | |
| | |
| 26 | | LoCorr Macro Strategies Fund - Consolidated Schedule of Open Futures Contracts (continued) |
| | |
| | | Number of | | | | | | Current | | | |
| | Value | |
| Description | | Contracts
Purchased (Sold) | | | Settlement
Month-Year | | | Notional
Amount | | | Value at
Trade Date | | | Unrealized
Appreciation | | | Unrealized
(Depreciation) | |
| | | | | | | | | | | | | | | | | | | |
| Purchase Contracts: (continued) | | | | | | | | | | | | | | | | | | |
| | | Gasoline RBOB (a) | | 2 | | | Sep-19 | | $ | 155,744 | | $ | 157,205 | | $ | — | | $ | (1,461) | |
| | | Gasoline RBOB (a) | | 1 | | | Oct-19 | | | 71,316 | | | 71,834 | | | — | | | (518) | |
| | | Gasoline RBOB (a) | | 1 | | | Nov-19 | | | 69,573 | | | 70,436 | | | — | | | (863) | |
| | | Gold (a) | | 238 | | | Aug-19 | | | 33,646,060 | | | 32,688,850 | | | 957,210 | | | — | |
| | | Hang Seng Index | | 142 | | | Jul-19 | | | 25,907,997 | | | 25,792,878 | | | 115,119 | | | — | |
| | | Heating Oil (a) | | 23 | | | Aug-19 | | | 1,873,460 | | | 1,740,248 | | | 133,213 | | | — | |
| | | H-Shares Index | | 42 | | | Jul-19 | | | 2,912,746 | | | 2,895,644 | | | 17,102 | | | — | |
| | | Japanese 10 Yr Bond | | 27 | | | Sep-19 | | | 38,528,498 | | | 38,444,347 | | | 84,151 | | | — | |
| | | KOSPI 200 Index | | 3 | | | Sep-19 | | | 180,834 | | | 181,175 | | | — | | | (341) | |
| | | Lead (a)(b) | | 9 | | | Sep-19 | | | 434,700 | | | 418,148 | | | 16,552 | | | — | |
| | | Long Gilt | | 536 | | | Sep-19 | | | 88,694,615 | | | 88,259,236 | | | 435,379 | | | — | |
| | | Low Sulphur Gasoil (a) | | 4 | | | Aug-19 | | | 239,000 | | | 218,605 | | | 20,395 | | | — | |
| | | MSCI Taiwan Index | | 29 | | | Jul-19 | | | 1,120,850 | | | 1,122,520 | | | — | | | (1,670) | |
| | | Nasdaq 100 E-Mini Index | | 419 | | | Sep-19 | | | 64,473,625 | | | 63,956,837 | | | 516,788 | | | — | |
| | | Natural Gas (a) | | 10 | | | Aug-19 | | | 230,800 | | | 234,653 | | | — | | | (3,853) | |
| | | Nickel - 90 Day Settlement (a)(b) | | 1 | | | Aug-19 | | | 76,117 | | | 72,734 | | | 3,383 | | | — | |
| | | Nickel (a)(b) | | 14 | | | Sep-19 | | | 1,067,220 | | | 1,025,570 | | | 41,650 | | | — | |
| | | Platinum (a) | | 2 | | | Oct-19 | | | 84,110 | | | 81,514 | | | 2,596 | | | — | |
| | | Russell 2000 Mini Index | | 89 | | | Sep-19 | | | 6,973,595 | | | 6,825,377 | | | 148,218 | | | — | |
| | | S&P 500 E-Mini Index | | 505 | | | Sep-19 | | | 74,341,050 | | | 73,714,953 | | | 626,097 | | | — | |
| | | S&P/TSX 60 Index | | 30 | | | Sep-19 | | | 4,479,554 | | | 4,481,635 | | | — | | | (2,081) | |
| | | SET 50 Index | | 174 | | | Sep-19 | | | 1,302,922 | | | 1,290,194 | | | 12,728 | | | — | |
| | | Soybean (a) | | 178 | | | Nov-19 | | | 8,214,700 | | | 8,146,335 | | | 68,365 | | | — | |
| | | Soybean Meal (a) | | 28 | | | Dec-19 | | | 904,120 | | | 916,432 | | | — | | | (12,312) | |
| | | SPI 200 Index | | 25 | | | Sep-19 | | | 2,877,966 | | | 2,872,465 | | | 5,501 | | | — | |
| | | Sugar (a) | | 10 | | | Oct-19 | | | 141,344 | | | 141,260 | | | 84 | | | — | |
| | | Swiss Franc | | 26 | | | Sep-19 | | | 3,354,650 | | | 3,349,684 | | | 4,966 | | | — | |
| | | TWSE Capitalization Weighted Stock Index | | 45 | | | Jul-19 | | | 3,064,860 | | | 3,006,658 | | | 58,202 | | | — | |
| | | U.S. 10 Yr Note | | 733 | | | Sep-19 | | | 93,801,094 | | | 92,579,782 | | | 1,221,312 | | | — | |
| | | U.S. 2 Yr Note | | 1,024 | | | Sep-19 | | | 220,344,001 | | | 219,173,019 | | | 1,170,982 | | | — | |
| | | U.S. 5 Yr Note | | 1,544 | | | Sep-19 | | | 182,433,250 | | | 181,115,573 | | | 1,317,677 | | | — | |
| | | U.S. Long Bond | | 413 | | | Sep-19 | | | 64,260,219 | | | 62,404,762 | | | 1,855,457 | | | — | |
| | | U.S. Ultra Bond | | 19 | | | Sep-19 | | | 3,373,688 | | | 3,373,832 | | | — | | | (144) | |
| | | Wheat (a) | | 74 | | | Sep-19 | | | 1,950,825 | | | 1,960,030 | | | — | | | (9,205) | |
| | | WTI Crude (a) | | 16 | | | Aug-19 | | | 935,520 | | | 947,834 | | | — | | | (12,314) | |
| | | WTI Crude (a) | | 21 | | | Sep-19 | | | 1,228,920 | | | 1,244,007 | | | — | | | (15,087) | |
| | | WTI Crude (a) | | 10 | | | Oct-19 | | | 584,000 | | | 590,227 | | | — | | | (6,227) | |
| | | WTI Crude (a) | | 6 | | | Nov-19 | | | 349,320 | | | 352,200 | | | — | | | (2,880) | |
| | | WTI Crude (a) | | 3 | | | Dec-19 | | | 173,940 | | | 176,565 | | | — | | | (2,625) | |
| | | WTI Crude (a) | | 2 | | | Jan-20 | | | 115,420 | | | 115,453 | | | — | | | (33) | |
| | | WTI Crude (a) | | 1 | | | Feb-20 | | | 57,420 | | | 58,301 | | | — | | | (881) | |
| | | Zinc - 90 Day Settlement (a)(b) | | 1 | | | Jul-19 | | | 63,525 | | | 69,322 | | | — | | | (5,797) | |
| | | Zinc - 90 Day Settlement (a)(b) | | 2 | | | Aug-19 | | | 125,625 | | | 130,912 | | | — | | | (5,287) | |
| | | Zinc - 90 Day Settlement (a)(b) | | 1 | | | Aug-19 | | | 62,765 | | | 65,529 | | | — | | | (2,764) | |
| | | Zinc - 90 Day Settlement (a)(b) | | 1 | | | Sep-19 | | | 62,531 | | | 62,940 | | | — | | | (409) | |
| | | Zinc - 90 Day Settlement (a)(b) | | 1 | | | Sep-19 | | | 62,504 | | | 62,376 | | | 128 | | | — | |
| | | Zinc (a)(b) | | 74 | | | Sep-19 | | | 4,626,850 | | | 4,761,667 | | | — | | | (134,817) | |
| Total Purchase Contracts | | | | | | | | | | | | | | 12,529,165 | | | (1,123,359) | |
| Sale Contracts: | | | | | | | | | | | | | | | | | | |
| | | Aluminum - 90 Day Settlement (a)(b) | | (1 | ) | | Jul-19 | | $ | 44,263 | | $ | 47,783 | | $ | 3,520 | | $ | — | |
| | | Aluminum - 90 Day Settlement (a)(b) | | (1 | ) | | Jul-19 | | | 44,494 | | | 47,183 | | | 2,689 | | | — | |
| | | Aluminum - 90 Day Settlement (a)(b) | | (1 | ) | | Jul-19 | | | 44,492 | | | 47,356 | | | 2,864 | | | — | |
| | | Aluminum - 90 Day Settlement (a)(b) | | (1 | ) | | Aug-19 | | | 44,734 | | | 45,553 | | | 819 | | | — | |
| | | Aluminum - 90 Day Settlement (a)(b) | | (1 | ) | | Aug-19 | | | 44,811 | | | 45,938 | | | 1,127 | | | — | |
| | | Aluminum - 90 Day Settlement (a)(b) | | (1 | ) | | Sep-19 | | | 45,000 | | | 44,233 | | | — | | | (767) | |
| | | Aluminum - 90 Day Settlement (a)(b) | | (1 | ) | | Sep-19 | | | 45,038 | | | 43,932 | | | — | | | (1,106) | |
| | | Aluminum - 90 Day Settlement (a)(b) | | (1 | ) | | Sep-19 | | | 45,036 | | | 44,637 | | | — | | | (399) | |
The accompanying notes are an integral part of these consolidated financial statements.
| | |
| | |
| LoCorr Macro Strategies Fund - Consolidated Schedule of Open Futures Contracts (continued) | | 27 |
| | |
| | | Number of | | | | | | Current | | | |
| | Value | |
| Description | | Contracts
Purchased (Sold) | | | Settlement
Month-Year | | | Notional
Amount | | | Value at
Trade Date | | | Unrealized
Appreciation | | | Unrealized
(Depreciation) | |
| | | | | | | | | | | | | | |
| Sale Contracts: (continued) | |
| |
| |
| |
| |
| |
| |
| | | Aluminum - 90 Day Settlement (a)(b) | | (1 | ) | | Sep-19 | | $ | 45,033 | | $ | 44,573 | | $ | — | | $ | (460) |
|
| | | Aluminum (a)(b) | | (268 | ) | | Sep-19 | | | 12,061,675 | | | 12,138,003 | | | 76,328 | | | — | |
| | | Australian 10 Yr Bond | | (194 | ) | | Sep-19 | | | 19,564,815 | | | 19,498,329 | | | — | | | (66,486) | |
| | | British Pound | | (66 | ) | | Sep-19 | | | 5,258,963 | | | 5,258,554 | | | — | | | (409) | |
| | | CAC 40 10 Euro Index | | (38 | ) | | Jul-19 | | | 2,390,799 | | | 2,386,588 | | | — | | | (4,211) | |
| | | Canadian 10 Yr Bond | | (72 | ) | | Sep-19 | | | 7,858,394 | | | 7,860,953 | | | 2,559 | | | — | |
| | | CBOE Volatility Index | | (70 | ) | | Jul-19 | | | 1,086,750 | | | 1,144,773 | | | 58,023 | | | — | |
| | | CBOE Volatility Index | | (45 | ) | | Aug-19 | | | 745,875 | | | 765,268 | | | 19,393 | | | — | |
| | | CBOE Volatility Index | | (6 | ) | | Sep-19 | | | 101,550 | | | 103,589 | | | 2,039 | | | — | |
| | | Cocoa (NYBOT) (a) | | (7 | ) | | Sep-19 | | | 169,750 | | | 172,983 | | | 3,233 | | | — | |
| | | Coffee (a) | | (86 | ) | | Sep-19 | | | 3,529,763 | | | 3,213,269 | | | — | | | (316,494) | |
| | | Copper - 90 Day Settlement (a)(b) | | (1 | ) | | Jul-19 | | | 149,413 | | | 162,728 | | | 13,315 | | | — | |
| | | Copper - 90 Day Settlement (a)(b) | | (1 | ) | | Jul-19 | | | 149,793 | | | 162,148 | | | 12,355 | | | — | |
| | | Copper - 90 Day Settlement (a)(b) | | (1 | ) | | Jul-19 | | | 149,761 | | | 159,977 | | | 10,216 | | | — | |
| | | Copper - 90 Day Settlement (a)(b) | | (1 | ) | | Aug-19 | | | 149,847 | | | 148,846 | | | — | | | (1,001) | |
| | | Copper - 90 Day Settlement (a)(b) | | (1 | ) | | Aug-19 | | | 149,900 | | | 147,418 | | | — | | | (2,482) | |
| | | Copper - 90 Day Settlement (a)(b) | | (1 | ) | | Sep-19 | | | 149,953 | | | 147,988 | | | — | | | (1,965) | |
| | | Copper - 90 Day Settlement (a)(b) | | (1 | ) | | Sep-19 | | | 149,850 | | | 148,026 | | | — | | | (1,824) | |
| | | Copper - 90 Day Settlement (a)(b) | | (1 | ) | | Sep-19 | | | 149,828 | | | 150,569 | | | 741 | | | — | |
| | | Copper (a)(b) | | (137 | ) | | Sep-19 | | | 20,536,300 | | | 20,591,392 | | | 55,092 | | | — | |
| | | Copper (COMEX) (a) | | (63 | ) | | Sep-19 | | | 4,273,763 | | | 4,268,506 | | | — | | | (5,257) | |
| | | Corn (a) | | (288 | ) | | Dec-19 | | | 6,213,600 | | | 6,504,216 | | | 290,616 | | | — | |
| | | Cotton No.2 (a) | | (72 | ) | | Dec-19 | | | 2,378,880 | | | 2,422,067 | | | 43,187 | | | — | |
| | | DAX Index | | (8 | ) | | Sep-19 | | | 2,817,279 | | | 2,799,915 | | | — | | | (17,364) | |
| | | Euro-Bobl | | (31 | ) | | Sep-19 | | | 4,739,024 | | | 4,736,370 | | | — | | | (2,654) | |
| | | Euro-Bund | | (53 | ) | | Sep-19 | | | 10,410,402 | | | 10,405,905 | | | — | | | (4,497) | |
| | | Euro-Buxl 30 Yr Bond | | (4 | ) | | Sep-19 | | | 922,870 | | | 921,731 | | | — | | | (1,139) | |
| | | Euro-OAT | | (105 | ) | | Sep-19 | | | 19,684,739 | | | 19,647,466 | | | — | | | (37,273) | |
| | | Euro-Schatz | | (178 | ) | | Sep-19 | | | 22,726,914 | | | 22,686,742 | | | — | | | (40,172) | |
| | | FTSE 100 Index | | (90 | ) | | Sep-19 | | | 8,422,463 | | | 8,405,556 | | | — | | | (16,907) | |
| | | FTSE MIB Index | | (6 | ) | | Sep-19 | | | 721,695 | | | 719,238 | | | — | | | (2,457) | |
| | | FTSE/JSE Top 40 Index | | (26 | ) | | Sep-19 | | | 967,861 | | | 978,790 | | | 10,929 | | | — | |
| | | Gold (a) | | (4 | ) | | Aug-19 | | | 565,480 | | | 565,353 | | | — | | | (127) | |
| | | Hard Red Wheat (a) | | (150 | ) | | Sep-19 | | | 3,461,250 | | | 3,572,070 | | | 110,820 | | | — | |
| | | Heating Oil (a) | | (41 | ) | | Aug-19 | | | 3,339,647 | | | 3,373,287 | | | 33,640 | | | — | |
| | | Heating Oil (a) | | (9 | ) | | Sep-19 | | | 736,042 | | | 741,674 | | | 5,632 | | | — | |
| | | Heating Oil (a) | | (2 | ) | | Oct-19 | | | 164,111 | | | 165,556 | | | 1,445 | | | — | |
| | | IBEX 35 Index | | (11 | ) | | Jul-19 | | | 1,147,368 | | | 1,145,076 | | | — | | | (2,292) | |
| | | Japanese 10 Yr Bond | | (9 | ) | | Sep-19 | | | 12,842,833 | | | 12,836,214 | | | — | | | (6,619) | |
| | | Lead (a)(b) | | (10 | ) | | Sep-19 | | | 483,000 | | | 467,357 | | | — | | | (15,643) | |
| | | Lean Hogs (a) | | (6 | ) | | Aug-19 | | | 182,400 | | | 186,736 | | | 4,336 | | | — | |
| | | Live Cattle (a) | | (20 | ) | | Aug-19 | | | 834,800 | | | 839,584 | | | 4,784 | | | — | |
| | | Low Sulphur Gasoil (a) | | (59 | ) | | Aug-19 | | | 3,525,250 | | | 3,438,656 | | | — | | | (86,594) | |
| | | Low Sulphur Gasoil (a) | | (45 | ) | | Sep-19 | | | 2,702,250 | | | 2,689,672 | | | — | | | (12,578) | |
| | | Low Sulphur Gasoil (a) | | (11 | ) | | Oct-19 | | | 663,850 | | | 661,862 | | | — | | | (1,988) | |
| | | MSCI EAFE Index | | (35 | ) | | Sep-19 | | | 3,365,775 | | | 3,319,416 | | | — | | | (46,359) | |
| | | MSCI Emerging Markets Index | | (180 | ) | | Sep-19 | | | 9,480,600 | | | 9,386,898 | | | — | | | (93,702) | |
| | | Natural Gas (a) | | (321 | ) | | Aug-19 | | | 7,408,680 | | | 7,577,244 | | | 168,564 | | | — | |
| | | Natural Gas (a) | | (82 | ) | | Sep-19 | | | 1,871,240 | | | 1,929,339 | | | 58,099 | | | — | |
| | | Natural Gas (a) | | (51 | ) | | Oct-19 | | | 1,178,610 | | | 1,207,166 | | | 28,556 | | | — | |
| | | Natural Gas (a) | | (16 | ) | | Nov-19 | | | 383,840 | | | 384,581 | | | 741 | | | — | |
| | | Natural Gas (a) | | (10 | ) | | Dec-19 | | | 259,500 | | | 258,492 | | | — | | | (1,008) | |
| | | Nickel - 90 Day Settlement (a)(b) | | (1 | ) | | Aug-19 | | | 76,117 | | | 72,077 | | | — | | | (4,040) | |
| | | Nickel (a)(b) | | (14 | ) | | Sep-19 | | | 1,067,220 | | | 1,009,411 | | | — | | | (57,809) | |
| | | Nikkei 225 Index | | (13 | ) | | Sep-19 | | | 2,563,465 | | | 2,553,235 | | | — | | | (10,230) | |
| | | OMX Stockholm 30 Index | | (20 | ) | | Jul-19 | | | 349,068 | | | 348,045 | | | — | | | (1,023) | |
| | | Russell 2000 Mini Index | | (106 | ) | | Sep-19 | | | 8,305,630 | | | 8,172,745 | | | — | | | (132,885) | |
| | | SGX Nifty 50 Index | | (8 | ) | | Jul-19 | | | 189,408 | | | 189,960 | | | 552 | | | — | |
The accompanying notes are an integral part of these consolidated financial statements.
| | |
| | |
| 28 | | LoCorr Macro Strategies Fund - Consolidated Schedule of Open Futures Contracts (continued) |
| | |
| | | Number of | | | | | | Current | | | |
| | Value | |
| Description | | Contracts
Purchased (Sold) | | | Settlement
Month-Year | | | Notional
Amount | | | Value at
Trade Date | | | Unrealized
Appreciation | | | Unrealized
(Depreciation) | |
| | | | | | | | | | | | | | | | |
| Sale Contracts: (continued) | |
| |
| |
| |
| |
| |
| |
| | | Silver (a) | | (148 | ) | | Sep-19 | | $ | 11,352,340 | | $ | 11,155,306 | | $ | — | | $ | (197,034) | |
| | | Soybean (a) | | (188 | ) | | Nov-19 | | | 8,676,200 | | | 8,821,105 | | | 144,905 | | | — | |
| | | Soybean Meal (a) | | (76 | ) | | Dec-19 | | | 2,454,040 | | | 2,509,319 | | | 55,279 | | | — | |
| | | Soybean Oil (a) | | (111 | ) | | Dec-19 | | | 1,920,078 | | | 1,924,789 | | | 4,711 | | | — | |
| | | Sugar (a) | | (200 | ) | | Oct-19 | | | 2,826,880 | | | 2,742,158 | | | — | | | (84,722) | |
| | | Tokyo Price Index | | (214 | ) | | Sep-19 | | | 30,785,512 | | | 30,761,068 | | | — | | | (24,444) | |
| | | U.S. 10 Yr Note | | (84 | ) | | Sep-19 | | | 10,749,375 | | | 10,735,622 | | | — | | | (13,753) | |
| | | Wheat (a) | | (28 | ) | | Sep-19 | | | 738,150 | | | 748,738 | | | 10,588 | | | — | |
| | | Wheat (a) | | (144 | ) | | Dec-19 | | | 3,877,200 | | | 3,930,833 | | | 53,633 | | | — | |
| | | WTI Crude (a) | | (77 | ) | | Aug-19 | | | 4,502,190 | | | 4,190,197 | | | — | | | (311,993) | |
| | | Zinc - 90 Day Settlement (a)(b) | | (1 | ) | | Jul-19 | | | 63,525 | | | 68,947 | | | 5,422 | | | — | |
| | | Zinc - 90 Day Settlement (a)(b) | | (2 | ) | | Aug-19 | | | 125,625 | | | 131,394 | | | 5,769 | | | — | |
| | | Zinc - 90 Day Settlement (a)(b) | | (1 | ) | | Aug-19 | | | 62,765 | | | 65,248 | | | 2,483 | | | — | |
| | | Zinc - 90 Day Settlement (a)(b) | | (1 | ) | | Sep-19 | | | 62,531 | | | 62,874 | | | 343 | | | — | |
| | | Zinc - 90 Day Settlement (a)(b) | | (1 | ) | | Sep-19 | | | 62,504 | | | 61,890 | | | — | | | (614) | |
| | | Zinc (a)(b) | | (202 | ) | | Sep-19 | | | 12,630,050 | | | 12,712,856 | | | 82,806 | | | — | |
| Total Sale Contracts | | | | | | | | | | | | | | 1,392,153 | | | (1,630,781) | |
| Total Futures Contracts | | | | | | | | | | | | | $ | 13,921,318 | | $ | (2,754,140) | |
| Net Unrealized Appreciation | | | | | | | | | | | | | $ | 11,167,178 | | | | |
| (a) | Contract held by LCMFS Fund Limited. |
| (b) | London Metal Exchange (‘’LME’’) futures contracts settle on their respective maturity date. The unrealized appreciation on these contracts is a receivable for unsettled open futures contracts and the unrealized depreciation is a payable for unsettled open futures contracts on the Fund’s consolidated statement of assets and liabilities. |
| COMEX | Commodity Exchange, Inc. |
| ICE | Intercontinental Exchange |
| NYBOT | New York Board of Trade |
The accompanying notes are an integral part of these consolidated financial statements.
| | |
| | |
| LoCorr Long/Short Commodities Strategy Fund - Consolidated Schedule of Investments | | 29 |
| | |
LoCorr Long/Short Commodities Strategy Fund
1 As a percentage of total investments.
Consolidated Schedule of Investments
June 30, 2019 (Unaudited)
| | Maturity Date | | Coupon Rate | | Principal Amount | | | Value | |
| ASSET BACKED SECURITIES: 13.55% | | | | | | | | | | |
| 321 Henderson Receivables I LLC | | | | | | | | | | |
Series 2006-4A A1 (1 Month LIBOR USD + 0.200%) (a)(c) | 12/15/2041 | | | 2.59 | % | | $ | 192,459 | | | $ | 190,580 | |
Series 2004-A A1 (1 Month LIBOR USD + 0.350%) (a)(c) | 09/15/2045 | | | 2.74 | % | | | 66,207 | | | | 64,732 | |
| Ally Auto Receivables Trust, 2017-3 A4 | 03/15/2022 | | | 2.01 | % | | | 225,000 | | | | 224,218 | |
| American Express Credit Account Master Trust | | | | | | | | | | | | | |
| Series 2018-4 A | 12/15/2023 | | | 2.99 | % | | | 800,000 | | | | 812,758 | |
| Series 2019-1 A | 10/15/2024 | | | 2.87 | % | | | 1,050,000 | | | | 1,073,250 | |
| Asset Backed Securities Corp Home Equity Loan Trust Series, 2002-HE1 M1 | | | | | | | | | | | | | |
(1 Month LIBOR USD + 1.650%) (c) | 03/15/2032 | | | 4.04 | % | | | 527,131 | | | | 535,566 | |
Bank of The West Auto Trust, 2017-1 A3 (a) | 01/15/2023 | | | 2.11 | % | | | 750,000 | | | | 747,849 | |
Barclays Dryrock Issuance Trust, 2017-2 A (1 Month LIBOR USD + 0.300%) (c) | 05/15/2023 | | | 2.69 | % | | | 725,000 | | | | 725,793 | |
| California Republic Auto Receivables Trust, 2018-1 A3 | 08/15/2022 | | | 3.14 | % | | | 290,000 | | | | 292,054 | |
| Capital One Multi-Asset Execution Trust | | | | | | | | | | | | | |
Series 2016-A7 (1 Month LIBOR USD + 0.510%) (c) | 09/16/2024 | | | 2.90 | % | | | 526,000 | | | | 529,195 | |
| Series 2015-A4 | 05/15/2025 | | | 2.75 | % | | | 1,210,000 | | | | 1,235,651 | |
| CarMax Auto Owner Trust | | | | | | | | | | | | | |
| Series 2018-1 A3 | 11/15/2022 | | | 2.48 | % | | | 496,000 | | | | 497,308 | |
| Series 2018-4 A3 | 09/15/2023 | | | 3.36 | % | | | 900,000 | | | | 920,768 | |
| Citibank Credit Card Issuance Trust | | | | | | | | | | | | | |
| Series 2018-A6 | 12/09/2024 | | | 3.21 | % | | | 1,500,000 | | | | 1,554,130 | |
| Series 2018-A3 | 05/23/2025 | | | 3.29 | % | | | 1,085,000 | | | | 1,129,741 | |
Conn’s Receivables Funding LLC, 2018-A A (a) | 07/17/2023 | | | 3.25 | % | | | 183,317 | | | | 184,028 | |
Countrywide Asset-Backed Certificates, 2004-AB1 (1 Month LIBOR USD + 0.975%) (c) | 11/25/2034 | | | 3.38 | % | | | 152,448 | | | | 152,724 | |
DB Master Finance LLC, 2019-1A A2I (a) | 05/20/2049 | | | 3.79 | % | | | 960,000 | | | | 980,467 | |
Diamond Resorts Owner Trust, 2018-1 A (a) | 01/21/2031 | | | 3.70 | % | | | 1,080,771 | | | | 1,096,149 | |
Discover Card Execution Note Trust, 2018-2 A (1 Month LIBOR USD + 0.330%) (c) | 08/15/2025 | | | 2.72 | % | | | 1,225,000 | | | | 1,222,511 | |
Domino’s Pizza Master Issuer LLC, 2017-1A A2I (3 Month LIBOR USD + 1.250%) (a)(c) | 07/25/2047 | | | 3.83 | % | | | 491,250 | | | | 488,455 | |
Evergreen Credit Card Trust, 2018-2 A (1 Month LIBOR USD + 0.350%) (a)(b)(c) | 07/15/2022 | | | 2.74 | % | | | 375,000 | | | | 375,632 | |
| FirstEnergy Ohio PIRB Special Purpose Trust, 2013-1 A2 | 01/15/2022 | | | 1.73 | % | | | 62,472 | | | | 62,365 | |
The accompanying notes are an integral part of these consolidated financial statements.
| | |
| | |
| 30 | | LoCorr Long/Short Commodities Strategy Fund - Consolidated Schedule of Investments (continued) |
| | |
| | Maturity Date | | Coupon Rate | | Principal Amount | | | Value | |
ASSET BACKED SECURITIES (continued) | | | | | | | | | | |
| Ford Credit Auto Owner Trust | | | | | | | | | | |
Series 2015-2 A (a) | 01/15/2027 | | | 2.44 | % | | $ | 1,350,000 | | | $ | 1,351,688 | |
Series 2016-1 A (a) | 08/15/2027 | | | 2.31 | % | | | 1,360,000 | | | | 1,364,614 | |
GLS Auto Receivables Trust, 2018-2A A (a) | 04/18/2022 | | | 3.25 | % | | | 199,373 | | | | 199,859 | |
| GM Financial Consumer Automobile Receivables Trust, 2018-1 A3 | 07/18/2022 | | | 2.32 | % | | | 445,000 | | | | 445,784 | |
| Honda Auto Receivables Owner Trust, 2017-4 A | 03/21/2024 | | | 2.21 | % | | | 1,260,000 | | | | 1,262,214 | |
| Invitation Homes Trust | | | | | | | | | | | | | |
Series 2017-SFR2 A (1 Month LIBOR USD + 0.850%) (a)(c) | 12/19/2036 | | | 3.24 | % | | | 462,210 | | | | 459,128 | |
Series 2018-SFR1 A (1 Month LIBOR USD + 0.700%) (a)(c) | 03/19/2037 | | | 3.09 | % | | | 635,374 | | | | 627,428 | |
Series 2018-SFR2 A (1 Month LIBOR USD + 0.900%) (a)(c) | 06/18/2037 | | | 3.29 | % | | | 582,090 | | | | 580,793 | |
Series 2018-SFR3 A (1 Month LIBOR USD + 1.000%) (a)(c) | 07/17/2037 | | | 3.39 | % | | | 478,513 | | | | 477,166 | |
Series 2018-SFR4 A (1 Month LIBOR USD + 1.100%) (a)(c) | 01/19/2038 | | | 3.49 | % | | | 482,215 | | | | 484,836 | |
| Mercedes-Benz Auto Lease Trust, 2018-A A2 | 04/15/2020 | | | 2.20 | % | | | 60,398 | | | | 60,390 | |
MVW Owner Trust, 2019-1A A (a) | 11/20/2036 | | | 2.89 | % | | | 960,000 | | | | 972,649 | |
| NRZ Advance Receivables Trust | | | | | | | | | | | | | |
Series 2017-T1 AT1 (a) | 02/15/2051 | | | 3.21 | % | | | 1,413,000 | | | | 1,428,607 | |
Series 2016-T3 AT3 (a) | 10/16/2051 | | | 2.83 | % | | | 1,110,000 | | | | 1,118,223 | |
| Ocwen Master Advance Receivables Trust | | | | | | | | | | | | | |
Series 2016-T2 AT2 (a) | 08/16/2049 | | | 2.72 | % | | | 725,000 | | | | 724,716 | |
Series 2018-T2 AT2 (a) | 08/15/2050 | | | 3.60 | % | | | 735,000 | | | | 742,637 | |
OneMain Financial Issuance Trust, 2016-2 B (a) | 03/20/2028 | | | 5.94 | % | | | 650,638 | | | | 653,152 | |
Planet Fitness Master Issuer LLC, 2018-1A A2I (a) | 09/05/2048 | | | 4.26 | % | | | 913,100 | | | | 940,666 | |
Progress Residential Trust, 2017-SFR1 A (a) | 08/17/2034 | | | 2.77 | % | | | 323,959 | | | | 326,015 | |
Prosper Marketplace Issuance Trust, 2018-1A A (a) | 06/17/2024 | | | 3.11 | % | | | 88,224 | | | | 88,274 | |
Santander Retail Auto Lease Trust, 2017-A A2A (a) | 03/20/2020 | | | 2.02 | % | | | 734 | | | | 734 | |
SMB Private Education Loan Trust, 2018-C A1 (1 Month LIBOR USD + 0.300%) (a)(c) | 09/15/2025 | | | 2.69 | % | | | 244,635 | | | | 244,612 | |
| SoFi Professional Loan Program LLC | | | | | | | | | | | | | |
Series 2015-A A2 (a) | 03/25/2030 | | | 2.42 | % | | | 188,075 | | | | 187,960 | |
Series 2016-D A-2B (a) | 04/25/2033 | | | 2.34 | % | | | 1,191,588 | | | | 1,190,147 | |
Series 2015-C A2 (a) | 08/25/2033 | | | 2.51 | % | | | 301,886 | | | | 302,607 | |
Series 2015-D A2 (a) | 10/27/2036 | | | 2.72 | % | | | 115,537 | | | | 116,149 | |
Series 2016-A A2 (a) | 12/26/2036 | | | 2.76 | % | | | 674,776 | | | | 678,749 | |
Series 2017-B A2FX (a) | 05/25/2040 | | | 2.74 | % | | | 924,000 | | | | 923,904 | |
Series 2017-D A1FX (a) | 09/25/2040 | | | 1.72 | % | | | 31,890 | | | | 31,814 | |
SPS Servicer Advance Receivables Trust, 2018-T1 AT1 (a) | 10/17/2050 | | | 3.62 | % | | | 1,195,000 | | | | 1,211,920 | |
Starwood Waypoint Homes Trust, 2017-1 A (1 Month LIBOR USD + 0.950%) (a)(c) | 01/22/2035 | | | 3.34 | % | | | 622,447 | | | | 622,020 | |
| Synchrony Card Issuance Trust, 2018-A1 A1 | 09/15/2024 | | | 3.38 | % | | | 1,035,000 | | | | 1,062,012 | |
| Synchrony Credit Card Master Note Trust, 2018-1 A | 03/15/2024 | | | 2.97 | % | | | 1,400,000 | | | | 1,417,902 | |
| TCF Auto Receivables Owner Trust | | | | | | | | | | | | | |
Series 2016-1A A3 (a) | 04/15/2021 | | | 1.71 | % | | | 18,338 | | | | 18,328 | |
Series 2016-PT1 A (a) | 06/15/2022 | | | 1.93 | % | | | 211,875 | | | | 211,301 | |
| Toyota Auto Receivables Owner Trust, 2019-A A3 | 07/17/2023 | | | 2.91 | % | | | 1,355,000 | | | | 1,375,249 | |
Tricon American Homes Trust, 2017-SFR1 A (a) | 09/19/2034 | | | 2.72 | % | | | 1,226,991 | | | | 1,228,967 | |
| Verizon Owner Trust | | | | | | | | | | | | | |
Series 2018-1A A1B (1 Month LIBOR USD + 0.260%) (a)(c) | 09/20/2022 | | | 2.64 | % | | | 475,000 | | | | 474,766 | |
| Series 2018-A A1A | 04/20/2023 | | | 3.23 | % | | | 705,000 | | | | 718,580 | |
| Series 2019-B A1A | 12/20/2023 | | | 2.33 | % | | | 1,215,000 | | | | 1,218,668 | |
| Volkswagen Auto Loan Enhanced Trust, 2018-1 A3 | 11/21/2022 | | | 3.02 | % | | | 719,000 | | | | 729,157 | |
| TOTAL ASSET BACKED SECURITIES (Cost $42,806,321) | | | | | | | | | | | | 43,370,309 | |
| | | | | | | | | | | | | | |
| CORPORATE BONDS: 24.87% | | | | | | | | | | | | | |
| Aerospace/Defense: 0.44% | | | | | | | | | | | | | |
| L3 Technologies, Inc. | 02/15/2021 | | | 4.95 | % | | | 515,000 | | | | 532,154 | |
| United Technologies Corp. | 08/16/2023 | | | 3.65 | % | | | 825,000 | | | | 864,015 | |
| | | | | | | | | | | | | 1,396,169 | |
| Agriculture: 0.30% | | | | | | | | | | | | | |
| Altria Group, Inc. | 02/14/2024 | | | 3.80 | % | | | 915,000 | | | | 953,813 | |
| | | | | | | | | | | | | | |
| Auto Manufacturers: 0.72% | | | | | | | | | | | | | |
| American Honda Finance Corp. | 02/12/2021 | | | 2.65 | % | | | 520,000 | | | | 523,179 | |
| General Motors Financial Co., Inc. | 05/09/2023 | | | 3.70 | % | | | 1,065,000 | | | | 1,080,485 | |
The accompanying notes are an integral part of these consolidated financial statements.
| | |
| | |
| LoCorr Long/Short Commodities Strategy Fund - Consolidated Schedule of Investments (continued) | | 31 |
| | |
| | Maturity Date | | Coupon Rate | | Principal Amount | | | Value | |
CORPORATE BONDS (continued) | | | | | | | | | | |
Hyundai Capital America (a) | 03/18/2021 | | | 3.00 | % | | $ | 690,000 | | | $ | 693,651 | |
| | | | | | | | | | | | | 2,297,315 | |
| Banks: 9.28% | | | | | | | | | | | | | |
| Bank of America Corp. | 10/21/2022 | | | 2.50 | % | | | 775,000 | | | | 776,950 | |
| Bank of America Corp. | 01/11/2023 | | | 3.30 | % | | | 2,625,000 | | | | 2,705,790 | |
Bank of Montreal (b) | 03/26/2022 | | | 2.90 | % | | | 845,000 | | | | 857,935 | |
| Bank of New York Mellon Corp. | 02/07/2022 | | | 2.60 | % | | | 385,000 | | | | 388,884 | |
| BB&T Corp. | 12/06/2023 | | | 3.75 | % | | | 720,000 | | | | 759,899 | |
| Citigroup, Inc. | 10/26/2020 | | | 2.65 | % | | | 805,000 | | | | 807,833 | |
| Citigroup, Inc. | 01/14/2022 | | | 4.50 | % | | | 1,455,000 | | | | 1,529,479 | |
Citigroup, Inc. (3 Month LIBOR USD + 0.722%) (d) | 01/24/2023 | | | 3.14 | % | | | 710,000 | | | | 722,137 | |
Cooperatieve Rabobank UA (b) | 11/09/2022 | | | 3.95 | % | | | 895,000 | | | | 928,394 | |
Danske Bank (a)(b) | 01/12/2022 | | | 5.00 | % | | | 575,000 | | | | 601,477 | |
| Fifth Third Bancorp | 07/27/2020 | | | 2.88 | % | | | 190,000 | | | | 190,872 | |
| Fifth Third Bancorp | 03/15/2022 | | | 3.50 | % | | | 790,000 | | | | 812,897 | |
| Goldman Sachs Group, Inc. | 09/15/2020 | | | 2.75 | % | | | 250,000 | | | | 251,043 | |
| Goldman Sachs Group, Inc. | 02/25/2021 | | | 2.88 | % | | | 1,125,000 | | | | 1,133,079 | |
| Goldman Sachs Group, Inc. | 01/22/2023 | | | 3.63 | % | | | 910,000 | | | | 944,083 | |
| Goldman Sachs Group, Inc. | 02/23/2023 | | | 3.20 | % | | | 1,155,000 | | | | 1,182,020 | |
HSBC Holdings PLC (b) | 04/05/2021 | | | 5.10 | % | | | 580,000 | | | | 606,060 | |
| Huntington National Bank | 04/01/2022 | | | 3.13 | % | | | 780,000 | | | | 795,266 | |
| JP Morgan Chase & Co. | 05/10/2021 | | | 4.63 | % | | | 130,000 | | | | 135,330 | |
| JP Morgan Chase & Co. | 09/23/2022 | | | 3.25 | % | | | 910,000 | | | | 934,871 | |
| JP Morgan Chase & Co. | 01/25/2023 | | | 3.20 | % | | | 2,450,000 | | | | 2,514,074 | |
| KeyBank NA | 02/01/2022 | | | 3.30 | % | | | 695,000 | | | | 713,275 | |
| Morgan Stanley | 07/24/2020 | | | 5.50 | % | | | 450,000 | | | | 464,507 | |
| Morgan Stanley | 07/28/2021 | | | 5.50 | % | | | 910,000 | | | | 966,841 | |
| Morgan Stanley | 01/23/2023 | | | 3.13 | % | | | 1,975,000 | | | | 2,019,569 | |
| PNC Bank NA | 01/22/2021 | | | 2.50 | % | | | 705,000 | | | | 707,358 | |
Royal Bank of Canada (b) | 04/29/2022 | | | 2.80 | % | | | 695,000 | | | | 705,953 | |
| State Street Corp. | 08/18/2020 | | | 2.55 | % | | | 305,000 | | | | 306,355 | |
| State Street Corp. | 05/15/2023 | | | 3.10 | % | | | 740,000 | | | | 759,781 | |
| SunTrust Banks, Inc. | 03/03/2021 | | | 2.90 | % | | | 915,000 | | | | 923,233 | |
| SunTrust Banks, Inc. | 08/01/2022 | | | 2.45 | % | | | 305,000 | | | | 305,915 | |
| Wells Fargo & Co. | 02/13/2023 | | | 3.45 | % | | | 1,640,000 | | | | 1,685,457 | |
| Zions Bancorp NA | 03/04/2022 | | | 3.35 | % | | | 590,000 | | | | 600,974 | |
| | | | | | | | | | | | | 29,737,591 | |
| Beverages: 0.53% | | | | | | | | | | | | | |
| Anheuser-Busch InBev Finance, Inc. | 02/01/2023 | | | 3.30 | % | | | 630,000 | | | | 650,262 | |
Heineken NV (a)(b) | 04/01/2022 | | | 3.40 | % | | | 280,000 | | | | 288,174 | |
| PepsiCo, Inc. | 03/05/2022 | | | 2.75 | % | | | 740,000 | | | | 753,760 | |
| | | | | | | | | | | | | 1,692,196 | |
| Biotechnology: 0.24% | | | | | | | | | | | | | |
| Celgene Corp. | 02/20/2023 | | | 3.25 | % | | | 735,000 | | | | 753,433 | |
| | | | | | | | | | | | | | |
| Computers: 0.21% | | | | | | | | | | | | | |
| Apple, Inc. | 02/23/2021 | | | 2.25 | % | | | 675,000 | | | | 677,411 | |
| | | | | | | | | | | | | | |
| Diversified Financial Services: 2.90% | | | | | | | | | | | | | |
AerCap Ireland Capital DAC/AerCap Global Aviation Trust (b) | 02/01/2022 | | | 3.95 | % | | | 1,165,000 | | | | 1,198,608 | |
| Air Lease Corp. | 07/03/2023 | | | 3.88 | % | | | 1,155,000 | | | | 1,203,800 | |
| American Express Co. | 05/20/2022 | | | 2.75 | % | | | 1,200,000 | | | | 1,214,653 | |
| Capital One Bank | 02/15/2023 | | | 3.38 | % | | | 519,000 | | | | 529,405 | |
| Capital One Financial Corp. | 07/15/2021 | | | 4.75 | % | | | 505,000 | | | | 527,899 | |
CDP Financial, Inc. (a)(b) | 03/07/2022 | | | 2.75 | % | | | 990,000 | | | | 1,009,898 | |
| Charles Schwab Corp. | 01/25/2023 | | | 2.65 | % | | | 1,065,000 | | | | 1,078,248 | |
| Dragon 2012 LLC | 03/12/2024 | | | 1.97 | % | | | 10,834 | | | | 10,792 | |
| Helios Leasing I LLC | 05/29/2024 | | | 2.02 | % | | | 11,148 | | | | 11,108 | |
| Helios Leasing I LLC | 07/24/2024 | | | 1.73 | % | | | 11,640 | | | | 11,514 | |
| Helios Leasing I LLC | 09/28/2024 | | | 1.56 | % | | | 11,547 | | | | 11,371 | |
| Mastercard, Inc. | 11/21/2021 | | | 2.00 | % | | | 450,000 | | | | 448,919 | |
The accompanying notes are an integral part of these consolidated financial statements.
| | |
| | |
| 32 | | LoCorr Long/Short Commodities Strategy Fund - Consolidated Schedule of Investments (continued) |
| | |
| | Maturity Date | | Coupon Rate | | Principal Amount | | | Value | |
CORPORATE BONDS (continued) | | | | | | | | | | |
MSN 41079 and 41084 Ltd. (b) | 07/13/2024 | | | 1.72 | % | | $ | 11,621 | | | $ | 11,511 | |
OMERS Finance Trust (a)(b) | 05/02/2024 | | | 2.50 | % | | | 920,000 | | | | 940,543 | |
| Phoenix 2012 LLC | 07/03/2024 | | | 1.61 | % | | | 11,649 | | | | 11,491 | |
Safina Ltd. (b) | 01/15/2022 | | | 1.55 | % | | | 7,371 | | | | 7,309 | |
| Tagua Leasing LLC | 11/16/2024 | | | 1.58 | % | | | 12,091 | | | | 11,918 | |
| Visa, Inc. | 12/14/2022 | | | 2.80 | % | | | 1,055,000 | | | | 1,080,282 | |
| | | | | | | | | | | | | 9,319,269 | |
| Electric: 0.39% | | | | | | | | | | | | | |
| Berkshire Hathaway Energy Co. | 01/15/2021 | | | 2.38 | % | | | 210,000 | | | | 210,575 | |
| Dominion Energy, Inc. | 08/15/2021 | | | 2.00 | % | | | 440,000 | | | | 436,405 | |
| Nextera Energy Capital Holdings, Inc. | 04/01/2022 | | | 2.90 | % | | | 590,000 | | | | 600,232 | |
| | | | | | | | | | | | | 1,247,212 | |
| Environmental Control: 0.22% | | | | | | | | | | | | | |
| Waste Management, Inc. | 06/15/2024 | | | 2.95 | % | | | 700,000 | | | | 721,542 | |
| | | | | | | | | | | | | | |
| Food: 0.39% | | | | | | | | | | | | | |
| Sysco Corp. | 10/01/2020 | | | 2.60 | % | | | 625,000 | | | | 627,094 | |
| Tyson Foods, Inc. | 06/15/2022 | | | 4.50 | % | | | 595,000 | | | | 627,628 | |
| | | | | | | | | | | | | 1,254,722 | |
| Healthcare - Products: 0.23% | | | | | | | | | | | | | |
| Abbott Laboratories | 11/30/2021 | | | 2.90 | % | | | 710,000 | | | | 721,764 | |
| | | | | | | | | | | | | | |
| Healthcare - Services: 0.16% | | | | | | | | | | | | | |
| UnitedHealth Group, Inc. | 10/15/2020 | | | 3.88 | % | | | 195,000 | | | | 198,142 | |
| UnitedHealth Group, Inc. | 03/15/2022 | | | 2.88 | % | | | 300,000 | | | | 304,587 | |
| | | | | | | | | | | | | 502,729 | |
| Insurance: 1.35% | | | | | | | | | | | | | |
| Chubb INA Holdings, Inc. | 11/03/2020 | | | 2.30 | % | | | 165,000 | | | | 165,071 | |
| Chubb INA Holdings, Inc. | 03/13/2023 | | | 2.70 | % | | | 220,000 | | | | 223,553 | |
| Hartford Financial Services Group, Inc. | 03/30/2020 | | | 5.50 | % | | | 745,000 | | | | 761,258 | |
| Lincoln National Corp. | 09/01/2023 | | | 4.00 | % | | | 650,000 | | | | 687,646 | |
Metropolitan Life Global Funding I (a) | 01/11/2022 | | | 3.38 | % | | | 930,000 | | | | 955,952 | |
| Prudential Financial, Inc. | 11/15/2020 | | | 4.50 | % | | | 680,000 | | | | 700,768 | |
| Unum Group | 05/15/2021 | | | 3.00 | % | | | 845,000 | | | | 849,519 | |
| | | | | | | | | | | | | 4,343,767 | |
| Machinery - Construction & Mining: 0.13% | | | | | | | | | | | | | |
| Caterpillar, Inc. | 06/26/2022 | | | 2.60 | % | | | 405,000 | | | | 409,062 | |
| | | | | | | | | | | | | | |
| Machinery - Diversified: 0.15% | | | | | | | | | | | | | |
| John Deere Capital Corp. | 01/08/2021 | | | 2.55 | % | | | 480,000 | | | | 482,845 | |
| | | | | | | | | | | | | | |
| Media: 1.23% | | | | | | | | | | | | | |
| 21st Century Fox America, Inc. | 02/15/2021 | | | 4.50 | % | | | 830,000 | | | | 857,343 | |
| CBS Corp. | 03/01/2022 | | | 3.38 | % | | | 795,000 | | | | 813,447 | |
| Comcast Corp. | 04/15/2024 | | | 3.70 | % | | | 655,000 | | | | 695,183 | |
| Discovery Communications LLC | 04/01/2023 | | | 3.25 | % | | | 510,000 | | | | 518,420 | |
Fox Corp. (a) | 01/25/2022 | | | 3.67 | % | | | 490,000 | | | | 506,374 | |
| NBCUniversal Media LLC | 01/15/2023 | | | 2.88 | % | | | 550,000 | | | | 561,808 | |
| | | | | | | | | | | | | 3,952,575 | |
| Miscellaneous Manufacturing: 0.67% | | | | | | | | | | | | | |
| General Electric Co. | 01/07/2021 | | | 4.63 | % | | | 330,000 | | | | 339,619 | |
| General Electric Co. | 10/09/2022 | | | 2.70 | % | | | 375,000 | | | | 374,583 | |
| Ingersoll-Rand Global Holding Co. Ltd. | 06/15/2023 | | | 4.25 | % | | | 525,000 | | | | 558,567 | |
| Parker-Hannifin Corp. | 06/14/2024 | | | 2.70 | % | | | 855,000 | | | | 865,323 | |
| | | | | | | | | | | | | 2,138,092 | |
| Oil & Gas: 1.30% | | | | | | | | | | | | | |
BP Capital Markets PLC (b) | 03/11/2021 | | | 4.74 | % | | | 535,000 | | | | 556,881 | |
| Chevron Corp. | 12/05/2022 | | | 2.36 | % | | | 370,000 | | | | 371,727 | |
| ConocoPhillips Co. | 12/15/2022 | | | 2.40 | % | | | 1,105,000 | | | | 1,108,710 | |
| Occidental Petroleum Corp. | 02/01/2021 | | | 4.10 | % | | | 605,000 | | | | 618,864 | |
Saudi Arabian Oil Co. (a)(b) | 04/16/2022 | | | 2.75 | % | | | 1,000,000 | | | | 1,009,247 | |
The accompanying notes are an integral part of these consolidated financial statements.
| | |
| | |
| LoCorr Long/Short Commodities Strategy Fund - Consolidated Schedule of Investments (continued) | | 33 |
| | |
| | Maturity Date | | Coupon Rate | | Principal Amount | | | Value | |
CORPORATE BONDS (continued) | | | | | | | | | | |
Total Capital International SA (b) | 06/19/2021 | | | 2.75 | % | | $ | 505,000 | | | $ | 510,823 | |
| | | | | | | | | | | | | 4,176,252 | |
| Oil & Gas Services: 0.20% | | | | | | | | | | | | | |
Schlumberger Holdings Corp. (a) | 12/21/2020 | | | 3.00 | % | | | 625,000 | | | | 630,125 | |
| | | | | | | | | | | | | | |
| Packaging & Containers: 0.11% | | | | | | | | | | | | | |
| Packaging Corp. of America | 12/15/2020 | | | 2.45 | % | | | 360,000 | | | | 359,705 | |
| | | | | | | | | | | | | | |
| Pharmaceuticals: 0.44% | | | | | | | | | | | | | |
| AbbVie, Inc. | 11/06/2022 | | | 2.90 | % | | | 855,000 | | | | 860,699 | |
| CVS Health Corp. | 07/20/2020 | | | 2.80 | % | | | 540,000 | | | | 541,380 | |
| | | | | | | | | | | | | 1,402,079 | |
| Pipelines: 0.20% | | | | | | | | | | | | | |
| Enterprise Products Operating LLC | 02/15/2021 | | | 2.80 | % | | | 625,000 | | | | 629,334 | |
| | | | | | | | | | | | | | |
| Real Estate Investment Trusts: 0.21% | | | | | | | | | | | | | |
| Alexandria Real Estate Equities, Inc. | 01/15/2024 | | | 4.00 | % | | | 635,000 | | | | 671,667 | |
| | | | | | | | | | | | | | |
| Retail: 0.53% | | | | | | | | | | | | | |
| Home Depot Inc. | 06/01/2022 | | | 2.63 | % | | | 445,000 | | | | 452,584 | |
| Walmart, Inc. | 12/15/2022 | | | 2.35 | % | | | 1,220,000 | | | | 1,233,686 | |
| | | | | | | | | | | | | 1,686,270 | |
| Software: 0.59% | | | | | | | | | | | | | |
| Fiserv, Inc. | 07/01/2024 | | | 2.75 | % | | | 780,000 | | | | 786,951 | |
| Microsoft Corp. | 02/06/2022 | | | 2.40 | % | | | 445,000 | | | | 449,673 | |
| Oracle Corp. | 10/15/2022 | | | 2.50 | % | | | 640,000 | | | | 644,521 | |
| | | | | | | | | | | | | 1,881,145 | |
| Telecommunications: 1.08% | | | | | | | | | | | | | |
| AT&T, Inc. | 02/17/2021 | | | 2.80 | % | | | 1,310,000 | | | | 1,318,204 | |
| AT&T, Inc. | 03/11/2024 | | | 3.90 | % | | | 680,000 | | | | 717,488 | |
| Verizon Communications, Inc. | 03/15/2021 | | | 3.45 | % | | | 440,000 | | | | 450,010 | |
| Verizon Communications, Inc. | 09/15/2023 | | | 5.15 | % | | | 855,000 | | | | 954,672 | |
| | | | | | | | | | | | | 3,440,374 | |
| Transportation: 0.67% | | | | | | | | | | | | | |
| Burlington Northern Santa Fe LLC | 09/15/2021 | | | 3.45 | % | | | 375,000 | | | | 384,136 | |
| FedEx Corp. | 01/14/2022 | | | 3.40 | % | | | 860,000 | | | | 881,694 | |
| Union Pacific Corp. | 03/01/2024 | | | 3.15 | % | | | 840,000 | | | | 866,139 | |
| | | | | | | | | | | | | 2,131,969 | |
| TOTAL CORPORATE BONDS (Cost $77,753,243) | | | | | | | | | | | | 79,610,427 | |
| | | | | | | | | | | | | | |
| FOREIGN GOVERNMENT BOND: 0.00%* | | | | | | | | | | | | | |
Petroleos Mexicanos (b) | 12/20/2022 | | | 2.00 | % | | | 8,750 | | | | 8,735 | |
| TOTAL FOREIGN GOVERNMENT BOND (Cost $8,750) | | | | | | | | | | | | 8,735 | |
| | | | | | | | | | | | | | |
| MORTGAGE BACKED SECURITIES: 11.86% | | | | | | | | | | | | | |
BX Trust, 2018-MCSF A (1 Month LIBOR USD + 0.577%) (a)(c) | 04/16/2035 | | | 2.97 | % | | | 865,000 | | | | 863,943 | |
| Citigroup Commercial Mortgage Trust, 2012-GC8 A4A-4 | 09/12/2045 | | | 3.02 | % | | | 1,205,636 | | | | 1,231,263 | |
| Comm Mortgage Trust, 2014-UBS2 AM | 03/12/2047 | | | 4.20 | % | | | 1,150,000 | | | | 1,215,173 | |
| COMM Mortgage Trust, 2015-CCR27 AM | 10/13/2048 | | | 3.98 | % | | | 1,000,000 | | | | 1,062,450 | |
Deephaven Residential Mortgage Trust, 2018-3A A1 (a)(d) | 08/25/2058 | | | 3.79 | % | | | 349,820 | | | | 354,306 | |
Fannie Mae Aces, 2010-M3 A3 (d) | 03/25/2020 | | | 4.33 | % | | | 85,282 | | | | 86,009 | |
| Fannie Mae Connecticut Avenue Securities | | | | | | | | | | | | | |
Series 2014-C02 1M2 (1 Month LIBOR USD + 2.600%) (c) | 05/28/2024 | | | 5.00 | % | | | 959,354 | | | | 991,517 | |
Series 2017-C01 1M1 (1 Month LIBOR USD + 1.300%) (c) | 07/25/2029 | | | 3.70 | % | | | 178,321 | | | | 178,932 | |
Series 2017-C02 2M1 (1 Month LIBOR USD + 1.150%) (c) | 09/25/2029 | | | 3.55 | % | | | 146,373 | | | | 146,800 | |
Series 2018-C02 2M1 (1 Month LIBOR USD + 0.650%) (c) | 08/26/2030 | | | 3.05 | % | | | 240,607 | | | | 240,690 | |
Series 2018-C03 1M1 (1 Month LIBOR USD + 0.680%) (c) | 10/25/2030 | | | 3.08 | % | | | 405,557 | | | | 405,652 | |
Series 2018-C05 1M1 (1 Month LIBOR USD + 0.720%) (c) | 01/27/2031 | | | 3.12 | % | | | 684,224 | | | | 684,463 | |
Series 2019-R03 1M1 (1 Month LIBOR USD + 0.750%) (a)(c) | 09/25/2031 | | | 3.15 | % | | | 692,437 | | | | 692,749 | |
Series 2019-R04 2M1 (1 Month LIBOR USD + 0.750%) (a)(c) | 06/27/2039 | | | 3.15 | % | | | 1,300,000 | | | | 1,300,000 | |
The accompanying notes are an integral part of these consolidated financial statements.
| | |
| | |
| 34 | | LoCorr Long/Short Commodities Strategy Fund - Consolidated Schedule of Investments (continued) |
| | |
| | Maturity Date | | Coupon Rate | | Principal Amount | | | Value | |
MORTGAGE BACKED SECURITIES (continued) | | | | | | | | | | |
| FHLMC Multifamily Structured Pass Through Certificates | | | | | | | | | | |
Series K-F08 A (1 Month LIBOR USD + 0.300%) (c) | 01/25/2022 | | | 2.73 | % | | $ | 272,610 | | | $ | 272,012 | |
| Series K-052 A1 | 01/25/2025 | | | 2.60 | % | | | 474,543 | | | | 480,448 | |
| Flagstar Mortgage Trust | | | | | | | | | | | | | |
Series 2017-2 A5 (a)(d) | 10/25/2047 | | | 3.50 | % | | | 900,252 | | | | 913,474 | |
Series 2018-4 A4 (a)(d) | 07/25/2048 | | | 4.00 | % | | | 697,349 | | | | 703,918 | |
Freddie Mac Structured Agency Credit Risk Debt Notes, 2018-SPI2 M1 (a)(d) | 05/25/2048 | | | 3.82 | % | | | 381,071 | | | | 382,344 | |
| GS Mortgage Securities Trust | | | | | | | | | | | | | |
Series 2010-C1 A1 (a) | 08/12/2043 | | | 3.68 | % | | | 43,188 | | | | 43,268 | |
| Series 2015-GC28 A5 | 02/12/2048 | | | 3.76 | % | | | 885,000 | | | | 929,364 | |
| JP Morgan Chase Commercial Mortgage Securities Trust | | | | | | | | | | | | | |
Series 2018-BCON A (a) | 01/07/2031 | | | 3.73 | % | | | 335,000 | | | | 350,687 | |
Series 2010-C2 A3 (a) | 11/15/2043 | | | 4.07 | % | | | 300,412 | | | | 304,577 | |
| Series 2012-C8 ASB | 10/17/2045 | | | 2.38 | % | | | 337,638 | | | | 337,529 | |
| Series 2014-C18 ASB | 02/15/2047 | | | 3.57 | % | | | 913,330 | | | | 936,515 | |
| Series 2014-C23 ASB | 09/17/2047 | | | 3.66 | % | | | 1,330,000 | | | | 1,376,889 | |
| JP Morgan Mortgage Trust | | | | | | | | | | | | | |
Series 2016-1 A5 (a)(d) | 05/25/2046 | | | 3.50 | % | | | 193,127 | | | | 196,085 | |
Series 2016-4 A5 (a)(d) | 10/25/2046 | | | 3.50 | % | | | 205,033 | | | | 208,044 | |
Series 2018-9 A5 (a)(d) | 02/25/2049 | | | 4.00 | % | | | 901,247 | | | | 916,936 | |
Morgan Stanley Bank of America Merrill Lynch Trust, 2013-C10 ASB (d) | 07/17/2046 | | | 3.91 | % | | | 481,970 | | | | 495,922 | |
Morgan Stanley Capital I Trust, 2017-CLS A (1 Month LIBOR USD + 0.700%) (a)(c) | 11/15/2034 | | | 3.09 | % | | | 560,000 | | | | 559,475 | |
| New Residential Mortgage Loan Trust | | | | | | | | | | | | | |
Series 2018-NQM1 A1 (a)(d) | 11/25/2048 | | | 3.99 | % | | | 721,735 | | | | 735,760 | |
Series 2015-1A A3 (a)(d) | 05/28/2052 | | | 3.75 | % | | | 824,328 | | | | 852,156 | |
Series 2014-2A A3 (a)(d) | 05/25/2054 | | | 3.75 | % | | | 132,165 | | | | 134,560 | |
Series 2016-1A A1 (a)(d) | 03/25/2056 | | | 3.75 | % | | | 303,506 | | | | 310,287 | |
Series 2017-1A A1 (a)(d) | 02/25/2057 | | | 4.00 | % | | | 567,912 | | | | 590,929 | |
Series 2017-3A A1 (a)(d) | 04/25/2057 | | | 4.00 | % | | | 1,265,753 | | | | 1,317,102 | |
Series 2017-6A A1 (a)(d) | 08/25/2057 | | | 4.00 | % | | | 255,726 | | | | 265,436 | |
Series 2018-5 A1 (a)(d) | 12/25/2057 | | | 4.75 | % | | | 1,273,945 | | | | 1,337,313 | |
| OBX Trust | | | | | | | | | | | | | |
Series 2018-EXP1 1A6 (a)(d) | 04/25/2048 | | | 4.50 | % | | | 421,734 | | | | 429,714 | |
Series 2018-EXP2 1A1 (a)(d) | 07/25/2058 | | | 4.00 | % | | | 1,068,371 | | | | 1,085,013 | |
| Sequoia Mortgage Trust | | | | | | | | | | | | | |
Series 2017-CH1 A11 (a)(d) | 08/25/2047 | | | 3.50 | % | | | 398,101 | | | | 400,543 | |
Series 2017-CH2 A10 (a)(d) | 12/25/2047 | | | 4.00 | % | | | 704,942 | | | | 713,151 | |
Series 2018-CH4 A10 (a)(d) | 10/25/2048 | | | 4.50 | % | | | 360,211 | | | | 369,985 | |
Shellpoint Co-Originator Trust, 2017-2 A4 (a)(d) | 10/25/2047 | | | 3.50 | % | | | 537,585 | | | | 546,635 | |
Spruce Hill Mortgage Loan Trust, 2019-SH1 A1 (a)(d) | 04/29/2049 | | | 3.40 | % | | | 565,425 | | | | 570,626 | |
STACR Trust, 2018-DNA2 M1 (1 Month LIBOR USD + 0.800%) (a)(c) | 12/26/2030 | | | 3.20 | % | | | 804,304 | | | | 805,732 | |
| UBS-Barclays Commercial Mortgage Trust, 2012-C4 A-5 | 12/12/2045 | | | 2.85 | % | | | 870,000 | | | | 885,344 | |
| Verus Securitization Trust | | | | | | | | | | | | | |
Series 2018-2 A-1 (a)(d) | 07/25/2058 | | | 3.68 | % | | | 422,614 | | | | 427,438 | |
Series 2018-3 A-1 (a)(d) | 10/25/2058 | | | 4.11 | % | | | 342,372 | | | | 349,818 | |
| VNDO Mortgage Trust | | | | | | | | | | | | | |
Series 2013-PENN A (a) | 12/13/2029 | | | 3.81 | % | | | 605,000 | | | | 615,792 | |
Series 2012-6AVE A (a) | 11/15/2030 | | | 3.00 | % | | | 1,500,000 | | | | 1,535,751 | |
| Wells Fargo Commercial Trust, 2016-C32 A-SB | 01/17/2059 | | | 3.32 | % | | | 1,000,000 | | | | 1,035,931 | |
| WFRBS Commercial Mortgage Trust | | | | | | | | | | | | | |
Series 2011-C2 A4 (a)(d) | 02/15/2044 | | | 4.87 | % | | | 1,168,069 | | | | 1,203,599 | |
Series 2011-C3 A4 (a) | 03/17/2044 | | | 4.38 | % | | | 1,285,000 | | | | 1,324,062 | |
| Series 2012-C10 A3 | 12/15/2045 | | | 2.88 | % | | | 975,000 | | | | 991,424 | |
| Series 2013-C17 ABS | 12/17/2046 | | | 3.56 | % | | | 266,257 | | | | 273,316 | |
| TOTAL MORTGAGE BACKED SECURITIES (Cost $37,384,187) | | | | | | | | | | | | 37,968,851 | |
| | | | | | | | | | | | | | |
| MUNICIPAL BONDS: 0.01% | | | | | | | | | | | | | |
| County of Forsyth, NC | 04/01/2020 | | | 3.55 | % | | | 30,000 | | | | 30,306 | |
| Maricopa County School District No. 28 | 07/01/2019 | | | 5.38 | % | | | 15,000 | | | | 15,000 | |
| TOTAL MUNICIPAL BONDS (Cost $45,320) | | | | | | | | | | | | 45,306 | |
The accompanying notes are an integral part of these consolidated financial statements.
| | |
| | |
| LoCorr Long/Short Commodities Strategy Fund - Consolidated Schedule of Investments (continued) | | 35 |
| | |
| | Maturity Date | | Coupon Rate | | Principal Amount | | | Value | |
| U.S. GOVERNMENT AGENCY ISSUES: 8.51% | | | | | | | | | | |
| Federal Farm Credit Banks | 07/24/2019 | | | 1.40 | % | | $ | 450,000 | | | $ | 449,747 | |
| Federal Farm Credit Banks | 11/15/2021 | | | 3.05 | % | | | 4,115,000 | | | | 4,233,369 | |
| Federal Farm Credit Banks | 06/26/2023 | | | 1.77 | % | | | 2,450,000 | | | | 2,442,348 | |
| Federal Farm Credit Banks | 07/17/2023 | | | 2.88 | % | | | 1,600,000 | | | | 1,660,539 | |
| Federal Home Loan Banks | 07/07/2021 | | | 1.88 | % | | | 2,420,000 | | | | 2,422,289 | |
| Federal Home Loan Banks | 06/10/2022 | | | 2.13 | % | | | 3,000,000 | | | | 3,026,103 | |
| Federal Home Loan Banks | 06/10/2022 | | | 2.75 | % | | | 1,000,000 | | | | 1,026,367 | |
| Federal Home Loan Banks | 06/09/2023 | | | 3.25 | % | | | 2,345,000 | | | | 2,468,148 | |
| Federal Home Loan Banks | 09/08/2023 | | | 3.38 | % | | | 4,235,000 | | | | 4,504,009 | |
| Federal Home Loan Banks | 12/08/2023 | | | 3.38 | % | | | 2,325,000 | | | | 2,473,500 | |
| Federal Home Loan Mortgage Corp. | 05/29/2020 | | | 2.53 | % | | | 2,300,000 | | | | 2,300,783 | |
| Federal National Mortgage Association | 01/19/2023 | | | 2.38 | % | | | 220,000 | | | | 224,324 | |
| Small Business Administration Participation Certificates | 11/01/2032 | | | 2.09 | % | | | 11,607 | | | | 11,590 | |
| TOTAL U.S. GOVERNMENT AGENCY ISSUES (Cost $26,673,460) | | | | | | | | | | | | 27,243,116 | |
| | | | | | | | | | | | | | |
| U.S. GOVERNMENT NOTES: 15.35% | | | | | | | | | | | | | |
| United States Treasury Note | 02/28/2021 | | | 1.13 | % | | | 7,090,000 | | | | 7,009,961 | |
| United States Treasury Note | 05/15/2021 | | | 8.13 | % | | | 3,165,000 | | | | 3,529,840 | |
| United States Treasury Note | 05/15/2022 | | | 1.75 | % | | | 1,860,000 | | | | 1,861,380 | |
| United States Treasury Note | 12/31/2023 | | | 2.63 | % | | | 2,200,000 | | | | 2,282,844 | |
| United States Treasury Note | 02/29/2024 | | | 2.38 | % | | | 2,025,000 | | | | 2,082,032 | |
| United States Treasury Note | 03/31/2024 | | | 2.13 | % | | | 3,500,000 | | | | 3,558,516 | |
| United States Treasury Note | 04/30/2024 | | | 2.00 | % | | | 5,195,000 | | | | 5,251,617 | |
| United States Treasury Note | 04/30/2024 | | | 2.25 | % | | | 1,585,000 | | | | 1,621,127 | |
| United States Treasury Note | 05/15/2024 | | | 2.50 | % | | | 12,295,000 | | | | 12,717,161 | |
| United States Treasury Note | 12/31/2024 | | | 2.25 | % | | | 5,720,000 | | | | 5,854,956 | |
| United States Treasury Note | 02/15/2025 | | | 2.00 | % | | | 1,500,000 | | | | 1,515,234 | |
| United States Treasury Note | 02/15/2025 | | | 7.63 | % | | | 960,000 | | | | 1,256,400 | |
| United States Treasury Note | 05/31/2025 | | | 2.88 | % | | | 575,000 | | | | 608,849 | |
| TOTAL U.S. GOVERNMENT NOTES (Cost $48,125,039) | | | | | | | | | | | | 49,149,917 | |
| | | | | | | | | | | | | | |
| SHORT TERM INVESTMENTS: 6.67% | | | | | | | | | | | | | |
| U.S. GOVERNMENT NOTES: 2.81% | | | | | | | | | | | | | |
| United States Treasury Note | 08/31/2019 | | | 1.25 | % | | | 3,600,000 | | | | 3,593,820 | |
| United States Treasury Note | 08/31/2019 | | | 1.00 | % | | | 5,420,000 | | | | 5,408,475 | |
| TOTAL U.S. GOVERNMENT NOTES (Cost $8,998,778) | | | | | | | | | | | | 9,002,295 | |
| | | | | | | | | | | | | | |
| MONEY MARKET FUND: 3.86% | | | | | | | Shares | | | | | |
STIT-Government & Agency Portfolio, Institutional Class, 2.26% (e)(f) | | | | | | | | 12,339,016 | | | | 12,339,016 | |
| TOTAL MONEY MARKET FUND (Cost $12,339,016) | | | | | | | | | | | | 12,339,016 | |
| TOTAL SHORT TERM INVESTMENTS (Cost $21,337,794) | | | | | | | | | | | | 21,341,311 | |
| | | | | | | | | | | | | | |
| TOTAL INVESTMENTS (Cost $254,134,114): 80.82% | | | | | | | | | | | | 258,737,972 | |
Other Assets in Excess of Liabilities: 19.18% (g) | | | | | | | | | | | | 61,405,416 | |
| TOTAL NET ASSETS: 100.00% | | | | | | | | | | | $ | 320,143,388 | |
| (a) | Security as defined in Rule 144A under the Securities Act of 1933 and determined to be liquid. Purchased in a private placement transaction; resale to the public may require registration or may extend only to qualified institutional buyers. At June 30, 2019, the value of these securities total $54,458,970 which represents 17.01% of total net assets. |
| (b) | Foreign issued security. |
| (c) | Variable rate security based on a reference index and spread. The rate reported is the rate in effect as of June 30, 2019. |
| (d) | Variable rate security. The coupon is based on an underlying pool of loans. The rate reported is the rate in effect as of June 30, 2019. |
| (e) | The rate quoted is the annualized seven-day effective yield as of June 30, 2019.
|
| (f) | A portion of this security is held by LCLSCS Fund Limited and pledged as collateral for swap contracts. |
| (g) | Includes assets pledged as collateral for swap contracts. |
* Amount rounds to less than 0.005% of net assets.
LIBOR London Interbank Offered Rate
The accompanying notes are an integral part of these consolidated financial statements.
| | |
| | |
| 36 | | LoCorr Long/Short Commodities Strategy Fund - Consolidated Schedule of Swap Contracts |
| | |
LoCorr Long/Short Commodities Strategy Fund
Consolidated Schedule of Swap Contracts
June 30, 2019 (Unaudited)
LONG TOTAL RETURN SWAP CONTRACTS
This investment is a holding of LCLSCS Fund Limited. See Note 1.
| Termination Date | Reference Index | Financing Rate | Payment
Frequency | Notional Amount | Unrealized
(Depreciation)* | Counterparty |
| 12/16/2022 | LoCorr Commodities Index^ | 0.50% | Quarterly | $292,945,098 | $(2,466,015) | Deutsche Bank AG |
| ^ | Comprised of a proprietary basket of Commodity Trading Advisor’s ‘‘CTA’’) Programs investing in various futures contracts, forward currency contracts, foreign currency and other similar investments. See Notes 2 & 3. |
| * | Unrealized depreciation is a payable on the Fund’s consolidated statement of assets and liabilities. |
The underlying components of the basket as of June 30, 2019 are shown below: ^
| Description | | Expiration Date | | Number of Contracts
Purchased (Sold) | | | Value | | | Concentration %
of Exposure | |
| Futures Contracts: | | | | | | | | | | | | | | |
| Purchase Contracts:(1) | | | | | | | | | | | | | | |
| Copper | | 12/27/2019 | | | 966.65 | | | $ | 65,756,102 | | | | 5.94 | % |
| WTI Crude (NYMEX) | | 11/20/2019 | | | 1,095.43 | | | | 64,378,530 | | | | 5.81 | % |
| Brent Crude | | 07/31/2019 | | | 701.99 | | | | 45,976,541 | | | | 4.15 | % |
| Hard Red Wheat | | 12/13/2019 | | | 1,420.92 | | | | 35,531,822 | | | | 3.21 | % |
| Gasoline RBOB | | 08/30/2019 | | | 447.84 | | | | 35,169,803 | | | | 3.18 | % |
| Corn | | 12/13/2019 | | | 1,347.63 | | | | 30,363,818 | | | | 2.74 | % |
| Natural Gas | | 11/26/2019 | | | 1,111.42 | | | | 28,869,231 | | | | 2.61 | % |
| WTI Crude (NYMEX) | | 08/20/2019 | | | 485.39 | | | | 28,786,347 | | | | 2.60 | % |
| Coffee | | 05/18/2020 | | | 382.98 | | | | 17,061,693 | | | | 1.54 | % |
| Sugar No.11 | | 02/28/2020 | | | 1,090.74 | | | | 16,620,295 | | | | 1.50 | % |
| WTI Crude (NYMEX) | | 09/20/2019 | | | 162.44 | | | | 9,614,185 | | | | 0.87 | % |
| Wheat | | 12/13/2019 | | | 326.77 | | | | 9,074,030 | | | | 0.82 | % |
| Cocoa | | 09/13/2019 | | | 367.94 | | | | 8,946,370 | | | | 0.81 | % |
| WTI Crude (ICE) | | 08/19/2019 | | | 131.50 | | | | 7,798,034 | | | | 0.70 | % |
| Coffee | | 12/18/2019 | | | 164.38 | | | | 6,977,794 | | | | 0.63 | % |
| Feeder Cattle | | 01/30/2020 | | | 89.59 | | | | 6,035,831 | | | | 0.54 | % |
| Palladium | | 09/26/2019 | | | 36.74 | | | | 5,661,919 | | | | 0.51 | % |
| Natural Gas | | 10/29/2019 | | | 203.55 | | | | 4,899,351 | | | | 0.44 | % |
| Lean Hogs | | 12/13/2019 | | | 160.51 | | | | 4,636,261 | | | | 0.42 | % |
| Lean Hogs | | 07/15/2019 | | | 157.62 | | | | 4,601,832 | | | | 0.42 | % |
| Lean Hogs | | 06/12/2020 | | | 122.43 | | | | 4,360,475 | | | | 0.39 | % |
| Soybean Oil | | 07/14/2020 | | | 200.82 | | | | 3,559,353 | | | | 0.32 | % |
| Live Cattle | | 12/31/2019 | | | 73.13 | | | | 3,246,656 | | | | 0.29 | % |
| Total Purchase Contracts | | | | | | | | | 447,926,273 | | | | 40.44 | % |
| | | | | | | | | | | | | | | |
| Sale Contracts: (1) | | | | | | | | | | | | | | |
| WTI Crude (NYMEX) | | 07/22/2019 | | | (1,771.31 | ) | | $ | 104,959,001 | | | | 9.48 | % |
| Copper | | 09/26/2019 | | | (828.13 | ) | | | 56,199,121 | | | | 5.07 | % |
| Live Cattle | | 10/31/2019 | | | (898.20 | ) | | | 38,200,261 | | | | 3.45 | % |
| Hard Red Wheat | | 09/13/2019 | | | (1,496.34 | ) | | | 35,790,525 | | | | 3.23 | % |
| Coffee | | 09/18/2019 | | | (766.25 | ) | | | 31,507,392 | | | | 2.85 | % |
| Brent Crude | | 08/30/2019 | | | (431.25 | ) | | | 28,078,511 | | | | 2.53 | % |
| Gasoline RBOB | | 07/31/2019 | | | (344.22 | ) | | | 27,642,588 | | | | 2.50 | % |
| Soybean Oil | | 12/13/2019 | | | (1,595.98 | ) | | | 27,243,448 | | | | 2.46 | % |
| Natural Gas | | 08/28/2019 | | | (994.60 | ) | | | 22,796,174 | | | | 2.06 | % |
The accompanying notes are an integral part of these consolidated financial statements.
| | |
| | |
| LoCorr Long/Short Commodities Strategy Fund - Consolidated Schedule of Swap Contracts (continued) | | 37 |
| | |
| Description | | Expiration Date | | Number of Contracts
Purchased (Sold) | | | Value | | | Concentration %
of Exposure | |
| Sale Contracts: (1) (continued) | | | | | | | | | | | | | | |
| Natural Gas | | 07/29/2019 | | | (899.51 | ) | | $ | 20,855,199 | | | | 1.88 | % |
| Aluminum | | 08/21/2019 | | | (391.00 | ) | | | 17,617,483 | | | | 1.59 | % |
| Sugar No.11 | | 09/30/2019 | | | (1,163.26 | ) | | | 16,565,774 | | | | 1.49 | % |
| Wheat | | 09/13/2019 | | | (542.44 | ) | | | 14,805,313 | | | | 1.34 | % |
| Lean Hogs | | 08/14/2019 | | | (381.58 | ) | | | 11,922,560 | | | | 1.08 | % |
| Brent Crude | | 09/30/2019 | | | (170.18 | ) | | | 11,030,107 | | | | 1.00 | % |
| Soybean Meal | | 12/13/2019 | | | (269.91 | ) | | | 8,619,603 | | | | 0.78 | % |
| Low Sulphur Gasoil | | 08/12/2019 | | | (113.13 | ) | | | 6,756,683 | | | | 0.61 | % |
| Natural Gas | | 09/26/2019 | | | (265.14 | ) | | | 6,152,517 | | | | 0.55 | % |
| Feeder Cattle | | 08/29/2019 | | | (89.59 | ) | | | 6,097,421 | | | | 0.55 | % |
| Cotton No.2 | | 03/09/2020 | | | (142.14 | ) | | | 4,786,838 | | | | 0.43 | % |
| Corn | | 09/13/2019 | | | (182.75 | ) | | | 4,067,292 | | | | 0.37 | % |
| Silver | | 09/26/2019 | | | (50.28 | ) | | | 3,858,358 | | | | 0.35 | % |
| Heating Oil | | 07/31/2019 | | | (40.61 | ) | | | 3,339,579 | | | | 0.30 | % |
| London Cocoa | | 09/13/2019 | | | (128.60 | ) | | | 2,951,954 | | | | 0.27 | % |
| Total Sale Contracts | | | | | | | | | 511,843,702 | | | | 46.22 | % |
| Other Futures Contracts | | | | | | | | | 43,972,645 | | | | 3.97 | % |
| Total Futures Contracts | | | | | | | | | 1,003,742,620 | | | | 90.63 | % |
| Forward Currency Contracts: | | | | | | Delivered (in USD) | | |
| | Received (in USD) | | | | |
| Purchase Contracts:(1) | | | | U.S. | | | | | | | | | | | | | |
| USD/EUR | | 06/30/2019 | | Dollar | | $ | 4,215,174 | | | Euro | | $ | 4,217,143 | | | 0.80 | % |
| Total Forward Currency Contracts | | | | | | | | | | | | | 4,217,143 | | | 0.80 | % |
| | | | | | | | | | | | | | | | | | |
| Cash and Foreign Currency: | | | | | | Quantity | | | | | Value | | | | |
| Cash and Foreign Currency Purchased:(1) | | | | | | | | | | | | | | | | | |
| U.S. Dollar | | | | | | | 44,432,235 | | | | | $ | 44,432,235 | | | 4.01 | % |
| Total Cash and Foreign Currency Purchased | | | | | | | | | | | |
| 44,432,235 | | | 4.01 | % |
| | | | | | | | | | | | | | | | | | |
| Cash and Foreign Currency Sold:(1) | | | | | | | | | | | | | | | | | |
| Euro | | | | | | | 46,804,167 | | | | | $ | 53,221,026 | | | 4.81 | % |
| Total Cash and Foreign Currency Sold | | | | | | | | | | | | | 53,221,026 | | | 4.81 | % |
| Other Cash and Foreign Currency | | | | | | | | | | | | | 1,852,292 | | | 0.17 | % |
| Total Cash and Foreign Currency | | | | | | | | | | | | | 99,505,553 | | | 8.99 | % |
| Total Underlying Positions | | | | | | | | | | | | $ | 1,107,465,316 | | | 100.00 | % |
| ^ | The investment is not a direct holding of LoCorr Long/Short Commodities Strategy Fund. The top 50 holdings and other futures contracts, other forward currency contracts, and other cash and foreign currency were determined based on the absolute notional values of the positions within the underlying swap basket. |
| (1) | Represents the 50 largest components of the basket. |
| ICE | Intercontinental Exchange |
| NYMEX | New York Mercantile Exchange |
The accompanying notes are an integral part of these consolidated financial statements.
| | |
| | |
| 38 | | LoCorr Market Trend Fund - Consolidated Schedule of Investments |
| | |
LoCorr Market Trend Fund
Composition of Consolidated Investment Portfolio1
June 30, 2019 (Unaudited)

1 As a percentage of total investments.
Consolidated Schedule of Investments
June 30, 2019 (Unaudited)
| | | Maturity Date | | Coupon Rate | | Principal Amount | | | Value | |
| ASSET BACKED SECURITIES: 17.27% | | | | | | | | | | | | | |
| Ally Auto Receivables Trust, 2018-3 A3 | | 01/17/2023 | | 3.00 | % | | $ | 2,500,000 | | | $ | 2,523,519 | |
| Barclays Dryrock Issuance Trust, 2017-2 A (1 Month LIBOR USD + 0.300%) (c) | | 05/15/2023 | | 2.69 | % | | | 4,000,000 | | | | 4,004,378 | |
| BMW Vehicle Lease Trust, 2018-1 A3 | | 07/20/2021 | | 3.26 | % | | | 2,450,000 | | | | 2,482,019 | |
| Cabela’s Credit Card Master Trust, 2015-2 A1 | | 07/17/2023 | | 2.25 | % | | | 2,500,000 | | | | 2,499,495 | |
| California Republic Auto Receivables Trust, 2018-1 A3 | | 08/15/2022 | | 3.14 | % | | | 2,400,000 | | | | 2,417,001 | |
| CarMax Auto Owner Trust, 2018-4 A3 | | 09/15/2023 | | 3.36 | % | | | 2,750,000 | | | | 2,813,457 | |
| CenterPoint Energy Residential Bond, 2009-1 A-3 | | 08/15/2023 | | 4.24 | % | | | 1,784,283 | | | | 1,845,447 | |
| Chase Issuance Trust, 2018-A1 A1 (1 Month LIBOR USD + 0.200%) (c) | | 04/17/2023 | | 2.59 | % | | | 3,050,000 | | | | 3,053,051 | |
| Citibank Credit Card Issuance Trust | | | | | | | | | | | | | |
| Series 2017-A4 A4 (1 Month LIBOR USD + 0.220%) (c) | | 04/07/2022 | | 2.64 | % | | | 2,150,000 | | | | 2,151,657 | |
| Series 2018-A1 A1 | | 01/20/2023 | | 2.49 | % | | | 1,935,000 | | | | 1,948,225 | |
| Entergy Arkansas Restoration Funding LLC, 2010-A A1 | | 08/01/2021 | | 2.30 | % | | | 1,624,196 | | | | 1,618,492 | |
| Evergreen Credit Card Trust, 2018-2 A (1 Month LIBOR USD + 0.350%) (a)(b)(c) | | 07/15/2022 | | 2.74 | % | | | 1,650,000 | | | | 1,652,782 | |
| Ford Credit Auto Owner Trust, 2018-B A-3 | | 04/15/2023 | | 3.24 | % | | | 2,000,000 | | | | 2,039,575 | |
| GM Financial Consumer Automobile Receivables Trust, 2018-4 A3 | | 10/16/2023 | | 3.21 | % | | | 2,520,000 | | | | 2,570,425 | |
| Mercedes-Benz Auto Receivables Trust, 2018-1 A3 | | 01/17/2023 | | 3.03 | % | | | 2,625,000 | | | | 2,660,203 | |
| Santander Retail Auto Lease Trust | | | | | | | | | | | | | |
| Series 2017-A A2A (a) | | 03/20/2020 | | 2.02 | % | | | 2,521 | | | | 2,520 | |
| Series 2018-A A2A (a) | | 10/20/2020 | | 2.71 | % | | | 1,237,871 | | | | 1,238,504 | |
| TCF Auto Receivables Owner Trust | | | | | | | | | | | | | |
| Series 2016-1A A3 (a) | | 04/15/2021 | | 1.71 | % | | | 200,574 | | | | 200,459 | |
| Series 2016-PT1 A (a) | | 06/15/2022 | | 1.93 | % | | | 1,117,585 | | | | 1,114,555 | |
| Toyota Auto Receivables Owner Trust, 2018-D A-3 | | 03/15/2023 | | 3.18 | % | | | 2,010,000 | | | | 2,050,285 | |
| Verizon Owner Trust | | | | | | | | | | | | | |
| Series 2018-1A A1B (1 Month LIBOR USD + 0.260%) (a)(c) | | 09/20/2022 | | 2.64 | % | | | 1,250,000 | | | | 1,249,384 | |
| Series 2019-B A1A | | 12/20/2023 | | 2.33 | % | | | 1,080,000 | | | | 1,083,261 | |
The accompanying notes are an integral part of these consolidated financial statements.
| | |
| | |
| LoCorr Market Trend Fund - Consolidated Schedule of Investments (continued) | | 39 |
| | |
| | | Maturity Date | | Coupon Rate | | Principal Amount | | | Value | |
| ASSET BACKED SECURITIES (continued) | | | | | | | | | | | | | |
| World Omni Auto Trust, 2018-B A3 | | 07/17/2023 | | 2.87 | % | | $ | 2,025,000 | | | $ | 2,047,631 | |
| TOTAL ASSET BACKED SECURITIES (Cost $44,848,158) | | | | | | | | | | | | 45,266,325 | |
| | | | | | | | | | | | | | |
| MORTGAGE BACKED SECURITIES: 10.91% | | | | | | | | | | | | | |
| Fannie Mae Aces | | | | | | | | | | | | | |
| Series 2010-M1 A2 | | 09/25/2019 | | 4.45 | % | | | 562,649 | | | | 561,943 | |
| Series 2010-M3 A3(d) | | 03/25/2020 | | 4.33 | % | | | 874,267 | | | | 881,714 | |
| Series 2010-M7 A2 | | 11/25/2020 | | 3.66 | % | | | 292,491 | | | | 295,627 | |
| Series 2015-M17 FA (1 Month LIBOR USD + 0.930%) (c) | | 11/25/2022 | | 3.37 | % | | | 1,307,355 | | | | 1,307,909 | |
| FHLMC Multifamily Structured Pass Through Certificates | | | | | | | | | | | | | |
| Series K-P04 AG1 (1 Month LIBOR USD + 0.220%) (c) | | 07/25/2020 | | 2.65 | % | | | 3,450,000 | | | | 3,447,772 | |
| Series K-I03 A (1 Month LIBOR USD + 0.250%) (c) | | 02/25/2021 | | 2.68 | % | | | 2,178,574 | | | | 2,175,811 | |
| Series K-F08 A (1 Month LIBOR USD + 0.300%) (c) | | 01/25/2022 | | 2.73 | % | | | 1,258,201 | | | | 1,255,438 | |
| Series K-J22 A-1 | | 03/25/2022 | | 3.17 | % | | | 2,611,324 | | | | 2,663,031 | |
| Series K-J06 A | | 01/25/2023 | | 2.27 | % | | | 2,110,000 | | | | 2,112,330 | |
| Series K-S05 A (1 Month LIBOR USD + 0.500%) (c) | | 01/25/2023 | | 2.93 | % | | | 2,908,813 | | | | 2,909,724 | |
| Series K-102 A (1 Month LIBOR USD + 0.200%) (c) | | 02/25/2023 | | 2.63 | % | | | 1,697,977 | | | | 1,694,534 | |
| FREMF Multifamily Aggregation Risk Transfer Trust, 2017-KT01 A (1 Month LIBOR USD + 0.320%) (c) | | 02/25/2020 | | 2.72 | % | | | 5,890,000 | | | | 5,888,684 | |
| NCUA Guaranteed Notes Trust, 2010-R1 1A (1 Month LIBOR USD + 0.450%)(c) | | 10/07/2020 | | 2.87 | % | | | 3,394,543 | | | | 3,399,729 | |
| TOTAL MORTGAGE BACKED SECURITIES (Cost $28,561,390) | | | | | | | | | | | | 28,594,246 | |
| | | | | | | | | | | | | | |
| MUNICIPAL BOND: 0.42% | | | | | | | | | | | | | |
| Tennessee Valley Authority | | 03/15/2020 | | 2.25 | % | | | 1,110,000 | | | | 1,111,224 | |
| TOTAL MUNICIPAL BOND (Cost $1,107,602) | | | | | | | | | | | | 1,111,224 | |
| | | | | | | | | | | | | | |
| U.S. GOVERNMENT AGENCY ISSUES: 24.00% | | | | | | | | | | | | | |
| Federal Farm Credit Banks | | 10/13/2020 | | 1.68 | % | | | 8,000,000 | | | | 7,976,045 | |
| Federal Farm Credit Banks | | 10/26/2020 | | 1.75 | % | | | 10,095,000 | | | | 10,074,430 | |
| Federal Farm Credit Banks | | 04/05/2021 | | 2.54 | % | | | 4,255,000 | | | | 4,303,455 | |
| Federal Farm Credit Banks | | 11/15/2021 | | 3.05 | % | | | 2,500,000 | | | | 2,571,913 | |
| Federal Home Loan Banks | | 07/07/2021 | | 1.88 | % | | | 3,200,000 | | | | 3,203,027 | |
| Federal Home Loan Banks | | 06/10/2022 | | 2.13 | % | | | 2,620,000 | | | | 2,642,797 | |
| Federal Home Loan Banks | | 06/10/2022 | | 2.75 | % | | | 5,000,000 | | | | 5,131,837 | |
| Federal Home Loan Banks | | 12/09/2022 | | 3.00 | % | | | 9,500,000 | | | | 9,877,122 | |
| Federal Home Loan Banks | | 06/09/2023 | | 3.25 | % | | | 1,120,000 | | | | 1,178,817 | |
| Federal Home Loan Mortgage Corp. | | 05/29/2020 | | 2.53 | % | | | 2,150,000 | | | | 2,150,732 | |
| Federal Home Loan Mortgage Corp. | | 11/17/2020 | | 1.88 | % | | | 3,715,000 | | | | 3,713,831 | |
| Federal Home Loan Mortgage Corp. | | 02/16/2021 | | 2.38 | % | | | 10,000,000 | | | | 10,086,588 | |
| TOTAL U.S. GOVERNMENT AGENCY ISSUES (Cost $62,283,419) | | | | | | | | | | | | 62,910,594 | |
| | | | | | | | | | | | | | |
| U.S. GOVERNMENT NOTES: 24.80% | | | | | | | | | | | | | |
| United States Treasury Note | | 07/15/2020 | | 1.50 | % | | | 1,820,000 | | | | 1,811,611 | |
| United States Treasury Note | | 01/15/2021 | | 2.00 | % | | | 5,000,000 | | | | 5,012,500 | |
| United States Treasury Note | | 02/15/2021 | | 2.25 | % | | | 3,055,000 | | | | 3,075,764 | |
| United States Treasury Note | | 04/30/2021 | | 1.38 | % | | | 1,500,000 | | | | 1,488,926 | |
| United States Treasury Note | | 07/31/2021 | | 2.25 | % | | | 12,330,000 | | | | 12,452,338 | |
| United States Treasury Note | | 08/15/2021 | | 2.75 | % | | | 4,000,000 | | | | 4,082,656 | |
| United States Treasury Note | | 09/30/2021 | | 1.13 | % | | | 4,285,000 | | | | 4,228,425 | |
| United States Treasury Note | | 11/30/2021 | | 1.88 | % | | | 3,275,000 | | | | 3,285,362 | |
| United States Treasury Note | | 12/31/2021 | | 2.13 | % | | | 3,000,000 | | | | 3,028,945 | |
| United States Treasury Note | | 01/15/2022 | | 2.50 | % | | | 9,635,000 | | | | 9,817,162 | |
| United States Treasury Note | | 04/30/2022 | | 1.88 | % | | | 5,000,000 | | | | 5,020,117 | |
| United States Treasury Note | | 11/30/2022 | | 2.00 | % | | | 10,085,000 | | | | 10,176,001 | |
| United States Treasury Note | | 01/31/2023 | | 2.38 | % | | | 1,500,000 | | | | 1,533,516 | |
| TOTAL U.S. GOVERNMENT NOTES (Cost $64,068,785) | | | | | | | | | | | | 65,013,323 | |
The accompanying notes are an integral part of these consolidated financial statements.
| | |
| | |
| 40 | | LoCorr Market Trend Fund - Consolidated Schedule of Investments (continued) |
| | |
| | | Maturity Date | | Coupon Rate | | Principal Amount | | | Value | |
| SHORT TERM INVESTMENTS: 5.48% | | | | | | | | | | | | | |
| U.S. GOVERNMENT AGENCY ISSUE: 0.42% | | | | | | | | | | | | | |
| Federal Home Loan Banks | | 03/20/2020 | | 2.58 | % | | $ | 1,100,000 | | | $ | 1,100,777 | |
| TOTAL U.S. GOVERNMENT AGENCY ISSUE (Cost $1,100,188) | | | | | | | | | | | | 1,100,777 | |
| | | | | | | | | | | | | | |
| U.S. GOVERNMENT NOTES: 1.05% | | | | | | | | | | | | | |
| United States Treasury Note | | 08/31/2019 | | 1.25 | % | | | 1,660,000 | | | | 1,657,150 | |
| United States Treasury Note | | 02/29/2020 | | 2.25 | % | | | 1,090,000 | | | | 1,091,405 | |
| TOTAL U.S. GOVERNMENT NOTES (Cost $2,745,254) | | | | | | | | | | | | 2,748,555 | |
| MONEY MARKET FUND: 4.01% | | Shares | | | | |
| STIT-Government & Agency Portfolio, Institutional Class, 2.26% (e)(f) | | | 10,513,203 | | | | 10,513,203 | |
| TOTAL MONEY MARKET FUND (Cost $10,513,203) | | | | | | | 10,513,203 | |
| TOTAL SHORT TERM INVESTMENTS (Cost $14,358,645) | | | | | | | 14,362,535 | |
| | | | | | | | | |
| TOTAL INVESTMENTS (Cost $215,227,999): 82.88% | | | | | | | 217,258,247 | |
| Other Assets in Excess of Liabilities: 17.12% (g) | | | | | | | 44,866,351 | |
| TOTAL NET ASSETS: 100.00% | | | | | | $ | 262,124,598 | |
| (a) | Security as defined in Rule 144A under the Securities Act of 1933 and determined to be liquid. Purchased in a private placement transaction; resale to the public may require registration or may extend only to qualified institutional buyers. At June 30, 2019, the value of these securities total $5,458,204 which represents 2.08% of total net assets. |
| (b) | Foreign issued security. |
| (c) | Variable rate security based on a reference index and spread. The rate reported is the rate in effect as of June 30, 2019. |
| (d) | Variable rate security. The coupon is based on an underlying pool of loans. The rate reported is the rate in effect as of June 30, 2019. |
| (e) | The rate quoted is the annualized seven-day effective yield as of June 30, 2019. |
| (f) | A portion of this security is held by LCMT Fund Limited and pledged as collateral for derivative contracts. |
| (g) | Includes assets pledged as collateral for derivative contracts. |
| LIBOR | London Interbank Offered Rate |
The accompanying notes are an integral part of these consolidated financial statements.
| | |
| | |
| LoCorr Market Trend Fund - Consolidated Schedule of Open Forward Currency Contracts | | 41 |
| | |
LoCorr Market Trend Fund
Consolidated Schedule of Open Forward Currency Contracts(a)
June 30, 2019 (Unaudited)
| | | | | | | | Currency to be Received | | | Currency to be Delivered | | | | | | | | | |
| | | | Notional
Amount | | Forward
Settlement Date | | Curr
Abbr. | | | U.S. $ Value at
June 30, 2019 | | | Curr
Abbr. | | | | U.S. $ Value on
Origination Date | | | | Unrealized
Appreciation | | | | Unrealized
(Depreciation) | |
| | | | | | | | | | | | | | | | | | | | | | | | | | | |
| Purchase Contracts: | | |
| | | | | | | | | | | | | | | | | | | | | | | |
| | | $ | 44,757,469 | | 09/20/2019 | | CAD | | $ | 44,915,368 | | | USD | | | $ | 44,757,469 | | | $ | 157,899 | | | $ | — | |
| | | | 1,848,325 | | 09/20/2019 | | CHF | | | 1,849,824 | | | USD | | | | 1,848,325 | | | | 1,499 | | | | — | |
| | | | 25,609,282 | | 09/20/2019 | | EUR | | | 25,668,764 | | | USD | | | | 25,609,282 | | | | 59,482 | | | | — | |
| | | | 2,948,207 | | 09/20/2019 | | GBP | | | 2,967,662 | | | USD | | | | 2,948,207 | | | | 19,455 | | | | — | |
| | | | 44,371,682 | | 09/20/2019 | | JPY | | | 44,272,068 | | | USD | | | | 44,371,682 | | | | — | | | | (99,614 | ) |
| | | | 16,803,752 | | 09/20/2019 | | MXN | | | 16,751,130 | | | USD | | | | 16,803,752 | | | | — | | | | (52,622 | ) |
| | | | 790,380 | | 09/20/2019 | | NZD | | | 807,428 | | | USD | | | | 790,380 | | | | 17,048 | | | | — | |
| Total Purchase Contracts | | |
| | | | | | | 137,232,244 | | | | | | | 137,129,097 | | | | 255,383 | | | | (152,236 | ) |
| | | | | | | | | | | | | | | | | | | | | | | | | | | |
| Sale Contracts: | | |
| | | | | | | | | | | | | | | | | | | | | | | |
| | | $ | 55,146,527 | | 09/20/2019 | | USD | | $ | 55,724,514 | | | AUD | | | $ | 55,146,527 | | | $ | — | | | $ | (577,987 | ) |
| | | | 65,229,438 | | 09/20/2019 | | USD | | | 66,197,187 | | | CAD | | | | 65,229,438 | | | | — | | | | (967,749 | ) |
| | | | 43,553,019 | | 09/20/2019 | | USD | | | 44,304,929 | | | CHF | | | | 43,553,019 | | | | — | | | | (751,910 | ) |
| | | | 115,957,400 | | 09/20/2019 | | USD | | | 116,517,391 | | | EUR | | | | 115,957,400 | | | | — | | | | (559,991 | ) |
| | | | 82,815,418 | | 09/20/2019 | | USD | | | 82,823,001 | | | GBP | | | | 82,815,418 | | | | — | | | | (7,583 | ) |
| | | | 13,399,257 | | 09/20/2019 | | USD | | | 13,424,680 | | | JPY | | | | 13,399,257 | | | | — | | | | (25,423 | ) |
| | | | 22,541,060 | | 09/20/2019 | | USD | | | 23,015,056 | | | NZD | | | | 22,541,060 | | | | — | | | | (473,996 | ) |
| Total Sale Contracts | | |
| | | | | | | 402,006,758 | | | | | | | 398,642,119 | | | | — | | | | (3,364,639 | ) |
| Net Forward Currency Contracts | | |
| | | | | | $ | (264,774,514 | ) | | | | | $ | (261,513,022 | ) | | $ | 255,383 | | | $ | (3,516,875 | ) |
| Net Unrealized Depreciation | | |
| | | | | | | | | | | | | | | | | | | | | $ | (3,261,492 | ) |
| Currency abbreviations: |
| AUD | AUSTRALIAN DOLLAR |
| CAD | CANADIAN DOLLAR |
| CHF | SWISS FRANC |
| EUR | EURO |
| GBP | BRITISH POUND |
| JPY | JAPANESE YEN |
| MXN | MEXICAN PESO |
| NZD | NEW ZEALAND DOLLAR |
| USD | U.S. DOLLAR |
| (a) | Bank of America Merrill Lynch is the counterparty for all open forward currency exchange contracts held by the Fund as of June 30, 2019. |
The accompanying notes are an integral part of these consolidated financial statements.
| | |
| | |
| 42 | | LoCorr Market Trend Fund - Consolidated Schedule of Open Futures Contracts |
| | |
LoCorr Market Trend Fund
Consolidated Schedule of Open Futures Contracts
June 30, 2019 (Unaudited)
| | | Number of
Contracts
Purchased (Sold) | | | | | Current
Notional
Amount | | | | | | Value | |
| Description | | | | Settlement
Month-Year | | | | Value at
Trade Date | | | Unrealized
Appreciation | | | Unrealized
(Depreciation) | |
| Purchase Contracts: | | | | | | | | | | | | | | | | | | | | | | |
| 10 Yr Mini JGB | | | 15 | | | Sep-19 | | $ | 2,141,168 | | | $ | 2,138,283 | | | $ | 2,885 | | | $ | — | |
| 90 Day Euro | | | 1,698 | | | Dec-20 | | | 417,899,025 | | | | 417,787,582 | | | | 111,443 | | | | — | |
| 90 Day Sterling | | | 1,473 | | | Dec-20 | | | 232,029,815 | | | | 232,007,001 | | | | 22,814 | | | | — | |
| Aluminum (a)(b) | | | 9 | | | Sep-19 | | | 405,056 | | | | 406,609 | | | | — | | | | (1,553 | ) |
| Australian 10 Yr Bond | | | 452 | | | Sep-19 | | | 45,584,002 | | | | 45,273,458 | | | | 310,544 | | | | — | |
| Brent Crude (a) | | | 109 | | | Sep-19 | | | 7,056,660 | | | | 6,966,328 | | | | 90,332 | | | | — | |
| CAC 40 10 Euro Index | | | 207 | | | Jul-19 | | | 13,023,561 | | | | 12,958,476 | | | | 65,085 | | | | — | |
| Canadian 10 Yr Bond | | | 657 | | | Sep-19 | | | 71,707,846 | | | | 70,932,256 | | | | 775,590 | | | | — | |
| Cocoa (a) | | | 152 | | | Sep-19 | | | 3,484,246 | | | | 3,458,279 | | | | 25,967 | | | | — | |
| Copper (a)(b) | | | 5 | | | Sep-19 | | | 749,500 | | | | 743,419 | | | | 6,081 | | | | — | |
| DAX Index | | | 112 | | | Sep-19 | | | 39,441,911 | | | | 39,124,491 | | | | 317,420 | | | | — | |
| Dollar | | | 88 | | | Sep-19 | | | 8,418,608 | | | | 8,500,870 | | | | — | | | | (82,262 | ) |
| Dow Jones Industrial Average Mini E-Cbot Index | | | 82 | | | Sep-19 | | | 10,903,130 | | | | 10,964,097 | | | | — | | | | (60,967 | ) |
| Euro-Bobl | | | 773 | | | Sep-19 | | | 118,169,860 | | | | 117,698,827 | | | | 471,033 | | | | — | |
| Euro-Bund | | | 136 | | | Sep-19 | | | 26,713,485 | | | | 26,466,349 | | | | 247,136 | | | | — | |
| Euro-Schatz | | | 64 | | | Sep-19 | | | 8,171,475 | | | | 8,165,337 | | | | 6,138 | | | | — | |
| Euro-Stoxx 50 Index | | | 1,135 | | | Sep-19 | | | 44,732,497 | | | | 44,387,065 | | | | 345,432 | | | | — | |
| FTSE 100 Index | | | 563 | | | Sep-19 | | | 52,687,185 | | | | 52,730,385 | | | | — | | | | (43,200 | ) |
| Gasoline RBOB (a) | | | 109 | | | Aug-19 | | | 8,682,635 | | | | 7,714,781 | | | | 967,854 | | | | — | |
| Gold (a) | | | 247 | | | Aug-19 | | | 34,918,390 | | | | 33,691,044 | | | | 1,227,346 | | | | — | |
| Hang Seng Index | | | 51 | | | Jul-19 | | | 9,304,985 | | | | 9,237,760 | | | | 67,225 | | | | — | |
| Heating Oil (a) | | | 27 | | | Aug-19 | | | 2,199,280 | | | | 2,023,570 | | | | 175,710 | | | | — | |
| Japanese 10 Yr Bond | | | 36 | | | Sep-19 | | | 51,371,330 | | | | 51,263,829 | | | | 107,501 | | | | — | |
| Long Gilt | | | 428 | | | Sep-19 | | | 70,823,311 | | | | 70,202,353 | | | | 620,958 | | | | — | |
| Low Sulphur Gasoil (a) | | | 5 | | | Aug-19 | | | 298,750 | | | | 273,381 | | | | 25,369 | | | | — | |
| Nasdaq 100 E-Mini Index | | | 205 | | | Sep-19 | | | 31,544,375 | | | | 30,866,450 | | | | 677,925 | | | | — | |
| S&P 500 E-Mini Index | | | 295 | | | Sep-19 | | | 43,426,950 | | | | 42,816,781 | | | | 610,169 | | | | — | |
| U.S. 10 Yr Note | | | 832 | | | Sep-19 | | | 106,470,000 | | | | 104,899,691 | | | | 1,570,309 | | | | — | |
| U.S. 2 Yr Note | | | 1,005 | | | Sep-19 | | | 216,255,586 | | | | 214,685,132 | | | | 1,570,454 | | | | — | |
| U.S. 5 Yr Note | | | 1,406 | | | Sep-19 | | | 166,127,688 | | | | 164,406,466 | | | | 1,721,222 | | | | — | |
| U.S. Long Bond | | | 455 | | | Sep-19 | | | 70,795,156 | | | | 68,398,672 | | | | 2,396,484 | | | | — | |
| Zinc (a)(b) | | | 71 | | | Sep-19 | | | 4,439,275 | | | | 4,629,778 | | | | — | | | | (190,503 | ) |
| Total Purchase Contracts | | | | | | | | | | | | | | | | | 14,536,426 | | | | (378,485 | ) |
| | | | | | | | | | | | | | | | | | | | | | | |
| Sales Contracts: | | | | | | | | | | | | | | | | | | | | | | |
| Aluminum (a)(b) | | | (315 | ) | | Sep-19 | | $ | 14,176,969 | | | $ | 14,281,319 | | | $ | 104,350 | | | $ | — | |
| Coffee (a) | | | (93 | ) | | Sep-19 | | | 3,817,069 | | | | 3,438,417 | | | | — | | | | (378,652 | ) |
| Copper (a)(b) | | | (157 | ) | | Sep-19 | | | 23,534,300 | | | | 23,577,757 | | | | 43,457 | | | | — | |
| Corn (a) | | | (369 | ) | | Dec-19 | | | 7,961,175 | | | | 8,346,097 | | | | 384,922 | | | | — | |
| Cotton No.2 (a) | | | (77 | ) | | Dec-19 | | | 2,544,080 | | | | 2,601,267 | | | | 57,187 | | | | — | |
| Hard Red Wheat (a) | | | (167 | ) | | Sep-19 | | | 3,853,525 | | | | 3,977,415 | | | | 123,890 | | | | — | |
| Natural Gas (a) | | | (258 | ) | | Aug-19 | | | 5,954,640 | | | | 6,143,305 | | | | 188,665 | | | | — | |
| Nikkei 225 Index | | | (16 | ) | | Sep-19 | | | 3,155,034 | | | | 3,142,482 | | | | — | | | | (12,552 | ) |
| Russell 2000 Mini Index | | | (141 | ) | | Sep-19 | | | 11,048,055 | | | | 10,870,539 | | | | — | | | | (177,516 | ) |
| Silver (a) | | | (173 | ) | | Sep-19 | | | 13,269,965 | | | | 13,013,051 | | | | — | | | | (256,914 | ) |
| Soybean (a) | | | (226 | ) | | Nov-19 | | | 10,429,900 | | | | 10,612,462 | | | | 182,562 | | | | — | |
| Soybean Meal (a) | | | (101 | ) | | Dec-19 | | | 3,261,290 | | | | 3,335,890 | | | | 74,600 | | | | — | |
| Soybean Oil (a) | | | (88 | ) | | Dec-19 | | | 1,522,224 | | | | 1,527,649 | | | | 5,425 | | | | — | |
The accompanying notes are an integral part of these consolidated financial statements.
| | |
| | |
| LoCorr Market Trend Fund - Consolidated Schedule of Open Futures Contracts (continued) | | 43 |
| | |
| | | Number of
Contracts
Purchased (Sold) | | | | | Current
Notional
Amount | | | | | | Value | |
| Description | | | | Settlement
Month-Year | | | | Value at
Trade Date | | | Unrealized
Appreciation | | | Unrealized
(Depreciation) | |
| Sale 1Contracts (continued) | | | | | | | | | | | | | | | | | | | | | | |
| Sugar (a) | | | (218 | ) | | Oct-19 | | $ | 3,081,299 | | | $ | 2,963,979 | | | $ | — | | | $ | (117,320 | ) |
| Tokyo Price Index | | | (234 | ) | | Sep-19 | | | 33,662,663 | | | | 33,693,514 | | | | 30,851 | | | | — | |
| Wheat (a) | | | (191 | ) | | Dec-19 | | | 5,142,675 | | | | 5,219,108 | | | | 76,433 | | | | — | |
| WTI Crude (a) | | | (85 | ) | | Aug-19 | | | 4,969,950 | | | | 4,536,331 | | | | — | | | | (433,619 | ) |
| Zinc (a)(b) | | | (236 | ) | | Sep-19 | | | 14,755,900 | | | | 14,833,048 | | | | 77,148 | | | | — | |
| Total Sale Contracts | | | | | | | | | | | | | | | | | 1,349,490 | | | | (1,376,573 | ) |
| Total Futures Contracts | | | | | | | | | | | | | | | | $ | 15,885,916 | | | $ | (1,755,058 | ) |
| Net Unrealized Appreciation | | | | | | | | | | | | | | | | $ | 14,130,858 | | | | | |
| (a) | Contract held by LCMT Fund Limited. |
| (b) | London Metal Exchange (‘‘LME’’) futures contracts settle on their respective maturity date. The unrealized appreciation on these contracts is a receivable for unsettled open futures contracts and the unrealized depreciation is a payable for unsettled open futures contracts on the Fund’s consolidated statement of assets and liabilities. |
The accompanying notes are an integral part of these consolidated financial statements.
| | |
| | |
| 44 | | LoCorr Dynamic Equity Fund - Schedule of Investments |
| | |
LoCorr Dynamic Equity Fund
Composition of Investment Portfolio1
June 30, 2019 (Unaudited)
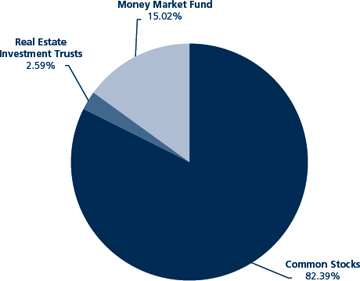
1 As a percentage of total investments.
Schedule of Investments
June 30, 2019 (Unaudited)
| | | Shares | | | Value | |
| COMMON STOCKS: 74.33% | | | | | | | | |
| Aerospace & Defense: 0.21% | | | | | | | | |
| Spirit AeroSystems Holdings, Inc. | | | 710 | | | $ | 57,773 | |
| | | | | | | | | |
| Airlines: 7.03% | | | | | | | | |
| Air Canada - ADR (a)(b) | | | 51,131 | | | | 1,568,189 | |
| JetBlue Airways Corp. (a) | | | 11,743 | | | | 217,128 | |
| Southwest Airlines Co. | | | 1,349 | | | | 68,502 | |
| United Continental Holdings, Inc. (a) | | | 825 | | | | 72,229 | |
| | | | | | | | 1,926,048 | |
| Apparel: 0.85% | | | | | | | | |
| Capri Holdings Ltd. (a)(b) | | | 2,543 | | | | 88,191 | |
| Kering SA (b) | | | 120 | | | | 70,969 | |
| Moncler SpA (b) | | | 1,699 | | | | 72,641 | |
| | | | | | | | 231,801 | |
| | | | | | | | | |
| Auto Manufacturers: 2.92% | | | | | | | | |
| Peugeot SA (b) | | | 2,665 | | | | 65,668 | |
| REV Group, Inc. | | | 51,057 | | | | 735,731 | |
| | | | | | | | 801,399 | |
| Auto Parts & Equipment: 5.08% | | | | | | | | |
| Allison Transmission Holdings, Inc. | | | 1,543 | | | | 71,518 | |
| American Axle & Manufacturing Holdings, Inc. (a) | | | 25,289 | | | | 322,688 | |
| Lear Corp. | | | 6,385 | | | | 889,239 | |
| Nexteer Automotive Group Ltd. (b) | | | 38,000 | | | | 47,283 | |
| TS Tech Co. Ltd. (b) | | | 2,245 | | | | 61,073 | |
| | | | | | | | 1,391,801 | |
| Banks: 2.41% | | | | | | | | |
| Banco Bilbao Vizcaya Argentaria SA (b) | | | 8,044 | | | | 44,975 | |
| Citizens Financial Group, Inc. | | | 1,979 | | | | 69,977 | |
| Dah Sing Financial Holdings Ltd. (b) | | | 9,600 | | | | 44,856 | |
| DBS Group Holdings Ltd. (b) | | | 2,500 | | | | 47,967 | |
| Texas Capital Bancshares, Inc. (a) | | | 6,449 | | | | 395,775 | |
The accompanying notes are an integral part of these financial statements.
| | |
| | |
| LoCorr Dynamic Equity Fund - Schedule of Investments (continued) | | 45 |
| | |
| | | Shares | | | Value | |
| COMMON STOCKS (continued) | | | | | | | | |
| Umpqua Holdings Corp. | | | 3,359 | | | $ | 55,726 | |
| | | | | | | | 659,276 | |
| Beverages: 1.04% | | | | | | | | |
| Cott Corp. (b) | | | 15,922 | | | | 212,559 | |
| Monster Beverage Corp. (a) | | | 1,140 | | | | 72,766 | |
| | | | | | | | 285,325 | |
| Biotechnology: 0.84% | | | | | | | | |
| Biogen, Inc. (a) | | | 221 | | | | 51,685 | |
| Exelixis, Inc. (a) | | | 284 | | | | 6,069 | |
| Incyte Corp. (a) | | | 702 | | | | 59,642 | |
| Ionis Pharmaceuticals, Inc. (a) | | | 697 | | | | 44,796 | |
| Vertex Pharmaceuticals, Inc. (a) | | | 379 | | | | 69,501 | |
| | | | | | | | 231,693 | |
| Building Materials: 0.51% | | | | | | | | |
| Buzzi Unicem SpA (b) | | | 3,347 | | | | 46,888 | |
| Masco Corp. | | | 1,230 | | | | 48,265 | |
| Rockwool International A/S (b) | | | 174 | | | | 44,427 | |
| | | | | | | | 139,580 | |
| Chemicals: 0.34% | | | | | | | | |
| Covestro AG (b) | | | 1,199 | | | | 60,957 | |
| Showa Denko KK (b) | | | 1,100 | | | | 32,342 | |
| | | | | | | | 93,299 | |
| Commercial Services: 0.73% | | | | | | | | |
| Robert Half International, Inc. | | | 1,055 | | | | 60,146 | |
| ServiceMaster Global Holdings, Inc. (a) | | | 1,339 | | | | 69,749 | |
| United Rentals, Inc. (a) | | | 526 | | | | 69,763 | |
| | | | | | | | 199,658 | |
| Distribution & Wholesale: 0.20% | | | | | | | | |
| G-III Apparel Group Ltd. (a) | | | 420 | | | | 12,356 | |
| HD Supply Holdings, Inc. (a) | | | 1,037 | | | | 41,770 | |
| | | | | | | | 54,126 | |
| Diversified Financial Services: 10.41% | | | | | | | | |
| Credit Acceptance Corp. (a) | | | 3,119 | | | | 1,509,066 | |
| Raymond James Financial, Inc. | | | 1,051 | | | | 88,862 | |
| SEI Investments Co. | | | 1,274 | | | | 71,471 | |
| Synchrony Financial | | | 32,822 | | | | 1,137,939 | |
| Zenkoku Hosho Co. Ltd. (b) | | | 1,200 | | | | 46,023 | |
| | | | | | | | 2,853,361 | |
| Electric: 1.42% | | | | | | | | |
| Ameren Corp. | | | 592 | | | | 44,465 | |
| Contact Energy Ltd. (b) | | | 9,587 | | | | 51,524 | |
| Hawaiian Electric Industries, Inc. | | | 140 | | | | 6,097 | |
| Hera SpA (b) | | | 12,013 | | | | 45,952 | |
| NRG Energy, Inc. | | | 1,686 | | | | 59,212 | |
| OGE Energy Corp. | | | 1,672 | | | | 71,160 | |
| Pinnacle West Capital Corp. | | | 454 | | | | 42,717 | |
| Red Electrica Corp. SA (b) | | | 3,299 | | | | 68,705 | |
| | | | | | | | 389,832 | |
| Electrical Components & Equipment: 0.41% | | | | | | | | |
| EnerSys | | | 982 | | | | 67,267 | |
| Hubbell, Inc. | | | 343 | | | | 44,727 | |
| | | | | | | | 111,994 | |
| Electronics: 0.49% | | | | | | | | |
| Gentex Corp. | | | 3,083 | | | | 75,873 | |
| Resideo Technologies Inc. (a) | | | 2,258 | | | | 49,495 | |
| Taiyo Yuden Co. Ltd. (b) | | | 400 | | | | 7,439 | |
| | | | | | | | 132,807 | |
| Energy - Alternate Sources: 1.13% | | | | | | | | |
| First Solar, Inc. (a) | | | 4,697 | | | | 308,499 | |
| | | | | | | | | |
| Engineering & Construction: 6.39% | | | | | | | | |
| Aena SME SA (b) | | | 234 | | | | 46,378 | |
| CIMIC Group Ltd. (b) | | | 1,999 | | | | 62,830 | |
| Frontdoor, Inc. (a) | | | 14,789 | | | | 644,061 | |
The accompanying notes are an integral part of these financial statements.
| | |
| | |
| 46 | | LoCorr Dynamic Equity Fund - Schedule of Investments (continued) |
| | |
| | | Shares | | | Value | |
| COMMON STOCKS (continued) | | | | | | | | |
| MasTec, Inc. (a) | | | 19,368 | | | $ | 998,033 | |
| | | | | | | | 1,751,302 | |
| Entertainment: 3.95% | | | | | | | | |
| Madison Square Garden Co. (a) | | | 1,337 | | | | 374,280 | |
| Marriott Vacations Worldwide Corp. | | | 7,345 | | | | 708,058 | |
| | | | | | | | 1,082,338 | |
| Food: 0.89% | | | | | | | | |
| Chocoladefabriken Lindt & Spruengli AG (b) | | | 10 | | | | 72,782 | |
| Sprouts Farmers Market, Inc. (a) | | | 2,090 | | | | 39,480 | |
| US Foods Holding Corp. (a) | | | 1,897 | | | | 67,837 | |
| Wesfarmers Ltd. (b) | | | 2,488 | | | | 63,161 | |
| | | | | | | | 243,260 | |
| Hand & Machine Tools: 0.02% | | | | | | | | |
| Regal Beloit Corp. | | | 79 | | | | 6,455 | |
| | | | | | | | | |
| Healthcare - Products: 0.41% | | | | | | | | |
| GN Store Nord AS (b) | | | 1,430 | | | | 66,727 | |
| Masimo Corp. (a) | | | 311 | | | | 46,283 | |
| | | | | | | | 113,010 | |
| Healthcare - Services: 0.26% | | | | | | | | |
| Molina Healthcare, Inc. (a) | | | 492 | | | | 70,425 | |
| | | | | | | | | |
| Holding Companies - Diversified: 0.39% | | | | | | | | |
| CK Hutchison Holdings Ltd. (b) | | | 4,500 | | | | 44,357 | |
| Swire Pacific Ltd. A (b) | | | 500 | | | | 6,145 | |
| Swire Pacific Ltd. B (b) | | | 30,000 | | | | 56,838 | |
| | | | | | | | 107,340 | |
| Home Builders: 0.39% | | | | | | | | |
| Haseko Corp. (b) | | | 1,700 | | | | 17,187 | |
| NVR, Inc. (a) | | | 13 | | | | 43,813 | |
| PulteGroup, Inc. | | | 1,477 | | | | 46,703 | |
| | | | | | | | 107,703 | |
| Home Furnishings: 0.07% | | | | | | | | |
| Rational AG (b) | | | 26 | | | | 17,901 | |
| | | | | | | | | |
| Household Products & Wares: 0.17% | | | | | | | | |
| Henkel AG & Co KGaA (b) | | | 504 | | | | 46,278 | |
| | | | | | | | | |
| Housewares: 0.24% | | | | | | | | |
| Toro Co. | | | 973 | | | | 65,094 | |
| | | | | | | | | |
| Insurance: 2.04% | | | | | | | | |
| Allianz (b) | | | 304 | | | | 73,284 | |
| Dai-ichi Life Holdings, Inc. (b) | | | 4,800 | | | | 72,346 | |
| Fidelity National Financial, Inc. | | | 1,141 | | | | 45,982 | |
| First American Financial Corp. | | | 1,294 | | | | 69,488 | |
| Hannover Rueck SE (b) | | | 289 | | | | 46,730 | |
| MS&AD Insurance Group Holdings, Inc. (b) | | | 1,300 | | | | 41,237 | |
| Old Republic International Corp. | | | 3,219 | | | | 72,041 | |
| Reinsurance Group of America, Inc. | | | 425 | | | | 66,313 | |
| Tokio Marine Holdings, Inc. (b) | | | 1,400 | | | | 70,107 | |
| | | | | | | | 557,528 | |
| Internet: 0.84% | | | | | | | | |
| CDW Corp. | | | 664 | | | | 73,704 | |
| EBAY, Inc. | | | 1,230 | | | | 48,585 | |
| Kakaku.com, Inc. (b) | | | 3,300 | | | | 63,665 | |
| Twitter, Inc. (a) | | | 1,272 | | | | 44,393 | |
| | | | | | | | 230,347 | |
| Investment Companies: 0.27% | | | | | | | | |
| EXOR NV (b) | | | 1,057 | | | | 74,038 | |
| | | | | | | | | |
| Iron & Steel: 0.70% | | | | | | | | |
| BlueScope Steel Ltd. (b) | | | 6,767 | | | | 57,247 | |
| Commercial Metals Co. | | | 4,704 | | | | 83,966 | |
The accompanying notes are an integral part of these financial statements.
| | |
| | |
| LoCorr Dynamic Equity Fund - Schedule of Investments (continued) | | 47 |
| | |
| | | Shares | | | Value | |
| COMMON STOCKS (continued) | | | | | | | | |
| Steel Dynamics, Inc. | | | 1,671 | | | $ | 50,464 | |
| | | | | | | | 191,677 | |
| Leisure Time: 0.94% | | | | | | | | |
| Callaway Golf Co. | | | 15,068 | | | | 258,567 | |
| | | | | | | | | |
| Lodging: 1.46% | | | | | | | | |
| Extended Stay America, Inc. | | | 18,688 | | | | 315,640 | |
| Wyndham Hotels & Resorts, Inc. | | | 1,532 | | | | 85,394 | |
| | | | | | | | 401,034 | |
| Machinery - Diversified: 0.28% | | | | | | | | |
| Atlas Copco AB (b) | | | 2,633 | | | | 75,535 | |
| | | | | | | | | |
| Media: 0.88% | | | | | | | | |
| DISH Network Corp. (a) | | | 4,379 | | | | 168,197 | |
| Mediaset SpA (a)(b) | | | 10,699 | | | | 34,977 | |
| RTL Group SA (b) | | | 767 | | | | 39,282 | |
| | | | | | | | 242,456 | |
| Mining: 0.61% | | | | | | | | |
| BHP Group Ltd. (b) | | | 1,223 | | | | 35,340 | |
| Boliden AB (b) | | | 2,333 | | | | 59,656 | |
| Rio Tinto Ltd. (b) | | | 999 | | | | 72,772 | |
| | | | | | | | 167,768 | |
| Miscellaneous Manufacturing: 0.35% | | | | | | | | |
| Carlisle Cos., Inc. | | | 363 | | | | 50,969 | |
| Nikon Corp. (b) | | | 3,100 | | | | 43,820 | |
| | | | | | | | 94,789 | |
| Oil & Gas: 1.52% | | | | | | | | |
| Apache Corp. | | | 3,002 | | | | 86,968 | |
| Cabot Oil & Gas Corp. | | | 2,305 | | | | 52,923 | |
| ConocoPhillips | | | 704 | | | | 42,944 | |
| Devon Energy Corp. | | | 1,262 | | | | 35,992 | |
| Equinor ASA (b) | | | 2,240 | | | | 44,233 | |
| HollyFrontier Corp. | | | 1,433 | | | | 66,319 | |
| Northern Oil and Gas, Inc. (a) | | | 9,011 | | | | 17,391 | |
| Range Resources Corp. | | | 10,077 | | | | 70,337 | |
| | | | | | | | 417,107 | |
| Packaging & Containers: 1.56% | | | | | | | | |
| Berry Global Group, Inc. (a) | | | 920 | | | | 48,383 | |
| Graphic Packaging Holding Co. | | | 23,657 | | | | 330,725 | |
| Silgan Holdings, Inc. | | | 1,545 | | | | 47,277 | |
| | | | | | | | 426,385 | |
| Pharmaceuticals: 1.00% | | | | | | | | |
| Astellas Pharma, Inc. (b) | | | 4,700 | | | | 66,916 | |
| Eisai Co. Ltd. (b) | | | 900 | | | | 50,845 | |
| Nektar Therapeutics (a) | | | 1,968 | | | | 70,021 | |
| Shionogi & Co. Ltd. (b) | | | 600 | | | | 34,554 | |
| Sumitomo Dainippon Pharma Co. Ltd. . (b) | | | 2,800 | | | | 53,058 | |
| | | | | | | | 275,394 | |
| Real Estate: 0.24% | | | | | | | | |
| Fastighets AB Balder (a)(b) | | | 1,997 | | | | 66,881 | |
| | | | | | | | | |
| Retail: 4.65% | | | | | | | | |
| Advance Auto Parts, Inc. | | | 2,938 | | | | 452,863 | |
| Bloomin’ Brands, Inc. | | | 8,751 | | | | 165,481 | |
| Children’s Place, Inc. | | | 931 | | | | 88,799 | |
| FamilyMart UNY Holdings Co., Ltd. (b) | | | 1,800 | | | | 42,940 | |
| Foot Locker, Inc. | | | 1,088 | | | | 45,609 | |
| Lowe’s Cos., Inc. | | | 72 | | | | 7,266 | |
| Michaels Companies, Inc. (a) | | | 4,711 | | | | 40,986 | |
| RH (a) | | | 1,596 | | | | 184,498 | |
| Ross Stores, Inc. | | | 740 | | | | 73,349 | |
| Sugi Holdings Co. Ltd. (b) | | | 900 | | | | 42,489 | |
| Sundrug Co., Ltd. (b) | | | 1,500 | | | | 40,569 | |
| TJX Cos., Inc. | | | 878 | | | | 46,429 | |
The accompanying notes are an integral part of these financial statements.
| | |
| | |
| 48 | | LoCorr Dynamic Equity Fund - Schedule of Investments (continued) |
| | |
| | | Shares | | | Value | |
| COMMON STOCKS (continued) | | | | | | | | |
| Urban Outfitters, Inc. (a) | | | 1,877 | | | $ | 42,702 | |
| | | | | | | | 1,273,980 | |
| Semiconductors: 2.06% | | | | | | | | |
| Advantest Corp. (b) | | | 2,500 | | | | 68,752 | |
| Applied Materials, Inc. | | | 640 | | | | 28,742 | |
| Broadcom, Inc. | | | 164 | | | | 47,209 | |
| Microchip Technology, Inc. | | | 1,041 | | | | 90,255 | |
| Micron Technology, Inc. (a) | | | 1,626 | | | | 62,747 | |
| NXP Semiconductors NV (b) | | | 683 | | | | 66,668 | |
| ON Semiconductor Corp. (a) | | | 2,834 | | | | 57,275 | |
| Skyworks Solutions, Inc. | | | 1,186 | | | | 91,642 | |
| Ultra Clean Holdings, Inc. (a) | | | 3,667 | | | | 51,045 | |
| | | | | | | | 564,335 | |
| Software: 2.44% | | | | | | | | |
| Activision Blizzard, Inc. | | | 1,033 | | | | 48,758 | |
| Amadeus IT Group SA (b) | | | 887 | | | | 70,260 | |
| Cadence Design System, Inc. (a) | | | 1,034 | | | | 73,218 | |
| Capcom Co. Ltd. (b) | | | 1,900 | | | | 38,100 | |
| Electronic Arts, Inc. (a) | | | 444 | | | | 44,959 | |
| Intuit, Inc. | | | 184 | | | | 48,085 | |
| Take-Two Interactive Software, Inc. (a) | | | 2,328 | | | | 264,298 | |
| Verra Mobility Corp. (a) | | | 6,111 | | | | 79,993 | |
| | | | | | | | 667,671 | |
| Telecommunications: 2.41% | | | | | | | | |
| Intelsat SA (a)(b) | | | 21,757 | | | | 423,174 | |
| Nippon Telegraph & Telephone Corp. (b) | | | 1,600 | | | | 74,453 | |
| SES SA (b) | | | 5,612 | | | | 87,744 | |
| Telenor ASA (b) | | | 3,504 | | | | 74,389 | |
| | | | | | | | 659,760 | |
| Toys, Games & Hobbies: 0.65% | | | | | | | | |
| Nintendo Co. Ltd. (b) | | | 484 | | | | 177,277 | |
| | | | | | | | | |
| Transportation: 0.23% | | | | | | | | |
| Schneider National, Inc. | | | 847 | | | | 15,449 | |
| Tidewater, Inc. (a) | | | 1,976 | | | | 46,396 | |
| | | | | | | | 61,845 | |
| TOTAL COMMON STOCKS (Cost $18,078,381) | | | | | | | 20,363,752 | |
| | | | | | | | | |
| REAL ESTATE INVESTMENT TRUSTS: 2.34% | | | | | | | | |
| Apartment Investment & Management Co. | | | 1,342 | | | | 67,261 | |
| Apple Hospitality REIT, Inc. | | | 2,832 | | | | 44,916 | |
| Champion Real Estate (b) | | | 70,000 | | | | 58,336 | |
| Douglas Emmett, Inc. | | | 1,736 | | | | 69,162 | |
| Equity Commonwealth | | | 1,330 | | | | 43,252 | |
| Equity LifeStyle Properties, Inc. | | | 605 | | | | 73,411 | |
| Host Hotels & Resorts, Inc. | | | 2,186 | | | | 39,829 | |
| Outfront Media, Inc. | | | 3,303 | | | | 85,184 | |
| VICI Properties, Inc. | | | 5,659 | | | | 124,724 | |
| Weingarten Realty Investors | | | 1,278 | | | | 35,043 | |
| TOTAL REAL ESTATE INVESTMENT TRUSTS (Cost $612,319) | | | | | | | 641,118 | |
| | | | | | | | | |
| SHORT TERM INVESTMENT: 13.55% | | | | | | | | |
| MONEY MARKET FUND: 13.55% | | | | | | | | |
| STIT-Government & Agency Portfolio, Institutional Class, 2.26% (c) | | | 3,711,070 | | | | 3,711,070 | |
| TOTAL MONEY MARKET FUND (Cost $3,711,070) | | | | | | | 3,711,070 | |
| TOTAL SHORT TERM INVESTMENT (Cost $3,711,070) | | | | | | | 3,711,070 | |
| | | | | | | | | |
| TOTAL INVESTMENTS (Cost $22,401,770): 90.22% | | | | | | | 24,715,940 | |
| Other Assets in Excess of Liabilities: 9.78% (d) | | | | | | | 2,679,630 | |
| TOTAL NET ASSETS: 100.00% | | | | | | $ | 27,395,570 | |
(a) Non-dividend income producing security.
(b) Foreign issued security.
(c) The rate quoted is the annualized seven-day effective yield as of June 30, 2019.
(d) Includes assets pledged as collateral for securities sold short and futures contracts.
ADR American Depositary Receipt
The accompanying notes are an integral part of these financial statements.
| | |
| | |
| LoCorr Dynamic Equity Fund - Schedule of Securities Sold Short | | 49 |
| | |
LoCorr Dynamic Equity Fund
Schedule of Securities Sold Short
June 30, 2019 (Unaudited)
| | | Shares | | | Value | |
| COMMON STOCKS: (29.52)% | | | | | | | | |
| Aerospace & Defense: (0.59)% | | | | | | | | |
| General Dynamics Corp. | | | (330 | ) | | $ | (60,001 | ) |
Saab AB (b) | | | (205 | ) | | | (6,671 | ) |
TransDigm Group, Inc. (a) | | | (86 | ) | | | (41,607 | ) |
| United Technologies Corp. | | | (413 | ) | | | (53,773 | ) |
| | | | | | | | (162,052 | ) |
| Apparel: (0.14)% | | |
|
| | | | |
ASICS Corp. (b) | | | (3,400 | ) | | | (36,802 | ) |
| | | | | | | | | |
| Auto Manufacturers: (0.66)% | | | | | | | | |
Daimler AG(b) | | | (901 | ) | | | (50,125 | ) |
| PACCAR, Inc. | | | (1,237 | ) | | | (88,643 | ) |
Tesla Motors, Inc. (a) | | | (183 | ) | | | (40,893 | ) |
| | | | | | | | (179,661 | ) |
| Banks: (0.62)% | | | | | | | | |
Banco BPM SpA (a)(b) | | | (20,998 | ) | | | (42,740 | ) |
| Goldman Sachs Group, Inc. | | | (210 | ) | | | (42,966 | ) |
Unione di Banche Italiane SpA (b) | | | (15,686 | ) | | | (42,808 | ) |
Yamaguchi Financial Group, Inc. (b) | | | (6,000 | ) | | | (40,959 | ) |
| | | | | | | | (169,473 | ) |
| Beverages: (0.46)% | | | | | | | | |
| Brown-Forman Corp. | | | (1,528 | ) | | | (84,697 | ) |
Coca-Cola Bottlers Japan Holdings, Inc. (b) | | | (1,600 | ) | | | (40,499 | ) |
| | | | | | | | (125,196 | ) |
| Biotechnology: (0.67)% | | | | | | | | |
Alnylam Pharmaceuticals, Inc. (a) | | | (619 | ) | | | (44,915 | ) |
Bluebird Bio, Inc. (a) | | | (350 | ) | | | (44,520 | ) |
Sage Therapeutics, Inc. (a) | | | (334 | ) | | | (61,152 | ) |
Seattle Genetics, Inc. (a) | | | (491 | ) | | | (33,982 | ) |
| | | | | | | | (184,569 | ) |
| Building Materials: (0.22)% | | | | | | | | |
| Armstrong World Industries, Inc. | | | (492 | ) | | | (47,822 | ) |
TOTO Ltd. (b) | | | (300 | ) | | | (11,840 | ) |
| | | | | | | | (59,662 | ) |
| Chemicals: (1.44)% | | | | | | | | |
| Albemarle Corp. | | | (677 | ) | | | (47,668 | ) |
| Ashland Global Holdings, Inc. | | | (505 | ) | | | (40,385 | ) |
| International Flavors & Fragrances, Inc. | | | (1,236 | ) | | | (179,331 | ) |
OCI Co. Ltd. (a)(b) | | | (1,481 | ) | | | (40,653 | ) |
Umicore SA(b) | | | (1,318 | ) | | | (42,263 | ) |
Yara International ASA (b) | | | (883 | ) | | | (42,833 | ) |
| | | | | | | | (393,133 | ) |
| Commercial Services: (1.28)% | | | | | | | | |
2U, Inc. (a) | | | (1,027 | ) | | | (38,656 | ) |
Atlantia SpA (b) | | | (1,525 | ) | | | (39,728 | ) |
| Macquarie Infrastructure Corp. | | | (960 | ) | | | (38,918 | ) |
| Robert Half International, Inc. | | | (1,702 | ) | | | (97,031 | ) |
| Service Corp International, Inc. | | | (2,953 | ) | | | (138,141 | ) |
| | | | | | | | (352,474 | ) |
| Computers: (0.21)% | | | | | | | | |
NCR Corp. (a) | | | (1,818 | ) | | | (56,540 | ) |
| | | | | | | | | |
| Cosmetics & Personal Care: (0.14)% | | | | | | | | |
Shiseido Co. Ltd. (b) | | | (500 | ) | | | (37,662 | ) |
| | | | | | | | | |
The accompanying notes are an integral part of these financial statements.
| |
| |
50 | | LoCorr Dynamic Equity Fund - Schedule of Securities Sold Short (continued) |
| |
| | | Shares | | | Value | |
COMMON STOCKS (continued) | | | | | | | | |
| Distribution & Wholesale: (0.66)% | | | | | | | | |
| Fastenal Company | | | (2,599 | ) | | $ | (84,701 | ) |
| Watsco, Inc. | | | (588 | ) | | | (96,156 | ) |
| | | | | | | | (180,857 | ) |
| Diversified Financial Services: (1.20)% | | | | | | | | |
Aiful Corp. (a)(b) | | | (22,500 | ) | | | (45,912 | ) |
| CME Group, Inc. | | | (118 | ) | | | (22,905 | ) |
Credit Acceptance Corp. (a) | | | (60 | ) | | | (29,030 | ) |
| Evercore Partners, Inc. | | | (444 | ) | | | (39,325 | ) |
| Interactive Brokers Group, Inc. | | | (989 | ) | | | (53,604 | ) |
Nomura Holdings, Inc. (b) | | | (14,800 | ) | | | (52,081 | ) |
SBI Holdings, Inc. (b) | | | (1,900 | ) | | | (47,000 | ) |
| Virtu Financial, Inc. | | | (1,810 | ) | | | (39,422 | ) |
| | | | | | | | (329,279 | ) |
| Electric: (0.63)% | | | | | | | | |
| Dominion Energy, Inc. | | | (510 | ) | | | (39,433 | ) |
| Entergy Corp. | | | (395 | ) | | | (40,657 | ) |
| Sempra Energy | | | (435 | ) | | | (59,786 | ) |
| Vistra Energy Corp. | | | (1,481 | ) | | | (33,530 | ) |
| | | | | | | | (173,406 | ) |
| Electrical Components & Equipment: (0.41)% | | | | | | | | |
| Energizer Holdings, Inc. | | | (941 | ) | | | (36,360 | ) |
Generac Holdings, Inc. (a) | | | (453 | ) | | | (31,443 | ) |
Prysmian SpA (b) | | | (2,217 | ) | | | (45,755 | ) |
| | | | | | | | (113,558 | ) |
| Electronics: (0.67)% | | | | | | | | |
| Badger Meter, Inc. | | | (71 | ) | | | (4,238 | ) |
Flex Ltd. (a)(b) | | | (5,149 | ) | | | (49,276 | ) |
Fujitsu General Ltd. (b) | | | (3,900 | ) | | | (61,928 | ) |
Hirose Electric Co. Ltd. (b) | | | (100 | ) | | | (11,149 | ) |
Ibiden Co. Ltd. (b) | | | (3,200 | ) | | | (55,977 | ) |
| | | | | | | | (182,568 | ) |
| Energy - Alternate Sources: (0.23)% | | | | | | | | |
First Solar, Inc. (a) | | | (960 | ) | | | (63,053 | ) |
| | | | | | | | | |
| Engineering & Construction: (0.98)% | | | | | | | | |
Boskalis Westminster (b) | | | (2,151 | ) | | | (49,676 | ) |
Cellnex Telecom SA (b) | | | (1,129 | ) | | | (41,774 | ) |
Ferrovial SA (b) | | | (1,600 | ) | | | (40,954 | ) |
| Jacobs Engineering Group, Inc. | | | (526 | ) | | | (44,389 | ) |
JGC Corp. (b) | | | (3,600 | ) | | | (49,351 | ) |
SNC-Lavalin Group, Inc. (b) | | | (2,135 | ) | | | (43,171 | ) |
| | | | | | | | (269,315 | ) |
| Entertainment: (0.79)% | | | | | | | | |
International Game Technology PLC (b) | | | (4,003 | ) | | | (51,919 | ) |
Sega Sammy Holdings, Inc. (b) | | | (4,400 | ) | | | (53,421 | ) |
| Six Flags Entertainment Corp. | | | (774 | ) | | | (38,452 | ) |
| Vail Resorts, Inc. | | | (329 | ) | | | (73,426 | ) |
| | | | | | | | (217,218 | ) |
| Environmental Control: (0.14)% | | | | | | | | |
Stericycle, Inc. (a) | | | (810 | ) | | | (38,678 | ) |
| | | | | | | | | |
| Food: (0.63)% | | | | | | | | |
| Campbell Soup Co. | | | (1,092 | ) | | | (43,756 | ) |
| Conagra Brands, Inc. | | | (1,929 | ) | | | (51,157 | ) |
Metro, Inc. CN (b) | | | (1,054 | ) | | | (39,551 | ) |
Shufersal Ltd. (b) | | | (5,855 | ) | | | (38,964 | ) |
| | | | | | | | (173,428 | ) |
| Food Service: (0.18)% | | | | | | | | |
| Aramark | | | (1,375 | ) | | | (49,583 | ) |
The accompanying notes are an integral part of these financial statements.
| | |
| | |
| LoCorr Dynamic Equity Fund - Schedule of Securities Sold Short (continued) | | 51 |
| | |
| | | Shares | | | Value | |
COMMON STOCKS (continued) | | | | | | | | |
| Forest Products & Paper: (0.14)% | | | | | | | | |
Nippon Paper Industries Co. Ltd. (b) | | | (2,200 | ) | | $ | (38,933 | ) |
| | | | | | | | | |
| Gas: (0.12)% | | | | | | | | |
| NiSource, Inc. | | | (1,140 | ) | | | (32,832 | ) |
| | | | | | | | | |
| Hand & Machine Tools: (0.16)% | | | | | | | | |
Colfax Corp. (a) | | | (1,555 | ) | | | (43,587 | ) |
| | | | | | | | | |
| Healthcare - Products: (0.90)% | | | | | | | | |
Align Technology, Inc. (a) | | | (381 | ) | | | (104,280 | ) |
| Cantel Medical Corp. | | | (83 | ) | | | (6,693 | ) |
Insulet Corp. (a) | | | (516 | ) | | | (61,600 | ) |
iRhythm Technologies, Inc. (a) | | | (858 | ) | | | (67,851 | ) |
Siemens Healthineers AG (b) | | | (148 | ) | | | (6,245 | ) |
| | | | | | | | (246,669 | ) |
| Healthcare - Services: (0.22)% | | | | | | | | |
Acadia Healthcare Co., Inc. (a) | | | (1,229 | ) | | | (42,954 | ) |
| Quest Diagnostics, Inc. | | | (177 | ) | | | (18,020 | ) |
| | | |
|
| | | (60,974 | ) | |
| Household Products & Wares: (0.68)% | | | | | | | | |
| Avery Dennison Corp. | | | (851 | ) | | | (98,444 | ) |
| Clorox Co. | | | (574 | ) | | | (87,885 | ) |
| | | | | | | | (186,329 | ) |
| Insurance: (1.01)% | | | | | | | | |
| American International Group, Inc. | | | (1,105 | ) | | | (58,874 | ) |
| American National Insurance Co. | | | (327 | ) | | | (38,086 | ) |
Assured Guaranty Ltd. (b) | | | (912 | ) | | | (38,377 | ) |
Axis Capital Holdings Ltd. (b) | | | (670 | ) | | | (39,966 | ) |
Markel Corp. (a) | | | (37 | ) | | | (40,315 | ) |
White Mountains Insurance Group Ltd. (b) | | | (59 | ) | | | (60,266 | ) |
| | | | | | | | (275,884 | ) |
| Internet: (1.56)% | | | | | | | | |
CyberAgent, Inc. (b) | | | (1,300 | ) | | | (47,085 | ) |
Delivery Hero SE (a)(b) | | | (1,250 | ) | | | (56,699 | ) |
Etsy, Inc. (a) | | | (1,559 | ) | | | (95,676 | ) |
FireEye, Inc. (a) | | | (2,574 | ) | | | (38,121 | ) |
GrubHub, Inc. (a) | | | (600 | ) | | | (46,794 | ) |
Uber Technologies, Inc. (a) | | | (894 | ) | | | (41,464 | ) |
Wayfair, Inc. (a) | | | (351 | ) | | | (51,246 | ) |
Zillow Group, Inc. Class A (a) | | | (249 | ) | | | (11,394 | ) |
Zillow Group, Inc. Class C (a) | | | (848 | ) | | | (39,339 | ) |
| | | | | | | | (427,818 | ) |
| Investment Companies: (0.33)% | | | | | | | | |
Kinnevik AB (b) | | | (1,526 | ) | | | (39,686 | ) |
Melrose Industries PLC (b) | | | (22,029 | ) | | | (50,594 | ) |
| | | | | | | | (90,280 | ) |
| Iron & Steel: (0.54)% | | | | | | | | |
| Reliance Steel & Aluminum Co. | | | (1,036 | ) | | | (98,026 | ) |
Thyssenkrupp AG (b) | | | (3,529 | ) | | | (51,465 | ) |
| | | | | | | | (149,491 | ) |
| Leisure Time: (0.03)% | | | | | | | | |
| Acushnet Holdings Corp. | | | (318 | ) | | | (8,351 | ) |
| | | | | | | | | |
| Lodging: (0.54)% | | | | | | | | |
| Choice Hotels International, Inc. | | | (510 | ) | | | (44,375 | ) |
City Developments Ltd. (b) | | | (5,600 | ) | | | (39,196 | ) |
Kyoritsu Maintenance Co. Ltd. (b) | | | (200 | ) | | | (9,331 | ) |
SJM Holdings Ltd. (b) | | | (6,000 | ) | | | (6,828 | ) |
The accompanying notes are an integral part of these financial statements.
| | |
| | |
| 52 | | LoCorr Dynamic Equity Fund - Schedule of Securities Sold Short (continued) |
| | |
| | | Shares | | Value |
| COMMON STOCKS (continued) | | | | | | | | |
| Wyndham Hotels & Resorts, Inc. | | | (873 | ) | | $ | (48,661 | ) |
| | | | | | | | (148,391 | ) |
| Machinery - Diversified: (0.98)% | | | | | | | | |
| Deere & Co. | | | (880 | ) | | | (145,826 | ) |
| Graco, Inc. | | | (505 | ) | | | (25,341 | ) |
| Wabtec Corp. | | | (762 | ) | | | (54,678 | ) |
| Welbilt, Inc. (a) | | | (2,484 | ) | | | (41,483 | ) |
| | | | | | | | (267,328 | ) |
| Media: (0.45)% | | | | | | | | |
| Disney Walt Co. | | | (277 | ) | | | (38,680 | ) |
| New York Times Co. | | | (2,594 | ) | | | (84,616 | ) |
| | | | | | | | (123,296 | ) |
| Metal Fabricate & Hardware: (0.14)% | | | | | | | | |
| MISUMI Group, Inc. (b) | | | (1,500 | ) | | | (37,592 | ) |
| | | | | | | | | |
| Mining: (0.67)% | | | | | | | | |
| Dowa Holdings Co. Ltd. (b) | | | (1,700 | ) | | | (54,478 | ) |
| Freeport-McMoRan, Inc. | | | (3,824 | ) | | | (44,397 | ) |
| Mitsui Mining & Smelting Co. Ltd. (b) | | | (1,900 | ) | | | (45,396 | ) |
| Wheaton Precious Metals Corp. (b) | | | (1,615 | ) | | | (39,057 | ) |
| | | | | | | | (183,328 | ) |
| Miscellaneous Manufacturing: (0.75)% | | | | | | | | |
| Axon Enterprise, Inc. (a) | | | (1,644 | ) | | | (105,561 | ) |
| General Electric Co. | | | (5,553 | ) | | | (58,307 | ) |
| Trinity Industries, Inc. | | | (2,037 | ) | | | (42,268 | ) |
| | | | | | | | (206,136 | ) |
| Oil & Gas: (0.30)% | | | | | | | | |
| Concho Resources, Inc. | | | (385 | ) | | | (39,724 | ) |
| Diamondback Energy, Inc. | | | (385 | ) | | | (41,953 | ) |
| | | | | | | | (81,677 | ) |
| Pharmaceuticals: (0.73)% | | | | | | | | |
| Agios Pharmaceuticals, Inc. (a) | | | (856 | ) | | | (42,697 | ) |
| Bayer AG (b) | | | (769 | ) | | | (53,288 | ) |
| CVS Health Corp. | | | (715 | ) | | | (38,960 | ) |
| Sarepta Therapeutics, Inc. (a) | | | (309 | ) | | | (46,953 | ) |
| Teva Pharmaceutical Industries Ltd. (a)(b) | | | (2,034 | ) | | | (18,637 | ) |
| | | | | | | | (200,535 | ) |
| Pipelines: (0.15)% | | | | | | | | |
| Targa Resources Corp. | | | (1,064 | ) | | | (41,773 | ) |
| | | | | | | | | |
| Real Estate: (0.76)% | | | | | | | | |
| Howard Hughes Corp. (a) | | | (371 | ) | | | (45,945 | ) |
| Nomura Real Estate Holdings, Inc. (b) | | | (1,900 | ) | | | (40,814 | ) |
| Sino Land Co. Ltd. (b) | | | (4,000 | ) | | | (6,708 | ) |
| Tokyu Fudosan Holdings Corp. (b) | | | (10,000 | ) | | | (55,187 | ) |
| UOL Group Ltd. (b) | | | (10,600 | ) | | | (59,150 | ) |
| | | | | | | | (207,804 | ) |
| Retail: (2.23)% | | | | | | | | |
| Canadian Tire Corp Ltd. (b) | | | (359 | ) | | | (39,114 | ) |
| CarMax, Inc. (a) | | | (503 | ) | | | (43,675 | ) |
| Carvana Co. (a) | | | (141 | ) | | | (8,825 | ) |
| Cracker Barrel Old Country Store, Inc. | | | (562 | ) | | | (95,950 | ) |
| Floor & Decor Holdings, Inc. (a) | | | (820 | ) | | | (34,358 | ) |
| Home Depot, Inc. | | | (422 | ) | | | (87,763 | ) |
| Marui Group Co Ltd. (b) | | | (1,700 | ) | | | (34,594 | ) |
| McDonald’s Corp. | | | (211 | ) | | | (43,816 | ) |
| Regis Corp. (a) | | | (6,265 | ) | | | (104,000 | ) |
| Texas Roadhouse, Inc. | | | (1,280 | ) | | | (68,698 | ) |
| Tiffany & Co. | | | (427 | ) | | | (39,984 | ) |
| Zalando SE (a)(b) | | | (207 | ) | | | (9,185 | ) |
| | | | | | | | (609,962 | ) |
The accompanying notes are an integral part of these financial statements.
| | |
| | |
| LoCorr Dynamic Equity Fund - Schedule of Securities Sold Short (continued) | | 53 |
| | |
| | | Shares | | Value |
| COMMON STOCKS (continued) | | | | | | | | |
| Semiconductors: (0.69)% | | | | | | | | |
| Marvell Technology Group Ltd. (b) | | | (1,649 | ) | | $ | (39,362 | ) |
| Microchip Technology, Inc. | | | (597 | ) | | | (51,760 | ) |
| Teradyne, Inc. | | | (2,062 | ) | | | (98,790 | ) |
| | | | | | | | (189,912 | ) |
| Software: (0.55)% | | | | | | | | |
| Appian Corp. (a) | | | (1,249 | ) | | | (45,051 | ) |
| DocuSign, Inc. (a) | | | (1,027 | ) | | | (51,052 | ) |
| PTC, Inc. (a) | | | (78 | ) | | | (7,001 | ) |
| Worldline SA (a)(b) | | | (659 | ) | | | (47,958 | ) |
| | | | | | | | (151,062 | ) |
| Telecommunications: (0.74)% | | | | | | | | |
| Tele2 AB (b) | | | (2,818 | ) | | | (41,119 | ) |
| Telecom Italia SpA (a)(b) | | | (77,332 | ) | | | (42,226 | ) |
| Telia Co. AB (b) | | | (7,455 | ) | | | (33,108 | ) |
| Verizon Communications, Inc. | | | (1,495 | ) | | | (85,409 | ) |
| | | | | | | | (201,862 | ) |
| Toys, Games & Hobbies: (0.19)% | | | | | | | | |
| Mattel, Inc. (a) | | | (3,932 | ) | | | (44,078 | ) |
| Sanrio Co. Ltd. (b) | | | (400 | ) | | | (8,878 | ) |
| | | | | | | | (52,956 | ) |
| Transportation: (1.00)% | | | | | | | | |
| Kirby Corp. (a) | | | (674 | ) | | | (53,246 | ) |
| Landstar System, Inc. | | | (422 | ) | | | (45,572 | ) |
| Mitsui OSK Lines Ltd. (b) | | | (2,200 | ) | | | (52,625 | ) |
| Nippon Yusen KK (b) | | | (3,400 | ) | | | (54,525 | ) |
| Nishi-Nippon Railroad Co Ltd. (b) | | | (2,200 | ) | | | (46,932 | ) |
| United Parcel Service, Inc. | | | (200 | ) | | | (20,654 | ) |
| | | | | | | | (273,554 | ) |
| TOTAL COMMON STOCKS (Proceeds $7,808,733) | | | | | | | (8,086,483 | ) |
| | | | | | | | | |
| EXCHANGE TRADED FUNDS: (0.64)% | | | | | | | | |
| iShares Russell 2000 | | | (569 | ) | | | (88,480 | ) |
| SPDR S&P500 Trust | | | (300 | ) | | | (87,900 | ) |
| TOTAL EXCHANGE TRADED FUNDS (Proceeds $173,840) | | | | | | | (176,380 | ) |
| | | | | | | | | |
| REAL ESTATE INVESTMENT TRUSTS: (2.39)% | | | | | | | | |
| AGNC Investment Corp. | | | (2,329 | ) | | | (39,174 | ) |
| Alexandria Real Estate Equities, Inc. | | | (260 | ) | | | (36,683 | ) |
| Annaly Capital Management, Inc. | | | (4,404 | ) | | | (40,209 | ) |
| Colony Capital, Inc. | | | (10,308 | ) | | | (51,540 | ) |
| CyrusOne, Inc. | | | (920 | ) | | | (53,102 | ) |
| Digital Realty Trust, Inc. | | | (468 | ) | | | (55,126 | ) |
| Equinix, Inc. | | | (68 | ) | | | (34,292 | ) |
| Iron Mountain, Inc. | | | (1,218 | ) | | | (38,123 | ) |
| Macerich Co. | | | (1,309 | ) | | | (43,838 | ) |
| New Residential Investment Corp. | | | (2,510 | ) | | | (38,629 | ) |
| Omega Healthcare Investors, Inc. | | | (1,093 | ) | | | (40,168 | ) |
| Realty Income Corp. | | | (527 | ) | | | (36,347 | ) |
| Retail Value, Inc. | | | (672 | ) | | | (23,386 | ) |
| SL Green Realty Corp. | | | (420 | ) | | | (33,755 | ) |
| Unibail-Rodamco-Westfield (b) | | | (330 | ) | | | (49,438 | ) |
| Uniti Group, Inc. | | | (4,236 | ) | | | (40,242 | ) |
| TOTAL REAL ESTATE INVESTMENT TRUSTS (Proceeds $711,986) | | | | | | | (654,052 | ) |
| TOTAL SECURITIES SOLD SHORT (Proceeds $8,694,559): (32.55)% | | | | | | $ | (8,916,915 | ) |
Percentages are stated as a percent of net assets.
(a) Non-dividend expense producing security.
(b) Foreign issued security.
The accompanying notes are an integral part of these financial statements.
| | |
| | |
| 54 | | LoCorr Dynamic Equity Fund - Schedule of Open Futures Contracts |
| | |
LoCorr Dynamic Equity Fund
Schedule of Open Futures Contracts
June 30, 2019 (Unaudited)
| | | | | | | | | | | Value |
| Description | | Number of
Contracts
Purchased (Sold) | | Settlement
Month-Year | | Current
Notional
Amount | | Value at
Trade Date | |
Unrealized
Appreciation | | Unrealized
(Depreciation) |
| | | | | | | | | | | | | |
| Purchase Contract: | | | | | | | | | | | | | | | | | | | | | | | | |
| MSCI World Index | | | 68 | | | | Sep-19 | | | $ | 4,318,000 | | | $ | 4,238,557 | | | $ | 79,443 | | | $ | — | |
| Total Purchase Contract | | | | | | | | | | | | | | | | | | | 79,443 | | | | — | |
| | | | | | | | | | | | | | | | | | | | | | | | | |
| Sale Contract: | | | | | | | | | | | | | | | | | | | | | | | | |
| S&P 500 E-Mini Index | | | (4 | ) | | | Sep-19 | | | $ | 588,840 | | | $ | 591,122 | | | $ | 2,282 | | | $ | — | |
| Total Sales Contract | | | | | | | | | | | | | | | | | | | 2,282 | | | | — | |
| Total Futures Contracts | | | | | | | | | | | | | | | | | | $ | 81,725 | | | $ | — | |
| Net Unrealized Appreciation | | | | | | | | | | | | | | | | | | $ | 81,725 | | | | | |
The accompanying notes are an integral part of these financial statements.
| | |
| | |
| LoCorr Spectrum Income Fund - Schedule of Investments | | 55 |
| | |
LoCorr Spectrum Income Fund
Composition of Investment Portfolio1
June 30, 2019 (Unaudited)
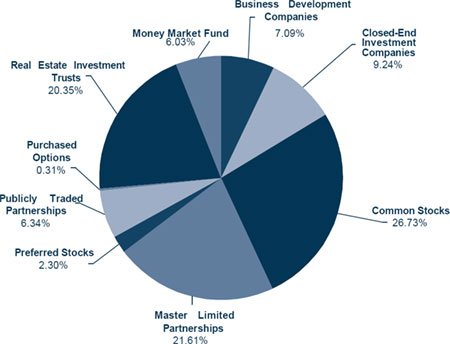
1 As a percentage of total investments.
Schedule of Investments
June 30, 2019 (Unaudited)
| | | Shares | | | Value | |
| BUSINESS DEVELOPMENT COMPANIES: 7.21% | | | | | | | | |
| Ares Capital Corp. | | | 81,233 | | | $ | 1,457,320 | |
| BlackRock TCP Capital Corp. | | | 51,024 | | | | 727,092 | |
| Hercules Capital, Inc. | | | 113,528 | | | | 1,455,429 | |
| Newtek Business Services Corp. | | | 80,744 | | | | 1,857,112 | |
| TOTAL BUSINESS DEVELOPMENT COMPANIES (Cost $5,139,209) | | | | | | | 5,496,953 | |
| | | | | | | | | |
| CLOSED-END INVESTMENT COMPANIES: 9.40% | | | | | | | | |
| Aberdeen Asia-Pacific Income Fund, Inc. | | | 195,748 | | | | 818,227 | |
| AllianceBernstein Global High Income Fund, Inc. | | | 60,622 | | | | 714,127 | |
| Eaton Vance Municipal Bond Fund | | | 66,065 | | | | 821,188 | |
| Invesco Trust for Investment Grade Municipals | | | 110,515 | | | | 1,400,225 | |
| Morgan Stanley Emerging Markets Domestic Debt Fund, Inc. | | | 122,954 | | | | 849,612 | |
| Nuveen Global High Income Fund | | | 46,737 | | | | 723,021 | |
| Nuveen Quality Municipal Income Fund | | | 79,444 | | | | 1,112,216 | |
| Western Asset Emerging Markets Debt Fund, Inc. | | | 50,903 | | | | 728,931 | |
| TOTAL CLOSED-END INVESTMENT COMPANIES (Cost $6,713,141) | | | | | | | 7,167,547 | |
| | | | | | | | | |
| COMMON STOCKS: 27.19% | | | | | | | | |
| Advertising: 0.71% | | | | | | | | |
| National CineMedia, Inc. | | | | | | | | |
| | | | 82,353 | | | | 540,236 | |
| Commercial Services: 1.09% | | | | | | | | |
| Macquarie Infrastructure Corp. | | | 20,492 | | | | 830,746 | |
| | | | | | | | | |
| Electric: 1.22% | | | | | | | | |
| Atlantica Yield PLC (a) | | | 41,076 | | | | 931,193 | |
| | | | | | | | | |
| Energy - Alternate Sources: 4.56% | | | | | | | | |
| NextEra Energy Partners LP | | | 30,827 | | | | 1,487,403 | |
| Pattern Energy Group, Inc. | | | 86,247 | | | | 1,991,443 | |
| | | | | | | | 3,478,846 | |
The accompanying notes are an integral part of these financial statements.
| | |
| | |
| 56 | | LoCorr Spectrum Income Fund - Schedule of Investments (continued) |
| | |
| | | Shares | | | Value | |
| COMMON STOCKS (continued) | | | | | | | | |
| Insurance: 1.09% | | | | | | | | |
| AMERISAFE, Inc. | | | 12,996 | | | $ | 828,755 | |
| | | | | | | | | |
| Lodging: 0.98% | | | | | | | | |
| Las Vegas Sands Corp. | | | 12,693 | | | | 750,029 | |
| | | | | | | | | |
| Oil & Gas: 8.02% | | | | | | | | |
| BP PLC - ADR (a) | | | 34,219 | | | | 1,426,932 | |
| Chevron Corp. | | | 6,000 | | | | 746,640 | |
| CVR Energy, Inc. | | | 23,221 | | | | 1,160,818 | |
| Marathon Petroleum Corp. | | | 12,121 | | | | 677,321 | |
| Royal Dutch Shell PLC - ADR (a) | | | 11,484 | | | | 747,264 | |
| Viper Energy Partners LP | | | 43,950 | | | | 1,354,539 | |
| | | | | | | | 6,113,514 | |
| Pipelines: 2.82% | | | | | | | | |
| EnLink Midstream LLC | | | 65,366 | | | | 659,543 | |
| Williams Cos., Inc. | | | 53,084 | | | | 1,488,475 | |
| | | | | | | | 2,148,018 | |
| Retail: 0.09% | | | | | | | | |
| Cracker Barrel Old Country Store, Inc. | | | 399 | | | | 68,121 | |
| | | | | | | | | |
| Transportation: 4.77% | | | | | | | | |
| GasLog Partners LP (a) | | | 54,823 | | | | 1,163,892 | |
| Golar LNG Partners LP (a) | | | 63,200 | | | | 714,160 | |
| Hoegh LNG Partners LP (a) | | | 62,764 | | | | 1,085,817 | |
| Ship Finance International Ltd. (a) | | | 53,570 | | | | 670,161 | |
| | | | | | | | 3,634,030 | |
| Trucking & Leasing: 1.84% | | | | | | | | |
| Fortress Transportation & Infrastructure Investors LLC | | | 92,886 | | | | 1,402,579 | |
| TOTAL COMMON STOCKS (Cost $20,024,695) | | | | | | | 20,726,067 | |
| | | | | | | | | |
| MASTER LIMITED PARTNERSHIPS: 21.99% | | | Units | | | | | |
| Coal: 1.01% | | | | | | | | |
| Alliance Resource Partners LP | | | 45,514 | | | | 772,828 | |
| | | | | | | | | |
| Energy - Alternate Sources: 0.97% | | | | | | | | |
| Enviva Partners LP | | | 23,603 | | | | 741,606 | |
| | | | | | | | | |
| Entertainment: 0.86% | | | | | | | | |
| Cedar Fair LP | | | 13,715 | | | | 654,068 | |
| | | | | | | | | |
| Gas: 2.14% | | | | | | | | |
| Global Partners LP | | | 81,959 | | | | 1,631,804 | |
| | | | | | | | | |
| Investment Companies: 2.00% | | | | | | | | |
| Icahn Enterprises LP | | | 21,055 | | | | 1,524,593 | |
| | | | | | | | | |
| Oil & Gas: 1.22% | | | | | | | | |
| Sunoco LP | | | 29,717 | | | | 929,548 | |
| | | | | | | | | |
| Oil & Gas Services: 2.15% | | | | | | | | |
| CrossAmerica Partners LP | | | 48,545 | | | | 779,147 | |
| USA Compression Partners LP | | | 48,414 | | | | 860,317 | |
| | | | | | | | 1,639,464 | |
| Pipelines: 10.71% | | | | | | | | |
| Crestwood Equity Partners LP | | | 70,011 | | | | 2,504,294 | |
| Delek Logistics Partners LP | | | 28,311 | | | | 905,952 | |
| Energy Transfer LP | | | 99,151 | | | | 1,396,046 | |
| Hess Midstream Partners LP | | | 33,882 | | | | 660,699 | |
| MPLX LP | | | 45,865 | | | | 1,476,394 | |
| NGL Energy Partners LP | | | 81,964 | | | | 1,210,608 | |
| | | | | | | | 8,153,993 | |
The accompanying notes are an integral part of these financial statements.
| | |
| | |
| LoCorr Spectrum Income Fund - Schedule of Investments (continued) | | 57 |
| | |
| | | Units | | | Value | |
| MASTER LIMITED PARTNERSHIPS (continued) | | | | | | | | |
| Transportation: 0.93% | | | | | | | | |
| Capital Product Partners LP (a) | | | 67,498 | | | $ | 708,729 | |
| TOTAL MASTER LIMITED PARTNERSHIPS (Cost $13,196,294) | | | | | | | 16,756,633 | |
| | | | | | | | | |
| PREFERRED STOCKS: 2.34% | | | Shares | | | | | |
| Pipelines: 1.22% | | | | | | | | |
| Crestwood Equity Partners LP, 9.250% | | | 99,680 | | | | 928,021 | |
| | | | | | | | | |
| Transportation: 1.12% | | | | | | | | |
| Hoegh LNG Partners LP, Series A, 8.750% (a) | | | 33,770 | | | | 858,096 | |
| TOTAL PREFERRED STOCKS (Cost $1,715,458) | | | | | | | 1,786,117 | |
| | | | | | | | | |
| PUBLICLY TRADED PARTNERSHIPS: 6.45% | | | Units | | | | | |
| Blackstone Group LP | | | 21,938 | | | | 974,486 | |
| Brookfield Renewable Partners LP (a) | | | 45,532 | | | | 1,574,952 | |
| Carlyle Group LP | | | 34,225 | | | | 773,827 | |
| Compass Diversified Holdings | | | 47,104 | | | | 900,157 | |
| Moelis & Co. | | | 19,777 | | | | 691,206 | |
| TOTAL PUBLICLY TRADED PARTNERSHIPS (Cost $4,079,484) | | | | | | | 4,914,628 | |
| | | | | | | | | |
| PURCHASED OPTIONS: 0.32% | | Notional Amount | | | Number of Contracts (b) | | | | |
| Put Options: 0.32% | | | | | | | | | |
| iShares Russell 2000 ETF | | | | | | | | | |
| Expiration: July 2019, Exercise Price $150.00 | | $ | 7,775,000 | | | | 500 | | | | 40,000 | |
| Expiration: August 2019, Exercise Price $140.00 | | | 18,660,000 | | | | 1,200 | | | | 64,800 | |
| SPDR S&P Oil & Gas Exploration & Production ETF Expiration: September 2019, | | | | | | | | | | | | |
| Exercise Price $27.00 | | | 2,452,500 | | | | 900 | | | | 137,700 | |
| TOTAL PURCHASED OPTIONS (Cost $488,415) | | | | | | | | | | | 242,500 | |
REAL ESTATE INVESTMENT TRUSTS: 20.70% | | Shares | | | | |
| AGNC Investment Corp. | | | 130,765 | | | | 2,199,466 | |
| Annaly Capital Management, Inc. | | | 224,912 | | | | 2,053,447 | |
| Apollo Commercial Real Estate Finance, Inc. | | | 89,434 | | | | 1,644,691 | |
| CoreSite Realty Corp. | | | 7,211 | | | | 830,491 | |
| EPR Properties | | | 9,128 | | | | 680,858 | |
| Global Net Lease, Inc. | | | 78,124 | | | | 1,532,793 | |
| Invesco Mortgage Capital, Inc. | | | 51,417 | | | | 828,842 | |
| Iron Mountain, Inc. | | | 42,561 | | | | 1,332,159 | |
| New York Mortgage Trust, Inc. | | | 132,404 | | | | 820,905 | |
| Sabra Health Care REIT, Inc. | | | 40,507 | | | | 797,583 | |
| Two Harbors Investment Corp. | | | 51,756 | | | | 655,749 | |
| W P CAREY, Inc. | | | 11,212 | | | | 910,190 | |
| Welltower, Inc. | | | 9,743 | | | | 794,347 | |
| Weyerhaeuser Co. | | | 26,434 | | | | 696,272 | |
| TOTAL REAL ESTATE INVESTMENT TRUSTS (Cost $16,471,883) | | | | | | | 15,777,793 | |
| | | | | | | | | |
| SHORT TERM INVESTMENT: 6.14% | | | | | | | | |
| MONEY MARKET FUND: 6.14% | | | | | | | | |
| STIT-Government & Agency Portfolio, Institutional Class, 2.26% (c) | | | 4,678,454 | | | | 4,678,454 | |
| TOTAL MONEY MARKET FUND (Cost $4,678,454) | | | | | | | 4,678,454 | |
| TOTAL SHORT TERM INVESTMENT (Cost $4,678,454) | | | | | | | 4,678,454 | |
| | | | | | | | | |
| TOTAL INVESTMENTS (Cost $72,507,033): 101.74% | | | | | | | 77,546,692 | |
| Liabilities in Excess of Other Assets: (1.74)% | | | | | | | (1,328,448 | ) |
| TOTAL NET ASSETS: 100.00% | | | | | | $ | 76,218,244 | |
(a) Foreign issued security.
(b) Each contract is equivalent to 100 shares of common stock.
(c) The rate quoted is the annualized seven-day effective yield as of June 30, 2019.
ADR | American Depositary Reciept |
PLC | Public Limited Company |
The accompanying notes are an integral part of these financial statements.
| | |
| | |
| 58 | | LoCorr Spectrum Income Fund - Schedule of Written Options |
| | |
LoCorr Spectrum Income Fund
Schedule of Written Options
June 30, 2019 (Unaudited)
| | | Notional Amount | | | Number of Contracts (a) | | | Value | |
| WRITTEN OPTIONS: 0.12% | | | | | | | | | | | | |
| Call Options: 0.12% | | | | | | | | | | | | |
| Blackstone Group Inc. Expiration: September 2019, Exercise Price: $49.00 | | $ | 972,798 | | | | (219 | ) | | $ | (8,979 | ) |
| Chevron Corp. Expiration: August 2019, Exercise Price: $130.00 | | | 746,640 | | | | (60 | ) | | | (6,780 | ) |
| CVR Energy, Inc. Expiration: September 2019, Exercise Price: $50.00 | | | 1,159,768 | | | | (232 | ) | | | (58,696 | ) |
| Energy Transfer LP Expiration: July 2019, Exercise Price: $16.00 | | | 1,395,328 | | | | (991 | ) | | | (2,973 | ) |
| Las Vegas Sands Corp. Expiration: August 2019, Exercise Price: $65.00 | | | 744,534 | | | | (126 | ) | | | (8,820 | ) |
| Marathon Petroleum Corp. Expiration: July 2019, Exercise Price: $60.00 | | | 676,148 | | | | (121 | ) | | | (5,929 | ) |
| Welltower, Inc. Expiration: July 2019, Exercise Price: $85.00 | | | 790,841 | | | | (97 | ) | | | (2,425 | ) |
| TOTAL WRITTEN OPTIONS (Premiums received $94,915) | | | | | | | | | | $ | (94,602 | ) |
Percentages are stated as a percent of net assets.
(a) Each contract is equivalent to 100 shares of common stock.
The accompanying notes are an integral part of these financial statements.
| | |
| | |
LoCorr Macro Strategies Fund, LoCorr Long/Short Commodities Strategy Fund and LoCorr Market Trend Fund -
Consolidated Statements of Assets & Liabilities | | 59 |
| | |
Consolidated Statements of Assets & Liabilities
June 30, 2019 (Unaudited)
| | | LoCorr Macro
Strategies Fund | | | LoCorr Long/Short
Commodities
Strategy Fund | | | LoCorr Market
Trend Fund | |
| Assets | | | | | | | | | |
| Investments, at value (Cost $531,625,256, $254,134,114 and $215,227,999, respectively) | | $ | 539,742,491 | | | $ | 258,737,972 | | | $ | 217,258,247 | |
| Cash (Note 2) | | | 17,500,102 | | | | 36,272 | | | | 16,720,000 | |
| Foreign currency, at value (Cost $13,134,069, $0 and $1,123,301, respectively) | | | 13,234,063 | | | | — | | | | 1,123,301 | |
| Receivable for variation margin on futures contracts | | | 1,699,415 | | | | — | | | | 1,439,593 | |
| Receivable for Fund shares sold | | | 2,319,627 | | | | 1,729,395 | | | | 597,947 | |
| Receivable for securities sold | | | 268,634 | | | | 1,639,342 | | | | 67,378 | |
| Interest receivable | | | 2,922,682 | | | | 1,328,674 | | | | 849,227 | |
| Receivable for unsettled open futures contracts | | | 355,266 | | | | — | | | | 231,036 | |
| Deposits with broker for derivative instruments (Note 2) | | | 39,471,515 | | | | 52,147,729 | | | | 28,562,945 | |
| Unrealized appreciation on forward currency contracts (Note 2) | | | 5,546,920 | | | | — | | | | 255,383 | |
| Advance receipt on swap contracts | | | — | | | | 11,034,228 | | | | — | |
| Prepaid expenses and other assets | | | 149,300 | | | | 68,012 | | | | 51,264 | |
| Total Assets | | | 623,210,015 | | | | 326,721,624 | | | | 267,156,321 | |
| | | | | | | | | | | | | |
| Liabilities | | | | | | | | | | | | |
| Payable for Fund shares redeemed | | $ | 1,079,789 | | | $ | 554,039 | | | $ | 608,786 | |
| Payable for securities purchased | | | 5,381,431 | | | | 2,926,980 | | | | — | |
| Payable for unsettled open futures contracts | | | 287,286 | | | | — | | | | 192,056 | |
| Accrued management fees (Note 5) | | | 859,913 | | | | 394,789 | | | | 323,529 | |
| Accrued Trustees' fees | | | 12,434 | | | | 5,001 | | | | 7,320 | |
| Accrued Rule 12b-1 fees | | | — | | | | 138,723 | | | | 141,896 | |
| Unrealized depreciation on swap contracts (Note 1) | | | — | | | | 2,466,015 | | | | — | |
| Unrealized depreciation on forward currency contracts (Note 2) | | | 9,031,139 | | | | — | | | | 3,516,875 | |
| Accrued expenses and other liabilities | | | 296,704 | | | | 92,689 | | | | 241,261 | |
| Total Liabilities | | | 16,948,696 | | | | 6,578,236 | | | | 5,031,723 | |
| | | | | | | | | | | | | |
| Net Assets | | $ | 606,261,319 | | | $ | 320,143,388 | | | $ | 262,124,598 | |
| | | | | | | | | | | | | |
| Net Assets Consist of: | | | | | | | | | | | | |
| Paid-in capital | | $ | 603,425,311 | | | $ | 317,797,678 | | | $ | 297,326,271 | |
| Total distributable earnings/(losses) | | | 2,836,008 | | | | 2,345,710 | | | | (35,201,673 | ) |
| NET ASSETS | | $ | 606,261,319 | | | $ | 320,143,388 | | | $ | 262,124,598 | |
| | | | | | | | | | | | | |
| Class A Shares | | | | | | | | | | | | |
| Net assets | | $ | 50,112,503 | | | $ | 63,020,742 | | | $ | 20,997,011 | |
| Shares issued and outstanding (unlimited shares authorized, no par value) | | | 5,891,564 | | | | 6,373,508 | | | | 1,972,241 | |
| Net asset value, redemption, and minimum offering price per share(a) | | $ | 8.51 | | | $ | 9.89 | | | $ | 10.65 | |
| Maximum offering price per share ($8.51/0.9425), ($9.89/0.9425), | | $ | 9.03 | | | $ | 10.49 | | | $ | 11.30 | |
| ($10.65/0.9425), respectively(b) | | | | | | | | | | | | |
| | | | | | | | | | | | | |
| Class C Shares | | | | | | | | | | | | |
| Net assets | | $ | 45,866,956 | | | $ | 7,489,258 | | | $ | 17,958,849 | |
| Shares issued and outstanding (unlimited shares authorized, no par value) | | | 5,649,056 | | | | 788,141 | | | | 1,737,772 | |
| Net asset value, redemption, and offering price per share(a) | | $ | 8.12 | | | $ | 9.50 | | | $ | 10.33 | |
| | | | | | | | | | | | | |
| Class I Shares | | | | | | | | | | | | |
| Net assets | | $ | 510,281,860 | | | $ | 249,633,388 | | | $ | 223,168,738 | |
| Shares issued and outstanding (unlimited shares authorized, no par value) | | | 59,037,803 | | | | 24,897,746 | | | | 20,775,212 | |
| Net asset value, redemption, and offering price per share | | $ | 8.64 | | | $ | 10.03 | | | $ | 10.74 | |
(a) | A 1.00% contingent deferred sales charge may apply to redemptions made within twelve months of purchase. The contingent deferred sales charge only applies to Class A share purchases of $1 million or more. |
(b) | On investments of $25,000 or more, the offering price is reduced. |
The accompanying notes are an integral part of these consolidated financial statements.
| | |
| | |
| 60 | | LoCorr Dynamic Equity Fund and LoCorr Spectrum Income Fund - Statements of Assets & Liabilities |
| | |
Statements of Assets & Liabilities
June 30, 2019 (Unaudited)
| | | | LoCorr
Dynamic Equity
Fund | | | | LoCorr
Spectrum
Income Fund | |
| | | | | | | | | |
| Assets | | | | | | | | |
| Investments, at value (Cost $22,401,770 and $72,507,033, respectively) | | $ | 24,715,940 | | | $ | 77,546,692 | |
| Cash (Note 2) | | | 3,015,933 | | | | — | |
| Foreign currency, at value (Cost $2,309,301 and $0, respectively) | | | 2,351,990 | | | | — | |
| Receivable for variation margin on futures contracts | | | 19,903 | | | | — | |
| Receivable for Fund shares sold | | | 167,551 | | | | 108,753 | |
| Receivable for securities sold | | | 684,499 | | | | 908,501 | |
| Dividends, interest and other receivables | | | 22,978 | | | | 319,323 | |
| Deposits with broker for futures contracts | | | 336,110 | | | | — | |
| Deposits with broker for securities sold short (Note 2) | | | 6,186,674 | | | | — | |
| Prepaid expenses and other assets | | | 37,436 | | | | 33,435 | |
| Total Assets | | | 37,539,014 | | | | 78,916,704 | |
| | | | | | | | | |
| Liabilities | | | | | | | | |
| Securities sold short, at value (Proceeds $8,694,559 and $0, respectively) | | $ | 8,916,915 | | | $ | — | |
| Options written, at value (Premiums received $0 and $94,915, respectively) | | | — | | | | 94,602 | |
| Payable for Fund shares redeemed | | | 75,747 | | | | 231,020 | |
| Payable for securities purchased | | | 1,055,298 | | | | 1,723,860 | |
| Payable for distributions | | | — | | | | 108,616 | |
| Dividend payable | | | 13,869 | | | | — | |
| Due to broker for options | | | — | | | | 326,773 | |
| Accrued management fees (Note 5) | | | 16,896 | | | | 80,963 | |
| Accrued Trustees' fees | | | 631 | | | | 1,681 | |
| Accrued Rule 12b-1 fees | | | 19,017 | | | | 71,584 | |
| Accrued expenses and other liabilities | | | 45,071 | | | | 59,361 | |
| Total Liabilities | | | 10,143,444 | | | | 2,698,460 | |
| | | | | | | | | |
| Net Assets | | $ | 27,395,570 | | | $ | 76,218,244 | |
| | | | | | | | | |
| Net Assets Consist of: | | | | | | | | |
| Paid-in capital | | $ | 26,796,187 | | | $ | 102,788,437 | |
| Total distributable earnings/(losses) | | | 599,383 | | | | (26,570,193 | ) |
| NET ASSETS | | $ | 27,395,570 | | | $ | 76,218,244 | |
| | | | | | | | | |
| Class A Shares | | | | | | | | |
| Net assets | | $ | 7,846,619 | | | $ | 26,036,905 | |
| Shares issued and outstanding (unlimited shares authorized, no par value) | | | 697,744 | | | | 3,795,342 | |
| Net asset value, redemption, and minimum offering price per share(a) | | $ | 11.25 | | | $ | 6.86 | (b) |
| Maximum offering price per share ($11.25/0.9425), ($6.86/0.9425), respectively (c) | | $ | 11.93 | | | $ | 7.28 | |
| | | | | | | | | |
| Class C Shares | | | | | | | | |
| Net assets | | $ | 4,547,156 | | | $ | 19,425,633 | |
| Shares issued and outstanding (unlimited shares authorized, no par value) | | | 425,030 | | | | 2,804,762 | |
| Net asset value, redemption, and offering price per share(a) | | $ | 10.70 | | | $ | 6.93 | (b) |
| | | | | | | | | |
| Class I Shares | | | | | | | | |
| Net assets | | $ | 15,001,795 | | | $ | 30,755,706 | |
| Shares issued and outstanding (unlimited shares authorized, no par value) | | | 1,311,613 | | | | 4,492,368 | |
| Net asset value, redemption, and offering price per share | | $ | 11.44 | | | $ | 6.85 | (b) |
(a) | A 1.00% contingent deferred sales charge may apply to redemptions made within twelve months of purchase. The contingent deferred sales charge only applies to Class A share purchases of $1 million or more. |
(b) | Redemptions made within 60 days of purchase may be assessed a redemption fee of 2.00%. |
(c) | On investments of $25,000 or more, the offering price is reduced. |
The accompanying notes are an integral part of these financial statements.
| | |
| | |
LoCorr Macro Strategies Fund, LoCorr Long/Short Commodities Strategy Fund and LoCorr Market Trend Fund -
Consolidated Statements of Operations | | 61 |
| | |
Consolidated Statements of Operations
Six Months Ended June 30, 2019 (Unaudited)
| | | LoCorr Macro
Strategies Fund | | | LoCorr Long/Short
Commodities
Strategy Fund | | | LoCorr Market
Trend Fund | |
| Investment Income | | | | | | | | | |
| Interest income | | $ | 7,691,991 | | | $ | 3,997,464 | | | $ | 3,188,827 | |
| Total Investment Income | | | 7,691,991 | | | | 3,997,464 | | | | 3,188,827 | |
| | | | | | | | | | | | | |
| Expenses | | | | | | | | | | | | |
| Management fees (Note 5) | | | 4,754,411 | | | | 2,174,528 | | | | 2,068,463 | |
| Fund administration fees | | | 112,764 | | | | 58,874 | | | | 81,207 | |
| Fund accounting fees | | | 116,484 | | | | 78,591 | | | | 72,129 | |
| Trustees' fees | | | 27,367 | | | | 12,014 | | | | 15,574 | |
| Transfer agent fees and expenses | | | 383,145 | | | | 217,790 | | | | 191,399 | |
| Custodian fees | | | 19,445 | | | | 8,349 | | | | 11,447 | |
| Registration expenses | | | 32,419 | | | | 32,228 | | | | 29,441 | |
| Rule 12b-1 fee - Class A (Note 5) | | | 62,512 | | | | 78,051 | | | | 29,708 | |
| Rule 12b-1 fee - Class C (Note 5) | | | 238,437 | | | | 36,225 | | | | 95,389 | |
| Legal and audit fees | | | 34,630 | | | | 19,636 | | | | 30,846 | |
| Printing and mailing expenses | | | 53,266 | | | | 9,306 | | | | 42,989 | |
| Other expenses | | | 11,242 | | | | 4,615 | | | | 6,800 | |
| Total expenses before fee recovery to Adviser | | | 5,846,122 | | | | 2,730,207 | | | | 2,675,392 | |
| Fee recovery to Adviser (Note 5) | | | 188,935 | | | | 103,619 | | | | — | |
| Net Expenses | | | 6,035,057 | | | | 2,833,826 | | | | 2,675,392 | |
| Net Investment Income | | | 1,656,934 | | | | 1,163,638 | | | | 513,435 | |
| | | | | | | | | | | | | |
| Realized and Unrealized Gain (Loss) on Investments, Swap Contracts, Forward Currency Contracts, Futures Contracts and Foreign Currency Translation: | | | | | | | | | | | | |
| Net realized gain (loss) on: | | | | | | | | | | | | |
| Investments | | | 692,961 | | | | 614,946 | | | | (252,448 | ) |
| Swap contracts | | | — |
| | | 615,496 | | | | — | |
| Forward currency contracts | | | (2,735,250 | ) | | | — | | | | (1,900,758 | ) |
| Futures contracts | | | 22,158,854 | | | | — | | | | 9,473,419 | |
| Foreign currency translation | | | 972,941 | | | | — | | | | (38,622 | ) |
| Net change in unrealized appreciation (depreciation) on: | | | | | | | | | | | — | |
| Investments | | | 10,773,148 | | | | 4,676,496 | | | | 2,617,353 | |
| Swap contracts | | | — | | | | (6,829,961 | ) | | | — | |
| Forward currency contracts | | | (2,556,937 | ) | | | — | | | | (755,268 | ) |
| Futures contracts | | | 9,874,681 | | | | — | | | | 18,020,012 | |
| Foreign currency translation | | | (138,840 | ) | | | — | | | | — | |
| Net realized and unrealized gain (loss) | | | 39,041,558 | | | | (923,023 | ) | | | 27,163,688 | |
| Net Increase in Net Assets Resulting From Operations | | $ | 40,698,492 | | | $ | 240,615 | | | $ | 27,677,123 | |
The accompanying notes are an integral part of these consolidated financial statements.
| | |
| | |
| 62 | | LoCorr Dynamic Equity Fund and LoCorr Spectrum Income Fund - Statements of Operations |
| | |
Statements of Operations
Six Months Ended June 30, 2019 (Unaudited)
| | | LoCorr Dynamic
Equity Fund | | | LoCorr
Spectrum
Income Fund | |
| Investment Income | | | | | | |
| Dividend and interest income(a) | | $ | 206,548 | | | $ | 1,766,788 | |
| Total Investment Income | | | 206,548 | | | | 1,766,788 | |
| | | | | | | | | |
| Expenses | | | | | | | | |
| Management fees (Note 5) | | | 200,879 | | | | 480,589 | |
| Fund administration fees | | | 28,795 | | | | 30,419 | |
| Fund accounting fees | | | 22,392 | | | | 22,047 | |
| Trustees' fees | | | 1,408 | | | | 3,543 | |
| Transfer agent fees and expenses | | | 41,679 | | | | 63,529 | |
| Custodian fees | | | 20,643 | | | | 3,202 | |
| Registration expenses | | | 22,352 | | | | 23,043 | |
| Rule 12b-1 fee - Class A (Note 5) | | | 10,163 | | | | 31,117 | |
| Rule 12b-1 fee - Class C (Note 5) | | | 25,607 | | | | 97,928 | |
| Legal and audit fees | | | 14,215 | | | | 13,904 | |
| Printing and mailing expenses | | | 4,000 | | | | 15,489 | |
| Other expenses | | | 2,067 | | | | 2,152 | |
| Total expense before dividend and interest expense | | | 394,200 | | | | 786,962 | |
| Dividend expense on securities sold short (Note 2) | | | 103,405 | | | | — | |
| Interest expense | | | — | | | | 528 | |
| Total expenses before fee waiver from Adviser | | | 497,605 | | | | 787,490 | |
| Fee waiver from Adviser (Note 5) | | | (91,924 | ) | | | — | |
| Net Expenses | | | 405,681 | | | | 787,490 | |
| Net Investment Income (Loss) | | | (199,133 | ) | | | 979,298 | |
| | | | | | | | | |
| Realized and Unrealized Gain (Loss) on Investments, Securities Sold Short, Futures Contracts, Foreign Currency Translation and Written Options: | | | | | | | | |
| Net realized gain (loss) on: | | | | | | | | |
| Investments | | | 177,794 | | | | (2,573,284 | ) |
| Securities sold short | | | (751,606 | ) | | | — | |
| Futures contracts | | | 527,419 | | | | — | |
| Foreign currency translation | | | (51,670 | ) | | | — | |
| Written options | | | — | | | | 14,253 | |
| Net change in unrealized appreciation (depreciation) on: | | | | | | | | |
| Investments | | | 4,118,605 | | | | 11,011,942 | |
| Securities sold short | | | (311,391 | ) | | | — | |
| Futures contracts | | | 81,725 | | | | — | |
| Foreign currency translation | | | 42,711 | | | | — | |
| Written options | | | — | | | | 313 | |
| Net realized and unrealized gain | | | 3,833,587 | | | | 8,453,224 | |
| Net Increase in Net Assets Resulting From Operations | | $ | 3,634,454 | | | $ | 9,432,522 | |
(a) Net foreign tax withheld of $7,643 and $1,619, respectively.
The accompanying notes are an integral part of these financial statements.
| | |
| | |
| LoCorr Macro Strategies Fund - Consolidated Statements of Changes in Net Assets | | 63 |
| | |
LoCorr Macro Strategies Fund
Consolidated Statements of Changes in Net Assets
| | | Six Months Ended
June 30, 2019
(Unaudited) | | | Year Ended
December 31, 2018 | |
| | | | | | | |
| Operations | | | | | | | | |
| Net investment income | | $ | 1,656,934 | | | $ | 1,090,770 | |
| Net realized gain (loss) on investments, forward currency contracts, futures contracts and foreign currency translation | | | 21,089,506 | | | | (36,778,521 | ) |
| Net change in unrealized appreciation (depreciation) of investments, forward currency contracts, futures contracts and foreign currency translation | | | 17,952,052 | | | | (6,412,563 | ) |
| Increase (Decrease) in Net Assets Resulting From Operations | | | 40,698,492 | | | | (42,100,314 | ) |
| | | | | | | | | |
| Distributions From Earnings | | | | | | | | |
| Class A | | | — | | | | (1,641,026 | ) |
| Class C | | | — | | | | (1,111,427 | ) |
| Class I | | | — | | | | (14,372,592 | ) |
| Total Distributions From Earnings | | | — | | | | (17,125,045 | ) |
| | | | | | | | | |
| Capital Transactions (Note 6) | | | | | | | | |
| Proceeds from shares sold | | | 165,304,950 | | | | 326,669,713 | |
| Reinvestment of distributions | | | — | | | | 15,654,959 | |
| Cost of shares redeemed | | | (153,823,390 | ) | | | (518,836,160 | ) |
| Increase (Decrease) in Net Assets From Capital Transactions | | | 11,481,560 | | | | (176,511,488 | ) |
| | | | | | | | | |
| Total Increase (Decrease) in Net Assets | | | 52,180,052 | | | | (235,736,847 | ) |
| | | | | | | | | |
| Net Assets | | | | | | | | |
| Beginning of period | | | 554,081,267 | | | | 789,818,114 | |
| End of period | | $ | 606,261,319 | | | $ | 554,081,267 | |
The accompanying notes are an integral part of these consolidated financial statements.
| | |
| | |
| 64 | | LoCorr Long/Short Commodities Strategy Fund - Consolidated Statements of Changes in Net Assets |
| | |
LoCorr Long/Short Commodities Strategy Fund
Consolidated Statements of Changes in Net Assets
| | | Six Months Ended
June 30, 2019
(Unaudited) | | | Year Ended
December 31, 2018 | |
| | | | | | | |
| | | | | | | |
| Operations | | | | | | | | |
| Net investment income | | $ | 1,163,638 | | | $ | 461,665 | |
| Net realized gain on investments and swap contracts | | | 1,230,442 | | | | 4,813,532 | |
| Net change in unrealized appreciation (depreciation) of investments and swap contracts | | | (2,153,465 | ) | | | 16,122,331 | |
| Increase in Net Assets Resulting From Operations | | | 240,615 | | | | 21,397,528 | |
| | | | | | | | | |
| Distributions From Earnings | | | | | | | | |
| Class A | | | — | | | | (5,426,159 | ) |
| Class C | | | — | | | | (652,659 | ) |
| Class I | | | — | | | | (17,507,215 | ) |
| Total Distributions From Earnings | | | — | | | | (23,586,033 | ) |
| | | | | | | | | |
| Capital Transactions (Note 6) | | | | | | | | |
| Proceeds from shares sold | | | 121,145,716 | | | | 195,310,076 | |
| Reinvestment of distributions | | | — | | | | 18,672,560 | |
| Cost of shares redeemed | | | (58,268,966 | ) | | | (38,015,146 | ) |
| Increase in Net Assets From Capital Transactions | | | 62,876,750 | | | | 175,967,490 | |
| | | | | | | | | |
| Total Increase in Net Assets | | | 63,117,365 | | | | 173,778,985 | |
| | | | | | | | | |
| Net Assets | | | | | | | | |
| Beginning of period | | | 257,026,023 | | | | 83,247,038 | |
| End of period | | $ | 320,143,388 | | | $ | 257,026,023 | |
The accompanying notes are an integral part of these consolidated financial statements.
| | |
| | |
| LoCorr Market Trend Fund - Consolidated Statements of Changes in Net Assets | | 65 |
| | |
LoCorr Market Trend Fund
Consolidated Statements of Changes in Net Assets
| | | Six Months Ended
June 30, 2019
(Unaudited) | | | Year Ended
December 31, 2018 | |
| | | | | | | |
| Operations | | | | | | | | |
| Net investment income (loss) | | $ | 513,435 | | | $ | (420,639 | ) |
| Net realized gain (loss) on investments, forward currency contracts, futures contracts and foreign currency translation | | | 7,281,591 | | | | (52,236,535 | ) |
| Net change in unrealized appreciation (depreciation) of investments, forward currency contracts, futures contracts and foreign currency translation | | | 19,882,097 | | | | (31,624,162 | ) |
| Increase (Decrease) in Net Assets Resulting From Operations | | | 27,677,123 | | | | (84,281,336 | ) |
| | | | | | | | | |
| Capital Transactions (Note 6) | | | | | | | | |
| Proceeds from shares sold | | | 53,974,851 | | | | 283,959,578 | |
| Cost of shares redeemed | | | (162,727,928 | ) | | | (523,178,776 | ) |
| Decrease in Net Assets From Capital Transactions | | | (108,753,077 | ) | | | (239,219,198 | ) |
| | | | | | | | | |
| Total Decrease in Net Assets | | | (81,075,954 | ) | | | (323,500,534 | ) |
| | | | | | | | | |
| Net Assets | | | | | | | | |
| Beginning of period | | | 343,200,552 | | | | 666,701,086 | |
| End of period | | $ | 262,124,598 | | | $ | 343,200,552 | |
The accompanying notes are an integral part of these consolidated financial statements.
| | |
| | |
| 66 | | LoCorr Dynamic Equity Fund - Statements of Changes in Net Assets |
| | |
LoCorr Dynamic Equity Fund
Statements of Changes in Net Assets
| | | Six Months Ended
June 30, 2019
(Unaudited) | | | Year Ended
December 31, 2018 | |
| | | | | | | |
| Operations | | | | | | | | |
| Net investment loss | | $ | (199,133 | ) | | $ | (1,110,481 | ) |
| Net realized gain (loss) on investments, securities sold short, futures contracts and foreign currency translation | | | (98,063 | ) | | | 2,095,066 | |
| Net change in unrealized appreciation (depreciation) of investments, securities sold short, futures contracts and foreign currency translation | | | 3,931,650 | | | | (7,056,676 | ) |
| Increase (Decrease) in Net Assets Resulting From Operations | | | 3,634,454 | | | | (6,072,091 | ) |
| | | | | | | | | |
| Distributions From Earnings | | | | | | | | |
| Class A | | | — | | | | (323,018 | ) |
| Class C | | | — | | | | (208,891 | ) |
| Class I | | | — | | | | (630,416 | ) |
| Total Distributions From Earnings | | | — | | | | (1,162,325 | ) |
| | | | | | | | | |
| Capital Transactions (Note 6) | | | | | | | | |
| Proceeds from shares sold | | | 5,830,916 | | | | 11,732,272 | |
| Reinvestment of distributions | | | — | | | | 1,093,095 | |
| Cost of shares redeemed | | | (12,342,696 | ) | | | (39,145,301 | ) |
| Decrease in Net Assets From Capital Transactions | | | (6,511,780 | ) | | | (26,319,934 | ) |
| | | | | | | | | |
| Total Decrease in Net Assets | | | (2,877,326 | ) | | | (33,554,350 | ) |
| | | | | | | | | |
| Net Assets | | | | | | | | |
| Beginning of period | | | 30,272,896 | | | | 63,827,246 | |
| End of period | | $ | 27,395,570 | | | $ | 30,272,896 | |
The accompanying notes are an integral part of these financial statements.
| | |
| | |
| LoCorr Spectrum Income Fund - Statements of Changes in Net Assets | | 67 |
| | |
LoCorr Spectrum Income Fund
Statements of Changes in Net Assets
| | | Six Months Ended
June 30, 2019
(Unaudited) | | | Year Ended
December 31, 2018 | |
| | | | | | | |
| Operations | | | | | | | | |
| Net investment income | | $ | 979,298 | | | $ | 2,402,701 | |
| Net realized gain (loss) on investments and written options | | | (2,559,031 | ) | | | 2,771 | |
| Net change in unrealized appreciation (depreciation) of investments and written options | | | 11,012,255 | | | | (9,102,504 | ) |
| Increase (Decrease) in Net Assets Resulting From Operations | | | 9,432,522 | | | | (6,697,032 | ) |
| | | | | | | | | |
| Distributions From Earnings | | | | | | | | |
| | | | | | | | | |
| Net investment income: | | | | | | | | |
| Class A | | | (976,423 | ) | | | (956,505 | ) |
| Class C | | | (671,687 | ) | | | (681,277 | ) |
| Class I | | | (1,219,093 | ) | | | (1,262,271 | ) |
| Return of capital: | | | | | | | | |
| Class A | | | — | | | | (1,144,116 | ) |
| Class C | | | — | | | | (814,904 | ) |
| Class I | | | — | | | | (1,509,857 | ) |
| Total Distributions From Earnings | | | (2,867,203 | ) | | | (6,368,930 | ) |
| | | | | | | | | |
| Capital Transactions (Note 6) | | | | | | | | |
| Proceeds from shares sold | | | 14,940,979 | | | | 24,514,502 | |
| Reinvestment of distributions | | | 2,151,350 | | | | 4,713,777 | |
| Cost of shares redeemed | | | (15,759,846 | ) | | | (44,379,996 | ) |
| Redemption fees | | | 482 | | | | 25,115 | |
| Increase (Decrease) in Net Assets From Capital Transactions | | | 1,332,965 | | | | (15,126,602 | ) |
| | | | | | | | | |
| Total Increase (Decrease) in Net Assets | | | 7,898,284 | | | | (28,192,564 | ) |
| | | | | | | | | |
| Net Assets | | | | | | | | |
| Beginning of period | | | 68,319,960 | | | | 96,512,524 | |
| End of period | | $ | 76,218,244 | | | $ | 68,319,960 | |
The accompanying notes are an integral part of these financial statements.
| | |
| | |
| 68 | | LoCorr Macro Strategies Fund - Consolidated Financial Highlights - Class A |
| | |
LoCorr Macro Strategies Fund - Class A
Consolidated Financial Highlights
Selected Data and Ratios (for a share outstanding throughout the period)
| | | Six Months Ended June 30, 2019* | | | Year Ended December 31, |
| | | (Unaudited) | | | 2018 | | | 2017 | | | 2016 | | | 2015 | | | 2014 | |
| | | | | | | | | | | | | | | | | | | |
| Per Share | | | | | | | | | | | | | | | | | | | | | | | | |
| Net asset value, beginning of period | | $ | 7.95 | | | $ | 8.64 | | | $ | 8.91 | | | $ | 8.54 | | | $ | 8.51 | | | $ | 8.28 | |
| | | | | | | | | | | | | | | | | | | | | | | | | |
| Income (loss) from investment operations: | | | | | | | | | | | | | | | | | | | | | | | | |
| Net investment income (loss)(a) | | | 0.02 | | | | 0.00 | (b) | | | (0.06 | ) | | | (0.09 | ) | | | (0.08 | ) | | | (0.08 | ) |
| Net realized and unrealized gain (loss) | | | 0.54 | | | | (0.46 | ) | | | 0.31 | | | | 0.64 | | | | 0.36 | | | | 1.36 | |
| Total from Investment Operations | | | 0.56 | | | | (0.46 | ) | | | 0.25 | | | | 0.55 | | | | 0.28 | | | | 1.28 | |
| | | | | | | | | | | | | | | | | | | | | | | | | |
| Distributions From Earnings: | | | | | | | | | | | | | | | | | | | | | | | | |
| Net investment income | | | — | | | | (0.10 | ) | | | — | | | | — | | | | (0.25 | ) | | | (1.04 | ) |
| Net realized gains | | | — | | | | (0.13 | ) | | | (0.52 | ) | | | (0.18 | ) | | | — | | | | (0.01 | ) |
| Total Distributions | | | — | | | | (0.23 | ) | | | (0.52 | ) | | | (0.18 | ) | | | (0.25 | ) | | | (1.05 | ) |
| | | | | | | | | | | | | | | | | | | | | | | | | |
| Redemption Fees | | | — | | | | — | | | | 0.00 | (b) | | | 0.00 | (b) | | | 0.00 | (b) | | | 0.00 | (b) |
| | | | | | | | | | | | | | | | | | | | | | | | | |
| Net Asset Value, End of Period | | $ | 8.51 | | | $ | 7.95 | | | $ | 8.64 | | | $ | 8.91 | | | $ | 8.54 | | | $ | 8.51 | |
| | | | | | | | | | | | | | | | | | | | | | | | | |
| Total Investment Return(c) | | | 7.04 | % | | | (5.36 | )% | | | 2.77 | % | | | 6.39 | % | | | 3.27 | % | | | 15.42 | % |
| | | | | | | | | | | | | | | | | | | | | | | | | |
| Net Assets, End of Period, in Thousands | | $ | 50,112 | | | $ | 55,075 | | | $ | 93,182 | | | $ | 297,844 | | | $ | 229,427 | | | $ | 206,931 | |
| | | | | | | | | | | | | | | | | | | | | | | | | |
| Ratios/Supplemental Data: | | | | | | | | | | | | | | | | | | | | | | | | |
| Ratio of expenses to average net assets: | | | | | | | | | | | | | | | | | | | | | | | | |
| Before expense waiver or recovery | | | 2.17 | % | | | 2.25 | % | | | 2.33 | % | | | 2.34 | %(d)(e) | | | 2.06 | %(d)(e) | | | 2.11 | %(d) |
| After expense waiver or recovery | | | 2.24 | % | | | 2.24 | % | | | 2.28 | % | | | 2.34 | %(d)(e) | | | 2.06 | %(d)(e) | | | 2.11 | %(d) |
| | | | | | | | | | | | | | | | | | | | | | | | | |
| Ratio of net investment income (loss) to average net assets: | | | | | | | | | | | | | | | | | | | | | | | | |
| Before expense waiver or recovery | | | 0.50 | % | | | 0.03 | % | | | (0.76 | )% | | | (0.96 | )%(d) | | | (0.90 | )%(d) | | | (0.94 | )%(d) |
| After expense waiver or recovery | | | 0.43 | % | | | 0.04 | % | | | (0.71 | )% | | | (0.96 | )%(d) | | | (0.90 | )%(d) | | | (0.94 | )%(d) |
| | | | | | | | | | | | | | | | | | | | | | | | | |
| Portfolio turnover rate(f) | | | 45 | % | | | 105 | % | | | 97 | % | | | 62 | % | | | 53 | % | | | 57 | % |
* All ratios have been annualized except total investment return and portfolio turnover.
| (a) | Net investment income (loss) per share is based on average shares outstanding. |
| (b) | Amount represents less than $0.005 per share. |
| (c) | Total investment return excludes the effect of applicable sales charges. |
| (d) | Ratios do not include the income and expenses of the CTAs included in the swap. |
| (e) | Includes interest expense of 0.01% and 0.00% for the years ended December 31, 2016 and 2015, respectively. |
| (f) | Portfolio turnover rate is calculated on the basis of the Fund as a whole without distinguishing between classes of shares issued. Consists of long-term investments only; excludes derivative instruments. |
The accompanying notes are an integral part of these consolidated financial statements.
| | |
| | |
| LoCorr Macro Strategies Fund - Consolidated Financial Highlights - Class C | | 69 |
| | |
LoCorr Macro Strategies Fund - Class C
Consolidated Financial Highlights
Selected Data and Ratios (for a share outstanding throughout the period)
| | | Six Months Ended June 30, 2019* | | | Year Ended December 31, |
| | | (Unaudited) | | | 2018 | | | 2017 | | | 2016 | | | 2015 | | | 2014 | |
| | | | | | | | | | | | | | | | | | | |
| Per Share | | | | | | | | | | | | | | | | | | | | | | | | |
| Net asset value, beginning of period | | $ | 7.62 | | | $ | 8.27 | | | $ | 8.62 | | | $ | 8.32 | | | $ | 8.30 | | | $ | 8.12 | |
| | | | | | | | | | | | | | | | | | | | | | | | | |
| Income (loss) from investment operations: | | | | | | | | | | | | | | | | | | | | | | | | |
| Net investment income (loss)(a) | | | (0.01 | ) | | | (0.06 | ) | | | (0.13 | ) | | | (0.15 | ) | | | (0.14 | ) | | | (0.15 | ) |
| Net realized and unrealized gain (loss) | | | 0.51 | | | | (0.43 | ) | | | 0.30 | | | | 0.63 | | | | 0.35 | | | | 1.33 | |
| Total from Investment Operations | | | 0.50 | | | | (0.49 | ) | | | 0.17 | | | | 0.48 | | | | 0.21 | | | | 1.18 | |
| | | | | | | | | | | | | | | | | | | | | | | | | |
| Distributions From Earnings: | | | | | | | | | | | | | | | | | | | | | | | | |
| Net investment income | | | — | | | | (0.03 | ) | | | — | | | | — | | | | (0.19 | ) | | | (0.99 | ) |
| Net realized gains | | | — | | | | (0.13 | ) | | | (0.52 | ) | | | (0.18 | ) | | | — | | | | (0.01 | ) |
| Total Distributions | | | — | | | | (0.16 | ) | | | (0.52 | ) | | | (0.18 | ) | | | (0.19 | ) | | | (1.00 | ) |
| | | | | | | | | | | | | | | | | | | | | | | | | |
| Redemption Fees | | | — | | | | — | | | | 0.00 | (b) | | | 0.00 | (b) | | | 0.00 | (b) | | | 0.00 | (b) |
| | | | | | | | | | | | | | | | | | | | | | | | | |
| Net Asset Value, End of Period | | $ | 8.12 | | | $ | 7.62 | | | $ | 8.27 | | | $ | 8.62 | | | $ | 8.32 | | | $ | 8.30 | |
| | | | | | | | | | | | | | | | | | | | | | | | | |
| Total Investment Return(c) | | | 6.56 | % | | | (5.98 | )% | | | 1.93 | % | | | 5.72 | % | | | 2.51 | % | | | 14.39 | % |
| | | | | | | | | | | | | | | | | | | | | | | | | |
| Net Assets, End of Period, in Thousands | | $ | 45,867 | | | $ | 53,148 | | | $ | 90,653 | | | $ | 113,814 | | | $ | 98,729 | | | $ | 93,924 | |
| | | | | | | | | | | | | | | | | | | | | | | | | |
| Ratios/Supplemental Data: | | | | | | | | | | | | | | | | | | | | | | | | |
| Ratio of expenses to average net assets: | | | | | | | | | | | | | | | | | | | | | | | | |
| Before expense waiver or recovery | | | 2.92 | % | | | 3.00 | % | | | 3.08 | % | | | 3.09 | %(d)(e) | | | 2.81 | %(d)(e) | | | 2.86 | %(d) |
| After expense waiver or recovery | | | 2.99 | % | | | 2.99 | % | | | 3.03 | % | | | 3.09 | %(d)(e) | | | 2.81 | %(d)(e) | | | 2.86 | %(d) |
| | | | | | | | | | | | | | | | | | | | | | | | | |
| Ratio of net investment income (loss) to average net assets: | | | | | | | | | | | | | | | | | | | | | | | | |
| Before expense waiver or recovery | | | (0.25 | )% | | | (0.72 | )% | | | (1.51 | )% | | | (1.71 | )%(d) | | | (1.65 | )%(d) | | | (1.69 | )%(d) |
| After expense waiver or recovery | | | (0.32 | )% | | | (0.71 | )% | | | (1.46 | )% | | | (1.71 | )%(d) | | | (1.65 | )%(d) | | | (1.69 | )%(d) |
| | | | | | | | | | | | | | | | | | | | | | | | | |
| Portfolio turnover rate(f) | | | 45 | % | | | 105 | % | | | 97 | % | | | 62 | % | | | 53 | % | | | 57 | % |
* All ratios have been annualized except total investment return and portfolio turnover.
| (a) | Net investment income (loss) per share is based on average shares outstanding. |
| (b) | Amount represents less than $0.005 per share. |
| (c) | Total investment return excludes the effect of applicable sales charges. |
| (d) | Ratios do not include the income and expenses of the CTAs included in the swap. |
| (e) | Includes interest expense of 0.01% and 0.00% for the years ended December 31, 2016 and 2015, respectively. |
| (f) | Portfolio turnover rate is calculated on the basis of the Fund as a whole without distinguishing between classes of shares issued. Consists of long-term investments only; excludes derivative instruments. |
The accompanying notes are an integral part of these consolidated financial statements.
| | |
| | |
| 70 | | LoCorr Macro Strategies Fund - Consolidated Financial Highlights - Class I |
| | |
LoCorr Macro Strategies Fund - Class I
Consolidated Financial Highlights
Selected Data and Ratios (for a share outstanding throughout the period)
| | | Six Months Ended June 30, 2019* | | | Year Ended December 31, |
| | | (Unaudited) | | | 2018 | | | 2017 | | | 2016 | | | 2015 | | | 2014 | |
| | | | | | | | | | | | | | | | | | | |
| Per Share | | | | | | | | | | | | | | | | | | | | | | | | |
| Net asset value, beginning of period | | $ | 8.07 | | | $ | 8.77 | | | $ | 9.01 | | | $ | 8.62 | | | $ | 8.57 | | | $ | 8.34 | |
| | | | | | | | | | | | | | | | | | | | | | | | | |
| Income (loss) from investment operations: | | | | | | | | | | | | | | | | | | | | | | | | |
| Net investment income (loss)(a) | | | 0.03 | | | | 0.02 | | | | (0.04 | ) | | | (0.07 | ) | | | (0.06 | ) | | | (0.06 | ) |
| Net realized and unrealized gain (loss) | | | 0.54 | | | | (0.47 | ) | | | 0.32 | | | | 0.64 | | | | 0.38 | | | | 1.36 | |
| Total from Investment Operations | | | 0.57 | | | | (0.45 | ) | | | 0.28 | | | | 0.57 | | | | 0.32 | | | | 1.30 | |
| | | | | | | | | | | | | | | | | | | | | | | | | |
| Distributions From Earnings: | | | | | | | | | | | | | | | | | | | | | | | | |
| Net investment income | | | — | | | | (0.12 | ) | | | — | | | | 0.00 | (b) | | | (0.27 | ) | | | (1.06 | ) |
| Net realized gains | | | — | | | | (0.13 | ) | | | (0.52 | ) | | | (0.18 | ) | | | — | | | | (0.01 | ) |
| Total Distributions | | | — | | | | (0.25 | ) | | | (0.52 | ) | | | (0.18 | ) | | | (0.27 | ) | | | (1.07 | ) |
| | | | | | | | | | | | | | | | | | | | | | | | | |
| Redemption Fees | | | — | | | | — | | | | 0.00 | (b) | | | 0.00 | (b) | | | 0.00 | (b) | | | 0.00 | (b) |
| | | | | | | | | | | | | | | | | | | | | | | | | |
| Net Asset Value, End of Period | | $ | 8.64 | | | $ | 8.07 | | | $ | 8.77 | | | $ | 9.01 | | | $ | 8.62 | | | $ | 8.57 | |
| | | | | | | | | | | | | | | | | | | | | | | | | |
| Total Investment Return | | | 7.19 | % | | | (5.08 | )% | | | 3.07 | % | | | 6.57 | % | | | 3.72 | % | | | 15.56 | % |
| | | | | | | | | | | | | | | | | | | | | | | | | |
| Net Assets, End of Period, in Thousands | | $ | 510,282 | | | $ | 445,858 | | | $ | 605,983 | | | $ | 471,002 | | | $ | 192,309 | | | $ | 190,052 | |
| | | | | | | | | | | | | | | | | | | | | | | | | |
| Ratios/Supplemental Data: | | | | | | | | | | | | | | | | | | | | | | | | |
| Ratio of expenses to average net assets: | | | | | | | | | | | | | | | | | | | | | | | | |
| Before expense waiver or recovery | | | 1.92 | % | | | 2.00 | % | | | 2.08 | % | | | 2.09 | %(c)(d) | | | 1.81 | %(c)(d) | | | 1.86 | %(c) |
| After expense waiver or recovery | | | 1.99 | % | | | 1.99 | % | | | 2.03 | % | | | 2.09 | %(c)(d) | | | 1.81 | %(c)(d) | | | 1.86 | %(c) |
| | | | | | | | | | | | | | | | | | | | | | | | | |
| Ratio of net investment income (loss) to average net assets: | | | | | | | | | | | | | | | | | | | | | | | | |
| Before expense waiver or recovery | | | 0.75 | % | | | 0.28 | % | | | (0.51 | )% | | | (0.71 | )%(c) | | | (0.65 | )%(c) | | | (0.69 | )%(c) |
| After expense waiver or recovery | | | 0.68 | % | | | 0.29 | % | | | (0.46 | )% | | | (0.71 | )%(c) | | | (0.65 | )%(c) | | | (0.69 | )%(c) |
| | | | | | | | | | | | | | | | | | | | | | | | | |
| Portfolio turnover rate(e) | | | 45 | % | | | 105 | % | | | 97 | % | | | 62 | % | | | 53 | % | | | 57 | % |
* All ratios have been annualized except total investment return and portfolio turnover.
| (a) | Net investment income (loss) per share is based on average shares outstanding. |
| (b) | Amount represents less than $0.005 per share. |
| (c) | Ratios do not include the income and expenses of the CTAs included in the swap. |
| (d) | Includes interest expense of 0.01% and 0.00% for the years ended December 31, 2016 and 2015, respectively. |
| (e) | Portfolio turnover rate is calculated on the basis of the Fund as a whole without distinguishing between classes of shares issued. Consists of long-term investments only; excludes derivative instruments. |
The accompanying notes are an integral part of these consolidated financial statements.
| | |
| | |
| LoCorr Long/Short Commodities Strategy Fund - Consolidated Financial Highlights - Class A | | 71 |
| | |
LoCorr Long/Short Commodities Strategy Fund - Class A
Consolidated Financial Highlights
Selected Data and Ratios (for a share outstanding throughout the period)
| | | Six Months Ended June 30, 2019* | | | Year Ended December 31, |
| | | (Unaudited) | | | 2018 | | | 2017 | | | 2016 | | | 2015 | | | 2014 | |
| | | | | | | | | | | | | | | | | | | |
| Per Share | | | | | | | | | | | | | | | | | | | | | | | | |
| Net asset value, beginning of period | | $ | 9.90 | | | $ | 9.71 | | | $ | 9.17 | | | $ | 9.72 | | | $ | 8.54 | | | $ | 7.67 | |
| | | | | | | | | | | | | | | | | | | | | | | | | |
| Income (loss) from investment operations: | | | | | | | | | | | | | | | | | | | | | | | | |
| Net investment income (loss)(a) | | | 0.03 | | | | 0.02 | | | | (0.04 | ) | | | (0.10 | ) | | | (0.13 | ) | | | (0.14 | ) |
| Net realized and unrealized gain (loss) | | | (0.04 | ) | | | 1.39 | | | | 0.58 | | | | (0.18 | ) | | | 2.02 | | | | 1.85 | |
| Total from Investment Operations | | | (0.01 | ) | | | 1.41 | | | | 0.54 | | | | (0.28 | ) | | | 1.89 | | | | 1.71 | |
| | | | | | | | | | | | | | | | | | | | | | | | | |
| Distributions From Earnings: | | | | | | | | | | | | | | | | | | | | | | | | |
| Net investment income | | | — | | | | (1.22 | ) | | | 0.00 | (b) | | | (0.27 | ) | | | (0.71 | ) | | | (0.84 | ) |
| Total Distributions | | | — | | | | (1.22 | ) | | | 0.00 | | | | (0.27 | ) | | | (0.71 | ) | | | (0.84 | ) |
| | | | | | | | | | | | | | | | | | | | | | | | | |
| Redemption Fees | | | — | | | | — | | | | 0.00 | (b) | | | 0.00 | (b) | | | 0.00 | (b) | | | 0.00 | (b) |
| | | | | | | | | | | | | | | | | | | | | | | | | |
| Net Asset Value, End of Period | | $ | 9.89 | | | $ | 9.90 | | | $ | 9.71 | | | $ | 9.17 | | | $ | 9.72 | | | $ | 8.54 | |
| | | | | | | | | | | | | | | | | | | | | | | | | |
| Total Investment Return(c) | | | (0.10 | )% | | | 15.05 | % | | | 5.91 | % | | | (2.98 | )% | | | 22.34 | % | | | 22.07 | % |
| | | | | | | | | | | | | | | | | | | | | | | | | |
| Net Assets, End of Period, in Thousands | | $ | 63,021 | | | $ | 68,719 | | | $ | 25,575 | | | $ | 34,860 | | | $ | 24,425 | | | $ | 43,345 | |
| | | | | | | | | | | | | | | | | | | | | | | | | |
| Ratio/Supplemental Data:(d) | | | | | | | | | | | | | | | | | | | | | | | | |
| Ratio of expenses to average net assets: | | | | | | | | | | | | | | | | | | | | | | | | |
| Before expense waiver or recovery | | | 2.06 | % | | | 2.16 | % | | | 2.28 | % | | | 2.22 | %(e) | | | 2.59 | %(e) | | | 3.01 | %(e) |
| After expense waiver or recovery | | | 2.13 | % | | | 2.20 | % | | | 2.20 | % | | | 2.20 | %(e) | | | 2.20 | %(e) | | | 2.20 | %(e) |
| | | | | | | | | | | | | | | | | | | | | | | | | |
| Ratio of net investment income (loss) to average net assets: | | | | | | | | | | | | | | | | | | | | | | | | |
| Before expense waiver or recovery | | | 0.70 | % | | | 0.22 | % | | | (0.52 | )% | | | (0.99 | )% | | | (1.79 | )% | | | (2.39 | )% |
| After expense waiver or recovery | | | 0.63 | % | | | 0.18 | % | | | (0.44 | )% | | | (0.97 | )% | | | (1.40 | )% | | | (1.58 | )% |
| | | | | | | | | | | | | | | | | | | | | | | | | |
| Portfolio turnover rate(f) | | | 48 | % | | | 92 | % | | | 74 | % | | | 105 | % | | | 164 | % | | | 55 | % |
* All ratios have been annualized except total investment return and portfolio turnover.
| (a) | Net investment income (loss) per share is based on average shares outstanding. |
| (b) | Amount represents less than $0.005 per share. |
| (c) | Total investment return excludes the effect of applicable sales charges. |
| (d) | Ratios do not include the income and expenses of the CTAs included in the swap. |
| (e) | Includes interest expense of 0.01% and 0.00% for the years ended December 31, 2016 and 2015, respectively. |
| (f) | Portfolio turnover rate is calculated on the basis of the Fund as a whole without distinguishing between classes of shares issued. Consists of long-term investments only; excludes derivative instruments. |
The accompanying notes are an integral part of these consolidated financial statements.
| | |
| | |
| 72 | | LoCorr Long/Short Commodities Strategy Fund - Consolidated Financial Highlights - Class C |
| | |
LoCorr Long/Short Commodities Strategy Fund - Class C
Consolidated Financial Highlights
Selected Data and Ratios (for a share outstanding throughout the period)
| | | Six Months Ended June 30, 2019* | | | Year Ended December 31, |
| | | (Unaudited) | | | 2018 | | | 2017 | | | 2016 | | | 2015 | | | 2014 | |
| | | | | | | | | | | | | | | | | | | |
| Per Share | | | | | | | | | | | | | | | | | | | | | | | | |
| Net asset value, beginning of period | | $ | 9.55 | | | $ | 9.41 | | | $ | 8.95 | | | $ | 9.51 | | | $ | 8.36 | | | $ | 7.54 | |
| | | | | | | | | | | | | | | | | | | | | | | | | |
| Income (loss) from investment operations: | | | | | | | | | | | | | | | | | | | | | | | | |
| Net investment income (loss)(a) | | | (0.01 | ) | | | (0.06 | ) | | | (0.11 | ) | | | (0.17 | ) | | | (0.19 | ) | | | (0.20 | ) |
| Net realized and unrealized gain (loss) | | | (0.04 | ) | | | 1.35 | | | | 0.57 | | | | (0.18 | ) | | | 1.96 | | | | 1.80 | |
| Total from Investment Operations | | | (0.05 | ) | | | 1.29 | | | | 0.46 | | | | (0.35 | ) | | | 1.77 | | | | 1.60 | |
| | | | | | | | | | | | | | | | | | | | | | | | | |
| Distributions From Earnings: | | | | | | | | | | | | | | | | | | | | | | | | |
| Net investment income | | | — | | | | (1.15 | ) | | | 0.00 | (b) | | | (0.21 | ) | | | (0.62 | ) | | | (0.78 | ) |
| Total Distributions | | | — | | | | (1.15 | ) | | | 0.00 | | | | (0.21 | ) | | | (0.62 | ) | | | (0.78 | ) |
| | | | | | | | | | | | | | | | | | | | | | | | | |
| Redemption Fees | | | — | | | | — | | | | 0.00 | (b) | | | 0.00 | (b) | | | — | | | | — | |
| | | | | | | | | | | | | | | | | | | | | | | | | |
| Net Asset Value, End of Period | | $ | 9.50 | | | $ | 9.55 | | | $ | 9.41 | | | $ | 8.95 | | | $ | 9.51 | | | $ | 8.36 | |
| | | | | | | | | | | | | | | | | | | | | | | | | |
| Total Investment Return(c) | | | (0.52 | )% | | | 14.20 | % | | | 5.17 | % | | | (3.72 | )% | | | 21.39 | % | | | 21.01 | % |
| | | | | | | | | | | | | | | | | | | | | | | | | |
| Net Assets, End of Period, in Thousands | | $ | 7,489 | | | $ | 6,503 | | | $ | 4,737 | | | $ | 7,383 | | | $ | 4,330 | | | $ | 2,983 | |
| | | | | | | | | | | | | | | | | | | | | | | | | |
| Ratio/Supplemental Data:(d) | | | | | | | | | | | | | | | | | | | | | | | | |
| Ratio of expenses to average net assets: | | | | | | | | | | | | | | | | | | | | | | | | |
| Before expense waiver or recovery | | | 2.81 | % | | | 2.91 | % | | | 3.03 | % | | | 2.97 | %(e) | | | 3.34 | %(e) | | | 3.76 | %(e) |
| After expense waiver or recovery | | | 2.88 | % | | | 2.95 | % | | | 2.95 | % | | | 2.95 | %(e) | | | 2.95 | %(e) | | | 2.95 | %(e) |
| | | | | | | | | | | | | | | | | | | | | | | | | |
| Ratio of net investment income (loss) to average net assets: | | | | | | | | | | | | | | | | | | | | | | | | |
| Before expense waiver or recovery | | | (0.05 | )% | | | (0.53 | )% | | | (1.27 | )% | | | (1.74 | )% | | | (2.54 | )% | | | (3.14 | )% |
| After expense waiver or recovery | | | (0.12 | )% | | | (0.57 | )% | | | (1.19 | )% | | | (1.72 | )% | | | (2.15 | )% | | | (2.33 | )% |
| | | | | | | | | | | | | | | | | | | | | | | | | |
| Portfolio turnover rate(f) | | | 48 | % | | | 92 | % | | | 74 | % | | | 105 | % | | | 164 | % | | | 55 | % |
* All ratios have been annualized except total investment return and portfolio turnover.
| (a) | Net investment income (loss) per share is based on average shares outstanding. |
| (b) | Amount represents less than $0.005 per share. |
| (c) | Total investment return excludes the effect of applicable sales charges. |
| (d) | Ratios do not include the income and expenses of the CTAs included in the swap. |
| (e) | Includes interest expense on line of credit of 0.00%, 0.00% and 0.00% for the years ended December 31, 2016, 2015 and 2014, respectively. |
| (f) | Portfolio turnover rate is calculated on the basis of the Fund as a whole without distinguishing between classes of shares issued. Consists of long-term investments only; excludes derivative instruments. |
The accompanying notes are an integral part of these consolidated financial statements.
| | |
| | |
| LoCorr Long/Short Commodities Strategy Fund - Consolidated Financial Highlights - Class I | | 73 |
| | |
LoCorr Long/Short Commodities Strategy Fund - Class I
Consolidated Financial Highlights
Selected Data and Ratios (for a share outstanding throughout the period)
| | | Six Months Ended June 30, 2019* | | | Year Ended December 31, |
| | | (Unaudited) | | | 2018 | | | 2017 | | | 2016 | | | 2015 | | | 2014 | |
| | | | | | | | | | | | | | | | | | | |
| Per Share | | | | | | | | | | | | | | | | | | | | | | | | |
| Net asset value, beginning of period | | $ | 10.03 | | | $ | 9.81 | | | $ | 9.24 | | | $ | 9.79 | | | $ | 8.59 | | | $ | 7.70 | |
| | | | | | | | | | | | | | | | | | | | | | | | | |
| Income (loss) from investment operations: | | | | | | | | | | | | | | | | | | | | | | | | |
| Net investment income (loss)(a) | | | 0.04 | | | | 0.05 | | | | (0.02 | ) | | | (0.07 | ) | | | (0.11 | ) | | | (0.12 | ) |
| Net realized and unrealized gain (loss) | | | (0.04 | ) | | | 1.41 | | | | 0.59 | | | | (0.18 | ) | | | 2.03 | | | | 1.86 | |
| Total from Investment Operations | | | 0.00 | | | | 1.46 | | | | 0.57 | | | | (0.25 | ) | | | 1.92 | | | | 1.74 | |
| | | | | | | | | | | | | | | | | | | | | | | | | |
| Distributions From Earnings: | | | | | | | | | | | | | | | | | | | | | | | | |
| Net investment income | | | — | | | | (1.24 | ) | | | 0.00 | (b) | | | (0.30 | ) | | | (0.72 | ) | | | (0.85 | ) |
| Total Distributions | | | — | | | | (1.24 | ) | | | 0.00 | | | | (0.30 | ) | | | (0.72 | ) | | | (0.85 | ) |
| | | | | | | | | | | | | | | | | | | | | | | | | |
| Redemption Fees | | | — | | | | — | | | | 0.00 | (b) | | | 0.00 | (b) | | | 0.00 | (b) | | | 0.00 | (b) |
| | | | | | | | | | | | | | | | | | | | | | | | | |
| Net Asset Value, End of Period | | $ | 10.03 | | | $ | 10.03 | | | $ | 9.81 | | | $ | 9.24 | | | $ | 9.79 | | | $ | 8.59 | |
| | | | | | | | | | | | | | | | | | | | | | | | | |
| Total Investment Return | | | 0.00 | % | | | 15.40 | % | | | 6.19 | % | | | (2.67 | )% | | | 22.61 | % | | | 22.36 | % |
| | | | | | | | | | | | | | | | | | | | | | | | | |
| Net Assets, End of Period, in Thousands | | $ | 249,633 | | | $ | 181,804 | | | $ | 52,935 | | | $ | 81,204 | | | $ | 31,166 | | | $ | 12,825 | |
| | | | | | | | | | | | | | | | | | | | | | | | | |
| Ratio/Supplemental Data:(c) | | | | | | | | | | | | | | | | | | | | | | | | |
| Ratio of expenses to average net assets: | | | | | | | | | | | | | | | | | | | | | | | | |
| Before expense waiver or recovery | | | 1.81 | % | | | 1.91 | % | | | 2.03 | % | | | 1.97 | %(d) | | | 2.34 | %(d) | | | 2.76 | %(d) |
| After expense waiver or recovery | | | 1.88 | % | | | 1.95 | % | | | 1.95 | % | | | 1.95 | %(d) | | | 1.95 | %(d) | | | 1.95 | %(d) |
| | | | | | | | | | | | | | | | | | | | | | | | | |
| Ratio of net investment income (loss) to average net assets: | | | | | | | | | | | | | | | | | | | | | | | | |
| Before expense waiver or recovery | | | 0.95 | % | | | 0.47 | % | | | (0.27 | )% | | | (0.74 | )% | | | (1.54 | )% | | | (2.14 | )% |
| After expense waiver or recovery | | | 0.88 | % | | | 0.43 | % | | | (0.19 | )% | | | (0.72 | )% | | | (1.15 | )% | | | (1.33 | )% |
| | | | | | | | | | | | | | | | | | | | | | | | | |
| Portfolio turnover rate(e) | | | 48 | % | | | 92 | % | | | 74 | % | | | 105 | % | | | 164 | % | | | 55 | % |
* All ratios have been annualized except total investment return and portfolio turnover.
| (a) | Net investment income (loss) per share is based on average shares outstanding. |
| (b) | Amount represents less than $0.005 per share. |
| (c) | Ratios do not include the income and expenses of the CTAs included in the swap. |
| (d) | Includes interest expense on line of credit of 0.00%, 0.00% and 0.00% for the years ended December 31, 2016, 2015 and 2014, respectively. |
| (e) | Portfolio turnover rate is calculated on the basis of the Fund as a whole without distinguishing between classes of shares issued. Consists of long-term investments only; excludes derivative instruments. |
The accompanying notes are an integral part of these consolidated financial statements.
| | |
| | |
| 74 | | LoCorr Market Trend Fund - Consolidated Financial Highlights - Class A |
| | |
LoCorr Market Trend Fund - Class A
Consolidated Financial Highlights
Selected Data and Ratios (for a share outstanding throughout the period)
| | | Six Months Ended June 30, 2019* | | | Year Ended December 31, | | | Period from
July 1, 2014
(commencement of
operations)
through | |
| | | (Unaudited) | | | 2018 | | | 2017 | | | 2016 | | | 2015 | | | December 31, 2014* | |
| | | | | | | | | | | | | | | | | | | |
| Per Share | | | | | | | | | | | | | | | | | | |
| Net asset value, beginning of period | | $ | 9.52 | | | $ | 11.03 | | | $ | 10.65 | | | $ | 12.00 | | | $ | 11.44 | | | $ | 10.00 | |
| | | | | | | | | | | | | | | | | | | | | | | | | |
| Income (loss) from investment operations: | | | | | | | | | | | | | | | | | | | | | | | | |
| Net investment income (loss)(a) | | | 0.01 | | | | (0.03 | ) | | | (0.10 | ) | | | (0.15 | ) | | | (0.19 | ) | | | (0.12 | ) |
| Net realized and unrealized gain (loss) | | | 1.12 | | | | (1.48 | ) | | | 0.48 | | | | (1.01 | ) | | | 0.84 | (b) | | | 1.99 | |
| Total from Investment Operations | | | 1.13 | | | | (1.51 | ) | | | 0.38 | | | | (1.16 | ) | | | 0.65 | | | | 1.87 | |
| | | | | | | | | | | | | | | | | | | | | | | | | |
| Distributions From Earnings: | | | | | | | | | | | | | | | | | | | | | | | | |
| Net investment income | | | — | | | | — | | | | — | | | | (0.19 | ) | | | (0.07 | ) | | | (0.25 | ) |
| Net realized gains | | | — | | | | — | | | | — | | | | — | | | | (0.02 | ) | | | (0.18 | ) |
| Total Distributions | | | — | | | | — | | | | — | | | | (0.19 | ) | | | (0.09 | ) | | | (0.43 | ) |
| | | | | | | | | | | | | | | | | | | | | | | | | |
| Redemption Fees | | | — | | | | — | | | | 0.00 | (c) | | | 0.00 | (c) | | | 0.00 | (c) | | | 0.00 | (c) |
| | | | | | | | | | | | | | | | | | | | | | | | | |
| Net Asset Value, End of Period | | $ | 10.65 | | | $ | 9.52 | | | $ | 11.03 | | | $ | 10.65 | | | $ | 12.00 | | | $ | 11.44 | |
| | | | | | | | | | | | | | | | | | | | | | | | | |
| Total Investment Return(d) | | | 11.87 | % | | | (13.69 | )% | | | 3.57 | % | | | (9.71 | )% | | | 5.68 | % | | | 18.74 | % |
| | | | | | | | | | | | | | | | | | | | | | | | | |
| Net Assets, End of Period, in Thousands | | $ | 20,997 | | | $ | 32,082 | | | $ | 61,557 | | | $ | 133,146 | | | $ | 110,324 | | | $ | 13,337 | |
| | | | | | | | | | | | | | | | | | | | | | | | | |
| Ratio/Supplemental Data: | | | | | | | | | | | | | | | | | | | | | | | | |
| Ratio of expenses to average net assets: | | | | | | | | | | | | | | | | | | | | | | | | |
| Before expense waiver or recovery | | | 2.10 | % | | | 1.99 | % | | | 2.00 | % | | | 2.02 | %(e) | | | 2.03 | % | | | 3.64 | % |
| After expense waiver or recovery | | | 2.10 | % | | | 1.99 | % | | | 2.00 | % | | | 2.02 | %(e) | | | 2.06 | % | | | 2.20 | % |
| | | | | | | | | | | | | | | | | | | | | | | | | |
| Ratio of net investment income (loss) to average net assets: | | | | | | | | | | | | | | | | | | | | | | | | |
| Before expense waiver or recovery | | | 0.21 | % | | | (0.24 | )% | | | (0.97 | )% | | | (1.24 | )% | | | (1.49 | )% | | | (3.48 | )% |
| After expense waiver or recovery | | | 0.21 | % | | | (0.24 | )% | | | (0.97 | )% | | | (1.24 | )% | | | (1.52 | )% | | | (2.04 | )% |
| | | | | | | | | | | | | | | | | | | | | | | | | |
| Portfolio turnover rate(f) | | | 40 | % | | | 91 | % | | | 85 | % | | | 83 | % | | | 27 | % | | | 6 | % |
* All ratios have been annualized except total investment return and portfolio turnover.
| (a) | Net investment income (loss) per share is based on average shares outstanding. |
| (b) | Realized and unrealized gains and losses per share in this caption are balancing amounts necessary to reconcile the change in net asset value per share for the period, and may not reconcile with the Fund’s consolidated statement of operations due to share transactions for the period. |
| (c) | Amount represents less than $0.005 per share. |
| (d) | Total investment return excludes the effect of applicable sales charges. |
| (e) | Includes 0.00% of interest expense for the year ended December 31, 2016. |
| (f) | Portfolio turnover rate is calculated on the basis of the Fund as a whole without distinguishing between classes of shares issued. Consists of long-term investments only; excludes derivative instruments. |
The accompanying notes are an integral part of these consolidated financial statements.
| | |
| | |
| LoCorr Market Trend Fund - Consolidated Financial Highlights - Class C | | 75 |
| | |
LoCorr Market Trend Fund - Class C
Consolidated Financial Highlights
Selected Data and Ratios (for a share outstanding throughout the period)
| | | Six Months Ended June 30, 2019* | | | Year Ended December 31, | | | Period from
July 1, 2014
(commencement of
operations)
through | |
| | | (Unaudited) | | | 2018 | | | 2017 | | | 2016 | | | 2015 | | | December 31, 2014* | |
| | | | | | | | | | | | | | | | | | | |
| Per Share | | | | | | | | | | | | | | | | | | |
| Net asset value, beginning of period | | $ | 9.28 | | | $ | 10.83 | | | $ | 10.53 | | | $ | 11.92 | | | $ | 11.41 | | | $ | 10.00 | |
| | | | | | | | | | | | | | | | | | | | | | | | | |
| Income (loss) from investment operations: | | | | | | | | | | | | | | | | | | | | | | | | |
| Net investment income (loss)(a) | | | (0.03 | ) | | | (0.10 | ) | | | (0.18 | ) | | | (0.23 | ) | | | (0.28 | ) | | | (0.16 | ) |
| Net realized and unrealized gain (loss) | | | 1.08 | | | | (1.45 | ) | | | 0.48 | | | | (1.01 | ) | | | 0.84 | (b) | | | 1.99 | |
| Total from Investment Operations | | | 1.05 | | | | (1.55 | ) | | | 0.30 | | | | (1.24 | ) | | | 0.56 | | | | 1.83 | |
| | | | | | | | | | | | | | | | | | | | | | | | | |
| Distributions From Earnings: | | | | | | | | | | | | | | | | | | | | | | | | |
| Net investment income | | | — | | | | — | | | | — | | | | (0.15 | ) | | | (0.03 | ) | | | (0.24 | ) |
| Net realized gains | | | — | | | | — | | | | — | | | | — | | | | (0.02 | ) | | | (0.18 | ) |
| Total Distributions | | | — | | | | — | | | | — | | | | (0.15 | ) | | | (0.05 | ) | | | (0.42 | ) |
| | | | | | | | | | | | | | | | | | | | | | | | | |
| Redemption Fees | | | — | | | | — | | | | 0.00 | (c) | | | 0.00 | (c) | | | 0.00 | (c) | | | 0.00 | (c) |
| | | | | | | | | | | | | | | | | | | | | | | | | |
| Net Asset Value, End of Period | | $ | 10.33 | | | $ | 9.28 | | | $ | 10.83 | | | $ | 10.53 | | | $ | 11.92 | | | $ | 11.41 | |
| | | | | | | | | | | | | | | | | | | | | | | | | |
| Total Investment Return(d) | | | 11.42 | % | | | (14.31 | )% | | | 2.85 | % | | | (10.45 | )% | | | 4.90 | % | | | 18.29 | % |
| | | | | | | | | | | | | | | | | | | | | | | | | |
| Net Assets, End of Period, in Thousands | | $ | 17,959 | | | $ | 23,417 | | | $ | 43,772 | | | $ | 89,454 | | | $ | 94,707 | | | $ | 6,949 | |
| | | | | | | | | | | | | | | | | | | | | | | | | |
| Ratio/Supplemental Data: | | | | | | | | | | | | | | | | | | | | | | | | |
| Ratio of expenses to average net assets: | | | | | | | | | | | | | | | | | | | | | | | | |
| Before expense waiver or recovery | | | 2.85 | % | | | 2.74 | % | | | 2.75 | % | | | 2.77 | %(e) | | | 2.78 | % | | | 4.39 | % |
| After expense waiver or recovery | | | 2.85 | % | | | 2.74 | % | | | 2.75 | % | | | 2.77 | %(e) | | | 2.81 | % | | | 2.95 | % |
| | | | | | | | | | | | | | | | | | | | | | | | | |
| Ratio of net investment income (loss) to average net assets: | | | | | | | | | | | | | | | | | | | | | | | | |
| Before expense waiver or recovery | | | (0.54 | )% | | | (0.99 | )% | | | (1.72 | )% | | | (1.99 | )% | | | (2.24 | )% | | | (4.23 | )% |
| After expense waiver or recovery | | | (0.54 | )% | | | (0.99 | )% | | | (1.72 | )% | | | (1.99 | )% | | | (2.27 | )% | | | (2.79 | )% |
| | | | | | | | | | | | | | | | | | | | | | | | | |
| Portfolio turnover rate(f) | | | 40 | % | | | 91 | % | | | 85 | % | | | 83 | % | | | 27 | % | | | 6 | % |
* All ratios have been annualized except total investment return and portfolio turnover.
| (a) | Net investment income (loss) per share is based on average shares outstanding. |
| (b) | Realized and unrealized gains and losses per share in this caption are balancing amounts necessary to reconcile the change in net asset value per share for the period, and may not reconcile with the Fund’s consolidated statement of operations due to share transactions for the period. |
| (c) | Amount represents less than $0.005 per share. |
| (d) | Total investment return excludes the effect of applicable sales charges. |
| (e) | Includes 0.00% of interest expense for the year ended December 31, 2016. |
| (f) | Portfolio turnover rate is calculated on the basis of the Fund as a whole without distinguishing between classes of shares issued. Consists of long-term investments only; excludes derivative instruments. |
The accompanying notes are an integral part of these consolidated financial statements.
| |
| |
| 76 | | LoCorr Market Trend Fund - Consolidated Financial Highlights - Class I |
| |
LoCorr Market Trend Fund - Class I
Consolidated Financial Highlights
Selected Data and Ratios (for a share outstanding throughout the period)
| | | Six Months Ended
June 30, 2019* | | | Year Ended December 31, | | | Period from
July 1, 2014
(commencement of
operations)
through | |
| | | (Unaudited) | | | 2018 | | | 2017 | | | 2016 | | | 2015 | | | December 31, 2014* | |
| | | | | | | | | | | | | | | | | | | |
| Per Share | | | | | | | | | | | | | | | | | | | | | | | | |
| Net asset value, beginning of period | | $ | 9.60 | | | $ | 11.09 | | | $ | 10.68 | | | $ | 12.02 | | | $ | 11.45 | | | $ | 10.00 | |
| | | | | | | | | | | | | | | | | | | | | | | | | |
| Income (loss) from investment operations: | | | | | | | | | | | | | | | | | | | | | | | | |
| Net investment income (loss)(a) | | | 0.02 | | | | 0.00 | (c) | | | (0.08 | ) | | | (0.12 | ) | | | (0.16 | ) | | | (0.10 | ) |
| Net realized and unrealized gain (loss) | | | 1.12 | | | | (1.49 | ) | | | 0.49 | | | | (1.02 | ) | | | 0.84 | (b) | | | 1.99 | |
| Total from Investment Operations | | | 1.14 | | | | (1.49 | ) | | | 0.41 | | | | (1.14 | ) | | | 0.68 | | | | 1.89 | |
| | | | | | | | | | | | | | | | | | | | | | | | | |
| Distributions From Earnings: | | | | | | | | | | | | | | | | | | | | | | | | |
| Net investment income | | | — | | | | — | | | | — | | | | (0.20 | ) | | | (0.09 | ) | | | (0.26 | ) |
| Net realized gains | | | — | | | | — | | | | — | | | | — | | | | (0.02 | ) | | | (0.18 | ) |
| Total Distributions | | | — | | | | — | | | | — | | | | (0.20 | ) | | | (0.11 | ) | | | (0.44 | ) |
| | | | | | | | | | | | | | | | | | | | | | | | | |
| Redemption Fees | | | — | | | | — | | | | 0.00 | (c) | | | 0.00 | (c) | | | 0.00 | (c) | | | 0.00 | (c) |
| | | | | | | | | | | | | | | | | | | | | | | | | |
| Net Asset Value, End of Period | | $ | 10.74 | | | $ | 9.60 | | | $ | 11.09 | | | $ | 10.68 | | | $ | 12.02 | | | $ | 11.45 | |
| | | | | | | | | | | | | | | | | | | | | | | | | |
| Total Investment Return | | | 11.88 | % | | | (13.44 | )% | | | 3.84 | % | | | (9.49 | )% | | | 5.96 | % | | | 18.88 | % |
| | | | | | | | | | | | | | | | | | | | | | | | | |
| Net Assets, End of Period, in Thousands | | $ | 223,169 | | | $ | 287,702 | | | $ | 561,372 | | | $ | 797,845 | | | $ | 695,987 | | | $ | 40,192 | |
| | | | | | | | | | | | | | | | | | | | | | | | | |
| Ratio/Supplemental Data: | | | | | | | | | | | | | | | | | | | | | | | | |
| Ratio of expenses to average net assets: | | | | | | | | | | | | | | | | | | | | |
| Before expense waiver or recovery | | | 1.85 | % | | | 1.74 | % | | | 1.75 | % | | | 1.77 | %(d) | | | 1.78 | % | | | 3.39 | % |
| After expense waiver or recovery | | | 1.85 | % | | | 1.74 | % | | | 1.75 | % | | | 1.77 | %(d) | | | 1.81 | % | | | 1.95 | % |
| | | | | | | | | | | | | | | | | | | | | | | | | |
| Ratio of net investment income (loss) to average net assets: | | | | | | | | | | | | | | | | | |
| Before expense waiver or recovery | | | 0.46 | % | | | 0.01 | % | | | (0.72 | )% | | | (0.99 | )% | | | (1.24 | )% | | | (3.23 | )% |
| After expense waiver or recovery | | | 0.46 | % | | | 0.01 | % | | | (0.72 | )% | | | (0.99 | )% | | | (1.27 | )% | | | (1.79 | )% |
| | | | | | | | | | | | | | | | | | | | | | | | | |
| Portfolio turnover rate(e) | | | 40 | % | | | 91 | % | | | 85 | % | | | 83 | % | | | 27 | % | | | 6 | % |
* All ratios have been annualized except total investment return and portfolio turnover.
| (a) | Net investment income (loss) per share is based on average shares outstanding. |
| (b) | Realized and unrealized gains and losses per share in this caption are balancing amounts necessary to reconcile the change in net asset value per share for the period, and may not reconcile with the Fund’s consolidated statement of operations due to share transactions for the period. |
| (c) | Amount represents less than $0.005 per share. |
(d) | Includes 0.00% of interest expense for the year ended December 31, 2016. |
| (e) | Portfolio turnover rate is calculated on the basis of the Fund as a whole without distinguishing between classes of shares issued. Consists of long-term investments only; excludes derivative instruments. |
The accompanying notes are an integral part of these consolidated financial statements.
| |
| |
| LoCorr Dynamic Equity Fund - Financial Highlights - Class A | | 77 |
| |
LoCorr Dynamic Equity Fund - Class A
Financial Highlights
Selected Data and Ratios (for a share outstanding throughout the period)
| | | Six Months Ended
June 30, 2019* | | | Year Ended December 31, | |
| | | (Unaudited) | | | 2018 | | | 2017 | | | 2016 | | | 2015 | | | 2014 | |
| | | | | | | | | | | | | | | | | | | |
| Per Share | | | | | | | | | | | | | | | | | | | | | | | | |
| Net asset value, beginning of period | | $ | 9.92 | | | $ | 11.82 | | | $ | 12.06 | | | $ | 9.64 | | | $ | 9.80 | | | $ | 11.48 | |
| | | | | | | | | | | | | | | | | | | | | | | | | |
| Income (loss) from investment operations: | | | | | | | | | | | | | | | | | | | | | | | | |
| Net investment income (loss)(a) | | | (0.08 | ) | | | (0.25 | ) | | | (0.30 | ) | | | (0.32 | ) | | | (0.27 | ) | | | (0.22 | ) |
| Net realized and unrealized gain (loss) | | | 1.41 | | | | (1.26 | ) | | | 0.59 | | | | 2.74 | | | | 0.11 | | | | (1.42 | ) |
| Total from Investment Operations | | | 1.33 | | | | (1.51 | ) | | | 0.29 | | | | 2.42 | | | | (0.16 | ) | | | (1.64 | ) |
| | | | | | | | | | | | | | | | | | | | | | | | | |
| Distributions From Earnings: | | | | | | | | | | | | | | | | | | | | | | | | |
| Net realized gains | | | — | | | | (0.39 | ) | | | (0.53 | ) | | | — | | | | — | | | | (0.04 | ) |
| Total Distributions | | | — | | | | (0.39 | ) | | | (0.53 | ) | | | — | | | | – | | | | (0.04 | ) |
| | | | | | | | | | | | | | | | | | | | | | | | | |
| Redemption Fees | | | — | | | | — | | | | 0.00 | (b) | | | 0.00 | (b) | | | 0.00 | (b) | | | 0.00 | (b) |
| | | | | | | | | | | | | | | | | | | | | | | | | |
| Net Asset Value, End of Period | | $ | 11.25 | | | $ | 9.92 | | | $ | 11.82 | | | $ | 12.06 | | | $ | 9.64 | | | $ | 9.80 | |
| | | | | | | | | | | | | | | | | | | | | | | | | |
| Total Investment Return(c) | | | 13.52 | % | | | (12.87 | )% | | | 2.38 | % | | | 25.10 | % | | | (1.53 | )% | | | (14.37 | )% |
| | | | | | | | | | | | | | | | | | | | | | | | | |
| Net Assets, End of Period, in Thousands | | $ | 7,847 | | | $ | 8,473 | | | $ | 19,962 | | | $ | 28,243 | | | $ | 12,446 | | | $ | 17,174 | |
| | | | | | | | | | | | | | | | | | | | | | | | | |
| Ratio/Supplemental Data: | | | | | | | | | | | | | | | | | | | | | | | | |
| Ratio of expenses to average net assets: | | | | | | | | | | | | | | | | | | |
| Before expense waiver or recovery | | | 3.70 | % | | | 3.40 | % | | | 3.42 | % | | | 3.74 | % | | | 3.72 | % | | | 3.55 | % |
| After expense waiver or recovery | | | 3.01 | % | | | 3.21 | % | | | 3.35 | % | | | 3.49 | % | | | 3.35 | % | | | 3.30 | % |
| | | | | | | | | | | | | | | | | | | | | | | | | |
| Ratio of expenses to average net assets (excluding dividend and interest expense): | | | | | | | | | | | | | | | | | |
| Before expense waiver or recovery | | | 2.93 | % | | | 3.20 | % | | | 3.22 | % | | | 3.40 | % | | | 3.52 | % | | | 3.40 | % |
| After expense waiver or recovery | | | 2.24 | % | | | 3.01 | % | | | 3.15 | % | | | 3.15 | % | | | 3.15 | % | | | 3.15 | % |
| | | | | | | | | | | | | | | | | | | | | | | | | |
| Ratio of net investment income (loss) to average net assets: | | | | | | | | | | | | | | | | | |
| Before expense waiver or recovery | | | (2.16 | )% | | | (2.39 | )% | | | (2.61 | )% | | | (3.23 | )% | | | (3.06 | )% | | | (2.41 | )% |
| After expense waiver or recovery | | | (1.47 | )% | | | (2.20 | )% | | | (2.54 | )% | | | (2.98 | )% | | | (2.69 | )% | | | (2.16 | )% |
| | | | | | | | | | | | | | | | | | | | | | | | | |
| Portfolio turnover rate(d) | | | 164 | % | | | 449 | % | | | 363 | % | | | 343 | % | | | 269 | % | | | 256 | % |
* All ratios have been annualized except total investment return and portfolio turnover.
| (a) | Net investment income (loss) per share is based on average shares outstanding. |
| (b) | Amount represents less than $0.005 per share. |
| (c) | Total investment return excludes the effect of applicable sales charges. |
| (d) | Portfolio turnover rate is calculated on the basis of the Fund as a whole without distinguishing between classes of shares issued. Consists of long-term investments only; excludes securities sold short. |
The accompanying notes are an integral part of these financial statements.
| |
| |
| 78 | | LoCorr Dynamic Equity Fund - Financial Highlights - Class C |
| |
LoCorr Dynamic Equity Fund - Class C
Financial Highlights
Selected Data and Ratios (for a share outstanding throughout the period)
| | | Six Months Ended
June 30, 2019* | | | Year Ended December 31, | |
| | | (Unaudited) | | | 2018 | | | 2017 | | | 2016 | | | 2015 | | | 2014 | |
| | | | | | | | | | | | | | | | | | | |
| Per Share | | | | | | | | | | | | | | | | | | | | | | | | |
| Net asset value, beginning of period | | $ | 9.47 | | | $ | 11.39 | | | $ | 11.73 | | | $ | 9.45 | | | $ | 9.67 | | | $ | 11.42 | |
| | | | | | | | | | | | | | | | | | | | | | | | | |
| Income (loss) from investment operations: | | | | | | | | | | | | | | | | | | | | | | | | |
| Net investment income (loss)(a) | | | (0.11 | ) | | | (0.32 | ) | | | (0.38 | ) | | | (0.38 | ) | | | (0.33 | ) | | | (0.29 | ) |
| Net realized and unrealized gain (loss) | | | 1.34 | | | | (1.21 | ) | | | 0.57 | | | | 2.66 | | | | 0.11 | | | | (1.42 | ) |
| Total from Investment Operations | | | 1.23 | | | | (1.53 | ) | | | 0.19 | | | | 2.28 | | | | (0.22 | ) | | | (1.71 | ) |
| | | | | | | | | | | | | | | | | | | | | | | | | |
| Distributions From Earnings: | | | | | | | | | | | | | | | | | | | | | | | | |
| Net realized gains | | | — | | | | (0.39 | ) | | | (0.53 | ) | | | — | | | | — | | | | (0.04 | ) |
| Total Distributions | | | — | | | | (0.39 | ) | | | (0.53 | ) | | | — | | | | — | | | | (0.04 | ) |
| | | | | | | | | | | | | | | | | | | | | | | | | |
| Redemption Fees | | | — | | | | — | | | | 0.00 | (b) | | | 0.00 | (b) | | | 0.00 | (b) | | | 0.00 | (b) |
| | | | | | | | | | | | | | | | | | | | | | | | | |
| Net Asset Value, End of Period | | $ | 10.70 | | | $ | 9.47 | | | $ | 11.39 | | | $ | 11.73 | | | $ | 9.45 | | | $ | 9.67 | |
| | | | | | | | | | | | | | | | | | | | | | | | | |
| Total Investment Return(c) | | | 12.99 | % | | | (13.45 | )% | | | 1.59 | % | | | 24.13 | % | | | (2.28 | )% | | | (14.98 | )% |
| | | | | | | | | | | | | | | | | | | | | | | | | |
| Net Assets, End of Period, in Thousands | | $ | 4,547 | | | $ | 5,255 | | | $ | 11,084 | | | $ | 11,218 | | | $ | 7,837 | | | $ | 12,158 | |
| | | | | | | | | | | | | | | | | | | | | | | | | |
| Ratio/Supplemental Data: | | | | | | | | | | | | | | | | | | | | | | | | |
| Ratio of expenses to average net assets: | | | | | | | | | | | | | | | | | | | | | | | | |
| Before expense waiver or recovery | | | 4.45 | % | | | 4.15 | % | | | 4.17 | % | | | 4.49 | % | | | 4.47 | % | | | 4.30 | % |
| After expense waiver or recovery | | | 3.76 | % | | | 3.96 | % | | | 4.10 | % | | | 4.24 | % | | | 4.10 | % | | | 4.05 | % |
| | | | | | | | | | | | | | | | | | | | | | | | | |
| Ratio of expenses to average net assets (excluding dividend and interest expense): | | | | | | | | | | | | | | | | | | | | | | | | |
| Before expense waiver or recovery | | | 3.68 | % | | | 3.95 | % | | | 3.97 | % | | | 4.15 | % | | | 4.27 | % | | | 4.15 | % |
| After expense waiver or recovery | | | 2.99 | % | | | 3.76 | % | | | 3.90 | % | | | 3.90 | % | | | 3.90 | % | | | 3.90 | % |
| | | | | | | | | | | | | | | | | | | | | | | | | |
| Ratio of net investment income (loss) to average net assets: | | | | | | | | | | | | | | | | | | | | | | | | |
| Before expense waiver or recovery | | | (2.91 | )% | | | (3.14 | )% | | | (3.36 | )% | | | (3.98 | )% | | | (3.81 | )% | | | (3.16 | )% |
| After expense waiver or recovery | | | (2.22 | )% | | | (2.95 | )% | | | (3.29 | )% | | | (3.73 | )% | | | (3.44 | )% | | | (2.91 | )% |
| | | | | | | | | | | | | | | | | | | | | | | | | |
| Portfolio turnover rate(d) | | | 164 | % | | | 449 | % | | | 363 | % | | | 343 | % | | | 269 | % | | | 256 | % |
* All ratios have been annualized except total investment return and portfolio turnover.
| (a) | Net investment income (loss) per share is based on average shares outstanding. |
| (b) | Amount represents less than $0.005 per share. |
| (c) | Total investment return excludes the effect of applicable sales charges. |
| (d) | Portfolio turnover rate is calculated on the basis of the Fund as a whole without distinguishing between classes of shares issued. Consists of long-term investments only; excludes securities sold short. |
The accompanying notes are an integral part of these financial statements.
| |
| |
| LoCorr Dynamic Equity Fund - Financial Highlights - Class I | | 79 |
| |
LoCorr Dynamic Equity Fund - Class I
Financial Highlights
Selected Data and Ratios (for a share outstanding throughout the year)
| | | Six Months Ended
June 30, 2019* | | | Year Ended December 31, | |
| | | (Unaudited) | | | 2018 | | | 2017 | | | 2016 | | | 2015 | | | 2014 | |
| | | | | | | | | | | | | | | | | | | |
| Per Share | | | | | | | | | | | | | | | | | | | | | | | | |
| Net asset value, beginning of period | | $ | 10.07 | | | $ | 11.96 | | | $ | 12.17 | | | $ | 9.71 | | | $ | 9.84 | | | $ | 11.50 | |
| | | | | | | | | | | | | | | | | | | | | | | | | |
| Income (loss) from investment operations: | | | | | | | | | | | | | | | | | | | | | | | | |
| Net investment income (loss)(a) | | | (0.07 | ) | | | (0.23 | ) | | | (0.28 | ) | | | (0.30 | ) | | | (0.24 | ) | | | (0.20 | ) |
| Net realized and unrealized gain (loss) | | | 1.44 | | | | (1.27 | ) | | | 0.60 | | | | 2.76 | | | | 0.11 | | | | (1.42 | ) |
| Total from Investment Operations | | | 1.37 | | | | (1.50 | ) | | | 0.32 | | | | 2.46 | | | | (0.13 | ) | | | (1.62 | ) |
| | | | | | | | | | | | | | | | | | | | | | | | | |
| Distributions From Earnings: | | | | | | | | | | | | | | | | | | | | | | | | |
| Net realized gains | | | — | | | | (0.39 | ) | | | (0.53 | ) | | | — | | | | — | | | | (0.04 | ) |
| Total Distributions | | | — | | | | (0.39 | ) | | | (0.53 | ) | | | — | | | | — | | | | (0.04 | ) |
| | | | | | | | | | | | | | | | | | | | | | | | | |
| Redemption Fees | | | — | | | | — | | | | 0.00 | (b) | | | 0.00 | (b) | | | 0.00 | (b) | | | 0.00 | (b) |
| | | | | | | | | | | | | | | | | | | | | | | | | |
| Net Asset Value, End of Period | | $ | 11.44 | | | $ | 10.07 | | | $ | 11.96 | | | $ | 12.17 | | | $ | 9.71 | | | $ | 9.84 | |
| | | | | | | | | | | | | | | | | | | | | | | | | |
| Total Investment Return | | | 13.60 | % | | | (12.55 | )% | | | 2.60 | % | | | 25.33 | % | | | (1.22 | )% | | | (14.18 | )% |
| | | | | | | | | | | | | | | | | | | | | | | | | |
| Net Assets, End of Period, in Thousands | | $ | 15,002 | | | $ | 16,545 | | | $ | 32,781 | | | $ | 44,816 | | | $ | 9,990 | | | $ | 12,304 | |
| | | | | | | | | | | | | | | | | | | | | | | | | |
| Ratio/Supplemental Data: | | | | | | | | | | | | | | | | | | | | | | | | |
| Ratio of expenses to average net assets: | | | | | | | | | | | | | | | | | | |
| Before expense waiver or recovery | | | 3.45 | % | | | 3.15 | % | | | 3.17 | % | | | 3.49 | % | | | 3.47 | % | | | 3.30 | % |
| After expense waiver or recovery | | | 2.76 | % | | | 2.96 | % | | | 3.10 | % | | | 3.24 | % | | | 3.10 | % | | | 3.05 | % |
| | | | | | | | | | | | | | | | | | | | | | | | | |
| Ratio of expenses to average net assets (excluding dividend and interest expense): | | | | | | | | | | | | | |
| Before expense waiver or recovery | | | 2.68 | % | | | 2.95 | % | | | 2.97 | % | | | 3.15 | % | | | 3.27 | % | | | 3.15 | % |
| After expense waiver or recovery | | | 1.99 | % | | | 2.76 | % | | | 2.90 | % | | | 2.90 | % | | | 2.90 | % | | | 2.90 | % |
| | | | | | | | | | | | | | | | | | | | | | | | | |
| Ratio of net investment income (loss) to average net assets: | | | | | | | | | | | | | | | | | |
| Before expense waiver or recovery | | | (1.91 | )% | | | (2.14 | )% | | | (2.36 | )% | | | (2.98 | )% | | | (2.81 | )% | | | (2.16 | )% |
| After expense waiver or recovery | | | (1.22 | )% | | | (1.95 | )% | | | (2.29 | )% | | | (2.73 | )% | | | (2.44 | )% | | | (1.91 | )% |
| | | | | | | | | | | | | | | | | | | | | | | | | |
| Portfolio turnover rate(c) | | | 164 | % | | | 449 | % | | | 363 | % | | | 343 | % | | | 269 | % | | | 256 | % |
* All ratios have been annualized except total investment return and portfolio turnover.
| (a) | Net investment income (loss) per share is based on average shares outstanding. |
| (b) | Amount represents less than $0.005 per share. |
| (c) | Portfolio turnover rate is calculated on the basis of the Fund as a whole without distinguishing between classes of shares issued. Consists of long-term investments only; excludes securities sold short. |
The accompanying notes are an integral part of these financial statements.
| |
| |
| 80 | | LoCorr Spectrum Income Fund - Financial Highlights - Class A |
| |
LoCorr Spectrum Income Fund - Class A
Financial Highlights
Selected Data and Ratios (for a share outstanding throughout the period)
| | | Six Months Ended
June 30, 2019* | | | Year Ended December 31, | |
| | (Unaudited) | | | | 2018 | | | | 2017 | | | | 2016 | | | | 2015 | | | | 2014 | |
| | | | | | | | | | | | | | | | | | | | | | | | | |
| Per Share | | | | | | | | | | | | | | | | | | | | | | | | |
| Net asset value, beginning of period | | $ | 6.26 | | | $ | 7.39 | | | $ | 7.70 | | | $ | 7.78 | | | $ | 8.97 | | | $ | 10.00 | |
| | | | | | | | | | | | | | | | | | | | | | | | | |
| Income (loss) from investment operations: | | | | | | | | | | | | | | | | | | | | | | | | |
| Net investment income (loss)(a) | | | 0.09 | | | | 0.22 | | | | 0.17 | | | | 0.29 | | | | 0.38 | | | | 0.41 | |
| Net realized and unrealized gain (loss) | | | 0.78 | | | | (0.78 | ) | | | 0.09 | | | | 0.20 | | | | (1.00 | ) | | | (0.91 | ) |
| Total from Investment Operations | | | 0.87 | | | | (0.56 | ) | | | 0.26 | | | | 0.49 | | | | (0.62 | ) | | | (0.50 | ) |
| | | | | | | | | | | | | | | | | | | | | | | | | |
| Distributions From Earnings: | | | | | | | | | | | | | | | | | | | | | | | | |
| Net investment income | | | (0.27 | ) | | | (0.26 | ) | | | (0.15 | ) | | | (0.37 | ) | | | (0.39 | ) | | | (0.36 | ) |
| Return of capital | | | — | | | | (0.31 | ) | | | (0.42 | ) | | | (0.20 | ) | | | (0.18 | ) | | | (0.17 | ) |
| Total Distributions | | | (0.27 | ) | | | (0.57 | ) | | | (0.57 | ) | | | (0.57 | ) | | | (0.57 | ) | | | (0.53 | ) |
| | | | | | | | | | | | | | | | | | | | | | | | | |
| Redemption Fees(b) | | | 0.00 | | | | 0.00 | | | | 0.00 | | | | 0.00 | | | | 0.00 | | | | 0.00 | |
| | | | | | | | | | | | | | | | | | | | | | | | | |
| Net Asset Value, End of Period | | $ | 6.86 | | | $ | 6.26 | | | $ | 7.39 | | | $ | 7.70 | | | $ | 7.78 | | | $ | 8.97 | |
| | | | | | | | | | | | | | | | | | | | | | | | | |
| Total Investment Return(c) | | | 13.94 | % | | | (8.22 | )% | | | 3.50 | % | | | 6.64 | % | | | (7.36 | )% | | | (5.45 | )% |
| | | | | | | | | | | | | | | | | | | | | | | | | |
| Net Assets, End of Period, in Thousands | | $ | 26,037 | | | $ | 22,610 | | | $ | 29,970 | | | $ | 33,032 | | | $ | 36,957 | | | $ | 37,425 | |
| | | | | | | | | | | | | | | | | | | | | | | | | |
| Ratio/Supplemental Data:(d) | | | | | | | | | | | | | | | | | | | | | | | | |
| Ratio of expenses to average net assets: | | | | | | | | | | | | | | | | | | | |
| Before expense waiver or recovery | | | 2.03 | %(e) | | | 1.98 | % | | | 1.95 | % | | | 2.02 | % | | | 1.99 | %(f) | | | 2.28 | %(f) |
| After expense waiver or recovery | | | 2.03 | %(e) | | | 1.98 | % | | | 1.99 | % | | | 2.05 | % | | | 2.05 | %(f) | | | 2.05 | %(f) |
| | | | | | | | | | | | | | | | | | | | | | | | | |
| Ratio of net investment income (loss) to average net assets: | | | | | | | | | | | | | | | | | | | |
| Before expense waiver or recovery | | | 2.75 | % | | | 3.01 | % | | | 2.27 | % | | | 3.81 | % | | | 4.41 | % | | | 3.88 | % |
| After expense waiver or recovery | | | 2.75 | % | | | 3.01 | % | | | 2.23 | % | | | 3.78 | % | | | 4.35 | % | | | 4.11 | % |
| | | | | | | | | | | | | | | | | | | | | | | | | |
| Portfolio turnover rate(g) | | | 50 | % | | | 82 | % | | | 84 | % | | | 92 | % | | | 54 | % | | | 43 | % |
* All ratios have been annualized except total investment return and portfolio turnover.
| (a) | Net investment income (loss) per share is based on average shares outstanding. |
| (b) | Amount represents less than $0.005 per share. |
| (c) | Total investment return excludes the effect of applicable sales charges. |
| (d) | Ratios do not include the expenses of the investment companies in which the Fund invests. |
| (e) | Includes 0.00% of interest expense for the period ended June 30, 2019. |
| (f) | Includes interest expense on line of credit of 0.00% and 0.00% for the years ended December 31, 2015 and 2014, respectively. |
| (g) | Portfolio turnover rate is calculated on the basis of the Fund as a whole without distinguishing between classes of shares issued. |
The accompanying notes are an integral part of these financial statements.
| |
| |
| LoCorr Spectrum Income Fund - Financial Highlights - Class C | | 81 |
| |
LoCorr Spectrum Income Fund - Class C
Financial Highlights
Selected Data and Ratios (for a share outstanding throughout the period)
| | | Six Months Ended
June 30, 2019* | | | Year Ended December 31,, | |
| | | (Unaudited) | | | | 2018 | | | | 2017 | | | | 2016 | | | | 2015 | | | | 2014 | |
| | | | | | | | | | | | | | | | | | | | | | | | | |
| Per Share | | | | | | | | | | | | | | | | | | | | | | | | |
| Net asset value, beginning of period | | $ | 6.31 | | | $ | 7.42 | | | $ | 7.72 | | | $ | 7.78 | | | $ | 8.96 | | | $ | 10.00 | |
| | | | | | | | | | | | | | | | | | | | | | | | | |
| Income (loss) from investment operations: | | | | | | | | | | | | | | | | | | | | | | | | |
Net investment income (loss)(a) | | | 0.07 | | | | 0.16 | | | | 0.11 | | | | 0.23 | | | | 0.32 | | | | 0.33 | |
| Net realized and unrealized gain (loss) | | | 0.79 | | | | (0.77 | ) | | | 0.09 | | | | 0.21 | | | | (1.00 | ) | | | (0.91 | ) |
| Total from Investment Operations | | | 0.86 | | | | (0.61 | ) | | | 0.20 | | | | 0.44 | | | | (0.68 | ) | | | (0.58 | ) |
| | | | | | | | | | | | | | | | | | | | | | | | | |
| Distributions From Earnings: | | | | | | | | | | | | | | | | | | | | | | | | |
| Net investment income | | | (0.24 | ) | | | (0.23 | ) | | | (0.13 | ) | | | (0.33 | ) | | | (0.34 | ) | | | (0.31 | ) |
| Return of capital | | | — | | | | (0.27 | ) | | | (0.37 | ) | | | (0.17 | ) | | | (0.16 | ) | | | (0.15 | ) |
| Total Distributions | | | (0.24 | ) | | | (0.50 | ) | | | (0.50 | ) | | | (0.50 | ) | | | (0.50 | ) | | | (0.46 | ) |
| | | | | | | | | | | | | | | | | | | | | | | | | |
| Redemption Fees(b) | | | 0.00 | | | | 0.00 | | | | 0.00 | | | | 0.00 | | | | 0.00 | | | | 0.00 | |
| | | | | | | | | | | | | | | | | | | | | | | | | |
| Net Asset Value, End of Period | | $ | 6.93 | | | $ | 6.31 | | | $ | 7.42 | | | $ | 7.72 | | | $ | 7.78 | | | $ | 8.96 | |
| | | | | | | | | | | | | | | | | | | | | | | | | |
| Total Investment Return(c) | | | 13.62 | % | | | (8.85 | )% | | | 2.62 | % | | | 5.88 | % | | | (8.05 | )% | | | (6.19 | )% |
| | | | | | | | | | | | | | | | | | | | | | | | | |
| Net Assets, End of Period, in Thousands | | $ | 19,425 | | | $ | 18,092 | | | $ | 23,511 | | | $ | 25,898 | | | $ | 27,817 | | | $ | 25,210 | |
| | | | | | | | | | | | | | | | | | | | | | | | | |
| Ratio/Supplemental Data:(d) | | | | | | | | | | | | | | | | | | | | | | | | |
| Ratio of expenses to average net assets: | | | | | | | | | | | | | | | | | | | | | |
| Before expense waiver or recovery | | | 2.78 | %(e) | | | 2.73 | % | | | 2.70 | % | | | 2.77 | % | | | 2.74 | %(f) | | | 3.03 | %(f) |
| After expense waiver or recovery | | | 2.78 | %(e) | | | 2.73 | % | | | 2.74 | % | | | 2.80 | % | | | 2.80 | %(f) | | | 2.80 | %(f) |
| | | | | | | | | | | | | | | | | | | | | | | | | |
| Ratio of net investment income (loss) to average net assets: | | | | | | | | | | | | | | | | | |
| Before expense waiver or recovery | | | 2.00 | % | | | 2.26 | % | | | 1.52 | % | | | 3.06 | % | | | 3.66 | % | | | 3.13 | % |
| After expense waiver or recovery | | | 2.00 | % | | | 2.26 | % | | | 1.48 | % | | | 3.03 | % | | | 3.60 | % | | | 3.36 | % |
| | | | | | | | | | | | | | | | | | | | | | | | | |
| Portfolio turnover rate(g) | | | 50 | % | | | 82 | % | | | 84 | % | | | 92 | % | | | 54 | % | | | 43 | % |
* All ratios have been annualized except total investment return and portfolio turnover.
| (a) | Net investment income (loss) per share is based on average shares outstanding. |
| (b) | Amount represents less than $0.005 per share. |
| (c) | Total investment return excludes the effect of applicable sales charges. |
| (d) | Ratios do not include the expenses of the investment companies in which the Fund invests. |
| (e) | Includes 0.00% of interest expense for the period ended June 30, 2019. |
| (f) | Includes interest expense on line of credit of 0.00% and 0.00% for the years ended December 31, 2015 and 2014, respectively. |
| (g) | Portfolio turnover rate is calculated on the basis of the Fund as a whole without distinguishing between classes of shares issued. |
The accompanying notes are an integral part of these financial statements.
| |
| |
| 82 | | LoCorr Spectrum Income Fund - Financial Highlights - Class I |
| |
LoCorr Spectrum Income Fund - Class I
Financial Highlights
Selected Data and Ratios (for a share outstanding throughout the period)
| | | Six Months Ended
June 30, 2019* | | | Year Ended December 31, | |
| | (Unaudited) | | | | 2018 | | | | 2017 | | | | 2016 | | | | 2015 | | | | 2014 | |
| | | | | | | | | | | | | | | | | | | | | | | | | |
| Per Share | | | | | | | | | | | | | | | | | | | | | | | | |
| Net asset value, beginning of period | | $ | 6.25 | | | $ | 7.38 | | | $ | 7.69 | | | $ | 7.78 | | | $ | 8.97 | | | $ | 10.00 | |
| | | | | | | | | | | | | | | | | | | | | | | | | |
| Income (loss) from investment operations: | | | | | | | | | | | | | | | | | | | | | | | | |
Net investment income (loss)(a) | | | 0.10 | | | | 0.24 | | | | 0.19 | | | | 0.31 | | | | 0.41 | | | | 0.43 | |
| Net realized and unrealized gain (loss) | | | 0.78 | | | | (0.77 | ) | | | 0.10 | | | | 0.20 | | | | (1.00 | ) | | | (0.91 | ) |
| Total from Investment Operations | | | 0.88 | | | | (0.53 | ) | | | 0.29 | | | | 0.51 | | | | (0.59 | ) | | | (0.48 | ) |
| | | | | | | | | | | | | | | | | | | | | | | | | |
| Distributions From Earnings: | | | | | | | | | | | | | | | | | | | | | | | | |
| Net investment income | | | (0.28 | ) | | | (0.27 | ) | | | (0.16 | ) | | | (0.39 | ) | | | (0.41 | ) | | | (0.38 | ) |
| Return of capital | | | – | | | | (0.33 | ) | | | (0.44 | ) | | | (0.21 | ) | | | (0.19 | ) | | | (0.17 | ) |
| Total Distributions | | | (0.28 | ) | | | (0.60 | ) | | | (0.60 | ) | | | (0.60 | ) | | | (0.60 | ) | | | (0.55 | ) |
| | | | | | | | | | | | | | | | | | | | | | | | | |
| Redemption Fees | | | – | | | | 0.00 | (b) | | | 0.00 | (b) | | | 0.00 | (b) | | | 0.00 | (b) | | | 0.00 | (b) |
| | | | | | | | | | | | | | | | | | | | | | | | | |
| Net Asset Value, End of Period | | $ | 6.85 | | | $ | 6.25 | | | $ | 7.38 | | | $ | 7.69 | | | $ | 7.78 | | | $ | 8.97 | |
| | | | | | | | | | | | | | | | | | | | | | | | | |
| Total Investment Return | | | 14.15 | % | | | (7.91 | )% | | | 3.85 | % | | | 6.85 | % | | | (7.10 | )% | | | (5.23 | )% |
| | | | | | | | | | | | | | | | | | | | | | | | | |
| Net Assets, End of Period, in Thousands | | $ | 30,756 | | | $ | 27,618 | | | $ | 43,032 | | | $ | 46,838 | | | $ | 28,292 | | | $ | 31,428 | |
| | | | | | | | | | | | | | | | | | | | | | | | | |
| Ratio/Supplemental Data:(c) | | | | | | | | | | | | | | | | | | | | | | | | |
| Ratio of expenses to average net assets: | | | | | | | | | | | | | | | | | | | | |
| Before expense waiver or recovery | | | 1.78 | %(d) | | | 1.73 | % | | | 1.70 | % | | | 1.77 | % | | | 1.74 | %(e) | | | 2.03 | %(e) |
| After expense waiver or recovery | | | 1.78 | %(d) | | | 1.73 | % | | | 1.74 | % | | | 1.80 | % | | | 1.80 | %(e) | | | 1.80 | %(e) |
| | | | | | | | | | | | | | | | | | | | | | | | | |
| Ratio of net investment income (loss) to average net assets: | | | | | | | | | | | | | | | | | | | |
| Before expense waiver or recovery | | | 3.00 | % | | | 3.26 | % | | | 2.52 | % | | | 4.06 | % | | | 4.66 | % | | | 4.13 | % |
| After expense waiver or recovery | | | 3.00 | % | | | 3.26 | % | | | 2.48 | % | | | 4.03 | % | | | 4.60 | % | | | 4.36 | % |
| | | | | | | | | | | | | | | | | | | | | | | | | |
| Portfolio turnover rate(f) | | | 50 | % | | | 82 | % | | | 84 | % | | | 92 | % | | | 54 | % | | | 43 | % |
* All ratios have been annualized except total investment return and portfolio turnover.
| (a) | Net investment income (loss) per share is based on average shares outstanding. |
| (b) | Amount represents less than $0.005 per share. |
| (c) | Ratios do not include the expenses of the investment companies in which the Fund invests. |
| (d) | Includes 0.00% of interest expense for the period ended June 30, 2019. |
| (e) | Includes interest expense on line of credit of 0.00% and 0.00% for the years ended December 31, 2015 and 2014, respectively. |
| (f) | Portfolio turnover rate is calculated on the basis of the Fund as a whole without distinguishing between classes of shares issued. |
The accompanying notes are an integral part of these financial statements.
| |
| |
LoCorr Macro Strategies Fund, LoCorr Long/Short Commodities Strategy Fund and LoCorr Market Trend Fund – Notes to Consolidated Financial
Statements / LoCorr Dynamic Equity Fund and LoCorr Spectrum Income Fund – Notes to Financial Statements | | 83 |
| |
LoCorr Investment Trust
Notes
June 30, 2019 (Unaudited)
1. Organization
LoCorr Investment Trust (the “Trust”), an Ohio business trust, was formed on November 15, 2010 and is an open-end management investment company registered under the Investment Company Act of 1940, as amended (“1940 Act”). Each fund is an investment company and accordingly follows the investment company accounting and reporting guidance of the Financial Accounting Standards Board (“FASB”) Accounting Standards Codification (“ASC”) Topic 946, Financial Services - Investment Companies. The LoCorr Macro Strategies Fund, LoCorr Long/Short Commodities Strategy Fund, LoCorr Market Trend Fund, LoCorr Dynamic Equity Fund and the LoCorr Spectrum Income Fund (individually a “Fund” and collectively the “Funds”) are series within the Trust. The Funds are each diversified funds.
The LoCorr Macro Strategies Fund’s primary investment objective is capital appreciation in rising and falling equity markets with managing volatility as a secondary objective.
The LoCorr Long/Short Commodities Strategy Fund’s primary investment objective is capital appreciation in rising and falling commodities markets with managing volatility as a secondary objective.
The LoCorr Market Trend Fund’s primary investment objective is capital appreciation in rising and falling equity markets with managing volatility as a secondary objective.
The LoCorr Dynamic Equity Fund’s primary investment objective is long-term capital appreciation with reduced volatility compared to traditional broad-based equity market indices as a secondary objective.
The LoCorr Spectrum Income Fund’s primary investment objective is current income with capital appreciation as a secondary objective.
Wholly-owned and Controlled Subsidiaries
In order to achieve their investment objectives, the LoCorr Macro Strategies Fund, the LoCorr Long/Short Commodities Strategy Fund and the LoCorr Market Trend Fund each invest up to 25% of their total assets (measured at the time of purchase) in wholly-owned subsidiaries, LCMFS Fund Limited (“LCMFS”), LCLSCS Fund Limited (“LCLSCS”) and LCMT Fund Limited (“LCMT”), respectively; each company is incorporated under the laws of the Cayman Islands. LCMFS, LCLSCS and LCMT act as investment vehicles in order to enter into certain investments for the LoCorr Macro Strategies Fund, the LoCorr Long/Short Commodities Strategy Fund and the LoCorr Market Trend Fund, respectively, consistent with their investment objectives and policies specified in the Prospectuses and Statement of Additional Information.
At June 30, 2019, investments in LCMFS, LCLSCS and LCMT represented 1.30%, 19.11% and 3.18% of the total net assets of LoCorr Macro Strategies Fund, LoCorr Long/Short Commodities Strategy Fund and LoCorr Market Trend Fund, respectively. See Note 2.
The consolidated financial statements of the LoCorr Macro Strategies Fund, LoCorr Long/Short Commodities Strategy Fund and the LoCorr Market Trend Fund each include the investment activity and financial statements of LCMFS, LCLSCS and LCMT, respectively. All intercompany accounts and transactions have been eliminated in consolidation. Because each Fund may invest a substantial portion of its assets in its respective subsidiary, the Fund may be considered to be investing indirectly in some of those investments through its subsidiary. For that reason, references to the Fund may also encompass its subsidiary. The subsidiary will be subject to the same investment restrictions and limitations, and follow the same compliance policies and procedures, as the Fund when viewed on a consolidated basis. Each Fund and its subsidiary are a “commodity pool” under the U.S. Commodity Exchange Act and LoCorr Fund Management, LLC (the “Adviser” or “Management”) is a “commodity pool operator” registered with and regulated by the Commodity Futures Trading Commission (“CFTC”). As a result, additional CFTC-mandated disclosure, reporting and recordkeeping obligations apply with respect to each Fund and its respective subsidiary under CFTC and the U.S. Securities and Exchange Commission (the “SEC”) harmonized regulations.
At June 30, 2019, the only investment held by LCLSCS is a swap contract, for which the notional amount was $292,945,098. At June 30, 2019, LCLSCS reported unrealized depreciation on the swap contract of $2,466,015. In addition, LCLSCS holds cash and cash equivalents as collateral on the swap contract. At June 30, 2019, investments held by LCMFS and LCMT include open futures contracts and other investments intended to serve as margin or collateral for futures positions. At June 30, 2019, LCMFS held long open futures contracts with a total notional amount of $101,078,777 and net unrealized appreciation of $1,484,999 and short open futures contracts with a total notional amount of $129,022,342 and net unrealized appreciation of $192,753. At June 30, 2019, LCMT held long open futures contracts with a total notional amount of $62,233,792 and net unrealized appreciation of $2,326,603 and short open futures contracts with a total notional amount of $118,274,961 and net unrealized appreciation of $132,134.
Share Classes
The Funds currently offer three classes of shares: Class A, Class C and Class I shares. Each share class represents an interest in the same assets of the Fund, has the same rights and is identical in all material respects except that (i) Class A shares have a maximum front end sales load of 5.75% and maximum deferred sales charge of 1.00% and Class C shares have a maximum deferred sales charge of 1.00%, (ii) Class A shares have a 12b-1 fee of 0.25% and Class C shares have a 12b-1 fee of 1.00%; (iii) certain other class-specific expenses will be borne solely by the class to which such expenses are attributable and (iv) each class will have exclusive voting rights with respect to matters relating to its own distribution arrangements.
| | |
| | |
| 84 | | LoCorr Macro Strategies Fund, LoCorr Long/Short Commodities Strategy Fund and LoCorr Market Trend Fund – Notes to Consolidated Financial Statements / LoCorr Dynamic Equity Fund and LoCorr Spectrum Income Fund – Notes to Financial Statements (continued) |
| | |
All classes with respect to the LoCorr Spectrum Income Fund are subject to a 2.00% redemption fee on redemptions made within 60 days of the original purchase. As of May 1, 2017, none of the other Funds are subject to a redemption fee.
The following table presents the class-specific commencement of operations dates for each of the Funds:
| | | Commencement of Operations |
| | | Class A | | Class C | | Class I |
| LoCorr Macro Strategies Fund | | March 22, 2011 | | March 24, 2011 | | March 24, 2011 |
| LoCorr Long/Short Commodities Strategy Fund | | January 1, 2012 | | January 1, 2012 | | January 1, 2012 |
| LoCorr Dynamic Equity Fund | | May 10, 2013 | | May 10, 2013 | | May 10, 2013 |
| LoCorr Spectrum Income Fund | | January 1, 2014 | | January 1, 2014 | | January 1, 2014 |
| LoCorr Market Trend Fund | | July 1, 2014 | | July 1, 2014 | | July 1, 2014 |
The Funds may issue an unlimited number of shares of beneficial interest, with no par value. All shares of the Funds have equal rights and privileges, except as to class-specific rights and privileges described above.
2. Significant Accounting Policies
The following is a summary of significant accounting policies consistently followed by the Funds in the preparation of the financial statements. These policies are in conformity with generally accepted accounting principles in the United States of America (“GAAP”).
Investment Valuation
The Funds follow fair valuation accounting standards in accordance with GAAP, which establish a definition of fair value and set out a hierarchy for measuring fair value. These standards require additional disclosures about the various inputs and valuation techniques used to develop the measurements of fair value and changes in valuation techniques and related inputs during the period. These inputs are summarized in three broad levels listed below:
Level 1- Unadjusted quoted prices in active markets for identical assets or liabilities that the Funds have the ability to access.
Level 2- Observable inputs other than quoted prices included in Level 1 that are observable for the asset or liability, either directly or indirectly. These inputs may include quoted prices for the identical instrument on an inactive market, prices for similar instruments, interest rates, prepayment speeds, credit risk, yield curves, default rates and similar data.
Level 3- Unobservable inputs for the asset or liability, to the extent relevant observable inputs are not available; representing the Funds’ own assumptions about the assumptions a market participant would use in valuing the asset or liability and would be based on the best information available.
Generally, the Funds’ investments are valued each day at the last quoted sales price on each investment’s primary exchange. Investments traded or dealt in one or more exchanges (whether domestic or foreign) for which market quotations are readily available and not subject to restrictions against resale shall be valued at the last quoted sales price on the primary exchange or, in the absence of a sale on the primary exchange, at the last bid on the primary exchange. Investments primarily traded in the National Association of Securities Dealers’ Automated Quotation System (“NASDAQ”) National Market System for which market quotations are readily available shall be valued using the NASDAQ Official Closing Price.
The Funds may use independent pricing services to assist in calculating the value of the Funds’ investments. In addition, market prices for foreign investments are not determined at the same time of day as the net asset value (“NAV”) for the Funds. Because the Funds may invest in portfolio investments primarily listed on foreign exchanges and these exchanges may trade on weekends or other days when the Funds do not price their shares, the value of some of the Funds’ portfolio investments may change on days when you may not be able to buy or sell the Funds’ shares. In computing the NAV, the Funds value foreign investments held by the Funds at the latest closing price on the exchange in which they are traded immediately prior to closing of the New York Stock Exchange. Prices of foreign investments quoted in foreign currencies are translated into U.S. dollars at current rates. If events materially affecting the value of an investment in the Funds’ portfolio, particularly foreign investments, occur after the close of trading on a foreign market but before the Funds price their shares, the investment will be valued at fair value.
American Depositary Receipts
The Funds may invest in sponsored and unsponsored American Depositary Receipts (“ADRs”), which are receipts issued by an American bank or trust company evidencing ownership of underlying securities issued by a foreign issuer. ADRs, in registered form, are designed for use in U.S. securities markets. Unsponsored ADRs may be created without the participation of the foreign issuer. Holders of unsponsored ADRs generally bear all the costs of the ADR facility, whereas foreign issuers typically bear certain costs in a sponsored ADR. The bank or trust company depositary of an unsponsored ADR may be under no obligation to distribute shareholder communications received from the foreign issuer or to pass through voting rights. ADRs are generally categorized in Level 1 or Level 2 of the fair value hierarchy depending on inputs used and market activity levels for specific securities.
Equity Securities
Equity securities, including common stocks, preferred stocks, securities convertible into common stocks such as convertible bonds, warrants, rights, options, master limited partnership (“MLP”) interests, real estate investment trusts (“REITs”), business development companies (“BDCs”) and royalty trusts are generally valued by using market quotations, but may be valued on the basis of prices furnished by a pricing service when the Adviser believes such prices accurately reflect the fair market value of such securities. MLP interests are limited partnerships, the interests in which (known as “units”) typically trade publicly, like stock. MLPs are also called publicly traded partnerships and public limited partnerships. Securities that are traded on any stock exchange or on the NASDAQ over-the-counter market are generally valued by the pricing service at the last quoted sale price. Lacking a last sale price, an equity security is generally valued by the pricing service at its last bid price. Equity securities are generally categorized in Level 1 or Level 2 of the fair value hierarchy depending on inputs used and market activity levels for specific securities.
| |
| |
LoCorr Macro Strategies Fund, LoCorr Long/Short Commodities Strategy Fund and LoCorr Market Trend Fund – Notes to Consolidated Financial
Statements / LoCorr Dynamic Equity Fund and LoCorr Spectrum Income Fund – Notes to Financial Statements (continued) | | 85 |
| |
Exchange Traded Funds
The Funds may invest in Exchange Traded Funds (“ETFs”). They are managed by professionals and provide the investor with diversification, cost and tax efficiency, liquidity, marginability, usability for hedging, the ability to go long and short, and (for some ETFs) the provision of periodic distributions. Additionally, some ETFs are unit investment trusts (“UITs”), which are unmanaged portfolios overseen by trustees. ETFs generally have two markets. The primary market is where institutions swap “creation units” in block-multiples of shares, typically 25,000 or 50,000, for in-kind securities and cash in the form of dividends. The secondary market is where individual investors can trade as little as a single share during trading hours on the exchange. This is different from open-ended mutual funds that are traded after hours once the NAV is calculated. ETF shares may trade at a premium or discount to NAV per share. ETFs share many similar risks with open-end and closed-end funds. ETFs are generally categorized in Level 1 of the fair value hierarchy.
The Funds may invest in ETFs and other investment companies that hold a portfolio of foreign securities. Investing in securities of foreign companies and countries involves certain considerations and risks that are not typically associated with investing in U.S. government securities and securities of domestic companies. There may be less publicly available information about a foreign issuer than a domestic one, and foreign companies are not generally subject to uniform accounting, auditing and financial standards and requirements comparable to those applicable to U.S. companies. There may also be less government supervision and regulation of foreign securities exchanges, brokers and listed companies than exists in the United States. Interest and dividends paid by foreign issuers may be subject to withholding and other foreign taxes, which may decrease the net return on such investments as compared to dividends and interest paid to the Funds by domestic companies or the U.S. government. There may be the possibility of expropriations, seizure or nationalization of foreign deposits, confiscatory taxation, political, economic or social instability, or diplomatic developments that could affect assets of the Funds held in foreign countries. Finally, the establishment of exchange controls or other foreign governmental laws or restrictions could adversely affect the payment of obligations.
Fixed Income Securities
Fixed income securities and certificates of deposit with maturities more than 60 days when acquired generally are valued using an evaluated price supplied by an independent pricing service. Inputs used by the pricing service for U.S. government and treasury securities are normally valued using a model that incorporates market observable data such as reported sales of similar securities, broker dealer quotes, yields, bids, offers and reference data. Agency issued debt securities, foreign issued bonds and municipal bonds are generally valued in a manner similar to U.S. government securities. Evaluations for corporate bonds are typically based on valuation methodologies such as market pricing and other analytical pricing models as well as market transactions and dealer quotations based on observable inputs. Fixed income securities are generally categorized in Level 1 or Level 2 of the fair value hierarchy depending on inputs used and market activity levels for specific securities.
The fair value of asset backed securities and mortgage backed securities is estimated on models that consider the estimated cash flows of each tranche of the entity, establish a benchmark yield, and develop an estimated tranche-specific spread to the benchmark yield based on the unique attributes of the tranche. Additional inputs such as creditworthiness of the underlying collateral and quotes from outside brokers for the same or similar issuance may also be considered in the development of fair value. Asset backed and mortgage backed securities are generally categorized in Level 2 of the fair value hierarchy.
Short-term investments in fixed income securities and certificates of deposit with maturities of less than 60 days when acquired, or which subsequently are within 60 days of maturity, are valued using an amortized cost method of valuation, and are generally categorized in Level 2.
Investment Companies
With respect to any portion of the Funds’ assets that are invested in one or more open-end management investment companies, including money market funds, registered under the 1940 Act, the Funds’ NAV is calculated based upon the NAVs of those open-end management investment companies, and the prospectuses for these companies explain the circumstances under which those companies will use fair value pricing and the effects of using fair value pricing.
The Funds generally will purchase shares of closed-end investment companies only in the secondary market. The shares of many closed-end investment companies, after their initial public offering, frequently trade at a price per share that is less than the NAV per share, the difference representing the “market discount” of such shares. This market discount may be due in part to the investment objective of long- term appreciation, which is sought by many closed-end investment companies, as well as to the fact that the shares of closed-end investment companies are not redeemable by the holder upon demand to the issuer at the next determined NAV but rather are subject to the principles of supply and demand in the secondary market. A relative lack of secondary market purchasers of closed-end investment company shares also may contribute to such shares trading at a discount to their NAV. Closed-end investment companies are generally categorized in Level 1 or Level 2 of the fair value hierarchy depending on inputs used and market activity levels for specific securities.
Financial Derivative Instruments
Financial derivative instruments, such as forward currency contracts, futures contracts or swap agreements, derive their value from underlying asset prices, indices, reference rates and other inputs or a combination of these factors. These contracts are normally valued on the basis of broker- dealer quotations or a pricing service at the settlement price determined by the relevant exchange. Depending on the product and the terms of the transaction, the value of the derivative contracts can be estimated by a pricing service provider using a series of techniques, including simulation pricing models. The pricing models use inputs that are observed from actively quoted markets such as issuer details, indices, spreads, interest rates, curves, dividends and exchange rates.
| | |
| | |
| 86 | | LoCorr Macro Strategies Fund, LoCorr Long/Short Commodities Strategy Fund and LoCorr Market Trend Fund – Notes to Consolidated Financial Statements / LoCorr Dynamic Equity Fund and LoCorr Spectrum Income Fund – Notes to Financial Statements (continued) |
| | |
Forward currency contracts represent the purchase or sale of a specific quantity of a foreign currency at the current or spot price, with delivery and settlement at a specified future date. Forward currency contracts are presented at fair value using spot currency rates and are adjusted for the time value of money (forward points) and contractual prices of the underlying financial instruments. Forward currency contracts are generally categorized in Level 2.
Futures contracts are carried at fair value using the primary exchange’s closing (settlement) price and are generally categorized in Level 1.
Total return swap contracts are stated at fair value daily based on the fair value of the underlying futures, forward currency and foreign currency contracts constituting the contract’s stated index, taking into account any fees and expenses associated with the swap agreement. Total return swap contracts are generally categorized in Level 2.
Fair Value Pricing
If market quotations are not readily available, investments will be valued at their fair value as determined in good faith by the Adviser in accordance with procedures approved by the Board of Trustees (the “Board”) and evaluated by the Board as to the reliability of the fair value method used.
In these cases, a Fund’s NAV will reflect certain portfolio investments’ fair value rather than their market price. Fair value pricing involves subjective judgments and it is possible that the fair value determined for an investment is materially different than the value that could be realized upon the sale of that investment. The fair value prices can differ from market prices when they become available or when a price becomes available.
Fair value determinations are required for the following securities:
| ● | securities for which market quotations are not readily available at the valuation time on a particular business day (including without limitation securities for which there is a short and temporary lapse in the provision of a price by the regular pricing source); |
| ● | securities determined to be illiquid in accordance with the Trust’s Liquidity Procedures; and |
| ● | securities with respect to which an event that will affect the value thereof has occurred subsequent to the determination by the Adviser/ relevant Sub-Adviser of the closing prices reported on the principal exchange on which the securities are traded, but prior to the relevant Fund’s calculation of its NAV. |
| ● | For any open-end mutual funds that do not provide timely NAV information, the Adviser/relevant Sub-Adviser shall evaluate those ‘similar’ funds and determine which are most appropriate based on funds having similar benchmarks or similar objectives. The Adviser/relevant Sub-Adviser shall then calculate the NAV percentage move of those ‘similar’ funds for the day to create an aggregate average percentage move, which it shall use to calculate the price movement for the day of the Fund at issue. For closed-end funds, the aforementioned practice shall be utilized, in addition to monitoring secondary market activity during the day. |
Performing Fair Value Pricing
The Adviser considers all appropriate factors relevant to the value of securities for which market quotations are not readily available. No single standard for determining fair value can be established, since fair value depends upon the circumstances of each individual case. As a general principle, the current fair value of an issue of securities being valued by the Adviser would appear to be the amount that the owner might reasonably expect to receive for them upon their current sale. Methods that are in accord with this principle may, for example, be based on:
| ● | a discount from market of a similar freely traded security (including a derivative security or a basket of securities traded on other markets, exchanges or among dealers); or |
| ● | yield to maturity with respect to debt issues, or a combination of these and other methods. |
Fair value determinations are not based on what the Adviser believes that a buyer may pay at a later time, such as when market conditions change or when the market ultimately recognizes a security’s true value as perceived by the Adviser. Similarly, bonds and other instruments may not be fair valued at par based on the expectation that the Funds will hold the investment until maturity.
Some of the general factors that the Adviser considers in determining a valuation method for an individual issue of securities include, but shall not be limited to:
| ● | the fundamental analytical data relating to the investment; |
| ● | the nature and duration of restrictions (if any) on disposition of the securities; |
| ● | evaluation of the forces that influence the market in which these securities are purchased or sold; |
| ● | changes in interest rates; |
| ● | government (domestic or foreign) actions or pronouncements; and |
With respect to securities traded on foreign markets, the Adviser considers the value of foreign securities traded on other foreign markets, ADR trading, closed-end fund trading, foreign currency exchange activity and the trading prices of financial products that are tied to baskets of foreign securities, such as WEBS.
Among the more specific factors that the Funds’ Adviser considers (if applicable) in determining a valuation method for an individual issue of securities are:
| |
| |
LoCorr Macro Strategies Fund, LoCorr Long/Short Commodities Strategy Fund and LoCorr Market Trend Fund – Notes to Consolidated Financial
Statements / LoCorr Dynamic Equity Fund and LoCorr Spectrum Income Fund – Notes to Financial Statements (continued) | | 87 |
| |
| ● | financial statements of the issuer; |
| ● | cost at date of purchase; |
| ● | discount from market value of unrestricted securities of the same class at time of purchase; |
| ● | special reports prepared by analysts; |
| ● | information as to any transactions or offers with respect to the security; |
| ● | existence of merger proposals or tender offers affecting the securities; |
| ● | price and extent of public trading in similar securities of the issuer or comparable companies; and |
As a general matter, the Funds’ Adviser will value the portfolio security or other asset primarily by reference to the public market if there is a public market for securities of the same class or similar securities; primarily by reference to private transactions if public market reference is not available and private transaction reports are available; and primarily by use of one or more analytical methods or models if public and private market references are not available or not reliable. The Adviser will use cost only if no better method of valuation is available.
The Adviser regularly evaluates whether its pricing methodologies continue to result in values that the Funds might reasonably expect to receive upon a current sale. In order to do this, the Adviser compares its fair value prices with values that are available from other sources (if there are any). The next actual sales price of a security might be one such source. However, the next-day opening prices or next actual sales prices for a security may differ from the fair value of that security as of the time for NAV calculation, given the subjectivity inherent in fair valuation and the fact that events could occur after NAV calculation. Thus, discrepancies between fair values and next-day opening prices or next actual sales prices may occur on a regular and recurring basis. These discrepancies do not necessarily indicate that the Adviser’s fair value methodology is inappropriate. Nonetheless, systematic comparisons of fair values to the next-day opening prices or next actual sales prices are useful to assist the Adviser with ongoing monitoring and evaluation of the appropriateness of its fair value methodologies.
The above guidance does not purport to delineate all factors that may be considered. The Adviser takes into consideration all indications of value available to it in determining the fair value assigned to a particular security.
The following table summarizes LoCorr Macro Strategies Fund’s consolidated investments and other financial instruments as of June 30, 2019:
| Security Classification | | Level 1 | | | Level 2 | | | Level 3 | | | Total | |
| Investments | | | | | | | | | | | | |
| Asset Backed Securities | | $ | — | | | $ | 90,434,012 | | | $ | — | | | $ | 90,434,012 | |
| Corporate Bonds | | | — | | | | 166,163,122 | | | | — | | | | 166,163,122 | |
| Mortgage Backed Securities | | | — | | | | 79,669,116 | | | | — | | | | 79,669,116 | |
| U.S. Government Agency Issues | | | — | | | | 79,503,317 | | | | — | | | | 79,503,317 | |
| U.S. Government Notes | | | — | | | | 97,576,749 | | | | — | | | | 97,576,749 | |
| Short Term Investment | | | 26,396,175 | | | | — | | | | — | | | | 26,396,175 | |
| Total Investments | | $ | 26,396,175 | | | $ | 513,346,316 | | | $ | — | | | $ | 539,742,491 | |
| | | | | | | | | | | | | | | | | |
| Other Financial Instruments* | | | | | | | | | | | | | | | | |
| Forward Currency Contracts | | | | | | | | | | | | | | | | |
| Purchase | | $ | — | | | $ | 5,366,738 | | | $ | — | | | $ | 5,366,738 | |
| Sale | | | — | | | | (8,850,957 | ) | | | — | | | | (8,850,957 | ) |
| Total Forward Currency Contracts | | | — | | | | (3,484,219 | ) | | | — | | | | (3,484,219 | ) |
| Futures Contracts | | | | | | | | | | | | | | | | |
| Long | | | 11,405,806 | | | | — | | | | — | | | | 11,405,806 | |
| Short | | | (238,628 | ) | | | — | | | | — | | | | (238,628 | ) |
| Total Futures Contracts | | | 11,167,178 | | | | — | | | | — | | | | 11,167,178 | |
| Total Other Financial Instruments | | $ | 11,167,178 | | | $ | (3,484,219 | ) | | $ | — | | | $ | 7,682,959 | |
See the Fund’s consolidated schedule of investments for the investments detailed by industry classification.
*The fair value of the Fund’s other financial instruments represent the net unrealized appreciation (depreciation) at June 30, 2019.
The LoCorr Macro Strategies Fund did not hold any Level 3 assets during the period.
| | |
| | |
| 88 | | LoCorr Macro Strategies Fund, LoCorr Long/Short Commodities Strategy Fund and LoCorr Market Trend Fund – Notes to Consolidated Financial
Statements / LoCorr Dynamic Equity Fund and LoCorr Spectrum Income Fund – Notes to Financial Statements (continued) |
| | |
The following table summarizes LoCorr Long/Short Commodities Strategy Fund’s consolidated investments and swap contracts as of June 30, 2019:
| Security Classification | | Level 1 | | | Level 2 | | | Level 3 | | | Total | |
| Investments | | | | | | | | | | | | |
| Asset Backed Securities | | $ | — | | | $ | 43,370,309 | | | $ | — | | | $ | 43,370,309 | |
| Corporate Bonds | | | — | | | | 79,610,427 | | | | — | | | | 79,610,427 | |
| Foreign Government Bond | | | — | | | | 8,735 | | | | — | | | | 8,735 | |
| Mortgage Backed Securities | | | — | | | | 37,968,851 | | | | — | | | | 37,968,851 | |
| Municipal Bonds | | | — | | | | 45,306 | | | | — | | | | 45,306 | |
| U.S. Government Agency Issues | | | — | | | | 27,243,116 | | | | — | | | | 27,243,116 | |
| U.S. Government Notes | | | — | | | | 49,149,917 | | | | — | | | | 49,149,917 | |
| Short Term Investments | | | 12,339,016 | | | | 9,002,295 | | | | — | | | | 21,341,311 | |
| Total Investments | | $ | 12,339,016 | | | $ | 246,398,956 | | | $ | — | | | $ | 258,737,972 | |
| | | | | | | | | | | | | | | | | |
| Swap Contracts* | | | | | | | | | | | | | | | | |
| Long Total Return Swap Contracts | | $ | — | | | $ | (2,466,015 | ) | | $ | — | | | $ | (2,466,015 | ) |
| Total Swap Contracts | | $ | — | | | $ | (2,466,015 | ) | | $ | — | | | $ | (2,466,015 | ) |
See the Fund’s consolidated schedule of investments for the investments detailed by industry classification.
*The fair value of the Fund’s investment in swap contracts represents the net unrealized depreciation at June 30, 2019.
The LoCorr Long/Short Commodities Strategy Fund did not hold any Level 3 assets during the period.
The following table summarizes LoCorr Market Trend Fund’s consolidated investments and other financial instruments as of June 30, 2019:
| Security Classification | | Level 1 | | | Level 2 | | | Level 3 | | | Total | |
| Investments | | | | | | | | | | | | |
| Asset Backed Securities | | $ | — | | | $ | 45,266,325 | | | $ | — | | | $ | 45,266,325 | |
| Mortgage Backed Securities | | | — | | | | 28,594,246 | | | | — | | | | 28,594,246 | |
| Municipal Bond | | | — | | | | 1,111,224 | | | | — | | | | 1,111,224 | |
| U.S. Government Agency Issues | | | — | | | | 62,910,594 | | | | — | | | | 62,910,594 | |
| U.S. Government Notes | | | — | | | | 65,013,323 | | | | — | | | | 65,013,323 | |
| Short Term Investment | | | 10,513,203 | | | | 3,849,332 | | | | — | | | | 14,362,535 | |
| Total Investments | | $ | 10,513,203 | | | $ | 206,745,044 | | | $ | — | | | $ | 217,258,247 | |
| | | | | | | | | | | | | | | | | |
| Other Financial Instruments* | | | | | | | | | | | | | | | | |
| Forward Currency Contracts | | | | | | | | | | | | | | | | |
| Purchase | | $ | — | | | $ | 103,147 | | | $ | — | | | $ | 103,147 | |
| Sale | | | — | | | | (3,364,639 | ) | | | — | | | | (3,364,639 | ) |
| Total Forward Currency Contracts | | | — | | | | (3,261,492 | ) | | | — | | | | (3,261,492 | ) |
| Futures Contracts | | | | | | | | | | | | | | | | |
| Long | | | 14,157,941 | | | | — | | | | — | | | | 14,157,941 | |
| Short | | | (27,083 | ) | | | — | | | | — | | | | (27,083 | ) |
| Total Futures Contracts | | | 14,130,858 | | | | — | | | | — | | | | 14,130,858 | |
| Total Other Financial Instruments | | $ | 14,130,858 | | | $ | (3,261,492 | ) | | $ | — | | | $ | 10,869,366 | |
See the Fund’s consolidated schedule of investments for the investments detailed by industry classification.
*The fair value of the Fund’s other financial instruments represent the net unrealized appreciation (depreciation) at June 30, 2019.
The LoCorr Market Trend Fund did not hold any Level 3 assets during the period.
| | |
| | |
LoCorr Macro Strategies Fund, LoCorr Long/Short Commodities Strategy Fund and LoCorr Market Trend Fund – Notes to Consolidated Financial Statements / LoCorr Dynamic Equity Fund and LoCorr Spectrum Income Fund – Notes to Financial Statements (continued) | | 89 |
| | |
The following table summarizes LoCorr Dynamic Equity Fund’s investments, securities sold short and futures contracts as of June 30, 2019:
| Security Classification | | Level 1 | | | Level 2 | | | Level 3 | | | Total | |
| Investments | | | | | | | | | | | | |
| Common Stocks | | $ | 20,363,752 | | | $ | — | | | $ | — | | | $ | 20,363,752 | |
| Real Estate Investment Trusts | | | 641,118 | | | | — | | | | — | | | | 641,118 | |
| Short Term Investment | | | 3,711,070 | | | | — | | | | — | | | | 3,711,070 | |
| Total Investments | | $ | 24,715,940 | | | $ | — | | | $ | — | | | $ | 24,715,940 | |
| | | | | | | | | | | | | | | | | |
| Securities Sold Short | | | | | | | | | | | | | | | | |
| Common Stocks | | $ | (8,086,483 | ) | | $ | — | | | $ | — | | | $ | (8,086,483 | ) |
| Exchange Traded Funds | | | (176,380 | ) | | | — | | | | — | | | | (176,380 | ) |
| Real Estate Investment Trusts | | | (654,052 | ) | | | — | | | | — | | | | (654,052 | ) |
| Total Securities Sold Short | | $ | (8,916,915 | ) | | $ | — | | | $ | — | | | $ | (8,916,915 | ) |
| | | | | | | | | | | | | | | | | |
| Futures Contracts* | | | | | | | | | | | | | | | | |
| Long | | $ | 79,443 | | | $ | — | | | $ | — | | | $ | 79,443 | |
| Short | | | 2,282 | | | | — | | | | — | | | | 2,282 | |
| Total Futures Contracts | | $ | 81,725 | | | $ | — | | | $ | — | | | $ | 81,725 | |
See the Fund’s schedule of investments and schedule of securities sold short for detail by industry classification.
*The fair value of the Fund’s investment in futures contracts represent the net unrealized appreciation at June 30, 2019.
The LoCorr Dynamic Equity Fund did not hold any Level 3 assets or liabilities during the period.
The following table summarizes LoCorr Spectrum Income Fund’s investments and written options as of June 30, 2019:
| Security Classification | | Level 1 | | | Level 2 | | | Level 3 | | | Total | |
| Investments | | | | | | | | | | | | |
| Business Development Companies | | $ | 5,496,953 | | | $ | — | | | $ | — | | | $ | 5,496,953 | |
| Closed-End Investment Companies | | | 7,167,547 | | | | — | | | | — | | | | 7,167,547 | |
| Common Stocks | | | 20,726,067 | | | | — | | | | — | | | | 20,726,067 | |
| Master Limited Partnerships | | | 16,756,633 | | | | — | | | | — | | | | 16,756,633 | |
| Preferred Stocks | | | 858,096 | | | | 928,021 | | | | — | | | | 1,786,117 | |
| Publicly Traded Partnerships | | | 4,914,628 | | | | — | | | | — | | | | 4,914,628 | |
| Purchased Put Options | | | 242,500 | | | | — | | | | — | | | | 242,500 | |
| Real Estate Investment Trusts | | | 15,777,793 | | | | — | | | | — | | | | 15,777,793 | |
| Short Term Investment | | | 4,678,454 | | | | — | | | | — | | | | 4,678,454 | |
| Total Investments | | $ | 76,618,671 | | | $ | 928,021 | | | $ | — | | | $ | 77,546,692 | |
| | | | | | | | | | | | | | | | | |
| Written Options | | | | | | | | | | | | | | | | |
| Written Call Options | | $ | (94,602 | ) | | $ | — | | | $ | — | | | $ | (94,602 | ) |
| Total Written Options | | $ | (94,602 | ) | | $ | — | | | $ | — | | | $ | (94,602 | )
|
See the Fund’s schedule of investments for detail by industry classification.
The LoCorr Spectrum Income Fund did not hold any Level 3 assets during the period.
Allocation of Income and Expenses
Net investment income, other than class specific expenses, and realized and unrealized gains and losses are allocated daily to each class of shares based upon the relative NAV of outstanding shares of each class of shares at the beginning of the day (after adjusting for the current capital shares activity of the respective class). Expenses associated with a specific Fund in the Trust are charged to that Fund. Common expenses are typically allocated based upon the relative net assets of each Fund, or by other equitable means.
Deposits with Broker
Forward Currency and Futures Contracts
When trading derivative instruments, such as forward or futures contracts, a Fund is only required to post initial or variation margin with the exchange or clearing broker. The use of margin in trading these instruments has the effect of creating leverage, which can expose the Fund to substantial gains or losses occurring from relatively small price changes in the value of the underlying instrument and can increase the volatility of the Fund’s returns. Volatility is a statistical measure of the dispersion of returns of an investment, where higher volatility generally indicates greater risk. At June 30, 2019, the LoCorr Macro Strategies Fund and the LoCorr Market Trend Fund pledged cash and cash equivalents, defined as short-term, highly liquid investments that are readily convertible to known amounts of cash, at U.S. Bank, N.A. (“U.S. Bank”) of $17,420,000 and $16,720,000, respectively, to Bank of America Merrill Lynch for each Fund’s investment in forward currency contracts.
| | |
| | |
| 90 | | LoCorr Macro Strategies Fund, LoCorr Long/Short Commodities Strategy Fund and LoCorr Market Trend Fund – Notes to Consolidated Financial Statements / LoCorr Dynamic Equity Fund and LoCorr Spectrum Income Fund – Notes to Financial Statements (continued) |
| | |
Upon entering into a futures contract, and to maintain the Fund’s open positions in futures contracts, the Fund is required to deposit with its custodian or futures broker in a segregated account in the name of the futures broker an amount of cash, U.S. government securities, suitable money market instruments, or other liquid securities, known as “initial margin.” The margin required for a particular futures contract is set by the exchange on which the contract is traded and may be significantly modified from time to time by the exchange during the term of the contract. Futures contracts are customarily purchased and sold on margins that may range upward from less than 5% of the value of the contract being traded.
At June 30, 2019, the LoCorr Macro Strategies Fund and LCMFS, collectively, had $39,471,515 in cash and cash equivalents on deposit with the broker for derivative instruments which is presented on the Fund’s consolidated statement of assets and liabilities. In addition, LCMFS pledged securities with a fair value of $12,047 as collateral for derivative instruments.
At June 30, 2019, the LoCorr Market Trend Fund and LCMT, collectively, had $28,562,945 in cash and cash equivalents on deposit with the broker for derivative instruments which is presented on the Fund’s consolidated statements of assets and liabilities. In addition, LCMT pledged securities with a fair value of $364,179 as collateral for derivative instruments.
At June 30, 2019, the LoCorr Dynamic Equity Fund had $336,110 in cash and cash equivalents on deposit with the broker for futures contracts which is presented on the Fund’s statements of assets and liabilities.
If the price of an open futures contract changes (by increase in underlying instrument or index in the case of a sale or by decrease in the case of a purchase) so that the loss on the futures contract reaches a point at which the margin on deposit does not satisfy margin requirements, the broker will require an increase in the margin. However, if the value of a position increases because of favorable price changes in the futures contract so that the margin deposit exceeds the required margin, the broker will pay the excess to the Fund.
These subsequent payments, called “variation margin,” to and from the futures broker (with the exception of futures contracts traded on the London Metal Exchange (“LME”)), are made on a daily basis as the price of the underlying assets fluctuate making the long and short positions in the futures contract more or less valuable, a process known as “marking to the market.” The variation margin on LME futures contracts do not settle daily, but rather settle at their respective maturity dates. At period end, the unrealized appreciation and depreciation on LME futures contracts is shown as receivable for unsettled open futures contracts and payable for unsettled open futures contracts, respectively, on the Funds’ consolidated statements of assets and liabilities. The Funds expect to earn interest income on any margin deposits.
Securities Sold Short
At June 30, 2019, the LoCorr Dynamic Equity Fund had cash on deposit with Morgan Stanley and J.P. Morgan in the amount of $6,186,674. In addition, at June 30, 2019, the LoCorr Dynamic Equity Fund pledged cash of $2,200,000 as collateral for securities sold short.
Swap Contracts
LCLSCS has a substantial portion of its assets on deposit with Deutsche Bank in connection with its trading of its swap contract. Assets deposited with Deutsche Bank in connection with the trading of the swap contract for LCLSCS are partially restricted due to deposit requirements. At June 30, 2019, the LoCorr Long/Short Commodities Strategy Fund had cash and cash equivalents on deposit with Deutsche Bank in the amount of $52,147,729, which is presented on the consolidated statements of assets and liabilities. In addition, at June 30, 2019, LCLSCS pledged securities with a fair value of $472,864 as collateral for the swap contract. Risks arise from the possible inability of the counterparty to meet the terms of its contract and may increase if the counterparty’s financial condition worsens.
Distributable Earnings and Investment Transactions
Net investment income and net realized gains (losses) may differ for financial reporting and tax purposes because of temporary or permanent book/tax differences. To the extent these differences are permanent; reclassifications are made to the appropriate equity accounts in the period that the difference arises.
Additionally, GAAP requires that certain components of net assets relating to permanent differences be reclassified between financial and tax reporting. These reclassifications have no effect on net assets or NAV per share. See Note 7.
Distributions from Earnings
Shareholder transactions are recorded on trade date. Dividends from net investment income are declared and paid at least annually by the Funds. Distribution of net realized capital gains, if any, are declared and paid at least annually. Distributions to shareholders are recorded on the ex-dividend date. The character of distributions made during the periods from net investment income or net realized gains may differ from the characterization for federal income tax purposes due to the difference in the recognition of income, expense and gain items for financial statement and tax purposes.
During the six months ended June 30, 2019, dividends for the LoCorr Spectrum Income Fund were distributed monthly. The estimated characterization of the distributions paid will be an ordinary dividend, qualified dividend or return of capital. This estimate is based on the Fund’s operating results during the period. It is anticipated that a significant portion of the distributions of the Fund’s investments in MLP and certain investments in REITs and royalty trusts will be comprised of return of capital as a result of the tax character of cash distributions made by each Fund’s investments. The actual characterization of the distributions made during the period is not determined until after the end of the fiscal year.| | |
| | |
LoCorr Macro Strategies Fund, LoCorr Long/Short Commodities Strategy Fund and LoCorr Market Trend Fund – Notes to Consolidated Financial Statements / LoCorr Dynamic Equity Fund and LoCorr Spectrum Income Fund – Notes to Financial Statements (continued) | | 91 |
| | |
The tax character of distributions paid during the periods was as follows:| 91
| | | Six Months Ended June 30, 2019 | |
| Fund | | Ordinary Income | | | Long-Term
Capital Gains | | | Return of
Capital | |
| LoCorr Spectrum Income Fund | | $ | 2,867,203 | | | $ | — | | | $ | — | |
| | | Year Ended December 31, 2018 | |
| Fund | | Ordinary
Income | | | Long-Term
Capital Gains | | | Return of
Capital | |
| LoCorr Macro Strategies Fund | | $ | 17,125,045 | | | $ | — | | | $ | — | |
| LoCorr Long/Short Commodities Strategy Fund | | | 23,586,033 | | | | — | | | | — | |
| LoCorr Dynamic Equity Fund | | | — | | | | 1,162,325 | | | | — | |
| LoCorr Spectrum Income Fund | | | 2,900,053 | | | | — | | | | 3,468,877 | |
Federal Income Taxes
The Funds intend to qualify as regulated investment companies pursuant to Subchapter M of the Internal Revenue Code of 1986, as amended. The Funds intend to distribute substantially all of their investment company net taxable income and net capital gains to shareholders. Therefore, no federal income tax provision is required.
As of and during the six months ended June 30, 2019, the Funds did not have any tax positions that did not meet the “more-likely-than-not” threshold of being sustained by applicable tax authorities. The Funds recognize interest and penalties, if any, related to unrecognized tax benefits on uncertain tax positions as interest or other expense in the statements of operations. During the six months ended June 30, 2019, the Funds did not incur any interest or penalties.
For tax purposes, LCMFS, LCLSCS and LCMT are exempted Cayman Islands investment companies. LCMFS, LCLSCS and LCMT have each received an undertaking from the Government of the Cayman Islands exempting them from all local income, profits, and capital gains taxes. No such taxes are levied in the Cayman Islands at the present time. For U.S. income tax purposes, LCMFS, LCLSCS and LCMT are controlled foreign corporations (“CFCs”) and as such are not subject to U.S. income tax. However, as a wholly-owned CFC, the net income and capital gain of each CFC, to the extent of its earnings and profits, will be included each year in the respective Funds’ investment company taxable income.
Foreign Securities and Currency
Investment securities and other assets and liabilities denominated in foreign currencies are translated into U.S. dollar amounts at the date of valuation. Purchases and sales of investment securities and income and expense items denominated in foreign currencies are translated into U.S. dollar amounts on the respective dates of such transactions.
The Funds do not isolate that portion of the results of operations resulting from changes in foreign exchange rates on investments from the fluctuations arising from changes in market prices of securities held. Such fluctuations are included with the net realized and unrealized gain or loss from investments.
Reported net realized foreign exchange gains or losses arise from sales of foreign currencies, currency gains or losses realized between the trade and settlement dates on securities transactions, and the difference between the amounts of dividends, interest, and foreign withholding taxes recorded on the Funds’ books and the U.S. dollar equivalent of the amounts actually received or paid. Net unrealized foreign exchange gains and losses arise from changes in the fair values of assets and liabilities, other than investments in securities at period end, resulting from changes in exchange rates.
Forward Currency Contracts
Gains or losses are realized when foreign currency contracts are liquidated. Any change in net unrealized gain or loss is reported in the statements of operations.
Futures Contracts
A futures contract provides for the future sale by one party and purchase by another party of a specified amount of a specific financial instrument (e.g., units of a stock index) for a specified price, date, time and place designated at the time the contract is made. Brokerage fees are incurred when a futures contract is bought or sold and margin deposits must be maintained. Entering into a contract to buy is commonly referred to as buying or purchasing a contract or holding a long position. Entering into a contract to sell is commonly referred to as selling a contract or holding a short position.
Unlike when a Fund purchases or sells a security, no price would be paid or received by the Fund upon the purchase or sale of a futures contract.
Although certain futures contracts, by their terms, require actual future delivery of and payment for the underlying instruments, in practice most futures contracts are usually closed out before the delivery date. Gains or losses are realized when contracts are liquidated. Closing out an open futures contract purchase or sale is affected by entering into an offsetting futures contract sale or purchase, respectively, for the same aggregate amount of the identical underlying instrument or index and the same delivery date. If the offsetting purchase price is less than the original sale price, the Fund realizes a gain; if it is more, the Fund realizes a loss. Conversely, if the offsetting sale price is more than the original purchase price, the Fund realizes a gain; if it is less, the Fund realizes a loss.
| | |
| | |
| 92 | | LoCorr Macro Strategies Fund, LoCorr Long/Short Commodities Strategy Fund and LoCorr Market Trend Fund – Notes to Consolidated Financial Statements / LoCorr Dynamic Equity Fund and LoCorr Spectrum Income Fund – Notes to Financial Statements (continued) |
| | |
The transaction costs must also be included in these calculations. There can be no assurance, however, that a Fund will be able to enter into an offsetting transaction with respect to a particular futures contract at a particular time. If a Fund is not able to enter into an offsetting transaction, the Fund will continue to be required to maintain the margin deposits on the futures contract.
Any change in net unrealized gain or loss is reported in the statements of operations.
Indemnifications
In the normal course of business, the Funds enter into contracts that contain general indemnifications to other parties. The Funds’ maximum exposure under these contracts is unknown as this would involve future claims that may be made against the Funds that have not yet occurred. However, based on experience, the Funds expect the risk of loss to be remote.
Market and Credit Risks
The Funds may engage in the speculative trading of U.S. and foreign futures, forward currency and swap contracts (collectively, “derivatives”). The Funds are exposed to both market risk, which is the risk arising from changes in the fair value of the contracts and credit risk, which is the risk of failure by another party to perform according to the terms of a contract.
Purchase and sale of futures contracts requires margin deposits with the broker. Additional deposits may be necessary for any loss on contract value. The Commodity Exchange Act requires a broker to segregate all customer transactions and assets from such broker’s proprietary activities. A customer’s cash and other property (for example, U.S. government securities) deposited with a broker are considered commingled with all other customer funds subject to the broker’s segregation requirements. In the event of a broker’s insolvency, recovery may be limited to a pro rata share of segregated funds available. It is possible that the recovered amount could be less than total cash and other property deposited.
For derivatives, risks arise from changes in the fair value of the contracts. Theoretically, the Funds are exposed to a market risk equal to the notional contract value of swap, futures and forward currency contracts purchased and unlimited liability on such contracts sold short.
The Funds also engage in investing its assets in U.S. government securities. Risks arise from investments in U.S. government securities due to possible market illiquidity. U.S. government securities are also sensitive to changes in interest rates and economic conditions.
The Funds have established procedures to actively monitor market risk and minimize credit risk, although there can be no assurance that they will, in fact, succeed in doing so.
New Accounting Pronouncements and/or SEC Regulatory Updates
In August 2018, the SEC issued Final Rule Release No. 33-10532, Disclosure Update and Simplification, which in part amends certain disclosure requirements of Regulation S-X that have become redundant, duplicative, overlapping, outdated, or superseded, in light of other Commission disclosure requirements, GAAP, or changes in the information environment. The amendments are intended to facilitate the disclosure of information to investors and simplify compliance without significantly altering the total mix of information provided to investors. The effective date for these disclosures was November 5, 2018. Management has adopted these amendments as currently required and these are reflected in the Funds’ financial statements and related disclosures.
In August 2018, FASB issued Accounting Standards Update No. 2018-13, Fair Value Measurement (Topic 820): Disclosure Framework—Changes to the Disclosure Requirements for Fair Value Measurement (“ASU 2018-13”). The primary focus of ASU No. 2018-13 is to improve the effectiveness of the disclosure requirements for fair value measurements. The changes affect all companies that are required to include fair value measurement disclosures. In general, the amendments in ASU 2018-13 are effective for all entities for fiscal years and interim periods within those fiscal years, beginning after December 15, 2019. An entity is permitted to early adopt the removed or modified disclosures upon the issuance of ASU No. 2018-13 and may delay adoption of the additional disclosures, which are required for public companies only, until their effective date. Management has adopted these amendments and these are reflected in the Fund’s financial statements and related disclosures.
Options on Securities
The Funds may purchase and write (i.e., sell) put and call options. Such options may relate to particular securities or stock indices and may or may not be listed on a domestic or foreign securities exchange and may or may not be issued by the Options Clearing Corporation. Option trading is a highly specialized activity that entails greater than ordinary investment risk. Options may be more volatile than the underlying instruments, and therefore, on a percentage basis, an investment in options may be subject to greater fluctuation than an investment in the underlying instruments themselves.
A call option for a particular security gives the purchaser of the option the right to buy, and the writer (seller) the obligation to sell, the underlying security at the stated exercise price at any time prior to the expiration of the option, regardless of the market price of the security. The premium paid to the writer is in consideration for undertaking the obligation under the option contract. A put option for a particular security gives the purchaser the right to sell the security at the stated exercise price at any time prior to the expiration date of the option, regardless of the market price of the security.
A Fund’s obligation to sell an instrument subject to a call option written by it, or to purchase an instrument subject to a put option written by it, may be terminated prior to the expiration date of the option by the Fund’s execution of a closing purchase transaction, which is effected by purchasing on an exchange an option of the same series (i.e., same underlying instrument, exercise price and expiration date) as the option previously written. A closing purchase transaction will ordinarily be effected to realize a profit on an outstanding option, to prevent an underlying instrument from being called, to permit the sale of the underlying instrument or to permit the writing of a new option containing different terms on such underlying instrument. The cost of such a liquidation purchase plus transactions costs may be greater than the premium received upon the original option, in which event the Fund will have incurred a loss in the transaction. There is no assurance that a liquid secondary market will exist for any particular option. An option writer unable to effect a closing purchase transaction will not be able to sell the underlying instrument or liquidate the assets held in a segregated account, as described below, until the option expires or the optioned instrument is delivered upon exercise. In such circumstances, the writer will be subject to the risk of market decline or appreciation in the instrument during such period.
| | |
| | |
LoCorr Macro Strategies Fund, LoCorr Long/Short Commodities Strategy Fund and LoCorr Market Trend Fund – Notes to Consolidated Financial Statements / LoCorr Dynamic Equity Fund and LoCorr Spectrum Income Fund – Notes to Financial Statements (continued) | | 93 |
| | |
If an option purchased by a Fund expires unexercised, the Fund realizes a loss equal to the premium paid. If a Fund enters into a closing sale transaction on an option purchased by it, the Fund will realize a gain if the premium received by the Fund on the closing transaction is more than the premium paid to purchase the option or a loss if it is less. If an option written by a Fund expires on the stipulated expiration date or if the Fund enters into a closing purchase transaction, it will realize a gain (or loss if the cost of a closing purchase transaction exceeds the net premium received when the option is sold). If an option written by the Fund is exercised, the proceeds of the sale will be increased by the net premium originally received and the Fund will realize a gain or loss.
Security Transactions and Investment Income
Security transactions are recorded on trade date. Generally, realized gains and losses on sales of investments are calculated on the specifically identified cost basis of the securities.
In accordance with the investment restrictions outlined within the Funds’ respective prospectuses, each Fund may invest up to 15% of its net assets in illiquid securities. Illiquid securities may include securities subject to contractual or legal restrictions on resale (e.g., because they have not been registered under the Securities Act) and securities that are otherwise not readily marketable (e.g., because trading in the security is suspended or because market makers do not exist or will not entertain bids or offers). Securities that have not been registered under the Securities Act are referred to as private investments or restricted securities and are purchased directly from the issuer or in the secondary market. Foreign securities that are freely tradable in their principal markets are not considered to be illiquid. Under guidelines adopted by the Trust’s Board, the Adviser of the Funds may determine that particular Rule 144A securities, and commercial paper issued in reliance on the private placement exemption from registration afforded by Section 4(a)(2) of the Securities Act, are liquid even though they are not registered. At June 30, 2019, the Adviser deemed all of the 144A securities held in the LoCorr Macro Strategies Fund, the LoCorr Long/Short Commodities Strategy Fund and the LoCorr Market Trend Fund to be liquid. At June 30, 2019, there were no illiquid or restricted securities held in the LoCorr Dynamic Equity Fund or the LoCorr Spectrum Income Fund.
Dividend income, less foreign taxes withheld, if any, are recorded on the ex-dividend date.
Distributions received from the investments in MLP interests, REITs, private investments, closed end funds, business development companies and royalty trusts generally are comprised of ordinary income, capital gains and return of capital. For financial statement purposes, the Funds use estimates to characterize these distributions received as return of capital, capital gains or ordinary income. Such estimates are based on historical information available from each MLP, REIT, private investment, closed end fund, business development company or royalty trust and other industry sources. These estimates may subsequently be revised based on information received from the MLP, REIT, private investment, closed end fund, business development company or royalty trust after their tax reporting periods are concluded, as the actual character of these distributions is not known until after the fiscal year end of the Funds. The distributions received from the MLP, REIT, private investment, closed end fund, business development company and royalty trust securities that have been classified as income and capital gains are included in investment income and net realized gain (loss) on investments, respectively, on the statements of operations. The distributions received that are classified as return of capital reduce the cost of investments on the statements of assets and liabilities.
Interest income and expense are recognized on the accrual basis. Market discounts, premiums and original issue discounts on fixed-income securities are amortized daily over the expected life of the security using the effective yield method.
Short Sales
The Funds may sell securities short. A short sale is a transaction in which a Fund sells a security it does not own or have the right to acquire (or that it owns but does not wish to deliver) in anticipation that the market price of that security will decline.
When a Fund makes a short sale, the broker-dealer through which the short sale is made must borrow the security sold short and deliver it to the party purchasing the security. The Funds are required to make a margin deposit in connection with such short sales; the Funds may have to pay a fee to borrow particular securities and will often be obligated to pay over any dividends and accrued interest on borrowed securities.
If the price of the security sold short increases between the time of the short sale and the time a Fund covers its short position, the Fund will incur a loss; conversely, if the price declines, the Fund will realize a gain. A gain, limited to the price at which the Fund sold the security short, or a loss, unlimited in size, will be recognized upon the close of a short sale. Any gain will be decreased, and any loss increased, by the transaction costs described above. The successful use of short selling may be adversely affected by imperfect correlation between movements in the price of the security sold short and the securities being hedged. Gains or losses from closed positions of securities sold short are presented as net realized gain or loss on securities sold short on the statements of operations.
In addition, the Funds are required to pay the lender any dividends declared on short positions. Dividends declared on open short positions are recorded on ex-date and shown as an expense for financial reporting purposes. To borrow the security, the Funds also may be required to pay fees, which are shown as an expense for financial reporting purposes.
To the extent the Funds sell securities short, it will provide collateral to the broker-dealer and (except in the case of short sales “against the box”) will maintain additional asset coverage in the form of cash, U.S. government securities or other liquid securities with its custodian in a segregated account in an amount at least equal to the difference between the current fair value of the securities sold short and any amounts required to be deposited as collateral with the selling broker (not including the proceeds of the short sale). A short sale is “against the box” to the extent the Funds contemporaneously own, or have the right to obtain at no added cost, securities identical to those sold short. Short sales are collateralized by cash deposits with the counterparty broker and pledged securities held at the custodian, U.S. Bank. The collateral required is determined daily by reference to the fair value of the short positions.
| | |
| | |
| 94 | | LoCorr Macro Strategies Fund, LoCorr Long/Short Commodities Strategy Fund and LoCorr Market Trend Fund – Notes to Consolidated Financial Statements / LoCorr Dynamic Equity Fund and LoCorr Spectrum Income Fund – Notes to Financial Statements (continued) |
| | |
Total Return Swap Contracts
The Funds may enter into total return swap agreements. A total return swap entered into by the Funds is a derivative contract that transfers the market risk of underlying portfolios of futures contracts, forward currency contracts and foreign currencies (considered the “index” within each total return swap contract) between counterparties. The “notional amount” of each total return swap agreement is the agreed upon amount or value of the index used for calculating the returns that the parties to a swap agreement have agreed to exchange. The total return swaps are marked to market daily and any change is recorded in unrealized gain/loss on the consolidated statements of operations based on the value of the index on which the total return swap is referenced, as defined within the total return swap agreement between the counterparties. The composition of the index may vary based on how the underlying portfolio of futures contracts, forward currency contracts and foreign currencies is traded. A Fund’s obligation under a total return swap agreement, including any related fees, offset against amounts owed to the Fund in the case of positive performance, will be covered by designating liquid assets on the Fund’s books and records (see the consolidated statement of assets and liabilities for deposits with broker for derivative instruments). Gains or losses will be realized when the total return swap contracts are liquidated and will be presented as net realized gain or loss on swap contracts on the consolidated statements of operations. Changes in notional value and any cash holding adjustments, which represent voluntary realizations by a Fund of swap value at any point in time, are also presented as net realized gain or loss on swap contracts on the consolidated statements of operations. Further, any cash holding adjustments realized by a Fund are subject to interest charges, which are recorded as part of unrealized gain/loss on the consolidated statements of operations. A corresponding asset or liability for “advance receipt on swap contracts” or “advance payment on swap contracts,” respectively, is recorded on the consolidated statements of assets and liabilities for the gain or loss realized on changes in notional value. Total return swaps outstanding at period end, if any, are listed after the Funds’ consolidated schedules of investments.
Use of Estimates
The preparation of financial statements in conformity with GAAP requires management to make estimates and assumptions that affect the reported amounts of assets and liabilities, disclosure of contingent assets and liabilities at the date of the financial statements and the reported revenues and expenses during the reporting period. Actual results could differ from those estimates.
Warrants
The Funds may invest in warrants. Warrants are options to purchase common stock at a specific price (usually at a premium above the market value of the optioned common stock at issuance) valid for a specific period of time. Warrants may have a life ranging from less than one year to twenty years, or they may be perpetual. However, most warrants have expiration dates after which they are worthless. In addition, a warrant is worthless if the market price of the common stock does not exceed the warrant’s exercise price during the life of the warrant. Warrants have no voting rights, pay no dividends and have no rights with respect to the assets of the corporation issuing them. The percentage increase or decrease in the market price of the warrant may tend to be greater than the percentage increase or decrease in the market price of the optioned common stock.
3. Derivative and Other Financial Instruments
The Funds may invest in derivatives such as futures, forward currency and swap contracts, in order to hedge against market movements while liquidating certain positions and buying other securities or as substitutes for securities, as well as for speculative purposes to gain exposure to such market movements.
The Funds’ market risk related to their derivatives trading is influenced by a wide variety of factors, including the level and volatility of interest rates, exchange rates, weather, supply and demand of commodities, the market value of futures and forward currency contracts, the diversification effects among the Funds’ open positions and the liquidity of the markets in which they trade. The following are the primary trading risk exposures by market sector of the Funds as encompassed in the total return swap contracts:
Agricultural. (grains, livestock and softs). The Funds’ primary exposure is to agricultural price movements which are often directly affected by severe or unexpected weather conditions.
Currencies. Exchange rate risk is a principal market exposure of the Funds. The Funds’ currency exposure is to exchange rate fluctuations, primarily fluctuations which disrupt the historical pricing relationships between different currencies and currency pairs. The fluctuations are influenced by interest rate changes as well as political and general economic conditions. The Funds trade in a large number of currencies including cross-rates- e.g., positions between two currencies other than the U.S. dollar.
Energy. The Funds’ primary energy market exposure is to gas and oil price movements, often resulting from political developments in the Middle East and economic conditions worldwide. Energy prices are volatile and substantial profits and losses have been and are expected to continue to be experienced in this market.
Interest rates. Interest rate movements directly affect the price of the sovereign bond futures positions held by the Funds and indirectly the value of its stock index currency positions. Interest rate movements in one country as well as relative interest rate movements between countries may materially impact the Funds’ profitability. The Funds’ primary interest rate exposure is to interest rate fluctuations in countries or regions including Australia, Canada, Japan, Switzerland, the United Kingdom, the United States and the Eurozone. However, the Funds also may take positions in futures contracts on the government debt of other nations. The Funds anticipate that interest rates in these industrialized countries or areas, both long-term and short-term, will remain a primary market exposure of the Funds for the foreseeable future.
Metals. The Funds’ metals market exposure is to fluctuations in the price of aluminum, copper, gold, lead, nickel, palladium, tin, silver and zinc.
Stock index. The Funds’ equity exposure, through stock index futures, is to equity price risk in the major industrialized countries as well as other countries.
| | |
| | |
LoCorr Macro Strategies Fund, LoCorr Long/Short Commodities Strategy Fund and LoCorr Market Trend Fund – Notes to Consolidated Financial Statements / LoCorr Dynamic Equity Fund and LoCorr Spectrum Income Fund – Notes to Financial Statements (continued) | | 95 |
| | |
At June 30, 2019, the LoCorr Macro Strategies Fund, the LoCorr Long/Short Commodities Strategy Fund, the LoCorr Market Trend Fund, the LoCorr Dynamic Equity Fund and the LoCorr Spectrum Income Fund held derivative and other financial instruments which are not subject to a master netting arrangement. As the tables below illustrate, no positions are netted in these consolidated and non-consolidated financial statements.
| LoCorr Macro Strategies Fund - June 30, 2019 | | | | | | | | | |
| Assets: | | | | | | | | | | | | Gross Amounts not offset in the
Consolidated Statement of Assets & Liabilities | | | | |
| Description | | Gross Amounts of
Recognized Assets | | Gross Amounts
Offset in the
Consolidated
Statement of
Assets & Liabilities | | Net Amounts
Presented in the
Consolidated
Statement of
Assets & Liabilities | | Financial
Instruments | | Collateral Pledged
(Received) | | Net Amount | |
| Forward currency contracts | | $ | 5,546,920 | | $ | — | | $ | 5,546,920 | | $ | — | | $ | — | | $ | 5,546,920 | |
| Futures contracts | | | 2,054,681 | | | — | | | 2,054,681 | | | — | | | — | | | 2,054,681 | |
| Total | | $ | 7,601,601 | | $ | — | | $ | 7,601,601 | | $ | — | | $ | — | | $ | 7,601,601 | |
| Liabilities: | | | | | | | | | | | | | | | | | | | |
| | | | | | | | | | | | | Gross Amounts not offset in the
Consolidated Statement of Assets & Liabilities | | | | |
| Description | | Gross Amounts of
Recognized Liabilities | | Gross Amounts
Offset in the
Consolidated
Statement of
Assets & Liabilities | | Net Amounts
Presented in the
Consolidated
Statement of
Assets & Liabilities | | Financial
Instruments | | Collateral Received (Pledged) | | Net Amount | |
| Forward currency contracts | | $ | 9,031,139 | | $ | — | | $ | 9,031,139 | | $ | — | | $ | (9,031,139) | | $ | — | |
| Futures contracts | | | 287,286 | | | — | | | 287,286 | | | — | | | (287,286) | | | — | |
| Total | | $ | 9,318,425 | | $ | — | | $ | 9,318,425 | | $ | — | | $ | (9,318,425) | | $ | — | |
LoCorr Long/Short Commodities Strategy Fund - June 30, 2019 | | | | | | | | | |
| Assets: | | | | | | | | | | | | Gross Amounts not offset in the
Consolidated Statement of Assets & Liabilities | | | | |
| Description | | Gross Amounts of
Recognized Assets | | Gross Amounts
Offset in the
Consolidated
Statement of
Assets & Liabilities | | Net Amounts
Presented in the
Consolidated
Statement of
Assets & Liabilities | | Financial
Instruments | | Collateral Pledged (Received) | | Net Amount | |
| Swap Contracts* | | $ | 11,034,228 | | $ | — | | $ | 11,034,228 | | $ | — | | $ | — | | $ | 11,034,228 | |
| Total | | $ | 11,034,228 | | $ | — | | $ | 11,034,228 | | $ | — | | $ | — | | $ | 11,034,228 | |
| Liabilities: | | | | | | | | | | | | | | | | | | | |
| | | | | | | | | | | | | Gross Amounts not offset in the
Consolidated Statement of Assets & Liabilities | | | | |
| Description | | Gross Amounts of
Recognized Liabilities | | Gross Amounts
Offset in the
Consolidated
Statement of
Assets & Liabilities | | Net Amounts
Presented in the
Consolidated
Statement of Assets & Liabilities | | Financial
Instruments | | | Collateral Received (Pledged) | Net Amount | |
| Swap Contracts | | $ | 2,466,015 | | $ | — | | $ | 2,466,015 | | $ | — | | $ | (2,466,015) | | $ | — | |
| Total | | $ | 2,466,015 | | $ | — | | $ | 2,466,015 | | $ | — | | $ | (2,466,015) | | $ | — | |
*Represents advance receipt on swap contracts.
LoCorr Market Trend Fund - June 30, 2019 | | | | | | | | | |
| Assets: | | | | | | | | | | | | Gross Amounts not offset in the
Consolidated Statement of Assets & Liabilities | | | | |
| Description | | Gross Amounts of
Recognized Assets | | Gross Amounts
Offset in the
Consolidated
Statement of
Assets & Liabilities | | Net Amounts
Presented in the
ConsolidatedStatement of
Assets & Liabilities | | | Financial
Instruments | | Collateral Pledged (Received) | | Net Amount | |
| Forward currency contracts | | $ | 255,383 | | $ | — | | $ | 255,383 | | $ | — | | $ | — | | $ | 255,383 | |
| Futures contracts | | | 1,670,629 | | | — | | | 1,670,629 | | | — | | | — | | | 1,670,629 | |
| Total | | $ | 1,926,012 | | $ | — | | $ | 1,926,012 | | $ | — | | $ | — | | $ | 1,926,012 | |
| Liabilities: | | | | | | | | | | | | Gross Amounts not offset in the
Consolidated Statement of Assets & Liabilities | | | | |
| Description | | Gross Amounts of Recognized Liabilities | | Gross Amounts
Offset in the
Consolidated
Statement of
Assets & Liabilities | | Net Amounts
Presented in the
Consolidated
Statement of
Assets & Liabilities | | Financial
Instruments | | Collateral Received (Pledged) | | Net Amount | |
| Forward currency contracts | | $ | 3,516,875 | | $ | — | | $ | 3,516,875 | | $ | — | | $ | (3,516,875) | | $ | — | |
| Futures contracts | | | 192,056 | | | — | | | 192,056 | | | — | | | (192,056) | | | — | |
| Total | | $ | 3,708,931 | | $ | — | | $ | 3,708,931 | | $ | — | | $ | (3,708,931) | | $ | — | |
| | |
| | |
| 96 | | LoCorr Macro Strategies Fund, LoCorr Long/Short Commodities Strategy Fund and LoCorr Market Trend Fund – Notes to Consolidated Financial Statements / LoCorr Dynamic Equity Fund and LoCorr Spectrum Income Fund – Notes to Financial Statements (continued) |
| | |
| LoCorr Dynamic Equity Fund - June 30, 2019 | | | | | | | | | |
| Assets: | | | | | | | | | | | | Gross Amounts not offset in the
Statement of Assets & Liabilities | | | | |
| Description | | Gross Amounts of
Recognized Assets | | Gross Amounts
Offset in the
Consolidated
Statement of
Assets & Liabilities | | Net Amounts
Presented in the
ConsolidatedStatement of
Assets & Liabilities | | Financial
Instruments | | Collateral Pledged (Received) | | Net Amount | |
| Futures contracts | | $ | 19,903 | | $ | — | | $ | 19,903 | | $ | — | | $ | — | | $ | 19,903 | |
| Total | | $ | 19,903 | | $ | — | | $ | 19,903 | | $ | — | | $ | — | | $ | 19,903 | |
The Funds have adopted authoritative standards regarding disclosure about derivatives and hedging activities and how they affect the Funds’ consolidated statements of assets and liabilities and consolidated statements of operations. Fair value of swap contracts are recorded in the consolidated statements of assets and liabilities as net unrealized gain on swap contracts or net unrealized loss on swap contracts and net unrealized appreciation of swap contracts or net unrealized depreciation of swap contracts.
Since the derivatives held long or short are for speculative trading purposes, the derivative instruments are not designated as hedging instruments. Accordingly, all realized gains and losses, as well as any change in net unrealized gains or losses on open contracts from the preceding period, are recognized as part of realized and unrealized gain (loss) in the consolidated statements of operations.
The following table presents the fair value of consolidated derivative instruments for the LoCorr Macro Strategies Fund, the LoCorr Long/Short Commodities Strategy Fund, the LoCorr Market Trend Fund and the non-consolidated derivative instruments for the LoCorr Dynamic Equity Fund and the LoCorr Spectrum Income Fund as of June 30, 2019 as presented on each Fund’s consolidated and non-consolidated statements of assets and liabilities:
| | | | | | | | | | Net Unrealized
Gain (Loss) on | |
| | | | Fair Value | | | Open | |
| Derivatives Not Accounted for as Hedging Instruments | | | Assets | | | Liabilities | | | Positions | |
| LoCorr Macro Strategies Fund | | | | | | | | | | |
| Forward Currency Contracts(a) | | | | | | | | | | |
| Long | | $ | 5,546,723 | | $ | 179,985 | | $ | 5,366,738 | |
| Short | | | 197 | | | 8,851,154 | | | (8,850,957 | ) |
| Total Forward Currency Contracts | | | 5,546,920 | | | 9,031,139 | | | (3,484,219 | ) |
| | | | | | | | | | | |
| Futures Contracts(b) | | | | | | | | | | |
| Long Contracts | | | | | | | | | | |
| Commodity | | | 2,332,043 | | | 847,044 | | | 1,484,999 | |
| Equity | | | 2,268,171 | | | 105,009 | | | 2,163,162 | |
| Foreign exchange | | | 136,671 | | | 62,219 | | | 74,452 | |
| Interest rate | | | 7,792,280 | | | 109,087 | | | 7,683,193 | |
| Total Long Contracts | | | 12,529,165 | | | 1,123,359 | | | 11,405,806 | |
| | | | | | | | | | | |
| Short Contracts | | | | | | | | | | |
| Commodity | | | 1,298,658 | | | 1,105,905 | | | 192,753 | |
| Equity | | | 90,936 | | | 351,874 | | | (260,938 | ) |
| Foreign exchange | | | — | | | 409 | | | (409 | ) |
| Interest rate | | | 2,559 | | | 172,593 | | | (170,034 | ) |
| Total Short Contracts | | | 1,392,153 | | | 1,630,781 | | | (238,628 | ) |
| Total Futures Contracts | | | 13,921,318 | | | 2,754,140 | | | 11,167,178 | |
| Total Forward Currency Contracts and Futures Contracts | | $ | 19,468,238 | | $ | 11,785,279 | | $ | 7,682,959 | |
| | |
| | |
LoCorr Macro Strategies Fund, LoCorr Long/Short Commodities Strategy Fund and LoCorr Market Trend Fund – Notes to Consolidated Financial Statements / LoCorr Dynamic Equity Fund and LoCorr Spectrum Income Fund – Notes to Financial Statements (continued) | | 97 |
| | |
| | | | | | | | | | Net Unrealized
Gain (Loss) on | |
| | | | Fair Value | | | Open | |
| Derivatives Not Accounted for as Hedging Instruments | | | Assets | | | Liabilities | | | Positions | |
| LoCorr Long/Short Commodities Strategy Fund | | | | | | | | | | |
| Long Total Return Swap Contracts | | | | | | | | | | |
| LoCorr Commodities Index | | $ | — | | $ | 2,466,015 | | $ | (2,466,015 | ) |
| | | | | | | | | | | |
| LoCorr Market Trend Fund | | | | | | | | | | |
| Forward Currency Contracts(a) | | | | | | | | | | |
| Long | | $ | 255,383 | | $ | 152,236 | | $ | 103,147 | |
| Short | | | — | | | 3,364,639 | | | (3,364,639 | ) |
| Total Forward Currency Contracts | | | 255,383 | | | 3,516,875 | | | (3,261,492 | ) |
| | | | | | | | | | | |
| Futures Contracts(b) | | | | | | | | | | |
| Long Contracts | | | | | | | | | | |
| Commodity | | | 2,518,659 | | | 192,056 | | | 2,326,603 | |
| Equity | | | 2,083,256 | | | 104,167 | | | 1,979,089 | |
| Foreign exchange | | | — | | | 82,262 | | | (82,262 | ) |
| Interest rate | | | 9,934,511 | | | — | | | 9,934,511 | |
| Total Long Contracts | | | 14,536,426 | | | 378,485 | | | 14,157,941 | |
| | | | | | | | | | | |
| Short Contracts | | | | | | | | | | |
| Commodity | | | 1,318,639 | | | 1,186,505 | | | 132,134 | |
| Equity | | | 30,851 | | | 190,068 | | | (159,217 | ) |
| Total Short Contracts | | | 1,349,490 | | | 1,376,573 | | | (27,083 | ) |
| Total Futures Contracts | | | 15,885,916 | | | 1,755,058 | | | 14,130,858 | |
| Total Forward Currency Contracts and Futures Contracts | | $ | 16,141,299 | | $ | 5,271,933 | | $ | 10,869,366 | |
| | | | | | | | | | | |
| LoCorr Dynamic Equity Fund | | | | | | | | | | |
| Futures Contracts(b) | | | | | | | | | | |
| Long Contracts | | | | | | | | | | |
| Equity | | $ | 79,443 | | $ | — | | $ | 79,443 | |
| Total Long Contracts | | | 79,443 | | | — | | | 79,443 | |
| | | | | | | | | | | |
| Short Contracts | | | | | | | | | | |
| Equity | | | 2,282 | | | — | | | 2,282 | |
| Total Short Contracts | | | 2,282 | | | — | | | 2,282 | |
| Total Futures Contracts | | $ | 81,725 | | $ | — | | $ | 81,725 | |
| | | | | | | | | | | |
| LoCorr Spectrum Income Fund | | | | | | | | | | |
| Options (c) | | | | | | | | | | |
| Purchased Options | | | | | | | | | | |
| Put Options | | $ | 242,500 | | $ | — | | $ | (245,915 | ) |
| Written Options | | | | | | | | | | |
| Call Options | | | — | | | 94,602 | | | 313 | |
| Total Options | | $ | 242,500 | | $ | (94,602 | ) | $ | (245,602 | ) |
| (a) | Unrealized appreciation on forward currency contracts is a receivable and unrealized depreciation on forward currency contracts is a payable on the Fund’s consolidated statement of assets and liabilities. |
| (b) | Reflects the cumulative unrealized appreciation (depreciation) of futures contracts as reported in the Fund’s consolidated and non-consolidated schedule of open futures contracts. Only the current day variation margin for futures contracts is separately reported within the Fund’s consolidated and non-consolidated statement of assets and liabilities. |
| (c) | Purchased options are included within Investments at value, and written options are reported as liabilities on the Fund’s statements of assets and liabilities. |
| | |
| | |
| 98 | | LoCorr Macro Strategies Fund, LoCorr Long/Short Commodities Strategy Fund and LoCorr Market Trend Fund – Notes to Consolidated Financial Statements / LoCorr Dynamic Equity Fund and LoCorr Spectrum Income Fund – Notes to Financial Statements (continued) |
| | |
The following table presents the results of the derivative trading and information related to volume for the six months ended June 30, 2019 for the LoCorr Macro Strategies Fund, the LoCorr Long/Short Commodities Strategy Fund, the LoCorr Market Trend Fund, the LoCorr Dynamic Equity Fund and the LoCorr Spectrum Income Fund. The below captions of “Net Realized” and “Net Change in Unrealized” correspond to the captions in each Fund’s consolidated and non-consolidated statement of operations.
| | | | Gain (Loss) from Trading | |
| Fund and Type of Derivative Instrument | | | Net Realized | | | Net Change
in Unrealized | |
| LoCorr Macro Strategies Fund | | | | | | | |
| Forward Currency Contracts | | $ | (2,735,250 | ) | $ | (2,556,937 | ) |
| Futures Contracts | | | | | | | |
| Commodity | | | (13,165,105 | ) | | (2,102,421 | ) |
| Equity | | | 4,820,143 | | | 2,565,863 | |
| Foreign exchange | | | (464,745 | ) | | 186,930 | |
| Interest rate | | | 30,968,561 | | | 9,224,309 | |
| Total Futures Contracts | | | 22,158,854 | | | 9,874,681 | |
| Total Forward Currency Contracts and Futures Contracts | | $ | 19,423,604 | | $ | 7,317,744 | |
| | | | | | | | |
| LoCorr Long/Short Commodities Strategy Fund | | | | | | | |
| Swap Contracts | | $ | 615,496 | | $ | (6,829,961 | ) |
| | | | | | | | |
| LoCorr Market Trend Fund | | | | | | | |
| Forward Currency Contracts | | $ | (1,900,758 | ) | $ | (755,268 | ) |
| Futures Contracts | | | | | | | |
| Commodity | | | (20,145,279 | ) | | 2,281,000 | |
| Equity | | | 4,614,462 | | | 2,647,869 | |
| Foreign exchange | | | (2,819 | ) | | 132,513 | |
| Interest rate | | | 25,007,055 | | | 12,958,630 | |
| Total Futures Contracts | | | 9,473,419 | | | 18,020,012 | |
| Total Forward Currency Contracts and Futures Contracts | | $ | 7,572,661 | | $ | 17,264,744 | |
| | | | | | | | |
| LoCorr Dynamic Equity Fund | | | | | | | |
| Futures Contracts | | | | | | | |
| Equity | | $ | 527,419 | | $ | 81,725 | |
| Total Futures Contracts | | $ | 527,419 | | $ | 81,725 | |
| | | | | | | | |
| LoCorr Spectrum Income Fund | | | | | | | |
| Options | | | | | | | |
| Purchased Options | | | | | | | |
| Put Options | | $ | 42,907 | | $ | (245,915 | ) |
| Written Options | | | | | | | |
| Call Options | | | 14,253 | | | 313 | |
| Total Options | | $ | 57,160 | | $ | (245,602 | ) |
The average monthly notional amount is shown as an indicator of volume. The average monthly notional amounts during the six months ended June 30, 2019 were:
| | | | Average Notional Amount | |
| | | | Long Contracts | | | Short Contracts | |
| LoCorr Macro Strategies Fund | | | | | | | |
| Forward Currency Contracts | | $ | 599,419,327 | | $ | 854,144,192 | |
| Futures Contracts | | | 1,935,532,467 | | | 594,060,960 | |
| | | | | | | | |
| LoCorr Long/Short Commodities Strategy Fund | | | | | | | |
| Swap Contracts | | $ | 221,087,955 | | $ | — | |
| | | | | | | | |
| LoCorr Market Trend Fund | | | | | | | |
| Forward Currency Contracts | | $ | 296,856,174 | | $ | 602,027,184 | |
| Futures Contracts | | | 1,824,110,198 | | | 501,014,686 | |
| | |
LoCorr Macro Strategies Fund, LoCorr Long/Short Commodities Strategy Fund and LoCorr Market Trend Fund – Notes to Consolidated Financial
Statements / LoCorr Dynamic Equity Fund and LoCorr Spectrum Income Fund – Notes to Financial Statements (continued) | | 99 |
| | |
| | | Average Notional Amount | |
| | | Long Contracts | | Short Contracts | |
| LoCorr Dynamic Equity Fund* | | | | | | | |
| Futures Contracts | | $ | 4,680,200 | | $ | 517,229 | |
| | | | | | | | |
| LoCorr Spectrum Income Fund** | | | | | | | |
| Options | | $ | 380,600 | | $ | 5,028,411 | |
* Represents the average notional amount for the period of January 9, 2019 to June 30, 2019, when the Fund began trading futures contracts.
** Represents the average notional amount for the period of May 21, 2019 to June 30, 2019, when the Fund began trading options.
The swap contracts and the commodity-related futures contracts reported in the tables in Note 3 represent balances and activity of each Fund’s respective wholly-owned and controlled subsidiary. See Note 2.
Please refer to the Funds’ prospectuses for a full listing of risks associated with these investments.
4. Investment Transactions
The cost of security purchases and proceeds from security sales, excluding short-term investments, derivative instruments, short sales and purchases to cover short sales for the six months ended June 30, 2019 were as follows:
| | | U.S. Government Obligations | | All Other | |
| | | Purchases | | Sales | | Purchases | | Sales | |
| LoCorr Macro Strategies Fund | | $ | 101,045,815 | | $ | 40,792,981 | | $ | 136,485,948 | | $ | 180,772,801 | |
| LoCorr Long/Short Commodities Strategy Fund | | | 49,789,415 | | | 22,924,220 | | | 102,680,021 | | | 79,045,701 | |
| LoCorr Market Trend Fund | | | 57,275,553 | | | 20,494,760 | | | 28,950,006 | | | 152,776,850 | |
| LoCorr Dynamic Equity Fund | | | — | | | — | | | 32,584,426 | | | 38,970,289 | |
| LoCorr Spectrum Income Fund | | | — | | | — | | | 33,474,720 | | | 34,844,093 | |
5. Management Fees and Other Transactions with Affiliates
Management Agreement
The Trust has a Management Agreement with the Adviser, with whom certain officers and Trustees of the Funds are affiliated, to furnish investment advisory services to the Funds. Pursuant to the amended Management Agreement, the Adviser is entitled to receive a fee as follows:
| Fund | Annual Advisory Fee as a Percentage
of the Average Daily Net Assets of the Fund |
| LoCorr Macro Strategies Fund | 1.65% |
| LoCorr Market Trend Fund | 1.50% |
| LoCorr Dynamic Equity Fund | 1.50% |
| LoCorr Spectrum Income Fund | 1.30% |
Pursuant to the amended Management Agreement, the Adviser is entitled to receive a fee, in accordance with the Incremental Advisory Fee schedule below based on the LoCorr Long/Short Commodities Strategy Fund’s average daily net assets.
Net Assets for the LoCorr Long/Short
Commodities Strategy Fund | Incremental
Advisory Fee* |
| $0.0 - $0.5 billion | 1.50% |
| $0.5 - $1.0 billion | 1.40% |
| $1.0 - $1.5 billion | 1.30% |
| $1.5 - $2.0 billion | 1.20% |
| $2.0 - $2.5 billion | 1.10% |
| Over $2.5 billion | 1.00% |
*Incremental advisory fee represents the fees paid on net assets at the related net asset level. For example, with $3 billion in net assets in the Fund, the Adviser would earn 1.50% on the first $500 million, plus 1.40% on the next $500 million, plus 1.30% on the next $500 million, plus 1.20% on the next $500 million, plus 1.10% on the next $500 million, plus 1.00% on the final $500 million.
| | |
| 100 | | LoCorr Macro Strategies Fund, LoCorr Long/Short Commodities Strategy Fund and LoCorr Market Trend Fund – Notes to Consolidated Financial
Statements / LoCorr Dynamic Equity Fund and LoCorr Spectrum Income Fund – Notes to Financial Statements (continued) |
| | |
As of and for the six months ended June 30, 2019, the Funds reported the following in regards to management fees:
| Fund | | Management Fees For
the Six Months Ended
June 30, 2019 | | Accrued Net
Management Fees
as of
June 30, 2019 | |
| LoCorr Macro Strategies Fund | | | $ | 4,754,411 | | | | $ | 859,913 | | |
| LoCorr Long/Short Commodities Strategy Fund | | | | 2,174,528 | | | | | 394,789 | | |
| LoCorr Market Trend Fund | | | | 2,068,463 | | | | | 323,529 | | |
| LoCorr Dynamic Equity Fund | | | | 200,879 | | | | | 16,896 | | |
| LoCorr Spectrum Income Fund | | | | 480,589 | | | | | 80,963 | | |
Sub-Advisory Agreements
Sub-advisory services are provided to the Funds, pursuant to agreements between the Adviser and the below listed sub-advisers. Under the terms of these sub-advisory agreements, the Adviser compensates the sub-advisers based on the portion of each Fund’s average daily net assets which they have been allocated to manage.
| LoCorr Macro Strategies Fund: |
| Graham Capital Management, L.P. |
| Millburn Ridgefield Corporation |
| Nuveen Asset Management, LLC |
| Revolution Capital Management LLC |
| |
| LoCorr Long/Short Commodities Strategy Fund: |
| Nuveen Asset Management, LLC |
| |
| LoCorr Market Trend Fund: |
| Graham Capital Management, L.P. |
| Nuveen Asset Management, LLC |
| |
| LoCorr Dynamic Equity Fund: |
| Billings Capital Management LLC |
| First Quadrant, L.P. |
| Kettle Hill Capital Management, LLC |
| |
| LoCorr Spectrum Income Fund: |
| Trust & Fiduciary Income Partners, LLC |
The Adviser is solely responsible for the payment of the sub-adviser’s fees, and the sub-adviser agrees not to seek payment of its fees from the Trust or the Funds.
Expense Limitation Agreement
The Funds’ Adviser has contractually agreed to waive management fees and/or reimburse the Funds for expenses they incur, but only to the extent necessary to maintain the Funds’ total annual operating expenses after fee waiver and/or reimbursement (excluding any Rule 12b-1 distribution and/or servicing fees, taxes, interest, brokerage commissions, expenses incurred in connection with any merger or reorganization, dividend expenses on short sales, swap fees, indirect expenses, expenses of other investment companies in which the Funds may invest, or extraordinary expenses such as litigation expenses and inclusive of offering and organizational costs incurred prior to the commencement of operations) at the percentages listed below:
| Fund | Expense Limit as a Percentage of the
Average Daily Net Assets of the Fund | Effective Period Through |
| LoCorr Macro Strategies Fund | 1.99% | April 30, 2020 |
| LoCorr Long/Short Commodities Strategy Fund | 1.95% | April 30, 2020 |
| LoCorr Market Trend Fund | 1.95% | April 30, 2020 |
| LoCorr Dynamic Equity Fund | 1.99% | April 30, 2020 |
| LoCorr Spectrum Income Fund | 1.80% | April 30, 2020 |
Any waiver or reimbursement is subject to repayment by the respective Fund within the three fiscal years following the fiscal year in which the expenses occurred, if the Fund is able to make the repayment without exceeding its current expense limitations and the repayment is approved by the Board. The organizational and offering costs are subject to repayment by the Funds.
| | |
LoCorr Macro Strategies Fund, LoCorr Long/Short Commodities Strategy Fund and LoCorr Market Trend Fund – Notes to Consolidated Financial
Statements / LoCorr Dynamic Equity Fund and LoCorr Spectrum Income Fund – Notes to Financial Statements (continued) | | 101 |
| | |
The total amounts of management fees waived and/or expenses reimbursed which are subject to recovery, and their related expiration date are as follows:
| | | | | | | | | | | | | | |
| LoCorr Macro Strategies Fund | |
| | | Management Fees | | Recovery to Adviser | | | | Subject to Recovery on or | |
| Period | | (Waived) by Adviser
Subject to Recovery | | Six Months Ended
June 30, 2019 | | Remaining Available
Subject to Recovery | | Before Fiscal Year Ending
December 31, | |
| Six Months Ended June 30, 2019 | | $ | — | | $ | — | | $ | — | | | 2022 | |
| Year Ended December 31, 2018 | | | (67,297 | ) | | — | | | (67,297 | ) | | 2021 | |
| Year Ended December 31, 2017 | | | (485,398 | ) | | 188,935 | | | (296,463 | ) | | 2020 | |
| Total | | $ | (552,695 | ) | $ | 188,935 | | $ | (363,760 | ) | | | |
| | | | | | | | | | | | | | |
| LoCorr Long/Short Commodities Strategy Fund |
| | | Management Fees | | Recovery to Adviser | | | | Subject to Recovery on or | |
| Period | | (Waived) by Adviser
Subject to Recovery | | Six Months Ended
June 30, 2019 | | Remaining Available
Subject to Recovery | | Before Fiscal Year Ending
December 31, | |
| Six Months Ended June 30, 2019 | | $ | — | | $ | — | | $ | — | | | 2022 | |
| Year Ended December 31, 2018 | | | — | | | — | | | — | | | 2021 | |
| Year Ended December 31, 2017 | | | (81,840 | ) | | 81,840 | | | — | | | 2020 | |
| Year Ended December 31, 2016 | | | (21,779 | ) | | 21,779 | | | — | | | 2019 | |
| Total | | $ | (103,619 | ) | $ | 103,619 | | $ | — | | | | |
| | | | | | | | | | | | | | |
| LoCorr Dynamic Equity Fund |
| | | Management Fees | | Recovery to Adviser | | | | Subject to Recovery on or | |
| Period | | (Waived) by Adviser
Subject to Recovery | | Six Months Ended
June 30, 2019 | | Remaining Available
Subject to Recovery | | Before Fiscal Year Ending
December 31, | |
| Six Months Ended June 30, 2019 | | $ | (91,924 | ) | $ | — | | $ | (91,924 | ) | | 2022 | |
| Year Ended December 31, 2018 | | | (95,089 | ) | | — | | | (95,089 | ) | | 2021 | |
| Year Ended December 31, 2017 | | | (58,609 | ) | | — | | | (58,609 | ) | | 2020 | |
| Year Ended December 31, 2016 | | | (102,813 | ) | | — | | | (102,813 | ) | | 2019 | |
| Total | | $ | (348,435 | ) | $ | — | | $ | (348,435 | ) | | | |
At June 30, 2019, there were no fees subject to recovery for the LoCorr Long/Short Commodities Strategy Fund, LoCorr Market Trend Fund or the LoCorr Spectrum Income Fund.
Rule 12b-1 Distribution Agreement
The Funds have entered into a Rule 12b-1 distribution agreement with Quasar Distributors, LLC (“Quasar”). Class A shareholders pay distribution expenses to Quasar at the annual rate of 0.25% of the Fund’s average daily net assets. Class C shareholders pay to Quasar an annual rate of 1.00%, which is comprised of 0.75% in distribution expenses and 0.25% in service fees, of the Fund’s average daily net assets. Class I shareholders pay no 12b-1 fees.
| | |
| 102 | | LoCorr Macro Strategies Fund, LoCorr Long/Short Commodities Strategy Fund and LoCorr Market Trend Fund – Notes to Consolidated Financial
Statements / LoCorr Dynamic Equity Fund and LoCorr Spectrum Income Fund – Notes to Financial Statements (continued) |
| | |
6. Fund Shares
At June 30, 2019, there were an unlimited number of shares of beneficial interest authorized. The following table summarizes the activity in shares and dollar amounts applicable to each class of the Funds:
| | | | | | | | | | | | | | |
| LoCorr Macro Strategies Fund – Class A | |
| | | For the Six Months Ended June 30, 2019 | | For the Year Ended December 31, 2018 | |
| | | | Shares | | | Amount | | | Shares | | | Amount | |
| Shares Sold | | | 890,823 | | $ | 7,172,973 | | | 2,896,743 | | $ | 24,405,481 | |
| Reinvestment of Distributions | | | — | | | — | | | 199,801 | | | 1,570,436 | |
| Shares Redeemed | | | (1,925,904 | ) | | (15,416,402 | ) | | (6,956,481 | ) | | (57,264,468 | ) |
| | | | (1,035,081 | ) | $ | (8,243,429 | ) | | (3,859,937 | ) | $ | (31,288,551 | ) |
| Beginning Shares | | | 6,926,645 | | | | | | 10,786,582 | | | | |
| Ending Shares | | | 5,891,564 | | | | | | 6,926,645 | | | | |
| | | | | | | | | | | | | | |
| LoCorr Macro Strategies Fund – Class C | |
| | | For the Six Months Ended June 30, 2019 | | For the Year Ended December 31, 2018 | |
| | | | Shares | | | Amount | | | Shares | | | Amount | |
| Shares Sold | | | 305,016 | | $ | 2,383,751 | | | 780,250 | | $ | 6,256,139 | |
| Reinvestment of Distributions | | | — | | | — | | | 143,755 | | | 1,082,469 | |
| Shares Redeemed | | | (1,632,492 | ) | | (12,590,306 | ) | | (4,904,955 | ) | | (38,557,306 | ) |
| | | | (1,327,476 | ) | $ | (10,206,555 | ) | | (3,980,950 | ) | $ | (31,218,698 | ) |
| Beginning Shares | | | 6,976,532 | | | | | | 10,957,482 | | | | |
| Ending Shares | | | 5,649,056 | | | | | | 6,976,532 | | | | |
| | | | | | | | | | | | | | |
| LoCorr Macro Strategies Fund – Class I | |
| | | For the Six Months Ended June 30, 2019 | | For the Year Ended December 31, 2018 | |
| | | | Shares | | | Amount | | | Shares | | | Amount | |
| Shares Sold | | | 19,135,788 | | $ | 155,748,226 | | | 35,161,086 | | $ | 296,008,093 | |
| Reinvestment of Distributions | | | — | | | — | | | 1,631,374 | | | 13,002,054 | |
| Shares Redeemed | | | (15,350,722 | ) | | (125,816,682 | ) | | (50,629,729 | ) | | (423,014,386 | ) |
| | | | 3,785,066 | | $ | 29,931,544 | | | (13,837,269 | ) | $ | (114,004,239 | ) |
| Beginning Shares | | | 55,252,737 | | | | | | 69,090,006 | | | | |
| Ending Shares | | | 59,037,803 | | | | | | 55,252,737 | | | | |
| LoCorr Macro Strategies Fund | | | | | | | | | | | | | |
| Total Net Increase (Decrease) | | | | | $ | 11,481,560 | | | | | $ | (176,511,488 | ) |
| | | | | | | | | | | | | | |
| LoCorr Long/Short Commodities Strategy Fund – Class A | |
| | | For the Six Months Ended June 30, 2019 | | For the Year Ended December 31, 2018 | |
| | | | Shares | | | Amount | | | Shares | | | Amount | |
| Shares Sold | | | 1,647,370 | | $ | 16,064,177 | | | 4,847,619 | | $ | 49,396,793 | |
| Reinvestment of Distributions | | | — | | | — | | | 513,483 | | | 4,883,224 | |
| Shares Redeemed | | | (2,213,439 | ) | | (21,333,358 | ) | | (1,055,893 | ) | | (10,813,133 | ) |
| | | | (566,069 | ) | $ | (5,269,181 | ) | | 4,305,209 | | $ | 43,466,884 | |
| Beginning Shares | | | 6,939,577 | | | | | | 2,634,368 | | | | |
| Ending Shares | | | 6,373,508 | | | | | | 6,939,577 | | | | |
| | | | | | | | | | | | | | |
| LoCorr Long/Short Commodities Strategy Fund – Class C | |
| | | For the Six Months Ended June 30, 2019 | | For the Year Ended December 31, 2018 | |
| | | | Shares | | | Amount | | | Shares | | | Amount | |
| Shares Sold | | | 216,805 | | $ | 2,032,938 | | | 257,769 | | $ | 2,549,916 | |
| Reinvestment of Distributions | | | — | | | — | | | 69,279 | | | 635,984 | |
| Shares Redeemed | | | (109,426 | ) | | (1,034,622 | ) | | (149,818 | ) | | (1,446,429 | ) |
| | | | 107,379 | | $ | 998,316 | | | 177,230 | | $ | 1,739,471 | |
| Beginning Shares | | | 680,762 | | | | | | 503,532 | | | | |
| Ending Shares | | | 788,141 | | | | | | 680,762 | | | | |
| | | | | | | | | | | | | | |
| LoCorr Long/Short Commodities Strategy Fund – Class I | |
| | | For the Six Months Ended June 30, 2019 | | For the Year Ended December 31, 2018 | |
| | | | Shares | | | Amount | | | Shares | | | Amount | |
| Shares Sold | | | 10,374,376 | | $ | 103,048,601 | | | 13,864,200 | | $ | 143,363,367 | |
| Reinvestment of Distributions | | | — | | | — | | | 1,365,873 | | | 13,153,352 | |
| Shares Redeemed | | | (3,604,338 | ) | | (35,900,986 | ) | | (2,498,836 | ) | | (25,755,584 | ) |
| | | | 6,770,038 | | $ | 67,147,615 | | | 12,731,237 | | $ | 130,761,135 | |
| Beginning Shares | | | 18,127,708 | | | | | | 5,396,471 | | | | |
| Ending Shares | | | 24,897,746 | | | | | | 18,127,708 | | | | |
| LoCorr Long/Short Commodities Strategy Fund | |
| Total Net Increase | | | | | $ | 62,876,750 | | | | | $ | 175,967,490 | |
| | |
LoCorr Macro Strategies Fund, LoCorr Long/Short Commodities Strategy Fund and LoCorr Market Trend Fund – Notes to Consolidated Financial
Statements / LoCorr Dynamic Equity Fund and LoCorr Spectrum Income Fund – Notes to Financial Statements (continued) | | 103 |
| | |
| | | | | | | | | | | | | | |
| LoCorr Market Trend Fund – Class A | |
| | | For the Six Months Ended June 30, 2019 | | For the Year Ended December 31, 2018 | |
| | | | Shares | | | Amount | | | Shares | | | Amount | |
| Shares Sold | | | 228,017 | | $ | 2,210,796 | | | 2,041,593 | | $ | 21,534,780 | |
| Shares Redeemed | | | (1,624,024 | ) | | (15,556,599 | ) | | (4,253,791 | ) | | (44,013,360 | ) |
| | | | (1,396,007 | ) | $ | (13,345,803 | ) | | (2,212,198 | ) | $ | (22,478,580 | ) |
| Beginning Shares | | | 3,368,248 | | | | | | 5,580,446 | | | | |
| Ending Shares | | | 1,972,241 | | | | | | 3,368,248 | | | | |
| | | | �� | | | | | | | | | | |
| LoCorr Market Trend Fund – Class C | |
| | | For the Six Months Ended June 30, 2019 | | For the Year Ended December 31, 2018 | |
| | | | Shares | | | Amount | | | Shares | | | Amount | |
| Shares Sold | | | 5,099 | | $ | 49,487 | | | 354,298 | | $ | 3,626,237 | |
| Shares Redeemed | | | (790,622 | ) | | (7,372,260 | ) | | (1,872,667 | ) | | (18,856,227 | ) |
| | | | (785,523 | ) | $ | (7,322,773 | ) | | (1,518,369 | ) | $ | (15,229,990 | ) |
| Beginning Shares | | | 2,523,295 | | | | | | 4,041,664 | | | | |
| Ending Shares | | | 1,737,772 | | | | | | 2,523,295 | | | | |
| | | | | | | | | | | | | | |
| LoCorr Market Trend Fund – Class I | |
| | | For the Six Months Ended June 30, 2019 | | For the Year Ended December 31, 2018 | |
| | | | Shares | | | Amount | | | Shares | | | Amount | |
| Shares Sold | | | 5,350,312 | | $ | 51,714,568 | | | 24,293,597 | | $ | 258,798,561 | |
| Shares Redeemed | | | (14,545,509 | ) | | (139,799,069 | ) | | (44,938,075 | ) | | (460,309,189 | ) |
| | | | (9,195,197 | ) | $ | (88,084,501 | ) | | (20,644,478 | ) | $ | (201,510,628 | ) |
| Beginning Shares | | | 29,970,409 | | | | | | 50,614,887 | | | | |
| Ending Shares | | | 20,775,212 | | | | | | 29,970,409 | | | | |
| LoCorr Market Trend Fund | |
| Total Net Decrease | | | | | $ | (108,753,077 | ) | | | | $ | (239,219,198 | ) |
| | | | | | | | | | | | | | |
| LoCorr Dynamic Equity Fund – Class A | |
| | | For the Six Months Ended June 30, 2019 | | For the Year Ended December 31, 2018 | |
| | | | Shares | | | Amount | | | Shares | | | Amount | |
| Shares Sold | | | 153,285 | | $ | 1,662,436 | | | 204,446 | | $ | 2,334,198 | |
| Reinvestment of Distributions | | | — | | | — | | | 30,595 | | | 303,192 | |
| Shares Redeemed | | | (309,943 | ) | | (3,340,496 | ) | | (1,070,038 | ) | | (11,843,915 | ) |
| | | | (156,658 | ) | $ | (1,678,060 | ) | | (834,997 | ) | $ | (9,206,525 | ) |
| Beginning Shares | | | 854,402 | | | | | | 1,689,399 | | | | |
| Ending Shares | | | 697,744 | | | | | | 854,402 | | | | |
| | | | | | | | | | | | | | |
| LoCorr Dynamic Equity Fund – Class C | |
| | | For the Six Months Ended June 30, 2019 | | For the Year Ended December 31, 2018 | |
| | | | Shares | | | Amount | | | Shares | | | Amount | |
| Shares Sold | | | 8,630 | | $ | 87,695 | | | 12,061 | | $ | 129,613 | |
| Reinvestment of Distributions | | | — | | | — | | | 20,409 | | | 193,276 | |
| Shares Redeemed | | | (138,464 | ) | | (1,434,469 | ) | | (451,054 | ) | | (4,895,777 | ) |
| | | | (129,834 | ) | $ | (1,346,774 | ) | | (418,584 | ) | $ | (4,572,888 | ) |
| Beginning Shares | | | 554,864 | | | | | | 973,448 | | | | |
| Ending Shares | | | 425,030 | | | | | | 554,864 | | | | |
| | | | | | | | | | | | | | |
| LoCorr Dynamic Equity Fund – Class I | |
| | | For the Six Months Ended June 30, 2019 | | For the Year Ended December 31, 2018 | |
| | | | Shares | | | Amount | | | Shares | | | Amount | |
| Shares Sold | | | 368,055 | | $ | 4,080,785 | | | 808,578 | | $ | 9,268,461 | |
| Reinvestment of Distributions | | | — | | | — | | | 59,248 | | | 596,627 | |
| Shares Redeemed | | | (698,818 | ) | | (7,567,731 | ) | | (1,965,613 | ) | | (22,405,609 | ) |
| | | | (330,763 | ) | $ | (3,486,946 | ) | | (1,097,787 | ) | $ | (12,540,521 | ) |
| Beginning Shares | | | 1,642,376 | | | | | | 2,740,163 | | | | |
| Ending Shares | | | 1,311,613 | | | | | | 1,642,376 | | | | |
| LoCorr Dynamic Equity Fund | |
| Total Net Decrease | | | | | $ | (6,511,780 | ) | | | | $ | (26,319,934 | ) |
| | |
| 104 | | LoCorr Macro Strategies Fund, LoCorr Long/Short Commodities Strategy Fund and LoCorr Market Trend Fund – Notes to Consolidated Financial
Statements / LoCorr Dynamic Equity Fund and LoCorr Spectrum Income Fund – Notes to Financial Statements (continued) |
| | |
| | | | | | | | | | | | | | |
| LoCorr Spectrum Income Fund – Class A | |
| | | For the Six Months Ended June 30, 2019 | | For the Year Ended December 31, 2018 | |
| | | | Shares | | | Amount | | | Shares | | | Amount | |
| Shares Sold | | | 567,149 | | $ | 3,913,040 | | | 1,001,209 | | $ | 7,351,429 | |
| Reinvestment of Distributions | | | 101,628 | | | 697,951 | | | 202,320 | | | 1,445,202 | |
| Shares Redeemed | | | (486,350 | ) | | (3,350,931 | ) | | (1,648,412 | ) | | (11,964,611 | ) |
| Redemption Fees | | | — | | | 419 | | | — | | | 523 | |
| | | | 182,427 | | $ | 1,260,479 | | | (444,883 | ) | $ | (3,167,457 | ) |
| Beginning Shares | | | 3,612,915 | | | | | | 4,057,798 | | | | |
| Ending Shares | | | 3,795,342 | | | | | | 3,612,915 | | | | |
| | | | | | | | | | | | | | |
| LoCorr Spectrum Income Fund – Class C | |
| | | For the Six Months Ended June 30, 2019 | | For the Year Ended December 31, 2018 | |
| | | | Shares | | | Amount | | | Shares | | | Amount | |
| Shares Sold | | | 260,456 | | $ | 1,811,885 | | | 560,060 | | $ | 4,179,406 | |
| Reinvestment of Distributions | | | 76,156 | | | 528,237 | | | 156,310 | | | 1,123,445 | |
| Shares Redeemed | | | (399,001 | ) | | (2,767,930 | ) | | (1,017,079 | ) | | (7,360,766 | ) |
| Redemption Fees | | | — | | | 63 | | | — | | | 408 | |
| | | | (62,389 | ) | $ | (427,745 | ) | | (300,709 | ) | $ | (2,057,507 | ) |
| Beginning Shares | | | 2,867,151 | | | | | | 3,167,860 | | | | |
| Ending Shares | | | 2,804,762 | | | | | | 2,867,151 | | | | |
| | | | | | | | | | | | | | |
| LoCorr Spectrum Income Fund – Class I | |
| | | For the Six Months Ended June 30, 2019 | | For the Year Ended December 31, 2018 | |
| | | | Shares | | | Amount | | | Shares | | | Amount | |
| Shares Sold | | | 1,336,189 | | $ | 9,216,054 | | | 1,790,254 | | $ | 12,983,667 | |
| Reinvestment of Distributions | | | 134,864 | | | 925,162 | | | 300,481 | | | 2,145,130 | |
| Shares Redeemed | | | (1,398,784 | ) | | (9,640,985 | ) | | (3,504,043 | ) | | (25,054,619 | ) |
| Redemption Fees | | | — | | | — | | | — | | | 24,184 | |
| | | | 72,269 | | $ | 500,231 | | | (1,413,308 | ) | $ | (9,901,638 | ) |
| Beginning Shares | | | 4,420,099 | | | | | | 5,833,407 | | | | |
| Ending Shares | | | 4,492,368 | | | | | | 4,420,099 | | | | |
| LoCorr Spectrum Income Fund | |
| Total Net Increase (Decrease) | | | | | $ | 1,332,965 | | | | | $ | (15,126,602 | ) |
7. Federal Tax Information
At December 31, 2018, the components of accumulated earnings (losses) on a tax basis were as follows(1):
| | | | | | | | | | | |
| | | LoCorr
Macro Strategies
Fund (2) | | LoCorr Long/Short
Commodities Strategy
Fund (2) | | LoCorr Market
Trend Fund (2) | |
| Tax cost of portfolio | | $ | 564,003,036 | | $ | 242,747,901 | | $ | 312,199,163 | |
| Gross unrealized appreciation | | $ | 7,855,108 | | $ | 11,187,250 | | $ | 5,325,322 | |
| Gross unrealized depreciation | | | (5,908,737 | ) | | (6,896,884 | ) | | (4,953,334 | ) |
| Net unrealized appreciation (depreciation) | | | 1,946,371 | | | 4,290,366 | | | 371,988 | |
| Undistributed ordinary income | | | 9,770,918 | | | 15,958 | | | 3,078,171 | |
| Undistributed long-term capital gains | | | — | | | — | | | — | |
| Total distributable earnings | | | 9,770,918 | | | 15,958 | | | 3,078,171 | |
| Other accumulated losses | | | (49,579,773 | ) | | (2,201,229 | ) | | (66,328,955 | ) |
| Total accumulated earnings (losses) | | $ | (37,862,484 | ) | $ | 2,105,095 | | $ | (62,878,796 | ) |
| | | | | | | | | | | |
| | | LoCorr Dynamic
Equity Fund | | LoCorr Spectrum
Income Fund | | | | |
| Tax cost of portfolio | | $ | 29,383,989 | | $ | 73,493,864 | | | | |
| Gross unrealized appreciation | | $ | 1,167,022 | | $ | 5,251,648 | | | | |
| Gross unrealized depreciation | | | (4,080,140 | ) | | (10,231,469 | ) | | | |
| Net unrealized appreciation (depreciation) | | | (2,913,118 | ) | | (4,979,821 | ) | | | |
| Undistributed ordinary income | | | — | | | — | | | | |
| Undistributed long-term capital gains | | | 93,534 | | | — | | | | |
| Total distributable earnings | | | 93,534 | | | — | | | | |
| Other accumulated earnings (losses) | | | (215,487 | ) | | (28,155,691 | ) | | | |
| Total accumulated earnings (losses) | | $ | (3,035,071 | ) | $ | (33,135,512 | ) | | | |
(1) | Total Portfolio represents aggregate amounts of Fund’s investments, securities sold short, forward currency contracts and futures contracts, where applicable. |
(2) | Tax Cost is presented on a non-consolidated basis and includes each of the Fund’s investment in the respective CFC’s and the unrealized appreciation and depreciation associated with those investments. |
| | |
LoCorr Macro Strategies Fund, LoCorr Long/Short Commodities Strategy Fund and LoCorr Market Trend Fund - Notes to Consolidated Financial
Statements / LoCorr Dynamic Equity Fund and LoCorr Spectrum Income Fund - Notes to Financial Statements (continued) | | 105 |
| | |
Undistributed income or net realized gains for financial statement purposes may differ from amounts recognized for federal income tax purposes due to differences in the recognition and characterization of income, expense and capital gain items. The difference between book-basis and tax-basis unrealized appreciation (depreciation) is attributed primarily to the tax deferral of losses on wash sales and other temporary differences.
Under the current tax law, capital losses realized after October 31 may be deferred and treated as occurring on the first day of the following fiscal year. As presented in the table below, the following Funds elected to defer capital losses for the fiscal year ended December 31, 2018:
| | | Post October
Loss Deferral | | Late Year Ordinary
Loss Deferral | |
| LoCorr Dynamic Equity Fund | | $ | 167,174 | | $ | — | |
At December 31, 2018, accumulated net realized capital loss carryovers, if any, and the year(s) in which the capital loss carryovers expire were:
| | | | | | | | | | | |
| | | Capital Loss Carryover | | Year of
Expiration | |
| | | Short-Term | | Long-Term | | |
| LoCorr Macro Strategies Fund | | $ | 25,624,736 | | $ | 24,193,872 | | | Indefinitely | |
| LoCorr Long/Short Commodities Strategy Fund | | | 1,125,032 | | | 1,076,197 | | | Indefinitely | |
| LoCorr Market Trend Fund | | | 32,588,883 | | | 33,724,138 | | | Indefinitely | |
| LoCorr Spectrum Income Fund | | | 11,098,789 | | | 15,638,249 | | | Indefinitely | |
None of the Funds utilized any capital loss carryovers during the year ended December 31, 2018.
8. Line of Credit
The Trust entered into an unsecured, uncommitted Loan Agreement (“Line of Credit” or “LOC”) with U.S. Bank not individually but as an umbrella facility on behalf of the Funds in the Trust. The LOC expires on March 10, 2020. The LOC was established to provide the Funds a temporary short-term liquidity source, subject to certain restrictions, covenants and the right of setoff on the Funds’ assets, to meet unanticipated redemptions. Under terms of the LOC, borrowings for each Fund are limited to the lesser of one-third of the net unencumbered assets (including the amount borrowed) of the respective Fund, 5% of the gross assets of the respective Fund or $50 million in the aggregate for all of the Funds under this agreement. U.S. Bank charges an interest rate per annum equal to the Prime Rate (5.50% as of June 30, 2019).
The Funds did not utilize the Line of Credit during the six months ended June 30, 2019.
9. Subsequent Events
In preparing the financial statements, the Adviser has evaluated events after June 30, 2019.
Declaration of Dividends
The LoCorr Spectrum Income Fund declared the following ordinary income distributions:
Dividend Declaration
Date (a) | | Shareholder of
Record Date | | Distribution Amount per Share Class | |
| | | Class A | | Class C | | Class I | |
| July 31, 2019 | | | July 30, 2019 | | $ | 0.03860 | | $ | 0.03470 | | $ | 0.04000 | |
(a) Ex-date, reinvest date and payable date.
The estimated characterization of the distributions paid will be an ordinary dividend, qualified dividend or return of capital. See Note 2 for additional information.
There were no additional subsequent events since June 30, 2019 through the date the financial statements were issued that would require adjustments to or additional disclosure in these financial statements.
| | |
| | |
| 106 | | LoCorr Investment Trust - Expense Example (Unaudited) |
| | |
Expense Example
June 30, 2019 (Unaudited)
As a shareholder of a mutual fund, you incur two types of costs: (1) transaction costs, including sales charges (loads) on purchase payments; redemption fees; and (2) ongoing costs, including management fees; distribution and/or service (12b-1) fees and other Fund expenses.
This Example is intended to help you understand your ongoing costs (in dollars) of investing in each of the Funds and to compare these costs with the ongoing costs of investing in other mutual funds. The Example is based on an investment of $1,000 invested at the beginning of the period and held for the entire period (January 1, 2019 through June 30, 2019).
Actual Expenses
The actual return columns in the following table provide information about account values based on actual returns and actual expenses. You may use the information in these columns, together with the amount you invested, to estimate the expenses that you paid over the period. Simply divide your account value by $1,000 (for example, an $8,600 account value divided by $1,000 = 8.6), then multiply the result by the number in the first line under the heading entitled “Expenses Paid During Period” to estimate the expenses you paid on your account during this period. The only transaction fees you may be required to pay are for outgoing wire transfers, returned checks and stop payment orders at prevailing rates charged by U.S. Bancorp Fund Services, LLC, doing business as U.S. Bank Global Fund Services, the Funds’ transfer agent. These fees are assessed on all accounts, as applicable. If you request that a redemption be made by wire transfer, currently the Funds’ transfer agent charges a $15.00 fee. The Funds’ transfer agent charges a transaction fee of $25.00 on returned checks and stop payment orders. If you paid a transaction fee, you would add the fee amount to the expenses paid on your account this period to obtain your total expenses paid.
Hypothetical Example for Comparison Purposes
The hypothetical return columns in the following table provide information about hypothetical account values and hypothetical expenses based on the Funds’ actual expense ratio and an assumed rate of return of 5% per year before expenses, which is not the Funds’ actual return. The hypothetical account values and expenses may not be used to estimate the actual ending account balance or expenses you paid for the period. You may use this information to compare the ongoing costs of investing in the Funds and other funds. To do so, compare this 5% hypothetical example with the 5% hypothetical examples that appear in the shareholder reports of the other funds. A transaction fee of $15.00 may be assessed on outgoing wire transfers and a transaction fee of $25.00 may be assessed on returned checks and stop payment orders. To include this fee in the calculation, you would add the estimated transaction fee to the hypothetical expenses shown in the table. Please note that the expenses shown in the table are meant to highlight your ongoing costs only and do not reflect the transaction fees discussed above. Therefore, those columns are useful in comparing ongoing costs only, and will not help you determine the relative total costs of owning different funds. In addition, if these transactional costs were included, your costs would have been higher.
| | |
| | |
| LoCorr Investment Trust - Expense Example (Unaudited) (continued) | | 107 |
| | |
Actual vs Hypothetical Returns
Actual vs. Hypothetical returns for the Six Months Ended June 30, 2019 (Unaudited)
| | | | | | | Actual | | Hypothetical
(5% gross annual return) |
| | Class | Fund’s
Annualized
Expense Ratio
1, 2 | | Beginning
Account Value
January 1,
2019 | | Ending
Account Value
June 30, 2019 | | Expenses Paid
During Period
1, 2, 3 | | Ending
Account Value
June 30, 2019 | | Expenses Paid
During Period
1, 2, 3 |
| | | | | | | | | | | | | |
| LoCorr Macro Strategies Fund |
| | A | 2.24% | | $1,000.00 | | $1,070.40 | | $11.50 | | $1,013.69 | | $11.18 |
| | C | 2.99% | | $1,000.00 | | $1,065.60 | | $15.31 | | $1,009.97 | | $14.90 |
| | I | 1.99% | | $1,000.00 | | $1,071.90 | | $10.22 | | $1,014.93 | | $9.94 |
| | | | | | | | | | | | | |
| LoCorr Long/Short Commodities Strategy Fund |
| | A | 2.13% | | $1,000.00 | | $999.00 | | $10.56 | | $1,014.23 | | $10.64 |
| | C | 2.88% | | $1,000.00 | | $994.80 | | $14.24 | | $1,010.51 | | $14.36 |
| | I | 1.88% | | $1,000.00 | | $1,000.00 | | $9.32 | | $1,015.47 | | $9.39 |
| | | | | | | | | | | | | |
| LoCorr Market Trend Fund |
| | A | 2.10% | | $1,000.00 | | $1,118.70 | | $11.03 | | $1,014.38 | | $10.49 |
| | C | 2.85% | | $1,000.00 | | $1,114.20 | | $14.94 | | $1,010.66 | | $14.21 |
| | I | 1.85% | | $1,000.00 | | $1,118.80 | | $9.72 | | $1,015.62 | | $9.25 |
| | | | | | | | | | | | | |
| LoCorr Dynamic Equity Fund |
| | A | 3.01% | | $1,000.00 | | $1,135.20 | | $15.94 | | $1,009.87 | | $15.00 |
| | C | 3.76% | | $1,000.00 | | $1,129.90 | | $19.86 | | $1,006.15 | | $18.70 |
| | I | 2.76% | | $1,000.00 | | $1,136.00 | | $14.62 | | $1,011.11 | | $13.76 |
| | | | | | | | | | | | | |
| LoCorr Spectrum Income Fund |
| | A | 2.03% | | $1,000.00 | | $1,139.40 | | $10.77 | | $1,014.73 | | $10.14 |
| | C | 2.78% | | $1,000.00 | | $1,136.20 | | $14.72 | | $1,011.01 | | $13.86 |
| | I | 1.78% | | $1,000.00 | | $1,141.50 | | $9.45 | | $1,015.97 | | $8.90 |
| 1 | Includes dividend and/or interest expense of 0.00%, 0.00%, 0.00%, 0.77% and 0.00% for the LoCorr Macro Strategies Fund, the LoCorr Long/Short Commodities Strategy Fund, the LoCorr Market Trend Fund, the LoCorr Dynamic Equity Fund and the LoCorr Spectrum Income Fund, respectively. |
| 2 | Includes expenses of wholly-owned and controlled Cayman Islands subsidiaries for the LoCorr Macro Strategies Fund, the LoCorr Long/Short Commodities Strategy Fund and the LoCorr Market Trend Fund. |
| 3 | Expenses Paid During Period are equal to the net annualized expense ratio for the class, multiplied by the average account value over the period, multiplied by 181/365 (to reflect the one-half year period). |
| | |
| | |
| 108 | | Approval of Advisory Agreements (Unaudited) |
| | |
LoCorr Investment Trust
June 30, 2019 (Unaudited)
Review of Management and Sub-Advisory Agreements
Approval of Advisory Agreement
The Board considered the nature, extent and quality of services to be provided by LoCorr Fund Management, LLC (the “Adviser”) to the LoCorr Macro Strategies Fund (the “Macro Fund”) and its wholly-owned subsidiary, LCMFS Fund Limited, the LoCorr Long/Short Commodities Strategy Fund (the “LLSCS Fund”) and its wholly-owned subsidiary, LCLSCS Fund Limited, the LoCorr Dynamic Equity Fund (the “LDE Fund”) and the LoCorr Spectrum Income Fund (the “LSI Fund”) and reviewed the 15(c) responses for each, which included the backgrounds and experience of the key personnel of the Adviser. The Trustees considered that the Adviser provides a continuous investment program for the Funds consistent with each Fund’s investment objective. policies and regulatory restrictions. Counsel reminded the Trustees that the Adviser oversees and evaluates the sub-advisers and that the Adviser also provides overall portfolio and risk management consistent each Fund’s investment strategy. The Trust’s chief compliance officer (“CCO”) then discussed the Adviser’s compliance program with the Trustees. A representative from the Adviser discussed the Adviser’s financial statements with the Trustees. The Trustees noted that, based on their review of the Adviser’s financial statements and discussions with the Adviser, its financial position was strong and stable, and that the Adviser has sufficient resources to perform its obligations to each of the Funds.
The CCO and a representative of the Adviser reviewed the compliance policies and noted that the Adviser reported no material compliance issues. Counsel indicated to the Board that the Adviser had adopted a code of ethics as required under Rule 17j-1 of the 1940 Act. The CCO and Counsel further noted for the Board that the Adviser had only made minor changes to its compliance policies in the last year. After a discussion, the Board concluded that the Adviser has compliance policies and procedures in place in order to perform its duties under the renewed management agreements for the Funds.
The CCO stated there had been a recent routine examination of the Adviser by the U.S. Securities and Exchange Commission (SEC”), noting that no material deficiencies or violations were identified. Counsel noted for the Trustees that the Adviser continued to carry Errors & Omissions and Directors and Officers (“E&O/D&O”) insurance coverage at an appropriate level of coverage. A representative of the Adviser stated that the Adviser would continue to evaluate the level of insurance coverage with its insurance broker. After a discussion, the Board concluded that the Adviser is well resourced with experienced personnel and investment expertise and has provided, and is expected to continue to provide, high quality services to the Funds.
The Board reviewed and discussed the performance of the Macro Fund, noting that the one-year, five-year and since inception returns of the Fund. Management noted that the one-year performance was higher than the Morningstar category and peer group average but lower than the benchmark index. Counsel did indicate that the Fund’s five-year and since inception performance was significantly better than the benchmark, peer group and Morningstar category. A representative of the Adviser reviewed the various sub-advisers and their respective managed futures programs. After a discussion, the Board concluded that the Macro Fund’s performance was satisfactory.
Counsel then directed the Board’s attention to the investment performance of the LLSCS Fund, noting its annualized returns for the one, three, five-year and since inception periods. The Board discussed that the Fund had materially outperformed each of the peer group, benchmark and Morningstar category for all periods. After further discussion, the Trustees concluded that they were very satisfied with the Fund’s performance.
The Trustees then reviewed and discussed the performance of the LDE Fund, noting that the one-year performance of the LDE Fund has lagged the peer group, benchmark index and Morningstar category. Counsel noted for the Board that the Fund had outperformed the peer group and Morningstar category for the three-year and since inception periods but had trailed the benchmark index for those periods. A representative of the Adviser discussed the Fund’s allocations to its various sub-advisers, noting that an additional sub-adviser would be managing a portion of the Fund’s assets shortly. After a discussion, the Board concluded that the Fund’s performance was not unreasonable.
Counsel then directed the Trustees to the performance of the LSI Fund. The Board discussed the performance of the LSI Fund, reviewing that the one-year return had outperformed the peer group and Morningstar category but had lagged the benchmark index. The Board then discussed that the three-year return had underperformed the benchmark, peer group and Morningstar Category average and that the five-year performance has outperformed the peer group but had underperformed the category average and benchmark. After a discussion, the Board concluded that the LSI Fund’s performance was not unreasonable but that the Board would continue to monitor the Fund’s performance.
The Board then reviewed and discussed the costs of services provided and profits to be realized by the Adviser with respect to the Funds.
The Trustees noted that the management fee for the Macro Fund was above the average of its peer group and Morningstar Category. However, Counsel reviewed with the Trustees that the management fee was within range of management fees for the Fund’s peer group and Morningstar Category Average. The Adviser noted that it had recently lowered the Fund’s management fee. After a discussion, the Board agreed that the Macro Fund’s management fee was reasonable.
The Trustees then discussed the management fee for the LLSCS Fund, noting that it was above the average of the Fund’s peer group and Morningstar Category, but was well below the high-end range of management fees reported for the Fund’s Morningstar Category and was within the range of advisory fees for the peer group. A representative of the Adviser discussed with the Board that it is difficult to find a large number of peers for the Fund, given the Fund’s unique structure and strategy. After a discussion, the Board concluded that the management fee of the Fund was reasonable.
| | |
| | |
| Approval of Advisory Agreements (Unaudited) (continued) | | 109 |
| | |
Counsel directed the Board to review the management fee for the LDE Fund, noting for the Board that it was below the average of its peer group and Morningstar Category. Management noted that the advisory fee recently had been lowered in October 2018. Management then discussed the Fund’s unique structure and its use of sub-advisers, which differentiated the Fund from many other long/short equity funds. After a discussion, the Board agreed that the LDE Fund’s management fee was not unreasonable.
The Trustees noted that the LSI Fund’s management fee was above the averages for the Fund’s peer group and Morningstar Category but within the range of the Morningstar Category. A representative of the Adviser indicated that it was difficult, given the Fund’s unique strategy, to identify a sizeable peer group for the LSI Fund. Counsel reviewed with the Trustees that the LSI Fund’s expense ratio was above the average expense ratio for the Morningstar Category but below the high range of the Morningstar Category. After a discussion, the Board considered the Fund’s unique strategy and structure and agreed that the management fee of the LSI Fund was not excessive.
The Board considered all of these factors with regards to the renewal of the expense limitation agreements with the Adviser for an additional one-year period for the Macro Fund, LLSCS Fund, LDE Fund and LSI Fund.
The Board reviewed the profit analysis of the Adviser with respect to the Macro Fund and considered that the Adviser’s profits from the advisory agreement, net of sub-advisory fees and overhead. The Board also considered and agreed that the Adviser’s total net profits related to the Macro Fund was reasonable.
The Board then reviewed the profitability of the Adviser with respect to the LLSCS Fund. Counsel noted that the Adviser’s net profits with respect to the LLSCS Fund which the Board agreed was reasonable.
The Board then reviewed the profitability of the Adviser with respect to the LDE Fund. Counsel pointed out to the Board that the Adviser had a small total net profit margin. The Board concluded that the Adviser’s profits with respect to the LDE Fund were not excessive.
Next, Counsel directed the Board’s attention to the profitability of the Adviser with respect to the LSI Fund. The Board noted that the Adviser showed a net profit and agreed that the Adviser’s total net profits was reasonable.
The Board considered the economies of scale to be realized by the shareholders of the Macro Fund, LLSCS Fund, LDE Fund and LSI Fund, noting that, with the exception of the Macro Fund, the management fees reflect an incremental fee schedule which includes break points.
Having requested and received such information from the Adviser as the Trustees believed to be reasonably necessary to evaluate the terms of the Advisory Agreement, and as assisted by the advice of counsel, the Trustees concluded that the fee structure is reasonable, and that approval of the Advisory Agreement is in the best interests of the shareholders of the Macro Fund, LLSCS Fund, LDE Fund and LSI Fund.
Approval of Sub-Advisory Agreements
Nuveen Asset Management, LLC (“Nuveen”), Sub-Adviser (Macro Fund, LLSCS Fund and LMT Fund)
Counsel then turned the attention of the Trustees to the 15(c) materials provided by Nuveen. The Board reviewed the nature, extent and quality of services provided by Nuveen for the fixed income strategies in the Macro Fund, LLSCS Fund and the Market Trend Fund (“LMT Fund”). The Board discussed Nuveen’s key individuals, noted many years of experience and a depth of investment capabilities. The Trustees further noted that Nuveen provides credit research, security selection, trade execution and compliance monitoring for the fixed income portion of the Macro, LLSCS and LMT Fund’s portfolios. A representative of the Adviser reviewed the minor changes with respect to the Nuveen personnel providing services to the Funds but stressed the overall continuity of the Nuveen fixed income team. The representative further discussed that the Adviser continued to very satisfied with the services and performance of Nuveen for all of the Funds.
Counsel noted for the Board the updates to Nuveen’s compliance manual that had been included in the materials. The CCO stated that these compliance updates were not material. A representative of the Adviser indicated that Nuveen continued to follow the same investment-grade strategy that it has always pursued for each of the Funds.
Counsel reported that Nuveen reported no material compliance or regulatory agency issues in the past 36 months and no material litigation that would impact its ability to continue to provide services to the Funds. Counsel further stated that Nuveen continued to carry an E&O/D&O policy in an appropriate amount. After a discussion, the Board concluded that Nuveen had the appropriate personnel and resources to continue to provide satisfactory services to the Funds.
Next, the Trustees discussed the investment performance for Nuveen, noting the one-year and since inception returns for the Macro, LLSCS and LMT Funds. The Trustees compared Nuveen’s reported returns to its benchmark index returns for the one-year and since inception periods. Counsel noted for the Trustees that Nuveen had outperformed its benchmark index for all Funds for all periods. After a discussion, the Board noted it very satisfied with Nuveen’s performance with respect to Macro Fund, LLSCS Fund and LMT Fund.
The Trustees discussed the costs of services provided by Nuveen to Macro Fund, LLSCS Fund and LMT Fund, and noted that Nuveen reported that it is not profitable with regard to sub-advising any of the Funds. The Board concluded that the sub-advisory fees paid to Nuveen by the Adviser were reasonable in light of the services to be provided under the sub-advisory agreements and the fees charged by Nuveen for managing similar accounts.
Having requested and received such information from Nuveen as the Trustees believed to be reasonably necessary to evaluate the terms of the Sub-Advisory Agreement, and as assisted by the advice of counsel, the Trustees concluded that the fee structure is reasonable, and that approval of the Sub-Advisory Agreement is in the best interests of the shareholders of Macro Fund, LLSCS Fund and LMT Fund.
| | |
| | |
| 110 | | Approval of Advisory Agreements (Unaudited) (continued) |
| | |
Millburn Ridgefield Corporation (“Millburn”), Sub-Adviser (Macro Fund & LCMFS Fund Limited)
The Board then reviewed the nature, extent and quality of sub-advisory services provided by Millburn to the Fund. Counsel directed the Board’s attention to the 15(c) responses for Millburn. The Board reviewed the responsibilities of Millburn’s personnel, noted the depth of experience for the portfolio management team and their investment capabilities. The Trustees considered the services that Millburn provides including portfolio construction, investment strategy development and trade execution for the Fund’s portfolio as well as compliance services to assure assets are managed within the Fund’s investment restrictions.
The Board noted that Millburn did not have any material compliance issues in the past 36 months or had any material litigations. Counsel noted that the National Futures Association (“NFA”) had recently examined Millburn in June 2017 with no material findings. The Board considered Millburn’s compliance controls including its pre and post-trade compliance checks and that Millburn carried an appropriate E&O/D&O policy. A representative of the Adviser noted the Adviser’s satisfaction with Millburn’s services. The Board concluded that Millburn is well-resourced and has experienced portfolio management personnel. The Board concluded that the services provided by Millburn to the Fund have been satisfactory and that the Board expects Millburn to continue to provide quality services in the future.
The Board then reviewed the investment performance of Millburn’s allocation of the Fund’s portfolio. A representative of the Adviser discussed that the Adviser was satisfied with Millburn’s performance, noting that Milburn had outperformed the overall Fund for each performance period since inception. After a discussion, the Trustees concluded that they were satisfied with Millburn’s performance for the Fund.
The Board also noted that the sub-advisory fee structure was lower than the fee charged by Millburn to its separately managed account clients and did not include an incentive fee. After further discussion, the Trustees concluded that the sub-advisory fee was reasonable.
The Trustees considered whether there were any economies of scale with respect to the management of the Fund. The Trustees agreed that this was primarily an adviser level issue and should be considered with respect to the overall advisory contract, taking into consideration the impact of the sub-advisory expense. After discussion, it was the consensus of the Trustees that a lack of breakpoints was acceptable.
The Trustees considered the profits realized by Millburn in connection with its relationship with the Fund and whether the amount of profit is a reasonable profit with respect to the sub-advisory services provided to the Fund. After a discussion, the Trustees concluded that the level of profit was not excessive.
Having requested and received such information from Millburn as the Trustees believed to be reasonably necessary to evaluate the terms of the Sub-Advisory Agreement, and as assisted by the advice of counsel, the Trustees concluded that the fee structure is reasonable, and that approval of the Sub-Advisory Agreement is in the best interests of the shareholders of the Macro Fund and LCMFS Fund Limited.
Graham Capital Management, L.P. (“Graham”), Sub-Adviser (Macro Fund & LCMFS Fund Limited)
The Board considered the nature, extent and quality of services to be provided by Graham to the Fund. Counsel directed the Board’s attention to the 15(c) responses for Graham. The Board reviewed the responsibilities of Graham’s personnel providing services to the Fund. Management further noted for the Trustees that Graham provides quantitative research, security selection and trade execution for the Fund’s portfolio as well as compliance services to assure assets are managed within the Fund’s investment restrictions.
Counsel and the CCO noted that Graham had adopted appropriate compliance policies and procedures and a code of ethics under Rule 17j-1 of the 1940 Act. Counsel further reviewed with the Board that Graham did not report any material compliance issues in the past 36 months. A representative of the Adviser indicated that Graham did have a routine SEC examination that had not yet concluded. Counsel noted for the Trustees that Graham carries an appropriate E&O/D&O policy. The Board concluded that Graham had sufficient resources and investment personnel to perform the services as sub-adviser to the Fund.
Counsel directed the Board’s attention the investment performance of Graham’s sleeve of the Fund and its representative accounts for its tactical trend strategy. A representative from the Adviser indicated that Graham’s recent performance had been negative but that the Adviser was satisfied overall with how Graham was executing its strategy for the Fund. After a discussion, the Trustees concluded that Graham’s performance was not unreasonable but asked the Adviser to continue to monitor Graham’s performance.
The Trustees considered the sub-advisory fee paid to Graham by the Adviser was higher than some of its other clients but did not include a performance incentive fee. The Trustees did note that the Fund’s sub-advisory fee for Graham was lower than the average fee charged by Graham to some of its other client accounts After further discussion, the Trustees concluded that the sub-advisory fee was not unreasonable.
Counsel then reviewed the profits realized by Graham and whether the amount of profit is reasonable with respect to the sub-advisory services to be provided to the Fund. The Trustees also considered whether there will be economies of scale with respect to the management of the Fund. The Trustees agreed that this was primarily an adviser level issue and should be considered with respect to the overall advisory contract, taking into consideration the impact of the sub-advisory expense. After discussion, it was the consensus of the Trustees that a lack of breakpoints was acceptable. After a discussion, the Trustees concluded that Graham’s level of profit was not excessive.
Having requested and received such information from Graham as the Trustees believed to be reasonably necessary to evaluate the terms of the Sub-Advisory Agreement, and as assisted by the advice of counsel, the Trustees concluded that the fee structure is reasonable, and that approval of the Sub-Advisory Agreement is in the best interests of the shareholders of the Macro Fund.
| | |
| | |
| Approval of Advisory Agreements (Unaudited) (continued) | | 111 |
| | |
Revolution Capital Management, LLC (“Revolution”), Sub-Adviser (Macro Fund & LCMFS Fund Limited)
The Board then directed their attention to the 15(c) responses for Revolution. The Board reviewed the responsibilities of Revolution’s investment personnel, noting their experience and backgrounds. Counsel further noted that Revolution is responsible for the maintenance and improvement of its trading models used in its strategy for the Fund’s portfolio and trade execution as well as compliance services to assure assets are managed within the Fund’s investment restrictions. In response to a question, a representative of the Adviser indicated that Revolution continued to execute the same strategy as it has since it became a sub-adviser to the Fund.
The Trustees noted Revolution’s trading models, compliance controls and risk control systems. Counsel indicated that Revolution did not report any material compliance issues or material litigations in the past 36 months. The CCO noted that Revolution has adopted appropriate compliance policies and procedures and that it had recently designated a new chief compliance officer. Counsel reported that Revolution had not had any recent regulatory examinations. Counsel stated that Revolution maintained an E&O/D&O insurance policy in an appropriate amount. After a discussion, the Board concluded that Revolution is well staffed and has the resources and investment expertise needed to continue to provide quality services to the Fund.
The Board then reviewed the investment performance of Revolution’s strategy for the Fund. Counsel indicated for the Board that Revolution had underperformed its benchmark since becoming a sub-adviser to the Fund and for the one-year period. A representative of the Adviser noted that the Adviser was satisfied with Revolution’s execution of its strategy. After a discussion, the Trustees concluded that Revolution’s performance was not unreasonable.
The Trustees considered that the sub-advisory fee structure was favorable compared to the average fee charged by Revolution to its separately managed account clients in the same strategy. Counsel also noted for the Trustees that there was not an incentive fee component in the subadvisory fee. After further discussion, the Trustees concluded that the proposed sub-advisory fee was reasonable.
The Trustees considered whether there were any economies of scale with respect to the management of the Fund. The Trustees agreed that this was primarily an adviser level issue and should be considered with respect to the overall advisory contract, taking into consideration the impact of the sub-advisory expense. After discussion, it was the consensus of the Trustees that a lack of breakpoints was acceptable.
The Trustees next considered the profits realized by Revolution in connection with its relationship with the Fund and whether the amount of profit is a fair entrepreneurial profit with respect to the sub-advisory services to be provided to the Fund. The Trustees concluded that Revolution’s level of profit was not excessive.
Having requested and received such information from Revolution as the Trustees believed to be reasonably necessary to evaluate the terms of the Sub-Advisory Agreement, and as assisted by the advice of counsel, the Trustees concluded that the fee structure is reasonable, and that approval of the Sub-Advisory Agreement is in the best interests of the shareholders of the Macro Fund.
Billings Capital Management, LLC (“Billings”), Sub-Adviser (LDE Fund)
The Board then considered the nature, extent and quality of services provided by Billings for the LDE Fund. The Board reviewed the responsibilities of Billings’ key personnel and their experience in sub-advising the long/short equity strategies for the Fund. Counsel discussed with the Board that Billings provides fundamental research, security selection and trade execution for the Fund’s portfolio as well as compliance services to assure assets are managed within the Fund’s investment restrictions.
Counsel reported that Billings did not report any material compliance issues in the past 36 months. Counsel also indicated that Billings did not have any recent regulatory examinations, material compliance issues or material litigations in the past 36 months. The Trustees noted that Billings carries an appropriate E&O/D&O policy. The Board concluded that Billings had adequate resources and experienced investment professionals to continue to provide quality services to the Fund.
The Trustees then turned their attention to the performance for Billings for the Fund. The Board noted that Billings had provided overall positive performance for the Fund since Billings became a sub-adviser but that it had negative performance for the one-year period. The Board and representatives of the Adviser’s discussed the recent performance of Billings. A representative of the Adviser acknowledged the recent performance and indicated that the Adviser was overall satisfied with the performance of the Billings strategy for the Fund. After a discussion, the Board concluded that the performance was not unreasonable but that it would continue to monitor Billings’ performance.
The Board then discussed the cost of services and profitability of Billings with respect to the Funds. A representative of the Adviser reminded the Trustees that Billings is paid on a sliding scale that took into account the aggregate assets of the LDE Fund. Counsel noted for the Board that Billings also received a performance fee from such other accounts. Counsel also noted the profitability of the Fund for Billings. After a discussion, the Board concluded that Billings’ sub-advisory fee and profitability were not excessive.
Having requested and received such information from Billings as the Trustees believed to be reasonably necessary to evaluate the terms of the Sub-Advisory Agreement, and as assisted by the advice of counsel, the Trustees concluded that the fee structure is reasonable, and that approval of the Sub-Advisory Agreement is in the best interests of the shareholders of the LDE Fund.
| | |
| | |
| 112 | | Approval of Advisory Agreements (Unaudited) (continued) |
| | |
Trust & Fiduciary Income Partners, LLC (“TFIP”), Sub-Adviser (LSI Fund)
The Board then considered the renewal of the sub-advisory agreements with TFIP with respect to the LSI Fund.
The Board also considered the nature, extent and quality of services provided or to be provided by TFIP for the income strategies for the LSI Fund. The Board reviewed the 15(c) responses for TFIP and discussed responsibilities of TFIP’s personnel. The Trustees further noted that TFIP provides quantitative research, security selection and trade execution for the income portion of the LSI Fund’s portfolios. Counsel stated that TFIP continued to operate under the compliance policies and procedures of Bramshill in providing compliance oversight for its management of the Fund.
Counsel noted that TFIP reported no material compliance issues or material litigations in the past 36 months. Counsel also stated that TFIP carries a sufficient E&O/D&O policy. The Board concluded that TFIP has appropriate resources available and sufficient insurance coverage. The Board concluded that TFIP is appropriately resourced, has experienced personnel and fixed income investment expertise and has provided high quality services to the LSI Fund. The Board concluded that TFIP was well-suited to perform the services as sub-adviser to the LSI Fund.
The Board then directed its attention to the performance information for TFIP with respect to the LSI Fund. The Board noted that TFIP’s performance exceeded the Fund’s benchmark and the sub-adviser’s selected benchmark for the one-year period and had outperformed the overall Fund. A representative of the Adviser reviewed TFIP’s performance and stated that the Adviser was overall very satisfied with the performance of TFIP. After a discussion, the Board deemed TFIP’s performance was satisfactory.
The Trustees discussed the costs of services provided and to be provided by TFIP to the LSI Fund. The Board noted that TFIP was slightly profitable with respect to the LSI Fund. Counsel directed the Trustees’ attention to the materials for TFIP which indicated that TFIP’s sub-advisory fee was favorable in comparison to fees it charges to other clients. The Board concluded that the sub-advisory fees to be paid to TFIP by the Adviser were reasonable in light of the services to be provided under the sub-advisory agreements.
Having requested and received such information from TFIP as the Trustees believed to be reasonably necessary to evaluate the terms of the SubAdvisory Agreement, and as assisted by the advice of counsel, the Trustees concluded that the fee structure is reasonable, and that approval of the Sub-Advisory Agreement is in the best interests of the shareholders of the LSI Fund.
Review of Management and Sub-Advisory Agreements
Approval of Advisory Agreement
The Board reviewed the nature, extent and quality of services to be provided by the Adviser to the LoCorr Market Trend Fund (the “LMT Fund”) and its wholly-owned subsidiary, LCMT Fund Limited and reviewed the 15(c) responses, which included a review of the personnel of the Adviser providing services to the LMT Fund. A representative of the Adviser noted that there had been no changes in the personnel providing services to the LMT Fund since the most recent renewal of the LMT Fund’s advisory agreement. The Trustees discussed that the Adviser oversees the overall investment program for the LMT Fund consistent with its investment objective, policies and regulatory restrictions as it has since the Fund’s inception. The Trustees further noted that the Adviser evaluates and oversees the LMT Fund’s sub-advisers.
Fund Counsel noted for the benefit of the Trustees that there were no material compliance issues or litigations since the most recent renewal of the advisory agreement for the LMT Fund. Fund Counsel also noted that that the Adviser continues to maintain appropriate insurance for E&O/D&O coverage.
After a discussion, the Board concluded that the Adviser is appropriately resourced with experienced personnel and provides valuable investment expertise and oversight of the LMT Fund and is expected to continue to provide such valuable services.
The Trustees then reviewed the Fund’s performance, noting that the Fund had lagged its peer group average, benchmark index and Morningstar category for the one-year period. A representative of the Adviser discussed the Fund’s market trend strategy’s underperformance during the one-year period while noting that the Fund’s fixed income strategy had outperformed on a relative basis. The Trustees discussed the Fund’s since-inception performance, noting that it was essentially in-line with its peer group average, benchmark index and Morningstar category for that period. A representative of the Adviser stated that the Adviser continued to be satisfied with the performance of the LMT Fund’s two sub- advisers and noted that it would continue to monitor the performance of the market trend strategy. After a discussion, the Trustees agreed that the Fund’s performance was not unreasonable.
Counsel then reviewed the Adviser’s responses regarding its advisory fee and its profitability with respect to the LMT Fund. the Trustees noted that the investment advisory fee was slightly above the peer group and Morningstar category averages but well within the ranges for each. A representative of the Adviser discussed the peer group and noted the differences between the LMT Fund and some of its peers. Counsel then reviewed with the Trustees the Adviser’s profitability with respect to the LMT Fund, noting its profitability margin. After a discussion, the Board concluded that the LMT Fund’s advisory fee and the Adviser’s profitability with respect to the LMT Fund were not unreasonable.
Fund Counsel then directed the Trustees to the Adviser’s financial statements which a representative of the Adviser discussed with the Trustees. The Trustees noted that, based on their review of the Adviser’s financial statements, the Adviser has the appropriate financial resources to continue to manage the LMT Fund.
| | |
| | |
| Approval of Advisory Agreements (Unaudited) (continued) | | 113 |
| | |
Having requested and received such information from the Adviser as the Trustees believed to be reasonably necessary to evaluate the terms of the Advisory Agreement, and as assisted by the advice of Counsel, the Trustees concluded that the fee structure is reasonable, and that approval of the Advisory Agreement is in the best interests of the LMT Fund and its shareholders.
Approval of Sub-Advisory Agreement
Graham Capital Management, L.P. (“Graham”), Sub-Adviser (LMT Fund & LCMT Fund Limited)
The Trustees then reviewed to the responses provided by Graham in its 15(c) questionnaire. The Board then discussed the nature, extent and quality of services provided by Graham. Counsel reviewed Graham’s personnel responsible for providing services to the Fund, noting that had been no material changes in the sub-adviser’s personnel. A representative of the Adviser reviewed Graham’s market trend strategy and the CCO discussed its compliance program. Fund Counsel noted that Graham did not have any recent compliance, litigation or regulatory issues and that it maintained appropriate insurance coverage. The Board concluded that Graham was well positioned to continue to provide a high-level of services to the LMT Fund.
The Board then reviewed Graham’s performance for the LMT Fund with a representative of the Adviser. The representative of the Adviser noted Graham’s overall performance as a sub-adviser to the Fund since inception in July 2014 but stated that the strategy had underperformed during the past one-year and three-year periods. The Adviser indicated that it would continue to monitor the performance of Graham closely. After a discussion, the Trustees concluded that the overall performance of Graham was not unreasonable.
Fund Counsel then directed the Trustees to information related to Graham’s sub-advisory fee and its fees for similar accounts. The Trustees noted that the sub-advisory fee remained favorable in comparison to the Graham’s fee for other accounts, further noting that Graham did not charge a performance fee for the LMT Fund as it does for some other of its private accounts. The Trustees then reviewed Graham’s profitability chart with respect to the LMT Fund. The Trustees agreed that the sub-advisory fee and Graham’s profitability with respect to the LMT Fund was reasonable.
Having requested and received such information from Graham as the Trustees believed to be reasonably necessary to evaluate the terms of the sub-advisory agreement, and as assisted by the advice of Counsel, the Trustees concluded that the fee structure is reasonable and that approval of the sub-advisory agreement with Graham for the LMT Fund is in the best interests of the Fund and its shareholders.
| | |
| | |
| 114 | | Notice of Privacy Policy & Practices/Quarterly Portfolio Holdings/Proxy (Unaudited) |
| | |
Notice of Privacy Policy & Practices
(Unaudited)
Your privacy is important to us. The Funds are committed to maintaining the confidentiality, integrity, and security of your personal information. When you provide personal information, the Funds believe that you should be aware of policies to protect the confidentiality of that information.
The Funds collect the following nonpublic personal information about you:
| ● | Information we receive from you on or in applications or other forms, correspondence, or conversations, including, but not limited to, your name, address, phone number, social security number, assets, income and date of birth; and |
| ● | Information about your transactions with us, our affiliates, or others, including, but not limited to, your account number and balance, payments history, parties to transactions, cost basis information and other financial information. |
The Funds do not disclose any nonpublic personal information about our current or former shareholders to affiliated or nonaffiliated third parties, except as permitted by law. For example, the Funds are permitted by law to disclose all of the information we collect, as described above, to our transfer agent to process your transactions. Furthermore, the Funds restrict access to your nonpublic personal information to those persons who require such information to provide products or services to you. The Funds maintain physical, electronic and procedural safeguards that comply with applicable federal and state standards to guard your nonpublic personal information.
In the event that you hold shares of the Funds through a financial intermediary, including, but not limited to, a broker-dealer, bank, or trust company, the privacy policy of your financial intermediary would govern how your nonpublic personal information would be shared with affiliated or non-affiliated third parties.
Portfolio Holdings Disclosure
(Unaudited)
The Funds file a complete schedule of portfolio holdings with the U.S. Securities and Exchange Commission (the “SEC”) for the first and third quarters of each fiscal year on Part F of Form N-PORT. The Funds’ Part F of Form N-PORT are available on the SEC’s website at www.sec.gov and may be reviewed and copied at the SEC’s Public Reference Room in Washington, D.C. Information on the operation of the Public Reference Room may be obtained by calling 1-800-SEC-0330. The Funds’ Part F of Form N-PORT may also be obtained by calling toll-free 1-855-523-8637.
Proxy voting policies, procedures and record
(Unaudited)
You may obtain a description of the Funds’ (1) proxy voting policies, (2) proxy voting procedures and (3) information regarding how the Funds voted any proxies related to portfolio securities during the most recent 12-month period ended June 30 for which an SEC filing has been made, without charge, upon request by contacting the Funds directly at 1-855-523-8637, or on the EDGAR Database on the SEC’s website (http:// www.sec.gov).
| | |
| | |
| Independent Trustees/Interested Trustees and Officers | | 115 |
| | |
The Statement of Additional Information includes additional information about the Independent Trustees/Interested Trustees and Officers and is available, without charge, by calling 1-855-523-8637.
| Independent Trustees |
Name and
Year of Birth | Position/Term
of Office1 | Principal Occupation
During the Past 5 Years | Number of Portfolios
in Fund Complex2
Overseen by Trustee | Other Directorships
Held by Trustee
During the
Past 5 Years |
Gary Jarrett
Year of Birth: 1954 | Trustee/
2016 to present | Chief Executive Officer, Black River Asset Management LLC, investment subsidiary of Cargill, Inc., 2002 to 2015. | 5 | None |
Mark Thompson
Year of Birth: 1959 | Trustee/
2011 to present | Chairman and Chief Manager, Riverbridge Partners, LLC (investment management), 1987 to present. | 5 | None |
Ronald A. Tschetter
Year of Birth: 1941 | Trustee/
2011 to present | Mr. Tschetter is presently retired from his principal occupations; Director of the U.S. Peace Corps, 2006 to 2009. | 5 | None |
| Interested Trustees and Officers |
Name and
Year of Birth | Position/Term
of Office1 | Principal Occupation
During the Past 5 Years | Number of Portfolios
in Fund Complex2
Overseen by Trustee | Other Directorships
Held by Trustee
During the
Past 5 Years |
Jon C. Essen3
Year of Birth: 1963 | Treasurer, Secretary, Chief Financial Officer/2011 to present; Trustee/ 2010 to present | LoCorr Fund Management, LLC: Chief Operating Officer (2010-2016), Chief Compliance Officer, (2010-2017); LoCorr Distributors, LLC: Principal, Chief Financial Officer, and Registered Representative (2008 to present) Chief Compliance Officer (2008-2017) | 5 | None |
Kevin M. Kinzie4
Year of Birth: 1956 | President, Trustee/2011 to present | Chief Executive Officer of LoCorr Fund Management, LLC, 2010 to present; President and Chief Executive Officer of LoCorr Distributors, LLC (broker/dealer), 2002 to present. | 5 | None |
Jason Roeske5
Year of Birth: 1969 | Chief Compliance Officer/2017 to present | Consultant at Encore Consulting Group (2013); Chief Compliance Officer of Welsh Securities, LLC (2014-2016); Chief Compliance Officer of LoCorr Fund Management, LLC, (2017-present). | 5 | Chief Compliance Officer of Welsh Securities, LLC (2014-2016) |
1 The term of office for each Trustee listed above will continue indefinitely.
2 The term “Fund Complex” refers to the LoCorr Investment Trust.
3 Mr. Essen is an interested Trustee because he is an officer of the Funds’ Adviser.
4 Mr. Kinzie is an interested Trustee because he is an officer and indirect controlling interest holder of the Funds’ Adviser.
5 Mr. Roeske is an interested person because he is an officer of the Funds’ Adviser.
This page left intentionally blank.
This page left intentionally blank.
This page left intentionally blank.

Not applicable for semi-annual reports.
Not applicable for semi-annual reports.
Not applicable for semi-annual reports.
Not applicable to registrants who are not listed issuers (as defined in Rule 10A-3 under the Securities Exchange Act of 1934).
Not applicable to open-end investment companies.
Not applicable to open-end investment companies.
Not applicable to open-end investment companies.
There have been no material changes to the procedures by which shareholders may recommend nominees to the registrant’s Board of Trustees.
Not applicable to open-end investment companies.
Not applicable for semi-annual reports.
Filed herewith.
Not applicable to open-end investment companies.
There was no change in the registrant’s independent public accountant for the period covered by the report.
Furnished herewith.
Pursuant to the requirements of the Securities Exchange Act of 1934 and the Investment Company Act of 1940, the registrant has duly caused this report to be signed on its behalf by the undersigned, thereunto duly authorized.
Pursuant to the requirements of the Securities Exchange Act of 1934 and the Investment Company Act of 1940, this report has been signed below by the following persons on behalf of the registrant and in the capacities and on the dates indicated.