UNITED STATES
SECURITIES AND EXCHANGE COMMISSION
Washington, D.C. 20549
FORM N-CSR
CERTIFIED SHAREHOLDER REPORT OF REGISTERED
MANAGEMENT INVESTMENT COMPANIES
Investment Company Act file number 811-22509
LoCorr Investment Trust
(Exact name of registrant as specified in charter)
687 Excelsior Blvd
Excelsior, MN 55331
(Address of principal executive offices) (Zip code)
CT Corporation System
1300 East Ninth Street
Cleveland, OH 44114
(Name and address of agent for service)
952.767.2920
Registrant's telephone number, including area code
Date of fiscal year end: December 31
Date of reporting period: June 30, 2022
Item 1. Reports to Stockholders.

Letter to Shareholders
LoCorr Funds seeks to provide investments that, over time, will have low correlation to traditional asset classes such as stocks and bonds. We believe that adding low correlating investments to a portfolio has the potential to significantly reduce overall portfolio risk while enhancing returns. Correlation measures the degree to which the returns of two investments move together over time. LoCorr offers products that provide the potential for positive returns in rising or falling markets and are designed to generate returns independent of traditional stock, bond and commodity investments. In this report, LoCorr Funds is reporting on five mutual funds: LoCorr Macro Strategies Fund, LoCorr Long/Short Commodities Strategy Fund, LoCorr Market Trend Fund, LoCorr Dynamic Equity Fund and LoCorr Spectrum Income Fund (collectively, the “Funds”).
LoCorr Macro Strategies Fund
The LoCorr Macro Strategies Fund (the “Fund”) seeks capital appreciation as its primary investment objective with managing volatility as a secondary objective. The Fund attempts to achieve its objective by investing in two main strategies – a Managed Futures Strategy and a Fixed Income Strategy.
The Fund employs four sub-advisers to manage the managed futures portion of the Fund:
● | Millburn Ridgefield (“Millburn”) manages a portfolio for the Fund that is similar to its Millburn Diversified Program which commenced operations in 1977. Millburn invests in a diversified portfolio of global futures contracts by employing a systematic, statistical learning-based, multi-factor approach. |
● | Graham Capital Management (“Graham”) manages a portfolio for the Fund that is similar to its Tactical Trend strategy, a systematic medium- to long-term trend following program that commenced trading in 2006. |
● | Revolution Capital Management (“Revolution”) manages a strategy for the Fund that is similar to its Alpha Program that has been available in a managed account program since 2007. Revolution employs a short-term pattern recognition strategy. |
● | R. G. Niederhoffer Capital Management (“R. G. Niederhoffer”) manages a strategy for the Fund that is similar to its Smart Alpha Program which began trading in 1993 as part of a broader strategy and since 2018 as a stand-alone strategy. R.G. Niederhoffer employs a short-term oriented systematic behavioral bias capture approach. |
Market Commentary
Entering 2022, market participants focused on soaring inflation and the ensuing action taken by the Federal Reserve (“Fed”) to combat surging prices. In the first half of 2022, the Consumer Price Index (“CPI”) reached +7.5%, its highest level since 1982. While wages rose at their fastest level in at least twenty years, it was still not enough to offset the rapid rise in inflation. As the year progressed, the market’s expectations regarding monetary policy evolved as it became increasingly evident the Fed was well behind the curve. The first 25 basis point interest rate hike was approved at the Fed’s March meeting, with the Committee indicating it would increase rates at each of the six remaining meetings this year and begin to reduce its balance sheet. Later in the period, The Fed’s posture turned even more hawkish, raising the federal funds rate by half a point in May and three-quarters of a point in June, the largest increase since 1994.
Coupled with domestic economic concerns, Russia’s invasion of Ukraine on February 24th would become one of the most dominant themes during the period. This unlawful invasion would upend the world order that has generally kept the peace in Europe since World War II and have far-reaching effects on financial markets. Strong condemnation and increasingly strict sanctions by the U.S. and its allies may cripple the Russian economy, but given Russia is a key producer of oil, natural gas, and wheat, has exacerbated an already difficult inflationary picture by causing many commodities to surge to new heights.
The aforementioned rising prices had a direct impact on the consumer’s wallet as household expenditures rose considerably year- over-year. Food-related costs increased over +10% and energy prices surged over +34% during the 12-month period ending June 2022. While many areas of the economy were expected to slow, the U.S. jobs market remained resilient as the unemployment rate held steady at 3.6%, a level not seen in the last 50 years. Additionally, the low levels of unemployment could remain strong as 11.3 million jobs in America remain vacant, according to the July Fed Economic Data report.
Equities
Stock prices across the globe sank sharply as the MSCI World Index declined -20.29% on a local currency basis while the S&P 500 dropped -19.96%, posting the worst first half since 1970. The CBOE Volatility Index, commonly referred to as the market’s fear gauge, topped out in March, up more than 100% from the beginning of the year as investors became increasingly jittery
in response to the growing humanitarian crisis in the Ukraine, skyrocketing inflation, and recessionary fears. Rising interest rates would pressure growth and high-valuation stocks while value and more defensive sectors along with commodity stocks would perform best.
Fixed Income
Global bond yields rose sharply as it became increasingly clear that the Fed and other central banks would aggressively raise rates in response to rising prices. The U.S. 10-year Treasury yield topped out at 3.49% in mid-June, before retreating and closing the semi-annual period slightly below 3%. Yields rose outside the U.S. as well with the German 10-year Bund climbing out of negative yielding territory to finish the period around +1.20%. Further, with the increasingly hawkish posture of the Fed forcing the short end of the curve higher while at the same time the risk of recession increased, the 2-year and 10-year yield curve briefly inverted at the end of March, before returning to upward sloping. This interest rate volatility continued, as the 2-year and 10-year yield curve inverted again in June. For the semi-annual period, the sell-off in bonds saw the Bloomberg U.S. Aggregate Bond Index decline -10.35%.
Commodities
The Bloomberg Commodity Index rose +18.44% in the first half of 2022 as commodity prices continued their recovery from the depths of the pandemic. However, this upward move did not come without volatility, as commodity prices fell -14.24% from 6/10/22 into the end of the period. A lack of investment in commodities over the past decade, coupled with surging demand following the pandemic shutdowns, has contributed to the massive surge in prices which was exacerbated by the Russian invasion of Ukraine. With Western Europe particularly reliant on Russian oil and natural gas, the largest gains were generally in the energy sector. After finishing 2021 near $79/barrel, Brent crude traded as high as $139 in early March, its highest level since July 2008. In agricultural markets, wheat prices rocketed higher as the Ukraine and Russia account for approximately a third of global wheat exports. Metal prices also moved higher though generally lagged other commodities with the exception of nickel which moved sharply higher. Metal prices were volatile as market participants balanced supply scarcity and China’s Zero-Covid policy-sparked lockdowns in the country which in turn curbed demand for industrial metals.
Foreign Currency
In currency markets, the U.S. Dollar (“USD”) appreciated against a basket of major currencies, rising over +8% versus the Euro and over +17% versus the Yen through the first six months of 2022. We attribute the strength in the USD to be related to high inflation, strong relative economic data, and the Fed’s increasingly aggressive posture along with a general flight to safety.
Fund Performance Summary
For the semi-annual period ended June 30, 2022, the Fund returned +15.72% versus +0.17% for the ICE BofAML 3 Month U.S. Treasury Note Index. The Fund outpaced the +8.18% return for the Barclay CTA Index during the period. Given the sell-off in stocks and bonds during the period, we were pleased with the Fund’s positive absolute returns which provided valuable diversification for investors. Trading in fixed income, energy and currencies were the largest contributors to the Fund’s returns while metals trading was unprofitable.
Performance of the sub-advisers was mixed. While all four sub-advisers managing the Managed Futures Strategy had positive returns, the largest contribution was from Graham’s systematic medium- to long-term trend following strategy. While Millburn’s statistical learning-based, multi-factor strategy lagged traditional trend followers, it provided beneficial diversification at times during the first half of 2022. The Fund’s short-term oriented strategies contributed, with R.G. Niederhoffer outperforming Revolution during the period as choppy markets provided a better trading environment. Overall, the Fund’s combination of differentiated trading styles and strategies that tend to zig and zag at different times has contributed to its strong returns and less volatile returns than most peers.
The allocations to each sub-adviser in the Managed Futures Strategy at the end of the period were as follows:
● | Millburn Ridgefield: 37.5% |
● | Graham Capital Management: 37.5% |
● | Revolution Capital Management: 15.0% |
● | R.G. Niederhoffer Capital Management: 10.0% |
Managed Futures Strategy
Equity Indices
Trading in equity indices was a moderate contributor to performance during the period as all the Fund’s trading styles were in positive territory. Overall, net equity exposure was generally short in varying sizes which benefitted from the sell-off in stocks. While all major markets outside the US were slightly positive, the DAX contributed most to Fund performance. Equity exposure at quarter end was marginally short across the board, with a focus in Asia and Europe.
Commodities
Persistent long energy exposure throughout the period benefitted from the continued upward move in the price of oil and oil-related commodities. The largest gains in energy trading were from long Brent Crude and heating oil positions. In agricultural markets, the spike in grain prices led to significant gains from long corn and soybeans positions. Trading in metals was more mixed with gains in base metals, notably aluminum, largely offset by losses in precious metals, primarily gold. As volatility in the commodity markets soared during the quarter, the Fund’s sub-advisers reduced exposure accordingly. The Fund ended the period with long positions in energy, agriculture, and short positions in both precious and base metals.
Fixed Income
The Fund’s sub-advisers capitalized on the strong downward trends in global fixed income prices where the largest gains stemmed from trading in U.S. bond markets. While the Fund held a consistent short position since early January, the managers reduced this to a modest net short at the end of the period, notwithstanding U.S. markets, which moved modestly long during the last week of June. Gains from short U.S. Treasuries were attributable to the 5- and 10-Year notes as increased volatility proved beneficial for the managers to take advantage of. Mixed exposure in Europe was a modest contributor as range-bound markets towards the latter half of the semi-annual period proved more difficult for the Fund’s managers to trade as they offered limited opportunities. Additionally, trading in Asian and Canadian markets was a slight contributor to Fund performance.
Foreign Currencies
Currency trading was profitable in the first six months of 2022 led by short positions in Asia and Europe. The largest gain was from a short position in the Japanese Yen which weakened versus the USD. Positive performance in European currencies was led by short exposure to the British Pound and Euro as inflation, coupled with mounting recession fears, boosted the greenback against the Pound. Overall, foreign currency exposure finished the period short versus the USD.
Outlook
We believe allocators should increasingly challenge the 60% equity / 40% fixed income status quo when it comes to their investment portfolios. In our view, the outlook for bonds remains murky as we experience significantly differentiated economic conditions from recent history. Thus, we continue to believe fixed income investments have limited upside and will struggle to provide the kind of returns and diversification investors have enjoyed in the past. Thus far in 2022, the bond market reflects this sentiment as the Barclay’s U.S. Aggregate Bond Index declined -10.35% in the first half of the year. We believe allocators would be well served to consider the usage of alternative diversifying strategies, including managed futures, to help achieve their diversification goals.
Overall, we remain highly confident in the outlook for the Fund. We believe its differentiated high conviction, multi-manager structure will continue to help the Fund navigate markets in a smoother and less volatile fashion than peers, while providing the potential for strong risk-adjusted returns, downside protection during bouts of equity market volatility, and low correlation to stocks and bonds.
Fixed Income Strategy
The Fund invests most of its remaining assets in a Fixed Income Strategy comprised of high quality, short to intermediate term investment grade corporate and government agency securities managed by Nuveen Asset Management (“Nuveen”). During the period, LoCorr reduced its allocation to the fixed income portfolio in expectations of a difficult bond market.
The Fixed Income Strategy of the Fund is managed against the Barclays 1-5 Government Credit Index. Returns for the fixed income portion of the portfolio were -3.07% compared to -4.55% for the benchmark in the first half of 2022. Nuveen maintained its underweight duration position during the period as inflation and growth concerns intensified. As such, duration positioning had a positive impact on relative performance versus the respective benchmark as interest rates rose rapidly. The
duration of the fixed income component of the fund was managed between 1.5 and 1.8 years during the period compared to about 2.6 years for the benchmark. Nuveen allocated between 24-27% in investment grade corporate bonds and 25-30% in high quality, short duration securitized sectors. Nuveen’s portfolio maintained broad corporate bond diversification with an overweight to financials. Given that spreads for non-government securities widened the sector strategy was a detractor to investment returns during the reporting period.
LoCorr Long/Short Commodities Strategy Fund
The LoCorr Long/Short Commodities Strategy Fund (the “Long/Short Commodities Fund” or the “Fund”) provides investors with access to a commodities futures strategy in a mutual fund structure. Historically, investors have primarily accessed exposure to long-only commodities which rely on rising commodity prices to generate positive returns. Of course, commodity prices do not always appreciate and occasionally experience sharp declines, as was seen in 2020, 2018, 2014/2015 and 2008. The Long/Short Commodities Fund has the potential to profit while commodity prices increase or decrease which differentiates it from most commodity-oriented mutual funds. The Fund’s primary investment objective is capital appreciation in rising and falling commodities markets. The Fund attempts to achieve its investment objective by investing in two primary strategies – a Commodities Strategy and a Fixed Income Strategy.
The Fund accesses the returns of:
● | ARCOM Capital (“ARCOM”), which began trading in 2015. ARCOM is led by Alastair Riach, who has over 30 years of experience trading commodities, and manages a discretionary natural gas specialist strategy that trades primarily relative value. |
● | East X was founded in 2017 and manages a strategy that traces its roots back to 2014. East Alpha manages a systematic approach that combines fundamental insights gleaned from discretionary traders with pattern recognition technique in a rigorous systematic framework. The portfolio will hold long/short directional, relative value (inter-market), and structural (calendar spread) positions. |
● | First Quadrant’s Commodities Long/Short strategy (“First Quadrant”), which began trading in 2010. FQ employs a systematic long/short directional strategy that attempts to capture commercial market participant behavior across 20+ commodity markets. |
● | J E Moody & Company Commodity Relative Value Program (“JEM CRV”), which began trading in 2006. JEM CRV employs a market neutral, systematic trading strategy that invests in relative value calendar spread positions across 20+ commodity markets. |
● | Millburn Ridgefield is the successor firm to an organization that was established in 1971. The firm began trading dedicated long/short commodity programs beginning in 2005. Millburn employs a systematic trading strategy that takes primarily outright long/short and relative value spread positions across 40+ commodity markets. |
● | CoreCommodity began trading the current strategy in 2017 but traces its roots back to the firm’s inception in 2003. CoreCommodity manages a discretionary approach based on a microeconomic analysis centered on four dimensions; quantitative, fundamental, market dynamics, and manager discretion. The portfolio will hold long/short directional, relative value (inter-market), and structural (calendar spread) positions. |
● | Valent Asset Management was founded in 2019 and manages a dedicated metals strategy that combines discretionary views with the use of sophisticated quantitative tools. The lead portfolio manager has traded metals at other firms since 2007. |
Market Commentary
Entering 2022, market participants focused on soaring inflation and the ensuing action taken by the Federal Reserve (“Fed”) to combat surging prices. In the first half of 2022, the Consumer Price Index (“CPI”) reached +7.5%, its highest level since 1982. While wages rose at their fastest level in at least twenty years, it was still not enough to offset the rapid rise in inflation. As the year progressed, the market’s expectations regarding monetary policy evolved as it became increasingly evident the Fed was well behind the curve. The first 25 basis point interest rate hike was approved at the Fed’s March meeting, with the Committee indicating it would increase rates at each of the six remaining meetings this year and begin to reduce its balance sheet. Later in the period, The Fed’s posture turned even more hawkish, raising the federal funds rate by half a point in May and three-quarters of a point in June, the largest increase since 1994.
Coupled with domestic economic concerns, Russia’s invasion of Ukraine on February 24th would become one of the most dominant themes during the period. This unlawful invasion would upend the world order that has generally kept the peace in Europe since World War II and have far-reaching effects on financial markets. Strong condemnation and increasingly strict sanctions by the U.S. and its allies may cripple the Russian economy, but given Russia is a key producer of oil, natural gas, and wheat, has exacerbated an already difficult inflationary picture by causing many commodities to surge to new heights.
The aforementioned rising prices had a direct impact on the consumer’s wallet as household expenditures rose considerably year-over-year. Food-related costs increased over +10% and energy prices surged over +34% during the 12-month period ending June 2022. While many areas of the economy were expected to slow, the U.S. jobs market remained resilient as the unemployment rate held steady at 3.6%, a level not seen in the last 50 years. Additionally, the low levels of unemployment could remain strong as 11.3 million jobs in America remain vacant, according to the July Fed Economic Data report.
The Bloomberg Commodity Index increased over +18% during the semi-annual period. We attribute the upward movement to tight commodity markets caused by the post-COVID recovery in demand and overall lack of capital investment over the past decade. These conditions were exacerbated by disruptions and reduced supplies stemming from Russia’s invasion of Ukraine. The strength in commodities did not persist through the entire period as the Index declined approximately -6% in the second quarter as many commodities began moving lower on fears over faltering economic growth. During the period overall, energy commodities surged higher while metal markets finished lower. Agricultural commodities moved higher, albeit not at the same pace as energy markets.
Energy prices rocketed higher during the semi-annual period with the S&P GSCI Energy Index climbing +63.5%. Petroleum, as measured by West Texas Intermediate (“WTI”) crude oil, moved from approximately $77/barrel at the end of 2021 to as high as $130/barrel during the first half of 2022 and closing June at $108/barrel. With demand outpacing supply and low global inventories, an already tight oil market was exacerbated by supply disruptions caused sanctions placed against Russia in retaliation for their invasion of Ukraine. With Europe having become increasingly reliant on Russian natural gas for its power needs, concerns over reduced Russian shipments to Europe were compounded by a devastating heat wave. These conditions caused natural gas and power prices In Europe to explode higher. Russia would eventually weaponize its natural gas, slashing gas deliveries through its largest pipeline into Europe, Nord Stream I. European natural gas prices, as measured by the ICE Dutch TTF contract, would reach an all-time high and finish June approximately 7x higher than one year ago. While the movement in U.S. natural gas reached their highest level since 2008, though the magnitude of the move paled in comparison to European prices. In the U.S., the higher prices were attributable to hot weather and increasing LNG shipments to Europe, though the latter was impacted by the shutdown at Freeport, a major LNG export facility, due to damage sustained from a fire.
While base metal prices got off to a strong start in 2022, concerns regarding weakening global economic growth and the impact from China’s Zero-COVID lockdowns would cause prices to decline overall for the period. In the first quarter, however, nickel prices would skyrocket over +55% on strong fundamentals and a short squeeze, the latter of which caused the London Metal Exchange to halt trading for approximately a week. Copper and aluminum prices also rose in the first quarter before losing steam and finishing the semi-annual period lower. Precious metal prices moved lower as gold failed to act as an inflation hedge while silver and platinum prices also declined.
Agricultural markets would broadly move higher as strength in the first quarter was enough to offset weakness later in the period. Grain markets generally moved higher as disruptions from Russia’s invasion of Ukraine, a major grain producer, caused global shortages which were further exacerbated by hot and dry weather. Wheat prices surged past record highs set in 2008. Soybean prices would also hit a record high in June, reaching approximately $18/bushel. Soft markets were little changed in aggregate while livestock prices were mixed. Lean hog prices would move sharply higher in the first quarter due to lower supply, reaching a record high before softening in in April/May due to economic slowdown fears and reduced consumption in China due to its lockdown.
Fund Performance Summary
The Fund’s Class I share gained +4.38% during the semi-annual period ended June 30, 2022, versus the +18.44% return for the Bloomberg Commodity Total Return Index (“Index”) and the +0.17% gain for the ICE BofAML T-Bill Index. Despite the upward surge in commodity prices during the period, there were two sharp selloffs in the broader long-only commodity index. In March, the Index declined -9.01% from March 9th to March 16th and more recently sold-off -18.83% from June 10th to July 6th. During these two periods, the Fund fared considerably better, declining -1.31% and -0.80% respectively.
While the Fund did not keep pace with the tremendous move in commodities overall in the period, it had a positive total return and exhibited significantly lower volatility during bouts of commodity weakness which is consistent with our expectations for the Fund. We expect it to participate in strong upward moving commodity prices, however, due to the Funds long/short philosophy, we wouldn’t expect it to fully keep pace. We also expect the Fund to exhibit lower volatility and drawdowns than the Index while providing valuable diversification for investors.
Trading in energy was the largest contributor during the semi-annual period while agricultural commodities were modestly profitable. The metals sector was not a significant return driver.
Energy
Energy trading was profitable during the period as the underlying managers were able to capitalize on surging prices in the oil complex. The Fund’s exposure was consistently long biased in both the first and second quarters, though the size of the exposure fell as the period progressed which proved beneficial in June when oil price retreated sharply. Overall, trading in both directional and relative value strategies were profitable. By market, the largest winners for the Fund included Brent crude and Reformulated Blendstock for Oxygenate Blending (“RBOB”) gasoline which benefitted from both long positioning and profitable calendar spread trading. Other winners included London gas oil, natural gas, and power markets. Energy exposure remained long at the end of June, though considerably reduced from earlier in the period.
Agricultural
Trading in agricultural commodities was profitable as gains from positions in grain markets were only partially offset by slight losses in softs and livestock. Corn was the largest winner in the grain markets, benefitting from a long bias though calendar spread positions, which accounted for the bulk of the profits, particularly in the first quarter. Small losses in livestock were primarily attributable to trading in hogs. In softs, gains from long cotton positions were more than offset by losses from sugar and cocoa markets. At the end of the period, grain exposure had shifted short while softs and livestock were slightly long.
Metals
In metals trading, gains during the first quarter were offset by losses in the second. In base metals trading, a long nickel position in the first quarter was profitable as prices moved higher on strong fundamentals and then exploded higher in March due to a short squeeze. These gains were partially offset by unprofitable long positions in aluminum and copper. In precious metals trading, mixed positioning in gold produced losses while directional and calendar spread trading in palladium and silver was also unprofitable. The Fund finished the period with long precious metal and short base metal exposure.
Outlook
We believe allocators should increasingly challenge the 60% equity / 40% fixed income status quo when it comes to their investment portfolios. In our view, the outlook for bonds remains murky as we experience significantly differentiated economic conditions from recent history. Thus, we continue to believe fixed income investments have limited upside and will struggle to provide the kind of returns and diversification investors have enjoyed in the past. Thus far in 2022, the bond market reflects this sentiment as the Barclay’s U.S. Aggregate Bond Index declined -10.35% in the first half of the year.
The semi-annual period provided a good reminder of the volatility that commodities can exhibit. While overall the broader commodity complex had a strong first half of the year, the selloffs in March and June were sudden and violent. Over time these types of swings may challenge investor fortitude, despite what we believe to be a favorable long-term backdrop as a result of the massive capital underinvestment over the past decade or so and ever-increasing demand. We believe a long/short approach that offers the potential to benefit from either upward or downward price movements can take advantage of this volatility.
Overall, we remain highly confident in the outlook for the Fund. We believe the Fund may be highly attractive to investors seeking uncorrelated solutions to most investment strategies and asset classes, or for investors seeking alternatives in the commodity market. The underlying managers in the Fund can take both long and short directional positions (benefit from commodities moving up or down), as well as relative value positions (calendar, geographic, and inter-market spreads) to capture this diverse and robust set of opportunities over time, making it a potentially ideal solution regardless of the market environment for commodities. Finally, the Fund’s multi-manager approach has the potential to smooth the ride for investors as the underlying managers tend to perform independently of each other over time which may help reduce volatility and limit drawdowns.
Fixed Income Strategy
The Fund invests most of its remaining assets in a Fixed Income Strategy comprised of high quality, short to intermediate term investment grade corporate and government agency securities managed by Nuveen Asset Management (“Nuveen”). During the period, LoCorr reduced its allocation to the fixed income portfolio in expectations of a difficult bond market.
The fixed income component of the Fund is managed against the Barclays 1-5 Government Credit Index. Returns for the fixed income portion of the portfolio were -3.13% compared to -4.55% for the benchmark in the first half of 2022. Nuveen maintained its underweight duration position during the period as inflation and growth concerns intensified. As such, duration positioning had a positive impact on relative performance versus the respective benchmark as interest rates rose rapidly. The
duration of the fixed income component of Nuveen’s portfolio was managed between 1.5 and 1.8 years during the period compared to about 2.6 years for the benchmark. Nuveen’s portfolio was between 24-27% in investment grade corporate bonds and 25-30% in high quality, short duration securitized sectors. Nuveen’s portfolio maintained broad corporate bond diversification with an overweight to financials. Given that spreads for non-government securities widened the sector strategy was a detractor to investment returns during the reporting period.
LoCorr Market Trend Fund
The LoCorr Market Trend Fund (the “Market Trend Fund” or the “Fund”) was created to provide investors with access to a trend following futures strategy managed by one of the leading managers in this space—Graham Capital Management. Graham was founded in 1994 and manages approximately $18 billion in assets. The Market Trend Strategy is managed similarly to Graham’s Tactical Trend program, a systematic medium- to long-term trend following strategy that commenced trading in 2006. The Fund seeks capital appreciation as its primary investment objective with managing volatility as a secondary objective. The Fund attempts to achieve its objective by investing in two main strategies – a Market Trend Strategy and a Fixed Income Strategy.
Market Commentary
Entering 2022, market participants focused on soaring inflation and the ensuing action taken by the Federal Reserve (“Fed”) to combat surging prices. In the first half of 2022, the Consumer Price Index (“CPI”) reached +7.5%, its highest level since 1982. While wages rose at their fastest level in at least twenty years, it was still not enough to offset the rapid rise in inflation. As the year progressed, the market’s expectations regarding monetary policy evolved as it became increasingly evident the Fed was well behind the curve. The first 25 basis point interest rate hike was approved at the Fed’s March meeting, with the Committee indicating it would increase rates at each of the six remaining meetings this year and begin to reduce its balance sheet. Later in the period, The Fed’s posture turned even more hawkish, raising the federal funds rate by half a point in May and three-quarters of a point in June, the largest increase since 1994.
Coupled with domestic economic concerns, Russia’s invasion of Ukraine on February 24th would become one of the most dominant themes during the period. This unlawful invasion would upend the world order that has generally kept the peace in Europe since World War II and have far-reaching effects on financial markets. Strong condemnation and increasingly strict sanctions by the U.S. and its allies may cripple the Russian economy, but given Russia is a key producer of oil, natural gas, and wheat, has exacerbated an already difficult inflationary picture by causing many commodities to surge to new heights.
The aforementioned rising prices had a direct impact on the consumer’s wallet as household expenditures rose considerably year- over-year. Food-related costs increased over +10% and energy prices surged over +34% during the 12-month period ending June 2022. While many areas of the economy were expected to slow, the U.S. jobs market remained resilient as the unemployment rate held steady at 3.6%, a level not seen in the last 50 years. Additionally, the low levels of unemployment could remain strong as 11.3 million jobs in America remain vacant, according to the July Fed Economic Data report.
Fund Performance Commentary
The Fund’s Class I shares gained +34.06% during the semi-annual period ended June 30,2022, versus the +0.17% return for the ICE BofAML T-Bill Index. We were pleased to see the Fund not only protect capital but realize gains during a volatile period for both equities and fixed income. This was particularly evident from 1/4/22 – 6/16/22 when the S&P 500 corrected by -22.99% while the Fund gained +38.93%. The Fund benefitted from a continuation of the favorable environment for trend following, evidenced by the +28.97% return for the SG Trend Index. Favorable trending activity in global commodity, fixed income, and currency markets drove the Fund’s positive returns. Equity trading, while positive, was not a significant contributor to performance.
Market Trend Strategy
Commodities
Persistent long energy exposure throughout the period benefitted from the continued upward move in the price of oil and oil-related commodities. The largest gains in energy trading were from long Brent Crude and heating oil positions. In agricultural markets, the spike in grain prices led to significant gains from long corn and wheat positions. Trading in metals was more mixed with gains in aluminum largely offset by losses in copper. As volatility in the commodity markets soared during the quarter, the Fund’s sub-adviser, Graham, reduced exposure accordingly. The Fund ended the period with long positions in energy, agriculture, and precious metals while positioning in base metals finished modestly short.
Equity Indices
Trading in equity indices was a moderate contributor to performance during the period as heighted volatility and relatively choppy markets kept position sizes small. Overall, net equity exposure was short in varying sizes and benefitted from the sell-off in stocks. While all major markets outside the US were slightly positive, the Russell 2000 contributed most to Fund performance, while the NASDAQ detracted. Equity exposure at the end of the period was marginally short across the board, with a focus in the US.
Foreign Currencies
Currency trading was profitable in the first six months of 2022 led by short positions in Asia and Europe. The largest gain was from a short position in the Japanese Yen which weakened versus the USD. Positive performance in European currencies was led by short exposure to the British Pound and Euro as inflation, coupled with mounting recession fears, boosted the greenback. Overall, foreign currency exposure finished the period short versus the USD.
Fixed Income
Graham capitalized on the strong downward trends in global fixed income prices where the largest gains stemmed from trading in European bond markets. The Fund held a consistent short position since early January, however, the manager moderated this short at the end of the semi-annual period ended June 30, 2022. Gains from short European positioning were attributable to the BOBL and Bund as the downward trend strengthened providing a beneficial environment for the manager to take advantage of. Short exposure in the US and Asia was a modest contributor as range-bound markets towards the latter half of the semi-annual period proved more difficult for the Fund’s manager to trade as they offered limited opportunities.
Outlook
We believe allocators should increasingly challenge the 60% equity / 40% fixed income status quo when it comes to their investment portfolios. In our view, the outlook for bonds remains murky as we experience significantly differentiated economic conditions from recent history. Thus, we continue to believe fixed income investments have limited upside and will struggle to provide the kind of returns and diversification investors have enjoyed in the past. Thus far in 2022, the bond market reflects this sentiment as the Barclay’s U.S. Aggregate Bond Index declined -10.35% in the first half of the year. We believe allocators would be well served to consider the usage of alternative diversifying strategies, including managed futures, to help achieve their diversification goals.
We have been pleased to see a robust environment for trending activity since the end of 2018, which has provided a nice tailwind for the Fund. We believe the outlook remains favorable for trend followers as the potential for continued inflationary pressure could create a favorable environment for persistent directional price movement across commodities, fixed income, and currency markets. LoCorr continues to believe that Graham Capital is one of the premiere trend followers and we remain highly confident in the potential for the Fund to help diversify investor portfolios and protect capital during periods of market stress.
Fixed Income Strategy
The Fund invests most of its remaining assets in a Fixed Income Strategy comprised of high quality, short to intermediate term investment grade corporate and government agency securities managed by Nuveen Asset Management (“Nuveen”).
The fixed income component of the Fund is managed against the Barclays 1-5 Government Credit Index. Returns for the fixed income portion of the portfolio were -3.02% compared to -4.55% for the benchmark in the first half of 2022. Nuveen maintained its underweight duration position during the period as inflation and growth concerns intensified. As such, duration positioning had a positive impact on relative performance versus the respective benchmark as interest rates rose rapidly. The duration of the fixed income component of Nuveen’s portfolio was managed between 1.5 and 1.8 years during the period compared to about 2.6 years for the benchmark. Nuveen’s portfolio allocated between 24-27% in investment grade corporate bonds and 25-30% in high quality, short duration securitized sectors. Nuveen’s portfolio maintained broad corporate bond diversification with an overweight to financials. Given that spreads for non-government securities widened, the sector strategy was a detractor to investment returns during the reporting period.
LoCorr Dynamic Equity Fund
The LoCorr Dynamic Equity Fund (the “Fund”) seeks long-term capital appreciation with reduced volatility compared to traditional broad-based equity market indices as a secondary objective. Consistent with the “low correlation” our LoCorr Fund family seeks, long/short equity funds have the ability to provide positive returns when equity markets are rising, yet they offer the potential for downside protection when equity prices are falling.
After a review of the Fund’s underlying managers, a decision was made to add Millrace Asset Group as a sub-advisor and retain Kettle Hill. Two of the previous managers, First Quadrant and Billings Capital Management, were removed as sub-advisers. The restructuring will aim to reduce volatility and improve risk-adjusted returns. We are optimistic about the future of the Fund considering the strength and longevity of the underlying track records of both Kettle Hill and Millrace.
At June 30, the Fund employed two sub-advisers to manage the Fund:
● | Kettle Hill Capital Management (“Kettle Hill”) seeks to generate alpha by combining a bottom-up, fundamental analysis with a top-down opportunistic overlay. Investing primarily in small cap securities, Kettle Hill targets a conservative net exposure to the market through its long/short investment approach. The sub-portfolio managed by Kettle Hill is similar to a strategy that this manager has executed since its inception in 2003. |
● | Millrace Asset Group (“Millrace”) employs a bottom-up fundamental investment philosophy. The team focuses on identifying high growth businesses in the relatively inefficient micro- to small-cap segment of the market. The sub-portfolio managed by Millrace is similar to its long/short strategy that this manager has executed since 2002. |
Market Commentary
Entering 2022, market participants focused on soaring inflation and the ensuing action taken by the Federal Reserve (“Fed”) to combat surging prices. In the first half of 2022, the Consumer Price Index (“CPI”) reached +7.5%, its highest level since 1982. While wages rose at their fastest level in at least twenty years, it was still not enough to offset the rapid rise in inflation. As the year progressed, the market’s expectations regarding monetary policy evolved as it became increasingly evident the Fed was well behind the curve. The first 25 basis point interest rate hike was approved at the Fed’s March meeting, with the Committee indicating it would increase rates at each of the six remaining meetings this year and begin to reduce its balance sheet. Later in the period, The Fed’s posture turned even more hawkish, raising the federal funds rate by half a point in May and three-quarters of a point in June, the largest increase since 1994.
Coupled with domestic economic concerns, Russia’s invasion of Ukraine on February 24th would become one of the most dominant themes during the period. This unlawful invasion would upend the world order that has generally kept the peace in Europe since World War II and have far-reaching effects on financial markets. Strong condemnation and increasingly strict sanctions by the U.S. and its allies may cripple the Russian economy, but given Russia is a key producer of oil, natural gas, and wheat, has exacerbated an already difficult inflationary picture by causing many commodities to surge to new heights.
The aforementioned rising prices had a direct impact on the consumer’s wallet as household expenditures rose considerably year- over-year. Food-related costs increased over +10% and energy prices surged over +34% during the 12-month period ending June 2022. While many areas of the economy were expected to slow, the U.S. jobs market remained resilient as the unemployment rate held steady at 3.6%, a level not seen in the last 50 years. Additionally, the low levels of unemployment could remain strong as 11.3 million jobs in America remain vacant, according to the July Fed Economic Data report.
In the first half of 2022, the S&P 500 sold off due to a growing humanitarian crisis in the Ukraine, skyrocketing inflation, and recessionary fears, closing the six-month period with a -19.96% loss. The Index finished June with ten of the eleven S&P sectors in the red during the first half of the year. After outperforming all sectors by a significant margin in 2021, the energy sector continued its outperformance, finishing the first six months of 2022 up +31.76%. Utilities were the second strongest sector, though finished the period down -0.55%. Additionally, both value and growth stocks posted double-digit losses in the first half of 2022 though growth stocks fared worse: the S&P 500 Value index fell -11.41%, outpacing the S&P 500 Growth index which fell -27.62%.
Portfolio Update
LoCorr Dynamic Equity Class I share (the “Fund”) finished the semi-annual period ended June 30, 2022, down -12.64%, trailing the Morningstar Long/Short Equity Index category which closed down -9.69% and leading the S&P 500 Total Return Index which fell -19.96%. While the Fund slightly lagged the category, sub-adviser lineup changes previously mentioned were completed in June.
The Fund’s long book was the main negative contributor for the first six months of 2022; however, the Fund saw a positive contribution from the short book. In the long book, its best performance came from companies within the Communication Services, Technology, and Energy sectors. Within the Communication Services sector, a long position that flipped short at the end of the period in Nextar Media Group (-0.24% of the Fund as of 6/30/22), a local television and media company, traded higher throughout the first quarter after management announced they expected a strong 2022 due to increased spending on political campaign advertisements for midterm elections. In the Technology sector, another long position that flipped short was Zoom Video Communications (-0.40% of the Fund as of 6/30/2022), a communications technology company which traded higher after posting stronger-than-expected earnings for the second quarter. In the Energy sector, a long position that was exited before the end of the period in APA (0.00% of the Fund as of 6/30/2022), a hydrocarbon exploration holding company, moved higher with the overall sector and crude oil prices during the first quarter.
With the general move downward in risk assets during the first half of the year, the Fund’s long book had several detractors. The largest of which came within the Communication Services sector. A position in Dish Network Corp (1.43% of the Fund as of 6/30/2022), a television service provider, detracted due to higher-than-expected subscriber losses as well as declining revenue in its core TV business. In the Financial Services sector, a long position that was exited before the end of the period in Credit Acceptance Corp (0.00% of the Fund as of 6/30/2022), a specialized consumer auto finance company, traded lower due to a weakening used-vehicle market. In the Consumer Cyclical sector, a long position that flipped short in Frontdoor (-0.25% of the Fund as of 06/30/2022), a home service plan and appliance company, declined in the period due to inflationary fears.
The Fund’s short book saw positive contributions from the general downward movement in risk-assets during the period. The largest contributing sectors in the short book were Consumer Cyclical and Technology. In the Consumer Cyclical sector, a short position in Restoration Hardware (-0.26% of the Fund as of 6/30/2022), an upscale home-furnishings company, was a positive contributor after the stock sold off due to a decline in furniture spending. Also, within the Consumer Cyclical sector, Dick’s Sporting Goods (-0.48% of the Fund as of 6/30/2022), a sporting goods retail company, declined in the second quarter following a poor quarterly earnings report which included weaker-than-expected forward guidance. In the Technology sector, a short position in Apple (-0.99% of the Fund as of 6/30/2022), a consumer electronics and software company, benefitted from a general move down in technology stocks.
Outlook
U.S. equities had a dismal first half of 2022 as the S&P 500 finished the period down -19.96%, posting the worst first half since 1970. Looking ahead, financial markets will likely be driven by the rate of inflation, decisions by the Fed and other policy makers around the globe, and the continuing humanitarian crisis in Russia and Ukraine. In this type of environment, a long/short equity strategy may allow for participation in equity markets if they rise while their ability to mitigate losses from stocks falling in price.
We are excited about the changes made to the Fund during the second quarter. We are highly confident that the combination of the two sub-advisers, Kettle Hill and Millrace, who have successfully run long/short equity strategies for approximately 20 years, will produce compelling risk-adjusted returns and diversification for investors.
LoCorr Spectrum Income Fund
The LoCorr Spectrum Income Fund (the “Spectrum Income Fund” or the “Fund”) has an objective of current income with capital appreciation as a secondary objective. The Fund is designed to fit within the “low correlation” of the LoCorr Fund family by seeking to provide relatively high levels of income with low correlation to the bond market. The Fund is sub-advised by Bramshill Investments (“Bramshill”). Bramshill invests in a portfolio of primarily pass-through securities with an integrated covered call and hedging strategy. Bramshill seeks to generate high current income, much of which the Fund distributes monthly to investors.
Market Commentary
After a fairly consistent upward trend in 2021, markets pivoted downwards in the first half of 2022 as persistently high inflation forced the Fed to alter its narrative that inflation would be “transitory”. Russia’s invasion of Ukraine and the resulting sanctions imposed by the West on Russia added fuel to the inflationary fire. This forced the Fed to ramp up its tightening process and added to the concern that the Fed was behind the curve. With inflation metrics consistently coming in higher than estimates, the Fed went from raising 25 basis points in March, to 50 basis points in May, to 75 basis points in June with speculation about even additional increases in future meetings. Hawkish Fed policy and speculation about its impact and timing roiled the U.S. Treasury market, leading to higher rates and inverting the yield curve, a traditional foreshadowing of a recession in the U.S. economy. This, in turn, impacted some sectors of the equity market whose profitability depends upon various levels and relationships within the bond market. While most style factors were negative, value outperformed growth and larger capitalization stocks outperformed smaller.
Portfolio Update
The Fund’s Class I shares fell -4.60% during the first half of 2022, outperforming the -16.10% return for the S&P 500 and the (-10.35%) return for the Bloomberg U.S. Aggregate Bond Index. The Fund saw negative performance from all major sectors except for Master Limited Partnerships (“MLPs”) in the first half of 2022, and even that gave back nearly half of its gains in the second quarter as fears of the possibility that the Fed could hike the economy into a recession took hold. When faced with such carnage and elevated volatility, Bramshill’s strategy has been to allocate to lower beta, defensive companies in which they have confidence in the sustainability of cash flows, such as utilities, consumer staples, and natural gas weighted midstream energy. With the situation in the Ukraine causing widespread shortages of the commodity, especially in Europe, companies producing and transporting natural gas stand to do well. Also, elevated energy prices should bode well for renewable energy producers, in which the manager maintains exposure.
Negative market sentiment in the first half of the year, driven by the aforementioned events, has left investors with few places to hide with high levels of volatility in equities, bonds, and commodities. Bramshill has been actively hedging throughout the year, helping reduce the volatility of the Fund and mitigating drawdowns during market sell-offs. By opportunistically placing hedges on mortgage real estate, oil & gas exploration & production, and general small-cap exposure, the manager has protected against an additional 2% in losses YTD, approximately.
MLPs were the top performing sector for the Fund through the first half of 2022. Over the period, MLPs, as measured by the Alerian MLP Index, rose +10.04%. Within the MLP sector, the Fund saw positive contributions from Global Partners (0.66% of the Fund as of 6/30/22), a downstream MLP that benefitted from high refined product pricing and continues to raise its distribution; and Knot Offshore Partners (0.80% of the Fund as of 6/30/22), which operates shuttle tankers and took advantage of higher tanker rates. Also, CVR Partners (0.74% of the Fund as of 6/30/22), a fertilizer producer which rallied on strong agricultural demand.
The largest losses in the portfolio year-to-date have been from Mortgage Real Estate Investment Trusts (“mREITs”) and Closed-End Funds (“CEFs”) dropping -19.86% and -18.51%, respectively, as measured by the FTSE NAREIT Mortgage REITs Index and S-Network Composite Closed-End Index. The largest individual detractors for the Fund have been Annaly Capital Management (2.67% of the Fund as of 6/30/22), a mREIT which traded lower on rising rates and fears surrounding the Fed tapering MBS purchases; Hannon Armstrong (1.98% of the Fund as of 6/30/22), a renewable energy mREIT which sold off with solar renewables on concerns that the Department of Commerce was investigating solar panels imported from Asia, plus potential supply chain disruptions due to Covid lockdowns in China; and Virtus Convertible and Income Fund (0.00% of the Fund as of 6/30/22), which sold off in sympathy with the rout in fixed income and was sold from the portfolio.
Outlook
With inflation thus far showing no signs of slowing, the Fed finds itself in catch-up mode, having to increase the size of its rate increases and indicating its willingness to ramp further. Consensus earnings expectations for the remainder of the year remain stubbornly high, in Bramshill’s opinion. It remains to be seen whether the Fed can produce a soft landing or whether the U.S. economy will fall into recession. The manager continues to emphasize defensive allocations and the use of options to hedge downside volatility when warranted. They also expect a period of gains for recession beneficiaries such as utilities and bond surrogates later this year as the U.S. economy decelerates and the market begins to anticipate a pivot by the Fed to an easier policy later in the year. Bramshill also anticipates commodity-related holdings to benefit, due primarily to the effect of the Ukraine war on reducing the availability of traded food and energy, even in an environment of slower economic activity. While risks remain, markets have already fallen significantly and it must be remembered that current economic conditions are part of the business cycle, which historically experiences significant tailwinds after periods of turbulence.
Thank you for investing in the LoCorr Funds
The S&P 500 Index is a broad-based unmanaged index of 500 stocks, which is widely recognized as representative of the equity market in general. Consumer Price Index measures the variation in prices paid by typical consumers for retail goods and other items. The Barclays U.S. Government/Credit 1-5 Year Index is an index of all investment grade bonds with maturities of more than one year and less than 5 years. MSCI EAFE Index was designed to measure the equity market performance of developed markets outside of the U.S. & Canada. BOBL futures contract is a standardized futures contract based on a basket of medium-term debt issued by the German Federal Government. BOBL is an acronym for a German term, Bundesobligation, which translated to English is federal government bond. Bund is a debt instrument issued by Germany’s federal government to finance outgoing expenditures. Bunds, German for “bonds”, are widely viewed as the German equivalent of U.S. Treasury bonds (T-bonds). VIX - Chicago Board Options Exchange (CBOE), the Volatility Index, or VIX, is a real-time market index that represents the market’s expectation of 30-day forward-looking volatility. Derived from the price inputs of the S&P 500 index options, it provides a measure of market risk and investors’ sentiments. It is also known by other names like “Fear Gauge” or “Fear Index.” Investors, research analysts and portfolio managers look to VIX values as a way to measure market risk, fear and stress before they take investment decisions. ICE BofAML 3-M T-Bill Index tracks the performance of the U.S. dollar denominated U.S. Treasury Bills publicly issued in the U.S. domestic market with a remaining term to final maturity of less than 3 months. Morningstar Managed Futures Category is an average monthly return of all funds in the Morningstar Managed Futures Category. These funds typically take long and short positions in futures options, swaps, and foreign exchange contracts, both listed and over the
counter, based on market trends or momentum. (A long position is a bet an investment will gain in value, while a short position is a bet that an investment will decline in value.) A majority of these funds follow trend-following, price-momentum strategies. Other strategies included in this category are systematic mean-reversion, discretionary global macro strategies, commodity index tracking, and other futures strategies. More than 60% of these funds’ exposure is invested through derivative securities. TOPIX Index (Tokyo Stock Price Index) is an important stock market index for the Tokyo Stock Exchange (TSE) in Japan, tracking all domestic companies of the exchange’s First Section. Dow Jones EURO STOXX 50 Index is a market capitalization-weighted stock index of 50 large, blue-chip European companies operating within eurozone nations. Bloomberg Commodity Index is a broadly diversified commodity price index distributed by Bloomberg Indexes. The index was originally launched in 1998 as the Dow Jones-AIG Commodity Index and renamed to Dow Jones-UBS Commodity Index in 2009, when UBS acquired the index from AIG. SG Trend Index is a subset of the SG CTA Index and follows traders of trend following methodologies. The SG CTA Index is equal weighted, calculates the daily rate of return for a pool of CTAs selected from the larger managers that are open to new investment. Morningstar Long/Short Equity Category is an average monthly return of all funds in the Morningstar Long-Short Equity Category. The category contains a universe of funds with similar investment objectives and investment style, as defined by Morningstar. Performance of the indices and Morningstar Category Average is generated on the first business day of the month. Bloomberg Barclays U.S. Aggregate Bond Index is a broad-based bond index comprised of government, corporate, mortgage and asset-back issues rated investment grade or higher. West Texas Intermediate is a crude oil that serves as one of the main global oil benchmarks. It is sourced primarily from Texas and is one of the highest quality oils in the world, which is easy to refine. WTI is the underlying commodity for the NYMEX’s oil futures contract. One cannot invest directly in an index. Reformulated Gasoline Blendstock for Oxygen Blending (RBOB) is the term given to unleaded gas futures.
Please refer to the Schedule of Investments in this report for full holdings information. Fund holdings and sector allocations are subject to change and should not be considered recommendations to buy or sell any security.
Alpha is an annualized return measure of how much better or worse a fund’s performance is relative to an index of funds in the same category, after allowing for differences in risk. Basis Points (bps) - A unit that is equal to 1/100th of 1% and is used to denote the change in a financial instrument. The basis point is commonly used for calculating changes in interest rates, equity indexes and the yield of a fixed-income security. Beta measures the sensitivity of a stock’s return relative to the return of a selected market index. When beta is greater than one, it means a stock will rise or fall more than the market. Cash Flows refers to a company’s free cash flow which is a measure of how much cash a business generates after capital expenditures. Duration is a commonly used measure of the potential volatility of the price of a debt security, or the aggregate market value of a portfolio of debt securities, prior to maturity. Securities with a longer duration generally have more volatile prices than securities of comparable quality with a shorter duration. Investment Grade refers to bonds that are rated BBB or higher. Bond ratings are grades given to bonds that indicate their credit quality as determined by private independent rating services such as Standard & Poor’s, Moody’s and Fitch. These firms evaluate a bond issuer’s financial strength, or its ability to pay a bond’s principal and interest in a timely fashion. Ratings are expressed as letters ranging from ‘AAA’, which is the highest grade, to ‘D’, which is the lowest grade. Spread is the percentage point difference between yields of various classes of bonds compared to treasury bonds. Calendar spread is an options or futures spread established by simultaneously entering a long and short position on the same underlying asset at the same strike price but with different delivery months. It is sometimes referred to as an inter-delivery, intra-market, time, or horizontal spread. Yield Curve is a line that plots the interest rates, at a set point in time, of bonds having equal credit quality, but differing maturity dates. The most frequently reported yield curve compares the three-month, two-year, five-year and 30-year U.S. Treasury debt. The curve is used to predict changes in economic output and growth.
Must be preceded or accompanied by a prospectus.
Opinions expressed are those of the Investment Manager and are subject to change, are not guaranteed and should not be considered investment advice.
Earnings growth is not representative of the Funds’ future performance.
Past performance is not a guarantee of future results.
Diversification does not assure a profit nor protect against loss in a declining market.
Mutual fund investing involves risk. Principal loss is possible. LoCorr Macro Strategies Fund, LoCorr Long/Short Commodities Strategy Fund, LoCorr Market Trend Fund, LoCorr Dynamic Equity Fund and LoCorr Spectrum Income Fund are diversified funds. The Funds invest in foreign investments and foreign currencies which involve greater volatility and political, economic and currency risks and differences in accounting methods. The Funds may make short sales of securities, which involves the risk that losses may exceed the original amount invested. Investing in commodities may subject the Funds to greater risks and volatility as commodity prices may be influenced by a variety of factors including unfavorable weather, environmental factors, and changes in government regulations. The Funds may invest in derivative securities, which derive their performance from the performance of an underlying asset, index, interest rate or currency exchange rate. Derivatives can be volatile and involve various types and degrees of risks, and, depending upon the characteristics of a particular derivative, suddenly can become illiquid. Investments in debt securities typically decrease in value when interest rates rise. This risk is usually greater for longer-term debt securities. Investments in Asset-Backed, Mortgage-Backed, and Collateralized Mortgage-Backed Securities include additional risks that investors should be aware of such as credit risk, prepayment risk, possible illiquidity and default, as well as increased susceptibility to adverse economic developments. Investments in Real Estate Investment Trusts (REITs) involve additional risks such as declines in the value of real estate and increased susceptibility to adverse economic or regulatory developments.
Derivative contracts ordinarily have leverage inherent in their terms which can magnify a Fund’s potential for gains or losses through increased long and short position exposure. A Fund may access derivatives via a swap agreement. A risk of a swap agreement is the risk that the counterparty to the agreement will default on its obligation to pay the Fund.
A Fund will incur a loss as a result of a short position if the price of the short position instrument increases in value between the date of the short position sale and the date on which an offsetting position is purchased.
Investments in small- and medium-capitalization companies involve additional risks such as limited liquidity and greater volatility. Investments in lower rated and non-rated securities presents a greater risk of loss to principal and interest than higher-rated securities. ETF investments are subject to investment advisory and other expenses, which will be indirectly paid by the Fund. As a result, the cost of investing in the Fund will be
higher than the cost of investing directly in ETFs and may be higher than other mutual funds that invest directly in stocks and bonds. ETFs are subject to specific risks, depending on the nature of the ETF.
A Fund’s portfolio will be significantly impacted by the performance of the real estate market generally, and a Fund may be exposed to greater risk and experience higher volatility than would a more economically diversified portfolio. Property values may fall due to increasing vacancies or declining rents resulting from economic, legal, cultural, or technological developments. Investments in Limited Partnerships (including master limited partnerships) involve risks different from those of investing in common stock including risks related to limited control and limited rights to vote on matters affecting the Limited Partnership, risks related to potential conflicts of interest between the Limited Partnership and the Limited Partnership’s general partner, cash flow risks, dilution risks and risks related to the general partner’s limited call right. Underlying Funds are subject to management and other expenses, which will be indirectly paid by a Fund.
The LoCorr Funds are distributed by Quasar Distributors, LLC.
LoCorr Macro Strategies Fund
Rate of Return — For the period ended June 30, 2022 (Unaudited)
| | Inception | | Average Annual |
| | Date | 6 Month | 1 Year | 5 Year | 10 Year | Since Inception |
LoCorr Macro Strategies Fund - Class A (without maximum load) | 3/22/11 | 15.62% | 10.52% | 6.48% | 4.75% | 3.03% |
LoCorr Macro Strategies Fund - Class A (with maximum load) | 3/22/11 | 8.92% | 4.20% | 5.22% | 4.13% | 2.49% |
LoCorr Macro Strategies Fund - Class C | 3/24/11 | 14.28% | 8.77% | 5.71% | 3.98% | 2.27% |
LoCorr Macro Strategies Fund - Class I | 3/24/11 | 15.72% | 10.71% | 6.74% | 5.01% | 3.28% |
Bank of America Merrill Lynch U.S. 3-Month Treasury Bill Index | | 0.14% | 0.17% | 1.11% | 0.64% | 0.58% |
Barclay CTA Index | | 8.37% | 9.14% | 4.63% | 2.23% | 1.69% |
$100,000 investment in the
LoCorr Macro Strategies Fund – Class I
For the period ended June 30, 2022 (Unaudited)

This chart illustrates the performance of a hypothetical $100,000 investment made in the Fund on June 30, 2012. Assumes reinvestment of distributions, but does not reflect the effect of any applicable sales charge or redemption fees. This chart does not imply any future performance. Performance will vary from class to class based on differences in class-specific expenses and sales charges. The returns do not reflect the deduction of taxes that a shareholder would pay on Fund distributions or the redemption of Fund shares.
Performance data represents past performance; past performance does not guarantee future results. The investment return and principal value of an investment will fluctuate so that an investor’s shares, when redeemed, may be worth more or less than their original cost. Current performance of the Fund may be lower or higher than the performance quoted. Performance data current to the most recent month end may be obtained by calling 1.855.LCFUNDS, or visiting www.LoCorrFunds.com.
Performance data shown reflects the Class A maximum sales charge of 5.75% and reflects the Class C Contingent Deferred Sales Charge (CDSC) of 1.00%. Performance of the Class A without load does not reflect the deduction of the sales load or fee. If reflected, the load or fee would reduce the performance quoted.
The returns reflect the actual performance for each period and do not include the impact on trades executed on the last business day of the period that were recorded on the first business day of the next period.
Per the fee table in the Fund’s May 2, 2022 prospectus, the Fund’s annual operating expense ratio is, before fee waivers 2.15%, 2.90% and 1.90% for Class A, Class C and Class I shares, respectively.
The Bank of America Merrill Lynch U.S. 3-Month Treasury Bill Index is an unmanaged index that seeks to measure the performance of U.S. Treasury bills available in the marketplace.
The Barclay CTA Index is a leading industry benchmark of representative performance of commodity trading advisors.
One cannot invest directly in an index.
LoCorr Long/Short Commodities Strategy Fund
Rate of Return — For the period ended June 30, 2022 (Unaudited)
| | Inception | | Average Annual |
| | Date | 6 Month | 1 Year | 5 Year | 10 Year | Since Inception |
LoCorr Long/Short Commodities Strategy Fund - Class A (without maximum load) | 12/31/11 | 4.35% | 10.07% | 9.08% | 5.82% | 4.97% |
LoCorr Long/Short Commodities Strategy Fund - Class A (with maximum load) | 12/31/11 | -1.69% | 3.69% | 7.81% | 5.19% | 4.38% |
LoCorr Long/Short Commodities Strategy Fund - Class C | 12/31/11 | 2.87% | 8.07% | 8.25% | 5.02% | 4.15% |
LoCorr Long/Short Commodities Strategy Fund - Class I | 12/31/11 | 4.38% | 10.27% | 9.35% | 6.08% | 5.22% |
Bank of America Merrill Lynch U.S. 3-Month Treasury Bill Index | | 0.14% | 0.17% | 1.11% | 0.64% | 0.61% |
HFRI Macro Commodity Index | | 10.81% | 19.98% | 8.69% | 4.09% | 3.65% |
$100,000 investment in the
LoCorr Long/Short Commodities Strategy Fund – Class I
For the period ended June 30, 2022 (Unaudited)
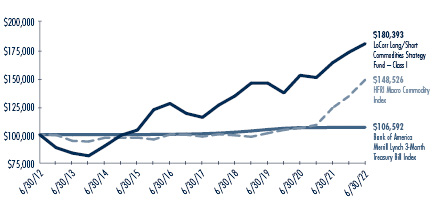
This chart illustrates the performance of a hypothetical $100,000 investment made in the Fund on June 30, 2012. Assumes reinvestment of distributions, but does not reflect the effect of any applicable sales charge or redemption fees. This chart does not imply any future performance. Performance will vary from class to class based on differences in class-specific expenses and sales charges. The returns do not reflect the deduction of taxes that a shareholder would pay on Fund distributions or the redemption of Fund shares.
Performance data represents past performance; past performance does not guarantee future results. The investment return and principal value of an investment will fluctuate so that an investor’s shares, when redeemed, may be worth more or less than their original cost. Current performance of the Fund may be lower or higher than the performance quoted. Performance data current to the most recent month end may be obtained by calling 1.855.LCFUNDS, or visiting www.LoCorrFunds.com.
Performance data shown reflects the Class A maximum sales charge of 5.75% and reflects the Class C Contingent Deferred Sales Charge (CDSC) of 1.00%. Performance of the Class A without load does not reflect the deduction of the sales load or fee. If reflected, the load or fee would reduce the performance quoted.
The returns reflect the actual performance for each period and do not include the impact on trades executed on the last business day of the period that were recorded on the first business day of the next period.
Per the fee table in the Fund’s May 2, 2022 prospectus, the Fund’s annual operating expense ratio is, before fee waivers 2.47%, 3.22% and 2.22% for Class A, Class C and Class I shares, respectively.
The Bank of America Merrill Lynch U.S. 3-Month Treasury Bill Index is an unmanaged index that seeks to measure the performance of U.S. Treasury bills available in the marketplace.
The HFRI Macro Commodity Index employs an investment process designed to identify opportunities in markets exhibiting trending or momentum characteristics across commodity assets classes, frequently with related ancillary exposure in commodity sensitive equities or other derivative instruments.
One cannot invest directly in an index.
LoCorr Market Trend Fund
Rate of Return — For the period ended June 30, 2022 (Unaudited)
| | Inception | | Average Annual |
| | Date | 6 Month | 1 Year | 5 Year | Since Inception |
LoCorr Market Trend Fund - Class A (without maximum load) | 6/30/14 | 33.92% | 27.86% | 9.09% | 6.79% |
LoCorr Market Trend Fund - Class A (with maximum load) | 6/30/14 | 26.18% | 20.54% | 7.80% | 6.00% |
LoCorr Market Trend Fund - Class C | 6/30/14 | 32.58% | 26.01% | 8.29% | 6.00% |
LoCorr Market Trend Fund - Class I | 6/30/14 | 34.06% | 28.14% | 9.33% | 7.05% |
Bank of America Merrill Lynch U.S. 3-Month Treasury Bill Index | | 0.14% | 0.17% | 1.11% | 0.78% |
Barclay CTA Index | | 8.37% | 9.14% | 4.63% | 3.18% |
$100,000 investment in the
LoCorr Market Trend Fund - Class I
For the period ended June 30, 2022 (Unaudited)

This chart illustrates the performance of a hypothetical $100,000 investment made in the Fund since inception. Assumes reinvestment of distributions, but does not reflect the effect of any applicable sales charge or redemption fees. This chart does not imply any future performance. Performance will vary from class to class based on differences in class-specific expenses and sales charges. The returns do not reflect the deduction of taxes that a shareholder would pay on Fund distributions or the redemption of Fund shares.
Performance data represents past performance; past performance does not guarantee future results. The investment return and principal value of an investment will fluctuate so that an investor’s shares, when redeemed, may be worth more or less than their original cost. Current performance of the Fund may be lower or higher than the performance quoted. Performance data current to the most recent month end may be obtained by calling 1.855.LCFUNDS, or visiting www.LoCorrFunds.com.
Performance data shown reflects the Class A maximum sales charge of 5.75% and reflects the Class C Contingent Deferred Sales Charge (CDSC) of 1.00%. Performance of the Class A without load does not reflect the deduction of the sales load or fee. If reflected, the load or fee would reduce the performance quoted.
The returns reflect the actual performance for each period and do not include the impact on trades executed on the last business day of the period that were recorded on the first business day of the next period.
Per the fee table in the Fund’s May 2, 2022 prospectus, the Fund’s annual operating expense ratio is, before fee waivers 2.02%, 2.77% and 1.77% for Class A, Class C and Class I shares, respectively.
The Bank of America Merrill Lynch U.S. 3-Month Treasury Bill Index is an unmanaged index that seeks to measure the performance of U.S. Treasury bills available in the marketplace.
The Barclay CTA Index is a leading industry benchmark of representative performance of commodity trading advisors.
One cannot invest directly in an index.
LoCorr Dynamic Equity Fund
Rate of Return — For the period ended June 30, 2022 (Unaudited)
| | Inception | | Average Annual |
| | Date | 6 Month | 1 Year | 5 Year | Since Inception |
LoCorr Dynamic Equity Fund - Class A (without maximum load) | 5/10/13 | -12.79% | -10.84% | 1.04% | 2.63% |
LoCorr Dynamic Equity Fund - Class A (with maximum load) | 5/10/13 | -17.78% | -15.95% | -0.15% | 1.97% |
LoCorr Dynamic Equity Fund - Class C | 5/10/13 | -13.95% | -12.33% | 0.29% | 1.86% |
LoCorr Dynamic Equity Fund - Class I | 5/10/13 | -12.64% | -10.59% | 1.31% | 2.89% |
S&P 500 Total Return Index | | -19.96% | -10.62% | 11.31% | 11.77% |
Morningstar Long/Short Equity Index | | -9.69% | -6.79% | 3.52% | 3.46% |
$100,000 investment in the
LoCorr Dynamic Equity Fund - Class I
For the period ended June 30, 2022 (Unaudited)
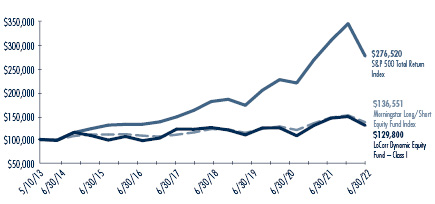
This chart illustrates the performance of a hypothetical $100,000 investment made in the Fund since inception. Assumes reinvestment of distributions, but does not reflect the effect of any applicable sales charge or redemption fees. This chart does not imply any future performance. Performance will vary from class to class based on differences in class-specific expenses and sales charges. The returns do not reflect the deduction of taxes that a shareholder would pay on Fund distributions or the redemption of Fund shares.
Performance data represents past performance; past performance does not guarantee future results. The investment return and principal value of an investment will fluctuate so that an investor’s shares, when redeemed, may be worth more or less than their original cost. Current performance of the Fund may be lower or higher than the performance quoted. Performance data current to the most recent month end may be obtained by calling 1.855.LCFUNDS, or visiting www.LoCorrFunds.com.
Performance data shown reflects the Class A maximum sales charge of 5.75% and reflects the Class C Contingent Deferred Sales Charge (CDSC) of 1.00%. Performance of the Class A without load does not reflect the deduction of the sales load or fee. If reflected, the load or fee would reduce the performance quoted.
The returns reflect the actual performance for each period and do not include the impact on trades executed on the last business day of the period that were recorded on the first business day of the next period.
Per the fee table in the Fund’s May 2, 2022 prospectus, the Fund’s annual operating expense ratio is, before fee waivers 3.91%, 4.66% and 3.66% for Class A, Class C and Class I shares, respectively.
The S&P 500 Total Return Index is an unmanaged capitalization-weighted index of 500 stocks designed to measure performance of the broad domestic economy through changes in the aggregate market value of the 500 stocks which represent all major industries.
The Morningstar Long/Short Equity Index category holds sizeable stakes in both long and short positions in equities and related derivative. At least 75% of the assets are in equity securities or derivatives.
One cannot invest directly in an index.
LoCorr Spectrum Income Fund
Rate of Return — For the period ended June 30, 2022 (Unaudited)
| | Inception | | Average Annual |
| | Date | 6 Month | 1 Year | 5 Year | Since Inception |
LoCorr Spectrum Income Fund - Class A (without maximum load) | 12/31/13 | -4.70% | -5.55% | 4.25% | 1.98% |
LoCorr Spectrum Income Fund - Class A (with maximum load) | 12/31/13 | -10.23% | -10.93% | 3.04% | 1.27% |
LoCorr Spectrum Income Fund - Class C | 12/31/13 | -5.89% | -7.13% | 3.48% | 1.21% |
LoCorr Spectrum Income Fund - Class I | 12/31/13 | -4.60% | -5.34% | 4.51% | 2.23% |
Bloomberg Barclays U.S. Aggregate Bond Index | | -10.35% | -10.29% | 0.88% | 1.85% |
Morningstar Allocation - 85% Equity | | -17.09% | -13.37% | 5.20% | 5.17% |
$100,000 investment in the
LoCorr Spectrum Income Fund - Class I
For the period ended June 30, 2022 (Unaudited)
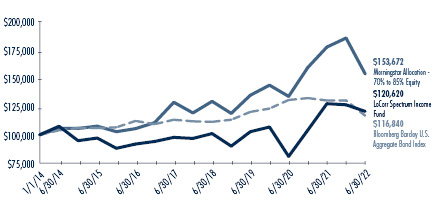
This chart illustrates the performance of a hypothetical $100,000 investment made in the Fund since inception. Assumes reinvestment of distributions, but does not reflect the effect of any applicable sales charge or redemption fees. This chart does not imply any future performance. Performance will vary from class to class based on differences in class-specific expenses and sales charges. The returns do not reflect the deduction of taxes that a shareholder would pay on Fund distributions or the redemption of Fund shares.
Performance data represents past performance; past performance does not guarantee future results. The investment return and principal value of an investment will fluctuate so that an investor’s shares, when redeemed, may be worth more or less than their original cost. Current performance of the Fund may be lower or higher than the performance quoted. Performance data current to the most recent month end may be obtained by calling 1.855.LCFUNDS, or visiting www.LoCorrFunds.com.
Performance data shown reflects the Class A maximum sales charge of 5.75% and reflects the Class C Contingent Deferred Sales Charge (CDSC) of 1.00%. Performance of the Class A without load does not reflect the deduction of the sales load or fee. If reflected, the load or fee would reduce the performance quoted.
The returns reflect the actual performance for each period and do not include the impact on trades executed on the last business day of the period that were recorded on the first business day of the next period.
Per the fee table in the Fund’s May 2, 2022 prospectus, the Fund’s annual operating expense ratio is, before fee waivers 3.68%, 4.43% and 3.43% for Class A, Class C and Class I shares, respectively.
The Bloomberg Barclays U.S. Aggregate Bond Index is a long term, market capitalization-weighted index used to represent investment grade bonds being traded in the United States.
The Morningstar Allocation - 70% to 85% Equity portfolios seek to provide both income and capital appreciation by investing in multiple asset classes, including stocks, bonds and cash. These portfolios are dominated by domestic holdings and have equity expenses between 70% and 85%.
One cannot invest directly in an index.
LoCorr Macro Strategies Fund – Consolidated Schedule of Investments |
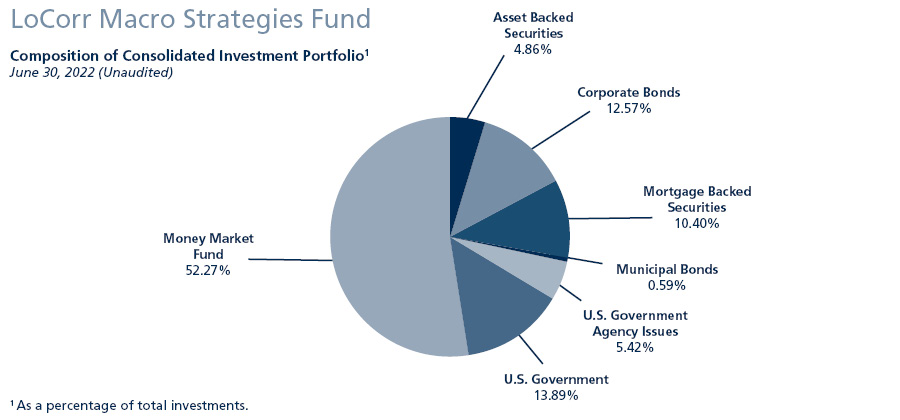
Consolidated Schedule of Investments
June 30, 2022 (Unaudited)
| | Maturity Date | | | Coupon Rate | | | Principal
Amount | | | Value | |
ASSET BACKED SECURITIES: 4.47% |
321 Henderson Receivables I LLC |
Series 2006-1A A1 (1 Month LIBOR USD + 0.200%) (a)(c) | | | 03/15/2041 | | | | 1.52% | | | $ | 139,118 | | | $ | 138,377 | |
Series 2006-4A A1 (1 Month LIBOR USD + 0.200%) (a)(c) | | | 12/15/2041 | | | | 1.52% | | | | 20,422 | | | | 20,413 | |
Series 2004-A A1 (1 Month LIBOR USD + 0.350%) (a)(c) | | | 09/15/2045 | | | | 1.67% | | | | 52,872 | | | | 52,160 | |
American Homes 4 Rent Trust, 2014-SFR2 A (a) | | | 10/17/2036 | | | | 3.79% | | | | 721,676 | | | | 717,749 | |
AmeriCredit Automobile Receivables Trust, 2021-2 A3 | | | 12/18/2026 | | | | 0.34% | | | | 5,010,000 | | | | 4,858,874 | |
AMSR Trust, 2020-SFR1 A (a) | | | 04/17/2037 | | | | 1.82% | | | | 499,521 | | | | 474,389 | |
Bank of America Credit Card Trust, 2021-A1 A1 | | | 09/15/2026 | | | | 0.44% | | | | 2,120,000 | | | | 2,014,480 | |
Carmax Auto Owner Trust |
Series 2019-1 A3 | | | 03/15/2024 | | | | 3.05% | | | | 207,557 | | | | 207,807 | |
Series 2021-4 A3 | | | 09/15/2026 | | | | 0.56% | | | | 3,805,000 | | | | 3,646,965 | |
Carvana Auto Receivables Trust |
Series 2021-P2 A3 | | | 03/10/2026 | | | | 0.49% | | | | 6,120,000 | | | | 5,897,707 | |
Series 2021-P4 A-3 | | | 01/10/2027 | | | | 1.31% | | | | 7,270,000 | | | | 6,881,681 | |
Citibank Credit Card Issuance Trust, 2018-A3 A3 | | | 05/23/2025 | | | | 3.29% | | | | 3,500,000 | | | | 3,502,618 | |
Corevest American Finance Trust, 2020-1 A1 (a) | | | 03/17/2050 | | | | 1.83% | | | | 253,710 | | | | 241,002 | |
DB Master Finance LLC, 2021-1A A2I (a) | | | 11/20/2051 | | | | 2.05% | | | | 4,079,500 | | | | 3,622,192 | |
Diamond Resorts Owner Trust |
Series 2018-1 A (a) | | | 01/21/2031 | | | | 3.70% | | | | 625,837 | | | | 624,327 | |
Series 2021-1A A (a) | | | 11/21/2033 | | | | 1.51% | | | | 1,515,973 | | | | 1,420,570 | |
Elara HGV Timeshare Issuer, 2021-A A (a) | | | 08/27/2035 | | | | 1.36% | | | | 2,341,932 | | | | 2,152,046 | |
Entergy New Orleans Storm Recovery Funding LLC, 2015-1 A | | | 06/01/2027 | | | | 2.67% | | | | 460,706 | | | | 448,243 | |
Ford Credit Auto Owner Trust, 2018-2 A (a) | | | 01/15/2030 | | | | 3.47% | | | | 1,400,000 | | | | 1,395,598 | |
Freddie Mac STACR REMIC Trust, 2021-HQA4 M1 (SOFR30A + 0.950%) (a)(c) | | | 12/26/2041 | | | | 1.88% | | | | 5,950,000 | | | | 5,754,929 | |
GM Financial Consumer Automobile Receivables Trust |
Series 2021-1 A3 | | | 10/16/2025 | | | | 0.35% | | | | 3,640,000 | | | | 3,550,242 | |
Series 2021-3 A3 | | | 06/16/2026 | | | | 0.48% | | | | 5,370,000 | | | | 5,132,671 | |
Hilton Grand Vacations Trust, 2019-AA A (a) | | | 07/25/2033 | | | | 2.34% | | | | 1,428,737 | | | | 1,367,549 | |
The accompanying notes are an integral part of these consolidated financial statements. | 19 |
LoCorr Macro Strategies Fund – Consolidated Schedule of Investments (continued) |
| | Maturity Date | | | Coupon Rate | | | Principal
Amount | | | Value | |
ASSET BACKED SECURITIES (continued) |
Hyundai Auto Receivables Trust, 2020-C A3 | | | 05/15/2025 | | | | 0.38% | | | $ | 5,416,926 | | | $ | 5,303,672 | |
Invitation Homes Trust, 2018-SFR4 A (1 Month LIBOR USD + 1.100%) (a)(c) | | | 01/19/2038 | | | | 2.62% | | | | 894,463 | | | | 889,407 | |
Morgan Stanley Capital I Trust, 2004-HE6 M1 (1 Month LIBOR USD + 0.825%) (c) | | | 08/25/2034 | | | | 2.45% | | | | 191,760 | | | | 184,177 | |
MVW Owner Trust |
Series 2019-1A A (a) | | | 11/20/2036 | | | | 2.89% | | | | 627,481 | | | | 606,838 | |
Series 2019-2A A (a) | | | 10/20/2038 | | | | 2.22% | | | | 895,749 | | | | 848,255 | |
Series 2021-1WA A (a) | | | 01/22/2041 | | | | 1.14% | | | | 2,508,017 | | | | 2,333,142 | |
Navient Student Loan Trust, 2021-A A (a) | | | 05/15/2069 | | | | 0.84% | | | | 2,257,599 | | | | 2,068,197 | |
PFS Financing Corp. |
Series 2020-G A (a) | | | 02/17/2026 | | | | 0.97% | | | | 2,288,000 | | | | 2,173,014 | |
Series 2021-B A (a) | | | 08/17/2026 | | | | 0.77% | | | | 3,550,000 | | | | 3,293,971 | |
Planet Fitness Master Issuer LLC, 3.25100 (a) | | | 12/05/2051 | | | | 3.25% | | | | 3,192,000 | | | | 2,872,992 | |
Sierra Receivables Funding LLC, 2018-3A A (a) | | | 09/20/2035 | | | | 3.69% | | | | 663,255 | | | | 655,719 | |
SoFi Professional Loan Program LLC |
Series 2016-C A2B (a) | | | 12/27/2032 | | | | 2.36% | | | | 66,095 | | | | 66,066 | |
Series 2016-D A2B (a) | | | 04/25/2033 | | | | 2.34% | | | | 236,495 | | | | 234,528 | |
SoFi Professional Loan Program Trust, 2021-B AFX (a) | | | 02/15/2047 | | | | 1.14% | | | | 1,862,701 | | | | 1,680,587 | |
Taco Bell Funding LLC, 2021-1A A21 (a) | | | 08/25/2051 | | | | 1.95% | | | | 5,840,650 | | | | 5,088,801 | |
Tesla Auto Lease Trust, 2021-A B (a) | | | 03/20/2025 | | | | 1.02% | | | | 2,900,000 | | | | 2,755,533 | |
Toyota Lease Owner Trust, 2021-B A3 (a) | | | 10/21/2024 | | | | 0.42% | | | | 6,185,000 | | | | 5,959,505 | |
Tricon American Homes Trust, 2017-SFR2 A (a) | | | 01/18/2036 | | | | 2.93% | | | | 470,872 | | | | 465,285 | |
Verizon Owner Trust |
Series 2019-B A1A | | | 12/20/2023 | | | | 2.33% | | | | 322,330 | | | | 322,403 | |
Series 2019-C A1A | | | 04/20/2024 | | | | 1.94% | | | | 237,872 | | | | 237,590 | |
Volkswagen Auto Loan Enhanced Trust, 2021-1 A-3 | | | 06/22/2026 | | | | 1.02% | | | | 5,570,000 | | | | 5,339,862 | |
TOTAL ASSET BACKED SECURITIES (Cost $102,741,534) | | | | | | | | | | | | | | | 97,502,133 | |
| | | | | | | | | | | | | | | | | |
CORPORATE BONDS: 11.55% |
Aerospace & Defense: 0.09% |
Boeing Co. | | | 02/04/2026 | | | | 2.20% | | | | 2,145,000 | | | | 1,932,055 | |
| | | | | | | | | | | | | | | | | |
Auto Manufacturers: 0.34% |
Daimler Finance North America LLC (a) | | | 03/01/2024 | | | | 0.75% | | | | 910,000 | | | | 865,076 | |
General Motors Financial Co., Inc. | | | 10/15/2024 | | | | 1.20% | | | | 1,040,000 | | | | 968,059 | |
General Motors Financial Co., Inc. | | | 06/20/2025 | | | | 2.75% | | | | 3,050,000 | | | | 2,864,343 | |
Volkswagen Group of America Finance LLC (a) | | | 11/22/2023 | | | | 0.88% | | | | 1,415,000 | | | | 1,356,218 | |
Volkswagen Group of America Finance LLC (a) | | | 11/24/2025 | | | | 1.25% | | | | 1,600,000 | | | | 1,433,192 | |
| | | | | | | | | | | | | | | | 7,486,888 | |
Banks: 5.57% |
Banco Santander SA (b) | | | 02/23/2023 | | | | 3.13% | | | | 2,025,000 | | | | 2,016,663 | |
Banco Santander SA (b) | | | 03/24/2025 | | | | 3.50% | | | | 1,375,000 | | | | 1,344,265 | |
Banco Santander SA (b) | | | 05/28/2025 | | | | 2.75% | | | | 1,015,000 | | | | 961,976 | |
Bank of America Corp. (SOFR + 0.690%) (c) | | | 04/22/2025 | | | | 0.98% | | | | 12,315,000 | | | | 11,592,171 | |
Bank of America Corp. (SOFR + 1.150%) (c) | | | 06/19/2026 | | | | 1.32% | | | | 5,740,000 | | | | 5,213,477 | |
Bank of America Corp. (SOFR + 1.010%) (c) | | | 10/24/2026 | | | | 1.20% | | | | 4,785,000 | | | | 4,287,273 | |
Barclays PLC (1 Year CMT Rate + 0.800%) (b)(c) | | | 12/10/2024 | | | | 1.01% | | | | 2,340,000 | | | | 2,223,933 | |
BNP Paribas SA (3 Month LIBOR USD + 1.111%) (a)(b)(c) | | | 11/19/2025 | | | | 2.82% | | | | 2,840,000 | | | | 2,715,717 | |
Canadian Imperial Bank (b) | | | 04/07/2027 | | | | 3.45% | | | | 1,900,000 | | | | 1,826,407 | |
Citigroup, Inc. (3 Month LIBOR USD + 1.023%) (c) | | | 06/01/2024 | | | | 4.04% | | | | 2,305,000 | | | | 2,298,504 | |
Citigroup, Inc. (SOFR + 0.669%) (c) | | | 05/01/2025 | | | | 0.98% | | | | 3,940,000 | | | | 3,694,244 | |
Citigroup, Inc. (SOFR + 1.372%) (c) | | | 05/24/2025 | | | | 4.14% | | | | 3,700,000 | | | | 3,687,837 | |
Citigroup, Inc. (SOFR + 0.528%) (c) | | | 11/03/2025 | | | | 1.28% | | | | 2,090,000 | | | | 1,942,562 | |
Citigroup, Inc. (SOFR + 0.765%) (c) | | | 01/28/2027 | | | | 1.12% | | | | 1,570,000 | | | | 1,387,887 | |
Credit Suisse AG (b) | | | 05/05/2023 | | | | 1.00% | | | | 2,610,000 | | | | 2,554,426 | |
20 | The accompanying notes are an integral part of these consolidated financial statements. |
LoCorr Macro Strategies Fund – Consolidated Schedule of Investments (continued) |
| | Maturity Date | | | Coupon Rate | | | Principal
Amount | | | Value | |
CORPORATE BONDS: (continued) |
Credit Suisse AG (b) | | | 08/09/2023 | | | | 0.52% | | | $ | 1,805,000 | | | $ | 1,742,101 | |
Deutsche Bank NY (b) | | | 05/28/2024 | | | | 0.90% | | | | 1,135,000 | | | | 1,064,226 | |
Federation des Caisses Desjardins du Quebec (a)(b) | | | 05/21/2024 | | | | 0.70% | | | | 2,055,000 | | | | 1,933,170 | |
Goldman Sachs Group, Inc. (SOFR + 0.572%) (c) | | | 03/08/2024 | | | | 0.67% | | | | 4,995,000 | | | | 4,882,325 | |
Goldman Sachs Group, Inc. | | | 03/15/2024 | | | | 3.00% | | | | 2,450,000 | | | | 2,416,410 | |
Goldman Sachs Group, Inc. (3 Month LIBOR USD + 1.201%) (c) | | | 09/29/2025 | | | | 3.27% | | | | 3,965,000 | | | | 3,855,923 | |
Goldman Sachs Group, Inc. (SOFR + 0.609%) (c) | | | 02/12/2026 | | | | 0.86% | | | | 1,750,000 | | | | 1,593,417 | |
Goldman Sachs Group, Inc. (SOFR + 0.789%) (c) | | | 12/09/2026 | | | | 1.09% | | | | 2,710,000 | | | | 2,416,348 | |
HSBC Bank Canada (a)(b) | | | 09/10/2023 | | | | 1.65% | | | | 2,000,000 | | | | 1,996,163 | |
HSBC Holdings PLC (SOFR + 1.538%) (b)(c) | | | 04/18/2026 | | | | 1.65% | | | | 750,000 | | | | 688,206 | |
HSBC Holdings PLC (SOFR + 1.929%) (b)(c) | | | 06/04/2026 | | | | 2.10% | | | | 4,050,000 | | | | 3,751,151 | |
ING Groep NV (b) | | | 04/09/2024 | | | | 3.55% | | | | 2,050,000 | | | | 2,033,066 | |
ING Groep NV (SOFR + 1.640%) (b)(c) | | | 03/28/2026 | | | | 3.87% | | | | 1,960,000 | | | | 1,920,966 | |
JP Morgan Chase & Co. (TSFR3M + 0.600%) (c) | | | 09/16/2024 | | | | 0.65% | | | | 450,000 | | | | 431,495 | |
JP Morgan Chase & Co. (SOFR + 0.420%) (c) | | | 02/16/2025 | | | | 0.56% | | | | 925,000 | | | | 872,259 | |
JP Morgan Chase & Co. (SOFR + 0.540%) (c) | | | 06/01/2025 | | | | 0.82% | | | | 5,485,000 | | | | 5,129,994 | |
JP Morgan Chase & Co. (SOFR + 0.800%) (c) | | | 11/19/2026 | | | | 1.05% | | | | 5,560,000 | | | | 4,947,922 | |
JP Morgan Chase & Co. (TSFR3M + 0.695%) (c) | | | 02/04/2027 | | | | 1.04% | | | | 2,755,000 | | | | 2,439,454 | |
Mitsubishi UFJ Financial Group, Inc. (1 Year CMT Rate + 0.680%) (b)(c) | | | 09/15/2024 | | | | 0.85% | | | | 2,435,000 | | | | 2,345,415 | |
Mitsubishi UFJ Financial Group, Inc. (b) | | | 02/25/2025 | | | | 2.19% | | | | 2,035,000 | | | | 1,930,763 | |
Morgan Stanley (SOFR + 0.616%) (c) | | | 04/05/2024 | | | | 0.73% | | | | 2,500,000 | | | | 2,437,981 | |
Morgan Stanley (SOFR + 0.525%) (c) | | | 05/30/2025 | | | | 0.79% | | | | 2,390,000 | | | | 2,229,907 | |
Morgan Stanley (SOFR + 1.152%) (c) | | | 07/22/2025 | | | | 2.72% | | | | 1,105,000 | | | | 1,065,328 | |
Morgan Stanley (SOFR + 0.858%) (c) | | | 07/20/2027 | | | | 1.51% | | | | 4,160,000 | | | | 3,653,076 | |
NatWest Markets PLC (a)(b) | | | 05/21/2023 | | | | 2.38% | | | | 1,370,000 | | | | 1,350,735 | |
NatWest Markets PLC (a)(b) | | | 08/12/2024 | | | | 0.80% | | | | 1,500,000 | | | | 1,393,631 | |
Standard Chartered PLC (3 Month LIBOR USD + 1.080%) (a)(b)(c) | | | 03/15/2024 | | | | 3.89% | | | | 1,175,000 | | | | 1,171,729 | |
Svenska Handelsbanken AB (a)(b) | | | 06/30/2023 | | | | 0.63% | | | | 1,510,000 | | | | 1,467,122 | |
Svenska Handelsbanken AB (a)(b) | | | 06/11/2024 | | | | 0.55% | | | | 930,000 | | | | 873,541 | |
Toronto-Dominion Bank (b) | | | 06/06/2025 | | | | 3.77% | | | | 1,855,000 | | | | 1,842,680 | |
Toronto-Dominion Bank (b) | | | 09/10/2026 | | | | 1.25% | | | | 2,285,000 | | | | 2,026,511 | |
Truist Financial Corp. | | | 08/05/2025 | | | | 1.20% | | | | 670,000 | | | | 616,128 | |
UBS AG/London (a)(b) | | | 06/01/2023 | | | | 0.38% | | | | 1,615,000 | | | | 1,563,262 | |
UBS AG/London (a)(b) | | | 08/09/2024 | | | | 0.70% | | | | 2,175,000 | | | | 2,037,470 | |
UBS Group AG (1 Year CMT Rate + 0.830%) (a)(b)(c) | | | 07/30/2024 | | | | 1.01% | | | | 600,000 | | | | 581,249 | |
UBS Group AG (1 Year CMT Rate + 1.550%) (a)(b)(c) | | | 05/12/2026 | | | | 4.49% | | | | 1,100,000 | | | | 1,097,612 | |
| | | | | | | | | | | | | | | | 121,546,078 | |
Beverages: 0.11% |
Constellation Brands, Inc. | | | 05/09/2024 | | | | 3.60% | | | | 2,440,000 | | | | 2,432,833 | |
| | | | | | | | | | | | | | | | | |
Cosmetics & Personal Care: 0.22% |
GSK Consumer Healthcare Capital UK PLC (a)(b) | | | 03/24/2025 | | | | 3.13% | | | | 4,870,000 | | | | 4,746,759 | |
| | | | | | | | | | | | | | | | | |
Diversified Financial Services: 0.92% |
AerCap Ireland Capital/Global Aviation Trust (b) | | | 10/29/2023 | | | | 1.15% | | | | 2,730,000 | | | | 2,602,691 | |
AerCap Ireland Capital/Global Aviation Trust (b) | | | 10/29/2024 | | | | 1.65% | | | | 4,415,000 | | | | 4,080,811 | |
AerCap Ireland Capital/Global Aviation Trust (b) | | | 01/15/2025 | | | | 3.50% | | | | 3,200,000 | | | | 3,058,544 | |
AerCap Ireland Capital/Global Aviation Trust (b) | | | 01/30/2026 | | | | 1.75% | | | | 1,415,000 | | | | 1,238,137 | |
Air Lease Corp. | | | 07/03/2023 | | | | 3.88% | | | | 870,000 | | | | 862,446 | |
Air Lease Corp. | | | 02/01/2024 | | | | 4.25% | | | | 775,000 | | | | 766,136 | |
Capital One Bank | | | 02/15/2023 | | | | 3.38% | | | | 975,000 | | | | 974,260 | |
Capital One Financial Corp. (SOFR + 1.370%) (c) | | | 05/09/2025 | | | | 4.17% | | | | 1,940,000 | | | | 1,913,085 | |
Charles Schwab Corp. | | | 03/03/2027 | | | | 2.45% | | | | 1,550,000 | | | | 1,447,624 | |
The accompanying notes are an integral part of these consolidated financial statements. | 21 |
LoCorr Macro Strategies Fund – Consolidated Schedule of Investments (continued) |
| | Maturity Date | | | Coupon Rate | | | Principal
Amount | | | Value | |
CORPORATE BONDS: (continued) |
OMERS Finance Trust (a)(b) | | | 05/02/2024 | | | | 2.50% | | | $ | 1,930,000 | | | $ | 1,907,753 | |
Private Export Funding Corp. | | | 06/15/2025 | | | | 3.25% | | | | 1,255,000 | | | | 1,256,663 | |
| | | | | | | | | | | | | | | | 20,108,150 | |
Electric: 0.23% |
Eversource Energy | | | 08/15/2025 | | | | 0.80% | | | | 360,000 | | | | 325,264 | |
Southern California Edison Co. | | | 08/01/2023 | | | | 0.70% | | | | 1,900,000 | | | | 1,842,250 | |
Southern California Edison Co. | | | 04/01/2024 | | | | 1.10% | | | | 2,645,000 | | | | 2,518,080 | |
Southern California Edison Co. | | | 02/01/2026 | | | | 1.20% | | | | 540,000 | | | | 483,684 | |
| | | | | | | | | | | | | | | | 5,169,278 | |
Entertainment: 0.24% |
Magallanes, Inc. (a) | | | 03/15/2025 | | | | 3.64% | | | | 2,875,000 | | | | 2,789,058 | |
Magallanes, Inc. (a) | | | 03/15/2027 | | | | 3.76% | | | | 2,530,000 | | | | 2,373,228 | |
| | | | | | | | | | | | | | | | 5,162,286 | |
Food: 0.12% |
Conagra Brands, Inc. | | | 08/11/2023 | | | | 0.50% | | | | 1,235,000 | | | | 1,190,971 | |
McCormick & Co., Inc. | | | 08/15/2024 | | | | 3.15% | | | | 690,000 | | | | 676,812 | |
Mondelez International, Inc. | | | 03/17/2024 | | | | 2.13% | | | | 890,000 | | | | 868,122 | |
| | | | | | | | | | | | | | | | 2,735,905 | |
Healthcare - Products: 0.60% |
Baxter International, Inc. | | | 11/29/2024 | | | | 1.32% | | | | 4,730,000 | | | | 4,444,983 | |
DH Europe Finance II Sarl (b) | | | 11/15/2024 | | | | 2.20% | | | | 1,905,000 | | | | 1,829,253 | |
PerkinElmer, Inc. | | | 09/15/2024 | | | | 0.85% | | | | 4,480,000 | | | | 4,150,354 | |
Thermo Fisher Scientific, Inc. | | | 10/18/2024 | | | | 1.22% | | | | 2,885,000 | | | | 2,735,923 | |
| | | | | | | | | | | | | | | | 13,160,513 | |
Healthcare - Services: 0.12% |
HCA, Inc. (a) | | | 03/15/2027 | | | | 3.13% | | | | 1,040,000 | | | | 946,203 | |
UnitedHealth Group, Inc. | | | 05/15/2024 | | | | 0.55% | | | | 1,755,000 | | | | 1,671,826 | |
| | | | | | | | | | | | | | | | 2,618,029 | |
Insurance: 0.66% |
Berkshire Hathaway Finance Corp. | | | 03/15/2027 | | | | 2.30% | | | | 1,425,000 | | | | 1,347,937 | |
Equitable Financial Life Global (a) | | | 11/17/2023 | | | | 0.50% | | | | 625,000 | | | | 599,444 | |
Equitable Financial Life Global (a) | | | 07/07/2025 | | | | 1.40% | | | | 1,875,000 | | | | 1,724,840 | |
Metropolitan Life Global Funding I (a) | | | 06/07/2024 | | | | 0.55% | | | | 2,370,000 | | | | 2,231,038 | |
Metropolitan Life Global Funding I (a) | | | 07/02/2025 | | | | 0.95% | | | | 1,805,000 | | | | 1,661,452 | |
Principal Life Global Funding II (a) | | | 04/12/2024 | | | | 0.75% | | | | 2,275,000 | | | | 2,153,171 | |
Principal Life Global Funding II (a) | | | 01/12/2026 | | | | 0.88% | | | | 1,845,000 | | | | 1,635,495 | |
Protective Life Global Funding (a) | | | 07/05/2024 | | | | 0.78% | | | | 3,185,000 | | | | 2,992,478 | |
| | | | | | | | | | | | | | | | 14,345,855 | |
Media: 0.07% |
Comcast Corp. | | | 03/01/2026 | | | | 3.15% | | | | 1,495,000 | | | | 1,456,845 | |
| | | | | | | | | | | | | | | | | |
Miscellaneous Manufacturing: 0.04% |
Trane Technologies Luxembourg Finance SA (b) | | | 03/21/2026 | | | | 3.50% | | | | 995,000 | | | | 968,340 | |
| | | | | | | | | | | | | | | | | |
Oil & Gas: 0.08% |
Phillips 66 | | | 02/15/2024 | | | | 0.90% | | | | 1,815,000 | | | | 1,729,513 | |
| | | | | | | | | | | | | | | | | |
Packaging & Containers: 0.19% |
Amcor Finance, Inc. | | | 04/28/2026 | | | | 3.63% | | | | 2,545,000 | | | | 2,451,740 | |
Berry Global, Inc. | | | 02/15/2024 | | | | 0.95% | | | | 1,845,000 | | | | 1,748,819 | |
| | | | | | | | | | | | | | | | 4,200,559 | |
Pharmaceuticals: 0.51% |
AbbVie, Inc. | | | 11/21/2024 | | | | 2.60% | | | | 4,645,000 | | | | 4,500,742 | |
22 | The accompanying notes are an integral part of these consolidated financial statements. |
LoCorr Macro Strategies Fund – Consolidated Schedule of Investments (continued) |
| | Maturity Date | | | Coupon Rate | | | Principal
Amount | | | Value | |
CORPORATE BONDS: (continued) |
AbbVie, Inc. | | | 05/14/2026 | | | | 3.20% | | | $ | 910,000 | | | $ | 876,546 | |
Astrazeneca Finance LLC | | | 05/28/2024 | | | | 0.70% | | | | 2,975,000 | | | | 2,821,759 | |
Takeda Pharmaceutical Co. Ltd. (b) | | | 11/26/2023 | | | | 4.40% | | | | 2,845,000 | | | | 2,867,898 | |
| | | | | | | | | | | | | | | | 11,066,945 | |
Pipelines: 0.31% |
Enbridge, Inc. (b) | | | 02/14/2025 | | | | 2.50% | | | | 1,105,000 | | | | 1,061,590 | |
Energy Transfer Operating LP | | | 05/15/2025 | | | | 2.90% | | | | 595,000 | | | | 566,048 | |
MPLX LP | | | 03/01/2026 | | | | 1.75% | | | | 2,140,000 | | | | 1,929,143 | |
ONEOK, Inc. | | | 09/01/2024 | | | | 2.75% | | | | 1,000,000 | | | | 967,836 | |
TransCanada PipeLines Ltd. (b) | | | 10/12/2024 | | | | 1.00% | | | | 2,490,000 | | | | 2,324,815 | |
| | | | | | | | | | | | | | | | 6,849,432 | |
Real Estate Investment Trusts: 0.38% |
American Tower Corp. | | | 09/15/2025 | | | | 1.30% | | | | 4,075,000 | | | | 3,692,580 | |
Brixmor Operating Partnership LP | | | 06/15/2024 | | | | 3.65% | | | | 970,000 | | | | 956,737 | |
Crown Castle International Corp. | | | 07/15/2025 | | | | 1.35% | | | | 735,000 | | | | 672,481 | |
SITE Centers Corp. | | | 02/01/2025 | | | | 3.63% | | | | 1,115,000 | | | | 1,084,602 | |
SITE Centers Corp. | | | 06/01/2027 | | | | 4.70% | | | | 1,825,000 | | | | 1,803,224 | |
| | | | | | | | | | | | | | | | 8,209,624 | |
Retail: 0.03% |
Genuine Parts Co. | | | 02/01/2025 | | | | 1.75% | | | | 620,000 | | | | 585,807 | |
| | | | | | | | | | | | | | | | | |
Software: 0.15% |
Roper Technologies, Inc. | | | 09/15/2024 | | | | 2.35% | | | | 810,000 | | | | 785,229 | |
VMware, Inc. | | | 08/15/2024 | | | | 1.00% | | | | 2,580,000 | | | | 2,415,635 | |
| | | | | | | | | | | | | | | | 3,200,864 | |
Telecommunications: 0.38% |
NBN Co. Ltd. (a)(b) | | | 10/08/2024 | | | | 0.88% | | | | 1,660,000 | | | | 1,551,191 | |
NTT Finance Corp. (a)(b) | | | 04/03/2026 | | | | 1.16% | | | | 2,050,000 | | | | 1,843,655 | |
Verizon Communications, Inc. | | | 11/20/2025 | | | | 0.85% | | | | 3,875,000 | | | | 3,513,227 | |
Verizon Communications, Inc. | | | 03/20/2026 | | | | 1.45% | | | | 1,500,000 | | | | 1,373,617 | |
| | | | | | | | | | | | | | | | 8,281,690 | |
Transportation: 0.19% |
Canadian Pacific Railway Co. (b) | | | 12/02/2024 | | | | 1.35% | | | | 4,315,000 | | | | 4,063,358 | |
TOTAL CORPORATE BONDS (Cost $265,619,033) | | | | | | | | | | | | | | | 252,057,606 | |
| | | | | | | | | | | | | | | | | |
MORTGAGE BACKED SECURITIES: 9.56% |
ACRE Commercial Mortgage Trust, 2021-FL4 A (1 Month LIBOR USD + 0.830%) (a)(b)(c) | | | 12/18/2037 | | | | 2.44% | | | | 1,563,092 | | | | 1,531,683 | |
Alen Mortgage Trust, 2021-ACEN A (1 Month LIBOR USD + 1.150%) (a)(c) | | | 04/17/2034 | | | | 2.47% | | | | 3,150,000 | | | | 3,024,925 | |
Angel Oak Mortgage Trust |
Series 2020-1 M1 (a)(d) | | | 12/25/2059 | | | | 3.16% | | | | 1,915,000 | | | | 1,794,805 | |
Series 2020-5 A3 (a)(d) | | | 05/25/2065 | | | | 2.04% | | | | 157,113 | | | | 149,177 | |
Barclays Commercial Mortgage Securities LLC, 2015-VFM A1 (a) | | | 03/12/2036 | | | | 2.47% | | | | 931,407 | | | | 887,482 | |
BHP Trust, 2019-BXHP A (1 Month LIBOR USD + 0.975%) (a)(c) | | | 08/15/2036 | | | | 2.30% | | | | 2,366,383 | | | | 2,295,036 | |
BIG Commercial Mortgage Trust, 2022-BIG A (TSFR1M + 1.342%) (a)(c) | | | 02/15/2039 | | | | 2.62% | | | | 5,600,000 | | | | 5,428,406 | |
BSREP Commercial Mortgage Trust, 2021-DC A (1 Month LIBOR USD + 0.950%) (a)(c) | | | 08/16/2038 | | | | 2.28% | | | | 4,330,000 | | | | 4,157,831 | |
BX Commercial Mortgage Trust |
Series 2021-21M A (1 Month LIBOR USD + 0.730%) (a)(c) | | | 10/15/2036 | | | | 2.05% | | | | 2,340,000 | | | | 2,224,778 | |
Series 2019-XL A (1 Month LIBOR USD + 0.920%) (a)(c) | | | 10/15/2036 | | | | 2.24% | | | | 2,266,278 | | | | 2,226,372 | |
Series 2021-XL2 B (1 Month LIBOR USD + 0.998%) (a)(c) | | | 10/15/2038 | | | | 2.32% | | | | 5,134,041 | | | | 4,850,408 | |
Series 2021-CIP A (1 Month LIBOR USD + 0.921%) (a)(c) | | | 12/15/2038 | | | | 2.25% | | | | 6,050,000 | | | | 5,867,694 | |
Citigroup Commercial Mortgage Trust |
Series 2019-PRM B (a) | | | 05/10/2035 | | | | 3.64% | | | | 2,100,000 | | | | 2,083,031 | |
The accompanying notes are an integral part of these consolidated financial statements. | 23 |
LoCorr Macro Strategies Fund – Consolidated Schedule of Investments (continued) |
| | Maturity Date | | | Coupon Rate | | | Principal
Amount | | | Value | |
MORTGAGE BACKED SECURITIES: (continued) |
Series 2021-PRM2 A (1 Month LIBOR USD + 0.950%) (a)(c) | | | 10/15/2038 | | | | 2.28% | | | $ | 5,250,000 | | | $ | 5,074,151 | |
Comm Mortgage Trust |
Series 2015-3BP A (a) | | | 02/12/2035 | | | | 3.18% | | | | 1,030,000 | | | | 984,283 | |
Series 2013-CR6 A4 | | | 03/10/2046 | | | | 3.10% | | | | 615,000 | | | | 612,003 | |
Series 2013-CR10 A4 (d) | | | 08/10/2046 | | | | 4.21% | | | | 615,000 | | | | 614,274 | |
Series 2014-UBS2 AM | | | 03/12/2047 | | | | 4.20% | | | | 2,450,000 | | | | 2,430,382 | |
Series 2014-CR19 A5 | | | 08/12/2047 | | | | 3.80% | | | | 1,380,133 | | | | 1,366,555 | |
Series 2014-LC17 A5 | | | 10/11/2047 | | | | 3.92% | | | | 724,000 | | | | 719,129 | |
Series 2014-CR21 A3 | | | 12/10/2047 | | | | 3.53% | | | | 1,667,396 | | | | 1,643,502 | |
Series 2015-CR27 AM | | | 10/13/2048 | | | | 3.98% | | | | 2,000,000 | | | | 1,957,390 | |
Connecticut Avenue Securities Trust |
Series 2021-R01 1M2 (SOFR30A + 1.550%) (a)(c) | | | 10/25/2041 | | | | 2.48% | | | | 1,820,000 | | | | 1,688,095 | |
Series 2021-R03 1M1 (SOFR30A + 0.850%) (a)(c) | | | 12/26/2041 | | | | 1.78% | | | | 5,164,196 | | | | 5,059,767 | |
Series 2022-R01 1M1 (SOFR30A + 1.000%) (a)(c) | | | 12/26/2041 | | | | 1.93% | | | | 2,171,851 | | | | 2,125,586 | |
Series 2022-R04 (SOFR30A + 2.000%) (a)(c) | | | 03/25/2042 | | | | 2.93% | | | | 2,045,630 | | | | 2,042,492 | |
Series 2022-R03 1M1 (SOFR30A + 2.100%) (a)(c) | | | 03/25/2042 | | | | 3.03% | | | | 4,809,395 | | | | 4,765,553 | |
Series 2022-R06 (SOFR30A + 2.750%) (a)(c) | | | 05/25/2042 | | | | 3.70% | | | | 1,341,875 | | | | 1,338,561 | |
Credit Suisse Mortgage Capital Certificates, 2019-ICE4 A (1 Month LIBOR USD + 0.980%) (a)(c) | | | 05/15/2036 | | | | 2.30% | | | | 3,500,000 | | | | 3,442,701 | |
ELP Commercial Mortgage Trust, 2021-ELP B (1 Month LIBOR USD + 1.120%) (a)(c) | | | 11/15/2038 | | | | 2.45% | | | | 5,400,000 | | | | 5,155,913 | |
EQUS Mortgage Trust, 2021-EQAZ A (1 Month LIBOR USD + 0.755%) (a)(c) | | | 10/15/2036 | | | | 2.08% | | | | 5,400,000 | | | | 5,155,885 | |
Extended Stay America Trust, 2021-ESH A (1 Month LIBOR USD + 1.080%) (a)(c) | | | 07/15/2038 | | | | 2.41% | | | | 1,192,660 | | | | 1,162,709 | |
Fannie Mae Connecticut Avenue Securities |
Series 2014-C02 1M2 (1 Month LIBOR USD + 2.600%) (c) | | | 05/28/2024 | | | | 4.22% | | | | 766,185 | | | | 763,252 | |
Series 2018-C01 1EB1 (1 Month LIBOR USD + 0.450%) (c) | | | 07/25/2030 | | | | 2.07% | | | | 1,099,604 | | | | 1,088,055 | |
Series 2021-R02 2M1 (SOFR30A + 0.900%) (a)(c) | | | 11/25/2041 | | | | 1.83% | | | | 2,625,095 | | | | 2,564,902 | |
FHLMC Multifamily Structured Pass Through Certificates |
Series K059 A1 | | | 09/25/2025 | | | | 2.76% | | | | 1,530,275 | | | | 1,509,348 | |
Series KC06 A1 | | | 02/25/2026 | | | | 2.17% | | | | 662,328 | | | | 659,987 | |
Freddie Mac STACR REMIC Trust |
Series 2021-DNA5 M2 (SOFR30A + 1.650%) (a)(c) | | | 01/25/2034 | | | | 2.58% | | | | 1,780,972 | | | | 1,717,234 | |
Series 2021-DNA6 M1 (SOFR30A + 0.800%) (a)(c) | | | 10/25/2041 | | | | 1.73% | | | | 5,250,000 | | | | 5,143,694 | |
Series 2022-DNA1 M1A (SOFR30A + 1.000%) (a)(c) | | | 01/27/2042 | | | | 1.93% | | | | 5,500,000 | | | | 5,306,648 | |
Series 2022-HQA1 M1A (SOFR30A + 2.100%) (a)(c) | | | 03/25/2042 | | | | 3.03% | | | | 4,724,727 | | | | 4,684,341 | |
Series 2022-DNA3 (SOFR30A + 2.000%) (a)(c) | | | 04/25/2042 | | | | 2.93% | | | | 2,200,886 | | | | 2,155,003 | |
Freddie Mac STACR Trust, 2018-HRP2 M3AS (1 Month LIBOR USD + 1.000%) (a)(c) | | | 02/25/2047 | | | | 2.62% | | | | 4,650,000 | | | | 4,571,713 | |
Freddie Mac Structured Agency Credit Risk Debt Notes |
Series 2021-DNA7 M1 (SOFR30A + 0.850%) (a)(c) | | | 11/25/2041 | | | | 1.78% | | | | 5,150,000 | | | | 4,995,207 | |
Series 2022-DNA2 M1A (SOFR30A + 1.300%) (a)(c) | | | 02/25/2042 | | | | 2.23% | | | | 5,330,123 | | | | 5,207,710 | |
Series 2018-HRP2 M3 (1 Month LIBOR USD + 2.400%) (a)(c) | | | 02/25/2047 | | | | 4.02% | | | | 2,000,000 | | | | 1,966,347 | |
FRESB Multifamily Mortgage Pass Through Certificates |
Series 2016-SB17 A7F (d) | | | 05/25/2023 | | | | 2.15% | | | | 1,187,357 | | | | 1,172,031 | |
Series 2016-SB22 A7F (d) | | | 09/25/2023 | | | | 1.98% | | | | 2,608,629 | | | | 2,571,401 | |
Series 2017-SB32 A7F (d) | | | 04/25/2024 | | | | 2.44% | | | | 718,465 | | | | 707,201 | |
Series 2019-SB67 A5F (d) | | | 07/25/2024 | | | | 2.09% | | | | 1,773,703 | | | | 1,725,844 | |
Series 2019-SB69 A5F (d) | | | 10/25/2024 | | | | 2.25% | | | | 4,603,030 | | | | 4,499,407 | |
Series 2016-SB23 A10F (d) | | | 09/25/2026 | | | | 2.31% | | | | 1,197,325 | | | | 1,154,233 | |
GCT Commercial Mortgage Trust, 2021-GCT A (1 Month LIBOR USD + 0.800%) (a)(c) | | | 02/15/2038 | | | | 2.12% | | | | 3,850,000 | | | | 3,726,923 | |
GS Mortgage Securities Corp II, 2021-ARDN A (1 Month LIBOR USD + 1.250%) (a)(c) | | | 11/17/2036 | | | | 2.57% | | | | 5,400,000 | | | | 5,268,923 | |
GS Mortgage Securities Trust |
Series 2017-SLP A (a) | | | 10/12/2032 | | | | 3.42% | | | | 3,000,000 | | | | 2,992,734 | |
Series 2019-600C A (a) | | | 09/12/2034 | | | | 2.94% | | | | 2,065,000 | | | | 1,963,277 | |
Series 2021-ROSS A (1 Month LIBOR USD + 1.150%) (a)(c) | | | 06/16/2036 | | | | 2.48% | | | | 5,000,000 | | | | 4,823,446 | |
24 | The accompanying notes are an integral part of these consolidated financial statements. |
LoCorr Macro Strategies Fund – Consolidated Schedule of Investments (continued) |
| | Maturity Date | | | Coupon Rate | | | Principal
Amount | | | Value | |
MORTGAGE BACKED SECURITIES: (continued) |
Series 2013-GC16 B (d) | | | 11/10/2046 | | | | 5.16% | | | $ | 206,000 | | | $ | 203,572 | |
Series 2015-GC28 A5 | | | 02/10/2048 | | | | 3.40% | | | | 1,000,000 | | | | 982,749 | |
Series 2015-GC28 AS | | | 02/12/2048 | | | | 3.76% | | | | 1,985,000 | | | | 1,944,091 | |
Series 2021-NQM1 A3 (a)(d) | | | 07/25/2061 | | | | 1.53% | | | | 1,520,766 | | | | 1,379,106 | |
JP Morgan Chase Commercial Mortgage Securities Trust |
Series 2018-BCON A (a) | | | 01/07/2031 | | | | 3.73% | | | | 3,630,000 | | | | 3,608,469 | |
Series 2021-MHC A (1 Month LIBOR USD + 0.800%) (a)(c) | | | 04/15/2038 | | | | 2.12% | | | | 4,157,546 | | | | 4,011,301 | |
Series 2013-C15 A-S | | | 11/17/2045 | | | | 4.42% | | | | 3,325,000 | | | | 3,319,855 | |
Series 2013-C13 A4 (d) | | | 01/18/2046 | | | | 3.99% | | | | 513,180 | | | | 511,596 | |
Series 2014-C23 ASB | | | 09/17/2047 | | | | 3.66% | | | | 1,352,466 | | | | 1,344,373 | |
Series 2014-C22 AS | | | 09/17/2047 | | | | 4.11% | | | | 3,650,000 | | | | 3,582,009 | |
Series 2013-C10 AS | | | 12/17/2047 | | | | 3.37% | | | | 200,000 | | | | 198,513 | |
Series 2016-JP3 A-5 | | | 08/15/2049 | | | | 2.87% | | | | 1,000,000 | | | | 944,849 | |
Ladder Capital Commercial Mortgage Trust, 2013-GCP A1 (a) | | | 02/15/2036 | | | | 3.57% | | | | 1,981,593 | | | | 1,913,666 | |
Morgan Stanley Capital I Trust, 2017-CLS A (1 Month LIBOR USD + 0.700%) (a)(c) | | | 11/15/2034 | | | | 2.02% | | | | 2,785,000 | | | | 2,757,574 | |
Natixis Commercial Mortgage Securities Trust, 2018-285M A (a)(d) | | | 11/15/2032 | | | | 3.92% | | | | 1,000,000 | | | | 994,082 | |
New Residential Mortgage Loan Trust |
Series 2016-1A A1 (a)(d) | | | 03/25/2056 | | | | 3.75% | | | | 787,101 | | | | 762,659 | |
Series 2017-2A A3 (a)(d) | | | 03/25/2057 | | | | 4.00% | | | | 1,179,048 | | | | 1,148,989 | |
OBX Trust, 2018-1 A2 (1 Month LIBOR USD + 0.650%) (a)(c) | | | 06/25/2057 | | | | 2.27% | | | | 682,338 | | | | 667,677 | |
OPG TRUST, 2021-PORT B (1 Month LIBOR USD + 0.713%) (a)(c) | | | 10/15/2036 | | | | 2.04% | | | | 5,550,000 | | | | 5,187,769 | |
PKHL Commercial Mortgage Trust, 2021-MF A (1 Month LIBOR USD + 0.880%) (a)(c) | | | 07/15/2038 | | | | 2.21% | | | | 5,750,000 | | | | 5,544,825 | |
Sequoia Mortgage Trust, 2020-2 A4 (a)(d) | | | 03/25/2050 | | | | 3.50% | | | | 9,021 | | | | 8,999 | |
SREIT Trust, 2021-MFP2 A (1 Month LIBOR USD + 0.822%) (a)(c) | | | 11/17/2036 | | | | 2.15% | | | | 5,000,000 | | | | 4,792,119 | |
UBS-Barclays Commercial Mortgage Trust |
Series 2013-C5 B (a)(d) | | | 03/12/2046 | | | | 3.65% | | | | 265,000 | | | | 258,183 | |
Series 2013-C6 B (a)(d) | | | 04/12/2046 | | | | 3.88% | | | | 700,000 | | | | 683,505 | |
Verus Securitization Trust |
Series 2020-1 A1 (a)(d) | | | 01/25/2060 | | | | 2.42% | | | | 519,955 | | | | 510,204 | |
Series 2020-1 A3 (a)(d) | | | 01/25/2060 | | | | 2.72% | | | | 1,330,561 | | | | 1,304,186 | |
Wells Fargo Commercial Mortgage Trust, 2012-LC5 AS | | | 10/17/2045 | | | | 3.54% | | | | 650,000 | | | | 649,301 | |
WFRBS Commercial Mortgage Trust |
Series 2013-C13 AS | | | 05/17/2045 | | | | 3.35% | | | | 650,000 | | | | 643,844 | |
Series 2013-C14 A5 | | | 06/15/2046 | | | | 3.34% | | | | 727,218 | | | | 716,018 | |
Series 2014-C24 A5 | | | 11/18/2047 | | | | 3.61% | | | | 1,000,000 | | | | 983,844 | |
Series 2014-C22 AS (d) | | | 09/17/2057 | | | | 4.07% | | | | 350,000 | | | | 344,311 | |
TOTAL MORTGAGE BACKED SECURITIES (Cost $215,998,762) | | | | | | | | | | | | | | | 208,701,658 | |
| | | | | | | | | | | | | | | | | |
MUNICIPAL BONDS: 0.54% |
Forsyth County School District | | | 02/01/2024 | | | | 0.92% | | | | 1,330,000 | | | | 1,285,207 | |
Miami Dade County Florida Aviation Refunding Taxable Series B | | | 10/01/2023 | | | | 2.37% | | | | 1,350,000 | | | | 1,330,818 | |
Nebraska Public Power District | | | 01/01/2024 | | | | 2.22% | | | | 1,700,000 | | | | 1,670,870 | |
Pennsylvania State University | | | 09/01/2023 | | | | 1.35% | | | | 2,945,000 | | | | 2,891,799 | |
State of Hawaii | | | 08/01/2025 | | | | 1.03% | | | | 4,220,000 | | | | 3,932,701 | |
Water Works Board of the City of Birmingham | | | 01/01/2024 | | | | 2.20% | | | | 695,000 | | | | 685,122 | |
TOTAL MUNICIPAL BONDS (Cost $12,241,785) | | | | | | | | | | | | | | | 11,796,517 | |
| | | | | | | | | | | | | | | | | |
U.S. GOVERNMENT AGENCY ISSUES: 4.98% |
Federal Farm Credit Banks | | | 05/10/2023 | | | | 0.13% | | | | 19,410,000 | | | | 18,964,753 | |
Federal Farm Credit Banks | | | 06/26/2023 | | | | 1.77% | | | | 5,135,000 | | | | 5,074,049 | |
Federal Farm Credit Banks | | | 07/17/2023 | | | | 2.88% | | | | 10,985,000 | | | | 10,988,910 | |
Federal Home Loan Banks | | | 06/09/2023 | | | | 3.25% | | | | 15,200,000 | | | | 15,245,721 | |
Federal Home Loan Banks | | | 09/08/2023 | | | | 3.38% | | | | 9,000,000 | | | | 9,046,054 | |
The accompanying notes are an integral part of these consolidated financial statements. | 25 |
LoCorr Macro Strategies Fund – Consolidated Schedule of Investments (continued) |
| | Maturity Date | | | Coupon Rate | | | Principal
Amount | | | Value | |
U.S. GOVERNMENT AGENCY ISSUES: (continued) |
Federal Home Loan Banks | | | 06/14/2024 | | | | 1.75% | | | $ | 12,435,000 | | | $ | 12,134,502 | |
Federal Home Loan Banks | | | 04/14/2025 | | | | 0.50% | | | | 9,350,000 | | | | 8,727,546 | |
Federal Home Loan Mortgage Corp. | | | 05/19/2023 | | | | 0.25% | | | | 7,210,000 | | | | 7,041,904 | |
Federal Home Loan Mortgage Corp. | | | 09/08/2023 | | | | 0.25% | | | | 2,000,000 | | | | 1,939,048 | |
Federal National Mortgage Association | | | 09/06/2022 | | | | 1.38% | | | | 5,855,000 | | | | 5,850,937 | |
Federal National Mortgage Association | | | 07/10/2023 | | | | 0.25% | | | | 9,000,000 | | | | 8,761,675 | |
Federal National Mortgage Association | | | 07/02/2024 | | | | 1.75% | | | | 5,000,000 | | | | 4,891,084 | |
TOTAL U.S. GOVERNMENT AGENCY ISSUES (Cost $110,991,505) | | | | | | | | | | | | | | | 108,666,183 | |
| | | | | | | | | | | | | | | | | |
U.S. GOVERNMENT NOTES: 12.77% |
United States Treasury Note | | | 08/31/2023 | | | | 0.13% | | | | 20,140,000 | | | | 19,491,744 | |
United States Treasury Note | | | 06/15/2024 | | | | 0.25% | | | | 11,640,000 | | | | 11,047,542 | |
United States Treasury Note | | | 06/30/2024 | | | | 1.75% | | | | 1,885,000 | | | | 1,841,409 | |
United States Treasury Note | | | 08/15/2024 | | | | 0.38% | | | | 10,150,000 | | | | 9,610,385 | |
United States Treasury Note | | | 09/15/2024 | | | | 0.38% | | | | 33,700,000 | | | | 31,835,969 | |
United States Treasury Note | | | 09/30/2024 | | | | 1.50% | | | | 16,795,000 | | | | 16,261,627 | |
United States Treasury Note | | | 02/15/2025 | | | | 7.63% | | | | 1,500,000 | | | | 1,674,141 | |
United States Treasury Note | | | 05/31/2025 | | | | 0.25% | | | | 124,940,000 | | | | 115,418,205 | |
United States Treasury Note | | | 04/15/2025 | | | | 2.63% | | | | 72,095,000 | | | | 71,385,315 | |
TOTAL U.S. GOVERNMENT NOTES (Cost $282,509,793) | | | | | | | | | | | | | | | 278,566,337 | |
| | | | | | | | | | | | | | | | | |
SHORT TERM INVESTMENT: 48.13% | | | | | | | | | | Shares | | | | | |
MONEY MARKET FUND: 48.13% | | | | | | | | | | | | | | | | |
STIT-Government & Agency Portfolio, Institutional Class, 1.38% (e)(f)^ | | | | | | | | | | | 1,048,537,023 | | | | 1,048,537,023 | |
TOTAL MONEY MARKET FUND (Cost $1,048,537,023) | | | | | | | | | | | | | | | 1,048,537,023 | |
TOTAL SHORT TERM INVESTMENT (Cost $1,048,537,023) | | | | | | | | | | | | | | | 1,048,537,023 | |
| | | | | | | | | | | | | | | | | |
TOTAL INVESTMENTS (Cost $2,038,639,435): 91.93% | | | | | | | | | | | | | | | 2,005,827,457 | |
Other Assets in Excess of Liabilities: 8.07% (g) | | | | | | | | | | | | | | | 176,034,993 | |
TOTAL NET ASSETS: 100.00% | | | | | | | | | | | | | | $ | 2,181,862,450 | |
| |
(a) | Security as defined in Rule 144A under the Securities Act of 1933 and determined to be liquid. Purchased in a private placement transaction; resale to the public may require registration or may extend only to qualified institutional buyers. At June 30, 2022, the value of these securities total $268,103,532 which represents 12.29% of total net assets. |
(b) | Foreign issued security. |
(c) | Variable rate security based on a reference index and spread. The rate reported is the rate in effect as of June 30, 2022. |
(d) | Variable rate security. The coupon is based on an underlying pool of loans. The rate reported is the rate in effect as of June 30, 2022. |
(e) | The rate quoted is the annualized seven-day effective yield as of June 30, 2022. |
(f) | All or a portion of this security is pledged as collateral for derivative contracts. At June 30, 2022, the value of this collateral totals $12,244. |
(g) | Includes assets pledged as collateral for derivative contracts. At June 30, 2022, the value of these assets totals $122,408,250. |
^ | Holdings is greater than 25% of portfolio value. Additional information regarding the underlying Fund’s holdings and financial statements may be found at https://sec.gov. |
CMT | Constant Maturity Treasury | SOFR | Secured Overnight Financing Rate |
LIBOR | London Interbank Offered Rate | SOFR30A | 30 Day Average Secured Overnight Financing Rate |
PLC | Public Limited Company | TSFR1M | 1 Month Term Secured Overnight Financing Rate |
26 | The accompanying notes are an integral part of these consolidated financial statements. |
LoCorr Macro Strategies Fund – Consolidated Schedule of Open Forward Currency Contracts |
LoCorr Macro Strategies Fund
Consolidated Schedule of Open Forward Currency Contracts
June 30, 2022 (Unaudited)
| | | | | | | | | | | | | | | Currency to be Received | | | Currency to be Delivered | | | | | | | | | |
| | | Notional
Amount | | | Counterparty
Abbreviation | | | Forward
Settlement
Date | | | Currency
Abbreviation | | | U.S. $
Notional
Amount at
June 30,
2022 | | | Currency
Abbreviation | | | U.S. $
Notional
Amount on
Origination
Date | | | Unrealized
Appreciation | | | Unrealized
(Depreciation) | |
| | | | See key for abbreviation | | | | | | | | | | | | | | | | | | | | | | | | | | | | | |
Purchase Contracts: | | | | | | | | | | | | | | | | | | | | | | | | | | | | | | | | |
| | | $ | 10,796,836 | | | | DB | | | | 07/20/2022 | | | | KRW | | | $ | 10,532,775 | | | | USD | | | $ | 10,796,836 | | | $ | — | | | $ | (264,061 | ) |
| | | | 85,023,666 | | | | DB | | | | 07/20/2022 | | | | JPY | | | | 84,026,912 | | | | USD | | | | 85,023,666 | | | | — | | | | (996,754 | ) |
| | | | 60,049,648 | | | | BAML | | | | 09/22/2022 | | | | JPY | | | | 59,709,762 | | | | USD | | | | 60,049,648 | | | | — | | | | (339,886 | ) |
| | | | 3,761,332 | | | | DB | | | | 07/20/2022 | | | | CLP | | | | 3,558,079 | | | | USD | | | | 3,761,332 | | | | — | | | | (203,253 | ) |
| | | | 47,900,863 | | | | DB | | | | 07/20/2022 | | | | MXN | | | | 47,539,326 | | | | USD | | | | 47,900,863 | | | | — | | | | (361,537 | ) |
| | | | 678,556 | | | | DB | | | | 08/17/2022 | | | | KRW | | | | 673,806 | | | | USD | | | | 678,556 | | | | — | | | | (4,750 | ) |
| | | | 42,078,718 | | | | BAML | | | | 09/23/2022 | | | | MXN | | | | 41,200,737 | | | | USD | | | | 42,078,718 | | | | — | | | | (877,981 | ) |
| | | | 3,899,555 | | | | DB | | | | 07/20/2022 | | | | INR | | | | 3,845,602 | | | | USD | | | | 3,899,555 | | | | — | | | | (53,953 | ) |
| | | | 26,310,015 | | | | DB | | | | 07/20/2022 | | | | SEK | | | | 25,733,773 | | | | USD | | | | 26,310,015 | | | | — | | | | (576,242 | ) |
| | | | 11,947,839 | | | | DB | | | | 07/20/2022 | | | | ZAR | | | | 11,749,900 | | | | USD | | | | 11,947,839 | | | | — | | | | (197,939 | ) |
| | | | 16,414,564 | | | | DB | | | | 07/20/2022 | | | | NOK | | | | 16,405,014 | | | | EUR | | | | 16,414,564 | | | | — | | | | (9,550 | ) |
| | | | 102,704,045 | | | | DB | | | | 07/20/2022 | | | | CHF | | | | 104,325,690 | | | | USD | | | | 102,704,045 | | | | 1,621,645 | | | | — | |
| | | 9,863,666 | | | | DB | | | | 07/20/2022 | | | | NOK | | | | 9,816,047 | | | | USD | | | | 9,863,666 | | | | — | | | | (47,619 | ) |
| | | | 19,658,773 | | | | DB | | | | 07/20/2022 | | | | BRL | | | | 18,345,749 | | | | USD | | | | 19,658,773 | | | | — | | | | (1,313,024 | ) |
| | | | 67,626,093 | | | | DB | | | | 07/20/2022 | | | | AUD | | | | 66,673,450 | | | | USD | | | | 67,626,093 | | | | — | | | | (952,643 | ) |
| | | | 100,291,255 | | | | DB | | | | 07/20/2022 | | | | EUR | | | | 99,195,646 | | | | USD | | | | 100,291,255 | | | | — | | | | (1,095,609 | ) |
| | | | 7,674,933 | | | | DB | | | | 07/20/2022 | | | | SEK | | | | 7,629,212 | | | | EUR | | | | 7,674,933 | | | | — | | | | (45,721 | ) |
| | | | 59,715,827 | | | | DB | | | | 07/20/2022 | | | | CAD | | | | 59,555,266 | | | | USD | | | | 59,715,827 | | | | — | | | | (160,561 | ) |
| | | | 79,432,177 | | | | DB | | | | 07/20/2022 | | | | GBP | | | | 77,969,817 | | | | USD | | | | 79,432,177 | | | | — | | | | (1,462,360 | ) |
| | | | 13,723,607 | | | | DB | | | | 07/20/2022 | | | | PLN | | | | 13,471,977 | | | | USD | | | | 13,723,607 | | | | — | | | | (251,630 | ) |
| | | | 32,438,924 | | | | DB | | | | 07/20/2022 | | | | NZD | | | | 31,722,484 | | | | USD | | | | 32,438,924 | | | | — | | | | (716,440 | ) |
| | | | 43,295,107 | | | | BAML | | | | 09/23/2022 | | | | CHF | | | | 44,860,725 | | | | USD | | | | 43,295,107 | | | | 1,565,618 | | | | — | |
| | | | 7,765,360 | | | | DB | | | | 07/20/2022 | | | | PLN | | | | 7,523,529 | | | | EUR | | | | 7,765,360 | | | | — | | | | (241,831 | ) |
| | | | 35,029,489 | | | | BAML | | | | 09/23/2022 | | | | EUR | | | | 34,872,471 | | | | USD | | | | 35,029,489 | | | | — | | | | (157,018 | ) |
| | | | 3,179,857 | | | | DB | | | | 08/17/2022 | | | | SEK | | | | 3,187,506 | | | | EUR | | | | 3,179,857 | | | | 7,649 | | | | — | |
| | | | 35,160,494 | | | | BAML | | | | 09/23/2022 | | | | GBP | | | | 35,210,197 | | | | USD | | | | 35,160,494 | | | | 49,703 | | | | — | |
| | | | 16,956,037 | | | | BAML | | | | 09/23/2022 | | | | NZD | | | | 16,870,212 | | | | USD | | | | 16,956,037 | | | | — | | | | (85,825 | ) |
| | | | 15,007,937 | | | | BAML | | | | 09/23/2022 | | | | CAD | | | | 14,629,898 | | | | USD | | | | 15,007,937 | | | | — | | | | (378,039 | ) |
| | | | 9,459,570 | | | | BAML | | | | 09/23/2022 | | | | AUD | | | | 9,315,439 | | | | USD | | | | 9,459,570 | | | | — | | | | (144,131 | ) |
| | | | 9,897,371 | | | | DB | | | | 07/20/2022 | | | | EUR | | | | 9,748,520 | | | | NOK | | | | 9,897,371 | | | | — | | | | (148,851 | ) |
| | | | 2,270,835 | | | | DB | | | | 07/20/2022 | | | | ILS | | | | 2,218,305 | | | | USD | | | | 2,270,835 | | | | — | | | | (52,530 | ) |
| | | | 7,779,411 | | | | DB | | | | 07/20/2022 | | | | EUR | | | | 7,691,781 | | | | SEK | | | | 7,779,411 | | | | — | | | | (87,630 | ) |
| | | | 5,087,831 | | | | DB | | | | 07/20/2022 | | | | SGD | | | | 5,081,757 | | | | USD | | | | 5,087,831 | | | | — | | | | (6,074 | ) |
| | | | 7,694,493 | | | | DB | | | | 08/17/2022 | | | | GBP | | | | 7,712,627 | | | | USD | | | | 7,694,493 | | | | 18,134 | | | | — | |
| | | | 4,024,468 | | | | DB | | | | 07/20/2022 | | | | EUR | | | | 4,029,528 | | | | PLN | | | | 4,024,468 | | | | 5,060 | | | | — | |
| | | | 801,929 | | | | DB | | | | 08/17/2022 | | | | AUD | | | | 800,112 | | | | USD | | | | 801,929 | | | | — | | | | (1,817 | ) |
Total Purchase Contracts | | | | | | | | | | | | 997,433,631 | | | | | | | | 1,005,401,081 | | | | 3,267,809 | | | | (11,235,259 | ) |
| | | | | | | | | | | | | | | | | | | | | | | | | | | | | | | | | | | | | |
The accompanying notes are an integral part of these consolidated financial statements. | 27 |
LoCorr Macro Strategies Fund – Consolidated Schedule of Open Forward Currency Contracts (continued) |
| | | | | | | | | | | | | | | Currency to be Received | | | Currency to be Delivered | | | | | | | | | |
| | | Notional
Amount | | | Counterparty
Abbreviation | | | Forward
Settlement
Date | | | Currency
Abbreviation | | | U.S. $
Notional
Amount at
June 30,
2022 | | | Currency
Abbreviation | | | U.S. $
Notional
Amount on
Origination
Date | | | Unrealized
Appreciation | | | Unrealized
(Depreciation) | |
| | | | See key for abbreviation | | | | | | | | | | | | | | | | | | | | | | | | | | | | | |
Sale Contracts: | | | | | | | | | | | | | | | | | | | | | | | | | | | | | | | | |
| | | $ | 90,054 | | | | BAML | | | | 09/23/2022 | | | | USD | | | $ | 89,104 | | | | MXN | | | $ | 90,054 | | | $ | 950 | | | $ | — | |
| | | | 3,179,858 | | | | DB | | | | 08/17/2022 | | | | SEK | | | | 3,196,854 | | | | EUR | | | | 3,179,858 | | | | — | | | | (16,996 | ) |
| | | | 5,115,554 | | | | DB | | | | 08/17/2022 | | | | USD | | | | 5,117,383 | | | | GBP | | | | 5,115,554 | | | | — | | | | (1,829 | ) |
| | | | 7,765,361 | | | | DB | | | | 07/20/2022 | | | | PLN | | | | 7,618,327 | | | | EUR | | | | 7,765,361 | | | | 147,034 | | | | — | |
| | | | 7,674,933 | | | | DB | | | | 07/20/2022 | | | | SEK | | | | 7,691,781 | | | | EUR | | | | 7,674,933 | | | | — | | | | (16,848 | ) |
| | | | 3,461,512 | | | | DB | | | | 07/20/2022 | | | | USD | | | | 3,373,315 | | | | ILS | | | | 3,461,512 | | | | 88,197 | | | | — | |
| | | | 2,745,062 | | | | DB | | | | 07/20/2022 | | | | USD | | | | 2,734,444 | | | | PLN | | | | 2,745,062 | | | | 10,618 | | | | — | |
| | | | 10,975,931 | | | | DB | | | | 07/20/2022 | | | | USD | | | | 10,984,081 | | | | SGD | | | | 10,975,931 | | | | — | | | | (8,150 | ) |
| | | | 16,414,563 | | | | DB | | | | 07/20/2022 | | | | NOK | | | | 16,401,438 | | | | EUR | | | | 16,414,563 | | | | 13,125 | | | | — | |
| | | | 4,024,468 | | | | DB | | | | 07/20/2022 | | | | EUR | | | | 4,027,886 | | | | PLN | | | | 4,024,468 | | | | — | | | | (3,418 | ) |
| | | | 19,442,768 | | | | DB | | | | 07/20/2022 | | | | USD | | | | 19,314,497 | | | | NZD | | | | 19,442,768 | | | | 128,271 | | | | — | |
| | | | 22,467,457 | | | | BAML | | | | 09/23/2022 | | | | USD | | | | 21,582,448 | | | | AUD | | | | 22,467,457 | | | | 885,009 | | | | — | |
| | | | 36,332,247 | | | | BAML | | | | 09/23/2022 | | | | USD | | | | 35,415,090 | | | | CAD | | | | 36,332,247 | | | | 917,157 | | | | — | |
| | | | 79,404,383 | | | | BAML | | | | 09/23/2022 | | | | USD | | | | 77,219,537 | | | | GBP | | | | 79,404,383 | | | | 2,184,846 | | | | — | |
| | | | 77,637,683 | | | | DB | | | | 07/20/2022 | | | | USD | | | | 77,969,817 | | | | GBP | | | | 77,637,683 | | | | — | | | | (332,134 | ) |
| | | | 54,923,209 | | | | DB | | | | 07/20/2022 | | | | USD | | | | 54,070,525 | | | | CAD | | | | 54,923,209 | | | | 852,684 | | | | — | |
| | | | 7,779,411 | | | | DB | | | | 07/20/2022 | | | | EUR | | | | 7,580,693 | | | | SEK | | | | 7,779,411 | | | | 198,718 | | | | — | |
| | | | 9,897,370 | | | | DB | | | | 07/20/2022 | | | | EUR | | | | 9,535,823 | | | | NOK | | | | 9,897,370 | | | | 361,547 | | | | — | |
| | | | 18,497,247 | | | | DB | | | | 07/20/2022 | | | | USD | | | | 18,098,911 | | | | BRL | | | | 18,497,247 | | | | 398,336 | | | | — | |
| | | | 68,379,819 | | | | DB | | | | 07/20/2022 | | | | USD | | | | 66,673,450 | | | | AUD | | | | 68,379,819 | | | | 1,706,369 | | | | — | |
| | | | 105,088,351 | | | | BAML | | | | 09/23/2022 | | | | USD | | | | 103,347,789 | | | | EUR | | | | 105,088,351 | | | | 1,740,562 | | | | — | |
| | | | 104,162,933 | | | | BAML | | | | 09/23/2022 | | | | USD | | | | 106,382,018 | | | | CHF | | | | 104,162,933 | | | | — | | | | (2,219,085 | ) |
| | | | 70,079,189 | | | | BAML | | | | 09/23/2022 | | | | USD | | | | 68,359,955 | | | | NZD | | | | 70,079,189 | | | | 1,719,234 | | | | — | |
| | | | 150,019,373 | | | | DB | | | | 07/20/2022 | | | | USD | | | | 153,861,251 | | | | CHF | | | | 150,019,373 | | | | — | | | | (3,841,878 | ) |
| | | | 9,288,712 | | | | DB | | | | 07/20/2022 | | | | USD | | | | 9,066,978 | | | | ZAR | | | | 9,288,712 | | | | 221,734 | | | | — | |
| | | | 171,963,176 | | | | DB | | | | 07/20/2022 | | | | USD | | | | 169,471,033 | | | | EUR | | | | 171,963,176 | | | | 2,492,143 | | | | — | |
| | | | 20,250,221 | | | | DB | | | | 07/20/2022 | | | | USD | | | | 19,889,048 | | | | NOK | | | | 20,250,221 | | | | 361,173 | | | | — | |
| | | | 30,338,554 | | | | DB | | | | 07/20/2022 | | | | USD | | | | 29,370,758 | | | | SEK | | | | 30,338,554 | | | | 967,796 | | | | — | |
| | | | 388,671 | | | | DB | | | | 08/17/2022 | | | | USD | | | | 389,327 | | | | KRW | | | | 388,671 | | | | — | | | | (656 | ) |
| | | | 25,932,787 | | | | DB | | | | 07/20/2022 | | | | USD | | | | 26,467,766 | | | | MXN | | | | 25,932,787 | | | | — | | | | (534,979 | ) |
| | | | 11,360,893 | | | | DB | | | | 07/20/2022 | | | | USD | | | | 11,293,304 | | | | INR | | | | 11,360,893 | | | | 67,589 | | | | — | |
| | | | 5,501,692 | | | | DB | | | | 07/20/2022 | | | | USD | | | | 5,083,280 | | | | CLP | | | | 5,501,692 | | | | 418,412 | | | | — | |
| | | | 10,805,064 | | | | DB | | | | 07/20/2022 | | | | USD | | | | 10,532,775 | | | | KRW | | | | 10,805,064 | | | | 272,289 | | | | — | |
| | | | 118,877,733 | | | | DB | | | | 07/20/2022 | | | | USD | | | | 115,779,594 | | | | JPY | | | | 118,877,733 | | | | 3,098,139 | | | | — | |
| | | | 152,722,761 | | | | BAML | | | | 09/22/2022 | | | | USD | | | | 152,090,302 | | | | JPY | | | | 152,722,761 | | | | 632,459 | | | | — | |
Total Sale Contracts | | | | | | | | | | | | | | | 1,430,080,582 | | | | | | | | 1,442,989,000 | | | | 19,884,391 | | | | (6,975,973 | ) |
Net Forward Currency Contracts | | | | | | | | | | $ | (432,646,951 | ) | | | | | | $ | (437,587,919 | ) | | $ | 23,152,200 | | | $ | (18,211,232 | ) |
Net Unrealized Appreciation | | | | | | | | | | | | | | | | | | | | | | | $ | 4,940,968 | | | | | |
Counterparty Abbreviations:
BAML | Bank of America Merrill Lynch |
DB | Deutsche Bank |
Currency Abbreviations:
AUD | AUSTRALIAN DOLLAR | EUR | EURO | NOK | NORWEGIAN KRONE | USD | U.S. DOLLAR |
BRL | BRAZILIAN REAL | GBP | BRITISH POUND | NZD | NEW ZEALAND DOLLAR | ZAR | SOUTH AFRICAN RAND |
CAD | CANADIAN DOLLAR | ILS | ISRAELI NEW SHEQEL | PLN | POLISH ZLOTY | | |
CHF | SWISS FRANC | INR | INDIAN RUPEE | SEK | SWEDISH KRONA | | |
CLP | CHILEAN PESO | JPY | JAPANESE YEN | SGD | SINGAPORE DOLLAR | | |
28 | The accompanying notes are an integral part of these consolidated financial statements. |
LoCorr Macro Strategies Fund – Consolidated Schedule of Open Futures Contracts |
LoCorr Macro Strategies Fund
Consolidated Schedule of Open Futures Contracts
June 30, 2022 (Unaudited)
| | | Number of
Contracts | | | | | | | Current | | | Notional | | | Value | |
Description | | Purchased
(Sold) | | | Settlement
Month-Year | | | Notional
Amount | | | Amount At
Trade Date | | | Unrealized
Appreciation | | | Unrealized
(Depreciation) | |
Purchase Contracts: | | | | | | | | | | | | | | | | | | | | | | | | |
3 Mo Euro Euribor | | | 8 | | | | Jun-23 | | | $ | 2,059,230 | | | $ | 2,059,272 | | | $ | — | | | $ | (42 | ) |
3 Mo Euro Euribor | | | 26 | | | | Mar-24 | | | | 6,682,281 | | | | 6,682,524 | | | | — | | | | (243 | ) |
3 Mo Euro Euribor | | | 34 | | | | Jun-24 | | | | 8,739,704 | | | | 8,739,871 | | | | — | | | | (167 | ) |
3 Mo Euro Euribor | | | 36 | | | | Sep-23 | | | | 9,254,747 | | | | 9,255,412 | | | | — | | | | (665 | ) |
3 Mo Euro Euribor | | | 1867 | | | | Dec-23 | | | | 479,814,735 | | | | 478,979,024 | | | | 835,711 | | | | — | |
3 Mo Euro Euribor | | | 41 | | | | Sep-24 | | | | 10,539,592 | | | | 10,537,887 | | | | 1,705 | | | | — | |
90 Day Euro | | | 11 | | | | Mar-23 | | | | 2,650,450 | | | | 2,646,955 | | | | 3,495 | | | | — | |
90 Day Euro | | | 90 | | | | Jun-23 | | | | 21,727,125 | | | | 21,677,618 | | | | 49,507 | | | | — | |
90 Day Euro | | | 106 | | | | Sep-23 | | | | 25,640,075 | | | | 25,561,731 | | | | 78,344 | | | | — | |
90 Day Euro | | | 2381 | | | | Dec-23 | | | | 576,827,013 | | | | 574,865,600 | | | | 1,961,413 | | | | — | |
90 Day Euro | | | 340 | | | | Mar-24 | | | | 82,467,000 | | | | 82,172,403 | | | | 294,597 | | | | — | |
90 Day Euro | | | 384 | | | | Jun-24 | | | | 93,225,600 | | | | 92,925,573 | | | | 300,027 | | | | — | |
90 Day Euro | | | 419 | | | | Sep-24 | | | | 101,769,863 | | | | 101,484,104 | | | | 285,759 | | | | — | |
Aluminum - 90 Day Settlement (a) | | | 1 | | | | Jul-22 | | | | 60,752 | | | | 82,200 | | | | — | | | | (21,448 | ) |
Aluminum - 90 Day Settlement (a) | | | 1 | | | | Jul-22 | | | | 60,802 | | | | 83,631 | | | | — | | | | (22,829 | ) |
Aluminum - 90 Day Settlement (a) | | | 1 | | | | Jul-22 | | | | 60,839 | | | | 77,457 | | | | — | | | | (16,618 | ) |
Aluminum - 90 Day Settlement (a) | | | 2 | | | | Aug-22 | | | | 121,754 | | | | 148,561 | | | | — | | | | (26,807 | ) |
Aluminum - 90 Day Settlement (a) | | | 1 | | | | Aug-22 | | | | 60,963 | | | | 72,703 | | | | — | | | | (11,740 | ) |
Aluminum - 90 Day Settlement (a) | | | 2 | | | | Aug-22 | | | | 121,963 | | | | 145,829 | | | | — | | | | (23,866 | ) |
Aluminum (a)(b) | | | 198 | | | | Sep-22 | | | | 12,103,988 | | | | 14,159,529 | | | | — | | | | (2,055,541 | ) |
Australian 10 Yr Bond | | | 522 | | | | Sep-22 | | | | 42,839,110 | | | | 42,409,133 | | | | 429,977 | | | | — | |
Australian 3 Yr Bond | | | 178 | | | | Sep-22 | | | | 13,202,976 | | | | 13,086,057 | | | | 116,919 | | | | — | |
Brent Crude (a) | | | 340 | | | | Jul-22 | | | | 37,070,200 | | | | 37,729,085 | | | | — | | | | (658,885 | ) |
Brent Crude (a) | | | 20 | | | | Aug-22 | | | | 2,111,800 | | | | 2,127,713 | | | | — | | | | (15,913 | ) |
Brent Crude (a) | | | 8 | | | | Sep-22 | | | | 822,560 | | | | 833,089 | | | | — | | | | (10,529 | ) |
Brent Crude (a) | | | 1 | | | | Nov-22 | | | | 98,600 | | | | 100,341 | | | | — | | | | (1,741 | ) |
Brent Crude (a) | | | 3 | | | | Oct-22 | | | | 301,740 | | | | 305,933 | | | | — | | | | (4,193 | ) |
British Pound | | | 6 | | | | Sep-22 | | | | 457,463 | | | | 458,451 | | | | — | | | | (988 | ) |
CAC 40 10 Euro Index | | | 47 | | | | Jul-22 | | | | 2,912,873 | | | | 2,909,536 | | | | 3,337 | | | | — | |
Canadian 10 Yr Bond | | | 288 | | | | Sep-22 | | | | 27,741,704 | | | | 27,342,725 | | | | 398,979 | | | | — | |
Canadian Dollar | | | 13 | | | | Sep-22 | | | | 1,010,100 | | | | 1,008,075 | | | | 2,025 | | | | — | |
Carbon Emission | | | 45 | | | | Dec-22 | | | | 4,251,761 | | | | 4,099,091 | | | | 152,670 | | | | — | |
Cocoa (NYBOT) (a) | | | 12 | | | | Sep-22 | | | | 280,800 | | | | 291,079 | | | | — | | | | (10,279 | ) |
Coffee (a) | | | 148 | | | | Sep-22 | | | | 12,770,550 | | | | 12,956,893 | | | | — | | | | (186,343 | ) |
Copper - 90 Day Settlement (a) | | | 1 | | | | Jul-22 | | | | 206,409 | | | | 257,456 | | | | — | | | | (51,047 | ) |
Copper - 90 Day Settlement (a) | | | 1 | | | | Aug-22 | | | | 206,639 | | | | 236,590 | | | | — | | | | (29,951 | ) |
Copper - 90 Day Settlement (a) | | | 1 | | | | Aug-22 | | | | 206,636 | | | | 236,841 | | | | — | | | | (30,205 | ) |
Copper - 90 Day Settlement (a) | | | 1 | | | | Aug-22 | | | | 206,631 | | | | 230,904 | | | | — | | | | (24,273 | ) |
Copper - 90 Day Settlement (a) | | | 1 | | | | Aug-22 | | | | 206,613 | | | | 228,601 | | | | — | | | | (21,988 | ) |
Copper - 90 Day Settlement (a) | | | 1 | | | | Aug-22 | | | | 206,563 | | | | 231,946 | | | | — | | | | (25,383 | ) |
Copper - 90 Day Settlement (a) | | | 1 | | | | Sep-22 | | | | 206,631 | | | | 241,522 | | | | — | | | | (34,891 | ) |
Copper (a)(b) | | | 37 | | | | Sep-22 | | | | 7,640,500 | | | | 8,635,291 | | | | — | | | | (994,791 | ) |
Corn (a) | | | 645 | | | | Dec-22 | | | | 19,986,938 | | | | 23,163,025 | | | | — | | | | (3,176,087 | ) |
Cotton No.2 (a) | | | 101 | | | | Dec-22 | | | | 4,991,420 | | | | 6,213,158 | | | | — | | | | (1,221,738 | ) |
Dollar | | | 222 | | | | Sep-22 | | | | 23,191,008 | | | | 23,137,336 | | | | 53,672 | | | | — | |
Dow Jones Industrial Average Mini E-Cbot Index | | | 16 | | | | Sep-22 | | | | 2,462,480 | | | | 2,438,863 | | | | 23,617 | | | | — | |
Euro-Bobl | | | 527 | | | | Sep-22 | | | | 68,586,657 | | | | 67,741,331 | | | | 845,326 | | | | — | |
The accompanying notes are an integral part of these consolidated financial statements. | 29 |
LoCorr Macro Strategies Fund – Consolidated Schedule of Open Futures Contracts (continued) |
| | | Number of
Contracts | | | | | | | Current | | | Notional | | | Value | |
Description | | Purchased
(Sold) | | | Settlement
Month-Year | | | Notional
Amount | | | Amount At
Trade Date | | | Unrealized
Appreciation | | | Unrealized
(Depreciation) | |
Purchase Contracts: (continued) |
Euro-BTP | | | 203 | | | | Sep-22 | | | $ | 26,191,900 | | | $ | 25,671,403 | | | $ | 520,497 | | | $ | — | |
Euro-Bund | | | 279 | | | | Sep-22 | | | | 43,500,187 | | | | 42,819,205 | | | | 680,982 | | | | — | |
Euro-Buxl 30 Yr Bond | | | 43 | | | | Sep-22 | | | | 7,370,347 | | | | 7,155,894 | | | | 214,453 | | | | — | |
Euro-OAT | | | 114 | | | | Sep-22 | | | | 16,549,736 | | | | 16,336,218 | | | | 213,518 | | | | — | |
Euro-Schatz | | | 252 | | | | Sep-22 | | | | 28,823,503 | | | | 28,704,867 | | | | 118,636 | | | | — | |
FTSE 100 Index | | | 565 | | | | Sep-22 | | | | 48,976,432 | | | | 49,147,101 | | | | — | | | | (170,669 | ) |
Gasoline RBOB (a) | | | 108 | | | | Jul-22 | | | | 16,040,657 | | | | 17,079,637 | | | | — | | | | (1,038,980 | ) |
Gold (a) | | | 67 | | | | Aug-22 | | | | 12,108,910 | | | | 12,348,695 | | | | — | | | | (239,785 | ) |
Hang Seng Index | | | 11 | | | | Jul-22 | | | | 1,524,086 | | | | 1,538,089 | | | | — | | | | (14,003 | ) |
Hard Red Wheat (a) | | | 229 | | | | Sep-22 | | | | 10,897,538 | | | | 13,254,745 | | | | — | | | | (2,357,207 | ) |
Heating Oil (a) | | | 98 | | | | Jul-22 | | | | 15,766,338 | | | | 17,470,577 | | | | — | | | | (1,704,239 | ) |
Heating Oil (a) | | | 2 | | | | Aug-22 | | | | 316,252 | | | | 336,063 | | | | — | | | | (19,811 | ) |
Heating Oil (a) | | | 2 | | | | Sep-22 | | | | 310,682 | | | | 329,758 | | | | — | | | | (19,076 | ) |
Heating Oil (a) | | | 1 | | | | Oct-22 | | | | 152,279 | | | | 163,852 | | | | — | | | | (11,573 | ) |
Japanese 10 Yr Bond | | | 40 | | | | Sep-22 | | | | 43,811,910 | | | | 43,755,497 | | | | 56,413 | | | | — | |
Japanese Yen | | | 54 | | | | Sep-22 | | | | 5,005,463 | | | | 4,989,582 | | | | 15,881 | | | | — | |
Lead (a)(b) | | | 13 | | | | Sep-22 | | | | 620,263 | | | | 674,700 | | | | — | | | | (54,437 | ) |
Copper - 90 Day Settlement (a) | | | 1 | | | | Jul-22 | | | | 206,625 | | | | 246,213 | | | | — | | | | (39,588 | ) |
Live Cattle (a) | | | 57 | | | | Aug-22 | | | | 3,022,710 | | | | 3,042,713 | | | | — | | | | (20,003 | ) |
Long Gilt | | | 475 | | | | Sep-22 | | | | 65,905,243 | | | | 65,211,850 | | | | 693,393 | | | | — | |
Low Sulphur Gasoil (a) | | | 134 | | | | Aug-22 | | | | 15,061,600 | | | | 16,673,982 | | | | — | | | | (1,612,382 | ) |
Mexican Peso | | | 73 | | | | Sep-22 | | | | 1,787,040 | | | | 1,787,777 | | | | — | | | | (737 | ) |
Nasdaq 100 E-Mini Index | | | 2 | | | | Sep-22 | | | | 461,180 | | | | 462,999 | | | | — | | | | (1,819 | ) |
Natural Gas (a) | | | 108 | | | | Jul-22 | | | | 5,857,920 | | | | 8,053,837 | | | | — | | | | (2,195,917 | ) |
Nickel (a)(b) | | | 1 | | | | Sep-22 | | | | 136,206 | | | | 159,738 | | | | — | | | | (23,532 | ) |
Nikkei 225 Index (SGX) | | | 1 | | | | Sep-22 | | | | 96,919 | | | | 98,468 | | | | — | | | | (1,549 | ) |
S&P 500 E-Mini Index | | | 104 | | | | Sep-22 | | | | 19,705,400 | | | | 19,714,135 | | | | — | | | | (8,735 | ) |
S&P/TSX 60 Index | | | 35 | | | | Sep-22 | | | | 6,213,098 | | | | 6,277,708 | | | | — | | | | (64,610 | ) |
Soybean (a) | | | 464 | | | | Nov-22 | | | | 33,825,600 | | | | 35,396,935 | | | | — | | | | (1,571,335 | ) |
Soybean Meal (a) | | | 269 | | | | Dec-22 | | | | 10,940,230 | | | | 10,642,181 | | | | 298,049 | | | | — | |
Soybean Oil (a) | | | 235 | | | | Dec-22 | | | | 9,088,860 | | | | 10,529,222 | | | | — | | | | (1,440,362 | ) |
Sugar (a) | | | 551 | | | | Sep-22 | | | | 11,416,720 | | | | 11,940,374 | | | | — | | | | (523,654 | ) |
New Zealand Dollar | | | 27 | | | | Sep-22 | | | | 1,685,340 | | | | 1,686,545 | | | | — | | | | (1,205 | ) |
Swiss Franc | | | 5 | | | | Jun-23 | | | | 1,475,368 | | | | 1,475,296 | | | | 72 | | | | — | |
Swiss Franc | | | 10 | | | | Sep-23 | | | | 2,952,866 | | | | 2,951,946 | | | | 920 | | | | — | |
Swiss Franc | | | 38 | | | | Sep-24 | | | | 11,256,741 | | | | 11,242,880 | | | | 13,861 | | | | — | |
Swiss Franc | | | 39 | | | | Jun-24 | | | | 11,543,476 | | | | 11,528,916 | | | | 14,560 | | | | — | |
Swiss Franc | | | 17 | | | | Dec-23 | | | | 5,024,529 | | | | 5,022,793 | | | | 1,736 | | | | — | |
Swiss Franc | | | 309 | | | | Mar-24 | | | | 91,398,724 | | | | 91,276,371 | | | | 122,353 | | | | — | |
Swiss Franc | | | 22 | | | | Dec-24 | | | | 6,521,747 | | | | 6,515,420 | | | | 6,327 | | | | — | |
Swiss Franc | | | 1 | | | | Sep-22 | | | | 131,794 | | | | 131,509 | | | | 285 | | | | — | |
U.S. 10 Yr Note | | | 129 | | | | Sep-22 | | | | 15,290,531 | | | | 15,210,929 | | | | 79,602 | | | | — | |
U.S. 2 Yr Note | | | 481 | | | | Sep-22 | | | | 101,017,517 | | | | 100,648,224 | | | | 369,293 | | | | — | |
U.S. 5 Yr Note | | | 439 | | | | Sep-22 | | | | 49,277,750 | | | | 48,790,858 | | | | 486,892 | | | | — | |
U.S. Long Bond | | | 84 | | | | Sep-22 | | | | 11,644,500 | | | | 11,534,031 | | | | 110,469 | | | | — | |
U.S. Ultra Bond | | | 129 | | | | Sep-22 | | | | 19,910,344 | | | | 19,346,266 | | | | 564,078 | | | | — | |
Wheat (a) | | | 195 | | | | Dec-22 | | | | 8,779,875 | | | | 10,655,322 | | | | — | | | | (1,875,447 | ) |
WTI Crude (a) | | | 175 | | | | Jul-22 | | | | 18,508,000 | | | | 19,529,212 | | | | — | | | | (1,021,212 | ) |
Zinc - 90 Day Settlement (a) | | | 1 | | | | Jul-22 | | | | 79,452 | | | | 105,118 | | | | — | | | | (25,666 | ) |
Zinc - 90 Day Settlement (a) | | | 1 | | | | Aug-22 | | | | 79,281 | | | | 89,328 | | | | — | | | | (10,047 | ) |
Zinc - 90 Day Settlement (a) | | | 1 | | | | Sep-22 | | | | 79,019 | | | | 89,572 | | | | — | | | | (10,553 | ) |
Zinc - 90 Day Settlement (a) | | | 1 | | | | Sep-22 | | | | 78,975 | | | | 88,934 | | | | — | | | | (9,959 | ) |
30 | The accompanying notes are an integral part of these consolidated financial statements. |
LoCorr Macro Strategies Fund – Consolidated Schedule of Open Futures Contracts (continued) |
| | | Number of
Contracts | | | | | | | Current | | | Notional | | | Value | |
Description | | Purchased
(Sold) | | | Settlement
Month-Year | | | Notional
Amount | | | Amount At
Trade Date | | | Unrealized
Appreciation | | | Unrealized
(Depreciation) | |
Purchase Contracts: (continued) |
Zinc (a)(b) | | | 125 | | | | Sep-22 | | | $ | 9,877,344 | | | $ | 11,395,999 | | | $ | — | | | $ | (1,518,655 | ) |
Total Purchase Contracts | | | | | | | | | | | | | | | | | | | 10,419,350 | | | | (26,285,938 | ) |
| | | | | | | | | | | | | | | | | | | | | | | | |
Sale Contracts: | | | | | | | | | | | | | | | | | | | | | | | | |
10 Yr Mini JGB | | | (10) | | | | Sep-22 | | | $ | 1,095,593 | | | $ | 1,093,790 | | | $ | — | | | $ | (1,803 | ) |
3 Mo Euro Euribor | | | (2) | | | | Mar-23 | | | | 516,039 | | | | 515,868 | | | | — | | | | (171 | ) |
90 Day Euro | | | (114) | | | | Dec-24 | | | | 27,692,025 | | | | 27,668,242 | | | | — | | | | (23,783 | ) |
Aluminum - 90 Day Settlement (a) | | | (1) | | | | Jul-22 | | | | 60,752 | | | | 81,509 | | | | 20,757 | | | | — | |
Aluminum - 90 Day Settlement (a) | | | (1) | | | | Jul-22 | | | | 60,802 | | | | 82,420 | | | | 21,618 | | | | — | |
Aluminum - 90 Day Settlement (a) | | | (1) | | | | Jul-22 | | | | 60,839 | | | | 77,477 | | | | 16,638 | | | | — | |
Aluminum - 90 Day Settlement (a) | | | (2) | | | | Aug-22 | | | | 121,754 | | | | 145,929 | | | | 24,175 | | | | — | |
Aluminum - 90 Day Settlement (a) | | | (1) | | | | Aug-22 | | | | 60,963 | | | | 71,441 | | | | 10,478 | | | | — | |
Aluminum - 90 Day Settlement (a) | | | (2) | | | | Aug-22 | | | | 121,963 | | | | 144,997 | | | | 23,034 | | | | — | |
Aluminum (a)(b) | | | (164) | | | | Sep-22 | | | | 10,025,525 | | | | 10,987,308 | | | | 961,783 | | | | — | |
Australian 10 Yr Bond | | | (807) | | | | Sep-22 | | | | 66,228,282 | | | | 66,189,493 | | | | — | | | | (38,789 | ) |
Australian Dollar | | | (254) | | | | Sep-22 | | | | 17,553,940 | | | | 17,533,020 | | | | — | | | | (20,920 | ) |
Bovespa Index | | | (840) | | | | Aug-22 | | | | 16,019,941 | | | | 16,413,839 | | | | 393,898 | | | | — | |
Brent Crude (a) | | | (3) | | | | Jul-22 | | | | 327,090 | | | | 327,235 | | | | 145 | | | | — | |
British Pound | | | (181) | | | | Sep-22 | | | | 13,800,119 | | | | 13,745,898 | | | | — | | | | (54,221 | ) |
CAC 40 10 Euro Index | | | (180) | | | | Jul-22 | | | | 11,155,684 | | | | 11,293,621 | | | | 137,937 | | | | — | |
Canadian 10 Yr Bond | | | (524) | | | | Sep-22 | | | | 50,474,487 | | | | 52,020,466 | | | | 1,545,979 | | | | — | |
Canadian Dollar | | | (59) | | | | Sep-22 | | | | 4,584,300 | | | | 4,582,214 | | | | — | | | | (2,086 | ) |
CBOE Volatility Index (a) | | | (105) | | | | Jul-22 | | | | 2,999,042 | | | | 2,984,966 | | | | — | | | | (14,076 | ) |
CBOE Volatility Index (a) | | | (38) | | | | Aug-22 | | | | 1,108,741 | | | | 1,112,544 | | | | 3,803 | | | | — | |
CBOE Volatility Index (a) | | | (1) | | | | Sep-22 | | | | 29,530 | | | | 28,547 | | | | — | | | | (983 | ) |
CBOE Volatility Index (a) | | | (55) | | | | Sep-22 | | | | 7,005,625 | | | | 6,959,026 | | | | — | | | | (46,599 | ) |
Cocoa (ICE) (a) | | | (188) | | | | Sep-22 | | | | 3,920,243 | | | | 4,037,460 | | | | 117,217 | | | | — | |
Coffee (a) | | | (5) | | | | Sep-22 | | | | 431,437 | | | | 417,700 | | | | — | | | | (13,737 | ) |
Copper - 90 Day Settlement (a) | | | (1) | | | | Jul-22 | | | | 206,409 | | | | 258,174 | | | | 51,765 | | | | — | |
Copper - 90 Day Settlement (a) | | | (1) | | | | Jul-22 | | | | 206,625 | | | | 247,393 | | | | 40,768 | | | | — | |
Copper - 90 Day Settlement (a) | | | (1) | | | | Aug-22 | | | | 206,638 | | | | 237,398 | | | | 30,760 | | | | — | |
Copper - 90 Day Settlement (a) | | | (1) | | | | Aug-22 | | | | 206,636 | | | | 239,519 | | | | 32,883 | | | | — | |
Copper - 90 Day Settlement (a) | | | (1) | | | | Aug-22 | | | | 206,631 | | | | 232,952 | | | | 26,321 | | | | — | |
Copper - 90 Day Settlement (a) | | | (1) | | | | Aug-22 | | | | 206,612 | | | | 226,567 | | | | 19,955 | | | | — | |
Copper - 90 Day Settlement (a) | | | (1) | | | | Aug-22 | | | | 206,562 | | | | 231,608 | | | | 25,046 | | | | — | |
Copper - 90 Day Settlement (a) | | | (1) | | | | Sep-22 | | | | 206,631 | | | | 240,454 | | | | 33,823 | | | | — | |
Copper (a)(b) | | | (167) | | | | Sep-22 | | | | 34,485,500 | | | | 36,706,684 | | | | 2,221,184 | | | | — | |
Copper (COMEX) (a) | | | (248) | | | | Sep-22 | | | | 23,002,000 | | | | 23,391,308 | | | | 389,308 | | | | — | |
Corn (a) | | | (220) | | | | Dec-22 | | | | 6,817,250 | | | | 7,358,081 | | | | 540,831 | | | | — | |
Cotton No.2 (a) | | | (46) | | | | Dec-22 | | | | 2,273,320 | | | | 2,322,468 | | | | 49,148 | | | | — | |
DAX Index | | | (210) | | | | Sep-22 | | | | 70,262,984 | | | | 71,867,054 | | | | 1,604,070 | | | | — | |
Dow Jones Industrial Average Mini E-Cbot Index | | | (34) | | | | Sep-22 | | | | 5,232,770 | | | | 5,346,567 | | | | 113,797 | | | | — | |
Euro | | | (827) | | | | Sep-22 | | | | 108,936,575 | | | | 108,911,903 | | | | — | | | | (24,672 | ) |
Euro-Bobl | | | (672) | | | | Sep-22 | | | | 87,457,746 | | | | 86,325,971 | | | | — | | | | (1,131,775 | ) |
Euro-BTP | | | (27) | | | | Sep-22 | | | | 3,483,652 | | | | 3,462,144 | | | | — | | | | (21,508 | ) |
Euro-Bund | | | (869) | | | | Sep-22 | | | | 135,489,835 | | | | 133,410,901 | | | | — | | | | (2,078,934 | ) |
Euro-Buxl 30 Yr Bond | | | (5) | | | | Sep-22 | | | | 857,017 | | | | 843,405 | | | | — | | | | (13,612 | ) |
Euro-OAT | | | (29) | | | | Sep-22 | | | | 4,210,020 | | | | 4,195,470 | | | | — | | | | (14,550 | ) |
Euro-Schatz | | | (1,362) | | | | Sep-22 | | | | 155,784,174 | | | | 155,524,968 | | | | — | | | | (259,206 | ) |
Euro-Stoxx 50 Index | | | (959) | | | | Sep-22 | | | | 34,581,646 | | | | 34,774,215 | | | | 192,569 | | | | — | |
FTSE China A50 Index | | | (88) | | | | Jul-22 | | | | 1,309,704 | | | | 1,287,127 | | | | — | | | | (22,577 | ) |
FTSE MIB Index | | | (9) | | | | Sep-22 | | | | 1,000,126 | | | | 1,019,728 | | | | 19,602 | | | | — | |
The accompanying notes are an integral part of these consolidated financial statements. | 31 |
LoCorr Macro Strategies Fund – Consolidated Schedule of Open Futures Contracts (continued) |
| | | Number of
Contracts | | | | | | | Current | | | Notional | | | Value | |
Description | | Purchased
(Sold) | | | Settlement
Month-Year | | | Notional
Amount | | | Amount At
Trade Date | | | Unrealized
Appreciation | | | Unrealized
(Depreciation) | |
Sale Contracts: (continued) |
FTSE/JSE Top 40 Index | | | (1) | | | | Sep-22 | | | $ | 36,854 | | | $ | 37,131 | | | $ | 277 | | | $ | — | |
Gasoline RBOB (a) | | | (33) | | | | Jul-22 | | | | 4,901,312 | | | | 5,098,904 | | | | 197,592 | | | | — | |
Gasoline RBOB (a) | | | (17) | | | | Aug-22 | | | | 2,428,957 | | | | 2,561,012 | | | | 132,055 | | | | — | |
Gasoline RBOB (a) | | | (4) | | | | Sep-22 | | | | 521,875 | | | | 551,684 | | | | 29,809 | | | | — | |
Gasoline RBOB (a) | | | (1) | | | | Oct-22 | | | | 123,039 | | | | 128,464 | | | | 5,425 | | | | — | |
Gold (a) | | | (127) | | | | Aug-22 | | | | 22,952,710 | | | | 23,008,938 | | | | 56,228 | | | | — | |
Hang Seng Index | | | (476) | | | | Jul-22 | | | | 65,951,369 | | | | 66,930,127 | | | | 978,758 | | | | — | |
Hard Red Wheat (a) | | | (39) | | | | Sep-22 | | | | 1,855,912 | | | | 1,998,174 | | | | 142,262 | | | | — | |
Heating Oil (a) | | | (35) | | | | Jul-22 | | | | 5,630,835 | | | | 5,654,343 | | | | 23,508 | | | | — | |
H-Shares Index | | | (211) | | | | Jul-22 | | | | 10,203,389 | | | | 10,331,776 | | | | 128,387 | | | | — | |
IBEX 35 Index | | | (31) | | | | Jul-22 | | | | 2,611,791 | | | | 2,629,027 | | | | 17,236 | | | | — | |
Japanese 10 Yr Bond | | | (167) | | | | Sep-22 | | | | 182,914,726 | | | | 183,539,356 | | | | 624,630 | | | | — | |
Japanese Yen | | | (199) | | | | Sep-22 | | | | 18,446,057 | | | | 18,382,217 | | | | — | | | | (63,840 | ) |
KOSPI 200 Index | | | (258) | | | | Sep-22 | | | | 15,273,048 | | | | 15,627,555 | | | | 354,507 | | | | — | |
Lead (a)(b) | | | (15) | | | | Sep-22 | | | | 715,688 | | | | 816,535 | | | | 100,847 | | | | — | |
Lean Hogs (a) | | | (5) | | | | Aug-22 | | | | 204,200 | | | | 204,198 | | | | — | | | | (2 | ) |
Long Gilt | | | (1,383) | | | | Sep-22 | | | | 191,888,324 | | | | 192,409,773 | | | | 521,449 | | | | — | |
Low Sulphur Gasoil (a) | | | (29) | | | | Aug-22 | | | | 3,259,600 | | | | 3,387,317 | | | | 127,717 | | | | — | |
Low Sulphur Gasoil (a) | | | (8) | | | | Sep-22 | | | | 881,600 | | | | 887,391 | | | | 5,791 | | | | — | |
Low Sulphur Gasoil (a) | | | (1) | | | | Oct-22 | | | | 108,275 | | | | 107,774 | | | | — | | | | (501 | ) |
MSCI EAFE Index | | | (207) | | | | Sep-22 | | | | 19,215,810 | | | | 19,057,166 | | | | — | | | | (158,644 | ) |
MSCI Emerging Markets Index | | | (567) | | | | Sep-22 | | | | 28,426,545 | | | | 28,349,735 | | | | — | | | | (76,810 | ) |
MSCI Taiwan Index | | | (48) | | | | Jul-22 | | | | 2,434,560 | | | | 2,448,366 | | | | 13,806 | | | | — | |
Nasdaq 100 E-Mini Index | | | (80) | | | | Sep-22 | | | | 18,447,200 | | | | 18,530,524 | | | | 83,324 | | | | — | |
Natural Gas (a) | | | (224) | | | | Jul-22 | | | | 12,149,760 | | | | 13,629,601 | | | | 1,479,841 | | | | — | |
Natural Gas (a) | | | (50) | | | | Aug-22 | | | | 2,696,000 | | | | 3,075,140 | | | | 379,140 | | | | — | |
Natural Gas (a) | | | (32) | | | | Sep-22 | | | | 1,730,880 | | | | 2,058,272 | | | | 327,392 | | | | — | |
Natural Gas (a) | | | (16) | | | | Oct-22 | | | | 883,200 | | | | 968,551 | | | | 85,351 | | | | — | |
Natural Gas (a) | | | (4) | | | | Nov-22 | | | | 226,320 | | | | 254,713 | | | | 28,393 | | | | — | |
Nickel (a)(b) | | | (1) | | | | Sep-22 | | | | 136,206 | | | | 158,355 | | | | 22,149 | | | | — | |
Nikkei 225 Index (OSE) | | | (122) | | | | Sep-22 | | | | 23,720,225 | | | | 23,759,060 | | | | 38,835 | | | | — | |
Nikkei 225 Index (SGX) | | | (33) | | | | Sep-22 | | | | 3,198,334 | | | | 3,219,823 | | | | 21,489 | | | | — | |
Platinum (a) | | | (9) | | | | Oct-22 | | | | 402,885 | | | | 406,808 | | | | 3,923 | | | | — | |
Russell 2000 Mini Index | | | (676) | | | | Sep-22 | | | | 57,730,400 | | | | 57,837,908 | | | | 107,508 | | | | — | |
S&P 500 E-Mini Index | | | (29) | | | | Sep-22 | | | | 5,494,775 | | | | 5,514,318 | | | | 19,543 | | | | — | |
S&P MidCap 400 E-Mini Index | | | (3) | | | | Sep-22 | | | | 680,400 | | | | 702,405 | | | | 22,005 | | | | — | |
SET 50 Index | | | (273) | | | | Sep-22 | | | | 1,451,058 | | | | 1,461,887 | | | | 10,829 | | | | — | |
SGX Nifty 50 Index | | | (200) | | | | Jul-22 | | | | 6,289,000 | | | | 6,304,256 | | | | 15,256 | | | | — | |
Silver (a) | | | (446) | | | | Sep-22 | | | | 45,384,960 | | | | 46,417,360 | | | | 1,032,400 | | | | — | |
Soybean (a) | | | (165) | | | | Nov-22 | | | | 12,028,500 | | | | 11,996,158 | | | | — | | | | (32,342 | ) |
Soybean Meal (a) | | | (120) | | | | Dec-22 | | | | 4,880,400 | | | | 4,769,269 | | | | — | | | | (111,131 | ) |
Soybean Oil (a) | | | (101) | | | | Dec-22 | | | | 3,906,276 | | | | 4,105,662 | | | | 199,386 | | | | — | |
SPI 200 Index | | | (61) | | | | Sep-22 | | | | 6,801,053 | | | | 6,877,553 | | | | 76,500 | | | | — | |
Sugar (a) | | | (238) | | | | Sep-22 | | | | 4,931,360 | | | | 5,042,464 | | | | 111,104 | | | | — | |
Swiss Franc | | | (110) | | | | Sep-22 | | | | 14,497,313 | | | | 14,457,158 | | | | — | | | | (40,155 | ) |
Tokyo Price Index | | | (194) | | | | Sep-22 | | | | 26,745,062 | | | | 26,675,198 | | | | — | | | | (69,864 | ) |
U.S. 10 Yr Note | | | (1,087) | | | | Sep-22 | | | | 128,843,469 | | | | 127,333,034 | | | | — | | | | (1,510,435 | ) |
U.S. 5 Yr Note | | | (605) | | | | Sep-22 | | | | 67,911,250 | | | | 67,382,355 | | | | — | | | | (528,895 | ) |
U.S. Long Bond | | | (402) | | | | Sep-22 | | | | 55,727,250 | | | | 56,016,497 | | | | 289,247 | | | | — | |
U.S. Ultra Bond | | | (28) | | | | Sep-22 | | | | 4,321,625 | | | | 4,267,401 | | | | — | | | | (54,224 | ) |
Wheat (a) | | | (71) | | | | Sep-22 | | | | 3,138,200 | | | | 3,524,599 | | | | 386,399 | | | | — | |
WTI Crude (a) | | | (8) | | | | Jul-22 | | | | 846,080 | | | | 846,623 | | | | 543 | | | | — | |
32 | The accompanying notes are an integral part of these consolidated financial statements. |
LoCorr Macro Strategies Fund – Consolidated Schedule of Open Futures Contracts (continued) |
| | | Number of
Contracts | | | | | | | Current | | | Notional | | | Value | |
Description | | Purchased
(Sold) | | | Settlement
Month-Year | | | Notional
Amount | | | Amount At
Trade Date | | | Unrealized
Appreciation | | | Unrealized
(Depreciation) | |
Sale Contracts: (continued) |
WTI Crude (a) | | | (10) | | | | Aug-22 | | | $ | 1,031,000 | | | $ | 1,033,872 | | | $ | 2,872 | | | $ | — | |
WTI Crude (a) | | | (6) | | | | Sep-22 | | | | 601,620 | | | | 604,599 | | | | 2,979 | | | | — | |
WTI Crude (a) | | | (2) | | | | Dec-22 | | | | 187,340 | | | | 188,796 | | | | 1,456 | | | | — | |
WTI Crude (a) | | | (2) | | | | Oct-22 | | | | 195,500 | | | | 195,856 | | | | 356 | | | | — | |
WTI Crude (a) | | | (3) | | | | Nov-22 | | | | 286,680 | | | | 287,435 | | | | 755 | | | | — | |
Zinc - 90 Day Settlement (a) | | | (1) | | | | Jul-22 | | | | 79,452 | | | | 105,222 | | | | 25,770 | | | | — | |
Zinc - 90 Day Settlement (a) | | | (1) | | | | Aug-22 | | | | 79,281 | | | | 87,882 | | | | 8,601 | | | | — | |
Zinc - 90 Day Settlement (a) | | | (1) | | | | Sep-22 | | | | 79,019 | | | | 90,348 | | | | 11,329 | | | | — | |
Zinc - 90 Day Settlement (a) | | | (1) | | | | Sep-22 | | | | 78,975 | | | | 88,441 | | | | 9,466 | | | | — | |
Zinc (a)(b) | | | (36) | | | | Sep-22 | | | | 2,844,675 | | | | 3,205,488 | | | | 360,813 | | | | — | |
Total Sale Contracts | | | | | | | | | | | | | | | | | | | 17,294,530 | | | | (6,430,845 | ) |
Total Futures Contracts | | | | | | | | | | | | | | | | | | $ | 27,713,880 | | | $ | (32,716,783 | ) |
Net Unrealized Depreciation | | | | | | | | | | | | | | | | | | | | | | $ | (5,002,903 | ) |
(a) | London Metal Exchange (‘’LME’’) futures contracts settle on their respective maturity date. The unrealized appreciation on these contracts is a receivable for unsettled open futures contracts and the unrealized depreciation is a payable for unsettled open futures contracts on the Fund’s consolidated statement of assets and liabilities. |
ICE | Intercontinental Exchange | OSE | Osaka Securities Exchange |
NYBOT | New York Board of Trade | SGX | Singapore Exchange Limited |
The accompanying notes are an integral part of these consolidated financial statements. | 33 |
LoCorr Long/Short Commodities Strategy Fund - Consolidated Schedule of Investments |
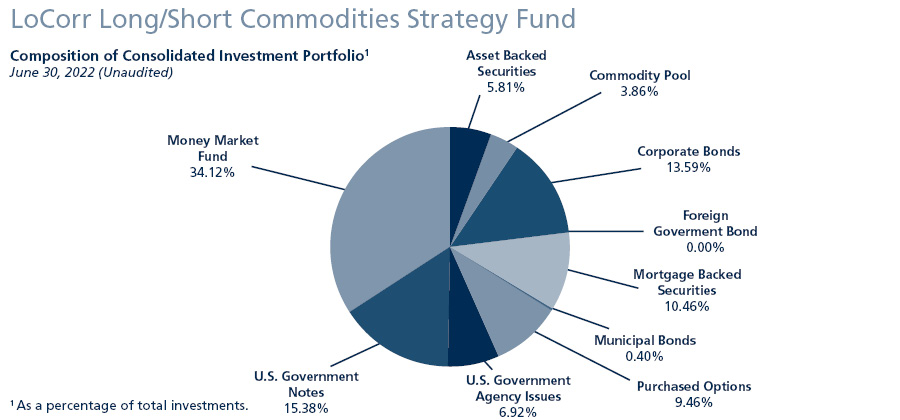
Consolidated Schedule of Investments
June 30, 2022 (Unaudited)
| | Maturity Date | | | Coupon Rate | | | Principal
Amount | | | Value | |
ASSET BACKED SECURITIES: 5.21% |
321 Henderson Receivables I LLC |
Series 2006-4A A1 (1 Month LIBOR USD + 0.200%) (a)(c) | | | 12/15/2041 | | | | 1.52% | | | $ | 4,099 | | | $ | 4,097 | |
Series 2004-A A1 (1 Month LIBOR USD + 0.350%) (a)(c) | | | 09/15/2045 | | | | 1.67% | | | | 26,243 | | | | 25,890 | |
American Homes 4 Rent Trust, 2014-SFR2 A (a) | | | 10/17/2036 | | | | 3.79% | | | | 277,435 | | | | 275,925 | |
AmeriCredit Automobile Receivables Trust |
Series 2020-3 A-3 | | | 06/18/2025 | | | | 0.53% | | | | 1,827,483 | | | | 1,803,190 | |
Series 2021-2 A3 | | | 12/18/2026 | | | | 0.34% | | | | 2,010,000 | | | | 1,949,368 | |
Asset Backed Securities Corp Home Equity Loan Trust, 2002-HE1 M1 (1 Month LIBOR USD + 1.650%) (c) | | | 03/15/2032 | | | | 2.97% | | | | 294,619 | | | | 289,078 | |
Bank of America Credit Card Trust, 2021-A1 A1 | | | 09/15/2026 | | | | 0.44% | | | | 850,000 | | | | 807,693 | |
Capital One Multi-Asset Execution Trust, 2015-A4 A4 | | | 05/15/2025 | | | | 2.75% | | | | 1,210,000 | | | | 1,210,486 | |
Carmax Auto Owner Trust, 2021-4 A3 | | | 09/15/2026 | | | | 0.56% | | | | 2,620,000 | | | | 2,511,182 | |
CarMax Auto Owner Trust, 2018-4 A3 | | | 09/15/2023 | | | | 3.36% | | | | 5,018 | | | | 5,023 | |
Carvana Auto Receivables Trust |
Series 2021-P2 A3 | | | 03/10/2026 | | | | 0.49% | | | | 2,630,000 | | | | 2,534,472 | |
Series 2021-P4 A-3 | | | 01/10/2027 | | | | 1.31% | | | | 3,620,000 | | | | 3,426,642 | |
Chase Issuance Trust, 2020-A1 A1 | | | 01/15/2025 | | | | 1.53% | | | | 1,050,000 | | | | 1,042,054 | |
Citibank Credit Card Issuance Trust |
Series 2018-A6 A6 | | | 12/09/2024 | | | | 3.21% | | | | 1,500,000 | | | | 1,503,173 | |
Series 2018-A3 A3 | | | 05/23/2025 | | | | 3.29% | | | | 1,085,000 | | | | 1,085,812 | |
DB Master Finance LLC, 2021-1A A2I (a) | | | 11/20/2051 | | | | 2.05% | | | | 2,039,750 | | | | 1,811,096 | |
Diamond Resorts Owner Trust |
Series 2018-1 A (a) | | | 01/21/2031 | | | | 3.70% | | | | 286,097 | | | | 285,407 | |
Series 2021-1A A (a) | | | 11/21/2033 | | | | 1.51% | | | | 611,708 | | | | 573,212 | |
Discover Card Execution Note Trust, 2018-A2 A2 (1 Month LIBOR USD + 0.330%) (c) | | | 08/15/2025 | | | | 1.65% | | | | 1,225,000 | | | | 1,225,607 | |
Elara HGV Timeshare Issuer, 2021-A A (a) | | | 08/27/2035 | | | | 1.36% | | | | 2,341,932 | | | | 2,152,046 | |
Freddie Mac STACR REMIC Trust, 2021-HQA4 M1 (SOFR30A + 0.950%) (a)(c) | | | 12/26/2041 | | | | 1.88% | | | | 3,250,000 | | | | 3,143,449 | |
34 | The accompanying notes are an integral part of these consolidated financial statements. |
LoCorr Long/Short Commodities Strategy Fund - Consolidated Schedule of Investments (continued) |
| | Maturity Date | | | Coupon Rate | | | Principal
Amount | | | Value | |
ASSET BACKED SECURITIES: (continued) |
GM Financial Automobile Leasing Trust, 2021-2 A4 | | | 05/20/2025 | | | | 0.41% | | | $ | 2,182,000 | | | $ | 2,101,533 | |
GM Financial Consumer Automobile Receivables Trust |
Series 2021-1 A3 | | | 10/16/2025 | | | | 0.35% | | | | 1,400,000 | | | | 1,365,478 | |
Series 2021-3 A3 | | | 06/16/2026 | | | | 0.48% | | | | 2,310,000 | | | | 2,207,909 | |
Series 2021-4 A3 | | | 09/16/2026 | | | | 0.68% | | | | 1,736,000 | | | | 1,648,248 | |
Honda Auto Receivables Owner Trust, 2020-3 A3 | | | 10/18/2024 | | | | 0.37% | | | | 1,962,532 | | | | 1,926,990 | |
Hyundai Auto Receivables Trust, 2020-C A3 | | | 05/15/2025 | | | | 0.38% | | | | 2,109,853 | | | | 2,065,742 | |
Invitation Homes Trust, 2018-SFR1 A (1 Month LIBOR USD + 0.700%) (a)(c) | | | 03/19/2037 | | | | 2.22% | | | | 554,213 | | | | 546,075 | |
Morgan Stanley Capital I Trust, 2004-HE6 M1 (1 Month LIBOR USD + 0.825%) (c) | | | 08/25/2034 | | | | 2.45% | | | | 63,920 | | | | 61,392 | |
MVW Owner Trust |
Series 2018-1A A (a) | | | 01/21/2036 | | | | 3.45% | | | | 630,663 | | | | 620,415 | |
Series 2019-1A A (a) | | | 11/20/2036 | | | | 2.89% | | | | 293,845 | | | | 284,178 | |
Series 2019-2A A (a) | | | 10/20/2038 | | | | 2.22% | | | | 373,229 | | | | 353,440 | |
Series 2021-1WA A (a) | | | 01/22/2041 | | | | 1.14% | | | | 1,024,402 | | | | 952,973 | |
Navient Student Loan Trust, 2021-A A (a) | | | 05/15/2069 | | | | 0.84% | | | | 820,945 | | | | 752,072 | |
OneMain Financial Issuance Trust |
Series 2016-3A A (a) | | | 06/18/2031 | | | | 3.83% | | | | 6,219 | | | | 6,217 | |
Series 2018-2A A (a) | | | 03/14/2033 | | | | 3.57% | | | | 500,000 | | | | 491,622 | |
PFS Financing Corp. |
Series 2020-F A (a) | | | 08/15/2024 | | | | 0.93% | | | | 1,150,000 | | | | 1,147,692 | |
Series 2020-G A (a) | | | 02/17/2026 | | | | 0.97% | | | | 900,000 | | | | 854,769 | |
Series 2021-B A (a) | | | 08/17/2026 | | | | 0.77% | | | | 1,450,000 | | | | 1,345,425 | |
Planet Fitness Master Issuer LLC, 3.25100 (a) | | | 12/05/2051 | | | | 3.25% | | | | 2,394,000 | | | | 2,154,744 | |
Santander Drive Auto Receivables Trust, 2021-4 A3 | | | 08/15/2025 | | | | 0.51% | | | | 2,950,000 | | | | 2,900,895 | |
SoFi Professional Loan Program LLC |
Series 2016-D A2B (a) | | | 04/25/2033 | | | | 2.34% | | | | 156,545 | | | | 155,243 | |
Series 2017-B A2FX (a) | | | 05/25/2040 | | | | 2.74% | | | | 90,216 | | | | 89,547 | |
SoFi Professional Loan Program Trust, 2021-B AFX (a) | | | 02/15/2047 | | | | 1.14% | | | | 1,862,701 | | | | 1,680,587 | |
Taco Bell Funding LLC, 2021-1A A21 (a) | | | 08/25/2051 | | | | 1.95% | | | | 2,512,375 | | | | 2,188,965 | |
Tesla Auto Lease Trust, 2021-A B (a) | | | 03/20/2025 | | | | 1.02% | | | | 1,100,000 | | | | 1,045,202 | |
Toyota Auto Receivables Owner Trust, 2019-A A3 | | | 07/17/2023 | | | | 2.91% | | | | 45,425 | | | | 45,440 | |
Toyota Lease Owner Trust, 2021-B A3 (a) | | | 10/21/2024 | | | | 0.42% | | | | 2,640,000 | | | | 2,543,750 | |
Tricon American Homes Trust, 2017-SFR2 A (a) | | | 01/18/2036 | | | | 2.93% | | | | 188,349 | | | | 186,114 | |
Verizon Owner Trust |
Series 2019-B A1A | | | 12/20/2023 | | | | 2.33% | | | | 150,801 | | | | 150,835 | |
Series 2019-C A1A | | | 04/20/2024 | | | | 1.94% | | | | 67,481 | | | | 67,401 | |
Series 2020-A A1A | | | 07/20/2024 | | | | 1.85% | | | | 934,573 | | | | 931,690 | |
Volkswagen Auto Loan Enhanced Trust, 2021-1 A-3 | | | 06/22/2026 | | | | 1.02% | | | | 2,790,000 | | | | 2,674,724 | |
TOTAL ASSET BACKED SECURITIES (Cost $66,120,429) | | | | | | | | | | | | | | | 63,212,209 | |
| | | | | | | | | | | | | | | | | |
COMMODITY POOL: 3.46% | | | | | | | | | | Shares | | | | | |
Galaxy Commmodity Polaris Fund - Valent(j) | | | | | | | | | | | 39,332 | | | | 41,993,465 | |
TOTAL COMMODITY POOL (Cost $41,140,000) | | | | | | | | | | | | | | | 41,993,465 | |
| | | | | | | | | | | | | | | | | |
| | | | | | | | | | | Principal
Amount | | | | | |
CORPORATE BONDS: 12.19% | | | | | | | | | | | | | | | | |
Aerospace & Defense: 0.09% | | | | | | | | | | | | | | | | |
Boeing Co. | | | 02/04/2026 | | | | 2.20% | | | $ | 1,260,000 | | | | 1,134,913 | |
| | | | | | | | | | | | | | | | | |
Auto Manufacturers: 0.37% | | | | | | | | | | | | | | | | |
Daimler Finance North America LLC (a) | | | 03/01/2024 | | | | 0.75% | | | | 540,000 | | | | 513,342 | |
General Motors Financial Co., Inc. | | | 10/15/2024 | | | | 1.20% | | | | 620,000 | | | | 577,112 | |
The accompanying notes are an integral part of these consolidated financial statements. | 35 |
LoCorr Long/Short Commodities Strategy Fund - Consolidated Schedule of Investments (continued) |
| | Maturity Date | | | Coupon Rate | | | Principal
Amount | | | Value | |
CORPORATE BONDS: (continued) |
General Motors Financial Co., Inc. | | | 06/20/2025 | | | | 2.75% | | | $ | 1,795,000 | | | $ | 1,685,736 | |
Volkswagen Group of America Finance LLC (a) | | | 11/22/2023 | | | | 0.88% | | | | 960,000 | | | | 920,120 | |
Volkswagen Group of America Finance LLC (a) | | | 11/24/2025 | | | | 1.25% | | | | 850,000 | | | | 761,383 | |
| | | | | | | | | | | | | | | | 4,457,693 | |
Banks: 5.84% | | | | | | | | | | | | | | | | |
Banco Santander SA (b) | | | 02/23/2023 | | | | 3.13% | | | | 1,200,000 | | | | 1,195,060 | |
Banco Santander SA (b) | | | 03/24/2025 | | | | 3.50% | | | | 800,000 | | | | 782,118 | |
Banco Santander SA (b) | | | 05/28/2025 | | | | 2.75% | | | | 585,000 | | | | 554,440 | |
Bank of America Corp. (SOFR + 0.690%) (c) | | | 04/22/2025 | | | | 0.98% | | | | 7,280,000 | | | | 6,852,700 | |
Bank of America Corp. (SOFR + 1.150%) (c) | | | 06/19/2026 | | | | 1.32% | | | | 4,070,000 | | | | 3,696,664 | |
Bank of America Corp. (SOFR + 1.010%) (c) | | | 10/24/2026 | | | | 1.20% | | | | 2,115,000 | | | | 1,895,002 | |
Barclays PLC (1 Year CMT Rate + 0.800%) (b)(c) | | | 12/10/2024 | | | | 1.01% | | | | 1,385,000 | | | | 1,316,302 | |
BNP Paribas SA (3 Month LIBOR USD + 1.111%) (a)(b)(c) | | | 11/19/2025 | | | | 2.82% | | | | 1,700,000 | | | | 1,625,605 | |
Canadian Imperial Bank (b) | | | 04/07/2027 | | | | 3.45% | | | | 1,125,000 | | | | 1,081,425 | |
Citigroup, Inc. (3 Month LIBOR USD + 1.023%) (c) | | | 06/01/2024 | | | | 4.04% | | | | 1,255,000 | | | | 1,251,463 | |
Citigroup, Inc. (SOFR + 0.669%) (c) | | | 05/01/2025 | | | | 0.98% | | | | 2,325,000 | | | | 2,179,979 | |
Citigroup, Inc. (SOFR + 1.372%) (c) | | | 05/24/2025 | | | | 4.14% | | | | 2,175,000 | | | | 2,167,850 | |
Citigroup, Inc. (SOFR + 0.528%) (c) | | | 11/03/2025 | | | | 1.28% | | | | 1,420,000 | | | | 1,319,827 | |
Citigroup, Inc. (SOFR + 0.765%) (c) | | | 01/28/2027 | | | | 1.12% | | | | 850,000 | | | | 751,404 | |
Credit Suisse AG (b) | | | 05/05/2023 | | | | 1.00% | | | | 1,100,000 | | | | 1,076,578 | |
Credit Suisse AG (b) | | | 08/09/2023 | | | | 0.52% | | | | 1,490,000 | | | | 1,438,078 | |
Deutsche Bank NY (b) | | | 05/28/2024 | | | | 0.90% | | | | 670,000 | | | | 628,222 | |
Federation des Caisses Desjardins du Quebec (a)(b) | | | 05/21/2024 | | | | 0.70% | | | | 1,220,000 | | | | 1,147,672 | |
Goldman Sachs Group, Inc. (SOFR + 0.572%) (c) | | | 03/08/2024 | | | | 0.67% | | | | 2,955,000 | | | | 2,888,343 | |
Goldman Sachs Group, Inc. | | | 03/15/2024 | | | | 3.00% | | | | 1,450,000 | | | | 1,430,120 | |
Goldman Sachs Group, Inc. (3 Month LIBOR USD + 1.201%) (c) | | | 09/29/2025 | | | | 3.27% | | | | 3,400,000 | | | | 3,306,466 | |
Goldman Sachs Group, Inc. (SOFR + 0.789%) (c) | | | 12/09/2026 | | | | 1.09% | | | | 1,585,000 | | | | 1,413,251 | |
HSBC Bank Canada (a)(b) | | | 09/10/2023 | | | | 1.65% | | | | 870,000 | | | | 868,331 | |
HSBC Holdings PLC (SOFR + 0.708%) (b)(c) | | | 05/24/2025 | | | | 0.98% | | | | 930,000 | | | | 867,864 | |
HSBC Holdings PLC (SOFR + 1.538%) (b)(c) | | | 04/18/2026 | | | | 1.65% | | | | 675,000 | | | | 619,386 | |
HSBC Holdings PLC (SOFR + 1.929%) (b)(c) | | | 06/04/2026 | | | | 2.10% | | | | 1,245,000 | | | | 1,153,132 | |
ING Groep NV (b) | | | 04/09/2024 | | | | 3.55% | | | | 1,210,000 | | | | 1,200,005 | |
ING Groep NV (SOFR + 1.640%) (b)(c) | | | 03/28/2026 | | | | 3.87% | | | | 1,165,000 | | | | 1,141,799 | |
JP Morgan Chase & Co. (TSFR3M + 0.600%) (c) | | | 09/16/2024 | | | | 0.65% | | | | 225,000 | | | | 215,748 | |
JP Morgan Chase & Co. (SOFR + 0.420%) (c) | | | 02/16/2025 | | | | 0.56% | | | | 550,000 | | | | 518,640 | |
JP Morgan Chase & Co. (SOFR + 0.540%) (c) | | | 06/01/2025 | | | | 0.82% | | | | 2,800,000 | | | | 2,618,775 | |
JP Morgan Chase & Co. (SOFR + 0.800%) (c) | | | 11/19/2026 | | | | 1.05% | | | | 3,290,000 | | | | 2,927,817 | |
JP Morgan Chase & Co. (TSFR3M + 0.695%) (c) | | | 02/04/2027 | | | | 1.04% | | | | 1,605,000 | | | | 1,421,170 | |
Mitsubishi UFJ Financial Group, Inc. (1 Year CMT Rate + 0.680%) (b)(c) | | | 09/15/2024 | | | | 0.85% | | | | 1,435,000 | | | | 1,382,205 | |
Mitsubishi UFJ Financial Group, Inc. (b) | | | 02/25/2025 | | | | 2.19% | | | | 1,205,000 | | | | 1,143,277 | |
Morgan Stanley (SOFR + 0.616%) (c) | | | 04/05/2024 | | | | 0.73% | | | | 1,480,000 | | | | 1,443,285 | |
Morgan Stanley (SOFR + 0.525%) (c) | | | 05/30/2025 | | | | 0.79% | | | | 425,000 | | | | 396,532 | |
Morgan Stanley (SOFR + 1.152%) (c) | | | 07/22/2025 | | | | 2.72% | | | | 1,525,000 | | | | 1,470,250 | |
Morgan Stanley (SOFR + 0.858%) (c) | | | 07/20/2027 | | | | 1.51% | | | | 2,455,000 | | | | 2,155,842 | |
NatWest Markets PLC (a)(b) | | | 05/21/2023 | | | | 2.38% | | | | 755,000 | | | | 744,383 | |
NatWest Markets PLC (a)(b) | | | 08/12/2024 | | | | 0.80% | | | | 850,000 | | | | 789,724 | |
Standard Chartered PLC (3 Month LIBOR USD + 1.080%) (a)(b)(c) | | | 03/15/2024 | | | | 3.89% | | | | 675,000 | | | | 673,121 | |
Svenska Handelsbanken AB (a)(b) | | | 06/30/2023 | | | | 0.63% | | | | 785,000 | | | | 762,709 | |
Svenska Handelsbanken AB (a)(b) | | | 06/11/2024 | | | | 0.55% | | | | 670,000 | | | | 629,325 | |
Toronto-Dominion Bank (b) | | | 06/06/2025 | | | | 3.77% | | | | 1,100,000 | | | | 1,092,694 | |
Toronto-Dominion Bank (b) | | | 09/10/2026 | | | | 1.25% | | | | 1,350,000 | | | | 1,197,282 | |
Truist Financial Corp. | | | 08/05/2025 | | | | 1.20% | | | | 360,000 | | | | 331,054 | |
UBS AG/London (a)(b) | | | 06/01/2023 | | | | 0.38% | | | | 770,000 | | | | 745,332 | |
36 | The accompanying notes are an integral part of these consolidated financial statements. |
LoCorr Long/Short Commodities Strategy Fund - Consolidated Schedule of Investments (continued) |
| | Maturity Date | | | Coupon Rate | | | Principal
Amount | | | Value | |
CORPORATE BONDS: (continued) |
UBS AG/London (a)(b) | | | 08/09/2024 | | | | 0.70% | | | $ | 1,200,000 | | | $ | 1,124,121 | |
UBS Group AG (1 Year CMT Rate + 0.830%) (a)(b)(c) | | | 07/30/2024 | | | | 1.01% | | | | 525,000 | | | | 508,593 | |
UBS Group AG (1 Year CMT Rate + 1.550%) (a)(b)(c) | | | 05/12/2026 | | | | 4.49% | | | | 650,000 | | | | 648,589 | |
| | | | | | | | | | | | | | | | 70,789,554 | |
Beverages: 0.12% | | | | | | | | | | | | | | | | |
Constellation Brands, Inc. | | | 05/09/2024 | | | | 3.60% | | | | 1,440,000 | | | | 1,435,770 | |
| | | | | | | | | | | | | | | | | |
Cosmetics & Personal Care: 0.23% | | | | | | | | | | | | | | | | |
GSK Consumer Healthcare Capital UK PLC (a)(b) | | | 03/24/2025 | | | | 3.13% | | | | 2,875,000 | | | | 2,802,245 | |
| | | | | | | | | | | | | | | | | |
Diversified Financial Services: 0.95% | | | | | | | | | | | | | | | | |
AerCap Ireland Capital/Global Aviation Trust (b) | | | 10/29/2023 | | | | 1.15% | | | | 1,425,000 | | | | 1,358,547 | |
AerCap Ireland Capital/Global Aviation Trust (b) | | | 10/29/2024 | | | | 1.65% | | | | 2,745,000 | | | | 2,537,220 | |
AerCap Ireland Capital/Global Aviation Trust (b) | | | 01/15/2025 | | | | 3.50% | | | | 1,900,000 | | | | 1,816,010 | |
AerCap Ireland Capital/Global Aviation Trust (b) | | | 01/30/2026 | | | | 1.75% | | | | 925,000 | | | | 809,383 | |
Air Lease Corp. | | | 07/03/2023 | | | | 3.88% | | | | 510,000 | | | | 505,572 | |
Air Lease Corp. | | | 02/01/2024 | | | | 4.25% | | | | 450,000 | | | | 444,853 | |
Capital One Bank | | | 02/15/2023 | | | | 3.38% | | | | 549,000 | | | | 548,583 | |
Capital One Financial Corp. (SOFR + 1.370%) (c) | | | 05/09/2025 | | | | 4.17% | | | | 1,150,000 | | | | 1,134,045 | |
Charles Schwab Corp. | | | 03/03/2027 | | | | 2.45% | | | | 915,000 | | | | 854,565 | |
Dragon 2012 LLC | | | 03/12/2024 | | | | 1.97% | | | | 4,115 | | | | 4,071 | |
Helios Leasing I LLC | | | 05/29/2024 | | | | 2.02% | | | | 4,593 | | | | 4,537 | |
Helios Leasing I LLC | | | 07/24/2024 | | | | 1.73% | | | | 5,131 | | | | 5,051 | |
Helios Leasing I LLC | | | 09/28/2024 | | | | 1.56% | | | | 5,071 | | | | 4,930 | |
MSN 41079 and 41084 Ltd. (b) | | | 07/13/2024 | | | | 1.72% | | | | 5,119 | | | | 5,024 | |
OMERS Finance Trust (a)(b) | | | 05/02/2024 | | | | 2.50% | | | | 920,000 | | | | 909,395 | |
Phoenix 2012 LLC | | | 07/03/2024 | | | | 1.61% | | | | 5,091 | | | | 5,001 | |
Private Export Funding Corp. | | | 06/15/2025 | | | | 3.25% | | | | 510,000 | | | | 510,676 | |
Tagua Leasing LLC (c) | | | 11/16/2024 | | | | 1.58% | | | | 5,636 | | | | 5,513 | |
| | | | | | | | | | | | | | | | 11,462,976 | |
Electric: 0.25% | | | | | | | | | | | | | | | | |
Eversource Energy | | | 08/15/2025 | | | | 0.80% | | | | 200,000 | | | | 180,702 | |
Southern California Edison Co. | | | 08/01/2023 | | | | 0.70% | | | | 1,125,000 | | | | 1,090,806 | |
Southern California Edison Co. | | | 04/01/2024 | | | | 1.10% | | | | 1,565,000 | | | | 1,489,903 | |
Southern California Edison Co. | | | 02/01/2026 | | | | 1.20% | | | | 350,000 | | | | 313,499 | |
| | | | | | | | | | | | | | | | 3,074,910 | |
Entertainment: 0.25% | | | | | | | | | | | | | | | | |
Magallanes, Inc. (a) | | | 03/15/2025 | | | | 3.64% | | | | 1,700,000 | | | | 1,649,182 | |
Magallanes, Inc. (a) | | | 03/15/2027 | | | | 3.76% | | | | 1,500,000 | | | | 1,407,052 | |
| | | | | | | | | | | | | | | | 3,056,234 | |
Food: 0.13% | | | | | | | | | | | | | | | | |
Conagra Brands, Inc. | | | 08/11/2023 | | | | 0.50% | | | | 700,000 | | | | 675,044 | |
McCormick & Co., Inc. | | | 08/15/2024 | | | | 3.15% | | | | 400,000 | | | | 392,355 | |
Mondelez International, Inc. | | | 03/17/2024 | | | | 2.13% | | | | 525,000 | | | | 512,095 | |
| | | | | | | | | | | | | | | | 1,579,494 | |
Healthcare - Products: 0.64% | | | | | | | | | | | | | | | | |
Baxter International, Inc. | | | 11/29/2024 | | | | 1.32% | | | | 2,800,000 | | | | 2,631,280 | |
DH Europe Finance II Sarl (b) | | | 11/15/2024 | | | | 2.20% | | | | 1,125,000 | | | | 1,080,268 | |
PerkinElmer, Inc. | | | 09/15/2024 | | | | 0.85% | | | | 2,655,000 | | | | 2,459,640 | |
Thermo Fisher Scientific, Inc. | | | 10/18/2024 | | | | 1.22% | | | | 1,705,000 | | | | 1,616,897 | |
| | | | | | | | | | | | | | | | 7,788,085 | |
Healthcare - Services: 0.13% | | | | | | | | | | | | | | | | |
HCA, Inc. (a) | | | 03/15/2027 | | | | 3.13% | | | | 610,000 | | | | 554,985 | |
The accompanying notes are an integral part of these consolidated financial statements. | 37 |
LoCorr Long/Short Commodities Strategy Fund - Consolidated Schedule of Investments (continued) |
| | Maturity Date | | | Coupon Rate | | | Principal
Amount | | | Value | |
CORPORATE BONDS: (continued) |
UnitedHealth Group, Inc. | | | 05/15/2024 | | | | 0.55% | | | $ | 1,030,000 | | | $ | 981,185 | |
| | | | | | | | | | | | | | | | 1,536,170 | |
Insurance: 0.69% | | | | | | | | | | | | | | | | |
Berkshire Hathaway Finance Corp. | | | 03/15/2027 | | | | 2.30% | | | | 845,000 | | | | 799,303 | |
Equitable Financial Life Global (a) | | | 11/17/2023 | | | | 0.50% | | | | 375,000 | | | | 359,667 | |
Equitable Financial Life Global (a) | | | 07/07/2025 | | | | 1.40% | | | | 1,125,000 | | | | 1,034,904 | |
Metropolitan Life Global Funding I (a) | | | 06/07/2024 | | | | 0.55% | | | | 1,510,000 | | | | 1,421,463 | |
Metropolitan Life Global Funding I (a) | | | 07/02/2025 | | | | 0.95% | | | | 945,000 | | | | 869,846 | |
Principal Life Global Funding II (a) | | | 04/12/2024 | | | | 0.75% | | | | 1,340,000 | | | | 1,268,241 | |
Principal Life Global Funding II (a) | | | 01/12/2026 | | | | 0.88% | | | | 1,090,000 | | | | 966,227 | |
Protective Life Global Funding (a) | | | 07/05/2024 | | | | 0.78% | | | | 1,740,000 | | | | 1,634,823 | |
| | | | | | | | | | | | | | | | 8,354,474 | |
Media: 0.07% | | | | | | | | | | | | | | | | |
Comcast Corp. | | | 03/01/2026 | | | | 3.15% | | | | 875,000 | | | | 852,668 | |
| | | | | | | | | | | | | | | | | |
Miscellaneous Manufacturing: 0.05% | | | | | | | | | | | | | | | | |
Trane Technologies Luxembourg Finance SA (b) | | | 03/21/2026 | | | | 3.50% | | | | 615,000 | | | | 598,522 | |
| | | | | | | | | | | | | | | | | |
Oil & Gas: 0.08% | | | | | | | | | | | | | | | | |
Phillips 66 | | | 02/15/2024 | | | | 0.90% | | | | 1,080,000 | | | | 1,029,132 | |
| | | | | | | | | | | | | | | | | |
Packaging & Containers: 0.21% | | | | | | | | | | | | | | | | |
Amcor Finance, Inc. | | | 04/28/2026 | | | | 3.63% | | | | 1,535,000 | | | | 1,478,751 | |
Berry Global, Inc. | | | 02/15/2024 | | | | 0.95% | | | | 1,085,000 | | | | 1,028,438 | |
| | | | | | | | | | | | | | | | 2,507,189 | |
Pharmaceuticals: 0.54% | | | | | | | | | | | | | | | | |
AbbVie, Inc. | | | 11/21/2024 | | | | 2.60% | | | | 2,720,000 | | | | 2,635,526 | |
AbbVie, Inc. | | | 05/14/2026 | | | | 3.20% | | | | 535,000 | | | | 515,332 | |
Astrazeneca Finance LLC | | | 05/28/2024 | | | | 0.70% | | | | 1,755,000 | | | | 1,664,601 | |
Takeda Pharmaceutical Co. Ltd. (b) | | | 11/26/2023 | | | | 4.40% | | | | 1,675,000 | | | | 1,688,481 | |
| | | | | | | | | | | | | | | | 6,503,940 | |
Pipelines: 0.34% | | | | | | | | | | | | | | | | |
Enbridge, Inc. (b) | | | 02/14/2025 | | | | 2.50% | | | | 655,000 | | | | 629,268 | |
Energy Transfer Operating LP | | | 05/15/2025 | | | | 2.90% | | | | 360,000 | | | | 342,483 | |
MPLX LP | | | 03/01/2026 | | | | 1.75% | | | | 1,265,000 | | | | 1,140,358 | |
ONEOK, Inc. | | | 09/01/2024 | | | | 2.75% | | | | 610,000 | | | | 590,380 | |
TransCanada PipeLines Ltd. (b) | | | 10/12/2024 | | | | 1.00% | | | | 1,475,000 | | | | 1,377,150 | |
| | | | | | | | | | | | | | | | 4,079,639 | |
Real Estate Investment Trusts: 0.43% | | | | | | | | | | | | | | | | |
American Tower Corp. | | | 09/15/2025 | | | | 1.30% | | | | 2,405,000 | | | | 2,179,302 | |
Brixmor Operating Partnership LP | | | 06/15/2024 | | | | 3.65% | | | | 650,000 | | | | 641,112 | |
Crown Castle International Corp. | | | 07/15/2025 | | | | 1.35% | | | | 455,000 | | | | 416,298 | |
SITE Centers Corp. | | | 02/01/2025 | | | | 3.63% | | | | 525,000 | | | | 510,688 | |
SITE Centers Corp. | | | 06/01/2027 | | | | 4.70% | | | | 1,505,000 | | | | 1,487,042 | |
| | | | | | | | | | | | | | | | 5,234,442 | |
Retail: 0.03% | | | | | | | | | | | | | | | | |
Genuine Parts Co. | | | 02/01/2025 | | | | 1.75% | | | | 360,000 | | | | 340,146 | |
| | | | | | | | | | | | | | | | | |
Software: 0.15% | | | | | | | | | | | | | | | | |
Roper Technologies, Inc. | | | 09/15/2024 | | | | 2.35% | | | | 470,000 | | | | 455,627 | |
VMware, Inc. | | | 08/15/2024 | | | | 1.00% | | | | 1,535,000 | | | | 1,437,209 | |
| | | | | | | | | | | | | | | | 1,892,836 | |
38 | The accompanying notes are an integral part of these consolidated financial statements. |
LoCorr Long/Short Commodities Strategy Fund - Consolidated Schedule of Investments (continued) |
| | Maturity Date | | | Coupon Rate | | | Principal
Amount | | | Value | |
CORPORATE BONDS: (continued) |
Telecommunications: 0.40% | | | | | | | | | | | | | | | | |
NBN Co. Ltd. (a)(b) | | | 10/08/2024 | | | | 0.88% | | | $ | 980,000 | | | $ | 915,764 | |
NTT Finance Corp. (a)(b) | | | 04/03/2026 | | | | 1.16% | | | | 1,215,000 | | | | 1,092,703 | |
Verizon Communications, Inc. | | | 11/20/2025 | | | | 0.85% | | | | 2,285,000 | | | | 2,071,670 | |
Verizon Communications, Inc. | | | 03/20/2026 | | | | 1.45% | | | | 880,000 | | | | 805,855 | |
| | | | | | | | | | | | | | | | 4,885,992 | |
Transportation: 0.20% | | | �� | | | | | | | | | | | | | |
Canadian Pacific Railway Co. (b) | | | 12/02/2024 | | | | 1.35% | | | | 2,545,000 | | | | 2,396,581 | |
TOTAL CORPORATE BONDS (Cost $155,534,931) | | | | | | | | | | | | | | | 147,793,605 | |
| | | | | | | | | | | | | | | | | |
FOREIGN GOVERNMENT BOND: 0.00%* | | | | | | | | | | | | | | | | |
Petroleos Mexicanos (b) | | | 12/20/2022 | | | | 2.00% | | | | 1,250 | | | | 1,245 | |
TOTAL FOREIGN GOVERNMENT BOND (Cost $1,250) | | | | | | | | | | | | | | | 1,245 | |
| | | | | | | | | | | | | | | | | |
MORTGAGE BACKED SECURITIES: 9.39% | | | | | | | | | | | | | | | | |
ACRE Commercial Mortgage Trust, 2021-FL4 A (1 Month LIBOR USD + 0.830%) (a)(b)(c) | | | 12/18/2037 | | | | 2.44% | | | | 542,297 | | | | 531,400 | |
Alen Mortgage Trust, 2021-ACEN A (1 Month LIBOR USD + 1.150%) (a)(c) | | | 04/17/2034 | | | | 2.47% | | | | 1,250,000 | | | | 1,200,367 | |
Angel Oak Mortgage Trust | | | | | | | | | | | | | | | | |
Series 2020-1 M1 (a)(d) | | | 12/25/2059 | | | | 3.16% | | | | 877,000 | | | | 821,955 | |
Series 2020-5 A3 (a)(d) | | | 05/25/2065 | | | | 2.04% | | | | 65,464 | | | | 62,157 | |
BAMLL Commercial Mortgage Securities Trust, 2022-DKLX A (TSFR1M + 1.150%) (a)(c) | | | 01/18/2039 | | | | 2.43% | | | | 3,750,000 | | | | 3,643,121 | |
BHP Trust, 2019-BXHP A (1 Month LIBOR USD + 0.975%) (a)(c) | | | 08/15/2036 | | | | 2.30% | | | | 1,920,766 | | | | 1,862,854 | |
BSREP Commercial Mortgage Trust, 2021-DC A (1 Month LIBOR USD + 0.950%) (a)(c) | | | 08/16/2038 | | | | 2.28% | | | | 2,000,000 | | | | 1,920,476 | |
BX Commercial Mortgage Trust | | | | | | | | | | | | | | | | |
Series 2021-21M A (1 Month LIBOR USD + 0.730%) (a)(c) | | | 10/15/2036 | | | | 2.05% | | | | 1,150,000 | | | | 1,093,374 | |
Series 2021-XL2 B (1 Month LIBOR USD + 0.998%) (a)(c) | | | 10/15/2038 | | | | 2.32% | | | | 3,267,117 | | | | 3,086,623 | |
Series 2021-CIP A (1 Month LIBOR USD + 0.921%) (a)(c) | | | 12/15/2038 | | | | 2.25% | | | | 2,950,000 | | | | 2,861,107 | |
Citigroup Commercial Mortgage Trust, 2021-PRM2 A (1 Month LIBOR USD + 0.950%) (a)(c) | | | 10/15/2038 | | | | 2.28% | | | | 3,750,000 | | | | 3,624,394 | |
Comm Mortgage Trust | | | | | | | | | | | | | | | | |
Series 2015-3BP A (a) | | | 02/12/2035 | | | | 3.18% | | | | 1,030,000 | | | | 984,283 | |
Series 2013-CR9 A4 (d) | | | 07/12/2045 | | | | 4.41% | | | | 873,825 | | | | 872,031 | |
Series 2013-CR6 A4 | | | 03/10/2046 | | | | 3.10% | | | | 440,000 | | | | 437,856 | |
Series 2013-CR6 AM (a) | | | 03/12/2046 | | | | 3.15% | | | | 1,000,000 | | | | 988,811 | |
Series 2013-CR10 A4 (d) | | | 08/10/2046 | | | | 4.21% | | | | 200,000 | | | | 199,764 | |
Series 2014-UBS2 A5 | | | 03/10/2047 | | | | 3.96% | | | | 1,150,000 | | | | 1,143,806 | |
Series 2014-UBS2 AM | | | 03/12/2047 | | | | 4.20% | | | | 1,150,000 | | | | 1,140,791 | |
Series 2015-CR27 AM | | | 10/13/2048 | | | | 3.98% | | | | 1,000,000 | | | | 978,695 | |
Connecticut Avenue Securities Trust | | | | | | | | | | | | | | | | |
Series 2021-R01 1M2 (SOFR30A + 1.550%) (a)(c) | | | 10/25/2041 | | | | 2.48% | | | | 1,570,000 | | | | 1,456,213 | |
Series 2021-R03 1M1 (SOFR30A + 0.850%) (a)(c) | | | 12/26/2041 | | | | 1.78% | | | | 2,534,104 | | | | 2,482,860 | |
Series 2022-R01 1M1 (SOFR30A + 1.000%) (a)(c) | | | 12/26/2041 | | | | 1.93% | | | | 1,737,481 | | | | 1,700,469 | |
Series 2022-R04 (SOFR30A + 2.000%) (a)(c) | | | 03/25/2042 | | | | 2.93% | | | | 2,505,322 | | | | 2,501,479 | |
Series 2022-R03 1M1 (SOFR30A + 2.100%) (a)(c) | | | 03/25/2042 | | | | 3.03% | | | | 2,660,125 | | | | 2,635,875 | |
Series 2022-R06 (SOFR30A + 2.750%) (a)(c) | | | 05/25/2042 | | | | 3.70% | | | | 609,943 | | | | 608,437 | |
CSMC Trust, 2017-CALI A (a) | | | 11/12/2032 | | | | 3.43% | | | | 1,750,000 | | | | 1,688,322 | |
ELP Commercial Mortgage Trust, 2021-ELP B (1 Month LIBOR USD + 1.120%) (a)(c) | | | 11/15/2038 | | | | 2.45% | | | | 2,650,000 | | | | 2,530,217 | |
EQUS Mortgage Trust, 2021-EQAZ A (1 Month LIBOR USD + 0.755%) (a)(c) | | | 10/15/2036 | | | | 2.08% | | | | 2,650,000 | | | | 2,530,203 | |
Extended Stay America Trust, 2021-ESH A (1 Month LIBOR USD + 1.080%) (a)(c) | | | 07/15/2038 | | | | 2.41% | | | | 1,192,660 | | | | 1,162,709 | |
Fannie Mae Connecticut Avenue Securities | | | | | | | | | | | | | | | | |
Series 2014-C02 1M2 (1 Month LIBOR USD + 2.600%) (c) | | | 05/28/2024 | | | | 4.22% | | | | 604,685 | | | | 602,370 | |
The accompanying notes are an integral part of these consolidated financial statements. | 39 |
LoCorr Long/Short Commodities Strategy Fund - Consolidated Schedule of Investments (continued) |
| | Maturity Date | | | Coupon Rate | | | Principal
Amount | | | Value | |
MORTGAGE BACKED SECURITIES: (continued) |
Series 2018-C01 1EB1 (1 Month LIBOR USD + 0.450%) (c) | | | 07/25/2030 | | | | 2.07% | | | $ | 243,583 | | | $ | 241,025 | |
Series 2021-R02 2M1 (SOFR30A + 0.900%) (a)(c) | | | 11/25/2041 | | | | 1.83% | | | | 1,928,501 | | | | 1,884,281 | |
FHLMC Multifamily Structured Pass Through Certificates | | | | | | | | | | | | | | | | |
Series K052 A1 | | | 01/25/2025 | | | | 2.60% | | | | 238,623 | | | | 236,021 | |
Series K050 A1 | | | 01/25/2025 | | | | 2.80% | | | | 1,753,174 | | | | 1,739,347 | |
Series K059 A1 | | | 09/25/2025 | | | | 2.76% | | | | 684,980 | | | | 675,613 | |
Series KC06 A1 | | | 02/25/2026 | | | | 2.17% | | | | 244,826 | | | | 243,961 | |
Freddie Mac STACR REMIC Trust | | | | | | | | | | | | | | | | |
Series 2021-DNA5 M2 (SOFR30A + 1.650%) (a)(c) | | | 01/25/2034 | | | | 2.58% | | | | 524,371 | | | | 505,605 | |
Series 2021-DNA6 M1 (SOFR30A + 0.800%) (a)(c) | | | 10/25/2041 | | | | 1.73% | | | | 3,250,000 | | | | 3,184,191 | |
Series 2022-DNA1 M1A (SOFR30A + 1.000%) (a)(c) | | | 01/27/2042 | | | | 1.93% | | | | 5,000,000 | | | | 4,824,225 | |
Series 2022-HQA1 M1A (SOFR30A + 2.100%) (a)(c) | | | 03/25/2042 | | | | 3.03% | | | | 1,019,059 | | | | 1,010,348 | |
Series 2022-DNA3 (SOFR30A + 2.000%) (a)(c) | | | 04/25/2042 | | | | 2.93% | | | | 2,620,102 | | | | 2,565,480 | |
Freddie Mac STACR Trust, 2018-HRP2 M3AS (1 Month LIBOR USD + 1.000%) (a)(c) | | | 02/25/2047 | | | | 2.62% | | | | 2,750,000 | | | | 2,703,701 | |
Freddie Mac Structured Agency Credit Risk Debt Notes | | | | | | | | | | | | | | | | |
Series 2021-DNA7 M1 (SOFR30A + 0.850%) (a)(c) | | | 11/25/2041 | | | | 1.78% | | | | 3,750,000 | | | | 3,637,287 | |
Series 2022-DNA2 M1A (SOFR30A + 1.300%) (a)(c) | | | 02/25/2042 | | | | 2.23% | | | | 3,303,795 | | | | 3,227,919 | |
FRESB Multifamily Mortgage Pass Through Certificates | | | | | | | | | | | | | | | | |
Series 2016-SB17 A7F (d) | | | 05/25/2023 | | | | 2.15% | | | | 533,719 | | | | 526,831 | |
Series 2017-SB32 A7F (d) | | | 04/25/2024 | | | | 2.44% | | | | 287,204 | | | | 282,701 | |
Series 2019-SB67 A5F (d) | | | 07/25/2024 | | | | 2.09% | | | | 703,324 | | | | 684,346 | |
Series 2019-SB69 A5F (d) | | | 10/25/2024 | | | | 2.25% | | | | 1,454,403 | | | | 1,421,661 | |
Series 2016-SB23 A10F (d) | | | 09/25/2026 | | | | 2.31% | | | | 583,083 | | | | 562,098 | |
GCT Commercial Mortgage Trust, 2021-GCT A (1 Month LIBOR USD + 0.800%) (a)(c) | | | 02/15/2038 | | | | 2.12% | | | | 1,400,000 | | | | 1,355,245 | |
GS Mortgage Securities Corp II, 2021-ARDN A (1 Month LIBOR USD + 1.250%) (a)(c) | | | 11/17/2036 | | | | 2.57% | | | | 2,650,000 | | | | 2,585,675 | |
GS Mortgage Securities Trust | | | | | | | | | | | | | | | | |
Series 2021-ROSS A (1 Month LIBOR USD + 1.150%) (a)(c) | | | 06/16/2036 | | | | 2.48% | | | | 2,000,000 | | | | 1,929,378 | |
Series 2013-GC10 AS | | | 02/12/2046 | | | | 2.94% | | | | 1,720,000 | | | | 1,709,189 | |
Series 2015-GC28 AS | | | 02/12/2048 | | | | 3.76% | | | | 885,000 | | | | 866,761 | |
Series 2021-NQM1 A3 (a)(d) | | | 07/25/2061 | | | | 1.53% | | | | 1,052,838 | | | | 954,766 | |
JP Morgan Chase Commercial Mortgage Securities Trust | | | | | | | | | | | | | | | | |
Series 2021-MHC A (1 Month LIBOR USD + 0.800%) (a)(c) | | | 04/15/2038 | | | | 2.12% | | | | 1,653,569 | | | | 1,595,404 | |
Series 2013-C15 A-S | | | 11/17/2045 | | | | 4.42% | | | | 1,250,000 | | | | 1,248,065 | |
Series 2014-C23 ASB | | | 09/17/2047 | | | | 3.66% | | | | 609,756 | | | | 606,107 | |
Series 2014-C22 AS | | | 09/17/2047 | | | | 4.11% | | | | 1,350,000 | | | | 1,324,853 | |
Series 2013-C10 AS | | | 12/17/2047 | | | | 3.37% | | | | 762,000 | | | | 756,336 | |
Series 2016-JP3 A-5 | | | 08/15/2049 | | | | 2.87% | | | | 1,500,000 | | | | 1,417,274 | |
MHC Commercial Mortgage Trust, 2021-MHC A (1 Month LIBOR USD + 0.801%) (a)(c) | | | 04/15/2038 | | | | 2.12% | | | | 2,000,000 | | | | 1,948,713 | |
New Residential Mortgage Loan Trust | | | | | | | | | | | | | | | | |
Series 2016-1A A1 (a)(d) | | | 03/25/2056 | | | | 3.75% | | | | 125,973 | | | | 122,061 | |
Series 2018-5A A1 (a)(d) | | | 12/25/2057 | | | | 4.75% | | | | 422,380 | | | | 421,092 | |
OBX Trust, 2018-1 A2 (1 Month LIBOR USD + 0.650%) (a)(c) | | | 06/25/2057 | | | | 2.27% | | | | 255,877 | | | | 250,379 | |
OPG TRUST, 2021-PORT B (1 Month LIBOR USD + 0.713%) (a)(c) | | | 10/15/2036 | | | | 2.04% | | | | 2,700,000 | | | | 2,523,780 | |
PKHL Commercial Mortgage Trust, 2021-MF A (1 Month LIBOR USD + 0.880%) (a)(c) | | | 07/15/2038 | | | | 2.21% | | | | 3,250,000 | | | | 3,134,031 | |
SMR Mortgage Trust, 2022-IND A (TSFR1M + 1.650%) (a)(c) | | | 02/15/2039 | | | | 2.93% | | | | 3,617,214 | | | | 3,490,316 | |
SREIT Trust, 2021-MFP2 A (1 Month LIBOR USD + 0.822%) (a)(c) | | | 11/17/2036 | | | | 2.15% | | | | 3,750,000 | | | | 3,594,090 | |
UBS Commercial Mortgage Trust, 2017-C6 ASB | | | 12/16/2050 | | | | 3.50% | | | | 1,000,000 | | | | 980,909 | |
UBS-Barclays Commercial Mortgage Trust, 2012-C4 A5 | | | 12/12/2045 | | | | 2.85% | | | | 514,375 | | | | 514,044 | |
Verus Securitization Trust | | | | | | | | | | | | | | | | |
Series 2020-1 A1 (a)(d) | | | 01/25/2060 | | | | 2.42% | | | | 207,982 | | | | 204,081 | |
Series 2020-1 A3 (a)(d) | | | 01/25/2060 | | | | 2.72% | | | | 490,207 | | | | 480,490 | |
Wells Fargo Commercial Mortgage Trust, 2012-LC5 AS | | | 10/17/2045 | | | | 3.54% | | | | 185,000 | | | | 184,801 | |
WFRBS Commercial Mortgage Trust | | | | | | | | | | | | | | | | |
Series 2013-C13 AS | | | 05/17/2045 | | | | 3.35% | | | | 185,000 | | | | 183,248 | |
40 | The accompanying notes are an integral part of these consolidated financial statements. |
LoCorr Long/Short Commodities Strategy Fund - Consolidated Schedule of Investments (continued) |
| | Maturity Date | | | Coupon Rate | | | Principal
Amount | | | Value | |
MORTGAGE BACKED SECURITIES: (continued) |
Series 2012-C10 A3 | | | 12/15/2045 | | | | 2.88% | | | $ | 975,000 | | | $ | 973,260 | |
Series 2013-UBS1 A4 (d) | | | 03/16/2046 | | | | 4.08% | | | | 690,322 | | | | 689,212 | |
Series 2013-C14 A5 | | | 06/15/2046 | | | | 3.34% | | | | 200,000 | | | | 196,920 | |
Series 2013-C17 ASB | | | 12/17/2046 | | | | 3.56% | | | | 76,804 | | | | 76,535 | |
TOTAL MORTGAGE BACKED SECURITIES (Cost $117,907,755) | | | | | | | | | | | | | | | 113,826,675 | |
| | | | | | | | | | | | | | | | | |
MUNICIPAL BONDS: 0.36% | | | | | | | | | | | | | | | | |
County of King WA Sewer Revenue | | | 07/01/2025 | | | | 0.80% | | | | 320,000 | | | | 296,097 | |
Forsyth County School District | | | 02/01/2024 | | | | 0.92% | | | | 660,000 | | | | 637,772 | |
Miami Dade County Florida Aviation Refunding Taxable Series B | | | 10/01/2023 | | | | 2.37% | | | | 650,000 | | | | 640,764 | |
Nebraska Public Power District | | | 01/01/2024 | | | | 2.22% | | | | 675,000 | | | | 663,434 | |
State of Hawaii | | | 08/01/2025 | | | | 1.03% | | | | 1,955,000 | | | | 1,821,903 | |
Water Works Board of the City of Birmingham | | | 01/01/2024 | | | | 2.20% | | | | 270,000 | | | | 266,162 | |
TOTAL MUNICIPAL BONDS (Cost $4,530,859) | | | | | | | | | | | | | | | 4,326,132 | |
| | | | | | | | | | | | | | | | | |
PURCHASED OPTIONS: 8.48% | | | | | | Counterparty | | | Number of
Contracts | | | | | |
Call Options: 8.48% | | | | | | | | | | | | | | | | |
Nomura Galaxy Option- CoreCommodity, Expiration: July 2023, Current Price: $1,075, Exercise Price: $0.0001 (h) | | | | | | | Nomura Securities | | | | 36,424 | | | | 39,141,443 | |
Nomura Galaxy Option- East Alpha, Expiration: August 2022, Current Price: $9,831, Exercise Price: $0.0001 (i) | | | | | | | Nomura Securities | | | | 6,485 | | | | 63,746,148 | |
TOTAL PURCHASED OPTIONS (Cost $64,957,320) | | | | | | | | | | | | | | | 102,887,591 | |
| | | | | | | | | | | | | | | | | |
U.S. GOVERNMENT AGENCY ISSUES: 6.21% | | | | | Coupon Rate | | | Principal
Amount | | | | | |
Federal Farm Credit Banks | | | 05/10/2023 | | | | 0.13% | | | | 8,180,000 | | | | 7,992,359 | |
Federal Farm Credit Banks | | | 06/14/2023 | | | | 0.13% | | | | 10,000,000 | | | | 9,737,065 | |
Federal Farm Credit Banks | | | 06/26/2023 | | | | 1.77% | | | | 2,450,000 | | | | 2,420,919 | |
Federal Farm Credit Banks | | | 07/17/2023 | | | | 2.88% | | | | 1,600,000 | | | | 1,600,570 | |
Federal Farm Credit Banks | | | 11/09/2023 | | | | 0.40% | | | | 5,900,000 | | | | 5,708,214 | |
Federal Home Loan Banks | | | 06/09/2023 | | | | 3.25% | | | | 2,345,000 | | | | 2,352,054 | |
Federal Home Loan Banks | | | 08/28/2023 | | | | 0.13% | | | | 7,000,000 | | | | 6,792,736 | |
Federal Home Loan Banks | | | 09/08/2023 | | | | 3.38% | | | | 2,235,000 | | | | 2,246,437 | |
Federal Home Loan Banks | | | 12/08/2023 | | | | 3.38% | | | | 2,325,000 | | | | 2,338,202 | |
Federal Home Loan Banks | | | 06/14/2024 | | | | 1.75% | | | | 5,365,000 | | | | 5,235,352 | |
Federal Home Loan Banks | | | 12/20/2024 | | | | 1.00% | | | | 5,835,000 | | | | 5,547,034 | |
Federal Home Loan Banks | | | 04/14/2025 | | | | 0.50% | | | | 3,950,000 | | | | 3,687,038 | |
Federal Home Loan Mortgage Corp. | | | 05/19/2023 | | | | 0.25% | | | | 2,730,000 | | | | 2,666,352 | |
Federal Home Loan Mortgage Corp. | | | 06/26/2023 | | | | 0.25% | | | | 3,000,000 | | | | 2,919,919 | |
Federal Home Loan Mortgage Corp. | | | 09/08/2023 | | | | 0.25% | | | | 885,000 | | | | 858,029 | |
Federal Home Loan Mortgage Corp. | | | 11/06/2023 | | | | 0.25% | | | | 4,000,000 | | | | 3,860,773 | |
Federal National Mortgage Association | | | 01/19/2023 | | | | 2.38% | | | | 220,000 | | | | 219,872 | |
Federal National Mortgage Association | | | 07/10/2023 | | | | 0.25% | | | | 3,350,000 | | | | 3,261,290 | |
Federal National Mortgage Association | | | 07/02/2024 | | | | 1.75% | | | | 6,000,000 | | | | 5,869,300 | |
Small Business Administration Participation Certificates | | | 11/01/2032 | | | | 2.09% | | | | 6,110 | | | | 5,783 | |
TOTAL U.S. GOVERNMENT AGENCY ISSUES (Cost $77,601,921) | | | | | | | | | | | | | | | 75,319,298 | |
| | | | | | | | | | | | | | | | |
U.S. GOVERNMENT NOTES: 13.80% | | | | | | | | | | | | | | | | |
United States Treasury Note | | | 01/15/2024 | | | | 0.13% | | | | 9,970,000 | | | | 9,551,338 | |
United States Treasury Note | | | 04/30/2024 | | | | 2.25% | | | | 1,585,000 | | | | 1,565,559 | |
United States Treasury Note | | | 05/15/2024 | | | | 2.50% | | | | 6,030,000 | | | | 5,980,771 | |
United States Treasury Note | | | 06/15/2024 | | | | 0.25% | | | | 8,065,000 | | | | 7,654,504 | |
United States Treasury Note | | | 08/15/2024 | | | | 0.38% | | | | 20,310,000 | | | | 19,230,238 | |
The accompanying notes are an integral part of these consolidated financial statements. | 41 |
LoCorr Long/Short Commodities Strategy Fund - Consolidated Schedule of Investments (continued) |
| | Maturity Date | | | Coupon Rate | | | Principal
Amount | | | Value | |
U.S. GOVERNMENT NOTES: (continued) |
United States Treasury Note | | | 09/15/2024 | | | | 0.38% | | | $ | 14,135,000 | | | $ | 13,353,158 | |
United States Treasury Note | | | 09/30/2024 | | | | 1.50% | | | | 500,000 | | | | 484,121 | |
United States Treasury Note | | | 05/31/2025 | | | | 0.25% | | | | 74,925,000 | | | | 69,214,895 | |
United States Treasury Note | | | 04/15/2025 | | | | 2.63% | | | | 40,685,000 | | | | 40,284,506 | |
TOTAL U.S. GOVERNMENT NOTES (Cost $170,078,052) | | | | | | | | | | | | | | | 167,319,090 | |
| | | | | | | | | | | | | | | | | |
SHORT TERM INVESTMENT: 30.60% | | | | | | | | | | Shares | | | | | |
MONEY MARKET FUND: 30.60% | | | | | | | | | | | | | | | | |
STIT-Government & Agency Portfolio, Institutional Class, 1.38% (e)(f)^ | | | | | | | | | | | 371,119,454 | | | | 371,119,454 | |
TOTAL MONEY MARKET FUND (Cost $371,119,454) | | | | | | | | | | | | | | | 371,119,454 | |
TOTAL SHORT TERM INVESTMENT (Cost $371,119,454) | | | | | | | | | | | | | | | 371,119,454 | |
| | | | | | | | | | | | | | | | | |
TOTAL INVESTMENTS (Cost $1,068,991,971): 89.70% | | | | | | | | | | | | | | | 1,087,798,764 | |
Other Assets in Excess of Liabilities: 10.30% (g) | | | | | | | | | | | | | | | 124,947,235 | |
TOTAL NET ASSETS: 100.00% | | | | | | | | | | | | | | $ | 1,212,745,999 | |
(a) | Security as defined in Rule 144A under the Securities Act of 1933 and determined to be liquid. Purchased in a private placement transaction; resale to the public may require registration or may extend only to qualified institutional buyers. At June 30, 2022, the value of these securities total $145,129,243 which represents 11.97% of total net assets. |
(b) | Foreign issued security. |
(c) | Variable rate security based on a reference index and spread. The rate reported is the rate in effect as of June 30, 2022. |
(d) | Variable rate security. The coupon is based on an underlying pool of loans. The rate reported is the rate in effect as of June 30, 2022. |
(e) | The rate quoted is the annualized seven-day effective yield as of June 30, 2022. |
(f) | All or a portion of this security is held by LCLSCS Fund Limited and pledged as collateral for derivative contracts. At June 30, 2022, the value of this collateral totals $36,150. |
(g) | Includes assets pledged as collateral for derivative contracts. At June 30, 2022, the value of these assets totals $29,927,511. |
(h) | The Nomura call option is issued by Nomura Securities Ltd. and provides LoCorr Long/Short Commodities Strategy Fund access to the performance of the Galaxy Plus Fund — CoreCommodity Feeder Fund (558), LLC which effectuates its trading strategy through the Galaxy Plus Fund — CoreCommodity Master Fund (558) LLC. The underlying strategy is a quantitative trading program specializing in commodity futures contracts. |
(i) | The Nomura call option is issued by Nomura Securities Ltd. and provides LoCorr Long/Short Commodities Strategy Fund access to the performance of the Galaxy Plus Fund — East Alpha Feeder Fund (548), LLC which effectuates its trading strategy through the Galaxy Plus Fund — East Alpha Master Fund (548) LLC. The underlying strategy is a quantitative trading program specializing in commodity futures contracts. |
(j) | Investment valued using net asset value per share as practical expedient. See Note 2. This investment falls into the common equity co-investment investment category, has no unfunded commitments or redemption lock-up period, as the investment offers daily redemptions. |
* | Amount rounds to less than 0.005% of net assets. |
^ | Holdings is greater than 25% of portfolio value. Additional information regarding the underlying Fund’s holdings and financial statements may be found at https://sec.gov. |
CMT | Constant Maturity Treasury | SOFR | Secured Overnight Financing Rate |
LIBOR | London Interbank Offered Rate | TSFR1M | 1 Month Average Secured Overnight Financing Rate |
PLC | Public Limited Company | | |
42 | The accompanying notes are an integral part of these consolidated financial statements. |
LoCorr Long/Short Commodities Strategy Fund – Consolidated Schedule of Swap Contracts |
LoCorr Long/Short Commodities Strategy Fund
Consolidated Schedule of Swap Contracts
June 30, 2022 (Unaudited)
LONG TOTAL RETURN SWAP CONTRACTS
Termination Date | Reference Index | Financing Rate | Payment Frequency | Notional Amount | Unrealized Appreciation | Counterparty |
12/16/2022 | LoCorr Commodities Index# | 0.50% | Quarterly | $455,445,098 | $79,517,959 | Deutsche Bank AG |
# | Comprised of a proprietary basket of Commodity Trading Advisor’s ‘’CTA’’) Programs investing in various futures contracts, forward currency contracts, foreign currency and other similar investments. See Notes 2 & 3. |
The underlying components of the basket as of June 30, 2022 are shown below:#
Description | | Expiration Date | | | Number of Contracts
Purchased (Sold) | | | Notional
Amount | | | Concentration
% of Exposure | |
Futures Contracts: | | | | | | | | | | | | | | | | |
Purchase Contracts:(1) | | | | | | | | | | | | | | | | |
Brent Crude (ICE) | | | Jul-22 | | | | 865 | | | $ | 94,420,574 | | | | 6.43 | % |
Natural Gas | | | Jan-23 | | | | 1,221 | | | | 75,921,780 | | | | 5.17 | % |
WTI Crude | | | Aug-22 | | | | 505 | | | | 52,173,683 | | | | 3.55 | % |
Gasoline RBOB | | | Aug-22 | | | | 292 | | | | 41,629,379 | | | | 2.83 | % |
WTI Crude | | | Dec-22 | | | | 341 | | | | 31,635,526 | | | | 2.15 | % |
Brent Crude | | | Aug-22 | | | | 452 | | | | 27,550,637 | | | | 1.88 | % |
Heating Oil | | | Aug-22 | | | | 89 | | | | 13,899,429 | | | | 0.95 | % |
Lean Hogs | | | Jul-22 | | | | 210 | | | | 9,214,832 | | | | 0.63 | % |
Live Cattle | | | Feb-23 | | | | 134 | | | | 8,007,840 | | | | 0.55 | % |
Copper | | | Feb-23 | | | | 144 | | | | 8,149,680 | | | | 0.55 | % |
Lean Hogs | | | Feb-23 | | | | 223 | | | | 7,887,510 | | | | 0.54 | % |
Feeder Cattle | | | Jan-23 | | | | 86 | | | | 7,729,250 | | | | 0.53 | % |
Soybean Oil | | | Mar-23 | | | | 197 | | | | 7,665,954 | | | | 0.52 | % |
Live Cattle | | | Aug-22 | | | | 137 | | | | 7,252,434 | | | | 0.49 | % |
Coffee | | | Dec-22 | | | | 76 | | | | 6,428,357 | | | | 0.44 | % |
Cotton No.2 | | | Dec-22 | | | | 132 | | | | 6,487,020 | | | | 0.44 | % |
Heating Oil | | | Sep-22 | | | | 38 | | | | 5,780,138 | | | | 0.39 | % |
Natural Gas | | | Sep-22 | | | | 89 | | | | 5,430,175 | | | | 0.37 | % |
Cocoa | | | Sep-22 | | | | 213 | | | | 4,999,185 | | | | 0.34 | % |
Feeder Cattle | | | Oct-22 | | | | 54 | | | | 4,790,511 | | | | 0.33 | % |
WTI Crude | | | Dec-22 | | | | 42 | | | | 4,295,550 | | | | 0.29 | % |
WTI Crude | | | Sep-22 | | | | 128 | | | | 4,173,358 | | | | 0.28 | % |
Total Purchase Contracts | | | | | | | | | | | 435,522,802 | | | | 29.65 | % |
| | | | | | | | | | | | | | | | | |
Sale Contracts:(1) | | | | | | | | | | | | | | | | |
Natural Gas | | | Dec-22 | | | | (1,323) | | | $ | 85,009,365 | | | | 5.79 | % |
WTI Crude | | | Jul-22 | | | | (649) | | | | 68,748,265 | | | | 4.68 | % |
Brent Crude (ICE) | | | Aug-22 | | | | (552) | | | | 58,397,554 | | | | 3.97 | % |
Gasoline RBOB | | | Jul-22 | | | | (327) | | | | 48,183,032 | | | | 3.28 | % |
Natural Gas | | | Jul-22 | | | | (681) | | | | 41,635,320 | | | | 2.83 | % |
WTI Crude | | | Sep-22 | | | | (435) | | | | 40,281,234 | | | | 2.74 | % |
Brent Crude | | | Aug-22 | | | | (497) | | | | 20,610,783 | | | | 1.40 | % |
Soybean | | | Nov-22 | | | | (275) | | | | 20,056,673 | | | | 1.37 | % |
WTI Crude | | | Sep-22 | | | | (147) | | | | 15,156,473 | | | | 1.03 | % |
Soybean Meal | | | Dec-22 | | | | (335) | | | | 13,505,734 | | | | 0.92 | % |
Live Cattle | | | Oct-22 | | | | (233) | | | | 12,923,565 | | | | 0.88 | % |
Feeder Cattle | | | Aug-22 | | | | (143) | | | | 12,295,858 | | | | 0.84 | % |
The accompanying notes are an integral part of these consolidated financial statements. | 43 |
LoCorr Long/Short Commodities Strategy Fund – Consolidated Schedule of Swap Contracts (continued) |
Description | | Expiration Date | | | Number of Contracts
Purchased (Sold) | | | Notional
Amount | | | Concentration
% of Exposure | |
Sale Contracts:(1) (continued) | | | | | | | | | | | | | | | | |
Copper (LME) | | | Sep-22 | | | | (49) | | | $ | 10,167,815 | | | | 0.69 | % |
Heating Oil | | | Jul-22 | | | | (61) | | | | 9,693,175 | | | | 0.66 | % |
Copper | | | Dec-22 | | | | (241) | | | | 9,507,915 | | | | 0.65 | % |
Red Spring Wheat | | | Sep-22 | | | | (174) | | | | 8,864,750 | | | | 0.60 | % |
Aluminum | | | Sep-22 | | | | (145) | | | | 8,844,975 | | | | 0.60 | % |
Corn | | | Dec-22 | | | | (246) | | | | 7,837,823 | | | | 0.53 | % |
Wheat | | | Dec-22 | | | | (127) | | | | 5,958,294 | | | | 0.41 | % |
Gold | | | Aug-22 | | | | (34) | | | | 6,058,033 | | | | 0.41 | % |
Coffee | | | Sep-22 | | | | (59) | | | | 5,050,886 | | | | 0.34 | % |
Red Spring Wheat | | | Dec-22 | | | | (88) | | | | 4,504,452 | | | | 0.31 | % |
Brent Crude (ICE) | | | Oct-22 | | | | (41) | | | | 4,159,214 | | | | 0.28 | % |
WTI Crude | | | Sep-22 | | | | (50) | | | | 3,977,020 | | | | 0.27 | % |
Total Sale Contracts | | | | | | | | | | | 521,428,208 | | | | 35.48 | % |
Other Futures Contracts | | | | | | | | | | | 87,002,254 | | | | 5.92 | % |
Total Futures Contracts | | | | | | | | | | | 1,043,953,264 | | | | 71.05 | % |
Forward Currency Contracts: | | | | | | | | | | Delivered
(in USD) | | | | | | | Received
(in USD) | | | | | |
Sales Contracts:(1) | | | | | | | | | | | | | | | | | | | | | | | | |
USD/EUR | | | 06/30/2022 | | | | U.S. Dollar | | | $ | 25,545,757 | | Euro | | $ | 25,375,627 | | | | 1.73 | % |
Total Forward Currency Contracts Sold | | | | | | | | | | | | | | | | | | | 25,375,627 | | | | 1.73 | % |
Other Forward Currency Contracts | | | | | | | | | | | | | | | | | | | 1,840 | | | | 0.00 | % |
Total Forward Currency Contracts | | | | | | | | | | | | | | | | | | | 25,377,467 | | | | 1.73 | % |
| | | | | | | | | | | | | | | | | | | | | | | | | |
Cash and Foreign Currency: | | | | | | Quantity | | | | | | | | | | | | | |
Cash and Foreign Currency Purchased:(1) | | | | | | | | | | | | | | | | | | | | | | | | |
U.S. Dollar | | | | | | | | | | | 186,134,306 | | | | | | | $ | 186,134,306 | | | | 12.67 | % |
British Pound | | | | | | | | | | | 8,210,615 | | | | | | | | 6,744,938 | | | | 0.46 | % |
Total Cash and Foreign Currency Purchased | | | | | | | | | | | | | | | | | | | 192,879,244 | | | | 13.13 | % |
| | | | | | | | | | | | | | | | | | | | | | | | | |
Cash and Foreign Currency Sold:(1) | | | | | | | | | | | | | | | | | | | | | | | | |
Euro | | | | | | | | | | | 214,903,927 | | | | | | | $ | 205,069,923 | | | | 13.96 | % |
Total Cash and Foreign Currency Sold | | | | | | | | | | | | | | | | | | | 205,069,923 | | | | 13.96 | % |
Other Cash and Foreign Currency | | | | | | | | | | | | | | | | | | | 1,937,796 | | | | 0.13 | % |
Total Cash and Foreign Currency | | | | | | | | | | | | | | | | | | | 399,886,963 | | | | 27.22 | % |
Total Underlying Positions | | | | | | | | | | | | | | | | | | $ | 1,469,217,694 | | | | 100.00 | % |
# | The investment is not a direct holding of LoCorr Long/Short Commodities Strategy Fund. The top 50 holdings and other futures contracts, other forward currency contracts, and other cash and foreign currency were determined based on the absolute notional amount of the positions within the underlying swap basket. |
(1) | Represents the 50 largest components of the basket. |
44 | The accompanying notes are an integral part of these consolidated financial statements. |
LoCorr Market Trend Fund – Consolidated Schedule of Investments |
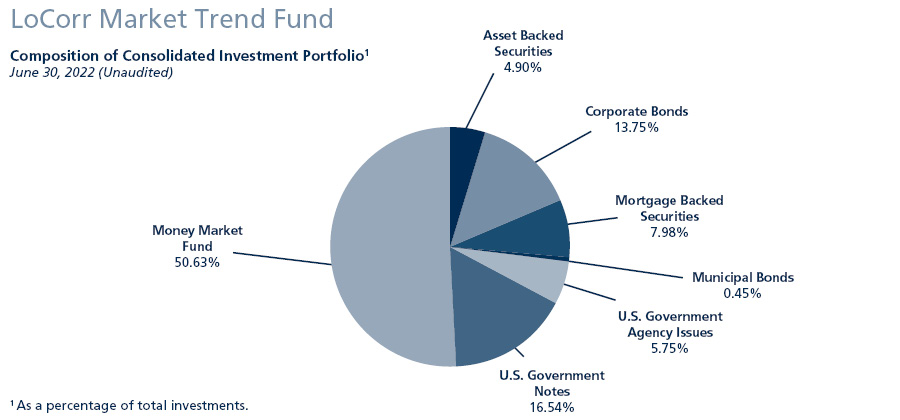
Consolidated Schedule of Investments
June 30, 2022 (Unaudited)
| | Maturity Date | | | Coupon Rate | | | Principal
Amount | | | Value | |
ASSET BACKED SECURITIES: 4.46% |
American Homes 4 Rent Trust, 2014-SFR2 A (a) | | | 10/17/2036 | | | | 3.79% | | | $ | 380,284 | | | $ | 378,215 | |
AmeriCredit Automobile Receivables Trust | | | | | | | | | | | | | | | | |
Series 2021-3 A-3 | | | 08/18/2026 | | | | 0.76% | | | | 1,000,000 | | | | 959,775 | |
Series 2021-2 A3 | | | 12/18/2026 | | | | 0.34% | | | | 930,000 | | | | 901,946 | |
AMSR Trust, 2020-SFR1 A (a) | | | 04/17/2037 | | | | 1.82% | | | | 324,688 | | | | 308,353 | |
Carmax Auto Owner Trust, 2021-4 A3 | | | 09/15/2026 | | | | 0.56% | | | | 595,000 | | | | 570,287 | |
CarMax Auto Owner Trust | | | | | | | | | | | | | | | | |
Series 2018-4 A3 | | | 09/15/2023 | | | | 3.36% | | | | 15,333 | | | | 15,348 | |
Series 2021-3 | | | 06/15/2026 | | | | 0.55% | | | | 2,650,000 | | | | 2,546,022 | |
Carvana Auto Receivables Trust | | | | | | | | | | | | | | | | |
Series 2021-P2 A3 | | | 03/10/2026 | | | | 0.49% | | | | 900,000 | | | | 867,310 | |
Series 2021-P4 A-3 | | | 01/10/2027 | | | | 1.31% | | | | 1,230,000 | | | | 1,164,301 | |
CenterPoint Energy Residential Bond, 2009-1 A3 | | | 08/15/2023 | | | | 4.24% | | | | 250,310 | | | | 250,778 | |
Corevest American Finance Trust, 2020-1 A1 (a) | | | 03/17/2050 | | | | 1.83% | | | | 215,654 | | | | 204,852 | |
DB Master Finance LLC, 2021-1A A2I (a) | | | 11/20/2051 | | | | 2.05% | | | | 646,750 | | | | 574,250 | |
Freddie Mac STACR REMIC Trust, 2021-HQA4 M1 (SOFR30A + 0.950%) (a)(c) | | | 12/26/2041 | | | | 1.88% | | | | 800,000 | | | | 773,772 | |
GM Financial Automobile Leasing Trust, 2021-2 A4 | | | 05/20/2025 | | | | 0.41% | | | | 1,050,000 | | | | 1,011,278 | |
GM Financial Consumer Automobile Receivables Trust | | | | | | | | | | | | | | | | |
Series 2021-1 A3 | | | 10/16/2025 | | | | 0.35% | | | | 750,000 | | | | 731,506 | |
Series 2021-3 A3 | | | 06/16/2026 | | | | 0.48% | | | | 1,000,000 | | | | 955,805 | |
Hilton Grand Vacations Trust, 2019-AA A (a) | | | 07/25/2033 | | | | 2.34% | | | | 408,210 | | | | 390,728 | |
Honda Auto Receivables Owner Trust, 2020-3 A3 | | | 10/18/2024 | | | | 0.37% | | | | 1,169,168 | | | | 1,147,994 | |
Hyundai Auto Receivables Trust, 2020-C A3 | | | 05/15/2025 | | | | 0.38% | | | | 1,128,526 | | | | 1,104,932 | |
Invitation Homes Trust | | | | | | | | | | | | | | | | |
Series 2018-SFR1 A (1 Month LIBOR USD + 0.700%) (a)(c) | | | 03/19/2037 | | | | 2.22% | | | | 419,858 | | | | 413,693 | |
Series 2018-SFR4 A (1 Month LIBOR USD + 1.100%) (a)(c) | | | 01/19/2038 | | | | 2.62% | | | | 670,847 | | | | 667,056 | |
Morgan Stanley Capital I Trust, 2004-HE6 M1 (1 Month LIBOR USD + 0.825%) (c) | | | 08/25/2034 | | | | 2.45% | | | | 63,920 | | | | 61,392 | |
MVW Owner Trust, 2019-1A A (a) | | | 11/20/2036 | | | | 2.89% | | | | 892,248 | | | | 862,895 | |
The accompanying notes are an integral part of these consolidated financial statements. | 45 |
LoCorr Market Trend Fund – Consolidated Schedule of Investments (continued) |
| | Maturity Date | | | Coupon Rate | | | Principal
Amount | | | Value | |
ASSET BACKED SECURITIES: (continued) |
PFS Financing Corp. | | | | | | | | | | | | | | | | |
Series 2020-F A (a) | | | 08/15/2024 | | | | 0.93% | | | $ | 700,000 | | | $ | 698,595 | |
Series 2020-G A (a) | | | 02/17/2026 | | | | 0.97% | | | | 500,000 | | | | 474,872 | |
Planet Fitness Master Issuer LLC, 3.25100 (a) | | | 12/05/2051 | | | | 3.25% | | | | 798,000 | | | | 718,248 | |
Santander Drive Auto Receivables Trust | | | | | | | | | | | | | | | | |
Series 2021-4 A3 | | | 08/15/2025 | | | | 0.51% | | | | 1,030,000 | | | | 1,012,855 | |
Series 2022-1 A-3 | | | 11/17/2025 | | | | 1.94% | | | | 2,000,000 | | | | 1,953,051 | |
Taco Bell Funding LLC, 2021-1A A21 (a) | | | 08/25/2051 | | | | 1.95% | | | | 1,019,875 | | | | 888,590 | |
Toyota Lease Owner Trust, 2021-B A3 (a) | | | 10/21/2024 | | | | 0.42% | | | | 1,090,000 | | | | 1,050,260 | |
Tricon American Homes Trust, 2017-SFR2 A (a) | | | 01/18/2036 | | | | 2.93% | | | | 94,174 | | | | 93,057 | |
Verizon Owner Trust | | | | | | | | | | | | | | | | |
Series 2019-B A1A | | | 12/20/2023 | | | | 2.33% | | | | 134,045 | | | | 134,076 | |
Series 2020-A A1A | | | 07/20/2024 | | | | 1.85% | | | | 643,030 | | | | 641,046 | |
Volkswagen Auto Loan Enhanced Trust, 2021-1 A-3 | | | 06/22/2026 | | | | 1.02% | | | | 950,000 | | | | 910,748 | |
VSE VOI Mortgage LLC, 2018-A A (a) | | | 02/20/2036 | | | | 3.56% | | | | 254,120 | | | | 250,017 | |
TOTAL ASSET BACKED SECURITIES (Cost $26,603,472) | | | | | | | | | | | | | | | 25,687,903 | |
| | | | | | | | | | | | | | | | | |
CORPORATE BONDS: 11.69% | | | | | | | | | | | | | | | | |
Aerospace & Defense: 0.09% | | | | | | | | | | | | | | | | |
Boeing Co. | | | 02/04/2026 | | | | 2.20% | | | | 565,000 | | | | 508,910 | |
| | | | | | | | | | | | | | | | | |
Auto Manufacturers: 0.35% | | | | | | | | | | | | | | | | |
Daimler Finance North America LLC (a) | | | 03/01/2024 | | | | 0.75% | | | | 250,000 | | | | 237,658 | |
General Motors Financial Co., Inc. | | | 10/15/2024 | | | | 1.20% | | | | 265,000 | | | | 246,669 | |
General Motors Financial Co., Inc. | | | 06/20/2025 | | | | 2.75% | | | | 820,000 | | | | 770,086 | |
Volkswagen Group of America Finance LLC (a) | | | 11/22/2023 | | | | 0.88% | | | | 425,000 | | | | 407,345 | |
Volkswagen Group of America Finance LLC (a) | | | 11/24/2025 | | | | 1.25% | | | | 375,000 | | | | 335,904 | |
| | | | | | | | | | | | | | | | 1,997,662 | |
Banks: 5.78% | | | | | | | | | | | | | | | | |
Banco Santander SA (b) | | | 02/23/2023 | | | | 3.13% | | | | 540,000 | | | | 537,777 | |
Banco Santander SA (b) | | | 03/24/2025 | | | | 3.50% | | | | 400,000 | | | | 391,059 | |
Banco Santander SA (b) | | | 05/28/2025 | | | | 2.75% | | | | 230,000 | | | | 217,985 | |
Bank of America Corp. (SOFR + 0.690%) (c) | | | 04/22/2025 | | | | 0.98% | | | | 3,280,000 | | | | 3,087,480 | |
Bank of America Corp. (SOFR + 1.150%) (c) | | | 06/19/2026 | | | | 1.32% | | | | 1,130,000 | | | | 1,026,347 | |
Bank of America Corp. (SOFR + 1.010%) (c) | | | 10/24/2026 | | | | 1.20% | | | | 1,655,000 | | | | 1,482,850 | |
Barclays PLC (1 Year CMT Rate + 0.800%) (b)(c) | | | 12/10/2024 | | | | 1.01% | | | | 625,000 | | | | 593,999 | |
BNP Paribas SA (3 Month LIBOR USD + 1.111%) (a)(b)(c) | | | 11/19/2025 | | | | 2.82% | | | | 750,000 | | | | 717,179 | |
Canadian Imperial Bank (b) | | | 04/07/2027 | | | | 3.45% | | | | 520,000 | | | | 499,859 | |
Citigroup, Inc. (3 Month LIBOR USD + 1.023%) (c) | | | 06/01/2024 | | | | 4.04% | | | | 460,000 | | | | 458,703 | |
Citigroup, Inc. (SOFR + 0.669%) (c) | | | 05/01/2025 | | | | 0.98% | | | | 1,055,000 | | | | 989,195 | |
Citigroup, Inc. (SOFR + 0.528%) (c) | | | 11/03/2025 | | | | 1.28% | | | | 550,000 | | | | 511,200 | |
Citigroup, Inc. (SOFR + 0.765%) (c) | | | 01/28/2027 | | | | 1.12% | | | | 370,000 | | | | 327,082 | |
Citigroup, Inc. (SOFR + 1.372%) (c) | | | 05/24/2025 | | | | 4.14% | | | | 1,000,000 | | | | 996,713 | |
Credit Suisse AG (b) | | | 05/05/2023 | | | | 1.00% | | | | 715,000 | | | | 699,776 | |
Credit Suisse AG (b) | | | 08/09/2023 | | | | 0.52% | | | | 455,000 | | | | 439,145 | |
Deutsche Bank NY (b) | | | 05/28/2024 | | | | 0.90% | | | | 310,000 | | | | 290,670 | |
Federation des Caisses Desjardins du Quebec (a)(b) | | | 09/26/2023 | | | | 1.95% | | | | 700,000 | | | | 699,029 | |
Federation des Caisses Desjardins du Quebec (a)(b) | | | 05/21/2024 | | | | 0.70% | | | | 550,000 | | | | 517,393 | |
Goldman Sachs Group, Inc. (SOFR + 0.572%) (c) | | | 03/08/2024 | | | | 0.67% | | | | 1,335,000 | | | | 1,304,886 | |
Goldman Sachs Group, Inc. | | | 03/15/2024 | | | | 3.00% | | | | 650,000 | | | | 641,088 | |
Goldman Sachs Group, Inc. (3 Month LIBOR USD + 1.201%) (c) | | | 09/29/2025 | | | | 3.27% | | | | 1,320,000 | | | | 1,283,687 | |
Goldman Sachs Group, Inc. (SOFR + 0.609%) (c) | | | 02/12/2026 | | | | 0.86% | | | | 345,000 | | | | 314,131 | |
Goldman Sachs Group, Inc. (SOFR + 0.789%) (c) | | | 12/09/2026 | | | | 1.09% | | | | 545,000 | | | | 485,944 | |
46 | The accompanying notes are an integral part of these consolidated financial statements. |
LoCorr Market Trend Fund – Consolidated Schedule of Investments (continued) |
| | Maturity Date | | | Coupon Rate | | | Principal
Amount | | | Value | |
CORPORATE BONDS: (continued) |
HSBC Bank Canada (a)(b) | | | 09/10/2023 | | | | 1.65% | | | $ | 930,000 | | | $ | 928,216 | |
HSBC Holdings PLC (SOFR + 1.538%) (b)(c) | | | 04/18/2026 | | | | 1.65% | | | | 300,000 | | | | 275,282 | |
HSBC Holdings PLC (SOFR + 1.929%) (b)(c) | | | 06/04/2026 | | | | 2.10% | | | | 965,000 | | | | 893,793 | |
ING Groep NV (b) | | | 04/09/2024 | | | | 3.55% | | | | 540,000 | | | | 535,539 | |
ING Groep NV (SOFR + 1.640%) (b)(c) | | | 03/28/2026 | | | | 3.87% | | | | 525,000 | | | | 514,544 | |
JP Morgan Chase & Co. (TSFR3M + 0.600%) (c) | | | 09/16/2024 | | | | 0.65% | | | | 160,000 | | | | 153,421 | |
JP Morgan Chase & Co. (SOFR + 0.420%) (c) | | | 02/16/2025 | | | | 0.56% | | | | 345,000 | | | | 325,329 | |
JP Morgan Chase & Co. (SOFR + 0.540%) (c) | | | 06/01/2025 | | | | 0.82% | | | | 1,220,000 | | | | 1,141,038 | |
JP Morgan Chase & Co. (SOFR + 0.800%) (c) | | | 11/19/2026 | | | | 1.05% | | | | 1,645,000 | | | | 1,463,909 | |
JP Morgan Chase & Co. (TSFR3M + 0.695%) (c) | | | 02/04/2027 | | | | 1.04% | | | | 625,000 | | | | 553,415 | |
Mitsubishi UFJ Financial Group, Inc. (1 Year CMT Rate + 0.680%) (b)(c) | | | 09/15/2024 | | | | 0.85% | | | | 660,000 | | | | 635,718 | |
Mitsubishi UFJ Financial Group, Inc. (b) | | | 02/25/2025 | | | | 2.19% | | | | 545,000 | | | | 517,084 | |
Morgan Stanley (SOFR + 0.616%) (c) | | | 04/05/2024 | | | | 0.73% | | | | 665,000 | | | | 648,503 | |
Morgan Stanley (SOFR + 0.525%) (c) | | | 05/30/2025 | | | | 0.79% | | | | 475,000 | | | | 443,182 | |
Morgan Stanley (SOFR + 1.152%) (c) | | | 07/22/2025 | | | | 2.72% | | | | 450,000 | | | | 433,844 | |
Morgan Stanley (SOFR + 0.858%) (c) | | | 07/20/2027 | | | | 1.51% | | | | 1,105,000 | | | | 970,348 | |
NatWest Markets PLC (a)(b) | | | 05/21/2023 | | | | 2.38% | | | | 370,000 | | | | 364,797 | |
NatWest Markets PLC (a)(b) | | | 08/12/2024 | | | | 0.80% | | | | 400,000 | | | | 371,635 | |
Standard Chartered PLC (3 Month LIBOR USD + 1.080%) (a)(b)(c) | | | 03/15/2024 | | | | 3.89% | | | | 300,000 | | | | 299,165 | |
Svenska Handelsbanken AB (a)(b) | | | 06/30/2023 | | | | 0.63% | | | | 405,000 | | | | 393,500 | |
Svenska Handelsbanken AB (a)(b) | | | 06/11/2024 | | | | 0.55% | | | | 250,000 | | | | 234,823 | |
Toronto-Dominion Bank (b) | | | 06/06/2025 | | | | 3.77% | | | | 495,000 | | | | 491,713 | |
Toronto-Dominion Bank (b) | | | 09/10/2026 | | | | 1.25% | | | | 625,000 | | | | 554,297 | |
Truist Financial Corp. | | | 08/05/2025 | | | | 1.20% | | | | 235,000 | | | | 216,104 | |
UBS AG/London (a)(b) | | | 06/01/2023 | | | | 0.38% | | | | 440,000 | | | | 425,904 | |
UBS AG/London (a)(b) | | | 08/09/2024 | | | | 0.70% | | | | 600,000 | | | | 562,061 | |
UBS Group AG (1 Year CMT Rate + 0.830%) (a)(b)(c) | | | 07/30/2024 | | | | 1.01% | | | | 200,000 | | | | 193,750 | |
UBS Group AG (1 Year CMT Rate + 1.550%) (a)(b)(c) | | | 05/12/2026 | | | | 4.49% | | | | 250,000 | | | | 249,457 | |
| | | | | | | | | | | | | | | | 33,303,548 | |
Beverages: 0.11% | | | | | | | | | | | | | | | | |
Constellation Brands, Inc. | | | 05/09/2024 | | | | 3.60% | | | | 655,000 | | | | 653,076 | |
| | | | | | | | | | | | | | | | | |
Cosmetics & Personal Care: 0.22% | | | | | | | | | | | | | | | | |
GSK Consumer Healthcare Capital UK PLC (a)(b) | | | 03/24/2025 | | | | 3.13% | | | | 1,295,000 | | | | 1,262,228 | |
| | | | | | | | | | | | | | | | | |
Diversified Financial Services: 0.82% | | | | | | | | | | | | | | | | |
AerCap Ireland Capital/Global Aviation Trust (b) | | | 10/29/2023 | | | | 1.15% | | | | 700,000 | | | | 667,356 | |
AerCap Ireland Capital/Global Aviation Trust (b) | | | 10/29/2024 | | | | 1.65% | | | | 1,190,000 | | | | 1,099,924 | |
AerCap Ireland Capital/Global Aviation Trust (b) | | | 01/15/2025 | | | | 3.50% | | | | 850,000 | | | | 812,426 | |
AerCap Ireland Capital/Global Aviation Trust (b) | | | 01/30/2026 | | | | 1.75% | | | | 385,000 | | | | 336,878 | |
Air Lease Corp. | | | 07/03/2023 | | | | 3.88% | | | | 230,000 | | | | 228,003 | |
Air Lease Corp. | | | 02/01/2024 | | | | 4.25% | | | | 200,000 | | | | 197,713 | |
Capital One Bank | | | 02/15/2023 | | | | 3.38% | | | | 290,000 | | | | 289,780 | |
Capital One Financial Corp. (SOFR + 1.370%) (c) | | | 05/09/2025 | | | | 4.17% | | | | 525,000 | | | | 517,716 | |
Charles Schwab Corp. | | | 03/03/2027 | | | | 2.45% | | | | 415,000 | | | | 387,590 | |
Private Export Funding Corp. | | | 06/15/2025 | | | | 3.25% | | | | 200,000 | | | | 200,265 | |
| | | | | | | | | | | | | | | | 4,737,651 | |
Electric: 0.24% | | | | | | | | | | | | | | | | |
Eversource Energy | | | 08/15/2025 | | | | 0.80% | | | | 80,000 | | | | 72,281 | |
Southern California Edison Co. | | | 08/01/2023 | | | | 0.70% | | | | 515,000 | | | | 499,347 | |
Southern California Edison Co. | | | 04/01/2024 | | | | 1.10% | | | | 700,000 | | | | 666,410 | |
Southern California Edison Co. | | | 02/01/2026 | | | | 1.20% | | | | 135,000 | | | | 120,921 | |
| | | | | | | | | | | | | | | | 1,358,959 | |
The accompanying notes are an integral part of these consolidated financial statements. | 47 |
LoCorr Market Trend Fund – Consolidated Schedule of Investments (continued) |
| | Maturity Date | | | Coupon Rate | | | Principal
Amount | | | Value | |
CORPORATE BONDS: (continued) |
Entertainment: 0.24% | | | | | | | | | | | | | | | | |
Magallanes, Inc. (a) | | | 03/15/2025 | | | | 3.64% | | | $ | 760,000 | | | $ | 737,281 | |
Magallanes, Inc. (a) | | | 03/15/2027 | | | | 3.76% | | | | 685,000 | | | | 642,554 | |
| | | | | | | | | | | | | | | | 1,379,835 | |
Food: 0.11% | | | | | | | | | | | | | | | | |
Conagra Brands, Inc. | | | 08/11/2023 | | | | 0.50% | | | | 245,000 | | | | 236,266 | |
McCormick & Co., Inc. | | | 08/15/2024 | | | | 3.15% | | | | 170,000 | | | | 166,751 | |
Mondelez International, Inc. | | | 03/17/2024 | | | | 2.13% | | | | 245,000 | | | | 238,977 | |
| | | | | | | | | | | | | | | | 641,994 | |
Healthcare - Products: 0.61% | | | | | | | | | | | | | | | | |
Baxter International, Inc. | | | 11/29/2024 | | | | 1.32% | | | | 1,255,000 | | | | 1,179,379 | |
DH Europe Finance II Sarl (b) | | | 11/15/2024 | | | | 2.20% | | | | 510,000 | | | | 489,721 | |
PerkinElmer, Inc. | | | 09/15/2024 | | | | 0.85% | | | | 1,200,000 | | | | 1,111,702 | |
Thermo Fisher Scientific, Inc. | | | 10/18/2024 | | | | 1.22% | | | | 775,000 | | | | 734,953 | |
| | | | | | | | | | | | | | | | 3,515,755 | |
Healthcare - Services: 0.12% | | | | | | | | | | | | | | | | |
HCA, Inc. (a) | | | 03/15/2027 | | | | 3.13% | | | | 265,000 | | | | 241,100 | |
UnitedHealth Group, Inc. | | | 05/15/2024 | | | | 0.55% | | | | 475,000 | | | | 452,488 | |
| | | | | | | | | | | | | | | | 693,588 | |
Insurance: 0.66% | | | | | | | | | | | | | | | | |
Berkshire Hathaway Finance Corp. | | | 03/15/2027 | | | | 2.30% | | | | 390,000 | | | | 368,909 | |
Equitable Financial Life Global (a) | | | 11/17/2023 | | | | 0.50% | | | | 150,000 | | | | 143,867 | |
Equitable Financial Life Global (a) | | | 07/07/2025 | | | | 1.40% | | | | 490,000 | | | | 450,758 | |
Metropolitan Life Global Funding I (a) | | | 06/07/2024 | | | | 0.55% | | | | 645,000 | | | | 607,181 | |
Metropolitan Life Global Funding I (a) | | | 07/02/2025 | | | | 0.95% | | | | 475,000 | | | | 437,224 | |
Principal Life Global Funding II (a) | | | 04/12/2024 | | | | 0.75% | | | | 620,000 | | | | 586,798 | |
Principal Life Global Funding II (a) | | | 01/12/2026 | | | | 0.88% | | | | 485,000 | | | | 429,927 | |
Protective Life Global Funding (a) | | | 07/05/2024 | | | | 0.78% | | | | 845,000 | | | | 793,923 | |
| | | | | | | | | | | | | | | | 3,818,587 | |
Media: 0.07% | | | | | | | | | | | | | | | | |
Comcast Corp. | | | 03/01/2026 | | | | 3.15% | | | | 395,000 | | | | 384,919 | |
| | | | | | | | | | | | | | | | | |
Miscellaneous Manufacturing: 0.04% | | | | | | | | | | | | | | | | |
Trane Technologies Luxembourg Finance SA (b) | | | 03/21/2026 | | | | 3.50% | | | | 260,000 | | | | 253,034 | |
| | | | | | | | | | | | | | | | | |
Oil & Gas: 0.08% | | | | | | | | | | | | | | | | |
Phillips 66 | | | 02/15/2024 | | | | 0.90% | | | | 495,000 | | | | 471,685 | |
| | | | | | | | | | | | | | | | | |
Packaging & Containers: 0.19% | | | | | | | | | | | | | | | | |
Amcor Finance, Inc. | | | 04/28/2026 | | | | 3.63% | | | | 670,000 | | | | 645,449 | |
Berry Global, Inc. | | | 02/15/2024 | | | | 0.95% | | | | 480,000 | | | | 454,977 | |
| | | | | | | | | | | | | | | | 1,100,426 | |
Pharmaceuticals: 0.51% | | | | | | | | | | | | | | | | |
AbbVie, Inc. | | | 11/21/2024 | | | | 2.60% | | | | 1,245,000 | | | | 1,206,334 | |
AbbVie, Inc. | | | 05/14/2026 | | | | 3.20% | | | | 235,000 | | | | 226,361 | |
Astrazeneca Finance LLC | | | 05/28/2024 | | | | 0.70% | | | | 790,000 | | | | 749,308 | |
Takeda Pharmaceutical Co. Ltd. (b) | | | 11/26/2023 | | | | 4.40% | | | | 750,000 | | | | 756,036 | |
| | | | | | | | | | | | | | | | 2,938,039 | |
Pipelines: 0.32% | | | | | | | | | | | | | | | | |
Enbridge, Inc. (b) | | | 02/14/2025 | | | | 2.50% | | | | 300,000 | | | | 288,214 | |
Energy Transfer Operating LP | | | 05/15/2025 | | | | 2.90% | | | | 175,000 | | | | 166,485 | |
MPLX LP | | | 03/01/2026 | | | | 1.75% | | | | 570,000 | | | | 513,837 | |
ONEOK, Inc. | | | 09/01/2024 | | | | 2.75% | | | | 270,000 | | | | 261,316 | |
48 | The accompanying notes are an integral part of these consolidated financial statements. |
LoCorr Market Trend Fund – Consolidated Schedule of Investments (continued) |
| | Maturity Date | | | Coupon Rate | | | Principal
Amount | | | Value | |
CORPORATE BONDS: (continued) |
TransCanada PipeLines Ltd. (b) | | | 10/12/2024 | | | | 1.00% | | | $ | 680,000 | | | $ | 634,889 | |
| | | | | | | | | | | | | | | | 1,864,741 | |
Real Estate Investment Trusts: 0.38% | | | | | | | | | | | | | | | | |
American Tower Corp. | | | 09/15/2025 | | | | 1.30% | | | | 1,090,000 | | | | 987,709 | |
Brixmor Operating Partnership LP | | | 06/15/2024 | | | | 3.65% | | | | 250,000 | | | | 246,582 | |
Crown Castle International Corp. | | | 07/15/2025 | | | | 1.35% | | | | 195,000 | | | | 178,413 | |
SITE Centers Corp. | | | 02/01/2025 | | | | 3.63% | | | | 190,000 | | | | 184,820 | |
SITE Centers Corp. | | | 06/01/2027 | | | | 4.70% | | | | 580,000 | | | | 573,079 | |
| | | | | | | | | | | | | | | | 2,170,603 | |
Retail: 0.03% | | | | | | | | | | | | | | | | |
Genuine Parts Co. | | | 02/01/2025 | | | | 1.75% | | | | 160,000 | | | | 151,176 | |
| | | | | | | | | | | | | | | | | |
Software: 0.15% | | | | | | | | | | | | | | | | |
Roper Technologies, Inc. | | | 09/15/2024 | | | | 2.35% | | | | 220,000 | | | | 213,272 | |
VMware, Inc. | | | 08/15/2024 | | | | 1.00% | | | | 695,000 | | | | 650,724 | |
| | | | | | | | | | | | | | | | 863,996 | |
Telecommunications: 0.38% | | | | | | | | | | | | | | | | |
NBN Co. Ltd. (a)(b) | | | 10/08/2024 | | | | 0.88% | | | | 435,000 | | | | 406,487 | |
NTT Finance Corp. (a)(b) | | | 04/03/2026 | | | | 1.16% | | | | 560,000 | | | | 503,632 | |
Verizon Communications, Inc. | | | 11/20/2025 | | | | 0.85% | | | | 1,020,000 | | | | 924,772 | |
Verizon Communications, Inc. | | | 03/20/2026 | | | | 1.45% | | | | 395,000 | | | | 361,719 | |
| | | | | | | | | | | | | | | | 2,196,610 | |
Transportation: 0.19% | | | | | | | | | | | | | | | | |
Canadian Pacific Railway Co. (b) | | | 12/02/2024 | | | | 1.35% | | | | 1,145,000 | | | | 1,078,226 | |
TOTAL CORPORATE BONDS (Cost $70,625,572) | | | | | | | | | | | | | | | 67,345,248 | |
| | | | | | | | | | | | | | | | | |
MORTGAGE BACKED SECURITIES: 7.25% | | | | | | | | | | | | | | | | |
ACRE Commercial Mortgage Trust, 2021-FL4 A (1 Month LIBOR USD + 0.830%) (a)(b)(c) | | | 12/18/2037 | | | | 2.44% | | | | 318,998 | | | | 312,588 | |
Alen Mortgage Trust, 2021-ACEN A (1 Month LIBOR USD + 1.150%) (a)(c) | | | 04/17/2034 | | | | 2.47% | | | | 600,000 | | | | 576,176 | |
Angel Oak Mortgage Trust | | | | | | | | | | | | | | | | |
Series 2020-1 M1 (a)(d) | | | 12/25/2059 | | | | 3.16% | | | | 418,000 | | | | 391,764 | |
Series 2020-5 A3 (a)(d) | | | 05/25/2065 | | | | 2.04% | | | | 26,185 | | | | 24,863 | |
BAMLL Commercial Mortgage Securities Trust, 2022-DKLX A (TSFR1M + 1.150%) (a)(c) | | | 01/18/2039 | | | | 2.43% | | | | 1,250,000 | | | | 1,214,374 | |
BIG Commercial Mortgage Trust, 2022-BIG A (TSFR1M + 1.342%) (a)(c) | | | 02/15/2039 | | | | 2.62% | | | | 1,400,000 | | | | 1,357,102 | |
BSREP Commercial Mortgage Trust, 2021-DC A (1 Month LIBOR USD + 0.950%) (a)(c) | | | 08/16/2038 | | | | 2.28% | | | | 335,000 | | | | 321,680 | |
BX Commercial Mortgage Trust | | | | | | | | | | | | | | | | |
Series 2021-21M A (1 Month LIBOR USD + 0.730%) (a)(c) | | | 10/15/2036 | | | | 2.05% | | | | 410,000 | | | | 389,811 | |
Series 2019-XL A (1 Month LIBOR USD + 0.920%) (a)(c) | | | 10/15/2036 | | | | 2.24% | | | | 389,044 | | | | 382,194 | |
Series 2021-CIP A (1 Month LIBOR USD + 0.921%) (a)(c) | | | 12/15/2038 | | | | 2.25% | | | | 1,000,000 | | | | 969,867 | |
Comm Mortgage Trust | | | | | | | | | | | | | | | | |
Series 2013-CR6 A4 | | | 03/10/2046 | | | | 3.10% | | | | 185,000 | | | | 184,098 | |
Series 2013-CR6 AM (a) | | | 03/12/2046 | | | | 3.15% | | | | 1,000,000 | | | | 988,811 | |
Series 2013-CR10 A4 (d) | | | 08/10/2046 | | | | 4.21% | | | | 185,000 | | | | 184,782 | |
Series 2013-CR11 B (d) | | | 08/12/2050 | | | | 5.28% | | | | 575,000 | | | | 575,662 | |
Connecticut Avenue Securities Trust | | | | | | | | | | | | | | | | |
Series 2021-R03 1M1 (SOFR30A + 0.850%) (a)(c) | | | 12/26/2041 | | | | 1.78% | | | | 902,294 | | | | 884,049 | |
Series 2022-R01 1M1 (SOFR30A + 1.000%) (a)(c) | | | 12/26/2041 | | | | 1.93% | | | | 434,370 | | | | 425,117 | |
Series 2022-R04 (SOFR30A + 2.000%) (a)(c) | | | 03/25/2042 | | | | 2.93% | | | | 1,195,199 | | | | 1,193,366 | |
Series 2022-R03 1M1 (SOFR30A + 2.100%) (a)(c) | | | 03/25/2042 | | | | 3.03% | | | | 1,274,835 | | | | 1,263,214 | |
Credit Suisse Mortgage Capital Certificates, 2019-ICE4 A (1 Month LIBOR USD + 0.980%) (a)(c) | | | 05/15/2036 | | | | 2.30% | | | | 1,000,000 | | | | 983,629 | |
The accompanying notes are an integral part of these consolidated financial statements. | 49 |
LoCorr Market Trend Fund – Consolidated Schedule of Investments (continued) |
| | Maturity Date | | | Coupon Rate | | | Principal
Amount | | | Value | |
MORTGAGE BACKED SECURITIES: (continued) |
ELP Commercial Mortgage Trust, 2021-ELP B (1 Month LIBOR USD + 1.120%) (a)(c) | | | 11/15/2038 | | | | 2.45% | | | $ | 950,000 | | | $ | 907,059 | |
EQUS Mortgage Trust, 2021-EQAZ A (1 Month LIBOR USD + 0.755%) (a)(c) | | | 10/15/2036 | | | | 2.08% | | | | 950,000 | | | | 907,054 | |
Fannie Mae Aces | | | | | | | | | | | | | | | | |
Series 2015-M17 FA (1 Month LIBOR USD + 0.930%) (c) | | | 11/25/2022 | | | | 1.86% | | | | 59,896 | | | | 59,833 | |
Series 2014-M11 1A (d) | | | 08/25/2024 | | | | 3.23% | | | | 481,793 | | | | 479,329 | |
Fannie Mae Connecticut Avenue Securities | | | | | | | | | | | | | | | | |
Series 2018-C01 1EB1 (1 Month LIBOR USD + 0.450%) (c) | | | 07/25/2030 | | | | 2.07% | | | | 253,074 | | | | 250,415 | |
Series 2021-R02 2M1 (SOFR30A + 0.900%) (a)(c) | | | 11/25/2041 | | | | 1.83% | | | | 593,649 | | | | 580,037 | |
Freddie Mac STACR REMIC Trust | | | | | | | | | | | | | | | | |
Series 2021-DNA5 M2 (SOFR30A + 1.650%) (a)(c) | | | 01/25/2034 | | | | 2.58% | | | | 198,411 | | | | 191,310 | |
Series 2022-DNA1 M1A (SOFR30A + 1.000%) (a)(c) | | | 01/27/2042 | | | | 1.93% | | | | 1,500,000 | | | | 1,447,267 | |
Series 2022-HQA1 M1A (SOFR30A + 2.100%) (a)(c) | | | 03/25/2042 | | | | 3.03% | | | | 1,204,342 | | | | 1,194,048 | |
Series 2022-DNA3 (SOFR30A + 2.000%) (a)(c) | | | 04/25/2042 | | | | 2.93% | | | | 1,133,790 | | | | 1,110,153 | |
Freddie Mac STACR Trust, 2018-HRP2 M3AS (1 Month LIBOR USD + 1.000%) (a)(c) | | | 02/25/2047 | | | | 2.62% | | | | 600,000 | | | | 589,898 | |
Freddie Mac Structured Agency Credit Risk Debt Notes | | | | | | | | | | | | | | | | |
Series 2021-DNA7 M1 (SOFR30A + 0.850%) (a)(c) | | | 11/25/2041 | | | | 1.78% | | | | 1,100,000 | | | | 1,066,938 | |
Series 2022-DNA2 M1A (SOFR30A + 1.300%) (a)(c) | | | 02/25/2042 | | | | 2.23% | | | | 1,233,417 | | | | 1,205,090 | |
Series 2018-HRP2 M3 (1 Month LIBOR USD + 2.400%) (a)(c) | | | 02/25/2047 | | | | 4.02% | | | | 400,000 | | | | 393,269 | |
FRESB Multifamily Mortgage Pass Through Certificates | | | | | | | | | | | | | | | | |
Series 2016-SB17 A7F (d) | | | 05/25/2023 | | | | 2.15% | | | | 474,605 | | | | 468,479 | |
Series 2017-SB31 A7F (d) | | | 01/25/2024 | | | | 2.46% | | | | 627,599 | | | | 620,967 | |
Series 2017-SB32 A7F (d) | | | 04/25/2024 | | | | 2.44% | | | | 240,704 | | | | 236,930 | |
Series 2019-SB67 A5F (d) | | | 07/25/2024 | | | | 2.09% | | | | 632,281 | | | | 615,221 | |
GCT Commercial Mortgage Trust, 2021-GCT A (1 Month LIBOR USD + 0.800%) (a)(c) | | | 02/15/2038 | | | | 2.12% | | | | 750,000 | | | | 726,024 | |
GS Mortgage Securities Corp II, 2021-ARDN A (1 Month LIBOR USD + 1.250%) (a)(c) | | | 11/17/2036 | | | | 2.57% | | | | 950,000 | | | | 926,940 | |
GS Mortgage Securities Trust | | | | | | | | | | | | | | | | |
Series 2015-GC28 A5 | | | 02/10/2048 | | | | 3.40% | | | | 1,000,000 | | | | 982,749 | |
Series 2015-GC32 AS (d) | | | 07/10/2048 | | | | 4.02% | | | | 1,000,000 | | | | 980,970 | |
JP Morgan Chase Commercial Mortgage Securities Trust | | | | | | | | | | | | | | | | |
2022-NLP (TSFR1M + 0.597%) (a)© | | | 04/15/2037 | | | | 1.88% | | | | 1,000,000 | | | | 939,883 | |
Series 2021-MHC A (1 Month LIBOR USD + 0.800%) (a)(c) | | | 04/15/2038 | | | | 2.12% | | | | 803,162 | | | | 774,910 | |
Series 2013-C13 A4 (d) | | | 01/18/2046 | | | | 3.99% | | | | 513,180 | | | | 511,596 | |
Series 2014-C22 AS | | | 09/17/2047 | | | | 4.11% | | | | 685,000 | | | | 672,240 | |
Series 2013-C10 AS | | | 12/17/2047 | | | | 3.37% | | | | 200,000 | | | | 198,513 | |
MTN Commercial Mortgage Trust, 2022-LPFL A (TSFR1M + 1.397%) (a)(c) | | | 03/15/2039 | | | | 2.68% | | | | 1,500,000 | | | | 1,473,073 | |
Natixis Commercial Mortgage Securities Trust, 2018-285M A (a)(d) | | | 11/15/2032 | | | | 3.92% | | | | 1,000,000 | | | | 994,082 | |
OPG TRUST, 2021-PORT B (1 Month LIBOR USD + 0.713%) (a)(c) | | | 10/15/2036 | | | | 2.04% | | | | 750,000 | | | | 701,050 | |
PKHL Commercial Mortgage Trust, 2021-MF A (1 Month LIBOR USD + 0.880%) (a)(c) | | | 07/15/2038 | | | | 2.21% | | | | 1,000,000 | | | | 964,317 | |
Sequoia Mortgage Trust, 2020-2 A4 (a)(d) | | | 03/25/2050 | | | | 3.50% | | | | 4,101 | | | | 4,091 | |
SMR Mortgage Trust, 2022-IND A (TSFR1M + 1.650%) (a)(c) | | | 02/15/2039 | | | | 2.93% | | | | 1,205,738 | | | | 1,163,439 | |
SREIT Trust, 2021-MFP2 A (1 Month LIBOR USD + 0.822%) (a)(c) | | | 11/17/2036 | | | | 2.15% | | | | 1,250,000 | | | | 1,198,030 | |
Verus Securitization Trust | | | | | | | | | | | | | | | | |
Series 2020-1 A1 (a)(d) | | | 01/25/2060 | | | | 2.42% | | | | 97,874 | | | | 96,038 | |
Series 2020-1 A3 (a)(d) | | | 01/25/2060 | | | | 2.72% | | | | 280,118 | | | | 274,566 | |
Wells Fargo Commercial Mortgage Trust | | | | | | | | | | | | | | | | |
Series 2012-LC5 AS | | | 10/17/2045 | | | | 3.54% | | | | 165,000 | | | | 164,822 | |
Series 2015-NXS2 A-4 | | | 07/17/2058 | | | | 3.50% | | | | 1,000,000 | | | | 978,588 | |
WFRBS Commercial Mortgage Trust | | | | | | | | | | | | | | | | |
Series 2013-C13 AS | | | 05/17/2045 | | | | 3.35% | | | | 165,000 | | | | 163,437 | |
Series 2013-C14 A5 | | | 06/15/2046 | | | | 3.34% | | | | 185,000 | | | | 182,151 | |
Series 2014-C24 A5 | | | 11/18/2047 | | | | 3.61% | | | | 1,000,000 | | | | 983,844 | |
Series 2013-C12 AS | | | 03/17/2048 | | | | 3.56% | | | | 780,000 | | | | 775,800 | |
TOTAL MORTGAGE BACKED SECURITIES (Cost $43,109,168) | | | | | | | | | | | | | | | 41,777,597 | |
50 | The accompanying notes are an integral part of these consolidated financial statements. |
LoCorr Market Trend Fund – Consolidated Schedule of Investments (continued) |
| | Maturity Date | | | Coupon Rate | | | Principal
Amount | | | Value | |
MUNICIPAL BONDS: 0.41% | | | | | | | | | | | | | | | | |
City of Sacramento CA Water Revenue | | | 09/01/2023 | | | | 1.61% | | | $ | 555,000 | | | $ | 545,660 | |
Forsyth County School District | | | 02/01/2024 | | | | 0.92% | | | | 230,000 | | | | 222,254 | |
Pennsylvania State University | | | 09/01/2023 | | | | 1.35% | | | | 940,000 | | | | 923,019 | |
State of Hawaii | | | 08/01/2025 | | | | 1.03% | | | | 720,000 | | | | 670,982 | |
TOTAL MUNICIPAL BONDS (Cost $2,445,000) | | | | | | | | | | | | | | | 2,361,915 | |
| | | | | | | | | | | | | | | | | |
U.S. GOVERNMENT AGENCY ISSUES: 5.23% | | | | | | | | | | | | | | | | |
Federal Farm Credit Banks | | | 05/10/2023 | | | | 0.13% | | | | 1,105,000 | | | | 1,079,652 | |
Federal Farm Credit Banks | | | 08/14/2023 | | | | 1.60% | | | | 2,270,000 | | | | 2,236,638 | |
Federal Farm Credit Banks | | | 11/09/2023 | | | | 0.40% | | | | 2,100,000 | | | | 2,031,737 | |
Federal Farm Credit Banks | | | 12/01/2023 | | | | 0.50% | | | | 3,480,000 | | | | 3,364,951 | |
Federal Farm Credit Banks | | | 02/14/2025 | | | | 1.75% | | | | 2,680,000 | | | | 2,594,280 | |
Federal Home Loan Banks | | | 12/09/2022 | | | | 3.00% | | | | 4,500,000 | | | | 4,513,477 | |
Federal Home Loan Banks | | | 06/14/2024 | | | | 1.75% | | | | 2,200,000 | | | | 2,146,836 | |
Federal Home Loan Banks | | | 12/20/2024 | | | | 1.00% | | | | 1,980,000 | | | | 1,882,284 | |
Federal Home Loan Banks | | | 04/14/2025 | | | | 0.50% | | | | 1,700,000 | | | | 1,586,827 | |
Federal Home Loan Mortgage Corp. | | | 05/19/2023 | | | | 0.25% | | | | 1,330,000 | | | | 1,298,992 | |
Federal Home Loan Mortgage Corp. | | | 08/24/2023 | | | | 0.25% | | | | 1,700,000 | | | | 1,649,476 | |
Federal Home Loan Mortgage Corp. | | | 09/08/2023 | | | | 0.25% | | | | 535,000 | | | | 518,695 | |
Federal National Mortgage Association | | | 09/06/2022 | | | | 1.38% | | | | 2,310,000 | | | | 2,308,397 | |
Federal National Mortgage Association | | | 07/10/2023 | | | | 0.25% | | | | 2,000,000 | | | | 1,947,039 | |
Federal National Mortgage Association | | | 07/02/2024 | | | | 1.75% | | | | 1,000,000 | | | | 978,217 | |
TOTAL U.S. GOVERNMENT AGENCY ISSUES (Cost $30,939,867) | | | | | | | | | | | | | | | 30,137,498 | |
| | | | | | | | | | | | | | | | | |
U.S. GOVERNMENT NOTES: 15.04% | | | | | | | | | | | | | | | | |
United States Treasury Note | | | 08/31/2023 | | | | 0.13% | | | | 2,450,000 | | | | 2,371,141 | |
United States Treasury Note | | | 01/15/2024 | | | | 0.13% | | | | 13,050,000 | | | | 12,502,002 | |
United States Treasury Note | | | 05/15/2024 | | | | 0.25% | | | | 15,000 | | | | 14,268 | |
United States Treasury Note | | | 06/15/2024 | | | | 0.25% | | | | 3,170,000 | | | | 3,008,652 | |
United States Treasury Note | | | 08/15/2024 | | | | 0.38% | | | | 8,125,000 | | | | 7,693,042 | |
United States Treasury Note | | | 09/15/2024 | | | | 0.38% | | | | 6,510,000 | | | | 6,149,916 | |
United States Treasury Note | | | 09/30/2024 | | | | 1.50% | | | | 8,620,000 | | | | 8,346,248 | |
United States Treasury Note | | | 02/15/2025 | | | | 7.63% | | | | 900,000 | | | | 1,004,484 | |
United States Treasury Note | | | 04/15/2025 | | | | 2.63% | | | | 15,760,000 | | | | 15,604,862 | |
United States Treasury Note | | | 05/31/2025 | | | | 0.25% | | | | 32,410,000 | | | | 29,940,003 | |
TOTAL U.S. GOVERNMENT NOTES (Cost $88,370,872) | | | | | | | | | | | | | | | 86,634,618 | |
| | | | | | | | | | | | | | | | | |
SHORT TERM INVESTMENTS: 46.84% | | | | | | | | | | | | | | | | |
CORPORATE BOND: 0.81% | | | | | | | | | | | | | | | | |
Diversified Financial Services: 0.81% | | | | | | | | | | | | | | | | |
Private Export Funding Corp. | | | 11/15/2022 | | | | 2.05% | | | | 4,680,000 | | | | 4,670,552 | |
TOTAL CORPORATE BOND (Cost $4,674,038) | | | | | | | | | | | | | | | 4,670,552 | |
| | | | | | | | | | | | | | | | | |
MONEY MARKET FUND: 46.03% | | | | | | | | | | Shares | | | | | |
STIT-Government & Agency Portfolio, Institutional Class, 1.38% (e)(f)^ | | | | | | | | | | | 265,218,112 | | | | 265,218,112 | |
TOTAL MONEY MARKET FUND (Cost $265,218,112) | | | | | | | | | | | | | | | 265,218,112 | |
TOTAL SHORT TERM INVESTMENTS (Cost $269,892,152) | | | | | | | | | | | | | | | 269,888,664 | |
| | | | | | | | | | | | | | | | | |
TOTAL INVESTMENTS (Cost $531,986,101): 90.92% | | | | | | | | | | | | | | | 523,833,443 | |
Other Assets in Excess of Liabilities: 9.08% (g) | | | | | | | | | | | | | | | 52,312,550 | |
TOTAL NET ASSETS: 100.00% | | | | | | | | | | | | | | $ | 576,145,993 | |
The accompanying notes are an integral part of these consolidated financial statements. | 51 |
LoCorr Market Trend Fund – Consolidated Schedule of Investments (continued) |
(a) | Security as defined in Rule 144A under the Securities Act of 1933 and determined to be liquid. Purchased in a private placement transaction; resale to the public may require registration or may extend only to qualified institutional buyers. At June 30, 2022, the value of these securities total $53,435,400 which represents 9.45% of total net assets. |
(b) | Foreign issued security. |
(c) | Variable rate security based on a reference index and spread. The rate reported is the rate in effect as of June 30, 2022. |
(d) | Variable rate security. The coupon is based on an underlying pool of loans. The rate reported is the rate in effect as of June 30, 2022. |
(e) | The rate quoted is the annualized seven-day effective yield as of June 30, 2022. |
(f) | All or a portion of this security is pledged as collateral for derivative contracts. At June 30, 2022, the value of this collateral totals $370,130. |
(g) | Includes assets pledged as collateral and deposits with broker for derivative contracts. At June 30, 2022, the value of these assets totals $53,017,359. |
^ | Holdings is greater than 25% of portfolio value. Additional information regarding the underlying Fund’s holdings and financial statements may be found at https://sec.gov. |
CMT | Constant Maturity Treasury | SOFR30 | 30 Day Average Secured Overnight Financing Rate |
LIBOR | London Interbank Offered Rate | TSFR1 | 1 Month Average Secured Overnight Financing Rate |
PLC | Public Limited Company | | |
52 | The accompanying notes are an integral part of these consolidated financial statements. |
LoCorr Market Trend Fund - Consolidated Schedule of Open Forward Currency Contracts |
LoCorr Market Trend Fund
Consolidated Schedule of Open Forward Currency Contracts(a)
June 30, 2022 (Unaudited)
| | | | | | | | | | | Currency to be Received | | | Currency to be Delivered | | | | | | | | | |
| | | Notional
Amount | | | Forward
Settlement
Date | | | Currency
Abbreviation | | | U.S. $
Notional
Amount at
June 30, 2022 | | | Currency
Abbreviation | | | U.S. $
Notional
Amount on
Origination
Date | | | Unrealized
Appreciation | | | Unrealized
(Depreciation) | |
Purchase Contracts: | | | | | | | | | | | | | | | | | | | | | | | | | | | | |
| | $ | 7,755,615 | | | | 09/23/2022 | | | | AUD | | | $ | 7,647,281 | | | | USD | | | $ | 7,755,615 | | | $ | — | | | $ | (108,334 | ) |
| | | | 13,526,050 | | | | 09/23/2022 | | | | CAD | | | | 13,210,341 | | | | USD | | | | 13,526,050 | | | | — | | | | (315,709 | ) |
| | | | 35,214,781 | | | | 09/23/2022 | | | | CHF | | | | 36,514,103 | | | | USD | | | | 35,214,781 | | | | 1,299,322 | | | | — | |
| | | | 31,600,656 | | | | 09/23/2022 | | | | EUR | | | | 31,427,404 | | | | USD | | | | 31,600,656 | | | | — | | | | (173,252 | ) |
| | | | 30,272,564 | | | | 09/23/2022 | | | | GBP | | | | 30,335,202 | | | | USD | | | | 30,272,564 | | | | 62,638 | | | | — | |
| | | | 53,216,272 | | | | 09/22/2022 | | | | JPY | | | | 52,920,485 | | | | USD | | | | 53,216,272 | | | | — | | | | (295,787 | ) |
| | | | 38,613,672 | | | | 09/23/2022 | | | | MXN | | | | 37,873,470 | | | | USD | | | | 38,613,672 | | | | — | | | | (740,202 | ) |
| | | | 14,491,675 | | | | 09/23/2022 | | | | NZD | | | | 14,427,560 | | | | USD | | | | 14,491,675 | | | | — | | | | (64,115 | ) |
Total Purchase Contracts | | | | | | | | | | | | 224,355,846 | | | | | | | | 224,691,285 | | | | 1,361,960 | | | | (1,697,399 | ) |
| | | | | | | | | | | | | | | | | | | | | | | | | | | | | | | | | |
Sale Contracts: | | | | | | | | | | | | | | | | | | | | | | | | | | | | | | | | |
| | | $ | 19,310,500 | | | | 09/23/2022 | | | | USD | | | $ | 18,543,844 | | | | AUD | | | $ | 19,310,500 | | | $ | 766,656 | | | $ | — | |
| | | | 32,469,760 | | | | 09/23/2022 | | | | USD | | | | 31,674,672 | | | | CAD | | | | 32,469,760 | | | | 795,088 | | | | — | |
| | | | 89,251,804 | | | | 09/23/2022 | | | | USD | | | | 91,165,613 | | | | CHF | | | | 89,251,804 | | | | — | | | | (1,913,809 | ) |
| | | | 93,815,717 | | | | 09/23/2022 | | | | USD | | | | 92,255,454 | | | | EUR | | | | 93,815,717 | | | | 1,560,263 | | | | — | |
| | | | 69,567,768 | | | | 09/23/2022 | | | | USD | | | | 67,653,670 | | | | GBP | | | | 69,567,768 | | | | 1,914,098 | | | | — | |
| | | | 135,524,796 | | | | 09/22/2022 | | | | USD | | | | 134,985,039 | | | | JPY | | | | 135,524,796 | | | | 539,757 | | | | — | |
| | | | 1,364,397 | | | | 09/23/2022 | | | | USD | | | | 1,352,701 | | | | MXN | | | | 1,364,397 | | | | 11,696 | | | | — | |
| | | | 61,677,164 | | | | 09/23/2022 | | | | USD | | | | 60,167,242 | | | | NZD | | | | 61,677,164 | | | | 1,509,922 | | | | — | |
Total Sale Contracts | | | | | | | | | | | | | | | 497,798,235 | | | | | | | | 502,981,906 | | | | 7,097,480 | | | | (1,913,809 | ) |
Net Forward Currency Contracts | | | | | | | | | | $ | (273,442,389 | ) | | | | | | $ | (278,290,621 | ) | | $ | 8,459,440 | | | $ | (3,611,208 | ) |
Net Unrealized Appreciation | | | | | | | | | | | | | | | | | | | | | | | $ | 4,848,232 | | | | | |
Currency Abbreviations:
AUD | AUSTRALIAN DOLLAR |
CAD | CANADIAN DOLLAR |
CHF | SWISS FRANC |
EUR | EURO |
GBP | BRITISH POUND |
JPY | JAPANESE YEN |
MXN | MEXICAN PESO |
NZD | NEW ZEALAND DOLLAR |
USD | U.S. DOLLAR |
(a) | Bank of America Merrill Lynch is the counterparty for all open forward currency exchange contracts held by the Fund as of June 30, 2022. |
The accompanying notes are an integral part of these consolidated financial statements. | 53 |
LoCorr Market Trend Fund – Consolidated Schedule of Open Futures Contracts |
LoCorr Market Trend Fund
Consolidated Schedule of Open Futures Contracts(a)
June 30, 2022 (Unaudited)
| | | Number of
Contracts | | | | | | | Current | | | Notional | | | Value | |
Description | | Purchased
(Sold) | | | Settlement
Month-Year | | | Notional
Amount | | | Amount At
Trade Date | | | Unrealized
Appreciation | | | Unrealized
(Depreciation) | |
Purchase Contracts: | | | | | | | | | | | | | | | | | | | | | | | | |
3 Mo Euro Euribor | | | 1,618 | | | | Dec-23 | | | $ | 415,822,304 | | | $ | 415,073,562 | | | $ | 748,742 | | | $ | — | |
90 Day Euro | | | 1,875 | | | | Dec-23 | | | | 454,242,188 | | | | 452,681,219 | | | | 1,560,969 | | | | — | |
Aluminum (a) | | | 123 | | | | Sep-22 | | | | 7,519,144 | | | | 8,844,854 | | | | — | | | | (1,325,710 | ) |
Brent Crude | | | 155 | | | | Jul-22 | | | | 16,899,650 | | | | 17,331,082 | | | | — | | | | (431,432 | ) |
CAC 40 10 Euro Index | | | 42 | | | | Jul-22 | | | | 2,602,993 | | | | 2,600,116 | | | | 2,877 | | | | — | |
Coffee | | | 131 | | | | Sep-22 | | | | 11,303,663 | | | | 11,462,062 | | | | — | | | | (158,399 | ) |
Corn | | | 573 | | | | Dec-22 | �� | | | 17,755,838 | | | | 20,616,739 | | | | — | | | | (2,860,901 | ) |
Cotton No.2 | | | 90 | | | | Dec-22 | | | | 4,447,800 | | | | 5,532,096 | | | | — | | | | (1,084,296 | ) |
Dollar | | | 197 | | | | Sep-22 | | | | 20,579,408 | | | | 20,531,788 | | | | 47,620 | | | | — | |
Euro-Bobl | | | 18 | | | | Sep-22 | | | | 2,342,618 | | | | 2,310,812 | | | | 31,806 | | | | — | |
FTSE 100 Index | | | 388 | | | | Sep-22 | | | | 33,633,373 | | | | 33,660,956 | | | | — | | | | (27,583 | ) |
Gasoline RBOB | | | 96 | | | | Jul-22 | | | | 14,258,362 | | | | 15,169,593 | | | | — | | | | (911,231 | ) |
Gold | | | 60 | | | | Aug-22 | | | | 10,843,800 | | | | 11,058,609 | | | | — | | | | (214,809 | ) |
Hard Red Wheat | | | 203 | | | | Sep-22 | | | | 9,660,263 | | | | 11,748,759 | | | | — | | | | (2,088,496 | ) |
Heating Oil | | | 84 | | | | Jul-22 | | | | 13,514,004 | | | | 15,021,874 | | | | — | | | | (1,507,870 | ) |
Low Sulphur Gasoil | | | 119 | | | | Aug-22 | | | | 13,375,600 | | | | 14,814,539 | | | | — | | | | (1,438,939 | ) |
Natural Gas | | | 96 | | | | Jul-22 | | | | 5,207,040 | | | | 7,124,814 | | | | — | | | | (1,917,774 | ) |
S&P 500 E-Mini Index | | | 66 | | | | Sep-22 | | | | 12,505,350 | | | | 12,556,060 | | | | — | | | | (50,710 | ) |
Soybean | | | 412 | | | | Nov-22 | | | | 30,034,800 | | | | 31,419,035 | | | | — | | | | (1,384,235 | ) |
Soybean Meal | | | 239 | | | | Dec-22 | | | | 9,720,130 | | | | 9,463,588 | | | | 256,542 | | | | — | |
Soybean Oil | | | 209 | | | | Dec-22 | | | | 8,083,284 | | | | 9,359,550 | | | | — | | | | (1,276,266 | ) |
Sugar | | | 490 | | | | Sep-22 | | | | 10,152,800 | | | | 10,601,981 | | | | — | | | | (449,181 | ) |
Swiss Franc | | | 239 | | | | Mar-24 | | | | 70,693,511 | | | | 70,596,048 | | | | 97,463 | | | | — | |
U.S. 2 Yr Note | | | 30 | | | | Sep-22 | | | | 6,300,469 | | | | 6,276,146 | | | | 24,323 | | | | — | |
Wheat | | | 173 | | | | Dec-22 | | | | 7,789,325 | | | | 9,458,569 | | | | — | | | | (1,669,244 | ) |
WTI Crude | | | 155 | | | | Jul-22 | | | | 16,392,800 | | | | 17,249,243 | | | | — | | | | (856,443 | ) |
Zinc (a) | | | 100 | | | | Sep-22 | | | | 7,901,875 | | | | 9,103,813 | | | | — | | | | (1,201,938 | ) |
Total Purchase Contracts | | | | | | | | | | | | | | | | | | | 2,770,342 | | | | (20,855,457 | ) |
| | | | | | | | | | | | | | | | | | | | | | | | | |
Sale Contracts: | | | | | | | | | | | | | | | | | | | | | | | | |
10 Yr Mini JGB | | | (13) | | | | Sep-22 | | | $ | 1,424,270 | | | $ | 1,421,256 | | | $ | — | | | $ | (3,014 | ) |
Aluminum (a) | | | (39) | | | | Sep-22 | | | | 2,384,119 | | | | 2,719,918 | | | | 335,799 | | | | — | |
Australian 10 Yr Bond | | | (484) | | | | Sep-22 | | | | 39,720,556 | | | | 39,765,327 | | | | 44,771 | | | | — | |
Canadian 10 Yr Bond | | | (466) | | | | Sep-22 | | | | 44,887,617 | | | | 46,106,177 | | | | 1,218,560 | | | | — | |
Cocoa (ICE) | | | (167) | | | | Sep-22 | | | | 3,482,343 | | | | 3,582,447 | | | | 100,104 | | | | — | |
Copper (a) | | | (90) | | | | Sep-22 | | | | 18,585,000 | | | | 19,006,409 | | | | 421,409 | | | | — | |
DAX Index | | | (119) | | | | Sep-22 | | | | 39,815,691 | | | | 40,881,990 | | | | 1,066,299 | | | | — | |
Euro-Bund | | | (131) | | | | Sep-22 | | | | 20,424,820 | | | | 19,998,965 | | | | — | | | | (425,855 | ) |
Euro-Schatz | | | (884) | | | | Sep-22 | | | | 101,111,020 | | | | 100,958,966 | | | | — | | | | (152,054 | ) |
Euro-Stoxx 50 Index | | | (496) | | | | Sep-22 | | | | 17,885,815 | | | | 17,899,478 | | | | 13,663 | | | | — | |
Hang Seng Index | | | (316) | | | | Jul-22 | | | | 43,782,842 | | | | 44,473,719 | | | | 690,877 | | | | — | |
Japanese 10 Yr Bond | | | (148) | | | | Sep-22 | | | | 162,104,068 | | | | 162,629,136 | | | | 525,068 | | | | — | |
Long Gilt | | | (830) | | | | Sep-22 | | | | 115,160,744 | | | | 116,242,153 | | | | 1,081,409 | | | | — | |
Nasdaq 100 E-Mini Index | | | (54) | | | | Sep-22 | | | | 12,451,860 | | | | 12,570,016 | | | | 118,156 | | | | — | |
Nikkei 225 Index (OSE) | | | (48) | | | | Sep-22 | | | | 9,332,547 | | | | 9,278,815 | | | | — | | | | (53,732 | ) |
Russell 2000 Mini Index | | | (496) | | | | Sep-22 | | | | 42,358,400 | | | | 42,301,137 | | | | — | | | | (57,263 | ) |
Silver | | | (197) | | | | Sep-22 | | | | 20,046,720 | | | | 20,552,714 | | | | 505,994 | | | | — | |
54 | The accompanying notes are an integral part of these consolidated financial statements. |
LoCorr Market Trend Fund – Consolidated Schedule of Open Futures Contracts |
| | | Number of
Contracts | | | | | | | Current | | | Notional | | | Value | |
Description | | Purchased
(Sold) | | | Settlement
Month-Year | | | Notional
Amount | | | Amount At
Trade Date | | | Unrealized
Appreciation | | | Unrealized
(Depreciation) | |
Sale Contracts: (continued) | | | | | | | | | | | | | | | | | | | | | | | | |
U.S. 10 Yr Note | | | (758) | | | | Sep-22 | | | $ | 89,846,688 | | | $ | 88,649,979 | | | $ | — | | | $ | (1,196,709 | ) |
U.S. 5 Yr Note | | | (42) | | | | Sep-22 | | | | 4,714,500 | | | | 4,673,582 | | | | — | | | | (40,918 | ) |
U.S. Long Bond | | | (328) | | | | Sep-22 | | | | 45,469,000 | | | | 45,740,936 | | | | 271,936 | | | | — | |
Zinc (a) | | | (4) | | | | Sep-22 | | | | 316,075 | | | | 355,771 | | | | 39,696 | | | | — | |
Total Sale Contracts | | | | | | | | | | | | | | | | | | | 6,433,741 | | | | (1,929,545 | ) |
Total Futures Contracts | | | | | | | | | | | | | | | | | | $ | 9,204,083 | | | $ | (22,785,002 | ) |
Net Unrealized Depreciation | | | | | | | | | | | | | | | | | | | | | | $ | (13,580,919 | ) |
(a) | London Metal Exchange (‘’LME’’) futures contracts settle on their respective maturity date. The unrealized appreciation on these contracts is a receivable for unsettled open futures contracts and the unrealized depreciation is a payable for unsettled open futures contracts on the Fund’s consolidated statement of assets and liabilities. |
The accompanying notes are an integral part of these consolidated financial statements. | 55 |
LoCorr Dynamic Equity Fund - Schedule of Investments |
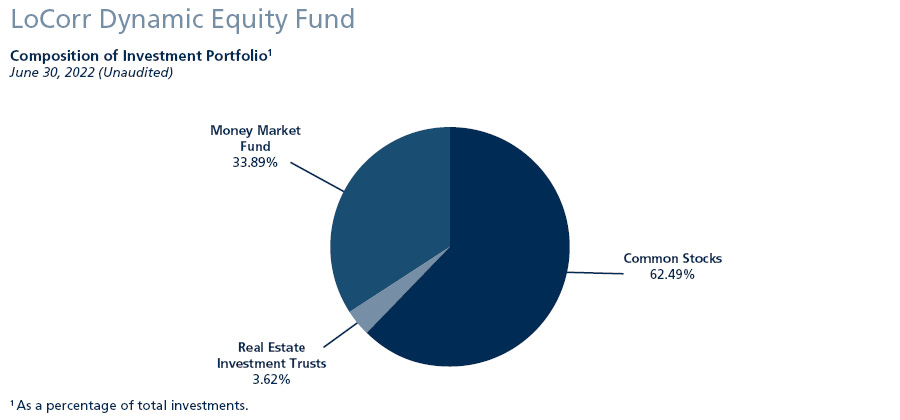
Schedule of Investments
June 30, 2022 (Unaudited)
| | Shares | | | Value | |
COMMON STOCKS: 56.56% |
Airlines: 0.73% |
SkyWest, Inc. (a) | | | 15,609 | | | $ | 331,691 | |
| | | | | | | | | |
Banks: 4.20% |
American National Bankshares, Inc. | | | 5,664 | | | | 196,031 | |
Bank OZK | | | 1,870 | | | | 70,181 | |
JPMorgan Chase & Co. | | | 5,957 | | | | 670,818 | |
Wintrust Financial Corp. | | | 3,946 | | | | 316,272 | |
Zions Bancorporation | | | 12,734 | | | | 648,160 | |
| | | | | | | | 1,901,462 | |
Biotechnology: 1.49% |
Alaunos Therapeutics, Inc. (a) | | | 11,200 | | | | 13,888 | |
Champions Oncology, Inc. (a) | | | 17,897 | | | | 144,787 | |
Gilead Sciences, Inc. | | | 1,879 | | | | 116,141 | |
Iovance Biotherapeutics, Inc. (a) | | | 2,662 | | | | 29,388 | |
Nkarta, Inc. (a) | | | 1,900 | | | | 23,408 | |
TransMedics Group, Inc. (a) | | | 3,584 | | | | 112,717 | |
Veracyte, Inc. (a) | | | 11,788 | | | | 234,581 | |
| | | | | | | | 674,910 | |
Building Materials: 0.49% |
SPX Corp. (a) | | | 4,161 | | | | 219,867 | |
| | | | | | | | | |
Commercial Services: 0.70% |
Alta Equipment Group, Inc. (a) | | | 35,098 | | | | 314,829 | |
| | | | | | | | | |
Computers: 1.00% |
Rapid7, Inc. (a) | | | 2,757 | | | | 184,167 | |
Stratasys Ltd. - ADR (a)(b) | | | 14,220 | | | | 266,483 | |
| | | | | | | | 450,650 | |
56 | The accompanying notes are an integral part of these financial statements. |
LoCorr Dynamic Equity Fund – Schedule of Investments (continued) |
| | Shares | | | Value | |
COMMON STOCKS: (continued) |
Cosmetics & Personal Care: 0.33% |
Coty, Inc. (a) | | | 18,438 | | | $ | 147,688 | |
| | | | | | | | | |
Diversified Finan Services: 1.43% |
Encore Capital Group, Inc. (a) | | | 9,428 | | | | 544,656 | |
Evercore Partners, Inc. | | | 1,095 | | | | 102,503 | |
| | | | | | | | 647,159 | |
Electronics: 3.89% |
Benchmark Electronics, Inc. | | | 19,900 | | | | 448,944 | |
Enovix Corp. (a) | | | 21,971 | | | | 195,761 | |
Flex Ltd. - ADR (a)(b) | | | 46,928 | | | | 679,048 | |
Identiv, Inc. (a) | | | 17,303 | | | | 200,369 | |
Vontier Corp. | | | 10,334 | | | | 237,579 | |
| | | | | | | | 1,761,701 | |
Energy - Alternate Sources: 0.42% |
Archaea Energy, Inc. (a) | | | 12,351 | | | | 191,811 | |
| | | | | | | | | |
Engineering & Construction: 1.06% |
Bowman Consulting Group Ltd. (a) | | | 23,341 | | | | 288,028 | |
Dycom Industries, Inc. (a) | | | 2,047 | | | | 190,453 | |
| | | | | | | | 478,481 | |
Entertainment: 1.15% |
Everi Holdings, Inc. (a) | | | 18,687 | | | | 304,785 | |
International Game Technology PLC (b) | | | 11,652 | | | | 216,261 | |
| | | | | | | | 521,046 | |
Environmental Control: 0.74% |
Clean Harbors, Inc. (a) | | | 3,845 | | | | 337,091 | |
| | | | | | | | | |
Food: 1.65% |
The Real Good Food Co., Inc. (a) | | | 43,158 | | | | 303,401 | |
Stryve Foods, Inc. (a) | | | 3,815 | | | | 3,360 | |
SunOpta, Inc. - ADR (a)(b) | | | 56,305 | | | | 438,053 | |
| | | | | | | | 744,814 | |
Healthcare - Products: 2.10% |
AtriCure, Inc. (a) | | | 6,753 | | | | 275,928 | |
Cerus Corp. (a) | | | 29,991 | | | | 158,653 | |
DermTech, Inc. (a) | | | 3,341 | | | | 18,509 | |
Merit Medical Systems, Inc. (a) | | | 3,545 | | | | 192,387 | |
Omnicell, Inc. (a) | | | 2,671 | | | | 303,826 | |
| | | | | | | | 949,303 | |
Healthcare Services: 0.70% |
Amedisys, Inc. (a) | | | 582 | | | | 61,180 | |
Neuronetics, Inc. (a) | | | 79,338 | | | | 254,675 | |
| | | | | | | | 315,855 | |
Home Furnishings: 0.59% |
Arhaus, Inc. (a) | | | 23,103 | | | | 103,964 | |
Lovesac Co. (a) | | | 5,937 | | | | 163,268 | |
| | | | | | | | 267,232 | |
Internet: 4.91% |
Cogent Communications Holdings, Inc. | | | 1,879 | | | | 114,168 | |
Edgio, Inc. (a) | | | 53,071 | | | | 122,594 | |
Magnite, Inc. (a) | | | 29,540 | | | | 262,315 | |
Yatra Online, Inc. - ADR (a)(b) | | | 141,671 | | | | 318,760 | |
The accompanying notes are an integral part of these financial statements. | 57 |
LoCorr Dynamic Equity Fund – Schedule of Investments (continued) |
| | Shares | | | Value | |
COMMON STOCKS: (continued) |
Zendesk, Inc. (a) | | | 18,997 | | | $ | 1,407,108 | |
| | | | | | | | 2,224,945 | |
Lodging: 1.60% |
Full House Resorts, Inc. (a) | | | 16,742 | | | | 101,791 | |
Wynn Resorts Ltd. (a) | | | 10,965 | | | | 624,786 | |
| | | | | | | | 726,577 | |
Machinery - Construction & Mining: 0.33% |
Babcock & Wilcox Enterprises, Inc. (a) | | | 24,710 | | | | 149,001 | |
| | | | | | | | | |
Media: 1.39% |
DISH Network Corp. (a) | | | 35,128 | | | | 629,845 | |
| | | | | | | | | |
Metal Fabricate & Hardware: 0.46% |
Hillman Solutions Corp. (a) | | | 24,314 | | | | 210,073 | |
| | | | | | | | | |
Miscellaneous Manufacturing: 0.23% |
AMMO, Inc. (a) | | | 27,446 | | | | 105,667 | |
| | | | | | | | | |
Oil & Gas: 1.05% |
Diamond Offshore Drilling, Inc. (a) | | | 18,359 | | | | 108,135 | |
DMC Global, Inc. (a) | | | 2,316 | | | | 41,757 | |
Transocean Ltd. - ADR (a)(b) | | | 62,588 | | | | 208,418 | |
Valaris Ltd. - ADR (a)(b) | | | 2,825 | | | | 119,328 | |
| | | | | | | | 477,638 | |
Pharmaceuticals: 1.20% |
Achilles Therapeutics PLC - ADR (a)(b) | | | 8,719 | | | | 21,972 | |
Better Choice Co, Inc. (a) | | | 90,446 | | | | 198,981 | |
Lyell Immunopharma, Inc. (a) | | | 5,700 | | | | 37,164 | |
NexImmune, Inc. (a) | | | 9,698 | | | | 15,614 | |
PetIQ, Inc. (a) | | | 15,956 | | | | 267,901 | |
| | | | | | | | 541,632 | |
Pipelines: 0.23% |
Kinetik Holdings, Inc. | | | 3,000 | | | | 102,420 | |
| | | | | | | | | |
Retail: 1.01% |
Noodles & Co. (a) | | | 54,969 | | | | 258,354 | |
Papa John’s International, Inc. | | | 2,373 | | | | 198,193 | |
| | | | | | | | 456,547 | |
Semiconductors: 5.44% |
Axcelis Technologies, Inc. (a) | | | 6,599 | | | | 361,889 | |
AXT, Inc. (a) | | | 12,139 | | | | 71,134 | |
Cirrus Logic, Inc. (a) | | | 8,956 | | | | 649,668 | |
MaxLinear, Inc. (a) | | | 7,972 | | | | 270,889 | |
Micron Technology, Inc. | | | 3,814 | | | | 210,838 | |
Silicon Motion Technology Corp. - ADR (b) | | | 4,499 | | | | 376,566 | |
SiTime Corp. (a) | | | 860 | | | | 140,206 | |
Synaptics, Inc. (a) | | | 1,464 | | | | 172,825 | |
Veeco Instruments, Inc. (a) | | | 10,694 | | | | 207,464 | |
| | | | | | | | 2,461,479 | |
Software: 11.93% |
Absolute Software Corp. - ADR (b) | | | 37,610 | | | | 325,327 | |
ACI Worldwide, Inc. (a) | | | 10,722 | | | | 277,593 | |
Amplitude, Inc. (a) | | | 18,124 | | | | 258,992 | |
Augmedix, Inc. (a) | | | 109,894 | | | | 197,809 | |
58 | The accompanying notes are an integral part of these financial statements. |
LoCorr Dynamic Equity Fund – Schedule of Investments (continued) |
| | Shares | | | Value | |
COMMON STOCKS: (continued) |
Braze, Inc. (a) | | | 3,100 | | | $ | 112,313 | |
Coupa Software, Inc. (a) | | | 3,741 | | | | 213,611 | |
Domo, Inc. (a) | | | 431 | | | | 11,982 | |
E2open Parent Holdings, Inc. (a) | | | 5,300 | | | | 41,234 | |
Ebix, Inc. | | | 10,452 | | | | 176,639 | |
Elastic NV - ADR (a)(b) | | | 1,600 | | | | 108,272 | |
Everbridge, Inc. (a) | | | 32,207 | | | | 898,253 | |
Five9, Inc. (a) | | | 1,336 | | | | 121,763 | |
LivePerson, Inc. (a) | | | 4,208 | | | | 59,501 | |
Microsoft Corp. | | | 2,608 | | | | 669,813 | |
New Relic, Inc. (a) | | | 18,421 | | | | 921,971 | |
Porch Group, Inc. (a) | | | 17,800 | | | | 45,568 | |
Smartsheet, Inc. (a) | | | 4,815 | | | | 151,335 | |
SS&C Technologies Holdings, Inc. | | | 12,234 | | | | 710,428 | |
Tabula Rasa HealthCare, Inc. (a) | | | 15,514 | | | | 39,871 | |
Zuora, Inc. (a) | | | 6,495 | | | | 58,130 | |
| | | | | | | | 5,400,405 | |
Telecommunications: 4.11% |
Cambium Networks Corp. - ADR (a)(b) | | | 22,141 | | | | 324,366 | |
Ceragon Networks Ltd. - ADR (a)(b) | | | 83,892 | | | | 215,602 | |
CommScope Holding Co., Inc. (a) | | | 16,858 | | | | 103,171 | |
DZS, Inc. (a) | | | 10,164 | | | | 165,368 | |
Harmonic, Inc. (a) | | | 34,401 | | | | 298,257 | |
Lantronix, Inc. (a) | | | 12,769 | | | | 68,697 | |
NeoPhotonics Corp. (a) | | | 18,713 | | | | 294,356 | |
Sierra Wireless, Inc. - ADR (a)(b) | | | 16,737 | | | | 391,646 | |
| | | | | | | | 1,861,463 | |
TOTAL COMMON STOCKS (Cost $26,973,065) | | | | | | | 25,603,282 | |
| | | | | | | | | |
REAL ESTATE INVESTMENT TRUSTS: 3.27% |
Kimco Realty Corp. | | | 33,705 | | | | 666,348 | |
Park Hotels & Resorts, Inc. | | | 60,047 | | | | 814,838 | |
TOTAL REAL ESTATE INVESTMENT TRUSTS (Cost $1,670,922) | | | | | | | 1,481,186 | |
| | | | | | | | | |
SHORT TERM INVESTMENT: 30.67% |
MONEY MARKET FUND: 30.67% |
STIT-Government & Agency Portfolio, Institutional Class, 1.38% (c)^ | | | 13,884,647 | | | | 13,884,647 | |
TOTAL MONEY MARKET FUND (Cost $13,884,647) | | | | | | | 13,884,647 | |
TOTAL SHORT TERM INVESTMENT (Cost $13,884,647) | | | | | | | 13,884,647 | |
| | | | | | | | | |
TOTAL INVESTMENTS (Cost $42,528,634): 90.50% | | | | | | | 40,969,115 | |
Other Assets in Excess of Liabilities: 9.50% (d) | | | | | | | 4,302,121 | |
TOTAL NET ASSETS: 100.00% | | | | | | $ | 45,271,236 | |
(a) | Non-dividend income producing security. |
(b) | Foreign issued security. |
(c) | The rate quoted is the annualized seven-day effective yield as of June 30, 2022. |
(d) | Includes assets pledged as collateral and deposits with broker for securities sold short. At June 30, 2022, the value of these assets total $18,128,907. |
^ | Holdings is greater than 25% of portfolio value. Additional information regarding the underlying Fund’s holdings and financial statements may be found at https://sec.gov. |
ADR | American Depositary Reciept |
PLC | Public Limited Company |
The accompanying notes are an integral part of these financial statements. | 59 |
LoCorr Dynamic Equity Fund – Schedule of Securities Sold Short |
LoCorr Dynamic Equity Fund
Schedule of Securities Sold Short
June 30, 2022 (Unaudited)
| | Shares | | | Value | |
COMMON STOCKS: (23.63)% |
Agriculture: (0.39)% |
Andersons Inc. | | | (2,506 | ) | | $ | (82,673 | ) |
Bunge Ltd. - ADR (b) | | | (1,016 | ) | | | (92,141 | ) |
| | | | | | | | (174,814 | ) |
Banks: (0.21)% | | | | | | | | |
Banner Corp. | | | (1,714 | ) | | | (96,344 | ) |
| | | | | | | | | |
Biotechnology: (0.04)% | | | | | | | | |
Vivos Therapeutics, Inc. (a) | | | (12,844 | ) | | | (16,569 | ) |
| | | | | | | | | |
Chemicals: (0.26)% | | | | | | | | |
Mosaic Co. | | | (2,441 | ) | | | (115,288 | ) |
| | | | | | | | | |
Commercial Services: (1.64)% | | | | | | | | |
AMN Healthcare Services, Inc. (a) | | | (1,124 | ) | | | (123,314 | ) |
Cross Country Healthcare, Inc. (a) | | | (6,350 | ) | | | (132,271 | ) |
Insperity, Inc. | | | (1,504 | ) | | | (150,144 | ) |
Progyny, Inc. (a) | | | (2,473 | ) | | | (71,841 | ) |
Rollins, Inc. | | | (4,378 | ) | | | (152,880 | ) |
TriNet Group, Inc. (a) | | | (1,468 | ) | | | (113,946 | ) |
| | | | | | | | (744,396 | ) |
Computers: (1.40)% | | | | | | | | |
Apple, Inc. | | | (3,210 | ) | | | (438,871 | ) |
Maximus, Inc. | | | (3,090 | ) | | | (193,156 | ) |
| | | | | | | | (632,027 | ) |
Cosmetics & Personal Care: (0.38)% | | | | | | | | |
The Beauty Health Co. (a) | | | (13,425 | ) | | | (172,646 | ) |
| | | | | | | | | |
Distribution & Wholesale: (0.49)% | | | | | | | | |
Pool Corp. | | | (637 | ) | | | (223,734 | ) |
| | | | | | | | | |
Diversified Financial Services: (2.17)% | | | | | | | | |
Futu Holdings Ltd. - ADR (a)(b) | | | (2,020 | ) | | | (105,464 | ) |
Mastercard, Inc. | | | (1,379 | ) | | | (435,047 | ) |
Visa, Inc. | | | (2,243 | ) | | | (441,624 | ) |
| | | | | | | | (982,135 | ) |
Electronics: (0.27)% | | | | | | | | |
Avnet, Inc. | | | (2,841 | ) | | | (121,822 | ) |
| | | | | | | | | |
Engineering & Construction: (0.57)% | | | | | | | | |
Frontdoor, Inc. (a) | | | (4,602 | ) | | | (110,816 | ) |
NV5 Global, Inc. (a) | | | (1,270 | ) | | | (148,260 | ) |
| | | | | | | | (259,076 | ) |
Entertainment: (0.12)% | | | | | | | | |
Red Rock Resorts, Inc. | | | (1,591 | ) | | | (53,076 | ) |
| | | | | | | | | |
Food: (0.76)% | | | | | | | | |
Hormel Foods Corp. | | | (1,191 | ) | | | (56,406 | ) |
Hostess Brands, Inc. (a) | | | (5,425 | ) | | | (115,064 | ) |
60 | The accompanying notes are an integral part of these financial statements. |
LoCorr Dynamic Equity Fund – Schedule of Securities Sold Short (continued) |
| | Shares | | | Value | |
COMMON STOCKS: (continued) |
Lancaster Colony Corp. | | | (1,333 | ) | | $ | (171,664 | ) |
| | | | | | | | (343,134 | ) |
Healthcare - Products: (0.08)% | | | | | | | | |
LeMaitre Vascular, Inc. | | | (836 | ) | | | (38,080 | ) |
| | | | | | | | | |
Home Builders: (0.81)% | | | | | | | | |
Thor Industries, Inc. | | | (1,259 | ) | | | (94,085 | ) |
Toll Brothers, Inc. | | | (2,924 | ) | | | (130,410 | ) |
Winnebago Industries, Inc. | | | (2,968 | ) | | | (144,126 | ) |
| | | | | | | | (368,621 | ) |
Home Furnishings: (0.14)% | | | | | | | | |
Sleep Number Corp. (a) | | | (2,091 | ) | | | (64,716 | ) |
| | | | | | | | | |
Internet: (1.24)% | | | | | | | | |
Alphabet, Inc. (a) | | | (193 | ) | | | (420,597 | ) |
CarParts.com, Inc. (a) | | | (8,280 | ) | | | (57,463 | ) |
Q2 Holdings, Inc. (a) | | | (2,116 | ) | | | (81,614 | ) |
| | | | | | | | (559,674 | ) |
Leisure Time: (0.48)% | | | | | | | | |
Callaway Golf Co. (a) | | | (5,401 | ) | | | (110,180 | ) |
Harley-Davidson, Inc. | | | (3,430 | ) | | | (108,594 | ) |
| | | | | | | | (218,774 | ) |
Lodging: (0.40)% | | | | | | | | |
Hilton Worldwide Holdings, Inc. | | | (825 | ) | | | (91,938 | ) |
Marriott International Inc/MD | | | (668 | ) | | | (90,855 | ) |
| | | | | | | | (182,793 | ) |
Machinery Diversified: (0.71)% | | | | | | | | |
Ichor Holdings Ltd. - ADR (a)(b) | | | (5,900 | ) | | | (153,282 | ) |
Kornit Digital Ltd. - ADR (a)(b) | | | (1,671 | ) | | | (52,971 | ) |
Xylem Inc/NY | | | (1,487 | ) | | | (116,254 | ) |
| | | | | | | | (322,507 | ) |
Media: (0.24)% | | | | | | | | |
Nexstar Broadcasting Group, Inc. | | | (654 | ) | | | (106,524 | ) |
| | | | | | | | | |
Metal Fabricate & Hardware: (0.44)% | | | | | | | | |
Proto Labs, Inc. (a) | | | (4,195 | ) | | | (200,689 | ) |
| | | | | | | | | |
Miscellaneous Manufacturing: (0.11)% | | | | | | | | |
A.O. Smith Corp. | | | (917 | ) | | | (50,142 | ) |
| | | | | | | | | |
Pharmaceuticals: (0.23)% | | | | | | | | |
Pacira Pharmaceuticals, Inc. (a) | | | (1,806 | ) | | | (105,290 | ) |
| | | | | | | | | |
Private Equity: (0.48)% | | | | | | | | |
KKR & Co., Inc. | | | (4,653 | ) | | | (215,387 | ) |
| | | | | | | | | |
Retail: (5.54)% | | | | | | | | |
Abercrombie & Fitch Co. (a) | | | (12,039 | ) | | | (203,700 | ) |
Casey’s General Stores, Inc. | | | (626 | ) | | | (115,797 | ) |
Cheesecake Factory, Inc. | | | (9,663 | ) | | | (255,296 | ) |
Dave & Buster’s Entertainment, Inc. (a) | | | (1,336 | ) | | | (43,794 | ) |
Dick’s Sporting Goods, Inc. | | | (2,846 | ) | | | (214,503 | ) |
Five Below, Inc. (a) | | | (1,003 | ) | | | (113,770 | ) |
Home Depot, Inc. | | | (1,627 | ) | | | (446,237 | ) |
Lowe’s Cos, Inc. | | | (2,493 | ) | | | (435,452 | ) |
The accompanying notes are an integral part of these financial statements. | 61 |
LoCorr Dynamic Equity Fund – Schedule of Securities Sold Short (continued) |
| | Shares | | | Value | |
COMMON STOCKS: (continued) |
RH (a) | | | (524 | ) | | $ | (111,224 | ) |
Shake Shack, Inc. (a) | | | (2,377 | ) | | | (93,844 | ) |
Texas Roadhouse, Inc. | | | (3,636 | ) | | | (266,155 | ) |
Williams-Sonoma, Inc. | | | (1,858 | ) | | | (206,145 | ) |
| | | | | | | | (2,505,917 | ) |
Semiconductors: (0.07)% | | | | | | | | |
Alpha & Omega Semiconductor Ltd. - ADR (a)(b) | | | (919 | ) | | | (30,639 | ) |
| | | | | | | | | |
Software: (3.45)% | | | | | | | | |
AppLovin Corp. (a) | | | (6,194 | ) | | | (213,321 | ) |
CS Disco, Inc. (a) | | | (2,141 | ) | | | (38,624 | ) |
Digimarc Corp. (a) | | | (9,312 | ) | | | (131,672 | ) |
DocuSign, Inc. (a) | | | (1,787 | ) | | | (102,538 | ) |
EngageSmart, Inc. (a) | | | (5,847 | ) | | | (94,020 | ) |
Evolent Health, Inc. (a) | | | (1,243 | ) | | | (38,173 | ) |
Fastly, Inc. (a) | | | (2,511 | ) | | | (29,153 | ) |
Lightspeed Commerce, Inc. - ADR (a)(b) | | | (4,076 | ) | | | (90,895 | ) |
Procore Technologies, Inc. (a) | | | (5,864 | ) | | | (266,167 | ) |
PTC, Inc. (a) | | | (1,587 | ) | | | (168,762 | ) |
Roblox Corp. (a) | | | (2,822 | ) | | | (92,731 | ) |
Sprout Social, Inc. (a) | | | (2,038 | ) | | | (118,347 | ) |
Zoom Video Communications, Inc. (a) | | | (1,630 | ) | | | (175,991 | ) |
| | | | | | | | (1,560,394 | ) |
Telecommunications: (0.38)% | | | | | | | | |
Frontier Communications Parent, Inc. (a) | | | (2,187 | ) | | | (51,482 | ) |
Lumen Technologies, Inc. | | | (11,121 | ) | | | (121,330 | ) |
| | | | | | | | (172,812 | ) |
Transportation: (0.25)% | | | | | | | | |
Knight-Swift Transportation Holdings, Inc. | | | (2,392 | ) | | | (110,726 | ) |
TOTAL COMMON STOCKS (Proceeds $11,209,115) | | | | | | | (10,748,746 | ) |
| | | | | | | | | |
EXCHANGE TRADED FUNDS: (8.46)% | | | | | | | | |
iShares Russell 2000 | | | (8,227 | ) | | | (1,393,325 | ) |
iShares Russell 2000 Growth ETF | | | (2,929 | ) | | | (604,282 | ) |
iShares Semiconductor ETF | | | (1,662 | ) | | | (581,052 | ) |
ProShares Ultra Financials | | | (2,005 | ) | | | (86,516 | ) |
ProShares Ultra Russell2000 (a) | | | (2,099 | ) | | | (64,838 | ) |
SPDR S&P500 Trust | | | (2,915 | ) | | | (1,099,684 | ) |
TOTAL EXCHANGE TRADED FUNDS (Proceeds $3,894,447) | | | | | | | (3,829,697 | ) |
TOTAL SECURITIES SOLD SHORT (Proceeds $15,103,562): (32.20)% | | | | | | $ | (14,578,443 | ) |
Percentages are stated as a percent of net assets.
(a) | Non-dividend expense producing security. |
(b) | Foreign issued security. |
ADR | American Depositary Reciept |
PLC | Public Limited Company |
62 | The accompanying notes are an integral part of these financial statements. |
LoCorr Dynamic Equity Fund – Schedule of Written Options |
LoCorr Dynamic Equity Fund
Schedule of Written Option
June 30, 2022 (Unaudited)
| | | Notional
Amount | | | Number of
Contracts (a) | | | Value | |
WRITTEN OPTION (0.02%) | | | | | | | | | | | | |
Call Option: (0.65)% | | | | | | | | | | | | |
Axcelis Expiration: December 2022, Exercise Price: $54.84 | | $ | (104,196 | ) | | | (19 | ) | | $ | (10,640 | ) |
TOTAL WRITTEN OPTION (Premiums received $13,388)(0.02%) | | | | | | | | | | $ | (10,640 | ) |
Percentages are stated as a percent of net assets.
(a) | Each contract is equivalent to 100 shares of common stock. |
The accompanying notes are an integral part of these financial statements. | 63 |
LoCorr Spectrum Income Fund – Schedule of Investments |

Schedule of Investments
June 30, 2022 (Unaudited)
| | | | | Shares | | | Value | |
BUSINESS DEVELOPMENT COMPANIES: 3.06% |
Ares Capital Corp. | | | | | | | 48,688 | | | $ | 872,976 | |
BlackRock TCP Capital Corp. | | | | | | | 59,078 | | | | 740,247 | |
FS KKR Capital Corp. | | | | | | | 35,000 | | | | 679,700 | |
New Mountain Finance Corp. | | | | | | | 74,302 | | | | 884,937 | |
TOTAL BUSINESS DEVELOPMENT COMPANIES (Cost $3,372,485) | | | | | | | | | | | 3,177,860 | |
| | | | | | | | | | | | | |
CLOSED-END INVESTMENT COMPANIES: 6.43% |
Aberdeen Global Premier Properties Fund | | | | | | | 158,792 | | | | 779,669 | |
BlackRock Taxable Municipal Bond Trust | | | | | | | 96,006 | | | | 1,839,475 | |
Nuveen Credit Strategies Income Fund (d) | | | | | | | 179,120 | | | | 931,424 | |
Nuveen Taxable Municipal Income Fund | | | | | | | 110,147 | | | | 1,960,616 | |
Oaktree Specialty Lending Corp. | | | | | | | 90,809 | | | | 594,799 | |
Sixth Street Specialty Lending, Inc. | | | | | | | 31,739 | | | | 587,172 | |
TOTAL CLOSED-END INVESTMENT COMPANIES (Cost $7,612,435) | | | | | | | | | | | 6,693,155 | |
| | | | | | | | | | | | | |
COMMON STOCKS: 43.36% |
Agriculture: 0.81% |
Altria Group, Inc. | | | | | | | 20,168 | | | | 842,417 | |
| | | | | | | | | | | | | |
Chemicals: 1.47% |
CVR Partners LP | | | | | | | 7,590 | | | | 757,861 | |
LyondellBasell Industries NV - ADR (a) | | | | | | | 8,807 | | | | 770,260 | |
| | | | | | | | | | | | 1,528,121 | |
Computers: 1.70% |
International Business Machines Corp. | | | | | | | 12,495 | | | | 1,764,169 | |
| | | | | | | | | | | | | |
Diversified Financial Services: 0.82% |
OneMain Holdings, Inc. | | | | | | | 22,789 | | | | 851,853 | |
| | | | | | | | | | | | | |
64 | The accompanying notes are an integral part of these financial statements. |
LoCorr Spectrum Income Fund – Schedule of Investments (continued) |
| | | | | Shares | | | Value | |
COMMON STOCKS: (continued) |
Electric: 12.62% |
AES Corp. VA | | | | | | | 96,837 | | | $ | 2,034,545 | |
Algonquin Power & Utilities Corp. - ADR (a) | | | | | | | 114,962 | | | | 1,543,940 | |
American Electric Power Co, Inc. | | | | | | | 20,002 | | | | 1,918,992 | |
Avangrid, Inc. | | | | | | | 36,739 | | | | 1,694,403 | |
Clearway Energy, Inc. (d) | | | | | | | 60,401 | | | | 2,104,371 | |
Dominion Energy, Inc. | | | | | | | 24,091 | | | | 1,922,703 | |
Entergy Corp. | | | | | | | 16,907 | | | | 1,904,404 | |
| | | | | | | | | | | | 13,123,358 | |
Energy - Alternate Sources: 4.79% |
Atlantica Yield PLC - ADR (a)(d) | | | | | | | 50,377 | | | | 1,625,162 | |
Enviva, Inc. | | | | | | | 19,886 | | | | 1,137,877 | |
NextEra Energy Partners LP (d) | | | | | | | 29,868 | | | | 2,215,011 | |
| | | | | | | | | | | | 4,978,050 | |
Food: 2.47% |
B&G Foods, Inc. | | | | | | | 25,539 | | | | 607,317 | |
Kraft Heinz Co. | | | | | | | 51,540 | | | | 1,965,736 | |
| | | | | | | | | | | | 2,573,053 | |
Insurance: 0.84% |
American Financial Group Inc/OH | | | | | | | 6,287 | | | | 872,699 | |
| | | | | | | | | | | | | |
Machinery - Diversified: 0.68% |
AGCO Corp. | | | | | | | 7,174 | | | | 708,074 | |
| | | | | | | | | | | | | |
Mining: 1.74% |
Newmont Corp. | | | | | | | 30,354 | | | | 1,811,223 | |
| | | | | | | | | | | | | |
Oil & Gas: 3.11% |
Chesapeake Energy Corp. | | | | | | | 20,963 | | | | 1,700,099 | |
Petroleo Brasileiro SA - ADR (a) | | | | | | | 57,000 | | | | 665,760 | |
Pioneer Natural Resources Co. | | | | | | | 3,886 | | | | 866,889 | |
| | | | | | | | | | | | 3,232,748 | |
Pharmaceuticals: 1.94% |
Pfizer, Inc. | | | | | | | 38,403 | | | | 2,013,469 | |
| | | | | | | | | | | | | |
Pipelines: 4.33% |
Antero Midstream Corp. | | | | | | | 127,693 | | | | 1,155,622 | |
Cheniere Energy Partners LP | | | | | | | 15,939 | | | | 715,183 | |
Hess Midstream LP | | | | | | | 24,988 | | | | 699,664 | |
Williams Cos. Inc. | | | | | | | 61,955 | | | | 1,933,615 | |
| | | | | | | | | | | | 4,504,084 | |
Telecommunications: 3.52% |
AT&T, Inc. | | | | | | | 90,000 | | | | 1,886,400 | |
Verizon Communications, Inc. | | | | | | | 35,000 | | | | 1,776,250 | |
| | | | | | | | | | | | 3,662,650 | |
Transportation: 2.52% |
Costamare, Inc. - ADR (a) | | | | | | | 76,176 | | | | 921,729 | |
Golden Ocean Group Ltd. - ADR (a) | | | | | | | 68,892 | | | | 801,903 | |
Star Bulk Carriers Corp. - ADR (a) | | | | | | | 35,834 | | | | 895,492 | |
| | | | | | | | | | | | 2,619,124 | |
TOTAL COMMON STOCKS (Cost $46,055,315) | | | | | | | | | | | 45,085,092 | |
| | | | | | | | | | | | | |
The accompanying notes are an integral part of these financial statements. | 65 |
LoCorr Spectrum Income Fund – Schedule of Investments (continued) |
| | | | | Units | | | Value | |
MASTER LIMITED PARTNERSHIPS: 11.74% | | | | | | | | | | | | |
Gas: 0.66% |
Global Partners LP | | | | | | | 29,083 | | | $ | 683,451 | |
| | | | | | | | | | | | | |
Oil & Gas: 0.65% |
Sunoco LP | | | | | | | 18,089 | | | | 673,815 | |
| | | | | | | | | | | | | |
Oil & Gas Services: 1.87% |
CrossAmerica Partners LP | | | | | | | 36,081 | | | | 730,640 | |
USA Compression Partners LP | | | | | | | 72,368 | | | | 1,209,993 | |
| | | | | | | | | | | | 1,940,633 | |
Pipelines: 6.31% |
Crestwood Equity Partners LP | | | | | | | 51,428 | | | | 1,238,386 | |
Delek Logistics Partners LP | | | | | | | 19,643 | | | | 956,614 | |
Enterprise Products Partners LP | | | | | | | 64,000 | | | | 1,559,680 | |
Magellan Midstream Partners LP | | | | | | | 44,138 | | | | 2,108,031 | |
MPLX LP | | | | | | | 24,000 | | | | 699,600 | |
| | | | | | | | | | | | 6,562,311 | |
Private Equity: 2.25% |
Icahn Enterprises LP | | | | | | | 48,907 | | | | 2,353,405 | |
TOTAL MASTER LIMITED PARTNERSHIPS (Cost $10,814,360) | | | | | | | | | | | 12,213,615 | |
| | | | | | | | | | | | | |
PREFERRED STOCKS: 2.90% | | | | | | Shares | | | | | |
Pipelines: 2.90% |
Crestwood Equity Partners LP, 9.250% | | | | | | | 205,122 | | | | 1,866,610 | |
NuStar Energy LP 7.625% | | | | | | | 55,789 | | | | 1,148,696 | |
TOTAL PREFERRED STOCKS (Cost $2,105,652) | | | | | | | | | | | 3,015,306 | |
| | | | | | | | | | | | | |
PUBLICLY TRADED PARTNERSHIPS: 2.68% | | | | | | Units | | | | | |
Brookfield Renewable Partners LP (a)(d) | | | | | | | 56,915 | | | | 1,980,642 | |
KNOT Offshore Partners LP (a) | | | | | | | 50,021 | | | | 818,844 | |
TOTAL PUBLICLY TRADED PARTNERSHIPS (Cost $2,544,024) | | | | | | | | | | | 2,799,486 | |
| | | | | | | | | | | | | |
PURCHASED OPTIONS: 0.79% | | Notional
Amount | | | Number of
Contracts (b) | | | | | |
Call Options: 0.01% | | | | | | | | | | | | |
iShares Russell 2000 ETF | | | | | | | | | | | | |
Expiration: June 2022, Exercise Price $203.00 | | | 33,872,000 | | | | 2,000 | | | | 1,000 | |
Expiration: July 2022, Exercise Price $203.00 | | | 33,872,000 | | | | 2,000 | | | | 2,000 | |
iShares TR Russell 2000 ETF | | | | | | | | | | | | |
Expiration: July 2022, Exercise Price $192.00 | | | 16,936,000 | | | | 1,000 | | | | 5,000 | |
Total Call Options (Cost $155,696) | | | | | | | | | | | 8,000 | |
Put Options: 0.78% | | | | | | | | | | | | |
iShares Russell 2000 ETF | | | | | | | | | | | | |
Expiration: June 2022, Exercise Price $164.00 | | | 21,170,000 | | | | 1,250 | | | | 1,250 | |
iShares TR Russell 2000 ETF | | | | | | | | | | | | |
Expiration: July 2022, Exercise Price $165.00 | | | 33,872,000 | | | | 3,000 | | | | 816,000 | |
Total Put Options (Cost $1,281,023) | | | | | | | | | | | 817,250 | |
TOTAL PURCHASED OPTIONS (Cost $1,436,719) | | | | | | | | | | | 825,250 | |
| | | | | | | | | | | | | |
| | | | | | | Shares | | | | | |
REAL ESTATE INVESTMENT TRUSTS: 20.29% | | | | | | | | | | | | |
AGNC Investment Corp. (d) | | | | | | | 122,096 | | | | 1,351,603 | |
Annaly Capital Management, Inc. | | | | | | | 464,680 | | | | 2,746,259 | |
Apollo Commercial Real Estate Finance, Inc. | | | | | | | 123,535 | | | | 1,289,705 | |
66 | The accompanying notes are an integral part of these financial statements. |
LoCorr Spectrum Income Fund – Schedule of Investments (continued) |
| | | | | Shares | | | Value | |
REAL ESTATE INVESTMENT TRUSTS: (continued) |
Crown Castle International Corp. | | | | | | | 3,298 | | | $ | 555,317 | |
Digital Realty Trust, Inc. | | | | | | | 14,695 | | | | 1,907,852 | |
Gaming and Leisure Properties, Inc. | | | | | | | 17,244 | | | | 790,810 | |
Global Net Lease, Inc. (d) | | | | | | | 105,603 | | | | 1,495,339 | |
Hannon Armstrong Sustainable Infrastructure Capital, Inc. (d) | | | | | | | 53,773 | | | | 2,035,846 | |
Iron Mountain, Inc. (d) | | | | | | | 37,810 | | | | 1,840,969 | |
New Residential Investment Corp. | | | | | | | 44,900 | | | | 968,044 | |
New Residential Investment Corp. | | | | | | | 75,573 | | | | 704,340 | |
Sabra Health Care, Inc. | | | | | | | 60,586 | | | | 846,386 | |
SL Green Realty Corp. (d) | | | | | | | 9,582 | | | | 442,209 | |
Starwood Property Trust, Inc. | | | | | | | 53,076 | | | | 1,108,758 | |
The Necessity Retail REIT Inc. | | | | | | | 104,117 | | | | 757,972 | |
WP Carey, Inc. | | | | | | | 27,292 | | | | 2,261,414 | |
TOTAL REAL ESTATE INVESTMENT TRUSTS (Cost $23,514,858) | | | | | | | | | | | 21,102,823 | |
| | | | | | | | | | | | | |
SHORT TERM INVESTMENT: 7.54% | | | | | | | | | | | | |
MONEY MARKET FUND: 7.54% | | | | | | | | | | | | |
STIT-Government & Agency Portfolio, Institutional Class, 1.38% (c) | | | | | | | 7,846,936 | | | | 7,846,936 | |
TOTAL MONEY MARKET FUND (Cost $7,846,936) | | | | | | | | | | | 7,846,936 | |
TOTAL SHORT TERM INVESTMENT (Cost $7,846,936) | | | | | | | | | | | 7,846,936 | |
| | | | | | | | | | | | | |
TOTAL INVESTMENTS (Cost $105,302,785): 98.79% | | | | | | | | | | | 102,759,523 | |
Other Assets in Excess of Liabilities: 1.21% | | | | | | | | | | | 1,260,661 | |
TOTAL NET ASSETS: 100.00% | | | | | | | | | | $ | 104,020,184 | |
(a) | Foreign issued security. |
(b) | Each contract is equivalent to 100 shares of common stock. |
(c) | The rate quoted is the annualized seven-day effective yield as of June 30, 2022. |
(d) | All of a portion of this security is held as collateral for options written. At June 30, 2022, the value of this collateral is $10,423,494. |
ADR | American Depositary Receipts |
PLC | Public Limited Company |
The accompanying notes are an integral part of these financial statements. | 67 |
LoCorr Spectrum Income Fund – Schedule of Written Options |
LoCorr Spectrum Income Fund
Schedule of Written Options
June 30, 2022 (Unaudited)
| | | Notional
Amount | | | Number of
Contracts (a) | | | Value | |
WRITTEN OPTIONS (0.30)% | | | | | | | | | | | | |
Call Options: 0.30% | | | | | | | | | | | | |
Chesapeake Energy Corp. Expiration: August 2022, Exercise Price: $100.00 | | $ | 1,694,990 | | | | (209 | ) | | $ | (56,430 | ) |
Clearway Energy, Inc. Expiration: August 2022, Exercise Price: $40.00 | | | 2,104,336 | | | | (604 | ) | | | (18,120 | ) |
CVR Partners LP Expiration: August 2022, Exercise Price: $130.00 | | | 748,875 | | | | (75 | ) | | | (22,500 | ) |
iShares TR Russell 2000 ETF Expiration: July 2022, Exercise Price: $175.00 | | | 16,936,000 | | | | (1,000 | ) | | | (175,000 | ) |
NextEra Energy Partners LP Expiration: August 2022, Exercise Price: $85.00 | | | 2,209,968 | | | | (298 | ) | | | (14,900 | ) |
Pfizer, Inc. Expiration: August 2022, Exercise Price: $57.50 | | | 2,013,312 | | | | (384 | ) | | | (23,424 | ) |
TOTAL WRITTEN OPTIONS (Premiums received $384,349)(0.30)% | | | | | | | | | | $ | (310,374 | ) |
Percentages are stated as a percent of net assets.
(a) | Each contract is equivalent to 100 shares of common stock. |
68 | The accompanying notes are an integral part of these financial statements. |
LoCorr Macro Strategies Fund, LoCorr Long/Short Commodities Strategy Fund and LoCorr Market Trend Fund
Consolidated Statements of Assets & Liabilities |
Consolidated Statements of Assets & Liabilities
June 30, 2022 (Unaudited)
| | | LoCorr Macro
Strategies Fund | | | LoCorr Long/Short
Commodities
Strategy Fund | | | LoCorr Market
Trend Fund | |
Assets | | | | | | | | | | | | |
Investments, at value (Cost $2,038,639,435, $1,068,991,971 and $531,986,101, respectively) | | $ | 2,005,827,457 | | | $ | 1,087,798,764 | | | $ | 523,833,443 | |
Cash | | | 35,188,806 | | | | — | | | | — | |
Cash held as collateral for forward currency contracts (Note 2) | | | 8,666,806 | | | | — | | | | 7,780,000 | |
Foreign currency, at value (Cost $3,392,550, $0 and $12,245, respectively) | | | 1,802,795 | | | | — | | | | 12,245 | |
Receivable for variation margin on futures contracts | | | — | | | | — | | | | 796,904 | |
Deposits with broker for derivative instruments (Note 2) | | | 113,741,444 | | | | 29,927,511 | | | | 45,237,359 | |
Unrealized appreciation on swap contracts (Note 1) | | | — | | | | 79,517,959 | | | | — | |
Unrealized appreciation on forward currency contracts (Note 2) | | | 23,152,200 | | | | — | | | | 8,459,440 | |
Receivable for Fund shares sold | | | 17,567,890 | | | | 5,194,883 | | | | 4,172,360 | |
Receivable for securities sold | | | 752,097 | | | | 345,254 | | | | — | |
Interest receivable | | | 3,322,903 | | | | 1,623,189 | | | | 879,748 | |
Receivable for unsettled open futures contracts | | | 4,099,961 | | | | — | | | | — | |
Advance receipt on swap contracts | | | — | | | | 14,113,147 | | | | — | |
Prepaid expenses and other assets | | | 212,783 | | | | 351,899 | | | | 79,266 | |
Total Assets | | | 2,214,335,142 | | | | 1,218,872,606 | | | | 591,250,765 | |
| | | | | | | | | | | | | |
Liabilities | | | | | | | | | | | | |
Payable for Fund shares redeemed | | | 2,823,833 | | | | 2,000,279 | | | | 1,559,986 | |
Payable for securities purchased | | | — | | | | — | | | | 253,862 | |
Unrealized depreciation on forward currency contracts (Note 2) | | | 18,211,232 | | | | — | | | | 3,611,208 | |
Payable for unsettled open futures contracts | | | 5,083,815 | | | | — | | | | 2,527,648 | |
Payable for variation margin on futures contracts | | | 2,965,576 | | | | — | | | | 6,207,130 | |
Payable to custodian | | | — | | | | 2,429,304 | | | | — | |
Accrued management fees (Note 5) | | | 2,863,257 | | | | 1,408,246 | | | | 726,197 | |
Accrued Trustees’ fees | | | 22,318 | | | | 12,230 | | | | 4,980 | |
Accrued Rule 12b-1 fees | | | 190,669 | | | | 160,512 | | | | 124,512 | |
Accrued expenses and other liabilities | | | 311,992 | | | | 116,036 | | | | 89,249 | |
Total Liabilities | | | 32,472,692 | | | | 6,126,607 | | | | 15,104,772 | |
| | | | | | | | | | | | | |
Net Assets | | $ | 2,181,862,450 | | | $ | 1,212,745,999 | | | $ | 576,145,993 | |
| | | | | | | | | | | | | |
Net Assets Consist of: | | | | | | | �� | | | | | |
Paid-in capital | | $ | 1,975,799,253 | | | $ | 1,097,111,435 | | | $ | 474,671,056 | |
Total distributable earnings/(accumulated loss) | | | 206,063,197 | | | | 115,634,564 | | | | 101,474,937 | |
NET ASSETS | | $ | 2,181,862,450 | | | $ | 1,212,745,999 | | | $ | 576,145,993 | |
| | | | | | | | | | | | | |
Class A Shares | | | | | | | | | | | | |
Net assets | | $ | 76,945,719 | | | $ | 43,220,586 | | | $ | 25,182,770 | |
Shares issued and outstanding (unlimited shares authorized, no par value) | | | 8,197,866 | | | | 3,916,423 | | | | 1,647,548 | |
Net asset value, redemption, and minimum offering price per share (a) | | $ | 9.39 | | | $ | 11.04 | | | $ | 15.28 | |
Maximum offering price per share ($9.39/0.9425) ($11.04/0.9425) ($15.28/0.9425)(b) | | $ | 9.96 | | | $ | 11.71 | | | $ | 16.22 | |
| | | | | | | | | | | | | |
Class C Shares | | | | | | | | | | | | |
Net assets | | $ | 48,515,024 | | | $ | 13,960,692 | | | $ | 17,154,393 | |
Shares issued and outstanding (unlimited shares authorized, no par value) | | | 5,455,774 | | | | 1,333,115 | | | | 1,165,328 | |
Net asset value, redemption, and offering price per share (a) | | $ | 8.89 | | | $ | 10.47 | | | $ | 14.72 | |
| | | | | | | | | | | | | |
Class I Shares | | | | | | | | | | | | |
Net assets | | $ | 2,056,401,707 | | | $ | 1,155,564,721 | | | $ | 533,808,830 | |
Shares issued and outstanding (unlimited shares authorized, no par value) | | | 215,074,558 | | | | 103,281,285 | | | | 34,762,791 | |
Net asset value, redemption, and offering price per share | | $ | 9.56 | | | $ | 11.19 | | | $ | 15.36 | |
(a) | A 1.00% contingent deferred sales charge may apply to redemptions made within twelve months of purchase. The contingent deferred sales charge only applies to Class A share purchases of $1 million or more. |
(b) | On investments of $25,000 or more, the offering price is reduced. |
The accompanying notes are an integral part of these consolidated financial statements. | 69 |
LoCorr Dynamic Equity Fund and LoCorr Spectrum Income Fund - Statements of Assets & Liabilities |
Statements of Assets & Liabilities
June 30, 2022 (Unaudited)
| | | LoCorr Dynamic
Equity Fund | | | LoCorr Spectrum
Income Fund | |
Assets | | | | | | | | |
Investments, at value (Cost $42,528,634 and $105,302,785, respectively) | | $ | 40,969,115 | | | $ | 102,759,523 | |
Cash held as collateral for securities sold short (Note 2) | | | 2,353,718 | | | | — | |
Cash pledged as collateral for options contracts (Note 2) | | | — | | | | 1,643 | |
Deposits with broker for securities sold short (Note 2) | | | 15,775,189 | | | | — | |
Receivable for Fund shares sold | | | 1,597,684 | | | | 914,143 | |
Receivable for securities sold | | | 1,198,367 | | | | 524,601 | |
Dividends, interest and other receivables | | | 20,100 | | | | 430,926 | |
Deposits with broker for options | | | 13,388 | | | | 461,593 | |
Prepaid expenses and other assets | | | 39,349 | | | | 41,500 | |
Total Assets | | | 61,966,910 | | | | 105,133,929 | |
| | | | | | | | | |
Liabilities | | | | | | | | |
Securities sold short, at value (Proceeds $15,103,562 and $0, respectively) | | $ | 14,578,443 | | | $ | — | |
Options written, at value (Premiums received $13,388 and $384,349, respectively) | | | 10,640 | | | | 310,374 | |
Foreign currency, due to custodian (Cost $8,830 and $0, respectively) | | | 8,822 | | | | — | |
Payable for securities purchased | | | 1,953,254 | | | | 342,731 | |
Payable for Fund shares redeemed | | | 37,772 | | | | 109,868 | |
Payable for distributions | | | — | | | | 119,061 | |
Dividends payable | | | 4,425 | | | | — | |
Accrued management fees (Note 5) | | | 23,786 | | | | 114,891 | |
Accrued Trustees’ fees | | | 319 | | | | 942 | |
Accrued Rule 12b-1 fees | | | 12,289 | | | | 78,751 | |
Accrued expenses and other liabilities | | | 65,924 | | | | 37,127 | |
Total Liabilities | | | 16,695,674 | | | | 1,113,745 | |
| | | | | | | | | |
Net Assets | | $ | 45,271,236 | | | $ | 104,020,184 | |
| | | | | | | | | |
Net Assets Consist of: | | | | | | | | |
Paid-in capital | | $ | 48,029,103 | | | $ | 134,419,592 | |
Total distributable earnings/(accumulated loss) | | | (2,757,867 | ) | | | (30,399,408 | ) |
NET ASSETS | | $ | 45,271,236 | | | $ | 104,020,184 | |
| | | | | | | | | |
Class A Shares | | | | | | | | |
Net assets | | $ | 3,053,625 | | | $ | 14,238,583 | |
Shares issued and outstanding (unlimited shares authorized, no par value) | | | 279,903 | | | | 2,215,265 | |
Net asset value, redemption, and minimum offering price per share (a) | | $ | 10.91 | | | $ | 6.43 | (b) |
Maximum offering price per share ($10.91/0.9425), ($6.43/0.9425), respectively(c) | | $ | 11.58 | | | $ | 6.82 | |
| | | | | | | | | |
Class C Shares | | | | | | | | |
Net assets | | $ | 2,802,541 | | | $ | 17,396,895 | |
Shares issued and outstanding (unlimited shares authorized, no par value) | | | 277,550 | | | | 2,677,830 | |
Net asset value, redemption, and offering price per share (a) | | $ | 10.10 | | | $ | 6.50 | (b) |
| | | | | | | | | |
Class I Shares | | | | | | | | |
Net assets | | $ | 39,415,070 | | | $ | 72,384,706 | |
Shares issued and outstanding (unlimited shares authorized, no par value) | | | 3,517,544 | | | | 11,300,852 | |
Net asset value, redemption, and offering price per share | | $ | 11.21 | | | $ | 6.41 | (b) |
(a) | A 1.00% contingent deferred sales charge may apply to redemptions made within twelve months of purchase. The contingent deferred sales charge only applies to Class A share purchases of $1 million or more. |
(b) | Redemptions made within 60 days of purchase may be assessed a redemption fee of 2.00%. |
(c) | On investments of $25,000 or more, the offering price is reduced. |
70 | The accompanying notes are an integral part of these financial statements. |
LoCorr Macro Strategies Fund, LoCorr Long/Short Commodities Strategy Fund and LoCorr Market Trend Fund –
Consolidated Statements of Operations |
Consolidated Statements of Operations
Six Months Ended June 30, 2022 (Unaudited)
| | LoCorr Macro
Strategies Fund | | | LoCorr Long/Short
Commodities
Strategy Fund | | | LoCorr Market
Trend Fund | |
Investment Income | | | | | | | | | | | | |
Interest income | | $ | 9,485,140 | | | $ | 4,518,737 | | | $ | 2,100,422 | |
Total Investment Income | | | 9,485,140 | | | | 4,518,737 | | | | 2,100,422 | |
| | | | | | | | | | | | | |
Expenses | | | | | | | | | | | | |
Management fees (Note 5) | | | 14,063,215 | | | | 7,595,962 | | | | 3,064,716 | |
Transfer agent fees and expenses | | | 1,005,043 | | | | 573,311 | | | | 123,295 | |
Fund accounting fees | | | 237,380 | | | | 154,895 | | | | 85,863 | |
Fund administration fees | | | 230,300 | | | | 145,106 | | | | 81,437 | |
Rule 12b-1 fee - Class A (Note 5) | | | 88,448 | | | | 33,956 | | | | 16,593 | |
Rule 12b-1 fee - Class C (Note 5) | | | 132,800 | | | | 61,249 | | | | 51,415 | |
Registration expenses | | | 75,985 | | | | 68,746 | | | | 38,625 | |
Printing and mailing expenses | | | 69,118 | | | | 30,343 | | | | 11,922 | |
Trustees’ fees | | | 47,738 | | | | 28,136 | | | | 10,360 | |
Legal and audit fees | | | 40,793 | | | | 30,846 | | | | 23,541 | |
Custodian fees | | | 42,799 | | | | 20,945 | | | | 9,070 | |
Service fees paid for options | | | — | | | | 565,171 | | | | — | |
Other expenses | | | 13,011 | | | | 5,743 | | | | 3,010 | |
Total Expenses | | | 16,046,630 | | | | 9,314,409 | | | | 3,519,847 | |
Net Investment Income (Loss) | | | (6,561,490 | ) | | | (4,795,672 | ) | | | (1,419,425 | ) |
| | | | | | | | | | | | | |
Realized and Unrealized Gain (Loss) on Investments, Swap Contracts, Forward Currency Contracts, Futures Contracts and Foreign Currency: | | | | | | | | | | | | |
Net realized gain (loss) on: | | | | | | | | | | | | |
Investments | | | (13,235,069 | ) | | | 22,158,638 | | | | (1,489,683 | ) |
Forward currency contracts | | | 36,962,316 | | | | — | | | | 15,479,933 | |
Futures contracts | | | 257,613,689 | | | | — | | | | 110,168,984 | |
Foreign currency transactions | | | 2,367,911 | | | | — | | | | (57,919 | ) |
Net change in unrealized appreciation/depreciation on: | | | | | | | | | | | | |
Investments | | | (32,706,599 | ) | | | (20,048,850 | ) | | | (7,853,985 | ) |
Swap contracts | | | — | | | | 42,261,898 | | | | — | |
Forward currency contracts | | | 10,483,300 | | | | — | | | | 7,323,639 | |
Futures contracts | | | (14,171,375 | ) | | | — | | | | (18,369,555 | ) |
Foreign currency translation | | | (1,378,745 | ) | | | — | | | | (18 | ) |
Net realized and unrealized gain (loss) | | | 245,935,428 | | | | 44,371,686 | | | | 105,201,396 | |
Net Increase (Decrease) in Net Assets Resulting From Operations | | $ | 239,373,938 | | | $ | 39,576,014 | | | $ | 103,781,971 | |
The accompanying notes are an integral part of these consolidated financial statements. | 71 |
LoCorr Dynamic Equity Fund and LoCorr Spectrum Income Fund – Statements of Operations |
Statements of Operations
Six Months Ended June 30, 2022 (Unaudited)
| | LoCorr Dynamic
Equity Fund | | | LoCorr Spectrum
Income Fund | |
Investment Income | | | | | | | | |
Dividend and interest income (a) | | $ | 126,903 | | | $ | 2,220,781 | |
Total Investment Income | | | 126,903 | | | | 2,220,781 | |
| | | | | | | | | |
Expenses | | | | | | | | |
Management fees (Note 5) | | | 214,735 | | | | 577,492 | |
Fund administration fees | | | 34,870 | | | | 29,286 | |
Fund accounting fees | | | 29,597 | | | | 22,256 | |
Trustees’ fees | | | 731 | | | | 2,371 | |
Transfer agent fees and expenses | | | 38,435 | | | | 53,415 | |
Custodian fees | | | 33,242 | | | | 3,526 | |
Registration expenses | | | 25,436 | | | | 28,747 | |
Rule 12b-1 fee - Class A (Note 5) | | | 3,127 | | | | 13,386 | |
Rule 12b-1 fee - Class C (Note 5) | | | 13,726 | | | | 89,117 | |
Legal and audit fees | | | 15,117 | | | | 13,361 | |
Printing and mailing expenses | | | 1,221 | | | | 9,702 | |
Other expenses | | | 1,363 | | | | 1,664 | |
Total expenses before dividend and interest expense | | | 411,600 | | | | 844,323 | |
Dividend expense on securities sold short (Note 2) | | | 41,672 | | | | — | |
Interest expense | | | 7,613 | | | | 5,528 | |
Total expenses before fee waiver from Advisor | | | 460,885 | | | | 849,851 | |
Fee waiver from Adviser (Note 5) | | | (109,866 | ) | | | — | |
Fee recovery to Adviser (Note 5) | | | — | | | | 57,785 | |
Net Expenses | | | 351,019 | | | | 907,636 | |
Net Investment Income (Loss) | | | (224,116 | ) | | | 1,313,145 | |
| | | | | | | | | |
Realized and Unrealized Gain (Loss) on Investments, Securities Sold Short, Futures Contracts, Foreign Currency and Written Options: | | | | | | | | |
Net realized gain (loss) on: | | | | | | | | |
Investments | | | (2,341,977 | ) | | | (19,444 | ) |
Securities sold short | | | 1,624,976 | | | | — | |
Futures contracts | | | (117,190 | ) | | | — | |
Foreign currency transactions | | | (11,691 | ) | | | — | |
Written options | | | — | | | | 4,391,783 | |
Net change in unrealized appreciation/depreciation on: | | | | | | | | |
Investments | | | (3,087,498 | ) | | | (10,303,824 | ) |
Securities sold short | | | 418,978 | | | | — | |
Futures contracts | | | — | | | | — | |
Foreign currency translation | | | (106 | ) | | | — | |
Written options | | | 2,748 | | | | (363,185 | ) |
Net realized and unrealized gain (loss) | | | (3,511,760 | ) | | | (6,294,670 | ) |
Net Increase (Decrease) in Net Assets Resulting From Operations | | $ | (3,735,876 | ) | | $ | (4,981,525 | ) |
(a) Net foreign tax withheld of $5,708 and $11,907, respectively.
72 | The accompanying notes are an integral part of these financial statements. |
LoCorr Macro Strategies Fund – Consolidated Statements of Changes in Net Assets |
LoCorr Macro Strategies Fund
Consolidated Statements of Changes in Net Assets
| | Six Months Ended
June 30, 2022
(Unaudited) | | | Year Ended
December 31,
2021 | |
Operations | | | | | | | | |
Net investment income (loss) | | $ | (6,561,490 | ) | | $ | (12,384,383 | ) |
Net realized gain (loss) on investments, forward currency contracts, futures contracts and foreign currency transactions | | | 283,708,847 | | | | 56,224,334 | |
Net change in unrealized appreciation/depreciation of investments, forward currency contracts, futures contracts and foreign currency translation | | | (37,773,419 | ) | | | (54,370,707 | ) |
Increase (Decrease) in Net Assets Resulting From Operations | | | 239,373,938 | | | | (10,530,756 | ) |
| | | | | | | | | |
Distributions From Earnings | | | | | | | | |
Class A | | | — | | | | (4,127,819 | ) |
Class C | | | — | | | | (1,383,724 | ) |
Class I | | | — | | | | (64,619,838 | ) |
Total Distributions From Earnings | | | — | | | | (70,131,381 | ) |
| | | | | | | | | |
Capital Transactions (Note 6) | | | | | | | | |
Proceeds from shares sold | | | 839,532,611 | | | | 696,943,275 | |
Reinvestment of distributions | | | — | | | | 60,719,026 | |
Cost of shares redeemed | | | (323,069,164 | ) | | | (435,141,347 | ) |
Increase (Decrease) in Net Assets From Capital Transactions | | | 516,463,447 | | | | 322,520,954 | |
| | | | | | | | | |
Total Increase (Decrease) in Net Assets | | | 755,837,385 | | | | 241,858,817 | |
| | | | | | | | | |
Net Assets | | | | | | | | |
Beginning of period | | | 1,426,025,065 | | | | 1,184,166,248 | |
End of period | | $ | 2,181,862,450 | | | $ | 1,426,025,065 | |
The accompanying notes are an integral part of these consolidated financial statements. | 73 |
LoCorr Long/Short Commodities Strategy Fund – Consolidated Statements of Changes in Net Assets |
LoCorr Long/Short Commodities Strategy Fund
Consolidated Statements of Changes in Net Assets
| | Six Months Ended
June 30, 2022
(Unaudited) | | | Year Ended
December 31,
2021 | |
Operations | | | | | | | | |
Net investment income (loss) | | $ | (4,795,672 | ) | | $ | (7,452,304 | ) |
Net realized gain (loss) on investments and swap contracts | | | 22,158,638 | | | | 24,366,282 | |
Net change in unrealized appreciation/depreciation of investments and swap contracts | | | 22,213,048 | | | | 77,237,237 | |
Increase (Decrease) in Net Assets Resulting From Operations | | | 39,576,014 | | | | 94,151,215 | |
| | | | | | | | | |
Distributions From Earnings | | | | | | | | |
Class A | | | — | | | | (2,253,811 | ) |
Class C | | | — | | | | (680,758 | ) |
Class I | | | — | | | | (57,133,795 | ) |
Total Distributions From Earnings | | | — | | | | (60,068,364 | ) |
| | | | | | | | | |
Capital Transactions (Note 6) | | | | | | | | |
Proceeds from shares sold | | | 460,262,463 | | | | 516,986,498 | |
Reinvestment of distributions | | | — | | | | 47,195,180 | |
Cost of shares redeemed | | | (185,451,355 | ) | | | (177,740,338 | ) |
Increase (Decrease) in Net Assets From Capital Transactions | | | 274,811,108 | | | | 386,441,340 | |
| | | | | | | | | |
Total Increase (Decrease) in Net Assets | | | 314,387,122 | | | | 420,524,191 | |
| | | | | | | | | |
Net Assets | | | | | | | | |
Beginning of period | | | 898,358,877 | | | | 477,834,686 | |
End of period | | $ | 1,212,745,999 | | | $ | 898,358,877 | |
74 | The accompanying notes are an integral part of these consolidated financial statements. |
LoCorr Market Trend Fund – Consolidated Statements of Changes in Net Assets |
LoCorr Market Trend Fund
Consolidated Statements of Changes in Net Assets
| | Six Months Ended
June 30, 2022
(Unaudited) | | | Year Ended
December 31,
2021 | |
Operations | | | | | | | | |
Net investment income (loss) | | $ | (1,419,425 | ) | | $ | (2,460,200 | ) |
Net realized gain (loss) on investments, forward currency contracts, futures contracts and foreign currency transactions | | | 124,101,315 | | | | 24,266,193 | |
Net change in unrealized appreciation/depreciation of investments, forward currency contracts, futures contracts and foreign currency translation | | | (18,899,919 | ) | | | (20,218,470 | ) |
Increase (Decrease) in Net Assets Resulting From Operations | | | 103,781,971 | | | | 1,587,523 | |
| | | | | | | | | |
Distributions From Earnings | | | | | | | | |
Class A | | | — | | | | (502,242 | ) |
Class C | | | — | | | | (279,635 | ) |
Class I | | | — | | | | (8,675,899 | ) |
Total Distributions to Shareholders | | | — | | | | (9,457,776 | ) |
| | | | | | | | | |
Capital Transactions (Note 6) | | | | | | | | |
Proceeds from shares sold | | | 329,389,890 | | | | 90,011,450 | |
Reinvestment of distributions | | | — | | | | 9,157,589 | |
Cost of shares redeemed | | | (123,466,912 | ) | | | (80,974,775 | ) |
Increase (Decrease) in Net Assets From Capital Transactions | | | 205,922,978 | | | | 18,194,264 | |
| | | | | | | | | |
Total Increase (Decrease) in Net Assets | | | 309,704,949 | | | | 10,324,011 | |
| | | | | | | | | |
Net Assets | | | | | | | | |
Beginning of period | | | 266,441,044 | | | | 256,117,033 | |
End of period | | $ | 576,145,993 | | | $ | 266,441,044 | |
The accompanying notes are an integral part of these consolidated financial statements. | 75 |
LoCorr Dynamic Equity Fund – Statements of Changes in Net Assets |
LoCorr Dynamic Equity Fund
Statements of Changes in Net Assets
| | Six Months Ended
June 30, 2022
(Unaudited) | | | Year Ended
December 31,
2021 | |
Operations | | | | | | | | |
Net investment income (loss) | | $ | (224,116 | ) | | $ | (370,714 | ) |
Net realized gain (loss) on investments, securities sold short, futures contracts and foreign currency transactions | | | (845,882 | ) | | | 3,571,750 | |
Net change in unrealized appreciation/depreciation of investments, securities sold short, futures contracts, foreign currency translation and written options | | | (2,665,878 | ) | | | (650,857 | ) |
Increase (Decrease) in Net Assets Resulting From Operations | | | (3,735,876 | ) | | | 2,550,179 | |
| | | | | | | | | |
Distributions From Earnings | | | | | | | | |
Class A | | | — | | | | (240,081 | ) |
Class C | | | — | | | | (177,259 | ) |
Class I | | | — | | | | (1,025,665 | ) |
Total Distributions From Earnings | | | — | | | | (1,443,005 | ) |
| | | | | | | | | |
Capital Transactions (Note 6) | | | | | | | | |
Proceeds from shares sold | | | 27,669,034 | | | | 10,887,135 | |
Reinvestment of distributions | | | — | | | | 1,335,949 | |
Cost of shares redeemed | | | (3,170,613 | ) | | | (6,894,102 | ) |
Increase (Decrease) in Net Assets From Capital Transactions | | | 24,498,421 | | | | 5,328,982 | |
| | | | | | | | | |
Total Increase (Decrease) in Net Assets | | | 20,762,545 | | | | 6,436,156 | |
| | | | | | | | | |
Net Assets | | | | | | | | |
Beginning of period | | | 24,508,691 | | | | 18,072,535 | |
End of period | | $ | 45,271,236 | | | $ | 24,508,691 | |
76 | The accompanying notes are an integral part of these financial statements. |
LoCorr Spectrum Income Fund – Statements of Changes in Net Assets |
LoCorr Spectrum Income Fund | |
Statements of Changes in Net Assets
| | Six Months Ended
June 30, 2022
(Unaudited) | | | Year Ended
December 31,
2021 | |
Operations | | | | | | | | |
Net investment income (loss) | | $ | 1,313,145 | | | $ | 715,685 | |
Net realized gain (loss) on investments and written options | | | 4,372,339 | | | | 6,335,816 | |
Net change in unrealized appreciation/depreciation of investments and written options | | | (10,667,009 | ) | | | 3,380,502 | |
Increase (Decrease) in Net Assets Resulting From Operations | | | (4,981,525 | ) | | | 10,432,003 | |
| | | | | | | | | |
Distributions From: | | | | | | | | |
Earnings: | | | | | | | | |
Class A | | | (486,276 | ) | | | (581,259 | ) |
Class C | | | (544,177 | ) | | | (573,863 | ) |
Class I | | | (2,129,214 | ) | | | (1,362,103 | ) |
Return of capital: | | | | | | | | |
Class A | | | — | | | | (373,680 | ) |
Class C | | | — | | | | (368,925 | ) |
Class I | | | — | | | | (875,669 | ) |
Total Distributions From Earnings | | | (3,159,667 | ) | | | (4,135,499 | ) |
| | | | | | | | | |
Capital Transactions (Note 6) | | | | | | | | |
Proceeds from shares sold | | | 47,790,200 | | | | 32,470,780 | |
Reinvestment of distributions | | | 2,446,945 | | | | 3,075,791 | |
Cost of shares redeemed | | | (13,884,755 | ) | | | (14,181,847 | ) |
Redemption fees | | | 1,888 | | | | 515 | |
Increase (Decrease) in Net Assets From Capital Transactions | | | 36,354,278 | | | | 21,365,239 | |
| | | | | | | | | |
Total Increase (Decrease) in Net Assets | | | 28,213,086 | | | | 27,661,743 | |
| | | | | | | | | |
Net Assets | | | | | | | | |
Beginning of period | | | 75,807,098 | | | | 48,145,355 | |
End of period | | $ | 104,020,184 | | | $ | 75,807,098 | |
The accompanying notes are an integral part of these financial statements. | 77 |
LoCorr Macro Strategies Fund – Consolidated Financial Highlights – Class A |
LoCorr Macro Strategies Fund - Class A
Consolidated Financial Highlights
Selected Data and Ratios (for a share outstanding throughout the period)
| | | Six Month
Ended
June 30, 2022* | | | Year Ended December 31, | |
| | | (Unaudited) | | | 2021 | | | 2020 | | | 2019 | | | 2018 | | | 2017 | |
Per Share | | | | | | | | | | | | | | | | | | | | | | | | |
Net asset value, beginning of period | | $ | 8.13 | | | $ | 8.53 | | | $ | 8.56 | | | $ | 7.95 | | | $ | 8.64 | | | $ | 8.91 | |
| | | | | | | | | | | | | | | | | | | | | | | | | |
Income (loss) from investment operations: | | | | | | | | | | | | | | | | | | | | | | | | |
Net investment income (loss)(a) | | | (0.04 | ) | | | (0.10 | ) | | | (0.04 | ) | | | 0.02 | | | | 0.00 | (c) | | | (0.06 | ) |
Net realized and unrealized gain (loss)(b) | | | 1.30 | | | | 0.09 | | | | 0.49 | | | | 0.98 | | | | (0.46 | ) | | | 0.31 | |
Total from Investment Operations | | | 1.26 | | | | (0.01 | ) | | | 0.45 | | | | 1.00 | | | | (0.46 | ) | | | 0.25 | |
| | | | | | | | | | | | | | | | | | | | | | | | | |
Distributions From Earnings: | | | | | | | | | | | | | | | | | | | | | | | | |
Net investment income | | | — | | | | (0.39 | ) | | | (0.39 | ) | | | (0.16 | ) | | | (0.10 | ) | | | — | |
Net realized gains | | | — | | | | — | | | | (0.09 | ) | | | (0.23 | ) | | | (0.13 | ) | | | (0.52 | ) |
Total Distributions | | | — | | | | (0.39 | ) | | | (0.48 | ) | | | (0.39 | ) | | | (0.23 | ) | | | (0.52 | ) |
| | | | | | | | | | | | | | | | | | | | | | | | | |
Redemption Fees | | | — | | | | — | | | | — | | | | — | | | | — | | | | 0.00 | (c) |
| | | | | | | | | | | | | | | | | | | | | | | | | |
Net Asset Value, End of Period | | $ | 9.39 | | | $ | 8.13 | | | $ | 8.53 | | | $ | 8.56 | | | $ | 7.95 | | | $ | 8.64 | |
| | | | | | | | | | | | | | | | | | | | | | | | |
Total Investment Return(d) | | | 15.62 | % | | | (0.15 | )% | | | 5.41 | % | | | 12.52 | % | | | (5.36 | )% | | | 2.77 | % |
| | | | | | | | | | | | | | | | | | | | | | | | | |
Net Assets, End of Period, in Thousands | | $ | 76,946 | | | $ | 84,981 | | | $ | 77,035 | | | $ | 53,320 | | | $ | 55,075 | | | $ | 93,182 | |
| | | | | | | | | | | | | | | | | | | | | | | | | |
Ratios/Supplemental Data: | | | | | | | | | | | | | | | | | | | | | | | | |
Ratio of expenses to average net assets: | | | | | | | | | | | | | | | | | | | | | | | | |
Before expense waiver or recovery | | | 2.11 | % | | | 2.15 | % | | | 2.17 | % | | | 2.16 | % | | | 2.25 | % | | | 2.33 | % |
After expense waiver or recovery | | | 2.11 | % | | | 2.15 | % | | | 2.18 | % | | | 2.24 | % | | | 2.24 | % | | | 2.28 | % |
| | | | | | | | | | | | | | | | | | | | | | | | | |
Ratio of net investment income (loss) to average net assets: | | | | | | | | | | | | | | | | | | | | | | | | |
Before expense waiver or recovery | | | (0.99 | )% | | | (1.10 | )% | | | (0.49 | )% | | | 0.32 | % | | | 0.03 | % | | | (0.76 | )% |
After expense waiver or recovery | | | (0.99 | )% | | | (1.10 | )% | �� | | (0.50 | )% | | | 0.24 | % | | | 0.04 | % | | | (0.71 | )% |
| | | | | | | | | | | | | | | | | | | | | | | | | |
Portfolio turnover rate(e) | | | 39 | % | | | 75 | % | | | 56 | % | | | 84 | % | | | 105 | % | | | 97 | % |
* All ratios have been annualized except total investment return and portfolio turnover.
(a) | Net investment income (loss) per share is based on average shares outstanding. |
(b) | Realized and unrealized gains and losses per share in this caption may be balancing amounts necessary to reconcile the change in net asset value per share for the period, and may not reconcile with the Fund’s statement of operations due to share transactions for the period. |
(c) | Amount represents less than $0.005 per share. |
(d) | Total investment return excludes the effect of applicable sales charges. |
(e) | Portfolio turnover rate is calculated on the basis of the Fund as a whole without distinguishing between classes of shares issued. Consists of long-term investments only; excludes derivative instruments. |
78 | The accompanying notes are an integral part of these consolidated financial statements. |
LoCorr Macro Strategies Fund – Consolidated Financial Highlights – Class C |
LoCorr Macro Strategies Fund - Class C
Consolidated Financial Highlights
Selected Data and Ratios (for a share outstanding throughout the period)
| | | Six Month
Ended
June 30, 2022* | | | Year Ended December 31, | |
| | | (Unaudited) | | | 2021 | | | 2020 | | | 2019 | | | 2018 | | | 2017 | |
Per Share | | | | | | | | | | | | | | | | | | | | | | | | |
Net asset value, beginning of period | | $ | 7.72 | | | $ | 8.11 | | | $ | 8.15 | | | $ | 7.62 | | | $ | 8.27 | | | $ | 8.62 | |
| | | | | | | | | | | | | | | | | | | | | | | | | |
Income (loss) from investment operations: | | | | | | | | | | | | | | | | | | | | | | | | |
Net investment income (loss)(a) | | | (0.06 | ) | | | (0.15 | ) | | | (0.10 | ) | | | (0.04 | ) | | | (0.06 | ) | | | (0.13 | ) |
Net realized and unrealized gain (loss)(b) | | | 1.23 | | | | 0.08 | | | | 0.47 | | | | 0.92 | | | | (0.43 | ) | | | 0.30 | |
Total from Investment Operations | | | 1.17 | | | | (0.07 | ) | | | 0.37 | | | | 0.88 | | | | (0.49 | ) | | | 0.17 | |
| | | | | | | | | | | | | | | | | | | | | | | | | |
Distributions From Earnings: | | | | | | | | | | | | | | | | | | | | | | | | |
Net investment income | | | — | | | | (0.32 | ) | | | (0.32 | ) | | | (0.12 | ) | | | (0.03 | ) | | | — | |
Net realized gains | | | — | | | | — | | | | (0.09 | ) | | | (0.23 | ) | | | (0.13 | ) | | | (0.52 | ) |
Total Distributions | | | — | | | | (0.32 | ) | | | (0.41 | ) | | | (0.35 | ) | | | (0.16 | ) | | | (0.52 | ) |
| | | | | | | | | | | | | | | | | | | | | | | | | |
Redemption Fees | | | — | | | | — | | | | — | | | | — | | | | — | | | | 0.00 | (c) |
| | | | | | | | | | | | | | | | | | | | | | | | | |
Net Asset Value, End of Period | | $ | 8.89 | | | $ | 7.72 | | | $ | 8.11 | | | $ | 8.15 | | | $ | 7.62 | | | $ | 8.27 | |
| | | | | | | | | | | | | | | | | | | | | | | | | |
Total Investment Return(d) | | | 15.28 | % | | | (0.91 | )% | | | 4.69 | % | | | 11.57 | % | | | (5.98 | )% | | | 1.93 | % |
| | | | | | | | | | | | | | | | | | | | | | | | |
Net Assets, End of Period, in Thousands | | $ | 48,515 | | | $ | 34,789 | | | $ | 43,684 | | | $ | 47,205 | | | $ | 53,148 | | | $ | 90,653 | |
| | | | | | | | | | | | | | | | | | | | | | | | | |
Ratios/Supplemental Data: | | | | | | | | | | | | | | | | | | | | | | | | |
Ratio of expenses to average net assets: | | | | | | | | | | | | | | | | | | | | | | | | |
Before expense waiver or recovery | | | 2.55 | % | | | 2.90 | % | | | 2.92 | % | | | 2.91 | % | | | 3.00 | % | | | 3.08 | % |
After expense waiver or recovery | | | 2.55 | % | | | 2.90 | % | | | 2.93 | % | | | 2.99 | % | | | 2.99 | % | | | 3.03 | % |
| | | | | | | | | | | | | | | | | | | | | | | | | |
Ratio of net investment income (loss) to average net assets: | | | | | | | | | | | | | | | | | | | | | | | | |
Before expense waiver or recovery | | | (1.43 | )% | | | (1.85 | )% | | | (1.24 | )% | | | (0.43 | )% | | | (0.72 | )% | | | (1.51 | )% |
After expense waiver or recovery | | | (1.43 | )% | | | (1.85 | )% | | | (1.25 | )% | | | (0.51 | )% | | | (0.71 | )% | | | (1.46 | )% |
| | | | | | | | | | | | | | | | | | | | | | | | | |
Portfolio turnover rate(e) | | | 39 | % | | | 75 | % | | | 56 | % | | | 84 | % | | | 105 | % | | | 97 | % |
* All ratios have been annualized except total investment return and portfolio turnover.
(a) | Net investment income (loss) per share is based on average shares outstanding. |
(b) | Realized and unrealized gains and losses per share in this caption may be balancing amounts necessary to reconcile the change in net asset value per share for the period, and may not reconcile with the Fund’s statement of operations due to share transactions for the period. |
(c) | Amount represents less than $0.005 per share. |
(d) | Total investment return excludes the effect of applicable sales charges. |
(e) | Portfolio turnover rate is calculated on the basis of the Fund as a whole without distinguishing between classes of shares issued. Consists of long-term investments only; excludes derivative instruments. |
The accompanying notes are an integral part of these consolidated financial statements. | 79 |
LoCorr Macro Strategies Fund – Consolidated Financial Highlights – Class I |
LoCorr Macro Strategies Fund - Class I
Consolidated Financial Highlights
Selected Data and Ratios (for a share outstanding throughout the period)
| | | Six Month
Ended
June 30, 2022* | | | Year Ended December 31, | |
| | | (Unaudited) | | | 2021 | | | 2020 | | | 2019 | | | 2018 | | | 2017 | |
Per Share | | | | | | | | | | | | | | | | | | | | | | | | |
Net asset value, beginning of period | | $ | 8.27 | | | $ | 8.67 | | | $ | 8.69 | | | $ | 8.07 | | | $ | 8.77 | | | $ | 9.01 | |
| | | | | | | | | | | | | | | | | | | | | | | | | |
Income (loss) from investment operations: | | | | | | | | | | | | | | | | | | | | | | | | |
Net investment income (loss)(a) | | | (0.03 | ) | | | (0.08 | ) | | | (0.02 | ) | | | 0.04 | | | | 0.02 | | | | (0.04 | ) |
Net realized and unrealized gain (loss)(b) | | | 1.32 | | | | 0.09 | | | | 0.50 | | | | 0.99 | | | | (0.47 | ) | | | 0.32 | |
Total from Investment Operations | | | 1.29 | | | | 0.01 | | | | 0.48 | | | | 1.03 | | | | (0.45 | ) | | | 0.28 | |
| | | | | | | | | | | | | | | | | | | | | | | | | |
Distributions From Earnings: | | | | | | | | | | | | | | | | | | | | | | | | |
Net investment income | | | — | | | | (0.41 | ) | | | (0.41 | ) | | | (0.18 | ) | | | (0.12 | ) | | | — | |
Net realized gains | | | — | | | | — | | | | (0.09 | ) | | | (0.23 | ) | | | (0.13 | ) | | | (0.52 | ) |
Total Distributions | | | — | | | | (0.41 | ) | | | (0.50 | ) | | | (0.41 | ) | | | (0.25 | ) | | | (0.52 | ) |
| | | | | | | | | | | | | | | | | | | | | | | | | |
Redemption Fees | | | — | | | | — | | | | — | | | | — | | | | — | | | | 0.00 | (c) |
| | | | | | | | | | | | | | | | | | | | | | | | | |
Net Asset Value, End of Period | | $ | 9.56 | | | $ | 8.27 | | | $ | 8.67 | | | $ | 8.69 | | | $ | 8.07 | | | $ | 8.77 | |
| | | | | | | | | | | | | | | | | | | | | | | | | |
Total Investment Return | | | 15.72 | % | | | 0.08 | % | | | 5.70 | % | | | 12.72 | % | | | (5.08 | )% | | | 3.07 | % |
| | | | | | | | | | | | | | | | | | | | | | | | | |
Net Assets, End of Period, in Thousands | | $ | 2,056,401 | | | $ | 1,306,255 | | | $ | 1,063,447 | | | $ | 726,061 | | | $ | 445,858 | | | $ | 605,983 | |
| | | | | | | | | | | | | | | | | | | | | | | | | |
Ratios/Supplemental Data: | | | | | | | | | | | | | | | | | | | | | | | | |
Ratio of expenses to average net assets: | | | | | | | | | | | | | | | | | | | | | | | | |
Before expense waiver or recovery | | | 1.86 | % | | | 1.90 | % | | | 1.92 | % | | | 1.91 | % | | | 2.00 | % | | | 2.08 | % |
After expense waiver or recovery | | | 1.86 | % | | | 1.90 | % | | | 1.93 | % | | | 1.99 | % | | | 1.99 | % | | | 2.03 | % |
| | | | | | | | | | | | | | | | | | | | | | | | | |
Ratio of net investment income (loss) to average net assets: | | | | | | | | | | | | | | | | | | | | | | | | |
Before expense waiver or recovery | | | (0.74 | )% | | | (0.85 | )% | | | (0.24 | )% | | | 0.57 | % | | | 0.28 | % | | | (0.51 | )% |
After expense waiver or recovery | | | (0.74 | )% | | | (0.85 | )% | | | (0.25 | )% | | | 0.49 | % | | | 0.29 | % | | | (0.46 | )% |
| | | | | | | | | | | | | | | | | | | | | | | | | |
Portfolio turnover rate(d) | | | 39 | % | | | 75 | % | | | 56 | % | | | 84 | % | | | 105 | % | | | 97 | % |
* All ratios have been annualized except total investment return and portfolio turnover.
(a) | Net investment income (loss) per share is based on average shares outstanding. |
(b) | Realized and unrealized gains and losses per share in this caption may be balancing amounts necessary to reconcile the change in net asset value per share for the period, and may not reconcile with the Fund’s statement of operations due to share transactions for the period. |
(c) | Amount represents less than $0.005 per share. |
(d) | Portfolio turnover rate is calculated on the basis of the Fund as a whole without distinguishing between classes of shares issued. Consists of long-term investments only; excludes derivative instruments. |
80 | The accompanying notes are an integral part of these consolidated financial statements. |
LoCorr Long/Short Commodities Strategy Fund – Consolidated Financial Highlights – Class A |
LoCorr Long/Short Commodities Strategy Fund - Class A
Consolidated Financial Highlights
Selected Data and Ratios (for a share outstanding throughout the period)
| | | Six Month
Ended
June 30, 2022* | | | Year Ended December 31, | |
| | | (Unaudited) | | | 2021 | | | 2020 | | | 2019 | | | 2018 | | | 2017 | |
Per Share | | | | | | | | | | | | | | | | | | | | | | | | |
Net asset value, beginning of period | | $ | 10.58 | | | $ | 9.89 | | | $ | 9.26 | | | $ | 9.90 | | | $ | 9.71 | | | $ | 9.17 | |
| | | | | | | | | | | | | | | | | | | | | | | | | |
Income (loss) from investment operations: | | | | | | | | | | | | | | | | | | | | | | | | |
Net investment income (loss)(a) | | | (0.06 | ) | | | (0.14 | ) | | | (0.07 | ) | | | 0.05 | | | | 0.02 | | | | (0.04 | ) |
Net realized and unrealized gain (loss)(b) | | | 0.52 | | | | 1.57 | | | | 0.96 | | | | (0.67 | ) | | | 1.39 | | | | 0.58 | |
Total from Investment Operations | | | 0.46 | | | | 1.43 | | | | 0.89 | | | | (0.62 | ) | | | 1.41 | | | | 0.54 | |
| | | | | | | | | | | | | | | | | | | | | | | | | |
Distributions From Earnings: | | | | | | | | | | | | | | | | | | | | | | | | |
Net investment income | | | — | | | | (0.74 | ) | | | (0.26 | ) | | | (0.02 | ) | | | (1.22 | ) | | | 0.00 | (c) |
Net realized gains | | | — | | | | — | | | | (0.00 | )(c) | | | — | | | | — | | | | — | |
Total Distributions | | | — | | | | (0.74 | ) | | | (0.26 | ) | | | (0.02 | ) | | | (1.22 | ) | | | 0.00 | |
| | | | | | | | | | | | | | | | | | | | | | | | | |
Redemption Fees | | | — | | | | — | | | | — | | | | — | | | | — | | | | 0.00 | (c) |
| | | | | | | | | | | | | | | | | | | | | | | | |
Net Asset Value, End of Period | | $ | 11.04 | | | $ | 10.58 | | | $ | 9.89 | | | $ | 9.26 | | | $ | 9.90 | | | $ | 9.71 | |
| | | | | | | | | | | | | | | | | | | | | | | | | |
Total Investment Return(d) | | | 4.35 | % | | | 14.55 | % | | | 9.66 | % | | | (6.24 | )% | | | 15.05 | % | | | 5.91 | % |
| | | | | | | | | | | | | | | | | | | | | | | | | |
Net Assets, End of Period, in Thousands | | $ | 43,220 | | | $ | 35,149 | | | $ | 26,546 | | | $ | 45,513 | | | $ | 68,719 | | | $ | 25,575 | |
| | | | | | | | | | | | | | | | | | | | | | | | | |
Ratios/Supplemental Data:(e) | | | | | | | | | | | | | | | | | | | | | | | | |
Ratio of expenses to average net assets: | | | | | | | | | | | | | | | | | | | | | | | | |
Before expense waiver or recovery | | | 1.92 | %(f) | | | 2.08 | %(f) | | | 2.08 | %(f) | | | 2.11 | % | | | 2.16 | % | | | 2.28 | % |
After expense waiver or recovery | | | 1.92 | %(f) | | | 2.08 | %(f) | | | 2.08 | %(f) | | | 2.14 | % | | | 2.20 | % | | | 2.20 | % |
| | | | | | | | | | | | | | | | | | | | | | | | | |
Ratio of net investment income (loss) to average net assets: | | | | | | | | | | | | | | | | | | | | | | | | |
Before expense waiver or recovery | | | (1.06 | )%(f) | | | (1.31 | )%(f) | | | (0.65 | )%(f) | | | 0.57 | % | | | 0.22 | % | | | (0.52 | )% |
After expense waiver or recovery | | | (1.06 | )%(f) | | | (1.31 | )%(f) | | | (0.65 | )%(f) | | | 0.54 | % | | | 0.18 | % | | | (0.44 | )% |
| | | | | | | | | | | | | | | | | | | | | | | | | |
Portfolio turnover rate(g) | | | 44 | % | | | 66 | % | | | 60 | % | | | 103 | % | | | 92 | % | | | 74 | % |
* All ratios have been annualized except total investment return and portfolio turnover.
(a) | Net investment income (loss) per share is based on average shares outstanding. |
(b) | Realized and unrealized gains and losses per share in this caption may be balancing amounts necessary to reconcile the change in net asset value per share for the period, and may not reconcile with the Fund’s statement of operations due to share transactions for the period. |
(c) | Amount represents less than $0.005 per share. |
(d) | Total investment return excludes the effect of applicable sales charges. |
(e) | Ratios do not include the income and expenses of the CTAs included in the swap. |
(f) | Includes 0.02%, 0.08% and 0.11% of service fees paid for options for the years ended December 31, 2020, December 31, 2021 and six months ended June 30, 2022. |
(g) | Portfolio turnover rate is calculated on the basis of the Fund as a whole without distinguishing between classes of shares issued. Consists of long-term investments only; excludes derivative instruments. |
The accompanying notes are an integral part of these consolidated financial statements. | 81 |
LoCorr Long/Short Commodities Strategy Fund – Consolidated Financial Highlights – Class C |
LoCorr Long/Short Commodities Strategy Fund - Class C
Consolidated Financial Highlights
Selected Data and Ratios (for a share outstanding throughout the period)
| | | Six Month
Ended
June 30, 2022* | | | Year Ended December 31, | |
| | | (Unaudited) | | | 2021 | | | 2020 | | | 2019 | | | 2018 | | | 2017 | |
Per Share | | | | | | | | | | | | | | | | | | | | | | | | |
Net asset value, beginning of period | | $ | 10.08 | | | $ | 9.47 | | | $ | 8.89 | | | $ | 9.55 | | | $ | 9.41 | | | $ | 8.95 | |
| | | | | | | | | | | | | | | | | | | | | | | | | |
Income (loss) from investment operations: | | | | | | | | | | | | | | | | | | | | | | | | |
Net investment income (loss)(a) | | | (0.10 | ) | | | (0.21 | ) | | | (0.13 | ) | | | (0.02 | ) | | | (0.06 | ) | | | (0.11 | ) |
Net realized and unrealized gain (loss)(b) | | | 0.49 | | | | 1.50 | | | | 0.91 | | | | (0.64 | ) | | | 1.35 | | | | 0.57 | |
Total from Investment Operations | | | 0.39 | | | | 1.29 | | | | 0.78 | | | | (0.66 | ) | | | 1.29 | | | | 0.46 | |
| | | | | | | | | | | | | | | | | | | | | | | | | |
Distributions From Earnings: | | | | | | | | | | | | | | | | | | | | | | | | |
Net investment income | | | — | | | | (0.68 | ) | | | (0.20 | ) | | | (0.00 | )(c) | | | (1.15 | ) | | | 0.00 | (c) |
Net realized gains | | | — | | | | — | | | | (0.00 | )(c) | | | — | | | | — | | | | — | |
Total Distributions | | | — | | | | (0.68 | ) | | | (0.20 | ) | | | (0.00 | ) | | | (1.15 | ) | | | 0.00 | |
| | | | | | | | | | | | | | | | | | | | | | | | | |
Redemption Fees | | | — | | | | — | | | | — | | | | — | | | | — | | | | 0.00 | (c) |
| | | | | | | | | | | | | | | | | | | | | | | | | |
Net Asset Value, End of Period | | $ | 10.47 | | | $ | 10.08 | | | $ | 9.47 | | | $ | 8.89 | | | $ | 9.55 | | | $ | 9.41 | |
| | | | | | | | | | | | | | | | | | | | | | | | |
Total Investment Return(d) | | | 3.87 | % | | | 13.66 | % | | | 8.83 | % | | | (6.90 | )% | | | 14.20 | % | | | 5.17 | % |
| | | | | | | | | | | | | | | | | | | | | | | | | |
Net Assets, End of Period, in Thousands | | $ | 13,961 | | | $ | 11,058 | | | $ | 7,938 | | | $ | 6,645 | | | $ | 6,503 | | | $ | 4,737 | |
| | | | | | | | | | | | | | | | | | | | | | | | | |
Ratios/Supplemental Data:(e) | | | | | | | | | | | | | | | | | | | | | | | | |
Ratio of expenses to average net assets: | | | | | | | | | | | | | | | | | | | | | | | | |
Before expense waiver or recovery | | | 2.75 | %(f) | | | 2.83 | %(f) | | | 2.83 | %(f) | | | 2.86 | % | | | 2.91 | % | | | 3.03 | % |
After expense waiver or recovery | | | 2.75 | %(f) | | | 2.83 | %(f) | | | 2.83 | %(f) | | | 2.89 | % | | | 2.95 | % | | | 2.95 | % |
| | | | | | | | | | | | | | | | | | | | | | | | | |
Ratio of net investment income (loss) to average net assets: | | | | | | | | | | | | | | | | | | | | | | | | |
Before expense waiver or recovery | | | (1.89 | )%(f) | | | (2.06 | )%(f) | | | (1.40 | )%(f) | | | (0.18 | )% | | | (0.53 | )% | | | (1.27 | )% |
After expense waiver or recovery | | | (1.89 | )%(f) | | | (2.06 | )%(f) | | | (1.40 | )%(f) | | | (0.21 | )% | | | (0.57 | )% | | | (1.19 | )% |
| | | | | | | | | | | | | | | | | | | | �� | | | | | |
Portfolio turnover rate(g) | | | 44 | % | | | 66 | % | | | 60 | % | | | 103 | % | | | 92 | % | | | 74 | % |
* All ratios have been annualized except total investment return and portfolio turnover.
(a) | Net investment income (loss) per share is based on average shares outstanding. |
(b) | Realized and unrealized gains and losses per share in this caption may be balancing amounts necessary to reconcile the change in net asset value per share for the period, and may not reconcile with the Fund’s statement of operations due to share transactions for the period. |
(c) | Amount represents less than $0.005 per share. |
(d) | Total investment return excludes the effect of applicable sales charges. |
(e) | Ratios do not include the income and expenses of the CTAs included in the swap. |
(f) | Includes 0.02%, 0.08% and 0.11% of service fees paid for options for the years ended December 31, 2020, December 31, 2021 and six months ended June 30, 2022. |
(g) | Portfolio turnover rate is calculated on the basis of the Fund as a whole without distinguishing between classes of shares issued. Consists of long-term investments only; excludes derivative instruments. |
82 | The accompanying notes are an integral part of these consolidated financial statements. |
LoCorr Long/Short Commodities Strategy Fund – Consolidated Financial Highlights – Class I |
LoCorr Long/Short Commodities Strategy Fund - Class I
Consolidated Financial Highlights
Selected Data and Ratios (for a share outstanding throughout the period)
| | | Six Month
Ended
June 30, 2022* | | | Year Ended December 31, | |
| | | (Unaudited) | | | 2021 | | | 2020 | | | 2019 | | | 2018 | | | 2017 | |
Per Share | | | | | | | | | | | | | | | | | | | | | | | | |
Net asset value, beginning of period | | $ | 10.72 | | | $ | 10.00 | | | $ | 9.38 | | | $ | 10.03 | | | $ | 9.81 | | | $ | 9.24 | |
| | | | | | | | | | | | | | | | | | | | | | | | | |
Income (loss) from investment operations: | | | | | | | | | | | | | | | | | | | | | | | | |
Net investment income (loss)(a) | | | (0.05 | ) | | | (0.11 | ) | | | (0.04 | ) | | | 0.08 | | | | 0.05 | | | | (0.02 | ) |
Net realized and unrealized gain (loss)(b) | | | 0.52 | | | | 1.59 | | | | 0.95 | | | | (0.68 | ) | | | 1.41 | | | | 0.59 | |
Total from Investment Operations | | | 0.47 | | | | 1.48 | | | | 0.91 | | | | (0.60 | ) | | | 1.46 | | | | 0.57 | |
| | | | | | | | | | | | | | | | | | | | | | | | | |
Distributions From Earnings: | | | | | | | | | | | | | | | | | | | | | | | | |
Net investment income | | | — | | | | (0.76 | ) | | | (0.29 | ) | | | (0.05 | ) | | | (1.24 | ) | | | (0.00 | )(c) |
Net realized gains | | | — | | | | — | | | | (0.00 | )(c) | | | — | | | | — | | | | — | |
Total Distributions | | | — | | | | (0.76 | ) | | | (0.29 | ) | | | (0.05 | ) | | | (1.24 | ) | | | (0.00 | ) |
| | | | | | | | | | | | | | | | | | | | | | | | | |
Redemption Fees | | | — | | | | — | | | | — | | | | — | | | | — | | | | 0.00 | (c) |
| | | | | | | | | | | | | | | | | | | | | | | | |
Net Asset Value, End of Period | | $ | 11.19 | | | $ | 10.72 | | | $ | 10.00 | | | $ | 9.38 | | | $ | 10.03 | | | $ | 9.81 | |
| | | | | | | | | | | | | | | | | | | | | | | | | |
Total Investment Return | | | 4.38 | % | | | 14.82 | % | | | 9.91 | % | | | (5.97 | )% | | | 15.40 | % | | | 6.19 | % |
| | | | | | | | | | | | | | | | | | | | | | | | | |
Net Assets, End of Period, in Thousands | | $ | 1,155,565 | | | $ | 852,152 | | | $ | 443,351 | | | $ | 203,887 | | | $ | 181,804 | | | $ | 52,935 | |
| | | | | | | | | | | | | | | | | | | | | | | | | |
Ratios/Supplemental Data:(d) | | | | | | | | | | | | | | | | | | | | | | | | |
Ratio of expenses to average net assets: | | | | | | | | | | | | | | | | | | | | | | | | |
Before expense waiver or recovery | | | 1.75 | %(e) | | | 1.83 | %(e) | | | 1.83 | %(e) | | | 1.86 | % | | | 1.91 | % | | | 2.03 | % |
After expense waiver or recovery | | | 1.75 | %(e) | | | 1.83 | %(e) | | | 1.83 | %(e) | | | 1.89 | % | | | 1.95 | % | | | 1.95 | % |
| | | | | | | | | | | | | | | | | | | | | | | | | |
Ratio of net investment income (loss) to average net assets: | | | | | | | | | | | | | | | | | | | | | | | | |
Before expense waiver or recovery | | | (0.89 | )%(e) | | | (1.06 | )%(e) | | | (0.40 | )%(e) | | | 0.82 | % | | | 0.47 | % | | | (0.27 | )% |
After expense waiver or recovery | | | (0.89 | )%(e) | | | (1.06 | )%(e) | | | (0.40 | )%(e) | | | 0.79 | % | | | 0.43 | % | | | (0.19 | )% |
| | | | | | | | | | | | | | | | | | | | | | | | | |
Portfolio turnover rate(f) | | | 44 | % | | | 66 | % | | | 60 | % | | | 103 | % | | | 92 | % | | | 74 | % |
* All ratios have been annualized except total investment return and portfolio turnover.
(a) | Net investment income (loss) per share is based on average shares outstanding. |
(b) | Realized and unrealized gains and losses per share in this caption may be balancing amounts necessary to reconcile the change in net asset value per share for the period, and may not reconcile with the Fund’s statement of operations due to share transactions for the period. |
(c) | Amount represents less than $0.005 per share. |
(d) | Ratios do not include the income and expenses of the CTAs included in the swap. |
(e) | Includes 0.02%, 0.08% and 0.11% of service fees paid for options for the years ended December 31, 2020, December 31, 2021 and six months ended June 30, 2022. |
(f) | Portfolio turnover rate is calculated on the basis of the Fund as a whole without distinguishing between classes of shares issued. Consists of long-term investments only; excludes derivative instruments. |
The accompanying notes are an integral part of these consolidated financial statements. | 83 |
LoCorr Market Trend Fund – Consolidated Financial Highlights – Class A |
LoCorr Market Trend Fund - Class A
Consolidated Financial Highlights
Selected Data and Ratios (for a share outstanding throughout the period)
| | | Six Month
Ended
June 30, 2022* | | | Year Ended December 31, | |
| | | (Unaudited) | | | 2021 | | | 2020 | | | 2019 | | | 2018 | | | 2017 | |
Per Share | | | | | | | | | | | | | | | | | | | | | | | | |
Net asset value, beginning of period | | $ | 11.41 | | | $ | 11.70 | | | $ | 11.19 | | | $ | 9.52 | | | $ | 11.03 | | | $ | 10.65 | |
| | | | | | | | | | | | | | | | | | | | | | | | | |
Income (loss) from investment operations: | | | | | | | | | | | | | | | | | | | | | | | | |
Net investment income (loss)(a) | | | (0.06 | ) | | | (0.13 | ) | | | (0.06 | ) | | | 0.01 | | | | (0.03 | ) | | | (0.10 | ) |
Net realized and unrealized gain (loss)(b) | | | 3.93 | | | | 0.22 | | | | 0.57 | | | | 1.74 | | | | (1.48 | ) | | | 0.48 | |
Total from Investment Operations | | | 3.87 | | | | 0.09 | | | | 0.51 | | | | 1.75 | | | | (1.51 | ) | | | 0.38 | |
| | | | | | | | | | | | | | | | | | | | | | | | | |
Distributions From Earnings: | | | | | | | | | | | | | | | | | | | | | | | | |
Net investment income | | | — | | | | (0.38 | ) | | | — | | | | (0.08 | ) | | | — | | | | — | |
Total Distributions | | | — | | | | (0.38 | ) | | | — | | | | (0.08 | ) | | | — | | | | — | |
| | | | | | | | | | | | | | | | | | | | | | | | |
Redemption Fees | | | — | | | | — | | | | — | | | | — | | | | — | | | | 0.00 | (c) |
| | | | | | | | | | | | | | | | | | | | | | | | | |
Net Asset Value, End of Period | | $ | 15.28 | | | $ | 11.41 | | | $ | 11.70 | | | $ | 11.19 | | | $ | 9.52 | | | $ | 11.03 | |
| | | | | | | | | | | | | | | | | | | | | | | | | |
Total Investment Return(d) | | | 33.92 | % | | | 0.87 | % | | | 4.47 | % | | | 18.33 | % | | | (13.69 | )% | | | 3.57 | % |
| | | | | | | | | | | | | | | | | | | | | | | | | |
Net Assets, End of Period, in Thousands | | $ | 25,183 | | | $ | 15,109 | | | $ | 16,952 | | | $ | 21,966 | | | $ | 32,082 | | | $ | 61,557 | |
| | | | | | | | | | | | | | | | | | | | | | | | | |
Ratios/Supplemental Data: | | | | | | | | | | | | | | | | | | | | | | | | |
Ratio of expenses to average net assets: | | | 1.86 | % | | | 2.02 | % | | | 2.04 | % | | | 2.02 | % | | | 1.99 | % | | | 2.00 | % |
| | | | | | | | | | | | | | | | | | | | | | | | | |
Ratio of net investment income (loss) to average net assets: | | | (0.83 | )% | | | (1.10 | )% | | | (0.52 | )% | | | 0.14 | % | | | (0.24 | )% | | | (0.97 | )% |
| | | | | | | | | | | | | | | | | | | | | | | | | |
Portfolio turnover rate(e) | | | 34 | % | | | 110 | % | | | 125 | % | | | 119 | % | | | 91 | % | | | 85 | % |
* All ratios have been annualized except total investment return and portfolio turnover.
(a) | Net investment income (loss) per share is based on average shares outstanding. |
(b) | Realized and unrealized gains and losses per share in this caption may be balancing amounts necessary to reconcile the change in net asset value per share for the period, and may not reconcile with the Fund’s statement of operations due to share transactions for the period. |
(c) | Amount represents less than $0.005 per share. |
(d) | Total investment return excludes the effect of applicable sales charges. |
(e) | Portfolio turnover rate is calculated on the basis of the Fund as a whole without distinguishing between classes of shares issued. Consists of long-term investments only; excludes derivative instruments. |
84 | The accompanying notes are an integral part of these consolidated financial statements. |
LoCorr Market Trend Fund - Consolidated Financial Highlights – Class C |
LoCorr Market Trend Fund - Class C
Consolidated Financial Highlights
Selected Data and Ratios (for a share outstanding throughout the period)
| | | Six Month
Ended
June 30, 2022* | | | Year Ended December 31, | |
| | | (Unaudited) | | | 2021 | | | 2020 | | | 2019 | | | 2018 | | | 2017 | |
Per Share | | | | | | | | | | | | | | | | | | | | | | | | |
Net asset value, beginning of period | | $ | 11.02 | | | $ | 11.30 | | | $ | 10.89 | | | $ | 9.28 | | | $ | 10.83 | | | $ | 10.53 | |
| | | | | | | | | | | | | | | | | | | | | | | | | |
Income (loss) from investment operations: | | | | | | | | | | | | | | | | | | | | | | | | |
Net investment income (loss)(a) | | | (0.10 | ) | | | (0.22 | ) | | | (0.13 | ) | | | (0.06 | ) | | | (0.10 | ) | | | (0.18 | ) |
Net realized and unrealized gain (loss)(b) | | | 3.80 | | | | 0.23 | | | | 0.54 | | | | 1.67 | | | | (1.45 | ) | | | 0.48 | |
Total from Investment Operations | | | 3.70 | | | | 0.01 | | | | 0.41 | | | | 1.61 | | | | (1.55 | ) | | | 0.30 | |
| | | | | | | | | | | | | | | | | | | | | | | | | |
Distributions From Earnings: | | | | | | | | | | | | | | | | | | | | | | | | |
Net investment income | | | — | | | | (0.29 | ) | | | — | | | | — | | | | — | | | | — | |
Total Distributions | | | — | | | | (0.29 | ) | | | — | | | | — | | | | — | | | | — | |
| | | | | | | | | | | | | | | | | | | | | | | | | |
Redemption Fees | | | — | | | | — | | | | — | | | | — | | | | — | | | | 0.00 | (c) |
| | | | | | | | | | | | | | | | | | | | | | | | | |
Net Asset Value, End of Period | | $ | 14.72 | | | $ | 11.02 | | | $ | 11.30 | | | $ | 10.89 | | | $ | 9.28 | | | $ | 10.83 | |
| | | | | | | | | | | | | | | | | | | | | | | | |
Total Investment Return(d) | | | 33.58 | % | | | 0.05 | % | | | 3.76 | % | | | 17.35 | % | | | (14.31 | )% | | | 2.85 | % |
| | | | | | | | | | | | | | | | | | | | | | | | | |
Net Assets, End of Period, in Thousands | | $ | 17,154 | | | $ | 10,825 | | | $ | 13,170 | | | $ | 16,320 | | | $ | 23,417 | | | $ | 43,772 | |
| | | | | | | | | | | | | | | | | | | | | | | | | |
Ratios/Supplemental Data: | | | | | | | | | | | | | | | | | | | | | | | | |
Ratio of expenses to average net assets: | | | 2.48 | % | | | 2.77 | % | | | 2.79 | % | | | 2.77 | % | | | 2.74 | % | | | 2.75 | % |
| | | | | | | | | | | | | | | | | | | | | | | | | |
Ratio of net investment income (loss) to average net assets: | | | (1.45 | )% | | | (1.85 | )% | | | (1.27 | )% | | | (0.61 | )% | | | (0.99 | )% | | | (1.72 | )% |
| | | | | | | | | | | | | | | | | | | | | | | | | |
Portfolio turnover rate(e) | | | 34 | % | | | 110 | % | | | 125 | % | | | 119 | % | | | 91 | % | | | 85 | % |
* All ratios have been annualized except total investment return and portfolio turnover.
(a) | Net investment income (loss) per share is based on average shares outstanding. |
(b) | Realized and unrealized gains and losses per share in this caption may be balancing amounts necessary to reconcile the change in net asset value per share for the period, and may not reconcile with the Fund’s statement of operations due to share transactions for the period. |
(c) | Amount represents less than $0.005 per share. |
(d) | Total investment return excludes the effect of applicable sales charges. |
(e) | Portfolio turnover rate is calculated on the basis of the Fund as a whole without distinguishing between classes of shares issued. Consists of long-term investments only; excludes derivative instruments. |
The accompanying notes are an integral part of these consolidated financial statements. | 85 |
LoCorr Market Trend Fund - Consolidated Financial Highlights – Class I |
LoCorr Market Trend Fund - Class I
Consolidated Financial Highlights
Selected Data and Ratios (for a share outstanding throughout the period)
| | | Six Month
Ended
June 30, 2022* | | | Year Ended December 31, | |
| | | (Unaudited) | | | 2021 | | | 2020 | | | 2019 | | | 2018 | | | 2017 | |
Per Share | | | | | | | | | | | | | | | | | | | | | | | | |
Net asset value, beginning of period | | $ | 11.45 | | | $ | 11.74 | | | $ | 11.23 | | | $ | 9.60 | | | $ | 11.09 | | | $ | 10.68 | |
| | | | | | | | | | | | | | | | | | | | | | | | | |
Income (loss) from investment operations: | | | | | | | | | | | | | | | | | | | | | | | | |
Net investment income (loss)(a) | | | (0.05 | ) | | | (0.10 | ) | | | (0.03 | ) | | | 0.04 | | | | 0.00 | (c) | | | (0.08 | ) |
Net realized and unrealized gain (loss)(b) | | | 3.96 | | | | 0.22 | | | | 0.57 | | | | 1.74 | | | | (1.49 | ) | | | 0.49 | |
Total from Investment Operations | | | 3.91 | | | | 0.12 | | | | 0.54 | | | | 1.78 | | | | (1.49 | ) | | | 0.41 | |
| | | | | | | | | | | | | | | | | | | | | | | | | |
Distributions From Earnings: | | | | | | | | | | | | | | | | | | | | | | | | |
Net investment income | | | — | | | | (0.41 | ) | | | (0.03 | ) | | | (0.15 | ) | | | — | | | | — | |
Total Distributions | | | — | | | | (0.41 | ) | | | (0.03 | ) | | | (0.15 | ) | | | — | | | | — | |
| | | | | | | | | | | | | | | | | | | | | | | | | |
Redemption Fees | | | — | | | | — | | | | — | | | | — | | | | — | | | | 0.00 | (c) |
| | | | | | | | | | | | | | | | | | | | | | | | | |
Net Asset Value, End of Period | | $ | 15.36 | | | $ | 11.45 | | | $ | 11.74 | | | $ | 11.23 | | | $ | 9.60 | | | $ | 11.09 | |
| | | | | | | | | | | | | | | | | | | | | | | | | |
Total Investment Return | | | 34.06 | % | | | 1.04 | % | | | 4.81 | % | | | 18.53 | % | | | (13.44 | )% | | | 3.84 | % |
| | | | | | | | | | | | | | | | | | | | | | | | |
Net Assets, End of Period, in Thousands | | $ | 533,809 | | | $ | 240,507 | | | $ | 225,995 | | | $ | 234,919 | | | $ | 287,702 | | | $ | 561,372 | |
| | | | | | | | | | | | | | | | | | | | | | | | | |
Ratios/Supplemental Data: | | | | | | | | | | | | | | | | | | | | | | | | |
Ratio of expenses to average net assets: | | | 1.69 | % | | | 1.77 | % | | | 1.79 | % | | | 1.77 | % | | | 1.74 | % | | | 1.75 | % |
| | | | | | | | | | | | | | | | | | | | | | | | | |
Ratio of net investment income (loss) to average net assets: | | | (0.66 | )% | | | (0.85 | )% | | | (0.27 | )% | | | 0.39 | % | | | 0.01 | % | | | (0.72 | )% |
| | | | | | | | | | | | | | | | | | | | | | | | | |
Portfolio turnover rate(d) | | | 34 | % | | | 110 | % | | | 125 | % | | | 119 | % | | | 91 | % | | | 85 | % |
| | | | | | | | | | | | | | | | | | | | | | | | | |
* All ratios have been annualized except total investment return and portfolio turnover.
(a) | Net investment income (loss) per share is based on average shares outstanding. |
(b) | Realized and unrealized gains and losses per share in this caption may be balancing amounts necessary to reconcile the change in net asset value per share for the period, and may not reconcile with the Fund’s statement of operations due to share transactions for the period. |
(c) | Amount represents less than $0.005 per share. |
(d) | Portfolio turnover rate is calculated on the basis of the Fund as a whole without distinguishing between classes of shares issued. Consists of long-term investments only; excludes derivative instruments. |
86 | The accompanying notes are an integral part of these consolidated financial statements. |
LoCorr Dynamic Equity Fund - Financial Highlights – Class A |
LoCorr Dynamic Equity Fund - Class A
Financial Highlights
Selected Data and Ratios (for a share outstanding throughout the period)
| | | Six Month
Ended
June 30, 2022* | | | Year Ended December 31, | |
| | | (Unaudited) | | | 2021 | | | 2020 | | | 2019 | | | 2018 | | | 2017 | |
Per Share | | | | | | | | | | | | | | | | | | | | | | | | |
Net asset value, beginning of period | | $ | 12.46 | | | $ | 11.62 | | | $ | 11.20 | | | $ | 9.92 | | | $ | 11.82 | | | $ | 12.06 | |
| | | | | | | | | | | | | | | | | | | | | | | | | |
Income (loss) from investment operations: | | | | | | | | | | | | | | | | | | | | | | | | |
Net investment income (loss)(a) | | | (0.09 | ) | | | (0.23 | ) | | | (0.20 | ) | | | (0.19 | ) | | | (0.25 | ) | | | (0.30 | ) |
Net realized and unrealized gain (loss)(b) | | | (1.46 | ) | | | 1.85 | | | | 0.62 | | | | 1.51 | | | | (1.26 | ) | | | 0.59 | |
Total from Investment Operations | | | (1.55 | ) | | | 1.62 | | | | 0.42 | | | | 1.32 | | | | (1.51 | ) | | | 0.29 | |
| | | | | | | | | | | | | | | | | | | | | | | | | |
Distributions From Earnings: | | | | | | | | | | | | | | | | | | | | | | | | |
Net realized gains | | | — | | | | (0.78 | ) | | | — | | | | (0.04 | ) | | | (0.39 | ) | | | (0.53 | ) |
Total Distributions | | | — | | | | (0.78 | ) | | | — | | | | (0.04 | ) | | | (0.39 | ) | | | (0.53 | ) |
| | | | | | | | | | | | | | | | | | | | | | | | | |
Redemption Fees | | | — | | | | — | | | | — | | | | — | | | | — | | | | 0.00 | (c) |
| | | | | | | | | | | | | | | | | | | | | | | | | |
Net Asset Value, End of Period | | $ | 10.91 | | | $ | 12.46 | | | $ | 11.62 | | | $ | 11.20 | | | $ | 9.92 | | | $ | 11.82 | |
| | | | | | | | | | | | | | | | | | | | | | | | |
Total Investment Return(d) | | | (12.79 | )% | | | 14.38 | % | | | 3.75 | % | | | 13.40 | % | | | (12.87 | )% | | | 2.38 | % |
| | | | | | | | | | | | | | | | | | | | | | | | | |
Net Assets, End of Period, in Thousands | | $ | 3,054 | | | $ | 4,010 | | | $ | 3,828 | | | $ | 6,744 | | | $ | 8,473 | | | $ | 19,962 | |
| | | | | | | | | | | | | | | | | | | | | | | | | |
Ratios/Supplemental Data: | | | | | | | | | | | | | | | | | | | | | | | | |
Ratio of expenses to average net assets: | | | | | | | | | | | | | | | | | | | | | | | | |
Before expense waiver or recovery | | | 3.28 | % | | | 3.90 | % | | | 4.51 | % | | | 3.73 | % | | | 3.40 | % | | | 3.42 | % |
After expense waiver or recovery | | | 2.51 | % | | | 2.67 | % | | | 3.15 | % | | | 3.02 | % | | | 3.21 | % | | | 3.35 | % |
| | | | | | | | | | | | | | | | | | | | | | | | | |
Ratio of expenses to average net assets (excluding dividend and interest expense): | | | | | | | | | | | | | | | | | | | | | | | | |
Before expense waiver or recovery | | | 2.93 | % | | | 3.47 | % | | | 3.60 | % | | | 2.95 | % | | | 3.20 | % | | | 3.22 | % |
After expense waiver or recovery | | | 2.17 | % | | | 2.24 | % | | | 2.24 | % | | | 2.24 | % | | | 3.01 | % | | | 3.15 | % |
| | | | | | | | | | | | | | | | | | | | | | | | | |
Ratio of net investment income (loss) to average net assets: | | | | | | | | | | | | | | | | | | | | | | | | |
Before expense waiver or recovery | | | (2.39 | )% | | | (3.02 | )% | | | (3.31 | )% | | | (2.44 | )% | | | (2.39 | )% | | | (2.61 | )% |
After expense waiver or recovery | | | (1.63 | )% | | | (1.79 | )% | | | (1.95 | )% | | | (1.73 | )% | | | (2.20 | )% | | | (2.54 | )% |
| | | | | | | | | | | | | | | | | | | | | | | | | |
Portfolio turnover rate(e) | | | 430 | % | | | 506 | % | | | 953 | % | | | 300 | % | | | 449 | % | | | 363 | % |
* All ratios have been annualized except total investment return and portfolio turnover.
(a) | Net investment income (loss) per share is based on average shares outstanding. |
(b) | Realized and unrealized gains and losses per share in this caption may be balancing amounts necessary to reconcile the change in net asset value per share for the period, and may not reconcile with the Fund’s statement of operations due to share transactions for the period. |
(c) | Amount represents less than $0.005 per share. |
(d) | Total investment return excludes the effect of applicable sales charges. |
(e) | Portfolio turnover rate is calculated on the basis of the Fund as a whole without distinguishing between classes of shares issued. Consists of long-term investments only; excludes securities sold short. |
The accompanying notes are an integral part of these financial statements. | 87 |
LoCorr Dynamic Equity Fund - Financial Highlights – Class C |
LoCorr Dynamic Equity Fund - Class C
Financial Highlights
Selected Data and Ratios (for a share outstanding throughout the period)
| | | Six Month
Ended
June 30, 2022* | | | Year Ended December 31, | |
| | | (Unaudited) | | | 2021 | | | 2020 | | | 2019 | | | 2018 | | | 2017 | |
Per Share | | | | | | | | | | | | | | | | | | | | | | | | |
Net asset value, beginning of period | | $ | 11.58 | | | $ | 10.93 | | | $ | 10.62 | | | $ | 9.47 | | | $ | 11.39 | | | $ | 11.73 | |
| | | | | | | | | | | | | | | | | | | | | | | | | |
Income (loss) from investment operations: | | | | | | | | | | | | | | | | | | | | | | | | |
Net investment income (loss)(a) | | | (0.13 | ) | | | (0.31 | ) | | | (0.26 | ) | | | (0.26 | ) | | | (0.32 | ) | | | (0.38 | ) |
Net realized and unrealized gain (loss)(b) | | | (1.35 | ) | | | 1.74 | | | | 0.57 | | | | 1.45 | | | | (1.21 | ) | | | 0.57 | |
Total from Investment Operations | | | (1.48 | ) | | | 1.43 | | | | 0.31 | | | | 1.19 | | | | (1.53 | ) | | | 0.19 | |
| | | | | | | | | | | | | | | | | | | | | | | | | |
Distributions From Earnings: | | | | | | | | | | | | | | | | | | | | | | | | |
Net realized gains | | | — | | | | (0.78 | ) | | | — | | | | (0.04 | ) | | | (0.39 | ) | | | (0.53 | ) |
Total Distributions | | | — | | | | (0.78 | ) | | | — | | | | (0.04 | ) | | | (0.39 | ) | | | (0.53 | ) |
| | | | | | | | | | | | | | | | | | | | | | | | | |
Redemption Fees | | | — | | | | — | | | | — | | | | — | | | | — | | | | 0.00 | (c) |
| | | | | | | | | | | | | | | | | | | | | | | | | |
Net Asset Value, End of Period | | $ | 10.10 | | | $ | 11.58 | | | $ | 10.93 | | | $ | 10.62 | | | $ | 9.47 | | | $ | 11.39 | |
| | | | | | | | | | | | | | | | | | | | | | | | |
Total Investment Return(d) | | | (13.08 | )% | | | 13.46 | % | | | 2.92 | % | | | 12.54 | % | | | (13.45 | )% | | | 1.59 | % |
| | | | | | | | | | | | | | | | | | | | | | | | | |
Net Assets, End of Period, in Thousands | | $ | 2,802 | | | $ | 2,786 | | | $ | 2,436 | | | $ | 4,031 | | | $ | 5,255 | | | $ | 11,084 | |
| | | | | | | | | | | | | | | | | | | | | | | | | |
Ratios/Supplemental Data: | | | | | | | | | | | | | | | | | | | | | | | | |
Ratio of expenses to average net assets: | | | | | | | | | | | | | | | | | | | | | | | | |
Before expense waiver or recovery | | | 4.10 | % | | | 4.65 | % | | | 5.26 | % | | | 4.48 | % | | | 4.15 | % | | | 4.17 | % |
After expense waiver or recovery | | | 3.33 | % | | | 3.42 | % | | | 3.90 | % | | | 3.77 | % | | | 3.96 | % | | | 4.10 | % |
| | | | | | | | | | | | | | | | | | | | | | | | | |
Ratio of expenses to average net assets (excluding dividend and interest expense): | | | | | | | | | | | | | | | | | | | | | | | | |
Before expense waiver or recovery | | | 3.76 | % | | | 4.22 | % | | | 4.35 | % | | | 3.70 | % | | | 3.95 | % | | | 3.97 | % |
After expense waiver or recovery | | | 2.99 | % | | | 2.99 | % | | | 2.99 | % | | | 2.99 | % | | | 3.76 | % | | | 3.90 | % |
| | | | | | | | | | | | | | | | | | | | | | | | | |
Ratio of net investment income (loss) to average net assets: | | | | | | | | | | | | | | | | | | | | | | | | |
Before expense waiver or recovery | | | (3.22 | )% | | | (3.77 | )% | | | (4.06 | )% | | | (3.19 | )% | | | (3.14 | )% | | | (3.36 | )% |
After expense waiver or recovery | | | (2.45 | )% | | | (2.54 | )% | | | (2.70 | )% | | | (2.48 | )% | | | (2.95 | )% | | | (3.29 | )% |
| | | | | | | | | | | | | | | | | | | | | | | | | |
Portfolio turnover rate(e) | | | 430 | % | | | 506 | % | | | 953 | % | | | 300 | % | | | 449 | % | | | 363 | % |
* All ratios have been annualized except total investment return and portfolio turnover.
(a) | Net investment income (loss) per share is based on average shares outstanding. |
(b) | Realized and unrealized gains and losses per share in this caption may be balancing amounts necessary to reconcile the change in net asset value per share for the period, and may not reconcile with the Fund’s statement of operations due to share transactions for the period. |
(c) | Amount represents less than $0.005 per share. |
(d) | Total investment return excludes the effect of applicable sales charges. |
(e) | Portfolio turnover rate is calculated on the basis of the Fund as a whole without distinguishing between classes of shares issued. Consists of long-term investments only; excludes securities sold short. |
88 | The accompanying notes are an integral part of these financial statements. |
LoCorr Dynamic Equity Fund - Financial Highlights – Class I |
LoCorr Dynamic Equity Fund - Class I
Financial Highlights
Selected Data and Ratios (for a share outstanding throughout the period)
| | | Six Month
Ended
June 30, 2022* | | | Year Ended December 31, | |
| | | (Unaudited) | | | 2021 | | | 2020 | | | 2019 | | | 2018 | | | 2017 | |
Per Share | | | | | | | | | | | | | | | | | | | | | | | | |
Net asset value, beginning of period | | $ | 12.77 | | | $ | 11.86 | | | $ | 11.41 | | | $ | 10.07 | | | $ | 11.96 | | | $ | 12.17 | |
| | | | | | | | | | | | | | | | | | | | | | | | | |
Income (loss) from investment operations: | | | | | | | | | | | | | | | | | | | | | | | | |
Net investment income (loss)(a) | | | (0.09 | ) | | | (0.20 | ) | | | (0.17 | ) | | | (0.17 | ) | | | (0.23 | ) | | | (0.28 | ) |
Net realized and unrealized gain (loss)(b) | | | (1.47 | ) | | | 1.89 | | | | 0.62 | | | | 1.55 | | | | (1.27 | ) | | | 0.60 | |
Total from Investment Operations | | | (1.56 | ) | | | 1.69 | | | | 0.45 | | | | 1.38 | | | | (1.50 | ) | | | 0.32 | |
| | | | | | | | | | | | | | | | | | | | | | | | | |
Distributions From Earnings: | | | | | | | | | | | | | | | | | | | | | | | | |
Net realized gains | | | — | | | | (0.78 | ) | | | — | | | | (0.04 | ) | | | (0.39 | ) | | | (0.53 | ) |
Total Distributions | | | — | | | | (0.78 | ) | | | — | | | | (0.04 | ) | | | (0.39 | ) | | | (0.53 | ) |
| | | | | | | | | | | | | | | | | | | | | | | | | |
Redemption Fees | | | — | | | | — | | | | — | | | | — | | | | — | | | | 0.00 | (c) |
| | | | | | | | | | | | | | | | | | | | | | | | | |
Net Asset Value, End of Period | | $ | 11.21 | | | $ | 12.77 | | | $ | 11.86 | | | $ | 11.41 | | | $ | 10.07 | | | $ | 11.96 | |
| | | | | | | | | | | | | | | | | | | | | | | | | |
Total Investment Return | | | (12.64 | )% | | | 14.58 | % | | | 4.03 | % | | | 13.68 | % | | | (12.55 | )% | | | 2.60 | % |
| | | | | | | | | | | | | | | | | | | | | | | | | |
Net Assets, End of Period, in Thousands | | $ | 39,415 | | | $ | 17,713 | | | $ | 11,809 | | | $ | 16,923 | | | $ | 16,545 | | | $ | 32,781 | |
| | | | | | | | | | | | | | | | | | | | | | | | | |
Ratios/Supplemental Data: | | | | | | | | | | | | | | | | | | | | | | | | |
Ratio of expenses to average net assets: | | | | | | | | | | | | | | | | | | | | | | | | |
Before expense waiver or recovery | | | 3.10 | % | | | 3.65 | % | | | 4.26 | % | | | 3.48 | % | | | 3.15 | % | | | 3.17 | % |
After expense waiver or recovery | | | 2.33 | % | | | 2.42 | % | | | 2.90 | % | | | 2.77 | % | | | 2.96 | % | | | 3.10 | % |
| | | | | | | | | | | | | | | | | | | | | | | | | |
Ratio of expenses to average net assets (excluding dividend and interest expense): | | | | | | | | | | | | | | | | | | | | | | | | |
Before expense waiver or recovery | | | 2.76 | % | | | 3.22 | % | | | 3.35 | % | | | 2.70 | % | | | 2.95 | % | | | 2.97 | % |
After expense waiver or recovery | | | 1.99 | % | | | 1.99 | % | | | 1.99 | % | | | 1.99 | % | | | 2.76 | % | | | 2.90 | % |
| | | | | | | | | | | | | | | | | | | | | | | | | |
Ratio of net investment income (loss) to average net assets: | | | | | | | | | | | | | | | | | | | | | | | | |
Before expense waiver or recovery | | | (2.22 | )% | | | (2.77 | )% | | | (3.06 | )% | | | (2.19 | )% | | | (2.14 | )% | | | (2.36 | )% |
After expense waiver or recovery | | | (1.45 | )% | | | (1.54 | )% | | | (1.70 | )% | | | (1.48 | )% | | | (1.95 | )% | | | (2.29 | )% |
| | | | | | | | | | | | | | | | | | | | | | | | | |
Portfolio turnover rate(d) | | | 430 | % | | | 506 | % | | | 953 | % | | | 300 | % | | | 449 | % | | | 363 | % |
* All ratios have been annualized except total investment return and portfolio turnover.
(a) | Net investment income (loss) per share is based on average shares outstanding. |
(b) | Realized and unrealized gains and losses per share in this caption may be balancing amounts necessary to reconcile the change in net asset value per share for the period, and may not reconcile with the Fund’s statement of operations due to share transactions for the period. |
(c) | Amount represents less than $0.005 per share. |
(d) | Portfolio turnover rate is calculated on the basis of the Fund as a whole without distinguishing between classes of shares issued. Consists of long-term investments only; excludes securities sold short. |
The accompanying notes are an integral part of these financial statements. | 89 |
LoCorr Spectrum Income Fund – Financial Highlights – Class A |
LoCorr Spectrum Income Fund - Class A
Financial Highlights
Selected Data and Ratios (for a share outstanding throughout the period)
| | | Six Month
Ended
June 30, 2022* | | | Year Ended December 31, | |
| | | (Unaudited) | | | 2021 | | | 2020 | | | 2019 | | | 2018 | | | 2017 | |
Per Share | | | | | | | | | | | | | | | | | | | | | | | | |
Net asset value, beginning of period | | $ | 6.98 | | | $ | 6.15 | | | $ | 6.89 | | | $ | 6.26 | | | $ | 7.39 | | | $ | 7.70 | |
| | | | | | | | | | | | | | | | | | | | | | | | | |
Income (loss) from investment operations: | | | | | | | | | | | | | | | | | | | | | | | | |
Net investment income (loss)(a) | | | 0.10 | | | | 0.08 | | | | 0.12 | | | | 0.13 | | | | 0.22 | | | | 0.17 | |
Net realized and unrealized gain (loss)(b) | | | (0.42 | ) | | | 1.21 | | | | (0.40 | ) | | | 1.00 | | | | (0.78 | ) | | | 0.09 | |
Total from Investment Operations | | | (0.32 | ) | | | 1.29 | | | | (0.28 | ) | | | 1.13 | | | | (0.56 | ) | | | 0.26 | |
| | | | | | | | | | | | | | | | | | | | | | | | | |
Distributions From: | | | | | | | | | | | | | | | | | | | | | | | | |
Net investment income | | | (0.23 | ) | | | (0.28 | ) | | | (0.18 | ) | | | (0.12 | ) | | | (0.26 | ) | | | (0.15 | ) |
Return of capital | | | — | | | | (0.18 | ) | | | (0.28 | ) | | | (0.38 | ) | | | (0.31 | ) | | | (0.42 | ) |
Total Distributions | | | (0.23 | ) | | | (0.46 | ) | | | (0.46 | ) | | | (0.50 | ) | | | (0.57 | ) | | | (0.57 | ) |
| | | | | | | | | | | | | | | | | | | | | | | | | |
Redemption Fees (c) | | | 0.00 | | | | 0.00 | | | | 0.00 | | | | 0.00 | | | | 0.00 | | | | 0.00 | |
| | | | | | | | | | | | | | | | | | | | | | | | | |
Net Asset Value, End of Period | | $ | 6.43 | | | $ | 6.98 | | | $ | 6.15 | | | $ | 6.89 | | | $ | 6.26 | | | $ | 7.39 | |
| | | | | | | | | | | | | | | | | | | | | | | | | |
Total Investment Return(d) | | | (4.70 | )% | | | 21.33 | % | | | (2.75 | )% | | | 18.37 | % | | | (8.22 | )% | | | 3.50 | % |
| | | | | | | | | | | | | | | | | | | | | | | | | |
Net Assets, End of Period, in Thousands | | $ | 14,238 | | | $ | 13,838 | | | $ | 13,635 | | | $ | 25,192 | | | $ | 22,610 | | | $ | 29,970 | |
| | | | | | | | | | | | | | | | | | | | | | | | |
Ratios/Supplemental Data:(e) | | | | | | | | | | | | | | | | | | | | | | | | |
Ratio of expenses to average net assets: | | | | | | | | | | | | | | | | | | | | | | | | |
Before expense waiver or recovery | | | 1.87 | % | | | 2.06 | % | | | 2.19 | % | | | 2.02 | % | | | 1.98 | % | | | 1.95 | % |
After expense waiver or recovery | | | 2.00 | % | | | 2.05 | % | | | 2.06 | % | | | 2.02 | % | | | 1.98 | % | | | 1.99 | % |
| | | | | | | | | | | | | | | | | | | | | | | | | |
Ratio of expenses to average net assets (excluding dividend and interest expense): | | | | | | | | | | | | | | | | | | | | | | | | |
Before expense waiver or recovery | | | 1.86 | % | | | 2.06 | % | | | 2.18 | % | | | 2.02 | % | | | 1.98 | % | | | 1.95 | % |
After expense waiver or recovery | | | 1.99 | % | | | 2.05 | % | | | 2.04 | % | | | 2.02 | % | | | 1.98 | % | | | 1.99 | % |
| | | | | | | | | | | | | | | | | | | | | | | | | |
Ratio of net investment income (loss) to average net assets: | | | | | | | | | | | | | | | | | | | | | | | | |
Before expense waiver or recovery | | | 3.13 | % | | | 1.21 | % | | | 1.93 | % | | | 1.94 | % | | | 3.01 | % | | | 2.27 | % |
After expense waiver or recovery | | | 3.00 | % | | | 1.22 | % | | | 2.07 | % | | | 1.94 | % | | | 3.01 | % | | | 2.23 | % |
| | | | | | | | | | | | | | | | | | | | | | | | | |
Portfolio turnover rate(f) | | | 37 | % | | | 53 | % | | | 88 | % | | | 75 | % | | | 82 | % | | | 84 | % |
* All ratios have been annualized except total investment return and portfolio turnover.
(a) | Net investment income (loss) per share is based on average shares outstanding. |
(b) | Realized and unrealized gains and losses per share in this caption may be balancing amounts necessary to reconcile the change in net asset value per share for the period, and may not reconcile with the Fund’s statement of operations due to share transactions for the period. |
(c) | Amount represents less than $0.005 per share. |
(d) | Total investment return excludes the effect of applicable sales charges. |
(e) | Ratios do not include the expenses of the investment companies in which the Fund invests. |
(f) | Portfolio turnover rate is calculated on the basis of the Fund as a whole without distinguishing between classes of shares issued. |
90 | The accompanying notes are an integral part of these financial statements. |
LoCorr Spectrum Income Fund – Financial Highlights – Class C |
LoCorr Spectrum Income Fund - Class C
Financial Highlights
Selected Data and Ratios (for a share outstanding throughout the period)
| | | Six Month
Ended
June 30, 2022* | | | Year Ended December 31, | |
| | | (Unaudited) | | | 2021 | | | 2020 | | | 2019 | | | 2018 | | | 2017 | |
Per Share | | | | | | | | | | | | | | | | | | | | | | | | |
Net asset value, beginning of period | | $ | 7.05 | | | $ | 6.21 | | | $ | 6.96 | | | $ | 6.31 | | | $ | 7.42 | | | $ | 7.72 | |
| | | | | | | | | | | | | | | | | | | | | | | | | |
Income (loss) from investment operations: | | | | | | | | | | | | | | | | | | | | | | | | |
Net investment income (loss)(a) | | | 0.08 | | | | 0.03 | | | | 0.07 | | | | 0.08 | | | | 0.16 | | | | 0.11 | |
Net realized and unrealized gain (loss)(b) | | | (0.42 | ) | | | 1.23 | | | | (0.40 | ) | | | 1.01 | | | | (0.77 | ) | | | 0.09 | |
Total from Investment Operations | | | (0.34 | ) | | | 1.26 | | | | (0.33 | ) | | | 1.09 | | | | (0.61 | ) | | | 0.20 | |
| | | | | | | | | | | | | | | | | | | | | | | | | |
Distributions From: | | | | | | | | | | | | | | | | | | | | | | | | |
Net investment income | | | (0.21 | ) | | | (0.26 | ) | | | (0.17 | ) | | | (0.10 | ) | | | (0.23 | ) | | | (0.13 | ) |
Return of capital | | | — | | | | (0.16 | ) | | | (0.25 | ) | | | (0.34 | ) | | | (0.27 | ) | | | (0.37 | ) |
Total Distributions | | | (0.21 | ) | | | (0.42 | ) | | | (0.42 | ) | | | (0.44 | ) | | | (0.50 | ) | | | (0.50 | ) |
| | | | | | | | | | | | | | | | | | | | | | | | | |
Redemption Fees (c) | | | 0.00 | | | | 0.00 | | | | 0.00 | | | | 0.00 | | | | 0.00 | | | | 0.00 | |
| | | | | | | | | | | | | | | | | | | | | | | | | |
Net Asset Value, End of Period | | $ | 6.50 | | | $ | 7.05 | | | $ | 6.21 | | | $ | 6.96 | | | $ | 6.31 | | | $ | 7.42 | |
| | | | | | | | | | | | | | | | | | | | | | | | | |
Total Investment Return(d) | | | (4.97 | )% | | | 20.47 | % | | | (3.70 | )% | | | 17.59 | % | | | (8.85 | )% | | | 2.62 | % |
| | | | | | | | | | | | | | | | | | | | | | | | | |
Net Assets, End of Period, in Thousands | | $ | 17,397 | | | $ | 17,777 | | | $ | 13,295 | | | $ | 18,645 | | | $ | 18,092 | | | $ | 23,511 | |
| | | | | | | | | | | | | | | | | | | | | | | | | |
Ratios/Supplemental Data:(e) | | | | | | | | | | | | | | | | | | | | | | | | |
Ratio of expenses to average net assets: | | | | | | | | | | | | | | | | | | | | | | | | |
Before expense waiver or recovery | | | 2.68 | % | | | 2.81 | % | | | 2.94 | % | | | 2.77 | % | | | 2.73 | % | | | 2.70 | % |
After expense waiver or recovery | | | 2.81 | % | | | 2.80 | % | | | 2.81 | % | | | 2.77 | % | | | 2.73 | % | | | 2.74 | % |
| | | | | | | | | | | | | | | | | | | | | | | | |
Ratio of expenses to average net assets (excluding dividend and interest expense): | | | | | | | | | | | | | | | | | | | | | | | | |
Before expense waiver or recovery | | | 2.67 | % | | | 2.81 | % | | | 2.93 | % | | | 2.77 | % | | | 2.73 | % | | | 2.70 | % |
After expense waiver or recovery | | | 2.80 | % | | | 2.80 | % | | | 2.79 | % | | | 2.77 | % | | | 2.73 | % | | | 2.74 | % |
| | | | | | | | | | | | | | | | | | | | | | | | | |
Ratio of net investment income (loss) to average net assets: | | | | | | | | | | | | | | | | | | | | | | | | |
Before expense waiver or recovery | | | 2.32 | % | | | 0.46 | % | | | 1.18 | % | | | 1.19 | % | | | 2.26 | % | | | 1.52 | % |
After expense waiver or recovery | | | 2.19 | % | | | 0.47 | % | | | 1.32 | % | | | 1.19 | % | | | 2.26 | % | | | 1.48 | % |
| | | | | | | | | | | | | | | | | | | | | | | | | |
Portfolio turnover rate(f) | | | 37 | % | | | 53 | % | | | 88 | % | | | 75 | % | | | 82 | % | | | 84 | % |
* All ratios have been annualized except total investment return and portfolio turnover.
(a) | Net investment income (loss) per share is based on average shares outstanding. |
(b) | Realized and unrealized gains and losses per share in this caption may be balancing amounts necessary to reconcile the change in net asset value per share for the period, and may not reconcile with the Fund’s statement of operations due to share transactions for the period. |
(c) | Amount represents less than $0.005 per share. |
(d) | Total investment return excludes the effect of applicable sales charges. |
(e) | Ratios do not include the expenses of the investment companies in which the Fund invests. |
(f) | Portfolio turnover rate is calculated on the basis of the Fund as a whole without distinguishing between classes of shares issued. |
The accompanying notes are an integral part of these financial statements. | 91 |
LoCorr Spectrum Income Fund - Financial Highlights – Class I |
LoCorr Spectrum Income Fund - Class I
Financial Highlights
Selected Data and Ratios (for a share outstanding throughout the period)
| | | Six Month
Ended
June 30, 2022* | | | Year Ended December 31, | |
| | | (Unaudited) | | | 2021 | | | 2020 | | | 2019 | | | 2018 | | | 2017 | |
Per Share | | | | | | | | | | | | | | | | | | | | | | | | |
Net asset value, beginning of period | | $ | 6.95 | | | $ | 6.13 | | | $ | 6.88 | | | $ | 6.25 | | | $ | 7.38 | | | $ | 7.69 | |
| | | | | | | | | | | | | | | | | | | | | | | | | |
Income (loss) from investment operations: | | | | | | | | | | | | | | | | | | | | | | | | |
Net investment income (loss)(a) | | | 0.11 | | | | 0.10 | | | | 0.13 | | | | 0.15 | | | | 0.24 | | | | 0.19 | |
Net realized and unrealized gain (loss)(b) | | | (0.41 | ) | | | 1.20 | | | | (0.40 | ) | | | 1.00 | | | | (0.77 | ) | | | 0.10 | |
Total from Investment Operations | | | (0.30 | ) | | | 1.30 | | | | (0.27 | ) | | | 1.15 | | | | (0.53 | ) | | | 0.29 | |
| | | | | | | | | | | | | | | | | | | | | | | | | |
Distributions From: | | | | | | | | | | | | | | | | | | | | | | | | |
Net investment income | | | (0.24 | ) | | | (0.29 | ) | | | (0.19 | ) | | | (0.12 | ) | | | (0.27 | ) | | | (0.16 | ) |
Return of capital | | | — | | | | (0.19 | ) | | | (0.29 | ) | | | (0.40 | ) | | | (0.33 | ) | | | (0.44 | ) |
Total Distributions | | | (0.24 | ) | | | (0.48 | ) | | | (0.48 | ) | | | (0.52 | ) | | | (0.60 | ) | | | (0.60 | ) |
| | | | | | | | | | | | | | | | | | | | | | | | | |
Redemption Fees (c) | | | 0.00 | | | | 0.00 | | | | 0.00 | | | | 0.00 | | | | 0.00 | | | | 0.00 | |
| | | | | | | | | | | | | | | | | | | | | | | | | |
Net Asset Value, End of Period | | $ | 6.41 | | | $ | 6.95 | | | $ | 6.13 | | | $ | 6.88 | | | $ | 6.25 | | | $ | 7.38 | |
| | | | | | | | | | | | | | | | | | | | | | | | |
Total Investment Return | | | (4.60 | )% | | | 21.53 | % | | | (2.60 | )% | | | 18.74 | % | | | (7.91 | )% | | | 3.85 | % |
| | | | | | | | | | | | | | | | | | | | | | | | | |
Net Assets, End of Period, in Thousands | | $ | 72,385 | | | $ | 44,192 | | | $ | 21,215 | | | $ | 30,049 | | | $ | 27,618 | | | $ | 43,032 | |
| | | | | | | | | | | | | | | | | | | | | | | | | |
Ratios/Supplemental Data:(d) | | | | | | | | | | | | | | | | | | | | | | | | |
Ratio of expenses to average net assets: | | | | | | | | | | | | | | | | | | | | | | | | |
Before expense waiver or recovery | | | 1.68 | % | | | 1.81 | % | | | 1.94 | % | | | 1.77 | % | | | 1.73 | % | | | 1.70 | % |
After expense waiver or recovery | | | 1.81 | % | | | 1.80 | % | | | 1.81 | % | | | 1.77 | % | | | 1.73 | % | | | 1.74 | % |
| | | | | | | | | | | | | | | | | | | | | | | | | |
Ratio of expenses to average net assets (excluding dividend and interest expense): | | | | | | | | | | | | | | | | | | | | | | | | |
Before expense waiver or recovery | | | 1.67 | % | | | 1.81 | % | | | 1.93 | % | | | 1.77 | % | | | 1.73 | % | | | 1.70 | % |
After expense waiver or recovery | | | 1.80 | % | | | 1.80 | % | | | 1.79 | % | | | 1.77 | % | | | 1.73 | % | | | 1.74 | % |
| | | | | | | | | | | | | | | | | | | | | | | | | |
Ratio of net investment income (loss) to average net assets: | | | | | | | | | | | | | | | | | | | | | | | | |
Before expense waiver or recovery | | | 3.32 | % | | | 1.46 | % | | | 2.18 | % | | | 2.19 | % | | | 3.26 | % | | | 2.52 | % |
After expense waiver or recovery | | | 3.19 | % | | | 1.47 | % | | | 2.32 | % | | | 2.19 | % | | | 3.26 | % | | | 2.48 | % |
| | | | | | | | | | | | | | | | | | | | | | | | | |
Portfolio turnover rate(e) | | | 37 | % | | | 53 | % | | | 88 | % | | | 75 | % | | | 82 | % | | | 84 | % |
* All ratios have been annualized except total investment return and portfolio turnover.
(a) | Net investment income (loss) per share is based on average shares outstanding. |
(b) | Realized and unrealized gains and losses per share in this caption may be balancing amounts necessary to reconcile the change in net asset value per share for the period, and may not reconcile with the Fund’s statement of operations due to share transactions for the period. |
(c) | Amount represents less than $0.005 per share. |
(d) | Ratios do not include the expenses of the investment companies in which the Fund invests. |
(e) | Portfolio turnover rate is calculated on the basis of the Fund as a whole without distinguishing between classes of shares issued. |
92 | The accompanying notes are an integral part of these financial statements. |
LoCorr Macro Strategies Fund, LoCorr Long/Short Commodities Strategy Fund and LoCorr Market Trend Fund – Notes to Consolidated Financial
Statements / LoCorr Dynamic Equity Fund and LoCorr Spectrum Income Fund – Notes to Financial Statements |
LoCorr Investment Trust
Notes
June 30, 2022 (Unaudited)
1. Organization
LoCorr Investment Trust (the “Trust”), an Ohio business trust, was formed on November 15, 2010 and is an open-end management investment company registered under the Investment Company Act of 1940, as amended (“1940 Act”). Each fund is an investment company and accordingly follows the investment company accounting and reporting guidance of the Financial Accounting Standards Board (“FASB”) Accounting Standards Codification (“ASC”) Topic 946, Financial Services- Investment Companies. The LoCorr Macro Strategies Fund, LoCorr Long/Short Commodities Strategy Fund, LoCorr Market Trend Fund, LoCorr Dynamic Equity Fund and the LoCorr Spectrum Income Fund (individually a “Fund” and collectively the “Funds”) are series within the Trust. The Funds are each diversified funds.
The LoCorr Macro Strategies Fund’s primary investment objective is capital appreciation in rising and falling equity markets with managing volatility as a secondary objective.
The LoCorr Long/Short Commodities Strategy Fund’s primary investment objective is capital appreciation in rising and falling commodities markets with managing volatility as a secondary objective.
The LoCorr Market Trend Fund’s primary investment objective is capital appreciation in rising and falling equity markets with managing volatility as a secondary objective.
The LoCorr Dynamic Equity Fund’s primary investment objective is long-term capital appreciation with reduced volatility compared to traditional broad-based equity market indices as a secondary objective.
The LoCorr Spectrum Income Fund’s primary investment objective is current income with capital appreciation as a secondary objective.
Wholly-owned and Controlled Subsidiaries
In order to achieve their investment objectives, the LoCorr Macro Strategies Fund, the LoCorr Long/Short Commodities Strategy Fund and the LoCorr Market Trend Fund each invest up to 25% of their total assets (measured at the time of purchase) in wholly-owned subsidiaries, LCMFS Fund Limited (“LCMFS”), LCLSCS Fund Limited (“LCLSCS”) and LCMT Fund Limited (“LCMT”), respectively; each company is incorporated under the laws of the Cayman Islands. LCMFS, LCLSCS and LCMT act as investment vehicles in order to enter into certain investments for the LoCorr Macro Strategies Fund, the LoCorr Long/Short Commodities Strategy Fund and the LoCorr Market Trend Fund, respectively, consistent with their investment objectives and policies specified in the Prospectuses and Statement of Additional Information.
At June 30, 2022 investments in LCMFS, LCLSCS and LCMT represented 1.24%, 21.95% and 2.20% of the total net assets of LoCorr Macro Strategies Fund, LoCorr Long/Short Commodities Strategy Fund and LoCorr Market Trend Fund, respectively. See Note 2.
The consolidated financial statements of the LoCorr Macro Strategies Fund, LoCorr Long/Short Commodities Strategy Fund and the LoCorr Market Trend Fund each include the investment activity and financial statements of LCMFS, LCLSCS and LCMT, respectively. All intercompany accounts and transactions have been eliminated in consolidation. Because each Fund may invest a substantial portion of its assets in its respective subsidiary, the Fund may be considered to be investing indirectly in some of those investments through its subsidiary. For that reason, references to the Fund may also encompass its subsidiary. The subsidiary will be subject to the same investment restrictions and limitations, and follow the same compliance policies and procedures, as the Fund when viewed on a consolidated basis. Each Fund and its subsidiary are a “commodity pool” under the U.S. Commodity Exchange Act and LoCorr Fund Management, LLC (the “Adviser” or “Management”) is a “commodity pool operator” registered with and regulated by the Commodity Futures Trading Commission (“CFTC”). As a result, additional CFTC- mandated disclosure, reporting and recordkeeping obligations apply with respect to each Fund and its respective subsidiary under CFTC and the U.S. Securities and Exchange Commission (the “SEC”) harmonized regulations.
Share Classes
The Funds currently offer three classes of shares: Class A, Class C and Class I shares. Each share class represents an interest in the same assets of the Fund, has the same rights and is identical in all material respects except that (i) Class A shares have a maximum front end sales load of 5.75% and maximum deferred sales charge of 1.00% and Class C shares have a maximum
LoCorr Macro Strategies Fund, LoCorr Long/Short Commodities Strategy Fund and LoCorr Market Trend Fund – Notes to Consolidated Financial
Statements / LoCorr Dynamic Equity Fund and LoCorr Spectrum Income Fund – Notes to Financial Statements (continued) |
deferred sales charge of 1.00%, (ii) Class A shares have a 12b-1 fee of 0.25% and Class C shares have a 12b-1 fee of 1.00%; (iii) certain other class-specific expenses will be borne solely by the class to which such expenses are attributable and (iv) each class will have exclusive voting rights with respect to matters relating to its own distribution arrangements.
All classes with respect to the LoCorr Spectrum Income Fund are subject to a 2.00% redemption fee on redemptions made within 60 days of the original purchase. As of May 1, 2017, none of the other Funds are subject to a redemption fee.
The following table presents the class-specific commencement of operations dates for each of the Funds:
| | Commencement of Operations |
| | Class A | Class C | Class I |
LoCorr Macro Strategies Fund | March 22, 2011 | March 24, 2011 | March 24, 2011 |
LoCorr Long/Short Commodities Strategy Fund | January 1, 2012 | January 1, 2012 | January 1, 2012 |
LoCorr Dynamic Equity Fund | May 10, 2013 | May 10, 2013 | May 10, 2013 |
LoCorr Spectrum Income Fund | January 1, 2014 | January 1, 2014 | January 1, 2014 |
LoCorr Market Trend Fund | July 1, 2014 | July 1, 2014 | July 1, 2014 |
The Funds may issue an unlimited number of shares of beneficial interest, with no par value. All shares of the Funds have equal rights and privileges, except as to class-specific rights and privileges described above.
2. Significant Accounting Policies
The following is a summary of significant accounting policies consistently followed by the Funds in the preparation of the financial statements. These policies are in conformity with generally accepted accounting principles in the United States of America (“GAAP”).
Investment Valuation
The Funds follow fair valuation accounting standards in accordance with GAAP, which establish a definition of fair value and set out a hierarchy for measuring fair value. These standards require additional disclosures about the various inputs and valuation techniques used to develop the measurements of fair value and changes in valuation techniques and related inputs during the period. These inputs are summarized in three broad levels listed below:
Level 1 – Unadjusted quoted prices in active markets for identical assets or liabilities that the Funds have the ability to access.
Level 2 – Observable inputs other than quoted prices included in Level 1 that are observable for the asset or liability, either directly or indirectly. These inputs may include quoted prices for the identical instrument on an inactive market, prices for similar instruments, interest rates, prepayment speeds, credit risk, yield curves, default rates and similar data.
Level 3 – Unobservable inputs for the asset or liability, to the extent relevant observable inputs are not available; representing the Funds’ own assumptions about the assumptions a market participant would use in valuing the asset or liability and would be based on the best information available.
Generally, the Funds’ investments are valued each day at the last quoted sales price on each investment’s primary exchange. Investments traded or dealt in one or more exchanges (whether domestic or foreign) for which market quotations are readily available and not subject to restrictions against resale shall be valued at the last quoted sales price on the primary exchange or, in the absence of a sale on the primary exchange, at the last bid on the primary exchange. Investments primarily traded in the National Association of Securities Dealers’ Automated Quotation System (“NASDAQ”) National Market System for which market quotations are readily available shall be valued using the NASDAQ Official Closing Price.
The Funds may use independent pricing services to assist in calculating the value of the Funds’ investments. In addition, market prices for foreign investments are not determined at the same time of day as the net asset value (“NAV”) for the Funds. Because the Funds may invest in portfolio investments primarily listed on foreign exchanges and these exchanges may trade on weekends or other days when the Funds do not price their shares, the value of some of the Funds’ portfolio investments may change on days when you may not be able to buy or sell the Funds’ shares. In computing the NAV, the Funds value foreign investments held by the Funds at the latest closing price on the exchange in which they are traded immediately prior to closing of the New York Stock Exchange. Prices of foreign investments quoted in foreign currencies are translated into U.S. dollars at current rates. If events materially affecting the value of an investment in the Funds’ portfolio, particularly foreign investments, occur after the close of trading on a foreign market but before the Funds price their shares, the investment will be valued at fair value.
LoCorr Macro Strategies Fund, LoCorr Long/Short Commodities Strategy Fund and LoCorr Market Trend Fund – Notes to Consolidated Financial
Statements / LoCorr Dynamic Equity Fund and LoCorr Spectrum Income Fund – Notes to Financial Statements (continued) |
Certain investments such as commodity pools are measured based upon NAV as a practical expedient to determine fair value and are not required to be categorized in the fair value hierarchy.
American Depositary Receipts
The Funds may invest in sponsored and unsponsored American Depositary Receipts (“ADRs”), which are receipts issued by an American bank or trust company evidencing ownership of underlying securities issued by a foreign issuer. ADRs, in registered form, are designed for use in U.S. securities markets. Unsponsored ADRs may be created without the participation of the foreign issuer. Holders of unsponsored ADRs generally bear all the costs of the ADR facility, whereas foreign issuers typically bear certain costs in a sponsored ADR. The bank or trust company depositary of an unsponsored ADR may be under no obligation to distribute shareholder communications received from the foreign issuer or to pass through voting rights. ADRs are generally categorized in Level 1 or Level 2 of the fair value hierarchy depending on inputs used and market activity levels for specific securities.
Equity Securities
Equity securities, including common stocks, preferred stocks, securities convertible into common stocks such as convertible bonds, warrants, rights, options, master limited partnership (“MLP”) interests, real estate investment trusts (“REITs”), business development companies (“BDCs”) and royalty trusts are generally valued by using market quotations, but may be valued on the basis of prices furnished by a pricing service when the Adviser believes such prices accurately reflect the fair market value of such securities. MLP interests are limited partnerships, the interests in which (known as “units”) typically trade publicly, like stock. MLPs are also called publicly traded partnerships and public limited partnerships. Securities that are traded on any stock exchange or on the NASDAQ over-the-counter market are generally valued by the pricing service at the last quoted sale price. Lacking a last sale price, an equity security is generally valued by the pricing service at its last bid price. Equity securities are generally categorized in Level 1 or Level 2 of the fair value hierarchy depending on inputs used and market activity levels for specific securities.
Exchange Traded Funds
The Funds may invest in Exchange Traded Funds (“ETFs”). They are managed by professionals and provide the investor with diversification, cost and tax efficiency, liquidity, marginability, usability for hedging, the ability to go long and short, and (for some ETFs) the provision of periodic distributions. Additionally, some ETFs are unit investment trusts (“UITs”), which are unmanaged portfolios overseen by trustees. ETFs generally have two markets. The primary market is where institutions swap “creation units” in block-multiples of shares, typically 25,000 or 50,000, for in-kind securities and cash in the form of dividends. The secondary market is where individual investors can trade as little as a single share during trading hours on the exchange. This is different from open-ended mutual funds that are traded after hours once the NAV is calculated. ETF shares may trade at a premium or discount to NAV per share. ETFs share many similar risks with open-end and closed-end funds. ETFs are generally categorized in Level 1 of the fair value hierarchy.
The Funds may invest in ETFs and other investment companies that hold a portfolio of foreign securities. Investing in securities of foreign companies and countries involves certain considerations and risks that are not typically associated with investing in U.S. government securities and securities of domestic companies. There may be less publicly available information about a foreign issuer than a domestic one, and foreign companies are not generally subject to uniform accounting, auditing and financial standards and requirements comparable to those applicable to U.S. companies. There may also be less government supervision and regulation of foreign securities exchanges, brokers and listed companies than exists in the United States. Interest and dividends paid by foreign issuers may be subject to withholding and other foreign taxes, which may decrease the net return on such investments as compared to dividends and interest paid to the Funds by domestic companies or the U.S. government. There may be the possibility of expropriations, seizure or nationalization of foreign deposits, confiscatory taxation, political, economic or social instability, or diplomatic developments that could affect assets of the Funds held in foreign countries. Finally, the establishment of exchange controls or other foreign governmental laws or restrictions could adversely affect the payment of obligations.
Fixed Income Securities
Fixed income securities and certificates of deposit with maturities more than 60 days when acquired generally are valued using an evaluated price supplied by an independent pricing service. Inputs used by the pricing service for U.S. government and treasury securities are normally valued using a model that incorporates market observable data such as reported sales of similar securities, broker dealer quotes, yields, bids, offers and reference data. Agency issued debt securities, foreign issued bonds and municipal bonds are generally valued in a manner similar to U.S. government securities. Evaluations for corporate bonds are typically based on valuation methodologies such as market pricing and other analytical pricing models as well as market transactions and dealer quotations based on observable inputs. Fixed income securities are generally categorized in Level1 or Level 2 of the fair value hierarchy depending on inputs used and market activity levels for specific securities.
LoCorr Macro Strategies Fund, LoCorr Long/Short Commodities Strategy Fund and LoCorr Market Trend Fund – Notes to Consolidated Financial
Statements / LoCorr Dynamic Equity Fund and LoCorr Spectrum Income Fund – Notes to Financial Statements (continued) |
The fair value of asset backed securities and mortgage backed securities is estimated on models that consider the estimated cash flows of each tranche of the entity, establish a benchmark yield, and develop an estimated tranche-specific spread to the benchmark yield based on the unique attributes of the tranche. Additional inputs such as creditworthiness of the underlying collateral and quotes from outside brokers for the same or similar issuance may also be considered in the development of fair value. Asset backed and mortgage backed securities are generally categorized in Level 2 of the fair value hierarchy.
Short-term investments in fixed income securities and certificates of deposit with maturities of less than 60 days when acquired, or which subsequently are within 60 days of maturity, are valued using an amortized cost method of valuation, and are generally categorized in Level 2.
Investment Companies
With respect to any portion of the Funds’ assets that are invested in one or more open-end management investment companies, including money market funds, registered under the 1940 Act, the Funds’ NAV is calculated based upon the NAVs of those open-end management investment companies, and the prospectuses for these companies explain the circumstances under which those companies will use fair value pricing and the effects of using fair value pricing.
The Funds generally will purchase shares of closed-end investment companies only in the secondary market. The shares of many closed end investment companies, after their initial public offering, frequently trade at a price per share that is less than the NAV per share, the difference representing the “market discount” of such shares. This market discount may be due in part to the investment objective of longterm appreciation, which is sought by many closed-end investment companies, as well as to the fact that the shares of closed-end investment companies are not redeemable by the holder upon demand to the issuer at the next determined NAV but rather are subject to the principles of supply and demand in the secondary market. A relative lack of secondary market purchasers of closed-end investment company shares also may contribute to such shares trading at a discount to their NAV. Closed-end investment companies are generally categorized in Level 1 or Level 2 of the fair value hierarchy depending on inputs used and market activity levels for specific securities.
Financial Derivative Instruments
Financial derivative instruments, such as forward currency contracts, futures contracts or swap agreements, derive their value from underlying asset prices, indices, reference rates and other inputs or a combination of these factors. These contracts are normally valued on the basis of broker- dealer quotations or a pricing service at the settlement price determined by the relevant exchange. Depending on the product and the terms of the transaction, the value of the derivative contracts can be estimated by a pricing service provider using a series of techniques, including simulation pricing models. The pricing models use inputs that are observed from actively quoted markets such as issuer details, indices, spreads, interest rates, curves, dividends and exchange rates.
Forward currency contracts represent the purchase or sale of a specific quantity of a foreign currency at the current or spot price, with delivery and settlement at a specified future date. Forward currency contracts are presented at fair value using spot currency rates and are adjusted for the time value of money (forward points) and contractual prices of the underlying financial instruments. Forward currency contracts are generally categorized in Level 2.
Futures contracts are carried at fair value using the primary exchange’s closing (settlement) price and are generally categorized in Level 1.
Total return swap contracts are stated at fair value daily based on the fair value of the underlying futures, forward currency and foreign currency contracts constituting the contract’s stated index, taking into account any fees and expenses associated with the swap agreement. Total return swap contracts are generally categorized in Level 2.
Fund-linked options are stated at fair value based on the fair value of Galaxy Plus Fund – East Alpha Feeder Fund (548) LLC and Galaxy Plus Fund – CoreCommodity Feeder Fund (558), taking into account any fees and expenses associated with the fund-linked option. Fund-linked options are generally categorized in Level 2.
Fair Value Pricing
If market quotations are not readily available, investments will be valued at their fair value as determined in good faith by the Adviser in accordance with procedures approved by the Board of Trustees (the “Board”) and evaluated by the Board as to the reliability of the fair value method used.
LoCorr Macro Strategies Fund, LoCorr Long/Short Commodities Strategy Fund and LoCorr Market Trend Fund – Notes to Consolidated Financial
Statements / LoCorr Dynamic Equity Fund and LoCorr Spectrum Income Fund – Notes to Financial Statements (continued) |
In these cases, a Fund’s NAV will reflect certain portfolio investments’ fair value rather than their market price. Fair value pricing involves subjective judgments and it is possible that the fair value determined for an investment is materially different than the value that could be realized upon the sale of that investment. The fair value prices can differ from market prices when they become available or when a price becomes available.
Fair value determinations are required for the following securities:
● | securities for which market quotations are not readily available at the valuation time on a particular business day (including without limitation securities for which there is a short and temporary lapse in the provision of a price by the regular pricing source); |
● | securities determined to be illiquid in accordance with the Trust’s Liquidity Procedures; and |
● | securities with respect to which an event that will affect the value thereof has occurred subsequent to the determination by the Adviser/relevant Sub-Adviser of the closing prices reported on the principal exchange on which the securities are traded, but prior to the relevant Fund’s calculation of its NAV. |
● | For any open-end mutual funds that do not provide timely NAV information, the Adviser/relevant Sub-Adviser shall evaluate those ‘similar’ funds and determine which are most appropriate based on funds having similar benchmarks or similar objectives. The Adviser/relevant Sub-Adviser shall then calculate the NAV percentage move of those ‘similar’ funds for the day to create an aggregate average percentage move, which it shall use to calculate the price movement for the day of the Fund at issue. For closed-end funds, the aforementioned practice shall be utilized, in addition to monitoring secondary market activity during the day. |
Performing Fair Value Pricing
The Adviser considers all appropriate factors relevant to the value of securities for which market quotations are not readily available. No single standard for determining fair value can be established, since fair value depends upon the circumstances of each individual case. As a general principle, the current fair value of an issue of securities being valued by the Adviser would appear to be the amount that the owner might reasonably expect to receive for them upon their current sale.
As a general matter, the Funds’ Adviser will value the portfolio security or other asset primarily by reference to the public market if there is a public market for securities of the same class or similar securities; primarily by reference to private transactions if public market reference is not available and private transaction reports are available; and primarily by use of one or more analytical methods or models if public and private market references are not available or not reliable. The Adviser will use cost only if no better method of valuation is available.
The Adviser regularly evaluates whether its pricing methodologies continue to result in values that the Funds might reasonably expect to receive upon a current sale. In order to do this, the Adviser compares its fair value prices with values that are available from other sources (if there are any). The next actual sales price of a security might be one such source. However, the next-day opening prices or next actual sales prices for a security may differ from the fair value of that security as of the time for NAV calculation, given the subjectivity inherent in fair valuation and the fact that events could occur after NAV calculation. Thus, discrepancies between fair values and next-day opening prices or next actual sales prices may occur on a regular and recurring basis. These discrepancies do not necessarily indicate that the Adviser’s fair value methodology is inappropriate. Nonetheless, systematic comparisons of fair values to the next-day opening prices or next actual sales prices are useful to assist the Adviser with ongoing monitoring and evaluation of the appropriateness of its fair value methodologies. The above guidance does not purport to delineate all factors that may be considered. The Adviser takes into consideration all indications of value available to it in determining the fair value assigned to a particular security.
The following table summarizes LoCorr Macro Strategies Fund’s consolidated investments and other financial instruments as of June 30, 2022:
Security Classification | | Level 1 | | | Level 2 | | | Level 3 | | | Total | |
Investments | | | | | | | | | | | | | | | | |
Asset Backed Securities | | $ | — | | | $ | 97,502,133 | | | $ | — | | | $ | 97,502,133 | |
Corporate Bonds | | | — | | | | 252,057,606 | | | | — | | | | 252,057,606 | |
Mortgage Backed Securities | | | — | | | | 208,701,658 | | | | — | | | | 208,701,658 | |
Municipal Bonds | | | — | | | | 11,796,517 | | | | — | | | | 11,796,517 | |
U.S. Government Agency Issues | | | — | | | | 108,666,183 | | | | — | | | | 108,666,183 | |
U.S. Government Notes | | | — | | | | 278,566,337 | | | | — | | | | 278,566,337 | |
Short Term Investment | | | 1,048,537,023 | | | | — | | | | — | | | | 1,048,537,023 | |
Total Investments | | $ | 1,048,537,023 | | | $ | 957,290,434 | | | $ | — | | | $ | 2,005,827,457 | |
LoCorr Macro Strategies Fund, LoCorr Long/Short Commodities Strategy Fund and LoCorr Market Trend Fund – Notes to Consolidated Financial
Statements / LoCorr Dynamic Equity Fund and LoCorr Spectrum Income Fund – Notes to Financial Statements (continued) |
Security Classification | | Level 1 | | | Level 2 | | | Level 3 | | | Total | |
Other Financial Instruments* | | | | | | | | | | | | | | | | |
Forward Currency Contracts | | | | | | | | | | | | | | | | |
Purchase | | $ | — | | | $ | (7,967,450 | ) | | $ | — | | | $ | (7,967,450 | ) |
Sale | | | — | | | | 12,908,418 | | | | — | | | | 12,908,418 | |
Total Forward Currency Contracts | | | — | | | | 4,940,968 | | | | — | | | | 4,940,968 | |
Futures Contracts | | | | | | | | | | | | | | | | |
Long | | $ | (15,866,588 | ) | | | — | | | | — | | | $ | (15,866,588 | ) |
Short | | | 10,863,685 | | | | — | | | | — | | | | 10,863,685 | |
Total Futures Contracts | | | (5,002,903 | ) | | | — | | | | — | | | | (5,002,903 | ) |
Total Other Financial Instruments | | $ | (5,002,903 | ) | | $ | 4,940,968 | | | $ | — | | | $ | (61,935 | ) |
See the Fund’s consolidated schedule of investments for the investments detailed by industry classification.
* | The fair value of the Fund’s other financial instruments represent the net unrealized appreciation (depreciation) at June 30, 2022. |
The LoCorr Macro Strategies Fund did not hold any Level 3 assets during the period.
The following table summarizes LoCorr Long/Short Commodities Strategy Fund’s consolidated investments and swap contracts as of June 30, 2022:
Security Classification | | Level 1 | | | Level 2 | | | Level 3 | | | Nav as a Practical
Expediant | | | Total | |
Investments | | | | | | | | | | | | | | | | | | | | |
Asset Backed Securities | | $ | — | | | $ | 63,212,209 | | | $ | — | | | $ | — | | | $ | 63,212,209 | |
Commodity Pool | | | — | | | | — | | | | — | | | | 41,993,465 | | | | 41,993,465 | |
Corporate Bonds | | | — | | | | 147,793,605 | | | | — | | | | — | | | | 147,793,605 | |
Foreign Government Bond | | | — | | | | 1,245 | | | | — | | | | — | | | | 1,245 | |
Mortgage Backed Securities | | | — | | | | 113,826,675 | | | | — | | | | — | | | | 113,826,675 | |
Municipal Bonds | | | — | | | | 4,326,132 | | | | — | | | | — | | | | 4,326,132 | |
Purchased Call Options | | | — | | | | 102,887,591 | | | | — | | | | — | | | | 102,887,591 | |
U.S. Government Agency Issues | | | — | | | | 75,319,298 | | | | — | | | | — | | | | 75,319,298 | |
U.S. Government Notes | | | — | | | | 167,319,090 | | | | — | | | | — | | | | 167,319,090 | |
Short Term Investment | | | 371,119,454 | | | | — | | | | — | | | | — | | | | 371,119,454 | |
Total Investments | | $ | 371,119,454 | | | $ | 674,685,845 | | | $ | — | | | $ | 41,993,465 | | | $ | 1,087,798,764 | |
| | | | | | | | | | | | | | | | | | | | | |
Swap Contracts* | | | | | | | | | | | | | | | | | | | | |
Long Total Return Swap Contracts | | $ | — | | | $ | 79,518,959 | | | $ | — | | | $ | — | | | $ | 79,518,959 | |
Total Swap Contracts | | $ | — | | | $ | 79,518,959 | | | $ | — | | | $ | — | | | $ | 79,518,959 | |
See the Fund’s consolidated schedule of investments for the investments detailed by industry classification.
* | The fair value of the Fund’s investment in swap contracts represents the net unrealized appreciation at June 30, 2022. |
The LoCorr Long/Short Commodities Strategy Fund did not hold any Level 3 assets during the period.
LoCorr Macro Strategies Fund, LoCorr Long/Short Commodities Strategy Fund and LoCorr Market Trend Fund – Notes to Consolidated Financial
Statements / LoCorr Dynamic Equity Fund and LoCorr Spectrum Income Fund – Notes to Financial Statements (continued) |
The following table summarizes LoCorr Market Trend Fund’s consolidated investments and other financial instruments as of June 30, 2022:
Security Classification | | Level 1 | | | Level 2 | | | Level 3 | | | Total | |
Investments | | | | | | | | | | | | | | | | |
Asset Backed Securities | | $ | — | | | $ | 25,687,903 | | | $ | — | | | $ | 25,687,903 | |
Corporate Bonds | | | — | | | | 67,345,248 | | | | — | | | | 67,345,248 | |
Mortgage Backed Securities | | | — | | | | 41,777,597 | | | | — | | | | 41,777,597 | |
Municipal Bonds | | | — | | | | 2,361,915 | | | | — | | | | 2,361,915 | |
U.S. Government Agency Issues | | | — | | | | 30,137,498 | | | | — | | | | 30,137,498 | |
U.S. Government Notes | | | — | | | | 86,634,618 | | | | — | | | | 86,634,618 | |
Short Term Investments | | | 265,218,112 | | | | 4,670,552 | | | | — | | | | 269,888,664 | |
Total Investments | | $ | 265,218,112 | | | $ | 258,615,331 | | | $ | — | | | $ | 523,833,443 | |
| | | | | | | | | | | | | | | | |
Other Financial Instruments* | | | | | | | | | | | | | | | | |
Forward Currency Contracts | | | | | | | | | | | | | | | | |
Purchase | | $ | — | | | $ | (335,439 | ) | | $ | — | | | $ | (335,439 | ) |
Sale | | | — | | | | 5,183,671 | | | | — | | | | 5,183,671 | |
Total Forward Currency Contracts | | | — | | | | 4,848,232 | | | | — | | | | 4,848,232 | |
Futures Contracts | | | | | | | | | | | | | | | | |
Long | | $ | (18,085,115 | ) | | $ | — | | | $ | — | | | $ | (18,085,115 | ) |
Short | | | 4,504,196 | | | | — | | | | — | | | | 4,504,196 | |
Total Futures Contracts | | | (13,580,919 | ) | | | — | | | | — | | | | (13,580,919 | ) |
Total Other Financial Instruments | | $ | (13,580,919 | ) | | $ | 4,848,232 | | | $ | — | | | $ | (8,732,687 | ) |
See the Fund’s consolidated schedule of investments for the investments detailed by industry classification.
* | The fair value of the Fund’s other financial instruments represent the net unrealized appreciation (depreciation) at June 30, 2022. |
The LoCorr Market Trend Fund did not hold any Level 3 assets during the period.
The following table summarizes LoCorr Dynamic Equity Fund’s investments and securities sold short as of June 30, 2022:
Security Classification | | Level 1 | | | Level 2 | | | Level 3 | | | Total | |
Investments | | | | | | | | | | | | | | | | |
Common Stocks | | $ | 25,603,282 | | | $ | — | | | $ | — | | | $ | 25,603,282 | |
Real Estate Investment Trusts | | | 1,481,186 | | | | — | | | | — | | | | 1,481,186 | |
Short Term Investment | | | 13,884,647 | | | | — | | | | — | | | | 13,884,647 | |
Total Investments | | $ | 40,969,115 | | | $ | — | | | $ | — | | | $ | 40,969,115 | |
| | | | | | | | | | | | | | | | |
Securities Sold Short | | | | | | | | | | | | | | | | |
Common Stocks | | $ | (10,748,746 | ) | | $ | — | | | $ | — | | | $ | (10,748,746 | ) |
Exchange Traded Funds | | | (3,829,697 | ) | | | — | | | | — | | | | (3,829,697 | ) |
Total Securities Sold Short | | $ | (14,578,443 | ) | | $ | — | | | $ | — | | | $ | (14,578,443 | ) |
| | | | | | | | | | | | | | | | | |
Written Option | | | | | | | | | | | | | | | | |
Written Call Option | | $ | (10,640 | ) | | $ | — | | | $ | — | | | $ | (10,640 | ) |
Total Written Option | | $ | (10,640 | ) | | $ | — | | | $ | — | | | $ | (10,640 | ) |
See the Fund’s schedule of investments and schedule of securities sold short for detail by industry classification.
The LoCorr Dynamic Equity Fund did not hold any Level 3 assets or liabilities during the period.
LoCorr Macro Strategies Fund, LoCorr Long/Short Commodities Strategy Fund and LoCorr Market Trend Fund – Notes to Consolidated Financial
Statements / LoCorr Dynamic Equity Fund and LoCorr Spectrum Income Fund – Notes to Financial Statements (continued) |
The following table summarizes LoCorr Spectrum Income Fund’s investments and written options as of June 30, 2022:
Security Classification | | Level 1 | | | Level 2 | | | Level 3 | | | Total | |
Investments | | | | | | | | | | | | | | | | |
Business Development Companies | | $ | 3,177,860 | | | $ | — | | | $ | — | | | $ | 3,177,860 | |
Closed-End Investment Companies | | | 6,693,155 | | | | — | | | | — | | | | 6,693,155 | |
Common Stocks | | | 45,085,092 | | | | — | | | | — | | | | 45,085,092 | |
Master Limited Partnerships | | | 12,213,615 | | | | — | | | | — | | | | 12,213,615 | |
Preferred Stocks | | | 3,015,306 | | | | — | | | | — | | | | 3,015,306 | |
Publicly Traded Partnerships | | | 2,799,486 | | | | — | | | | — | | | | 2,799,486 | |
Purchased Put Options | | | 825,250 | | | | — | | | | — | | | | 825,250 | |
Real Estate Investment Trusts | | | 21,102,823 | | | | — | | | | — | | | | 21,102,823 | |
Short Term Investment | | | 7,846,936 | | | | — | | | | — | | | | 7,846,936 | |
Total Investments | | $ | 102,759,523 | | | $ | — | | | $ | — | | | $ | 102,759,523 | |
| | | | | | | | | | | | | | | | |
Written Options | | | | | | | | | | | | | | | | |
Written Call Options | | $ | (310,374 | ) | | $ | — | | | $ | — | | | $ | (310,374 | ) |
Total Written Options | | $ | (310,374 | ) | | $ | — | | | $ | — | | | $ | (310,374 | ) |
See the Fund’s schedule of investments for detail by industry classification.
The LoCorr Spectrum Income Fund did not hold any Level 3 assets or liabilities during the period.
Allocation of Income and Expenses
Net investment income, other than class specific expenses, and realized and unrealized gains and losses are allocated daily to each class of shares based upon the relative NAV of outstanding shares of each class of shares at the beginning of the day (after adjusting for the current capital shares activity of the respective class). Expenses associated with a specific Fund in the Trust are charged to that Fund. Common expenses are typically allocated based upon the relative net assets of each Fund, or by other equitable means.
Deposits with Broker
Forward Currency and Futures Contracts
When trading derivative instruments, such as forward or futures contracts, a Fund is only required to post initial or variation margin with the exchange or clearing broker. The use of margin in trading these instruments has the effect of creating leverage, which can expose the Fund to substantial gains or losses occurring from relatively small price changes in the value of the underlying instrument and can increase the volatility of the Fund’s returns. Volatility is a statistical measure of the dispersion of returns of an investment, where higher volatility generally indicates greater risk. At June 30, 2022, the LoCorr Macro Strategies Fund and the LoCorr Market Trend Fund pledged cash and cash equivalents, defined as short-term, highly liquid investments that are readily convertible to known amounts of cash at U.S. Bank, N.A. (“U.S. Bank”) to Bank of America Merrill Lynch for each Fund’s investment in forward currency contracts. See the Funds’ consolidated statements of assets and liabilities for these amounts.
Upon entering into a futures contract, and to maintain the Fund’s open positions in futures contracts, the Fund is required to deposit with its custodian or futures broker in a segregated account in the name of the futures broker an amount of cash, U.S. government securities, suitable money market instruments, or other liquid securities, known as “initial margin.” The margin required fora particular futures contract is set by the exchange on which the contract is traded and may be significantly modified from time to time by the exchange during the term of the contract. Futures contracts are customarily purchased and sold on margins that may range upward from less than 5% of the value of the contract being traded.
At June 30, 2022, the LoCorr Macro Strategies Fund and LCMFS, collectively, had cash and cash equivalents including foreign currency on deposit with the broker for derivative instruments which is presented on the Fund’s consolidated statement of assets and liabilities. In addition, LCMFS pledged securities collateral for derivative instruments. See the Fund’s consolidated schedule of investments for the fair value of securities pledged as collateral.
LoCorr Macro Strategies Fund, LoCorr Long/Short Commodities Strategy Fund and LoCorr Market Trend Fund – Notes to Consolidated Financial
Statements / LoCorr Dynamic Equity Fund and LoCorr Spectrum Income Fund – Notes to Financial Statements (continued) |
At June 30, 2022, the LoCorr Market Trend Fund and LCMT, collectively, cash and cash equivalents including foreign currency on deposit with the broker for derivative instruments which is presented on the Fund’s consolidated statement of assets and liabilities. In addition, LCMT pledged cash at U.S. Bank as collateral for derivative instruments. See the Fund’s consolidated schedule of investments for the fair value of securities pledged as collateral.
If the price of an open futures contract changes (by increase in underlying instrument or index in the case of a sale or by decrease in the case of a purchase) so that the loss on the futures contract reaches a point at which the margin on deposit does not satisfy margin requirements, the broker will require an increase in the margin. However, if the value of a position increases because of favorable price changes in the futures contract so that the margin deposit exceeds the required margin, the broker will pay the excess to the Fund.
These subsequent payments, called “variation margin,” to and from the futures broker (with the exception of futures contracts traded on the London Metal Exchange (“LME”)), are made on a daily basis as the price of the underlying assets fluctuate making the long and short positions in the futures contract more or less valuable, a process known as “marking to the market.” The variation margin on LME futures contracts do not settle daily, but rather settle at their respective maturity dates. At period end, the unrealized appreciation and depreciation on LME futures contracts is shown as receivable for unsettled open futures contracts and payable for unsettled open futures contracts, respectively, on the Funds’ consolidated statements of assets and liabilities. The Funds expect to earn interest income on any margin deposits.
Securities Sold Short
At June 30, 2022, the LoCorr Dynamic Equity Fund had cash on deposit with Morgan Stanley and J.P. Morgan. In addition, at June 30, 2022, the LoCorr Dynamic Equity Fund pledged cash with U.S. Bank as collateral for securities sold short. See the Fund’s statement of assets and liabilities for amounts.
Swap Contracts
LCLSCS has a substantial portion of its assets on deposit with Deutsche Bank in connection with its trading of its swap contract. Assets deposited with Deutsche Bank in connection with the trading of the swap contract for LCLSCS are partially restricted due to deposit requirements. At June 30, 2022, the LoCorr Long/Short Commodities Strategy Fund had cash and cash equivalents on deposit with Deutsche Bank which is presented on the consolidated statements of assets and liabilities. In addition, at June 30, 2022, LCLSCS pledged securities as collateral for the swap contract. See the Fund’s consolidated schedule of investments for the fair value of securities pledged as collateral. Risks arise from the possible inability of the counterparty to meet the terms of its contract and may increase if the counterparty’s financial condition worsens.
Options
At June 30, 2022, the LoCorr Spectrum Income Fund had cash and cash equivalents on deposit with Pershing, LLC for options contracts which is presented on the Fund’s statement of assets and liabilities. In addition, the LoCorr Spectrum Income Fund pledged securities as collateral for options. See the Fund’s consolidated schedule of investments for the fair value of securities pledged as collateral.
Distributable Earnings and Investment Transactions
Net investment income and net realized gains (losses) may differ for financial reporting and tax purposes because of temporary or permanent book/tax differences. To the extent these differences are permanent; reclassifications are made to the appropriate equity accounts in the period that the difference arises.
Additionally, GAAP requires that certain components of net assets relating to permanent differences be reclassified between financial and tax reporting. These reclassifications have no effect on net assets or NAV per share. See Note 7.
Distributions from Earnings
Shareholder transactions are recorded on trade date. Dividends from net investment income are declared and paid at least annually by the Funds. Distribution of net realized capital gains, if any, are declared and paid at least annually. Distributions to shareholders are recorded on the ex-dividend date. The character of distributions made during the periods from net investment income or net realized gains may differ from the characterization for federal income tax purposes due to the difference in the recognition of income, expense and gain items for financial statement and tax purposes.
LoCorr Macro Strategies Fund, LoCorr Long/Short Commodities Strategy Fund and LoCorr Market Trend Fund – Notes to Consolidated Financial
Statements / LoCorr Dynamic Equity Fund and LoCorr Spectrum Income Fund – Notes to Financial Statements (continued) |
During the six months ended June 30, 2022, dividends for the LoCorr Spectrum Income Fund were distributed monthly. The estimated characterization of the distributions paid will be an ordinary dividend, qualified dividend or return of capital. This estimate is based on the Fund’s operating results during the period. It is anticipated that a significant portion of the distributions of the Fund’s investments in MLP and certain investments in REITs and royalty trusts will be comprised of return of capital as a result of the tax character of cash distributions made by each Fund’s investments. The actual characterization of the distributions made during the period is not determined until after the end of the fiscal year.
The tax character of distributions paid during the periods was as follows:
| | | Six Months Ended June 30, 2022 | |
Fund | | Ordinary
Income | | | Long-Term
Capital Gains | | | Return of
Capital | |
LoCorr Spectrum Income Fund | | $ | 3,159,667 | | | $ | — | | | $ | — | |
| | | Year Ended December 31, 2021 | |
Fund | | Ordinary
Income | | | Long-Term
Capital Gains | | | Return of
Capital | |
LoCorr Macro Strategies Fund | | $ | 70,131,381 | | | $ | — | | | $ | — | |
LoCorr Long/Short Commodities Strategy Fund | | | 60,068,364 | | | | — | | | | — | |
LoCorr Market Trend Fund | | | 9,457,776 | | | | — | | | | — | |
LoCorr Dynamic Equity Fund | | | 431,821 | | | | 1,011,184 | | | | — | |
LoCorr Spectrum Income Fund | | | 2,517,225 | | | | — | | | | 1,618,274 | |
Federal Income Taxes
The Funds intend to qualify as regulated investment companies pursuant to Subchapter M of the Internal Revenue Code of 1986, as amended. The Funds intend to distribute substantially all of their investment company net taxable income and net capital gains to shareholders. Therefore, no federal income tax provision is required.
As of and during the six months ended June 30, 2022, the Funds did not have any tax positions that did not meet the “more- likely-than-not” threshold of being sustained by applicable tax authorities. The Funds recognize interest and penalties, if any, related to unrecognized tax benefits on uncertain tax positions as interest or other expense in the statements of operations. During the six months ended June 30, 2022, the Funds did not incur any interest or penalties.
For tax purposes, LCMFS, LCLSCS and LCMT are exempted Cayman Islands investment companies. LCMFS, LCLSCS and LCMT have each received an undertaking from the Government of the Cayman Islands exempting them from all local income, profits, and capital gains taxes. No such taxes are levied in the Cayman Islands at the present time. For U.S. income tax purposes, LCMFS, LCLSCS and LCMT are controlled foreign corporations (“CFCs”) and as such are not subject to U.S. income tax. However, as a wholly-owned CFC, the net income and capital gain of each CFC, to the extent of its earnings and profits, will be included each year in the respective Funds’ investment company taxable income.
Foreign Securities and Currency
Investment securities and other assets and liabilities denominated in foreign currencies are translated into U.S. dollar amounts at the date of valuation. Purchases and sales of investment securities and income and expense items denominated in foreign currencies are translated into U.S. dollar amounts on the respective dates of such transactions.
The Funds do not isolate that portion of the results of operations resulting from changes in foreign exchange rates on investments from the fluctuations arising from changes in market prices of securities held. Such fluctuations are included with the net realized and unrealized gain or loss from investments.
Reported net realized foreign exchange gains or losses arise from sales of foreign currencies, currency gains or losses realized between the trade and settlement dates on securities transactions, and the difference between the amounts of dividends, interest, and foreign withholding taxes recorded on the Funds’ books and the U.S. dollar equivalent of the amounts actually received or paid. Net unrealized foreign exchange gains and losses arise from changes in the fair values of assets and liabilities, other than investments in securities at period end, resulting from changes in exchange rates.
LoCorr Macro Strategies Fund, LoCorr Long/Short Commodities Strategy Fund and LoCorr Market Trend Fund – Notes to Consolidated Financial
Statements / LoCorr Dynamic Equity Fund and LoCorr Spectrum Income Fund – Notes to Financial Statements (continued) |
Forward Currency Contracts
Gains or losses are realized when foreign currency contracts are liquidated. Any change in net unrealized gain or loss is reported in the statements of operations.
Futures Contracts
A futures contract provides for the future sale by one party and purchase by another party of a specified amount of a specific financial instrument (e.g., units of a stock index) for a specified price, date, time and place designated at the time the contract is made. Brokerage fees are incurred when a futures contract is bought or sold and margin deposits must be maintained. Entering into a contract to buy is commonly referred to as buying or purchasing a contract or holding a long position. Entering into a contract to sell is commonly referred to as selling a contract or holding a short position. Unlike when a Fund purchases or sells a security, no price would be paid or received by the Fund upon the purchase or sale of a futures contract.
Although certain futures contracts, by their terms, require actual future delivery of and payment for the underlying instruments, in practice most futures contracts are usually closed out before the delivery date. Gains or losses are realized when contracts are liquidated. Closing out an open futures contract purchase or sale is affected by entering into an offsetting futures contract sale or purchase, respectively, for the same aggregate amount of the identical underlying instrument or index and the same delivery date. If the offsetting purchase price is less than the original sale price, the Fund realizes a gain; if it is more, the Fund realizes a loss. Conversely, if the offsetting sale price is more than the original purchase price, the Fund realizes a gain; if it is less, the Fund realizes a loss.
The transaction costs must also be included in these calculations. There can be no assurance, however, that a Fund will be able to enter into an offsetting transaction with respect to a particular futures contract at a particular time. If a Fund is not able to enter into an offsetting transaction, the Fund will continue to be required to maintain the margin deposits on the futures contract. Any change in net unrealized gain or loss is reported in the statements of operations.
Indemnifications
In the normal course of business, the Funds enter into contracts that contain general indemnifications to other parties. The Funds’ maximum exposure under these contracts is unknown as this would involve future claims that may be made against the Funds that have not yet occurred. However, based on experience, the Funds expect the risk of loss to be remote.
Market and Credit Risks
The Funds may engage in the speculative trading of U.S. and foreign futures, forward currency and swap contracts (collectively, “derivatives”). The Funds are exposed to both market risk, which is the risk arising from changes in the fair value of the contracts and credit risk, which is the risk of failure by another party to perform according to the terms of a contract.
Purchase and sale of futures contracts requires margin deposits with the broker. Additional deposits may be necessary for any loss on contract value. The Commodity Exchange Act requires a broker to segregate all customer transactions and assets from such broker’s proprietary activities. A customer’s cash and other property (for example, U.S. government securities) deposited with a broker are considered commingled with all other customer funds subject to the broker’s segregation requirements. In the event of a broker’s insolvency, recovery may be limited to a pro rata share of segregated funds available. It is possible that the recovered amount could be less than total cash and other property deposited.
For derivatives, risks arise from changes in the fair value of the contracts. Theoretically, the Funds are exposed to a market risk equal to the notional contract value of swap, futures and forward currency contracts purchased and unlimited liability on such contracts sold short.
The Funds also engage in investing its assets in U.S. government securities. Risks arise from investments in U.S. government securities due to possible market illiquidity. U.S. government securities are also sensitive to changes in interest rates and economic conditions.
The Funds have established procedures to actively monitor market risk and minimize credit risk, although there can be no assurance that they will, in fact, succeed in doing so.
The global outbreak of COVID-19 (commonly referred to as “coronavirus”) has disrupted economic markets and the prolonged economic impact is uncertain. The ultimate economic fallout from the pandemic, and the long-term impact on economies, markets, industries and individual issuers, are not known. The operational and financial performance of the issuers of securities
LoCorr Macro Strategies Fund, LoCorr Long/Short Commodities Strategy Fund and LoCorr Market Trend Fund – Notes to Consolidated Financial
Statements / LoCorr Dynamic Equity Fund and LoCorr Spectrum Income Fund – Notes to Financial Statements (continued) |
in which the Funds invest depends on future developments, including the duration and spread of the outbreak, and such uncertainty may in turn adversely affect the value and liquidity of the Funds’ investments, impair the Funds’ ability to satisfy redemption requests, and negatively impact the Funds’ performance.
New Accounting Pronouncements and/or SEC Regulatory Updates
In March 2020, FASB issued Accounting Standards Update 2020-04, Reference Rate Reform: Facilitation of the Effects of Reference Rate Reform on Financial Reporting (“ASU 2020-04”) and in January 2021, the FASB issued Accounting Standards Update 2021-01, Reference Rate Reform (Topic 848): Scope (“ASU 2021-01”), which provides optional, temporary relief with respect to the financial reporting of contracts subject to certain types of modifications due to the planned discontinuation of the London Interbank Offered Rate (“LIBOR”) and other interbank offered rates as of the end of 2021. The temporary relief provided by ASU 2020-04 and ASU 2021-01 is effective for certain reference rate-related contract modifications that occur during the period from March 12, 2020 through December 31, 2022. Management is evaluating the impact of ASU 2020-04 and ASU 2021-01 on the Funds’ investments, derivatives, debt and other contracts that will undergo reference rate-related modifications as a result of the reference rate reform. Management is also currently actively working with other financial institutions and counterparties to modify contracts as required by applicable regulation and within the regulatory deadlines.
In October 2020, the SEC adopted new regulations governing the use of derivatives by registered investment companies (“Rule 18f-4”). Rule 18f-4 will impose limits on the amount of derivatives a Fund can enter into, eliminate the asset segregation framework currently used by funds to comply with Section 18 of the 1940 Act, and require funds whose use of derivatives is greater than a limited specified amount to establish and maintain a comprehensive derivatives risk management program and appoint a derivatives risk manager. The compliance date for Rule 18f-4 is August 19, 2022.
In December 2020, the SEC adopted a new rule providing a framework for fund valuation practices (“Rule 2a-5”). Rule 2a-5 establishes requirements for determining fair value in good faith for purposes of the 1940 Act. Rule 2a-5 will permit fund boards to designate certain parties to perform fair value determinations, subject to board oversight and certain other conditions. Rule 2a-5 also defines when market quotations are “readily available” for purposes of the 1940 Act and the threshold for determining whether a fund must fair value a security. In connection with Rule 2a-5, the SEC also adopted related recordkeeping requirements and is rescinding previously issued guidance, including with respect to the role of a board in determining fair value and the accounting and auditing of fund investments. The Funds will be required to comply with the rules by September 8, 2022.
Options on Securities
The Funds may purchase and write (i.e., sell) put and call options. Such options may relate to particular securities or stock indices and may or may not be listed on a domestic or foreign securities exchange and may or may not be issued by the Options Clearing Corporation. Option trading is a highly specialized activity that entails greater than ordinary investment risk. Options may be more volatile than the underlying instruments, and therefore, on a percentage basis, an investment in options may be subject to greater fluctuation than an investment in the underlying instruments themselves.
A call option for a particular security gives the purchaser of the option the right to buy, and the writer (seller) the obligation to sell, the underlying security at the stated exercise price at any time prior to the expiration of the option, regardless of the market price of the security. The premium paid to the writer is in consideration for undertaking the obligation under the option contract. A put option for a particular security gives the purchaser the right to sell the security at the stated exercise price at any time prior to the expiration date of the option, regardless of the market price of the security.
A Fund’s obligation to sell an instrument subject to a call option written by it, or to purchase an instrument subject to a put option written by it, may be terminated prior to the expiration date of the option by the Fund’s execution of a closing purchase transaction, which is effected by purchasing on an exchange an option of the same series (i.e., same underlying instrument, exercise price and expiration date) as the option previously written. A closing purchase transaction will ordinarily be effected to realize a profit on an outstanding option, to prevent an underlying instrument from being called, to permit the sale of the underlying instrument or to permit the writing of a new option containing different terms on such underlying instrument. The cost of such a liquidation purchase plus transactions costs may be greater than the premium received upon the original option, in which event the Fund will have incurred a loss in the transaction. There is no assurance that a liquid secondary market will exist for any particular option. An option writer unable to effect a closing purchase transaction will not be able to sell the underlying instrument or liquidate the assets held in a segregated account, as described below, until the option expires or the optioned instrument is delivered upon exercise. In such circumstances, the writer will be subject to the risk of market decline or appreciation in the instrument during such period.
LoCorr Macro Strategies Fund, LoCorr Long/Short Commodities Strategy Fund and LoCorr Market Trend Fund – Notes to Consolidated Financial
Statements / LoCorr Dynamic Equity Fund and LoCorr Spectrum Income Fund – Notes to Financial Statements (continued) |
If an option purchased by a Fund expires unexercised, the Fund realizes a loss equal to the premium paid. If a Fund enters into a closing sale transaction on an option purchased by it, the Fund will realize a gain if the premium received by the Fund on the closing transaction is more than the premium paid to purchase the option or a loss if it is less. If an option written by a Fund expires on the stipulated expiration date or if the Fund enters into a closing purchase transaction, it will realize a gain (or loss if the cost of a closing purchase transaction exceeds the net premium received when the option is sold). If an option written by the Fund is exercised, the proceeds of the sale will be increased by the net premium originally received and the Fund will realize a gain or loss.
Security Transactions and Investment Income
Security transactions are recorded on trade date. Generally, realized gains and losses on sales of investments are calculated on the specifically identified cost basis of the securities.
In accordance with the investment restrictions outlined within the Funds’ prospectus, each Fund may invest up to 15% of its net assets in illiquid securities. Illiquid securities may include securities subject to contractual or legal restrictions on resale (e.g., because they have not been registered under the Securities Act) and securities that are otherwise not readily marketable (e.g., because trading in the security is suspended or because market makers do not exist or will not entertain bids or offers). Securities that have not been registered under the Securities Act are referred to as private investments or restricted securities and are purchased directly from the issuer or in the secondary market. Foreign securities that are freely tradable in their principal markets are not considered to be illiquid. Under guidelines adopted by the Trust’s Board, the Adviser of the Funds may determine that particular Rule 144A securities, and commercial paper issued in reliance on the private placement exemption from registration afforded by Section 4(a)(2) of the Securities Act, are liquid even though they are not registered. At June 30, 2022, the Adviser deemed all of the 144A securities held in the LoCorr Macro Strategies Fund, the LoCorr Long/ Short Commodities Strategy Fund and the LoCorr Market Trend Fund to be liquid. At June 30, 2022, there were no illiquid or restricted securities held in the LoCorr Dynamic Equity Fund or the LoCorr Spectrum Income Fund.
Dividend income, less foreign taxes withheld, if any, are recorded on the ex-dividend date.
Distributions received from the investments in MLP interests, REITs, private investments, closed end funds, business development companies and royalty trusts generally are comprised of ordinary income, capital gains and return of capital. For financial statement purposes, the Funds use estimates to characterize these distributions received as return of capital, capital gains or ordinary income. Such estimates are based on historical information available from each MLP, REIT, private investment, closed end fund, business development company or royalty trust and other industry sources. These estimates may subsequently be revised based on information received from the MLP, REIT, private investment, closed end fund, business development company or royalty trust after their tax reporting periods are concluded, as the actual character of these distributions is not known until after the fiscal year end of the Funds. The distributions received from the MLP, REIT, private investment, closed end fund, business development company and royalty trust securities that have been classified as income and capital gains are included in investment income and net realized gain (loss) on investments, respectively, on the statements of operations. The distributions received that are classified as return of capital reduce the cost of investments on the statements of assets and liabilities.
Interest income and expense are recognized on the accrual basis. Market discounts, premiums and original issue discounts on fixed-income securities are amortized daily over the expected life of the security using the effective yield method.
Short Sales
The Funds may sell securities short. A short sale is a transaction in which a Fund sells a security it does not own or have the right to acquire (or that it owns but does not wish to deliver) in anticipation that the market price of that security will decline. When a Fund makes a short sale, the broker-dealer through which the short sale is made must borrow the security sold short and deliver it to the party purchasing the security. The Funds are required to make a margin deposit in connection with such short sales; the Funds may have to pay a fee to borrow particular securities and will often be obligated to pay over any dividends and accrued interest on borrowed securities.
If the price of the security sold short increases between the time of the short sale and the time a Fund covers its short position, the Fund will incur a loss; conversely, if the price declines, the Fund will realize a gain. A gain, limited to the price at which the Fund sold the security short, or a loss, unlimited in size, will be recognized upon the close of a short sale. Any gain will be decreased, and any loss increased, by the transaction costs described above. The successful use of short selling may be adversely affected by imperfect correlation between movements in the price of the security sold short and the securities being hedged. Gains or losses from closed positions of securities sold short are presented as net realized gain or loss on securities sold short on the statements of operations.
LoCorr Macro Strategies Fund, LoCorr Long/Short Commodities Strategy Fund and LoCorr Market Trend Fund – Notes to Consolidated Financial
Statements / LoCorr Dynamic Equity Fund and LoCorr Spectrum Income Fund – Notes to Financial Statements (continued) |
In addition, the Funds are required to pay the lender any dividends declared on short positions. Dividends declared on open short positions are recorded on ex-date and shown as an expense for financial reporting purposes. To borrow the security, the Funds also may be required to pay fees, which are shown as an expense for financial reporting purposes.
To the extent the Funds sell securities short, it will provide collateral to the broker-dealer and (except in the case of short sales “against the box”) will maintain additional asset coverage in the form of cash, U.S. government securities or other liquid securities with its custodian in a segregated account in an amount at least equal to the difference between the current fair value of the securities sold short and any amounts required to be deposited as collateral with the selling broker (not including the proceeds of the short sale). A short sale is “against the box” to the extent the Funds contemporaneously own or have the right to obtain at no added cost, securities identical to those sold short. Short sales are collateralized by cash deposits with the counterparty broker and pledged securities held at the custodian, U.S. Bank. The collateral required is determined daily by reference to the fair value of the short positions.
Total Return Swap Contracts
The Funds may enter into total return swap agreements. A total return swap entered into by the Funds is a derivative contract that transfers the market risk of underlying portfolios of futures contracts, forward currency contracts and foreign currencies (considered the “index” within each total return swap contract) between counterparties. The “notional amount” of each total return swap agreement is the agreed upon amount or value of the index used for calculating the returns that the parties to a swap agreement have agreed to exchange. The total return swaps are marked to market daily and any change is recorded in unrealized gain/loss on the consolidated statements of operations based on the value of the index on which the total return swap is referenced, as defined within the total return swap agreement between the counterparties. The composition of the index may vary based on how the underlying portfolio of futures contracts, forward currency contracts and foreign currencies is traded. A Fund’s obligation under total return swap agreement, including any related fees, offset against amounts owed to the Fund in the case of positive performance, will be covered by designating liquid assets on the Fund’s books and records (see the consolidated statement of assets and liabilities for deposits with broker for derivative instruments). Gains or losses will be realized when the total return swap contracts are liquidated and will be presented as net realized gain or loss on swap contracts on the consolidated statements of operations. Changes in notional value and any cash holding adjustments, which represent voluntary realizations by a Fund of swap value at any point in time, are also presented as net realized gain or loss on swap contracts on the consolidated statements of operations. Further, any cash holding adjustments realized by a Fund are subject to interest charges, which are recorded as part of unrealized gain/loss on the consolidated statements of operations. A corresponding asset or liability for “advance receipt on swap contracts” or “advance payment on swap contracts,” respectively, is recorded on the consolidated statements of assets and liabilities for the gain or loss realized on changes in notional value. Total return swaps outstanding at period end, if any, are listed after the Funds’ consolidated schedules of investments.
Use of Estimates
The preparation of financial statements in conformity with GAAP requires management to make estimates and assumptions that affect the reported amounts of assets and liabilities, disclosure of contingent assets and liabilities at the date of the financial statements and the reported revenues and expenses during the reporting period. Actual results could differ from those estimates.
Warrants
The Funds may invest in warrants. Warrants are options to purchase common stock at a specific price (usually at a premium above the market value of the optioned common stock at issuance) valid for a specific period of time. Warrants may have a life ranging from less than one year to twenty years, or they may be perpetual. However, most warrants have expiration dates after which they are worthless. In addition, a warrant is worthless if the market price of the common stock does not exceed the warrant’s exercise price during the life of the warrant. Warrants have no voting rights, pay no dividends and have no rights with respect to the assets of the corporation issuing them. The percentage increase or decrease in the market price of the warrant may tend to be greater than the percentage increase or decrease in the market price of the optioned common stock.
3. Derivative and Other Financial Instruments
The Funds may invest in derivatives such as futures, forward currency and swap contracts, in order to hedge against market movements while liquidating certain positions and buying other securities or as substitutes for securities, as well as for speculative purposes to gain exposure to such market movements.
LoCorr Macro Strategies Fund, LoCorr Long/Short Commodities Strategy Fund and LoCorr Market Trend Fund – Notes to Consolidated Financial
Statements / LoCorr Dynamic Equity Fund and LoCorr Spectrum Income Fund – Notes to Financial Statements (continued) |
The Funds’ market risk related to their derivatives trading is influenced by a wide variety of factors, including the level and volatility of interest rates, exchange rates, weather, supply and demand of commodities, the market value of futures and forward currency contracts, the diversification effects among the Funds’ open positions and the liquidity of the markets in which they trade.
The following are the primary trading risk exposures by market sector of the Funds as encompassed in the total return swap contracts:
Agricultural. (grains, livestock and softs). The Funds’ primary exposure is to agricultural price movements which are often directly affected by severe or unexpected weather conditions.
Currencies. Exchange rate risk is a principal market exposure of the Funds. The Funds’ currency exposure is to exchange rate fluctuations, primarily fluctuations which disrupt the historical pricing relationships between different currencies and currency pairs. The fluctuations are influenced by interest rate changes as well as political and general economic conditions. The Funds trade in a large number of currencies including cross-rates– e.g., positions between two currencies other than the U.S. dollar.
Energy. The Funds’ primary energy market exposure is to gas and oil price movements, often resulting from political developments in the Middle East and economic conditions worldwide. Energy prices are volatile and substantial profits and losses have been and are expected to continue to be experienced in this market.
Interest Rates. Interest rate movements directly affect the price of the sovereign bond futures positions held by the Funds and indirectly the value of its stock index currency positions. Interest rate movements in one country as well as relative interest rate movements between countries may materially impact the Funds’ profitability. The Funds’ primary interest rate exposure is to interest rate fluctuations in countries or regions including Australia, Canada, Japan, Switzerland, the United Kingdom, the United States and the Eurozone. However, the Funds also may take positions in futures contracts on the government debt of other nations. The Funds anticipate that interest rates in these industrialized countries or areas, both long-term and short-term, will remain a primary market exposure of the Funds for the foreseeable future.
Metals. The Funds’ metals market exposure is to fluctuations in the price of aluminum, copper, gold, lead, nickel, palladium, tin, silver and zinc.
Stock Index. The Funds’ equity exposure, through stock index futures, is to equity price risk in the major industrialized countries as well as other countries.
The Fund invests in options which are not traded on an exchange. In doing so, it is assuming a credit risk with regard to the party with which it trades and also bears the risk of settlement default. These risks may differ materially from risks associated with transactions effected on an exchange, which generally are backed by clearing organization guarantees, daily mark-to market and settlement, segregation and minimum capital requirements applicable to intermediaries. Relying on a counterparty exposes the Fund to the risk that a counterparty will not settle a transaction in accordance with its terms and conditions because of a dispute over the terms of the contract (whether or not bona fide) or because of a credit or liquidity problem, thus causing the Fund to suffer a loss. If a counterparty defaults on its payment obligations to the Fund, this default will cause the value of an investment in the Fund to decrease.
At June 30, 2022, the LoCorr Macro Strategies Fund, the LoCorr Long/Short Commodities Strategy Fund and the LoCorr Market Trend Fund held derivative and other financial instruments which are not subject to a master netting arrangement. As the tables below illustrate, no positions are netted in these consolidated financial statements.
LoCorr Macro Strategies Fund - June 30, 2022 | | | | | | | | | | | | |
Assets: | | | | | | | | | | | | | | Gross Amounts
not offset in the Consolidated
Statement of Assets & Liabilities | | | | | |
Description | | Gross Amounts of
Recognized Assets | | | Gross Amounts
Offset in the
Consolidated
Statement of
Assets & Liabilities | | | Net Amounts
Presented in the
Consolidated
Statement of
Assets & Liabilities | | | Financial
Instruments | | | Collateral Pledged
(Received) | | | Net Amount | |
Forward currency contracts | | $ | 23,152,200 | | | $ | — | | | $ | 23,152,200 | | | $ | — | | | $ | — | | | $ | 23,152,200 | |
Futures contracts (a) | | | 4,099,961 | | | | — | | | | 4,099,961 | | | | — | | | | — | | | | 4,099,961 | |
Total | | $ | 27,252,161 | | | $ | — | | | $ | 27,252,161 | | | $ | — | | | $ | — | | | $ | 27,252,161 | |
LoCorr Macro Strategies Fund, LoCorr Long/Short Commodities Strategy Fund and LoCorr Market Trend Fund – Notes to Consolidated Financial
Statements / LoCorr Dynamic Equity Fund and LoCorr Spectrum Income Fund – Notes to Financial Statements (continued) |
Liabilities: | | | | | | | | | | | | | | Gross Amounts
not offset in the Consolidated
Statement of Assets & Liabilities | | | | | |
Description | | Gross Amounts
of Recognized
Liabilities | | | Gross Amounts
Offset in the
Consolidated
Statement of
Assets & Liabilities | | | Net Amounts
Presented in the
Consolidated
Statement of
Assets & Liabilities | | | Financial
Instruments | | | Collateral Received
(Pledged) | | | Net Amount | |
Forward currency contracts | | $ | 18,211,232 | | | $ | — | | | $ | 18,211,232 | | | $ | — | | | $ | (18,211,232 | ) | | $ | — | |
Futures contracts (a) | | | 8,049,391 | | | | — | | | | 8,049,391 | | | | — | | | | (8,049,391 | ) | | | — | |
Total | | $ | 26,260,623 | | | $ | — | | | $ | 26,260,623 | | | $ | — | | | $ | (26,260,623 | ) | | $ | — | |
LoCorr Long/Short Commodities Strategy Fund - June 30, 2022 | | | | | | | | | | | | |
Assets: | | | | | | | | | | | | | | Gross Amounts
not offset in the Consolidated
Statement of Assets & Liabilities | | | | | |
Description | | Gross Amounts of
Recognized Assets | | | Gross Amounts
Offset in the
Consolidated
Statement of
Assets & Liabilities | | | Net Amounts
Presented in the
Consolidated
Statement of
Assets & Liabilities | | | Financial
Instruments | | | Collateral Pledged
(Received) | | | Net Amount | |
Swap Contracts* | | $ | 93,631,106 | | | $ | — | | | $ | 93,631,106 | | | $ | — | | | $ | — | | | $ | 93,631,106 | |
Total | | $ | 93,631,106 | | | $ | — | | | $ | 93,631,106 | | | $ | — | | | $ | — | | | $ | 93,631,106 | |
* | $14,113,147 Represents advance receipt on swap contracts. |
LoCorr Market Trend Fund - June 30, 2022 | | | | | | | | | | | | |
Assets: | | | | | | | | | | | | | | Gross Amounts
not offset in the Consolidated
Statement of Assets & Liabilities | | | | | |
Description | | Gross Amounts of
Recognized Assets | | | Gross Amounts
Offset in the
Consolidated
Statement of
Assets & Liabilities | | | Net Amounts
Presented in the
Consolidated
Statement of
Assets & Liabilities | | | Financial
Instruments | | | Collateral Pledged
(Received) | | | Net Amount | |
Forward currency contracts | | $ | 8,459,440 | | | $ | — | | | $ | 8,459,440 | | | $ | — | | | $ | — | | | $ | 8,459,440 | |
Futures contracts (a) | | | 796,904 | | | | — | | | | 796,904 | | | | — | | | | — | | | | 796,904 | |
Total | | $ | 9,256,344 | | | $ | — | | | $ | 9,256,344 | | | $ | — | | | $ | — | | | $ | 9,256,344 | |
Liabilities: | | | | | | | | | | | | | | Gross Amounts
not offset in the Consolidated
Statement of Assets & Liabilities | | | | | |
Description | | Gross Amounts of
Recognized Assets | | | Gross Amounts
Offset in the
Consolidated
Statement of
Assets & Liabilities | | | Net Amounts
Presented in the
Consolidated
Statement of
Assets & Liabilities | | | Financial
Instruments | | | Collateral Pledged
(Received) | | | Net Amount | |
Forward currency contracts | | $ | 3,611,208 | | | $ | — | | | $ | 3,611,208 | | | $ | — | | | $ | (3,611,208 | ) | | $ | — | |
Futures contracts (a) | | | 8,734,778 | | | | — | | | | 8,734,778 | | | | — | | | | (8,734,778 | ) | | | — | |
Total | | $ | 12,345,986 | | | $ | — | | | $ | 12,345,986 | | | $ | — | | | $ | (12,345,986 | ) | | $ | — | |
(a) | Reflects the current day variation margin and unsettled open futures contracts as separately reported within the Fund’s consolidated statement of assets and liabilities. |
The Funds have adopted authoritative standards regarding disclosure about derivatives and hedging activities and how they affect the Funds’ consolidated statements of assets and liabilities and consolidated statements of operations. Fair value of swap contracts are recorded in the consolidated statements of assets and liabilities as net unrealized appreciation on swap contracts or net unrealized depreciation on swap contracts.
Since the derivatives held long or short are for speculative trading purposes, the derivative instruments are not designated as hedging instruments. Accordingly, all realized gains and losses, as well as any change in net unrealized gains or losses on open contracts from the preceding period, are recognized as part of realized and unrealized gain (loss) in the consolidated statements of operations.
The following table presents the fair value of consolidated derivative instruments for the LoCorr Macro Strategies Fund, LoCorr Long/Short Commodities Strategy Fund and LoCorr Market Trend Fund and the non-consolidated derivative instruments for LoCorr Dynamic Equity Fund and LoCorr Spectrum Income Fund as of June 30, 2022 as presented on each Fund’s consolidated and non-consolidated statements of assets and liabilities:
| | | Fair Value | | | Net Unrealized
Gain (Loss) on | |
Derivatives Not Accounted for as Hedging Instruments | | Assets | | | Liabilities | | | Open Positions | |
LoCorr Macro Strategies Fund | | | | | | | | | | | | |
Forward Currency Contracts(a) | | | | | | | | | | | | |
Long | | $ | 3,267,809 | | | $ | 11,235,259 | | | $ | (7,967,450 | ) |
Short | | | 19,884,391 | | | | 6,975,973 | | | | 12,908,418 | |
Total Forward Currency Contracts | | | 23,152,200 | | | | 18,211,232 | | | | 4,940,968 | |
| | | | | | | | | | | | | |
Futures Contracts(b) | | | | | | | | | | | | |
Long Contracts | | | | | | | | | | | | |
Commodity | | | 450,719 | | | | 26,020,506 | | | | (25,569,787 | ) |
Equity | | | 26,954 | | | | 261,385 | | | | (234,431 | ) |
Foreign exchange | | | 71,863 | | | | 2,930 | | | | 68,933 | |
Interest rate | | | 9,869,814 | | | | 1,117 | | | | 9,868,697 | |
Total Long Contracts | | | 10,419,350 | | | | 26,285,938 | | | | (15,866,588 | ) |
Short Contracts | | | | | | | | | | | | |
Commodity | | | 9,959,289 | | | | 157,713 | | | | 9,801,576 | |
Equity | | | 4,353,936 | | | | 342,954 | | | | 4,010,982 | |
Foreign exchange | | | — | | | | 205,894 | | | | (205,894 | ) |
Interest rate | | | 2,981,305 | | | | 5,724,284 | | | | (2,742,979 | ) |
Total Short Contracts | | | 17,294,530 | | | | 6,430,845 | | | | 10,863,685 | |
Total Futures Contracts | | | 27,713,880 | | | | 32,716,783 | | | | (5,002,903 | ) |
Total Forward Currency Contracts and Futures Contracts | | $ | 50,866,080 | | | $ | 50,928,015 | | | $ | (61,935 | ) |
| | | | | | | | | | | | | |
LoCorr Long/Short Commodities Strategy Fund | | | | | | | | | | | | |
Long Total Return Swap Contracts | | | | | | | | | | | | |
LoCorr Commodities Index | | $ | 79,517,959 | | | $ | — | | | $ | 79,517,959 | |
Purchased Call Options | | | 102,887,591 | | | | — | | | | 37,930,381 | |
| | | | | | | | | | | | | |
LoCorr Market Trend Fund | | | | | | | | | | | | |
Forward Currency Contracts(a) | | | | | | | | | | | | |
Long | | $ | 1,361,960 | | | $ | 1,697,399 | | | $ | (335,439 | ) |
Short | | | 7,097,480 | | | | 1,913,809 | | | | 5,183,671 | |
Total Forward Currency Contracts | | | 8,459,440 | | | | 3,611,208 | | | | 4,848,232 | |
| | | | | | | | | | | | | |
Futures Contracts(b) | | | | | | | | | | | | |
Long Contracts | | | | | | | | | | | | |
Commodity | | | 256,542 | | | | 20,777,164 | | | | (20,520,622 | ) |
Equity | | | 2,877 | | | | 78,293 | | | | (75,416 | ) |
Foreign exchange | | | 47,620 | | | | — | | | | 47,620 | |
Interest rate | | | 2,463,303 | | | | — | | | | 2,463,303 | |
Total Long Contracts | | | 2,770,342 | | | | 20,855,457 | | | | (18,085,115 | ) |
LoCorr Macro Strategies Fund, LoCorr Long/Short Commodities Strategy Fund and LoCorr Market Trend Fund – Notes to Consolidated Financial
Statements / LoCorr Dynamic Equity Fund and LoCorr Spectrum Income Fund – Notes to Financial Statements (continued) |
| | | Fair Value | | | Net Unrealized
Gain (Loss) on | |
Derivatives Not Accounted for as Hedging Instruments | | Assets | | | Liabilities | | | Open Positions | |
LoCorr Market Trend Fund (continued) | | | | | | | | | | | | |
Short Contracts | | | | | | | | | | | | |
Commodity | | $ | 1,403,002 | | | $ | — | | | $ | 1,403,002 | |
Equity | | | 1,888,995 | | | | 110,995 | | | | 1,778,000 | |
Interest rate | | | 3,141,744 | | | | 1,818,550 | | | | 1,323,194 | |
Total Short Contracts | | | 6,433,741 | | | | 1,929,545 | | | | 4,504,196 | |
Total Futures Contracts | | | 9,204,083 | | | | 22,785,002 | | | | (13,580,919 | ) |
Total Forward Currency Contracts and Futures Contracts | | $ | 17,663,523 | | | $ | 26,396,210 | | | $ | (8,732,687 | ) |
| | | | | | | | | | | | | |
LoCorr Dynamic Equity Fund | | | | | | | | | | | | |
Options | | | | | | | | | | | | |
Written Options | | $ | — | | | $ | 10,640 | | | $ | 2,748 | |
Total Options | | $ | — | | | $ | 10,640 | | | $ | 2,748 | |
| | | | | | | | | | | | | |
LoCorr Spectrum Income Fund | | | | | | | | | | | | |
Options | | | | | | | | | | | | |
Purchased Options | | | 825,250 | | | | — | | | | 611,469 | |
Written Options | | | — | | | | 310,374 | | | | 73,975 | |
Total Options | | $ | 825,250 | | | $ | 310,374 | | | $ | 685,444 | |
(a) | Unrealized appreciation on forward currency contracts is a receivable and unrealized depreciation on forward currency contracts is a payable on the Fund’s consolidated statement of assets and liabilities. |
(b) | Reflects the cumulative unrealized appreciation (depreciation) of futures contracts as reported in the Fund’s consolidated schedule of open futures contracts. Only the current day variation margin and unsettled open futures contracts is separately reported within the Fund’s consolidated statement of assets and liabilities. |
The following table presents the results of the derivative trading and information related to volume for the six months ended June 30, 2022. The below captions of “Net Realized” and “Net Change in Unrealized” correspond to the captions in each Fund’s consolidated and non-consolidated statement of operations.
| | | Gain (Loss) from Trading | |
Fund and Type of Derivative Instrument | | Net Realized | | | Net Change in
Unrealized | |
LoCorr Macro Strategies Fund | | | | | | | | |
Forward Currency Contracts | | $ | 36,962,316 | | | $ | 10,483,300 | |
Futures Contracts | | | | | | | | |
Commodity | | | 124,837,203 | | | | (21,504,513 | ) |
Equity | | | 33,671,516 | | | | 955,071 | |
Foreign exchange | | | 7,806,829 | | | | 9,332 | |
Interest rate | | | 91,298,141 | | | | 6,368,735 | |
Total Futures Contracts | | | 257,613,689 | | | | (14,171,375 | ) |
Total Forward Currency Contracts and Futures Contracts | | $ | 294,576,005 | | | $ | (3,688,075 | ) |
| | | | | | | | | |
LoCorr Long/Short Commodities Strategy Fund | | | | | | | | |
Swap Contracts | | $ | — | | | $ | 42,261,898 | |
Purchased Call Options (d) | | | 24,314,333 | | | | (2,672,338 | ) |
| | | | | | | | | |
LoCorr Market Trend Fund | | | | | | | | |
Forward Currency Contracts | | $ | 15,479,933 | | | $ | 7,323,639 | |
Futures Contracts | | | | | | | | |
Commodity | | | 56,221,727 | | | | (21,277,577 | ) |
Equity | | | 1,704,431 | | | | 325,643 | |
LoCorr Macro Strategies Fund, LoCorr Long/Short Commodities Strategy Fund and LoCorr Market Trend Fund – Notes to Consolidated Financial
Statements / LoCorr Dynamic Equity Fund and LoCorr Spectrum Income Fund – Notes to Financial Statements (continued) |
| | | Gain (Loss) from Trading | |
Fund and Type of Derivative Instrument | | Net Realized | | | Net Change in
Unrealized | |
LoCorr Market Trend Fund (continued) | | | | | | | | |
Foreign exchange | | $ | 1,137,282 | | | $ | 134,869 | |
Interest rate | | | 51,105,544 | | | | 2,447,510 | |
Total Futures Contracts | | | 110,168,984 | | | | (18,369,555 | ) |
Total Forward Currency Contracts and Futures Contracts | | $ | 125,648,917 | | | $ | (11,045,916 | ) |
| | | | | | | | | |
| LoCorr Dynamic Equity Fund | | | | | | | | |
Futures Contract | | | | | | | | |
Equity | | $ | (117,190 | ) | | $ | — | |
Total Futures Contract | | $ | (117,190 | ) | | $ | — | |
Options | | | | | | | | |
Written Options | | | — | | | | 2,748 | |
Total Options | | $ | — | | | $ | 2,748 | |
| | | | | | | | | |
LoCorr Spectrum Income Fund | | | | | | | | |
Options | | | | | | | | |
Purchased Options(d) | | | (1,762,905 | ) | | | (567,279 | ) |
Written Options | | | 4,391,783 | | | | (363,185 | ) |
Total Options | | $ | 2,628,878 | | | $ | (930,464 | ) |
(d) | Purchased options are included within net realized gain (loss) on investments and net change in unrealized appreciation/depreciation on investments. |
The average monthly notional amount is shown as an indicator of volume. The average monthly notional amounts during the six months ended June 30, 2022 were:
| | | Average Notional Amount | |
| | | Long Contracts | | | Short Contracts | |
LoCorr Macro Strategies Fund | | | | | | | | |
Forward Currency Contracts | | $ | 1,252,934,735 | | | $ | 1,852,047,254 | |
Futures Contracts | | | 1,718,986,855 | | | | 3,163,157,036 | |
| | | | | | | | | |
LoCorr Long/Short Commodities Strategy Fund | | | | | | | | |
Swap Contracts | | $ | 435,159,384 | | | $ | — | |
Options | | | 139,009,581 | | | | — | |
| | | | | | | | | |
LoCorr Market Trend Fund | | | | | | | | |
Forward Currency Contracts | | $ | 311,326,860 | | | $ | 574,235,055 | |
Futures Contracts | | | 511,177,215 | | | | 1,139,238,943 | |
| | | | | | | | |
LoCorr Dynamic Equity Fund | | | | | | | | |
Options | | $ | — | | | $ | 104,196 | |
| | | | | | | | | |
LoCorr Spectrum Income Fund | | | | | | | | |
Options | | $ | 84,686,100 | | | $ | 42,508,395 | |
The swap contracts and the commodity-related futures contracts reported in the tables in Note 3 represent balances and activity of each Fund’s respective wholly-owned and controlled subsidiary. See Note 2.
Please refer to the Funds’ prospectus for a full listing of risks associated with these investments.
LoCorr Macro Strategies Fund, LoCorr Long/Short Commodities Strategy Fund and LoCorr Market Trend Fund – Notes to Consolidated Financial
Statements / LoCorr Dynamic Equity Fund and LoCorr Spectrum Income Fund – Notes to Financial Statements (continued) |
4. Investment Transactions
The cost of security purchases and proceeds from security sales, excluding short-term investments, derivative instruments, short sales and purchases to cover short sales, for the six months ended June 30, 2022 were as follows:
| | | U.S. Government Obligations | | | All Other | |
| | Purchases | | | Sales | | | Purchases | | | Sales | |
LoCorr Macro Strategies Fund | | $ | 280,081,301 | | | $ | 313,382,783 | | | $ | 170,646,616 | | | $ | 367,450,678 | |
LoCorr Long/Short Commodities Strategy Fund | | | 150,886,002 | | | | 159,184,125 | | | | 180,011,605 | | | | 240,548,000 | |
LoCorr Market Trend Fund | | | 74,702,385 | | | | 42,617,908 | | | | 62,450,296 | | | | 40,880,577 | |
LoCorr Dynamic Equity Fund | | | — | | | | — | | | | 90,997,300 | | | | 77,423,660 | |
LoCorr Spectrum Income Fund | | | — | | | | — | | | | 65,415,145 | | | | 30,352,570 | |
5. Management Fees and Other Transactions with Affiliates
Management Agreement
The Trust has a Management Agreement with the Adviser, with whom certain officers and Trustees of the Funds are affiliated, to furnish investment advisory services to the Funds. Pursuant to the amended Management Agreement, the Adviser is entitled to receive a fee as follows:
Fund | Annual Advisory Fee as a
Percentage of the Average Daily
Net Assets of the Fund |
LoCorr Macro Strategies Fund | 1.65% |
LoCorr Market Trend Fund | 1.50% |
LoCorr Dynamic Equity Fund | 1.50% |
LoCorr Spectrum Income Fund | 1.30% |
Pursuant to the amended Management Agreement, the Adviser is entitled to receive a fee, in accordance with the Incremental Advisory Fee schedule below based on the LoCorr Long/Short Commodities Strategy Fund’s average daily net assets.
Net Assets for the LoCorr Long/Short
Commodities Strategy Fund | Incremental
Advisory Fee* |
$0.0 - $0.5 billion | 1.50% |
$0.5 - $1.0 billion | 1.40% |
$1.0 - $1.5 billion | 1.30% |
$1.5 - $2.0 billion | 1.20% |
$2.0 - $2.5 billion | 1.10% |
Over $2.5 billion | 1.00% |
* | Incremental advisory fee represents the fees paid on net assets at the related net asset level. For example, with $3 billion in net assets in the Fund, the Adviser would earn 1.50% on the first $500 million, plus 1.40% on the next $500 million, plus 1.30% on the next $500 million, plus 1.20% on the next $500 million, plus 1.10% on the next $500 million, plus 1.00% on the final $500 million. |
As of and for the six months ended June 30, 2022, the Funds reported the following in regards to management fees:
Fund | | Management Fees
For the
Six Months Ended
June 30, 2022 | | | Accrued Net
Management
Fees as of
June 30, 2022 | |
LoCorr Macro Strategies Fund | | $ | 14,063,215 | | | $ | 2,863,257 | |
LoCorr Long/Short Commodities Strategy Fund | | | 7,595,962 | | | | 1,408,246 | |
LoCorr Market Trend Fund | | | 3,064,716 | | | | 726,197 | |
LoCorr Dynamic Equity Fund | | | 214,735 | | | | 23,786 | |
LoCorr Spectrum Income Fund | | | 577,492 | | | | 114,891 | |
LoCorr Macro Strategies Fund, LoCorr Long/Short Commodities Strategy Fund and LoCorr Market Trend Fund – Notes to Consolidated Financial
Statements / LoCorr Dynamic Equity Fund and LoCorr Spectrum Income Fund – Notes to Financial Statements (continued) |
Sub-Advisory Agreements
Sub-advisory services are provided to the Funds, pursuant to agreements between the Adviser and the below listed sub- advisers. Under the terms of these sub-advisory agreements, the Adviser compensates the sub-advisers based on the portion of each Fund’s average daily net assets which they have been allocated to manage.
LoCorr Macro Strategies Fund: | LoCorr Dynamic Equity Fund: |
Graham Capital Management, L.P. | Kettle Hill Capital Management, LLC |
Millburn Ridgefield Corporation | Millrace Asset Group, Inc. |
Nuveen Asset Management, LLC | |
Revolution Capital Management LLC | |
R.G. Niederhoffer Capital Management | |
| | |
LoCorr Long/Short Commodities Strategy Fund: | LoCorr Spectrum Income Fund: |
Nuveen Asset Management, LLC | Bramshill Investments, LLC |
| | |
LoCorr Market Trend Fund: | |
Graham Capital Management, L.P. | |
Nuveen Asset Management, LLC | |
The Adviser is solely responsible for the payment of the sub-adviser’s fees, and the sub-adviser agrees not to seek payment of its fees from the Trust or the Funds.
Expense Limitation Agreement
The Funds’ Adviser has contractually agreed to waive management fees and/or reimburse the Funds for expenses they incur, but only to the extent necessary to maintain the Funds’ total annual operating expenses after fee waiver and/or reimbursement (excluding any Rule 12b-1 distribution and/or servicing fees, taxes, interest, brokerage commissions, expenses incurred in connection with any merger or reorganization, dividend expenses on short sales, swap fees, indirect expenses, expenses of other investment companies in which the Funds may invest, or extraordinary expenses such as litigation expenses and inclusive of offering and organizational costs incurred prior to the commencement of operations) at the percentages listed below:
Fund | Expense Limit as a
Percentage of the Average Daily
Net Assets of the Fund | Effective Period Through |
LoCorr Macro Strategies Fund | 1.99% | April 30, 2023 |
LoCorr Long/Short Commodities Strategy Fund | 1.95% | April 30, 2023 |
LoCorr Market Trend Fund | 1.95% | April 30, 2023 |
LoCorr Dynamic Equity Fund | 1.99% | April 30, 2023 |
LoCorr Spectrum Income Fund | 1.80% | April 30, 2023 |
Any waiver or reimbursement is subject to repayment by the respective Fund within the three fiscal years following the fiscal year in which the expenses occurred if the Fund is able to make the repayment without exceeding its current expense limitations and the repayment is approved by the Board.
LoCorr Macro Strategies Fund, LoCorr Long/Short Commodities Strategy Fund and LoCorr Market Trend Fund – Notes to Consolidated Financial
Statements / LoCorr Dynamic Equity Fund and LoCorr Spectrum Income Fund – Notes to Financial Statements (continued) |
The total amounts of management fees waived and/or expenses reimbursed which are subject to recovery, and their related expiration date are as follows:
LoCorr Dynamic Equity Fund | | | | | | | | |
| | | Management Fees | | | Recovery to Adviser | | | | | | | Subject to Recovery
on or Before | |
Period | | (Waived) by Adviser
Subject to Recovery | | | Six Months Ended
June 30, 2022 | | | Remaining Available
Subject to Recovery | | | Fiscal Year Ending
December 31, | |
Six Months Ended June 30, 2022 | | $ | (109,866 | ) | | $ | — | | | $ | (109,866 | ) | | | 2025 | |
Year Ended December 31, 2021 | | | (263,217 | ) | | | — | | | | (263,217 | ) | | | 2024 | |
Year Ended December 31, 2020 | | | (278,103 | ) | | | — | | | | (278,103 | ) | | | 2023 | |
Year Ended December 31, 2019 | | | (192,060 | ) | | | — | | | | (192,060 | ) | | | 2022 | |
Total | | $ | (843,246 | ) | | $ | — | | | $ | (843,246 | ) | | | | |
LoCorr Spectrum Income Fund | | | | | | | | |
| | | Management Fees | | | Recovery to Adviser | | | | | | | Subject to Recovery
on or Before | |
Period | | (Waived) by Adviser
Subject to Recovery | | | Six Months Ended
June 30, 2022 | | | Remaining Available
Subject to Recovery | | | Fiscal Year Ending
December 31, | |
Six Months Ended June 30, 2022 | | $ | — | | | $ | — | | | $ | — | | | | 2025 | |
Year Ended December 31, 2021 | | | (17,766 | ) | | | — | | | | (17,766 | ) | | | 2024 | |
Year Ended December 31, 2020 | | | (58,527 | ) | | | 57,785 | | | | (742 | ) | | | 2023 | |
Year Ended December 31, 2019 | | | — | | | | — | | | | — | | | | 2022 | |
Total | | $ | (76,293 | ) | | $ | 57,785 | | | $ | (18,508 | ) | | | | |
At June 30, 2022, there were no fees subject to recovery for the LoCorr Macro Strategies Fund, the LoCorr Long/Short Commodities Strategy Fund or the LoCorr Market Trend Fund.
Rule 12b-1 Distribution Agreement
The Funds have entered into a Rule 12b-1 distribution agreement with Quasar Distributors, LLC (“Quasar”). Class A shareholders pay distribution expenses to Quasar at the annual rate not to exceed 0.25% of the Fund’s average daily net assets. Class C shareholders pay to Quasar an annual rate not to exceed 1.00%, which is comprised of 0.75% in distribution expenses and 0.25% in service fees, of the Fund’s average daily net assets. Class I shareholders pay no 12b-1 fees.
6. Fund Shares
At June 30, 2022 there were an unlimited number of shares of beneficial interest authorized. The following table summarizes the activity in shares and dollar amounts applicable to each class of the Funds:
LoCorr Macro Strategies Fund - Class A | | | | | | | | |
| | | For the Six Months Ended June 30, 2022 | | | For the Year Ended December 31, 2021 | |
| | Shares | | | Amount | | | Shares | | | Amount | |
Shares Sold | | | 1,697,913 | | | $ | 15,094,187 | | | | 3,801,615 | | | $ | 33,278,684 | |
Reinvestment of Distributions | | | — | | | | — | | | | 486,441 | | | | 3,979,091 | |
Shares Redeemed | | | (3,952,275 | ) | | | (32,845,186 | ) | | | (2,866,304 | ) | | | (24,670,429 | ) |
| | | | (2,254,362 | ) | | $ | (17,750,999 | ) | | | 1,421,752 | | | $ | 12,587,346 | |
Beginning Shares | | | 10,452,228 | | | | | | | | 9,030,476 | | | | | |
Ending Shares | | | 8,197,866 | | | | | | | | 10,452,228 | | | | | |
LoCorr Macro Strategies Fund - Class C | | | | | | | | |
| | For the Six Months Ended June 30, 2022 | | | For the Year Ended December 31, 2021 | |
| | Shares | | | Amount | | | Shares | | | Amount | |
Shares Sold | | | 1,485,494 | | | $ | 12,842,539 | | | | 886,701 | | | $ | 7,352,721 | |
Reinvestment of Distributions | | | — | | | | — | | | | 168,958 | | | | 1,312,807 | |
LoCorr Macro Strategies Fund, LoCorr Long/Short Commodities Strategy Fund and LoCorr Market Trend Fund – Notes to Consolidated Financial
Statements / LoCorr Dynamic Equity Fund and LoCorr Spectrum Income Fund – Notes to Financial Statements (continued) |
LoCorr Macro Strategies Fund - Class C | | | | | | | | |
| | For the Six Months Ended June 30, 2022 | | | For the Year Ended December 31, 2021 | |
| | Shares | | | Amount | | | Shares | | | Amount | |
Shares Redeemed | | | (535,608 | ) | | | (4,425,745 | ) | | | (1,936,406 | ) | | | (16,082,903 | ) |
| | | | 949,886 | | | $ | 8,416,794 | | | | (880,747 | ) | | $ | (7,417,375 | ) |
Beginning Shares | | | 4,505,888 | | | | | | | | 5,386,635 | | | | | |
Ending Shares | | | 5,455,774 | | | | | | | | 4,505,888 | | | | | |
LoCorr Macro Strategies Fund - Class I | | | | | | | | |
| | For the Six Months Ended June 30, 2022 | | | For the Year Ended December 31, 2021 | |
| | Shares | | | Amount | | | Shares | | | Amount | |
Shares Sold | | | 88,977,461 | | | $ | 811,595,885 | | | | 73,777,122 | | | $ | 656,311,870 | |
Reinvestment of Distributions | | | — | | | | — | | | | 6,661,915 | | | | 55,427,128 | |
Shares Redeemed | | | (31,793,677 | ) | | | (285,798,233 | ) | | | (45,173,806 | ) | | | (394,388,015 | ) |
| | | | 57,183,784 | | | $ | 525,797,652 | | | | 35,265,231 | | | $ | 317,350,983 | |
Beginning Shares | | | 157,890,774 | | | | | | | | 122,625,543 | | | | | |
Ending Shares | | | 215,074,558 | | | | | | | | 157,890,774 | | | | | |
LoCorr Macro Strategies Fund | | | | | | | | |
Total Net Increase (Decrease) | | | | | | $ | 516,463,447 | | | | | | | $ | 322,520,954 | |
LoCorr Long/Short Commodities Strategy Fund - Class A | | | | | | | | |
| | | For the Six Months Ended June 30, 2022 | | | For the Year Ended December 31, 2021 | |
| | Shares | | | Amount | | | Shares | | | Amount | |
Shares Sold | | | 1,276,084 | | | $ | 14,048,160 | | | | 1,667,484 | | | $ | 17,812,643 | |
Reinvestment of Distributions | | | — | | | | — | | | | 203,898 | | | | 2,134,816 | |
Shares Redeemed | | | (680,613 | ) | | | (7,480,833 | ) | | | (1,234,990 | ) | | | (13,046,493 | ) |
| | | | 595,471 | | | $ | 6,567,327 | | | | 636,392 | | | $ | 6,900,966 | |
Beginning Shares | | | 3,320,952 | | | | | | | | 2,684,560 | | | | | |
Ending Shares | | | 3,916,423 | | | | | | | | 3,320,952 | | | | | |
LoCorr Long/Short Commodities Strategy Fund - Class C | | | | | | | | |
| | For the Six Months Ended June 30, 2022 | | | For the Year Ended December 31, 2021 | |
| | Shares | | | Amount | | | Shares | | | Amount | |
Shares Sold | | | 311,699 | | | $ | 3,266,956 | | | | 467,896 | | | $ | 4,757,926 | |
Reinvestment of Distributions | | | — | | | | — | | | | 64,706 | | | | 645,764 | |
Shares Redeemed | | | (75,085 | ) | | | (786,695 | ) | | | (274,590 | ) | | | (2,738,196 | ) |
| | | | 236,614 | | | $ | 2,480,261 | | | | 258,012 | | | $ | 2,665,494 | |
Beginning Shares | | | 1,096,501 | | | | | | | | 838,489 | | | | | |
Ending Shares | | | 1,333,115 | | | | | | | | 1,096,501 | | | | | |
LoCorr Long/Short Commodities Strategy Fund - Class I | | | | | | | | |
| | For the Six Months Ended June 30, 2022 | | | For the Year Ended December 31, 2021 | |
| | Shares | | | Amount | | | Shares | | | Amount | |
Shares Sold | | | 39,713,128 | | | $ | 442,947,347 | | | | 46,260,270 | | | $ | 494,415,929 | |
Reinvestment of Distributions | | | — | | | | — | | | | 4,190,057 | | | | 44,414,600 | |
Shares Redeemed | | | (15,914,409 | ) | | | (177,183,827 | ) | | | (15,282,846 | ) | | | (161,955,649 | ) |
| | | | 23,798,719 | | | $ | 265,763,520 | | | | 35,167,481 | | | $ | 376,874,880 | |
Beginning Shares | | | 79,482,566 | | | | | | | | 44,315,085 | | | | | |
Ending Shares | | | 103,281,285 | | | | | | | | 79,482,566 | | | | | |
LoCorr Long/Short Commodities Strategy Fund | | | | | | | | |
Total Net Increase (Decrease) | | | | | | $ | 274,811,108 | | | | | | | $ | 386,441,340 | |
LoCorr Macro Strategies Fund, LoCorr Long/Short Commodities Strategy Fund and LoCorr Market Trend Fund – Notes to Consolidated Financial
Statements / LoCorr Dynamic Equity Fund and LoCorr Spectrum Income Fund – Notes to Financial Statements (continued) |
LoCorr Market Trend Fund - Class A | | | | | | | | |
| | | For the Six Months Ended June 30, 2022 | | | For the Year Ended December 31, 2021 | |
| | Shares | | | Amount | | | Shares | | | Amount | |
Shares Sold | | | 565,201 | | | $ | 8,165,066 | | | | 504,953 | | | $ | 6,130,437 | |
Reinvestment of Distributions | | | — | | | | — | | | | 42,073 | | | | 482,993 | |
Shares Redeemed | | | (242,062 | ) | | | (3,356,915 | ) | | | (672,087 | ) | | | (8,089,327 | ) |
| | | | 323,139 | | | $ | 4,808,151 | | | | (125,061 | ) | | $ | (1,475,897 | ) |
Beginning Shares | | | 1,324,409 | | | | | | | | 1,449,470 | | | | | |
Ending Shares | | | 1,647,548 | | | | | | | | 1,324,409 | | | | | |
LoCorr Market Trend Fund - Class C | | | | | | | | |
| | For the Six Months Ended June 30, 2022 | | | For the Year Ended December 31, 2021 | |
| | Shares | | | Amount | | | Shares | | | Amount | |
Shares Sold | | | 343,172 | | | $ | 4,876,379 | | | | 124,588 | | | $ | 1,476,798 | |
Dividends Reinvested | | | — | | | | — | | | | 24,223 | | | | 268,880 | |
Shares Redeemed | | | (160,178 | ) | | | (2,080,157 | ) | | | (331,933 | ) | | | (3,905,783 | ) |
| | | | 182,994 | | | $ | 2,796,222 | | | | (183,122 | ) | | $ | (2,160,105 | ) |
Beginning Shares | | | 982,334 | | | | | | | | 1,165,456 | | | | | |
Ending Shares | | | 1,165,328 | | | | | | | | 982,334 | | | | | |
LoCorr Market Trend Fund - Class I | | | | | | | | |
| | For the Six Months Ended June 30, 2022 | | | For the Year Ended December 31, 2021 | |
| | Shares | | | Amount | | | Shares | | | Amount | |
Shares Sold | | | 21,792,012 | | | $ | 316,348,445 | | | | 6,776,071 | | | $ | 82,404,215 | |
Reinvestment of Distributions | | | — | | | | — | | | | 729,663 | | | | 8,405,716 | |
Shares Redeemed | | | (8,033,278 | ) | | | (118,029,840 | ) | | | (5,753,991 | ) | | | (68,979,665 | ) |
| | | | 13,758,734 | | | $ | 198,318,605 | | | | 1,751,743 | | | $ | 21,830,266 | |
Beginning Shares | | | 21,004,057 | | | | | | | | 19,252,314 | | | | | |
Ending Shares | | | 34,762,791 | | | | | | | | 21,004,057 | | | | | |
LoCorr Market Trend Fund | | | | | | | | |
Total Net Increase (Decrease) | | | | | | $ | 205,922,978 | | | | | | | $ | 18,194,264 | |
LoCorr Dynamic Equity Fund - Class A | | | | | | | | |
| | | For the Six Months Ended June 30, 2022 | | | For the Year Ended December 31, 2021 | |
| | Shares | | | Amount | | | Shares | | | Amount | |
Shares Sold | | | 21,201 | | | $ | 246,657 | | | | 102,566 | | | $ | 1,323,999 | |
Reinvestment of Distributions | | | — | | | | — | | | | 15,874 | | | | 198,590 | |
Shares Redeemed | | | (63,201 | ) | | | (743,413 | ) | | | (125,982 | ) | | | (1,600,048 | ) |
| | | | (42,000 | ) | | $ | (496,756 | ) | | | (7,542 | ) | | $ | (77,459 | ) |
Beginning Shares | | | 321,903 | | | | | | | | 329,445 | | | | | |
Ending Shares | | | 279,903 | | | | | | | | 321,903 | | | | | |
LoCorr Dynamic Equity Fund - Class C | | | | | | | | |
| | For the Six Months Ended June 30, 2022 | | | For the Year Ended December 31, 2021 | |
| | Shares | | | Amount | | | Shares | | | Amount | |
Shares Sold | | | 55,145 | | | $ | 602,800 | | | | 70,466 | | | $ | 859,097 | |
Reinvestment of Distributions | | | — | | | | — | | | | 14,422 | | | | 167,585 | |
Shares Redeemed | | | (18,243 | ) | | | (200,761 | ) | | | (67,143 | ) | | | (802,281 | ) |
| | | | 36,902 | | | $ | 402,039 | | | | 17,745 | | | $ | 224,401 | |
Beginning Shares | | | 240,648 | | | | | | | | 222,903 | | | | | |
Ending Shares | | | 277,550 | | | | | | | | 240,648 | | | | | |
LoCorr Macro Strategies Fund, LoCorr Long/Short Commodities Strategy Fund and LoCorr Market Trend Fund – Notes to Consolidated Financial
Statements / LoCorr Dynamic Equity Fund and LoCorr Spectrum Income Fund – Notes to Financial Statements (continued) |
LoCorr Dynamic Equity Fund - Class I | | | | | | | | |
| | For the Six Months Ended June 30, 2022 | | | For the Year Ended December 31, 2021 | |
| | Shares | | | Amount | | | Shares | | | Amount | |
Shares Sold | | | 2,317,072 | | | $ | 26,819,577 | | | | 659,035 | | | $ | 8,704,039 | |
Reinvestment of Distributions | | | — | | | | — | | | | 75,645 | | | | 969,774 | |
Shares Redeemed | | | (186,736 | ) | | | (2,226,439 | ) | | | (342,978 | ) | | | (4,491,773 | ) |
| | | | 2,130,336 | | | $ | 24,593,138 | | | | 391,702 | | | $ | 5,182,040 | |
Beginning Shares | | | 1,387,208 | | | | | | | | 995,506 | | | | | |
Ending Shares | | | 3,517,544 | | | | | | | | 1,387,208 | | | | | |
LoCorr Dynamic Equity Fund | | | | | | | | |
Total Net Increase (Decrease) | | | | | | $ | 24,498,421 | | | | | | | $ | 5,328,982 | |
LoCorr Spectrum Income Fund - Class A | | | | | | | | |
| | | For the Six Months Ended June 30, 2022 | | | For the Year Ended December 31, 2021 | |
| | Shares | | | Amount | | | Shares | | | Amount | |
Shares Sold | | | 421,751 | | | $ | 2,899,765 | | | | 341,419 | | | $ | 2,415,690 | |
Reinvestment of Distributions | | | 48,039 | | | | 326,379 | | | | 96,107 | | | | 664,027 | |
Shares Redeemed | | | (238,272 | ) | | | (1,630,441 | ) | | | (672,361 | ) | | | (4,649,336 | ) |
Redemption Fees | | | — | | | | 258 | | | | — | | | | 113 | |
| | | | 231,518 | | | $ | 1,595,961 | | | | (234,835 | ) | | $ | (1,569,506 | ) |
Beginning Shares | | | 1,983,746 | | | | | | | | 2,218,581 | | | | | |
Ending Shares | | | 2,215,264 | | | | | | | | 1,983,746 | | | | | |
LoCorr Spectrum Income Fund - Class C | | | | | | | | |
| | For the Six Months Ended June 30, 2022 | | | For the Year Ended December 31, 2021 | |
| | Shares | | | Amount | | | Shares | | | Amount | |
Shares Sold | | | 418,462 | | | $ | 2,894,206 | | | | 608,586 | | | $ | 4,302,885 | |
Reinvestment of Distributions | | | 62,139 | | | | 426,980 | | | | 103,688 | | | | 725,686 | |
Shares Redeemed | | | (323,538 | ) | | | (2,231,601 | ) | | | (331,191 | ) | | | (2,315,660 | ) |
Redemption Fees | | | — | | | | 316 | | | | — | | | | 128 | |
| | | | 157,063 | | | $ | 1,089,901 | | | | 381,083 | | | $ | 2,713,039 | |
Beginning Shares | | | 2,520,766 | | | | | | | | 2,139,683 | | | | | |
Ending Shares | | | 2,677,830 | | | | | | | | 2,520,766 | | | | | |
LoCorr Spectrum Income Fund - Class I | | | | | | | | |
| | For the Six Months Ended June 30, 2022 | | | For the Year Ended December 31, 2021 | |
| | Shares | | | Amount | | | Shares | | | Amount | |
Shares Sold | | | 6,192,940 | | | $ | 41,996,229 | | | | 3,695,955 | | | $ | 25,752,205 | |
Reinvestment of Distributions | | | 251,170 | | | | 1,693,586 | | | | 243,713 | | | | 1,686,078 | |
Shares Redeemed | | | (1,500,367 | ) | | | (10,022,713 | ) | | | (1,045,875 | ) | | | (7,216,851 | ) |
Redemption Fees | | | — | | | | 1,314 | | | | — | | | | 274 | |
| | | | 4,943,743 | | | $ | 33,668,416 | | | | 2,893,793 | | | $ | 20,221,706 | |
Beginning Shares | | | 6,357,108 | | | | | | | | 3,463,315 | | | | | |
Ending Shares | | | 11,300,852 | | | | | | | | 6,357,108 | | | | | |
LoCorr Spectrum Income Fund | | | | | | | | |
Total Net Increase (Decrease) | | | | | | $ | 36,354,278 | | | | | | | $ | 21,365,239 | |
LoCorr Macro Strategies Fund, LoCorr Long/Short Commodities Strategy Fund and LoCorr Market Trend Fund – Notes to Consolidated Financial
Statements / LoCorr Dynamic Equity Fund and LoCorr Spectrum Income Fund – Notes to Financial Statements (continued) |
Conversion Feature
Class C shares purchased directly from the Funds or through a financial intermediary, except as otherwise disclosed in the Funds’ prospectus, automatically convert to Class A shares in the month of the 8-year anniversary date of the purchase of the Class C shares, based on the relative NAV of each such class without the imposition of any sales charge, fee or other charge.
7. Federal Tax Information
At December 31, 2021, the components of accumulated earnings (losses) on a tax basis were as follows(1):
| | | LoCorr Macro
Strategies Fund(2) | | | LoCorr Long/Short
Commodities
Strategy Fund(2) | | | LoCorr Market
Trend Fund(2) | |
Tax cost of portfolio | | $ | 1,365,872,436 | | | $ | 852,506,664 | | | $ | 235,994,190 | |
| | | | | | | | | | | | |
Gross unrealized appreciation | | $ | 15,884,479 | | | $ | 79,810,333 | | | $ | 3,396,239 | |
Gross unrealized depreciation | | | (9,936,573 | ) | | | (3,751,783 | ) | | | (1,579,513 | ) |
Net unrealized appreciation (depreciation) | | | 5,947,906 | | | | 76,058,550 | | | | 1,816,726 | |
Undistributed ordinary income | | | 14,070,824 | | | | — | | | | 19,346,938 | |
Undistributed long-term capital gains | | | — | | | | — | | | | — | |
Total earnings accumulated | | | 14,070,824 | | | | — | | | | 19,346,938 | |
Other accumulated losses | | | (53,329,471 | ) | | | — | | | | (23,470,698 | ) |
Total accumulated earnings (accumulated losses) | | $ | (33,310,741 | ) | | $ | 76,058,550 | | | $ | (2,307,034 | ) |
| | | LoCorr Dynamic
Equity Fund | | | LoCorr Spectrum
Income Fund | |
Tax cost of portfolio | | $ | 27,763,020 | | | $ | 66,656,853 | |
| | | | | | | | |
Gross unrealized appreciation | | $ | 2,681,807 | | | $ | 13,997,428 | |
Gross unrealized depreciation | | | (1,894,138 | ) | | | (3,946,192 | ) |
Net unrealized appreciation | | | 787,669 | | | | 10,051,236 | |
Undistributed ordinary income | | | 54,493 | | | | — | |
Undistributed long-term capital gains | | | 241,693 | | | | — | |
Total earnings accumulated | | | 296,186 | | | | — | |
Other accumulated losses | | | (105,846 | ) | | | (32,309,452 | ) |
Total accumulated earnings (accumulated losses) | | $ | 978,009 | | | $ | (22,258,216 | ) |
(1) | Total Portfolio represents aggregate amounts of each Fund’s investments, securities sold short, forward currency contracts and futures contracts, where applicable. |
(2) | Tax Cost is presented on a non-consolidated basis and includes each Fund’s investment in the respective CFC and the unrealized appreciation and depreciation associated with those investments. |
Undistributed income or net realized gains for financial statement purposes may differ from amounts recognized for federal income tax purposes due to differences in the recognition and characterization of income, expense and capital gain items. The difference between book-basis and tax-basis unrealized appreciation (depreciation) is attributed primarily to the tax deferral of losses on wash sales, mark to market, investments in partnerships and other temporary differences.
At December 31, 2021, accumulated net realized capital loss carryovers, if any, and the year(s) in which the capital loss carryovers expire were:
| | | Capital Loss Carryover | | | | | |
| | | Short-Term | | | Long-Term | | | Year of
Expiration | |
LoCorr Macro Strategies Fund | | $ | 41,066,331 | | | $ | 12,052,130 | | | | Indefinitely | |
LoCorr Market Trend Fund | | | 21,379,634 | | | | 2,079,699 | | | | Indefinitely | |
LoCorr Macro Strategies Fund, LoCorr Long/Short Commodities Strategy Fund and LoCorr Market Trend Fund – Notes to Consolidated Financial
Statements / LoCorr Dynamic Equity Fund and LoCorr Spectrum Income Fund – Notes to Financial Statements (continued) |
| | | Capital Loss Carryover | | | | | |
| | | Short-Term | | | Long-Term | | | Year of
Expiration | |
LoCorr Spectrum Income Fund | | | 10,561,718 | | | | 21,159,411 | | | | Indefinitely | |
During the year ended December 31, 2021, the LoCorr Dynamic Equity Fund and the LoCorr Spectrum Income Fund utilized unlimited capital loss carryover of $890,609 and $4,171,140, respectively. The LoCorr Macro Strategies Fund, the LoCorr Long/ Short Commodities Strategy Fund and the LoCorr Market Trend Fund did not utilize any capital loss carryovers during the year ended December 31, 2021.
8. Line of Credit
The Trust entered into an unsecured, uncommitted Loan Agreement (“Line of Credit” or “LOC”) with U.S. Bank not individually but as an umbrella facility on behalf of the Funds in the Trust. The LOC expires on March 8, 2023. The LOC was established to provide the Funds a temporary short-term liquidity source, subject to certain restrictions, covenants and the right of setoff on the Funds’ assets, to meet unanticipated redemptions. Under terms of the LOC, borrowings for each Fund are limited to the lesser of one-third of the net unencumbered assets (including the amount borrowed) of the respective Fund, 5% of the gross assets of the respective Fund or $50 million in the aggregate for all of the Funds under this agreement. U.S. Bank, N.A. charges an interest rate per annum equal to the Prime Rate (4.75% as of June 30, 2022).
The Funds did not utilize the Line of Credit for the six months ended June 30, 2022.
9. Subsequent Events
In preparing the financial statements, the Adviser has evaluated events after June 30, 2022.
Declaration of Dividends
The LoCorr Spectrum Income Fund declared the following ordinary income distributions:
| | | Distribution Amount per Share Class |
Dividend Declaration
Date (a) | Shareholder of
Record Date | Class A | Class C | Class I |
July 29, 2022 | July 28, 2022 | $0.0386 | $0.03470 | $0.04000 |
(a) | Ex-date, reinvest date and payable date. |
The estimated characterization of the distributions paid will be an ordinary dividend, qualified dividend or return of capital. See Note 2 for additional information.
There were no additional subsequent events since June 30, 2022 through the date the financial statements were issued that would require adjustments to or additional disclosure in these financial statements.
LoCorr Investment Trust - Expense Example (Unaudited) |
Expense Example
June 30, 2022 (Unaudited)
��
As a shareholder of a mutual fund, you incur two types of costs: (1) transaction costs, including sales charges (loads) on purchase payments; redemption fees; and (2) ongoing costs, including management fees; distribution and/or service (12b-1) fees and other Fund expenses.
This Example is intended to help you understand your ongoing costs (in dollars) of investing in each of the Funds and to compare these costs with the ongoing costs of investing in other mutual funds. The Example is based on an investment of $1,000 invested at the beginning of the period and held for the entire period (January 1, 2022 through June 30, 2022).
Actual Expenses
The actual return columns in the following table provide information about account values based on actual returns and actual expenses. You may use the information in these columns, together with the amount you invested, to estimate the expenses that you paid over the period. Simply divide your account value by $1,000 (for example, an $8,600 account value divided by $1,000 = 8.6), then multiply the result by the number in the first line under the heading entitled “Expenses Paid During Period” to estimate the expenses you paid on your account during this period. The only transaction fees you may be required to pay are for outgoing wire transfers, returned checks and stop payment orders at prevailing rates charged by U.S. Bancorp Fund Services, LLC, doing business as U.S. Bank Global Fund Services, the Funds’ transfer agent. These fees are assessed on all accounts, as applicable. If you request that a redemption be made by wire transfer, currently the Funds’ transfer agent charges a $15.00 fee. The Funds’ transfer agent charges a transaction fee of $25.00 on returned checks and stop payment orders. If you paid a transaction fee, you would add the fee amount to the expenses paid on your account this period to obtain your total expenses paid.
Hypothetical Example for Comparison Purposes
The hypothetical return columns in the following table provide information about hypothetical account values and hypothetical expenses based on the Funds’ actual expense ratio and an assumed rate of return of 5% per year before expenses, which is not the Funds’ actual return. The hypothetical account values and expenses may not be used to estimate the actual ending account balance or expenses you paid for the period. You may use this information to compare the ongoing costs of investing in the Funds and other funds. To do so, compare this 5% hypothetical example with the 5% hypothetical examples that appear in the shareholder reports of the other funds. A transaction fee of $15.00 may be assessed on outgoing wire transfers and a transaction fee of $25.00 may be assessed on returned checks and stop payment orders. To include this fee in the calculation, you would add the estimated transaction fee to the hypothetical expenses shown in the table. Please note that the expenses shown in the table are meant to highlight your ongoing costs only and do not reflect the transaction fees discussed above. Therefore, those columns are useful in comparing ongoing costs only, and will not help you determine the relative total costs of owning different funds. In addition, if these transactional costs were included, your costs would have been higher.
LoCorr Investment Trust - Expense Example (Unaudited) (continued) |
Actual vs Hypothetical Returns
Actual vs. Hypothetical returns for the Six Months Ended June 30, 2022 (Unaudited)
| | | | | | | | | | | | | | | Actual | | | Hypothetical
(5% gross annual return) | |
Fund | | Class | | | Fund’s
Annualized
Expense Ratio 1, 2 | | | Beginning
Account Value
January 1, 2022 | | | Ending
Account Value
June 30,
2022 | | | Expenses Paid
During Period 1, 2, 3 | | | Ending
Account Value
June 30,
2022 | | | Expenses Paid
During Period 1, 2, 3 | |
| | | | | | | | | | | | | | | | | | | | | | | | | | | | | |
LoCorr Macro Strategies Fund | | | | | | | | | | | | | | | | |
| | | | A | | | | 2.11 | % | | $ | 1,000.00 | | | $ | 1,089.20 | | | $ | 10.93 | | | $ | 1,014.33 | | | $ | 10.54 | |
| | | | C | | | | 2.55 | % | | $ | 1,000.00 | | | $ | 1,142.80 | | | $ | 13.55 | | | $ | 1,012.15 | | | $ | 12.72 | |
| | | | I | | | | 1.86 | % | | $ | 1,000.00 | | | $ | 1,157.20 | | | $ | 9.95 | | | $ | 1,015.57 | | | $ | 9.30 | |
| | | | | | | | | | | | | | | | | | | | | | | | | | | | | |
LoCorr Long/Short Commodities Strategy Fund | | | | | | | | | | | | |
| | | | A | | | | 1.92 | % | | $ | 1,000.00 | | | $ | 983.10 | | | $ | 9.44 | | | $ | 1,015.27 | | | $ | 9.59 | |
| | | | C | | | | 2.75 | % | | $ | 1,000.00 | | | $ | 1,028.70 | | | $ | 13.83 | | | $ | 1,011.16 | | | $ | 13.71 | |
| | | | I | | | | 1.75 | % | | $ | 1,000.00 | | | $ | 1,043.80 | | | $ | 8.87 | | | $ | 1,016.12 | | | $ | 8.75 | |
| | | | | | | | | | | | | | | | | | | | | | | | | | | | | |
LoCorr Market Trend Fund | | | | | | | | | | | | |
| | | | A | | | | 1.86 | % | | $ | 1,000.00 | | | $ | 1,261.80 | | | $ | 10.43 | | | $ | 1,015.57 | | | $ | 9.30 | |
| | | | C | | | | 2.48 | % | | $ | 1,000.00 | | | $ | 1,325.80 | | | $ | 14.30 | | | $ | 1,012.50 | | | $ | 12.37 | |
| | | | I | | | | 1.69 | % | | $ | 1,000.00 | | | $ | 1,340.60 | | | $ | 9.81 | | | $ | 1,016.41 | | | $ | 8.45 | |
| | | | | | | | | | | | | | | | | | | | | | | | | | | | | |
LoCorr Dynamic Equity Fund | | | | | | | | | | | | | | | | |
| | | | A | | | | 2.51 | % | | $ | 1,000.00 | | | $ | 822.20 | | | $ | 11.34 | | | $ | 1,012.35 | | | $ | 12.52 | |
| | | | C | | | | 3.33 | % | | $ | 1,000.00 | | | $ | 860.50 | | | $ | 15.36 | | | $ | 1,008.28 | | | $ | 16.58 | |
| | | | I | | | | 2.33 | % | | $ | 1,000.00 | | | $ | 873.60 | | | $ | 10.82 | | | $ | 1,013.24 | | | $ | 11.63 | |
| | | | | | | | | | | | | | | | | | | | | | | | | | | | | |
LoCorr Spectrum Income Fund | | | | | | | | | | | | |
| | | | A | | | | 2.00 | % | | $ | 1,000.00 | | | $ | 897.70 | | | $ | 9.41 | | | $ | 1,014.88 | | | $ | 9.99 | |
| | | | C | | | | 2.81 | % | | $ | 1,000.00 | | | $ | 941.10 | | | $ | 13.52 | | | $ | 1,010.86 | | | $ | 14.01 | |
| | | | I | | | | 1.81 | % | | $ | 1,000.00 | | | $ | 954.00 | | | $ | 8.77 | | | $ | 1,015.82 | | | $ | 9.05 | |
1 | Includes dividend and/or interest expense of 0.00%, 0.00%, 0.00%, 0.34% and 0.01% for the LoCorr Macro Strategies Fund, the LoCorr Long/Short Commodities Strategy Fund, the LoCorr Market Trend Fund, the LoCorr Dynamic Equity Fund and the LoCorr Spectrum Income Fund, respectively. |
2 | Includes expenses of wholly-owned and controlled Cayman Islands subsidiaries for the LoCorr Macro Strategies Fund, the LoCorr Long/Short Commodities Strategy Fund and the LoCorr Market Trend Fund. |
3 | Expenses Paid During Period are equal to the net annualized expense ratio for the class, multiplied by the average account value over the period, multiplied by 181/365 (to reflect the one-half year period). |
Review of Management and Sub-Advisory Agreements (Unaudited) |
LoCorr Investment Trust
June 30, 2022 (Unaudited)
Review of Management and Sub-Advisory Agreements
Approval of Advisory Agreement
The Board considered the nature, extent and quality of services to be provided by LoCorr Fund Management, LLC (the “Adviser”) to the LoCorr Macro Strategies Fund (the “Macro Fund”) and its wholly-owned subsidiary, LCMFS Fund Limited, the LoCorr Long/Short Commodities Strategy Fund (the “LLSCS Fund”) and its wholly-owned subsidiary, LCLSCS Fund Limited, the LoCorr Dynamic Equity Fund (the “LDE Fund”) and the LoCorr Spectrum Income Fund (the “LSI Fund”) and reviewed the 15(c) responses for each, which included a review of the experience of the key personnel of the Adviser., noting that there had not been any changes in key personnel in the last year. The Trustees noted the continued contributions of Brian Hull, the chief compliance officer (“CCO”) of the Trust and Adviser, in overseeing and implementing the Trust’s and Adviser’s compliance programs.
The Trustees noted that the Adviser has provided and will continue to provide a continuous investment program for each of the Funds consistent with each Fund’s investment objective, policies and regulatory limitations. Counsel and a representative of the Adviser reminded the Trustees that the Adviser oversees and continually evaluates sub-advisers and that the Adviser also provides overall portfolio and risk management consistent with each Fund’s investment strategy, guidelines and limitations. The Trustees also discussed the Adviser’s compliance program with the Trust’s CCO. A representative from the Adviser reviewed the Adviser’s financial statements and insurance policy with the Trustees. The Trustees concluded that, based on their review of the Adviser’s financial statements and discussions with the Adviser, the Adviser has sufficient resources to continue to provide advisory services to each of the Funds.
The CCO reviewed the compliance policies and noted that the Adviser reported no material compliance issues. Counsel noted that the Adviser had a code of ethics as required under Rule 17j-1 of the 1940 Act. The CCO further noted that the Adviser had not made any material changes to its compliance policies in the last year. After a discussion, the Trustees concluded that the Adviser has compliance policies and procedures in place in order to perform its duties under the management agreements for the Funds.
Counsel indicated that there had not been any recent examinations of the Adviser by the SEC but noted that LoCorr Distributors had recently been examined by FINRA with no material findings. After a discussion, the Trustees concluded that the Adviser is well resourced with experienced personnel and investment expertise and has provided, and is expected to continue to provide, high quality services to the Funds and their respective shareholders.
The Trustees next reviewed and evaluated the performance of the Macro Fund, noting that the one-year returns lagged the Morningstar category and the Barclays CTA Index but that the five-year, ten-year and since inception returns of the Fund outperformed the Morningstar category and benchmark index. After a discussion, the Trustees concluded that the Macro Fund’s performance was satisfactory.
The Trustees next considered the investment performance of the LCLSCS Fund, noting its annualized returns for the one, three, five-year and since inception periods. The Trustees noted that the Fund significantly outperformed its Morningstar category and the Barclay CTA Index during the past year but had lagged its peer group for the period. Counsel indicated for the Trustees that Fund continued to have strong relative performance for the 3, 5 and 10 year periods. After a discussion, the Trustees concluded that they were satisfied with the Fund’s performance.
The Trustees then reviewed and discussed the performance of the LDE Fund, noting that the Fund outperformed the per group and Morningstar category for the one-year period The Trustees observed that the Fund did trail the benchmark index for all periods but that the Fund’s performance relative to its peer group and Morningstar category was solid. After a discussion, the Trustees concluded that the LDE Fund’s performance was satisfactory.
Counsel next referred the Trustees to the performance of the LSI Fund. The Trustees noted performance of the LSI Fund, observing that the Fund’s performance for the one-year period had outperformed the Morningstar Category average and the Barclays U.S. Aggregate Bond Index, its benchmark, but had lagged the peer group average. Counsel indicated that the Fund had outperformed the peer group for the 3, 5-year and since inception periods. The Trustees also considered the Fund’s performance relative to its benchmark and Morningstar category for the 3, 5-year and since inception periods. After a discussion, the Trustees concluded that the LSI Fund’s performance was reasonable.
The Trustees then reviewed and discussed the costs of services provided and profits to be realized by the Adviser with respect to each of the Funds.
Review of Management and Sub-Advisory Agreements (Unaudited) (continued) |
Counsel noted for the benefit of the Trustees noted that the management fee for the Macro Fund was above the average of its peer group and the Morningstar Category. The Trustees also observed that the management fee was within range of management fees for the Fund’s peer group and Morningstar Category Average. After a discussion, the Trustees agreed that the Macro Fund’s management fee was not unreasonable.
The Trustees next reviewed the management fee for the LCLSCS Fund, noting that it was above the average of its peer group and Morningstar category, but within of the range of management fees for the Fund’s peer group and Morningstar category. A representative of the Adviser noted the Fund’s exposure to several commodity trading advisers and the use of Nuveen as a subadviser to the Fund. After a discussion, the Trustees agreed that the LCLSCS Fund’s management fee was reasonable.
The Trustees noted that the LDE Fund’s management fee was within the range of both its peer group and Morningstar category though above the averages for both comparisons. In response to a question from Counsel, a representative of the Adviser stated that the Adviser engages several sub-advisers to manage the fund while many funds in the Morningstar category are single manager funds. After a discussion, the Trustees concluded that the LDE Fund’s management fee was not excessive.
Counsel directed the Trustees to review the management fee for the LSI Fund, noting that it was above the average of its peer group and Morningstar category, and above the high-end range for the management fees reported for the LSI Fund’s peer group. A representative of the Adviser discussed the unique nature of the Fund and its strategy and indicated that assembling a meaningful peer group was difficult. After a discussion, the Trustees agreed that the Fund’s management fee was not unreasonable.
The Trustees considered all of these factors with regards to the renewal of the expense limitation agreements with the Adviser for an additional one-year period for the Macro Fund, LCLSCS Fund, LDE Fund and LSI Fund.
The Trustees noted the profit analysis of the Adviser with respect to the Macro Fund and considered the Adviser’s profits from the advisory agreement, net of expenses. The Trustees determined that the Adviser’s profits related to the Macro Fund were reasonable.
The Trustees then discussed the profitability of the Adviser with respect to the LCLSCS Fund. Counsel noted the Adviser’s net profits with respect to the LCLSCS Fund. After a discussion, the Trustees determined that the Adviser’s profits with respect to the Fund were reasonable.
The Trustees then reviewed the profitability of the Adviser with respect to the LDE Fund and noted that the Adviser did not show a net profit with respect to the Fund.
Counsel directed the Trustees’ attention to the profitability of the Adviser with respect to the LSI Fund. The Trustees noted that the Adviser showed a net profit and agreed that the Adviser’s total net profits as a percentage of revenues and absolute amount were reasonable.
The Trustees considered the economies of scale to be realized by the shareholders of the Macro Fund, LLSCS Fund, LDE Fund and LSI Fund, noting that, with the exception of the Macro Fund, the management fees reflect an incremental fee schedule which includes break points.
Having requested and received such information from the Adviser as the Trustees believed to be reasonably necessary to evaluate the terms of the Advisory Agreement, and as assisted by the advice of counsel, the Trustees concluded that each Fund’s management fee is reasonable and that approval of the Advisory Agreement is in the best interests of the shareholders of Macro Fund, LLSCS Fund, LDE Fund and LSI Fund.
Approval of Sub-Advisory Agreements
Nuveen Asset Management, LLC (“Nuveen”), Sub-Adviser (Macro Fund, LLSCS Fund and LoCorr Market Trend Fund (the “LMT Fund”))
The Trustees next considered the 15(c) materials provided by Nuveen. The Trustees reviewed the nature, extent and quality of services provided by Nuveen for the fixed income strategies in the Macro Fund, LCLSCS Fund and the LMT Fund. The Trustees reviewed Nuveen’s key individuals, noted many years of experience and depth of investment capabilities. A representative of the Adviser noted that Nuveen’s Global Fixed Income team had added a portfolio manager and three research analysts since the last subadvisory agreement renewal. The Trustees observed that Nuveen continued to provide credit research, security selection, trade execution and compliance monitoring for the fixed income portion of the Macro, LCLSCS and LMT Funds.
Review of Management and Sub-Advisory Agreements (Unaudited) (continued) |
The CCO noted for the Trustees that Nuveen provides quarterly summaries of its updates to its compliance manual. The CCO indicated that he believed that these compliance updates from the past year were minor in nature. In response to a question from Counsel, a representative of the Adviser indicated that the Adviser continued to be satisfied with the services provided by Nuveen to the Funds.
The Trustees observed that Nuveen did not have any material compliance, material litigations or regulatory agency issues in the past year. Counsel stated that Nuveen continued to carry an E&O/D&O policy through its parent company. After a discussion, the Trustees concluded that Nuveen had a great depth of experienced personnel and was well resourced and therefore was expected to continue to provide satisfactory services to the Funds.
Next, the Trustees discussed the investment performance for Nuveen, noting the one-year, five-year and since inception returns for the Macro, LCLSCS and LMT Funds. The Trustees compared Nuveen’s reported returns to its benchmark index returns for the one-year, five-year and since inception periods and noted that Nuveen had continued to outperform its benchmark index for all Funds for all periods. After a discussion, the Trustees noted it was pleased with Nuveen’s performance with respect to Macro, LCLSCS and LMT Funds and deemed Nuveen’s performance to be satisfactory.
The Trustees discussed the costs of services provided by Nuveen to Macro Fund, LCLSCS Fund and LMT Fund, and noted that Nuveen it is not profitable with regard to sub-advising the Funds. The Trustees also considered that the subadvisory fee for the Funds compared favorably to fee schedule that Nuveen charged to institutional accounts with the same strategy. The Trustees concluded that the sub-advisory fees paid to Nuveen by the Adviser were reasonable in light of the services to be provided under the sub-advisory agreements.
Having requested and received such information from Nuveen as the Trustees believed to be reasonably necessary to evaluate the terms of the Sub-Advisory Agreement, and as assisted by the advice of counsel, the Trustees concluded that Nuveen’s fee structure is reasonable and that approval of the Sub-Advisory Agreement is in the best interest of the shareholders of Macro Fund, LLSCS Fund and LMT Fund.
Millburn Ridgefield Corporation (“Millburn”), Sub-Adviser (Macro Fund & LCMFS Fund Limited)
Counsel then turned the Trustees’ attention to the 15(c) responses for Millburn. The Trustees reviewed the experience and backgrounds of Millburn’s personnel providing services to the Fund, noting that Millburn had added a deputy chief investment officer in the past year. A representative of the Adviser further noted that Millburn provides portfolio management, investment strategy development and trade execution for the Fund’s portfolio as well as compliance services to assure the assets allocated to it are managed within the Fund’s investment restrictions.
Counsel noted for the Trustees that Millburn reported not having any material compliance or litigation issues in the past year. The Trustees reviewed Millburn’s compliance controls with the CCO including its pre- and post-trade compliance checks. The CCO reported to the Board that Millburn made minor revisions to its compliance policies and procedures, including a revision to its trade error policy. The CCO noted that he reviewed the revised policies and was comfortable with them. The Trustees further observed that Millburn carried an appropriate E&O/D&O policy. The Trustees determined that the services provided by Millburn to the Fund have been satisfactory and that the Trustees expects Millburn to continue to provide quality services in the future.
The Trustees then reviewed the investment performance of Millburn’s allocation of the Fund’s portfolio. A representative of the Adviser noted Millburn’s significant outperformance in the past year. The representative noted that Milburn had now outperformed its benchmark for the one-year and five-year periods. After a discussion, the Trustees concluded that they were satisfied with Millburn’s performance for the Fund.
Counsel noted for the Trustees that the sub-advisory fee structure was lower than the fee charged by Millburn to its separately managed account clients. The Trustees further observed that Millburn’s fee did not include an incentive fee. After further discussion, the Trustees concluded that the sub-advisory fee was reasonable.
The Trustees considered whether there were any economies of scale with respect to the management of the Fund. The Trustees agreed that this was primarily an adviser level issue and should be considered with respect to the overall advisory contract, taking into consideration the impact of the sub-advisory expense. After a discussion, the Trustees concluded that a lack of breakpoints was acceptable.
The Trustees next considered the profits realized by Millburn in connection with its relationship with the Fund and whether the amount of profit is a fair profit with respect to the sub-advisory services provided to the Fund. After a discussion, it was the consensus of the Trustees that the level of profit was reasonable.
Review of Management and Sub-Advisory Agreements (Unaudited) (continued) |
Having requested and received such information from Millburn as the Trustees believed to be reasonably necessary to evaluate the terms of the Sub-Advisory Agreement, and as assisted by the advice of Counsel, the Trustees concluded that Millburn’s fee structure was not unreasonable and that approval of the Sub-Advisory Agreement is in the best interests of the shareholders of the Macro Fund.
Graham Capital Management, L.P. (“Graham”), Sub-Adviser (Macro Fund & LCMFS Fund Limited)
The Trustees next considered the nature, extent and quality of services to be provided by Graham to the Fund. The Trustees turned their attention to the 15(c) responses for Graham. The Trustees discussed the responsibilities of Graham’s key personnel providing services to the Fund, noting the recent change in the firm’s chief executive officer. A representative of the Adviser indicated that it did not believe that this would change Graham’s quality of services provided to the Fund. The Trustees noted that Graham provides quantitative research, security selection and trade execution for the Fund’s portfolio as well as compliance services to assure assets are managed within the Fund’s investment restrictions.
The CCO indicated that Graham adopted appropriate compliance policies and procedures and that Graham had not made any material revisions to such policies in the past year. Counsel stated that Graham continued to carry an appropriate E&O/D&O policy. The Trustees noted that Graham did not have material regulatory examinations, litigations since its last renewal. After a discussion, the Trustees concluded that Graham continued to have appropriate resources and investment personnel to perform the services as sub-adviser to the Fund.
Next, the Trustees discussed the investment performance for Graham’s allocation of the Fund, noting that Graham has outperformed the Fund’s benchmark and the Fund as a whole. After a discussion, the Trustees concluded that Graham’s performance was satisfactory.
The Trustees reviewed the sub-advisory fee paid to Graham and considered that it was slightly higher than the fee charged by Graham for another similar investment vehicle but that did not include a performance incentive fee. The Trustees also noted that the fee was less than the fee Graham charged to another similar investment vehicle that did not have a performance fee component. After further discussion, the Trustees concluded that the sub-advisory fee was reasonable.
Counsel next turned the Trustees’ attention to the profits realized by Graham with respect to the Fund. The Board discussed whether the amount of profit was reasonable with respect to the sub-advisory services provided to the Fund. The Trustees also considered whether there were any economies of scale with respect to the management of the Fund. The Trustees agreed that this was primarily an adviser level issue and should be considered with respect to the overall advisory contract, taking into consideration the impact of the sub-advisory expense.
After a discussion, the Trustees concluded that Graham’s level of profit was reasonable. Having requested and received such information from Graham as the Trustees believed to be reasonably necessary to evaluate the terms of the Sub-Advisory Agreement, and as assisted by the advice of counsel, the Trustees concluded that the fee structure is reasonable and that approval of the Sub-Advisory Agreement is in the best interests of the shareholders of the Macro Fund.
Revolution Capital Management, LLC (“Revolution”), Sub-Adviser (Macro Fund & LCMFS Fund Limited)
The Trustees then reviewed the nature, extent and quality of services provided or to be provided by Revolution. The Trustees then directed their attention to the 15(c) responses for Revolution. The Trustees reviewed the backgrounds and responsibilities of Revolution’s key investment personnel, noting the experience of these individuals. Counsel discussed that Revolution has been responsible for the maintenance and improvement of its trading models used in Revolution’s strategy for the Fund’s portfolio and trade execution. Counsel further noted that Revolution has been responsible for the compliance services which includes assuring that assets are managed within the Fund’s investment restrictions. A representative of the Adviser indicated that Revolution continued to execute the same strategy as it has since it became a sub-adviser to the Fund.
The Trustees next considered Revolution’s investment process and compliance structure with representatives of the Adviser. Counsel indicated that Revolution did not report any material compliance issues, regulatory examinations or material litigations in the past year. Counsel stated that Revolution maintained an E&O/D&O insurance policy in an appropriate amount. Counsel and the CCO noted that Revolution had not made any material revisions to its compliance policies and procedures in the past year. After a discussion, the Trustees concluded that Revolution has adequate resources available to continue to provide satisfactory services to the Fund.
Next, the Trustees reviewed the investment returns for Revolution, noting of Revolution’s strategy for the Fund. The Trustees considered Revolution’s returns to its benchmark for the one-year and since inception periods and noted that the recent underperformance. A representative of the Adviser noted the recent underperformance but indicated that the Adviser still
Review of Management and Sub-Advisory Agreements (Unaudited) (continued) |
was satisfied with the overall with Revolution’s execution of its trading strategy. After a discussion, the Trustees concluded that Revolution’s performance was not unreasonable but that it would continue to monitor Revolution’s performance at future meetings.
The Trustees considered that the sub-advisory fee structure was favorable compared to the average fee charged by Revolution to its separately managed account clients in the same strategy. The Trustees also noted that there was not an incentive fee component in the sub-advisory fee. After further discussion, the Trustees concluded that the proposed sub-advisory fee was reasonable.
The Trustees considered whether there were any economies of scale with respect to the management of the Fund. The Trustees agreed that this was primarily an adviser level issue and should be considered with respect to the overall advisory contract, taking into consideration the impact of the sub-advisory expense. After a discussion, the Trustees agreed that a lack of breakpoints was acceptable.
The Trustees next considered the profits realized by Revolution in connection with its relationship with the Fund and whether the amount of profit was a reasonable profit with respect to the sub-advisory services to be provided to the Fund. The Trustees concluded that Revolution’s level of profit was not excessive.
Having requested and received such information from Revolution as the Trustees believed to be reasonably necessary to evaluate the terms of the Sub-Advisory Agreement, and as assisted by the advice of counsel, the Trustees concluded that the fee structure is reasonable and that approval of the Sub-Advisory Agreement is in the best interests of the shareholders of the Macro Fund.
Billings Capital Management, LLC (“Billings”), Sub-Adviser (LDE Fund)
The Trustees then reviewed the nature, extent and quality of services provided by Billings for the LDE Fund. The Trustees discussed the responsibilities of Billings’ key personnel as well as the experience of these individuals in sub-advising the long/short equity strategies for the Fund. A representative of the Adviser discussed the services provided by Billings including fundamental research, security selection and trade execution for its allocation of the Fund’s portfolio as well as compliance services to assure assets are managed within the Fund’s investment restrictions and guidelines.
The CCO indicated for the Trustees that Billings had not made any material changes to its compliance policies and procedures in the past year. Counsel reported that Billings reported no material compliance, material litigations or regulatory agency issues in the past year. Counsel further stated that Billings carries an appropriate E&O/D&O policy. The Trustees concluded that Billings had experienced personnel and had appropriate resources to continue to provide quality services to the Fund.
Next, the Trustees reviewed and discussed the investment performance for Billings for the Fund. The Trustees noted that Billings had performed well in the past year, beating out the benchmark and the Fund’s performance as a whole. In response to a question, a representative of the Adviser indicated that the Adviser was overall satisfied with the performance of the Billings strategy for the Fund. After a discussion, the Trustees concluded that the performance of Billings was satisfactory.
Counsel discussed the cost of services and profitability realized by Billings and whether the amount of profit was reasonable with respect to the sub-advisory services to be provided to the Fund. Counsel noted for the Trustees that Billings also received a performance fee from such other accounts. Counsel also noted the profitability of the Fund for Billings. After a discussion, the Trustees concluded that Billings’ fees and profitability were not excessive.
Having requested and received such information from Billings as the Trustees believed to be reasonably necessary to evaluate the terms of the Sub-Advisory Agreement, and as assisted by the advice of counsel, the Trustees concluded that the fee structure is reasonable and that approval of the Sub-Advisory Agreement is in the best interests of the shareholders of the LDE Fund.
Bramshill Investments, LLC (“Bramshill”), Sub-Adviser (LSI Fund)
The Trustees then considered the renewal of the sub-advisory agreement with Bramshill with respect to the LSI Fund.
The Trustees considered the nature, extent and quality of services provided or to be provided by Bramshill for the income strategies for the LSI Fund. The Trustees reviewed the responsibilities of Bramshill’s investment and administrative personnel. A representative of the Adviser stated that Bramshill provides research, security selection and trade execution for the Fund.
Review of Management and Sub-Advisory Agreements (Unaudited) (continued) |
Counsel indicated to the Trustees that Bramshill has not reported any material compliance issues, material litigations or regulatory examinations in the past year. The Trustees decided that, based on Bramshill’s experienced personnel and fixed income expertise, Bramshill has adequate resources available to provide services to the Fund. The Trustees determined that Bramshill was well-suited to continue to perform the services as sub-adviser to the LSI Fund.
The Trustees then reviewed the investment performance information for Bramshill with respect to the LSI Fund. The Trustees noted that Bramshill’s performance outperformed the Fund’s benchmark and the overall Fund but had underperformed the sub-adviser’s selected benchmark for the one-year period and other periods. In response to a question from Counsel, a representative of the Adviser reviewed Bramshill’s strategy and recent performance and stated that the Adviser continued to be satisfied with the overall performance of Bramshill. After a discussion, the Trustees agreed that Bramshill’s performance was not unsatisfactory.
The Trustees discussed the costs of services provided and to be provided by Bramshill to the LSI Fund. The Trustees noted that Bramshill was profitable with respect to the LSI Fund. Counsel directed the Trustees’ attention to the materials for Bramshill which indicated that Bramshill’s sub-advisory fee was favorable in comparison to fees it charges to other clients. The Trustees concluded that the sub-advisory fees to be paid to Bramshill by the Adviser were reasonable in light of the services to be provided under the sub-advisory agreements.
Having requested and received such information from Bramshill as the Trustees believed to be reasonably necessary to evaluate the terms of the Sub-Advisory Agreement, and as assisted by the advice of Counsel, the Trustees concluded that the fee structure is reasonable and that approval of the Sub-Advisory Agreement is in the best interests of the shareholders of the LSI Fund.
Review of Management and Sub-Advisory Agreements
Approval of Advisory Agreement
The Board reviewed the nature, extent and quality of services provided by the Adviser to the LoCorr Market Trend Fund (the “LMT Fund”) and its wholly-owned subsidiary, LCMT Fund Limited with Counsel and then reviewed the 15(c) responses including the key personnel of the Adviser. A Trustees noted that there had been no changes in the personnel providing services to the LMT Fund since the most recent renewal of the LMT Fund’s advisory agreement. A representative of the Adviser noted for the Board that it had continued to oversee the investment program for the LMT Fund consistent with its investment objective, policies and regulatory restrictions since the Fund’s inception and that the Adviser evaluates and oversees the LMT Fund’s sub-advisers. The CCO noted that the Adviser had not made any material changes to its compliance policies since the Board’s last review.
Fund Counsel indicated to the Trustees that there were no material compliance issues or litigations with respect to the Adviser since the most recent renewal of the advisory agreement for the LMT Fund. A representative of the Adviser discussed the Adviser’s financial statements with the Board. Fund Counsel also noted that the Adviser continues to maintain insurance for E&O/D&O coverage. The Trustees noted that, based on their review of the Adviser’s financial statements and their discussion with representatives of the Adviser, the Adviser has the appropriate financial resources to continue to manage the LMT Fund.
After a discussion, the Board concluded that the Adviser continued to be well staffed with experienced personnel, has appropriate financial resources and provides valuable investment expertise and oversight of the LMT Fund and is expected to continue to provide high quality services to the Fund.
The Trustees next evaluated the Fund’s performance, noting that the Fund had outperformed its peer group average, benchmark indexes and Morningstar category all periods since inception. A representative of the Adviser stated that the Adviser continued to be satisfied with the performance of the LMT Fund’s two subadvisers. After a discussion, the Trustees agreed that the Fund’s performance was satisfactory.
The Trustees next discussed the advisory fee and the Adviser’s profitability with respect to the LMT Fund. Fund Counsel noted that the investment advisory fee was above the peer group and Morningstar category averages but well within the ranges for each. A representative of the Adviser discussed the peer group and noted the differences between the LMT Fund and some of its peer funds. Fund Counsel then reviewed with the Trustees the Adviser’s profitability with respect to the LMT Fund, noting its profitability margin. After a discussion, the Board concluded that the LMT Fund’s advisory fee and the Adviser’s profitability with respect to the LMT Fund were both reasonable.
Review of Management and Sub-Advisory Agreements (Unaudited) (continued) |
Having requested and received such information from the Adviser as the Trustees believed to be reasonably necessary to evaluate the terms of the Advisory Agreement, and as assisted by the advice of Counsel, the Trustees concluded that the fee structure is reasonable and that approval of the Advisory Agreement is in the best interests of the LMT Fund and its shareholders.
Approval of Sub-Advisory Agreement
Graham Capital Management, L.P. (“Graham”), Sub-Adviser (LMT Fund & LCMT Fund Limited)
The Trustees then reviewed the responses provided by Graham in its 15(c) questionnaire. The Board again considered the nature, extent and quality of services provided by Graham. Fund Counsel reviewed the individuals responsible for providing services to the Fund, noting that the former chief operating officer had been promoted to chief executive officer in the last year. A representative of the Adviser reviewed Graham’s market trend strategy, risk management practices and its compliance program. Fund Counsel noted for the Board that Graham did not have any recent compliance, litigation or regulatory issues and that Graham continued to maintain appropriate insurance coverage. The Trustees noted that Graham did have a recent routine examination conducted by the SEC and that Graham had reported that there were no material findings from that examination.
The Board next reviewed Graham’s performance for the LMT Fund with a representative of the Adviser. The representative of the Adviser noted Graham’s strong performance for all periods since inception. The Trustees and the Adviser noted their satisfaction with Graham’s overall performance. After a discussion, the Trustees concluded that the overall performance of Graham was reasonable.
Fund Counsel then directed the Trustees to information related to Graham’s subadvisory fee and its fees for similar accounts. Counsel stated that the subadvisory fee was relatively favorable in comparison to the Graham’s fee for other accounts, further noting that Graham did not charge a performance fee for the LMT Fund as it does for some other of its private accounts. The Trustees then reviewed Graham’s profitability with respect to the Fund. After a brief discussion, the Trustees agreed that the subadvisory fee and Graham’s profitability with respect to the LMT Fund were both reasonable.
Having requested and received such information from Graham as the Trustees believed to be reasonably necessary to evaluate the terms of the subadvisory agreement, and as assisted by the advice of Fund Counsel, the Trustees concluded that the fee structure is reasonable and that approval of the subadvisory agreement with Graham for the LMT Fund is in the best interests of the Fund and its shareholders.
Review of Management and Sub-Advisory Agreements (Unaudited) (continued) |
LoCorr Fund Management Liquidity Risk Management Program Assessment
August 2022 (Unaudited)
Effective June 1, 2019, the funds adopted a liquidity risk management program (the “Liquidity Risk Management Program”) pursuant to the requirements of Rule 22e-4 under the Investment Company Act of 1940, as amended. Rule 22e-4 requires registered open-end funds, including mutual funds and exchange-traded funds but not money market funds, to establish liquidity risk management programs in order to effectively manage fund liquidity and shareholder redemptions. The rule is designed to mitigate the risk that a fund could not meet redemption requests without significantly diluting the interests of remaining investors.
The rule requires the funds to assess, manage and review their liquidity risk at least annually considering applicable factors such as investment strategy and liquidity during normal and foreseeable stressed conditions, including whether the strategy is appropriate for an open-end fund and whether the fund has a relatively concentrated portfolio or large positions in particular issuers. The fund must also assess its use of borrowings and derivatives, short-term and long-term cash flow projections in normal and stressed conditions, holdings of cash and cash equivalents, and borrowing arrangements and other funding sources.
The rule also requires the funds to classify its investments as highly liquid, moderately liquid, less liquid or illiquid based on the number of days the fund expects it would take to liquidate the investment, and to review these classifications at least monthly or more often under certain conditions. The periods range from three or fewer business days for a highly liquid investment to greater than seven calendar days for settlement of a less liquid investment. Illiquid investments are those a fund does not expect to be able to sell or dispose of within seven calendar days without significantly changing the market value. The fund is prohibited from acquiring an investment if, after the acquisition, its holdings of illiquid assets will exceed 15% of its net assets. In addition, if a fund permits redemptions in-kind, the rule requires the fund to establish redemption in-kind policies and procedures governing how and when it will engage in such redemptions.
Pursuant to the rule’s requirements, the Liquidity Risk Management Program has been reviewed and approved by the funds’ board. Furthermore, the board has received a written report prepared by the Program’s Administrator that addresses the operation of the Program, assesses its adequacy and effectiveness and describes any material changes made to the Program.
Assessment of Program
In the opinion of the Program Administrator, the Program approved by the fund board continues to be adequate for the fund and the Program has been implemented effectively. The Program Administrator has monitored the fund’s liquidity risk and the liquidity classification of the securities held by the fund and has determined that the Program is operating effectively.
During the period from July 1, 2021 to June 30, 2022, there were no material changes to the Program and no material liquidity events that impacted the funds. During the period, the funds held sufficient highly liquid assets to meet fund redemptions.
Notice of Privacy Policy & Practices/Quarterly Portfolio Holdings/Proxy (Unaudited) |
Notice of Privacy Policy & Practices
(Unaudited)
Your privacy is important to us. The Funds are committed to maintaining the confidentiality, integrity, and security of your personal information. When you provide personal information, the Funds believe that you should be aware of policies to protect the confidentiality of that information.
The Funds collect the following nonpublic personal information about you:
● | Information we receive from you on or in applications or other forms, correspondence, or conversations, including, but not limited to, your name, address, phone number, social security number, assets, income and date of birth; and |
● | Information about your transactions with us, our affiliates, or others, including, but not limited to, your account number and balance, payments history, parties to transactions, cost basis information and other financial information. |
The Funds do not disclose any nonpublic personal information about our current or former shareholders to affiliated or nonaffiliated third parties, except as permitted by law. For example, the Funds are permitted by law to disclose all of the information we collect, as described above, to our transfer agent to process your transactions. Furthermore, the Funds restrict access to your nonpublic personal information to those persons who require such information to provide products or services to you. The Funds maintain physical, electronic and procedural safeguards that comply with applicable federal and state standards to guard your nonpublic personal information.
In the event that you hold shares of the Funds through a financial intermediary, including, but not limited to, a broker-dealer, bank, or trust company, the privacy policy of your financial intermediary would govern how your nonpublic personal information would be shared with affiliated or non-affiliated third parties.
Portfolio Holdings Disclosure
(Unaudited)
The Funds file a complete schedule of portfolio holdings with the U.S. Securities and Exchange Commission (the “SEC”) for the first and third quarters of each fiscal year on Part F of Form N-PORT. The Funds’ Part F of Form N-PORT are available on the SEC’s website at www.sec.gov and may be reviewed and copied at the SEC’s Public Reference Room in Washington, D.C. Information on the operation of the Public Reference Room may be obtained by calling 1-800-SEC-0330. The Funds’ Part F of Form N-PORT may also be obtained by calling toll-free 1-855-523-8637.
Proxy voting policies, procedures and record
(Unaudited)
You may obtain a description of the Funds’ (1) proxy voting policies, (2) proxy voting procedures and (3) information regarding how the Funds voted any proxies related to portfolio securities during the most recent 12-month period ended June 30 for which an SEC filing has been made, without charge, upon request by contacting the Funds directly at 1-855-523-8637, or on the EDGAR Database on the SEC’s website (http:// www.sec.gov).
Independent Trustees/Interested Trustees and Officers |
The Statement of Additional Information includes additional information about the Independent Trustees/Interested Trustees and Officers and is available, without charge, by calling 1-855-523-8637.
Independent Trustees | | | |
Name and
Year of Birth | Position/Term
of Office1 | Principal Occupation
During the Past 5 Years | Number of
Portfolios in
Fund Complex2
Overseen by
Trustee | Other
Directorships
Held by Trustee
During the Past
5 Years |
Gary Jarrett
Year of Birth: 1954 | Trustee/
2016–present | Chief Executive Officer, Black River Asset Management LLC, investment subsidiary of Cargill, Inc., 2002–2015. | 5 | None |
Mark Thompson
Year of Birth: 1959 | Trustee/
2011–present | Chairman and Chief Manager, Riverbridge Partners, LLC (investment management), 1987–present. | 5 | None |
Ronald A. Tschetter
Year of Birth: 1941 | Trustee/
2011–present | Mr. Tschetter is presently retired from his principal occupations; Director of the U.S. Peace Corps, 2006–2009. | 5 | None |
Interested Trustees and Officers | | | |
Name and
Year of Birth | Position/Term
of Office1 | Principal Occupation
During the Past 5 Years | Number of
Portfolios in
Fund Complex2
Overseen by
Trustee | Other
Directorships
Held by Trustee
During the Past
5 Years |
Jon C. Essen3
Year of Birth: 1963 | Treasurer,
Secretary, Chief Financial Officer/ 2011–present; Trustee/
2010–present | LoCorr Fund Management, LLC: Chief Operating Officer (2010–2016), Chief Compliance Officer, (2010–2017); LoCorr Distributors, LLC: Principal, Chief Financial Officer, and Registered Representative (2008–present) Chief Compliance Officer (2008–2017); Steben & Company (broker/dealer and registered investment adviser): Principal and Chief Financial Officer (2020–present) | 5 | None |
Kevin M. Kinzie4
Year of Birth: 1956 | President, Trustee/ 2011–present | Chief Executive Officer of LoCorr Fund Management, LLC, 2010 to present; President and Chief Executive Officer of LoCorr Distributors, LLC (broker/dealer), 2002– present. President and Chief Executive Officer of Steben & Company (broker/dealer and registered investment adviser), (2019–present). | 5 | None |
Brian Hull5
Year of Birth: 1968 | Chief Compliance Officer/
2019–present | Steben & Company (broker/dealer and registered investment adviser): Chief Compliance Officer 2002–2007 and 2012–Present; Financial & Operations Principal (FINOP) 2002–Present; Registered Representative 2002–Present. | 5 | None |
1 | The term of office for each Trustee listed above will continue indefinitely. |
2 | The term “Fund Complex” refers to the LoCorr Investment Trust. |
3 | Mr. Essen is an interested Trustee because he is an officer of the Funds’ Adviser. |
4 | Mr. Kinzie is an interested Trustee because he is an officer and indirect controlling interest holder of the Funds’ Adviser. |
5 | Mr. Hull is an interested person because he is an officer of the Funds’ Adviser. |
This page left intentionally blank.
This page left intentionally blank.
This page left intentionally blank.


Item 2. Code of Ethics.
Not applicable for semi-annual reports.
Item 3. Audit Committee Financial Expert.
Not applicable for semi-annual reports.
Item 4. Principal Accountant Fees and Services.
Not applicable for semi-annual reports.
Item 5. Audit Committee of Listed Registrants.
Not applicable to registrants who are not listed issuers (as defined in Rule 10A-3 under the Securities Exchange Act of 1934).
Item 6. Investments.
| (a) | Schedule of Investments is included as part of the report to shareholders filed under Item 1 of this Form. |
Item 7. Disclosure of Proxy Voting Policies and Procedures for Closed-End Management Investment Companies.
Not applicable to open-end investment companies.
Item 8. Portfolio Managers of Closed-End Management Investment Companies.
Not applicable to open-end investment companies.
Item 9. Purchases of Equity Securities by Closed-End Management Investment Company and Affiliated Purchasers.
Not applicable to open-end investment companies.
Item 10. Submission of Matters to a Vote of Security Holders.
There have been no material changes to the procedures by which shareholders may recommend nominees to the registrant’s Board of Trustees.
Item 11. Controls and Procedures.
| (a) | The registrant’s President and Treasurer have reviewed the registrant's disclosure controls and procedures (as defined in Rule 30a-3(c) under the Investment Company Act of 1940 (the “Act”)) as of a date within 90 days of the filing of this report, as required by Rule 30a-3(b) under the Act and Rules 13a-15(b) or 15d-15(b) under the Securities Exchange Act of 1934. Based on their review, such officers have concluded that the disclosure controls and procedures are effective in ensuring that information required to be disclosed in this report is appropriately recorded, processed, summarized and reported and made known to them by others within the registrant and by the registrant’s service provider. |
| (b) | There were no changes in the registrant's internal control over financial reporting (as defined in Rule 30a-3(d) under the Act) that occurred during the period covered by this report that has materially affected, or is reasonably likely to materially affect, the registrant's internal control over financial reporting. |
Item 12. Disclosure of Securities Lending Activities for Closed-End Management Investment Companies
Not applicable to open-end investment companies.
Item 13. Exhibits.
| (a) | (1) Any code of ethics or amendment thereto, that is the subject of the disclosure required by Item 2, to the extent that the registrant intends to satisfy Item 2 requirements through filing an exhibit. |
Not applicable for semi-annual reports.
(2) A separate certification for each principal executive and principal financial officer pursuant to Section 302 of the Sarbanes-Oxley Act of 2002.
Filed herewith.
(3) Any written solicitation to purchase securities under Rule 23c-1 under the Act sent or given during the period covered by the report by or on behalf of the registrant to 10 or more persons.
Not applicable to open-end investment companies.
(4) Changes in the registrant’s independent public accountant.
There was no change in the registrant’s independent public accountant for the period covered by the report.
| (b) | Certifications pursuant to Section 906 of the Sarbanes-Oxley Act of 2002. |
Furnished herewith.
SIGNATURES
Pursuant to the requirements of the Securities Exchange Act of 1934 and the Investment Company Act of 1940, the registrant has duly caused this report to be signed on its behalf by the undersigned, thereunto duly authorized.
| | (Registrant) | LoCorr Investment Trust | |
| | | | |
| | By (Signature and Title) |  | |
| | | Kevin Kinzie, President | |
| | | | |
| | Date | 9/7/22 | |
Pursuant to the requirements of the Securities Exchange Act of 1934 and the Investment Company Act of 1940, this report has been signed below by the following persons on behalf of the registrant and in the capacities and on the dates indicated.
| | By (Signature and Title) |  | |
| | | Kevin Kinzie, President | |
| | | | |
| | Date | 9/7/22 | |
| | | | |
| | By (Signature and Title) |  | |
| | | Jon Essen, Treasurer | |
| | | | |
| | Date | 9/7/22 | |