LoCorr Investment Trust
Core Financial Statements
June 30, 2024 (Unaudited)
UNITED STATES
SECURITIES AND EXCHANGE COMMISSION
Washington, D.C. 20549
FORM N-CSR
CERTIFIED SHAREHOLDER REPORT OF REGISTERED
MANAGEMENT INVESTMENT COMPANIES
Investment Company Act file number 811-22509
LoCorr Investment Trust
(Exact name of registrant as specified in charter)
687 Excelsior Blvd
Excelsior, MN 55331
(Address of principal executive offices) (Zip code)
CT Corporation System
1300 East Ninth Street
Cleveland, OH 44114
(Name and address of agent for service)
952.767.2920
Registrant’s telephone number, including area code
Date of fiscal year end: December 31
Date of reporting period: June 30, 2024
Item 1. Reports to Stockholders.
| (a) |
 | LoCorr Macro Strategies Fund |  |
| Class A | LFMAX | ||
| Semi-Annual Shareholder Report | June 30, 2024 |
Class Name | Costs of a $10,000 investment | Costs paid as a percentage of a $10,000 investment |
| Class A | $111 | 2.14% |
Net Assets | $1,677,974,161 |
Number of Holdings | 487 |
Portfolio Turnover | 71% |

Top 10 Issuers | (%) |
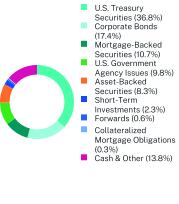
United States Treasury Note | 36.8% |
Federal National Mortgage Association | 4.0% |
Federal Farm Credit Banks Funding Corp. | 3.9% |
United States Treasury Bill | 2.3% |
Fannie Mae Connecticut Avenue Securities | 2.2% |
Freddie Mac Structured Agency Credit Risk Debt Notes | 2.0% |
Federal Home Loan Banks | 1.9% |
Bank of America Corp. | 1.2% |
BX Trust | 0.9% |
Toyota Auto Receivables Owner Trust | 0.9% |
| LoCorr Macro Strategies Fund | PAGE 1 | TSR_SAR_540132107 |
| LoCorr Macro Strategies Fund | PAGE 2 | TSR_SAR_540132107 |
 | LoCorr Macro Strategies Fund |  |
| Class C | LFMCX | ||
| Semi-Annual Shareholder Report | June 30, 2024 |
Class Name | Costs of a $10,000 investment | Costs paid as a percentage of a $10,000 investment |
| Class C | $150 | 2.89% |
Net Assets | $1,677,974,161 |
Number of Holdings | 487 |
Portfolio Turnover | 71% |
Top 10 Issuers | (%) |
United States Treasury Note | 36.8% |
Federal National Mortgage Association | 4.0% |
Federal Farm Credit Banks Funding Corp. | 3.9% |
United States Treasury Bill | 2.3% |
Fannie Mae Connecticut Avenue Securities | 2.2% |
Freddie Mac Structured Agency Credit Risk Debt Notes | 2.0% |
Federal Home Loan Banks | 1.9% |
Bank of America Corp. | 1.2% |
BX Trust | 0.9% |
Toyota Auto Receivables Owner Trust | 0.9% |
| LoCorr Macro Strategies Fund | PAGE 1 | TSR_SAR_540132206 |
| LoCorr Macro Strategies Fund | PAGE 2 | TSR_SAR_540132206 |
 | LoCorr Macro Strategies Fund |  |
| Class I | LFMIX | ||
| Semi-Annual Shareholder Report | June 30, 2024 |
Class Name | Costs of a $10,000 investment | Costs paid as a percentage of a $10,000 investment |
| Class I | $98 | 1.89% |
Net Assets | $1,677,974,161 |
Number of Holdings | 487 |
Portfolio Turnover | 71% |

Top 10 Issuers | (%) |
United States Treasury Note | 36.8% |
Federal National Mortgage Association | 4.0% |
Federal Farm Credit Banks Funding Corp. | 3.9% |
United States Treasury Bill | 2.3% |
Fannie Mae Connecticut Avenue Securities | 2.2% |
Freddie Mac Structured Agency Credit Risk Debt Notes | 2.0% |
Federal Home Loan Banks | 1.9% |
Bank of America Corp. | 1.2% |
BX Trust | 0.9% |
Toyota Auto Receivables Owner Trust | 0.9% |
| LoCorr Macro Strategies Fund | PAGE 1 | TSR_SAR_540132305 |
| LoCorr Macro Strategies Fund | PAGE 2 | TSR_SAR_540132305 |
 | LoCorr Long/Short Commodities Strategy Fund |  |
| Class A | LCSAX | ||
| Semi-Annual Shareholder Report | June 30, 2024 |
Class Name | Costs of a $10,000 investment | Costs paid as a percentage of a $10,000 investment |
| Class A | $99 | 1.99% |
Net Assets | $872,030,457 |
Number of Holdings | 216 |
Portfolio Turnover | 42% |
Top 10 Issuers | (%) |
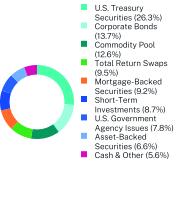
United States Treasury Note | 26.3% |
Galaxy Commodity - Polaris Fund LLC | 12.6% |
LoCorr Commodities Index | 9.5% |
United States Treasury Bill | 8.7% |
Federal Home Loan Banks | 3.7% |
Federal National Mortgage Association | 2.7% |
Fannie Mae Connecticut Avenue Securities | 1.9% |
Federal Farm Credit Banks Funding Corp. | 1.4% |
Freddie Mac Structured Agency Credit Risk Debt Notes | 1.3% |
Bank of America Corp. | 1.0% |
| LoCorr Long/Short Commodities Strategy Fund | PAGE 1 | TSR_SAR_540132404 |
| LoCorr Long/Short Commodities Strategy Fund | PAGE 2 | TSR_SAR_540132404 |
 | LoCorr Long/Short Commodities Strategy Fund |  |
| Class C | LCSCX | ||
| Semi-Annual Shareholder Report | June 30, 2024 |
Class Name | Costs of a $10,000 investment | Costs paid as a percentage of a $10,000 investment |
| Class C | $137 | 2.74% |
Net Assets | $872,030,457 |
Number of Holdings | 216 |
Portfolio Turnover | 42% |

Top 10 Issuers | (%) |
United States Treasury Note | 26.3% |
Galaxy Commodity - Polaris Fund LLC | 12.6% |
LoCorr Commodities Index | 9.5% |
United States Treasury Bill | 8.7% |
Federal Home Loan Banks | 3.7% |
Federal National Mortgage Association | 2.7% |
Fannie Mae Connecticut Avenue Securities | 1.9% |
Federal Farm Credit Banks Funding Corp. | 1.4% |
Freddie Mac Structured Agency Credit Risk Debt Notes | 1.3% |
Bank of America Corp. | 1.0% |
| LoCorr Long/Short Commodities Strategy Fund | PAGE 1 | TSR_SAR_540132503 |
| LoCorr Long/Short Commodities Strategy Fund | PAGE 2 | TSR_SAR_540132503 |
 | LoCorr Long/Short Commodities Strategy Fund |  |
| Class I | LCSIX | ||
| Semi-Annual Shareholder Report | June 30, 2024 |
Class Name | Costs of a $10,000 investment | Costs paid as a percentage of a $10,000 investment |
| Class I | $87 | 1.74% |
Net Assets | $872,030,457 |
Number of Holdings | 216 |
Portfolio Turnover | 42% |

Top 10 Issuers | (%) |
United States Treasury Note | 26.3% |
Galaxy Commodity - Polaris Fund LLC | 12.6% |
LoCorr Commodities Index | 9.5% |
United States Treasury Bill | 8.7% |
Federal Home Loan Banks | 3.7% |
Federal National Mortgage Association | 2.7% |
Fannie Mae Connecticut Avenue Securities | 1.9% |
Federal Farm Credit Banks Funding Corp. | 1.4% |
Freddie Mac Structured Agency Credit Risk Debt Notes | 1.3% |
Bank of America Corp. | 1.0% |
| LoCorr Long/Short Commodities Strategy Fund | PAGE 1 | TSR_SAR_540132602 |
| LoCorr Long/Short Commodities Strategy Fund | PAGE 2 | TSR_SAR_540132602 |
 | LoCorr Market Trend Fund |  |
| Class A | LOTAX | ||
| Semi-Annual Shareholder Report | June 30, 2024 |
Class Name | Costs of a $10,000 investment | Costs paid as a percentage of a $10,000 investment |
| Class A | $108 | 2.02% |
Net Assets | $419,638,280 |
Number of Holdings | 274 |
Portfolio Turnover | 64% |

Top 10 Issuers | (%) |
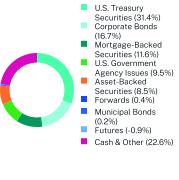
United States Treasury Note | 31.4% |
Federal Home Loan Banks | 5.0% |
Federal Farm Credit Banks Funding Corp. | 2.9% |
Freddie Mac Structured Agency Credit Risk Debt Notes | 2.4% |
Fannie Mae Connecticut Avenue Securities | 2.2% |
Federal National Mortgage Association | 1.6% |
Bank of America Corp. | 1.2% |
BX Trust | 0.8% |
GM Financial Consumer Automobile Receivables Trust | 0.8% |
MVW Owner Trust | 0.8% |
| LoCorr Market Trend Fund | PAGE 1 | TSR_SAR_540132842 |
 | LoCorr Market Trend Fund |  |
| Class C | LOTCX | ||
| Semi-Annual Shareholder Report | June 30, 2024 |
Class Name | Costs of a $10,000 investment | Costs paid as a percentage of a $10,000 investment |
| Class C | $148 | 2.77% |
Net Assets | $419,638,280 |
Number of Holdings | 274 |
Portfolio Turnover | 64% |

Top 10 Issuers | (%) |
United States Treasury Note | 31.4% |
Federal Home Loan Banks | 5.0% |
Federal Farm Credit Banks Funding Corp. | 2.9% |
Freddie Mac Structured Agency Credit Risk Debt Notes | 2.4% |
Fannie Mae Connecticut Avenue Securities | 2.2% |
Federal National Mortgage Association | 1.6% |
Bank of America Corp. | 1.2% |
BX Trust | 0.8% |
GM Financial Consumer Automobile Receivables Trust | 0.8% |
MVW Owner Trust | 0.8% |
| LoCorr Market Trend Fund | PAGE 1 | TSR_SAR_540132834 |
 | LoCorr Market Trend Fund |  |
| Class I | LOTIX | ||
| Semi-Annual Shareholder Report | June 30, 2024 |
Class Name | Costs of a $10,000 investment | Costs paid as a percentage of a $10,000 investment |
| Class I | $95 | 1.77% |
Net Assets | $419,638,280 |
Number of Holdings | 274 |
Portfolio Turnover | 64% |
Top 10 Issuers | (%) |
United States Treasury Note | 31.4% |
Federal Home Loan Banks | 5.0% |
Federal Farm Credit Banks Funding Corp. | 2.9% |
Freddie Mac Structured Agency Credit Risk Debt Notes | 2.4% |
Fannie Mae Connecticut Avenue Securities | 2.2% |
Federal National Mortgage Association | 1.6% |
Bank of America Corp. | 1.2% |
BX Trust | 0.8% |
GM Financial Consumer Automobile Receivables Trust | 0.8% |
MVW Owner Trust | 0.8% |
| LoCorr Market Trend Fund | PAGE 1 | TSR_SAR_540132826 |
 | LoCorr Dynamic Opportunity Fund |  |
| Class A | LEQAX | ||
| Semi-Annual Shareholder Report | June 30, 2024 |
Class Name | Costs of a $10,000 investment | Costs paid as a percentage of a $10,000 investment |
| Class A | $119 | 2.39% |
Net Assets | $52,608,098 |
Number of Holdings | 178 |
Portfolio Turnover | 300% |
Top 10 Issuers | (%) |
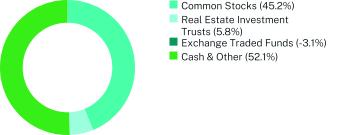
TKO Group Holdings, Inc. | 2.9% |
Kimco Realty Corp. | 2.7% |
Penn National Gaming, Inc. | 1.8% |
Park Hotels & Resorts, Inc. | 1.8% |
Zoom Video Communications, Inc. | 1.5% |
Sprinklr, Inc. | 1.5% |
ROBLOX Corp. | 1.3% |
Healthcare Realty Trust, Inc. | 1.3% |
SPDR S&P Biotech ETF | 1.2% |
Endeavor Group Holdings, Inc. | 1.1% |
| LoCorr Dynamic Opportunity Fund | PAGE 1 | TSR-SAR-540132701 |
 | LoCorr Dynamic Opportunity Fund |  |
| Class C | LEQCX | ||
| Semi-Annual Shareholder Report | June 30, 2024 |
Class Name | Costs of a $10,000 investment | Costs paid as a percentage of a $10,000 investment |
| Class C | $157 | 3.14% |
Net Assets | $52,608,098 |
Number of Holdings | 178 |
Portfolio Turnover | 300% |

Top 10 Issuers | (%) |
TKO Group Holdings, Inc. | 2.9% |
Kimco Realty Corp. | 2.7% |
Penn National Gaming, Inc. | 1.8% |
Park Hotels & Resorts, Inc. | 1.8% |
Zoom Video Communications, Inc. | 1.5% |
Sprinklr, Inc. | 1.5% |
ROBLOX Corp. | 1.3% |
Healthcare Realty Trust, Inc. | 1.3% |
SPDR S&P Biotech ETF | 1.2% |
Endeavor Group Holdings, Inc. | 1.1% |
| LoCorr Dynamic Opportunity Fund | PAGE 1 | TSR-SAR-540132800 |
 | LoCorr Dynamic Opportunity Fund |  |
| Class I | LEQIX | ||
| Semi-Annual Shareholder Report | June 30, 2024 |
Class Name | Costs of a $10,000 investment | Costs paid as a percentage of a $10,000 investment |
| Class I | $107 | 2.14% |
Net Assets | $52,608,098 |
Number of Holdings | 178 |
Portfolio Turnover | 300% |

Top 10 Issuers | (%) |
TKO Group Holdings, Inc. | 2.9% |
Kimco Realty Corp. | 2.7% |
Penn National Gaming, Inc. | 1.8% |
Park Hotels & Resorts, Inc. | 1.8% |
Zoom Video Communications, Inc. | 1.5% |
Sprinklr, Inc. | 1.5% |
ROBLOX Corp. | 1.3% |
Healthcare Realty Trust, Inc. | 1.3% |
SPDR S&P Biotech ETF | 1.2% |
Endeavor Group Holdings, Inc. | 1.1% |
| LoCorr Dynamic Opportunity Fund | PAGE 1 | TSR-SAR-540132883 |
 | LoCorr Spectrum Income Fund |  |
| Class A | LSPAX | ||
| Semi-Annual Shareholder Report | June 30, 2024 |
Class Name | Costs of a $10,000 investment | Costs paid as a percentage of a $10,000 investment |
| Class A | $105 | 2.05% |
Net Assets | $70,321,755 |
Number of Holdings | 72 |
Portfolio Turnover | 30% |
Top 10 Issuers | (%) |
AGNC Investment Corp. | 4.1% |
Annaly Capital Management, Inc. | 4.0% |
Rithm Capital Corp. | 2.8% |
Agnico Eagle Mines Ltd. | 2.8% |
Barrick Gold Corp. | 2.6% |
Energy Transfer LP | 2.5% |
Enterprise Products Partners LP | 2.4% |
Blackstone Secured Lending Fund | 2.2% |
CVR Partners LP | 2.2% |
FS KKR Capital Corp. | 2.1% |
| LoCorr Spectrum Income Fund | PAGE 1 | TSR_SAR_540132875 |
| LoCorr Spectrum Income Fund | PAGE 2 | TSR_SAR_540132875 |
 | LoCorr Spectrum Income Fund |  |
| Class C | LSPCX | ||
| Semi-Annual Shareholder Report | June 30, 2024 |
Class Name | Costs of a $10,000 investment | Costs paid as a percentage of a $10,000 investment |
| Class C | $143 | 2.80% |
Net Assets | $70,321,755 |
Number of Holdings | 72 |
Portfolio Turnover | 30% |

Top 10 Issuers | (%) |
AGNC Investment Corp. | 4.1% |
Annaly Capital Management, Inc. | 4.0% |
Rithm Capital Corp. | 2.8% |
Agnico Eagle Mines Ltd. | 2.8% |
Barrick Gold Corp. | 2.6% |
Energy Transfer LP | 2.5% |
Enterprise Products Partners LP | 2.4% |
Blackstone Secured Lending Fund | 2.2% |
CVR Partners LP | 2.2% |
FS KKR Capital Corp. | 2.1% |
| LoCorr Spectrum Income Fund | PAGE 1 | TSR_SAR_540132867 |
| LoCorr Spectrum Income Fund | PAGE 2 | TSR_SAR_540132867 |
 | LoCorr Spectrum Income Fund |  |
| Class I | LSPIX | ||
| Semi-Annual Shareholder Report | June 30, 2024 |
Class Name | Costs of a $10,000 investment | Costs paid as a percentage of a $10,000 investment |
| Class I | $92 | 1.80% |
Net Assets | $70,321,755 |
Number of Holdings | 72 |
Portfolio Turnover | 30% |

Top 10 Issuers | (%) |
AGNC Investment Corp. | 4.1% |
Annaly Capital Management, Inc. | 4.0% |
Rithm Capital Corp. | 2.8% |
Agnico Eagle Mines Ltd. | 2.8% |
Barrick Gold Corp. | 2.6% |
Energy Transfer LP | 2.5% |
Enterprise Products Partners LP | 2.4% |
Blackstone Secured Lending Fund | 2.2% |
CVR Partners LP | 2.2% |
FS KKR Capital Corp. | 2.1% |
| LoCorr Spectrum Income Fund | PAGE 1 | TSR_SAR_540132859 |
| LoCorr Spectrum Income Fund | PAGE 2 | TSR_SAR_540132859 |
| (b) | Not applicable. |
Item 2. Code of Ethics.
Not applicable for semi-annual reports.
Item 3. Audit Committee Financial Expert.
Not applicable for semi-annual reports.
Item 4. Principal Accountant Fees and Services.
Not applicable for semi-annual reports.
Item 5. Audit Committee of Listed Registrants.
Not applicable for semi-annual reports.
Item 6. Investments.
| (a) | Schedule of Investments is included within the financial statements filed under Item 7 of this Form. |
| (b) | Not applicable |
Item 7. Financial Statements and Financial Highlights for Open-End Investment Companies.
| (a) |
Page | |||
Schedules of Investments | |||
Par | Value | |||||
U.S. TREASURY SECURITIES - 36.8% | ||||||
United States Treasury Note | ||||||
7.63%, 02/15/2025 | $1,500,000 | $ 1,524,023 | ||||
4.25%, 01/31/2026 | 97,035,000 | 96,102,554 | ||||
3.75%, 04/15/2026 | 33,280,000 | 32,684,600 | ||||
0.75%, 05/31/2026 | 16,590,000 | 15,385,281 | ||||
4.50%, 07/15/2026 | 29,605,000 | 29,478,948 | ||||
1.50%, 08/15/2026 | 16,175,000 | 15,136,893 | ||||
4.13%, 02/15/2027 | 135,425,000 | 133,890,889 | ||||
4.50%, 04/15/2027 | 45,265,000 | 45,204,883 | ||||
3.88%, 11/30/2027 | 15,990,000 | 15,690,812 | ||||
3.63%, 03/31/2028 | 26,735,000 | 25,996,654 | ||||
1.38%, 10/31/2028 | 33,490,000 | 29,547,076 | ||||
3.75%, 12/31/2028 | 27,240,000 | 26,557,936 | ||||
4.25%, 02/28/2029 | 86,210,000 | 85,876,610 | ||||
4.63%, 04/30/2029 | 63,775,000 | 64,547,276 | ||||
TOTAL U.S. TREASURY SECURITIES (Cost $618,593,344) | 617,624,435 | |||||
CORPORATE BONDS - 17.4% | ||||||
Aerospace & Defense - 0.6% | ||||||
Boeing Co., 3.25%, 02/01/2028 | 5,445,000 | 4,987,819 | ||||
L3Harris Technologies, Inc., 5.40%, 01/15/2027 | 3,145,000 | 3,158,359 | ||||
RTX Corp., 4.13%, 11/16/2028 | 1,455,000 | 1,401,393 | ||||
9,547,571 | ||||||
Agriculture - 0.2% | ||||||
Philip Morris International, Inc., 4.88%, 02/15/2028 | 2,655,000 | 2,633,069 | ||||
Auto Manufacturers - 1.0% | ||||||
Daimler Truck Finance North America LLC, 5.00%, 01/15/2027(a) | 2,625,000 | 2,606,388 | ||||
Ford Motor Credit Co. LLC, 5.85%, 05/17/2027 | 4,755,000 | 4,756,103 | ||||
General Motors Financial Co., Inc., 5.80%, 06/23/2028 | 4,605,000 | 4,663,735 | ||||
Toyota Motor Credit Corp., 5.60%, 09/11/2025 | 1,380,000 | 1,385,344 | ||||
Volkswagen Group of America Finance LLC, 1.25%, 11/24/2025(a) | 2,975,000 | 2,806,610 | ||||
16,218,180 | ||||||
Banks - 6.4% | ||||||
Banco Santander SA | ||||||
3.50%, 03/24/2025 | 2,535,000 | 2,497,511 | ||||
2.75%, 05/28/2025 | 390,000 | 379,879 | ||||
Bank of America Corp. | ||||||
4.38% to 04/27/2027 then SOFR + 1.58%, 04/27/2028 | 8,610,000 | 8,404,109 | ||||
5.82% to 09/15/2028 then SOFR + 1.57%, 09/15/2029 | 12,225,000 | 12,486,586 | ||||
Bank of America NA, 5.53%, 08/18/2026 | 11,290,000 | 11,368,067 | ||||
Barclays PLC, 6.49% to 09/13/2028 then SOFR + 2.22%, 09/13/2029 | 4,410,000 | 4,567,080 | ||||
Canadian Imperial Bank of Commerce, 3.45%, 04/07/2027 | 2,070,000 | 1,982,149 | ||||
Citibank NA, 5.44%, 04/30/2026 | 3,895,000 | 3,908,615 | ||||
Credit Suisse AG, 5.00%, 07/09/2027 | 1,900,000 | 1,884,607 | ||||
1 |
Par | Value | |||||
CORPORATE BONDS - (Continued) | ||||||
Banks - (Continued) | ||||||
Federation des Caisses Desjardins du Quebec, 5.70%, 03/14/2028(a) | $ 3,280,000 | $ 3,314,628 | ||||
Goldman Sachs Group, Inc. | ||||||
5.80% to 08/10/2025 then SOFR + 1.08%, 08/10/2026 | 9,115,000 | 9,118,537 | ||||
6.48% to 10/24/2028 then SOFR + 1.77%, 10/24/2029 | 1,870,000 | 1,953,452 | ||||
HSBC Holdings PLC, 6.16% to 03/09/2028 then SOFR + 1.97%, 03/09/2029 | 2,820,000 | 2,886,279 | ||||
ING Groep NV, 3.87% to 03/28/2025 then SOFR + 1.64%, 03/28/2026 | 2,700,000 | 2,660,854 | ||||
JPMorgan Chase & Co., 5.58% to 04/22/2029 then SOFR + 1.16%, 04/22/2030 | 10,015,000 | 10,179,357 | ||||
Morgan Stanley, 5.66% to 04/18/2029 then SOFR + 1.26%, 04/18/2030 | 1,505,000 | 1,531,384 | ||||
Morgan Stanley Bank NA, 4.95% to 01/14/2027 then SOFR + 1.08%, 01/14/2028 | 8,200,000 | 8,139,342 | ||||
NatWest Markets PLC, 5.41%, 05/17/2029(a) | 2,875,000 | 2,885,606 | ||||
Toronto-Dominion Bank | ||||||
3.77%, 06/06/2025 | 1,990,000 | 1,957,827 | ||||
1.25%, 09/10/2026 | 4,775,000 | 4,378,779 | ||||
UBS Group AG | ||||||
4.49% to 05/12/2025 then 1 yr. CMT Rate + 1.55%, 05/12/2026(a) | 1,135,000 | 1,121,557 | ||||
6.33% to 12/22/2026 then 1 yr. CMT Rate + 1.60%, 12/22/2027(a) | 2,940,000 | 2,988,609 | ||||
Wells Fargo & Co., 5.57% to 07/25/2028 then SOFR + 1.74%, 07/25/2029 | 7,645,000 | 7,718,348 | ||||
108,313,162 | ||||||
Beverages - 0.2% | ||||||
PepsiCo, Inc., 5.13%, 11/10/2026 | 2,930,000 | 2,942,627 | ||||
Biotechnology - 0.2% | ||||||
Amgen, Inc., 5.15%, 03/02/2028 | 3,805,000 | 3,805,705 | ||||
Building Materials - 0.1% | ||||||
Trane Technologies Financing Ltd., 3.50%, 03/21/2026 | 1,410,000 | 1,364,834 | ||||
Chemicals - 0.1% | ||||||
Nutrien Ltd., 4.90%, 03/27/2028 | 1,405,000 | 1,389,150 | ||||
Cosmetics & Personal Care - 0.3% | ||||||
Haleon US Capital LLC, 3.38%, 03/24/2027 | 5,555,000 | 5,300,974 | ||||
Diversified Financial Services - 0.7% | ||||||
AerCap Ireland Capital/Global Aviation Trust, 6.10%, 01/15/2027 | 6,375,000 | 6,470,097 | ||||
Air Lease Corp., 5.85%, 12/15/2027 | 3,470,000 | 3,514,473 | ||||
Private Export Funding Corp., 3.25%, 06/15/2025 | 1,255,000 | 1,230,127 | ||||
11,214,697 | ||||||
Electric - 1.2% | ||||||
Duke Energy Progress LLC, 3.45%, 03/15/2029 | 2,080,000 | 1,941,047 | ||||
Florida Power & Light Co. | ||||||
5.05%, 04/01/2028 | 3,605,000 | 3,619,737 | ||||
4.40%, 05/15/2028 | 4,560,000 | 4,483,335 | ||||
Georgia Power Co., 5.00%, 02/23/2027 | 3,890,000 | 3,878,347 | ||||
2 |
Par | Value | |||||
CORPORATE BONDS - (Continued) | ||||||
Electric - (Continued) | ||||||
NSTAR Electric Co., 3.20%, 05/15/2027 | $ 2,935,000 | $ 2,793,220 | ||||
Southern California Edison Co., 1.20%, 02/01/2026 | 895,000 | 838,428 | ||||
Virginia Power Fuel Securitization LLC, 5.09%, 05/01/2027 | 2,830,000 | 2,816,072 | ||||
20,370,186 | ||||||
Electronics - 0.1% | ||||||
Honeywell International, Inc., 4.88%, 09/01/2029 | 1,515,000 | 1,518,092 | ||||
Entertainment - 0.1% | ||||||
Warnermedia Holdings, Inc., 3.76%, 03/15/2027 | 2,480,000 | 2,355,127 | ||||
Food - 0.1% | ||||||
Sysco Corp., 3.25%, 07/15/2027 | 2,480,000 | 2,348,715 | ||||
Healthcare-Products - 0.4% | ||||||
Baxter International, Inc., 1.32%, 11/29/2024 | 3,400,000 | 3,338,260 | ||||
Revvity, Inc., 0.85%, 09/15/2024 | 3,150,000 | 3,114,986 | ||||
6,453,246 | ||||||
Healthcare-Services - 0.2% | ||||||
HCA, Inc., 3.13%, 03/15/2027 | 3,540,000 | 3,343,569 | ||||
Insurance - 0.5% | ||||||
Equitable Financial Life Global, 1.40%, 07/07/2025(a) | 2,070,000 | 1,983,068 | ||||
Metropolitan Life Global Funding I, 5.05%, 01/06/2028(a) | 975,000 | 975,477 | ||||
Principal Life Global Funding II, 0.88%, 01/12/2026(a) | 2,130,000 | 1,990,220 | ||||
Protective Life Global Funding, 0.78%, 07/05/2024(a) | 3,820,000 | 3,817,884 | ||||
8,766,649 | ||||||
Machinery-Diversified - 0.1% | ||||||
John Deere Capital Corp., 4.95%, 07/14/2028 | 1,505,000 | 1,507,052 | ||||
Media - 0.0%(b) | ||||||
Charter Communications Operating LLC, 4.91%, 07/23/2025 | 929,000 | 920,017 | ||||
Oil & Gas - 0.1% | ||||||
Marathon Oil Corp., 5.30%, 04/01/2029 | 955,000 | 959,444 | ||||
Packaging & Containers - 0.1% | ||||||
Amcor Group Finance PLC, 5.45%, 05/23/2029 | 1,345,000 | 1,350,118 | ||||
Pharmaceuticals - 0.9% | ||||||
AbbVie, Inc., 4.80%, 03/15/2029 | 1,525,000 | 1,519,594 | ||||
Astrazeneca Finance LLC, 4.80%, 02/26/2027 | 1,235,000 | 1,228,066 | ||||
CVS Health Corp. | ||||||
2.88%, 06/01/2026 | 5,925,000 | 5,641,317 | ||||
5.00%, 01/30/2029 | 965,000 | 955,630 | ||||
Pfizer Investment Enterprises Pte Ltd., 4.45%, 05/19/2028 | 5,985,000 | 5,883,095 | ||||
15,227,702 | ||||||
3 |
Par | Value | |||||
CORPORATE BONDS - (Continued) | ||||||
Pipelines - 1.0% | ||||||
Enbridge, Inc. | ||||||
2.50%, 02/14/2025 | $ 2,005,000 | $ 1,964,750 | ||||
6.00%, 11/15/2028 | 2,565,000 | 2,643,623 | ||||
Energy Transfer LP, 6.05%, 12/01/2026 | 5,825,000 | 5,899,418 | ||||
Williams Cos, Inc. | ||||||
5.40%, 03/02/2026 | 4,170,000 | 4,165,821 | ||||
4.90%, 03/15/2029 | 1,950,000 | 1,925,131 | ||||
16,598,743 | ||||||
REITS - 1.4% | ||||||
American Homes 4 Rent LP, 4.90%, 02/15/2029 | 1,415,000 | 1,383,775 | ||||
Brixmor Operating Partnership LP | ||||||
3.85%, 02/01/2025 | 1,955,000 | 1,933,698 | ||||
4.13%, 06/15/2026 | 1,730,000 | 1,684,241 | ||||
Essex Portfolio LP, 1.70%, 03/01/2028 | 1,435,000 | 1,259,935 | ||||
Kite Realty Group LP, 4.00%, 10/01/2026 | 4,200,000 | 4,058,930 | ||||
Prologis Targeted US Logistics Fund LP, 5.25%, 04/01/2029(a) | 3,310,000 | 3,314,155 | ||||
SITE Centers Corp. | ||||||
3.63%, 02/01/2025 | 5,580,000 | 5,505,988 | ||||
4.70%, 06/01/2027 | 3,665,000 | 3,637,747 | ||||
22,778,469 | ||||||
Retail - 0.4% | ||||||
Home Depot, Inc., 4.88%, 06/25/2027 | 2,410,000 | 2,405,549 | ||||
O’Reilly Automotive, Inc. | ||||||
5.75%, 11/20/2026 | 3,460,000 | 3,492,592 | ||||
4.20%, 04/01/2030 | 1,250,000 | 1,190,634 | ||||
7,088,775 | ||||||
Semiconductors - 0.1% | ||||||
Texas Instruments, Inc., 4.60%, 02/08/2027 | 1,810,000 | 1,798,462 | ||||
Software - 0.1% | ||||||
Oracle Corp., 2.30%, 03/25/2028 | 2,305,000 | 2,085,122 | ||||
Telecommunications - 0.8% | ||||||
AT&T, Inc., 2.30%, 06/01/2027 | 3,640,000 | 3,367,619 | ||||
T-Mobile USA, Inc. | ||||||
4.80%, 07/15/2028 | 2,375,000 | 2,344,059 | ||||
4.85%, 01/15/2029 | 4,580,000 | 4,525,380 | ||||
Verizon Communications, Inc., 2.10%, 03/22/2028 | 3,890,000 | 3,499,796 | ||||
13,736,854 | ||||||
TOTAL CORPORATE BONDS (Cost $292,137,772) | 291,936,311 | |||||
MORTGAGE-BACKED SECURITIES - 10.7% | ||||||
Alen Mortgage Trust, Series 2021-ACEN, Class A, 6.59% (1 mo. Term SOFR + 1.26%), 04/15/2034(a) | 3,150,000 | 2,867,988 | ||||
4 |
Par | Value | |||||
MORTGAGE-BACKED SECURITIES - (Continued) | ||||||
ARES Commercial Mortgage Trust, Series 2024-IND, Class A, 7.01% (1 mo. Term SOFR + 1.69%), 07/15/2041(a) | $ 1,420,000 | $ 1,416,891 | ||||
Ares Commercial Real Estate Corp., Series 2021-FL4, Class A, 6.28% (1 mo. Term SOFR + 0.94%), 12/18/2037(a) | 40,091 | 39,999 | ||||
BBCMS Trust | ||||||
Series 2015-VFM, Class A1, 2.47%, 03/10/2036(a) | 447,482 | 430,159 | ||||
Series 2023-C19, Class A2B, 5.75%, 04/15/2056 | 7,135,000 | 7,125,279 | ||||
BLP Commercial Mortgage Trust, Series 2024-IND2, Class B, 7.02% (1 mo. Term SOFR + 1.69%), 03/15/2041(a) | 3,435,000 | 3,404,928 | ||||
BX Trust | ||||||
Series 2021-CIP, Class A, 6.36% (1 mo. Term SOFR + 1.04%), 12/15/2038(a) | 6,050,000 | 5,981,971 | ||||
Series 2021-XL2, Class B, 6.44% (1 mo. Term SOFR + 1.11%), 10/15/2038(a) | 3,871,495 | 3,813,458 | ||||
Series 2022-PSB, Class B, 8.28% (1 mo. Term SOFR + 2.95%), 08/15/2039(a) | 877,789 | 876,417 | ||||
Series 2022-VAMF, Class B, 6.61% (1 mo. Term SOFR + 1.28%), 01/15/2039(a) | 1,750,000 | 1,721,563 | ||||
Series 2024-XL5, Class A, 6.72% (1 mo. Term SOFR + 1.39%), 03/15/2041(a) | 3,356,439 | 3,337,559 | ||||
Citigroup Commercial Mortgage Trust | ||||||
Series 2014-GC25, Class A4, 3.64%, 10/10/2047 | 2,500,000 | 2,489,071 | ||||
Series 2016-C3, Class A4, 3.15%, 11/15/2049 | 704,000 | 663,046 | ||||
Series 2021-PRM2, Class A, 6.39% (1 mo. Term SOFR + 1.06%), 10/15/2038(a) | 5,250,000 | 5,197,532 | ||||
Cold Storage Trust, Series 2020-ICE5, Class A, 6.34% (1 mo. Term SOFR + 1.01%), 11/15/2037(a) | 5,667,923 | 5,646,669 | ||||
Computershare Corporate Trust, Series 2015-NXS1, Class A5, 3.15%, 05/15/2048 | 2,450,000 | 2,394,578 | ||||
ELP Commercial Mortgage Trust | ||||||
Series 2021-ELP, Class A, 6.14% (1 mo. Term SOFR + 0.82%), 11/15/2038(a) | 1,997,675 | 1,973,966 | ||||
Series 2021-ELP, Class B, 6.56% (1 mo. Term SOFR + 1.23%), 11/15/2038(a) | 5,393,722 | 5,326,524 | ||||
Fannie Mae Connecticut Avenue Securities | ||||||
Series 2018-C05, Class 1M2, 7.80% (30 day avg SOFR US + 2.46%), 01/25/2031 | 902,877 | 923,192 | ||||
Series 2022-R01, Class 1M2, 7.24% (30 day avg SOFR US + 1.90%), 12/25/2041(a) | 875,000 | 885,396 | ||||
Series 2022-R03, Class 1M2, 8.84% (30 day avg SOFR US + 3.50%), 03/25/2042(a) | 5,000,000 | 5,262,825 | ||||
Series 2022-R04, Class 1M2, 8.44% (30 day avg SOFR US + 3.10%), 03/25/2042(a) | 2,915,000 | 3,036,326 | ||||
Series 2022-R05, Class 2M2, 8.34% (30 day avg SOFR US + 3.00%), 04/25/2042(a) | 380,000 | 393,431 | ||||
Series 2022-R06, Class 1M2, 9.19% (30 day avg SOFR US + 3.85%), 05/25/2042(a) | 1,245,000 | 1,319,627 | ||||
5 |
Par | Value | |||||
MORTGAGE-BACKED SECURITIES - (Continued) | ||||||
Series 2022-R07, Class 1M2, 9.99% (30 day avg SOFR US + 4.65%), 06/25/2042(a) | $ 3,214,706 | $ 3,483,941 | ||||
Series 2022-R08, Class 1M2, 8.94% (30 day avg SOFR US + 3.60%), 07/25/2042(a) | 4,090,000 | 4,331,908 | ||||
Series 2023-R01, Class 1M2, 9.09% (30 day avg SOFR US + 3.75%), 12/25/2042(a) | 4,400,000 | 4,713,278 | ||||
Series 2023-R02, Class 1M2, 8.69% (30 day avg SOFR US + 3.35%), 01/25/2043(a) | 5,000,000 | 5,281,117 | ||||
Series 2023-R04, Class 1M2, 8.89% (30 day avg SOFR US + 3.55%), 05/25/2043(a) | 4,407,000 | 4,741,189 | ||||
Fannie Mae Pool, Pool MA5149, 5.50%, 09/01/2038 | 2,225,271 | 2,231,423 | ||||
Freddie Mac Multifamily Structured Pass Through Certificates, Series K059, Class A1, 2.76%, 09/25/2025 | 1,071,022 | 1,045,277 | ||||
Freddie Mac Pool, Pool SB8261, 5.50%, 10/01/2038 | 9,779,957 | 9,806,997 | ||||
Freddie Mac Structured Agency Credit Risk Debt Notes | ||||||
Series 2021-DNA7, Class M2, 7.14% (30 day avg SOFR US + 1.80%), 11/25/2041(a) | 3,590,000 | 3,626,908 | ||||
Series 2022-DNA2, Class M1B, 7.74% (30 day avg SOFR US + 2.40%), 02/25/2042(a) | 2,834,196 | 2,904,973 | ||||
Series 2022-DNA3, Class M1B, 8.24% (30 day avg SOFR US + 2.90%), 04/25/2042(a) | 5,280,000 | 5,487,501 | ||||
Series 2022-DNA4, Class M1B, 8.69% (30 day avg SOFR US + 3.35%), 05/25/2042(a) | 2,685,000 | 2,818,825 | ||||
Series 2022-DNA5, Class M1B, 9.84% (30 day avg SOFR US + 4.50%), 06/25/2042(a) | 7,680,000 | 8,331,103 | ||||
Series 2022-DNA6, Class M1B, 9.04% (30 day avg SOFR US + 3.70%), 09/25/2042(a) | 2,670,000 | 2,843,372 | ||||
Series 2023-DNA1, Class M1B, 8.44% (30 day avg SOFR US + 3.10%), 03/25/2043(a) | 2,085,000 | 2,198,968 | ||||
Series 2023-DNA2, Class M1B, 8.59% (30 day avg SOFR US + 3.25%), 04/25/2043(a) | 5,210,000 | 5,516,098 | ||||
FRESB Multifamily Structured Pass Through Certificates | ||||||
Series 2016-SB23, Class A10F, 2.31%, 09/25/2026(c) | 1,025,981 | 981,773 | ||||
Series 2019-SB69, Class A5F, 2.25%, 10/25/2024(c) | 3,478,620 | 3,445,915 | ||||
GCT Commercial Mortgage Trust, Series 2021-GCT, Class A, 6.24% (1 mo. Term SOFR + 0.91%), 02/15/2038(a) | 3,850,000 | 3,161,079 | ||||
GS Mortgage Securities Corp. II, Series 2021-ARDN, Class A, 6.69% (1 mo. Term SOFR + 1.36%), 11/15/2036(a) | 6,000,000 | 5,928,295 | ||||
GS Mortgage-Backed Securities Trust, Series 2021-NQM1, Class A3, 1.53%, 07/25/2061(a)(c) | 1,132,473 | 994,503 | ||||
GSCG Trust, Series 2019-600C, Class A, 2.94%, 09/06/2034(a) | 2,065,000 | 1,534,553 | ||||
JP Morgan Chase Commercial Mortgage Securities, Series 2021-MHC, Class A, 6.49% (1 mo. Term SOFR + 1.16%), 04/15/2038(a) | 850,407 | 850,085 | ||||
JPMBB Commercial Mortgage Securities Trust, Series 2014-C23, Class ASB, 3.66%, 09/15/2047 | 56,080 | 55,934 | ||||
Ladder Capital Commercial Mortgage Securities LLC, Series 2013-GCP, Class A1, 3.57%, 02/15/2036(a) | 1,345,413 | 1,259,607 | ||||
6 |
Par | Value | |||||
MORTGAGE-BACKED SECURITIES - (Continued) | ||||||
MCR Mortgage Trust, Series 2024-HTL, Class A, 7.09% (1 mo. Term SOFR + 1.76%), 02/15/2037(a) | $ 1,014,333 | $ 1,009,284 | ||||
MHC Commercial Mortgage Trust, Series 2021-MHC, Class B, 6.54% (1 mo. Term SOFR + 1.22%), 04/15/2038(a) | 2,894,125 | 2,861,600 | ||||
Morgan Stanley Capital I Trust 2014-MP, Series 2015-MS1, Class A4, 3.78%, 05/15/2048(c) | 1,000,000 | 977,633 | ||||
Natixis Commercial Mortgage Securities Trust, Series 2018-285M, Class A, 3.92%, 11/15/2032(a)(c) | 876,796 | 789,029 | ||||
New Residential Mortgage Loan Trust | ||||||
Series 2016-1A, Class A1, 3.75%, 03/25/2056(a)(c) | 552,741 | 514,861 | ||||
Series 2017-2A, Class A3, 4.00%, 03/25/2057(a)(c) | 832,108 | 782,968 | ||||
NRTH PARK Mortgage Trust, Series 2024-PARK, Class A, 6.97% (1 mo. Term SOFR + 1.64%), 03/15/2041(a) | 3,270,000 | 3,261,825 | ||||
Onslow Bay Mortgage Loan Trust, Series 2018-1, Class A2, 6.11% (1 mo. Term SOFR + 0.76%), 06/25/2057(a) | 452,080 | 437,587 | ||||
PKHL Commercial Mortgage Trust, Series 2021-MF, Class A, 6.32% (1 mo. Term SOFR + 0.99%), 07/15/2038(a) | 5,750,000 | 5,483,391 | ||||
SMR Mortgage Trust, Series 2022-IND, Class A, 6.98% (1 mo. Term SOFR + 1.65%), 02/15/2039(a) | 1,948,222 | 1,900,336 | ||||
SREIT Trust, Series 2021-MFP2, Class A, 6.27% (1 mo. Term SOFR + 0.94%), 11/15/2036(a) | 4,625,000 | 4,567,188 | ||||
TX Trust, Series 2024-HOU, Class A, 6.91% (1 mo. Term SOFR + 1.59%), 06/15/2039(a) | 2,000,000 | 1,982,489 | ||||
Verus Securitization Trust, Series 2020-1, Class A1, 3.42%, 01/25/2060(a)(d) | 286,877 | 275,079 | ||||
WF-RBS Commercial Mortgage Trust | ||||||
Series 2014-C22, Class AS, 4.07%, 09/15/2057(c) | 350,000 | 322,563 | ||||
Series 2014-C24, Class A5, 3.61%, 11/15/2047 | 1,000,000 | 991,281 | ||||
TOTAL MORTGAGE-BACKED SECURITIES (Cost $182,378,412) | 180,260,131 | |||||
U.S. GOVERNMENT AGENCY ISSUES - 9.8% | ||||||
Federal Farm Credit Banks Funding Corp. | ||||||
4.63%, 03/05/2026 | 20,625,000 | 20,551,383 | ||||
4.50%, 08/14/2026 | 11,900,000 | 11,839,657 | ||||
4.75%, 12/14/2026 | 3,725,000 | 3,728,522 | ||||
4.38%, 03/08/2027 | 29,840,000 | 29,685,497 | ||||
Federal Home Loan Banks | ||||||
0.60%, 02/12/2026 | 7,100,000 | 6,618,174 | ||||
4.75%, 04/09/2027 | 14,750,000 | 14,794,019 | ||||
1.10%, 02/25/2028 | 11,160,000 | 9,906,591 | ||||
Federal National Mortgage Association | ||||||
1.75%, 07/02/2024 | 5,000,000 | 4,999,447 | ||||
0.63%, 04/22/2025 | 6,045,000 | 5,828,941 | ||||
1.88%, 09/24/2026 | 26,835,000 | 25,236,529 | ||||
0.75%, 10/08/2027 | 34,505,000 | 30,543,495 | ||||
TOTAL U.S. GOVERNMENT AGENCY ISSUES (Cost $163,997,862) | 163,732,255 | |||||
7 |
Par | Value | |||||
ASSET-BACKED SECURITIES - 8.3% | ||||||
321 Henderson Receivables I LLC, Series 2004-A, Class A1, 5.79% (1 mo. Term SOFR + 0.46%), 09/15/2045(a) | $ 6,002 | $ 5,976 | ||||
American Express Travel Related Services Co., Inc., Series 2024-1, Class A, 5.23%, 04/16/2029 | 9,350,000 | 9,435,622 | ||||
Angel Oak Mortgage Trust LLC, Series 2020-5, Class A3, 2.04%, 05/25/2065(a)(c) | 89,615 | 83,979 | ||||
Argent Securities, Inc. Asset-Backed Pass-Through Certificates, Series 2003-W6, Class M1, 6.51% (1 mo. Term SOFR + 1.16%), 01/25/2034 | 627,118 | 625,580 | ||||
Bank of America Auto Trust, Series 2024-1A, Class A3, 5.35%, 11/15/2028(a) | 5,225,000 | 5,240,782 | ||||
CarMax Auto Owner Trust, Series 2021-4, Class A3, 0.56%, 09/15/2026 | 1,655,872 | 1,612,187 | ||||
Carvana Auto Receivables Trust | ||||||
Series 2021-P2, Class A3, 0.49%, 03/10/2026 | 251,201 | 250,711 | ||||
Series 2021-P4, Class A3, 1.31%, 01/11/2027 | 3,596,631 | 3,510,943 | ||||
Series 2022-P3, Class A3, 4.61%, 11/10/2027 | 4,541,376 | 4,500,118 | ||||
DB Master Finance Parent LLC, Series 2021-1A, Class A2I, 2.05%, 11/20/2051(a) | 3,997,500 | 3,670,520 | ||||
Diamond Resorts Owner Trust, Series 2021-1A, Class A, 1.51%, 11/21/2033(a) | 658,293 | 616,707 | ||||
Elara Depositor LLC, Series 2021-A, Class A, 1.36%, 08/27/2035(a) | 1,122,309 | 1,033,630 | ||||
Ford Credit Auto Owner Trust, Series 2024-A, Class A3, 5.09%, 12/15/2028 | 3,825,000 | 3,819,870 | ||||
GM Financial Consumer Automobile Receivables Trust | ||||||
Series 2021-1, Class A3, 0.35%, 10/16/2025 | 40,004 | 39,902 | ||||
Series 2021-3, Class A3, 0.48%, 06/16/2026 | 1,600,749 | 1,573,478 | ||||
Series 2024-2, Class A3, 5.10%, 03/16/2029 | 5,170,000 | 5,165,217 | ||||
GM Financial Leasing Trust, Series 2024-2, Class A3, 5.39%, 07/20/2027 | 12,820,000 | 12,854,524 | ||||
Hilton Grand Vacations, Inc. | ||||||
Series 2019-AA, Class A, 2.34%, 07/25/2033(a) | 678,141 | 650,528 | ||||
Series 2024-2A, Class A, 5.50%, 03/25/2038(a) | 4,352,619 | 4,371,838 | ||||
Honda Auto Receivables Owner Trust, Series 2024-1, Class A3, 5.21%, 08/15/2028 | 3,410,000 | 3,413,524 | ||||
Invitation Homes Trust, Series 2018-SFR4, Class A, 6.54% (1 mo. Term SOFR + 1.21%), 01/17/2038(a) | 833,235 | 834,211 | ||||
IPFS Corp. | ||||||
Series 2021-B, Class A, 0.77%, 08/15/2026(a) | 3,550,000 | 3,526,836 | ||||
Series 2024-B, Class A, 4.95%, 02/15/2029(a) | 4,000,000 | 3,967,648 | ||||
Series 2024-D, Class A, 5.34%, 04/15/2029(a) | 4,440,000 | 4,447,236 | ||||
John Deere Owner Trust 2022, Series 2022-C, Class A2, 4.98%, 08/15/2025 | 505,219 | 505,084 | ||||
Marriott Vacations Worldwide Corp. | ||||||
Series 2019-2A, Class A, 2.22%, 10/20/2038(a) | 443,396 | 423,423 | ||||
Series 2021-1WA, Class A, 1.14%, 01/22/2041(a) | 1,083,378 | 1,011,132 | ||||
MVW Owner Trust | ||||||
Series 2019-1A, Class A, 2.89%, 11/20/2036(a) | 296,260 | 288,954 | ||||
Series 2024-1A, Class A, 5.32%, 02/20/2043(a) | 5,293,412 | 5,294,857 | ||||
Navient Student Loan Trust, Series 2021-A, Class A, 0.84%, 05/15/2069(a) | 1,476,772 | 1,304,925 | ||||
Planet Fitness SPV Guarantor LLC, Series 2022-1A, Class A2I, 3.25%, 12/05/2051(a) | 2,502,400 | 2,360,079 | ||||
Santander Consumer USA, Inc., Series 2022-6, Class A3, 4.49%, 11/16/2026 | 1,221,759 | 1,219,149 | ||||
8 |
Par | Value | |||||
ASSET-BACKED SECURITIES - (Continued) | ||||||
Sierra Timeshare Conduit Receivables Funding LLC, Series 2023-2A, Class A, 5.80%, 04/20/2040(a) | $ 707,023 | $ 705,933 | ||||
SoFi Professional Loan Program LLC, Series 2021-B, Class AFX, 1.14%, 02/15/2047(a) | 1,335,765 | 1,137,891 | ||||
Synchrony Bank, Series 2024-A1, Class A, 5.04%, 03/15/2030 | 1,300,000 | 1,298,078 | ||||
Taco Bell Corp., Series 2021-1A, Class A2I, 1.95%, 08/25/2051(a) | 5,767,275 | 5,244,020 | ||||
Tesla Auto Lease Trust, Series 2024-A, Class A3, 5.30%, 06/21/2027(a) | 3,790,000 | 3,775,285 | ||||
T-Mobile US Trust 2024-1, Series 2024-1A, Class A, 5.05%, 09/20/2029(a) | 2,140,000 | 2,136,054 | ||||
Toyota Auto Loan Extended Note Trust, Series 2020-1A, Class A, 1.35%, 05/25/2033(a) | 1,950,000 | 1,877,200 | ||||
Toyota Auto Receivables Owner Trust | ||||||
Series 2022-C, Class A3, 3.76%, 04/15/2027 | 3,000,000 | 2,956,800 | ||||
Series 2024-B, Class A3, 5.33%, 01/16/2029 | 11,650,000 | 11,706,069 | ||||
Toyota Lease Owner Trust, Series 2024-A, Class A3, 5.25%, 04/20/2027(a) | 7,650,000 | 7,645,556 | ||||
Volkswagen Auto Lease Trust, Series 2024-A, Class A3, 5.21%, 06/21/2027 | 4,750,000 | 4,740,392 | ||||
Volkswagen Auto Loan Enhanced Trust, Series 2021-1, Class A3, 1.02%, 06/22/2026 | 2,063,836 | 2,026,622 | ||||
World Omni Automobile Lease Securitization Trust, Series 2024-A, Class A3, 5.26%, 10/15/2027 | 6,720,000 | 6,725,929 | ||||
TOTAL ASSET-BACKED SECURITIES (Cost $141,233,870) | 139,634,999 | |||||
COLLATERALIZED MORTGAGE OBLIGATIONS - 0.3% | ||||||
Benchmark Mortgage Trust, Series 2018-B1, Class A5, 3.67%, 01/15/2051(c) | 1,000,000 | 937,783 | ||||
Citigroup/Deutsche Bank Commercial Mortgage Trust, Series 2017-CD6, Class A5, 3.46%, 11/13/2050 | 2,300,000 | 2,155,437 | ||||
GS Mortgage Securities Corp. II, Series 2017-GS6, Class A3, 3.43%, 05/10/2050 | 2,000,000 | 1,869,480 | ||||
TOTAL COLLATERALIZED MORTGAGE OBLIGATIONS (Cost $4,961,876) | 4,962,700 | |||||
MUNICIPAL BOND - 0.2% | ||||||
State of Hawaii, 1.03%, 08/01/2025 | 4,220,000 | 4,034,810 | ||||
TOTAL MUNICIPAL BOND (Cost $4,220,000) | 4,034,810 | |||||
SHORT-TERM INVESTMENT - 2.3% | ||||||
U.S. Treasury Bill - 2.3% | ||||||
5.08%, 07/18/2024(e) | 38,975,000 | 38,883,896 | ||||
TOTAL SHORT-TERM INVESTMENT (Cost $38,883,896) | 38,883,896 | |||||
TOTAL INVESTMENTS - 85.8% (Cost $1,446,407,032) | 1,441,069,537 | |||||
Money Market Deposit Account - 3.8%(f)(g) | 62,967,575 | |||||
Other Assets in Excess of Liabilities - 10.4%(h) | 173,937,049 | |||||
TOTAL NET ASSETS - 100.0% | $1,677,974,161 | |||||
9 |
(a) | Security is exempt from registration pursuant to Rule 144A under the Securities Act of 1933, as amended. These securities may only be resold in transactions exempt from registration to qualified institutional investors. As of June 30, 2024, the value of these securities total $236,265,571 or 14.1% of the Fund’s net assets. |
(b) | Represents less than 0.05% of net assets. |
(c) | Coupon rate is variable based on the weighted average coupon of the underlying collateral. To the extent the weighted average coupon of the underlying assets which comprise the collateral increases or decreases, the coupon rate of this security will increase or decrease correspondingly. The rate disclosed is as of June 30, 2024. |
(d) | Step coupon bond. The rate disclosed is as of June 30, 2024. |
(e) | The rate shown is the effective yield as of June 30, 2024. |
(f) | A portion of this deposit account is pledged as collateral for derivative contracts. As of the reporting date, the value of this collateral totals $13,347. |
(g) | The U.S. Bank Money Market Deposit Account (the “MMDA”) is a short-term vehicle in which the Fund holds cash balances. The MMDA will bear interest at a variable rate that is determined based on market conditions and is subject to change daily. The rate as of June 30, 2024 was 5.24%. |
(h) | Includes assets and liabilities pledged as collateral and due to broker for derivative contracts. As of the reporting date, the net value of these assets and liabilities totals $155,189,231. |
10 |
Description | Contracts Purchased | Expiration Date | Notional | Value/Unrealized Appreciation (Depreciation) | ||||||||
3-Month Secured Overnight Financing Rate | 56 | 03/17/2026 | $13,444,200 | $(6,190) | ||||||||
3-Month Secured Overnight Financing Rate | 9 | 09/15/2026 | 2,164,613 | (1,439) | ||||||||
Aluminum - 90 Day Settlement | 1 | 07/10/2024 | 62,225 | (145) | ||||||||
Aluminum - 90 Day Settlement | 1 | 07/12/2024 | 62,264 | (1,606) | ||||||||
Aluminum - 90 Day Settlement | 1 | 07/22/2024 | 62,355 | (2,725) | ||||||||
Aluminum - 90 Day Settlement | 2 | 08/13/2024 | 125,352 | (3,174) | ||||||||
Aluminum - 90 Day Settlement | 1 | 08/16/2024 | 62,729 | (3,018) | ||||||||
Aluminum - 90 Day Settlement | 1 | 08/19/2024 | 62,729 | (5,733) | ||||||||
Aluminum - 90 Day Settlement | 1 | 09/25/2024 | 63,112 | (37) | ||||||||
Arabica Coffee | 205 | 09/18/2024 | 17,435,250 | (178,854) | ||||||||
Australian Dollar | 311 | 09/16/2024 | 20,794,317 | 10,187 | ||||||||
Brent Crude Oil | 751 | 07/31/2024 | 63,835,000 | 529,757 | ||||||||
Brent Crude Oil | 78 | 08/30/2024 | 6,566,820 | (14,538) | ||||||||
Brent Crude Oil | 5 | 09/30/2024 | 417,500 | (5,306) | ||||||||
Brent Crude Oil | 5 | 10/31/2024 | 414,450 | (4,016) | ||||||||
CAC40 10 Euro Index | 386 | 07/19/2024 | 30,058,355 | (457,328) | ||||||||
Canadian Dollar | 81 | 09/17/2024 | 5,929,200 | 495 | ||||||||
Copper | 198 | 09/26/2024 | 21,737,925 | (119,752) | ||||||||
Copper - 90 Day Settlement | 1 | 07/08/2024 | 236,894 | 810 | ||||||||
Copper - 90 Day Settlement | 1 | 07/22/2024 | 237,497 | (7,717) | ||||||||
Copper - 90 Day Settlement | 1 | 07/25/2024 | 237,743 | (14,812) | ||||||||
Copper - 90 Day Settlement | 1 | 07/26/2024 | 237,793 | (16,536) | ||||||||
Copper - 90 Day Settlement | 1 | 08/09/2024 | 238,481 | (15,831) | ||||||||
Copper - 90 Day Settlement | 1 | 08/13/2024 | 238,555 | (18,828) | ||||||||
Copper - 90 Day Settlement | 1 | 08/30/2024 | 239,172 | (14,847) | ||||||||
Copper - 90 Day Settlement | 1 | 09/02/2024 | 239,196 | (9,607) | ||||||||
Copper - 90 Day Settlement | 1 | 09/09/2024 | 239,520 | (5,359) | ||||||||
Copper - 90 Day Settlement | 1 | 09/11/2024 | 239,608 | (5,108) | ||||||||
Crude Oil | 724 | 07/22/2024 | 59,034,960 | 1,141,210 | ||||||||
Crude Oil | 71 | 08/20/2024 | 5,725,440 | 130,192 | ||||||||
Crude Oil | 17 | 09/20/2024 | 1,355,920 | 21,109 | ||||||||
Crude Oil | 6 | 10/22/2024 | 474,000 | 4,979 | ||||||||
Crude Oil | 3 | 11/20/2024 | 235,020 | 2,855 | ||||||||
Crude Oil | 1 | 12/19/2024 | 77,740 | (162) | ||||||||
Dollar Index | 130 | 09/16/2024 | 13,720,850 | 131,955 | ||||||||
Dow Jones Industrial Average Index | 251 | 09/20/2024 | 50,212,034 | 339,220 | ||||||||
Euro BUXL 30 Year Bonds | 1 | 09/06/2024 | 139,481 | (1,746) | ||||||||
Euro STOXX 50 Quanto Index | 1,314 | 09/20/2024 | 69,170,084 | (150,012) | ||||||||
Euro-BOBL | 38 | 09/06/2024 | 4,738,656 | (5,069) | ||||||||
Euro-Schatz | 82 | 09/06/2024 | 9,282,356 | (4,348) | ||||||||
FTSE 100 Index | 640 | 09/20/2024 | 66,436,770 | (12,458) | ||||||||
FTSE China A50 Index | 4,042 | 07/30/2024 | 48,107,884 | (79,635) | ||||||||
FTSE/MIB Index | 28 | 09/20/2024 | 5,002,667 | (50,808) | ||||||||
German Stock Index | 147 | 09/20/2024 | 73,081,013 | 325,768 | ||||||||
Gold | 198 | 08/28/2024 | 46,324,080 | (574,620) | ||||||||
Hang Seng Index | 129 | 07/30/2024 | 14,389,280 | (172,479) | ||||||||
11 |
Description | Contracts Purchased | Expiration Date | Notional | Value/Unrealized Appreciation (Depreciation) | ||||||||
IBEX 35 Index | 8 | 07/19/2024 | $931,813 | $(2,352) | ||||||||
Lean Hogs | 1 | 08/14/2024 | 35,800 | 218 | ||||||||
Live Cattle | 16 | 08/30/2024 | 1,186,720 | 2,627 | ||||||||
London Cocoa | 36 | 09/13/2024 | 2,896,091 | (263,207) | ||||||||
London Metals - Aluminum | 256 | 09/16/2024 | 16,150,784 | (348,256) | ||||||||
London Metals - Copper | 176 | 09/16/2024 | 42,205,460 | (1,963,317) | ||||||||
London Metals - Lead | 10 | 09/16/2024 | 557,262 | (1,904) | ||||||||
London Metals - Nickel | 4 | 09/16/2024 | 414,546 | (74,798) | ||||||||
London Metals - Zinc | 130 | 09/16/2024 | 9,540,278 | 14,842 | ||||||||
Long Gilt | 2 | 09/26/2024 | 246,675 | (2,175) | ||||||||
Low Sulphur Gas Oil | 327 | 08/12/2024 | 25,636,800 | (25,912) | ||||||||
Mexican Peso | 131 | 09/16/2024 | 3,529,140 | (24,140) | ||||||||
MSCI EAFE Index | 11 | 09/20/2024 | 1,288,760 | 1,034 | ||||||||
MSCI Singapore Index | 139 | 07/30/2024 | 3,242,821 | (6,402) | ||||||||
Nasdaq 100 Index | 229 | 09/20/2024 | 89,656,326 | (805,240) | ||||||||
Natural Gas | 1 | 07/29/2024 | 26,010 | (872) | ||||||||
Natural Gas | 15 | 07/30/2024 | 412,098 | (3,151) | ||||||||
Natural Gas | 7 | 10/29/2024 | 215,670 | (12,013) | ||||||||
Natural Gas | 1 | 11/26/2024 | 35,580 | (962) | ||||||||
Nickel - 90 Day Settlement | 1 | 09/23/2024 | 103,710 | 181 | ||||||||
Nifty 50 Index | 86 | 07/25/2024 | 4,151,994 | 7,932 | ||||||||
Nikkei 225 Index | 254 | 09/12/2024 | 63,177,083 | 691,409 | ||||||||
Nikkei 225 Index | 432 | 09/12/2024 | 53,191,858 | 14,159 | ||||||||
NY Harbor ULSD | 15 | 07/31/2024 | 1,595,853 | (20,390) | ||||||||
NY Harbor ULSD | 1 | 09/30/2024 | 107,428 | (468) | ||||||||
NY Harbor ULSD | 2 | 10/31/2024 | 214,822 | 236 | ||||||||
Platinum | 3 | 10/29/2024 | 152,115 | (2,221) | ||||||||
Platinum - 90 Day Settlement | 1 | 07/31/2024 | 54,997 | (196) | ||||||||
Platinum - 90 Day Settlement | 1 | 08/05/2024 | 55,087 | (979) | ||||||||
Reformulated Gasoline Blendstock | 43 | 07/31/2024 | 4,517,709 | (49,085) | ||||||||
Russell 2000 Index | 120 | 09/20/2024 | 12,390,000 | 155,768 | ||||||||
S&P 500 Index | 497 | 09/20/2024 | 136,480,235 | (364,520) | ||||||||
SGX FTSE Taiwan Index | 71 | 07/30/2024 | 5,477,650 | 35,615 | ||||||||
Silver | 151 | 09/26/2024 | 22,317,800 | 18,168 | ||||||||
Soybean Meal | 31 | 12/13/2024 | 1,040,050 | (63,337) | ||||||||
Sugar #11 | 18 | 09/30/2024 | 409,248 | 4,171 | ||||||||
Swiss Franc | 66 | 09/16/2024 | 9,260,126 | (7,099) | ||||||||
TAIEX Index | 12 | 07/17/2024 | 1,700,045 | (1,018) | ||||||||
TOPIX Index | 416 | 09/12/2024 | 73,395,864 | 727,084 | ||||||||
U.S. Treasury Long Bonds | 32 | 09/19/2024 | 3,786,000 | (17,958) | ||||||||
U.S. Cocoa | 4 | 09/13/2024 | 309,240 | (40,090) | ||||||||
Zinc - 90 Day Settlement | 1 | 07/03/2024 | 72,023 | 6,343 | ||||||||
Zinc - 90 Day Settlement | 1 | 07/08/2024 | 72,128 | 3,714 | ||||||||
Zinc - 90 Day Settlement | 1 | 07/09/2024 | 72,153 | 3,092 | ||||||||
Zinc - 90 Day Settlement | 1 | 09/11/2024 | 73,287 | 2,663 | ||||||||
Total Purchase Contracts | $(1,738,112) | |||||||||||
12 |
Description | Contracts Sold | Expiration Date | Notional | Value/Unrealized Appreciation (Depreciation) | ||||||||
10 Year Japanese Government Bonds | (12) | 09/11/2024 | $1,064,553 | $7,000 | ||||||||
10 Year U.S. Ultra Treasury Notes | (119) | 09/19/2024 | 13,510,219 | 5,033 | ||||||||
3 Month Euribor | (276) | 03/17/2025 | 71,612,209 | (58,119) | ||||||||
3 Month Euribor | (259) | 06/16/2025 | 67,315,730 | (44,354) | ||||||||
3 Month Euribor | (224) | 09/15/2025 | 58,290,978 | (20,944) | ||||||||
3 Month Euribor | (1,860) | 12/15/2025 | 484,871,458 | (399,972) | ||||||||
3 Month Euribor | (121) | 03/16/2026 | 31,534,511 | (7,515) | ||||||||
3 Month Euribor | (52) | 06/15/2026 | 13,556,894 | (12,303) | ||||||||
3 Month Euribor | (40) | 09/14/2026 | 10,431,057 | (8,096) | ||||||||
3-Month Secured Overnight Financing Rate | (148) | 06/17/2025 | 35,310,950 | 17,263 | ||||||||
3-Month Secured Overnight Financing Rate | (57) | 09/16/2025 | 13,635,113 | 8,671 | ||||||||
3-Month Secured Overnight Financing Rate | (36) | 12/16/2025 | 8,629,200 | (58) | ||||||||
3-Month Secured Overnight Financing Rate | (2,739) | 03/17/2026 | 657,565,425 | (103,791) | ||||||||
3-Month Secured Overnight Financing Rate | (27) | 06/16/2026 | 6,489,113 | (81) | ||||||||
3-Month Secured Overnight Financing Rate | (3) | 12/15/2026 | 721,913 | (5) | ||||||||
3-Month Secured Overnight Financing Rate | (60) | 03/16/2027 | 14,443,500 | (238) | ||||||||
Aluminum - 90 Day Settlement | (1) | 07/10/2024 | 62,225 | 21 | ||||||||
Aluminum - 90 Day Settlement | (1) | 07/12/2024 | 62,264 | 947 | ||||||||
Aluminum - 90 Day Settlement | (1) | 07/22/2024 | 62,355 | 2,430 | ||||||||
Aluminum - 90 Day Settlement | (2) | 08/13/2024 | 125,352 | 3,678 | ||||||||
Aluminum - 90 Day Settlement | (1) | 08/16/2024 | 62,729 | 2,927 | ||||||||
Aluminum - 90 Day Settlement | (1) | 08/19/2024 | 62,729 | 5,243 | ||||||||
Aluminum - 90 Day Settlement | (1) | 09/25/2024 | 63,112 | (215) | ||||||||
ASX SPI 200 Index | (40) | 09/19/2024 | 5,184,686 | (35,498) | ||||||||
Australian Dollar | (245) | 09/16/2024 | 16,373,350 | 3,040 | ||||||||
Austrailian Government 10 Year Bonds | (809) | 09/16/2024 | 61,590,637 | (149,734) | ||||||||
Austrailian Government 3 Year Bonds | (509) | 09/16/2024 | 35,808,240 | (81) | ||||||||
Brent Crude Oil | (1) | 12/30/2024 | 81,830 | (301) | ||||||||
British Pound | (639) | 09/16/2024 | 50,335,395 | 90,775 | ||||||||
Canadian 10 Year Government Bonds | (344) | 09/18/2024 | 30,179,446 | 12,492 | ||||||||
Canadian Dollar | (129) | 09/17/2024 | 9,454,416 | (11,616) | ||||||||
CBOE Volatility Index | (102) | 07/17/2024 | 1,430,326 | 32,144 | ||||||||
CBOE Volatility Index | (116) | 08/21/2024 | 1,733,063 | 27,847 | ||||||||
CBOE Volatility Index | (42) | 09/18/2024 | 663,923 | 7,071 | ||||||||
Copper - 90 Day Settlement | (1) | 07/08/2024 | 236,894 | (2,462) | ||||||||
Copper - 90 Day Settlement | (1) | 07/22/2024 | 237,497 | 7,351 | ||||||||
Copper - 90 Day Settlement | (1) | 07/25/2024 | 237,743 | 12,741 | ||||||||
Copper - 90 Day Settlement | (1) | 07/26/2024 | 237,793 | 12,156 | ||||||||
Copper - 90 Day Settlement | (1) | 08/09/2024 | 238,481 | 14,069 | ||||||||
Copper - 90 Day Settlement | (1) | 08/13/2024 | 238,555 | 17,014 | ||||||||
Copper - 90 Day Settlement | (1) | 08/30/2024 | 239,172 | 14,494 | ||||||||
Copper - 90 Day Settlement | (1) | 09/02/2024 | 239,196 | 11,288 | ||||||||
Copper - 90 Day Settlement | (1) | 09/09/2024 | 239,520 | 3,236 | ||||||||
Copper - 90 Day Settlement | (1) | 09/11/2024 | 239,608 | 3,998 | ||||||||
Corn No. 2 Yellow | (1,162) | 12/13/2024 | 24,445,575 | 2,438,838 | ||||||||
Cotton No.2 | (154) | 12/06/2024 | 5,597,130 | 51,426 | ||||||||
13 |
Description | Contracts Sold | Expiration Date | Notional | Value/Unrealized Appreciation (Depreciation) | ||||||||
Crude Soybean Oil | (323) | 12/13/2024 | $8,486,502 | $7,337 | ||||||||
Euro BUXL 30 Year Bonds | (145) | 09/06/2024 | 20,224,685 | 165,431 | ||||||||
Euro STOXX 50 Quanto Index | (469) | 09/20/2024 | 24,742,104 | 180,588 | ||||||||
Euro | (809) | 09/16/2024 | 108,607,053 | 61,273 | ||||||||
Euro-BOBL | (2,433) | 09/06/2024 | 306,513,030 | (1,557,173) | ||||||||
Euro-BTP Italian Government Bonds | (302) | 09/06/2024 | 37,164,434 | 123,469 | ||||||||
Euro-Bund | (1,031) | 09/06/2024 | 146,258,861 | (310,215) | ||||||||
Euro-Schatz | (3,651) | 09/06/2024 | 416,484,401 | (1,596,579) | ||||||||
French Government Bonds | (790) | 09/06/2024 | 103,582,134 | 583,649 | ||||||||
FTSE 100 Index | (396) | 09/20/2024 | 40,896,588 | 211,164 | ||||||||
FTSE China A50 Index | (14) | 07/30/2024 | 166,628 | 6 | ||||||||
FTSE/JSE Top 40 Index | (55) | 09/19/2024 | 2,229,233 | 9,138 | ||||||||
Gold | (75) | 08/28/2024 | 17,547,000 | (161,784) | ||||||||
Hang Seng China Enterprises Index | (187) | 07/30/2024 | 7,501,265 | 122,296 | ||||||||
Hang Seng Index | (78) | 07/30/2024 | 8,804,784 | 111,868 | ||||||||
Hard Red Winter Wheat | (146) | 09/13/2024 | 4,279,625 | 130,567 | ||||||||
ICE 3 Month SONIA Rate | (84) | 06/17/2025 | 25,348,764 | (18,545) | ||||||||
ICE 3 Month SONIA Rate | (68) | 09/16/2025 | 20,562,333 | (22,418) | ||||||||
ICE 3 Month SONIA Rate | (53) | 12/16/2025 | 16,054,160 | (11,660) | ||||||||
ICE 3 Month SONIA Rate | (287) | 03/17/2026 | 87,164,510 | (107,275) | ||||||||
ICE 3 Month SONIA Rate | (29) | 06/16/2026 | 8,806,347 | (7,799) | ||||||||
ICE 3 Month SONIA Rate | (16) | 09/15/2026 | 4,862,972 | (4,786) | ||||||||
ICE 3 Month SONIA Rate | (11) | 12/15/2026 | 3,345,553 | (4,276) | ||||||||
ICE European Climate Exchange Emissions | (33) | 12/16/2024 | 2,384,482 | 33,709 | ||||||||
Japanese 10 Year Government Bonds | (145) | 09/12/2024 | 128,622,992 | 127,707 | ||||||||
Japanese Yen | (2,256) | 09/16/2024 | 175,746,476 | 851,012 | ||||||||
KOSPI 200 Index | (51) | 09/12/2024 | 3,578,614 | (47,158) | ||||||||
Lean Hogs | (7) | 08/14/2024 | 250,600 | (5,229) | ||||||||
Live Cattle | (14) | 08/30/2024 | 1,038,380 | (15,964) | ||||||||
London Metals - Aluminum | (86) | 09/16/2024 | 5,425,654 | 202,942 | ||||||||
London Metals - Copper | (60) | 09/16/2024 | 14,388,225 | 721,306 | ||||||||
London Metals - Lead | (12) | 09/16/2024 | 668,715 | 6,212 | ||||||||
London Metals - Nickel | (9) | 09/16/2024 | 932,729 | 76,194 | ||||||||
London Metals - Zinc | (38) | 09/16/2024 | 2,788,697 | (16,374) | ||||||||
Long Gilt | (566) | 09/26/2024 | 69,485,538 | 161,805 | ||||||||
MSCI Emerging Markets Index | (274) | 09/20/2024 | 14,908,340 | (43,802) | ||||||||
Natural Gas | (193) | 07/29/2024 | 5,019,930 | 215,720 | ||||||||
Natural Gas | (5) | 09/26/2024 | 134,600 | 7,811 | ||||||||
New Zealand Dollar | (85) | 09/16/2024 | 5,166,203 | 14,547 | ||||||||
Nickel - 90 Day Settlement | (1) | 09/23/2024 | 103,710 | (794) | ||||||||
NY Harbor ULSD | (155) | 07/31/2024 | 16,490,481 | (363,064) | ||||||||
NY Harbor ULSD | (1) | 08/30/2024 | 107,054 | 784 | ||||||||
Platinum | (5) | 10/29/2024 | 253,525 | 521 | ||||||||
Platinum - 90 Day Settlement | (1) | 07/31/2024 | 54,998 | (178) | ||||||||
Platinum - 90 Day Settlement | (1) | 08/05/2024 | 55,087 | 899 | ||||||||
14 |
Description | Contracts Sold | Expiration Date | Notional | Value/Unrealized Appreciation (Depreciation) | ||||||||
Reformulated Gasoline Blendstock | (22) | 07/31/2024 | $2,311,386 | $11,094 | ||||||||
Reformulated Gasoline Blendstock | (12) | 08/30/2024 | 1,245,384 | (2,664) | ||||||||
Reformulated Gasoline Blendstock | (6) | 09/30/2024 | 575,467 | (7,126) | ||||||||
Reformulated Gasoline Blendstock | (1) | 10/31/2024 | 93,454 | (426) | ||||||||
Russell 2000 Index | (46) | 09/20/2024 | 4,780,891 | (31,391) | ||||||||
S&P Mid Cap 400 Index | (7) | 09/20/2024 | 2,070,670 | (13,882) | ||||||||
S&P/Toronto Stock Exchange 60 Index | (18) | 09/19/2024 | 3,448,558 | (19,523) | ||||||||
Sao Paulo Stock Exchange Index(Bovespa) | (255) | 08/14/2024 | 5,720,337 | (96,655) | ||||||||
SET50 Index | (329) | 09/27/2024 | 1,439,988 | 9,852 | ||||||||
SGX FTSE Taiwan Index | (24) | 07/30/2024 | 1,851,600 | 5,140 | ||||||||
SGX TSI Iron Ore | (11) | 08/30/2024 | 116,985 | (3,365) | ||||||||
Silver | (76) | 09/26/2024 | 11,232,800 | 9,618 | ||||||||
Soybean Meal | (131) | 12/13/2024 | 4,395,050 | 89,441 | ||||||||
Soybeans | (688) | 11/14/2024 | 37,977,600 | 1,300,400 | ||||||||
Sugar #11 | (485) | 09/30/2024 | 11,026,960 | (763,759) | ||||||||
Swiss Franc | (68) | 09/16/2024 | 9,548,050 | 51,788 | ||||||||
U.S. Treasury 10 Year Notes | (1,240) | 09/19/2024 | 137,747,459 | (455,611) | ||||||||
U.S. Treasury 2 Year Notes | (3,683) | 09/30/2024 | 756,924,614 | (1,595,653) | ||||||||
U.S. Treasury 5 Year Note | (2,837) | 09/30/2024 | 304,480,070 | (705,977) | ||||||||
U.S. Treasury Long Bonds | (345) | 09/19/2024 | 40,939,244 | (60,716) | ||||||||
U.S. Treasury Ultra Bonds | (214) | 09/19/2024 | 26,566,578 | 256,985 | ||||||||
Wheat | (719) | 09/13/2024 | 20,617,325 | (98,001) | ||||||||
Wheat | (349) | 12/13/2024 | 10,417,650 | (45,796) | ||||||||
Zinc - 90 Day Settlement | (1) | 07/03/2024 | 72,023 | (6,114) | ||||||||
Zinc - 90 Day Settlement | (1) | 07/08/2024 | 72,128 | (2,626) | ||||||||
Zinc - 90 Day Settlement | (1) | 07/09/2024 | 72,153 | (3,414) | ||||||||
Zinc - 90 Day Settlement | (1) | 09/11/2024 | 73,287 | (4,102) | ||||||||
Total Sale Contracts | $(391,791) | |||||||||||
Total Unrealized Appreciation (Depreciation) | $(2,129,903) | |||||||||||
15 |
Settlement Date | Currency Purchased | Currency Sold | Counterparty | Unrealized Appreciation (Depreciation) | ||||||||||||||
07/17/2024 | AUD | 55,690,000 | USD | 37,035,860 | Deutsche Bank | $134,405 | ||||||||||||
09/20/2024 | AUD | 18,654,000 | USD | 12,481,380 | Bank of America Securities, Inc. | (10,037) | ||||||||||||
07/17/2024 | BRL | 87,810,000 | USD | 16,293,460 | Deutsche Bank | (620,818) | ||||||||||||
07/17/2024 | CAD | 54,730,000 | USD | 39,929,539 | Merrill Lynch | 94,264 | ||||||||||||
09/20/2024 | CAD | 5,616,000 | USD | 4,099,923 | Bank of America Securities, Inc. | 13,558 | ||||||||||||
07/17/2024 | CHF | 12,860,000 | USD | 14,402,137 | Deutsche Bank | (55,042) | ||||||||||||
09/20/2024 | CHF | 7,565,000 | USD | 8,607,951 | Bank of America Securities, Inc. | (100,791) | ||||||||||||
07/17/2024 | CLP | 3,945,000,000 | USD | 4,238,961 | Deutsche Bank | (47,491) | ||||||||||||
07/17/2024 | EUR | 55,820,000 | USD | 60,247,584 | Merrill Lynch | (412,466) | ||||||||||||
07/17/2024 | GBP | 18,250,000 | USD | 23,145,633 | Merrill Lynch | (73,065) | ||||||||||||
09/20/2024 | GBP | 56,124,000 | USD | 71,815,244 | Bank of America Securities, Inc. | (824,146) | ||||||||||||
07/17/2024 | ILS | 13,210,000 | USD | 3,564,723 | Deutsche Bank | (64,689) | ||||||||||||
07/18/2024 | INR | 821,150,000 | USD | 9,828,528 | Deutsche Bank | 12,804 | ||||||||||||
07/17/2024 | JPY | 5,607,000,000 | USD | 35,841,036 | Merrill Lynch | (887,662) | ||||||||||||
09/20/2024 | JPY | 438,750,000 | USD | 2,806,106 | Bank of America Securities, Inc. | (43,360) | ||||||||||||
07/17/2024 | KRW | 13,658,000,000 | USD | 9,888,774 | Deutsche Bank | 44,238 | ||||||||||||
07/17/2024 | MXN | 1,331,500,000 | USD | 73,634,258 | Merrill Lynch | (1,070,303) | ||||||||||||
09/20/2024 | MXN | 304,659,000 | USD | 15,882,864 | Bank of America Securities, Inc. | 549,864 | ||||||||||||
07/17/2024 | NOK | 86,050,000 | USD | 8,125,398 | Deutsche Bank | (61,925) | ||||||||||||
07/17/2024 | NZD | 46,010,000 | USD | 28,138,285 | Deutsche Bank | (113,475) | ||||||||||||
09/20/2024 | NZD | 52,325,000 | USD | 32,233,922 | Bank of America Securities, Inc. | (363,375) | ||||||||||||
07/17/2024 | PLN | 77,650,000 | USD | 19,289,594 | Deutsche Bank | (4,471) | ||||||||||||
07/17/2024 | SEK | 60,480,000 | USD | 5,830,785 | Deutsche Bank | (119,110) | ||||||||||||
07/17/2024 | SGD | 24,390,000 | USD | 18,072,610 | Deutsche Bank | (69,114) | ||||||||||||
07/17/2024 | USD | 99,792,066 | AUD | 149,830,000 | Deutsche Bank | (211,895) | ||||||||||||
09/20/2024 | USD | 649,721 | AUD | 979,000 | Bank of America Securities, Inc. | (4,801) | ||||||||||||
07/17/2024 | USD | 45,524,900 | BRL | 243,860,000 | Deutsche Bank | 1,999,895 | ||||||||||||
07/17/2024 | USD | 82,151,528 | CAD | 112,010,000 | Merrill Lynch | 239,120 | ||||||||||||
09/20/2024 | USD | 118,422,786 | CAD | 161,817,000 | Bank of America Securities, Inc. | (101,283) | ||||||||||||
07/17/2024 | USD | 150,385,850 | CHF | 133,760,000 | Deutsche Bank | 1,158,213 | ||||||||||||
09/20/2024 | USD | 91,323,450 | CHF | 80,455,000 | Bank of America Securities, Inc. | 848,432 | ||||||||||||
07/17/2024 | USD | 4,040,768 | CLP | 3,757,000,000 | Deutsche Bank | 49,045 | ||||||||||||
07/17/2024 | USD | 189,993,253 | EUR | 175,760,000 | Merrill Lynch | 1,590,880 | ||||||||||||
09/20/2024 | USD | 87,684,012 | EUR | 81,262,000 | Bank of America Securities, Inc. | 297,249 | ||||||||||||
07/17/2024 | USD | 100,710,625 | GBP | 79,260,000 | Merrill Lynch | 506,146 | ||||||||||||
09/20/2024 | USD | 3,388,251 | GBP | 2,679,000 | Bank of America Securities, Inc. | (409) | ||||||||||||
07/17/2024 | USD | 5,752,907 | ILS | 21,510,000 | Deutsche Bank | 53,759 | ||||||||||||
07/18/2024 | USD | 9,839,583 | INR | 822,400,000 | Deutsche Bank | (16,730) | ||||||||||||
07/17/2024 | USD | 128,812,715 | JPY | 20,209,000,000 | Merrill Lynch | 2,832,202 | ||||||||||||
09/20/2024 | USD | 82,195,353 | JPY | 12,641,936,000 | Bank of America Securities, Inc. | 2,590,907 | ||||||||||||
07/17/2024 | USD | 13,077,964 | KRW | 17,912,000,000 | Deutsche Bank | 51,158 | ||||||||||||
07/17/2024 | USD | 47,991,187 | MXN | 865,640,000 | Merrill Lynch | 815,623 | ||||||||||||
09/20/2024 | USD | 29,165,761 | MXN | 550,071,000 | Bank of America Securities, Inc. | (504,024) | ||||||||||||
07/17/2024 | USD | 37,699,578 | NOK | 399,350,000 | Deutsche Bank | 277,757 | ||||||||||||
07/17/2024 | USD | 37,190,519 | NZD | 60,490,000 | Deutsche Bank | 345,903 | ||||||||||||
09/20/2024 | USD | 52,411 | NZD | 86,000 | Bank of America Securities, Inc. | 29 | ||||||||||||
16 |
Settlement Date | Currency Purchased | Currency Sold | Counterparty | Unrealized Appreciation (Depreciation) | ||||||||||||||
07/17/2024 | USD | 13,299,241 | PLN | 53,830,000 | Deutsche Bank | $(69,956) | ||||||||||||
07/17/2024 | USD | 44,469,532 | SEK | 466,600,000 | Deutsche Bank | 404,258 | ||||||||||||
07/17/2024 | USD | 30,925,255 | SGD | 41,820,000 | Deutsche Bank | 55,792 | ||||||||||||
07/17/2024 | USD | 18,366,448 | ZAR | 334,170,000 | Deutsche Bank | 25,777 | ||||||||||||
07/17/2024 | ZAR | 163,730,000 | USD | 8,749,793 | Deutsche Bank | 236,406 | ||||||||||||
Total Unrealized Appreciation (Depreciation) | $ 9,377,246 | |||||||||||||||||
17 |
Par | Value | |||||
U.S. TREASURY SECURITIES - 26.3% | ||||||
United States Treasury Note | ||||||
0.25%, 05/31/2025 | $885,000 | $846,342 | ||||
0.25%, 10/31/2025 | 2,400,000 | 2,255,531 | ||||
3.75%, 04/15/2026 | 21,885,000 | 21,493,464 | ||||
0.75%, 05/31/2026 | 10,655,000 | 9,881,264 | ||||
4.50%, 07/15/2026 | 5,145,000 | 5,123,094 | ||||
1.50%, 08/15/2026 | 21,795,000 | 20,396,204 | ||||
4.13%, 02/15/2027 | 11,930,000 | 11,794,856 | ||||
4.50%, 04/15/2027 | 27,460,000 | 27,423,530 | ||||
3.88%, 11/30/2027 | 12,730,000 | 12,491,810 | ||||
3.50%, 01/31/2028 | 12,855,000 | 12,453,783 | ||||
3.63%, 03/31/2028 | 14,185,000 | 13,793,250 | ||||
1.38%, 10/31/2028 | 20,990,000 | 18,518,755 | ||||
3.75%, 12/31/2028 | 18,345,000 | 17,885,658 | ||||
4.25%, 02/28/2029 | 31,920,000 | 31,796,559 | ||||
4.63%, 04/30/2029 | 22,895,000 | 23,172,244 | ||||
TOTAL U.S. TREASURY SECURITIES (Cost $230,188,725) | 229,326,344 | |||||
CORPORATE BONDS - 13.7% | ||||||
Aerospace & Defense - 0.4% | ||||||
Boeing Co., 3.25%, 02/01/2028 | 2,185,000 | 2,001,540 | ||||
L3Harris Technologies, Inc., 5.40%, 01/15/2027 | 1,240,000 | 1,245,267 | ||||
RTX Corp., 4.13%, 11/16/2028 | 600,000 | 577,894 | ||||
3,824,701 | ||||||
Agriculture - 0.1% | ||||||
Philip Morris International, Inc., 4.88%, 02/15/2028 | 1,090,000 | 1,080,996 | ||||
Auto Manufacturers - 0.7% | ||||||
Daimler Truck Finance North America LLC, 5.00%, 01/15/2027(a) | 1,035,000 | 1,027,662 | ||||
Ford Motor Credit Co. LLC, 5.85%, 05/17/2027 | 1,905,000 | 1,905,442 | ||||
General Motors Financial Co., Inc., 5.80%, 06/23/2028 | 1,840,000 | 1,863,468 | ||||
Toyota Motor Credit Corp., 5.60%, 09/11/2025 | 550,000 | 552,130 | ||||
Volkswagen Group of America Finance LLC, 1.25%, 11/24/2025(a) | 1,200,000 | 1,132,078 | ||||
6,480,780 | ||||||
Banks - 5.0% | ||||||
Banco Santander SA | ||||||
3.50%, 03/24/2025 | 1,105,000 | 1,088,659 | ||||
2.75%, 05/28/2025 | 265,000 | 258,123 | ||||
Bank of America Corp. | ||||||
4.38% to 04/27/2027 then SOFR + 1.58%, 04/27/2028 | 3,435,000 | 3,352,859 | ||||
5.82% to 09/15/2028 then SOFR + 1.57%, 09/15/2029 | 4,890,000 | 4,994,634 | ||||
Bank of America NA, 5.53%, 08/18/2026 | 4,520,000 | 4,551,254 | ||||
Barclays PLC, 6.49% to 09/13/2028 then SOFR + 2.22%, 09/13/2029 | 1,775,000 | 1,838,224 | ||||
Canadian Imperial Bank of Commerce, 3.45%, 04/07/2027 | 900,000 | 861,804 | ||||
Citibank NA, 5.44%, 04/30/2026 | 1,580,000 | 1,585,523 | ||||
Credit Suisse AG, 5.00%, 07/09/2027 | 700,000 | 694,329 | ||||
18 |
Par | Value | |||||
CORPORATE BONDS - (Continued) | ||||||
Banks - (Continued) | ||||||
Federation des Caisses Desjardins du Quebec, 5.70%, 03/14/2028(a) | $ 1,290,000 | $ 1,303,619 | ||||
Goldman Sachs Group, Inc. | ||||||
5.80% to 08/10/2025 then SOFR + 1.08%, 08/10/2026 | 3,630,000 | 3,631,408 | ||||
6.48% to 10/24/2028 then SOFR + 1.77%, 10/24/2029 | 770,000 | 804,363 | ||||
HSBC Holdings PLC, 6.16% to 03/09/2028 then SOFR + 1.97%, 03/09/2029 | 1,125,000 | 1,151,441 | ||||
ING Groep NV, 3.87% to 03/28/2025 then SOFR + 1.64%, 03/28/2026 | 1,095,000 | 1,079,124 | ||||
JPMorgan Chase & Co., 5.58% to 04/22/2029 then SOFR + 1.16%, 04/22/2030 | 4,040,000 | 4,106,301 | ||||
Morgan Stanley, 5.66% to 04/18/2029 then SOFR + 1.26%, 04/18/2030 | 625,000 | 635,957 | ||||
Morgan Stanley Bank NA, 4.95% to 01/14/2027 then SOFR + 1.08%, 01/14/2028 | 3,315,000 | 3,290,478 | ||||
NatWest Markets PLC, 5.41%, 05/17/2029(a) | 1,150,000 | 1,154,242 | ||||
Toronto-Dominion Bank | ||||||
3.77%, 06/06/2025 | 820,000 | 806,743 | ||||
1.25%, 09/10/2026 | 2,080,000 | 1,907,405 | ||||
UBS Group AG | ||||||
4.49% to 05/12/2025 then 1 yr. CMT Rate + 1.55%, 05/12/2026(a) | 450,000 | 444,670 | ||||
6.33% to 12/22/2026 then 1 yr. CMT Rate + 1.60%, 12/22/2027(a) | 1,210,000 | 1,230,006 | ||||
Wells Fargo & Co., 5.57% to 07/25/2028 then SOFR + 1.74%, 07/25/2029 | 3,080,000 | 3,109,550 | ||||
43,880,716 | ||||||
Beverages - 0.1% | ||||||
PepsiCo, Inc., 5.13%, 11/10/2026 | 1,225,000 | 1,230,279 | ||||
Biotechnology - 0.2% | ||||||
Amgen, Inc., 5.15%, 03/02/2028 | 1,655,000 | 1,655,307 | ||||
Building Materials - 0.1% | ||||||
Trane Technologies Financing Ltd., 3.50%, 03/21/2026 | 595,000 | 575,941 | ||||
Chemicals - 0.1% | ||||||
Nutrien Ltd., 4.90%, 03/27/2028 | 580,000 | 573,457 | ||||
Cosmetics & Personal Care - 0.2% | ||||||
Haleon US Capital LLC, 3.38%, 03/24/2027 | 2,220,000 | 2,118,481 | ||||
Diversified Financial Services - 0.5% | ||||||
AerCap Ireland Capital/Global Aviation Trust, 6.10%, 01/15/2027 | 2,570,000 | 2,608,337 | ||||
Air Lease Corp., 5.85%, 12/15/2027 | 1,390,000 | 1,407,815 | ||||
Latam Airlines Group SA, 1.58%, 11/16/2024 | 1,147 | 1,135 | ||||
MSN 41079 and 41084 Ltd., 1.72%, 07/13/2024 | 579 | 578 | ||||
Phoenix 2012 LLC, 1.61%, 07/03/2024 | 573 | 573 | ||||
Private Export Funding Corp., 3.25%, 06/15/2025 | 510,000 | 499,892 | ||||
4,518,330 | ||||||
Electric - 1.0% | ||||||
Duke Energy Progress LLC, 3.45%, 03/15/2029 | 860,000 | 802,548 | ||||
Florida Power & Light Co. | ||||||
5.05%, 04/01/2028 | 1,430,000 | 1,435,846 | ||||
4.40%, 05/15/2028 | 1,820,000 | 1,789,401 | ||||
19 |
Par | Value | |||||
CORPORATE BONDS - (Continued) | ||||||
Electric - (Continued) | ||||||
Georgia Power Co., 5.00%, 02/23/2027 | $ 1,540,000 | $ 1,535,387 | ||||
NSTAR Electric Co., 3.20%, 05/15/2027 | 1,210,000 | 1,151,549 | ||||
Southern California Edison Co., 1.20%, 02/01/2026 | 335,000 | 313,825 | ||||
Virginia Power Fuel Securitization LLC, 5.09%, 05/01/2027 | 1,780,000 | 1,771,240 | ||||
8,799,796 | ||||||
Electronics - 0.1% | ||||||
Honeywell International, Inc., 4.88%, 09/01/2029 | 625,000 | 626,275 | ||||
Entertainment - 0.1% | ||||||
Warnermedia Holdings, Inc., 3.76%, 03/15/2027 | 985,000 | 935,403 | ||||
Food - 0.1% | ||||||
Sysco Corp., 3.25%, 07/15/2027 | 1,025,000 | 970,739 | ||||
Healthcare-Products - 0.4% | ||||||
Baxter International, Inc., 1.32%, 11/29/2024 | 1,690,000 | 1,659,312 | ||||
Revvity, Inc., 0.85%, 09/15/2024 | 1,565,000 | 1,547,604 | ||||
3,206,916 | ||||||
Healthcare-Services - 0.2% | ||||||
HCA, Inc., 3.13%, 03/15/2027 | 1,400,000 | 1,322,315 | ||||
Insurance - 0.4% | ||||||
Equitable Financial Life Global, 1.40%, 07/07/2025(a) | 900,000 | 862,203 | ||||
Metropolitan Life Global Funding I, 5.05%, 01/06/2028(a) | 375,000 | 375,184 | ||||
Principal Life Global Funding II, 0.88%, 01/12/2026(a) | 930,000 | 868,969 | ||||
Protective Life Global Funding, 0.78%, 07/05/2024(a) | 1,685,000 | 1,684,067 | ||||
3,790,423 | ||||||
Machinery-Diversified - 0.1% | ||||||
John Deere Capital Corp., 4.95%, 07/14/2028 | 625,000 | 625,852 | ||||
Media - 0.0%(b) | ||||||
Charter Communications Operating LLC, 4.91%, 07/23/2025 | 399,000 | 395,142 | ||||
Oil & Gas - 0.1% | ||||||
Marathon Oil Corp., 5.30%, 04/01/2029 | 405,000 | 406,885 | ||||
Packaging & Containers - 0.1% | ||||||
Amcor Group Finance PLC, 5.45%, 05/23/2029 | 560,000 | 562,131 | ||||
Pharmaceuticals - 0.7% | ||||||
AbbVie, Inc., 4.80%, 03/15/2029 | 630,000 | 627,767 | ||||
Astrazeneca Finance LLC, 4.80%, 02/26/2027 | 515,000 | 512,108 | ||||
CVS Health Corp. | ||||||
2.88%, 06/01/2026 | 2,395,000 | 2,280,330 | ||||
5.00%, 01/30/2029 | 400,000 | 396,116 | ||||
20 |
Par | Value | |||||
CORPORATE BONDS - (Continued) | ||||||
Pharmaceuticals - (Continued) | ||||||
Pfizer Investment Enterprises Pte Ltd., 4.45%, 05/19/2028 | $ 2,420,000 | $2,378,796 | ||||
6,195,117 | ||||||
Pipelines - 0.8% | ||||||
Enbridge, Inc. | ||||||
2.50%, 02/14/2025 | 820,000 | 803,539 | ||||
6.00%, 11/15/2028 | 1,010,000 | 1,040,959 | ||||
Energy Transfer LP, 6.05%, 12/01/2026 | 2,320,000 | 2,349,639 | ||||
Williams Cos, Inc. | ||||||
5.40%, 03/02/2026 | 1,655,000 | 1,653,341 | ||||
4.90%, 03/15/2029 | 805,000 | 794,734 | ||||
6,642,212 | ||||||
REITS - 1.1% | ||||||
American Homes 4 Rent LP, 4.90%, 02/15/2029 | 585,000 | 572,091 | ||||
Brixmor Operating Partnership LP | ||||||
3.85%, 02/01/2025 | 810,000 | 801,174 | ||||
4.13%, 06/15/2026 | 700,000 | 681,485 | ||||
Essex Portfolio LP, 1.70%, 03/01/2028 | 590,000 | 518,022 | ||||
Kite Realty Group LP, 4.00%, 10/01/2026 | 1,675,000 | 1,618,740 | ||||
Prologis Targeted US Logistics Fund LP, 5.25%, 04/01/2029(a) | 1,320,000 | 1,321,657 | ||||
SITE Centers Corp. | ||||||
3.63%, 02/01/2025 | 2,210,000 | 2,180,687 | ||||
4.70%, 06/01/2027 | 1,755,000 | 1,741,949 | ||||
9,435,805 | ||||||
Retail - 0.3% | ||||||
Home Depot, Inc., 4.88%, 06/25/2027 | 975,000 | 973,199 | ||||
O’Reilly Automotive, Inc. | ||||||
5.75%, 11/20/2026 | 1,385,000 | 1,398,046 | ||||
4.20%, 04/01/2030 | 545,000 | 519,117 | ||||
2,890,362 | ||||||
Semiconductors - 0.1% | ||||||
Texas Instruments, Inc., 4.60%, 02/08/2027 | 745,000 | 740,251 | ||||
Software - 0.1% | ||||||
Oracle Corp., 2.30%, 03/25/2028 | 960,000 | 868,424 | ||||
Telecommunications - 0.6% | ||||||
AT&T, Inc., 2.30%, 06/01/2027 | 1,485,000 | 1,373,877 | ||||
T-Mobile USA, Inc. | ||||||
4.80%, 07/15/2028 | 980,000 | 967,233 | ||||
4.85%, 01/15/2029 | 1,840,000 | 1,818,056 | ||||
Verizon Communications, Inc., 2.10%, 03/22/2028 | 1,540,000 | 1,385,524 | ||||
5,544,690 | ||||||
TOTAL CORPORATE BONDS (Cost $120,072,357) | 119,897,726 | |||||
21 |
Shares | Value | |||||
COMMODITY POOL - 12.6% | ||||||
Galaxy Commodity - Polaris Fund LLC(c)(d) | 190,448 | $109,712,615 | ||||
TOTAL COMMODITY POOL (Cost $141,359,330) | 109,712,615 | |||||
Par | ||||||
MORTGAGE-BACKED SECURITIES - 9.2% | ||||||
Alen Mortgage Trust, Series 2021-ACEN, Class A, 6.59% (1 mo. Term SOFR + 1.26%), 04/15/2034(a) | $ 1,250,000 | 1,138,091 | ||||
ARES Commercial Mortgage Trust, Series 2024-IND, Class A, 7.01% (1 mo. Term SOFR + 1.69%), 07/15/2041(a) | 500,000 | 498,905 | ||||
Ares Commercial Real Estate Corp., Series 2021-FL4, Class A, 6.28% (1 mo. Term SOFR + 0.94%), 12/18/2037(a) | 13,909 | 13,877 | ||||
Banc of America-Remic Trust, Series 2022-DKLX, Class A, 6.48% (1 mo. Term SOFR + 1.15%), 01/15/2039(a) | 3,750,000 | 3,713,672 | ||||
BBCMS Trust, Series 2023-C19, Class A2B, 5.75%, 04/15/2056 | 2,750,000 | 2,746,253 | ||||
BLP Commercial Mortgage Trust, Series 2024-IND2, Class B, 7.02% (1 mo. Term SOFR + 1.69%), 03/15/2041(a) | 1,325,000 | 1,313,400 | ||||
BX Trust | ||||||
Series 2021-CIP, Class A, 6.36% (1 mo. Term SOFR + 1.04%), 12/15/2038(a) | 2,950,000 | 2,916,829 | ||||
Series 2021-XL2, Class B, 6.44% (1 mo. Term SOFR + 1.11%), 10/15/2038(a) | 2,463,679 | 2,426,746 | ||||
Citigroup Commercial Mortgage Trust | ||||||
Series 2016-C3, Class A4, 3.15%, 11/15/2049 | 300,000 | 282,548 | ||||
Series 2021-PRM2, Class A, 6.39% (1 mo. Term SOFR + 1.06%), 10/15/2038(a) | 1,050,000 | 1,039,506 | ||||
Commercial Mortgage Pass Through Certificates | ||||||
Series 2015-3BP, Class A, 3.18%, 02/10/2035(a) | 1,030,000 | 944,222 | ||||
Series 2015-CR27, Class AM, 3.98%, 10/10/2048 | 1,000,000 | 962,135 | ||||
Credit Suisse Mortgage Capital Certificates, Series 2017-CALI, Class A, 3.43%, 11/10/2032(a) | 1,750,000 | 1,472,275 | ||||
ELP Commercial Mortgage Trust, Series 2021-ELP, Class B, 6.56% (1 mo. Term SOFR + 1.23%), 11/15/2038(a) | 2,646,919 | 2,613,942 | ||||
Fannie Mae Connecticut Avenue Securities | ||||||
Series 2018-C05, Class 1M2, 7.80% (30 day avg SOFR US + 2.46%), 01/25/2031 | 1,077,769 | 1,102,019 | ||||
Series 2022-R03, Class 1M2, 8.84% (30 day avg SOFR US + 3.50%), 03/25/2042(a) | 2,137,057 | 2,249,391 | ||||
Series 2022-R04, Class 1M2, 8.44% (30 day avg SOFR US + 3.10%), 03/25/2042(a) | 1,975,000 | 2,057,202 | ||||
Series 2022-R05, Class 2M2, 8.34% (30 day avg SOFR US + 3.00%), 04/25/2042(a) | 130,000 | 134,595 | ||||
Series 2022-R06, Class 1M2, 9.19% (30 day avg SOFR US + 3.85%), 05/25/2042(a) | 915,000 | 969,847 | ||||
Series 2022-R07, Class 1M2, 9.99% (30 day avg SOFR US + 4.65%), 06/25/2042(a) | 1,655,000 | 1,793,608 | ||||
Series 2022-R08, Class 1M2, 8.94% (30 day avg SOFR US + 3.60%), 07/25/2042(a) | 1,900,000 | 2,012,378 | ||||
22 |
Par | Value | |||||
MORTGAGE-BACKED SECURITIES - (Continued) | ||||||
Series 2023-R01, Class 1M2, 9.09% (30 day avg SOFR US + 3.75%), 12/25/2042(a) | $ 2,830,000 | $ 3,031,495 | ||||
Series 2023-R02, Class 1M2, 8.69% (30 day avg SOFR US + 3.35%), 01/25/2043(a) | 2,000,000 | 2,112,447 | ||||
Series 2023-R04, Class 1M2, 8.89% (30 day avg SOFR US + 3.55%), 05/25/2043(a) | 2,000,000 | 2,151,663 | ||||
Fannie Mae Pool, Pool MA5149, 5.50%, 09/01/2038 | 1,413,128 | 1,417,035 | ||||
Freddie Mac Multifamily Structured Pass Through Certificates | ||||||
Series K050, Class A1, 2.80%, 01/25/2025 | 376,565 | 372,457 | ||||
Series K052, Class A1, 2.60%, 01/25/2025 | 49,418 | 48,932 | ||||
Series K059, Class A1, 2.76%, 09/25/2025 | 479,410 | 467,886 | ||||
Freddie Mac Pool, Pool SB8261, 5.50%, 10/01/2038 | 6,216,460 | 6,233,648 | ||||
Freddie Mac Structured Agency Credit Risk Debt Notes | ||||||
Series 2021-DNA7, Class M2, 7.14% (30 day avg SOFR US + 1.80%), 11/25/2041(a) | 735,000 | 742,556 | ||||
Series 2022-DNA2, Class M1B, 7.74% (30 day avg SOFR US + 2.40%), 02/25/2042(a) | 1,120,000 | 1,147,969 | ||||
Series 2022-DNA3, Class M1B, 8.24% (30 day avg SOFR US + 2.90%), 04/25/2042(a) | 2,626,000 | 2,729,200 | ||||
Series 2022-DNA5, Class M1B, 9.84% (30 day avg SOFR US + 4.50%), 06/25/2042(a) | 1,455,000 | 1,578,353 | ||||
Series 2022-DNA6, Class M1B, 9.04% (30 day avg SOFR US + 3.70%), 09/25/2042(a) | 1,830,000 | 1,948,828 | ||||
Series 2023-DNA1, Class M1B, 8.44% (30 day avg SOFR US + 3.10%), 03/25/2043(a) | 760,000 | 801,542 | ||||
Series 2023-DNA2, Class M1B, 8.59% (30 day avg SOFR US + 3.25%), 04/25/2043(a) | 2,195,000 | 2,323,961 | ||||
FRESB Multifamily Structured Pass Through Certificates | ||||||
Series 2016-SB23, Class A10F, 2.31%, 09/25/2026(e) | 499,641 | 478,112 | ||||
Series 2019-SB69, Class A5F, 2.25%, 10/25/2024(e) | 1,099,127 | 1,088,793 | ||||
GCT Commercial Mortgage Trust, Series 2021-GCT, Class A, 6.24% (1 mo. Term SOFR + 0.91%), 02/15/2038(a) | 1,400,000 | 1,149,483 | ||||
GS Mortgage Securities Corp. II, Series 2021-ARDN, Class A, 6.69% (1 mo. Term SOFR + 1.36%), 11/15/2036(a) | 3,685,000 | 3,640,961 | ||||
GS Mortgage-Backed Securities Trust, Series 2021-NQM1, Class A3, 1.53%, 07/25/2061(a)(e) | 784,020 | 688,502 | ||||
JP Morgan Chase Commercial Mortgage Securities, Series 2021-MHC, Class A, 6.49% (1 mo. Term SOFR + 1.16%), 04/15/2038(a) | 708,673 | 708,404 | ||||
JPMBB Commercial Mortgage Securities Trust | ||||||
Series 2014-C22, Class AS, 4.11%, 09/15/2047 | 1,350,000 | 1,283,710 | ||||
Series 2014-C23, Class ASB, 3.66%, 09/15/2047 | 25,283 | 25,218 | ||||
MHC Commercial Mortgage Trust, Series 2021-MHC, Class A, 6.24% (1 mo. Term SOFR + 0.92%), 04/15/2038(a) | 1,677,753 | 1,664,136 | ||||
New Residential Mortgage Loan Trust, Series 2016-1A, Class A1, 3.75%, 03/25/2056(a)(e) | 88,464 | 82,402 | ||||
NRTH PARK Mortgage Trust, Series 2024-PARK, Class A, 6.97% (1 mo. Term SOFR + 1.64%), 03/15/2041(a) | 700,000 | 698,250 | ||||
23 |
Par | Value | |||||
MORTGAGE-BACKED SECURITIES - (Continued) | ||||||
Onslow Bay Mortgage Loan Trust, Series 2018-1, Class A2, 6.11% (1 mo. Term SOFR + 0.76%), 06/25/2057(a) | $169,530 | $164,095 | ||||
PKHL Commercial Mortgage Trust, Series 2021-MF, Class A, 6.32% (1 mo. Term SOFR + 0.99%), 07/15/2038(a) | 3,250,000 | 3,099,308 | ||||
SMR Mortgage Trust, Series 2022-IND, Class A, 6.98% (1 mo. Term SOFR + 1.65%), 02/15/2039(a) | 3,478,968 | 3,393,457 | ||||
SREIT Trust, Series 2021-MFP2, Class A, 6.27% (1 mo. Term SOFR + 0.94%), 11/15/2036(a) | 1,000,000 | 987,500 | ||||
TX Trust, Series 2024-HOU, Class A, 6.91% (1 mo. Term SOFR + 1.59%), 06/15/2039(a) | 600,000 | 594,747 | ||||
UBS Commercial Mortgage Trust, Series 2017-C6, Class ASB, 3.50%, 12/15/2050 | 646,878 | 626,045 | ||||
Verus Securitization Trust, Series 2020-1, Class A1, 3.42%, 01/25/2060(a)(f) | 114,751 | 110,032 | ||||
TOTAL MORTGAGE-BACKED SECURITIES (Cost $81,292,189) | 79,992,568 | |||||
U.S. GOVERNMENT AGENCY ISSUES - 7.8% | ||||||
Federal Farm Credit Banks Funding Corp. | ||||||
4.63%, 03/05/2026 | 8,685,000 | 8,654,001 | ||||
4.38%, 03/08/2027 | 3,720,000 | 3,700,739 | ||||
Federal Home Loan Banks | ||||||
1.00%, 12/20/2024 | 5,835,000 | 5,716,223 | ||||
2.07%, 08/28/2025 | 11,855,000 | 11,484,476 | ||||
0.60%, 02/12/2026 | 3,100,000 | 2,889,625 | ||||
4.75%, 04/09/2027 | 6,200,000 | 6,218,503 | ||||
1.10%, 02/25/2028 | 6,475,000 | 5,747,776 | ||||
Federal National Mortgage Association | ||||||
1.75%, 07/02/2024 | 6,000,000 | 5,999,336 | ||||
1.88%, 09/24/2026 | 4,523,000 | 4,253,580 | ||||
0.75%, 10/08/2027 | 14,670,000 | 12,985,743 | ||||
United States of America Executive Branch, Series 2012-20K, Class 1, 2.09%, 11/01/2032 | 3,926 | 3,542 | ||||
TOTAL U.S. GOVERNMENT AGENCY ISSUES (Cost $67,833,032) | 67,653,544 | |||||
ASSET-BACKED SECURITIES - 6.6% | ||||||
321 Henderson Receivables I LLC, Series 2004-A, Class A1, 5.79% (1 mo. Term SOFR + 0.46%), 09/15/2045(a) | 2,979 | 2,967 | ||||
American Express Travel Related Services Co., Inc., Series 2024-1, Class A, 5.23%, 04/16/2029 | 2,810,000 | 2,835,732 | ||||
Angel Oak Mortgage Trust LLC, Series 2020-5, Class A3, 2.04%, 05/25/2065(a)(e) | 37,340 | 34,991 | ||||
Argent Securities, Inc. Asset-Backed Pass-Through Certificates, Series 2003-W6, Class M1, 6.51% (1 mo. Term SOFR + 1.16%), 01/25/2034 | 268,765 | 268,106 | ||||
Asset Backed Securities Corp. Home Equity Loan Trust, Series 2002-HE1, Class M1, 7.09% (1 mo. Term SOFR + 1.76%), 03/15/2032 | 118,759 | 121,840 | ||||
Bank of America Auto Trust, Series 2024-1A, Class A3, 5.35%, 11/15/2028(a) | 3,475,000 | 3,485,496 | ||||
Barclays Dryrock Funding LLC, Series 2023-1, Class A, 4.72%, 02/15/2029 | 4,900,000 | 4,855,842 | ||||
24 |
Par | Value | |||||
ASSET-BACKED SECURITIES - (Continued) | ||||||
CarMax Auto Owner Trust, Series 2021-4, Class A3, 0.56%, 09/15/2026 | $ 1,140,180 | $1,110,100 | ||||
Carvana Auto Receivables Trust | ||||||
Series 2021-P2, Class A3, 0.49%, 03/10/2026 | 107,951 | 107,740 | ||||
Series 2021-P4, Class A3, 1.31%, 01/11/2027 | 1,790,895 | 1,748,228 | ||||
Series 2022-P3, Class A3, 4.61%, 11/10/2027 | 3,618,909 | 3,586,031 | ||||
DB Master Finance Parent LLC, Series 2021-1A, Class A2I, 2.05%, 11/20/2051(a) | 1,998,750 | 1,835,260 | ||||
Dell Equipment Finance Trust, Series 2023-2, Class A2, 5.84%, 01/22/2029(a) | 673,629 | 673,626 | ||||
Diamond Resorts Owner Trust, Series 2021-1A, Class A, 1.51%, 11/21/2033(a) | 265,627 | 248,847 | ||||
Elara Depositor LLC, Series 2021-A, Class A, 1.36%, 08/27/2035(a) | 1,122,309 | 1,033,630 | ||||
GM Financial Consumer Automobile Receivables Trust | ||||||
Series 2021-1, Class A3, 0.35%, 10/16/2025 | 15,386 | 15,347 | ||||
Series 2021-3, Class A3, 0.48%, 06/16/2026 | 688,590 | 676,859 | ||||
Series 2021-4, Class A3, 0.68%, 09/16/2026 | 776,456 | 758,383 | ||||
Series 2023-4, Class A3, 5.78%, 08/16/2028 | 1,560,000 | 1,573,414 | ||||
GM Financial Leasing Trust, Series 2024-2, Class A3, 5.39%, 07/20/2027 | 4,750,000 | 4,762,792 | ||||
Hilton Grand Vacations, Inc. | ||||||
Series 2019-AA, Class A, 2.34%, 07/25/2033(a) | 649,078 | 622,648 | ||||
Series 2024-2A, Class A, 5.50%, 03/25/2038(a) | 1,613,892 | 1,621,018 | ||||
Honda Auto Receivables Owner Trust | ||||||
Series 2023-2, Class A2, 5.41%, 04/15/2026 | 2,343,085 | 2,340,171 | ||||
Series 2024-1, Class A3, 5.21%, 08/15/2028 | 2,080,000 | 2,082,150 | ||||
IPFS Corp. | ||||||
Series 2021-B, Class A, 0.77%, 08/15/2026(a) | 1,450,000 | 1,440,539 | ||||
Series 2024-D, Class A, 5.34%, 04/15/2029(a) | 1,890,000 | 1,893,080 | ||||
Marriott Vacations Worldwide Corp. | ||||||
Series 2019-2A, Class A, 2.22%, 10/20/2038(a) | 184,748 | 176,426 | ||||
Series 2021-1WA, Class A, 1.14%, 01/22/2041(a) | 442,506 | 412,998 | ||||
MVW Owner Trust | ||||||
Series 2018-1A, Class A, 3.45%, 01/21/2036(a) | 278,885 | 278,394 | ||||
Series 2019-1A, Class A, 2.89%, 11/20/2036(a) | 138,736 | 135,315 | ||||
Navient Student Loan Trust, Series 2021-A, Class A, 0.84%, 05/15/2069(a) | 537,008 | 474,518 | ||||
OneMain Financial Issuance Trust, Series 2018-2A, Class A, 3.57%, 03/14/2033(a) | 51,192 | 51,072 | ||||
Planet Fitness SPV Guarantor LLC, Series 2022-1A, Class A2I, 3.25%, 12/05/2051(a) | 2,346,000 | 2,212,574 | ||||
SoFi Professional Loan Program LLC, Series 2021-B, Class AFX, 1.14%, 02/15/2047(a) | 1,335,765 | 1,137,891 | ||||
Taco Bell Corp., Series 2021-1A, Class A2I, 1.95%, 08/25/2051(a) | 2,480,813 | 2,255,733 | ||||
T-Mobile US Trust 2024-1, Series 2024-1A, Class A, 5.05%, 09/20/2029(a) | 1,330,000 | 1,327,547 | ||||
Toyota Auto Loan Extended Note Trust, Series 2020-1A, Class A, 1.35%, 05/25/2033(a) | 1,050,000 | 1,010,800 | ||||
Toyota Auto Receivables Owner Trust, Series 2024-B, Class A3, 5.33%, 01/16/2029 | 5,500,000 | 5,526,470 | ||||
Volkswagen Auto Lease Trust, Series 2024-A, Class A3, 5.21%, 06/21/2027 | 2,000,000 | 1,995,955 | ||||
25 |
Par | Value | |||||
ASSET-BACKED SECURITIES - (Continued) | ||||||
Volkswagen Auto Loan Enhanced Trust, Series 2021-1, Class A3, 1.02%, 06/22/2026 | $1,033,771 | $1,015,130 | ||||
TOTAL ASSET-BACKED SECURITIES (Cost $58,729,022) | 57,745,660 | |||||
MUNICIPAL BONDS - 0.2% | ||||||
County of King WA Sewer Revenue, 0.80%, 07/01/2025 | 320,000 | 306,655 | ||||
State of Hawaii, 1.03%, 08/01/2025 | 1,955,000 | 1,869,207 | ||||
TOTAL MUNICIPAL BONDS (Cost $2,275,000) | 2,175,862 | |||||
SHORT-TERM INVESTMENT - 8.7% | ||||||
U.S. Treasury Bill - 8.7% | ||||||
5.08%, 07/18/2024(g) | 75,899,000 | 75,721,586 | ||||
TOTAL SHORT-TERM INVESTMENT (Cost $75,721,586) | 75,721,586 | |||||
TOTAL INVESTMENTS - 85.1% (Cost $777,471,241) | $742,225,905 | |||||
Money Market Deposit Account - 3.7%(h)(i) | 32,181,223 | |||||
Other Assets in Excess of Liabilities - 11.2%(j) | 97,623,329 | |||||
TOTAL NET ASSETS - 100.0% | $872,030,457 | |||||
(a) | Security is exempt from registration pursuant to Rule 144A under the Securities Act of 1933, as amended. These securities may only be resold in transactions exempt from registration to qualified institutional investors. As of June 30, 2024, the value of these securities total $96,627,504 or 11.1% of the Fund’s net assets. |
(b) | Represents less than 0.05% of net assets. |
(c) | Non-income producing security. |
(d) | Investment valued using net asset value per share as practical expedient. See Note 2. Galaxy Commodity - Polaris Fund, LLC’s (“Galaxy”) investment objective is to generate diversified investment returns that are uncorrelated with the equity and debt markets by committing its assets to the investment discretion of a select group of experienced sub-managers that pursue various alternative investment strategies. Specifically, Galaxy accesses the sub-managers through an affiliated platform called Galaxy Plus Fund, LLC (the “Platform”). The Platform identifies sub-managers that, in its judgment, are capable of generating attractive investment returns whose correlation to the U.S. equity and fixed-income markets is minimal. In implementing their strategies, the sub-managers selected by the Platform will have the discretion to invest and trade in a broad variety of securities and other financial instruments (including derivatives). Galaxy has no unfunded commitments or redemption lock-up period, as the investment offers daily redemptions. However, the managers of Galaxy may temporarily suspend redemptions in certain limited circumstances. |
(e) | Coupon rate is variable based on the weighted average coupon of the underlying collateral. To the extent the weighted average coupon of the underlying assets which comprise the collateral increases or decreases, the coupon rate of this security will increase or decrease correspondingly. The rate disclosed is as of June 30, 2024. |
(f) | Step coupon bond. The rate disclosed is as of June 30, 2024. |
(g) | The rate shown is the effective yield as of June 30, 2024. |
26 |
(h) | A portion of this deposit account is held by LCLSCS Fund Limited and pledged as collateral for derivative contracts. As of the reporting date, the value of this collateral totals $42,438. |
(i) | The U.S. Bank Money Market Deposit Account (the “MMDA”) is a short-term vehicle in which the Fund holds cash balances. The MMDA will bear interest at a variable rate that is determined based on market conditions and is subject to change daily. The rate as of June 30, 2024 was 5.24%. |
(j) | Includes assets pledged as collateral for derivative contracts. As of the reporting date, the value of these assets totals $419,083. |
27 |
Termination Date | Reference Index | Financing Rate | Payment Frequency | Notional Amount | Value | Advance Receipt on Swap Contracts (Received)/Paid | Unrealized Appreciation | Counterparty | ||||||||||||||||
12-17-2027 | LoCorr Commodities Index# | 0.50% | Quarterly | $ 328,445,098 | $ 95,606,789 | $ (33,100,739) | $ 62,506,050 | Deutsche Bank AG | ||||||||||||||||
| # | Comprised of a proprietary basket of Commodity Trading Advisor’s “CTA”) Programs investing in various futures contracts, forward currency contracts, foreign currency and other similar investments. See Notes 2 & 3. |
Description | Expiration Date | Number of Contracts Purchased (Sold) | Notional Amount | Concentration % of Exposure | ||||||||
Futures Contracts: | ||||||||||||
Purchase Contracts:(1) | ||||||||||||
WTI Crude (NYMEX) | Jul-24 | 2,937 | $ 238,754,067 | 12.67% | ||||||||
Brent Crude (ICE) | Jul-24 | 2,810 | 238,400,645 | 12.65% | ||||||||
Low Sulphur Gasoil | Jul-24 | 640 | 50,283,767 | 2.67% | ||||||||
Gasoline RBOB | Jul-24 | 458 | 48,261,212 | 2.56% | ||||||||
Natural Gas | Jan-25 | 1,191 | 43,685,880 | 2.32% | ||||||||
Copper (COMEX) | Dec-24 | 358 | 39,666,363 | 2.10% | ||||||||
Endex Dutch TTF Gas Future | Sep-24 | 1,164 | 33,724,773 | 1.79% | ||||||||
WTI Crude | Nov-24 | 412 | 32,280,300 | 1.71% | ||||||||
Sugar No. 11 | Feb-25 | 1,160 | 26,501,133 | 1.40% | ||||||||
Natural Gas | Aug-24 | 600 | 15,817,267 | 0.84% | ||||||||
Endex Dutch TTF Gas Future | Feb-25 | 389 | 12,165,390 | 0.64% | ||||||||
Natural Gas | Sep-24 | 441 | 12,020,802 | 0.64% | ||||||||
Endex Dutch TTF Gas Future | Jan-25 | 404 | 11,618,814 | 0.62% | ||||||||
Heating Oil | Jul-24 | 98 | 10,490,934 | 0.56% | ||||||||
Coffee | Dec-24 | 116 | 9,739,475 | 0.52% | ||||||||
Endex Dutch TTF Gas Future | Dec-24 | 306 | 9,747,676 | 0.52% | ||||||||
Natural Gas | Oct-24 | 306 | 9,505,027 | 0.50% | ||||||||
White Sugar | Jul-24 | 283 | 8,339,949 | 0.44% | ||||||||
Feeder Cattle | Oct-24 | 61 | 7,970,170 | 0.42% | ||||||||
White Sugar | Sep-24 | 237 | 6,694,834 | 0.35% | ||||||||
Low Sulphur Gasoil | Sep-24 | 72 | 5,634,873 | 0.30% | ||||||||
Low Sulphur Gasoil | Oct-24 | 72 | 5,637,569 | 0.30% | ||||||||
Total Purchase Contracts | 876,940,920 | 46.52% | ||||||||||
Sale Contracts:(1) | ||||||||||||
WTI Crude (NYMEX) | Aug-24 | (2,849) | 229,187,709 | 12.16% | ||||||||
Brent Crude (ICE) | Aug-24 | (1,971) | 165,747,634 | 8.79% | ||||||||
Gasoline RBOB | Aug-24 | (542) | 56,396,691 | 2.99% | ||||||||
Natural Gas | Dec-24 | (1,223) | 46,859,245 | 2.49% | ||||||||
Low Sulphur Gasoil | Aug-24 | (550) | 43,132,789 | 2.29% | ||||||||
Copper (COMEX) | Sep-24 | (343) | 37,795,577 | 2.01% | ||||||||
Natural Gas | Jul-24 | (1,383) | 36,505,480 | 1.94% | ||||||||
Sugar No.11 | Sep-24 | (1,493) | 33,611,499 | 1.78% | ||||||||
28 |
Description | Expiration Date | Number of Contracts Purchased (Sold) | Notional Amount | Concentration % of Exposure | ||||||||
Futures Contracts - (Continued) | ||||||||||||
Sale Contracts - (Continued) | ||||||||||||
Endex Dutch TTF Gas Future | Jul-24 | (1,172) | $32,164,971 | 1.71% | ||||||||
Heating Oil | Aug-24 | (247) | 26,595,927 | 1.41% | ||||||||
Endex Dutch TTF Gas Future | Aug-24 | (962) | 26,235,015 | 1.39% | ||||||||
WTI Crude (NYMEX) | Sep-24 | (304) | 24,204,564 | 1.28% | ||||||||
Corn | Sep-24 | (547) | 11,633,184 | 0.62% | ||||||||
Brent Crude (ICE) | Oct-24 | (131) | 10,827,956 | 0.57% | ||||||||
Wheat | Sep-24 | (366) | 10,603,918 | 0.56% | ||||||||
Soybean | Nov-24 | (185) | 10,270,855 | 0.54% | ||||||||
WTI Crude (NYMEX) | Oct-24 | (115) | 9,063,589 | 0.48% | ||||||||
Silver | Sep-24 | (58) | 8,559,063 | 0.45% | ||||||||
Milling Wheat | Sep-24 | (690) | 8,391,986 | 0.45% | ||||||||
Soybean Meal | Dec-24 | (246) | 8,388,571 | 0.45% | ||||||||
Soybean Oil | Dec-24 | (314) | 8,225,283 | 0.44% | ||||||||
Feeder Cattle | Sep-24 | (62) | 8,060,443 | 0.43% | ||||||||
Soybean | Jan-25 | (137) | 7,717,642 | 0.41% | ||||||||
Red Spring Wheat | Sep-24 | (228) | 7,055,690 | 0.37% | ||||||||
Platinum | Oct-24 | (129) | 6,574,952 | 0.35% | ||||||||
Gold | Aug-24 | (26) | 6,013,531 | 0.32% | ||||||||
Nickel | Sep-24 | (52) | 5,418,898 | 0.29% | ||||||||
Total Sale Contracts | 885,242,662 | 46.97% | ||||||||||
Other Futures Contracts | 100,714,804 | 5.34% | ||||||||||
Total Futures Contracts | 1,862,898,386 | 98.83% | ||||||||||
Cash and Foreign Currency: | ||||||||||||
Cash and Foreign Currency Purchased:(1) | ||||||||||||
U.S. Dollar | $16,111,344 | 0.85% | ||||||||||
Other Cash and Foreign Currency | 4,539,702 | 0.24% | ||||||||||
Total Cash and Foreign Currency | 20,651,046 | 1.09% | ||||||||||
Forward Currency Contracts | 1,453,388 | 0.08% | ||||||||||
Total Underlying Positions | $1,885,002,820 | 100.00% | ||||||||||
| # | The investment is not a direct holding of LoCorr Long/Short Commodities Strategy Fund. The top 50 holdings and other futures contracts, other forward currency contracts, and other cash and foreign currency were determined based on the absolute notional amount of the positions within the underlying swap basket. |
(1) | Represents the 50 largest components of the basket. |
29 |
Par | Value | |||||
U.S. TREASURY SECURITIES - 31.4% | ||||||
United States Treasury Note | ||||||
0.25%, 05/31/2025 | $4,995,000 | $4,776,810 | ||||
0.25%, 08/31/2025 | 775,000 | 733,253 | ||||
0.25%, 10/31/2025 | 2,000,000 | 1,879,609 | ||||
4.25%, 01/31/2026 | 20,000 | 19,808 | ||||
0.75%, 05/31/2026 | 3,300,000 | 3,060,363 | ||||
4.13%, 02/15/2027 | 39,150,000 | 38,706,504 | ||||
1.88%, 02/28/2027 | 4,685,000 | 4,370,776 | ||||
4.50%, 04/15/2027 | 8,285,000 | 8,273,997 | ||||
3.88%, 11/30/2027 | 7,235,000 | 7,099,626 | ||||
3.50%, 01/31/2028 | 990,000 | 959,101 | ||||
3.63%, 03/31/2028 | 7,165,000 | 6,967,123 | ||||
1.38%, 10/31/2028 | 15,210,000 | 13,419,260 | ||||
3.75%, 12/31/2028 | 7,860,000 | 7,663,193 | ||||
4.25%, 02/28/2029 | 20,735,000 | 20,654,814 | ||||
4.63%, 04/30/2029 | 13,135,000 | 13,294,057 | ||||
TOTAL U.S. TREASURY SECURITIES (Cost $132,192,721) | 131,878,294 | |||||
CORPORATE BONDS - 16.7% | ||||||
Aerospace & Defense - 0.5% | ||||||
Boeing Co., 3.25%, 02/01/2028 | 1,290,000 | 1,181,687 | ||||
L3Harris Technologies, Inc., 5.40%, 01/15/2027 | 730,000 | 733,101 | ||||
RTX Corp., 4.13%, 11/16/2028 | 345,000 | 332,289 | ||||
2,247,077 | ||||||
Agriculture - 0.1% | ||||||
Philip Morris International, Inc., 4.88%, 02/15/2028 | 645,000 | 639,672 | ||||
Auto Manufacturers - 0.9% | ||||||
Daimler Truck Finance North America LLC, 5.00%, 01/15/2027(a) | 550,000 | 546,100 | ||||
Ford Motor Credit Co. LLC, 5.85%, 05/17/2027 | 1,115,000 | 1,115,259 | ||||
General Motors Financial Co., Inc., 5.80%, 06/23/2028 | 1,090,000 | 1,103,902 | ||||
Toyota Motor Credit Corp., 5.60%, 09/11/2025 | 370,000 | 371,433 | ||||
Volkswagen Group of America Finance LLC, 1.25%, 11/24/2025(a) | 660,000 | 622,643 | ||||
3,759,337 | ||||||
Banks - 6.1% | ||||||
Banco Santander SA | ||||||
3.50%, 03/24/2025 | 635,000 | 625,609 | ||||
2.75%, 05/28/2025 | 80,000 | 77,924 | ||||
Bank of America Corp. | ||||||
4.38% to 04/27/2027 then SOFR + 1.58%, 04/27/2028 | 2,015,000 | 1,966,815 | ||||
5.82% to 09/15/2028 then SOFR + 1.57%, 09/15/2029 | 2,870,000 | 2,931,411 | ||||
Bank of America NA, 5.53%, 08/18/2026 | 2,640,000 | 2,658,255 | ||||
Barclays PLC, 6.49% to 09/13/2028 then SOFR + 2.22%, 09/13/2029 | 1,040,000 | 1,077,044 | ||||
Canadian Imperial Bank of Commerce, 3.45%, 04/07/2027 | 530,000 | 507,507 | ||||
30 |
Par | Value | |||||
CORPORATE BONDS - (Continued) | ||||||
Banks - (Continued) | ||||||
Citibank NA, 5.44%, 04/30/2026 | $855,000 | $857,989 | ||||
Credit Suisse AG, 5.00%, 07/09/2027 | 465,000 | 461,233 | ||||
Federation des Caisses Desjardins du Quebec, 5.70%, 03/14/2028(a) | 715,000 | 722,548 | ||||
Goldman Sachs Group, Inc. | ||||||
5.80% to 08/10/2025 then SOFR + 1.08%, 08/10/2026 | 2,130,000 | 2,130,826 | ||||
6.48% to 10/24/2028 then SOFR + 1.77%, 10/24/2029 | 440,000 | 459,636 | ||||
HSBC Holdings PLC, 6.16% to 03/09/2028 then SOFR + 1.97%, 03/09/2029 | 590,000 | 603,867 | ||||
ING Groep NV, 3.87% to 03/28/2025 then SOFR + 1.64%, 03/28/2026 | 580,000 | 571,591 | ||||
JPMorgan Chase & Co., 5.58% to 04/22/2029 then SOFR + 1.16%, 04/22/2030 | 2,370,000 | 2,408,894 | ||||
Morgan Stanley, 5.66% to 04/18/2029 then SOFR + 1.26%, 04/18/2030 | 370,000 | 376,486 | ||||
Morgan Stanley Bank NA, 4.95% to 01/14/2027 then SOFR + 1.08%, 01/14/2028 | 1,960,000 | 1,945,501 | ||||
NatWest Markets PLC, 5.41%, 05/17/2029(a) | 675,000 | 677,490 | ||||
Toronto-Dominion Bank | ||||||
3.77%, 06/06/2025 | 545,000 | 536,189 | ||||
1.25%, 09/10/2026 | 1,225,000 | 1,123,352 | ||||
UBS Group AG | ||||||
4.49% to 05/12/2025 then 1 yr. CMT Rate + 1.55%, 05/12/2026(a) | 250,000 | 247,039 | ||||
6.33% to 12/22/2026 then 1 yr. CMT Rate + 1.60%, 12/22/2027(a) | 645,000 | 655,664 | ||||
Wells Fargo & Co., 5.57% to 07/25/2028 then SOFR + 1.74%, 07/25/2029 | 1,805,000 | 1,822,318 | ||||
25,445,188 | ||||||
Beverages - 0.2% | ||||||
PepsiCo, Inc., 5.13%, 11/10/2026 | 805,000 | 808,469 | ||||
Biotechnology - 0.2% | ||||||
Amgen, Inc., 5.15%, 03/02/2028 | 975,000 | 975,181 | ||||
Building Materials - 0.1% | ||||||
Trane Technologies Financing Ltd., 3.50%, 03/21/2026 | 380,000 | 367,828 | ||||
Chemicals - 0.1% | ||||||
Nutrien Ltd., 4.90%, 03/27/2028 | 340,000 | 336,164 | ||||
Cosmetics & Personal Care - 0.3% | ||||||
Haleon US Capital LLC, 3.38%, 03/24/2027 | 1,290,000 | 1,231,009 | ||||
Diversified Financial Services - 0.6% | ||||||
AerCap Ireland Capital/Global Aviation Trust, 6.10%, 01/15/2027 | 1,515,000 | 1,537,600 | ||||
Air Lease Corp., 5.85%, 12/15/2027 | 820,000 | 830,509 | ||||
Private Export Funding Corp., 3.25%, 06/15/2025 | 200,000 | 196,036 | ||||
2,564,145 | ||||||
31 |
Par | Value | |||||
CORPORATE BONDS - (Continued) | ||||||
Electric - 1.2% | ||||||
Duke Energy Progress LLC, 3.45%, 03/15/2029 | $510,000 | $475,930 | ||||
Florida Power & Light Co. | ||||||
5.05%, 04/01/2028 | 840,000 | 843,434 | ||||
4.40%, 05/15/2028 | 1,085,000 | 1,066,758 | ||||
Georgia Power Co., 5.00%, 02/23/2027 | 910,000 | 907,274 | ||||
NSTAR Electric Co., 3.20%, 05/15/2027 | 700,000 | 666,185 | ||||
Southern California Edison Co., 1.20%, 02/01/2026 | 215,000 | 201,410 | ||||
Virginia Power Fuel Securitization LLC, 5.09%, 05/01/2027 | 760,000 | 756,260 | ||||
4,917,251 | ||||||
Electronics - 0.1% | ||||||
Honeywell International, Inc., 4.88%, 09/01/2029 | 370,000 | 370,755 | ||||
Entertainment - 0.1% | ||||||
Warnermedia Holdings, Inc., 3.76%, 03/15/2027 | 575,000 | 546,047 | ||||
Food - 0.1% | ||||||
Sysco Corp., 3.25%, 07/15/2027 | 605,000 | 572,973 | ||||
Healthcare-Products - 0.4% | ||||||
Baxter International, Inc., 1.32%, 11/29/2024 | 945,000 | 927,840 | ||||
Revvity, Inc., 0.85%, 09/15/2024 | 890,000 | 880,107 | ||||
1,807,947 | ||||||
Healthcare-Services - 0.2% | ||||||
HCA, Inc., 3.13%, 03/15/2027 | 825,000 | 779,222 | ||||
Insurance - 0.6% | ||||||
Equitable Financial Life Global, 1.40%, 07/07/2025(a) | 535,000 | 512,532 | ||||
Metropolitan Life Global Funding I, 5.05%, 01/06/2028(a) | 245,000 | 245,120 | ||||
Principal Life Global Funding II, 0.88%, 01/12/2026(a) | 550,000 | 513,906 | ||||
Protective Life Global Funding, 0.78%, 07/05/2024(a) | 1,085,000 | 1,084,399 | ||||
2,355,957 | ||||||
Machinery-Diversified - 0.1% | ||||||
John Deere Capital Corp., 4.95%, 07/14/2028 | 365,000 | 365,498 | ||||
Media - 0.1% | ||||||
Charter Communications Operating LLC, 4.91%, 07/23/2025 | 256,000 | 253,525 | ||||
Oil & Gas - 0.1% | ||||||
Marathon Oil Corp., 5.30%, 04/01/2029 | 235,000 | 236,094 | ||||
Packaging & Containers - 0.1% | ||||||
Amcor Group Finance PLC, 5.45%, 05/23/2029 | 330,000 | 331,256 | ||||
32 |
Par | Value | |||||
CORPORATE BONDS - (Continued) | ||||||
Pharmaceuticals - 0.9% | ||||||
AbbVie, Inc., 4.80%, 03/15/2029 | $370,000 | $368,689 | ||||
Astrazeneca Finance LLC, 4.80%, 02/26/2027 | 320,000 | 318,203 | ||||
CVS Health Corp. | ||||||
2.88%, 06/01/2026 | 1,405,000 | 1,337,730 | ||||
5.00%, 01/30/2029 | 235,000 | 232,718 | ||||
Pfizer Investment Enterprises Pte Ltd., 4.45%, 05/19/2028 | 1,430,000 | 1,405,652 | ||||
3,662,992 | ||||||
Pipelines - 0.9% | ||||||
Enbridge, Inc. | ||||||
2.50%, 02/14/2025 | 480,000 | 470,364 | ||||
6.00%, 11/15/2028 | 580,000 | 597,778 | ||||
Energy Transfer LP, 6.05%, 12/01/2026 | 1,365,000 | 1,382,439 | ||||
Williams Cos, Inc. | ||||||
5.40%, 03/02/2026 | 970,000 | 969,028 | ||||
4.90%, 03/15/2029 | 475,000 | 468,942 | ||||
3,888,551 | ||||||
REITS - 1.3% | ||||||
American Homes 4 Rent LP, 4.90%, 02/15/2029 | 345,000 | 337,387 | ||||
Brixmor Operating Partnership LP | ||||||
3.85%, 02/01/2025 | 475,000 | 469,824 | ||||
4.13%, 06/15/2026 | 420,000 | 408,891 | ||||
Essex Portfolio LP, 1.70%, 03/01/2028 | 350,000 | 307,301 | ||||
Kite Realty Group LP, 4.00%, 10/01/2026 | 1,000,000 | 966,412 | ||||
Prologis Targeted US Logistics Fund LP, 5.25%, 04/01/2029(a) | 780,000 | 780,979 | ||||
SITE Centers Corp. | ||||||
3.63%, 02/01/2025 | 1,425,000 | 1,406,099 | ||||
4.70%, 06/01/2027 | 945,000 | 937,973 | ||||
5,614,866 | ||||||
Retail - 0.4% | ||||||
Home Depot, Inc., 4.88%, 06/25/2027 | 565,000 | 563,957 | ||||
O’Reilly Automotive, Inc. | ||||||
5.75%, 11/20/2026 | 815,000 | 822,677 | ||||
4.20%, 04/01/2030 | 310,000 | 295,277 | ||||
1,681,911 | ||||||
Semiconductors - 0.1% | ||||||
Texas Instruments, Inc., 4.60%, 02/08/2027 | 435,000 | 432,227 | ||||
Software - 0.1% | ||||||
Oracle Corp., 2.30%, 03/25/2028 | 565,000 | 511,104 | ||||
33 |
Par | Value | |||||
CORPORATE BONDS - (Continued) | ||||||
Telecommunications - 0.8% | ||||||
AT&T, Inc., 2.30%, 06/01/2027 | $875,000 | $809,524 | ||||
T-Mobile USA, Inc. | ||||||
4.80%, 07/15/2028 | 565,000 | 557,639 | ||||
4.85%, 01/15/2029 | 1,090,000 | 1,077,001 | ||||
Verizon Communications, Inc., 2.10%, 03/22/2028 | 910,000 | 818,718 | ||||
3,262,882 | ||||||
TOTAL CORPORATE BONDS (Cost $69,988,090) | 69,965,128 | |||||
MORTGAGE-BACKED SECURITIES - 11.6% | ||||||
Alen Mortgage Trust, Series 2021-ACEN, Class A, 6.59% (1 mo. Term SOFR + 1.26%), 04/15/2034(a) | 600,000 | 546,283 | ||||
ARES Commercial Mortgage Trust, Series 2024-IND, Class A, 7.01% (1 mo. Term SOFR + 1.69%), 07/15/2041(a) | 500,000 | 498,905 | ||||
Ares Commercial Real Estate Corp., Series 2021-FL4, Class A, 6.28% (1 mo. Term SOFR + 0.94%), 12/18/2037(a) | 8,182 | 8,163 | ||||
Banc of America-Remic Trust, Series 2022-DKLX, Class A, 6.48% (1 mo. Term SOFR + 1.15%), 01/15/2039(a) | 1,250,000 | 1,237,891 | ||||
BANK-2022, Series 2022-BNK39, Class A1, 1.74%, 02/15/2055 | 377,343 | 357,712 | ||||
BBCMS Trust, Series 2023-C19, Class A2B, 5.75%, 04/15/2056 | 1,100,000 | 1,098,501 | ||||
BLP Commercial Mortgage Trust, Series 2024-IND2, Class B, 7.02% (1 mo. Term SOFR + 1.69%), 03/15/2041(a) | 530,000 | 525,360 | ||||
BX Trust | ||||||
Series 2021-CIP, Class A, 6.36% (1 mo. Term SOFR + 1.04%), 12/15/2038(a) | 1,000,000 | 988,756 | ||||
Series 2022-PSB, Class A, 7.78% (1 mo. Term SOFR + 2.45%), 08/15/2039(a) | 797,990 | 796,743 | ||||
Series 2022-VAMF, Class B, 6.61% (1 mo. Term SOFR + 1.28%), 01/15/2039(a) | 250,000 | 245,937 | ||||
Series 2024-XL5, Class A, 6.72% (1 mo. Term SOFR + 1.39%), 03/15/2041(a) | 1,438,474 | 1,430,382 | ||||
Citigroup Commercial Mortgage Trust, Series 2014-GC25, Class A4, 3.64%, 10/10/2047 | 1,050,000 | 1,045,410 | ||||
Cold Storage Trust, Series 2020-ICE5, Class A, 6.34% (1 mo. Term SOFR + 1.01%), 11/15/2037(a) | 1,965,981 | 1,958,609 | ||||
Computershare Corporate Trust, Series 2015-NXS1, Class A5, 3.15%, 05/15/2048 | 750,000 | 733,034 | ||||
ELP Commercial Mortgage Trust | ||||||
Series 2021-ELP, Class A, 6.14% (1 mo. Term SOFR + 0.82%), 11/15/2038(a) | 1,445,318 | 1,428,164 | ||||
Series 2021-ELP, Class B, 6.56% (1 mo. Term SOFR + 1.23%), 11/15/2038(a) | 948,896 | 937,074 | ||||
Fannie Mae Aces, Series 2014-M11, Class 1A, 3.18%, 08/25/2024(b) | 217,360 | 216,060 | ||||
Fannie Mae Connecticut Avenue Securities | ||||||
Series 2018-C05, Class 1M2, 7.80% (30 day avg SOFR US + 2.46%), 01/25/2031 | 467,835 | 478,361 | ||||
34 |
Par | Value | |||||
MORTGAGE-BACKED SECURITIES - (Continued) | ||||||
Series 2022-R01, Class 1M2, 7.24% (30 day avg SOFR US + 1.90%), 12/25/2041(a) | $375,000 | $379,456 | ||||
Series 2022-R03, Class 1M2, 8.84% (30 day avg SOFR US + 3.50%), 03/25/2042(a) | 2,000,000 | 2,105,130 | ||||
Series 2022-R04, Class 1M2, 8.44% (30 day avg SOFR US + 3.10%), 03/25/2042(a) | 1,150,000 | 1,197,864 | ||||
Series 2022-R05, Class 2M2, 8.34% (30 day avg SOFR US + 3.00%), 04/25/2042(a) | 35,000 | 36,237 | ||||
Series 2022-R06, Class 1M2, 9.19% (30 day avg SOFR US + 3.85%), 05/25/2042(a) | 285,000 | 302,083 | ||||
Series 2022-R07, Class 1M2, 9.99% (30 day avg SOFR US + 4.65%), 06/25/2042(a) | 520,000 | 563,551 | ||||
Series 2022-R08, Class 1M2, 8.94% (30 day avg SOFR US + 3.60%), 07/25/2042(a) | 970,000 | 1,027,372 | ||||
Series 2023-R01, Class 1M2, 9.09% (30 day avg SOFR US + 3.75%), 12/25/2042(a) | 865,000 | 926,588 | ||||
Series 2023-R02, Class 1M2, 8.69% (30 day avg SOFR US + 3.35%), 01/25/2043(a) | 1,445,000 | 1,526,243 | ||||
Series 2023-R04, Class 1M2, 8.89% (30 day avg SOFR US + 3.55%), 05/25/2043(a) | 600,000 | 645,499 | ||||
Fannie Mae Pool, Pool MA5149, 5.50%, 09/01/2038 | 613,168 | 614,863 | ||||
Freddie Mac Pool, Pool SB8261, 5.50%, 10/01/2038 | 2,686,074 | 2,693,500 | ||||
Freddie Mac Structured Agency Credit Risk Debt Notes | ||||||
Series 2021-DNA7, Class M2, 7.14% (30 day avg SOFR US + 1.80%), 11/25/2041(a) | 1,825,000 | 1,843,762 | ||||
Series 2022-DNA2, Class M1B, 7.74% (30 day avg SOFR US + 2.40%), 02/25/2042(a) | 990,000 | 1,014,723 | ||||
Series 2022-DNA3, Class M1B, 8.24% (30 day avg SOFR US + 2.90%), 04/25/2042(a) | 2,050,000 | 2,130,564 | ||||
Series 2022-DNA5, Class M1B, 9.84% (30 day avg SOFR US + 4.50%), 06/25/2042(a) | 2,115,000 | 2,294,308 | ||||
Series 2022-DNA6, Class M1B, 9.04% (30 day avg SOFR US + 3.70%), 09/25/2042(a) | 720,000 | 766,752 | ||||
Series 2023-DNA1, Class M1B, 8.44% (30 day avg SOFR US + 3.10%), 03/25/2043(a) | 745,000 | 785,722 | ||||
Series 2023-DNA2, Class M1B, 8.59% (30 day avg SOFR US + 3.25%), 04/25/2043(a) | 1,605,000 | 1,699,297 | ||||
GCT Commercial Mortgage Trust, Series 2021-GCT, Class A, 6.24% (1 mo. Term SOFR + 0.91%), 02/15/2038(a) | 750,000 | 615,795 | ||||
GS Mortgage Securities Corp. II, Series 2021-ARDN, Class A, 6.69% (1 mo. Term SOFR + 1.36%), 11/15/2036(a) | 1,500,000 | 1,482,074 | ||||
JP Morgan Chase Commercial Mortgage Securities, Series 2021-MHC, Class A, 6.49% (1 mo. Term SOFR + 1.16%), 04/15/2038(a) | 330,714 | 330,588 | ||||
JPMBB Commercial Mortgage Securities Trust, Series 2014-C22, Class AS, 4.11%, 09/15/2047 | 685,000 | 651,364 | ||||
MHC Commercial Mortgage Trust, Series 2021-MHC, Class B, 6.54% (1 mo. Term SOFR + 1.22%), 04/15/2038(a) | 754,989 | 746,504 | ||||
35 |
Par | Value | |||||
MORTGAGE-BACKED SECURITIES - (Continued) | ||||||
MTN Commercial Mortgage Trust, Series 2022-LPFL, Class A, 6.73% (1 mo. Term SOFR + 1.40%), 03/15/2039(a) | $1,500,000 | $1,481,719 | ||||
Natixis Commercial Mortgage Securities Trust, Series 2018-285M, Class A, 3.92%, 11/15/2032(a)(b) | 876,796 | 789,029 | ||||
NRTH PARK Mortgage Trust, Series 2024-PARK, Class A, 6.97% (1 mo. Term SOFR + 1.64%), 03/15/2041(a) | 1,400,000 | 1,396,500 | ||||
PKHL Commercial Mortgage Trust, Series 2021-MF, Class A, 6.32% (1 mo. Term SOFR + 0.99%), 07/15/2038(a) | 1,000,000 | 953,633 | ||||
SMR Mortgage Trust, Series 2022-IND, Class A, 6.98% (1 mo. Term SOFR + 1.65%), 02/15/2039(a) | 1,159,656 | 1,131,152 | ||||
SREIT Trust, Series 2021-MFP2, Class A, 6.27% (1 mo. Term SOFR + 0.94%), 11/15/2036(a) | 1,050,000 | 1,036,875 | ||||
Verus Securitization Trust, Series 2020-1, Class A1, 3.42%, 01/25/2060(a)(c) | 54,000 | 51,780 | ||||
WF-RBS Commercial Mortgage Trust, Series 2014-C24, Class A5, 3.61%, 11/15/2047 | 1,000,000 | 991,281 | ||||
TOTAL MORTGAGE-BACKED SECURITIES (Cost $49,065,096) | 48,743,153 | |||||
U.S. GOVERNMENT AGENCY ISSUES - 9.5% | ||||||
Federal Farm Credit Banks Funding Corp. | ||||||
4.63%, 03/05/2026 | 5,690,000 | 5,669,691 | ||||
4.38%, 03/08/2027 | 6,555,000 | 6,521,060 | ||||
Federal Home Loan Banks | ||||||
1.00%, 12/20/2024 | 1,980,000 | 1,939,695 | ||||
2.07%, 08/28/2025 | 2,145,000 | 2,077,959 | ||||
0.60%, 02/12/2026 | 1,990,000 | 1,854,953 | ||||
1.00%, 03/23/2026 | 1,950,000 | 1,824,207 | ||||
4.63%, 09/11/2026 | 7,070,000 | 7,055,147 | ||||
4.75%, 04/09/2027 | 4,050,000 | 4,062,087 | ||||
1.10%, 02/25/2028 | 2,365,000 | 2,099,381 | ||||
Federal National Mortgage Association | ||||||
1.75%, 07/02/2024 | 1,000,000 | 999,889 | ||||
1.88%, 09/24/2026 | 2,735,000 | 2,572,085 | ||||
0.75%, 10/08/2027 | 3,825,000 | 3,385,853 | ||||
TOTAL U.S. GOVERNMENT AGENCY ISSUES (Cost $40,148,580) | 40,062,007 | |||||
ASSET-BACKED SECURITIES - 8.5% | ||||||
American Express Travel Related Services Co., Inc., Series 2024-1, Class A, 5.23%, 04/16/2029 | 1,870,000 | 1,887,124 | ||||
AmeriCredit Automobile Receivables Trust, Series 2021-3, Class A3, 0.76%, 08/18/2026 | 275,075 | 271,436 | ||||
Angel Oak Mortgage Trust LLC, Series 2020-5, Class A3, 2.04%, 05/25/2065(a)(b) | 14,936 | 13,996 | ||||
Avis Budget Car Rental LLC | ||||||
Series 2019-3A, Class A, 2.36%, 03/20/2026(a) | 264,000 | 259,225 | ||||
Series 2023-2A, Class A, 5.20%, 10/20/2027(a) | 200,000 | 198,971 | ||||
36 |
Par | Value | |||||
ASSET-BACKED SECURITIES - (Continued) | ||||||
CarMax Auto Owner Trust | ||||||
Series 2021-3, Class A3, 0.55%, 06/15/2026 | $922,043 | $902,287 | ||||
Series 2021-4, Class A3, 0.56%, 09/15/2026 | 258,934 | 252,103 | ||||
Carvana Auto Receivables Trust | ||||||
Series 2021-P2, Class A3, 0.49%, 03/10/2026 | 36,941 | 36,869 | ||||
Series 2021-P4, Class A3, 1.31%, 01/11/2027 | 608,508 | 594,011 | ||||
Series 2022-P3, Class A3, 4.61%, 11/10/2027 | 1,821,281 | 1,804,735 | ||||
DB Master Finance Parent LLC, Series 2021-1A, Class A2I, 2.05%, 11/20/2051(a) | 633,750 | 581,912 | ||||
Ford Credit Auto Owner Trust, Series 2024-A, Class A3, 5.09%, 12/15/2028 | 1,175,000 | 1,173,424 | ||||
GM Financial Consumer Automobile Receivables Trust | ||||||
Series 2020-4, Class A4, 0.50%, 02/17/2026 | 843,526 | 836,114 | ||||
Series 2021-1, Class A3, 0.35%, 10/16/2025 | 8,243 | 8,221 | ||||
Series 2021-3, Class A3, 0.48%, 06/16/2026 | 298,091 | 293,013 | ||||
Series 2023-4, Class A3, 5.78%, 08/16/2028 | 1,380,000 | 1,391,867 | ||||
Series 2024-2, Class A3, 5.10%, 03/16/2029 | 825,000 | 824,237 | ||||
GM Financial Leasing Trust, Series 2024-2, Class A3, 5.39%, 07/20/2027 | 2,280,000 | 2,286,140 | ||||
Hilton Grand Vacations, Inc. | ||||||
Series 2019-AA, Class A, 2.34%, 07/25/2033(a) | 193,755 | 185,865 | ||||
Series 2023-1A, Class A, 5.72%, 01/25/2038(a) | 108,359 | 109,201 | ||||
Series 2024-2A, Class A, 5.50%, 03/25/2038(a) | 489,058 | 491,218 | ||||
Honda Auto Receivables Owner Trust, Series 2024-1, Class A3, 5.21%, 08/15/2028 | 940,000 | 940,971 | ||||
Invitation Homes Trust, Series 2018-SFR4, Class A, 6.54% (1 mo. Term SOFR + 1.21%), 01/17/2038(a) | 624,926 | 625,658 | ||||
IPFS Corp. | ||||||
Series 2022-D, Class A, 4.27%, 08/15/2027(a) | 1,200,000 | 1,182,965 | ||||
Series 2024-B, Class A, 4.95%, 02/15/2029(a) | 500,000 | 495,956 | ||||
Series 2024-D, Class A, 5.34%, 04/15/2029(a) | 1,240,000 | 1,242,021 | ||||
Marriott Vacations Worldwide Corp., Series 2018-A, Class A, 3.56%, 02/20/2036(a) | 110,086 | 109,334 | ||||
MVW Owner Trust | ||||||
Series 2019-1A, Class A, 2.89%, 11/20/2036(a) | 421,267 | 410,879 | ||||
Series 2024-1A, Class A, 5.32%, 02/20/2043(a) | 2,851,030 | 2,851,808 | ||||
Planet Fitness SPV Guarantor LLC, Series 2022-1A, Class A2I, 3.25%, 12/05/2051(a) | 782,000 | 737,525 | ||||
Santander Consumer USA, Inc. | ||||||
Series 2022-5, Class A3, 4.11%, 08/17/2026 | 148,452 | 148,310 | ||||
Series 2022-6, Class A3, 4.49%, 11/16/2026 | 312,227 | 311,560 | ||||
Sierra Timeshare Conduit Receivables Funding LLC, Series 2023-2A, Class A, 5.80%, 04/20/2040(a) | 180,517 | 180,238 | ||||
Synchrony Bank, Series 2024-A1, Class A, 5.04%, 03/15/2030 | 1,000,000 | 998,522 | ||||
Taco Bell Corp., Series 2021-1A, Class A2I, 1.95%, 08/25/2051(a) | 1,007,063 | 915,694 | ||||
Tesla Auto Lease Trust, Series 2024-A, Class A3, 5.30%, 06/21/2027(a) | 2,040,000 | 2,032,079 | ||||
T-Mobile US Trust 2024-1, Series 2024-1A, Class A, 5.05%, 09/20/2029(a) | 610,000 | 608,875 | ||||
37 |
Par | Value | |||||
ASSET-BACKED SECURITIES - (Continued) | ||||||
Toyota Auto Loan Extended Note Trust, Series 2020-1A, Class A, 1.35%, 05/25/2033(a) | $500,000 | $481,333 | ||||
Toyota Auto Receivables Owner Trust, Series 2024-B, Class A3, 5.33%, 01/16/2029 | 2,850,000 | 2,863,716 | ||||
Toyota Lease Owner Trust, Series 2024-A, Class A3, 5.25%, 04/20/2027(a) | 2,350,000 | 2,348,635 | ||||
Volkswagen Auto Lease Trust, Series 2024-A, Class A3, 5.21%, 06/21/2027 | 1,300,000 | 1,297,370 | ||||
Volkswagen Auto Loan Enhanced Trust, Series 2021-1, Class A3, 1.02%, 06/22/2026 | 352,001 | 345,654 | ||||
TOTAL ASSET-BACKED SECURITIES (Cost $35,738,600) | 35,531,072 | |||||
MUNICIPAL BOND - 0.2% | ||||||
State of Hawaii, 1.03%, 08/01/2025 | 720,000 | 688,404 | ||||
TOTAL MUNICIPAL BOND (Cost $720,000) | 688,404 | |||||
TOTAL INVESTMENTS - 77.9% (Cost $327,853,087) | $326,868,058 | |||||
Money Market Deposit Account - 5.5%(d)(e) | 23,149,378 | |||||
Other Assets in Excess of Liabilities - 16.6%(f) | 69,620,844 | |||||
TOTAL NET ASSETS - 100.0% | $419,638,280 | |||||
(a) | Security is exempt from registration pursuant to Rule 144A under the Securities Act of 1933, as amended. These securities may only be resold in transactions exempt from registration to qualified institutional investors. As of June 30, 2024, the value of these securities total $62,534,875 or 14.9% of the Fund’s net assets. |
(b) | Coupon rate is variable based on the weighted average coupon of the underlying collateral. To the extent the weighted average coupon of the underlying assets which comprise the collateral increases or decreases, the coupon rate of this security will increase or decrease correspondingly. The rate disclosed is as of June 30, 2024. |
(c) | Step coupon bond. The rate disclosed is as of June 30, 2024. |
(d) | A portion of this deposit account is pledged as collateral for derivative contracts. As of the reporting date, the value of this collateral totals $403,486. |
(e) | The U.S. Bank Money Market Deposit Account (the “MMDA”) is a short-term vehicle in which the Fund holds cash balances. The MMDA will bear interest at a variable rate that is determined based on market conditions and is subject to change daily. The rate as of June 30, 2024 was 5.24%. |
(f) | Includes assets pledged as collateral for derivative contracts. As of the reporting date, the value of these assets totals $64,254,446. |
38 |
Description | Contracts Purchased | Expiration Date | Notional | Value/Unrealized Appreciation (Depreciation) | ||||||||
Arabica Coffee | 145 | 09/18/2024 | $12,332,250 | $(139,297) | ||||||||
Brent Crude Oil | 248 | 07/31/2024 | 21,080,000 | 375,415 | ||||||||
CAC40 10 Euro Index | 186 | 07/19/2024 | 14,924,819 | (241,622) | ||||||||
Crude Oil | 236 | 07/22/2024 | 19,243,440 | 441,094 | ||||||||
Dollar Index | 103 | 09/16/2024 | 10,871,135 | 105,624 | ||||||||
Dow Jones Industrial Average Index | 178 | 09/20/2024 | 35,127,410 | 286,000 | ||||||||
Euro STOXX 50 Quanto Index | 880 | 09/20/2024 | 46,424,418 | (48,460) | ||||||||
FTSE 100 Index | 508 | 09/20/2024 | 52,734,186 | (7,585) | ||||||||
German Stock Index | 103 | 09/20/2024 | 50,749,906 | 250,792 | ||||||||
Gold | 157 | 08/28/2024 | 36,731,720 | (449,368) | ||||||||
Hang Seng Index | 54 | 07/30/2024 | 6,095,620 | (117,633) | ||||||||
London Cocoa | 29 | 09/13/2024 | 2,332,963 | (207,856) | ||||||||
London Metals - Aluminum | 128 | 09/16/2024 | 8,075,392 | (147,171) | ||||||||
London Metals - Copper | 99 | 09/16/2024 | 23,740,571 | (1,021,645) | ||||||||
London Metals - Zinc | 76 | 09/16/2024 | 5,577,393 | 15,803 | ||||||||
Low Sulphur Gas Oil | 153 | 08/12/2024 | 11,995,200 | 66,137 | ||||||||
Nasdaq 100 Index | 141 | 09/20/2024 | 56,194,845 | (421,166) | ||||||||
Nikkei 225 Index | 178 | 09/12/2024 | 43,789,173 | 538,168 | ||||||||
Reformulated Gasoline Blendstock | 29 | 07/31/2024 | 3,046,827 | (40,297) | ||||||||
Russell 2000 Index | 95 | 09/20/2024 | 9,808,750 | 123,699 | ||||||||
S&P 500 Index | 298 | 09/20/2024 | 82,270,350 | (78,896) | ||||||||
Silver | 120 | 09/26/2024 | 17,736,000 | 12,824 | ||||||||
Soybean Meal | 25 | 12/13/2024 | 838,750 | (51,672) | ||||||||
TOPIX Index | 273 | 09/12/2024 | 47,688,887 | 519,194 | ||||||||
Total Purchase Contracts | $(237,918) | |||||||||||
Description | Contracts Sold | Expiration Date | Notional | Value/Unrealized Appreciation (Depreciation) | ||||||||
10 Year Japanese Government Bonds | (13) | 09/11/2024 | $1,153,266 | $6,987 | ||||||||
3 Month Euribor | (1,376) | 12/15/2025 | 358,404,712 | (302,492) | ||||||||
3-Month Secured Overnight Financing Rate | (2,174) | 03/17/2026 | 521,923,050 | (89,282) | ||||||||
Austrailian Government 10 Year Bonds | (190) | 09/16/2024 | 14,394,712 | (1,296) | ||||||||
Canadian 10 Year Government Bonds | (54) | 09/18/2024 | 4,739,432 | (46,499) | ||||||||
Corn No. 2 Yellow | (674) | 12/13/2024 | 14,179,275 | 1,665,633 | ||||||||
Cotton No. 2 | (103) | 12/06/2024 | 3,743,535 | 40,622 | ||||||||
Crude Soybean Oil | (145) | 12/13/2024 | 3,809,730 | 16,403 | ||||||||
Euro-BOBL | (1,058) | 09/06/2024 | 131,934,158 | (1,107,648) | ||||||||
Euro-Bund | (384) | 09/06/2024 | 54,128,064 | (488,839) | ||||||||
Euro-Schatz | (2,067) | 09/06/2024 | 233,983,293 | (1,082,679) | ||||||||
Hard Red Winter Wheat | (79) | 09/13/2024 | 2,315,688 | 8,805 | ||||||||
ICE 3 Month SONIA Rate | (207) | 03/17/2026 | 62,790,410 | (85,737) | ||||||||
Japanese 10 Year Government Bonds | (102) | 09/12/2024 | 90,569,457 | 105,829 | ||||||||
London Metals - Aluminum | (21) | 09/16/2024 | 1,324,869 | 60,670 | ||||||||
London Metals - Copper | (12) | 09/16/2024 | 2,877,645 | 79,994 | ||||||||
39 |
Description | Contracts Sold | Expiration Date | Notional | Value/Unrealized Appreciation (Depreciation) | ||||||||
London Metals - Zinc | (10) | 09/16/2024 | $733,868 | $(12,660) | ||||||||
Long Gilt | (124) | 09/26/2024 | 15,293,877 | (121,157) | ||||||||
Natural Gas | (58) | 07/29/2024 | 1,508,580 | 78,238 | ||||||||
NY Harbor ULSD | (107) | 07/31/2024 | 11,383,751 | (297,203) | ||||||||
Soybeans | (343) | 11/14/2024 | 18,933,600 | 844,954 | ||||||||
Sugar #11 | (343) | 09/30/2024 | 7,798,448 | (547,416) | ||||||||
U.S. Treasury 10 Year Notes | (467) | 09/19/2024 | 51,362,703 | (378,603) | ||||||||
U.S. Treasury 2 Year Notes | (1,612) | 09/30/2024 | 329,200,625 | (896,568) | ||||||||
U.S. Treasury 5 Year Note | (1,037) | 09/30/2024 | 110,521,516 | (726,350) | ||||||||
U.S. Treasury Long Bonds | (66) | 09/19/2024 | 7,808,625 | (88,457) | ||||||||
Wheat | (277) | 12/13/2024 | 8,268,450 | (37,092) | ||||||||
Total Sale Contracts | $(3,401,843) | |||||||||||
Total Unrealized Appreciation (Depreciation) | $ (3,639,761) | |||||||||||
40 |
Settlement Date | Currency Purchased | Currency Sold | Counterparty | Unrealized Appreciation (Depreciation) | ||||||||||||||
09/20/2024 | AUD | 14,933,000 | USD | 9,992,207 | Bank of America Securities, Inc. | $(8,580) | ||||||||||||
09/20/2024 | CAD | 6,679,000 | USD | 4,873,720 | Bank of America Securities, Inc. | 18,363 | ||||||||||||
09/20/2024 | CHF | 6,873,000 | USD | 7,816,192 | Bank of America Securities, Inc. | (87,216) | ||||||||||||
09/20/2024 | GBP | 44,516,000 | USD | 56,971,262 | Bank of America Securities, Inc. | (663,093) | ||||||||||||
09/20/2024 | JPY | 521,792,000 | USD | 3,345,153 | Bank of America Securities, Inc. | (59,504) | ||||||||||||
09/20/2024 | MXN | 246,098,000 | USD | 12,828,905 | Bank of America Securities, Inc. | 445,154 | ||||||||||||
09/20/2024 | NZD | 41,537,000 | USD | 25,591,255 | Bank of America Securities, Inc. | (291,553) | ||||||||||||
09/20/2024 | USD | 598,463 | AUD | 902,000 | Bank of America Securities, Inc. | (4,580) | ||||||||||||
09/20/2024 | USD | 95,631,316 | CAD | 130,674,000 | Bank of America Securities, Inc. | (81,830) | ||||||||||||
09/20/2024 | USD | 73,480,778 | CHF | 64,735,000 | Bank of America Securities, Inc. | 683,559 | ||||||||||||
09/20/2024 | USD | 69,608,871 | EUR | 64,507,000 | Bank of America Securities, Inc. | 239,942 | ||||||||||||
09/20/2024 | USD | 2,643,524 | GBP | 2,090,000 | Bank of America Securities, Inc. | (111) | ||||||||||||
09/20/2024 | USD | 66,378,784 | JPY | 10,208,900,000 | Bank of America Securities, Inc. | 2,094,814 | ||||||||||||
09/20/2024 | USD | 23,368,390 | MXN | 440,910,000 | Bank of America Securities, Inc. | (413,458) | ||||||||||||
09/20/2024 | USD | 42,046 | NZD | 69,000 | Bank of America Securities, Inc. | 19 | ||||||||||||
Total Unrealized Appreciation (Depreciation) | $1,871,926 | ||
41 |
Shares | Value | |||||
COMMON STOCKS - 62.2% | ||||||
Apparel - 0.5% | ||||||
VF Corp. | 18,449 | $249,062 | ||||
Auto Parts & Equipment - 1.1% | ||||||
Gentherm, Inc.(a) | 7,214 | 355,795 | ||||
indie Semiconductor, Inc. - Class A(a) | 31,919 | 196,940 | ||||
552,735 | ||||||
Biotechnology - 0.6% | ||||||
Avid Bioservices, Inc.(a) | 34,702 | 247,772 | ||||
GRAIL, Inc.(a) | 1,819 | 27,958 | ||||
Iovance Biotherapeutics, Inc.(a) | 1,956 | 15,687 | ||||
291,417 | ||||||
Chemicals - 0.2% | ||||||
Avient Corp. | 2,224 | 97,078 | ||||
Commercial Services - 6.4% | ||||||
Arlo Technologies, Inc.(a) | 16,664 | 217,299 | ||||
Franklin Covey Co.(a) | 8,354 | 317,452 | ||||
Huron Consulting Group, Inc.(a) | 5,152 | 507,472 | ||||
LiveRamp Holdings, Inc.(a) | 11,057 | 342,104 | ||||
Marqeta, Inc. - Class A(a) | 20,439 | 112,006 | ||||
Repay Holdings Corp.(a) | 19,241 | 203,185 | ||||
Sabre Corp.(a) | 55,459 | 148,075 | ||||
Sezzle, Inc.(a) | 3,796 | 334,883 | ||||
Shift4 Payments, Inc. - Class A(a) | 5,063 | 371,371 | ||||
Spire Global, Inc.(a) | 12,537 | 135,901 | ||||
Terawulf, Inc.(a) | 11,029 | 49,079 | ||||
Universal Technical Institute, Inc.(a) | 9,524 | 149,812 | ||||
Vestis Corp. | 40,565 | 496,110 | ||||
3,384,749 | ||||||
Computers - 0.6% | ||||||
Mitek Systems, Inc.(a) | 27,488 | 307,316 | ||||
Distribution & Wholesale - 0.7% | ||||||
VSE Corp. | 4,241 | 374,396 | ||||
Diversified Financial Services - 0.2% | ||||||
Bit Digital, Inc.(a) | 11,399 | 36,249 | ||||
LendingTree, Inc.(a) | 1,425 | 59,266 | ||||
95,515 | ||||||
Electric - 2.9% | ||||||
CMS Energy Corp. | 8,699 | 517,851 | ||||
Consolidated Edison, Inc. | 5,560 | 497,175 | ||||
PPL Corp. | 19,118 | 528,613 | ||||
1,543,639 | ||||||
42 |
Shares | Value | |||||
COMMON STOCKS - (Continued) | ||||||
Electronics - 2.5% | ||||||
Applied Optoelectronics, Inc.(a) | 10,052 | $83,331 | ||||
Coherent Corp.(a) | 3,514 | 254,624 | ||||
Enovix Corp.(a) | 25,458 | 393,581 | ||||
OSI Systems, Inc.(a) | 3,076 | 423,012 | ||||
Vicor Corp.(a) | 5,425 | 179,893 | ||||
1,334,441 | ||||||
Engineering & Construction - 1.8% | ||||||
Bowman Consulting Group Ltd.(a) | 14,922 | 474,370 | ||||
Fluor Corp.(a) | 8,820 | 384,111 | ||||
Limbach Holdings, Inc.(a) | 1,756 | 99,969 | ||||
958,450 | ||||||
Entertainment - 4.7% | ||||||
Penn National Gaming, Inc.(a) | 49,510 | 958,266 | ||||
TKO Group Holdings, Inc. | 13,751 | 1,484,971 | ||||
2,443,237 | ||||||
Environmental Control - 0.8% | ||||||
CECO Environmental Corp.(a) | 3,573 | 103,081 | ||||
Montrose Environmental Group, Inc.(a) | 7,518 | 335,002 | ||||
438,083 | ||||||
Food - 0.3% | ||||||
Mama’s Creations, Inc.(a) | 26,506 | 178,650 | ||||
Healthcare-Products - 6.4% | ||||||
Alphatec Holdings, Inc.(a) | 20,669 | 215,991 | ||||
AtriCure, Inc.(a) | 13,380 | 304,663 | ||||
CONMED Corp. | 1,439 | 99,752 | ||||
Globus Medical, Inc. - Class A(a) | 4,163 | 285,124 | ||||
ICU Medical, Inc.(a) | 2,641 | 313,619 | ||||
Inari Medical, Inc.(a) | 5,622 | 270,699 | ||||
Inogen, Inc.(a) | 27,498 | 223,559 | ||||
Insulet Corp.(a) | 1,798 | 362,836 | ||||
Integra LifeSciences Holdings Corp.(a) | 3,621 | 105,516 | ||||
iRhythm Technologies, Inc.(a) | 3,558 | 382,983 | ||||
Masimo Corp.(a) | 1,316 | 165,737 | ||||
MiMedx Group, Inc.(a) | 39,669 | 274,906 | ||||
Natera, Inc.(a) | 1,891 | 204,776 | ||||
TransMedics Group, Inc.(a) | 886 | 133,449 | ||||
3,343,610 | ||||||
Healthcare-Services - 1.0% | ||||||
Neuronetics, Inc.(a) | 104,419 | 187,954 | ||||
Oscar Health, Inc. - Class A(a) | 4,447 | 70,351 | ||||
Viemed Healthcare, Inc.(a) | 38,612 | 252,909 | ||||
511,214 | ||||||
43 |
Shares | Value | |||||
COMMON STOCKS - (Continued) | ||||||
Home Furnishings - 0.5% | ||||||
Arhaus, Inc. | 3,142 | $53,226 | ||||
Lovesac Co.(a) | 8,018 | 181,046 | ||||
234,272 | ||||||
Housewares - 0.3% | ||||||
Scotts Miracle-Gro Co. | 2,750 | 178,915 | ||||
Internet - 3.0% | ||||||
Magnite, Inc.(a) | 40,370 | 536,517 | ||||
Snap, Inc. - Class A(a) | 15,528 | 257,920 | ||||
Sprinklr, Inc. - Class A(a) | 80,137 | 770,918 | ||||
1,565,355 | ||||||
Iron & Steel - 0.5% | ||||||
Carpenter Technology Corp. | 2,524 | 276,580 | ||||
Leisure Time - 0.5% | ||||||
Bowlero Corp. | 18,754 | 271,746 | ||||
Lodging - 0.5% | ||||||
Las Vegas Sands Corp. | 6,052 | 267,801 | ||||
Machinery-Diversified - 0.5% | ||||||
Flowserve Corp. | 5,281 | 254,016 | ||||
Media - 1.6% | ||||||
Comcast Corp. - Class A | 6,583 | 257,790 | ||||
Endeavor Group Holdings, Inc. - Class A | 20,496 | 554,007 | ||||
811,797 | ||||||
Metal Fabricate & Hardware - 0.3% | ||||||
Hillman Solutions Corp.(a) | 18,548 | 164,150 | ||||
Oil & Gas - 0.7% | ||||||
Transocean Ltd.(a) | 71,942 | 384,890 | ||||
Oil & Gas Services - 0.5% | ||||||
Bristow Group, Inc.(a) | 4,830 | 161,950 | ||||
TETRA Technologies, Inc.(a) | 33,288 | 115,176 | ||||
277,126 | ||||||
Pharmaceuticals - 0.7% | ||||||
Pacira Pharmaceuticals, Inc.(a) | 3,525 | 100,850 | ||||
PetIQ, Inc.(a) | 12,362 | 272,706 | ||||
373,556 | ||||||
Retail - 7.1% | ||||||
Abercrombie & Fitch Co. - Class A(a) | 1,669 | 296,815 | ||||
Dick’s Sporting Goods, Inc. | 1,767 | 379,640 | ||||
Ollie’s Bargain Outlet Holdings, Inc.(a) | 3,971 | 389,833 | ||||
Portillo’s, Inc. - Class A(a) | 17,824 | 173,249 | ||||
44 |
Shares | Value | |||||
COMMON STOCKS - (Continued) | ||||||
Retail - (Continued) | ||||||
RH(a) | 2,777 | $678,810 | ||||
Shake Shack, Inc. - Class A(a) | 6,678 | 601,020 | ||||
Sweetgreen, Inc. - Class A(a) | 9,935 | 299,441 | ||||
Ulta Beauty, Inc.(a) | 1,325 | 511,278 | ||||
Urban Outfitters, Inc.(a) | 10,349 | 424,826 | ||||
3,754,912 | ||||||
Savings & Loans - 0.2% | ||||||
New York Community Bancorp, Inc. | 33,243 | 107,042 | ||||
Semiconductors - 1.6% | ||||||
MaxLinear, Inc.(a) | 19,984 | 402,478 | ||||
Silicon Motion Technology Corp. - ADR | 3,959 | 320,639 | ||||
SiTime Corp.(a) | 1,121 | 139,430 | ||||
862,547 | ||||||
Software - 8.3% | ||||||
AvePoint, Inc.(a) | 44,372 | 462,356 | ||||
Dynatrace, Inc.(a) | 2,886 | 129,120 | ||||
Five9, Inc.(a) | 3,161 | 139,400 | ||||
Freshworks, Inc. - Class A(a) | 32,452 | 411,816 | ||||
Lightspeed Commerce, Inc.(a) | 10,007 | 136,996 | ||||
PDF Solutions, Inc.(a) | 11,200 | 407,456 | ||||
PROS Holdings, Inc.(a) | 10,494 | 300,653 | ||||
ROBLOX Corp. - Class A(a) | 21,296 | 792,424 | ||||
Unity Software, Inc.(a) | 6,379 | 103,723 | ||||
Workday, Inc. - Class A(a) | 575 | 128,547 | ||||
Zeta Global Holdings Corp. - Class A(a) | 30,683 | 541,555 | ||||
Zoom Video Communications, Inc. - Class A(a) | 13,574 | 803,445 | ||||
4,357,491 | ||||||
Telecommunications - 3.8% | ||||||
Aviat Networks, Inc.(a) | 7,980 | 228,946 | ||||
Calix, Inc.(a) | 10,721 | 379,845 | ||||
Ceragon Networks Ltd.(a) | 72,975 | 182,438 | ||||
Ciena Corp.(a) | 7,913 | 381,248 | ||||
Corning, Inc. | 10,638 | 413,286 | ||||
Infinera Corp.(a) | 70,442 | 428,992 | ||||
2,014,755 | ||||||
Transportation - 0.9% | ||||||
C.H. Robinson Worldwide, Inc. | 2,895 | 255,107 | ||||
Castle Biosciences, Inc.(a) | 3,306 | 71,972 | ||||
Covenant Logistics Group, Inc. | 3,091 | 152,355 | ||||
479,434 | ||||||
TOTAL COMMON STOCKS (Cost $31,032,845) | 32,739,977 | |||||
45 |
Shares | Value | |||||
REITS - 5.8% | ||||||
Healthcare Realty Trust, Inc. | 40,668 | $670,209 | ||||
Kimco Realty Corp. | 73,281 | 1,426,048 | ||||
Park Hotels & Resorts, Inc. | 63,109 | 945,373 | ||||
TOTAL REITS (Cost $2,982,907) | 3,041,630 | |||||
EXCHANGE TRADED FUND - 1.2% | ||||||
SPDR S&P Biotech ETF | 6,628 | 614,482 | ||||
TOTAL EXCHANGE TRADED FUND (Cost $583,569) | 614,482 | |||||
TOTAL INVESTMENTS - 69.2% (Cost $34,599,321) | 36,396,089 | |||||
Money Market Deposit Account - 21.8%(b) | 11,458,727 | |||||
Other Assets in Excess of Liabilities - 9.0%(c) | 4,753,282 | |||||
TOTAL NET ASSETS - 100.0% | $52,608,098 | |||||
(a) | Non-income producing security. |
(b) | The U.S. Bank Money Market Deposit Account (the “MMDA”) is a short-term vehicle in which the Fund holds cash balances. The MMDA will bear interest at a variable rate that is determined based on market conditions and is subject to change daily. The rate as of June 30, 2024 was 5.24%. |
(c) | Includes assets pledged as collateral for securities sold short and due to broker for derivatives. As of the reporting date, the net value of these assets and liabilities totals $16,676,390. |
46 |
Shares | Value | |||||
COMMON STOCKS - (17.0)% | ||||||
Aerospace & Defense - (0.3)% | ||||||
Mercury Systems, Inc. | (5,833) | $(157,433) | ||||
Agriculture - (0.0)%(a) | ||||||
Vital Farms, Inc. | (434) | (20,298) | ||||
Apparel - (0.5)% | ||||||
On Holding AG - Class A | (3,249) | (126,061) | ||||
Under Armour, Inc. - Class A | (18,902) | (126,077) | ||||
(252,138) | ||||||
Banks - (1.4)% | ||||||
Bank of America Corp. | (6,869) | (273,180) | ||||
Goldman Sachs Group, Inc. | (588) | (265,964) | ||||
Pinnacle Financial Partners, Inc. | (2,392) | (191,456) | ||||
(730,600) | ||||||
Building Materials - (0.2)% | ||||||
Armstrong World Industries, Inc. | (576) | (65,226) | ||||
Aspen Aerogels, Inc. | (2,364) | (56,382) | ||||
(121,608) | ||||||
Commercial Services - (1.2)% | ||||||
Alta Equipment Group, Inc. | (14,544) | (116,934) | ||||
Cintas Corp. | (180) | (126,047) | ||||
Cross Country Healthcare, Inc. | (5,154) | (71,331) | ||||
United Rentals, Inc. | (497) | (321,425) | ||||
(635,737) | ||||||
Computers - (0.1)% | ||||||
ASGN, Inc. | (442) | (38,971) | ||||
Cosmetics & Personal Care - (0.1)% | ||||||
The Beauty Health Co. | (28,042) | (53,841) | ||||
Diversified Financial Services - (0.9)% | ||||||
Capital One Financial Corp. | (914) | (126,543) | ||||
Evercore Partners, Inc. - Class A | (997) | (207,805) | ||||
Synchrony Financial | (2,755) | (130,008) | ||||
(464,356) | ||||||
Electronics - (0.8)% | ||||||
Advanced Energy Industries, Inc. | (2,083) | (226,547) | ||||
Benchmark Electronics, Inc. | (4,596) | (181,358) | ||||
(407,905) | ||||||
Engineering & Construction - (0.3)% | ||||||
Construction Partners, Inc. - Class A | (2,678) | (147,852) | ||||
47 |
Shares | Value | |||||
COMMON STOCKS - (Continued) | ||||||
Entertainment - (0.4)% | ||||||
Red Rock Resorts, Inc. - Class A | (3,506) | $(192,585) | ||||
Food - (0.1)% | ||||||
Beyond Meat, Inc. | (9,562) | (64,161) | ||||
Healthcare-Products - (0.2)% | ||||||
Integer Holdings Corp. | (1,121) | (129,801) | ||||
Home Builders - (0.2)% | ||||||
Toll Brothers, Inc. | (1,003) | (115,525) | ||||
Home Furnishings - (0.2)% | ||||||
Traeger, Inc. | (49,776) | (119,462) | ||||
Internet - (1.7)% | ||||||
Alphabet, Inc. - Class A | (689) | (125,501) | ||||
Etsy, Inc. | (1,624) | (95,784) | ||||
Hims & Hers Health, Inc. | (9,978) | (201,456) | ||||
Match Group, Inc. | (3,295) | (100,102) | ||||
Meta Platforms, Inc. - Class A | (378) | (190,595) | ||||
Pinterest, Inc. - Class A | (4,346) | (191,528) | ||||
(904,966) | ||||||
Iron & Steel - (0.5)% | ||||||
Nucor Corp. | (780) | (123,302) | ||||
Steel Dynamics, Inc. | (1,023) | (132,479) | ||||
(255,781) | ||||||
Leisure Time - (0.2)% | ||||||
YETI Holdings, Inc. | (2,297) | (87,631) | ||||
Machinery-Construction & Mining - (0.7)% | ||||||
Caterpillar, Inc. | (965) | (321,442) | ||||
Terex Corp. | (1,117) | (61,256) | ||||
(382,698) | ||||||
Metal Fabricate & Hardware - (0.3)% | ||||||
Valmont Industries, Inc. | (559) | (153,418) | ||||
Miscellaneous Manufacturing - (0.2)% | ||||||
Fabrinet | (518) | (126,801) | ||||
Oil & Gas - (0.5)% | ||||||
Exxon Mobil Corp. | (1,112) | (128,013) | ||||
Range Resources Corp. | (3,698) | (123,994) | ||||
(252,007) | ||||||
48 |
Shares | Value | |||||
COMMON STOCKS - (Continued) | ||||||
Pharmaceuticals - (0.5)% | ||||||
Organon & Co. | (9,680) | $(200,376) | ||||
Perrigo Co. PLC | (2,164) | (55,571) | ||||
(255,947) | ||||||
Retail - (3.6)% | ||||||
Boot Barn Holdings, Inc. | (1,445) | (186,304) | ||||
Brinker International, Inc. | (3,434) | (248,587) | ||||
Cheesecake Factory, Inc. | (3,160) | (124,156) | ||||
First Watch Restaurant Group, Inc. | (7,116) | (124,957) | ||||
Floor & Decor Holdings, Inc. - Class A | (2,261) | (224,766) | ||||
Gap, Inc. | (5,566) | (132,972) | ||||
McDonald’s Corp. | (1,218) | (310,395) | ||||
RH | (736) | (179,908) | ||||
Shake Shack, Inc. - Class A | (1,118) | (100,620) | ||||
Ulta Beauty, Inc. | (662) | (255,446) | ||||
(1,888,111) | ||||||
Semiconductors - (0.3)% | ||||||
Rambus, Inc. | (3,130) | (183,919) | ||||
Software - (0.8)% | ||||||
Clearwater Analytics Holdings, Inc. - Class A | (8,090) | (149,827) | ||||
Digi International, Inc. | (6,757) | (154,938) | ||||
Fastly, Inc. - Class A | (2,436) | (17,953) | ||||
ROBLOX Corp. - Class A | (2,111) | (78,550) | ||||
(401,268) | ||||||
Telecommunications - (0.4)% | ||||||
A10 Networks, Inc. | (11,875) | (164,469) | ||||
Calix, Inc. | (1,309) | (46,378) | ||||
(210,847) | ||||||
Transportation - (0.4)% | ||||||
Werner Enterprises, Inc. | (5,615) | (201,185) | ||||
TOTAL COMMON STOCKS (Proceeds $9,140,521) | (8,956,852) | |||||
EXCHANGE TRADED FUNDS - (4.3)% | ||||||
iShares Russell 2000 | (3,985) | (808,517) | ||||
iShares Russell 2000 Growth ETF | (2,923) | (767,375) | ||||
ProShares Ultra Financials | (2,017) | (129,068) | ||||
SPDR S&P500 Trust | (981) | (533,880) | ||||
TOTAL EXCHANGE TRADED FUNDS (Proceeds $2,118,220) | (2,238,840) | |||||
TOTAL SECURITIES SOLD SHORT - (21.3)% (Proceeds $11,258,741) | (11,195,692) | |||||
(a) | Represents less than 0.05% of net assets. |
49 |
Units | Value | |||||
MASTER LIMITED PARTNERSHIPS - 24.0% | ||||||
Chemicals - 2.2% | ||||||
CVR Partners LP(a) | 20,553 | $1,555,040 | ||||
Coal - 1.2% | ||||||
Alliance Resource Partners LP | 34,516 | 844,261 | ||||
Diversified Financial Services - 1.0% | ||||||
AllianceBernstein Holding LP | 20,207 | 682,794 | ||||
Gas - 1.2% | ||||||
Global Partners LP | 18,601 | 848,764 | ||||
Investment Companies - 0.8% | ||||||
Icahn Enterprises LP | 35,902 | 591,665 | ||||
Oil & Gas - 2.9% | ||||||
Black Stone Minerals LP | 63,568 | 996,111 | ||||
Sunoco LP | 18,100 | 1,023,374 | ||||
2,019,485 | ||||||
Oil & Gas Services - 2.4% | ||||||
CrossAmerica Partners LP | 47,160 | 936,126 | ||||
USA Compression Partners LP | 32,235 | 764,937 | ||||
1,701,063 | ||||||
Pipelines - 12.3% | ||||||
Cheniere Energy Partners LP | 30,010 | 1,473,791 | ||||
Delek Logistics Partners LP | 23,911 | 967,917 | ||||
Energy Transfer LP(d) | 107,981 | 1,751,452 | ||||
Enterprise Products Partners LP | 58,576 | 1,697,532 | ||||
MPLX LP | 15,925 | 678,246 | ||||
Plains All American Pipeline LP | 76,496 | 1,366,219 | ||||
Western Midstream Partners LP | 17,425 | 692,295 | ||||
8,627,452 | ||||||
TOTAL MASTER LIMITED PARTNERSHIPS (Cost $13,516,126) | 16,870,524 | |||||
Shares | ||||||
COMMON STOCKS - 20.4% | ||||||
Diversified Financial Services - 1.0% | ||||||
Artisan Partners Asset Management, Inc. - Class A | 16,636 | 686,568 | ||||
Energy-Alternate Sources - 1.0% | ||||||
NextEra Energy Partners LP | 26,388 | 729,364 | ||||
Mining - 7.2% | ||||||
Agnico Eagle Mines Ltd. | 30,313 | 1,982,470 | ||||
Barrick Gold Corp.(d) | 108,252 | 1,805,643 | ||||
Newmont Corp. | 15,923 | 666,696 | ||||
Rio Tinto PLC - ADR | 9,645 | 635,895 | ||||
5,090,704 | ||||||
50 |
Shares | Value | |||||
COMMON STOCKS - (Continued) | ||||||
Oil & Gas - 2.0% | ||||||
SandRidge Energy, Inc. | 49,159 | $635,626 | ||||
Viper Energy, Inc. | 20,017 | 751,238 | ||||
1,386,864 | ||||||
Pipelines - 4.9% | ||||||
Antero Midstream Corp. | 61,983 | 913,629 | ||||
Enbridge, Inc. | 18,984 | 675,641 | ||||
Hess Midstream LP - Class A | 23,951 | 872,775 | ||||
Kinetik Holdings, Inc. | 23,814 | 986,852 | ||||
3,448,897 | ||||||
Transportation - 4.3% | ||||||
FLEX LNG Ltd. | 32,645 | 882,721 | ||||
Frontline PLC | 25,345 | 652,887 | ||||
Genco Shipping & Trading Ltd. | 35,098 | 747,938 | ||||
SFL Corp Ltd. | 52,459 | 728,131 | ||||
3,011,677 | ||||||
TOTAL COMMON STOCKS (Cost $13,505,874) | 14,354,074 | |||||
REITS - 17.6% | ||||||
AGNC Investment Corp.(d) | 208,003 | 1,984,349 | ||||
American Homes 4 Rent - Class A | 19,063 | 708,381 | ||||
Annaly Capital Management, Inc. | 69,356 | 1,321,925 | ||||
Apollo Commercial Real Estate Finance, Inc. | 65,631 | 642,527 | ||||
Brandywine Realty Trust | 198,986 | 891,457 | ||||
Digital Realty Trust, Inc. | 4,929 | 749,454 | ||||
Gaming and Leisure Properties, Inc. | 14,931 | 675,031 | ||||
Global Net Lease, Inc.(d) | 96,236 | 707,335 | ||||
Iron Mountain, Inc. | 8,828 | 791,165 | ||||
Rithm Capital Corp. | 80,427 | 877,459 | ||||
Sabra Health Care, Inc. | 47,245 | 727,573 | ||||
Simon Property Group, Inc. | 4,605 | 699,039 | ||||
Starwood Property Trust, Inc. | 51,375 | 973,043 | ||||
Weyerhaeuser Co. | 22,115 | 627,845 | ||||
TOTAL REITS (Cost $12,936,168) | 12,376,583 | |||||
BUSINESS DEVELOPMENT COMPANIES - 11.3% | ||||||
Ares Capital Corp. | 64,081 | 1,335,448 | ||||
Blackstone Secured Lending Fund | 51,192 | 1,567,499 | ||||
FS KKR Capital Corp. | 76,372 | 1,506,820 | ||||
New Mountain Finance Corp. | 71,919 | 880,289 | ||||
Oaktree Specialty Lending Corp. | 76,661 | 1,441,993 | ||||
Sixth Street Specialty Lending, Inc. | 57,809 | 1,234,222 | ||||
TOTAL BUSINESS DEVELOPMENT COMPANIES (Cost $7,474,625) | 7,966,271 | |||||
51 |
Shares | Value | |||||
CLOSED END FUNDS - 10.3% | ||||||
Apollo Senior Floating Rate Fund, Inc. | 47,301 | $687,757 | ||||
FS Credit Opportunities Corp. | 128,001 | 815,366 | ||||
KKR Income Opportunities Fund | 44,182 | 605,293 | ||||
MainStay CBRE Global Infrastructure Megatrends Term Fund | 56,241 | 720,447 | ||||
Morgan Stanley Emerging Markets Domestic Debt Fund, Inc. | 23,171 | 105,660 | ||||
Nuveen Credit Strategies Income Fund | 151,830 | 842,656 | ||||
Nuveen Floating Rate Income Fund | 85,564 | 740,129 | ||||
Park Hotels & Resorts, Inc. | 46,595 | 697,993 | ||||
PIMCO Access Income Fund | 52,917 | 836,618 | ||||
PIMCO Dynamic Income Opportunities Fund | 89,204 | 1,185,521 | ||||
TOTAL CLOSED END FUNDS (Cost $7,159,411) | 7,237,440 | |||||
PREFERRED STOCKS - 7.5% | ||||||
Diversified Financial Services - 1.2% | ||||||
FTAI Aviation Ltd., Series D, 9.50% to 06/15/2028 then 5 yr. CMT Rate + 5.16%, Perpetual | 31,665 | 827,090 | ||||
REITS - 6.3% | ||||||
AGNC Investment Corp., Series F, 6.13% to 04/15/2025 then 3 mo. LIBOR US + 4.70%, Perpetual(b) | 38,915 | 939,019 | ||||
Annaly Capital Management, Inc. | ||||||
Series F, 10.56% (3 mo. Term SOFR + 5.25%), Perpetual | 27,535 | 701,867 | ||||
Series G, 9.74% (3 mo. Term SOFR + 4.43%), Perpetual | 31,674 | 808,004 | ||||
Chimera Investment Corp., Series B, 11.35% (3 mo. Term SOFR + 6.05%), Perpetual | 36,013 | 887,720 | ||||
Rithm Capital Corp., Series D, 7.00% to 11/15/2026 then 5 yr. CMT Rate + 6.22%, Perpetual | 48,146 | 1,114,580 | ||||
4,451,190 | ||||||
TOTAL PREFERRED STOCKS (Cost $4,484,961) | 5,278,280 | |||||
ROYALTY TRUSTS - 2.9% | ||||||
Oil & Gas - 2.9% | ||||||
Kimbell Royalty Partners LP | 68,881 | 1,126,893 | ||||
Sabine Royalty Trust | 13,617 | 880,884 | ||||
2,007,777 | ||||||
TOTAL ROYALTY TRUSTS (Cost $2,058,933) | 2,007,777 | |||||
52 |
Shares | Value | |||||
PUBLICLY TRADED PARTNERSHIP - 1.3% | ||||||
Oil & Gas - 1.3% | ||||||
TXO Partners LP | 44,920 | $905,587 | ||||
TOTAL PUBLICLY TRADED PARTNERSHIP (Cost $851,066) | 905,587 | |||||
TOTAL INVESTMENTS - 95.3% (Cost $61,987,164) | $66,996,536 | |||||
Money Market Deposit Account - 3.9%(c) | 2,763,644 | |||||
Other Assets in Excess of Liabilities - 0.8%(e) | 561,575 | |||||
TOTAL NET ASSETS - 100.0% | $70,321,755 | |||||
(a) | Held in connection with written option contracts. See Schedule of Options Written for further information. |
(b) | Securities referencing LIBOR are expected to transition to an alternative reference rate by the security’s next scheduled coupon reset date. |
(c) | The U.S. Bank Money Market Deposit Account (the “MMDA”) is a short-term vehicle in which the Fund holds cash balances. The MMDA will bear interest at a variable rate that is determined based on market conditions and is subject to change daily. The rate as of June 30, 2024 was 5.24%. |
(d) | All or a portion of this security is held as collateral for options written. As of the reporting date, the value of this collateral is $3,420,061. |
(e) | Includes deposits with broker for derivatives and securities sold short. As of the reporting date, the value of these assets total $673,310. |
53 |
Notional Amount | Contracts | Value | |||||||
WRITTEN OPTION - 0.0%(a)(b)(c) | |||||||||
Call Option - 0.0%(b) | |||||||||
CVR Partners LP, Expiration: 07/19/2024; Exercise Price: $100.00 | $ (1,551,030) | (205) | $ (21,525) | ||||||
TOTAL WRITTEN OPTION (Premiums received $50,834) | (21,525) | ||||||||
(a) | Exchange-traded. |
(b) | Represents less than 0.05% of net assets. |
(c) | 100 shares per contract. |
54 |
LoCorr Macro Strategies Fund | LoCorr Long/Short Commodities Strategy Fund | LoCorr Market Trend Fund | |||||||
ASSETS | |||||||||
Investments, at value (Cost $1,446,407,032, $777,471,241 and $327,853,087, respectively) | $1,441,069,537 | $742,225,905 | $326,868,058 | ||||||
Cash held in interest bearing deposit account (Note 2) | 62,967,575 | 32,181,223 | 23,149,378 | ||||||
Cash held as collateral for forward currency contracts (Note 2) | 24,300,000 | — | 11,679,809 | ||||||
Foreign currency, at value (Cost $0, $0, and $715,901, respectively) | — | — | 715,901 | ||||||
Receivable for Fund shares sold | 1,264,838 | 534,206 | 773,575 | ||||||
Receivable for securities sold short | — | 4,414 | — | ||||||
Interest receivable | 14,056,332 | 4,717,336 | 2,950,593 | ||||||
Receivable for unsettled open futures contracts | 1,150,793 | — | 156,467 | ||||||
Deposits with broker for derivative instruments | 147,501,111 | 419,083 | 52,574,637 | ||||||
Receivable for variation margin on futures contracts | 1,435,247 | — | 1,080,448 | ||||||
Unrealized appreciation on swap contracts (Note 2) | — | 62,506,050 | — | ||||||
Unrealized appreciation on forward currency contracts (Note 2) | 15,227,684 | — | 3,481,851 | ||||||
Advance receipt on swap contracts | — | 33,100,739 | — | ||||||
Prepaid expenses and other assets | 397,160 | 70,707 | 180,345 | ||||||
Total Assets | 1,709,370,277 | 875,759,663 | 423,611,062 | ||||||
Liabilities | |||||||||
Payable for Fund shares redeemed | 2,587,771 | 1,909,389 | 224,775 | ||||||
Payable for securities purchased | 371,178 | — | — | ||||||
Foreign currency due to broker, at value (Cost $16,863,380, $0, and $0, respectively) | 16,611,880 | — | — | ||||||
Unrealized depreciation on forward currency contracts (Note 2) | 5,850,438 | — | 1,609,925 | ||||||
Payable for unsettled open futures contracts | 2,550,811 | — | 1,181,477 | ||||||
Payable to custodian | — | 6,456 | — | ||||||
Accrued management fees (Note 5) | 2,269,908 | 1,050,497 | 515,019 | ||||||
Accrued Trustees’ fees | 50,089 | 30,331 | 12,288 | ||||||
Accrued Rule 12b-1 fees | 387,883 | 263,512 | 171,241 | ||||||
Accrued expenses and other liabilities | 716,158 | 469,021 | 258,057 | ||||||
Total Liabilities | 31,396,116 | 3,729,206 | 3,972,782 | ||||||
NET ASSETS | $1,677,974,161 | $872,030,457 | $419,638,280 | ||||||
Net Assets Consist of: | |||||||||
Paid-in capital | $1,794,411,365 | $ 873,822,019 | $ 419,057,089 | ||||||
Total distributable earnings/(accumulated loss) | (116,437,204) | (1,791,562) | 581,191 | ||||||
Net Assets | $1,677,974,161 | $872,030,457 | $419,638,280 | ||||||
55 |
LoCorr Macro Strategies Fund | LoCorr Long/Short Commodities Strategy Fund | LoCorr Market Trend Fund | |||||||
Class A Shares | |||||||||
Net assets | $76,776,658 | $100,911,590 | $30,574,137 | ||||||
Shares issued and outstanding (unlimited shares authorized, no par value) | 9,520,358 | 10,424,132 | 2,433,831 | ||||||
Net asset value, redemption, and minimum offering price per share(a) | $8.06 | $9.68 | $12.56 | ||||||
Maximum offering price per share ($8.06/0.9425) ($9.68/0.9425) ($12.56/0.9425)(b) | $8.55 | $10.27 | $13.33 | ||||||
Class C Shares | |||||||||
Net assets | $29,955,653 | $7,153,894 | $18,289,809 | ||||||
Shares issued and outstanding (unlimited shares authorized, no par value) | 3,961,134 | 781,199 | 1,534,971 | ||||||
Net asset value, redemption, and offering price per share(a) | $7.56 | $9.16 | $11.92 | ||||||
Class I Shares | |||||||||
Net assets | $1,571,241,850 | $763,964,973 | $370,774,334 | ||||||
Shares issued and outstanding (unlimited shares authorized, no par value) | 190,661,042 | 77,587,316 | 29,336,921 | ||||||
Net asset value, redemption, and offering price per share | $8.24 | $9.85 | $12.64 | ||||||
(a) | A 1.00% contingent deferred sales charge may apply to redemptions made within twelve months of purchase. The contingent deferred sales charge only applies to Class A share purchases of $1 million or more. |
(b) | On investments of $25,000 or more, the offering price is reduced. |
56 |
LoCorr Dynamic Opportunity Fund | LoCorr Spectrum Income Fund | |||||
ASSETS | ||||||
Investments, at value (Cost $34,599,321 and $61,987,164, respectively) | $36,396,089 | $66,996,536 | ||||
Cash held in interest bearing deposit account (Note 2) | 11,458,727 | 2,763,644 | ||||
Cash held as collateral for securities sold short (Note 2) | 3,928,000 | 28,603 | ||||
Deposits with broker for securities sold short (Note 2) | 12,779,182 | — | ||||
Receivable for Fund shares sold | 4,291 | 48,955 | ||||
Receivable for securities sold | 1,802,796 | — | ||||
Dividends, interest, and other receivables | 77,615 | 354,375 | ||||
Deposits with broker for derivative instruments (Note 2) | — | 644,707 | ||||
Prepaid expenses and other assets | 46,809 | 32,285 | ||||
Total Assets | 66,493,509 | 70,869,105 | ||||
Liabilities | ||||||
Securities sold short, at value (Proceeds $11,258,741 and $0, respectively) | $11,195,692 | $— | ||||
Written options, at value (Premiums received $0 and $50,834, respectively) | — | 21,525 | ||||
Payable for securities purchased | 2,214,835 | — | ||||
Payable for Fund shares redeemed | 280,108 | 195,682 | ||||
Payable for distributions | — | 124,667 | ||||
Dividends payable | 4,075 | — | ||||
Due to broker for options | 30,792 | — | ||||
Accrued management fees (Note 5) | 59,904 | 71,509 | ||||
Accrued Trustees’ fees | 1,639 | 2,099 | ||||
Accrued Rule 12b-1 fees | 20,142 | 47,370 | ||||
Accrued expenses and other liabilities | 78,224 | 84,498 | ||||
Total Liabilities | 13,885,411 | 547,350 | ||||
NET ASSETS | $52,608,098 | $70,321,755 | ||||
Net Assets Consist of: | ||||||
Paid-in capital | $ 53,979,625 | $ 109,943,188 | ||||
Total distributable earnings/(accumulated loss) | (1,371,527) | (39,621,433) | ||||
Net Assets | $52,608,098 | $70,321,755 | ||||
Class A Shares | ||||||
Net assets | $2,836,997 | $14,385,824 | ||||
Shares issued and outstanding (unlimited shares authorized, no par value) | 245,837 | 2,618,536 | ||||
Net asset value, redemption, and minimum offering price per share(a) | $11.54 | $5.49 | ||||
Maximum offering price per share ($11.54/0.9425) ($5.49/0.9425)(c) | $12.24 | $5.83 | ||||
Class C Shares | ||||||
Net assets | $1,125,610 | $9,068,404 | ||||
Shares issued and outstanding (unlimited shares authorized, no par value) | 106,099 | 1,626,836 | ||||
Net asset value, redemption, and offering price per share(a) | $10.61 | $5.57(b) | ||||
57 |
LoCorr Dynamic Opportunity Fund | LoCorr Spectrum Income Fund | |||||
Class I Shares | ||||||
Net assets | $48,645,491 | $46,867,527 | ||||
Shares issued and outstanding (unlimited shares authorized, no par value) | 4,089,539 | 8,570,999 | ||||
Net asset value, redemption, and offering price per share | $11.90 | $5.47(b) | ||||
(a) | A 1.00% contingent deferred sales charge may apply to redemptions made within twelve months of purchase. The contingent deferred sales charge only applies to Class A share purchases of $1 million or more. |
(b) | Redemptions made within 60 days of purchase may be assessed a redemption fee of 2.00%. |
(c) | On investments of $25,000 or more, the offering price is reduced. |
58 |
LoCorr Macro Strategies Fund | LoCorr Long/Short Commodities Strategy Fund | LoCorr Market Trend Fund | |||||||
Investment Income | |||||||||
Interest income | $35,164,070 | $16,473,164 | $8,651,356 | ||||||
Broker interest income | 2,271,584 | 11,081 | 746,347 | ||||||
Total Investment Income | 37,435,654 | 16,484,245 | 9,397,703 | ||||||
Expenses | |||||||||
Management fees (Note 5) | 13,177,809 | 6,599,872 | 3,099,957 | ||||||
Fund administration fees | 226,846 | 163,000 | 100,999 | ||||||
Fund accounting fees | 207,595 | 151,212 | 93,588 | ||||||
Trustees’ fees | 104,834 | 61,716 | 26,558 | ||||||
Transfer agent fees and expenses | 1,054,027 | 714,944 | 217,073 | ||||||
Custodian fees | 56,591 | 26,869 | 16,636 | ||||||
Registration expenses | 53,617 | 51,696 | 36,873 | ||||||
Rule 12b-1 fee - Class A (Note 5) | 93,387 | 127,778 | 35,940 | ||||||
Rule 12b-1 fee - Class C (Note 5) | 156,341 | 41,764 | 95,111 | ||||||
Legal and audit fees | 48,416 | 41,734 | 30,575 | ||||||
Printing and mailing expenses | 113,344 | 62,855 | 24,915 | ||||||
Other expenses | 15,030 | 10,212 | 4,138 | ||||||
Total expenses | 15,307,837 | 8,053,652 | 3,782,363 | ||||||
Net Investment Income (Loss) | 22,127,817 | 8,430,593 | 5,615,340 | ||||||
Realized and Unrealized Gain (Loss) on Investments, Swap Contracts, Forward Currency Contracts, Futures Contracts, Foreign Currency, and Securities Litigation: | |||||||||
Net realized gain (loss) on: | |||||||||
Investments | (2,760,894) | (16,849,479) | (696,932) | ||||||
Swap contracts | — | 2,392,320 | — | ||||||
Forward currency contracts | (10,924,166) | — | (8,286,804) | ||||||
Futures contracts | 94,202,302 | — | 46,185,197 | ||||||
Foreign currency transactions | (50,497) | — | (115,992) | ||||||
Securities litigation | 172 | — | — | ||||||
Net change in unrealized appreciation (depreciation) on: | |||||||||
Investments | 1,777,143 | 16,958,604 | 221,256 | ||||||
Swap contracts | — | (2,713,507) | — | ||||||
Forward currency contracts | 20,815,798 | — | 8,924,197 | ||||||
Futures contracts | 12,548,607 | — | 5,699,502 | ||||||
Foreign currency translation | 931,134 | — | — | ||||||
Net realized and unrealized gain (loss) | 116,539,599 | (212,062) | 51,930,424 | ||||||
Net Increase (Decrease) in Net Assets From Operations | $ 138,667,416 | $8,218,531 | $ 57,545,764 | ||||||
59 |
LoCorr Dynamic Opportunity Fund | LoCorr Spectrum Income Fund | |||||
Investment Income | ||||||
Dividend income(a) | $148,153 | $ 2,222,091 | ||||
Interest income | 372,206 | 75,918 | ||||
Broker interest income | 263,019 | 9,409 | ||||
Total Investment Income | 783,378 | 2,307,418 | ||||
Expenses | ||||||
Management fees (Note 5) | 428,836 | 481,060 | ||||
Fund administration fees | 33,511 | 32,289 | ||||
Fund accounting fees | 22,187 | 21,953 | ||||
Trustees’ fees | 3,692 | 4,928 | ||||
Transfer agent fees and expenses | 67,058 | 69,616 | ||||
Custodian fees | 19,652 | 4,138 | ||||
Registration expenses | 25,080 | 26,231 | ||||
Rule 12b-1 fee - Class A (Note 5) | 3,725 | 17,903 | ||||
Rule 12b-1 fee - Class C (Note 5) | 7,710 | 47,337 | ||||
Legal and audit fees | 14,679 | 15,403 | ||||
Printing and mailing expenses | 4,889 | 24,553 | ||||
Other expenses | 1,677 | 4,446 | ||||
Total expenses before dividend and tax expense | 632,696 | 749,857 | ||||
Dividend expense on securities sold short (Note 2) | 42,764 | — | ||||
Tax expense | 362 | — | ||||
Total expenses before fee (waiver from)/recovery to Adviser | 675,822 | 749,857 | ||||
Fee waiver from Adviser (Note 5) | (52,339) | (18,533) | ||||
Net expenses | 623,483 | 731,324 | ||||
Net Investment Income (Loss) | 159,895 | 1,576,094 | ||||
Realized and Unrealized Gain (Loss) on Investments, Securities Sold Short, Foreign Currency, Securities Litigation, and Written Options: | ||||||
Net realized gain (loss) on: | ||||||
Investments | 3,046,586 | 2,059,961 | ||||
Securities sold short | (1,238,088) | — | ||||
Foreign currency transactions | — | — | ||||
Securities litigation | 30,553 | 15,748 | ||||
Written options | — | 92,862 | ||||
Net change in unrealized appreciation (depreciation) on: | ||||||
Investments | (2,348,870) | 769,582 | ||||
Securities sold short | 804,274 | — | ||||
Foreign currency translation | 13 | — | ||||
Futures contracts | — | — | ||||
Written options | — | 43,573 | ||||
Net realized and unrealized gain (loss) | 294,468 | 2,981,726 | ||||
Net Increase (Decrease) in Net Assets From Operations | $454,363 | $ 4,557,820 | ||||
(a) | Net of issuance fees and/or foreign tax withheld of $0 and $7,501, respectively. |
60 |
Six Months Ended June 30, 2024 (Unaudited) | Year Ended December 31, 2023 | |||||
OPERATIONS: | ||||||
Net investment income (loss) | $22,127,817 | $47,885,481 | ||||
Net realized gain (loss) on investments, forward currency contracts, futures contracts, foreign currency transactions, and securities litigation | 80,466,917 | (138,648,336) | ||||
Net change in unrealized appreciation/depreciation of investments, forward currency contracts, futures contracts and foreign currency translation | 36,072,682 | (40,769,293) | ||||
Increase (decrease) in net assets from operations | 138,667,416 | (131,532,148) | ||||
Distributions | ||||||
Class A | — | (2,141,193) | ||||
Class C | — | (733,380) | ||||
Class I | — | (46,560,499) | ||||
Total distributions | — | (49,435,072) | ||||
Capital Transactions (Note 6) | ||||||
Proceeds from shares sold | 390,907,538 | 711,007,731 | ||||
Reinvestment of distributions | — | 44,704,286 | ||||
Cost of shares redeemed | (343,545,826) | (1,448,508,119) | ||||
Increase (decrease) in net assets from capital transactions | 47,361,712 | (692,796,102) | ||||
Total increase (decrease) in net assets | 186,029,128 | (873,763,322) | ||||
Net Assets | ||||||
Beginning of period | 1,491,945,033 | 2,365,708,355 | ||||
End of period | $1,677,974,161 | $1,491,945,033 | ||||
61 |
Six Months Ended June 30, 2024 (Unaudited) | Year Ended December 31, 2023 | |||||
OPERATIONS: | ||||||
Net investment income (loss) | $8,430,593 | $19,944,845 | ||||
Net realized gain (loss) on investments, swap contracts and securities litigation | (14,457,159) | (27,523,393) | ||||
Net change in unrealized appreciation/depreciation of investments and swap contracts | 14,245,097 | (36,701,242) | ||||
Increase (decrease) in net assets from operations | 8,218,531 | (44,279,790) | ||||
Distributions From: | ||||||
Earnings: | ||||||
Class A | — | (3,326,991) | ||||
Class C | — | (76,672) | ||||
Class I | — | (16,291,274) | ||||
Return of capital: | ||||||
Class A | — | (2,689) | ||||
Class C | — | (62) | ||||
Class I | — | (13,170) | ||||
Total distributions | — | (19,710,858) | ||||
Capital Transactions (Note 6) | ||||||
Proceeds from shares sold | 176,004,614 | 429,006,881 | ||||
Reinvestment of distributions | — | 16,343,432 | ||||
Cost of shares redeemed | (231,115,274) | (828,838,252) | ||||
Increase (decrease) in net assets from capital transactions | (55,110,660) | (383,487,939) | ||||
Total increase (decrease) in net assets | (46,892,129) | (447,478,587) | ||||
Net Assets | ||||||
Beginning of period | 918,922,586 | 1,366,401,173 | ||||
End of period | $872,030,457 | $918,922,586 | ||||
62 |
Six Months Ended June 30, 2024 (Unaudited) | Year Ended December 31, 2023 | |||||
OPERATIONS: | ||||||
Net investment income (loss) | $5,615,340 | $11,604,941 | ||||
Net realized gain (loss) on investments, forward currency contracts, futures contracts, foreign currency transactions, and securities litigation | 37,085,469 | (44,624,504) | ||||
Net change in unrealized appreciation/depreciation of investments, forward currency contracts, futures contracts and foreign currency translation | 14,844,955 | (20,593,321) | ||||
Increase (decrease) in net assets from operations | 57,545,764 | (53,612,884) | ||||
Distributions | ||||||
Class A | — | (672,331) | ||||
Class C | — | (315,089) | ||||
Class I | — | (9,999,263) | ||||
Total distributions | — | (10,986,683) | ||||
Capital Transactions (Note 6) | ||||||
Proceeds from shares sold | 102,638,694 | 228,914,608 | ||||
Reinvestment of distributions | — | 10,535,522 | ||||
Cost of shares redeemed | (142,638,465) | (277,489,887) | ||||
Increase (decrease) in net assets from capital transactions | (39,999,771) | (38,039,757) | ||||
Total increase (decrease) in net assets | 17,545,993 | (102,639,324) | ||||
Net Assets | ||||||
Beginning of period | 402,092,287 | 504,731,611 | ||||
End of period | $419,638,280 | $402,092,287 | ||||
63 |
Six Months Ended June 30, 2024 (Unaudited) | Year Ended December 31, 2023 | |||||
OPERATIONS: | ||||||
Net investment income (loss) | $159,895 | $789,618 | ||||
Net realized gain (loss) on investments, securities sold short, foreign currency transactions and securities litigation | 1,839,051 | (992,638) | ||||
Net change in unrealized appreciation/depreciation of investments, securities sold short and foreign currency translation | (1,544,583) | 870,167 | ||||
Increase (decrease) in net assets from operations | 454,363 | 667,147 | ||||
Distributions | ||||||
Class A | — | (45,555) | ||||
Class C | — | (7,402) | ||||
Class I | — | (848,889) | ||||
Total distributions | — | (901,846) | ||||
Capital Transactions (Note 6) | ||||||
Proceeds from shares sold | 17,725,270 | 59,750,030 | ||||
Reinvestment of distributions | — | 708,119 | ||||
Cost of shares redeemed | (28,033,618) | (79,795,915) | ||||
Increase (decrease) in net assets from capital transactions | (10,308,348) | (19,337,766) | ||||
Total increase (decrease) in net assets | (9,853,985) | (19,572,465) | ||||
Net Assets | ||||||
Beginning of period | 62,462,083 | 82,034,548 | ||||
End of period | $52,608,098 | $62,462,083 | ||||
64 |
Six Months Ended June 30, 2024 (Unaudited) | Year Ended December 31, 2023 | |||||
OPERATIONS: | ||||||
Net investment income (loss) | $1,576,094 | $3,210,457 | ||||
Net realized gain (loss) on investments, securities litigation and written options | 2,168,571 | (7,920,168) | ||||
Net change in unrealized appreciation/depreciation of investments and written options | 813,155 | 5,325,402 | ||||
Increase (decrease) in net assets from operations | 4,557,820 | 615,691 | ||||
Distributions From: | ||||||
Earnings: | ||||||
Class A | (605,014) | (689,340) | ||||
Class C | (356,201) | (470,397) | ||||
Class I | (2,203,330) | (3,275,284) | ||||
Return of capital: | ||||||
Class A | — | (657,403) | ||||
Class C | — | (448,604) | ||||
Class I | — | (3,123,544) | ||||
Total distributions | (3,164,545) | (8,664,572) | ||||
Capital Transactions (Note 6) | ||||||
Proceeds from shares sold | 13,187,816 | 28,206,402 | ||||
Reinvestment of distributions | 2,497,745 | 6,973,051 | ||||
Cost of shares redeemed | (32,627,061) | (57,769,695) | ||||
Redemption fees | 19,579 | 6,188 | ||||
Increase (decrease) in net assets from capital transactions | (16,921,921) | (22,584,054) | ||||
Total increase (decrease) in net assets | (15,528,646) | (30,632,935) | ||||
Net Assets | ||||||
Beginning of period | 85,850,401 | 116,483,336 | ||||
End of period | $70,321,755 | $85,850,401 | ||||
65 |
Six Months Ended June 30, 2024* (Unaudited) | Year Ended December 31, | |||||||||||||||||
2023 | 2022 | 2021 | 2020 | 2019 | ||||||||||||||
Per Share | ||||||||||||||||||
Net asset value, beginning of period | $7.38 | $8.15 | $8.13 | $8.53 | $8.56 | $7.95 | ||||||||||||
Income (loss) from investment operations: | ||||||||||||||||||
Net investment income (loss)(a) | 0.10 | 0.17 | (0.01) | (0.10) | (0.04) | 0.02 | ||||||||||||
Net realized and unrealized gain (loss)(b) | 0.58 | (0.72) | 1.21 | 0.09 | 0.49 | 0.98 | ||||||||||||
Total from investment operations | 0.68 | (0.55) | 1.20 | (0.01) | 0.45 | 1.00 | ||||||||||||
Distributions: | ||||||||||||||||||
Net investment income | — | (0.22) | (0.24) | (0.39) | (0.39) | (0.16) | ||||||||||||
Net realized gains | — | — | (0.94) | — | (0.09) | (0.23) | ||||||||||||
Total distributions | — | (0.22) | (1.18) | (0.39) | (0.48) | (0.39) | ||||||||||||
Net asset value, end of period | $8.06 | $7.38 | $8.15 | $8.13 | $8.53 | $8.56 | ||||||||||||
Total investment return(c) | 9.20 % | (6.71)% | 15.01 % | (0.15) % | 5.41 % | 12.52 % | ||||||||||||
Net assets, end of period, in thousands | $76,776 | $70,795 | $79,936 | $84,981 | $77,035 | $53,320 | ||||||||||||
Ratios/Supplemental Data: | ||||||||||||||||||
Ratio of expenses to average net assets: | ||||||||||||||||||
Before expense waiver or recovery | 2.14 % | 2.14 % | 2.13 % | 2.15 % | 2.17 % | 2.16 % | ||||||||||||
After expense waiver or recovery | 2.14 % | 2.14 % | 2.13 % | 2.15 % | 2.18 % | 2.24 % | ||||||||||||
Ratio of net investment income (loss) to average net assets: | ||||||||||||||||||
Before expense waiver or recovery | 2.55 % | 2.17 % | (0.11) % | (1.10) % | (0.49) % | 0.32 % | ||||||||||||
After expense waiver or recovery | 2.55 % | 2.17 % | (0.11) % | (1.10) % | (0.50) % | 0.24 % | ||||||||||||
Portfolio turnover rate(d) | 71 % | 74 % | 76 % | 75 % | 56 % | 84 % | ||||||||||||
* | All ratios have been annualized except total investment return and portfolio turnover. |
(a) | Net investment income (loss) per share is based on average shares outstanding. |
(b) | Realized and unrealized gains and losses per share in this caption may be balancing amounts necessary to reconcile the change in net asset value per share for the period, and may not reconcile with the Fund’s statement of operations due to share transactions for the period. |
(c) | Total investment return excludes the effect of applicable sales charges. |
(d) | Portfolio turnover rate is calculated on the basis of the Fund as a whole without distinguishing between classes of shares issued. Consists of long-term investments only; excludes derivative instruments. |
66 |
Six Months Ended June 30, 2024* (Unaudited) | Year Ended December 31, | |||||||||||||||||
2023 | 2022 | 2021 | 2020 | 2019 | ||||||||||||||
Per Share | ||||||||||||||||||
Net asset value, beginning of period | $6.95 | $7.67 | $7.72 | $8.11 | $8.15 | $7.62 | ||||||||||||
Income (loss) from investment operations: | ||||||||||||||||||
Net investment income (loss)(a) | 0.07 | 0.11 | (0.07) | (0.15) | (0.10) | (0.04) | ||||||||||||
Net realized and unrealized gain (loss)(b) | 0.54 | (0.68) | 1.14 | 0.08 | 0.47 | 0.92 | ||||||||||||
Total from investment operations | 0.61 | (0.57) | 1.07 | (0.07) | 0.37 | 0.88 | ||||||||||||
Distributions: | ||||||||||||||||||
Net investment income | — | (0.15) | (0.18) | (0.32) | (0.32) | (0.12) | ||||||||||||
Net realized gains | — | — | (0.94) | — | (0.09) | (0.23) | ||||||||||||
Total distributions | — | (0.15) | (1.12) | (0.32) | (0.41) | (0.35) | ||||||||||||
Net asset value, end of period | $7.56 | $6.95 | $7.67 | $7.72 | $8.11 | $8.15 | ||||||||||||
Total investment return(c) | 8.92% | (7.48) % | 14.17 % | (0.91) % | 4.69 % | 11.57 % | ||||||||||||
Net assets, end of period, in thousands | $29,956 | $33,146 | $51,327 | $34,789 | $43,684 | $47,205 | ||||||||||||
Ratios/Supplemental Data: | ||||||||||||||||||
Ratio of expenses to average net assets: | ||||||||||||||||||
Before expense waiver or recovery | 2.89 % | 2.89 % | 2.88 % | 2.90 % | 2.92 % | 2.91 % | ||||||||||||
After expense waiver or recovery | 2.89 % | 2.89 % | 2.88 % | 2.90 % | 2.93 % | 2.99 % | ||||||||||||
Ratio of net investment income (loss) to average net assets: | ||||||||||||||||||
Before expense waiver or recovery | 1.80 % | 1.42 % | (0.86) % | (1.85) % | (1.24) % | (0.43) % | ||||||||||||
After expense waiver or recovery | 1.80 % | 1.42 % | (0.86) % | (1.85) % | (1.25) % | (0.51) % | ||||||||||||
Portfolio turnover rate(d) | 71 % | 74 % | 76 % | 75 % | 56 % | 84 % | ||||||||||||
* | All ratios have been annualized except total investment return and portfolio turnover. |
(a) | Net investment income (loss) per share is based on average shares outstanding. |
(b) | Realized and unrealized gains and losses per share in this caption may be balancing amounts necessary to reconcile the change in net asset value per share for the period, and may not reconcile with the Fund’s statement of operations due to share transactions for the period. |
(c) | Total investment return excludes the effect of applicable sales charges. |
(d) | Portfolio turnover rate is calculated on the basis of the Fund as a whole without distinguishing between classes of shares issued. Consists of long-term investments only; excludes derivative instruments. |
67 |
Six Months Ended June 30, 2024* (Unaudited) | Year Ended December 31, | |||||||||||||||||
2023 | 2022 | 2021 | 2020 | 2019 | ||||||||||||||
Per Share | ||||||||||||||||||
Net asset value, beginning of period | $7.54 | $8.31 | $8.27 | $8.67 | $8.69 | $8.07 | ||||||||||||
Income (loss) from investment operations: | ||||||||||||||||||
Net investment income (loss)(a) | 0.11 | 0.20 | 0.01 | (0.08) | (0.02) | 0.04 | ||||||||||||
Net realized and unrealized gain (loss)(b) | 0.59 | (0.73) | 1.23 | 0.09 | 0.50 | 0.99 | ||||||||||||
Total from investment operations | 0.70 | (0.53) | 1.24 | 0.01 | 0.48 | 1.03 | ||||||||||||
Distributions: | ||||||||||||||||||
Net investment income | — | (0.24) | (0.26) | (0.41) | (0.41) | (0.18) | ||||||||||||
Net realized gains | — | — | (0.94) | — | (0.09) | (0.23) | ||||||||||||
Total distributions | — | (0.24) | (1.20) | (0.41) | (0.50) | (0.41) | ||||||||||||
Net asset value, end of period | $8.24 | $7.54 | $8.31 | $8.27 | $8.67 | $8.69 | ||||||||||||
Total investment return | 9.42 % | (6.58) % | 15.40 % | 0.08 % | 5.70 % | 12.72 % | ||||||||||||
Net assets, end of period, in thousands | $1,571,242 | $1,388,004 | $2,234,445 | $1,306,255 | $1,063,447 | $726,061 | ||||||||||||
Ratios/Supplemental Data: | ||||||||||||||||||
Ratio of expenses to average net assets: | ||||||||||||||||||
Before expense waiver or recovery | 1.89 % | 1.89 % | 1.88 % | 1.90 % | 1.92 % | 1.91 % | ||||||||||||
After expense waiver or recovery | 1.89 % | 1.89 % | 1.88 % | 1.90 % | 1.93 % | 1.99 % | ||||||||||||
Ratio of net investment income (loss) to average net assets: | ||||||||||||||||||
Before expense waiver or recovery | 2.80 % | 2.42 % | 0.14 % | (0.85) % | (0.24) % | 0.57 % | ||||||||||||
After expense waiver or recovery | 2.80 % | 2.42 % | 0.14 % | (0.85) % | (0.25) % | 0.49 % | ||||||||||||
Portfolio turnover rate(c) | 71 % | 74 % | 76 % | 75 % | 56 % | 84 % | ||||||||||||
* | All ratios have been annualized except total investment return and portfolio turnover. |
(a) | Net investment income (loss) per share is based on average shares outstanding. |
(b) | Realized and unrealized gains and losses per share in this caption may be balancing amounts necessary to reconcile the change in net asset value per share for the period, and may not reconcile with the Fund’s statement of operations due to share transactions for the period. |
(c) | Amount represents less than $0.005 per share. |
68 |
Six Months Ended June 30, 2024* (Unaudited) | Year Ended December 31, | |||||||||||||||||
2023 | 2022 | 2021 | 2020 | 2019 | ||||||||||||||
Per Share | ||||||||||||||||||
Net asset value, beginning of period | $9.61 | $10.10 | $10.58 | $9.89 | $9.26 | $9.90 | ||||||||||||
Income (loss) from investment operations: | ||||||||||||||||||
Net investment income (loss)(a) | 0.08 | 0.13 | (0.05) | (0.14) | (0.07) | 0.05 | ||||||||||||
Net realized and unrealized gain (loss)(b) | (0.01) | (0.46) | 0.66 | 1.57 | 0.96 | (0.67) | ||||||||||||
Total from investment operations | 0.07 | (0.33) | 0.61 | 1.43 | 0.89 | (0.62) | ||||||||||||
Distributions: | ||||||||||||||||||
Net investment income | — | (0.16) | (1.09) | (0.74) | (0.26) | (0.02) | ||||||||||||
Net realized gains | — | — | — | — | (0.00)(c) | — | ||||||||||||
Return of capital | (0.00)(c) | — | — | — | — | |||||||||||||
Total distributions | — | (0.16) | (1.09) | (0.74) | (0.26) | (0.02) | ||||||||||||
Net asset value, end of period | $9.68 | $9.61 | $10.10 | $10.58 | $9.89 | $9.26 | ||||||||||||
Total investment return(d) | 0.73 % | (3.26) % | 5.84 % | 14.55 % | 9.66 % | (6.24) % | ||||||||||||
Net assets, end of period, in thousands | $100,911 | $103,239 | $187,553 | $35,149 | $26,546 | $45,513 | ||||||||||||
Ratios/Supplemental Data(e): | ||||||||||||||||||
Ratio of expenses to average net assets: | ||||||||||||||||||
Before expense waiver or recovery | 1.99 % | 1.94 % | 2.00%(f) | 2.08%(f) | 2.08%(f) | 2.11 % | ||||||||||||
After expense waiver or recovery | 1.99 % | 1.94 % | 2.00%(f) | 2.08%(f) | 2.08%(f) | 2.14 % | ||||||||||||
Ratio of net investment income (loss) to average net assets: | ||||||||||||||||||
Before expense waiver or recovery | 1.65 % | 1.37 % | (0.46)%(f) | (1.31)%(f) | (0.65)%(f) | 0.57 % | ||||||||||||
After expense waiver or recovery | 1.65 % | 1.37 % | (0.46)%(f) | (1.31)%(f) | (0.65)%(f) | 0.54 % | ||||||||||||
Portfolio turnover rate(g) | 42 % | 64 % | 90 % | 66 % | 60 % | 103 % | ||||||||||||
* | All ratios have been annualized except total investment return and portfolio turnover. |
(a) | Net investment income (loss) per share is based on average shares outstanding. |
(b) | Realized and unrealized gains and losses per share in this caption may be balancing amounts necessary to reconcile the change in net asset value per share for the period, and may not reconcile with the Fund’s statement of operations due to share transactions for the period. |
(c) | Amount represents less than $0.005 per share. |
(d) | Total investment return excludes the effect of applicable sales charges. |
(e) | Ratios do not include the income and expenses of the CTAs included in the swap nor the commodity pool in which the Fund invests. |
(f) | Includes 0.07%, 0.08% and 0.02% service fees paid for options for the years ended December 31, 2022, December 31, 2021 and December 31, 2020, respectively. |
(g) | Portfolio turnover rate is calculated on the basis of the Fund as a whole without distinguishing between classes of shares issued. Consists of long-term investments. |
69 |
Six Months Ended June 30, 2024* (Unaudited) | Year Ended December 31, | |||||||||||||||||
2023 | 2022 | 2021 | 2020 | 2019 | ||||||||||||||
Per Share | ||||||||||||||||||
Net asset value, beginning of period | $9.12 | $9.58 | $10.08 | $9.47 | $8.89 | $9.55 | ||||||||||||
Income (loss) from investment operations: | ||||||||||||||||||
Net investment income (loss)(a) | 0.04 | 0.06 | (0.13) | (0.21) | (0.13) | (0.02) | ||||||||||||
Net realized and unrealized gain (loss)(b) | (0.00)(c) | (0.45) | 0.63 | 1.50 | 0.91 | (0.64) | ||||||||||||
Total from investment operations | 0.04 | (0.39) | 0.50 | 1.29 | 0.78 | (0.66) | ||||||||||||
Distributions: | ||||||||||||||||||
Net investment income | — | (0.07) | (1.00) | (0.68) | (0.20) | (0.00)(c) | ||||||||||||
Net realized gains | — | — | — | — | (0.00)(c) | — | ||||||||||||
Return of capital | — | (0.00)(c) | — | — | — | — | ||||||||||||
Total distributions | — | (0.07) | (1.00) | (0.68) | (0.20) | (0.00) | ||||||||||||
Net asset value, end of period | $9.16 | $9.12 | $9.58 | $10.08 | $9.47 | $8.89 | ||||||||||||
Total investment return(d) | 0.44 % | (4.03) % | 5.03 % | 13.66 % | 8.83 % | (6.90) % | ||||||||||||
Net assets, end of period, in thousands | $7,154 | $9,369 | $13,384 | $11,058 | $7,938 | $6,645 | ||||||||||||
Ratios/Supplemental Data:(e) | ||||||||||||||||||
Ratio of expenses to average net assets: | ||||||||||||||||||
Before expense waiver or recovery | 2.74 % | 2.69 % | 2.75%(f) | 2.83%(f) | 2.83 %(f) | 2.86 % | ||||||||||||
After expense waiver or recovery | 2.74 % | 2.69 % | 2.75%(f) | 2.83%(f) | 2.83%(f) | 2.89 % | ||||||||||||
Ratio of net investment income (loss) to average net assets: | ||||||||||||||||||
Before expense waiver or recovery | 0.90 % | 0.62 % | (1.21)%(f) | (2.06)%(f) | (1.40)%(f) | (0.18) % | ||||||||||||
After expense waiver or recovery | 0.90 % | 0.62 % | (1.21)%(f) | (2.06)%(f) | (1.40)%(f) | (0.21) % | ||||||||||||
Portfolio turnover rate(g) | 42 % | 64 % | 90 % | 66 % | 60 % | 103 % | ||||||||||||
* | All ratios have been annualized except total investment return and portfolio turnover. |
(a) | Net investment income (loss) per share is based on average shares outstanding. |
(b) | Realized and unrealized gains and losses per share in this caption may be balancing amounts necessary to reconcile the change in net asset value per share for the period, and may not reconcile with the Fund’s statement of operations due to share transactions for the period. |
(c) | Amount represents less than $0.005 per share. |
(d) | Total investment return excludes the effect of applicable sales charges. |
(e) | Ratios do not include the income and expenses of the CTAs included in the swap nor the commodity pool in which the Fund invests. |
(f) | Includes 0.07%, 0.08% and 0.02% service fees paid for options for the years ended December 31, 2022, December 31, 2021 and December 31, 2020, respectively. |
(g) | Portfolio turnover rate is calculated on the basis of the Fund as a whole without distinguishing between classes of shares issued. Consists of long-term investments only; excludes derivative instruments. |
70 |
Six Months Ended June 30, 2024* (Unaudited) | Year Ended December 31, | |||||||||||||||||
2023 | 2022 | 2021 | 2020 | 2019 | ||||||||||||||
Per Share | ||||||||||||||||||
Net asset value, beginning of period | $9.76 | $10.26 | $10.72 | $10.00 | $9.38 | $10.03 | ||||||||||||
Income (loss) from investment operations: | ||||||||||||||||||
Net investment income (loss)(a) | 0.09 | 0.16 | (0.02) | (0.11) | (0.04) | 0.08 | ||||||||||||
Net realized and unrealized gain (loss)(b) | (0.00)(c) | (0.48) | 0.66 | 1.59 | 0.95 | (0.68) | ||||||||||||
Total from investment operations | 0.09 | (0.32) | 0.64 | 1.48 | 0.91 | (0.60) | ||||||||||||
Distributions: | ||||||||||||||||||
Net investment income | — | (0.18) | (1.10) | (0.76) | (0.29) | (0.05) | ||||||||||||
Net realized gains | — | — | — | — | (0.00)(c) | — | ||||||||||||
Return of capital | — | (0.00)(c) | — | — | — | — | ||||||||||||
Total distributions | — | (0.18) | (1.10) | (0.76) | (0.29) | (0.05) | ||||||||||||
Net asset value, end of period | $9.85 | $9.76 | $10.26 | $10.72 | $10.00 | $9.38 | ||||||||||||
Total investment return | 0.92 % | (3.07) % | 6.06 % | 14.82 % | 9.91 % | (5.97) % | ||||||||||||
Net assets, end of period, in thousands | $763,965 | $806,315 | $1,165,464 | $852,152 | $443,351 | $203,887 | ||||||||||||
Ratios/Supplemental Data:(d) | ||||||||||||||||||
Ratio of expenses to average net assets: | ||||||||||||||||||
Before expense waiver or recovery | 1.74 % | 1.69 % | 1.75%(e) | 1.83%(e) | 1.83%(e) | 1.86% | ||||||||||||
After expense waiver or recovery | 1.74 % | 1.69 % | 1.75%(e) | 1.83%(e) | 1.83%(e) | 1.89% | ||||||||||||
Ratio of net investment income (loss) to average net assets: | ||||||||||||||||||
Before expense waiver or recovery | 1.90 % | 1.62 % | (0.21) %(e) | (1.06) %(e) | (0.40) %(e) | 0.82 % | ||||||||||||
After expense waiver or recovery | 1.90 % | 1.62 % | (0.21) %(e) | (1.06) %(e) | (0.40) %(e) | 0.79 % | ||||||||||||
Portfolio turnover rate(f) | 42 % | 64 % | 90 % | 66 % | 60 % | 103 % | ||||||||||||
* | All ratios have been annualized except total investment return and portfolio turnover. |
(a) | Net investment income (loss) per share is based on average shares outstanding. |
(b) | Realized and unrealized gains and losses per share in this caption may be balancing amounts necessary to reconcile the change in net asset value per share for the period, and may not reconcile with the Fund’s statement of operations due to share transactions for the period. |
(c) | Amount represents less than $0.005 per share. |
(d) | Ratios do not include the income and expenses of the CTAs included in the swap nor the commodity pool in which the Fund invests. |
(e) | Includes 0.07%, 0.08% and 0.02% service fees paid for options for the years ended December 31, 2022, December 31, 2021 and December 31, 2020, respectively. |
(f) | Portfolio turnover rate is calculated on the basis of the Fund as a whole without distinguishing between classes of shares issued. Consists of long-term investments only; excludes derivative instruments. |
71 |
Six Months Ended June 30, 2024* (Unaudited) | Year Ended December 31, | |||||||||||||||||
2023 | 2022 | 2021 | 2020 | 2019 | ||||||||||||||
Per Share | ||||||||||||||||||
Net asset value, beginning of period | $10.89 | $12.55 | $11.41 | $11.70 | $11.19 | $9.52 | ||||||||||||
Income (loss) from investment operations: | ||||||||||||||||||
Net investment income (loss)(a) | 0.14 | 0.26 | (0.01) | (0.13) | (0.06) | 0.01 | ||||||||||||
Net realized and unrealized gain (loss)(b) | 1.53 | (1.65) | 3.34 | 0.22 | 0.57 | 1.74 | ||||||||||||
Total from investment operations | 1.67 | (1.39) | 3.33 | 0.09 | 0.51 | 1.75 | ||||||||||||
Distributions: | ||||||||||||||||||
Net investment income | — | (0.27) | (0.53) | (0.38) | — | (0.08) | ||||||||||||
Net realized gains | — | — | (1.66) | — | — | — | ||||||||||||
Total distributions | — | (0.27) | (2.19) | (0.38) | — | (0.08) | ||||||||||||
Net asset value, end of period | $12.56 | $10.89 | $12.55 | $11.41 | $11.70 | $11.19 | ||||||||||||
Total investment return(c) | 15.34 % | (11.18) % | 29.59 % | 0.87 % | 4.47 % | 18.33 % | ||||||||||||
Net assets, end of period, in thousands | $30,574 | $25,345 | $27,903 | $15,109 | $16,952 | $21,966 | ||||||||||||
Ratios/Supplemental Data: | ||||||||||||||||||
Ratio of expenses to average net assets: | 2.02 % | 2.00 % | 2.00 % | 2.02 % | 2.04 % | 2.02 % | ||||||||||||
Ratio of net investment income (loss) to average net assets: | 2.53 % | 2.13 % | (0.10) % | (1.10) % | (0.52) % | 0.14 % | ||||||||||||
Portfolio turnover rate(d) | 64 % | 77 % | 100 % | 110 % | 125 % | 119 % | ||||||||||||
* | All ratios have been annualized except total investment return and portfolio turnover. |
(a) | Net investment income (loss) per share is based on average shares outstanding. |
(b) | Realized and unrealized gains and losses per share in this caption may be balancing amounts necessary to reconcile the change in net asset value per share for the period, and may not reconcile with the Fund’s statement of operations due to share transactions for the period. |
(c) | Total investment return excludes the effect of applicable sales charges. |
(d) | Portfolio turnover rate is calculated on the basis of the Fund as a whole without distinguishing between classes of shares issued. Consists of long-term investments only; excludes derivative instruments. |
72 |
Six Months Ended June 30, 2024* (Unaudited) | Year Ended December 31, | |||||||||||||||||
2023 | 2022 | 2021 | 2020 | 2019 | ||||||||||||||
Per Share | ||||||||||||||||||
Net asset value, beginning of period | $10.36 | $11.95 | $11.02 | $11.30 | $10.89 | $9.28 | ||||||||||||
Income (loss) from investment operations: | ||||||||||||||||||
Net investment income (loss)(a) | 0.10 | 0.16 | (0.12) | (0.22) | (0.13) | (0.06) | ||||||||||||
Net realized and unrealized gain (loss)(b) | 1.46 | (1.57) | 3.23 | 0.23 | 0.54 | 1.67 | ||||||||||||
Total from investment operations | 1.56 | (1.41) | 3.11 | 0.01 | 0.41 | 1.61 | ||||||||||||
Distributions: | ||||||||||||||||||
Net investment income | — | (0.18) | (0.52) | (0.29) | — | — | ||||||||||||
Net realized gains | — | — | (1.66) | — | — | — | ||||||||||||
Total distributions | — | (0.18) | (2.18) | (0.29) | — | — | ||||||||||||
Net asset value, end of period | $11.92 | $10.36 | $11.95 | $11.02 | $11.30 | $10.89 | ||||||||||||
Total investment return(c) | 14.96 % | (11.90) % | 28.67 % | 0.05 % | 3.76 % | 17.35 % | ||||||||||||
Net assets, end of period, in thousands | $18,290 | $18,079 | $19,569 | $10,825 | $13,170 | $16,320 | ||||||||||||
Ratios/Supplemental Data: | ||||||||||||||||||
Ratio of expenses to average net assets: | 2.77 % | 2.75 % | 2.75 % | 2.77 % | 2.79 % | 2.77 % | ||||||||||||
Ratio of net investment income (loss) to average net assets: | 1.78 % | 1.38 % | (0.85) % | (1.85) % | (1.27) % | (0.61) % | ||||||||||||
Portfolio turnover rate(d) | 64 % | 77 % | 100 % | 110 % | 125 % | 119 % | ||||||||||||
* | All ratios have been annualized except total investment return and portfolio turnover. |
(a) | Net investment income (loss) per share is based on average shares outstanding. |
(b) | Realized and unrealized gains and losses per share in this caption may be balancing amounts necessary to reconcile the change in net asset value per share for the period, and may not reconcile with the Fund’s statement of operations due to share transactions for the period. |
(c) | Total investment return excludes the effect of applicable sales charges. |
(d) | Portfolio turnover rate is calculated on the basis of the Fund as a whole without distinguishing between classes of shares issued. Consists of long-term investments only; excludes derivative instruments. |
73 |
Six Months Ended June 30, 2024* (Unaudited) | Year Ended December 31, | |||||||||||||||||
2023 | 2022 | 2021 | 2020 | 2019 | ||||||||||||||
Per Share | ||||||||||||||||||
Net asset value, beginning of period | $10.94 | $12.61 | $11.45 | $11.74 | $11.23 | $9.60 | ||||||||||||
Income (loss) from investment operations: | ||||||||||||||||||
Net investment income (loss)(a) | 0.17 | 0.30 | 0.02 | (0.10) | (0.03) | 0.04 | ||||||||||||
Net realized and unrealized gain (loss)(b) | 1.53 | (1.67) | 3.36 | 0.22 | 0.57 | 1.74 | ||||||||||||
Total from investment operations | 1.70 | (1.37) | 3.38 | 0.12 | 0.54 | 1.78 | ||||||||||||
Distributions: | ||||||||||||||||||
Net investment income | — | (0.30) | (0.56) | (0.41) | (0.03) | (0.15) | ||||||||||||
Net realized gains | — | — | (1.66) | — | — | — | ||||||||||||
Total distributions | — | (0.30) | (2.22) | (0.41) | (0.03) | (0.15) | ||||||||||||
Net asset value, end of period | $12.64 | $10.94 | $12.61 | $11.45 | $11.74 | $11.23 | ||||||||||||
Total investment return | 15.54 % | (10.98) % | 29.94 % | 1.04 % | 4.81 % | 18.53 % | ||||||||||||
Net assets, end of period, in thousands | $370,774 | $358,668 | $457,260 | $240,507 | $225,995 | $234,919 | ||||||||||||
Ratios/Supplemental Data: | ||||||||||||||||||
Ratio of expenses to average net assets: | 1.77 % | 1.75 % | 1.75 % | 1.77 % | 1.79 % | 1.77 % | ||||||||||||
Ratio of net investment income (loss) to average net assets: | 2.78 % | 2.38 % | 0.15 % | (0.85) % | (0.27) % | 0.39 % | ||||||||||||
Portfolio turnover rate(c) | 64 % | 77 % | 100 % | 110 % | 125 % | 119 % | ||||||||||||
* | All ratios have been annualized except total investment return and portfolio turnover. |
(a) | Net investment income (loss) per share is based on average shares outstanding. |
(b) | Realized and unrealized gains and losses per share in this caption may be balancing amounts necessary to reconcile the change in net asset value per share for the period, and may not reconcile with the Fund’s statement of operations due to share transactions for the period. |
(c) | Portfolio turnover rate is calculated on the basis of the Fund as a whole without distinguishing between classes of shares issued. Consists of long-term investments only; excludes derivative instruments. |
74 |
Six Months Ended June 30, 2024* (Unaudited) | Year Ended December 31, | |||||||||||||||||
2023 | 2022 | 2021 | 2020 | 2019 | ||||||||||||||
Per Share | ||||||||||||||||||
Net asset value, beginning of period | $11.43 | $11.22 | $12.46 | $11.62 | $11.20 | $9.92 | ||||||||||||
Income (loss) from investment operations: | ||||||||||||||||||
Net investment income (loss)(a) | 0.02 | 0.09 | (0.09) | (0.23) | (0.20) | (0.19) | ||||||||||||
Net realized and unrealized gain (loss)(b) | 0.09 | 0.27 | (1.00) | 1.85 | 0.62 | 1.51 | ||||||||||||
Total from investment operations | 0.11 | 0.36 | (1.09) | 1.62 | 0.42 | 1.32 | ||||||||||||
Distributions: | ||||||||||||||||||
Net investment income | — | (0.11) | — | — | — | — | ||||||||||||
Net realized gains | — | (0.04) | (0.15) | (0.78) | — | (0.04) | ||||||||||||
Total distributions | — | (0.15) | (0.15) | (0.78) | — | (0.04) | ||||||||||||
Net asset value, end of period | $11.54 | $11.43 | $11.22 | $12.46 | $11.62 | $11.20 | ||||||||||||
Total investment return(c) | 1.05% | 3.19 % | (9.18) % | 14.38 % | 3.75 % | 13.40 % | ||||||||||||
Net assets, end of period, in thousands | $ 2,837 | $ 3,557 | $3,534 | $4,010 | $3,828 | $6,744 | ||||||||||||
Ratios/Supplemental Data: | ||||||||||||||||||
Ratio of expenses to average net assets: | ||||||||||||||||||
Before expense waiver or recovery | 2.57 % | 2.53 % | 2.82 % | 3.90 % | 4.51 % | 3.73 % | ||||||||||||
After expense waiver or recovery | 2.39 % | 2.47 % | 2.51 % | 2.67 % | 3.15 % | 3.02 % | ||||||||||||
Ratio of expenses to average net assets (excluding dividend, interest, and tax expense): | ||||||||||||||||||
Before expense waiver or recovery | 2.42 % | 2.30 % | 2.55 % | 3.47 % | 3.60 % | 2.95 % | ||||||||||||
After expense waiver or recovery | 2.24 % | 2.24 % | 2.24 % | 2.24 % | 2.24 % | 2.24 % | ||||||||||||
Ratio of net investment income (loss) to average net assets: | ||||||||||||||||||
Before expense waiver or recovery | 0.17 % | 0.73 % | (1.08) % | (3.02) % | (3.31) % | (2.44) % | ||||||||||||
After expense waiver or recovery | 0.35 % | 0.79 % | (0.77) % | (1.79) % | (1.95) % | (1.73) % | ||||||||||||
Portfolio turnover rate(d) | 300 % | 932 % | 686 % | 506 % | 953 % | 300 % | ||||||||||||
* | All ratios have been annualized except total investment return and portfolio turnover. |
(a) | Net investment income (loss) per share is based on average shares outstanding. |
(b) | Realized and unrealized gains and losses per share in this caption may be balancing amounts necessary to reconcile the change in net asset value per share for the period, and may not reconcile with the Fund’s statement of operations due to share transactions for the period. |
(c) | Total investment return excludes the effect of applicable sales charges. |
(d) | Portfolio turnover rate is calculated on the basis of the Fund as a whole without distinguishing between classes of shares issued. Consists of long-term investments only; excludes securities sold short. |
75 |
Six Months Ended June 30, 2024* (Unaudited) | Year Ended December 31, | |||||||||||||||||
2023 | 2022 | 2021 | 2020 | 2019 | ||||||||||||||
Per Share | ||||||||||||||||||
Net asset value, beginning of period | $10.55 | $10.33 | $11.58 | $10.93 | $10.62 | $9.47 | ||||||||||||
Income (loss) from investment operations: | ||||||||||||||||||
Net investment income (loss)(a) | (0.02) | 0.00(c) | (0.16) | (0.31) | (0.26) | (0.26) | ||||||||||||
Net realized and unrealized gain (loss)(b) | 0.08 | 0.26 | (0.94) | 1.74 | 0.57 | 1.45 | ||||||||||||
Total from investment operations | 0.06 | 0.26 | (1.10) | 1.43 | 0.31 | 1.19 | ||||||||||||
Distributions: | ||||||||||||||||||
Net realized gains | — | (0.04) | (0.15) | (0.78) | — | (0.04) | ||||||||||||
Total distributions | — | (0.04) | (0.15) | (0.78) | — | (0.04) | ||||||||||||
Net asset value, end of period | $10.61 | $10.55 | $10.33 | $11.58 | $10.93 | $10.62 | ||||||||||||
Total investment return(d) | 0.66 % | 2.43 % | (9.80) % | 13.46 % | 2.92 % | 12.54 % | ||||||||||||
Net assets, end of period, in thousands | $1,126 | $1,914 | $3,086 | $2,786 | $2,436 | $4,031 | ||||||||||||
Ratios/Supplemental Data: | ||||||||||||||||||
Ratio of expenses to average net assets: | ||||||||||||||||||
Before expense waiver or recovery | 3.32 % | 3.28 % | 3.57 % | 4.65 % | 5.26 % | 4.48 % | ||||||||||||
After expense waiver or recovery | 3.14 % | 3.22 % | 3.26 % | 3.42 % | 3.90 % | 3.77 % | ||||||||||||
Ratio of expenses to average net assets (excluding dividend, interest, and tax expense): | ||||||||||||||||||
Before expense waiver or recovery | 3.17 % | 3.05% | 2.30 % | 4.22 % | 4.35 % | 3.70 % | ||||||||||||
After expense waiver or recovery | 2.99 % | 2.99 % | 2.99 % | 2.99 % | 2.99 % | 2.99 % | ||||||||||||
Ratio of net investment income (loss) to average net assets: | ||||||||||||||||||
Before expense waiver or recovery | (0.58) % | (0.02) % | (1.83) % | (3.77) % | (4.06) % | (3.19) % | ||||||||||||
After expense waiver or recovery | (0.40) % | 0.04 % | (1.52) % | (2.54) % | (2.70) % | (2.48) % | ||||||||||||
Portfolio turnover rate(e) | 300 % | 932 % | 686 % | 506 % | 953 % | 300 % | ||||||||||||
* | All ratios have been annualized except total investment return and portfolio turnover. |
(a) | Net investment income (loss) per share is based on average shares outstanding. |
(b) | Realized and unrealized gains and losses per share in this caption may be balancing amounts necessary to reconcile the change in net asset value per share for the period, and may not reconcile with the Fund’s statement of operations due to share transactions for the period. |
(c) | Amount represents less than $0.005 per share. |
(d) | Total investment return excludes the effect of applicable sales charges. |
(e) | Portfolio turnover rate is calculated on the basis of the Fund as a whole without distinguishing between classes of shares issued. Consists of long-term investments only; excludes securities sold short. |
76 |
Six Months Ended June 30, 2024* (Unaudited) | Year Ended December 31, | |||||||||||||||||
2023 | 2022 | 2021 | 2020 | 2019 | ||||||||||||||
Per Share | ||||||||||||||||||
Net asset value, beginning of period | $11.77 | $11.54 | $12.77 | $11.86 | $11.41 | $10.07 | ||||||||||||
Income (loss) from investment operations: | ||||||||||||||||||
Net investment income (loss)(a) | 0.03 | 0.12 | (0.06) | (0.20) | (0.17) | (0.17) | ||||||||||||
Net realized and unrealized gain (loss)(b) | 0.10 | 0.29 | (1.02) | 1.89 | 0.62 | 1.55 | ||||||||||||
Total from investment operations | 0.13 | 0.41 | (1.08) | 1.69 | 0.45 | 1.38 | ||||||||||||
Distributions: | ||||||||||||||||||
Net investment income | — | (0.14) | — | — | — | — | ||||||||||||
Net realized gains | — | (0.04) | (0.15) | (0.78) | — | (0.04) | ||||||||||||
Total distributions | — | (0.18) | (0.15) | (0.78) | — | (0.04) | ||||||||||||
Net asset value, end of period | $11.90 | $11.77 | $11.54 | $12.77 | $11.86 | $11.41 | ||||||||||||
Total investment return | 1.11 % | 3.44 % | (8.80) % | 14.58 % | 4.03 % | 13.68 % | ||||||||||||
Net assets, end of period, in thousands | $ 48,645 | $ 56,991 | $ 75,415 | $ 17,713 | $ 11,809 | $ 16,923 | ||||||||||||
Ratios/Supplemental Data: | ||||||||||||||||||
Ratio of expenses to average net assets: | ||||||||||||||||||
Before expense waiver or recovery | 2.32 % | 2.28 % | 2.57 % | 3.65 % | 4.26 % | 3.48 % | ||||||||||||
After expense waiver or recovery | 2.14 % | 2.22 % | 2.26 % | 2.42 % | 2.90 % | 2.77 % | ||||||||||||
Ratio of expenses to average net assets (excluding dividend, interest, and tax expense): | ||||||||||||||||||
Before expense waiver or recovery | 2.17 % | 2.05 % | 2.30 % | 3.22 % | 3.35 % | 2.70 % | ||||||||||||
After expense waiver or recovery | 1.99 % | 1.99 % | 1.99 % | 1.99 % | 1.99 % | 1.99 % | ||||||||||||
Ratio of net investment income (loss) to average net assets: | ||||||||||||||||||
Before expense waiver or recovery | 0.42 % | 0.98 % | (0.83) % | (2.77) % | (3.06) % | (2.19) % | ||||||||||||
After expense waiver or recovery | 0.60 % | 1.04 % | (0.52) % | (1.54) % | (1.70) % | (1.48) % | ||||||||||||
Portfolio turnover rate(c) | 300 % | 932 % | 686 % | 506 % | 953 % | 300 % | ||||||||||||
* | All ratios have been annualized except total investment return and portfolio turnover. |
(a) | Net investment income (loss) per share is based on average shares outstanding. |
(b) | Realized and unrealized gains and losses per share in this caption may be balancing amounts necessary to reconcile the change in net asset value per share for the period, and may not reconcile with the Fund’s statement of operations due to share transactions for the period. |
(c) | Portfolio turnover rate is calculated on the basis of the Fund as a whole without distinguishing between classes of shares issued. Consists of long-term investments only; excludes securities sold short. |
77 |
Six Months Ended June 30, 2024* (Unaudited) | Year Ended December 31, | |||||||||||||||||
2023 | 2022 | 2021 | 2020 | 2019 | ||||||||||||||
Per Share | ||||||||||||||||||
Net asset value, beginning of period | $5.38 | $5.76 | $6.98 | $6.15 | $6.89 | $6.26 | ||||||||||||
Income (loss) from investment operations: | ||||||||||||||||||
Net investment income (loss)(a) | 0.11 | 0.17 | 0.17 | 0.08 | 0.12 | 0.13 | ||||||||||||
Net realized and unrealized gain (loss)(b) | 0.23 | (0.09) | (0.93) | 1.21 | (0.40) | 1.00 | ||||||||||||
Total from investment operations | 0.34 | 0.08 | (0.76) | 1.29 | (0.28) | 1.13 | ||||||||||||
Distributions From: | ||||||||||||||||||
Net investment income | (0.23) | (0.24) | (0.17) | (0.28) | (0.18) | (0.12) | ||||||||||||
Return of capital | — | (0.22) | (0.29) | (0.18) | (0.28) | (0.38) | ||||||||||||
Total distributions | (0.23) | (0.46) | (0.46) | (0.46) | (0.46) | (0.50) | ||||||||||||
Redemption fees(c) | 0.00 | 0.00 | 0.00 | 0.00 | 0.00 | 0.00 | ||||||||||||
Net asset value, end of period | $5.49 | $5.38 | $5.76 | $6.98 | $6.15 | $6.89 | ||||||||||||
Total investment return(d) | 6.47% | 1.70 % | (11.31) % | 21.33 % | (2.75) % | 18.37 % | ||||||||||||
Net assets, end of period, in thousands | $ 14,386 | $ 15,350 | $15,696 | $ 13,838 | $ 13,635 | $ 25,192 | ||||||||||||
Ratios/Supplemental Data:(e) | ||||||||||||||||||
Ratio of expenses to average net assets: | ||||||||||||||||||
Before expense waiver or recovery | 2.10 % | 2.02 % | 2.02 % | 2.06 % | 2.19 % | 2.02 % | ||||||||||||
After expense waiver or recovery | 2.05 % | 2.03 % | 2.09 % | 2.05 % | 2.06 % | 2.02 % | ||||||||||||
Ratio of expenses to average net assets (excluding dividend and interest expense): | ||||||||||||||||||
Before expense waiver or recovery | 2.10 % | 2.02 % | 1.98 % | 2.06 % | 2.18 % | 2.02 % | ||||||||||||
After expense waiver or recovery | 2.05 % | 2.03 % | 2.05 % | 2.05 % | 2.04 % | 2.02 % | ||||||||||||
Ratio of net investment income (loss) to average net assets: | ||||||||||||||||||
Before expense waiver or recovery | 4.14 % | 3.07 % | 2.63 % | 1.21 % | 1.93 % | 1.94 % | ||||||||||||
After expense waiver or recovery | 4.19 % | 3.06 % | 2.56 % | 1.22 % | 2.07 % | 1.94 % | ||||||||||||
Portfolio turnover rate(f) | 30 % | 38 % | 50 % | 53 % | 88 % | 75 % | ||||||||||||
* | All ratios have been annualized except total investment return and portfolio turnover. |
(a) | Net investment income (loss) per share is based on average shares outstanding. |
(b) | Realized and unrealized gains and losses per share in this caption may be balancing amounts necessary to reconcile the change in net asset value per share for the period, and may not reconcile with the Fund’s statement of operations due to share transactions for the period. |
(c) | Amount represents less than $0.005 per share. |
(d) | Total investment return excludes the effect of applicable sales charges. |
(e) | Ratios do not include the income and expenses of the investment companies in which the Fund invests. |
(f) | Portfolio turnover rate is calculated on the basis of the Fund as a whole without distinguishing between classes of shares issued. |
78 |
Six Months Ended June 30, 2024* (Unaudited) | Year Ended December 31, | |||||||||||||||||
2023 | 2022 | 2021 | 2020 | 2019 | ||||||||||||||
Per Share | ||||||||||||||||||
Net asset value, beginning of period | $5.45 | $5.83 | $7.05 | $6.21 | $6.96 | $6.31 | ||||||||||||
Income (loss) from investment operations: | ||||||||||||||||||
Net investment income (loss)(a) | 0.09 | 0.13 | 0.12 | 0.03 | 0.07 | 0.08 | ||||||||||||
Net realized and unrealized gain (loss)(b) | 0.24 | (0.09) | (0.92) | 1.23 | (0.40) | 1.01 | ||||||||||||
Total from investment operations | 0.33 | 0.04 | (0.80) | 1.26 | (0.33) | 1.09 | ||||||||||||
Distributions From: | ||||||||||||||||||
Net investment income | (0.21) | (0.21) | (0.15) | (0.26) | (0.17) | (0.10) | ||||||||||||
Return of capital | — | (0.21) | (0.27) | (0.16) | (0.25) | (0.34) | ||||||||||||
Total distributions | (0.21) | (0.42) | (0.42) | (0.42) | (0.42) | (0.44) | ||||||||||||
Redemption fees(c) | 0.00 | 0.00 | 0.00 | 0.00 | 0.00 | 0.00 | ||||||||||||
Net asset value, end of period | $5.57 | $5.45 | $5.83 | $7.05 | $6.21 | $6.96 | ||||||||||||
Total investment return(d) | 6.12 % | 0.82 % | (11.83) % | 20.47 % | (3.70) % | 17.59 % | ||||||||||||
Net assets, end of period, in thousands | $ 9,068 | $ 10,218 | $14,617 | $ 17,777 | $ 13,295 | $ 18,645 | ||||||||||||
Ratios/Supplemental Data:(e) | ||||||||||||||||||
Ratio of expenses to average net assets: | ||||||||||||||||||
Before expense waiver or recovery | 2.85 % | 2.77 % | 2.77 % | 2.81 % | 2.94 % | 2.77 % | ||||||||||||
After expense waiver or recovery | 2.80 % | 2.78 % | 2.84 % | 2.80 % | 2.81 % | 2.77 % | ||||||||||||
Ratio of expenses to average net assets (excluding dividend and interest expense): | ||||||||||||||||||
Before expense waiver or recovery | 2.85 % | 2.77 % | 2.73 % | 2.81 % | 2.93 % | 2.77 % | ||||||||||||
After expense waiver or recovery | 2.80 % | 2.78 % | 2.80 % | 2.80 % | 2.79 % | 2.77 % | ||||||||||||
Ratio of net investment income (loss) to average net assets: | ||||||||||||||||||
Before expense waiver or recovery | 3.39 % | 2.32 % | 1.88 % | 0.46 % | �� | 1.18 % | 1.19 % | |||||||||||
After expense waiver or recovery | 3.44 % | 2.31 % | 1.81 % | 0.47 % | 1.32 % | 1.19 % | ||||||||||||
Portfolio turnover rate(f) | 30 % | 38 % | 50 % | 53 % | 88 % | 75 % | ||||||||||||
* | All ratios have been annualized except total investment return and portfolio turnover. |
(a) | Net investment income (loss) per share is based on average shares outstanding. |
(b) | Realized and unrealized gains and losses per share in this caption may be balancing amounts necessary to reconcile the change in net asset value per share for the period, and may not reconcile with the Fund’s statement of operations due to share transactions for the period. |
(c) | Amount represents less than $0.005 per share. |
(d) | Total investment return excludes the effect of applicable sales charges. |
(e) | Ratios do not include the income and expenses of the investment companies in which the Fund invests. |
(f) | Portfolio turnover rate is calculated on the basis of the Fund as a whole without distinguishing between classes of shares issued. |
79 |
Six Months Ended June 30, 2024* (Unaudited) | Year Ended December 31, | |||||||||||||||||
2023 | 2022 | 2021 | 2020 | 2019 | ||||||||||||||
Per Share | ||||||||||||||||||
Net asset value, beginning of period | $5.36 | $5.74 | $6.95 | $6.13 | $6.88 | $6.25 | ||||||||||||
Income (loss) from investment operations: | ||||||||||||||||||
Net investment income (loss)(a) | 0.12 | 0.18 | 0.18 | 0.10 | 0.13 | 0.15 | ||||||||||||
Net realized and unrealized gain (loss)(b) | 0.23 | (0.08) | (0.91) | 1.20 | (0.40) | 1.00 | ||||||||||||
Total from investment operations | 0.35 | 0.10 | (0.73) | 1.30 | (0.27) | 1.15 | ||||||||||||
Distributions From: | ||||||||||||||||||
Net investment income | (0.24) | (0.25) | (0.18) | (0.29) | (0.19) | (0.12) | ||||||||||||
Return of capital | — | (0.23) | (0.30) | (0.19) | (0.29) | (0.40) | ||||||||||||
Total distributions | (0.24) | (0.48) | (0.48) | (0.48) | (0.48) | (0.52) | ||||||||||||
Redemption fees(c) | 0.00 | 0.00 | 0.00 | 0.00 | 0.00 | 0.00 | ||||||||||||
Net asset value, end of period | $5.47 | $5.36 | $5.74 | $6.95 | $6.13 | $6.88 | ||||||||||||
Total investment return | 6.66 % | 2.02 % | (10.99) % | 21.53 % | (2.60) % | 18.74 % | ||||||||||||
Net assets, end of period, in thousands | $46,868 | $60,282 | $86,170 | $44,192 | $21,215 | $30,049 | ||||||||||||
Ratios/Supplemental Data:(d) | ||||||||||||||||||
Ratio of expenses to average net assets: | ||||||||||||||||||
Before expense waiver or recovery | 1.85 % | 1.77 % | 1.77 % | 1.81 % | 1.94 % | 1.77 % | ||||||||||||
After expense waiver or recovery | 1.80 % | 1.78 % | 1.84 % | 1.80 % | 1.81 % | 1.77 % | ||||||||||||
Ratio of expenses to average net assets (excluding dividend and interest expense): | ||||||||||||||||||
Before expense waiver or recovery | 1.85 % | 1.77 % | 1.73 % | 1.81 % | 1.93 % | 1.77 % | ||||||||||||
After expense waiver or recovery | 1.80 % | 1.78 % | 1.80 % | 1.80 % | 1.79 % | 1.77 % | ||||||||||||
Ratio of net investment income (loss) to average net assets: | ||||||||||||||||||
Before expense waiver or recovery | 4.39 % | 3.32 % | 2.88 % | 1.46 % | 2.18 % | 2.19 % | ||||||||||||
After expense waiver or recovery | 4.44 % | 3.31 % | 2.81 % | 1.47 % | 2.32 % | 2.19 % | ||||||||||||
Portfolio turnover rate(e) | 30 % | 38 % | 50 % | 53 % | 88 % | 75% | ||||||||||||
* | All ratios have been annualized except total investment return and portfolio turnover. |
(a) | Net investment income (loss) per share is based on average shares outstanding. |
(b) | Realized and unrealized gains and losses per share in this caption may be balancing amounts necessary to reconcile the change in net asset value per share for the period, and may not reconcile with the Fund’s statement of operations due to share transactions for the period. |
(c) | Amount represents less than $0.005 per share. |
(d) | Ratios do not include the income and expenses of the investment companies in which the Fund invests. |
(e) | Portfolio turnover rate is calculated on the basis of the Fund as a whole without distinguishing between classes of shares issued. |
80 |
81 |
Commencement of Operations | |||||||||
Class A | Class C | Class I | |||||||
LoCorr Macro Strategies Fund | March 22, 2011 | March 24, 2011 | March 24, 2011 | ||||||
LoCorr Long/Short Commodities Strategy Fund | January 1, 2012 | January 1, 2012 | January 1, 2012 | ||||||
LoCorr Dynamic Opportunity Fund | May 10, 2013 | May 10, 2013 | May 10, 2013 | ||||||
LoCorr Spectrum Income Fund | January 1, 2014 | January 1, 2014 | January 1, 2014 | ||||||
LoCorr Market Trend Fund | July 1, 2014 | July 1, 2014 | July 1, 2014 | ||||||
82 |
83 |
84 |
| • | securities for which market quotations are not readily available at the valuation time on a particular business day (including without limitation securities for which there is a short and temporary lapse in the provision of a price by the regular pricing source); |
| • | securities determined to be illiquid in accordance with the Trust’s Liquidity Procedures; and |
| • | securities with respect to which an event that will affect the value thereof has occurred subsequent to the determination by the Adviser/relevant Sub-Adviser of the closing prices reported on the principal exchange on which the securities are traded, but prior to the relevant Fund’s calculation of its NAV. |
| • | For any open-end mutual funds that do not provide timely NAV information, the Adviser/relevant Sub-Adviser shall evaluate those ‘similar’ funds and determine which are most appropriate based on funds having similar benchmarks or similar objectives. The Adviser/relevant Sub-Adviser shall then calculate the NAV percentage move of those ‘similar’ funds for the day to create an aggregate average percentage move, which it shall use to calculate the price movement for the day of the Fund at issue. For closed-end funds, the aforementioned practice shall be utilized, in addition to monitoring secondary market activity during the day. |
85 |
Security Classification | Level 1 | Level 2 | Level 3 | Total | ||||||||
Investments | ||||||||||||
Asset-Backed Securities | $— | $139,634,999 | $ — | $139,634,999 | ||||||||
Corporate Bonds | — | 291,936,311 | — | 291,936,311 | ||||||||
Collateralized Mortgage Obligations | — | 4,962,700 | — | 4,962,700 | ||||||||
Mortgage-Backed Securities | — | 180,260,131 | — | 180,260,131 | ||||||||
Municipal Bond | — | 4,034,810 | — | 4,034,810 | ||||||||
U.S. Government Agency Issues | — | 163,732,255 | — | 163,732,255 | ||||||||
U.S. Treasury Securities | — | 617,624,435 | — | 617,624,435 | ||||||||
Short-Term Investment | — | 38,883,896 | — | 38,883,896 | ||||||||
Total Investments | $— | $1,441,069,537 | $— | $1,441,069,537 | ||||||||
Other Financial Instruments* | ||||||||||||
Forward Currency Contracts | ||||||||||||
Purchase | $— | $15,227,684 | $— | $15,227,684 | ||||||||
Sale | — | (5,850,438) | — | (5,850,438) | ||||||||
Total Forward Currency Contracts | — | 9,377,246 | — | 9,377,246 | ||||||||
Futures Contracts | ||||||||||||
Long | $(1,738,112) | $— | $— | $(1,738,112) | ||||||||
Short | (391,791) | — | — | (391,791) | ||||||||
Total Futures Contracts | (2,129,903) | — | — | (2,129,903) | ||||||||
Total Other Financial Instruments | $(2,129,903) | $9,377,246 | $— | $7,247,343 | ||||||||
86 |
| * | The fair value of the Fund’s other financial instruments represent the net unrealized appreciation (depreciation) at June 30, 2024. |
Security Classification | Level 1 | Level 2 | Level 3 | NAV as Practical Expedient | Total | ||||||||||
Investments | |||||||||||||||
Asset-Backed Securities | $ — | $57,745,660 | $ — | $— | $57,745,660 | ||||||||||
Commodity Pool | — | — | — | 109,712,615 | 109,712,615 | ||||||||||
Corporate Bonds | — | 119,897,726 | — | — | 119,897,726 | ||||||||||
Mortgage-Backed Securities | — | 79,992,568 | — | — | 79,992,568 | ||||||||||
Municipal Bonds | — | 2,175,862 | — | — | 2,175,862 | ||||||||||
U.S. Government Agency Issues | — | 67,653,544 | — | — | 67,653,544 | ||||||||||
U.S. Treasury Securities | — | 229,326,344 | — | — | 229,326,344 | ||||||||||
Short-Term Investment | — | 75,721,586 | — | — | 75,721,586 | ||||||||||
Total Investments | $— | $632,513,290 | $— | $109,712,615 | $742,225,905 | ||||||||||
Swap Contracts* | |||||||||||||||
Long Total Return Swap Contracts | $— | $62,506,050 | $— | $— | $62,506,050 | ||||||||||
Total Swap Contracts | $— | $62,506,050 | $— | $— | $62,506,050 | ||||||||||
| * | The fair value of the Fund’s investment in swap contracts represents the net unrealized appreciation at June 30, 2024. |
Security Classification | Level 1 | Level 2 | Level 3 | Total | ||||||||
Investments | ||||||||||||
Asset-Backed Securities | $— | $35,531,072 | $ — | $35,531,072 | ||||||||
Corporate Bonds | — | 69,965,128 | — | 69,965,128 | ||||||||
Mortgage-Backed Securities | — | 48,743,153 | — | 48,743,153 | ||||||||
Municipal Bond | — | 688,404 | — | 688,404 | ||||||||
U.S. Government Agency Issues | — | 40,062,007 | — | 40,062,007 | ||||||||
U.S. Treasury Securities | — | 131,878,294 | — | 131,878,294 | ||||||||
Total Investments | $— | $326,868,058 | $— | $326,868,058 | ||||||||
Other Financial Instruments* | ||||||||||||
Forward Currency Contracts | ||||||||||||
Purchase | $— | $(646,429) | $— | $(646,429) | ||||||||
Sale | — | 2,518,355 | — | 2,518,355 | ||||||||
Total Forward Currency Contracts | — | 1,871,926 | — | 1,871,926 | ||||||||
Futures Contracts | ||||||||||||
Long | $(237,918) | $— | $— | $(237,918) | ||||||||
Short | (3,401,843) | — | — | (3,401,843) | ||||||||
Total Futures Contracts | (3,639,761) | — | — | (3,639,761) | ||||||||
Total Other Financial Instruments | $(3,639,761) | $1,871,926 | $— | $(1,767,835) | ||||||||
87 |
| * | The fair value of the Fund’s other financial instruments represent the net unrealized appreciation (depreciation) at June 30, 2024. |
Security Classification | Level 1 | Level 2 | Level 3 | Total | ||||||||
Investments | ||||||||||||
Common Stocks | $32,739,977 | $ — | $ — | $32,739,977 | ||||||||
Exchange Traded Fund | 614,482 | — | — | 614,482 | ||||||||
REITS | 3,041,630 | — | — | 3,041,630 | ||||||||
Total Investments | $36,396,089 | $— | $— | $36,396,089 | ||||||||
Securities Sold Short | ||||||||||||
Common Stocks | $(8,956,852) | $— | $— | $(8,956,852) | ||||||||
Exchange Traded Funds | (2,238,840) | — | — | (2,238,840) | ||||||||
Total Securities Sold Short | $(11,195,692) | $— | $— | $(11,195,692) | ||||||||
Security Classification | Level 1 | Level 2 | Level 3 | Total | ||||||||
Investments | ||||||||||||
Business Development Companies | $7,966,271 | $ — | $ — | $7,966,271 | ||||||||
Closed End Funds | 7,237,440 | — | — | 7,237,440 | ||||||||
Common Stocks | 14,354,074 | — | — | 14,354,074 | ||||||||
Master Limited Partnerships | 16,870,524 | — | — | 16,870,524 | ||||||||
Preferred Stocks | 5,278,280 | — | — | 5,278,280 | ||||||||
Publicly Traded Partnership | 905,587 | — | — | 905,587 | ||||||||
REITS | 12,376,583 | — | — | 12,376,583 | ||||||||
Royalty Trusts | 2,007,777 | — | — | 2,007,777 | ||||||||
Total Investments | $66,996,536 | $— | $— | $66,996,536 | ||||||||
Written Option | ||||||||||||
Written Call Option | $(21,525) | $— | $— | $(21,525) | ||||||||
Total Written Option | $(21,525) | $— | $— | $(21,525) | ||||||||
88 |
89 |
Six Months Ended June 30, 2024 | |||||||||
Fund | Ordinary Income | Long-Term Capital Gains | Return of Capital | ||||||
LoCorr Spectrum Income Fund | $3,164,545 | $— | $— | ||||||
90 |
Year Ended December 31, 2023 | |||||||||
Fund | Ordinary Income | Long-Term Capital Gains | Return of Capital | ||||||
LoCorr Macro Strategies Fund | $49,435,072 | $ — | $ — | ||||||
LoCorr Long/Short Commodities Strategy Fund | 19,694,937 | — | 15,921 | ||||||
LoCorr Market Trend Fund | 10,986,683 | — | — | ||||||
LoCorr Dynamic Opportunity Fund | 889,196 | 12,650 | — | ||||||
LoCorr Spectrum Income Fund | 4,435,021 | — | 4,229,551 | ||||||
91 |
92 |
93 |
94 |
95 |
96 |
Gross Amounts of Recognized Assets | Gross Amounts Offset in the Consolidated Statement of Assets & Liabilities | Net Amounts Presented in the Consolidated Statement of Assets & Liabilities | Gross Amounts not offset in the Consolidated Statement of Assets & Liabilities | Net Amount | ||||||||||||||
Financial Instruments | Collateral Pledged (Received) | |||||||||||||||||
Assets: | ||||||||||||||||||
Description | ||||||||||||||||||
Forward currency contracts | $15,227,684 | $ — | $15,227,684 | $— | $— | $15,227,684 | ||||||||||||
Total | $15,227,684 | $— | $15,227,684 | $— | $— | $15,227,684 | ||||||||||||
Liabilities: | ||||||||||||||||||
Description | ||||||||||||||||||
Forward currency contracts | $5,850,438 | $— | $5,850,438 | $— | $(5,850,438) | $— | ||||||||||||
Total | $5,850,438 | $— | $5,850,438 | $ — | $(5,850,438) | $— | ||||||||||||
Gross Amounts of Recognized Assets | Gross Amounts Offset in the Consolidated Statement of Assets & Liabilities | Net Amounts Presented in the Consolidated Statement of Assets & Liabilities | Gross Amounts not offset in the Consolidated Statement of Assets & Liabilities | Net Amount | ||||||||||||||
Financial Instruments | Collateral Pledged (Received) | |||||||||||||||||
Assets: | ||||||||||||||||||
Description | ||||||||||||||||||
Swap Contracts* | $95,606,789 | $ — | $95,606,789 | $— | $— | $95,606,789 | ||||||||||||
Total | $95,606,789 | $— | $95,606,789 | $ — | $ — | $95,606,789 | ||||||||||||
| * | Includes $33,100,739 of advance receipt on swap contracts. |
Gross Amounts of Recognized Assets | Gross Amounts Offset in the Consolidated Statement of Assets & Liabilities | Net Amounts Presented in the Consolidated Statement of Assets & Liabilities | Gross Amounts not offset in the Consolidated Statement of Assets & Liabilities | Net Amount | ||||||||||||||
Financial Instruments | Collateral Pledged (Received) | |||||||||||||||||
Assets: | ||||||||||||||||||
Description | ||||||||||||||||||
Forward currency contracts | $3,481,851 | $ — | $3,481,851 | $ — | $— | $3,481,851 | ||||||||||||
Total | $3,481,851 | $— | $3,481,851 | $— | $— | $3,481,851 | ||||||||||||
Liabilities: | ||||||||||||||||||
Description | ||||||||||||||||||
Forward currency contracts | $1,609,925 | $— | $1,609,925 | $— | $(1,609,925) | $— | ||||||||||||
Total | $1,609,925 | $— | $1,609,925 | $— | $(1,609,925) | $— | ||||||||||||
(a) | Reflects the current day variation margin and unsettled open futures contracts as separately reported within the Fund’s consolidated statement of assets and liabilities. |
97 |
Fair Value | Net Unrealized Gain (Loss) on Open Positions | ||||||||
Derivatives Not Accounted for as Hedging Instruments | Assets | Liabilities | |||||||
LoCorr Macro Strategies Fund | |||||||||
Forward Currency Contracts(a) | |||||||||
Long | $1,085,539 | $4,941,340 | $(3,855,801) | ||||||
Short | 14,142,145 | 909,098 | 13,233,047 | ||||||
Total Forward Currency Contracts | 15,227,684 | 5,850,438 | 9,377,246 | ||||||
Futures Contracts(b) | |||||||||
Long Contracts | |||||||||
Commodity | 1,999,803 | 4,006,122 | (2,006,319) | ||||||
Equity | 2,334,252 | 2,138,515 | 195,737 | ||||||
Foreign exchange | 149,104 | 37,707 | 111,397 | ||||||
Interest rate | — | 38,926 | (38,926) | ||||||
Total Long Contracts | 4,483,159 | 6,221,270 | (1,738,112) | ||||||
Short Contracts | |||||||||
Commodity | 5,632,982 | 1,720,328 | 3,912,654 | ||||||
Equity | 717,613 | 288,407 | 429,206 | ||||||
Foreign exchange | 1,241,108 | 180,291 | 1,060,817 | ||||||
Interest rate | 2,325,705 | 8,120,174 | (5,794,469) | ||||||
Total Short Contracts | 9,917,408 | 10,309,200 | (391,791) | ||||||
Total Futures Contracts | 14,400,567 | 16,530,470 | (2,129,903) | ||||||
Total Forward Currency Contracts and Futures Contracts | $29,628,251 | $22,380,908 | $7,247,343 | ||||||
LoCorr Long/Short Commodities Strategy Fund | |||||||||
Long Total Return Swap Contracts | |||||||||
LoCorr Commodities Index | $62,506,050 | $— | $62,506,050 | ||||||
LoCorr Market Trend Fund | |||||||||
Forward Currency Contracts(a) | |||||||||
Long | 463,517 | 1,109,946 | (646,429) | ||||||
Short | 3,018,334 | 499,979 | 2,518,355 | ||||||
Total Forward Currency Contracts | 3,481,851 | 1,609,925 | 1,871,926 | ||||||
98 |
Fair Value | Net Unrealized Gain (Loss) on Open Positions | ||||||||
Derivatives Not Accounted for as Hedging Instruments | Assets | Liabilities | |||||||
Futures Contracts(b) | |||||||||
Long Contracts | |||||||||
Commodity | $911,273 | $2,057,306 | $(1,146,033) | ||||||
Equity | 1,717,853 | 915,362 | 802,491 | ||||||
Foreign exchange | 105,624 | — | 105,624 | ||||||
Interest rate | — | — | — | ||||||
Total Long Contracts | 2,734,750 | 2,972,668 | (237,918) | ||||||
Short Contracts | |||||||||
Commodity | 2,795,320 | 894,372 | 1,900,949 | ||||||
Equity | — | — | — | ||||||
Interest rate | 112,816 | 5,415,607 | (5,302,792) | ||||||
Total Short Contracts | 2,908,136 | 6,309,979 | (3,401,843) | ||||||
Total Futures Contracts | 5,642,886 | 9,282,647 | (3,639,761) | ||||||
Total Forward Currency Contracts and Futures Contracts | $9,124,737 | $10,892,572 | $(1,767,835) | ||||||
LoCorr Spectrum Income Fund | |||||||||
Options | |||||||||
Written Options | $— | $(21,525) | $43,573 | ||||||
Total Options | $— | $(21,525) | $43,573 | ||||||
(a) | Unrealized appreciation on forward currency contracts is a receivable and unrealized depreciation on forward currency contracts is a payable on the Fund’s consolidated statement of assets and liabilities. |
(b) | Reflects the cumulative unrealized appreciation (depreciation) of futures contracts as reported in the Fund’s consolidated schedule of open futures contracts. Only the current day variation margin and unsettled open futures contracts is separately reported within the Fund’s consolidated statement of assets and liabilities. |
Gain (Loss) from Trading | ||||||
Fund and Type of Derivative Instrument | Net Realized | Net Change in Unrealized | ||||
LoCorr Macro Strategies Fund | ||||||
Forward Currency Contracts | $(10,924,166) | $20,815,798 | ||||
Futures Contracts | ||||||
Commodity | 20,133,133 | 7,238,625 | ||||
Equity | 62,080,351 | (3,760,709) | ||||
Foreign exchange | (6,534,160) | 1,811,074 | ||||
Interest rate | 18,522,978 | 7,259,617 | ||||
Total Futures Contracts | 94,202,302 | 12,548,607 | ||||
Total Forward Currency Contracts and Futures Contracts | $83,278,136 | $33,364,405 | ||||
LoCorr Long/Short Commodities Strategy Fund | ||||||
Swap Contracts | $2,392,320 | $(2,713,507) | ||||
99 |
Gain (Loss) from Trading | ||||||
Fund and Type of Derivative Instrument | Net Realized | Net Change in Unrealized | ||||
LoCorr Market Trend Fund | ||||||
Forward Currency Contracts | $(8,286,804) | $8,924,197 | ||||
Futures Contracts | ||||||
Commodity | 8,814,285 | 3,197,436 | ||||
Equity | 33,809,017 | (2,395,070) | ||||
Foreign exchange | 262,420 | 272,268 | ||||
Interest rate | 3,299,475 | 4,624,868 | ||||
Total Futures Contracts | 46,185,197 | 5,699,502 | ||||
Total Forward Currency Contracts and Futures Contracts | $37,898,393 | $14,623,699 | ||||
LoCorr Spectrum Income Fund | ||||||
Options | ||||||
Written Options | 92,862 | 43,573 | ||||
Total Options | $92,862 | $43,573 | ||||
(d) | Purchased options are included within net realized gain (loss) on investments and net change in unrealized appreciation/depreciation on investments. |
Average Notional Amount | ||||||
Long Contracts | Short Contracts | |||||
LoCorr Macro Strategies Fund | ||||||
Forward Currency Contracts | $936,569,280 | $1,250,576,573 | ||||
Futures Contracts | 1,619,061,209 | 4,121,370,349 | ||||
LoCorr Long/Short Commodities Strategy Fund | ||||||
Swap Contracts | $332,730,812 | $— | ||||
LoCorr Market Trend Fund | ||||||
Forward Currency Contracts | $306,898,526 | $416,735,450 | ||||
Futures Contracts | 693,869,713 | 1,659,064,555 | ||||
LoCorr Spectrum Income Fund | ||||||
Options(a) | $— | $3,124,395 | ||||
(a) | Represents an average of each month the Fund held purchased or written options. |
100 |
U.S. Government Obligations | All Other | |||||||||||
Purchases | Sales | Purchases | Sales | |||||||||
LoCorr Macro Strategies Fund | $930,761,112 | $493,191,088 | $574,306,876 | $212,077,366 | ||||||||
LoCorr Long/Short Commodities Strategy Fund | 254,068,358 | 134,227,431 | 171,952,758 | 106,328,080 | ||||||||
LoCorr Market Trend Fund | 209,465,654 | 124,349,530 | 125,369,021 | 41,567,944 | ||||||||
LoCorr Dynamic Opportunity Fund | — | — | 109,656,247 | 112,762,546 | ||||||||
LoCorr Spectrum Income Fund | — | — | 21,688,311 | 38,235,458 | ||||||||
Fund | Annual Advisory Fee as a Percentage of the Average Daily Net Assets of the Fund | ||
LoCorr Macro Strategies Fund | 1.65% | ||
LoCorr Market Trend Fund | 1.50% | ||
LoCorr Dynamic Opportunity Fund | 1.50% | ||
LoCorr Spectrum Income Fund | 1.30% | ||
Net Assets for the LoCorr Long/Short Commodities Strategy Fund | Incremental Advisory Fee* | ||
$0.0 - $0.5 billion | 1.50% | ||
$0.5 - $1.0 billion | 1.40% | ||
$1.0 - $1.5 billion | 1.30% | ||
$1.5 - $2.0 billion | 1.20% | ||
$2.0 - $2.5 billion | 1.10% | ||
Over $2.5 billion | 1.00% | ||
| * | Incremental advisory fee represents the fees paid on net assets at the related net asset level. For example, with $3 billion in net assets in the Fund, the Adviser would earn 1.50% on the first $500 million, plus 1.40% on the next $500 million, plus 1.30% on the next $500 million, plus 1.20% on the next $500 million, plus 1.10% on the next $500 million, plus 1.00% on the final $500 million. |
Fund | Management Fees For the Six Months Ended June 30, 2024 | Accrued Net Management Fees as of June 30, 2024 | ||||
LoCorr Macro Strategies Fund | $13,177,809 | $2,269,908 | ||||
LoCorr Long/Short Commodities Strategy Fund | 6,599,872 | 1,050,497 | ||||
LoCorr Market Trend Fund | 3,099,957 | 515,019 | ||||
LoCorr Dynamic Opportunity Fund | 428,836 | 59,904 | ||||
LoCorr Spectrum Income Fund | 481,060 | 71,509 | ||||
101 |
LoCorr Macro Strategies Fund: | LoCorr Dynamic Opportunity Fund: | ||
Graham Capital Management, L.P. | Kettle Hill Capital Management, LLC | ||
Millburn Ridgefield Corporation | Millrace Asset Group, Inc. | ||
Nuveen Asset Management, LLC | |||
Revolution Capital Management LLC | |||
R.G. Niederhoffer Capital Management | |||
LoCorr Long/Short Commodities Strategy Fund: | LoCorr Spectrum Income Fund: | ||
Nuveen Asset Management, LLC | Bramshill Investments, LLC | ||
LoCorr Market Trend Fund: | |||
Graham Capital Management, L.P. | |||
Nuveen Asset Management, LLC | |||
Fund | Expense Limit as a Percentage of the Average Daily Net Assets of the Fund | Effective Period Through | ||||
LoCorr Macro Strategies Fund | 1.99% | April 30, 2025 | ||||
LoCorr Long/Short Commodities Strategy Fund | 1.95% | April 30, 2025 | ||||
LoCorr Market Trend Fund | 1.95% | April 30, 2025 | ||||
LoCorr Dynamic Opportunity Fund | 1.99% | April 30, 2025 | ||||
LoCorr Spectrum Income Fund | 1.80% | April 30, 2025 | ||||
102 |
Period | Management Fees (Waived) by Adviser Subject to Recovery | Recovery to Adviser | Remaining Available Subject to Recovery | Subject to Recovery on or Before Fiscal Year Ending December 31, | ||||||||
Six Months Ended June 30, 2024 | ||||||||||||
Six Months Ended June 30, 2024 | $(52,339) | $— | $(52,339) | 2027 | ||||||||
Year Ended December 31, 2023 | (50,998) | — | (50,998) | 2026 | ||||||||
Year Ended December 31, 2022 | (154,575) | — | (154,575) | 2025 | ||||||||
Year Ended December 31, 2021 | (263,217) | — | (263,217) | 2024 | ||||||||
Total | $(521,129) | $ — | $(521,129) | |||||||||
Period | Management Fees (Waived) by Adviser Subject to Recovery | Recovery to Adviser | Remaining Available Subject to Recovery | Subject to Recovery on or Before Fiscal Year Ending December 31, | ||||||||
Six Months Ended June 30, 2024 | ||||||||||||
Six Months Ended June 30, 2024 | $(18,533) | $ — | $(18,533) | 2027 | ||||||||
Year Ended December 31, 2023 | — | — | — | 2026 | ||||||||
Year Ended December 31, 2022 | — | — | — | 2025 | ||||||||
Year Ended December 31, 2021 | — | — | — | 2024 | ||||||||
Total | $(18,533) | $ — | $(18,533) | |||||||||
Fund | Class A CDSC Retained by Distributor | Class C CDSC Retained by Distributor | ||||
LoCorr Macro Strategies Fund | $— | $2,447 | ||||
LoCorr Long/Short Commodities Strategy Fund | — | 721 | ||||
LoCorr Market Trend Fund | (266) | 871 | ||||
LoCorr Dynamic Opportunity Fund | — | — | ||||
LoCorr Spectrum Income Fund | — | 22 | ||||
103 |
For the Six Months Ended June 30, 2024 | For the Year Ended December 31, 2023 | |||||||||||
Shares | Amount | Shares | Amount | |||||||||
Shares Sold | 1,395,152 | $10,957,044 | 3,495,601 | $27,906,925 | ||||||||
Reinvestment of Distributions | — | — | 272,677 | 2,069,619 | ||||||||
Shares Redeemed | (1,461,896) | (11,483,096) | (3,989,358) | (31,449,278) | ||||||||
(66,744) | $(526,052) | (221,080) | $(1,472,734) | |||||||||
Beginning Shares | 9,587,102 | 9,808,182 | ||||||||||
Ending Shares | 9,520,358 | 9,587,102 | ||||||||||
For the Six Months Ended June 30, 2024 | For the Year Ended December 31, 2023 | |||||||||||
Shares | Amount | Shares | Amount | |||||||||
Shares Sold | 341,506 | $2,538,497 | 650,312 | $4,863,443 | ||||||||
Reinvestment of Distributions | — | — | 100,755 | 720,399 | ||||||||
Shares Redeemed | (1,149,043) | (8,422,422) | (2,673,794) | (19,923,852) | ||||||||
(807,537) | $(5,883,925) | (1,922,727) | $(14,340,010) | |||||||||
Beginning Shares | 4,768,671 | 6,691,398 | ||||||||||
Ending Shares | 3,961,134 | 4,768,671 | ||||||||||
For the Six Months Ended June 30, 2024 | For the Year Ended December 31, 2023 | |||||||||||
Shares | Amount | Shares | Amount | |||||||||
Shares Sold | 47,011,495 | $377,411,997 | 83,659,132 | $678,237,363 | ||||||||
Reinvestment of Distributions | — | — | 5,408,293 | 41,914,268 | ||||||||
Shares Redeemed | (40,512,233) | (323,640,308) | (173,679,275) | (1,397,134,989) | ||||||||
6,499,262 | $53,771,689 | (84,611,850) | $(676,983,358) | |||||||||
Beginning Shares | 184,161,780 | 268,773,630 | ||||||||||
Ending Shares | 190,661,042 | 184,161,780 | ||||||||||
Total Net Increase (Decrease) | $47,361,712 | $(692,796,102) | ||||||||||
For the Six Months Ended June 30, 2024 | For the Year Ended December 31, 2023 | |||||||||||
Shares | Amount | Shares | Amount | |||||||||
Shares Sold | 595,471 | $5,780,284 | 4,554,740 | $45,161,098 | ||||||||
Reinvestment of Distributions | — | — | 343,576 | 3,277,713 | ||||||||
Shares Redeemed | (918,711) | (8,870,992) | (12,723,610) | (122,762,856) | ||||||||
(323,240) | $(3,090,708) | (7,825,294) | $(74,324,045) | |||||||||
Beginning Shares | 10,747,372 | 18,572,666 | ||||||||||
Ending Shares | 10,424,132 | 10,747,372 | ||||||||||
104 |
For the Six Months Ended June 30, 2024 | For the Year Ended December 31, 2023 | |||||||||||
Shares | Amount | Shares | Amount | |||||||||
Shares Sold | 36,519 | $334,728 | 65,225 | $611,999 | ||||||||
Reinvestment of Distributions | — | — | 7,858 | 71,193 | ||||||||
Shares Redeemed | (282,465) | (2,594,658) | (443,040) | (4,118,456) | ||||||||
(245,946) | $(2,259,930) | (369,957) | $(3,435,264) | |||||||||
Beginning Shares | 1,027,145 | 1,397,102 | ||||||||||
Ending Shares | 781,199 | 1,027,145 | ||||||||||
For the Six Months Ended June 30, 2024 | For the Year Ended December 31, 2023 | |||||||||||
Shares | Amount | Shares | Amount | |||||||||
Shares Sold | 17,271,991 | $169,889,602 | 38,008,360 | $383,233,784 | ||||||||
Reinvestment of Distributions | — | — | 1,341,024 | 12,994,526 | ||||||||
Shares Redeemed | (22,311,140) | (219,649,624) | (70,352,644) | (701,956,940) | ||||||||
(5,039,149) | $(49,760,022) | (31,003,260) | $(305,728,630) | |||||||||
Beginning Shares | 82,626,465 | 113,629,725 | ||||||||||
Ending Shares | 77,587,316 | 82,626,465 | ||||||||||
LoCorr Long/Short Commodities Strategy Fund | ||||||||||||
Total Net Increase (Decrease) | $(55,110,660) | $ (383,487,939) | ||||||||||
For the Six Months Ended June 30, 2024 | For the Year Ended December 31, 2023 | |||||||||||
Shares | Amount | Shares | Amount | |||||||||
Shares Sold | 407,238 | $5,042,183 | 809,102 | $10,146,943 | ||||||||
Reinvestment of Distributions | — | — | 54,786 | 624,566 | ||||||||
Shares Redeemed | (301,687) | (3,679,550) | (758,379) | (9,051,634) | ||||||||
105,551 | $1,362,633 | 105,509 | $1,719,875 | |||||||||
Beginning Shares | 2,328,280 | 2,222,771 | ||||||||||
Ending Shares | 2,433,831 | 2,328,280 | ||||||||||
For the Six Months Ended June 30, 2024 | For the Year Ended December 31, 2023 | |||||||||||
Shares | Amount | Shares | Amount | |||||||||
Shares Sold | 105,373 | $1,213,901 | 684,365 | $8,183,338 | ||||||||
Dividends Reinvested | — | — | 28,367 | 307,781 | ||||||||
Shares Redeemed | (314,761) | (3,650,699) | (605,338) | (7,022,335) | ||||||||
(209,388) | $(2,436,798) | 107,394 | $1,468,784 | |||||||||
Beginning Shares | 1,744,359 | 1,636,965 | ||||||||||
Ending Shares | 1,534,971 | 1,744,359 | ||||||||||
105 |
For the Six Months Ended June 30, 2024 | For the Year Ended December 31, 2023 | |||||||||||
Shares | Amount | Shares | Amount | |||||||||
Shares Sold | 7,990,875 | $96,382,610 | 17,147,874 | $210,584,327 | ||||||||
Reinvestment of Distributions | — | — | 838,705 | 9,603,175 | ||||||||
Shares Redeemed | (11,442,960) | (135,308,216) | (21,447,171) | (261,415,918) | ||||||||
(3,452,085) | $(38,925,606) | (3,460,592) | $(41,228,416) | |||||||||
Beginning Shares | 32,789,006 | 36,249,598 | ||||||||||
Ending Shares | 29,336,921 | 32,789,006 | ||||||||||
LoCorr Market Trend Fund | ||||||||||||
Total Net Increase (Decrease) | $ (39,999,771) | $ (38,039,757) | ||||||||||
For the Six Months Ended June 30, 2024 | For the Year Ended December 31, 2023 | |||||||||||
Shares | Amount | Shares | Amount | |||||||||
Shares Sold | 29,794 | $339,264 | 92,549 | $1,042,714 | ||||||||
Reinvestment of Distributions | — | — | 3,209 | 36,642 | ||||||||
Shares Redeemed | (95,159) | (1,078,983) | (99,623) | (1,084,217) | ||||||||
(65,365) | $(739,719) | (3,865) | $(4,861) | |||||||||
Beginning Shares | 311,202 | 315,067 | ||||||||||
Ending Shares | 245,837 | 311,202 | ||||||||||
For the Six Months Ended June 30, 2024 | For the Year Ended December 31, 2023 | |||||||||||
Shares | Amount | Shares | Amount | |||||||||
Shares Sold | 399 | $4,200 | 4,503 | $46,207 | ||||||||
Reinvestment of Distributions | — | — | 680 | 7,167 | ||||||||
Shares Redeemed | (75,813) | (796,703) | (122,278) | (1,237,422) | ||||||||
(75,414) | $(792,503) | (117,095) | $(1,184,048) | |||||||||
Beginning Shares | 181,513 | 298,608 | ||||||||||
Ending Shares | 106,099 | 181,513 | ||||||||||
For the Six Months Ended June 30, 2024 | For the Year Ended December 31, 2023 | |||||||||||
Shares | Amount | Shares | Amount | |||||||||
Shares Sold | 1,476,327 | $17,381,806 | 5,076,372 | $58,661,109 | ||||||||
Reinvestment of Distributions | — | — | 56,489 | 664,310 | ||||||||
Shares Redeemed | (2,230,149) | (26,157,932) | (6,822,774) | (77,474,276) | ||||||||
(753,822) | $(8,776,126) | (1,689,913) | $(18,148,857) | |||||||||
Beginning Shares | 4,843,361 | 6,533,274 | ||||||||||
Ending Shares | 4,089,539 | 4,843,361 | ||||||||||
LoCorr Dynamic Opportunity Fund | ||||||||||||
Total Net Increase (Decrease) | $(10,308,348) | $(19,337,766) | ||||||||||
106 |
For the Six Months Ended June 30, 2024 | For the Year Ended December 31, 2023 | |||||||||||
Shares | Amount | Shares | Amount | |||||||||
Shares Sold | 304,464 | $1,656,296 | 819,818 | $4,507,897 | ||||||||
Reinvestment of Distributions | 82,758 | 449,638 | 184,362 | 1,000,182 | ||||||||
Shares Redeemed | (621,298) | (3,354,972) | (875,802) | (4,687,202) | ||||||||
Redemption Fees | — | 3,789 | — | 966 | ||||||||
(234,076) | $(1,245,249) | 128,378 | $821,843 | |||||||||
Beginning Shares | 2,852,612 | 2,724,234 | ||||||||||
Ending Shares | 2,618,536 | 2,852,612 | ||||||||||
For the Six Months Ended June 30, 2024 | For the Year Ended December 31, 2023 | |||||||||||
Shares | Amount | Shares | Amount | |||||||||
Shares Sold | 46,464 | $257,131 | 103,710 | $586,632 | ||||||||
Reinvestment of Distributions | 54,150 | 298,488 | 133,738 | 736,654 | ||||||||
Shares Redeemed | (347,188) | (1,911,392) | (872,145) | (4,777,672) | ||||||||
Redemption Fees | — | 2,505 | — | 751 | ||||||||
(246,574) | $(1,353,268) | (634,697) | $(3,453,635) | |||||||||
Beginning Shares | 1,873,410 | 2,508,107 | ||||||||||
Ending Shares | 1,626,836 | 1,873,410 | ||||||||||
For the Six Months Ended June 30, 2024 | For the Year Ended December 31, 2023 | |||||||||||
Shares | Amount | Shares | Amount | |||||||||
Shares Sold | 2,074,646 | $11,274,389 | 4,168,407 | $23,111,873 | ||||||||
Reinvestment of Distributions | 323,719 | 1,749,619 | 965,973 | 5,236,215 | ||||||||
Shares Redeemed | (5,077,534) | (27,360,697) | (8,890,669) | (48,304,821) | ||||||||
Redemption Fees | — | 13,285 | — | 4,471 | ||||||||
(2,679,169) | $(14,323,404) | (3,756,289) | $(19,952,262) | |||||||||
Beginning Shares | 11,250,168 | 15,006,457 | ||||||||||
Ending Shares | 8,570,999 | 11,250,168 | ||||||||||
LoCorr Spectrum Income Fund | ||||||||||||
Total Net Increase (Decrease) | $ (16,921,921) | $ (22,584,054) | ||||||||||
107 |
LoCorr Macro Strategies Fund(2) | LoCorr Long/Short Commodities Strategy Fund(2) | LoCorr Market Trend Fund(2) | |||||||
Tax cost of portfolio | $1,436,243,801 | $1,054,337,246 | $347,539,308 | ||||||
Gross unrealized appreciation | $18,015,059 | $114,569,158 | $4,088,109 | ||||||
Gross unrealized depreciation | (34,047,696) | (101,849,135) | (10,853,364) | ||||||
Net unrealized appreciation (depreciation) | (16,032,637) | 12,720,023 | (6,765,255) | ||||||
Undistributed ordinary income | 96,889 | — | 227,874 | ||||||
Undistributed long-term capital gains | — | — | — | ||||||
Total earnings accumulated | 96,889 | — | 227,874 | ||||||
Other accumulated losses | (239,168,872) | (22,730,116) | (50,427,192) | ||||||
Total distributable earnings (accumulated losses) | $(255,104,620) | $(10,010,093) | $(56,964,573) | ||||||
LoCorr Dynamic Opportunity Fund | LoCorr Spectrum Income Fund | |||||
Tax cost of portfolio | $53,161,442 | $75,786,599 | ||||
Gross unrealized appreciation | $4,593,891 | $11,518,637 | ||||
Gross unrealized depreciation | (3,616,911) | (5,531,870) | ||||
Net unrealized appreciation | 976,980 | 5,986,767 | ||||
Undistributed ordinary income | 193,268 | — | ||||
Undistributed long-term capital gains | — | — | ||||
Total earnings accumulated | 193,268 | — | ||||
Other accumulated losses | (2,996,138) | (47,001,475) | ||||
Total distributable earnings (accumulated losses) | $(1,825,890) | $(41,014,708) | ||||
(1) | Total Portfolio represents aggregate amounts of Fund’s investments, securities sold short, forward currency contracts and futures contracts, where applicable. |
(2) | Tax Cost is presented on a non-consolidated basis and includes each of the Fund’s investment in the respective CFC’s and the unrealized appreciation and depreciation associated with those investments. |
108 |
Capital Loss Carryover | Year of | ||||||||
Short-Term | Long-Term | Expiration | |||||||
LoCorr Macro Strategies Fund | $114,095,151 | $125,073,721 | Indefinitely | ||||||
LoCorr Long/Short Commodities Strategy Fund | 10,271,568 | 12,458,548 | Indefinitely | ||||||
LoCorr Market Trend Fund | 17,274,492 | 33,144,351 | Indefinitely | ||||||
LoCorr Dynamic Opportunity Fund | 2,142,678 | 827,386 | Indefinitely | ||||||
LoCorr Spectrum Income Fund | 19,815,765 | 26,092,569 | Indefinitely | ||||||
Dividend Declaration Date (a) | Shareholder of Record Date | Distribution Amount per Share Class | ||||||||||
Class A | Class C | Class I | ||||||||||
July 31, 2024 | July 30, 2024 | $0.0386 | $0.03470 | $0.04000 | ||||||||
(a) | Ex-date, reinvest date and payable date. |
109 |
110 |
111 |
112 |
113 |
114 |
115 |
116 |
117 |
118 |
119 |
120 |
| (b) | Financial Highlights are included within the financial statements filed under Item 7 of this Form. |
Item 8. Changes in and Disagreements with Accountants for Open-End Investment Companies.
There were no changes in or disagreements with accountants during the period covered by this report.
Item 9. Proxy Disclosure for Open-End Investment Companies.
There were no matters submitted to a vote of shareholders during the period covered by this report.
Item 10. Remuneration Paid to Directors, Officers, and Others of Open-End Investment Companies.
See Item 7(a).
Item 11. Statement Regarding Basis for Approval of Investment Advisory Contract.
See Item 7(a).
Item 12. Disclosure of Proxy Voting Policies and Procedures for Closed-End Management Investment Companies.
Not applicable to open-end investment companies.
Item 13. Portfolio Managers of Closed-End Management Investment Companies.
Not applicable to open-end investment companies.
Item 14. Purchases of Equity Securities by Closed-End Management Investment Company and Affiliated Purchasers.
Not applicable to open-end investment companies.
Item 15. Submission of Matters to a Vote of Security Holders.
There have been no material changes to the procedures by which shareholders may recommend nominees to the registrant’s board of trustees.
Item 16. Controls and Procedures.
| (a) | The Registrant’s Principal Executive Officer and Principal Financial Officer have reviewed the Registrant’s disclosure controls and procedures (as defined in Rule 30a-3(c) under the Investment Company Act of 1940 (the “Act”)) as of a date within 90 days of the filing of this report, as required by Rule 30a-3(b) under the Act and Rules 13a-15(b) or 15d-15(b) under the Securities Exchange Act of 1934. Based on their review, such officers have concluded that the disclosure controls and procedures are effective in ensuring that information required to be disclosed in this report is appropriately recorded, processed, summarized and reported and made known to them by others within the Registrant and by the Registrant’s service provider. |
| (b) | There were no changes in the Registrant’s internal control over financial reporting (as defined in Rule 30a-3(d) under the Act) that occurred during the period covered by this report that have materially affected, or are reasonably likely to materially affect, the Registrant’s internal control over financial reporting. |
Item 17. Disclosure of Securities Lending Activities for Closed-End Management Investment Companies
Not applicable to open-end investment companies.
Item 18. Recovery of Erroneously Awarded Compensation.
Not applicable to open-end investment companies.
Item 19. Exhibits.
| (a) | (1) Incorporated by reference to previous Form N-CSR filing. |
| (b) | Certifications pursuant to Section 906 of the Sarbanes-Oxley Act of 2002. Furnished herewith. |
| SIGNATURES |
Pursuant to the requirements of the Securities Exchange Act of 1934 and the Investment Company Act of 1940, the registrant has duly caused this report to be signed on its behalf by the undersigned, thereunto duly authorized.
| (Registrant) | LoCorr Investment Trust |
| By (Signature and Title)* | /s/ Kevin Kinzie | ||
| Kevin Kinzie, Principal Executive Officer |
| Date | 9/3/24 |
Pursuant to the requirements of the Securities Exchange Act of 1934 and the Investment Company Act of 1940, this report has been signed below by the following persons on behalf of the registrant and in the capacities and on the dates indicated.
| By (Signature and Title)* | /s/ Kevin Kinzie | ||
| Kevin Kinzie, Principal Executive Officer |
| Date | 9/3/24 |
| By (Signature and Title)* | /s/ Jon Essen | ||
| Jon Essen, Principal Financial Officer |
| Date | 9/3/24 |
* Print the name and title of each signing officer under his or her signature.