UNITED STATES
SECURITIES AND EXCHANGE COMMISSION
Washington, D.C. 20549
FORM N-CSR
CERTIFIED SHAREHOLDER REPORT OF REGISTERED
MANAGEMENT INVESTMENT COMPANIES
Investment Company Act file number 811-22509
LoCorr Investment Trust
(Exact name of registrant as specified in charter)
687 Excelsior Blvd
Excelsior, MN 55331
(Address of principal executive offices) (Zip code)
CT Corporation System
1300 East Ninth Street
Cleveland, OH 44114
(Name and address of agent for service)
952.767.2920
Registrant's telephone number, including area code
Date of fiscal year end: December 31
Date of reporting period: June 30, 2021
Item 1. Reports to Stockholders.

Letter to Shareholders
LoCorr Funds seeks to provide investments that, over time, will have low correlation to traditional asset classes such as stocks and bonds. We believe that adding low correlating investments to portfolios can significantly reduce overall portfolio risk while enhancing returns. Correlation measures the degree to which the returns of two investments move together over time. LoCorr offers products that provide the potential for positive returns in rising or falling markets and are designed to generate returns independent of traditional stock, bond and commodity investments. In this report, LoCorr Funds is reporting on five mutual funds: LoCorr Macro Strategies Fund, LoCorr Long/Short Commodities Strategy Fund, LoCorr Market Trend Fund, LoCorr Dynamic Equity Fund and LoCorr Spectrum Income Fund (collectively, the “Funds”).
LoCorr Macro Strategies Fund
The LoCorr Macro Strategies Fund (the “Fund”) seeks capital appreciation as its primary investment objective with managing volatility as a secondary objective. The Fund attempts to achieve its objective by investing in two main strategies — a Managed Futures Strategy and a Fixed Income Strategy.
The Fund employs three sub-advisers to manage the managed futures portion of the Fund:
| ● | Millburn Ridgefield Corporation (“Millburn”) manages a portfolio for the Fund that is similar to its Millburn Diversified Program which commenced operations in 1977. Millburn invests in a diversified portfolio of global futures contracts by employing a systematic, statistical learning-based, multi-factor approach. |
| ● | Graham Capital Management LP (“Graham”) manages a portfolio for the Fund that is similar to its Tactical Trend strategy, a systematic medium- to long-term trend following program that commenced trading in 2006. |
| ● | Revolution Capital Management (“Revolution”) manages a strategy for the Fund that is similar to its Alpha Program that has been available in a managed account program since 2007. Revolution employs a short-term pattern recognition strategy. |
Market Commentary
Market participants increasingly embraced the global recovery/return-to-normal narrative during the semi-annual period as the acceleration in vaccinations led to COVID-19 market-related concerns receding. Economic growth continued to recover from the 2020 lockdowns. While that rebound in the global economy has been uneven, the World Bank expects global growth to rise +5.6% in 2021, the fastest post-recession recovery in 80 years.
As we entered 2021, and through much of the semi-annual period, the Federal Reserve assured market participants of its intention to maintain accommodative monetary policies. Evidence of significantly improving economic conditions was widespread as noted above and market participants wrested with whether the Fed was falling behind the inflation curve. U.S. Manufacturing Purchasing Managers’ Index climbed above 60, indicating strong expansion, beginning with the April 2021 report. In June, the labor market added a better-than-expected 850,000 jobs and wages rose +3.6% year-over-year as signs of tightness emerged. The Consumer Price Index (“CPI”) increased +5.4 in June, its fastest annual rate in nearly 13 years. Excluding food and energy, the core CPI rose +4.5%, its largest jump since 1991. Meanwhile consumer balance sheets are strong and are increasing spending.
With economic activity surging and inflationary pressure mounting, the Fed’s outlook shifted forward somewhat at the June Federal Open Market Committee (“FOMC”) meeting as officials signaled their expectation to raise rates by late 2023, sooner than previously anticipated. Of course, economic activity and inflationary pressure is building outside the U.S. as well. Perhaps more surprisingly, there were some FOMC members who expected interest rate hikes to begin in 2022. The Eurozone PMI reached an all-time high for a third consecutive month in May while the headline CPI in the European Union rose +2.0% in May, its highest level since 2018. China’s economic recovery from the pandemic was earlier than most, though showed signs of losing steam as reported Q2 GDP growth was +7.9%, a marked slowdown from the +18.3% in the first quarter.
Equities
Stock prices rallied sharply during the first half of 2021 with global equities reaching all-time highs and the MSCI World Index advancing +13.29% on a local currency basis while the S&P 500 gained +15.25%. Stock prices continued to be fueled by improving economic conditions and the massive injection of liquidity from accommodative monetary and fiscal policy with strength evident in both U.S. and international equities. Volatility, as measured by the CBOE Volatility Index (“VIX”), continued to decline from its 2020 peak with infrequent spikes that did not persist as investors bought any market dips during the period.
Fixed Income
Global bond yields surged in response to the vaccine roll-out, improving global economy, potential for additional fiscal U.S. stimulus and related inflationary concerns. The yield on the U.S. 10-year Treasury reached 1.75%, nearly 90 basis points higher than it started the year. Yields rose outside the U.S. as well with the German 10-Year Bund yield almost reaching positive territory. Somewhat unexpectedly the recovery in global yields stalled, however, with U.S. rates peaking in March and the yield curve flattening towards the end of the period as market participants feared the Fed’s more hawkish stance may negatively impact future growth as well as inflationary pressure and perhaps some mounting concerns regarding the delta variant. Abroad, yields for most sovereign debt began falling during the second quarter. For the semi-annual period, the Bloomberg Barclays U.S. Aggregate Bond Index declined -1.60%.
Commodities
The Bloomberg Commodity Index rose +21.15% as commodity prices continued their recovery from the depths of the pandemic. Oil prices which had generally lagged the recovery in other commodities were buoyed by improving demand and continued production discipline by OPEC+. West Texas Intermediate crude (“WTI”) climbed from just under $50 per barrel to end June near $74 per barrel, reaching its highest level since 2018. Agricultural commodities also moved sharply higher led by strong gains in most grain prices, notably corn and soybean due to challenging weather conditions and increased Chinese consumption. The improving economy and recovery optimism helped fuel a rise in industrial metal prices, leading to gains in the price of copper. Precious metal prices generally declined as gold prices moved lower on higher interest rates and perhaps some switching to crypto currency as a non-fiat currency. Outside of energy, most commodity fell in June particularly in markets like lumber which had seen meteoric rises in prices that cooled off somewhat.
Foreign Currency
The U.S. dollar (“USD”) appreciated +2.78% against a basket of major currencies during the semi-annual period which was marked by range-bound trading and reversals. After declining since March 2020, the USD strengthened in the first quarter of 2021 before weakening in April and May as U.S. Treasury yields declined. The USD rebounded in June as the Fed pulled forward its expectation for interest rate hikes to 2023. These reversals created challenging trading conditions overall for macro investors.
Fund Performance Summary
For the semi-annual period ended June 30th, 2021, the Fund returned +4.61% versus +0.02% for the Bank of America Merrill Lynch 3-Month Treasury Bill Index. The Fund lagged the +6.40% return for the Morningstar Systematic Trend category during the period. Trading in commodities and equities were the largest contributor to the Fund’s returns while currency and fixed income markets were unprofitable.
Performance of the sub-advisers was mixed. While all three managers that sub-advise the Managed Futures Strategy Fund had positive returns, the largest contribution was from Millburn’s statistical learning-based, multi-factor strategy. The Fund’s dedicated trend-following allocation sub-advised by Graham also performed well. While Revolution’s short-term pattern recognition strategy produced substantial positive returns during last year’s pandemic-induced sell-off, it was more challenged during the first half of 2021 though still has slightly positive results. Overall, the Fund’s combination of differentiated trading styles and strategies that tend to produce differing returns at different times has contributed to its strong returns and less volatile returns than most peers.
The target allocation to each sub-adviser was unchanged during the period:
| ● | Millburn Ridgefield Corporation: 40% |
| ● | Graham Capital Management: 40% |
| ● | Revolution Capital Management: 20% |
Managed Futures Strategy
Equity Indices
Trading in equity indices was the largest contributor to the Fund’s returns as persistent long exposure across most geographies benefited from the continued recovery in stock prices. The largest contributor was long exposure in U.S. markets, notably the E-Mini S&P 500. Long European exposure also helped, benefitting from higher stock prices with notable contributions from trading in the German DAX. Trading in developed Asian markets was a slight positive contributor as were long positions in emerging markets. The Fund ended the semi-annual period with modest long positions across the U.S., Europe, and Asia.
Commodities
Trading in commodities also produced significant gains with the largest contributions coming from energy markets. In the energy sector, the Fund began the year with a slightly long posture, however, long exposure increased significantly as oil prices moved higher. The largest contributions in the oil patch were from long positions in crude oil (WTI and Brent) and RBOB gasoline while natural gas markets were unprofitable. Metal trading was also profitable as gains from positions in base metals were partially offset by losses from precious metals, notably gold. Trading in agricultural markets was profitable, led by gains from long grain positions, particularly corn. The Fund ended the semi-annual period with significant long exposure in energy markets along with smaller long positions in base metals and softs. Grain and precious metal markets were slightly short at the end of June.
Fixed Income
Trading in fixed income was unprofitable as exposure fluctuated between long and short during the semi-annual period. The largest losses were from European markets, notably trading in the Euro Bund and BOBL contracts. Trading in the Canadian 10-Year was also unprofitable as long exposure in the first quarter was hurt by a rising yield. Partially offsetting these losses were gains from trading in U.S. instruments, particularly the 10-year U.S. Treasury and the U.S. T-Bond contracts. The Fund ended June with slightly short exposure in fixed income. By region, Asian positions were slightly short while European and U.S. exposure was marginally long.
Foreign Currencies
Trading in currencies was the largest detractor in the first half of the year, with most of the losses occurring in June. Positioning vacillated between long and short as currency markets exhibited low volatility, reversals, and were fairly range-bound. The largest losses occurred in European currencies, notably from trading in the Euro and Swiss Franc. Trading in Asian currencies was also unprofitable, though to a lesser extent. Currency positioning ended the semi-annual period slightly long overall versus the USD, though mixed by market. The largest long FX positions were in the Canadian dollar with the largest short exposure in the Yen and Euro.
Outlook
We enter the second half of 2021 with global economic growth surging yet remaining uneven. The accelerating pace of vaccinations has led to an increasing number of countries and regions exiting pandemic lockdowns and moving down a return-to-normal path. Accordingly, investors were generally more sanguine with respect to CVOID-19 during the first half of the year, however, the emergence of the more contagious variants including the delta and beta variants bears watching. For countries and regions of the world with less access to vaccines and to unvaccinated portions of more developed markets including the U.S. and Europe, investor anxiety may increase if the case and hospitalization counts swell and ultimately lead to renewed restrictions and lockdown type of measures.
The outlook for inflation and interest rates is another key market narrative. Investors will likely focus on whether current high inflationary pressure is transitory or more persistent in nature. Given the recent downward move in long-term U.S. bond yields and flattening of the yield curve, particularly following the mid-June FOMC meeting, market participants seem to be taking the stance at this time that high inflation is transitory. In addition to monitoring CPI/PPI, we believe investors will pay close attention to wage inflation which has been moving higher on tightening labor markets and the difficulty many companies are having finding new workers. Many investors will closely monitor central bank policy as they move toward a path of balance sheet normalization. At this point the Federal Reserve is likely to begin tapering in 2022 though perhaps we could get an announcement by the end of 2021 on this front. Meanwhile the Fed, at this point, anticipates hiking rates toward the end of 2023. To the extent tapering is delayed or accelerates, market participants will need to weigh what this means with respect to the outlook for inflation and growth and accordingly for financial markets.
We believe allocators should increasingly challenge the 60% equity / 40% fixed income status quo when it comes to their investment portfolios. In our view, the outlook for bonds remains murky as bond yields remain remarkably low with limited ability to move lower unless you are of the belief that U.S. rates could move negative, which we view as unlikely. Thus, we continue to believe fixed income investments have limited upside and will struggle to provide the kind of returns investors have enjoyed in the past. Thus far in 2021, the bond market reflects this sentiment as the Barclays U.S. Aggregate Bond Index declined -1.60% in the first half of the year. We believe allocators would be well served to consider the usage of alternative diversifying strategies, including managed futures, to help achieve their diversification goals.
Overall, we remain highly confident in the outlook for the Fund. We believe its differentiated high conviction, multi-manager structure will continue to help the Fund navigate markets in a smoother and less volatile fashion than peers, while providing the potential for strong risk-adjusted returns, downside protection during bouts of equity market volatility, and low correlation to stocks and bonds.
Fixed Income Strategy
The Fund invests most of its remaining assets in a Fixed Income Strategy comprised of high quality, short to intermediate term investment grade corporate and government agency securities managed by Nuveen Asset Management (“Nuveen”).
The fixed income component of the Fund is managed against the Barclays 1–5 Government Credit Index. Returns for the fixed income portion of the portfolio were -0.11% compared to -0.30% for the benchmark in the first half of 2021. Nuveen increased the underweight duration position during the period as growth and inflation surprised to the upside. As such, duration positioning had a positive impact on relative performance versus the respective benchmark as interest rates rose. The portfolio remained overweight to non-government sectors which was a positive contributor to performance, as these sectors were positively impacted by spread tightening during the period. The duration of the portfolio was managed between 1.9 and 2.5 years and finished the quarter at 1.97 years versus 2.51 at the end of 2020. The portfolio’s allocation was between 26–28% investment grade corporate bonds and 23–26% in higher quality, shorter duration securitized sectors, with the balance in government agency and treasury securities. The Fund maintained broad corporate bond diversification with a modest overweight to financials. Given that spreads for non-government securities tightened during the period, sector positioning was a contributor to returns. Given Nuveen’s outlook on the Fed and expectations for incoming economic data, the team expects to keep duration below that of the benchmark.
LoCorr Long/Short Commodities Strategy Fund
The LoCorr Long/Short Commodities Strategy Fund (the “Long/Short Commodities Fund” or the “Fund”) provides investors with access to a commodities futures strategy in a mutual fund structure. Historically, investors have primarily achieved commodities exposure via long-only investments that rely on rising prices to generate positive returns. Of course, commodity prices don’t always appreciate and occasionally experience sharp declines, as was seen in 2020, 2018, 2014/2015 and 2008. The Long/Short Commodities Fund has the potential to profit when commodity prices increase or decrease, which differentiates it from most commodity-oriented mutual funds. The Fund’s primary investment objective is capital appreciation in rising and falling commodities markets. The Fund attempts to achieve its investment objective by investing in two primary strategies — a Commodities Strategy and a Fixed Income Strategy.
The Fund accesses, via a total return swap agreement or a fund-linked option, the returns of:
| ● | Millburn’s Commodity Program (“MILCOM”), began trading in 2005. MILCOM employs a systematic trading strategy that takes outright long/short positions and relative value spread positions across 40+ commodity futures markets. |
| ● | J E Moody’s Commodity Relative Value Program (“JEM CRV”), began trading in 2006. JEM CRV employs a market neutral, systematic trading strategy that invests in relative value calendar spread positions across 20+ commodity markets. |
| ● | First Quadrant’s (“FQ”) Commodities Long/Short strategy began trading in 2010. FQ employs a systematic long/short directional strategy that attempts to capture commercial market participant behavior across 20+ commodity markets. |
| ● | ARCOM Capital (“ARCOM”), began trading in 2015. ARCOM is led by Alastair Riach, who has over 30 years of experience trading commodities, and manages a discretionary natural gas specialist strategy that trades primarily relative value. |
| ● | East X, began trading in 2014. East X seeks diversified returns across 30 global commodity markets, time frames, and market structure using a systematic approach. Adaptive signals provide a long or short view in a machine learning framework to determine conviction and risk for each position. |
Market Commentary
The semi-annual market environment continued to be dominated by COVID-19 related events, including increased vaccination rates and reduced case counts. These positive developments led to loosened restrictions and continued economic growth. While this rebound in the global economy has been uneven, the World Bank expects global growth to rise +5.6% in 2021, the fastest post-recession recovery in 80 years.
Investor nervousness surrounding rising inflationary pressure appeared to relax early in the semi-annual period as the Federal Reserve maintained its easy monetary policy. This reassurance from the Fed came as job growth, wage growth, and Consumer Price Index (“CPI”) accelerated. As the semi-annual period came to a close, however, the Fed communicated a new hawkish stance to raise rates sooner than expected as the most recent economic data continued to strengthen. The Eurozone PMI reached an all-time high for a third consecutive month in May while the headline CPI in the European Union rose +2.0% in May, its highest level since 2018. China’s economic recovery from the pandemic was earlier than most, though showed signs of losing steam as reported Q2 GDP growth was +7.9%, a marked slowdown from the +18.3% in the first quarter.
The Bloomberg Commodity Index rose +21.15% over the semi-annual period as commodity prices continued their recovery from the depths of the pandemic. Oil prices which had generally lagged the recovery in other commodities were buoyed by improving demand from reopening economies and continued production discipline by OPEC+. West Texas Intermediate crude (“WTI”) climbed from just under $50 per barrel to end June near $74 per barrel, reaching its highest level since 2018. The strength in oil extended to other oil products as gasoline prices at the pump surged, closing the semi-annual period at an average price of $3.15 per gallon, about a +36% increase from the end of 2020.
The improving economy and recovery optimism helped fuel a rise in industrial metal prices, leading to notable gains in the price of copper, which rose over +20% since the start of the year. Other industrial metals such as aluminum, nickel, and zinc saw rising prices, but to a lesser extent, supported by the cyclical forces, electric car requirements, green infrastructure, and proposed infrastructure packages. Precious metal prices generally declined as gold prices moved lower on higher interest rates and perhaps some switching to crypto currency as a non-fiat currency.
Agricultural commodities also moved sharply higher led by strong gains in most grain prices, notably corn and soybean due to challenging weather conditions and increased Chinese consumption. In the second quarter, corn reached levels not seen since the first half of 2013, but fell off at the end of the period as favorable weather conditions prevailed. The live hog market started the year strong as renewed concerns arose on African swine flu in China. This upward movement quickly reversed course in the second quarter as prices slumped on export worries due to signs of slowing Chinese demand, having rebuilt their herds during the first quarter.
Fund Performance Summary
The Fund’s Class I share gained +8.69% during the semi-annual period ended June 30, 2021, versus the +21.15% return for the Bloomberg Commodity Total Return Index and the +0.07% gain for the ICE BofAML T-Bill Index. During the semi-annual period, the Fund benefitted from positive contributions from all managers while ARCOM was flat. Trading in Energy was overwhelmingly the largest driver of the Fund’s positive returns while grains, metals, and livestock positions also contributed positively. Trading in soft markets were modestly unprofitable.
Energy
The Fund generated sizable profits from the energy sector during the first half of 2021. Consistent long directional exposure and calendar spread positioning benefitted from the continual rise in oil and oil products during the period. Specifically, positions in crude and natural gas drove the sector’s positive performance as the Fund’s managers were able to navigate the reopening economy, changing weather factors, and OPEC+ production negotiations. The Fund finished the period with long positions across oil and oil products, natural gas, and power markets.
Metals
Trading in Metals was profitable during the semi-annual period with gains from base metals and small losses from precious metals. In base metals, positions remained long during the semi-annual period, but dipped to a modest brief short posture at the end of the first quarter as markets became rangebound. This bearish position quickly faded, and the Fund’s view moved back to bullish. In precious metals, long positions in gold during the first quarter drove losses as market participants exited perceived “safe haven assets” and moved into risk-on securities. The Fund finished the period with long base metal, primarily in copper and aluminum, and long precious metal positions.
Agricultural
Trading in livestock was profitable for the Fund, driven by gains from dynamic positioning during the last two months of the semi-annual period. Long positions in feeder cattle were particularly profitable as prices jumped in June amid surging demand. Trading in grain markets were the most profitable agricultural market as long relative value and directional trading in corn led these gains. Trading in softs was modestly unprofitable, with losses being driven by fluctuating coffee positioning. At the end of the period, positions in grain and livestock markets were short while exposure in soft markets were long.
Outlook
We enter the second half of 2021 with global economic growth surging yet remaining uneven. The accelerating pace of vaccinations has led to an increasing number of countries and regions exiting pandemic lockdowns and moving down a return-to-normal path. Accordingly, investors were generally more sanguine with respect to CVOID-19 during the first half of the year, however, the emergence of the more contagious variants including the delta and beta variants bears watching. For countries and regions of the world with less access to vaccines and to unvaccinated portions of more developed markets including the U.S. and Europe, investor anxiety may increase if the case and hospitalization counts swell and ultimately lead to renewed restrictions and lockdown type of measures.
The outlook for inflation and interest rates is another key market narrative. Investors will likely focus on whether current high inflationary pressure is transitory or more persistent in nature. Given the recent downward move in long-term U.S. bond yields and flattening of the yield curve, particularly following the mid-June FOMC meeting, market participants seem to be taking the stance at this time that high inflation is transitory. In addition to monitoring CPI/PPI, we believe investors will pay close attention to wage inflation which has been moving higher on tightening labor markets and the difficulty many companies are having finding new workers. Many investors will closely monitor central bank policy as they move toward a path of balance sheet normalization. At this point the Federal Reserve is likely to begin tapering in 2022 though perhaps we could get an announcement by the end of 2021 on this front. Meanwhile the Fed, at this point, anticipates hiking rates toward the end of 2023. To the extent tapering is delayed or accelerates, market participants will need to weigh what this means with respect to the outlook for inflation and growth and accordingly for financial markets.
We believe allocators should increasingly challenge the 60% equity / 40% fixed income status quo when it comes to their investment portfolios. In our view, the outlook for bonds remains murky as bond yields remain remarkably low with limited ability to move lower unless you are of the belief that U.S. rates could move negative which we view as unlikely. Thus, we continue to believe fixed income investments have limited upside and will struggle to provide the kind of returns investors have enjoyed in the past. Thus far in 2021, the bond market reflects this sentiment as the Barclays U.S. Aggregate Bond Index declined -1.60% in the first half of the year. We believe allocators would be well served to consider the usage of alternative diversifying strategies, including managed futures, to help achieve their diversification goals.
We believe the Fund may be highly attractive to investors seeking solutions that are uncorrelated to most investment strategies and asset classes, or for investors that are seeking alternatives in the commodity market. Commodity markets are characterized by high volatility and subject to sizable drawdowns as we have seen in 2020. This volatility also creates tremendous opportunities which we believe the Fund can take advantage of. The underlying managers in the Fund have the ability to take both long and short directional positions (benefit from commodity prices moving up or down), as well as to trade along the forward curve (relative value calendar spread trading) to capture this diverse and robust set of opportunities over time. Finally, the Fund’s multi-manager approach has the potential to dampen volatility for investors as the underlying managers tend to produce differing returns at different times, which may also help to limit drawdowns. We remain confident in the outlook for the Fund and the underlying managers and strategies.
Fixed Income Strategy
The Fund invests most of its remaining assets in a Fixed Income Strategy comprised of high quality, short to intermediate term investment grade corporate and government agency securities managed by Nuveen Asset Management (“Nuveen”).
The fixed income component of the Fund is managed against the Barclays 1–5 Government Credit Index. Returns for the fixed income portion of the portfolio were -0.14% compared to -0.30% for the benchmark in the first half of 2021. Nuveen increased the underweight duration position during the period as growth and inflation surprised to the upside. As such, duration positioning had a positive impact on relative performance versus the respective benchmark as interest rates rose. The portfolio remained overweight to non-government sectors which was a positive contributor to performance, as these sectors were positively impacted by spread tightening during the period. The duration of the portfolio was managed between 1.95 and 2.55 years and finished the quarter at 1.96 years versus 2.50 at the end of 2020. The portfolio’s allocation was between 26–28% investment grade corporate bonds and 21–26% in high quality, short duration securitized sectors, with the balance in government agency and treasury securities. The Fund maintained broad corporate bond diversification with a modest overweight to financials. Given that spreads for non-government securities tightened during the period, sector positioning was a contributor to returns. Given Nuveen’s outlook on the Fed and expectations for incoming economic data, the team expects to keep duration below that of the benchmark.
LoCorr Market Trend Fund
The LoCorr Market Trend Fund (the “Market Trend Fund” or the “Fund”) was created to provide investors with access to a trend following futures strategy managed by one of the leading managers in this space — Graham Capital Management. Graham was founded in 1994 and manages approximately $18 billion in assets. The Market Trend Strategy is managed similarly to Graham’s Tactical Trend program, a systematic medium- to long-term trend following strategy that commenced trading in 2006. The Fund seeks capital appreciation as its primary investment objective with managing volatility as a secondary objective. The Fund attempts to achieve its objective by investing in two main strategies — a Managed Futures Strategy and a Fixed Income Strategy.
Market Commentary
The semi-annual market environment continued to be dominated by COVID-19 related events, including increased vaccination rates and reduced case counts. These positive developments led to loosened restrictions and continued economic growth. While this rebound in the global economy has been uneven, the World Bank expects global growth to rise +5.6% in 2021, the fastest post-recession recovery in 80 years.
Investor nervousness surrounding rising inflationary pressure appeared to relax early in the semi-annual period as the Federal Reserve maintained its easy monetary policy. This reassurance from the Fed came as job growth, wage growth, and Consumer Price Index (“CPI”) accelerated. As the semi-annual period came to a close, however, the Fed communicated a new hawkish stance to raise rates sooner than expected as the most recent economic data continued to strengthen. The Eurozone PMI reached an all-time high for a third consecutive month in May while the headline CPI in the European Union rose +2.0% in May, its highest level since 2018. China’s economic recovery from the pandemic was earlier than most, though showed signs of losing steam as reported Q2 GDP growth was +7.9%, a marked slowdown from the +18.3% in the first quarter.
The Bloomberg Commodity Index rose +21.15% over the semi-annual period as commodity prices continued their recovery from the depths of the pandemic. Oil prices which had generally lagged the recovery in other commodities were buoyed by improving demand from reopening economies and continued production discipline by OPEC+. West Texas Intermediate crude (“WTI”) climbed from just under $50 per barrel to end June near $74 per barrel, reaching its highest level since 2018. The strength in oil extended to other oil products as gasoline prices at the pump surged, closing the semi-annual period at an average price of $3.15 per gallon, about a +36% increase from the end of 2020.
The improving economy and recovery optimism helped fuel a rise in industrial metal prices, leading to notable gains in the price of copper, which rose over +20% since the start of the year. Other industrial metals such as aluminum, nickel, and zinc saw rising prices, but to a lesser extent, supported by the cyclical forces, electric car requirements, green infrastructure, and proposed infrastructure packages. Precious metal prices generally declined as gold prices moved lower on higher interest rates and perhaps some switching to crypto currency as a non-fiat currency.
Agricultural commodities also moved sharply higher led by strong gains in most grain prices, notably corn and soybean due to challenging weather conditions and increased Chinese consumption. In the second quarter, corn reached levels not seen since the first half of 2013, but fell off at the end of the period as favorable weather conditions prevailed. The live hog market started the year strong as renewed concerns arose on African swine flu in China. This upward movement quickly reversed course in the second quarter as prices slumped on export worries due to signs of slowing Chinese demand, having rebuilt their herds during the first quarter.
Fund Performance Commentary
The Fund’s Class I shares gained +5.71% during the semi-annual period ended June 30th,2021, versus the +0.07% return for the ICE BofAML T-Bill Index. The Fund benefitted from a continuation of the favorable environment for trend following, evidenced by the +6.40% return for the Morningstar Systematic Trend category. Favorable trending activity in global commodity and equity markets drove the Fund’s positive returns. Gains in these sectors were partially offset by losses from fixed income and currency markets.
Market Trend Strategy
Commodities
Trading in commodities produced sizable gains for the Fund with the largest contributions coming from energy markets. While the recovery in oil prices lagged other commodities, the Fund’s long exposure benefitted as prices climbed with notable contributions from both oil and oil derived products like RBOB gasoline. Trading in metal markets was mixed with gains from long exposure in base metals, particularly copper, largely offset by losses from precious metals, notably gold. Trading in agricultural markets was nicely profitable as well, led by gains from long positions in grains and, to a lesser extent, soft markets. The Fund ended the period with long exposure in energy, base metal, and soft markets while positioning was shot in precious metal and grain markets.
Equity Indices
The Fund was also able to profit substantially from the strong upward trending activity in global equity markets. The largest gains were from long positions in U.S. markets, including strong contributions from the E-Mini S&P 500 and Russell 2000 contracts. Trading in European markets also made significant positive contributions, notably long positions in the German DAX. Long exposure in Asia was profitable, albeit to a lesser degree. The Fund ended the period with long equity positions.
Foreign Currencies
Trading in currencies was unprofitable during the first half of the year as positioning fluctuated between long and short FX vs. USD. With overall conditions proving to be challenging throughout the period, the Fund experienced its largest losses in the sector from trading in European currencies, notably the Swiss Franc and Euro. Trading in Asian currencies was profitable, particularly in the Japanese Yen. Exposure finished the quarter with mixed positioning but overall, slightly long FX versus the USD.
Fixed Income
Trading in fixed income produced the largest losses for the Fund during the semi-annual period, particularly during the second quarter as the upward trend in medium- and long-term interest rates reversed course and bond yields declined to varying degrees. With positioning shifting short in medium- and long-term instruments during the period, the Fund was hurt as those yields began climbing. The largest detractor was from European markets with smaller losses from positions in U.S., Canada, and Asia. Trading was also unprofitable in shorter-duration instruments as long positions were hurt by rising yields as the Fed moved its timetable forward for interest rate hikes which caused interest rates at the front end of the yield curve to move higher. The Fund finished the period with short exposure in fixed income markets.
Outlook
We enter the second half of 2021 with global economic growth surging yet remaining uneven. The accelerating pace of vaccinations has led to an increasing number of countries and regions exiting pandemic lockdowns and moving down a return-to-normal path. Accordingly, investors were generally more sanguine with respect to CVOID-19 during the first half of the year, however, the emergence of the more contagious variants including the delta and beta variants bears watching. For countries and regions of the world with less access to vaccines and to unvaccinated portions of more developed markets including the U.S. and Europe, investor anxiety may increase if the case and hospitalization counts swell and ultimately lead to renewed restrictions and lockdown type of measures.
The outlook for inflation and interest rates is another key market narrative. Investors will likely focus on whether current high inflationary pressure is transitory or more persistent in nature. Given the recent downward move in long-term U.S. bond yields and flattening of the yield curve, particularly following the mid-June FOMC meeting, market participants seem to be taking the stance at this time that high inflation is transitory. In addition to monitoring CPI/PPI, we believe investors will pay close attention to wage inflation which has been moving higher on tightening labor markets and the difficulty many companies are having finding new workers. Many investors will closely monitor central bank policy as they move toward a path of balance sheet normalization. At this point the Federal Reserve is likely to begin tapering in 2022 though perhaps we could get an announcement by the end of 2021 on this front. Meanwhile the Fed, at this point, anticipates hiking rates toward the end of 2023. To the extent tapering is delayed or accelerates, market participants will need to weigh what this means with respect to the outlook for inflation and growth and accordingly for financial markets.
We believe allocators should increasingly challenge the 60% equity / 40% fixed income status quo when it comes to their investment portfolios. In our view, the outlook for bonds remains murky as bond yields remain remarkably low with limited ability to move lower unless you are of the belief that U.S. rates could move negative, which we view as unlikely. Thus, we continue to believe fixed income investments have limited upside and will struggle to provide the kind of returns investors have enjoyed in the past. Thus far in 2021, the bond market reflects this sentiment as the Barclays U.S. Aggregate Bond Index declined -1.60% in the first half of the year. We believe allocators would be well served to consider the usage of alternative diversifying strategies, including managed futures, to help achieve their diversification goals.
We have been pleased to see a robust environment for trending activity since the end of 2018, which has provided a nice tailwind for the Fund. We believe the outlook remains favorable for trend followers as the potential for continued inflationary pressure could create a favorable environment for persistent directional price movement across commodities, fixed income, and currency markets. LoCorr continues to believe that Graham Capital is one of the premiere trend followers and we remain highly confident in the potential for the Fund to help diversify investor portfolios and protect capital during periods of market stress.
Fixed Income Strategy
The Fund invests most of its remaining assets in a Fixed Income Strategy comprised of high quality, short to intermediate term investment grade corporate and government agency securities managed by Nuveen Asset Management (“Nuveen”).
The fixed income component of the Fund is managed against the Barclays 1–5 Government Credit Index. Returns for the fixed income portion of the portfolio were -0.13% compared to -0.30% for the benchmark in the first half of 2021. Nuveen increased the underweight duration position during the period as growth and inflation surprised to the upside. As such, duration positioning had a positive impact on relative performance versus the respective benchmark as interest rates rose. The portfolio remained overweight to non-government sectors which was a positive contributor to performance, as these sectors were positively impacted by spread tightening during the period. The duration of the portfolio was managed between 1.9 and 2.5 years and finished the quarter at 1.98 years versus 2.51 at the end of 2020. The portfolio’s allocation was between 26 – 28% investment grade corporate bonds and 23 – 26% in high quality, short duration securitized sectors, with the balance in government agency and treasury securities. The Fund maintained broad corporate bond diversification with a modest overweight to financials. Given that spreads for non government securities tightened during the period, sector positioning was a contributor to returns. Given Nuveen’s outlook on the Fed and expectations for incoming economic data, the team expects to keep duration below that of the benchmark.
LoCorr Dynamic Equity Fund
The LoCorr Dynamic Equity Fund (the “Fund”) seeks long-term capital appreciation with reduced volatility compared to traditional broad-based equity market indices as a secondary objective. Consistent with the “low correlation” our LoCorr Fund family seeks, long/short equity funds have the ability to provide positive returns when equity markets are rising, yet they offer the potential for downside protection when equity prices are falling.
The Fund employs three sub-advisers to manage the long/short equity strategy of the Fund:
| ● | Billings Capital Management (“Billings”) manages a strategy which is based on a value-oriented, concentrated, fundamental, bottom-up long/short equity approach. This manager seeks to maximize absolute returns, exceeding the S&P 500 over the long term. The sub-portfolio managed by Billings is similar to a strategy that this manager has executed since 2008 with their current firm and for many years prior to that at a different entity. |
| ● | Kettle Hill Capital Management (“Kettle Hill”) seeks to generate alpha by combining a bottom-up, fundamental analysis with a top-down opportunistic overlay. Investing primarily in small cap securities, Kettle Hill targets a conservative net exposure to the market. The sub-portfolio managed by Kettle Hill is similar to a strategy that this manager has executed since its inception in 2003. |
| ● | First Quadrant manages an equity strategy which is similar to a global long/short strategy the manager has executed since 2016. FQ utilizes a systematic multi-factor approach coupled with an active beta management approach to maximize upside opportunities while reducing downside performance. FQ invests in developed international and U.S. markets and was added to the portfolio January 2019. |
Market Commentary
In the first half of 2021, the S&P 500 continued to rebound strongly from the 2020 pandemic-related selloff, closing the six-month period with a +15.25% gain. The index finished June at an all-time high with all 11 S&P sectors gaining during the first half of the year. After suffering the largest losses of any sector during the pandemic, the energy sector outperformed all others by a sizable margin, finishing the first six months of 2021 up +45.64%. Energy was followed by Financials, which gained +25.69% during the period. Additionally, both value and growth stocks posted double-digit gains in the first half of 2021, as the S&P 500 Value index rose +16.30%, narrowly outpacing the S&P 500 Growth index which gained +14.31%.
After beginning 2021 with a -1.01% loss in January, the S&P 500 posted two solid months and finished Q1 on a high note, ending the quarter up +6.17%. Following the distribution of a second round of stimulus checks to taxpayers at the beginning of the quarter, many businesses that were significantly impacted by the virus bounced back. The added stimulus paired with the rollout of the COVID-19 vaccine provided optimism to investors. Value stocks that faced greater challenges from the pandemic rallied sharply, and fears of high valuations and rising interest rates caused investors to shift away from growth stocks. The S&P 500 Value index gained +10.77% in Q1, whereas the S&P 500 Growth index posted a relatively incremental gain of +0.94%. The end of the first quarter was marked by more stimulus as President Biden signed a monumental $1.9T coronavirus relief bill into law.
With the added stimulus and COVID-19 vaccine distribution rates accelerating, U.S. stocks extended their rally in the second quarter. By the end of June, approximately 60% of American adults were fully vaccinated. This allowed an almost complete reopening of the US economy. Retail sales soared +24.4% from one year ago with clothing and clothing accessories stores sales up over 200%. PMI bumped up to 63.9 in June from 59.7 in March, signaling expansion. However, the news wasn’t all positive. Towards the end of the second quarter, an influx in cases of a new “Delta” variant of COVID-19 began to make headlines. Yet, investors seemingly brushed off these fears as the S&P 500 reached a new all-time high with a quarterly return of +8.55%. Growth and value stocks both recorded strong second quarter returns, but contrary to Q1, growth handily outperformed value as the S&P 500 Growth index gained +11.93% while the S&P Value index gained +4.99.
Portfolio Update
LoCorr Dynamic Equity Class I share (the “Fund”) finished the period with a +11.96% return, leading the Morningstar Long/Short Equity category which closed up +8.94% and trailing the S&P 500 Index’s +15.25% gain.
Billings led the way for the Fund, posting a stellar six-month return while both First Quadrant and Kettle Hill were positive but trailed the S&P 500 during the period. LoCorr believes that Billings’ ability to identify undervalued securities that have compelling upside was a significant factor to the sub-adviser’s positive performance in the first half of 2021. Billings’ long exposure to value stocks that performed well during the period reinforces this notion. The Fund’s overall net exposure oscillated throughout the first half of 2021, ending the period within its typical 40-60% range, at 55.9% net exposure.
The Fund’s long book was the main positive contributor for the first six months of 2021; however, the Fund saw a negative contribution from the short book. The long book had positive performance in all S&P 500 sectors during the period, but its best performance came from the Financial Services, Industrials, and Consumer Cyclical sectors. Within the Financial Services sector, a position in Wells Fargo (4.03% of the Fund as of 6/30/21), was a positive contributor after releasing a very bullish Q1 earnings report that indicated higher loan growth and improving cost controls. A position in Credit Acceptance Corp. (5.60% of the Fund as of 06/30/21), a specialized consumer finance company within the auto industry, traded higher on hopes of increased auto loan volume after a recovery from a major microchip-related disruption in the automotive market. Another contributor was MasTec (3.35% of the Fund as of 6/30/2021), a multinational infrastructure engineering and construction company. The stock benefitted from news that President Biden secured a deal on an infrastructure bill that will expand roads, bridges, and broadband networks.
Although there were no overall sectors that performed negatively for the Fund on the long side, there were some individual holdings that detracted. A position in Bumble (0.52% of the Fund as of 06/30/21), an online dating application company, traded lower from its IPO price in the 1st quarter due to inflationary fears and the impact on heavy debt-related companies. A position in Allegiant Travel Company (3.44% of the Fund as of 06/30/2021), an ultra-low-cost airline that operates scheduled and charter flights, trended lower in the second quarter on fears related to the spread of the Delta variant of COVID-19 limiting travel in the near-term, as well as pressure from rising oil prices. In the Consumer Cyclical sector, a position in Frontdoor (4.49% of the Fund as of 06/30/2021), a home service plan and appliance company, declined in the second quarter due to inflationary fears, as well as a resurgence in COVID-19 cases.
The Fund’s short book was a detractor during the first half of 2021 as equity markets continued to gain on accelerating COVID-19 vaccine distribution and economic reopening. The largest detracting sectors in the short book were the Consumer Cyclical, Technology, and Financial Services sectors. In the Consumer Cyclical sector, a short position in Express Inc. (0.00% of the Fund as of 06/30/2021), a domestic apparel and accessory company, detracted as the company was a short-squeeze target during the Reddit craze in the first quarter. The Fund benefitted from a short position in Nikola Corp (-0.10% of the Fund as of 6/30/2021), an American zero-emission vehicle manufacturer, by strategically trading around increasingly bearish market sentiment regarding operational headwinds.
Outlook
U.S. equities closed the first half of 2021 on a high note as the S&P 500 finished the second quarter up +8.55%, continuing its rebound off of the equity market’s fastest and deepest selloff in history. Looking ahead, financial markets will likely be driven by the rate of inflation, decisions by the Fed and other policy makers around the globe, the distribution of the COVID-19 vaccine, and continuation of global economic reopening. In this type of environment, a long/short equity strategy may allow for continued participation in equity markets if prices rise while its ability to benefit from stocks falling in price may potentially mitigate losses if equities were to sell off.
The Fund performed well in the first half of 2021, outperforming the Morningstar Long-Short Equity Fund Category by over 3%. We remain highly confident in the ability of the Fund to provide positive absolute returns and compelling diversification for investors.
LoCorr Spectrum Income Fund
The LoCorr Spectrum Income Fund (the “Spectrum Income Fund” or the “Fund”) has an objective of current income with capital appreciation as a secondary objective. The Fund is designed to fit within the “low correlation” of the LoCorr Fund family by seeking to provide relatively high levels of income with low correlation to the bond market. The Fund is sub-advised by Bramshill Investments. Bramshill invests in a portfolio of primarily pass-through securities with an integrated covered call and hedging strategy. Bramshill seeks to generate high current income, much of which the Fund distributes monthly to investors.
Market Commentary
The year began with U.S. markets in full reflation mode, with accelerating growth and inflation, a dovish Fed, vaccine rollouts, and additional stimulus pushing value and cyclical stocks higher. The U.S. 10-year Treasury yield started off the year at 0.92%, rallied sharply in the first quarter to 1.74%, then retreated to 1.45% by the end of June, which closely correlated to the outperformance of cyclical value in Q1 and then the reemergence of growth stock leadership in Q2. By the end of June, approximately 60% of American adults were fully vaccinated. As the economy continued its reopening, investors increasingly embraced the global recovery/return-to-normal narrative that was backed by strong economic data releases and accommodative monetary policy. The ISM Purchasing Managers’ Index (“PMI”) has indicated strong U.S. economic expansion so far this year, with the manufacturing and service sectors both climbing above 60 during the period. Since the start of 2021, the U.S. unemployment rate has fallen from 6.7% to 5.9%, adding back 3.3 million jobs. Amid this growth, inflationary pressures built and resulted in a +5.4% jump for the Consumer Price Index (“CPI”) in June, marking its fastest annual rate in nearly 13 years. With the proliferation of economic activity and inflationary pressures in mind at the June FOMC meeting, Chairman Jerome Powell expressed a shift in tone regarding inflation, and implied that the Fed might tighten rates earlier than markets previously anticipated. By the end of June, most of the big market winners year-to-date had paused their uptrends, as if awaiting further data.
Portfolio Update
The Fund’s Class I shares rose +22.48% during the first half of 2021, outperforming the +15.25% return for the S&P 500 and the -1.60% return for the Bloomberg Barclays U.S. Aggregate Bond Index. The Fund saw positive performance from all major sectors invested in during the period, but the largest contributions came from Master Limited Partnerships (“MLPs”), Business Development Companies (“BDCs”), and C-Corps. During the first half of the year, conditions warranted being completely unhedged so as not to limit upside potential. However, towards the end of Q2, Bramshill started selling calls covered against long positions to generate additional yield and to fund potential hedges going forward.
MLPs were the top performing sector for the Fund through the first half of 2021. Bramshill generally maintained overweight MLP positions throughout the period, which were supported by sector tailwinds as illustrated by the Alerian Index posting returns of +47.84%. Within the MLP sector, the Fund saw positive contributions from Crestwood Equity Partners (MLP security: 2.90% and Preferred security: 1.69% of the Fund as of 6/30/21), a midstream MLP that rallied on news that it is simplifying its structure by buying out its general partner interest, as well as Global Partners (3.19% of the Fund as of 6/30/21), a downstream MLP that moved higher on the back of better-than-expected quarterly earnings and news that the firm had increased its distribution. Fund holdings within the BDC sector were also among the most rewarding year-to-date, exemplified by the Vaneck BDC Income ETF, which rallied +28.00%. Within the BDC sector, the Fund benefited from a position in Newtek Business Services (1.01% of the Fund as of 6/30/21), which reported solid earnings, raised its distribution guidance, and experienced tailwinds from a favorable credit environment.
Although all major sectors invested in during the period were profitable, Fund returns were moderately impacted by producers of renewable energy selling off in the absence of any major news, presumably consolidating strong prior gains. The top three detractors to the Fund for the first half of the year all belong to this group and include: Brookfield Renewable Partners (2.28% of the Fund as of 6/30/21), Hannon Armstrong Sustainable Infrastructure (1.56% of the Fund as of 6/30/21), and Clearway Energy (1.13% of the Fund as of 6/30/21). Bramshill continues to believe that strong tailwinds persist for renewables, as the clear trend is towards increased utilization and further infrastructure build out, especially considering the Biden administration’s strong public support for the sector.
Outlook
As we move into the second half of the year, Bramshill is wary of the Fed’s balancing act of bolstering U.S. economic expansion while keeping runaway inflation at bay. Looking forward at the upcoming Fed summit in Jackson Hole, Bramshill is considering diversifying away from some of the reflationary beneficiaries that have worked so well for the past several quarters, in addition to possibly hedging areas of the portfolio that are at higher risk of volatility in the event of a significant change in monetary policy. Headline growth and inflation metrics continue to run hot, but it should be noted that the easy year-over-year comparisons are likely to subside, and it remains to be seen what levels are sustainable. Though still unclear, Bramshill believes it could ultimately level off above trend, potentially ushering in a stagflationary environment of slowing growth and relatively high inflation.
Thank you for investing in the LoCorr Funds
The S&P 500 Index is a broad-based unmanaged index of 500 stocks, which is widely recognized as representative of the equity market in general. Barclays 1-5 Year Government Credit Index-The Barclays U.S. Government/Credit 1-5 Year Index is an index of all investment grade bonds with maturities of more than one year and less than 5 years. MSCI EAFE Index was designed to measure the equity market performance of developed markets outside of the U.S. & Canada. VIX - Chicago Board Options Exchange (CBOE), the Volatility Index, or VIX, is a real-time market index that represents the market’s expectation of 30-day forward-looking volatility. Derived from the price inputs of the S&P 500 index options, it provides a measure of market risk and investors’ sentiments. It is also known by other names like “Fear Gauge” or “Fear Index.” Investors, research analysts and portfolio managers look to VIX values as a way to measure market risk, fear and stress before they take investment decisions. ICE BofAML 3-M T-Bill Index tracks the performance of the U.S. dollar denominated U.S. Treasury Bills publicly issued in the U.S. domestic market with a remaining term to final maturity of less than 3 months. Morningstar Managed Futures Category is an average monthly return of all funds in the Morningstar Managed Futures Category. These funds typically take long and short positions in futures options, swaps, and foreign exchange contracts, both listed and over the counter, based on market trends or momentum. (A long position is a bet an investment will gain in value, while a short position is a bet that an investment will decline in value.) A majority of these funds follow trend-following, price-momentum strategies. Other strategies included in this category are systematic mean-reversion, discretionary global macro strategies, commodity index tracking, and other futures strategies. More than 60% of these funds’ exposure is invested through derivative securities. TOPIX Index (Tokyo Stock Price Index) is an important stock market index for the Tokyo Stock Exchange (TSE) in Japan, tracking all domestic companies of the exchange’s First Section. Dow Jones EURO STOXX 50 Index is a market capitalization-weighted stock index of 50 large, blue-chip European companies operating within eurozone nations. Bloomberg Commodity Index is a broadly diversified commodity price index distributed by Bloomberg Indexes. The index was originally launched in 1998 as the Dow Jones-AIG Commodity Index and renamed to Dow Jones-UBS Commodity Index in 2009, when UBS acquired the index from AIG. SG Trend Index is a subset of the SG CTA Index, and follows traders of trend following methodologies. The SG CTA Index is equal weighted, calculates the daily rate of return for a pool of CTAs selected from the larger managers that are open to new investment. Morningstar Long/Short Equity Category is an average monthly return of all funds in the Morningstar Long-Short Equity Category. The category contains a universe of funds with similar investment objectives and investment style, as defined by Morningstar. Performance of the indices and Morningstar Category Average is generated on the first business day of the month. Bloomberg Barclays U.S. Aggregate Bond Index is a broad-based bond index comprised of government, corporate, mortgage and asset-back issues rated investment grade or higher. West Texas Intermediate is a crude oil that serves as one of the main global oil benchmarks. It is sourced primarily from Texas and is one of the highest quality oils in the world, which is easy to refine. WTI is the underlying commodity for the NYMEX’s oil futures contract. One cannot invest directly in an index.
Please refer to the Schedule of Investments in this report for full holdings information. Fund holdings and sector allocations are subject to change and should not be considered recommendations to buy or sell any security.
Alpha is an annualized return measure of how much better or worse a fund’s performance is relative to an index of funds in the same category, after allowing for differences in risk. Basis Points (bps) - A unit that is equal to 1/100th of 1% and is used to denote the change in a financial instrument. The basis point is commonly used for calculating changes in interest rates, equity indexes and the yield of a fixed-income security. Beta measures the sensitivity of a stock’s return relative to the return of a selected market index. When beta is greater than one, it means a stock will rise or fall more than the market. Cash Flows refers to a company’s free cash flow which is a measure of how much cash a business generates after capital expenditures Duration is a commonly used measure of the potential volatility of the price of a debt security, or the aggregate market value of a portfolio of debt securities, prior to maturity. Securities with a longer duration generally have more volatile prices than securities of comparable quality with a shorter duration. Investment Grade refers to bonds that are rated BBB or higher. Bond ratings are grades given to bonds that indicate their credit quality as determined by private independent rating services such as Standard & Poor’s, Moody’s and Fitch. These firms evaluate a bond issuer’s financial strength, or its ability to pay a bond’s principal and interest in a timely fashion. Ratings are expressed as letters ranging from ‘AAA’, which is the highest grade, to ‘D’, which is the lowest grade. Spread is the percentage point difference between yields of various classes of bonds compared to treasury bonds. Calendar spread is an options or futures spread established by simultaneously entering a long and short position on the same underlying asset at the same strike price but with different delivery months. It is sometimes referred to as an inter-delivery, intra-market, time, or horizontal spread. Yield Curve is a line that plots the interest rates, at a set point in time, of bonds having equal credit quality, but differing maturity dates. The most frequently reported yield curve compares the three-month, two-year, five-year and 30-year U.S. Treasury debt. The curve is used to predict changes in economic output and growth.
Must be preceded or accompanied by a prospectus.
Opinions expressed are those of the Investment Manager and are subject to change, are not guaranteed and should not be considered investment advice.
Earnings growth is not representative of the Funds’ future performance.
Past performance is not a guarantee of future results.
Diversification does not assure a profit nor protect against loss in a declining market.
Mutual fund investing involves risk. Principal loss is possible. LoCorr Macro Strategies Fund, LoCorr Long/Short Commodities Strategy Fund, LoCorr Market Trend Fund, LoCorr Dynamic Equity Fund and LoCorr Spectrum Income Fund are diversified funds. The Funds invest in foreign investments and foreign currencies which involve greater volatility and political, economic and currency risks and differences in accounting methods. The Funds may make short sales of securities, which involves the risk that losses may exceed the original amount invested. Investing in commodities may subject the Funds to greater risks and volatility as commodity prices may be influenced by a variety of factors including unfavorable weather, environmental factors, and changes in government regulations. The Funds may invest in derivative securities, which derive their performance from the performance of an underlying asset, index, interest rate or currency exchange rate. Derivatives can be volatile and involve various types and degrees of risks, and, depending upon the characteristics of a particular derivative, suddenly can become illiquid. Investments in debt securities typically decrease in value when interest rates rise. This risk is usually greater for longer-term debt securities. Investments in Asset Backed, Mortgage Backed, and Collateralized Mortgage Backed Securities include additional risks that investors should be aware of such as credit risk, prepayment risk, possible illiquidity and default, as well as increased susceptibility to adverse economic developments. Investments in Real Estate Investment Trusts (REITs) involve additional risks such as declines in the value of real estate and increased susceptibility to adverse economic or regulatory developments.
Derivative contracts ordinarily have leverage inherent in their terms which can magnify a Fund’s potential for gains or losses through increased long and short position exposure. A Fund may access derivatives via a swap agreement. A risk of a swap agreement is the risk that the counterparty to the agreement will default on its obligation to pay the Fund.
A Fund will incur a loss as a result of a short position if the price of the short position instrument increases in value between the date of the short position sale and the date on which an offsetting position is purchased.
Investments in small- and medium-capitalization companies involve additional risks such as limited liquidity and greater volatility. Investments in lower rated and non-rated securities presents a greater risk of loss to principal and interest than higher-rated securities. ETF investments are subject to investment advisory and other expenses, which will be indirectly paid by the Fund. As a result, the cost of investing in the Fund will be higher than the cost of investing directly in ETFs and may be higher than other mutual funds that invest directly in stocks and bonds. ETFs are subject to specific risks, depending on the nature of the ETF.
A Fund’s portfolio will be significantly impacted by the performance of the real estate market generally, and a Fund may be exposed to greater risk and experience higher volatility than would a more economically diversified portfolio. Property values may fall due to increasing vacancies or declining rents resulting from economic, legal, cultural, or technological developments. Investments in Limited Partnerships (including master limited partnerships) involve risks different from those of investing in common stock including risks related to limited control and limited rights to vote on matters affecting the Limited Partnership, risks related to potential conflicts of interest between the Limited Partnership and the Limited Partnership’s general partner, cash flow risks, dilution risks and risks related to the general partner’s limited call right. Underlying Funds are subject to management and other expenses, which will be indirectly paid by a Fund.
The LoCorr Funds are distributed by Quasar Distributors, LLC.
LoCorr Macro Strategies Fund
Rate of Return — For the period ended June 30, 2021 (Unaudited)
| | Inception | | Average Annual |
| | Date | 6 Month | 1 Year | 5 Year | 10 Year | Since Inception |
| LoCorr Macro Strategies Fund - Class A (without maximum load) | 3/22/11 | 4.45% | 10.11% | 2.81% | 2.87% | 2.32% |
| LoCorr Macro Strategies Fund - Class A (with maximum load) | 3/22/11 | -1.55% | 3.80% | 1.61% | 2.27% | 1.74% |
| LoCorr Macro Strategies Fund - Class C | 3/24/11 | 3.07% | 8.36% | 2.07% | 2.11% | 1.57% |
| LoCorr Macro Strategies Fund - Class I | 3/24/11 | 4.61% | 10.45% | 3.09% | 3.13% | 2.59% |
| Bank of America Merrill Lynch 3-Month Treasury Bill Index | | 0.02% | 0.09% | 1.17% | 0.63% | 0.62% |
| Barclay CTA Index | | 4.53% | 9.46% | 1.93% | 1.31% | 1.01% |
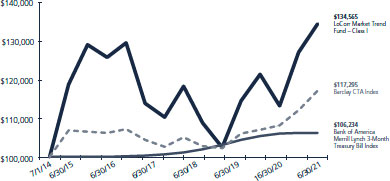
$100,000 investment in the
LoCorr Macro Strategies Fund – Class I
For the period ended June 30, 2021 (Unaudited)

This chart illustrates the performance of a hypothetical $100,000 investment made in the Fund since inception. Assumes reinvestment of distributions, but does not reflect the effect of any applicable sales charge or redemption fees. This chart does not imply any future performance. Performance will vary from class to class based on differences in class-specific expenses and sales charges. The returns do not reflect the deduction of taxes that a shareholder would pay on Fund distributions or the redemption of Fund shares.
Performance data represents past performance; past performance does not guarantee future results. The investment return and principal value of an investment will fluctuate so that an investor’s shares, when redeemed, may be worth more or less than their original cost. Current performance of the Fund may be lower or higher than the performance quoted. Performance data current to the most recent month end may be obtained by calling 1.855.LCFUNDS, or visiting www.LoCorrFunds.com.
Performance data shown reflects the Class A maximum sales charge of 5.75% and reflects the Class C Contingent Deferred Sales Charge (CDSC) of 1.00%. Performance of the Class A without load does not reflect the deduction of the sales load or fee. If reflected, the load or fee would reduce the performance quoted.
The returns reflect the actual performance for each period and do not include the impact on trades executed on the last business day of the period that were recorded on the first business day of the next period.
Per the fee table in the Fund’s April 30, 2021 prospectus, the Fund’s annual operating expense ratio is, before fee waivers 2.18%, 2.93% and 1.93% for Class A, Class C and Class I shares, respectively.
The Bank of America Merrill Lynch U.S. 3-Month Treasury Bill Index is an unmanaged index that seeks to measure the performance of U.S. Treasury bills available in the marketplace.
The Barclay CTA Index is a leading industry benchmark of representative performance of commodity trading advisors.
One cannot invest directly in an index.
LoCorr Long/Short Commodities Strategy Fund
Rate of Return — For the period ended June 30, 2021 (Unaudited)
| | Inception | | Average Annual |
| | Date | 6 Month | 1 Year | 5 Year | Since Inception |
| LoCorr Long/Short Commodities Strategy Fund - Class A (without maximum load) | 12/31/11 | 8.59% | 7.06% | 4.80% | 4.45% |
| LoCorr Long/Short Commodities Strategy Fund - Class A (with maximum load) | 12/31/11 | 2.38% | 0.89% | 3.56% | 3.80% |
| LoCorr Long/Short Commodities Strategy Fund - Class C | 12/31/11 | 7.24% | 5.31% | 4.05% | 3.64% |
| LoCorr Long/Short Commodities Strategy Fund - Class I | 12/31/11 | 8.69% | 7.33% | 5.10% | 4.70% |
| Bank of America Merrill Lynch 3-Month Treasury Bill Index | | 0.02% | 0.09% | 1.17% | 0.66% |
| HFRI Macro Commodity Index* | | 13.93% | 16.84% | 4.33% | 2.01% |
$100,000 investment in the
LoCorr Long/Short Commodities Strategy Fund – Class I
For the period ended June 30, 2021 (Unaudited)

This chart illustrates the performance of a hypothetical $100,000 investment made in the Fund since inception. Assumes reinvestment of distributions, but does not reflect the effect of any applicable sales charge or redemption fees. This chart does not imply any future performance. Performance will vary from class to class based on differences in class-specific expenses and sales charges. The returns do not reflect the deduction of taxes that a shareholder would pay on Fund distributions or the redemption of Fund shares.
Performance data represents past performance; past performance does not guarantee future results. The investment return and principal value of an investment will fluctuate so that an investor’s shares, when redeemed, may be worth more or less than their original cost. Current performance of the Fund may be lower or higher than the performance quoted. Performance data current to the most recent month end may be obtained by calling 1.855.LCFUNDS, or visiting www.LoCorrFunds.com.
Performance data shown reflects the Class A maximum sales charge of 5.75% and reflects the Class C Contingent Deferred Sales Charge (CDSC) of 1.00%. Performance of the Class A without load does not reflect the deduction of the sales load or fee. If reflected, the load or fee would reduce the performance quoted.
The returns reflect the actual performance for each period and do not include the impact on trades executed on the last business day of the period that were recorded on the first business day of the next period.
Per the fee table in the Fund’s April 30, 2021 prospectus, the Fund’s annual operating expense ratio is, before fee waivers 2.57%, 3.32% and 2.32% for Class A, Class C and Class I shares, respectively.
The Bank of America Merrill Lynch U.S. 3-Month Treasury Bill Index is an unmanaged index that seeks to measure the performance of U.S. Treasury bills available in the marketplace.
The HFRI Macro Commodity Index employs an investment process designed to identify opportunities in markets exhibiting trending or momentum characteristics across commodity assets classes, frequently with related ancillary exposure in commodity sensitive equities or other derivative instruments.
* Prior to May 3, 2021, the LLSCS Fund utilized the Morningstar Long/Short Commodity Index as a primary benchmark. The Index was discontinued as of May 3, 2021 and replaced by the HFRI Macro Commodity Index. The Morningstar Long/Short Commodity Index was a fully collateralized commodity futures index that used the momentum rule to determine if each commodity is held long, short, or flat.
One cannot invest directly in an index.
LoCorr Market Trend Fund
Rate of Return — For the period ended June 30, 2021 (Unaudited)
| | Inception | | Average Annual |
| | Date | 6 Month | 1 Year | 5 Year | Since Inception |
| LoCorr Market Trend Fund - Class A (without maximum load) | 6/30/14 | 5.65% | 18.52% | 0.51% | 4.07% |
| LoCorr Market Trend Fund - Class A (with maximum load) | 6/30/14 | -0.40% | 11.66% | -0.67% | 3.20% |
| LoCorr Market Trend Fund - Class C | 6/30/14 | 4.22% | 16.61% | -0.24% | 3.29% |
| LoCorr Market Trend Fund - Class I | 6/30/14 | 5.71% | 18.83% | 0.75% | 4.33% |
| Bank of America Merrill Lynch 3-Month Treasury Bill Index | | 0.02% | 0.09% | 1.17% | 0.87% |
| Barclay CTA Index | | 4.53% | 9.46% | 1.93% | 2.39% |
$100,000 investment in the
LoCorr Market Trend Fund – Class I
For the period ended June 30, 2021 (Unaudited)
This chart illustrates the performance of a hypothetical $100,000 investment made in the Fund since inception. Assumes reinvestment of distributions, but does not reflect the effect of any applicable sales charge or redemption fees. This chart does not imply any future performance. Performance will vary from class to class based on differences in class-specific expenses and sales charges. The returns do not reflect the deduction of taxes that a shareholder would pay on Fund distributions or the redemption of Fund shares.
Performance data represents past performance; past performance does not guarantee future results. The investment return and principal value of an investment will fluctuate so that an investor’s shares, when redeemed, may be worth more or less than their original cost. Current performance of the Fund may be lower or higher than the performance quoted. Performance data current to the most recent month end may be obtained by calling 1.855.LCFUNDS, or visiting www.LoCorrFunds.com.
Performance data shown reflects the Class A maximum sales charge of 5.75% and reflects the Class C Contingent Deferred Sales Charge (CDSC) of 1.00%. Performance of the Class A without load does not reflect the deduction of the sales load or fee. If reflected, the load or fee would reduce the performance quoted.
The returns reflect the actual performance for each period and do not include the impact on trades executed on the last business day of the period that were recorded on the first business day of the next period.
Per the fee table in the Fund’s April 30, 2021 prospectus, the Fund’s annual operating expense ratio is, before fee waivers 2.05%, 2.80% and 1.80% for Class A, Class C and Class I shares, respectively.
The Bank of America Merrill Lynch U.S. 3-Month Treasury Bill Index is an unmanaged index that seeks to measure the performance of U.S. Treasury bills available in the marketplace.
The Barclay CTA Index is a leading industry benchmark of representative performance of commodity trading advisors.
One cannot invest directly in an index.
LoCorr Dynamic Equity Fund
Rate of Return — For the period ended June 30, 2021 (Unaudited)
| | Inception | | Average Annual |
| | Date | 6 Month | 1 Year | 5 Year | Since Inception |
| LoCorr Dynamic Equity Fund - Class A (without maximum load) | 5/10/13 | 11.88% | 34.30% | 6.82% | 4.42% |
| LoCorr Dynamic Equity Fund - Class A (with maximum load) | 5/10/13 | 5.43% | 26.58% | 5.57% | 3.66% |
| LoCorr Dynamic Equity Fund - Class C | 5/10/13 | 10.44% | 32.26% | 6.04% | 3.63% |
| LoCorr Dynamic Equity Fund - Class I | 5/10/13 | 11.96% | 34.51% | 7.10% | 4.69% |
| S&P 500 Total Return Index | | 15.25% | 40.79% | 17.65% | 14.88% |
| Morningstar Long/Short Equity Fund Index | | 9.04% | 22.21% | 6.70% | 4.77% |
$100,000 investment in the
LoCorr Dynamic Equity Fund – Class I
For the period ended June 30, 2021 (Unaudited)

This chart illustrates the performance of a hypothetical $100,000 investment made in the Fund since inception. Assumes reinvestment of distributions, but does not reflect the effect of any applicable sales charge or redemption fees. This chart does not imply any future performance. Performance will vary from class to class based on differences in class-specific expenses and sales charges. The returns do not reflect the deduction of taxes that a shareholder would pay on Fund distributions or the redemption of Fund shares.
Performance data represents past performance; past performance does not guarantee future results. The investment return and principal value of an investment will fluctuate so that an investor’s shares, when redeemed, may be worth more or less than their original cost. Current performance of the Fund may be lower or higher than the performance quoted. Performance data current to the most recent month end may be obtained by calling 1.855.LCFUNDS, or visiting www.LoCorrFunds.com.
Performance data shown reflects the Class A maximum sales charge of 5.75% and reflects the Class C Contingent Deferred Sales Charge (CDSC) of 1.00%. Performance of the Class A without load does not reflect the deduction of the sales load or fee. If reflected, the load or fee would reduce the performance quoted.
The returns reflect the actual performance for each period and do not include the impact on trades executed on the last business day of the period that were recorded on the first business day of the next period.
Per the fee table in the Fund’s April 30, 2021 prospectus, the Fund’s annual operating expense ratio is, before fee waivers 4.53%, 5.28% and 4.28% for Class A, Class C and Class I shares, respectively.
The S&P 500 Total Return Index is an unmanaged capitalization-weighted index of 500 stocks designed to measure performance of the broad domestic economy through changes in the aggregate market value of the 500 stocks which represent all major industries.
The Morningstar Long/Short Equity Index category holds sizeable stakes in both long and short positions in equities and related derivative. At least 75% of the assets are in equity securities or derivatives.
One cannot invest directly in an index.
LoCorr Spectrum Income Fund
Rate of Return — For the period ended June 30, 2021 (Unaudited)
| | Inception | | Average Annual |
| | Date | 6 Month | 1 Year | 5 Year | Since Inception |
| LoCorr Spectrum Income Fund - Class A (without maximum load) | 12/31/13 | 22.42% | 57.42% | 6.52% | 3.03% |
| LoCorr Spectrum Income Fund - Class A (with maximum load) | 12/31/13 | 15.30% | 48.49% | 5.26% | 2.22% |
| LoCorr Spectrum Income Fund - Class C | 12/31/13 | 21.12% | 54.94% | 5.72% | 2.25% |
| LoCorr Spectrum Income Fund - Class I | 12/31/13 | 22.48% | 57.56% | 6.78% | 3.29% |
| Bloomberg Barclay U.S. Aggregate Bond Index | | -1.60% | -0.33% | 3.03% | 3.59% |
| Morningstar Allocation – 70% to 85% Equity | | 11.34% | 32.58% | 10.98% | 7.94% |
$100,000 investment in the
LoCorr Spectrum Income Fund – Class I
For the period ended June 30, 2021 (Unaudited)
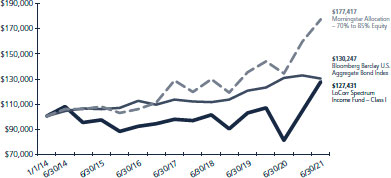
This chart illustrates the performance of a hypothetical $100,000 investment made in the Fund since inception. Assumes reinvestment of distributions, but does not reflect the effect of any applicable sales charge or redemption fees. This chart does not imply any future performance. Performance will vary from class to class based on differences in class-specific expenses and sales charges. The returns do not reflect the deduction of taxes that a shareholder would pay on Fund distributions or the redemption of Fund shares.
Performance data represents past performance; past performance does not guarantee future results. The investment return and principal value of an investment will fluctuate so that an investor’s shares, when redeemed, may be worth more or less than their original cost. Current performance of the Fund may be lower or higher than the performance quoted. Performance data current to the most recent month end may be obtained by calling 1.855.LCFUNDS, or visiting www.LoCorrFunds.com.
Performance data shown reflects the Class A maximum sales charge of 5.75% and reflects the Class C Contingent Deferred Sales Charge (CDSC) of 1.00%. Performance of the Class A without load does not reflect the deduction of the sales load or fee. If reflected, the load or fee would reduce the performance quoted.
The returns reflect the actual performance for each period and do not include the impact on trades executed on the last business day of the period that were recorded on the first business day of the next period.
Per the fee table in the Fund’s April 30, 2021 prospectus, the Fund’s annual operating expense ratio is, before fee waivers 3.57%, 4.32% and 3.32% for Class A, Class C and Class I shares, respectively.
The Bloomberg Barclay U.S. Aggregate Bond Index is a long term, market capitalization-weighted index used to represent investment grade bonds being traded in the United States.
The Morningstar Allocation – 70% to 85% Equity portfolios seek to provide both income and capital appreciation by investing in multiple asset classes, including stocks, bonds and cash. These portfolios are dominated by domestic holdings and have equity expenses between 70% and 85%.
One cannot invest directly in an index.
| |
| |
| LoCorr Macro Strategies Fund – Consolidated Schedule of Investments | | 17 |
| |
LoCorr Macro Strategies Fund
Composition of Consolidated Investment Portfolio1
June 30,2021 (Unaudited)
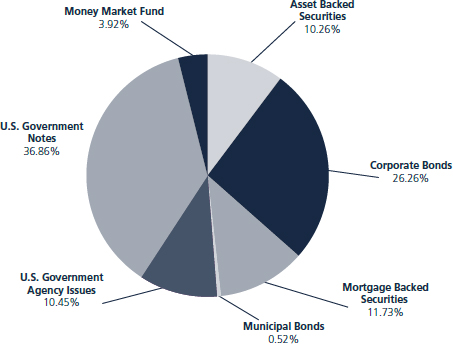
1 As a percentage of total investments.
Consolidated Schedule of Investments
June 30, 2021 (Unaudited)
| | | Maturity Date | | Coupon Rate | | Principal Amount | | | Value | |
| ASSET BACKED SECURITIES: 9.44% | | | | | | | | | | | | | | |
| 321 Henderson Receivables I LLC | | | | | | | | | | | | | | |
| Series 2006-1A A1 (1 Month LIBOR USD + 0.200%) (a)(c) | | 03/15/2041 | | | 0.27 | % | | $ | 325,587 | | | $ | 322,965 | |
| Series 2006-4A A1 (1 Month LIBOR USD + 0.200%) (a)(c) | | 12/15/2041 | | | 0.27 | % | | | 305,219 | | | | 303,792 | |
| Series 2004-A A1 (1 Month LIBOR USD + 0.350%) (a)(c) | | 09/15/2045 | | | 0.42 | % | | | 70,381 | | | | 69,343 | |
| American Express Credit Account Master Trust, 2019-1 A | | 10/15/2024 | | | 2.87 | % | | | 2,390,000 | | | | 2,435,204 | |
| American Homes 4 Rent Trust, 2014-SFR2 A (a) | | 10/17/2036 | | | 3.79 | % | | | 737,935 | | | | 784,515 | |
| AmeriCredit Automobile Receivables Trust | | | | | | | | | | | | | | |
| Series 2020-3 A-3 | | 06/18/2025 | | | 0.53 | % | | | 5,420,000 | | | | 5,438,037 | |
| Series 2021-2 A3 | | 12/18/2026 | | | 0.34 | % | | | 5,010,000 | | | | 5,020,339 | |
| AMSR Trust, 2020-SFR1 A (a) | | 04/17/2037 | | | 1.82 | % | | | 499,521 | | | | 506,261 | |
| Angel Oak Mortgage Trust LLC, 2020-5 A3 (a)(d) | | 05/25/2065 | | | 2.04 | % | | | 378,535 | | | | 381,132 | |
| Bank of America Credit Card Trust, 2021-A1 A1 | | 09/15/2026 | | | 0.44 | % | | | 2,120,000 | | | | 2,114,448 | |
| Carmax Auto Owner Trust | | | | | | | | | | | | | | |
| Series 2019-1 A3 | | 03/15/2024 | | | 3.05 | % | | | 1,489,389 | | | | 1,512,223 | |
| Series 2020-1 A3 | | 12/16/2024 | | | 1.89 | % | | | 4,150,000 | | | | 4,225,615 | |
| Carvana Auto Receivables Trust, 2021-P2 A3 | | 03/10/2026 | | | 0.49 | % | | | 6,120,000 | | | | 6,110,480 | |
| Chase Issuance Trust, 2020-A1 A1 | | 01/15/2025 | | | 1.53 | % | | | 3,850,000 | | | | 3,925,008 | |
| Citibank Credit Card Issuance Trust, 2018-A3 A3 | | 05/23/2025 | | | 3.29 | % | | | 3,500,000 | | | | 3,698,774 | |
| Corevest American Finance Trust, 2020-1 A1 (a) | | 03/17/2050 | | | 1.83 | % | | | 430,935 | | | | 437,887 | |
| DB Master Finance LLC, 2019-1A A2I (a) | | 05/20/2049 | | | 3.79 | % | | | 1,979,738 | | | | 2,005,415 | |
| Diamond Resorts Owner Trust | | | | | | | | | | | | | | |
| Series 2018-1 A (a) | | 01/21/2031 | | | 3.70 | % | | | 1,065,901 | | | | 1,110,335 | |
| Series 2021-1A A (a) | | 11/20/2033 | | | 1.51 | % | | | 2,661,907 | | | | 2,672,357 | |
| Discover Card Execution Note Trust, 2018-A2 A2 (1 Month LIBOR USD + 0.330%) (c) | | 08/15/2025 | | | 0.40 | % | | | 2,775,000 | | | | 2,788,276 | |
| Entergy New Orleans Storm Recovery Funding LLC, 2015-1 A | | 06/01/2027 | | | 2.67 | % | | | 682,054 | | | | 693,953 | |
| Ford Credit Auto Lease Trust, 2019-B A3 | | 10/15/2022 | | | 2.22 | % | | | 1,057,531 | | | | 1,060,915 | |
| Ford Credit Auto Owner Trust, 2018-2 A (a) | | 01/15/2030 | | | 3.47 | % | | | 1,400,000 | | | | 1,486,270 | |
| GM Financial Consumer Automobile Receivables Trust | | | | | | | | | | | | | | |
| Series 2020-2 A2B (1 Month LIBOR USD + 1.050%) (c) | | 03/16/2023 | | | 1.12 | % | | | 319,200 | | | | 319,630 | |
| Series 2020-1 A3 | | 09/16/2024 | | | 1.84 | % | | | 1,680,000 | | | | 1,698,859 | |
| Series 2021-1 A-3 | | 10/16/2025 | | | 0.35 | % | | | 3,640,000 | | | | 3,641,724 | |
| Hilton Grand Vacations Trust, 2019-AA A (a) | | 07/25/2033 | | | 2.34 | % | | | 2,141,866 | | | | 2,202,498 | |
The accompanying notes are an integral part of these consolidated financial statements.
| |
| |
| 18 | | LoCorr Macro Strategies Fund – Consolidated Schedule of Investments (continued) |
| |
| | | Maturity Date | | Coupon Rate | | Principal Amount | | | Value | |
ASSET BACKED SECURITIES (continued) | | | | | | | | | | | | | | |
| Honda Auto Receivables Owner Trust | | | | | | | | | | | | | | |
| Series 2019-1 A3 | | 03/20/2023 | | | 2.83 | % | | $ | 2,585,037 | | | $ | 2,616,042 | |
| Series 2020-3 A3 | | 10/18/2024 | | | 0.37 | % | | | 6,550,000 | | | | 6,558,423 | |
| Hyundai Auto Receivables Trust, 2020-C A3 | | 05/15/2025 | | | 0.38 | % | | | 5,520,000 | | | | 5,523,673 | |
| Invitation Homes Trust | | | | | | | | | | | | | | |
| Series 2017-SFR2 A (1 Month LIBOR USD + 0.850%) (a)(c) | | 12/19/2036 | | | 0.93 | % | | | 1,436,768 | | | | 1,438,027 | |
| Series 2018-SFR2 A (1 Month LIBOR USD + 0.900%) (a)(c) | | 06/18/2037 | | | 0.97 | % | | | 2,386,641 | | | | 2,392,145 | |
| Series 2018-SFR3 A (1 Month LIBOR USD + 1.000%) (a)(c) | | 07/17/2037 | | | 1.08 | % | | | 2,750,365 | | | | 2,754,413 | |
| Series 2018-SFR4 A (1 Month LIBOR USD + 1.100%) (a)(c) | | 01/19/2038 | | | 1.18 | % | | | 908,535 | | | | 910,967 | |
| Series 2018-SFR4 D (1 Month LIBOR USD + 1.650%) (a)(c) | | 01/19/2038 | | | 1.73 | % | | | 2,272,564 | | | | 2,276,814 | |
| Morgan Stanley Capital I Trust, 2004-HE6 M1 (1 Month LIBOR USD + 0.825%) (c) | | 08/25/2034 | | | 0.92 | % | | | 528,386 | | | | 523,375 | |
| MVW Owner Trust | | | | | | | | | | | | | | |
| Series 2019-1A A (a) | | 11/20/2036 | | | 2.89 | % | | | 952,057 | | | | 978,516 | |
| Series 2019-2A A (a) | | 10/20/2038 | | | 2.22 | % | | | 1,389,709 | | | | 1,414,781 | |
| Series 2021-1WA A (a) | | 01/20/2041 | | | 1.14 | % | | | 3,478,716 | | | | 3,477,083 | |
| Navient Student Loan Trust, 2021-A A (a) | | 05/15/2069 | | | 0.84 | % | | | 3,723,590 | | | | 3,717,101 | |
| PFS Financing Corp. | | | | | | | | | | | | | | |
| Series 2020-F A (a) | | 08/15/2024 | | | 0.93 | % | | | 3,150,000 | | | | 3,165,017 | |
| Series 2020-G A (a) | | 02/17/2026 | | | 0.97 | % | | | 2,288,000 | | | | 2,303,768 | |
| Series 2021-B A (a) | | 08/17/2026 | | | 0.77 | % | | | 3,550,000 | | | | 3,530,896 | |
| Progress Residential Trust, 2019-SFR4 B (a) | | 11/17/2036 | | | 2.94 | % | | | 1,300,000 | | | | 1,323,859 | |
| Santander Drive Auto Receivables Trust, 2020-4 A-3 | | 07/15/2024 | | | 0.48 | % | | | 4,640,000 | | | | 4,647,687 | |
| Sierra Receivables Funding LLC, 2018-3A A (a) | | 09/20/2035 | | | 3.69 | % | | | 1,045,743 | | | | 1,091,899 | |
| SoFi Professional Loan Program LLC | | | | | | | | | | | | | | |
| Series 2016-C A2B (a) | | 12/27/2032 | | | 2.36 | % | | | 445,782 | | | | 449,987 | |
| Series 2016-D A2B (a) | | 04/25/2033 | | | 2.34 | % | | | 545,881 | | | | 555,241 | |
| Series 2016-A A2 (a) | | 12/26/2036 | | | 2.76 | % | | | 1,075,628 | | | | 1,087,160 | |
| Synchrony Card Issuance Trust, 2018-A1 A | | 09/15/2024 | | | 3.38 | % | | | 2,935,000 | | | | 2,954,081 | |
| Tesla Auto Lease Trust | | | | | | | | | | | | | | |
| Series 2020-A A2 (a) | | 05/20/2023 | | | 0.55 | % | | | 1,997,856 | | | | 2,000,712 | |
| Series 2021-A B (a) | | 03/20/2025 | | | 1.02 | % | | | 2,900,000 | | | | 2,914,336 | |
| Toyota Auto Receivables Owner Trust, 2020-B A2 | | 12/15/2022 | | | 1.38 | % | | | 1,990,542 | | | | 1,995,147 | |
| Tricon American Homes Trust | | | | | | | | | | | | | | |
| Series 2017-SFR1 A (a) | | 09/19/2034 | | | 2.72 | % | | | 2,780,602 | | | | 2,789,631 | |
| Series 2017-SFR2 A (a) | | 01/18/2036 | | | 2.93 | % | | | 493,562 | | | | 504,542 | |
| Series 2017-SFR2 B (a) | | 01/18/2036 | | | 3.28 | % | | | 650,000 | | | | 664,776 | |
| Verizon Owner Trust | | | | | | | | | | | | | | |
| Series 2018-A A1A | | 04/20/2023 | | | 3.23 | % | | | 1,650,181 | | | | 1,661,538 | |
| Series 2019-B A1A | | 12/20/2023 | | | 2.33 | % | | | 2,597,000 | | | | 2,625,543 | |
| Series 2019-C A1A | | 04/20/2024 | | | 1.94 | % | | | 705,000 | | | | 714,958 | |
| Series 2020-A A1A | | 07/20/2024 | | | 1.85 | % | | | 6,765,000 | | | | 6,881,442 | |
| TOTAL ASSET BACKED SECURITIES (Cost $134,290,649) | | | | | | | | | | | | | 135,409,835 | |
| | | | | | | | | | | | | | | |
| CORPORATE BONDS: 24.18% | | | | | | | | | | | | | | |
| Agriculture: 0.37% | | | | | | | | | | | | | | |
| BAT Capital Corp. | | 08/15/2024 | | | 3.22 | % | | | 1,125,000 | | | | 1,195,020 | |
| BAT International Finance PLC (b) | | 03/25/2026 | | | 1.67 | % | | | 4,085,000 | | | | 4,084,488 | |
| | | | | | | | | | | | | | 5,279,508 | |
| Auto Manufacturers: 0.50% | | | | | | | | | | | | | | |
| Daimler Finance North America LLC (a) | | 03/01/2024 | | | 0.75 | % | | | 1,275,000 | | | | 1,277,882 | |
| General Motors Financial Co., Inc. | | 06/20/2025 | | | 2.75 | % | | | 3,845,000 | | | | 4,049,796 | |
| Volkswagen Group of America Finance LLC (a) | | 11/24/2025 | | | 1.25 | % | | | 1,800,000 | | | | 1,789,642 | |
| | | | | | | | | | | | | | 7,117,320 | |
| Banks: 13.08% | | | | | | | | | | | | | | |
| Banco Santander SA (b) | | 02/23/2023 | | | 3.13 | % | | | 2,800,000 | | | | 2,916,432 | |
| Banco Santander SA (b) | | 05/28/2025 | | | 2.75 | % | | | 1,015,000 | | | | 1,069,987 | |
| Bank of America Corp. | | 10/21/2022 | | | 2.50 | % | | | 3,680,000 | | | | 3,704,582 | |
| Bank of America Corp. | | 01/11/2023 | | | 3.30 | % | | | 4,240,000 | | | | 4,424,685 | |
| Bank of America Corp. (3 Month LIBOR USD + 0.930%) (c) | | 07/21/2023 | | | 2.82 | % | | | 2,150,000 | | | | 2,203,341 | |
| Bank of America Corp. (SOFR + 0.740%) (c) | | 10/24/2024 | | | 0.81 | % | | | 3,765,000 | | | | 3,780,161 | |
| Bank of America Corp. (SOFR + 0.690%) (c) | | 04/22/2025 | | | 0.98 | % | | | 7,740,000 | | | | 7,765,377 | |
The accompanying notes are an integral part of these consolidated financial statements.
| |
| |
| LoCorr Macro Strategies Fund – Consolidated Schedule of Investments (continued) | | 19 |
| |
| | | Maturity Date | | Coupon Rate | | Principal Amount | | | Value | |
CORPORATE BONDS (continued) | | | | | | | | | | | | | | |
| Bank of America Corp. (SOFR + 1.150%) (c) | | 06/19/2026 | | | 1.32 | % | | $ | 6,095,000 | | | $ | 6,110,590 | |
| Bank of America Corp. (SOFR + 1.010%) (c) | | 10/24/2026 | | | 1.20 | % | | | 3,925,000 | | | | 3,888,958 | |
| Bank of Montreal (b) | | 03/26/2022 | | | 2.90 | % | | | 1,770,000 | | | | 1,804,889 | |
| Bank of New York Mellon Corp. | | 10/24/2024 | | | 2.10 | % | | | 1,200,000 | | | | 1,259,202 | |
| Barclays PLC (1 Year CMT Rate + 0.800%) (b)(c) | | 12/10/2024 | | | 1.01 | % | | | 3,025,000 | | | | 3,036,717 | |
| BNP Paribas SA (3 Month LIBOR USD + 1.111%) (a)(b)(c) | | 11/19/2025 | | | 2.82 | % | | | 3,640,000 | | | | 3,830,126 | |
| Citigroup, Inc. (3 Month LIBOR USD + 0.722%) (c) | | 01/24/2023 | | | 3.14 | % | | | 5,735,000 | | | | 5,821,609 | |
| Citigroup, Inc. (3 Month LIBOR USD + 1.023%) (c) | | 06/01/2024 | | | 4.04 | % | | | 4,140,000 | | | | 4,409,680 | |
| Citigroup, Inc. (SOFR + 0.686%) (c) | | 10/30/2024 | | | 0.78 | % | | | 2,490,000 | | | | 2,495,873 | |
| Citigroup, Inc. (SOFR + 0.669%) (c) | | 05/01/2025 | | | 0.98 | % | | | 5,030,000 | | | | 5,043,969 | |
| Citigroup, Inc. (SOFR + 0.765%) (c) | | 01/28/2027 | | | 1.12 | % | | | 1,610,000 | | | | 1,587,880 | |
| Cooperatieve Rabobank UA (b) | | 11/09/2022 | | | 3.95 | % | | | 2,130,000 | | | | 2,229,603 | |
| Credit Suisse AG (b) | | 05/05/2023 | | | 1.00 | % | | | 2,610,000 | | | | 2,637,875 | |
| Danske Bank A/S (1 Year CMT Rate + 1.730%) (a)(b)(c) | | 01/12/2023 | | | 5.00 | % | | | 2,895,000 | | | | 2,958,268 | |
| Deutsche Bank NY (b) | | 05/28/2024 | | | 0.90 | % | | | 1,670,000 | | | | 1,663,255 | |
| Federation des Caisses Desjardins du Quebec (a)(b) | | 05/21/2024 | | | 0.70 | % | | | 2,935,000 | | | | 2,931,202 | |
| Goldman Sachs Group, Inc. | | 01/22/2023 | | | 3.63 | % | | | 3,685,000 | | | | 3,868,197 | |
| Goldman Sachs Group, Inc. | | 02/23/2023 | | | 3.20 | % | | | 4,935,000 | | | | 5,148,096 | |
| Goldman Sachs Group, Inc. (SOFR + 0.572%) (c) | | 03/08/2024 | | | 0.67 | % | | | 20,205,000 | | | | 20,239,108 | |
| Goldman Sachs Group, Inc. | | 04/01/2025 | | | 3.50 | % | | | 1,925,000 | | | | 2,089,122 | |
| HSBC Bank Canada (a)(b) | | 09/10/2023 | | | 1.65 | % | | | 2,000,000 | | | | 2,033,509 | |
| HSBC Holdings PLC (SOFR + 0.708%) (b)(c) | | 05/24/2025 | | | 0.98 | % | | | 670,000 | | | | 669,488 | |
| HSBC Holdings PLC (SOFR + 1.538%) (b)(c) | | 04/18/2026 | | | 1.65 | % | | | 750,000 | | | | 760,324 | |
| HSBC Holdings PLC (SOFR + 1.929%) (b)(c) | | 06/04/2026 | | | 2.10 | % | | | 4,900,000 | | | | 5,040,487 | |
| ING Groep NV (b) | | 04/09/2024 | | | 3.55 | % | | | 3,095,000 | | | | 3,334,058 | |
| JP Morgan Chase & Co. | | 01/25/2023 | | | 3.20 | % | | | 5,845,000 | | | | 6,104,893 | |
| JP Morgan Chase & Co. (SOFR + 0.600%) (c) | | 09/16/2024 | | | 0.65 | % | | | 450,000 | | | | 450,204 | |
| JP Morgan Chase & Co. (SOFR + 0.420%) (c) | | 02/16/2025 | | | 0.56 | % | | | 1,650,000 | | | | 1,641,106 | |
| JP Morgan Chase & Co. (SOFR + 0.540%) (c) | | 06/01/2025 | | | 0.82 | % | | | 2,575,000 | | | | 2,570,262 | |
| JP Morgan Chase & Co. (SOFR + 0.800%) (c) | | 11/19/2026 | | | 1.05 | % | | | 2,000,000 | | | | 1,975,495 | |
| JP Morgan Chase & Co. (SOFR + 0.695%) (c) | | 02/04/2027 | | | 1.04 | % | | | 2,120,000 | | | | 2,086,047 | |
| Mitsubishi UFJ Financial Group, Inc. (1 Year CMT Rate + 0.680%) (b)(c) | | 09/15/2024 | | | 0.85 | % | | | 3,025,000 | | | | 3,040,618 | |
| Morgan Stanley | | 11/01/2022 | | | 4.88 | % | | | 1,900,000 | | | | 2,007,227 | |
| Morgan Stanley | | 01/23/2023 | | | 3.13 | % | | | 4,775,000 | | | | 4,978,032 | |
| Morgan Stanley (SOFR + 0.455%) (c) | | 01/25/2024 | | | 0.53 | % | | | 4,700,000 | | | | 4,698,122 | |
| Morgan Stanley (SOFR + 0.616%) (c) | | 04/05/2024 | | | 0.73 | % | | | 5,590,000 | | | | 5,601,233 | |
| Morgan Stanley (SOFR + 0.525%) (c) | | 05/30/2025 | | | 0.79 | % | | | 2,000,000 | | | | 1,992,040 | |
| National Bank of Canada (a)(b) | | 10/07/2022 | | | 2.15 | % | | | 1,600,000 | | | | 1,635,343 | |
| NatWest Markets PLC (a)(b) | | 05/21/2023 | | | 2.38 | % | | | 3,345,000 | | | | 3,461,072 | |
| NatWest Markets PLC (a)(b) | | 08/12/2024 | | | 0.80 | % | | | 650,000 | | | | 646,879 | |
| Royal Bank of Canada (b) | | 11/01/2024 | | | 2.25 | % | | | 1,855,000 | | | | 1,943,335 | |
| Standard Chartered PLC (3 Month LIBOR USD + 1.080%) (a)(b)(c) | | 03/15/2024 | | | 3.89 | % | | | 1,450,000 | | | | 1,524,415 | |
| State Street Corp. (SOFR + 2.690%) (c) | | 03/30/2023 | | | 2.83 | % | | | 2,010,000 | | | | 2,047,489 | |
| Svenska Handelsbanken AB (a)(b) | | 06/30/2023 | | | 0.63 | % | | | 1,860,000 | | | | 1,868,966 | |
| Svenska Handelsbanken AB (a)(b) | | 06/11/2024 | | | 0.55 | % | | | 2,500,000 | | | | 2,491,086 | |
| Truist Financial Corp. | | 08/05/2025 | | | 1.20 | % | | | 2,565,000 | | | | 2,594,126 | |
| UBS AG/London (a)(b) | | 04/21/2022 | | | 1.75 | % | | | 1,750,000 | | | | 1,769,555 | |
| UBS AG/London (a)(b) | | 06/01/2023 | | | 0.38 | % | | | 2,410,000 | | | | 2,407,229 | |
| UBS Group AG (1 Year CMT Rate + 0.830%) (a)(b)(c) | | 07/30/2024 | | | 1.01 | % | | | 600,000 | | | | 604,248 | |
| Wells Fargo & Co. | | 02/13/2023 | | | 3.45 | % | | | 4,195,000 | | | | 4,397,534 | |
| Wells Fargo & Co. (SOFR + 1.600%) (c) | | 06/02/2024 | | | 1.65 | % | | | 2,375,000 | | | | 2,425,526 | |
| | | | | | | | | | | | | | 187,718,732 | |
| Biotechnology: 0.36% | | | | | | | | | | | | | | |
| Gilead Sciences, Inc. | | 09/29/2023 | | | 0.75 | % | | | 1,650,000 | | | | 1,651,160 | |
| Royalty Pharma PLC (a)(b) | | 09/02/2023 | | | 0.75 | % | | | 3,525,000 | | | | 3,534,904 | |
| | | | | | | | | | | | | | 5,186,064 | |
| Chemicals: 0.13% | | | | | | | | | | | | | | |
| DuPont de Nemours, Inc. | | 11/15/2023 | | | 4.21 | % | | | 1,765,000 | | | | 1,912,276 | |
| | | | | | | | | | | | | | | |
| Diversified Financial Services: 1.86% | | | | | | | | | | | | | | |
| AerCap Ireland Capital/Global Aviation Trust (b) | | 01/15/2025 | | | 3.50 | % | | | 4,045,000 | | | | 4,288,143 | |
The accompanying notes are an integral part of these consolidated financial statements.
| |
| |
| 20 | | LoCorr Macro Strategies Fund – Consolidated Schedule of Investments (continued) |
| |
| | | Maturity Date | | Coupon Rate | | Principal Amount | | | Value | |
CORPORATE BONDS (continued) | | | | | | | | | | | | | | |
| AerCap Ireland Capital/Global Aviation Trust (b) | | 01/30/2026 | | | 1.75 | % | | $ | 1,790,000 | | | $ | 1,768,674 | |
| Air Lease Corp. | | 07/03/2023 | | | 3.88 | % | | | 1,855,000 | | | | 1,967,723 | |
| Air Lease Corp. | | 02/01/2024 | | | 4.25 | % | | | 925,000 | | | | 1,003,168 | |
| American Express Co. | | 05/20/2022 | | | 2.75 | % | | | 505,000 | | | | 514,951 | |
| American Express Co. | | 07/30/2024 | | | 2.50 | % | | | 2,000,000 | | | | 2,108,106 | |
| Capital One Bank | | 02/15/2023 | | | 3.38 | % | | | 1,700,000 | | | | 1,778,983 | |
| CDP Financial, Inc. (a)(b) | | 03/07/2022 | | | 2.75 | % | | | 2,190,000 | | | | 2,227,643 | |
| GE Capital International Funding Co Unlimited Co. (b) | | 11/15/2025 | | | 3.37 | % | | | 8,205,000 | | | | 8,956,226 | |
| OMERS Finance Trust (a)(b) | | 05/02/2024 | | | 2.50 | % | | | 1,930,000 | | | | 2,032,353 | |
| | | | | | | | | | | | | | 26,645,970 | |
| Electric: 0.64% | | | | | | | | | | | | | | |
| Eversource Energy | | 08/15/2025 | | | 0.80 | % | | | 350,000 | | | | 346,289 | |
| Exelon Generation Co. LLC | | 03/15/2022 | | | 3.40 | % | | | 620,000 | | | | 631,072 | |
| Exelon Generation Co. LLC | | 06/01/2025 | | | 3.25 | % | | | 810,000 | | | | 873,670 | |
| Nextera Energy Capital Holdings, Inc. | | 04/01/2022 | | | 2.90 | % | | | 3,100,000 | | | | 3,161,830 | |
| Southern California Edison Co. | | 04/01/2024 | | | 1.10 | % | | | 3,415,000 | | | | 3,438,976 | |
| Southern California Edison Co. | | 02/01/2026 | | | 1.20 | % | | | 700,000 | | | | 695,044 | |
| | | | | | | | | | | | | | 9,146,881 | |
| Healthcare - Services: 0.20% | | | | | | | | | | | | | | |
| UnitedHealth Group, Inc. | | 05/15/2024 | | | 0.55 | % | | | 2,920,000 | | | | 2,916,683 | |
| | | | | | | | | | | | | | | |
| Insurance: 1.36% | | | | | | | | | | | | | | |
| American International Group, Inc. | | 06/30/2025 | | | 2.50 | % | | | 665,000 | | | | 701,993 | |
| Aon Corp. | | 11/15/2022 | | | 2.20 | % | | | 1,660,000 | | | | 1,700,538 | |
| Equitable Financial Life Global (a) | | 07/07/2025 | | | 1.40 | % | | | 2,435,000 | | | | 2,456,387 | |
| Metropolitan Life Global Funding I (a) | | 06/07/2024 | | | 0.55 | % | | | 3,170,000 | | | | 3,158,988 | |
| Metropolitan Life Global Funding I (a) | | 07/02/2025 | | | 0.95 | % | | | 3,155,000 | | | | 3,150,637 | |
| Principal Life Global Funding II (a) | | 04/12/2024 | | | 0.75 | % | | | 3,340,000 | | | | 3,342,151 | |
| Protective Life Global Funding | | 07/05/2024 | | | 0.78 | % | | | 3,085,000 | | | | 3,086,669 | |
| Voya Financial, Inc. | | 07/15/2024 | | | 3.13 | % | | | 1,765,000 | | | | 1,878,410 | |
| | | | | | | | | | | | | | 19,475,773 | |
| Media: 0.37% | | | | | | | | | | | | | | |
| Comcast Corp. | | 04/15/2024 | | | 3.70 | % | | | 4,830,000 | | | | 5,237,849 | |
| | | | | | | | | | | | | | | |
| Miscellaneous Manufacturing: 0.11% | | | | | | | | | | | | | | |
| Parker-Hannifin Corp. | | 06/14/2024 | | | 2.70 | % | | | 1,540,000 | | | | 1,622,745 | |
| | | | | | | | | | | | | | | |
| Oil & Gas: 1.08% | | | | | | | | | | | | | | |
| Atmos Energy Corp. (3 Month LIBOR USD + 0.380%) (c) | | 03/09/2023 | | | 0.50 | % | | | 1,035,000 | | | | 1,035,137 | |
| Diamondback Energy, Inc. | | 12/01/2024 | | | 2.88 | % | | | 1,865,000 | | | | 1,969,813 | |
| ONE Gas, Inc. | | 03/11/2024 | | | 1.10 | % | | | 7,950,000 | | | | 7,955,526 | |
| Phillips 66 | | 02/15/2024 | | | 0.90 | % | | | 2,280,000 | | | | 2,283,018 | |
| Saudi Arabian Oil Co. (a)(b) | | 04/16/2022 | | | 2.75 | % | | | 2,150,000 | | | | 2,188,356 | |
| | | | | | | | | | | | | | 15,431,850 | |
| Packaging & Containers: 0.12% | | | | | | | | | | | | | | |
| Berry Global, Inc. (a) | | 02/15/2024 | | | 0.95 | % | | | 1,655,000 | | | | 1,656,440 | |
| | | | | | | | | | | | | | | |
| Pharmaceuticals: 1.36% | | | | | | | | | | | | | | |
| AbbVie, Inc. | | 11/06/2022 | | | 2.90 | % | | | 1,015,000 | | | | 1,048,400 | |
| AbbVie, Inc. | | 11/21/2022 | | | 2.30 | % | | | 1,805,000 | | | | 1,852,344 | |
| AbbVie, Inc. | | 11/21/2024 | | | 2.60 | % | | | 6,205,000 | | | | 6,543,592 | |
| Astrazeneca Finance LLC | | 05/28/2024 | | | 0.70 | % | | | 4,025,000 | | | | 4,020,854 | |
| Bristol-Myers Squibb Co. | | 11/13/2023 | | | 0.54 | % | | | 1,855,000 | | | | 1,857,104 | |
| CVS Health Corp. | | 08/12/2024 | | | 3.38 | % | | | 3,880,000 | | | | 4,170,991 | |
| | | | | | | | | | | | | | 19,493,285 | |
| Pipelines: 0.32% | | | | | | | | | | | | | | |
| Energy Transfer Operating LP | | 05/15/2025 | | | 2.90 | % | | | 790,000 | | | | 831,357 | |
| MPLX LP | | 03/01/2026 | | | 1.75 | % | | | 2,935,000 | | | | 2,967,894 | |
| ONEOK, Inc. | | 09/01/2024 | | | 2.75 | % | | | 775,000 | | | | 816,203 | |
| | | | | | | | | | | | | | 4,615,454 | |
The accompanying notes are an integral part of these consolidated financial statements.
| |
| |
| LoCorr Macro Strategies Fund – Consolidated Schedule of Investments (continued) | | 21 |
| |
| | | Maturity Date | | Coupon Rate | | Principal Amount | | | Value | |
CORPORATE BONDS (continued) | | | | | | | | | | | | | | |
| Real Estate Investment Trusts: 0.66% | | | | | | | | | | | | | | |
| American Tower Corp. | | 09/15/2025 | | | 1.30 | % | | $ | 4,860,000 | | | $ | 4,872,764 | |
| Camden Property Trust | | 12/15/2022 | | | 2.95 | % | | | 1,457,000 | | | | 1,498,673 | |
| Crown Castle International Corp. | | 07/15/2025 | | | 1.35 | % | | | 1,760,000 | | | | 1,772,633 | |
| Kilroy Realty LP | | 01/15/2023 | | | 3.80 | % | | | 1,300,000 | | | | 1,352,802 | |
| | | | | | | | | | | | | | 9,496,872 | |
| Retail: 0.04% | | | | | | | | | | | | | | |
| 7-Eleven, Inc. (a) | | 02/10/2024 | | | 0.80 | % | | | 575,000 | | | | 573,616 | |
| | | | | | | | | | | | | | | |
| Software: 0.07% | | | | | | | | | | | | | | |
| Roper Technologies, Inc. | | 09/15/2024 | | | 2.35 | % | | | 960,000 | | | | 1,005,873 | |
| | | | | | | | | | | | | | | |
| Telecommunications: 1.43% | | | | | | | | | | | | | | |
| NTT Finance Corp. (a)(b) | | 04/03/2026 | | | 1.16 | % | | | 2,695,000 | | | | 2,689,994 | |
| T-Mobile USA, Inc. | | 04/15/2025 | | | 3.50 | % | | | 5,770,000 | | | | 6,253,786 | |
| Verizon Communications, Inc. | | 11/01/2024 | | | 3.50 | % | | | 3,085,000 | | | | 3,337,846 | |
| Verizon Communications, Inc. | | 11/20/2025 | | | 0.85 | % | | | 5,955,000 | | | | 5,892,221 | |
| Verizon Communications, Inc. | | 03/20/2026 | | | 1.45 | % | | | 2,290,000 | | | | 2,312,585 | |
| | | | | | | | | | | | | | 20,486,432 | |
| Transportation: 0.12% | | | | | | | | | | | | | | |
| Burlington Northern Santa Fe LLC | | 09/01/2024 | | | 3.40 | % | | | 1,580,000 | | | | 1,707,805 | |
| TOTAL CORPORATE BONDS (Cost $342,481,816) | | | | | | | | | | | | | 346,727,428 | |
| | | | | | | | | | | | | | | |
| MORTGAGE BACKED SECURITIES: 10.80% | | | | | | | | | | | | | | |
| ACRE Commercial Mortgage Trust, 2021-FL4 A (1 Month LIBOR USD + 0.830%) (a)(b)(c) | | 12/18/2037 | | | 0.91 | % | | | 2,450,000 | | | | 2,440,121 | |
| Alen Mortgage Trust, 2021-ACEN A (1 Month LIBOR USD + 1.150%) (a)(c) | | 04/15/2038 | | | 1.22 | % | | | 3,150,000 | | | | 3,150,938 | |
| Angel Oak Mortgage Trust, 2020-1 M1 (a)(d) | | 12/25/2059 | | | 3.16 | % | | | 1,915,000 | | | | 1,930,473 | |
| Barclays Commercial Mortgage Securities LLC, 2015-VFM A1 (a) | | 03/12/2036 | | | 2.47 | % | | | 1,161,212 | | | | 1,183,988 | |
| BHP Trust, 2019-BXHP A (1 Month LIBOR USD + 0.975%) (a)(c) | | 08/15/2036 | | | 1.05 | % | | | 2,366,383 | | | | 2,367,125 | |
| BX Commercial Mortgage Trust | | | | | | | | | | | | | | |
| Series 2020-FOX A (1 Month LIBOR USD + 1.000%) (a)(c) | | 11/15/2032 | | | 1.07 | % | | | 4,912,056 | | | | 4,927,445 | |
| Series 2019-XL A (1 Month LIBOR USD + 0.920%) (a)(c) | | 10/15/2036 | | | 0.99 | % | | | 2,715,797 | | | | 2,719,344 | |
| Citigroup Commercial Mortgage Trust, 2019-PRM B (a) | | 05/10/2035 | | | 3.64 | % | | | 2,100,000 | | | | 2,228,516 | |
| Comm Mortgage Trust | | | | | | | | | | | | | | |
| Series 2015-3BP A (a) | | 02/12/2035 | | | 3.18 | % | | | 1,030,000 | | | | 1,099,160 | |
| Series 2013-CR6 A4 | | 03/10/2046 | | | 3.10 | % | | | 615,000 | | | | 630,953 | |
| Series 2013-CR10 A4 (d) | | 08/10/2046 | | | 4.21 | % | | | 615,000 | | | | 656,366 | |
| Series 2014-UBS2 AM | | 03/12/2047 | | | 4.20 | % | | | 2,450,000 | | | | 2,624,548 | |
| Series 2014-CR19 A5 | | 08/12/2047 | | | 3.80 | % | | | 1,380,133 | | | | 1,494,083 | |
| Series 2014-LC17 A5 | | 10/11/2047 | | | 3.92 | % | | | 724,000 | | | | 789,693 | |
| Series 2014-CR21 A3 | | 12/10/2047 | | | 3.53 | % | | | 1,667,519 | | | | 1,775,371 | |
| Series 2015-CR27 AM | | 10/13/2048 | | | 3.98 | % | | | 2,000,000 | | | | 2,191,561 | |
| Credit Suisse Mortgage Capital Certificates, 2019-ICE4 A (1 Month LIBOR USD + 0.980%) (a)(c) | | 05/15/2036 | | | 1.05 | % | | | 3,500,000 | | | | 3,509,355 | |
| Extended Stay America Trust, 2021-ESH A (1 Month LIBOR USD + 1.080%) (a)(c) | | 07/15/2038 | | | 1.16 | % | | | 1,200,000 | | | | 1,203,373 | |
| Fannie Mae Aces | | | | | | | | | | | | | | |
| Series 2017-M7 A1 | | 02/25/2027 | | | 2.60 | % | | | 3,104,092 | | | | 3,251,087 | |
| Series 2019-M6 A1 | | 08/25/2028 | | | 3.30 | % | | | 5,450,981 | | | | 5,932,495 | |
| Fannie Mae Connecticut Avenue Securities | | | | | | | | | | | | | | |
| Series 2014-C02 1M2 (1 Month LIBOR USD + 2.600%) (c) | | 05/28/2024 | | | 2.69 | % | | | 1,097,883 | | | | 1,104,251 | |
| Series 2014-C03 1M2 (1 Month LIBOR USD + 3.000%) (c) | | 07/25/2024 | | | 3.09 | % | | | 1,155,726 | | | | 1,164,470 | |
| Series 2017-C02 2ED4 (1 Month LIBOR USD + 0.850%) (c) | | 09/25/2029 | | | 0.94 | % | | | 872,509 | | | | 852,164 | |
| Series 2017-C02 2ED3 (1 Month LIBOR USD + 1.350%) (c) | | 09/25/2029 | | | 1.44 | % | | | 1,067,760 | | | | 1,074,679 | |
| Series 2017-C05 1M2 (1 Month LIBOR USD + 2.200%) (c) | | 01/25/2030 | | | 2.29 | % | | | 1,822,633 | | | | 1,851,688 | |
| Series 2018-C01 1EB1 (1 Month LIBOR USD + 0.450%) (c) | | 07/25/2030 | | | 0.54 | % | | | 1,738,000 | | | | 1,722,368 | |
| FHLMC Multifamily Structured Pass Through Certificates | | | | | | | | | | | | | | |
| Series K059 A1 | | 09/25/2025 | | | 2.76 | % | | | 1,728,831 | | | | 1,830,563 | |
| Series KC06 A1 | | 02/25/2026 | | | 2.17 | % | | | 4,085,000 | | | | 4,207,070 | |
| Freddie Mac STACR Trust | | | | | | | | | | | | | | |
| Series 2018-DNA2 M2A (1 Month LIBOR USD + 2.150%) (a)(c) | | 12/26/2030 | | | 2.24 | % | | | 1,900,000 | | | | 1,912,559 | |
| Series 2018-DNA3 M2A (1 Month LIBOR USD + 2.100%) (a)(c) | | 09/25/2048 | | | 2.19 | % | | | 1,950,000 | | | | 1,966,429 | |
The accompanying notes are an integral part of these consolidated financial statements.
| |
| |
| 22 | | LoCorr Macro Strategies Fund – Consolidated Schedule of Investments (continued) |
| |
| | | Maturity Date | | Coupon Rate | | Principal Amount | | | Value | |
MORTGAGE BACKED SECURITIES (continued) | | | | | | | | | | | | | | |
| Series 2020-DNA2 M1 (1 Month LIBOR USD + 0.750%) (a)(c) | | 02/25/2050 | | | 0.84 | % | | $ | 15,527 | | | $ | 15,527 | |
| Series 2020-DNA4 M2AR (1 Month LIBOR USD + 1.500%) (a)(c) | | 08/25/2050 | | | 1.59 | % | | | 907,960 | | | | 908,786 | |
| Freddie Mac Structured Agency Credit Risk Debt Notes | | | | | | | | | | | | | | |
| Series 2017-DNA2 M1 (1 Month LIBOR USD + 1.200%) (c) | | 10/25/2029 | | | 1.29 | % | | | 528,677 | | | | 529,089 | |
| Series 2018-HRP2 M3 (1 Month LIBOR USD + 2.400%) (a)(c) | | 02/25/2047 | | | 2.49 | % | | | 2,000,000 | | | | 2,036,896 | |
| Series 2019-HRP1 M2 (1 Month LIBOR USD + 1.400%) (a)(c) | | 02/25/2049 | | | 1.49 | % | | | 947,596 | | | | 953,694 | |
| Series 2020-HQA2 M1 (1 Month LIBOR USD + 1.100%) (a)(c) | | 03/25/2050 | | | 1.19 | % | | | 32,695 | | | | 32,705 | |
| FRESB Multifamily Mortgage Pass Through Certificates | | | | | | | | | | | | | | |
| Series 2016-SB17 A7F (d) | | 05/25/2023 | | | 2.15 | % | | | 1,254,109 | | | | 1,272,009 | |
| Series 2016-SB22 A7F (d) | | 09/25/2023 | | | 1.98 | % | | | 3,013,172 | | | | 3,070,411 | |
| Series 2017-SB32 A7F (d) | | 04/25/2024 | | | 2.44 | % | | | 2,493,275 | | | | 2,553,016 | |
| Series 2019-SB67 A5F (d) | | 07/25/2024 | | | 2.09 | % | | | 3,453,679 | | | | 3,531,776 | |
| Series 2019-SB69 A5F (d) | | 10/25/2024 | | | 2.25 | % | | | 4,982,905 | | | | 5,163,106 | |
| Series 2016-SB23 A10F (d) | | 09/25/2026 | | | 2.31 | % | | | 1,754,558 | | | | 1,804,407 | |
| GCT Commercial Mortgage Trust, 2021-GCT A (1 Month LIBOR USD + 0.800%) (a)(c) | | 02/15/2038 | | | 0.87 | % | | | 3,850,000 | | | | 3,854,581 | |
| GS Mortgage Securities Trust | | | | | | | | | | | | | | |
| Series 2017-SLP A (a) | | 10/12/2032 | | | 3.42 | % | | | 3,000,000 | | | | 3,079,534 | |
| Series 2019-600C A (a) | | 09/12/2034 | | | 2.94 | % | | | 2,065,000 | | | | 2,162,372 | |
| Series 2021-ROSS A (1 Month LIBOR USD + 1.150%) (a)(c) | | 06/16/2036 | | | 1.22 | % | | | 5,000,000 | | | | 5,001,705 | |
| Series 2013-GC16 B (d) | | 11/10/2046 | | | 5.16 | % | | | 206,000 | | | | 220,407 | |
| Series 2015-GC28 A5 | | 02/10/2048 | | | 3.40 | % | | | 1,000,000 | | | | 1,077,271 | |
| Series 2015-GC28 AS | | 02/12/2048 | | | 3.76 | % | | | 1,985,000 | | | | 2,128,445 | |
| JP Morgan Chase Commercial Mortgage Securities Trust | | | | | | | | | | | | | | |
| Series 2018-BCON A (a) | | 01/07/2031 | | | 3.73 | % | | | 3,630,000 | | | | 3,764,427 | |
| Series 2021-MHC A (1 Month LIBOR USD + 0.800%) (a)(c) | | 04/15/2038 | | | 0.87 | % | | | 4,157,546 | | | | 4,162,701 | |
| Series 2010-C2 A3 (a) | | 11/15/2043 | | | 4.07 | % | | | 1,065,783 | | | | 1,068,469 | |
| Series 2013-C15 A-S | | 11/17/2045 | | | 4.42 | % | | | 3,325,000 | | | | 3,561,361 | |
| Series 2013-C13 A4 (d) | | 01/18/2046 | | | 3.99 | % | | | 513,180 | | | | 543,041 | |
| Series 2014-C23 ASB | | 09/17/2047 | | | 3.66 | % | | | 1,903,243 | | | | 1,998,943 | |
| Series 2014-C22 AS | | 09/17/2047 | | | 4.11 | % | | | 3,650,000 | | | | 3,907,614 | |
| Series 2013-C10 AS | | 12/17/2047 | | | 3.37 | % | | | 200,000 | | | | 207,334 | |
| Series 2016-JP3 A-5 | | 08/15/2049 | | | 2.87 | % | | | 1,000,000 | | | | 1,069,435 | |
| KKR Industrial Portfolio Trust, 2020-AIP D (1 Month LIBOR USD + 2.030%) (a)(c) | | 03/16/2037 | | | 2.10 | % | | | 1,398,098 | | | | 1,400,288 | |
| Ladder Capital Commercial Mortgage Trust, 2013-GCP A1 (a) | | 02/15/2036 | | | 3.57 | % | | | 2,277,098 | | | | 2,434,215 | |
| Merit, 2020-HILL A (1 Month LIBOR USD + 1.150%) (a)(c) | | 08/17/2037 | | | 1.22 | % | | | 6,300,000 | | | | 6,321,728 | |
| Morgan Stanley Capital I Trust, 2017-CLS A (1 Month LIBOR USD + 0.700%) (a)(c) | | 11/15/2034 | | | 0.77 | % | | | 2,785,000 | | | | 2,785,877 | |
| Natixis Commercial Mortgage Securities Trust, 2018-285M A (a)(d) | | 11/15/2032 | | | 3.92 | % | | | 1,000,000 | | | | 1,028,881 | |
| New Residential Mortgage Loan Trust | | | | | | | | | | | | | | |
| Series 2015-1A A3 (a)(d) | | 05/28/2052 | | | 3.75 | % | | | 524,583 | | | | 554,010 | |
| Series 2014-2A A3 (a)(d) | | 05/25/2054 | | | 3.75 | % | | | 527,833 | | | | 559,798 | |
| Series 2016-1A A1 (a)(d) | | 03/25/2056 | | | 3.75 | % | | | 1,093,904 | | | | 1,155,053 | |
| Series 2017-1A A1 (a)(d) | | 02/25/2057 | | | 4.00 | % | | | 1,484,931 | | | | 1,579,613 | |
| Series 2017-2A A3 (a)(d) | | 03/25/2057 | | | 4.00 | % | | | 1,607,501 | | | | 1,716,524 | |
| OBX Trust, 2018-1 A2 (1 Month LIBOR USD + 0.650%) (a)(c) | | 06/25/2057 | | | 0.74 | % | | | 1,021,355 | | | | 1,022,144 | |
| Sequoia Mortgage Trust | | | | | | | | | | | | | | |
| Series 2017-1 A4 (a)(d) | | 02/25/2047 | | | 3.50 | % | | | 291,987 | | | | 292,446 | |
| Series 2019-5 A4 (a)(d) | | 12/25/2049 | | | 3.50 | % | | | 231,791 | | | | 232,523 | |
| Series 2020-1 A4 (a)(d) | | 02/25/2050 | | | 3.50 | % | | | 365,067 | | | | 366,347 | |
| Series 2020-2 A4 (a)(d) | | 03/25/2050 | | | 3.50 | % | | | 569,900 | | | | 574,456 | |
| UBS Commercial Mortgage Trust, 2012-C1 A3 | | 05/12/2045 | | | 3.40 | % | | | 881,152 | | | | 888,417 | |
| UBS-Barclays Commercial Mortgage Trust | | | | | | | | | | | | | | |
| Series 2013-C5 B (a)(d) | | 03/12/2046 | | | 3.65 | % | | | 265,000 | | | | 269,181 | |
| Series 2013-C6 B (a)(d) | | 04/12/2046 | | | 3.88 | % | | | 700,000 | | | | 707,474 | |
| Verus Securitization Trust | | | | | | | | | | | | | | |
| Series 2020-1 A1 (a)(d) | | 01/25/2060 | | | 2.42 | % | | | 2,055,442 | | | | 2,082,091 | |
| Series 2020-1 A3 (a)(d) | | 01/25/2060 | | | 2.72 | % | | | 1,804,621 | | | | 1,825,375 | |
| Wells Fargo Commercial Mortgage Trust, 2012-LC5 AS | | 10/17/2045 | | | 3.54 | % | | | 650,000 | | | | 669,122 | |
| WFRBS Commercial Mortgage Trust | | | | | | | | | | | | | | |
| Series 2013-C13 AS | | 05/17/2045 | | | 3.35 | % | | | 650,000 | | | | 674,904 | |
| Series 2013-C14 A5 | | 06/15/2046 | | | 3.34 | % | | | 727,218 | | | | 761,703 | |
The accompanying notes are an integral part of these consolidated financial statements.
| |
| |
| LoCorr Macro Strategies Fund – Consolidated Schedule of Investments (continued) | | 23 |
| |
| | | Maturity Date | | Coupon Rate | | Principal Amount | | | Value | |
MORTGAGE BACKED SECURITIES (continued) | | | | | | | | | | | | | | |
| Series 2014-C24 A5 | | 11/18/2047 | | | 3.61 | % | | $ | 1,000,000 | | | $ | 1,076,935 | |
| Series 2014-C22 AS (d) | | 09/17/2057 | | | 4.07 | % | | | 350,000 | | | | 378,565 | |
| TOTAL MORTGAGE BACKED SECURITIES (Cost $152,693,897) | | | | | | | | | | | 154,828,968 | |
| | | | | | | | | | | | | | | |
| MUNICIPAL BONDS: 0.48% | | | | | | | | | | | | | | |
| Miami Dade County Florida Aviation Refunding Taxable Series B | | 10/01/2023 | | | 2.37 | % | | | 1,350,000 | | | | 1,405,949 | |
| Nebraska Public Power District | | 01/01/2024 | | | 2.22 | % | | | 1,700,000 | | | | 1,769,428 | |
| Pennsylvania State University | | 09/01/2023 | | | 1.35 | % | | | 2,945,000 | | | | 2,997,553 | |
| Water Works Board of the City of Birmingham | | 01/01/2024 | | | 2.20 | % | | | 695,000 | | | | 722,421 | |
| TOTAL MUNICIPAL BONDS (Cost $6,693,176) | | | | | | | | | | | | | 6,895,351 | |
| | | | | | | | | | | | | | | |
| U.S. GOVERNMENT AGENCY ISSUES: 9.62% | | | | | | | | | | | | | | |
| Federal Farm Credit Banks | | 05/10/2023 | | | 0.13 | % | | | 19,410,000 | | | | 19,373,469 | |
| Federal Farm Credit Banks | | 06/26/2023 | | | 1.77 | % | | | 5,135,000 | | | | 5,286,685 | |
| Federal Farm Credit Banks | | 07/17/2023 | | | 2.88 | % | | | 10,985,000 | | | | 11,563,460 | |
| Federal Home Loan Banks | | 06/10/2022 | | | 2.13 | % | | | 14,115,000 | | | | 14,384,819 | |
| Federal Home Loan Banks | | 06/10/2022 | | | 2.75 | % | | | 6,015,000 | | | | 6,164,181 | |
| Federal Home Loan Banks | | 06/09/2023 | | | 3.25 | % | | | 15,200,000 | | | | 16,078,592 | |
| Federal Home Loan Banks | | 09/08/2023 | | | 3.38 | % | | | 9,000,000 | | | | 9,592,106 | |
| Federal Home Loan Banks | | 04/14/2025 | | | 0.50 | % | | | 9,350,000 | | | | 9,298,088 | |
| Federal Home Loan Mortgage Corp. | | 05/19/2023 | | | 0.25 | % | | | 7,210,000 | | | | 7,208,598 | |
| Federal Home Loan Mortgage Corp. | | 07/20/2023 | | | 0.41 | % | | | 6,725,000 | | | | 6,726,079 | |
| Federal Home Loan Mortgage Corp. | | 09/08/2023 | | | 0.25 | % | | | 2,000,000 | | | | 1,998,021 | |
| Federal Home Loan Mortgage Corp. | | 02/12/2025 | | | 1.50 | % | | | 11,395,000 | | | | 11,760,532 | |
| Federal National Mortgage Association | | 04/12/2022 | | | 2.25 | % | | | 3,500,000 | | | | 3,558,174 | |
| Federal National Mortgage Association | | 09/06/2022 | | | 1.38 | % | | | 5,855,000 | | | | 5,939,181 | |
| Federal National Mortgage Association | | 07/10/2023 | | | 0.25 | % | | | 9,000,000 | | | | 8,998,977 | |
| TOTAL U.S. GOVERNMENT AGENCY ISSUES (Cost $135,335,048) | | | | | | | | | | | 137,930,962 | |
| | | | | | | | | | | | | | | |
| U.S. GOVERNMENT NOTES: 33.93% | | | | | | | | | | | | | | |
| United States Treasury Note | | 03/31/2022 | | | 1.88 | % | | | 955,000 | | | | 967,758 | |
| United States Treasury Note | | 05/15/2022 | | | 1.75 | % | | | 53,910,000 | | | | 54,689,168 | |
| United States Treasury Note | | 07/15/2022 | | | 1.75 | % | | | 10,935,000 | | | | 11,121,237 | |
| United States Treasury Note | | 08/15/2022 | | | 1.50 | % | | | 15,135,000 | | | | 15,370,893 | |
| United States Treasury Note | | 09/15/2022 | | | 1.50 | % | | | 6,785,000 | | | | 6,896,846 | |
| United States Treasury Note | | 10/15/2022 | | | 1.38 | % | | | 18,295,000 | | | | 18,585,147 | |
| United States Treasury Note | | 10/31/2022 | | | 2.00 | % | | | 5,210,000 | | | | 5,338,215 | |
| United States Treasury Note | | 11/30/2022 | | | 0.13 | % | | | 46,625,000 | | | | 46,594,038 | |
| United States Treasury Note | | 03/31/2023 | | | 0.13 | % | | | 139,430,000 | | | | 139,206,694 | |
| United States Treasury Note | | 03/31/2023 | | | 1.50 | % | | | 50,175,000 | | | | 51,294,138 | |
| United States Treasury Note | | 09/30/2023 | | | 2.88 | % | | | 36,730,000 | | | | 38,850,584 | |
| United States Treasury Note | | 12/31/2023 | | | 2.63 | % | | | 10,545,000 | | | | 11,141,452 | |
| United States Treasury Note | | 02/15/2024 | | | 2.75 | % | | | 5,000,000 | | | | 5,309,766 | |
| United States Treasury Note | | 02/29/2024 | | | 2.38 | % | | | 2,265,000 | | | | 2,384,355 | |
| United States Treasury Note | | 03/31/2024 | | | 2.13 | % | | | 4,320,000 | | | | 4,522,669 | |
| United States Treasury Note | | 04/30/2024 | | | 2.00 | % | | | 11,530,000 | | | | 12,042,995 | |
| United States Treasury Note | | 05/15/2024 | | | 0.25 | % | | | 12,530,000 | | | | 12,462,455 | |
| United States Treasury Note | | 06/15/2024 | | | 0.25 | % | | | 12,645,000 | | | | 12,568,932 | |
| United States Treasury Note | | 06/30/2024 | | | 1.75 | % | | | 1,885,000 | | | | 1,957,749 | |
| United States Treasury Note | | 09/30/2024 | | | 1.50 | % | | | 16,795,000 | | | | 17,329,685 | |
| United States Treasury Note | | 11/15/2024 | | | 2.25 | % | | | 12,000,000 | | | | 12,686,719 | |
| United States Treasury Note | | 01/31/2025 | | | 1.38 | % | | | 3,260,000 | | | | 3,350,032 | |
| United States Treasury Note | | 02/15/2025 | | | 7.63 | % | | | 1,500,000 | | | | 1,879,629 | |
| TOTAL U.S. GOVERNMENT NOTES (Cost $483,594,838) | | | | | | | | | | | | | 486,551,156 | |
| | | | | | | | | | | | | | | |
| SHORT TERM INVESTMENT: 3.61% | | | | | | | | | | | | | | |
| MONEY MARKET FUND: 3.61% | | | | | | | | Shares | | | | | |
| STIT-Government & Agency Portfolio, Institutional Class, 0.03% (e)(f) | | | | | | | | | 51,766,425 | | | | 51,766,425 | |
| TOTAL MONEY MARKET FUND (Cost $51,766,425) | | | | | | | | | | | | | 51,766,425 | |
The accompanying notes are an integral part of these consolidated financial statements.
| |
| |
| 24 | | LoCorr Macro Strategies Fund – Consolidated Schedule of Investments (continued) |
| |
| | | Value | |
SHORT TERM INVESTMENT (continued) | | | | |
| TOTAL SHORT TERM INVESTMENT (Cost $51,766,425) | | $ | 51,766,425 | |
| | | | | |
| TOTAL INVESTMENTS (Cost $1,306,855,849): 92.06% | | | 1,320,110,125 | |
| Other Assets in Excess of Liabilities: 7.94% (g) | | | 113,861,929 | |
| TOTAL NET ASSETS: 100.00% | | $ | 1,433,972,054 | |
| (a) | Security as defined in Rule 144A under the Securities Act of 1933 and determined to be liquid. Purchased in a private placement transaction; resale to the public may require registration or may extend only to qualified institutional buyers. At June 30, 2021, the value of these securities total $196,853,579 which represents 13.73% of total net assets. |
| (b) | Foreign issued security. |
| (c) | Variable rate security based on a reference index and spread. The rate reported is the rate in effect as of June 30, 2021. |
| (d) | Variable rate security. The coupon is based on an underlying pool of loans. The rate reported is the rate in effect as of June 30, 2021. |
| (e) | The rate quoted is the annualized seven-day effective yield as of June 30, 2021. |
| (f) | All or a portion of this security is held by LCMFS Fund Limited and pledged as collateral for derivative contracts. At June 30, 2021, the value of this collateral totals $12,231. |
| (g) | Includes assets and deposits with broker pledged as collateral for derivative contracts. At June 30, 2021, the value of these assets totals $100,048,331. |
| CMT | Constant Maturity Treasury |
| LIBOR | London Interbank Offered Rate |
| PLC | Public Limited Company |
| SOFR | Secured Overnight Financing Rate |
The accompanying notes are an integral part of these consolidated financial statements.
| | |
| | |
| LoCorr Macro Strategies Fund – Consolidated Schedule of Open Forward Currency Contracts | | 25 |
| | |
LoCorr Macro Strategies Fund
Consolidated Schedule of Open Forward Currency Contracts
June 30, 2021 (Unaudited)
| | | | | | | | | | Currency to be Received | | | Currency to be Delivered | | | | | | | | | |
| | | | | | | | | | | U.S. $ Notional | | | | | U.S. $ Notional | | | | | | | |
| | | Notional | | Counter- | | Forward | | Curr | | Amount at | | | Curr | | Amount on | | | Unrealized | | | Unrealized | |
| | | Amount | | party | | Settlement Date | | Abbr. | | June 30, 2021 | | | Abbr. | | Origination Date | | | Appreciation | | | (Depreciation) | |
| | | | | | See key for
abbreviation | | | | | | | | | | | | | | | | | | | | | | |
| Purchase Contracts: | | | | | | | | | | | | | | | | | |
| | $ | 244,352,338 | | | DB | | 07/21/2021 | | AUD | | $ | 239,710,018 | | | USD | | $ | 244,352,338 | | | $ | — | | | $ | (4,642,320 | ) |
| | | 1,565,220 | | | BAML | | 09/17/2021 | | AUD | | | 1,513,919 | | | USD | | | 1,565,220 | | | | — | | | | (51,301 | ) |
| | | 7,627,353 | | | DB | | 07/21/2021 | | BRL | | | 7,768,847 | | | USD | | | 7,627,353 | | | | 141,494 | | | | — | |
| | | 158,834,643 | | | DB | | 07/21/2021 | | CAD | | | 157,016,741 | | | USD | | | 158,834,643 | | | | — | | | | (1,817,902 | ) |
| | | 61,887,033 | | | BAML | | 09/17/2021 | | CAD | | | 60,399,076 | | | USD | | | 61,887,033 | | | | — | | | | (1,487,957 | ) |
| | | 243,509,859 | | | DB | | 07/21/2021 | | CHF | | | 238,137,229 | | | USD | | | 243,509,859 | | | | — | | | | (5,372,630 | ) |
| | | 8,548,194 | | | BAML | | 09/17/2021 | | CHF | | | 8,273,945 | | | USD | | | 8,548,194 | | | | — | | | | (274,249 | ) |
| | | 9,229,278 | | | DB | | 07/21/2021 | | CLP | | | 9,116,947 | | | USD | | | 9,229,278 | | | | — | | | | (112,331 | ) |
| | | 33,016,057 | | | DB | | 07/21/2021 | | EUR | | | 32,361,752 | | | NOK | | | 33,016,057 | | | | — | | | | (654,305 | ) |
| | | 474,299 | | | DB | | 08/18/2021 | | EUR | | | 474,787 | | | NOK | | | 474,299 | | | | 488 | | | | — | |
| | | 6,098,350 | | | DB | | 07/21/2021 | | EUR | | | 5,990,720 | | | PLN | | | 6,098,350 | | | | — | | | | (107,630 | ) |
| | | 58,869,846 | | | DB | | 07/21/2021 | | EUR | | | 57,843,073 | | | SEK | | | 58,869,846 | | | | — | | | | (1,026,773 | ) |
| | | 3,271,515 | | | DB | | 08/18/2021 | | EUR | | | 3,264,158 | | | SEK | | | 3,271,515 | | | | — | | | | (7,357 | ) |
| | | 243,214,724 | | | DB | | 07/21/2021 | | EUR | | | 239,059,392 | | | USD | | | 243,214,724 | | | | — | | | | (4,155,332 | ) |
| | | 34,028,896 | | | BAML | | 09/17/2021 | | EUR | | | 33,112,798 | | | USD | | | 34,028,896 | | | | — | | | | (916,098 | ) |
| | | 207,800,196 | | | DB | | 07/21/2021 | | GBP | | | 204,713,313 | | | USD | | | 207,800,196 | | | | — | | | | (3,086,883 | ) |
| | | 74,738,365 | | | BAML | | 09/17/2021 | | GBP | | | 73,162,127 | | | USD | | | 74,738,365 | | | | — | | | | (1,576,238 | ) |
| | | 14,318,572 | | | DB | | 07/21/2021 | | ILS | | | 14,271,658 | | | USD | | | 14,318,572 | | | | — | | | | (46,914 | ) |
| | | 6,246,348 | | | DB | | 07/22/2021 | | INR | | | 6,186,789 | | | USD | | | 6,246,348 | | | | — | | | | (59,559 | ) |
| | | 122,767,838 | | | DB | | 07/21/2021 | | JPY | | | 121,782,026 | | | USD | | | 122,767,838 | | | | — | | | | (985,812 | ) |
| | | 45,132,017 | | | BAML | | 09/17/2021 | | JPY | | | 44,839,237 | | | USD | | | 45,132,017 | | | | — | | | | (292,780 | ) |
| | | 5,545,892 | | | DB | | 07/21/2021 | | KRW | | | 5,523,419 | | | USD | | | 5,545,892 | | | | — | | | | (22,473 | ) |
| | | 84,828,617 | | | DB | | 07/21/2021 | | MXN | | | 85,223,581 | | | USD | | | 84,828,617 | | | | 394,964 | | | | — | |
| | | 30,249,279 | | | BAML | | 09/17/2021 | | MXN | | | 30,035,999 | | | USD | | | 30,249,279 | | | | — | | | | (213,280 | ) |
| | | 32,867,538 | | | DB | | 07/21/2021 | | NOK | | | 32,139,966 | | | EUR | | | 32,867,538 | | | | — | | | | (727,572 | ) |
| | | 2,785,138 | | | DB | | 08/18/2021 | | NOK | | | 2,772,162 | | | EUR | | | 2,785,138 | | | | — | | | | (12,976 | ) |
| | | 46,042,362 | | | DB | | 07/21/2021 | | NOK | | | 45,202,702 | | | USD | | | 46,042,362 | | | | — | | | | (839,660 | ) |
| | | 3,045,768 | | | DB | | 08/18/2021 | | NOK | | | 3,037,860 | | | USD | | | 3,045,768 | | | | — | | | | (7,908 | ) |
| | | 146,932,213 | | | DB | | 07/21/2021 | | NZD | | | 144,274,578 | | | USD | | | 146,932,213 | | | | — | | | | (2,657,635 | ) |
| | | 7,123,310 | | | BAML | | 09/17/2021 | | NZD | | | 6,912,759 | | | USD | | | 7,123,310 | | | | — | | | | (210,551 | ) |
| | | 10,254,877 | | | DB | | 07/21/2021 | | PLN | | | 10,093,487 | | | EUR | | | 10,254,877 | | | | — | | | | (161,390 | ) |
| | | 31,011,919 | | | DB | | 07/21/2021 | | PLN | | | 30,504,419 | | | USD | | | 31,011,919 | | | | — | | | | (507,500 | ) |
| | | 26,334,394 | | | DB | | 07/21/2021 | | RUB | | | 26,518,751 | | | USD | | | 26,334,394 | | | | 184,357 | | | | — | |
| | | 58,742,106 | | | DB | | 07/21/2021 | | SEK | | | 57,685,477 | | | EUR | | | 58,742,106 | | | | — | | | | (1,056,629 | ) |
| | | 820,632 | | | DB | | 08/18/2021 | | SEK | | | 818,646 | | | EUR | | | 820,632 | | | | — | | | | (1,986 | ) |
| | | 106,706,694 | | | DB | | 07/21/2021 | | SEK | | | 104,675,257 | | | USD | | | 106,706,694 | | | | — | | | | (2,031,437 | ) |
| | | 27,977,892 | | | DB | | 07/21/2021 | | SGD | | | 27,745,966 | | | USD | | | 27,977,892 | | | | — | | | | (231,926 | ) |
| | | 46,975,387 | | | DB | | 07/21/2021 | | ZAR | | | 45,538,331 | | | USD | | | 46,975,387 | | | | — | | | | (1,437,056 | ) |
| | | 6,624,485 | | | DB | | 08/18/2021 | | ZAR | | | 6,631,024 | | | USD | | | 6,624,485 | | | | 6,539 | | | | — | |
| Total Purchase Contracts | | 2,224,332,936 | | | | | | 2,260,399,444 | | | | 727,842 | | | | (36,794,350 | ) |
| | | | | | | | | | | | | | | | | | | | | | | | | | | | |
| Sale Contracts: | | | | | | | | | | | | | | | | | |
| | $ | 211,500,649 | | | DB | | 07/21/2021 | | USD | | $ | 208,868,729 | | | AUD | | $ | 211,500,649 | | | $ | 2,631,920 | | | $ | — | |
| | | 7,963,956 | | | BAML | | 09/17/2021 | | USD | | | 7,726,392 | | | AUD | | | 7,963,956 | | | | 237,564 | | | | — | |
| | | 3,673,818 | | | DB | | 07/21/2021 | | USD | | | 3,747,020 | | | BRL | | | 3,673,818 | | | | — | | | | (73,202 | ) |
| | | 114,188,520 | | | DB | | 07/21/2021 | | USD | | | 112,414,112 | | | CAD | | | 114,188,520 | | | | 1,774,408 | | | | — | |
| | | 20,188,560 | | | BAML | | 09/17/2021 | | USD | | | 19,761,412 | | | CAD | | | 20,188,560 | | | | 427,148 | | | | — | |
| | | 242,753,384 | | | DB | | 07/21/2021 | | USD | | | 238,137,229 | | | CHF | | | 242,753,384 | | | | 4,616,155 | | | | — | |
| | | 8,718,414 | | | DB | | 08/18/2021 | | USD | | | 8,722,683 | | | CHF | | | 8,718,414 | | | | — | | | | (4,269 | ) |
| | | 25,543,473 | | | BAML | | 09/17/2021 | | USD | | | 25,378,559 | | | CHF | | | 25,543,473 | | | | 164,914 | | | | — | |
| | | 9,097,673 | | | DB | | 07/21/2021 | | USD | | | 9,082,924 | | | CLP | | | 9,097,673 | | | | 14,749 | | | | — | |
| | | 32,867,537 | | | DB | | 07/21/2021 | | NOK | | | 32,361,752 | | | EUR | | | 32,867,537 | | | | 505,785 | | | | — | |
| | | 2,785,138 | | | DB | | 08/18/2021 | | NOK | | | 2,777,501 | | | EUR | | | 2,785,138 | | | | 7,637 | | | | — | |
| | | 10,254,877 | | | DB | | 07/21/2021 | | PLN | | | 10,130,842 | | | EUR | | | 10,254,877 | | | | 124,035 | | | | — | |
| | | 58,742,106 | | | DB | | 07/21/2021 | | SEK | | | 57,843,073 | | | EUR | | | 58,742,106 | | | | 899,033 | | | | — | |
| | | 820,632 | | | DB | | 08/18/2021 | | SEK | | | 819,007 | | | EUR | | | 820,632 | | | | 1,625 | | | | — | |
The accompanying notes are an integral part of these consolidated financial statements.
| | |
| | |
| 26 | | LoCorr Macro Strategies Fund – Consolidated Schedule of Open Forward Currency Contracts (continued) |
| | |
| | | | | | | | | Currency to be Received | | Currency to be Delivered | | | | | | |
| | | | | | | | | | | U.S. $ Notional | | | | | U.S. $ Notional | | | | | | | |
| | Notional | | | Counter- | | Forward | | Curr | | Amount at | | | Curr | | Amount on | | | Unrealized | | | Unrealized | |
| | Amount | | | party | | Settlement Date | | Abbr. | | June 30, 2021 | | | Abbr. | | Origination Date | | | Appreciation | | | (Depreciation) | |
| | | | | See key for | | | | | | | | | | | | | | | | | | |
| | | abbreviation | | | | | | | | | | | | | | | | | | |
| | $ | 241,710,589 | | | DB | | 07/21/2021 | | USD | | $ | 239,877,927 | | | EUR | | $ | 241,710,589 | | | $ | 1,832,662 | | | $ | — | |
| | | 23,898,294 | | | BAML | | 09/17/2021 | | USD | | | 23,705,955 | | | EUR | | | 23,898,294 | | | | 192,339 | | | | — | |
| | | 206,118,067 | | | DB | | 07/21/2021 | | USD | | | 204,713,313 | | | GBP | | | 206,118,067 | | | | 1,404,754 | | | | — | |
| | | 12,325,818 | | | DB | | 08/18/2021 | | USD | | | 12,354,341 | | | GBP | | | 12,325,818 | | | | — | | | | (28,523 | ) |
| | | 28,472,211 | | | BAML | | 09/17/2021 | | USD | | | 28,247,941 | | | GBP | | | 28,472,211 | | | | 224,270 | | | | — | |
| | | 10,309,232 | | | DB | | 07/21/2021 | | USD | | | 10,298,787 | | | ILS | | | 10,309,232 | | | | 10,445 | | | | — | |
| | | 7,710,785 | | | DB | | 07/22/2021 | | USD | | | 7,628,995 | | | INR | | | 7,710,785 | | | | 81,790 | | | | — | |
| | | 148,256,733 | | | DB | | 07/21/2021 | | USD | | | 147,350,220 | | | JPY | | | 148,256,733 | | | | 906,513 | | | | — | |
| | | 142,794,007 | | | BAML | | 09/17/2021 | | USD | | | 140,958,785 | | | JPY | | | 142,794,007 | | | | 1,835,222 | | | | — | |
| | | 5,724,826 | | | DB | | 07/21/2021 | | USD | | | 5,710,759 | | | KRW | | | 5,724,826 | | | | 14,067 | | | | — | |
| | | 66,569,444 | | | DB | | 07/21/2021 | | USD | | | 67,563,063 | | | MXN | | | 66,569,444 | | | | — | | | | (993,619 | ) |
| | | 252,246 | | | BAML | | 09/17/2021 | | USD | | | 260,584 | | | MXN | | | 252,246 | | | | — | | | | (8,338 | ) |
| | | 33,016,057 | | | DB | | 07/21/2021 | | EUR | | | 32,203,236 | | | NOK | | | 33,016,057 | | | | 812,821 | | | | — | |
| | | 474,299 | | | DB | | 08/18/2021 | | EUR | | | 473,555 | | | NOK | | | 474,299 | | | | 744 | | | | — | |
| | | 46,145,535 | | | DB | | 07/21/2021 | | USD | | | 45,202,702 | | | NOK | | | 46,145,535 | | | | 942,833 | | | | — | |
| | | 3,489,801 | | | DB | | 08/18/2021 | | USD | | | 3,453,751 | | | NOK | | | 3,489,801 | | | | 36,050 | | | | — | |
| | | 113,254,517 | | | DB | | 07/21/2021 | | USD | | | 112,764,971 | | | NZD | | | 113,254,517 | | | | 489,546 | | | | — | |
| | | 7,191,795 | | | BAML | | 09/17/2021 | | USD | | | 7,032,258 | | | NZD | | | 7,191,795 | | | | 159,537 | | | | — | |
| | | 6,098,349 | | | DB | | 07/21/2021 | | EUR | | | 5,984,633 | | | PLN | | | 6,098,349 | | | | 113,716 | | | | — | |
| | | 23,253,365 | | | DB | | 07/21/2021 | | USD | | | 23,149,785 | | | PLN | | | 23,253,365 | | | | 103,580 | | | | — | |
| | | 16,707,243 | | | DB | | 07/21/2021 | | USD | | | 16,547,551 | | | RUB | | | 16,707,243 | | | | 159,692 | | | | — | |
| | | 58,869,846 | | | DB | | 07/21/2021 | | EUR | | | 57,748,433 | | | SEK | | | 58,869,846 | | | | 1,121,413 | | | | — | |
| | | 3,271,515 | | | DB | | 08/18/2021 | | EUR | | | 3,259,307 | | | SEK | | | 3,271,515 | | | | 12,208 | | | | — | |
| | | 87,637,761 | | | DB | | 07/21/2021 | | USD | | | 86,495,814 | | | SEK | | | 87,637,761 | | | | 1,141,947 | | | | — | |
| | | 23,136,675 | | | DB | | 07/21/2021 | | USD | | | 23,060,906 | | | SGD | | | 23,136,675 | | | | 75,769 | | | | — | |
| | | 46,571,037 | | | DB | | 07/21/2021 | | USD | | | 45,538,331 | | | ZAR | | | 46,571,037 | | | | 1,032,706 | | | | — | |
| | | 3,657,640 | | | DB | | 08/18/2021 | | USD | | | 3,640,139 | | | ZAR | | | 3,657,640 | | | | 17,501 | | | | — | |
| Total Sale Contracts | | | | 2,092,997,277 | | | | | | 2,116,016,424 | | | | 24,127,098 | | | | (1,107,951 | ) |
| Net Forward Currency Contracts | | | $ | 131,335,659 | | | | | $ | 144,383,020 | | | $ | 24,854,940 | | | $ | (37,902,301 | ) |
| Net Unrealized Depreciation | | | | | | | | | | | | | | | | | $ | (13,047,361 | ) |
| Counterparty Abbreviations: |
| BAML | Bank of America Merrill Lynch |
| DB | Deutsche Bank |
| Currency Abbreviations: |
| AUD | AUSTRALIAN DOLLAR |
| BRL | BRAZILIAN REAL |
| CAD | CANADIAN DOLLAR |
| CHF | SWISS FRANC |
| CLP | CHILEAN PESO |
| COP | COLOMBIAN PESO |
| EUR | EURO |
| GBP | BRITISH POUND |
| ILS | ISRAELI NEW SHEQEL |
| INR | INDIAN RUPEE |
| JPY | JAPANESE YEN |
| KRW | SOUTH KOREAN WON |
| MXN | MEXICAN PESO |
| NOK | NORWEGIAN KRONE |
| NZD | NEW ZEALAND DOLLAR |
| PLN | POLISH ZLOTY |
| RUB | RUSSIAN RUBLE |
| SEK | SWEDISH KRONA |
| SGD | SINGAPORE DOLLAR |
| USD | U.S. DOLLAR |
| ZAR | SOUTH AFRICAN RAND |
The accompanying notes are an integral part of these consolidated financial statements.
| | |
| | |
| LoCorr Macro Strategies Fund – Consolidated Schedule of Open Futures Contracts | | 27 |
| | |
LoCorr Macro Strategies Fund
Consolidated Schedule of Open Futures Contracts
June 30, 2021 (Unaudited)
| | | Number of | | | | | Current | | | Notional | | | Value | |
| | | Contracts | | | Settlement | | Notional | | | Amount at | | | Unrealized | | | Unrealized | |
| Description | | Purchased (Sold) | | | Month-Year | | Amount | | | Trade Date | | | Appreciation | | | (Depreciation) | |
| | | | | | | | | | | | | | | | | | | | | | | |
| Purchase Contracts: | | | | | | | | | | | | | | | | | | | | | | |
| 3 Mo Euro Euribor | | | 1598 | | | Dec-22 | | $ | 475,814,045 | | | $ | 475,892,488 | | | $ | — | | | $ | (78,443 | ) |
| 90 Day Euro | | | 196 | | | Jun-22 | | | 48,867,700 | | | | 48,896,584 | | | | — | | | | (28,884 | ) |
| 90 Day Euro | | | 12 | | | Sep-22 | | | 2,989,050 | | | | 2,990,569 | | | | — | | | | (1,519 | ) |
| 90 Day Euro | | | 700 | | | Dec-22 | | | 174,090,000 | | | | 174,127,972 | | | | — | | | | (37,972 | ) |
| 90 Day Euro | | | 254 | | | Mar-22 | | | 63,373,000 | | | | 63,380,196 | | | | — | | | | (7,196 | ) |
| Aluminum – 90 Day Settlement (a)(b) | | | 1 | | | Jul-21 | | | 63,450 | | | | 55,618 | | | | 7,832 | | | | — | |
| Aluminum – 90 Day Settlement (a)(b) | | | 2 | | | Jul-21 | | | 125,800 | | | | 114,258 | | | | 11,542 | | | | — | |
| Aluminum – 90 Day Settlement (a)(b) | | | 1 | | | Jul-21 | | | 62,989 | | | | 59,623 | | | | 3,366 | | | | — | |
| Aluminum – 90 Day Settlement (a)(b) | | | 1 | | | Jul-21 | | | 62,998 | | | | 59,951 | | | | 3,047 | | | | — | |
| Aluminum – 90 Day Settlement (a)(b) | | | 1 | | | Jul-21 | | | 62,997 | | | | 60,256 | | | | 2,741 | | | | — | |
| Aluminum – 90 Day Settlement (a)(b) | | | 1 | | | Aug-21 | | | 63,002 | | | | 60,918 | | | | 2,084 | | | | — | |
| Aluminum – 90 Day Settlement (a)(b) | | | 2 | | | Aug-21 | | | 126,039 | | | | 123,772 | | | | 2,267 | | | | — | |
| Aluminum – 90 Day Settlement (a)(b) | | | 1 | | | Aug-21 | | | 63,054 | | | | 63,290 | | | | — | | | | (236 | ) |
| Aluminum – 90 Day Settlement (a)(b) | | | 1 | | | Aug-21 | | | 63,063 | | | | 60,890 | | | | 2,173 | | | | — | |
| Aluminum – 90 Day Settlement (a)(b) | | | 1 | | | Aug-21 | | | 63,125 | | | | 59,330 | | | | 3,795 | | | | — | |
| Aluminum – 90 Day Settlement (a)(b) | | | 2 | | | Aug-21 | | | 126,275 | | | | 119,475 | | | | 6,800 | | | | — | |
| Aluminum – 90 Day Settlement (a)(b) | | | 2 | | | Sep-21 | | | 126,213 | | | | 124,898 | | | | 1,315 | | | | — | |
| Aluminum – 90 Day Settlement (a)(b) | | | 1 | | | Sep-21 | | | 63,111 | | | | 62,294 | | | | 817 | | | | — | |
| Aluminum – 90 Day Settlement (a)(b) | | | 2 | | | Sep-21 | | | 126,175 | | | | 122,200 | | | | 3,975 | | | | — | |
| Aluminum – 90 Day Settlement (a)(b) | | | 1 | | | Sep-21 | | | 63,113 | | | | 62,240 | | | | 873 | | | | — | |
| Aluminum (a)(b) | | | 402 | | | Sep-21 | | | 25,371,225 | | | | 24,837,765 | | | | 533,460 | | | | — | |
| Amsterdam Exchange Index | | | 11 | | | Jul-21 | | | 1,902,562 | | | | 1,908,736 | | | | — | | | | (6,174 | ) |
| Australian 10 Yr Bond | | | 369 | | | Sep-21 | | | 39,071,521 | | | | 38,853,276 | | | | 218,245 | | | | — | |
| Brent Crude (a) | | | 526 | | | Jul-21 | | | 39,250,120 | | | | 38,055,145 | | | | 1,194,975 | | | | — | |
| Brent Crude (a) | | | 93 | | | Aug-21 | | | 6,862,470 | | | | 6,656,585 | | | | 205,885 | | | | — | |
| Brent Crude (a) | | | 28 | | | Sep-21 | | | 2,045,400 | | | | 1,972,652 | | | | 72,748 | | | | — | |
| Brent Crude (a) | | | 7 | | | Nov-21 | | | 502,390 | | | | 491,948 | | | | 10,442 | | | | — | |
| Brent Crude (a) | | | 4 | | | Dec-21 | | | 284,960 | | | | 278,095 | | | | 6,865 | | | | — | |
| Brent Crude (a) | | | 11 | | | Oct-21 | | | 796,070 | | | | 782,532 | | | | 13,538 | | | | — | |
| CAC 40 10 Euro Index | | | 434 | | | Jul-21 | | | 33,475,662 | | | | 34,035,895 | | | | — | | | | (560,233 | ) |
| Canadian 10 Yr Bond | | | 296 | | | Sep-21 | | | 34,748,242 | | | | 34,662,820 | | | | 85,422 | | | | — | |
| Canadian Dollar | | | 48 | | | Sep-21 | | | 3,869,760 | | | | 3,873,167 | | | | — | | | | (3,407 | ) |
| CBOE Volatility Index (a) | | | 4 | | | Sep-21 | | | 84,056 | | | | 88,363 | | | | — | | | | (4,307 | ) |
| Cocoa (NYBOT) (a) | | | 22 | | | Sep-21 | | | 525,580 | | | | 529,894 | | | | — | | | | (4,314 | ) |
| Coffee (a) | | | 168 | | | Sep-21 | | | 10,064,250 | | | | 10,129,825 | | | | — | | | | (65,575 | ) |
| Copper – 90 Day Settlement (a)(b) | | | 1 | | | Jul-21 | | | 233,888 | | | | 225,013 | | | | 8,875 | | | | — | |
| Copper – 90 Day Settlement (a)(b) | | | 1 | | | Jul-21 | | | 233,990 | | | | 221,559 | | | | 12,431 | | | | — | |
| Copper – 90 Day Settlement (a)(b) | | | 1 | | | Jul-21 | | | 234,041 | | | | 230,822 | | | | 3,219 | | | | — | |
| Copper – 90 Day Settlement (a)(b) | | | 1 | | | Jul-21 | | | 234,025 | | | | 236,265 | | | | — | | | | (2,240 | ) |
| Copper – 90 Day Settlement (a)(b) | | | 1 | | | Jul-21 | | | 234,010 | | | | 242,524 | | | | — | | | | (8,514 | ) |
| Copper – 90 Day Settlement (a)(b) | | | 1 | | | Aug-21 | | | 234,139 | | | | 250,843 | | | | — | | | | (16,704 | ) |
| Copper – 90 Day Settlement (a)(b) | | | 1 | | | Aug-21 | | | 234,250 | | | | 258,381 | | | | — | | | | (24,131 | ) |
| Copper – 90 Day Settlement (a)(b) | | | 1 | | | Aug-21 | | | 234,200 | | | | 254,184 | | | | — | | | | (19,984 | ) |
| Copper – 90 Day Settlement (a)(b) | | | 1 | | | Aug-21 | | | 234,200 | | | | 251,735 | | | | — | | | | (17,535 | ) |
| Copper – 90 Day Settlement (a)(b) | | | 1 | | | Sep-21 | | | 234,350 | | | | 255,575 | | | | — | | | | (21,225 | ) |
| Copper – 90 Day Settlement (a)(b) | | | 1 | | | Sep-21 | | | 234,408 | | | | 251,111 | | | | — | | | | (16,703 | ) |
| Copper – 90 Day Settlement (a)(b) | | | 1 | | | Sep-21 | | | 234,438 | | | | 249,240 | | | | — | | | | (14,802 | ) |
| Copper – 90 Day Settlement (a)(b) | | | 2 | | | Sep-21 | | | 468,638 | | | | 461,945 | | | | 6,693 | | | | — | |
| Copper – 90 Day Settlement (a)(b) | | | 1 | | | Sep-21 | | | 234,331 | | | | 233,116 | | | | 1,215 | | | | — | |
| Copper – 90 Day Settlement (a)(b) | | | 1 | | | Sep-21 | | | 234,363 | | | | 233,376 | | | | 987 | | | | — | |
| Copper (a)(b) | | | 115 | | | Sep-21 | | | 26,958,875 | | | | 28,628,566 | | | | — | | | | (1,669,691 | ) |
| Copper (COMEX) (a) | | | 108 | | | Sep-21 | | | 11,580,300 | | | | 11,599,147 | | | | — | | | | (18,847 | ) |
| Corn (a) | | | 78 | | | Dec-21 | | | 2,295,150 | | | | 2,278,286 | | | | 16,864 | | | | — | |
| Cotton No.2 (a) | | | 67 | | | Dec-21 | | | 2,844,150 | | | | 2,847,783 | | | | — | | | | (3,633 | ) |
| DAX Index | | | 82 | | | Sep-21 | | | 37,745,183 | | | | 38,087,206 | | | | — | | | | (342,023 | ) |
| Dow Jones Industrial Average Mini E-Cbot Index | | | 336 | | | Sep-21 | | | 57,790,320 | | | | 57,631,453 | | | | 158,867 | | | | — | |
| Euro-Bobl | | | 892 | | | Sep-21 | | | 141,888,656 | | | | 141,915,811 | | | | — | | | | (27,155 | ) |
| Euro-BTP | | | 379 | | | Sep-21 | | | 68,043,386 | | | | 67,933,550 | | | | 109,836 | | | | — | |
| Euro-Bund | | | 938 | | | Sep-21 | | | 191,982,186 | | | | 191,626,868 | | | | 355,318 | | | | — | |
| Euro-Buxl 30 Yr Bond | | | 101 | | | Sep-21 | | | 24,340,119 | | | | 24,229,803 | | | | 110,316 | | | | — | |
The accompanying notes are an integral part of these consolidated financial statements.
| | |
| | |
| 28 | | LoCorr Macro Strategies Fund – Consolidated Schedule of Open Futures Contracts (continued) |
| | |
| | | Number of | | | | | Current | | | Notional | | | Value | |
| | | Contracts | | | Settlement | | Notional | | | Amount at | | | Unrealized | | | Unrealized | |
| Description | | Purchased (Sold) | | | Month-Year | | Amount | | | Trade Date | | | Appreciation | | | (Depreciation) | |
| | | | | | | | | | | | | | | | | | | | | | | |
| Euro-OAT | | | 684 | | | Sep-21 | | $ | 128,989,575 | | | $ | 128,644,906 | | | $ | 344,669 | | | $ | — | |
| Euro-Schatz | | | 154 | | | Sep-21 | | | 20,477,334 | | | | 20,485,413 | | | | — | | | | (8,079 | ) |
| Euro-Stoxx 50 Index | | | 1172 | | | Sep-21 | | | 56,359,114 | | | | 57,112,396 | | | | — | | | | (753,282 | ) |
| FTSE 100 Index | | | 346 | | | Sep-21 | | | 33,410,148 | | | | 33,881,371 | | | | — | | | | (471,223 | ) |
| FTSE MIB Index | | | 12 | | | Sep-21 | | | 1,778,906 | | | | 1,795,830 | | | | — | | | | (16,924 | ) |
| FTSE/JSE Top 40 Index | | | 46 | | | Sep-21 | | | 1,928,779 | | | | 1,932,296 | | | | — | | | | (3,517 | ) |
| Gasoline RBOB (a) | | | 220 | | | Jul-21 | | | 20,714,232 | | | | 20,330,032 | | | | 384,200 | | | | — | |
| Gold (a) | | | 79 | | | Aug-21 | | | 13,995,640 | | | | 13,996,587 | | | | — | | | | (947 | ) |
| Hang Seng Index | | | 123 | | | Jul-21 | | | 22,677,447 | | | | 23,041,143 | | | | — | | | | (363,696 | ) |
| Heating Oil (a) | | | 218 | | | Jul-21 | | | 19,486,715 | | | | 19,394,539 | | | | 92,176 | | | | — | |
| Heating Oil (a) | | | 57 | | | Aug-21 | | | 5,100,896 | | | | 5,163,621 | | | | — | | | | (62,725 | ) |
| Heating Oil (a) | | | 15 | | | Sep-21 | | | 1,342,782 | | | | 1,335,896 | | | | 6,886 | | | | — | |
| Heating Oil (a) | | | 8 | | | Oct-21 | | | 715,781 | | | | 717,017 | | | | — | | | | (1,236 | ) |
| IBEX 35 Index | | | 24 | | | Jul-21 | | | 2,500,969 | | | | 2,528,201 | | | | — | | | | (27,232 | ) |
| Japanese 10 Yr Bond | | | 31 | | | Sep-21 | | | 42,327,647 | | | | 42,339,279 | | | | — | | | | (11,632 | ) |
| Lead – 90 Day Settlement (a)(b) | | | 1 | | | Sep-21 | | | 56,840 | | | | 56,742 | | | | 98 | | | | — | |
| Lead (a)(b) | | | 17 | | | Sep-21 | | | 965,175 | | | | 934,150 | | | | 31,025 | | | | — | |
| Live Cattle (a) | | | 45 | | | Aug-21 | | | 2,209,050 | | | | 2,188,085 | | | | 20,965 | | | | — | |
| Long Gilt | | | 696 | | | Sep-21 | | | 123,331,534 | | | | 122,844,809 | | | | 486,725 | | | | — | |
| Low Sulphur Gasoil (a) | | | 276 | | | Aug-21 | | | 16,511,700 | | | | 16,518,898 | | | | — | | | | (7,198 | ) |
| Low Sulphur Gasoil (a) | | | 20 | | | Sep-21 | | | 1,199,500 | | | | 1,209,023 | | | | — | | | | (9,523 | ) |
| Low Sulphur Gasoil (a) | | | 6 | | | Oct-21 | | | 360,150 | | | | 363,007 | | | | — | | | | (2,857 | ) |
| MSCI EAFE Index | | | 78 | | | Sep-21 | | | 8,985,990 | | | | 9,036,995 | | | | — | | | | (51,005 | ) |
| MSCI Taiwan Index | | | 128 | | | Jul-21 | | | 7,809,280 | | | | 7,773,429 | | | | 35,851 | | | | — | |
| Nasdaq 100 E-Mini Index | | | 310 | | | Sep-21 | | | 90,203,800 | | | | 88,797,759 | | | | 1,406,041 | | | | — | |
| Natural Gas (a) | | | 838 | | | Jul-21 | | | 30,587,000 | | | | 30,179,770 | | | | 407,230 | | | | — | |
| Natural Gas (a) | | | 62 | | | Aug-21 | | | 2,246,880 | | | | 2,300,292 | | | | — | | | | (53,412 | ) |
| Natural Gas (a) | | | 18 | | | Sep-21 | | | 651,420 | | | | 656,843 | | | | — | | | | (5,423 | ) |
| Natural Gas (a) | | | 21 | | | Oct-21 | | | 768,180 | | | | 783,318 | | | | — | | | | (15,138 | ) |
| Natural Gas (a) | | | 5 | | | Nov-21 | | | 187,150 | | | | 189,439 | | | | — | | | | (2,289 | ) |
| Nickel – 90 Day Settlement (a)(b) | | | 1 | | | Jul-21 | | | 109,257 | | | | 100,279 | | | | 8,978 | | | | — | |
| Nickel – 90 Day Settlement (a)(b) | | | 1 | | | Jul-21 | | | 109,244 | | | | 98,244 | | | | 11,000 | | | | — | |
| Nickel – 90 Day Settlement (a)(b) | | | 1 | | | Jul-21 | | | 109,236 | | | | 96,973 | | | | 12,263 | | | | — | |
| Nickel – 90 Day Settlement (a)(b) | | | 1 | | | Aug-21 | | | 109,224 | | | | 107,403 | | | | 1,821 | | | | — | |
| Nickel – 90 Day Settlement (a)(b) | | | 1 | | | Aug-21 | | | 109,226 | | | | 107,868 | | | | 1,358 | | | | — | |
| Nickel – 90 Day Settlement (a)(b) | | | 1 | | | Aug-21 | | | 109,227 | | | | 107,275 | | | | 1,952 | | | | — | |
| Nickel – 90 Day Settlement (a)(b) | | | 2 | | | Aug-21 | | | 218,490 | | | | 213,661 | | | | 4,829 | | | | — | |
| Nickel – 90 Day Settlement (a)(b) | | | 1 | | | Aug-21 | | | 109,250 | | | | 103,779 | | | | 5,471 | | | | — | |
| Nickel – 90 Day Settlement (a)(b) | | | 1 | | | Sep-21 | | | 109,284 | | | | 104,131 | | | | 5,153 | | | | — | |
| Nickel (a)(b) | | | 52 | | | Sep-21 | | | 5,682,768 | | | | 5,617,494 | | | | 65,274 | | | | — | |
| Nikkei 225 Index (OSE) | | | 120 | | | Sep-21 | | | 31,086,907 | | | | 31,313,641 | | | | — | | | | (226,734 | ) |
| Nikkei 225 Index (SGX) | | | 5 | | | Sep-21 | | | 646,744 | | | | 651,363 | | | | — | | | | (4,619 | ) |
| Platinum (a) | | | 1 | | | Oct-21 | | | 53,645 | | | | 55,382 | | | | — | | | | (1,737 | ) |
| Russell 2000 Mini Index | | | 332 | | | Sep-21 | | | 38,309,480 | | | | 38,266,756 | | | | 42,724 | | | | — | |
| S&P 500 E-Mini Index | | | 362 | | | Sep-21 | | | 77,623,660 | | | | 76,967,351 | | | | 656,309 | | | | — | |
| S&P MidCap 400 E-Mini Index | | | 21 | | | Sep-21 | | | 5,654,040 | | | | 5,654,423 | | | | — | | | | (383 | ) |
| S&P/TSX 60 Index | | | 50 | | | Sep-21 | | | 9,702,324 | | | | 9,704,382 | | | | — | | | | (2,058 | ) |
| SET 50 Index | | | 298 | | | Sep-21 | | | 1,761,967 | | | | 1,765,169 | | | | — | | | | (3,202 | ) |
| Silver (a) | | | 60 | | | Sep-21 | | | 7,858,200 | | | | 7,854,613 | | | | 3,587 | | | | — | |
| Soybean (a) | | | 19 | | | Nov-21 | | | 1,329,050 | | | | 1,306,494 | | | | 22,556 | | | | — | |
| Soybean Oil (a) | | | 29 | | | Dec-21 | | | 1,092,024 | | | | 967,921 | | | | 124,103 | | | | — | |
| SPI 200 Index | | | 6 | | | Sep-21 | | | 812,535 | | | | 818,241 | | | | — | | | | (5,706 | ) |
| Sugar (a) | | | 271 | | | Sep-21 | | | 5,429,973 | | | | 5,351,044 | | | | 78,929 | | | | — | |
| Tokyo Price Index | | | 168 | | | Sep-21 | | | 29,382,420 | | | | 29,621,634 | | | | — | | | | (239,214 | ) |
| U.S. 10 Yr Note | | | 883 | | | Sep-21 | | | 116,997,500 | | | | 116,799,486 | | | | 198,014 | | | | — | |
| U.S. 2 Yr Note | | | 1022 | | | Sep-21 | | | 225,167,359 | | | | 225,541,756 | | | | — | | | | (374,397 | ) |
| U.S. 5 Yr Note | | | 268 | | | Sep-21 | | | 33,079,157 | | | | 33,052,407 | | | | 26,750 | | | | — | |
| U.S. Long Bond | | | 454 | | | Sep-21 | | | 72,980,500 | | | | 72,564,729 | | | | 415,771 | | | | — | |
| U.S. Ultra Bond | | | 137 | | | Sep-21 | | | 26,398,188 | | | | 26,156,803 | | | | 241,385 | | | | — | |
| WTI Crude (a) | | | 412 | | | Jul-21 | | | 30,269,642 | | | | 29,757,262 | | | | 512,380 | | | | — | |
| WTI Crude (a) | | | 82 | | | Aug-21 | | | 5,967,140 | | | | 5,932,688 | | | | 34,452 | | | | — | |
| WTI Crude (a) | | | 24 | | | Sep-21 | | | 1,722,240 | | | | 1,666,143 | | | | 56,097 | | | | — | |
| WTI Crude (a) | | | 12 | | | Oct-21 | | | 850,680 | | | | 822,042 | | | | 28,638 | | | | — | |
| WTI Crude (a) | | | 6 | | | Nov-21 | | | 420,780 | | | | 422,331 | | | | — | | | | (1,551 | ) |
| WTI Crude (a) | | | 4 | | | Dec-21 | | | 277,720 | | | | 274,537 | | | | 3,183 | | | | — | |
| Zinc – 90 Day Settlement (a)(b) | | | 1 | | | Jul-21 | | | 74,238 | | | | 69,731 | | | | 4,507 | | | | — | |
The accompanying notes are an integral part of these consolidated financial statements.
| | |
| | |
| LoCorr Macro Strategies Fund – Consolidated Schedule of Open Futures Contracts (continued) | | 29 |
| | |
| | | Number of | | | | | Current | | | Notional | | | Value | |
| | | Contracts | | | Settlement | | Notional | | | Amount at | | | Unrealized | | | Unrealized | |
| Description | | Purchased (Sold) | | | Month-Year | | Amount | | | Trade Date | | | Appreciation | | | (Depreciation) | |
| | | | | | | | | | | | | | | | | | | | | | | |
| Zinc – 90 Day Settlement (a)(b) | | | 1 | | | Aug-21 | | $ | 74,331 | | | $ | 76,705 | | | $ | — | | | $ | (2,374 | ) |
| Zinc – 90 Day Settlement (a)(b) | | | 2 | | | Aug-21 | | | 148,650 | | | | 150,091 | | | | — | | | | (1,441 | ) |
| Zinc – 90 Day Settlement (a)(b) | | | 1 | | | Aug-21 | | | 74,319 | | | | 74,157 | | | | 162 | | | | — | |
| Zinc – 90 Day Settlement (a)(b) | | | 1 | | | Sep-21 | | | 74,362 | | | | 77,389 | | | | — | | | | (3,027 | ) |
| Zinc – 90 Day Settlement (a)(b) | | | 2 | | | Sep-21 | | | 148,775 | | | | 149,058 | | | | — | | | | (283 | ) |
| Zinc (a)(b) | | | 199 | | | Sep-21 | | | 14,810,575 | | | | 14,772,027 | | | | 38,548 | | | | — | |
| Total Purchase Contracts | | | | | | | | | | | | $ | 2,936,133,631 | | | | 9,000,888 | | | | (5,735,511 | ) |
| | | | | | | | | | | | | | | | | | | | | | | |
| Sale Contracts: | | | | | | | | | | | | | | | | | | | | | | |
| 10 Yr Mini JGB | | | (14 | ) | | Sep-21 | | $ | 1,912,453 | | | $ | 1,909,754 | | | $ | — | | | $ | (2,699 | ) |
| 90 Day Euro | | | (285 | ) | | Mar-23 | | | 70,797,563 | | | | 70,839,274 | | | | 41,711 | | | | — | |
| 90 Day Euro | | | (106 | ) | | Jun-23 | | | 26,293,300 | | | | 26,309,995 | | | | 16,695 | | | | — | |
| 90 Day Euro | | | (212 | ) | | Dec-22 | | | 52,724,400 | | | | 52,747,664 | | | | 23,264 | | | | — | |
| 90 Day Euro | | | (416 | ) | | Sep-23 | | | 102,960,000 | | | | 103,029,444 | | | | 69,444 | | | | — | |
| 90 Day Sterling | | | (2,399 | ) | | Dec-22 | | | 412,949,831 | | | | 413,044,544 | | | | 94,713 | | | | — | |
| Aluminum – 90 Day Settlement (a)(b) | | | (1 | ) | | Jul-21 | | | 63,450 | | | | 55,729 | | | | — | | | | (7,721 | ) |
| Aluminum – 90 Day Settlement (a)(b) | | | (2 | ) | | Jul-21 | | | 125,800 | | | | 114,517 | | | | — | | | | (11,283 | ) |
| Aluminum – 90 Day Settlement (a)(b) | | | (1 | ) | | Jul-21 | | | 62,989 | | | | 59,575 | | | | — | | | | (3,414 | ) |
| Aluminum – 90 Day Settlement (a)(b) | | | (1 | ) | | Jul-21 | | | 62,997 | | | | 60,014 | | | | — | | | | (2,983 | ) |
| Aluminum – 90 Day Settlement (a)(b) | | | (1 | ) | | Jul-21 | | | 62,998 | | | | 59,955 | | | | — | | | | (3,043 | ) |
| Aluminum – 90 Day Settlement (a)(b) | | | (1 | ) | | Aug-21 | | | 63,002 | | | | 60,779 | | | | — | | | | (2,223 | ) |
| Aluminum – 90 Day Settlement (a)(b) | | | (2 | ) | | Aug-21 | | | 126,039 | | | | 124,409 | | | | — | | | | (1,630 | ) |
| Aluminum – 90 Day Settlement (a)(b) | | | (1 | ) | | Aug-21 | | | 63,054 | | | | 64,464 | | | | 1,410 | | | | — | |
| Aluminum – 90 Day Settlement (a)(b) | | | (1 | ) | | Aug-21 | | | 63,063 | | | | 60,197 | | | | — | | | | (2,866 | ) |
| Aluminum – 90 Day Settlement (a)(b) | | | (1 | ) | | Aug-21 | | | 63,125 | | | | 59,230 | | | | — | | | | (3,895 | ) |
| Aluminum – 90 Day Settlement (a)(b) | | | (2 | ) | | Aug-21 | | | 126,275 | | | | 119,702 | | | | — | | | | (6,573 | ) |
| Aluminum – 90 Day Settlement (a)(b) | | | (2 | ) | | Sep-21 | | | 126,213 | | | | 123,690 | | | | — | | | | (2,523 | ) |
| Aluminum – 90 Day Settlement (a)(b) | | | (1 | ) | | Sep-21 | | | 63,111 | | | | 61,913 | | | | — | | | | (1,198 | ) |
| Aluminum – 90 Day Settlement (a)(b) | | | (2 | ) | | Sep-21 | | | 126,175 | | | | 122,419 | | | | — | | | | (3,756 | ) |
| Aluminum – 90 Day Settlement (a)(b) | | | (1 | ) | | Sep-21 | | | 63,113 | | | | 61,649 | | | | — | | | | (1,464 | ) |
| Aluminum (a)(b) | | | (248 | ) | | Sep-21 | | | 15,651,900 | | | | 15,235,823 | | | | — | | | | (416,077 | ) |
| Australian 10 Yr Bond | | | (809 | ) | | Sep-21 | | | 85,660,865 | | | | 85,620,078 | | | | — | | | | (40,787 | ) |
| Australian 3 Yr Bond | | | (36 | ) | | Sep-21 | | | 3,144,945 | | | | 3,143,819 | | | | — | | | | (1,126 | ) |
| Australian Dollar | | | (279 | ) | | Sep-21 | | | 20,919,420 | | | | 20,954,317 | | | | 34,897 | | | | — | |
| Bovespa Index | | | (135 | ) | | Aug-21 | | | 3,453,957 | | | | 3,448,522 | | | | — | | | | (5,435 | ) |
| British Pound | | | (226 | ) | | Sep-21 | | | 19,499,563 | | | | 19,521,044 | | | | 21,481 | | | | — | |
| CAC 40 10 Euro Index | | | (28 | ) | | Jul-21 | | | 2,159,720 | | | | 2,194,121 | | | | 34,401 | | | | — | |
| Canadian 10 Yr Bond | | | (600 | ) | | Sep-21 | | | 70,435,624 | | | | 69,830,949 | | | | — | | | | (604,675 | ) |
| CBOE Volatility Index (a) | | | (111 | ) | | Jul-21 | | | 1,987,266 | | | | 2,018,173 | | | | 30,907 | | | | — | |
| CBOE Volatility Index (a) | | | (29 | ) | | Aug-21 | | | 572,712 | | | | 603,536 | | | | 30,824 | | | | — | |
| Cocoa (ICE) (a) | | | (134 | ) | | Sep-21 | | | 3,028,814 | | | | 3,010,177 | | | | — | | | | (18,637 | ) |
| Coffee (a) | | | (14 | ) | | Sep-21 | | | 838,688 | | | | 818,253 | | | | — | | | | (20,435 | ) |
| Copper – 90 Day Settlement (a)(b) | | | (1 | ) | | Jul-21 | | | 233,888 | | | | 225,475 | | | | — | | | | (8,413 | ) |
| Copper – 90 Day Settlement (a)(b) | | | (1 | ) | | Jul-21 | | | 233,990 | | | | 220,695 | | | | — | | | | (13,295 | ) |
| Copper – 90 Day Settlement (a)(b) | | | (1 | ) | | Jul-21 | | | 234,041 | | | | 231,598 | | | | — | | | | (2,443 | ) |
| Copper – 90 Day Settlement (a)(b) | | | (1 | ) | | Jul-21 | | | 234,025 | | | | 235,954 | | | | 1,929 | | | | — | |
| Copper – 90 Day Settlement (a)(b) | | | (1 | ) | | Jul-21 | | | 234,010 | | | | 242,469 | | | | 8,459 | | | | — | |
| Copper – 90 Day Settlement (a)(b) | | | (1 | ) | | Aug-21 | | | 234,139 | | | | 248,697 | | | | 14,558 | | | | — | |
| Copper – 90 Day Settlement (a)(b) | | | (1 | ) | | Aug-21 | | | 234,250 | | | | 258,840 | | | | 24,590 | | | | — | |
| Copper – 90 Day Settlement (a)(b) | | | (1 | ) | | Aug-21 | | | 234,200 | | | | 251,191 | | | | 16,991 | | | | — | |
| Copper – 90 Day Settlement (a)(b) | | | (1 | ) | | Aug-21 | | | 234,200 | | | | 253,206 | | | | 19,006 | | | | — | |
| Copper – 90 Day Settlement (a)(b) | | | (1 | ) | | Sep-21 | | | 234,350 | | | | 253,899 | | | | 19,549 | | | | — | |
| Copper – 90 Day Settlement (a)(b) | | | (1 | ) | | Sep-21 | | | 234,408 | | | | 250,086 | | | | 15,678 | | | | — | |
| Copper – 90 Day Settlement (a)(b) | | | (1 | ) | | Sep-21 | | | 234,438 | | | | 248,666 | | | | 14,228 | | | | — | |
| Copper – 90 Day Settlement (a)(b) | | | (2 | ) | | Sep-21 | | | 468,638 | | | | 457,285 | | | | — | | | | (11,353 | ) |
| Copper – 90 Day Settlement (a)(b) | | | (1 | ) | | Sep-21 | | | 234,331 | | | | 229,842 | | | | — | | | | (4,489 | ) |
| Copper – 90 Day Settlement (a)(b) | | | (1 | ) | | Sep-21 | | | 234,363 | | | | 232,419 | | | | — | | | | (1,944 | ) |
| Copper (a)(b) | | | (79 | ) | | Sep-21 | | | 18,519,575 | | | | 19,748,718 | | | | 1,229,143 | | | | — | |
| Corn (a) | | | (116 | ) | | Dec-21 | | | 3,413,300 | | | | 3,099,325 | | | | — | | | | (313,975 | ) |
| Cotton No.2 (a) | | | (3 | ) | | Dec-21 | | | 127,350 | | | | 129,183 | | | | 1,833 | | | | — | |
| DAX Index | | | (13 | ) | | Sep-21 | | | 5,983,992 | | | | 5,982,077 | | | | — | | | | (1,915 | ) |
| Dollar | | | (144 | ) | | Sep-21 | | | 13,310,064 | | | | 12,979,126 | | | | — | | | | (330,938 | ) |
| Euro | | | (617 | ) | | Sep-21 | | | 91,508,813 | | | | 91,784,984 | | | | 276,171 | | | | — | |
| Euro-Bobl | | | (1,985 | ) | | Sep-21 | | | 315,749,985 | | | | 315,456,393 | | | | — | | | | (293,592 | ) |
| Euro-Bund | | | (979 | ) | | Sep-21 | | | 200,373,736 | | | | 199,397,469 | | | | — | | | | (976,267 | ) |
The accompanying notes are an integral part of these consolidated financial statements.
| | |
| | |
| 30 | | LoCorr Macro Strategies Fund – Consolidated Schedule of Open Futures Contracts (continued) |
| | |
| | | Number of | | | | | Current | | | Notional | | | Value | |
| | | Contracts | | | Settlement | | Notional | | | Amount at | | | Unrealized | | | Unrealized | |
| Description | | Purchased (Sold) | | | Month-Year | | Amount | | | Trade Date | | | Appreciation | | | (Depreciation) | |
| | | | | | | | | | | | | | | | | | | | | | | |
| Euro-Schatz | | | (106 | ) | | Sep-21 | | $ | 14,094,789 | | | $ | 14,102,568 | | | $ | 7,779 | | | $ | — | |
| FTSE China A50 Index | | | (143 | ) | | Jul-21 | | | 2,473,900 | | | | 2,465,720 | | | | — | | | | (8,180 | ) |
| Gasoline RBOB (a) | | | (5 | ) | | Aug-21 | | | 466,914 | | | | 466,439 | | | | — | | | | (475 | ) |
| Gasoline RBOB (a) | | | (5 | ) | | Sep-21 | | | 440,832 | | | | 441,953 | | | | 1,121 | | | | — | |
| Gasoline RBOB (a) | | | (1 | ) | | Oct-21 | | | 92,403 | | | | 86,237 | | | | — | | | | (6,166 | ) |
| Gold (a) | | | (204 | ) | | Aug-21 | | | 36,140,640 | | | | 36,108,198 | | | | — | | | | (32,442 | ) |
| Hang Seng Index | | | (27 | ) | | Jul-21 | | | 4,977,976 | | | | 5,004,467 | | | | 26,491 | | | | — | |
| Hard Red Wheat (a) | | | (56 | ) | | Sep-21 | | | 1,845,200 | | | | 1,725,448 | | | | — | | | | (119,752 | ) |
| H-Shares Index | | | (118 | ) | | Jul-21 | | | 8,032,778 | | | | 8,096,400 | | | | 63,622 | | | | — | |
| Japanese 10 Yr Bond | | | (96 | ) | | Sep-21 | | | 131,079,166 | | | | 130,834,907 | | | | — | | | | (244,259 | ) |
| Japanese Yen | | | (433 | ) | | Sep-21 | | | 48,750,388 | | | | 48,765,709 | | | | 15,321 | | | | — | |
| Lead – 90 Day Settlement (a)(b) | | | (1 | ) | | Sep-21 | | | 56,840 | | | | 57,800 | | | | 960 | | | | — | |
| Lead (a)(b) | | | (12 | ) | | Sep-21 | | | 681,300 | | | | 653,282 | | | | — | | | | (28,018 | ) |
| Lean Hogs (a) | | | (16 | ) | | Aug-21 | | | 660,800 | | | | 660,833 | | | | 33 | | | | — | |
| Long Gilt | | | (604 | ) | | Sep-21 | | | 107,029,091 | | | | 106,240,291 | | | | — | | | | (788,800 | ) |
| MSCI Emerging Markets Index | | | (149 | ) | | Sep-21 | | | 10,167,760 | | | | 10,189,972 | | | | 22,212 | | | | — | |
| Nickel – 90 Day Settlement (a)(b) | | | (1 | ) | | Jul-21 | | | 109,257 | | | | 100,066 | | | | — | | | | (9,191 | ) |
| Nickel – 90 Day Settlement (a)(b) | | | (1 | ) | | Jul-21 | | | 109,244 | | | | 96,751 | | | | — | | | | (12,493 | ) |
| Nickel – 90 Day Settlement (a)(b) | | | (1 | ) | | Jul-21 | | | 109,236 | | | | 96,717 | | | | — | | | | (12,519 | ) |
| Nickel – 90 Day Settlement (a)(b) | | | (1 | ) | | Aug-21 | | | 109,224 | | | | 107,295 | | | | — | | | | (1,929 | ) |
| Nickel – 90 Day Settlement (a)(b) | | | (1 | ) | | Aug-21 | | | 109,226 | | | | 107,037 | | | | — | | | | (2,189 | ) |
| Nickel – 90 Day Settlement (a)(b) | | | (1 | ) | | Aug-21 | | | 109,227 | | | | 107,045 | | | | — | | | | (2,182 | ) |
| Nickel – 90 Day Settlement (a)(b) | | | (2 | ) | | Aug-21 | | | 218,490 | | | | 208,212 | | | | — | | | | (10,278 | ) |
| Nickel – 90 Day Settlement (a)(b) | | | (1 | ) | | Aug-21 | | | 109,250 | | | | 103,186 | | | | — | | | | (6,064 | ) |
| Nickel – 90 Day Settlement (a)(b) | | | (1 | ) | | Sep-21 | | | 109,284 | | | | 103,707 | | | | — | | | | (5,577 | ) |
| Nickel (a)(b) | | | (39 | ) | | Sep-21 | | | 4,262,076 | | | | 4,099,143 | | | | — | | | | (162,933 | ) |
| OMX Stockholm 30 Index | | | (151 | ) | | Jul-21 | | | 3,998,154 | | | | 3,992,840 | | | | — | | | | (5,314 | ) |
| SGX Nifty 50 Index | | | (65 | ) | | Jul-21 | | | 2,047,110 | | | | 2,064,419 | | | | 17,309 | | | | — | |
| Silver (a) | | | (43 | ) | | Sep-21 | | | 5,631,710 | | | | 5,549,932 | | | | — | | | | (81,778 | ) |
| Soybean (a) | | | (183 | ) | | Nov-21 | | | 12,800,850 | | | | 12,003,035 | | | | — | | | | (797,815 | ) |
| Soybean Meal (a) | | | (317 | ) | | Dec-21 | | | 12,099,890 | | | | 11,796,206 | | | | — | | | | (303,684 | ) |
| Soybean Oil (a) | | | (10 | ) | | Dec-21 | | | 376,560 | | | | 362,443 | | | | — | | | | (14,117 | ) |
| Sugar (a) | | | (7 | ) | | Sep-21 | | | 140,258 | | | | 130,587 | | | | — | | | | (9,671 | ) |
| Swiss Franc | | | (18 | ) | | Sep-21 | | | 2,434,275 | | | | 2,443,560 | | | | 9,285 | | | | — | |
| Tokyo Price Index | | | (51 | ) | | Sep-21 | | | 8,919,663 | | | | 8,930,879 | | | | 11,216 | | | | — | |
| U.S. 10 Yr Note | | | (1,362 | ) | | Sep-21 | | | 180,465,000 | | | | 179,655,919 | | | | — | | | | (809,081 | ) |
| U.S. 2 Yr Note | | | (1,033 | ) | | Sep-21 | | | 227,590,880 | | | | 227,674,593 | | | | 83,713 | | | | — | |
| U.S. 5 Yr Note | | | (3,293 | ) | | Sep-21 | | | 406,453,963 | | | | 406,609,924 | | | | 155,961 | | | | — | |
| U.S. Long Bond | | | (352 | ) | | Sep-21 | | | 56,584,000 | | | | 55,823,270 | | | | — | | | | (760,730 | ) |
| Wheat (a) | | | (55 | ) | | Sep-21 | | | 1,868,625 | | | | 1,799,120 | | | | — | | | | (69,505 | ) |
| Wheat (a) | | | (10 | ) | | Dec-21 | | | 342,500 | | | | 321,239 | | | | — | | | | (21,261 | ) |
| Zinc – 90 Day Settlement (a)(b) | | | (1 | ) | | Jul-21 | | | 74,238 | | | | 69,181 | | | | — | | | | (5,057 | ) |
| Zinc – 90 Day Settlement (a)(b) | | | (1 | ) | | Aug-21 | | | 74,331 | | | | 76,972 | | | | 2,641 | | | | — | |
| Zinc – 90 Day Settlement (a)(b) | | | (2 | ) | | Aug-21 | | | 148,650 | | | | 147,316 | | | | — | | | | (1,334 | ) |
| Zinc – 90 Day Settlement (a)(b) | | | (1 | ) | | Aug-21 | | | 74,319 | | | | 74,092 | | | | — | | | | (227 | ) |
| Zinc – 90 Day Settlement (a)(b) | | | (1 | ) | | Sep-21 | | | 74,362 | | | | 77,072 | | | | 2,710 | | | | — | |
| Zinc – 90 Day Settlement (a)(b) | | | (2 | ) | | Sep-21 | | | 148,775 | | | | 145,565 | | | | — | | | | (3,210 | ) |
| Zinc (a)(b) | | | (104 | ) | | Sep-21 | | | 7,740,200 | | | | 7,741,042 | | | | 842 | | | | — | |
| Total Sale Contracts | | | | | | | | | | | | | | | | | 2,463,098 | | | | (7,459,298 | ) |
| Total Futures Contracts | | | | | | | | | | | | | | | | $ | 11,463,986 | | | $ | (13,194,809 | ) |
| Net Unrealized Depreciation | | | | | | | | | | | | | | | | | | | | $ | (1,730,823 | ) |
| (a) | Contract held by LCMFS Fund Limited. |
| (b) | London Metal Exchange (‘’LME’’) futures contracts settle on their respective maturity date. |
| ICE | Intercontinental Exchange |
| NYBOT | New York Board of Trade |
| OSE | Osaka Securities Exchange |
| SGX | Singapore Exchange Limited |
The accompanying notes are an integral part of these consolidated financial statements.
| |
| |
| LoCorr Long/Short Commodities Strategy Fund – Consolidated Schedule of Investments | 31 |
| |
LoCorr Long/Short Commodities Strategy Fund
Composition of Consolidated Investment Portfolio1
June 30, 2021 (Unaudited)
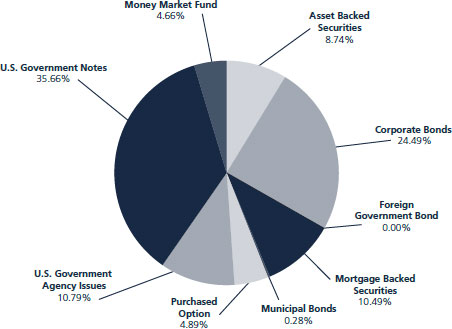
1 As a percentage of total investments.
Consolidated Schedule of Investments
June 30, 2021 (Unaudited)
| | | Maturity Date | | Coupon Rate | | Principal Amount | | | Value | |
| ASSET BACKED SECURITIES: 7.35% | | | | | | | | | | | | | | |
| 321 Henderson Receivables I LLC | | | | | | | | | | | | | | |
| Series 2006-4A A1 (1 Month LIBOR USD + 0.200%) (a)(c) | | 12/15/2041 | | | 0.27 | % | | $ | 61,266 | | | $ | 60,980 | |
| Series 2004-A A1 (1 Month LIBOR USD + 0.350%) (a)(c) | | 09/15/2045 | | | 0.42 | % | | | 34,934 | | | | 34,419 | |
| American Homes 4 Rent Trust, 2014-SFR2 A (a) | | 10/17/2036 | | | 3.79 | % | | | 283,685 | | | | 301,592 | |
| AmeriCredit Automobile Receivables Trust | | | | | | | | | | | | | | |
| Series 2020-3 A-3 | | 06/18/2025 | | | 0.53 | % | | | 2,150,000 | | | | 2,157,155 | |
| Series 2021-2 A3 | | 12/18/2026 | | | 0.34 | % | | | 2,010,000 | | | | 2,014,148 | |
| Angel Oak Mortgage Trust LLC, 2020-5 A3 (a)(d) | | 05/25/2065 | | | 2.04 | % | | | 157,723 | | | | 158,805 | |
| Asset Backed Securities Corp Home Equity Loan Trust, 2002-HE1 M1 | | | | | | | | | | | | | | |
| (1 Month LIBOR USD + 1.650%) (c) | | 03/15/2032 | | | 1.72 | % | | | 366,437 | | | | 367,884 | |
| Bank of America Credit Card Trust, 2021-A1 A1 | | 09/15/2026 | | | 0.44 | % | | | 850,000 | | | | 847,774 | |
| Capital One Multi-Asset Execution Trust, 2015-A4 A4 | | 05/15/2025 | | | 2.75 | % | | | 1,210,000 | | | | 1,242,294 | |
| CarMax Auto Owner Trust, 2018-4 A3 | | 09/15/2023 | | | 3.36 | % | | | 467,171 | | | | 473,502 | |
| Carvana Auto Receivables Trust, 2021-P2 A3 | | 03/10/2026 | | | 0.49 | % | | | 2,630,000 | | | | 2,625,909 | |
| Chase Issuance Trust, 2020-A1 A1 | | 01/15/2025 | | | 1.53 | % | | | 1,050,000 | | | | 1,070,457 | |
| Citibank Credit Card Issuance Trust | | | | | | | | | | | | | | |
| Series 2018-A6 A6 | | 12/09/2024 | | | 3.21 | % | | | 1,500,000 | | | | 1,563,823 | |
| Series 2018-A3 A3 | | 05/23/2025 | | | 3.29 | % | | | 1,085,000 | | | | 1,146,620 | |
| DB Master Finance LLC, 2019-1A A2I (a) | | 05/20/2049 | | | 3.79 | % | | | 943,200 | | | | 955,433 | |
| Diamond Resorts Owner Trust | | | | | | | | | | | | | | |
| Series 2018-1 A (a) | | 01/21/2031 | | | 3.70 | % | | | 487,269 | | | | 507,581 | |
| Series 2021-1A A (a) | | 11/20/2033 | | | 1.51 | % | | | 1,074,103 | | | | 1,078,320 | |
| Discover Card Execution Note Trust, 2018-A2 A2 (1 Month LIBOR USD + 0.330%) (c) | | 08/15/2025 | | | 0.40 | % | | | 1,225,000 | | | | 1,230,860 | |
| Ford Credit Auto Lease Trust, 2019-B A3 | | 10/15/2022 | | | 2.22 | % | | | 231,394 | | | | 232,134 | |
| GM Financial Automobile Leasing Trust 2021-2, 2021-2 | | 05/20/2025 | | | 0.41 | % | | | 2,182,000 | | | | 2,179,028 | |
| GM Financial Consumer Automobile Receivables Trust | | | | | | | | | | | | | | |
| Series 2020-2 A2B (1 Month LIBOR USD + 1.050%) (c) | | 03/16/2023 | | | 1.12 | % | | | 91,527 | | | | 91,650 | |
| Series 2021-1 A-3 | | 10/16/2025 | | | 0.35 | % | | | 1,400,000 | | | | 1,400,663 | |
| Honda Auto Receivables Owner Trust | | | | | | | | | | | | | | |
| Series 2019-1 A3 | | 03/20/2023 | | | 2.83 | % | | | 430,212 | | | | 435,372 | |
| Series 2020-3 A3 | | 10/18/2024 | | | 0.37 | % | | | 2,350,000 | | | | 2,353,022 | |
The accompanying notes are an integral part of these consolidated financial statements.
| |
| |
| 32 | LoCorr Long/Short Commodities Strategy Fund – Consolidated Schedule of Investments (continued) |
| |
| | | Maturity Date | | Coupon Rate | | Principal Amount | | | Value | |
| ASSET BACKED SECURITIES: (continued) | | | | | | | | | | | | | | |
| Hyundai Auto Receivables Trust, 2020-C A3 | | 05/15/2025 | | | 0.38 | % | | $ | 2,150,000 | | | $ | 2,151,431 | |
| Invitation Homes Trust | | | | | | | | | | | | | | |
| Series 2017-SFR2 A (1 Month LIBOR USD + 0.850%) (a)(c) | | 12/19/2036 | | | 0.93 | % | | | 432,815 | | | | 433,194 | |
| Series 2018-SFR1 A (1 Month LIBOR USD + 0.700%) (a)(c) | | 03/19/2037 | | | 0.78 | % | | | 568,157 | | | | 568,683 | |
| Series 2018-SFR2 A (1 Month LIBOR USD + 0.900%) (a)(c) | | 06/18/2037 | | | 0.97 | % | | | 537,955 | | | | 539,195 | |
| Series 2018-SFR3 A (1 Month LIBOR USD + 1.000%) (a)(c) | | 07/17/2037 | | | 1.08 | % | | | 443,315 | | | | 443,968 | |
| Series 2018-SFR4 D (1 Month LIBOR USD + 1.650%) (a)(c) | | 01/19/2038 | | | 1.73 | % | | | 914,020 | | | | 915,730 | |
| Morgan Stanley Capital I Trust, 2004-HE6 M1 (1 Month LIBOR USD + 0.825%) (c) | | 08/25/2034 | | | 0.92 | % | | | 176,129 | | | | 174,458 | |
| MVW Owner Trust | | | | | | | | | | | | | | |
| Series 2018-1A A (a) | | 01/21/2036 | | | 3.45 | % | | | 966,954 | | | | 1,001,546 | |
| Series 2019-1A A (a) | | 11/20/2036 | | | 2.89 | % | | | 445,841 | | | | 458,232 | |
| Series 2019-2A A (a) | | 10/20/2038 | | | 2.22 | % | | | 579,046 | | | | 589,492 | |
| Series 2021-1WA A (a) | | 01/20/2041 | | | 1.14 | % | | | 1,420,884 | | | | 1,420,217 | |
| Navient Student Loan Trust, 2021-A A (a) | | 5/15/2069 | | | 0.84 | % | | | 1,354,033 | | | | 1,351,673 | |
| OneMain Financial Issuance Trust | | | | | | | | | | | | | | |
| Series 2016-3A A (a) | | 06/18/2031 | | | 3.83 | % | | | 639,818 | | | | 645,193 | |
| Series 2018-2A A (a) | | 03/14/2033 | | | 3.57 | % | | | 500,000 | | | | 526,698 | |
| PFS Financing Corp. | | | | | | | | | | | | | | |
| Series 2020-F A (a) | | 08/15/2024 | | | 0.93 | % | | | 1,150,000 | | | | 1,155,482 | |
| Series 2020-G A (a) | | 02/17/2026 | | | 0.97 | % | | | 900,000 | | | | 906,203 | |
| Series 2021-B A (a) | | 08/17/2026 | | | 0.77 | % | | | 1,450,000 | | | | 1,442,197 | |
| Progress Residential Trust, 2019-SFR4 B (a) | | 11/17/2036 | | | 2.94 | % | | | 600,000 | | | | 611,012 | |
| Santander Drive Auto Receivables Trust, 2020-4 A-3 | | 07/15/2024 | | | 0.48 | % | | | 1,800,000 | | | | 1,802,982 | |
| SoFi Professional Loan Program LLC | | | | | | | | | | | | | | |
| Series 2016-D A2B (a) | | 04/25/2033 | | | 2.34 | % | | | 361,340 | | | | 367,535 | |
| Series 2015-D A2 (a) | | 10/27/2036 | | | 2.72 | % | | | 43,927 | | | | 44,421 | |
| Series 2016-A A2 (a) | | 12/26/2036 | | | 2.76 | % | | | 237,290 | | | | 239,834 | |
| Series 2017-B A2FX (a) | | 05/25/2040 | | | 2.74 | % | | | 258,992 | | | | 262,939 | |
| Synchrony Card Issuance Trust, 2018-A1 A | | 09/15/2024 | | | 3.38 | % | | | 1,035,000 | | | | 1,041,729 | |
| Tesla Auto Lease Trust | | | | | | | | | | | | | | |
| Series 2020-A A2 (a) | | 05/20/2023 | | | 0.55 | % | | | 1,331,904 | | | | 1,333,808 | |
| Series 2021-A B (a) | | 03/20/2025 | | | 1.02 | % | | | 1,100,000 | | | | 1,105,438 | |
| Toyota Auto Receivables Owner Trust | | | | | | | | | | | | | | |
| Series 2020-B A2 | | 12/15/2022 | | | 1.38 | % | | | 538,454 | | | | 539,700 | |
| Series 2019-A A3 | | 07/17/2023 | | | 2.91 | % | | | 344,485 | | | | 349,018 | |
| Tricon American Homes Trust | | | | | | | | | | | | | | |
| Series 2017-SFR1 A (a) | | 09/19/2034 | | | 2.72 | % | | | 1,204,275 | | | | 1,208,185 | |
| Series 2017-SFR2 A (a) | | 01/18/2036 | | | 2.93 | % | | | 197,425 | | | | 201,817 | |
| Series 2017-SFR2 B (a) | | 01/18/2036 | | | 3.28 | % | | | 250,000 | | | | 255,683 | |
| Verizon Owner Trust | | | | | | | | | | | | | | |
| Series 2018-A A1A | | 04/20/2023 | | | 3.23 | % | | | 414,019 | | | | 416,868 | |
| Series 2019-B A1A | | 12/20/2023 | | | 2.33 | % | | | 1,215,000 | | | | 1,228,354 | |
| Series 2019-C A1A | | 04/20/2024 | | | 1.94 | % | | | 200,000 | | | | 202,825 | |
| Series 2020-A A1A | | 07/20/2024 | | | 1.85 | % | | | 1,715,000 | | | | 1,744,519 | |
| TOTAL ASSET BACKED SECURITIES (Cost $51,776,380) | | | | | | | | | | | | | 52,209,684 | |
| | | | | | | | | | | | | | | |
| CORPORATE BONDS: 20.61% | | | | | | | | | | | | | | |
| Agriculture: 0.26% | | | | | | | | | | | | | | |
| BAT Capital Corp. | | 08/15/2024 | | | 3.22 | % | | | 240,000 | | | | 254,937 | |
| BAT International Finance PLC (b) | | 03/25/2026 | | | 1.67 | % | | | 1,615,000 | | | | 1,614,798 | |
| | | | | | | | | | | | | | 1,869,735 | |
| Auto Manufacturers: 0.45% | | | | | | | | | | | | | | |
| Daimler Finance North America LLC (a) | | 03/01/2024 | | | 0.75 | % | | | 725,000 | | | | 726,639 | |
| General Motors Financial Co., Inc. | | 08/18/2023 | | | 1.70 | % | | | 1,000,000 | | | | 1,020,514 | |
| General Motors Financial Co., Inc. | | 06/20/2025 | | | 2.75 | % | | | 1,375,000 | | | | 1,448,236 | |
| | | | | | | | | | | | | | 3,195,389 | |
| Banks: 10.84% | | | | | | | | | | | | | | |
| Banco Santander SA (b) | | 05/28/2025 | | | 2.75 | % | | | 1,310,000 | | | | 1,380,968 | |
| Bank of America Corp. | | 01/11/2023 | | | 3.30 | % | | | 2,525,000 | | | | 2,634,984 | |
| Bank of America Corp. (3 Month LIBOR USD + 0.930%) (c) | | 07/21/2023 | | | 2.82 | % | | | 625,000 | | | | 640,506 | |
The accompanying notes are an integral part of these consolidated financial statements.
| |
| |
| LoCorr Long/Short Commodities Strategy Fund – Consolidated Schedule of Investments (continued) | 33 |
| |
| | | Maturity Date | | Coupon Rate | | Principal Amount | | | Value | |
| CORPORATE BONDS: (continued) | | | | | | | | | | | | | | |
| Bank of America Corp. (SOFR + 1.460%) (c) | | 05/19/2024 | | | 1.49 | % | | $ | 2,000,000 | | | $ | 2,033,916 | |
| Bank of America Corp. (SOFR + 0.740%) (c) | | 10/24/2024 | | | 0.81 | % | | | 2,035,000 | | | | 2,043,195 | |
| Bank of America Corp. (SOFR + 0.690%) (c) | | 04/22/2025 | | | 0.98 | % | | | 2,175,000 | | | | 2,182,131 | |
| Bank of America Corp. (SOFR + 1.150%) (c) | | 06/19/2026 | | | 1.32 | % | | | 3,495,000 | | | | 3,503,940 | |
| Bank of America Corp. (SOFR + 1.010%) (c) | | 10/24/2026 | | | 1.20 | % | | | 250,000 | | | | 247,704 | |
| Bank of Montreal (b) | | 03/26/2022 | | | 2.90 | % | | | 845,000 | | | | 861,656 | |
| Bank of New York Mellon Corp. | | 10/24/2024 | | | 2.10 | % | | | 650,000 | | | | 682,067 | |
| Barclays PLC (1 Year CMT Rate + 0.800%) (b)(c) | | 12/10/2024 | | | 1.01 | % | | | 1,150,000 | | | | 1,154,454 | |
| BNP Paribas SA (3 Month LIBOR USD + 1.111%) (a)(b)(c) | | 11/19/2025 | | | 2.82 | % | | | 1,150,000 | | | | 1,210,067 | |
| Citigroup, Inc. | | 01/14/2022 | | | 4.50 | % | | | 1,270,000 | | | | 1,298,903 | |
| Citigroup, Inc. (3 Month LIBOR USD + 0.722%) (c) | | 01/24/2023 | | | 3.14 | % | | | 1,205,000 | | | | 1,223,198 | |
| Citigroup, Inc. (3 Month LIBOR USD + 1.023%) (c) | | 06/01/2024 | | | 4.04 | % | | | 1,425,000 | | | | 1,517,825 | |
| Citigroup, Inc. (SOFR + 0.686%) (c) | | 10/30/2024 | | | 0.78 | % | | | 1,360,000 | | | | 1,363,208 | |
| Citigroup, Inc. (SOFR + 0.669%) (c) | | 05/01/2025 | | | 0.98 | % | | | 2,275,000 | | | | 2,281,318 | |
| Citigroup, Inc. (SOFR + 0.765%) (c) | | 01/28/2027 | | | 1.12 | % | | | 725,000 | | | | 715,039 | |
| Cooperatieve Rabobank UA (b) | | 11/09/2022 | | | 3.95 | % | | | 895,000 | | | | 936,852 | |
| Credit Suisse AG (b) | | 05/05/2023 | | | 1.00 | % | | | 900,000 | | | | 909,612 | |
| Danske Bank A/S (1 Year CMT Rate + 1.730%) (a)(b)(c) | | 01/12/2023 | | | 5.00 | % | | | 815,000 | | | | 832,811 | |
| Deutsche Bank NY (b) | | 05/28/2024 | | | 0.90 | % | | | 660,000 | | | | 657,334 | |
| Federation des Caisses Desjardins du Quebec (a)(b) | | 05/21/2024 | | | 0.70 | % | | | 1,190,000 | | | | 1,188,460 | |
| Goldman Sachs Group, Inc. | | 01/22/2023 | | | 3.63 | % | | | 1,195,000 | | | | 1,254,408 | |
| Goldman Sachs Group, Inc. | | 02/23/2023 | | | 3.20 | % | | | 3,385,000 | | | | 3,531,166 | |
| Goldman Sachs Group, Inc. (SOFR + 0.572%) (c) | | 03/08/2024 | | | 0.67 | % | | | 9,325,000 | | | | 9,340,741 | |
| Goldman Sachs Group, Inc. (SOFR + 0.789%) (c) | | 12/09/2026 | | | 1.09 | % | | | 235,000 | | | | 231,551 | |
| HSBC Bank Canada (a)(b) | | 09/10/2023 | | | 1.65 | % | | | 870,000 | | | | 884,577 | |
| HSBC Holdings PLC (SOFR + 0.708%) (b)(c) | | 05/24/2025 | | | 0.98 | % | | | 530,000 | | | | 529,595 | |
| HSBC Holdings PLC (SOFR + 1.538%) (b)(c) | | 04/18/2026 | | | 1.65 | % | | | 675,000 | | | | 684,292 | |
| HSBC Holdings PLC (SOFR + 1.929%) (b)(c) | | 06/04/2026 | | | 2.10 | % | | | 1,245,000 | | | | 1,280,695 | |
| ING Groep NV (b) | | 04/09/2024 | | | 3.55 | % | | | 965,000 | | | | 1,039,537 | |
| JP Morgan Chase & Co. | | 01/25/2023 | | | 3.20 | % | | | 2,650,000 | | | | 2,767,830 | |
| JP Morgan Chase & Co. (SOFR + 0.600%) (c) | | 09/16/2024 | | | 0.65 | % | | | 225,000 | | | | 225,102 | |
| JP Morgan Chase & Co. (SOFR + 0.540%) (c) | | 06/01/2025 | | | 0.82 | % | | | 925,000 | | | | 923,298 | |
| JP Morgan Chase & Co. (SOFR + 0.695%) (c) | | 02/04/2027 | | | 1.04 | % | | | 2,530,000 | | | | 2,489,480 | |
| Mitsubishi UFJ Financial Group, Inc. (1 Year CMT Rate + 0.680%) (b)(c) | | 09/15/2024 | | | 0.85 | % | | | 1,295,000 | | | | 1,301,686 | |
| Morgan Stanley | | 11/01/2022 | | | 4.88 | % | | | 515,000 | | | | 544,064 | |
| Morgan Stanley | | 01/23/2023 | | | 3.13 | % | | | 2,440,000 | | | | 2,543,749 | |
| Morgan Stanley (SOFR + 0.455%) (c) | | 01/25/2024 | | | 0.53 | % | | | 1,650,000 | | | | 1,649,341 | |
| Morgan Stanley (SOFR + 0.616%) (c) | | 04/05/2024 | | | 0.73 | % | | | 1,680,000 | | | | 1,683,376 | |
| Morgan Stanley | | 04/29/2024 | | | 3.88 | % | | | 640,000 | | | | 696,163 | |
| Morgan Stanley (SOFR + 1.152%) (c) | | 07/22/2025 | | | 2.72 | % | | | 1,000,000 | | | | 1,051,859 | |
| National Bank of Canada (a)(b) | | 10/07/2022 | | | 2.15 | % | | | 505,000 | | | | 516,155 | |
| NatWest Markets PLC (a)(b) | | 05/21/2023 | | | 2.38 | % | | | 955,000 | | | | 988,139 | |
| NatWest Markets PLC (a)(b) | | 08/12/2024 | | | 0.80 | % | | | 250,000 | | | | 248,800 | |
| Royal Bank of Canada (b) | | 04/29/2022 | | | 2.80 | % | | | 280,000 | | | | 286,034 | |
| Royal Bank of Canada (b) | | 11/01/2024 | | | 2.25 | % | | | 645,000 | | | | 675,715 | |
| Standard Chartered PLC (3 Month LIBOR USD + 1.080%) (a)(b)(c) | | 03/15/2024 | | | 3.89 | % | | | 675,000 | | | | 709,641 | |
| State Street Corp. (SOFR + 2.690%) (c) | | 03/30/2023 | | | 2.83 | % | | | 550,000 | | | | 560,258 | |
| Svenska Handelsbanken AB (a)(b) | | 06/30/2023 | | | 0.63 | % | | | 610,000 | | | | 612,941 | |
| Svenska Handelsbanken AB (a)(b) | | 06/11/2024 | | | 0.55 | % | | | 1,000,000 | | | | 996,434 | |
| Truist Financial Corp. | | 08/05/2025 | | | 1.20 | % | | | 1,700,000 | | | | 1,719,304 | |
| UBS AG/London (a)(b) | | 04/21/2022 | | | 1.75 | % | | | 475,000 | | | | 480,308 | |
| UBS AG/London (a)(b) | | 06/01/2023 | | | 0.38 | % | | | 950,000 | | | | 948,908 | |
| UBS Group AG (1 Year CMT Rate + 0.830%) (a)(b)(c) | | 07/30/2024 | | | 1.01 | % | | | 200,000 | | | | 201,416 | |
| Wells Fargo & Co. | | 02/13/2023 | | | 3.45 | % | | | 1,075,000 | | | | 1,126,901 | |
| Wells Fargo & Co. (SOFR + 1.600%) (c) | | 06/02/2024 | | | 1.65 | % | | | 740,000 | | | | 755,743 | |
| | | | | | | | | | | | | | 76,979,355 | |
| Beverage: 0.08% | | | | | | | | | | | | | | |
| Diageo Capital PLC (b) | | 09/29/2025 | | | 1.38 | % | | | 575,000 | | | | 584,653 | |
The accompanying notes are an integral part of these consolidated financial statements.
| |
| |
| 34 | LoCorr Long/Short Commodities Strategy Fund - Consolidated Schedule of Investments (continued) |
| |
| | | Maturity Date | | Coupon Rate | | Principal Amount | | | Value | |
| CORPORATE BONDS: (continued) | | | | | | | | | | | | | | |
| Biotechnology: 0.29% | | | | | | | | | | | | | | |
| Gilead Sciences, Inc. | | 09/29/2023 | | | 0.75 | % | | $ | 660,000 | | | $ | 660,464 | |
| Royalty Pharma PLC (a)(b) | | 09/02/2023 | | | 0.75 | % | | | 1,400,000 | | | | 1,403,934 | |
| | | | | | | | | | | | | | 2,064,398 | |
| Chemicals: 0.12% | | | | | | | | | | | | | | |
| DuPont de Nemours, Inc. | | 11/15/2023 | | | 4.21 | % | | | 780,000 | | | | 845,085 | |
| | | | | | | | | | | | | | | |
| Diversified Financial Services: 1.62% | | | | | | | | | | | | | | |
| AerCap Ireland Capital/Global Aviation Trust (b) | | 01/15/2025 | | | 3.50 | % | | | 1,930,000 | | | | 2,046,011 | |
| AerCap Ireland Capital/Global Aviation Trust (b) | | 01/30/2026 | | | 1.75 | % | | | 725,000 | | | | 716,363 | |
| Air Lease Corp. | | 07/03/2023 | | | 3.88 | % | | | 675,000 | | | | 716,018 | |
| Air Lease Corp. | | 02/01/2024 | | | 4.25 | % | | | 350,000 | | | | 379,577 | |
| American Express Co. | | 07/30/2024 | | | 2.50 | % | | | 905,000 | | | | 953,918 | |
| Capital One Bank | | 02/15/2023 | | | 3.38 | % | | | 799,000 | | | | 836,122 | |
| CDP Financial, Inc. (a)(b) | | 03/07/2022 | | | 2.75 | % | | | 990,000 | | | | 1,007,017 | |
| Dragon 2012 LLC | | 03/12/2024 | | | 1.97 | % | | | 6,401 | | | | 6,542 | |
| GE Capital International Funding Co Unlimited Co. (b) | | 11/15/2025 | | | 3.37 | % | | | 3,490,000 | | | | 3,809,534 | |
| Helios Leasing I LLC | | 05/29/2024 | | | 2.02 | % | | | 6,822 | | | | 6,986 | |
| Helios Leasing I LLC | | 07/24/2024 | | | 1.73 | % | | | 7,342 | | | | 7,488 | |
| Helios Leasing I LLC | | 09/28/2024 | | | 1.56 | % | | | 7,266 | | | | 7,406 | |
| MSN 41079 and 41084 Ltd. (b) | | 07/13/2024 | | | 1.72 | % | | | 7,326 | | | | 7,475 | |
| OMERS Finance Trust (a)(b) | | 05/02/2024 | | | 2.50 | % | | | 920,000 | | | | 968,790 | |
| Phoenix 2012 LLC | | 07/03/2024 | | | 1.61 | % | | | 7,306 | | | | 7,428 | |
| Safina Ltd. (b) | | 01/15/2022 | | | 1.55 | % | | | 1,784 | | | | 1,789 | |
| Tagua Leasing LLC | | 11/16/2024 | | | 1.58 | % | | | 7,824 | | | | 7,971 | |
| | | | | | | | | | | | | | 11,486,435 | |
| Electric: 0.50% | | | | | | | | | | | | | | |
| Eversource Energy | | 08/15/2025 | | | 0.80 | % | | | 125,000 | | | | 123,675 | |
| Exelon Generation Co. LLC | | 03/15/2022 | | | 3.40 | % | | | 265,000 | | | | 269,732 | |
| Exelon Generation Co. LLC | | 06/01/2025 | | | 3.25 | % | | | 220,000 | | | | 237,293 | |
| Nextera Energy Capital Holdings, Inc. | | 04/01/2022 | | | 2.90 | % | | | 1,065,000 | | | | 1,086,242 | |
| Southern California Edison Co. | | 04/01/2024 | | | 1.10 | % | | | 1,850,000 | | | | 1,862,988 | |
| | | | | | | | | | | | | | 3,579,930 | |
| Healthcare - Services: 0.17% | | | | | | | | | | | | | | |
| UnitedHealth Group, Inc. | | 05/15/2024 | | | 0.55 | % | | | 1,190,000 | | | | 1,188,648 | |
| | | | | | | | | | | | | | | |
| Insurance: 1.13% | | | | | | | | | | | | | | |
| Aon Corp. | | 11/15/2022 | | | 2.20 | % | | | 775,000 | | | | 793,926 | |
| Equitable Financial Life Global (a) | | 07/07/2025 | | | 1.40 | % | | | 925,000 | | | | 933,124 | |
| Metropolitan Life Global Funding I (a) | | 06/07/2024 | | | 0.55 | % | | | 1,210,000 | | | | 1,205,797 | |
| Metropolitan Life Global Funding I (a) | | 07/02/2025 | | | 0.95 | % | | | 1,145,000 | | | | 1,143,417 | |
| New York Life Global Funding (a) | | 10/21/2023 | | | 0.40 | % | | | 500,000 | | | | 499,512 | |
| Principal Life Global Funding II (a) | | 04/12/2024 | | | 0.75 | % | | | 1,085,000 | | | | 1,085,699 | |
| Protective Life Global Funding | | 07/05/2024 | | | 0.78 | % | | | 1,340,000 | | | | 1,340,725 | |
| Voya Financial, Inc. | | 07/15/2024 | | | 3.13 | % | | | 970,000 | | | | 1,032,327 | |
| | | | | | | | | | | | | | 8,034,527 | |
| Media: 0.29% | | | | | | | | | | | | | | |
| Comcast Corp. | | 04/15/2024 | | | 3.70 | % | | | 1,920,000 | | | | 2,082,127 | |
| | | | | | | | | | | | | | | |
| Miscellaneous Manufacturing: 0.09% | | | | | | | | | | | | | | |
| Parker-Hannifin Corp. | | 06/14/2024 | | | 2.70 | % | | | 610,000 | | | | 642,776 | |
| | | | | | | | | | | | | | | |
| Oil & Gas: 0.85% | | | | | | | | | | | | | | |
| Atmos Energy Corp. (3 Month LIBOR USD + 0.380%) (c) | | 03/09/2023 | | | 0.50 | % | | | 390,000 | | | | 390,052 | |
| Diamondback Energy, Inc. | | 12/01/2024 | | | 2.88 | % | | | 335,000 | | | | 353,827 | |
| ONE Gas, Inc. | | 03/11/2024 | | | 1.10 | % | | | 3,355,000 | | | | 3,357,332 | |
| Phillips 66 | | 02/15/2024 | | | 0.90 | % | | | 890,000 | | | | 891,178 | |
| Saudi Arabian Oil Co. (a)(b) | | 04/16/2022 | | | 2.75 | % | | | 1,000,000 | | | | 1,017,840 | |
| | | | | | | | | | | | | | 6,010,229 | |
| Packaging & Containers: 0.16% | | | | | | | | | | | | | | |
| Berry Global, Inc. (a) | | 02/15/2024 | | | 0.95 | % | | | 1,100,000 | | | | 1,100,957 | |
The accompanying notes are an integral part of these consolidated financial statements.
| |
| |
| LoCorr Long/Short Commodities Strategy Fund – Consolidated Schedule of Investments (continued) | 35 |
| |
| | | Maturity Date | | Coupon Rate | | Principal Amount | | | Value | |
| CORPORATE BONDS: (continued) | | | | | | | | | | | | | | |
| Pharmaceuticals: 1.19% | | | | | | | | | | | | | | |
| AbbVie, Inc. | | 11/21/2022 | | | 2.30 | % | | $ | 1,600,000 | | | $ | 1,641,967 | |
| AbbVie, Inc. | | 11/21/2024 | | | 2.60 | % | | | 2,495,000 | | | | 2,631,146 | |
| Astrazeneca Finance LLC | | 05/28/2024 | | | 0.70 | % | | | 1,600,000 | | | | 1,598,352 | |
| Bristol-Myers Squibb Co. | | 11/13/2023 | | | 0.54 | % | | | 745,000 | | | | 745,845 | |
| CVS Health Corp. | | 08/12/2024 | | | 3.38 | % | | | 1,690,000 | | | | 1,816,746 | |
| | | | | | | | | | | | | | 8,434,056 | |
| Pipelines: 0.33% | | | | | | | | | | | | | | |
| Energy Transfer Operating LP | | 05/15/2025 | | | 2.90 | % | | | 520,000 | | | | 547,223 | |
| MPLX LP | | 03/01/2026 | | | 1.75 | % | | | 1,185,000 | | | | 1,198,281 | |
| ONEOK, Inc. | | 09/01/2024 | | | 2.75 | % | | | 560,000 | | | | 589,772 | |
| | | | | | | | | | | | | | 2,335,276 | |
| Real Estate Investment Trusts: 0.63% | | | | | | | | | | | | | | |
| American Tower Corp. | | 09/15/2025 | | | 1.30 | % | | | 2,360,000 | | | | 2,366,198 | |
| Brixmor Operating Partnership LP | | 06/15/2024 | | | 3.65 | % | | | 650,000 | | | | 700,370 | |
| Camden Property Trust | | 12/15/2022 | | | 2.95 | % | | | 375,000 | | | | 385,726 | |
| Crown Castle International Corp. | | 07/15/2025 | | | 1.35 | % | | | 505,000 | | | | 508,625 | |
| Kilroy Realty LP | | 01/15/2023 | | | 3.80 | % | | | 470,000 | | | | 489,090 | |
| | | | | | | | | | | | | | 4,450,009 | |
| Retail: 0.07% | | | | | | | | | | | | | | |
| 7-Eleven, Inc. (a) | | 02/10/2024 | | | 0.80 | % | | | 475,000 | | | | 473,856 | |
| | | | | | | | | | | | | | | |
| Software: 0.08% | | | | | | | | | | | | | | |
| Roper Technologies, Inc. | | 09/15/2024 | | | 2.35 | % | | | 550,000 | | | | 576,281 | |
| | | | | | | | | | | | | | | |
| Telecommunications: 1.35% | | | | | | | | | | | | | | |
| AT&T, Inc. | | 03/25/2024 | | | 0.90 | % | | | 1,000,000 | | | | 1,002,200 | |
| NTT Finance Corp. (a)(b) | | 04/03/2026 | | | 1.16 | % | | | 1,020,000 | | | | 1,018,105 | |
| T-Mobile USA, Inc. | | 04/15/2025 | | | 3.50 | % | | | 2,780,000 | | | | 3,013,089 | |
| Verizon Communications, Inc. | | 11/01/2024 | | | 3.50 | % | | | 1,030,000 | | | | 1,114,419 | |
| Verizon Communications, Inc. | | 11/20/2025 | | | 0.85 | % | | | 2,605,000 | | | | 2,577,538 | |
| Verizon Communications, Inc. | | 03/20/2026 | | | 1.45 | % | | | 870,000 | | | | 878,580 | |
| | | | | | | | | | | | | | 9,603,931 | |
| Transportation: 0.11% | | | | | | | | | | | | | | |
| Burlington Northern Santa Fe LLC | | 09/01/2024 | | | 3.40 | % | | | 715,000 | | | | 772,836 | |
| TOTAL CORPORATE BONDS (Cost $144,687,779) | | | | | | | | | | | | | 146,310,489 | |
| | | | | | | | | | | | | | | |
| FOREIGN GOVERNMENT BOND: 0.00%* | | | | | | | | | | | | | | |
| Petroleos Mexicanos (b) | | 12/20/2022 | | | 2.00 | % | | | 3,750 | | | | 3,807 | |
| TOTAL FOREIGN GOVERNMENT BOND (Cost $3,750) | | | | | | | | | | | | | 3,807 | |
| | | | | | | | | | | | | | | |
| MORTGAGE BACKED SECURITIES: 8.83% | | | | | | | | | | | | | | |
| ACRE Commercial Mortgage Trust, 2021-FL4 A (1 Month LIBOR USD + 0.830%) (a)(b)(c) | | 12/18/2037 | | | 0.91 | % | | | 850,000 | | | | 846,572 | |
| Alen Mortgage Trust, 2021-ACEN A (1 Month LIBOR USD + 1.150%) (a)(c) | | 04/15/2038 | | | 1.22 | % | | | 1,250,000 | | | | 1,250,372 | |
| Angel Oak Mortgage Trust, 2020-1 M1 (a)(d) | | 12/25/2059 | | | 3.16 | % | | | 877,000 | | | | 884,086 | |
| BHP Trust, 2019-BXHP A (1 Month LIBOR USD + 0.975%) (a)(c) | | 08/15/2036 | | | 1.05 | % | | | 1,920,766 | | | | 1,921,368 | |
| BX Commercial Mortgage Trust, 2020-FOX A (1 Month LIBOR USD + 1.000%) (a)(c) | | 11/15/2032 | | | 1.07 | % | | | 1,964,823 | | | | 1,970,978 | |
| Comm Mortgage Trust | | | | | | | | | | | | | | |
| Series 2015-3BP A (a) | | 02/12/2035 | | | 3.18 | % | | | 1,030,000 | | | | 1,099,160 | |
| Series 2013-CR9 A4 (d) | | 07/12/2045 | | | 4.39 | % | | | 946,086 | | | | 1,005,494 | |
| Series 2013-CR6 A4 | | 03/10/2046 | | | 3.10 | % | | | 440,000 | | | | 451,413 | |
| Series 2013-CR10 A4 (d) | | 08/10/2046 | | | 4.21 | % | | | 200,000 | | | | 213,452 | |
| Series 2014-UBS2 A5 | | 03/10/2047 | | | 3.96 | % | | | 1,150,000 | | | | 1,236,746 | |
| Series 2014-UBS2 AM | | 03/12/2047 | | | 4.20 | % | | | 1,150,000 | | | | 1,231,931 | |
| Series 2015-CR27 AM | | 10/13/2048 | | | 3.98 | % | | | 1,000,000 | | | | 1,095,780 | |
| Extended Stay America Trust, 2021-ESH A (1 Month LIBOR USD + 1.080%) (a)(c) | | 07/15/2038 | | | 1.16 | % | | | 1,200,000 | | | | 1,203,373 | |
| Fannie Mae Aces, 2017-M7 A1 | | 02/25/2027 | | | 2.60 | % | | | 2,512,837 | | | | 2,631,832 | |
| Fannie Mae Connecticut Avenue Securities | | | | | | | | | | | | | | |
| Series 2014-C02 1M2 (1 Month LIBOR USD + 2.600%) (c) | | 05/28/2024 | | | 2.69 | % | | | 866,467 | | | | 871,493 | |
| Series 2014-C03 1M2 (1 Month LIBOR USD + 3.000%) (c) | | 07/25/2024 | | | 3.09 | % | | | 376,383 | | | | 379,230 | |
The accompanying notes are an integral part of these consolidated financial statements.
| |
| |
| 36 | LoCorr Long/Short Commodities Strategy Fund – Consolidated Schedule of Investments (continued) |
| |
| | | Maturity Date | | Coupon Rate | | Principal Amount | | | Value | |
| MORTGAGE BACKED SECURITIES: (continued) | | | | | | | | | | | | | | |
| Series 2017-C02 2ED4 (1 Month LIBOR USD + 0.850%) (c) | | 09/25/2029 | | | 0.94 | % | | $ | 167,790 | | | $ | 163,878 | |
| Series 2017-C02 2ED3 (1 Month LIBOR USD + 1.350%) (c) | | 09/25/2029 | | | 1.44 | % | | | 396,595 | | | | 399,165 | |
| Series 2017-C05 1M2A (1 Month LIBOR USD + 2.200%) (c) | | 01/25/2030 | | | 2.29 | % | | | 153,809 | | | | 154,296 | |
| Series 2017-C05 1M2 (1 Month LIBOR USD + 2.200%) (c) | | 01/25/2030 | | | 2.29 | % | | | 679,020 | | | | 689,844 | |
| Series 2018-C01 1EB1 (1 Month LIBOR USD + 0.450%) (c) | | 07/25/2030 | | | 0.54 | % | | | 385,000 | | | | 381,537 | |
| FHLMC Multifamily Structured Pass Through Certificates | | | | | | | | | | | | | | |
| Series KF08 A (1 Month LIBOR USD + 0.300%) (c) | | 01/25/2022 | | | 0.39 | % | | | 128,432 | | | | 128,263 | |
| Series K052 A1 | | 01/25/2025 | | | 2.60 | % | | | 327,648 | | | | 340,177 | |
| Series K050 A1 | | 01/25/2025 | | | 2.80 | % | | | 2,339,745 | | | | 2,439,159 | |
| Series K059 A1 | | 09/25/2025 | | | 2.76 | % | | | 773,858 | | | | 819,395 | |
| Series KC06 A1 | | 02/25/2026 | | | 2.17 | % | | | 1,510,000 | | | | 1,555,123 | |
| Freddie Mac STACR Trust | | | | | | | | | | | | | | |
| Series 2018-DNA2 M2A (1 Month LIBOR USD + 2.150%) (a)(c) | | 12/26/2030 | | | 2.24 | % | | | 700,000 | | | | 704,627 | |
| Series 2018-DNA3 M2A (1 Month LIBOR USD + 2.100%) (a)(c) | | 09/25/2048 | | | 2.19 | % | | | 855,000 | | | | 862,203 | |
| Series 2020-DNA2 M1 (1 Month LIBOR USD + 0.750%) (a)(c) | | 02/25/2050 | | | 0.84 | % | | | 6,470 | | | | 6,470 | |
| Series 2020-DNA4 M2AR (1 Month LIBOR USD + 1.500%) (a)(c) | | 08/25/2050 | | | 1.59 | % | | | 907,960 | | | | 908,786 | |
| Freddie Mac Structured Agency Credit Risk Debt Notes | | | | | | | | | | | | | | |
| Series 2017-DNA2 M1 (1 Month LIBOR USD + 1.200%) (c) | | 10/25/2029 | | | 1.29 | % | | | 355,402 | | | | 355,680 | |
| Series 2020-HQA2 M1 (1 Month LIBOR USD + 1.100%) (a)(c) | | 03/25/2050 | | | 1.19 | % | | | 109,238 | | | | 109,272 | |
| FRESB Multifamily Mortgage Pass Through Certificates | | | | | | | | | | | | | | |
| Series 2016-SB17 A7F (d) | | 05/25/2023 | | | 2.15 | % | | | 563,724 | | | | 571,771 | |
| Series 2017-SB32 A7F (d) | | 04/25/2024 | | | 2.44 | % | | | 996,677 | | | | 1,020,558 | |
| Series 2019-SB67 A5F (d) | | 07/25/2024 | | | 2.09 | % | | | 1,369,483 | | | | 1,400,451 | |
| Series 2019-SB69 A5F (d) | | 10/25/2024 | | | 2.25 | % | | | 1,574,430 | | | | 1,631,368 | |
| Series 2016-SB23 A10F (d) | | 09/25/2026 | | | 2.31 | % | | | 854,449 | | | | 878,725 | |
| GCT Commercial Mortgage Trust, 2021-GCT A (1 Month LIBOR USD + 0.800%) (a)(c) | | 02/15/2038 | | | 0.87 | % | | | 1,400,000 | | | | 1,401,666 | |
| GS Mortgage Securities Trust | | | | | | | | | | | | | | |
| Series 2021-ROSS A (1 Month LIBOR USD + 1.150%) (a)(c) | | 06/16/2036 | | | 1.22 | % | | | 2,000,000 | | | | 2,000,682 | |
| Series 2013-GC10 AS | | 02/12/2046 | | | 2.94 | % | | | 1,720,000 | | | | 1,774,303 | |
| Series 2015-GC28 AS | | 02/12/2048 | | | 3.76 | % | | | 885,000 | | | | 948,954 | |
| JP Morgan Chase Commercial Mortgage Securities Trust | | | | | | | | | | | | | | |
| Series 2021-MHC A (1 Month LIBOR USD + 0.800%) (a)(c) | | 04/15/2038 | | | 0.87 | % | | | 1,653,569 | | | | 1,655,619 | |
| Series 2010-C2 A3 (a) | | 11/15/2043 | | | 4.07 | % | | | 78,383 | | | | 78,580 | |
| Series 2012-C8 ASB | | 10/17/2045 | | | 2.38 | % | | | 136,017 | | | | 137,459 | |
| Series 2013-C15 A-S | | 11/17/2045 | | | 4.42 | % | | | 1,250,000 | | | | 1,338,858 | |
| Series 2014-C23 ASB | | 09/17/2047 | | | 3.66 | % | | | 858,072 | | | | 901,218 | |
| Series 2014-C22 AS | | 09/17/2047 | | | 4.11 | % | | | 1,350,000 | | | | 1,445,282 | |
| Series 2013-C10 AS | | 12/17/2047 | | | 3.37 | % | | | 762,000 | | | | 789,943 | |
| Series 2016-JP3 A-5 | | 08/15/2049 | | | 2.87 | % | | | 1,500,000 | | | | 1,604,153 | |
| KKR Industrial Portfolio Trust, 2020-AIP D (1 Month LIBOR USD + 2.030%) (a)(c) | | 03/16/2037 | | | 2.10 | % | | | 482,103 | | | | 482,858 | |
| Merit, 2020-HILL A (1 Month LIBOR USD + 1.150%) (a)(c) | | 08/17/2037 | | | 1.22 | % | | | 2,350,000 | | | | 2,358,105 | |
| MHC Commercial Mortgage Trust, 2021-MHC A (1 Month LIBOR USD + 0.801%) (a)(c) | | 04/15/2038 | | | 0.87 | % | | | 2,000,000 | | | | 2,001,252 | |
| New Residential Mortgage Loan Trust | | | | | | | | | | | | | | |
| Series 2015-1A A3 (a)(d) | | 05/28/2052 | | | 3.75 | % | | | 420,827 | | | | 444,433 | |
| Series 2014-2A A3 (a)(d) | | 05/25/2054 | | | 3.75 | % | | | 76,234 | | | | 80,851 | |
| Series 2016-1A A1 (a)(d) | | 03/25/2056 | | | 3.75 | % | | | 175,076 | | | | 184,862 | |
| Series 2017-1A A1 (a)(d) | | 02/25/2057 | | | 4.00 | % | | | 336,935 | | | | 358,418 | |
| Series 2017-6A A1 (a)(d) | | 08/25/2057 | | | 4.00 | % | | | 163,162 | | | | 174,558 | |
| Series 2018-5A A1 (a)(d) | | 12/25/2057 | | | 4.75 | % | | | 653,463 | | | | 688,475 | |
| OBX Trust, 2018-1 A2 (1 Month LIBOR USD + 0.650%) (a)(c) | | 06/25/2057 | | | 0.74 | % | | | 383,008 | | | | 383,304 | |
| Sequoia Mortgage Trust | | | | | | | | | | | | | | |
| Series 2017-1 A4 (a)(d) | | 02/25/2047 | | | 3.50 | % | | | 88,151 | | | | 88,289 | |
| Series 2019-5 A4 (a)(d) | | 12/25/2049 | | | 3.50 | % | | | 115,895 | | | | 116,262 | |
| Series 2020-1 A4 (a)(d) | | 02/25/2050 | | | 3.50 | % | | | 122,931 | | | | 123,362 | |
| STACR Trust, 2018-DNA2 M1 (1 Month LIBOR USD + 0.800%) (a)(c) | | 12/26/2030 | | | 0.89 | % | | | 197,741 | | | | 197,741 | |
| UBS Commercial Mortgage Trust, 2017-C6 ASB | | 12/16/2050 | | | 3.50 | % | | | 1,000,000 | | | | 1,083,483 | |
| UBS-Barclays Commercial Mortgage Trust, 2012-C4 A5 | | 12/12/2045 | | | 2.85 | % | | | 870,000 | | | | 891,358 | |
| Verus Securitization Trust | | | | | | | | | | | | | | |
| Series 2020-1 A1 (a)(d) | | 01/25/2060 | | | 2.42 | % | | | 822,177 | | | | 832,836 | |
| Series 2020-1 A3 (a)(d) | | 01/25/2060 | | | 2.72 | % | | | 664,860 | | | | 672,507 | |
The accompanying notes are an integral part of these consolidated financial statements.
| |
| |
| LoCorr Long/Short Commodities Strategy Fund – Consolidated Schedule of Investments (continued) | 37 |
| |
| | | Maturity Date | | Coupon Rate | | Principal Amount | | | Value | |
| MORTGAGE BACKED SECURITIES: (continued) | | | | | | | | | | | | | | |
| VNDO Mortgage Trust, 2012-6AVE A (a) | | 11/15/2030 | | | 3.00 | % | | $ | 1,000,000 | | | $ | 1,027,163 | |
| Wells Fargo Commercial Mortgage Trust, 2012-LC5 AS | | 10/17/2045 | | | 3.54 | % | | | 185,000 | | | | 190,443 | |
| WFRBS Commercial Mortgage Trust | | | | | | | | | | | | | | |
| Series 2013-C13 AS | | 05/17/2045 | | | 3.35 | % | | | 185,000 | | | | 192,088 | |
| Series 2012-C10 A3 | | 12/15/2045 | | | 2.88 | % | | | 975,000 | | | | 1,000,105 | |
| Series 2013-UBS1 A4 (d) | | 03/16/2046 | | | 4.08 | % | | | 772,216 | | | | 824,177 | |
| Series 2013-C14 A5 | | 06/15/2046 | | | 3.34 | % | | | 200,000 | | | | 209,484 | |
| Series 2013-C17 ASB | | 12/17/2046 | | | 3.56 | % | | | 147,723 | | | | 152,816 | |
| TOTAL MORTGAGE BACKED SECURITIES (Cost $61,837,021) | | | | | | | | | | | | | 62,649,975 | |
| | | | | | | | | | | | | | | |
| MUNICIPAL BONDS: 0.23% | | | | | | | | | | | | | | |
| Miami Dade County Florida Aviation Refunding Taxable Series B | | 10/01/2023 | | | 2.37 | % | | | 650,000 | | | | 676,938 | |
| Nebraska Public Power District | | 01/01/2024 | | | 2.22 | % | | | 675,000 | | | | 702,567 | |
| Water Works Board of the City of Birmingham | | 01/01/2024 | | | 2.20 | % | | | 270,000 | | | | 280,653 | |
| TOTAL MUNICIPAL BONDS (Cost $1,596,529) | | | | | | | | | | | | | 1,660,158 | |
| PURCHASED OPTION: 4.12% | | | | | | Number of | | | | |
| Call Option: 4.12% | | | | Counterparty | | Contracts | | | | |
| Nomura Galaxy East X Option, Expiration: August 2022, Current Price: $2,648.20, | | | | | | | | | | | | | |
| Exercise Price: $0.0001 (h) | | | | | Nomura Securities | | | 11,039 | | | | 29,234,066 | |
| TOTAL PURCHASED OPTION (Cost $13,741,962) | | | | | (Bermuda) | | | | | | | 29,234,066 | |
| | | | | Coupon Rate | | Principal Amount | | | | |
| U.S. GOVERNMENT AGENCY ISSUES: 9.07% | | | | | | | | | | | | | | |
| Federal Farm Credit Banks | | 05/10/2023 | | | 0.13 | % | | | 8,180,000 | | | | 8,164,605 | |
| Federal Farm Credit Banks | | 06/14/2023 | | | 0.13 | % | | | 10,000,000 | | | | 9,972,095 | |
| Federal Farm Credit Banks | | 06/26/2023 | | | 1.77 | % | | | 2,450,000 | | | | 2,522,372 | |
| Federal Farm Credit Banks | | 07/17/2023 | | | 2.88 | % | | | 1,600,000 | | | | 1,684,255 | |
| Federal Home Loan Banks | | 07/07/2021 | | | 1.88 | % | | | 2,420,000 | | | | 2,420,830 | |
| Federal Home Loan Banks | | 06/10/2022 | | | 2.13 | % | | | 5,575,000 | | | | 5,681,570 | |
| Federal Home Loan Banks | | 06/10/2022 | | | 2.75 | % | | | 1,000,000 | | | | 1,024,802 | |
| Federal Home Loan Banks | | 06/09/2023 | | | 3.25 | % | | | 2,345,000 | | | | 2,480,546 | |
| Federal Home Loan Banks | | 09/08/2023 | | | 3.38 | % | | | 2,235,000 | | | | 2,382,040 | |
| Federal Home Loan Banks | | 12/08/2023 | | | 3.38 | % | | | 2,325,000 | | | | 2,495,757 | |
| Federal Home Loan Banks | | 04/14/2025 | | | 0.50 | % | | | 3,950,000 | | | | 3,928,069 | |
| Federal Home Loan Mortgage Corp. | | 05/19/2023 | | | 0.25 | % | | | 2,730,000 | | | | 2,729,469 | |
| Federal Home Loan Mortgage Corp. | | 06/26/2023 | | | 0.25 | % | | | 3,000,000 | | | | 2,999,600 | |
| Federal Home Loan Mortgage Corp. | | 07/20/2023 | | | 0.41 | % | | | 2,465,000 | | | | 2,465,396 | |
| Federal Home Loan Mortgage Corp. | | 09/08/2023 | | | 0.25 | % | | | 885,000 | | | | 884,124 | |
| Federal Home Loan Mortgage Corp. | | 11/06/2023 | | | 0.25 | % | | | 4,000,000 | | | | 3,995,688 | |
| Federal Home Loan Mortgage Corp. | | 02/12/2025 | | | 1.50 | % | | | 4,850,000 | | | | 5,005,580 | |
| Federal National Mortgage Association | | 01/19/2023 | | | 2.38 | % | | | 220,000 | | | | 227,417 | |
| Federal National Mortgage Association | | 07/10/2023 | | | 0.25 | % | | | 3,350,000 | | | | 3,349,619 | |
| Small Business Administration Participation Certificates | | 11/01/2032 | | | 2.09 | % | | | 8,204 | | | | 8,511 | |
| TOTAL U.S. GOVERNMENT AGENCY ISSUES (Cost $63,763,592) | | | | | | | | | | | | | 64,422,345 | |
| | | | | | | | | | | | | | | |
| U.S. GOVERNMENT NOTES: 30.00% | | | | | | | | | | | | | | |
| United States Treasury Note | | 05/15/2022 | | | 1.75 | % | | | 39,655,000 | | | | 40,228,139 | |
| United States Treasury Note | | 08/15/2022 | | | 1.50 | % | | | 3,495,000 | | | | 3,549,473 | |
| United States Treasury Note | | 11/30/2022 | | | 0.13 | % | | | 15,625,000 | | | | 15,614,624 | |
| United States Treasury Note | | 02/15/2023 | | | 2.00 | % | | | 11,500,000 | | | | 11,835,567 | |
| United States Treasury Note | | 03/31/2023 | | | 0.13 | % | | | 54,330,000 | | | | 54,242,987 | |
| United States Treasury Note | | 03/31/2023 | | | 1.50 | % | | | 35,755,000 | | | | 36,552,504 | |
| United States Treasury Note | | 12/31/2023 | | | 2.63 | % | | | 14,425,000 | | | | 15,240,914 | |
| United States Treasury Note | | 01/15/2024 | | | 0.13 | % | | | 1,330,000 | | | | 1,321,947 | |
| United States Treasury Note | | 04/30/2024 | | | 2.00 | % | | | 6,020,000 | | | | 6,287,843 | |
| United States Treasury Note | | 04/30/2024 | | | 2.25 | % | | | 1,585,000 | | | | 1,666,355 | |
| United States Treasury Note | | 05/15/2024 | | | 0.25 | % | | | 5,240,000 | | | | 5,211,753 | |
| United States Treasury Note | | 05/15/2024 | | | 2.50 | % | | | 6,030,000 | | | | 6,387,796 | |
| United States Treasury Note | | 06/15/2024 | | | 0.25 | % | | | 8,070,000 | | | | 8,021,454 | |
The accompanying notes are an integral part of these consolidated financial statements.
| |
| |
| 38 | LoCorr Long/Short Commodities Strategy Fund – Consolidated Schedule of Investments (continued) |
| |
| | | Maturity Date | | Coupon Rate | | Principal Amount | | | Value | |
| U.S. GOVERNMENT NOTES: (continued) | | | | | | | | | | | | | | |
| United States Treasury Note | | 09/30/2024 | | | 1.50 | % | | | 500,000 | | | | 515,918 | |
| United States Treasury Note | | 12/31/2024 | | | 2.25 | % | | $ | 440,000 | | | $ | 465,678 | |
| United States Treasury Note | | 01/31/2025 | | | 1.38 | % | | | 5,655,000 | | | | 5,811,175 | |
| TOTAL U.S. GOVERNMENT NOTES (Cost $212,790,814) | | | | | | | | | | | | | 212,954,127 | |
| SHORT TERM INVESTMENT: 3.92% | | | | | | |
| MONEY MARKET FUND: 3.92% | | Shares | | | | |
| STIT-Government & Agency Portfolio, Institutional Class, 0.03% (e)(f) | | | 27,804,003 | | | | 27,804,003 | |
| TOTAL MONEY MARKET FUND (Cost $27,804,003) | | | | | | | 27,804,003 | |
| TOTAL SHORT TERM INVESTMENT (Cost $27,804,003) | | | | | | | 27,804,003 | |
| | | | | | | | | |
| TOTAL INVESTMENTS (Cost $578,001,830): 84.13% | | | | | | | 597,248,654 | |
| Other Assets in Excess of Liabilities: 15.87% (g) | | | | | | | 112,641,156 | |
| TOTAL NET ASSETS: 100.00% | | | | | | $ | 709,889,810 | |
| (a) | Security as defined in Rule 144A under the Securities Act of 1933 and determined to be liquid. Purchased in a private placement transaction; resale to the public may require registration or may extend only to qualified institutional buyers. At June 30, 2021, the value of these securities total $70,647,939 which represents 9.95% of total net assets. |
| (b) | Foreign issued security. |
| (c) | Variable rate security based on a reference index and spread. The rate reported is the rate in effect as of June 30, 2021. |
| (d) | Variable rate security. The coupon is based on an underlying pool of loans. The rate reported is the rate in effect as of June 30, 2021. |
| (e) | The rate quoted is the annualized seven-day effective yield as of June 30, 2021. |
| (f) | A portion of this security is held by LCLSCS Fund Limited and pledged as collateral for swap contracts. At June 30, 2021, the value of this collateral totals $435,885. |
| (g) | Includes deposits with broker for swap contracts. At June 30, 2021, the value of these assets total $69,803,311. |
| (h) | The Nomura Call option is issued by Nomura Securities Ltd. provides LoCorr Long/Short Commodities Strategy Fund access to the performance of the Galaxy Plus Fund – East Alpha Feeder Fund (548) LLC which effectuates its trading strategy through the Galaxy Plus Fund – East Alpha Master Fund (548) LLC. The underlying strategy is a quantitative trading program specializing in commodity futures contracts. |
| * | Amount rounds to less than 0.005% of net assets. |
| CMT | Constant Maturity Treasury |
| LIBOR | London Interbank Offered Rate |
| PLC | Public Limited Company |
| SOFR | Secured Overnight Financing Rate |
The accompanying notes are an integral part of these consolidated financial statements.
| |
| |
| LoCorr Long/Short Commodities Strategy Fund – Consolidated Schedule of Swap Contracts | 39 |
| |
LoCorr Long/Short Commodities Strategy Fund
Consolidated Schedule of Swap Contracts
June 30, 2021 (Unaudited)
LONG TOTAL RETURN SWAP CONTRACTS
This investment is a holding of LCLSCS Fund Limited. See Note 1.
| Termination Date | | Reference Index | | Financing Rate | | | Payment
Frequency | | Notional Amount | | | Unrealized
Appreciation* | | | Counterparty |
| 12/16/2022 | | LoCorr Commodities Index # | | | 0.50 | % | | Quarterly | | $ | 414,945,098 | | | $ | 20,590,264 | | | Deutsche Bank AG |
| # | Comprised of a proprietary basket of Commodity Trading Advisor’s (“CTA”) Programs investing in various futures contracts, forward currency contracts, and foreign currency. See Notes 2 & 3. |
| * | Unrealized appreciation is an asset on the Fund’s consolidated statement of assets and liabilities. |
The underlying components of the basket as of June 30, 2021 are shown below: #
| | | | | | | | | | | | |
| Description | | Expiration Date | | Number of Contracts
Purchased (Sold) | | | Notional Amount | | | Concentration %
of Exposure | |
| Futures Contracts: | | | | | | | | | | | | | | |
| Purchase Contracts:(1) | | | | | | | | | | | | | | |
| WTI Crude | | Aug-21 | | | 1,595 | | | $ | 115,690,049 | | | | 6.55 | % |
| Natural Gas | | Sep-21 | | | 2,805 | | | | 100,597,898 | | | | 5.69 | % |
| Natural Gas | | Feb-22 | | | 2,229 | | | | 77,379,735 | | | | 4.38 | % |
| Brent Crude | | Aug-21 | | | 544 | | | | 40,104,627 | | | | 2.27 | % |
| Gasoline RBOB | | Aug-21 | | | 423 | | | | 39,368,779 | | | | 2.23 | % |
| Hard Red Wheat | | Dec-21 | | | 1,117 | | | | 35,014,088 | | | | 1.98 | % |
| Copper | | Dec-21 | | | 323 | | | | 34,516,091 | | | | 1.95 | % |
| Brent Crude | | Sep-21 | | | 333 | | | | 24,307,471 | | | | 1.38 | % |
| Heating Oil | | Aug-21 | | | 264 | | | | 23,529,304 | | | | 1.33 | % |
| Sugar No.11 | | Feb-22 | | | 1,163 | | | | 23,260,436 | | | | 1.32 | % |
| WTI Crude | | Nov-21 | | | 313 | | | | 21,925,523 | | | | 1.24 | % |
| WTI Crude | | Sep-21 | | | 283 | | | | 20,257,385 | | | | 1.15 | % |
| Natural Gas | | Jan-22 | | | 370 | | | | 13,714,050 | | | | 0.78 | % |
| Coffee | | May-22 | | | 205 | | | | 12,791,208 | | | | 0.72 | % |
| Gold | | Aug-21 | | | 72 | | | | 12,662,472 | | | | 0.72 | % |
| Lead | | Sep-21 | | | 183 | | | | 10,518,125 | | | | 0.60 | % |
| Brent Crude | | Oct-21 | | | 134 | | | | 9,668,695 | | | | 0.55 | % |
| Soybean | | Jan-22 | | | 147 | | | | 9,574,069 | | | | 0.54 | % |
| Aluminum | | Sep-21 | | | 145 | | | | 9,193,856 | | | | 0.52 | % |
| Lean Hogs | | Dec-21 | | | 271 | | | | 8,678,617 | | | | 0.49 | % |
| Coffee | | Mar-22 | | | 131 | | | | 8,108,268 | | | | 0.46 | % |
| Nickel | | Sep-21 | | | 70 | | | | 7,713,828 | | | | 0.44 | % |
| WTI Crude | | Oct-21 | | | 108 | | | | 7,648,598 | | | | 0.43 | % |
| Feeder Cattle | | Oct-21 | | | 87 | | | | 7,033,950 | | | | 0.40 | % |
| Live Cattle | | Feb-22 | | | 130 | | | | 6,956,950 | | | | 0.39 | % |
| Soybean Oil | | Mar-22 | | | 191 | | | | 6,751,448 | | | | 0.38 | % |
| Low Sulphur Gasoil | | Sep-21 | | | 110 | | | | 6,607,523 | | | | 0.37 | % |
| Total Purchase Contracts | | | | | | | | | 693,573,043 | | | | 39.26 | % |
| | | | | | | | | | | | | | | |
| Sale Contracts:(1) | | | | | | | | | | | | | | |
| WTI Crude | | Jul-21 | | | (2,046 | ) | | $ | 149,839,108 | | | | 8.48 | % |
| Natural Gas | | Jul-21 | | | (4,087 | ) | | | 147,656,566 | | | | 8.35 | % |
| Brent Crude | | Jul-21 | | | (742 | ) | | | 55,229,955 | | | | 3.13 | % |
| Hard Red Wheat | | Sep-21 | | | (1,068 | ) | | | 32,997,648 | | | | 1.87 | % |
| Gasoline RBOB | | Jul-21 | | | (340 | ) | | | 31,884,321 | | | | 1.80 | % |
The accompanying notes are an integral part of these consolidated financial statements.
| |
| |
| 40 | LoCorr Long/Short Commodities Strategy Fund – Consolidated Schedule of Swap Contracts (continued) |
| |
| | | | | | | | | | | | |
| Description | | Expiration Date | | Number of Contracts
Purchased (Sold) | | | Notional Amount | | | Concentration %
of Exposure | |
| | | | | | | | | | | | |
| Natural Gas | | Aug-21 | | | (871 | ) | | $ | 31,235,720 | | | | 1.77 | % |
| Coffee | | Sep-21 | | | (448 | ) | | | 26,789,914 | | | | 1.52 | % |
| Heating Oil | | Jul-21 | | | (267 | ) | | | 23,810,051 | | | | 1.35 | % |
| Soybean | | Nov-21 | | | (365 | ) | | | 23,616,163 | | | | 1.33 | % |
| Copper | | Sep-21 | | | (206 | ) | | | 22,015,515 | | | | 1.24 | % |
| Lean Hogs | | Aug-21 | | | (506 | ) | | | 20,905,252 | | | | 1.18 | % |
| Natural Gas | | Dec-21 | | | (376 | ) | | | 14,233,480 | | | | 0.81 | % |
| Low Sulphur Gasoil | | Jul-21 | | | (221 | ) | | | 13,210,502 | | | | 0.75 | % |
| Corn | | Sep-21 | | | (461 | ) | | | 12,567,657 | | | | 0.71 | % |
| Feeder Cattle | | Aug-21 | | | (131 | ) | | | 10,354,610 | | | | 0.59 | % |
| Soybean Oil | | Dec-21 | | | (248 | ) | | | 8,934,602 | | | | 0.51 | % |
| Sugar No.11 | | Sep-21 | | | (419 | ) | | | 8,286,320 | | | | 0.47 | % |
| Endex Dutch TTF Gas Future | | Mar-22 | | | (318 | ) | | | 6,487,766 | | | | 0.37 | % |
| Wheat | | Dec-21 | | | (199 | ) | | | 6,451,485 | | | | 0.37 | % |
| Live Cattle | | Aug-21 | | | (131 | ) | | | 6,332,788 | | | | 0.36 | % |
| Total Sale Contracts | | | | | | | | | 652,839,423 | | | | 36.96 | % |
| Other Futures Contracts | | | | | | | | | 146,455,090 | | | | 8.29 | % |
| Total Futures Contracts | | | | | | | | | 1,492,867,556 | | | | 84.51 | % |
| Forward Currency Contracts: | | | | | | Delivered (in USD) | | | | | Received (in USD) | | | | |
| Sales Contracts:(1) | | | | | | | | | | | | | | | |
| USD/EUR | | 06/30/2021 | | U.S. Dollar | | $ | (22,033,383 | ) | | Euro | | $ | 21,910,991 | | | | 1.24 | % |
| Total Forward Currency Contracts Sold | | | | | | | | | | | | | 21,910,991 | | | | 1.24 | % |
| Total Forward Currency Contracts | | | | | | | | | | | | | 21,910,991 | | | | 1.24 | % |
| Cash and Foreign Currency: | | Quantity | | | | | | | |
| Cash and Foreign Currency Purchased:(1) | | | | | | | | | | | | |
| U.S. Dollar | | $ | 104,609,656 | | | $ | 104,609,656 | | | | 5.92 | % |
| Total Cash and Foreign Currency Purchased | | | | | | | 104,609,656 | | | | 5.92 | % |
| | | | | | | | | | | | | |
| Cash and Foreign Currency Sold:(1) | | | | | | | | | | | | |
| Euro | | $ | 141,189,761 | | | $ | 141,189,761 | | | | 7.99 | % |
| Total Cash and Foreign Currency Sold | | | | | | | 141,189,761 | | | | 7.99 | % |
| Other Cash and Foreign Currency | | | | | | | 6,057,453 | | | | 0.34 | % |
| Total Cash and Foreign Currency | | | | | | | 251,856,870 | | | | 14.25 | % |
| Total Underlying Positions | | | | | | $ | 1,766,635,417 | | | | 100.00 | % |
| # | The investment is not a direct holding of LoCorr Long/Short Commodities Strategy Fund. The top 50 holdings and other futures contracts, other forward currency contracts, and other cash and foreign currency were determined based on the absolute notional amount of the positions within the underlying swap basket. |
| (1) | Represents the 50 largest components of the basket. |
The accompanying notes are an integral part of these consolidated financial statements.
| |
| |
| LoCorr Market Trend Fund – Consolidated Schedule of Investments | 41 |
| |
LoCorr Market Trend Fund
Composition of Consolidated Investment Portfolio1
June 30, 2021 (Unaudited)
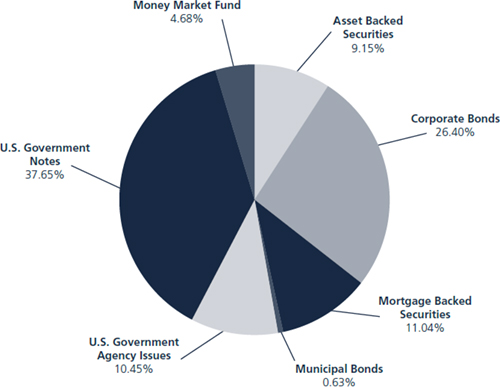
1 As a percentage of total investments.
Consolidated Schedule of Investments
June 30, 2021 (Unaudited)
| | Maturity Date | | Coupon Rate | | Principal Amount | | Value | |
ASSET BACKED SECURITIES: 8.05% | | | | | | | | | | | | | |
American Homes 4 Rent Trust, 2014-SFR2 A (a) | | | 10/17/2036 | | | 3.79 | % | $ | 388,852 | | $ | 413,397 | |
AmeriCredit Automobile Receivables Trust, 2021-2 A3 | | | 12/18/2026 | | | 0.34 | % | | 930,000 | | | 931,919 | |
AMSR Trust, 2020-SFR1 A (a) | | | 04/17/2037 | | | 1.82 | % | | 324,688 | | | 329,069 | |
Angel Oak Mortgage Trust LLC, 2020-5 A3 (a)(d) | | | 05/25/2065 | | | 2.04 | % | | 63,089 | | | 63,522 | |
CarMax Auto Owner Trust, 2018-4 A3 | | | 09/15/2023 | | | 3.36 | % | | 1,427,466 | | | 1,446,812 | |
Carvana Auto Receivables Trust, 2021-P2 A3 | | | 03/10/2026 | | | 0.49 | % | | 900,000 | | | 898,600 | |
CenterPoint Energy Residential Bond, 2009-1 A3 | | | 08/15/2023 | | | 4.24 | % | | 788,968 | | | 808,999 | |
Corevest American Finance Trust, 2020-1 A1 (a) | | | 03/17/2050 | | | 1.83 | % | | 366,295 | | | 372,204 | |
DB Master Finance LLC, 2019-1A A2I (a) | | | 05/20/2049 | | | 3.79 | % | | 1,628,985 | | | 1,650,113 | |
Ford Credit Auto Lease Trust, 2019-B A3 | | | 10/15/2022 | | | 2.22 | % | | 414,718 | | | 416,045 | |
GM Financial Automobile Leasing Trust 2021-2, 2021-2 | | | 05/20/2025 | | | 0.41 | % | | 1,050,000 | | | 1,048,570 | |
GM Financial Consumer Automobile Receivables Trust | | | | | | | | | | | | | |
Series 2018-4 A3 | | | 10/16/2023 | | | 3.21 | % | | 972,219 | | | 983,829 | |
Series 2021-1 A-3 | | | 10/16/2025 | | | 0.35 | % | | 750,000 | | | 750,355 | |
Hilton Grand Vacations Trust, 2019-AA A (a) | | | 07/25/2033 | | | 2.34 | % | | 611,962 | | | 629,285 | |
Honda Auto Receivables Owner Trust | | | | | | | | | | | | | |
Series 2019-1 A3 | | | 03/20/2023 | | | 2.83 | % | | 403,324 | | | 408,161 | |
Series 2020-3 A3 | | | 10/18/2024 | | | 0.37 | % | | 1,400,000 | | | 1,401,801 | |
Hyundai Auto Receivables Trust, 2020-C A3 | | | 05/15/2025 | | | 0.38 | % | | 1,150,000 | | | 1,150,765 | |
Invitation Homes Trust | | | | | | | | | | | | | |
Series 2017-SFR2 A (1 Month LIBOR USD + 0.850%) (a)(c) | | | 12/19/2036 | | | 0.93 | % | | 446,201 | | | 446,592 | |
Series 2018-SFR1 A (1 Month LIBOR USD + 0.700%) (a)(c) | | | 03/19/2037 | | | 0.78 | % | | 430,422 | | | 430,820 | |
Series 2018-SFR2 A (1 Month LIBOR USD + 0.900%) (a)(c) | | | 06/18/2037 | | | 0.97 | % | | 426,948 | | | 427,933 | |
Series 2018-SFR3 A (1 Month LIBOR USD + 1.000%) (a)(c) | | | 07/17/2037 | | | 1.08 | % | | 452,363 | | | 453,029 | |
Series 2018-SFR4 A (1 Month LIBOR USD + 1.100%) (a)(c) | | | 01/19/2038 | | | 1.18 | % | | 681,402 | | | 683,225 | |
Series 2018-SFR4 D (1 Month LIBOR USD + 1.650%) (a)(c) | | | 01/19/2038 | | | 1.73 | % | | 489,475 | | | 490,391 | |
Morgan Stanley Capital I Trust, 2004-HE6 M1 (1 Month LIBOR USD + 0.825%) (c) | | | 08/25/2034 | | | 0.92 | % | | 176,129 | | | 174,458 | |
MVW Owner Trust, 2019-1A A (a) | | | 11/20/2036 | | | 2.89 | % | | 557,302 | | | 572,790 | |
The accompanying notes are an integral part of these consolidated financial statements.
| |
| |
| 42 | LoCorr Market Trend Fund – Consolidated Schedule of Investments (continued) |
| |
| | Maturity Date | | Coupon Rate | | Principal Amount | | Value | |
ASSET BACKED SECURITIES: (continued) | | | | | | | | | | | | | |
PFS Financing Corp. | | | | | | | | | | | | | |
Series 2020-F A (a) | | | 08/15/2024 | | | 0.93 | % | $ | 700,000 | | $ | 703,337 | |
Series 2020-G A (a) | | | 02/17/2026 | | | 0.97 | % | | 500,000 | | | 503,446 | |
Tricon American Homes Trust | | | | | | | | | | | | | |
Series 2017-SFR2 A (a) | | | 01/18/2036 | | | 2.93 | % | | 98,712 | | | 100,909 | |
Series 2017-SFR2 B (a) | | | 01/18/2036 | | | 3.28 | % | | 400,000 | | | 409,093 | |
Verizon Owner Trust | | | | | | | | | | | | | |
Series 2018-A A1A | | | 04/20/2023 | | | 3.23 | % | | 197,432 | | | 198,791 | |
Series 2019-B A1A | | | 12/20/2023 | | | 2.33 | % | | 1,080,000 | | | 1,091,870 | |
Series 2020-A A1A | | | 07/20/2024 | | | 1.85 | % | | 1,180,000 | | | 1,200,311 | |
VSE VOI Mortgage LLC, 2018-A A (a) | | | 02/20/2036 | | | 3.56 | % | | 395,557 | | | 415,944 | |
TOTAL ASSET BACKED SECURITIES (Cost $21,862,749) | | | | | | | | | | | | 22,006,385 | |
| | | | | | | | | | | | | |
CORPORATE BONDS: 23.23% | | | | | | | | | | | | | |
Agriculture: 0.36% | | | | | | | | | | | | | |
BAT Capital Corp. | | | 08/15/2024 | | | 3.22 | % | | 135,000 | | | 143,402 | |
BAT International Finance PLC (b) | | | 03/25/2026 | | | 1.67 | % | | 835,000 | | | 834,896 | |
| | | | | | | | | | | | 978,298 | |
Auto Manufacturers: 0.34% | | | | | | | | | | | | | |
General Motors Financial Co., Inc. | | | 06/20/2025 | | | 2.75 | % | | 895,000 | | | 942,670 | |
| | | | | | | | | | | | | |
Banks: 13.11% | | | | | | | | | | | | | |
Banco Santander SA (b) | | | 02/23/2023 | | | 3.13 | % | | 540,000 | | | 562,455 | |
Banco Santander SA (b) | | | 05/28/2025 | | | 2.75 | % | | 230,000 | | | 242,460 | |
Bank of America Corp. | | | 01/11/2023 | | | 3.30 | % | | 1,740,000 | | | 1,815,791 | |
Bank of America Corp. (SOFR + 1.460%) (c) | | | 05/19/2024 | | | 1.49 | % | | 425,000 | | | 432,207 | |
Bank of America Corp. (SOFR + 0.740%) (c) | | | 10/24/2024 | | | 0.81 | % | | 500,000 | | | 502,013 | |
Bank of America Corp. (SOFR + 0.690%) (c) | | | 04/22/2025 | | | 0.98 | % | | 660,000 | | | 662,164 | |
Bank of America Corp. (SOFR + 1.150%) (c) | | | 06/19/2026 | | | 1.32 | % | | 1,070,000 | | | 1,072,737 | |
Bank of America Corp. (SOFR + 1.010%) (c) | | | 10/24/2026 | | | 1.20 | % | | 1,150,000 | | | 1,139,440 | |
Barclays PLC (1 Year CMT Rate + 0.800%) (b)(c) | | | 12/10/2024 | | | 1.01 | % | | 625,000 | | | 627,421 | |
BB&T Corp. | | | 12/06/2023 | | | 3.75 | % | | 190,000 | | | 204,370 | |
BNP Paribas SA (3 Month LIBOR USD + 1.111%) (a)(b)(c) | | | 11/19/2025 | | | 2.82 | % | | 750,000 | | | 789,174 | |
Citigroup, Inc. (3 Month LIBOR USD + 0.722%) (c) | | | 01/24/2023 | | | 3.14 | % | | 495,000 | | | 502,475 | |
Citigroup, Inc. (3 Month LIBOR USD + 1.023%) (c) | | | 06/01/2024 | | | 4.04 | % | | 435,000 | | | 463,336 | |
Citigroup, Inc. (SOFR + 0.686%) (c) | | | 10/30/2024 | | | 0.78 | % | | 1,165,000 | | | 1,167,748 | |
Citigroup, Inc. (SOFR + 0.669%) (c) | | | 05/01/2025 | | | 0.98 | % | | 550,000 | | | 551,527 | |
Citigroup, Inc. (SOFR + 0.765%) (c) | | | 01/28/2027 | | | 1.12 | % | | 350,000 | | | 345,191 | |
Cooperatieve Rabobank UA (b) | | | 11/09/2022 | | | 3.95 | % | | 535,000 | | | 560,018 | |
Credit Suisse AG (b) | | | 05/05/2023 | | | 1.00 | % | | 565,000 | | | 571,034 | |
Danske Bank A/S (1 Year CMT Rate + 1.730%) (a)(b)(c) | | | 01/12/2023 | | | 5.00 | % | | 630,000 | | | 643,768 | |
Deutsche Bank NY (b) | | | 05/28/2024 | | | 0.90 | % | | 310,000 | | | 308,748 | |
Federation des Caisses Desjardins du Quebec (a)(b) | | | 09/26/2023 | | | 1.95 | % | | 700,000 | | | 714,395 | |
Federation des Caisses Desjardins du Quebec (a)(b) | | | 05/21/2024 | | | 0.70 | % | | 550,000 | | | 549,288 | |
Goldman Sachs Group, Inc. | | | 02/23/2023 | | | 3.20 | % | | 2,180,000 | | | 2,274,134 | |
Goldman Sachs Group, Inc. (SOFR + 0.572%) (c) | | | 03/08/2024 | | | 0.67 | % | | 3,660,000 | | | 3,666,178 | |
Goldman Sachs Group, Inc. | | | 04/01/2025 | | | 3.50 | % | | 225,000 | | | 244,183 | |
Goldman Sachs Group, Inc. (SOFR + 0.789%) (c) | | | 12/09/2026 | | | 1.09 | % | | 165,000 | | | 162,578 | |
HSBC Bank Canada (a)(b) | | | 09/10/2023 | | | 1.65 | % | | 1,130,000 | | | 1,148,933 | |
HSBC Holdings PLC (SOFR + 0.708%) (b)(c) | | | 05/24/2025 | | | 0.98 | % | | 200,000 | | | 199,847 | |
HSBC Holdings PLC (SOFR + 1.929%) (b)(c) | | | 06/04/2026 | | | 2.10 | % | | 1,165,000 | | | 1,198,402 | |
ING Groep NV (b) | | | 04/09/2024 | | | 3.55 | % | | 540,000 | | | 581,710 | |
JP Morgan Chase & Co. | | | 01/25/2023 | | | 3.20 | % | | 1,065,000 | | | 1,112,354 | |
JP Morgan Chase & Co. (SOFR + 0.420%) (c) | | | 02/16/2025 | | | 0.56 | % | | 350,000 | | | 348,113 | |
JP Morgan Chase & Co. (SOFR + 0.800%) (c) | | | 11/19/2026 | | | 1.05 | % | | 375,000 | | | 370,405 | |
JP Morgan Chase & Co. (SOFR + 0.695%) (c) | | | 02/04/2027 | | | 1.04 | % | | 590,000 | | | 580,551 | |
Mitsubishi UFJ Financial Group, Inc. (1 Year CMT Rate + 0.680%) (b)(c) | | | 09/15/2024 | | | 0.85 | % | | 660,000 | | | 663,408 | |
Morgan Stanley | | | 11/01/2022 | | | 4.88 | % | | 485,000 | | | 512,371 | |
Morgan Stanley | | | 01/23/2023 | | | 3.13 | % | | 1,230,000 | | | 1,282,299 | |
Morgan Stanley (SOFR + 0.455%) (c) | | | 01/25/2024 | | | 0.53 | % | | 1,365,000 | | | 1,364,455 | |
The accompanying notes are an integral part of these consolidated financial statements.
| |
| |
| LoCorr Market Trend Fund – Consolidated Schedule of Investments (continued) | 43 |
| |
| | Maturity Date | | Coupon Rate | | Principal Amount | | Value | |
CORPORATE BONDS: (continued) | | | | | | | | | | | | | |
Morgan Stanley (SOFR + 0.616%) (c) | | | 04/05/2024 | | | 0.73 | % | $ | 1,035,000 | | $ | 1,037,080 | |
National Bank of Canada (a)(b) | | | 10/07/2022 | | | 2.15 | % | | 365,000 | | | 373,063 | |
NatWest Markets PLC (a)(b) | | | 05/21/2023 | | | 2.38 | % | | 820,000 | | | 848,454 | |
NatWest Markets PLC (a)(b) | | | 08/12/2024 | | | 0.80 | % | | 200,000 | | | 199,040 | |
Svenska Handelsbanken AB (a)(b) | | | 06/30/2023 | | | 0.63 | % | | 405,000 | | | 406,952 | |
Svenska Handelsbanken AB (a)(b) | | | 06/11/2024 | | | 0.55 | % | | 500,000 | | | 498,217 | |
UBS AG/London (a)(b) | | | 04/21/2022 | | | 1.75 | % | | 440,000 | | | 444,917 | |
UBS AG/London (a)(b) | | | 06/01/2023 | | | 0.38 | % | | 440,000 | | | 439,494 | |
UBS Group AG (1 Year CMT | | | | | | | | | | | | | |
Rate + 0.830%) (a)(b)(c) | | | 07/30/2024 | | | 1.01 | % | | 200,000 | | | 201,416 | |
Wells Fargo & Co. | | | 02/13/2023 | | | 3.45 | % | | 625,000 | | | 655,175 | |
Wells Fargo & Co. (SOFR + 1.600%) (c) | | | 06/02/2024 | | | 1.65 | % | | 575,000 | | | 587,232 | |
| | | | | | | | | | | | 35,828,721 | |
Biotechnology: 0.36% | | | | | | | | | | | | | |
Gilead Sciences, Inc. | | | 09/29/2023 | | | 0.75 | % | | 360,000 | | | 360,253 | |
Royalty Pharma PLC (a)(b) | | | 09/02/2023 | | | 0.75 | % | | 625,000 | | | 626,756 | |
| | | | | | | | | | | | 987,009 | |
Chemicals: 0.14% | | | | | | | | | | | | | |
DuPont de Nemours, Inc. | | | 11/15/2023 | | | 4.21 | % | | 345,000 | | | 373,788 | |
| | | | | | | | | | | | | |
Diversified Financial Services: 1.32% | | | | | | | | | | | | | |
AerCap Ireland Capital/Global Aviation Trust (b) | | | 01/15/2025 | | | 3.50 | % | | 500,000 | | | 530,055 | |
AerCap Ireland Capital/Global Aviation Trust (b) | | | 01/30/2026 | | | 1.75 | % | | 235,000 | | | 232,200 | |
Air Lease Corp. | | | 07/03/2023 | | | 3.88 | % | | 430,000 | | | 456,130 | |
Air Lease Corp. | | | 02/01/2024 | | | 4.25 | % | | 150,000 | | | 162,676 | |
Capital One Bank | | | 02/15/2023 | | | 3.38 | % | | 290,000 | | | 303,473 | |
GE Capital International Funding Co Unlimited Co. (b) | | | 11/15/2025 | | | 3.37 | % | | 1,755,000 | | | 1,915,683 | |
| | | | | | | | | | | | 3,600,217 | |
Electric: 0.44% | | | | | | | | | | | | | |
Eversource Energy | | | 08/15/2025 | | | 0.80 | % | | 75,000 | | | 74,205 | |
Exelon Generation Co. LLC | | | 03/15/2022 | | | 3.40 | % | | 270,000 | | | 274,822 | |
Exelon Generation Co. LLC | | | 06/01/2025 | | | 3.25 | % | | 195,000 | | | 210,328 | |
Southern California Edison Co. | | | 04/01/2024 | | | 1.10 | % | | 635,000 | | | 639,458 | |
| | | | | | | | | | | | 1,198,813 | |
Healthcare - Services: 0.20% | | | | | | | | | | | | | |
UnitedHealth Group, Inc. | | | 05/15/2024 | | | 0.55 | % | | 555,000 | | | 554,369 | |
| | | | | | | | | | | | | |
Insurance: 1.33% | | | | | | | | | | | | | |
Aon Corp. | | | 11/15/2022 | | | 2.20 | % | | 325,000 | | | 332,937 | |
Equitable Financial Life Global (a) | | | 07/07/2025 | | | 1.40 | % | | 530,000 | | | 534,655 | |
Metropolitan Life Global Funding I (a) | | | 06/07/2024 | | | 0.55 | % | | 570,000 | | | 568,020 | |
Metropolitan Life Global Funding I (a) | | | 07/02/2025 | | | 0.95 | % | | 325,000 | | | 324,551 | |
Principal Life Global Funding II (a) | | | 04/12/2024 | | | 0.75 | % | | 750,000 | | | 750,483 | |
Protective Life Global Funding | | | 07/05/2024 | | | 0.78 | % | | 575,000 | | | 575,311 | |
Voya Financial, Inc. | | | 07/15/2024 | | | 3.13 | % | | 520,000 | | | 553,412 | |
| | | | | | | | | | | | 3,639,369 | |
Media: 0.15% | | | | | | | | | | | | | |
Comcast Corp. | | | 04/15/2024 | | | 3.70 | % | | 370,000 | | | 401,243 | |
| | | | | | | | | | | | | |
Miscellaneous Manufacturing: 0.14% | | | | | | | | | | | | | |
Parker-Hannifin Corp. | | | 06/14/2024 | | | 2.70 | % | | 355,000 | | | 374,074 | |
| | | | | | | | | | | | | |
Oil & Gas: 0.88% | | | | | | | | | | | | | |
Atmos Energy Corp. (3 Month LIBOR USD + 0.380%) (c) | | | 03/09/2023 | | | 0.50 | % | | 200,000 | | | 200,027 | |
Diamondback Energy, Inc. | | | 12/01/2024 | | | 2.88 | % | | 300,000 | | | 316,860 | |
ONE Gas, Inc. | | | 03/11/2024 | | | 1.10 | % | | 1,420,000 | | | 1,420,987 | |
Phillips 66 | | | 02/15/2024 | | | 0.90 | % | | 470,000 | | | 470,622 | |
| | | | | | | | | | | | 2,408,496 | |
Packaging & Containers: 0.12% | | | | | | | | | | | | | |
Berry Global, Inc. (a) | | | 02/15/2024 | | | 0.95 | % | | 330,000 | | | 330,287 | |
The accompanying notes are an integral part of these consolidated financial statements.
| |
| |
| 44 | LoCorr Market Trend Fund – Consolidated Schedule of Investments (continued) |
| |
| | Maturity Date | | Coupon Rate | | Principal Amount | | Value | |
CORPORATE BONDS: (continued) | | | | | | | | | | | | | |
Pharmaceuticals: 1.28% | | | | | | | | | | | | | |
AbbVie, Inc. | | | 11/21/2022 | | | 2.30 | % | $ | 625,000 | | $ | 641,394 | |
AbbVie, Inc. | | | 11/21/2024 | | | 2.60 | % | | 1,110,000 | | | 1,170,570 | |
Astrazeneca Finance LLC | | | 05/28/2024 | | | 0.70 | % | | 570,000 | | | 569,413 | |
Bristol-Myers Squibb Co. | | | 11/13/2023 | | | 0.54 | % | | 395,000 | | | 395,448 | |
CVS Health Corp. | | | 08/12/2024 | | | 3.38 | % | | 665,000 | | | 714,873 | |
| | | | | | | | | | | | 3,491,698 | |
Pipelines: 0.43% | | | | | | | | | | | | | |
Energy Transfer Operating LP | | | 05/15/2025 | | | 2.90 | % | | 240,000 | | | 252,564 | |
MPLX LP | | | 03/01/2026 | | | 1.75 | % | | 640,000 | | | 647,173 | |
ONEOK, Inc. | | | 09/01/2024 | | | 2.75 | % | | 260,000 | | | 273,823 | |
| | | | | | | | | | | | 1,173,560 | |
Real Estate Investment Trusts: 1.12% | | | | | | | | | | | | | |
American Tower Corp. | | | 09/15/2025 | | | 1.30 | % | | 1,055,000 | | | 1,057,771 | |
Brixmor Operating Partnership LP | | | 06/15/2024 | | | 3.65 | % | | 225,000 | | | 242,436 | |
Camden Property Trust | | | 12/15/2022 | | | 2.95 | % | | 395,000 | | | 406,298 | |
Crown Castle International Corp. | | | 07/15/2025 | | | 1.35 | % | | 430,000 | | | 433,086 | |
Duke Realty LP | | | 04/15/2023 | | | 3.63 | % | | 535,000 | | | 559,701 | |
Kilroy Realty LP | | | 01/15/2023 | | | 3.80 | % | | 335,000 | | | 348,607 | |
| | | | | | | | | | | | 3,047,899 | |
Software: 0.16% | | | | | | | | | | | | | |
Roper Technologies, Inc. | | | 09/15/2024 | | | 2.35 | % | | 430,000 | | | 450,547 | |
| | | | | | | | | | | | | |
Telecommunications: 1.24% | | | | | | | | | | | | | |
NTT Finance Corp. (a)(b) | | | 04/03/2026 | | | 1.16 | % | | 560,000 | | | 558,960 | |
T-Mobile USA, Inc. | | | 04/15/2025 | | | 3.50 | % | | 1,120,000 | | | 1,213,906 | |
Verizon Communications, Inc. | | | 11/01/2024 | | | 3.50 | % | | 490,000 | | | 530,160 | |
Verizon Communications, Inc. | | | 11/20/2025 | | | 0.85 | % | | 670,000 | | | 662,937 | |
Verizon Communications, Inc. | | | 03/20/2026 | | | 1.45 | % | | 425,000 | | | 429,192 | |
| | | | | | | | | | | | 3,395,155 | |
Transportation: 0.11% | | | | | | | | | | | | | |
Burlington Northern Santa Fe LLC | | | 09/01/2024 | | | 3.40 | % | | 270,000 | | | 291,840 | |
TOTAL CORPORATE BONDS (Cost $62,719,988) | | | | | | | | | | | | 63,468,053 | |
| | | | | | | | | | | | | |
MORTGAGE BACKED SECURITIES: 9.71% | | | | | | | | | | | | | |
ACRE Commercial Mortgage Trust, 2021-FL4 A (1 Month LIBOR USD + 0.830%) (a)(b)(c) | | | 12/18/2037 | | | 0.91 | % | | 500,000 | | | 497,984 | |
Alen Mortgage Trust, 2021-ACEN A (1 Month LIBOR USD + 1.150%) (a)(c) | | | 04/15/2038 | | | 1.22 | % | | 600,000 | | | 600,178 | |
Angel Oak Mortgage Trust, 2020-1 M1 (a)(d) | | | 12/25/2059 | | | 3.16 | % | | 418,000 | | | 421,377 | |
BX Commercial Mortgage Trust, 2019-XL A (1 Month LIBOR USD + 0.920%) (a)(c) | | | 10/15/2036 | | | 0.99 | % | | 466,212 | | | 466,821 | |
Comm Mortgage Trust | | | | | | | | | | | | | |
Series 2013-CR6 A4 | | | 03/10/2046 | | | 3.10 | % | | 185,000 | | | 189,799 | |
Series 2013-CR6 AM (a) | | | 03/12/2046 | | | 3.15 | % | | 1,000,000 | | | 1,026,228 | |
Series 2013-CR10 A4 (d) | | | 08/10/2046 | | | 4.21 | % | | 185,000 | | | 197,443 | |
Series 2013-CR11 B (d) | | | 08/12/2050 | | | 5.28 | % | | 575,000 | | | 622,188 | |
Credit Suisse Mortgage Capital Certificates, 2019-ICE4 A | | | | | | | | | | | | | |
(1 Month LIBOR USD + 0.980%) (a)(c) | | | 05/15/2036 | | | 1.05 | % | | 1,000,000 | | | 1,002,673 | |
Fannie Mae Aces | | | | | | | | | | | | | |
Series 2015-M17 FA (1 Month LIBOR USD + 0.930%) (c) | | | 11/25/2022 | | | 1.03 | % | | 746,149 | | | 747,158 | |
Series 2014-M11 1A (d) | | | 08/25/2024 | | | 3.23 | % | | 507,800 | | | 537,114 | |
Fannie Mae Connecticut Avenue Securities | | | | | | | | | | | | | |
Series 2014-C03 1M2 (1 Month LIBOR USD + 3.000%) (c) | | | 07/25/2024 | | | 3.09 | % | | 53,585 | | | 53,991 | |
Series 2017-C02 2ED3 (1 Month LIBOR USD + 1.350%) (c) | | | 09/25/2029 | | | 1.44 | % | | 213,551 | | | 214,935 | |
Series 2017-C05 1M2 (1 Month LIBOR USD + 2.200%) (c) | | | 01/25/2030 | | | 2.29 | % | | 357,379 | | | 363,076 | |
Series 2018-C01 1EB1 (1 Month LIBOR USD + 0.450%) (c) | | | 07/25/2030 | | | 0.54 | % | | 400,000 | | | 396,402 | |
FHLMC Multifamily Structured Pass Through Certificates, KF08 A | | | | | | | | | | | | | |
(1 Month LIBOR USD + 0.300%) (c) | | | 01/25/2022 | | | 0.39 | % | | 592,762 | | | 591,983 | |
Freddie Mac STACR Trust | | | | | | | | | | | | | |
Series 2018-DNA2 M2A (1 Month LIBOR USD + 2.150%) (a)(c) | | | 12/26/2030 | | | 2.24 | % | | 400,000 | | | 402,644 | |
Series 2018-DNA3 M2A (1 Month LIBOR USD + 2.100%) (a)(c) | | | 09/25/2048 | | | 2.19 | % | | 300,000 | | | 302,527 | |
Series 2020-DNA2 M1 (1 Month LIBOR USD + 0.750%) (a)(c) | | | 02/25/2050 | | | 0.84 | % | | 3,882 | | | 3,882 | |
The accompanying notes are an integral part of these consolidated financial statements.
| |
| |
| LoCorr Market Trend Fund – Consolidated Schedule of Investments (continued) | 45 |
| |
| | Maturity Date | | Coupon Rate | | Principal Amount | | Value | |
MORTGAGE BACKED SECURITIES: (continued) | | | | | | | | | | | | | |
Freddie Mac Structured Agency Credit Risk Debt Notes | | | | | | | | | | | | | |
Series 2017-DNA2 M1 (1 Month LIBOR USD + 1.200%) (c) | | | 10/25/2029 | | | 1.29 | % | $ | 132,169 | | $ | 132,272 | |
Series 2018-HRP2 M3 (1 Month LIBOR USD + 2.400%) (a)(c) | | | 02/25/2047 | | | 2.49 | % | | 400,000 | | | 407,379 | |
Series 2019-HRP1 M2 (1 Month LIBOR USD + 1.400%) (a)(c) | | | 02/25/2049 | | | 1.49 | % | | 658,330 | | | 662,567 | |
FRESB Multifamily Mortgage Pass Through Certificates | | | | | | | | | | | | | |
Series 2016-SB17 A7F (d) | | | 05/25/2023 | | | 2.15 | % | | 501,287 | | | 508,442 | |
Series 2017-SB31 A7F (d) | | | 01/25/2024 | | | 2.46 | % | | 632,858 | | | 642,954 | |
Series 2017-SB32 A7F (d) | | | 04/25/2024 | | | 2.44 | % | | 835,311 | | | 855,325 | |
Series 2019-SB67 A5F (d) | | | 07/25/2024 | | | 2.09 | % | | 1,231,151 | | | 1,258,991 | |
GCT Commercial Mortgage Trust, 2021-GCT A (1 Month LIBOR USD + 0.800%) (a)(c) | | | 02/15/2038 | | | 0.87 | % | | 750,000 | | | 750,892 | |
GS Mortgage Securities Trust | | | | | | | | | | | | | |
Series 2015-GC28 A5 | | | 02/10/2048 | | | 3.40 | % | | 1,000,000 | | | 1,077,270 | |
Series 2015-GC32 AS (d) | | | 07/10/2048 | | | 4.02 | % | | 1,000,000 | | | 1,094,103 | |
JP Morgan Chase Commercial Mortgage Securities Trust | | | | | | | | | | | | | |
Series 2021-MHC A (1 Month LIBOR USD + 0.800%) (a)(c) | | | 04/15/2038 | | | 0.87 | % | | 803,162 | | | 804,158 | |
Series 2013-C13 A4 (d) | | | 01/18/2046 | | | 3.99 | % | | 513,180 | | | 543,041 | |
Series 2014-C22 AS | | | 09/17/2047 | | | 4.11 | % | | 685,000 | | | 733,347 | |
Series 2013-C10 AS | | | 12/17/2047 | | | 3.37 | % | | 200,000 | | | 207,334 | |
KKR Industrial Portfolio Trust, 2020-AIP D (1 Month LIBOR USD + 2.030%) (a)(c) | | | 03/16/2037 | | | 2.10 | % | | 289,262 | | | 289,715 | |
Merit, 2020-HILL A (1 Month LIBOR USD + 1.150%) (a)(c) | | | 08/17/2037 | | | 1.22 | % | | 1,350,000 | | | 1,354,656 | |
Natixis Commercial Mortgage Securities Trust, 2018-285M A (a)(d) | | | 11/15/2032 | | | 3.92 | % | | 1,000,000 | | | 1,028,881 | |
Sequoia Mortgage Trust | | | | | | | | | | | | | |
Series 2020-1 A4 (a)(d) | | | 02/25/2050 | | | 3.50 | % | | 122,931 | | | 123,362 | |
Series 2020-2 A4 (a)(d) | | | 03/25/2050 | | | 3.50 | % | | 259,045 | | | 261,116 | |
UBS Commercial Mortgage Trust, 2012-C1 A3 | | | 05/12/2045 | | | 3.40 | % | | 881,152 | | | 888,417 | |
Verus Securitization Trust | | | | | | | | | | | | | |
Series 2020-1 A1 (a)(d) | | | 01/25/2060 | | | 2.42 | % | | 386,907 | | | 391,923 | |
Series 2020-1 A3 (a)(d) | | | 01/25/2060 | | | 2.72 | % | | 379,920 | | | 384,289 | |
Wells Fargo Commercial Mortgage Trust | | | | | | | | | | | | | |
Series 2012-LC5 AS | | | 10/17/2045 | | | 3.54 | % | | 165,000 | | | 169,854 | |
Series 2015-NXS2 A-4 | | | 07/17/2058 | | | 3.50 | % | | 1,000,000 | | | 1,067,863 | |
WFRBS Commercial Mortgage Trust | | | | | | | | | | | | | |
Series 2013-C13 AS | | | 05/17/2045 | | | 3.35 | % | | 165,000 | | | 171,322 | |
Series 2013-C14 A5 | | | 06/15/2046 | | | 3.34 | % | | 185,000 | | | 193,773 | |
Series 2014-C24 A5 | | | 11/18/2047 | | | 3.61 | % | | 1,000,000 | | | 1,076,935 | |
Series 2013-C12 AS | | | 03/17/2048 | | | 3.56 | % | | 780,000 | | | 812,355 | |
TOTAL MORTGAGE BACKED SECURITIES (Cost $26,256,716) | | | | | | | | | | | | 26,530,939 | |
| | | | | | | | | | | | | |
MUNICIPAL BONDS: 0.56% | | | | | | | | | | | | | |
City of Sacramento CA Water Revenue | | | 09/01/2023 | | | 1.61 | % | | 555,000 | | | 569,678 | |
Pennsylvania State University | | | 09/01/2023 | | | 1.35 | % | | 940,000 | | | 956,774 | |
TOTAL MUNICIPAL BONDS (Cost $1,495,000) | | | | | | | | | | | | 1,526,452 | |
| | | | | | | | | | | | | |
U.S. GOVERNMENT AGENCY ISSUES: 9.19% | | | | | | | | | | | | | |
Federal Farm Credit Banks | | | 05/10/2023 | | | 0.13 | % | | 1,105,000 | | | 1,102,920 | |
Federal Farm Credit Banks | | | 08/14/2023 | | | 1.60 | % | | 2,270,000 | | | 2,332,127 | |
Federal Home Loan Banks | | | 06/10/2022 | | | 2.13 | % | | 2,620,000 | | | 2,670,083 | |
Federal Home Loan Banks | | | 06/10/2022 | | | 2.75 | % | | 3,180,000 | | | 3,258,869 | |
Federal Home Loan Banks | | | 12/09/2022 | | | 3.00 | % | | 4,500,000 | | | 4,681,626 | |
Federal Home Loan Banks | | | 04/14/2025 | | | 0.50 | % | | 1,700,000 | | | 1,690,562 | |
Federal Home Loan Mortgage Corp. | | | 05/19/2023 | | | 0.25 | % | | 1,330,000 | | | 1,329,741 | |
Federal Home Loan Mortgage Corp. | | | 07/20/2023 | | | 0.41 | % | | 1,470,000 | | | 1,470,236 | |
Federal Home Loan Mortgage Corp. | | | 08/24/2023 | | | 0.25 | % | | 1,700,000 | | | 1,699,597 | |
Federal Home Loan Mortgage Corp. | | | 09/08/2023 | | | 0.25 | % | | 535,000 | | | 534,471 | |
Federal National Mortgage Association | | | 09/06/2022 | | | 1.38 | % | | 2,310,000 | | | 2,343,212 | |
Federal National Mortgage Association | | | 07/10/2023 | | | 0.25 | % | | 2,000,000 | | | 1,999,773 | |
TOTAL U.S. GOVERNMENT AGENCY ISSUES (Cost $24,722,530) | | | | | | | | | | | | 25,113,217 | |
The accompanying notes are an integral part of these consolidated financial statements.
| |
| |
| 46 | LoCorr Market Trend Fund – Consolidated Schedule of Investments (continued) |
| |
| | Maturity Date | | Coupon Rate | | Principal Amount | | Value | |
U.S. GOVERNMENT NOTES: 33.12% | | | | | | | | | | | | | |
United States Treasury Note | | | 3/31/2022 | | | 1.88 | % | $ | 3,370,000 | | $ | 3,415,021 | |
United States Treasury Note | | | 05/15/2022 | | | 1.75 | % | | 1,330,000 | | | 1,349,223 | |
United States Treasury Note | | | 11/30/2022 | | | 0.13 | % | | 4,270,000 | | | 4,267,165 | |
United States Treasury Note | | | 01/31/2023 | | | 2.38 | % | | 3,765,000 | | | 3,895,010 | |
United States Treasury Note | | | 03/31/2023 | | | 0.13 | % | | 26,265,000 | | | 26,222,935 | |
United States Treasury Note | | | 03/31/2023 | | | 1.50 | % | | 14,555,000 | | | 14,879,645 | |
United States Treasury Note | | | 05/15/2023 | | | 1.75 | % | | 1,810,000 | | | 1,861,189 | |
United States Treasury Note | | | 06/30/2023 | | | 2.63 | % | | 11,910,000 | | | 12,472,003 | |
United States Treasury Note | | | 09/30/2023 | | | 2.88 | % | | 505,000 | | | 534,156 | |
United States Treasury Note | | | 05/15/2024 | | | 0.25 | % | | 2,265,000 | | | 2,252,790 | |
United States Treasury Note | | | 06/15/2024 | | | 0.25 | % | | 4,585,000 | | | 4,557,418 | |
United States Treasury Note | | | 06/30/2024 | | | 2.00 | % | | 2,390,000 | | | 2,499,604 | |
United States Treasury Note | | | 09/30/2024 | | | 1.50 | % | | 9,730,000 | | | 10,039,764 | |
United States Treasury Note | | | 01/31/2025 | | | 1.38 | % | | 1,090,000 | | | 1,120,103 | |
United States Treasury Note | | | 02/15/2025 | | | 7.63 | % | | 900,000 | | | 1,127,777 | |
TOTAL U.S. GOVERNMENT NOTES (Cost $90,101,079) | | | | | | | | | | | | 90,493,803 | |
SHORT TERM INVESTMENT: 4.11% | | | | | | | |
MONEY MARKET FUND: 4.11% | | Shares | | | |
STIT-Government & Agency Portfolio, Institutional Class, 0.03% (e)(f) | | | 11,239,381 | | | 11,239,381 | |
TOTAL MONEY MARKET FUND (Cost $11,239.381) | | | | | | 11,239,381 | |
TOTAL SHORT TERM INVESTMENT (Cost $11,239,381) | | | | | | 11,239,381 | |
| | | | | | | |
TOTAL INVESTMENTS (Cost $238,397,443): 87.97% | | | | | | 240,378,230 | |
Other Assets in Excess of Liabilities: 12.03% (g) | | | | | | 32,863,620 | |
TOTAL NET ASSETS: 100.00% | | | | | $ | 273,241,850 | |
(a) | Security as defined in Rule 144A under the Securities Act of 1933 and determined to be liquid. Purchased in a private placement transaction; resale to the public may require registration or may extend only to qualified institutional buyers. At June 30, 2021, the value of these securities total $31,229,174 which represents 11.43% of total net assets. |
(b) | Foreign issued security. |
(c) | Variable rate security based on a reference index and spread. The rate reported is the rate in effect as of June 30, 2021. |
(d) | Variable rate security. The coupon is based on an underlying pool of loans. The rate reported is the rate in effect as of June 30, 2021. |
(e) | The rate quoted is the annualized seven-day effective yield as of June 30, 2021. |
(f) | All or a portion of this security is held by LCMT Fund Limited and pledged as collateral for derivative contracts. At June 30, 2021, the value of this collateral totals $369,727. |
(g) | Includes assets pledged as collateral and deposits with broker for derivative contracts. At June 30, 2021, the value of these assets totals $36,514,022. |
CMT | Constant Maturity Treasury |
LIBOR | London Interbank Offered Rate |
PLC | Public Limited Company |
SOFR | Secured Overnight Financing Rate |
The accompanying notes are an integral part of these consolidated financial statements.
| |
| |
| LoCorr Market Trend Fund - Consolidated Schedule of Open Forward Currency Contracts | 47 |
| |
LoCorr Market Trend Fund
Consolidated Schedule of Open Forward Currency Contracts(a)
June 30, 2021 (Unaudited)
| | | | | | | | Currency to be Received | | | Currency to be Delivered | | | | | |
| | Notional Amount | | | Forward Settlement Date | | | Curr Abbr. | | | U.S. $ Notional Amount as of June 30, 2021 | | | Curr Abbr. | | | U.S. $ Notional Amount on Origination Date | | Unrealized Appreciation | | Unrealized (Depreciation) | |
Purchase Contracts: | | | | | | | | | | | | | | | | | | | | | | | | | |
| | $ | 1,047,367 | | | | 09/17/2021 | | | | AUD | | | $ | 1,015,781 | | | | USD | | | $ | 1,047,367 | | $ | — | | $ | (31,586 | ) |
| | | 37,102,073 | | | | 09/17/2021 | | | | CAD | | | | 36,207,340 | | | | USD | | | | 37,102,073 | | | — | | | (894,733 | ) |
| | | 5,081,321 | | | | 09/17/2021 | | | | CHF | | | | 4,916,277 | | | | USD | | | | 5,081,321 | | | — | | | (165,044 | ) |
| | | 20,404,583 | | | | 09/17/2021 | | | | EUR | | | | 19,856,514 | | | | USD | | | | 20,404,583 | | | — | | | (548,069 | ) |
| | | 44,558,573 | | | | 09/17/2021 | | | | GBP | | | | 43,620,566 | | | | USD | | | | 44,558,573 | | | — | | | (938,007 | ) |
| | | 24,556,506 | | | | 09/17/2021 | | | | JPY | | | | 24,385,795 | | | | USD | | | | 24,556,506 | | | — | | | (170,711 | ) |
| | | 18,056,774 | | | | 09/17/2021 | | | | MXN | | | | 17,921,388 | | | | USD | | | | 18,056,774 | | | — | | | (135,386 | ) |
| | | 4,260,268 | | | | 09/17/2021 | | | | NZD | | | | 4,134,238 | | | | USD | | | | 4,260,268 | | | — | | | (126,030 | ) |
Total Purchase Contracts | | | | | | | | | | 152,057,899 | | | | | | | | 155,067,465 | | | — | | | (3,009,566 | ) |
| | | | | | | | | | | | | | | | | | | | | | | | | | | | | | |
Sale Contracts: | | | | | | | | | | | | | | | | | | | | | | | | | |
| | $ | 4,741,472 | | | | 09/17/2021 | | | | USD | | | $ | 4,599,525 | | | | AUD | | | $ | 4,741,472 | | $ | 141,947 | | $ | — | |
| | | 13,030,205 | | | | 09/17/2021 | | | | USD | | | | 12,766,629 | | | | CAD | | | | 13,030,205 | | | 263,576 | | | — | |
| | | 14,879,245 | | | | 09/17/2021 | | | | USD | | | | 14,782,407 | | | | CHF | | | | 14,879,245 | | | 96,838 | | | — | |
| | | 14,551,428 | | | | 09/17/2021 | | | | USD | | | | 14,430,951 | | | | EUR | | | | 14,551,428 | | | 120,477 | | | — | |
| | | 17,846,879 | | | | 09/17/2021 | | | | USD | | | | 17,712,208 | | | | GBP | | | | 17,846,879 | | | 134,671 | | | — | |
| | | 80,885,807 | | | | 09/17/2021 | | | | USD | | | | 79,829,791 | | | | JPY | | | | 80,885,807 | | | 1,056,016 | | | — | |
| | | 729,689 | | | | 09/17/2021 | | | | USD | | | | 746,249 | | | | MXN | | | | 729,689 | | | — | | | (16,560 | ) |
| | | 4,298,685 | | | | 09/17/2021 | | | | USD | | | | 4,203,421 | | | | NZD | | | | 4,298,685 | | | 95,264 | | | — | |
Total Sale Contracts | | | | | | | | | | 149,071,181 | | | | | | | | 150,963,410 | | | 1,908,789 | | | (16,560 | ) |
Net Forward Currency Contracts | | | | | | | | | $ | 2,986,718 | | | | | | | $ | 4,104,055 | | $ | 1,908,789 | | $ | (3,026,126 | ) |
Net Unrealized Depreciation | | | | | | | | | | | | | | | | | | | | | | | $ | (1,117,337 | ) |
Currency Abbreviations: |
AUD | AUSTRALIAN DOLLAR |
CAD | CANADIAN DOLLAR |
CHF | SWISS FRANC |
EUR | EURO |
GBP | BRITISH POUND |
JPY | JAPANESE YEN |
MXN | MEXICAN PESO |
NZD | NEW ZEALAND DOLLAR |
USD | U.S. DOLLAR |
(a) | Bank of America Merrill Lynch is the counterparty for all open forward currency exchange contracts held by the Fund as of June 30, 2021. |
The accompanying notes are an integral part of these consolidated financial statements.
| |
| |
| 48 | LoCorr Market Trend Fund - Consolidated Schedule of Open Futures Contracts |
| |
LoCorr Market Trend Fund
Consolidated Schedule of Open Futures Contracts
June 30, 2021 (Unaudited)
| | | | | | | | | | | | | | Value | |
Description | | Number of Contracts Purchased (Sold) | | | Settlement Month-Year | | | Current Notional Amount | | | Notional Amount at Trade Date | | | Unrealized Appreciation | | | Unrealized (Depreciation) | |
Purchase Contracts: | | | | | | | | | | | | | | | | | | | | | | | | |
3 Mo Euro Euribor | | | 921 | | | | Dec-22 | | | $ | 274,233,251 | | | $ | 274,277,666 | | | $ | — | | | $ | (44,415 | ) |
90 Day Euro | | | 404 | | | | Dec-22 | | | | 100,474,800 | | | | 100,491,895 | | | | — | | | | (17,095 | ) |
Aluminum (a)(b) | | | 156 | | | | Sep-21 | | | | 9,845,550 | | | | 9,713,521 | | | | 132,029 | | | | — | |
Brent Crude (a) | | | 127 | | | | Jul-21 | | | | 9,476,740 | | | | 9,270,499 | | | | 206,241 | | | | — | |
CAC 40 10 Euro Index | | | 208 | | | | Jul-21 | | | | 16,043,635 | | | | 16,347,095 | | | | — | | | | (303,460 | ) |
Coffee (a) | | | 97 | | | | Sep-21 | | | | 5,810,907 | | | | 5,849,409 | | | | — | | | | (38,502 | ) |
Copper (a)(b) | | | 37 | | | | Sep-21 | | | | 8,673,725 | | | | 9,315,108 | | | | — | | | | (641,383 | ) |
Corn (a) | | | 36 | | | | Dec-21 | | | | 1,059,300 | | | | 1,066,246 | | | | — | | | | (6,946 | ) |
Cotton No.2 (a) | | | 39 | | | | Dec-21 | | | | 1,655,550 | | | | 1,660,270 | | | | — | | | | (4,720 | ) |
DAX Index | | | 47 | | | | Sep-21 | | | | 21,634,434 | | | | 21,831,623 | | | | — | | | | (197,189 | ) |
Dow Jones Industrial Average Mini E-Cbot Index | | | 83 | | | | Sep-21 | | | | 14,275,585 | | | | 14,244,587 | | | | 30,998 | | | | — | |
Euro-Stoxx 50 Index | | | 423 | | | | Sep-21 | | | | 20,341,217 | | | | 20,707,574 | | | | — | | | | (366,357 | ) |
FTSE 100 Index | | | 177 | | | | Sep-21 | | | | 17,091,318 | | | | 17,361,438 | | | | — | | | | (270,120 | ) |
Gasoline RBOB (a) | | | 77 | | | | Jul-21 | | | | 7,249,981 | | | | 7,020,818 | | | | 229,163 | | | | — | |
Hang Seng Index | | | 66 | | | | Jul-21 | | | | 12,168,386 | | | | 12,362,145 | | | | — | | | | (193,759 | ) |
Heating Oil (a) | | | 94 | | | | Jul-21 | | | | 8,402,529 | | | | 8,326,935 | | | | 75,594 | | | | — | |
Low Sulphur Gasoil (a) | | | 158 | | | | Aug-21 | | | | 9,452,350 | | | | 9,458,335 | | | | — | | | | (5,985 | ) |
Nasdaq 100 E-Mini Index | | | 89 | | | | Sep-21 | | | | 25,897,220 | | | | 25,093,266 | | | | 803,954 | | | | — | |
Natural Gas (a) | | | 91 | | | | Jul-21 | | | | 3,321,500 | | | | 3,115,294 | | | | 206,206 | | | | — | |
Nikkei 225 Index | | | 50 | | | | Sep-21 | | | | 12,952,878 | | | | 13,048,744 | | | | — | | | | (95,866 | ) |
Russell 2000 Mini Index | | | 75 | | | | Sep-21 | | | | 8,654,250 | | | | 8,626,785 | | | | 27,465 | | | | — | |
S&P 500 E-Mini Index | | | 130 | | | | Sep-21 | | | | 27,875,900 | | | | 27,525,308 | | | | 350,592 | | | | — | |
Silver (a) | | | 22 | | | | Sep-21 | | | | 2,881,340 | | | | 2,885,457 | | | | — | | | | (4,117 | ) |
Soybean (a) | | | 11 | | | | Nov-21 | | | | 769,450 | | | | 758,051 | | | | 11,399 | | | | — | |
Soybean Oil (a) | | | 17 | | | | Dec-21 | | | | 640,152 | | | | 568,125 | | | | 72,027 | | | | — | |
Sugar (a) | | | 144 | | | | Sep-21 | | | | 2,885,299 | | | | 2,843,176 | | | | 42,123 | | | | — | |
Tokyo Price Index | | | 97 | | | | Sep-21 | | | | 16,964,850 | | | | 17,103,671 | | | | — | | | | (138,821 | ) |
U.S. 2 Yr Note | | | 589 | | | | Sep-21 | | | | 129,768,664 | | | | 129,983,520 | | | | — | | | | (214,856 | ) |
WTI Crude (a) | | | 122 | | | | Jul-21 | | | | 8,963,340 | | | | 8,753,241 | | | | 210,099 | | | | — | |
Zinc (a)(b) | | | 89 | | | | Sep-21 | | | | 6,623,825 | | | | 6,615,337 | | | | 8,488 | | | | — | |
Total Purchase Contracts | | | | | | | | | | | | | | | | | | | 2,406,378 | | | | (2,543,591 | ) |
| | | | | | | | | | | | | | | | | | | | | | | | | |
Sale Contracts: | | | | | | | | | | | | | | | | | | | | | | | | |
10 Yr Mini JGB | | | (12 | ) | | | Sep-21 | | | $ | 1,639,246 | | | $ | 1,637,664 | | | $ | — | | | $ | (1,582 | ) |
90 Day Sterling | | | (1,384 | ) | | | Dec-22 | | | | 238,233,667 | | | | 238,292,122 | | | | 58,455 | | | | — | |
Aluminum (a)(b) | | | (67 | ) | | | Sep-21 | | | | 4,228,537 | | | | 4,106,864 | | | | — | | | | (121,673 | ) |
Australian 10 Yr Bond | | | (443 | ) | | | Sep-21 | | | | 46,906,992 | | | | 46,896,537 | | | | — | | | | (10,455 | ) |
Canadian 10 Yr Bond | | | (346 | ) | | | Sep-21 | | | | 40,617,877 | | | | 40,270,954 | | | | — | | | | (346,923 | ) |
Cocoa (a) | | | (77 | ) | | | Sep-21 | | | | 1,740,438 | | | | 1,730,104 | | | | — | | | | (10,334 | ) |
Copper (a)(b) | | | (20 | ) | | | Sep-21 | | | | 4,688,500 | | | | 4,959,615 | | | | 271,115 | | | | — | |
Dollar | | | (83 | ) | | | Sep-21 | | | | 7,671,773 | | | | 7,480,344 | | | | — | | | | (191,429 | ) |
Euro-Bobl | | | (1,143 | ) | | | Sep-21 | | | | 181,814,727 | | | | 181,643,994 | | | | — | | | | (170,733 | ) |
Euro-Bund | | | (565 | ) | | | Sep-21 | | | | 115,639,592 | | | | 115,072,045 | | | | — | | | | (567,547 | ) |
Euro-Schatz | | | (61 | ) | | | Sep-21 | | | | 8,111,152 | | | | 8,115,645 | | | | 4,493 | | | | — | |
Gold (a) | | | (44 | ) | | | Aug-21 | | | | 7,795,040 | | | | 7,815,414 | | | | 20,374 | | | | — | |
Hard Red Wheat (a) | | | (3 | ) | | | Sep-21 | | | | 98,850 | | | | 92,555 | | | | — | | | | (6,295 | ) |
Japanese 10 Yr Bond | | | (55 | ) | | | Sep-21 | | | | 75,097,439 | | | | 74,956,934 | | | | — | | | | (140,505 | ) |
Long Gilt | | | (349 | ) | | | Sep-21 | | | | 61,842,968 | | | | 61,388,428 | | | | — | | | | (454,540 | ) |
Soybean Meal (a) | | | (111 | ) | | | Dec-21 | | | | 4,236,870 | | | | 4,167,149 | | | | — | | | | (69,721 | ) |
U.S. 10 Yr Note | | | (786 | ) | | | Sep-21 | | | | 104,145,000 | | | | 103,678,965 | | | | — | | | | (466,035 | ) |
U.S. 5 Yr Note | | | (1,682 | ) | | | Sep-21 | | | | 207,608,735 | | | | 207,722,946 | | | | 114,211 | | | | — | |
U.S. Long Bond | | | (111 | ) | | | Sep-21 | | | | 17,843,250 | | | | 17,437,121 | | | | — | | | | (406,129 | ) |
Wheat (a) | | | (6 | ) | | | Dec-21 | | | | 205,500 | | | | 192,836 | | | | — | | | | (12,664 | ) |
Zinc (a)(b) | | | (39 | ) | | | Sep-21 | | | | 2,902,575 | | | | 2,938,987 | | | | 36,412 | | | | — | |
Total Sale Contracts | | | | | | | | | | | | | | | | | | | 505,060 | | | | (2,976,565 | ) |
Total Futures Contracts | | | | | | | | | | | | | | | | | | $ | 2,911,438 | | | $ | (5,520,156 | ) |
Net Unrealized Depreciation | | | | | | | | | | | | | | | | | | | | | | $ | (2,608,718 | ) |
(a) | Contract held by LCMT Fund Limited. |
(b) | London Metal Exchange (“LME”) futures contracts settle on their respective maturity date. The unrealized appreciation on these contracts is a receivable for unsettled open futures contracts and the unrealized depreciation is a payable for unsettled open futures contracts on the Fund’s consolidated statement of assets and liabilities. |
| | |
| The accompanying notes are an integral part of these consolidated financial statements. |
| | |
| | |
| LoCorr Dynamic Equity Fund - Schedule of Investments | | 49 |
| | |
LoCorr Dynamic Equity Fund
Composition of Investment Portfolio1
June 30, 2021 (Unaudited)
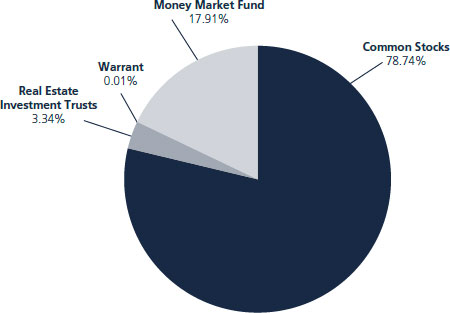
1 As a percentage of total investments.
Consolidated Schedule of Investments
June 30, 2021 (Unaudited)
| | Shares | | Value | |
COMMON STOCKS: 73.64% | | | | | | | |
Advertising: 0.45% | | | | | | | |
DKSH Holding AG (b) | | | 402 | | $ | 30,761 | |
Hakuhodo DY Holdings, Inc. (b) | | | 1,800 | | | 27,933 | |
Interpublic Group of Cos., Inc. | | | 964 | | | 31,320 | |
Publicis Groupe SA (b) | | | 156 | | | 9,978 | |
| | | | | | 99,992 | |
Aerospace & Defense: 0.49% | | | | | | | |
IHI Corp. (a)(b) | | | 1,200 | | | 28,473 | |
Kawasaki Heavy Industries Ltd. (a)(b) | | | 1,200 | | | 25,654 | |
Rheinmetall AG (b) | | | 270 | | | 26,668 | |
Saab AB (b) | | | 1,007 | | | 26,722 | |
| | | | | | 107,517 | |
Agriculture: 1.58% | | | | | | | |
Archer-Daniels-Midland Co. | | | 532 | | | 32,239 | |
Bunge Ltd. – ADR (b) | | | 390 | | | 30,479 | |
Turning Point Brands, Inc. | | | 6,239 | | | 285,559 | |
| | | | | | 348,277 | |
Airlines: 3.39% | | | | | | | |
Allegiant Travel Co. (a) | | | 3,860 | | | 748,840 | |
| | | | | | | |
Auto Manufacturers: 0.11% | | | | | | | |
Tesla Motors, Inc. (a) | | | 11 | | | 7,477 | |
Toyota Motor Corp. (b) | | | 200 | | | 17,480 | |
| | | | | | 24,957 | |
Auto Parts & Equipment: 0.13% | | | | | | | |
Commercial Vehicle Group, Inc. (a) | | | 2,746 | | | 29,190 | |
| | | | | | | |
Banks: 5.40% | | | | | | | |
Aozora Bank Ltd. (b) | | | 1,200 | | | 26,842 | |
Banco BPM SpA (b) | | | 9,511 | | | 30,596 | |
Banco de Sabadell SA (a)(b) | | | 43,471 | | | 29,598 | |
Bank of Queensland Ltd. (b) | | | 4,525 | | | 30,915 | |
BAWAG Group AG (b) | | | 524 | | | 27,885 | |
Bendigo & Adelaide Bank Ltd. (b) | | | 3,912 | | | 30,776 | |
The accompanying notes are an integral part of these financial statements.
| | |
| | |
50 | | LoCorr Dynamic Equity Fund – Schedule of Investments (continued) |
| | |
| | Shares | | Value | |
COMMON STOCKS: (continued) | | | | | | | |
Community Financial Corp. | | | 758 | | $ | 26,151 | |
CYBG PLC (a)(b) | | | 11,055 | | | 30,363 | |
Fifth Third Bancorp | | | 820 | | | 31,349 | |
Israel Discount Bank Ltd. (a)(b) | | | 1,678 | | | 7,988 | |
Regions Financial Corp. | | | 1,389 | | | 28,030 | |
Wells Fargo & Co. | | | 19,687 | | | 891,625 | |
| | | | | | 1,192,118 | |
Beverages: 1.14% | | | | | | | |
Coca-Cola Co. | | | 154 | | | 8,333 | |
Endeavour Group Ltd./Australia (a)(b) | | | 243 | | | 1,146 | |
Molson Coors Beverage Co. (a) | | | 4,510 | | | 242,142 | |
| | | | | | 251,621 | |
Biotechnology: 0.34% | | | | | | | |
Corteva, Inc. | | | 181 | | | 8,027 | |
CSL Ltd. (b) | | | 55 | | | 11,763 | |
Harvard Bioscience, Inc. (a) | | | 4,196 | | | 34,953 | |
Viracta Therapeutics, Inc. (a) | | | 1,722 | | | 19,528 | |
| | | | | | 74,271 | |
Building Materials: 0.55% | | | | | | | |
AGC, Inc. (b) | | | 600 | | | 25,168 | |
Boise Cascade Co. | | | 430 | | | 25,091 | |
HeidelbergCement AG (b) | | | 97 | | | 8,320 | |
Louisiana-Pacific Corp. | | | 555 | | | 33,461 | |
Wienerberger AG (b) | | | 764 | | | 29,442 | |
| | | | | | 121,482 | |
Chemicals: 0.51% | | | | | | | |
American Vanguard Corp. | | | 1,434 | | | 25,109 | |
Clariant AG (b) | | | 1,264 | | | 25,137 | |
Nifco, Inc. (b) | | | 800 | | | 30,208 | |
Sumitomo Chemical Co Ltd. (b) | | | 5,900 | | | 31,281 | |
| | | | | | 111,735 | |
Commercial Services: 1.40% | | | | | | | |
AMERCO | | | 55 | | | 32,417 | |
Brambles Ltd. (b) | | | 2,284 | | | 19,595 | |
Bureau Veritas SA (b) | | | 395 | | | 12,496 | |
Cross Country Healthcare, Inc. (a) | | | 1,769 | | | 29,206 | |
Gartner, Inc. (a) | | | 128 | | | 31,002 | |
GP Strategies Corp. (a) | | | 2,119 | | | 33,311 | |
Hays PLC (a)(b) | | | 13,651 | | | 29,949 | |
Herc Holdings, Inc. (a) | | | 258 | | | 28,914 | |
TechnoPro Holdings, Inc. (b) | | | 1,200 | | | 28,386 | |
TOPPAN, Inc. (b) | | | 1,800 | | | 28,921 | |
Worley Ltd. (b) | | | 3,906 | | | 35,035 | |
| | | | | | 309,232 | |
Computers: 0.89% | | | | | | | |
Apple, Inc. | | | 65 | | | 8,902 | |
Cognizant Technology Solutions Corp. | | | 418 | | | 28,950 | |
Cognyte Software Ltd. - ADR (a)(b) | | | 360 | | | 8,820 | |
Hewlett Packard Enterprise Co. | | | 2,129 | | | 31,041 | |
HP, Inc. | | | 1,057 | | | 31,911 | |
Quantum Corp. (a) | | | 3,847 | | | 26,506 | |
Sopra Steria Group SACA (b) | | | 161 | | | 30,965 | |
TietoEVRY Oyj (b) | | | 928 | | | 29,314 | |
| | | | | | 196,409 | |
Cosmetics & Personal Care: 1.43% | | | | | | | |
Colgate-Palmolive Co. | | | 429 | | | 34,899 | |
Coty, Inc. (a) | | | 27,432 | | | 256,215 | |
Procter & Gamble Company | | | 105 | | | 14,168 | |
Unilever PLC (b) | | | 165 | | | 9,656 | |
| | | | | | 314,938 | |
Distribution/Wholesale: 0.64% | | | | | | | |
Inchcape PLC (b) | | | 2,759 | | | 29,330 | |
Marubeni Corp. (b) | | | 3,400 | | | 29,567 | |
Sojitz Corp. (b) | | | 10,100 | | | 30,456 | |
Sumitomo Corp. (b) | | | 2,200 | | | 29,467 | |
Toyota Tsusho Corp. (b) | | | 500 | | | 23,628 | |
| | | | | | 142,448 | |
The accompanying notes are an integral part of these financial statements.
| | |
| | |
| LoCorr Dynamic Equity Fund - Schedule of Investments | | 51 |
| | |
| | Shares | | Value | |
COMMON STOCKS: (continued) | | | | | | | |
Diversified Financial Services: 6.53% | | | | | | | |
Close Brothers Group PLC (b) | | | 1,408 | | $ | 29,507 | |
Credit Acceptance Corp. (a) | | | 2,743 | | | 1,245,624 | |
Evercore Partners, Inc. | | | 236 | | | 33,222 | |
PennyMac Financial Services, Inc. | | | 1,200 | | | 74,064 | |
Pzena Investment Management, Inc. | | | 2,798 | | | 30,806 | |
Quilter PLC (b) | | | 14,551 | | | 29,941 | |
| | | | | | 1,443,164 | |
Electric: 1.32% | | | | | | | |
AES Corp. VA | | | 921 | | | 24,011 | |
Alliant Energy Corp. | | | 544 | | | 30,333 | |
Chubu Electric Power Co., Inc. (b) | | | 2,900 | | | 35,449 | |
CLP Holdings Ltd. (b) | | | 1,500 | | | 14,837 | |
CMS Energy Corp. | | | 555 | | | 32,789 | |
Contact Energy Ltd. (b) | | | 5,699 | | | 32,984 | |
DTE Energy Co. | | | 255 | | | 33,048 | |
Electric Power Development Co. Ltd. (b) | | | 1,400 | | | 19,974 | |
Enel SpA (b) | | | 1,028 | | | 9,547 | |
Iberdrola SA (b) | | | 719 | | | 8,764 | |
NextEra Energy, Inc. | | | 112 | | | 8,207 | |
PPL Corp. | | | 427 | | | 11,943 | |
Spark Infrastructure Group (b) | | | 17,957 | | | 30,301 | |
| | | | | | 292,187 | |
Electrical Components & Equipment: 0.14% | | | | | | | |
Signify NV (b) | | | 507 | | | 32,067 | |
| | | | | | | |
Electronics: 2.19% | | | | | | | |
Arrow Electronics, Inc. (a) | | | 274 | | | 31,189 | |
Electrocomponents PLC (b) | | | 2,072 | | | 29,493 | |
Flex Ltd. - ADR (a)(b) | | | 6,552 | | | 117,084 | |
Identiv, Inc. (a) | | | 1,883 | | | 32,011 | |
IntriCon Corp. (a) | | | 1,484 | | | 33,360 | |
Mettler-Toledo International, Inc. (a) | | | 23 | | | 31,863 | |
Sanmina Corp. (a) | | | 804 | | | 31,324 | |
SCREEN Holdings Co. Ltd. (b) | | | 200 | | | 19,767 | |
Spectris PLC (b) | | | 636 | | | 28,487 | |
Venture Corp Ltd. (b) | | | 2,000 | | | 28,572 | |
Vontier Corp. | | | 2,764 | | | 90,051 | |
Yokogawa Electric Corp. (b) | | | 700 | | | 10,460 | |
| | | | | | 483,661 | |
Engineering & Construction: 8.52% | | | | | | | |
Ackermans & Van Haaren NV (b) | | | 168 | | | 28,367 | |
COMSYS Holdings Corp. (b) | | | 1,100 | | | 30,447 | |
Frontdoor, Inc. (a) | | | 19,966 | | | 994,706 | |
Kyowa Exeo Corp. (b) | | | 1,200 | | | 29,542 | |
MasTec, Inc. (a) | | | 6,969 | | | 739,411 | |
Orion Group Holdings, Inc. (a) | | | 5,158 | | | 29,659 | |
Singapore Technologies Engineering Ltd. (b) | | | 10,200 | | | 29,355 | |
| | | | | | 1,881,487 | |
Entertainment: 0.58% | | | | | | | |
Cinemark Holdings, Inc. (a) | | | 3,528 | | | 77,440 | |
Red Rock Resorts, Inc. (a) | | | 1,168 | | | 49,640 | |
| | | | | | 127,080 | |
Environmental Control: 0.14% | | | | | | | |
Pure Cycle Corp. (a) | | | 2,281 | | | 31,523 | |
| | | | | | | |
Food: 1.95% | | | | | | | |
Ajinomoto Co., Inc. (b) | | | 1,200 | | | 31,152 | |
Axfood AB (b) | | | 1,128 | | | 31,198 | |
Chocoladefabriken Lindt & Spruengli AG (b) | | | 3 | | | 29,846 | |
Corbion NV (b) | | | 484 | | | 27,662 | |
Glanbia PLC (b) | | | 1,672 | | | 27,141 | |
J Sainsbury PLC (b) | | | 8,272 | | | 31,101 | |
Kewpie Corp. (b) | | | 1,300 | | | 29,172 | |
Marks & Spencer Group PLC (a)(b) | | | 14,375 | | | 29,121 | |
Nestle SA (b) | | | 208 | | | 25,902 | |
Nichirei Corp. (b) | | | 1,000 | | | 26,275 | |
Seneca Foods Corp. (a) | | | 555 | | | 28,349 | |
Sysco Corp. | | | 320 | | | 24,880 | |
The accompanying notes are an integral part of these financial statements.
| | |
| | |
52 | | LoCorr Dynamic Equity Fund – Schedule of Investments (continued) |
| | |
| | Shares | | Value | |
COMMON STOCKS: (continued) | | | | | | | |
Tate & Lyle PLC (b) | | | 2,793 | | $ | 28,529 | |
Viscofan SA (b) | | | 385 | | | 26,843 | |
Woolworths Group Ltd. (b) | | | 243 | | | 6,949 | |
Yamazaki Baking Co. Ltd. (b) | | | 1,900 | | | 26,783 | |
| | | | | | 430,903 | |
Forest Products & Paper: 0.13% | | | | | | | |
BillerudKorsnas AB (b) | | | 1,493 | | | 29,631 | |
| | | | | | | |
Gas: 0.30% | | | | | | | |
Centrica PLC (a)(b) | | | 37,627 | | | 26,784 | |
Hong Kong & China Gas Co. Ltd. (b) | | | 5,250 | | | 8,155 | |
Italgas SpA (b) | | | 4,765 | | | 31,143 | |
| | | | | | 66,082 | |
Health Care - Products: 1.37% | | | | | | | |
Ansell Ltd. (b) | | | 951 | | | 31,032 | |
Butterfly Network, Inc. (a) | | | 1,500 | | | 21,720 | |
Conformis, Inc. (a) | | | 29,469 | | | 33,889 | |
FONAR Corp. (a) | | | 1,772 | | | 31,329 | |
Getinge AB (b) | | | 827 | | | 31,193 | |
GN Store Nord AS (b) | | | 353 | | | 30,835 | |
IDEXX Laboratories, Inc. (a) | | | 55 | | | 34,735 | |
Nihon Kohden Corp. (b) | | | 1,000 | | | 28,534 | |
Tecan Group AG (b) | | | 60 | | | 29,726 | |
Utah Medical Products, Inc. | | | 348 | | | 29,594 | |
| | | | | | 302,587 | |
Healthcare - Services: 0.15% | | | | | | | |
Sonic Healthcare Ltd. (b) | | | 1,185 | | | 34,126 | |
| | | | | | | |
Holding Companies - Diversified: 0.51% | | | | | | | |
Mission Advancement Corp. (a) | | | 5,083 | | | 49,356 | |
Mudrick Capital Acquisition Corp II (a) | | | 3,119 | | | 38,863 | |
Swire Pacific Ltd. (b) | | | 3,500 | | | 23,733 | |
| | | | | | 111,952 | |
Home Builders: 0.50% | | | | | | | |
Bellway PLC (b) | | | 558 | | | 25,009 | |
Haseko Corp. (b) | | | 2,200 | | | 30,140 | |
NVR, Inc. (a) | | | 5 | | | 24,866 | |
Vistry Group PLC (b) | | | 1,828 | | | 29,750 | |
| | | | | | 109,765 | |
Home Furnishings: 0.19% | | | | | | | |
Hooker Furniture Corp. | | | 482 | | | 16,697 | |
Whirlpool Corporation | | | 114 | | | 24,854 | |
| | | | | | 41,551 | |
Housewares: 0.12% | | | | | | | |
Lifetime Brands, Inc. | | | 1,773 | | | 26,542 | |
| | | | | | | |
Insurance: 0.88% | | | | | | | |
eHealth, Inc. (a) | | | 1,868 | | | 109,091 | |
Medibank Pvt Ltd. (b) | | | 12,458 | | | 29,523 | |
Storebrand ASA (b) | | | 2,960 | | | 26,815 | |
W R Berkley Corp. | | | 383 | | | 28,507 | |
| | | | | | 193,936 | |
Internet: 4.97% | | | | | | | |
Alibaba Group Holding Ltd. - ADR (a)(b) | | | 784 | | | 177,796 | |
Alphabet, Inc. (a) | | | 4 | | | 10,025 | |
Alphabet, Inc. (a) | | | 6 | | | 14,651 | |
Amazon.com, Inc. (a) | | | 7 | | | 24,081 | |
ASOS PLC (a)(b) | | | 115 | | | 7,890 | |
Bumble, Inc. (a) | | | 2,002 | | | 115,315 | |
carsales.com Ltd. (b) | | | 1,946 | | | 28,838 | |
Expedia, Inc. (a) | | | 182 | | | 29,795 | |
Facebook, Inc. (a) | | | 26 | | | 9,040 | |
GoDaddy, Inc. (a) | | | 2,572 | | | 223,661 | |
IAC/InterActiveCorp. (a) | | | 194 | | | 29,909 | |
Magnite, Inc. (a) | | | 3,090 | | | 104,566 | |
Netflix, Inc. (a) | | | 14 | | | 7,395 | |
Opendoor Technologies, Inc. (a) | | | 7,694 | | | 136,415 | |
The accompanying notes are an integral part of these financial statements.
| | |
| | |
| LoCorr Dynamic Equity Fund - Schedule of Investments (continued) | | 53 |
| | |
| | Shares | | Value | |
COMMON STOCKS: (continued) | | | | | | | |
Snap, Inc. (a) | | | 2,633 | | $ | 179,413 | |
| | | | | | 1,098,790 | |
Leisure Time: 0.25% | | | | | | | |
Thule Group AB (b) | | | 695 | | | 30,811 | |
Yamaha Motor Co. Ltd. (b) | | | 900 | | | 24,465 | |
| | | | | | 55,276 | |
Lodging: 1.07% | | | | | | | |
Full House Resorts, Inc. (a) | | | 6,175 | | | 61,379 | |
Wynn Resorts Ltd. (a) | | | 1,436 | | | 175,623 | |
| | | | | | 237,002 | |
Machinery - Diversified: 0.91% | | | | | | | |
Bucher Industries AG (b) | | | 59 | | | 30,850 | |
CNH Industrial NV (b) | | | 1,197 | | | 19,764 | |
Ebara Corp. (b) | | | 600 | | | 29,542 | |
Husqvarna AB (b) | | | 684 | | | 9,087 | |
Ingersoll Rand, Inc. (a) | | | 475 | | | 23,185 | |
Nabtesco Corp. (b) | | | 500 | | | 18,903 | |
Otis Worldwide Corp. | | | 211 | | | 17,254 | |
Sumitomo Heavy Industries Ltd. (b) | | | 1,000 | | | 27,544 | |
THK Co. Ltd. (b) | | | 800 | | | 23,872 | |
| | | | | | 200,001 | |
Media: 6.83% | | | | | | | |
Cumulus Media, Inc. (a) | | | 2,230 | | | 32,669 | |
DISH Network Corp. (a) | | | 2,681 | | | 112,066 | |
Entravision Communications Corp. | | | 6,784 | | | 45,317 | |
Hemisphere Media Group, Inc. (a) | | | 2,627 | | | 30,999 | |
Liberty Media Corp. - Liberty Formula One (a) | | | 577 | | | 27,817 | |
News Corporation | | | 9,196 | | | 236,981 | |
Nexstar Broadcasting Group, Inc. | | | 4,811 | | | 711,451 | |
Pearson PLC (b) | | | 2,076 | | | 23,835 | |
ProSiebenSat.1 Media SE (b) | | | 1,589 | | | 31,607 | |
ViacomCBS, Inc. | | | 5,495 | | | 248,374 | |
Walt Disney Co. (a) | | | 42 | | | 7,382 | |
| | | | | | 1,508,498 | |
Metal Fabricate & Hardware: 0.22% | | | | | | | |
Olympic Steel, Inc. | | | 802 | | | 23,571 | |
Park-Ohio Holdings Corp. | | | 779 | | | 25,037 | |
| | | | | | 48,608 | |
Mining: 0.14% | | | | | | | |
BHP Group Ltd. (b) | | | 258 | | | 9,397 | |
Mitsubishi Materials Corp. (b) | | | 1,100 | | | 21,932 | |
| | | | | | 31,329 | |
Miscellaneous Manufacturing: 0.28% | | | | | | | |
Nikon Corp. (b) | | | 2,800 | | | 29,866 | |
Textron, Inc. | | | 468 | | | 32,185 | |
| | | | | | 62,051 | |
Office & Business Equipment: 0.13% | | | | | | | |
Konica Minolta, Inc. (b) | | | 5,300 | | | 29,292 | |
| | | | | | | |
Oil & Gas: 1.78% | | | | | | | |
APA Corp. | | | 11,440 | | | 247,447 | |
Exxon Mobil Corp. | | | 123 | | | 7,759 | |
Hess Corp. | | | 347 | | | 30,300 | |
Rubis SCA (b) | | | 584 | | | 25,961 | |
SandRidge Energy, Inc. (a) | | | 2,937 | | | 18,444 | |
TOTAL SA (b) | | | 176 | | | 7,963 | |
Trecora Resources (a) | | | 2,108 | | | 17,539 | |
VAALCO Energy, Inc. (a) | | | 9,217 | | | 29,955 | |
Woodside Petroleum Ltd. (b) | | | 482 | | | 8,028 | |
| | | | | | 393,396 | |
Oil & Gas Services: 0.22% | | | | | | | |
John Wood Group PLC (a)(b) | | | 7,209 | | | 21,909 | |
SBM Offshore NV (b) | | | 1,775 | | | 26,972 | |
| | | | | | 48,881 | |
Packaging & Containers: 0.39% | | | | | | | |
Gerresheimer AG (b) | | | 270 | | | 29,854 | |
Huhtamaki Oyj (b) | | | 559 | | | 26,480 | |
Sealed Air Corp. | | | 519 | | | 30,751 | |
| | | | | | 87,085 | |
The accompanying notes are an integral part of these financial statements.
| | |
| | |
54 | | LoCorr Dynamic Equity Fund – Schedule of Investments (continued) |
| | |
| | Shares | | Value | |
COMMON STOCKS: (continued) | | | | | | | |
Pharmaceuticals: 2.59% | | | | | | | |
Bausch Health Cos, Inc. - ADR (a)(b) | | | 3,828 | | $ | 112,237 | |
Cardinal Health, Inc. | | | 204 | | | 11,646 | |
Galenica AG (b) | | | 441 | | | 31,124 | |
Harrow Health, Inc. (a) | | | 3,089 | | | 28,697 | |
Heron Therapeutics, Inc. (a) | | | 3,471 | | | 53,870 | |
Hisamitsu Pharmaceutical Co., Inc. (b) | | | 500 | | | 24,618 | |
Medipal Holdings Corp. (b) | | | 1,400 | | | 26,741 | |
Nature’s Sunshine Products, Inc. | | | 1,635 | | | 28,400 | |
Novartis AG (b) | | | 82 | | | 7,473 | |
Roche Holding AG (b) | | | 28 | | | 10,548 | |
Viatris, Inc. | | | 13,631 | | | 194,787 | |
Zogenix, Inc. (a) | | | 2,410 | | | 41,645 | |
| | | | | | 571,786 | |
Pipelines: 0.13% | | | | | | | |
Cheniere Energy, Inc. (a) | | | 342 | | | 29,665 | |
| | | | | | | |
Real Estate: 0.28% | | | | | | | |
Hang Lung Group Ltd. (b) | | | 10,000 | | | 25,501 | |
Tokyo Tatemono Co. Ltd. (b) | | | 2,000 | | | 28,516 | |
Vonovia SE (b) | | | 136 | | | 8,792 | |
| | | | | | 62,809 | |
Retail: 1.99% | | | | | | | |
Bassett Furniture Industries, Inc. | | | 1,162 | | | 28,295 | |
Domino’s Pizza Inc | | | 70 | | | 32,654 | |
Genuine Parts Co. | | | 187 | | | 23,650 | |
Grafton Group PLC (b) | | | 1,862 | | | 29,543 | |
HUGO BOSS AG (b) | | | 551 | | | 29,976 | |
Kingfisher PLC (b) | | | 5,884 | | | 29,668 | |
K’s Holdings Corp. (b) | | | 2,700 | | | 31,036 | |
Sugi Holdings Co. Ltd. (b) | | | 400 | | | 29,164 | |
Ulta Beauty, Inc. (a) | | | 427 | | | 147,644 | |
Walgreens Boots Alliance, Inc. | | | 154 | | | 8,102 | |
Walmart, Inc. | | | 60 | | | 8,461 | |
Yamada Holdings Co. Ltd. (b) | | | 6,700 | | | 30,938 | |
Zalando SE (a)(b) | | | 105 | | | 10,919 | |
| | | | | | 440,050 | |
Semiconductors: 0.97% | | | | | | | |
ASML Holding NV (b) | | | 19 | | | 13,054 | |
Cirrus Logic, Inc. (a) | | | 2,049 | | | 174,411 | |
EMCORE Corp. (a) | | | 2,883 | | | 26,581 | |
| | | | | | 214,046 | |
Software: 3.99% | | | | | | | |
Avaya Holdings Corp. (a) | | | 2,732 | | | 73,491 | |
Castlight Health, Inc. (a) | | | 14,959 | | | 39,342 | |
Media and Games Invest SE (a)(b) | | | 28,619 | | | 169,607 | |
Microsoft Corp. | | | 29 | | | 7,856 | |
salesforce.com, Inc. (a) | | | 722 | | | 176,363 | |
SS&C Technologies Holdings, Inc. | | | 2,389 | | | 172,151 | |
Take-Two Interactive Software, Inc. (a) | | | 1,376 | | | 243,579 | |
| | | | | | 882,389 | |
Telecommunications: 1.98% | | | | | | | |
AT&T, Inc. | | | 5,004 | | | 144,015 | |
Corning, Inc. | | | 733 | | | 29,980 | |
Deutsche Telekom AG (b) | | | 369 | | | 7,794 | |
Echostar Corp. (a) | | | 820 | | | 19,918 | |
Eutelsat Communications SA (b) | | | 2,572 | | | 30,052 | |
Freenet AG (b) | | | 1,304 | | | 30,801 | |
Motorola Solutions, Inc. | | | 145 | | | 31,443 | |
NetLink NBN Trust (b) | | | 41,100 | | | 29,036 | |
SoftBank Group Corp. (b) | | | 200 | | | 13,997 | |
Spok Holdings, Inc. | | | 2,773 | | | 26,676 | |
Vonage Holdings Corp. (a) | | | 5,105 | | | 73,563 | |
| | | | | | 437,275 | |
Toys, Games & Hobbies: 0.04% | | | | | | | |
Hasbro, Inc. | | | 88 | | | 8,318 | |
The accompanying notes are an integral part of these financial statements.
| | |
| | |
| LoCorr Dynamic Equity Fund - Schedule of Investments (continued) | | 55 |
| | |
| | Shares | | Value | |
COMMON STOCKS: (continued) | | | | | | | |
Transportation: 0.51% | | | | | | | |
ComfortDelGro Corp. Ltd. (b) | | | 23,800 | | $ | 29,026 | |
Kamigumi Co. Ltd. (b) | | | 1,500 | | | 30,420 | |
Royal Mail PLC (b) | | | 3,826 | | | 30,559 | |
Sankyu, Inc. (b) | | | 500 | | | 21,671 | |
| | | | | | 111,676 | |
TOTAL COMMON STOCKS (Cost $14,089,370) | | | | | | 16,269,494 | |
| | | | | | | |
REAL ESTATE INVESTMENT TRUSTS: 3.12% | | | | | | | |
AGNC Investment Corp. | | | 464 | | | 7,837 | |
Alstria Office REIT-AG (b) | | | 1,663 | | | 30,742 | |
Big Yellow Group PLC (b) | | | 1,748 | | | 31,603 | |
Braemar Hotels & Resorts, Inc. (a) | | | 5,047 | | | 31,342 | |
Daiwa Office Investment Corp. (b) | | | 4 | | | 27,832 | |
Duke Realty Corp. | | | 660 | | | 31,251 | |
Equity Commonwealth | | | 670 | | | 17,554 | |
Invitation Homes, Inc. | | | 840 | | | 31,324 | |
Japan Logistics Fund, Inc. (b) | | | 9 | | | 27,058 | |
Japan Prime Realty Investment Corp. (b) | | | 3 | | | 11,747 | |
Kenedix Office Investment Corp. (b) | | | 3 | | | 21,144 | |
Keppel DC REIT (b) | | | 16,500 | | | 30,553 | |
Kimco Realty Corp. | | | 6,956 | | | 145,033 | |
LondonMetric Property PLC (b) | | | 9,190 | | | 29,417 | |
Mori Hills REIT Investment Corp. (b) | | | 20 | | | 29,992 | |
Park Hotels & Resorts, Inc. (a) | | | 7,240 | | | 149,216 | |
Retail Value, Inc. | | | 1,635 | | | 35,561 | |
TOTAL REAL ESTATE INVESTMENT TRUSTS (Cost $680,125) | | | | | | 689,206 | |
| | | | | | | |
WARRANT: 0.01% | | | | | | | |
Mission Advancement Corp., Exercise Price: $11.50, 03/05/2026 (Acquired 03/03/2021, Cost $973) (a) | | | 1,624 | | | 1,315 | |
TOTAL WARRANT (Cost $973) | | | | | | 1,315 | |
| | | | | | | |
SHORT TERM INVESTMENT: 16.75% | | | | | | | |
MONEY MARKET FUND: 16.75% | | | | | | | |
STIT-Government & Agency Portfolio, Institutional Class, 0.03% (c) | | | 3,701,507 | | | 3,701,507 | |
TOTAL MONEY MARKET FUND (Cost $3,701,507) | | | | | | 3,701,507 | |
TOTAL SHORT TERM INVESTMENT (Cost $3,701,507) | | | | | | 3,701,507 | |
| | | | | | | |
TOTAL INVESTMENTS (Cost $18,471,975): 93.52% | | | | | | 20,661,522 | |
Other Assets in Excess of Liabilities: 6.48% (d) | | | | | | 1,432,545 | |
TOTAL NET ASSETS: 100.00% | | | | | $ | 22,094,067 | |
| | | | | | | | |
(a) | Non-dividend income producing security. |
(b) | Foreign issued security. |
(c) | The rate quoted is the annualized seven-day effective yield as of June 30, 2021. |
(d) | Includes assets pledged as collateral and deposits with broker for securities sold short. At June 30, 2021, the value of these assets total $6,103,400. |
ADR | American Depositary Reciept |
PLC | Public Limited Company |
The accompanying notes are an integral part of these financial statements.
| |
| |
| 56 | LoCorr Dynamic Equity Fund – Schedule of Securities Sold Short |
| |
LoCorr Dynamic Equity Fund
Schedule of Securities Sold Short
June 30, 2021 (Unaudited)
| | Shares | | | Value | |
COMMON STOCKS: (17.63)% | | | | | | | | |
Aerospace & Defense: (0.41)% | | | | | | | | |
Boeing Co. (a) | | | (112 | ) | | $ | (26,831 | ) |
Raytheon Technologies Corp. | | | (300 | ) | | | (25,593 | ) |
Rolls-Royce Holdings PLC (a)(b) | | | (10,070 | ) | | | (13,779 | ) |
Safran SA (b) | | | (177 | ) | | | (24,539 | ) |
| | | | | | | (90,742 | ) |
Agriculture: (0.09)% | | | | | | | | |
British American Tobacco PLC (b) | | | (518 | ) | | | (20,063 | ) |
| | | | | | | | |
Airlines: (0.62)% | | | | | | | | |
Air Canada | | | (357 | ) | | | (7,344 | ) |
ANA Holdings, Inc. (a)(b) | | | (1,200 | ) | | | (28,214 | ) |
Delta Air Lines, Inc. (a) | | | (1,705 | ) | | | (73,758 | ) |
Japan Airlines Co. Ltd. (a)(b) | | | (1,300 | ) | | | (28,096 | ) |
| | | | | | | (137,412 | ) |
Apparel: (0.79)% | | | | | | | | |
Adidas AG (b) | | | (73 | ) | | | (27,171 | ) |
Skechers U.S.A., Inc. (a) | | | (1,498 | ) | | | (74,645 | ) |
Tapestry, Inc. (a) | | | (1,694 | ) | | | (73,655 | ) |
| | | | | | | (175,471 | ) |
Auto Manufacturers: (0.10)% | | | | | | | | |
Subaru Corp. (b) | | | (500 | ) | | | (9,863 | ) |
Volvo AB (b) | | | (469 | ) | | | (11,284 | ) |
| | | | | | | (21,147 | ) |
Banks: (0.70)% | | | | | | | | |
Banco Santander SA (b) | | | (7,030 | ) | | | (26,837 | ) |
Goldman Sachs Group, Inc. | | | (207 | ) | | | (78,563 | ) |
ING Groep NV (b) | | | (1,923 | ) | | | (25,401 | ) |
Intesa Sanpaolo SpA (b) | | | (8,973 | ) | | | (24,785 | ) |
| | | | | | | (155,586 | ) |
Beverages: (0.30)% | | | | | | | | |
Diageo PLC (b) | | | (413 | ) | | | (19,773 | ) |
National Beverage Corp. | | | (607 | ) | | | (28,669 | ) |
Pernod Ricard SA (b) | | | (75 | ) | | | (16,648 | ) |
| | | | | | | (65,090 | ) |
Chemicals: (0.42)% | | | | | | | | |
Ecolab, Inc. | | | (104 | ) | | | (21,421 | ) |
Givaudan SA (b) | | | (4 | ) | | | (18,603 | ) |
International Flavors & Fragrances, Inc. | | | (190 | ) | | | (28,386 | ) |
Nippon Paint Holdings Co. Ltd. (b) | | | (1,800 | ) | | | (24,433 | ) |
| | | | | | | (92,843 | ) |
Commercial Services: (0.49)% | | | | | | | | |
ADT, Inc. | | | (3,156 | ) | | | (34,053 | ) |
Atlantia SpA (a)(b) | | | (1,466 | ) | | | (26,544 | ) |
RELX PLC (b) | | | (944 | ) | | | (25,059 | ) |
Strategic Education, Inc. | | | (293 | ) | | | (22,286 | ) |
| | | | | | | (107,942 | ) |
Computers: (0.12)% | | | | | | | | |
Nomura Research Institute Ltd. (b) | | | (800 | ) | | | (26,464 | ) |
| | | | | | | | |
Cosmetics & Personal Care: (0.12)% | | | | | | | | |
Kao Corp. (b) | | | (200 | ) | | | (12,305 | ) |
Shiseido Co. Ltd. (b) | | | (200 | ) | | | (14,710 | ) |
| | | | | | | (27,015 | ) |
Distribution/Wholesale: (0.05)% | | | | | | | | |
Titan Machinery, Inc. (a) | | | (363 | ) | | | (11,231 | ) |
| | | | | | | | |
Diversified Financial Services: (1.78)% | | | | | | | | |
Charles Schwab Corp./The | | | (1,541 | ) | | | (112,200 | ) |
LendingTree, Inc. (a) | | | (144 | ) | | | (30,511 | ) |
London Stock Exchange Group PLC (b) | | | (266 | ) | | | (29,326 | ) |
Moelis & Co. | | | (660 | ) | | | (37,547 | ) |
The accompanying notes are an integral part of these financial statements.
| |
| |
| LoCorr Dynamic Equity Fund – Schedule of Securities Sold Short (continued) | 57 |
| |
| | Shares | | | Value | |
COMMON STOCKS: (continued) | | | | | | | | |
Nasdaq, Inc. | | | (636 | ) | | $ | (111,809 | ) |
Raymond James Financial, Inc. | | | (556 | ) | | | (72,224 | ) |
| | | | | | | (393,617 | ) |
Electric: (0.43)% | | | | | | | | |
Electricite de France SA (b) | | | (1,844 | ) | | | (25,189 | ) |
Engie SA (b) | | | (1,478 | ) | | | (20,249 | ) |
National Grid PLC (b) | | | (1,543 | ) | | | (19,654 | ) |
PG&E Corp. (a) | | | (2,893 | ) | | | (29,422 | ) |
| | | | | | | (94,514 | ) |
Electrical Components & Equipment: (0.14)% | | | | | | | | |
Vestas Wind System (b) | | | (795 | ) | | | (31,033 | ) |
| | | | | | | | |
Electronics: (0.23)% | | | | | | | | |
Assa Abloy AB (b) | | | (872 | ) | | | (26,268 | ) |
Kyocera Corp. (b) | | | (400 | ) | | | (24,728 | ) |
| | | | | | | (50,996 | ) |
Energy - Alternate Sources: (0.15)% | | | | | | | | |
Ballard Power Systems, Inc. (b) | | | (1,828 | ) | | | (33,151 | ) |
| | | | | | | | |
Engineering & Construction: (0.44)% | | | | | | | | |
Aeroports de Paris (a)(b) | | | (208 | ) | | | (27,093 | ) |
Fraport AG Frankfurt Airport Services Worldwide (a)(b) | | | (227 | ) | | | (15,466 | ) |
Japan Airport Terminal Co. Ltd. (a)(b) | | | 500 | ) | | | (22,458 | ) |
SWECO AB (b) | | | (1,709 | ) | | | (31,092 | ) |
| | | | | | | (96,109 | ) |
Entertainment: (0.30)% | | | | | | | | |
CTS Eventim AG & Co. KGaA (a)(b) | | | (438 | ) | | | (27,370 | ) |
Oriental Land Co. Ltd./Japan (b) | | | (100 | ) | | | (14,249 | ) |
Toho Co. Ltd. (b) | | | (600 | ) | | | (24,736 | ) |
| | | | | | | (66,355 | ) |
Food: (0.61)% | | | | | | | | |
Beyond Meat, Inc. (a) | | | (408 | ) | | | (64,256 | ) |
General Mills, Inc. | | | (1,155 | ) | | | (70,374 | ) |
| | | | | | | (134,630 | ) |
Food Service: (0.11)% | | | | | | | | |
Compass Group PLC (a)(b) | | | (1,185 | ) | | | (24,949 | ) |
| | | | | | | | |
Healthcare - Services: (0.14)% | | | | | | | | |
Teladoc, Inc. (a) | | | (190 | ) | | | (31,595 | ) |
| | | | | | | | |
Insurance: (0.82)% | | | | | | | | |
Hiscox Ltd. (a)(b) | | | (2,632 | ) | | | (30,277 | ) |
Kinsale Capital Group, Inc. | | | (179 | ) | | | (29,494 | ) |
Lemonade, Inc. (a) | | | (280 | ) | | | (30,635 | ) |
MBIA, Inc. (a) | | | (2,870 | ) | | | (31,570 | ) |
Palomar Holdings, Inc. (a) | | | (396 | ) | | | (29,882 | ) |
United Insurance Holdings Corp. | | | (5,053 | ) | | | (28,802 | ) |
| | | | | | | (180,660 | ) |
Internet: (0.94)% | | | | | | | | |
CarParts.com, Inc. (a) | | | (1,812 | ) | | | (36,892 | ) |
Delivery Hero SE (a)(b) | | | (234 | ) | | | (30,910 | ) |
Facebook, Inc. (a) | | | (105 | ) | | | (36,510 | ) |
Prosus NV (b) | | | (228 | ) | | | (22,296 | ) |
Rakuten, Inc. (b) | | | (1,800 | ) | | | (20,318 | ) |
Stitch Fix, Inc. (a) | | | (549 | ) | | | (33,105 | ) |
Z Holdings Corp. (b) | | | (5,400 | ) | | | (27,064 | ) |
| | | | | | | (207,095 | ) |
Leisure Time: (1.11)% | | | | | | | | |
Brunswick Corp. | | | (239 | ) | | | (23,809 | ) |
Norwegian Cruise Line Holdings Ltd. - ADR (a)(b) | | | (2,507 | ) | | | (73,731 | ) |
Peloton Interactive, Inc. (a) | | | (304 | ) | | | (37,702 | ) |
Polaris Industries, Inc. | | | (189 | ) | | | (25,885 | ) |
Royal Caribbean Cruises Ltd. - ADR (a)(b) | | | (869 | ) | | | (74,108 | ) |
Virgin Galactic Holdings, Inc. (a) | | | (207 | ) | | | (9,522 | ) |
| | | | | | | (244,757 | ) |
Lodging: (0.92)% | | | | | | | | |
Hilton Worldwide Holdings, Inc. (a) | | | (617 | ) | | | (74,423 | ) |
Hyatt Hotels Corp. (a) | | | (1,322 | ) | | | (102,640 | ) |
The accompanying notes are an integral part of these financial statements.
| |
| |
| 58 | LoCorr Dynamic Equity Fund – Schedule of Securities Sold Short (continued) |
| |
| | Shares | | | Value | |
COMMON STOCKS: (continued) | | | | | | | | |
Las Vegas Sands Corp. (a) | | | (494 | ) | | $ | (26,029 | ) |
| | | | | | | (203,092 | ) |
Mining: (0.10)% | | | | | | | | |
B2Gold Corp. | | | (5,182 | ) | | | (21,738 | ) |
| | | | | | | | |
Oil & Gas: (0.51)% | | | | | | | | |
Devon Energy Corp. | | | (1,307 | ) | | | (38,151 | ) |
Diamondback Energy, Inc. | | | (401 | ) | | | (37,650 | ) |
Exxon Mobil Corp. | | | (589 | ) | | | (37,154 | ) |
| | | | | | | (112,955 | ) |
Pharmaceuticals: (0.48)% | | | | | | | | |
Chugai Pharmaceutical Co. Ltd. (b) | | | (400 | ) | | | (15,850 | ) |
Daiichi Sankyo Co. Ltd. (b) | | | (900 | ) | | | (19,398 | ) |
Eisai Co. Ltd. (b) | | | (200 | ) | | | (19,668 | ) |
Pacira Pharmaceuticals, Inc. (a) | | | (403 | ) | | | (24,454 | ) |
Reata Pharmaceuticals, Inc. (a) | | | (59 | ) | | | (8,350 | ) |
Viatris, Inc. | | | (1,324 | ) | | | (18,920 | ) |
| | | | | | | (106,640 | ) |
Pipelines: (0.12)% | | | | | | | | |
Equitrans Midstream Corp. | | | (2,258 | ) | | | (19,216 | ) |
TC Energy Corp. (b) | | | (156 | ) | | | (7,719 | ) |
| | | | | | | (26,935 | ) |
Real Estate: (0.22)% | | | | | | | | |
Relo Group, Inc. (b) | | | (1,100 | ) | | | (25,150 | ) |
Wharf Real Estate Investment Co. Ltd. (b) | | | (4,000 | ) | | | (23,260 | ) |
| | | | | | | (48,410 | ) |
Retail: (1.65)% | | | | | | | | |
Asbury Automotive Group, Inc. (a) | | | (229 | ) | | | (39,244 | ) |
AutoNation, Inc. (a) | | | (411 | ) | | | (38,967 | ) |
Boot Barn Holdings, Inc. (a) | | | (314 | ) | | | (26,392 | ) |
Carvana Co. (a) | | | (123 | ) | | | (37,124 | ) |
Dick’s Sporting Goods, Inc. | | | (377 | ) | | | (37,772 | ) |
Hennes & Mauritz AB (a)(b) | | | (1,105 | ) | | | (26,211 | ) |
PetMed Express, Inc. | | | (862 | ) | | | (27,455 | ) |
RH (a) | | | (54 | ) | | | (36,666 | ) |
Texas Roadhouse, Inc. | | | (397 | ) | | | (38,191 | ) |
Vroom, Inc. (a) | | | (716 | ) | | | (29,972 | ) |
Welcia Holdings Co. Ltd. (b) | | | (800 | ) | | | (26,140 | ) |
| | | | | | | (364,134 | ) |
Software: (0.82)% | | | | | | | | |
Medallia, Inc. (a) | | | (1,150 | ) | | | (38,813 | ) |
Snowflake, Inc. (a) | | | (138 | ) | | | (33,368 | ) |
SolarWinds Corp. (a) | | | (1,032 | ) | | | (17,430 | ) |
TeamViewer AG (a)(b) | | | (196 | ) | | | (7,372 | ) |
Twilio, Inc. (a) | | | (32 | ) | | | (12,613 | ) |
Zoom Video Communications, Inc. (a) | | | (185 | ) | | | (71,601 | ) |
| | | | | | | (181,197 | ) |
Telecommunications: (0.26)% | | | | | | | | |
BT Group PLC (a)(b) | | | (10,131 | ) | | | (27,187 | ) |
Inseego Corp. (a) | | | (2,943 | ) | | | (29,695 | ) |
| | | | | | | (56,882 | ) |
Transportation: (1.14)% | | | | | | | | |
Atlas Air Worldwide Holdings, Inc. (a) | | | (506 | ) | | | (34,464 | ) |
East Japan Railway Co. (b) | | | (400 | ) | | | (28,541 | ) |
Hankyu Hanshin Holdings, Inc. (b) | | | (800 | ) | | | (24,664 | ) |
Keisei Electric Railway Co. Ltd. (b) | | | (900 | ) | | | (28,719 | ) |
Kintetsu Group Holdings Co Ltd. (a)(b) | | | (800 | ) | | | (28,083 | ) |
Kirby Corp. (a) | | | (418 | ) | | | (25,347 | ) |
MTR Corp. Ltd. (b) | | | (5,000 | ) | | | (27,852 | ) |
Tobu Railway Co. Ltd. (b) | | | (1,000 | ) | | | (25,852 | ) |
West Japan Railway Co. (b) | | | (500 | ) | | | (28,507 | ) |
| | | | | | | (252,029 | ) |
TOTAL COMMON STOCKS (Proceeds $3,772,457) | | | | | | | (3,894,479 | ) |
The accompanying notes are an integral part of these financial statements.
| |
| |
| LoCorr Dynamic Equity Fund – Schedule of Securities Sold Short (continued) | 59 |
| |
| | Shares | | | Value | |
EXCHANGE TRADED FUNDS: (3.35)% | | | | | | | | |
iShares Russell 2000 | | | (1,599 | ) | | $ | (366,762 | ) |
SPDR S&P500 Trust | | | (872 | ) | | | (373,267 | ) |
TOTAL EXCHANGE TRADED FUNDS (Proceeds $737,238) | | | | | | | (740,029 | ) |
| | | | | | | | |
REAL ESTATE INVESTMENT TRUSTS: (0.23)% | | | | | | | | |
Hannon Armstrong Sustainable Infrastructure Capital, Inc. | | | (511 | ) | | | (28,693 | ) |
Segro PLC (b) | | | (1,529 | ) | | | (23,149 | ) |
TOTAL REAL ESTATE INVESTMENT TRUSTS (Proceeds $47,850) | | | | | | | (51,842 | ) |
TOTAL SECURITIES SOLD SHORT (Proceeds $4,557,545): (21.21%) | | | | | | | (4,686,350 | ) |
(a) | Non-dividend expense producing security. |
(b) | Foreign issued security. |
ADR American Depositary Reciept
PLC Public Limited Company
The accompanying notes are an integral part of these financial statements.
| |
| |
| 60 | LoCorr Spectrum Income Fund – Schedule of Investments (continued) |
| |
LoCorr Spectrum Income Fund
Composition of Investment Portfolio1
June 30, 2021 (Unaudited)
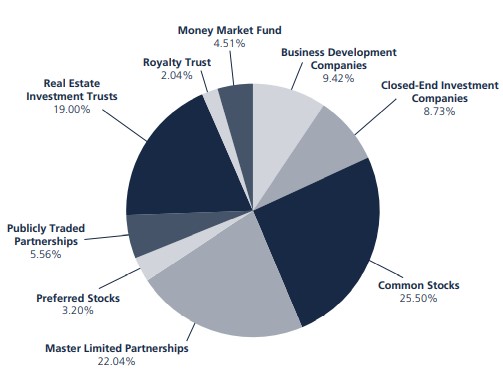
1 As a percentage of total investments.
Consolidated Schedule of Investments | |
June 30, 2021 (Unaudited)
| | Shares | | | Value | |
BUSINESS DEVELOPMENT COMPANIES: 9.38% | | | | | | | | |
Ares Capital Corp. | | | 91,985 | | | $ | 1,801,986 | |
BlackRock TCP Capital Corp. | | | 48,279 | | | | 667,216 | |
Hercules Capital, Inc. (c) | | | 103,637 | | | | 1,768,047 | |
New Mountain Finance Corp. | | | 82,448 | | | | 1,085,840 | |
Newtek Business Services Corp. | | | 18,338 | | | | 640,363 | |
TOTAL BUSINESS DEVELOPMENT COMPANIES (Cost $5,239,644) | | | | | | | 5,963,452 | |
| | | | | | | | |
CLOSED-END INVESTMENT COMPANIES: 8.69% | | | | | | | | |
Nuveen Credit Strategies Income Fund | | | 176,203 | | | | 1,189,370 | |
Oaktree Specialty Lending Corp. | | | 89,331 | | | | 597,625 | |
Sixth Street Specialty Lending, Inc. | | | 23,352 | | | | 518,181 | |
TriplePoint Venture Growth BDC Corp. | | | 36,037 | | | | 547,402 | |
Virtus AllianzGI Convertible & Income Fund | | | 218,386 | | | | 1,340,890 | |
Virtus AllianzGI Convertible & Income Fund II | | | 248,475 | | | | 1,329,341 | |
TOTAL CLOSED-END INVESTMENT COMPANIES (Cost $5,094,437) | | | | | | | 5,522,809 | |
| | | | | | | | |
COMMON STOCKS: 25.40% | | | | | | | | |
Auto Parts & Equipment: 0.91% | | | | | | | | |
China Yuchai International Ltd. – ADR (a) | | | 35,938 | | | | 576,445 | |
| | | | | | | | |
Diversified Financial Services: 7.00% | | | | | | | | |
Artisan Partners Asset Management, Inc. (c) | | | 11,455 | | | | 582,143 | |
Lazard Ltd. – ADR (a) | | | 13,618 | | | | 616,215 | |
Moelis & Co. | | | 33,529 | | | | 1,907,465 | |
OneMain Holdings, Inc. (c) | | | 22,418 | | | | 1,343,062 | |
| | | | | | | 4,448,885 | |
Electric: 3.10% | | | | | | | | |
Avangrid, Inc. | | | 24,336 | | | | 1,251,601 | |
Clearway Energy, Inc. | | | 27,040 | | | | 716,019 | |
| | | | | | | 1,967,620 | |
Energy – Alternate Sources: 4.11% | | | | | | | | |
Atlantica Yield PLC – ADR (a)(c) | | | 38,495 | | | | 1,432,784 | |
NextEra Energy Partners LP (c) | | | 15,486 | | | | 1,182,511 | |
| | | | | | | 2,615,295 | |
The accompanying notes are an integral part of these financial statements.
| |
| |
| LoCorr Spectrum Income Fund – Schedule of Investments (continued) | 61 |
| |
| | Shares | | | Value | |
COMMON STOCKS: (continued) | | | | | | | | |
Insurance: 0.83% | | | | | | | | |
AMERISAFE, Inc. | | | 8,800 | | | $ | 525,272 | |
| | | | | | | | |
Mining: 0.78% | | | | | | | | |
Southern Copper Corp. (c) | | | 7,718 | | | | 496,422 | |
| | | | | | | | |
Pipelines: 4.95% | | | | | | | | |
Antero Midstream Corp. | | | 125,614 | | | | 1,305,130 | |
Hess Midstream LP | | | 24,582 | | | | 620,696 | |
Williams Cos. Inc. | | | 45,919 | | | | 1,219,149 | |
| | | | | | | 3,144,975 | |
Real Estate Invesmtment Trusts: 0.33% | | | | | | | | |
American Finance Trust, Inc. | | | 24,961 | | | | 211,669 | |
| | | | | | | | |
Transportation: 3.39% | | | | | | | | |
Euronav NV - ADR (a) | | | 36,974 | | | | 344,598 | |
Hoegh LNG Partners LP (a) | | | 102,802 | | | | 1,808,287 | |
| | | | | | | 2,152,885 | |
TOTAL COMMON STOCKS (Cost $12,966,142) | | | | | | | 16,139,468 | |
| | | | | | | | |
MASTER LIMITED PARTNERSHIPS: 21.94% | | | Units | | | | | |
Diversified Financial Services: 1.15% | | | | | | | | |
AllianceBernstein Holding LP | | | 15,683 | | | | 730,200 | |
| | | | | | | | |
Energy - Alternate Sources: 1.41% | | | | | | | | |
Enviva Partners LP (c) | | | 17,109 | | | | 896,683 | |
| | | | | | | | |
Gas: 3.18% | | | | | | | | |
Global Partners LP | | | 78,023 | | | | 2,022,356 | |
| | | | | | | | |
Oil & Gas: 3.53% | | | | | | | | |
Black Stone Minerals LP (c) | | | 58,456 | | | | 628,402 | |
Kimbell Royalty Partners LP | | | 55,407 | | | | 711,980 | |
Sunoco LP | | | 23,992 | | | | 904,498 | |
| | | | | | | 2,244,880 | |
Oil & Gas Services: 3.10% | | | | | | | | |
CrossAmerica Partners LP | | | 41,789 | | | | 796,498 | |
USA Compression Partners LP (c) | | | 71,189 | | | | 1,173,195 | |
| | | | | | | 1,969,693 | |
Pipelines: 6.78% | | | | | | | | |
Crestwood Equity Partners LP | | | 61,258 | | | | 1,836,515 | |
Delek Logistics Partners LP | | | 14,405 | | | | 604,434 | |
Magellan Midstream Partners LP | | | 25,712 | | | | 1,257,574 | |
Oasis Midstream Partners LP | | | 26,014 | | | | 610,028 | |
| | | | | | | 4,308,551 | |
Private Equity: 2.79% | | | | | | | | |
Icahn Enterprises LP (c) | | | 32,251 | | | | 1,773,483 | |
TOTAL MASTER LIMITED PARTNERSHIPS (Cost $9,446,527) | | | | | | | 13,945,846 | |
| | | | | | | | |
PREFERRED STOCKS: 3.19% | | | | | | | | |
Pipelines: 3.19% | | | Shares | | | | | |
Crestwood Equity Partners LP, 9.250% | | | 113,962 | | | | 1,068,963 | |
NuStar Energy LP 7.625% | | | 43,362 | | | | 958,734 | |
TOTAL PREFERRED STOCKS (Cost $1,098,458) | | | | | | | 2,027,697 | |
| | | | | | | | |
PUBLICLY TRADED PARTNERSHIPS: 5.54% | | | Units | | | | | |
Brookfield Renewable Partners LP (a)(c) | | | 37,413 | | | | 1,443,019 | |
Compass Diversified Holdings | | | 31,268 | | | | 797,334 | |
KNOT Offshore Partners LP (a) | | | 64,060 | | | | 1,279,919 | |
TOTAL PUBLICLY TRADED PARTNERSHIPS (Cost $2,789,649) | | | | | | | 3,520,272 | |
| | | | | | | | |
REAL ESTATE INVESTMENT TRUSTS: 18.92% | | | Shares | | | | | |
AGNC Investment Corp. | | | 68,436 | | | | 1,155,884 | |
Annaly Capital Management, Inc. | | | 134,021 | | | | 1,190,106 | |
Apollo Commercial Real Estate Finance, Inc. | | | 45,525 | | | | 726,124 | |
Equity Commonwealth | | | 23,057 | | | | 604,093 | |
Global Net Lease, Inc. | | | 103,883 | | | | 1,921,836 | |
Hannon Armstrong Sustainable Infrastructure Capital, Inc. (c) | | | 17,649 | | | | 990,991 | |
Invesco Mortgage Capital, Inc. | | | 320,893 | | | | 1,251,483 | |
New Residential Investment Corp. | | | 55,211 | | | | 584,684 | |
PotlatchDeltic Corp. (c) | | | 20,157 | | | | 1,071,345 | |
The accompanying notes are an integral part of these financial statements.
| |
| |
| 62 | LoCorr Spectrum Income Fund – Schedule of Investments (continued) |
| |
| | Shares | | | Value | |
REAL ESTATE INVESTMENT TRUSTS: (continued) | | | | | | | | |
Sabra Health Care, Inc. | | | 30,088 | | | $ | 547,602 | |
Starwood Property Trust, Inc. | | | 52,212 | | | | 1,366,388 | |
W.P. Carey, Inc. | | | 8,210 | | | | 612,630 | |
TOTAL REAL ESTATE INVESTMENT TRUSTS (Cost $10,653,256) | | | | | | | 12,023,166 | |
| | | | | | | | |
ROYALTY TRUST: 2.03% | | | | | | | | |
Mesabi Trust (c) | | | 36,381 | | | | 1,287,887 | |
TOTAL ROYALTY TRUST (Cost $1,047,010) | | | | | | | 1,287,887 | |
| | | | | | | | |
SHORT TERM INVESTMENT: 4.49% | | | | | | | | |
MONEY MARKET FUND: 4.49% | | | | | | | | |
STIT-Government & Agency Portfolio, Institutional Class, 0.03% (b) | | | 2,851,640 | | | | 2,851,640 | |
TOTAL MONEY MARKET FUND (Cost $2,851,640) | | | | | | | 2,851,640 | |
TOTAL SHORT TERM INVESTMENT (Cost $2,851,640) | | | | | | | 2,851,640 | |
| | | | | | | | |
TOTAL INVESTMENTS (Cost $51,186,763): 99.58% | | | | | | | 63,282,237 | |
Other Assets in Excess of Liabilities: 0.42% (d) | | | | | | | 266,640 | |
TOTAL NET ASSETS: 100.00% | | | | | | $ | 63,548,877 | |
| (a) | Foreign issued security. |
| (b) | The rate quoted is the annualized seven-day effective yield as of June 30, 2021. |
| (c) | All of a portion of this security is held as collateral for options written. At June 30, 2021, the value of this collateral is $7,383,240. |
| (d) | Includes deposits at broker for derivative instruments. At June 30, 2021, the value of these assets total $452,048. |
ADR | American Depositary Receipts |
PLC | Public Limited Company |
The accompanying notes are an integral part of these financial statements.
| |
| |
| LoCorr Spectrum Income Fund – Schedule of Written Options | 63 |
| |
LoCorr Spectrum Income Fund
Schedule of Written Options
June 30, 2021 (Unaudited)
| | Notional
Amount | | | Number of
Contracts (a) | | | Value | |
WRITTEN OPTIONS: 0.19% | | | | | | | | | | | | |
Call Options: 0.19% | | | | | | | | | | | | |
Artisan Partners Asset Management, Inc. Expiration: July 2021, Exercise Price: $55.00 | | $ | 559,020 | | | | (110 | ) | | $ | (1,100 | ) |
Atlantica Sustainable Infrastructure PLC Expiration: July 2021, Exercise Price: $40.00 | | | 1,380,862 | | | | (371 | ) | | | (2,226 | ) |
Black Stone Minerals LP Expiration: August 2021, Exercise Price: $12.50 | | | 627,800 | | | | (584 | ) | | | (5,840 | ) |
Brookfield Renewable Partners LP Expiration: July 2021, Exercise Price: $45.00 | | | 212,135 | | | | (55 | ) | | | (275 | ) |
Enviva Partners LP Expiration: August 2021, Exercise Price: $55.00 | | | 225,363 | | | | (43 | ) | | | (3,225 | ) |
Hannon Armstrong Sustainable Infrastructure Capital, Inc. Expiration: July 2021, Exercise Price: $55.00 | | | 954,550 | | | | (170 | ) | | | (31,620 | ) |
Hercules Capital, Inc. Expiration: July 2021, Exercise Price: $17.50 | | | 1,704,294 | | | | (999 | ) | | | (7,992 | ) |
Icahn Enterprises LP Expiration: August 2021, Exercise Price: $60.00 | | | 1,770,678 | | | | (322 | ) | | | (10,304 | ) |
MesabiTrust Expiration: August 2021, Exercise Price: $40.00 | | | 1,285,020 | | | | (363 | ) | | | (12,705 | ) |
NextEra Energy Partners LP Expiration: August 2021, Exercise Price: $80.00 | | | 244,352 | | | | (32 | ) | | | (4,160 | ) |
OneMain Holdings, Inc. Expiration: August 2021, Exercise Price: $66.50 | | | 1,341,984 | | | | (224 | ) | | | (29,120 | ) |
PotlatchDeltic Corp. Expiration: July 2021, Exercise Price: $65.00 | | | 1,031,110 | | | | (194 | ) | | | (2,425 | ) |
Southern Copper Corp. Expiration: August 2021, Exercise Price: $70.00 | | | 495,264 | | | | (77 | ) | | | (11,165 | ) |
USA Compression Partners LP Expiration: July 2021, Exercise Price: $17.50 | | | 80,752 | | | | (49 | ) | | | (245 | ) |
TOTAL WRITTEN OPTIONS (Premiums received $149,056) | | | | | | | | | | $ | (122,402 | ) |
Percentages are stated as a percent of net assets.
| (a) | Each contract is equivalent to 100 shares of common stock. |
The accompanying notes are an integral part of these financial statements.
| | |
| | |
64 | | LoCorr Macro Strategies Fund, LoCorr Long/Short Commodities Strategy Fund and LoCorr Market Trend Fund – Consolidated Statements of Assets & Liabilities |
| | |
Consolidated Statements of Assets & Liabilities
June 30, 2021 (Unaudited)
| | LoCorr Macro
Strategies Fund | | | LoCorr Long/Short
Commodities
Strategy Fund | | | LoCorr Market
Trend Fund | |
Assets | | | | | | | | | | | | |
Investments, at value | | | | | | | | | | | | |
(Cost $1,306,855,849, $578,001,830 and $238,397,443, respectively) | | $ | 1,320,110,125 | | | $ | 597,248,654 | | | $ | 240,378,230 | |
Cash held as collateral for forward currency contracts (Note 2) | | | 12,180,000 | | | | — | | | | 6,930,000 | |
Foreign currency, at value (Cost $28,326,116, $0 and $0, respectively) | | | 27,923,017 | | | | — | | | | — | |
Receivable for Fund shares sold | | | 6,361,378 | | | | 4,650,344 | | | | 751,426 | |
Receivable for securities sold | | | — | | | | 8,450,000 | | | | — | |
Interest receivable | | | 3,818,039 | | | | 1,486,982 | | | | 642,346 | |
Receivable for unsettled open futures contracts | | | 2,184,640 | | | | — | | | | 448,044 | |
Deposits with broker for derivative instruments (Note 2) | | | 87,868,331 | | | | 69,803,311 | | | | 29,584,022 | |
Unrealized appreciation on swap contracts (Note 1) | | | — | | | | 20,590,264 | | | | — | |
Unrealized appreciation on forward currency contracts (Note 2) | | | 24,854,940 | | | | — | | | | 1,908,789 | |
Advance receipt on swap contracts | | | — | | | | 14,113,147 | | | | — | |
Prepaid expenses and other assets | | | 160,057 | | | | 103,067 | | | | 52,397 | |
Total Assets | | | 1,485,460,527 | | | | 716,445,769 | | | | 280,695,254 | |
| | | | | | | | | | | | |
Liabilities | | | | | | | | | | | | |
Payable for Fund shares redeemed | | $ | 2,246,984 | | | $ | 159,752 | | | $ | 532,443 | |
Payable for securities purchased | | | 4,289,196 | | | | 5,250,728 | | | | 575,782 | |
Payable for unsettled open futures contracts | | | 2,594,677 | | | | — | | | | 763,056 | |
Payable for variation margin on futures contracts | | | 1,966,266 | | | | — | | | | 1,959,449 | |
Accrued management fees (Note 5) | | | 1,913,210 | | | | 817,590 | | | | 338,880 | |
Accrued Trustees’ fees | | | 25,842 | | | | 11,373 | | | | 5,477 | |
Accrued Rule 12b-1 fees | | | 134,015 | | | | 132,074 | | | | 135,631 | |
Unrealized depreciation on forward currency contracts (Note 2) | | | 37,902,301 | | | | — | | | | 3,026,126 | |
Accrued expenses and other liabilities | | | 415,982 | | | | 184,442 | | | | 116,560 | |
Total Liabilities | | | 51,488,473 | | | | 6,555,959 | | | | 7,453,404 | |
Net Assets | | $ | 1,433,972,054 | | | $ | 709,889,810 | | | $ | 273,241,850 | |
| | | | | | | | | | | | |
Net Assets Consist of: | | | | | | | | | | | | |
Paid-in capital | | $ | 1,333,164,332 | | | $ | 661,622,600 | | | $ | 251,501,087 | |
Total distributable earnings | | | 100,807,722 | | | | 48,267,210 | | | | 21,740,763 | |
NET ASSETS | | $ | 1,433,972,054 | | | $ | 709,889,810 | | | $ | 273,241,850 | |
| | | | | | | | | | | | |
Class A Shares | | | | | | | | | | | | |
Net assets | | $ | 86,256,716 | | | $ | 29,520,723 | | | $ | 16,325,316 | |
Shares issued and outstanding (unlimited shares authorized, no par value) | | | 9,669,767 | | | | 2,747,625 | | | | 1,322,071 | |
Net asset value, redemption, and minimum offering price per share (a) | | | $ 8.92 | | | | $ 10.74 | | | | $ 12.35 | |
Maximum offering price per share | | | | | | | | | | | | |
($8.92/0.9425) ($10.74/0.9425) ($12.35/0.9425)(b) | | | $ 9.46 | | | | $ 11.40 | | | | $ 13.10 | |
| | | | | | | | | | | | |
Class C Shares | | | | | | | | | | | | |
Net assets | | $ | 41,284,552 | | | $ | 9,227,976 | | | $ | 12,368,896 | |
Shares issued and outstanding (unlimited shares authorized, no par value) | | | 4,886,421 | | | | 900,535 | | | | 1,040,517 | |
Net asset value, redemption, and offering price per share (a) | | | $ 8.45 | | | | $ 10.25 | | | | $ 11.89 | |
| | | | | | | | | | | | |
Class I Shares | | | | | | | | | | | | |
Net assets | | $ | 1,306,430,786 | | | $ | 671,141,111 | | | $ | 244,547,638 | |
Shares issued and outstanding (unlimited shares authorized, no par value) | | | 143,885,043 | | | | 61,665,082 | | | | 19,706,423 | |
Net asset value, redemption, and offering price per share | | | $ 9.08 | | | | $ 10.88 | | | | $ 12.41 | |
(a) | A 1.00% contingent deferred sales charge may apply to redemptions made within twelve months of purchase. The contingent deferred sales charge only applies to Class A share purchases of $1 million or more. |
(b) | On investments of $25,000 or more, the offering price is reduced. |
The accompanying notes are an integral part of these consolidated financial statements.
| |
| |
| LoCorr Dynamic Equity Fund and LoCorr Spectrum Income Fund – Statements of Assets & Liabilities | 65 |
| |
| |
Statements of Assets & Liabilities
June 30, 2021 (Unaudited)
| | LoCorr
Dynamic
Equity Fund | | | LoCorr
Spectrum
Income Fund | |
Assets | | | | | | | | |
Investments, at value (Cost $18,471,975 and $51,186,763, respectively) | | $ | 20,661,522 | | | $ | 63,282,237 | |
Cash | | | — | | | | 8,296 | |
Cash held as collateral for securities sold short (Note 2) | | | 1,282,144 | | | | — | |
Foreign currency, at value (Cost $327,919 and $0, respectively) | | | 327,987 | | | | — | |
Receivable for Fund shares sold | | | 49,981 | | | | 528,870 | |
Receivable for securities sold | | | 682,481 | | | | 353,935 | |
Dividends, interest and other receivables | | | 11,839 | | | | 197,369 | |
Deposits with broker for securities sold short (Note 2) | | | 4,493,269 | | | | — | |
Deposits with broker for options | | | — | | | | 452,048 | |
Prepaid expenses and other assets | | | 36,924 | | | | 29,849 | |
Total Assets | | | 27,546,147 | | | | 64,852,604 | |
| | | | | | | | |
Liabilities | | | | | | | | |
Securities sold short, at value (Proceeds $4,557,545 and $0, respectively) | | $ | 4,686,350 | | | $ | — | |
Options written, at value (Premiums received $0 and $149,056, respectively) | | | — | | | | 122,402 | |
Payable for Fund shares redeemed | | | 3,202 | | | | 84,903 | |
Payable for securities purchased | | | 681,943 | | | | 829,184 | |
Payable for distributions | | | — | | | | 85,644 | |
Dividends payable | | | 4,048 | | | | — | |
Accrued management fees (Note 5) | | | 5,158 | | | | 66,250 | |
Accrued Trustees’ fees | | | 413 | | | | 1,157 | |
Accrued Rule 12b-1 fees | | | 13,440 | | | | 63,652 | |
Accrued expenses and other liabilities | | | 57,526 | | | | 50,535 | |
Total Liabilities | | | 5,452,080 | | | | 1,303,727 | |
| | | | | | | | |
Net Assets | | $ | 22,094,067 | | | $ | 63,548,877 | |
| | | | | | | | |
Net Assets Consist of: | | | | | | | | |
Paid-in capital | | $ | 19,902,838 | | | $ | 84,032,985 | |
Total distributable earnings/(accumulated loss) | | | 2,191,229 | | | | (20,484,108 | ) |
NET ASSETS | | $ | 22,094,067 | | | $ | 63,548,877 | |
| | | | | | | | |
Class A Shares | | | | | | | | |
Net assets | | $ | 3,898,958 | | | $ | 14,849,847 | |
Shares issued and outstanding (unlimited shares authorized, no par value) | | | 299,884 | | | | 2,040,866 | |
Net asset value, redemption, and minimum offering price per share (a) | | | $ 13.00 | | | | $ 7.28 | (b) |
| | | | | | | | |
Maximum offering price per share ($13.00/0.9425), ($7.28/0.9425), respectively(c) | | | $ 13.79 | | | | $ 7.72 | |
| | | | | | | | |
Class C Shares | | | | | | | | |
Net assets | | $ | 2,427,411 | | | $ | 16,256,514 | |
Shares issued and outstanding (unlimited shares authorized, no par value) | | | 199,253 | | | | 2,209,707 | |
Net asset value, redemption, and offering price per share (a) | | | $ 12.18 | | | | $ 7.36 | (b) |
| | | | | | | | |
Class I Shares | | | | | | | | |
Net assets | | $ | 15,767,698 | | | $ | 32,442,516 | |
Shares issued and outstanding (unlimited shares authorized, no par value) | | | 1,186,306 | | | | 4,473,787 | |
Net asset value, redemption, and offering price per share | | | $ 13.29 | | | | $ 7.25 | (b) |
(a) | A 1.00% contingent deferred sales charge may apply to redemptions made within twelve months of purchase. The contingent deferred sales charge only applies to Class A share purchases of $1 million or more. |
(b) | Redemptions made within 60 days of purchase may be assessed a redemption fee of 2.00%. |
(c) | On investments of $25,000 or more, the offering price is reduced. |
The accompanying notes are an integral part of these financial statements.
| | |
| | |
66 | | LoCorr Macro Strategies Fund, LoCorr Long/Short Commodities Strategy Fund and LoCorr Market Trend Fund – Consolidated Statements of Operations |
| | |
Consolidated Statements of Operations
Six Months Ended June 30, 2021 (Unaudited)
| | LoCorr Macro Strategies Fund | | | LoCorr Long/Short
Commodities
Strategy Fund | | | LoCorr Market
Trend Fund | |
Investment Income | | | | | | | | | | | | |
Interest income | | $ | 7,632,635 | | | $ | 2,563,655 | | | $ | 1,401,660 | |
Total Investment Income | | | 7,632,635 | | | | 2,563,655 | | | | 1,401,660 | |
| | | | | | | | | | | | |
Expenses | | | | | | | | | | | | |
Management fees (Note 5) | | | 10,566,022 | | | | 4,221,803 | | | | 1,957,927 | |
Fund administration fees | | | 195,347 | | | | 104,435 | | | | 64,613 | |
Fund accounting fees | | | 213,313 | | | | 119,373 | | | | 72,160 | |
Trustees’ fees | | | 52,484 | | | | 22,660 | | | | 11,063 | |
Transfer agent fees and expenses | | | 884,239 | | | | 404,885 | | | | 130,610 | |
Custodian fees | | | 33,469 | | | | 13,061 | | | | 8,070 | |
Registration expenses | | | 68,445 | | | | 64,613 | | | | 31,757 | |
Rule 12b-1 fee – Class A (Note 5) | | | 102,051 | | | | 34,933 | | | | 20,419 | |
Rule 12b-1 fee – Class C (Note 5) | | | 212,934 | | | | 39,827 | | | | 64,219 | |
Legal and audit fees | | | 41,602 | | | | 30,296 | | | | 23,673 | |
Printing and mailing expenses | | | 35,146 | | | | 13,101 | | | | 8,066 | |
Other expenses | | | 15,235 | | | | 224,203 | | | | 4,648 | |
Net Expenses | | | 12,420,287 | | | | 5,293,190 | | | | 2,397,225 | |
Net Investment Loss | | | (4,787,652 | ) | | | (2,729,535 | ) | | | (995,565 | ) |
| | | | | | | | | | | | |
Realized and Unrealized Gain (Loss) on Investments, Swap Contracts, Forward | | | | | | | | | | | | |
Currency Contracts, Futures Contracts and Foreign Currency Translation: | | | | | | | | | | | | |
Net realized gain (loss) on: | | | | | | | | | | | | |
Investments | | | 1,642,383 | | | | 11,116,009 | | | | 603,538 | |
Swap contracts | | | — | | | | — | | | | — | |
Forward currency contracts | | | (2,994,454 | ) | | | — | | | | 174,625 | |
Futures contracts | | | 117,102,230 | | | | — | | | | 38,327,172 | |
Foreign currency transactions | | | 4,826,459 | | | | — | | | | 37,614 | |
Net change in unrealized appreciation/depreciation on: | | | | | | | | | | | | |
Investments | | | (10,314,317 | ) | | | 7,273,138 | | | | (2,348,541 | ) |
Swap contracts | | | — | | | | 33,689,483 | | | | — | |
Forward currency contracts | | | (18,114,160 | ) | | | — | | | | (4,407,082 | ) |
Futures contracts | | | (30,504,397 | ) | | | — | | | | (17,222,689 | ) |
Foreign currency translation | | | (676,552 | ) | | | — | | | | — | |
Net realized and unrealized gain | | | 60,967,192 | | | | 52,078,630 | | | | 15,164,637 | |
Net Increase in Net Assets Resulting From Operations | | $ | 56,179,540 | | | $ | 49,349,095 | | | $ | 14,169,072 | |
The accompanying notes are an integral part of these consolidated financial statements.
| | |
| | |
LoCorr Dynamic Equity Fund and LoCorr Spectrum Income Fund – Statements of Operations | 67 |
| | |
Statements of Operations
Six Months Ended June 30, 2021 (Unaudited)
| | LoCorr
Dynamic
Equity Fund | | | LoCorr
Spectrum
Income Fund | |
Investment Income | | | | | | | | |
Dividend and interest income (a) | | $ | 93,007 | | | $ | 954,265 | |
Total Investment Income | | | 93,007 | | | | 954,265 | |
| | | | | | | | |
Expenses | | | | | | | | |
Management fees (Note 5) | | | 150,575 | | | | 361,291 | |
Fund administration fees | | | 35,422 | | | | 30,692 | |
Fund accounting fees | | | 31,783 | | | | 22,045 | |
Trustees’ fees | | | 806 | | | | 2,248 | |
Transfer agent fees and expenses | | | 34,256 | | | | 50,025 | |
Custodian fees | | | 47,127 | | | | 4,772 | |
Registration expenses | | | 23,361 | | | | 19,791 | |
Rule 12b-1 fee – Class A (Note 5) | | | 4,733 | | | | 17,728 | |
Rule 12b-1 fee – Class C (Note 5) | | | 12,078 | | | | 74,456 | |
Legal and audit fees | | | 11,984 | | | | 16,375 | |
Printing and mailing expenses | | | 440 | | | | 8,720 | |
Other expenses | | | 1,360 | | | | 2,056 | |
Total expenses before dividend and interest expense | | | 353,925 | | | | 610,199 | |
Dividend expense on securities sold short (Note 2) | | | 38,782 | | | | — | |
Interest expense | | | 13,808 | | | | 498 | |
Interest expense on credit line (Note 8) | | | 167 | | | | — | |
Total expenses before fee waiver from Adviser | | | 406,682 | | | | 610,697 | |
Fee waiver from Adviser (Note 5) | | | (137,352 | ) | | | (17,766 | ) |
Net Expenses | | | 269,330 | | | | 592,931 | |
Net Investment Income (Loss) | | | (176,323 | ) | | | 361,334 | |
| | | | | | | | |
Realized and Unrealized Gain (Loss) on Investments, Securities Sold Short, | | | | | | | | |
Futures Contracts, Foreign Currency Translation and Written Options: | | | | | | | | |
Net realized gain (loss) on: | | | | | | | | |
Investments | | | 3,418,938 | | | | 4,126,297 | |
Securities sold short | | | (1,204,694 | ) | | | — | |
Futures contracts | | | 295,292 | | | | — | |
Foreign currency transactions | | | 4,326 | | | | — | |
Written options | | | — | | | | 113,982 | |
Net change in unrealized appreciation/depreciation on: | | | | | | | | |
Investments | | | (466,568 | ) | | | 6,314,872 | |
Securities sold short | | | 286,742 | | | | — | |
Futures contracts | | | (39,152 | ) | | | — | |
Foreign currency translation | | | (6,032 | ) | | | — | |
Written options | | | — | | | | 26,654 | |
Net realized and unrealized gain | | | 2,288,852 | | | | 10,581,805 | |
Net Increase in Net Assets Resulting From Operations | | $ | 2,112,529 | | | $ | 10,943,139 | |
(a) Net foreign tax withheld of $7,140 and $6,128, respectively.
The accompanying notes are an integral part of these financial statements.
| | |
| | |
68 | LoCorr Macro Strategies Fund – Consolidated Statements of Changes in Net Assets |
| | |
LoCorr Macro Strategies Fund
Consolidated Statements of Changes in Net Assets
| | Six Months Ended June 30, 2021 (Unaudited) | | | Year Ended December 31, 2020 | |
Operations | | | | | | | | |
Net investment loss | | $ | (4,787,652 | ) | | $ | (3,108,934 | ) |
Net realized gain on investments, forward currency contracts, futures contracts and | | | | | | | | |
foreign currency transactions | | | 120,576,618 | | | | 6,907,586 | |
Net change in unrealized appreciation/depreciation of investments, forward currency contracts, futures | | | | | | | | |
contracts and foreign currency translation | | | (59,609,426 | ) | | | 54,310,602 | |
Increase in Net Assets Resulting From Operations | | | 56,179,540 | | | | 58,109,254 | |
| | | | | | | | |
Distributions From Earnings | | | | | | | | |
Class A | | | — | | | | (3,044,869 | ) |
Class C | | | — | | | | (2,143,479 | ) |
Class I | | | — | | | | (58,170,598 | ) |
Total Distributions From Earnings | | | — | | | | (63,358,946 | ) |
| | | | | | | | |
Capital Transactions (Note 6) | | | | | | | | |
Proceeds from shares sold | | | 373,696,873 | | | | 686,900,731 | |
Proceeds from shares issued in connection with reorganization (a) | | | — | | | | 57,875,149 | |
Reinvestment of distributions | | | — | | | | 56,490,383 | |
Cost of shares redeemed | | | (180,070,607 | ) | | | (438,436,073 | ) |
Increase in Net Assets From Capital Transactions | | | 193,626,266 | | | | 362,830,190 | |
| | | | | | | | |
Total Increase in Net Assets | | | 249,805,806 | | | | 357,580,498 | |
| | | | | | | | |
Net Assets | | | | | | | | |
Beginning of period | | | 1,184,166,248 | | | | 826,585,750 | |
End of period | | $ | 1,433,972,054 | | | $ | 1,184,166,248 | |
(a) Shares of the Steben Managed Futures Strategy Fund converted into shares of the LoCorr Macro Strategies Fund on January 24, 2020. See Note 1.
The accompanying notes are an integral part of these consolidated financial statements.
| | |
| | |
LoCorr Long/Short Commodities Strategy Fund – Consolidated Statements of Changes in Net Assets | 69 |
| | |
LoCorr Long/Short Commodities Strategy Fund
Consolidated Statements of Changes in Net Assets
| | Six Months Ended June 30, 2021 (Unaudited) | | | Year Ended December 31, 2020 | |
Operations | | | | | | | | |
Net investment loss | | $ | (2,729,535 | ) | | $ | (1,734,973 | ) |
Net realized gain on investments and swap contracts | | | 11,116,009 | | | | 2,871,953 | |
Net change in unrealized appreciation of investments and swap contracts | | | 40,962,621 | | | | 21,760,669 | |
Increase in Net Assets Resulting From Operations | | | 49,349,095 | | | | 22,897,649 | |
| | | | | | | | |
Distributions From Earnings | | | | | | | | |
Class A | | | — | | | | (687,537 | ) |
Class C | | | — | | | | (165,370 | ) |
Class I | | | — | | | | (12,840,661 | ) |
Total Distributions From Earnings | | | — | | | | (13,693,568 | ) |
| | | | | | | | |
Capital Transactions (Note 6) | | | | | | | | |
Proceeds from shares sold | | | 278,169,189 | | | | 425,232,265 | |
Reinvestment of distributions | | | — | | | | 10,893,359 | |
Cost of shares redeemed | | | (95,463,160 | ) | | | (223,539,698 | ) |
Increase in Net Assets From Capital Transactions | | | 182,706,029 | | | | 212,585,926 | |
| | | | | | | | |
Total Increase in Net Assets | | | 232,055,124 | | | | 221,790,007 | |
| | | | | | | | |
Net Assets | | | | | | | | |
Beginning of period | | | 477,834,686 | | | | 256,044,679 | |
End of period | | $ | 709,889,810 | | | $ | 477,834,686 | |
The accompanying notes are an integral part of these consolidated financial statements.
| |
| | |
70 | | LoCorr Market Trend Fund – Consolidated Statements of Changes in Net Assets |
| |
LoCorr Market Trend Fund
Consolidated Statements of Changes in Net Assets
| | Six Months Ended June 30, 2021 (Unaudited) | | | Year Ended December 31, 2020 | |
| | | | | | | | | |
Operations | | | | | | | | |
Net investment loss | | $ | (995,565 | ) | | $ | (884,021 | ) |
Net realized gain (loss) on investments, forward currency contracts, futures contracts and foreign currency transctions | | | 39,142,949 | | | | (13,247,099 | ) |
Net change in unrealized appreciation/depreciation of investments, forward currency contracts, futures contracts and foreign currency translation | | | (23,978,312 | ) | | | 23,640,454 | |
Increase in Net Assets Resulting From Operations | | | 14,169,072 | | | | 9,509,334 | |
| | | | | | | | |
Distributions From Earnings | | | | | | | | |
Class I | | | — | | | | (570,347 | ) |
Total Distributions to Shareholders | | | — | | | | (570,347 | ) |
| | | | | | | | |
Capital Transactions (Note 6) | | | | | | | | |
Proceeds from shares sold | | | 45,187,447 | | | | 100,733,510 | |
Reinvestment of distributions | | | — | | | | 551,952 | |
Cost of shares redeemed | | | (42,231,702 | ) | | | (127,312,911 | ) |
Increase (Decrease) in Net Assets From Capital Transactions | | | 2,955,745 | | | | (26,027,449 | ) |
| | | | | | | | |
Total Increase (Decrease) in Net Assets | | | 17,124,817 | | | | (17,088,462 | ) |
| | | | | | | | |
Net Assets | | | | | | | | |
Beginning of period | | | 256,117,033 | | | | 273,205,495 | |
End of period | | $ | 273,241,850 | | | $ | 256,117,033 | |
The accompanying notes are an integral part of these consolidated financial statements.
| |
| | |
LoCorr Dynamic Equity Fund – Statements of Changes in Net Assets | | 71 |
| |
LoCorr Dynamic Equity Fund
Statements of Changes in Net Assets
| | Six Months
Ended June
30, 2021
(Unaudited) | | | Year Ended
December 31,
2020 | |
| | | | | | | | | |
Operations | | | | | | | | |
Net investment loss | | $ | (176,323 | ) | | $ | (384,911 | ) |
Net realized gain (loss) on investments, securities sold short, futures contracts and foreign currency transactions | | | 2,513,862 | | | | (19,925 | ) |
Net change in unrealized depreciation of investments, securities sold short, futures contracts and foreign currency translation | | | (225,010 | ) | | | (702,798 | ) |
Increase (Decrease) in Net Assets Resulting From Operations | | | 2,112,529 | | | | (1,107,634 | ) |
| | | | | | | | |
Capital Transactions (Note 6) | | | | | | | | |
Proceeds from shares sold | | | 5,470,476 | | | | 6,264,879 | |
Reinvestment of distributions | | | — | | | | — | |
Cost of shares redeemed | | | (3,561,473 | ) | | | (14,782,464 | ) |
Increase (Decrease) in Net Assets From Capital Transactions | | | 1,909,003 | | | | (8,517,585 | ) |
| | | | | | | | |
Total Increase (Decrease) in Net Assets | | | 4,021,532 | | | | (9,625,219 | ) |
| | | | | | | | |
Net Assets | | | | | | | | |
Beginning of period | | | 18,072,535 | | | | 27,697,754 | |
End of period | | $ | 22,094,067 | | | $ | 18,072,535 | |
The accompanying notes are an integral part of these financial statements.
| |
| | |
72 | | LoCorr Spectrum Income Fund – Statements of Changes in Net Assets |
| |
LoCorr Spectrum Income Fund
Statements of Changes in Net Assets
| | Six Months Ended June 30, 2021 (Unaudited) | | | Year Ended December 31, 2020 | |
| | | | | | | | | |
Operations | | | | | | | | |
Net investment income | | $ | 361,334 | | | $ | 1,033,961 | |
Net realized gain (loss) on investments and written options | | | 4,240,279 | | | | (8,616,208 | ) |
Net change in unrealized appreciation of investments and written options | | | 6,341,526 | | | | 571,050 | |
Increase (Decrease) in Net Assets Resulting From Operations | | | 10,943,139 | | | | (7,011,197 | ) |
| | | | | | | | |
Distributions From: | | | | | | | | |
Earnings: | | | | | | | | |
Class A | | | (478,735 | ) | | | (524,026 | ) |
Class C | | | (448,504 | ) | | | (394,734 | ) |
Class I | | | (951,851 | ) | | | (757,177 | ) |
Return of capital: | | | | | | | | |
Class A | | | — | | | | (801,917 | ) |
Class C | | | — | | | | (604,063 | ) |
Class I | | | — | | | | (1,158,708 | ) |
Total Distributions From Earnings | | | (1,879,090 | ) | | | (4,240,625 | ) |
| | | | | | | | |
Capital Transactions (Note 6) | | | | | | | | |
Proceeds from shares sold | | | 12,380,074 | | | | 10,635,063 | |
Reinvestment of distributions | | | 1,366,795 | | | | 3,001,128 | |
Cost of shares redeemed | | | (7,407,396 | ) | | | (28,130,066 | ) |
Redemption fees | | | — | | | | 4,942 | |
Increase (Decrease) in Net Assets From Capital Transactions | | | 6,339,473 | | | | (14,488,933 | ) |
| | | | | | | | |
Total Increase (Decrease) in Net Assets | | | 15,403,522 | | | | (25,740,755 | ) |
| | | | | | | | |
Net Assets | | | | | | | | |
Beginning of period | | | 48,145,355 | | | | 73,886,110 | |
End of period | | $ | 63,548,877 | | | $ | 48,145,355 | |
The accompanying notes are an integral part of these financial statements.
| |
| | |
LoCorr Macro Strategies Fund – Consolidated Financial Highlights – Class A | | 73 |
| |
LoCorr Macro Strategies Fund – Class A
Consolidated Financial Highlights
Selected Data and Ratios (for a share outstanding throughout the period)
| | Six Months Ended | | | Year Ended December 31, | |
| | June 30, 2021*
(Unaudited) | | | 2020 | | | 2019 | | | 2018 | | | 2017 | | | 2016 | |
| | | | | | | | | | | | | | | | | | | | | | | | | |
Per Share | | | | | | | | | | | | | | | | | | | | | | | | |
Net asset value, beginning of period | | $ | 8.53 | | | $ | 8.56 | | | $ | 7.95 | | | $ | 8.64 | | | $ | 8.91 | | | $ | 8.54 | |
| | | | | | | | | | | | | | | | | | | | | | | | |
Income (loss) from investment operations: | | | | | | | | | | | | | | | | | | | | | | | | |
Net investment income (loss)(a) | | | (0.04 | ) | | | (0.04 | ) | | | 0.02 | | | | 0.00 | (b) | | | (0.06 | ) | | | (0.09 | ) |
Net realized and unrealized gain (loss) | | | 0.43 | | | | 0.49 | | | | 0.98 | | | | (0.46 | ) | | | 0.31 | | | | 0.64 | |
Total from Investment Operations | | | 0.39 | | | | 0.45 | | | | 1.00 | | | | (0.46 | ) | | | 0.25 | | | | 0.55 | |
| | | | | | | | | | | | | | | | | | | | | | | | |
Distributions From Earnings: | | | | | | | | | | | | | | | | | | | | | | | | |
Net investment income | | | — | | | | (0.39 | ) | | | (0.16 | ) | | | (0.10 | ) | | | — | | | | — | |
Net realized gains | | | — | | | | (0.09 | ) | | | (0.23 | ) | | | (0.13 | ) | | | (0.52 | ) | | | (0.18 | ) |
Total Distributions | | | — | | | | (0.48 | ) | | | (0.39 | ) | | | (0.23 | ) | | | (0.52 | ) | | | (0.18 | ) |
| | | | | | | | | | | | | | | | | | | | | | | | |
Redemption Fees | | | — | | | | — | | | | — | | | | — | | | | 0.00 | (b) | | | 0.00 | (b) |
| | | | | | | | | | | | | | | | | | | | | | | | |
Net Asset Value, End of Period | | $ | 8.92 | | | $ | 8.53 | | | $ | 8.56 | | | $ | 7.95 | | | $ | 8.64 | | | $ | 8.91 | |
| | | | | | | | | | | | | | | | | | | | | | | | |
Total Investment Return(c) | | | 4.45 | % | | | 5.41 | % | | | 12.52 | % | | | (5.36 | )% | | | 2.77 | % | | | 6.39 | % |
| | | | | | | | | | | | | | | | | | | | | | | | |
Net Assets, End of Period, in Thousands | | $ | 86,257 | | | $ | 77,035 | | | $ | 53,320 | | | $ | 55,075 | | | $ | 93,182 | | | $ | 297,844 | |
| | | | | | | | | | | | | | | | | | | | | | | | |
Ratios/Supplemental Data: | | | | | | | | | | | | | | | | | | | | | | | | |
Ratio of expenses to average net assets: | | | | | | | | | | | | | | | | | | | | | | | | |
Before expense waiver or recovery | | | 2.14 | % | | | 2.17 | % | | | 2.16 | % | | | 2.25 | % | | | 2.33 | % | | | 2.34 | %(d)(e) |
After expense waiver or recovery | | | 2.14 | % | | | 2.18 | % | | | 2.24 | % | | | 2.24 | % | | | 2.28 | % | | | 2.34 | %(d)(e) |
| | | | | | | | | | | | | | | | | | | | | | | | |
Ratio of net investment income (loss) to average net assets: | | | | | | | | | | | | | | | | | | | | | | | | |
Before expense waiver or recovery | | | (0.95 | )% | | | (0.49 | )% | | | 0.32 | % | | | 0.03 | % | | | (0.76 | )% | | | (0.96 | )%(d) |
After expense waiver or recovery | | | (0.95 | )% | | | (0.50 | )% | | | 0.24 | % | | | 0.04 | % | | | (0.71 | )% | | | (0.96 | )%(d) |
| | | | | | | | | | | | | | | | | | | | | | | | |
Portfolio turnover rate(f) | | | 29 | % | | | 56 | % | | | 84 | % | | | 105 | % | | | 97 | % | | | 62 | % |
* All ratios have been annualized except total investment return and portfolio turnover.
(a) | Net investment income (loss) per share is based on average shares outstanding. |
(b) | Amount represents less than $0.005 per share. |
(c) | Total investment return excludes the effect of applicable sales charges. |
(d) | Ratios do not include the income and expenses of the CTAs included in the swap. |
(e) | Includes interest expense of 0.01% for the year ended December 31, 2016. |
(f) | Portfolio turnover rate is calculated on the basis of the Fund as a whole without distinguishing between classes of shares issued. Consists of long-term investments only; excludes derivative instruments. |
The accompanying notes are an integral part of these consolidated financial statements.
| |
| | |
74 | | LoCorr Macro Strategies Fund – Consolidated Financial Highlights – Class C |
| |
LoCorr Macro Strategies Fund – Class C
Consolidated Financial Highlights
Selected Data and Ratios (for a share outstanding throughout the period)
| | Six Months Ended | | | Year Ended December 31, | |
| | June 30, 2021*
(Unaudited) | | | 2020 | | | 2019 | | | 2018 | | | 2017 | | | 2016 | |
| | | | | | | | | | | | | | | | | | | | | | | | | |
Per Share | | | | | | | | | | | | | | | | | | | | | | | | |
Net asset value, beginning of period | | $ | 8.11 | | | $ | 8.15 | | | $ | 7.62 | | | $ | 8.27 | | | $ | 8.62 | | | $ | 8.32 | |
| | | | | | | | | | | | | | | | | | | | | | | | |
Income (loss) from investment operations: | | | | | | | | | | | | | | | | | | | | | | | | |
Net investment loss (a) | | | (0.07 | ) | | | (0.10 | ) | | | (0.04 | ) | | | (0.06 | ) | | | (0.13 | ) | | | (0.15 | ) |
Net realized and unrealized gain (loss) | | | 0.41 | | | | 0.47 | | | | 0.92 | | | | (0.43 | ) | | | 0.30 | | | | 0.63 | |
Total from Investment Operations | | | 0.34 | | | | 0.37 | | | | 0.88 | | | | (0.49 | ) | | | 0.17 | | | | 0.48 | |
| | | | | | | | | | | | | | | | | | | | | | | | |
Distributions From Earnings: | | | | | | | | | | | | | | | | | | | | | | | | |
Net investment income | | | — | | | | (0.32 | ) | | | (0.12 | ) | | | (0.03 | ) | | | — | | | | — | |
Net realized gains | | | — | | | | (0.09 | ) | | | (0.23 | ) | | | (0.13 | ) | | | (0.52 | ) | | | (0.18 | ) |
Total Distributions | | | — | | | | (0.41 | ) | | | (0.35 | ) | | | (0.16 | ) | | | (0.52 | ) | | | (0.18 | ) |
| | | | | | | | | | | | | | | | | | | | | | | | |
Redemption Fees | | | — | | | | — | | | | — | | | | — | | | | 0.00 | (b) | | | 0.00 | (b) |
| | | | | | | | | | | | | | | | | | | | | | | | |
Net Asset Value, End of Period | | $ | 8.45 | | | $ | 8.11 | | | $ | 8.15 | | | $ | 7.62 | | | $ | 8.27 | | | $ | 8.62 | |
| | | | | | | | | | | | | | | | | | | | | | | | |
Total Investment Return(c) | | | 4.07 | % | | | 4.69 | % | | | 11.57 | % | | | (5.98 | )% | | | 1.93 | % | | | 5.72 | % |
| | | | | | | | | | | | | | | | | | | | | | | | |
Net Assets, End of Period, in Thousands | | $ | 41,284 | | | $ | 43,684 | | | $ | 47,205 | | | $ | 53,148 | | | $ | 90,653 | | | $ | 113,814 | |
| | | | | | | | | | | | | | | | | | | | | | | | |
Ratios/Supplemental Data: | | | | | | | | | | | | | | | | | | | | | | | | |
Ratio of expenses to average net assets: | | | | | | | | | | | | | | | | | | | | | | | | |
Before expense waiver or recovery | | | 2.89 | % | | | 2.92 | % | | | 2.91 | % | | | 3.00 | % | | | 3.08 | % | | | 3.09 | %(d)(e) |
After expense waiver or recovery | | | 2.89 | % | | | 2.93 | % | | | 2.99 | % | | | 2.99 | % | | | 3.03 | % | | | 3.09 | %(d)(e) |
| | | | | | | | | | | | | | | | | | | | | | | | |
Ratio of net investment income (loss) to average net assets: | | | | | | | | | | | | | | | | | | | | | | | | |
Before expense waiver or recovery | | | (1.70 | )% | | | (1.24 | )% | | | (0.43 | )% | | | (0.72 | )% | | | (1.51 | )% | | | (1.71 | )%(d) |
After expense waiver or recovery | | | (1.70 | )% | | | (1.25 | )% | | | (0.51 | )% | | | (0.71 | )% | | | (1.46 | )% | | | (1.71 | )%(d) |
| | | | | | | | | | | | | | | | | | | | | | | | |
Portfolio turnover rate(f) | | | 29 | % | | | 56 | % | | | 84 | % | | | 105 | % | | | 97 | % | | | 62 | % |
* All ratios have been annualized except total investment return and portfolio turnover.
(a) | Net investment income (loss) per share is based on average shares outstanding. |
(b) | Amount represents less than $0.005 per share. |
(c) | Total investment return excludes the effect of applicable sales charges. |
(d) | Ratios do not include the income and expenses of the CTAs included in the swap. |
(e) | Includes interest expense of 0.01% for the year ended December 31, 2016. |
(f) | Portfolio turnover rate is calculated on the basis of the Fund as a whole without distinguishing between classes of shares issued. Consists of long-term investments only; excludes derivative instruments. |
The accompanying notes are an integral part of these consolidated financial statements.
| |
| | |
LoCorr Macro Strategies Fund – Consolidated Financial Highlights – Class I | | 75 |
| |
LoCorr Macro Strategies Fund – Class I
Consolidated Financial Highlights
Selected Data and Ratios (for a share outstanding throughout the period)
| | Six Months Ended | | | Year Ended December 31, | |
| | June 30, 2021*
(Unaudited) | | | 2020 | | | 2019 | | | 2018 | | | 2017 | | | 2016 | |
| | | | | | | | | | | | | | | | | | | | | | | | | |
Per Share | | | | | | | | | | | | | | | | | | | | | | | | |
Net asset value, beginning of period | | $ | 8.67 | | | $ | 8.69 | | | $ | 8.07 | | | $ | 8.77 | | | $ | 9.01 | | | $ | 8.62 | |
| | | | | | | | | | | | | | | | | | | | | | | | |
Income (loss) from investment operations: | | | | | | | | | | | | | | | | | | | | | | | | |
Net investment income (loss)(a) | | | (0.03 | ) | | | (0.02 | ) | | | 0.04 | | | | 0.02 | | | | (0.04 | ) | | | (0.07 | ) |
Net realized and unrealized gain (loss) | | | 0.44 | | | | 0.50 | | | | 0.99 | | | | (0.47 | ) | | | 0.32 | | | | 0.64 | |
Total from Investment Operations | | | 0.41 | | | | 0.48 | | | | 1.03 | | | | (0.45 | ) | | | 0.28 | | | | 0.57 | |
| | | | | | | | | | | | | | | | | | | | | | | | |
Distributions From Earnings: | | | | | | | | | | | | | | | | | | | | | | | | |
Net investment income | | | — | | | | (0.41 | ) | | | (0.18 | ) | | | (0.12 | ) | | | — | | | | (0.00 | ) |
Net realized gains | | | — | | | | (0.09 | ) | | | (0.23 | ) | | | (0.13 | ) | | | (0.52 | ) | | | (0.18 | ) |
Total Distributions | | | — | | | | (0.50 | ) | | | (0.41 | ) | | | (0.25 | ) | | | (0.52 | ) | | | (0.18 | ) |
| | | | | | | | | | | | | | | | | | | | | | | | |
Redemption Fees | | | — | | | | — | | | | — | | | | — | | | | 0.00 | (b) | | | 0.00 | (b) |
| | | | | | | | | | | | | | | | | | | | | | | | |
Net Asset Value, End of Period | | $ | 9.08 | | | $ | 8.67 | | | $ | 8.69 | | | $ | 8.07 | | | $ | 8.77 | | | $ | 9.01 | |
| | | | | | | | | | | | | | | | | | | | | | | | |
Total Investment Return | | | 4.61 | % | | | 5.70 | % | | | 12.72 | % | | | (5.08 | )% | | | 3.07 | % | | | 6.57 | % |
| | | | | | | | | | | | | | | | | | | | | | | | |
Net Assets, End of Period, in Thousands | | $ | 1,306,431 | | | $ | 1,063,447 | | | $ | 726,061 | | | $ | 445,858 | | | $ | 605,983 | | | $ | 471,002 | |
| | | | | | | | | | | | | | | | | | | | | | | | |
Ratios/Supplemental Data: | | | | | | | | | | | | | | | | | | | | | | | | |
Ratio of expenses to average net assets: | | | | | | | | | | | | | | | | | | | | | | | | |
Before expense waiver or recovery | | | 1.89 | % | | | 1.92 | % | | | 1.91 | % | | | 2.00 | % | | | 2.08 | % | | | 2.09 | %(c)(d) |
After expense waiver or recovery | | | 1.89 | % | | | 1.93 | % | | | 1.99 | % | | | 1.99 | % | | | 2.03 | % | | | 2.09 | %(c)(d) |
| | | | | | | | | | | | | | | | | | | | | | | | |
Ratio of net investment income (loss) to average net assets: | | | | | | | | | | | | | | | | | | | | | | | | |
Before expense waiver or recovery | | | (0.70 | )% | | | (0.24 | )% | | | (0.57 | )% | | | (0.28 | )% | | | (0.51 | )% | | | (0.71 | )%(c) |
After expense waiver or recovery | | | (0.70 | )% | | | (0.25 | )% | | | (0.49 | )% | | | (0.29 | )% | | | (0.46 | )% | | | (0.71 | )%(c) |
| | | | | | | | | | | | | | | | | | | | | | | | |
Portfolio turnover rate(e) | | | 29 | % | | | 56 | % | | | 84 | % | | | 105 | % | | | 97 | % | | | 62 | % |
* All ratios have been annualized except total investment return and portfolio turnover.
(a) | Net investment income (loss) per share is based on average shares outstanding. |
(b) | Amount represents less than $0.005 per share. |
(c) | Ratios do not include the income and expenses of the CTAs included in the swap. |
(d) | Includes interest expense of 0.01% for the year ended December 31, 2016. |
(e) | Portfolio turnover rate is calculated on the basis of the Fund as a whole without distinguishing between classes of shares issued. Consists of long-term investments only; excludes derivative instruments. |
The accompanying notes are an integral part of these consolidated financial statements.
| |
| | |
76 | | LoCorr Long/Short Commodities Strategy Fund – Consolidated Financial Highlights – Class A |
| |
LoCorr Long/Short Commodities Strategy Fund – Class A
Consolidated Financial Highlights
Selected Data and Ratios (for a share outstanding throughout the period)
| | | Six Months Ended | | | Year Ended December 31, | |
| | | June 30, 2021*
(Unaudited) | | | 2020 | | | 2019 | | | 2018 | | | 2017 | | | 2016 | |
| | | | | | | | | | | | | | | | | | | | | | | | | |
| Per Share | | | | | | | | | | | | | | | | | | | | | | | | |
| Net asset value, beginning of period | | $ | 9.89 | | | $ | 9.26 | | | $ | 9.90 | | | $ | 9.71 | | | $ | 9.17 | | | $ | 9.72 | |
| | | | | | | | | | | | | | | | | | | | | | | | | |
| Income (loss) from investment operations: | | | | | | | | | | | | | | | | | | | | | | | | |
| Net investment income (loss)(a) | | | (0.06 | ) | | | (0.07 | ) | | | 0.05 | | | | 0.02 | | | | (0.04 | ) | | | (0.10 | ) |
| Net realized and unrealized gain (loss) | | | 0.91 | | | | 0.96 | | | | (0.67 | ) | | | 1.39 | | | | 0.58 | | | | (0.18 | ) |
| Total from Investment Operations | | | 0.85 | | | | 0.89 | | | | (0.62 | ) | | | 1.41 | | | | 0.54 | | | | (0.28 | ) |
| | | | | | | | | | | | | | | | | | | | | | | | | |
| Distributions From Earnings: | | | | | | | | | | | | | | | | | | | | | | | | |
| Net investment income | | | — | | | | (0.26 | ) | | | (0.02 | ) | | | (1.22 | ) | | | (0.00 | )(b) | | | (0.27 | ) |
| Net realized gains | | | — | | | | (0.00 | )(b) | | | — | | | | — | | | | — | | | | — | |
| Total Distributions | | | — | | | | (0.26 | ) | | | (0.02 | ) | | | (1.22 | ) | | | (0.00 | ) | | | (0.27 | ) |
| | | | | | | | | | | | | | | | | | | | | | | | | |
| Redemption Fees | | | — | | | | — | | | | — | | | | — | | | | 0.00 | (b) | | | 0.00 | (b) |
| | | | | | | | | | | | | | | | | | | | | | | | | |
| Net Asset Value, End of Period | | $ | 10.74 | | | $ | 9.89 | | | $ | 9.26 | | | $ | 9.90 | | | $ | 9.71 | | | $ | 9.17 | |
| | | | | | | | | | | | | | | | | | | | | | | | | |
| Total Investment Return(c) | | | 8.59 | % | | | 9.66 | % | | | (6.24 | )% | | | 15.05 | % | | | 5.91 | % | | | (2.98 | )% |
| | | | | | | | | | | | | | | | | | | | | | | | | |
| Net Assets, End of Period, in Thousands | | $ | 29,521 | | | $ | 26,546 | | | $ | 45,513 | | | $ | 68,719 | | | $ | 25,575 | | | $ | 34,860 | |
| | | | | | | | | | | | | | | | | | | | | | | | | |
| Ratios/Supplemental Data:(d) | | | | | | | | | | | | | | | | | | | | | | | | |
| Ratio of expenses to average net assets: | | | | | | | | | | | | | | | | | | | | | | | | |
| Before expense waiver or recovery | | | 2.09 | % | | | 2.08 | % | | | 2.11 | % | | | 2.16 | % | | | 2.28 | % | | | 2.22 | %(e) |
| After expense waiver or recovery | | | 2.09 | % | | | 2.08 | % | | | 2.14 | % | | | 2.20 | % | | | 2.20 | % | | | 2.20 | %(e) |
| | | | | | | | | | | | | | | | | | | | | | | | | |
| Ratio of net investment income (loss) to average net assets: | | | | | | | | | | | | | | | | | | | | | | | | |
| Before expense waiver or recovery | | | (1.19 | )% | | | (0.65 | )% | | | 0.57 | % | | | 0.22 | % | | | (0.52 | )% | | | (0.99 | )% |
| After expense waiver or recovery | | | (1.19 | )% | | | (0.65 | )% | | | 0.54 | % | | | 0.18 | % | | | (0.44 | )% | | | (0.97 | )% |
| | | | | | | | | | | | | | | | | | | | | | | | | |
| Portfolio turnover rate(f) | | | 29 | % | | | 60 | % | | | 103 | % | | | 92 | % | | | 74 | % | | | 105 | % |
* All ratios have been annualized except total investment return and portfolio turnover.
| (a) | Net investment income (loss) per share is based on average shares outstanding. |
| (b) | Amount represents less than $0.005 per share. |
| (c) | Total investment return excludes the effect of applicable sales charges. |
| (d) | Ratios do not include the income and expenses of the CTAs included in the swap. |
| (e) | Includes interest expense of 0.00% for the year ended December 31, 2016. |
| (f) | Portfolio turnover rate is calculated on the basis of the Fund as a whole without distinguishing between classes of shares issued. Consists of long-term investments only; excludes derivative instruments. |
The accompanying notes are an integral part of these consolidated financial statements.
| |
| | |
LoCorr Long/Short Commodities Strategy Fund – Consolidated Financial Highlights – Class C | | 77 |
| |
LoCorr Long/Short Commodities Strategy Fund – Class C
Consolidated Financial Highlights
Selected Data and Ratios (for a share outstanding throughout the period)
| | | Six Months Ended | | | Year Ended December 31, | |
| | | June 30, 2021*
(Unaudited) | | | 2020 | | | 2019 | | | 2018 | | | 2017 | | | 2016 | |
| | | | | | | | | | | | | | | | | | | | | | | | | |
| Per Share | | | | | | | | | | | | | | | | | | | | | | | | |
| Net asset value, beginning of period | | $ | 9.47 | | | $ | 8.89 | | | $ | 9.55 | | | $ | 9.41 | | | $ | 8.95 | | | $ | 9.51 | |
| | | | | | | | | | | | | | | | | | | | | | | | | |
| Income (loss) from investment operations: | | | | | | | | | | | | | | | | | | | | | | | | |
| Net investment income (loss)(a) | | | (0.09 | ) | | | (0.13 | ) | | | (0.02 | ) | | | (0.06 | ) | | | (0.11 | ) | | | (0.17 | ) |
| Net realized and unrealized gain (loss) | | | 0.87 | | | | 0.91 | | | | (0.64 | ) | | | 1.35 | | | | 0.57 | | | | (0.18 | ) |
| Total from Investment Operations | | | 0.78 | | | | 0.78 | | | | (0.66 | ) | | | 1.29 | | | | 0.46 | | | | (0.35 | ) |
| | | | | | | | | | | | | | | | | | | | | | | | | |
| Distributions From Earnings: | | | | | | | | | | | | | | | | | | | | | | | | |
| Net investment income | | | — | | | | (0.20 | ) | | | (0.00 | )(b) | | | (1.15 | ) | | | (0.00 | )(b) | | | (0.21 | ) |
| Net realized gains | | | — | | | | (0.00 | )(b) | | | — | | | | — | | | | — | | | | — | |
| Total Distributions | | | — | | | | (0.20 | ) | | | (0.00 | ) | | | (1.15 | ) | | | (0.00 | ) | | | (0.21 | ) |
| | | | | | | | | | | | | | | | | | | | | | | | | |
| Redemption Fees | | | — | | | | — | | | | — | | | | — | | | | 0.00 | (b) | | | 0.00 | (b) |
| | | | | | | | | | | | | | | | | | | | | | | | | |
| Net Asset Value, End of Period | | $ | 10.25 | | | $ | 9.47 | | | $ | 8.89 | | | $ | 9.55 | | | $ | 9.41 | | | $ | 8.95 | |
| | | | | | | | | | | | | | | | | | | | | | | | | |
| Total Investment Return(c) | | | 8.24 | % | | | 8.83 | % | | | (6.90 | )% | | | 14.20 | % | | | 5.17 | % | | | (3.72 | )% |
| | | | | | | | | | | | | | | | | | | | | | | | | |
| Net Assets, End of Period, in Thousands | | $ | 9,228 | | | $ | 7,938 | | | $ | 6,645 | | | $ | 6,503 | | | $ | 4,737 | | | $ | 7,383 | |
| | | | | | | | | | | | | | | | | | | | | | | | | |
| Ratios/Supplemental Data:(d) | | | | | | | | | | | | | | | | | | | | | | | | |
| Ratio of expenses to average net assets: | | | | | | | | | | | | | | | | | | | | | | | | |
| Before expense waiver or recovery | | | 2.84 | % | | | 2.83 | % | | | 2.86 | % | | | 2.91 | % | | | 3.03 | % | | | 2.97 | %(e) |
| After expense waiver or recovery | | | 2.84 | % | | | 2.83 | % | | | 2.89 | % | | | 2.95 | % | | | 2.95 | % | | | 2.95 | %(e) |
| | | | | | | | | | | | | | | | | | | | | | | | | |
| Ratio of net investment income (loss) to average net assets: | | | | | | | | | | | | | | | | | | | | | | | | |
| Before expense waiver or recovery | | | (1.94 | )% | | | (1.40 | )% | | | (0.18 | )% | | | (0.53 | )% | | | (1.27 | )% | | | (1.74 | )% |
| After expense waiver or recovery | | | (1.94 | )% | | | (1.40 | )% | | | (0.21 | )% | | | (0.57 | )% | | | (1.19 | )% | | | (1.72 | )% |
| | | | | | | | | | | | | | | | | | | | | | | | | |
| Portfolio turnover rate(f) | | | 29 | % | | | 60 | % | | | 103 | % | | | 92 | % | | | 74 | % | | | 105 | % |
* All ratios have been annualized except total investment return and portfolio turnover.
| (a) | Net investment income (loss) per share is based on average shares outstanding. |
| (b) | Amount represents less than $0.005 per share. |
| (c) | Total investment return excludes the effect of applicable sales charges. |
| (d) | Ratios do not include the income and expenses of the CTAs included in the swap. |
| (e) | Includes interest expense of 0.00% for the year ended December 31, 2016. |
| (f) | Portfolio turnover rate is calculated on the basis of the Fund as a whole without distinguishing between classes of shares issued. Consists of long-term investments only; excludes derivative instruments. |
The accompanying notes are an integral part of these consolidated financial statements.
| |
| | |
78 | | LoCorr Long/Short Commodities Strategy Fund – Consolidated Financial Highlights – Class I |
| |
LoCorr Long/Short Commodities Strategy Fund – Class I
Consolidated Financial Highlights
Selected Data and Ratios (for a share outstanding throughout the period)
| | | Six Months Ended | | | | Year Ended December 31, | |
| | | June 30, 2021*
(Unaudited) | | | 2020 | | | 2019 | | | 2018 | | | 2017 | | | 2016 | |
| | | | | | | | | | | | | | | | | | | | | | | | | |
| Per Share | | | | | | | | | | | | | | | | | | | | | | | | |
| Net asset value, beginning of period | | $ | 10.00 | | | $ | 9.38 | | | $ | 10.03 | | | $ | 9.81 | | | $ | 9.24 | | | $ | 9.79 | |
| | | | | | | | | | | | | | | | | | | | | | | | | |
| Income (loss) from investment operations: | | | | | | | | | | | | | | | | | | | | | | | | |
| Net investment income (loss)(a) | | | (0.05 | ) | | | (0.04 | ) | | | 0.08 | | | | 0.05 | | | | (0.02 | ) | | | (0.07 | ) |
| Net realized and unrealized gain (loss) | | | 0.93 | | | | 0.95 | | | | (0.68 | ) | | | 1.41 | | | | 0.59 | | | | (0.18 | ) |
| Total from Investment Operations | | | 0.88 | | | | 0.91 | | | | (0.60 | ) | | | 1.46 | | | | 0.57 | | | | (0.25 | ) |
| | | | | | | | | | | | | | | | | | | | | | | | | |
| Distributions From Earnings: | | | | | | | | | | | | | | | | | | | | | | | | |
| Net investment income | | | — | | | | (0.29 | ) | | | (0.05 | ) | | | (1.24 | ) | | | (0.00 | )(b) | | | (0.30 | ) |
| Net realized gains | | | — | | | | (0.00 | )(b) | | | — | | | | — | | | | — | | | | — | |
| Total Distributions | | | — | | | | (0.29 | ) | | | (0.05 | ) | | | (1.24 | ) | | | (0.00 | ) | | | (0.30 | ) |
| | | | | | | | | | | | | | | | | | | | | | | | | |
| Redemption Fees | | | — | | | | — | | | | — | | | | — | | | | 0.00 | (b) | | | 0.00 | (b) |
| | | | | | | | | | | | | | | | | | | | | | | | | |
| Net Asset Value, End of Period | | $ | 10.88 | | | $ | 10.00 | | | $ | 9.38 | | | $ | 10.03 | | | $ | 9.81 | | | $ | 9.24 | |
| | | | | | | | | | | | | | | | | | | | | | | | | |
| Total Investment Return | | | 8.69 | % | | | 9.91 | % | | | (5.97 | )% | | | 15.40 | % | | | 6.19 | % | | | (2.67 | )% |
| | | | | | | | | | | | | | | | | | | | | | | | | |
| Net Assets, End of Period, in Thousands | | $ | 671,141 | | | $ | 443,351 | | | $ | 203,887 | | | $ | 181,804 | | | $ | 52,935 | | | $ | 81,204 | |
| | | | | | | | | | | | | | | | | | | | | | | | | |
| Ratios/Supplemental Data:(c) | | | | | | | | | | | | | | | | | | | | | | | | |
| Ratio of expenses to average net assets: | | | | | | | | | | | | | | | | | | | | | | | | |
| Before expense waiver or recovery | | | 1.84 | % | | | 1.83 | % | | | 1.86 | % | | | 1.91 | % | | | 2.03 | % | | | 1.97 | %(d) |
| After expense waiver or recovery | | | 1.84 | % | | | 1.83 | % | | | 1.89 | % | | | 1.95 | % | | | 1.95 | % | | | 1.95 | %(d) |
| | | | | | | | | | | | | | | | | | | | | | | | | |
| Ratio of net investment income (loss) to average net assets: | | | | | | | | | | | | | | | | | | | | | | | | |
| Before expense waiver or recovery | | | (0.94 | )% | | | (0.40 | )% | | | 0.82 | % | | | 0.47 | % | | | (0.27 | )% | | | (0.74 | )% |
| After expense waiver or recovery | | | (0.94 | )% | | | (0.40 | )% | | | 0.79 | % | | | 0.43 | % | | | (0.19 | )% | | | (0.72 | )% |
| | | | | | | | | | | | | | | | | | | | | | | | | |
| Portfolio turnover rate(e) | | | 29 | % | | | 60 | % | | | 103 | % | | | 92 | % | | | 74 | % | | | 105 | % |
* All ratios have been annualized except total investment return and portfolio turnover.
| (a) | Net investment income (loss) per share is based on average shares outstanding. |
| (b) | Amount represents less than $0.005 per share. |
| (c) | Ratios do not include the income and expenses of the CTAs included in the swap. |
| (d) | Includes interest expense of 0.00% for the year ended December 31, 2016. |
| (e) | Portfolio turnover rate is calculated on the basis of the Fund as a whole without distinguishing between classes of shares issued. Consists of long-term investments only; excludes derivative instruments. |
The accompanying notes are an integral part of these consolidated financial statements.
| |
| | |
LoCorr Market Trend Fund – Consolidated Financial Highlights – Class A | | 79 |
| |
LoCorr Market Trend Fund – Class A
Consolidated Financial Highlights
Selected Data and Ratios (for a share outstanding throughout the period)
| | | Six Months Ended | | | Year Ended December 31, | |
| | | June 30, 2021*
(Unaudited) | | | 2020 | | | 2019 | | | 2018 | | | 2017 | | | 2016 | |
| | | | | | | | | | | | | | | | | | | | | | | | | |
| Per Share | | | | | | | | | | | | | | | | | | | | | | | | |
| Net asset value, beginning of period | | $ | 11.70 | | | $ | 11.19 | | | $ | 9.52 | | | $ | 11.03 | | | $ | 10.65 | | | $ | 12.00 | |
| | | | | | | | | | | | | | | | | | | | | | | | | |
| Income (loss) from investment operations: | | | | | | | | | | | | | | | | | | | | | | | | |
| Net investment income (loss)(a) | | | (0.06 | ) | | | (0.06 | ) | | | 0.01 | | | | (0.03 | ) | | | (0.10 | ) | | | (0.15 | ) |
| Net realized and unrealized gain (loss) | | | 0.71 | | | | 0.57 | | | | 1.74 | | | | (1.48 | ) | | | 0.48 | | | | (1.01 | ) |
| Total from Investment Operations | | | 0.65 | | | | 0.51 | | | | 1.75 | | | | (1.51 | ) | | | 0.38 | | | | (1.16 | ) |
| | | | | | | | | | | | | | | | | | | | | | | | | |
| Distributions From Earnings: | | | | | | | | | | | | | | | | | | | | | | | | |
| Net investment income | | | — | | | | — | | | | (0.08 | ) | | | — | | | | — | | | | (0.19 | ) |
| Net realized gains | | | — | | | | — | | | | — | | | | — | | | | — | | | | — | |
| Total Distributions | | | — | | | | — | | | | (0.08 | ) | | | — | | | | — | | | | (0.19 | ) |
| | | | | | | | | | | | | | | | | | | | | | | | | |
| Redemption Fees | | | — | | | | — | | | | — | | | | — | | | | 0.00 | (b) | | | 0.00 | (b) |
| | | | | | | | | | | | | | | | | | | | | | | | | |
| Net Asset Value, End of Period | | $ | 12.35 | | | $ | 11.70 | | | $ | 11.19 | | | $ | 9.52 | | | $ | 11.03 | | | $ | 10.65 | |
| | | | | | | | | | | | | | | | | | | | | | | | | |
| Total Investment Return(c) | | | 5.65 | % | | | 4.47 | % | | | 18.33 | % | | | (13.69 | )% | | | 3.57 | % | | | (9.71 | )% |
| | | | | | | | | | | | | | | | | | | | | | | | | |
| Net Assets, End of Period, in Thousands | | $ | 16,325 | | | $ | 16,952 | | | $ | 21,966 | | | $ | 32,082 | | | $ | 61,557 | | | $ | 133,146 | |
| | | | | | | | | | | | | | | | | | | | | | | | | |
| Ratios/Supplemental Data: | | | | | | | | | | | | | | | | | | | | | | | | |
| Ratio of expenses to average net assets: | | | | | | | | | | | | | | | | | | | | | | | | |
| Before expense waiver or recovery | | | 2.02 | % | | | 2.04 | % | | | 2.02 | % | | | 1.99 | % | | | 2.00 | % | | | 2.02 | %(d) |
| After expense waiver or recovery | | | 2.02 | % | | | 2.04 | % | | | 2.02 | % | | | 1.99 | % | | | 2.00 | % | | | 2.02 | %(d) |
| | | | | | | | | | | | | | | | | | | | | | | | | |
| Ratio of net investment income (loss) to average net assets: | | | | | | | | | | | | | | | | | | | | | | | | |
| Before expense waiver or recovery | | | (0.95 | )% | | | (0.52 | )% | | | 0.14 | % | | | (0.24 | )% | | | (0.97 | )% | | | (1.24 | )% |
| After expense waiver or recovery | | | (0.95 | )% | | | (0.52 | )% | | | 0.14 | % | | | (0.24 | )% | | | (0.97 | )% | | | (1.24 | )% |
| | | | | | | | | | | | | | | | | | | | | | | | | |
| Portfolio turnover rate(e) | | | 32 | % | | | 125 | % | | | 119 | % | | | 91 | % | | | 85 | % | | | 83 | % |
* All ratios have been annualized except total investment return and portfolio turnover.
| (a) | Net investment income (loss) per share is based on average shares outstanding. |
| (b) | Amount represents less than $0.005 per share. |
| (c) | Total investment return excludes the effect of applicable sales charges. |
| (d) | Includes 0.00% of interest expense for the year ended December 31, 2016. |
| (e) | Portfolio turnover rate is calculated on the basis of the Fund as a whole without distinguishing between classes of shares issued. Consists of long-term investments only; excludes derivative instruments. |
The accompanying notes are an integral part of these consolidated financial statements.
| |
| | |
80 | | LoCorr Market Trend Fund - Consolidated Financial Highlights – Class C |
| |
LoCorr Market Trend Fund – Class C
Consolidated Financial Highlights
Selected Data and Ratios (for a share outstanding throughout the period)
| | | Six Months Ended | | | Year Ended December 31, | |
| | | June 30, 2021*
(Unaudited) | | | 2020 | | | 2019 | | | 2018 | | | 2017 | | | 2016 | |
| | | | | | | | | | | | | | | | | | | | | | | | | |
| Per Share | | | | | | | | | | | | | | | | | | | | | | | | |
| Net asset value, beginning of period | | $ | 11.30 | | | $ | 10.89 | | | $ | 9.28 | | | $ | 10.83 | | | $ | 10.53 | | | $ | 11.92 | |
| | | | | | | | | | | | | | | | | | | | | | | | | |
| Income (loss) from investment operations: | | | | | | | | | | | | | | | | | | | | | | | | |
| Net investment loss (a) | | | (0.10 | ) | | | (0.13 | ) | | | (0.06 | ) | | | (0.10 | ) | | | (0.18 | ) | | | (0.23 | ) |
| Net realized and unrealized gain (loss) | | | 0.69 | | | | 0.54 | | | | 1.67 | | | | (1.45 | ) | | | 0.48 | | | | (1.01 | ) |
| Total from Investment Operations | | | 0.59 | | | | 0.41 | | | | 1.61 | | | | (1.55 | ) | | | 0.30 | | | | (1.24 | ) |
| | | | | | | | | | | | | | | | | | | | | | | | | |
| Distributions From Earnings: | | | | | | | | | | | | | | | | | | | | | | | | |
| Net investment income | | | — | | | | — | | | | — | | | | — | | | | — | | | | (0.15 | ) |
| Net realized gains | | | — | | | | — | | | | — | | | | — | | | | — | | | | — | |
| Total Distributions | | | — | | | | — | | | | — | | | | — | | | | — | | | | (0.15 | ) |
| | | | | | | | | | | | | | | | | | | | | | | | | |
| Redemption Fees | | | — | | | | — | | | | — | | | | — | | | | 0.00 | (b) | | | 0.00 | (b) |
| | | | | | | | | | | | | | | | | | | | | | | | | |
| Net Asset Value, End of Period | | $ | 11.89 | | | $ | 11.30 | | | $ | 10.89 | | | $ | 9.28 | | | $ | 10.83 | | | $ | 10.53 | |
| | | | | | | | | | | | | | | | | | | | | | | | | |
| Total Investment Return(c) | | | 5.22 | % | | | 3.76 | % | | | 17.35 | % | | | (14.31 | )% | | | 2.85 | % | | | (10.45 | )% |
| | | | | | | | | | | | | | | | | | | | | | | | | |
| Net Assets, End of Period, in Thousands | | $ | 12,369 | | | $ | 13,170 | | | $ | 16,320 | | | $ | 23,417 | | | $ | 43,772 | | | $ | 89,454 | |
| | | | | | | | | | | | | | | | | | | | | | | | | |
| Ratios/Supplemental Data: | | | | | | | | | | | | | | | | | | | | | | | | |
| Ratio of expenses to average net assets: | | | | | | | | | | | | | | | | | | | | | | | | |
| Before expense waiver or recovery | | | 2.77 | % | | | 2.79 | % | | | 2.77 | % | | | 2.74 | % | | | 2.75 | % | | | 2.77 | %(d) |
| After expense waiver or recovery | | | 2.77 | % | | | 2.79 | % | | | 2.77 | % | | | 2.74 | % | | | 2.75 | % | | | 2.77 | %(d) |
| | | | | | | | | | | | | | | | | | | | | | | | | |
| Ratio of net investment income (loss) to average net assets: | | | | | | | | | | | | | | | | | | | | | | | | |
| Before expense waiver or recovery | | | (1.70 | )% | | | (1.27 | )% | | | (0.61 | )% | | | (0.99 | )% | | | (1.72 | )% | | | (1.99 | )% |
| After expense waiver or recovery | | | (1.70 | )% | | | (1.27 | )% | | | (0.61 | )% | | | (0.99 | )% | | | (1.72 | )% | | | (1.99 | )% |
| | | | | | | | | | | | | | | | | | | | | | | | | |
| Portfolio turnover rate(e) | | | 32 | % | | | 125 | % | | | 119 | % | | | 91 | % | | | 85 | % | | | 83 | % |
* All ratios have been annualized except total investment return and portfolio turnover.
| (a) | Net investment income (loss) per share is based on average shares outstanding. |
| (b) | Amount represents less than $0.005 per share. |
| (c) | Total investment return excludes the effect of applicable sales charges. |
| (d) | Includes 0.00% of interest expense for the year ended December 31, 2016. |
| (e) | Portfolio turnover rate is calculated on the basis of the Fund as a whole without distinguishing between classes of shares issued. Consists of long-term investments only; excludes derivative instruments. |
The accompanying notes are an integral part of these consolidated financial statements.
| |
| | |
LoCorr Market Trend Fund - Consolidated Financial Highlights – Class I | | 81 |
| |
LoCorr Market Trend Fund – Class I
Consolidated Financial Highlights
Selected Data and Ratios (for a share outstanding throughout the period)
| | Six Months Ended | | Year Ended December 31, |
| | June 30, 2021
(Unaudited) | | | 2020 | | | 2019 | | | 2018 | | | 2017 | | | 2016 | |
| | | | | | | | | | | | | | | | | | | | | | | | | |
Per Share | | | | | | | | | | | | | | | | | | | | | | | | |
Net asset value, beginning of period | | $ | 11.74 | | | $ | 11.23 | | | $ | 9.60 | | | $ | 11.09 | | | $ | 10.68 | | | $ | 12.02 | |
| | | | | | | | | | | | | | | | | | | | | | | | |
Income (loss) from investment operations: |
Net investment income (loss)(a) | | | (0.04 | ) | | | (0.03 | ) | | | 0.04 | | | | 0.00 | (b) | | | (0.08 | ) | | | (0.12 | ) |
Net realized and unrealized gain (loss) | | | 0.71 | | | | 0.57 | | | | 1.74 | | | | (1.49 | ) | | | 0.49 | | | | (1.02 | ) |
Total from Investment Operations | | | 0.67 | | | | 0.54 | | | | 1.78 | | | | (1.49 | ) | | | 0.41 | | | | (1.14 | ) |
| | | | | | | | | | | | | | | | | | | | | | | | |
Distributions From Earnings: |
Net investment income | | | — | | | | (0.03 | ) | | | (0.15 | ) | | | — | | | | — | | | | (0.20 | ) |
Net realized gains | | | — | | | | — | | | | — | | | | — | | | | — | | | | — | |
Total Distributions | | | — | | | | (0.03 | ) | | | (0.15 | ) | | | — | | | | — | | | | (0.20 | ) |
| | | | | | | | | | | | | | | | | | | | | | | | |
Redemption Fees | | | — | | | | — | | | | — | | | | — | | | | 0.00 | (b) | | | 0.00 | (b) |
| | | | | | | | | | | | | | | | | | | | | | | | |
Net Asset Value, End of Period | | $ | 12.41 | | | $ | 11.74 | | | $ | 11.23 | | | $ | 9.60 | | | $ | 11.09 | | | $ | 10.68 | |
| | | | | | | | | | | | | | | | | | | | | | | | |
Total Investment Return | | | 5.71 | % | | | 4.81 | % | | | 18.53 | % | | | (13.44 | )% | | | 3.84 | % | | | (9.49 | )% |
| | | | | | | | | | | | | | | | | | | | | | | | |
Net Assets, End of Period, in Thousands | | $ | 244,548 | | | $ | 225,995 | | | $ | 234,919 | | | $ | 287,702 | | | $ | 561,372 | | | $ | 797,845 | |
| | | | | | | | | | | | | | | | | | | | | | | | |
Ratios/Supplemental Data: |
Ratio of expenses to average net assets: | | | | | | | | | | | | | | | | | | | | | | | | |
Before expense waiver or recovery | | | 1.77 | % | | | 1.79 | % | | | 1.77 | % | | | 1.74 | % | | | 1.75 | % | | | 1.77 | %(c) |
After expense waiver or recovery | | | 1.77 | % | | | 1.79 | % | | | 1.77 | % | | | 1.74 | % | | | 1.75 | % | | | 1.77 | %(c) |
| | | | | | | | | | | | | | | | | | | | | | | | |
Ratio of net investment income (loss) to average net assets: |
Before expense waiver or recovery | | | (0.70 | )% | | | (0.27 | )% | | | 0.39 | % | | | 0.01 | % | | | (0.72 | )% | | | (0.99 | )% |
After expense waiver or recovery | | | (0.70 | )% | | | (0.27 | )% | | | 0.39 | % | | | 0.01 | % | | | (0.72 | )% | | | (0.99 | )% |
| | | | | | | | | | | | | | | | | | | | | | | | |
Portfolio turnover rate(d) | | | 32 | % | | | 125 | % | | | 119 | % | | | 91 | % | | | 85 | % | | | 83 | % |
* | All ratios have been annualized except total investment return and portfolio turnover. |
(a) | Net investment income (loss) per share is based on average shares outstanding. |
(b) | Amount represents less than $0.005 per share. |
(c) | Includes 0.00% of interest expense for the year ended December 31, 2016. |
(d) | Portfolio turnover rate is calculated on the basis of the Fund as a whole without distinguishing between classes of shares issued. Consists of long-term investments only; excludes derivative instruments. |
The accompanying notes are an integral part of these consolidated financial statements.
| |
| | |
82 | | LoCorr Dynamic Equity Fund – Financial Highlights – Class A |
| |
LoCorr Dynamic Equity Fund – Class A
Financial Highlights
Selected Data and Ratios (for a share outstanding throughout the period)
| | Six Months Ended | | Year Ended December 31, |
| | June 30, 2021*
(Unaudited) | | | 2020 | | | 2019 | | | 2018 | | | 2017 | | | 2016 | |
| | | | | | | | | | | | | | | | | | | | | | | | | |
Per Share | | | | | | | | | | | | | | | | | | | | | | | | |
Net asset value, beginning of period | | $ | 11.62 | | | $ | 11.20 | | | $ | 9.92 | | | $ | 11.82 | | | $ | 12.06 | | | $ | 9.64 | |
| | | | | | | | | | | | | | | | | | | | | | | | |
Income (loss) from investment operations: |
Net investment loss (a) | | | (0.12 | ) | | | (0.20 | ) | | | (0.19 | ) | | | (0.25 | ) | | | (0.30 | ) | | | (0.32 | ) |
Net realized and unrealized gain (loss) | | | 1.50 | | | | 0.62 | (b) | | | 1.51 | | | | (1.26 | ) | | | 0.59 | | | | 2.74 | |
Total from Investment Operations | | | 1.38 | | | | 0.42 | | | | 1.32 | | | | (1.51 | ) | | | 0.29 | | | | 2.42 | |
| | | | | | | | | | | | | | | | | | | | | | | | |
Distributions From Earnings: |
Net realized gains | | | — | | | | — | | | | (0.04 | ) | | | (0.39 | ) | | | (0.53 | ) | | | — | |
Total Distributions | | | — | | | | — | | | | (0.04 | ) | | | (0.39 | ) | | | (0.53 | ) | | | — | |
| | | | | | | | | | | | | | | | | | | | | | | | |
Redemption Fees | | | — | | | | — | | | | — | | | | — | | | | 0.00 | (c) | | | 0.00 | (c) |
| | | | | | | | | | | | | | | | | | | | | | | | |
Net Asset Value, End of Period | | $ | 13.00 | | | $ | 11.62 | | | $ | 11.20 | | | $ | 9.92 | | | $ | 11.82 | | | $ | 12.06 | |
| | | | | | | | | | | | | | | | | | | | | | | | |
Total Investment Return(d) | | | 11.88 | % | | | 3.75 | % | | | 13.40 | % | | | (12.87) | % | | | 2.38 | % | | | 25.10 | % |
| | | | | | | | | | | | | | | | | | | | | | | | |
Net Assets, End of Period, in Thousands | | $ | 3,899 | | | $ | 3,828 | | | $ | 6,744 | | | $ | 8,473 | | | $ | 19,962 | | | $ | 28,243 | |
| | | | | | | | | | | | | | | | | | | | | | | | |
Ratios/Supplemental Data: | | | | | | | | | | | | | | | | | | | | | | | | |
Ratio of expenses to average net assets: | | | | | | | | | | | | | | | | | | | | | | | | |
Before expense waiver or recovery | | | 4.13 | % | | | 4.51 | % | | | 3.73 | % | | | 3.40 | % | | | 3.42 | % | | | 3.74 | % |
After expense waiver or recovery | | | 2.77 | % | | | 3.15 | % | | | 3.02 | % | | | 3.21 | % | | | 3.35 | % | | | 3.49 | % |
| | | | | | | | | | | | | | | | | | | | | | | | |
Ratio of expenses to average net assets (excluding dividend and interest expense): |
Before expense waiver or recovery | | | 3.61 | % | | | 3.60 | % | | | 2.95 | % | | | 3.20 | % | | | 3.22 | % | | | 3.40 | % |
After expense waiver or recovery | | | 2.24 | % | | | 2.24 | % | | | 2.24 | % | | | 3.01 | % | | | 3.15 | % | | | 3.15 | % |
| | | | | | | | | | | | | | | | | | | | | | | | |
Ratio of net investment income (loss) to average net assets: |
Before expense waiver or recovery | | | (3.21 | )% | | | (3.31 | )% | | | (2.44 | )% | | | (2.39 | )% | | | (2.61 | )% | | | (3.23 | )% |
After expense waiver or recovery | | | (1.84 | )% | | | (1.95 | )% | | | (1.73 | )% | | | (2.20 | )% | | | (2.54 | )% | | | (2.98 | )% |
| | | | | | | | | | | | | | | | | | | | | | | | |
Portfolio turnover rate(e) | | | 305 | % | | | 953 | % | | | 300 | % | | | 449 | % | | | 363 | % | | | 343 | % |
* | All ratios have been annualized except total investment return and portfolio turnover. |
(a) | Net investment income (loss) per share is based on average shares outstanding. |
(b) | Realized and unrealized gains and losses per share in this caption are balancing amounts necessary to reconcile the change in net asset value per share for the period, and may not reconcile with the Fund’s consolidated statement of operations due to share transactions for the period. |
(c) | Amount represents less than $0.005 per share. |
(d) | Total investment return excludes the effect of applicable sales charges. |
(e) | Portfolio turnover rate is calculated on the basis of the Fund as a whole without distinguishing between classes of shares issued. Consists of long-term investments only; excludes securities sold short. |
The accompanying notes are an integral part of these financial statements.
| |
| | |
LoCorr Dynamic Equity Fund – Financial Highlights – Class C | | 83 |
| |
LoCorr Dynamic Equity Fund – Class C
Financial Highlights
Selected Data and Ratios (for a share outstanding throughout the period)
| | Six Months Ended | | Year Ended December 31, |
| |
June 30, 2021*
(Unaudited) | | | 2020 | | | 2019 | | | 2018 | | | 2017 | | | 2016 | |
| | | | | | | | | | | | | | | | | | | | | | | | | |
Per Share | | | | | | | | | | | | | | | | | | | | | | | | |
Net asset value, beginning of period | | $ | 10.93 | | | $ | 10.62 | | | $ | 9.47 | | | $ | 11.39 | | | $ | 11.73 | | | $ | 9.45 | |
| | | | | | | | | | | | | | | | | | | | | | | | |
Income (loss) from investment operations: |
Net investment loss (a) | | | (0.15 | ) | | | (0.26 | ) | | | (0.26 | ) | | | (0.32 | ) | | | (0.38 | ) | | | (0.38 | ) |
Net realized and unrealized gain (loss) | | | 1.40 | | | | 0.57 | (b) | | | 1.45 | | | | (1.21 | ) | | | 0.57 | | | | 2.66 | |
Total from Investment Operations | | | 1.25 | | | | 0.31 | | | | 1.19 | | | | (1.53 | ) | | | 0.19 | | | | 2.28 | |
| | | | | | | | | | | | | | | | | | | | | | | | |
Distributions From Earnings: |
Net realized gains | | | — | | | | — | | | | (0.04 | ) | | | (0.39 | ) | | | (0.53 | ) | | | — | |
Total Distributions | | | — | | | | — | | | | (0.04 | ) | | | (0.39 | ) | | | (0.53 | ) | | | — | |
| | | | | | | | | | | | | | | | | | | | | | | | |
Redemption Fees | | | — | | | | — | | | | — | | | | — | | | | 0.00 | (c) | | | 0.00 | (c) |
| | | | | | | | | | | | | | | | | | | | | | | | |
Net Asset Value, End of Period | | $ | 12.18 | | | $ | 10.93 | | | $ | 10.62 | | | $ | 9.47 | | | $ | 11.39 | | | $ | 11.73 | |
| | | | | | | | | | | | | | | | | | | | | | | | |
Total Investment Return(d) | | | 11.44 | % | | | 2.92 | % | | | 12.54 | % | | | (13.45) | % | | | 1.59 | % | | | 24.13 | % |
| | | | | | | | | | | | | | | | | | | | | | | | |
Net Assets, End of Period, in Thousands | | $ | 2,427 | | | $ | 2,436 | | | $ | 4,031 | | | $ | 5,255 | | | $ | 11,084 | | | $ | 11,218 | |
| | | | | | | | | | | | | | | | | | | | | | | | |
Ratios/Supplemental Data: |
Ratio of expenses to average net assets: | | | | | | | | | | | | | | | | | | | | | | | | |
Before expense waiver or recovery | | | 4.88 | % | | | 5.26 | % | | | 4.48 | % | | | 4.15 | % | | | 4.17 | % | | | 4.49 | % |
After expense waiver or recovery | | | 3.52 | % | | | 3.90 | % | | | 3.77 | % | | | 3.96 | % | | | 4.10 | % | | | 4.24 | % |
| | | | | | | | | | | | | | | | | | | | | | | | |
Ratio of expenses to average net assets (excluding dividend and interest expense): |
Before expense waiver or recovery | | | 4.36 | % | | | 4.35 | % | | | 3.70 | % | | | 3.95 | % | | | 3.97 | % | | | 4.15 | % |
After expense waiver or recovery | | | 2.99 | % | | | 2.99 | % | | | 2.99 | % | | | 3.76 | % | | | 3.90 | % | | | 3.90 | % |
| | | | | | | | | | | | | | | | | | | | | | | | |
Ratio of net investment income (loss) to average net assets: |
Before expense waiver or recovery | | | (3.96 | )% | | | (4.06 | )% | | | (3.19 | )% | | | (3.14 | )% | | | (3.36 | )% | | | (3.98 | )% |
After expense waiver or recovery | | | (2.59 | )% | | | (2.70 | )% | | | (2.48 | )% | | | (2.95 | )% | | | (3.29 | )% | | | (3.73 | )% |
| | | | | | | | | | | | | | | | | | | | | | | | |
Portfolio turnover rate(e) | | | 305 | % | | | 953 | % | | | 300 | % | | | 449 | % | | | 363 | % | | | 343 | % |
* | All ratios have been annualized except total investment return and portfolio turnover. |
(a) | Net investment income (loss) per share is based on average shares outstanding. |
(b) | Realized and unrealized gains and losses per share in this caption are balancing amounts necessary to reconcile the change in net asset value per share for the period, and may not reconcile with the Fund’s consolidated statement of operations due to share transactions for the period. |
(c) | Amount represents less than $0.005 per share. |
(d) | Total investment return excludes the effect of applicable sales charges. |
(e) | Portfolio turnover rate is calculated on the basis of the Fund as a whole without distinguishing between classes of shares issued. Consists of long-term investments only; excludes securities sold short. |
The accompanying notes are an integral part of these financial statements.
| |
| | |
84 | | LoCorr Dynamic Equity Fund – Financial Highlights – Class I |
| |
LoCorr Dynamic Equity Fund – Class I
Financial Highlights
Selected Data and Ratios (for a share outstanding throughout the period)
| | Six Months Ended | | Year Ended December 31, |
| |
June 30, 2021*
(Unaudited) | | | 2020 | | | 2019 | | | 2018 | | | 2017 | | | 2016 | |
| | | | | | | | | | | | | | | | | | | | | | | | | |
Per Share | | | | | | | | | | | | | | | | | | | | | | | | |
Net asset value, beginning of period | | $ | 11.86 | | | $ | 11.41 | | | $ | 10.07 | | | $ | 11.96 | | | $ | 12.17 | | | $ | 9.71 | |
| | | | | | | | | | | | | | | | | | | | | | | | |
Income (loss) from investment operations: |
Net investment loss (a) | | | (0.10 | ) | | | (0.17 | ) | | | (0.17 | ) | | | (0.23 | ) | | | (0.28 | ) | | | (0.30 | ) |
Net realized and unrealized gain (loss) | | | 1.53 | | | | 0.62 | (b) | | | 1.55 | | | | (1.27 | ) | | | 0.60 | | | | 2.76 | |
Total from Investment Operations | | | 1.43 | | | | 0.45 | | | | 1.38 | | | | (1.50 | ) | | | 0.32 | | | | 2.46 | |
| | | | | | | | | | | | | | | | | | | | | | | | |
Distributions From Earnings: |
Net realized gains | | | — | | | | — | | | | (0.04 | ) | | | (0.39 | ) | | | (0.53 | ) | | | — | |
Total Distributions | | | — | | | | — | | | | (0.04 | ) | | | (0.39 | ) | | | (0.53 | ) | | | — | |
| | | | | | | | | | | | | | | | | | | | | | | | |
Redemption Fees | | | — | | | | — | | | | — | | | | — | | | | 0.00 | (c) | | | 0.00 | (c) |
| | | | | | | | | | | | | | | | | | | | | | | | |
Net Asset Value, End of Period | | $ | 13.29 | | | $ | 11.86 | | | $ | 11.41 | | | $ | 10.07 | | | $ | 11.96 | | | $ | 12.17 | |
| | | | | | | | | | | | | | | | | | | | | | | | |
Total Investment Return | | | 11.96 | % | | | 4.03 | % | | | 13.68 | % | | | (12.55) | % | | | 2.60 | % | | | 25.33 | % |
| | | | | | | | | | | | | | | | | | | | | | | | |
Net Assets, End of Period, in Thousands | | $ | 15,768 | | | $ | 11,809 | | | $ | 16,293 | | | $ | 16,545 | | | $ | 32,781 | | | $ | 44,816 | |
| | | | | | | | | | | | | | | | | | | | | | | | |
Ratios/Supplemental Data: | | | | | | | | | | | | | | | | | | | | | | | | |
Ratio of expenses to average net assets: | | | | | | | | | | | | | | | | | | | | | | | | |
Before expense waiver or recovery | | | 3.88 | % | | | 4.26 | % | | | 3.48 | % | | | 3.15 | % | | | 3.17 | % | | | 3.49 | % |
After expense waiver or recovery | | | 2.52 | % | | | 2.90 | % | | | 2.77 | % | | | 2.96 | % | | | 3.10 | % | | | 3.24 | % |
| | | | | | | | | | | | | | | | | | | | | | | | |
Ratio of expenses to average net assets (excluding dividend and interest expense): |
Before expense waiver or recovery | | | 3.36 | % | | | 3.35 | % | | | 2.70 | % | | | 2.95 | % | | | 2.97 | % | | | 3.15 | % |
After expense waiver or recovery | | | 1.99 | % | | | 1.99 | % | | | 1.99 | % | | | 2.76 | % | | | 2.90 | % | | | 2.90 | % |
| | | | | | | | | | | | | | | | | | | | | | | | |
Ratio of net investment income (loss) to average net assets: |
Before expense waiver or recovery | | | (2.96 | )% | | | (3.06 | )% | | | (2.19 | )% | | | (2.14 | )% | | | (2.36 | )% | | | (2.98 | )% |
After expense waiver or recovery | | | (1.59 | )% | | | (1.70 | )% | | | (1.48 | )% | | | (1.95 | )% | | | (2.29 | )% | | | (2.73 | )% |
| | | | | | | | | | | | | | | | | | | | | | | | |
Portfolio turnover rate(d) | | | 305 | % | | | 953 | % | | | 300 | % | | | 449 | % | | | 363 | % | | | 343 | % |
* | All ratios have been annualized except total investment return and portfolio turnover. |
(a) | Net investment income (loss) per share is based on average shares outstanding. |
(b) | Realized and unrealized gains and losses per share in this caption are balancing amounts necessary to reconcile the change in net asset value per share for the period, and may not reconcile with the Fund’s consolidated statement of operations due to share transactions for the period. |
(c) | Amount represents less than $0.005 per share. |
(d) | Portfolio turnover rate is calculated on the basis of the Fund as a whole without distinguishing between classes of shares issued. Consists of long-term investments only; excludes securities sold short. |
The accompanying notes are an integral part of these financial statements.
| | |
| | |
LoCorr Spectrum Income Fund – Financial Highlights – Class A | | 85 |
| | |
LoCorr Spectrum Income Fund – Class A
Financial Highlights
Selected Data and Ratios (for a share outstanding throughout the period)
| | | Six Months Ended
June 30, 2021* (Unaudited) | | | Year Ended December 31, | |
| | | | | | 2020 | | | | 2019 | | | | 2018 | | | | 2017 | | | | 2016 | |
| | | | | | | | | | | | | | | | | | | | | | | | |
Per Share | | | | | | | | | | | | | | | | | | | | | | | | |
Net asset value, beginning of period | | $ | 6.15 | | | $ | 6.89 | | | $ | 6.26 | | | $ | 7.39 | | | $ | 7.70 | | | $ | 7.78 | |
| | | | | | | | | | | | | | | | | | | | | | | | |
Income (loss) from investment operations: | | | | | | | | | | | | | | | | | | | | | | | | |
Net investment income (a) | | | 0.05 | | | | 0.12 | | | | 0.13 | | | | 0.22 | | | | 0.17 | | | | 0.29 | |
Net realized and unrealized gain (loss) | | | 1.31 | | | | (0.40 | ) | | | 1.00 | | | | (0.78 | ) | | | 0.09 | | | | 0.20 | |
Total from Investment Operations | | | 1.36 | | | | (0.28 | ) | | | 1.13 | | | | (0.56 | ) | | | 0.26 | | | | 0.49 | |
| | | | | | | | | | | | | | | | | | | | | | | | |
Distributions From Earnings: | | | | | | | | | | | | | | | | | | | | | | | | |
Net investment income | | | (0.23 | ) | | | (0.18 | ) | | | (0.12 | ) | | | (0.26 | ) | | | (0.15 | ) | | | (0.37 | ) |
Return of capital | | | — | | | | (0.28 | ) | | | (0.38 | ) | | | (0.31 | ) | | | (0.42 | ) | | | (0.20 | ) |
Total Distributions | | | (0.23 | ) | | | (0.46 | ) | | | (0.50 | ) | | | (0.57 | ) | | | (0.57 | ) | | | (0.57 | ) |
| | | | | | | | | | | | | | | | | | | | | | | | |
Redemption Fees | | | — | | | | 0.00 | (b) | | | 0.00 | (b) | | | 0.00 | (b) | | | 0.00 | (b) | | | 0.00 | (b) |
| | | | | | | | | | | | | | | | | | | | | | | | |
Net Asset Value, End of Period | | $ | 7.28 | | | $ | 6.15 | | | $ | 6.89 | | | $ | 6.26 | | | $ | 7.39 | | | $ | 7.70 | |
| | | | | | | | | | | | | | | | | | | | | | | | |
Total Investment Return (c) | | | 22.42 | % | | | (2.75 | )% | | | 18.37 | % | | | (8.22 | )% | | | 3.50 | % | | | 6.64 | % |
| | | | | | | | | | | | | | | | | | | | | | | | |
Net Assets, End of Period, in Thousands | | $ | 14,850 | | | $ | 13,635 | | | $ | 25,192 | | | $ | 22,610 | | | $ | 29,970 | | | $ | 33,032 | |
| | | | | | | | | | | | | | | | | | | | | | | | |
Ratios/Supplemental Data:(d) | | | | | | | | | | | | | | | | | | | | | | | | |
Ratio of expenses to average net assets: | | | | | | | | | | | | | | | | | | | | | | | | |
Before expense waiver or recovery | | | 2.12 | % | | | 2.19 | % | | | 2.02 | % | | | 1.98 | % | | | 1.95 | % | | | 2.02 | % |
After expense waiver or recovery | | | 2.05 | % | | | 2.06 | % | | | 2.02 | % | | | 1.98 | % | | | 1.99 | % | | | 2.05 | % |
| | | | | | | | | | | | | | | | | | | | | | | | |
Ratio of expenses to average net assets (excluding dividend and interest expense): | | | | | | | | | | |
Before expense waiver or recovery | | | 2.11 | % | | | 2.18 | % | | | 2.02 | % | | | 1.98 | % | | | 1.95 | % | | | 2.02 | % |
After expense waiver or recovery | | | 2.05 | % | | | 2.04 | % | | | 2.02 | % | | | 1.98 | % | | | 1.99 | % | | | 2.05 | % |
| | | | | | | | | | | | | | | | | | | | | | | | |
Ratio of net investment income (loss) to average net assets: | | | | | | | | | | | | | | | | | |
Before expense waiver or recovery | | | 1.32 | % | | | 1.93 | % | | | 1.94 | % | | | 3.01 | % | | | 2.27 | % | | | 3.81 | % |
After expense waiver or recovery | | | 1.38 | % | | | 2.07 | % | | | 1.94 | % | | | 3.01 | % | | | 2.23 | % | | | 3.78 | % |
| | | | | | | | | | | | | | | | | | | | | | | | |
Portfolio turnover rate(e) | | | 31 | % | | | 88 | % | | | 75 | % | | | 82 | % | | | 84 | % | | | 92 | % |
* All ratios have been annualized except total investment return and portfolio turnover.
(a) Net investment income (loss) per share is based on average shares outstanding.
(b) Amount represents less than $0.005 per share.
(c) Total investment return excludes the effect of applicable sales charges.
(d) Ratios do not include the expenses of the investment companies in which the Fund invests.
(e) Portfolio turnover rate is calculated on the basis of the Fund as a whole without distinguishing between classes of shares issued.
The accompanying notes are an integral part of these financial statements.
| | |
| | |
86 | | LoCorr Spectrum Income Fund – Financial Highlights – Class C |
| | |
LoCorr Spectrum Income Fund – Class C
Financial Highlights
Selected Data and Ratios (for a share outstanding throughout the period)
| | | Six Months Ended
June 30, 2021* (Unaudited) | | | Year Ended December 31, | |
| | | | | | 2020 | | | | 2019 | | | | 2018 | | | | 2017 | | | | 2016 | |
| | | | | | | | | | | | | | | | | | | | | | | | |
Per Share | | | | | | | | | | | | | | | | | | | | | | | | |
Net asset value, beginning of period | | $ | 6.21 | | | $ | 6.96 | | | $ | 6.31 | | | $ | 7.42 | | | $ | 7.72 | | | $ | 7.78 | |
| | | | | | | | | | | | | | | | | | | | | | | | |
Income (loss) from investment operations: | | | | | | | | | | | | | | | | | | | | | | | | |
Net investment income(a) | | | 0.02 | | | | 0.07 | | | | 0.08 | | | | 0.16 | | | | 0.11 | | | | 0.23 | |
Net realized and unrealized gain (loss) | | | 1.34 | | | | (0.40 | ) | | | 1.01 | | | | (0.77 | ) | | | 0.09 | | | | 0.21 | |
Total from Investment Operations | | | 1.36 | | | | (0.33 | ) | | | 1.09 | | | | (0.61 | ) | | | 0.20 | | | | 0.44 | |
| | | | | | | | | | | | | | | | | | | | | | | | |
Distributions From Earnings: | | | | | | | | | | | | | | | | | | | | | | | | |
Net investment income | | | (0.21 | ) | | | (0.17 | ) | | | (0.10 | ) | | | (0.23 | ) | | | (0.13 | ) | | | (0.33 | ) |
Return of capital | | | — | | | | (0.25 | ) | | | (0.34 | ) | | | (0.27 | ) | | | (0.37 | ) | | | (0.17 | ) |
Total Distributions | | | (0.21 | ) | | | (0.42 | ) | | | (0.44 | ) | | | (0.50 | ) | | | (0.50 | ) | | | (0.50 | ) |
| | | | | | | | | | | | | | | | | | | | | | | | |
Redemption Fees | | | — | | | | 0.00 | (b) | | | 0.00 | (b) | | | 0.00 | (b) | | | 0.00 | (b) | | | 0.00 | (b) |
| | | | | | | | | | | | | | | | | | | | | | | | |
Net Asset Value, End of Period | | $ | 7.36 | | | $ | 6.21 | | | $ | 6.96 | | | $ | 6.31 | | | $ | 7.42 | | | $ | 7.72 | |
| | | | | | | | | | | | | | | | | | | | | | | | |
Total Investment Return (c) | | | 22.12 | % | | | (3.70 | )% | | | 17.59 | % | | | (8.85 | )% | | | 2.62 | % | | | 5.88 | % |
| | | | | | | | | | | | | | | | | | | | | | | | |
Net Assets, End of Period, in Thousands | | $ | 16,256 | | | $ | 13,295 | | | $ | 18,645 | | | $ | 18,092 | | | $ | 23,511 | | | $ | 25,898 | |
| | | | | | | | | | | | | | | | | | | | | | | | |
Ratios/Supplemental Data:(d) | | | | | | | | | | | | | | | | | | | | | | | | |
Ratio of expenses to average net assets: | | | | | | | | | | | | | | | | | | | | | | | | |
Before expense waiver or recovery | | | 2.87 | % | | | 2.94 | % | | | 2.77 | % | | | 2.73 | % | | | 2.70 | % | | | 2.77 | % |
After expense waiver or recovery | | | 2.80 | % | | | 2.81 | % | | | 2.77 | % | | | 2.73 | % | | | 2.74 | % | | | 2.80 | % |
| | | | | | | | | | | | | | | | | | | | | | | | |
Ratio of expenses to average net assets (excluding dividend and interest expense): | | | | | | | | | | | | | | |
Before expense waiver or recovery | | | 2.86 | % | | | 2.93 | % | | | 2.77 | % | | | 2.73 | % | | | 2.70 | % | | | 2.77 | % |
After expense waiver or recovery | | | 2.80 | % | | | 2.79 | % | | | 2.77 | % | | | 2.73 | % | | | 2.74 | % | | | 2.80 | % |
| | | | | | | | | | | | | | | | | | | | | | | | |
Ratio of net investment income (loss) to average net assets: | | | | | | | | | | | | | | | | | |
Before expense waiver or recovery | | | 0.57 | % | | | 1.18 | % | | | 1.19 | % | | | 2.26 | % | | | 1.52 | % | | | 3.06 | % |
After expense waiver or recovery | | | 0.63 | % | | | 1.32 | % | | | 1.19 | % | | | 2.26 | % | | | 1.48 | % | | | 3.03 | % |
| | | | | | | | | | | | | | | | | | | | | | | | |
Portfolio turnover rate(e) | | | 31 | % | | | 88 | % | | | 75 | % | | | 82 | % | | | 84 | % | | | 92 | % |
* All ratios have been annualized except total investment return and portfolio turnover.
(a) Net investment income (loss) per share is based on average shares outstanding.
(b) Amount represents less than $0.005 per share.
(c) Total investment return excludes the effect of applicable sales charges.
(d) Ratios do not include the expenses of the investment companies in which the Fund invests.
(e) Portfolio turnover rate is calculated on the basis of the Fund as a whole without distinguishing between classes of shares issued.
The accompanying notes are an integral part of these financial statements.
| | |
| | |
LoCorr Spectrum Income Fund – Financial Highlights – Class I | | 87 |
| | |
LoCorr Spectrum Income Fund – Class I
Financial Highlights
Selected Data and Ratios (for a share outstanding throughout the period)
| | | Six Months Ended
June 30, 2021* (Unaudited) | | | Year Ended December 31, | |
| | | | | | 2020 | | | | 2019 | | | | 2018 | | | | 2017 | | | | 2016 | |
| | | | | | | | | | | | | | | | | | | | | | | | |
Per Share | | | | | | | | | | | | | | | | | | | | | | | | |
Net asset value, beginning of period | | $ | 6.13 | | | $ | 6.88 | | | $ | 6.25 | | | $ | 7.38 | | | $ | 7.69 | | | $ | 7.78 | |
| | | | | | | | | | | | | | | | | | | | | | | | |
Income (loss) from investment operations: | | | | | | | | | | | | | | | | | | | | | | | | |
Net investment income(a) | | | 0.06 | | | | 0.13 | | | | 0.15 | | | | 0.24 | | | | 0.19 | | | | 0.31 | |
Net realized and unrealized gain (loss) | | | 1.30 | | | | (0.40 | ) | | | 1.00 | | | | (0.77 | ) | | | 0.10 | | | | 0.20 | |
Total from Investment Operations | | | 1.36 | | | | (0.27 | ) | | | 1.15 | | | | (0.53 | ) | | | 0.29 | | | | 0.51 | |
| | | | | | | | | | | | | | | | | | | | | | | | |
Distributions From Earnings: | | | | | | | | | | | | | | | | | | | | | | | | |
Net investment income | | | (0.24 | ) | | | (0.19 | ) | | | (0.12 | ) | | | (0.27 | ) | | | (0.16 | ) | | | (0.39 | ) |
Return of capital | | | — | | | | (0.29 | ) | | | (0.40 | ) | | | (0.33 | ) | | | (0.44 | ) | | | (0.21 | ) |
Total Distributions | | | (0.24 | ) | | | (0.48 | ) | | | (0.52 | ) | | | (0.60 | ) | | | (0.60 | ) | | | (0.60 | ) |
| | | | | | | | | | | | | | | | | | | | | | | | |
Redemption Fees | | | — | | | | 0.00 | (b) | | | 0.00 | (b) | | | 0.00 | (b) | | | 0.00 | (b) | | | 0.00 | (b) |
| | | | | | | | | | | | | | | | | | | | | | | | |
Net Asset Value, End of Period | | $ | 7.25 | | | $ | 6.13 | | | $ | 6.88 | | | $ | 6.25 | | | $ | 7.38 | | | $ | 7.69 | |
| | | | | | | | | | | | | | | | | | | | | | | | |
Total Investment Return | | | 22.48 | % | | | (2.60 | )% | | | 18.74 | % | | | (7.91 | )% | | | 3.85 | % | | | 6.85 | % |
| | | | | | | | | | | | | | | | | | | | | | | | |
Net Assets, End of Period, in Thousands | | $ | 32,443 | | | $ | 21,215 | | | $ | 30,049 | | | $ | 27,618 | | | $ | 43,032 | | | $ | 46,838 | |
| | | | | | | | | | | | | | | | | | | | | | | | |
Ratios/Supplemental Data:(c) | | | | | | | | | | | | | | | | | | | | | | | | |
Ratio of expenses to average net assets: | | | | | | | | | | | | | | | | | | | | | | | | |
Before expense waiver or recovery | | | 1.87 | % | | | 1.94 | % | | | 1.77 | % | | | 1.73 | % | | | 1.70 | % | | | 1.77 | % |
After expense waiver or recovery | | | 1.80 | % | | | 1.81 | % | | | 1.77 | % | | | 1.73 | % | | | 1.74 | % | | | 1.80 | % |
| | | | | | | | | | | | | | | | | | | | | | | | |
Ratio of expenses to average net assets (excluding dividend and interest expense): | | | | | | | | | | | | | | |
Before expense waiver or recovery | | | 1.86 | % | | | 1.93 | % | | | 1.77 | % | | | 1.73 | % | | | 1.70 | % | | | 1.77 | % |
After expense waiver or recovery | | | 1.80 | % | | | 1.79 | % | | | 1.77 | % | | | 1.73 | % | | | 1.74 | % | | | 1.80 | % |
| | | | | | | | | | | | | | | | | | | | | | | | |
Ratio of net investment income (loss) to average net assets: | | | | | | | | | | | | | | | | | |
Before expense waiver or recovery | | | 1.57 | % | | | 2.18 | % | | | 2.19 | % | | | 3.26 | % | | | 2.52 | % | | | 4.06 | % |
After expense waiver or recovery | | | 1.63 | % | | | 2.32 | % | | | 2.19 | % | | | 3.26 | % | | | 2.48 | % | | | 4.03 | % |
| | | | | | | | | | | | | | | | | | | | | | | | |
Portfolio turnover rate(d) | | | 31 | % | | | 88 | % | | | 75 | % | | | 82 | % | | | 84 | % | | | 92 | % |
* All ratios have been annualized except total investment return and portfolio turnover.
(a) Net investment income (loss) per share is based on average shares outstanding.
(b) Amount represents less than $0.005 per share.
(c) Ratios do not include the expenses of the investment companies in which the Fund invests.
(d) Portfolio turnover rate is calculated on the basis of the Fund as a whole without distinguishing between classes of shares issued.
The accompanying notes are an integral part of these financial statements.
| | |
| 88 | | LoCorr Macro Strategies Fund, LoCorr Long/Short Commodities Strategy Fund and LoCorr Market Trend Fund – Notes to Consolidated Financial Statements / LoCorr Dynamic Equity Fund and LoCorr Spectrum Income Fund – Notes to Financial Statements |
| | |
LoCorr Investment Trust
Notes
June 30, 2021 (Unaudited)
1. Organization
LoCorr Investment Trust (the “Trust”), an Ohio business trust, was formed on November 15, 2010 and is an open-end management investment company registered under the Investment Company Act of 1940, as amended (“1940 Act”). Each fund is an investment company and accordingly follows the investment company accounting and reporting guidance of the Financial Accounting Standards Board (“FASB”) Accounting Standards Codification (“ASC”) Topic 946, Financial Services- Investment Companies. The LoCorr Macro Strategies Fund, LoCorr Long/Short Commodities Strategy Fund, LoCorr Market Trend Fund, LoCorr Dynamic Equity Fund and the LoCorr Spectrum Income Fund (individually a “Fund” and collectively the “Funds”) are series within the Trust. The Funds are each diversified funds.
The LoCorr Macro Strategies Fund’s primary investment objective is capital appreciation in rising and falling equity markets with managing volatility as a secondary objective.
The LoCorr Long/Short Commodities Strategy Fund’s primary investment objective is capital appreciation in rising and falling commodities markets with managing volatility as a secondary objective.
The LoCorr Market Trend Fund’s primary investment objective is capital appreciation in rising and falling equity markets with managing volatility as a secondary objective.
The LoCorr Dynamic Equity Fund’s primary investment objective is long-term capital appreciation with reduced volatility compared to traditional broad-based equity market indices as a secondary objective.
The LoCorr Spectrum Income Fund’s primary investment objective is current income with capital appreciation as a secondary objective.
The Steben Managed Futures Strategy Fund reorganized into the LoCorr Macro Strategies Fund as of the close of business on January 24, 2020. Under the terms of the Plan, the Adviser paid all expenses associated with the reorganization. In addition, under the terms of the Plan, shareholders of the Steben Managed Futures Strategy Fund received shares of the LoCorr Macro Strategies Fund equal in U.S. dollar value to the interests of such shareholders in the Steben Managed Futures Strategy Fund with each LoCorr Macro Strategies Fund’s shares ordinarily valued as of the close of regular trading on the NYSE on the business day immediately prior to the closing date. This was accomplished as a tax free exchange. For financial reporting purposes, assets received, and shares issued by the LoCorr Macro Strategies Fund were recorded at fair value; however, the cost basis of the investments received from the Steben Managed Futures Strategy Fund was carried forward to align ongoing reporting of the LoCorr Macro Strategies Fund’s realized and unrealized gains and losses with amounts distributable to shareholders for tax purposes.
Wholly-owned and Controlled Subsidiaries
In order to achieve their investment objectives, the LoCorr Macro Strategies Fund, the LoCorr Long/Short Commodities Strategy Fund and the LoCorr Market Trend Fund each invest up to 25% of their total assets (measured at the time of purchase) in wholly-owned subsidiaries, LCMFS Fund Limited (“LCMFS”), LCLSCS Fund Limited (“LCLSCS”) and LCMT Fund Limited (“LCMT”), respectively; each company is incorporated under the laws of the Cayman Islands. LCMFS, LCLSCS and LCMT act as investment vehicles in order to enter into certain investments for the LoCorr Macro Strategies Fund, the LoCorr Long/Short Commodities Strategy Fund and the LoCorr Market Trend Fund, respectively, consistent with their investment objectives and policies specified in the Prospectuses and Statement of Additional Information.
At June 30, 2021 investments in LCMFS, LCLSCS and LCMT represented 1.70%, 20.09% and 2.15% of the total net assets of LoCorr Macro Strategies Fund, LoCorr Long/Short Commodities Strategy Fund and LoCorr Market Trend Fund, respectively. See Note 2.
The consolidated financial statements of the LoCorr Macro Strategies Fund, LoCorr Long/Short Commodities Strategy Fund and the LoCorr Market Trend Fund each include the investment activity and financial statements of LCMFS, LCLSCS and LCMT, respectively. All intercompany accounts and transactions have been eliminated in consolidation. Because each Fund may invest a substantial portion of its assets in its respective subsidiary, the Fund may be considered to be investing indirectly in some of those investments through its subsidiary. For that reason, references to the Fund may also encompass its subsidiary. The subsidiary will be subject to the same investment restrictions and limitations, and follow the same compliance policies and procedures, as the Fund when viewed on a consolidated basis. Each Fund and its subsidiary are a “commodity pool” under the U.S. Commodity Exchange Act and LoCorr Fund Management, LLC (the “Adviser” or “Management”) is a “commodity pool operator” registered with and regulated by the Commodity Futures Trading Commission (“CFTC”). As a result, additional CFTC-mandated disclosure, reporting and recordkeeping obligations apply with respect to each Fund and its respective subsidiary under CFTC and the U.S. Securities and Exchange Commission (the “SEC”) harmonized regulations.
At June 30, 2021 LCLSCS Fund Limited invested in a swap contract, for which the notional amount was $414,945,098. At June 30, 2021, LCLSCS reported unrealized appreciation on the swap contract of $20,590,264. In addition, LCLSCS holds cash and cash equivalents as collateral on the swap contract. At June 30, 2021, LCLSCS Fund Limited invested in a purchased option, for which the value, as reported on the consolidated schedule of investments is an accurate representation of the volume of activity for the period ended June 30, 2021. At June 30, 2021, LCLSCS reported unrealized appreciation on the purchased call option of $15,492,104.
At June 30, 2021 investments held by LCMFS and LCMT include open futures contracts and other investments intended to serve as margin or collateral for futures positions. At June 30, 2021, LCMFS held long open futures contracts with a total notional amount of $329,024,312 and net unrealized appreciation of $2,029,043 and short open futures contracts with a total notional amount of $136,482,991 and net unrealized depreciation of $1,148,088. At June 30, 2021, LCMT held long open futures contracts with a total notional amount of $87,711,538 and net unrealized appreciation of $491,716 and short open futures contracts with a total notional amount of $25,896,310 and net unrealized appreciation of $107,214.
| | |
LoCorr Macro Strategies Fund, LoCorr Long/Short Commodities Strategy Fund and LoCorr Market Trend Fund – Notes to Consolidated Financial Statements / LoCorr Dynamic Equity Fund and LoCorr Spectrum Income Fund – Notes to Financial Statements (continued) | | 89 |
| |
Share Classes
The Funds currently offer three classes of shares: Class A, Class C and Class I shares. Each share class represents an interest in the same assets of the Fund, has the same rights and is identical in all material respects except that (i) Class A shares have a maximum front end sales load of 5.75% and maximum deferred sales charge of 1.00% and Class C shares have a maximum deferred sales charge of 1.00%, (ii) Class A shares have a 12b-1 fee of 0.25% and Class C shares have a 12b-1 fee of 1.00%; (iii) certain other class-specific expenses will be borne solely by the class to which such expenses are attributable and (iv) each class will have exclusive voting rights with respect to matters relating to its own distribution arrangements.
All classes with respect to the LoCorr Spectrum Income Fund are subject to a 2.00% redemption fee on redemptions made within 60 days of the original purchase. As of May 1, 2017, none of the other Funds are subject to a redemption fee.
The following table presents the class-specific commencement of operations dates for each of the Funds:
| | Commencement of Operations |
| | Class A | Class C | Class I |
| LoCorr Macro Strategies Fund | March 22, 2011 | March 24, 2011 | March 24, 2011 |
| LoCorr Long/Short Commodities Strategy Fund | January 1, 2012 | January 1, 2012 | January 1, 2012 |
| LoCorr Dynamic Equity Fund | May 10, 2013 | May 10, 2013 | May 10, 2013 |
| LoCorr Spectrum Income Fund | January 1, 2014 | January 1, 2014 | January 1, 2014 |
| LoCorr Market Trend Fund | July 1, 2014 | July 1, 2014 | July 1, 2014 |
The Funds may issue an unlimited number of shares of beneficial interest, with no par value. All shares of the Funds have equal rights and privileges, except as to class-specific rights and privileges described above.
2. Significant Accounting Policies
The following is a summary of significant accounting policies consistently followed by the Funds in the preparation of the financial statements. These policies are in conformity with generally accepted accounting principles in the United States of America (“GAAP”).
Investment Valuation
The Funds follow fair valuation accounting standards in accordance with GAAP, which establish a definition of fair value and set out a hierarchy for measuring fair value. These standards require additional disclosures about the various inputs and valuation techniques used to develop the measurements of fair value and changes in valuation techniques and related inputs during the period. These inputs are summarized in three broad levels listed below:
Level 1 – Unadjusted quoted prices in active markets for identical assets or liabilities that the Funds have the ability to access.
Level 2 – Observable inputs other than quoted prices included in Level 1 that are observable for the asset or liability, either directly or indirectly. These inputs may include quoted prices for the identical instrument on an inactive market, prices for similar instruments, interest rates, prepayment speeds, credit risk, yield curves, default rates and similar data.
Level 3 – Unobservable inputs for the asset or liability, to the extent relevant observable inputs are not available; representing the Funds’ own assumptions about the assumptions a market participant would use in valuing the asset or liability and would be based on the best information available.
Generally, the Funds’ investments are valued each day at the last quoted sales price on each investment’s primary exchange. Investments traded or dealt in one or more exchanges (whether domestic or foreign) for which market quotations are readily available and not subject to restrictions against resale shall be valued at the last quoted sales price on the primary exchange or, in the absence of a sale on the primary exchange, at the last bid on the primary exchange. Investments primarily traded in the National Association of Securities Dealers’ Automated Quotation System (“NASDAQ”) National Market System for which market quotations are readily available shall be valued using the NASDAQ Official Closing Price.
The Funds may use independent pricing services to assist in calculating the value of the Funds’ investments. In addition, market prices for foreign investments are not determined at the same time of day as the net asset value (“NAV”) for the Funds. Because the Funds may invest in portfolio investments primarily listed on foreign exchanges and these exchanges may trade on weekends or other days when the Funds do not price their shares, the value of some of the Funds’ portfolio investments may change on days when you may not be able to buy or sell the Funds’ shares. In computing the NAV, the Funds value foreign investments held by the Funds at the latest closing price on the exchange in which they are traded immediately prior to closing of the New York Stock Exchange. Prices of foreign investments quoted in foreign currencies are translated into U.S. dollars at current rates. If events materially affecting the value of an investment in the Funds’ portfolio, particularly foreign investments, occur after the close of trading on a foreign market but before the Funds price their shares, the investment will be valued at fair value.
| | |
| 90 | | LoCorr Macro Strategies Fund, LoCorr Long/Short Commodities Strategy Fund and LoCorr Market Trend Fund – Notes to Consolidated Financial Statements / LoCorr Dynamic Equity Fund and LoCorr Spectrum Income Fund – Notes to Financial Statements (continued) |
| | |
American Depositary Receipts
The Funds may invest in sponsored and unsponsored American Depositary Receipts (“ADRs”), which are receipts issued by an American bank or trust company evidencing ownership of underlying securities issued by a foreign issuer. ADRs, in registered form, are designed for use in U.S. securities markets. Unsponsored ADRs may be created without the participation of the foreign issuer. Holders of unsponsored ADRs generally bear all the costs of the ADR facility, whereas foreign issuers typically bear certain costs in a sponsored ADR. The bank or trust company depositary of an unsponsored ADR may be under no obligation to distribute shareholder communications received from the foreign issuer or to pass through voting rights. ADRs are generally categorized in Level 1 or Level 2 of the fair value hierarchy depending on inputs used and market activity levels for specific securities.
Equity Securities
Equity securities, including common stocks, preferred stocks, securities convertible into common stocks such as convertible bonds, warrants, rights, options, master limited partnership (“MLP”) interests, real estate investment trusts (“REITs”), business development companies (“BDCs”) and royalty trusts are generally valued by using market quotations, but may be valued on the basis of prices furnished by a pricing service when the Adviser believes such prices accurately reflect the fair market value of such securities. MLP interests are limited partnerships, the interests in which (known as “units”) typically trade publicly, like stock. MLPs are also called publicly traded partnerships and public limited partnerships. Securities that are traded on any stock exchange or on the NASDAQ over-the-counter market are generally valued by the pricing service at the last quoted sale price. Lacking a last sale price, an equity security is generally valued by the pricing service at its last bid price. Equity securities are generally categorized in Level 1 or Level 2 of the fair value hierarchy depending on inputs used and market activity levels for specific securities.
Exchange Traded Funds
The Funds may invest in Exchange Traded Funds (“ETFs”). They are managed by professionals and provide the investor with diversification, cost and tax efficiency, liquidity, marginability, usability for hedging, the ability to go long and short, and (for some ETFs) the provision of periodic distributions. Additionally, some ETFs are unit investment trusts (“UITs”), which are unmanaged portfolios overseen by trustees. ETFs generally have two markets. The primary market is where institutions swap “creation units” in block-multiples of shares, typically 25,000 or 50,000, for in-kind securities and cash in the form of dividends. The secondary market is where individual investors can trade as little as a single share during trading hours on the exchange. This is different from open-ended mutual funds that are traded after hours once the NAV is calculated. ETF shares may trade at a premium or discount to NAV per share. ETFs share many similar risks with open-end and closed-end funds. ETFs are generally categorized in Level 1 of the fair value hierarchy.
The Funds may invest in ETFs and other investment companies that hold a portfolio of foreign securities. Investing in securities of foreign companies and countries involves certain considerations and risks that are not typically associated with investing in U.S. government securities and securities of domestic companies. There may be less publicly available information about a foreign issuer than a domestic one, and foreign companies are not generally subject to uniform accounting, auditing and financial standards and requirements comparable to those applicable to U.S. companies. There may also be less government supervision and regulation of foreign securities exchanges, brokers and listed companies than exists in the United States. Interest and dividends paid by foreign issuers may be subject to withholding and other foreign taxes, which may decrease the net return on such investments as compared to dividends and interest paid to the Funds by domestic companies or the U.S. government. There may be the possibility of expropriations, seizure or nationalization of foreign deposits, confiscatory taxation, political, economic or social instability, or diplomatic developments that could affect assets of the Funds held in foreign countries. Finally, the establishment of exchange controls or other foreign governmental laws or restrictions could adversely affect the payment of obligations.
Fixed Income Securities
Fixed income securities and certificates of deposit with maturities more than 60 days when acquired generally are valued using an evaluated price supplied by an independent pricing service. Inputs used by the pricing service for U.S. government and treasury securities are normally valued using a model that incorporates market observable data such as reported sales of similar securities, broker dealer quotes, yields, bids, offers and reference data. Agency issued debt securities, foreign issued bonds and municipal bonds are generally valued in a manner similar to U.S. government securities. Evaluations for corporate bonds are typically based on valuation methodologies such as market pricing and other analytical pricing models as well as market transactions and dealer quotations based on observable inputs. Fixed income securities are generally categorized in Level1 or Level 2 of the fair value hierarchy depending on inputs used and market activity levels for specific securities.
The fair value of asset backed securities and mortgage backed securities is estimated on models that consider the estimated cash flows of each tranche of the entity, establish a benchmark yield, and develop an estimated tranche-specific spread to the benchmark yield based on the unique attributes of the tranche. Additional inputs such as creditworthiness of the underlying collateral and quotes from outside brokers for the same or similar issuance may also be considered in the development of fair value. Asset backed and mortgage backed securities are generally categorized in Level 2 of the fair value hierarchy.
Short-term investments in fixed income securities and certificates of deposit with maturities of less than 60 days when acquired, or which subsequently are within 60 days of maturity, are valued using an amortized cost method of valuation, and are generally categorized in Level 2.
Investment Companies
With respect to any portion of the Funds’ assets that are invested in one or more open-end management investment companies, including money market funds, registered under the 1940 Act, the Funds’ NAV is calculated based upon the NAVs of those open-end management investment companies, and the prospectuses for these companies explain the circumstances under which those companies will use fair value pricing and the effects of using fair value pricing.
| | |
LoCorr Macro Strategies Fund, LoCorr Long/Short Commodities Strategy Fund and LoCorr Market Trend Fund – Notes to Consolidated Financial Statements / LoCorr Dynamic Equity Fund and LoCorr Spectrum Income Fund – Notes to Financial Statements (continued) | | 91 |
| |
The Funds generally will purchase shares of closed-end investment companies only in the secondary market. The shares of many closed-end investment companies, after their initial public offering, frequently trade at a price per share that is less than the NAV per share, the difference representing the “market discount” of such shares. This market discount may be due in part to the investment objective of long-term appreciation, which is sought by many closed-end investment companies, as well as to the fact that the shares of closed-end investment companies are not redeemable by the holder upon demand to the issuer at the next determined NAV but rather are subject to the principles of supply and demand in the secondary market. A relative lack of secondary market purchasers of closed-end investment company shares also may contribute to such shares trading at a discount to their NAV. Closed-end investment companies are generally categorized in Level 1 or Level 2 of the fair value hierarchy depending on inputs used and market activity levels for specific securities.
Financial Derivative Instruments
Financial derivative instruments, such as forward currency contracts, futures contracts or swap agreements, derive their value from underlying asset prices, indices, reference rates and other inputs or a combination of these factors. These contracts are normally valued on the basis of broker- dealer quotations or a pricing service at the settlement price determined by the relevant exchange. Depending on the product and the terms of the transaction, the value of the derivative contracts can be estimated by a pricing service provider using a series of techniques, including simulation pricing models. The pricing models use inputs that are observed from actively quoted markets such as issuer details, indices, spreads, interest rates, curves, dividends and exchange rates.
Forward currency contracts represent the purchase or sale of a specific quantity of a foreign currency at the current or spot price, with delivery and settlement at a specified future date. Forward currency contracts are presented at fair value using spot currency rates and are adjusted for the time value of money (forward points) and contractual prices of the underlying financial instruments. Forward currency contracts are generally categorized in Level 2.
Futures contracts are carried at fair value using the primary exchange’s closing (settlement) price and are generally categorized in Level 1.
Total return swap contracts are stated at fair value daily based on the fair value of the underlying futures, forward currency and foreign currency contracts constituting the contract’s stated index, taking into account any fees and expenses associated with the swap agreement. Total return swap contracts are generally categorized in Level 2.
Fund-linked options are stated at fair value based on the fair value of Galaxy Plus Fund – East Alpha Feeder Fund (548) LLC, taking into account any fees and expenses associated with the fund-linked option. Fund-linked options are generally categorized in Level 2.
Fair Value Pricing
If market quotations are not readily available, investments will be valued at their fair value as determined in good faith by the Adviser in accordance with procedures approved by the Board of Trustees (the “Board”) and evaluated by the Board as to the reliability of the fair value method used.
In these cases, a Fund’s NAV will reflect certain portfolio investments’ fair value rather than their market price. Fair value pricing involves subjective judgments and it is possible that the fair value determined for an investment is materially different than the value that could be realized upon the sale of that investment. The fair value prices can differ from market prices when they become available or when a price becomes available.
Fair value determinations are required for the following securities:
| ● | securities for which market quotations are not readily available at the valuation time on a particular business day (including without limitation securities for which there is a short and temporary lapse in the provision of a price by the regular pricing source); |
| ● | securities determined to be illiquid in accordance with the Trust’s Liquidity Procedures; and |
| ● | securities with respect to which an event that will affect the value thereof has occurred subsequent to the determination by the Adviser/ relevant Sub-Adviser of the closing prices reported on the principal exchange on which the securities are traded, but prior to the relevant Fund’s calculation of its NAV. |
| ● | For any open-end mutual funds that do not provide timely NAV information, the Adviser/relevant Sub-Adviser shall evaluate those ‘similar’ funds and determine which are most appropriate based on funds having similar benchmarks or similar objectives. The Adviser/relevant Sub-Adviser shall then calculate the NAV percentage move of those ‘similar’ funds for the day to create an aggregate average percentage move, which it shall use to calculate the price movement for the day of the Fund at issue. For closed-end funds, the aforementioned practice shall be utilized, in addition to monitoring secondary market activity during the day. |
Performing Fair Value Pricing
The Adviser considers all appropriate factors relevant to the value of securities for which market quotations are not readily available. No single standard for determining fair value can be established, since fair value depends upon the circumstances of each individual case. As a general principle, the current fair value of an issue of securities being valued by the Adviser would appear to be the amount that the owner might reasonably expect to receive for them upon their current sale. Methods that are in accord with this principle may, for example, be based on:
| ● | a discount from market of a similar freely traded security (including a derivative security or a basket of securities traded on other markets, exchanges or among dealers); or |
| ● | yield to maturity with respect to debt issues, or a combination of these and other methods. |
| | |
| 92 | | LoCorr Macro Strategies Fund, LoCorr Long/Short Commodities Strategy Fund and LoCorr Market Trend Fund – Notes to Consolidated Financial Statements / LoCorr Dynamic Equity Fund and LoCorr Spectrum Income Fund – Notes to Financial Statements (continued) |
| | |
Fair value determinations are not based on what the Adviser believes that a buyer may pay at a later time, such as when market conditions change or when the market ultimately recognizes a security’s true value as perceived by the Adviser. Similarly, bonds and other instruments may not be fair valued at par based on the expectation that the Funds will hold the investment until maturity.
Some of the general factors that the Adviser considers in determining a valuation method for an individual issue of securities include, but shall not be limited to:
| ● | the fundamental analytical data relating to the investment; |
| ● | the nature and duration of restrictions (if any) on disposition of the securities; |
| ● | evaluation of the forces that influence the market in which these securities are purchased or sold; |
| ● | changes in interest rates; |
| ● | government (domestic or foreign) actions or pronouncements; and |
With respect to securities traded on foreign markets, the Adviser considers the value of foreign securities traded on other foreign markets, ADR trading, closed-end fund trading, foreign currency exchange activity and the trading prices of financial products that are tied to baskets of foreign securities, such as WEBS.
Among the more specific factors that the Funds’ Adviser considers (if applicable) in determining a valuation method for an individual issue of securities are:
| ● | financial statements of the issuer; |
| ● | cost at date of purchase; |
| ● | discount from market value of unrestricted securities of the same class at time of purchase; |
| ● | special reports prepared by analysts; |
| ● | information as to any transactions or offers with respect to the security; |
| ● | existence of merger proposals or tender offers affecting the securities; |
| ● | price and extent of public trading in similar securities of the issuer or comparable companies; and |
As a general matter, the Funds’ Adviser will value the portfolio security or other asset primarily by reference to the public market if there is a public market for securities of the same class or similar securities; primarily by reference to private transactions if public market reference is not available and private transaction reports are available; and primarily by use of one or more analytical methods or models if public and private market references are not available or not reliable. The Adviser will use cost only if no better method of valuation is available.
The Adviser regularly evaluates whether its pricing methodologies continue to result in values that the Funds might reasonably expect to receive upon a current sale. In order to do this, the Adviser compares its fair value prices with values that are available from other sources (if there are any). The next actual sales price of a security might be one such source. However, the next-day opening prices or next actual sales prices for a security may differ from the fair value of that security as of the time for NAV calculation, given the subjectivity inherent in fair valuation and the fact that events could occur after NAV calculation. Thus, discrepancies between fair values and next-day opening prices or next actual sales prices may occur on a regular and recurring basis. These discrepancies do not necessarily indicate that the Adviser’s fair value methodology is inappropriate. Nonetheless, systematic comparisons of fair values to the next-day opening prices or next actual sales prices are useful to assist the Adviser with ongoing monitoring and evaluation of the appropriateness of its fair value methodologies.
The above guidance does not purport to delineate all factors that may be considered. The Adviser takes into consideration all indications of value available to it in determining the fair value assigned to a particular security.
| | |
LoCorr Macro Strategies Fund, LoCorr Long/Short Commodities Strategy Fund and LoCorr Market Trend Fund – Notes to Consolidated Financial Statements / LoCorr Dynamic Equity Fund and LoCorr Spectrum Income Fund – Notes to Financial Statements (continued) | | 93 |
| |
The following table summarizes LoCorr Macro Strategies Fund’s consolidated investments and other financial instruments as of June 30, 2021:
Security Classification | | Level 1 | | | Level 2 | | | Level 3 | | | Total | |
Investments | | | | | | | | | | | | | | | | |
Asset Backed Securities | | $ | — | | | $ | 135,409,835 | | | $ | — | | | $ | 135,409,835 | |
Corporate Bonds | | | — | | | | 346,727,428 | | | | — | | | | 346,727,428 | |
Mortgage Backed Securities | | | — | | | | 154,828,968 | | | | — | | | | 154,828,968 | |
Municipal Bonds | | | — | | | | 6,895,351 | | | | — | | | | 6,895,351 | |
U.S. Government Agency Issues | | | — | | | | 137,930,962 | | | | — | | | | 137,930,962 | |
U.S. Government Notes | | | — | | | | 486,551,156 | | | | — | | | | 486,551,156 | |
Short Term Investment | | | 51,766,425 | | | | — | | | | — | | | | 51,766,425 | |
Total Investments | | $ | 51,766,425 | | | $ | 1,268,343,700 | | | $ | — | | | $ | 1,320,110,125 | |
| | | | | | | | | | | | | | | | |
Other Financial Instruments* | | | | | | | | | | | | | | | | |
Forward Currency Contracts | | | | | | | | | | | | | | | | |
Purchase | | $ | — | | | $ | (36,066,508 | ) | | $ | — | | | $ | (36,066,508 | ) |
Sale | | | — | | | | 23,019,147 | | | | — | | | | 23,019,147 | |
Total Forward Currency Contracts | | | — | | | | (13,047,361 | ) | | | — | | | | (13,047,361 | ) |
Futures Contracts | | | | | | | | | | | | | | | | |
Long | | $ | 3,257,545 | | | $ | 7,832 | | | $ | — | | | $ | 3,265,377 | |
Short | | | (4,988,479 | ) | | | (7,721 | ) | | | — | | | | (4,996,200 | ) |
Total Futures Contracts | | | (1,730,934 | ) | | | 111 | | | | — | | | | (1,730,823 | ) |
Total Other Financial Instruments | | $ | (1,730,934 | ) | | $ | (13,047,250 | ) | | $ | — | | | $ | (14,778,184 | ) |
See the Fund’s consolidated schedule of investments for the investments detailed by industry classification.
* | The fair value of the Fund’s other financial instruments represent the net unrealized appreciation (depreciation) at June 30, 2021. |
The LoCorr Macro Strategies Fund did not hold any Level 3 assets during the period.
The following table summarizes LoCorr Long/Short Commodities Strategy Fund’s consolidated investments and swap contracts as of June 30, 2021:
Security Classification | | Level 1 | | | Level 2 | | | Level 3 | | | Total | |
Investments | | | | | | | | | | | | | | | | |
Asset Backed Securities | | $ | — | | | $ | 52,209,684 | | | $ | — | | | $ | 52,209,684 | |
Corporate Bonds | | | — | | | | 146,310,489 | | | | — | | | | 146,310,489 | |
Foreign Government Bond | | | — | | | | 3,807 | | | | — | | | | 3,807 | |
Mortgage Backed Securities | | | — | | | | 62,649,975 | | | | — | | | | 62,649,975 | |
Municipal Bonds | | | — | | | | 1,660,158 | | | | — | | | | 1,660,158 | |
Purchased Call Option | | | — | | | | 29,234,066 | | | | — | | | | 29,234,066 | |
U.S. Government Agency Issues | | | — | | | | 64,422,345 | | | | — | | | | 64,422,345 | |
U.S. Government Notes | | | — | | | | 212,954,127 | | | | — | | | | 212,954,127 | |
Short Term Investment | | | 27,804,003 | | | | — | | | | — | | | | 27,804,003 | |
Total Investments | | $ | 27,804,003 | | | $ | 569,444,651 | | | $ | — | | | $ | 597,248,654 | |
| | | | | | | | | | | | | | | | |
Swap Contracts* | | | | | | | | | | | | | | | | |
Long Total Return Swap Contracts | | $ | — | | | $ | 20,590,264 | | | $ | — | | | $ | 20,590,264 | |
Total Swap Contracts | | $ | — | | | $ | 20,590,264 | | | $ | — | | | $ | 20,590,264 | |
See the Fund’s consolidated schedule of investments for the investments detailed by industry classification.
* | The fair value of the Fund’s investment in swap contracts represents the net unrealized appreciation at June 30, 2021. |
The LoCorr Long/Short Commodities Strategy Fund did not hold any Level 3 assets during the period.
| | |
| 94 | | LoCorr Macro Strategies Fund, LoCorr Long/Short Commodities Strategy Fund and LoCorr Market Trend Fund – Notes to Consolidated Financial Statements / LoCorr Dynamic Equity Fund and LoCorr Spectrum Income Fund – Notes to Financial Statements (continued) |
| | |
The following table summarizes LoCorr Market Trend Fund’s consolidated investments and other financial instruments as of June 30, 2021:
Security Classification | | Level 1 | | | Level 2 | | | Level 3 | | | Total | |
Investments | | | | | | | | | | | | | | | | |
Asset Backed Securities | | $ | — | | | $ | 22,006,385 | | | $ | — | | | $ | 22,006,385 | |
Corporate Bonds | | | — | | | | 63,468,053 | | | | — | | | | 63,468,053 | |
Mortgage Backed Securities | | | — | | | | 26,530,939 | | | | — | | | | 26,530,939 | |
Municipal Bonds | | | — | | | | 1,526,452 | | | | — | | | | 1,526,452 | |
U.S. Government Agency Issues | | | — | | | | 25,113,217 | | | | — | | | | 25,113,217 | |
U.S. Government Notes | | | — | | | | 90,493,803 | | | | — | | | | 90,493,803 | |
Short Term Investment | | | 11,239,381 | | | | — | | | | — | | | | 11,239,381 | |
Total Investments | | $ | 11,239,381 | | | $ | 229,138,849 | | | $ | — | | | $ | 240,378,230 | |
| | | | | | | | | | | | | | | | |
Other Financial Instruments* | | | | | | | | | | | | | | | | |
Forward Currency Contracts | | | | | | | | | | | | | | | | |
Purchase | | $ | — | | | $ | (3,009,566 | ) | | $ | — | | | $ | (3,009,566 | ) |
Sale | | | — | | | | 1,892,229 | | | | — | | | | 1,892,229 | |
Total Forward Currency Contracts | | | — | | | | (1,117,337 | ) | | | — | | | | (1,117,337 | ) |
Futures Contracts | | | | | | | | | | | | | | | | |
Long | | $ | (137,213 | ) | | $ | — | | | $ | — | | | $ | (137,213 | ) |
Short | | | (2,471,505 | ) | | | — | | | | — | | | | (2,471,505 | ) |
Total Futures Contracts | | | (2,608,718 | ) | | | — | | | | — | | | | (2,608,718 | ) |
Total Other Financial Instruments | | $ | (2,608,718 | ) | | $ | (1,117,337 | ) | | $ | — | | | $ | (3,726,055 | ) |
See the Fund’s consolidated schedule of investments for the investments detailed by industry classification.
* | The fair value of the Fund’s other financial instruments represent the net unrealized appreciation (depreciation) at June 30, 2021. |
The LoCorr Market Trend Fund did not hold any Level 3 assets during the period.
The following table summarizes LoCorr Dynamic Equity Fund’s investments and securities sold short as of June 30, 2021:
Security Classification | | Level 1 | | | Level 2 | | | Level 3 | | | Total | |
Investments | | | | | | | | | | | | | | | | |
Common Stocks | | $ | 16,258,575 | | | $ | 10,919 | | | $ | — | | | $ | 16,269,494 | |
Real Estate Investment Trusts | | | 689,206 | | | | — | | | | — | | | | 689,206 | |
Warrant | | | 1,315 | | | | — | | | | — | | | | 1,315 | |
Short Term Investment | | | 3,701,507 | | | | — | | | | — | | | | 3,701,507 | |
Total Investments | | $ | 20,650,603 | | | $ | 10,919 | | | | — | | | $ | 20,661,522 | |
| | | | | | | | | | | | | | | | |
Securities Sold Short | | | | | | | | | | | | | | | | |
Common Stocks | | $ | (3,894,479 | ) | | $ | — | | | $ | — | | | $ | (3,894,479 | ) |
Exchange Traded Funds | | | (740,029 | ) | | | — | | | | — | | | | (740,029 | ) |
Real Estate Investment Trusts | | | (51,842 | ) | | | — | | | | — | | | | (51,842 | ) |
Total Securities Sold Short | | $ | (4,686,350 | ) | | $ | — | | | $ | — | | | $ | (4,686,350 | ) |
See the Fund’s schedule of investments and schedule of securities sold short for detail by industry classification.
The LoCorr Dynamic Equity Fund did not hold any Level 3 assets or liabilities during the year.
| | |
LoCorr Macro Strategies Fund, LoCorr Long/Short Commodities Strategy Fund and LoCorr Market Trend Fund – Notes to Consolidated Financial Statements / LoCorr Dynamic Equity Fund and LoCorr Spectrum Income Fund – Notes to Financial Statements (continued) | | 95 |
| |
The following table summarizes LoCorr Spectrum Income Fund’s investments and written options as of June 30, 2021:
Security Classification | | Level 1 | | | Level 2 | | | Level 3 | | | Total | |
Investments | | | | | | | | | | | | | | | | |
Business Development Companies | | $ | 5,963,452 | | | $ | — | | | $ | — | | | $ | 5,963,452 | |
Closed-End Investment Companies | | | 5,522,809 | | | | — | | | | — | | | | 5,522,809 | |
Common Stocks | | | 16,139,468 | | | | — | | | | — | | | | 16,139,468 | |
Master Limited Partnerships | | | 13,945,846 | | | | — | | | | — | | | | 13,945,846 | |
Preferred Stocks | | | 2,027,697 | | | | — | | | | — | | | | 2,027,697 | |
Publicly Traded Partnerships | | | 3,520,272 | | | | — | | | | — | | | | 3,520,272 | |
Real Estate Investment Trusts | | | 12,023,166 | | | | — | | | | — | | | | 12,023,166 | |
Royalty Trust | | | 1,287,887 | | | | — | | | | — | | | | 1,287,887 | |
Short Term Investment | | | 2,851,640 | | | | — | | | | — | | | | 2,851,640 | |
Total Investments | | $ | 63,282,237 | | | $ | — | | | $ | — | | | $ | 63,282,237 | |
| | | | | | | | | | | | | | | | |
Written Options | | | | | | | | | | | | | | | | |
Written Call Options | | | — | | | $ | (122,402 | ) | | | — | | | $ | (122,402 | ) |
Total Written Options | | $ | — | | | $ | (122,402 | ) | | $ | — | | | $ | (122,402 | ) |
See the Fund’s schedule of investments for detail by industry classification.
The LoCorr Spectrum Income Fund did not hold any Level 3 assets during the period.
Allocation of Income and Expenses
Net investment income, other than class specific expenses, and realized and unrealized gains and losses are allocated daily to each class of shares based upon the relative NAV of outstanding shares of each class of shares at the beginning of the day (after adjusting for the current capital shares activity of the respective class). Expenses associated with a specific Fund in the Trust are charged to that Fund. Common expenses are typically allocated based upon the relative net assets of each Fund, or by other equitable means.
Deposits with Broker
Forward Currency and Futures Contracts
When trading derivative instruments, such as forward or futures contracts, a Fund is only required to post initial or variation margin with the exchange or clearing broker. The use of margin in trading these instruments has the effect of creating leverage, which can expose the Fund to substantial gains or losses occurring from relatively small price changes in the value of the underlying instrument and can increase the volatility of the Fund’s returns. Volatility is a statistical measure of the dispersion of returns of an investment, where higher volatility generally indicates greater risk. At June 30, 2021, the LoCorr Macro Strategies Fund and the LoCorr Market Trend Fund pledged cash and cash equivalents, defined as short-term, highly liquid investments that are readily convertible to known amounts of cash, at U.S. Bank, N.A. (“U.S. Bank”) of $12,180,000 and $6,930,000, respectively, to Bank of America Merrill Lynch for each Fund’s investment in forward currency contracts.
Upon entering into a futures contract, and to maintain the Fund’s open positions in futures contracts, the Fund is required to deposit with its custodian or futures broker in a segregated account in the name of the futures broker an amount of cash, U.S. government securities, suitable money market instruments, or other liquid securities, known as “initial margin.” The margin required fora particular futures contract is set by the exchange on which the contract is traded and may be significantly modified from time to time by the exchange during the term of the contract. Futures contracts are customarily purchased and sold on margins that may range upward from less than 5% of the value of the contract being traded.
At June 30, 2021, the LoCorr Macro Strategies Fund and LCMFS, collectively, had $87,868,331 in net cash and cash equivalents including foreign currency on deposit with the broker for derivative instruments which is presented on the Fund’s consolidated statement of assets and liabilities. In addition, LCMFS pledged securities with a fair value of $12,231 collateral for derivative instruments.
At June 30, 2021, the LoCorr Market Trend Fund and LCMT, collectively, had $29,584,022 in net cash and cash equivalents including foreign currency on deposit with the broker for derivative instruments which is presented on the Fund’s consolidated statements of assets and liabilities. In addition, LCMT pledged securities with a fair value of $369,727 as collateral for derivative instruments.
If the price of an open futures contract changes (by increase in underlying instrument or index in the case of a sale or by decrease in the case of a purchase) so that the loss on the futures contract reaches a point at which the margin on deposit does not satisfy margin requirements, the broker will require an increase in the margin. However, if the value of a position increases because of favorable price changes in the futures contract so that the margin deposit exceeds the required margin, the broker will pay the excess to the Fund.
These subsequent payments, called “variation margin,” to and from the futures broker (with the exception of futures contracts traded on the London Metal Exchange (“LME”)), are made on a daily basis as the price of the underlying assets fluctuate making the long and short positions in the futures contract more or less valuable, a process known as “marking to the market.” The variation margin on LME futures contracts do not settle daily, but rather settle at their respective maturity dates. At period end, the unrealized appreciation and depreciation on LME futures contracts is shown as receivable for unsettled open futures contracts and payable for unsettled open futures contracts, respectively, on the Funds’ consolidated statements of assets and liabilities. The Funds expect to earn interest income on any margin deposits.
| | |
| 96 | | LoCorr Macro Strategies Fund, LoCorr Long/Short Commodities Strategy Fund and LoCorr Market Trend Fund – Notes to Consolidated Financial Statements / LoCorr Dynamic Equity Fund and LoCorr Spectrum Income Fund – Notes to Financial Statements (continued) |
| | |
Securities Sold Short
At June 30, 2021, the LoCorr Dynamic Equity Fund had cash on deposit with Morgan Stanley and J.P. Morgan in the amount of $4,493,269. In addition, at June 30, 2021, the LoCorr Dynamic Equity Fund pledged cash of $1,282,144 as collateral for securities sold short.
Swap Contracts
LCLSCS has a substantial portion of its assets on deposit with Deutsche Bank in connection with its trading of its swap contract. Assets deposited with Deutsche Bank in connection with the trading of the swap contract for LCLSCS are partially restricted due to deposit requirements. At June 30, 2021, the LoCorr Long/Short Commodities Strategy Fund had cash and cash equivalents on deposit with Deutsche Bank in the amount of $69,803,311, which is presented on the consolidated statements of assets and liabilities. In addition, at June 30, 2021, LCLSCS pledged securities with a fair value of $435,885 as collateral for the swap contract. Risks arise from the possible inability of the counterparty to meet the terms of its contract and may increase if the counterparty’s financial condition worsens.
Options
At June 30, 2021, the LoCorr Spectrum Income Fund had $453,048 in cash and cash equivalents on deposit with Pershing, LLC for options contracts which is presented on the Fund’s statement of assets and liabilities. In addition, the LoCorr Spectrum Income Fund pledged securities with a fair value of $7,383,240 as collateral for options.
Distributable Earnings and Investment Transactions
Net investment income and net realized gains (losses) may differ for financial reporting and tax purposes because of temporary or permanent book/tax differences. To the extent these differences are permanent; reclassifications are made to the appropriate equity accounts in the period that the difference arises.
Additionally, GAAP requires that certain components of net assets relating to permanent differences be reclassified between financial and tax reporting. These reclassifications have no effect on net assets or NAV per share. See Note 7.
Distributions from Earnings
Shareholder transactions are recorded on trade date. Dividends from net investment income are declared and paid at least annually by the Funds. Distribution of net realized capital gains, if any, are declared and paid at least annually. Distributions to shareholders are recorded on the ex-dividend date. The character of distributions made during the periods from net investment income or net realized gains may differ from the characterization for federal income tax purposes due to the difference in the recognition of income, expense and gain items for financial statement and tax purposes.
During the six months ended June 30, 2021, dividends for the LoCorr Spectrum Income Fund were distributed monthly. The estimated characterization of the distributions paid will be an ordinary dividend, qualified dividend or return of capital. This estimate is based on the Fund’s operating results during the period. It is anticipated that a significant portion of the distributions of the Fund’s investments in MLP and certain investments in REITs and royalty trusts will be comprised of return of capital as a result of the tax character of cash distributions made by each Fund’s investments. The actual characterization of the distributions made during the period is not determined until after the end of the fiscal year.
The tax character of distributions paid during the periods was as follows:
Federal Income Taxes | | Six Months Ended June 30, 2021 | |
Fund | | Ordinary
Income | | | Long-Term
Capital Gains | | | Return of
Capital | |
LoCorr Spectrum Income Fund | | $ | 1,879,090 | | | $ | — | | | $ | — | |
| | Year Ended December 31, 2020 | |
Fund | | Ordinary
Income | | | Long-Term
Capital Gains | | | Return of
Capital | |
LoCorr Macro Strategies Fund | | $ | 59,908,737 | | | $ | 3,450,209 | | | $ | — | |
LoCorr Long/Short Commodities Strategy Fund | | | 13,693,568 | | | | — | | | | — | |
LoCorr Market Trend Fund | | | 570,347 | | | | — | | | | — | |
LoCorr Spectrum Income Fund | | | 1,675,937 | | | | — | | | | 2,564,688 | |
| | |
LoCorr Macro Strategies Fund, LoCorr Long/Short Commodities Strategy Fund and LoCorr Market Trend Fund – Notes to Consolidated Financial Statements / LoCorr Dynamic Equity Fund and LoCorr Spectrum Income Fund – Notes to Financial Statements (continued) | | 97 |
| |
The Funds intend to qualify as regulated investment companies pursuant to Subchapter M of the Internal Revenue Code of 1986, as amended. The Funds intend to distribute substantially all of their investment company net taxable income and net capital gains to shareholders. Therefore, no federal income tax provision is required.
As of and during the six months ended June 30, 2021, the Funds did not have any tax positions that did not meet the “more-likely-than-not” threshold of being sustained by applicable tax authorities. The Funds recognize interest and penalties, if any, related to unrecognized tax benefits on uncertain tax positions as interest or other expense in the statements of operations. During the six months ended June 30, 2021, the Funds did not incur any interest or penalties.
For tax purposes, LCMFS, LCLSCS and LCMT are exempted Cayman Islands investment companies. LCMFS, LCLSCS and LCMT have each received an undertaking from the Government of the Cayman Islands exempting them from all local income, profits, and capital gains taxes. No such taxes are levied in the Cayman Islands at the present time. For U.S. income tax purposes, LCMFS, LCLSCS and LCMT are controlled foreign corporations (“CFCs”) and as such are not subject to U.S. income tax. However, as a wholly-owned CFC, the net income and capital gain of each CFC, to the extent of its earnings and profits, will be included each year in the respective Funds’ investment company taxable income.
Foreign Securities and Currency
Investment securities and other assets and liabilities denominated in foreign currencies are translated into U.S. dollar amounts at the date of valuation. Purchases and sales of investment securities and income and expense items denominated in foreign currencies are translated into U.S. dollar amounts on the respective dates of such transactions.
The Funds do not isolate that portion of the results of operations resulting from changes in foreign exchange rates on investments from the fluctuations arising from changes in market prices of securities held. Such fluctuations are included with the net realized and unrealized gain or loss from investments.
Reported net realized foreign exchange gains or losses arise from sales of foreign currencies, currency gains or losses realized between the trade and settlement dates on securities transactions, and the difference between the amounts of dividends, interest, and foreign withholding taxes recorded on the Funds’ books and the U.S. dollar equivalent of the amounts actually received or paid. Net unrealized foreign exchange gains and losses arise from changes in the fair values of assets and liabilities, other than investments in securities at period end, resulting from changes in exchange rates.
Forward Currency Contracts
Gains or losses are realized when foreign currency contracts are liquidated. Any change in net unrealized gain or loss is reported in the statements of operations.
Futures Contracts
A futures contract provides for the future sale by one party and purchase by another party of a specified amount of a specific financial instrument (e.g., units of a stock index) for a specified price, date, time and place designated at the time the contract is made. Brokerage fees are incurred when a futures contract is bought or sold and margin deposits must be maintained. Entering into a contract to buy is commonly referred to as buying or purchasing a contract or holding a long position. Entering into a contract to sell is commonly referred to as selling a contract or holding a short position. Unlike when a Fund purchases or sells a security, no price would be paid or received by the Fund upon the purchase or sale of a futures contract.
Although certain futures contracts, by their terms, require actual future delivery of and payment for the underlying instruments, in practice most futures contracts are usually closed out before the delivery date. Gains or losses are realized when contracts are liquidated. Closing out an open futures contract purchase or sale is affected by entering into an offsetting futures contract sale or purchase, respectively, for the same aggregate amount of the identical underlying instrument or index and the same delivery date. If the offsetting purchase price is less than the original sale price, the Fund realizes a gain; if it is more, the Fund realizes a loss. Conversely, if the offsetting sale price is more than the original purchase price, the Fund realizes a gain; if it is less, the Fund realizes a loss.
The transaction costs must also be included in these calculations. There can be no assurance, however, that a Fund will be able to enter into an offsetting transaction with respect to a particular futures contract at a particular time. If a Fund is not able to enter into an offsetting transaction, the Fund will continue to be required to maintain the margin deposits on the futures contract.
Any change in net unrealized gain or loss is reported in the statements of operations.
Indemnifications
In the normal course of business, the Funds enter into contracts that contain general indemnifications to other parties. The Funds’ maximum exposure under these contracts is unknown as this would involve future claims that may be made against the Funds that have not yet occurred. However, based on experience, the Funds expect the risk of loss to be remote.
Market and Credit Risks
The Funds may engage in the speculative trading of U.S. and foreign futures, forward currency and swap contracts (collectively, “derivatives”). The Funds are exposed to both market risk, which is the risk arising from changes in the fair value of the contracts and credit risk, which is the risk of failure by another party to perform according to the terms of a contract.
Purchase and sale of futures contracts requires margin deposits with the broker. Additional deposits may be necessary for any loss on contract value. The Commodity Exchange Act requires a broker to segregate all customer transactions and assets from such broker’s proprietary activities. A customer’s cash and other property (for example, U.S. government securities) deposited with a broker are considered commingled with all other customer funds subject to the broker’s segregation requirements. In the event of a broker’s insolvency, recovery may be limited to a pro rata share of segregated funds available. It is possible that the recovered amount could be less than total cash and other property deposited.
| | |
| 98 | | LoCorr Macro Strategies Fund, LoCorr Long/Short Commodities Strategy Fund and LoCorr Market Trend Fund – Notes to Consolidated Financial Statements / LoCorr Dynamic Equity Fund and LoCorr Spectrum Income Fund – Notes to Financial Statements (continued) |
| | |
For derivatives, risks arise from changes in the fair value of the contracts. Theoretically, the Funds are exposed to a market risk equal to the notional contract value of swap, futures and forward currency contracts purchased and unlimited liability on such contracts sold short.
The Funds also engage in investing its assets in U.S. government securities. Risks arise from investments in U.S. government securities due to possible market illiquidity. U.S. government securities are also sensitive to changes in interest rates and economic conditions.
The Funds have established procedures to actively monitor market risk and minimize credit risk, although there can be no assurance that they will, in fact, succeed in doing so.
The global outbreak of COVID-19 (commonly referred to as “coronavirus”) has disrupted economic markets and the prolonged economic impact is uncertain. The ultimate economic fallout from the pandemic, and the long-term impact on economies, markets, industries and individual issuers, are not known. The operational and financial performance of the issuers of securities in which the Funds invest depends on future developments, including the duration and spread of the outbreak, and such uncertainty may in turn adversely affect the value and liquidity of the Funds’ investments, impair the Funds’ ability to satisfy redemption requests, and negatively impact the Funds’ performance.
New Accounting Pronouncements and/or SEC Regulatory Updates
In October 2020, the SEC adopted new regulations governing the use of derivatives by registered investment companies (“Rule 18f-4”). Rule 18f-4 will impose limits on the amount of derivatives a Fund can enter into, eliminate the asset segregation framework currently used by funds to comply with Section 18 of the 1940 Act, and require funds whose use of derivatives is greater than a limited specified amount to establish and maintain a comprehensive derivatives risk management program and appoint a derivatives risk manager. Funds will be required to comply with Rule 18f-4 by August 19, 2022. It is not currently clear what impact, if any, Rule 18f-4 will have on the availability, liquidity or performance of derivatives. Management is currently evaluating the potential impact of Rule 18f-4 on the Fund(s). When fully implemented, Rule 18f-4 may require changes in how a Fund uses derivatives, adversely affect the Fund’s performance and increase costs related to the Fund’s use of derivatives.
In October 2020, the SEC adopted new Rule 12d1-4 under the 1940 Act and other regulatory changes which are expected to be effective on or about January 19, 2022. Those changes are intended to streamline and enhance the regulatory framework for investments by one fund into another fund or ‘fund-of-funds arrangements.’ These regulatory changes may limit a Fund’s ability to pursue its principal investment strategies by investing in other investment companies or pooled investment vehicles or to invest in those investment companies or pooled investment vehicles it believes are most desirable. Management is currently assessing the potential impact of the new rule on the Funds’ financial statements.
In December 2020, the SEC adopted a new rule providing a framework for fund valuation practices (“Rule 2a-5”). Rule 2a-5 establishes requirements for determining fair value in good faith for purposes of the 1940 Act. Rule 2a-5 will permit fund boards to designate certain parties to perform fair value determinations, subject to board oversight and certain other conditions. Rule 2a-5 also defines when market quotations are “readily available” for purposes of the 1940 Act and the threshold for determining whether a fund must fair value a security. In connection with Rule 2a-5, the SEC also adopted related recordkeeping requirements and is rescinding previously issued guidance, including with respect to the role of a board in determining fair value and the accounting and auditing of fund investments. The Funds will be required to comply with the rules by September 8, 2022. Management is currently assessing the potential impact of the new rules on the Funds’ financial statements.
Options on Securities
The Funds may purchase and write (i.e., sell) put and call options. Such options may relate to particular securities or stock indices and may or may not be listed on a domestic or foreign securities exchange and may or may not be issued by the Options Clearing Corporation. Option trading is a highly specialized activity that entails greater than ordinary investment risk. Options may be more volatile than the underlying instruments, and therefore, on a percentage basis, an investment in options may be subject to greater fluctuation than an investment in the underlying instruments themselves.
A call option for a particular security gives the purchaser of the option the right to buy, and the writer (seller) the obligation to sell, the underlying security at the stated exercise price at any time prior to the expiration of the option, regardless of the market price of the security. The premium paid to the writer is in consideration for undertaking the obligation under the option contract. A put option for a particular security gives the purchaser the right to sell the security at the stated exercise price at any time prior to the expiration date of the option, regardless of the market price of the security.
A Fund’s obligation to sell an instrument subject to a call option written by it, or to purchase an instrument subject to a put option written by it, may be terminated prior to the expiration date of the option by the Fund’s execution of a closing purchase transaction, which is effected by purchasing on an exchange an option of the same series (i.e., same underlying instrument, exercise price and expiration date) as the option previously written. A closing purchase transaction will ordinarily be effected to realize a profit on an outstanding option, to prevent an underlying instrument from being called, to permit the sale of the underlying instrument or to permit the writing of a new option containing different terms on such underlying instrument. The cost of such a liquidation purchase plus transactions costs may be greater than the premium received upon the original option, in which event the Fund will have incurred a loss in the transaction. There is no assurance that a liquid secondary market will exist for any particular option. An option writer unable to effect a closing purchase transaction will not be able to sell the underlying instrument or liquidate the assets held in a segregated account, as described below, until the option expires or the optioned instrument is delivered upon exercise. In such circumstances, the writer will be subject to the risk of market decline or appreciation in the instrument during such period.
| | |
LoCorr Macro Strategies Fund, LoCorr Long/Short Commodities Strategy Fund and LoCorr Market Trend Fund – Notes to Consolidated Financial Statements / LoCorr Dynamic Equity Fund and LoCorr Spectrum Income Fund – Notes to Financial Statements (continued) | | 99 |
| |
If an option purchased by a Fund expires unexercised, the Fund realizes a loss equal to the premium paid. If a Fund enters into a closing sale transaction on an option purchased by it, the Fund will realize a gain if the premium received by the Fund on the closing transaction is more than the premium paid to purchase the option or a loss if it is less. If an option written by a Fund expires on the stipulated expiration date or if the Fund enters into a closing purchase transaction, it will realize a gain (or loss if the cost of a closing purchase transaction exceeds the net premium received when the option is sold). If an option written by the Fund is exercised, the proceeds of the sale will be increased by the net premium originally received and the Fund will realize a gain or loss.
Security Transactions and Investment Income
Security transactions are recorded on trade date. Generally, realized gains and losses on sales of investments are calculated on the specifically identified cost basis of the securities.
In accordance with the investment restrictions outlined within the Funds’ prospectus, each Fund may invest up to 15% of its net assets in illiquid securities. Illiquid securities may include securities subject to contractual or legal restrictions on resale (e.g., because they have not been registered under the Securities Act) and securities that are otherwise not readily marketable (e.g., because trading in the security is suspended or because market makers do not exist or will not entertain bids or offers). Securities that have not been registered under the Securities Act are referred to as private investments or restricted securities and are purchased directly from the issuer or in the secondary market. Foreign securities that are freely tradable in their principal markets are not considered to be illiquid. Under guidelines adopted by the Trust’s Board, the Adviser of the Funds may determine that particular Rule 144A securities, and commercial paper issued in reliance on the private placement exemption from registration afforded by Section 4(a)(2) of the Securities Act, are liquid even though they are not registered. At June 30, 2021, the Adviser deemed all of the 144A securities held in the LoCorr Macro Strategies Fund, the LoCorr Long/Short Commodities Strategy Fund and the LoCorr Market Trend Fund to be liquid. At June 30, 2021, there were no illiquid or restricted securities held in the LoCorr Dynamic Equity Fund or the LoCorr Spectrum Income Fund.
Dividend income, less foreign taxes withheld, if any, are recorded on the ex-dividend date.
Distributions received from the investments in MLP interests, REITs, private investments, closed end funds, business development companies and royalty trusts generally are comprised of ordinary income, capital gains and return of capital. For financial statement purposes, the Funds use estimates to characterize these distributions received as return of capital, capital gains or ordinary income. Such estimates are based on historical information available from each MLP, REIT, private investment, closed end fund, business development company or royalty trust and other industry sources. These estimates may subsequently be revised based on information received from the MLP, REIT, private investment, closed end fund, business development company or royalty trust after their tax reporting periods are concluded, as the actual character of these distributions is not known until after the fiscal year end of the Funds. The distributions received from the MLP, REIT, private investment, closed end fund, business development company and royalty trust securities that have been classified as income and capital gains are included in investment income and net realized gain (loss) on investments, respectively, on the statements of operations. The distributions received that are classified as return of capital reduce the cost of investments on the statements of assets and liabilities.
Interest income and expense are recognized on the accrual basis. Market discounts, premiums and original issue discounts on fixed-income securities are amortized daily over the expected life of the security using the effective yield method.
Short Sales
The Funds may sell securities short. A short sale is a transaction in which a Fund sells a security it does not own or have the right to acquire (or that it owns but does not wish to deliver) in anticipation that the market price of that security will decline.
When a Fund makes a short sale, the broker-dealer through which the short sale is made must borrow the security sold short and deliver it to the party purchasing the security. The Funds are required to make a margin deposit in connection with such short sales; the Funds may have to pay a fee to borrow particular securities and will often be obligated to pay over any dividends and accrued interest on borrowed securities.
If the price of the security sold short increases between the time of the short sale and the time a Fund covers its short position, the Fund will incur a loss; conversely, if the price declines, the Fund will realize a gain. A gain, limited to the price at which the Fund sold the security short, or a loss, unlimited in size, will be recognized upon the close of a short sale. Any gain will be decreased, and any loss increased, by the transaction costs described above. The successful use of short selling may be adversely affected by imperfect correlation between movements in the price of the security sold short and the securities being hedged. Gains or losses from closed positions of securities sold short are presented as net realized gain or loss on securities sold short on the statements of operations.
In addition, the Funds are required to pay the lender any dividends declared on short positions. Dividends declared on open short positions are recorded on ex-date and shown as an expense for financial reporting purposes. To borrow the security, the Funds also may be required to pay fees, which are shown as an expense for financial reporting purposes.
To the extent the Funds sell securities short, it will provide collateral to the broker-dealer and (except in the case of short sales “against the box”) will maintain additional asset coverage in the form of cash, U.S. government securities or other liquid securities with its custodian in a segregated account in an amount at least equal to the difference between the current fair value of the securities sold short and any amounts required to be deposited as collateral with the selling broker (not including the proceeds of the short sale). A short sale is “against the box” to the extent the Funds contemporaneously own, or have the right to obtain at no added cost, securities identical to those sold short. Short sales are collateralized by cash deposits with the counterparty broker and pledged securities held at the custodian, U.S. Bank. The collateral required is determined daily by reference to the fair value of the short positions.
| | |
| 100 | | LoCorr Macro Strategies Fund, LoCorr Long/Short Commodities Strategy Fund and LoCorr Market Trend Fund – Notes to Consolidated Financial Statements / LoCorr Dynamic Equity Fund and LoCorr Spectrum Income Fund – Notes to Financial Statements (continued) |
| | |
Total Return Swap Contracts
The Funds may enter into total return swap agreements. A total return swap entered into by the Funds is a derivative contract that transfers the market risk of underlying portfolios of futures contracts, forward currency contracts and foreign currencies (considered the “index” within each total return swap contract) between counterparties. The “notional amount” of each total return swap agreement is the agreed upon amount or value of the index used for calculating the returns that the parties to a swap agreement have agreed to exchange. The total return swaps are marked to market daily and any change is recorded in unrealized gain/loss on the consolidated statements of operations based on the value of the index on which the total return swap is referenced, as defined within the total return swap agreement between the counterparties. The composition of the index may vary based on how the underlying portfolio of futures contracts, forward currency contracts and foreign currencies is traded. A Fund’s obligation under total return swap agreement, including any related fees, offset against amounts owed to the Fund in the case of positive performance, will be covered by designating liquid assets on the Fund’s books and records (see the consolidated statement of assets and liabilities for deposits with broker for derivative instruments). Gains or losses will be realized when the total return swap contracts are liquidated and will be presented as net realized gain or loss on swap contracts on the consolidated statements of operations. Changes in notional value and any cash holding adjustments, which represent voluntary realizations by a Fund of swap value at any point in time, are also presented as net realized gain or loss on swap contracts on the consolidated statements of operations. Further, any cash holding adjustments realized by a Fund are subject to interest charges, which are recorded as part of unrealized gain/loss on the consolidated statements of operations. A corresponding asset or liability for “advance receipt on swap contracts” or “advance payment on swap contracts,” respectively, is recorded on the consolidated statements of assets and liabilities for the gain or loss realized on changes in notional value. Total return swaps outstanding at period end, if any, are listed after the Funds’ consolidated schedules of investments.
Use of Estimates
The preparation of financial statements in conformity with GAAP requires management to make estimates and assumptions that affect the reported amounts of assets and liabilities, disclosure of contingent assets and liabilities at the date of the financial statements and the reported revenues and expenses during the reporting period. Actual results could differ from those estimates.
Warrants
The Funds may invest in warrants. Warrants are options to purchase common stock at a specific price (usually at a premium above the market value of the optioned common stock at issuance) valid for a specific period of time. Warrants may have a life ranging from less than one year to twenty years, or they may be perpetual. However, most warrants have expiration dates after which they are worthless. In addition, a warrant is worthless if the market price of the common stock does not exceed the warrant’s exercise price during the life of the warrant. Warrants have no voting rights, pay no dividends and have no rights with respect to the assets of the corporation issuing them. The percentage increase or decrease in the market price of the warrant may tend to be greater than the percentage increase or decrease in the market price of the optioned common stock.
3. Derivative and Other Financial Instruments
The Funds may invest in derivatives such as futures, forward currency and swap contracts, in order to hedge against market movements while liquidating certain positions and buying other securities or as substitutes for securities, as well as for speculative purposes to gain exposure to such market movements.
The Funds’ market risk related to their derivatives trading is influenced by a wide variety of factors, including the level and volatility of interest rates, exchange rates, weather, supply and demand of commodities, the market value of futures and forward currency contracts, the diversification effects among the Funds’ open positions and the liquidity of the markets in which they trade.
The following are the primary trading risk exposures by market sector of the Funds as encompassed in the total return swap contracts:
Agricultural. (grains, livestock and softs). The Funds’ primary exposure is to agricultural price movements which are often directly affected by severe or unexpected weather conditions.
Currencies. Exchange rate risk is a principal market exposure of the Funds. The Funds’ currency exposure is to exchange rate fluctuations, primarily fluctuations which disrupt the historical pricing relationships between different currencies and currency pairs. The fluctuations are influenced by interest rate changes as well as political and general economic conditions. The Funds trade in a large number of currencies including cross-rates – e.g., positions between two currencies other than the U.S. dollar.
Energy. The Funds’ primary energy market exposure is to gas and oil price movements, often resulting from political developments in the Middle East and economic conditions worldwide. Energy prices are volatile and substantial profits and losses have been and are expected to continue to be experienced in this market.
Interest Rates. Interest rate movements directly affect the price of the sovereign bond futures positions held by the Funds and indirectly the value of its stock index currency positions. Interest rate movements in one country as well as relative interest rate movements between countries may materially impact the Funds’ profitability. The Funds’ primary interest rate exposure is to interest rate fluctuations in countries or regions including Australia, Canada, Japan, Switzerland, the United Kingdom, the United States and the Eurozone. However, the Funds also may take positions in futures contracts on the government debt of other nations. The Funds anticipate that interest rates in these industrialized countries or areas, both long-term and short-term, will remain a primary market exposure of the Funds for the foreseeable future.
Metals. The Funds’ metals market exposure is to fluctuations in the price of aluminum, copper, gold, lead, nickel, palladium, tin, silver and zinc.
Stock Index. The Funds’ equity exposure, through stock index futures, is to equity price risk in the major industrialized countries as well as other countries.
| | |
LoCorr Macro Strategies Fund, LoCorr Long/Short Commodities Strategy Fund and LoCorr Market Trend Fund – Notes to Consolidated Financial Statements / LoCorr Dynamic Equity Fund and LoCorr Spectrum Income Fund – Notes to Financial Statements (continued) | | 101 |
| |
The Fund invests in options which are not traded on an exchange. In doing so, it is assuming a credit risk with regard to the party with which it trades and also bears the risk of settlement default. These risks may differ materially from risks associated with transactions effected on an exchange, which generally are backed by clearing organization guarantees, daily mark-to market and settlement, segregation and minimum capital requirements applicable to intermediaries. Relying on a counterparty exposes the Fund to the risk that a counterparty will not settle a transaction in accordance with its terms and conditions because of a dispute over the terms of the contract (whether or not bona fide) or because of a credit or liquidity problem, thus causing the Fund to suffer a loss. If a counterparty defaults on its payment obligations to the Fund, this default will cause the value of an investment in the Fund to decrease.
At June 30, 2021, the LoCorr Macro Strategies Fund, LoCorr Long/Short Commodities Strategy Fund and LoCorr Market Trend Fund held derivative and other financial instruments which are not subject to a master netting arrangement. As the tables below illustrate, no positions are netted in these consolidated financial statements.
LoCorr Macro Strategies Fund – June 30,2021 |
Assets: | | | | | | | | | | | Gross Amounts not offset in the Consolidated Statement of Assets & Liabilities | | | | |
Description | | Gross Amounts of Recognized Assets | | | Gross Amounts Offset in the Consolidated Statement of Assets & Liabilities | | | Net Amounts Presented in the Consolidated Statement of Assets & Liabilities | | | Financial Instruments | | | Collateral Pledged (Received) | | | Net Amount | |
Forward currency contracts | | $ | 24,854,940 | | | $ | — | | | $ | 24,854,940 | | | $ | — | | | $ | — | | | $ | 24,854,940 | |
Futures contracts (a) | | | 2,184,640 | | | | — | | | | 2,184,640 | | | | — | | | | — | | | | 2,184,640 | |
Total | | $ | 27,039,580 | | | $ | — | | | $ | 27,039,580 | | | $ | — | | | $ | — | | | $ | 27,039,580 | |
Liabilities: | | | | | | | | | | | Gross Amounts not offset in the Consolidated Statement of Assets & Liabilities | | | | |
Description | | Gross Amounts of Recognized Liabilities | | | Gross Amounts Offset in the Consolidated Statement of Assets & Liabilities | | | Net Amounts Presented in the Consolidated Statement of Assets & Liabilities | | | Financial Instruments | | | Collateral Received (Pledged) | | | Net Amount | |
Forward currency contracts | | $ | 37,902,301 | | | $ | — | | | $ | 37,902,301 | | | $ | — | | | $ | (37,902,301 | ) | | $ | — | |
Futures contracts (a) | | | 4,560,943 | | | | — | | | | 4,560,943 | | | | — | | | | (4,560,943 | ) | | | — | |
Total | | $ | 42,463,244 | | | $ | — | | | $ | 42,463,244 | | | $ | — | | | $ | (42,463,244 | ) | | $ | — | |
LoCorr Long/Short Commodities Strategy Fund – June 30,2021 |
Assets: | | | | | | | | | | | Gross Amounts not offset in the Consolidated Statement of Assets & Liabilities | | | | |
Description | | Gross Amounts of Recognized Assets | | | Gross Amounts Offset in the Consolidated Statement of Assets & Liabilities | | | Net Amounts Presented in the Consolidated Statement of Assets & Liabilities | | | Financial Instruments | | | Collateral Pledged (Received) | | | Net Amount | |
Swap Contracts* | | $ | 34,703,411 | | | $ | — | | | $ | 34,703,411 | | | $ | — | | | $ | — | | | $ | 34,703,411 | |
Total | | $ | 34,703,411 | | | $ | — | | | $ | 34,703,411 | | | $ | — | | | $ | — | | | $ | 34,703,411 | |
* $14,113,147 represents advance receipt on swap contracts.
| | |
| 102 | | LoCorr Macro Strategies Fund, LoCorr Long/Short Commodities Strategy Fund and LoCorr Market Trend Fund – Notes to Consolidated Financial Statements / LoCorr Dynamic Equity Fund and LoCorr Spectrum Income Fund – Notes to Financial Statements (continued) |
| | |
LoCorr Market Trend Fund – June 30, 2021 |
Assets: | | | | | | | | | | | Gross Amounts not offset in the Consolidated Statement of Assets & Liabilities | | | | |
Description | | Gross Amounts of Recognized Assets | | | Gross Amounts Offset in the Consolidated Statement of Assets & Liabilities | | | Net Amounts Presented in the Consolidated Statement of Assets & Liabilities | | | Financial Instruments | | | Collateral Pledged (Received) | | | Net Amount | |
Forward currency contracts | | $ | 1,908,789 | | | $ | — | | | $ | 1,908,789 | | | $ | — | | | $ | — | | | $ | 1,908,789 | |
Futures contracts (a) | | | 448,044 | | | | — | | | | 448,044 | | | | — | | | | — | | | | 448,044 | |
Total | | $ | 2,356,833 | | | $ | — | | | $ | 2,356,833 | | | $ | — | | | $ | — | | | $ | 2,356,833 | |
Liabilities: | | | | | | | | | | | Gross Amounts not offset in the Consolidated Statement of Assets & Liabilities | | | | |
Description | | Gross Amounts of Recognized Liabilities | | | Gross Amounts Offset in the Consolidated Statement of Assets & Liabilities | | | Net Amounts Presented in the Consolidated Statement of Assets & Liabilities | | | Financial Instruments | | | Collateral Received (Pledged) | | | Net Amount | |
Forward currency contracts | | $ | 3,026,126 | | | $ | — | | | $ | 3,026,126 | | | $ | — | | | $ | (3,026,126 | ) | | $ | — | |
Futures contracts (a) | | | 2,722,505 | | | | — | | | | 2,722,505 | | | | — | | | | (2,722,505 | ) | | | — | |
Total | | $ | 5,748,631 | | | $ | — | | | $ | 5,748,631 | | | $ | — | | | $ | (5,748,631 | ) | | $ | — | |
(a) Reflects the current day variation margin and unsettled open futures contracts which are separately reported within the Fund’s consolidated statement of assets and liabilities.
The Funds have adopted authoritative standards regarding disclosure about derivatives and hedging activities and how they affect the Funds’ consolidated statements of assets and liabilities and consolidated statements of operations. Fair value of swap contracts are recorded in the consolidated statements of assets and liabilities as net unrealized appreciation on swap contracts or net unrealized depreciation on swap contracts.
Since the derivatives held long or short are for speculative trading purposes, the derivative instruments are not designated as hedging instruments. Accordingly, all realized gains and losses, as well as any change in net unrealized gains or losses on open contracts from the preceding period, are recognized as part of realized and unrealized gain (loss) in the consolidated statements of operations.
| | |
LoCorr Macro Strategies Fund, LoCorr Long/Short Commodities Strategy Fund and LoCorr Market Trend Fund – Notes to Consolidated Financial Statements / LoCorr Dynamic Equity Fund and LoCorr Spectrum Income Fund – Notes to Financial Statements (continued) | | 103 |
| |
The following table presents the fair value of consolidated derivative instruments for the LoCorr Macro Strategies Fund, LoCorr Long/Short Commodities Strategy Fund, LoCorr Market Trend Fund and the non-consolidated derivative instruments for the LoCorr Spectrum Income Fund as of June 30, 2021 as presented on each Fund’s consolidated and non-consolidated statements of assets and liabilities:
| | | | | | | | Net Unrealized | |
| | Fair Value | | | Gain (Loss) on | |
Derivatives Not Accounted for as Hedging Instruments | | Assets | | | Liabilities | | | Open Positions | |
| | | | | | | | | | | | |
LoCorr Macro Strategies Fund | | | | | | | | | | | | |
Forward Currency Contracts(a) | | | | | | | | | | | | |
Long | | $ | 727,842 | | | $ | 36,794,350 | | | $ | (36,066,508 | ) |
Short | | | 24,127,098 | | | | 1,107,951 | | | | 23,019,147 | |
Total Forward Currency Contracts | | | 24,854,940 | | | | 37,902,301 | | | | (13,047,361 | ) |
| | | | | | | | | | | | |
Futures Contracts(b) | | | | | | | | | | | | |
Long Contracts | | | | | | | | | | | | |
Commodity | | | 4,108,645 | | | | 2,075,295 | | | | 2,033,350 | |
Equity | | | 2,299,792 | | | | 3,081,532 | | | | (781,740 | ) |
Foreign exchange | | | — | | | | 3,407 | | | | (3,407 | ) |
Interest rate | | | 2,592,451 | | | | 575,277 | | | | 2,017,174 | |
Total Long Contracts | | | 9,000,888 | | | | 5,735,511 | | | | 3,265,377 | |
| | | | | | | | | | | | |
Short Contracts | | | | | | | | | | | | |
Commodity | | | 1,375,681 | | | | 2,585,500 | | | | (1,209,819 | ) |
Equity | | | 236,982 | | | | 20,844 | | | | 216,138 | |
Foreign exchange | | | 357,155 | | | | 330,938 | | | | 26,217 | |
Interest rate | | | 493,280 | | | | 4,522,016 | | | | (4,028,736 | ) |
Total Short Contracts | | | 2,463,098 | | | | 7,459,298 | | | | (4,996,200 | ) |
Total Futures Contracts | | | 11,463,986 | | | | 13,194,809 | | | | (1,730,823 | ) |
Total Forward Currency Contracts and Futures Contracts | | $ | 36,318,926 | | | $ | 51,097,110 | | | $ | (14,778,184 | ) |
| | | | | | | | | | | | |
LoCorr Long/Short Commodities Strategy Fund | | | | | | | | | | | | |
Long Total Return Swap Contracts | | | | | | | | | | | | |
LoCorr Commodities Index | | $ | 20,590,264 | | | $ | — | | | $ | 20,590,264 | |
Purchased Call Option | | | 15,492,104 | | | | — | | | | 15,492,104 | |
| | | | | | | | | | | | |
LoCorr Market Trend Fund | | | | | | | | | | | | |
Forward Currency Contracts(a) | | | | | | | | | | | | |
Long | | $ | — | | | $ | 3,009,566 | | | $ | (3,009,566 | ) |
Short | | | 1,908,789 | | | | 16,560 | | | | 1,892,229 | |
Total Forward Currency Contracts | | | 1,908,789 | | | | 3,026,126 | | | | (1,117,337 | ) |
| | | | | | | | | | | | |
Futures Contracts(b) | | | | | | | | | | | | |
Long Contracts | | | | | | | | | | | | |
Commodity | | | 1,193,369 | | | | 701,653 | | | | 491,716 | |
Equity | | | 1,213,009 | | | | 1,565,572 | | | | (352,563 | ) |
Interest rate | | | — | | | | 276,366 | | | | (276,366 | ) |
Total Long Contracts | | | 2,406,378 | | | | 2,543,591 | | | | (137,213 | ) |
| | | | | | | | | | | | |
Short Contracts | | | | | | | | | | | | |
Commodity | | | 317,660 | | | | 220,687 | | | | 107,214 | |
Foreign exchange | | | — | | | | 191,429 | | | | (191,429 | ) |
Interest rate | | | 177,159 | | | | 2,564,449 | | | | (2,387,290 | ) |
Total Short Contracts | | | 505,060 | | | | 2,976,565 | | | | (2,471,505 | ) |
Total Futures Contracts | | | 2,911,438 | | | | 5,520,156 | | | | (2,608,718 | ) |
Total Forward Currency Contracts and Futures Contracts | | $ | 4,820,227 | | | $ | 8,546,282 | | | $ | (3,726,055 | ) |
| |
104 | | LoCorr Macro Strategies Fund, LoCorr Long/Short Commodities Strategy Fund and LoCorr Market Trend Fund – Notes to Consolidated Financial |
Statements / LoCorr Dynamic Equity Fund and LoCorr Spectrum Income Fund – Notes to Financial Statements (continued) |
| |
| | | | | | | | Net Unrealized | |
| | | | | | | | | Gain (Loss) on | |
| | | Fair Value | | | Open | |
Derivatives Not Accounted for as Hedging Instruments | | Assets | | | Liabilities | | | Positions | |
| | | | | | | | | | | | |
LoCorr Spectrum Income Fund | | | | | | | | | | | | |
Options | | | | | | | | | | | | |
Written Options | | $ | — | | | $ | 122,402 | | | $ | 26,654 | |
Total Options | | $ | — | | | $ | 122,402 | | | $ | 26,654 | |
(a) | Unrealized appreciation on forward currency contracts is a receivable and unrealized depreciation on forward currency contracts is a payable on the Fund’s consolidated statement of assets and liabilities. |
(b) | Reflects the cumulative unrealized appreciation (depreciation) of futures contracts as reported in the Fund’s consolidated schedule of open futures contracts. Only the current day variation margin and unsettled open futures contracts is separately reported within the Fund’s consolidated statement of assets and liabilities. |
| |
LoCorr Macro Strategies Fund, LoCorr Long/Short Commodities Strategy Fund and LoCorr Market Trend Fund – Notes to Consolidated Financial Statements / LoCorr Dynamic Equity Fund and LoCorr Spectrum Income Fund – Notes to Financial Statements (continued) | | 105 |
| | |
The following table presents the results of the derivative trading and information related to volume for the six months ended June 30, 2021. The below captions of “Net Realized” and “Net Change in Unrealized” correspond to the captions in each Fund’s consolidated and non-consolidated statement of operations.
| | Gain (Loss) from Trading | |
| | | | | Net Change | |
Fund and Type of Derivative Instrument | | Net Realized | | | in Unrealized | |
LoCorr Macro Strategies Fund | | | | | | | | |
Forward Currency Contracts | | $ | (2,994,454 | ) | | $ | (18,114,160 | ) |
Futures Contracts | | | | | | | | |
Commodity | | | 67,224,377 | | | | (18,255,408 | ) |
Equity | | | 55,139,095 | | | | (6,107,135 | ) |
Foreign exchange | | | (3,260,575 | ) | | | (35,472 | ) |
Interest rate | | | (2,000,667 | ) | | | (6,106,382 | ) |
Total Futures Contracts | | | 117,102,230 | | | | (30,504,397 | ) |
Total Forward Currency Contracts and Futures Contracts | | $ | 114,107,776 | | | $ | (48,618,557 | ) |
| | | | | | | | |
LoCorr Long/Short Commodities Strategy Fund | | | | | | | | |
Swap Contracts | | $ | — | | | $ | 33,689,483 | |
Purchased Call Option(d) | | | — | | | | 11,130,210 | |
| | | | | | | | |
LoCorr Market Trend Fund | | | | | | | | |
Forward Currency Contracts | | $ | 174,625 | | | $ | (4,407,082 | ) |
Futures Contracts | | | | | | | | |
Commodity | | | 28,753,603 | | | | (10,099,764 | ) |
Equity | | | 19,187,884 | | | | (2,303,218 | ) |
Foreign exchange | | | (277,785 | ) | | | (227,732 | ) |
Interest rate | | | (9,336,530 | ) | | | (4,591,975 | ) |
Total Futures Contracts | | | 38,327,172 | | | | (17,222,689 | ) |
Total Forward Currency Contracts and Futures Contracts | | $ | 38,501,797 | | | $ | (21,629,771 | ) |
| | | | | | | | |
LoCorr Dynamic Equity Fund | | | | | | | | |
Futures Contract | | | | | | | | |
Equity | | $ | 295,292 | | | $ | (39,152 | ) |
Total Futures Contract | | $ | 295,292 | | | $ | (39,152 | ) |
| | | | | | | | |
LoCorr Spectrum Income Fund | | | | | | | | |
Options | | | | | | | | |
Written Options | | | 113,982 | | | | 26,654 | |
Total Options | | $ | 113,982 | | | $ | 26,654 | |
(d) | Purchased options are included within net realized gain (loss) on investments and net change in unrealized appreciation/depreciation on investments. |
| |
| 106 | | LoCorr Macro Strategies Fund, LoCorr Long/Short Commodities Strategy Fund and LoCorr Market Trend Fund – Notes to Consolidated Financial
Statements / LoCorr Dynamic Equity Fund and LoCorr Spectrum Income Fund – Notes to Financial Statements (continued) |
| | |
The average monthly notional amount is shown as an indicator of volume. The average monthly notional amounts during the six months ended June 30, 2021 were:
| | Average Notional Amount | |
| | Long Contracts | | | Short Contracts | |
LoCorr Macro Strategies Fund | | | | | | | | |
Forward Currency Contracts | | $ | 1,851,572,934 | | | $ | 1,597,006,045 | |
Futures Contracts | | | 4,112,718,820 | | | | 1,574,972,270 | |
| | | | | | | | |
LoCorr Long/Short Commodities Strategy Fund | | | | | | | | |
Swap Contracts | | $ | 386,945,098 | | | $ | — | |
| | | | | | | | |
LoCorr Market Trend Fund | | | | | | | | |
Forward Currency Contracts | | $ | 356,276,482 | | | $ | 269,378,514 | |
Futures Contracts | | | 1,543,220,627 | | | | 552,377,442 | |
| | | | | | | | |
LoCorr Dynamic Equity Fund | | | | | | | | |
Futures Contracts | | $ | 406,213 | | | $ | — | |
| | | | | | | | |
LoCorr Spectrum Income Fund | | | | | | | | |
Options | | $ | — | | | $ | 4,639,823 | |
The swap contracts and the commodity-related futures contracts reported in the tables in Note 3 represent balances and activity of each Fund’s respective wholly-owned and controlled subsidiary. See Note 2.
The Fund considers the purchased call option held in LCLSCS at June 30, 2021, as noted on the consolidated schedule of investments, to be an accurate representation of the volume of activity for the period ended June 30, 2021.
Please refer to the Funds’ prospectus for a full listing of risks associated with these investments.
4. Investment Transactions
The cost of security purchases and proceeds from security sales, excluding short-term investments, derivative instruments, short sales and purchases to cover short sales for the year ended June 30, 2021 were as follows:
| | U.S. Government Obligations | | | All Other | |
| | Purchases | | | Sales | | | Purchases | | | Sales | |
| | | | | | | | | | | | | | | | | |
LoCorr Macro Strategies Fund | | $ | 318,304,949 | | | $ | 184,373,987 | | | $ | 268,163,376 | | | $ | 144,982,981 | |
| | | | | | | | | | | | | | | | | |
LoCorr Long/Short Commodities Strategy Fund | | | 148,845,009 | | | | 60,129,096 | | | | 138,358,058 | | | | 75,793,975 | |
| | | | | | | | | | | | | | | | | |
LoCorr Market Trend Fund | | | 81,434,688 | | | | 47,557,494 | | | | 36,641,788 | | | | 20,053,909 | |
| | | | | | | | | | | | | | | | | |
LoCorr Dynamic Equity Fund | | | — | | | | — | | | | 47,842,028 | | | | 48,100,270 | |
| | | | | | | | | | | | | | | | | |
LoCorr Spectrum Income Fund | | | — | | | | — | | | | 21,839,993 | | | | 16,477,121 | |
5. Management Fees and Other Transactions with Affiliates
Management Agreement
The Trust has a Management Agreement with the Adviser, with whom certain officers and Trustees of the Funds are affiliated, to furnish investment advisory services to the Funds. Pursuant to the amended Management Agreement, the Adviser is entitled to receive a fee as follows:
| Annual Advisory Fee as a Percentage |
Fund | of the Average Daily Net Assets of the Fund |
LoCorr Macro Strategies Fund | 1.65% |
LoCorr Market Trend Fund | 1.50% |
LoCorr Dynamic Equity Fund | 1.50% |
LoCorr Spectrum Income Fund | 1.30% |
| |
LoCorr Macro Strategies Fund, LoCorr Long/Short Commodities Strategy Fund and LoCorr Market Trend Fund – Notes to Consolidated Financial Statements / LoCorr Dynamic Equity Fund and LoCorr Spectrum Income Fund – Notes to Financial Statements (continued) | | 107 |
| | |
Pursuant to the amended Management Agreement, the Adviser is entitled to receive a fee, in accordance with the Incremental Advisory Fee schedule below based on the LoCorr Long/Short Commodities Strategy Fund’s average daily net assets.
Net Assets for the LoCorr Long/Short | Incremental |
Commodities Strategy Fund | Advisory Fee* |
$0.0 – $0.5 billion | 1.50% |
$0.5 – $1.0 billion | 1.40% |
$1.0 – $1.5 billion | 1.30% |
$1.5 – $2.0 billion | 1.20% |
$2.0 – $2.5 billion | 1.10% |
Over $2.5 billion | 1.00% |
* | Incremental advisory fee represents the fees paid on net assets at the related net asset level. For example, with $3 billion in net assets in the Fund, the Adviser would earn 1.50% on the first $500 million, plus 1.30% on the next $500 million, plus 1.20% on the next $500 million, plus 1.10% on the next $500 million, plus 1.00% on the final $500 million. |
Fund | | Management Fees for
the Six Months Ended
June 30, 2021 | | | Accrued Net
Management Fees as of
June 30, 2021 | |
LoCorr Macro Strategies Fund | | $ | 10,566,022 | | | $ | 1,913,210 | |
LoCorr Long/Short Commodities Strategy Fund | | | 4,221,803 | | | | 817,590 | |
LoCorr Market Trend Fund | | | 1,957,927 | | | | 338,880 | |
LoCorr Dynamic Equity Fund | | | 150,575 | | | | 5,158 | |
LoCorr Spectrum Income Fund | | | 361,291 | | | | 66,250 | |
Sub-Advisory Agreements
Sub-advisory services are provided to the Funds, pursuant to agreements between the Adviser and the below listed sub-advisers. Under the terms of these sub-advisory agreements, the Adviser compensates the sub-advisers based on the portion of each Fund’s average daily net assets which they have been allocated to manage.
The Adviser is solely responsible for the payment of the sub-adviser’s fees, and the sub-adviser agrees not to seek payment of its fees from the Trust or the Funds.
LoCorr Macro Strategies Fund: |
Graham Capital Management, L.P. |
Millburn Ridgefield Corporation |
Nuveen Asset Management, LLC |
Revolution Capital Management LLC |
R.G. Niederhoffer Capital Management |
|
LoCorr Long/Short Commodities Strategy Fund: |
Nuveen Asset Management, LLC |
|
LoCorr Market Trend Fund: |
Graham Capital Management, L.P. |
Nuveen Asset Management, LLC |
|
LoCorr Dynamic Equity Fund: |
Billings Capital Management LLC |
First Quadrant, L.P. |
Kettle Hill Capital Management, LLC |
|
LoCorr Spectrum Income Fund: |
Bramshill Investments, LLC |
Expense Limitation Agreement
The Funds’ Adviser has contractually agreed to waive management fees and/or reimburse the Funds for expenses they incur, but only to the extent necessary to maintain the Funds’ total annual operating expenses after fee waiver and/or reimbursement (excluding any Rule 12b-1 distribution and/or servicing fees, taxes, interest, brokerage commissions, expenses incurred in connection with any merger or reorganization, dividend expenses on short sales, swap fees, indirect expenses, expenses of other investment companies in which the Funds may invest, or extraordinary expenses such as litigation expenses and inclusive of offering and organizational costs incurred prior to the commencement of operations) at the percentages listed below:
| Expense Limit as a Percentage of the | |
Fund | Average Daily Net Assets of the Fund | Effective Period Through |
| | | |
LoCorr Macro Strategies Fund | 1.99% | April 30, 2022 |
LoCorr Long/Short Commodities Strategy Fund | 1.95% | April 30, 2022 |
LoCorr Market Trend Fund | 1.95% | April 30, 2022 |
LoCorr Dynamic Equity Fund | 1.99% | April 30, 2022 |
LoCorr Spectrum Income Fund | 1.80% | April 30, 2022 |
Any waiver or reimbursement is subject to repayment by the respective Fund within the three fiscal years following the fiscal year in which the expenses occurred, if the Fund is able to make the repayment without exceeding its current expense limitations and the repayment is approved by the Board.
| |
| 108 | | LoCorr Macro Strategies Fund, LoCorr Long/Short Commodities Strategy Fund and LoCorr Market Trend Fund – Notes to Consolidated Financial Statements / LoCorr Dynamic Equity Fund and LoCorr Spectrum Income Fund – Notes to Financial Statements (continued) |
| | |
The total amounts of management fees waived and/or expenses reimbursed which are subject to recovery, and their related expiration date are as follows:
LoCorr Dynamic Equity Fund | | | | | | | | | | | | |
| | Management Fees | | | Recovery to Adviser | | | | | | Subject to Recovery on | |
Period | | (Waived) by Adviser
Subject to Recovery | | | Six Months Ended
June 30, 2021 | | | Remaining Available
Subject to Recovery | | | or Before Fiscal Year Ending
December 31, | |
Six Months Ended June 30, 2021 | | $ | (137,352 | ) | | $ | — | | | $ | (137,352 | ) | | | 2024 | |
Year Ended December 31, 2020 | | | (278,103 | ) | | | — | | | | (278,103 | ) | | | 2023 | |
Year Ended December 31, 2019 | | | (192,060 | ) | | | — | | | | (192,060 | ) | | | 2022 | |
Year Ended December 31, 2018 | | | (95,089 | ) | | | — | | | | (95,089 | ) | | | 2021 | |
Total | | $ | (702,604 | ) | | $ | — | | | $ | (702,604 | ) | | | | |
LoCorr Spectrum Income Fund | | | | | | | | | | | | |
| | Management Fees | | | Recovery to Adviser | | | | | | Subject to Recovery on | |
Period | | (Waived) by Adviser
Subject to Recovery | | | Six Months Ended
June 30, 2021 | | | Remaining Available
Subject to Recovery | | | or Before Fiscal Year Ending
December 31, | |
Six Months Ended June 30, 2021 | | $ | (17,766 | ) | | $ | — | | | $ | (17,766 | ) | | | 2024 | |
Year Ended December 31, 2020 | | | (70,114 | ) | | | — | | | | (70,114 | ) | | | 2023 | |
Year Ended December 31, 2019 | | | — | | | | — | | | | — | | | | 2022 | |
Year Ended December 31, 2018 | | | — | | | | — | | | | — | | | | 2021 | |
Total | | $ | (87,880 | ) | | $ | — | | | $ | (87,880 | ) | | | | |
At June 30, 2021, there were no fees subject to recovery for the LoCorr Macro Strategies Fund, the LoCorr Long/Short Commodities Strategy Fund or the LoCorr Market Trend Fund.
Rule 12b-1 Distribution Agreement
The Funds have entered into a Rule 12b-1 distribution agreement with Quasar Distributors, LLC (“Quasar”). Class A shareholders pay distribution expenses to Quasar at the annual rate of 0.25% of the Fund’s average daily net assets. Class C shareholders pay to Quasar an annual rate of 1.00%, which is comprised of 0.75% in distribution expenses and 0.25% in service fees, of the Fund’s average daily net assets. Class I shareholders pay no 12b-1 fees.
| |
LoCorr Macro Strategies Fund, LoCorr Long/Short Commodities Strategy Fund and LoCorr Market Trend Fund – Notes to Consolidated Financial
Statements / LoCorr Dynamic Equity Fund and LoCorr Spectrum Income Fund – Notes to Financial Statements (continued) | | 109 |
| | |
6. Fund Shares
At June 30, 2021 there were an unlimited number of shares of beneficial interest authorized. The following table summarizes the activity in shares and dollar amounts applicable to each class of the Funds:
LoCorr Macro Strategies Fund – Class A | | | | | | | | | | | | |
| | For the Six Months Ended June 30,2021 | | | For the Year Ended December 31, 2020 | |
| | Shares | | | Amount | | | Shares | | | Amount | |
Shares Sold | | | 1,790,191 | | | $ | 15,779,299 | | | | 4,716,157 | | | $ | 40,079,233 | |
Shares Issued in Connection with Reorganization | | | — | | | | — | | | | 818,672 | | | | 7,154,396 | |
Reinvestment of Distributions | | | — | | | | — | | | | 351,493 | | | | 2,927,933 | |
Shares Redeemed | | | (1,150,900 | ) | | | (10,154,987 | ) | | | (3,086,234 | ) | | | (26,552,310 | ) |
| | | 639,291 | | | $ | 5,642,312 | | | | 2,800,088 | | | $ | 23,609,252 | |
Beginning Shares | | | 9,030,476 | | | | | | | | 6,230,388 | | | | | |
Ending Shares | | | 9,669,767 | | | | | | | | 9,030,476 | | | | | |
LoCorr Macro Strategies Fund – Class C | | | | | | | | | | | | |
| | For the Six Months Ended June 30,2021 | | | For the Year Ended December 31, 2020 | |
| | Shares | | | Amount | | | Shares | | | Amount | |
Shares Sold | | | 454,311 | | | $ | 3,817,977 | | | | 735,024 | | | $ | 6,010,955 | |
Shares Issued in Connection with Reorganization | | | — | | | | — | | | | 115,243 | | | | 970,352 | |
Reinvestment of Distributions | | | — | | | | — | | | | 259,232 | | | | 2,053,116 | |
Shares Redeemed | | | (954,525 | ) | | | (7,998,596 | ) | | | (1,512,807 | ) | | | (12,342,406 | ) |
| | | (500,214 | ) | | $ | (4,180,619 | ) | | | (403,308 | ) | | $ | (3,307,983 | ) |
Beginning Shares | | | 5,386,635 | | | | | | | | 5,789,943 | | | | | |
Ending Shares | | | 4,886,421 | | | | | | | | 5,386,635 | | | | | |
LoCorr Macro Strategies Fund – Class I | | | | | | | | | | | | |
| | For the Six Months Ended June 30,2021 | | | For the Year Ended December 31, 2020 | |
| | Shares | | | Amount | | | Shares | | | Amount | |
Shares Sold | | | 39,451,119 | | | $ | 354,099,597 | | | | 73,017,857 | | | $ | 640,810,543 | |
Shares Issued in Connection with Reorganization | | | — | | | | — | | | | 5,647,389 | | | | 49,750,401 | |
Reinvestment of Distributions | | | — | | | | — | | | | 6,081,373 | | | | 51,509,334 | |
Shares Redeemed | | | (18,191,619 | ) | | | (161,917,024 | ) | | | (45,653,059 | ) | | | (399,541,357 | ) |
| | | 21,259,500 | | | $ | 192,182,573 | | | | 39,093,560 | | | $ | 342,528,921 | |
Beginning Shares | | | 122,625,543 | | | | | | | | 83,531,983 | | | | | |
Ending Shares | | | 143,885,043 | | | | | | | | 122,625,543 | | | | | |
LoCorr Macro Strategies Fund | | | | | | | | | | | | | | | | |
Total Net Increase | | | | | | $ | 193,626,266 | | | | | | | $ | 362,830,190 | |
LoCorr Long/Short Commodities Strategy Fund – Class A | | | | | | | | |
| | For the Six Months Ended June 30,2021 | | | For the Year Ended December 31, 2020 | |
| | Shares | | | Amount | | | Shares | | | Amount | |
Shares Sold | | | 551,717 | | | $ | 5,647,571 | | | | 2,181,652 | | | $ | 21,959,749 | |
Reinvestment of Distributions | | | — | | | | — | | | | 63,271 | | | | 616,890 | |
Shares Redeemed | | | (488,652 | ) | | | (5,019,447 | ) | | | (4,473,884 | ) | | | (45,549,248 | ) |
| | | 63,065 | | | $ | 628,124 | | | | (2,228,961 | ) | | $ | (22,972,609 | ) |
Beginning Shares | | | 2,684,560 | | | | | | | | 4,913,521 | | | | | |
Ending Shares | | | 2,747,625 | | | | | | | | 2,684,560 | | | | | |
LoCorr Long/Short Commodities Strategy Fund – Class C | | | | | | | | |
| | For the Six Months Ended June 30,2021 | | | For the Year Ended December 31, 2020 | |
| | Shares | | | Amount | | | Shares | | | Amount | |
Shares Sold | | | 231,609 | | | $ | 2,291,946 | | | | 251,310 | | | $ | 2,442,849 | |
Reinvestment of Distributions | | | — | | | | — | | | | 17,021 | | | | 158,973 | |
Shares Redeemed | | | (169,563 | ) | | | (1,655,692 | ) | | | (177,356 | ) | | | (1,707,358 | ) |
| | | 62,046 | | | $ | 636,254 | | | | 90,975 | | | $ | 894,464 | |
Beginning Shares | | | 838,489 | | | | | | | | 747,514 | | | | | |
Ending Shares | | | 900,535 | | | | | | | | 838,489 | | | | | |
LoCorr Long/Short Commodities Strategy Fund – Class I | | | | | | | | |
| | For the Six Months Ended June 30,2021 | | | For the Year Ended December 31, 2020 | |
| | Shares | | | Amount | | | Shares | | | Amount | |
Shares Sold | | | 25,947,957 | | | $ | 270,229,672 | | | | 38,743,237 | | | $ | 400,829,667 | |
Reinvestment of Distributions | | | — | | | | — | | | | 1,026,115 | | | | 10,117,496 | |
Shares Redeemed | | | (8,597,960 | ) | | | (88,788,021 | ) | | | (17,200,077 | ) | | | (176,283,092 | ) |
| | | 17,349,997 | | | $ | 181,441,651 | | | | 22,569,275 | | | $ | 234,664,071 | |
Beginning Shares | | | 44,315,085 | | | | | | | | 21,745,810 | | | | | |
Ending Shares | | | 61,665,082 | | | | | | | | 44,315,085 | | | | | |
LoCorr Long/Short Commodities Strategy Fund | | | | | | | | | | | | | | | | |
Total Net Increase | | | | | | $ | 182,706,029 | | | | | | | $ | 212,585,926 | |
| |
| 110 | | LoCorr Macro Strategies Fund, LoCorr Long/Short Commodities Strategy Fund and LoCorr Market Trend Fund – Notes to Consolidated Financial
Statements / LoCorr Dynamic Equity Fund and LoCorr Spectrum Income Fund – Notes to Financial Statements (continued) |
| | |
LoCorr Market Trend Fund – Class A | | | | | | | | | | | | |
| | For the Six Months Ended June 30,2021 | | | For the Year Ended December 31, 2020 | |
| | Shares | | | Amount | | | Shares | | | Amount | |
Shares Sold | | | 281,583 | | | $ | 3,444,515 | | | | 298,426 | | | $ | 3,250,712 | |
Shares Redeemed | | | (408,982 | ) | | | (4,952,999 | ) | | | (812,653 | ) | | | (8,875,621 | ) |
| | | (127,399 | ) | | $ | (1,508,484 | ) | | | (514,227 | ) | | $ | (5,624,909 | ) |
Beginning Shares | | | 1,449,470 | | | | | | | | 1,963,697 | | | | | |
Ending Shares | | | 1,322,071 | | | | | | | | 1,449,470 | | | | | |
LoCorr Market Trend Fund – Class C | | | | | | | | | | | | |
| | For the Six Months Ended June 30,2021 | | | For the Year Ended December 31, 2020 | |
| | Shares | | | Amount | | | Shares | | | Amount | |
Shares Sold | | | 78,637 | | | $ | 940,671 | | | | 59,186 | | | $ | 633,263 | |
Shares Redeemed | | | (203,576 | ) | | | (2,405,908 | ) | | | (392,452 | ) | | | (4,127,730 | ) |
| | | (124,939 | ) | | $ | (1,465,237 | ) | | | (333,266 | ) | | $ | (3,494,467 | ) |
Beginning Shares | | | 1,165,456 | | | | | | | | 1,498,722 | | | | | |
Ending Shares | | | 1,040,517 | | | | | | | | 1,165,456 | | | | | |
LoCorr Market Trend Fund – Class I | | | | | | | | | | | | |
| | For the Six Months Ended June 30,2021 | | | For the Year Ended December 31, 2020 | |
| | Shares | | | Amount | | | Shares | | | Amount | |
Shares Sold | | | 3,323,431 | | | $ | 40,802,261 | | | | 8,851,198 | | | $ | 96,849,535 | |
Reinvestment of Distributions | | | — | | | | — | | | | 49,414 | | | | 551,952 | |
Shares Redeemed | | | (2,869,322 | ) | | | (34,872,795 | ) | | | (10,571,183 | ) | | | (114,309,560 | ) |
| | | 454,109 | | | $ | 5,929,466 | | | | (1,670,571 | ) | | $ | (16,908,073 | ) |
Beginning Shares | | | 19,252,314 | | | | | | | | 20,922,885 | | | | | |
Ending Shares | | | 19,706,423 | | | | | | | | 19,252,314 | | | | | |
LoCorr Market Trend Fund | | | | | | | | | | | | | | | | |
Total Net Increase (Decrease) | | | | | | $ | 2,955,745 | | | | | | | $ | (26,027,449 | ) |
LoCorr Dynamic Equity Fund – Class A | | | | | | | | | | | | |
| | For the Six Months Ended June 30,2021 | | | For the Year Ended December 31, 2020 | |
| | Shares | | | Amount | | | Shares | | | Amount | |
Shares Sold | | | 21,765 | | | $ | 274,178 | | | | 50,164 | | | $ | 499,777 | |
Shares Redeemed | | | (51,326 | ) | | | (625,567 | ) | | | (322,671 | ) | | | (3,199,298 | ) |
| | | (29,561 | ) | | $ | (351,389 | ) | | | (272,507 | ) | | $ | (2,699,521 | ) |
Beginning Shares | | | 329,445 | | | | | | | | 601,952 | | | | | |
Ending Shares | | | 299,884 | | | | | | | | 329,445 | | | | | |
LoCorr Dynamic Equity Fund – Class C | | | | | | | | | | | | |
| | For the Six Months Ended June 30,2021 | | | For the Year Ended December 31, 2020 | |
| | Shares | | | Amount | | | Shares | | | Amount | |
Shares Sold | | | 7,608 | | | $ | 92,400 | | | | 4,223 | | | $ | 36,979 | |
Shares Redeemed | | | (31,258 | ) | | | (366,242 | ) | | | (161,078 | ) | | | (1,472,858 | ) |
| | | (23,650 | ) | | $ | (273,842 | ) | | | (156,855 | ) | | $ | (1,435,879 | ) |
Beginning Shares | | | 222,903 | | | | | | | | 379,758 | | | | | |
Ending Shares | | | 199,253 | | | | | | | | 222,903 | | | | | |
LoCorr Dynamic Equity Fund – Class I | | | | | | | | | | | | |
| | For the Six Months Ended June 30,2021 | | | For the Year Ended December 31, 2020 | |
| | Shares | | | Amount | | | Shares | | | Amount | |
Shares Sold | | | 388,401 | | | $ | 5,103,898 | | | | 544,142 | | | $ | 5,728,123 | |
Shares Redeemed | | | (197,601 | ) | | | (2,569,664 | ) | | | (1,031,948 | ) | | | (10,110,308 | ) |
| | | 190,800 | | | $ | 2,534,234 | | | | (487,806 | ) | | $ | (4,382,185 | ) |
Beginning Shares | | | 995,506 | | | | | | | | 1,483,312 | | | | | |
Ending Shares | | | 1,186,306 | | | | | | | | 995,506 | | | | | |
LoCorr Dynamic Equity Fund | | | | | | | | | | | | | | | | |
Total Net Increase (Decrease) | | | | | | $ | 1,909,003 | | | | | | | $ | (8,517,585 | ) |
| |
| | LoCorr Macro Strategies Fund, LoCorr Long/Short Commodities Strategy Fund and LoCorr Market Trend Fund – Notes to Consolidated Financial
Statements / LoCorr Dynamic Equity Fund and LoCorr Spectrum Income Fund – Notes to Financial Statements (continued) | | 111 |
| | |
LoCorr Spectrum Income Fund – Class A | | | | | | | | | | | | |
| | For the Six Months Ended June 30,2021 | | | For the Year Ended December 31, 2020 | |
| | Shares | | | Amount | | | Shares | | | Amount | |
Shares Sold | | | 169,418 | | | $ | 1,199,506 | | | | 284,686 | | | $ | 1,707,329 | |
Reinvestment of Distributions | | | 48,882 | | | | 334,971 | | | | 171,555 | | | | 926,014 | |
Shares Redeemed | | | (396,015 | ) | | | (2,714,307 | ) | | | (1,893,903 | ) | | | (10,310,359 | ) |
Redemption Fees | | | — | | | | — | | | | — | | | | 4,449 | |
| | | (177,715 | ) | | $ | (1,179,830 | ) | | | (1,437,662 | ) | | $ | (7,672,567 | ) |
Beginning Shares | | | 2,218,581 | | | | | | | | 3,656,243 | | | | | |
Ending Shares | | | 2,040,866 | | | | | | | | 2,218,581 | | | | | |
LoCorr Spectrum Income Fund – Class C | | | | | | | | | | | | |
| | For the Six Months Ended June 30,2021 | | | For the Year Ended December 31, 2020 | |
| | Shares | | | Amount | | | Shares | | | Amount | |
Shares Sold | | | 210,292 | | | $ | 1,461,338 | | | | 96,324 | | | $ | 617,906 | |
Reinvestment of Distributions | | | 49,443 | | | | 343,657 | | | | 144,053 | | | | 784,112 | |
Shares Redeemed | | | (189,711 | ) | | | (1,309,556 | ) | | | (781,385 | ) | | | (4,311,479 | ) |
Redemption Fees | | | — | | | | — | | | | — | | | | 218 | |
| | | 70,024 | | | $ | 495,439 | | | | (541,008 | ) | | $ | (2,909,243 | ) |
Beginning Shares | | | 2,139,683 | | | | | | | | 2,680,691 | | | | | |
Ending Shares | | | 2,209,707 | | | | | | | | 2,139,683 | | | | | |
LoCorr Spectrum Income Fund – Class I | | | | | | | | | | | | |
| | For the Six Months Ended June 30,2021 | | | For the Year Ended December 31, 2020 | |
| | Shares | | | Amount | | | Shares | | | Amount | |
Shares Sold | | | 1,404,051 | | | $ | 9,719,230 | | | | 1,412,246 | | | $ | 8,309,828 | |
Reinvestment of Distributions | | | 99,939 | | | | 688,167 | | | | 239,666 | | | | 1,291,002 | |
Shares Redeemed | | | (493,518 | ) | | | (3,383,533 | ) | | | (2,558,879 | ) | | | (13,508,228 | ) |
Redemption Fees | | | — | | | | — | | | | — | | | | 275 | |
| | | 1,010,472 | | | $ | 7,023,864 | | | | (906,967 | ) | | $ | (3,907,123 | ) |
Beginning Shares | | | 3,463,315 | | | | | | | | 4,370,282 | | | | | |
Ending Shares | | | 4,473,787 | | | | | | | | 3,463,315 | | | | | |
LoCorr Spectrum Income Fund | | | | | | | | | | | | | | | | |
Total Net Increase (Decrease) | | | | | | $ | 6,339,473 | | | | | | | $ | (14,488,933 | ) |
7. Federal Tax Information
At December 31, 2020, the components of accumulated earnings (losses) on a tax basis were as follows(1):
| | LoCorr Macro Strategies Fund (2) | | | LoCorr Long/Short Commodities Strategy Fund (2) | | | LoCorr Market Trend Fund (2) | |
Tax cost of portfolio | | $ | 1,121,065,283 | | | $ | 495,007,071 | | | $ | 220,165,613 | |
| | | | | | | | | | | | |
Gross unrealized appreciation | | $ | 49,541,026 | | | $ | 12,116,511 | | | $ | 17,114,743 | |
Gross unrealized depreciation | | | (2,029,719 | ) | | | (13,242,321 | ) | | | (197,108 | ) |
Net unrealized appreciation (depreciation) | | | 47,511,307 | | | | (1,125,810 | ) | | | 16,917,635 | |
Undistributed ordinary income | | | 12,994,597 | | | | 43,925 | | | | — | |
Undistributed long-term capital gains | | | — | | | | — | | | | — | |
Total earnings accumulated | | | 12,994,597 | | | | 43,925 | | | | — | |
Other accumulated losses | | | (15,877,721 | ) | | | — | | | | (9,345,944 | ) |
Total distributable earnings (accumulated losses) | | $ | 44,628,183 | | | $ | (1,081,885 | ) | | $ | 7,571,691 | |
| | | | | | | | | | | | |
| | | LoCorr Dynamic Equity Fund | | | | LoCorr Spectrum Income Fund | | | | | |
Tax cost of portfolio | | $ | 14,526,547 | | | $ | 41,179,403 | | | | | |
| | | | | | | | | | | | |
Gross unrealized appreciation | | $ | 2,777,030 | | | $ | 9,130,806 | | | | | |
Gross unrealized depreciation | | | (1,732,383 | ) | | | (2,564,887 | ) | | | | |
Net unrealized appreciation | | | 1,044,647 | | | | 6,565,919 | | | | | |
| | | | | | | | | | | | |
Undistributed ordinary income | | | — | | | | — | | | | | |
Undistributed long-term capital gains | | | — | | | | — | | | | | |
Total earnings accumulated | | | — | | | | — | | | | | |
Other accumulated losses | | | (965,947 | ) | | | (36,114,076 | ) | | | | |
Total distributable earnings (accumulated losses) | | $ | 78,700 | | | $ | (29,548,157 | ) | | | | |
(1) | Total Portfolio represents aggregate amounts of Fund’s investments, securities sold short, forward currency contracts and futures contracts, where applicable. |
(2) | Tax Cost is presented on a non-consolidated basis and includes each of the Fund’s investment in the respective CFC’s and the unrealized appreciation and depreciation associated with those investments. |
| | |
| 112 | | LoCorr Macro Strategies Fund, LoCorr Long/Short Commodities Strategy Fund and LoCorr Market Trend Fund – Notes to Consolidated Financial Statements / LoCorr Dynamic Equity Fund and LoCorr Spectrum Income Fund – Notes to Financial Statements (continued) |
| | |
Undistributed income or net realized gains for financial statement purposes may differ from amounts recognized for federal income tax purposes due to differences in the recognition and characterization of income, expense and capital gain items. The difference between book-basis and tax-basis unrealized appreciation (depreciation) is attributed primarily to the tax deferral of losses on wash sales, mark to market, on forward currency contracts and futures contracts investments in partnerships and other temporary differences.
Under the current tax law, capital losses realized after October 31 may be deferred and treated as occurring on the first day of the following fiscal year. The Funds elected to defer no capital losses for the fiscal year ended December 31, 2020 :
| | Post October Loss Deferral | | | Late Year Loss Deferral | |
LoCorr Market Trend Fund | | $ | — | | | $ | 69,121 | |
LoCorr Spectrum Income Fund | | | — | | | | 114,080 | |
At December 31, 2020, accumulated net capital loss carryovers, if any, and the year(s) in which the capital loss carryovers expire were:
| | Capital Loss Carryover | | | Year of
Expiration |
| | Short-Term | | | Long-Term |
LoCorr Macro Strategies Fund | | $ | 16,149,213 | | | $ | — | | | | Indefinitely | |
LoCorr Market Trend Fund | | | 9,263,923 | | | | — | | | | Indefinitely | |
LoCorr Dynamic Equity Fund | | | 498,096 | | | | 392,513 | | | | Indefinitely | |
LoCorr Spectrum Income Fund | | | 13,860,781 | | | | 22,070,168 | | | | Indefinitely | |
During the year ended December 31, 2020, the LoCorr Dynamic Equity Fund utilized capital loss carryover of $385,378. The LoCorr Macro Strategies Fund, the LoCorr Long/Short Commodities Strategy Fund, the LoCorr Market Trend Fund and the LoCorr Spectrum Income Fund did not utilize any capital loss carryovers during the year ended December 31, 2020.
8. Line of Credit
The Trust entered into an unsecured, uncommitted Loan Agreement (“Line of Credit” or “LOC”) with U.S. Bank not individually but as an umbrella facility on behalf of the Funds in the Trust. The LOC expires on March 8, 2022. The LOC was established to provide the Funds a temporary short-term liquidity source, subject to certain restrictions, covenants and the right of setoff on the Funds’ assets, to meet unanticipated redemptions. Under terms of the LOC, borrowings for each Fund are limited to the lesser of one-third of the net unencumbered assets (including the amount borrowed) of the respective Fund, 5% of the gross assets of the respective Fund or $50 million in the aggregate for all of the Funds under this agreement. U.S. Bank, N.A. charges an interest rate per annum equal to the Prime Rate (3.25% as of June 30, 2021).
Line of Credit activity for the period was as follows:
| | For the Six Months Ended June 30, 2021 |
| | Interest Charges | | | Average Daily | | | Weighted | | | Maximum Amount Borrowed |
Fund | | Incurred | | | Loan Balance | | | Average % | | | $ | | | Date | |
LoCorr Dynamic Equity Fund | | $ | 167 | | | $ | 5,131 | | | | 3.25% | | | | 479,000 | | | | June 25, 2021 | |
The LoCorr Dynamic Equity Fund was the only Fund that utilized the Line of Credit during the six months ended June 30, 2021. At June 30, 2021, the Funds did not have any outstanding borrowings.
9. Subsequent Events
In preparing the financial statements, the Adviser has evaluated events after June 30, 2021.
Declaration of Dividends
The LoCorr Spectrum Income Fund declared the following ordinary income distributions:
Dividend Declaration Date (a) | | Shareholder of Record Date | | Distribution Amount per Share Class |
| | | Class A | | Class C | | Class I | |
July 30, 2021 | | July 29, 2021 | | $0.0386 | | $0.03470 | | $0.04000 | |
| | |
(a) | Ex-date, reinvest date and payable date. |
The estimated characterization of the distributions paid will be an ordinary dividend, qualified dividend or return of capital. See Note 2 for additional information.
| | |
LoCorr Macro Strategies Fund, LoCorr Long/Short Commodities Strategy Fund and LoCorr Market Trend Fund – Notes to Consolidated Financial Statements / LoCorr Dynamic Equity Fund and LoCorr Spectrum Income Fund – Notes to Financial Statements (continued) | | 113 |
| | |
On July 7, 2021, Foreside Financial Group, LLC (“Foreside”), the parent company of Quasar Distributors, LLC (“Quasar”), the Fund’s distributor, announced that it had entered into a definitive purchase and sale agreement with Genstar Capital (“Genstar”) such that Genstar would acquire a majority stake in Foreside. The transaction is expected to close at the end of the third quarter of 2021. Quasar will remain the Funds’ distributor at the close of the transaction, subject to Board approval.
There were no additional subsequent events since June 30, 2021 through the date the financial statements were issued that would require adjustments to or additional disclosure in these financial statements.
| | |
| | |
114 | | LoCorr Investment Trust – Expense Example (Unaudited) |
| | |
Expense Example
June 30, 2021 (Unaudited)
As a shareholder of a mutual fund, you incur two types of costs: (1) transaction costs, including sales charges (loads) on purchase payments; redemption fees; and (2) ongoing costs, including management fees; distribution and/or service (12b-1) fees and other Fund expenses.
This Example is intended to help you understand your ongoing costs (in dollars) of investing in each of the Funds and to compare these costs with the ongoing costs of investing in other mutual funds. The Example is based on an investment of $1,000 invested at the beginning of the period and held for the entire period (January 1, 2021 through June 30, 2021).
Actual Expenses
The actual return columns in the following table provide information about account values based on actual returns and actual expenses. You may use the information in these columns, together with the amount you invested, to estimate the expenses that you paid over the period. Simply divide your account value by $1,000 (for example, an $8,600 account value divided by $1,000 = 8.6), then multiply the result by the number in the first line under the heading entitled “Expenses Paid During Period” to estimate the expenses you paid on your account during this period. The only transaction fees you may be required to pay are for outgoing wire transfers, returned checks and stop payment orders at prevailing rates charged by U.S. Bancorp Fund Services, LLC, doing business as U.S. Bank Global Fund Services, the Funds’ transfer agent. These fees are assessed on all accounts, as applicable. If you request that a redemption be made by wire transfer, currently the Funds’ transfer agent charges a $15.00 fee. The Funds’ transfer agent charges a transaction fee of $25.00 on returned checks and stop payment orders. If you paid a transaction fee, you would add the fee amount to the expenses paid on your account this period to obtain your total expenses paid.
Hypothetical Example for Comparison Purposes
The hypothetical return columns in the following table provide information about hypothetical account values and hypothetical expenses based on the Funds’ actual expense ratio and an assumed rate of return of 5% per year before expenses, which is not the Funds’ actual return. The hypothetical account values and expenses may not be used to estimate the actual ending account balance or expenses you paid for the period. You may use this information to compare the ongoing costs of investing in the Funds and other funds. To do so, compare this 5% hypothetical example with the 5% hypothetical examples that appear in the shareholder reports of the other funds. A transaction fee of $15.00 may be assessed on outgoing wire transfers and a transaction fee of $25.00 may be assessed on returned checks and stop payment orders. To include this fee in the calculation, you would add the estimated transaction fee to the hypothetical expenses shown in the table. Please note that the expenses shown in the table are meant to highlight your ongoing costs only and do not reflect the transaction fees discussed above. Therefore, those columns are useful in comparing ongoing costs only, and will not help you determine the relative total costs of owning different funds. In addition, if these transactional costs were included, your costs would have been higher.
| | |
| | |
LoCorr Investment Trust – Expense Example (Unaudited) (continued) | | 115 |
| | |
Actual vs Hypothetical Returns
Actual vs. Hypothetical returns for the Six Months Ended June 30, 2021 (Unaudited)
| |
| | | | | Actual | | Hypothetical
(5% gross annual return) |
| | Class | Fund’s Annualized Expense Ratio 1, 2 | Beginning Account Value
January 1, 2021 | Ending Account Value June 30, 2021 | Expenses Paid
During Period 1, 2, 3 | | Ending Account Value June 30, 2021 | Expenses Paid During Period 1, 2, 3 |
| |
| LoCorr Macro Strategies Fund |
| | A | 2.14% | $1,000.00 | $1,044.50 | $10.85 | | $1,014.18 | $10.69 |
| | C | 2.89% | $1,000.00 | $1,040.70 | $14.62 | | $1,010.46 | $14.41 |
| | I | 1.89% | $1,000.00 | $1,046.10 | $9.59 | | $1,015.42 | $9.44 |
| | | | | | | | | |
| LoCorr Long/Short Commodities Strategy Fund | | | | | | |
| | A | 2.09% | $1,000.00 | $1,085.90 | $10.81 | | $1,014.43 | $10.44 |
| | C | 2.84% | $1,000.00 | $1,082.40 | $14.66 | | $1,010.71 | $14.16 |
| | I | 1.84% | $1,000.00 | $1,086.90 | $9.52 | | $1,015.67 | $9.20 |
| | | | | | | | | |
| LoCorr Market Trend Fund |
| | A | 2.02% | $1,000.00 | $1,056.50 | $10.30 | | $1,014.78 | $10.09 |
| | C | 2.77% | $1,000.00 | $1,052.20 | $14.09 | | $1,011.06 | $13.81 |
| | I | 1.77% | $1,000.00 | $1,057.10 | $9.03 | | $1,016.02 | $8.85 |
| | | | | | | | | |
| LoCorr Dynamic Equity Fund |
| | A | 2.77% | $1,000.00 | $1,118.80 | $14.55 | | $1,011.06 | $13.81 |
| | C | 3.52% | $1,000.00 | $1,114.40 | $18.45 | | $1,007.34 | $17.52 |
| | I | 2.52% | $1,000.00 | $1,119.60 | $13.24 | | $1,012.30 | $12.57 |
| | | | | | | | | |
| LoCorr Spectrum Income Fund |
| | A | 2.05% | $1,000.00 | $1,224.20 | $11.31 | | $1,014.63 | $10.24 |
| | C | 2.80% | $1,000.00 | $1,221.20 | $15.42 | | $1,010.91 | $13.96 |
| | I | 1.80% | $1,000.00 | $1,224.80 | $9.93 | | $1,015.87 | $9.00 |
1. | Includes dividend and/or interest expense of 0.00%, 0.00%, 0.00%, 0.53% and 0.00% for the LoCorr Macro Strategies Fund, the LoCorr Long/Short Commodities Strategy Fund, the LoCorr Market Trend Fund, the LoCorr Dynamic Equity Fund and the LoCorr Spectrum Income Fund, respectively. |
2. | Includes expenses of wholly-owned and controlled Cayman Islands subsidiaries for the LoCorr Macro Strategies Fund, the LoCorr Long/Short Commodities Strategy Fund and the LoCorr Market Trend Fund. |
3. | Expenses Paid During Period are equal to the net annualized expense ratio for the class, multiplied by the average account value over the period, multiplied by 181/365 (to reflect the one-half year period). |
| | |
| | |
116 | | Review of Management and Sub-Advisory Agreements (Unaudited) |
| | |
LoCorr Investment Trust
June 30, 2021 (Unaudited)
Review of Management and Sub-Advisory Agreements
Approval of Advisory Agreement
The Board considered the nature, extent and quality of services to be provided by LoCorr Fund Management, LLC (the “Adviser”) to the LoCorr Macro Strategies Fund (the “Macro Fund”) and its wholly-owned subsidiary, LCMFS Fund Limited, the LoCorr Long/Short Commodities Strategy Fund (the “LLSCS Fund”) and its wholly-owned subsidiary, LCLSCS Fund Limited, the LoCorr Dynamic Equity Fund (the “LDE Fund”) and the LoCorr Spectrum Income Fund (the “LSI Fund”) and reviewed the 15(c) responses for each, which included the backgrounds and experience of the key personnel of the Adviser. The Trustees expressed their satisfaction with the addition of the Funds’ new Chief Compliance Officer (the “CCO”) of the Trust and Adviser. The Trustees considered that the Adviser has provided and will continue to provide a continuous investment program for each of the Funds consistent with each Fund’s investment objective, policies and regulatory limitations. Counsel and a representative of the Adviser noted that the Adviser oversees and continually evaluates sub-advisers and that the Adviser also provides overall portfolio and risk management consistent each Fund’s investment strategy. The Trustees also discussed the Adviser’s compliance program with the Trust’s CCO. A representative from the Adviser discussed the Adviser’s financial statements with the Trustees. The Trustees concluded that, based on their review of the Adviser’s financial statements and discussions with the Adviser, the Adviser has sufficient resources to continue to provide advisory services to each of the Funds.
The CCO reviewed the compliance policies and noted that the Adviser reported no material compliance issues. Counsel noted that the Adviser had a code of ethics as required under Rule 17j-1 of the 1940 Act. The CCO further noted that the Adviser had only made minor changes to its compliance policies in the last year. After a discussion, the Trustees concluded that the Adviser has compliance policies and procedures in place in order to perform its duties under the renewed management agreements for the Funds.
Counsel indicated that there had not been any recent examinations of the Adviser by the SEC but noted that LoCorr Distributors had recently been examined by the SEC with no material findings to date. Counsel noted for the Trustees that the Adviser continued to carry Errors & Omissions and Directors and Officers (“E&O/D&O”) insurance coverage at a suitable level of coverage. After a discussion, the Trustees concluded that the Adviser is well resourced with experienced personnel and investment expertise and has provided, and is expected to continue to provide, high quality services to the Funds and their respective shareholders.
The Trustees next reviewed and evaluated the performance of the Macro Fund, noting that the one-year, five-year and since inception returns of the Fund. Counsel also indicated that the Fund continued to outperform the benchmark, peer group and Morningstar category for all periods. A discussion ensued regarding performance of the Fund’s fixed income strategy managed by Nuveen. After a discussion, the Trustees concluded that the LCMFS Fund’s performance was satisfactory.
The Trustees turned their attention to the investment performance of the LLSCS Fund, noting its annualized returns for the one, three, five-year and since inception periods. The Trustees noted that the Fund outperformed its peer group, Morningstar category and the Barclay CTA Index for all periods as a result of particularly strong performance in the past year. After a discussion, the Trustees concluded that they were satisfied with the Fund’s performance.
The Trustees then reviewed and discussed the performance of the LDE Fund, noting that the one-year performance of the LDE Fund was better than the peer group but had underperformed compared to the Morningstar category and benchmark index. Counsel noted for the Trustees that the Fund had outperformed the peer group for the five-year period but had trailed the benchmark index for the 5 year and since inception periods. A representative of the Adviser discussed the Fund’s recent performance and the efforts of each Fund’s sub-advisers. After a discussion, the Trustees concluded that the LDE Fund’s performance was satisfactory.
Counsel turned the Trustees’ attention to the performance of the LSI Fund. The Trustees reviewed and discussed the performance of the LSI Fund, noting that one, three, five and since inception returns was better than the peer group’s but had lagged the Morningstar category. The Trustees then discussed that the one, three, and five-year returns had outperformed the peer group but had underperformed the Morningstar category and benchmark index. After a discussion, the Trustees concluded that the LSI Fund’s performance was reasonable.
The Trustees then reviewed and discussed the costs of services provided and profits to be realized by the Adviser with respect to each of the Funds.
The Trustees noted that the management fee for the LCMFS Fund was above the average of its peer group but below its Morningstar Category. However, Counsel discussed with the Trustees that the management fee was within range of management fees for the Fund’s peer group and Morningstar Category Average. After a discussion, the Trustees agreed that the LCMFS Fund’s management fee was not unreasonable.
The Trustees next reviewed the management fee for the LCLSCS Fund, noting that it was above the average of its peer group and Morningstar category, but below the high end of the range of management fees for the LCLSCS Fund’s peer group and Morningstar category. After a discussion, the Trustees agreed that the LCLSCS Fund’s management fee was reasonable.
| | |
| | |
Review of Management and Sub-Advisory Agreements (Unaudited) Continued | | 117 |
| | |
The Trustees noted that the LDE Fund’s management fee was above the averages for the Fund’s peer group and Morningstar category and within the range of both as well. A representative of the Adviser reminded the Trustees that the Adviser engages and pays multiple sub-advisers to manage the fund while many funds in the Morningstar category are single manager funds. After a discussion, the Trustees concluded that the LDE Fund’s management fee was not excessive.
Counsel directed the Trustees to review the management fee for the LSI Fund, noting that it was above the average of its peer group and Morningstar category, and above the high-end range for the management fees reported for the LSI Fund’s peer group. A representative of the Adviser discussed the Fund’s structure including the engagement of a sub-adviser. The Trustees along with Counsel reviewed and noted that LSI’s expense ratio was above the expense ratio for the Morningstar category but significantly below the high end of the Morningstar category. After a discussion, the Trustees agreed that the Fund’s management fee was not unreasonable.
The Trustees considered all of these factors with regards to the renewal of the expense limitation agreements with the Adviser for an additional one-year period for the LCMFS Fund, LCLSCS Fund, LDE Fund and LSI Fund.
The Trustees noted the profit analysis of the Adviser with respect to the LCMFS Fund and considered the Adviser’s profits from the advisory agreement, net of sub-advisory fees and overhead. The Trustees also considered and agreed that the Adviser’s total net profits related to the LCMFS Fund was reasonable. The Trustees then discussed the profitability of the Adviser with respect to the LCLSCS Fund. Counsel noted the Adviser’s net profits with respect to the LCLSCS Fund which the Trustees agreed was reasonable.
The Trustees then reviewed the profitability of the Adviser with respect to the LDE Fund. Counsel pointed out to the Trustees that the Adviser did not show a net profit. The Trustees concluded that the Adviser’s profits with respect to the LDE Fund were reasonable.
Counsel directed the Trustees’ attention to the profitability of the Adviser with respect to the LSI Fund. The Trustees noted that the Adviser showed a net profit and agreed that the Adviser’s total net profits were reasonable.
The Trustees considered the economies of scale to be realized by the shareholders of the LCMFS Fund, LLSCS Fund, LDE Fund and LSI Fund, noting that, with the exception of the LCMFS Fund, the management fees reflect an incremental fee schedule which includes break points.
Having requested and received such information from the Adviser as the Trustees believed to be reasonably necessary to evaluate the terms of the Advisory Agreement, and as assisted by the advice of counsel, the Trustees concluded that each Fund’s management fee is reasonable and that approval of the Advisory Agreement is in the best interests of the shareholders of LCMFS Fund, LLSCS Fund, LDE Fund and LSI Fund.
Approval of Sub-Advisory Agreements
Nuveen Asset Management, LLC (“Nuveen”), Sub-Adviser (Macro Fund, LLSCS Fund and LoCorr Market Trend Fund (the “LMT Fund”))
The Trustees turned their attention to the 15(c) materials provided by Nuveen. The Trustees reviewed the nature, extent and quality of services provided by Nuveen for the fixed income strategies in the Macro Fund, LLSCS Fund and the LMT Fund. The Trustees discussed Nuveen’s key individuals, noted many years of experience and depth of investment capabilities. The Trustees further noted that Nuveen provides credit research, security selection, trade execution and compliance monitoring for the fixed income portion of the Macro, LLSCS and LMT Fund’s portfolios. The CCO noted that there had not been any changes with respect to the Nuveen personnel providing services to the Funds.
The CCO noted for the Trustees that Nuveen provides quarterly updates to its compliance manual. The CCO further noted that these compliance updates were minor in nature and then discussed Nuveen’s overall strategy and risk controls. A representative of the Adviser indicated that the Adviser was satisfied with the services provided by Nuveen to the Funds.
Counsel indicated that Nuveen reported no material compliance, material litigations or regulatory agency issues in the past year. Counsel stated that Nuveen continued to carry an E&O/D&O policy. After a discussion, the Trustees concluded that Nuveen had a great depth of experienced personnel and was well resourced and therefore expected to continue to provide satisfactory services to the Funds.
Next, the Trustees discussed the investment performance for Nuveen, noting the one-year, five-year and since inception returns for the Macro, LLSCS and LMT Funds. The Trustees compared Nuveen’s reported returns to its benchmark index returns for the one-year, five-year and since inception periods and noted that Nuveen had outperformed its benchmark index for all Funds for all periods. After a discussion, the Trustees noted it was pleased with Nuveen’s performance with respect to Macro, LLSCS and LMT Funds and deemed Nuveen’s performance to be satisfactory.
The Trustees discussed the costs of services provided by Nuveen to Macro Fund, LLSCS Fund and LMT Fund, and noted that Nuveen it is not profitable with regard to sub-advising the Funds. The Trustees concluded that the sub-advisory fees paid to Nuveen by the Adviser were reasonable in light of the services to be provided under the sub-advisory agreements.
Having requested and received such information from Nuveen as the Trustees believed to be reasonably necessary to evaluate the terms of the Sub-Advisory Agreement, and as assisted by the advice of counsel, the Trustees concluded that Nuveen’s fee structure is reasonable and that approval of the Sub-Advisory Agreement is in the best interest of the shareholders of Macro Fund, LLSCS Fund and LMT Fund.
| | |
| | |
118 | | Review of Management and Sub-Advisory Agreements (Unaudited) Continued |
| | |
Millburn Ridgefield Corporation (“Millburn”), Sub-Adviser (Macro Fund & LCMFS Fund Limited)
The Trustees reviewed the nature, extent and quality of subadvisory services provided by Millburn to the Fund. Counsel directed the Trustees’ attention to the 15(c) responses for Millburn. The Trustees reviewed the responsibilities of Millburn’s personnel providing services to the Fund, noting that there were no material changes in key personnel. A representative of the Adviser further noted that Millburn provides portfolio management, investment strategy development and trade execution for the Fund’s portfolio as well as compliance services to assure the assets allocated to it are managed within the Fund’s investment restrictions.
Counsel discussed with the Trustees that Millburn did not have any material compliance issues in the past year nor any material litigation issues. The Trustees discussed Millburn’s compliance controls including its pre and post-trade compliance checks. Counsel stated that Millburn carried an appropriate E&O/D&O policy. The Trustees concluded that Millburn is well-resourced and has experienced portfolio management personnel. The Trustees deduced that the services provided by Millburn to the Fund have been satisfactory and that the Trustees expects Millburn to continue to provide quality services in the future.
The Trustees then reviewed the investment performance of Millburn’s allocation of the Fund’s portfolio. A representative of the Adviser discussed Millburn’s recent underperformance but further noted that the Adviser was satisfied with the execution of Millburn’s strategy. The representative noted that Milburn had underperformed its benchmark for the one-year period. After a discussion, the Trustees concluded that they were satisfied with Millburn’s performance for the Fund.
Counsel noted that the sub-advisory fee structure was lower than the fee charged by Millburn to its separately managed account clients. The Trustees also noted that Millburn’s fee did not include an incentive fee. After further discussion, the Trustees concluded that the sub-advisory fee was reasonable.
The Trustees considered whether there were any economies of scale with respect to the management of the Fund. The Trustees agreed that this was primarily an adviser level issue and should be considered with respect to the overall advisory contract, taking into consideration the impact of the sub-advisory expense. After a discussion, the Trustees concluded that a lack of breakpoints was acceptable.
The Trustees next considered the profits realized by Millburn in connection with its relationship with the Fund and whether the amount of profit is a fair profit with respect to the sub-advisory services provided to the Fund. After a discussion, it was the consensus of the Trustees that the level of profit was reasonable.
Having requested and received such information from Millburn as the Trustees believed to be reasonably necessary to evaluate the terms of the Sub-Advisory Agreement, and as assisted by the advice of Counsel, the Trustees concluded that Millburn’s fee structure was not unreasonable and that approval of the Sub-Advisory Agreement is in the best interests of the shareholders of the Macro Fund.
Graham Capital Management, L.P. (“Graham”), Sub-Adviser (Macro Fund & LCMFS Fund Limited)
The Trustees reviewed and considered the nature, extent and quality of services to be provided by Graham to the Fund. The Trustees turned their attention to the 15(c) responses for Graham. The Trustees discussed the responsibilities of Graham’s key personnel providing services to the Fund, noting the recent retirement of a key member of the firm’s investment committee. A representative of the Adviser indicated that it did not believe that this would have any impact on Graham’s quality of services provided to the Fund. The Trustees noted that Graham provides quantitative research, security selection and trade execution for the Fund’s portfolio as well as compliance services to assure assets are managed within the Fund’s investment restrictions.
Counsel noted that Graham had adopted a code of ethics under Rule 17j-1 of the 1940 Act. The CCO noted that Graham adopted appropriate compliance policies and procedures and that Graham had not made any material revisions to such policies in the past year. Counsel stated that Graham carries an appropriate E&O/D&O policy. Counsel stated that Graham had a routine NFA examination in 2020 and that there were no material findings as a result of such examination. After a discussion, the Trustees concluded that Graham had sufficient resources and investment personnel to perform the services as sub-adviser to the Fund.
Next, the Trustees discussed the investment performance for Graham’s allocation of the Fund, noting that Graham performance had been positive and that the Adviser was satisfied with how Graham was executing its strategy for the Fund. After a discussion, the Trustees deduced that it was reasonable that Graham would continue to provide satisfactory performance. The Trustees also acknowledged and noted that the sub-advisory fee paid to Graham was slightly higher than the average fee charged by Graham to its separately managed account clients but did not include a performance incentive fee. After further discussion, the Trustees concluded that the sub-advisory fee was reasonable.
Counsel then directed the Trustees attention to the profits realized by Graham and discussed whether the amount of profit was reasonable with respect to the sub-advisory services provided to the Fund. The Trustees also considered whether there were any economies of scale with respect to the management of the Fund. The Trustees agreed that this was primarily an adviser level issue and should be considered with respect to the overall advisory contract, taking into consideration the impact of the sub-advisory expense. After a discussion, the Trustees concluded that Graham’s level of profit was reasonable.
| | |
| | |
Review of Management and Sub-Advisory Agreements (Unaudited) Continued | | 119 |
| | |
Having requested and received such information from Graham as the Trustees believed to be reasonably necessary to evaluate the terms of the Sub-Advisory Agreement, and as assisted by the advice of counsel, the Trustees concluded that the fee structure is reasonable and that approval of the Sub-Advisory Agreement is in the best interests of the shareholders of the Macro Fund.
Revolution Capital Management, LLC (“Revolution”), Sub-Adviser (Macro Fund & LCMFS Fund Limited)
The Trustees then reviewed the nature, extent and quality of services provided or to be provided by Revolution. The Trustees then directed their attention to the 15(c) responses for Revolution. The Trustees reviewed the backgrounds and responsibilities of Revolution’s key investment personnel, noting the experience of these individuals. Counsel discussed that Revolution has been responsible for the maintenance and improvement of its trading models used in Revolution’s strategy for the Fund’s portfolio and trade execution. Counsel further noted that Revolution has been responsible for the compliance services which includes assuring that assets are managed within the Fund’s investment restrictions. A representative of the Adviser indicated that Revolution continued to execute the same strategy as it has since it became a sub-adviser to the Fund.
The Trustees reviewed Revolution’s investment process and compliance structure. Counsel indicated that Revolution did not report any material compliance issues, regulatory examinations or material litigations in the past year. Counsel stated that Revolution maintained an E&O/D&O insurance policy in an appropriate amount. The CCO indicated that Revolution had not made any material revisions to its compliance policies and procedures in the past year. After a discussion, the Trustees concluded that Revolution has adequate resources available to continue to provide satisfactory services to the Fund.
Next, the Trustees reviewed the investment returns for Revolution, noting of Revolution’s strategy for the Fund. The Trustees considered Revolution’s returns to its benchmark for the one-year and since inception periods and noted that the outperformance for Revolution was impressive. A representative of the Adviser noted the Adviser’s continued satisfaction with Revolution’s execution of its strategy. After a discussion, the Trustees concluded that Revolution’s performance was reasonable.
The Trustees considered that the sub-advisory fee structure was favorable compared to the average fee charged by Revolution to its separately managed account clients in the same strategy. Counsel also noted for the Trustees that there was not an incentive fee component in the sub-advisory fee. After further discussion, the Trustees concluded that the proposed sub-advisory fee was reasonable.
The Trustees considered whether there were any economies of scale with respect to the management of the Fund. The Trustees agreed that this was primarily an adviser level issue and should be considered with respect to the overall advisory contract, taking into consideration the impact of the sub-advisory expense. After a discussion, the Trustees agreed that a lack of breakpoints was acceptable.
The Trustees next considered the profits t realized by Revolution in connection with its relationship with the Fund and whether the amount of profit is a fair entrepreneurial profit with respect to the sub-advisory services to be provided to the Fund. The Trustees concluded that Revolution’s level of profit was not excessive.
Having requested and received such information from Revolution as the Trustees believed to be reasonably necessary to evaluate the terms of the Sub-Advisory Agreement, and as assisted by the advice of counsel, the Trustees concluded that the fee structure is reasonable and that approval of the Sub-Advisory Agreement is in the best interests of the shareholders of the Macro Fund.
Billings Capital Management, LLC (“Billings”), Sub-Adviser (LDE Fund)
The Trustees then reviewed the nature, extent and quality of services provided by Billings for the LDE Fund. The Trustees discussed the responsibilities of Billings’ key personnel as well as the experience of these individuals in sub-advising the long/short equity strategies for the Fund. The CCO discussed that Billings provides fundamental research, security selection and trade execution for the Fund’s portfolio as well as compliance services to assure assets are managed within the Fund’s investment restrictions.
Counsel reported that Billings reported no material compliance, material litigations or regulatory agency issues in the past year. Counsel further stated that Billings carries an appropriate E&O/D&O policy. The Trustees concluded that Billings had experienced personnel and had appropriate resources to continue to provide quality services to the Fund.
Next, the Trustees discussed the investment performance for Billings for the Fund. The Trustees noted that Billings had underperformed for the one and five-year periods as well as the since inception period as compared to its benchmark index returns. A representative of the Adviser indicated that the Adviser was overall satisfied with the performance of the Billings strategy for the Fund. After a discussion, the Trustees concluded that the performance of Billings was not unreasonable.
Counsel discussed the cost of services and profitability realized by Billings and whether the amount of profit was reasonable with respect to the sub-advisory services to be provided to the Fund. Counsel noted for the Trustees that Billings also received a performance fee from such other accounts. Counsel also noted the profitability of the Fund for Billings. After a discussion, the Trustees concluded that Billings’ fees and profitability were not excessive.
Having requested and received such information from Billings as the Trustees believed to be reasonably necessary to evaluate the terms of the Sub-Advisory Agreement, and as assisted by the advice of counsel, the Trustees concluded that the fee structure is reasonable and that approval of the Sub-Advisory Agreement is in the best interests of the shareholders of the LDE Fund.
| | |
| | |
120 | | Review of Management and Sub-Advisory Agreements (Unaudited) Continued |
| | |
Bramshill Investments, LLC (“Bramshill”), Sub-Adviser (LSI Fund)
The Trustees then considered the renewal of the sub-advisory agreement with Bramshill with respect to the LSI Fund.
The Trustees considered the nature, extent and quality of services provided or to be provided by Bramshill for the income strategies for the LSI Fund. The Trustees reviewed the responsibilities of Bramshill’s key personnel. Counsel indicated that Bramshill provides quantitative research, security selection and trade execution for the income portion of the LSI Fund’s as well as compliance services and procedures under the oversight of Bramshill.
The Trustees noted that Bramshill has not reported any material compliance issues, material litigations or regulatory examinations in the past year. The Trustees decided that, based on Bramshill’s experienced personnel and fixed income expertise, Bramshill has adequate resources available to provide services to the Funds. The Trustees determined that Bramshill was well-suited to continue to perform the services as sub-adviser to the LSI Fund.
Counsel then directed the Trustees attention to the investment performance information for Bramshill with respect to the LSI Fund. The Trustees noted that Bramshill’s performance lagged the Fund’s benchmark and the sub-adviser’s selected benchmark for the one-year period and had outperformed the overall Fund. A representative of the Adviser reviewed Bramshill’s strategy and recent performance and stated that the Adviser was satisfied with the performance of Bramshill. After a discussion, the Trustees agreed that Bramshill’s performance was not unsatisfactory.
The Trustees discussed the costs of services provided and to be provided by Bramshill to the LSI Fund. The Trustees noted that Bramshill was profitable with respect to the LSI Fund. Counsel directed the Trustees’ attention to the materials for Bramshill which indicated that Bramshill’s sub-advisory fee was favorable in comparison to fees it charges to other clients. The Trustees concluded that the sub-advisory fees to be paid to Bramshill by the Adviser were reasonable in light of the services to be provided under the sub-advisory agreements.
Having requested and received such information from Bramshill as the Trustees believed to be reasonably necessary to evaluate the terms of the Sub-Advisory Agreement, and as assisted by the advice of Counsel, the Trustees concluded that the fee structure is reasonable and that approval of the Sub-Advisory Agreement is in the best interests of the shareholders of the LSI Fund.
Review of Management and Sub-Advisory Agreements
Approval of Advisory Agreement
The Board reviewed the nature, extent and quality of services provided by the Adviser to the LMT Fund with Counsel and then reviewed the 15(c) responses from the the Adviser. The Trustees reviewed the adviser personnel that provided services to the Fund. A representative of the Adviser noted that there had been no changes in the personnel providing services to the LMT Fund since the most recent renewal of the LMT Fund’s advisory agreement. The Trustees noted that the Adviser provided oversight of the Fund’s investment program consistent with its investment objective, policies and regulatory restrictions since the Fund’s inception and that the Adviser continues to evaluate and oversee the LMT Fund’s sub-advisers.
The Trustees noted that there were no material compliance issues, regulatory examinations or litigations in the past year. A representative of LFM discussed the Adviser’s financial statements with the Trustees. The Trustees noted that, based on their review of the Adviser’s financial statements and their discussion with representatives of the Adviser, the Adviser has the appropriate financial resources to continue to manage the LMT Fund. Fund Counsel also noted that the Adviser continues to maintain insurance for E&O/D&O insurance coverage. After a discussion, the Board concluded that the Adviser continued to be well staffed with experienced personnel, has appropriate financial resources and provides valuable investment expertise and oversight of the LMT Fund and is expected to continue to provide high quality services to the Fund.
The Trustees next reviewed the Fund’s performance, noting that the Fund had significantly outperformed its peer group average, benchmark indexes and Morningstar category for the 1-year period. A representative of the Adviser noted that both the Fund’s market trend strategy and fixed income strategy had continued to perform well during the 1-year period. Fund counsel noted for the Trustees the Fund’s since-inception performance, indicating that it had outperformed its peer group average, benchmark index and Morningstar category since that time. After a discussion, the Trustees agreed that the Fund’s performance was satisfactory.
Fund Counsel directed the Trustees to information regarding LFM’s advisory fee and its profitability with respect to the LMT Fund. Fund Counsel stated that the investment advisory fee remained slightly above the peer group and Morningstar category averages but well within the ranges for each. A representative of the Adviser discussed the peer group and noted the differences between the LMT Fund and some of its peer funds. Fund Counsel then reviewed with the Trustees the Adviser’s profitability with respect to the LMT Fund, noting its profitability margin. After a discussion, the Board concluded that the LMT Fund’s advisory fee and the Adviser’s profitability with respect to the LMT Fund were both reasonable.
Having requested and received such information from the Adviser as the Trustees believed to be reasonably necessary to evaluate the terms of the Advisory Agreement, and as assisted by the advice of Counsel, the Trustees concluded that the fee structure is reasonable and that approval of the Advisory Agreement is in the best interests of the LMT Fund and its shareholders.
| | |
| | |
Review of Management and Sub-Advisory Agreements (Unaudited) Continued | | 121 |
| | |
Approval of Sub-Advisory Agreement
Graham Capital Management, L.P. (“Graham”), Sub-Adviser (LMT Fund & LCMT Fund Limited)
The Trustees next reviewed the responses provided by Graham in its 15(c) questionnaire. The Board discussed the nature, extent and quality of services provided by Graham. Management and Fund Counsel reviewed the individuals responsible for providing services to the Fund and confirmed with the Adviser that had been no material changes in the Graham’s personnel directly providing services to the Fund. A representative of the Adviser reviewed Graham’s market trend strategy, risk management practices and its compliance program. Fund Counsel noted for the Board that Graham did not have any recent compliance, litigation or regulatory issues and that Graham continued to maintain appropriate insurance coverage. The Trustees noted that Graham did have a recent routine examination with the NFA and that Graham had reported that there were no material findings from that examination.
The Board then reviewed and discussed Graham’s performance for the LMT Fund. A representative of the Adviser noted Graham’s strong performance for the 1-year period but that it had slightly underperformed the benchmark index over the 5-year period. The Trustees noted their satisfaction with Graham’s recent outperformance. After a discussion, the Trustees concluded that the overall performance of Graham was satisfactory.
Fund Counsel then directed the Trustees to information related to Graham’s subadvisory fee and its fees for similar accounts. The Trustees noted that the subadvisory fee was relatively favorable in comparison to the Graham’s fee for other accounts, further noting that Graham did not charge a performance fee for the LMT Fund as it does for some other of its private accounts. The Trustees then reviewed Graham’s profitability with respect to the Fund. After a brief discussion, the Trustees agreed that the subadvisory fee and Graham’s profitability with respect to the LMT Fund were not unreasonable.
Having requested and received such information from Graham as the Trustees believed to be reasonably necessary to evaluate the terms of the subadvisory agreement, and as assisted by the advice of Fund Counsel, the Trustees concluded that the fee structure is reasonable and that approval of the subadvisory agreement with Graham for the LMT Fund is in the best interests of the Fund and its shareholders.
R.G. Niederhoffer Capital Management (“Niederhoffer”), Sub-Adviser (Macro Fund and LCMFS Fund Limited)
Counsel then directed the Trustees to the responses provided by Niederhoffer in its 15(c) questionnaire. The Board first reviewed the nature, extent and quality of services provided by Niederhoffer. Counsel and a representative of the Adviser reviewed the personnel that would be responsible for providing services to the Macro Fund. A representative of the Adviser discussed Niederhoffer’s strategy, noting that and its compliance program. The CCO noted that he had reviewed the compliance program, business continuity and code of ethics for Niederhoffer and had found them all to be appropriate in light of its business and the services to be provided to the Fund. Fund Counsel noted that Niederhoffer had recent examinations with both the SEC and NFA and noted that there were no material findings as a result of either examination. The Trustees noted that Niederhoffer did not have any recent compliance or litigation issues.
The Board then reviewed Niederhoffer’s performance for an account that is similar in strategy to the strategy to be used for the Macro Fund. The representative of the Adviser noted Niederhoffer’s performance for the various periods presented. After a discussion, the Trustees concluded that Niederhoffer could be expected to provide satisfactory for the Fund and its shareholders.
Counsel then directed the Trustees to information related to Niederhoffer’s subadvisory fee and its fees for similar accounts. Counsel stated that the subadvisory fee was favorable in comparison to the Niederhoffer’s fee for other accounts, further noting that Niederhoffer did not charge a performance fee for the Macro Fund as it does for some other of its private accounts. The Trustees then reviewed Niederhoffer’s expected profitability with respect to the Macro Fund. After a discussion, the Trustees agreed that the subadvisory fee and Niederhoffer’s profitability with respect to the Macro Fund was reasonable.
Having requested and received such information from Niederhoffer as the Trustees believed to be reasonably necessary to evaluate the terms of the subadvisory agreement, and as assisted by the advice of Counsel, the Trustees concluded that the fee structure is reasonable and that approval of the subadvisory agreement with Niederhoffer for the Macro Fund is in the best interests of the Fund and its shareholders.
| | |
| | |
122 | | Review of Management and Sub-Advisory Agreements (Unaudited) Continued |
| | |
LoCorr Fund Management Liquidity Risk Management Program Assessment
August 2021 (Unaudited)
Effective June 1, 2019, the funds adopted a liquidity risk management program (the “Liquidity Risk Management Program”) pursuant to the requirements of Rule 22e-4 under the Investment Company Act of 1940, as amended. Rule 22e-4 requires registered open-end funds, including mutual funds and exchange-traded funds but not money market funds, to establish liquidity risk management programs in order to effectively manage fund liquidity and shareholder redemptions. The rule is designed to mitigate the risk that a fund could not meet redemption requests without significantly diluting the interests of remaining investors.
The rule requires the funds to assess, manage and review their liquidity risk at least annually considering applicable factors such as investment strategy and liquidity during normal and foreseeable stressed conditions, including whether the strategy is appropriate for an open-end fund and whether the fund has a relatively concentrated portfolio or large positions in particular issuers. The fund must also assess its use of borrowings and derivatives, short-term and long-term cash flow projections in normal and stressed conditions, holdings of cash and cash equivalents, and borrowing arrangements and other funding sources.
The rule also requires the funds to classify its investments as highly liquid, moderately liquid, less liquid or illiquid based on the number of days the fund expects it would take to liquidate the investment, and to review these classifications at least monthly or more often under certain conditions. The periods range from three or fewer business days for a highly liquid investment to greater than seven calendar days for settlement of a less liquid investment. Illiquid investments are those a fund does not expect to be able to sell or dispose of within seven calendar days without significantly changing the market value. The fund is prohibited from acquiring an investment if, after the acquisition, its holdings of illiquid assets will exceed 15% of its net assets. In addition, if a fund permits redemptions in-kind, the rule requires the fund to establish redemption in-kind policies and procedures governing how and when it will engage in such redemptions.
Pursuant to the rule’s requirements, the Liquidity Risk Management Program has been reviewed and approved by the funds’ board. Furthermore, the board has received a written report prepared by the Program’s Administrator that addresses the operation of the Program, assesses its adequacy and effectiveness and describes any material changes made to the Program.
Assessment of Program
In the opinion of the Program Administrator, the Program approved by the fund board continues to be adequate for the fund and the Program has been implemented effectively. The Program Administrator has monitored the fund’s liquidity risk and the liquidity classification of the securities held by the fund and has determined that the Program is operating effectively.
During the period from July 1, 2020 to June 30, 2021, there were no material changes to the Program and no material liquidity events that impacted the funds. During the period, the funds held sufficient highly liquid assets to meet fund redemptions.
| |
| | |
| Notice of Privacy Policy & Practices/Quarterly Portfolio Holdings/Proxy (Unaudited) | | 123 |
| | |
Notice of Privacy Policy & Practices
(Unaudited)
Your privacy is important to us. The Funds are committed to maintaining the confidentiality, integrity, and security of your personal information. When you provide personal information, the Funds believe that you should be aware of policies to protect the confidentiality of that information.
The Funds collect the following nonpublic personal information about you:
● | Information we receive from you on or in applications or other forms, correspondence, or conversations, including, but not limited to, your name, address, phone number, social security number, assets, income and date of birth; and |
| |
● | Information about your transactions with us, our affiliates, or others, including, but not limited to, your account number and balance, payments history, parties to transactions, cost basis information and other financial information. |
The Funds do not disclose any nonpublic personal information about our current or former shareholders to affiliated or nonaffiliated third parties, except as permitted by law. For example, the Funds are permitted by law to disclose all of the information we collect, as described above, to our transfer agent to process your transactions. Furthermore, the Funds restrict access to your nonpublic personal information to those persons who require such information to provide products or services to you. The Funds maintain physical, electronic and procedural safeguards that comply with applicable federal and state standards to guard your nonpublic personal information.
In the event that you hold shares of the Funds through a financial intermediary, including, but not limited to, a broker-dealer, bank, or trust company, the privacy policy of your financial intermediary would govern how your nonpublic personal information would be shared with affiliated or non-affiliated third parties.
Portfolio Holdings Disclosure
(Unaudited)
The Funds file a complete schedule of portfolio holdings with the U.S. Securities and Exchange Commission (the “SEC”) for the first and third quarters of each fiscal year on Part F of Form N-PORT. The Funds’ Part F of Form N-PORT are available on the SEC’s website at www.sec.gov and may be reviewed and copied at the SEC’s Public Reference Room in Washington, D.C. Information on the operation of the Public Reference Room may be obtained by calling 1-800-SEC-0330. The Funds’ Part F of Form N-PORT may also be obtained by calling toll-free 1-855-523-8637.
Proxy voting policies, procedures and record
(Unaudited)
You may obtain a description of the Funds’ (1) proxy voting policies, (2) proxy voting procedures and (3) information regarding how the Funds voted any proxies related to portfolio securities during the most recent 12-month period ended June 30 for which an SEC filing has been made, without charge, upon request by contacting the Funds directly at 1-855-523-8637, or on the EDGAR Database on the SEC’s website (http:// www.sec.gov).
| |
| | |
| 124 | | Independent Trustees/Interested Trustees and Officers |
| | |
The Statement of Additional Information includes additional information about the Independent Trustees/Interested Trustees and Officers and is available, without charge, by calling 1-855-523-8637.
Independent Trustees |
Name and
Year of Birth | Position/Term
of Office1 | Principal Occupation
During the Past 5 Years | Number of
Portfolios in
Fund Complex2
Overseen by
Trustee | Other
Directorships
Held by Trustee
During the Past
5 Years |
Gary Jarrett
Year of Birth: 1954 | Trustee/
2016 to present | Chief Executive Officer, Black River Asset Management LLC, investment subsidiary of Cargill, Inc., 2002 to 2015. | 5 | None |
Mark Thompson
Year of Birth: 1959 | Trustee/
2011 to present | Chairman and Chief Manager, Riverbridge Partners, LLC (investment management), 1987 to present. | 5 | None |
Ronald A. Tschetter
Year of Birth: 1941 | Trustee/
2011 to present | Mr. Tschetter is presently retired from his principal occupations; Director of the U.S. Peace Corps, 2006 to 2009. | 5 | None |
Interested Trustees and Officers |
Name and Year of Birth | Position/Term of Office1 | Principal Occupation
During the Past 5 Years | Number of Portfolios in Fund Complex2 Overseen by Trustee | Other Directorships Held by Trustee During the Past 5 Years |
Jon C. Essen3
Year of Birth: 1963 | Treasurer, Secretary, Chief Financial Officer/ 2011 to present; Trustee/ 2010 to present | LoCorr Fund Management, LLC: Chief Operating Officer (2010 to 2016), Chief Compliance Officer, (2010 to 2017); LoCorr Distributors, LLC: Principal, Chief Financial Officer, and Registered Representative (2008 to present) Chief Compliance Officer (2008 to 2017); Steben & Company (registered investment adviser): Principal and Chief Financial Officer (2020 to present) | 5 | None |
Kevin M. Kinzie4 Year of Birth: 1956 | President, Trustee/ 2011 to present | Chief Executive Officer of LoCorr Fund Management, LLC, 2010 to present; President and Chief Executive Officer of LoCorr Distributors, LLC (broker/dealer), 2002 to present. President and Chief Executive Officer of Steben & Company (registered investment adviser), (2019 to present). | 5 | None |
Brian Hull5 Year of Birth: 1968 | Chief Compliance Officer/ 2019 to present | Steben & Company (registered investment adviser): Chief Compliance Officer 2002 to 2007 and 2012 to Present; Financial & Operations Principal (FINOP) 2002 to Present; Registered Representative 2002 to Present. | 5 | None |
| 1 | The term of office for each Trustee listed above will continue indefinitely. |
| 2 | The term “Fund Complex” refers to the LoCorr Investment Trust. |
| 3 | Mr. Essen is an interested Trustee because he is an officer of the Funds’ Adviser. |
| 4 | Mr. Kinzie is an interested Trustee because he is an officer and indirect controlling interest holder of the Funds’ Adviser. |
| 5 | Mr. Hull is an interested person because he is an officer of the Funds’ Adviser. |
This page left intentionally blank.
This page left intentionally blank.

Item 2. Code of Ethics.
Not applicable for semi-annual reports.
Item 3. Audit Committee Financial Expert.
Not applicable for semi-annual reports.
Item 4. Principal Accountant Fees and Services.
Not applicable for semi-annual reports.
Item 5. Audit Committee of Listed Registrants.
Not applicable to registrants who are not listed issuers (as defined in Rule 10A-3 under the Securities Exchange Act of 1934).
Item 6. Investments.
(a) | Schedule of Investments is included as part of the report to shareholders filed under Item 1 of this Form. |
Item 7. Disclosure of Proxy Voting Policies and Procedures for Closed-End Management Investment Companies.
Not applicable to open-end investment companies.
Item 8. Portfolio Managers of Closed-End Management Investment Companies.
Not applicable to open-end investment companies.
Item 9. Purchases of Equity Securities by Closed‑End Management Investment Company and Affiliated Purchasers.
Not applicable to open-end investment companies.
Item 10. Submission of Matters to a Vote of Security Holders.
There have been no material changes to the procedures by which shareholders may recommend nominees to the registrant’s Board of Trustees.
Item 11. Controls and Procedures.
(a) | The registrant’s President and Treasurer have reviewed the registrant's disclosure controls and procedures (as defined in Rule 30a-3(c) under the Investment Company Act of 1940 (the “Act”)) as of a date within 90 days of the filing of this report, as required by Rule 30a-3(b) under the Act and Rules 13a-15(b) or 15d‑15(b) under the Securities Exchange Act of 1934. Based on their review, such officers have concluded that the disclosure controls and procedures are effective in ensuring that information required to be disclosed in this report is appropriately recorded, processed, summarized and reported and made known to them by others within the registrant and by the registrant’s service provider. |
(b) | There were no changes in the registrant's internal control over financial reporting (as defined in Rule 30a-3(d) under the Act) that occurred during the period covered by this report that has materially affected, or is reasonably likely to materially affect, the registrant's internal control over financial reporting. |
Item 12. Disclosure of Securities Lending Activities for Closed-End Management Investment Companies
Not applicable to open-end investment companies.
Item 13. Exhibits.
| (a) | (1) Any code of ethics or amendment thereto, that is the subject of the disclosure required by Item 2, to the extent that the registrant intends to satisfy Item 2 requirements through filing an exhibit. |
Not applicable for semi-annual reports.
(2) A separate certification for each principal executive and principal financial officer pursuant to Section 302 of the Sarbanes-Oxley Act of 2002.
Filed herewith.
(3) Any written solicitation to purchase securities under Rule 23c‑1 under the Act sent or given during the period covered by the report by or on behalf of the registrant to 10 or more persons.
Not applicable to open-end investment companies.
(4) Changes in the registrant’s independent public accountant.
There was no change in the registrant’s independent public accountant for the period covered by the report.
| (b) | Certifications pursuant to Section 906 of the Sarbanes‑Oxley Act of 2002. |
Furnished herewith.
SIGNATURES
Pursuant to the requirements of the Securities Exchange Act of 1934 and the Investment Company Act of 1940, the registrant has duly caused this report to be signed on its behalf by the undersigned, thereunto duly authorized.
(Registrant) LoCorr Investment Trust
By (Signature and Title) /s/ Kevin Kinzie
Kevin Kinzie, President
Date September 7, 2021
Pursuant to the requirements of the Securities Exchange Act of 1934 and the Investment Company Act of 1940, this report has been signed below by the following persons on behalf of the registrant and in the capacities and on the dates indicated.
By (Signature and Title) /s/ Kevin Kinzie
Kevin Kinzie, President
Date September 7, 2021
By (Signature and Title) /s/ Jon Essen
Jon Essen, Treasurer
Date September 7, 2021