As filed with the Securities and Exchange Commission on September 4, 2014
UNITED STATES
SECURITIES AND EXCHANGE COMMISSION
Washington, D.C. 20549
FORM N-CSR
CERTIFIED SHAREHOLDER REPORT OF REGISTERED
MANAGEMENT INVESTMENT COMPANIES
Investment Company Act file number 811-22509
LoCorr Investment Trust
(Exact name of registrant as specified in charter)
261 School Avenue, 4th Floor
Excelsior, MN 55331
(Address of principal executive offices) (Zip code)
CT Corporation System
1300 East Ninth Street
Cleveland, OH 44114
(Name and address of agent for service)
952.767.2920
Registrant's telephone number, including area code
Date of fiscal year end: December 31
Date of reporting period: June 30, 2014
Item 1. Reports to Stockholders.
Letter to Shareholders
LoCorr Funds seek to provide investments that, over time, may have low correlation to traditional asset classes – such as stocks and bonds. We believe that adding low correlating investments to portfolios can significantly help reduce the overall portfolio risk while potentially enhancing returns. Correlation measures the degree to which the returns of two investments move together over time. LoCorr offers products that provide the potential for positive returns in rising or falling markets and are designed to resist correlation with traditional stock, bond and commodity investments. In this semi-annual report, LoCorr Funds are reporting on four mutual funds: LoCorr Managed Futures Strategy Fund, LoCorr Long/Short Commodities Strategy Fund, LoCorr Long/Short Equity Fund and LoCorr Spectrum Income Fund (collectively, the “Funds”). LoCorr Funds did recently launch another Fund – LoCorr Market Trend Fund – that commenced operations after June 30, 2014 and will be reported in the next annual report.
LoCorr Managed Futures Strategy Fund
The LoCorr Managed Futures Strategy Fund’s (the “Managed Futures Fund” or the “Fund”) primary objective is capital appreciation in rising and falling equity markets with managing volatility as a secondary objective. The Managed Futures Fund attempts to achieve its objective by investing in two main strategies – a Managed Futures strategy and a Fixed Income strategy.
Managed Futures Strategy
The Managed Futures Fund invests up to 25% of its total assets into a portfolio of globally diversified managed futures positions. The Fund accesses the returns of certain trading programs of Millburn Ridgefield Corporation (“Millburn”) and Crabel Capital Management, LLC (“Crabel”) via its investment in a total return swap agreement. The Fund uses Millburn and Crabel to execute its Managed Futures strategy. Millburn was founded in 1971 and manages about $1.3 billion in assets. Crabel was founded in 1992 and manages about $1.4 billion in assets. The Managed Futures Fund accesses returns generated by Millburn’s Diversified Program (“MDP”), a commodity pool which commenced operations in 1977. MDP systematically invests in about 120 futures markets with long and short positions in sectors such as currencies, interest rates, stock indices and commodities (agricultural, energy and metals). The Managed Futures Fund also accesses returns generated by Crabel’s Multi-Product program, a short-term trend following strategy that commenced trading in March 1998. Crabel’s program was added in late 2013 to complement Millburn’s longer-term trend strategy in an attempt to improve the Fund’s risk-adjusted returns.
The Fund produced a profit during the first half of 2014 predominantly due to gains from long interest rate and equity futures positions, and from short U.S. dollar trades. Long energy positions and trading of agricultural commodities did register small gains, while metal trading was unprofitable. Both managers were profitable, particularly Millburn’s program, leading the Fund’s Class I shares to a +10.07% return for the six month period ending June 30, 2014.
Shifting perceptions about U.S. and Chinese growth prospects, future course of Federal Reserve monetary policy, political and economic turmoil in several emerging economies—including Turkey, India, Indonesia, and Thailand, the impact of the Russia/ Ukraine situation, and the simmering cauldron that is the Middle East kept markets off balance and led to significant market volatility early in the period. However, persistently accommodative monetary policy in developed economies—underscored by a further easing of European Central Bank (ECB) monetary policy in early June—and the growth rebound from the weather-induced first quarter slowdown helped settle trading thereafter.
Given the concerns about worldwide growth, the social and political unrest in numerous emerging markets, a lack of inflationary impulses in the developed world, and persistent easy money in the developed world, it should come as no surprise that a solid demand for government securities would push up note and bond prices. Consequently, Millburn’s long positions in foreign and U.S. note and bond futures were profitable.
Millburn also generally profited from long equity trades. Equity prices were particularly volatile during the period, weakening as the markets digested weather-related growth problems in the U.S., the outlook for U.S. quantitative easing, worries about Chinese growth, and Chinese policy efforts to wring excess debt and capacity out of the economy without threatening too many corporate defaults or bankruptcies. However, prices recovered as U.S. growth rebounded against the background of continued easy money in the developed economies.
Millburn’s short U.S. dollar trades were generally profitable too. Higher interest rates and/or stronger growth prospects in certain countries weighed on the U.S. dollar, even though foreign exchange markets were periodically rattled by the political and economic turmoil in a number of emerging markets.
Millburn’s commodity trades in agriculture and energy contributed smaller profits while metals trades produced small losses.
Crabel’s Multi-Product program posted modest gains through the first half of 2014. The low volatility regime in many of the markets Crabel trades has remained firmly in place. As of June 30, there have been 50 trading days since the S&P 500 Index moved at least 1% in a day, the longest such streak since 1995. As expected in such an environment, short-term momentum models have struggled, suffering three losing months in the last five. Mean-reversion models had a significantly positive period and long-term trend following models were slightly profitable. Through the first half of 2014, stock indices, interest rates and commodities were profitable while currencies were slightly negative. The most profitable markets were the E-Mini S&P 500 Index, the British Pound and the German Bund. The worst performing markets were the Euro/Yen, Japanese Yen and the DJ EuroStoxx 50 Index.
Fixed Income Strategy
The Managed Futures Fund invests most of its remaining assets in a Fixed Income strategy comprised of short- to intermediate-term investment grade corporate and government agency securities. Nuveen Asset Management (“Nuveen”) is the sub-adviser for this strategy – a shorter duration, high quality portfolio. Nuveen manages over $100 billion in assets.
Although the U.S. economy lost momentum early in 2014, partially due to brutal winter weather, recent data has shown that the economy has been re-accelerating. Employment data have posted steady gains, consumer spending continues to advance at a moderate pace, and manufacturing has strengthened. Core inflation remained subdued and the Fed continued to taper asset purchases.
The Fixed Income portion of the Managed Futures Fund posted a return of 1.53% for the six month period ended June 30, 2014, compared to 1.06% for the Fund’s benchmark – the Barclays Capital 1-5 Year Government/Credit Bond Index. Fixed Income outperformance was primarily attributable to sector allocation and security selection. Our duration strategy, which continued to be managed to be about one half year short of the benchmark, was a non-factor to performance as short-term rates were little changed over first half of the year.
Looking ahead, we expect that moderate growth and subdued inflation could allow the Fed to remain deliberate in normalizing policy. Asset purchases should wind down later in 2014 and we believe the Fed to begin raising the Fed Funds Rate in mid-2015. To the extent that economic growth does not surprise on the upside and inflation remains in check, it seems likely that the Fed’s forward guidance may be successful in managing market expectations for higher rates and that the withdrawal of stimulus should not be overly disruptive to the financial markets. Given that credit fundamentals for non-government sectors remain strong, we expect to retain a high-level portfolio emphasis on corporates and non-government securitized debt. That said, valuations are now at the expensive end of the post-crisis range, so we seek to moderate our exposure in these sectors and increase portfolio weightings to Treasuries for liquidity and potential risk management purposes over the coming months. Finally, we plan to maintain our defensive duration posture in the portfolio as we believe short rates will likely grind higher as the Fed begins to gradually withdraw accommodation over the coming year.
LoCorr Long/Short Commodities Strategy Fund
The LoCorr Long/Short Commodities Strategy Fund (the “Long/Short Commodities Fund” or the “Fund”) was created to provide investors with access to a commodities futures strategy in a mutual fund structure. Historically, investors have primarily accessed exposure to long-only commodities that rely on rising commodity prices to generate positive returns. Of course, commodity prices don’t always appreciate and occasionally experience sharp declines. The Long/Short Commodities Fund has the ability to profit while commodity prices increase or decrease.
The Long/Short Commodities Fund’s primary investment objective is capital appreciation in rising and falling commodities markets with managing volatility as a secondary objective. The Long/Short Commodities Fund attempts to achieve its investment objective by investing in two primary strategies – a Commodities strategy and a Fixed Income strategy.
Commodities Strategy
The Fund accesses, via a total return swap agreement, the returns of Millburn’s Commodity Program (“Milcom”) which began trading in 2005. Milcom systematically invests in about 50 futures markets with long and short positions in sectors such as energy, metals, livestock, grains and softs and lumber.
The Fund posted a strong gain during the six month period ending June 30, 2014, as the Class I shares were +10.78%. Trading of energy futures and energy spreads, grain futures and grain spreads, and soft commodity futures and spreads led the advance. Livestock futures and spread trading was also profitable, while losses from trading metal futures outdistanced the gain from metal spread trading.
The expanding turmoil in the Middle East pushed energy prices higher, particularly in May and June, and long positions in Brent crude, West Texas Intermediate crude and RBOB (Reformulated Blendstock for Oxygenate Blending) gasoline were profitable, outpacing losses from trading heating oil, London gas oil and kerosene. Trading of U.S. and U.K. natural gas was also profitable. Energy spread trading was very profitable.
Grain prices were volatile during the period, rising early on due to dry weather in the U.S. and concern about the impact of the Russia-Ukraine confrontation, and falling later due to improved weather conditions and better USDA crop forecasts. Long soybean, soybean meal, European rapeseed, Comex wheat, and maize positions were profitable, even though losses late in the period reduced those gains. Those same price swings, meanwhile, led to solid gains from grain spread trading. On the other hand, long corn, KC wheat, milling wheat, and Spring wheat positions, and trading of soybean oil and canola were unprofitable.
Long cattle, coffee and cocoa positions and trading of cotton generated gains, while short sugar and long crude palm oil and rubber trades resulted in smaller losses. Soft commodity and livestock spread trading were both profitable.
Trading of metal futures was unprofitable. A long nickel trade benefitted from the Indonesian export ban that drove prices higher; long palladium and platinum trades were profitable as labor turmoil in South Africa and Russian tensions boosted prices; and a long gold trade was a positive due to flight to safety demand. Metal spread trading produced a fractional gain, yet trading of aluminum, copper, lead, tin, zinc and silver generated more than offsetting losses.
Fixed Income Strategy
The Long/Short Commodities Fund invests most of its remaining assets in a Fixed Income strategy comprised of short- to intermediate-term investment grade corporate and government agency securities. Nuveen is the sub-adviser for this strategy – a shorter duration, high quality portfolio.
The Fixed Income portion of the LoCorr Long/Short Commodities Fund posted a return of 1.37% for the six month period ending June 30, 2014, compared to 1.06% for the Fund’s benchmark—the Barclays Capital 1-5 Year Government/Credit Bond Index. Fixed Income outperformance was primarily attributable to sector allocation and security selection. Our portfolio duration, which was shortened to about .30 years short of the benchmark, was a non-factor to performance as short-term rates were little changed over first half of the year. Nuveen’s outlook for the fixed income market is stated above.
LoCorr Long/Short Equity Fund
The LoCorr Long/Short Equity Fund (the “Long/Short Equity Fund” or the “Fund”) was launched in May 2013. The Fund’s objective is long-term capital appreciation with reduced volatility compared to traditional broad-based equity market indices as a secondary objective. Consistent with the “low correlation” our LoCorr Fund family seeks, long/short equity funds have the ability to provide positive returns when equity markets are rising yet they can provide the potential for downside protection when equity prices are declining.
One of the Fund’s sub-advisers, Millennium Asset Management (“Millennium”), focuses on small and micro cap stocks as the core long holdings. Millennium will also look to short individual stocks and hold bear Exchange Traded Funds (“ETFs”) to seek to mitigate volatility and to profit when prices decline. Millennium was founded in 1999 and the Fund invests based on a strategy of theirs that commenced trading in 2000.
The Fund added another sub-adviser in early 2014 – Billings Capital Management (“Billings”). Billings’ strategy is based on a value-oriented, fundamental, bottom-up long/short equity approach. They seek to maximize returns, exceeding the S&P 500 Index over the long term. Relative value drives the selection process for both long and short positions. The Fund invests with Billings based on a strategy they have managed since 2008 with their current firm and for many years prior to that at a different firm.
Billings was added to complement the strategy used by Millennium. Billings’ inclusion was beneficial to the Fund’s results during the first six months of 2014. The Fund’s Class I shares lost 5.91% for the period ended June 30, 2014, despite Billings’ stellar +12.00% results on the portion of the Fund’s assets they managed since March 25, 2014. Millennium was down 6.35% for the six month period on their portion of Fund assets.
Millennium has a strong focus on smaller cap equities. Small cap equities underperformed the broader equity market in the first half of 2014. Selling pressure in small caps was driven by worldwide economic growth concerns and profit taking after a strong 2013. A decline in the Chinese economic growth and currency concerns for emerging economies led to strong selling pressure in U.S. small cap companies as international investment losses were covered with reduced allocation to domestic small cap. The flight to quality caused large cap stocks to be favored while small cap stocks were sold. Micro cap equities fared even worse than small cap equities in 2014 through the low point in mid-May. Millennium’s portion of the portfolio had a higher exposure to micro cap equities at the beginning of 2014, which was detrimental to performance. The average market cap of the portfolio has increased throughout 2014 to lessen exposure to micro cap names.
The favoritism for larger equities kept large cap names relatively buoyant while small and micro cap names declined. This anomaly caused Millennium’s hedge of generally shorting large cap names to be less effective early in the year. The Millennium portfolio performed much better in March through the end of Q2 2014, but it was not enough to overcome the weak early year performance.
Through the difficulties of the first half of 2014, the portfolio has gone through changes. Turnover was relatively high as we eliminated positions where our conviction for outperformance declined and increased the average market cap. The net long exposure was as low as 60% in May and reached a high of 93% in June.
Millennium’s economic outlook is for continued U.S. growth and increasing interest rates driven by the Fed’s belief the economic expansion is self-sustaining. The Millennium portfolio is exposed to long-term secular growth in technology and healthcare. The portfolio is exposed to cyclical growth in the energy, aerospace, and automobile sectors. The short portfolio is primarily exposed to the consumer and technology sectors.
Billings generally invests in mid to larger cap equities. Equity markets, as represented by the S&P 500 Index, proved strong through the first six months of 2014 returning 7.14% as of June 30, 2014, marked the 6th consecutive quarterly gain for the index. That hasn’t occurred since 1998. After a tough January, many believed a much anticipated correction was unfolding. But, to the contrary, equities posted five consecutive positive months with volatility well below historical levels. Equity returns thus far have not been top heavy nor isolated. Within the S&P 500 there were 11 constituents up for every one that was down and eight of the ten sectors posted positive returns.
Many investors are becoming valuation sensitive, which, as value-oriented investors, is a mindset with which Billings agrees. We believe markets are hovering in the realm of fair valuation. Stock picking is proving more difficult than the glut of opportunities experienced in 2013. Despite the outsized market gains in 2013 and steady climb thus far in 2014, there still appear to be attractive opportunities to be found on both the long and short sides. Billings continues to remain constructive on the long-term outlook for the U.S. economy, as well as equity markets.
Since the inception of the Fund’s relationship with Billings, the net exposure has remained fairly constant at levels above 90% long. All market caps contributed positively to performance, as well as each of the four sectors to which the Billings portfolio is exposed. The strongest driver of performance came from the technology, media and telecommunications (TMT) sector, followed by, in order, financial services, consumer and industrials.
Billings continues to keep in search of truly attractive businesses trading at what we view as attractive prices (or the opposite for short positions). We believe that we can drive significant long-term outperformance by focusing on our intensive research process as opposed to predicting the direction of the markets over shorter time horizons.
LoCorr Spectrum Income Fund
The LoCorr Spectrum Income Fund (the “Spectrum Income Fund” or the “Fund”) was launched at the beginning of 2014. The Fund’s objective is current income with capital appreciation as a secondary objective. The Fund is designed to fit within the “low correlation” of the LoCorr Fund family by seeking to provide relatively high levels of income with low correlation to the bond market.
The Fund uses two strategies to attempt to achieve its objective – an Income strategy and a Loan Investment strategy. The sub-adviser of the Income strategy is Trust & Fiduciary Management Services (“TFMS”). TFMS invests in pass-through securities to seek high current income, much of which the Fund distributes monthly to investors. The Fund’s initial six months of operations ending June 30, 2014, were profitable as the Fund’s Class I shares gained 7.50%.
Income Strategy
TFMS sub-advises the Fund’s Income strategy. TFMS was founded in 2000 and the Fund invests based on a strategy that TFMS commenced in 2001. The Income Strategy managed by TFMS is based upon a diversified portfolio consisting primarily of exchange traded pass-through securities, i.e. entities which are exempt from U.S. corporate income tax on the condition that they distribute substantially all of their profits directly to shareholders. This category of securities includes Real Estate Investment Trusts (“REITs”), Master Limited Partnerships, Closed-End Funds, Royalty Trusts, and Business Development Companies. In addition, common stocks with extremely high free cash flow and distributions are sometimes used in the portfolio. The portfolio composition at any point in time is based upon a combination of macroeconomic factors determining classes of securities to be emphasized, combined with intensive bottom-up research focusing on sustainable distributions, quality of management, and valuation concerns.
For the first half of 2014, the portfolio posted very positive results. Most elements of the portfolio performed well, but the strongest areas were those related to energy. Interestingly, this included “upstream” holdings which were focused on the production of oil and gas, “midstream” holdings related to the transportation and storage of these items, and “downstream” entities which process raw materials into value-added products such as gasoline, fuel oil, fertilizers, and chemicals. Under ordinary circumstances these securities seldom move together, with relative performance based upon the spread and trends between raw materials and final products, as well as growth (or its lack) in general volumes due to the economy. For this period, they all generally moved together due to disorder in the Middle East and a perceived threat to supplies of crude commodities and final products, which in turn led to higher prices for securities related to most energy prices.
Apart from the double digit returns from most of our energy-related holdings, most of our other securities—almost all of which were chosen for their potential ability to increase their distributions in an environment of at least moderate growth and a little inflation—posted solid positive returns. Holdings in this category included closed-end funds holding emerging market debt; REITs with properties in hospitality, entertainment, office, and retail sectors; private equity and alternative asset managers; closed-end funds with U.S. high-yield and preferred securities; lower rated mortgage REITs; transportation-related equities; and a number of individual special situations. Laggards for the period included business development companies, which suffered from being removed from the Russell indexes alternative asset managers, which corrected from a sharp gain late last year; and a few individual holdings which experienced company-specific setbacks.
Looking ahead, TFMS believes that the portfolio continues to be well positioned with its emphasis on pass-through securities which have substantial potential to increase their distributions as a consequence of increased economic growth in the U.S. and abroad. Our portfolio has benefitted from an environment of moderate economic growth combined with an accommodative monetary policy from the U.S. Federal Reserve. While we recognize that these conditions cannot continue forever, we do not, at present, foresee a situation in which they will come to an abrupt halt. In this environment, we regard the types of securities in our portfolio as attractively valued. We anticipate any changes in the portfolio in the foreseeable future will be based on changes in our evaluation of individual current holdings or the identification of exceptional new individual opportunities which we will wish to add to the portfolio.
Loan Investment Strategy
The Loan Investment strategy is designed to invest in secured real estate loans that provide the Fund with the potential to enhance yield, reduce volatility and provide the portfolio benefits of lower correlation to stocks and bonds. The Fund’s Loan Investment strategy is based on its investment in a pool of secured real estate loans managed and administered by Terra Capital Partners (“Terra”), which was founded in 2002. During the period, this investment has generated a steady source of high income and helped dampen the Fund’s volatility.
Thank you for investing in LoCorr Funds.
It is not possible to invest directly into an index.
Mean-reversion models are models based on the theory that prices eventually move back to the mean. Correlation measures how much the returns of two investments move together over time. Duration is a commonly used measure of the potential volatility of the price of the debt security, or the aggregate market value of a portfolio of debt securities, prior to maturity. Securities with a longer duration generally have more volatile prices than securities of comparable quality with a shorter duration. Market cap refers to the size of companies held based on the value of all outstanding shares. Free cash flow is an entity’s operating cash flow less capital expenditures.
E-Mini S&P 500 Index is based on the S&P 500 Index but has contracts that are one fifth the size. DJ EuroStoxx 50 Index is a capitalization-weighted stock index of 50 large European companies. Barclays Capital 1-5 Year Government/Credit Index is an unmanaged index considered representative of performance of short-term U.S. corporate bonds and U.S. government bonds with maturities from one to five years.
The opinions expressed in the letter are those of the Fund manager, are subject to change, are not guaranteed and should not be considered investment advice.
The LoCorr Market Trend Fund’s investment objectives, risks, charges and expenses must be considered carefully before investing. The prospectus contains this and other important information about the investment company, and it may be obtained by calling 1.855.LCFUNDS, or visiting www.LoCorrFunds.com. Read it carefully before investing.
Must be preceded or accompanied by a prospectus. Fund holdings and sector allocation are subject to change and should not be considered a recommendation to buy or sell any security. For a complete list of Fund holdings please refer to the Schedule of Investments included in this report.
Mutual fund investing involves risk. Principal loss is possible. The Funds are non-diversified, meaning they may invest their assets in fewer individual holdings than a diversified fund. Therefore, the Funds are more exposed to individual stock volatility than a diversified fund. The Funds invest in foreign investments and foreign currencies which involve greater volatility and political, economic and currency risks and differences in accounting methods. The Funds may make short sales of securities, which involves the risk that losses may exceed the original amount invested. Investing in commodities may subject the Funds to greater risks and volatility as commodity prices may be influenced by a variety of factors including unfavorable weather, environmental factors, and changes in government regulations. The Funds may invest in derivative securities, which derive their performance from the performance of an underlying asset, index, interest rate or currency exchange rate. Derivatives can be volatile and involve various types and degrees of risks, and, depending upon the characteristics of a particular derivative, suddenly can become illiquid. Investments in debt securities typically decrease in value when interest rates rise. This risk is usually greater for longer-term debt securities. Investments in Asset Backed, Mortgage Backed, and Collateralized Mortgage Backed Securities include additional risks that investors should be aware of such as credit risk, prepayment risk, possible illiquidity and default, as well as increased susceptibility to adverse economic developments.
Diversification does not assure a profit nor protect against loss in a declining market.
Past performance is not a guarantee of future results.
Derivative contracts ordinarily have leverage inherent in their terms which can magnify the Fund’s potential for gains or losses through increased long and short position exposure. The Fund may access derivatives via a swap agreement. A risk of a swap agreement is the risk that the counterparty to the agreement will default on its obligation to pay the Fund.
The Fund will incur a loss as a result of a short position if the price of the short position instrument increases in value between the date of the short position sale and the date on which an offsetting position is purchased.
Investments in small - and medium-capitalization companies involve additional risks such as limited liquidity and greater volatility. Investments in lowerrated and non-rated securities presents a greater risk of loss to principal and interest than higher-rated securities. ETF investments are subject to investment advisory and other expenses, which will be indirectly paid by the Fund. As a result, the cost of investing in the Fund will be higher than the cost of investing directly in ETFs and may be higher than other mutual funds that invest directly in stocks and bonds. ETFs are subject to specific risks, depending on the nature of the ETF.
The Fund’s portfolio will be significantly impacted by the performance of the real estate market generally, and the Fund may be exposed to greater risk and experience higher volatility than would a more economically diversified portfolio. Property values may fall due to increasing vacancies or declining rents resulting from economic, legal, cultural, or technological developments. Investments in Limited Partnerships (including master limited partnerships) involve risks different from those of investing in common stock including risks related to limited control and limited rights to vote on matters affecting the Limited Partnership, risks related to potential conflicts of interest between the Limited Partnership and the Limited Partnership’s general partner, cash flow risks, dilution risks and risks related to the general partner’s limited call right. Underlying Funds are subject to management and other expenses, which will be indirectly paid by the Fund.
The LoCorr Managed Futures Strategy Fund, LoCorr Long/Short Commodities Strategy Fund, LoCorr Long/Short Equity Fund, LoCorr Spectrum Income Fund, and LoCorr Market Trend Fund are distributed by Quasar Distributors, LLC.
LoCorr Managed Futures Strategy Fund
Rate of Return — For the period ended June 30, 2014 (Unaudited)
| | | Inception Date | | 6 Month | | 1 Year | | Since Inception |
| LoCorr Managed Futures Strategy Fund - Class A (without maximum load) | | 3/22/11 | | 10.02 | % | | 11.44 | % | | -2.78 | % |
| LoCorr Managed Futures Strategy Fund - Class A (with maximum load) | | 3/22/11 | | 3.64 | % | | 5.02 | % | | -4.52 | % |
| LoCorr Managed Futures Strategy Fund - Class C | | 3/24/11 | | 8.48 | % | | 9.64 | % | | -3.51 | % |
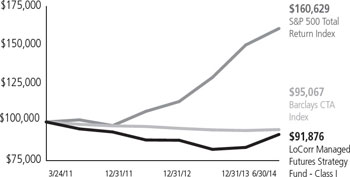
| LoCorr Managed Futures Strategy Fund - Class I | | 3/24/11 | | 10.07 | % | | 11.75 | % | | -2.56 | % |
| S&P 500 Total Return Index | | | | 7.14 | % | | 24.61 | % | | 15.60 | %1 |
| Barclays CTA Index | | | | 0.68 | % | | 0.27 | % | | -1.53 | %2 |
$100,000 investment in the
LoCorr Managed Futures Strategy Fund – Class I
For the period ended June 30, 2014 (Unaudited)
This chart illustrates the performance of a hypothetical $100,000 investment made in the Fund’s Class I shares since inception. Assumes reinvestment of dividends and capital gains, but does not reflect the effect of any applicable sales charge or redemption fees. This chart does not imply any future performance. Performance will vary from class to class based on differences in class-specific expenses and sales charges. The returns do not reflect the deduction of taxes that a shareholder would pay on Fund distributions or the redemption of Fund shares.
Performance data represents past performance; past performance does not guarantee future results. The investment return and principal value of an investment will fluctuate so that an investor’s shares, when redeemed, may be worth more or less than their original cost. Current performance of the Fund may be lower or higher than the performance quoted. Performance data current to the most recent month end may be obtained by calling 1.855.LCFUNDS, or visiting www.LoCorrFunds.com.
Performance data shown reflects the Class A maximum sales charge of 5.75% and reflects the Class C Contingent Deferred Sales Charge (CDSC) of 1.00%. Performance of the Class A without load does not reflect the deduction of the sales load or fee. If reflected, the load or fee would reduce the performance quoted.
The Fund imposes a 1.00% redemption fee on shares held for less than 30 days. Performance data does not reflect the redemption fee. If it had, return would be reduced.
Per the fee table in the Fund’s May 1, 2014 prospectus, the Fund’s annual operating expense ratio is 2.58%, 3.33%, and 2.33% for Class A, Class C and Class I shares, respectively.
The S&P 500 Total Return Index is an unmanaged capitalization-weighted index of 500 stocks designed to measure performance of the broad domestic economy through changes in the aggregate market value of the 500 stocks which represent all major industries. The Barclays CTA Index is a leading industry benchmark of representative performance of commodity trading advisors.
One cannot invest directly in an index.
1 Since inception return as of March 24, 2011.
2 Since inception return as of March 31, 2011.
LoCorr Long/Short Commodities Strategy Fund
Rate of Return — For the period ended June 30, 2014 (Unaudited)
| | | Inception Date | | 6 Month | | 1 Year | | Average Annual
Since Inception1 |
| LoCorr Long/Short Commodities Strategy Fund - Class A (without maximum load) | | 1/1/12 | | 10.56 | % | | 7.21 | % | | -6.38 | % |
| LoCorr Long/Short Commodities Strategy Fund - Class A (with maximum load) | | 1/1/12 | | 4.18 | % | | 1.07 | % | | -8.57 | % |
| LoCorr Long/Short Commodities Strategy Fund - Class C | | 1/1/12 | | 9.21 | % | | 5.54 | % | | -7.13 | % |
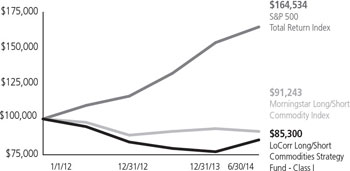
| LoCorr Long/Short Commodities Strategy Fund - Class I | | 1/1/12 | | 10.78 | % | | 7.57 | % | | -6.16 | % |
| S&P 500 Total Return Index | | | | 7.14 | % | | 24.61 | % | | 22.03 | % |
| Morningstar Long/Short Commodity Index | | | | -2.09 | % | | 0.21 | % | | -3.58 | % |
$100,000 investment in the
LoCorr Long/Short Commodities Strategy Fund – Class I
For the period ended June 30, 2014 (Unaudited)
This chart illustrates the performance of a hypothetical $100,000 investment made in the Fund’s Class I shares since inception. Assumes reinvestment of dividends and capital gains, but does not reflect the effect of any applicable sales charge or redemption fees. This chart does not imply any future performance. Performance will vary from class to class based on differences in class-specific expenses and sales charges. The returns do not reflect the deduction of taxes that a shareholder would pay on Fund distributions or the redemption of Fund shares.
Performance data represents past performance; past performance does not guarantee future results. The investment return and principal value of an investment will fluctuate so that an investor’s shares, when redeemed, may be worth more or less than their original cost. Current performance of the Fund may be lower or higher than the performance quoted. Performance data current to the most recent month end may be obtained by calling 1.855.LCFUNDS, or visiting www.LoCorrFunds.com.
Performance data shown reflects the Class A maximum sales charge of 5.75% and reflects the Class C Contingent Deferred Sales Charge (CDSC) of 1.00%. Performance of the Class A without load does not reflect the deduction of the sales load or fee. If reflected, the load or fee would reduce the performance quoted.
The Fund imposes a 1.00% redemption fee on shares held for less than 30 days. Performance data does not reflect the redemption fee. If it had, return would be reduced.
Per the fee table in the Fund’s May 1, 2014 prospectus, the Fund’s annual operating expense ratio, before fee waivers is 4.69%, 5.44%, and 4.44% for Class A, Class C and Class I shares, respectively.
The S&P 500 Total Return Index is an unmanaged capitalization-weighted index of 500 stocks designed to measure performance of the broad domestic economy through changes in the aggregate market value of the 500 stocks which represent all major industries. The Morningstar Long/Short Commodity Index is a fully collateralized commodity futures index that uses the momentum rule to determine if each commodity is held long, short, or flat.
One cannot invest directly in an index.
1 Since inception returns as of January 1, 2012.
LoCorr Long/Short Equity Fund
Rate of Return — For the period ended June 30, 2014 (Unaudited)
| | | Inception Date | | 6 Month | | 1 Year | | Since Inception1 |
| LoCorr Long/Short Equity Fund - Class A (without maximum load) | | 5/10/13 | | -6.01 | % | | 10.10 | % | | 6.90 | % |
| LoCorr Long/Short Equity Fund - Class A (with maximum load) | | 5/10/13 | | -11.41 | % | | 3.75 | % | | 1.49 | % |
| LoCorr Long/Short Equity Fund - Class C | | 5/10/13 | | -7.24 | % | | 8.41 | % | | 6.12 | % |
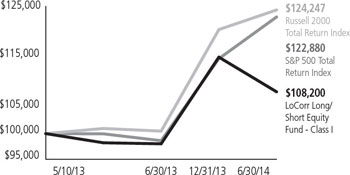
| LoCorr Long/Short Equity Fund - Class I | | 5/10/13 | | -5.91 | % | | 10.41 | % | | 7.16 | % |
| S&P 500 Total Return Index | | | | 7.14 | % | | 24.61 | % | | 19.82 | % |
| Russell 2000 Total Return Index | | | | 3.19 | % | | 23.64 | % | | 20.98 | % |
$100,000 investment in the
LoCorr Long/Short Equity Fund - Class I
For the period ended June 30, 2014 (Unaudited)
This chart illustrates the performance of a hypothetical $100,000 investment made in the Fund’s Class I shares since inception. Assumes reinvestment of dividends and capital gains, but does not reflect the effect of any applicable sales charge or redemption fees. This chart does not imply any future performance. Performance will vary from class to class based on differences in class-specific expenses and sales charges. The returns do not reflect the deduction of taxes that a shareholder would pay on Fund distributions or the redemption of Fund shares.
Performance data represents past performance; past performance does not guarantee future results. The investment return and principal value of an investment will fluctuate so that an investor’s shares, when redeemed, may be worth more or less than their original cost. Current performance of the Fund may be lower or higher than the performance quoted. Performance data current to the most recent month end may be obtained by calling 1.855.LCFUNDS, or visiting www.LoCorrFunds.com.
Performance data shown reflects the Class A maximum sales charge of 5.75% and reflects the Class C Contingent Deferred Sales Charge (CDSC) of 1.00%. Performance of the Class A without load does not reflect the deduction of the sales load or fee. If reflected, the load or fee would reduce the performance quoted.
The Fund imposes a 1.00% redemption fee on shares held for less than 30 days. Performance data does not reflect the redemption fee. If it had, return would be reduced.
Per the fee table in the Fund’s May 1, 2014 prospectus, the Fund’s annual operating expense ratio, before fee waivers is 5.09%, 5.84%, and 4.84% for Class A, Class C and Class I shares, respectively.
The S&P 500 Total Return Index is an unmanaged capitalization-weighted index of 500 stocks designed to measure performance of the broad domestic economy through changes in the aggregate market value of the 500 stocks which represent all major industries. The Russell 2000 Total Return Index measures the performance of the small-cap segment of the U.S. equity universe.
One cannot invest directly in an index.
1 Since inception returns as of May 10, 2013.
LoCorr Spectrum Income Fund
Rate of Return — For the period ended June 30, 2014 (Unaudited)
| | | Inception Date | | 6 Month | | Since Inception1 |
| LoCorr Spectrum Income Fund - Class A (without maximum load) | | 1/1/14 | | 7.39% | | 7.39% |
| LoCorr Spectrum Income Fund - Class A (with maximum load) | | 1/1/14 | | 1.22% | | 1.22% |
| LoCorr Spectrum Income Fund - Class C | | 1/1/14 | | 5.97% | | 5.97% |
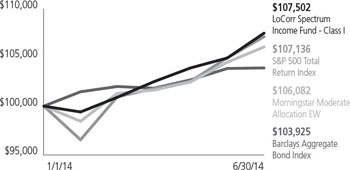
| LoCorr Spectrum Income Fund - Class I | | 1/1/14 | | 7.50% | | 7.50% |
| S&P 500 Total Return Index | | | | 7.14% | | 7.14% |
| Morningstar Moderate Allocation EW | | | | 5.44% | | 5.44% |
| Barclays Aggregate Bond Index | | | | 3.93% | | 3.93% |
$100,000 investment in the
LoCorr Spectrum Income Fund - Class I
For the period ended June 30, 2014 (Unaudited)
This chart illustrates the performance of a hypothetical $100,000 investment made in the Fund’s Class I shares since inception. Assumes reinvestment of dividends and capital gains, but does not reflect the effect of any applicable sales charge or redemption fees. This chart does not imply any future performance. Performance will vary from class to class based on differences in class-specific expenses and sales charges. The returns do not reflect the deduction of taxes that a shareholder would pay on Fund distributions or the redemption of Fund shares.
Performance data represents past performance; past performance does not guarantee future results. The investment return and principal value of an investment will fluctuate so that an investor’s shares, when redeemed, may be worth more or less than their original cost. Current performance of the Fund may be lower or higher than the performance quoted. Performance data current to the most recent month end may be obtained by calling 1.855.LCFUNDS, or visiting www.LoCorrFunds.com.
Performance data shown reflects the Class A maximum sales charge of 5.75% and reflects the Class C Contingent Deferred Sales Charge (CDSC) of 1.00%. Performance of the Class A without load does not reflect the deduction of the sales load or fee. If reflected, the load or fee would reduce the performance quoted.
The Fund imposes a 2.00% redemption fee on shares held for less than 60 days. Performance data does not reflect the redemption fee. If it had, return would be reduced.
Per the fee table in the Fund’s May 1, 2014 prospectus, the Fund’s annual operating expense ratio is 2.23%, 2.98%, and 1.98% for Class A, Class C and Class I shares, respectively.
The S&P 500 Total Return Index is an unmanaged capitalization-weighted index of 500 stocks designed to measure performance of the broad domestic economy through changes in the aggregate market value of the 500 stocks which represent all major industries. The Barclays Aggregate Bond Index is a long term, market capitalization-weighted index used to represent investment grade bonds being traded in the United States. The Morningstar Moderate Allocation portfolios seek to provide both capital appreciation and income by investing in three major areas: stocks, bonds and cash. Equal weighting (EW) gives each fund in the data set the same weight, regardless of assets.
One cannot invest directly in an index.
1 Cumulative total return since inception of January 1, 2014.
| |
| LoCorr Managed Futures Strategy Fund - Consolidated Schedule of Investments | 11 |
| |
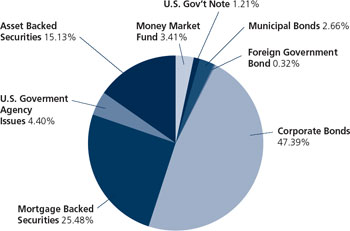
LoCorr Managed Futures Strategy Fund
Composition of Consolidated Investment Portfolio1
June 30, 2014 (Unaudited)
1 As a percentage of total investments.
Consolidated Schedule of Investments
June 30, 2014 (Unaudited)
| | Maturity Date | | Coupon Rate | | Principal Amount | | Value |
| ASSET BACKED SECURITIES: 11.48% | | | | | | | | | |
| 321 Henderson Receivables I LLC, 2004-A A1 (Acquired 02/08/2013, Cost, $472,235) (a)(c) | 09/15/2045 | | | 0.50 | % | | $ | 496,111 | | | $ | 483,151 |
| American Express Credit Account Master Trust | | | | | | | | | | | | |
| Series 2009-2 A (c) | 03/15/2017 | | | 1.40 | % | | | 150,000 | | | | 150,228 |
| Series 2012-2 A | 03/15/2018 | | | 0.68 | % | | | 2,500,000 | | | | 2,508,222 |
| American Homes 4 Rent 2014-SFR1 A (Acquired 05/13/2014, Cost, $1,080,000) (a)(c) | 06/17/2031 | | | 1.25 | % | | | 1,080,000 | | | | 1,081,464 |
| AmeriCredit Automobile Receivables Trust, 2012-1 A3 | 09/08/2016 | | | 1.23 | % | | | 979,116 | | | | 980,003 |
| Atlantic City Electric Transition Funding LLC | | | | | | | | | | | | |
| Series 2002-1 A3 | 07/20/2017 | | | 4.91 | % | | | 54,343 | | | | 55,437 |
| Series 2003-1 A3 | 10/20/2020 | | | 5.05 | % | | | 1,100,000 | | | | 1,196,790 |
| Cabela’s Master Credit Card Trust | | | | | | | | | | | | |
| Series 2010-2A A2 (Acquired 12/27/2012 and 02/08/2013, Cost, $2,287,819) (a)(c) | 09/15/2018 | | | 0.85 | % | | | 2,275,000 | | | | 2,286,698 |
| Series 2012-1A A1 (Acquired 05/08/2012 and 07/23/2012, Cost, $1,513,283) (a) | 02/18/2020 | | | 1.63 | % | | | 1,500,000 | | | | 1,520,337 |
| California Republic Auto Receivables Trust 2013-2 A2 | 03/15/2019 | | | 1.23 | % | | | 957,528 | | | | 964,260 |
| Capital One Multi-Asset Execution Trust, 2007-A2 A2 (c) | 12/15/2019 | | | 0.23 | % | | | 2,000,000 | | | | 1,991,352 |
| Carfinance Capital Auto Trust 2013-1A A (Acquired 05/21/2013, Cost, $982,355) (a) | 07/17/2017 | | | 1.65 | % | | | 982,376 | | | | 985,484 |
| CenterPoint Energy Restoration Bond Co. LLC, 2009-1 A2 (Acquired 08/25/2011, | | | | | | | | | | | | |
| 05/10/2013 and 05/15/2013, Cost, $1,882,794) (a) | 08/15/2019 | | | 3.46 | % | | | 1,792,000 | | | | 1,892,087 |
| CenterPoint Energy Transition Bond Co. IV LLC, 2012-1 A1 | 04/15/2018 | | | 0.90 | % | | | 2,119,987 | | | | 2,123,523 |
| Citibank Credit Card Issuance Trust, 2013-A12 (Acquired 03/19/2014, | | | | | | | | | | | | |
| Cost, $1,000,000) (a)(c) | 11/07/2018 | | | 0.45 | % | | | 1,000,000 | | | | 1,000,138 |
| Citibank Omni Master Trust, 2009-A14A A14 (Acquired 08/22/2013, | | | | | | | | | | | | |
| Cost, $1,504,445) (a)(c) | 08/15/2018 | | | 2.90 | % | | | 1,500,000 | | | | 1,504,863 |
| Colony American Homes 2014-1A A (Acquired 04/02/2014, Cost, $2,705,179) (a)(c) | 05/17/2031 | | | 1.40 | % | | | 2,711,652 | | | | 2,725,256 |
| Discover Card Execution Note Trust | | | | | | | | | | | | |
| Series 2011-A3 A (c) | 03/15/2017 | | | 0.36 | % | | | 1,000,000 | | | | 1,000,278 |
| Series 2012-A1 A1 | 08/15/2017 | | | 0.81 | % | | | 700,000 | | | | 702,027 |
| Series 2013-A1 A1 (c) | 08/17/2020 | | | 0.45 | % | | | 1,000,000 | | | | 1,001,389 |
| Dryrock Issuance Trust, 2012-2 A | 08/15/2018 | | | 0.64 | % | | | 1,500,000 | | | | 1,500,255 |
| Entergy Gulf States Reconstruction Funding 1 LLC, 2007-A A2 | 10/01/2018 | | | 5.79 | % | | | 1,055,791 | | | | 1,145,319 |
| Entergy Texas Restoration Funding LLC, 2009-A A1 | 02/01/2016 | | | 2.12 | % | | | 784,995 | | | | 788,865 |
| Fifth Third Auto Trust, 2013-A B | 04/15/2019 | | | 1.21 | % | | | 1,500,000 | | | | 1,505,558 |
| Ford Credit Auto Owner Trust, 2013-B A3 | 10/15/2017 | | | 0.57 | % | | | 3,000,000 | | | | 3,003,999 |
| Gracechurch Card Funding PLC, 2012-1A A1 (Acquired 03/02/2012, 05/15/2013 and | | | | | | | | | | | | |
| 03/19/2014, Cost, $2,553,753) (a)(b)(c) | 02/15/2017 | | | 0.85 | % | | | 2,550,000 | | | | 2,557,084 |
The accompanying notes are an integral part of these consolidated financial statements.
| |
12 | LoCorr Managed Futures Strategy Fund - Consolidated Schedule of Investments (continued) |
| |
| | Maturity Date | | Coupon Rate | | Principal Amount | | Value |
ASSET BACKED SECURITIES (continued) | | | | | | | | | |
| HLSS Servicer Advance Receivables Backed Notes | | | | | | | | | |
| Series 2013-T2 A2 (Acquired 05/17/2013, Cost, $2,249,998) (a) | 05/16/2044 | | | 1.15 | % | | $ | 2,250,000 | | | $ | 2,250,450 |
| Series 2013-T1 D2 (Acquired 01/16/2013, Cost, $750,000) (a) | 01/16/2046 | | | 3.23 | % | | | 750,000 | | | | 755,025 |
| Series 2013-T7 A7 (Acquired 03/28/2014, Cost, $438,350) (a) | 11/15/2046 | | | 1.98 | % | | | 440,000 | | | | 440,836 |
| Invitation Homes 2013-SFR1 Trust A (Acquired 11/05/2013, Cost, $1,239,255) (a)(c) | 12/17/2030 | | | 1.40 | % | | | 1,239,255 | | | | 1,245,104 |
| Santander Drive Auto Receivables Trust 2014-2 A2A | 07/17/2017 | | | 0.54 | % | | | 1,000,000 | | | | 1,000,262 |
| SMART Trust/Australia, 2012-2USA A3B (Acquired 02/08/2013, Cost, $918,476) (a)(b)(c) | 10/14/2016 | | | 1.10 | % | | | 914,712 | | | | 918,605 |
| United States Small Business Administration, 2008-10B 1 | 09/10/2018 | | | 5.73 | % | | | 65,076 | | | | 68,132 |
| TOTAL ASSET BACKED SECURITIES (Cost $43,228,154) | | | | | | | | | | | | 43,332,481 |
| | | | | | | | | | | | | |
| CORPORATE BONDS: 35.96% | | | | | | | | | | | | |
| Administrative and Support and Waste Management and Remediation Services: 0.49% | | | | | | | | | | | | |
| Xstrata Finance (Canada) Ltd. (Acquired 02/14/2012 and 03/12/2013, | | | | | | | | | | | | |
| Cost, $1,807,789) (a)(b) | 01/15/2017 | | | 3.60 | % | | | 1,750,000 | | | | 1,836,032 |
| | | | | | | | | | | | | |
| Finance and Insurance: 15.30% | | | | | | | | | | | | |
| Aflac Inc. | 02/15/2017 | | | 2.65 | % | | | 1,750,000 | | | | 1,818,540 |
| Allied World Assurance Co., Ltd. (b) | 08/01/2016 | | | 7.50 | % | | | 1,500,000 | | | | 1,686,147 |
| American Express Co. | 05/22/2018 | | | 1.55 | % | | | 1,000,000 | | | | 996,817 |
| American International Group, Inc. | 09/15/2016 | | | 4.88 | % | | | 1,500,000 | | | | 1,622,493 |
| Asciano Finance Limited (Acquired 03/12/2014, Cost, $2,153,900) (a)(b) | 04/07/2018 | | | 5.00 | % | | | 2,000,000 | | | | 2,177,746 |
| Bank of America, N.A. | 11/14/2016 | | | 1.13 | % | | | 4,475,000 | | | | 4,478,177 |
| Barclays Bank PLC (b) | 09/22/2016 | | | 5.00 | % | | | 1,000,000 | | | | 1,086,951 |
| Berkshire Hathaway Inc. | 08/15/2016 | | | 2.20 | % | | | 860,000 | | | | 887,376 |
| Boeing Capital Corp. | 08/15/2018 | | | 2.90 | % | | | 1,250,000 | | | | 1,317,799 |
| Capital One Financial Corp. | 09/01/2016 | | | 6.15 | % | | | 1,000,000 | | | | 1,106,665 |
| Citigroup, Inc. | 11/21/2017 | | | 6.13 | % | | | 4,465,000 | | | | 5,106,830 |
| Credit Agricole SA (Acquired 10/01/2012, Cost, $1,503,306) (a)(b) | 10/01/2017 | | | 3.00 | % | | | 1,500,000 | | | | 1,566,039 |
| Deutsche Bank Aktiengesellschaft (b) | 02/13/2019 | | | 2.50 | % | | | 1,060,000 | | | | 1,080,639 |
| Fifth Third Bancorp | 06/01/2018 | | | 4.50 | % | | | 1,000,000 | | | | 1,091,100 |
| Ford Motor Credit Company LLC | 01/17/2017 | | | 1.50 | % | | | 1,500,000 | | | | 1,508,154 |
| General Electric Capital Corp. | 04/27/2017 | | | 2.30 | % | | | 235,000 | | | | 242,722 |
| General Electric Capital Corp. | 05/01/2018 | | | 5.63 | % | | | 3,085,000 | | | | 3,534,901 |
| Goldman Sachs Group, Inc./The | 09/01/2017 | | | 6.25 | % | | | 4,135,000 | | | | 4,707,516 |
| Health Care REIT, Inc. | 04/01/2019 | | | 4.13 | % | | | 1,500,000 | | | | 1,613,536 |
| Heineken N.V. (Acquired 10/02/2012, Cost, $996,700) (a)(b) | 10/01/2017 | | | 1.40 | % | | | 1,000,000 | | | | 999,519 |
| ING Bank N.V. (Acquired 02/29/2012 and 10/23/2012, Cost, $1,524,097) (a)(b) | 03/07/2017 | | | 3.75 | % | | | 1,500,000 | | | | 1,595,505 |
| JPMorgan Chase & Co. | 01/15/2018 | | | 6.00 | % | | | 3,115,000 | | | | 3,567,046 |
| Morgan Stanley (c) | 10/18/2016 | | | 0.68 | % | | | 1,000,000 | | | | 998,884 |
| Morgan Stanley | 12/28/2017 | | | 5.95 | % | | | 1,565,000 | | | | 1,781,704 |
| Nomura Holdings, Inc. (b) | 09/13/2016 | | | 2.00 | % | | | 1,250,000 | | | | 1,270,400 |
| Nordea Bank AB (Acquired 02/12/2013, Cost, $1,038,661) (a)(b) | 03/20/2017 | | | 3.13 | % | | | 1,000,000 | | | | 1,053,394 |
| Private Export Funding Corp. | 05/15/2015 | | | 4.55 | % | | | 750,000 | | | | 778,185 |
| Private Export Funding Corp. | 02/15/2017 | | | 1.38 | % | | | 780,000 | | | | 790,354 |
| Rabobank Nederland (b) | 01/19/2017 | | | 3.38 | % | | | 1,000,000 | | | | 1,058,958 |
| Royal Bank of Scotland Group Public Limited Co./The (b) | 09/18/2015 | | | 2.55 | % | | | 1,000,000 | | | | 1,020,624 |
| Simon Property Group LP | 03/01/2017 | | | 5.88 | % | | | 1,000,000 | | | | 1,115,409 |
| Toyota Motor Credit Corp. | 05/22/2017 | | | 1.75 | % | | | 790,000 | | | | 805,189 |
| UBS AG (b) | 12/20/2017 | | | 5.88 | % | | | 872,000 | | | | 995,962 |
| WellPoint, Inc. | 01/15/2018 | | | 1.88 | % | | | 1,250,000 | | | | 1,258,775 |
| Wells Fargo & Co. | 06/15/2016 | | | 3.68 | % | | | 1,000,000 | | | | 1,055,303 |
| | | | | | | | | | | | | 57,775,359 |
| Health Care and Social Assistance: 0.77% | | | | | | | | | | | | |
| Catholic Health Initiatives | 11/01/2017 | | | 1.60 | % | | | 1,900,000 | | | | 1,869,879 |
| Quest Diagnostics Inc. | 11/01/2015 | | | 5.45 | % | | | 320,000 | | | | 339,015 |
| Quest Diagnostics Inc. | 07/01/2017 | | | 6.40 | % | | | 610,000 | | | | 692,560 |
| | | | | | | | | | | | | 2,901,454 |
| Information: 1.90% | | | | | | | | | | | | |
| AT&T Inc. | 02/12/2016 | | | 0.90 | % | | | 945,000 | | | | 947,501 |
| CBS Corp. | 07/01/2017 | | | 1.95 | % | | | 1,000,000 | | | | 1,016,618 |
| Comcast Corp. | 02/15/2018 | | | 5.88 | % | | | 1,000,000 | | | | 1,152,798 |
| DIRECTV Holdings LLC / DIRECTV Financing Co., Inc. | 03/15/2017 | | | 2.40 | % | | | 1,500,000 | | | | 1,544,772 |
| Total System Services, Inc. | 06/01/2018 | | | 2.38 | % | | | 1,000,000 | | | | 1,000,560 |
| Verizon Communications, Inc. | 09/14/2018 | | | 3.65 | % | | | 1,400,000 | | | | 1,497,273 |
| | | | | | | | | | | | | 7,159,522 |
The accompanying notes are an integral part of these consolidated financial statements.
| |
LoCorr Managed Futures Strategy Fund - Consolidated Schedule of Investments (continued) | 13 |
| |
| | Maturity Date | | Coupon Rate | | Principal Amount | | Value |
CORPORATE BONDS (continued) | | | | | | | | | |
| Management of Companies and Enterprises: 0.92% | | | | | | | | | |
| BNP Paribas (b) | 08/20/2018 | | | 2.70 | % | | $ | 1,750,000 | | | $ | 1,790,264 |
| Macy’s Retail Holdings, Inc. | 12/01/2016 | | | 5.90 | % | | | 1,500,000 | | | | 1,671,627 |
| | | | | | | | | | | | | 3,461,891 |
| Manufacturing: 8.48% | | | | | | | | | | | | |
| ACTAVIS, Inc. | 10/01/2017 | | | 1.88 | % | | | 1,500,000 | | | | 1,513,379 |
| Anheuser-Busch Companies LLC | 10/15/2016 | | | 5.05 | % | | | 1,500,000 | | | | 1,638,574 |
| Apple Inc. (c) | 05/05/2017 | | | 0.29 | % | | | 2,920,000 | | | | 2,919,988 |
| Cisco Systems, Inc. | 03/14/2017 | | | 3.15 | % | | | 1,285,000 | | | | 1,356,510 |
| ConAgra Foods, Inc. | 01/25/2018 | | | 1.90 | % | | | 1,500,000 | | | | 1,503,616 |
| Dow Chemical Co./The | 02/15/2016 | | | 2.50 | % | | | 1,290,000 | | | | 1,325,328 |
| Dr Pepper Snapple Group, Inc. | 01/15/2016 | | | 2.90 | % | | | 1,000,000 | | | | 1,034,187 |
| Eastman Chemical Co. | 06/01/2017 | | | 2.40 | % | | | 2,000,000 | | | | 2,059,068 |
| Ecolab Inc. | 12/08/2017 | | | 1.45 | % | | | 1,500,000 | | | | 1,501,920 |
| EMC Corp. | 06/01/2018 | | | 1.88 | % | | | 1,750,000 | | | | 1,761,562 |
| Hershey Co./The | 11/01/2016 | | | 1.50 | % | | | 1,000,000 | | | | 1,018,355 |
| Hewlett-Packard Co. | 12/01/2020 | | | 3.75 | % | | | 1,500,000 | | | | 1,567,874 |
| Johnson Controls, Inc. | 11/02/2017 | | | 1.40 | % | | | 1,255,000 | | | | 1,254,125 |
| Kellogg Co. | 05/21/2018 | | | 3.25 | % | | | 1,500,000 | | | | 1,578,972 |
| Lorillard Tobacco Co. | 08/21/2017 | | | 2.30 | % | | | 1,500,000 | | | | 1,530,954 |
| Motorola Solutions, Inc. | 11/15/2017 | | | 6.00 | % | | | 1,250,000 | | | | 1,419,323 |
| Reynolds American Inc. | 10/30/2015 | | | 1.05 | % | | | 1,800,000 | | | | 1,799,653 |
| Sherwin-Williams Co./The | 12/15/2017 | | | 1.35 | % | | | 1,640,000 | | | | 1,642,116 |
| Thermo Fisher Scientific Inc. | 02/01/2017 | | | 1.30 | % | | | 565,000 | | | | 565,833 |
| Tyco Electronics Group S.A. (b) | 12/17/2018 | | | 2.38 | % | | | 1,000,000 | | | | 1,007,827 |
| Tyco International Finance S.A. (b) | 10/15/2015 | | | 3.38 | % | | | 1,000,000 | | | | 1,029,295 |
| Zoetis Inc. | 02/01/2018 | | | 1.88 | % | | | 1,000,000 | | | | 1,002,250 |
| | | | | | | | | | | | | 32,030,709 |
| Mining, Quarrying, and Oil and Gas Extraction: 3.69% | | | | | | | | | | | | |
| Anadarko Petroleum Corp. | 09/15/2017 | | | 6.38 | % | | | 1,000,000 | | | | 1,151,340 |
| BHP Billiton Finance (USA) Ltd. (b) | 02/24/2017 | | | 1.63 | % | | | 1,015,000 | | | | 1,032,786 |
| Ensco PLC (b) | 03/15/2016 | | | 3.25 | % | | | 1,575,000 | | | | 1,639,180 |
| Noble Holding International, Ltd. (b) | 08/01/2015 | | | 3.45 | % | | | 1,150,000 | | | | 1,182,788 |
| Occidental Petroleum Corp. | 02/15/2018 | | | 1.50 | % | | | 425,000 | | | | 424,109 |
| Petrobras International Finance Co. (b) | 02/06/2017 | | | 3.50 | % | | | 880,000 | | | | 903,320 |
| Phillips 66 | 05/01/2017 | | | 2.95 | % | | | 1,500,000 | | | | 1,572,046 |
| Rio Tinto Finance (USA) PLC (b) | 08/21/2017 | | | 1.63 | % | | | 1,505,000 | | | | 1,522,673 |
| Sinopec Group Overseas Development (2014) Ltd. (Acquired 04/02/2014, | | | | | | | | | | | | |
| Cost, $1,500,000) (a)(b)(c) | 04/10/2017 | | | 1.01 | % | | | 1,500,000 | | | | 1,501,227 |
| Teck Resources Ltd. (b) | 08/15/2017 | | | 3.85 | % | | | 2,000,000 | | | | 2,128,502 |
| Vale Overseas Ltd. (b) | 01/11/2016 | | | 6.25 | % | | | 825,000 | | | | 886,534 |
| | | | | | | | | | | | | 13,944,505 |
| Professional, Scientific, and Technical Services: 0.24% | | | | | | | | | | | | |
| Computer Sciences Corp. | 03/15/2018 | | | 6.50 | % | | | 795,000 | | | | 920,507 |
| | | | | | | | | | | | | |
| Real Estate and Rental and Leasing: 0.51% | | | | | | | | | | | | |
| Penske Truck Leasing Co. LP / PTL Finance Corp. (Acquired 05/14/2012, Cost, $902,599) (a) | 05/11/2015 | | | 3.13 | % | | | 900,000 | | | | 919,580 |
| Ventas Realty LP / Ventas Capital Corp. | 02/15/2018 | | | 2.00 | % | | | 1,000,000 | | | | 1,008,202 |
| | | | | | | | | | | | | 1,927,782 |
| Retail Trade: 0.87% | | | | | | | | | | | | |
| BP Capital Markets (b) | 11/01/2016 | | | 2.25 | % | | | 1,000,000 | | | | 1,031,054 |
| Tesco PLC (Acquired 07/17/2013, Cost, $2,205,816) (a)(b) | 11/15/2017 | | | 5.50 | % | | | 2,000,000 | | | | 2,243,316 |
| | | | | | | | | | | | | 3,274,370 |
| Transportation and Warehousing: 0.99% | | | | | | | | | | | | |
| Carnival Corp. (b) | 12/15/2017 | | | 1.88 | % | | | 775,000 | | | | 779,482 |
| GATX Corp. | 07/30/2018 | | | 2.38 | % | | | 2,000,000 | | | | 2,017,488 |
| Spectra Energy Partners, LP | 09/25/2018 | | | 2.95 | % | | | 915,000 | | | | 949,806 |
| | | | | | | | | | | | | 3,746,776 |
| Utilities: 0.57% | | | | | | | | | | | | |
| Exelon Generation Co., LLC | 10/01/2019 | | | 5.20 | % | | | 1,000,000 | | | | 1,124,650 |
| Sempra Energy | 04/01/2017 | | | 2.30 | % | | | 1,000,000 | | | | 1,026,550 |
| | | | | | | | | | | | | 2,151,200 |
The accompanying notes are an integral part of these consolidated financial statements.
| |
14 | LoCorr Managed Futures Strategy Fund - Consolidated Schedule of Investments (continued) |
| |
| | Maturity Date | | Coupon Rate | | Principal Amount | | Value |
CORPORATE BONDS (continued) | | | | | | | | | |
| Wholesale Trade: 1.23% | | | | | | | | | |
| B.A.T. International Finance P.L.C. (Acquired 06/06/2012, Cost, $995,160) (a)(b) | 06/07/2017 | | | 2.13 | % | | $ | 1,000,000 | | | $ | 1,024,738 |
| Express Scripts Holding Co. | 11/15/2016 | | | 3.50 | % | | | 1,500,000 | | | | 1,592,683 |
| Samsung Electronics America, Inc. (Acquired 04/18/2013, Cost, $2,025,711) (a) | 04/10/2017 | | | 1.75 | % | | | 2,000,000 | | | | 2,009,352 |
| | | | | | | | | | | | | 4,626,773 |
| TOTAL CORPORATE BONDS (Cost $134,171,224) | | | | | | | | | | | | 135,756,880 |
| | | | | | | | | | | | | |
| MORTGAGE BACKED SECURITIES: 19.34% | | | | | | | | | | | | |
| American Tower Trust I, 2013-1-2 (Acquired 03/06/2013, Cost, $1,830,000) (a) | 03/15/2043 | | | 1.55 | % | | | 1,830,000 | | | | 1,822,554 |
| Bear Stearns Commercial Mortgage Securities Trust | | | | | | | | | | | | |
| Series 2006-PWR12 A4 (c) | 09/11/2038 | | | 5.90 | % | | | 2,235,000 | | | | 2,406,536 |
| Series 2005-PWR10 A4 (c) | 12/11/2040 | | | 5.41 | % | | | 2,250,000 | | | | 2,340,486 |
| CD 2005-CD1 Commercial Mortgage Trust, 2005-CD1 A4 (c) | 07/15/2044 | | | 5.40 | % | | | 245,214 | | | | 254,970 |
| COMM 2012-CCRE2 Mortgage Trust, 2012-CR2 A1 | 08/15/2045 | | | 0.82 | % | | | 1,896,954 | | | | 1,899,961 |
| COMM 2012-CCRE4 Mortgage Trust, 2012-CR4 A2 | 10/15/2045 | | | 1.80 | % | | | 2,000,000 | | | | 2,010,066 |
| COMM 2012-LC4 Mortgage Trust, 2012-LC4 A1 | 12/10/2044 | | | 1.16 | % | | | 520,037 | | | | 522,971 |
| Commercial Mortgage Trust, 2007-GG11 A4 | 12/10/2049 | | | 5.74 | % | | | 1,250,000 | | | | 1,389,634 |
| CSMC Trust, 2013-6 1A1 (Acquired 07/24/2013, Cost, $2,689,103) (a)(c) | 07/25/2028 | | | 2.50 | % | | | 2,755,405 | | | | 2,750,668 |
| DBUBS 2011-LC3 Mortgage Trust, A2 | 08/10/2044 | | | 3.64 | % | | | 1,990,000 | | | | 2,089,681 |
| Extended Stay America Trust | | | | | | | | | | | | |
| Series 2013-ESFL A2FL (Acquired 01/24/2013, Cost, $1,565,000) (a)(c) | 12/05/2031 | | | 0.85 | % | | | 1,565,000 | | | | 1,564,131 |
| Series 2013-ESFL A1FL (Acquired 01/24/2013, Cost, $782,652) (a)(c) | 12/05/2031 | | | 0.95 | % | | | 782,652 | | | | 782,891 |
| Fannie Mae-Aces | | | | | | | | | | | | |
| Series 2009-M1 A1 | 07/25/2019 | | | 3.40 | % | | | 363,675 | | | | 377,887 |
| Series 2012-M8 ASQ1 | 12/25/2019 | | | 1.17 | % | | | 1,142,200 | | | | 1,151,120 |
| Fannie Mae Pool | 01/01/2016 | | | 2.67 | % | | | 376,218 | | | | 376,225 |
| Fannie Mae Pool | 02/01/2021 | | | 3.50 | % | | | 106,156 | | | | 112,651 |
| Fannie Mae Pool | 06/01/2021 | | | 3.50 | % | | | 139,119 | | | | 147,626 |
| Fannie Mae Pool | 08/01/2021 | | | 3.00 | % | | | 373,008 | | | | 390,005 |
| Fannie Mae Pool | 09/01/2021 | | | 3.00 | % | | | 447,033 | | | | 467,408 |
| Fannie Mae Pool | 11/01/2021 | | | 3.00 | % | | | 853,340 | | | | 892,302 |
| Fannie Mae Pool | 12/01/2025 | | | 3.50 | % | | | 582,012 | | | | 617,563 |
| Fannie Mae Pool | 09/01/2026 | | | 3.50 | % | | | 568,339 | | | | 603,054 |
| Fannie Mae Pool (c) | 10/01/2033 | | | 2.55 | % | | | 1,293,913 | | | | 1,387,729 |
| FDIC Commercial Mortgage Trust | | | | | | | | | | | | |
| Series 2011-C1 A (Acquired 06/06/2012, Cost, $107,817) (a)(c) | 04/25/2031 | | | 1.84 | % | | | 107,205 | | | | 107,570 |
| Series 2012-C1 A (Acquired 05/10/2012, Cost, $455,524) (a)(c) | 05/25/2035 | | | 0.84 | % | | | 455,524 | | | | 456,662 |
| FDIC Guaranteed Notes Trust | | | | | | | | | | | | |
| Series 2010-S4 A (Acquired 02/24/2012, Cost, $682,078) (a)(c) | 12/04/2020 | | | 0.87 | % | | | 679,701 | | | | 683,689 |
| Series 2010-S1 2A (Acquired 03/01/2012, Cost, $788,907) (a) | 04/25/2038 | | | 3.25 | % | | | 776,778 | | | | 801,095 |
| Series 2010-S1 1A (Acquired 11/18/2011, Cost, $442,039) (a)(c) | 02/25/2048 | | | 0.70 | % | | | 442,731 | | | | 442,928 |
| FHLMC Multifamily Structured Pass Through Certificates | | | | | | | | | | | | |
| Series K501 A1 | 06/25/2016 | | | 1.34 | % | | | 467,775 | | | | 471,761 |
| Series K703 A1 | 01/25/2018 | | | 1.87 | % | | | 373,021 | | | | 380,535 |
| Series K709 A1 | 10/25/2018 | | | 1.56 | % | | | 1,456,403 | | | | 1,475,379 |
| Fosse Master Issuer PLC, 2011-1A A2 (Acquired 09/30/2011 and 06/27/2012, | | | | | | | | | | | | |
| Cost, $947,164) (a)(b)(c) | 10/19/2054 | | | 1.63 | % | | | 947,088 | | | | 947,526 |
| Freddie Mac REMICS, 3855 HE | 02/15/2026 | | | 2.50 | % | | | 49,254 | | | | 50,493 |
| Freddie Mac Structured Agency Credit Risk Debt Notes | | | | | | | | | | | | |
| Series 2013-DN2 M1 (c) | 11/25/2023 | | | 1.60 | % | | | 1,800,096 | | | | 1,819,562 |
| Series 2014-DN2 M1 (c) | 04/25/2024 | | | 1.00 | % | | | 2,269,222 | | | | 2,273,400 |
| FREMF Mortgage Trust 2013-KF02, (Acquired 11/01/2013, Cost, $1,357,766) (a)(c) | 12/25/2045 | | | 2.82 | % | | | 1,357,766 | | | | 1,387,379 |
| GS Mortgage Securities Corp. II, 2005-GG4 A4A | 07/10/2039 | | | 4.75 | % | | | 235,284 | | | | 240,116 |
| GS Mortgage Securities Trust | | | | | | | | | | | | |
| Series 2010-C2 A1 (Acquired 04/11/2012, Cost, $1,441,286) (a) | 12/10/2043 | | | 3.85 | % | | | 1,361,619 | | | | 1,427,035 |
| Series 2011-GC5 A2 | 08/10/2044 | | | 3.00 | % | | | 1,715,000 | | | | 1,778,939 |
| Series 2007-GG10 A4 (c) | 08/10/2045 | | | 6.00 | % | | | 2,065,815 | | | | 2,287,607 |
| Holmes Master Issuer PLC, 2012-1A A2 (Acquired 01/18/2012, Cost, $720,682) (a)(b)(c) | 10/15/2054 | | | 1.88 | % | | | 720,682 | | | | 726,900 |
| JPMorgan Chase Commercial Mortgage Securities Trust | | | | | | | | | | | | |
| Series 2013-FL3 A2 (Acquired 04/24/2013, Cost, $1,104,315) (a)(c) | 04/15/2028 | | | 0.85 | % | | | 1,104,315 | | | | 1,103,088 |
| Series 2013-JWRZ A (Acquired 05/22/2013, Cost, $2,960,000) (a)(c) | 04/15/2030 | | | 0.93 | % | | | 2,960,000 | | | | 2,961,344 |
| Series 2010-C1 A1 (Acquired 12/30/2011, Cost, $1,203,298) (a) | 06/15/2043 | | | 3.85 | % | | | 1,156,341 | | | | 1,181,322 |
| Series 2005-LDP5 A4 (c) | 12/15/2044 | | | 5.41 | % | | | 250,000 | | | | 261,428 |
| Series 2007-CIBC20 A4 (c) | 02/12/2051 | | | 5.79 | % | | | 1,400,000 | | | | 1,553,286 |
The accompanying notes are an integral part of these consolidated financial statements.
| |
LoCorr Managed Futures Strategy Fund - Consolidated Schedule of Investments (continued) | 15 |
| |
| | Maturity Date | | Coupon Rate | | Principal Amount | | Value |
MORTGAGE BACKED SECURITIES (continued) | | | | | | | | | |
| Morgan Stanley Capital I Trust | | | | | | | | | |
| Series 2008-TOP29 A4 (c) | 01/11/2043 | | | 6.46 | % | | $ | 1,250,000 | | | $ | 1,435,828 |
| Series 2011-C1 A2 (Acquired 09/20/2011 and 06/28/2012, Cost, $2,263,467) (a) | 09/17/2047 | | | 3.88 | % | | | 2,150,000 | | | | 2,233,667 |
| Motel 6 Trust, 2012-MTL6 A2 (Acquired 11/02/2012, Cost, $1,999,992) (a) | 10/05/2025 | | | 1.95 | % | | | 2,000,000 | | | | 2,002,272 |
| NCUA Guaranteed Notes Trust | | | | | | | | | | | | |
| Series 2010-R2 1A (c) | 11/06/2017 | | | 0.52 | % | | | 2,189,557 | | | | 2,194,306 |
| Series 2011-R1 1A (c) | 01/08/2020 | | | 0.60 | % | | | 100,172 | | | | 100,669 |
| Series 2011-R2 1A (c) | 02/06/2020 | | | 0.55 | % | | | 2,694,078 | | | | 2,703,163 |
| Series 2011-R3 1A (c) | 03/11/2020 | | | 0.55 | % | | | 3,152,153 | | | | 3,160,772 |
| Series 2010-R1 1A (c) | 10/07/2020 | | | 0.60 | % | | | 320,298 | | | | 322,021 |
| SBA Tower Trust (Acquired 06/12/2014, Cost, $1,515,527) (a) | 12/15/2042 | | | 2.93 | % | | | 1,472,000 | | | | 1,500,121 |
| Sequoia Mortgage Trust, 2013-1 1A1 (c) | 02/25/2043 | | | 1.45 | % | | | 1,325,655 | | | | 1,268,752 |
| Springleaf Mortgage Loan Trust | | | | | | | | | | | | |
| Series 2013-3A A (Acquired 10/04/2013, Cost, $1,786,637) (a)(c) | 09/25/2057 | | | 1.87 | % | | | 1,786,873 | | | | 1,786,582 |
| Series 2013-1A A (Acquired 04/03/2013, Cost, $1,903,527) (a)(c) | 06/25/2058 | | | 1.27 | % | | | 1,903,678 | | | | 1,896,865 |
| Series 2012-3A A (Acquired 10/18/2012, Cost, $601,860) (a)(c) | 12/25/2059 | | | 1.57 | % | | | 601,939 | | | | 601,612 |
| WIMC Capital Trust, 2012-A A1 (Acquired 06/21/2012, Cost, $618,744) (a) | 10/16/2050 | | | 4.55 | % | | | 618,750 | | | | 627,276 |
| TOTAL MORTGAGE BACKED SECURITIES (Cost $73,140,692) | | | | | | | | | | | | 73,011,069 |
| | | | | | | | | | | | | |
| MUNICIPAL BONDS: 2.02% | | | | | | | | | | | | |
| County of Hamilton OH Sewer System Revenue | 12/01/2016 | | | 1.23 | % | | | 825,000 | | | | 822,814 |
| Louisiana Local Government Environmental Facilities & Community Development Authority | 02/01/2018 | | | 1.52 | % | | | 766,684 | | | | 772,173 |
| Louisiana Local Government Environmental Facilities & Community Development Authority | 02/01/2021 | | | 3.22 | % | | | 850,000 | | | | 889,627 |
| Metropolitan Council, (Minneapolis - St. Paul Metropolitan Area), State of Minnesota | 09/01/2017 | | | 1.20 | % | | | 2,020,000 | | | | 2,035,554 |
| Metropolitan Government of Nashville & Davidson County TN | 07/01/2017 | | | 1.21 | % | | | 1,500,000 | | | | 1,499,430 |
| State of Ohio | 08/01/2017 | | | 3.33 | % | | | 1,500,000 | | | | 1,605,480 |
| TOTAL MUNICIPAL BONDS (Cost $7,606,459) | | | | | | | | | | | | 7,625,078 |
| | | | | | | | | | | | | |
| FOREIGN GOVERNMENT BOND: 0.24% | | | | | | | | | | | | |
| Hydro-Quebec (b) | 06/30/2016 | | | 2.00 | % | | | 900,000 | | | | 924,030 |
| TOTAL FOREIGN GOVERNMENT BOND (Cost $909,214) | | | | | | | | | | | | 924,030 |
| | | | | | | | | | | | | |
| U.S. GOVERNMENT AGENCY ISSUES: 3.34% | | | | | | | | | | | | |
| Federal Home Loan Mortgage Corp. | 08/20/2014 | | | 1.00 | % | | | 4,000,000 | | | | 4,004,892 |
| Federal Home Loan Mortgage Corp. | 08/27/2014 | | | 1.00 | % | | | 3,000,000 | | | | 3,004,242 |
| Federal Home Loan Mortgage Corp. | 09/10/2015 | | | 1.75 | % | | | 1,000,000 | | | | 1,018,086 |
| Federal National Mortgage Association | 10/30/2014 | | | 0.63 | % | | | 1,060,000 | | | | 1,061,945 |
| Federal National Mortgage Association | 12/19/2014 | | | 0.75 | % | | | 3,500,000 | | | | 3,510,349 |
| TOTAL U.S. GOVERNMENT AGENCY ISSUES (Cost $12,577,378) | | | | | | | | | | | | 12,599,514 |
| | | | | | | | | | | | | |
| U.S. GOVERNMENT NOTE: 0.92% | | | | | | | | | | | | |
| United States Treasury Note | 10/31/2017 | | | 0.75 | % | | | 3,500,000 | | | | 3,466,092 |
| TOTAL U.S. GOVERNMENT NOTE (Cost $3,445,141) | | | | | | | | | | | | 3,466,092 |
| | | | | | | | | | | | | |
| SHORT TERM INVESTMENT: 2.58% | | | | | | | | | | | | |
| MONEY MARKET FUND: 2.58% | | | | | | | | Shares | | | | |
| Fidelity Institutional Money Market Portfolio - Class I , 0.05% (d) | | | | | | | | 9,761,451 | | | | 9,761,451 |
| TOTAL MONEY MARKET FUND (Cost $9,761,451) | | | | | | | | | | | | 9,761,451 |
| TOTAL SHORT TERM INVESTMENT (Cost $9,761,451) | | | | | | | | | | | | 9,761,451 |
| | | | | | | | | | | | | |
| TOTAL INVESTMENTS (Cost $284,839,713): 75.88% | | | | | | | | | | | | 286,476,595 |
| Other Assets in Excess of Liabilities, 24.12% (e) | | | | | | | | | | | | 91,081,602 |
| TOTAL NET ASSETS, 100.00% | | | | | | | | | | | $ | 377,558,197 |
(a) Restricted security as defined in Rule 144(a) under the Securities Act of 1933 and determined to be liquid. Purchased in a private placement
transaction; resale to the public may require registration or may extend only to qualified institutional buyers. At June 30, 2014, the fair value
of these securities total $68,368,207 which represents 18.11% of total net assets.
(b) Foreign issued security.
(c) Variable rate security. The rate reported is the rate in effect as of June 30, 2014.
(d) The rate quoted is the annualized seven-day effective yield as of June 30, 2014.
(e) Includes assets pledged as collateral for swap contracts.
The accompanying notes are an integral part of these consolidated financial statements.
16 | LoCorr Managed Futures Strategy Fund - Consolidated Schedule of Swap Contracts |
Consolidated Schedule of Swap Contracts
June 30, 2014 (Unaudited)
LONG TOTAL RETURN SWAP CONTRACTS
This investment is a holding of LCMFS Fund Limited. See Note 1.
| Termination Date | Reference Index | Notional | Unrealized Appreciation (Depreciation)* | Counterparty |
| | | | | |
| 12/20/17 | LoCorr Managed Futures Index^ | $385,769,768 | $(8,328,818) | Deutsche Bank AG |
^Comprised of a proprietary basket of Commodity Trading Advisors’ (“CTA”) Programs investing in various futures, forwards, and currency derivative contracts and other similar investments. See Notes 2 and 3.
* Unrealized depreciation is a payable on the Fund’s consolidated statement of assets and liabilities.
The accompanying notes are an integral part of these consolidated financial statements.
LoCorr Long/Short Commodities Strategy Fund - Consolidated Schedule of Investments | 17 |
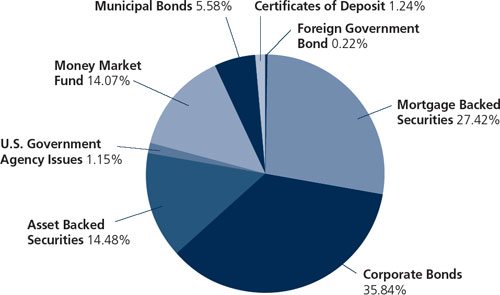
LoCorr Long/Short Commodities Strategy Fund
Composition of Consolidated Investment Portfolio1
June 30, 2014 (Unaudited)
1 As a percentage of total investments.
Consolidated Schedule of Investments
June 30, 2014 (Unaudited)
| | | | | | | | | | | |
| | | Maturity Date | | Coupon Rate | | Principal Amount | | Value |
| ASSET BACKED SECURITIES: 11.02% | | | | | | | | | | |
| Ally Auto Receivables Trust | | | | | | | | | | |
| Series 2012-4 A3 | | 01/17/2017 | | 0.59% | | $ | 21,120 | | $ | 21,140 |
| Series 2012-5 A3 | | 03/15/2017 | | 0.62% | | | 48,610 | | | 48,686 |
| American Homes 4 Rent 2014-SFR1 A (Acquired 05/13/2014, Cost, $100,000) (a)(c) | | 06/17/2031 | | 1.25% | | | 100,000 | | | 100,136 |
| AmeriCredit Automobile Receivables Trust | | | | | | | | | | |
| Series 2012-5 A2 | | 01/08/2016 | | 0.51% | | | 2,757 | | | 2,757 |
| Series 2013-2 A2 | | 11/08/2016 | | 0.53% | | | 21,987 | | | 21,994 |
| Series 2012-4 A3 | | 06/08/2017 | | 0.67% | | | 25,000 | | | 25,029 |
| Series 2013-1 A3 | | 10/10/2017 | | 0.61% | | | 45,000 | | | 45,037 |
| Series 2013-3 A3 | | 04/09/2018 | | 0.92% | | | 50,000 | | | 50,175 |
| Capital Auto Receivables Asset Trust | | | | | | | | | | |
| Series 2013-2 A1 | | 07/20/2015 | | 0.77% | | | 25,000 | | | 25,014 |
| Series 2013-1 A2 | | 07/20/2016 | | 0.62% | | | 48,997 | | | 49,020 |
| CarMax Auto Owner Trust, 2012-3 A3 | | 07/17/2017 | | 0.52% | | | 23,001 | | | 23,021 |
| Chase Issuance Trust 2013-A3 A3 (c) | | 04/15/2020 | | 0.43% | | | 100,000 | | | 99,972 |
| Citibank Credit Card Issuance Trust 2013-A11 (c) | | 02/07/2018 | | 0.39% | | | 100,000 | | | 100,078 |
| CNH Equipment Trust | | | | | | | | | | |
| Series 2012-B A3 | | 09/15/2017 | | 0.86% | | | 8,177 | | | 8,196 |
| Series 2012-C A3 | | 12/15/2017 | | 0.57% | | | 23,899 | | | 23,920 |
| Series 2012-D A3 | | 04/16/2018 | | 0.65% | | | 50,000 | | | 50,088 |
| Colony American Homes 2014-1A A (Acquired 04/02/2014, Cost, $99,455) (a)(c) | | 05/17/2031 | | 1.40% | | | 99,693 | | | 100,193 |
| Discover Card Execution Note Trust, 2010-A2 A2 (c) | | 03/15/2018 | | 0.73% | | | 100,000 | | | 100,527 |
| Fifth Third Auto Trust, 2013-A A3 | | 09/15/2017 | | 0.61% | | | 50,000 | | | 50,065 |
| GE Equipment Midticket LLC 2012-1 A3 | | 05/23/2016 | | 0.60% | | | 20,339 | | | 20,355 |
| GE Equipment Small Ticket LLC 2012-1A A3 (Acquired 05/22/2012, Cost, $9,474) (a) | | 09/21/2015 | | 1.04% | | | 9,475 | | | 9,492 |
| GE Equipment Transportation LLC 2012-2 A3 | | 07/25/2016 | | 0.62% | | | 25,323 | | | 25,350 |
| Honda Auto Receivables Owner Trust, 2012-4 A3 | | 08/18/2016 | | 0.52% | | | 24,595 | | | 24,623 |
| Hyundai Auto Receivables Trust, 2012-B A3 | | 09/15/2016 | | 0.62% | | | 13,711 | | | 13,725 |
| John Deere Owner Trust, 2013-A A3 | | 03/15/2017 | | 0.60% | | | 50,000 | | | 50,114 |
| Mercedes-Benz Auto Lease Trust, 2013-A A3 | | 02/15/2016 | | 0.59% | | | 50,000 | | | 50,035 |
The accompanying notes are an integral part of these consolidated financial statements.
18 | LoCorr Long/Short Commodities Strategy Fund - Consolidated Schedule of Investments (continued) |
| | | | | | | | | | | |
| | | Maturity Date | | Coupon Rate | | Principal Amount | | Value |
ASSET BACKED SECURITIES (continued) | | | | | | | | | | |
| Santander Drive Auto Receivables Trust | | | | | | | | | | |
| Series 2013-4 A2 | | 09/15/2016 | | 0.89% | | $ | 11,010 | | $ | 11,023 |
| Series 2013-1 A3 | | 06/15/2017 | | 0.62% | | | 22,901 | | | 22,922 |
| Series 2013-2 A3 | | 09/15/2017 | | 0.70% | | | 40,000 | | | 40,051 |
| Series 2013-3 A3 | | 10/16/2017 | | 0.70% | | | 50,000 | | | 50,110 |
| Small Business Administration Participation Certificates, 2012-20K 1 | | 11/01/2032 | | 2.09% | | | 22,749 | | | 21,742 |
| World Omni Auto Receivables Trust | | | | | | | | | | |
| Series 2012-A A3 | | 02/15/2017 | | 0.64% | | | 18,455 | | | 18,484 |
| Series 2012-B A3 | | 06/15/2017 | | 0.61% | | | 25,000 | | | 25,035 |
| Series 2013-A A3 | | 04/16/2018 | | 0.64% | | | 75,000 | | | 75,107 |
| TOTAL ASSET BACKED SECURITIES (Cost $1,401,835) | | | | | | | | | | 1,403,216 |
| | | | | | | | | | | |
| CORPORATE BONDS: 27.26% | | | | | | | | | | |
| Administrative and Support and Waste Management and Remediation Services: 0.97% | | | | | | | | | | |
| Glencore Finance (Canada) Ltd. (Acquired 04/07/2014, Cost, $82,220) (a)(b) | | 11/15/2016 | | 5.80% | | | 75,000 | | | 82,525 |
| Waste Management, Inc. | | 09/01/2016 | | 2.60% | | | 40,000 | | | 41,385 |
| | | | | | | | | | | 123,910 |
| Finance and Insurance: 11.05% | | | | | | | | | | |
| Aflac Inc. | | 02/15/2017 | | 2.65% | | | 40,000 | | | 41,567 |
| American Express Co. | | 05/22/2018 | | 1.55% | | | 40,000 | | | 39,873 |
| American International Group, Inc. | | 09/15/2016 | | 4.88% | | | 40,000 | | | 43,266 |
| Bank of America Corp. | | 08/01/2016 | | 6.50% | | | 30,000 | | | 33,252 |
| Bank of America, N.A. | | 11/14/2016 | | 1.13% | | | 50,000 | | | 50,036 |
| Bank of New York Mellon Corp./The | | 07/28/2016 | | 2.30% | | | 20,000 | | | 20,626 |
| Bank of Nova Scotia/The (b) | | 07/15/2016 | | 1.38% | | | 30,000 | | | 30,343 |
| BB&T Corp. | | 01/12/2018 | | 1.45% | | | 20,000 | | | 19,905 |
| Capital One Financial Corp. | | 09/01/2016 | | 6.15% | | | 40,000 | | | 44,267 |
| Caterpillar Financial Services Corp. | | 02/17/2015 | | 4.75% | | | 15,000 | | | 15,417 |
| Caterpillar Financial Services Corp. | | 05/29/2015 | | 1.10% | | | 10,000 | | | 10,075 |
| Citigroup, Inc. | | 11/21/2017 | | 6.13% | | | 75,000 | | | 85,780 |
| Deutsche Bank Aktiengesellschaft (b) | | 02/13/2019 | | 2.50% | | | 30,000 | | | 30,584 |
| Diageo Capital plc (b) | | 05/11/2017 | | 1.50% | | | 20,000 | | | 20,229 |
| Dragon 2012 LLC | | 03/12/2024 | | 1.97% | | | 21,157 | | | 20,801 |
| Fifth Third Bancorp | | 06/01/2018 | | 4.50% | | | 20,000 | | | 21,822 |
| General Electric Capital Corp. | | 12/11/2015 | | 1.00% | | | 10,000 | | | 10,077 |
| General Electric Capital Corp. | | 01/09/2017 | | 2.90% | | | 30,000 | | | 31,381 |
| General Electric Capital Corp. | | 05/01/2018 | | 5.63% | | | 55,000 | | | 63,021 |
| Goldman Sachs Group, Inc./The | | 01/15/2015 | | 5.13% | | | 35,000 | | | 35,837 |
| Goldman Sachs Group, Inc./The | | 09/01/2017 | | 6.25% | | | 60,000 | | | 68,307 |
| Health Care REIT, Inc. | | 04/01/2019 | | 4.13% | | | 35,000 | | | 37,649 |
| Heineken N.V. (Acquired 10/02/2012, Cost, $9,983) (a)(b) | | 10/01/2015 | | 0.80% | | | 10,000 | | | 10,032 |
| Helios Leasing I LLC | | 05/29/2024 | | 2.02% | | | 21,238 | | | 20,893 |
| Helios Leasing I LLC | | 07/24/2024 | | 1.73% | | | 21,699 | | | 21,035 |
| Helios Leasing I LLC | | 09/28/2024 | | 1.56% | | | 22,138 | | | 21,197 |
| John Deere Capital Corp. | | 06/29/2015 | | 0.95% | | | 15,000 | | | 15,092 |
| John Deere Capital Corp. | | 04/13/2017 | | 5.50% | | | 15,000 | | | 16,800 |
| JPMorgan Chase & Co. | | 08/15/2017 | | 2.00% | | | 65,000 | | | 66,102 |
| JPMorgan Chase & Co. | | 01/15/2018 | | 6.00% | | | 25,000 | | | 28,628 |
| KeyBank National Association | | 11/01/2017 | | 5.70% | | | 27,000 | | | 30,402 |
| Morgan Stanley | | 03/22/2017 | | 4.75% | | | 30,000 | | | 32,662 |
| MSN 41079 and 41084 Ltd. (b) | | 07/13/2024 | | 1.72% | | | 21,690 | | | 21,007 |
| New York Life Global Funding (Acquired 10/09/2012, Cost, $20,391) (a) | | 05/04/2015 | | 3.00% | | | 20,000 | | | 20,392 |
| Phoenix 2012 LLC | | 07/03/2024 | | 1.61% | | | 22,020 | | | 21,258 |
| PNC Funding Corp. | | 09/19/2016 | | 2.70% | | | 10,000 | | | 10,384 |
| Realty Income Corp. | | 09/15/2016 | | 5.95% | | | 15,000 | | | 16,549 |
| Safina Ltd. (b) | | 01/15/2022 | | 1.55% | | | 20,605 | | | 20,341 |
| Simon Property Group LP | | 03/01/2017 | | 5.88% | | | 40,000 | | | 44,616 |
| State Street Bank & Trust Co. | | 10/15/2018 | | 5.25% | | | 20,000 | | | 22,648 |
| Tagua Leasing LLC | | 11/16/2024 | | 1.58% | | | 22,146 | | | 21,214 |
| Total Capital International (b) | | 06/28/2017 | | 1.55% | | | 15,000 | | | 15,215 |
| Toyota Motor Credit Corp. | | 01/12/2017 | | 2.05% | | | 10,000 | | | 10,272 |
| Travelers Companies, Inc./The | | 12/01/2015 | | 5.50% | | | 16,000 | | | 17,106 |
The accompanying notes are an integral part of these consolidated financial statements.
LoCorr Long/Short Commodities Strategy Fund - Consolidated Schedule of Investments (continued) | 19 |
| | | | | | | | | | | |
| | | Maturity Date | | Coupon Rate | | Principal Amount | | Value |
CORPORATE BONDS (continued) | | | | | | | | | | |
| WellPoint, Inc. | | 01/15/2018 | | 1.88% | | $ | 45,000 | | $ | 45,316 |
| Wells Fargo & Co. | | 06/15/2016 | | 3.68% | | | 80,000 | | | 84,424 |
| | | | | | | | | | | 1,407,700 |
| Information: 1.85% | | | | | | | | | | |
| AT&T Inc. | | 05/15/2016 | | 2.95% | | | 10,000 | | | 10,393 |
| AT&T Inc. | | 06/01/2017 | | 1.70% | | | 10,000 | | | 10,116 |
| CBS Corp. | | 07/01/2017 | | 1.95% | | | 30,000 | | | 30,499 |
| Comcast Corp. | | 06/15/2016 | | 4.95% | | | 8,000 | | | 8,650 |
| Comcast Corp. | | 02/15/2018 | | 5.88% | | | 35,000 | | | 40,348 |
| DIRECTV Holdings LLC / DIRECTV Financing Co., Inc. | | 03/15/2017 | | 2.40% | | | 35,000 | | | 36,045 |
| Total System Services, Inc. | | 06/01/2018 | | 2.38% | | | 45,000 | | | 45,025 |
| Verizon Communications, Inc. | | 09/14/2018 | | 3.65% | | | 35,000 | | | 37,432 |
| Walt Disney Co./The | | 09/15/2016 | | 5.63% | | | 15,000 | | | 16,593 |
| | | | | | | | | | | 235,101 |
| Management of Companies and Enterprises: 0.76% | | | | | | | | | | |
| BNP Paribas (b) | | 08/20/2018 | | 2.70% | | | 40,000 | | | 40,920 |
| Macy’s Retail Holdings, Inc. | | 12/01/2016 | | 5.90% | | | 50,000 | | | 55,721 |
| | | | | | | | | | | 96,641 |
| Manufacturing: 6.94% | | | | | | | | | | |
| AbbVie Inc. | | 11/06/2015 | | 1.20% | | | 20,000 | | | 20,135 |
| ACTAVIS, Inc. | | 10/01/2017 | | 1.88% | | | 40,000 | | | 40,357 |
| Anheuser-Busch InBev Worldwide Inc. | | 07/15/2015 | | 0.80% | | | 15,000 | | | 15,068 |
| Anheuser-Busch InBev Worldwide Inc. | | 02/15/2016 | | 2.88% | | | 15,000 | | | 15,555 |
| Apple Inc. (c) | | 05/05/2017 | | 0.29% | | | 95,000 | | | 95,001 |
| Baxter International Inc. | | 01/15/2017 | | 1.85% | | | 10,000 | | | 10,201 |
| Chevron Corp. | | 12/05/2017 | | 1.10% | | | 10,000 | | | 9,954 |
| Coca Cola Co./The | | 11/15/2017 | | 5.35% | | | 30,000 | | | 34,083 |
| ConAgra Foods, Inc. | | 01/25/2018 | | 1.90% | | | 40,000 | | | 40,096 |
| Covidien International Finance S.A. (b) | | 05/29/2015 | | 1.35% | | | 7,000 | | | 7,057 |
| Dow Chemical Co./The | | 02/15/2016 | | 2.50% | | | 40,000 | | | 41,095 |
| Eastman Chemical Co. | | 06/01/2017 | | 2.40% | | | 75,000 | | | 77,216 |
| Eaton Corp. | | 11/02/2017 | | 1.50% | | | 35,000 | | | 35,043 |
| Ecolab Inc. | | 02/15/2015 | | 4.88% | | | 15,000 | | | 15,407 |
| Ecolab Inc. | | 12/08/2016 | | 3.00% | | | 15,000 | | | 15,688 |
| E.I. du Pont de Nemours & Co. | | 03/15/2015 | | 4.75% | | | 14,000 | | | 14,419 |
| EMC Corp. | | 06/01/2018 | | 1.88% | | | 40,000 | | | 40,264 |
| General Mills, Inc. | | 03/17/2015 | | 5.20% | | | 25,000 | | | 25,840 |
| Intel Corp. | | 12/15/2017 | | 1.35% | | | 25,000 | | | 25,007 |
| Johnson Controls, Inc. | | 11/02/2017 | | 1.40% | | | 40,000 | | | 39,972 |
| Kellogg Co. | | 05/17/2017 | | 1.75% | | | 40,000 | | | 40,477 |
| Kraft Foods Group, Inc. | | 06/05/2017 | | 2.25% | | | 30,000 | | | 30,817 |
| Lockheed Martin Corp. | | 09/15/2016 | | 2.13% | | | 10,000 | | | 10,294 |
| Lorillard Tobacco Co. | | 08/21/2017 | | 2.30% | | | 40,000 | | | 40,825 |
| Motorola Solutions, Inc. | | 11/15/2017 | | 6.00% | | | 55,000 | | | 62,450 |
| Thermo Fisher Scientific Inc. | | 06/01/2015 | | 5.00% | | | 10,000 | | | 10,402 |
| Thermo Fisher Scientific Inc. | | 02/01/2017 | | 1.30% | | | 10,000 | | | 10,015 |
| Tyco Electronics Group S.A. (b) | | 12/17/2018 | | 2.38% | | | 30,000 | | | 30,235 |
| United Technologies Corp. | | 06/01/2017 | | 1.80% | | | 30,000 | | | 30,642 |
| | | | | | | | | | | 883,615 |
| Mining, Quarrying, and Oil and Gas Extraction: 2.23% | | | | | | | | | | |
| Anadarko Petroleum Corp. | | 09/15/2017 | | 6.38% | | | 25,000 | | | 28,784 |
| BHP Billiton Finance (USA) Ltd. (b) | | 02/24/2017 | | 1.63% | | | 35,000 | | | 35,613 |
| Devon Energy Corp. | | 05/15/2017 | | 1.88% | | | 15,000 | | | 15,259 |
| Phillips 66 | | 05/01/2017 | | 2.95% | | | 85,000 | | | 89,083 |
| Rio Tinto Finance (USA) PLC (b) | | 03/22/2017 | | 2.00% | | | 10,000 | | | 10,234 |
| Rio Tinto Finance (USA) PLC (b) | | 08/21/2017 | | 1.63% | | | 15,000 | | | 15,176 |
| Teck Resources Ltd. (b) | | 08/15/2017 | | 3.85% | | | 85,000 | | | 90,461 |
| | | | | | | | | | | 284,610 |
The accompanying notes are an integral part of these consolidated financial statements.
20 | LoCorr Long/Short Commodities Strategy Fund - Consolidated Schedule of Investments (continued) |
| | | | | | | | | | | |
| | | Maturity Date | | Coupon Rate | | Principal Amount | | Value |
CORPORATE BONDS (continued) | | | | | | | | | | |
| Professional, Scientific, and Technical Services: 0.44% | | | | | | | | | | |
| ABB Treasury Center (USA), Inc. (Acquired 06/19/2012, Cost, $15,258) (a) | | 06/15/2016 | | 2.50% | | $ | 15,000 | | $ | 15,447 |
| Computer Sciences Corp. | | 03/15/2018 | | 6.50% | | | 35,000 | | | 40,526 |
| | | | | | | | | | | 55,973 |
| Real Estate and Rental and Leasing: 0.42% | | | | | | | | | | |
| Boston Properties Limited Partnership | | 06/01/2015 | | 5.00% | | | 10,000 | | | 10,399 |
| Liberty Property Limited Partnership | | 10/01/2017 | | 6.63% | | | 25,000 | | | 28,596 |
| Ventas Realty LP / Ventas Capital Corp. | | 02/15/2018 | | 2.00% | | | 15,000 | | | 15,123 |
| | | | | | | | | | | 54,118 |
| Retail Trade: 0.16% | | | | | | | | | | |
| BP Capital Markets (b) | | 05/05/2017 | | 1.85% | | | 20,000 | | | 20,426 |
| | | | | | | | | | | |
| Transportation and Warehousing: 1.78% | | | | | | | | | | |
| Canadian National Railway Co. (b) | | 06/01/2016 | | 5.80% | | | 20,000 | | | 21,958 |
| Carnival Corp. (b) | | 12/15/2017 | | 1.88% | | | 15,000 | | | 15,087 |
| GATX Corp. | | 07/30/2018 | | 2.38% | | | 90,000 | | | 90,787 |
| Norfolk Southern Corp. | | 01/15/2016 | | 5.75% | | | 20,000 | | | 21,485 |
| Spectra Energy Partners, LP | | 09/25/2018 | | 2.95% | | | 50,000 | | | 51,902 |
| Union Pacific Corp. | | 01/15/2015 | | 4.88% | | | 25,000 | | | 25,610 |
| | | | | | | | | | | 226,829 |
| Utilities: 0.66% | | | | | | | | | | |
| Commonwealth Edison Co. | | 04/15/2015 | | 4.70% | | | 20,000 | | | 20,687 |
| Connecticut Light & Power Co./The | | 03/01/2017 | | 5.38% | | | 20,000 | | | 21,974 |
| Sempra Energy | | 04/01/2017 | | 2.30% | | | 25,000 | | | 25,664 |
| Southern California Edison Co. | | 04/01/2015 | | 4.65% | | | 15,000 | | | 15,481 |
| | | | | | | | | | | 83,806 |
| TOTAL CORPORATE BONDS (Cost $3,461,029) | | | | | | | | | | 3,472,729 |
| | | | | | | | | | | |
| MORTGAGE BACKED SECURITIES: 20.86% | | | | | | | | | | |
| Banc of America Commercial Mortgage Trust, 2006-2 A4 (c) | | 05/10/2045 | | 5.92% | | | 20,000 | | | 21,433 |
| Bear Stearns Commercial Mortgage Securities Trust | | | | | | | | | | |
| Series 2006-PWR12 A4 (c) | | 09/11/2038 | | 5.90% | | | 25,000 | | | 26,919 |
| Series 2006-PWR14 A4 | | 12/11/2038 | | 5.20% | | | 25,000 | | | 27,152 |
| Series 2006-TOP24 A4 | | 10/12/2041 | | 5.54% | | | 24,068 | | | 26,137 |
| Citigroup Commercial Mortgage Trust, 2006-C5 A4 | | 10/15/2049 | | 5.43% | | | 35,000 | | | 37,964 |
| Commercial Mortgage Pass-Through Certificates, 2012-CRE3 A1 | | 10/17/2045 | | 0.67% | | | 17,572 | | | 17,549 |
| Commercial Mortgage Trust, 2007-GG9 | | 03/10/2039 | | 5.44% | | | 80,000 | | | 87,293 |
| Credit Suisse Commercial Mortgage Trust, 2006-C1 A4 (c) | | 02/15/2039 | | 5.61% | | | 10,000 | | | 10,558 |
| Fannie Mae-Aces | | | | | | | | | | |
| Series 2012-M17 ASQ2 | | 11/25/2015 | | 0.95% | | | 101,920 | | | 102,531 |
| Series 2013-M3 ASQ2 | | 02/25/2016 | | 1.08% | | | 44,108 | | | 44,403 |
| Series 2013-M1 ASQ2 | | 11/25/2016 | | 1.07% | | | 71,753 | | | 72,259 |
| Series 2013-M7 ASQ2 | | 03/25/2018 | | 1.23% | | | 97,983 | | | 98,369 |
| Fannie Mae Pool | | 06/01/2017 | | 1.49% | | | 25,000 | | | 25,354 |
| Fannie Mae Pool | | 07/01/2017 | | 1.50% | | | 35,000 | | | 35,426 |
| Fannie Mae Pool | | 09/01/2017 | | 1.27% | | | 50,000 | | | 50,321 |
| Fannie Mae Pool | | 09/01/2022 | | 2.50% | | | 35,959 | | | 37,161 |
| Fannie Mae Pool | | 10/01/2022 | | 2.50% | | | 55,713 | | | 57,576 |
| Fannie Mae Pool | | 10/01/2022 | | 2.50% | | | 18,424 | | | 19,040 |
| Fannie Mae Pool | | 11/01/2022 | | 2.50% | | | 18,416 | | | 19,032 |
| Fannie Mae Pool | | 01/01/2023 | | 2.50% | | | 59,025 | | | 60,992 |
| Fannie Mae Pool | | 02/01/2023 | | 2.50% | | | 40,175 | | | 41,513 |
| Fannie Mae Pool | | 03/01/2023 | | 2.50% | | | 40,969 | | | 42,331 |
| Fannie Mae Pool | | 05/01/2023 | | 2.00% | | | 42,405 | | | 43,131 |
| Fannie Mae Pool | | 06/01/2023 | | 2.00% | | | 42,918 | | | 43,653 |
| Fannie Mae Pool | | 08/01/2023 | | 2.50% | | | 44,158 | | | 45,612 |
| Fannie Mae Pool | | 09/01/2023 | | 2.00% | | | 44,838 | | | 45,607 |
| Fannie Mae Pool | | 09/01/2027 | | 3.00% | | | 8,649 | | | 8,905 |
| Fannie Mae Pool | | 09/01/2027 | | 3.00% | | | 20,823 | | | 21,439 |
| Fannie Mae Pool | | 10/01/2027 | | 3.00% | | | 44,329 | | | 45,641 |
| Fannie Mae Pool | | 12/01/2027 | | 2.50% | | | 43,869 | | | 44,354 |
| Fannie Mae Pool | | 12/01/2027 | | 2.50% | | | 44,353 | | | 44,870 |
| Fannie Mae Pool (c) | | 09/01/2042 | | 2.31% | | | 19,229 | | | 19,579 |
The accompanying notes are an integral part of these consolidated financial statements.
LoCorr Long/Short Commodities Strategy Fund - Consolidated Schedule of Investments (continued) | 21 |
| | | | | | | | | | | |
| | | Maturity Date | | Coupon Rate | | Principal Amount | | Value |
MORTGAGE BACKED SECURITIES (continued) | | | | | | | | | | |
| FHLMC Multifamily Structured Pass Through Certificates | | | | | | | | | | |
| Series K502 A2 | | 08/25/2017 | | 1.43% | | $ | 130,000 | | $ | 131,098 |
| Series K701 A2 (c) | | 11/25/2017 | | 3.88% | | | 50,000 | | | 53,945 |
| Series K708 A2 | | 01/25/2019 | | 2.13% | | | 30,000 | | | 30,460 |
| Series K709 A2 | | 03/25/2019 | | 2.09% | | | 25,000 | | | 25,283 |
| Series KF01 A (c) | | 04/25/2019 | | 0.50% | | | 70,795 | | | 70,726 |
| Series K710 A2 | | 05/25/2019 | | 1.88% | | | 50,000 | | | 50,047 |
| Freddie Mac Gold Pool | | 04/01/2023 | | 2.50% | | | 41,233 | | | 42,443 |
| Freddie Mac Gold Pool | | 04/01/2023 | | 2.50% | | | 41,419 | | | 42,637 |
| Freddie Mac Gold Pool | | 12/01/2027 | | 2.50% | | | 21,970 | | | 22,137 |
| Freddie Mac Gold Pool | | 12/01/2027 | | 2.50% | | | 45,631 | | | 46,094 |
| Freddie Mac Gold Pool | | 12/01/2027 | | 2.50% | | | 45,956 | | | 46,307 |
| Freddie Mac Non Gold Pool (c) | | 07/01/2042 | | 2.17% | | | 11,543 | | | 11,914 |
| Freddie Mac Non Gold Pool (c) | | 07/01/2042 | | 2.38% | | | 14,321 | | | 14,880 |
| Freddie Mac Non Gold Pool (c) | | 07/01/2042 | | 2.43% | | | 17,862 | | | 18,291 |
| Freddie Mac Non Gold Pool (c) | | 08/01/2042 | | 2.59% | | | 16,295 | | | 16,765 |
| Freddie Mac Non Gold Pool (c) | | 10/01/2042 | | 2.19% | | | 16,783 | | | 17,309 |
| Freddie Mac Non Gold Pool (c) | | 01/01/2043 | | 2.16% | | | 64,778 | | | 65,509 |
| Freddie Mac Non Gold Pool (c) | | 01/01/2043 | | 2.21% | | | 20,045 | | | 20,302 |
| Freddie Mac Non Gold Pool (c) | | 02/01/2043 | | 2.14% | | | 43,667 | | | 44,125 |
| GS Mortgage Securities Trust | | | | | | | | | | |
| Series 2006-GG8 A4 | | 11/10/2039 | | 5.56% | | | 25,000 | | | 27,109 |
| Series 2007-GG10 A4 (c) | | 08/10/2045 | | 6.00% | | | 90,805 | | | 100,554 |
| JP Morgan Chase Commercial Mortgage Securities Trust | | | | | | | | | | |
| Series 2006-LDP6 A4 (c) | | 04/15/2043 | | 5.48% | | | 33,610 | | | 35,740 |
| Series 2006-LDP7 A4 (c) | | 04/15/2045 | | 5.86% | | | 25,000 | | | 26,891 |
| Series 2012-C8 ASB (Acquired 04/23/2013, Cost, $50,846) (a) | | 10/17/2045 | | 2.38% | | | 50,000 | | | 50,015 |
| LB Commercial Mortgage Trust, 2007-C3 A4B | | 07/15/2044 | | 5.52% | | | 35,000 | | | 38,451 |
| LB-UBS Commercial Mortgage Trust, 2006-C6 A4 | | 09/15/2039 | | 5.37% | | | 40,000 | | | 43,292 |
| Morgan Stanley Bank of America Merrill Lynch Trust, 2012-C6 A1 | | 11/17/2045 | | 0.66% | | | 17,318 | | | 17,268 |
| Morgan Stanley Capital I Trust | | | | | | | | | | |
| Series 2006-IQ12 A4 | | 12/15/2043 | | 5.33% | | | 24,243 | | | 26,118 |
| Series 2006-TOP21 A4 (c) | | 10/12/2052 | | 5.16% | | | 25,000 | | | 26,173 |
| NCUA Guaranteed Notes Trust | | | | | | | | | | |
| Series 2010-R2 1A (c) | | 11/06/2017 | | 0.52% | | | 31,702 | | | 31,771 |
| Series 2011-R2 1A (c) | | 02/06/2020 | | 0.55% | | | 92,569 | | | 92,881 |
| SBA Tower Trust (Acquired 06/12/2014, Cost, $46,331) (a) | | 12/15/2042 | | 2.93% | | | 45,000 | | | 45,860 |
| TOTAL MORTGAGE BACKED SECURITIES (Cost $2,644,990) | | | | | | | | | | 2,656,499 |
| | | | | | | | | | | |
| MUNICIPAL BONDS: 4.24% | | | | | | | | | | |
| City of El Paso, TX | | 08/15/2014 | | 3.61% | | | 50,000 | | | 50,190 |
| City of Huntsville, AL | | 09/01/2016 | | 2.41% | | | 40,000 | | | 41,158 |
| City of Lubbock, TX | | 02/15/2018 | | 4.44% | | | 25,000 | | | 27,273 |
| City of Rochester, MN | | 02/01/2016 | | 2.25% | | | 25,000 | | | 25,301 |
| County of Berks, PA | | 11/15/2016 | | 1.01% | | | 25,000 | | | 24,859 |
| County of Forsyth, NC | | 04/01/2020 | | 3.55% | | | 30,000 | | | 32,275 |
| Denton Independent School District | | 08/15/2015 | | 2.00% | | | 40,000 | | | 40,726 |
| Maricopa County School District No. 28 Kyrene Elementary | | 07/01/2019 | | 5.38% | | | 15,000 | | | 17,335 |
| Rosemount-Apple Valley-Eagan Independent School District No. 196 | | 02/01/2019 | | 5.00% | | | 25,000 | | | 28,419 |
| State of Hawaii | | 02/01/2017 | | 3.73% | | | 25,000 | | | 26,535 |
| State of Mississippi | | 11/01/2017 | | 1.35% | | | 30,000 | | | 30,035 |
| State of Ohio | | 04/01/2018 | | 3.66% | | | 45,000 | | | 48,657 |
| State of Tennessee | | 05/01/2017 | | 3.82% | | | 25,000 | | | 26,965 |
| State of Texas | | 10/01/2017 | | 2.50% | | | 25,000 | | | 26,054 |
| State of Washington | | 02/01/2017 | | 3.04% | | | 40,000 | | | 42,254 |
| University of Texas System | | 08/15/2018 | | 3.81% | | | 25,000 | | | 27,206 |
| Virginia College Building Authority | | 02/01/2016 | | 2.40% | | | 25,000 | | | 25,564 |
| TOTAL MUNICIPAL BONDS (Cost $537,810) | | | | | | | | | | 540,806 |
| | | | | | | | | | | |
| FOREIGN GOVERNMENT BOND: 0.17% | | | | | | | | | | |
| Petroleos Mexicanos (b) | | 12/20/2022 | | 2.00% | | | 21,250 | | | 21,136 |
| TOTAL FOREIGN GOVERNMENT BOND (Cost $21,250) | | | | | | | | | | 21,136 |
The accompanying notes are an integral part of these consolidated financial statements.
22 | LoCorr Long/Short Commodities Strategy Fund - Consolidated Schedule of Investments (continued) |
| | | | | | | | | | | |
| | | Maturity Date | | Coupon Rate | | Principal Amount | | Value |
| U.S. GOVERNMENT AGENCY ISSUES: 0.87% | | | | | | | | | | |
| Ginnie Mae II Pool | | 07/20/2060 | | 5.31% | | $ | 25,298 | | $ | 28,070 |
| Ginnie Mae II Pool | | 07/20/2062 | | 4.56% | | | 25,141 | | | 27,637 |
| Ginnie Mae II Pool | | 08/20/2062 | | 4.12% | | | 51,028 | | | 55,322 |
| TOTAL U.S. GOVERNMENT AGENCY ISSUES (Cost $111,181) | | | | | | | | | | 111,029 |
| | | | | | | | | | | |
| CERTIFICATES OF DEPOSIT: 0.94% | | | | | | | | | | |
| BMW Bank of North America | | 07/18/2014 | | 1.00% | | | 40,000 | | | 39,880 |
| Discover Bank | | 07/11/2014 | | 1.00% | | | 40,000 | | | 39,880 |
| GE Capital Retail Bank | | 07/07/2014 | | 1.00% | | | 40,000 | | | 40,002 |
| TOTAL CERTIFICATES OF DEPOSIT ($119,680) | | | | | | | | | | 119,762 |
| | | | | | | | | | | |
| SHORT TERM INVESTMENT: 10.71% | | | | | | | | | | |
| MONEY MARKET FUND: 10.71% | | | | | | Shares | | | |
| Fidelity Institutional Money Market Portfolio - Class I , 0.05% (d) | | | | | | | 1,363,704 | | | 1,363,704 |
| TOTAL MONEY MARKET FUND (Cost $1,363,704) | | | | | | | | | | 1,363,704 |
| TOTAL SHORT TERM INVESTMENT (Cost $1,363,704) | | | | | | | | | | 1,363,704 |
| | | | | | | | | | | |
| TOTAL INVESTMENTS (Cost $9,661,479): 76.07% | | | | | | | | | | 9,688,881 |
| Other Assets in Excess of Liabilities, 23.93% (e) | | | | | | | | | | 3,048,319 |
| TOTAL NET ASSETS, 100.00% | | | | | | | | | $ | 12,737,200 |
(a) Restricted security as defined in Rule 144(a) under the Securities Act of 1933 and determined to be liquid. Purchased in a private
placement transaction; resale to the public may require registration or may extend only to qualified institutional buyers. At June 30, 2014,
the market value of these securities total $434,092 which represents 3.41% of total net assets.
(b) Foreign issued security.
(c) Variable rate security. The rate reported is the rate in effect as of June 30, 2014.
(d) The rate quoted is the annualized seven-day effective yield as of June 30, 2014.
(e) Includes assets pledged as collateral for swap contracts.
The accompanying notes are an integral part of these consolidated financial statements.
| |
LoCorr Long/Short Commodities Strategy Fund - Consolidated Schedule of Swap Contracts | 23 |
| |
Consolidated Schedule of Swap Contracts
June 30, 2014 (Unaudited)
LONG TOTAL RETURN SWAP CONTRACTS
This investment is a holding of LCLSCS Fund Limited. See Note 1.
| | | | | |
| Termination Date | Reference Index | Notional | Unrealized
Appreciation
(Depreciation)* | Counterparty |
| | | | | |
| 12/20/17 | LoCorr Commodities Index^ | $12,650,000 | $328,460 | Deutsche Bank AG |
^Comprised of a proprietary basket of Commodity Trading Advisor’s (“CTA”) Programs investing in various futures, forwards, and currency derivative contracts and other similar investments. See Notes 2 and 3.
*Unrealized appreciation is a receivable on the Fund’s consolidated statement of assets and liabilities.
The accompanying notes are an integral part of these consolidated financial statements.
| |
24 | LoCorr Long/Short Equity Fund - Schedule of Investments |
| |
LoCorr Long/Short Equity Fund
Composition of Investment Portfolio1
June 30, 2014 (Unaudited)
1 As a percentage of total investments.
Schedule of Investments
June 30, 2014 (Unaudited)
| | | | | | | |
| | | Shares | | Value |
| COMMON STOCKS: 96.24% | | | | | | |
| Accommodation and Food Services: 2.98% | | | | | | |
| Diamond Resorts International, Inc. (a) | | | 65,860 | | $ | 1,532,562 |
| University General Health System, Inc. (a) | | | 807,896 | | | 131,283 |
| | | | | | | 1,663,845 |
| Administrative and Support and Waste Management and Remediation Services: 4.70% | | | | | | |
| Hudson Technologies, Inc. (a) | | | 63,264 | | | 182,833 |
| TrueBlue, Inc. (a) | | | 40,000 | | | 1,102,800 |
| Vertex Energy, Inc. (a) | | | 137,285 | | | 1,333,037 |
| | | | | | | 2,618,670 |
| Construction: 2.39% | | | | | | |
| Tutor Perini Corporation (a) | | | 42,000 | | | 1,333,080 |
| | | | | | | |
| Finance and Insurance: 15.04% | | | | | | |
| Atlas Financial Holdings, Inc. (a)(b) | | | 83,312 | | | 1,263,010 |
| Banco Latinoamericano de Comercio Exterior, S.A. (b) | | | 34,900 | | | 1,035,483 |
| FBR & Co. (a) | | | 50,801 | | | 1,378,231 |
| Franklin Resources, Inc. | | | 24,815 | | | 1,435,300 |
| USA Technologies, Inc. (a) | | | 306,302 | | | 646,297 |
| Viad Corp. | | | 7,500 | | | 178,800 |
| Wells Fargo & Company | | | 46,531 | | | 2,445,669 |
| | | | | | | 8,382,790 |
| Industrials: 0.37% | | | | | | |
| Aceto Corporation | | | 11,450 | | | 207,703 |
| | | | | | | |
| Information: 7.79% | | | | | | |
| DIRECTV (a) | | | 14,129 | | | 1,201,106 |
| Media General, Inc. (a) | | | 39,612 | | | 813,234 |
| Nexstar Broadcasting Group, Inc. | | | 15,906 | | | 820,909 |
| Salem Communications Corporation | | | 66,948 | | | 633,328 |
| Sinclair Broadcast Group, Inc. | | | 25,080 | | | 871,530 |
| | | | | | | 4,340,107 |
The accompanying notes are an integral part of these financial statements.
| |
LoCorr Long/Short Equity Fund - Schedule of Investments (continued) | 25 |
| |
| | | | Shares | | | Value |
COMMON STOCKS (continued) | | | | | | |
| Manufacturing: 42.54% | | | | | | |
| Acme United Corporation | | | 10,518 | | $ | 176,176 |
| Advanced Emissions Solutions, Inc. (a)(c) | | | 28,000 | | | 642,040 |
| Akorn, Inc. (a) | | | 40,000 | | | 1,330,000 |
| Amkor Technology, Inc. (a) | | | 140,000 | | | 1,565,200 |
| Anika Therapeutics, Inc. (a)(c) | | | 17,950 | | | 831,624 |
| Astronics Corporation (a)(c) | | | 24,037 | | | 1,356,889 |
| Flexsteel Industries, Inc. | | | 14,222 | | | 474,304 |
| Flotek Industries, Inc. (a) | | | 36,400 | | | 1,170,624 |
| Gencor Industries, Inc. (a) | | | 27,100 | | | 298,371 |
| Insys Therapeutics, Inc. (a)(c) | | | 41,000 | | | 1,280,430 |
| Lannett Company, Inc. (a) | | | 24,000 | | | 1,190,880 |
| LSB Industries, Inc. (a) | | | 20,000 | | | 833,400 |
| Manitex International, Inc. (a) | | | 55,406 | | | 899,793 |
| Methode Electronics, Inc. | | | 24,000 | | | 917,040 |
| Multi-Color Corporation | | | 27,000 | | | 1,080,270 |
| Nature’s Sunshine Products, Inc. | | | 60,000 | | | 1,018,200 |
| NN, Inc. (c) | | | 37,985 | | | 971,656 |
| Nova Measuring Instruments Ltd. (a)(b) | | | 141,100 | | | 1,694,611 |
| Nymox Pharmaceutical Corporation (a)(b) | | | 193,300 | | | 956,835 |
| Shiloh Industries, Inc. (a) | | | 45,999 | | | 849,142 |
| Sparton Corporation (a)(c) | | | 48,500 | | | 1,345,390 |
| Super Micro Computer, Inc. (a) | | | 56,200 | | | 1,420,174 |
| WABCO Holdings Inc. (a) | | | 8,981 | | | 959,350 |
| Xplore Technologies Corp. (a) | | | 78,663 | | | 453,886 |
| | | | | | | 23,716,285 |
| Mining, Quarrying, and Oil and Gas Extraction: 5.99% | | | | | | |
| C&J Energy Services, Inc. (a) | | | 41,000 | | | 1,384,980 |
| Rose Rock Midstream, L.P. | | | 10,000 | | | 546,400 |
| Trecora Resources (a) | | | 118,800 | | | 1,406,592 |
| | | | | | | 3,337,972 |
| Professional, Scientific, and Technical Services: 6.11% | | | | | | |
| Enanta Pharmaceuticals, Inc. (a) | | | 32,000 | | | 1,378,240 |
| Innovative Solutions and Support, Inc. (a) | | | 134,334 | | | 999,445 |
| International Business Machines Corporation | | | 5,682 | | | 1,029,976 |
| | | | | | | 3,407,661 |
| Transportation and Warehousing: 5.12% | | | | | | |
| GasLog Ltd. (b)(c) | | | 49,000 | | | 1,562,610 |
| NuStar GP Holdings, LLC (c) | | | 33,000 | | | 1,290,630 |
| | | | | | | 2,853,240 |
| Wholesale Trade: 3.21% | | | | | | |
| Amira Nature Foods Ltd. (a)(b) | | | 82,040 | | | 1,123,128 |
| Gentherm Inc. (a) | | | 15,000 | | | 666,750 |
| | | | | | | 1,789,878 |
| TOTAL COMMON STOCKS (Cost $50,094,695) | | | | | | 53,651,231 |
| | | | | | | |
| EXCHANGE TRADED FUND: 0.75% | | | | | | |
| Finance and Insurance: 0.75% | | | | | | |
| Direxion Daily Small Cap Bear 3X Shares (a) | | | 30,000 | | | 418,800 |
| TOTAL EXCHANGE TRADED FUND (Cost $442,161) | | | | | | 418,800 |
| | | | | | | |
| SHORT TERM INVESTMENT: 3.92% | | | | | | |
| MONEY MARKET FUND: 3.92% | | | | | | |
| Fidelity Institutional Money Market Portfolio - Class I , 0.05% (d) | | | 2,185,019 | | | 2,185,019 |
| TOTAL MONEY MARKET FUND (Cost $2,185,019) | | | | | | 2,185,019 |
| TOTAL SHORT TERM INVESTMENT (Cost $2,185,019) | | | | | | 2,185,019 |
| | | | | | | |
| TOTAL INVESTMENTS (Cost $52,721,875): 100.91% | | | | | | 56,255,050 |
| Liabilities in Excess of Other Assets: (0.91)% | | | | | | (505,963) |
| TOTAL NET ASSETS: 100.00% | | | | | $ | 55,749,087 |
(a) Non-income producing security. |
| (b) Foreign issued security. |
| (c) This security or a portion of this security is pledged to cover short positions. See Note 2. |
| (d) The rate quoted is the annualized seven-day effective yield as of June 30, 2014. |
The accompanying notes are an integral part of these financial statements.
| |
26 | LoCorr Long/Short Equity Fund - Schedule of Securities Sold Short |
| |
Schedule of Securities Sold Short
June 30, 2014 (Unaudited)
| | | | | | | |
| | | Shares | | Value |
| COMMON STOCKS: (7.35)% | | | | | | |
| Information: (1.43)% | | | | | | |
| NetSuite Inc. (a) | | | (3,000 | ) | $ | (260,640) |
| Pandora Media, Inc. (a) | | | (7,000 | ) | | (206,500) |
| Twitter, Inc. (a) | | | (8,000 | ) | | (327,760) |
| | | | | | | (794,900) |
| | | | | | | |
| Management of Companies and Enterprises: (0.32)% | | | | | | |
| Compass Diversified Holdings | | | (10,000 | ) | | (181,500) |
| | | | | | | |
| Manufacturing: (2.35)% | | | | | | |
| Callaway Golf Company | | | (50,000 | ) | | (416,000) |
| Elizabeth Arden, Inc. (a) | | | (9,000 | ) | | (192,780) |
| Guidewire Software, Inc. (a) | | | (9,000 | ) | | (365,940) |
| Lancaster Colony Corporation | | | (3,500 | ) | | (333,060) |
| | | | | | | (1,307,780) |
| | | | | | | |
| Other Services (except Public Administration): (1.04)% | | | | | | |
| Regis Corp. | | | (41,268 | ) | | (581,053) |
| | | | | | | |
| Professional, Scientific, and Technical Services: (1.66)% | | | | | | |
| athenahealth, Inc. (a) | | | (2,000 | ) | | (250,260) |
| Intralinks Holdings, Inc. (a) | | | (22,000 | ) | | (195,580) |
| Syntel, Inc. (a) | | | (3,000 | ) | | (257,880) |
| Workday, Inc. (a) | | | (2,500 | ) | | (224,650) |
| | | | | | | (928,370) |
| | | | | | | |
| Retail Trade: (0.55)% | | | | | | |
| Urban Outfitters, Inc. (a) | | | (9,000 | ) | | (304,740) |
| | | | | | | |
| TOTAL COMMON STOCKS (Proceeds $3,910,701): (7.35)% | | | | | | (4,098,343) |
| TOTAL SECURITIES SOLD SHORT (Proceeds $3,910,701): (7.35)% | | | | | $ | (4,098,343) |
| (a) Non-dividend expense producing security. | |
| Percentages are stated as a percent of net assets. | |
The accompanying notes are an integral part of these financial statements.
| |
LoCorr Spectrum Income Fund - Schedule of Investments | 27 |
| |
LoCorr Spectrum Income Fund
Composition of Investment Portfolio1
June 30, 2014 (Unaudited)
1 As a percentage of total investments.
Schedule of Investments
June 30, 2014 (Unaudited)
| | | | | | | |
| | | Shares | | Value |
| BUSINESS DEVELOPMENT COMPANIES: 7.49% | | | | | | |
| Finance and Insurance: 7.49% | | | | | | |
| Ares Capital Corporation | | | 117,640 | | $ | 2,101,050 |
| Fifth Street Finance Corp. | | | 93,341 | | | 917,542 |
| Prospect Capital Corporation | | | 174,705 | | | 1,856,241 |
| TOTAL BUSINESS DEVELOPMENT COMPANIES (Cost $4,797,100) | | | | | | 4,874,833 |
| | | | | | | |
| COMMON STOCKS: 13.22% | | | | | | |
| Finance and Insurance: 1.88% | | | | | | |
| Banco Santander, S.A. - ADR (a) | | | 117,365 | | | 1,222,943 |
| | | | | | | |
| Information: 4.13% | | | | | | |
| Frontier Communications Corporation | | | 460,097 | | | 2,686,967 |
| | | | | | | |
| Manufacturing: 1.55% | | | | | | |
| HollyFrontier Corporation | | | 22,991 | | | 1,004,477 |
| | | | | | | |
| Mining, Quarrying, and Oil and Gas Extraction: 3.02% | | | | | | |
| Seadrill Limited (a) | | | 49,217 | | | 1,966,219 |
| | | | | | | |
| Transportation and Warehousing: 2.64% | | | | | | |
| Ship Finance International Limited (a) | | | 61,608 | | | 1,145,293 |
| Student Transportation Inc. (a) | | | 85,976 | | | 569,161 |
| | | | | | | 1,714,454 |
| TOTAL COMMON STOCKS (Cost $8,285,905) | | | | | | 8,595,060 |
| | | | | | | |
| CLOSED-END INVESTMENT COMPANIES: 11.88% | | | | | | |
| Finance and Insurance: 11.88% | | | | | | |
| Avenue Income Credit Strategies Fund | | | 72,966 | | | 1,311,929 |
| BlackRock Corporate High Yield Fund Inc. | | | 70,763 | | | 869,677 |
| Morgan Stanley Emerging Markets Domestic Debt Fund, Inc. | | | 160,869 | | | 2,142,775 |
| Nuveen Preferred Income Opportunities Fund | | | 119,498 | | | 1,159,131 |
The accompanying notes are an integral part of these financial statements.
| |
28 | LoCorr Spectrum Income Fund - Schedule of Investments (continued) |
| |
| | | | Shares | | | Value |
INVESTMENT COMPANIES (continued) | | | | | | |
| Stone Harbor Emerging Markets Income Fund | | | 27,603 | | $ | 581,871 |
| Western Asset Emerging Markets Income Fund Inc. | | | 45,982 | | | 594,547 |
| Western Asset Global High Income Fund Inc. | | | 82,740 | | | 1,063,209 |
| TOTAL CLOSED-END INVESTMENT COMPANIES (Cost $7,586,855) | | | | | | 7,723,139 |
| | | | | | | |
| MASTER LIMITED PARTNERSHIPS: 26.35% | | Units | | | |
| Finance and Insurance: 5.74% | | | | | | |
| KKR & Co. L.P. | | | 101,119 | | | 2,460,225 |
| Och-Ziff Capital Management, L.P. | | | 91,964 | | | 1,271,862 |
| | | | | | | 3,732,087 |
| | | | | | | |
| Manufacturing: 6.84% | | | | | | |
| CVR Partners, LP | | | 67,115 | | | 1,254,379 |
| CVR Refining, LP | | | 45,500 | | | 1,137,955 |
| Northern Tier Energy LP | | | 42,265 | | | 1,130,166 |
| Terra Nitrogen Company, L.P. | | | 6,402 | | | 923,937 |
| | | | | | | 4,446,437 |
| | | | | | | |
| Mining, Quarrying, and Oil and Gas Extraction: 7.63% | | | | | | |
| PetroLogistics LP | | | 89,624 | | | 1,287,001 |
| Regency Energy Partners LP | | | 45,156 | | | 1,454,475 |
| Vanguard Natural Resources, LLC | | | 68,973 | | | 2,220,931 |
| | | | | | | 4,962,407 |
| | | | | | | |
| Other Services (except Public Administration): 1.71% | | | | | | |
| StoneMor Partners L.P. | | | 45,982 | | | 1,114,144 |
| | | | | | | |
| Transportation and Warehousing: 4.43% | | | | | | |
| Navios Maritime Partners L.P. (a) | | | 87,352 | | | 1,698,123 |
| Niska Gas Storage Partners LLC | | | 76,752 | | | 1,181,213 |
| | | | | | | 2,879,336 |
| TOTAL MASTER LIMITED PARTNERSHIPS (Cost $16,361,037) | | | | | | 17,134,411 |
| | | Shares | | |
| REAL ESTATE INVESTMENT TRUSTS: 21.20% | | | | | | |
| Finance and Insurance: 6.46% | | | | | | |
| American Capital Mortgage Investment Corp. | | | 101,119 | | | 2,024,402 |
| Apollo Commercial Real Estate Finance, Inc. | | | 64,361 | | | 1,061,313 |
| Invesco Mortgage Capital Inc. | | | 64,361 | | | 1,117,307 |
| | | | | | | 4,203,022 |
| | | | | | | |
| Real Estate and Rental and Leasing: 14.74% | | | | | | |
| American Realty Capital Properties, Inc. | | | 176,770 | | | 2,214,928 |
| Capstead Mortgage Corporation | | | 81,845 | | | 1,076,262 |
| EPR Properties | | | 42,747 | | | 2,388,276 |
| Hospitality Properties Trust | | | 72,621 | | | 2,207,678 |
| Senior Housing Properties Trust | | | 48,736 | | | 1,183,797 |
| Whitestone REIT | | | 34,487 | | | 514,201 |
| | | | | | | 9,585,142 |
| TOTAL REAL ESTATE INVESTMENT TRUSTS (Cost $13,479,273) | | | | | | 13,788,164 |
| | | | | | | |
| ROYALTY TRUST: 3.63% | | | | | | |
| Manufacturing: 3.63% | | | | | | |
| BP Prudhoe Bay Royalty Trust | | | 23,886 | | | 2,363,281 |
| TOTAL ROYALTY TRUST (Cost $2,114,020) | | | | | | 2,363,281 |
| PRIVATE PLACEMENT: 8.69% | | Coupon | | | | | | |
| Finance and Insurance: 8.69% | | Rate | | Units ($) | | | |
| Terra Secured Income Fund 5, LLC (b) | | | 8.50% | | $ | 6,240,000 | | | 5,651,139 |
| TOTAL PRIVATE PLACEMENT (Cost $5,651,139) | | | | | | | | | 5,651,139 |
The accompanying notes are an integral part of these financial statements.
| |
LoCorr Spectrum Income Fund - Schedule of Investments (continued) | 29 |
| |
| | | | Shares | | | Value |
| SHORT TERM INVESTMENT: 5.28% | | | | | | |
| MONEY MARKET FUND: 5.28% | | | | | | |
| Fidelity Institutional Money Market Portfolio - Class I, 0.05% (c) | | | 3,431,511 | | $ | 3,431,511 |
| TOTAL MONEY MARKET FUND (Cost $3,431,511) | | | | | | 3,431,511 |
| TOTAL SHORT TERM INVESTMENT (Cost $3,431,511) | | | | | | 3,431,511 |
| | | | | | | |
| TOTAL INVESTMENTS (Cost $61,706,840): 97.74% | | | | | | 63,561,538 |
| Other Assets in Excess of Liabilities, 2.26% | | | | | | 1,466,492 |
| TOTAL NET ASSETS, 100.00% | | | | | $ | 65,028,030 |
ADR American Depository Receipt
(a) Foreign issued security.
(b) Deemed to be illiquid. At June 30, 2014, the fair value of these securities total $5,651,139, which represents 8.69% of total net assets. See Note 2.
(c) The rate quoted is the annualized seven-day effective yield as of June 30, 2014.
The accompanying notes are an integral part of these financial statements.
| |
30 | LoCorr Managed Futures Strategy Fund and LoCorr Long/Short Commodities Strategy Fund - Consolidated Statements of Assets & Liabilities |
| |
Consolidated Statements of Assets & Liabilities
June 30, 2014 (Unaudited)
| | | | | | | | | | | | |
| | | LoCorr Managed Futures Strategy Fund | | LoCorr Long/Short Commodities Strategy Fund | |
| | | | | | | | | | | | |
| Assets | | | | | | | | | | | |
| Investments, at value (Cost $284,839,713 and $9,661,479, respectively) | | | $ | 286,476,595 | | | | $ | 9,688,881 | | |
| Cash | | | | 8,760 | | | | | 3,239 | | |
| Receivable for Fund shares sold | | | | 1,830,270 | | | | | 18,515 | | |
| Receivable for securities sold | | | | - | | | | | 3,013 | | |
| Interest receivable | | | | 1,420,962 | | | | | 40,557 | | |
| Receivable from Adviser (Note 5) | | | | - | | | | | 1,490 | | |
| Unrealized gain on swap contracts (Note 1) | | | | - | | | | | 328,460 | | |
| Deposits with broker for swap contracts (Note 2) | | | | 101,000,010 | | | | | 2,700,010 | | |
| Prepaid expenses and other assets | | | | 88,770 | | | | | 26,218 | | |
| Total Assets | | | | 390,825,367 | | | | | 12,810,383 | | |
| | | | | | | | | | | | |
| Liabilities | | | | | | | | | | | |
| Payable for Fund shares redeemed | | | $ | 456,265 | | | | $ | 9,503 | | |
| Accrued management fees (Note 5) | | | | 455,240 | | | | | - | | |
| Accrued Trustees’ fees | | | | 9,500 | | | | | 254 | | |
| Accrued Rule 12b-1 fees | | | | 43,361 | | | | | 6,098 | | |
| Unrealized loss on swap contracts (Note 1) | | | | 8,328,818 | | | | | - | | |
| Advance payment on swap contracts | | | | 3,693,363 | | | | | 18,144 | | |
| Accrued expenses and other liabilities | | | | 280,623 | | | | | 39,184 | | |
| Total Liabilities | | | | 13,267,170 | | | | | 73,183 | | |
| | | | | | | | | | | | |
| Net Assets | | | $ | 377,558,197 | | | | $ | 12,737,200 | | |
| | | | | | | | | | | | |
| Net Assets Consist of: | | | | | | | | | | | |
| Paid-in capital | | | $ | 384,148,715 | | | | $ | 12,490,399 | | |
| Accumulated net investment loss | | | | (1,620,224) | | | | | (75,757) | | |
| Accumulated undistributed net realized gain (loss) on investments and swap contracts | | | | 1,721,642 | | | | | (33,304) | | |
| Net unrealized appreciation of investments | | | | 1,636,882 | | | | | 27,402 | | |
| Net unrealized appreciation (depreciation) of swap contracts | | | | (8,328,818) | | | | | 328,460 | | |
| NET ASSETS | | | $ | 377,558,197 | | | | $ | 12,737,200 | | |
| | | | | | | | | | | | |
| Class A Shares | | | | | | | | | | | |
| Net assets | | | $ | 201,567,861 | | | | $ | 5,120,344 | | |
| Shares issued and outstanding (unlimited shares authorized, no par value) | | | | 22,135,605 | | | | | 603,472 | | |
| Net asset value, redemption, and minimum offering price per share (a)(b) | | | | | | | | | | | |
| Maximum offering price per share ($9.11/0.9425) ($8.48/0.9425) (c) | | | | $9.67 | | | | | $9.00 | | |
| | | | | | | | | | | | |
| Class C Shares | | | | | | | | | | | |
| Net assets | | | $ | 76,928,982 | | | | $ | 1,502,761 | | |
| Shares issued and outstanding (unlimited shares authorized, no par value) | | | | 8,656,460 | | | | | 180,888 | | |
| Net asset value, redemption, and offering price per share (a)(b) | | | | | | | | | | | |
| | | | | | | | | | | | |
| Class I Shares | | | | | | | | | | | |
| Net assets | | | $ | 99,061,354 | | | | $ | 6,114,095 | | |
| Shares issued and outstanding (unlimited shares authorized, no par value) | | | | 10,789,334 | | | | | 716,650 | | |
| Net asset value, redemption, and offering price per share (b) | | | | | | | | | | | |
| (a) | A 1.00% contingent deferred sales charge may apply to redemptions made within twelve months of purchase. The contingent deferred sales charge only applies to Class A share purchases of $1 million or more. |
| (b) | Redemptions made within 30 days of purchase may be assessed a redemption fee of 1.00%. |
| (c) | On investments of $25,000 or more, the offering price is reduced. |
The accompanying notes are an integral part of these consolidated financial statements.
| |
LoCorr Long/Short Equity Fund and LoCorr Spectrum Income Fund - Statements of Assets & Liabilities | 31 |
| |
Statements of Assets & Liabilities
June 30, 2014 (Unaudited)
| | | | | | | | |
| | | LoCorr Long/Short Equity Fund | | LoCorr Spectrum Income Fund | |
| | | | | | | | |
| Assets | | | | | | | |
| Investments, at value (Cost $52,721,875 and $61,706,840, respectively) | | $ | 56,255,050 | | $ | 63,561,538 | |
| Cash | | | 255,064 | | | - | |
| Receivable for Fund shares sold | | | 290,970 | | | 3,148,566 | |
| Receivable for securities sold | | | 1,670,789 | | | - | |
| Dividends, interest and other receivables | | | 10,589 | | | 286,888 | |
| Deferred offering costs (Note 2) | | | - | | | 44,679 | |
| Deposits with broker for securities sold short (Note 2) | | | 3,679,414 | | | - | |
| Prepaid expenses and other assets | | | 85,882 | | | 4,564 | |
| Total Assets | | | 62,247,758 | | | 67,046,235 | |
| | | | | | | | |
| Liabilities | | | | | | | |
| Securities sold short, at fair value (proceeds $3,910,701) | | $ | 4,098,343 | | $ | - | |
| Payable for securities purchased | | | 1,574,204 | | | 1,839,879 | |
| Payable for Fund shares redeemed | | | 639,441 | | | 17,334 | |
| Other payables | | | - | | | 24,809 | |
| Accrued management fees | | | 108,700 | | | 52,347 | |
| Accrued Trustees’ fees | | | 1,139 | | | 336 | |
| Accrued Rule 12b-1 fees | | | 41,532 | | | 33,207 | |
| Accrued expenses and other liabilities | | | 35,312 | | | 50,293 | |
| Total Liabilities | | | 6,498,671 | | | 2,018,205 | |
| | | | | | | | |
| Net Assets | | $ | 55,749,087 | | $ | 65,028,030 | |
| | | | | | | | |
| Net Assets Consist of: | | | | | | | |
| Paid-in capital | | $ | 54,916,285 | | $ | 63,209,809 | |
| Accumulated net investment loss | | | (612,330) | | | - | |
| Accumulated distributions in excess of net investment income | | | - | | | (124,385) | |
| Accumulated undistributed net realized gain (loss) on investments and securities sold short | | | (1,900,401) | | | 87,908 | |
| Net unrealized appreciation of investments | | | 3,533,175 | | | 1,854,698 | |
| Net unrealized depreciation of securities sold short | | | (187,642) | | | - | |
| NET ASSETS | | $ | 55,749,087 | | $ | 65,028,030 | |
| | | | | | | | |
| Class A Shares | | | | | | | |
| Net assets | | $ | 25,028,249 | | $ | 26,295,024 | |
| Shares issued and outstanding (unlimited shares authorized, no par value) | | | 2,318,852 | | | 2,506,548 | |
| Net asset value, redemption, and minimum offering price per share (a) | | | | (b) | | $10.49 | (c) |
| Maximum offering price per share ($10.79/0.9425) ($10.49/0.9425) (d) | | | | | | $11.13 | |
| | | | | | | | |
| Class C Shares | | | | | | | |
| Net assets | | $ | 15,162,499 | | $ | 14,821,013 | |
| Shares issued and outstanding (unlimited shares authorized, no par value) | | | 1,417,305 | | | 1,413,922 | |
| Net asset value, redemption, and offering price per share (a) | | | $10.70 | (b) | | $10.48 | (c) |
| | | | | | | | |
| Class I Shares | | | | | | | |
| Net assets | | $ | 15,558,339 | | $ | 23,911,993 | |
| Shares issued and outstanding (unlimited shares authorized, no par value) | | | 1,437,538 | | | 2,278,960 | |
| Net asset value, redemption, and offering price per share | | | $10.82 | (b) | | $10.49 | (c) |
| (a) | A 1.00% contingent deferred sales charge may apply to redemptions made within twelve months of purchase. The contingent deferred sales charge only applies to Class A share purchases of $1 million or more. |
| (b) | Redemptions made within 30 days of purchase may be assessed a redemption fee of 1.00%. |
| (c) | Redemptions made within 60 days of purchase may be assessed a redemption fee of 2.00%. |
| (d) | On investments of $25,000 or more, the offering price is reduced. |
The accompanying notes are an integral part of these financial statements.
| |
32 | LoCorr Managed Futures Strategy Fund and LoCorr Long/Short Commodities Strategy Fund - Consolidated Statements of Operations |
| |
Consolidated Statements of Operations
Six Months Ended June 30, 2014 (Unaudited)
| | | | | | | | | | | | |
| | | LoCorr Managed Futures Strategy Fund | | LoCorr Long/Short Commodities Strategy Fund | |
| | | | | | | | | | | | |
| Investment Income | | | | | | | | | | | |
Interest income (a) | | | $ | 2,369,127 | | | | $ | 54,317 | | |
| Total Investment Income | | | | 2,369,127 | | | | | 54,317 | | |
| | | | | | | | | | | | |
| Expenses | | | | | | | | | | | |
| Management fees (Note 5) | | | | 2,687,028 | | | | | 90,478 | | |
| Fund administration fees | | | | 70,530 | | | | | 19,498 | | |
| Fund accounting fees | | | | 87,879 | | | | | 38,132 | | |
| Trustees’ fees | | | | 25,353 | | | | | 755 | | |
| Transfer agent fees and expenses | | | | 340,627 | | | | | 22,971 | | |
| Custodian fees | | | | 8,599 | | | | | 4,057 | | |
| Registration expenses | | | | 36,030 | | | | | 20,430 | | |
| Rule 12b-1 fees - Class A (Note 5) | | | | 236,761 | | | | | 5,159 | | |
| Rule 12b-1 fees - Class C (Note 5) | | | | 361,257 | | | | | 7,250 | | |
| Legal and audit fees | | | | 44,988 | | | | | 14,363 | | |
| Printing and mailing expenses | | | | 66,732 | | | | | 1,866 | | |
| Other expenses | | | | 23,567 | | | | | 487 | | |
| Total expense before interest expense | | | | 3,989,351 | | | | | 225,446 | | |
| Interest expense on line of credit (Note 8) | | | | - | | | | | 44 | | |
| Total expenses before reimbursement | | | | 3,989,351 | | | | | 225,490 | | |
| Reimbursement from Adviser (Note 5) | | | | - | | | | | (95,416) | | |
| Net Expenses | | | | 3,989,351 | | | | | 130,074 | | |
| Net Investment Loss | | | | (1,620,224) | | | | | (75,757) | | |
| | | | | | | | | | | | |
| Realized and Unrealized Gain (Loss) on Investments and Swap Contracts | | | | | | | | | | | |
| Net realized gain (loss) on investments | | | | 471,431 | | | | | (14,723) | | |
| Net realized gain on swap contracts | | | | 900,478 | | | | | 18,634 | | |
| Net change in unrealized appreciation of investments | | | | 1,542,569 | | | | | 73,100 | | |
| Net change in unrealized appreciation of swap contracts | | | | 32,598,553 | | | | | 1,181,874 | | |
| Net realized and unrealized gain on investments and swap contracts | | | | 35,513,031 | | | | | 1,258,885 | | |
| Net Increase in Net Assets From Operations | | | $ | 33,892,807 | | | | $ | 1,183,128 | | |
| (a) | Net of foreign tax withheld of $0 and $21, respectively. |
The accompanying notes are an integral part of these consolidated financial statements.
| |
LoCorr Long/Short Equity and LoCorr Spectrum Income Fund - Statements of Operations | 33 |
| |
Statements of Operations
Six Months Ended June 30, 2014 (Unaudited)
| | | | | | | | |
| | | LoCorr Long/Short Equity Fund | | LoCorr Spectrum Income Fund | |
| | | | | | | | |
| Investment Income | | | | | | | |
Dividend income (a) | | $ | 239,676 | | $ | 734,049 | |
| Distributions received from master limited partnership (“MLP”) interests | | | - | | | 273,707 | |
| Less: return of capital on distributions from MLP interests (Note 2) | | | - | | | (273,707) | |
| Interest income | | | 726 | | | 186,876 | |
| Total Investment Income | | | 240,402 | | | 920,925 | |
| | | | | | | | |
| Expenses | | | | | | | |
| Management fees (Note 5) | | | 616,987 | | | 173,398 | |
| Fund administration fees | | | 20,825 | | | 20,258 | |
| Fund accounting fees | | | 21,215 | | | 20,846 | |
| Trustees’ fees | | | 3,435 | | | 735 | |
| Transfer agent fees and expenses | | | 45,764 | | | 32,297 | |
| Custodian fees | | | 6,937 | | �� | 12,365 | |
| Registration expenses | | | 17,468 | | | 10,547 | |
| Rule 12b-1 fees - Class A (Note 5) | | | 28,491 | | | 12,907 | |
| Rule 12b-1 fees - Class C (Note 5) | | | 60,747 | | | 27,558 | |
| Legal and audit fees | | | 11,918 | | | 29,272 | |
| Printing and mailing expenses | | | 3,985 | | | 2,067 | |
| Organizational costs (Note 2) | | | - | | | 4,638 | |
| Offering costs (Note 2) | | | - | | | 28,945 | |
| Other expenses | | | 638 | | | 2,796 | |
| Total expense before dividend and interest expense | | | 838,410 | | | 378,629 | |
| Dividend and interest expense on securities sold short (Note 2) | | | 33,000 | | | - | |
| Interest expense on line of credit (Note 8) | | | 183 | | | - | |
| Total expenses before reimbursement | | | 871,593 | | | 378,629 | |
| Reimbursement from Adviser (Note 5) | | | (18,861) | | | (106,966) | |
| Net Expenses | | | 852,732 | | | 271,663 | |
| Net Investment Income (Loss) | | | (612,330) | | | 649,262 | |
| | | | | | | | |
| Realized and Unrealized Gain (Loss) on Investments and Securities Sold Short | | | | | | | |
| Net realized gain (loss) on investments | | | (1,485,707) | | | 87,908 | |
| Net realized loss on securities sold short | | | (357,031) | | | - | |
| Net change in unrealized appreciation of investments | | | 47,567 | | | 1,854,698 | |
| Net change in unrealized depreciation of securities sold short | | | (141,616) | | | - | |
| Net realized and unrealized gain (loss) on investments and securities sold short | | | (1,936,787) | | | 1,942,606 | |
| Net Increase (Decrease) in Net Assets From Operations | | $ | (2,549,117) | | $ | 2,591,868 | |
| (a) | Net of foreign tax withheld of $0 and $1,314, respectively. |
The accompanying notes are an integral part of these financial statements.
| |
34 | LoCorr Managed Futures Strategy Fund - Consolidated Statements of Changes in Net Assets |
| |
LoCorr Managed Futures Strategy Fund
Consolidated Statements of Changes in Net Assets
| | | | | | | | | | | | |
| | | Six Months Ended June 30, 2014 (Unaudited) | | Year Ended December 31, 2013 | |
| | | | | | | | | | | | |
| Operations | | | | | | | | | | | |
| Net investment loss | | | $ | (1,620,224) | | | | $ | (4,034,624) | | |
| Net realized gain on investments and swap contracts | | | | 1,371,909 | | | | | 16,119,969 | | |
| Net change in unrealized appreciation (depreciation) of investments and swap contracts | | | | 34,141,122 | | | | | (42,761,137) | | |
| Increase (Decrease) in Net Assets From Operations | | | | 33,892,807 | | | | | (30,675,792) | | |
| | | | | | | | | | | | |
| Distributions to Shareholders From | | | | | | | | | | | |
| Net realized gain on investments - Class A | | | | - | | | | | (118,249) | | |
| Net realized gain on investments - Class C | | | | - | | | | | (46,075) | | |
| Net realized gain on investments - Class I | | | | - | | | | | (62,047) | | |
| Total Distributions to Shareholders | | | | - | | | | | (226,371) | | |
| | | | | | | | | | | | |
| Capital Transactions (Note 6) | | | | | | | | | | | |
| Proceeds from shares sold | | | | 68,365,743 | | | | | 226,031,105 | | |
| Reinvestment of distributions | | | | - | | | | | 199,893 | | |
| Cost of shares redeemed | | | | (95,725,437) | | | | | (221,857,981) | | |
| Redemption fees | | | | 9,272 | | | | | 12,946 | | |
| Increase (Decrease) in Net Assets From Capital Transactions | | | | (27,350,422) | | | | | 4,385,963 | | |
| | | | | | | | | | | | |
| Total Increase (Decrease) in Net Assets | | | | 6,542,385 | | | | | (26,516,200) | | |
| | | | | | | | | | | | |
| Net Assets | | | | | | | | | | | |
| Beginning of period | | | | 371,015,812 | | | | | 397,532,012 | | |
End of period (including accumulated net investment
loss of $1,620,224 and $0, respectively) | | | $ | 377,558,197 | | | | $ | 371,015,812 | | |
The accompanying notes are an integral part of these consolidated financial statements.
| |
LoCorr Long/Short Commodities Strategy Fund - Consolidated Statements of Changes in Net Assets | 35 |
| |
LoCorr Long/Short Commodities Strategy Fund
Consolidated Statements of Changes in Net Assets
| | | | | | | | | | | | |
| | | Six Months Ended June 30, 2014 (Unaudited) | | Year Ended December 31, 2013 | |
| | | | | | | | | | | | |
| Operations | | | | | | | | | | | |
| Net investment loss | | | $ | (75,757) | | | | $ | (165,132) | | |
| Net realized gain (loss) on investments and swap contracts | | | | 3,911 | | | | | (62,996) | | |
| Net change in unrealized appreciation (depreciation) of investments and swap contracts | | | | 1,254,974 | | | | | (788,015) | | |
| Increase (Decrease) in Net Assets From Operations | | | | 1,183,128 | | | | | (1,016,143) | | |
| | | | | | | | | | | | |
| | | | | | | | | | | | |
| Capital Transactions (Note 6) | | | | | | | | | | | |
| Proceeds from shares sold | | | | 7,147,629 | | | | | 6,725,757 | | |
| Cost of shares redeemed | | | | (6,401,865) | | | | | (6,091,987) | | |
| Redemption fees | | | | 319 | | | | | 96 | | |
| Increase in Net Assets From Capital Transactions | | | | 746,083 | | | | | 633,866 | | |
| | | | | | | | | | | | |
| Total Increase (Decrease) in Net Assets | | | | 1,929,211 | | | | | (382,277) | | |
| | | | | | | | | | | | |
| Net Assets | | | | | | | | | | | |
| Beginning of period | | | | 10,807,989 | | | | | 11,190,266 | | |
End of period (including accumulated net investment
loss of $75,757 and $0, respectively) | | | $ | 12,737,200 | | | | $ | 10,807,989 | | |
The accompanying notes are an integral part of these consolidated financial statements.
| |
36 | LoCorr Long/Short Equity Fund - Statements of Changes in Net Assets |
| |
LoCorr Long/Short Equity Fund
Statements of Changes in Net Assets
| | | | | | | | | | | | |
| | | Six Months Ended June 30, 2014 (Unaudited) | | Period from May 10, 2013 (commencement of operations) through December 31, 2013 | |
| | | | | | | | | | | | |
| Operations | | | | | | | | | | | |
| Net investment loss | | | $ | (612,330) | | | | $ | (148,250) | | |
| Net realized gain (loss) on investments and securities sold short | | | | (1,842,738) | | | | | 90,587 | | |
| Net change in unrealized appreciation (depreciation) of investments and securities sold short | | | | (94,049) | | | | | 3,439,582 | | |
| Increase (Decrease) in Net Assets From Operations | | | | (2,549,117) | | | | | 3,381,919 | | |
| | | | | | | | | | | | |
| Capital Transactions (Note 6) | | | | | | | | | | | |
| Proceeds from shares sold | | | | 28,280,705 | | | | | 39,645,814 | | |
| Cost of shares redeemed | | | | (12,044,170) | | | | | (968,088) | | |
| Redemption fees | | | | 1,377 | | | | | 647 | | |
| Increase in Net Assets From Capital Transactions | | | | 16,237,912 | | | | | 38,678,373 | | |
| | | | | | | | | | | | |
| Total Increase in Net Assets | | | | 13,688,795 | | | | | 42,060,292 | | |
| | | | | | | | | | | | |
| Net Assets | | | | | | | | | | | |
| Beginning of period | | | | 42,060,292 | | | | | - | | |
End of period (including accumulated net investment
loss of $612,330 and $0, respectively) | | | $ | 55,749,087 | | | | $ | 42,060,292 | | |
The accompanying notes are an integral part of these financial statements.
| |
LoCorr Spectrum Income Fund - Statement of Changes in Net Assets | 37 |
| |
LoCorr Spectrum Income Fund
Statement of Changes in Net Assets
| | | | | | | |
| | | Six Months Ended June 30, 2014 (Unaudited) | |
| | | | | | | |
| Operations | | | | | | |
| Net investment income | | | $ | 649,262 | | |
| Net realized gain on investments | | | | 87,908 | | |
| Net change in unrealized appreciation | | | | 1,854,698 | | |
| Increase in Net Assets From Operations | | | | 2,591,868 | | |
| | | | | | | |
| Distributions to Shareholders From | | | | | | |
| Net investment income - Class A | | | | (316,523) | | |
| Net investment income - Class C | | | | (148,301) | | |
| Net investment income - Class I | | | | (308,823) | | |
| Total Distributions to Shareholders | | | | (773,647) | | |
| | | | | | | |
| Capital Transactions (Note 6) | | | | | | |
| Proceeds from shares sold | | | | 63,794,648 | | |
| Reinvestment of distributions | | | | 478,337 | | |
| Cost of shares redeemed | | | | (1,071,204) | | |
| Redemption fees | | | | 8,028 | | |
| Increase in Net Assets From Capital Transactions | | | | 63,209,809 | | |
| | | | | | | |
| Total Increase in Net Assets | | | | 65,028,030 | | |
| | | | | | | |
| Net Assets | | | | | | |
| Beginning of period | | | | - | | |
End of period (including accumulated distributions in excess of
net investment income of $124,385) | | | $ | 65,028,030 | | |
The accompanying notes are an integral part of these financial statements.
38 | LoCorr Managed Futures Strategy Fund - Consolidated Financial Highlights - Class A |
LoCorr Managed Futures Strategy Fund - Class A
Consolidated Financial Highlights
Selected Data and Ratios (for a share outstanding throughout the period) do not include non-controlling interest
| | | | | | | | | | | | | | | | | | | | | | |
| | | Six Months Ended June 30, 20141 (Unaudited) | | Year Ended December 31, 2013 | | Year Ended December 31, 20122 | | Period from March 22, 2011 (commencement of operations) through December 31, 20111, 2 | |
| | | | | | | | | | | | | | |
| Per Share | | | | | | | | | | | | | |
| Net asset value, beginning of period | | | $ | 8.28 | | | | $ | 8.77 | | | | $ | 9.33 | | | | $ | 10.00 | | |
| | | | | | | | | | | | | | | | | | | | | | |
| Income (loss) from investment operations: | | | | | | | | | | | | | | | | | | | | | |
Net investment income (loss)3 | | | | (0.03) | | | | | (0.07) | | | | | (0.24) | | | | | (0.22) | | |
| Net realized and unrealized gain (loss) | | | | 0.86 | | | | | (0.41) | | | | | (0.32) | | | | | (0.45) | | |
| Total from Investment Operations | | | | 0.83 | | | | | (0.48) | | | | | (0.56) | | | | | (0.67) | | |
| | | | | | | | | | | | | | | | | | | | | | |
| Distributions to shareholders from: | | | | | | | | | | | | | | | | | | | | | |
| Net investment income | | | | - | | | | | - | | | | | - | | | | | - | | |
| Net realized gains on investments | | | | - | | | | | (0.01) | | | | | (0.00) | 4 | | | | - | | |
| Total Distributions | | | | - | | | | | (0.01) | | | | | (0.00) | | | | | - | | |
| | | | | | | | | | | | | | | | | | | | | | |
Redemption Fees4 | | | | - | | | | | - | | | | | - | | | | | - | | |
| | | | | | | | | | | | | | | | | | | | | | |
| Net Asset Value, End of Period | | | $ | 9.11 | | | | $ | 8.28 | | | | $ | 8.77 | | | | $ | 9.33 | | |
| | | | | | | | | | | | | | | | | | | | | | |
Total Investment Return5 | | | | 10.02 | % | | | | (5.53) | % | | | | (5.98) | % | | | | (6.70) | % | |
| | | | | | | | | | | | | | | | | | | | | | |
| Net Assets, End of Period, in Thousands | | | $ | 201,568 | | | | $ | 195,046 | | | | $ | 182,457 | | | | $ | 71,532 | | |
| | | | | | | | | | | | | | | | | | | | | | |
| Ratios/Supplemental Data: | | | | | | | | | | | | | | | | | | | | | |
| Ratio of expenses to average net assets: | | | | | | | | | | | | | | | | | | | | | |
| Before expense reimbursement or recovery | | | | 2.14 | %6 | | | | 2.08 | %6 | | | | 3.95 | %6 | | | | 4.15 | % | |
| After expense reimbursement or recovery | | | | 2.14 | %6 | | | | 2.08 | %6 | | | | 4.00 | %6 | | | | 3.93 | % | |
| Ratio of net investment income (loss) to average net assets: | | | | | | | | | | | | | | | | | | | | | |
| Before expense reimbursement or recovery | | | | (0.82) | %6 | | | | (0.87) | %6 | | | | (2.60) | %6 | | | | (3.18) | % | |
| After expense reimbursement or recovery | | | | (0.82) | %6 | | | | (0.87) | %6 | | | | (2.65) | %6 | | | | (2.96) | % | |
| | | | | | | | | | | | | | | | | | | | | | |
Portfolio turnover rate7 | | | | 18 | % | | | | 46 | % | | | | 46 | % | | | | 18 | % | |
1 All ratios have been annualized except total investment return and portfolio turnover.
2 Selected data and ratios (for a share outstanding throughout the period) do not include non-controlling interest.
3 Net investment income (loss) per share is based on average shares outstanding.
4 Amount represents less than $0.005 per share.
5 Total investment return excludes the effect of applicable sales charges.
6 Ratios do not include the income and expenses of the CTAs included in the swap.
7 Portfolio turnover rate is calculated on the basis of the Fund as a whole without distinguishing between classes of shares issued.
The accompanying notes are an integral part of these consolidated financial statements.
LoCorr Managed Futures Strategy Fund - Consolidated Financial Highlights - Class C | 39 |
LoCorr Managed Futures Strategy Fund - Class C
Consolidated Financial Highlights
Selected Data and Ratios (for a share outstanding throughout the period) do not include non-controlling interest
| | | | | | | | | | | | | | | | | | | | | | |
| | | Six Months Ended June 30, 20141 (Unaudited) | | Year Ended December 31, 2013 | | Year Ended December 31, 20122 | | Period from March 24, 2011 (commencement of operations) through December 31, 20111, 2 | |
| | | | | | | | | | | | | | |
| Per Share | | | | | | | | | | | | | |
| Net asset value, beginning of period | | | $ | 8.12 | | | | $ | 8.65 | | | | $ | 9.28 | | | | $ | 10.00 | | |
| | | | | | | | | | | | | | | | | | | | | | |
| Income (loss) from investment operations: | | | | | | | | | | | | | | | | | | | | | |
Net investment income (loss)3 | | | | (0.06) | | | | | (0.14) | | | | | (0.30) | | | | | (0.27) | | |
| Net realized and unrealized gain (loss) | | | | 0.83 | | | | | (0.38) | | | | | (0.33) | | | | | (0.45) | | |
| Total from Investment Operations | | | | 0.77 | | | | | (0.52) | | | | | (0.63) | | | | | (0.72) | | |
| | | | | | | | | | | | | | | | | | | | | | |
| Distributions to shareholders from: | | | | | | | | | | | | | | | | | | | | | |
| Net investment income | | | | - | | | | | - | | | | | - | | | | | - | | |
| Net realized gains on investments | | | | - | | | | | (0.01) | | | | | (0.00) | 4 | | | | - | | |
| Total Distributions | | | | - | | | | | (0.01) | | | | | (0.00) | | | | | - | | |
| | | | | | | | | | | | | | | | | | | | | | |
Redemption Fees4 | | | | - | | | | | - | | | | | - | | | | | - | | |
| | | | | | | | | | | | | | | | | | | | | | |
| Net Asset Value, End of Period | | | $ | 8.89 | | | | $ | 8.12 | | | | $ | 8.65 | | | | $ | 9.28 | | |
| | | | | | | | | | | | | | | | | | | | | | |
Total Investment Return5 | | | | 9.48 | % | | | | (6.07) | % | | | | (6.77) | % | | | | (7.20) | % | |
| | | | | | | | | | | | | | | | | | | | | | |
| Net Assets, End of Period, in Thousands | | | $ | 76,929 | | | | $ | 73,691 | | | | $ | 76,979 | | | | $ | 38,055 | | |
| | | | | | | | | | | | | | | | | | | | | | |
| Ratios/Supplemental Data: | | | | | | | | | | | | | | | | | | | | | |
| Ratio of expenses to average net assets: | | | | | | | | | | | | | | | | | | | | | |
| Before expense reimbursement or recovery | | | | 2.89 | %6 | | | | 2.83 | %6 | | | | 4.70 | %6 | | | | 4.89 | % | |
| After expense reimbursement or recovery | | | | 2.89 | %6 | | | | 2.83 | %6 | | | | 4.75 | %6 | | | | 4.68 | % | |
| Ratio of net investment income (loss) to average net assets: | | | | | | | | | | | | | | | | | | | | | |
| Before expense reimbursement or recovery | | | | (1.57) | %6 | | | | (1.62) | %6 | | | | (3.35) | %6 | | | | (3.92) | % | |
| After expense reimbursement or recovery | | | | (1.57) | %6 | | | | (1.62) | %6 | | | | (3.40) | %6 | | | | (3.71) | % | |
| | | | | | | | | | | | | | | | | | | | | | |
Portfolio turnover rate7 | | | | 18 | % | | | | 46 | % | | | | 46 | % | | | | 18 | % | |
1 All ratios have been annualized except total investment return and portfolio turnover.
2 Selected data and ratios (for a share outstanding throughout the period) do not include non-controlling interest.
3 Net investment income (loss) per share is based on average shares outstanding.
4 Amount represents less than $0.005 per share.
5 Total investment return excludes the effect of applicable sales charges.
6 Ratios do not include the income and expenses of the CTAs included in the swap.
7 Portfolio turnover rate is calculated on the basis of the Fund as a whole without distinguishing between classes of shares issued.
The accompanying notes are an integral part of these consolidated financial statements.
40 | LoCorr Managed Futures Strategy Fund - Consolidated Financial Highlights - Class I |
LoCorr Managed Futures Strategy Fund - Class I
Consolidated Financial Highlights
Selected Data and Ratios (for a share outstanding throughout the period) do not include non-controlling interest
| | | | | | | | | | | | | | | | | | | | | | |
| | | Six Months Ended June 30, 20141 (Unaudited) | | Year Ended December 31, 2013 | | Year Ended December 31, 20122 | | Period from March 24, 2011 (commencement of operations) through December 31, 20111, 2 | |
| | | | | | | | | | | | | | |
| Per Share | | | | | | | | | | | | | | | | | |
| Net asset value, beginning of period | | | $ | 8.34 | | | | $ | 8.81 | | | | $ | 9.35 | | | | $ | 10.00 | | |
| | | | | | | | | | | | | | | | | | | | | | |
| Income (loss) from investment operations: | | | | | | | | | | | | | | | | | | | | | |
Net investment income (loss)3 | | | | (0.02) | | | | | (0.05) | | | | | (0.22) | | | | | (0.20) | | |
| Net realized and unrealized gain (loss) | | | | 0.86 | | | | | (0.41) | | | | | (0.32) | | | | | (0.45) | | |
| Total from Investment Operations | | | | 0.84 | | | | | (0.46) | | | | | (0.54) | | | | | (0.65) | | |
| | | | | | | | | | | | | | | | | | | | | | |
| Distributions to shareholders from: | | | | | | | | | | | | | | | | | | | | | |
| Net investment income | | | | - | | | | | - | | | | | - | | | | | - | | |
| Net realized gains on investments | | | | - | | | | | (0.01) | | | | | (0.00) | 4 | | | | - | | |
| Total Distributions | | | | - | | | | | (0.01) | | | | | (0.00) | | | | | - | | |
| | | | | | | | | | | | | | | | | | | | | | |
Redemption Fees4 | | | | - | | | | | - | | | | | - | | | | | - | | |
| | | | | | | | | | | | | | | | | | | | | | |
| Net Asset Value, End of Period | | | $ | 9.18 | | | | $ | 8.34 | | | | $ | 8.81 | | | | $ | 9.35 | | |
| | | | | | | | | | | | | | | | | | | | | | |
| Total Investment Return | | | | 10.07 | % | | | | (5.28) | % | | | | (5.75) | % | | | | (6.50) | % | |
| | | | | | | | | | | | | | | | | | | | | | |
| Net Assets, End of Period, in Thousands | | | $ | 99,061 | | | | $ | 102,279 | | | | $ | 138,096 | | | | $ | 91,161 | | |
| | | | | | | | | | | | | | | | | | | | | | |
| Ratios/Supplemental Data: | | | | | | | | | | | | | | | | | | | | | |
| Ratio of expenses to average net assets: | | | | | | | | | | | | | | | | | | | | | |
| Before expense reimbursement or recovery | | | | 1.89 | %5 | | | | 1.83 | %5 | | | | 3.70 | %5 | | | | 3.89 | % | |
| After expense reimbursement or recovery | | | | 1.89 | %5 | | | | 1.83 | %5 | | | | 3.75 | %5 | | | | 3.68 | % | |
| Ratio of net investment income (loss) to average net assets: | | | | | | | | | | | | | | | | | | | | | |
| Before expense reimbursement or recovery | | | | (0.57) | %5 | | | | (0.62) | %5 | | | | (2.35) | %5 | | | | (2.92) | % | |
| After expense reimbursement or recovery | | | | (0.57) | %5 | | | | (0.62) | %5 | | | | (2.40) | %5 | | | | (2.71) | % | |
| | | | | | | | | | | | | | | | | | | | | | |
Portfolio turnover rate6 | | | | 18 | % | | | | 46 | % | | | | 46 | % | | | | 18 | % | |
1 All ratios have been annualized except total investment return and portfolio turnover.
2 Selected data and ratios (for a share outstanding throughout the period) do not include non-controlling interest.
3 Net investment income (loss) per share is based on average shares outstanding.
4 Amount represents less than $0.005 per share.
5 Ratios do not include the income and expenses of the CTAs included in the swap.
6 Portfolio turnover rate is calculated on the basis of the Fund as a whole without distinguishing between classes of shares issued.
The accompanying notes are an integral part of these consolidated financial statements.
LoCorr Long/Short Commodities Strategy Fund - Consolidated Financial Highlights - Class A | 41 |
LoCorr Long/Short Commodities Strategy Fund - Class A
Consolidated Financial Highlights
Selected Data and Ratios (for a share outstanding throughout the period)
| | | | | | | | | | | | | | | | | |
| | | Six Months Ended June 30, 20141 (Unaudited) | | Year Ended December 31, 2013 | | Year Ended December 31, 2012 | |
| | | | | | | | | | | |
| Per Share | | | | | | | | | | |
| Net asset value, beginning of period | | | $ | 7.67 | | | | $ | 8.37 | | | | $ | 10.00 | | |
| | | | | | | | | | | | | | | | | |
| Income (loss) from investment operations: | | | | | | | | | | | | | | | | |
Net investment income (loss)2 | | | | (0.05) | | | | | (0.12) | | | | | (0.17) | | |
| Net realized and unrealized gain (loss) | | | | 0.86 | | | | | (0.58) | | | | | (1.46) | | |
| Total from Investment Operations | | | | 0.81 | | | | | (0.70) | | | | | (1.63) | | |
| | | | | | | | | | | | | | | | | |
Redemption Fees3 | | | | - | | | | | - | | | | | - | | |
| | | | | | | | | | | | | | | | | |
| Net Asset Value, End of Period | | | $ | 8.48 | | | | $ | 7.67 | | | | $ | 8.37 | | |
| | | | | | | | | | | | | | | | | |
Total Investment Return4 | | | | 10.56 | % | | | | (8.36) | % | | | | (16.30) | % | |
| | | | | | | | | | | | | | | | | |
| Net Assets, End of Period, in Thousands | | | $ | 5,120 | | | | $ | 3,653 | | | | $ | 3,213 | | |
| | | | | | | | | | | | | | | | | |
Ratios/Supplemental Data:5 | | | | | | | | | | | | | | | | |
| Ratio of expenses to average net assets: | | | | | | | | | | | | | | | | |
| Before expense reimbursement or recovery | | | | 3.78 | %6 | | | | 4.18 | % | | | | 6.12 | % | |
| After expense reimbursement or recovery | | | | 2.20 | %6 | | | | 2.20 | % | | | | 2.20 | % | |
| Ratio of net investment income (loss) to average net assets: | | | | | | | | | | | | | | | | |
| Before expense reimbursement or recovery | | | | (2.88) | % | | | | (3.46) | % | | | | (5.82) | % | |
| After expense reimbursement or recovery | | | | (1.30) | % | | | | (1.48) | % | | | | (1.90) | % | |
| | | | | | | | | | | | | | | | | |
Portfolio turnover rate7 | | | | 33 | % | | | | 59 | % | | | | 60 | % | |
1 All ratios have been annualized except total investment return and portfolio turnover.
2 Net investment income (loss) per share is based on average shares outstanding.
3 Amount represents less than $0.005 per share.
4 Total return excludes the effect of applicable sales charges.
5 Ratios do not include the income and expenses of the CTAs included in the swap.
6 Includes 0.00% of interest expense on line of credit.
7 Portfolio turnover rate is calculated on the basis of the Fund as a whole without distinguishing between classes of shares issued.
The accompanying notes are an integral part of these consolidated financial statements.
42 | LoCorr Long/Short Commodities Strategy Fund - Consolidated Financial Highlights - Class C |
LoCorr Long/Short Commodities Strategy Fund - Class C
Consolidated Financial Highlights
Selected Data and Ratios (for a share outstanding throughout the period)
| | | | | | | | | | | | | | | | | |
| | | Six Months Ended June 30, 20141 (Unaudited) | | Year Ended December 31, 2013 | | Year Ended December 31, 2012 | |
| | | | | | | | | | | |
| Per Share | | | | | | | | | | |
| Net asset value, beginning of period | | | $ | 7.54 | | | | $ | 8.29 | | | | $ | 10.00 | | |
| | | | | | | | | | | | | | | | | |
| Income (loss) from investment operations: | | | | | | | | | | | | | | | | |
Net investment income (loss)2 | | | | (0.08) | | | | | (0.17) | | | | | (0.24) | | |
| Net realized and unrealized gain (loss) | | | | 0.85 | | | | | (0.58) | | | | | (1.47) | | |
| Total from Investment Operations | | | | 0.77 | | | | | (0.75) | | | | | (1.71) | | |
| | | | | | | | | | | | | | | | | |
| Redemption Fees | | | | - | | | | | - | | | | | - | 3 | |
| | | | | | | | | | | | | | | | | |
| Net Asset Value, End of Period | | | $ | 8.31 | | | | $ | 7.54 | | | | $ | 8.29 | | |
| | | | | | | | | | | | | | | | | |
Total Investment Return4 | | | | 10.21 | % | | | | (9.05) | % | | | | (17.10) | % | |
| | | | | | | | | | | | | | | | | |
| Net Assets, End of Period, in Thousands | | | $ | 1,503 | | | | $ | 1,653 | | | | $ | 1,605 | | |
| | | | | | | | | | | | | | | | | |
Ratios/Supplemental Data:5 | | | | | | | | | | | | | | | | |
| Ratio of expenses to average net assets: | | | | | | | | | | | | | | | | |
| Before expense reimbursement or recovery | | | | 4.53 | %6 | | | | 4.93 | % | | | | 6.87 | % | |
| After expense reimbursement or recovery | | | | 2.95 | %6 | | | | 2.95 | % | | | | 2.95 | % | |
| Ratio of net investment income (loss) to average net assets: | | | | | | | | | | | | | | | | |
| Before expense reimbursement or recovery | | | | (3.63) | % | | | | (4.21) | % | | | | (6.57) | % | |
| After expense reimbursement or recovery | | | | (2.05) | % | | | | (2.23) | % | | | | (2.65) | % | |
| | | | | | | | | | | | | | | | | |
Portfolio turnover rate7 | | | | 33 | % | | | | 59 | % | | | | 60 | % | |
1 All ratios have been annualized except total investment return and portfolio turnover.
2 Net investment income (loss) per share is based on average shares outstanding.
3 Amount represents less than $0.005 per share.
4 Total return excludes the effect of applicable sales charges.
5 Ratios do not include the income and expenses of the CTAs included in the swap.
6 Includes 0.00% of interest expense on line of credit.
7 Portfolio turnover rate is calculated on the basis of the Fund as a whole without distinguishing between classes of shares issued.
The accompanying notes are an integral part of these consolidated financial statements.
LoCorr Long/Short Commodities Strategy Fund - Consolidated Financial Highlights - Class I | 43 |
LoCorr Long/Short Commodities Strategy Fund - Class I
Consolidated Financial Highlights
Selected Data and Ratios (for a share outstanding throughout the period)
| | | | | | | | | | | | | | | | | |
| | | Six Months Ended June 30, 20141 (Unaudited) | | Year Ended December 31, 2013 | | Year Ended December 31, 2012 | |
| | | | | | | | | | | |
| Per Share | | | | | | | | | | |
| Net asset value, beginning of period | | | $ | 7.70 | | | | $ | 8.38 | | | | $ | 10.00 | | |
| | | | | | | | | | | | | | | | | |
| Income (loss) from investment operations: | | | | | | | | | | | | | | | | |
Net investment income (loss)2 | | | | (0.04) | | | | | (0.10) | | | | | (0.15) | | |
| Net realized and unrealized gain (loss) | | | | 0.87 | | | | | (0.58) | | | | | (1.47) | | |
| Total from Investment Operations | | | | 0.83 | | | | | (0.68) | | | | | (1.62) | | |
| | | | | | | | | | | | | | | | | |
Redemption Fees3 | | | | - | | | | | - | | | | | - | | |
| | | | | | | | | | | | | | | | | |
| Net Asset Value, End of Period | | | $ | 8.53 | | | | $ | 7.70 | | | | $ | 8.38 | | |
| | | | | | | | | | | | | | | | | |
| Total Investment Return | | | | 10.78 | % | | | | (8.11) | % | | | | (16.20) | % | |
| | | | | | | | | | | | | | | | | |
| Net Assets, End of Period, in Thousands | | | $ | 6,114 | | | | $ | 5,502 | | | | $ | 6,373 | | |
| | | | | | | | | | | | | | | | | |
Ratios/Supplemental Data:4 | | | | | | | | | | | | | | | | |
| Ratio of expenses to average net assets: | | | | | | | | | | | | | | | | |
| Before expense reimbursement or recovery | | | | 3.53 | %5 | | | | 3.93 | % | | | | 5.87 | % | |
| After expense reimbursement or recovery | | | | 1.95 | %5 | | | | 1.95 | % | | | | 1.95 | % | |
| Ratio of net investment income (loss) to average net assets: | | | | | | | | | | | | | | | | |
| Before expense reimbursement or recovery | | | | (2.63) | % | | | | (3.21) | % | | | | (5.57) | % | |
| After expense reimbursement or recovery | | | | (1.05) | % | | | | (1.23) | % | | | | (1.65) | % | |
| | | | | | | | | | | | | | | | | |
Portfolio turnover rate6 | | | | 33 | % | | | | 59 | % | | | | 60 | % | |
1 All ratios have been annualized except total investment return and portfolio turnover.
2 Net investment income (loss) per share is based on average shares outstanding.
3 Amount represents less than $0.005 per share.
4 Ratios do not include the income and expenses of the CTAs included in the swap.
5 Includes 0.00% of interest expense on line of credit.
6 Portfolio turnover rate is calculated on the basis of the Fund as a whole without distinguishing between classes of shares issued.
The accompanying notes are an integral part of these consolidated financial statements.
| |
44 | LoCorr Long/Short Equity Fund - Financial Highlights - Class A |
| |
LoCorr Long/Short Equity Fund - Class A
Financial Highlights
Selected Data and Ratios (for a share outstanding throughout the period)
| | | | | | | | | | | | |
| | | Six Months Ended June 30, 20141 (Unaudited) | | Period from May 10, 2013 (commencement of operations) through December 31, 20131 | |
| | | | | | | | | | | | |
| Per Share | | | | | | | | | | | |
| Net asset value, beginning of period | | | $ | 11.48 | | | | $ | 10.00 | | |
| | | | | | | | | | | | |
| Income (loss) from investment operations: | | | | | | | | | | | |
Net investment income (loss)2 | | | | (0.12) | | | | | (0.13) | | |
| Net realized and unrealized gain (loss) | | | | (0.57) | | | | | 1.61 | | |
| Total from Investment Operations | | | | (0.69) | | | | | 1.48 | | |
| | | | | | | | | | | | |
Redemption Fees3 | | | | - | | | | | - | | |
| | | | | | | | | | | | |
| Net Asset Value, End of Period | | | $ | 10.79 | | | | $ | 11.48 | | |
| | | | | | | | | | | | |
Total Investment Return4 | | | | (6.01) | % | | | | 14.80 | % | |
| | | | | | | | | | | | |
| Net Assets, End of Period, in Thousands | | | $ | 25,028 | | | | $ | 21,256 | | |
| | | | | | | | | | | | |
| Ratios/Supplemental Data: | | | | | | | | | | | |
| Ratio of expenses to average net assets: | | | | | | | | | | | |
| Before expense reimbursement or recovery | | | | 3.35 | % | | | | 5.05 | % | |
| After expense reimbursement or recovery | | | | 3.28 | % | | | | 3.26 | % | |
| | | | | | | | | | | | |
Ratio of expenses to average net assets (excluding dividend and interest expense on securities sold short and interest expense on line of credit): | | | | | | | | | | | |
| Before expense reimbursement or recovery | | | | 3.22 | % | | | | 4.94 | % | |
| After expense reimbursement or recovery | | | | 3.15 | % | | | | 3.15 | % | |
| | | | | | | | | | | | |
| Ratio of net investment income (loss) to average net assets: | | | | | | | | | | | |
| Before expense reimbursement or recovery | | | | (2.40) | % | | | | (3.64) | % | |
| After expense reimbursement or recovery | | | | (2.33) | % | | | | (1.85) | % | |
| | | | | | | | | | | | |
Portfolio turnover rate5 | | | | 106 | % | | | | 66 | % | |
| 1 | All ratios have been annualized except total investment return and portfolio turnover. |
| 2 | Net investment income (loss) per share is based on average shares outstanding. |
| 3 | Amount represents less than $0.005 per share. |
| 4 | Total return excludes the effect of applicable sales charges. |
| 5 | Portfolio turnover rate is calculated on the basis of the Fund as a whole without distinguishing between classes of shares issued. The portfolio turnover rate excludes purchases and sales of short positions as the Adviser does not intend to hold the short positions for more than one year. |
The accompanying notes are an integral part of these financial statements.
| |
LoCorr Long/Short Equity Fund - Financial Highlights - Class C | 45 |
| |
LoCorr Long/Short Equity Fund - Class C
Financial Highlights
Selected Data and Ratios (for a share outstanding throughout the period)
| | | | | | | | | | | | |
| | | Six Months Ended June 30, 20141 (Unaudited) | | Period from May 10, 2013 (commencement of operations) through December 31, 20131 | |
| | | | | | | | | | | | |
| Per Share | | | | | | | | | | | |
| Net asset value, beginning of period | | | $ | 11.42 | | | | $ | 10.00 | | |
| | | | | | | | | | | | |
| Income (loss) from investment operations: | | | | | | | | | | | |
Net investment income (loss)2 | | | | (0.16) | | | | | (0.18) | | |
| Net realized and unrealized gain (loss) | | | | (0.56) | | | | | 1.60 | | |
| Total from Investment Operations | | | | (0.72) | | | | | 1.42 | | |
| | | | | | | | | | | | |
| Redemption Fees | | | | - | 3 | | | | - | | |
| | | | | | | | | | | | |
| Net Asset Value, End of Period | | | $ | 10.70 | | | | $ | 11.42 | | |
| | | | | | | | | | | | |
Total Investment Return4 | | | | (6.30) | % | | | | 14.20 | % | |
| | | | | | | | | | | | |
| Net Assets, End of Period, in Thousands | | | $ | 15,163 | | | | $ | 8,443 | | |
| | | | | | | | | | | | |
| Ratios/Supplemental Data: | | | | | | | | | | | |
| Ratio of expenses to average net assets: | | | | | | | | | | | |
| Before expense reimbursement or recovery | | | | 4.10 | % | | | | 5.80 | % | |
| After expense reimbursement or recovery | | | | 4.03 | % | | | | 4.01 | % | |
| | | | | | | | | | | | |
Ratio of expenses to average net assets (excluding dividend and interest expense on securities sold short and interest expense on line of credit): | | | | | | | | | | | |
| Before expense reimbursement or recovery | | | | 3.97 | % | | | | 5.69 | % | |
| After expense reimbursement or recovery | | | | 3.90 | % | | | | 3.90 | % | |
| | | | | | | | | | | | |
| Ratio of net investment income (loss) to average net assets: | | | | | | | | | | | |
| Before expense reimbursement or recovery | | | | (3.15) | % | | | | (4.39) | % | |
| After expense reimbursement or recovery | | | | (3.08) | % | | | | (2.60) | % | |
| | | | | | | | | | | | |
Portfolio turnover rate5 | | | | 106 | % | | | | 66 | % | |
| 1 | All ratios have been annualized except total investment return and portfolio turnover. |
| 2 | Net investment income (loss) per share is based on average shares outstanding. |
| 3 | Amount represents less than $0.005 per share. |
| 4 | Total return excludes the effect of applicable sales charges. |
| 5 | Portfolio turnover rate is calculated on the basis of the Fund as a whole without distinguishing between classes of shares issued. The portfolio turnover rate excludes purchases and sales of short positions as the Adviser does not intend to hold the short positions for more than one year. |
The accompanying notes are an integral part of these financial statements.
| |
46 | LoCorr Long/Short Equity Fund - Financial Highlights - Class I |
| |
LoCorr Long/Short Equity Fund - Class I
Financial Highlights
Selected Data and Ratios (for a share outstanding throughout the period)
| | | | | | | | | | | | |
| | | Six Months Ended June 30, 20141 (Unaudited) | | Period from May 10, 2013 (commencement of operations) through December 31, 20131 | |
| | | | | | | | |
| Per Share | | | | | | | | | | | |
| Net asset value, beginning of period | | | $ | 11.50 | | | | $ | 10.00 | | |
| | | | | | | | | | | | |
| Income (loss) from investment operations: | | | | | | | | | | | |
Net investment income (loss)2 | | | | (0.11) | | | | | (0.11) | | |
| Net realized and unrealized gain (loss) | | | | (0.57) | | | | | 1.61 | | |
| Total from Investment Operations | | | | (0.68) | | | | | 1.50 | | |
| | | | | | | | | | | | |
Redemption Fees3 | | | | - | | | | | - | | |
| | | | | | | | | | | | |
| Net Asset Value, End of Period | | | $ | 10.82 | | | | $ | 11.50 | | |
| | | | | | | | | | | | |
| Total Investment Return | | | | (5.91) | % | | | | 15.00 | % | |
| | | | | | | | | | | | |
| Net Assets, End of Period, in Thousands | | | $ | 15,558 | | | | $ | 12,361 | | |
| | | | | | | | | | | | |
| Ratios/Supplemental Data: | | | | | | | | | | | |
| Ratio of expenses to average net assets: | | | | | | | | | | | |
| Before expense reimbursement or recovery | | | | 3.10 | % | | | | 4.80 | % | |
| After expense reimbursement or recovery | | | | 3.03 | % | | | | 3.01 | % | |
| | | | | | | | | | | | |
Ratio of expenses to average net assets (excluding dividend and interest expense on securities sold short and interest expense on line of credit): | | | | | | | | | | | |
| Before expense reimbursement or recovery | | | | 2.97 | % | | | | 4.69 | % | |
| After expense reimbursement or recovery | | | | 2.90 | % | | | | 2.90 | % | |
| | | | | | | | | | | | |
| Ratio of net investment income (loss) to average net assets: | | | | | | | | | | | |
| Before expense reimbursement or recovery | | | | (2.15) | % | | | | (3.39) | % | |
| After expense reimbursement or recovery | | | | (2.08) | % | | | | (1.60) | % | |
| | | | | | | | | | | | |
Portfolio turnover rate4 | | | | 106 | % | | | | 66 | % | |
| 1 | All ratios have been annualized except total investment return and portfolio turnover. |
| 2 | Net investment income (loss) per share is based on average shares outstanding. |
| 3 | Amount represents less than $0.005 per share. |
| 4 | Portfolio turnover rate is calculated on the basis of the Fund as a whole without distinguishing between classes of shares issued. The portfolio turnover rate excludes purchases and sales of short positions as the Adviser does not intend to hold the short positions for more than one year. |
The accompanying notes are an integral part of these financial statements.
| |
LoCorr Spectrum Income Fund - Financial Highlights - Class A | 47 |
| |
LoCorr Spectrum Income Fund - Class A
Financial Highlights
Selected Data and Ratios (for a share outstanding throughout the period)
| | | | | | | |
| | | Six Months Ended June 30, 20141 (Unaudited) | |
| | | | | | | |
| Per Share | | | | | | |
| Net asset value, beginning of period | | | $ | 10.00 | | |
| | | | | | | |
| Income (loss) from investment operations: | | | | | | |
Net investment income (loss)2 | | | | 0.20 | | |
| Net realized and unrealized gain (loss) | | | | 0.53 | | |
| Total from Investment Operations | | | | 0.73 | | |
| | | | | | | |
| Distributions to shareholders from: | | | | | | |
| Net investment income | | | | (0.24) | | |
| Total Distributions | | | | (0.24) | | |
| | | | | | | |
Redemption Fees3 | | | | - | | |
| | | | | | | |
| Net Asset Value, End of Period | | | $ | 10.49 | | |
| | | | | | | |
Total Investment Return4 | | | | 7.39 | % | |
| | | | | | | |
| Net Assets, End of Period, in Thousands | | | $ | 26,295 | | |
| | | | | | | |
Ratios/Supplemental Data5: | | | | | | |
| Ratio of expenses to average net assets: | | | | | | |
| Before expense reimbursement or recovery | | | | 2.88 | % | |
| After expense reimbursement or recovery | | | | 2.05 | % | |
| Ratio of net investment income (loss) to average net assets: | | | | | | |
| Before expense reimbursement or recovery | | | | 4.29 | % | |
| After expense reimbursement or recovery | | | | 5.12 | % | |
| | | | | | | |
Portfolio turnover rate6 | | | | 10 | % | |
| 1 | All ratios have been annualized except total investment return and portfolio turnover. |
| 2 | Net investment income (loss) per share is based on average shares outstanding. |
| 3 | Amount represents less than $0.005 per share. |
| 4 | Total return excludes the effect of applicable sales charges. |
| 5 | Ratios do not include the expenses of the investment companies in which the Fund invests. |
| 6 | Portfolio turnover rate is calculated on the basis of the Fund as a whole without distinguishing between classes of shares issued. |
The accompanying notes are an integral part of these financial statements.
| |
48 | LoCorr Spectrum Income Fund - Financial Highlights - Class C |
| |
LoCorr Spectrum Income Fund - Class C
Financial Highlights
Selected Data and Ratios (for a share outstanding throughout the period)
| | | | | | | |
| | | Six Months Ended June 30, 20141 (Unaudited) | |
| | | | | | | |
| Per Share | | | | | | |
| Net asset value, beginning of period | | | $ | 10.00 | | |
| | | | | | | |
| Income (loss) from investment operations: | | | | | | |
Net investment income (loss)2 | | | | 0.17 | | |
| Net realized and unrealized gain (loss) | | | | 0.52 | | |
| Total from Investment Operations | | | | 0.69 | | |
| | | | | | | |
| Distributions to shareholders from: | | | | | | |
| Net investment income | | | | (0.21) | | |
| Total Distributions | | | | (0.21) | | |
| | | | | | | |
Redemption Fees3 | | | | - | | |
| | | | | | | |
| Net Asset Value, End of Period | | | $ | 10.48 | | |
| | | | | | | |
Total Investment Return4 | | | | 6.97 | % | |
| | | | | | | |
| Net Assets, End of Period, in Thousands | | | $ | 14,821 | | |
| | | | | | | |
Ratios/Supplemental Data5: | | | | | | |
| Ratio of expenses to average net assets: | | | | | | |
| Before expense reimbursement or recovery | | | | 3.63 | % | |
| After expense reimbursement or recovery | | | | 2.80 | % | |
| Ratio of net investment income (loss) to average net assets: | | | | | | |
| Before expense reimbursement or recovery | | | | 3.54 | % | |
| After expense reimbursement or recovery | | | | 4.37 | % | |
| | | | | | | |
Portfolio turnover rate6 | | | | 10 | % | |
| 1 | All ratios have been annualized except total investment return and portfolio turnover. |
| 2 | Net investment income (loss) per share is based on average shares outstanding. |
| 3 | Amount represents less than $0.005 per share. |
| 4 | Total return excludes the effect of applicable sales charges. |
| 5 | Ratios do not include the expenses of the investment companies in which the Fund invests. |
| 6 | Portfolio turnover rate is calculated on the basis of the Fund as a whole without distinguishing between classes of shares issued. |
The accompanying notes are an integral part of these financial statements.
| |
LoCorr Spectrum Income Fund - Financial Highlights - Class I | 49 |
| |
LoCorr Spectrum Income Fund - Class I
Financial Highlights
Selected Data and Ratios (for a share outstanding throughout the period)
| | | | | | | |
| | | Six Months Ended June 30, 20141 (Unaudited) | |
| | | | | | | |
| Per Share | | | | | | |
| Net asset value, beginning of period | | | $ | 10.00 | | |
| | | | | | | |
| Income (loss) from investment operations: | | | | | | |
Net investment income (loss)2 | | | | 0.21 | | |
| Net realized and unrealized gain (loss) | | | | 0.53 | | |
| Total from Investment Operations | | | | 0.74 | | |
| | | | | | | |
| Distributions to shareholders from: | | | | | | |
| Net investment income | | | | (0.25) | | |
| Total Distributions | | | | (0.25) | | |
| | | | | | | |
Redemption Fees3 | | | | - | | |
| | | | | | | |
| Net Asset Value, End of Period | | | $ | 10.49 | | |
| | | | | | | |
| Total Investment Return | | | | 7.50 | % | |
| | | | | | | |
| Net Assets, End of Period, in Thousands | | | $ | 23,912 | | |
| | | | | | | |
Ratios/Supplemental Data4: | | | | | | |
| Ratio of expenses to average net assets: | | | | | | |
| Before expense reimbursement or recovery | | | | 2.63 | % | |
| After expense reimbursement or recovery | | | | 1.80 | % | |
| Ratio of net investment income (loss) to average net assets: | | | | | | |
| Before expense reimbursement or recovery | | | | 4.54 | % | |
| After expense reimbursement or recovery | | | | 5.37 | % | |
| | | | | | | |
Portfolio turnover rate5 | | | | 10 | % | |
| 1 | All ratios have been annualized except total investment return and portfolio turnover. |
| 2 | Net investment income (loss) per share is based on average shares outstanding. |
| 3 | Amount represents less than $0.005 per share. |
| 4 | Ratios do not include the expenses of the investment companies in which the Fund invests. |
| 5 | Portfolio turnover rate is calculated on the basis of the Fund as a whole without distinguishing between classes of shares issued. |
The accompanying notes are an integral part of these financial statements.
| |
| 50 | | LoCorr Managed Futures Strategy Fund and LoCorr Long/Short Commodities Strategy Fund - Notes to Consolidated Financial Statements (Unaudited) |
| LoCorr Long/Short Equity Fund and LoCorr Spectrum Income Fund - Notes to Financial Statements (Unaudited) |
| |
LoCorr Investment Trust
Notes
June 30, 2014 (Unaudited)
1. Organization
LoCorr Investment Trust (the “Trust”), an Ohio business trust, was formed on November 15, 2010 and is an open-end management investment company registered under the Investment Company Act of 1940, as amended (“1940 Act”). The LoCorr Managed Futures Strategy Fund, LoCorr Long/Short Commodities Strategy Fund, LoCorr Long/Short Equity Fund and the LoCorr Spectrum Income Fund (individually a “Fund” and collectively the “Funds”) are series within the Trust. The LoCorr Long/Short Commodities Strategy Fund, the LoCorr Long/Short Equity Fund and the LoCorr Spectrum Income Fund are each non-diversified funds, and the LoCorr Managed Futures Strategy Fund is a diversified fund. The LoCorr Managed Futures Strategy Fund’s primary investment objective is capital appreciation in rising and falling equity markets with managing volatility as a secondary objective. The LoCorr Long/Short Commodities Strategy Fund’s primary objective is capital appreciation in rising and falling commodities markets with managing volatility as a secondary objective. The LoCorr Long/Short Equity Fund’s primary investment objective is long-term capital appreciation with reduced volatility compared to traditional broad-based equity market indices as a secondary objective. The LoCorr Spectrum Income Fund’s primary objective is current income with capital appreciation as a secondary objective.
In order to achieve their investment objectives, the LoCorr Managed Futures Strategy Fund and the LoCorr Long/Short Commodities Strategy Fund each invest up to 25% of their total assets (measured at the time of purchase) in wholly-owned subsidiaries, LCMFS Fund Limited (“LCMFS”) and LCLSCS Fund Limited (“LCLSCS”), respectively; both companies incorporated under the laws of the Cayman Islands. LCMFS and LCLSCS act as investment vehicles in order to enter into certain investments for the LoCorr Managed Futures Strategy Fund and LoCorr Long/Short Commodity Strategy Fund, respectively, consistent with their investment objectives and policies specified in the Prospectus and Statement of Additional Information. The consolidated financial statements of the LoCorr Managed Futures Strategy Fund and the LoCorr Long/Short Commodities Strategy Fund each include the investment activity and financial statements of LCMFS and LCLSCS, respectively. The only investment held by LCMFS and LCLSCS as of June 30, 2014 are swap contracts, for which the notional value was $385,769,768 and $12,650,000, respectively. At June 30, 2014, the LCMFS reported an unrealized loss on swap contracts of $8,328,818 and LCLSCS reported an unrealized gain on swap contracts of $328,460. In addition, LCMFS and LCLSCS may hold cash and cash equivalents as collateral on the swap contracts. See Note 2.
During the year ended December 31, 2012, LCMFS had a controlling ownership interest in Millburn Diversified Plus L.P. (the “Partnership”), a limited partnership organized on February 14, 2011 under the Delaware Revised Uniform Limited Partnership Act, which commenced operations on March 24, 2011. The Partnership engaged in speculative trading of futures and forward currency contracts. Similarly, LCLSCS had an investment in a partnership during the year ended December 31, 2012, however, based on the ownership percentage held during the year ended December 31, 2012, LCLSCS was not considered to have a controlling interest in that entity. The General Partner of the Partnership was Millburn Ridgefield Corporation (the “General Partner”). LCMFS and LCLSCS had fully redeemed out of their positions held in the partnerships as of December 20, 2012, and as a result, LCMFS no longer consolidated the Partnership, and its assets, liabilities, and related non-controlling interest are no longer included in the LoCorr Managed Futures Strategy Fund’s financial statements. As of December 20, 2012, there was no gain or loss on the redemption and deconsolidation because the investment in the Partnership was carried at fair value on a daily basis by LCMFS.
Because LCMFS had a controlling interest (greater than 50% but less than 100%) in the Partnership for the period January 1, 2012 through December 20, 2012, the financial activity of the Partnership for that period ended December 20, 2012, has also been consolidated with the financial statements of LCMFS. All intercompany balances, revenues, and expenses have been eliminated in consolidation. LoCorr Managed Futures Strategy Fund, LCMFS and the Partnership are collectively referred to as the LoCorr Managed Futures Strategy Fund throughout these consolidated financial statements.
Non-controlling interest is the portion of equity ownership in the Partnership not attributable to the LoCorr Managed Futures Strategy Fund. Non-controlling interest represents additional, non-related partners in the Partnership and was equal to 2.20% of the Partnership’s net assets prior to LCMFS having fully redeemed its holding of the Partnership.
The Funds currently offer three classes of shares, Class A, Class C and Class I shares. Each share class represents an interest in the same assets of the Fund, has the same rights and is identical in all material respects except that (i) Class A shares have a maximum front end sales load of 5.75% and maximum deferred sales charge of 1.00% and Class C shares have a maximum deferred sales charge of 1.00%, (ii) Class A shares have a 12b-1 fee of 0.25% and Class C shares have a 12b-1 fee of 1.00%; (iii) certain other class-specific expenses will be borne solely by the class to which such expenses are attributable and (iv) each class will have exclusive voting rights with respect to matters relating to its own distribution arrangements. With respect to the LoCorr Managed Futures Strategy Fund, the LoCorr Long/Short Commodities Strategy Fund and the LoCorr Long/Short Equity Fund, all classes are subject to a 1.00% redemption fee on redemptions made within 30 days of the original purchase. All classes with respect to the LoCorr Spectrum Income Fund are subject to a 2.00% redemption fee on redemptions made within 60 days of the original purchase. The LoCorr Managed Futures Strategy Fund Class A shares commenced operations on March 22, 2011 and Class C and Class I shares commenced operations on March 24, 2011. All three classes of the LoCorr Long/Short Commodities Strategy Fund commenced operations on January 1, 2012. All three classes of the LoCorr Long/Short Equity Fund commenced operations on May 10, 2013. All three classes of the LoCorr Spectrum Income Fund commenced operations on January 1, 2014.
The Funds may issue an unlimited number of shares of beneficial interest, with no par value. All shares of the Funds have equal rights and privileges, except as to class-specific rights and privileges described above.
| |
| LoCorr Managed Futures Strategy Fund and LoCorr Long/Short Commodities Strategy Fund - Notes to Consolidated Financial Statements (Unaudited) (continued) | | 51 |
| LoCorr Long/Short Equity Fund and LoCorr Spectrum Income Fund - Notes to Financial Statements (Unaudited) (continued) |
| |
2. Significant Accounting Policies
Investment Valuation
The Funds follow fair valuation accounting standards which establish a definition of fair value and set out a hierarchy for measuring fair value. These standards require additional disclosures about the various inputs and valuation techniques used to develop the measurements of fair value and changes in valuation techniques and related inputs during the period. These inputs are summarized in three broad levels listed below:
Level 1 – Unadjusted quoted prices in active markets for identical assets or liabilities that the Funds have the ability to access.
Level 2 – Observable inputs other than quoted prices included in Level 1 that are observable for the asset or liability, either directly or indirectly. These inputs may include quoted prices for the identical instrument on an inactive market, prices for similar instruments, interest rates, prepayment speeds, credit risk, yield curves, default rates and similar data.
Level 3 – Unobservable inputs for the asset or liability, to the extent relevant observable inputs are not available; representing the Funds’ own assumptions about the assumptions a market participant would use in valuing the asset or liability, and would be based on the best information available.
Generally, the Funds’ investments are valued each day at the last quoted sales price on each investment’s primary exchange. Investments traded or dealt in upon one or more exchanges (whether domestic or foreign) for which market quotations are readily available and not subject to restrictions against resale shall be valued at the last quoted sales price on the primary exchange or, in the absence of a sale on the primary exchange, at the last bid on the primary exchange. Investments primarily traded in the National Association of Securities Dealers’ Automated Quotation System (“NASDAQ”) National Market System for which market quotations are readily available shall be valued using the NASDAQ Official Closing Price. If market quotations are not readily available, investments will be valued at their fair value as determined in good faith by LoCorr Fund Management, LLC (the “Adviser”) in accordance with procedures approved by the Board of Trustees (the “Board”) and evaluated by the Board as to the reliability of the fair value method used. In these cases, a Fund’s net asset value (“NAV”) will reflect certain portfolio investments’ fair value rather than their market price. Fair value pricing involves subjective judgments and it is possible that the fair value determined for an investment is materially different than the value that could be realized upon the sale of that investment. The fair value prices can differ from market prices when they become available or when a price becomes available.
The Funds may use independent pricing services to assist in calculating the value of the Funds’ investments. In addition, market prices for foreign investments are not determined at the same time of day as the NAV for the Funds. Because the Funds may invest in portfolio investments primarily listed on foreign exchanges, and these exchanges may trade on weekends or other days when the Funds do not price their shares, the value of some of the Funds’ portfolio investments may change on days when you may not be able to buy or sell the Funds’ shares. In computing the NAV, the Funds value foreign investments held by the Funds at the latest closing price on the exchange in which they are traded immediately prior to closing of the NYSE. Prices of foreign investments quoted in foreign currencies are translated into U.S. dollars at current rates. If events materially affecting the value of an investment in the Funds’ portfolio, particularly foreign investments, occur after the close of trading on a foreign market but before the Funds price their shares, the investment will be valued at fair value.
Fixed income securities and certificates of deposit with maturities more than 60 days when acquired are valued using an evaluated price supplied by an independent pricing service. Inputs used by the pricing service for U.S. government and treasury securities are normally valued using a model that incorporates market observable data such as reported sales of similar securities, broker dealer quotes, yields, bids, offers, and reference data. Agency issued debt securities, foreign issued bonds and municipal bonds are generally valued in a manner similar to U.S. government securities. Evaluations for corporate bonds are typically based on valuation methodologies such as market pricing and other analytical pricing models as well as market transactions and dealer quotations based on observable inputs. Fixed income securities are generally categorized in Level 1 or Level 2 of the fair value hierarchy depending on inputs used and market activity levels for specific securities.
The fair value of asset backed securities and mortgage backed securities is estimated on models that consider the estimated cash flows of each tranche of the entity, establish a benchmark yield, and develop an estimated tranche-specific spread to the benchmark yield based on the unique attributes of the tranche. Additional inputs such as creditworthiness of the underlying collateral and quotes from outside brokers for the same or similar issuance may also be considered in the development of fair value. Asset backed and mortgage backed securities are generally categorized in Level 2 of the fair value hierarchy. Short-term investments in fixed income securities and certificates of deposit with maturities of less than 60 days when acquired, or which subsequently are within 60 days of maturity, are valued using an amortized cost method of valuation, and are categorized Level 2.
Equity securities, including master limited partnership (“MLP”) interests, real estate investment trusts (“REITs”), business development companies, and royalty trusts, generally are valued by using market quotations, but may be valued on the basis of prices furnished by a pricing service when the Adviser believes such prices accurately reflect the fair market value of such securities. MLP interests are limited partnerships, the interests in which (known as “units”) typically trade publicly, like stock. Master limited partnerships are also called publicly traded partnerships and public limited partnerships. Securities that are traded on any stock exchange or on the NASDAQ over-the-counter market are generally valued by the pricing service at the last quoted sale price. Lacking a last sale price, an equity security is generally valued by the pricing service at its last bid price. Equity securities are generally categorized in Level 1 or Level 2 of the fair value hierarchy.
With respect to any portion of the Funds’ assets that are invested in one or more open-end management investment companies, including money market funds, registered under the 1940 Act, the Funds’ net asset value is calculated based upon the net asset values of those open-end management investment companies, and the prospectuses for these companies explain the circumstances under which those companies will use fair value pricing and the effects of using fair value pricing.
The Funds generally will purchase shares of closed-end investment companies only in the secondary market. The shares of many closed-end investment companies, after their initial public offering, frequently trade at a price per share that is less than the net asset value per share, the difference representing the “market discount” of such shares. This market discount may be due in part to the investment objective of long-term appreciation, which is sought by many closed-end investment companies, as well as to the fact that the shares of closed-end investment companies are not redeemable by the holder upon demand to the issuer at the next determined net asset value but rather are subject to the principles of supply and demand in the secondary market. A relative lack of secondary market purchasers of closed-end investment company shares also may contribute to such shares trading at a discount to their net asset value. Closed-end investment companies are generally categorized in Level 1 or Level 2 of the fair value hierarchy.
| |
| 52 | | LoCorr Managed Futures Strategy Fund and LoCorr Long/Short Commodities Strategy Fund - Notes to Consolidated Financial Statements (Unaudited) (continued) |
| LoCorr Long/Short Equity Fund and LoCorr Spectrum Income Fund - Notes to Financial Statements (Unaudited) (continued) |
| |
The fair value of the LoCorr Spectrum Income Fund’s investment in Terra Secured Income Fund 5, LLC (“Terra”) is based on management’s analysis of certain existing data to determine the significance and character of inputs used to determine value. These inputs include, but are not limited to, financial statements (audited and unaudited) of Terra and the value used by other investors in Terra. Management also engaged a third party appraisal firm to review the valuation process used by Terra and the Fund’s management in determining the value of the investment. Changes to the fair value of this investment would result from changes to the underlying financial performance of Terra or other market factors. Terra is a private placement, limited liability company formed to originate, fund and structure real estate-related loans, including mezzanine loans, first and second mortgage loans, subordinated mortgage loans, bridge loans, preferred equity investments and other loans related to high quality commercial real estate in the United States. Units invested with Terra are not registered with the Securities and Exchange Commission (the “SEC”) under the Securities Act of 1933, as amended (the “Securities Act”) or the securities agency of any state. The units were offered in reliance upon an exemption from the registration provisions of the Securities Act and state securities laws applicable only to offers and sales to investors meeting the suitability requirements set forth herein. Due to lack of market activity and observable inputs, the LoCorr Spectrum Income Fund’s investment in Terra is categorized in Level 3 of the fair value hierarchy.
Futures contracts are carried at fair value using the primary exchange’s closing (settlement) price, and are categorized as Level 1. Forward currency contracts are carried at fair value using spot currency rates and are adjusted for the time value of money (forward points) and contractual prices of the underlying financial instruments. Forward currency contracts are generally categorized as Level 2.
Total return swap contracts are stated at fair value daily based on the fair value of the underlying futures and forward currency contracts constituting the contract’s stated index, taking into account any fees and expenses associated with the swap agreement. Total return swap contracts are generally categorized in Level 2.
The following table summarizes the LoCorr Managed Futures Strategy Fund’s consolidated investments and swap contracts as of June 30, 2014:
| | | | | | | | | | | | | |
| Security Classification | | Level 1 | | | Level 2 | | | Level 3 | | | Total | |
| Investments | | | | | | | | | | | | |
| Asset Backed Securities | | $ | - | | | $ | 43,332,481 | | | $ | - | | | $ | 43,332,481 | |
| Corporate Bonds | | | - | | | | 135,756,880 | | | | - | | | | 135,756,880 | |
| Mortgage Backed Securities | | | - | | | | 73,011,069 | | | | - | | | | 73,011,069 | |
| Municipal Bonds | | | - | | | | 7,625,078 | | | | - | | | | 7,625,078 | |
| Foreign Government Bond | | | - | | | | 924,030 | | | | - | | | | 924,030 | |
| U.S. Government Agency Issues | | | - | | | | 12,599,514 | | | | - | | | | 12,599,514 | |
| U.S. Government Note | | | - | | | | 3,466,092 | | | | - | | | | 3,466,092 | |
| Money Market Fund | | | 9,761,451 | | | | - | | | | - | | | | 9,761,451 | |
| Total Investments | | $ | 9,761,451 | | | $ | 276,715,144 | | | $ | - | | | $ | 286,476,595 | |
| | | | | | | | | | | | | | | | | |
Swap Contracts* | | | | | | | | | | | | | | | | |
| Long Total Return Swap Contracts | | $ | - | | | $ | (8,328,818) | | | $ | - | | | $ | (8,328,818) | |
| Total Swap Contracts | | $ | - | | | $ | (8,328,818) | | | $ | - | | | $ | (8,328,818) | |
See the consolidated schedule of investments for the investments detailed by industry classification.
*Swap contracts are derivative instruments not reflected in the consolidated schedule of investments, which are presented at the unrealized depreciation on the instrument.
The LoCorr Managed Futures Strategy Fund did not hold any Level 3 assets during the period.
The following table summarizes the LoCorr Long/Short Commodities Strategy Fund’s consolidated investments and swap contracts as of June 30, 2014:
| | | | | | | | | | | | | |
| Security Classification | | Level 1 | | | Level 2 | | | Level 3 | | | Total | |
| Investments | | | | | | | | | | | | |
| Asset Backed Securities | | $ | - | | | $ | 1,403,216 | | | $ | - | | | $ | 1,403,216 | |
| Corporate Bonds | | | - | | | | 3,472,729 | | | | - | | | | 3,472,729 | |
| Mortgage Backed Securities | | | - | | | | 2,656,499 | | | | - | | | | 2,656,499 | |
| Municipal Bonds | | | - | | | | 540,806 | | | | - | | | | 540,806 | |
| Foreign Government Bond | | | - | | | | 21,136 | | | | - | | | | 21,136 | |
| U.S. Government Agency Issues | | | - | | | | 111,029 | | | | - | | | | 111,029 | |
| Certificates of Deposit | | | - | | | | 119,762 | | | | - | | | | 119,762 | |
| Money Market Fund | | | 1,363,704 | | | | - | | | | - | | | | 1,363,704 | |
| Total Investments | | $ | 1,363,704 | | | $ | 8,325,177 | | | $ | - | | | $ | 9,688,881 | |
| | | | | | | | | | | | | | | | | |
Swap Contracts* | | | | | | | | | | | | | | | | |
| Long Total Return Swap Contracts | | $ | - | | | $ | 328,460 | | | $ | - | | | $ | 328,460 | |
| Total Swap Contracts | | $ | - | | | $ | 328,460 | | | $ | - | | | $ | 328,460 | |
See the consolidated schedule of investments for the investments detailed by industry classification.
*Swap contracts are derivative instruments not reflected in the consolidated schedule of investments, which are presented at the unrealized appreciation on the instrument.
| |
LoCorr Managed Futures Strategy Fund and LoCorr Long/Short Commodities Strategy Fund - Notes to Consolidated Financial Statements (Unaudited) (continued)
LoCorr Long/Short Equity Fund and LoCorr Spectrum Income Fund - Notes to Financial Statements (Unaudited) (continued) | | 53 |
| |
The LoCorr Long/Short Commodities Strategy Fund did not hold any Level 3 assets during the period.
The following table summarizes the LoCorr Long/Short Equity Fund’s investments and securities sold short as of June 30, 2014:
| | | | | | | | | | | | | |
| Security Classification | | Level 1 | | | Level 2 | | | Level 3 | | | Total | |
| Investments | | | | | | | | | | | | |
| Common Stocks | | $ | 53,651,231 | | | $ | - | | | $ | - | | | $ | 53,651,231 | |
| Exchange Traded Fund | | | 418,800 | | | | - | | | | - | | | | 418,800 | |
| Money Market Fund | | | 2,185,019 | | | | - | | | | - | | | | 2,185,019 | |
| Total Investments | | $ | 56,255,050 | | | $ | - | | | $ | - | | | $ | 56,255,050 | |
| | | | | | | | | | | | | | | | | |
| Securities Sold Short | | | | | | | | | | | | | | | | |
| Common Stocks | | $ | (4,098,343) | | | $ | - | | | $ | - | | | $ | (4,098,343) | |
| Total Securities Sold Short | | $ | (4,098,343) | | | $ | - | | | $ | - | | | $ | (4,098,343) | |
See the schedule of investments and schedule of securities sold short for detail by industry classification.
The LoCorr Long/Short Equity Fund did not hold any Level 3 assets during the period.
The following table summarizes the LoCorr Spectrum Income Fund’s investments as of June 30, 2014:
| | | | | | | | | | | | | |
| Security Classification | | Level 1 | | | Level 2 | | | Level 3 | | | Total | |
| Investments | | | | | | | | | | | | |
| Business Development Companies | | $ | 4,874,833 | | | $ | - | | | $ | - | | | $ | 4,874,833 | |
| Common Stocks | | | 8,595,060 | | | | - | | | | - | | | | 8,595,060 | |
| Closed-End Investment Companies | | | 7,723,139 | | | | - | | | | - | | | | 7,723,139 | |
| Master Limited Partnerships | | | 17,134,411 | | | | - | | | | - | | | | 17,134,411 | |
| Real Estate Investment Trusts | | | 13,788,164 | | | | - | | | | - | | | | 13,788,164 | |
| Royalty Trust | | | 2,363,281 | | | | - | | | | - | | | | 2,363,281 | |
| Private Placement | | | - | | | | - | | | | 5,651,139 | | | | 5,651,139 | |
| Money Market Fund | | | 3,431,511 | | | | - | | | | - | | | | 3,431,511 | |
| Total Investments | | $ | 57,910,399 | | | $ | - | | | $ | 5,651,139 | | | $ | 63,561,538 | |
See the schedule of investments for detail by industry classification.
The following is a reconciliation of the beginning and ending balances for assets and liabilities measured at fair value using significant unobservable inputs (Level 3) during the period ended June 30, 2014:
| | | Investments | |
| | | in Securities, | |
| Level 3 Reconciliation Disclosure | | at fair value | |
| | | | | |
| Balance, December 31, 2013* | | $ | - | |
| Purchases | | | 5,616,000 | |
| (Sales) | | | - | |
| Discount accretion | | | 35,139 | |
| Realized gain (loss) | | | - | |
| Change in net unrealized gain (loss) | | | - | |
| Transfer into Level 3 | | | - | |
| Transfer out of Level 3 | | | - | |
| Balance, June 30, 2014 | | $ | 5,651,139 | |
| Net unrealized gains relating to Level 3 investments still held at June 30, 2014 | | $ | - | |
* The Fund commenced operations on January 1, 2014.
Quantitative Information about Level 3 Fair Value Measurements held in the LoCorr Spectrum Income Fund:
| | | | | | | | |
| | | | | | Fair Value at |
| Type of Security | Valuation Technique | Unobservable Input | Range | | June 30, 2014 |
| Private Placement | See note below | Subscription Price $50,000 | Unchanged | | | $ 5,651,139 | |
| | | Net Asset Value $50,000 | | | | | |
Note: Management’s fair valuation is based on the issuer’s financial statements and other data, as well as other trades in this security as noted above.
For each of the Funds, there were no transfers between levels during the period. Transfers between levels are recognized at the end of the reporting period.
| |
| 54 | | LoCorr Managed Futures Strategy Fund and LoCorr Long/Short Commodities Strategy Fund - Notes to Consolidated Financial Statements (Unaudited) (continued)
LoCorr Long/Short Equity Fund and LoCorr Spectrum Income Fund - Notes to Financial Statements (Unaudited) (continued) |
| |
Deferred Offering Costs
Offering Costs are accounted for as a deferred charge until operations begin and thereafter amortized to expense over twelve months on a straight-line basis. For the LoCorr Spectrum Income Fund, these costs consisted of legal fees pertaining to preparing the Fund’s initial registration statement, printing costs, and SEC and state registration fees. For the six months ended June 30, 2014, the LoCorr Spectrum Income Fund amortized $28,945 in deferred offering costs. At June 30, 2014, the remaining cumulative balance of unamortized offering costs for the LoCorr Spectrum Income Fund amounted to $44,679.
Organizational Costs
Organizational costs in connection with the organization of the Funds are expensed as incurred. For the six months ended June 30, 2014, the LoCorr Spectrum Income Fund expensed $4,638 in organizational costs associated with the legal fees related to the Fund’s formation and incorporation of business.
Federal Income Taxes
The Funds intend to qualify as regulated investment companies pursuant to Subchapter M of the Internal Revenue Code. The Funds intend to distribute substantially all of their investment company net taxable income and net capital gains to shareholders. Therefore, no federal income tax provision is required.
As of and during the period ended June 30, 2014, the Funds did not have any tax positions that did not meet the “more-likely-than-not” threshold of being sustained by applicable tax authorities. The Funds recognize interest and penalties, if any, related to unrecognized tax benefits on uncertain tax position as interest or, other expense in the statements of operations. During the period ended June 30, 2014, the Funds did not incur any interest or penalties. Generally, tax authorities can examine all the tax returns filed for the last three years.
For tax purposes, LCMFS and LCLSCS are exempted Cayman investment companies. LCMFS and LCLSCS have received an undertaking from the Government of the Cayman Islands exempting them from all local income, profits, and capital gains taxes. No such taxes are levied in the Cayman Islands at the present time. For U.S. income tax purposes, LCMFS and LCLSCS are controlled foreign corporations (“CFCs”) and as such are not subject to U.S. income tax. However, as a wholly-owned CFC, LCMFS’s and LCLSCS’s net income and capital gain, to the extent of its earnings and profits, will be included each year in the respective Funds’ investment company taxable income.
Use of Estimates
The preparation of consolidated financial statements in conformity with accounting principles generally accepted in the United States of America requires management to make estimates and assumptions that affect the reported amounts of assets and liabilities, disclosure of contingent assets and liabilities at the date of the financial statements and the reported revenues and expenses during the reporting period. Actual results could differ from those estimates.
Indemnifications
In the normal course of business, the Funds enter into contracts that contain general indemnifications to other parties. The Funds’ maximum exposure under these contracts is unknown as this would involve future claims that may be made against the Funds that have not yet occurred. However, based on experience, the Funds expect the risk of loss to be remote.
Security Transactions and Investment Income
Security transactions are recorded on trade date. Generally, realized gains and losses on sales of investments are calculated on the specifically identified cost basis of the securities.
Each Fund may invest up to 15% of its net assets in illiquid securities. Illiquid securities may include securities subject to contractual or legal restrictions on resale (e.g., because they have not been registered under the Securities Act) and securities that are otherwise not readily marketable (e.g., because trading in the security is suspended or because market makers do not exist or will not entertain bids or offers). Securities that have not been registered under the Securities Act are referred to as private placements or restricted securities and are purchased directly from the issuer or in the secondary market. Foreign securities that are freely tradable in their principal markets are not considered to be illiquid. Under guidelines adopted by the Trust’s Board, the Adviser of the Fund may determine that particular Rule 144A securities, and commercial paper issued in reliance on the private placement exemption from registration afforded by Section 4(a)(2) of the Securities Act, are liquid even though they are not registered. At June 30, 2014, the Adviser deemed all of the restricted securities held in each of the LoCorr Managed Futures Strategy Fund and the LoCorr Long/Short Commodities Strategy Fund to be liquid. The LoCorr Spectrum Income Fund’s investment in Terra was deemed by the Adviser to be illiquid at June 30, 2014 and represented 8.69% of the Fund’s net assets. There were no illiquid or restricted securities held in the LoCorr Long/Short Equity Fund at June 30, 2014.
Dividend income, less foreign taxes withheld, if any, are recorded on the ex-dividend date.
Distributions received from the LoCorr Spectrum Income Fund’s investment in MLP interests, REITs and royalty trusts generally are comprised of ordinary income, capital gains and return of capital. For financial statement purposes, the Fund uses estimates to characterize these distributions received as return of capital, capital gains or ordinary income. Such estimates are based on historical information available from each MLP, REIT or royalty trust and other industry sources. These estimates may subsequently be revised based on information received from the MLP, REIT or royalty trust after their tax reporting periods are concluded, as the actual character of these distributions is not known until after the fiscal year end of the Fund. The distributions received from the MLP, REIT and royalty trust securities that have been classified as income and capital gains are included in dividend income and net realized gain (loss) on investments, respectively, on the statement of operations. The distributions received that are classified as return of capital reduce the cost of investments on the statement of assets and liabilities. For the six months ended June 30, 2014, the LoCorr Spectrum Income Fund estimated that 100% of the MLP distributions received would be treated as return of capital.
Interest income and expense are recognized on the accrual basis. Market discounts, premiums and original issue discounts on fixed-income securities are amortized daily over the expected life of the security using the effective yield method. The purchase discount on LoCorr Spectrum Income Fund’s investment in Terra is accreted on a straight-line basis over a period of five years.
LoCorr Managed Futures Strategy Fund and LoCorr Long/Short Commodities Strategy Fund - Notes to Consolidated Financial Statements (Unaudited) (continued) LoCorr Long/Short Equity Fund and LoCorr Spectrum Income Fund - Notes to Financial Statements (Unaudited) (continued) | | 55 |
Allocation of Income and Expenses
Net investment income, other than class specific expenses, and realized and unrealized gains and losses are allocated daily to each class of shares based upon the relative net asset value of outstanding shares of each class of shares at the beginning of the day (after adjusting for the current capital shares activity of the respective class). Expenses associated with a specific Fund in the Trust are charged to that Fund. Common expenses are typically allocated based upon the relative net assets of each Fund, or by other equitable means.
Distributions to Shareholders
Shareholder transactions are recorded on trade date. Dividends from net investment income are declared and paid at least annually by the Funds. Distribution of net realized capital gains, if any, are declared and paid at least annually. Distributions to shareholders are recorded on the ex-dividend date. The character of distributions made during the periods from net investment income or net realized gains may differ from the characterization for federal income tax purposes due to the difference in the recognition of income, expense and gain items for financial statement and tax purposes.
Beginning in February 2014, dividends for the LoCorr Spectrum Income Fund are declared and distributed monthly. The estimated characterization of the distributions paid will be either a qualified dividend or return of capital. This estimate is based on the LoCorr Spectrum Income Fund’s operating results during the period. It is anticipated that a significant portion of the distributions of the LoCorr Spectrum Income Fund’s investments in MLP and certain investments in REIT and royalty trusts will be comprised of return of capital as a result of the tax character of cash distributions made by the Fund’s investments. The actual characterization of the distributions made during the period will not be determined until after the end of the fiscal year.
The tax character of distributions paid during the periods was as follows:
| | | | | | | | | | | | | | | | | |
| | | Six Months Ended June 30, 2014 | |
| Fund | | Ordinary Income | | Long-Term Capital Gains | | Return of Capital | |
| LoCorr Spectrum Income Fund | | | $ | 773,647 | | | | $ | - | | | | $ | - | | |
| | | | | | | | | | | | | | | | | |
| | | Year Ended December 31, 2013 | |
| Fund | | Ordinary Income | | Long-Term Capital Gains | | Return of Capital | |
| LoCorr Managed Futures Strategy Fund | | | $ | - | | | | $ | 226,371 | | | | $ | - | | |
For the periods presented in the tables above, there were no distributions for the LoCorr Long/Short Commodities Strategy Fund or the LoCorr Long/Short Equity Fund.
Distributable Earnings and Investment Transactions
Net investment income and net realized gains (losses) may differ for financial reporting and tax purposes because of temporary or permanent book/tax differences. To the extent these differences are permanent; reclassifications are made to the appropriate equity accounts in the period that the difference arises.
Additionally, U.S. generally accepted accounting principles require that certain components of net assets relating to permanent differences be reclassified between financial and tax reporting. These reclassifications have no effect on net assets or net asset value per share.
Foreign Securities and Currency
Investment securities and other assets and liabilities denominated in foreign currencies are translated into U.S. dollar amounts at the date of valuation. Purchases and sales of investment securities and income and expense items denominated in foreign currencies are translated into U.S. dollar amounts on the respective dates of such transactions.
The Funds do not isolate that portion of the results of operations resulting from changes in foreign exchange rates on investments from the fluctuations arising from changes in market prices of securities held. Such fluctuations are included with the net realized and unrealized gain or loss from investments.
Reported net realized foreign exchange gains or losses arise from sales of foreign currencies, currency gains or losses realized between the trade and settlement dates on securities transactions, and the difference between the amounts of dividends, interest, and foreign withholding taxes recorded on the Funds’ books and the U.S. dollar equivalent of the amounts actually received or paid. Net unrealized foreign exchange gains and losses arise from changes in the fair values of assets and liabilities, other than investments in securities at period end, resulting from changes in exchange rates.
Futures Contracts
Gains or losses are realized when contracts are liquidated. Any change in net unrealized gain or loss is reported in the statement of operations. Brokerage commissions on open futures contracts are charged to expense when paid.
Forward Currency Contracts
Gains or losses are realized when foreign currency contracts are liquidated. Any change in net unrealized gain or loss is reported in the statement of operations.
| 56 | | LoCorr Managed Futures Strategy Fund and LoCorr Long/Short Commodities Strategy Fund - Notes to Consolidated Financial Statements (Unaudited) (continued) LoCorr Long/Short Equity Fund and LoCorr Spectrum Income Fund - Notes to Financial Statements (Unaudited) (continued) |
Total Return Swap Contracts
The Funds may enter into total return swap agreements. A total return swap entered into by the Funds is a derivative contract that transfers the market risk of underlying portfolios of futures and forward currency contracts (considered the “index” within each total return swap contract) between counterparties. The “notional amount” of each total return swap agreement is the agreed upon amount or value of the index used for calculating the returns that the parties to a swap agreement have agreed to exchange. The total return swaps are marked to market daily and any change is recorded in unrealized gain/loss on the consolidated statement of operations based on the value of the index on which the total return swap is referenced, as defined within the total return swap agreement between the counterparties. The composition of the index may vary based on how the underlying portfolio of futures and forward currency contracts is traded. A Fund’s obligation under a total return swap agreement, including any related fees, offset against amounts owed to the Fund in the case of positive performance, will be covered by designating liquid assets on the Fund’s books and records (see the consolidated statement of assets and liabilities for cash collateral). Gains or losses will be realized when the total return swap contracts are liquidated and will be presented as net realized gain or loss on swap contracts on the consolidated statements of operations. In addition, changes in notional value and any cash holding adjustments, which represent voluntary realizations by a Fund of swap value at any point in time, are also presented as net realized gain or loss on swap contracts on the consolidated statements of operations. A corresponding asset or liability for “advance payment on swap contracts” is recorded on the consolidated statements of assets and liabilities for the gain or loss realized on changes in notional value. Total return swaps outstanding at period end, if any, are listed after the Funds’ consolidated schedules of investments.
Short Sales
The LoCorr Long/Short Equity Fund may sell securities short. A short sale is a transaction in which the Fund sells a security it does not own or have the right to acquire (or that it owns but does not wish to deliver) in anticipation that the market price of that security will decline.
When the Fund makes a short sale, the broker-dealer through which the short sale is made must borrow the security sold short and deliver it to the party purchasing the security. The Fund is required to make a margin deposit in connection with such short sales; the Fund may have to pay a fee to borrow particular securities and will often be obligated to pay over any dividends and accrued interest on borrowed securities.
If the price of the security sold short increases between the time of the short sale and the time the Fund covers its short position, the Fund will incur a loss; conversely, if the price declines, the Fund will realize a capital gain. A gain, limited to the price at which the Fund sold the security short, or a loss, unlimited in size, will be recognized upon the close of a short sale. Any gain will be decreased, and any loss increased, by the transaction costs described above. The successful use of short selling may be adversely affected by imperfect correlation between movements in the price of the security sold short and the securities being hedged. Gains or losses from closed positions of securities sold short are presented as net realized gain or loss on securities sold short on the statement of operations.
In addition, the Fund is required to pay the lender any dividends declared on short positions. Dividends declared on open short positions are recorded on ex-date and shown as an expense for financial reporting purposes. To borrow the security, the Fund also may be required to pay fees, which is shown as an expense for financial reporting purposes.
To the extent the Fund sells securities short, it will provide collateral to the broker-dealer and (except in the case of short sales “against the box”) will maintain additional asset coverage in the form of cash, U.S. government securities or other liquid securities with its custodian in a segregated account in an amount at least equal to the difference between the current fair value of the securities sold short and any amounts required to be deposited as collateral with the selling broker (not including the proceeds of the short sale). A short sale is “against the box” to the extent the Fund contemporaneously owns, or has the right to obtain at no added cost, securities identical to those sold short. Short sales are collateralized by cash deposits with the counterparty broker and pledged securities held at the custodian, U.S. Bank, N.A. The collateral required is determined daily by reference to the fair value of the short positions. At June 30, 2014, the LoCorr Long/Short Equity Fund had cash on deposit with the broker-dealer in the amount of $3,679,414 and pledged securities with a fair value of $5,021,114.
Deposits with Broker
LCMFS and LCLSCS have a substantial portion of their assets on deposit with Deutsche Bank in connection with their trading of swap contracts. Assets deposited with Deutsche Bank in connection with the trading of swap contracts for LCMFS and LCLSCS are partially restricted due to deposit requirements. At June 30, 2014, the LoCorr Managed Futures Strategy Fund and LoCorr Long/Short Commodities Strategy Fund had cash and cash equivalents on deposit with Deutsche Bank in the amount of $101,000,010 and $2,700,010, respectively, which have been presented on the consolidated statements of assets and liabilities of LoCorr Managed Futures Strategy Fund and LoCorr Long/Short Commodities Strategy Fund, respectively. Risks arise from the possible inability of the counterparty to meet the term of its contract and may increase if the counterparty’s financial condition worsens.
Market and Credit Risks
The Funds may engage in the speculative trading of U.S. and foreign futures, forward currency and swap contracts (collectively, derivatives). The Funds are exposed to both market risk, which is the risk arising from changes in the fair value of the contracts, and credit risk, which is the risk of failure by another party to perform according to the terms of a contract.
Purchase and sale of futures contracts requires margin deposits with the broker. Additional deposits may be necessary for any loss on contract value. The Commodity Exchange Act requires a broker to segregate all customer transactions and assets from such broker’s proprietary activities A customer’s cash and other property (for example, U.S. government securities) deposited with a broker are considered commingled with all other customer funds subject to the broker’s segregation requirements. In the event of a broker’s insolvency, recovery may be limited to a pro rata share of segregated funds available. It is possible that the recovered amount could be less than total cash and other property deposited.
For derivatives, risks arise from changes in the fair value of the contracts. Theoretically, the Funds are exposed to a market risk equal to the notional contract value of swap, futures and forward currency contracts purchased and unlimited liability on such contracts sold short.
The Funds also engage in investing its assets in U.S. government securities. Risks arise from investments in U.S. government securities due to possible market illiquidity. U.S. government securities are also sensitive to changes in interest rates and economic conditions.
The Funds have established procedures to actively monitor market risk and minimize credit risk, although there can be no assurance that it will, in fact, succeed in doing so.
LoCorr Managed Futures Strategy Fund and LoCorr Long/Short Commodities Strategy Fund - Notes to Consolidated Financial Statements (Unaudited) (continued) LoCorr Long/Short Equity Fund and LoCorr Spectrum Income Fund - Notes to Financial Statements (Unaudited) (continued) | | 57 |
3. Derivatives
The Funds may invest in derivatives such as futures, forward currency, and swap contracts, in order to hedge against market movements while liquidating certain positions and buying other securities or as substitutes for securities, as well as for speculative purposes to gain exposure to such market movements.
The Funds’ market risk related to its derivatives trading is influenced by a wide variety of factors, including the level and volatility of interest rates, exchange rates, weather, supply and demand of commodities, the market value of futures and forward currency contracts, the diversification effects among the Funds’ open positions and the liquidity of the markets in which they trade.
Prior to December 20, 2012, the LoCorr Managed Futures Strategy Fund and the LoCorr Long/Short Commodities Strategy Fund engaged in the speculative trading of futures, forward currency and swap contracts. The Funds traded futures contracts on interest rates, commodities, currencies, metals, energies, livestock and stock indices. During the year ended December 31, 2012, the majority of the Funds’ futures and forward currency contracts activity was in the underlying partnership investments of LCMFS and LCLSCS. It was the Funds’ intention that the total return swap contracts currently held will provide futures exposure to such market movements. The following were the primary trading risk exposures by market sector of the Funds, and as encompassed in the total return swap contracts:
Agricultural (grains, livestock and softs). The Funds’ primary exposure is to agricultural price movements which are often directly affected by severe or unexpected weather conditions.
Currencies. Exchange rate risk is a principal market exposure of the Funds. The Funds’ currency exposure is to exchange rate fluctuations, primarily fluctuations which disrupt the historical pricing relationships between different currencies and currency pairs. The fluctuations are influenced by interest rate changes as well as political and general economic conditions. The Funds trade in a large number of currencies including cross-rates – e.g., positions between two currencies other than the U.S. dollar.
Energy. The Funds’ primary energy market exposure is to gas and oil price movements, often resulting from political developments in the Middle East and economic conditions worldwide. Energy prices are volatile and substantial profits and losses have been and are expected to continue to be experienced in this market.
Interest rates. Interest rate movements directly affect the price of the sovereign bond futures positions held by the Funds and indirectly the value of its stock index currency positions. Interest rate movements in one country as well as relative interest rate movements between countries may materially impact the Funds’ profitability. The Funds’ primary interest rate exposure is to interest rate fluctuations in countries or regions including Australia, Canada, Japan, Switzerland, the United Kingdom, the United States and the Eurozone. However, the Funds also may take positions in futures contracts on the government debt of other nations. The Funds anticipate that interest rates in these industrialized countries or areas, both long-term and short-term, will remain a primary market exposure of the Funds for the foreseeable future.
Metals. The Funds’ metals market exposure is to fluctuations in the price of aluminum, copper, gold, lead, nickel, palladium, tin, silver and zinc.
Stock index. The Funds’ equity exposure, through stock index futures, is to equity price risk in the major industrialized countries as well as other countries.
At June 30, 2014, the LoCorr Managed Futures Strategy Fund and the LoCorr Long/Short Commodities Strategy Fund held swap contracts which are not subject to a master netting agreement. As the tables below illustrate, no positions are netted in these financial statements.
| | | | | | | | | | | | | | | | | | | | |
| LoCorr Managed Futures Strategy Fund - June 30, 2014 | |
| Liabilities: | | | | | | | | | | | Gross Amounts not offset in the Consolidated Statement of Asset & Liabilities | | | | |
| Description | | Gross Amounts of Recognized Liabilities | | Gross Amounts Offset in the Statement of Assets & Liabilities | | Net Amounts Presented in the Statement of Assets & Liabilities | | Financial Instruments | | Collateral Pledged (Received) | | Net Amount | |
Swap Contracts* | | $ | 12,022,181 | | $ | - | | $ | 12,022,181 | | $ | - | | $ | 12,022,181 | | $ | - | |
| Total | | $ | 12,022,181 | | $ | - | | $ | 12,022,181 | | $ | - | | $ | 12,022,181 | | $ | - | |
*Includes advance payment on swap contracts.
| 58 | | LoCorr Managed Futures Strategy Fund and LoCorr Long/Short Commodities Strategy Fund - Notes to Consolidated Financial Statements (Unaudited) (continued) LoCorr Long/Short Equity Fund and LoCorr Spectrum Income Fund - Notes to Financial Statements (Unaudited) (continued) |
| | | | | | | | | | | | | | | | | | | | |
| LoCorr Long/Short Commodities Strategy Fund - June 30, 2014 | |
| Assets: | | | | | | | | | | | Gross Amounts not offset in the Consolidated Statement of Asset & Liabilities | | | | |
| Description | | Gross Amounts of Recognized Assets | | Gross Amounts Offset in the Statement of Assets & Liabilities | | Net Amounts Presented in the Statement of Assets & Liabilities | | Financial Instruments | | Collateral Pledged (Received) | | Net Amount | |
| Swap Contracts | | $ | 328,460 | | $ | - | | $ | 328,460 | | $ | - | | $ | - | | $ | 328,460 | |
| Total | | $ | 328,460 | | $ | - | | $ | 328,460 | | $ | - | | $ | - | | $ | 328,460 | |
| | | | | | | | | | | | | | | | | | | | |
| Liabilities: | | | | | | | | | | | Gross Amounts not offset in the Consolidated Statement of Asset & Liabilities | | | | |
| Description | | Gross Amounts of Recognized Liabilities | | Gross Amounts Offset in the Statement of Assets & Liabilities | | Net Amounts Presented in the Statement of Assets & Liabilities | | Financial Instruments | | Collateral Pledged (Received) | | Net Amount | |
Swap Contracts* | | $ | 18,144 | | $ | - | | $ | 18,144 | | $ | - | | $ | 18,144 | | $ | - | |
| Total | | $ | 18,144 | | $ | - | | $ | 18,144 | | $ | - | | $ | 18,144 | | $ | - | |
*Represents advance payment on swap contracts.
The Funds have adopted authoritative standards regarding disclosure about derivatives and hedging activities and how they affect the Funds’ consolidated statements of asset and liabilities and statements of operations. Fair value of swap contracts are recorded in the consolidated statement of assets and liabilities as net unrealized gain on swap contracts or net unrealized loss on swap contracts and net unrealized appreciation of swap contracts or net unrealized depreciation of swap contracts.
Since the derivatives held long or short are for speculative trading purposes, the derivative instruments are not designated as hedging instruments. Accordingly, all realized gains and losses, as well as any change in net unrealized gains or losses on open contracts from the preceding period, are recognized as part of realized and unrealized gain (loss) in the consolidated statements of operations.
The following table presents the fair value of consolidated open swap contracts for the LoCorr Managed Futures Strategy Fund at June 30, 2014 as presented on the consolidated statement of assets and liabilities.
| | | | | | | | | | | | | | | | | |
| June 30, 2014 | | | | | | | | | | | | | | | | |
| | | Fair Value – Long Positions | | Fair Value – Short Positions | | Net Unrealized Gain (Loss) on Open Positions | |
| Swap Contracts | | Assets | | Liabilities | | Assets | | Liabilities | | |
| LoCorr Managed Futures Index | | $ | - | | $ | 8,328,818 | | $ | - | | $ | - | | | $ (8,328,818 | ) |
| Total Swap Contracts | | $ | - | | $ | 8,328,818 | | $ | - | | $ | - | | | $ (8,328,818 | ) |
The following table presents the fair value of consolidated open swap contracts for the LoCorr Long/Short Commodities Strategy Fund at June 30, 2014 as presented on the consolidated statement of assets and liabilities:
| | | | | | | | | | | | | | | | | |
| June 30, 2014 | | | | | | | | | | | | | | | | |
| | | Fair Value – Long Positions | | Fair Value – Short Positions | | Net Unrealized Gain (Loss) on Open Positions | |
| Swap Contracts | | Assets | | Liabilities | | Assets | | Liabilities | | |
| LoCorr Commodities Index | | $ | 328,460 | | $ | - | | $ | - | | $ | - | | | $ 328,460 | |
| Total Swap Contracts | | $ | 328,460 | | $ | - | | $ | - | | $ | - | | | $ 328,460 | |
The following table presents the trading results of the derivative trading and information related to the volume of the LoCorr Managed Futures Strategy Fund and the LoCorr Long/Short Commodities Strategy Fund for the six months ended June 30, 2014. The below captions of “Net Realized” and “Net Change in Unrealized” correspond to the captions in the consolidated statement of operations.
| | | | | | | | | | |
LoCorr Managed Futures Strategy Fund Six Months Ended June 30, 2014 | | | | | | | | | |
| | | Gain (Loss) from Trading | | | |
| | | Net Realized | | Net Change in Unrealized | | | |
| Swap Contracts | | $ | 900,478 | | $ | 32,598,553 | | | |
| | | | | | | | | | |
LoCorr Long/Short Commodities Strategy Fund Six Months Ended June 30, 2014 | | | | | | | | | |
| | | Gain (Loss) from Trading | | | |
| | | Net Realized | | Net Change in Unrealized | | | |
| Swap Contracts | | $ | 18,634 | | $ | 1,181,874 | | | |
LoCorr Managed Futures Strategy Fund and LoCorr Long/Short Commodities Strategy Fund - Notes to Consolidated Financial Statements (Unaudited) (continued) LoCorr Long/Short Equity Fund and LoCorr Spectrum Income Fund - Notes to Financial Statements (Unaudited) (continued) | | 59 |
The average monthly notional amount of the swap contracts during the six months ended June 30, 2014 for the LoCorr Managed Futures Strategy Fund and the LoCorr Long/Short Commodities Strategy Fund was $407,198,339 and $12,164,286, respectively.
Please refer to the Funds’ prospectus for a full listing of risks associated with these investments.
4. Investment Transactions
The cost of security purchases and proceeds from security sales, other than U.S. Government obligations, short-term investments, swaps, short sales, purchases to cover and short-term securities for the six months ended June 30, 2014 were as follows:
| | | | | | | | |
| Fund | | Purchases | | Sales | |
| LoCorr Managed Futures Strategy Fund | | | $46,869,938 | | | $68,585,174 | |
| LoCorr Long/Short Commodities Strategy Fund | | | 3,044,829 | | | 2,629,847 | |
| LoCorr Long/Short Equity Fund | | | 65,211,494 | | | 49,210,400 | |
| LoCorr Spectrum Income Fund | | | 61,231,042 | | | 2,802,323 | |
| | | | | | | | |
Purchases and sales of U.S. Government obligations for six months ended June 30, 2014 were as follows:
| | | | | | | | |
| Fund | | Purchases | | Sales | |
| LoCorr Managed Futures Strategy Fund | | | $3,932,656 | | | $5,536,476 | |
| LoCorr Long/Short Commodities Strategy Fund | | | - | | | 1,022 | |
| LoCorr Long/Short Equity Fund | | | - | | | - | |
| LoCorr Spectrum Income Fund | | | - | | | - | |
5. Management Fees and Other Transactions with Affiliates
The Trust has a Management Agreement with the Adviser, with whom certain officers and Trustees of the Funds are affiliated, to furnish investment advisory services to the Funds. Pursuant to the Management Agreement, the Adviser is entitled to receive a fee, in accordance with the Incremental Advisory Fee schedule below based on each of the LoCorr Managed Futures Strategy Fund and the LoCorr Long/Short Commodities Strategy Fund’s average daily net assets. In addition, pursuant to a Management Agreement, the Adviser is entitled to receive, on a monthly basis, an annual advisory fee of 2.45% of the LoCorr Long/Short Equity Fund’s average daily net assets, and 1.35% of the LoCorr Spectrum Income Fund’s average daily net assets.
| | |
Net Assets per Fund for each of the LoCorr Managed Futures Strategy Fund and the LoCorr Long/Short Commodities Strategy Fund | Incremental* Advisory Fee |
| $0.0 – $0.5 billion | 1.50% |
| $0.5 – $1.0 billion | 1.40% |
| $1.0 – $1.5 billion | 1.30% |
| $1.5 – $2.0 billion | 1.20% |
| $2.0 – $2.5 billion | 1.10% |
| Over $2.5 billion | 1.00% |
* Incremental advisory fee represents the fees paid on net assets at the related net asset level. For example, with $2 billion in net assets in a Fund, the Adviser would earn 1.50% on the first $500 million, plus 1.40% on the next $500 million, plus 1.30% on the next $500 million, plus 1.20% on the final $500 million.
For the six months ended June 30, 2014, the LoCorr Managed Futures Strategy Fund, the LoCorr Long/Short Commodities Strategy Fund, the LoCorr Long/Short Equity Fund and the LoCorr Spectrum Income Fund incurred $2,687,028, $90,478, $616,987 and $173,398, respectively, in advisory fees. At June 30, 2014, the LoCorr Managed Futures Strategy Fund, the LoCorr Long/Short Equity Fund, and the LoCorr Spectrum Income Fund owed the Adviser $455,240, $108,700 and $52,347, respectively. The LoCorr Long/Short Commodities Strategy Fund reported a receivable from the Adviser of $1,490 at June 30, 2014.
Pursuant to a sub-advisory agreement between the Adviser and Nuveen Asset Management, LLC (“Nuveen”) related to the LoCorr Managed Futures Strategy Fund and the LoCorr Long/Short Commodities Strategy Fund, Nuveen is entitled to receive a monthly fee at an annual rate equal to 0.18% of the average daily net assets of the first $50 million of sub-advised assets, 0.14% of the average daily net assets of the next $50 million of sub-advised assets, 0.10% of the average daily net assets of the next $200 million of sub-advised assets, 0.07% of the average daily net assets of the next $700 million of sub-advised assets, and 0.05% of the average daily net assets in excess of $1 billion of sub-advised assets. The minimum annual fee payable by the Adviser to Nuveen is $45,000.
Pursuant to a sub-advisory agreement between the Adviser and Millennium Asset Management, L.L.C. (“Millennium”) related to the LoCorr Long/Short Equity Fund, Millennium is entitled to receive a monthly fee at an annual rate equal to 1.25% of the first $10 million of the average daily net assets of the sub-advised assets and 1.00% of the average daily net assets of the sub-advised assets over $10 million.
| | |
60 | | LoCorr Managed Futures Strategy Fund and LoCorr Long/Short Commodities Strategy Fund - Notes to Consolidated Financial Statements (Unaudited) (continued) |
| LoCorr Long/Short Equity Fund and LoCorr Spectrum Income Fund - Notes to Financial Statements (Unaudited) (continued) |
| | |
Pursuant to a sub-advisory agreement between the Adviser and Billings Capital Management, LLC (“Billings”) related to the LoCorr Long/Short Equity Fund, Billings is entitled to receive a monthly fee at an annual rate equal to 1.70% of the first $50 million of the average daily net asset value of the sub-advised assets, plus 1.50% of the next $50 million of the average daily net asset value of the sub-advised assets plus 1.30% of the average daily net asset value of the sub-advised assets over $100 million. In addition to the monthly fee, the Adviser will pay an additional $100,000 fee to Billings if Billings is managing less than $50 million of sub-advised assets during the entire one year period following the date of the initial allocation. The Adviser shall be relieved from the payment obligation of the additional $100,000 fee to Billings if at any time during this period after the initial allocation, Billings’ total return during such one-year period lags the S&P 500 Total Return Index by 7% (700 basis points) or more. Billings agrees to manage at least $200 million in the LoCorr Long/Short Equity Fund’s sub-advised assets and may increase this amount upon mutual consent of all parties.
Pursuant to a sub-advisory agreement between the Adviser and Trust & Fiduciary Management Services, Inc. (“TFMS”) related to the LoCorr Spectrum Income Fund, TFMS is entitled to receive, on a monthly basis, an annual rate equal to 0.40% of the average daily net assets of the sub-advised assets.
The Adviser is solely responsible for the payment of the sub-adviser’s fees, and the sub-adviser agrees not to seek payment of its fees from the Trust or the Funds.
The Funds’ Adviser has contractually agreed to waive management fees and/or reimburse the Funds for expenses it incurs but only to the extent necessary to maintain the Funds’ total annual operating expenses after fee waiver and/or reimbursement (excluding any Rule 12b-1 distribution and/or servicing fees, taxes, interest, brokerage commissions, expenses incurred in connection with any merger or reorganization, dividend expenses on short sales, swap fees, indirect expenses, expenses of other investment companies in which the Funds may invest, or extraordinary expenses such as litigation and inclusive of organizational costs incurred prior to the commencement of operations) at the percentages listed below:
| | | |
| Fund | Expense Limit as a Percentage of the Average Daily Net Assets of the Fund | Effective Period Through |
| | | |
| LoCorr Managed Futures Strategy Fund | 1.95% | April 30, 2015 |
| LoCorr Long/Short Commodities Strategy Fund | 1.95% | April 30, 2015 |
| LoCorr Long/Short Equity Fund | 2.90% | April 30, 2015 |
| LoCorr Spectrum Income Fund | 1.80% | April 30, 2015 |
Any waiver or reimbursement is subject to repayment by the Funds within the three fiscal years following the fiscal year in which the expenses occurred, if the Funds are able to make the repayment without exceeding their current expense limitations and the repayment is approved by the Trustees. The organizational and offering costs are subject to repayment by the Funds.
| | | | | | | | | | | | | | | |
| LoCorr Long/Short Commodities Strategy Fund | |
| | | | Fee Waived or Expenses Borne by Adviser Subject to Recovery | | | Subject to Recovery on or before Fiscal Year Ended December 31, | |
| | | | | | | | | |
| Period | | | Management Fee | | Other Expenses | | Total | |
| Six Months Ended June 30, 2014 | | | $ | 90,478 | | $ | 4,938 | | $ | 95,416 | | | 2017 | |
| Year Ended December 31, 2013 | | | | 171,188 | | | 54,559 | | | 225,747 | | | 2016 | |
| Year Ended December 31, 2012 | | | | 80,503 | | | 129,605 | | | 210,108 | | | 2015 | |
| Total | | | $ | 342,169 | | $ | 189,102 | | $ | 531,271 | | | | |
| | | | | | | | | | | | | | | |
| LoCorr Long/Short Equity Fund | |
| | | | Fee Waived or Expenses Borne by Adviser Subject to Recovery | | | Subject to Recovery on or before Fiscal Year Ended December 31, | |
| | | | | | | | | | | | |
| Period | | | Management Fee | | Other Expenses | | Total | |
| Six Months Ended June 30, 2014 | | | $ | 18,861 | | $ | - | | $ | 18,861 | | | 2017 | |
Period Ended December 31, 20131 | | | | 140,599 | | | - | | | 140,599 | | | 2016 | |
| Total | | | $ | 159,460 | | $ | - | | $ | 159,460 | | | | |
| | |
1Period from May 10, 2013 (commencement of operations) through December 31, 2013. | |
| | | | | | | | | | | | | | | |
| LoCorr Spectrum Income Fund | |
| | | | Fee Waived or Expenses Borne by Adviser Subject to Recovery | | | Subject to Recovery on or before Fiscal Year Ended December 31, | |
| | | | | | | | | | | | |
| Period | | | Management Fee | | Other Expenses | | Total | |
| Six Months Ended June 30, 2014 | | | $ | 106,966 | | $ | - | | $ | 106,966 | | | 2017 | |
| Total | | | $ | 106,966 | | $ | - | | $ | 106,966 | | | | |
At June 30, 2014, there were no fees subject to recovery for the LoCorr Managed Futures Strategy Fund.
The Funds have entered into a 12b-1 distribution agreement with Quasar Distributors, LLC (“Quasar”). Class A and Class C shareholders pay Rule 12b-1 fees to Quasar at the annual rate of 0.25% and 1.00%, respectively, of average daily net assets. Class I shareholders pay no 12b-1 fees.
| | |
| LoCorr Managed Futures Strategy Fund and LoCorr Long/Short Commodities Strategy Fund - Notes to Consolidated Financial Statements (Unaudited) (continued) | | 61 |
| LoCorr Long/Short Equity Fund and LoCorr Spectrum Income Fund - Notes to Financial Statements (Unaudited) (continued) |
| | |
6. Fund Shares
At June 30, 2014, there were an unlimited number of shares of beneficial interest authorized. The following table summarizes the activity in shares and dollar amounts applicable to each class of the Funds:
| | | | | | | | | | | | | | |
| LoCorr Managed Futures Strategy Fund – Class A | |
| | | For the Six Months Ended June 30, 2014 | | For the Year Ended December 31, 2013 | |
| | | | Shares | | | Amount | | | Shares | | | Amount | |
| Shares Sold | | | 3,933,607 | | $ | 33,599,326 | | | 15,802,350 | | $ | 137,298,641 | |
| Dividends Reinvested | | | - | | | - | | | 12,712 | | | 105,250 | |
| Shares Redeemed | | | (5,340,696) | | | (45,179,537) | | | (13,087,793) | | | (109,305,113) | |
| Redemption Fees | | | - | | | 1,522 | | | - | | | 8,254 | |
| | | | (1,407,089) | | $ | (11,578,689) | | | 2,727,269 | | $ | 28,107,032 | |
| Beginning Shares | | | 23,542,694 | | | | | | 20,815,425 | | | | |
| Ending Shares | | | 22,135,605 | | | | | | 23,542,694 | | | | |
| | | | | | | | | | | | | | |
| LoCorr Managed Futures Strategy Fund – Class C | |
| | | For the Six Months Ended June 30, 2014 | | For the Year Ended December 31, 2013 | |
| | | Shares | | Amount | | Shares | | Amount | |
| Shares Sold | | | 1,197,732 | | $ | 10,002,650 | | | 3,731,653 | | $ | 32,072,451 | |
| Dividends Reinvested | | | - | | | - | | | 5,414 | | | 43,958 | |
| Shares Redeemed | | | (1,621,390) | | | (13,416,143) | | | (3,554,436) | | | (29,102,705) | |
| Redemption Fees | | | - | | | 2 | | | - | | | 57 | |
| | | | (423,658) | | $ | (3,413,491) | | | 182,631 | | $ | 3,013,761 | |
| Beginning Shares | | | 9,080,118 | | | | | | 8,897,487 | | | | |
| Ending Shares | | | 8,656,460 | | | | | | 9,080,118 | | | | |
| | | | | | | | | | | | | | |
| LoCorr Managed Futures Strategy Fund – Class I | |
| | | For the Six Months Ended June 30, 2014 | | For the Year Ended December 31, 2013 | |
| | | Shares | | Amount | | Shares | | Amount | |
| Shares Sold | | | 2,862,721 | | $ | 24,763,767 | | | 6,457,395 | | $ | 56,660,013 | |
| Dividends Reinvested | | | - | | | - | | | 6,077 | | | 50,685 | |
| Shares Redeemed | | | (4,333,029) | | | (37,129,757) | | | (9,887,057) | | | (83,450,163) | |
| Redemption Fees | | | - | | | 7,748 | | | - | | | 4,635 | |
| | | | (1,470,308) | | $ | (12,358,242) | | | (3,423,585) | | $ | (26,734,830) | |
| Beginning Shares | | | 12,259,642 | | | | | | 15,683,227 | | | | |
| Ending Shares | | | 10,789,334 | | | | | | 12,259,642 | | | | |
| LoCorr Managed Futures Strategy Fund | |
| Total Net Increase (Decrease) | | | | | $ | (27,350,422) | | | | | $ | 4,385,963 | |
| | | | | | | | | | | | | | |
| LoCorr Long/Short Commodities Strategy Fund – Class A | |
| | | For the Six Months Ended June 30, 2014 | | For the Year Ended December 31, 2013 | |
| | | | Shares | | | Amount | | | Shares | | | Amount | |
| Shares Sold | | | 358,961 | | $ | 2,942,187 | | | 242,156 | | $ | 1,923,048 | |
| Shares Redeemed | | | (231,509) | | | (1,893,956) | | | (149,871) | | | (1,185,412) | |
| Redemption Fees | | | - | | | 108 | | | - | | | 47 | |
| | | | 127,452 | | $ | 1,048,339 | | | 92,285 | | $ | 737,683 | |
| Beginning Shares | | | 476,020 | | | | | | 383,735 | | | | |
| Ending Shares | | | 603,472 | | | | | | 476,020 | | | | |
| | | | | | | | | | | | | | |
| LoCorr Long/Short Commodities Strategy Fund – Class C | |
| | | For the Six Months Ended June 30, 2014 | | For the Year Ended December 31, 2013 | |
| | | | Shares | | | Amount | | | Shares | | | Amount | |
| Shares Sold | | | 26,258 | | $ | 214,492 | | | 65,017 | | $ | 513,702 | |
| Shares Redeemed | | | (64,586) | | | (511,114) | | | (39,451) | | | (307,189) | |
| Redemption Fees | | | - | | | - | | | - | | | - | |
| | | | (38,328) | | $ | (296,622) | | | 25,566 | | $ | 206,513 | |
| Beginning Shares | | | 219,216 | | | | | | 193,650 | | | | |
| Ending Shares | | | 180,888 | | | | | | 219,216 | | | | |
| | | | | | | | | | | | | | |
| LoCorr Long/Short Commodities Strategy Fund – Class I | |
| | | For the Six Months Ended June 30, 2014 | | For the Year Ended December 31, 2013 | |
| | | | Shares | | | Amount | | | Shares | | | Amount | |
| Shares Sold | | | 481,865 | | $ | 3,990,950 | | | 537,283 | | $ | 4,289,007 | |
| Shares Redeemed | | | (479,385) | | | (3,996,795) | | | (583,252) | | | (4,599,386) | |
| Redemption Fees | | | - | | | 211 | | | - | | | 49 | |
| | | | 2,480 | | $ | (5,634) | | | (45,969) | | $ | (310,330) | |
| Beginning Shares | | | 714,170 | | | | | | 760,139 | | | | |
| Ending Shares | | | 716,650 | | | | | | 714,170 | | | | |
| LoCorr Long/Short Commodities Strategy Fund Fund | |
| Total Net Increase (Decrease) | | | | | $ | 746,083 | | | | | $ | 633,866 | |
| | |
62 | | LoCorr Managed Futures Strategy Fund and LoCorr Long/Short Commodities Strategy Fund - Notes to Consolidated Financial Statements (Unaudited) (continued) |
| LoCorr Long/Short Equity Fund and LoCorr Spectrum Income Fund - Notes to Financial Statements (Unaudited) (continued) |
| | |
| | | | | | | | | | | | | | |
| LoCorr Long/Short Equity Fund – Class A | |
| | | For the Six Months Ended June 30, 2014 | | For the Period Ended December 31, 20131 | |
| | | | Shares | | | Amount | | | Shares | | | Amount | |
| Shares Sold | | | 871,891 | | $ | 9,199,844 | | | 1,882,536 | | $ | 19,916,774 | |
| Shares Redeemed | | | (404,674) | | | (4,232,653) | | | (30,901) | | | (326,451) | |
| Redemption Fees | | | - | | | 337 | | | - | | | 82 | |
| | | | 467,217 | | $ | 4,967,528 | | | 1,851,635 | | $ | 19,590,405 | |
| Beginning Shares | | | 1,851,635 | | | | | | - | | | | |
| Ending Shares | | | 2,318,852 | | | | | | 1,851,635 | | | | |
| | | | | | | | | | | | | | |
| LoCorr Long/Short Equity Fund – Class C | |
| | | For the Six Months Ended June 30, 2014 | | For the Period Ended December 31, 20131 | |
| | | | Shares | | | Amount | | | Shares | | | Amount | |
| Shares Sold | | | 789,851 | | $ | 8,337,688 | | | 744,342 | | $ | 7,875,752 | |
| Shares Redeemed | | | (111,823) | | | (1,152,674) | | | (5,065) | | | (54,359) | |
| Redemption Fees | | | - | | | 729 | | | - | | | - | |
| | | | 678,028 | | $ | 7,185,743 | | | 739,277 | | $ | 7,821,393 | |
| Beginning Shares | | | 739,277 | | | | | | - | | | | |
| Ending Shares | | | 1,417,305 | | | | | | 739,277 | | | | |
| | | | | | | | | | | | | | |
| LoCorr Long/Short Equity Fund – Class I | |
| | | For the Six Months Ended June 30, 2014 | | For the Period Ended December 31, 20131 | |
| | | | Shares | | | Amount | | | Shares | | | Amount | |
| Shares Sold | | | 1,007,898 | | $ | 10,743,173 | | | 1,131,914 | | $ | 11,853,288 | |
| Shares Redeemed | | | (645,512) | | | (6,658,843) | | | (56,762) | | | (587,278) | |
| Redemption Fees | | | - | | | 311 | | | - | | | 565 | |
| | | | 362,386 | | $ | 4,084,641 | | | 1,075,152 | | $ | 11,266,575 | |
| Beginning Shares | | | 1,075,152 | | | | | | - | | | | |
| Ending Shares | | | 1,437,538 | | | | | | 1,075,152 | | | | |
| LoCorr Long/Short Equity Fund | | | | | | | | | | | | | |
| Total Net Increase (Decrease) | | | | | $ | 16,237,912 | | | | | $ | 38,678,373 | |
1Class A, Class C and Class I shares of the LoCorr Long/Short Equity Fund commenced operations on May 10, 2013. | |
| | | | | | | | | | | | | | |
| LoCorr Spectrum Income Fund – Class A | | | | | | |
| | | For the Six Months Ended June 30, 2014 | | | | | | | |
| | | | Shares | | | Amount | | | | | | | |
| Shares Sold | | | 2,493,929 | | $ | 25,410,189 | | | | | | | |
| Dividends Reinvested | | | 17,115 | | | 175,608 | | | | | | | |
| Shares Redeemed | | | (4,496) | | | (46,646) | | | | | | | |
| Redemption Fees | | | - | | | 541 | | | | | | | |
| | | | 2,506,548 | | $ | 25,539,692 | | | | | | | |
| Beginning Shares | | | - | | | | | | | | | | |
| Ending Shares | | | 2,506,548 | | | | | | | | | | |
| | | | | | | | | | | | | | |
| LoCorr Spectrum Income Fund – Class C | | | | | | |
| | | For the Six Months Ended June 30, 2014 | | | | | | | |
| | | | Shares | | | Amount | | | | | | | |
| Shares Sold | | | 1,429,103 | | $ | 14,567,677 | | | | | | | |
| Dividends Reinvested | | | 10,251 | | | 105,083 | | | | | | | |
| Shares Redeemed | | | (25,432) | | | (263,181) | | | | | | | |
| Redemption Fees | | | - | | | 3,320 | | | | | | | |
| | | | 1,413,922 | | $ | 14,412,899 | | | | | | | |
| Beginning Shares | | | - | | | | | | | | | | |
| Ending Shares | | | 1,413,922 | | | | | | | | | | |
| | | | | | | | | | | | | | |
| LoCorr Spectrum Income Fund – Class I | | | | | | |
| | | For the Six Months Ended June 30, 2014 | | | | | | | |
| | | | Shares | | | Amount | | | | | | | |
| Shares Sold | | | 2,335,221 | | $ | 23,816,782 | | | | | | | |
| Dividends Reinvested | | | 19,265 | | | 197,646 | | | | | | | |
| Shares Redeemed | | | (75,526) | | | (761,377) | | | | | | | |
| Redemption Fees | | | - | | | 4,167 | | | | | | | |
| | | | 2,278,960 | | $ | 23,257,218 | | | | | | | |
| Beginning Shares | | | - | | | | | | | | | | |
| Ending Shares | | | 2,278,960 | | | | | | | | | | |
| LoCorr Spectrum Income Fund | | | | | | |
| Total Net Increase (Decrease) | | | | | $ | 63,209,809 | | | | | | | |
LoCorr Managed Futures Strategy Fund and LoCorr Long/Short Commodities Strategy Fund - Notes to Consolidated Financial Statements (Unaudited) (continued) LoCorr Long/Short Equity Fund and LoCorr Spectrum Income Fund - Notes to Financial Statements (Unaudited) (continued) | | 63 |
7. Federal Tax Information
At December 31, 2013, the components of accumulated earnings (losses) on a tax basis were as follows:
| | | | | | | | | | | | | | | | | |
| | | LoCorr Managed Futures Strategy Fund | | LoCorr Long/Short Commodities Strategy Fund | | LoCorr Long/Short Equity Fund | |
| | | Year Ended December 31, 2013 | | Year Ended December 31, 2013 | | May 10, 20131 through December 31, 2013 | |
| Tax cost of investments | | | $ | 312,674,465 | | | | $ | 9,208,377 | | | | $ | 37,742,205 | | |
| | | | | | | | | | | | | | | | | |
| Gross unrealized appreciation | | | | 1,706,713 | | | | | 40,030 | | | | | 4,199,290 | | |
| Gross unrealized depreciation | | | | (1,612,400) | | | | | (85,728) | | | | | (941,016) | | |
| Net unrealized appreciation (depreciation) | | | | 94,313 | | | | | (45,698) | | | | | 3,258,274 | | |
| | | | | | | | | | | | | | | | | |
| Undistributed ordinary income | | | | - | | | | | - | | | | | 169,671 | | |
| Undistributed long-term capital gains | | | | 349,733 | | | | | - | | | | | - | | |
| Total distributable earnings | | | $ | 349,733 | | | | $ | - | | | | $ | 169,671 | | |
| Other accumulated losses | | | $ | (40,927,371) | | | | $ | (890,629) | | | | $ | (46,026) | | |
| Total accumulated earnings/(losses) | | | $ | (40,483,325) | | | | $ | (936,327) | | | | $ | 3,381,919 | | |
¹ Commencement of operations.
Undistributed income or net realized gains for financial statement purposes may differ from amounts recognized for federal income tax purposes due to differences in the recognition and characterization of income, expense and capital gain items. The difference between book-basis and tax-basis unrealized appreciation (depreciation) is primarily attributable to the tax deferral of losses on wash sales.
The LoCorr Spectrum Income Fund commenced operations on January 1, 2014; accordingly, the Fund did not have any year end tax components as of December 31, 2013.
Under the current tax law, capital losses realized after October 31 may be deferred and treated as occurring on the first day of the following fiscal year. For the year ended December 31, 2013, the LoCorr Long/Short Commodities Strategy Fund elected to defer capital losses occurring between November 1, 2013 and December 31, 2013 in the amount of $8,184.
At December 31, 2013 accumulated net realized capital loss carryovers, if any, and the year(s) in which the capital loss carryovers expire were:
| | | | | | | | | | | |
| | | Capital Loss Carryover | | Year of | |
| | | Short-Term | | Long-Term | | Expiration | |
| LoCorr Long/Short Commodities Strategy Fund | | $ | 28,387 | | $ | 644 | | | Indefinitely | |
During the year ended December 31, 2013, none of the Funds utilized capital loss carryovers.
8. Line of Credit
On March 17, 2014, the Trust entered into an unsecured, uncommitted Loan Agreement (“Line of Credit” or “LOC”) with U.S. Bank National Association (“U.S. Bank”) not individually but as an umbrella facility on behalf of the LoCorr Managed Futures Strategy Fund, the LoCorr Long/Short Commodities Strategy Fund, the LoCorr Long/Short Equity Fund and the LoCorr Spectrum Income Fund to provide the Funds a temporary short-term liquidity source to meet unanticipated redemptions. Under terms of the LOC, borrowings for each Fund are limited to one-third of the total assets (including the amount borrowed) of the respective Fund, or as otherwise indicated within the Funds’ agreement with U.S. Bank, as to not to exceed $16 million in the aggregate for all of the Funds under this agreement. U.S. Bank charges interest rate per annum equal to the Prime Rate (weighted average of 3.25% for the first six months of 2014). For the six months ended June 30, 2014, the LoCorr Long Short Commodities Strategy Fund and the LoCorr Long/Short Equity Fund incurred interest charges of $44 and $183, respectively, on average daily loan balances of $2,674 and $11,326, respectively. The LoCorr Managed Futures Strategy Fund and the LoCorr Spectrum Income Fund did not borrow from the LOC during the six months ended June 30, 2014. At June 30, 2014, the Funds did not have any outstanding borrowings.
| 64 | | LoCorr Managed Futures Strategy Fund and LoCorr Long/Short Commodities Strategy Fund - Notes to Consolidated Financial Statements (Unaudited) (continued) LoCorr Long/Short Equity Fund and LoCorr Spectrum Income Fund - Notes to Financial Statements (Unaudited) (continued) |
9. Subsequent Events
In preparing the financial statements, the Adviser has evaluated events after June 30, 2014.
LoCorr Market Trend Fund
On July 1, 2014, the LoCorr Market Trend Fund, a new series of the Trust, commenced operations. The LoCorr Market Trend Fund’s primary investment objective is capital appreciation in rising and falling equity markets with managing volatility as a secondary objective.
LoCorr Spectrum Income Fund
The LoCorr Spectrum Income Fund declared the following ordinary income distributions:
| | | | | | | | | |
| Dividend Declaration | | Shareholder of | | Distribution Amount per Share Class |
Date1 | | Record Date | | Class A | | Class C | | Class I |
| July 25, 2014 | | July 24, 2014 | | $0.0479 | | $0.0417 | | $0.0500 |
| August 26, 2014 | | August 25, 2014 | | $0.0479 | | $0.0417 | | $0.0500 |
1Ex-Date, reinvest date and payable date.
The estimated characterization of the distributions paid will be either a qualified dividend or return of capital. See Note 2 for additional information.
There were no additional subsequent events since June 30, 2014, through the date the financial statements were issued that would require adjustment to or additional disclosure in these financial statements.
LoCorr Investment Trust - Expense Example (Unaudited) | 65 |
Expense Example
June 30, 2014 (Unaudited)
As a shareholder of a Fund, you incur two types of costs: (1) transaction costs, including sales charges (loads) on purchase payments; redemption fees; and (2) ongoing costs, including management fees; distribution and/or service (12b-1) fees and other Fund expenses.
This Example is intended to help you understand your ongoing costs (in dollars) of investing in each of the Funds and to compare these costs with the ongoing costs of investing in other mutual funds. The Example is based on an investment of $1,000 invested at the beginning of the period and held for the entire period (January 1, 2014 through June 30, 2014).
Actual Expenses
The actual return columns in the following table provide information about account values based on actual returns and actual expenses. You may use the information in these columns, together with the amount you invested, to estimate the expenses that you paid over the period. Simply divide your account value by $1,000 (for example, an $8,600 account value divided by $1,000 = 8.6), then multiply the result by the number in the first line under the heading entitled “Expenses Paid During Period” to estimate the expenses you paid on your account during this period. The only transaction fees you may be required to pay are for outgoing wire transfers, returned checks and stop payment orders at prevailing rates charged by U.S. Bancorp Fund Services, LLC, the Funds’ transfer agent. These fees are assessed on all accounts, as applicable. If you request that a redemption be made by wire transfer, currently the Funds’ transfer agent charges a $15.00 fee. The Funds’ transfer agent charges a transaction fee of $25.00 on returned checks and stop payment orders. If you paid a transaction fee, you would add the fee amount to the expenses paid on your account this period to obtain your total expenses paid.
Hypothetical Example for Comparison Purposes
The hypothetical return columns in the following table provide information about hypothetical account values and hypothetical expenses based on the Funds’ actual expense ratio and an assumed rate of return of 5% per year before expenses, which is not the Funds’ actual return. The hypothetical account values and expenses may not be used to estimate the actual ending account balance or expenses you paid for the period. You may use this information to compare the ongoing costs of investing in the Funds and other funds. To do so, compare this 5% hypothetical example with the 5% hypothetical examples that appear in the shareholder reports of the other funds. A transaction fee of $15.00 may be assessed on outgoing wire transfers and a transaction fee of $25.00 may be assessed on returned checks and stop payment orders. To include this fee in the calculation, you would add the estimated transaction fee to the hypothetical expenses shown in the table. Please note that the expenses shown in the table are meant to highlight your ongoing costs only and do not reflect the transaction fees discussed above. Therefore, those columns are useful in comparing ongoing costs only, and will not help you determine the relative total costs of owning different funds. In addition, if these transactional costs were included, your costs would have been higher.
Actual vs. Hypothetical Returns
Actual vs. Hypothetical Returns for the Six Months Ended June 30, 2014 (Unaudited)
| | | | | | | | | | | | | |
| | | Fund’s Annualized Consolidated Expense Ratio | | Beginning Account Value 01/01/2014 | | Ending Account Value 6/30/2014 | | Consolidated Expenses Paid During Period1 | |
| LoCorr Managed Futures Strategy Fund – Class A | |
| Actual | | 2.14% | | | $1,000.00 | | | $1,100.20 | | | $11.14 | |
Hypothetical2 | | 2.14% | | | $1,000.00 | | | $1,014.18 | | | $10.69 | |
| LoCorr Managed Futures Strategy Fund – Class C | |
| Actual | | 2.89% | | | $1,000.00 | | | $1,094.80 | | | $15.01 | |
Hypothetical2 | | 2.89% | | | $1,000.00 | | | $1,010.46 | | | $14.41 | |
| LoCorr Managed Futures Strategy Fund – Class I | |
| Actual | | 1.89% | | | $1,000.00 | | | $1,100.70 | | | $9.84 | |
Hypothetical2 | | 1.89% | | | $1,000.00 | | | $1,015.42 | | | $9.44 | |
1 Consolidated expenses are equal to the Fund’s annualized expense ratio multiplied by the average account value over the period, multiplied by 181 days and divided by 365 to reflect the period of January 1, 2014 through June 30, 2014.
2 Hypothetical assumes a 5% return.
66 | LoCorr Investment Trust - Expense Example (Unaudited) (continued) |
Actual vs. Hypothetical Returns for the Six Months Ended June 30, 2014 (Unaudited)
| | | | | | | | | | | | | |
| | | Fund’s Annualized Consolidated Expense Ratio | | Beginning Account Value 01/01/2014 | | Ending Account Value 06/30/2014 | | Consolidated Expenses Paid During Period1 | |
| LoCorr Long/Short Commodities Strategy Fund – Class A | |
| Actual | | 2.20% | | | $1,000.00 | | | $1,105.60 | | | $11.49 | |
Hypothetical2 | | 2.20% | | | $1,000.00 | | | $1,013.88 | | | $10.99 | |
| LoCorr Long/Short Commodities Strategy Fund – Class C | |
| Actual | | 2.95% | | | $1,000.00 | | | $1,102.10 | | | $15.38 | |
Hypothetical2 | | 2.95% | | | $1,000.00 | | | $1,010.17 | | | $14.70 | |
| LoCorr Long/Short Commodities Strategy Fund – Class I | |
| Actual | | 1.95% | | | $1,000.00 | | | $1,107.80 | | | $10.19 | |
Hypothetical2 | | 1.95% | | | $1,000.00 | | | $1,015.12 | | | $9.74 | |
1 Consolidated expenses are equal to the Fund’s annualized expense ratio multiplied by the average account value over the period, multiplied by 181 days and divided by 365 to reflect the period of January 1, 2014 through June 30, 2014.
2 Hypothetical assumes a 5% return.
Actual vs. Hypothetical Returns for the Six Months Ended June 30, 2014 (Unaudited)
| | | | | | | | | | | | | |
| | | Fund’s Annualized Expense Ratio | | Beginning Account Value 01/01/2014 | | Ending Account Value 06/30/2014 | | Expenses Paid During Period1 | |
| LoCorr Long/Short Equity Fund – Class A | |
Actual2 | | 3.28% | | | $1,000.00 | | | $939.90 | | | $15.78 | |
Hypothetical2, 3 | | 3.28% | | | $1,000.00 | | | $1,008.53 | | | $16.33 | |
| LoCorr Long/Short Equity Fund – Class C | |
Actual2 | | 4.03% | | | $1,000.00 | | | $937.00 | | | $19.35 | |
Hypothetical2, 3 | | 4.03% | | | $1,000.00 | | | $1,004.81 | | | $20.03 | |
| LoCorr Long/Short Equity Fund – Class I | |
Actual2 | | 3.03% | | | $1,000.00 | | | $940.90 | | | $14.58 | |
Hypothetical2, 3 | | 3.03% | | | $1,000.00 | | | $1,009.77 | | | $15.10 | |
1 Expenses are equal to the Fund’s annualized expense ratio multiplied by the average account value over the period, multiplied by 181 days and divided by 365 to reflect the period of January 1, 2014 through June 30, 2014.
2 Includes 0.13% of dividend and interest expense on securities sold short.
3 Hypothetical assumes a 5% return.
Actual vs. Hypothetical Returns for the Six Months Ended June 30, 2014 (Unaudited)
| | | | | | | | | | | | | |
| | | Fund’s Annualized Expense Ratio | | Beginning Account Value 01/01/2014 | | Ending Account Value 06/30/2014 | | Expenses Paid During Period1 | |
| LoCorr Spectrum Income Fund – Class A | |
| Actual | | 2.05% | | | $1,000.00 | | | $1,073.90 | | | $10.54 | |
Hypothetical2 | | 2.05% | | | $1,000.00 | | | $1,014.63 | | | $10.24 | |
| LoCorr Spectrum Income Fund – Class C | |
| Actual | | 2.80% | | | $1,000.00 | | | $1,069.70 | | | $14.37 | |
Hypothetical2 | | 2.80% | | | $1,000.00 | | | $1,010.91 | | | $13.96 | |
| LoCorr Spectrum Income Fund – Class I | |
| Actual | | 1.80% | | | $1,000.00 | | | $1,075.00 | | | $9.26 | |
Hypothetical2 | | 1.80% | | | $1,000.00 | | | $1,015.87 | | | $9.00 | |
1 Expenses are equal to the Fund’s annualized expense ratio multiplied by the average account value over the period, multiplied by 181 days and divided by 365 to reflect the period of January 1, 2014 through June 30, 2014.
2 Hypothetical assumes a 5% return.
Approval of Advisory Agreements (Unaudited) | 67 |
LoCorr Investment Trust
June 30, 2014 (Unaudited)
Approval of Advisory Agreement
In connection with a regular meeting held on February 25, 2014 (the “Meeting”), the Board of Trustees (the “Board” or “Trustees”) of LoCorr Investment Trust (the “Trust”), including a majority of the Trustees who are not interested persons of the Trust or interested persons to the investment management agreement (the “Independent Trustees���), discussed the review and renewal of the Investment Advisory Agreement (the “Management Agreement”) between LoCorr Fund Management, LLC (the “Adviser”) and the Trust, with respect to the LoCorr Managed Futures Strategy Fund (“LCMFS Fund”), LoCorr Long/Short Commodities Strategy Fund (“LCLSCS Fund”) and approval of the Management Agreement with respect to the LoCorr Market Trend Fund (“LMT Fund”) (each a “Fund”, collectively, the “Funds”).
The Trustees reviewed a memorandum which had been provided to them prior to the Meeting from Thompson Hine LLP (“Legal Counsel”) entitled “Duties of Trustees with Respect to Approval and Renewal of Investment Advisory and Sub-Advisory Contracts”. Legal Counsel emphasized that the Trustees must apply their business judgment to the question of whether the overall arrangements provided under the terms of the Management Agreement are reasonable business arrangements for the Funds.
The Board considered the nature, extent and quality of services to be provided by the Adviser to the Funds. The Board noted that the Adviser furnishes a continuous investment program and compliance program for the LCMFS and LCLSCS Funds and would also do so for the LMT Fund. After a discussion, the Board concluded that the Adviser is well-staffed and offers experienced personnel and investment expertise.
The Board discussed the performance of the Funds and their relative benchmarks. The Board noted that one-year and since inception performance numbers of the LCMFS Fund lagged its Morningstar Category average. The Board also noted that the allocation of the LCMFS Fund’s assets would be modified. The Board noted that the one-year performance numbers of the LCLSCS Fund were better than its Morningstar Category average and its peer group although it lagged its benchmark. The Board concluded that the performance of the LCMFS and LCLSCS Funds was acceptable in light of the planned changes for improving performance. The Board also concluded that they expected that the performance of the LMT Fund would be satisfactory.
The Board reviewed and discussed the costs of services provided and profits to be realized by the Adviser. The Board noted that the advisory fees for each of the Funds was above the average for each of their respective Morningstar categories but were within the reasonable range for fees for each Fund’s category. The Board also noted the expense limitation in place for each of the Funds as well as the Adviser’s level of profitability. The Board concluded that the cost of services provided and profitability to be realized by the Adviser was within the range reasonableness and that the Adviser has sufficient resources to fulfill its obligations to the Trust.
The Board considered the economies of scale to be realized by the shareholders of the Funds. The Board noted the breakpoints of the new incremental fee schedule that had been implemented. With respect to the LMT Fund, the Board agreed to discuss future breakpoints after the Fund had sufficient operating history to consider.
Having received and reviewed information from the Adviser as the Board believed to be reasonably necessary, the Trustees, including the Independent Trustees, concluded that the advisory fee structure is fair and reasonable and that renewal of the Management Agreement with respect to the LCMFS Fund and the LCLSCS Fund and approval with respect to the LMT Fund was in the best interests of the Trust and each Fund’s shareholders, and unanimously approved or renewed the Management Agreement between the Adviser and the Funds.
Consideration and Approval of Sub-Advisory Agreements
Nuveen Asset Management, LLC
In connection with the regular meeting held on February 25, 2014, the Board discussed the sub-advisory agreement (the “Sub-Advisory Agreement”) between the Adviser and Nuveen Asset Management, LLC (“Nuveen”) with respect to the LCMFS and LMT Funds.
Legal Counsel noted that the same factors that the Board considered with respect to the renewal of the LCMFS Management Agreement and the approval of the LMT Management Agreement would apply to its consideration of each of the Sub-Advisory Agreements.
The Board noted that Nuveen’s performance for its allocation of the LCMFS Fund outperformed the benchmark on a one-year and since inception basis.
The Board also considered and discussed the services provided and the qualifications of Nuveen’s investment professionals involved with managing the LCMFS Fund. The Board reviewed the responses provided by Nuveen in its sub-adviser questionnaire. The Board noted the many years of experience of the key personnel involved as well as Nuveen’s depth of investment capabilities and compliance procedures. The Board further noted that the personnel involved with managing the LCMFS Fund would also be providing such services to the LMT Fund. The Board concluded that Nuveen is well-staffed and has provided high quality services with respect to the LCMFS Fund and is expected to do so for the LMT Fund as well.
68 | Approval of Advisory Agreements (Unaudited) (continued) |
The Board reviewed the fees paid to Nuveen and Nuveen’s profits to be realized for providing services to the Funds. The Board noted that Nuveen’s level of profitability with respect to the Funds as well as the fees paid to it by the Adviser. After a discussion, the Board concluded that the fees paid to Nuveen and its profitability were reasonable in light of the services provided.
Having received and reviewed information from Nuveen as the Board believed to be reasonably necessary, the Trustees, including the Independent Trustees, concluded that the sub-advisory fee structure is fair and reasonable and that renewal of the Sub-Advisory Agreement with respect to the LCMFS Fund and the approval of the Sub-Advisory Agreement with respect to the LMT Fund was in the best interests of the Trust and each Fund’s shareholders, and unanimously approved the renewal and approval of the Sub-Advisory Agreements with Nuveen for the LCMFS Fund and LMT Fund, respectively.
Graham Capital Management, L.P.
In connection with the regular meeting held on February 25, 2014, the Board discussed the proposed sub-advisory agreement (the “Sub-Advisory Agreement”) between the Adviser and Graham Capital Management, L.P. (“Graham”) with respect to the LMT Fund.
The Board reviewed and discussed the nature, extent and quality of the services to be provided by Graham and noted that Graham offers a multitude of experienced investment personnel, The Board then reviewed the qualifications of the applicable investment personnel as well as Graham’s approach to risk management and compliance. The Board concluded that it was satisfied with the nature, extent and quality of the services to be provided by Graham with respect to the LMT Fund.
The Board noted the performance of Graham’s tactical trend strategy which Graham will use in managing a portion of the assets of the LMT Fund. The Board considered that Graham’s performance was favorable when compared to the Morningstar category average for various time periods. The Board concluded that it expects Graham’s performance to be satisfactory.
Having received and reviewed information from Graham as the Board believed to be reasonably necessary, the Trustees, including the Independent Trustees, concluded that the sub-advisory fee structure is fair and reasonable and that the approval of the Sub-Advisory Agreement with respect to the LMT Fund was in the best interests of the Trust and the Fund’s shareholders, and unanimously approved the Sub-Advisory Agreement with respect to the LMT Fund with Graham.
Billings Capital Management, LLC
In connection with the regular meeting held on February 25, 2014, the Board discussed the proposed sub-advisory agreement (the “Sub-Advisory Agreement”) between the Adviser and Billings Capital Management, LLC (“Billings”) with respect to the LoCorr Long/Short Equity Fund (“LLSE Fund”).
The Board reviewed and discussed the nature, extent and quality of the services to be provided by Billings and noted that Billings will provide research, security selection, trade execution as well as compliance services and proxy voting for its portion of the LLSE Fund’s portfolio. The Board also reviewed a summary of Billings’ compliance materials and its code of ethics adopted under Rule 17j-1. The Board concluded that it was satisfied with the nature, extent and quality of the services to be provided by Billings with respect to the LLSE Fund.
The Board reviewed the one-year, five-year and ten-year returns for Billings and noted that that the returns outperformed the S&P 500 Index for all periods, except for the five-year period. After a discussion, the Board concluded that it expects the performance of Billings to be satisfactory.
The Board then considered the costs of services provided and profits to be realized by Billings. The Board noted the expected profitability of Billings with respect to its management of the LLSE Fund’s portfolio as well as the proposed sub-advisory fee schedule which includes break points.
The Board concluded, based on the consideration of all the factors in their totality, that the Sub-Advisory Agreement, including the sub-advisory fees, was fair and reasonable. The Board, therefore, determined that the approval of the Sub-Advisory Agreement between the Adviser and Billings would be in the best interest of the LLSE Fund and its shareholders.
Notice of Privacy Policy & Practices / Quarterly Portfolio Holdings/Proxy | 69 |
Notice of Privacy Policy & Practices
(Unaudited)
Your privacy is important to us. The Funds are committed to maintaining the confidentiality, integrity, and security of your personal information. When you provide personal information, the Funds believe that you should be aware of policies to protect the confidentiality of that information.
The Funds collect the following nonpublic personal information about you:
● Information we receive from you on or in applications or other forms, correspondence, or conversations, including, but not limited to, your name, address, phone number, social security number, assets, income, and date of birth; and
● Information about your transactions with us, our affiliates, or others, including, but not limited to, your account number and balance, payments history, parties to transactions, cost basis information, and other financial information.
The Funds do not disclose any nonpublic personal information about our current or former shareholders to affiliated or nonaffiliated third parties, except as permitted by law. For example, the Funds are permitted by law to disclose all of the information we collect, as described above, to our transfer agent to process your transactions. Furthermore, the Funds restrict access to your nonpublic personal information to those persons who require such information to provide products or services to you. The Funds maintain physical, electronic, and procedural safeguards that comply with applicable federal and state standards to guard your nonpublic personal information.
In the event that you hold shares of the Funds through a financial intermediary, including, but not limited to, a broker-dealer, bank, or trust company, the privacy policy of your financial intermediary would govern how your nonpublic personal information would be shared with affiliated or non-affiliated third parties.
Quarterly Form N-Q portfolio schedule
(Unaudited)
The Funds file their complete schedule of portfolio holdings with the Securities and Exchange Commission (“SEC”) for the first and third quarters of each fiscal year on Form N-Q. The Funds’ Forms N-Q are available on the SEC’s website at http://www.sec.gov. The Funds’ Forms N-Q may be reviewed and copied at the SEC’s Public Reference Room in Washington, D.C. Information on the operation of the SEC’s Public Reference Room may be obtained by calling 1-800-SEC-0330. Additionally, you may obtain copies of Forms N-Q from the Funds upon request by calling 1-855-523-8637.
Proxy voting policies, procedures and record
(Unaudited)
You may obtain a description of the Funds’ (1) proxy voting policies, (2) proxy voting procedures and (3) information regarding how the Funds voted any proxies related to portfolio securities during the most recent 12-month period ended June 30 for which an SEC filing has been made, without charge, upon request by contacting the Funds directly at 1-855-523-8637, or on the EDGAR Database on the SEC’s website (http:// www.sec.gov).
70 | Independent Trustees/Interested Trustees and Officers (Unaudited) |
This page left intentionally blank.
Item 2. Code of Ethics.
Not applicable for semi-annual reports.
Item 3. Audit Committee Financial Expert.
Not applicable for semi-annual reports.
Item 4. Principal Accountant Fees and Services.
Not applicable for semi-annual reports.
Item 5. Audit Committee of Listed Registrants.
Not applicable to registrants who are not listed issuers (as defined in Rule 10A-3 under the Securities Exchange Act of 1934).
Item 6. Investments.
| (a) | Schedule of Investments is included as part of the report to shareholders filed under Item 1 of this Form. |
Item 7. Disclosure of Proxy Voting Policies and Procedures for Closed-End Management Investment Companies.
Not applicable to open-end investment companies.
Item 8. Portfolio Managers of Closed-End Management Investment Companies.
Not applicable to open-end investment companies.
Item 9. Purchases of Equity Securities by Closed-End Management Investment Company and Affiliated Purchasers.
Not applicable to open-end investment companies.
Item 10. Submission of Matters to a Vote of Security Holders.
There have been no material changes to the procedures by which shareholders may recommend nominees to the registrant’s Board of Trustees.
Item 11. Controls and Procedures.
| (a) | The registrant’s President and Treasurer have reviewed the registrant's disclosure controls and procedures (as defined in Rule 30a-3(c) under the Investment Company Act of 1940 (the “Act”)) as of a date within 90 days of the filing of this report, as required by Rule 30a-3(b) under the Act and Rules 13a-15(b) or 15d-15(b) under the Securities Exchange Act of 1934. Based on their review, such officers have concluded that the disclosure controls and procedures are effective in ensuring that information required to be disclosed in this report is appropriately recorded, processed, summarized and reported and made known to them by others within the registrant and by the registrant’s service provider. |
| (b) | There were no changes in the registrant's internal control over financial reporting (as defined in Rule 30a-3(d) under the Act) that occurred during the second fiscal quarter of the period covered by this report that has materially affected, or is reasonably likely to materially affect, the registrant's internal control over financial reporting. |
Item 12. Exhibits.
| (a) | (1) Any code of ethics or amendment thereto, that is the subject of the disclosure required by Item 2, to the extent that the registrant intends to satisfy Item 2 requirements through filing an exhibit. |
Not applicable for semi-annual reports.
(2) A separate certification for each principal executive and principal financial officer pursuant to Section 302 of the Sarbanes-Oxley Act of 2002.
Filed herewith.
(3) Any written solicitation to purchase securities under Rule 23c-1 under the Act sent or given during the period covered by the report by or on behalf of the registrant to 10 or more persons.
Not applicable to open-end investment companies.
| (b) | Certifications pursuant to Section 906 of the Sarbanes-Oxley Act of 2002. |
Furnished herewith.
SIGNATURES
Pursuant to the requirements of the Securities Exchange Act of 1934 and the Investment Company Act of 1940, the registrant has duly caused this report to be signed on its behalf by the undersigned, thereunto duly authorized.
(Registrant) LoCorr Investment Trust
By (Signature and Title) /s/ Kevin Kinzie
Kevin Kinzie, President
Date 9/3/14
Pursuant to the requirements of the Securities Exchange Act of 1934 and the Investment Company Act of 1940, this report has been signed below by the following persons on behalf of the registrant and in the capacities and on the dates indicated.
By (Signature and Title) /s/ Kevin Kinzie
Kevin Kinzie, President
Date 9/3/14
By (Signature and Title) /s/ Jon Essen
Jon Essen, Treasurer
Date 9/3/14