Washington, D.C. 20549
Item 1. Reports to Stockholders.
LoCorr Funds seek to provide investments that, over time, will have low correlation to traditional asset classes – such as stocks and bonds. We believe that adding low correlating investments to portfolios can significantly reduce the overall portfolio risk while enhancing returns. Correlation measures the degree to which the returns of two investments move together over time. LoCorr offers products that provide the potential for positive returns in rising or falling markets and are designed to resist correlation with traditional stock, bond and commodity investments. In this annual report, LoCorr Funds are reporting on three mutual funds: LoCorr Managed Futures Strategy Fund, LoCorr Long/Short Commodities Strategy Fund and LoCorr Long/Short Equity Fund (collectively, the “Funds”). LoCorr Funds did launch another Fund – LoCorr Spectrum Income Fund – that will be reported in the next semi-annual report.
LoCorr Managed Futures Strategy Fund
The LoCorr Managed Futures Strategy Fund (the “Managed Futures Fund” or the “Fund”) seeks capital appreciation as its primary investment objective with managing volatility as a secondary objective. The Managed Futures Fund attempts to achieve its objective by investing in two main strategies – a Managed Futures strategy and a Fixed Income strategy.
Managed Futures Strategy
The Managed Futures Fund invests up to 25% of its total assets into a portfolio of globally diversified managed futures positions. The Fund accesses the returns of certain trading programs of Millburn Ridgefield Corporation (“Millburn”) and Crabel Capital Management, LLC (“Crabel”) via its investment in a total return swap agreement. The Fund uses Millburn and Crabel to execute its Managed Futures strategy. Millburn was founded in 1971 and manages about $1.4 billion in assets. The Managed Futures Fund accesses returns generated by Millburn’s Diversified Program (“MDP”), a commodity pool which commenced operations in 1977. MDP systematically invests in about 120 futures markets with long and short positions in sectors such as currencies, interest rates, stock indices and commodities (agricultural, energy and metals). The Managed Futures Fund also allocates capital via the swap to Crabel’s Multi-Product program, a short-term trend following strategy that commenced trading in March 1998. Crabel’s program was added to complement Millburn’s longer-term trend strategy in an attempt to improve the Fund’s risk-adjusted returns.
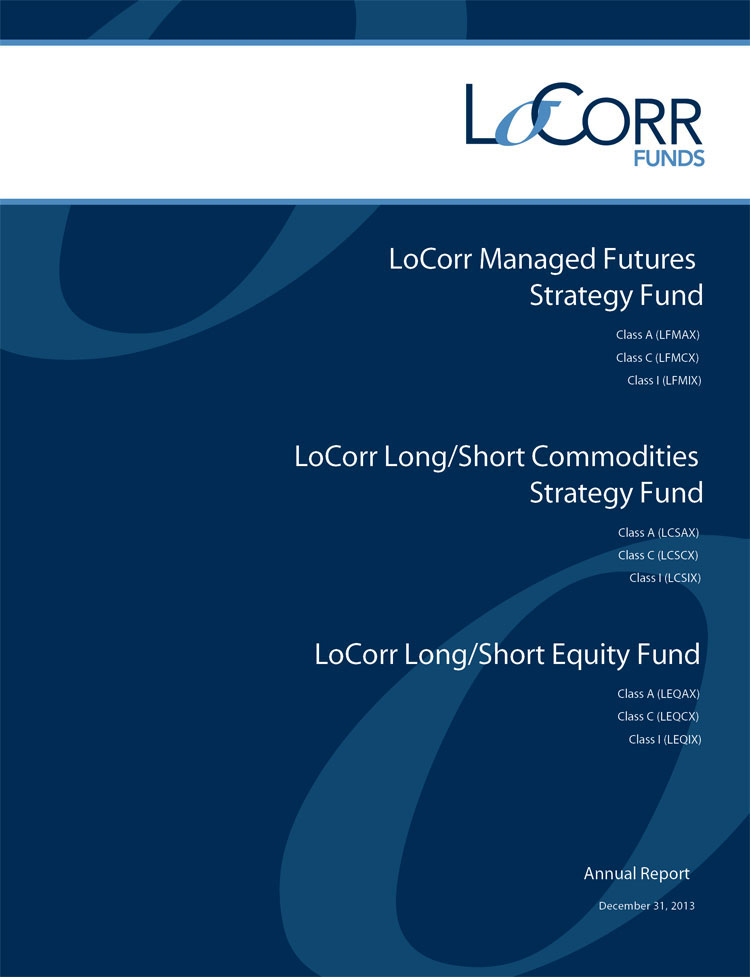
The Fund’s Futures strategy was unprofitable for the year as losses from trading interest rate futures, currency forwards, and energy and metal futures outpaced the sizable gain from trading equity futures and a lesser gain from trading agricultural and soft commodities.
During the year, market participants were encouraged by the gradual, but persistent, improvement in U.S. economic conditions; by signs that China’s growth, while transitioning to a slower pace, would be solid; by at least a modest improvement in European growth dynamics; by continued monetary ease worldwide for most of 2013; and by evidence that some grudging progress was being made on the banking and fiscal problems that have plagued developed economies in recent years.
However, this underlying positive current was interrupted frequently by policy concerns, and political and social disruptions and their ensuing economic uncertainties. On the monetary policy front, the on again-off again talk of Fed tapering; the moves toward a more restrictive policy by the People’s Bank of China (PBOC) starting around midyear and the interest rate changes by many central banks to influence their currencies frequently disrupted interest rate and currency markets. U.S. fiscal policy events that influenced market activity included: sequestration at the start of the year, the October government shutdown and the December budget agreement. Political and social tensions were rampant worldwide and included: Spanish scandals; Italy elections; Cypriot economic collapse; social unrest in Turkey, Indonesia, Thailand, Brazil, and South Africa; and armed conflict in Syria, Egypt, Iraq and Iran.
Interest rate trading was volatile and unprofitable in 2013. As the year began, the market was still focused on deflation concerns and persistent ease of monetary policy, and long interest rate futures positions were profitable. In May, however, Chairman Bernanke and other Fed officials raised the prospects of “tapering” the Fed’s policy of quantitative ease (QE). In response, yields on U.S. notes and bonds reversed abruptly and moved sharply higher. Thereafter, the uncertain timing of the QE taper led to unsettled trading conditions. Consequently, long positions in notes and bonds generated losses.
Equity prices were buoyed by the improving worldwide economic outlook and long positions in U.S., Japanese, European, Australian and Canadian equity futures were highly profitable. On the other hand, the policy tightening in China and the sharp fall in the yen led to losses from trading Chinese, Korean and Singaporean equity futures.
Foreign exchange markets were volatile without sustained direction this year. Large changes in interest rates of developed markets and uncertainty about QE influenced currency movements. In addition, several countries took steps to weaken their currencies, while others took steps to support their currencies. Finally, the group of commodity currencies was buffeted by the uncertainty around Chinese growth dynamics. Consequently, losses were sustained in trading the U.S. dollar. Non-dollar cross rate trading was fractionally unprofitable.
Energy trading was marginally unprofitable. Metal trading was fractionally unprofitable as gains from trading copper fell short of losses from long lead and zinc positions and from trading precious metals. The small profits from trading soft and agricultural commodities were due to short positions in sugar, coffee, wheat and soybean oil, and to trading of soybeans.
Fixed Income Strategy
The Managed Futures Fund invests most of its remaining assets in a Fixed Income strategy comprised of investment grade corporate and government agency securities. Nuveen Asset Management (“Nuveen”) is the sub-adviser for this strategy – a short duration, high quality portfolio.
The Fund’s Fixed Income strategy allocation outperformed the Barclays Capital 1-5 Year Government/Credit Bond Index for the 1 year period ending 12/31/2013 by 0.42%. Interest rates rose during the period as a result of stronger economic growth, a “pull forward” of Federal Reserve tapering expectations and persistent outflows from longer-term investment-grade fixed income funds. Credit-related and securitized sectors were supported by strong credit fundamentals and outperformed government securities.
With our macro outlook calling for continued moderate domestic growth and strong corporate earnings, we positioned the Fund’s Fixed Income strategy with an emphasis on a diversified core portfolio of short duration investment-grade corporate and securitized debt while maintaining a significant underweight to the Treasury and agency segments of the market. Within the investment-grade credit space, our security selection added value as the Fund was overweight to financials, an industry sector that outperformed the broad credit market amid ongoing improvement in credit fundamentals. In addition, our exposure to short duration residential mortgage products within the structured space performed well as these market sectors were supported by strong housing fundamentals and investor demand for high-quality short duration paper.
We remain relatively constructive on the trajectory of the economy and expect the Federal Reserve to continue to gradually withdraw accommodation in 2014. Although the process of normalizing monetary policy appears to be a lengthy one, we expect rates to be pressured higher as they move closer to fair value levels. At the same time, as the economy continues to improve, corporate and securitized fundamentals should remain strong and may be supportive of current valuations. In this environment, we expect that credit and securitized sectors could continue to perform better than Treasuries, although by a smaller margin as gains may be driven by income as opposed to spread tightening. Against this backdrop, we remain focused on income generation and interest rate risk management. We expect to maintain the Fund’s overweight to corporate bonds, although less so than in recent periods. Because our bias is to be strategically defensive with our interest rate positioning, we maintained the Fund’s duration shorter than its benchmark at year end.
LoCorr Long/Short Commodities Strategy Fund
The LoCorr Long/Short Commodities Strategy Fund (the “Long/Short Commodities Fund” or the “Fund”) was created to provide investors with access to a commodities futures strategy in a mutual fund structure. Historically, investors have primarily accessed exposure to commodities in long-only funds, funds that rely on commodity price increases to generate positive returns. Of course, commodity prices don’t always appreciate and occasionally experience sharp declines. The Long/Short Commodities Fund has the ability to profit while commodity prices increase or decrease.
The Long/Short Commodities Fund’s primary investment objective is capital appreciation in rising and falling commodities markets. The Long/Short Commodities Fund attempts to achieve its investment objective by investing in two primary strategies – a Commodities strategy and a Fixed Income strategy.
Commodities Strategy
The Long/Short Commodities Fund invests up to 25% of its total assets into a portfolio of globally diversified commodity futures positions. The Long/Short Commodities Fund accesses returns generated by Millburn’s Commodity Program (“Milcom”), a commodity pool which commenced operations in 2005. The Fund accesses the Millburn returns via its investment in a total return swap agreement. The Fund uses Millburn to execute its Commodities strategy as manager of the swap’s reference index. Milcom systematically invests in about 50 futures markets with long and short positions in sectors such as energy, metals, softs, grains and livestock.
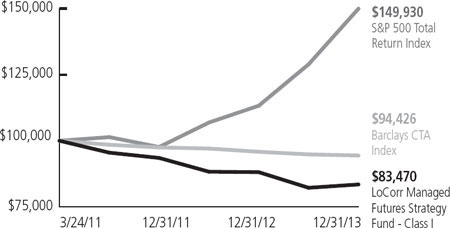
The Fund was unprofitable due to losses from trading energy, metal and soft commodity futures. Grain trading was fractionally positive and livestock trading was nearly flat. Spread trading was quite profitable across all sectors.
The global and domestic dynamics discussed above influenced commodity prices during the year. Energy prices were buffeted by conflicting forces in 2013. Underpinning prices was the overall improvement in growth, particularly in the developed world, and the turmoil that continues to envelop the Middle East. Weighing down prices was the impact of the shale oil revolution, and the transition in China to a less manufacturing focused growth model. In this environment, trading of crude oil, Reformulated Gasoline Blendstock for Oxygen Blending gasoline, London gas oil, heating oil and natural gas were unprofitable. Gains from energy spread trading offset most of these other energy sector losses.
In light of the disturbances listed above, metal prices were volatile in 2013. Prices started the year firm, fell after the first quarter, especially when Chinese and U.S. monetary policies tightened, and fluctuated erratically thereafter. Consequently, long positions and subsequent trading of zinc, lead, tin, gold, silver, palladium and platinum produced sizable losses. On the other hand, short copper positions were slightly profitable.
Trading of soft commodities produced a loss. Short cocoa trades, long lumber and Orange Juice positions, and trading of cotton and London sugar generated losses that outpaced the profits from short coffee and sugar positions. Spread trading of softs countered virtually all of these other soft sector losses.
Grain trading was profitable thanks to short soybean oil and wheat trades, and long trades in soybean and rapeseed. These gains slightly outweighed losses from trading oats, rice and maize. Grain spread trading added significantly to the profits. Livestock trading was marginally positive due to gains from spread trading.
Fixed Income Strategy
The Fund’s fixed income portfolio was sub-advised by Galliard Capital Management for most of the year until being replaced by Nuveen in late November. Nuveen will use a similar Fixed Income strategy as described above in the LoCorr Managed Futures Strategy Fund. The Long/Short Commodities Fund’s Fixed Income strategy lagged its benchmark, the Barclays Capital 1-5 Year Government/Credit Index, by 0.33% for the year ending 12/31/2013. Underperformance during the period was driven by overweight allocations in non-U.S. Treasury sectors relative to the benchmark. In particular, allocations to Agency Mortgage-Backed Securities, Commercial Mortgage-Backed Securities and Asset-Backed Securities (“ABS”) were a drag on performance, as was an allocation to Treasury Inflation Protected Securities (“TIPS”). Additionally, the longer term bonds underperformed shorter term bonds as prices dropped and yield rose on the longer end of the yield curve.
Nuveen’s outlook is described above. Because our bias is to be strategically defensive with our interest rate positioning, we reduced the Fund’s duration to be about 2.5 years at year end, which is modestly short to the benchmark and our mortgage focus is on security types with stable prepayment profiles with little to no extension risk.
LoCorr Long/Short Equity Fund
LoCorr Long/Short Equity Fund (the “Long/Short Equity Fund” or the “Fund”) is the newest addition to LoCorr Funds. Launched in May 2013, the Fund’s objective is long-term capital appreciation with reduced volatility compared to traditional broad-based equity market indices as a secondary objective. Consistent with the “low correlation” our Funds seek, long/short equity funds have the ability to provide positive returns when equity markets are rising yet they can provide downside protection when equity prices are declining.
The Fund’s initial sub-adviser, Millennium Asset Management, focuses on small and micro-cap stocks as the core long holdings. Millennium may also look to short individual stocks and hold bear ETFs to seek to mitigate volatility and to profit when prices decline.
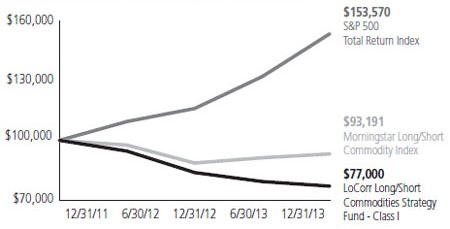
During the Fund’s abbreviated period ending on December 31, 2013, the Fund’s net long exposure ranged from 77% to 94%. The Fund’s Class I shares were up 15% from May 10, 2013 through December 31, 2013.
The equity markets were weak from the launch of the Long/Short Equity Fund in May through the end of June due to fears of the Federal Reserve changing its easing stance, and continuing concerns of slower growth in China. The congressional stalemate over addressing budgetary items added to market concerns in the August to November timeframe. Between August and December there were four different equity market corrections of 4 - 5% each. Each corrective phase ended with the recognition of the underlying strength of the U.S. economy.
The portfolio was positioned to benefit from growth in the U.S. with exposure to the continuing expansion of the U.S. economy. This exposure benefited the Fund during 2013, and also drove short term underperformance when the market corrections focused on selling economically sensitive equities.
In the last few months of 2013, the Fund performed exceptionally well due to the Fund’s exposure to growth of the U.S. economy and the outperformance of small cap stocks. Short positions have been focused on market sectors and different issues that have become overvalued due to over-enthusiastic valuations.
Thank you for investing in LoCorr Funds.
It is not possible to invest directly into an index.
Correlation measures how much the returns of two investments move together over time. Duration is a commonly used measure of the potential volatility of the price of the debt security, or the aggregate market value of a portfolio of debt securities, prior to maturity. Securities with a longer duration generally have more volatile prices than securities of comparable quality with a shorter duration.
Barclays Capital 1-5 Year Government/Credit Index is an unmanaged index considered representative of performance of short-term U.S. corporate bonds and U.S. government bonds with maturities from one to five years.
The opinions expressed in the letter are those of the fund manager, are subject to change, are not guaranteed and should not be considered investment advice.
Must be preceded or accompanied by a prospectus. Fund holdings and sector allocation are subject to change and should not be considered a recommendation to buy or sell any security. For a complete list of fund holdings please refer to the Schedule of Investments included in this report.
Mutual fund investing involves risk. Principal loss is possible. The Funds are non-diversified, meaning they may invest their assets in fewer individual holdings than a diversified fund. Therefore, the Funds are more exposed to individual stock volatility than a diversified fund. The Funds invest in foreign investments and foreign currencies which involve greater volatility and political, economic and currency risks and differences in accounting methods. The Funds may make short sales of securities, which involves the risk that losses may exceed the original amount invested. Investing in commodities may subject the Funds to greater risks and volatility as commodity prices may be influenced by a variety of factors including unfavorable weather, environmental factors, and changes in government regulations. The Funds may invest in derivative securities, which derive their performance from the performance of an underlying asset, index, interest rate or currency exchange rate. Derivatives can be volatile and involve various types and degrees of risks, and, depending upon the characteristics of a particular derivative, suddenly can become illiquid. Investments in debt securities typically decrease in value when interest rates rise. This risk is usually greater for longer-term debt securities. Investments in Asset Backed, Mortgage Backed, and Collateralized Mortgage Backed Securities include additional risks that investors should be aware of such as credit risk, prepayment risk, possible illiquidity and default, as well as increased susceptibility to adverse economic developments.
Diversification does not assure a profit nor protect against loss in a declining market.
Past performance is not a guarantee of future results.
The LoCorr Managed Futures Strategy Fund, LoCorr Long/Short Commodities Strategy Fund and LoCorr Long/Short Equity Fund are distributed by Quasar Distributors, LLC.
LoCorr Managed Futures Strategy Fund
Rate of Return — For the period ended December 31, 2013 (Unaudited)
| | | | | | | | | | | Average Annual | |
| | | Inception Date | | 6 Month | | 1 Year | | Since Inception | |
| LoCorr Managed Futures Strategy Fund - Class A (without maximum load) | | | 3/22/11 | | 1.28 | % | | | -5.53 | % | | | -6.54 | % | |
| LoCorr Managed Futures Strategy Fund - Class A (with maximum load) | | | 3/22/11 | | -4.55 | % | | | -11.01 | % | | | -8.51 | % | |
| LoCorr Managed Futures Strategy Fund - Class C | | | 3/24/11 | | 1.06 | % | | | -6.07 | % | | | -7.21 | % | |
| LoCorr Managed Futures Strategy Fund - Class I | | | 3/24/11 | | 1.52 | % | | | -5.28 | % | | | -6.31 | % | |
| Barclays CTA Index | | | | | -0.45 | % | | | -1.46 | % | | | -2.06 | %1 | |
| S&P 500 Total Return Index | | | | | 16.31 | % | | | 32.39 | % | | | 15.73 | %2 | |
$100,000 investment in the
LoCorr Managed Futures Strategy Fund – Class I
For the period ended December 31, 2013 (Unaudited)
This chart illustrates the performance of a hypothetical $100,000 investment made in the Fund’s Class I shares since inception. Assumes reinvestment of dividends and capital gains, but does not reflect the effect of any applicable sales charge or redemption fees. This chart does not imply any future performance. Performance will vary from class to class based on differences in class-specific expenses and sales charges. The returns do not reflect the deduction of taxes that a shareholder would pay on Fund distributions or the redemption of Fund shares.
Performance data represents past performance; past performance does not guarantee future results. The investment return and principal value of an investment will fluctuate so that an investor’s shares, when redeemed, may be worth more or less than their original cost. Current performance of the Fund may be lower or higher than the performance quoted. Performance data current to the most recent month end may be obtained by calling 1.855.LCFUNDS, or visiting www.LoCorrFunds.com.
Performance data shown reflects the Class A maximum sales charge of 5.75% and reflects the Class C Contingent Deferred Sales Charge (CDSC) of 1.00%. Performance of the Class A without load does not reflect the deduction of the sales load or fee. If reflected, the load or fee would reduce the performance quoted.
The Fund imposes a 1.00% redemption fee on shares held for less than 30 days. Performance data does not reflect the redemption fee. If it had, return would be reduced.
The S&P 500 Total Return Index is an unmanaged capitalization-weighted index of 500 stocks designed to measure performance of the broad domestic economy through changes in the aggregate market value of the 500 stocks which represent all major industries. The Barclays CTA Index is a leading industry benchmark of representative performance of commodity trading advisors.
One cannot invest directly in an index.
1 Since inception return as of March 31, 2011.
2 Since inception return as of March 24, 2011.
LoCorr Long/Short Commodities Strategy Fund
Rate of Return — For the period ended December 31, 2013 (Unaudited)
| | | | | | | | | | | Average Annual | |
| | | Inception Date | | 6 Month | | | 1 Year | | Since Inception | |
| LoCorr Long/Short Commodities Strategy Fund - Class A (without maximum load) | | | 1/1/12 | | -3.03 | % | | | -8.36 | % | | | -12.41 | % | |
| LoCorr Long/Short Commodities Strategy Fund - Class A (with maximum load) | | | 1/1/12 | | -8.58 | % | | | -13.63 | % | | | -14.96 | % | |
| LoCorr Long/Short Commodities Strategy Fund - Class C | | | 1/1/12 | | -3.33 | % | | | -9.05 | % | | | -13.15 | % | |
| LoCorr Long/Short Commodities Strategy Fund - Class I | | | 1/1/12 | | -2.90 | % | | | -8.11 | % | | | -12.23 | % | |
| Morningstar Long/Short Commodity Index | | | | | 2.35 | % | | | 5.40 | % | | | -3.43 | %1 | |
| S&P 500 Total Return Index | | | | | 16.31 | % | | | 32.39 | % | | | 23.89 | %1 | |
$100,000 investment in the
LoCorr Long/Short Commodities Strategy Fund – Class I
For the period ended December 31, 2013 (Unaudited)
This chart illustrates the performance of a hypothetical $100,000 investment made in the Fund’s Class I shares since inception. Assumes reinvestment of dividends and capital gains, but does not reflect the effect of any applicable sales charge or redemption fees. This chart does not imply any future performance. Performance will vary from class to class based on differences in class-specific expenses and sales charges. The returns do not reflect the deduction of taxes that a shareholder would pay on Fund distributions or the redemption of Fund shares.
Performance data represents past performance; past performance does not guarantee future results. The investment return and principal value of an investment will fluctuate so that an investor’s shares, when redeemed, may be worth more or less than their original cost. Current performance of the Fund may be lower or higher than the performance quoted. Performance data current to the most recent month end may be obtained by calling 1.855.LCFUNDS, or visiting www.LoCorrFunds.com.
Performance data shown reflects the Class A maximum sales charge of 5.75% and reflects the Class C Contingent Deferred Sales Charge (CDSC) of 1.00%. Performance of the Class A without load does not reflect the deduction of the sales load or fee. If reflected, the load or fee would reduce the performance quoted.
The Fund imposes a 1.00% redemption fee on shares held for less than 30 days. Performance data does not reflect the redemption fee. If it had, return would be reduced.
The S&P 500 Total Return Index is an unmanaged capitalization-weighted index of 500 stocks designed to measure performance of the broad domestic economy through changes in the aggregate market value of the 500 stocks which represent all major industries. The Morningstar Long/Short Commodity Index is a fully collateralized commodity futures index that uses the momentum rule to determine if each commodity is held long, short, or flat.
One cannot invest directly in an index.
1 Since inception returns as of January 1, 2012.
LoCorr Long/Short Equity Fund
Rate of Return — For the period ended December 31, 2013 (Unaudited)
| | | Inception Date | | 6 Month | | Since Inception1 | |
| LoCorr Long/Short Equity Fund - Class A (without maximum load) | | | 5/10/13 | | 17.14 | % | | | 14.80 | % | |
| LoCorr Long/Short Equity Fund - Class A (with maximum load) | | | 5/10/13 | | 10.38 | % | | | 8.20 | % | |
| LoCorr Long/Short Equity Fund - Class C | | | 5/10/13 | | 16.77 | % | | | 14.20 | % | |
| LoCorr Long/Short Equity Fund - Class I | | | 5/10/13 | | 17.35 | % | | | 15.00 | % | |
| Russell 2000 Total Return Index | | | | | 19.82 | % | | | 20.41 | % | |
| S&P 500 Total Return Index | | | | | 16.31 | % | | | 14.70 | % | |
$100,000 investment in the
LoCorr Long/Short Equity Fund - Class I
For the period ended December 31, 2013 (Unaudited)
This chart illustrates the performance of a hypothetical $100,000 investment made in the Fund’s Class I shares since inception. Assumes reinvestment of dividends and capital gains, but does not reflect the effect of any applicable sales charge or redemption fees. This chart does not imply any future performance. Performance will vary from class to class based on differences in class-specific expenses and sales charges. The returns do not reflect the deduction of taxes that a shareholder would pay on Fund distributions or the redemption of Fund shares.
Performance data represents past performance; past performance does not guarantee future results. The investment return and principal value of an investment will fluctuate so that an investor’s shares, when redeemed, may be worth more or less than their original cost. Current performance of the Fund may be lower or higher than the performance quoted. Performance data current to the most recent month end may be obtained by calling 1.855.LCFUNDS, or visiting www.LoCorrFunds.com.
Performance data shown reflects the Class A maximum sales charge of 5.75% and reflects the Class C Contingent Deferred Sales Charge (CDSC) of 1.00%. Performance of the Class A without load does not reflect the deduction of the sales load or fee. If reflected, the load or fee would reduce the performance quoted.
The Fund imposes a 1.00% redemption fee on shares held for less than 30 days. Performance data does not reflect the redemption fee. If it had, return would be reduced.
The S&P 500 Total Return Index is an unmanaged capitalization-weighted index of 500 stocks designed to measure performance of the broad domestic economy through changes in the aggregate market value of the 500 stocks which represent all major industries. The Russell 2000 Total Return Index measures the performance of the small-cap segment of the U.S. equity universe.
One cannot invest directly in an index.
1 Cumulative total return since inception of May 10, 2013.
| |
LoCorr Managed Futures Strategy Fund - Consolidated Schedule of Investments | 9 |
| |
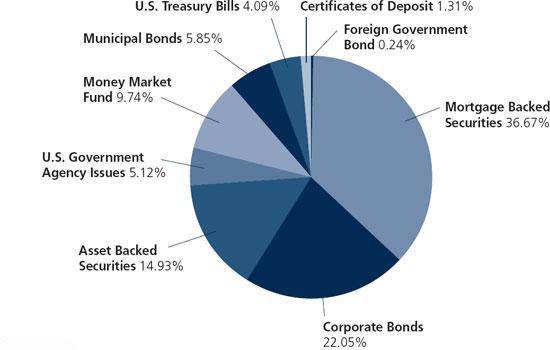
LoCorr Managed Futures Strategy Fund
Composition of Consolidated Investment Portfolio1
December 31, 2013 (Unaudited)
1 As a percentage of total investments.
Consolidated Schedule of Investments
December 31, 2013
| | | | | | | | | | | |
| | | Maturity Date | | Coupon Rate | | Principal Amount | | Value | |
| ASSET BACKED SECURITIES: 12.36% | | | | | | | | | | |
| 321 Henderson Receivables I LLC, 2004-A A1 (Acquired 02/08/2013, Cost, $529,626) (a)(c) | | 09/15/2045 | | 0.52 | % | | $ | 556,403 | | $ | 539,634 | |
| AEP Texas Central Transition Funding III LLC, 2012-1 A1 | | 12/01/2018 | | 0.88 | % | | | 1,409,453 | | | 1,411,587 | |
| Ally Auto Receivables Trust, 2012-3 A2 | | 01/15/2015 | | 0.70 | % | | | 34,820 | | | 34,823 | |
| American Express Credit Account Master Trust | | | | | | | | | | | | |
| Series 2009-2 A (c) | | 03/15/2017 | | 1.42 | % | | | 150,000 | | | 151,125 | |
| Series 2012-2 A | | 03/15/2018 | | 0.68 | % | | | 2,500,000 | | | 2,504,507 | |
| AmeriCredit Automobile Receivables Trust, 2012-1 A3 | | 09/08/2016 | | 1.23 | % | | | 2,765,000 | | | 2,771,371 | |
| Atlantic City Electric Transition Funding LLC | | | | | | | | | | | | |
| Series 2002-1 A3 | | 07/20/2017 | | 4.91 | % | | | 78,738 | | | 81,085 | |
| Series 2003-1 A3 | | 10/20/2020 | | 5.05 | % | | | 1,100,000 | | | 1,212,832 | |
| BA Credit Card Trust, 2007-A6 A6 (c) | | 09/15/2016 | | 0.23 | % | | | 1,000,000 | | | 999,913 | |
| Cabela’s Master Credit Card Trust | | | | | | | | | | | | |
| Series 2010-2A A2 (Acquired 12/27/2012 and 02/08/2013, Cost, $2,293,030) (a)(c) | | 09/15/2018 | | 0.87 | % | | | 2,275,000 | | | 2,290,682 | |
| Series 2012-1A A1 (Acquired 05/08/2012 and 07/23/2012, Cost, $1,515,762) (a) | | 02/18/2020 | | 1.63 | % | | | 1,500,000 | | | 1,513,192 | |
| California Republic Auto Receivables Trust 2013-2 A2 | | 03/15/2019 | | 1.23 | % | | | 1,000,000 | | | 999,249 | |
| Capital One Multi-Asset Execution Trust, 2007-A2 A2 (c) | | 12/15/2019 | | 0.25 | % | | | 2,000,000 | | | 1,984,548 | |
| Carfinance Capital Auto Trust 2013-1A A (Acquired 05/21/2013, Cost, $1,629,861) (a) | | 07/17/2017 | | 1.65 | % | | | 1,629,896 | | | 1,626,297 | |
CenterPoint Energy Restoration Bond Co. LLC, 2009-1 A2 (Acquired 08/25/2011, 05/10/2013 and 05/15/2013, Cost, $1,901,902) (a) | | 08/15/2019 | | 3.46 | % | | | 1,792,000 | | | 1,905,534 | |
| CenterPoint Energy Transition Bond Co. IV LLC, 2012-1 A1 | | 04/15/2018 | | 0.90 | % | | | 2,461,750 | | | 2,462,085 | |
| Citibank Omni Master Trust, 2009-A14A A14 (Acquired 08/22/2013, Cost, $1,522,280) (a)(c) | | 08/15/2018 | | 2.92 | % | | | 1,500,000 | | | 1,522,658 | |
| Discover Card Execution Note Trust | | | | | | | | | | | | |
| Series 2011-A3 A (c) | | 03/15/2017 | | 0.38 | % | | | 1,000,000 | | | 1,000,286 | |
| Series 2012-A1 A1 | | 08/15/2017 | | 0.81 | % | | | 700,000 | | | 702,450 | |
| Series 2013-A1 A1 (c) | | 08/17/2020 | | 0.47 | % | | | 1,000,000 | | | 1,003,255 | |
| Dryrock Issuance Trust, 2012-2 A | | 08/15/2018 | | 0.64 | % | | | 1,500,000 | | | 1,495,953 | |
| Entergy Texas Restoration Funding LLC, 2009-A A1 | | 02/01/2016 | | 2.12 | % | | | 1,345,688 | | | 1,356,066 | |
| Fifth Third Auto Trust, 2013-A B | | 04/15/2019 | | 1.21 | % | | | 1,500,000 | | | 1,485,969 | |
| Ford Credit Auto Owner Trust, 2013-B A3 | | 10/15/2017 | | 0.57 | % | | | 3,000,000 | | | 3,003,519 | |
| GE Capital Credit Card Master Note Trust, 2011-1 A (c) | | 01/15/2017 | | 0.72 | % | | | 250,000 | | | 250,044 | |
The accompanying notes are an integral part of these consolidated financial statements.
| |
10 | LoCorr Managed Futures Strategy Fund - Consolidated Schedule of Investments (continued) |
| |
| | | | | | | | | | | | | |
| | | Maturity Date | | Coupon Rate | | Principal Amount | | Value | |
ASSET BACKED SECURITIES (continued) | | | | | | | | | | | | |
Gracechurch Card Funding PLC, 2012-1A A1 (Acquired 03/02/2012 and 05/15/2013, Cost, $1,451,020) (a)(b)(c) | | 02/15/2017 | | 0.87 | % | | $ | 1,450,000 | | $ | 1,455,549 | |
| HLSS Servicer Advance Receivables Backed Notes | | | | | | | | | | | | |
| Series 2013-T1 A1 (Acquired 01/16/2013, Cost, $1,000,000) (a) | | 01/15/2044 | | 0.90 | % | | | 1,000,000 | | | 1,000,000 | |
| Series 2013-T2 A2 (Acquired 05/17/2013, Cost, $2,249,998) (a) | | 05/16/2044 | | 1.15 | % | | | 2,250,000 | | | 2,238,300 | |
| Series 2013-T1 D2 (Acquired 01/16/2013, Cost, $750,000) (a) | | 01/16/2046 | | 3.23 | % | | | 750,000 | | | 749,400 | |
| Invitation Homes 2013-SFR1 Trust A (c) | | 12/17/2030 | | 1.31 | % | | | 1,250,000 | | | 1,251,633 | |
| Newcastle Investment Trust, 2011-MH1 A (Acquired 10/24/2012, Cost, $323,013) (a) | | 12/10/2033 | | 2.45 | % | | | 319,941 | | | 323,034 | |
| Nissan Auto Lease Trust, 2012-A A3 | | 05/15/2015 | | 0.98 | % | | | 1,099,140 | | | 1,100,586 | |
| Penarth Master Issuer PLC, 2012-1A A1 (Acquired 02/08/2013, Cost, $1,664,405) (a)(b)(c) | | 03/18/2016 | | 0.74 | % | | | 1,660,000 | | | 1,661,298 | |
Porsche Financial Auto Securitization Trust, 2011-1 A4 (Acquired 12/13/2011, Cost, $653,935) (a) | | 12/17/2018 | | 1.19 | % | | | 652,924 | | | 654,356 | |
| SMART Trust/Australia, 2012-2USA A3B (Acquired 02/08/2013, Cost, $1,006,169) (a)(b)(c) | | 10/14/2016 | | 1.12 | % | | | 1,000,000 | | | 1,004,201 | |
| United States Small Business Administration, 2008-10B 1 | | 09/10/2018 | | 5.73 | % | | | 109,384 | | | 117,527 | |
| TOTAL ASSET BACKED SECURITIES (Cost $45,888,577) | | | | | | | | | | | 45,864,548 | |
| | | | | | | | | | | | | |
| CORPORATE BONDS: 37.82% | | | | | | | | | | | | |
| Administrative and Support and Waste Management and Remediation Services: 0.23% | | | | | | | | | | | | |
| Waste Management, Inc. | | 09/01/2016 | | 2.60 | % | | | 840,000 | | | 867,024 | |
| | | | | | | | | | | | | |
| Construction: 0.41% | | | | | | | | | | | | |
| Transocean, Inc. (b) | | 10/15/2017 | | 2.50 | % | | | 1,500,000 | | | 1,515,891 | |
| | | | | | | | | | | | | |
| Finance and Insurance: 15.12% | | | | | | | | | | | | |
| Aflac Inc. | | 02/15/2017 | | 2.65 | % | | | 1,750,000 | | | 1,805,841 | |
| Allied World Assurance Co., Ltd. (b) | | 08/01/2016 | | 7.50 | % | | | 1,500,000 | | | 1,721,997 | |
| American Express Credit Corp. | | 09/19/2016 | | 2.80 | % | | | 1,000,000 | | | 1,044,880 | |
| American International Group, Inc. | | 09/15/2016 | | 4.88 | % | | | 1,500,000 | | | 1,647,490 | |
| Australia & New Zealand Banking Group Ltd. (Acquired 11/15/2011, Cost, $995,930) (a)(b) | | 11/23/2016 | | 2.40 | % | | | 1,000,000 | | | 1,035,400 | |
| Bank Of America, N.A. | | 11/14/2016 | | 1.13 | % | | | 4,475,000 | | | 4,480,083 | |
| Barclays Bank PLC (b) | | 09/22/2016 | | 5.00 | % | | | 1,000,000 | | | 1,100,944 | |
| B.A.T. International Finance P.L.C. (Acquired 06/06/2012, Cost, $995,160) (a)(b) | | 06/07/2017 | | 2.13 | % | | | 1,000,000 | | | 1,011,213 | |
| Berkshire Hathaway Inc. | | 08/15/2016 | | 2.20 | % | | | 860,000 | | | 888,291 | |
| BP Capital Markets P.L.C. (b) | | 11/01/2016 | | 2.25 | % | | | 1,000,000 | | | 1,034,861 | |
| Citigroup, Inc. | | 12/15/2015 | | 4.59 | % | | | 3,465,000 | | | 3,702,748 | |
| Citigroup, Inc. | | 11/21/2017 | | 6.13 | % | | | 1,000,000 | | | 1,152,709 | |
| Credit Agricole SA (Acquired 10/01/2012, Cost, $1,503,784) (a)(b) | | 10/01/2017 | | 3.00 | % | | | 1,500,000 | | | 1,551,841 | |
Daimler Finance North America LLC (Acquired 01/04/2012 and 04/10/2012, Cost, $1,003,003) (a) | | 01/09/2015 | | 2.30 | % | | | 1,000,000 | | | 1,013,893 | |
| Deutsche Bank AG (b) | | 09/01/2017 | | 6.00 | % | | | 1,000,000 | | | 1,142,172 | |
| Fifth Third Bancorp | | 06/01/2018 | | 4.50 | % | | | 1,000,000 | | | 1,066,373 | |
| General Electric Capital Corp. | | 04/27/2017 | | 2.30 | % | | | 1,820,000 | | | 1,870,729 | |
| General Electric Capital Corp. | | 05/01/2018 | | 5.63 | % | | | 1,500,000 | | | 1,722,552 | |
| Goldman Sachs Group, Inc./The | | 09/01/2017 | | 6.25 | % | | | 4,135,000 | | | 4,733,996 | |
| Hartford Financial Services Group, Inc./The | | 03/30/2015 | | 4.00 | % | | | 1,000,000 | | | 1,038,893 | |
| Health Care REIT, Inc. | | 04/01/2019 | | 4.13 | % | | | 1,500,000 | | | 1,579,440 | |
| ING Bank N.V. (Acquired 02/29/2012 and 10/23/2012, Cost, $1,529,064) (a)(b) | | 03/07/2017 | | 3.75 | % | | | 1,500,000 | | | 1,579,830 | |
| JPMorgan Chase & Co. | | 10/01/2015 | | 5.15 | % | | | 3,105,000 | | | 3,318,621 | |
| Morgan Stanley | | 02/25/2016 | | 1.75 | % | | | 1,565,000 | | | 1,586,010 | |
| Morgan Stanley (c) | | 10/18/2016 | | 0.70 | % | | | 1,000,000 | | | 991,764 | |
| Nomura Holdings, Inc. (b) | | 09/13/2016 | | 2.00 | % | | | 1,250,000 | | | 1,260,334 | |
| Nordea Bank AB (Acquired 02/12/2013, Cost, $1,045,518) (a)(b) | | 03/20/2017 | | 3.13 | % | | | 1,000,000 | | | 1,045,681 | |
| Private Export Funding Corp. | | 05/15/2015 | | 4.55 | % | | | 750,000 | | | 793,519 | |
| Private Export Funding Corp. | | 02/15/2017 | | 1.38 | % | | | 780,000 | | | 787,309 | |
| Rabobank Nederland (b) | | 01/19/2017 | | 3.38 | % | | | 1,000,000 | | | 1,052,890 | |
| Royal Bank of Scotland Group Public Limited Co./The (b) | | 09/18/2015 | | 2.55 | % | | | 1,000,000 | | | 1,022,757 | |
| Simon Property Group L.P. | | 03/01/2017 | | 5.88 | % | | | 1,000,000 | | | 1,121,547 | |
| UBS AG (b) | | 12/20/2017 | | 5.88 | % | | | 872,000 | | | 1,000,643 | |
| Ventas Realty LP / Ventas Capital Corp. | | 11/30/2015 | | 3.13 | % | | | 1,000,000 | | | 1,039,989 | |
| Vornado Realty L.P. | | 04/01/2015 | | 4.25 | % | | | 815,000 | | | 840,455 | |
| Wellpoint, Inc. | | 01/15/2018 | | 1.88 | % | | | 1,250,000 | | | 1,236,014 | |
| Wells Fargo & Co. | | 06/15/2016 | | 3.68 | % | | | 1,000,000 | | | 1,064,744 | |
| | | | | | | | | | | | 56,088,453 | |
The accompanying notes are an integral part of these consolidated financial statements.
| |
LoCorr Managed Futures Strategy Fund - Consolidated Schedule of Investments (continued) | 11 |
| |
| | | | | | | | | | | | | |
| | | Maturity Date | | Coupon Rate | | Principal Amount | | Value | |
CORPORATE BONDS (continued) | | | | | | | | | | | | |
| Health Care and Social Assistance: 0.93% | | | | | | | | | | | | |
| Catholic Health Initiatives | | 11/01/2017 | | 1.60 | % | | $ | 1,900,000 | | $ | 1,841,571 | |
| Quest Diagnostics Inc. | | 11/01/2015 | | 5.45 | % | | | 1,500,000 | | | 1,616,765 | |
| | | | | | | | | | | | 3,458,336 | |
| Information: 2.48% | | | | | | | | | | | | |
| AT&T Inc. | | 02/12/2016 | | 0.90 | % | | | 945,000 | | | 940,198 | |
| DIRECTV Holdings LLC / DIRECTV Financing Co., Inc. | | 03/15/2015 | | 3.55 | % | | | 500,000 | | | 516,483 | |
| DIRECTV Holdings LLC / DIRECTV Financing Co., Inc. | | 02/15/2016 | | 3.13 | % | | | 1,000,000 | | | 1,040,223 | |
| NBCUniversal Media, LLC | | 04/30/2015 | | 3.65 | % | | | 750,000 | | | 779,999 | |
| Qwest Corp. | | 10/01/2014 | | 7.50 | % | | | 300,000 | | | 314,891 | |
| Time Warner Cable Inc. | | 07/01/2018 | | 6.75 | % | | | 2,000,000 | | | 2,242,876 | |
| Tyco International Finance S.A. (b) | | 10/15/2015 | | 3.38 | % | | | 1,000,000 | | | 1,037,554 | |
| Verizon Communications, Inc. | | 11/02/2015 | | 0.70 | % | | | 1,250,000 | | | 1,246,513 | |
| Vodafone Group Public Limited Co. (b) | | 09/15/2015 | | 5.00 | % | | | 1,000,000 | | | 1,069,287 | |
| | | | | | | | | | | | 9,188,024 | |
| Management of Companies and Enterprises: 1.51% | | | | | | | | | | | | |
| BHP Billiton Finance (USA) Ltd. (b) | | 02/24/2017 | | 1.63 | % | | | 1,015,000 | | | 1,017,751 | |
| BNP Paribas (b) | | 08/20/2018 | | 2.70 | % | | | 1,750,000 | | | 1,782,814 | |
| Capital One Financial Corp. | | 09/01/2016 | | 6.15 | % | | | 1,000,000 | | | 1,118,482 | |
| Macy’s Retail Holdings, Inc. | | 12/01/2016 | | 5.90 | % | | | 1,500,000 | | | 1,682,517 | |
| | | | | | | | | | | | 5,601,564 | |
| Manufacturing: 9.50% | | | | | | | | | | | | |
| ACTAVIS, Inc. | | 10/01/2017 | | 1.88 | % | | | 1,500,000 | | | 1,484,356 | |
| Anheuser-Busch Companies LLC | | 10/15/2016 | | 5.05 | % | | | 1,500,000 | | | 1,668,758 | |
| Boeing Capital Corp. | | 08/15/2018 | | 2.90 | % | | | 1,250,000 | | | 1,300,389 | |
| Cisco Systems, Inc. | | 03/14/2017 | | 3.15 | % | | | 1,285,000 | | | 1,359,773 | |
| ConAgra Foods, Inc. | | 01/25/2018 | | 1.90 | % | | | 1,500,000 | | | 1,472,498 | |
| Covidien International Finance S.A. (b) | | 05/29/2015 | | 1.35 | % | | | 1,000,000 | | | 1,007,336 | |
| Dow Chemical Co./The | | 02/15/2016 | | 2.50 | % | | | 1,290,000 | | | 1,329,473 | |
| Dr Pepper Snapple Group, Inc. | | 01/15/2016 | | 2.90 | % | | | 1,000,000 | | | 1,037,849 | |
| Eastman Chemical Co. | | 06/01/2017 | | 2.40 | % | | | 2,000,000 | | | 2,021,432 | |
| ECOLAB Inc. | | 12/08/2017 | | 1.45 | % | | | 1,500,000 | | | 1,465,831 | |
| EMC Corp. | | 06/01/2018 | | 1.88 | % | | | 1,750,000 | | | 1,730,120 | |
| Ford Motor Credit Company LLC | | 01/17/2017 | | 1.50 | % | | | 1,500,000 | | | 1,499,328 | |
| Heineken N.V. (Acquired 10/02/2012, Cost, $996,700) (a)(b) | | 10/01/2017 | | 1.40 | % | | | 1,000,000 | | | 981,073 | |
| Hershey Co./The | | 11/01/2016 | | 1.50 | % | | | 1,000,000 | | | 1,008,744 | |
| Hewlett-Packard Co. | | 12/01/2020 | | 3.75 | % | | | 1,500,000 | | | 1,496,727 | |
| Intel Corp. | | 10/01/2016 | | 1.95 | % | | | 750,000 | | | 770,998 | |
| Kellogg Co. | | 05/21/2018 | | 3.25 | % | | | 1,500,000 | | | 1,559,953 | |
| Lorillard Tobacco Co. | | 08/21/2017 | | 2.30 | % | | | 1,500,000 | | | 1,503,307 | |
| Motorola Solutions, Inc. | | 11/15/2017 | | 6.00 | % | | | 1,250,000 | | | 1,421,819 | |
| Phillips 66 | | 05/01/2017 | | 2.95 | % | | | 1,500,000 | | | 1,560,585 | |
| Procter & Gamble Co./The | | 08/15/2016 | | 1.45 | % | | | 800,000 | | | 811,674 | |
| Reynolds American Inc. | | 10/30/2015 | | 1.05 | % | | | 1,800,000 | | | 1,805,724 | |
| Samsung Electronics America, Inc. (Acquired 04/18/2013, Cost, $2,030,211) (a) | | 04/10/2017 | | 1.75 | % | | | 2,000,000 | | | 1,987,192 | |
| Thermo Fisher Scientific Inc. | | 08/15/2016 | | 2.25 | % | | | 1,150,000 | | | 1,176,081 | |
| Toyota Motor Credit Corp. | | 05/22/2017 | | 1.75 | % | | | 790,000 | | | 793,726 | |
| Zoetis, Inc. | | 02/01/2018 | | 1.88 | % | | | 1,000,000 | | | 991,782 | |
| | | | | | | | | | | | 35,246,528 | |
| Mining, Quarrying, and Oil and Gas Extraction: 3.29% | | | | | | | | | | | | |
| Anadarko Petroleum Corp. | | 09/15/2017 | | 6.38 | % | | | 1,000,000 | | | 1,148,069 | |
| Ensco PLC (b) | | 03/15/2016 | | 3.25 | % | | | 1,575,000 | | | 1,644,371 | |
| Freeport-McMoRan Copper & Gold Inc. | | 03/01/2017 | | 2.15 | % | | | 1,500,000 | | | 1,509,774 | |
| Noble Holding International, Ltd. (b) | | 08/01/2015 | | 3.45 | % | | | 1,150,000 | | | 1,192,446 | |
| Occidental Petroleum Corp. | | 02/15/2018 | | 1.50 | % | | | 425,000 | | | 415,384 | |
| Petrobras International Finance Co. (b) | | 02/06/2015 | | 2.88 | % | | | 830,000 | | | 842,452 | |
| Rio Tinto Finance (USA) PLC (b) | | 08/21/2017 | | 1.63 | % | | | 1,505,000 | | | 1,504,402 | |
| Teck Resources Ltd. (b) | | 08/15/2017 | | 3.85 | % | | | 2,000,000 | | | 2,115,078 | |
| Xstrata Finance (Canada) Ltd. (Acquired 02/14/2012 and 03/12/2013, Cost, $1,818,784) (a)(b) | | 01/15/2017 | | 3.60 | % | | | 1,750,000 | | | 1,825,371 | |
| | | | | | | | | | | | 12,197,347 | |
The accompanying notes are an integral part of these consolidated financial statements.
| |
12 | LoCorr Managed Futures Strategy Fund - Consolidated Schedule of Investments (continued) |
| |
| | | | | | | | | | | | | |
| | | Maturity Date | | Coupon Rate | | Principal Amount | | Value | |
CORPORATE BONDS (continued) | | | | | | | | | | | | |
| Professional, Scientific, and Technical Services: 0.76% | | | | | | | | | | | | |
| Asciano Finance Ltd. (Acquired 05/24/2012 and 06/27/2013, Cost, $2,017,538) (a)(b) | | 09/23/2015 | | 3.13 | % | | $ | 2,000,000 | | $ | 2,045,260 | |
| Computer Sciences Corp. | | 09/15/2015 | | 2.50 | % | | | 750,000 | | | 765,538 | |
| | | | | | | | | | | | 2,810,798 | |
| Real Estate and Rental and Leasing: 0.25% | | | | | | | | | | | | |
| Penske Truck Leasing Co. LP / PTL Finance Corp. (Acquired 05/14/2012, Cost, $904,074) (a) | | 05/11/2015 | | 3.13 | % | | | 900,000 | | | 925,632 | |
| | | | | | | | | | | | | |
| Retail Trade: 1.03% | | | | | | | | | | | | |
| Sherwin-Williams Co./The | | 12/15/2017 | | 1.35 | % | | | 1,640,000 | | | 1,596,886 | |
| Tesco PLC (Acquired 07/17/2013, Cost, $2,234,879) (a)(b) | | 11/15/2017 | | 5.50 | % | | | 2,000,000 | | | 2,216,952 | |
| | | | | | | | | | | | 3,813,838 | |
| Transportation and Warehousing: 1.03% | | | | | | | | | | | | |
| GATX Corp. | | 07/30/2018 | | 2.38 | % | | | 2,000,000 | | | 2,003,308 | |
| Spectra Energy Partners, LP | | 09/25/2018 | | 2.95 | % | | | 915,000 | | | 927,467 | |
| Vale Overseas Ltd. (b) | | 01/11/2016 | | 6.25 | % | | | 825,000 | | | 898,219 | |
| | | | | | | | | | | | 3,828,994 | |
| Utilities: 0.85% | | | | | | | | | | | | |
| Exelon Generation Co., LLC | | 10/01/2019 | | 5.20 | % | | | 2,000,000 | | | 2,155,346 | |
| Sempra Energy | | 04/01/2017 | | 2.30 | % | | | 1,000,000 | | | 1,012,953 | |
| | | | | | | | | | | | 3,168,299 | |
| Wholesale Trade: 0.43% | | | | | | | | | | | | |
| Express Scripts Holding Co | | 11/15/2016 | | 3.50 | % | | | 1,500,000 | | | 1,585,824 | |
| | | | | | | | | | | | | |
| TOTAL CORPORATE BONDS (Cost $139,857,949) | | | | | | | | | | | 140,296,552 | |
| | | | | | | | | | | | | |
| MORTGAGE BACKED SECURITIES: 21.95% | | | | | | | | | | | | |
| American Tower Trust I, 2013-1-2 (Acquired 03/06/2013, Cost, $1,830,000) (a) | | 03/15/2043 | | 1.55 | % | | | 1,830,000 | | | 1,786,043 | |
| Bear Stearns Commercial Mortgage Securities Trust | | | | | | | | | | | | |
| Series 2006-PWR12 A4 (c) | | 09/11/2038 | | 5.71 | % | | | 2,235,000 | | | 2,443,081 | |
| Series 2005-PWR10 A4 (c) | | 12/11/2040 | | 5.41 | % | | | 2,250,000 | | | 2,387,131 | |
| CD 2005-CD1 Commercial Mortgage Trust, 2005-CD1 A4 (c) | | 07/15/2044 | | 5.22 | % | | | 255,000 | | | 270,368 | |
| COMM 2012-CCRE2 Mortgage Trust, 2012-CR2 A1 | | 08/15/2045 | | 0.82 | % | | | 2,192,471 | | | 2,184,310 | |
| COMM 2012-CCRE4 Mortgage Trust, 2012-CR4 A2 | | 10/15/2045 | | 1.80 | % | | | 2,000,000 | | | 1,978,822 | |
| COMM 2012-LC4 Mortgage Trust, 2012-LC4 A1 | | 12/10/2044 | | 1.16 | % | | | 635,560 | | | 637,393 | |
| Commercial Mortgage Trust, 2007-GG11 A4 | | 12/10/2049 | | 5.74 | % | | | 1,250,000 | | | 1,395,954 | |
| CSMC Trust | | | | | | �� | | | | | | |
| Series 2013-6 1A1 (Acquired 07/24/2013, Cost, $2,833,428) (a)(c) | | 07/25/2028 | | 2.50 | % | | | 2,903,289 | | | 2,822,052 | |
| Series 2013-IVR4 A3 (Acquired 06/12/2013, Cost, $2,988,475) (a)(c) | | 07/25/2043 | | 3.00 | % | | | 2,941,281 | | | 2,973,452 | |
| DBUBS 2011-LC3 Mortgage Trust, A2 | | 08/10/2044 | | 3.64 | % | | | 1,990,000 | | | 2,090,553 | |
| Extended Stay America Trust | | | | | | | | | | | | |
| Series 2013-ESFL A2FL (Acquired 01/24/2013, Cost, $1,565,000) (a)(c) | | 12/05/2031 | | 0.87 | % | | | 1,565,000 | | | 1,567,319 | |
| Series 2013-ESFL A1FL (Acquired 01/24/2013, Cost, $785,000) (a)(c) | | 12/05/2031 | | 0.97 | % | | | 785,000 | | | 786,900 | |
| Fannie Mae-Aces | | | | | | | | | | | | |
| Series 2009-M1 A1 | | 07/25/2019 | | 3.40 | % | | | 482,817 | | | 505,433 | |
| Series 2012-M8 ASQ1 | | 12/25/2019 | | 1.17 | % | | | 1,296,729 | | | 1,300,572 | |
| Fannie Mae Connecticut Avenue Securities 2013-CO1 M1 (c) | | 10/25/2023 | | 2.17 | % | | | 2,194,141 | | | 2,204,157 | |
| Fannie Mae Pool | | 01/01/2016 | | 2.67 | % | | | 380,012 | | | 379,934 | |
| Fannie Mae Pool | | 02/01/2021 | | 3.50 | % | | | 121,459 | | | 127,665 | |
| Fannie Mae Pool | | 06/01/2021 | | 3.50 | % | | | 161,542 | | | 169,770 | |
| Fannie Mae Pool | | 08/01/2021 | | 3.00 | % | | | 425,557 | | | 441,320 | |
| Fannie Mae Pool | | 09/01/2021 | | 3.00 | % | | | 504,924 | | | 523,674 | |
| Fannie Mae Pool | | 11/01/2021 | | 3.00 | % | | | 961,957 | | | 997,647 | |
| Fannie Mae Pool | | 12/01/2025 | | 3.50 | % | | | 625,359 | | | 654,379 | |
| Fannie Mae Pool | | 09/01/2026 | | 3.50 | % | | | 619,329 | | | 648,009 | |
| Fannie Mae Pool (c) | | 10/01/2033 | | 2.55 | % | | | 1,405,985 | | | 1,496,929 | |
| FDIC Commercial Mortgage Trust | | | | | | | | | | | | |
| Series 2011-C1 A (Acquired 06/06/2012, Cost, $225,927) (a)(c) | | 04/25/2031 | | 1.84 | % | | | 224,554 | | | 225,697 | |
| Series 2012-C1 A (Acquired 05/10/2012, Cost, $640,282) (a)(c) | | 05/25/2035 | | 0.84 | % | | | 640,282 | | | 641,171 | |
| FDIC Guaranteed Notes Trust | | | | | | | | | | | | |
| Series 2010-S4 A (Acquired 02/24/2012, Cost, $739,690) (a)(c) | | 12/04/2020 | | 0.72 | % | | | 736,618 | | | 741,175 | |
| Series 2010-S1 2A (Acquired 03/01/2012, Cost, $870,453) (a) | | 04/25/2038 | | 3.25 | % | | | 855,490 | | | 883,824 | |
| Series 2010-S1 1A (Acquired 11/18/2011, Cost, $526,846) (a)(c) | | 02/25/2048 | | 0.72 | % | | | 527,670 | | | 528,903 | |
The accompanying notes are an integral part of these consolidated financial statements.
| |
LoCorr Managed Futures Strategy Fund - Consolidated Schedule of Investments (continued) | 13 |
| |
| | | | | | | | | | | | | |
| | | Maturity Date | | Coupon Rate | | Principal Amount | | Value | |
MORTGAGE BACKED SECURITIES (continued) | | | | | | | | | | | | |
| FHLMC Multifamily Structured Pass Through Certificates | | | | | | | | | | | | |
| Series K501 A1 | | 06/25/2016 | | 1.34 | % | | $ | 485,381 | | $ | 489,419 | |
| Series K703 A1 | | 01/25/2018 | | 1.87 | % | | | 605,857 | | | 616,986 | |
| Series K709 A1 | | 10/25/2018 | | 1.56 | % | | | 1,569,408 | | | 1,581,427 | |
| Fosse Master Issuer PLC, 2011-1A A2 (Acquired 09/30/2011 and 06/27/2012, Cost, $1,072,026) (a)(b)(c) | | 10/19/2054 | | 1.67 | % | | | 1,071,796 | | | 1,077,066 | |
| Freddie Mac REMICS, 3855 HE | | 02/15/2026 | | 2.50 | % | | | 57,292 | | | 58,711 | |
| FREMF Mortgage Trust 2013-KF02 (Acquired 11/01/2013, Cost, $1,498,865) (a)(c) | | 12/25/2045 | | 3.16 | % | | | 1,498,865 | | | 1,514,105 | |
| GS Mortgage Securities Corp. II, 2005-GG4 A4A | | 07/10/2039 | | 4.75 | % | | | 246,769 | | | 255,638 | |
| GS Mortgage Securities Trust | | | | | | | | | | | | |
| Series 2010-C2 A1 (Acquired 04/11/2012, Cost, $1,468,366) (a) | | 12/10/2043 | | 3.85 | % | | | 1,383,564 | | | 1,459,077 | |
| Series 2011-GC5 A2 | | 08/10/2044 | | 3.00 | % | | | 1,715,000 | | | 1,783,739 | |
| Series 2007-GG10 A4 (c) | | 08/10/2045 | | 5.80 | % | | | 2,275,000 | | | 2,498,105 | |
| Holmes Master Issuer PLC, 2012-1A A2 (Acquired 01/18/2012, Cost, $886,994) (a)(b)(c) | | 10/15/2054 | | 1.89 | % | | | 886,994 | | | 897,929 | |
| JPMorgan Chase Commercial Mortgage Securities Trust | | | | | | | | | | | | |
| Series 2013 - FL3 A2 (Acquired 04/24/2013, Cost, $2,805,000) (a)(c) | | 04/15/2028 | | 0.87 | % | | | 2,805,000 | | | 2,792,742 | |
| Series 2013-JWRZ A (Acquired 05/22/2013, Cost, $2,960,000) (a)(c) | | 04/15/2030 | | 0.95 | % | | | 2,960,000 | | | 2,946,440 | |
| Series 2010-C1 A1 (Acquired 12/30/2011, Cost, $1,474,124) (a) | | 06/15/2043 | | 3.85 | % | | | 1,413,801 | | | 1,459,986 | |
| Series 2005 - LPD5 A4 (c) | | 12/15/2044 | | 5.20 | % | | | 250,000 | | | 266,359 | |
| Series 2011-C3 A1 (Acquired 09/20/2011, Cost, $333,385) (a) | | 02/15/2046 | | 1.87 | % | | | 331,729 | | | 333,105 | |
| Series 2007-CIBC18 A3 | | 06/12/2047 | | 5.45 | % | | | 200,473 | | | 202,772 | |
| Series 2007-CIBC20 A4 (c) | | 02/12/2051 | | 5.79 | % | | | 1,400,000 | | | 1,569,407 | |
| Morgan Stanley Capital I Trust | | | | | | | | | | | | |
| Series 2008-TOP29 A4 (c) | | 01/11/2043 | | 6.28 | % | | | 1,250,000 | | | 1,442,504 | |
| Series 2011-C1 A2 (Acquired 09/20/2011 and 06/28/2012, Cost, $2,268,396) (a) | | 09/17/2047 | | 3.88 | % | | | 2,150,000 | | | 2,259,007 | |
| Motel 6 Trust, 2012-MTL6 A2 (Acquired 11/02/2012, Cost, $1,999,992) (a) | | 10/05/2025 | | 1.95 | % | | | 2,000,000 | | | 1,979,888 | |
| NCUA Guaranteed Notes Trust | | | | | | | | | | | | |
| Series 2010-R2 1A (c) | | 11/06/2017 | | 0.54 | % | | | 2,435,381 | | | 2,438,425 | |
| Series 2011-R1 1A (c) | | 01/08/2020 | | 0.62 | % | | | 107,088 | | | 107,399 | |
| Series 2011-R2 1A (c) | | 02/06/2020 | | 0.57 | % | | | 2,864,922 | | | 2,882,111 | |
| Series 2011-R3 1A (c) | | 03/11/2020 | | 0.57 | % | | | 3,444,075 | | | 3,444,075 | |
| Series 2010-R1 1A (c) | | 10/07/2020 | | 0.62 | % | | | 345,420 | | | 347,279 | |
| Sequoia Mortgage Trust, 2013-1 1A1 (c) | | 02/25/2043 | | 1.45 | % | | | 1,453,194 | | | 1,427,785 | |
| Springleaf Mortgage Loan Trust | | | | | | | | | | | | |
| Series 2013-1A A (Acquired 04/03/2013, Cost, $2,199,735) (a)(c) | | 06/25/2058 | | 1.27 | % | | | 2,199,910 | | | 2,194,388 | |
| Series 2012-3A A (Acquired 10/18/2012, Cost, $717,835) (a)(c) | | 12/25/2059 | | 1.57 | % | | | 717,930 | | | 715,103 | |
| Series 2013-3A A (Acquired 10/04/2013, Cost, $1,931,253) (a)(c) | | 09/25/2057 | | 1.87 | % | | | 1,931,508 | | | 1,931,321 | |
| Structured Agency Credit Risk Debt Notes 2013-dn2 M1 (c) | | 11/25/2023 | | 1.62 | % | | | 1,949,107 | | | 1,944,622 | |
| WIMC Capital Trust, 2012-A A1 (Acquired 06/21/2012, Cost, $730,140) (a) | | 10/16/2050 | | 4.55 | % | | | 730,148 | | | 740,218 | |
| TOTAL MORTGAGE BACKED SECURITIES (Cost $81,774,483) | | | | | | | | | | | 81,450,775 | |
| | | | | | | | | | | | | |
| MUNICIPAL BONDS: 1.86% | | | | | | | | | | | | |
| County of Hamilton OH Sewer System Revenue | | 12/01/2016 | | 1.23 | % | | | 825,000 | | | 819,910 | |
| Louisiana Local Government Environmental Facilities & Community Development Authority | | 02/01/2018 | | 1.52 | % | | | 1,017,051 | | | 1,023,316 | |
| Metropolitan Council, (Minneapolis - St. Paul Metropolitan Area), State of Minnesota | | 09/01/2017 | | 1.20 | % | | | 2,020,000 | | | 1,998,487 | |
| Metropolitan Government of Nashville & Davidson County TN | | 07/01/2017 | | 1.21 | % | | | 1,500,000 | | | 1,478,025 | |
| State of Ohio | | 08/01/2017 | | 3.33 | % | | | 1,500,000 | | | 1,582,260 | |
| TOTAL MUNICIPAL BONDS (Cost $6,986,735) | | | | | | | | | | | 6,901,998 | |
| | | | | | | | | | | | | |
| FOREIGN GOVERNMENT BOND: 0.25% | | | | | | | | | | | | |
| Hydro-Quebec (b) | | 06/30/2016 | | 2.00 | % | | | 900,000 | | | 924,120 | |
| TOTAL FOREIGN GOVERNMENT BOND (Cost $911,466) | | | | | | | | | | | 924,120 | |
| | | | | | | | | | | | | |
| U.S. GOVERNMENT AGENCY ISSUES: 5.05% | | | | | | | | | | | | |
| Federal Home Loan Mortgage Corp. | | 08/20/2014 | | 1.00 | % | | | 6,000,000 | | | 6,031,272 | |
| Federal Home Loan Mortgage Corp. | | 08/27/2014 | | 1.00 | % | | | 3,000,000 | | | 3,017,445 | |
| Federal Home Loan Mortgage Corp. | | 09/10/2015 | | 1.75 | % | | | 1,000,000 | | | 1,023,317 | |
| Federal Home Loan Mortgage Corp. | | 08/25/2016 | | 2.00 | % | | | 1,500,000 | | | 1,551,168 | |
| Federal National Mortgage Association | | 05/15/2014 | | 2.50 | % | | | 1,500,000 | | | 1,513,125 | |
| Federal National Mortgage Association | | 10/30/2014 | | 0.63 | % | | | 1,060,000 | | | 1,063,904 | |
| Federal National Mortgage Association | | 12/19/2014 | | 0.75 | % | | | 3,500,000 | | | 3,518,865 | |
| Federal National Mortgage Association | | 07/28/2015 | | 2.38 | % | | | 1,000,000 | | | 1,031,606 | |
| TOTAL U.S. GOVERNMENT AGENCY ISSUES (Cost $18,684,217) | | | | | | | | | | | 18,750,702 | |
The accompanying notes are an integral part of these consolidated financial statements.
| |
14 | LoCorr Managed Futures Strategy Fund - Consolidated Schedule of Investments (continued) |
| |
| | | | | | | | | | | | |
| | | Maturity Date | | Coupon Rate | | Principal Amount | | Value | |
| U.S. GOVERNMENT NOTE: 1.35% | | | | | | | | | | |
| United States Treasury Note | | 10/15/2015 | | 0.25 | % | | $ | 5,000,000 | | $ | 4,993,555 | |
| TOTAL U.S. GOVERNMENT NOTE (Cost $4,996,406) | | | | | | | | | | | 4,993,555 | |
| | | | | | | | | | | | | |
| SHORT TERM INVESTMENTS: 3.66% | | | | | | | | | | | | |
| | | | | | | | | | | | | |
| U.S. GOVERNMENT AGENCY ISSUES: 2.43% | | | | | | | | | | | | |
| Federal Home Loan Banks | | 03/04/2014 | | 0.13 | % | | | 5,000,000 | | | 4,999,955 | |
| Federal Home Loan Mortgage Corp. | | 03/21/2014 | | 0.30 | % | | | 4,000,000 | | | 4,001,844 | |
| TOTAL U.S. GOVERNMENT AGENCY ISSUES | | | | | | | | | | | 9,001,799 | |
| | | | | | | | | | | | | |
| MONEY MARKET FUND: 1.23% | | | | | | | Shares | | | | |
| Fidelity Institutional Money Market Portfolio - Class I , 0.03% (d) | | | | | | | | 4,584,729 | | | 4,584,729 | |
| TOTAL MONEY MARKET FUND | | | | | | | | | | | 4,584,729 | |
| | | | | | | | | | | | | |
| TOTAL SHORT TERM INVESTMENTS (Cost $13,574,632) | | | | | | | | | | | 13,586,528 | |
| | | | | | | | | | | | | |
| TOTAL INVESTMENTS (Cost $312,674,465): 84.30% | | | | | | | | | | | 312,768,778 | |
| Other Assets in Excess of Liabilities: 15.70% (e) | | | | | | | | | | | 58,247,034 | |
| TOTAL NET ASSETS: 100.00% | | | | | | | | | | $ | 371,015,812 | |
(a) Restricted security as defined in Rule 144(a) under the Securities Act of 1933 and determined to be liquid. Purchased in a private placement transaction; resale to the public may require registration or may extend only to qualified institutional buyers. At December 31, 2013, the fair value of these securities total $70,960,384 which represents 19.13% of total net assets.
(b) Foreign issued security.
(c) Variable rate security. The rate reported is the rate in effect as of December 31, 2013.
(d) The rate quoted is the annualized seven-day effective yield as of December 31, 2013.
(e) Includes assets pledged as collateral for swap contracts.
The accompanying notes are an integral part of these consolidated financial statements.
| |
LoCorr Managed Futures Strategy Fund - Consolidated Schedule of Swap Contracts | 15 |
| |
Consolidated Schedule of Swap Contracts
December 31, 2013
LONG TOTAL RETURN SWAP CONTRACTS
This investment is a holding of LCMFS Fund Limited. See Note 1.
| | | | | | | | | |
| | | | | | | Unrealized | | |
| | | | | | | Appreciation | | |
| Termination Date | | Reference Index | | Notional | | | | Counterparty |
| | LoCorr Managed Futures Index^ | | | | | | Deutsche Bank AG |
^Comprised of a proprietary basket of Commodity Trading Advisors’ (“CTA”) Programs investing in various futures, forwards, and currency derivative contracts and other similar investments. See Notes 2 and 3.
*Unrealized depreciation is a payable on the Fund’s consolidated statement of assets and liabilities.
The accompanying notes are an integral part of these consolidated financial statements.
| |
16 | LoCorr Long/Short Commodities Strategy Fund - Consolidated Schedule of Investments |
| |
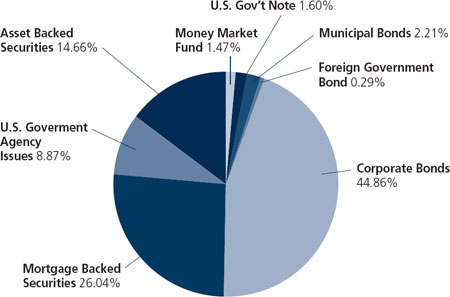
LoCorr Long/Short Commodities Strategy Fund
Composition of Consolidated Investment Portfolio1
December 31, 2013 (Unaudited)
1 As a percentage of total investments.
Consolidated Schedule of Investments
December 31, 2013
| | | | | | | | | | | |
| | | Maturity Date | | Coupon Rate | | Principal Amount | | Value | |
| ASSET BACKED SECURITIES: 12.66% | | | | | | | | | | |
| Ally Auto Receivables Trust | | | | | | | | | | |
| Series 2012-4 A3 | | 01/17/2017 | | 0.59 | % | | $ | 25,000 | | $ | 25,022 | |
| Series 2012-5 A3 | | 03/15/2017 | | 0.62 | % | | | 50,000 | | | 50,027 | |
| AmeriCredit Automobile Receivables Trust | | | | | | | | | | | | |
| Series 2012-3 A2 | | 12/08/2015 | | 0.71 | % | | | 5,764 | | | 5,765 | |
| Series 2012-5 A2 | | 01/08/2016 | | 0.51 | % | | | 17,747 | | | 17,740 | |
| Series 2013-2 A2 | | 11/08/2016 | | 0.53 | % | | | 42,606 | | | 42,596 | |
| Series 2012-4 A3 | | 06/08/2017 | | 0.67 | % | | | 25,000 | | | 24,991 | |
| Series 2013-1 A3 | | 10/10/2017 | | 0.61 | % | | | 45,000 | | | 44,921 | |
| Series 2013-3 A3 | | 04/09/2018 | | 0.92 | % | | | 50,000 | | | 50,028 | |
| Capital Auto Receivables Asset Trust | | | | | | | | | | | | |
| Series 2013-2 A1 | | 07/20/2015 | | 0.77 | % | | | 25,000 | | | 25,024 | |
| Series 2013-1 A2 | | 07/20/2016 | | 0.62 | % | | | 50,000 | | | 49,991 | |
| CarMax Auto Owner Trust, 2012-3 A3 | | 07/17/2017 | | 0.52 | % | | | 25,000 | | | 24,984 | |
| Citibank Credit Card Issuance Trust 2013-A11 (c) | | 02/07/2018 | | 0.41 | % | | | 100,000 | | | 100,028 | |
| CNH Equipment Trust | | | | | | | | | | | | |
| Series 2012-B A3 | | 09/15/2017 | | 0.86 | % | | | 15,000 | | | 15,043 | |
| Series 2012-C A3 | | 12/15/2017 | | 0.57 | % | | | 25,000 | | | 24,972 | |
| Series 2012-D A3 | | 04/16/2018 | | 0.65 | % | | | 50,000 | | | 50,040 | |
| Fifth Third Auto Trust, 2013-A A3 | | 09/15/2017 | | 0.61 | % | | | 50,000 | | | 49,893 | |
| Ford Credit Auto Owner Trust 2013-B A3 | | 10/15/2017 | | 0.57 | % | | | 50,000 | | | 50,059 | |
| GE Equipment Midticket LLC 2012-1 A3 | | 05/23/2016 | | 0.60 | % | | | 25,000 | | | 24,986 | |
| GE Equipment Small Ticket LLC Series 2012-1A A3 (Acquired 05/22/2012, | | | | | | | | | | | | |
| Cost, $14,997) (a) | | 09/21/2015 | | 1.04 | % | | | 15,000 | | | 15,047 | |
| GE Equipment Transportation LLC 2012-2 A3 | | 07/25/2016 | | 0.62 | % | | | 30,000 | | | 29,997 | |
| Honda Auto Receivables Owner Trust | | | | | | | | | | | | |
| Series 2012-4 A3 | | 08/18/2016 | | 0.52 | % | | | 25,000 | | | 25,025 | |
| Series 2013-2 A3 | | 02/16/2017 | | 0.53 | % | | | 50,000 | | | 49,984 | |
The accompanying notes are an integral part of these consolidated financial statements.
| |
LoCorr Long/Short Commodities Strategy Fund - Consolidated Schedule of Investments (continued) | 17 |
| |
| | | | | | | | | | | |
| | | Maturity Date | | Coupon Rate | | Principal Amount | | Value | |
ASSET BACKED SECURITIES (continued) | | | | | | | | | | |
| Hyundai Auto Receivables Trust | | | | | | | | | | |
| Series 2012-B A3 | | 09/15/2016 | | 0.62 | % | | $ | 24,770 | | $ | 24,804 | |
| Series 2013-B A3 | | 09/15/2017 | | 0.71 | % | | | 50,000 | | | 50,048 | |
| John Deere Owner Trust 2013-A A3 | | 03/15/2017 | | 0.60 | % | | | 50,000 | | | 50,023 | |
| Mercedes-Benz Auto Lease Trust 2013-A A3 | | 02/15/2016 | | 0.59 | % | | | 50,000 | | | 50,031 | |
| Mercedes-Benz Auto Receivables Trust 2012-1 A2 | | 03/16/2015 | | 0.37 | % | | | 6,352 | | | 6,352 | |
| Navistar Financial Owner Trust, 2012-A A2 (Acquired 06/26/2012, Cost, $4,452) (a) | | 03/18/2015 | | 0.85 | % | | | 4,452 | | | 4,452 | |
| Nissan Auto Receivables Owner Trust, 2013-A A3 | | 05/15/2017 | | 0.50 | % | | | 50,000 | | | 49,973 | |
| Santander Drive Auto Receivables Trust | | | | | | | | | | | | |
| Series 2013-4 A2 | | 09/15/2016 | | 0.89 | % | | | 24,155 | | | 24,195 | |
| Series 2013-1 A3 | | 06/15/2017 | | 0.62 | % | | | 25,000 | | | 24,983 | |
| Series 2013-2 A3 | | 09/15/2017 | | 0.70 | % | | | 40,000 | | | 40,010 | |
| Series 2013-3 A3 | | 10/16/2017 | | 0.70 | % | | | 50,000 | | | 49,956 | |
| Small Business Administration Participation Certificates, 2012-20K 1 | | 11/01/2032 | | 2.09 | % | | | 23,771 | | | 22,058 | |
| Toyota Auto Receivables Owner Trust, 2013-A A3 | | 01/17/2017 | | 0.55 | % | | | 50,000 | | | 49,999 | |
| World Omni Auto Receivables Trust | | | | | | | | | | | | |
| Series 2012-A A3 | | 02/15/2017 | | 0.64 | % | | | 25,000 | | | 25,049 | |
| Series 2012-B A3 | | 06/15/2017 | | 0.61 | % | | | 25,000 | | | 25,032 | |
| Series 2013-A A3 | | 04/16/2018 | | 0.64 | % | | | 75,000 | | | 74,975 | |
| TOTAL ASSET BACKED SECURITIES (Cost $1,369,683) | | | | | | | | | | | 1,368,103 | |
| | | | | | | | | | | | | |
| CORPORATE BONDS: 18.69% | | | | | | | | | | | | |
| Construction: 0.14% | | | | | | | | | | | | |
| ABB Treasury Center (USA), Inc. (Acquired 06/19/2012, Cost, $15,322) (a) | | 06/15/2016 | | 2.50 | % | | | 15,000 | | | 15,427 | |
| | | | | | | | | | | | | |
| Finance and Insurance: 8.59% | | | | | | | | | | | | |
| American Express Co. | | 05/22/2018 | | 1.55 | % | | | 20,000 | | | 19,528 | |
| American Express Credit Corp. | | 09/19/2016 | | 2.80 | % | | | 20,000 | | | 20,898 | |
| Bank of America Corp. | | 08/01/2016 | | 6.50 | % | | | 30,000 | | | 33,872 | |
| Bank of New York Mellon Corp./The | | 07/28/2016 | | 2.30 | % | | | 20,000 | | | 20,656 | |
| Bank of Nova Scotia/The (b) | | 07/15/2016 | | 1.38 | % | | | 30,000 | | | 30,330 | |
| BB&T Corp. | | 03/22/2017 | | 2.15 | % | | | 15,000 | | | 15,166 | |
| BB&T Corp. | | 08/15/2017 | | 1.60 | % | | | 20,000 | | | 19,821 | |
| Boston Properties Limited Partnership | | 06/01/2015 | | 5.00 | % | | | 10,000 | | | 10,580 | |
| BP Capital Markets P.L.C. (b) | | 05/05/2017 | | 1.85 | % | | | 20,000 | | | 20,201 | |
| Caterpillar Financial Services Corp. | | 02/17/2015 | | 4.75 | % | | | 15,000 | | | 15,715 | |
| Caterpillar Financial Services Corp. | | 05/29/2015 | | 1.10 | % | | | 10,000 | | | 10,081 | |
| Charles Schwab Corp./The | | 09/01/2017 | | 6.38 | % | | | 23,000 | | | 26,267 | |
| Citigroup, Inc. (c) | | 04/01/2014 | | 1.24 | % | | | 2,000 | | | 2,004 | |
| Citigroup, Inc. | | 11/21/2017 | | 6.13 | % | | | 25,000 | | | 28,818 | |
| Dragon 2012 LLC | | 03/12/2024 | | 1.97 | % | | | 22,133 | | | 21,471 | |
| ERP Operating Limited Partnership (Equity Residential only) | | 09/15/2014 | | 5.25 | % | | | 25,000 | | | 25,796 | |
| General Electric Capital Corp. | | 12/11/2015 | | 1.00 | % | | | 10,000 | | | 10,080 | |
| General Electric Capital Corp. | | 01/09/2017 | | 2.90 | % | | | 30,000 | | | 31,319 | |
| Goldman Sachs Group, Inc./The | | 01/15/2015 | | 5.13 | % | | | 35,000 | | | 36,560 | |
| Helios Leasing I LLC | | 05/29/2024 | | 2.02 | % | | | 22,192 | | | 21,528 | |
| Helios Leasing I LLC | | 07/24/2024 | | 1.73 | % | | | 22,653 | | | 21,633 | |
| Helios Leasing I LLC | | 09/28/2024 | | 1.56 | % | | | 22,620 | | | 21,353 | |
| John Deere Capital Corp. | | 06/29/2015 | | 0.95 | % | | | 15,000 | | | 15,110 | |
| John Deere Capital Corp. | | 04/13/2017 | | 5.50 | % | | | 15,000 | | | 16,801 | |
| JPMorgan Chase & Co. | | 08/15/2017 | | 2.00 | % | | | 20,000 | | | 20,287 | |
| JPMorgan Chase & Co. | | 01/15/2018 | | 6.00 | % | | | 25,000 | | | 28,787 | |
| KeyBank National Association | | 11/01/2017 | | 5.70 | % | | | 27,000 | | | 30,337 | |
| Kimco Realty Corp. | | 02/01/2018 | | 4.30 | % | | | 30,000 | | | 32,278 | |
| Liberty Property Limited Partnership | | 10/01/2017 | | 6.63 | % | | | 25,000 | | | 28,628 | |
| Morgan Stanley | | 03/22/2017 | | 4.75 | % | | | 30,000 | | | 32,740 | |
| MSN 41079 and 41084 Ltd. (b) | | 07/13/2024 | | 1.72 | % | | | 22,647 | | | 21,607 | |
| New York Life Global Funding (Acquired 10/09/2012, Cost, $20,621) (a) | | 05/04/2015 | | 3.00 | % | | | 20,000 | | | 20,639 | |
| Phoenix 2012 LLC | | 07/03/2024 | | 1.61 | % | | | 23,020 | | | 21,884 | |
| PNC Funding Corp. | | 09/19/2016 | | 2.70 | % | | | 10,000 | | | 10,431 | |
| Realty Income Corp. | | 09/15/2016 | | 5.95 | % | | | 15,000 | | | 16,669 | |
| Royal Bank of Canada (b) | | 09/19/2017 | | 1.20 | % | | | 25,000 | | | 24,771 | |
| Royal Bank of Canada (b) | | 10/01/2018 | | 2.00 | % | | | 10,000 | | | 9,948 | |
| Safina Ltd. (b) | | 01/15/2022 | | 1.55 | % | | | 21,873 | | | 21,435 | |
| Simon Property Group, L.P. | | 08/15/2014 | | 5.63 | % | | | 25,000 | | | 25,592 | |
The accompanying notes are an integral part of these consolidated financial statements.
| |
18 | LoCorr Long/Short Commodities Strategy Fund - Consolidated Schedule of Investments (continued) |
| |
| | | | | | | | | | | |
| | | Maturity Date | | Coupon Rate | | Principal Amount | | Value | |
CORPORATE BONDS (continued) | | | | | | | | | | |
| State Street Bank & Trust Co. | | 10/15/2018 | | 5.25 | % | | $ | 20,000 | | $ | 22,584 | |
| Tagua Leasing LLC | | 11/16/2024 | | 1.58 | % | | | 23,106 | | | 21,763 | |
| Travelers Companies, Inc./The | | 12/01/2015 | | 5.50 | % | | | 16,000 | | | 17,454 | |
| Ventas Realty LP / Ventas Capital Corp. | | 02/15/2018 | | 2.00 | % | | | 15,000 | | | 14,745 | |
| Vornado Realty L.P. | | 04/01/2015 | | 4.25 | % | | | 10,000 | | | 10,312 | |
| | | | | | | | | | | | 928,479 | |
| | | | | | | | | | | | | |
| Information: 1.09% | | | | | | | | | | | | |
| AT&T Inc. | | 05/15/2016 | | 2.95 | % | | | 10,000 | | | 10,427 | |
| AT&T Inc. | | 06/01/2017 | | 1.70 | % | | | 10,000 | | | 9,939 | |
| Comcast Corp. | | 06/15/2016 | | 4.95 | % | | | 8,000 | | | 8,735 | |
| DIRECTV Holdings LLC / DIRECTV Financing Co., Inc. | | 03/15/2017 | | 2.40 | % | | | 35,000 | | | 35,633 | |
| Oracle Corp. | | 04/15/2018 | | 5.75 | % | | | 13,000 | | | 15,022 | |
| Verizon Communications, Inc. | | 09/15/2016 | | 2.50 | % | | | 20,000 | | | 20,681 | |
| Walt Disney Co./The | | 09/15/2016 | | 5.63 | % | | | 15,000 | | | 16,841 | |
| | | | | | | | | | | | 117,278 | |
| | | | | | | | | | | | | |
| Management of Companies and Enterprises: 0.42% | | | | | | | | | | | | |
| BAE SYSTEMS Holdings, Inc. (Acquired 06/04/2012, Cost, $10,461) (a) | | 08/15/2015 | | 5.20 | % | | | 10,000 | | | 10,618 | |
| BHP Billiton Finance (USA) Ltd. (b) | | 02/24/2017 | | 1.63 | % | | | 35,000 | | | 35,095 | |
| | | | | | | | | | | | 45,713 | |
| | | | | | | | | | | | | |
| Manufacturing: 5.04% | | | | | | | | | | | | |
| AbbVie Inc. | | 11/06/2015 | | 1.20 | % | | | 20,000 | | | 20,203 | |
| Anheuser-Busch InBev Worldwide Inc. | | 07/15/2015 | | 0.80 | % | | | 15,000 | | | 15,075 | |
| Anheuser-Busch InBev Worldwide Inc. | | 02/15/2016 | | 2.88 | % | | | 15,000 | | | 15,615 | |
| Baxter International Inc. | | 01/15/2017 | | 1.85 | % | | | 10,000 | | | 10,108 | |
| Bemis Company, Inc. | | 08/01/2014 | | 5.65 | % | | | 20,000 | | | 20,559 | |
| Campbell Soup Co. | | 07/15/2017 | | 3.05 | % | | | 20,000 | | | 20,862 | |
| Chevron Corp. | | 12/05/2017 | | 1.10 | % | | | 10,000 | | | 9,780 | |
| Cintas Corp. No. 2 | | 06/01/2016 | | 2.85 | % | | | 15,000 | | | 15,472 | |
| Coca Cola Co./The | | 11/15/2017 | | 5.35 | % | | | 30,000 | | | 34,157 | |
| Covidien International Finance S.A. (b) | | 05/29/2015 | | 1.35 | % | | | 7,000 | | | 7,051 | |
| Diageo Capital PLC (b) | | 05/11/2017 | | 1.50 | % | | | 20,000 | | | 19,957 | |
| Eaton Corporation | | 11/02/2017 | | 1.50 | % | | | 35,000 | | | 34,312 | |
| ECOLAB Inc. | | 02/15/2015 | | 4.88 | % | | | 15,000 | | | 15,660 | |
| ECOLAB Inc. | | 12/08/2016 | | 3.00 | % | | | 15,000 | | | 15,716 | |
| E.I. du Pont de Nemours & Co. | | 03/15/2015 | | 4.75 | % | | | 14,000 | | | 14,682 | |
| General Mills, Inc. | | 03/17/2015 | | 5.20 | % | | | 25,000 | | | 26,359 | |
| Heineken N.V. (Acquired 10/02/2012, Cost, $9,983) (a)(b) | | 10/01/2015 | | 0.80 | % | | | 10,000 | | | 10,003 | |
| Ingredion Inc. | | 11/01/2015 | | 3.20 | % | | | 30,000 | | | 31,062 | |
| Intel Corp. | | 12/15/2017 | | 1.35 | % | | | 25,000 | | | 24,708 | |
| Kellogg Co. | | 05/17/2017 | | 1.75 | % | | | 40,000 | | | 39,953 | |
| Kraft Foods Group, Inc. | | 06/05/2017 | | 2.25 | % | | | 30,000 | | | 30,377 | |
| Lockheed Martin Corp. | | 09/15/2016 | | 2.13 | % | | | 10,000 | | | 10,260 | |
| Parker-Hannifin Corp. | | 05/15/2018 | | 5.50 | % | | | 10,000 | | | 11,328 | |
| Roper Industries, Inc. | | 11/15/2017 | | 1.85 | % | | | 15,000 | | | 14,870 | |
| SABMiller PLC (Acquired 08/15/2012, Cost, $15,023) (a)(b) | | 01/15/2014 | | 5.70 | % | | | 15,000 | | | 15,026 | |
| Thermo Fisher Scientific Inc. | | 06/01/2015 | | 5.00 | % | | | 10,000 | | | 10,590 | |
| Thermo Fisher Scientific Inc. | | 08/15/2016 | | 2.25 | % | | | 10,000 | | | 10,227 | |
| Toyota Motor Credit Corp. | | 01/12/2017 | | 2.05 | % | | | 10,000 | | | 10,220 | |
| United Technologies Corp. | | 06/01/2017 | | 1.80 | % | | | 30,000 | | | 30,462 | |
| | | | | | | | | | | | 544,654 | |
| | | | | | | | | | | | | |
| Mining, Quarrying, and Oil and Gas Extraction: 0.88% | | | | | | | | | | | | |
| Devon Energy Corp. | | 05/15/2017 | | 1.88 | % | | | 15,000 | | | 15,109 | |
| Rio Tinto Finance (USA) PLC (b) | | 03/22/2017 | | 2.00 | % | | | 10,000 | | | 10,049 | |
| Rio Tinto Finance (USA) PLC (b) | | 08/21/2017 | | 1.63 | % | | | 15,000 | | | 14,994 | |
| Schlumberger Norge AS (Acquired 07/24/2012 and 09/11/2012, Cost, $14,981) (a)(b) | | 08/01/2017 | | 1.25 | % | | | 15,000 | | | 14,661 | |
| Total Capital International SA (b) | | 06/28/2017 | | 1.55 | % | | | 15,000 | | | 15,003 | |
| XTO Energy Inc. | | 02/01/2014 | | 4.90 | % | | | 25,000 | | | 25,088 | |
| | | | | | | | | | | | 94,904 | |
| | | | | | | | | | | | | |
| Retail Trade: 0.37% | | | | | | | | | | | | |
| Sherwin-Williams Co./The | | 12/15/2014 | | 3.13 | % | | | 39,000 | | | 39,937 | |
The accompanying notes are an integral part of these consolidated financial statements.
| |
LoCorr Long/Short Commodities Strategy Fund - Consolidated Schedule of Investments (continued) | 19 |
| |
| | | | | | | | | | | |
| | | Maturity Date | | Coupon Rate | | Principal Amount | | Value | |
CORPORATE BONDS (continued) | | | | | | | | | | |
| Transportation and Warehousing: 0.71% | | | | | | | | | | |
| Canadian National Railway Co. (b) | | 06/01/2016 | | 5.80 | % | | $ | 20,000 | | $ | 22,067 | |
| Norfolk Southern Corp. | | 01/15/2016 | | 5.75 | % | | | 20,000 | | | 21,850 | |
| Union Pacific Corp. | | 01/15/2015 | | 4.88 | % | | | 25,000 | | | 26,114 | |
| VRG Linhas Aereas SA (b) | | 06/30/2014 | | 1.00 | % | | | 6,297 | | | 6,314 | |
| | | | | | | | | | | | 76,345 | |
| | | | | | | | | | | | | |
| Utilities: 1.45% | | | | | | | | | | | | |
| Atmos Energy Corp. | | 10/15/2014 | | 4.95 | % | | | 25,000 | | | 25,827 | |
| Avista Corp. | | 06/01/2018 | | 5.95 | % | | | 20,000 | | | 22,922 | |
| Commonwealth Edison Co. | | 04/15/2015 | | 4.70 | % | | | 20,000 | | | 21,006 | |
| Connecticut Light & Power Co./The | | 03/01/2017 | | 5.38 | % | | | 20,000 | | | 22,034 | |
| Southern California Edison Co. | | 09/15/2014 | | 4.15 | % | | | 15,000 | | | 15,392 | |
| Southern California Edison Co. | | 04/01/2015 | | 4.65 | % | | | 15,000 | | | 15,755 | |
| Wisconsin Electric Power Co. | | 04/01/2014 | | 6.00 | % | | | 11,000 | | | 11,147 | |
| Wisconsin Electric Power Co. | | 12/01/2015 | | 6.25 | % | | | 21,000 | | | 23,173 | |
| | | | | | | | | | | | 157,256 | |
| TOTAL CORPORATE BONDS (Cost $2,028,897) | | | | | | | | | | | 2,019,993 | |
| | | | | | | | | | | | | |
| MORTGAGE BACKED SECURITIES: 31.08% | | | | | | | | | | | | |
| Banc of America Commercial Mortgage Trust, 2006-2 A4 (c) | | 05/10/2045 | | 5.74 | % | | | 20,000 | | | 21,813 | |
| Bear Stearns Commercial Mortgage Securities Trust | | | | | | | | | | | | |
| Series 2006-PWR12 A4 (c) | | 09/11/2038 | | 5.71 | % | | | 25,000 | | | 27,328 | |
| Series 2006-PWR14 A4 | | 12/11/2038 | | 5.20 | % | | | 25,000 | | | 27,308 | |
| Series 2006-TOP24 A4 | | 10/12/2041 | | 5.54 | % | | | 25,000 | | | 27,322 | |
| Citigroup Commercial Mortgage Trust, 2006-C5 A4 | | 10/15/2049 | | 5.43 | % | | | 35,000 | | | 38,187 | |
| Commercial Mortgage Pass-Through Certificates Series 2012-CR3 A1 | | 10/17/2045 | | 0.67 | % | | | 20,013 | | | 19,877 | |
| Credit Suisse Commercial Mortgage Trust Series 2006-C1 A4 (c) | | 02/15/2039 | | 5.46 | % | | | 10,000 | | | 10,774 | |
| Fannie Mae-Aces | | | | | | | | | | | | |
| Series 2012-M17 ASQ2 | | 11/25/2015 | | 0.95 | % | | | 122,119 | | | 122,580 | |
| Series 2013-M3 ASQ2 | | 02/25/2016 | | 1.08 | % | | | 46,792 | | | 47,072 | |
| Series 2013-M1 ASQ2 | | 11/25/2016 | | 1.07 | % | | | 73,896 | | | 74,125 | |
| Series 2013-M7 ASQ2 | | 03/25/2018 | | 1.23 | % | | | 100,000 | | | 99,267 | |
| Fannie Mae Pool | | 06/01/2017 | | 1.49 | % | | | 25,000 | | | 25,274 | |
| Fannie Mae Pool | | 07/01/2017 | | 1.50 | % | | | 35,000 | | | 35,250 | |
| Fannie Mae Pool | | 09/01/2017 | | 1.27 | % | | | 50,000 | | | 50,054 | |
| Fannie Mae Pool | | 08/01/2022 | | 2.50 | % | | | 37,852 | | | 38,643 | |
| Fannie Mae Pool | | 09/01/2022 | | 2.50 | % | | | 78,039 | | | 79,671 | |
| Fannie Mae Pool | | 09/01/2022 | | 2.50 | % | | | 39,060 | | | 39,877 | |
| Fannie Mae Pool | | 10/01/2022 | | 2.50 | % | | | 61,103 | | | 62,382 | |
| Fannie Mae Pool | | 10/01/2022 | | 2.50 | % | | | 20,206 | | | 20,629 | |
| Fannie Mae Pool | | 11/01/2022 | | 2.50 | % | | | 103,533 | | | 105,701 | |
| Fannie Mae Pool | | 11/01/2022 | | 2.50 | % | | | 20,122 | | | 20,543 | |
| Fannie Mae Pool | | 12/01/2022 | | 2.00 | % | | | 71,120 | | | 71,518 | |
| Fannie Mae Pool | | 12/01/2022 | | 2.50 | % | | | 21,132 | | | 21,574 | |
| Fannie Mae Pool | | 12/01/2022 | | 2.50 | % | | | 158,525 | | | 161,844 | |
| Fannie Mae Pool | | 01/01/2023 | | 2.50 | % | | | 21,534 | | | 21,985 | |
| Fannie Mae Pool | | 01/01/2023 | | 2.50 | % | | | 64,263 | | | 65,610 | |
| Fannie Mae Pool | | 02/01/2023 | | 2.50 | % | | | 43,741 | | | 44,659 | |
| Fannie Mae Pool | | 03/01/2023 | | 2.50 | % | | | 44,085 | | | 45,009 | |
| Fannie Mae Pool | | 05/01/2023 | | 2.00 | % | | | 45,988 | | | 46,246 | |
| Fannie Mae Pool | | 06/01/2023 | | 2.00 | % | | | 46,316 | | | 46,575 | |
| Fannie Mae Pool | | 07/01/2023 | | 2.50 | % | | | 93,791 | | | 95,753 | |
| Fannie Mae Pool | | 08/01/2023 | | 2.00 | % | | | 142,880 | | | 143,679 | |
| Fannie Mae Pool | | 08/01/2023 | | 2.50 | % | | | 47,512 | | | 48,505 | |
| Fannie Mae Pool | | 09/01/2023 | | 2.00 | % | | | 48,059 | | | 48,328 | |
| Fannie Mae Pool | | 09/01/2027 | | 3.00 | % | | | 9,003 | | | 9,113 | |
| Fannie Mae Pool | | 09/01/2027 | | 3.00 | % | | | 22,675 | | | 22,950 | |
| Fannie Mae Pool | | 10/01/2027 | | 3.00 | % | | | 46,640 | | | 47,206 | |
| Fannie Mae Pool | | 12/01/2027 | | 2.50 | % | | | 45,431 | | | 44,637 | |
| Fannie Mae Pool | | 12/01/2027 | | 2.50 | % | | | 46,400 | | | 45,675 | |
| Fannie Mae Pool (c) | | 09/01/2042 | | 2.31 | % | | | 20,701 | | | 20,989 | |
| FHLMC Multifamily Structured Pass Through Certificates | | | | | | | | | | | | |
| Series K502 A2 | | 08/25/2017 | | 1.43 | % | | | 35,000 | | | 35,110 | |
| Series K701 A2 (c) | | 11/25/2017 | | 3.88 | % | | | 50,000 | | | 53,815 | |
The accompanying notes are an integral part of these consolidated financial statements.
| |
20 | LoCorr Long/Short Commodities Strategy Fund - Consolidated Schedule of Investments (continued) |
| |
| | | | | | | | | | | |
| | | Maturity Date | | Coupon Rate | | Principal Amount | | Value | |
MORTGAGE BACKED SECURITIES (continued) | | | | | | | | | | |
| Series K708 A2 | | 01/25/2019 | | 2.13 | % | | $ | 30,000 | | $ | 29,877 | |
| Series K709 A2 | | 03/25/2019 | | 2.09 | % | | | 25,000 | | | 24,769 | |
| Series KF01 A (c) | | 04/25/2019 | | 0.52 | % | | | 93,775 | | | 93,596 | |
| Series K710 A2 | | 05/25/2019 | | 1.88 | % | | | 50,000 | | | 48,939 | |
| Series K712 A2 | | 11/25/2019 | | 1.87 | % | | | 75,000 | | | 72,502 | |
| Freddie Mac Gold Pool | | 04/01/2023 | | 2.50 | % | | | 44,216 | | | 45,064 | |
| Freddie Mac Gold Pool | | 04/01/2023 | | 2.50 | % | | | 45,670 | | | 46,552 | |
| Freddie Mac Gold Pool | | 12/01/2027 | | 2.50 | % | | | 22,642 | | | 22,250 | |
| Freddie Mac Gold Pool | | 12/01/2027 | | 2.50 | % | | | 47,148 | | | 46,474 | |
| Freddie Mac Gold Pool | | 12/01/2027 | | 2.50 | % | | | 47,324 | | | 46,505 | |
| Freddie Mac Non Gold Pool (c) | | 07/01/2042 | | 2.17 | % | | | 13,480 | | | 13,830 | |
| Freddie Mac Non Gold Pool (c) | | 07/01/2042 | | 2.38 | % | | | 16,172 | | | 16,717 | |
| Freddie Mac Non Gold Pool (c) | | 07/01/2042 | | 2.43 | % | | | 19,251 | | | 19,568 | |
| Freddie Mac Non Gold Pool (c) | | 08/01/2042 | | 2.59 | % | | | 17,477 | | | 17,832 | |
| Freddie Mac Non Gold Pool (c) | | 10/01/2042 | | 2.19 | % | | | 18,220 | | | 18,615 | |
| Freddie Mac Non Gold Pool (c) | | 01/01/2043 | | 2.16 | % | | | 67,201 | | | 67,313 | |
| Freddie Mac Non Gold Pool (c) | | 01/01/2043 | | 2.21 | % | | | 22,136 | | | 22,178 | |
| Freddie Mac Non Gold Pool (c) | | 02/01/2043 | | 2.14 | % | | | 45,761 | | | 45,823 | |
| GS Mortgage Securities Trust, 2006-GG8 A4 | | 11/10/2039 | | 5.56 | % | | | 25,000 | | | 27,412 | |
| JP Morgan Chase Commercial Mortgage Securities Trust | | | | | | | | | | | | |
| Series 2006-LDP6 A4 (c) | | 04/15/2043 | | 5.48 | % | | | 33,610 | | | 36,357 | |
| Series 2006-LDP7 A4 (c) | | 04/15/2045 | | 5.87 | % | | | 25,000 | | | 27,291 | |
| Series 2012-C8 ASB (Acquired 04/23/2013, Cost, $50,885) (a) | | 10/17/2045 | | 2.38 | % | | | 50,000 | | | 48,167 | |
| LB Commercial Mortgage Trust, 2007-C3 A4B | | 07/15/2044 | | 5.52 | % | | | 35,000 | | | 38,617 | |
| LB-UBS Commercial Mortgage Trust, 2006-C6 A4 | | 09/15/2039 | | 5.37 | % | | | 40,000 | | | 43,632 | |
| Morgan Stanley Bank of America Merrill Lynch Trust, 2012-C6 A1 | | 11/17/2045 | | 0.66 | % | | | 19,921 | | | 19,825 | |
| Morgan Stanley Capital I Trust | | | | | | | | | | | | |
| Series 2006-IQ12 A4 | | 12/15/2043 | | 5.33 | % | | | 24,833 | | | 27,102 | |
| Series 2006-TOP21 A4 (c) | | 10/12/2052 | | 5.16 | % | | | 25,000 | | | 26,654 | |
| NCUA Guaranteed Notes Trust | | | | | | | | | | | | |
| Series 2010-R2 1A (c) | | 11/06/2017 | | 0.54 | % | | | 35,261 | | | 35,305 | |
| Series 2011-R2 1A (c) | | 02/06/2020 | | 0.57 | % | | | 98,439 | | | 99,030 | |
| Series 2010-R1 1A (c) | | 10/07/2020 | | 0.62 | % | | | 96,718 | | | 97,238 | |
| TOTAL MORTGAGE BACKED SECURITIES (Cost $3,386,321) | | | | | | | | | | | 3,359,491 | |
| | | | | | | | | | | | | |
| MUNICIPAL BONDS: 4.96% | | | | | | | | | | | | |
| City of El Paso, TX | | 08/15/2014 | | 3.61 | % | | | 50,000 | | | 50,989 | |
| City of Huntsville, AL | | 09/01/2016 | | 2.41 | % | | | 40,000 | | | 40,897 | |
| City of Lubbock, TX | | 02/15/2018 | | 4.44 | % | | | 25,000 | | | 27,200 | |
| City of Rochester, MN | | 02/01/2016 | | 2.25 | % | | | 25,000 | | | 25,341 | |
| County of Berks, PA | | 11/15/2016 | | 1.01 | % | | | 25,000 | | | 24,756 | |
| County of Forsyth, NC | | 04/01/2020 | | 3.55 | % | | | 30,000 | | | 31,003 | |
| Denton Independent School District | | 08/15/2015 | | 2.00 | % | | | 40,000 | | | 40,802 | |
| Maricopa County School District No. 28 Kyrene Elementary | | 07/01/2019 | | 5.38 | % | | | 15,000 | | | 17,145 | |
| Rosemount-Apple Valley-Eagan Independent School District No. 196 | | 02/01/2019 | | 5.00 | % | | | 25,000 | | | 27,950 | |
| State of Hawaii | | 02/01/2017 | | 3.73 | % | | | 25,000 | | | 26,469 | |
| State of Mississippi | | 11/01/2017 | | 1.35 | % | | | 30,000 | | | 29,702 | |
| State of Ohio | | 04/01/2018 | | 3.66 | % | | | 45,000 | | | 47,394 | |
| State of Tennessee | | 05/01/2017 | | 3.82 | % | | | 25,000 | | | 26,691 | |
| State of Texas | | 10/01/2017 | | 2.50 | % | | | 25,000 | | | 25,873 | |
| State of Washington | | 02/01/2017 | | 3.04 | % | | | 40,000 | | | 42,043 | |
| University of Texas System | | 08/15/2018 | | 3.81 | % | | | 25,000 | | | 26,699 | |
| Virginia College Building Authority | | 02/01/2016 | | 2.40 | % | | | 25,000 | | | 25,510 | |
| TOTAL MUNICIPAL BONDS (Cost $541,719) | | | | | | | | | | | 536,464 | |
| | | | | | | | | | | | | |
| FOREIGN GOVERNMENT BOND: 0.21% | | | | | | | | | | | | |
| Petroleos Mexicanos (b) | | 12/20/2022 | | 2.00 | % | | | 22,500 | | | 22,165 | |
| TOTAL FOREIGN GOVERNMENT BOND (Cost $22,500) | | | | | | | | | | | 22,165 | |
The accompanying notes are an integral part of these consolidated financial statements.
| |
LoCorr Long/Short Commodities Strategy Fund - Consolidated Schedule of Investments (continued) | 21 |
| |
| | | | | | | | | | | |
| | | Maturity Date | | Coupon Rate | | Principal Amount | | Value | |
| U.S. GOVERNMENT AGENCY ISSUES: 4.34% | | | | | | | | | | |
| Federal Home Loan Banks | | 01/29/2014 | | 0.38 | % | | $ | 250,000 | | $ | 250,046 | |
| Ginnie Mae II Pool | | 07/20/2060 | | 5.31 | % | | | 25,513 | | | 28,358 | |
| Ginnie Mae II Pool | | 06/20/2062 | | 4.22 | % | | | 99,717 | | | 107,540 | |
| Ginnie Mae II Pool | | 07/20/2062 | | 4.56 | % | | | 25,463 | | | 27,793 | |
| Ginnie Mae II Pool | | 08/20/2062 | | 4.12 | % | | | 51,341 | | | 55,186 | |
| TOTAL U.S. GOVERNMENT AGENCY ISSUES (Cost $472,337) | | | | | | | | | | | 468,923 | |
| | | | | | | | | | | | | |
| CERTIFICATES OF DEPOSIT: 1.11% | | | | | | | | | | | | |
| BMW Bank of North America | | 07/18/2014 | | 1.00 | % | | | 40,000 | | | 40,096 | |
| Discover Bank | | 07/11/2014 | | 1.00 | % | | | 40,000 | | | 40,092 | |
| GE Capital Retail Bank | | 07/07/2014 | | 1.00 | % | | | 40,000 | | | 40,090 | |
| TOTAL CERTIFICATES OF DEPOSIT (Cost $119,680) | | | | | | | | | | | 120,278 | |
| | | | | | | | | | | | | |
| | | | | | | | | | | | | |
| SHORT TERM INVESTMENTS: 11.73% | | | | | | | | | | | | |
| U.S. TREASURY BILLS: 3.47% | | | | | | | | | | | | |
| United States Treasury Bill | | 03/27/2014 | | 0.06 | %(d) | | | 125,000 | | | 124,981 | |
| United States Treasury Bill | | 09/18/2014 | | 0.07 | %(d) | | | 250,000 | | | 249,865 | |
| | | | | | | | | | | | 374,846 | |
| | | | | | | | | | | | | |
| MONEY MARKET FUND: 8.26% | | | | | | | Shares | | | | |
| Fidelity Institutional Money Market Portfolio - Class I , 0.03% (e) | | | | | | | | 892,416 | | | 892,416 | |
| | | | | | | | | | | | | |
| TOTAL SHORT TERM INVESTMENTS (Cost $1,267,240) | | | | | | | | | | | 1,267,262 | |
| | | | | | | | | | | | | |
| TOTAL INVESTMENTS (Cost $9,208,377): 84.78% | | | | | | | | | | | 9,162,679 | |
| Other Assets in Excess of Liabilities: 15.22% (f) | | | | | | | | | | | 1,645,310 | |
| TOTAL NET ASSETS: 100.00% | | | | | | | | | | $ | 10,807,989 | |
(a) Restricted security as defined in Rule 144(a) under the Securities Act of 1933 and determined to be liquid. Purchased in a private placement transaction; resale to the public may require registration or may extend only to qualified institutional buyers. At December 31, 2013, the fair value of these securities total $154,040 which represents 1.43% of total net assets.
(b) Foreign issued security.
(c) Variable rate security. The rate reported is the rate in effect as of December 31, 2013.
(d) Effective yield.
(e) The rate quoted is the annualized seven-day effective yield as of December 31, 2013.
(f) Includes assets pledged as collateral for swap contracts.
The accompanying notes are an integral part of these consolidated financial statements.
| |
22 | LoCorr Long/Short Commodities Strategy Fund - Consolidated Schedule of Swap Contracts |
| |
Consolidated Schedule of Swap ContractsDecember 31, 2013
LONG TOTAL RETURN SWAP CONTRACTS
This investment is a holding of LCLSCS Fund Limited. See Note 1.
| | | | | | | Unrealized | | |
| | | | | | | Appreciation | | |
| Termination Date | Reference Index | | Notional | | | (Depreciation)* | | Counterparty |
| 12/20/17 | LoCorr Commodities Index^ | | $ | 11,500,000 | | | $ | (853,414) | | Deutsche Bank AG |
| | | | | | | | | | | |
^Comprised of a proprietary basket of Commodity Trading Advisor’s (“CTA”) Programs investing in various futures, forwards, and currency derivative contracts and other similar investments. See Notes 2 and 3.
*Unrealized depreciation is a payable on the Fund’s consolidated statement of assets and liabilities.
The accompanying notes are an integral part of these consolidated financial statements.
| |
LoCorr Long/Short Equity Fund - Schedule of Investments | 23 |
| |
LoCorr Long/Short Equity Fund
Composition of Investment Portfolio1
December 31, 2013 (Unaudited)
| 1 | As a percentage of total investments. |
Schedule of Investments
December 31, 2013
| | | | | | | | |
| | | Shares | | Value | |
| COMMON STOCKS: 91.27% | | | | | | | |
| Accommodation and Food Services: 1.77% | | | | | | | |
| University General Health System, Inc. (a) | | | 1,913,490 | | $ | 746,261 | |
| | | | | | | | |
| Administrative and Support and Waste Management and Remediation Services: 3.31% | | | | | | | |
| Hudson Technologies, Inc. (a) | | | 151,154 | | | 559,270 | |
| Vertex Energy, Inc. (a) | | | 249,168 | | | 834,713 | |
| | | | | | | 1,393,983 | |
| | | | | | | | |
| Construction: 3.23% | | | | | | | |
| Erickson Air-Crane, Inc. (a) | | | 65,375 | | | 1,359,146 | |
| | | | | | | | |
| Finance and Insurance: 12.49% | | | | | | | |
| Atlas Financial Holdings, Inc. (a)(b) | | | 100,320 | | | 1,476,710 | |
| Banco Latinoamericano de Comercio Exterior, S.A. (b) | | | 59,900 | | | 1,678,398 | |
| INTL FCStone, Inc. (a) | | | 22,400 | | | 415,296 | |
| Viad Corp. | | | 60,500 | | | 1,680,690 | |
| | | | | | | 5,251,094 | |
| | | | | | | | |
| Industrials: 2.29% | | | | | | | |
| Aceto Corporation | | | 38,450 | | | 961,635 | |
| | | | | | | | |
| Information: 4.05% | | | | | | | |
| Blucora, Inc. (a) | | | 55,500 | | | 1,618,380 | |
| NetSol Technologies, Inc. (a) | | | 14,625 | | | 85,264 | |
| | | | | | | 1,703,644 | |
| | | | | | | | |
| Management of Companies and Enterprises: 2.92% | | | | | | | |
| Newtek Business Services, Inc. (a) | | | 391,260 | | | 1,228,556 | |
The accompanying notes are an integral part of these financial statements.
| |
24 | LoCorr Long/Short Equity Fund - Schedule of Investments (continued) |
| |
| | | | | | | | |
| | | Shares | | Value | |
COMMON STOCKS (continued) | | | | | | | |
| Manufacturing: 46.69% | | | | | | | |
| Acme United Corporation | | | 10,518 | | $ | 156,718 | |
| Advanced Emissions Solutions, Inc. (a)(c) | | | 37,100 | | | 2,011,933 | |
| Anika Therapeutics, Inc. (a)(c) | | | 26,450 | | | 1,009,332 | |
| Bacterin International Holdings, Inc. (a) | | | 228,225 | | | 114,113 | |
| Biolase, Inc. (a) | | | 102 | | | 287 | |
| Flotek Industries, Inc. (a) | | | 73,400 | | | 1,473,138 | |
| GSI Group, Inc. (a)(b) | | | 119,320 | | | 1,341,157 | |
| LSB Industries, Inc. (a) | | | 37,050 | | | 1,519,791 | |
| LSI Industries, Inc. | | | 113,100 | | | 980,577 | |
| Manitex International, Inc. (a) | | | 77,388 | | | 1,228,921 | |
| Multi-Color Corporation | | | 35,000 | | | 1,320,900 | |
| NN, Inc. | | | 38,300 | | | 773,277 | |
| Nova Measuring Instruments, Ltd. (a)(b) | | | 163,100 | | | 1,604,905 | |
| Nymox Pharmaceutical Corporation (a)(b) | | | 201,900 | | | 1,225,533 | |
| Orchids Paper Products Company (c) | | | 33,150 | | | 1,088,646 | |
| PhotoMedex, Inc. (a) | | | 1,200 | | | 15,540 | |
| Reeds, Inc. (a) | | | 185,378 | | | 1,479,316 | |
| Rocky Mountain Chocolate Factory, Inc. | | | 29,700 | | | 344,817 | |
| Sparton Corporation (a) | | | 60,500 | | | 1,690,975 | |
| UFP Technologies, Inc. (a) | | | 2,500 | | | 63,050 | |
| Xplore Technologies Corp. (a) | | | 31,200 | | | 195,000 | |
| | | | | | | 19,637,926 | |
| | | | | | | | |
| Mining, Quarrying, and Oil and Gas Extraction: 3.37% | | | | | | | |
| Arabian American Development Company (a) | | | 112,800 | | | 1,415,640 | |
| | | | | | | | |
| Professional, Scientific, and Technical Services: 1.49% | | | | | | | |
| Computer Task Group, Inc. | | | 12,050 | | | 227,745 | |
| Edgewater Technology, Inc. (a) | | | 12,300 | | | 85,977 | |
| Hackett Group, Inc./The | | | 50,451 | | | 313,301 | |
| | | | | | | 627,023 | |
| | | | | | | | |
| Real Estate and Rental and Leasing: 3.33% | | | | | | | |
| Global Ship Lease, Inc. (a)(b) | | | 233,046 | | | 1,400,606 | |
| | | | | | | | |
| Retail Trade: 0.21% | | | | | | | |
| REX American Resources Corporation (a) | | | 2,010 | | | 89,867 | |
| | | | | | | | |
| Wholesale Trade: 6.12% | | | | | | | |
| TESSCO Technologies, Inc. | | | 24,250 | | | 977,760 | |
| VOXX International Corporation (a) | | | 95,500 | | | 1,594,850 | |
| | | | | | | 2,572,610 | |
| TOTAL COMMON STOCKS (Cost $34,907,276) | | | | | | 38,387,991 | |
| | | | | | | | |
| EXCHANGE TRADED FUNDS: 2.66% | | | | | | | |
| Direxion Daily 20 Year Plus Treasury Bear 3X Shares (a) | | | 8,850 | | | 643,926 | |
| Direxion Daily Small Cap Bear 3X Shares (a) | | | 28,000 | | | 475,160 | |
| TOTAL EXCHANGE TRADED FUNDS (Cost $1,114,193) | | | | | | 1,119,086 | |
| | | | | | | | |
| MONEY MARKET FUND: 3.55% | | | | | | | |
| Fidelity Institutional Money Market Portfolio - Class I , 0.03% (d) | | | 1,493,402 | | | 1,493,402 | |
| TOTAL MONEY MARKET FUND (Cost $1,493,402) | | | | | | 1,493,402 | |
| | | | | | | | |
| TOTAL INVESTMENTS (Cost $37,514,871): 97.48% | | | | | | 41,000,479 | |
| Other Assets in Excess of Liabilities: 2.52% | | | | | | 1,059,813 | |
| TOTAL NET ASSETS: 100.00% | | | | | $ | 42,060,292 | |
(a) Non-income producing security.
(b) Foreign issued security.
(c) This security or a portion of this security is pledged to cover short positions. See Note 2.
(d) The rate quoted is the annualized seven-day effective yield as of December 31, 2013.
The accompanying notes are an integral part of these financial statements.
| |
LoCorr Long/Short Equity Fund - Schedule of Securities Sold Short | 25 |
| |
Schedule of Securities Sold Short
December 31, 2013
| | | | | | | | |
| | | Shares | | Value | |
| COMMON STOCKS: (3.63)% | | | | | | | |
| Construction: (0.79)% | | | | | | | |
| KB Home | | | (12,000 | ) | $ | (219,360 | ) |
| Solarcity Corporation (a) | | | (2,000 | ) | | (113,640 | ) |
| | | | | | | (333,000 | ) |
| Health Care & Social Assistance: (0.93)% | | | | | | | |
| Community Health Systems, Inc. (a) | | | (10,000 | ) | | (392,700 | ) |
| | | | | | | | |
| Information: (0.51)% | | | | | | | |
| Pandora Media, Inc. (a) | | | (8,000 | ) | | (212,800 | ) |
| | | | | | | | |
| Management of Companies & Enterprises: (0.56)% | | | | | | | |
| Tile Shop Holdings, Inc. (a) | | | (13,000 | ) | | (234,910 | ) |
| | | | | | | | |
| Retail Trade: (0.84)% | | | | | | | |
| Group 1 Automotive, Inc. | | | (5,000 | ) | | (355,100 | ) |
| | | | | | | | |
| TOTAL COMMON STOCKS (Proceeds $1,482,484): (3.63)% | | | | | | (1,528,510 | ) |
| TOTAL SECURITIES SOLD SHORT (Proceeds $1,482,484): (3.63)% | | | | | $ | (1,528,510 | ) |
(a) Non-dividend expense producing security.
Percentages are stated as a percent of net assets.
The accompanying notes are an integral part of these financial statements.
| |
26 | LoCorr Managed Futures Strategy Fund and LoCorr Long/Short Commodities Strategy Fund - Consolidated Statements of Assets & Liabilities |
| |
Consolidated Statements of Assets & Liabilities
December 31, 2013
| | | LoCorr Managed Futures Strategy Fund | LoCorr Long/Short Commodities Strategy Fund |
| | | | | | | | | | |
| Assets | | | | | | | | | |
| Investments, at value (Cost $312,674,465 and $9,208,377, respectively) | | | $ | 312,768,778 | | | $ | 9,162,679 | |
| Cash | | | | 4,257,395 | | | | 161,737 | |
| Receivable for Fund shares sold | | | | 1,036,604 | | | | 29,644 | |
| Receivable for securities sold | | | | - | | | | 1,520 | |
| Interest receivable | | | | 1,514,418 | | | | 31,678 | |
| Receivable from Adviser | | | | - | | | | 1,116 | |
| Deposits with broker for swap contracts (Note 2) | | | | 101,000,010 | | | | 2,400,010 | |
| Prepaid expenses and other assets | | | | 35,475 | | | | 19,686 | |
| Total Assets | | | | 420,612,680 | | | | 11,808,070 | |
| | | | | | | | | | |
| Liabilities | | | | | | | | | |
| Payable for Fund shares redeemed | | | $ | 3,228,294 | | | $ | 44,518 | |
| Payable for distributions | | | | 26,448 | | | | - | |
| Accrued management fees | | | | 485,750 | | | | - | |
| Accrued Trustees’ fees | | | | 13,390 | | | | 342 | |
| Accrued Rule 12b-1 fees | | | | 82,334 | | | | 6,231 | |
| Unrealized loss on swap contracts (Note 1) | | | | 40,927,371 | | | | 853,414 | |
| Advance payment on swap contracts | | | | 4,593,841 | | | | 36,778 | |
| Accrued expenses and other liabilities | | | | 239,440 | | | | 58,798 | |
| Total Liabilities | | | | 49,596,868 | | | | 1,000,081 | |
| | | | | | | | | | |
| Net Assets | | | $ | 371,015,812 | | | $ | 10,807,989 | |
| | | | | | | | | | |
| Net Assets Consist of: | | | | | | | | | |
| Paid-in capital | | | $ | 411,499,137 | | | $ | 11,744,316 | |
| Accumulated net realized gain (loss) on investments | | | | 349,733 | | | | (37,215 | ) |
| Net unrealized appreciation (depreciation) of investments | | | | 94,313 | | | | (45,698 | ) |
| Net unrealized depreciation of swap contracts | | | | (40,927,371 | ) | | | (853,414 | ) |
| NET ASSETS | | | $ | 371,015,812 | | | $ | 10,807,989 | |
| | | | | | | | | | |
| Class A Shares | | | | | | | | | |
| Net assets | | | $ | 195,045,630 | | | $ | 3,652,927 | |
| Shares issued and outstanding (unlimited shares authorized, no par value) | | | | 23,542,694 | | | | 476,020 | |
| Net asset value, redemption, and minimum offering price per share (a)(b) | | | $ | 8.28 | | | $ | 7.67 | |
| Maximum offering price per share ($8.28/0.9425) ($7.67/0.9425) (c) | | | $ | 8.79 | | | $ | 8.14 | |
| | | | | | | | | | |
| Class C Shares | | | | | | | | | |
| Net assets | | | $ | 73,691,176 | | | $ | 1,653,015 | |
| Shares issued and outstanding (unlimited shares authorized, no par value) | | | | 9,080,118 | | | | 219,216 | |
| Net asset value, redemption, and offering price per share (a)(b) | | | $ | 8.12 | | | $ | 7.54 | |
| | | | | | | | | | |
| Class I Shares | | | | | | | | | |
| Net assets | | | $ | 102,279,006 | | | $ | 5,502,047 | |
| Shares issued and outstanding (unlimited shares authorized, no par value) | | | | 12,259,642 | | | | 714,170 | |
| Net asset value, redemption, and offering price per share (b) | | | $ | 8.34 | | | $ | 7.70 | |
| (a) | A 1.00% contingent deferred sales charge may apply to redemptions made within twelve months of purchase.
The contingent deferred sales charge only applies to Class A share purchases of $1 million or more. |
| (b) | Redemptions made within 30 days of purchase may be assessed a redemption fee of 1.00%. |
| (c) | On investments of $25,000 or more, the offering price is reduced. |
The accompanying notes are an integral part of these consolidated financial statements.
| |
LoCorr Long/Short Equity Fund - Statement of Assets & Liabilities | 27 |
| |
Statement of Assets & Liabilities
December 31, 2013
| | | | | | | |
| | | LoCorr Long/Short Equity Fund | |
| | | | | | | |
| Assets | | | | | | |
| Investments, at value (Cost $37,514,871) | | | $ | 41,000,479 | | |
| Cash | | | | 6,026,606 | | |
| Receivable for Fund shares sold | | | | 689,939 | | |
| Receivable for securities sold | | | | 771,509 | | |
| Dividend and interest receivable | | | | 5,281 | | |
| Deposits with broker for securities sold short | | | | 1,365,526 | | |
| Prepaid expenses and other assets | | | | 202 | | |
| Total Assets | | | | 49,859,542 | | |
| | | | | | | |
| Liabilities | | | | | | |
| Securities sold short, at fair value (proceeds $1,482,484) | | | $ | 1,528,510 | | |
| Payable for securities purchased | | | | 6,120,597 | | |
| Payable for Fund shares redeemed | | | | 18,825 | | |
| Accrued management fees | | | | 54,420 | | |
| Accrued Trustees’ fees | | | | 398 | | |
| Accrued Rule 12b-1 fees | | | | 17,288 | | |
| Accrued expenses and other liabilities | | | | 59,212 | | |
| Total Liabilities | | | | 7,799,250 | | |
| Net Assets | | | $ | 42,060,292 | | |
| | | | | | | |
| Net Assets Consist of: | | | | | | |
| Paid-in capital | | | $ | 38,678,373 | | |
| Accumulated net realized loss on investments | | | | (57,663 | ) | |
| Net unrealized appreciation of investments | | | | 3,485,608 | | |
| Net unrealized depreciation of securities sold short | | | | (46,026 | ) | |
| NET ASSETS | | | $ | 42,060,292 | | |
| | | | | | | |
| Class A Shares | | | | | | |
| Net assets | | | $ | 21,256,054 | | |
| Shares issued and outstanding (unlimited shares authorized, no par value) | | | | 1,851,635 | | |
| Net asset value, redemption, and minimum offering price per share (a)(b) | | | $ | 11.48 | | |
| Maximum offering price per share ($11.48/0.9425) (c) | | | $ | 12.18 | | |
| | | | | | | |
| Class C Shares | | | | | | |
| Net assets | | | $ | 8,442,769 | | |
| Shares issued and outstanding (unlimited shares authorized, no par value) | | | | 739,277 | | |
| Net asset value, redemption, and offering price per share (a)(b) | | | $ | 11.42 | | |
| | | | | | | |
| Class I Shares | | | | | | |
| Net assets | | | $ | 12,361,469 | | |
| Shares issued and outstanding (unlimited shares authorized, no par value) | | | | 1,075,152 | | |
| Net asset value, redemption, and offering price per share (b) | | | $ | 11.50 | | |
| (a) | A 1.00% contingent deferred sales charge may apply to redemptions made within twelve months of purchase.
The contingent deferred sales charge only applies to Class A share purchases of $1 million or more. |
| (b) | Redemptions made within 30 days of purchase may be assessed a redemption fee of 1.00%. |
| (c) | On investments of $25,000 or more, the offering price is reduced. |
The accompanying notes are an integral part of these financial statements.
| |
28 | LoCorr Managed Futures Strategy Fund and LoCorr Long/Short Commodities Strategy Fund - Consolidated Statements of Operations |
| |
Consolidated Statements of Operations
Year Ended December 31, 2013
| | | | | | | | | | |
| | | LoCorr Managed Futures Strategy Fund | LoCorr Long/Short Commodities Strategy Fund |
| | | | | | | | | | |
| Investment Income | | | | | | | | | |
Interest income (a) | | | $ | 5,237,095 | | | $ | 82,679 | |
| Total Investment Income | | | | 5,237,095 | | | | 82,679 | |
| | | | | | | | | | |
| Expenses | | | | | | | | | |
| Management fees (Note 5) | | | | 6,473,306 | | | | 171,188 | |
| Fund administration fees | | | | 169,174 | | | | 44,003 | |
| Fund accounting fees | | | | 202,434 | | | | 80,150 | |
| Trustees’ fees | | | | 60,290 | | | | 2,934 | |
| Transfer agent fees and expenses | | | | 656,218 | | | | 51,573 | |
| Custodian fees | | | | 18,988 | | | | 8,545 | |
| Registration expenses | | | | 99,149 | | | | 47,816 | |
| Rule 12b-1 fees - Class A (Note 5) | | | | 533,061 | | | | 8,683 | |
| Rule 12b-1 fees - Class C (Note 5) | | | | 828,359 | | | | 16,583 | |
| Insurance expenses | | | | 31,526 | | | | 698 | |
| Legal and audit fees | | | | 85,938 | | | | 36,987 | |
| Printing and mailing expenses | | | | 111,692 | | | | 2,741 | |
| Other expenses | | | | 1,584 | | | | 1,657 | |
| Total expenses before reimbursement | | | | 9,271,719 | | | | 473,558 | |
| Reimbursement from Adviser (Note 5) | | | | - | | | | (225,747 | ) |
| Net Expenses | | | | 9,271,719 | | | | 247,811 | |
| Net Investment Loss | | | | (4,034,624 | ) | | | (165,132 | ) |
| | | | | | | | | | |
| Realized and Unrealized Gain (Loss) on Investments and Swap Contracts | | | | | | | | | |
| Net realized gain (loss) on investments | | | | 713,810 | | | | (26,218 | ) |
| Net realized gain (loss) on swap contracts | | | | 15,406,159 | | | | (36,778 | ) |
| Net change in unrealized depreciation of investments | | | | (3,658,966 | ) | | | (100,945 | ) |
| Net change in unrealized depreciation of swap contracts | | | | (39,102,171 | ) | | | (687,070 | ) |
| Net realized and unrealized loss on investments and swap contracts | | | | (26,641,168 | ) | | | (851,011 | ) |
| Net Decrease in Net Assets From Operations | | | $ | (30,675,792 | ) | | $ | (1,016,143 | ) |
| (a) | Net of foreign tax withheld of $93 and $0, respectively. |
The accompanying notes are an integral part of these consolidated financial statements.
| |
LoCorr Long/Short Equity Fund - Statement of Operations | 29 |
| |
Statement of Operations
Period from May 10, 2013(a) through December 31, 2013
| | | | | | |
| | | LoCorr Long/Short Equity Fund |
| | | | | | |
| Investment Income | | | | | |
| Dividend income | | | $ | 111,041 | |
| Interest income | | | | 137 | |
| Total Investment Income | | | | 111,178 | |
| | | | | | |
| Expenses | | | | | |
| Management fees (Note 5) | | | | 192,301 | |
| Fund administration fees | | | | 27,391 | |
| Fund accounting fees | | | | 28,156 | |
| Trustees’ fees | | | | 1,250 | |
| Transfer agent fees and expenses | | | | 39,092 | |
| Custodian fees | | | | 8,481 | |
| Registration expenses | | | | 20,944 | |
| Rule 12b-1 fees - Class A (Note 5) | | | | 9,282 | |
| Rule 12b-1 fees - Class C (Note 5) | | | | 13,715 | |
| Insurance expenses | | | | 675 | |
| Legal and audit fees | | | | 46,560 | |
| Printing and mailing expenses | | | | 1,890 | |
| Dividend and interest expense on securities sold short (See Note 2) | | | | 8,809 | |
| Other expenses | | | | 1,481 | |
| Total expenses before reimbursement | | | | 400,027 | |
| Reimbursement from Adviser (Note 5) | | | | (140,599 | ) |
| Net Expenses | | | | 259,428 | |
| Net Investment Loss | | | | (148,250 | ) |
| | | | | | |
| Realized and Unrealized Gain (Loss) on Investments and Securities Sold Short | | | | | |
| Net realized gain on investments | | | | 198,736 | |
| Net realized loss on securities sold short | | | | (108,149 | ) |
| Net change in unrealized appreciation of investments | | | | 3,485,608 | |
| Net change in unrealized depreciation of securities sold short | | | | (46,026 | ) |
| Net realized and unrealized gain on investments and securities sold short | | | | 3,530,169 | |
| Net Increase in Net Assets From Operations | | | $ | 3,381,919 | |
| (a) | Commencement of operations. |
The accompanying notes are an integral part of these financial statements.
| |
30 | LoCorr Managed Futures Strategy Fund - Consolidated Statements of Changes in Net Assets |
| |
LoCorr Managed Futures Strategy Fund
Consolidated Statements of Changes in Net Assets
| | | | | | | | | | | | |
| | | Year Ended December 31, 2013 | | Year Ended December 31, 2012 |
| | | | | | | | | | | | |
| Operations | | | | | | | | | | | |
| Net investment loss | | | $ | (4,034,624 | ) | | | $ | (8,515,283 | ) | |
| Net realized gain (loss) on investments, swap contracts, futures and forward currency contracts | | | | 16,119,969 | | | | | (8,992,411 | ) | |
| Net change in unrealized depreciation of investments, swap contracts, futures and forward currency contracts | | | | (42,761,137 | ) | | | | (250,715 | ) | |
| Decrease in Net Assets From Operations | | | | (30,675,792 | ) | | | | (17,758,409 | ) | |
| | | | | | | | | | | | |
| Distributions to Shareholders From | | | | | | | | | | | |
| Net realized gain on investments - Class A | | | | (118,249 | ) | | | | (41,404 | ) | |
| Net realized gain on investments - Class C | | | | (46,075 | ) | | | | (17,692 | ) | |
| Net realized gain on investments - Class I | | | | (62,047 | ) | | | | (31,260 | ) | |
| Total Distributions to Shareholders | | | | (226,371 | ) | | | | (90,356 | ) | |
| | | | | | | | | | | | |
| Capital Transactions (Note 6) (a) | | | | | | | | | | | |
| Proceeds from shares sold | | | | 226,031,105 | | | | | 299,150,001 | | |
| Reinvestment of distributions | | | | 199,893 | | | | | 76,672 | | |
| Cost of shares redeemed | | | | (221,857,981 | | | | | (85,081,010 | ) | |
| Redemption fees | | | | 12,946 | | | | | 13,286 | | |
| Increase in Net Assets From Capital Transactions | | | | 4,385,963 | | | | | 214,158,949 | | |
| | | | | | | | | | | | |
| Capital Transactions - Non-Controlling Interest | | | | | | | | | | | |
| Proceeds from Contributions | | | | - | | | | | 1,873,184 | | |
| Withdrawals | | | | - | | | | | (378,438 | ) | |
| Increase in Net Assets From Capital Transactions - Non-Controlling Interest | | | | - | | | | | 1,494,746 | | |
| | | | | | | | | | | | |
| Total Increase (Decrease) in Net Assets | | | | (26,516,200 | ) | | | | 197,804,930 | | |
| | | | | | | | | | | | |
| Deconsolidation of Partnership - Elimination of non-controlling interest (Note 1) | | | | - | | | | | (3,235,738 | ) | |
| | | | | | | | | | | | |
| Net Assets | | | | | | | | | | | |
| Beginning of year | | | | 397,532,012 | | | | | 202,962,820 | | |
| End of year (including accumulated net investment loss of $0 and $0, respectively) | | | $ | 371,015,812 | | | | $ | 397,532,012 | | |
| (a) | Capital transactions of Controlling Interest for the year ended December 31, 2012. |
The accompanying notes are an integral part of these consolidated financial statements.
| |
LoCorr Long/Short Commodities Strategy Fund - Consolidated Statements of Changes in Net Assets | 31 |
| |
LoCorr Long/Short Commodities Strategy Fund
Consolidated Statements of Changes in Net Assets
| | | | | | | | | | | | |
| | | Year Ended December 31, 2013 | | Year Ended December 31, 2012 |
| | | | | | | | | | | | |
| Operations | | | | | | | | | | | |
| Net investment loss | | | $ | (165,132 | ) | | | $ | (97,535 | ) | |
| Net realized loss on investments and swap contracts | | | | (62,996 | ) | | | | (1,163,156 | ) | |
| Net change in unrealized depreciation of investments and swap contracts | | | | (788,015 | ) | | | | (111,097 | ) | |
| Decrease in Net Assets From Operations | | | | (1,016,143 | ) | | | | (1,371,788 | ) | |
| | | | | | | | | | | | |
| Capital Transactions (Note 6) | | | | | | | | | | | |
| Proceeds from shares sold | | | | 6,725,757 | | | | | 14,516,303 | | |
| Cost of shares redeemed | | | | (6,091,987 | ) | | | | (1,954,698 | ) | |
| Redemption fees | | | | 96 | | | | | 449 | | |
| Increase in Net Assets From Capital Transactions | | | | 633,866 | | | | | 12,562,054 | | |
| | | | | | | | | | | | |
| Total Increase (Decrease) in Net Assets | | | | (382,277 | ) | | | | 11,190,266 | | |
| | | | | | | | | | | | |
| Net Assets | | | | | | | | | | | |
| Beginning of year | | | | 11,190,266 | | | | | - | | |
End of year (including accumulated net investment loss of $0 and $0, respectively) | | | $ | 10,807,989 | | | | $ | 11,190,266 | | |
The accompanying notes are an integral part of these consolidated financial statements.
| |
32 | LoCorr Long/Short Equity Fund - Statement of Changes in Net Assets |
| |
LoCorr Long/Short Equity Fund
Statement of Changes in Net Assets
| | | | | | | |
| | | Period from May 10, 2013(a) through December 31, 2013 |
| | | | | | | |
| Operations | | | | | | |
| Net investment loss | | | $ | (148,250 | ) | |
| Net realized gain on investments and securities sold short | | | | 90,587 | | |
| Net change in unrealized appreciation of investments and securities sold short | | | | 3,439,582 | | |
| Increase in Net Assets From Operations | | | | 3,381,919 | | |
| | | | | | | |
| Capital Transactions (Note 6) | | | | | | |
| Proceeds from shares sold | | | | 39,645,814 | | |
| Cost of shares redeemed | | | | (968,088 | ) | |
| Redemption fees | | | | 647 | | |
| Increase in Net Assets From Capital Transactions | | | | 38,678,373 | | |
| | | | | | | |
| Total Increase in Net Assets | | | | 42,060,292 | | |
| | | | | | | |
| Net Assets | | | | | | |
| Beginning of period | | | | - | | |
| End of period (including accumulated net investment loss of $0) | | | $ | 42,060,292 | | |
| (a) | Commencement of operations. |
The accompanying notes are an integral part of these financial statements.
| |
LoCorr Managed Futures Strategy Fund - Consolidated Financial Highlights - Class A | 33 |
| |
LoCorr Managed Futures Strategy Fund - Class A
Consolidated Financial Highlights
Selected Data and Ratios (for a share outstanding throughout the period) do not include non-controlling interest
| | | Year Ended December 31, 2013 | | Year Ended December 31, 20123 | | Period from March 22, 20111 through December 31, 20112, 3 |
| | | | | | | | | | | | | | | | | | | |
| Per Share | | | | | | | | | | | | | | | | | | |
| Net asset value, beginning of period | | | $ | 8.77 | | | | | $ | 9.33 | | | | | $ | 10.00 | | |
| | | | | | | | | | | | | | | | | | | |
| Income (loss) from investment operations: | | | | | | | | | | | | | | | | | | |
Net investment income (loss)4 | | | | (0.07 | ) | | | | | (0.24 | ) | | | | | (0.22 | ) | |
| Net realized and unrealized gain (loss) | | | | (0.41 | ) | | | | | (0.32 | ) | | | | | (0.45 | ) | |
| Total from Investment Operations | | | | (0.48 | ) | | | | | (0.56 | ) | | | | | (0.67 | ) | |
| | | | | | | | | | | | | | | | | | | |
| Distributions to shareholders from: | | | | | | | | | | | | | | | | | | |
| Net investment income | | | | - | | | | | | - | | | | | | - | | |
| Net realized gains on investments sold | | | | (0.01 | ) | | | | | (0.00 | )5 | | | | | - | | |
| Total Distributions | | | | (0.01 | ) | | | | | (0.00 | ) | | | | | - | | |
| | | | | | | | | | | | | | | | | | | |
Redemption Fees5 | | | | - | | | | | | - | | | | | | - | | |
| | | | | | | | | | | | | | | | | | | |
| Net Asset Value, End of Period | | | $ | 8.28 | | | | | $ | 8.77 | | | | | $ | 9.33 | | |
| | | | | | | | | | | | | | | | | | | |
Total Investment Return6 | | | | (5.53 | )% | | | | | (5.98 | )% | | | | | (6.70 | )% | |
| | | | | | | | | | | | | | | | | | | |
| Net Assets, End of Period, in Thousands | | | $ | 195,046 | | | | | $ | 182,457 | | | | | $ | 71,532 | | |
| | | | | | | | | | | | | | | | | | | |
| Ratios/Supplemental Data: | | | | | | | | | | | | | | | | | | |
| Ratio of expenses to average net assets: | | | | | | | | | | | | | | | | | | |
| Before expense reimbursement or recovery | | | | 2.08 | %7 | | | | | 3.95 | %7 | | | | | 4.15 | % | |
| After expense reimbursement or recovery | | | | 2.08 | %7 | | | | | 4.00 | %7 | | | | | 3.93 | % | |
| Ratio of net investment income (loss) to average net assets: | | | | | | | | | | | | | | | | | | |
| Before expense reimbursement or recovery | | | | (0.87 | )%7 | | | | | (2.60 | )%7 | | | | | (3.18 | )% | |
| After expense reimbursement or recovery | | | | (0.87 | )%7 | | | | | (2.65 | )%7 | | | | | (2.96 | )% | |
| | | | | | | | | | | | | | | | | | | |
Portfolio turnover rate8 | | | | 46 | % | | | | | 46 | % | | | | | 18 | % | |
| 1 | Commencement of share class operations. |
| 2 | All ratios have been annualized except total investment return and portfolio turnover. |
| 3 | Selected data and ratios (for a share outstanding throughout the period) do not include non-controlling interest. |
| 4 | Net investment income (loss) per share is based on average shares outstanding. |
| 5 | Amount represents less than $0.005 per share. |
| 6 | Total investment return excludes the effect of applicable sales charges. |
| 7 | Ratios do not include the income and expenses of the CTAs included in the swap. |
| 8 | Portfolio turnover rate is calculated on the basis of the Fund as a whole without distinguishing between classes of shares issued. |
The accompanying notes are an integral part of these consolidated financial statements.
| |
34 | LoCorr Managed Futures Strategy Fund - Consolidated Financial Highlights - Class C |
| |
LoCorr Managed Futures Strategy Fund - Class C
Consolidated Financial Highlights
Selected Data and Ratios (for a share outstanding throughout the period) do not include non-controlling interest
| | | | | | | | | | | | | | | | | | | |
| | | Year Ended December 31, 2013 | | Year Ended December 31, 20123 | | Period from March 24, 20111 through December 31, 20112, 3 |
| | | | | | | | | | | | | | | | | | | |
| Per Share | | | | | | | | | | | | | | | | | | |
| Net asset value, beginning of period | | | $ | 8.65 | | | | | $ | 9.28 | | | | | $ | 10.00 | | |
| | | | | | | | | | | | | | | | | | | |
| Income (loss) from investment operations: | | | | | | | | | | | | | | | | | | |
Net investment income (loss)4 | | | | (0.14 | ) | | | | | (0.30 | ) | | | | | (0.27 | ) | |
| Net realized and unrealized gain (loss) | | | | (0.38 | ) | | | | | (0.33 | ) | | | | | (0.45 | ) | |
| Total from Investment Operations | | | | (0.52 | ) | | | | | (0.63 | ) | | | | | (0.72 | ) | |
| | | | | | | | | | | | | | | | | | | |
| Distributions to shareholders from: | | | | | | | | | | | | | | | | | | |
| Net investment income | | | | - | | | | | | - | | | | | | - | | |
| Net realized gains on investments sold | | | | (0.01 | ) | | | | | (0.00 | )5 | | | | | - | | |
| Total Distributions | | | | (0.01 | ) | | | | | (0.00 | ) | | | | | - | | |
| | | | | | | | | | | | | | | | | | | |
Redemption Fees5 | | | | - | | | | | | - | | | | | | - | | |
| | | | | | | | | | | | | | | | | | | |
| Net Asset Value, End of Period | | | $ | 8.12 | | | | | $ | 8.65 | | | | | $ | 9.28 | | |
| | | | | | | | | | | | | | | | | | | |
Total Investment Return6 | | | | (6.07 | )% | | | | | (6.77 | )% | | | | | (7.20 | )% | |
| | | | | | | | | | | | | | | | | | | |
| Net Assets, End of Period, in Thousands | | | $ | 73,691 | | | | | $ | 76,979 | | | | | $ | 38,055 | | |
| | | | | | | | | | | | | | | | | | | |
| Ratios/Supplemental Data: | | | | | | | | | | | | | | | | | | |
| Ratio of expenses to average net assets: | | | | | | | | | | | | | | | | | | |
| Before expense reimbursement or recovery | | | | 2.83 | %7 | | | | | 4.70 | %7 | | | | | 4.89 | % | |
| After expense reimbursement or recovery | | | | 2.83 | %7 | | | | | 4.75 | %7 | | | | | 4.68 | % | |
| Ratio of net investment income (loss) to average net assets: | | | | | | | | | | | | | | | | | | |
| Before expense reimbursement or recovery | | | | (1.62 | )%7 | | | | | (3.35 | )%7 | | | | | (3.92 | )% | |
| After expense reimbursement or recovery | | | | (1.62 | )%7 | | | | | (3.40 | )%7 | | | | | (3.71 | )% | |
| | | | | | | | | | | | | | | | | | | |
Portfolio turnover rate8 | | | | 46 | % | | | | | 46 | % | | | | | 18 | % | |
| 1 | Commencement of share class operations. |
| 2 | All ratios have been annualized except total investment return and portfolio turnover. |
| 3 | Selected data and ratios (for a share outstanding throughout the period) do not include non-controlling interest. |
| 4 | Net investment income (loss) per share is based on average shares outstanding. |
| 5 | Amount represents less than $0.005 per share. |
| 6 | Total investment return excludes the effect of applicable sales charges. |
| 7 | Ratios do not include the income and expenses of the CTAs included in the swap. |
| 8 | Portfolio turnover rate is calculated on the basis of the Fund as a whole without distinguishing between classes of shares issued. |
The accompanying notes are an integral part of these consolidated financial statements.
| |
LoCorr Managed Futures Strategy Fund - Consolidated Financial Highlights - Class I | 35 |
| |
LoCorr Managed Futures Strategy Fund - Class I
Consolidated Financial Highlights
Selected Data and Ratios (for a share outstanding throughout the period) do not include non-controlling interest
| | | | | | | | | | | | | | | | | | | |
| | | Year Ended December 31, 2013 | | Year Ended December 31, 20123 | | Period from March 24, 20111 through December 31, 20112, 3 |
| | | | | | | | | | | | | | | | | | | |
| Per Share | | | | | | | | | | | | | | | | | | |
| Net asset value, beginning of period | | | $ | 8.81 | | | | | $ | 9.35 | | | | | $ | 10.00 | | |
| | | | | | | | | | | | | | | | | | | |
| Income (loss) from investment operations: | | | | | | | | | | | | | | | | | | |
Net investment income (loss)4 | | | | (0.05 | ) | | | | | (0.22 | ) | | | | | (0.20 | ) | |
| Net realized and unrealized gain (loss) | | | | (0.41 | ) | | | | | (0.32 | ) | | | | | (0.45 | ) | |
| Total from Investment Operations | | | | (0.46 | ) | | | | | (0.54 | ) | | | | | (0.65 | ) | |
| | | | | | | | | | | | | | | | | | | |
| Distributions to shareholders from: | | | | | | | | | | | | | | | | | | |
| Net investment income | | | | - | | | | | | - | | | | | | - | | |
| Net realized gains on investments sold | | | | (0.01 | ) | | | | | (0.00 | )5 | | | | | - | | |
| Total Distributions | | | | (0.01 | ) | | | | | (0.00 | ) | | | | | - | | |
| | | | | | | | | | | | | | | | | | | |
Redemption Fees5 | | | | - | | | | | | - | | | | | | - | | |
| | | | | | | | | | | | | | | | | | | |
| Net Asset Value, End of Period | | | $ | 8.34 | | | | | $ | 8.81 | | | | | $ | 9.35 | | |
| | | | | | | | | | | | | | | | | | | |
| Total Investment Return | | | | (5.28 | )% | | | | | (5.75 | )% | | | | | (6.50 | )% | |
| | | | | | | | | | | | | | | | | | | |
| Net Assets, End of Period, in Thousands | | | $ | 102,279 | | | | | $ | 138,096 | | | | | $ | 91,161 | | |
| | | | | | | | | | | | | | | | | | | |
| Ratios/Supplemental Data: | | | | | | | | | | | | | | | | | | |
| Ratio of expenses to average net assets: | | | | | | | | | | | | | | | | | | |
| Before expense reimbursement or recovery | | | | 1.83 | %6 | | | | | 3.70 | %6 | | | | | 3.89 | % | |
| After expense reimbursement or recovery | | | | 1.83 | %6 | | | | | 3.75 | %6 | | | | | 3.68 | % | |
| Ratio of net investment income (loss) to average net assets: | | | | | | | | | | | | | | | | | | |
| Before expense reimbursement or recovery | | | | (0.62 | )%6 | | | | | (2.35 | )%6 | | | | | (2.92 | )% | |
| After expense reimbursement or recovery | | | | (0.62 | )%6 | | | | | (2.40 | )%6 | | | | | (2.71 | )% | |
| | | | | | | | | | | | | | | | | | | |
Portfolio turnover rate7 | | | | 46 | % | | | | | 46 | % | | | | | 18 | % | |
| 1 | Commencement of share class operations. |
| 2 | All ratios have been annualized except total investment return and portfolio turnover. |
| 3 | Selected data and ratios (for a share outstanding throughout the period) do not include non-controlling interest. |
| 4 | Net investment income (loss) per share is based on average shares outstanding. |
| 5 | Amount represents less than $0.005 per share. |
| 6 | Ratios do not include the income and expenses of the CTAs included in the swap. |
| 7 | Portfolio turnover rate is calculated on the basis of the Fund as a whole without distinguishing between classes of shares issued. |
The accompanying notes are an integral part of these consolidated financial statements.
| |
36 | LoCorr Long/Short Commodities Strategy Fund - Consolidated Financial Highlights - Class A |
| |
LoCorr Long/Short Commodities Strategy Fund - Class A
Consolidated Financial Highlights
Selected Data and Ratios (for a share outstanding throughout the period)
| | | | | | | | | | | | |
| | | Year Ended | | Year Ended | |
| | | December 31, 2013 | | December 31, 2012 | |
| | | | | | | | | | | | |
| Per Share | | | | | | | | | | | |
| Net asset value, beginning of period | | | $ | 8.37 | | | | $ | 10.00 | | |
| | | | | | | | | | | | |
| Income (loss) from investment operations: | | | | | | | | | | | |
Net investment income (loss)1 | | | | (0.12 | ) | | | | (0.17 | ) | |
| Net realized and unrealized gain (loss) | | | | (0.58 | ) | | | | (1.46 | ) | |
| Total from Investment Operations | | | | (0.70 | ) | | | | (1.63 | ) | |
| | | | | | | | | | | | |
Redemption Fees2 | | | | - | | | | | - | | |
| | | | | | | | | | | | |
| Net Asset Value, End of Period | | | $ | 7.67 | | | | $ | 8.37 | | |
| | | | | | | | | | | | |
Total Investment Return3 | | | | (8.36 | )% | | | | (16.30 | )% | |
| | | | | | | | | | | | |
| Net Assets, End of Period, in Thousands | | | $ | 3,653 | | | | $ | 3,213 | | |
| | | | | | | | | | | | |
Ratios/Supplemental Data:4 | | | | | | | | | | | |
| Ratio of expenses to average net assets: | | | | | | | | | | | |
| Before expense reimbursement or recovery | | | | 4.18 | % | | | | 6.12 | % | |
| After expense reimbursement or recovery | | | | 2.20 | % | | | | 2.20 | % | |
| Ratio of net investment income (loss) to average net assets: | | | | | | | | | | | |
| Before expense reimbursement or recovery | | | | (3.46 | )% | | | | (5.82 | )% | |
| After expense reimbursement or recovery | | | | (1.48 | )% | | | | (1.90 | )% | |
| | | | | | | | | | | | |
Portfolio turnover rate5 | | | | 59 | % | | | | 60 | % | |
1 Net investment income (loss) per share is based on average shares outstanding.
2 Amount represents less than $0.005 per share.
3 Total return excludes the effect of applicable sales charges.
4 Ratios do not include the income and expenses of the CTAs included in the swap.
5 Portfolio turnover rate is calculated on the basis of the Fund as a whole without distinguishing between classes of shares issued.
The accompanying notes are an integral part of these consolidated financial statements.
| |
LoCorr Long/Short Commodities Strategy Fund - Consolidated Financial Highlights - Class C | 37 |
| |
LoCorr Long/Short Commodities Strategy Fund - Class C
Consolidated Financial Highlights
Selected Data and Ratios (for a share outstanding throughout the period)
| | | | | | | | | | | | |
| | | Year Ended | | Year Ended |
| | | December 31, 2013 | | December 31, 2012 |
| | | | | | | | | | | | |
| Per Share | | | | | | | | | | | |
| Net asset value, beginning of period | | | $ | 8.29 | | | | $ | 10.00 | | |
| | | | | | | | | | | | |
| Income (loss) from investment operations: | | | | | | | | | | | |
Net investment income (loss)1 | | | | (0.17 | ) | | | | (0.24 | ) | |
| Net realized and unrealized gain (loss) | | | | (0.58 | ) | | | | (1.47 | ) | |
| Total from Investment Operations | | | | (0.75 | ) | | | | (1.71 | ) | |
| | | | | | | | | | | | |
| Redemption Fees | | | | - | | | | | - | 2 | |
| | | | | | | | | | | | |
| Net Asset Value, End of Period | | | $ | 7.54 | | | | $ | 8.29 | | |
| | | | | | | | | | | | |
Total Investment Return3 | | | | (9.05 | )% | | | | (17.10 | )% | |
| | | | | | | | | | | | |
| Net Assets, End of Period, in Thousands | | | $ | 1,653 | | | | $ | 1,605 | | |
| | | | | | | | | | | | |
Ratios/Supplemental Data:4 | | | | | | | | | | | |
| Ratio of expenses to average net assets: | | | | | | | | | | | |
| Before expense reimbursement or recovery | | | | 4.93 | % | | | | 6.87 | % | |
| After expense reimbursement or recovery | | | | 2.95 | % | | | | 2.95 | % | |
| Ratio of net investment income (loss) to average net assets: | | | | | | | | | | | |
| Before expense reimbursement or recovery | | | | (4.21 | )% | | | | (6.57 | )% | |
| After expense reimbursement or recovery | | | | (2.23 | )% | | | | (2.65 | )% | |
| | | | | | | | | | | | |
Portfolio turnover rate5 | | | | 59 | % | | | | 60 | % | |
1 Net investment income (loss) per share is based on average shares outstanding.
2 Amount represents less than $0.005 per share.
3 Total return excludes the effect of applicable sales charges.
4 Ratios do not include the income and expenses of the CTAs included in the swap.
5 Portfolio turnover rate is calculated on the basis of the Fund as a whole without distinguishing between classes of shares issued.
The accompanying notes are an integral part of these consolidated financial statements.
| |
38 | LoCorr Long/Short Commodities Strategy Fund - Consolidated Financial Highlights - Class I |
| |
LoCorr Long/Short Commodities Strategy Fund - Class I
Consolidated Financial Highlights
Selected Data and Ratios (for a share outstanding throughout the period)
| | | | | | | | | | | | |
| | | Year Ended | | Year Ended | |
| | | December 31, 2013 | | December 31, 2012 | |
| | | | | | | | | | | | |
| Per Share | | | | | | | | | | | |
| Net asset value, beginning of period | | | $ | 8.38 | | | | $ | 10.00 | | |
| | | | | | | | | | | | |
| Income (loss) from investment operations: | | | | | | | | | | | |
Net investment income (loss)1 | | | | (0.10 | ) | | | | (0.15 | ) | |
| Net realized and unrealized gain (loss) | | | | (0.58 | ) | | | | (1.47 | ) | |
| Total from Investment Operations | | | | (0.68 | ) | | | | (1.62 | ) | |
| | | | | | | | | | | | |
Redemption Fees2 | | | | - | | | | | - | | |
| | | | | | | | | | | | |
| Net Asset Value, End of Period | | | $ | 7.70 | | | | $ | 8.38 | | |
| | | | | | | | | | | | |
| Total Investment Return | | | | (8.11 | )% | | | | (16.20 | )% | |
| | | | | | | | | | | | |
| Net Assets, End of Period, in Thousands | | | $ | 5,502 | | | | $ | 6,373 | | |
| | | | | | | | | | | | |
Ratios/Supplemental Data:3 | | | | | | | | | | | |
| Ratio of expenses to average net assets: | | | | | | | | | | | |
| Before expense reimbursement or recovery | | | | 3.93 | % | | | | 5.87 | % | |
| After expense reimbursement or recovery | | | | 1.95 | % | | | | 1.95 | % | |
| Ratio of net investment income (loss) to average net assets: | | | | | | | | | | | |
| Before expense reimbursement or recovery | | | | (3.21 | )% | | | | (5.57 | )% | |
| After expense reimbursement or recovery | | | | (1.23 | )% | | | | (1.65 | )% | |
| | | | | | | | | | | | |
Portfolio turnover rate4 | | | | 59 | % | | | | 60 | % | |
1 Net investment income (loss) per share is based on average shares outstanding.
2 Amount represents less than $0.005 per share.
3 Ratios do not include the income and expenses of the CTAs included in the swap.
4 Portfolio turnover rate is calculated on the basis of the Fund as a whole without distinguishing between classes of shares issued.
The accompanying notes are an integral part of these consolidated financial statements.
| |
LoCorr Long/Short Equity Fund - Financial Highlights - Class A | 39 |
| |
LoCorr Long/Short Equity Fund - Class A
Financial Highlights
Selected Data and Ratios (for a share outstanding throughout the period)
| | | | | | | |
| | | Period from May 10, 20131 through December 31, 20132 | |
| | | | | | | |
| Per Share | | | | | | |
| Net asset value, beginning of period | | | $ | 10.00 | | |
| | | | | | | |
| Income (loss) from investment operations: | | | | | | |
Net investment income (loss)3 | | | | (0.13 | ) | |
| Net realized and unrealized gain (loss) | | | | 1.61 | | |
| Total from Investment Operations | | | | 1.48 | | |
| | | | | | | |
Redemption Fees4 | | | | - | | |
| | | | | | | |
| Net Asset Value, End of Period | | | $ | 11.48 | | |
| | | | | | | |
Total Investment Return5 | | | | 14.80 | % | |
| | | | | | | |
| Net Assets, End of Period, in Thousands | | | $ | 21,256 | | |
| | | | | | | |
| Ratios/Supplemental Data: | | | | | | |
| Ratio of expenses to average net assets: | | | | | | |
| Before expense reimbursement or recovery | | | | 5.05 | % | |
| After expense reimbursement or recovery | | | | 3.26 | % | |
| Ratio of expenses to average net assets (excluding dividend and interest expense on securities sold short): | | | | | | |
| Before expense reimbursement or recovery | | | | 4.94 | % | |
| After expense reimbursement or recovery | | | | 3.15 | % | |
| Ratio of net investment income (loss) to average net assets: | | | | | | |
| Before expense reimbursement or recovery | | | | (3.64 | )% | |
| After expense reimbursement or recovery | | | | (1.85 | )% | |
| | | | | | | |
Portfolio turnover rate6 | | | | 66 | % | |
1 Commencement of operations.
2 All ratios have been annualized except total investment return and portfolio turnover.
3 Net investment income (loss) per share is based on average shares outstanding.
4 Amount represents less than $0.005 per share.
5 Total return excludes the effect of applicable sales charges.
6 Portfolio turnover rate is calculated on the basis of the Fund as a whole without distinguishing between classes of shares issued.
The portfolio turnover rate excludes purchases and sales of short positions as the Adviser does not intend to hold the short positions for more than one year.
The accompanying notes are an integral part of these financial statements.
| |
40 | LoCorr Long/Short Equity Fund - Financial Highlights - Class C |
| |
LoCorr Long/Short Equity Fund - Class C
Financial Highlights
Selected Data and Ratios (for a share outstanding throughout the period)
| | | | | | | |
| | | Period from May 10, 20131 through December 31, 20132 | |
| | | | | | | |
| Per Share | | | | | | |
| Net asset value, beginning of period | | | $ | 10.00 | | |
| | | | | | | |
| Income (loss) from investment operations: | | | | | | |
Net investment income (loss)3 | | | | (0.18 | ) | |
| Net realized and unrealized gain (loss) | | | | 1.60 | | |
| Total from Investment Operations | | | | 1.42 | | |
| | | | | | | |
| Redemption Fees | | | | - | | |
| | | | | | | |
| Net Asset Value, End of Period | | | $ | 11.42 | | |
| | | | | | | |
Total Investment Return4 | | | | 14.20 | % | |
| | | | | | | |
| Net Assets, End of Period, in Thousands | | | $ | 8,443 | | |
| | | | | | | |
| Ratios/Supplemental Data: | | | | | | |
| Ratio of expenses to average net assets: | | | | | | |
| Before expense reimbursement or recovery | | | | 5.80 | % | |
| After expense reimbursement or recovery | | | | 4.01 | % | |
| Ratio of expenses to average net assets (excluding dividend and interest expense on securities sold short): | | | | | | |
| Before expense reimbursement or recovery | | | | 5.69 | % | |
| After expense reimbursement or recovery | | | | 3.90 | % | |
| Ratio of net investment income (loss) to average net assets: | | | | | | |
| Before expense reimbursement or recovery | | | | (4.39 | )% | |
| After expense reimbursement or recovery | | | | (2.60 | )% | |
| | | | | | | |
Portfolio turnover rate5 | | | | 66 | % | |
1 Commencement of operations.
2 All ratios have been annualized except total investment return and portfolio turnover.
3 Net investment income (loss) per share is based on average shares outstanding.
4 Total return excludes the effect of applicable sales charges.
5 Portfolio turnover rate is calculated on the basis of the Fund as a whole without distinguishing between classes of shares issued.
The portfolio turnover rate excludes purchases and sales of short positions as the Adviser does not intend to hold the short positions for more than one year.
The accompanying notes are an integral part of these financial statements.
| |
LoCorr Long/Short Equity Fund - Financial Highlights - Class I | 41 |
| |
LoCorr Long/Short Equity Fund - Class I
Financial Highlights
Selected Data and Ratios (for a share outstanding throughout the period)
| | | | | | | |
| | | Period from May 10, 20131 | |
| | | through | |
| | | December 31, 20132 | |
| | | | | | | |
| Per Share | | | | | | |
| Net asset value, beginning of period | | | $ | 10.00 | | |
| | | | | | | |
| Income (loss) from investment operations: | | | | | | |
Net investment income (loss)3 | | | | (0.11 | ) | |
| Net realized and unrealized gain (loss) | | | | 1.61 | | |
| Total from Investment Operations | | | | 1.50 | | |
| | | | | | | |
Redemption Fees4 | | | | - | | |
| | | | | | | |
| Net Asset Value, End of Period | | | $ | 11.50 | | |
| | | | | | | |
| Total Investment Return | | | | 15.00 | % | |
| | | | | | | |
| Net Assets, End of Period, in Thousands | | | $ | 12,361 | | |
| | | | | | | |
| Ratios/Supplemental Data: | | | | | | |
| Ratio of expenses to average net assets: | | | | | | |
| Before expense reimbursement or recovery | | | | 4.80 | % | |
| After expense reimbursement or recovery | | | | 3.01 | % | |
| Ratio of expenses to average net assets (excluding dividend and interest expense on securities sold short): | | | | | | |
| Before expense reimbursement or recovery | | | | 4.69 | % | |
| After expense reimbursement or recovery | | | | 2.90 | % | |
| Ratio of net investment income (loss) to average net assets: | | | | | | |
| Before expense reimbursement or recovery | | | | (3.39 | )% | |
| After expense reimbursement or recovery | | | | (1.60 | )% | |
| | | | | | | |
Portfolio turnover rate5 | | | | 66 | % | |
1 Commencement of operations.
2 All ratios have been annualized except total investment return and portfolio turnover.
3 Net investment income (loss) per share is based on average shares outstanding.
4 Amount represents less than $0.005 per share.
5 Portfolio turnover rate is calculated on the basis of the Fund as a whole without distinguishing between classes of shares issued.
The portfolio turnover rate excludes purchases and sales of short positions as the Adviser does not intend to hold the short positions for more than one year.
The accompanying notes are an integral part of these financial statements.
| | LoCorr Managed Futures Strategy Fund and LoCorr Long/Short Commodities Strategy Fund - Notes to Consolidated Financial Statements LoCorr Long/Short Equity Fund - Notes to Financial Statements |
42 |
| |
LoCorr Investment Trust
Notes
December 31, 2013
1. Organization
LoCorr Investment Trust (the “Trust”), an Ohio business trust, was formed on November 15, 2010 and is a non-diversified, open-end management investment company under the Investment Company Act of 1940, as amended. The LoCorr Managed Futures Strategy Fund, LoCorr Long/Short Commodities Strategy Fund and the LoCorr Long/Short Equity Fund (individually a “Fund” and collectively the “Funds”) are series within the Trust. The LoCorr Managed Futures Strategy Fund’s primary investment objective is capital appreciation in rising and falling equity markets with managing volatility as a secondary objective. The LoCorr Long/Short Commodities Strategy Fund’s primary objective is capital appreciation in rising and falling commodities markets with managing volatility as a secondary objective. The LoCorr Long/Short Equity Fund’s primary investment objective is long-term capital appreciation with reduced volatility compared to traditional broad-based equity market indices as a secondary objective.
In order to achieve their investment objectives, the LoCorr Managed Futures Strategy Fund and the LoCorr Long/Short Commodities Strategy Fund each invest up to 25% of their total assets (measured at the time of purchase) in wholly-owned subsidiaries, LCMFS Fund Limited (“LCMFS”) and LCLSCS Fund Limited (“LCLSCS”), respectively; both companies incorporated under the laws of the Cayman Islands. LCMFS and LCLSCS act as investment vehicles in order to enter into certain investments for the LoCorr Managed Futures Strategy Fund and LoCorr Long/Short Commodity Strategy Fund, respectively, consistent with their investment objectives and policies specified in the Prospectus and Statement of Additional Information. The consolidated financial statements of the LoCorr Managed Futures Strategy Fund and the LoCorr Long/ Short Commodities Strategy Fund each include the investment activity and financial statements of LCMFS and LCLSCS, respectively. The only investment held by LCMFS and LCLSCS as of December 31, 2013 are swap contracts, for which the notional value was $410,769,768 and $11,500,000, respectively, and the unrealized loss was $40,927,371 and $853,414, respectively. In addition, LCMFS and LCLSCS may hold cash and cash equivalents as collateral on the swap contracts. See Note 2.
During the year ended December 31, 2012, LCMFS had a controlling ownership interest in Millburn Diversified Plus L.P. (the “Partnership”), a limited partnership organized on February 14, 2011 under the Delaware Revised Uniform Limited Partnership Act, which commenced operations on March 24, 2011. The Partnership engaged in speculative trading of futures and forward currency contracts. Similarly, LCLSCS had an investment in a partnership during the year ended December 31, 2012, however, based on the ownership percentage held during the year ended December 31, 2012, LCLSCS was not considered to have a controlling interest in that entity. The General Partner of the Partnership was Millburn Ridgefield Corporation (the “General Partner”). LCMFS and LCLSCS had fully redeemed out of their positions held in the partnerships as of December 20, 2012, and as a result, LCMFS no longer consolidated the Partnership, and its assets, liabilities, and related non-controlling interest are no longer included in the LoCorr Managed Futures Strategy Fund’s financial statements. As of December 20, 2012, there was no gain or loss on the redemption and deconsolidation because the investment in the Partnership was carried at fair value on a daily basis by LCMFS.
Because LCMFS had a controlling interest (greater than 50% but less than 100%) in the Partnership for the period January 1, 2012 through December 20, 2012, the financial activity of the Partnership for that period ended December 20, 2012, has also been consolidated with the financial statements of LCMFS. All intercompany balances, revenues, and expenses have been eliminated in consolidation. LoCorr Managed Futures Strategy Fund, LCMFS and the Partnership are collectively referred to as the LoCorr Managed Futures Strategy Fund throughout these consolidated financial statements.
Non-controlling interest is the portion of equity ownership in the Partnership not attributable to the LoCorr Managed Futures Strategy Fund. Non-controlling interest represents additional, non-related partners in the Partnership and was equal to 2.20% of the Partnership’s net assets prior to LCMFS having fully redeemed its holding of the Partnership.
The Funds currently offer three classes of shares, Class A, Class C and Class I shares. Each share class represents an interest in the same assets of the Fund, has the same rights and is identical in all material respects except that (i) Class A shares have a maximum front end sales load of 5.75% and maximum deferred sales charge of 1.00% and Class C shares have a maximum deferred sales charge of 1.00%, (ii) Class A shares have a 12b-1 fee of 0.25% and Class C shares have a 12b-1 fee of 1.00%; (iii) certain other class-specific expenses will be borne solely by the class to which such expenses are attributable and (iv) each class will have exclusive voting rights with respect to matters relating to its own distribution arrangements. All classes are subject to a 1.00% redemption fee on redemptions made within 30 days of the original purchase. The LoCorr Managed Futures Strategy Fund Class A commenced operations on March 22, 2011 and Class C and Class I commenced operations on March 24, 2011. All three classes of the LoCorr Long/Short Commodities Strategy Fund commenced operations on January 1, 2012. All three classes of the LoCorr Long/Short Equity Fund commenced operations on May 10, 2013.
The Funds may issue an unlimited number of shares of beneficial interest, with no par value. All shares of the Funds have equal rights and privileges, except as to class-specific rights and privileges described above.
2. Significant Accounting Policies
Investment Valuation
The Funds follow fair valuation accounting standards which establish a definition of fair value and set out a hierarchy for measuring fair value. These standards require additional disclosures about the various inputs and valuation techniques used to develop the measurements of fair value and changes in valuation techniques and related inputs during the period. These inputs are summarized in three broad levels listed below:
LoCorr Managed Futures Strategy Fund and LoCorr Long/Short Commodities Strategy Fund - Notes to Consolidated Financial Statements (continued) LoCorr Long/Short Equity Fund - Notes to Financial Statements (continued) | | |
| | | 43 |
| | |
Level 1 – Unadjusted quoted prices in active markets for identical assets or liabilities that the Funds have the ability to access.
Level 2 – Observable inputs other than quoted prices included in Level 1 that are observable for the asset or liability, either directly or indirectly. These inputs may include quoted prices for the identical instrument on an inactive market, prices for similar instruments, interest rates, prepayment speeds, credit risk, yield curves, default rates and similar data.
Level 3 – Unobservable inputs for the asset or liability, to the extent relevant observable inputs are not available; representing the Funds’ own assumptions about the assumptions a market participant would use in valuing the asset or liability, and would be based on the best information available.
Generally, the Funds’ investments are valued each day at the last quoted sales price on each investment’s primary exchange. Investments traded or dealt in upon one or more exchanges (whether domestic or foreign) for which market quotations are readily available and not subject to restrictions against resale shall be valued at the last quoted sales price on the primary exchange or, in the absence of a sale on the primary exchange, at the last bid on the primary exchange. Investments primarily traded in the National Association of Securities Dealers’ Automated Quotation System (“NASDAQ”) National Market System for which market quotations are readily available shall be valued using the NASDAQ Official Closing Price. If market quotations are not readily available, investments will be valued at their fair value as determined in good faith by LoCorr Fund Management, LLC (the “Adviser”) in accordance with procedures approved by the Board of Trustees (the “Board”) and evaluated by the Board as to the reliability of the fair value method used. In these cases, a Fund’s net asset value (“NAV”) will reflect certain portfolio investments’ fair value rather than their market price. Fair value pricing involves subjective judgments and it is possible that the fair value determined for an investment is materially different than the value that could be realized upon the sale of that investment. The fair value prices can differ from market prices when they become available or when a price becomes available.
The Funds may use independent pricing services to assist in calculating the value of the Funds’ investments. In addition, market prices for foreign investments are not determined at the same time of day as the NAV for the Funds. Because the Funds may invest in portfolio investments primarily listed on foreign exchanges, and these exchanges may trade on weekends or other days when the Funds do not price their shares, the value of some of the Funds’ portfolio investments may change on days when you may not be able to buy or sell the Funds’ shares. In computing the NAV, the Funds value foreign investments held by the Funds at the latest closing price on the exchange in which they are traded immediately prior to closing of the NYSE. Prices of foreign investments quoted in foreign currencies are translated into U.S. dollars at current rates. If events materially affecting the value of an investment in the Funds’ portfolio, particularly foreign investments, occur after the close of trading on a foreign market but before the Funds price their shares, the investment will be valued at fair value.
Fixed income securities and certificates of deposit with maturities more than 60 days when acquired are valued using an evaluated price supplied by an independent pricing service. Inputs used by the pricing service for U.S. government and treasury securities are normally valued using a model that incorporates market observable data such as reported sales of similar securities, broker dealer quotes, yields, bids, offers, and reference data. Agency issued debt securities, foreign issued bonds and municipal bonds are generally valued in a manner similar to U.S. government securities. Evaluations for corporate bonds are typically based on valuation methodologies such as market pricing and other analytical pricing models as well as market transactions and dealer quotations based on observable inputs. Fixed income securities are generally categorized in Level 1 or Level 2 of the fair value hierarchy depending on inputs used and market activity levels for specific securities.
The fair value of asset backed securities and mortgage backed securities is estimated on models that consider the estimated cash flows of each tranche of the entity, establish a benchmark yield, and develop an estimated tranche-specific spread to the benchmark yield based on the unique attributes of the tranche. Additional inputs such as creditworthiness of the underlying collateral and quotes from outside brokers for the same or similar issuance may also be considered in the development of fair value. Asset backed and mortgage backed securities are generally categorized in Level 2 of the fair value hierarchy. Short-term investments in fixed income securities and certificates of deposit with maturities of less than 60 days when acquired, or which subsequently are within 60 days of maturity, are valued using an amortized cost method of valuation, and are categorized Level 2.
Equity securities generally are valued by using market quotations, but may be valued on the basis of prices furnished by a pricing service when the Adviser believes such prices accurately reflect the fair market value of such securities. Securities that are traded on any stock exchange or on the NASDAQ over-the-counter market are generally valued by the pricing service at the last quoted sale price. Lacking a last sale price, an equity security is generally valued by the pricing service at its last bid price. Equity securities are generally categorized in Level 1 or Level 2 of the fair value hierarchy.
With respect to any portion of the Funds’ assets that are invested in one or more open-end management investment companies, including money market funds, registered under the 1940 Act, the Funds’ net asset value is calculated based upon the net asset values of those open-end management investment companies, and the prospectuses for these companies explain the circumstances under which those companies will use fair value pricing and the effects of using fair value pricing.
Futures contracts are carried at fair value using the primary exchange’s closing (settlement) price, and are categorized as Level 1. Forward currency contracts are carried at fair value using spot currency rates and are adjusted for the time value of money (forward points) and contractual prices of the underlying financial instruments. Forward currency contracts are generally categorized as Level 2.
Total return swap contracts are stated at fair value daily based on the fair value of the underlying futures and forward currency contracts constituting the contract’s stated index, taking into account any fees and expenses associated with the swap agreement. Total return swap contracts are generally categorized in Level 2.
| | LoCorr Managed Futures Strategy Fund and LoCorr Long/Short Commodities Strategy Fund - Notes to Consolidated Financial Statements (continued) LoCorr Long/Short Equity Fund - Notes to Financial Statements (continued) |
44 |
| |
The following table summarizes the LoCorr Managed Futures Strategy Fund’s consolidated investments and swap contracts as of December 31, 2013:
| Security Classification | | Level 1 | | Level 2 | | Level 3 | | Total | |
| Investments | | | | | | | | | |
| Asset Backed Securities | | $ | - | | $ | 45,864,548 | | $ | - | | $ | 45,864,548 | |
| Corporate Bonds | | | - | | | 140,296,552 | | | - | | | 140,296,552 | |
| Mortgage Backed Securities | | | - | | | 81,450,775 | | | - | | | 81,450,775 | |
| Municipal Bonds | | | - | | | 6,901,998 | | | - | | | 6,901,998 | |
| Foreign Government Bond | | | - | | | 924,120 | | | - | | | 924,120 | |
| U.S. Government Agency Issues | | | - | | | 18,750,702 | | | - | | | 18,750,702 | |
| U.S. Government Note | | | - | | | 4,993,555 | | | - | | | 4,993,555 | |
| Short Term Investments | | | 4,584,729 | | | 9,001,799 | | | - | | | 13,586,528 | |
| Total Investments | | $ | 4,584,729 | | $ | 308,184,049 | | $ | - | | $ | 312,768,778 | |
Swap Contracts* | | | | | | | | | | | | | |
| Long Total Return Swap Contracts | | $ | - | | $ | (40,927,371 | ) | $ | - | | $ | (40,927,371 | ) |
| Total Swap Contracts | | $ | - | | $ | (40,927,371 | ) | $ | - | | $ | (40,927,371 | ) |
See the consolidated schedule of investments for the investments detailed by industry classification.
*Swap contracts are derivative instruments not reflected in the consolidated schedule of investments, which are presented at the unrealized depreciation on the instrument.
The following table summarizes the LoCorr Long/Short Commodities Strategy Fund’s consolidated investments and swap contracts as of December 31, 2013:
| Security Classification | | Level 1 | | Level 2 | | Level 3 | | Total | |
| Investments | | | | | | | | | |
| Asset Backed Securities | | $ | - | | $ | 1,368,103 | | $ | - | | $ | 1,368,103 | |
| Corporate Bonds | | | - | | | 2,019,993 | | | - | | | 2,019,993 | |
| Mortgage Backed Securities | | | - | | | 3,359,491 | | | - | | | 3,359,491 | |
| Municipal Bonds | | | - | | | 536,464 | | | - | | | 536,464 | |
| Foreign Government Bond | | | - | | | 22,165 | | | - | | | 22,165 | |
| U.S. Government Agency Issues | | | - | | | 468,923 | | | - | | | 468,923 | |
| Certificates of Deposit | | | - | | | 120,278 | | | - | | | 120,278 | |
| Short Term Investments | | | 892,416 | | | 374,846 | | | - | | | 1,267,262 | |
| Total Investments | | $ | 892,416 | | $ | 8,270,263 | | $ | - | | $ | 9,162,679 | |
| | | | | | | | | | | | | | |
Swap Contracts* | | | | | | | | | | | | | |
| Long Total Return Swap Contracts | | $ | - | | $ | (853,414 | ) | $ | - | | $ | (853,414 | ) |
| Total Swap Contracts | | $ | - | | $ | (853,414 | ) | $ | - | | $ | (853,414 | ) |
See the consolidated schedule of investments for the investments detailed by industry classification.
*Swap contracts are derivative instruments not reflected in the consolidated schedule of investments, which are presented at the unrealized depreciation on the instrument.
The following table summarizes the LoCorr Long/Short Equity Fund’s investments and securities sold short as of December 31, 2013:
| Security Classification | | Level 1 | | Level 2 | | Level 3 | | Total | |
| Investments | | | | | | | | | |
| Common Stocks | | $ | 38,387,991 | | $ | - | | $ | - | | $ | 38,387,991 | |
| Exchange Traded Funds | | | 1,119,086 | | | - | | | - | | | 1,119,086 | |
| Money Market Fund | | | 1,493,402 | | | - | | | - | | | 1,493,402 | |
| Total Investments | | $ | 41,000,479 | | $ | - | | $ | - | | $ | 41,000,479 | |
| | | | | | | | | | | | | | |
| Securities Sold Short | | | | | | | | | | | | | |
| Common Stocks | | $ | (1,528,510 | ) | $ | - | | $ | - | | $ | (1,528,510 | ) |
| Total Securities Sold Short | | $ | (1,528,510 | ) | $ | - | | $ | - | | $ | (1,528,510 | ) |
See the schedule of investments and schedule of securities sold short for detail by industry classification.
LoCorr Managed Futures Strategy Fund and LoCorr Long/Short Commodities Strategy Fund - Notes to Consolidated Financial Statements (continued) LoCorr Long/Short Equity Fund - Notes to Financial Statements (continued) | | |
| | | 45 |
| | |
The Funds did not hold any Level 3 assets during the period. There were no transfers between levels during the period. Transfers between levels are recognized at the end of the reporting period.
Federal Income Taxes
The Funds intend to qualify as regulated investment companies pursuant to Subchapter M of the Internal Revenue Code. The Funds intend to distribute substantially all of their investment company net taxable income and net capital gains to shareholders. Therefore, no federal income tax provision is required.
As of and during the year ended December 31, 2013, the Funds did not have any tax positions that did not meet the “more-likely-than-not” threshold of being sustained by applicable tax authorities. The Funds recognize interest and penalties, if any, related to unrecognized tax benefits on uncertain tax position as interest or, other expense in the statements of operations. During the year ended December 31, 2013, the Funds did not incur any interest or penalties. Generally, tax authorities can examine all the tax returns filed for the last three years.
For tax purposes, LCMFS and LCLSCS are exempted Cayman investment companies. LCMFS and LCLSCS have received an undertaking from the Government of the Cayman Islands exempting them from all local income, profits, and capital gains taxes. No such taxes are levied in the Cayman Islands at the present time. For U.S. income tax purposes, LCMFS and LCLSCS are controlled foreign corporations (“CFCs”) and as such are not subject to U.S. income tax. However, as a wholly-owned CFC, LCMFS’s and LCLSCS’s net income and capital gain, to the extent of its earnings and profits, will be included each year in the respective Funds’ investment company taxable income.
Use of Estimates
The preparation of consolidated financial statements in conformity with accounting principles generally accepted in the United States of America requires management to make estimates and assumptions that affect the reported amounts of assets and liabilities, disclosure of contingent assets and liabilities at the date of the financial statements and the reported revenues and expenses during the reporting period. Actual results could differ from those estimates.
Indemnifications
In the normal course of business, the Funds enter into contracts that contain general indemnifications to other parties. The Funds’ maximum exposure under these contracts is unknown as this would involve future claims that may be made against the Funds that have not yet occurred. However, based on experience, the Funds expect the risk of loss to be remote.
Security Transactions and Investment Income
Security transactions are recorded on trade date. Generally, realized gains and losses on sales of investments are calculated on the specifically identified cost basis of the securities. Dividend income, less foreign taxes withheld, if any, are recorded on the ex-dividend date. Interest income and expense are recognized on the accrual basis. Market discounts, premiums and original issue discounts on fixed-income securities are amortized daily over the expected life of the security using the effective yield method.
Allocation of Income and Expenses
Net investment income, other than class specific expenses, and realized and unrealized gains and losses are allocated daily to each class of shares based upon the relative net asset value of outstanding shares of each class of shares at the beginning of the day (after adjusting for the current capital shares activity of the respective class). Expenses associated with a specific Fund in the Trust are charged to that Fund. Common expenses are typically allocated based upon the relative net assets of each Fund, or by other equitable means.
Distributions to Shareholders
Shareholder transactions are recorded on trade date. Dividends from net investment income are declared and paid at least annually by the Funds. Distribution of net realized capital gains, if any, are declared and paid at least annually. Distributions to shareholders are recorded on the ex-dividend date. The character of distributions made during the periods from net investment income or net realized gains may differ from the characterization for federal income tax purposes due to the difference in the recognition of income, expense and gain items for financial statement and tax purposes. The tax character of distributions paid during the periods ended December 31, 2013 and December 31, 2012 was as follows:
| | | | | | | | |
| | | | | | | May 10, 20131 | |
| | | | | | | through | |
| | | Year Ended December 31, 2013 | | December 31, 2013 | |
| | | LoCorr Managed | | LoCorr Long/Short | | LoCorr Long/Short | |
| | | Futures Strategy Fund | | Commodities Strategy Fund | | Equity Fund | |
| Distributions paid from: | | | | | | | |
| Ordinary Income | | $ | - | | $ | - | | $ | - | |
| Long Term Capital Gain | | | 226,371 | | | - | | | - | |
| Return of Capital | | | - | | | - | | | - | |
| Total Distributions Paid | | $ | 226,371 | | $ | - | | $ | - | |
| | | | | | | | | | | |
1Commencement of operations.
| | LoCorr Managed Futures Strategy Fund and LoCorr Long/Short Commodities Strategy Fund - Notes to Consolidated Financial Statements (continued) LoCorr Long/Short Equity Fund - Notes to Financial Statements (continued) |
46 |
| |
| | | | | | | | |
| | | | Year Ended December 31, 2012 | |
| | | | LoCorr Managed Futures Strategy Fund | | | Strategy Fund | |
| Distributions paid from: | | | | | | | | | |
| Ordinary Income | | | $ | - | | | $ | - | |
| Long Term Capital Gain | | | | 90,356 | | | | - | |
| Return of Capital | | | | - | | | | - | |
| Total Distributions Paid | | | $ | 90,356 | | | $ | - | |
Distributable Earnings and Investment Transactions
Net investment income and net realized gains (losses) may differ for financial reporting and tax purposes because of temporary or permanent book/tax differences. To the extent these differences are permanent; reclassifications are made to the appropriate equity accounts in the period that the difference arises.
Additionally, U.S. generally accepted accounting principles require that certain components of net assets relating to permanent differences be reclassified between financial and tax reporting. These reclassifications have no effect on net assets or net asset value per share. See Note 7.
Foreign Securities and Currency
Investment securities and other assets and liabilities denominated in foreign currencies are translated into U.S. dollar amounts at the date of valuation. Purchases and sales of investment securities and income and expense items denominated in foreign currencies are translated into U.S. dollar amounts on the respective dates of such transactions.
The Funds do not isolate that portion of the results of operations resulting from changes in foreign exchange rates on investments from the fluctuations arising from changes in market prices of securities held. Such fluctuations are included with the net realized and unrealized gain or loss from investments.
Reported net realized foreign exchange gains or losses arise from sales of foreign currencies, currency gains or losses realized between the trade and settlement dates on securities transactions, and the difference between the amounts of dividends, interest, and foreign withholding taxes recorded on the Funds’ books and the U.S. dollar equivalent of the amounts actually received or paid. Net unrealized foreign exchange gains and losses arise from changes in the fair values of assets and liabilities, other than investments in securities at period end, resulting from changes in exchange rates.
Futures Contracts
Gains or losses are realized when contracts are liquidated. Any change in net unrealized gain or loss is reported in the Statement of Operations. Brokerage commissions on open futures contracts are charged to expense when paid.
Forward Currency Contracts
Gains or losses are realized when foreign currency contracts are liquidated. Any change in net unrealized gain or loss is reported in the statement of operations.
Total Return Swap Contracts
The Funds may enter into total return swap agreements. A total return swap entered into by the Funds is a derivative contract that transfers the market risk of underlying portfolios of futures and forward currency contracts (considered the “index” within each total return swap contract) between counterparties. The “notional amount” of each total return swap agreement is the agreed upon amount or value of the index used for calculating the returns that the parties to a swap agreement have agreed to exchange. The total returns swaps are marked to market daily and any change is recorded in unrealized gain/loss on the consolidated statement of operations based on the value of the index on which the total return swap is referenced, as defined within the total return swap agreement between the counterparties. The composition of the index may vary based on how the underlying portfolio of futures and forward currency contracts is traded. A Fund’s obligation under a total return swap agreement, including any related fees, offset against amounts owed to the Fund in the case of positive performance, will be covered by designating liquid assets on the Fund’s books and records (see the consolidated statement of assets and liabilities for cash collateral). Gains or losses will be realized when the total return swap contracts are liquidated and will be presented as net realized gain or loss on swap contracts on the consolidated statements of operations. In addition, changes in notional value and any cash holding adjustments, which represent voluntary realizations by a Fund of swap value at any point in time, are also presented as net realized gain or loss on swap contracts on the consolidated statements of operations. A corresponding asset or liability for “advance payment on swap contracts” is recorded on the consolidated statements of assets and liabilities for the gain or loss realized on changes in notional value. Total return swaps outstanding at period end, if any, are listed after the Funds’ consolidated schedules of investments.
Short Sales
The LoCorr Long/Short Equity Fund may sell securities short. A short sale is a transaction in which the Fund sells a security it does not own or have the right to acquire (or that it owns but does not wish to deliver) in anticipation that the market price of that security will decline.
When the Fund makes a short sale, the broker-dealer through which the short sale is made must borrow the security sold short and deliver it to the party purchasing the security. The Fund is required to make a margin deposit in connection with such short sales; the Fund may have to pay a fee to borrow particular securities and will often be obligated to pay over any dividends and accrued interest on borrowed securities.
LoCorr Managed Futures Strategy Fund and LoCorr Long/Short Commodities Strategy Fund - Notes to Consolidated Financial Statements (continued) LoCorr Long/Short Equity Fund - Notes to Financial Statements (continued) | | |
| | | 47 |
| | |
If the price of the security sold short increases between the time of the short sale and the time the Fund covers its short position, the Fund will incur a loss; conversely, if the price declines, the Fund will realize a capital gain. A gain, limited to the price at which the Fund sold the security short, or a loss, unlimited in size, will be recognized upon the close of a short sale. Any gain will be decreased, and any loss increased, by the transaction costs described above. The successful use of short selling may be adversely affected by imperfect correlation between movements in the price of the security sold short and the securities being hedged. Gains or losses from closed positions of securities sold short are presented as net realized gain or loss on securities sold short on the Statement of Operations.
In addition, the Fund is required to pay the lender any dividends declared on short positions. Dividends declared on open short positions are recorded on ex-date and shown as an expense for financial reporting purposes. To borrow the security, the Fund also may be required to pay fees, which is shown as an expense for financial reporting purposes.
To the extent the Fund sells securities short, it will provide collateral to the broker-dealer and (except in the case of short sales “against the box”) will maintain additional asset coverage in the form of cash, U.S. government securities or other liquid securities with its custodian in a segregated account in an amount at least equal to the difference between the current fair value of the securities sold short and any amounts required to be deposited as collateral with the selling broker (not including the proceeds of the short sale). A short sale is “against the box” to the extent the Fund contemporaneously owns, or has the right to obtain at no added cost, securities identical to those sold short. Short sales are collateralized by cash deposits with the counterparty broker and pledged securities held at the custodian, U.S. Bank, N.A. The collateral required is determined daily by reference to the fair value of the short positions. At December 31, 2013, the LoCorr Long/Short Equity Fund had cash on deposit with the broker-dealer in the amount of $1,365,526 and pledged securities with a fair value of $1,908,226.
Deposits with Broker
LCMFS and LCLSCS have a substantial portion of their assets on deposit with Deutsche Bank in connection with their trading of swap contracts. Assets deposited with Deutsche Bank in connection with the trading of swap contracts for LCMFS and LCLSCS are partially restricted due to deposit requirements. At December 31, 2013, the LoCorr Managed Futures Strategy Fund and LoCorr Long/Short Commodities Strategy Fund had cash and cash equivalents on deposit with Deutsche Bank in the amount of $101,000,010 and $2,400,010, respectively, which have been presented on the consolidated statements of assets and liabilities of LoCorr Managed Futures Strategy Fund and LoCorr Long/Short Commodities Strategy Fund, respectively. Risks arise from the possible inability of the counterparty to meet the term of its contract and may increase if the counterparty’s financial condition worsens.
Market and Credit Risks
The Funds may engage in the speculative trading of U.S. and foreign futures, forward currency and swap contracts (collectively, derivatives). The Funds are exposed to both market risk, which is the risk arising from changes in the fair value of the contracts, and credit risk, which is the risk of failure by another party to perform according to the terms of a contract.
Purchase and sale of futures contracts requires margin deposits with the broker. Additional deposits may be necessary for any loss on contract value. The Commodity Exchange Act requires a broker to segregate all customer transactions and assets from such broker’s proprietary activities A customer’s cash and other property (for example, U.S. government securities) deposited with a broker are considered commingled with all other customer funds subject to the broker’s segregation requirements. In the event of a broker’s insolvency, recovery may be limited to a pro rata share of segregated funds available. It is possible that the recovered amount could be less than total cash and other property deposited.
For derivatives, risks arise from changes in the fair value of the contracts. Theoretically, the Funds are exposed to a market risk equal to the notional contract value of swap, futures and forward currency contracts purchased and unlimited liability on such contracts sold short.
The Funds also engage in investing its assets in U.S. government securities. Risks arise from investments in U.S. government securities due to possible market illiquidity. U.S. government securities are also sensitive to changes in interest rates and economic conditions.
The Funds have established procedures to actively monitor market risk and minimize credit risk, although there can be no assurance that it will, in fact, succeed in doing so.
3. Derivatives
The Funds may invest in derivatives such as futures, forward currency, and swap contracts, in order to hedge against market movements while liquidating certain positions and buying other securities or as substitutes for securities, as well as for speculative purposes to gain exposure to such market movements.
The Funds’ market risk related to its derivatives trading is influenced by a wide variety of factors, including the level and volatility of interest rates, exchange rates, weather, supply and demand of commodities, the market value of futures and forward currency contracts, the diversification effects among the Funds’ open positions and the liquidity of the markets in which they trade.
Prior to December 20, 2012, the LoCorr Managed Futures Strategy Fund and the LoCorr Long/Short Commodities Strategy Fund engaged in the speculative trading of futures, forward currency and swap contracts. The Funds traded futures contracts on interest rates, commodities, currencies, metals, energies, livestock and stock indices. During the year ended December 31, 2012, the majority of the Funds’ futures and forward currency contracts activity was in the underlying partnership investments of LCMFS and LCLSCS. It was the Funds’ intention that the total return swap contracts held as of and during the year ended December 31, 2013 will provide futures exposure to such market movements. The following were the primary trading risk exposures by market sector of the Funds, and as encompassed in the total return swap contracts:
Agricultural (grains, livestock and softs). The Funds’ primary exposure is to agricultural price movements which are often directly affected by severe or unexpected weather conditions.
| | LoCorr Managed Futures Strategy Fund and LoCorr Long/Short Commodities Strategy Fund - Notes to Consolidated Financial Statements (continued) LoCorr Long/Short Equity Fund - Notes to Financial Statements (continued) |
48 |
| |
Currencies. Exchange rate risk is a principal market exposure of the Funds. The Funds’ currency exposure is to exchange rate fluctuations, primarily fluctuations which disrupt the historical pricing relationships between different currencies and currency pairs. The fluctuations are influenced by interest rate changes as well as political and general economic conditions. The Funds trade in a large number of currencies including cross-rates – e.g., positions between two currencies other than the U.S. dollar.
Energy. The Funds’ primary energy market exposure is to gas and oil price movements, often resulting from political developments in the Middle East and economic conditions worldwide. Energy prices are volatile and substantial profits and losses have been and are expected to continue to be experienced in this market.
Interest rates. Interest rate movements directly affect the price of the sovereign bond futures positions held by the Funds and indirectly the value of its stock index currency positions. Interest rate movements in one country as well as relative interest rate movements between countries may materially impact the Funds’ profitability. The Funds’ primary interest rate exposure is to interest rate fluctuations in countries or regions including Australia, Canada, Japan, Switzerland, the United Kingdom, the United States and the Eurozone. However, the Funds also may take positions in futures contracts on the government debt of other nations. The Funds anticipate that interest rates in these industrialized countries or areas, both long-term and short-term, will remain a primary market exposure of the Funds for the foreseeable future.
Metals. The Funds’ metals market exposure is to fluctuations in the price of aluminum, copper, gold, lead, nickel, palladium, tin, silver and zinc.
Stock index. The Funds’ equity exposure, through stock index futures, is to equity price risk in the major industrialized countries as well as other countries.
In January 2013, the Financial Accounting Standards Board (“FASB”) issued Accounting Standard Update (“ASU”) ASU No. 2013-01 “Clarifying the Scope of Disclosures about Offsetting Assets and Liabilities” in Generally Accepted Accounting Principles (“GAAP”) and International Reporting Financial Standards (“IFRS”). ASU No. 2013-01 clarifies ASU No. 2011-11, Disclosures about Offsetting Assets and Liabilities to increase comparability and reduce presentation differences between financial statements prepared in accordance with GAAP and financial statements prepared in accordance with IFRS. This requires increased disclosure about derivative instruments that are offset in a reporting entity’s Statement of Assets and Liabilities and derivative instruments that are subject to a master netting agreement (“MNA”). Specifically, the ASU requires reporting entities to present separately for assets and liabilities, a) the gross amounts of those recognized assets and recognized liabilities, b) the amounts offset to determine the net amounts presented in the Statement of Assets and Liabilities, c) The net amount presented in the Statement of Assets and Liabilities, d) the amounts subject to an enforceable MNA not included in (b), and e) the net amount after deducting the amounts from (d) and (c). The effective date of the ASU is for interim and annual periods beginning on or after January 1, 2013.
At December 31, 2013, the LoCorr Managed Futures Strategy Fund and the LoCorr Long/Short Commodities Strategy Fund held swap contracts which are not subject to a master netting agreement. As the tables below illustrate, no positions are netted in these financial statements.
| | | | | | | | | | | | | | | | | | | | |
| LoCorr Managed Futures Strategy Fund - December 31, 2013 | | | | |
| Liabilities: | | | | | | | | | | | Gross Amounts not offset in the Statement | | | | |
| | | | | | | | | | | | of Asset & Liabilities | | | | |
| Description | | Gross Amounts of Recognized Liabilities | | Gross Amounts Offset in the Statement of Assets & Liabilities | | Net Amounts Presented in the Statement of Assets & Liabilities | | Financial Instruments | | Collateral Pledged (Received) | | Net Amount | |
Swap Contracts* | | $ | 45,521,212 | | $ | - | | $ | 45,521,212 | | $ | - | | $ | 45,521,212 | | $ | - | |
| Total | | $ | 45,521,212 | | $ | - | | $ | 45,521,212 | | $ | - | | $ | 45,521,212 | | $ | - | |
| LoCorr Long/Short Commodities Strategy Fund - December 31, 2013 | |
| Liabilities: | | | | | | | | | Gross Amounts not offset in the Statement | | | | |
| | | | | | | | | | of Asset & Liabilities | | | | |
| Description | | Gross Amounts of Recognized Liabilities | | Gross Amounts Offset in the Statement of Assets & Liabilities | | | Net Amounts Presented in the Statement of Assets & Liabilities | | Financial Instruments | | Collateral Pledged (Received) | | | Net Amount | |
Swap Contracts* | | $ | 890,192 | | $ | - | | | $ | 890,192 | | $ | - | | $ | 890,192 | | | $ | - | |
| Total | | $ | 890,192 | | $ | - | | | $ | 890,192 | | $ | - | | $ | 890,192 | | | $ | - | |
*Includes advance payment on swap contracts.
The Funds have adopted authoritative standards regarding disclosure about derivatives and hedging activities and how they affect the Funds’ consolidated statements of asset and liabilities and statements of operations. Fair value of swap contracts are recorded in the consolidated statement of assets and liabilities as net unrealized gain on swap contracts or net unrealized loss on swap contracts and net unrealized appreciation of swap contracts or net unrealized depreciation of swap contracts.
Since the derivatives held long or short are for speculative trading purposes, the derivative instruments are not designated as hedging instruments. Accordingly, all realized gains and losses, as well as any change in net unrealized gains or losses on open contracts from the preceding period, are recognized as part of realized and unrealized gain (loss) in the consolidated statements of operations.
LoCorr Managed Futures Strategy Fund and LoCorr Long/Short Commodities Strategy Fund - Notes to Consolidated Financial Statements (continued) LoCorr Long/Short Equity Fund - Notes to Financial Statements (continued) | | |
| | | 49 |
| | |
The following table presents the fair value of consolidated open swap contracts for the LoCorr Managed Futures Strategy Fund at December 31, 2013 as presented on the consolidated statement of assets and liabilities.
| | | | | | | | | | | | | | | | | |
| December 31, 2013 | | | | | | | |
| | | Fair Value – | | Fair Value – | | Net Unrealized | |
| | | Long Positions | | Short Positions | | Gain (Loss) on | |
| Swap Contracts | | Assets | | Liabilities | | Assets | | Liabilities | | Open Positions | |
| LoCorr Managed Futures Index | | $ | — | | $ | 40,927,371 | | $ | — | | $ | — | | $ | (40,927,371 | ) |
| Total Swap Contracts | | $ | — | | $ | 40,927,371 | | $ | — | | $ | — | | $ | (40,927,371 | ) |
The following table presents the fair value of consolidated open swap contracts for the LoCorr Long/Short Commodities Futures Strategy Fund at December 31, 2013 as presented on the consolidated statement of assets and liabilities.
| | | | | | | | | | | | | | | | | |
| December 31, 2013 | | | | | | | | | | | | | | | | |
| | | Fair Value – | | Fair Value – | | Net Unrealized | |
| | | Long Positions | | Short Positions | | Gain (Loss) on | |
| Swap Contracts | | Assets | | Liabilities | | Assets | | Liabilities | | Open Positions | |
| LoCorr Commodities Index | | $ | — | | $ | 853,414 | | $ | — | | $ | — | | $ | (853,414 | ) |
| Total Swap Contracts | | $ | — | | $ | 853,414 | | $ | — | | $ | — | | $ | (853,414 | ) |
The following table presents the trading results of the derivative trading and information related to the volume of the LoCorr Managed Futures Strategy Fund and the LoCorr Long/Short Commodities Strategy Fund for the year ended December 31, 2013. The below captions of “Net Realized” and “Net Change in Unrealized” correspond to the captions in the consolidated statement of operations.
| | | | | | | |
| LoCorr Managed Futures Strategy Fund | | | | | | |
| For the Year Ended December 31, 2013 | | | | | | |
| | | Gain (Loss) from Trading |
| | | | | | | Net Change in |
| | | | Net Realized | | | Unrealized |
| Swap Contracts | | $ | 15,406,159 | | $ | (39,102,171) |
| | | | | | | |
| LoCorr Long/Short Commodities Strategy Fund | | | | | | |
| For the Year Ended December 31, 2013 | | | | | | |
| | | Gain (Loss) from Trading |
| | | | | | | Net Change in |
| | | | Net Realized | | | Unrealized |
| Swap Contracts | | $ | (36,778 | ) | $ | (687,070) |
The average monthly notional amount of the swap contracts during the year ended December 31, 2013 for the LoCorr Managed Futures Strategy Fund and the LoCorr Long/Short Commodities Strategy Fund was $456,597,674 and $11,846,154, respectively.
Please refer to the Funds’ prospectus for a full listing of risks associated with these investments.
4. Investment Transactions
The cost of security purchases and proceeds from security sales, other than U.S. Government obligations, short-term investments, swaps, short sales, purchases to cover and short-term securities for the year ended December 31, 2013 for the LoCorr Managed Futures Strategy Fund and LoCorr Long/Short Commodities Strategy Fund and from May 10, 2013 (commencement of operations) through December 31, 2013 for the LoCorr Long/Short Equity Fund, were as follows:
| Fund | | Purchases | | | Sales |
| LoCorr Managed Futures Strategy Fund | $ | 148,423,816 | | $ | 145,496,240 |
| LoCorr Long/Short Commodities Strategy Fund | | 4,713,014 | | | 4,135,055 |
| LoCorr Long/Short Equity Fund | | 44,655,099 | | | 8,832,366 |
Purchases and sales of U.S. Government obligations for the year ended December 31, 2013 for the LoCorr Managed Futures Strategy Fund and LoCorr Long/Short Commodities Strategy Fund and from May 10, 2013 (commencement of operations) through December 31, 2013 for the LoCorr Long/Short Equity Fund were as follows:
| Fund | | Purchases | | | Sales |
| LoCorr Managed Futures Strategy Fund | $ | 13,001,758 | | $ | 8,091,063 |
| LoCorr Long/Short Commodities Strategy Fund | | 419,614 | | | 721,133 |
| LoCorr Long/Short Equity Fund | | - | | | - |
| | LoCorr Managed Futures Strategy Fund and LoCorr Long/Short Commodities Strategy Fund - Notes to Consolidated Financial Statements (continued) LoCorr Long/Short Equity Fund - Notes to Financial Statements (continued) |
50 |
| |
5. Management Fees and Other Transactions with Affiliates
The Funds have a Management Agreement with the Adviser, with whom certain officers and Trustees of the Funds are affiliated, to furnish investment advisory services to the Funds. Pursuant to the Management Agreement between the Funds and the Adviser, the Adviser is entitled to receive a fee, in accordance with the Incremental Advisory Fee schedule below based on each of the LoCorr Managed Futures Strategy Fund and the LoCorr Long/Short Commodities Strategy Fund’s average daily net assets and an annual rate of 2.45% of the LoCorr Long/Short Equity Fund’s average daily net assets, computed daily and payable monthly.
| | |
| Net Assets per Fund for each of the | |
| LoCorr Managed Futures Strategy Fund and the | Incremental* |
| LoCorr Long/Short Commodities Strategy Fund | Advisory Fee |
| $0 – $1 billion | 1.50% |
| $1.0 – $1.5 billion | 1.40% |
| $1.5 – $2.0 billion | 1.30% |
| $2.0 – $2.5 billion | 1.20% |
| $2.5 – $3.0 billion | 1.10% |
| Over $3.0 billion | 1.00% |
* Incremental advisory fee represents the fees paid on net assets at the related net asset level. For example, with $2 billion in net assets in a Fund, the Adviser would earn 1.50% on the first $1 billion, plus 1.40% on the next $500 million, plus 1.30% on the final $500 million.
For the year ended December 31, 2013, the LoCorr Managed Futures Strategy Fund and the LoCorr Long/Short Commodities Strategy Fund incurred $6,473,306 and $171,188 respectively, in advisory fees and the LoCorr Long/Short Equity Fund incurred $192,301 in advisory fees for the period from May 10, 2013 (commencement of operations) through December 31, 2013. At December 31, 2013, the LoCorr Managed Futures Strategy Fund and the LoCorr Long/Short Equity Fund owed the Adviser $485,750 and $54,420, respectively. The LoCorr Long/Short Commodities Strategy Fund reported a receivable from the Adviser of $1,116 at December 31, 2013.
Pursuant to a sub-advisory agreement between the Adviser and Nuveen Asset Management, LLC (“Nuveen”) related to the LoCorr Managed Futures Strategy Fund and the LoCorr Long/Short Commodities Strategy Fund, Nuveen is entitled to receive a monthly fee at an annual rate equal to 0.18% of the average daily net assets of the first $50 million of sub-advised assets, 0.14% of the average daily net assets of the next $50 million of sub-advised assets, and 0.10% of the average daily net assets in excess of $100 million of sub-advised assets. The minimum annual fee payable by Adviser to Nuveen is $45,000. Effective November 21, 2013, Nuveen replaced Galliard Capital Management, Inc. as sub-adviser to the LoCorr Long/Short Commodities Strategy Fund. See Note 8 – Subsequent Events, Information Statement for additional information.
Pursuant to a sub-advisory agreement between the Adviser and Millennium Asset Management, L.L.C. (“Millennium”) related to the LoCorr Long/Short Equity Fund, Millennium is entitled to receive a monthly fee at an annual rate equal to 1.25% of the first $10 million of the average daily net assets of the sub-advised assets and 1.00% of the average daily net assets of the sub-advised assets over $10 million.
The Adviser is solely responsible for the payment of the sub-adviser’s fees, and the sub-adviser agrees not to seek payment of its fees from the Trust or the Funds.
The Funds’ Adviser has contractually agreed to waive management fees and/or reimburse the Funds for expenses it incurs but only to the extent necessary to maintain the Funds’ total annual operating expenses after fee waiver and/or reimbursement (excluding taxes, any Rule 12b-1 distribution and/or servicing fees, interest, brokerage commissions, expenses incurred in connection with any merger or reorganization, dividend expenses on short sales, swap fees, indirect expenses, expenses of other investment companies in which the Funds may invest, or extraordinary expenses such as litigation, and inclusive of organizational costs incurred prior to the commencement of operations) at 1.95% of the average daily net assets of each share class of the LoCorr Managed Futures Strategy Fund and LoCorr Long/Short Commodities Strategy Fund and 2.90% of the average daily net assets of each share class of the LoCorr Long/Short Equity Fund.
Any waiver or reimbursement is subject to repayment by the Funds within the three fiscal years following the fiscal year in which the expenses occurred, if the Funds are able to make the repayment without exceeding their current expense limitations and the repayment is approved by the Trustees. The organizational and offering costs are subject to repayment by the Funds.
For the year ended December 31, 2013, the Adviser waived $171,188 in fees and reimbursed other expenses of $54,559 for the LoCorr Long/ Short Commodities Strategy Fund. The waived fees and reimbursed other expenses are subject to repayment on or before December 31, 2016. For the year ended December 31, 2012, the Adviser waived $80,503 in fees and reimbursed other expenses of $129,605 for the LoCorr Long/ Short Commodities Strategy Fund, which are subject to repayment on or before December 31, 2015.
For the LoCorr Long/Short Equity Fund, the Adviser waived $140,599 in fees during the period from May 10, 2013 (commencement of operations) through December 31, 2013. The waived fees are subject to repayment on or before December 31, 2016.
At December 31, 2013, there were no fees subject to recovery for the LoCorr Managed Futures Strategy Fund.
The Funds have entered into a 12b-1 distribution agreement with Quasar Distributors, LLC (“Quasar”). Class A and Class C shareholders pay Rule 12b-1 fees to Quasar at the annual rate of 0.25% and 1.00%, respectively, of average daily net assets. Class I shareholders pay no 12b-1 fees.
LoCorr Managed Futures Strategy Fund and LoCorr Long/Short Commodities Strategy Fund - Notes to Consolidated Financial Statements (continued) LoCorr Long/Short Equity Fund - Notes to Financial Statements (continued) | | |
| | | 51 |
| | |
6. Fund Shares
At December 31, 2013, there were an unlimited number of shares of beneficial interest authorized. The following table summarizes the activity in shares and dollar amounts applicable to each class of the Funds:
| LoCorr Managed Futures Strategy Fund – Class A | | | | | | | | | | |
| | | For the Year Ended December 31, 2013 | | | For the Year Ended December 31, 2012 | |
| | | Shares | | | Amount | | | Shares | | | Amount | |
| Shares Sold | | | 15,802,350 | | | $ | 137,298,641 | | | | 16,673,873 | | | $ | 149,055,259 | |
| Dividends Reinvested | | | 12,712 | | | | 105,250 | | | | 4,170 | | | | 36,572 | |
| Shares Redeemed | | | (13,087,793 | ) | | | (109,305,113 | ) | | | (3,527,192 | ) | | | (31,265,302 | ) |
| Redemption Fees | | | - | | | | 8,254 | | | | - | | | | 3,627 | |
| | | | 2,727,269 | | | $ | 28,107,032 | | | | 13,150,851 | | | $ | 117,830,156 | |
| Beginning Shares | | | 20,815,425 | | | | | | | | 7,664,574 | | | | | |
| Ending Shares | | | 23,542,694 | | | | | | | | 20,815,425 | | | | | |
| LoCorr Managed Futures Strategy Fund – Class C | | | | | | | | | | | | | |
| | | For the Year Ended December 31, 2013 | | | For the Year Ended December 31, 2012 | |
| | | Shares | | | Amount | | | Shares | | | Amount | |
| Shares Sold | | | 3,731,653 | | | $ | 32,072,451 | | | | 6,352,123 | | | $ | 56,157,775 | |
| Dividends Reinvested | | | 5,414 | | | | 43,958 | | | | 1,901 | | | | 16,448 | |
| Shares Redeemed | | | (3,554,436 | ) | | | (29,102,705 | ) | | | (1,556,670 | ) | | | (13,589,975 | ) |
| Redemption Fees | | | - | | | | 57 | | | | - | | | | 37 | |
| | | | 182,631 | | | $ | 3,013,761 | | | | 4,797,354 | | | $ | 42,584,285 | |
| Beginning Shares | | | 8,897,487 | | | | | | | | 4,100,133 | | | | | |
| Ending Shares | | | 9,080,118 | | | | | | | | 8,897,487 | | | | | |
| LoCorr Managed Futures Strategy Fund – Class I | | | | | | | | | | | | | |
| | | For the Year Ended December 31, 2013 | | | For the Year Ended December 31, 2012 | |
| | | Shares | | | Amount | | | Shares | | | Amount | |
| Shares Sold | | | 6,457,395 | | | $ | 56,660,013 | | | | 10,460,207 | | | $ | 93,936,967 | |
| Dividends Reinvested | | | 6,077 | | | | 50,685 | | | | 2,685 | | | | 23,652 | |
| Shares Redeemed | | | (9,887,057 | ) | | | (83,450,163 | ) | | | (4,529,051 | ) | | | (40,225,733 | ) |
| Redemption Fees | | | - | | | | 4,635 | | | | - | | | | 9,622 | |
| | | | (3,423,585 | ) | | $ | (26,734,830 | ) | | | 5,933,841 | | | $ | 53,744,508 | |
| Beginning Shares | | | 15,683,227 | | | | | | | | 9,749,386 | | | | | |
| Ending Shares | | | 12,259,642 | | | | | | | | 15,683,227 | | | | | |
| LoCorr Managed Futures Strategy Fund | | | | | | | | | | | | | | | | |
| Total Net Increase | | | | | | $ | 4,385,963 | | | | | | | $ | 214,158,949 | |
| LoCorr Long/Short Commodities Strategy Fund – Class A | | | | | | | | | | |
| | | For the Year Ended December 31, 2013 | | | For the Year Ended December 31, 2012 | |
| | | Shares | | | Amount | | | Shares | | | Amount | |
| Shares Sold | | | 242,156 | | | $ | 1,923,048 | | | | 403,443 | | | $ | 3,762,552 | |
| Shares Redeemed | | | (149,871 | ) | | | (1,185,412 | ) | | | (19,708 | ) | | | (172,315 | ) |
| Redemption Fees | | | - | | | | 47 | | | | - | | | | 22 | |
| | | | 92,285 | | | $ | 737,683 | | | | 383,735 | | | $ | 3,590,259 | |
| Beginning Shares | | | 383,735 | | | | | | | | - | | | | | |
| Ending Shares | | | 476,020 | | | | | | | | 383,735 | | | | | |
| LoCorr Long/Short Commodities Strategy Fund – Class C | | | | | | | | | | | | | |
| | | For the Year Ended December 31, 2013 | | | For the Year Ended December 31, 2012 | |
| | | Shares | | | Amount | | | Shares | | | Amount | |
| Shares Sold | | | 65,017 | | | $ | 513,702 | | | | 198,978 | | | $ | 1,779,954 | |
| Shares Redeemed | | | (39,451 | ) | | | (307,189 | ) | | | (5,328 | ) | | | (45,420 | ) |
| Redemption Fees | | | - | | | | - | | | | - | | | | 49 | |
| | | | 25,566 | | | $ | 206,513 | | | | 193,650 | | | $ | 1,734,583 | |
| Beginning Shares | | | 193,650 | | | | | | | | - | | | | | |
| Ending Shares | | | 219,216 | | | | | | | | 193,650 | | | | | |
| LoCorr Long/Short Commodities Strategy Fund – Class I | | | | | | | | | | | | | |
| | | For the Year Ended December 31, 2013 | | | For the Year Ended December 31, 2012 | |
| | | Shares | | | Amount | | | Shares | | | Amount | |
| Shares Sold | | | 537,283 | | | $ | 4,289,007 | | | | 961,026 | | | $ | 8,973,797 | |
| Shares Redeemed | | | (583,252 | ) | | | (4,599,386 | ) | | | (200,887 | ) | | | (1,736,963 | ) |
| Redemption Fees | | | - | | | | 49 | | | | - | | | | 378 | |
| | | | (45,969 | ) | | $ | (310,330 | ) | | | 760,139 | | | $ | 7,237,212 | |
| Beginning Shares | | | 760,139 | | | | | | | | - | | | | | |
| Ending Shares | | | 714,170 | | | | | | | | 760,139 | | | | | |
| LoCorr Long/Short Commodities Strategy Fund | | | | | | | | | | | | | |
| Total Net Increase | | | | | | $ | 633,866 | | | | | | | $ | 12,562,054 | |
| | LoCorr Managed Futures Strategy Fund and LoCorr Long/Short Commodities Strategy Fund - Notes to Consolidated Financial Statements (continued) LoCorr Long/Short Equity Fund - Notes to Financial Statements (continued) |
52 |
| |
| LoCorr Long/Short Equity Fund – Class A | | | | | | |
| | | For the Period Ended December 31, 2013¹ | |
| | | Shares | | | Amount | |
| Shares Sold | | | 1,882,536 | | | $ | 19,916,774 | |
| Shares Redeemed | | | (30,901 | ) | | | (326,451 | ) |
| Redemption Fees | | | - | | | | 82 | |
| | | | 1,851,635 | | | $ | 19,590,405 | |
| Beginning Shares | | | - | | | | | |
| Ending Shares | | | 1,851,635 | | | | | |
| LoCorr Long/Short Equity Fund – Class C | | | | | | | | |
| | | For the Period Ended December 31, 2013¹ | |
| | | Shares | | | Amount | |
| Shares Sold | | | 744,342 | | | $ | 7,875,752 | |
| Shares Redeemed | | | (5,065 | ) | | | (54,359 | ) |
| Redemption Fees | | | - | | | | - | |
| | | | 739,277 | | | $ | 7,821,393 | |
| Beginning Shares | | | - | | | | | |
| Ending Shares | | | 739,277 | | | | | |
| LoCorr Long/Short Equity Fund – Class I | | | | | | | | |
| | | For the Period Ended December 31, 2013¹ | |
| | | Shares | | | Amount | |
| Shares Sold | | | 1,131,914 | | | $ | 11,853,288 | |
| Shares Redeemed | | | (56,762 | ) | | | (587,278 | ) |
| Redemption Fees | | | - | | | | 565 | |
| | | | 1,075,152 | | | $ | 11,266,575 | |
| Beginning Shares | | | - | | | | | |
| Ending Shares | | | 1,075,152 | | | | | |
| LoCorr Long/Short Equity Fund | | | | | | | | |
| Total Net Increase | | | | | | $ | 38,678,373 | |
1 Class A, Class C and Class I of the LoCorr Long/Short Equity Fund commenced operations on May 10, 2013.
LoCorr Managed Futures Strategy Fund and LoCorr Long/Short Commodities Strategy Fund - Notes to Consolidated Financial Statements (continued) LoCorr Long/Short Equity Fund - Notes to Financial Statements (continued) | | |
| | | 53 |
| | |
7. Federal Tax Information
At December 31, 2013, the components of accumulated earnings (losses) on a tax basis were as follows:
| | | | | | | | | | |
| | | LoCorr Managed | | | LoCorr Long/Short | | | | |
| | | Futures Strategy | | | Commodities Strategy | | | LoCorr Long/Short | |
| | | Fund | | | Fund | | | Equity Fund | |
| | | Year Ended | | | Year Ended | | | May 10, 20131 through | |
| | | December 31, 2013 | | | December 31, 2013 | | | December 31, 2013 | |
| Tax cost of investments | | $ | 312,674,465 | | | $ | 9,208,377 | | | $ | 37,742,205 | |
| | | | | | | | | | | | | |
| Gross unrealized appreciation | | | 1,706,713 | | | | 40,030 | | | | 4,199,290 | |
| Gross unrealized depreciation | | | (1,612,400 | ) | | | (85,728 | ) | | | (941,016 | ) |
| Net unrealized appreciation (depreciation) | | | 94,313 | | | | (45,698 | ) | | | 3,258,274 | |
| | | | | | | | | | | | | |
| Undistributed ordinary income | | | - | | | | - | | | | 169,671 | |
| Undistributed long-term capital gains | | | 349,733 | | | | - | | | | - | |
| Total distributable earnings | | $ | 349,733 | | | $ | - | | | $ | 169,671 | |
| Other accumulated losses | | $ | (40,927,371 | ) | | $ | (890,629 | ) | | $ | (46,026 | ) |
| Total accumulated earnings/(losses) | | $ | (40,483,325 | ) | | $ | (936,327 | ) | | $ | 3,381,919 | |
¹ Commencement of operations.
Undistributed income or net realized gains for financial statement purposes may differ from amounts recognized for federal income tax purposes due to differences in the recognition and characterization of income, expense and capital gain items. The difference between book-basis and tax-basis unrealized appreciation (depreciation) is primarily attributable to the tax deferral of losses on wash sales.
The following reclassifications were made within the components of net assets as of December 31, 2013:
| | | | | | | | | | | | | |
| | | Undistributed Net | | | Accumulated Net | | | | |
| | | Investment | | | Realized Gain | | | | |
| | | Income (Loss) | | | (Loss) | | | Paid-in Capital | |
| LoCorr Managed Futures Strategy Fund | | $ | 4,034,624 | | | $ | (15,609,555 | ) | | $ | 11,574,931 | |
| LoCorr Long/Short Commodities Strategy Fund | | | 165,132 | | | | 25,781 | | | | (190,913 | ) |
| LoCorr Long/Short Equity Fund | | | 148,250 | | | | (148,250 | ) | | | - | |
Under the current tax law, capital losses realized after October 31 may be deferred and treated as occurring on the first day of the following fiscal year. For the year ended December 31, 2013, the LoCorr Long/Short Commodities Strategy Fund elected to defer capital losses occurring between November 1, 2013 and December 31, 2013 in the amount of $8,184.
At December 31, 2013, accumulated net realized capital loss carryovers, if any, and the year(s) in which the capital loss carryovers expire were:
| | | | | |
| | | Capital Loss Carryover | | Year of |
| | | Short-Term | | | Long-Term | | Expiration |
| LoCorr Long/Short Commodities Strategy Fund | | $ | 28,387 | | | $ | 644 | | Indefinitely |
During the year ended December 31, 2013, none of the Funds utilized capital loss carryovers.
| | LoCorr Managed Futures Strategy Fund and LoCorr Long/Short Commodities Strategy Fund - Notes to Consolidated Financial Statements (continued) LoCorr Long/Short Equity Fund - Notes to Financial Statements (continued) |
54 |
| |
8. Subsequent Events
LoCorr Spectrum Income Fund
On January 1, 2014, the LoCorr Spectrum Income Fund, a new series of the Trust, commenced operations. The LoCorr Spectrum Income Fund’s primary investment objective is current income with capital appreciation as a secondary objective.
Information Statement (Unaudited)
On February 4, 2014, the LoCorr Long/Short Commodities Strategy Fund filed a Notice of Internet Availability of Information Statement (the “Notice”) with the SEC. The Notice presents only an overview of the more complete Information Statement that is available on the Internet relating to the LoCorr Long/Short Commodities Strategy Fund, a series of the Trust.
The Information Statement details a recent sub-adviser change related to the LoCorr Long/Short Commodities Strategy Fund. Specifically, the Board approved a new sub-advisory agreement on behalf of the LoCorr Long/Short Commodities Strategy Fund between Nuveen and LoCorr, the Adviser to the LoCorr Long/Short Commodities Strategy Fund.
The LoCorr Long/Short Commodities Strategy Fund, the Adviser and the Trust have received an exemptive order (the “Manager of Managers Order”) from the SEC effective as of September 11, 2012. The Manager of Managers Order permits the Adviser to enter into and materially amend sub-advisory agreements (with non-affiliated entities) with the approval of the Board, including a majority of Trustees who are not parties to the agreement and are not interested persons, as defined in the Investment Company Act of 1940, as amended, of the parties to the agreement, without obtaining shareholder approval. The Manager of Managers Order requires that the Information Statement be provided to the shareholders of the Fund.
The LoCorr Long/Short Commodities Strategy Fund and the Trust are notifying shareholders of the LoCorr Long/Short Commodities Strategy Fund that they are making the Information Statement available online in lieu of mailing a copy. The Information Statement may be printed and viewed on the LoCorr Long/Short Commodities Strategy Fund’s website at http://www.locorrfunds.com, until at least May 11, 2014. A shareholder may request a paper or email copy of the Information Statement, free of charge, by contacting the LoCorr Long/Short Commodities Strategy Fund in writing at LoCorr Long/Short Commodities Strategy Fund, c/o U.S. Bancorp Fund Services, LLC, P.O. Box 701, Milwaukee, WI 53201-0701 or by calling (toll-free) 1-855-523-8637 by May 11, 2014. If a shareholder does not request a paper or email copy by this date, a shareholder may not otherwise receive a copy.
A paper copy of the Information Statement is available upon request. There is no charge for requesting a copy.
| |
Audit Opinion - LoCorr Investment Trust | 55 |
| |
Report of Independent Registered
Public Accounting Firm
To the Shareholders and Board of Trustees
LoCorr Investment Trust
We have audited the accompanying consolidated statements of assets and liabilities of LoCorr Managed Futures Strategy Fund and LoCorr Long/Short Commodities Strategy Fund, including the consolidated schedules of investments and swap contracts, and the accompanying statement of assets and liabilities of LoCorr Long/Short Equity Fund, including the schedules of investments and securities sold short, each a series of LoCorr Investment Trust (the “Funds”), as of December 31, 2013, and the related consolidated statements of operations for the year then ended, the consolidated statements of changes in net assets for each of the two periods in the period then ended, and the consolidated financial highlights of LoCorr Managed Futures Strategy Fund and LoCorr Long/Short Commodities Strategy Fund for each of the periods presented in the period then ended and the related statements of operations, and changes in net assets, and the financial highlights for the period May 10, 2013 (commencement of operations) through December 31, 2013 for LoCorr Long/Short Equity Fund. These financial statements and financial highlights are the responsibility of the Funds’ management. Our responsibility is to express an opinion on the financial statements and financial highlights based on our audits.
We conducted our audits in accordance with the standards of the Public Company Accounting Oversight Board (United States). Those standards require that we plan and perform the audit to obtain reasonable assurance about whether the financial statements and financial highlights are free of material misstatement. An audit includes examining, on a test basis, evidence supporting the amounts and disclosures in the financial statements. Our procedures included confirmation of securities owned as of December 31, 2013, by correspondence with the custodian and brokers. An audit also includes assessing the accounting principles used and significant estimates made by management, as well as evaluating the overall financial statement presentation. We believe that our audits provide a reasonable basis for our opinion.
In our opinion, the consolidated financial statements and financial highlights of LoCorr Managed Futures Strategy Fund and LoCorr Long/Short Commodities Strategy Fund and the financial statements and financial highlights of LoCorr Long/Short Equity Fund referred to above present fairly, in all material respects, the financial position of each of the Funds constituting LoCorr Investment Trust as of December 31, 2013, and the results of their operations, changes in their net assets, and their financial highlights for the periods indicated above, in conformity with accounting principles generally accepted in the United States of America.
COHEN FUND AUDIT SERVICES, LTD.
Cleveland, Ohio
February 28, 2014
| |
56 | LoCorr Investment Trust - Expense Example (Unaudited) |
| |
Expense Example
December 31, 2013 (Unaudited)
As a shareholder of a mutual fund, you incur two types of costs: (1) transaction costs, including sales charges (loads) on purchase payments; redemption fees; and (2) ongoing costs, including management fees; distribution and/or service (12b-1) fees and other Fund expenses.
This Example is intended to help you understand your ongoing costs (in dollars) of investing in each of the Funds and to compare these costs with the ongoing costs of investing in other mutual funds. For the Funds, the Example is based on an investment of $1,000 invested at the beginning of the period and held for the entire period (July 1, 2013 through December 31, 2013).
Actual Expenses
The actual return columns in the following table provide information about account values based on actual returns and actual expenses. You may use the information in these columns, together with the amount you invested, to estimate the expenses that you paid over the period. Simply divide your account value by $1,000 (for example, an $8,600 account value divided by $1,000 = 8.6), then multiply the result by the number in the first line under the heading entitled “Expenses Paid During Period” to estimate the expenses you paid on your account during this period. The only transaction fees you may be required to pay are for outgoing wire transfers, returned checks and stop payment orders at prevailing rates charged by U.S. Bancorp Fund Services, LLC, the Funds’ transfer agent. These fees are assessed on all accounts, as applicable. If you request that a redemption be made by wire transfer, currently the Funds’ transfer agent charges a $15.00 fee. The Funds’ transfer agent charges a transaction fee of $25.00 on returned checks and stop payment orders. If you paid a transaction fee, you would add the fee amount to the expenses paid on your account this period to obtain your total expenses paid.
Hypothetical Example for Comparison Purposes
The hypothetical return columns in the following table provide information about hypothetical account values and hypothetical expenses based on the Funds’ actual expense ratio and an assumed rate of return of 5% per year before expenses, which is not the Funds’ actual return. The hypothetical account values and expenses may not be used to estimate the actual ending account balance or expenses you paid for the period. You may use this information to compare the ongoing costs of investing in the Funds and other funds. To do so, compare this 5% hypothetical example with the 5% hypothetical examples that appear in the shareholder reports of the other funds. A transaction fee of $15.00 may be assessed on outgoing wire transfers and a transaction fee of $25.00 may be assessed on returned checks and stop payment orders. To include this fee in the calculation, you would add the estimated transaction fee to the hypothetical expenses shown in the table. Please note that the expenses shown in the table are meant to highlight your ongoing costs only and do not reflect the transaction fees discussed above. Therefore, those columns are useful in comparing ongoing costs only, and will not help you determine the relative total costs of owning different funds. In addition, if these transactional costs were included, your costs would have been higher.
Actual vs. Hypothetical Returns
Actual vs. Hypothetical Returns for the Six Months Ended December 31, 2013 (Unaudited)
| | | | | | | | | | |
| | | Fund’s Annualized Consolidated Expense Ratio | | Beginning Account Value 07/01/2013 | | Ending Account Value 12/31/2013 | | Consolidated Expenses Paid During Period1 |
| LoCorr Managed Futures Strategy Fund – Class A |
| Actual | | 2.13% | | $1,000.00 | | $ | | | |
Hypothetical2 | | | | $1,000.00 | | $ | | | |
| LoCorr Managed Futures Strategy Fund – Class C |
| Actual | | | | $1,000.00 | | $ | | | |
Hypothetical2 | | | | $1,000.00 | | $ | | | |
| LoCorr Managed Futures Strategy Fund – Class I |
| Actual | | | | $1,000.00 | | $ | | | |
Hypothetical2 | | | | $1,000.00 | | $ | | | |
1 Expenses are equal to the Fund’s annualized expense ratio multiplied by the average account value over the period, multiplied by 184 days and divided by 365 to reflect the period of July 1, 2013 through December 31, 2013.
2 Hypothetical assumes a 5% return.
| |
LoCorr Investment Trust - Expense Example (Unaudited) (continued) | 57 |
| |
Actual vs. Hypothetical Returns for the Six Months Ended December 31, 2013 (Unaudited)
| | | | | | | | | | |
| | | Fund’s Annualized Consolidated Expense Ratio | | Beginning Account Value 07/01/2013 | | Ending Account Value 12/31/2013 | | Consolidated Expenses Paid During Period1 |
LoCorr Long/Short Commodities Strategy Fund – Class A |
| Actual | | | | $1,000.00 | | $ | | | |
Hypothetical2 | | | | $1,000.00 | | $ | | | |
LoCorr Long/Short Commodities Strategy Fund – Class C |
| Actual | | | | $1,000.00 | | $ | | | |
Hypothetical2 | | | | $1,000.00 | | $ | | | |
LoCorr Long/Short Commodities Strategy Fund – Class I |
| Actual | | | | $1,000.00 | | $ | | | |
Hypothetical2 | | | | $1,000.00 | | $ | | | |
1 Expenses are equal to the Fund’s annualized expense ratio multiplied by the average account value over the period, multiplied by 184 days and divided by 365 to reflect the period of July 1, 2013 through December 31, 2013.
2 Hypothetical assumes a 5% return.
Actual vs. Hypothetical Returns for the Six Months Ended December 31, 2013 (Unaudited)
| | | | | | | | | | |
| | | Fund’s Annualized Expense Ratio | | Beginning Account Value 07/01/2013 | | Ending Account Value 12/31/2013 | | Expenses Paid During Period1 |
LoCorr Long/Short Equity Fund – Class A |
| | | | $1,000.00 | | $ | | | |
| | | | $1,000.00 | | $ | 1,008.77 | | |
LoCorr Long/Short Equity Fund – Class C |
| | | | $1,000.00 | | $ | | | |
| | | | $1,000.00 | | $ | | | |
LoCorr Long/Short Equity Fund – Class I |
| | | | $1,000.00 | | $ | | | |
| | | | $1,000.00 | | $ | | | |
1 Expenses are equal to the Fund’s annualized expense ratio multiplied by the average account value over the period, multiplied by 184 days and divided by 365 to reflect the period of July 1, 2013 through December 31, 2013.
2 Includes 0.11% of dividend and interest expense on securities sold short.
3 Hypothetical assumes a 5% return.
| |
58 | Approval of Advisory Agreements (Unaudited) |
| |
LoCorr Investment Trust
December 31, 2013 (Unaudited)
LoCorr Long/Short Commodities Strategy Fund
Consideration and Approval of Sub-Advisory Agreement
At a meeting of the Board of Trustees held November 18, 2013 (the “November 2013 Meeting”), the Board of Trustees approved Nuveen Asset Management, LLC (“NAM”) to replace Galliard as sub-adviser to the Fund. At the November 2013 Meeting, the Board of Trustees, including a majority of the Trustees who are not “interested persons” of the Trust within the meaning of the 1940 Act (the “Independent Trustees”), reviewed the various factors relevant to its consideration of the Sub-Advisory Agreement and the Board of Trustees’ legal responsibilities related to such consideration. After analysis and discussions of the factors identified below, the Board of Trustees, including a majority of the Independent Trustees, approved the Sub-Advisory Agreement for an initial two-year term.
Nature, Extent and Quality of Services Provided by Nuveen Asset Management, LLC to the Fund: The Trustees considered the nature, extent and quality of services to be provided by NAM to the Fund. The Trustees considered NAM’s specific responsibilities in all aspects of day-to-day management of a portion of the Fund’s assets, as well as the qualifications, experience and responsibilities of Chris J. Neuharth, CFA, who would serve as the portfolio manager for the segment of the Fund’s assets managed by NAM, and other key personnel at NAM. With respect to regulatory concerns, the Trustees noted that counsel had reviewed NAM’s Form ADV and reported that there was nothing disclosed that would impact NAM’s ability to service the Fund. The Trustees noted their familiarity with NAM as sub-adviser to another series of the Trust and agreed that over the three year tenure of the Trust’s relationship with NAM they were very satisfied with the services provided by the entire organization. The Trustees concluded that NAM had sufficient quality and depth of personnel, resources, investment methods and compliance policies and procedures essential to performing its duties under the Sub-Advisory Agreement and that the nature, overall quality and extent of the management services to be provided to the Fund were satisfactory and reliable.
Investment Performance of NAM: In assessing the portfolio management services to be provided by NAM, the Board considered the qualifications, background and experience of the portfolio manager. The Trustees reviewed performance of NAM as sub-adviser to another series of the Trust, the LoCorr Managed Futures Strategy Fund, noting its relevance because the Fund’s investment strategy would be repositioned following the sub-adviser transition to track the LoCorr Managed Futures Strategy Fund. They noted the sub-adviser’s outperformance over the one-year and since inception (March 22, 2011) periods with returns of 0.66% versus the Barclay’s Capital 1-5 Year Government/Credit Index returns of 0.35%, and 1.97% versus 1.82%, respectively. The Trustees concluded that NAM has the ability to provide adequate management services and may provide positive returns to the Fund.
Costs of Services Provided and Profitability to be Realized: The Trustees reviewed and considered the sub-advisory fees payable by the Adviser to NAM under the Sub-Advisory Agreement. The Trustees noted positively that the overall advisory fee paid by the Fund would not increase as a result of the change in sub-adviser. They reviewed the proposed sub-advisory fee noting that the fee provided was based on an estimate of the weighted average of the Fund’s assets, and as the Fund’s assets increase NAM’s fee may decrease proportionately, based on an incremental fee schedule. They noted that the fee is competitive as compared to the fees charged by NAM to its other account clients. The Trustees noted positively that the change in sub-adviser would not negatively impact shareholders through increased fees. Based on all factors considered, the Trustees concluded that the sub-advisory fees to be paid to NAM by the Adviser were reasonable in light of the services to be provided under the Sub-Advisory Agreement. With respect to profitability, the Trustees reviewed the profitability analysis provided by NAM and noted that NAM anticipates realizing a net loss during the first year. The Trustees concluded that NAM’s anticipated profitability was not unreasonable.
Benefits Derived from the Relationship with the Fund: The Trustees considered whether NAM would receive any additional direct and/or indirect benefits in connection with its relationship with the Fund. They noted NAM does not anticipate receiving any such benefits, such as brokerage commissions or soft dollars, outside the sub-advisory fee. The Trustees concluded that the benefits that NAM may receive appear to be reasonable, and in many cases benefit the Fund.
Extent of Economies of Scale to be Realized: The Trustees considered whether there will be economies of scale with respect to the management of the Fund. The Trustees agreed that this was an adviser level issue and should be considered with respect to the overall advisory contract, taking into consideration the impact of the sub-advisory fee.
The Trustees noted that the recommendation to hire NAM was made by the Adviser in the ordinary course of its ongoing evaluation of its sub-advisers. Importantly, they considered, the recommendation to hire NAM to manage a portion of the Fund’s assets was based on an evaluation of the qualifications of NAM’s investment personnel, investment philosophy and process and long-term performance results, among others factors, including the Adviser’s analysis that NAM’s investment strategy is beneficial to the Fund, and is therefore beneficial to shareholders of the Fund.
Conclusions: No single factor was determinative in the Trustees’ decision to approve the Sub-Advisory Agreement, but rather the Trustees based their determination on the total mix of information available. Based on a consideration of all the factors in their totality, the Trustees determined that the Sub-Advisory Agreement, including the sub-advisory fees, was fair and reasonable. The Board of Trustees, therefore, determined that the approval of Sub-Advisory Agreement for the Fund would be in the best interest of the Fund and its shareholders.
| |
Notice of Privacy Policy & Practices / Quarterly Portfolio Holdings/Proxy | 59 |
| |
Notice of Privacy Policy & Practices
(Unaudited)
Your privacy is important to us. The Funds are committed to maintaining the confidentiality, integrity, and security of your personal information. When you provide personal information, the Funds believe that you should be aware of policies to protect the confidentiality of that information.
The Funds collect the following nonpublic personal information about you:
● Information we receive from you on or in applications or other forms, correspondence, or conversations, including, but not limited to, your name, address, phone number, social security number, assets, income, and date of birth; and
● Information about your transactions with us, our affiliates, or others, including, but not limited to, your account number and balance, payments history, parties to transactions, cost basis information, and other financial information.
The Funds do not disclose any nonpublic personal information about our current or former shareholders to affiliated or nonaffiliated third parties, except as permitted by law. For example, the Funds are permitted by law to disclose all of the information we collect, as described above, to our transfer agent to process your transactions. Furthermore, the Funds restrict access to your nonpublic personal information to those persons who require such information to provide products or services to you. The Funds maintain physical, electronic, and procedural safeguards that comply with applicable federal and state standards to guard your nonpublic personal information.
In the event that you hold shares of the Funds through a financial intermediary, including, but not limited to, a broker-dealer, bank, or trust company, the privacy policy of your financial intermediary would govern how your nonpublic personal information would be shared with affiliated or non-affiliated third parties.
Quarterly Form N-Q portfolio schedule
(Unaudited)
The Funds file their complete schedule of portfolio holdings with the Securities and Exchange Commission (“SEC”) for the first and third quarters of each fiscal year on Form N-Q. The Funds’ Forms N-Q are available on the SEC’s website at http://www.sec.gov. The Funds’ Forms N-Q may be reviewed and copied at the SEC’s Public Reference Room in Washington, D.C. Information on the operation of the SEC’s Public Reference Room may be obtained by calling 1-800-SEC-0330. Additionally, you may obtain copies of Forms N-Q from the Funds upon request by calling 1-855-523-8637.
Proxy voting policies, procedures and record
(Unaudited)
You may obtain a description of the Funds’ (1) proxy voting policies, (2) proxy voting procedures and (3) information regarding how the Funds voted any proxies related to portfolio securities during the most recent 12-month period ended June 30 for which an SEC filing has been made, without charge, upon request by contacting the Funds directly at 1-855-523-8637, or on the EDGAR Database on the SEC’s website (http:// www.sec.gov).
| |
60 | Independent Trustees/Interested Trustees and Officers (Unaudited) |
| |
The Statement of Additional Information includes additional information about the Independent Trustees/Interested Trustees and Officers and is available, without charge, by calling 1-855-523-8637.
| Independent Trustees |
| Name, Address | Position/Term | Principal Occupation | Number of Portfolios | Other Directorships |
| and Year of Birth | of Office1 | During the Past 5 Years | in Fund Complex2 | held by Trustee |
| | | | Overseen by Trustee | During the Past 5 |
| | | | | Years |
Ronald A. Tschetter Year of Birth: 1941 | Trustee/ January 2011 to present | Mr. Tschetter is presently retired from his principal occupation; Director of the U.S. Peace Corps, September 2006 to January 2009. | 4 | None |
James W. Morton Year of Birth: 1939 | Trustee/ January 2011 to present | Chairman of the Board, Fidelity Bank (community bank), 2008 to present, President 1978 to 2008. | 4 | None |
Mark Thompson Year of Birth: 1959 | Trustee/ December 2011 to present | Chairman and Chief Manager, Riverbridge Partners, LLC (investment management), 1987 to present. | 4 | None |
| Interested Trustees and Officers | | | |
| Name, Address | Position/Term | Principal Occupation | Number of Portfolios | Other Directorships |
| and Year of Birth | of Office1 | During the Past 5 Years | in Fund Complex2 | held by Trustee |
| | | | Overseen by Trustee | During the Past 5 |
| | | | | Years |
Jon C. Essen3 Year of Birth: 1963 | Treasurer, Secretary, Chief Compliance Officer/January 2011 to present; Trustee/November, 2010 to present | Chief Operating Officer and Chief Compliance Officer of LoCorr Fund Management, LLC, November 2010 to present; Senior Vice President, Chief Operating Officer and Registered Representative of Octavus Group, LLC (broker/dealer), April 2008 to present; Chief Operating Officer of Hennessey Financial, LLC (commercial finance), May 2002 to April 2008. | 4 | None |
Kevin M. Kinzie4 Year of Birth: 1956 | President, Trustee/ January 2011 to present | Chief Executive Officer of LoCorr Fund Management, LLC, November 2010 to present; President and Chief Executive Officer of Octavus Group, LLC (broker/dealer), March 2002 to present. | 4 | None |
1The term of office for each Trustee listed above will continue indefinitely.
2The term “Fund Complex” refers to the LoCorr Investment Trust.
3Mr. Essen is an interested Trustee because he is an officer of the Funds’ Adviser.
4Mr. Kinzie is an interested Trustee because he is an officer and indirect controlling interest holder of the Funds’ Adviser.
This page left intentionally blank.
This page left intentionally blank.
Item 2. Code of Ethics.
The registrant has adopted a code of ethics that applies to the registrant’s principal executive officer and principal financial officer. The registrant has not made any amendments to its code of ethics during the period covered by this report. The registrant has not granted any waivers from any provisions of the code of ethics during the period covered by this report.
Item 3. Audit Committee Financial Expert.
The registrant’s Board of Trustees has determined that it does not have an audit committee financial expert serving on its Audit Committee. At this time, the registrant believes that the experience provided by each member of the Audit Committee together offers the registrant adequate oversight for the registrant’s level of financial complexity.
Item 4. Principal Accountant Fees and Services.
The registrant has engaged its principal accountant to perform audit services, audit-related services, tax services and other services during the past two fiscal years. “Audit services” refer to performing an audit of the registrant's annual financial statements or services that are normally provided by the accountant in connection with statutory and regulatory filings or engagements for those fiscal years. “Audit-related services” refer to the assurance and related services by the principal accountant that are reasonably related to the performance of the audit. “Tax services” refer to professional services rendered by the principal accountant for tax compliance, tax advice, and tax planning. “Other services” provided by the principal accountant of $3,500 and $2,500 represent a cursory review of the semi-annual report for LoCorr Investment Trust for the periods ended June 30, 2013 and June 30, 2012, respectively. The following table details the aggregate fees billed or expected to be billed for each of the last two fiscal years for audit fees, audit-related fees, tax fees and other fees by the principal accountant.
The Audit Committee has adopted pre-approval policies and procedures that require the Audit Committee to pre-approve all audit and non-audit services of the registrant, including services provided to any entity affiliated with the registrant.
The percentage of fees billed by Cohen Fund Audit Services, Ltd. applicable to non-audit services pursuant to waiver of pre-approval requirement were as follows:
All of the principal accountant’s hours spent on auditing the registrant’s financial statements were attributed to work performed by full-time permanent employees of the principal accountant.
Item 5. Audit Committee of Listed Registrants.
Not applicable to registrants who are not listed issuers (as defined in Rule 10A-3 under the Securities Exchange Act of 1934).
Item 6. Investments.
Item 7. Disclosure of Proxy Voting Policies and Procedures for Closed-End Management Investment Companies.
Not applicable to open-end investment companies.
Item 8. Portfolio Managers of Closed-End Management Investment Companies.
Not applicable to open-end investment companies.
Item 9. Purchases of Equity Securities by Closed-End Management Investment Company and Affiliated Purchasers.
Not applicable to open-end investment companies.
Item 10. Submission of Matters to a Vote of Security Holders.
There have been no material changes to the procedures by which shareholders may recommend nominees to the registrant’s Board of Trustees.
Item 11. Controls and Procedures.
Item 12. Exhibits.
Filed herewith.
Filed herewith.
Furnished herewith.
Pursuant to the requirements of the Securities Exchange Act of 1934 and the Investment Company Act of 1940, the registrant has duly caused this report to be signed on its behalf by the undersigned, thereunto duly authorized.
Pursuant to the requirements of the Securities Exchange Act of 1934 and the Investment Company Act of 1940, this report has been signed below by the following persons on behalf of the registrant and in the capacities and on the dates indicated.