As filed with the Securities and Exchange Commission on March 8, 2017
UNITED STATES
SECURITIES AND EXCHANGE COMMISSION
Washington, D.C. 20549
FORM N-CSR
CERTIFIED SHAREHOLDER REPORT OF REGISTERED
MANAGEMENT INVESTMENT COMPANIES
Investment Company Act file number 811-22509
LoCorr Investment Trust
(Exact name of registrant as specified in charter)
261 School Avenue, 4th Floor
Excelsior, MN 55331
(Address of principal executive offices) (Zip code)
CT Corporation System
1300 East Ninth Street
Cleveland, OH 44114
(Name and address of agent for service)
952.767.2920
Registrant’s telephone number, including area code
Date of fiscal year end: December 31
Date of reporting period: December 31, 2016
Item 1. Reports to Stockholders.

Letter to Shareholders
LoCorr Funds seek to provide investments that, over time, will have low correlation to traditional asset classes such as stocks and bonds. We believe that adding low correlating investments to portfolios can significantly reduce the overall portfolio risk while enhancing returns. Correlation measures the degree to which the returns of two investments move together over time. LoCorr offers products that provide the potential for positive returns in rising or falling markets and are designed to resist correlation with traditional stock, bond and commodity investments. In this report, LoCorr Funds are reporting on six mutual funds: LoCorr Managed Futures Strategy Fund, LoCorr Long/Short Commodities Strategy Fund, LoCorr Multi-Strategy Fund, LoCorr Market Trend Fund, LoCorr Long/Short Equity Fund and LoCorr Spectrum Income Fund (collectively, the “Funds”).
LoCorr Managed Futures Strategy Fund
The LoCorr Managed Futures Strategy Fund (the “Managed Futures Fund” or the “Fund”) seeks capital appreciation as its primary investment objective with managing volatility as a secondary objective. The Managed Futures Fund attempts to achieve its objective by investing in two main strategies – a Managed Futures Strategy and a Fixed Income Strategy.
In March, the Fund was restructured to reduce overall fees including the elimination of incentive fees and the use of the total return swap, increasing transparency, and improving tax efficiency while maintaining LoCorr’s goal of offering investors access to what we believe are some of the premier commodity trading advisors (“CTAs”) in the world.
The Fund invests a portion of its total assets into a portfolio of globally diversified managed futures positions. The Fund employs three sub-advisers to manage the Managed Futures Strategy: Millburn Ridgefield Corporation (“Millburn”), Graham Capital Management, LLC (“Graham”), and Revolution Capital Management, LLC (“Revolution”). Millburn traces its roots back to 1971 and manages approximately $2.7 billion in assets. Graham was founded in 1994 and manages about $12.9 billion in assets. Revolution was founded in 2004 and manages approximately $748 million in assets.
Millburn manages a portfolio for the Fund that is similar to its Millburn Diversified Program which commenced operations in 1977. Millburn invests in a diversified portfolio of global futures contracts by combining non-traditional and trend-following strategies in a systematic multi-factor approach. Graham manages a portfolio for the Fund that is similar to its Tactical Trend strategy, a systematic medium- to long-term trend following program that commenced trading in 2006. Revolution manages a strategy for the Fund that is similar to its Alpha Program that has been available in a managed account program since 2007. Revolution employs a short- to medium-term pattern recognition strategy that incorporates trend reversion and counter-trend signals.
Overall, the Fund was one of the best-performing managed futures funds in the category (category average was -2.75% and the Fund was 9.44% better) for the one year period ended December 31, 2016. The Fund’s Class I share gained +6.68% in 2016, led by strong gains from trading in Interest rate and Equity and to a lesser extent Foreign Currency markets. Trading in Commodities was unprofitable. With conditions challenging for traditional trend followers, the Fund’s diversification and blend of three complementary managers was particularly beneficial during this period and helped to drive its strong year-to-date results. The Fund performed well during periods of market stress in 2016. For example, in January the Fund gained +4.64% as the S&P 500 Total return Index (“S&P 500”) declined -4.96%. In the two-day period (June 24th – June 27th) following Brexit, the Fund gained +3.86% versus a -5.34% decline for the S&P 500.
Managed Futures Strategy
Interest Rates
Recurring concerns about global growth, persistently low inflation, accommodative global monetary policy, and periodic “flights to safety” generated strong demand for government securities which kept yields low in the first half of the year. Starting at mid-year, however, interest rates began to move higher as evidence began to mount that global growth and inflation were picking up. Later in the year, rates following Donald Trump’s surprise victory in the U.S. Presidential election and the Federal Reserve hiked rates by ¼ point as expected in December but indicated it was expecting three rate hikes in 2017. Overall, rates increased approximately +100 basis points between early July and mid-December.
Trading in Interest Rates was extremely profitable for the Fund during 2016. The Fund’s long positions during the first half of the year generated substantial gains due to declining yields through the end of June. The Fund’s Interest Rate exposure shifted between long and short as yields rose during the 2nd half of the year and the models adapted to the change in market conditions.
Foreign Currencies
Foreign Currency trading was profitable in 2016, as positioning shifted from long U.S. dollar early in the year to short and then back to long due to the volatility in the foreign exchange markets. The dollar opened the year on a strong note as investors searched for “safety”, oil prices declined, and due to the Federal Reserve’s “relatively hawkish” policy position. Thereafter, through mid-year, the dollar weakened in volatile trading reflecting the Fed’s delays in raising official interest rates due to sluggish economic activity. Following the surprise decision of the British electorate to leave the European Union (the “EU”), a “flight to safety” and quality prompted an upward U-turn for the dollar. After trading sideways for the remainder of the summer, the dollar moved higher from late September through year-end as U.S. economic data improved, Trump’s victory in the election, and the Fed interest rate hike.
Equity Indices
Global equity markets generally advanced during the year. The year was marked by periods of heightened volatility including the sharp sell-off from January through mid-February as weak economic data out of China, the collapse in oil prices, and worries about a Fed rate hike contributed to a renewed rout in Chinese equities and the yuan and led to risk-off global market conditions. Following a V-shaped recovery from the February lows, volatility re-emerged in June when U.K. voters unexpectedly voted to exit the EU (“Brexit”). Finally, market conditions became choppy in October and early November leading up to the U.S. elections. Though the Fund was short Equities at various points in time, its long bias throughout much of 2016 proved profitable.
Commodities
Commodity markets were particularly challenging for most CTAs during 2016. In the oil markets, crude slumped to approximately $27 per barrel in January as production was at or near record levels in many countries, Iranian exports were ramping up, and global demand was relatively sluggish. Reports that Saudi Arabia, Russia and a number of other producers were discussing plans for a production freeze sparked a rebound to roughly $40 per barrel during the spring. While an agreement wasn’t reached in April, WTI crude vacillated sharply between $40 and $50 per barrel until early December. On November 30th, the Organization of the Petroleum Exporting Countries (“OPEC”) announced a production cut that was larger than expected and non-OPEC countries including Russia also announced production cuts. As a result, crude prices spiked upward by 9-10%. The bulk of the Fund’s losses in the Commodities sector were from unprofitable trading in the Energy markets.
Elsewhere in the Commodities markets, trading in metals was unprofitable during 2016 with losses from both industrial and precious metal positions where positions fluctuated between long and short during the year. Trading in agricultural commodities was also unprofitable during the period.
Outlook
Looking forward to 2017 and beyond, we believe that the coupling of a new administration and a rate-hike-inclined Federal Reserve portend significant changes to come. Relative to the last seven years, which was characterized by a slow but steady economic recovery, low interest rates, and a steadily-rising stock market, the next few years seems more likely to be characterized by disruption. Whether these conjectured disruptive events are good or bad for the economy remains to be seen, but we believe it likely that the current market equilibria will be significantly upended in the near- to medium-term. In turn, this should increase the probability of a favorable environment for directional, futures-based strategies.
We believe the Managed Futures Fund has demonstrated an ability to perform in a variety of market environments including when equity markets are trending higher and sought reduced volatility during periods of market stress. Due to the diversified and complementary nature of this multi-manager fund, we expect it to generate “smoother” and less volatile returns than single manager peers with the potential to excel in a variety of market environments.
Fixed Income Strategy
The Managed Futures Fund invests most of its remaining assets in a Fixed Income Strategy comprised of short to intermediate term investment grade corporate and government agency securities. Nuveen Asset Management, LLC (“Nuveen”) is the sub-adviser for this strategy and manages a shorter duration, high quality portfolio.
The fixed income component of the Fund is managed against the Barclays 1-5 Government Credit Index. Returns for the fixed income portion of the portfolio in 2016 were +1.67% compared to +1.56% for the benchmark. The duration of the portfolio was managed between 1.7 and 2.0 years during the period versus approximately 2.7 years for the benchmark. Nuveen’s decision to position the portfolio’s duration defensively over the time period accounted for the portfolio’s underperformance versus the benchmark during the first half of the year, but contributed to its outperformance in the second half of 2016 as rates increased. Sector-wise, the portfolio was positioned with between a 40%-45% weighting to investment grade corporate bonds along with 35-40% aggregate weighting to high quality, short duration securitized instruments. The portfolio’s corporate bond issuer exposure was well diversified with modest overweighting in both Financials and Industrials. Given strong returns for non-government securities, Nuveen’s sector strategy was beneficial to investment returns during the reporting period.
The U.S. economy continued to expand at fairly moderate pace in 2016. Consumption was solid while trade and capital spending showed signs of improvement in the second half of the year following a sluggish first half. The global growth environment improved; Europe rebounded from Brexit-related fears while emerging market growth benefitted from an uptick in commodity prices and generally stable currencies. Chinese growth stabilized above 6.5% amid accommodative policy and strong investment. Domestic inflationary pressures were fairly subdued; despite ongoing U.S. job gains, there were no persistent signs of wage pressures as 2016 progressed. During the first half of the year, the European Central Bank (the “ECB”) expanded its quantitative easing (“QE”) program to allow for the purchase of corporate bonds and also lowered policy rates further into negative territory. Though the Fed continued to prepare the markets for further rate hikes, it ultimately dialed back its rate forecasts at the June Federal Open Market Committee meeting as labor markets cooled and expectations for growth shifted lower. Interest rates drifted higher and investor risk appetite improved as June’s Brexit-induced “flight to quality” subsided. Stocks moved gradually higher and fixed income credit spreads ground tighter amid solid fundamentals and strong demand from foreign buyers looking to invest in higher yielding U.S. securities. These market conditions largely prevailed until early November, when the outcome of the U.S. presidential election materially changed the landscape for U.S. financial markets. At the short end of the yield curve, rates for two-year and five-year Treasuries increased by approximately 40 basis points and 75 basis points, respectively, during the second half of the year. Investment-grade corporate bonds performed well in the “risk on” market environment with energy and basic material sectors continuing their outperformance on the back of higher commodity prices.
Looking ahead, Nuveen expects moderate economic growth in the U.S. economy through the first half of 2017, but with upside possible if fiscal stimulus becomes a reality. Global growth prospects appear to be improving due to continued policy accommodation and stabilizing commodity prices. The Fed is expected to follow economic developments, not lead them. Nuveen’s current forecast calls for two policy rate increases by the Fed in 2017, mostly coming in the second half of the year. Policymakers may be wary of excessive tightening in financial conditions, which should keep rates from rising too dramatically and consequently provide a stable technical backdrop for the fixed-income markets. Given its Fed outlook, Nuveen expects to manage the portfolio’s duration defensively versus the benchmark. Nuveen anticipates U.S. corporate bonds to continue to perform well, with spreads remaining firm on the prospects of credit-friendly policy, stable credit metrics, and positive market technical.
LoCorr Long/Short Commodities Strategy Fund
The LoCorr Long/Short Commodities Strategy Fund (the “Long/Short Commodities Fund” or the “Fund”) provides investors with access to a commodities futures strategy in a mutual fund structure. Investors who invest in long-only commodities rely on rising commodity prices to generate positive returns. Of course, commodity prices don’t always appreciate and occasionally experience sharp declines as was seen in 2014 and 2015. The Long/Short Commodities Fund has shown the ability to profit while commodity prices increase or decrease. The Long/Short Commodities Fund’s primary investment objective is capital appreciation in rising and falling commodities markets. The Long/Short Commodities Fund attempts to achieve its investment objective by investing in two primary strategies – a Commodities Strategy and a Fixed Income Strategy.
The Fund accesses, via a total return swap agreement, the returns of Millburn’s Commodity Program (“Milcom”), which began trading in 2005, and the returns of J E Moody & Company Commodity Relative Value Program (“JEM CRV”), which began trading in 2006. Milcom employs a systematic trading strategy that takes outright long/short positions and calendar spread positions across 45+ commodity futures markets. JEM CRV was added to the Fund during 2016 and employs a market neutral, systematic trading strategy that invests in calendar spread positions across 20+ commodity markets.
The Fund’s Class I shares declined -2.67% during the year ended December 31, 2016. Heading into December, the Fund’s year-to-date performance remained positive, but negative results from directional trading in Energy and Metals during the month were substantial enough to bring the Fund’s 2016 return into negative territory. J E Moody contributed positive absolute returns for the Fund since being added in June while Milcom returns were negative for the calendar year. During the year, the Fund benefitted from profitable trading in calendar spreads and directional trading in Grains. Losses occurred primarily from directional trading in Metals and Energy.
Commodities Strategy
Grains
Trading in Grains was profitable during the year. Long positions in soybeans and soybean meal were profitable during the second quarter as bad weather in Brazil and Argentina underpinned prices. Short corn positions were profitable as inventories reached 30-year highs and worldwide grain production surged. Spread trading in corn was also profitable as spread positions benefitted from confirmation that yields would be strong. Calendar spread trading of cattle was profitable as consumer beef demand proved favorable.
Energy
Directional trading in the Energy markets was unprofitable though these losses were partially offset by gains in calendar spread trading. For example, calendar spread positions in the 2nd half of the year in Reformulated Gasoline Blendstock for Oxygen Blending unleaded gasoline was profitable due to supply disruptions caused by a refinery outage and issues with the Colonial pipeline.
In the oil markets, crude slumped to approximately $27 per barrel in January as production was at or near record levels in many countries, Iranian exports were ramping up, and global demand was relatively sluggish. Reports that Saudi Arabia, Russia and a number of other producers were discussing plans for a production freeze sparked a rebound to roughly $40 per barrel during the spring. While an agreement wasn’t reached in April, West Texas Intermediate crude vacillated sharply between $40 and $50 per barrel until early December. On November 30th, OPEC announced a production cut that was larger than expected and non-OPEC countries including Russia also announced production cuts. As a result, crude prices spiked upward by 9-10%.
Softs
Trading in Softs was flat during the year as directional trading in cocoa was unprofitable, especially long trades in January. Directional trading in sugar was also unprofitable during the year. While positioning shifted between short and long, trading in Arabica coffee positions were unprofitable. Spread trading in softs was profitable and a long crude palm oil position generated gains during the fourth quarter as prices rose following the OPEC production cut agreement.
Metals
Trading in Metals was unprofitable during the year. Industrial metals price volatility during the year reflected uncertain economic developments, especially in China, as well as fluctuations in the U.S. dollar and energy prices. Trading in copper, aluminum, lead, nickel, palladium, platinum and silver were unprofitable. On the other hand, gains were made from trading in gold where positions shifted between long and short during the year. Trading in zinc was also profitable.
Outlook
We enter 2017 with many unanswered questions. Will Trump successfully move forward with actual tax, infrastructure, and regulatory policies that could lead to improved growth and inflation? Will the oil production control agreement between OPEC and non-OPEC producers actually result in a rebalancing of the energy markets? Will China find a way to deal with their debt and yuan problems as they prepare to convene their 19th Party Congress next fall, while still providing stable growth, labor and financial markets? Will the Federal Reserve, after a year of delays, follow the anticipated path to policy normalization? Will Europe’s political situation be more stable or unstable after the important 2017 elections in the Netherlands, France and Germany? Finally, what unexpected political and terrorist events will shake the financial world in 2017? As market participants search for and respond to the answers to these questions, it seems probable that capital flows from market to market and from country to country will generate price activity that can be beneficial to quantitative, systematic approaches to trading global markets. With respect to calendar spread trading, we expect opportunities across markets to continue, with increasing tradable volatility in the forward curves as optimism for global demand strengthens and the supply chain tightens.
Fixed Income Strategy
The Long/Short Commodities Fund invests most of its remaining assets in a Fixed Income Strategy comprised of short to intermediate term investment grade corporate and government agency securities. Nuveen is the sub-adviser for this strategy and manages a shorter duration, high quality portfolio.
The fixed income component of the Long/Short Commodities Fund’s portfolio is managed against the Barclays 1-5 Government Credit Index. Returns for the fixed income portion of the portfolio were +1.55% compared to +1.56% for the benchmark in 2016. The duration of the fixed income component of the Fund was managed between 1.5 and 2.0 years during the period compared to about 2.7 years for the benchmark. Nuveen’s decision to position the Fund’s duration defensively versus the benchmark contributed positively to returns during the second half of the year as yields rose. The Fund held approximately 40-45% exposure to investment grade corporate bonds and about 35% in securitized product. Within the corporate sector, Nuveen continues to focus on diversifying issuer exposure and maintaining above market weights to both Industrials and Financials.
LoCorr Multi-Strategy Fund
The LoCorr Multi-Strategy Fund (the “Multi-Strategy Fund” or the “Fund”) commenced operations in early April 2015. The Fund’s objective is capital appreciation and it invests in securities that are expected to produce a competitive level of current income. The Fund was launched in part due to demand for a Fund that would include a variety of our alternative investment strategies into one investment. Currently, the Fund’s exposure is allocated approximately equally between an equity-oriented portfolio and managed futures driven portfolio. The equity-oriented allocation is comprised of an income-oriented strategy and a long/short strategy while the managed futures allocation is comprised of a diversified multi-asset managed futures strategy and a long/short commodities strategy.
Portfolio Update
The Fund’s Class I shares gained +1.60 during the year ended December 31, 2016. During the year, the Fund benefited from strong performance from its equity-oriented manager allocations that was partially offset by losses from the managed futures allocation.
Income Strategy
The income portfolio is sub-advised by Trust and Fiduciary Income Partners, LLC (“TFIP”) which has managed a similar strategy, through a predecessor firm since 2001. The TFIP portfolio was up solidly for the year primarily attributable to positions in Closed End Funds (“CEFs”), Preferred Stocks, Equity Real Estate Investment Trusts (“REITs”) and Business Development Companies (“BDCs”). These gains were partially offset by losses from Master Limited Partnerships (“MLPs”) and Mortgage REIT holdings. Thematically, portfolio positioning shifted from a defense posture early in the year to a portfolio that was positioned to potentially benefit from emerging signs of reflation. Please refer to the commentary below for the Spectrum Income Fund to learn more about current portfolio positioning and market outlook.
Long/Short Equity Strategy
The long/short equity portfolio is sub-advised by Billings Capital Management, LLC (“Billings”) which has managed a similar strategy since the firm’s inception in early 2008. The Billings portfolio was up sharply during 2016, benefitting from contributions by both the long and short books. In the long book, positions in the Consumer Cyclical and Industrial sectors were strong performers led by engineering & construction, men’s clothing retailer, and a hospitality and vacation ownership holding. The portfolio experienced modest losses from holdings in the Communication Services sector due to weakness at a provider of commercial and business broadband connectivity solutions and wireless entertainment. On the short side, positions in the Consumer Cyclical and Industrial sectors were profitable, notably a holding in the airline industry and a company focused on nutritional and lifestyle improvement. Net exposure for the portfolio declined during the 2nd half of the year as positions approaching fair value were either sold or trimmed. The manager believes it has dry powder to opportunistically take advantage of opportunities in the market as they emerge.
Managed Futures Strategy
The Fund accesses the returns of Graham’s Tactical Trend strategy, which it has traded since 2006. During the annual period, the Graham Tactical Trend strategy experienced losses. The largest losses during the year occurred in Commodities, notably Energy, with losses also occurring in Equities. These losses were partially offset by gains from trading in Interest Rates. Please refer to the commentary below for the Market Trend Fund to learn more about current portfolio positioning and market outlook.
Commodities Strategy
The Fund accesses the returns of the Millburn Commodity Program (“Millburn”) which it has traded since 2005. During the annual period, the Millburn portion of the Fund produced slightly negative returns as directional trading produced negative returns that more than offset positive contributions from calendar spread trading. The largest losses occurred from trading in Metals. Losses also occurred from trading in Energy and Soft sectors, as unprofitable directional trading was only partially offset by gains from trading calendar spreads in those sectors. Trading in Grains was also profitable for the portfolio.
Outlook
We believe the combination of these complementary managers, each of which has successfully executed similar strategies to the underlying portfolios in the Fund since at least 2008, could produce attractive risk-adjusted returns in the future.
LoCorr Market Trend Fund
The LoCorr Market Trend Fund (the “Market Trend Fund” or the “Fund”) was created to provide investors with access to a trend following futures strategy managed by Graham Capital Management. Graham was founded in 1994 and manages approximately $12.9 billion in assets. The Market Trend Fund attempts to achieve its objective by investing in two main strategies – a Market Trend Strategy and a Fixed Income Strategy. The Fund’s Market Trend Strategy is managed similarly to Graham’s Tactical Trend program, a systematic medium- to long-term trend following strategy that commenced trading in 2006. The Fund seeks capital appreciation as its primary investment objective with managing volatility as a secondary objective.
The Fund’s Class I shares declined -9.49% during the year ended December 31, 2016, with the bulk of the losses occurring in the fourth quarter. The largest losses during the year occurred in Commodities, notably Energy, with losses also occurring in Equities. These losses were partially offset by gains from trading in Interest Rates. The Fund performed well during periods of market stress in 2016. For example, in January the Fund gained +4.58% as the S&P 500 declined -4.96%. In the two-day period (June 24th – June 27th) following Brexit, the Fund gained +2.47% versus a -5.34% decline for the S&P 500.
The 2016 market environment proved challenging for both the Fund and most peers, as trading conditions were particularly difficult for medium- to long-term trend-following strategies like Market Trend Fund. Markets across most asset classes were generally range-bound and the markets that did move tended to perform opposite of how they had performed in 2015. For example, after falling sharply in January, equities experienced a sharp reversal beginning in mid-February which proved difficult for medium- to long-term trend following models which may require time to adapt to a newly established trend. These difficult trading conditions led to significant drawdowns over the course of the year. In 2016, nine of the ten largest managed futures funds (measured December 31st) experienced drawdowns of at least -11.0%, with the largest drawdown being -21.9%. Market Trend Fund was not immune, experiencing a drawdown of -17.4% during 2016.
Market Trend Strategy
Commodities
The Fund experienced substantial losses from trading in the Commodities market with the largest losses stemming from trading in Energy futures. Significant losses were also realized from trading in Base Metals and Agricultural/Soft commodities. Overall in 2016, Commodity markets were particularly challenging for most trend followers. For example, crude slumped to approximately $27 per barrel in January before reversing course sharply beginning in February and rallying towards $40 per barrel in the spring. This sharp reversal caused losses in the Fund, as the systematic, medium-to long-term trend following models employed by the sub-adviser needed time to adapt to the newly established trend. When an agreement to cut production was not reached by OPEC in April, WTI crude vacillated sharply between $40 and $50 per barrel until early December. While range bound, prices whipsawed back and forth between that range with considerable volatility, creating challenging conditions for the sub-adviser’s model which typically performs better in trending markets. On November 30th, OPEC announced a production cut that was larger than expected and non-OPEC countries including Russia also announced production cuts, which caused crude prices to spike by 9-10%.
Interest Rate
Trading in Interest Rates was extremely profitable for the Fund during 2016 with gains coming from both the long and short end of the curve. The bulk of those gains occurred during the first half of the year, as long positions at both ends of the curve benefited from the decline in yields stemming from recurring concerns about global growth, persistently low inflation, accommodative global monetary policy, and periodic “flights to safety”. Interest rates began to move higher beginning at mid-year as evidence began to mount that global growth and inflation were picking up. Later in the year, rates climbed further following Trump’s surprise victory in the U.S. Presidential election. Overall, yield on the 10-year U.S. Treasury increased approximately +100 basis points between early July and mid-December. As the trend in interest rates changed positioning in U.S. interest rate futures shifted from long to short during the 2nd half of the year.
Equity Indices
The Fund experienced losses from trading in Equity Indices. The year began with heightened volatility as global equity markets sold-off sharply from January through mid-February. Weak economic data out of China, the collapse in oil prices, and worries about a Fed rate hike contributed to the risk-off global market conditions. The Fund’s short position in Equity Indices proved profitable during this period, but those gains were more than offset by losses created when markets reversed sharply in February through the spring. In the second half of the year, long positions in Equity Indices were slightly profitable, but were not sufficient to offset the losses from earlier in the year.
Foreign Currencies
Foreign Currency trading was slightly profitable in 2016. Long U.S. dollar positions were beneficial during the January to mid-February risk-off environment. These gains were offset by losses stemming from the dollar’s reversal as Fed rate hikes were tabled. The U.S. dollar gained strength in June, which benefited the Fund, following the “flight to safety” caused by the British vote to leave the EU (Brexit). The dollar generally moved higher versus foreign currencies in the fourth quarter as U.S. economic data improved, Trump’s surprise victory in the Presidential election, and the December Fed interest rate hike.
Outlook
2016 was a difficult year for trend following, as many of the prevailing trends in the market heading into the year, including falling interest rates and commodity prices, reversed course. Many markets also experienced range-bound periods while exhibiting tremendous volatility within those ranges…. again, difficult conditions for trend followers. While past performance is no guarantee of future results, we are encouraged that historically Graham’s Tactical Trend strategy, which is managed in a similar fashion to the Fund’s Market Trend Strategy, has performed strongly following episodes of difficult performance.
Graham believes that it is likely that we have reached the limits of global monetary policy, and a hand off to political and fiscal policy is creating new opportunities for macro markets that may persist for the foreseeable future. The markets have shifted from a mindset focused on expectations of sluggish growth and deflation to one of fiscal stimulus, growth and inflation. That being said, markets have come a long way already and much remains to be seen in terms of actual policies from the new administration in the U.S. While consensus continues to be that the U.S. dollar has further to run and bond yields will continue to grind higher, markets have moved relatively far in a short period and any anticipated policy implementation will not materialize overnight. As we move further into 2017, major elections in France and Germany will be a focal point, and to the extent that anti-establishment candidates are elected, the results could further disrupt the status quo in the Eurozone.
Fixed Income Strategy
The Fund invests most of its remaining assets in a high quality, short-duration fixed income portfolio comprised of primarily government securities and very highly rated corporate fixed income securities. Nuveen is the sub-adviser for this strategy.
The fixed income portion of LoCorr Market Trend Fund is conservatively managed as a short duration portfolio of the highest credit quality. It is managed against the Barclays 1-3 Year Government Index and focuses primarily on U.S. Treasuries and U.S. Government securities, but can own up to 30% in aggregate in corporate, municipal, and asset backed securities of the highest credit quality. Returns for the fixed income portion of the portfolio were +1.01% compared with +0.83% for the benchmark. Nuveen’s defensive interest rate strategy accounted for the outperformance relative to the index as the portfolio’s duration was positioned short to the benchmark by between .30 and .40 years over the second half of 2016. This strategy reduced the potential return volatility of the portfolio, while limiting negative total return as rates rose between July and December. The portfolio generally owned about 25% in non-government securities during the time frame; this was a boost to performance as these securities outperformed government securities in 2016. The portfolio also held about 10% in U.S. Agency multifamily mortgage backed securities; these securities also outperformed similar duration government securities and were beneficial to performance. As of December 31, 2016, the portfolio duration was 1.54 years compared to 1.95 years for the benchmark and about 71% of the portfolio was in U.S. government debt with the remainder in AAA rated non-government securities.
Long/Short Equity Strategy
The LoCorr Long/Short Equity Fund (the “Long/Short Equity Fund” or the “Fund”) seeks long-term capital appreciation with reduced volatility compared to traditional broad-based equity market indices as a secondary objective. Consistent with the “low correlation” our LoCorr Fund family seeks, long/short equity funds have the ability to provide positive returns when equity markets are rising, yet they offer the potential for downside protection when equity prices are falling.
The Fund employs two sub-advisers—Billings and Kettle Hill Capital Management, LLC (“Kettle Hill”). Billings’ strategy is based on a value- oriented, fundamental, bottom-up long/short equity approach. Billings seeks to maximize absolute returns, exceeding the S&P 500 index over the long term. The portfolio managed by Billings is similar to a strategy that this manager has executed since 2008 with their current firm and for many years prior to that at a different entity. Kettle Hill seeks to earn superior returns over an investment cycle while focusing on capital preservation and downside volatility. The manager’s investment process combines bottom-up, fundamental analysis with a top-down opportunistic overlay. Investing primarily in small cap securities, Kettle Hill targets a conservative net exposure to the market. The portfolio managed by Kettle Hill is similar to a strategy that this manager has executed since its inception in 2003.
Market Commentary
The S&P 500 Index finished 2016 up 11.96%; the 8th consecutive positive year. Within the S&P 500, 10 of 11 sectors finished the year in positive territory. Throughout the year, the S&P 500 experienced substantial swings due to emotional response by market participants to macro headlines, but the market always rebounded quickly. During the first week of January 2016, the S&P 500 sold off -5.91% and didn’t stop the bleeding until February 11th when it was down -10.27%. All of these losses had been recouped by the end of the first quarter in a stunning market reversal and move back towards risk assets. In June 2016, the world was stunned by the British citizen’s vote to leave the European Union that was dubbed Brexit. Global equity markets lost $3 trillion in total value during the following two days only to recoup the majority of those losses during the ensuing three days.
In November, the world was stunned by the election of Trump. In the late hours of the evening on election night, Tuesday November 8th, it became apparent that Trump was going to win. This caused a knee jerk reaction by investors to sell everything. The Nikkei closed down -5.35%, the broad European equity markets opened sharply lower the following day, and U.S. equity futures pointed to a sharp decline – greater than -5% at times – to the point that circuit breakers took over the pre-market to prevent further losses. By Wednesday morning, the S&P 500 surged back to open flat and ultimately finished the day in positive territory, +1.11%. Following the election, the equity market continued to rally on expectations of regulatory and tax reform and improved economic growth. As expected, the Federal Reserve increased the federal funds rate by 25 basis points during its December meeting. What surprised the market, however, was that the Fed, citing increased inflationary pressure, indicated that it expects three 25 basis points rate hikes during 2017, which was higher than market expectations.
Portfolio Update
The Fund (Class I shares) gained +25.33% during the twelve-month period ended December 31, 2016. This compares with the +11.96% rise for the S&P 500 Index and +1.09% for the Morningstar Global L/S Equity Index. During the period, the Fund benefited from positive alpha on both the long and short side of its book. During the year, both sub-advisers generated strong positive returns in excess of the S&P 500 Index. Net exposure for the Fund fell to approximately 33.2% at the end of the period as one of the sub-advisers reduced or sold positions that had advanced sharply while holding dry power to deploy when opportunities in the market present themselves.
During 2016, the Fund’s strong positive returns were primarily attributable to gains from its long book. Consumer Cyclical and Industrial holdings were the largest contributors in the period followed by gains in the Financial Services and Information Technology sectors. In the Consumer Cyclical sector, Tailored Brands, a men’s specialty retailer whose brands include Men’s Warehouse and Jos. A. Bank, generated impressive gains. The company’s outlook continued to improve and it has made progress turning around Jos. A. Bank whom the firm acquired in 2014. The Fund benefited from merger & acquisition activity as, Diamond Resorts International, a holding in the hospitality and vacation ownership industry was acquired by a private equity firm. In the Industrial sector, Mastec Inc., a holding in the engineering & construction industry, soared as sentiment towards industries with exposure to energy-related infrastructure changed and business fundamentals continued to improve. Partially offsetting these gains were losses from holdings in the Communications and Healthcare sectors.
On the short side, Consumer Cyclical and Communication holdings were the most notable contributors to the Fund. In the Consumer Cyclical sector, a company involved in nutritional and lifestyle improvement declined sharply (positive for the Fund’s short position) as the market became overly exuberant regarding its growth prospects. Short positions in a couple of specialty retailers also proved profitable for the Fund as their stock came under pressure during the period. Offsetting these gains were losses from holdings in the Industrial and Energy sector. In the Industrial sector, holdings in the integrated shipping & logistics industry detracted from results while a number of exploration & production and oil service holdings also detracted.
Outlook
Billings - Our outlook for 2017 remains the same as it did in prior years; cautiously optimistic. They believe that markets are fairly valued (plus or minus 5-10%) but believe that our concentrated, deep value approach can still generate meaningful positive returns to investors in fairly valued markets. Recently, Billings was holding more cash than typical as a result of selling/trimming into the “Trump pump”. They are comfortable with this and expect to find attractive new ideas and patiently await the market to provide us with interesting opportunities to enter new positions. While most anticipate volatility in 2017 and are positioned to mitigate the effects; Billings eagerly awaits its return.
Kettle Hill - Their opinion is that, following the Trump rally, many stocks have already discounted most of the anticipated benefits from the prospect of his administration, while ignoring much of the uncertainty. Future volatility events could arise from China’s shrinking reserves and bad debt, the ECB’s tapering of QE and the potential failure of Trump to enact campaign trail promises. Kettle Hill currently holds low net exposure due to high valuations, overbought conditions, low volatility, high expectations for fiscal policy stimulus and increasing hedge fund net long exposure. Kettle Hill has been finding more new short ideas, but fewer long ideas. When the top-down and bottom-up indicators point the same way, they think it beneficial to be cautious.
LoCorr Spectrum Income Fund
The LoCorr Spectrum Income Fund (the “Spectrum Income Fund” or the “Fund”) has an objective of current income with capital appreciation as a secondary objective. The Fund is designed to fit within the “low correlation” of the LoCorr Fund family by seeking to provide relatively high levels of income with low correlation to the bond market. The Fund’s sub-adviser is TFIP. TFIP invests in pass-through securities to seek high current income, much of which the Fund distributes monthly to investors.
During the period, the Fund exited its investment in a pool of secured real estate loans managed and administered by Terra Capital Partners.
The Fund’s Class I shares gained +6.85% during the annual period ending December 31, 2016 due primarily to profitable positions CEFs, Preferred Stocks, equity REITs and BDCs. These were partially offset by losses from MLPs and Mortgage REIT holdings.
Market Commentary
At the beginning of 2016, slow growth in China had continued to raise red flags for many areas of the market, including oil, whose price had declined since the middle of 2014. Compounding these problems for financial markets were the plans by the U. S. Federal Reserve to raise benchmark interest rates in 2016. Against this backdrop, the price of oil continued to decline and along with it, most equity markets, until February 11th. At this time the market was reassured by a combination of improving growth in China and action by global central banks to maintain an increasingly easy monetary policy. Global securities markets gradually firmed through the second quarter, most notably the previously hardest hit sectors such as emerging markets equities and debt; oil and other commodities; and high yield bonds.
Concerns regarding immigration, job loss, and income distribution prompted populist movements in many major countries, but no action was more significant in the second quarter than the United Kingdom’s vote to leave the European Union, popularly referred to as Brexit, in late June. This sparked a short-lived risk-off trade as long dated government bonds of many countries fell to negative interest rates, particularly in Europe. Following the Brexit sell-off, most securities markets ground slowly higher.
The centerpiece of virtually all U.S. securities market action in the fourth quarter was the surprise election of Donald Trump as President. Since the election, risk assets moved higher as President-elect Trump’s stated policy goals of increasing infrastructure investment, reforming taxes, reducing regulation, and revising policies on international trade served primarily to highlight and focus market sentiment around reflationary trends which have been evolving all year. A further catalyst for these trends was the announcement in November by OPEC that it would curtail production. By the time that the U.S. Federal Reserve raised interest rates in December, the action was well discounted and did not affect markets.
Portfolio Update
Overall, 2016 was a year of change as the portfolio went from being defensively positioned to anticipating a pickup in inflation and growth to actually seeing green shoots. The manager took steps in attempt to mitigate volatility and diversify the portfolio through portfolio constriction, while keeping a firm eye on distribution sustainability and growth.
The portfolio was tested right out of the gates in 2016, as previously mentioned global growth concerns and cratering energy commodity prices negatively affected the performance of energy and transportation positions. To dampen portfolio volatility, TFIP focused on higher yielding and lower volatility CEFs and selectively took advantage of high quality securities that the investment team believed were trading at significant discounts to intrinsic value, such as MLPs. Overall, the portfolio maintained a defensive stance in the first quarter and, most importantly, distributions were maintained at the portfolio level despite market volatility.
In the second quarter, REITs performed solidly as both growth and rates remained low. However, barely perceptible signs of global growth began to reveal themselves. The green shoots were subtle, but their effects were to stabilize commodity prices. The mere stabilization of energy prices and consistent quarterly reporting slowly repaired confidence, and TFIP began to focus the portfolio towards a reflationary theme. More economically sensitive positions including midstream MLPs, asset managers, emerging market debt CEFs and select global shippers were added. The portfolio hit a speedbump during the quarter as one of its refining MLP positions unexpectedly eliminated its distribution causing the manager to exit the position.
The portfolio appreciated in the third quarter after a sharp, but very brief, correction following Brexit. The portfolio pulled back slightly in September as rates rallied in anticipation of a possible increase in interest rates by the U.S. Federal Reserve. Within the portfolio, the strongest gains were posted by a variety of beneficiaries of improving economic growth, including alternative asset managers, BDCs, a CEF focused on convertible securities and liquid natural gas shippers. Portfolio additions continued to be concentrated in companies that benefit from accelerating growth and have catalysts and/or compelling valuation.
Two major events in the fourth quarter impacted the portfolio. First, the Trump victory in the U.S. election fueled the perception that growth would accelerate. Additionally, OPEC’s historic decision to cap production served to put a floor under energy commodities and accelerated the reflation trade. Additions to the portfolio during the quarter were focused on the reflation theme and included several MLPs with advantageous geographic exposure which should benefit from a resurgence of U.S. energy production, asset managers trading at compelling valuations and mortgage REITS that engage in spread lending and should benefit from a steeper yield curve.
Outlook
Looking ahead to the balance of 2017, TFIP remains optimistic regarding prospects for the portfolio as the investment team aims to continue to focus on securities benefiting from a modestly faster pace of economic growth, reduced regulation, and possibly some inflation. The team remains cognizant that appreciation potential for all assets may be limited by increases in interest rates and that distributions of individual securities can be affected by operational developments. In the manager’s view, the value proposition of the portfolio is extremely attractive right now because the average holding in the portfolio is trading far below its highs of the past three years, and the portfolio’s current yield is close to its highest spread above that of traditional bond indexes.
Thank you for investing in the LoCorr Funds
The S&P 500 Index is a broad based unmanaged index of 500 stocks, which is widely recognized as representative of the equity market in general. Barclays 1-5 Year Government Credit Index-The Barclays U.S. Government/Credit 1-5 Year Index is an index of all investment grade bonds with maturities of more than one year and less than 5 years. Barclays 1-3 Year Government Bond Index-The Barclays U.S. 1-3 Year Government/Credit Bond Index is a part of the Barclays U.S. Government/Credit Bond Index. It includes Treasury and agency securities (U.S. Government Bond Index) and publicly issued U.S. corporate and foreign debentures and secured notes (U.S. Credit Bond Index). The bonds in the index are investment- grade with a maturity between one and three years. Nikkei is Japan’s Nikkei 225 Stock Average, commonly used to measure a price-weighted index comprised of Japan’s top 225 blue-chip companies on the Tokyo Stock Exchange. Tokyo Stock Exchange is the largest stock exchange in Japan. The exchange has more than 2,200 listed companies, making it the third-largest in the world by this measure. Morningstar Global Long/Short Equity Index uses historical fund data dating back to the fund’s inception. Funds that have been liquidated or merged are included in analysis. The inception of the index is determined by the date at which the benchmark obtains five or more constituents, without falling below two constituents going forward. It includes funds with exposure to long and short positions in global equities or derivatives and is equally weighted. One cannot invest directly in an index.
Alpha is an annualized return measure of how much better or worse a fund’s performance is relative to an index of funds in the same category, after allowing for differences in risk.
Basis point (bp) is a unit equal to 1/100th of 1% and is used to denote the change in a financial instrument.
Duration is a commonly used measure of the potential volatility of the price of a debt security, or the aggregate market value of a portfolio of debt securities, prior to maturity. Securities with a longer duration generally have more volatile prices than securities of comparable quality with a shorter duration.
Investment Grade-Investment Grade refers to bonds that are rated BBB or higher. Bond ratings are grades given to bonds that indicate their credit quality as determined by private independent rating services such as Standard & Poor’s, Moody’s and Fitch. These firms evaluate a bond issuer’s financial strength, or its ability to pay a bond’s principal and interest in a timely fashion. Ratings are expressed as letters ranging from ‘AAA’, which is the highest grade, to ‘D’, which is the lowest grade.
Spread is the percentage point difference between yields of various classes of bonds compared to treasury bonds.
Yield Curve is a line that plots the interest rates, at a set point in time, of bonds having equal credit quality, but differing maturity dates. The most frequently reported yield curve compares the three-month, two-year, five-year and 30-year U.S. Treasury debt. The curve is used to predict changes in economic output and growth.
Must be preceded or accompanied by a prospectus.
Opinions expressed are those of the Investment Manager and are subject to change, are not guaranteed and should not be considered investment advice.
Earnings growth is not representative of the Funds’ future performance.
Past performance is not a guarantee of future results.
Diversification does not assure a profit nor protect against loss in a declining market.
Mutual fund investing involves risk. Principal loss is possible. The LoCorr Managed Futures Strategy Fund is a diversified fund. The LoCorr Long/Short Commodities Strategy Fund, the LoCorr Multi-Strategy Fund, the LoCorr Market Trend Fund, the LoCorr Long/Short Equity Fund and the LoCorr Spectrum Income Fund are each non-diversified funds, meaning they may invest their assets in fewer individual holdings than a diversified fund. Therefore, those Funds are more exposed to individual stock volatility than a diversified fund. The Funds invest in foreign investments and foreign currencies which involve greater volatility and political, economic and currency risks and differences in accounting methods. The Funds may make short sales of securities, which involves the risk that losses may exceed the original amount invested. Investing in commodities may subject the Funds to greater risks and volatility as commodity prices may be influenced by a variety of factors including unfavorable weather, environmental factors, and changes in government regulations. The Funds may invest in derivative securities, which derive their performance from the performance of an underlying asset, index, interest rate or currency exchange rate. Derivatives can be volatile and involve various types and degrees of risks, and, depending upon the characteristics of a particular derivative, suddenly can become illiquid. Investments in debt securities typically decrease in value when interest rates rise. This risk is usually greater for longer-term debt securities. Investments in Asset Backed, Mortgage Backed, and Collateralized Mortgage Backed Securities include additional risks that investors should be aware of such as credit risk, prepayment risk, possible illiquidity and default, as well as increased susceptibility to adverse economic developments. Investments in Real Estate Investment Trusts (REITs) involve additional risks such as declines in the value of real estate and increased susceptibility to adverse economic or regulatory developments.
Derivative contracts ordinarily have leverage inherent in their terms which can magnify a Fund’s potential for gains or losses through increased long and short position exposure. A Fund may access derivatives via a swap agreement. A risk of a swap agreement is the risk that the counterparty to the agreement will default on its obligation to pay the Fund.
A Fund will incur a loss as a result of a short position if the price of the short position instrument increases in value between the date of the short position sale and the date on which an offsetting position is purchased.
Investments in small- and medium-capitalization companies involve additional risks such as limited liquidity and greater volatility. Investments in lower rated and non-rated securities presents a greater risk of loss to principal and interest than higher-rated securities. ETF investments are subject to investment advisory and other expenses, which will be indirectly paid by the Fund. As a result, the cost of investing in the Fund will be higher than the cost of investing directly in ETFs and may be higher than other mutual funds that invest directly in stocks and bonds. ETFs are subject to specific risks, depending on the nature of the ETF.
A Fund’s portfolio will be significantly impacted by the performance of the real estate market generally, and a Fund may be exposed to greater risk and experience higher volatility than would a more economically diversified portfolio. Property values may fall due to increasing vacancies or declining rents resulting from economic, legal, cultural, or technological developments. Investments in Limited Partnerships (including master limited partnerships) involve risks different from those of investing in common stock including risks related to limited control and limited rights to vote on matters affecting the Limited Partnership, risks related to potential conflicts of interest between the Limited Partnership and the Limited Partnership’s general partner, cash flow risks, dilution risks and risks related to the general partner’s limited call right. Underlying Funds are subject to management and other expenses, which will be indirectly paid by a Fund.
The LoCorr Managed Futures Strategy Fund, LoCorr Long/Short Commodities Strategy Fund, LoCorr Multi-Strategy Fund, LoCorr Market Trend Fund, LoCorr Long/Short Equity Fund, and the LoCorr Spectrum Income Fund are distributed by Quasar Distributors, LLC.
LoCorr Managed Futures Strategy Fund
Rate of Return — For the period ended December 31, 2016 (Unaudited)
| | Inception Date | 6 Month | 1 Year | Average Annual
Since Inception |
| LoCorr Managed Futures Strategy Fund - Class A (without maximum load) | 3/22/11 | -4.56% | 6.51% | 0.88% |
| LoCorr Managed Futures Strategy Fund - Class A (with maximum load) | 3/22/11 | -10.03% | 0.39% | -0.15% |
| LoCorr Managed Futures Strategy Fund - Class C | 3/24/11 | -5.85% | 4.72% | 0.13% |
| LoCorr Managed Futures Strategy Fund - Class I | 3/24/11 | -4.41% | 6.68% | 1.13% |
| S&P 500 Total Return Index | | 7.82% | 11.96% | 12.11%1 |
| Barclays CTA Index | | -2.64% | -0.95% | -0.33%2 |
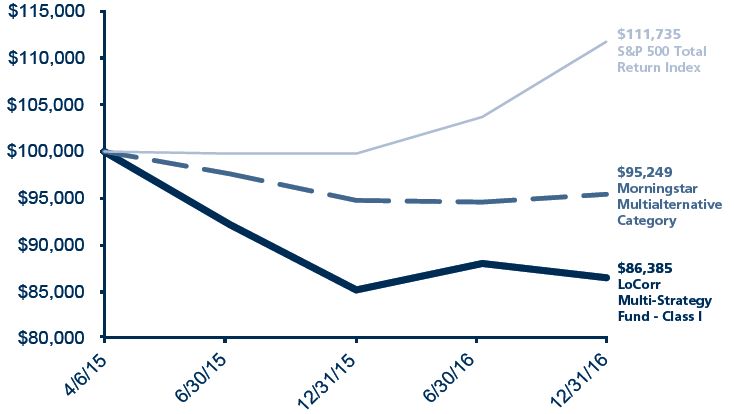
$100,000 investment in the LoCorr Managed Futures Strategy Fund - Class I
For the period ended December 31, 2016 (Unaudited)
This chart illustrates the performance of a hypothetical $100,000 investment made in the Fund since inception. Assumes reinvestment of distributions, but does not reflect the effect of any applicable sales charge or redemption fees. This chart does not imply any future performance. Performance will vary from class to class based on differences in class-specific expenses and sales charges. The returns do not reflect the deduction of taxes that a shareholder would pay on Fund distributions or the redemption of Fund shares.
Performance data represents past performance; past performance does not guarantee future results. The investment return and principal value of an investment will fluctuate so that an investor’s shares, when redeemed, may be worth more or less than their original cost. Current performance of the Fund may be lower or higher than the performance quoted. Performance data current to the most recent month end may be obtained by calling 1.855. LCFUNDS, or visiting www.LoCorrFunds.com.
Performance data shown reflects the Class A maximum sales charge of 5.75% and reflects the Class C Contingent Deferred Sales Charge (CDSC) of 1.00%. Performance of the Class A without load does not reflect the deduction of the sales load or fee. If reflected, the load or fee would reduce the performance quoted.
The returns reflect the actual performance for each period and do not include the impact on trades executed on the last business day of the period that were recorded on the first business day of the next period.
The Fund imposes a 1.00% redemption fee on shares held for less than 30 days. Performance data does not reflect the redemption fee. If it had, return would be reduced.
Per the fee table in the Fund’s May 1, 2016 prospectus, the Fund’s annual operating expense ratio is 2.43%, 3.18% and 2.18% for Class A, Class C and Class I shares, respectively.
The S&P 500 Total Return Index is an unmanaged capitalization-weighted index of 500 stocks designed to measure performance of the broad domestic economy through changes in the aggregate market value of the 500 stocks which represent all major industries.
The Barclays CTA Index is a leading industry benchmark of representative performance of commodity trading advisors.
One cannot invest directly in an index.
1 | Since inception return as of March 24, 2011. |
2 | Since inception return as of March 31, 2011. |
LoCorr Long/Short Commodities Strategy Fund
Rate of Return — For the period ended December 31, 2016 (Unaudited)
| | Inception Date | 6 Month | 1 Year | Average Annual
Since Inception1 |
| LoCorr Long/Short Commodities Strategy Fund - Class A (without maximum load) | 1/1/12 | -7.09% | -2.98% | 2.13% |
| LoCorr Long/Short Commodities Strategy Fund - Class A (with maximum load) | 1/1/12 | -12.44% | -8.53% | 0.93% |
| LoCorr Long/Short Commodities Strategy Fund - Class C | 1/1/12 | -8.22% | -4.55% | 1.32% |
| LoCorr Long/Short Commodities Strategy Fund - Class I | 1/1/12 | -6.86% | -2.67% | 2.37% |
| S&P 500 Total Return Index | | 7.82% | 11.96% | 14.66% |
| Morningstar Long/Short Commodity Index | | -3.94% | -7.88% | -3.61% |
$100,000 investment in the LoCorr Long/Short Commodities Strategy Fund - Class I
For the period ended December 31, 2016 (Unaudited)
This chart illustrates the performance of a hypothetical $100,000 investment made in the Fund since inception. Assumes reinvestment of distributions, but does not reflect the effect of any applicable sales charge or redemption fees. This chart does not imply any future performance. Performance will vary from class to class based on differences in class-specific expenses and sales charges. The returns do not reflect the deduction of taxes that a shareholder would pay on Fund distributions or the redemption of Fund shares.
Performance data represents past performance; past performance does not guarantee future results. The investment return and principal value of an investment will fluctuate so that an investor’s shares, when redeemed, may be worth more or less than their original cost. Current performance of the Fund may be lower or higher than the performance quoted. Performance data current to the most recent month end may be obtained by calling 1.855. LCFUNDS, or visiting www.LoCorrFunds.com.
Performance data shown reflects the Class A maximum sales charge of 5.75% and reflects the Class C Contingent Deferred Sales Charge (CDSC) of 1.00%. Performance of the Class A without load does not reflect the deduction of the sales load or fee. If reflected, the load or fee would reduce the performance quoted.
The returns reflect the actual performance for each period and do not include the impact on trades executed on the last business day of the period that were recorded on the first business day of the next period.
The Fund imposes a 1.00% redemption fee on shares held for less than 30 days. Performance data does not reflect the redemption fee. If it had, return would be reduced.
Per the fee table in the Fund’s May 1, 2016 prospectus, the Fund’s annual operating expense ratio, before fee waivers is 3.11%, 3.86% and 2.86% for Class A, Class C and Class I shares, respectively.
The S&P 500 Total Return Index is an unmanaged capitalization-weighted index of 500 stocks designed to measure performance of the broad domestic economy through changes in the aggregate market value of the 500 stocks which represent all major industries.
The Morningstar Long/Short Commodity Index is a fully collateralized commodity futures index that uses the momentum rule to determine if each commodity is held long, short, or flat.
One cannot invest directly in an index.
1 | Since inception returns as of January 1, 2012. |
LoCorr Multi-Strategy Fund
Rate of Return — For the period ended December 31, 2016 (Unaudited)
| | Inception Date | 6 Month | 1 Year | Average Annual
Since Inception1 |
| LoCorr Multi-Strategy Fund - Class A (without maximum load) | 4/6/15 | -1.83% | 1.41% | -8.28% |
| LoCorr Multi-Strategy Fund - Class A (with maximum load) | 4/6/15 | -7.42% | -4.45% | -11.35% |
| LoCorr Multi-Strategy Fund - Class C | 4/6/15 | -3.35% | -0.49% | -9.06% |
| LoCorr Multi-Strategy Fund - Class I | 4/6/15 | -1.68% | 1.60% | -8.08% |
| S&P 500 Total Return Index | | 7.82% | 11.96% | 6.59% |
| Morningstar Multialternative Category | | 0.76% | 0.77% | -2.34% |
$100,000 investment in the LoCorr Multi-Strategy Fund - Class I
For the period ended December 31, 2016 (Unaudited)
This chart illustrates the performance of a hypothetical $100,000 investment made in the Fund since inception. Assumes reinvestment of distributions, but does not reflect the effect of any applicable sales charge or redemption fees. This chart does not imply any future performance. Performance will vary from class to class based on differences in class-specific expenses and sales charges. The returns do not reflect the deduction of taxes that a shareholder would pay on Fund distributions or the redemption of Fund shares.
Performance data represents past performance; past performance does not guarantee future results. The investment return and when redeemed, may be worth more or less than their original cost. Current performance of the Fund may be lower or higher than the performance quoted. Performance data current to the most recent month end may be obtained by calling 1.855.LCFUNDS, or visiting www.LoCorrFunds.com.
Performance data shown reflects the Class A maximum sales charge of 5.75% and reflects the Class C Contingent Deferred Sales Charge (CDSC) of 1.00%. Performance of the Class A without load does not reflect the deduction of the sales load or fee. If reflected, the load or fee would reduce the performance quoted.
The returns reflect the actual performance for each period and do not include the impact on trades executed on the last business day of the period that were recorded on the first business day of the next period.
The Fund imposes a 1.00% redemption fee on shares held for less than 30 days. Performance data does not reflect the redemption fee. If it had, return would be reduced.
Per the fee table in the Fund’s May 1, 2016 prospectus, the Fund’s annual operating expense ratio, before fee waivers is 4.68%, 5.43% and 4.43% for Class A, Class C and Class I shares, respectively.
The S&P 500 Total Return Index is an unmanaged capitalization-weighted index of 500 stocks designed to measure performance of the broad domestic economy through changes in the aggregate market value of the 500 stocks which represent all major industries.
The funds in the Morningstar Multialternative Category use a combination of alternative strategies. Funds in this category have a majority of their assets exposed to alternative strategies and include both funds with static allocations to alternative strategies and funds tactically allocating among alternative strategies and asset classes.
One cannot invest directly in an index.
1 | Since inception return as of April 6, 2015. |
LoCorr Market Trend Fund
Rate of Return — For the period ended December 31, 2016 (Unaudited)
| | Inception Date | 6 Month | 1 Year | Average Annual
Since Inception1 |
| LoCorr Market Trend Fund - Class A (without maximum load) | 7/1/14 | -12.13% | -9.71% | 5.11% |
| LoCorr Market Trend Fund - Class A (with maximum load) | 7/1/14 | -17.17% | -14.89% | 2.65% |
| LoCorr Market Trend Fund - Class C | 7/1/14 | -13.37% | -11.33% | 4.30% |
| LoCorr Market Trend Fund - Class I | 7/1/14 | -12.05% | -9.49% | 5.37% |
| S&P 500 Total Return Index | | 7.82% | 11.96% | 7.73% |
| Barclays CTA Index | | -2.64% | -0.95% | 1.72% |
$100,000 investment in the LoCorr Market Trend Fund - Class I
For the period ended December 31, 2016 (Unaudited)
This chart illustrates the performance of a hypothetical $100,000 investment made in the Fund since inception. Assumes reinvestment of distributions, but does not reflect the effect of any applicable sales charge or redemption fees. This chart does not imply any future performance. Performance will vary from class to class based on differences in class- specific expenses and sales charges. The returns do not reflect the deduction of taxes that a shareholder would pay on Fund distributions or the redemption of Fund shares.
Performance data represents past performance; past performance does not guarantee future results. The investment return and principal value of an investment will fluctuate so that an investor’s shares, when redeemed, may be worth more or less than their original cost. Current performance of the Fund may be lower or higher than the performance quoted. Performance data current to the most recent month end may be obtained by calling 1.855.LCFUNDS, or visiting www.LoCorrFunds.com.
Performance data shown reflects the Class A maximum sales charge of 5.75% and reflects the Class C Contingent Deferred Sales Charge (CDSC) of 1.00%. Performance of the Class A without load does not reflect the deduction of the sales load or fee. If reflected, the load or fee would reduce the performance quoted.
The returns reflect the actual performance for each period and do not include the impact on trades executed on the last business day of the period that were recorded on the first business day of the next period.
The Fund imposes a 1.00% redemption fee on shares held for less than 30 days. Performance data does not reflect the redemption fee. If it had, return would be reduced.
Per the fee table in the Fund’s May 1, 2016 prospectus, the Fund’s annual operating expense ratio, before fee recoveries is 2.04%, 2.79% and 1.79% for Class A, Class C and Class I shares, respectively.
The S&P 500 Total Return Index is an unmanaged capitalization-weighted index of 500 stocks designed to measure performance of the broad domestic economy through changes in the aggregate market value of the 500 stocks which represent all major industries.
The Barclays CTA Index is a leading industry benchmark of representative performance of commodity trading advisors.
One cannot invest directly in an index.
1 | Since inception return as of July 1, 2014. |
LoCorr Long/Short Equity Fund
Rate of Return — For the period ended December 31, 2016 (Unaudited)
| | Inception Date | 6 Month | 1 Year | Average Annual
Since Inception1 |
| LoCorr Long/Short Equity Fund - Class A (without maximum load) | 5/10/13 | 18.47% | 25.10% | 5.39% |
| LoCorr Long/Short Equity Fund - Class A (with maximum load) | 5/10/13 | 11.67% | 17.89% | 3.69% |
| LoCorr Long/Short Equity Fund - Class C | 5/10/13 | 17.03% | 23.02% | 4.57% |
| LoCorr Long/Short Equity Fund - Class I | 5/10/13 | 18.62% | 25.33% | 5.65% |
| S&P 500 Total Return Index | | 7.82% | 11.96% | 11.36% |
| Russell 2000 Total Return Index | | 18.68% | 21.31% | 11.04% |
$100,000 investment in the LoCorr Long/Short Equity Fund - Class I
For the period ended December 31, 2016 (Unaudited)
This chart illustrates the performance of a hypothetical $100,000 investment made in the Fund since inception. Assumes reinvestment of distributions, but does not reflect the effect of any applicable sales charge or redemption fees. This chart does not imply any future performance. Performance will vary from class to class based on differences in class-specific expenses and sales charges. The returns do not reflect the deduction of taxes that a shareholder would pay on Fund distributions or the redemption of Fund shares.
Performance data represents past performance; past performance does not guarantee future results. The investment return and principal value of an investment will fluctuate so that an investor’s shares, when redeemed, may be worth more or less than their original cost. Current performance of the Fund may be lower or higher than the performance quoted. Performance data current to the most recent month end may be obtained by calling 1.855. LCFUNDS, or visiting www.LoCorrFunds.com.
Performance data shown reflects the Class A maximum sales charge of 5.75% and reflects the Class C Contingent Deferred Sales Charge (CDSC) of 1.00%. Performance of the Class A without load does not reflect the deduction of the sales load or fee. If reflected, the load or fee would reduce the performance quoted.
The returns reflect the actual performance for each period and do not include the impact on trades executed on the last business day of the period that were recorded on the first business day of the next period.
The Fund imposes a 1.00% redemption fee on shares held for less than 30 days. Performance data does not reflect the redemption fee. If it had, return would be reduced.
Per the fee table in the Fund’s May 1, 2016 prospectus, the Fund’s annual operating expense ratio, before fee waivers is 3.91%, 4.66% and 3.66% for Class A, Class C and Class I shares, respectively.
The S&P 500 Total Return Index is an unmanaged capitalization-weighted index of 500 stocks designed to measure performance of the broad domestic economy through changes in the aggregate market value of the 500 stocks which represent all major industries.
The Russell 2000 Total Return Index measures the performance of the small-cap segment of the U.S. equity universe.
One cannot invest directly in an index.
1 | Since inception returns as of May 10, 2013. |
LoCorr Spectrum Income Fund
Rate of Return — For the period ended December 31, 2016 (Unaudited)
| | Inception Date | 6 Month | 1 Year | Average Annual
Since Inception1 |
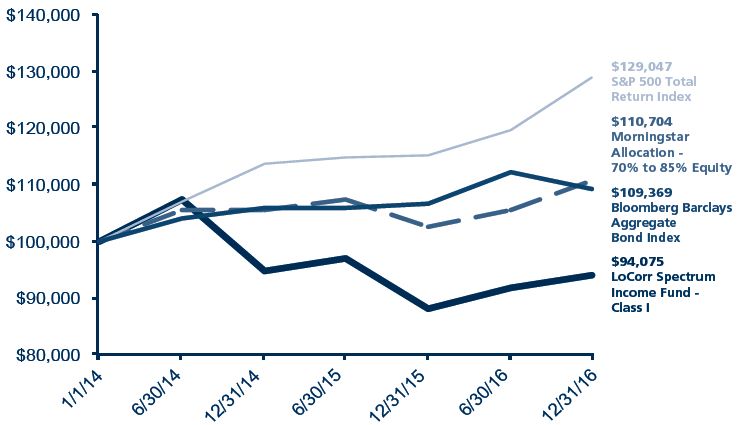
| LoCorr Spectrum Income Fund - Class A (without maximum load) | 1/1/14 | 2.44% | 6.64% | -2.25% |
| LoCorr Spectrum Income Fund - Class A (with maximum load) | 1/1/14 | -3.50% | 0.56% | -4.16% |
| LoCorr Spectrum Income Fund - Class C | 1/1/14 | 1.09% | 4.89% | -2.98% |
| LoCorr Spectrum Income Fund - Class I | 1/1/14 | 2.47% | 6.85% | -2.02% |
| S&P 500 Total Return Index | | 7.82% | 11.96% | 8.87% |
| Morningstar Allocation - 70% to 85% Equity | | 5.03% | 7.79% | 3.45% |
| Bloomberg Barclays Aggregate Bond Index | | -2.53% | 2.65% | 3.03% |
$100,000 investment in the LoCorr Spectrum Income Fund - Class I
For the period ended December 31, 2016 (Unaudited)
This chart illustrates the performance of a hypothetical $100,000 investment made in the Fund since inception. Assumes reinvestment of distributions, but does not reflect the effect of any applicable sales charge or redemption fees. This chart does not imply any future performance. Performance will vary from class to class based on differences in class-specific expenses and sales charges. The returns do not reflect the deduction of taxes that a shareholder would pay on Fund distributions or the redemption of Fund shares.
Performance data represents past performance; past performance does not guarantee future results. The investment return and principal value of an investment will fluctuate so that an investor’s shares, when redeemed, may be worth more or less than their original cost. Current performance of the Fund may be lower or higher than the performance quoted. Performance data current to the most recent month end may be obtained by calling 1.855.LCFUNDS, or visiting www.LoCorrFunds.com.
Performance data shown reflects the Class A maximum sales charge of 5.75% and reflects the Class C Contingent Deferred Sales Charge (CDSC) of 1.00%. Performance of the Class A without load does not reflect the deduction of the sales load or fee. If reflected, the load or fee would reduce the performance quoted.
The returns reflect the actual performance for each period and do not include the impact on trades executed on the last business day of the period that were recorded on the first business day of the next period.
The Fund imposes a 2.00% redemption fee on shares held for less than 60 days. Performance data does not reflect the redemption fee. If it had, return would be reduced.
Per the fee table in the Fund’s May 1, 2016 prospectus, the Fund’s annual operating expense ratio, before fee recoveries is 3.15%, 3.90% and 2.90% for Class A, Class C and Class I shares, respectively.
The S&P 500 Total Return Index is an unmanaged capitalization-weighted index of 500 stocks designed to measure performance of the broad domestic economy through changes in the aggregate market value of the 500 stocks which represent all major industries.
The Barclays Aggregate Bond Index is a long term, market capitalization-weighted index used to represent investment grade bonds being traded in the United States.
The Morningstar Allocation - 70% to 85% Equity portfolios seek to provide both income and capital appreciation by investing in multiple asset classes, including stocks, bonds, and cash. These portfolios are dominated by domestic holdings and have equity expenses between 70% and 85%.
One cannot invest directly in an index.
1 | Since inception returns as of January 1, 2014. |
| |
| |
LoCorr Managed Futures Strategy Fund - Consolidated Schedule of Investments | 15 |
| |
| |
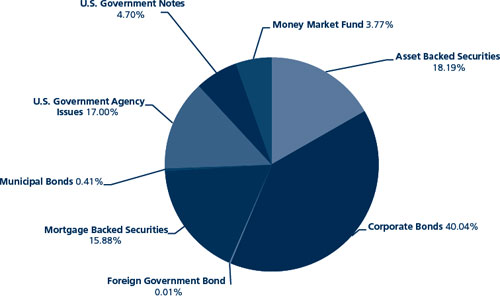
LoCorr Managed Futures Strategy Fund
Composition of Consolidated Investment Portfolio1
December 31, 2016 (Unaudited)
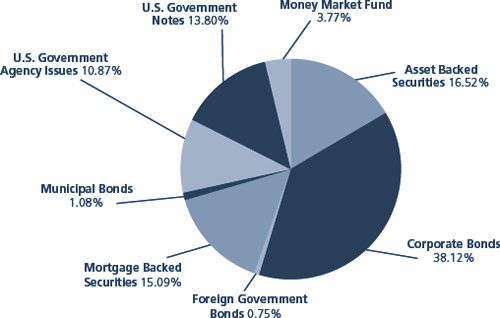
1 | As a percentage of total investments. |
Consolidated Schedule of Investments
December 31, 2016
| | | | | | | | | |
| | | Maturity Date | | Coupon Rate | | Principal Amount | | Value |
| ASSET BACKED SECURITIES: 14.73% | | | | | | | | | | | | |
| 321 Henderson Receivables I LLC | | | | | | | | | | | | |
Series 2006-1A A1 (Acquired 03/30/2015, Cost, $1,719,009) (a)(c) | | 03/15/2041 | | 0.74 | % | | $ | 1,743,804 | | $ | 1,697,247 | |
| Series 2006-4A A1 (Acquired 07/19/2016, Cost, $2,036,854) (a)(c) | | 12/15/2041 | | 0.74 | % | | | 2,106,807 | | | 2,075,463 | |
| Series 2004-A A1 (Acquired 02/08/2013, Cost, $263,483) (a)(c) | | 09/15/2045 | | 1.05 | % | | | 276,804 | | | 272,748 | |
American Homes 4 Rent, 2014-SFR1 A (Acquired 05/13/2014 through 10/08/2014, Cost, $3,473,557) (a)(c) | | 06/17/2031 | | 1.74 | % | | | 3,479,119 | | | 3,466,780 | |
| AmeriCredit Automobile Receivables, 2016-1 A2A (c) | | 06/10/2019 | | 1.52 | % | | | 2,319,879 | | | 2,322,424 | |
| Atlantic City Electric Transition Funding LLC, 2003-1 A3 | | 10/20/2020 | | 5.05 | % | | | 544,226 | | | 559,946 | |
| BA Credit Card Trust | | | | | | | | | | | | |
| Series 2014-3A A (c) | | 01/15/2020 | | 0.99 | % | | | 2,040,000 | | | 2,041,416 | |
| Series 2015-1A A (c) | | 06/15/2020 | | 1.03 | % | | | 3,475,000 | | | 3,479,667 | |
| Barclays Dryrock Issuance Trust, 2014-2 A (c) | | 03/16/2020 | | 1.04 | % | | | 3,000,000 | | | 3,000,519 | |
| Cabela’s Credit Card Master Note Trust | | | | | | | | | | | | |
| Series 2012-1A A1 (Acquired 05/08/2012 through 05/06/2015, Cost, $3,591,965) (a) | | 02/18/2020 | | 1.63 | % | | | 3,590,000 | | | 3,592,364 | |
| Series 2013-2A A2 (Acquired 05/24/2016 through 08/12/2016, Cost, $3,883,577) (a)(c) | | 08/16/2021 | | 1.08 | % | | | 3,885,000 | | | 3,901,377 | |
| California Republic Auto Receivables Trust | | | | | | | | | | | | |
| Series 2013-2 A2 | | 03/15/2019 | | 1.23 | % | | | 377,255 | | | 377,327 | |
| Series 2015-2 A2 | | 03/15/2019 | | 1.34 | % | | | 3,200,000 | | | 3,200,384 | |
| Series 2015-1 A3 | | 04/15/2019 | | 1.33 | % | | | 1,346,490 | | | 1,347,253 | |
| Capital Auto Receivables Asset Trust, 2015-2 A2 | | 09/20/2018 | | 1.39 | % | | | 2,000,000 | | | 2,001,192 | |
| Capital One Multi-Asset Execution Trust | | | | | | | | | | | | |
| Series 2014-3A (c) | | 01/18/2022 | | 1.08 | % | | | 1,260,000 | | | 1,260,511 | |
| Series 2016-1A (c) | | 02/15/2022 | | 1.15 | % | | | 5,310,000 | | | 5,331,570 | |
| CenterPoint Energy Restoration Bond Co. LLC, 2009-1 A2 | | 08/15/2019 | | 3.46 | % | | | 1,822,934 | | | 1,847,597 | |
| CenterPoint Energy Transition Bond Co. IV LLC, 2012-1 A1 | | 04/15/2018 | | 0.90 | % | | | 340,400 | | | 340,275 | |
| Chase Issuance Trust | | | | | | | | | | | | |
| Series 2013-A3 (c) | | 04/15/2020 | | 0.98 | % | | | 2,234,000 | | | 2,237,550 | |
| Series 2013-9A (c) | | 11/16/2020 | | 1.12 | % | | | 5,200,000 | | | 5,215,532 | |
| Series 2012-A4 | | 08/16/2021 | | 1.58 | % | | | 4,115,000 | | | 4,088,120 | |
| Citibank Credit Card Issuance Trust, 2007-A8 | | 09/20/2019 | | 5.65 | % | | | 4,650,000 | | | 4,794,275 | |
| Colony American Homes | | | | | | | | | | | | |
| Series 2014-A1 (Acquired 04/02/2014 through 09/21/2016, Cost, $4,839,840) (a)(c) | | 05/17/2031 | | 2.14 | % | | | 4,845,719 | | | 4,841,435 | |
Series 2015-C1 (Acquired 05/27/2015, Cost, $1,940,000) (a)(c) | | 07/17/2032 | | 2.69 | % | | | 1,940,000 | | | 1,936,770 | |
| Consumers 2014 Securitization Funding LLC, 2014-A A1 | | 11/01/2020 | | 1.33 | % | | | 1,308,314 | | | 1,298,693 | |
The accompanying notes are an integral part of these consolidated financial statements.
| |
| |
16 | LoCorr Managed Futures Strategy Fund - Consolidated Schedule of Investments (continued) |
| |
| |
| | | Maturity Date | | Coupon Rate | | Principal Amount | | Value |
| ASSET BACKED SECURITIES (continued) | | | | | | | | | | | | |
| Discover Card Execution Note Trust | | | | | | | | | | | | |
| Series 2007-A1 | | 03/16/2020 | | 5.65 | % | | $ | 4,036,000 | | $ | 4,158,088 | |
Series 2013-A1 (c) | | 08/17/2020 | | 1.00 | % | | | 5,400,000 | | | 5,404,422 | |
Series 2014-1 (c) | | 07/15/2021 | | 1.13 | % | | | 3,500,000 | | | 3,513,056 | |
| Entergy Arkansas Restoration Funding LLC, 2010-A A1 | | 08/01/2021 | | 2.30 | % | | | 1,257,673 | | | 1,266,239 | |
| Entergy Gulf States Reconstruction Funding 1 LLC, 2007-A A2 | | 10/01/2018 | | 5.79 | % | | | 290,918 | | | 296,374 | |
| Fifth Third Auto Trust, 2013-A B | | 04/15/2019 | | 1.21 | % | | | 1,500,000 | | | 1,499,959 | |
| Ford Credit Auto Owner Trust, 2016-REV1 A (Acquired 11/22/2016, Cost, $2,166,710) (a) | | 08/15/2027 | | 2.31 | % | | | 2,150,000 | | | 2,145,826 | |
| Huntington Auto Trust, 2015-1 A3 | | 09/16/2019 | | 1.24 | % | | | 5,390,700 | | | 5,387,558 | |
| Invitation Homes Trust | | | | | | | | | | | | |
Series 2013-SFR1 A (Acquired 11/05/2013 through 10/24/2014, Cost, $3,996,821) (a)(c) | | 12/17/2030 | | 1.89 | % | | | 3,996,821 | | | 3,996,875 | |
Series 2014-SFR2 A (Acquired 08/04/2014 through 05/06/2015, Cost, $3,703,384) (a)(c) | | 09/18/2031 | | 1.84 | % | | | 3,703,384 | | | 3,698,628 | |
| John Deere Owner Trust, 2015-A A3 | | 06/17/2019 | | 1.32 | % | | | 1,500,000 | | | 1,500,380 | |
| Nissan Auto Receivables Owner Trust, 2016-A A3 | | 10/15/2020 | | 1.34 | % | | | 3,000,000 | | | 2,990,990 | |
| Ocwen Master Advance Receivables Trust | | | | | | | | | | | | |
Series 2015-T3 AT3 (Acquired 11/06/2015, Cost, $1,549,987) (a) | | 11/15/2047 | | 3.21 | % | | | 1,550,000 | | | 1,549,675 | |
Series 2016-T2 AT2 (Acquired 08/03/2016, Cost, $3,189,997) (a) | | 08/16/2049 | | 2.72 | % | | | 3,190,000 | | | 3,181,028 | |
| Ohio Phase-In-Recovery Funding LLC, 2013-1 A1 | | 07/01/2018 | | 0.96 | % | | | 993,199 | | | 992,680 | |
| OneMain Direct Auto Receivables Trust, 2016 A1 (Acquired 11/09/2016, Cost, $1,731,839) (a) | | 01/15/2021 | | 2.04 | % | | | 1,727,707 | | | 1,730,624 | |
| RAMP Series Trust, 2004-RZ3 MII2 (c) | | 09/25/2034 | | 2.41 | % | | | 328,677 | | | 322,778 | |
| SoFi Professional Loan Program LLC, 2015-C A2 (Acquired 07/29/2015, Cost, $1,977,240) (a) | | 08/25/2033 | | 2.51 | % | | | 1,988,155 | | | 1,986,021 | |
| SPS Servicer Advance Receivables Trust, 2016-T1 A-T1 (Acquired 11/16/2016, Cost, $2,999,736) (a) | | 11/16/2048 | | 2.53 | % | | | 3,000,000 | | | 2,992,242 | |
SWAY Residential Trust, 2014-1 A (Acquired 12/04/2014 through 02/02/2016, Cost, $3,575,833) (a)(c) | | 01/20/2032 | | 2.04 | % | | | 3,595,158 | | | 3,597,490 | |
| Synchrony Credit Card Master Note Trust | | | | | | | | | | | | |
| Series 2014-1 A | | 11/15/2020 | | 1.61 | % | | | 2,935,000 | | | 2,940,509 | |
| Series 2015-3 A | | 09/15/2021 | | 1.74 | % | | | 2,000,000 | | | 2,001,063 | |
| TCF Auto Receivables Owner Trust, 2015-1A A3 (Acquired 09/19/2016, Cost, $2,108,334) (a) | | 12/16/2019 | | 1.49 | % | | | 2,106,216 | | | 2,107,013 | |
| United States Small Business Administration, 2008-10B 1 | | 09/10/2018 | | 5.73 | % | | | 18,716 | | | 19,313 | |
| Verizon Owner Trust, 2016-1A A (Acquired 07/12/2016 through 10/07/2016, Cost, $3,070,525) (a) | | 01/20/2021 | | 1.42 | % | | | 3,070,000 | | | 3,048,634 | |
| Volkswagen Auto Loan Enhanced Trust, 2014-1 A3 | | 10/22/2018 | | 0.91 | % | | | 1,200,080 | | | 1,198,512 | |
| TOTAL ASSET BACKED SECURITIES (Cost $130,127,752) | | | | | | | | | | | 130,054,412 | |
| | | | | | | | | | | | | |
| CORPORATE BONDS: 34.01% | | | | | | | | | | | | |
| Finance and Insurance: 14.85% | | | | | | | | | | | | |
| Aetna, Inc. | | 06/07/2019 | | 1.90 | % | | | 1,500,000 | | | 1,496,560 | |
| Aflac, Inc. | | 03/16/2020 | | 2.40 | % | | | 2,835,000 | | | 2,844,948 | |
| American Express Co. | | 05/22/2018 | | 1.55 | % | | | 2,500,000 | | | 2,495,142 | |
| American International Group, Inc. | | 08/15/2020 | | 3.38 | % | | | 3,000,000 | | | 3,086,400 | |
| Anthem, Inc. | | 01/15/2018 | | 1.88 | % | | | 1,250,000 | | | 1,250,550 | |
| Bank of America Corp. | | 05/01/2018 | | 5.65 | % | | | 5,715,000 | | | 5,987,960 | |
| Bank of America Corp. | | 05/13/2021 | | 5.00 | % | | | 1,640,000 | | | 1,786,022 | |
| Bank of Montreal (b) | | 07/18/2019 | | 1.50 | % | | | 1,875,000 | | | 1,850,441 | |
| BB&T Corp. | | 01/12/2018 | | 1.45 | % | | | 1,105,000 | | | 1,103,178 | |
| BB&T Corp. | | 01/15/2020 | | 2.45 | % | | | 1,500,000 | | | 1,511,755 | |
| Berkshire Hathaway Finance Corp. | | 08/15/2018 | | 2.00 | % | | | 1,330,000 | | | 1,339,472 | |
| Berkshire Hathaway Finance Corp. | | 01/15/2021 | | 4.25 | % | | | 1,500,000 | | | 1,616,607 | |
| BNP Paribas (b) | | 08/20/2018 | | 2.70 | % | | | 3,125,000 | | | 3,165,666 | |
| Capital One Financial Corp. | | 04/24/2019 | | 2.45 | % | | | 2,810,000 | | | 2,827,793 | |
| Charles Schwab Corp./The | | 03/10/2018 | | 1.50 | % | | | 2,050,000 | | | 2,050,484 | |
| Chubb INA Holdings, Inc. | | 11/03/2020 | | 2.30 | % | | | 2,500,000 | | | 2,499,428 | |
| Citigroup, Inc. | | 07/30/2018 | | 2.15 | % | | | 4,175,000 | | | 4,188,811 | |
| Citizens Bank NA | | 03/14/2019 | | 2.50 | % | | | 2,725,000 | | | 2,745,993 | |
| Cooperatieve Rabobank UA (b) | | 01/14/2019 | | 2.25 | % | | | 2,000,000 | | | 2,010,708 | |
Daimler Finance North America LLC (Acquired 09/19/2016, Cost, $2,287,024) (a) | | 07/05/2019 | | 1.50 | % | | | 2,300,000 | | | 2,262,912 | |
| Fifth Third Bancorp | | 06/01/2018 | | 4.50 | % | | | 1,300,000 | | | 1,341,009 | |
| Ford Motor Credit Company LLC | | 11/04/2019 | | 2.60 | % | | | 2,000,000 | | | 1,997,030 | |
| General Motors Financial Co., Inc. | | 05/09/2019 | | 2.40 | % | | | 2,170,000 | | | 2,164,252 | |
| Goldman Sachs Group, Inc./The | | 04/01/2018 | | 6.15 | % | | | 4,135,000 | | | 4,349,669 | |
| Goldman Sachs Group, Inc./The | | 02/25/2021 | | 2.88 | % | | | 3,420,000 | | | 3,435,814 | |
| Hartford Financial Services Group, Inc./The | | 03/30/2020 | | 5.50 | % | | | 2,775,000 | | | 3,030,097 | |
| HSBC Holdings PLC (b) | | 04/05/2021 | | 5.10 | % | | | 1,390,000 | | | 1,502,181 | |
ING Bank NV (Acquired 03/15/2016 through 10/11/2016, Cost, $2,510,641) (a)(b) | | 03/22/2019 | | 2.30 | % | | | 2,500,000 | | | 2,506,530 | |
| JPMorgan Chase & Co. | | 03/22/2019 | | 1.85 | % | | | 4,115,000 | | | 4,102,013 | |
| JPMorgan Chase & Co. | | 01/23/2020 | | 2.25 | % | | | 3,845,000 | | | 3,835,949 | |
| Keycorp | | 12/13/2018 | | 2.30 | % | | | 2,170,000 | | | 2,182,931 | |
| Lincoln National Corp. | | 02/15/2020 | | 6.25 | % | | | 1,155,000 | | | 1,275,602 | |
| Marsh & McLennan Cos, Inc. | | 07/15/2021 | | 4.80 | % | | | 2,000,000 | | | 2,173,972 | |
The accompanying notes are an integral part of these consolidated financial statements.
| |
| |
LoCorr Managed Futures Strategy Fund - Consolidated Schedule of Investments (continued) | 17 |
| |
| |
| | | Maturity Date | | Coupon Rate | | Principal Amount | | Value |
| CORPORATE BONDS (continued) | | | | | | | | | | | | |
Metropolitan Life Global Funding I (Acquired 06/16/2016 through 08/10/2016, Cost, $2,023,724) (a) | | 04/14/2020 | | 2.00 | % | | $ | 2,000,000 | | $ | 1,977,484 | |
| Morgan Stanley | | 07/24/2020 | | 5.50 | % | | | 6,135,000 | | | 6,719,107 | |
| National Rural Utilities Cooperative Finance Corp. | | 02/01/2019 | | 2.15 | % | | | 2,000,000 | | | 2,015,292 | |
| NextEra Energy Capital Holdings, Inc. | | 03/01/2019 | | 6.00 | % | | | 2,000,000 | | | 2,162,792 | |
| Nomura Holdings, Inc. (b) | | 03/19/2019 | | 2.75 | % | | | 1,560,000 | | | 1,574,764 | |
| PNC Bank NA | | 10/18/2019 | | 2.40 | % | | | 2,500,000 | | | 2,523,020 | |
| Pricoa Global Funding I (Acquired 09/14/2015, Cost, $1,849,186) (a) | | 09/21/2018 | | 1.90 | % | | | 1,850,000 | | | 1,855,254 | |
| Principal Life Global Funding II (Acquired 11/17/2015, Cost, $2,012,907) (a) | | 10/15/2018 | | 2.25 | % | | | 2,000,000 | | | 2,019,880 | |
| Prudential Financial, Inc. | | 06/15/2019 | | 7.38 | % | | | 1,400,000 | | | 1,575,990 | |
| Realty Income Corp. | | 01/31/2018 | | 2.00 | % | | | 1,750,000 | | | 1,754,939 | |
| Santander UK PLC (b) | | 08/23/2018 | | 3.05 | % | | | 1,505,000 | | | 1,528,759 | |
| Societe Generale SA (Acquired 04/04/2016, Cost, $1,498,875) (a)(b) | | 04/08/2021 | | 2.50 | % | | | 1,500,000 | | | 1,485,969 | |
| State Street Corp. | | 08/18/2020 | | 2.55 | % | | | 2,500,000 | | | 2,525,220 | |
| SunTrust Banks, Inc. | | 11/01/2018 | | 2.35 | % | | | 1,570,000 | | | 1,583,912 | |
| Teva Pharmaceutical Finance Netherlands III BV (b) | | 07/19/2019 | | 1.70 | % | | | 2,210,000 | | | 2,171,387 | |
| Toyota Motor Credit Corp. | | 10/24/2018 | | 2.00 | % | | | 2,030,000 | | | 2,042,026 | |
| Trinity Acquisition PLC (b) | | 09/15/2021 | | 3.50 | % | | | 1,665,000 | | | 1,681,249 | |
| UBS AG (b) | | 03/26/2018 | | 1.80 | % | | | 1,000,000 | | | 1,000,691 | |
| UnitedHealth Group, Inc. | | 10/15/2020 | | 3.88 | % | | | 1,500,000 | | | 1,579,625 | |
| Voya Financial, Inc. | | 02/15/2018 | | 2.90 | % | | | 2,125,000 | | | 2,151,320 | |
| Wells Fargo & Co. | | 01/16/2018 | | 1.50 | % | | | 2,725,000 | | | 2,721,735 | |
| Wells Fargo & Co. | | 04/22/2019 | | 2.13 | % | | | 2,790,000 | | | 2,799,028 | |
| Westpac Banking Corp. (b) | | 11/19/2019 | | 4.88 | % | | | 1,500,000 | | | 1,609,619 | |
| | | | | | | | | | | | 131,076,941 | |
| Information: 4.59% | | | | | | | | | | | | |
| 21st Century Fox America, Inc. | | 02/15/2021 | | 4.50 | % | | | 2,500,000 | | | 2,672,850 | |
| America Movil SAB de CV (b) | | 03/30/2020 | | 5.00 | % | | | 2,000,000 | | | 2,138,712 | |
| AT&T, Inc. | | 03/11/2019 | | 2.30 | % | | | 5,790,000 | | | 5,812,199 | |
| CBS Corp. | | 04/15/2020 | | 5.75 | % | | | 1,645,000 | | | 1,815,820 | |
| Charter Communications Operating LLC/Charter Communications Operating Capital | | 07/23/2020 | | 3.58 | % | | | 2,000,000 | | | 2,040,470 | |
| Comcast Corp. | | 02/15/2018 | | 5.88 | % | | | 1,500,000 | | | 1,572,756 | |
| Deutsche Telekom International Finance BV (b) | | 07/08/2019 | | 6.00 | % | | | 2,000,000 | | | 2,187,578 | |
| Discovery Communications LLC | | 08/15/2019 | | 5.63 | % | | | 1,250,000 | | | 1,350,424 | |
| Hewlett Packard Enterprise Co. | | 10/05/2018 | | 2.85 | % | | | 2,250,000 | | | 2,272,725 | |
| NBCUniversal Media LLC | | 04/01/2021 | | 4.38 | % | | | 2,380,000 | | | 2,571,159 | |
| Oracle Corp. | | 04/15/2018 | | 5.75 | % | | | 1,500,000 | | | 1,584,684 | |
| Orange SA (b) | | 11/03/2019 | | 1.63 | % | | | 2,000,000 | | | 1,968,198 | |
| Rogers Communications, Inc. (b) | | 08/15/2018 | | 6.80 | % | | | 2,000,000 | | | 2,156,494 | |
| Verizon Communications, Inc. | | 09/14/2018 | | 3.65 | % | | | 4,365,000 | | | 4,509,119 | |
| Visa, Inc. | | 12/14/2020 | | 2.20 | % | | | 4,235,000 | | | 4,248,167 | |
| Vodafone Group PLC (b) | | 02/19/2018 | | 1.50 | % | | | 1,575,000 | | | 1,569,151 | |
| | | | | | | | | | | | 40,470,506 | |
| Manufacturing: 8.76% | | | | | | | | | | | | |
| Abbott Laboratories | | 11/30/2021 | | 2.90 | % | | | 2,270,000 | | | 2,263,530 | |
| AbbVie, Inc. | | 05/14/2020 | | 2.50 | % | | | 1,845,000 | | | 1,845,481 | |
| AerCap Ireland Capital Ltd./AerCap Global Aviation Trust (b) | | 05/15/2019 | | 3.75 | % | | | 2,000,000 | | | 2,037,500 | |
| Altria Group, Inc. | | 01/14/2020 | | 2.63 | % | | | 2,000,000 | | | 2,022,792 | |
| Anheuser-Busch InBev Finance, Inc. | | 01/17/2018 | | 1.25 | % | | | 2,500,000 | | | 2,497,760 | |
| Anheuser-Busch InBev Finance, Inc. | | 02/01/2021 | | 2.65 | % | | | 1,000,000 | | | 1,005,745 | |
| Apple, Inc. | | 05/06/2019 | | 2.10 | % | | | 1,910,000 | | | 1,928,120 | |
| Applied Materials, Inc. | | 06/15/2021 | | 4.30 | % | | | 2,500,000 | | | 2,687,832 | |
| Archer-Daniels-Midland Co. | | 03/01/2021 | | 4.48 | % | | | 2,000,000 | | | 2,166,770 | |
| Becton, Dickinson & Co. | | 12/15/2017 | | 1.80 | % | | | 1,650,000 | | | 1,653,752 | |
| Bunge Ltd. Finance Corp. | | 11/24/2020 | | 3.50 | % | | | 2,410,000 | | | 2,452,958 | |
| Celgene Corp. | | 08/15/2018 | | 2.13 | % | | | 2,870,000 | | | 2,881,526 | |
| Chevron Corp. | | 03/03/2020 | | 1.96 | % | | | 2,280,000 | | | 2,272,414 | |
| Corning, Inc. | | 08/15/2020 | | 4.25 | % | | | 2,000,000 | | | 2,112,298 | |
| Dow Chemical Co./The | | 05/15/2018 | | 5.70 | % | | | 2,500,000 | | | 2,626,785 | |
| Dr. Pepper Snapple Group, Inc. | | 11/15/2021 | | 2.53 | % | | | 2,170,000 | | | 2,157,360 | |
| Eastman Chemical Co. | | 01/15/2020 | | 2.70 | % | | | 2,000,000 | | | 2,011,700 | |
| Ecolab, Inc. | | 12/08/2017 | | 1.45 | % | | | 1,500,000 | | | 1,498,519 | |
| General Electric Capital Corp. | | 05/01/2018 | | 5.63 | % | | | 3,085,000 | | | 3,255,894 | |
| General Electric Capital Corp. | | 08/07/2019 | | 6.00 | % | | | 3,565,000 | | | 3,938,844 | |
| General Mills, Inc. | | 10/21/2019 | | 2.20 | % | | | 1,500,000 | | | 1,507,301 | |
| Ingersoll-Rand Luxembourg Finance SA (b) | | 05/01/2020 | | 2.63 | % | | | 2,600,000 | | | 2,605,759 | |
| Intel Corp. | | 12/15/2017 | | 1.35 | % | | | 1,000,000 | | | 1,001,503 | |
| Intel Corp. | | 07/29/2020 | | 2.45 | % | | | 1,500,000 | | | 1,521,149 | |
The accompanying notes are an integral part of these consolidated financial statements.
| |
| |
18 | LoCorr Managed Futures Strategy Fund - Consolidated Schedule of Investments (continued) |
| |
| |
| | | Maturity Date | | Coupon Rate | | Principal Amount | | Value |
| CORPORATE BONDS (continued) | | | | | | | | | | | | |
| Kraft Heinz Foods Co. | | 07/02/2018 | | 2.00 | % | | $ | 1,500,000 | | $ | 1,500,338 | |
| Merck & Co., Inc. | | 05/18/2018 | | 1.30 | % | | | 1,580,000 | | | 1,578,360 | |
| Newell Brands, Inc. | | 03/29/2019 | | 2.60 | % | | | 1,580,000 | | | 1,597,337 | |
| PepsiCo, Inc. | | 10/14/2020 | | 2.15 | % | | | 2,400,000 | | | 2,404,253 | |
| Philip Morris International, Inc. | | 02/25/2019 | | 1.38 | % | | | 2,250,000 | | | 2,226,101 | |
| Qualcomm, Inc. | | 05/18/2018 | | 1.40 | % | | | 2,050,000 | | | 2,049,721 | |
| Reynolds American, Inc. | | 06/12/2020 | | 3.25 | % | | | 2,345,000 | | | 2,402,837 | |
| Sherwin-Williams Co./The | | 12/15/2017 | | 1.35 | % | | | 1,640,000 | | | 1,637,155 | |
Siemens Financieringsmaatschappij NV (Acquired 09/06/2016 through 12/15/2016, Cost, $3,241,032) (a)(b) | | 09/13/2019 | | 1.30 | % | | | 3,270,000 | | | 3,208,249 | |
| Statoil ASA (b) | | 11/08/2018 | | 1.95 | % | | | 2,250,000 | | | 2,257,274 | |
| Suncor Energy, Inc. (b) | | 06/01/2018 | | 6.10 | % | | | 2,355,000 | | | 2,493,321 | |
| Tyson Foods, Inc. | | 08/15/2019 | | 2.65 | % | | | 2,000,000 | | | 2,019,064 | |
| | | | | | | | | | | | 77,327,302 | |
| Mining, Quarrying, and Oil and Gas Extraction: 0.63% | | | | | | | | | | | | |
| ConocoPhillips Co. | | 03/15/2021 | | 4.20 | % | | | 2,000,000 | | | 2,124,442 | |
| Occidental Petroleum Corp. | | 02/15/2018 | | 1.50 | % | | | 425,000 | | | 425,386 | |
| Total Capital International SA (b) | | 01/10/2019 | | 2.13 | % | | | 3,000,000 | | | 3,023,853 | |
| | | | | | | | | | | | 5,573,681 | |
| Professional, Scientific, and Technical Services: 0.74% | | | | | | | | | | | | |
| Biogen, Inc. | | 09/15/2020 | | 2.90 | % | | | 2,250,000 | | | 2,278,697 | |
| eBay, Inc. | | 03/09/2018 | | 2.50 | % | | | 2,520,000 | | | 2,542,123 | |
| International Business Machines Corp. | | 05/17/2019 | | 1.80 | % | | | 1,750,000 | | | 1,750,747 | |
| | | | | | | | | | | | 6,571,567 | |
| Real Estate and Rental and Leasing: 0.19% | | | | | | | | | | | | |
| Air Lease Corp. | | 06/01/2021 | | 3.38 | % | | | 1,650,000 | | | 1,672,861 | |
| | | | | | | | | | | | 1,672,861 | |
| Retail Trade: 1.61% | | | | | | | | | | | | |
| Amazon.com, Inc. | | 12/05/2019 | | 2.60 | % | | | 2,000,000 | | | 2,039,402 | |
| BP Capital Markets (b) | | 09/26/2018 | | 2.24 | % | | | 1,000,000 | | | 1,007,481 | |
| CVS Health Corp. | | 12/05/2018 | | 2.25 | % | | | 2,115,000 | | | 2,133,538 | |
| Home Depot, Inc./The | | 06/15/2019 | | 2.00 | % | | | 1,500,000 | | | 1,513,061 | |
| Hyundai Capital America (Acquired 12/02/2016, Cost, $2,539,559) (a) | | 03/18/2021 | | 3.00 | % | | | 2,535,000 | | | 2,532,300 | |
| Kroger Co./The | | 09/30/2019 | | 1.50 | % | | | 2,000,000 | | | 1,969,608 | |
| Walgreens Boots Alliance, Inc. | | 11/18/2019 | | 2.70 | % | | | 3,000,000 | | | 3,039,795 | |
| | | | | | | | | | | | 14,235,185 | |
| Transportation and Warehousing: 0.37% | | | | | | | | | | | | |
| Carnival Corp. (b) | | 10/15/2020 | | 3.95 | % | | | 2,225,000 | | | 2,346,436 | |
| Spectra Energy Partners, LP | | 09/25/2018 | | 2.95 | % | | | 915,000 | | | 929,441 | |
| | | | | | | | | | | | 3,275,877 | |
| Utilities: 1.31% | | | | | | | | | | | | |
| Dominion Resources, Inc. | | 08/15/2019 | | 1.60 | % | | | 1,305,000 | | | 1,285,104 | |
| Duke Energy Corp. | | 09/15/2019 | | 5.05 | % | | | 2,000,000 | | | 2,156,072 | |
| Exelon Generation Co., LLC | | 10/01/2019 | | 5.20 | % | | | 2,000,000 | | | 2,143,522 | |
| Northern States Power Co. | | 08/15/2020 | | 2.20 | % | | | 2,000,000 | | | 2,003,074 | |
| Sempra Energy | | 03/15/2020 | | 2.40 | % | | | 2,475,000 | | | 2,471,347 | |
| Southern Power Co. | | 06/01/2018 | | 1.50 | % | | | 1,500,000 | | | 1,493,187 | |
| | | | | | | | | | | | 11,552,306 | |
| Wholesale Trade: 0.96% | | | | | | | | | | | | |
| Cardinal Health, Inc. | | 11/15/2019 | | 2.40 | % | | | 1,500,000 | | | 1,510,934 | |
| LyondellBasell Industries NV (b) | | 04/15/2019 | | 5.00 | % | | | 2,930,000 | | | 3,095,990 | |
| McKesson Corp. | | 03/15/2019 | | 2.28 | % | | | 2,120,000 | | | 2,127,939 | |
| Sysco Corp. | | 10/01/2020 | | 2.60 | % | | | 1,695,000 | | | 1,709,638 | |
| | | | | | | | | | | | 8,444,501 | |
| TOTAL CORPORATE BONDS (Cost $301,651,530) | | | | | | | | | | | 300,200,727 | |
| | | | | | | | | | | | | |
| FOREIGN GOVERNMENT BONDS: 0.67% | | | | | | | | | | | | |
| European Investment Bank (b) | | 03/15/2018 | | 1.00 | % | | | 3,500,000 | | | 3,486,549 | |
| European Investment Bank (b) | | 08/15/2018 | | 1.13 | % | | | 2,400,000 | | | 2,389,546 | |
| TOTAL FOREIGN GOVERNMENT BONDS (Cost $5,868,114) | | | | | | | | | | | 5,876,095 | |
| | | | | | | | | | | | | |
| MORTGAGE BACKED SECURITIES: 13.46% | | | | | | | | | | | | |
| American Tower Trust I, 2013-1-2 1A (Acquired 03/06/2013, Cost, $1,830,000)(a) | | 03/15/2043 | | 1.55 | % | | | 1,830,000 | | | 1,828,502 | |
BXHTL Mortgage Trust, 2015-JWRZ A (Acquired 06/19/2015 through 11/15/2016, Cost, $4,571,846)(a)(c) | | 05/15/2029 | | 1.93 | % | | | 4,585,000 | | | 4,597,948 | |
| CD Mortgage Trust, 2007-CD5 A4 (c) | | 11/15/2044 | | 5.89 | % | | | 2,355,780 | | | 2,394,239 | |
| Citigroup Commercial Mortgage Trust, 2016-GC37 A1 | | 04/12/2049 | | 1.64 | % | | | 3,448,487 | | | 3,426,350 | |
| COMM Mortgage Trust, 2007-C9 A4 (c) | | 12/10/2049 | | 5.81 | % | | | 2,895,567 | | | 2,918,976 | |
The accompanying notes are an integral part of these consolidated financial statements.
| |
| |
LoCorr Managed Futures Strategy Fund - Consolidated Schedule of Investments (continued) | 19 |
| |
| |
| | | Maturity Date | | Coupon Rate | | Principal Amount | | Value |
| MORTGAGE BACKED SECURITIES (continued) | | | | | | | | | | | | |
| Commercial Mortgage Trust | | | | | | | | | | | | |
Series 2012-CR4 A2 (c) | | 10/17/2045 | | 1.80 | % | | $ | 2,500,000 | | $ | 2,507,363 | |
| Series 2007-GG11 A4 | | 12/10/2049 | | 5.74 | % | | | 5,925,532 | | | 6,010,308 | |
| CSMC Trust | | | | | | | | | | | | |
Series 2013-6 1A1 (Acquired 07/24/2013, Cost, $1,747,378) (a)(c) | | 07/25/2028 | | 2.50 | % | | | 1,790,461 | | | 1,756,331 | |
Series 2015-2 A2 (Acquired 04/30/2015, Cost, $1,566,212) (a) | | 02/25/2045 | | 3.00 | % | | | 1,546,926 | | | 1,544,261 | |
| Fannie Mae Aces | | | | | | | | | | | | |
| Series 2014-M13 ASQ2 | | 11/25/2017 | | 1.64 | % | | | 1,653,089 | | | 1,655,043 | |
| Series 2015-M1 ASQ2 | | 02/25/2018 | | 1.63 | % | | | 647,293 | | | 648,831 | |
| Series 2015-M7 ASQ2 | | 04/25/2018 | | 1.55 | % | | | 2,500,000 | | | 2,501,434 | |
Series 2013-M13 FA (c) | | 05/25/2018 | | 1.11 | % | | | 1,024,218 | | | 1,024,245 | |
Series 2013-M14 FA (c) | | 08/25/2018 | | 1.11 | % | | | 2,481,731 | | | 2,485,064 | |
| Fannie Mae Connecticut Avenue Securities | | | | | | | | | | | | |
Series 2014-C02 1M1 (c) | | 05/28/2024 | | 1.53 | % | | | 1,682,523 | | | 1,686,188 | |
Series 2014-C03 1M1 (c) | | 07/25/2024 | | 1.78 | % | | | 1,152,501 | | | 1,155,534 | |
Series 2016-C03 2M1 (c) | | 10/25/2028 | | 2.79 | % | | | 2,376,945 | | | 2,401,505 | |
| Fannie Mae Pool | | 02/01/2021 | | 3.50 | % | | | 42,269 | | | 44,036 | |
| Fannie Mae Pool | | 08/01/2021 | | 3.00 | % | | | 158,731 | | | 163,029 | |
| Fannie Mae Pool | | 09/01/2021 | | 3.00 | % | | | 193,104 | | | 198,360 | |
| Fannie Mae Pool | | 11/01/2021 | | 3.00 | % | | | 378,008 | | | 388,621 | |
| Fannie Mae Pool | | 12/01/2025 | | 3.50 | % | | | 332,333 | | | 346,765 | |
| Fannie Mae Pool | | 09/01/2026 | | 3.50 | % | | | 309,337 | | | 322,698 | |
| FDIC Guaranteed Notes Trust | | | | | | | | | | | | |
Series 2010-S4 A (Acquired 02/24/2012, Cost, $521,804) (a)(c) | | 12/04/2020 | | 1.34 | % | | | 521,320 | | | 521,816 | |
Series 2010-S1 2A (Acquired 03/01/2012, Cost, $417,820) (a) | | 04/25/2038 | | 3.25 | % | | | 414,217 | | | 417,069 | |
| FHLMC Multifamily Structured Pass Through Certificates | | | | | | | | | | | | |
| Series K-702 A2 | | 02/25/2018 | | 3.15 | % | | | 4,822,554 | | | 4,894,254 | |
| Series K-709 A1 | | 10/25/2018 | | 1.56 | % | | | 657,640 | | | 658,187 | |
Series K-P02 A2 (c) | | 04/25/2021 | | 2.36 | % | | | 4,400,000 | | | 4,420,691 | |
| Series 3855 HE | | 02/15/2026 | | 2.50 | % | | | 18,405 | | | 18,553 | |
Series 4181 PF (c) | | 11/15/2042 | | 0.95 | % | | | 1,715,671 | | | 1,700,857 | |
| Freddie Mac Structured Agency Credit Risk Debt Notes | | | | | | | | | | | | |
Series 2013-DN2 M1 (c) | | 11/27/2023 | | 2.04 | % | | | 1,207,746 | | | 1,210,513 | |
Series 2014-HQ2 M1 (c) | | 09/25/2024 | | 2.03 | % | | | 764,283 | | | 767,061 | |
Series 2016-DNA2 M1 (c) | | 10/25/2028 | | 1.69 | % | | | 1,418,947 | | | 1,420,670 | |
FREMF Mortgage Trust | | | | | | | | | | | | |
Series 2011-K702 B (Acquired 06/16/2016 through 12/07/2016, Cost, $3,170,319)(a)(c) | | 04/25/2044 | | 4.77 | % | | | 3,060,000 | | | 3,150,373 | |
Series 2012-K708 B (Acquired 02/03/2015, Cost, $3,375,672) (a)(c) | | 02/25/2045 | | 3.75 | % | | | 3,250,000 | | | 3,333,345 | |
Series 2013-K502 B (Acquired 05/06/2015, Cost, $2,909,568) (a)(c) | | 03/25/2045 | | 2.61 | % | | | 2,875,000 | | | 2,880,175 | |
Series 2013-KF02 B (Acquired 11/01/2013, Cost, $299,175) (a)(c) | | 12/25/2045 | | 3.53 | % | | | 299,175 | | | 300,127 | |
Series 2011-K10 (Acquired 11/22/2016, Cost, $2,373,304) (a)(c) | | 11/25/2049 | | 4.63 | % | | | 2,220,000 | | | 2,353,121 | |
GAHR Commercial Mortgage Trust, 2015-NRF AFL1 (Acquired 05/07/2015, Cost, $2,849,852) (a)(c) | | 12/15/2034 | | 2.00 | % | | | 2,843,698 | | | 2,848,112 | |
GP Portfolio Trust, 2014-GPP A (Acquired 09/01/2016 through 12/27/2016, Cost, $3,336,897) (a)(c) | | 02/16/2027 | | 1.65 | % | | | 3,330,088 | | | 3,337,326 | |
| GS Mortgage Securities Trust | | | | | | | | | | | | |
| Series 2014-GSFL A (Acquired 08/06/2014, Cost, $681,677) (a)(c) | | 07/15/2031 | | 1.70 | % | | | 681,677 | | | 681,496 | |
Series 2010-C2 A1 (Acquired 04/11/2012, Cost, $179,248) (a) | | 12/10/2043 | | 3.85 | % | | | 171,353 | | | 177,311 | |
| Series 2011-GC5 A2 | | 08/10/2044 | | 3.00 | % | | | 67,504 | | | 67,471 | |
Series 2007-GG10 A4 (c) | | 08/10/2045 | | 5.79 | % | | | 5,060,404 | | | 5,091,914 | |
| JP Morgan Mortgage Trust, 2016-1 A5 (Acquired 06/09/2016, Cost, $1,684,730) (a) | | 05/25/2046 | | 3.50 | % | | | 1,640,286 | | | 1,666,813 | |
| JPMBB Commercial Mortgage Securities Trust, 2014-C25 A1 | | 11/18/2047 | | 1.52 | % | | | 3,609,478 | | | 3,598,666 | |
| JPMorgan Chase Commercial Mortgage Securities Trust | | | | | | | | | | | | |
Series 2011-C3 A3 (Acquired 04/17/2015, Cost, $2,457,284) (a) | | 02/16/2046 | | 4.39 | % | | | 2,299,149 | | | 2,367,493 | |
Series 2007-CB20 A4 (c) | | 02/12/2051 | | 5.79 | % | | | 2,148,868 | | | 2,181,827 | |
| MASTR Asset Securitization Trust, 2004-1 4A1 | | 02/25/2019 | | 4.50 | % | | | 109,370 | | | 109,808 | |
| Morgan Stanley Capital I Trust 2007-IQ16, 2007-IQ16 4A | | 12/12/2049 | | 5.81 | % | | | 2,080,742 | | | 2,111,357 | |
Morgan Stanley Re-REMIC Trust, 2010-R1 3A (Acquired 05/05/2016, Cost, $589,384) (a)(c) | | 07/26/2035 | | 3.18 | % | | | 587,540 | | | 584,317 | |
| NCUA Guaranteed Notes Trust | | | | | | | | | | | | |
Series 2011-R1 1A (c) | | 01/08/2020 | | 1.10 | % | | | 856,267 | | | 857,974 | |
Series 2011-R2 1A (c) | | 02/06/2020 | | 1.05 | % | | | 2,447,095 | | | 2,447,118 | |
Series 2011-R3 1A (c) | | 04/09/2020 | | 1.06 | % | | | 1,866,162 | | | 1,867,351 | |
Series 2010-R1 1A (c) | | 10/07/2020 | | 1.10 | % | | | 197,563 | | | 197,790 | |
| New Residential Mortgage Loan Trust | | | | | | | | | | | | |
Series 2015-1A A3 (Acquired 06/23/2015 through 04/19/2016, Cost, $1,966,950) (a) | | 05/28/2052 | | 3.75 | % | | | 1,922,330 | | | 1,978,211 | |
Series 2014-2A A3 (Acquired 02/18/2016, Cost, $1,864,144) (a)(c) | | 05/25/2054 | | 3.75 | % | | | 1,818,687 | | | 1,865,368 | |
Series 2016-1A A1 (Acquired 03/29/2016, Cost, $1,911,914) (a) | | 03/25/2056 | | 3.75 | % | | | 1,858,872 | | | 1,885,909 | |
Opteum Mortgage Acceptance Corp. Asset Backed Pass-Through Certificates, 2005-1 M3 (c) | | 02/25/2035 | | 1.61 | % | | | 1,400,000 | | | 1,396,544 | |
SBA Tower Trust, 2012-1 A (Acquired 06/12/2014 through 09/03/2014, Cost, $1,604,097)(a) | | 12/15/2042 | | 2.93 | % | | | 1,562,000 | | | 1,563,619 | |
The accompanying notes are an integral part of these consolidated financial statements.
| |
| |
20 | LoCorr Managed Futures Strategy Fund - Consolidated Schedule of Investments (continued) |
| |
| |
| | Maturity Date | | Coupon Rate | | Principal Amount | | Value |
MORTGAGE BACKED SECURITIES (continued) | | | | | | | | | | | | |
Sequoia Mortgage Trust, 2015-3 A4 (Acquired 06/19/2015, Cost, $1,084,170) (a)(c) | | 07/25/2045 | | 3.50 | % | | $ | 1,071,914 | | $ | 1,089,919 | |
| UBS-Citigroup Commercial Mortgage Trust, 2011-C1 A2 | | 01/12/2045 | | 2.80 | % | | | 2,116 | | | 2,111 | |
| Wells Fargo Commercial Mortgage Trust, 2015-LC22 A1 | | 09/17/2058 | | 1.64 | % | | | 5,196,902 | | | 5,182,717 | |
| WFRBS Commercial Mortgage Trust, 2012-C8 A2 | | 08/17/2045 | | 1.88 | % | | | 3,429,385 | | | 3,435,068 | |
WIMC Capital Trust, 2012-A A1 (Acquired 06/21/2012, Cost, $169,848) (a) | | 10/16/2050 | | 4.55 | % | | | 169,849 | | | 170,276 | |
| TOTAL MORTGAGE BACKED SECURITIES (Cost $119,772,564) | | | | | | | | | | | 118,816,329 | |
| | | | | | | | | | | | | |
| MUNICIPAL BONDS: 0.96% | | | | | | | | | | | | |
| Louisiana Local Government Environmental Facilities & Community Development Authority | | 02/01/2021 | | 3.22 | % | | | 636,520 | | | 645,877 | |
| Metropolitan Council, (Minneapolis - St. Paul Metropolitan Area), State of Minnesota | | 09/01/2017 | | 1.20 | % | | | 2,020,000 | | | 2,022,848 | |
| Metropolitan Government of Nashville & Davidson County TN | | 07/01/2017 | | 1.21 | % | | | 1,500,000 | | | 1,503,225 | |
| North Carolina Eastern Municipal Power Agency | | 07/01/2018 | | 2.00 | % | | | 1,385,000 | | | 1,391,897 | |
| St. Paul Housing & Redevelopment Authority | | 07/01/2018 | | 1.84 | % | | | 1,385,000 | | | 1,387,729 | |
| State of Ohio | | 08/01/2017 | | 3.33 | % | | | 1,500,000 | | | 1,518,780 | |
| TOTAL MUNICIPAL BONDS (Cost $8,465,368) | | | | | | | | | | | 8,470,356 | |
| | | | | | | | | | | | | |
| U.S. GOVERNMENT AGENCY ISSUES: 9.70% | | | | | | | | | | | | |
| Federal Farm Credit Banks Funding Corp. | | 09/14/2018 | | 0.88 | % | | | 5,000,000 | | | 4,973,620 | |
| Federal Farm Credit Banks Funding Corp. | | 09/27/2019 | | 1.55 | % | | | 4,000,000 | | | 4,004,864 | |
| Federal Home Loan Banks | | 01/16/2019 | | 1.25 | % | | | 14,000,000 | | | 13,995,114 | |
| Federal Home Loan Banks | | 12/11/2020 | | 1.88 | % | | | 7,000,000 | | | 7,022,253 | |
| Federal Home Loan Banks | | 02/18/2021 | | 1.38 | % | | | 4,385,000 | | | 4,301,952 | |
| Federal Home Loan Banks | | 07/14/2021 | | 1.13 | % | | | 11,095,000 | | | 10,709,560 | |
| Federal Home Loan Mortgage Corp. | | 07/27/2018 | | 0.85 | % | | | 4,970,000 | | | 4,945,647 | |
| Federal Home Loan Mortgage Corp. | | 08/12/2021 | | 1.13 | % | | | 6,000,000 | | | 5,776,542 | |
| Federal National Mortgage Association | | 02/26/2019 | | 1.00 | % | | | 10,000,000 | | | 9,937,830 | |
| Federal National Mortgage Association | | 08/02/2019 | | 0.88 | % | | | 5,925,000 | | | 5,842,696 | |
| Federal National Mortgage Association | | 10/24/2019 | | 1.00 | % | | | 6,900,000 | | | 6,804,614 | |
| Federal National Mortgage Association | | 10/07/2021 | | 1.38 | % | | | 7,500,000 | | | 7,296,525 | |
| TOTAL U.S. GOVERNMENT AGENCY ISSUES (Cost $86,712,240) | | | | | | | | | | | 85,611,217 | |
| | | | | | | | | | | | | |
| U.S. GOVERNMENT NOTES: 10.95% | | | | | | | | | | | | |
| United States Treasury Note | | 05/31/2018 | | 2.38 | % | | | 18,000,000 | | | 18,335,394 | |
| United States Treasury Note | | 07/15/2018 | | 0.88 | % | | | 15,000,000 | | | 14,951,955 | |
| United States Treasury Note | | 07/31/2020 | | 1.63 | % | | | 3,280,000 | | | 3,277,822 | |
| United States Treasury Note | | 09/30/2020 | | 1.38 | % | | | 2,340,000 | | | 2,313,492 | |
| United States Treasury Note | | 01/31/2021 | | 1.38 | % | | | 13,250,000 | | | 13,038,305 | |
| United States Treasury Note | | 04/30/2021 | | 1.38 | % | | | 5,320,000 | | | 5,218,798 | |
| United States Treasury Note | | 05/31/2021 | | 1.38 | % | | | 12,665,000 | | | 12,413,182 | |
| United States Treasury Note | | 07/31/2021 | | 1.13 | % | | | 6,000,000 | | | 5,799,846 | |
| United States Treasury Note | | 08/31/2021 | | 2.00 | % | | | 7,040,000 | | | 7,068,047 | |
| United States Treasury Note | | 10/31/2021 | | 1.25 | % | | | 14,725,000 | | | 14,278,656 | |
| TOTAL U.S. GOVERNMENT NOTES (Cost $97,893,544) | | | | | | | | | | | 96,695,497 | |
| | | | | | | | | | | | | |
| TOTAL SHORT TERM INVESTMENTS: 4.73% | | | | | | | | | | | | |
| U.S. GOVERNMENT NOTE 1.36% | | | | | | | | | | | | |
| United States Treasury Note | | 10/15/2017 | | 0.88 | % | | | 12,000,000 | | | 12,003,276 | |
| TOTAL U.S .GOVERNMENT NOTE (Cost 12,003,750) | | | | | | | | | | | 12,003,276 | |
| | | | | | | | | | | | | |
| MONEY MARKET FUND: 3.37% | | | | | | | | Shares | | | | |
STIT-Government & Agency Portfolio, Institutional Class, 0.43% (d)(e) | | | | | | | | 29,719,738 | | | 29,719,738 | |
| TOTAL MONEY MARKET FUND (Cost $29,719,738) | | | | | | | | | | | 29,719,738 | |
| TOTAL SHORT TERM INVESTMENTS (Cost $41,723,188) | | | | | | | | | | | 41,723,014 | |
| | | | | | | | | | | | | |
| TOTAL INVESTMENTS (Cost $792,214,600): 89.21% | | | | | | | | | | | 787,447,647 | |
| Other Assets in Excess of Liabilities: 10.79% (f) | | | | | | | | | | | 95,212,625 | |
| TOTAL NET ASSETS: 100.00% | | | | | | | | | | $ | 882,660,272 | |
| | | | | | | | | | | | | |
| (a) | Restricted security as defined in Rule 144(a) under the Securities Act of 1933 and determined to be liquid. Purchased in a private placement transaction; resale to the public may require registration or may extend only to qualified institutional buyers. At December 31, 2016, the value of these securities total $112,566,058 which represents 12.75% of total net assets. |
| (b) | Foreign issued security. |
| (c) | Variable rate security. The rate reported is the rate in effect as of December 31, 2016. |
| (d) | The rate quoted is the annualized seven-day effective yield as of December 31, 2016. |
| (e) | All or a portion of this security is held by LCMFS Fund Limited and pledged as collateral for derivative contracts. |
| (f) | Includes assets pledged as collateral for derivative contracts. |
The accompanying notes are an integral part of these consolidated financial statements.
| |
|
LoCorr Managed Futures Strategy Fund - Consolidated Schedule of Open Forward Currency Contracts | 21 |
|
LoCorr Managed Futures Strategy Fund
Consolidated Schedule of Open Forward Currency Contracts
December 31, 2016
| | | | | | | Currency to be Received | | Currency to be Delivered | | | | | | | |
| | | Notional
Amount | | Counter-
party | Forward
Settlement Date | Curr
Abbr. | | U.S. $ Value at
December 31, 2016 | | Curr
Abbr. | | U.S. $ Value on
Origination Date | | | Unrealized
Appreciation | | | Unrealized
(Depreciation) | |
| | | | | See key for
abbreviation | | | | | | | | | | | | | | | |
| Purchase Contracts: | | | | | | | | | | | | | | | | | |
| | | $ | 12,365,353 | | DB | 01/18/2017 | AUD | | $ | 11,965,891 | | USD | | $ | 12,365,353 | | | $ | — | | | $ | (399,462 | ) |
| | | | 51,304,791 | | BAML | 03/17/2017 | AUD | | | 49,475,785 | | USD | | | 51,304,791 | | | | — | | | | (1,829,006 | ) |
| | | | 11,734,410 | | DB | 01/18/2017 | BRL | | | 11,970,560 | | USD | | | 11,734,410 | | | | 236,150 | | | | — | |
| | | | 9,678,922 | | DB | 01/18/2017 | CAD | | | 9,647,465 | | USD | | | 9,678,922 | | | | — | | | | (31,457 | ) |
| | | | 10,387,835 | | BAML | 03/17/2017 | CAD | | | 10,200,399 | | USD | | | 10,387,835 | | | | — | | | | (187,436 | ) |
| | | | 4,953,118 | | DB | 01/18/2017 | CHF | | | 4,985,713 | | USD | | | 4,953,118 | | | | 32,595 | | | | — | |
| | | | 3,708,541 | | BAML | 03/17/2017 | CHF | | | 3,710,304 | | USD | | | 3,708,541 | | | | 1,763 | | | | — | |
| | | | 5,922,454 | | DB | 01/18/2017 | CLP | | | 5,817,272 | | USD | | | 5,922,454 | | | | — | | | | (105,182 | ) |
| | | | 2,415,434 | | DB | 01/18/2017 | COP | | | 2,405,277 | | USD | | | 2,415,434 | | | | — | | | | (10,157 | ) |
| | | | 6,419,975 | | DB | 01/18/2017 | CZK | | | 6,436,594 | | USD | | | 6,419,975 | | | | 16,619 | | | | — | |
| | | | 4,845,276 | | DB | 01/18/2017 | EUR | | | 4,805,429 | | PLN | | | 4,845,276 | | | | — | | | | (39,847 | ) |
| | | | 13,750,175 | | DB | 01/18/2017 | EUR | | | 13,657,535 | | SEK | | | 13,750,175 | | | | — | | | | (92,640 | ) |
| | | | 3,890,122 | | DB | 01/18/2017 | EUR | | | 3,856,989 | | TRY | | | 3,890,122 | | | | — | | | | (33,133 | ) |
| | | | 3,276,775 | | DB | 01/18/2017 | EUR | | | 3,319,540 | | USD | | | 3,276,775 | | | | 42,765 | | | | — | |
| | | | 2,287,647 | | BAML | 03/17/2017 | EUR | | | 2,279,502 | | USD | | | 2,287,647 | | | | — | | | | (8,145 | ) |
| | | | 8,190,374 | | DB | 01/18/2017 | GBP | | | 8,138,559 | | USD | | | 8,190,374 | | | | — | | | | (51,815 | ) |
| | | | 681,778 | | BAML | 03/17/2017 | GBP | | | 676,667 | | USD | | | 681,778 | | | | — | | | | (5,111 | ) |
| | | | 3,378,906 | | DB | 01/18/2017 | ILS | | | 3,363,387 | | USD | | | 3,378,906 | | | | — | | | | (15,519 | ) |
| | | | 7,561,484 | | DB | 01/18/2017 | INR | | | 7,562,212 | | USD | | | 7,561,484 | | | | 728 | | | | — | |
| | | | 14,466 | | BAML | 03/17/2017 | JPY | | | 14,525 | | USD | | | 14,466 | | | | 59 | | | | — | |
| | | | 7,593,859 | | DB | 01/18/2017 | MXN | | | 7,497,195 | | USD | | | 7,593,859 | | | | — | | | | (96,664 | ) |
| | | | 177,164 | | BAML | 03/17/2017 | MXN | | | 174,505 | | USD | | | 177,164 | | | | — | | | | (2,659 | ) |
| | | | 18,900,257 | | DB | 01/18/2017 | NOK | | | 18,855,390 | | EUR | | | 18,900,257 | | | | — | | | | (44,867 | ) |
| | | | 862,272 | | DB | 01/18/2017 | NOK | | | 866,398 | | USD | | | 862,272 | | | | 4,126 | | | | — | |
| | | | 11,271,067 | | DB | 01/18/2017 | NZD | | | 11,051,840 | | USD | | | 11,271,067 | | | | — | | | | (219,227 | ) |
| | | | 26,611,029 | | BAML | 03/17/2017 | NZD | | | 25,664,549 | | USD | | | 26,611,029 | | | | — | | | | (946,480 | ) |
| | | | 12,007,799 | | DB | 01/18/2017 | PLN | | | 12,086,210 | | EUR | | | 12,007,799 | | | | 78,411 | | | | — | |
| | | | 4,841,574 | | DB | 01/18/2017 | PLN | | | 4,882,659 | | USD | | | 4,841,574 | | | | 41,085 | | | | — | |
| | | | 6,860,311 | | DB | 01/18/2017 | RUB | | | 6,822,525 | | USD | | | 6,860,311 | | | | — | | | | (37,786 | ) |
| | | | 7,661,386 | | DB | 01/18/2017 | SEK | | | 7,791,438 | | EUR | | | 7,661,386 | | | | 130,052 | | | | — | |
| | | | 6,250,855 | | DB | 01/18/2017 | SEK | | | 6,308,001 | | USD | | | 6,250,855 | | | | 57,146 | | | | — | |
| | | | 1,752,346 | | DB | 01/18/2017 | SGD | | | 1,732,976 | | USD | | | 1,752,346 | | | | — | | | | (19,370 | ) |
| | | | 3,111,628 | | DB | 01/18/2017 | TRY | | | 3,096,036 | | EUR | | | 3,111,628 | | | | — | | | | (15,592 | ) |
| | | | 993,261 | | DB | 01/18/2017 | TRY | | | 991,193 | | USD | | | 993,261 | | | | — | | | | (2,068 | ) |
| | | | 4,342,114 | | DB | 01/18/2017 | ZAR | | | 4,355,890 | | USD | | | 4,342,114 | | | | 13,776 | | | | — | |
| Total Purchase Contracts | | | | | | | 276,466,410 | | | | | 280,004,758 | | | | 655,275 | | | | (4,193,623 | ) |
| | | | | | | | | | | | | | | | | | | | | | | | | |
| Sale Contracts: | | | | | | | | | | | | | | | | | | | | | |
| | | $ | 22,161,614 | | DB | 01/18/2017 | USD | | $ | (22,027,625 | ) | AUD | | $ | (22,161,614 | ) | | $ | 133,989 | | | $ | — | |
| | | | 32,384,128 | | BAML | 03/17/2017 | USD | | | (32,412,662 | ) | AUD | | | (32,384,128 | ) | | | — | | | | (28,534 | ) |
| | | | 41,209,000 | | DB | 01/18/2017 | USD | | | (40,355,458 | ) | CAD | | | (41,209,000 | ) | | | 853,542 | | | | — | |
| | | | 62,582,148 | | BAML | 03/17/2017 | USD | | | (61,287,376 | ) | CAD | | | (62,582,148 | ) | | | 1,294,772 | | | | — | |
| | | | 29,605,187 | | DB | 01/18/2017 | USD | | | (29,579,932 | ) | CHF | | | (29,605,187 | ) | | | 25,255 | | | | — | |
| | | | 38,680,632 | | BAML | 03/17/2017 | USD | | | (38,364,145 | ) | CHF | | | (38,680,632 | ) | | | 316,487 | | | | — | |
| | | | 1,169,190 | | DB | 01/18/2017 | USD | | | (1,182,239 | ) | CLP | | | (1,169,190 | ) | | | — | | | | (13,049 | ) |
| | | | 479,039 | | DB | 01/18/2017 | USD | | | (480,458 | ) | COP | | | (479,039 | ) | | | — | | | | (1,419 | ) |
| | | | 11,354,419 | | DB | 01/18/2017 | USD | | | (11,241,618 | ) | CZK | | | (11,354,419 | ) | | | 112,801 | | | | — | |
| | | | 18,900,256 | | DB | 01/18/2017 | NOK | | | (18,958,260 | ) | EUR | | | (18,900,256 | ) | | | — | | | | (58,004 | ) |
| | | | 12,007,799 | | DB | 01/18/2017 | PLN | | | (12,076,802 | ) | EUR | | | (12,007,799 | ) | | | — | | | | (69,003 | ) |
| | | | 7,661,385 | | DB | 01/18/2017 | SEK | | | (7,724,516 | ) | EUR | | | (7,661,385 | ) | | | — | | | | (63,131 | ) |
| | | | 3,111,629 | | DB | 01/18/2017 | TRY | | | (3,129,852 | ) | EUR | | | (3,111,629 | ) | | | — | | | | (18,223 | ) |
| | | | 46,783,563 | | DB | 01/18/2017 | USD | | | (46,515,709 | ) | EUR | | | (46,783,563 | ) | | | 267,854 | | | | — | |
| | | | 36,886,202 | | BAML | 03/17/2017 | USD | | | (36,474,145 | ) | EUR | | | (36,886,202 | ) | | | 412,057 | | | | — | |
| | | | 29,661,610 | | DB | 01/18/2017 | USD | | | (29,089,184 | ) | GBP | | | (29,661,610 | ) | | | 572,426 | | | | — | |
| | | | 65,192,245 | | BAML | 03/17/2017 | USD | | | (63,764,750 | ) | GBP | | | (65,192,245 | ) | | | 1,427,495 | | | | — | |
| | | | 1,911,495 | | DB | 01/18/2017 | USD | | | (1,898,560 | ) | ILS | | | (1,911,495 | ) | | | 12,935 | | | | — | |
| | | | 4,301,194 | | DB | 01/18/2017 | USD | | | (4,299,606 | ) | INR | | | (4,301,194 | ) | | | 1,588 | | | | — | |
The accompanying notes are an integral part of these consolidated financial statements.
| |
|
22 | LoCorr Managed Futures Strategy Fund - Consolidated Schedule of Open Forward Currency Contracts (continued) |
|
| | | | | | | Currency to be Received | | Currency to be Delivered | | | | | | | |
| | | Notional
Amount | | Counter-
party | Forward
Settlement Date | Curr
Abbr. | | U.S. $ Value at
December 31, 2016 | | Curr
Abbr. | | U.S. $ Value on
Origination Date | | | Unrealized
Appreciation | | | Unrealized
(Depreciation) | |
| | | | | See key for
abbreviation | | | | | | | | | | | | | | | |
Sale Contracts (continued) | | | | | | | | | | | | |
| | | $ | 30,701,913 | | DB | 01/18/2017 | USD | | $ | (30,325,948 | ) | JPY | | $ | (30,701,913 | ) | | $ | 375,965 | | | $ | — | |
| | | | 28,714,986 | | BAML | 03/17/2017 | USD | | | (28,758,453 | ) | JPY | | | (28,714,986 | ) | | | — | | | | (43,467 | ) |
| | | | 23,834,442 | | DB | 01/18/2017 | USD | | | (23,498,924 | ) | KRW | | | (23,834,442 | ) | | | 335,518 | | | | — | |
| | | | 2,708,143 | | DB | 01/18/2017 | USD | | | (2,668,843 | ) | MXN | | | (2,708,143 | ) | | | 39,300 | | | | — | |
| | | | 18,138,083 | | BAML | 03/17/2017 | USD | | | (17,693,010 | ) | MXN | | | (18,138,083 | ) | | | 445,073 | | | | — | |
| | | | 7,029,433 | | DB | 01/18/2017 | USD | | | (6,996,048 | ) | NOK | | | (7,029,433 | ) | | | 33,385 | | | | — | |
| | | | 2,206,937 | | DB | 01/18/2017 | USD | | | (2,200,649 | ) | NZD | | | (2,206,937 | ) | | | 6,288 | | | | — | |
| | | | 253,860 | | BAML | 03/17/2017 | USD | | | (253,672 | ) | NZD | | | (253,860 | ) | | | 188 | | | | — | |
| | | | 4,845,276 | | DB | 01/18/2017 | EUR | | | (4,867,587 | ) | PLN | | | (4,845,276 | ) | | | — | | | | (22,311 | ) |
| | | | 7,751,747 | | DB | 01/18/2017 | USD | | | (7,742,024 | ) | PLN | | | (7,751,747 | ) | | | 9,723 | | | | — | |
| | | | 2,419,632 | | DB | 01/18/2017 | USD | | | (2,436,651 | ) | RUB | | | (2,419,632 | ) | | | — | | | | (17,019 | ) |
| | | | 13,750,175 | | DB | 01/18/2017 | EUR | | | (13,863,994 | ) | SEK | | | (13,750,175 | ) | | | — | | | | (113,819 | ) |
| | | | 15,213,329 | | DB | 01/18/2017 | USD | | | (15,373,761 | ) | SEK | | | (15,213,329 | ) | | | — | | | | (160,432 | ) |
| | | | 26,696,146 | | DB | 01/18/2017 | USD | | | (26,408,891 | ) | SGD | | | (26,696,146 | ) | | | 287,255 | | | | — | |
| | | | 3,890,122 | | DB | 01/18/2017 | EUR | | | (3,864,057 | ) | TRY | | | (3,890,122 | ) | | | 26,065 | | | | — | |
| | | | 9,143,988 | | DB | 01/18/2017 | USD | | | (9,118,414 | ) | TRY | | | (9,143,988 | ) | | | 25,574 | | | | — | |
| | | | 460,074 | | DB | 01/18/2017 | USD | | | (472,220 | ) | ZAR | | | (460,074 | ) | | | — | | | | (12,146 | ) |
| Total Sale Contracts | | | | | | | (657,406,043 | ) | | | | (663,801,021 | ) | | | 7,015,535 | | | | (620,557 | ) |
| Total Forward Currency Contracts | | | | $ | (380,939,633 | ) | | | $ | (383,796,263 | ) | | $ | 7,670,810 | | | $ | (4,814,180 | ) |
| Net Unrealized Appreciation | | | | | | | | | | | | | | | $ | 2,856,630 | | | | | |
Counterparty: |
| BAML | Bank of America Merrill Lynch |
| DB | Deutsche Bank |
Currency abbreviations: | | COP | COLOMBIAN PESO | | JPY | JAPANESE YEN | | RUB | RUSSIAN RUBLE |
| AUD | AUSTRALIAN DOLLAR | | CZK | CZECH REPUBLIC KORUNA | | KRW | SOUTH KOREAN WON | | SEK | SWEDISH KRONA |
| BRL | BRAZILIAN REAL | | EUR | EURO | | MXN | MEXICAN PESO | | SGD | SINGAPORE DOLLAR |
| CAD | CANADIAN DOLLAR | | GBP | BRITISH POUND | | NOK | NORWEGIAN KRONE | | TRY | TURKISH LIRA |
| CHF | SWISS FRANC | | ILS | ISRAELI NEW SHEQEL | | NZD | NEW ZEALAND DOLLAR | | USD | U.S. DOLLAR |
| CLP | CHILEAN PESO | | INR | INDIAN RUPEE | | PLN | POLISH ZLOTY | | ZAR | SOUTH AFRICAN RAND |
The accompanying notes are an integral part of these consolidated financial statements.
| |
|
LoCorr Managed Futures Strategy Fund - Consolidated Schedule of Open Futures Contracts | 23 |
|
LoCorr Managed Futures Strategy Fund
Consolidated Schedule of Open Futures Contracts
December 31, 2016
| Description | | Notional Amount | | | Number of Contracts
Purchased (Sold) | | Settlement
Month-Year | | Unrealized
Appreciation | | | Unrealized
(Depreciation) | |
| | | | | | | | | | | | | | |
| Purchase Contracts: | | | | | | | | | | | | | |
| 10 Yr Mini JGB | | $ | 1,671,564 | | | 13 | | Mar-17 | | $ | 1,952 | | | $ | — | |
| 90 Day Euro | | | 6,165,313 | | | 25 | | Sep-17 | | | — | | | | (4,692 | ) |
| 90 Day Euro | | | 3,693,000 | | | 15 | | Dec-17 | | | — | | | | (3,838 | ) |
| 90 Day Euro | | | 53,360,300 | | | 217 | | Mar-18 | | | — | | | | (132,645 | ) |
| 90 Day Euro | | | 31,928,000 | | | 130 | | Jun-18 | | | — | | | | (78,227 | ) |
| 90 Day Euro | | | 36,306,250 | | | 148 | | Sep-18 | | | — | | | | (44,850 | ) |
| 90 Day Sterling | | | 42,330,980 | | | 276 | | Sep-17 | | | 3,745 | | | | — | |
| 90 Day Sterling | | | 24,225,650 | | | 158 | | Dec-17 | | | 1,474 | | | | — | |
| 90 Day Sterling | | | 39,848,972 | | | 260 | | Mar-18 | | | 13,644 | | | | — | |
| 90 Day Sterling | | | 32,632,376 | | | 213 | | Jun-18 | | | 12,498 | | | | — | |
| 90 Day Sterling | | | 5,971,938 | | | 39 | | Sep-18 | | | 1,809 | | | | — | |
Aluminum (a)(b) | | | 20,186,044 | | | 477 | | Mar-17 | | | — | | | | (480,971 | ) |
| Amsterdam Exchange Index | | | 14,645,866 | | | 144 | | Jan-17 | | | 193,490 | | | | — | |
| Australian 10 Yr Bond | | | 3,410,868 | | | 37 | | Mar-17 | | | 29,326 | | | | — | |
| Australian 3 Yr Bond | | | 30,004,294 | | | 373 | | Mar-17 | | | — | | | | (29,597 | ) |
Brent Crude (a) | | | 11,648,100 | | | 205 | | Jan-17 | | | 63,633 | | | | — | |
Brent Crude (a) | | | 287,450 | | | 5 | | Feb-17 | | | — | | | | (1,077 | ) |
| CAC 40 10 Euro Index | | | 13,975,021 | | | 273 | | Jan-17 | | | 219,028 | | | | — | |
| Canadian 10 Yr Bond | | | 18,949,875 | | | 185 | | Mar-17 | | | — | | | | (204,444 | ) |
Copper (LME) (a)(b) | | | 37,082,825 | | | 268 | | Mar-17 | | | — | | | | (66,113 | ) |
Copper (NYCOM) (a) | | | 6,827,488 | | | 109 | | Mar-17 | | | — | | | | (166,091 | ) |
Cotton No.2 (a) | | | 4,203,675 | | | 119 | | Mar-17 | | | 23,113 | | | | — | |
| DAX Index | | | 40,731,779 | | | 135 | | Mar-17 | | | 171,693 | | | | — | |
| Dollar | | | 19,536,626 | | | 191 | | Mar-17 | | | 87,625 | | | | — | |
| Dow Jones Industrial Average Mini E-Cbot Index | | | 71,485,000 | | | 725 | | Mar-17 | | | 256,985 | | | | — | |
| Euro-Bobl | | | 324,938,736 | | | 2,310 | | Mar-17 | | | 2,458,161 | | | | — | |
| Euro-BTP | | | 5,839,818 | | | 41 | | Mar-17 | | | — | | | | (2,076 | ) |
| Euro-Bund | | | 73,955,452 | | | 428 | | Mar-17 | | | 441,316 | | | | — | |
| Euro-Buxl 30 Yr Bond | | | 3,470,473 | | | 19 | | Mar-17 | | | — | | | | (1,906 | ) |
| Euro-OAT | | | 31,802,964 | | | 199 | | Mar-17 | | | 175,379 | | | | — | |
| Euro-Schatz | | | 337,349,902 | | | 2,854 | | Mar-17 | | | 453,727 | | | | — | |
| Euro-Stoxx 50 Index | | | 28,596,739 | | | 829 | | Mar-17 | | | 326,414 | | | | — | |
| FTSE 100 Index | | | 67,248,774 | | | 774 | | Mar-17 | | | 780,066 | | | | — | |
Gasoline RBOB (a) | | | 20,983,162 | | | 299 | | Jan-17 | | | 766,566 | | | | — | |
Gasoline RBOB (a) | | | 2,054,035 | | | 29 | | Feb-17 | | | 49,745 | | | | — | |
Gasoline RBOB (a) | | | 156,324 | | | 2 | | Mar-17 | | | 987 | | | | — | |
| Hang Seng Index | | | 5,664,324 | | | 40 | | Jan-17 | | | 93,467 | | | | — | |
Heating Oil (a) | | | 9,363,388 | | | 129 | | Jan-17 | | | 38,635 | | | | — | |
| IBEX 35 Index | | | 4,901,893 | | | 50 | | Jan-17 | | | 26,835 | | | | — | |
| Japanese 10 Yr Bond | | | 122,120,214 | | | 95 | | Mar-17 | | | 111,841 | | | | — | |
| KOSPI 200 Index | | | 13,995,074 | | | 130 | | Mar-17 | | | 285,950 | | | | — | |
Lead (a)(b) | | | 653,900 | | | 13 | | Mar-17 | | | — | | | | (79,800 | ) |
Lean Hogs (a) | | | 79,380 | | | 3 | | Feb-17 | | | 2,893 | | | | — | |
| Long Gilt | | | 32,410,429 | | | 209 | | Mar-17 | | | 533,294 | | | | — | |
Low Sulphur Gasoil (a) | | | 3,684,675 | | | 73 | | Feb-17 | | | 174,447 | | | | — | |
Low Sulphur Gasoil (a) | | | 406,000 | | | 8 | | Mar-17 | | | — | | | | (2,185 | ) |
| MSCI Singapore Index | | | 2,120,001 | | | 96 | | Jan-17 | | | — | | | | (5,352 | ) |
| MSCI Taiwan Index | | | 7,047,900 | | | 205 | | Jan-17 | | | 70,269 | | | | — | |
| Nasdaq 100 E-Mini Index | | | 42,997,760 | | | 442 | | Mar-17 | | | — | | | | (504,196 | ) |
Natural Gas (a) | | | 13,667,080 | | | 367 | | Jan-17 | | | — | | | | (29,105 | ) |
Natural Gas (a) | | | 713,200 | | | 20 | | Mar-17 | | | 10,732 | | | | — | |
The accompanying notes are an integral part of these consolidated financial statements.
| |
|
24 | LoCorr Managed Futures Strategy Fund - Consolidated Schedule of Open Futures Contracts (continued) |
|
| Description | | Notional Amount | | | Number of Contracts
Purchased (Sold) | | Settlement
Month-Year | | Unrealized
Appreciation | | | Unrealized
(Depreciation) | |
| | | | | | | | | | | | | | |
Purchase Contracts (continued) | | | | | | | | | | | | | |
Natural Gas (a) | | $ | 1,381,770 | | | 39 | | Apr-17 | | $ | 21,467 | | | $ | — | |
Nickel (a)(b) | | | 1,261,386 | | | 21 | | Mar-17 | | | — | | | | (105,997 | ) |
| Nikkei 225 Index (OSE) | | | 18,139,893 | | | 111 | | Mar-17 | | | 300,526 | | | | — | |
| Nikkei 225 Index (SGX) | | | 21,048,385 | | | 258 | | Mar-17 | | | 171,738 | | | | — | |
| Russell 2000 Mini Index | | | 38,671,650 | | | 570 | | Mar-17 | | | — | | | | (394,857 | ) |
| S&P/TSX 60 Index | | | 16,032,175 | | | 120 | | Mar-17 | | | 27,451 | | | | — | |
| S&P500 E-Mini Index | | | 61,942,740 | | | 554 | | Mar-17 | | | — | | | | (471,131 | ) |
Silver (a) | | | 11,911,805 | | | 149 | | Mar-17 | | | — | | | | (561,040 | ) |
Soybean (a) | | | 12,951,600 | | | 258 | | Mar-17 | | | — | | | | (421,142 | ) |
Soybean Meal (a) | | | 411,580 | | | 13 | | Mar-17 | | | — | | | | (3,560 | ) |
Soybean Oil (a) | | | 3,847,260 | | | 185 | | Mar-17 | | | — | | | | (212,307 | ) |
| SPI 200 Index | | | 16,660,845 | | | 164 | | Mar-17 | | | 217,729 | | | | — | |
Sugar (a) | | | 5,309,842 | | | 243 | | May-17 | | | — | | | | (203,315 | ) |
| Tokyo Price Index | | | 46,368,000 | | | 357 | | Mar-17 | | | 219,789 | | | | — | |
| U.S. 2 Yr Note | | | 104,226,688 | | | 481 | | Mar-17 | | | — | | | | (53,039 | ) |
Wti Crude (a) | | | 5,049,680 | | | 94 | | Jan-17 | | | — | | | | (20,566 | ) |
Zinc (a)(b) | | | 19,047,600 | | | 296 | | Mar-17 | | | — | | | | (732,643 | ) |
| Total Purchase Contracts | | | | | | | | | | | 8,839,439 | | | | (5,016,762 | ) |
| | | | | | | | | | | | | | | | | |
| Sale Contracts: | | | | | | | | | | | | | | | | |
| 3 Mo Euro Euribor | | $ | 257,702,031 | | | (977) | | Jun-18 | | $ | — | | | $ | (2,388 | ) |
| 90 Day Euro | | | 480,393,600 | | | (1,956) | | Jun-18 | | | 589,996 | | | | — | |
Aluminum (a)(b) | | | 1,269,563 | | | (30) | | Mar-17 | | | 28,553 | | | | — | |
| Australian 10 Yr Bond | | | 23,507,333 | | | (255) | | Mar-17 | | | — | | | | (123,926 | ) |
Brent Crude (a) | | | 3,636,480 | | | (64) | | Jan-17 | | | — | | | | (19,664 | ) |
Brent Crude (a) | | | 116,080 | | | (2) | | Mar-17 | | | — | | | | (403 | ) |
Brent Crude (a) | | | 58,440 | | | (1) | | Apr-17 | | | — | | | | (151 | ) |
| Canadian 10 Yr Bond | | | 1,434,045 | | | (14) | | Mar-17 | | | 108 | | | | — | |
| CBOE Volatility Index | | | 5,157,625 | | | (341) | | Jan-17 | | | — | | | | (305,226 | ) |
Cocoa (CME) (a) | | | 5,186,907 | | | (243) | | Mar-17 | | | 637,460 | | | | — | |
Cocoa (NYBOT) (a) | | | 85,040 | | | (4) | | Mar-17 | | | 4,130 | | | | — | |
Coffee (a) | | | 6,372,825 | | | (124) | | Mar-17 | | | — | | | | (102,536 | ) |
Copper (LME) (a)(b) | | | 5,396,381 | | | (39) | | Mar-17 | | | 77,655 | | | | — | |
Corn (a) | | | 11,598,400 | | | (659) | | Mar-17 | | | 51,552 | | | | — | |
| FTSE/JSE Top 40 Index | | | 3,322,849 | | | (103) | | Mar-17 | | | 19,429 | | | | — | |
Gold (a) | | | 48,141,060 | | | (418) | | Feb-17 | | | 356,877 | | | | — | |
| Hang Seng Index | | | 4,106,635 | | | (29) | | Jan-17 | | | — | | | | (44,963 | ) |
Hard Red Wheat (a) | | | 6,131,025 | | | (293) | | Mar-17 | | | 90,428 | | | | — | |
Heating Oil (a) | | | 1,959,779 | | | (27) | | Jan-17 | | | — | | | | (29,988 | ) |
Heating Oil (a) | | | 510,972 | | | (7) | | Feb-17 | | | — | | | | (3,923 | ) |
Heating Oil (a) | | | 219,177 | | | (3) | | Apr-17 | | | — | | | | (4,138 | ) |
| H-Shares Index | | | 2,239,706 | | | (37) | | Jan-17 | | | — | | | | (48,670 | ) |
Lead (a)(b) | | | 503,000 | | | (10) | | Mar-17 | | | 27,742 | | | | — | |
Live Cattle (a) | | | 46,420 | | | (1) | | Feb-17 | | | — | | | | (2,733 | ) |
Natural Gas (a) | | | 1,973,720 | | | (53) | | Jan-17 | | | 22,370 | | | | — | |
Natural Gas (a) | | | 589,440 | | | (16) | | Feb-17 | | | — | | | | (20,450 | ) |
Nickel (a)(b) | | | 840,924 | | | (14) | | Mar-17 | | | 60,254 | | | | — | |
| SGX Nifty 50 Index | | | 2,160,708 | | | (132) | | Jan-17 | | | — | | | | (42,600 | ) |
Soybean (a) | | | 1,054,200 | | | (21) | | Mar-17 | | | 12,839 | | | | — | |
Soybean Meal (a) | | | 4,654,020 | | | (147) | | Mar-17 | | | — | | | | (16,951 | ) |
Soybean Oil (a) | | | 519,900 | | | (25) | | Mar-17 | | | 3,458 | | | | — | |
Sugar (a) | | | 3,889,514 | | | (178) | | May-17 | | | — | | | | (53,389 | ) |
| U.S. 10 Yr Note | | | 31,816,000 | | | (256) | | Mar-17 | | | — | | | | (40,863 | ) |
| U.S. 2 Yr Note | | | 224,921,625 | | | (1,038) | | Mar-17 | | | 57,660 | | | | — | |
| U.S. 5 Yr Note | | | 100,955,766 | | | (858) | | Mar-17 | | | 142,805 | | | | — | |
| U.S. Long Bond | | | 41,581,125 | | | (276) | | Mar-17 | | | 48,608 | | | | — | |
The accompanying notes are an integral part of these consolidated financial statements.
| |
|
LoCorr Managed Futures Strategy Fund - Consolidated Schedule of Open Futures Contracts (continued) | 25 |
|
| Description | | Notional Amount | | | Number of Contracts
Purchased (Sold) | | Settlement
Month-Year | | Unrealized
Appreciation | | | Unrealized
(Depreciation) | |
| | | | | | | | | | | | | | |
Sale Contracts (continued) | | | | | | | | | | | | | |
| U.S. Ultra Bond | | $ | 3,365,250 | | | (21) | | Mar-17 | | $ | — | | | $ | (18,091 | ) |
| VSTOXX Mini Index | | | 259,753 | | | (124) | | Jan-17 | | | — | | | | (5,993 | ) |
Wheat (a) | | | 9,649,200 | | | (473) | | Mar-17 | | | 182,827 | | | | — | |
Wti Crude (a) | | | 4,136,440 | | | (77) | | Jan-17 | | | — | | | | (54,875 | ) |
Wti Crude (a) | | | 929,220 | | | (17) | | Feb-17 | | | — | | | | (4,912 | ) |
Wti Crude (a) | | | 332,580 | | | (6) | | Mar-17 | | | — | | | | (5,441 | ) |
Wti Crude (a) | | | 56,050 | | | (1) | | Apr-17 | | | — | | | | (102 | ) |
Zinc (a)(b) | | | 2,252,250 | | | (35) | | Mar-17 | | | 119,878 | | | | — | |
| Total Sale Contracts | | | | | | | | | | | 2,534,629 | | | | (952,376 | ) |
| Total Futures Contracts | | | | | | | | | | $ | 11,374,068 | | | $ | (5,969,138 | ) |
| Net Unrealized Appreciation | | | | | | | | | | $ | 5,404,930 | | | | | |
| (a) | Contract held by LCMFS Fund Limited. |
| (b) | London Metal Exchange (“LME”) futures contracts settle on their respective maturity date. The unrealized appreciation on these contracts is a receivable for unsettled open futures contracts and the unrealized depreciation is a payable for unsettled open futures contracts on the Fund’s consolidated statement of assets and liabilities. See Notes 2 and 3. |
The accompanying notes are an integral part of these consolidated financial statements.
| |
| |
26 | LoCorr Long/Short Commodities Strategy Fund - Consolidated Schedule of Investments |
| |
LoCorr Long/Short Commodities Strategy Fund
Composition of Consolidated Investment Portfolio1
December 31, 2016 (Unaudited)
1As a percentage of total investments.
Consolidated Schedule of Investments
December 31, 2016
| | Maturity Date | Coupon Rate | | Principal Amount | | Value |
| ASSET BACKED SECURITIES: 15.58% | | | | | | | | |
321 Henderson Receivables I LLC, 2006-4A A1 (Acquired 07/19/2016, Cost, $408,854) (a)(c) | 12/15/2041 | 0.74% | | $ | 422,895 | | $ | 416,603 |
| AEP Texas Central Transition Funding II LLC, 2006-2 A4 | 01/01/2020 | 5.17% | | | 370,292 | | | 376,867 |
| American Express Credit Account Master Trust | | | | | | | | |
Series 2012-1 A (c) | 01/15/2020 | 0.97% | | | 200,000 | | | 200,113 |
Series 2013-2 A (c) | 05/17/2021 | 1.12% | | | 600,000 | | | 601,842 |
| Cabela’s Credit Card Master Note Trust | | | | | | | | |
Series 2012-1A A2 (Acquired 03/24/2016, Cost, $749,648) (a)(c) | 02/18/2020 | 1.23% | | | 750,000 | | | 750,154 |
Series 2012-1A A1 (Acquired 03/11/2016, Cost, $650,207) (a) | 02/18/2020 | 1.63% | | | 650,000 | | | 650,428 |
Series 2014-1A (c) | 03/16/2020 | 1.05% | | | 310,000 | | | 310,028 |
Series 2012-2A A1 (Acquired 02/04/2016, Cost, $600,545) (a) | 06/15/2020 | 1.45% | | | 600,000 | | | 600,687 |
| California Republic Auto Receivables Trust | | | | | | | | |
| Series 2013-2 A2 | 03/15/2019 | 1.23% | | | 96,134 | | | 96,153 |
| Series 2016-2 A2 | 03/15/2019 | 1.34% | | | 500,000 | | | 500,060 |
| Series 2015-1 A3 | 04/15/2019 | 1.33% | | | 430,877 | | | 431,121 |
Series 2015-4 A3 (Acquired 09/02/2016, Cost, $301,892) (a) | 01/15/2020 | 2.04% | | | 300,000 | | | 301,888 |
| Capital Auto Receivables Asset Trust, 2015-1 A2 | 06/20/2018 | 1.42% | | | 253,442 | | | 253,496 |
Capital One Multi-Asset Execution Trust, 2016-A1 A1 (c) | 02/15/2022 | 1.15% | | | 747,000 | | | 750,034 |
| CenterPoint Energy Restoration Bond Co. LLC, 2009-1 A2 | 08/15/2019 | 3.46% | | | 145,222 | | | 147,187 |
| CenterPoint Energy Transition Bond Co. II LLC, 2005-A A4 | 08/01/2019 | 5.17% | | | 101,618 | | | 102,290 |
| CenterPoint Energy Transition Bond Co. IV LLC, 2012-1 A1 | 04/15/2018 | 0.90% | | | 278,642 | | | 278,540 |
| Chase Issuance Trust | | | | | | | | |
Series 2013-A3 (c) | 04/15/2020 | 0.98% | | | 545,000 | | | 545,866 |
Series 2013-9A (c) | 11/16/2020 | 1.12% | | | 800,000 | | | 802,390 |
| Series 2012-A4 | 08/16/2021 | 1.58% | | | 637,000 | | | 632,839 |
The accompanying notes are an integral part of these consolidated financial statements.
|
| |
LoCorr Long/Short Commodities Strategy Fund - Consolidated Schedule of Investments (continued) | 27 |
| |
| | Maturity Date | Coupon Rate | | Principal Amount | | Value |
ASSET BACKED SECURITIES (continued) | | | | | | | | |
| Colony American Homes | | | | | | | | |
Series 2014-1A A (Acquired 04/02/2014 through 05/09/2016, Cost, $670,134) (a)(c) | 05/17/2031 | 2.14% | | $ | 673,017 | | $ | 672,421 |
Series 2015-1A C (Acquired 05/27/2015 through 04/19/2016, Cost, $457,498) (a)(c) | 07/17/2032 | 2.69% | | | 470,000 | | | 469,218 |
| Discover Card Execution Note Trust | | | | | | | | |
Series 2013-A1 (c) | 08/17/2020 | 1.00% | | | 950,000 | | | 950,778 |
| Series 2012-A6 | 01/18/2022 | 1.67% | | | 450,000 | | | 448,288 |
Ford Credit Auto Owner Trust, 2016-REV1 A (Acquired 11/22/2016, Cost, $372,876) (a) | 08/15/2027 | 2.31% | | | 370,000 | | | 369,282 |
Green Tree Agency Advance Funding Trust I, 2016-T1 (Acquired 09/28/2016, Cost, $499,999) (a) | 10/15/2048 | 2.38% | | | 500,000 | | | 495,935 |
| Huntington Auto Trust, 2015-1 A3 | 09/16/2019 | 1.24% | | | 206,224 | | | 206,104 |
| Hyundai Auto Receivables Trust, 2013-C A4 | 03/15/2019 | 1.55% | | | 475,912 | | | 476,541 |
| Invitation Homes Trust | | | | | | | | |
Series 2013-SFR1 A (Acquired 02/24/2016, Cost, $460,516) (a)(c) | 12/17/2030 | 1.89% | | | 470,214 | | | 470,221 |
Series 2013-SFR1 B (Acquired 01/27/2016, Cost, $487,578) (a)(c) | 12/17/2030 | 1.92% | | | 500,000 | | | 497,839 |
Series 2014-SFR2 A (Acquired 03/03/2016, Cost, $592,501) (a)(c) | 09/18/2031 | 1.84% | | | 609,109 | | | 608,327 |
| Ocwen Master Advance Receivables Trust | | | | | | | | |
Series 2015-T3 AT3 (Acquired 11/06/2015, Cost, $99,999) (a) | 11/15/2047 | 3.21% | | | 100,000 | | | 99,979 |
Series 2016-T2 AT2 (Acquired 08/03/2016, Cost, $624,999) (a) | 08/16/2049 | 2.72% | | | 625,000 | | | 623,242 |
| Ohio Phase-In-Recovery Funding LLC, 2013-1 A1 | 07/01/2018 | 0.96% | | | 152,439 | | | 152,359 |
OneMain Direct Auto Receivables Trust, 2016 A1 (Acquired 11/09/2016, Cost, $312,785) (a) | 01/15/2021 | 2.04% | | | 312,038 | | | 312,565 |
RAMP Series Trust, 2004-RZ3 MII2 (c) | 09/25/2034 | 2.41% | | | 401,717 | | | 394,507 |
| Small Business Administration Participation Certificates, 2012-20K 1 | 11/01/2032 | 2.09% | | | 17,806 | | | 17,276 |
SMART ABS US Trust, 2014-1US A3A (b) | 06/14/2018 | 0.95% | | | 162,460 | | | 162,433 |
SoFi Professional Loan Program LLC, 2015-C A2 (Acquired 07/29/2015, Cost, $97,241) (a) | 08/25/2033 | 2.51% | | | 97,778 | | | 97,673 |
SPS Servicer Advance Receivables Trust, 2016-T1 A-T1 (Acquired 11/16/2016, Cost, $499,956) (a) | 11/16/2048 | 2.53% | | | 500,000 | | | 498,707 |
Susquehanna Auto Receivables Trust, 2014-1A A3 (Acquired 12/22/2015, Cost, $14,623) (a) | 02/15/2018 | 1.00% | | | 14,652 | | | 14,651 |
SWAY Residential Trust, 2014-1 A (Acquired 02/02/2016 through 04/04/2016, Cost, $721,573) (a)(c) | 01/20/2032 | 2.04% | | | 733,706 | | | 734,182 |
TCF Auto Receivables Owner Trust, 2015-1A A3 (Acquired 09/14/2016, Cost, $599,901) (a) | 04/15/2021 | 1.71% | | | 600,000 | | | 596,676 |
Verizon Owner Trust, 2016-A 1A (Acquired 07/12/2016, Cost, $459,923) (a) | 01/20/2021 | 1.42% | | | 460,000 | | | 456,799 |
| Volkswagen Auto Loan Enhanced Trust | | | | | | | | |
| Series 2013-2 A3 | 04/20/2018 | 0.70% | | | 196,991 | | | 196,802 |
| Series 2014-1 A3 | 10/22/2018 | 0.91% | | | 379,639 | | | 379,143 |
| World Omni Auto Receivables Trust, 2014-A A3 | 04/15/2019 | 0.94% | | | 86,766 | | | 86,708 |
| TOTAL ASSET BACKED SECURITIES (Cost $19,188,116) | | | | | | | | 19,237,242 |
| | | | | | | | | |
| CORPORATE BONDS: 34.31% | | | | | | | | |
| Administrative and Support and Waste Management and Remediation Services: 0.01% | | | | | | | | |
Safina Ltd. (b) | 01/15/2022 | 1.55% | | | 14,116 | | | 13,946 |
| Finance and Insurance: 15.12% | | | | | | | | |
| Aflac, Inc. | 03/16/2020 | 2.40% | | | 505,000 | | | 506,772 |
| American Express Co. | 05/22/2018 | 1.55% | | | 405,000 | | | 404,213 |
| American International Group, Inc. | 08/15/2020 | 3.38% | | | 330,000 | | | 339,504 |
| Bank of America Corp. | 05/01/2018 | 5.65% | | | 1,075,000 | | | 1,126,344 |
Bank of Montreal (b) | 07/18/2019 | 1.50% | | | 255,000 | | | 251,660 |
| BB&T Corp. | 01/15/2020 | 2.45% | | | 350,000 | | | 352,743 |
| Berkshire Hathaway Finance Corp. | 08/15/2018 | 2.00% | | | 175,000 | | | 176,246 |
| Berkshire Hathaway Finance Corp. | 01/15/2021 | 4.25% | | | 250,000 | | | 269,434 |
BNP Paribas (b) | 08/20/2018 | 2.70% | | | 500,000 | | | 506,507 |
| Capital One Financial Corp. | 04/24/2019 | 2.45% | | | 500,000 | | | 503,166 |
| Charles Schwab Corp./The | 03/10/2018 | 1.50% | | | 500,000 | | | 500,118 |
| Chubb INA Holdings, Inc. | 11/03/2020 | 2.30% | | | 350,000 | | | 349,920 |
| Citigroup, Inc. | 07/30/2018 | 2.15% | | | 585,000 | | | 586,935 |
| Citizens Bank NA | 03/14/2019 | 2.50% | | | 565,000 | | | 569,353 |
Cooperatieve Rabobank UA (b) | 01/14/2019 | 2.25% | | | 250,000 | | | 251,339 |
Daimler Finance North America LLC (Acquired 12/14/2016, Cost, $393,977) (a) | 07/05/2019 | 1.50% | | | 400,000 | | | 393,550 |
| Dragon 2012 LLC | 03/12/2024 | 1.97% | | | 16,128 | | | 15,943 |
The accompanying notes are an integral part of these consolidated financial statements.
| |
| |
28 | LoCorr Long/Short Commodities Strategy Fund - Consolidated Schedule of Investments (continued) |
| |
| | Maturity Date | Coupon Rate | | Principal Amount | | Value |
CORPORATE BONDS (continued) | | | | | | | | |
| Fifth Third Bancorp | 06/01/2018 | 4.50% | | $ | 260,000 | | $ | 268,202 |
| Ford Motor Credit Company LLC | 11/04/2019 | 2.60% | | | 455,000 | | | 454,324 |
| General Motors Financial Co., Inc. | 05/09/2019 | 2.40% | | | 310,000 | | | 309,179 |
| Goldman Sachs Group, Inc./The | 04/01/2018 | 6.15% | | | 465,000 | | | 489,140 |
| Goldman Sachs Group, Inc./The | 02/25/2021 | 2.88% | | | 535,000 | | | 537,474 |
| Hartford Financial Services Group, Inc./The | 03/30/2020 | 5.50% | | | 250,000 | | | 272,982 |
HSBC Holdings PLC (b) | 04/05/2021 | 5.10% | | | 215,000 | | | 232,352 |
ING Bank NV (Acquired 03/15/2016, Cost, $399,884) (a)(b) | 03/22/2019 | 2.30% | | | 400,000 | | | 401,045 |
| JPMorgan Chase & Co. | 03/22/2019 | 1.85% | | | 335,000 | | | 333,943 |
| JPMorgan Chase & Co. | 01/23/2020 | 2.25% | | | 955,000 | | | 952,752 |
| Keycorp | 12/13/2018 | 2.30% | | | 250,000 | | | 251,490 |
| Lincoln National Corp. | 02/15/2020 | 6.25% | | | 180,000 | | | 198,795 |
Metropolitan Life Global Funding I (Acquired 06/16/2016, Cost, $352,995) (a) | 04/14/2020 | 2.00% | | | 350,000 | | | 346,060 |
| Morgan Stanley | 07/24/2020 | 5.50% | | | 845,000 | | | 925,452 |
MSN 41079 and 41084 Ltd. (b) | 07/13/2024 | 1.72% | | | 16,772 | | | 16,401 |
| National Rural Utilities Cooperative Finance Corp. | 02/01/2019 | 2.15% | | | 350,000 | | | 352,676 |
| NextEra Energy Capital Holdings, Inc. | 03/01/2019 | 6.00% | | | 400,000 | | | 432,558 |
Nomura Holdings, Inc. (b) | 03/19/2019 | 2.75% | | | 90,000 | | | 90,852 |
| Phoenix 2012 LLC | 07/03/2024 | 1.61% | | | 16,920 | | | 16,496 |
| PNC Bank NA | 10/18/2019 | 2.40% | | | 305,000 | | | 307,808 |
Pricoa Global Funding I (Acquired 09/14/2015, Cost, $149,934) (a) | 09/21/2018 | 1.90% | | | 150,000 | | | 150,426 |
Principal Life Global Funding II (Acquired 11/17/2015 through 02/25/2016, Cost, $337,728) (a) | 10/15/2018 | 2.25% | | | 335,000 | | | 338,330 |
| Prudential Financial, Inc. | 06/15/2019 | 7.38% | | | 215,000 | | | 242,027 |
Santander UK PLC (b) | 08/23/2018 | 3.05% | | | 245,000 | | | 248,868 |
Societe Generale SA (Acquired 04/04/2016, Cost, $299,775) (a)(b) | 04/08/2021 | 2.50% | | | 300,000 | | | 297,194 |
| State Street Corp. | 08/18/2020 | 2.55% | | | 305,000 | | | 308,077 |
| SunTrust Banks, Inc. | 11/01/2018 | 2.35% | | | 250,000 | | | 252,215 |
| Tagua Leasing LLC | 11/16/2024 | 1.58% | | | 17,225 | | | 16,720 |
Teva Pharmaceutical Finance Netherlands III BV (b) | 07/19/2019 | 1.70% | | | 310,000 | | | 304,584 |
| Toyota Motor Credit Corp. | 10/24/2018 | 2.00% | | | 250,000 | | | 251,481 |
Trinity Acquisition PLC (b) | 09/15/2021 | 3.50% | | | 335,000 | | | 338,269 |
| UnitedHealth Group, Inc. | 10/15/2020 | 3.88% | | | 195,000 | | | 205,351 |
| Voya Financial, Inc. | 02/15/2018 | 2.90% | | | 237,000 | | | 239,935 |
| WellPoint, Inc. | 01/15/2018 | 1.88% | | | 200,000 | | | 200,088 |
| Wells Fargo & Co. | 01/16/2018 | 1.50% | | | 210,000 | | | 209,749 |
| Wells Fargo & Co. | 04/22/2019 | 2.13% | | | 765,000 | | | 767,476 |
| | | | | | | | | 18,664,518 |
| Information: 4.89% | | | | | | | | |
| 21st Century Fox America, Inc. | 02/15/2021 | 4.50% | | | 300,000 | | | 320,742 |
America Movil SAB de CV (b) | 03/30/2020 | 5.00% | | | 500,000 | | | 534,678 |
| AT&T, Inc. | 03/11/2019 | 2.30% | | | 700,000 | | | 702,684 |
| CBS Corp. | 04/15/2020 | 5.75% | | | 250,000 | | | 275,960 |
| Charter Communications Operating LLC/Charter Communications Operating Capital | 07/23/2020 | 3.58% | | | 400,000 | | | 408,094 |
| Comcast Corp. | 02/15/2018 | 5.88% | | | 435,000 | | | 456,099 |
| Discovery Communications LLC | 08/15/2019 | 5.63% | | | 415,000 | | | 448,341 |
| Hewlett Packard Enterprise Co. | 10/05/2018 | 2.85% | | | 297,000 | | | 300,000 |
| Oracle Corp. | 04/15/2018 | 5.75% | | | 230,000 | | | 242,985 |
| Oracle Corp. | 01/15/2019 | 2.38% | | | 165,000 | | | 167,208 |
Orange SA (b) | 11/03/2019 | 1.63% | | | 390,000 | | | 383,799 |
Rogers Communications, Inc. (b) | 08/15/2018 | 6.80% | | | 295,000 | | | 318,083 |
| Verizon Communications, Inc. | 09/14/2018 | 3.65% | | | 560,000 | | | 578,490 |
| Visa, Inc. | 12/14/2020 | 2.20% | | | 460,000 | | | 461,430 |
Vodafone Group PLC (b) | 02/19/2018 | 1.50% | | | 435,000 | | | 433,384 |
| | | | | | | | | 6,031,977 |
The accompanying notes are an integral part of these consolidated financial statements.
|
| |
LoCorr Long/Short Commodities Strategy Fund - Consolidated Schedule of Investments (continued) | 29 |
| |
| | Maturity Date | Coupon Rate | | Principal Amount | | Value |
CORPORATE BONDS (continued) | | | | | | | | |
| Manufacturing: 7.67% | | | | | | | | |
| Abbott Laboratories | 11/30/2021 | 2.90% | | $ | 345,000 | | $ | 344,017 |
| AbbVie, Inc. | 05/14/2020 | 2.50% | | | 505,000 | | | 505,132 |
AerCap Ireland Capital Ltd./AerCap Global Aviation Trust (b) | 05/15/2019 | 3.75% | | | 450,000 | | | 458,437 |
| Altria Group, Inc. | 01/14/2020 | 2.63% | | | 295,000 | | | 298,362 |
| Anheuser-Busch InBev Finance, Inc. | 01/17/2018 | 1.25% | | | 255,000 | | | 254,771 |
| Anheuser-Busch InBev Finance, Inc. | 02/01/2021 | 2.65% | | | 250,000 | | | 251,436 |
| Apple, Inc. | 05/06/2019 | 2.10% | | | 250,000 | | | 252,372 |
| Archer-Daniels-Midland Co. | 03/01/2021 | 4.48% | | | 500,000 | | | 541,692 |
| Becton, Dickinson & Co. | 12/15/2019 | 2.68% | | | 196,000 | | | 198,864 |
| Bunge Ltd. Finance Corp. | 11/24/2020 | 3.50% | | | 295,000 | | | 300,258 |
| Celgene Corp. | 08/15/2018 | 2.13% | | | 305,000 | | | 306,225 |
| Chevron Corp. | 03/03/2020 | 1.96% | | | 195,000 | | | 194,351 |
| Dr. Pepper Snapple Group, Inc. | 11/15/2021 | 2.53% | | | 330,000 | | | 328,078 |
| Eastman Chemical Co. | 01/15/2020 | 2.70% | | | 250,000 | | | 251,462 |
| Ecolab, Inc. | 12/08/2017 | 1.45% | | | 200,000 | | | 199,803 |
| General Electric Capital Corp. | 05/01/2018 | 5.63% | | | 370,000 | | | 390,496 |
| General Electric Capital Corp. | 08/07/2019 | 6.00% | | | 410,000 | | | 452,995 |
Ingersoll-Rand Luxembourg Finance SA (b) | 05/01/2020 | 2.63% | | | 500,000 | | | 501,108 |
| Kraft Heinz Foods Co. | 07/02/2018 | 2.00% | | | 400,000 | | | 400,090 |
| Merck & Co., Inc. | 05/18/2018 | 1.30% | | | 210,000 | | | 209,782 |
| Newell Brands, Inc. | 03/29/2019 | 2.60% | | | 345,000 | | | 348,786 |
| PepsiCo, Inc. | 10/14/2020 | 2.15% | | | 450,000 | | | 450,797 |
| Philip Morris International, Inc. | 02/25/2019 | 1.38% | | | 425,000 | | | 420,486 |
| Qualcomm, Inc. | 05/18/2018 | 1.40% | | | 430,000 | | | 429,942 |
| Reynolds American, Inc. | 06/12/2020 | 3.25% | | | 335,000 | | | 343,262 |
Siemens Financieringsmaatschappij NV (Acquired 09/14/2016, Cost, $498,270) (a)(b) | 09/13/2019 | 1.30% | | | 500,000 | | | 490,558 |
| Tyson Foods, Inc. | 08/15/2019 | 2.65% | | | 340,000 | | | 343,241 |
| | | | | | | | | 9,466,803 |
| Mining, Quarrying, and Oil and Gas Extraction: 0.50% | | | | | | | | |
| ConocoPhillips Co. | 03/15/2021 | 4.20% | | | 310,000 | | | 329,288 |
Total Capital International SA (b) | 01/10/2019 | 2.13% | | | 290,000 | | | 292,306 |
| | | | | | | | | 621,594 |
| Professional, Scientific, and Technical Services: 0.86% | | | | | | | | |
| Biogen, Inc. | 09/15/2020 | 2.90% | | | 300,000 | | | 303,826 |
| eBay, Inc. | 03/09/2018 | 2.50% | | | 500,000 | | | 504,390 |
| International Business Machines Corp. | 05/17/2019 | 1.80% | | | 250,000 | | | 250,107 |
| | | | | | | | | 1,058,323 |
| Real Estate and Rental and Leasing: 0.33% | | | | | | | | |
| Air Lease Corp. | 06/01/2021 | 3.38% | | | 350,000 | | | 354,849 |
| Helios Leasing I LLC | 05/29/2024 | 2.02% | | | 16,319 | | | 16,146 |
| Helios Leasing I LLC | 07/24/2024 | 1.73% | | | 16,788 | | | 16,431 |
| Helios Leasing I LLC | 09/28/2024 | 1.56% | | | 16,705 | | | 16,191 |
| | | | | | | | | 403,617 |
| Retail Trade: 1.86% | | | | | | | | |
| Amazon.com, Inc. | 12/05/2019 | 2.60% | | | 500,000 | | | 509,850 |
BP Capital Markets (b) | 09/26/2018 | 2.24% | | | 250,000 | | | 251,870 |
| CVS Health Corp. | 12/05/2018 | 2.25% | | | 450,000 | | | 453,944 |
| Home Depot, Inc./The | 06/15/2019 | 2.00% | | | 500,000 | | | 504,354 |
Hyundai Capital America (Acquired 12/02/2016, Cost, $310,558) (a) | 03/18/2021 | 3.00% | | | 310,000 | | | 309,670 |
| Walgreens Boots Alliance, Inc. | 11/18/2019 | 2.70% | | | 260,000 | | | 263,449 |
| | | | | | | | | 2,293,137 |
| Transportation and Warehousing: 0.30% | | | | | | | | |
Carnival Corp. (b) | 10/15/2020 | 3.95% | | | 350,000 | | | 369,102 |
The accompanying notes are an integral part of these consolidated financial statements.
| |
| |
30 | LoCorr Long/Short Commodities Strategy Fund - Consolidated Schedule of Investments (continued) |
| |
| | Maturity Date | Coupon Rate | | Principal Amount | | Value |
CORPORATE BONDS (continued) | | | | | | | | |
| Utilities: 1.80% | | | | | | | | |
| Dominion Resources, Inc. | 08/15/2019 | 1.60% | | $ | 360,000 | | $ | 354,511 |
| Duke Energy Corp. | 09/15/2019 | 5.05% | | | 400,000 | | | 431,214 |
| Exelon Generation Co., LLC | 10/01/2019 | 5.20% | | | 500,000 | | | 535,881 |
| Northern States Power Co. | 08/15/2020 | 2.20% | | | 345,000 | | | 345,530 |
| Sempra Energy | 03/15/2020 | 2.40% | | | 305,000 | | | 304,550 |
| Southern Power Co. | 06/01/2018 | 1.50% | | | 255,000 | | | 253,842 |
| | | | | | | | | 2,225,528 |
| Wholesale Trade: 0.97% | | | | | | | | |
| Cardinal Health, Inc. | 11/15/2019 | 2.40% | | | 255,000 | | | 256,859 |
LyondellBasell Industries NV (b) | 04/15/2019 | 5.00% | | | 290,000 | | | 306,429 |
| McKesson Corp. | 03/15/2019 | 2.28% | | | 410,000 | | | 411,535 |
| Sysco Corp. | 10/01/2020 | 2.60% | | | 225,000 | | | 226,943 |
| | | | | | | | | 1,201,766 |
| TOTAL CORPORATE BONDS (Cost $42,594,342) | | | | | | | | 42,350,311 |
| | | | | | | | | |
| FOREIGN GOVERNMENT BOND: 0.01% | | | | | | | | |
Petroleos Mexicanos (b) | 12/20/2022 | 2.00% | | | 15,000 | | | 14,964 |
| TOTAL FOREIGN GOVERNMENT BOND (Cost $15,000) | | | | | | | | 14,964 |
| | | | | | | | | |
| MORTGAGE BACKED SECURITIES: 13.61% | | | | | | | | |
Agate Bay Mortgage Trust, 2016-3 A5 (Acquired 08/08/2016, Cost, $534,166) (a) | 08/25/2046 | 3.50% | | | 521,235 | | | 529,990 |
BXHTL Mortgage Trust, 2015-JWRZ A (Acquired 03/10/2016, Cost, $734,063) (a)(c) | 05/15/2029 | 1.93% | | | 750,000 | | | 752,118 |
| Citigroup Commercial Mortgage Trust, 2016-GC37 A1 | 04/12/2049 | 1.64% | | | 639,653 | | | 635,547 |
Citigroup Mortgage Loan Trust, Inc., 2004-HE1 A (Acquired 12/20/2016, Cost, $432,950) (a)(c) | 09/25/2033 | 0.92% | | | 441,786 | | | 433,882 |
| Commercial Mortgage Trust | | | | | | | | |
Series 2014-BBG A (Acquired 03/09/2016, Cost, $658,547) (a)(c) | 03/15/2029 | 1.50% | | | 675,000 | | | 672,063 |
Series 2012-CR4 A2 (c) | 10/17/2045 | 1.80% | | | 200,000 | | | 200,589 |
| Series 2007-GG11 A4 | 12/10/2049 | 5.74% | | | 784,839 | | | 796,067 |
CSMC Trust, 2015-2 A2 (Acquired 04/30/2015, Cost, $72,096) (a) | 02/25/2045 | 3.00% | | | 71,208 | | | 71,085 |
| Fannie Mae Aces | | | | | | | | |
| Series 2014-M13 ASQ2 | 11/25/2017 | 1.64% | | | 306,128 | | | 306,489 |
| Series 2012-M9 ASQ2 | 12/25/2017 | 1.51% | | | 247,203 | | | 247,559 |
| Series 2015-M1 ASQ2 | 02/25/2018 | 1.63% | | | 330,436 | | | 331,221 |
| Series 2013-M7 ASQ2 | 03/25/2018 | 1.23% | | | 28,695 | | | 28,558 |
Series 2014-M8 FA (c) | 05/25/2018 | 0.78% | | | 174,247 | | | 173,942 |
Series 2014-M10 ASQ2 (c) | 09/25/2019 | 2.17% | | | 270,000 | | | 271,100 |
Series 2010-M3 A3 (c) | 03/25/2020 | 4.33% | | | 308,796 | | | 326,929 |
| Fannie Mae Connecticut Avenue Securities | | | | | | | | |
Series 2014-C01 M1 (c) | 01/25/2024 | 2.36% | | | 104,615 | | | 105,163 |
Series 2014-C02 1M1 (c) | 05/28/2024 | 1.53% | | | 169,952 | | | 170,322 |
Series 2014-C03 1M1 (c) | 07/25/2024 | 1.78% | | | 105,251 | | | 105,528 |
Series 2015-C03 2M1 (c) | 07/25/2025 | 2.09% | | | 164,748 | | | 165,072 |
Series 2016-C03 2M1 (c) | 10/25/2028 | 2.79% | | | 475,389 | | | 480,301 |
| Fannie Mae Pool | 07/01/2017 | 1.50% | | | 35,000 | | | 34,988 |
| FHLMC Multifamily Structured Pass Through Certificates | | | | | | | | |
Series K-701 A2 (c) | 11/25/2017 | 3.88% | | | 50,000 | | | 50,859 |
| Series K-702 A2 | 02/25/2018 | 3.15% | | | 741,931 | | | 752,962 |
Series K-705 A2 (c) | 09/25/2018 | 2.30% | | | 285,000 | | | 288,278 |
| Series K-708 A2 | 01/25/2019 | 2.13% | | | 29,790 | | | 30,059 |
| Series K-709 A2 | 03/25/2019 | 2.09% | | | 25,000 | | | 25,193 |
| Series K-710 A2 | 05/25/2019 | 1.88% | | | 50,000 | | | 50,247 |
Series K-P02 A2 (c) | 04/25/2021 | 2.36% | | | 420,000 | | | 421,975 |
| Freddie Mac Structured Agency Credit Risk Debt Notes | | | | | | | | |
Series 2013-DN2 M1 (c) | 11/27/2023 | 2.04% | | | 80,516 | | | 80,701 |
Series 2016-DNA2 M1 (c) | 10/25/2028 | 1.69% | | | 354,737 | | | 355,167 |
The accompanying notes are an integral part of these consolidated financial statements.
| |
| |
LoCorr Long/Short Commodities Strategy Fund - Consolidated Schedule of Investments (continued) | 31 |
| |
| | | Maturity Date | | Coupon Rate | | Principal Amount | | | Value | |
MORTGAGE BACKED SECURITIES (continued) | | | | | | | | | | | |
| FREMF Mortgage Trust | | | | | | | | | | | |
Series 2011-K704 B (Acquired 03/01/2016, Cost, $413,474) (a)(c) | | 10/25/2030 | | 4.69% | | $ | 400,000 | | $ | 414,138 | |
Series 2011-K702 B (Acquired 06/16/2016, Cost, $546,067) (a)(c) | | 04/25/2044 | | 4.77% | | | 525,000 | | | 540,505 | |
Series 2012-K708 B (Acquired 04/21/2015, Cost, $156,368) (a)(c) | | 02/25/2045 | | 3.75% | | | 150,000 | | | 153,847 | |
Series 2013-K502 B (Acquired 05/06/2015, Cost, $126,503) (a)(c) | | 03/25/2045 | | 2.61% | | | 125,000 | | | 125,225 | |
Series 2013-KF02 B (Acquired 04/06/2015, Cost, $46,991) (a)(c) | | 12/25/2045 | | 3.53% | | | 45,874 | | | 46,020 | |
Series 2011-K10 (Acquired 11/22/2016, Cost, $412,656) (a)(c) | | 11/25/2049 | | 4.63% | | | 386,000 | | | 409,146 | |
GAHR Commercial Mortgage Trust, 2015-NRF AFL1 (Acquired 05/07/2015 through 08/04/2016, Cost, $368,261) (a)(c) | | 12/15/2034 | | 2.00% | | | 366,609 | | | 367,178 | |
GP Portfolio Trust, 2014-GPP A (Acquired 04/29/2016, Cost, $249,630) (a)(c) | | 02/16/2027 | | 1.65% | | | 251,121 | | | 251,667 | |
| GS Mortgage Securities Trust | | | | | | | | | | | |
Series 2014-GSFL A (Acquired 08/06/2014, Cost, $34,084) (a)(c) | | 07/15/2031 | | 1.70% | | | 34,084 | | | 34,075 | |
| Series 2011-GC5 A2 | | 08/10/2044 | | 3.00% | | | 3,271 | | | 3,269 | |
Series 2007-GG10 A4 (c) | | 08/10/2045 | | 5.79% | | | 580,702 | | | 584,318 | |
JP Morgan Mortgage Trust, 2016-1 A5 (Acquired 06/09/2016, Cost, $336,948) (a) | | 05/25/2046 | | 3.50% | | | 328,057 | | | 333,363 | |
| JPMBB Commercial Mortgage Securities Trust, 2013-C12 A2 | | 07/17/2045 | | 2.42% | | | 176,030 | | | 177,645 | |
| JPMorgan Chase Commercial Mortgage Securities Trust | | | | | | | | | | | |
Series 2010-C2 A2 (Acquired 01/26/2016, Cost, $221,699) (a) | | 11/18/2043 | | 3.62% | | | 215,657 | | | 218,884 | |
| Series 2012-C8 ASB | | 10/17/2045 | | 2.38% | | | 50,000 | | | 50,233 | |
Series 2011-C3 A3 (Acquired 08/26/2015 through 03/03/2016, Cost, $721,984) (a) | | 02/16/2046 | | 4.39% | | | 689,745 | | | 710,248 | |
Series 2007-CB20 A4 (c) | | 02/12/2051 | | 5.79% | | | 467,240 | | | 474,407 | |
| LB Commercial Mortgage Trust, 2007-C3 A4B | | 07/15/2044 | | 5.52% | | | 27,633 | | | 28,020 | |
| MASTR Asset Securitization Trust | | | | | | | | | | | |
| Series 2003-2 1A1 | | 03/25/2018 | | 5.00% | | | 42,600 | | | 42,555 | |
| Series 2004-1 4A1 | | 02/25/2019 | | 4.50% | | | 74,570 | | | 74,869 | |
Morgan Stanley Re-REMIC Trust, 2010-R1 3A (Acquired 05/05/2016, Cost, $218,070) (a)(c) | | 07/26/2035 | | 3.18% | | | 217,390 | | | 216,197 | |
| New Residential Mortgage Loan Trust | | | | | | | | | | | |
Series 2015-1A A3 (Acquired 03/09/2016 through 04/19/2016, Cost, $403,825) (a) | | 05/28/2052 | | 3.75% | | | 394,791 | | | 406,268 | |
Series 2014-2A A3 (Acquired 02/18/2016, Cost, $269,241) (a)(c) | | 05/25/2054 | | 3.75% | | | 262,671 | | | 269,414 | |
Series 2016-1A A1 (Acquired 03/29/2016, Cost, $406,704) (a) | | 03/25/2056 | | 3.75% | | | 395,418 | | | 401,169 | |
Opteum Mortgage Acceptance Corp. Asset Backed Pass-Through Certificates, 2005-1 M3 (c) | | 02/25/2035 | | 1.61% | | | 200,000 | | | 199,506 | |
RBSSP Resecuritization Trust, 2009-7 (Acquired 12/14/2016, Cost, $376,911) (a)(c) | | 06/26/2037 | | 0.98% | | | 390,076 | | | 374,140 | |
SBA Tower Trust, 2012-1 A (Acquired 09/03/2014, Cost, $40,826) (a) | | 12/15/2042 | | 2.93% | | | 40,000 | | | 40,041 | |
Sequoia Mortgage Trust, 2015-3 A4 (Acquired 06/19/2015, Cost, $119,258) (a)(c) | | 07/25/2045 | | 3.50% | | | 117,911 | | | 119,891 | |
| UBS-Citigroup Commercial Mortgage Trust, 2011-C1 A2 | | 01/12/2045 | | 2.80% | | | 106 | | | 106 | |
Vornado DP LLC Trust, 2010-VN0 A1 (Acquired 03/01/2016, Cost, $430,913) (a) | | 09/14/2028 | | 2.97% | | | 422,320 | | | 430,826 | |
| Wells Fargo Commercial Mortgage Trust | | | | | | | | | | | |
| Series 2015-C26 A1 | | 02/18/2048 | | 1.45% | | | 76,858 | | | 76,533 | |
| Series 2015-LC22 A1 | | 09/17/2058 | | 1.64% | | | 188,978 | | | 188,462 | |
| WFRBS Commercial Mortgage Trust, 2012-C8 A2 | | 08/17/2045 | | 1.88% | | | 144,524 | | | 144,764 | |
| TOTAL MORTGAGE BACKED SECURITIES (Cost $16,817,892) | | | | | | | | | | 16,800,883 | |
| | | | | | | | | | | | |
| MUNICIPAL BONDS: 0.36% | | | | | | | | | | | |
| City of Lubbock, TX | | 02/15/2018 | | 4.44% | | | 25,000 | | | 25,969 | |
| County of Forsyth, NC | | 04/01/2020 | | 3.55% | | | 30,000 | | | 31,629 | |
| Maricopa County School District No. 28 Kyrene Elementary | | 07/01/2019 | | 5.38% | | | 15,000 | | | 16,408 | |
| North Carolina Eastern Municipal Power Agency | | 07/01/2018 | | 2.00% | | | 60,000 | | | 60,299 | |
| Rosemount-Apple Valley-Eagan Independent School District No. 196 | | 02/01/2019 | | 5.00% | | | 25,000 | | | 26,756 | |
| St. Paul Housing & Redevelopment Authority | | 07/01/2018 | | 1.84% | | | 60,000 | | | 60,118 | |
| State of Hawaii | | 02/01/2017 | | 3.73% | | | 25,000 | | | 25,052 | |
| State of Mississippi | | 11/01/2017 | | 1.35% | | | 30,000 | | | 30,020 | |
| State of Ohio | | 04/01/2018 | | 3.66% | | | 45,000 | | | 46,321 | |
| State of Tennessee | | 05/01/2017 | | 3.82% | | | 25,000 | | | 25,255 | |
| State of Texas | | 10/01/2017 | | 2.50% | | | 25,000 | | | 25,309 | |
| State of Washington | | 02/01/2017 | | 3.04% | | | 40,000 | | | 40,066 | |
| University of Texas System | | 08/15/2018 | | 3.81% | | | 25,000 | | | 26,002 | |
| TOTAL MUNICIPAL BONDS (Cost $436,842) | | | | | | | | | | 439,204 | |
The accompanying notes are an integral part of these consolidated financial statements.
| |
| |
32 | LoCorr Long/Short Commodities Strategy Fund - Consolidated Schedule of Investments (continued) |
| |
| | | Maturity Date | | Coupon Rate | | Principal Amount | | | Value | |
| U.S. GOVERNMENT AGENCY ISSUES: 14.57% | | | | | | | | | | | |
| Federal Farm Credit Banks Funding Corp. | | 03/03/2017 | | 0.65% | | $ | 500,000 | | $ | 500,212 | |
| Federal Farm Credit Banks Funding Corp. | | 09/14/2018 | | 0.88% | | | 650,000 | | | 646,571 | |
| Federal Home Loan Banks | | 01/16/2019 | | 1.25% | | | 3,325,000 | | | 3,323,840 | |
| Federal Home Loan Banks | | 08/05/2019 | | 0.88% | | | 1,500,000 | | | 1,478,770 | |
| Federal Home Loan Banks | | 02/18/2021 | | 1.38% | | | 985,000 | | | 966,345 | |
| Federal Home Loan Banks | | 07/14/2021 | | 1.13% | | | 1,200,000 | | | 1,158,312 | |
| Federal Home Loan Mortgage Corp. | | 07/19/2019 | | 0.88% | | | 2,515,000 | | | 2,481,779 | |
| Federal Home Loan Mortgage Corp. | | 08/12/2021 | | 1.13% | | | 1,260,000 | | | 1,213,074 | |
| Federal National Mortgage Association | | 08/02/2019 | | 0.88% | | | 1,170,000 | | | 1,153,747 | |
| Federal National Mortgage Association | | 08/28/2019 | | 1.00% | | | 2,140,000 | | | 2,116,227 | |
| Federal National Mortgage Association | | 10/24/2019 | | 1.00% | | | 1,165,000 | | | 1,148,895 | |
| Federal National Mortgage Association | | 10/07/2021 | | 1.38% | | | 1,750,000 | | | 1,702,523 | |
| Ginnie Mae II Pool | | 07/20/2060 | | 5.31% | | | 19,536 | | | 20,534 | |
| Ginnie Mae II Pool | | 07/20/2062 | | 4.56% | | | 22,876 | | | 23,986 | |
| Ginnie Mae II Pool | | 08/20/2062 | | 4.10% | | | 46,788 | | | 48,696 | |
| TOTAL U.S. GOVERNMENT AGENCY ISSUES (Cost $18,212,538) | | | | | | | | | | 17,983,511 | |
| | | | | | | | | | | | |
| U.S. GOVERNMENT NOTES: 3.21% | | | | | | | | | | | |
| United States Treasury Note | | 07/31/2021 | | 1.13% | | | 505,000 | | | 488,154 | |
| United States Treasury Note | | 08/15/2021 | | 2.13% | | | 900,000 | | | 908,543 | |
| United States Treasury Note | | 08/31/2021 | | 2.00% | | | 630,000 | | | 632,510 | |
| United States Treasury Note | | 10/31/2021 | | 1.25% | | | 2,000,000 | | | 1,939,375 | |
| TOTAL U.S. GOVERNMENT NOTES (Cost $4,030,187) | | | | | | | | | | 3,968,582 | |
| | | | | | | | | | | | |
| SHORT TERM INVESTMENTS: 4.04% | | | | | | | | | | | |
| U.S. GOVERNMENT NOTE: 0.81% | | | | | | | | | | | |
| United States Treasury Note | | 10/15/2017 | | 0.88% | | | 1,000,000 | | | 1,000,273 | |
| TOTAL U.S. GOVERNMENT NOTE (Cost $1,000,313) | | | | | | | | | | 1,000,273 | |
| | | | | | | | | | | | |
| MONEY MARKET FUND: 3.23% | | | | | | Shares | | | | |
STIT-Government & Agency Portfolio, Institutional Class, 0.43% (d)(e) | | | | | | | 3,985,481 | | | 3,985,481 | |
| TOTAL MONEY MARKET FUND (Cost $3,985,481) | | | | | | | | | | 3,985,481 | |
| TOTAL SHORT TERM INVESTMENTS (Cost $4,985,794) | | | | | | | | | | 4,985,754 | |
| | | | | | | | | | | | |
| TOTAL INVESTMENTS (Cost $106,280,711): 85.69% | | | | | | | | | | 105,780,451 | |
Other Assets in Excess of Liabilities: 14.31% (f) | | | | | | | | | | 17,666,944 | |
| TOTAL NET ASSETS: 100.00% | | | | | | | | | $ | 123,447,395 | |
| (a) | Restricted security as defined in Rule 144(a) under the Securities Act of 1933 and determined to be liquid. Purchased in a private placement transaction; resale to the public may require registration or may extend only to qualified institutional buyers. At December 31, 2016, the value of these securities total $20,785,689 which represents 16.84% of total net assets. |
| (b) | Foreign issued security. |
| (c) | Variable rate security. The rate reported is the rate in effect as of December 31, 2016. |
| (d) | The rate quoted is the annualized seven-day effective yield as of December 31, 2016. |
| (e) | All or a portion of this security is held by LCLSCS Fund Limited and pledged as collateral for swap contracts. |
| (f) | Includes assets pledged as collateral for swap contracts. |
The accompanying notes are an integral part of these consolidated financial statements.
| |
| |
LoCorr Long/Short Commodities Strategy Fund - Consolidated Schedule of Swap Contracts | 33 |
| |
Consolidated Schedule of Swap Contracts
December 31, 2016
LONG TOTAL RETURN SWAP CONTRACTS
This investment is a holding of LCLSCS Fund Limited. See Note 1.
| | | | | | | Unrealized | | |
| | | | | | | Appreciation | | |
| Termination Date | | Reference Index | | Notional | | (Depreciation)* | | Counterparty |
| 12/20/2017 | | LoCorr Commodities Index^ | | $125,600,000 | | $(18,990,950) | | Deutsche Bank AG |
| ^ | Comprised of a proprietary basket of Commodity Trading Advisor’s (“CTA”) Programs investing in various futures, forwards, and currency derivative contracts and other similar investments. See Notes 2 and 3. |
| * | Unrealized depreciation is a payable on the Fund’s consolidated statement of assets and liabilities. |
The accompanying notes are an integral part of these consolidated financial statements.
| |
| |
34 | LoCorr Multi-Strategy Fund - Consolidated Schedule of Investments |
| |
LoCorr Multi-Strategy Fund
Composition of Consolidated Investment Portfolio1
December 31, 2016 (Unaudited)
1 As a percentage of total investments.
Consolidated Schedule of Investments
December 31, 2016
| | | | Shares | | | Value | |
| BUSINESS DEVELOPMENT COMPANIES: 3.54% | | | | | | | |
| Ares Capital Corp. | | | 38,665 | | $ | 637,586 | |
| Hercules Capital, Inc. | | | 34,029 | | | 480,149 | |
| Prospect Capital Corp. | | | 32,906 | | | 274,765 | |
| TOTAL BUSINESS DEVELOPMENT COMPANIES (Cost $1,264,681) | | | | | | 1,392,500 | |
| | | | | | | | |
| CLOSED-END INVESTMENT COMPANIES: 6.85% | | | | | | | |
| AllianzGI Convertible & Income Fund II | | | 80,482 | | | 459,552 | |
| Invesco Dynamic Credit Opportunities Fund | | | 50,235 | | | 617,891 | |
| Invesco Senior Income Trust | | | 103,095 | | | 478,361 | |
| Nuveen Credit Strategies Income Fund | | | 55,131 | | | 487,909 | |
| Nuveen Quality Preferred Income Fund 2 | | | 22,868 | | | 212,901 | |
| Western Asset Global High Income Fund, Inc. | | | 44,636 | | | 438,772 | |
| TOTAL CLOSED-END INVESTMENT COMPANIES: (Cost $2,542,870) | | | | | | 2,695,386 | |
| | | | | | | | |
| COMMON STOCKS: 31.89% | | | | | | | |
| Construction: 2.15% | | | | | | | |
MasTec, Inc. (a) | | | 22,078 | | | 844,484 | |
| | | | | | | | |
| Finance and Insurance: 7.99% | | | | | | | |
| Apollo Global Management LLC | | | 24,276 | | | 469,983 | |
| Artisan Partners Asset Management, Inc. | | | 14,489 | | | 431,048 | |
Credit Acceptance Corp. (a) | | | 10,310 | | | 2,242,528 | |
| | | | | | | 3,143,559 | |
| Information: 5.48% | | | | | | | |
| Frontier Communications Corp. | | | 113,559 | | | 383,830 | |
Gogo, Inc. (a) | | | 109,916 | | | 1,013,425 | |
The accompanying notes are an integral part of these consolidated financial statements.
| |
| |
LoCorr Multi-Strategy Fund - Consolidated Schedule of Investments (continued) | 35 |
| |
| | | | Shares | | | Value | |
COMMON STOCKS (continued) | | | | | | | |
| Nexstar Broadcasting Group, Inc. | | | 9,877 | | $ | 625,214 | |
| Sinclair Broadcast Group, Inc. | | | 3,955 | | | 131,899 | |
| | | | | | | 2,154,368 | |
| Manufacturing: 3.52% | | | | | | | |
| BP Prudhoe Bay Royalty Trust | | | 7,763 | | | 184,371 | |
Tenneco, Inc. (a) | | | 19,195 | | | 1,199,112 | |
| | | | | | | 1,383,483 | |
| Mining, Quarrying, and Oil and Gas Extraction: 1.06% | | | | | | | |
| EnLink Midstream LLC | | | 11,152 | | | 212,445 | |
Seadrill Partners LLC (b) | | | 48,770 | | | 204,834 | |
| | | | | | | 417,279 | |
| Real Estate and Rental and Leasing: 0.78% | | | | | | | |
United Rentals, Inc. (a) | | | 2,922 | | | 308,505 | |
| | | | | | | | |
| Retail Trade: 5.47% | | | | | | | |
Signet Jewelers Ltd (b) | | | 10,393 | | | 979,644 | |
| Tailored Brands, Inc. | | | 45,795 | | | 1,170,062 | |
| | | | | | | 2,149,706 | |
| Transportation and Warehousing: 5.44% | | | | | | | |
DHT Holdings, Inc. (b) | | | 35,854 | | | 148,435 | |
Euronav NV (b) | | | 19,568 | | | 155,566 | |
| Fortress Transportation & Infrastructure Investors LLC | | | 30,739 | | | 408,829 | |
GasLog Partners LP (b) | | | 10,845 | | | 222,865 | |
Golar LNG Partners LP (b) | | | 12,300 | | | 295,692 | |
Scorpio Tankers, Inc. (b) | | | 93,986 | | | 425,757 | |
Ship Finance International Ltd. (b) | | | 32,484 | | | 482,387 | |
| | | | | | | 2,139,531 | |
| TOTAL COMMON STOCKS (Cost $10,751,235) | | | | | | 12,540,915 | |
| | | | | | | | |
| CONVERTIBLE PREFERRED STOCK: 2.11% | | | | | | | |
| Kinder Morgan, Inc. | | | 17,079 | | | 830,893 | |
| TOTAL CONVERTIBLE PREFERRED STOCK (Cost $727,917) | | | | | | 830,893 | |
| | | | Units | | | | |
| MASTER LIMITED PARTNERSHIPS: 12.43% | | | | | | | |
| Arts, Entertainment, and Recreation: 1.04% | | | | | | | |
| Cedar Fair LP | | | 6,376 | | | 409,339 | |
| | | | | | | | |
| Manufacturing: 2.03% | | | | | | | |
| CVR Partners LP | | | 76,827 | | | 461,731 | |
| Terra Nitrogen Co. LP | | | 3,275 | | | 336,375 | |
| | | | | | | 798,106 | |
| Mining, Quarrying, and Oil and Gas Extraction: 1.77% | | | | | | | |
| Enterprise Products Partners LP | | | 16,620 | | | 449,405 | |
| SunCoke Energy Partners LP | | | 12,773 | | | 245,880 | |
| | | | | | | 695,285 | |
| Other Services (except Public Administration): 1.42% | | | | | | | |
| StoneMor Partners LP | | | 62,936 | | | 560,760 | |
| | | | | | | | |
| Retail Trade: 3.77% | | | | | | | |
| Crestwood Equity Partners LP | | | 28,087 | | | 717,623 | |
| Global Partners LP | | | 39,328 | | | 764,929 | |
| | | | | | | 1,482,552 | |
| Transportation and Warehousing: 1.87% | | | | | | | |
| Energy Transfer Partners LP | | | 12,660 | | | 453,355 | |
| Summit Midstream Partners LP | | | 3,098 | | | 77,915 | |
| Targa Resources Corp. | | | 3,605 | | | 202,132 | |
| | | | | | | 733,402 | |
The accompanying notes are an integral part of these consolidated financial statements.
| |
| |
36 | LoCorr Multi-Strategy Fund - Consolidated Schedule of Investments (continued) |
| |
| | | | Units | | | Value | |
MASTER LIMITED PARTNERSHIPS (continued) | | | | | | | |
| Wholesale Trade: 0.53% | | | | | | | |
| Martin Midstream Partners LP | | | 11,426 | | $ | 209,667 | |
| TOTAL MASTER LIMITED PARTNERSHIPS (Cost $5,054,071) | | | | | | 4,889,111 | |
| | | | | | | | |
| PUBLICLY TRADED PARTNERSHIPS: 4.16% | | | | | | | |
| AllianceBernstein Holding LP | | | 16,710 | | | 391,850 | |
| Blackstone Group LP/The | | | 31,172 | | | 842,579 | |
| Carlyle Group LP/The | | | 26,260 | | | 400,465 | |
| TOTAL PUBLICLY TRADED PARTNERSHIPS (Cost $1,585,980) | | | | | | 1,634,894 | |
| | | | Shares | | | | |
| REAL ESTATE INVESTMENT TRUSTS: 13.39% | | | | | | | |
| Annaly Capital Management, Inc. | | | 58,992 | | | 588,150 | |
| Apollo Commercial Real Estate Finance, Inc. | | | 60,481 | | | 1,005,194 | |
| Care Capital Properties, Inc. | | | 14,597 | | | 364,925 | |
| Communications Sales & Leasing, Inc. | | | 18,304 | | | 465,105 | |
| Digital Realty Trust, Inc. | | | 14,838 | | | 402,852 | |
| Hospitality Properties Trust | | | 19,842 | | | 629,785 | |
| Ladder Capital Corp. | | | 29,193 | | | 400,528 | |
| LaSalle Hotel Properties | | | 6,965 | | | 212,223 | |
| Starwood Property Trust, Inc. | | | 27,604 | | | 605,908 | |
| Two Harbors Investment Corp. | | | 23,033 | | | 200,848 | |
| Washington Prime Group, Inc. | | | 37,446 | | | 389,813 | |
| TOTAL REAL ESTATE INVESTMENT TRUSTS (Cost $5,218,449) | | | | | | 5,265,331 | |
| | | | | | | | |
| SHORT TERM INVESTMENT: 13.12% | | | | | | | |
| MONEY MARKET FUND: 13.12% | | | | | | | |
STIT-Government & Agency Portfolio, Institutional Class, 0.43% (c)(d) | | | 5,161,976 | | | 5,161,976 | |
| TOTAL MONEY MARKET FUND (Cost $5,161,976) | | | | | | 5,161,976 | |
| TOTAL SHORT TERM INVESTMENT (Cost $5,161,976) | | | | | | 5,161,976 | |
| | | | | | | | |
| TOTAL INVESTMENTS (Cost $32,307,179): 87.49% | | | | | | 34,411,006 | |
Other Assets in Excess of Liabilities: 12.51% (e) | | | | | | 4,922,224 | |
| TOTAL NET ASSETS: 100.00% | | | | | $ | 39,333,230 | |
| (a) | Non-dividend income producing security. |
| (b) | Foreign issued security. |
| (c) | The rate quoted is the annualized seven-day effective yield as of December 31, 2016. |
| (d) | All or a portion of this security is held by LCMSF Fund Limited and pledged as collateral for swap contracts. |
| (e) | Includes assets pledged as collateral for swap contracts. |
The accompanying notes are an integral part of these consolidated financial statements.
| |
| |
LoCorr Multi-Strategy Fund - Consolidated Schedule of Securities Sold Short | 37 |
| |
Consolidated Schedule of Securities Sold Short
December 31, 2016
| | | | Shares | | | Value | |
| COMMON STOCKS: (2.35)% | | | | | | | |
| Manufacturing: (1.30)% | | | | | | | |
| Owens Corning | | | (9,925 | ) | $ | (511,733) | |
| | | | | | | | |
| Other Services (except Public Administration): (1.05)% | | | | | | | |
Regis Corp. (a) | | | (28,436 | ) | | (412,891) | |
| TOTAL COMMON STOCKS (Proceeds $933,409) | | | | | | (924,624) | |
| TOTAL SECURITIES SOLD SHORT (Proceeds $933,409) | | | | | $ | (924,624) | |
| (a) | Non-dividend expense producing security. |
Percentages are stated as a percent of net assets.
The accompanying notes are an integral part of these consolidated financial statements.
| |
| |
38 | LoCorr Multi-Strategy Fund - Consolidated Schedule of Swap Contracts |
| |
Consolidated Schedule of Swap Contracts
December 31, 2016
LONG TOTAL RETURN SWAP CONTRACTS
This investment is a holding of LCMSF Fund Limited. See Note 1.
| | | | | | | Unrealized | | |
| | | | | | | Appreciation | | |
| Termination Date | | Reference Index | | Notional | | (Depreciation)* | | Counterparty |
| 04/14/2020 | | LoCorr Multi-Strategy Index^ | | $39,982,500 | | $(3,704,355) | | Deutsche Bank AG |
| ^ | Comprised of a proprietary basket of Commodity Trading Advisor’s (“CTA”) Programs investing in various futures, forwards, and currency derivative contracts and other similar investments. See Notes 2 and 3. |
| * | Unrealized depreciation is a payable on the Fund’s consolidated statement of assets and liabilities. |
The accompanying notes are an integral part of these consolidated financial statements.
| |
| |
LoCorr Market Trend Fund - Consolidated Schedule of Investments | 39 |
| |
LoCorr Market Trend Fund
Composition of Consolidated Investment Portfolio1
December 31, 2016 (Unaudited)
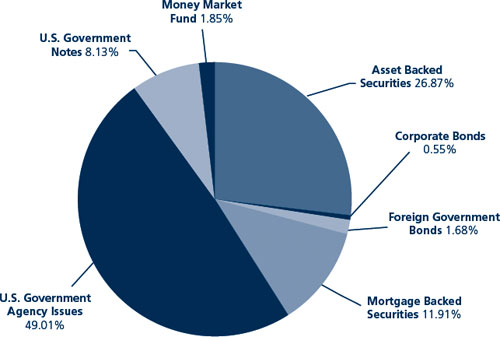
1 As a percentage of total investments.
Consolidated Schedule of Investments
December 31, 2016
| | | Maturity Date | | Coupon Rate | | Principal Amount | | Value |
| ASSET BACKED SECURITIES: 22.64% | | | | | | | | | | | | |
| AEP Texas Central Transition Funding II LLC, 2006-2 A4 | | 01/01/2020 | | | 5.17 | % | | $ | 3,016,295 | | $ | 3,069,851 |
| AEP Texas Central Transition Funding III LLC, 2012-1 A1 | | 12/01/2018 | | | 0.88 | % | | | 1,848,434 | | | 1,846,746 |
| Ally Auto Receivables Trust, 2014-2 A3 | | 04/15/2019 | | | 1.25 | % | | | 5,052,042 | | | 5,054,021 |
| American Express Credit Account Master Trust | | | | | | | | | | | | |
| Series 2012-1 A (c) | | 01/15/2020 | | | 0.97 | % | | | 1,590,000 | | | 1,590,902 |
| Series 2014-4 A | | 06/15/2020 | | | 1.43 | % | | | 5,000,000 | | | 5,008,285 |
| AmeriCredit Automobile Receivables Trust, 2016-3 A2A | | 11/08/2019 | | | 1.37 | % | | | 7,000,000 | | | 7,003,778 |
| BA Credit Card Trust | | | | | | | | | | | | |
| Series 2014-A2 A (c) | | 09/16/2019 | | | 0.97 | % | | | 6,000,000 | | | 6,001,178 |
| Series 2014-3A A (c) | | 01/15/2020 | | | 0.99 | % | | | 7,990,000 | | | 7,995,546 |
| Barclays Dryrock Issuance Trust, 2014-2 A (c) | | 03/16/2020 | | | 1.04 | % | | | 12,000,000 | | | 12,002,077 |
| Cabela’s Credit Card Master Note Trust | | | | | | | | | | | | |
| Series 2012-1A A2 (Acquired 02/27/2015 through 02/25/2016, Cost, $7,130,371) (a)(c) | | 02/18/2020 | | | 1.23 | % | | | 7,130,000 | | | 7,131,469 |
| Series 2012-1A A1 (Acquired 08/31/2015, Cost, $5,002,890) (a) | | 02/18/2020 | | | 1.63 | % | | | 5,000,000 | | | 5,003,293 |
| Series 2014-1 A (c) | | 03/16/2020 | | | 1.05 | % | | | 3,220,000 | | | 3,220,294 |
| California Republic Auto Receivables Trust | | | | | | | | | | | | |
| Series 2013-2 A2 | | 03/15/2019 | | | 1.23 | % | | | 1,756,201 | | | 1,756,537 |
| Series 2015-1 A3 | | 04/15/2019 | | | 1.33 | % | | | 517,052 | | | 517,345 |
| Capital Auto Receivables Asset Trust | | | | | | | | | | | | |
| Series 2015-1 A2 | | 06/20/2018 | | | 1.42 | % | | | 1,520,652 | | | 1,520,973 |
| Series 2016-1 A2A | | 11/20/2018 | | | 1.50 | % | | | 5,682,930 | | | 5,689,910 |
| Capital One Multi-Asset Execution Trust | | | | | | | | | | | | |
| Series 2007-A2 (c) | | 12/16/2019 | | | 0.78 | % | | | 2,300,000 | | | 2,300,000 |
| Series 2015-A6 (c) | | 06/15/2020 | | | 1.07 | % | | | 3,500,000 | | | 3,504,858 |
| Series 2007-A7 | | 07/15/2020 | | | 5.75 | % | | | 4,895,000 | | | 5,051,354 |
The accompanying notes are an integral part of these consolidated financial statements.
| |
| |
40 | LoCorr Market Trend Fund - Consolidated Schedule of Investments (continued) |
| |
| | | Maturity Date | | Coupon Rate | | Principal Amount | | Value |
| ASSET BACKED SECURITIES (continued) | | | | | | | | | | | | |
| CarMax Auto Owner Trust | | | | | | | | | | | | |
| Series 2013-1 A4 | | 08/15/2018 | | | 0.89 | % | | $ | 2,557,670 | | $ | 2,555,952 |
| Series 2014-1 A3 | | 10/15/2018 | | | 0.79 | % | | | 986,021 | | | 985,378 |
| CenterPoint Energy Restoration Bond Co. LLC, 2009-1 A2 | | 08/15/2019 | | | 3.46 | % | | | 3,217,067 | | | 3,260,591 |
| CenterPoint Energy Transition Bond Co. II LLC, 2005-A A4 | | 08/01/2019 | | | 5.17 | % | | | 704,083 | | | 708,739 |
| CenterPoint Energy Transition Bond Co. IV LLC, 2012-1 A1 | | 04/15/2018 | | | 0.90 | % | | | 2,358,294 | | | 2,357,427 |
| Chase Issuance Trust | | | | | | | | | | | | |
| Series 2007-A3 | | 04/15/2019 | | | 5.23 | % | | | 3,315,000 | | | 3,330,346 |
| Series 2014-A7 | | 11/15/2019 | | | 1.38 | % | | | 4,405,000 | | | 4,408,827 |
| Chrysler Capital Auto Receivables Trust, 2016-B A2 (Acquired 10/26/2016, Cost, $3,999,592) (a) | | 01/15/2020 | | | 1.36 | % | | | 4,000,000 | | | 3,994,648 |
| Citibank Credit Card Issuance Trust | | | | | | | | | | | | |
| Series 2007-A8 | | 09/20/2019 | | | 5.65 | % | | | 13,600,000 | | | 14,021,965 |
| Series 2008-A1 | | 02/07/2020 | | | 5.35 | % | | | 4,270,000 | | | 4,455,165 |
| Discover Card Execution Note Trust, 2007-A1 | | 03/16/2020 | | | 5.65 | % | | | 10,400,000 | | | 10,714,597 |
| Entergy Gulf States Reconstruction Funding 1 LLC, 2007-A A2 | | 10/01/2018 | | | 5.79 | % | | | 2,114,196 | | | 2,153,847 |
| Entergy Texas Restoration Funding LLC, 2009-A A2 | | 08/01/2019 | | | 3.65 | % | | | 556,052 | | | 564,215 |
| Ford Credit Auto Owner Trust, 2016-A A2A | | 12/15/2018 | | | 1.12 | % | | | 3,307,383 | | | 3,307,817 |
| Honda Auto Receivables Owner Trust | | | | | | | | | | | | |
| Series 2015-3 A2 | | 11/20/2017 | | | 0.92 | % | | | 980,121 | | | 979,985 |
| Series 2015-2 A3 | | 02/21/2019 | | | 1.04 | % | | | 4,966,078 | | | 4,960,794 |
| Series 2016-1 A3 | | 12/18/2019 | | | 1.22 | % | | | 9,000,000 | | | 8,979,252 |
| Huntington Auto Trust, 2015-1 A3 | | 09/16/2019 | | | 1.24 | % | | | 7,531,308 | | | 7,526,918 |
Hyundai Auto Lease Securitization Trust, 2016-A A2A (Acquired 01/26/2016, Cost, $3,466,435) (a) | | 07/16/2018 | | | 1.33 | % | | | 3,466,538 | | | 3,468,655 |
| Hyundai Auto Receivables Trust, 2014-B A3 | | 12/17/2018 | | | 0.90 | % | | | 1,972,853 | | | 1,971,322 |
| John Deere Owner Trust, 2015-A A3 | | 06/17/2019 | | | 1.32 | % | | | 1,500,000 | | | 1,500,380 |
| Nissan Auto Receivables Owner Trust, 2016-A A3 | | 10/15/2020 | | | 1.34 | % | | | 5,737,000 | | | 5,719,769 |
| Ohio Phase-In-Recovery Funding LLC, 2013-1 A1 | | 07/01/2018 | | | 0.96 | % | | | 3,609,286 | | | 3,607,401 |
| Santander Drive Auto Receivables Trust, 2016-2 A2A | | 07/15/2019 | | | 1.38 | % | | | 3,428,082 | | | 3,429,523 |
| Susquehanna Auto Receivables Trust, 2014-1A A3 (Acquired 12/22/2015, Cost, $277,837) (a) | | 02/15/2018 | | | 1.00 | % | | | 278,392 | | | 278,364 |
| Synchrony Credit Card Master Note Trust | | | | | | | | | | | | |
| Series 2010-2 A | | 03/15/2020 | | | 4.47 | % | | | 5,435,000 | | | 5,471,145 |
| Series 2012-6 A | | 08/15/2020 | | | 1.36 | % | | | 6,771,000 | | | 6,774,777 |
| Series 2014-1 A | | 11/15/2020 | | | 1.61 | % | | | 9,300,000 | | | 9,317,455 |
TCF Auto Receivables Owner Trust, 2015-1A A3 (Acquired 09/14/2016, Cost, $6,998,850) (a) | | 04/15/2021 | | | 1.71 | % | | | 7,000,000 | | | 6,961,219 |
| Toyota Auto Receivables Owner Trust, 2016-D A2A | | 05/15/2019 | | | 1.06 | % | | | 12,000,000 | | | 11,977,004 |
Verizon Owner Trust, 2016-A 1A (Acquired 07/12/2016, Cost, $4,159,299) (a) | | 01/20/2021 | | | 1.42 | % | | | 4,160,000 | | | 4,131,048 |
| Volkswagen Auto Loan Enhanced Trust, 2014-1 A3 | | 10/22/2018 | | | 0.91 | % | | | 1,927,720 | | | 1,925,202 |
| TOTAL ASSET BACKED SECURITIES (Cost $231,332,589) | | | | | | | | | | | | 231,068,144 |
| | | | | | | | | | | | | |
| CORPORATE BONDS: 0.46% | | | | | | | | | | | | |
| Finance and Insurance: 0.29% | | | | | | | | | | | | |
Bank of Montreal (Acquired 12/04/2014 through 06/18/2015, Cost, $3,002,458) (a)(b) | | 01/30/2017 | | | 1.95 | % | | | 3,000,000 | | | 3,001,827 |
| | | | | | | | | | | | | |
| Manufacturing: 0.17% | | | | | | | | | | | | |
| Johnson & Johnson | | 07/15/2018 | | | 5.15 | % | | | 1,595,000 | | | 1,686,269 |
| TOTAL CORPORATE BONDS (Cost $4,692,454) | | | | | | | | | | | | 4,688,096 |
| | | | | | | | | | | | | |
| FOREIGN GOVERNMENT BONDS: 1.42% | | | | | | | | | | | | |
| European Investment Bank (b) | | 03/15/2018 | | | 1.00 | % | | | 6,000,000 | | | 5,976,942 |
| European Investment Bank (b) | | 05/15/2018 | | | 1.25 | % | | | 1,000,000 | | | 998,244 |
| European Investment Bank (b) | | 08/15/2018 | | | 1.13 | % | | | 2,500,000 | | | 2,489,110 |
| International Bank for Reconstruction & Development (b) | | 11/15/2017 | | | 1.00 | % | | | 5,000,000 | | | 4,986,575 |
| TOTAL FOREIGN GOVERNMENT BONDS (Cost $14,478,080) | | | | | | | | | | | | 14,450,871 |
The accompanying notes are an integral part of these consolidated financial statements.
| |
| |
LoCorr Market Trend Fund - Consolidated Schedule of Investments (continued) | 41 |
| |
| | | Maturity Date | | Coupon Rate | | Principal Amount | | Value |
| MORTGAGE BACKED SECURITIES: 10.04% | | | | | | | | | | | | |
| Fannie Mae Aces | | | | | | | | | | | | |
| Series 2012-M13 ASQ2 | | 08/25/2017 | | | 1.25 | % | | $ | 963,811 | | $ | 963,167 |
| Series 2014-M13 ASQ2 | | 11/25/2017 | | | 1.64 | % | | | 5,384,786 | | | 5,391,149 |
| Series 2014-M6 FA (c) | | 12/25/2017 | | | 0.82 | % | | | 367,122 | | | 367,239 |
| Series 2015-M1 ASQ2 | | 02/25/2018 | | | 1.63 | % | | | 5,283,360 | | | 5,295,912 |
| Series 2015-M7 ASQ2 | | 04/25/2018 | | | 1.55 | % | | | 3,725,000 | | | 3,727,136 |
| Series 2014-M8 FA (c) | | 05/25/2018 | | | 0.78 | % | | | 2,038,695 | | | 2,035,123 |
| Series 2013-M13 FA (c) | | 05/25/2018 | | | 1.11 | % | | | 2,501,844 | | | 2,501,910 |
| Series 2013-M14 FA (c) | | 08/25/2018 | | | 1.11 | % | | | 1,299,314 | | | 1,301,058 |
| Series 2009-M2 A3 | | 01/25/2019 | | | 4.00 | % | | | 2,262,891 | | | 2,355,951 |
| Series 2014-M10 ASQ2 (c) | | 09/25/2019 | | | 2.17 | % | | | 4,880,000 | | | 4,899,874 |
| Series 2010-M1 A2 | | 09/25/2019 | | | 4.45 | % | | | 3,374,461 | | | 3,575,271 |
| Series 2010-M3 A3 (c) | | 03/25/2020 | | | 4.33 | % | | | 3,165,596 | | | 3,351,491 |
| Fannie Mae Pool | | 04/01/2017 | | | 1.92 | % | | | 2,500,000 | | | 2,498,265 |
| FHLMC Multifamily Structured Pass Through Certificates | | | | | | | | | | | | |
| Series K-701 A2 (c) | | 11/25/2017 | | | 3.88 | % | | | 5,000,000 | | | 5,085,929 |
| Series K-703 A2 | | 05/25/2018 | | | 2.70 | % | | | 3,951,307 | | | 4,006,349 |
| Series K-705 A2 (c) | | 09/25/2018 | | | 2.30 | % | | | 4,000,000 | | | 4,046,005 |
| Series K-706 A2 | | 10/25/2018 | | | 2.32 | % | | | 6,861,306 | | | 6,948,427 |
| Series K-708 A2 | | 01/25/2019 | | | 2.13 | % | | | 1,390,190 | | | 1,402,764 |
| Series K-P03 A2 | | 07/25/2019 | | | 1.78 | % | | | 10,000,000 | | | 9,966,197 |
| Series K006 A1 | | 07/25/2019 | | | 3.40 | % | | | 1,601,505 | | | 1,638,791 |
| Series K-504 A1 | | 10/25/2019 | | | 1.68 | % | | | 5,621,507 | | | 5,606,820 |
| Series K-504 A2 | | 09/25/2020 | | | 2.57 | % | | | 10,250,000 | | | 10,427,337 |
| NCUA Guaranteed Notes Trust | | | | | | | | | | | | |
| Series 2011-R1 1A (c) | | 01/08/2020 | | | 1.10 | % | | | 7,135,562 | | | 7,149,786 |
| Series 2010-R1 1A (c) | | 10/07/2020 | | | 1.10 | % | | | 7,902,515 | | | 7,911,584 |
| TOTAL MORTGAGE BACKED SECURITIES (Cost $102,366,308) | | | | | | | | | | | | 102,453,535 |
| | | | | | | | | | | | | |
| U.S. GOVERNMENT AGENCY ISSUES: 41.31% | | | | | | | | | | | | |
| Federal Farm Credit Banks Funding Corp. | | 03/03/2017 | | | 0.65 | % | | | 2,500,000 | | | 2,501,062 |
| Federal Farm Credit Banks Funding Corp. | | 09/14/2018 | | | 0.88 | % | | | 22,000,000 | | | 21,883,928 |
| Federal Farm Credit Banks Funding Corp. | | 09/27/2019 | | | 1.55 | % | | | 13,000,000 | | | 13,015,808 |
| Federal Home Loan Banks | | 12/08/2017 | | | 1.13 | % | | | 35,000,000 | | | 35,087,045 |
| Federal Home Loan Banks | | 12/08/2017 | | | 2.13 | % | | | 5,000,000 | | | 5,057,350 |
| Federal Home Loan Banks | | 03/19/2018 | | | 0.88 | % | | | 13,335,000 | | | 13,313,491 |
| Federal Home Loan Banks | | 06/29/2018 | | | 0.88 | % | | | 10,740,000 | | | 10,702,657 |
| Federal Home Loan Banks | | 08/07/2018 | | | 0.63 | % | | | 30,000,000 | | | 29,761,560 |
| Federal Home Loan Banks | | 12/14/2018 | | | 1.75 | % | | | 15,000,000 | | | 15,157,035 |
| Federal Home Loan Banks | | 06/14/2019 | | | 1.63 | % | | | 20,000,000 | | | 20,097,020 |
| Federal Home Loan Banks | | 08/05/2019 | | | 0.88 | % | | | 5,055,000 | | | 4,983,456 |
| Federal Home Loan Mortgage Corp. | | 07/25/2017 | | | 1.00 | % | | | 5,000,000 | | | 5,006,600 |
| Federal Home Loan Mortgage Corp. | | 12/15/2017 | | | 1.00 | % | | | 10,000,000 | | | 10,007,630 |
| Federal Home Loan Mortgage Corp. | | 07/27/2018 | | | 0.85 | % | | | 27,225,000 | | | 27,091,597 |
| Federal Home Loan Mortgage Corp. | | 10/12/2018 | | | 0.88 | % | | | 17,210,000 | | | 17,116,464 |
| Federal Home Loan Mortgage Corp. | | 04/15/2019 | | | 1.13 | % | | | 22,000,000 | | | 21,910,966 |
| Federal Home Loan Mortgage Corp. | | 07/19/2019 | | | 0.88 | % | | | 25,440,000 | | | 25,103,963 |
| Federal National Mortgage Association | | 02/19/2019 | | | 1.88 | % | | | 15,000,000 | | | 15,182,715 |
| Federal National Mortgage Association | | 02/26/2019 | | | 1.00 | % | | | 56,000,000 | | | 55,651,848 |
| Federal National Mortgage Association | | 08/02/2019 | | | 0.88 | % | | | 21,000,000 | | | 20,708,289 |
| Federal National Mortgage Association | | 08/28/2019 | | | 1.00 | % | | | 21,610,000 | | | 21,369,935 |
| Federal National Mortgage Association | | 10/24/2019 | | | 1.00 | % | | | 22,545,000 | | | 22,233,338 |
| Federal National Mortgage Association | | 11/26/2019 | | | 1.75 | % | | | 8,495,000 | | | 8,559,970 |
| TOTAL U.S. GOVERNMENT AGENCY ISSUES (Cost $423,635,292) | | | | | | | | | | | | 421,503,727 |
The accompanying notes are an integral part of these consolidated financial statements.
| |
| |
42 | LoCorr Market Trend Fund - Consolidated Schedule of Investments (continued) |
| |
| | | Maturity Date | | Coupon Rate | | Principal Amount | | Value |
| U.S. GOVERNMENT NOTES: 6.85% | | | | | | | | | | | | |
| United States Treasury Note | | 02/15/2019 | | | 0.75 | % | | $ | 26,500,000 | | $ | 26,236,033 |
| United States Treasury Note | | 05/31/2019 | | | 1.50 | % | | | 16,000,000 | | | 16,073,744 |
| United States Treasury Note | | 07/15/2019 | | | 0.75 | % | | | 17,025,000 | | | 16,777,610 |
| United States Treasury Note | | 03/31/2020 | | | 1.13 | % | | | 11,000,000 | | | 10,857,770 |
| TOTAL U.S. GOVERNMENT NOTES (Cost $70,407,849) | | | | | | | | | | | | 69,945,157 |
| | | | | | | | | | | | | |
| SHORT TERM INVESTMENT 1.56% | | | | | | | | | | | | |
| MONEY MARKET FUND: 1.56% | | | | | | | | | Shares | | | |
| STIT-Government & Agency Portfolio, Institutional Class, 0.43% (d)(e) | | | | | | | | | 15,947,064 | | | 15,947,064 |
| TOTAL MONEY MARKET FUND (Cost $15,947,064) | | | | | | | | | | | | 15,947,064 |
| TOTAL SHORT TERM INVESTMENT (Cost 15,947,064) | | | | | | | | | | | | 15,947,064 |
| | | | | | | | | | | | | |
| TOTAL INVESTMENTS (Cost $862,859,636): 84.28% | | | | | | | | | | | | 860,056,594 |
| Other Assets in Excess of Liabilities: 15.72% (f) | | | | | | | | | | | | 160,388,337 |
| TOTAL NET ASSETS: 100.00% | | | | | | | | | | | $ | 1,020,444,931 |
(a) | Restricted security as defined in Rule 144(a) under the Securities Act of 1933 and determined to be liquid. Purchased in a private placement transaction; resale to the public may require registration or may extend only to qualified institutional buyers. At December 31, 2016, the value of these securities total $33,970,523 which represents 3.33% of total net assets. |
(b) | Foreign issued security. |
(c) | Variable rate security. The rate reported is the rate in effect as of December 31, 2016. |
(d) | The rate quoted is the annualized seven-day effective yield as of December 31, 2016. |
(e) | All or a portion of this security is held by LCMT Fund Limited and pledged as collateral for derivative contracts. |
(f) | Includes assets pledged as collateral for derivative contracts. |
The accompanying notes are an integral part of these consolidated financial statements.
| |
| |
LoCorr Market Trend Fund - Consolidated Schedule of Open Forward Currency Contracts | 43 |
| |
LoCorr Market Trend Fund
Consolidated Schedule of Open Forward Currency Contracts(a)
December 31, 2016
| | | | | | | Currency to be Received | | Currency to be Delivered | | | | | | | |
| | | Notional
Amount | | Forward
Settlement
Date | | Curr Abbr. | | U.S. $ Value at
December 31, 2016 | | Curr Abbr. | | U.S. $ Value on
Origination Date | | | Unrealized
Appreciation | | | Unrealized
(Depreciation) | |
| | | | | | | | | | | | | | | | | | | | |
| Purchase Contracts: | | | | | | |
| | | | | | | | | | | | | | | | | | | | |
| | | $ | 197,153,620 | | 03/17/2017 | | AUD | | $ | 189,788,992 | | USD | | $ | 197,153,620 | | | $ | — | | | $ | (7,364,628 | ) |
| | | | 51,186,637 | | 03/17/2017 | | CAD | | | 50,465,993 | | USD | | | 51,186,637 | | | | — | | | | (720,644 | ) |
| | | | 24,841,228 | | 03/17/2017 | | CHF | | | 24,926,135 | | USD | | | 24,841,228 | | | | 84,907 | | | | — | |
| | | | 17,978,358 | | 03/17/2017 | | EUR | | | 18,007,749 | | USD | | | 17,978,358 | | | | 29,391 | | | | — | |
| | | | 10,377,081 | | 03/17/2017 | | GBP | | | 10,353,746 | | USD | | | 10,377,081 | | | | — | | | | (23,335 | ) |
| | | | 492,769 | | 03/17/2017 | | JPY | | | 494,403 | | USD | | | 492,769 | | | | 1,634 | | | | — | |
| | | | 4,169,069 | | 03/17/2017 | | MXN | | | 4,137,695 | | USD | | | 4,169,069 | | | | — | | | | (31,374 | ) |
| | | | 101,117,322 | | 03/17/2017 | | NZD | | | 97,252,070 | | USD | | | 101,117,322 | | | | — | | | | (3,865,252 | ) |
| Total Purchase Contracts | | | 395,426,783 | | | | | 407,316,084 | | | $ | 115,932 | | | $ | (12,005,233 | ) |
| | | | | | | | | | | | | | | | | | | | | | | | | |
| Sale Contracts: | | | | | | | | |
| | | $ | 128,432,802 | | 03/17/2017 | | USD | | $ | (128,514,736 | ) | AUD | | $ | (128,432,802 | ) | | $ | — | | | $ | (81,934 | ) |
| | | | 239,204,885 | | 03/17/2017 | | USD | | | (233,917,363 | ) | CAD | | | (239,204,885 | ) | | | 5,287,522 | | | | — | |
| | | | 150,715,402 | | 03/17/2017 | | USD | | | (149,367,349 | ) | CHF | | | (150,715,402 | ) | | | 1,348,053 | | | | — | |
| | | | 142,540,920 | | 03/17/2017 | | USD | | | (140,798,611 | ) | EUR | | | (142,540,920 | ) | | | 1,742,309 | | | | — | |
| | | | 242,709,748 | | 03/17/2017 | | USD | | | (236,902,594 | ) | GBP | | | (242,709,748 | ) | | | 5,807,154 | | | | — | |
| | | | 103,609,244 | | 03/17/2017 | | USD | | | (103,712,963 | ) | JPY | | | (103,609,244 | ) | | | — | | | | (103,719 | ) |
| | | | 68,813,593 | | 03/17/2017 | | USD | | | (67,046,041 | ) | MXN | | | (68,813,593 | ) | | | 1,767,552 | | | | — | |
| | | | 5,974,430 | | 03/17/2017 | | USD | | | (6,002,187 | ) | NZD | | | (5,974,430 | ) | | | — | | | | (27,757 | ) |
| Total Sale Contracts | | | | | | | | | | (1,066,261,844 | ) | | | | (1,082,001,024 | ) | | | 15,952,590 | | | | (213,410 | ) |
| Total Forward Currency Contracts | | | | | | | | | $ | (670,835,061 | ) | | | $ | (674,684,940 | ) | | $ | 16,068,522 | | | $ | (12,218,643 | ) |
| Net Unrealized Appreciation | | | | | | | | | | | | | | | | | | $ | 3,849,879 | | | | | |
Currency abbreviations:
(a) Bank of America Merrill Lynch is the counterparty for all open forward currency exchange contracts held by the Fund as of December 31, 2016.
The accompanying notes are an integral part of these consolidated financial statements.
| |
| |
44 | LoCorr Market Trend Fund - Consolidated Schedule of Open Futures Contracts |
| |
LoCorr Market Trend Fund
Consolidated Schedule of Open Futures Contracts
December 31, 2016
| | | | | | | | | | | | | | |
| Description | | Notional Amount | | | Number of Contracts
Purchased (Sold) | | Settlement
Month-Year | | Unrealized Appreciation | | | Unrealized
(Depreciation) | |
| Purchase Contracts: | | | | | | | | | | | | | |
| 10 Yr Mini JGB | | $ | 1,800,145 | | | | 14 | | Mar-17 | | $ | 2,072 | | | $ | — | |
| 90 Day Sterling | | | 9,651,830 | | | | 63 | | Jun-18 | | | 9,042 | | | | — | |
Aluminum (a)(b) | | | 54,168,000 | | | | 1,280 | | Mar-17 | | | — | | | | (665,924 | ) |
Brent Crude(a) | | | 41,876,340 | | | | 737 | | Jan-17 | | | 233,751 | | | | — | |
| CAC 40 10 Euro Index | | | 40,440,536 | | | | 790 | | Jan-17 | | | 780,103 | | | | — | |
| Canadian 10 Yr Bond | | | 68,014,687 | | | | 664 | | Mar-17 | | | — | | | | (847,864 | ) |
Copper (a)(b) | | | 96,858,125 | | | | 700 | | Mar-17 | | | — | | | | (2,349,625 | ) |
Cotton No.2(a) | | | 11,162,700 | | | | 316 | | Mar-17 | | | 123,803 | | | | — | |
| DAX Index | | | 95,342,534 | | | | 316 | | Mar-17 | | | 642,248 | | | | — | |
| Dollar | | | 70,065,910 | | | | 685 | | Mar-17 | | | 375,888 | | | | — | |
| Dow Jones Industrial Average Mini E-Cbot Index | | | 154,703,400 | | | | 1,569 | | Mar-17 | | | 1,426,454 | | | | — | |
| Euro-Bobl | | | 518,495,316 | | | | 3,686 | | Mar-17 | | | 3,222,801 | | | | — | |
| Euro-Bund | | | 109,205,246 | | | | 632 | | Mar-17 | | | — | | | | (76,745 | ) |
| Euro-Schatz | | | 435,694,373 | | | | 3,686 | | Mar-17 | | | 385,578 | | | | — | |
| Euro-Stoxx 50 Index | | | 44,326,670 | | | | 1,285 | | Mar-17 | | | 320,394 | | | | — | |
| FTSE 100 Index | | | 183,934,954 | | | | 2,117 | | Mar-17 | | | 1,803,061 | | | | — | |
Gasoline RBOB(a) | | | 73,195,445 | | | | 1,043 | | Jan-17 | | | 2,898,964 | | | | — | |
Heating Oil (a) | | | 33,606,577 | | | | 463 | | Jan-17 | | | 136,259 | | | | — | |
| Japanese 10 Yr Bond | | | 212,103,529 | | | | 165 | | Mar-17 | | | 9,500 | | | | — | |
| Long Gilt | | | 68,542,629 | | | | 442 | | Mar-17 | | | 1,002,096 | | | | — | |
Low Sulphur Gasoil (a) | | | 13,274,925 | | | | 263 | | Feb-17 | | | 662,242 | | | | — | |
| Nasdaq 100 E-Mini Index | | | 117,806,080 | | | | 1,211 | | Mar-17 | | | — | | | | (1,209,020 | ) |
Natural Gas (a) | | | 49,045,080 | | | | 1,317 | | Jan-17 | | | — | | | | (180,674 | ) |
| Nikkei 225 Index | | | 65,368,984 | | | | 400 | | Mar-17 | | | 1,272,750 | | | | — | |
| Russell 2000 Mini Index | | | 84,331,335 | | | | 1,243 | | Mar-17 | | | — | | | | (1,111,495 | ) |
| S&P500 E-Mini Index | | | 89,448,000 | | | | 800 | | Mar-17 | | | — | | | | (717,990 | ) |
Silver (a) | | | 35,335,690 | | | | 442 | | Mar-17 | | | — | | | | (2,160,875 | ) |
Soybean (a) | | | 46,535,400 | | | | 927 | | Mar-17 | | | — | | | | (2,136,176 | ) |
Soybean Oil(a) | | | 13,808,544 | | | | 664 | | Mar-17 | | | — | | | | (817,238 | ) |
Sugar (a) | | | 19,097,949 | | | | 874 | | May-17 | | | — | | | | (757,411 | ) |
| Tokyo Price Index | | | 87,540,706 | | | | 674 | | Mar-17 | | | 65,082 | | | | — | |
Wti Crude(a) | | | 18,103,640 | | | | 337 | | Jan-17 | | | — | | | | (75,277 | ) |
Zinc (a)(b) | | | 52,767,000 | | | | 820 | | Mar-17 | | | — | | | | (2,656,109 | ) |
| Total Purchase Contracts | | | | | | | | | | | | 15,372,088 | | | | (15,762,423 | ) |
| | | | | | | | | | | | | | | | | | |
| Sale Contracts: | | | | | | | | | | | | | | | | | |
| 3 Mo Euro Euribor | | $ | 925,036,869 | | | | (3,507) | | Jun-18 | | $ | — | | | $ | (2,079 | ) |
| 90 Day Euro | | | 1,725,340,000 | | | | (7,025) | | Jun-18 | | | 2,271,540 | | | | — | |
Aluminum (a)(b) | | | 6,009,263 | | | | (142) | | Mar-17 | | | 112,470 | | | | — | |
| Australian 10 Yr Bond | | | 84,442,027 | | | | (916) | | Mar-17 | | | — | | | | (416,749 | ) |
Cocoa (a) | | | 18,655,789 | | | | (874) | | Mar-17 | | | 2,405,266 | | | | — | |
Coffee (a) | | | 17,885,025 | | | | (348) | | Mar-17 | | | — | | | | (449,525 | ) |
Copper (a)(b) | | | 10,931,131 | | | | (79) | | Mar-17 | | | 386,834 | | | | — | |
Corn (a) | | | 22,052,800 | | | | (1,253) | | Mar-17 | | | 655,050 | | | | — | |
Gold (a) | | | 118,855,440 | | | | (1,032) | | Feb-17 | | | 2,189,552 | | | | — | |
| Hang Seng Index | | | 14,868,850 | | | | (105) | | Jan-17 | | | — | | | | (160,479 | ) |
Hard Red Wheat(a) | | | 14,103,450 | | | | (674) | | Mar-17 | | | 305,940 | | | | — | |
Soybean Meal (a) | | | 16,684,820 | | | | (527) | | Mar-17 | | | — | | | | (83,088 | ) |
| U.S. 10 Yr Note | | | 113,841,625 | | | | (916) | | Mar-17 | | | — | | | | (86,612 | ) |
| U.S. 2 Yr Note | | | 808,027,688 | | | | (3,729) | | Mar-17 | | | 335,822 | | | | — | |
| U.S. 5 Yr Note | | | 353,227,517 | | | | (3,002) | | Mar-17 | | | 738,409 | | | | — | |
| U.S. Long Bond | | | 127,003,219 | | | | (843) | | Mar-17 | | | 572,480 | | | | — | |
Wheat (a) | | | 18,482,400 | | | | (906) | | Mar-17 | | | 831,539 | | | | — | |
Zinc (a)(b) | | | 7,335,900 | | | | (114) | | Mar-17 | | | 311,721 | | | | — | |
| Total Sale Contracts | | | | | | | | | | | | 11,116,623 | | | | (1,198,532 | ) |
| Total Futures Contracts | | | | | | | | | | | $ | 26,488,711 | | | $ | (16,960,955 | ) |
| Net Unrealized Appreciation | | | | | | | | | | | $ | 9,527,756 | | | | | |
(a) Contract held by LCMT Fund Limited.
(b) London Metal Exchange (“LME”) futures contracts settle on their respective maturity date. The unrealized appreciation on these contracts is a receivable for unsettled open futures contracts and the unrealized depreciation is a payable for unsettled open futures contracts on the Fund’s consolidated statement of assets and liabilities. See Notes 2 and 3.
The accompanying notes are an integral part of these consolidated financial statements.
| |
| |
LoCorr Long/Short Equity Fund - Schedule of Investments | 45 |
| |
LoCorr Long/Short Equity Fund
Composition of Investment Portfolio1 December 31, 2016 (Unaudited) | Composition of Common Stock Portfolio1 December 31, 2016 (Unaudited) |
| |
| |
1As a percentage of total investments. | 1As a percentage of total common stocks. |
Schedule of Investments
December 31, 2016
| | | Shares | | | Value | |
| COMMON STOCKS: 58.71% | | | | | | |
| Accommodation and Food Services: 1.77% | | | | | | |
Dave & Buster’s Entertainment, Inc.(a) | | | 12,696 | | | $ | 714,785 | |
Pinnacle Entertainment, Inc.(a) | | | 53,734 | | | | 779,143 | |
| | | | | | | | 1,493,928 | |
| Arts, Entertainment, and Recreation: 0.78% | | | | | | | | |
| Six Flags Entertainment Corp. | | | 10,983 | | | | 658,541 | |
| | | | | | | | | |
| Construction: 3.41% | | | | | | | | |
MasTec, Inc. (a) | | | 75,075 | | | | 2,871,619 | |
| | | | | | | | | |
| Finance and Insurance: 12.46% | | | | | | | | |
Allied World Assurance Co. Holdings AG(b) | | | 20,294 | | | | 1,089,991 | |
| Comerica, Inc. | | | 13,047 | | | | 888,631 | |
Credit Acceptance Corp. (a) | | | 20,755 | | | | 4,514,420 | |
| JPMorgan Chase & Co. | | | 14,767 | | | | 1,274,244 | |
Match Group, Inc. (a) | | | 69,599 | | | | 1,190,143 | |
| Wells Fargo & Co. | | | 17,699 | | | | 975,392 | |
| Zions Bancorporation | | | 13,252 | | | | 570,366 | |
| | | | | | | | 10,503,187 | |
| Information: 11.56% | | | | | | | | |
| CDK Global, Inc. | | | 21,401 | | | | 1,277,426 | |
Cincinnati Bell, Inc.(a) | | | 20,799 | | | | 464,853 | |
Facebook, Inc. (a) | | | 1,685 | | | | 193,859 | |
Five9, Inc. (a) | | | 92,587 | | | | 1,313,809 | |
Liberty Global Plc LiLAC (a)(b) | | | 18,430 | | | | 390,163 | |
Lumos Networks Corp. (a) | | | 21,148 | | | | 330,332 | |
Madison Square Garden Co./The (a) | | | 7,165 | | | | 1,228,869 | |
| Mentor Graphics Corp. | | | 19,998 | | | | 737,726 | |
| Nexstar Broadcasting Group, Inc. | | | 29,534 | | | | 1,869,502 | |
| Sinclair Broadcast Group, Inc. | | | 9,136 | | | | 304,686 | |
Take-Two Interactive Software, Inc. (a) | | | 4,258 | | | | 209,877 | |
Zayo Group Holdings, Inc.(a) | | | 43,145 | | | | 1,417,745 | |
| | | | | | | | 9,738,847 | |
The accompanying notes are an integral part of these financial statements.
| |
| |
46 | LoCorr Long/Short Equity Fund - Schedule of Investments (continued) |
| |
| | | | | | | Shares | | | Value | |
COMMON STOCKS (continued) | | | | | | | | | | |
| Information Technology: 0.72% | | | | | | | | | | |
Mixi, Inc. (b) | | | | | | | 16,520 | | | $ | 603,554 | |
| | | | | | | | | | | | | |
| Manufacturing: 14.04% | | | | | | | | | | | | |
Ambarella, Inc.(a)(b) | | | | | | | 1,811 | | | | 98,029 | |
Applied Micro Circuits Corp. (a) | | | | | | | 15,700 | | | | 129,525 | |
Axcelis Technologies, Inc. (a) | | | | | | | 30,515 | | | | 443,993 | |
Commercial Vehicle Group, Inc. (a) | | | | | | | 39,314 | | | | 217,406 | |
Durect Corp. (a) | | | | | | | 80,353 | | | | 107,673 | |
Exar Corp. (a) | | | | | | | 60,774 | | | | 655,144 | |
Gogo, Inc.(a) | | | | | | | 374,471 | | | | 3,452,623 | |
Harmonic, Inc. (a) | | | | | | | 99,096 | | | | 495,480 | |
NCR Corp. (a) | | | | | | | 22,494 | | | | 912,357 | |
Tenneco, Inc. (a) | | | | | | | 59,979 | | | | 3,746,888 | |
Tesla Motors, Inc. (a) | | | | | | | 921 | | | | 196,809 | |
TimkenSteel Corp. (a) | | | | | | | 30,011 | | | | 464,570 | |
Zynga, Inc. (a) | | | | | | | 356,927 | | | | 917,302 | |
| | | | | | | | | | | | 11,837,799 | |
| Mining, Quarrying, and Oil and Gas Extraction: 2.70% | | | | | | | | | | | | |
Gran Tierra Energy, Inc. (a) | | | | | | | 191,594 | | | | 578,614 | |
Halcon Resources Corp. (a) | | | | | | | 143,933 | | | | 1,344,334 | |
Ultra Petroleum Corp. (a)(b) | | | | | | | 48,550 | | | | 351,017 | |
| | | | | | | | | | | | 2,273,965 | |
| Other Services (except Public Administration): 0.91% | | | | | | | | | | | | |
XO Group, Inc. (a) | | | | | | | 39,425 | | | | 766,816 | |
| | | | | | | | | | | | | |
| Real Estate and Rental and Leasing: 1.51% | | | | | | | | | | | | |
| H&E Equipment Services, Inc. | | | | | | | 11,132 | | | | 258,819 | |
United Rentals, Inc. (a) | | | | | | | 9,583 | | | | 1,011,773 | |
| | | | | | | | | | | | 1,270,592 | |
| Retail Trade: 8.49% | | | | | | | | | | | | |
MobileIron, Inc.(a) | | | | | | | 42,650 | | | | 159,937 | |
Signet Jewelers Ltd (b) | | | | | | | 35,288 | | | | 3,326,247 | |
Stamps.com, Inc. (a) | | | | | | | 1,815 | | | | 208,090 | |
| Tailored Brands, Inc. | | | | | | | 135,461 | | | | 3,461,029 | |
| | | | | | | | | | | | 7,155,303 | |
| Utilities: 0.25% | | | | | | | | | | | | |
Calpine Corp. (a) | | | | | | | 18,065 | | | | 206,483 | |
| | | | | | | | | | | | | |
| Wholesale Trade: 0.11% | | | | | | | | | | | | |
SunOpta, Inc. (a)(b) | | | | | | | 13,724 | | | | 96,754 | |
| TOTAL COMMON STOCKS (Cost $42,223,061) | | | | | | | | | | | 49,477,388 | |
| | | | | | | | | | | | | |
| SHORT TERM INVESTMENTS: 37.36% | | | | | | | | | | | | |
| U.S. TREASURY BILL: 7.07% | Maturity Date | | Coupon | | | Principal Amount | | | | | |
United States Treasury Bill (c) | 11/09/2017 | | | 0.79%(d) | | | | $ 6,000,000 | | | | 5,958,834 | |
| TOTAL U.S. TREASURY BILL (Cost $5,961,000) | | | | | | | | | | | | 5,958,834 | |
| | | | | | | | | | | | | | |
| MONEY MARKET FUND: 30.29% | | | | | | | Shares | | | | | |
STIT-Government & Agency Portfolio, Institutional Class, 0.43% (e) | | | | | | | | 25,529,082 | | | | 25,529,082 | |
| TOTAL MONEY MARKET FUND (Cost $25,529,082) | | | | | | | | | | | | 25,529,082 | |
| TOTAL SHORT TERM INVESTMENTS (Cost $31,490,082) | | | | | | | | | | | | 31,487,916 | |
| | | | | | | | | | | | | | |
| TOTAL INVESTMENTS (Cost $73,713,143): 96.07% | | | | | | | | | | | | 80,965,304 | |
Other Assets in Excess of Liabilities: 3.93% (f) | | | | | | | | | | | | 3,311,453 | |
| TOTAL NET ASSETS: 100.00% | | | | | | | | | | | $ | 84,276,757 | |
(a) Non-dividend income producing security.
(b) Foreign issued security.
(c) This security or a portion of this security is pledged to cover short positions. See Note 2.
(d) Effective yield as of December 31, 2016.
(e) The rate quoted is the annualized seven-day effective yield as of December 31, 2016.
(f) Includes assets pledged as collateral for securities sold short.
The accompanying notes are an integral part of these financial statements.
| |
| |
LoCorr Long/Short Equity Fund - Schedule of Securities Sold Short | 47 |
| |
Schedule of Securities Sold Short
December 31, 2016
| | | Shares | | | Value | |
| COMMON STOCKS: (19.43)% | | | | | | |
| Administrative and Support and Waste Management and Remediation Services: (0.64)% | | | | | | |
Criteo SA - ADR (a)(b) | | | (13,059 | ) | | $ | (536,464 | ) |
| | | | | | | | | |
| Construction: (0.75)% | | | | | | | | |
NVR, Inc. (a) | | | (259 | ) | | | (432,271 | ) |
Quanta Services, Inc. (a) | | | (5,792 | ) | | | (201,851 | ) |
| | | | | | | | (634,122 | ) |
| Finance and Insurance: (0.24)% | | | | | | | | |
| Goldman Sachs Group, Inc./The | | | (422 | ) | | | (101,048 | ) |
Texas Capital Bancshares, Inc.(a) | | | (1,265 | ) | | | (99,176 | ) |
| | | | | | | | (200,224 | ) |
| Information: (3.58)% | | | | | | | | |
| Argan, Inc. | | | (6,845 | ) | | | (482,915 | ) |
Aspen Technology, Inc. (a) | | | (1,855 | ) | | | (101,431 | ) |
| Blackbaud, Inc. | | | (7,475 | ) | | | (478,400 | ) |
Electronic Arts, Inc.(a) | | | (10,218 | ) | | | (804,770 | ) |
Gogo, Inc.(a) | | | (18,354 | ) | | | (169,224 | ) |
Manhattan Associates, Inc.(a) | | | (9,186 | ) | | | (487,133 | ) |
MSG Networks, Inc.(a) | | | (9,439 | ) | | | (202,938 | ) |
Palo Alto Networks, Inc. (a) | | | (2,291 | ) | | | (286,490 | ) |
| | | | | | | | (3,013,301 | ) |
| Management of Companies and Enterprises (0.12%) | | | | | | | | |
| Cullen/Frost Bankers, Inc. | | | (1,139 | ) | | | (100,494 | ) |
| | | | | | | | | |
| Manufacturing: (7.41)% | | | | | | | | |
| Aceto Corp. | | | (14,157 | ) | | | (311,029 | ) |
Advanced Micro Devices, Inc.(a) | | | (8,705 | ) | | | (98,715 | ) |
| Applied Materials, Inc. | | | (3,056 | ) | | | (98,617 | ) |
Cirrus Logic, Inc. (a) | | | (1,729 | ) | | | (97,758 | ) |
| Cognex Corp. | | | (1,581 | ) | | | (100,583 | ) |
| Energizer Holdings, Inc. | | | (8,446 | ) | | | (376,776 | ) |
Finisar Corp. (a) | | | (3,268 | ) | | | (98,922 | ) |
| Illinois Tool Works, Inc. | | | (4,007 | ) | | | (490,697 | ) |
Inphi Corp. (a) | | | (2,193 | ) | | | (97,852 | ) |
iRobot Corp. (a) | | | (8,463 | ) | | | (494,662 | ) |
| Lincoln Electric Holdings, Inc. | | | (1,307 | ) | | | (100,208 | ) |
| Methode Electronics, Inc. | | | (4,719 | ) | | | (195,131 | ) |
NETGEAR, Inc. (a) | | | (5,434 | ) | | | (295,338 | ) |
| NVIDIA Corp. | | | (906 | ) | | | (96,706 | ) |
Orthofix International NV (a)(b) | | | (8,477 | ) | | | (306,698 | ) |
| Owens Corning | | | (29,408 | ) | | | (1,516,276 | ) |
| ResMed, Inc. | | | (2,235 | ) | | | (138,682 | ) |
TASER International, Inc.(a) | | | (79 | ) | | | (1,915 | ) |
Trimble, Inc. (a) | | | (3,331 | ) | | | (100,430 | ) |
Universal Electronics, Inc. (a) | | | (10,218 | ) | | | (659,572 | ) |
ViaSat, Inc.(a) | | | (8,638 | ) | | | (572,008 | ) |
| | | | | | | | (6,248,575 | ) |
| Mining, Quarrying, and Oil and Gas Extraction: (1.22)% | | | | | | | | |
Clayton Williams Energy, Inc. (a) | | | (864 | ) | | | (103,041 | ) |
Cliffs Natural Resources, Inc. (a) | | | (21,128 | ) | | | (177,686 | ) |
| EOG Resources, Inc. | | | (3,672 | ) | | | (371,239 | ) |
Freeport-McMoRan, Inc. (a) | | | (14,029 | ) | | | (185,043 | ) |
| Patterson-UTI Energy, Inc. | | | (6,970 | ) | | | (187,632 | ) |
| | | | | | | | (1,024,641 | ) |
| Other Services (except Public Administration): (1.46)% | | | | | | | | |
Regis Corp. (a) | | | (84,506 | ) | | | (1,227,027 | ) |
The accompanying notes are an integral part of these financial statements.
| |
| |
48 | LoCorr Long/Short Equity Fund - Schedule of Securities Sold Short (continued) |
| |
| | | Shares | | | Value | |
COMMON STOCKS (continued) | | | | | | |
| Professional, Scientific, and Technical Services: (0.89)% | | | | | | |
| Computer Sciences Corp. | | | (1,686 | ) | | $ | (100,182 | ) |
F5 Networks, Inc.(a) | | | (696 | ) | | | (100,725 | ) |
LivePerson, Inc. (a) | | | (46,444 | ) | | | (350,652 | ) |
Verint Systems, Inc. (a) | | | (5,581 | ) | | | (196,731 | ) |
| | | | | | | | (748,290 | ) |
| Real Estate and Rental and Leasing: (0.52)% | | | | | | | | |
Avis Budget Group, Inc. (a) | | | (5,286 | ) | | | (193,890 | ) |
United Rentals, Inc. (a) | | | (2,345 | ) | | | (247,585 | ) |
| | | | | | | | (441,475 | ) |
| Retail Trade: (2.08)% | | | | | | | | |
| Dillard’s, Inc. | | | (5,520 | ) | | | (346,049 | ) |
| GameStop Corp. | | | (23,617 | ) | | | (596,565 | ) |
GrubHub, Inc. (a) | | | (13,342 | ) | | | (501,926 | ) |
| MSC Industrial Direct Co., Inc. | | | (1,076 | ) | | | (99,412 | ) |
Party City Holdco, Inc. (a) | | | (14,992 | ) | | | (212,886 | ) |
| | | | | | | | (1,756,838 | ) |
| Transportation and Warehousing: (0.12)% | | | | | | | | |
| Landstar System, Inc. | | | (1,202 | ) | | | (102,531 | ) |
| | | | | | | | | |
| Wholesale Trade: (0.40)% | | | | | | | | |
| Rockwell Automation, Inc. | | | (759 | ) | | | (102,010 | ) |
New Relic, Inc. (a) | | | (8,446 | ) | | | (238,600 | ) |
| | | | | | | | (340,610 | ) |
| TOTAL COMMON STOCKS (Proceeds $16,803,437) | | | | | | | (16,374,592 | ) |
| | | | | | | | | |
| EXCHANGE TRADED FUNDS: (3.37)% | | | | | | | | |
CurrencyShares Japanese Yen Trust (a) | | | (7,740 | ) | | | (638,705 | ) |
| iShares PHLX Semiconductor | | | (1,602 | ) | | | (196,597 | ) |
| iShares Russell 2000 Value | | | (5,062 | ) | | | (602,074 | ) |
| SPDR S&P Bank | | | (13,853 | ) | | | (602,190 | ) |
| SPDR S&P Regional Banking | | | (14,450 | ) | | | (802,987 | ) |
| TOTAL EXCHANGE TRADED FUNDS (Proceeds $2,883,723) | | | | | | | (2,842,553 | ) |
| TOTAL SECURITIES SOLD SHORT (Proceeds $19,687,160): (22.80)% | | | | | | $ | (19,217,145 | ) |
ADR American Depository Receipt
(a) Non-dividend expense producing security.
(b) Foreign issued security.
Percentages are stated as a percent of net assets.
The accompanying notes are an integral part of these financial statements.
| |
| |
LoCorr Spectrum Income Fund - Schedule of Investments | 49 |
| |
| |
LoCorr Spectrum Income Fund
Composition of Investment Portfolio1
December 31, 2016 (Unaudited)
1 As a percentage of total investments.
Schedule of Investments
December 31, 2016
| | | Shares | | | Value | |
| BUSINESS DEVELOPMENT COMPANIES: 6.17% | | | | | | |
| Ares Capital Corp. | | | 185,520 | | | $ | 3,059,225 | |
| Hercules Capital, Inc. | | | 154,725 | | | | 2,183,170 | |
| Prospect Capital Corp. | | | 153,195 | | | | 1,279,178 | |
| TOTAL BUSINESS DEVELOPMENT COMPANIES (Cost $6,210,679) | | | | | | | 6,521,573 | |
| | | | | | | | | |
| CLOSED-END INVESTMENT COMPANIES: 11.73% | | | | | | | | |
| AllianzGI Convertible & Income Fund II | | | 365,716 | | | | 2,088,238 | |
| Invesco Dynamic Credit Opportunities Fund | | | 241,298 | | | | 2,967,965 | |
| Invesco Senior Income Trust | | | 474,013 | | | | 2,199,420 | |
| Nuveen Credit Strategies Income Fund | | | 240,992 | | | | 2,132,779 | |
| Nuveen Quality Preferred Income Fund 2 | | | 109,840 | | | | 1,022,610 | |
| Western Asset Global High Income Fund, Inc. | | | 202,931 | | | | 1,994,813 | |
| TOTAL CLOSED-END INVESTMENT COMPANIES (Cost $11,719,347) | | | | | | | 12,405,825 | |
| | | | | | | | | |
| COMMON STOCKS: 17.71% | | | | | | | | |
| Finance and Insurance: 4.20% | | | | | | | | |
| Apollo Global Management LLC | | | 128,381 | | | | 2,485,456 | |
| Artisan Partners Asset Management, Inc. | | | 65,796 | | | | 1,957,431 | |
| | | | | | | | 4,442,887 | |
| Information: 1.72% | | | | | | | | |
| Frontier Communications Corp. | | | 537,437 | | | | 1,816,537 | |
| | | | | | | | | |
| Manufacturing: 0.81% | | | | | | | | |
| BP Prudhoe Bay Royalty Trust | | | 36,097 | | | | 857,304 | |
| | | | | | | | | |
| Mining, Quarrying, and Oil and Gas Extraction: 1.84% | | | | | | | | |
| EnLink Midstream LLC | | | 51,596 | | | | 982,904 | |
Seadrill Partners LLC (a) | | | 228,650 | | | | 960,330 | |
| | | | | | | | 1,943,234 | |
| Transportation and Warehousing: 9.14% | | | | | | | | |
DHT Holdings, Inc. (a) | | | 163,548 | | | | 677,089 | |
Euronav NV (a) | | | 89,061 | | | | 708,035 | |
| Fortress Transportation & Infrastructure Investors LLC | | | 143,253 | | | | 1,905,265 | |
GasLog Partners LP (a) | | | 49,593 | | | | 1,019,136 | |
Golar LNG Partners LP (a) | | | 57,221 | | | | 1,375,593 | |
Scorpio Tankers, Inc. (a) | | | 438,607 | | | | 1,986,889 | |
The accompanying notes are an integral part of these financial statements.
| |
| |
50 | LoCorr Spectrum Income Fund - Schedule of Investments (continued) |
| |
| |
| | | Shares | | | Value | |
COMMON STOCKS(continued) | | | | | | |
Transportation and Warehousing(continued) | | | | | | |
Ship Finance International Ltd. (a) | | | 134,875 | | | $ | 2,002,894 | |
| | | | | | | | 9,674,901 | |
| TOTAL COMMON STOCKS (Cost $19,813,701) | | | | | | | 18,734,863 | |
| | | | | | | | | |
| CONVERTIBLE PREFERRED STOCK: 4.71% | | | | | | | | |
| Kinder Morgan, Inc. | | | 102,312 | | | | 4,977,479 | |
| TOTAL CONVERTIBLE PREFERRED STOCK (Cost $4,359,992) | | | | | | | 4,977,479 | |
| | | Units | | | | | |
| MASTER LIMITED PARTNERSHIPS: 21.32% | | | | | | | | |
| Arts, Entertainment, and Recreation: 1.98% | | | | | | | | |
| Cedar Fair LP | | | 32,607 | | | | 2,093,369 | |
| | | | | | | | | |
| Manufacturing: 3.38% | | | | | | | | |
| CVR Partners LP | | | 349,326 | | | | 2,099,449 | |
| Terra Nitrogen Co. LP | | | 14,336 | | | | 1,472,451 | |
| | | | | | | | 3,571,900 | |
| Mining, Quarrying, and Oil and Gas Extraction: 3.02% | | | | | | | | |
| Enterprise Products Partners LP | | | 75,788 | | | | 2,049,307 | |
| SunCoke Energy Partners LP | | | 59,651 | | | | 1,148,282 | |
| | | | | | | | 3,197,589 | |
| Other Services (except Public Administration): 2.38% | | | | | | | | |
| StoneMor Partners LP | | | 282,472 | | | | 2,516,825 | |
| | | | | | | | | |
| Retail Trade: 6.52% | | | | | | | | |
| Crestwood Equity Partners LP | | | 129,417 | | | | 3,306,605 | |
| Global Partners LP | | | 184,385 | | | | 3,586,288 | |
| | | | | | | | 6,892,893 | |
| Transportation and Warehousing: 3.12% | | | | | | | | |
| Energy Transfer Partners LP | | | 55,002 | | | | 1,969,621 | |
| Summit Midstream Partners LP | | | 14,532 | | | | 365,480 | |
| Targa Resources Corp. | | | 17,315 | | | | 970,852 | |
| | | | | | | | 3,305,953 | |
| Wholesale Trade: 0.92% | | | | | | | | |
| Martin Midstream Partners LP | | | 52,879 | | | | 970,330 | |
| TOTAL MASTER LIMITED PARTNERSHIPS (Cost $23,527,095) | | | | | | | 22,548,859 | |
| | | | | | | | | |
| PUBLICLY TRADED PARTNERSHIPS: 7.22% | | | | | | | | |
| AllianceBernstein Holding LP | | | 76,017 | | | | 1,782,599 | |
| Blackstone Group LP/The | | | 148,835 | | | | 4,023,010 | |
| Carlyle Group LP/The | | | 119,616 | | | | 1,824,144 | |
| TOTAL PUBLICLY TRADED PARTNERSHIPS (Cost $7,434,932) | | | | | | | 7,629,753 | |
| | | Shares | | | | | |
| REAL ESTATE INVESTMENT TRUSTS: 23.21% | | | | | | | | |
| Annaly Capital Management, Inc. | | | 289,703 | | | | 2,888,339 | |
| Apollo Commercial Real Estate Finance, Inc. | | | 267,148 | | | | 4,440,000 | |
| Care Capital Properties, Inc. | | | 68,957 | | | | 1,723,925 | |
| Communications Sales & Leasing, Inc. | | | 80,298 | | | | 2,040,372 | |
| Digital Realty Trust, Inc. | | | 71,374 | | | | 1,937,804 | |
| Hospitality Properties Trust | | | 95,300 | | | | 3,024,822 | |
| Ladder Capital Corp. | | | 140,196 | | | | 1,923,489 | |
| LaSalle Hotel Properties | | | 32,654 | | | | 994,967 | |
| Starwood Property Trust, Inc. | | | 132,646 | | | | 2,911,580 | |
| Two Harbors Investment Corp. | | | 110,656 | | | | 964,920 | |
| Washington Prime Group, Inc. | | | 163,679 | | | | 1,703,899 | |
| TOTAL REAL ESTATE INVESTMENT TRUSTS (Cost $24,971,866) | | | | | | | 24,554,117 | |
| | | | | | | | | |
| SHORT TERM INVESTMENT: 7.43% | | | | | | | | |
| MONEY MARKET FUND: 7.43% | | | | | | | | |
STIT-Government & Agency Portfolio, Institutional Class, 0.43% (b) | | | 7,862,730 | | | | 7,862,730 | |
| TOTAL MONEY MARKET FUND (Cost $7,862,730) | | | | | | | 7,862,730 | |
| TOTAL SHORT TERM INVESTMENT (Cost $7,862,730) | | | | | | | | |
| | | | | | | | | |
| TOTAL INVESTMENTS (Cost $105,900,342): 99.50% | | | | | | | 105,235,199 | |
| Other Assets in Excess of Liabilities: 0.50% | | | | | | | 533,203 | |
| TOTAL NET ASSETS: 100.00% | | | | | | $ | 105,768,402 | |
| (a) | Foreign issued security. |
| (b) | The rate quoted is the annualized seven-day effective yield as of December 31, 2016. |
With the exception of short-term investments, all securities held are dividend income producing.
The accompanying notes are an integral part of these financial statements.
| | |
| LoCorr Managed Futures Strategy Fund, LoCorr Long/Short Commodities Strategy Fund, LoCorr Multi-Strategy Fund | | 51 |
| and LoCorr Market Trend Fund - Consolidated Statements of Assets & Liabilities |
| | |
Consolidated Statements of Assets & Liabilities
December 31, 2016
| | | LoCorr
Managed
Futures
Strategy Fund | | | LoCorr
Long/Short
Commodities
Strategy Fund | | | LoCorr
Multi-Strategy
Fund | | | LoCorr
Market
Trend Fund | |
| Assets | | | | | | | | | | | | |
| Investments, at value (Cost $792,214,600, $106,280,711,$32,307,179 and $862,859,636, respectively) | | $ | 787,447,647 | | | $ | 105,780,451 | | | $ | 34,411,006 | | | $ | 860,056,594 | |
| Cash (Note 2) | | | 11,328,877 | | | | — | | | | — | | | | 59,396,719 | |
| Foreign currency, at value (Cost $13,355,100, $0, $0 and $440,588, respectively) | | | 13,338,710 | | | | — | | | | — | | | | 440,588 | |
| Receivable for Fund shares sold | | | 4,103,035 | | | | 853,575 | | | | 575,137 | | | | 8,215,618 | |
| Receivable for securities sold | | | 14,690,300 | | | | 1,114,437 | | | | — | | | | — | |
| Dividend and interest receivable | | | 3,637,892 | | | | 493,632 | | | | 112,122 | | | | 2,197,695 | |
| Receivable for unsettled open futures contracts | | | 314,082 | | | | — | | | | — | | | | 811,025 | |
| Deposits with broker for derivative instruments (Note 2) | | | 64,402,880 | | | | 25,131,441 | | | | 8,189,500 | | | | 125,642,967 | |
| Deposits with broker for securities sold short (Note 2) | | | — | | | | — | | | | 1,410,784 | | | | — | |
| Unrealized appreciation on forward currency contracts (Note 2) | | | 7,670,810 | | | | — | | | | — | | | | 16,068,522 | |
| Advance receipt on swap contracts | | | — | | | | 12,427,453 | | | | — | | | | — | |
| Prepaid expenses and other assets | | | 52,509 | | | | 46,805 | | | | 3,567 | | | | 56,168 | |
| Total Assets | | | 906,986,742 | | | | 145,847,794 | | | | 44,702,116 | | | | 1,072,885,896 | |
| | | | | | | | | | | | | | | | | |
| Liabilities | | | | | | | | | | | | | | | | |
| Securities sold short, at value (Proceeds $0, $0, $933,409 and $0, respectively) | | $ | — | | | $ | — | | | $ | 924,624 | | | $ | — | |
| Payable for Fund shares redeemed | | | 1,613,880 | | | | 2,001,298 | | | | 40,959 | | | | 25,711,042 | |
| Payable for securities purchased | | | 12,028,148 | | | | 1,002,236 | | | | — | | | | — | |
| Payable for distributions | | | — | | | | — | | | | 14,632 | | | | 260 | |
| Payable for unsettled open futures contracts | | | 1,465,524 | | | | — | | | | — | | | | 5,671,658 | |
| Payable for variation margin on futures contracts | | | 2,540,395 | | | | — | | | | — | | | | 6,389,312 | |
| Payable to custodian | | | — | | | | 9,967 | | | | — | | | | — | |
| Dividend payable | | | — | | | | — | | | | 1,985 | | | | — | |
| Accrued management fees (Note 5) | | | 1,317,874 | | | | 167,754 | | | | 37,587 | | | | 1,399,002 | |
| Accrued Trustees’ fees | | | 13,708 | | | | 2,494 | | | | 622 | | | | 19,835 | |
| Accrued Rule 12b-1 fees | | | 113,104 | | | | 100,143 | | | | 18,181 | | | | 354,701 | |
| Unrealized depreciation on swap contracts (Note 1) | | | — | | | | 18,990,950 | | | | 3,704,355 | | | | — | |
| Unrealized depreciation on forward currency contracts (Note 2) | | | 4,814,180 | | | | — | | | | — | | | | 12,218,643 | |
| Advance payment on swap contracts | | | — | | | | — | | | | 564,864 | | | | — | |
| Accrued expenses and other liabilities | | | 419,657 | | | | 125,557 | | | | 61,077 | | | | 676,512 | |
| Total Liabilities | | | 24,326,470 | | | | 22,400,399 | | | | 5,368,886 | | | | 52,440,965 | |
| | | | | | | | | | | | | | | | | |
| Net Assets | | $ | 882,660,272 | | | $ | 123,447,395 | | | $ | 39,333,230 | | | $ | 1,020,444,931 | |
| | | | | | | | | | | | | | | | | |
| Net Assets Consist of: | | | | | | | | | | | | | | | | |
| Paid-in capital | | $ | 869,112,171 | | | $ | 143,233,832 | | | $ | 41,695,102 | | | $ | 1,054,833,787 | |
| Accumulated net investment income (loss) | | | — | | | | 16,545 | | | | (149,940 | ) | | | (430,397 | ) |
| Accumulated net realized gain (loss) | | | 10,069,884 | | | | (311,772 | ) | | | (620,189 | ) | | | (44,533,052 | ) |
| Net unrealized appreciation (depreciation) of: | | | | | | | | | | | | | | | | |
| Investments | | | (4,766,953 | ) | | | (500,260 | ) | | | 2,103,827 | | | | (2,803,042 | ) |
| Securities sold short | | | — | | | | — | | | | 8,785 | | | | — | |
| Swap contracts | | | — | | | | (18,990,950 | ) | | | (3,704,355 | ) | | | — | |
| Forward currency contracts | | | 2,856,630 | | | | — | | | | — | | | | 3,849,879 | |
| Futures contracts | | | 5,404,930 | | | | — | | | | — | | | | 9,527,756 | |
| Foreign currency translation | | | (16,390 | ) | | | — | | | | — | | | | — | |
| NET ASSETS | | $ | 882,660,272 | | | $ | 123,447,395 | | | $ | 39,333,230 | | | $ | 1,020,444,931 | |
| | | | | | | | | | | | | | | | | |
| Class A Shares | | | | | | | | | | | | | | | | |
| Net assets | | $ | 297,844,244 | | | $ | 34,860,291 | | | $ | 17,148,668 | | | $ | 133,145,534 | |
| Shares issued and outstanding (unlimited shares authorized, no par value) | | | 33,412,218 | | | | 3,800,744 | | | | 2,105,165 | | | | 12,505,112 | |
Net asset value, redemption, and minimum offering price per share (a)(b) | | | $8.91 | | | | $9.17 | | | | $8.15 | | | | $10.65 | |
| Maximum offering price per share | | | | | | | | | | | | | | | | |
($8.91/0.9425), ($9.17/0.9425) ($8.15/0.9425) ($10.65/0.9425) (c) | | | $9.45 | | | | $9.73 | | | | $8.65 | | | | $11.30 | |
| | | | | | | | | | | | | | | | | |
| Class C Shares | | | | | | | | | | | | | | | | |
| Net assets | | $ | 113,813,897 | | | $ | 7,382,944 | | | $ | 3,899,408 | | | $ | 89,454,344 | |
| Shares issued and outstanding (unlimited shares authorized, no par value) | | | 13,210,934 | | | | 824,453 | | | | 478,190 | | | | 8,493,445 | |
Net asset value, redemption, and offering price per share (a)(b) | | | $8.62 | | | | $8.95 | | | | $8.15 | | | | $10.53 | |
| | | | | | | | | | | | | | | | | |
| Class I Shares | | | | | | | | | | | | | | | | |
| Net assets | | $ | 471,002,131 | | | $ | 81,204,160 | | | $ | 18,285,154 | | | $ | 797,845,053 | |
| Shares issued and outstanding (unlimited shares authorized, no par value) | | | 52,255,421 | | | | 8,789,574 | | | | 2,247,664 | | | | 74,717,153 | |
Net asset value, redemption, and offering price per share (b) | | | $9.01 | | | | $9.24 | | | | $8.14 | | | | $10.68 | |
| (a) | A 1.00% contingent deferred sales charge may apply to redemptions made within twelve months of purchase. |
The contingent deferred sales charge only applies to Class A share purchases of $1 million or more.
| (b) | Redemptions made within 30 days of purchase may be assessed a redemption fee of 1.00%. |
| (c) | On investments of $25,000 or more, the offering price is reduced. |
The accompanying notes are an integral part of these consolidated financial statements.
| |
| |
52 | LoCorr Long/Short Equity Fund and LoCorr Spectrum Income Fund - Statements of Assets & Liabilities |
| |
Statements of Assets & Liabilities
December 31, 2016
| | | LoCorr | | | LoCorr | |
| | | Long/Short | | | Spectrum | |
| | | Equity Fund | | | Income Fund | |
| | | | | | | |
| Assets | | | | | | |
| Investments, at value (Cost $73,713,143 and $105,900,342, respectively) | | $ | 80,965,304 | | | $ | 105,235,199 | |
| Cash (Note 2) | | | 2,100,000 | | | | — | |
| Receivable for Fund shares sold | | | 602,879 | | | | 1,040,179 | |
| Receivable for securities sold | | | 7,164,655 | | | | — | |
| Dividend and interest receivable | | | 11,928 | | | | 515,708 | |
| Deposits with broker for securities sold short (Note 2) | | | 18,028,992 | | | | — | |
| Prepaid expenses and other assets | | | 11,623 | | | | 26,277 | |
| Total Assets | | | 108,885,381 | | | | 106,817,363 | |
| | | | | | | | | |
| Liabilities | | | | | | | | |
| Securities sold short, at value (Proceeds $19,687,160 and $0, respectively) | | $ | 19,217,145 | | | $ | — | |
| Payable for Fund shares redeemed | | | 80,144 | | | | 518,107 | |
| Payable for securities purchased | | | 5,048,328 | | | | — | |
| Payable for distributions | | | — | | | | 207,536 | |
| Payable to custodian | | | — | | | | 27,081 | |
| Accrued management fees (Note 5) | | | 153,305 | | | | 114,605 | |
| Accrued Trustees’ fees | | | 1,249 | | | | 1,759 | |
| Accrued Rule 12b-1 fees | | | 30,238 | | | | 84,318 | |
| Accrued expenses and other liabilities | | | 78,215 | | | | 95,555 | |
| Total Liabilities | | | 24,608,624 | | | | 1,048,961 | |
| | | | | | | | | |
| Net Assets | | $ | 84,276,757 | | | $ | 105,768,402 | |
| | | | | | | | | |
| Net Assets Consist of: | | | | | | | | |
| Paid-in capital | | $ | 75,838,615 | | | $ | 130,920,636 | |
| Accumulated net investment loss | | | — | | | | (1,508,340 | ) |
| Accumulated net realized gain (loss) | | | 715,966 | | | | (22,978,751 | ) |
| Net unrealized appreciation (depreciation) of: | | | | | | | | |
| Investments | | | 7,252,161 | | | | (665,143 | ) |
| Securities sold short | | | 470,015 | | | | — | |
| NET ASSETS | | $ | 84,276,757 | | | $ | 105,768,402 | |
| | | | | | | | | |
| Class A Shares | | | | | | | | |
| Net assets | | $ | 28,242,755 | | | $ | 33,032,467 | |
| Shares issued and outstanding (unlimited shares authorized, no par value) | | | 2,342,008 | | | | 4,291,419 | |
Net asset value, redemption, and minimum offering price per share(a) | | | $12.06 | (b) | | | $7.70 | (c) |
Maximum offering price per share ($12.06/0.9425) ($7.70/0.9425)(d) | | | $12.80 | | | | $8.17 | |
| | | | | | | | | |
| Class C Shares | | | | | | | | |
| Net assets | | $ | 11,218,336 | | | $ | 25,897,723 | |
| Shares issued and outstanding (unlimited shares authorized, no par value) | | | 956,669 | | | | 3,356,632 | |
Net asset value, redemption, and offering price per share (a) | | | $11.73 | (b) | | | $7.72 | (c) |
| | | | | | | | | |
| Class I Shares | | | | | | | | |
| Net assets | | $ | 44,815,666 | | | $ | 46,838,212 | |
| Shares issued and outstanding (unlimited shares authorized, no par value) | | | 3,682,147 | | | | 6,088,507 | |
| Net asset value, redemption, and offering price per share | | | $12.17 | (b) | | | $7.69 | (c) |
(a) A 1.00% contingent deferred sales charge may apply to redemptions made within twelve months of purchase.
The contingent deferred sales charge only applies to Class A share purchases of $1 million or more.
(b) Redemptions made within 30 days of purchase may be assessed a redemption fee of 1.00%.
(c) Redemptions made within 60 days of purchase may be assessed a redemption fee of 2.00%.
(d) On investments of $25,000 or more, the offering price is reduced.
The accompanying notes are an integral part of these financial statements.
| | |
| | |
LoCorr Managed Futures Strategy Fund, LoCorr Long/Short Commodities Strategy Fund, LoCorr Multi-Strategy Fund
and LoCorr Market Trend Fund - Consolidated Statements of Operations | | 53 |
| | |
Consolidated Statements of Operations
Year Ended December 31, 2016
| | | LoCorr | | | LoCorr | | | | | | | |
| | | Managed | | | Long/Short | | | LoCorr | | | LoCorr | |
| | | Futures | | | Commodities | | | Multi-Strategy | | | Market Trend | |
| | | Strategy Fund | | | Strategy Fund | | | Fund | | | Fund | |
| | | | | | | | | | | | | |
| Investment Income | | | | | | | | | | | | |
Dividend and interest income (a) | | $ | 9,496,542 | | | $ | 1,624,317 | | | $ | 1,166,376 | | | $ | 10,094,331 | |
| Distributions received from master limited partnerships (“MLP”) interests | | | — | | | | — | | | | 617,400 | | | | — | |
| Less: return of capital on distributions from MLP interests (Note 2) | | | — | | | | — | | | | (617,400 | ) | | | — | |
| Other income | | | 38,696 | | | | 1,472 | | | | — | | | | 32,412 | |
| Total Investment Income | | | 9,535,238 | | | | 1,625,789 | | | | 1,166,376 | | | | 10,126,743 | |
| | | | | | | | | | | | | | | | | |
| Expenses | | | | | | | | | | | | | | | | |
| Management fees (Note 5) | | | 12,322,937 | | | | 1,986,638 | | | | 638,252 | | | | 19,457,280 | |
| Fund administration fees | | | 246,814 | | | | 71,250 | | | | 42,718 | | | | 417,437 | |
| Fund accounting fees | | | 302,441 | | | | 112,795 | | | | 43,388 | | | | 444,544 | |
| Trustees’ fees | | | 43,977 | | | | 8,623 | | | | 2,320 | | | | 80,557 | |
| Transfer agent fees and expenses | | | 1,104,010 | | | | 282,879 | | | | 78,343 | | | | 2,024,155 | |
| Custodian fees | | | 38,492 | | | | 10,928 | | | | 6,830 | | | | 63,348 | |
| Registration expenses | | | 105,054 | | | | 70,693 | | | | 38,384 | | | | 159,190 | |
| Rule 12b-1 fees - Class A (Note 5) | | | 668,802 | | | | 117,283 | | | | 36,385 | | | | 413,989 | |
| Rule 12b-1 fees - Class C (Note 5) | | | 1,105,248 | | | | 72,799 | | | | 43,942 | | | | 1,135,455 | |
| Legal and audit fees | | | 49,068 | | | | 31,383 | | | | 37,193 | | | | 57,620 | |
| Printing and mailing expenses | | | 114,433 | | | | 24,642 | | | | 18,229 | | | | 192,312 | |
| Offering costs (Note 2) | | | — | | | | — | | | | 17,164 | | | | — | |
| Other expenses | | | 20,129 | | | | 4,578 | | | | 2,664 | | | | 29,065 | |
| Total expenses before dividend and interest expense | | | 16,121,405 | | | | 2,794,491 | | | | 1,005,812 | | | | 24,474,952 | |
| Dividend expense on securities sold short (See Note 2) | | | — | | | | — | | | | 5,343 | | | | — | |
| Interest expense | | | 46,604 | | | | — | | | | 12,317 | | | | 3,993 | |
| Interest expense on credit line (Note 8) | | | — | | | | 137 | | | | — | | | | — | |
| Total expenses before reimbursement | | | 16,168,009 | | | | 2,794,628 | | | | 1,023,472 | | | | 24,478,945 | |
| Reimbursement from Adviser (Note 5) | | | — | | | | (21,779 | ) | | | (181,466 | ) | | | — | |
| Net Expenses | | | 16,168,009 | | | | 2,772,849 | | | | 842,006 | | | | 24,478,945 | |
| Net Investment Income (Loss) | | | (6,632,771 | ) | | | (1,147,060 | ) | | | 324,370 | | | | (14,352,202 | ) |
Realized and Unrealized Gain (Loss) on Investments, Securities Sold Short, Swap Contracts,
Forward Currency Contracts, Futures Contracts and Foreign Currency Translation:
| Net realized gain (loss) on: | | | | | | | | | | | | |
| Investments | | | 233,213 | | | | (73,792 | ) | | | 211,890 | | | | (4,455 | ) |
| Securities sold short | | | — | | | | — | | | | 168,823 | | | | — | |
| Swap contracts | | | 17,162,980 | | | | 8,698,631 | | | | (520,618 | ) | | | — | |
| Forward currency contracts | | | 7,686,340 | | | | — | | | | — | | | | 12,466,119 | |
| Futures contracts | | | (7,616,403 | ) | | | — | | | | — | | | | (159,984,048 | ) |
| Foreign currency translation | | | (1,209,385 | ) | | | — | | | | — | | | | 190,086 | |
| Net change in unrealized appreciation (depreciation) on: | | | | | | | | | | | | | | | | |
| Investments | | | (2,146,156 | ) | | | (322,163 | ) | | | 3,872,790 | | | | (461,618 | ) |
| Securities sold short | | | — | | | | — | | | | (564 | ) | | | — | |
| Swap contracts | | | 12,934,752 | | | | (15,911,913 | ) | | | (3,509,155 | ) | | | — | |
| Forward currency contracts | | | 2,856,630 | | | | — | | | | — | | | | (10,376,445 | ) |
| Futures contracts | | | 5,404,930 | | | | — | | | | — | | | | 18,076,500 | |
| Foreign currency translation | | | (16,390 | ) | | | — | | | | — | | | | 331 | |
| Net realized and unrealized gain (loss) | | | 35,290,511 | | | | (7,609,237 | ) | | | 223,166 | | | | (140,093,530 | ) |
| Net Increase (Decrease) in Net Assets From Operations | | $ | 28,657,740 | | | $ | (8,756,297 | ) | | $ | 547,536 | | | $ | (154,445,732 | ) |
(a) Net of foreign tax credit (withheld) of $163, $(72), $(3,845) and $(113), respectively.
The accompanying notes are an integral part of these consolidated financial statements.
| | |
| | |
54 | | LoCorr Long/Short Equity and LoCorr Spectrum Income Fund - Statements of Operations |
| | |
Statements of Operations
Year Ended December 31, 2016
| | | LoCorr | | | LoCorr | |
| | | Long/Short | | | Spectrum | |
| | | Equity Fund | | | Income Fund | |
| | | | | | | |
| Investment Income | | | | | | |
Dividend and interest income (a) | | $ | 212,616 | | | $ | 5,438,706 | |
| Distributions received from master limited partnership (“MLP”) interests | | | — | | | | 2,667,640 | |
| Less: return of capital on distributions from MLP interests (Note 2) | | | — | | | | (2,667,640 | ) |
| Total Investment Income | | | 212,616 | | | | 5,438,706 | |
| | | | | | | | | |
| Expenses | | | | | | | | |
| Management fees (Note 5) | | | 1,015,046 | | | | 1,212,705 | |
| Fund administration fees | | | 44,734 | | | | 53,811 | |
| Fund accounting fees | | | 45,115 | | | | 59,204 | |
| Trustees’ fees | | | 2,728 | | | | 5,676 | |
| Transfer agent fees and expenses | | | 90,486 | | | | 162,742 | |
| Custodian fees | | | 29,415 | | | | 7,932 | |
| Registration expenses | | | 50,217 | | | | 51,328 | |
| Rule 12b-1 fees - Class A (Note 5) | | | 39,715 | | | | 84,100 | |
| Rule 12b-1 fees - Class C (Note 5) | | | 79,036 | | | | 267,272 | |
| Legal and audit fees | | | 17,905 | | | | 38,631 | |
| Printing and mailing expenses | | | 5,605 | | | | 55,393 | |
| Other expenses | | | 3,045 | | | | 4,956 | |
| Total expenses before dividend and interest expense | | | 1,423,047 | | | | 2,003,750 | |
| Dividend expense on securities sold short (Note 2) | | | 104,562 | | | | — | |
| Interest expense | | | 38,532 | | | | — | |
| Total expenses before recovery (reimbursement) | | | 1,566,141 | | | | 2,003,750 | |
| Recovery to (Reimbursement from) Adviser (Note 5) | | | (102,813 | ) | | | 26,753 | |
| Net Expenses | | | 1,463,328 | | | | 2,030,503 | |
| Net Investment Income (Loss) | | | (1,250,712 | ) | | | 3,408,203 | |
| | | | | | | | | |
Realized and Unrealized Gain (Loss) on Investments, Securities Sold
Short, Foreign Currency Translation and Securities Litigation: | | | | | | | | |
| Net realized gain (loss) on: | | | | | | | | |
| Investments | | | 4,711,221 | | | | (4,887,412 | ) |
| Securities sold short | | | (161,361 | ) | | | — | |
| Foreign currency translation | | | — | | | | 64 | |
| Securities litigation | | | 7,825 | | | | — | |
| Net change in unrealized appreciation on: | | | | | | | | |
| Investments | | | 6,415,531 | | | | 6,426,460 | |
| Securities sold short | | | 319,149 | | | | — | |
| Net realized and unrealized gain | | | 11,292,365 | | | | 1,539,112 | |
| Net Increase in Net Assets From Operations | | $ | 10,041,653 | | | $ | 4,947,315 | |
(a) Net of foreign tax withheld of $272 and $15,857, respectively.
The accompanying notes are an integral part of these financial statements.
| |
| |
LoCorr Managed Futures Strategy Fund - Consolidated Statements of Changes in Net Assets | 55 |
| |
| |
LoCorr Managed Futures Strategy Fund
Consolidated Statements of Changes in Net Assets
| | | | | | | | | | |
| | | Year Ended
December 31, 2016 | | Year Ended
December 31, 2015 | |
| | | | | | | | | | |
| Operations | | | | | | | | | |
| Net investment loss | | | $ | (6,632,771) | | | | $ | (5,025,905) | | |
Net realized gain on investments, swap contracts, forward currency contracts, futures contracts and foreign currency translation | | | | 16,256,745 | | | | | 53,264,692 | | |
| Net change in unrealized appreciation (depreciation) of investments, swap contracts, forward currency contracts, futures contracts and foreign currency translation | | | | 19,033,766 | | | | | (32,509,463) | | |
| Increase in Net Assets From Operations | | | | 28,657,740 | | | | | 15,729,324 | | |
| | | | | | | | | | | | |
| Distributions to Shareholders From | | | | | | | | | | | |
| Net investment income: | | | | | | | | | | | |
| Class A | | | | — | | | | | (6,432,086) | | |
| Class C | | | | — | | | | | (2,193,991) | | |
| Class I | | | | (24,016) | | | | | (5,902,168) | | |
| Net realized gain: | | | | | | | | | | | |
| Class A | | | | (5,711,451) | | | | | — | | |
| Class C | | | | (2,291,477) | | | | | — | | |
| Class I | | | | (8,002,729) | | | | | — | | |
| Total Distributions to Shareholders | | | | (16,029,673) | | | | | (14,528,245) | | |
| | | | | | | | | | | | |
| Capital Transactions (Note 6) | | | | | | | | | | | |
| Proceeds from shares sold | | | | 538,774,369 | | | | | 188,314,941 | | |
| Reinvestment of distributions | | | | 14,146,054 | | | | | 12,372,395 | | |
| Cost of shares redeemed | | | | (203,375,297) | | | | | (172,340,625) | | |
| Redemption fees | | | | 22,168 | | | | | 10,605 | | |
| Increase in Net Assets From Capital Transactions | | | | 349,567,294 | | | | | 28,357,316 | | |
| | | | | | | | | | | | |
| Total Increase in Net Assets | | | | 362,195,361 | | | | | 29,558,395 | | |
| | | | | | | | | | | | |
| Net Assets | | | | | | | | | | | |
| Beginning of year | | | | 520,464,911 | | | | | 490,906,516 | | |
| End of year (including accumulated net investment income of $0 and $23,817, respectively) | | | $ | 882,660,272 | | | | $ | 520,464,911 | | |
The accompanying notes are an integral part of these consolidated financial statements.
| |
| |
56 | LoCorr Long/Short Commodities Strategy Fund - Consolidated Statements of Changes in Net Assets |
| |
| |
LoCorr Long/Short Commodities Strategy Fund
Consolidated Statements of Changes in Net Assets
| | | | | | | | | | |
| | | Year Ended
December 31, 2016 | | Year Ended
December 31, 2015 | |
| | | | | | | | | | |
| Operations | | | | | | | | | |
| Net investment loss | | | $ | (1,147,060) | | | | $ | (539,687) | | |
| Net realized gain on investments and swap contracts | | | | 8,624,839 | | | | | 9,737,702 | | |
| Net change in unrealized depreciation of investments and swap contracts | | | | (16,234,076) | | | | | (1,260,950) | | |
| Increase (Decrease) in Net Assets From Operations | | | | (8,756,297) | | | | | 7,937,065 | | |
| | | | | | | | | | | | |
| Distributions to Shareholders From | | | | | | | | | | | |
| Net investment income: | | | | | | | | | | | |
| Class A | | | | (1,090,668) | | | | | (1,496,185) | | |
| Class C | | | | (185,406) | | | | | (252,385) | | |
| Class I | | | | (2,898,594) | | | | | (1,602,503) | | |
| Total Distributions to Shareholders | | | | (4,174,668) | | | | | (3,351,073) | | |
| | | | | | | | | | | | |
| Capital Transactions (Note 6) | | | | | | | | | | | |
| Proceeds from shares sold | | | | 184,501,674 | | | | | 44,224,957 | | |
| Reinvestment of distributions | | | | 3,318,366 | | | | | 2,944,665 | | |
| Cost of shares redeemed | | | | (111,389,429) | | | | | (50,989,816) | | |
| Redemption fees | | | | 26,941 | | | | | 1,609 | | |
| Increase (Decrease) in Net Assets From Capital Transactions | | | | 76,457,552 | | | | | (3,818,585) | | |
| | | | | | | | | | | | |
| Total Increase in Net Assets | | | | 63,526,587 | | | | | 767,407 | | |
| | | | | | | | | | | | |
| Net Assets | | | | | | | | | | | |
| Beginning of year | | | | 59,920,808 | | | | | 59,153,401 | | |
| End of year (including accumulated net investment income of $16,545 and $0, respectively) | | | $ | 123,447,395 | | | | $ | 59,920,808 | | |
The accompanying notes are an integral part of these consolidated financial statements.
| |
| |
LoCorr Multi-Strategy Fund - Consolidated Statements of Changes in Net Assets | 57 |
| |
| |
LoCorr Multi-Strategy Fund
Consolidated Statements of Changes in Net Assets
| | | | | | | | | | |
| | | Year Ended
December 31, 2016 | | Period from April 6, 2015
(commencement of operations)
through
December 31, 2015 | |
| | | | | | | | | | |
| Operations | | | | | | | | | |
| Net investment income | | | $ | 324,370 | | | | $ | 193,088 | | |
| Net realized loss on investments, securities sold short, swap contracts and foreign currency translation | | | | (139,905) | | | | | (1,448,509) | | |
| Net change in unrealized appreciation (depreciation) of investments, securities sold short and swap contracts | | | | 363,071 | | | | | (1,954,814) | | |
| Increase (Decrease) in Net Assets From Operations | | | | 547,536 | | | | | (3,210,235) | | |
| | | | | | | | | | | | |
| Distributions to Shareholders From | | | | | | | | | | | |
| Net investment income: | | | | | | | | | | | |
| Class A | | | | (154,251) | | | | | (57,171) | | |
| Class C | | | | (33,115) | | | | | (37,332) | | |
| Class I | | | | (199,550) | | | | | (172,857) | | |
| Return of capital: | | | | | | | | | | | |
| Class A | | | | (341,141) | | | | | (59,982) | | |
| Class C | | | | (73,235) | | | | | (39,167) | | |
| Class I | | | | (441,323) | | | | | (181,352) | | |
| Total Distributions to Shareholders | | | | (1,242,615) | | | | | (547,861) | | |
| | | | | | | | | | | | |
| Capital Transactions (Note 6) | | | | | | | | | | | |
| Proceeds from shares sold | | | | 21,301,189 | | | | | 40,943,678 | | |
| Reinvestment of distributions | | | | 1,018,144 | | | | | 397,009 | | |
| Cost of shares redeemed | | | | (16,445,492) | | | | | (3,428,828) | | |
| Redemption fees | | | | 238 | | | | | 467 | | |
| Increase in Net Assets From Capital Transactions | | | | 5,874,079 | | | | | 37,912,326 | | |
| | | | | | | | | | | | |
| Total Increase in Net Assets | | | | 5,179,000 | | | | | 34,154,230 | | |
| | | | | | | | | | | | |
| Net Assets | | | | | | | | | | | |
| Beginning of period | | | | 34,154,230 | | | | | — | | |
| End of period (including accumulated net investment loss of $149,940 and $9,659, respectively) | | | $ | 39,333,230 | | | | $ | 34,154,230 | | |
The accompanying notes are an integral part of these consolidated financial statements.
| |
| |
58 | LoCorr Market Trend Fund - Consolidated Statements of Changes in Net Assets |
| |
| |
LoCorr Market Trend Fund
Consolidated Statements of Changes in Net Assets
| | | | | | | | | |
| | | Year Ended
December 31, 2016 | Year Ended
December 31, 2015 | |
| | | | | | | | | |
| Operations | | | | | | | | |
| Net investment loss | | | $ | (14,352,202) | | | $ | (6,446,474) | | |
| Net realized loss on investments, forward currency contracts, futures contracts and foreign currency translation | | | | (147,332,298) | | | | (13,448,278) | | |
| Net change in unrealized appreciation of investments, forward currency contracts, futures contracts and foreign currency translation | | | | 7,238,768 | | | | 1,494,813 | | |
| Decrease in Net Assets From Operations | | | | (154,445,732) | | | | (18,399,939) | | |
| | | | | | | | | | | |
| Distributions to Shareholders From | | | | | | | | | | |
| Net investment income: | | | | | | | | | | |
| Class A | | | | (2,324,469) | | | | (555,579) | | |
| Class C | | | | (1,348,021) | | | | (187,583) | | |
| Class I | | | | (16,192,350) | | | | (4,581,749) | | |
| Net realized gain: | | | | | | | | | | |
| Class A | | | | — | | | | (199,576) | | |
| Class C | | | | — | | | | (175,420) | | |
| Class I | | | | — | | | | (1,224,826) | | |
| Total Distributions to Shareholders | | | | (19,864,840) | | | | (6,924,733) | | |
| | | | | | | | | | | |
| Capital Transactions (Note 6) | | | | | | | | | | |
| Proceeds from shares sold | | | | 1,129,819,283 | | | | 1,017,177,800 | | |
| Reinvestment of distributions | | | | 18,880,713 | | | | 6,556,398 | | |
| Cost of shares redeemed | | | | (854,994,134) | | | | (157,925,020) | | |
| Redemption fees | | | | 31,875 | | | | 55,555 | | |
| Increase in Net Assets From Capital Transactions | | | | 293,737,737 | | | | 865,864,733 | | |
| | | | | | | | | | | |
| Total Increase in Net Assets | | | | 119,427,165 | | | | 840,540,061 | | |
| | | | | | | | | | | |
| Net Assets | | | | | | | | | | |
| Beginning of year | | | | 901,017,766 | | | | 60,477,705 | | |
| End of year (including accumulated net investment income (loss) of $(430,397) and $5,933,169, respectively) | | | $ | 1,020,444,931 | | | $ | 901,017,766 | | |
The accompanying notes are an integral part of these consolidated financial statements.
| |
| |
LoCorr Long/Short Equity Fund - Statements of Changes in Net Assets | 59 |
| |
| |
LoCorr Long/Short Equity Fund
Statements of Changes in Net Assets
| | | | | | | |
| | | Year Ended
December 31, 2016 | | | Year Ended
December 31, 2015 | |
| | | | | | | |
| Operations | | | | | | |
| Net investment loss | | $ | (1,250,712) | | | $ | (997,517) | |
| Net realized gain on investments, securities sold short and securities litigation | | | 4,557,685 | | | | 1,963,831 | |
| Net change in unrealized appreciation (depreciation) of investments and securities sold short | | | 6,734,680 | | | | (1,306,541) | |
| Increase (Decrease) in Net Assets From Operations | | | 10,041,653 | | | | (340,227) | |
| | | | | | | �� | | |
| Capital Transactions (Note 6) | | | | | | | | |
| Proceeds from shares sold | | | 59,597,625 | | | | 11,326,336 | |
| Cost of shares redeemed | | | (15,637,868) | | | | (22,349,664) | |
| Redemption fees | | | 2,152 | | | | 279 | |
| Increase (Decrease) in Net Assets From Capital Transactions | | | 43,961,909 | | | | (11,023,049) | |
| | | | | | | | | |
| Total Increase (Decrease) in Net Assets | | | 54,003,562 | | | | (11,363,276) | |
| | | | | | | | | |
| Net Assets | | | | | | | | |
| Beginning of year | | | 30,273,195 | | | | 41,636,471 | |
| End of year (including accumulated net investment income of $0 and $0, respectively) | | $ | 84,276,757 | | | $ | 30,273,195 | |
The accompanying notes are an integral part of these financial statements.
| |
| |
60 | LoCorr Spectrum Income Fund - Statements of Changes in Net Assets |
| |
| |
LoCorr Spectrum Income Fund
Statements of Changes in Net Assets
| | | | | | | |
| | | Year Ended
December 31, 2016 | | | Year Ended December 31, 2015 | |
| | | | | | | |
| Operations | | | | | | |
| Net investment income | | $ | 3,408,203 | | | $ | 4,604,374 | |
| Net realized loss on investments and foreign currency translation | | | (4,887,348) | | | | (16,828,199) | |
| Net change in unrealized appreciation of investments | | | 6,426,460 | | | | 2,371,967 | |
| Increase (Decrease) in Net Assets From Operations | | | 4,947,315 | | | | (9,851,858) | |
| | | | | | | | | |
| Distributions to Shareholders From | | | | | | | | |
| Net investment income: | | | | | | | | |
| Class A | | | (1,640,399) | | | | (1,853,135) | |
| Class C | | | (1,132,883) | | | | (1,211,916) | |
| Class I | | | (1,733,891) | | | | (1,650,068) | |
| Return of capital: | | | | | | | | |
| Class A | | | (869,438) | | | | (883,774) | |
| Class C | | | (600,446) | | | | (577,971) | |
| Class I | | | (918,989) | | | | (786,930) | |
| Total Distributions to Shareholders | | | (6,896,046) | | | | (6,963,794) | |
| | | | | | | | | |
| Capital Transactions (Note 6) | | | | | | | | |
| Proceeds from shares sold | | | 51,290,652 | | | | 58,801,112 | |
| Reinvestment of distributions | | | 5,104,992 | | | | 5,179,324 | |
| Cost of shares redeemed | | | (41,752,967) | | | | (48,180,021) | |
| Redemption fees | | | 8,855 | | | | 17,905 | |
| Increase in Net Assets From Capital Transactions | | | 14,651,532 | | | | 15,818,320 | |
| | | | | | | | | |
| Total Increase (Decrease) in Net Assets | | | 12,702,801 | | | | (997,332) | |
| | | | | | | | | |
| Net Assets | | | | | | | | |
| Beginning of year | | | 93,065,601 | | | | 94,062,933 | |
| End of year (including accumulated net investment loss of $1,508,340 and $559,687, respectively) | | $ | 105,768,402 | | | $ | 93,065,601 | |
The accompanying notes are an integral part of these financial statements.
| |
| |
LoCorr Managed Futures Strategy Fund - Consolidated Financial Highlights - Class A | 61 |
| |
| |
LoCorr Managed Futures Strategy Fund- Class A
Consolidated Financial Highlights
Selected Data and Ratios (for a share outstanding throughout the period)
| |
| | | Year Ended |
| | | December 31, 2016 | | December 31, 2015 | | December 31, 2014 | | December 31, 2013 | | December 31, 2012(a) |
| | | | | | | | | | | | | | | | | | | | | | | | | | |
| Per Share | | | | | | | | | | | | | | | | | | | | | | | | | |
| Net asset value, beginning of year | | | $ | 8.54 | | | | $ | 8.51 | | | | $ | 8.28 | | | | $ | 8.77 | | | | $ | 9.33 | |
| | | | | | | | | | | | | | | | | | | | | | | | | | |
| Income (loss) from investment operations: | | | | | | | | | | | | | | | | | | | | | | | | | |
Net investment income (loss)(b) | | | | (0.09) | | | | | (0.08) | | | | | (0.08) | | | | | (0.07) | | | | | (0.24) | |
| Net realized and unrealized gain (loss) | | | | 0.64 | | | | | 0.36 | | | | | 1.36 | | | | | (0.41) | | | | | (0.32) | |
| Total from Investment Operations | | | | 0.55 | | | | | 0.28 | | | | | 1.28 | | | | | (0.48) | | | | | (0.56) | |
| | | | | | | | | | | | | | | | | | | | | | | | | | |
| Distributions to shareholders from: | | | | | | | | | | | | | | | | | | | | | | | | | |
| Net investment income | | | | — | | | | | (0.25) | | | | | (1.04) | | | | | — | | | | | — | |
| Net realized gains | | | | (0.18) | | | | | — | | | | | (0.01) | | | | | (0.01) | | | | | (0.00) | (c) |
| Total Distributions | | | | (0.18) | | | | | (0.25) | | | | | (1.05) | | | | | (0.01) | | | | | (0.00) | |
| | | | | | | | | | | | | | | | | | | | | | | | | | |
Redemption Fees(c) | | | | 0.00 | | | | | 0.00 | | | | | 0.00 | | | | | 0.00 | | | | | 0.00 | |
| | | | | | | | | | | | | | | | | | | | | | | | | | |
| Net Asset Value, End of Year | | | $ | 8.91 | | | | $ | 8.54 | | | | $ | 8.51 | | | | $ | 8.28 | | | | $ | 8.77 | |
| | | | | | | | | | | | | | | | | | | | | | | | | | |
Total Investment Return(d) | | | | 6.39 | % | | | | 3.27 | % | | | | 15.42 | % | | | | (5.53) | % | | | | (5.98) | % |
| | | | | | | | | | | | | | | | | | | | | | | | | | |
| Net Assets, End of Year, in Thousands | | | $ | 297,844 | | | | $ | 229,427 | | | | $ | 206,931 | | | | $ | 195,046 | | | | $ | 182,457 | |
| | | | | | | | | | | | | | | | | | | | | | | | | | |
| Ratios/Supplemental Data: | | | | | | | | | | | | | | | | | | | | | | | | | |
| Ratio of expenses to average net assets: | | | | | | | | | | | | | | | | | | | | | | | | | |
| Before expense reimbursement or recovery | | | | 2.34 | %(e),(f) | | | | 2.06 | %(e),(f) | | | | 2.11 | %(e) | | | | 2.08 | %(e) | | | | 3.95 | %(e),(g) |
| After expense reimbursement or recovery | | | | 2.34 | %(e),(f) | | | | 2.06 | %(e),(f) | | | | 2.11 | %(e) | | | | 2.08 | %(e) | | | | 4.00 | %(e),(g) |
| | | | | | | | | | | | | | | | | | | | | | | | | | |
| Ratio of net investment income (loss) to average net assets: | | | | | | | | | | | | | | | | | | | | | | | | | |
| Before expense reimbursement or recovery | | | | (0.96) | %(e) | | | | (0.90) | %(e) | | | | (0.94) | %(e) | | | | (0.87) | %(e) | | | | (2.60) | %(e),(h) |
| After expense reimbursement or recovery | | | | (0.96) | %(e) | | | | (0.90) | %(e) | | | | (0.94) | %(e) | | | | (0.87) | %(e) | | | | (2.65) | %(e),(h) |
| | | | | | | | | | | | | | | | | | | | | | | | | | |
Portfolio turnover rate(i) | | | | 62 | % | | | | 53 | % | | | | 57 | % | | | | 46 | % | | | | 46 | % |
| (a) | Selected data and ratios (for a share outstanding throughout the period) do not include non-controlling interest. |
| (b) | Net investment income (loss) per share is based on average shares outstanding. |
| (c) | Amount represents less than $0.005 per share. |
| (d) | Total investment return excludes the effect of applicable sales charges. |
| (e) | Ratios do not include the income and expenses of the CTAs included in the swap. |
| (f) | Includes interest expense of 0.01% and 0.00% for the years ended December 31, 2016 and 2015, respectively. |
| (g) | For the year ended December 31, 2012, the ratios include 1.88% of expenses attributable to the Partnership. See Note 1. |
| (h) | For the year ended December 31, 2012, the ratios include (1.63)% of net investment losses attributable to the Partnership. See Note 1. |
| (i) | Portfolio turnover rate is calculated on the basis of the Fund as a whole without distinguishing between classes of shares issued. Consists of long-term investments only; excludes derivative instruments. |
The accompanying notes are an integral part of these consolidated financial statements.
| |
| |
62 | LoCorr Managed Futures Strategy Fund - Consolidated Financial Highlights - Class C |
| |
| |
LoCorr Managed Futures Strategy Fund - Class C
Consolidated Financial Highlights
Selected Data and Ratios (for a share outstanding throughout the period)
| | | | | | | | | | | | | | | | | | | | | | | | | | |
| | | Year Ended |
| | | December 31, 2016 | | December 31, 2015 | | December 31, 2014 | | December 31, 2013 | | December 31, 2012(a) |
| | | | | | | | | | | | | | | | | | | | | | | | | | |
| Per Share | | | | | | | | | | | | | | | | | | | | | | | | | |
| Net asset value, beginning of year | | | $ | 8.32 | | | | $ | 8.30 | | | | $ | 8.12 | | | | $ | 8.65 | | | | $ | 9.28 | |
| | | | | | | | | | | | | | | | | | | | | | | | | | |
| Income (loss) from investment operations: | | | | | | | | | | | | | | | | | | | | | | | | | |
Net investment income (loss)(b) | | | | (0.15) | | | | | (0.14) | | | | | (0.15) | | | | | (0.14) | | | | | (0.30) | |
| Net realized and unrealized gain (loss) | | | | 0.63 | | | | | 0.35 | | | | | 1.33 | | | | | (0.38) | | | | | (0.33) | |
| Total from Investment Operations | | | | 0.48 | | | | | 0.21 | | | | | 1.18 | | | | | (0.52) | | | | | (0.63) | |
| | | | | | | | | | | | | | | | | | | | | | | | | | |
| Distributions to shareholders from: | | | | | | | | | | | | | | | | | | | | | | | | | |
| Net investment income | | | | — | | | | | (0.19) | | | | | (0.99) | | | | | — | | | | | — | |
| Net realized gains | | | | (0.18) | | | | | — | | | | | (0.01) | | | | | (0.01) | | | | | (0.00) | (c) |
| Total Distributions | | | | (0.18) | | | | | (0.19) | | | | | (1.00) | | | | | (0.01) | | | | | (0.00) | |
| | | | | | | | | | | | | | | | | | | | | | | | | | |
Redemption Fees(c) | | | | 0.00 | | | | | 0.00 | | | | | 0.00 | | | | | 0.00 | | | | | 0.00 | |
| | | | | | | | | | | | | | | | | | | | | | | | | | |
| Net Asset Value, End of Year | | | $ | 8.62 | | | | $ | 8.32 | | | | $ | 8.30 | | | | $ | 8.12 | | | | $ | 8.65 | |
| | | | | | | | | | | | | | | | | | | | | | | | | | |
Total Investment Return(d) | | | | 5.72 | % | | | | 2.51 | % | | | | 14.39 | % | | | | (6.07) | % | | | | (6.77) | % |
| | | | | | | | | | | | | | | | | | | | | | | | | | |
| Net Assets, End of Year, in Thousands | | | $ | 113,814 | | | | $ | 98,729 | | | | $ | 93,924 | | | | $ | 73,691 | | | | $ | 76,979 | |
| | | | | | | | | | | | | | | | | | | | | | | | | | |
| Ratios/Supplemental Data: | | | | | | | | | | | | | | | | | | | | | | | | | |
| Ratio of expenses to average net assets: | | | | | | | | | | | | | | | | | | | | | | | | | |
| Before expense reimbursement or recovery | | | | 3.09 | %(e),(f) | | | | 2.81 | %(e),(f) | | | | 2.86 | %(e) | | | | 2.83 | %(e) | | | | 4.70 | %(e),(g) |
| After expense reimbursement or recovery | | | | 3.09 | %(e),(f) | | | | 2.81 | %(e),(f) | | | | 2.86 | %(e) | | | | 2.83 | %(e) | | | | 4.75 | %(e),(g) |
| | | | | | | | | | | | | | | | | | | | | | | | | | |
| Ratio of net investment income (loss) to average net assets: | | | | | | | | | | | | | | | | | | | | | | | | | |
| Before expense reimbursement or recovery | | | | (1.71) | %(e) | | | | (1.65) | %(e) | | | | (1.69) | %(e) | | | | (1.62) | %(e) | | | | (3.35) | %(e),(h) |
| After expense reimbursement or recovery | | | | (1.71) | %(e) | | | | (1.65) | %(e) | | | | (1.69) | %(e) | | | | (1.62) | %(e) | | | | (3.40) | %(e),(h) |
| | | | | | | | | | | | | | | | | | | | | | | | | | |
Portfolio turnover rate(i) | | | | 62 | % | | | | 53 | % | | | | 57 | % | | | | 46 | % | | | | 46 | % |
| (a) | Selected data and ratios (for a share outstanding throughout the period) do not include non-controlling interest. |
(b) | Net investment income (loss) per share is based on average shares outstanding. |
| (c) | Amount represents less than $0.005 per share. |
| (d) | Total investment return excludes the effect of applicable sales charges. |
| (e) | Ratios do not include the income and expenses of the CTAs included in the swap. |
| (f) | Includes interest expense of 0.01% and 0.00% for the years ended December 31, 2016 and 2015, respectively. |
| (g) | For the year ended December 31, 2012, the ratios include 1.88% of expenses attributable to the Partnership. See Note 1. |
| (h) | For the year ended December 31, 2012, the ratios include (1.63)% of net investment losses attributable to the Partnership. See Note 1. |
| (i) | Portfolio turnover rate is calculated on the basis of the Fund as a whole without distinguishing between classes of shares issued. Consists of long-term investments only; excludes derivative instruments. |
The accompanying notes are an integral part of these consolidated financial statements.
| |
| |
LoCorr Managed Futures Strategy Fund - Consolidated Financial Highlights - Class I | 63 |
| |
| |
LoCorr Managed Futures Strategy Fund- Class I
Consolidated Financial Highlights
Selected Data and Ratios (for a share outstanding throughout the period)
| | | | | | | | | | | | | | | | | | | | | | | | | | |
| | | Year Ended |
| | | December 31, 2016 | | December 31, 2015 | | December 31, 2014 | | December 31, 2013 | | December 31, 2012(a) |
| | | | | | | | | | | | | | | | | | | | | | | | | | |
| Per Share | | | | | | | | | | | | | | | | | | | | | | | | | |
| Net asset value, beginning of year | | | $ | 8.62 | | | | $ | 8.57 | | | | $ | 8.34 | | | | $ | 8.81 | | | | $ | 9.35 | |
| | | | | | | | | | | | | | | | | | | | | | | | | | |
| Income (loss) from investment operations: | | | | | | | | | | | | | | | | | | | | | | | | | |
Net investment income (loss)(b) | | | | (0.07) | | | | | (0.06) | | | | | (0.06) | | | | | (0.05) | | | | | (0.22) | |
| Net realized and unrealized gain (loss) | | | | 0.64 | | | | | 0.38 | | | | | 1.36 | | | | | (0.41) | | | | | (0.32) | |
| Total from Investment Operations | | | | 0.57 | | | | | 0.32 | | | | | 1.30 | | | | | (0.46) | | | | | (0.54) | |
| | | | | | | | | | | | | | | | | | | | | | | | | | |
| Distributions to shareholders from: | | | | | | | | | | | | | | | | | | | | | | | | | |
| Net investment income | | | | 0.00 | (c) | | | | (0.27) | | | | | (1.06) | | | | | — | | | | | — | |
| Net realized gains | | | | (0.18) | | | | | — | | | | | (0.01) | | | | | (0.01) | | | | | (0.00) | (c) |
| Total Distributions | | | | (0.18) | | | | | (0.27) | | | | | (1.07) | | | | | (0.01) | | | | | (0.00) | |
| | | | | | | | | | | | | | | | | | | | | | | | | | |
Redemption Fees(c) | | | | 0.00 | | | | | 0.00 | | | | | 0.00 | | | | | 0.00 | | | | | 0.00 | |
| | | | | | | | | | | | | | | | | | | | | | | | | | |
| Net Asset Value, End of Year | | | $ | 9.01 | | | | $ | 8.62 | | | | $ | 8.57 | | | | $ | 8.34 | | | | $ | 8.81 | |
| | | | | | | | | | | | | | | | | | | | | | | | | | |
Total Investment Return(d) | | | | 6.57 | % | | | | 3.72 | % | | | | 15.56 | % | | | | (5.28) | % | | | | (5.75) | % |
| | | | | | | | | | | | | | | | | | | | | | | | | | |
| Net Assets, End of Year, in Thousands | | | $ | 471,002 | | | | $ | 192,309 | | | | $ | 190,052 | | | | $ | 102,279 | | | | $ | 138,096 | |
| | | | | | | | | | | | | | | | | | | | | | | | | | |
| Ratios/Supplemental Data: | | | | | | | | | | | | | | | | | | | | | | | | | |
| Ratio of expenses to average net assets: | | | | | | | | | | | | | | | | | | | | | | | | | |
| Before expense reimbursement or recovery | | | | 2.09 | %(d),(e) | | | | 1.81 | %(d),(e) | | | | 1.86 | %(d) | | | | 1.83 | %(d) | | | | 3.70 | %(d),(f) |
| After expense reimbursement or recovery | | | | 2.09 | %(d),(e) | | | | 1.81 | %(d),(e) | | | | 1.86 | %(d) | | | | 1.83 | %(d) | | | | 3.75 | %(d),(f) |
| | | | | | | | | | | | | | | | | | | | | | | | | | |
| Ratio of net investment income (loss) to average net assets: | | | | | | | | | | | | | | | | | | | | | | | | | |
| Before expense reimbursement or recovery | | | | (0.71) | %(d) | | | | (0.65) | %(d) | | | | (0.69) | %(d) | | | | (0.62) | %(d) | | | | (2.35) | %(d),(g) |
| After expense reimbursement or recovery | | | | (0.71) | %(d) | | | | (0.65) | %(d) | | | | (0.69) | %(d) | | | | (0.62) | %(d) | | | | (2.40) | %(d),(g) |
| | | | | | | | | | | | | | | | | | | | | | | | | | |
Portfolio turnover rate(h) | | | | 62 | % | | | | 53 | % | | | | 57 | % | | | | 46 | % | | | | 46 | % |
| (a) | Selected data and ratios (for a share outstanding throughout the period) do not include non-controlling interest. |
(b) | Net investment income (loss) per share is based on average shares outstanding. |
| (c) | Amount represents less than $0.005 per share. |
| (d) | Ratios do not include the income and expenses of the CTAs included in the swap. |
| (e) | Includes interest expense of 0.01% and 0.00% for the years ended December 31, 2016 and 2015, respectively. |
| (f) | For the year ended December 31, 2012, the ratios include 1.88% of expenses attributable to the Partnership. See Note 1. |
| (g) | For the year ended December 31, 2012, the ratios include (1.63)% of net investment losses attributable to the Partnership. See Note 1. |
| (h) | Portfolio turnover rate is calculated on the basis of the Fund as a whole without distinguishing between classes of shares issued. Consists of long-term investments only; excludes derivative instruments. |
The accompanying notes are an integral part of these consolidated financial statements.
| |
| |
64 | LoCorr Long/Short Commodities Strategy Fund - Consolidated Financial Highlights - Class A |
| |
| |
LoCorr Long/Short Commodities Strategy Fund- Class A
Consolidated Financial Highlights
Selected Data and Ratios (for a share outstanding throughout the period)
| | | | | | | | | | | | | | | | | | | | | | | | | | |
| | | Year Ended |
| | | December 31, 2016 | | December 31, 2015 | | December 31, 2014 | | December 31, 2013 | | December 31, 2012 |
| | | | | | | | | | | | | | | | | | | | | | | | | | |
| Per Share | | | | | | | | | | | | | | | | | | | | | | | | | |
| Net asset value, beginning of year | | | $ | 9.72 | | | | $ | 8.54 | | | | $ | 7.67 | | | | $ | 8.37 | | | | $ | 10.00 | |
| | | | | | | | | | | | | | | | | | | | | | | | | | |
| Income (loss) from investment operations: | | | | | | | | | | | | | | | | | | | | | | | | | |
Net investment income (loss)(a) | | | | (0.10) | | | | | (0.13) | | | | | (0.14) | | | | | (0.12) | | | | | (0.17) | |
| Net realized and unrealized gain (loss) | | | | (0.18) | | | | | 2.02 | | | | | 1.85 | | | | | (0.58) | | | | | (1.46) | |
| Total from Investment Operations | | | | (0.28) | | | | | 1.89 | | | | | 1.71 | | | | | (0.70) | | | | | (1.63) | |
| | | | | | | | | | | | | | | | | | | | | | | | | | |
| Distributions to shareholders from: | | | | | | | | | | | | | | | | | | | | | | | | | |
| Net investment income | | | | (0.27) | | | | | (0.71) | | | | | (0.84) | | | | | — | | | | | — | |
| Total Distributions | | | | (0.27) | | | | | (0.71) | | | | | (0.84) | | | | | — | | | | | — | |
| | | | | | | | | | | | | | | | | | | | | | | | | | |
Redemption Fees(b) | | | | 0.00 | | | | | 0.00 | | | | | 0.00 | | | | | 0.00 | | | | | 0.00 | |
| | | | | | | | | | | | | | | | | | | | | | | | | | |
| Net Asset Value, End of Year | | | $ | 9.17 | | | | $ | 9.72 | | | | $ | 8.54 | | | | $ | 7.67 | | | | $ | 8.37 | |
| | | | | | | | | | | | | | | | | | | | | | | | | | |
Total Investment Return(c) | | | | (2.98) | % | | | | 22.34 | % | | | | 22.07 | % | | | | (8.36) | % | | | | (16.30) | % |
| | | | | | | | | | | | | | | | | | | | | | | | | | |
| Net Assets, End of Year, in Thousands | | | $ | 34,860 | | | | $ | 24,425 | | | | $ | 43,345 | | | | $ | 3,653 | | | | $ | 3,213 | |
| | | | | | | | | | | | | | | | | | | | | | | | | | |
Ratios/Supplemental Data:(d) | | | | | | | | | | | | | | | | | | | | | | | | | |
| Ratio of expenses to average net assets: | | | | | | | | | | | | | | | | | | | | | | | | | |
| Before expense reimbursement or recovery | | | | 2.22 | %(e) | | | | 2.59 | %(e) | | | | 3.01 | %(e) | | | | 4.18 | % | | | | 6.12 | % |
| After expense reimbursement or recovery | | | | 2.20 | %(e) | | | | 2.20 | %(e) | | | | 2.20 | %(e) | | | | 2.20 | % | | | | 2.20 | % |
| | | | | | | | | | | | | | | | | | | | | | | | | | |
| Ratio of net investment income (loss) to average net assets: | | | | | | | | | | | | | | | | | | | | | | | | | |
| Before expense reimbursement or recovery | | | | (0.99) | % | | | | (1.79) | % | | | | (2.39) | % | | | | (3.46) | % | | | | (5.82) | % |
| After expense reimbursement or recovery | | | | (0.97) | % | | | | (1.40) | % | | | | (1.58) | % | | | | (1.48) | % | | | | (1.90) | % |
| | | | | | | | | | | | | | | | | | | | | | | | | | |
Portfolio turnover rate(f) | | | | 105 | % | | | | 164 | % | | | | 55 | % | | | | 59 | % | | | | 60 | % |
| (a) | Net investment income (loss) per share is based on average shares outstanding. |
| (b) | Amount represents less than $0.005 per share. |
| (c) | Total return excludes the effect of applicable sales charges. |
| (d) | Ratios do not include the income and expenses of the CTAs included in the swap. |
| (e) | Includes interest expense on line of credit of 0.00%, 0.00% and 0.00% for the years ended December 31, 2016, December 31, 2015 and December 31, 2014, respectively. |
| (f) | Portfolio turnover rate is calculated on the basis of the Fund as a whole without distinguishing between classes of shares issued. Consists of long-term investments only; excludes derivative instruments. |
The accompanying notes are an integral part of these consolidated financial statements.
| |
| |
LoCorr Long/Short Commodities Strategy Fund - Consolidated Financial Highlights - Class C | 65 |
| |
| |
LoCorr Long/Short Commodities Strategy Fund- Class C
Consolidated Financial Highlights
Selected Data and Ratios (for a share outstanding throughout the period)
| | | | | | | | | | | | | | | | |
| | | Year Ended |
| | | December 31, 2016 | | December 31, 2015 | | December 31, 2014 | | December 31, 2013 | | December 31, 2012 |
| | | | | | | | | | | | | | | | | | | | |
| Per Share | | | | | | | | | | | | | | | | | | | |
| Net asset value, beginning of year | | | $ | 9.51 | | | | $ | 8.36 | | | | $ | 7.54 | | | | $ | 8.29 | | | | $ | 10.00 | |
| | | | | | | | | | | | | | | | | | | | | | | | | | |
| Income (loss) from investment operations: | | | | | | | | | | | | | | | | | | | | | | | | | |
Net investment income (loss)(a) | | | | (0.17) | | | | | (0.19) | | | | | (0.20) | | | | | (0.17) | | | | | (0.24) | |
| Net realized and unrealized gain (loss) | | | | (0.18) | | | | | 1.96 | | | | | 1.80 | | | | | (0.58) | | | | | (1.47) | |
| Total from Investment Operations | | | | (0.35) | | | | | 1.77 | | | | | 1.60 | | | | | (0.75) | | | | | (1.71) | |
| | | | | | | | | | | | | | | | | | | | | | | | | | |
| Distributions to shareholders from: | | | | | | | | | | | | | | | | | | | | | | | | | |
| Net investment income | | | | (0.21) | | | | | (0.62) | | | | | (0.78) | | | | | — | | | | | — | |
| Total Distributions | | | | (0.21) | | | | | (0.62) | | | | | (0.78) | | | | | — | | | | | — | |
| | | | | | | | | | | | | | | | | | | | | | | | | | |
| Redemption Fees | | | | 0.00 | (b) | | | | — | | | | | — | | | | | — | | | | | 0.00 | (b) |
| | | | | | | | | | | | | | | | | | | | | | | | | | |
| Net Asset Value, End of Year | | | $ | 8.95 | | | | $ | 9.51 | | | | $ | 8.36 | | | | $ | 7.54 | | | | $ | 8.29 | |
| | | | | | | | | | | | | | | | | | | | | | | | | | |
Total Investment Return(c) | | | | (3.72) | % | | | | 21.39 | % | | | | 21.01 | % | | | | (9.05) | % | | | | (17.10) | % |
| | | | | | | | | | | | | | | | | | | | | | | | | | |
| Net Assets, End of Year, in Thousands | | | $ | 7,383 | | | | $ | 4,330 | | | | $ | 2,983 | | | | $ | 1,653 | | | | $ | 1,605 | |
| | | | | | | | | | | | | | | | | | | | | | | | | | |
Ratios/Supplemental Data:(d) | | | | | | | | | | | | | | | | | | | | | | | | | |
| Ratio of expenses to average net assets: | | | | | | | | | | | | | | | | | | | | | | | | | |
| Before expense reimbursement or recovery | | | | 2.97 | %(e) | | | | 3.34 | %(e) | | | | 3.76 | %(e) | | | | 4.93 | % | | | | 6.87 | % |
| After expense reimbursement or recovery | | | | 2.95 | %(e) | | | | 2.95 | %(e) | | | | 2.95 | %(e) | | | | 2.95 | % | | | | 2.95 | % |
| | | | | | | | | | | | | | | | | | | | | | | | | | |
| Ratio of net investment income (loss) to average net assets: | | | | | | | | | | | | | | | | | | | | | | | | | |
| Before expense reimbursement or recovery | | | | (1.74) | % | | | | (2.54) | % | | | | (3.14) | % | | | | (4.21) | % | | | | (6.57) | % |
| After expense reimbursement or recovery | | | | (1.72) | % | | | | (2.15) | % | | | | (2.33) | % | | | | (2.23) | % | | | | (2.65) | % |
| | | | | | | | | | | | | | | | | | | | | | | | | | |
Portfolio turnover rate(f) | | | | 105 | % | | | | 164 | % | | | | 55 | % | | | | 59 | % | | | | 60 | % |
| (a) | Net investment income (loss) per share is based on average shares outstanding. |
| (b) | Amount represents less than $0.005 per share. |
| (c) | Total return excludes the effect of applicable sales charges. |
| (d) | Ratios do not include the income and expenses of the CTAs included in the swap. |
| (e) | Includes interest expense on line of credit of 0.00%, 0.00% and 0.00% for the years ended December 31, 2016, December 31, 2015 and December 31, 2014, respectively. |
| (f) | Portfolio turnover rate is calculated on the basis of the Fund as a whole without distinguishing between classes of shares issued. Consists of long-term investments only; excludes derivative instruments. |
The accompanying notes are an integral part of these consolidated financial statements.
| |
| |
66 | LoCorr Long/Short Commodities Strategy Fund - Consolidated Financial Highlights - Class I |
| |
| |
LoCorr Long/Short Commodities Strategy Fund - Class I
Consolidated Financial Highlights
Selected Data and Ratios (for a share outstanding throughout the period)
| | | | | | | | | | | | | | | | | | | | | | | | | | |
| | | Year Ended |
| | | December 31, 2016 | | December 31, 2015 | | December 31, 2014 | | December 31, 2013 | | December 31, 2012 |
| | | | | | | | | | | | | | | | | | | | | | | | | | |
| Per Share | | | | | | | | | | | | | | | | | | | | | | | | | |
| Net asset value, beginning of year | | | $ | 9.79 | | | | $ | 8.59 | | | | $ | 7.70 | | | | $ | 8.38 | | | | $ | 10.00 | |
| | | | | | | | | | | | | | | | | | | | | | | | | | |
| Income (loss) from investment operations: | | | | | | | | | | | | | | | | | | | | | | | | | |
Net investment income (loss)(a) | | | | (0.07) | | | | | (0.11) | | | | | (0.12) | | | | | (0.10) | | | | | (0.15) | |
| Net realized and unrealized gain (loss) | | | | (0.18) | | | | | 2.03 | | | | | 1.86 | | | | | (0.58) | | | | | (1.47) | |
| Total from Investment Operations | | | | (0.25) | | | | | 1.92 | | | | | 1.74 | | | | | (0.68) | | | | | (1.62) | |
| | | | | | | | | | | | | | | | | | | | | | | | | | |
| Distributions to shareholders from: | | | | | | | | | | | | | | | | | | | | | | | | | |
| Net investment income | | | | (0.30) | | | | | (0.72) | | | | | (0.85) | | | | | — | | | | | — | |
| Total Distributions | | | | (0.30) | | | | | (0.72) | | | | | (0.85) | | | | | — | | | | | — | |
| | | | | | | | | | | | | | | | | | | | | | | | | | |
Redemption Fees(b) | | | | 0.00 | | | | | 0.00 | | | | | 0.00 | | | | | 0.00 | | | | | 0.00 | |
| | | | | | | | | | | | | | | | | | | | | | | | | | |
| Net Asset Value, End of Year | | | $ | 9.24 | | | | $ | 9.79 | | | | $ | 8.59 | | | | $ | 7.70 | | | | $ | 8.38 | |
| | | | | | | | | | | | | | | | | | | | | | | | | | |
| Total Investment Return | | | | (2.67) | % | | | | 22.61 | % | | | | 22.36 | % | | | | (8.11) | % | | | | (16.20) | % |
| | | | | | | | | | | | | | | | | | | | | | | | | | |
| Net Assets, End of Year, in Thousands | | | $ | 81,204 | | | | $ | 31,166 | | | | $ | 12,825 | | | | $ | 5,502 | | | | $ | 6,373 | |
| | | | | | | | | | | | | | | | | | | | | | | | | | |
Ratios/Supplemental Data:(c) | | | | | | | | | | | | | | | | | | | | | | | | | |
| Ratio of expenses to average net assets: | | | | | | | | | | | | | | | | | | | | | | | | | |
| Before expense reimbursement or recovery | | | | 1.97 | %(d) | | | | 2.34 | %(d) | | | | 2.76 | %(d) | | | | 3.93 | % | | | | 5.87 | % |
| After expense reimbursement or recovery | | | | 1.95 | %(d) | | | | 1.95 | %(d) | | | | 1.95 | %(d) | | | | 1.95 | % | | | | 1.95 | % |
| | | | | | | | | | | | | | | | | | | | | | | | | | |
| Ratio of net investment income (loss) to average net assets: | | | | | | | | | | | | | | | | | | | | | | | | | |
| Before expense reimbursement or recovery | | | | (0.74) | % | | | | (1.54) | % | | | | (2.14) | % | | | | (3.21) | % | | | | (5.57) | % |
| After expense reimbursement or recovery | | | | (0.72) | % | | | | (1.15) | % | | | | (1.33) | % | | | | (1.23) | % | | | | (1.65) | % |
| | | | | | | | | | | | | | | | | | | | | | | | | | |
Portfolio turnover rate(e) | | | | 105 | % | | | | 164 | % | | | | 55 | % | | | | 59 | % | | | | 60 | % |
| (a) | Net investment income (loss) per share is based on average shares outstanding. |
| (b) | Amount represents less than $0.005 per share. |
| (c) | Ratios do not include the income and expenses of the CTAs included in the swap. |
| (d) | Includes interest expense on line of credit of 0.00%, 0.00% and 0.00% for the years ended December 31, 2016, December 31, 2015 and December 31, 2014, respectively. |
| (e) | Portfolio turnover rate is calculated on the basis of the Fund as a whole without distinguishing between classes of shares issued. Consists of long-term investments only; excludes derivative instruments. |
The accompanying notes are an integral part of these consolidated financial statements.
| |
| |
LoCorr Multi-Strategy Fund - Consolidated Financial Highlights - Class A | 67 |
| |
| |
LoCorr Multi-Strategy Fund- Class A
Consolidated Financial Highlights
Selected Data and Ratios (for a share outstanding throughout the period)
| | | | | | | | | | | |
| | | Year Ended
December 31, 2016 | | Period from April 6, 2015
(commencement of operations)
through
December 31, 2015 (a) |
| | | | | | | | | | | |
| Per Share | | | | | | | | | | |
| Net asset value, beginning of period | | | $ | 8.31 | | | | $ | 10.00 | |
| | | | | | | | | | | |
| Income (loss) from investment operations: | | | | | | | | | | |
Net investment income (loss)(b) | | | | 0.06 | | | | | 0.07 | |
| Net realized and unrealized gain (loss) | | | | 0.06 | (c) | | | | (1.58) | |
| Total from Investment Operations | | | | 0.12 | | | | | (1.51) | |
| | | | | | | | | | | |
| Distributions to shareholders from: | | | | | | | | | | |
| Net investment income | | | | (0.09) | | | | | (0.09) | |
| Return of capital | | | | (0.19) | | | | | (0.09) | |
| Total Distributions | | | | (0.28) | | | | | (0.18) | |
| | | | | | | | | | | |
Redemption Fees(d) | | | | 0.00 | | | | | 0.00 | |
| | | | | | | | | | | |
| Net Asset Value, End of Period | | | $ | 8.15 | | | | $ | 8.31 | |
| | | | | | | | | | | |
Total Investment Return(e) | | | | 1.41 | % | | | | (15.14) | % |
| | | | | | | | | | | |
| Net Assets, End of Period, in Thousands | | | $ | 17,149 | | | | $ | 12,102 | |
| | | | | | | | | | | |
Ratios/Supplemental Data:(f)(g) | | | | | | | | | | |
| Ratio of expenses to average net assets: | | | | | | | | | | |
| Before expense reimbursement or recovery | | | | 2.84 | % | | | | 3.44 | % |
| After expense reimbursement or recovery | | | | 2.34 | % | | | | 2.30 | % |
| | | | | | | | | | | |
| Ratio of expenses to average net assets (excluding dividend and interest expense): | | | | | | | | | | |
| Before expense reimbursement or recovery | | | | 2.79 | % | | | | 3.43 | % |
| After expense reimbursement or recovery | | | | 2.29 | % | | | | 2.29 | % |
| | | | | | | | | | | |
| Ratio of net investment income (loss) to average net assets: | | | | | | | | | | |
| Before expense reimbursement or recovery | | | | 0.36 | % | | | | (0.04) | % |
| After expense reimbursement or recovery | | | | 0.86 | % | | | | 1.10 | % |
| | | | | | | | | | | |
Portfolio turnover rate(h) | | | | 95 | % | | | | 38 | % |
| (a) | All ratios have been annualized except total investment return and portfolio turnover. |
| (b) | Net investment income (loss) per share is based on average shares outstanding. |
| (c) | Realized and unrealized gains and losses in this caption are balancing amounts necessary to reconcile the change in net asset value per share for the period, and may not reconcile with the Fund’s consolidated statement of operations due to share transactions for the period. |
| (d) | Amount represents less than $0.005 per share. |
| (e) | Total return excludes the effect of applicable sales charges. |
| (f) | Ratios do not include the income and expenses of the CTAs included in the swap. |
| (g) | Ratios do not include the expenses of the investment companies in which the Fund invests. |
| (h) | Portfolio turnover rate is calculated on the basis of the Fund as a whole without distinguishing between classes of shares issued. Consists of long-term investments only; excludes securities sold short and swap transactions. |
The accompanying notes are an integral part of these consolidated financial statements.
| |
| |
68 | LoCorr Multi-Strategy Fund - Consolidated Financial Highlights - Class C |
| |
| |
LoCorr Multi-Strategy Fund- Class C
Consolidated Financial Highlights
Selected Data and Ratios (for a share outstanding throughout the period)
| | | | | | | |
| | | Year Ended
December 31, 2016 | | Period from April 6, 2015
(commencement of operations)
through
December 31, 2015 (a) |
| | | | | | | | | | | |
| Per Share | | | | | | | | | | |
| Net asset value, beginning of period | | | $ | 8.31 | | | | $ | 10.00 | |
| | | | | | | | | | | |
| Income (loss) from investment operations: | | | | | | | | | | |
Net investment income (loss)(b) | | | | 0.01 | | | | | 0.02 | |
| Net realized and unrealized gain (loss) | | | | 0.03 | (c) | | | | (1.58) | |
| Total from Investment Operations | | | | 0.04 | | | | | (1.56) | |
| | | | | | | | | | | |
| Distributions to shareholders from: | | | | | | | | | | |
| Net investment income | | | | (0.06) | | | | | (0.06) | |
| Return of capital | | | | (0.14) | | | | | (0.07) | |
| Total Distributions | | | | (0.20) | | | | | (0.13) | |
| | | | | | | | | | | |
Redemption Fees(d) | | | | 0.00 | | | | | 0.00 | |
| | | | | | | | | | | |
| Net Asset Value, End of Period | | | $ | 8.15 | | | | $ | 8.31 | |
| | | | | | | | | | | |
Total Investment Return(e) | | | | 0.49 | % | | | | (15.62) | % |
| | | | | | | | | | | |
| Net Assets, End of Period, in Thousands | | | $ | 3,899 | | | | $ | 5,490 | |
| | | | | | | | | | | |
Ratios/Supplemental Data:(f)(g) | | | | | | | | | | |
| Ratio of expenses to average net assets: | | | | | | | | | | |
| Before expense reimbursement or recovery | | | | 3.59 | % | | | | 4.19 | % |
| After expense reimbursement or recovery | | | | 3.09 | % | | | | 3.05 | % |
| | | | | | | | | | | |
| Ratio of expenses to average net assets (excluding dividend and interest expense): | | | | | | | | | | |
| Before expense reimbursement or recovery | | | | 3.54 | % | | | | 4.18 | % |
| After expense reimbursement or recovery | | | | 3.04 | % | | | | 3.04 | % |
| | | | | | | | | | | |
| Ratio of net investment income (loss) to average net assets: | | | | | | | | | | |
| Before expense reimbursement or recovery | | | | (0.39) | % | | | | (0.79) | % |
| After expense reimbursement or recovery | | | | 0.11 | % | | | | 0.35 | % |
| | | | | | | | | | | |
Portfolio turnover rate(h) | | | | 95 | % | | | | 38 | % |
| (a) | All ratios have been annualized except total investment return and portfolio turnover. |
| (b) | Net investment income (loss) per share is based on average shares outstanding. |
| (c) | Realized and unrealized gains and losses in this caption are balancing amounts necessary to reconcile the change in net asset value per share for the period, and may not reconcile with the Fund’s consolidated statement of operations due to share transactions for the period. |
| (d) | Amount represents less than $0.005 per share. |
| (e) | Total return excludes the effect of applicable sales charges. |
| (f) | Ratios do not include the income and expenses of the CTAs included in the swap. |
| (g) | Ratios do not include the expenses of the investment companies in which the Fund invests. |
| (h) | Portfolio turnover rate is calculated on the basis of the Fund as a whole without distinguishing between classes of shares issued. Consists of long-term investments only; excludes securities sold short and swap transactions. |
The accompanying notes are an integral part of these consolidated financial statements.
| |
| |
LoCorr Multi-Strategy Fund - Consolidated Financial Highlights - Class I | 69 |
| |
| |
LoCorr Multi-Strategy Fund- Class I
Consolidated Financial Highlights
Selected Data and Ratios (for a share outstanding throughout the period)
| | | | | | | | | | | |
| | | Year Ended
December 31, 2016 | | Period from April 6, 2015
(commencement of operations)
through
December 31, 2015 (a) |
| | | | | | | | | | | |
| Per Share | | | | | | | | | | |
| Net asset value, beginning of period | | | $ | 8.31 | | | | $ | 10.00 | |
| | | | | | | | | | | |
| Income (loss) from investment operations: | | | | | | | | | | |
Net investment income (loss)(b) | | | | 0.10 | | | | | 0.09 | |
| Net realized and unrealized gain (loss) | | | | 0.03 | (c) | | | | (1.58) | |
| Total from Investment Operations | | | | 0.13 | | | | | (1.49) | |
| | | | | | | | | | | |
| Distributions to shareholders from: | | | | | | | | | | |
| Net investment income | | | | (0.09) | | | | | (0.10) | |
| Return of capital | | | | (0.21) | | | | | (0.10) | |
| Total Distributions | | | | (0.30) | | | | | (0.20) | |
| | | | | | | | | | | |
Redemption Fees(d) | | | | 0.00 | | | | | 0.00 | |
| | | | | | | | | | | |
| Net Asset Value, End of Period | | | $ | 8.14 | | | | $ | 8.31 | |
| | | | | | | | | | | |
| Total Investment Return | | | | 1.60 | % | | | | (14.98) | % |
| | | | | | | | | | | |
| Net Assets, End of Period, in Thousands | | | $ | 18,285 | | | | $ | 16,562 | |
| | | | | | | | | | | |
Ratios/Supplemental Data:(e)(f) | | | | | | | | | | |
| Ratio of expenses to average net assets: | | | | | | | | | | |
| Before expense reimbursement or recovery | | | | 2.59 | % | | | | 3.19 | % |
| After expense reimbursement or recovery | | | | 2.09 | % | | | | 2.05 | % |
| | | | | | | | | | | |
| Ratio of expenses to average net assets (excluding dividend and interest expense): | | | | | | | | | | |
| Before expense reimbursement or recovery | | | | 2.54 | % | | | | 3.18 | % |
| After expense reimbursement or recovery | | | | 2.04 | % | | | | 2.04 | % |
| | | | | | | | | | | |
| Ratio of net investment income (loss) to average net assets: | | | | | | | | | | |
| Before expense reimbursement or recovery | | | | 0.61 | % | | | | 0.21 | % |
| After expense reimbursement or recovery | | | | 1.11 | % | | | | 1.35 | % |
| | | | | | | | | | | |
Portfolio turnover rate(g) | | | | 95 | % | | | | 38 | % |
| (a) | All ratios have been annualized except total investment return and portfolio turnover. |
| (b) | Net investment income (loss) per share is based on average shares outstanding. |
| (c) | Realized and unrealized gains and losses in this caption are balancing amounts necessary to reconcile the change in net asset value per share for the period, and may not reconcile with the Fund’s consolidated statement of operations due to share transactions for the period. |
| (d) | Amount represents less than $0.005 per share. |
| (e) | Ratios do not include the income and expenses of the CTAs included in the swap. |
| (f) | Ratios do not include the expenses of the investment companies in which the Fund invests. |
| (g) | Portfolio turnover rate is calculated on the basis of the Fund as a whole without distinguishing between classes of shares issued. Consists of long-term investments only; excludes securities sold short and swap transactions. |
The accompanying notes are an integral part of these consolidated financial statements.
| |
| |
70 | LoCorr Market Trend Fund - Consolidated Financial Highlights - Class A |
| |
| |
LoCorr Market Trend Fund- Class A
Consolidated Financial Highlights
Selected Data and Ratios (for a share outstanding throughout the period)
| | | | | | | | | | | | | | | | |
| | | | | | | | | | | | Period from July 1, 2014 | |
| | | | | | | | | | | | (commencement of operations) | |
| | | Year Ended | | through | |
| | | December 31, 2016 | | December 31, 2015 | | | December 31, 2014 (a) | |
| | | | | | | | | | | | | | | | |
| Per Share | | | | | | | | | | | | | | | |
| Net asset value, beginning of period | | | $ | 12.00 | | | $ | 11.44 | | | | $ | 10.00 | | |
| | | | | | | | | | | | | | | | |
| Income (loss) from investment operations: | | | | | | | | | | | | | | | |
Net investment income (loss)(b) | | | | (0.15) | | | | (0.19) | | | | | (0.12) | | |
| Net realized and unrealized gain (loss) | | | | (1.01) | | | | 0.84 | (c) | | | | 1.99 | | |
| Total from Investment Operations | | | | (1.16) | | | | 0.65 | | | | | 1.87 | | |
| | | | | | | | | | | | | | | | |
| Distributions to shareholders from: | | | | | | | | | | | | | | | |
| Net investment income | | | | (0.19) | | | | (0.07) | | | | | (0.25) | | |
| Net realized gains | | | | — | | | | (0.02) | | | | | (0.18) | | |
| Total Distributions | | | | (0.19) | | | | (0.09) | | | | | (0.43) | | |
| | | | | | | | | | | | | | | | |
Redemption Fees(d) | | | | 0.00 | | | | 0.00 | | | | | 0.00 | | |
| | | | | | | | | | | | | | | | |
| Net Asset Value, End of Period | | | $ | 10.65 | | | $ | 12.00 | | | | $ | 11.44 | | |
| | | | | | | | | | | | | | | | |
Total Investment Return(e) | | | | (9.71) | % | | | 5.68 | % | | | | 18.74 | % | |
| | | | | | | | | | | | | | | | |
| Net Assets, End of Period, in Thousands | | | $ | 133,146 | | | $ | 110,324 | | | | $ | 13,337 | | |
| | | | | | | | | | | | | | | | |
| Ratios/Supplemental Data: | | | | | | | | | | | | | | | |
| Ratio of expenses to average net assets: | | | | | | | | | | | | | | | |
| Before expense reimbursement or recovery | | | | 2.02 | %(f) | | | 2.03 | % | | | | 3.64 | % | |
| After expense reimbursement or recovery | | | | 2.02 | %(f) | | | 2.06 | % | | | | 2.20 | % | |
| | | | | | | | | | | | | | | | |
| Ratio of net investment income (loss) to average net assets: | | | | | | | | | | | | | | | |
| Before expense reimbursement or recovery | | | | (1.24) | % | | | (1.49) | % | | | | (3.48) | % | |
| After expense reimbursement or recovery | | | | (1.24) | % | | | (1.52) | % | | | | (2.04) | % | |
| | | | | | | | | | | | | | | | |
Portfolio turnover rate(g) | | | | 83 | % | | | 27 | % | | | | 6 | % | |
| (a) | All ratios have been annualized except total investment return and portfolio turnover. |
| (b) | Net investment income (loss) per share is based on average shares outstanding. |
| (c) | Realized and unrealized gains and losses per share in this caption are balancing amounts necessary to reconcile the change in net asset value per share for the period, and may not reconcile with the Fund’s consolidated statement of operations due to share transactions for the period. |
| (d) | Amount represents less than $0.005 per share. |
| (e) | Total return excludes the effect of applicable sales charges. |
| (f) | Includes interest expense of 0.00% for the year ended December 31, 2016. |
| (g) | Portfolio turnover rate is calculated on the basis of the Fund as a whole without distinguishing between classes of shares issued. Consists of long-term investments only; excludes derivative instruments. |
The accompanying notes are an integral part of these consolidated financial statements.
| |
| |
LoCorr Market Trend Fund - Consolidated Financial Highlights - Class C | 71 |
| |
| |
LoCorr Market Trend Fund- Class C
Consolidated Financial Highlights
Selected Data and Ratios (for a share outstanding throughout the period)
| | | | | | | | | | | | | | | | |
| | | | | | | | Period from July 1, 2014 | |
| | | | | | | | (commencement of operations) | |
| | | Year Ended | | through | |
| | | December 31, 2016 | | December 31, 2015 | | | December 31, 2014 (a) | |
| | | | | | | | | | | | | | | | |
| Per Share | | | | | | | | | | | | | | | |
| Net asset value, beginning of period | | | $ | 11.92 | | | $ | 11.41 | | | | $ | 10.00 | | |
| | | | | | | | | | | | | | | | |
| Income (loss) from investment operations: | | | | | | | | | | | | | | | |
Net investment income (loss)(b) | | | | (0.23) | | | | (0.28) | | | | | (0.16) | | |
| Net realized and unrealized gain (loss) | | | | (1.01) | | | | 0.84 | (c) | | | | 1.99 | | |
| Total from Investment Operations | | | | (1.24) | | | | 0.56 | | | | | 1.83 | | |
| | | | | | | | | | | | | | | | |
| Distributions to shareholders from: | | | | | | | | | | | | | | | |
| Net investment income | | | | (0.15) | | | | (0.03) | | | | | (0.24) | | |
| Net realized gains | | | | — | | | | (0.02) | | | | | (0.18) | | |
| Total Distributions | | | | (0.15) | | | | (0.05) | | | | | (0.42) | | |
| | | | | | | | | | | | | | | | |
Redemption Fees(d) | | | | 0.00 | | | | 0.00 | | | | | 0.00 | | |
| | | | | | | | | | | | | | | | |
| Net Asset Value, End of Period | | | $ | 10.53 | | | $ | 11.92 | | | | $ | 11.41 | | |
| | | | | | | | | | | | | | | | |
Total Investment Return(e) | | | | (10.45) | % | | | 4.90 | % | | | | 18.29 | % | |
| | | | | | | | | | | | | | | | |
| Net Assets, End of Period, in Thousands | | | $ | 89,454 | | | $ | 94,707 | | | | $ | 6,949 | | |
| | | | | | | | | | | | | | | | |
| Ratios/Supplemental Data: | | | | | | | | | | | | | | | |
| Ratio of expenses to average net assets: | | | | | | | | | | | | | | | |
| Before expense reimbursement or recovery | | | | 2.77 | %(f) | | | 2.78 | % | | | | 4.39 | % | |
| After expense reimbursement or recovery | | | | 2.77 | %(f) | | | 2.81 | % | | | | 2.95 | % | |
| | | | | �� | | | | | | | | | | | |
| Ratio of net investment income (loss) to average net assets: | | | | | | | | | | | | | | | |
| Before expense reimbursement or recovery | | | | (1.99) | % | | | (2.24) | % | | | | (4.23) | % | |
| After expense reimbursement or recovery | | | | (1.99) | % | | | (2.27) | % | | | | (2.79) | % | |
| | | | | | | | | | | | | | | | |
Portfolio turnover rate(g) | | | | 83 | % | | | 27 | % | | | | 6 | % | |
| (a) | All ratios have been annualized except total investment return and portfolio turnover. |
| (b) | Net investment income (loss) per share is based on average shares outstanding. |
| (c) | Realized and unrealized gains and losses per share in this caption are balancing amounts necessary to reconcile the change in net asset value per share for the period, and may not reconcile with the Fund’s consolidated statement of operations due to share transactions for the period. |
| (d) | Amount represents less than $0.005 per share. |
| (e) | Total return excludes the effect of applicable sales charges. |
| (f) | Includes interest expense of 0.00% for the year ended December 31, 2016. |
| (g) | Portfolio turnover rate is calculated on the basis of the Fund as a whole without distinguishing between classes of shares issued. Consists of long-term investments only; excludes derivative instruments. |
The accompanying notes are an integral part of these consolidated financial statements.
| |
| |
72 | LoCorr Market Trend Fund - Consolidated Financial Highlights - Class I |
| |
| |
LoCorr Market Trend Fund- Class I
Consolidated Financial Highlights
Selected Data and Ratios (for a share outstanding throughout the period)
| | | | | | | | | | | | | | | | |
| | | | | | | | Period from July 1, 2014 | |
| | | | | | | | (commencement of operations) | |
| | | Year Ended | | through | |
| | | December 31, 2016 | | December 31, 2015 | | | December 31, 2014 (a) | |
| | | | | | | | | | | | | | | | |
| Per Share | | | | | | | | | | | | | | | |
| Net asset value, beginning of period | | | $ | 12.02 | | | $ | 11.45 | | | | $ | 10.00 | | |
| | | | | | | | | | | | | | | | |
| Income (loss) from investment operations: | | | | | | | | | | | | | | | |
Net investment income (loss)(b) | | | | (0.12) | | | | (0.16) | | | | | (0.10) | | |
| Net realized and unrealized gain (loss) | | | | (1.02) | | | | 0.84 | (c) | | | | 1.99 | | |
| Total from Investment Operations | | | | (1.14) | | | | 0.68 | | | | | 1.89 | | |
| | | | | | | | | | | | | | | | |
| Distributions to shareholders from: | | | | | | | | | | | | | | | |
| Net investment income | | | | (0.20) | | | | (0.09) | | | | | (0.26) | | |
| Net realized gains | | | | — | | | | (0.02) | | | | | (0.18) | | |
| Total Distributions | | | | (0.20) | | | | (0.11) | | | | | (0.44) | | |
| | | | | | | | | | | | | | | | |
Redemption Fees(d) | | | | 0.00 | | | | 0.00 | | | | | 0.00 | | |
| | | | | | | | | | | | | | | | |
| Net Asset Value, End of Period | | | $ | 10.68 | | | $ | 12.02 | | | | $ | 11.45 | | |
| | | | | | | | | | | | | | | | |
| Total Investment Return | | | | (9.49) | % | | | 5.96 | % | | | | 18.88 | % | |
| | | | | | | | | | | | | | | | |
| Net Assets, End of Period, in Thousands | | | $ | 797,845 | | | $ | 695,987 | | | | $ | 40,192 | | |
| | | | | | | | | | | | | | | | |
| Ratios/Supplemental Data: | | | | | | | | | | | | | | | |
| Ratio of expenses to average net assets: | | | | | | | | | | | | | | | |
| Before expense reimbursement or recovery | | | | 1.77 | %(e) | | | 1.78 | % | | | | 3.39 | % | |
| After expense reimbursement or recovery | | | | 1.77 | %(e) | | | 1.81 | % | | | | 1.95 | % | |
| | | | | | | | | | | | | | | | |
| Ratio of net investment income (loss) to average net assets: | | | | | | | | | | | | | | | |
| Before expense reimbursement or recovery | | | | (0.99) | % | | | (1.24) | % | | | | (3.23) | % | |
| After expense reimbursement or recovery | | | | (0.99) | % | | | (1.27) | % | | | | (1.79) | % | |
| | | | | | | | | | | | | | | | |
Portfolio turnover rate(f) | | | | 83 | % | | | 27 | % | | | | 6 | % | |
| (a) | All ratios have been annualized except total investment return and portfolio turnover. |
| (b) | Net investment income (loss) per share is based on average shares outstanding. |
| (c) | Realized and unrealized gains and losses per share in this caption are balancing amounts necessary to reconcile the change in net asset value per share for the period, and may not reconcile with the Fund’s consolidated statement of operations due to share transactions for the period. |
| (d) | Amount represents less than $0.005 per share. |
| (e) | Includes interest expense of 0.00% for the year ended December 31, 2016. |
| (f) | Portfolio turnover rate is calculated on the basis of the Fund as a whole without distinguishing between classes of shares issued. Consists of long-term investments only; excludes derivative instruments. |
The accompanying notes are an integral part of these consolidated financial statements.
| |
| |
LoCorr Long/Short Equity Fund - Financial Highlights - Class A | 73 |
| |
| |
LoCorr Long/Short Equity Fund- Class A
Financial Highlights
Selected Data and Ratios (for a share outstanding throughout the period)
| | | | | | | | | | | | | | | | | | | | |
| | | | | | | | | | | | Period from May 10, 2013 | |
| | | | | | | | | | | | (commencement of operations) | |
| | | Year Ended | | through | |
| | | December 31, 2016 | | December 31, 2015 | | December 31, 2014 | | | December 31, 2013 (a) | |
| | | | | | | | | | | | | | | | | | | | |
| Per Share | | | | | | | | | | | | | | | | | | | |
| Net asset value, beginning of period | | | $ | 9.64 | | | $ | 9.80 | | | $ | 11.48 | | | | $ | 10.00 | | |
| | | | | | | | | | | | | | | | | | | | |
| Income (loss) from investment operations: | | | | | | | | | | | | | | | | | | | |
Net investment income (loss)(b) | | | | (0.32) | | | | (0.27) | | | | (0.22) | | | | | (0.13) | | |
| Net realized and unrealized gain (loss) | | | | 2.74 | | | | 0.11 | | | | (1.42) | | | | | 1.61 | | |
| Total from Investment Operations | | | | 2.42 | | | | (0.16) | | | | (1.64) | | | | | 1.48 | | |
| | | | | | | | | | | | | | | | | | | | |
| Distributions to shareholders from: | | | | | | | | | | | | | | | | | | | |
| Net realized gains | | | | — | | | | — | | | | (0.04) | | | | | — | | |
| Total Distributions | | | | — | | | | — | | | | (0.04) | | | | | — | | |
| | | | | | | | | | | | | | | | | | | | |
Redemption Fees(c) | | | | 0.00 | | | | 0.00 | | | | 0.00 | | | | | 0.00 | | |
| | | | | | | | | | | | | | | | | | | | |
| Net Asset Value, End of Period | | | $ | 12.06 | | | $ | 9.64 | | | $ | 9.80 | | | | $ | 11.48 | | |
| | | | | | | | | | | | | | | | | | | | |
Total Investment Return(d) | | | | 25.10 | % | | | (1.53) | % | | | (14.37) | % | | | | 14.80 | % | |
| | | | | | | | | | | | | | | | | | | | |
| Net Assets, End of Period, in Thousands | | | $ | 28,243 | | | $ | 12,446 | | | $ | 17,174 | | | | $ | 21,256 | | |
| | | | | | | | | | | | | | | | | | | | |
| Ratios/Supplemental Data: | | | | | | | | | | | | | | | | | | | |
| Ratio of expenses to average net assets: | | | | | | | | | | | | | | | | | | | |
| Before expense reimbursement or recovery | | | | 3.74 | % | | | 3.72 | % | | | 3.55 | % | | | | 5.05 | % | |
| After expense reimbursement or recovery | | | | 3.49 | % | | | 3.35 | % | | | 3.30 | % | | | | 3.26 | % | |
| | | | | | | | | | | | | | | | | | | | |
| Ratio of expenses to average net assets (excluding dividend and interest expense): | | | | | | | | | | | | | |
| Before expense reimbursement or recovery | | | | 3.40 | % | | | 3.52 | % | | | 3.40 | % | | | | 4.94 | % | |
| After expense reimbursement or recovery | | | | 3.15 | % | | | 3.15 | % | | | 3.15 | % | | | | 3.15 | % | |
| | | | | | | | | | | | | | | | | | | | |
| Ratio of net investment income (loss) to average net assets: | | | | | | | | | | | | | | | |
| Before expense reimbursement or recovery | | | | (3.23) | % | | | (3.06) | % | | | (2.41) | % | | | | (3.64) | % | |
| After expense reimbursement or recovery | | | | (2.98) | % | | | (2.69) | % | | | (2.16) | % | | | | (1.85) | % | |
| | | | | | | | | | | | | | | | | | | | |
Portfolio turnover rate(e) | | | | 343 | % | | | 269 | % | | | 256 | % | | | | 66 | % | |
| (a) | All ratios have been annualized except total investment return and portfolio turnover. |
| (b) | Net investment income (loss) per share is based on average shares outstanding. |
| (c) | Amount represents less than $0.005 per share. |
| (d) | Total return excludes the effect of applicable sales charges. |
| (e) | Portfolio turnover rate is calculated on the basis of the Fund as a whole without distinguishing between classes of shares issued. Consists of long-term investments only; excludes securities sold short. |
The accompanying notes are an integral part of these financial statements.
| |
| |
74 | LoCorr Long/Short Equity Fund - Financial Highlights - Class C |
| |
| |
LoCorr Long/Short Equity Fund- Class C
Financial Highlights
Selected Data and Ratios (for a share outstanding throughout the period)
| | | | | | | | | | | | | | | | | | | | |
| | | | | | | | | | | | Period from May 10, 2013 | |
| | | | | | | | | | | | (commencement of operations) | |
| | | Year Ended | | through | |
| | | December 31, 2016 | | December 31, 2015 | | December 31, 2014 | | | December 31, 2013 (a) | |
| | | | | | | | | | | | | | | | | | | | |
| Per Share | | | | | | | | | | | | | | | | | | | |
| Net asset value, beginning of period | | | $ | 9.45 | | | $ | 9.67 | | | $ | 11.42 | | | | $ | 10.00 | | |
| | | | | | | | | | | | | | | | | | | | |
| Income (loss) from investment operations: | | | | | | | | | | | | | | | | | | | |
Net investment income (loss)(b) | | | | (0.38) | | | | (0.33) | | | | (0.29) | | | | | (0.18) | | |
| Net realized and unrealized gain (loss) | | | | 2.66 | | | | 0.11 | | | | (1.42) | | | | | 1.60 | | |
| Total from Investment Operations | | | | 2.28 | | | | (0.22) | | | | (1.71) | | | | | 1.42 | | |
| | | | | | | | | | | | | | | | | | | | |
| Distributions to shareholders from: | | | | | | | | | | | | | | | | | | | |
| Net realized gains | | | | — | | | | — | | | | (0.04) | | | | | — | | |
| Total Distributions | | | | — | | | | — | | | | (0.04) | | | | | — | | |
| | | | | | | | | | | | | | | | | | | | |
| Redemption Fees | | | | 0.00 | (c) | | | 0.00 | (c) | | | 0.00 | (c) | | | | — | | |
| | | | | | | | | | | | | | | | | | | | |
| Net Asset Value, End of Period | | | $ | 11.73 | | | $ | 9.45 | | | $ | 9.67 | | | | $ | 11.42 | | |
| | | | | | | | | | | | | | | | | | | | |
Total Investment Return(d) | | | | 24.13 | % | | | (2.28) | % | | | (14.98) | % | | | | 14.20 | % | |
| | | | | | | | | | | | | | | | | | | | |
| Net Assets, End of Period, in Thousands | | | $ | 11,218 | | | $ | 7,837 | | | $ | 12,158 | | | | $ | 8,443 | | |
| | | | | | | | | | | | | | | | | | | | |
| Ratios/Supplemental Data: | | | | | | | | | | | | | | | | | | | |
| Ratio of expenses to average net assets: | | | | | | | | | | | | | | | | | | | |
| Before expense reimbursement or recovery | | | | 4.49 | % | | | 4.47 | % | | | 4.30 | % | | | | 5.80 | % | |
| After expense reimbursement or recovery | | | | 4.24 | % | | | 4.10 | % | | | 4.05 | % | | | | 4.01 | % | |
| | | | | | | | | | | | | | | | | | | | |
| Ratio of expenses to average net assets (excluding dividend and interest expense): | | | | | | | | | | | | | | |
| Before expense reimbursement or recovery | | | | 4.15 | % | | | 4.27 | % | | | 4.15 | % | | | | 5.69 | % | |
| After expense reimbursement or recovery | | | | 3.90 | % | | | 3.90 | % | | | 3.90 | % | | | | 3.90 | % | |
| | | | | | | | | | | | | | | | | | | | |
| Ratio of net investment income (loss) to average net assets: | | | | | | | | | | | | | | |
| Before expense reimbursement or recovery | | | | (3.98) | % | | | (3.81) | % | | | (3.16) | % | | | | (4.39) | % | |
| After expense reimbursement or recovery | | | | (3.73) | % | | | (3.44) | % | | | (2.91) | % | | | | (2.60) | % | |
| | | | | | | | | | | | | | | | | | | | |
Portfolio turnover rate(e) | | | | 343 | % | | | 269 | % | | | 256 | % | | | | 66 | % | |
| (a) | All ratios have been annualized except total investment return and portfolio turnover. |
| (b) | Net investment income (loss) per share is based on average shares outstanding. |
| (c) | Amount represents less than $0.005 per share. |
| (d) | Total return excludes the effect of applicable sales charges. |
| (e) | Portfolio turnover rate is calculated on the basis of the Fund as a whole without distinguishing between classes of shares issued. Consists of long-term investments only; excludes securities sold short. |
The accompanying notes are an integral part of these financial statements.
| |
| |
LoCorr Long/Short Equity Fund - Financial Highlights - Class I | 75 |
| |
| |
LoCorr Long/Short Equity Fund - Class I
Financial Highlights
Selected Data and Ratios (for a share outstanding throughout the period)
| | | | | | | | | | | | | | | | | | | | |
| | | | | | | | | | | | Period from May 10, 2013 | |
| | | | | | | | | | | | (commencement of operations) | |
| | | Year Ended | | through | |
| | | December 31, 2016 | | December 31, 2015 | | December 31, 2014 | | | December 31, 2013 (a) | |
| | | | | | | | | | | | | | | | | | | | |
| Per Share | | | | | | | | | | | | | | | | | | | |
| Net asset value, beginning of period | | | $ | 9.71 | | | $ | 9.84 | | | $ | 11.50 | | | | $ | 10.00 | | |
| | | | | | | | | | | | | | | | | | | | |
| Income (loss) from investment operations: | | | | | | | | | | | | | | | | | | | |
Net investment income (loss)(b) | | | | (0.30) | | | | (0.24) | | | | (0.20) | | | | | (0.11) | | |
| Net realized and unrealized gain (loss) | | | | 2.76 | | | | 0.11 | | | | (1.42) | | | | | 1.61 | | |
| Total from Investment Operations | | | | 2.46 | | | | (0.13) | | | | (1.62) | | | | | 1.50 | | |
| | | | | | | | | | | | | | | | | | | | |
| Distributions to shareholders from: | | | | | | | | | | | | | | | | | | | |
| Net realized gains | | | | — | | | | — | | | | (0.04) | | | | | — | | |
| Total Distributions | | | | — | | | | — | | | | (0.04) | | | | | — | | |
| | | | | | | | | | | | | | | | | | | | |
Redemption Fees(c) | | | | 0.00 | | | | 0.00 | | | | 0.00 | | | | | 0.00 | | |
| | | | | | | | | | | | | | | | | | | | |
| Net Asset Value, End of Period | | | $ | 12.17 | | | $ | 9.71 | | | $ | 9.84 | | | | $ | 11.50 | | |
| | | | | | | | | | | | | | | | | | | | |
| Total Investment Return | | | | 25.33 | % | | | (1.22) | % | | | (14.18) | % | | | | 15.00 | % | |
| | | | | | | | | | | | | | | | | | | | |
| Net Assets, End of Period, in Thousands | | | $ | 44,816 | | | $ | 9,990 | | | $ | 12,304 | | | | $ | 12,361 | | |
| | | | | | | | | | | | | | | | | | | | |
| Ratios/Supplemental Data: | | | | | | | | | | | | | | | | | | | |
| Ratio of expenses to average net assets: | | | | | | | | | | | | | | | | | | | |
| Before expense reimbursement or recovery | | | | 3.49 | % | | | 3.47 | % | | | 3.30 | % | | | | 4.80 | % | |
| After expense reimbursement or recovery | | | | 3.24 | % | | | 3.10 | % | | | 3.05 | % | | | | 3.01 | % | |
| | | | | | | | | | | | | | | | | | | | |
Ratio of expenses to average net assets (excluding dividend and interest expense): | | | | | | | | | | | | | | |
| Before expense reimbursement or recovery | | | | 3.15 | % | | | 3.27 | % | | | 3.15 | % | | | | 4.69 | % | |
| After expense reimbursement or recovery | | | | 2.90 | % | | | 2.90 | % | | | 2.90 | % | | | | 2.90 | % | |
| | | | | | | | | | | | | | | | | | | | |
| Ratio of net investment income (loss) to average net assets: | | | | | | | | | | | | | | |
| Before expense reimbursement or recovery | | | | (2.98) | % | | | (2.81) | % | | | (2.16) | % | | | | (3.39) | % | |
| After expense reimbursement or recovery | | | | (2.73) | % | | | (2.44) | % | | | (1.91) | % | | | | (1.60) | % | |
| | | | | | | | | | | | | | | | | | | | |
Portfolio turnover rate(d) | | | | 343 | % | | | 269 | % | | | 256 | % | | | | 66 | % | |
| (a) | All ratios have been annualized except total investment return and portfolio turnover. |
| (b) | Net investment income (loss) per share is based on average shares outstanding. |
| (c) | Amount represents less than $0.005 per share. |
| (d) | Portfolio turnover rate is calculated on the basis of the Fund as a whole without distinguishing between classes of shares issued. Consists of long-term investments only; excludes securities sold short. |
The accompanying notes are an integral part of these financial statements.
| |
| |
76 | LoCorr Spectrum Income Fund - Financial Highlights - Class A |
| |
| |
LoCorr Spectrum Income Fund - Class A
Financial Highlights
Selected Data and Ratios (for a share outstanding throughout the period)
| | | | | | | | | | | | | | | | |
| | | Year Ended |
| | | December 31, 2016 | | December 31, 2015 | | December 31, 2014 |
| | | | | | | | | | | | | | | | |
| Per Share | | | | | | | | | | | | | | | |
| Net asset value, beginning of year | | | $ | 7.78 | | | | $ | 8.97 | | | | $ | 10.00 | |
| | | | | | | | | | | | | | | | |
| Income (loss) from investment operations: | | | | | | | | | | | | | | | |
Net investment income (loss)(a) | | | | 0.29 | | | | | 0.38 | | | | | 0.41 | |
| Net realized and unrealized gain (loss) | | | | 0.20 | | | | | (1.00) | | | | | (0.91) | |
| Total from Investment Operations | | | | 0.49 | | | | | (0.62) | | | | | (0.50) | |
| | | | | | | | | | | | | | | | |
| Distributions to shareholders from: | | | | | | | | | | | | | | | |
| Net investment income | | | | (0.37) | | | | | (0.39) | | | | | (0.36) | |
| Return of capital | | | | (0.20) | | | | | (0.18) | | | | | (0.17) | |
| Total Distributions | | | | (0.57) | | | | | (0.57) | | | | | (0.53) | |
| | | | | | | | | | | | | | | | |
Redemption Fees(b) | | | | 0.00 | | | | | 0.00 | | | | | 0.00 | |
| | | | | | | | | | | | | | | | |
| Net Asset Value, End of Year | | | $ | 7.70 | | | | $ | 7.78 | | | | $ | 8.97 | |
| | | | | | | | | | | | | | | | |
Total Investment Return(c) | | | | 6.64 | % | | | | (7.36) | % | | | | (5.45) | % |
| | | | | | | | | | | | | | | | |
| Net Assets, End of Year, in Thousands | | | $ | 33,032 | | | | $ | 36,957 | | | | $ | 37,425 | |
| | | | | | | | | | | | | | | | |
Ratios/Supplemental Data:(d) | | | | | | | | | | | | | | | |
| Ratio of expenses to average net assets: | | | | | | | | | | | | | | | |
| Before expense reimbursement or recovery | | | | 2.02 | % | | | | 1.99 | %(e) | | | | 2.28 | %(e) |
| After expense reimbursement or recovery | | | | 2.05 | % | | | | 2.05 | %(e) | | | | 2.05 | %(e) |
| | | | | | | | | | | | | | | | |
| Ratio of net investment income (loss) to average net assets: | | | | | | | | | | | | | | | |
| Before expense reimbursement or recovery | | | | 3.81 | % | | | | 4.41 | % | | | | 3.88 | % |
| After expense reimbursement or recovery | | | | 3.78 | % | | | | 4.35 | % | | | | 4.11 | % |
| | | | | | | | | | | | | | | | |
Portfolio turnover rate(f) | | | | 92 | % | | | | 54 | % | | | | 43 | % |
| (a) | Net investment income (loss) per share is based on average shares outstanding. |
| (b) | Amount represents less than $0.005 per share. |
| (c) | Total return excludes the effect of applicable sales charges. |
| (d) | Ratios do not include the expenses of the investment companies in which the Fund invests. |
| (e) | Includes interest expense on line of credit of 0.00% and 0.00% for the years ended December 31, 2015 and December 31, 2014, respectively. |
| (f) | Portfolio turnover rate is calculated on the basis of the Fund as a whole without distinguishing between classes of shares issued. |
The accompanying notes are an integral part of these financial statements.
| |
| |
LoCorr Spectrum Income Fund - Financial Highlights - Class C | 77 |
| |
| |
LoCorr Spectrum Income Fund - Class C
Financial Highlights
Selected Data and Ratios (for a share outstanding throughout the period)
| | | | | | | | | | |
| | | Year Ended |
| | | December 31, 2016 | | December 31, 2015 | | December 31, 2014 |
| | | | | | | |
| | | | | | | | | | | | | | | | |
| Per Share | | | | | | | | | | | | | | | |
| Net asset value, beginning of year | | | $ | 7.78 | | | | $ | 8.96 | | | | $ | 10.00 | |
| | | | | | | | | | | | | | | | |
| Income (loss) from investment operations: | | | | | | | | | | | | | | | |
Net investment income (loss)(a) | | | | 0.23 | | | | | 0.32 | | | | | 0.33 | |
| Net realized and unrealized gain (loss) | | | | 0.21 | | | | | (1.00) | | | | | (0.91) | |
| Total from Investment Operations | | | | 0.44 | | | | | (0.68) | | | | | (0.58) | |
| | | | | | | | | | | | | | | | |
| Distributions to shareholders from: | | | | | | | | | | | | | | | |
| Net investment income | | | | (0.33) | | | | | (0.34) | | | | | (0.31) | |
| Return of capital | | | | (0.17) | | | | | (0.16) | | | | | (0.15) | |
| Total Distributions | | | | (0.50) | | | | | (0.50) | | | | | (0.46) | |
| | | | | | | | | | | | | | | | |
Redemption Fees(b) | | | | 0.00 | | | | | 0.00 | | | | | 0.00 | |
| | | | | | | | | | | | | | | | |
| Net Asset Value, End of Year | | | $ | 7.72 | | | | $ | 7.78 | | | | $ | 8.96 | |
| | | | | | | | | | | | | | | | |
Total Investment Return(c) | | | | 5.88 | % | | | | (8.05) | % | | | | (6.19) | % |
| | | | | | | | | | | | | | | | |
| Net Assets, End of Year, in Thousands | | | $ | 25,898 | | | | $ | 27,817 | | | | $ | 25,210 | |
| | | | | | | | | | | | | | | | |
Ratios/Supplemental Data:(d) | | | | | | | | | | | | | | | |
| Ratio of expenses to average net assets: | | | | | | | | | | | | | | | |
| Before expense reimbursement or recovery | | | | 2.77 | % | | | | 2.74 | %(e) | | | | 3.03 | %(e) |
| After expense reimbursement or recovery | | | | 2.80 | % | | | | 2.80 | %(e) | | | | 2.80 | %(e) |
| | | | | | | | | | | | | | | | |
| Ratio of net investment income (loss) to average net assets: | | | | | | | | | | | | | | | |
| Before expense reimbursement or recovery | | | | 3.06 | % | | | | 3.66 | % | | | | 3.13 | % |
| After expense reimbursement or recovery | | | | 3.03 | % | | | | 3.60 | % | | | | 3.36 | % |
| | | | | | | | | | | | | | | | |
Portfolio turnover rate(f) | | | | 92 | % | | | | 54 | % | | | | 43 | % |
| (a) | Net investment income (loss) per share is based on average shares outstanding. |
| (b) | Amount represents less than $0.005 per share. |
| (c) | Total return excludes the effect of applicable sales charges. |
| (d) | Ratios do not include the expenses of the investment companies in which the Fund invests. |
| (e) | Includes interest expense on line of credit of 0.00% and 0.00% for the years ended December 31, 2015 and December 31, 2014, respectively. |
| (f) | Portfolio turnover rate is calculated on the basis of the Fund as a whole without distinguishing between classes of shares issued. |
The accompanying notes are an integral part of these financial statements.
| |
| |
78 | LoCorr Spectrum Income Fund - Financial Highlights - Class I |
| |
| |
LoCorr Spectrum Income Fund - Class I
Financial Highlights
Selected Data and Ratios (for a share outstanding throughout the period)
| | | | | | | | | | | | | | | | |
| | | Year Ended |
| | | December 31, 2016 | | December 31, 2015 | | December 31, 2014 |
| | | | | | | |
| | | | | | | | | | | | | | | | |
| Per Share | | | | | | | | | | | | | | | |
| Net asset value, beginning of year | | | $ | 7.78 | | | | $ | 8.97 | | | | $ | 10.00 | |
| | | | | | | | | | | | | | | | |
| Income (loss) from investment operations: | | | | | | | | | | | | | | | |
Net investment income (loss)(a) | | | | 0.31 | | | | | 0.41 | | | | | 0.43 | |
| Net realized and unrealized gain (loss) | | | | 0.20 | | | | | (1.00) | | | | | (0.91) | |
| Total from Investment Operations | | | | 0.51 | | | | | (0.59) | | | | | (0.48) | |
| | | | | | | | | | | | | | | | |
| Distributions to shareholders from: | | | | | | | | | | | | | | | |
| Net investment income | | | | (0.39) | | | | | (0.41) | | | | | (0.38) | |
| Return of capital | | | | (0.21) | | | | | (0.19) | | | | | (0.17) | |
| Total Distributions | | | | (0.60) | | | | | (0.60) | | | | | (0.55) | |
| | | | | | | | | | | | | | | | |
Redemption Fees(b) | | | | 0.00 | | | | | 0.00 | | | | | 0.00 | |
| | | | | | | | | | | | | | | | |
| Net Asset Value, End of Year | | | $ | 7.69 | | | | $ | 7.78 | | | | $ | 8.97 | |
| | | | | | | | | | | | | | | | |
| Total Investment Return | | | | 6.85% | | | | | (7.10)% | | | | | (5.23)% | |
| | | | | | | | | | | | | | | | |
| Net Assets, End of Year, in Thousands | | | $ | 46,838 | | | | $ | 28,292 | | | | $ | 31,428 | |
| | | | | | | | | | | | | | | | |
Ratios/Supplemental Data:(c) | | | | | | | | | | | | | | | |
| Ratio of expenses to average net assets: | | | | | | | | | | | | | | | |
| Before expense reimbursement or recovery | | | | 1.77 | % | | | | 1.74 | %(d) | | | | 2.03 | %(d) |
| After expense reimbursement or recovery | | | | 1.80 | % | | | | 1.80 | %(d) | | | | 1.80 | %(d) |
| | | | | | | | | | | | | | | | |
| Ratio of net investment income (loss) to average net assets: | | | | | | | | | | | | | | | |
| Before expense reimbursement or recovery | | | | 4.06 | % | | | | 4.66 | % | | | | 4.13 | % |
| After expense reimbursement or recovery | | | | 4.03 | % | | | | 4.60 | % | | | | 4.36 | % |
| | | | | | | | | | | | | | | | |
Portfolio turnover rate(e) | | | | 92 | % | | | | 54 | % | | | | 43 | % |
| (a) | Net investment income (loss) per share is based on average shares outstanding. |
| (b) | Amount represents less than $0.005 per share. |
| (c) | Ratios do not include the expenses of the investment companies in which the Fund invests. |
| (d) | Includes interest expense on line of credit of 0.00% and 0.00% for the years ended December 31, 2015 and December 31, 2014, respectively. |
| (e) | Portfolio turnover rate is calculated on the basis of the Fund as a whole without distinguishing between classes of shares issued. |
The accompanying notes are an integral part of these financial statements.
| |
| |
| LoCorr Managed Futures Strategy Fund, LoCorr Long/Short Commodities Strategy Fund, LoCorr Multi-Strategy Fund and LoCorr Market Trend Fund – Notes to Consolidated Financial Statements / LoCorr Long/Short Equity Fund and LoCorr Spectrum Income Fund – Notes to Financial Statements | | 79 |
| |
LoCorr Investment Trust
Notes
December 31, 2016
1. Organization
LoCorr Investment Trust (the “Trust”), an Ohio business trust, was formed on November 15, 2010 and is an open-end management investment company registered under the Investment Company Act of 1940, as amended (“1940 Act”). Each Fund is an investment company and accordingly follows the investment company accounting and reporting guidance of the Financial Accounting Standards Board (“FASB”) Accounting Standards Codification Topic 946 “Financial Services - Investment Companies.” The LoCorr Managed Futures Strategy Fund, LoCorr Long/Short Commodities Strategy Fund, LoCorr Multi-Strategy Fund, LoCorr Market Trend Fund, LoCorr Long/Short Equity Fund and the LoCorr Spectrum Income Fund (individually a “Fund” and collectively the “Funds”) are series within the Trust. The LoCorr Long/Short Commodities Strategy Fund, the LoCorr Multi-Strategy Fund, the LoCorr Market Trend Fund, the LoCorr Long/Short Equity Fund and the LoCorr Spectrum Income Fund are each non-diversified funds and the LoCorr Managed Futures Strategy Fund is a diversified fund.
The LoCorr Managed Futures Strategy Fund’s primary investment objective is capital appreciation in rising and falling equity markets with managing volatility as a secondary objective.
The LoCorr Long/Short Commodities Strategy Fund’s primary investment objective is capital appreciation in rising and falling commodities markets with managing volatility as a secondary objective.
The LoCorr Multi-Strategy Fund’s investment objective is capital appreciation.
The LoCorr Market Trend Fund’s primary investment objective is capital appreciation in rising and falling equity markets with managing volatility as a secondary objective.
The LoCorr Long/Short Equity Fund’s primary investment objective is long-term capital appreciation with reduced volatility compared to traditional broad-based equity market indices as a secondary objective.
The LoCorr Spectrum Income Fund’s primary investment objective is current income with capital appreciation as a secondary objective.
Wholly-owned and Controlled Subsidiaries
In order to achieve their investment objectives, the LoCorr Managed Futures Strategy Fund, the LoCorr Long/Short Commodities Strategy Fund, the LoCorr Multi-Strategy Fund and the LoCorr Market Trend Fund each invest up to 25% of their total assets (measured at the time of purchase) in wholly-owned subsidiaries, LCMFS Fund Limited (“LCMFS”), LCLSCS Fund Limited (“LCLSCS”), LCMSF Fund Limited (“LCMSF”) and LCMT Fund Limited (“LCMT”), respectively; each company incorporated under the laws of the Cayman Islands. LCMFS, LCLSCS, LCMSF and LCMT act as investment vehicles in order to enter into certain investments for the LoCorr Managed Futures Strategy Fund, the LoCorr Long/Short Commodities Strategy Fund, the LoCorr Multi-Strategy Fund and the LoCorr Market Trend Fund, respectively, consistent with their investment objectives and policies specified in the Prospectus and Statement of Additional Information.
At December 31, 2016, each Fund’s investment in LCMFS, LCLSCS, LCMSF and LCMT represented 1.86%, 15.00%, 10.19% and 4.33% of the total assets of LoCorr Managed Futures Strategy Fund, LoCorr Long/Short Commodities Strategy Fund, LoCorr Multi-Strategy Fund and LoCorr Market Trend Fund, respectively. See Note 2.
The consolidated financial statements of the LoCorr Managed Futures Strategy Fund, LoCorr Long/Short Commodities Strategy Fund, LoCorr Multi-Strategy Fund and the LoCorr Market Trend Fund each include the investment activity and financial statements of LCMFS, LCLSCS, LCMSF and LCMT, respectively. All intercompany accounts and transactions have been eliminated in consolidation. Because each Fund may invest a substantial portion of its assets in its respective subsidiary, the Fund may be considered to be investing indirectly in some of those investments through its subsidiary. For that reason, references to the Fund may also include its subsidiary. The subsidiary will be subject to the same investment restrictions and limitations, and follow the same compliance policies and procedures, as the Fund when viewed on a consolidated basis. Each Fund and its subsidiary are a “commodity pool” under the U.S. Commodity Exchange Act and LoCorr Fund Management, LLC (the “Adviser” or “Management”) is a “commodity pool operator” registered with and regulated by the Commodity Futures Trading Commission (“CFTC”). As a result, additional CFTC-mandated disclosure, reporting and recordkeeping obligations apply with respect to each Fund and its respective subsidiary under CFTC and the U.S. Securities and Exchange Commission (the “SEC”) harmonized regulations.
At December 31, 2016, the only investment held by LCLSCS and LCMSF are swap contracts, for which the notional amount was $125,600,000 and $39,982,500, respectively. At December 31, 2016, LCLSCS and LCMSF reported unrealized depreciation on swap contracts of $18,990,950 and $3,704,355, respectively. In addition, LCLSCS and LCMSF hold cash and cash equivalents as collateral on the swap contracts.
At December 31, 2016, investments held by LCMFS and LCMT include open futures contracts and other investments intended to serve as margin or collateral for futures positions. At December 31, 2016, LCMFS held long open futures contracts with a total notional amount of $193,169,249 and net unrealized depreciation of $1,933,694 and short open futures contracts with a total notional amount of $122,109,007 and net unrealized appreciation of $1,356,367. At December 31, 2016, LCMT held long open futures contracts with a total notional amount of $558,835,415 and net unrealized depreciation of $7,744,290 and short open futures contracts with a total notional amount of $250,996,018 and net unrealized appreciation of $6,665,759.
| |
| |
| 80 | | LoCorr Managed Futures Strategy Fund, LoCorr Long/Short Commodities Strategy Fund, LoCorr Multi-Strategy Fund and LoCorr Market Trend Fund – Notes to Consolidated Financial Statements / LoCorr Long/Short Equity Fund and LoCorr Spectrum Income Fund – Notes to Financial Statements (continued) |
| |
Partnership Interest
During the year ended December 31, 2012, LCMFS had a controlling ownership interest in Millburn Diversified Plus L.P. (the “Partnership”), a limited partnership organized on February 14, 2011, under the Delaware Revised Uniform Limited Partnership Act, which commenced operations on March 24, 2011. The Partnership engaged in speculative trading of futures and forward currency contracts. Similarly, LCLSCS had an investment in a partnership during the year ended December 31, 2012, however, based on the ownership percentage held during the year ended December 31, 2012, LCLSCS was not considered to have a controlling interest in that entity. The General Partner of the Partnership was Millburn Ridgefield Corporation (the “General Partner”). LCMFS and LCLSCS had fully redeemed out of their positions held in the partnerships as of December 20, 2012, and as a result, LCMFS no longer consolidated the Partnership, and its assets, liabilities, and related non-controlling interest were no longer included in the LoCorr Managed Futures Strategy Fund’s financial statements. As of December 20, 2012, there was no gain or loss on the redemption and deconsolidation because the investment in the Partnership was carried at fair value on a daily basis by LCMFS.
Because LCMFS had a controlling interest (greater than 50% but less than 100%) in the Partnership for the period January 1, 2012 through December 20, 2012, the financial activity of the Partnership for that period ended December 20, 2012, was also consolidated with the financial statements of LCMFS. All intercompany balances, revenues, and expenses have been eliminated in consolidation. LoCorr Managed Futures Strategy Fund, LCMFS and the Partnership are collectively referred to as the LoCorr Managed Futures Strategy Fund throughout these consolidated financial statements.
Non-controlling interest is the portion of equity ownership in the Partnership not attributable to the LoCorr Managed Futures Strategy Fund. Non-controlling interest represents additional, non-related partners in the Partnership and was equal to 2.20% of the Partnership’s net assets prior to LCMFS having fully redeemed its holding of the Partnership.
Share Classes
The Funds currently offer three classes of shares: Class A, Class C and Class I shares. Each share class represents an interest in the same assets of the Fund, has the same rights and is identical in all material respects except that (i) Class A shares have a maximum front end sales load of 5.75% and maximum deferred sales charge of 1.00% and Class C shares have a maximum deferred sales charge of 1.00%, (ii) Class A shares have a 12b-1 fee of 0.25% and Class C shares have a 12b-1 fee of 1.00%; (iii) certain other class-specific expenses will be borne solely by the class to which such expenses are attributable and (iv) each class will have exclusive voting rights with respect to matters relating to its own distribution arrangements.
With respect to the LoCorr Managed Futures Strategy Fund, the LoCorr Long/Short Commodities Strategy Fund, the LoCorr Multi-Strategy Fund, the LoCorr Market Trend Fund and the LoCorr Long/Short Equity Fund, all classes are subject to a 1.00% redemption fee on redemptions made within 30 days of the original purchase. All classes with respect to the LoCorr Spectrum Income Fund are subject to a 2.00% redemption fee on redemptions made within 60 days of the original purchase.
The following table presents the class-specific commencement of operations dates for each of the Funds:
| | | Commencement of Operations |
| | | Class A | | Class C | | Class I |
| LoCorr Managed Futures Strategy Fund | | March 22, 2011 | | March 24, 2011 | | March 24, 2011 |
| LoCorr Long/Short Commodities Strategy Fund | | January 1, 2012 | | January 1, 2012 | | January 1, 2012 |
| LoCorr Long/Short Equity Fund | | May 10, 2013 | | May 10, 2013 | | May 10, 2013 |
| LoCorr Spectrum Income Fund | | January 1, 2014 | | January 1, 2014 | | January 1, 2014 |
| LoCorr Market Trend Fund | | July 1, 2014 | | July 1, 2014 | | July 1, 2014 |
| LoCorr Multi-Strategy Fund | | April 6, 2015 | | April 6, 2015 | | April 6, 2015 |
The Funds may issue an unlimited number of shares of beneficial interest, with no par value. All shares of the Funds have equal rights and privileges, except as to class-specific rights and privileges described above.
2. Significant Accounting Policies
The following is a summary of significant accounting policies consistently followed by the Funds in the preparation of the consolidated financial statements. These policies are in conformity with generally accepted accounting principles in the United States of America (“GAAP”).
Investment Valuation
The Funds follow fair valuation accounting standards which establish a definition of fair value and set out a hierarchy for measuring fair value. These standards require additional disclosures about the various inputs and valuation techniques used to develop the measurements of fair value and changes in valuation techniques and related inputs during the period. These inputs are summarized in three broad levels listed below:
Level 1 - Unadjusted quoted prices in active markets for identical assets or liabilities that the Funds have the ability to access.
Level 2 - Observable inputs other than quoted prices included in Level 1 that are observable for the asset or liability, either directly or indirectly. These inputs may include quoted prices for the identical instrument on an inactive market, prices for similar instruments, interest rates, prepayment speeds, credit risk, yield curves, default rates and similar data.
Level 3 - Unobservable inputs for the asset or liability, to the extent relevant observable inputs are not available; representing the Funds’ own assumptions about the assumptions a market participant would use in valuing the asset or liability, and would be based on the best information available.
Generally, the Funds’ investments are valued each day at the last quoted sales price on each investment’s primary exchange. Investments traded or dealt in upon one or more exchanges (whether domestic or foreign) for which market quotations are readily available and not subject to restrictions against resale shall be valued at the last quoted sales price on the primary exchange or, in the absence of a sale on the primary exchange, at the last bid on the primary exchange. Investments primarily traded in the National Association of Securities Dealers’ Automated Quotation System (“NASDAQ”) National Market System for which market quotations are readily available shall be valued using the NASDAQ Official Closing Price.
| |
| |
| LoCorr Managed Futures Strategy Fund, LoCorr Long/Short Commodities Strategy Fund, LoCorr Multi-Strategy Fund and LoCorr Market Trend Fund – Notes to Consolidated Financial Statements / LoCorr Long/Short Equity Fund and LoCorr Spectrum Income Fund – Notes to Financial Statements (continued) | | 81 |
| |
The Funds may use independent pricing services to assist in calculating the value of the Funds’ investments. In addition, market prices for foreign investments are not determined at the same time of day as the net asset value (“NAV”) for the Funds. Because the Funds may invest in portfolio investments primarily listed on foreign exchanges, and these exchanges may trade on weekends or other days when the Funds do not price their shares, the value of some of the Funds’ portfolio investments may change on days when you may not be able to buy or sell the Funds’ shares. In computing the NAV, the Funds value foreign investments held by the Funds at the latest closing price on the exchange in which they are traded immediately prior to closing of the NYSE. Prices of foreign investments quoted in foreign currencies are translated into U.S. dollars at current rates. If events materially affecting the value of an investment in the Funds’ portfolio, particularly foreign investments, occur after the close of trading on a foreign market but before the Funds price their shares, the investment will be valued at fair value.
American Depositary Receipts
The Funds may invest in sponsored and unsponsored American Depositary Receipts (“ADRs”), which are receipts issued by an American bank or trust company evidencing ownership of underlying securities issued by a foreign issuer. ADRs, in registered form, are designed for use in U.S. securities markets. Unsponsored ADRs may be created without the participation of the foreign issuer. Holders of unsponsored ADRs generally bear all the costs of the ADR facility, whereas foreign issuers typically bear certain costs in a sponsored ADR. The bank or trust company depositary of an unsponsored ADR may be under no obligation to distribute shareholder communications received from the foreign issuer or to pass through voting rights. ADRs are generally categorized in Level 1 or Level 2 of the fair value hierarchy depending on inputs used and market activity levels for specific securities.
Equity Securities
Equity securities, including common stocks, preferred stocks, securities convertible into common stocks, such as convertible bonds, warrants, rights, options, master limited partnership (“MLP”) interests, real estate investment trusts (“REITs”), business development companies and royalty trusts, generally are valued by using market quotations, but may be valued on the basis of prices furnished by a pricing service when the Adviser believes such prices accurately reflect the fair market value of such securities. MLP interests are limited partnerships, the interests in which (known as “units”) typically trade publicly, like stock. MLPs are also called publicly traded partnerships and public limited partnerships. Securities that are traded on any stock exchange or on the NASDAQ over-the-counter market are generally valued by the pricing service at the last quoted sale price. Lacking a last sale price, an equity security is generally valued by the pricing service at its last bid price. Equity securities are generally categorized in Level 1 or Level 2 of the fair value hierarchy depending on inputs used and market activity levels for specific securities.
Exchange Traded Funds
The Funds may invest in Exchange Traded Funds (“ETFs”). They are managed by professionals and provide the investor with diversification, cost and tax efficiency, liquidity, marginability, are useful for hedging, have the ability to go long and short, and some provide quarterly dividends. Additionally, some ETFs are unit investment trusts (“UITs”), which are unmanaged portfolios overseen by trustees. ETFs generally have two markets. The primary market is where institutions swap “creation units” in block-multiples of shares, typically 25,000 or 50,000, for in-kind securities and cash in the form of dividends. The secondary market is where individual investors can trade as little as a single share during trading hours on the exchange. This is different from open-ended mutual funds that are traded after hours once the NAV is calculated. ETFs share many similar risks with open-end and closed-end funds. ETFs are generally categorized in Level 1 of the fair value hierarchy.
The Funds may invest in ETFs and other investment companies that hold a portfolio of foreign securities. Investing in securities of foreign companies and countries involves certain considerations and risks that are not typically associated with investing in U.S. government securities and securities of domestic companies. There may be less publicly available information about a foreign issuer than a domestic one, and foreign companies are not generally subject to uniform accounting, auditing and financial standards and requirements comparable to those applicable to U.S. companies. There may also be less government supervision and regulation of foreign securities exchanges, brokers and listed companies than exists in the United States. Interest and dividends paid by foreign issuers may be subject to withholding and other foreign taxes, which may decrease the net return on such investments as compared to dividends and interest paid to the Fund by domestic companies or the U.S. government. There may be the possibility of expropriations, seizure or nationalization of foreign deposits, confiscatory taxation, political, economic or social instability or diplomatic developments that could affect assets of the Fund held in foreign countries. Finally, the establishment of exchange controls or other foreign governmental laws or restrictions could adversely affect the payment of obligations.
Fixed Income Securities
Fixed income securities and certificates of deposit with maturities more than 60 days when acquired generally are valued using an evaluated price supplied by an independent pricing service. Inputs used by the pricing service for U.S. government and treasury securities are normally valued using a model that incorporates market observable data such as reported sales of similar securities, broker dealer quotes, yields, bids, offers, and reference data. Agency issued debt securities, foreign issued bonds and municipal bonds are generally valued in a manner similar to U.S. government securities. Evaluations for corporate bonds are typically based on valuation methodologies such as market pricing and other analytical pricing models as well as market transactions and dealer quotations based on observable inputs. Fixed income securities are generally categorized in Level 1 or Level 2 of the fair value hierarchy depending on inputs used and market activity levels for specific securities.
The fair value of asset backed securities and mortgage backed securities is estimated on models that consider the estimated cash flows of each tranche of the entity, establish a benchmark yield, and develop an estimated tranche-specific spread to the benchmark yield based on the unique attributes of the tranche. Additional inputs such as creditworthiness of the underlying collateral and quotes from outside brokers for the same or similar issuance may also be considered in the development of fair value. Asset backed and mortgage backed securities are generally categorized in Level 2 of the fair value hierarchy.
| |
| |
| 82 | | LoCorr Managed Futures Strategy Fund, LoCorr Long/Short Commodities Strategy Fund, LoCorr Multi-Strategy Fund and LoCorr Market Trend Fund – Notes to Consolidated Financial Statements / LoCorr Long/Short Equity Fund and LoCorr Spectrum Income Fund – Notes to Financial Statements (continued) |
| |
Short-term investments in fixed income securities and certificates of deposit with maturities of less than 60 days when acquired, or which subsequently are within 60 days of maturity, are valued using an amortized cost method of valuation, and are generally categorized in Level 2.
Investment Companies
With respect to any portion of the Funds’ assets that are invested in one or more open-end management investment companies, including money market funds, registered under the 1940 Act, the Funds’ net asset value is calculated based upon the net asset values of those open-end management investment companies, and the prospectuses for these companies explain the circumstances under which those companies will use fair value pricing and the effects of using fair value pricing.
The Funds generally will purchase shares of closed-end investment companies only in the secondary market. The shares of many closed-end investment companies, after their initial public offering, frequently trade at a price per share that is less than the net asset value per share, the difference representing the “market discount” of such shares. This market discount may be due in part to the investment objective of long-term appreciation, which is sought by many closed-end investment companies, as well as to the fact that the shares of closed-end investment companies are not redeemable by the holder upon demand to the issuer at the next determined net asset value but rather are subject to the principles of supply and demand in the secondary market. A relative lack of secondary market purchasers of closed-end investment company shares also may contribute to such shares trading at a discount to their net asset value. Closed-end investment companies are generally categorized in Level 1 or Level 2 of the fair value hierarchy depending on inputs used and market activity levels for specific securities.
Over-the-counter Financial Derivative Instruments
Over-the-counter financial derivative instruments, such as forward currency contracts, futures contracts, or swap agreements, derive their value from underlying asset prices, indices, reference rates, and other inputs or a combination of these factors. These contracts are normally valued on the basis of broker-dealer quotations or a pricing service at the settlement price determined by the relevant exchange. Depending on the product and the terms of the transaction, the value of the derivative contracts can be estimated by a pricing service provider using a series of techniques, including simulation pricing models. The pricing models use inputs that are observed from actively quoted markets such as issuer details, indices, spreads, interest rates, curves, dividends and exchange rates.
Forward currency contracts represent the purchase or sale of a specific quantity of a foreign currency at the current or spot price, with delivery and settlement at a specified future date. Forward currency contracts are presented at fair value using spot currency rates and are adjusted for the time value of money (forward points) and contractual prices of the underlying financial instruments. Forward currency contracts are generally categorized in Level 2.
Futures contracts are carried at fair value using the primary exchange’s closing (settlement) price, and are generally categorized in Level 1.
Total return swap contracts are stated at fair value daily based on the fair value of the underlying futures and forward currency contracts constituting the contract’s stated index, taking into account any fees and expenses associated with the swap agreement. Total return swap contracts are generally categorized in Level 2.
Fair Value Pricing
If market quotations are not readily available, investments will be valued at their fair value as determined in good faith by the Adviser in accordance with procedures approved by the Board of Trustees (the “Board”) and evaluated by the Board as to the reliability of the fair value method used. In these cases, a Fund’s NAV will reflect certain portfolio investments’ fair value rather than their market price. Fair value pricing involves subjective judgments and it is possible that the fair value determined for an investment is materially different than the value that could be realized upon the sale of that investment. The fair value prices can differ from market prices when they become available or when a price becomes available.
Fair value determinations are required for the following securities:
| • | securities for which market quotations are not readily available at the valuation time on a particular business day (including without limitation securities for which there is a short and temporary lapse in the provision of a price by the regular pricing source); |
| • | securities for which, in the opinion of the Adviser/relevant Sub-Adviser, the prices or values available do not represent the fair value of the instrument, based upon factors that may include, but are not limited to, the following: the availability of only a bid price or an ask price; the spread between bid and ask prices; the frequency of sales; the thinness of the market; the size of reported trades; and actions of the securities markets or regulators, such as the suspension or limitation of trading; |
| • | securities determined to be illiquid in accordance with the Trust’s Liquidity Procedures; and |
| • | securities with respect to which an event that will affect the value thereof has occurred subsequent to the determination by the Adviser/relevant Sub-Adviser of the closing prices reported on the principal exchange on which the securities are traded, but prior to the relevant Fund’s calculation of its NAV. |
| • | For any open-end mutual funds that do not provide timely NAV information, the Adviser/relevant Sub-Adviser shall evaluate those ‘similar’ funds and determine which are most appropriate based on funds having similar benchmarks or similar objectives. The Adviser/relevant Sub-Adviser shall then calculate the NAV percentage move of those ‘similar’ funds for the day to create an aggregate average percentage move, which it shall use to calculate the price movement for the day of the Fund at issue. For closed-end funds, the aforementioned practice shall be utilized, in addition to monitoring secondary market activity during the day. |
| |
| |
| LoCorr Managed Futures Strategy Fund, LoCorr Long/Short Commodities Strategy Fund, LoCorr Multi-Strategy Fund and LoCorr Market Trend Fund – Notes to Consolidated Financial Statements / LoCorr Long/Short Equity Fund and LoCorr Spectrum Income Fund – Notes to Financial Statements (continued) | | 83 |
| |
Performing Fair Value Pricing
The Adviser considers all appropriate factors relevant to the value of securities for which market quotations are not readily available. No single standard for determining fair value can be established, since fair value depends upon the circumstances of each individual case. As a general principle, the current fair value of an issue of securities being valued by the Adviser would appear to be the amount that the owner might reasonably expect to receive for them upon their current sale. Methods that are in accord with this principle may, for example, be based on:
| • | a discount from market of a similar freely traded security (including a derivative security or a basket of securities traded on other markets, exchanges or among dealers); or |
| • | yield to maturity with respect to debt issues, or a combination of these and other methods. |
Fair value determinations are not based on what the Adviser believes that a buyer may pay at a later time, such as when market conditions change or when the market ultimately recognizes a security’s true value as perceived by the Adviser. Similarly, bonds and other instruments may not be fair valued at par based on the expectation that the Fund will hold the investment until maturity.
Some of the general factors that the Adviser considers in determining a valuation method for an individual issue of securities include, but shall not be limited to:
| • | the fundamental analytical data relating to the investment; |
| • | the nature and duration of restrictions (if any) on disposition of the securities; |
| • | evaluation of the forces that influence the market in which these securities are purchased or sold; |
| • | changes in interest rates; |
| • | government (domestic or foreign) actions or pronouncements; and |
With respect to securities traded on foreign markets, the Adviser considers the value of foreign securities traded on other foreign markets, ADR trading, closed-end fund trading, foreign currency exchange activity and the trading prices of financial products that are tied to baskets of foreign securities, such as WEBS.
Among the more specific factors that the Funds’ Adviser considers (if applicable) in determining a valuation method for an individual issue of securities are:
| • | financial statements of the issuer; |
| • | cost at date of purchase; |
| • | discount from market value of unrestricted securities of the same class at time of purchase; |
| • | special reports prepared by analysts; |
| • | information as to any transactions or offers with respect to the security; |
| • | existence of merger proposals or tender offers affecting the securities; |
| • | price and extent of public trading in similar securities of the issuer or comparable companies; and |
As a general matter, the Funds’ Adviser will value the portfolio security or other asset primarily by reference to the public market if there is a public market for securities of the same class or similar securities; primarily by reference to private transactions if public market reference is not available and private transaction reports are available; and primarily by use of one or more analytical methods or models if public and private market references are not available or not reliable. The Adviser will use cost only if no better method of valuation is available.
The Adviser regularly evaluates whether its pricing methodologies continue to result in values that the Fund might reasonably expect to receive upon a current sale. In order to do this, the Adviser compares its fair value prices with values that are available from other sources (if there are any). The next actual sales price of a security might be one such source. However, the next-day opening prices or next actual sales prices for a security may differ from the fair value of that security as of the time for NAV calculation, given the subjectivity inherent in fair valuation and the fact that events could occur after NAV calculation. Thus, discrepancies between fair values and next-day opening prices or next actual sales prices may occur on a regular and recurring basis. These discrepancies do not necessarily indicate that the Adviser’s fair value methodology is inappropriate. Nonetheless, systematic comparisons of fair values to the next-day opening prices or next actual sales prices are useful to assist the Adviser with ongoing monitoring and evaluation of the appropriateness of its fair value methodologies.
The above guidance does not purport to delineate all factors that may be considered. The Adviser takes into consideration all indications of value available to it in determining the fair value assigned to a particular security.
The fair value of the LoCorr Spectrum Income Fund’s investment in Terra Secured Income Fund 5, LLC (“Terra”) was based on the Adviser’s analysis of certain existing data to determine the significance and character of inputs used to determine value. These inputs include, but are not limited to, financial statements (audited and unaudited) of Terra and the value used by other investors in Terra. Management also engaged a third party appraisal firm to review the valuation process used by Terra and the Adviser in determining the value of the investment. Changes to the fair value of this investment would result from changes to the underlying financial performance of Terra or other market factors, such as adverse changes to the financial condition of Terra, its borrowers or the secured assets as well as the deterioration of real estate market or general economic conditions. Terra is a private investment, limited liability company formed to originate, fund and structure real estate-related loans, including mezzanine loans, first and second mortgage loans, subordinated mortgage loans, bridge loans, preferred equity investments and other loans related to high quality commercial real estate in the United States. Units invested with Terra are not registered with the SEC under the Securities Act of 1933, as amended (the “Securities Act”) or the securities agency of any state. The units were offered in reliance upon an exemption from the registration provisions of the Securities Act and state securities laws applicable only to offers and sales to investors meeting the suitability requirements set forth herein. Due to lack of market activity and observable inputs, the LoCorr Spectrum Income Fund’s investment in Terra was categorized in Level 3 of the fair value hierarchy. During the year ended December 31, 2016, the LoCorr Spectrum Income Fund’s sold its investment in Terra.
| |
| |
| 84 | | LoCorr Managed Futures Strategy Fund, LoCorr Long/Short Commodities Strategy Fund, LoCorr Multi-Strategy Fund and LoCorr Market Trend Fund – Notes to Consolidated Financial Statements / LoCorr Long/Short Equity Fund and LoCorr Spectrum Income Fund – Notes to Financial Statements (continued) |
| |
The following table summarizes LoCorr Managed Futures Strategy Fund’s consolidated investments and other financial instruments as of December 31, 2016:
| Security Classification | | Level 1 | | | Level 2 | | | Level 3 | | | Total | |
| Investments | | | | | | | | | | | | |
| Asset Backed Securities | | $ | — | | | $ | 130,054,412 | | | $ | — | | | $ | 130,054,412 | |
| Corporate Bonds | | | — | | | | 300,200,727 | | | | — | | | | 300,200,727 | |
| Foreign Government Bonds | | | — | | | | 5,876,095 | | | | — | | | | 5,876,095 | |
| Mortgage Backed Securities | | | — | | | | 118,816,329 | | | | — | | | | 118,816,329 | |
| Municipal Bonds | | | — | | | | 8,470,356 | | | | — | | | | 8,470,356 | |
| U.S. Government Agency Issues | | | — | | | | 85,611,217 | | | | — | | | | 85,611,217 | |
| U.S. Government Notes | | | — | | | | 96,695,497 | | | | — | | | | 96,695,497 | |
| Short Term Investments | | | 29,719,738 | | | | 12,003,276 | | | | — | | | | 41,723,014 | |
| Total Investments | | $ | 29,719,738 | | | $ | 757,727,909 | | | $ | — | | | $ | 787,447,647 | |
| | | | | | | | | | | | | | | | | |
| Other Financial Instruments* | | | | | | | | | | | | | | | | |
| Forward Currency Contracts | | | | | | | | | | | | | | | | |
| Long | | $ | — | | | $ | (3,538,348) | | | $ | — | | | $ | (3,538,348) | |
| Short | | | — | | | | 6,394,978 | | | | — | | | | 6,394,978 | |
| Total Forward Currency Contracts | | | — | | | | 2,856,630 | | | | — | | | | 2,856,630 | |
| Futures Contracts | | | | | | | | | | | | | | | | |
| Long | | | 3,822,677 | | | | — | | | | — | | | | 3,822,677 | |
| Short | | | 1,582,253 | | | | — | | | | — | | | | 1,582,253 | |
| Total Futures Contracts | | | 5,404,930 | | | | — | | | | — | | | | 5,404,930 | |
| Total Other Financial Instruments | | $ | 5,404,930 | | | $ | 2,856,630 | | | $ | — | | | $ | 8,261,560 | |
See the Fund’s consolidated schedule of investments for the investments detailed by industry classification.
*Other financial instruments include forward currency contracts and futures contracts which are not included in the Fund’s consolidated schedule of investments. The fair value of the Fund’s other financial instruments represent the net unrealized appreciation (depreciation) at December 31, 2016.
The LoCorr Managed Futures Strategy Fund did not hold any Level 3 assets during the period.
The following table summarizes LoCorr Long/Short Commodities Strategy Fund’s consolidated investments and swap contracts as of December 31, 2016:
| Security Classification | | Level 1 | | | Level 2 | | | Level 3 | | | Total | |
| Investments | | | | | | | | | | | | |
| Asset Backed Securities | | $ | — | | | $ | 19,237,242 | | | $ | — | | | $ | 19,237,242 | |
| Corporate Bonds | | | — | | | | 42,350,311 | | | | — | | | | 42,350,311 | |
| Foreign Government Bond | | | — | | | | 14,964 | | | | — | | | | 14,964 | |
| Mortgage Backed Securities | | | — | | | | 16,800,883 | | | | — | | | | 16,800,883 | |
| Municipal Bonds | | | — | | | | 439,204 | | | | — | | | | 439,204 | |
| U.S. Government Agency Issues | | | — | | | | 17,983,511 | | | | — | | | | 17,983,511 | |
| U.S. Government Notes | | | — | | | | 3,968,582 | | | | — | | | | 3,968,582 | |
| Short Term Investments | | | 3,985,481 | | | | 1,000,273 | | | | — | | | | 4,985,754 | |
| Total Investments | | $ | 3,985,481 | | | $ | 101,794,970 | | | $ | — | | | $ | 105,780,451 | |
| | | | | | | | | | | | | | | | | |
| Swap Contracts* | | | | | | | | | | | | | | | | |
| Long Total Return Swap Contracts | | $ | — | | | $ | (18,990,950) | | | $ | — | | | $ | (18,990,950) | |
| Total Swap Contracts | | $ | — | | | $ | (18,990,950) | | | $ | — | | | $ | (18,990,950) | |
See the Fund’s consolidated schedule of investments for the investments detailed by industry classification.
*Swap contracts are derivative instruments not reflected in the Fund’s consolidated schedule of investments. The fair value of the Fund’s investment in swap contracts represents the net unrealized depreciation at December 31, 2016.
The LoCorr Long/Short Commodities Strategy Fund did not hold any Level 3 assets during the period.
| |
| |
| LoCorr Managed Futures Strategy Fund, LoCorr Long/Short Commodities Strategy Fund, LoCorr Multi-Strategy Fund and LoCorr Market Trend Fund – Notes to Consolidated Financial Statements / LoCorr Long/Short Equity Fund and LoCorr Spectrum Income Fund – Notes to Financial Statements (continued) | | 85 |
| |
The following table summarizes LoCorr Multi-Strategy Fund’s consolidated investments, securities sold short and swap contracts as of December 31, 2016:
| Security Classification | | Level 1 | | | Level 2 | | | Level 3 | | | Total | |
| Investments | | | | | | | | | | | | |
| Business Development Companies | | $ | 1,392,500 | | | $ | — | | | $ | — | | | $ | 1,392,500 | |
| Closed-End Investment Companies | | | 2,695,386 | | | | — | | | | — | | | | 2,695,386 | |
| Common Stocks | | | 12,540,915 | | | | — | | | | — | | | | 12,540,915 | |
| Convertible Preferred Stock | | | 830,893 | | | | — | | | | — | | | | 830,893 | |
| Master Limited Partnerships | | | 4,889,111 | | | | — | | | | — | | | | 4,889,111 | |
| Publicly Traded Partnerships | | | 1,634,894 | | | | — | | | | — | | | | 1,634,894 | |
| Real Estate Investment Trusts | | | 5,265,331 | | | | — | | | | — | | | | 5,265,331 | |
| Short Term Investment | | | 5,161,976 | | | | — | | | | — | | | | 5,161,976 | |
| Total Investments | | $ | 34,411,006 | | | $ | — | | | $ | — | | | $ | 34,411,006 | |
| | | | | | | | | | | | | | | | | |
| Securities Sold Short | | | | | | | | | | | | | | | | |
| Common Stocks | | $ | (924,624) | | | $ | — | | | $ | — | | | $ | (924,624) | |
| Total Securities Sold Short | | $ | (924,624) | | | $ | — | | | $ | — | | | $ | (924,624) | |
| | | | | | | | | | | | | | | | | |
| Swap Contracts* | | | | | | | | | | | | | | | | |
| Long Total Return Swap Contracts | | $ | — | | | $ | (3,704,355) | | | $ | — | | | $ | (3,704,355) | |
| Total Swap Contracts | | $ | — | | | $ | (3,704,355) | | | $ | — | | | $ | (3,704,355) | |
See the Fund’s consolidated schedule of investments and schedule of securities sold short for the investments detailed by industry classification.
*Swap contracts are derivative instruments not reflected in the Fund’s consolidated schedule of investments. The fair value of the Fund’s investment in swap contracts represents the net unrealized depreciation at December 31, 2016.
The LoCorr Multi-Strategy Fund did not hold any Level 3 assets during the period.
The following table summarizes LoCorr Market Trend Fund’s consolidated investments and other financial instruments as of December 31, 2016:
| Security Classification | | Level 1 | | | Level 2 | | | Level 3 | | | Total | |
| Investments | | | | | | | | | | | | |
| Asset Backed Securities | | $ | — | | | $ | 231,068,144 | | | $ | — | | | $ | 231,068,144 | |
| Corporate Bonds | | | — | | | | 4,688,096 | | | | — | | | | 4,688,096 | |
| Foreign Government Bonds | | | — | | | | 14,450,871 | | | | — | | | | 14,450,871 | |
| Mortgage Backed Securities | | | — | | | | 102,453,535 | | | | — | | | | 102,453,535 | |
| U.S. Government Agency Issues | | | — | | | | 421,503,727 | | | | — | | | | 421,503,727 | |
| U.S. Government Notes | | | — | | | | 69,945,157 | | | | — | | | | 69,945,157 | |
| Short Term Investment | | | 15,947,064 | | | | — | | | | — | | | | 15,947,064 | |
| Total Investments | | $ | 15,947,064 | | | $ | 844,109,530 | | | $ | — | | | $ | 860,056,594 | |
| | | | | | | | | | | | | | | | | |
| Other Financial Instruments* | | | | | | | | | | | | | | | | |
| Forward Currency Contracts | | | | | | | | | | | | | | | | |
| Long | | $ | — | | | $ | (11,889,301) | | | $ | — | | | $ | (11,889,301) | |
| Short | | | — | | | | 15,739,180 | | | | — | | | | 15,739,180 | |
| Total Forward Currency Contracts | | | — | | | | 3,849,879 | | | | — | | | | 3,849,879 | |
| Futures Contracts | | | | | | | | | | | | | | | | |
| Long | | | (390,335) | | | | — | | | | — | | | | (390,335) | |
| Short | | | 9,918,091 | | | | — | | | | — | | | | 9,918,091 | |
| Total Futures Contracts | | | 9,527,756 | | | | — | | | | — | | | | 9,527,756 | |
| Total Other Financial Instruments | | $ | 9,527,756 | | | $ | 3,849,879 | | | $ | — | | | $ | 13,377,635 | |
See the Fund’s consolidated schedule of investments for the investments detailed by industry classification.
*Other financial instruments include forward currency contracts and futures contracts which are not included in the Fund’s consolidated schedule of investments. The fair value of the Fund’s other financial instruments represent the net unrealized appreciation (depreciation) at December 31, 2016.
The LoCorr Market Trend Fund did not hold any Level 3 assets during the period.
| |
| |
| 86 | | LoCorr Managed Futures Strategy Fund, LoCorr Long/Short Commodities Strategy Fund, LoCorr Multi-Strategy Fund and LoCorr Market Trend Fund – Notes to Consolidated Financial Statements / LoCorr Long/Short Equity Fund and LoCorr Spectrum Income Fund – Notes to Financial Statements (continued) |
| |
The following table summarizes LoCorr Long/Short Equity Fund’s investments and securities sold short as of December 31, 2016:
| Security Classification | | Level 1 | | | Level 2 | | | Level 3 | | | Total | |
| Investments | | | | | | | | | | | | |
| Common Stocks | | $ | 49,477,388 | | | $ | — | | | $ | — | | | $ | 49,477,388 | |
| Short Term Investments | | | 25,529,082 | | | | 5,958,834 | | | | — | | | | 31,487,916 | |
| Total Investments | | $ | 75,006,470 | | | $ | 5,958,834 | | | $ | — | | | $ | 80,965,304 | |
| | | | | | | | | | | | | | | | | |
| Securities Sold Short | | | | | | | | | | | | | | | | |
| Common Stocks | | $ | (16,374,592) | | | $ | — | | | $ | — | | | $ | (16,374,592) | |
| Exchange Traded Funds | | | (2,842,553) | | | | — | | | | — | | | | (2,842,553) | |
| Total Securities Sold Short | | $ | (19,217,145) | | | $ | — | | | $ | — | | | $ | (19,217,145) | |
See the Fund’s schedule of investments and schedule of securities sold short for detail by industry classification.
The LoCorr Long/Short Equity Fund did not hold any Level 3 assets during the period.
The following table summarizes LoCorr Spectrum Income Fund’s investments as of December 31, 2016:
| Security Classification | | Level 1 | | | Level 2 | | | Level 3 | | | Total | |
| Investments | | | | | | | | | | | | |
| Business Development Companies | | $ | 6,521,573 | | | $ | — | | | $ | — | | | $ | 6,521,573 | |
| Closed-End Investment Companies | | | 12,405,825 | | | | — | | | | — | | | | 12,405,825 | |
| Common Stocks | | | 18,734,863 | | | | — | | | | — | | | | 18,734,863 | |
| Convertible Preferred Stock | | | 4,977,479 | | | | — | | | | — | | | | 4,977,479 | |
| Master Limited Partnerships | | | 22,548,859 | | | | — | | | | — | | | | 22,548,859 | |
| Publicly Traded Partnerships | | | 7,629,753 | | | | — | | | | — | | | | 7,629,753 | |
| Real Estate Investment Trusts | | | 24,554,117 | | | | — | | | | — | | | | 24,554,117 | |
| Short Term Investment | | | 7,862,730 | | | | — | | | | — | | | | 7,862,730 | |
| Total Investments | | $ | 105,235,199 | | | $ | — | | | $ | — | | | $ | 105,235,199 | |
See the Fund’s schedule of investments for detail by industry classification.
The following is a reconciliation of the beginning and ending balances for assets measured at fair value using significant unobservable inputs (Level 3) during the year ended December 31, 2016:
| Level 3 Reconciliation Disclosure | | Investments in Securities, | |
| Balance, December 31, 2015 | | $ | 11,498,342 | |
| Purchases | | | — | |
| Sales | | | (11,646,771) | |
| Return of capital distributions | | | — | |
| Realized gain (loss) | | | 770,012 | |
| Change in net unrealized gain (loss) | | | (621,583) | |
| Transfer into Level 3 | | | — | |
| Transfer out of Level 3 | | | — | |
| Balance, December 31, 2016 | | $ | — | |
| | | | | |
| Net change in unrealized gains relating to Level 3 investments still held at December 31, 2016 | | $ | — | |
Note: Management’s fair valuation is based on the issuer’s financial statements and other data, as well as other trades in this security as noted above. See additional detail related to these considerations in the Investment Valuation disclosures. The purchase discount on LoCorr Spectrum Income Fund’s investment in Terra is accreted on a straight-line basis over a period of five years, and is presented as part of unrealized appreciation for financial reporting purposes.
For each of the Funds, there were no transfers between levels during the period. Transfers between levels are recognized at the end of the reporting period.
The LoCorr Funds did not hold any Level 3 assets as of December 31, 2016.
| |
| |
| LoCorr Managed Futures Strategy Fund, LoCorr Long/Short Commodities Strategy Fund, LoCorr Multi-Strategy Fund and LoCorr Market Trend Fund – Notes to Consolidated Financial Statements / LoCorr Long/Short Equity Fund and LoCorr Spectrum Income Fund – Notes to Financial Statements (continued) | | 87 |
| |
Allocation of Income and Expenses
Net investment income, other than class specific expenses, and realized and unrealized gains and losses are allocated daily to each class of shares based upon the relative net asset value of outstanding shares of each class of shares at the beginning of the day (after adjusting for the current capital shares activity of the respective class). Expenses associated with a specific Fund in the Trust are charged to that Fund. Common expenses are typically allocated based upon the relative net assets of each Fund, or by other equitable means.
Deferred Offering Costs
Offering costs are accounted for as a deferred charge until operations begin and thereafter amortized to expense over twelve months on a straight-line basis. For the LoCorr Multi-Strategy Fund, these costs consisted of legal fees pertaining to preparing the Fund’s initial registration statement, printing costs, and SEC and state registration fees. For the year ended December 31, 2016, the LoCorr Multi-Strategy Fund amortized $17,164 in deferred offering costs. At December 31, 2016, the LoCorr Multi-Strategy Fund fully amortized all of its deferred offering costs.
Deposits with Broker
Forward Currency and Futures Contracts
When trading derivative instruments, such as forward or futures contracts, the Fund is only required to post initial or variation margin with the exchange or clearing broker. The use of margin in trading these instruments has the effect of creating leverage, which can expose the Fund to substantial gains or losses occurring from relatively small price changes in the value of the underlying instrument and can increase the volatility of the Fund’s returns. Volatility is a statistical measure of the dispersion of returns of an investment, where higher volatility generally indicates greater risk. At December 31, 2016, the LoCorr Managed Futures Strategy Fund and the LoCorr Market Trend Fund pledged cash and cash equivalents at U.S. Bank, N.A. (“U.S. Bank”) of $11,328,877 and $30,510,000, respectively, with Bank of America Merrill Lynch for each Fund’s investment in forward currency contracts.
Upon entering into a futures contract, and to maintain the Fund’s open positions in futures contracts, the Fund is required to deposit with its custodian or futures broker in a segregated account in the name of the futures broker an amount of cash, U.S. government securities, suitable money market instruments, or other liquid securities, known as “initial margin.” The margin required for a particular futures contract is set by the exchange on which the contract is traded, and may be significantly modified from time to time by the exchange during the term of the contract. Futures contracts are customarily purchased and sold on margins that may range upward from less than 5% of the value of the contract being traded.
At December 31, 2016, the LoCorr Managed Futures Strategy Fund and LCMFS, collectively, had $64,402,880 in cash and cash equivalents on deposit with the broker for derivative instruments which is presented on the Fund’s consolidated statement of assets and liabilities. In addition, LCMFS pledged securities with a fair value of $11,617 as collateral for derivative instruments.
At December 31, 2016, the LoCorr Market Trend Fund and LCMT, collectively, had $125,642,967 in cash and cash equivalents (including foreign currency) on deposit with the broker for derivative instruments which is presented on the Fund’s consolidated statement of assets and liabilities. In addition, LCMT pledged securities with a fair value of $351,405 as collateral for derivative instruments.
If the price of an open futures contract changes (by increase in underlying instrument or index in the case of a sale or by decrease in the case of a purchase) so that the loss on the futures contract reaches a point at which the margin on deposit does not satisfy margin requirements, the broker will require an increase in the margin. However, if the value of a position increases because of favorable price changes in the futures contract so that the margin deposit exceeds the required margin, the broker will pay the excess to the Fund.
These subsequent payments, called “variation margin,” to and from the futures broker (with the exception of futures contracts traded on the London Metal Exchange (“LME”)), are made on a daily basis as the price of the underlying assets fluctuate making the long and short positions in the futures contract more or less valuable, a process known as “marking to the market”. The variation margin on LME futures contracts do not settle daily, but rather settle at their respective maturity dates. At period end, the unrealized appreciation and depreciation on LME futures contracts is shown as receivable for unsettled open futures contracts and payable for unsettled open futures contracts, respectively, on the Fund’s consolidated statement of assets and liabilities. The Funds expect to earn interest income on any margin deposits.
Securities Sold Short
At December 31, 2016, the LoCorr Multi-Strategy Fund and the LoCorr Long/Short Equity Fund had cash on deposit with the broker-dealer in the amount of $1,410,784 and $18,028,992, respectively. In addition, at December 31, 2016, the LoCorr Long/Short Equity Fund pledged cash and securities with a fair value of $2,100,000 and $5,958,834, respectively, as collateral for securities sold short.
Swap Contracts
LCLSCS and LCMSF have a substantial portion of their assets on deposit with Deutsche Bank in connection with their trading of swap contracts. Assets deposited with Deutsche Bank in connection with the trading of swap contracts for LCLSCS and LCMSF are partially restricted due to deposit requirements. At December 31, 2016, the LoCorr Long/Short Commodities Strategy Fund and the LoCorr Multi-Strategy Fund had cash and cash equivalents on deposit with Deutsche Bank in the amount of $25,131,441 and $8,189,500, respectively, which have been presented on the consolidated statements of assets and liabilities for each Fund. In addition, at December 31, 2016, the LCLSCS and LCMSF pledged securities with a fair value of $462,889 and $200,656, respectively, as collateral for swap contracts. Risks arise from the possible inability of the counterparty to meet the term of its contract and may increase if the counterparty’s financial condition worsens. During the year ended December 31, 2016, LCMFS liquidated its swap position resulting in a net realized gain of $17,162,980.
Distributable Earnings and Investment Transactions
Net investment income and net realized gains (losses) may differ for financial reporting and tax purposes because of temporary or permanent book/tax differences. To the extent these differences are permanent; reclassifications are made to the appropriate equity accounts in the period that the difference arises.
| |
| |
| 88 | | LoCorr Managed Futures Strategy Fund, LoCorr Long/Short Commodities Strategy Fund, LoCorr Multi-Strategy Fund and LoCorr Market Trend Fund – Notes to Consolidated Financial Statements / LoCorr Long/Short Equity Fund and LoCorr Spectrum Income Fund – Notes to Financial Statements (continued) |
| |
Additionally, U.S. generally accepted accounting principles require that certain components of net assets relating to permanent differences be reclassified between financial and tax reporting. These reclassifications have no effect on net assets or net asset value per share. See Note 7.
Distributions to Shareholders
Shareholder transactions are recorded on trade date. Dividends from net investment income are declared and paid at least annually by the Funds. Distribution of net realized capital gains, if any, are declared and paid at least annually. Distributions to shareholders are recorded on the ex-dividend date. The character of distributions made during the periods from net investment income or net realized gains may differ from the characterization for federal income tax purposes due to the difference in the recognition of income, expense and gain items for financial statement and tax purposes.
In 2016, the dividends for the LoCorr Multi-Strategy Fund and the LoCorr Spectrum Income Fund were distributed monthly. The estimated characterization of the distributions paid will be an ordinary dividend, qualified dividend or return of capital. This estimate is based on each Fund’s operating results during the period. It is anticipated that a significant portion of the distributions of the Funds’ investments in MLP and certain investments in REITs and royalty trusts will be comprised of return of capital as a result of the tax character of cash distributions made by each Fund’s investments. The actual characterization of the distributions made during the period is not determined until after the end of the fiscal year.
The tax character of distributions paid during the periods was as follows:
| | | Year Ended December 31, 2016 | |
| | | Ordinary | | | Long-Term | | | Return of | |
| Fund | | Income | | | Capital Gains | | | Capital | |
| LoCorr Managed Futures Strategy Fund | | $ | 3,094,731 | | | $ | 12,934,942 | | | $ | — | |
| LoCorr Long/Short Commodities Strategy Fund | | | 4,174,668 | | | | — | | | | — | |
| LoCorr Multi-Strategy Fund | | | 386,916 | | | | — | | | | 855,699 | |
| LoCorr Market Trend Fund | | | 19,864,840 | | | | — | | | | — | |
| LoCorr Spectrum Income Fund | | | 4,507,173 | | | | — | | | | 2,388,873 | |
| | | | | | | | | | | | | |
| | | Period Ended December 31, 2015(a) | |
| | | Ordinary | | | Long-Term | | | Return of | |
| Fund | | Income | | | Capital Gains | | | Capital | |
| LoCorr Managed Futures Strategy Fund | | $ | 14,528,245 | | | $ | — | | | $ | — | |
| LoCorr Long/Short Commodities Strategy Fund | | | 3,351,073 | | | | — | | | | — | |
| LoCorr Multi-Strategy Fund | | | 267,360 | | | | — | | | | 280,501 | |
| LoCorr Market Trend Fund | | | 5,964,617 | | | | 960,116 | | | | — | |
| LoCorr Spectrum Income Fund | | | 4,715,119 | | | | — | | | | 2,248,675 | |
(a) For the year ended December 31, 2015 for the LoCorr Managed Futures Strategy Fund, the LoCorr Long/Short Commodities Strategy Fund, the LoCorr Market Trend Fund and the LoCorr Spectrum Income Fund and for the period from April 6, 2015 (commencement of operations) through December 31, 2015 for the LoCorr Multi-Strategy Fund.
Federal Income Taxes
The Funds intend to qualify as regulated investment companies pursuant to Subchapter M of the Internal Revenue Code of 1986, as amended. The Funds intend to distribute substantially all of their investment company net taxable income and net capital gains to shareholders. Therefore, no federal income tax provision is required.
As of and during the year ended December 31, 2016, the Funds did not have any tax positions that did not meet the “more-likely-than-not” threshold of being sustained by applicable tax authorities. The Funds recognize interest and penalties, if any, related to unrecognized tax benefits on uncertain tax positions as interest or other expense in the statements of operations. During the year ended December 31, 2016, the Funds did not incur any interest or penalties.
For tax purposes, LCMFS, LCLSCS, LCMSF and LCMT are exempted Cayman Islands investment companies. LCMFS, LCLSCS, LCMSF and LCMT have each received an undertaking from the Government of the Cayman Islands exempting them from all local income, profits, and capital gains taxes. No such taxes are levied in the Cayman Islands at the present time. For U.S. income tax purposes, LCMFS, LCLSCS, LCMSF and LCMT are controlled foreign corporations (“CFCs”) and as such are not subject to U.S. income tax. However, as a wholly-owned CFC, the net income and capital gain of each CFC, to the extent of its earnings and profits, will be included each year in the respective Funds’ investment company taxable income.
Foreign Securities and Currency
Investment securities and other assets and liabilities denominated in foreign currencies are translated into U.S. dollar amounts at the date of valuation. Purchases and sales of investment securities and income and expense items denominated in foreign currencies are translated into U.S. dollar amounts on the respective dates of such transactions.
The Funds do not isolate that portion of the results of operations resulting from changes in foreign exchange rates on investments from the fluctuations arising from changes in market prices of securities held. Such fluctuations are included with the net realized and unrealized gain or loss from investments.
| |
| |
| LoCorr Managed Futures Strategy Fund, LoCorr Long/Short Commodities Strategy Fund, LoCorr Multi-Strategy Fund and LoCorr Market Trend Fund – Notes to Consolidated Financial Statements / LoCorr Long/Short Equity Fund and LoCorr Spectrum Income Fund – Notes to Financial Statements (continued) | | 89 |
| |
Reported net realized foreign exchange gains or losses arise from sales of foreign currencies, currency gains or losses realized between the trade and settlement dates on securities transactions, and the difference between the amounts of dividends, interest, and foreign withholding taxes recorded on the Funds’ books and the U.S. dollar equivalent of the amounts actually received or paid. Net unrealized foreign exchange gains and losses arise from changes in the fair values of assets and liabilities, other than investments in securities at period end, resulting from changes in exchange rates.
Forward Currency Contracts
Gains or losses are realized when foreign currency contracts are liquidated. Any change in net unrealized gain or loss is reported in the statement of operations.
Futures Contracts
A futures contract provides for the future sale by one party and purchase by another party of a specified amount of a specific financial instrument (e.g., units of a stock index) for a specified price, date, time and place designated at the time the contract is made. Brokerage fees are incurred when a futures contract is bought or sold and margin deposits must be maintained. Entering into a contract to buy is commonly referred to as buying or purchasing a contract or holding a long position. Entering into a contract to sell is commonly referred to as selling a contract or holding a short position.
Unlike when a Fund purchases or sells a security, no price would be paid or received by the Fund upon the purchase or sale of a futures contract.
Although certain futures contracts, by their terms, require actual future delivery of and payment for the underlying instruments, in practice most futures contracts are usually closed out before the delivery date. Gains or losses are realized when contracts are liquidated. Closing out an open futures contract purchase or sale is affected by entering into an offsetting futures contract sale or purchase, respectively, for the same aggregate amount of the identical underlying instrument or index and the same delivery date. If the offsetting purchase price is less than the original sale price, the Fund realizes a gain; if it is more, the Fund realizes a loss. Conversely, if the offsetting sale price is more than the original purchase price, the Fund realizes a gain; if it is less, the Fund realizes a loss.
The transaction costs must also be included in these calculations. There can be no assurance, however, that a Fund will be able to enter into an offsetting transaction with respect to a particular futures contract at a particular time. If a Fund is not able to enter into an offsetting transaction, the Fund will continue to be required to maintain the margin deposits on the futures contract.
Any change in net unrealized gain or loss is reported in the statement of operations.
Indemnifications
In the normal course of business, the Funds enter into contracts that contain general indemnifications to other parties. The Funds’ maximum exposure under these contracts is unknown as this would involve future claims that may be made against the Funds that have not yet occurred. However, based on experience, the Funds expect the risk of loss to be remote.
Market and Credit Risks
The Funds may engage in the speculative trading of U.S. and foreign futures, forward currency and swap contracts (collectively, derivatives). The Funds are exposed to both market risk, which is the risk arising from changes in the fair value of the contracts, and credit risk, which is the risk of failure by another party to perform according to the terms of a contract.
Purchase and sale of futures contracts requires margin deposits with the broker. Additional deposits may be necessary for any loss on contract value. The Commodity Exchange Act requires a broker to segregate all customer transactions and assets from such broker’s proprietary activities. A customer’s cash and other property (for example, U.S. government securities) deposited with a broker are considered commingled with all other customer funds subject to the broker’s segregation requirements. In the event of a broker’s insolvency, recovery may be limited to a pro rata share of segregated funds available. It is possible that the recovered amount could be less than total cash and other property deposited.
For derivatives, risks arise from changes in the fair value of the contracts. Theoretically, the Funds are exposed to a market risk equal to the notional contract value of swap, futures and forward currency contracts purchased and unlimited liability on such contracts sold short.
The Funds also engage in investing its assets in U.S. government securities. Risks arise from investments in U.S. government securities due to possible market illiquidity. U.S. government securities are also sensitive to changes in interest rates and economic conditions.
The Funds have established procedures to actively monitor market risk and minimize credit risk, although there can be no assurance that they will, in fact, succeed in doing so.
New Accounting Pronouncements and/or SEC Regulatory Updates
In October 2016, the SEC adopted new rules and amended existing rules (together, “final rules”) intended to modernize the reporting and disclosure of information by registered investment companies. In part, the final rules amend Regulation S-X and require standardized, enhanced disclosure about derivatives in investment company financial statements, as well as other amendments. The compliance date for the amendments to Regulation S-X is August 1, 2017. Management is currently evaluating the impact that the adoption of the amendments to Regulation S-X will have on the financial statements and related disclosures.
Options on Securities
The Funds may purchase and write (i.e., sell) put and call options. Such options may relate to particular securities or stock indices, and may or may not be listed on a domestic or foreign securities exchange and may or may not be issued by the Options Clearing Corporation. Option trading is a highly specialized activity that entails greater than ordinary investment risk. Options may be more volatile than the underlying instruments, and therefore, on a percentage basis, an investment in options may be subject to greater fluctuation than an investment in the underlying instruments themselves.
| |
| |
| 90 | | LoCorr Managed Futures Strategy Fund, LoCorr Long/Short Commodities Strategy Fund, LoCorr Multi-Strategy Fund and LoCorr Market Trend Fund – Notes to Consolidated Financial Statements / LoCorr Long/Short Equity Fund and LoCorr Spectrum Income Fund – Notes to Financial Statements (continued) |
| |
A call option for a particular security gives the purchaser of the option the right to buy, and the writer (seller) the obligation to sell, the underlying security at the stated exercise price at any time prior to the expiration of the option, regardless of the market price of the security. The premium paid to the writer is in consideration for undertaking the obligation under the option contract. A put option for a particular security gives the purchaser the right to sell the security at the stated exercise price at any time prior to the expiration date of the option, regardless of the market price of the security.
A Fund’s obligation to sell an instrument subject to a call option written by it, or to purchase an instrument subject to a put option written by it, may be terminated prior to the expiration date of the option by the Fund’s execution of a closing purchase transaction, which is effected by purchasing on an exchange an option of the same series (i.e., same underlying instrument, exercise price and expiration date) as the option previously written. A closing purchase transaction will ordinarily be effected to realize a profit on an outstanding option, to prevent an underlying instrument from being called, to permit the sale of the underlying instrument or to permit the writing of a new option containing different terms on such underlying instrument. The cost of such a liquidation purchase plus transactions costs may be greater than the premium received upon the original option, in which event the Fund will have incurred a loss in the transaction. There is no assurance that a liquid secondary market will exist for any particular option. An option writer unable to effect a closing purchase transaction will not be able to sell the underlying instrument or liquidate the assets held in a segregated account, as described below, until the option expires or the optioned instrument is delivered upon exercise. In such circumstances, the writer will be subject to the risk of market decline or appreciation in the instrument during such period.
If an option purchased by a Fund expires unexercised, the Fund realizes a loss equal to the premium paid. If a Fund enters into a closing sale transaction on an option purchased by it, the Fund will realize a gain if the premium received by the Fund on the closing transaction is more than the premium paid to purchase the option or a loss if it is less. If an option written by a Fund expires on the stipulated expiration date or if the Fund enters into a closing purchase transaction, it will realize a gain (or loss if the cost of a closing purchase transaction exceeds the net premium received when the option is sold). If an option written by the Fund is exercised, the proceeds of the sale will be increased by the net premium originally received and the Fund will realize a gain or loss.
Organizational Costs
Organizational costs in connection with the organization of the Funds are expensed as incurred.
Security Transactions and Investment Income
Security transactions are recorded on trade date. Generally, realized gains and losses on sales of investments are calculated on the specifically identified cost basis of the securities.
Each Fund may invest up to 15% of its net assets in illiquid securities. Illiquid securities may include securities subject to contractual or legal restrictions on resale (e.g., because they have not been registered under the Securities Act) and securities that are otherwise not readily marketable (e.g., because trading in the security is suspended or because market makers do not exist or will not entertain bids or offers). Securities that have not been registered under the Securities Act are referred to as private investments or restricted securities and are purchased directly from the issuer or in the secondary market. Foreign securities that are freely tradable in their principal markets are not considered to be illiquid. Under guidelines adopted by the Trust’s Board, the Adviser of the Fund may determine that particular Rule 144(a) securities, and commercial paper issued in reliance on the private placement exemption from registration afforded by Section 4(a)(2) of the Securities Act, are liquid even though they are not registered. At December 31, 2016, the Adviser deemed all of the restricted securities held in the LoCorr Managed Futures Strategy Fund, the LoCorr Long/Short Commodities Strategy Fund and the LoCorr Market Trend Fund to be liquid. At December 31, 2016, there were no illiquid or restricted securities held in the LoCorr Multi-Strategy Fund, the LoCorr Long/Short Equity Fund or the LoCorr Spectrum Income Fund. During the year, the LoCorr Spectrum Income Fund’s investment in Terra was deemed to be illiquid by the Adviser, but as of December 31, 2016, this investment has been sold. As of December 31, 2016, none of the Funds held any securities deemed to be illiquid.
Dividend income, less foreign taxes withheld, if any, are recorded on the ex-dividend date.
Distributions received from the investments in MLP interests, REITs, private investments and royalty trusts generally are comprised of ordinary income, capital gains and return of capital. For financial statement purposes, the Funds use estimates to characterize these distributions received as return of capital, capital gains or ordinary income. Such estimates are based on historical information available from each MLP, REIT, private investment or royalty trust and other industry sources. These estimates may subsequently be revised based on information received from the MLP, REIT, private investment or royalty trust after their tax reporting periods are concluded, as the actual character of these distributions is not known until after the fiscal year end of the Funds. The distributions received from the MLP, REIT, private investment and royalty trust securities that have been classified as income and capital gains are included in investment income and net realized gain (loss) on investments, respectively, on the statement of operations. The distributions received that are classified as return of capital reduce the cost of investments on the statement of assets and liabilities. For the year ended December 31, 2016, the Funds estimated that 100% of the MLP distributions received would be treated as return of capital. For the year ended December 31, 2016, approximately 100% of the total distributions received from Terra are estimated to be interest income.
Interest income and expense are recognized on the accrual basis. Market discounts, premiums and original issue discounts on fixed-income securities are amortized daily over the expected life of the security using the effective yield method.
Short Sales
The Funds may sell securities short. A short sale is a transaction in which the Fund sells a security it does not own or have the right to acquire (or that it owns but does not wish to deliver) in anticipation that the market price of that security will decline.
When a Fund makes a short sale, the broker-dealer through which the short sale is made must borrow the security sold short and deliver it to the party purchasing the security. The Funds are required to make a margin deposit in connection with such short sales; the Funds may have to pay a fee to borrow particular securities and will often be obligated to pay over any dividends and accrued interest on borrowed securities.
| |
| |
| LoCorr Managed Futures Strategy Fund, LoCorr Long/Short Commodities Strategy Fund, LoCorr Multi-Strategy Fund and LoCorr Market Trend Fund – Notes to Consolidated Financial Statements / LoCorr Long/Short Equity Fund and LoCorr Spectrum Income Fund – Notes to Financial Statements (continued) | | 91 |
| |
If the price of the security sold short increases between the time of the short sale and the time the Fund covers its short position, the Fund will incur a loss; conversely, if the price declines, the Fund will realize a gain. A gain, limited to the price at which the Fund sold the security short, or a loss, unlimited in size, will be recognized upon the close of a short sale. Any gain will be decreased, and any loss increased, by the transaction costs described above. The successful use of short selling may be adversely affected by imperfect correlation between movements in the price of the security sold short and the securities being hedged. Gains or losses from closed positions of securities sold short are presented as net realized gain or loss on securities sold short on the statement of operations.
In addition, the Funds are required to pay the lender any dividends declared on short positions. Dividends declared on open short positions are recorded on ex-date and shown as an expense for financial reporting purposes. To borrow the security, the Funds also may be required to pay fees, which are shown as an expense for financial reporting purposes.
To the extent the Funds sell securities short, it will provide collateral to the broker-dealer and (except in the case of short sales “against the box”) will maintain additional asset coverage in the form of cash, U.S. government securities or other liquid securities with its custodian in a segregated account in an amount at least equal to the difference between the current fair value of the securities sold short and any amounts required to be deposited as collateral with the selling broker (not including the proceeds of the short sale). A short sale is “against the box” to the extent the Funds contemporaneously own, or have the right to obtain at no added cost, securities identical to those sold short. Short sales are collateralized by cash deposits with the counterparty broker and pledged securities held at the custodian, U.S. Bank. The collateral required is determined daily by reference to the fair value of the short positions.
Total Return Swap Contracts
The Funds may enter into total return swap agreements. A total return swap entered into by the Funds is a derivative contract that transfers the market risk of underlying portfolios of futures and forward currency contracts (considered the “index” within each total return swap contract) between counterparties. The “notional amount” of each total return swap agreement is the agreed upon amount or value of the index used for calculating the returns that the parties to a swap agreement have agreed to exchange. The total return swaps are marked to market daily and any change is recorded in unrealized gain/loss on the consolidated statement of operations based on the value of the index on which the total return swap is referenced, as defined within the total return swap agreement between the counterparties. The composition of the index may vary based on how the underlying portfolio of futures and forward currency contracts is traded. A Fund’s obligation under a total return swap agreement, including any related fees, offset against amounts owed to the Fund in the case of positive performance, will be covered by designating liquid assets on the Fund’s books and records (see the consolidated statement of assets and liabilities for deposits with broker for derivative instruments). Gains or losses will be realized when the total return swap contracts are liquidated and will be presented as net realized gain or loss on swap contracts on the consolidated statements of operations. In addition, changes in notional value and any cash holding adjustments, which represent voluntary realizations by a Fund of swap value at any point in time, are also presented as net realized gain or loss on swap contracts on the consolidated statements of operations. A corresponding asset or liability for “advance receipt on swap contracts” or “advance payment on swap contracts”, respectively, is recorded on the consolidated statements of assets and liabilities for the gain or loss realized on changes in notional value. Total return swaps outstanding at period end, if any, are listed after the Funds’ consolidated schedules of investments.
Use of Estimates
The preparation of consolidated financial statements in conformity with GAAP requires management to make estimates and assumptions that affect the reported amounts of assets and liabilities, disclosure of contingent assets and liabilities at the date of the financial statements and the reported revenues and expenses during the reporting period. Actual results could differ from those estimates.
Warrants
The Funds may invest in warrants. Warrants are options to purchase common stock at a specific price (usually at a premium above the market value of the optioned common stock at issuance) valid for a specific period of time. Warrants may have a life ranging from less than one year to twenty years, or they may be perpetual. However, most warrants have expiration dates after which they are worthless. In addition, a warrant is worthless if the market price of the common stock does not exceed the warrant’s exercise price during the life of the warrant. Warrants have no voting rights, pay no dividends, and have no rights with respect to the assets of the corporation issuing them. The percentage increase or decrease in the market price of the warrant may tend to be greater than the percentage increase or decrease in the market price of the optioned common stock.
3. Derivative and Other Financial Instruments
The Funds may invest in derivatives such as futures, forward currency, and swap contracts, in order to hedge against market movements while liquidating certain positions and buying other securities or as substitutes for securities, as well as for speculative purposes to gain exposure to such market movements.
The Funds’ market risk related to their derivatives trading is influenced by a wide variety of factors, including the level and volatility of interest rates, exchange rates, weather, supply and demand of commodities, the market value of futures and forward currency contracts, the diversification effects among the Funds’ open positions and the liquidity of the markets in which they trade.
The following are the primary trading risk exposures by market sector of the Funds as encompassed in the total return swap contracts:
Agricultural (grains, livestock and softs). The Funds’ primary exposure is to agricultural price movements which are often directly affected by severe or unexpected weather conditions.
Currencies. Exchange rate risk is a principal market exposure of the Funds. The Funds’ currency exposure is to exchange rate fluctuations, primarily fluctuations which disrupt the historical pricing relationships between different currencies and currency pairs. The fluctuations are influenced by interest rate changes as well as political and general economic conditions. The Funds trade in a large number of currencies including cross-rates – e.g., positions between two currencies other than the U.S. dollar.
| |
| |
| 92 | | LoCorr Managed Futures Strategy Fund, LoCorr Long/Short Commodities Strategy Fund, LoCorr Multi-Strategy Fund and LoCorr Market Trend Fund – Notes to Consolidated Financial Statements / LoCorr Long/Short Equity Fund and LoCorr Spectrum Income Fund – Notes to Financial Statements (continued) |
| |
Energy. The Funds’ primary energy market exposure is to gas and oil price movements, often resulting from political developments in the Middle East and economic conditions worldwide. Energy prices are volatile and substantial profits and losses have been and are expected to continue to be experienced in this market.
Interest rates. Interest rate movements directly affect the price of the sovereign bond futures positions held by the Funds and indirectly the value of its stock index currency positions. Interest rate movements in one country as well as relative interest rate movements between countries may materially impact the Funds’ profitability. The Funds’ primary interest rate exposure is to interest rate fluctuations in countries or regions including Australia, Canada, Japan, Switzerland, the United Kingdom, the United States and the Eurozone. However, the Funds also may take positions in futures contracts on the government debt of other nations. The Funds anticipate that interest rates in these industrialized countries or areas, both long-term and short-term, will remain a primary market exposure of the Funds for the foreseeable future.
Metals. The Funds’ metals market exposure is to fluctuations in the price of aluminum, copper, gold, lead, nickel, palladium, tin, silver and zinc.
Stock index. The Funds’ equity exposure, through stock index futures, is to equity price risk in the major industrialized countries as well as other countries.
At December 31, 2016, the LoCorr Managed Futures Strategy Fund, the LoCorr Long/Short Commodities Strategy Fund, the LoCorr Multi-Strategy Fund and the LoCorr Market Trend Fund held derivative and other financial instruments which are not subject to a master netting arrangement. As the tables below illustrate, no positions are netted in these consolidated financial statements.
| LoCorr Managed Futures Strategy Fund - December 31, 2016 | | | | | | | | | | | | | |
| Assets: | | | | | | | | | | | Gross Amounts not offset in the
Consolidated Statement of Assets & Liabilities | | | | |
| Description | | Gross Amounts
of Recognized
Assets | | | Gross Amounts
Offset in the
Consolidated
Statement of
Assets & Liabilities | | | Net Amounts
Presented in the
Consolidated
Statement of
Assets & Liabilities | | | Financial
Instruments | | | Collateral Pledged
(Received) | | | Net Amount | |
| Forward currency contracts | | $ | 7,670,810 | | | $ | — | | | $ | 7,670,810 | | | $ | — | | | $ | — | | | $ | 7,670,810 | |
| Futures contracts | | | 314,082 | | | | — | | | | 314,082 | | | | — | | | | — | | | | 314,082 | |
| Total | | $ | 7,984,892 | | | $ | — | | | $ | 7,984,892 | | | $ | — | | | $ | — | | | $ | 7,984,892 | |
| Liabilities: | | | | | | | | | | | Gross Amounts not offset in the
Consolidated Statement of Assets & Liabilities | | | | |
| Description | | Gross Amounts
of Recognized
Liabilities | | | Gross Amounts
Offset in the
Consolidated
Statement of
Assets & Liabilities | | | Net Amounts
Presented in the
Consolidated
Statement of
Assets & Liabilities | | | Financial
Instruments | | | Collateral Received
(Pledged) | | | Net Amount | |
| Forward currency contracts | | $ | 4,814,180 | | | $ | — | | | $ | 4,814,180 | | | $ | — | | | $ | (4,814,180 | ) | | $ | — | |
| Futures contracts | | | 4,005,919 | | | | — | | | | 4,005,919 | | | | — | | | | (4,005,919 | ) | | | — | |
| Total | | $ | 8,820,099 | | | $ | — | | | $ | 8,820,099 | | | $ | — | | | $ | (8,820,099 | ) | | $ | — | |
| LoCorr Long/Short Commodities Strategy Fund - December 31, 2016 | |
| Liabilities: | | | | | | | | | | | Gross Amounts not offset in the
Consolidated Statement of Assets & Liabilities | | | | |
| Description | | Gross Amounts
of Recognized
Liabilities | | | Gross Amounts
Offset in the
Consolidated
Statement of
Assets & Liabilities | | | Net Amounts
Presented in the
Consolidated
Statement of
Assets & Liabilities | | | Financial
Instruments | | | Collateral Received
(Pledged) | | | Net Amount | |
| Swap Contracts | | $ | 18,990,950 | | | $ | — | | | $ | 18,990,950 | | | $ | — | | | $ | (18,990,950 | ) | | $ | — | |
| Total | | $ | 18,990,950 | | | $ | — | | | $ | 18,990,950 | | | $ | — | | | $ | (18,990,950 | ) | | $ | — | |
| LoCorr Multi-Strategy Fund - December 31, 2016 | | | | | | | | | | |
| Liabilities: | | | | | | | | | | | Gross Amounts not offset in the
Consolidated Statement of Assets & Liabilities | | | | |
| Description | | Gross Amounts
of Recognized
Liabilities | | | Gross Amounts
Offset in the
Consolidated
Statement of
Assets & Liabilities | | | Net Amounts
Presented in the
Consolidated
Statement of
Assets & Liabilities | | | Financial
Instruments | | | Collateral Received
(Pledged) | | | Net Amount | |
Swap Contracts* | | $ | 4,269,219 | | | $ | — | | | $ | 4,269,219 | | | $ | — | | | $ | (4,269,219 | ) | | $ | — | |
| Total | | $ | 4,269,219 | | | $ | — | | | $ | 4,269,219 | | | $ | — | | | $ | (4,269,219 | ) | | $ | — | |
*Includes advance payment on swap contracts.
| |
| |
LoCorr Managed Futures Strategy Fund, LoCorr Long/Short Commodities Strategy Fund, LoCorr Multi-Strategy Fund and LoCorr Market Trend Fund – Notes to Consolidated Financial Statements / LoCorr Long/Short Equity Fund and LoCorr Spectrum Income Fund – Notes to Financial Statements (continued) | | 93 |
| |
| LoCorr Market Trend Fund - December 31, 2016 | | | | | | | | | | | | |
| Assets: | | | | | | | | Gross Amounts not offset in the | | | |
| | | | | | | | | Consolidated Statement of Assets & Liabilities | | | |
| | | | Gross Amounts | | Net Amounts | | | | | | | |
| | | | Offset in the | | Presented in the | | | | | | | |
| | | | Consolidated | | Consolidated | | | | | | | |
| | Gross Amounts of | | Statement of | | Statement of | | Financial | | Collateral Received | | | |
| Description | Recognized Assets | | Assets & Liabilities | | Assets & Liabilities | | Instruments | | (Received) | | Net Amount | |
| Forward currency contracts | | $ | 16,068,522 | | | $ | — | | | $ | 16,068,522 | | | $ | — | | | $ | — | | | $ | 16,068,522 | |
| Futures contracts | | | 811,025 | | | | — | | | | 811,025 | | | | — | | | | — | | | | 811,025 | |
| Total | | $ | 16,879,547 | | | $ | — | | | $ | 16,879,547 | | | $ | — | | | $ | — | | | $ | 16,879,547 | |
| Liabilities: | | | | | | | | | Gross Amounts not offset in the | | | |
| | | | | | | | | | Consolidated Statement of Assets & Liabilities | | | |
| | | | Gross Amounts | | Net Amounts | | | | | | | |
| | | | Offset in the | | Presented in the | | | | | | | |
| | Gross Amounts | | Consolidated | | Consolidated | | | | | | | |
| | of Recognized | | Statement of | | Statement of | | Financial | | Collateral Received | | | |
| Description | Liabilities | | Assets & Liabilities | | Assets & Liabilities | | Instruments | | (Pledged) | | Net Amount | |
| Forward currency contracts | | $ | 12,218,643 | | | $ | — | | | $ | 12,218,643 | | | $ | — | | | $ | (12,218,643 | ) | | $ | — | |
| Futures contracts | | | 12,060,970 | | | | — | | | | 12,060,970 | | | | — | | | | (12,060,970 | ) | | | — | |
| Total | | $ | 24,279,613 | | | $ | — | | | $ | 24,279,613 | | | $ | — | | | $ | (24,279,613 | ) | | $ | — | |
The Funds have adopted authoritative standards regarding disclosure about derivatives and hedging activities and how they affect the Funds’ consolidated statements of assets and liabilities and consolidated statements of operations. Fair value of swap contracts are recorded in the consolidated statements of assets and liabilities as net unrealized gain on swap contracts or net unrealized loss on swap contracts and net unrealized appreciation of swap contracts or net unrealized depreciation of swap contracts.
Since the derivatives held long or short are for speculative trading purposes, the derivative instruments are not designated as hedging instruments. Accordingly, all realized gains and losses, as well as any change in net unrealized gains or losses on open contracts from the preceding period, are recognized as part of realized and unrealized gain (loss) in the consolidated statements of operations.
The following table presents the fair value of consolidated derivative instruments for the LoCorr Managed Futures Strategy Fund, the LoCorr Long/Short Commodities Strategy Fund, the LoCorr Multi-Strategy Fund and the LoCorr Market Trend Fund as of December 31, 2016 as presented on the Fund’s consolidated statement of assets and liabilities:
| | | | | | | | | Net Unrealized
Gain (Loss) on
Open
Positions | |
| | | | | | | | | |
| | | Fair Value | | | |
| Derivatives Not Accounted for as Hedging Instruments | | Assets | | | Liabilities | | | |
| LoCorr Managed Futures Strategy Fund | | | | | | | | | | | | |
Forward Currency Contracts(a) | | | | | | | | | | | | |
| Long | | $ | 655,275 | | | $ | 4,193,623 | | | $ | (3,538,348) | |
| Short | | | 7,015,535 | | | | 620,557 | | | | 6,394,978 | |
| Total Forward Currency Contracts | | | 7,670,810 | | | | 4,814,180 | | | | 2,856,630 | |
| | | | | | | | | | | | | |
Futures Contracts(b) | | | | | | | | | | | | |
| Long Contracts | | | | | | | | | | | | |
| Commodity | | | 1,152,218 | | | | 3,085,912 | | | | (1,933,694) | |
| Equity | | | 3,361,430 | | | | 1,375,536 | | | | 1,985,894 | |
| Foreign exchange | | | 87,625 | | | | — | | | | 87,625 | |
| Interest rate | | | 4,238,166 | | | | 555,314 | | | | 3,682,852 | |
| Total Long Contracts | | | 8,839,439 | | | | 5,016,762 | | | | 3,822,677 | |
| | | | | | | | | | | | | |
| Short Contracts | | | | | | | | | | | | |
| Commodity | | | 1,676,023 | | | | 319,656 | | | | 1,356,367 | |
| Equity | | | 19,429 | | | | 447,452 | | | | (428,023) | |
| Foreign exchange | | | — | | | | — | | | | — | |
| Interest rate | | | 839,177 | | | | 185,268 | | | | 653,909 | |
| Total Short Contracts | | | 2,534,629 | | | | 952,376 | | | | 1,582,253 | |
| Total Futures Contracts | | | 11,374,068 | | | | 5,969,138 | | | | 5,404,930 | |
| Total Forward Currency Contracts and Futures Contracts | | $ | 19,044,878 | | | $ | 10,783,318 | | | $ | 8,261,560 | |
| | |
| 94 | | LoCorr Managed Futures Strategy Fund, LoCorr Long/Short Commodities Strategy Fund, LoCorr Multi-Strategy Fund and LoCorr Market Trend Fund – Notes to
Consolidated Financial Statements / LoCorr Long/Short Equity Fund and LoCorr Spectrum Income Fund – Notes to Financial Statements (continued) |
| | |
| | | | | | Net Unrealized
Gain (Loss) on
Open
Positions | |
| | | | | | |
| | | | | | |
| | | Fair Value | | | |
| Derivatives Not Accounted for as Hedging Instruments | | Assets | | | Liabilities | | | |
| LoCorr Long/Short Commodities Strategy Fund | | | | | | | | | |
| Long Total Return Swap Contracts | | | | | | | | | |
| LoCorr Commodities Index | | $ | — | | | $ | 18,990,950 | | | $ | (18,990,950) | |
| | | | | | | | | | | | | |
| LoCorr Multi-Strategy Fund | | | | | | | | | | | | |
| Long Total Return Swap Contracts | | | | | | | | | | | | |
| LoCorr Multi-Strategy Index | | $ | — | | | $ | 3,704,355 | | | $ | (3,704,355) | |
| | | | | | | | | | | | | |
| LoCorr Market Trend Fund | | | | | | | | | | | | |
Forward Currency Contracts(a) | | | | | | | | | | | | |
| Long | | $ | 115,932 | | | $ | 12,005,233 | | | $ | (11,889,301) | |
| Short | | | 15,952,590 | | | | 213,410 | | | | 15,739,180 | |
| Total Forward Currency Contracts | | | 16,068,522 | | | | 12,218,643 | | | | 3,849,879 | |
| | | | | | | | | | | | | |
Futures Contracts(b) | | | | | | | | | | | | |
| Long Contracts | | | | | | | | | | | | |
| Commodity | | | 4,055,019 | | | | 11,799,309 | | | | (7,744,290) | |
| Equity | | | 6,310,092 | | | | 3,038,505 | | | | 3,271,587 | |
| Foreign exchange | | | 375,888 | | | | — | | | | 375,888 | |
| Interest rate | | | 4,631,089 | | | | 924,609 | | | | 3,706,480 | |
| Total Long Contracts | | | 15,372,088 | | | | 15,762,423 | | | | (390,335) | |
| | | | | | | | | | | | | |
| Short Contracts | | | | | | | | | | | | |
| Commodity | | | 7,198,372 | | | | 532,613 | | | | 6,665,759 | |
| Equity | | | — | | | | 160,479 | | | | (160,479) | |
| Foreign exchange | | | — | | | | — | | | | — | |
| Interest rate | | | 3,918,251 | | | | 505,440 | | | | 3,412,811 | |
| Total Short Contracts | | | 11,116,623 | | | | 1,198,532 | | | | 9,918,091 | |
| Total Futures Contracts | | | 26,488,711 | | | | 16,960,955 | | | | 9,527,756 | |
| Total Forward Currency Contracts and Futures Contracts | | $ | 42,557,233 | | | $ | 29,179,598 | | | $ | 13,377,635 | |
(a) Unrealized appreciation on forward currency contracts is a receivable and unrealized depreciation on forward currency contracts is a payable on the Fund’s consolidated statement of assets and liabilities.
(b) Reflects the cumulative unrealized appreciation (depreciation) of futures contracts as reported in the Fund’s consolidated schedule of open futures contracts. Only the current day variation margin for futures contracts is separately reported within the Fund’s consolidated statement of assets and liabilities.
The following table presents the results of the derivative trading and information related to volume for the year ended December 31, 2016 for the LoCorr Managed Futures Strategy Fund, the LoCorr Long/Short Commodities Strategy Fund, the LoCorr Multi-Strategy Fund, the LoCorr Market Trend Fund and the LoCorr Long/Short Equity Fund. The below captions of “Net Realized” and “Net Change in Unrealized” correspond to the captions in each Fund’s consolidated statement of operations.
| | | Gain (Loss) from Trading | |
| | | | | | Net Change | |
| Fund and Type of Derivative Instrument | | Net Realized | | | in Unrealized | |
| LoCorr Managed Futures Strategy Fund | | | | | | |
| Forward Currency Contracts | | $ | 7,686,340 | | | $ | 2,856,630 | |
| Futures Contracts | | | | | | | | |
| Commodity | | | (34,164,049) | | | | (577,327) | |
| Equity | | | 20,003,423 | | | | 1,557,871 | |
| Foreign exchange | | | (2,481,858) | | | | 87,625 | |
| Interest rate | | | 9,026,081 | | | | 4,336,761 | |
| Total Futures Contracts | | | (7,616,403) | | | | 5,404,930 | |
| Total Forward Currency Contracts and Futures Contracts | | $ | 69,937 | | | $ | 8,261,560 | |
| | | | | | | | | |
Swap Contracts(a) | | $ | 17,162,980 | | | $ | 12,934,752 | |
| | | | | | | | | |
| LoCorr Long/Short Commodities Strategy Fund | | | | | | | | |
| Swap Contracts | | $ | 8,698,631 | | | $ | (15,911,913) | |
| | |
LoCorr Managed Futures Strategy Fund, LoCorr Long/Short Commodities Strategy Fund, LoCorr Multi-Strategy Fund and LoCorr Market Trend Fund – Notes to Consolidated Financial Statements / LoCorr Long/Short Equity Fund and LoCorr Spectrum Income Fund – Notes to Financial Statements (continued) | | 95 |
| | |
| | | Gain (Loss) from Trading | |
| | | | | | Net Change | |
| Fund and Type of Derivative Instrument | | Net Realized | | | in Unrealized | |
| LoCorr Multi-Strategy Fund | | | | | | |
Put Options(b) | | $ | 120,883 | | | $ | (22,993) | |
| Swap Contracts | | | (520,618) | | | | (3,509,155) | |
| | | | | | | | | |
| LoCorr Market Trend Fund | | | | | | | | |
| Forward Currency Contracts | | $ | 12,466,119 | | | $ | (10,376,445) | |
| Futures Contracts | | | | | | | | |
| Commodity | | | (131,775,584) | | | | (4,824,109) | |
| Equity | | | (52,799,349) | | | | 8,780,762 | |
| Foreign exchange | | | (3,061,208) | | | | 375,888 | |
| Interest rate | | | 27,652,093 | | | | 13,743,959 | |
| Total Futures Contracts | | | (159,984,048) | | | | 18,076,500 | |
| Total Forward Currency Contracts and Futures Contracts | | $ | (147,517,929) | | | $ | 7,700,055 | |
| | | | | | | | | |
| LoCorr Long/Short Equity Fund | | | | | | | | |
Put Options (b) | | $ | 269,782 | | | $ | (55,392) | |
The average monthly notional amount is shown as an indicator of volume. The average monthly notional amounts during the year ended December 31, 2016 were:
| | | Average Notional Amount | |
| | | Long Contracts | | | Short Contracts | |
| LoCorr Managed Futures Strategy Fund | | | | | | |
Forward Currency Contracts(c) | | $ | 410,914,997 | | | $ | 512,943,009 | |
Futures Contracts(c) | | | 2,491,356,750 | | | | 677,883,204 | |
Swap Contracts(a) | | | 374,639,826 | | | | — | |
| | | | | | | | | |
| LoCorr Long/Short Commodities Strategy Fund | | | | | | | | |
| Swap Contracts | | $ | 113,984,615 | | | $ | — | |
| | | | | | | | | |
| LoCorr Multi-Strategy Fund | | | | | | | | |
| Swap Contracts | | $ | 35,690,192 | | | $ | — | |
| | | | | | | | | |
| LoCorr Market Trend Fund | | | | | | | | |
| Forward Currency Contracts | | $ | 1,405,569,503 | | | $ | 1,810,188,834 | |
| Futures Contracts | | | 7,268,685,138 | | | | 1,913,316,947 | |
(a) Swap contracts were liquidated as of March 31, 2016.
(b) Included in the consolidated statement of operations: Net realized gain (loss) on investments and net change in unrealized appreciation (depreciation) on investments.
(c) Represents trading activity of forward currency contracts and futures contracts for the period March 31, 2016 to December 31, 2016.
The commodity-related future contracts reported in the tables in Note 3 represent balances and activity of each Fund’s respective wholly-owned and controlled subsidiary. See Note 2.
The LoCorr Multi-Strategy Fund and the LoCorr Long/Short Equity Fund each held one option contract during the year ended December 31, 2016. As of December 31, 2016, these option contracts have been sold. Each of the Funds consider their respective option contract held to be an accurate representation of the volume of activity during the period.
Please refer to the Funds’ prospectus for a full listing of risks associated with these investments.
4. Investment Transactions
The cost of security purchases and proceeds from security sales, excluding short-term investments, derivative instruments, short sales and purchases to cover short sales for the year ended December 31, 2016 were as follows:
| | | U.S. Government Obligations | | | All Other | |
| | | Purchases | | | Sales | | | Purchases | | | Sales | |
| | | | | | | | | | | | | | | | | |
| LoCorr Managed Futures Strategy Fund | | $ | 191,228,610 | | | $ | 85,979,789 | | | $ | 483,168,446 | | | $ | 258,194,414 | |
| LoCorr Long/Short Commodities Strategy Fund | | | 32,633,429 | | | | 34,171,190 | | | | 127,661,558 | | | | 66,061,304 | |
| LoCorr Multi-Strategy Fund | | | — | | | | — | | | | 26,028,427 | | | | 26,110,333 | |
| LoCorr Market Trend Fund | | | 226,162,186 | | | | 314,817,212 | | | | 766,226,442 | | | | 530,169,455 | |
| LoCorr Long/Short Equity Fund | | | — | | | | — | | | | 109,665,486 | | | | 92,173,678 | |
| LoCorr Spectrum Income Fund | | | — | | | | — | | | | 91,387,614 | | | | 80,524,423 | |
| | |
| 96 | | LoCorr Managed Futures Strategy Fund, LoCorr Long/Short Commodities Strategy Fund, LoCorr Multi-Strategy Fund and LoCorr Market Trend Fund – Notes to Consolidated Financial Statements / LoCorr Long/Short Equity Fund and LoCorr Spectrum Income Fund – Notes to Financial Statements (continued) |
| | |
5. Management Fees and Other Transactions with Affiliates
Management Agreement
The Trust has a Management Agreement with the Adviser, with whom certain officers and Trustees of the Funds are affiliated, to furnish investment advisory services to the Funds. Pursuant to the Amendment to the Management Agreement, the Adviser is entitled to receive a fee as follows:
| | | Annual Advisory Fee as a Percentage |
| Fund | | of the Average Daily Net Assets of the Fund |
| LoCorr Managed Futures Strategy Fund | | 1.85 | %* |
| LoCorr Multi-Strategy Fund | | 1.75 | % |
| LoCorr Market Trend Fund | | 1.50 | % |
| LoCorr Long/Short Equity Fund | | 2.45 | % |
| LoCorr Spectrum Income Fund | | 1.30 | % |
*Effective March 11, 2016, the shareholders of the LoCorr Managed Futures Strategy Fund approved an amended Management Agreement pursuant to which the Adviser received a rate of 1.85% of that Fund’s average daily net assets. The new fee went into effect beginning March 16, 2016. Prior to March 16, 2016, the LoCorr Managed Futures Strategy Fund received a fee based on the Incremental Advisory Fee schedule as shown below for the LoCorr Long/Short Commodities Strategy Fund.
Pursuant to the Amendment to the Management Agreement, the Adviser is entitled to receive a fee, in accordance with the Incremental Advisory Fee schedule below based on the LoCorr Long/Short Commodities Strategy Fund’s average daily net assets.
Net Assets for the LoCorr Long/Short
Commodities Strategy Fund | Incremental** Advisory Fee |
| $0.0 - $0.5 billion | 1.50% |
| $0.5 - $1.0 billion | 1.40% |
| $1.0 - $1.5 billion | 1.30% |
| $1.5 - $2.0 billion | 1.20% |
| $2.0 - $2.5 billion | 1.10% |
| Over $2.5 billion | 1.00% |
**Incremental advisory fee represents the fees paid on net assets at the related net asset level. For example, with $3 billion in net assets in a Fund, the Adviser would earn 1.50% on the first $500 million, plus 1.40% on the next $500 million, plus 1.30% on the next $500 million, plus 1.20% on the next $500 million, plus 1.10% on the next $500 million, plus 1.00% on the final $500 million.
As of and for the year ended December 31, 2016, the Funds reported the following in regards to management fees:
| | Management Fees | | | Accrued
Management Fees | |
| Fund | For the Year Ended December 31, 2016 | | | | |
| LoCorr Managed Futures Strategy Fund | | $ | 12,322,937 | (a) | | | $ | 1,317,874 | |
| LoCorr Long/Short Commodities Strategy Fund | | | 1,986,638 | | | | | 167,754 | |
| LoCorr Multi-Strategy Fund | | | 638,252 | | | | | 37,587 | |
| LoCorr Market Trend Fund | | | 19,457,280 | | | | | 1,399,002 | |
| LoCorr Long/Short Equity Fund | | | 1,015,046 | | | | | 153,305 | |
| LoCorr Spectrum Income Fund | | | 1,212,705 | | | | | 114,605 | |
(a) In reference to the LoCorr Managed Futures Strategy Fund’s amended management agreement approved by the shareholders on March 11, 2016, the Adviser received a rate of 1.85% of the Fund’s average daily net assets, rather than receiving an incremental advisory fee based on net assets of the Fund. The fee went into effect beginning March 16, 2016.
Sub-Advisory Agreements
Sub-advisory services are provided to the Funds, pursuant to agreements between the Adviser and the below listed sub-advisers. Under the terms of these sub-advisory agreements, the Adviser compensates the sub-advisers based on the portion of each Fund’s average daily net assets which they have been allocated to manage.
| LoCorr Managed Futures Strategy Fund: |
Graham Capital Management, L.P. (a) |
Millburn Ridgefield Corporation (a) |
| Nuveen Asset Management, LLC |
Revolution Capital Management LLC (a) |
| |
| |
| LoCorr Long/Short Commodities Strategy Fund: |
| Nuveen Asset Management, LLC |
| |
| LoCorr Multi-Strategy Fund: |
| Billings Capital Management LLC |
Trust & Fiduciary Income Partners, LLC (b) |
| LoCorr Market Trend Fund: |
| Graham Capital Management, L.P. |
| Nuveen Asset Management, LLC |
| |
| LoCorr Long/Short Equity Fund: |
| Billings Capital Management LLC |
| Kettle Hill Capital Management, LLC |
| |
| LoCorr Spectrum Income Fund: |
Trust & Fiduciary Income Partners, LLC (b) |
(a) Sub-Advisory Agreements effective March 2016.
(b) Effective March 28, 2016, Trust & Fiduciary Management, Inc., sub-adviser to the LoCorr Spectrum Income Fund and LoCorr Multi-Strategy Fund, merged with Bramshill Investments, LLC in order to create the new entity, Trust and Fiduciary Income Partners, LLC.
| | |
| | |
LoCorr Managed Futures Strategy Fund, LoCorr Long/Short Commodities Strategy Fund, LoCorr Multi-Strategy Fund and LoCorr Market Trend Fund – Notes to Consolidated Financial Statements / LoCorr Long/Short Equity Fund and LoCorr Spectrum Income Fund – Notes to Financial Statements (continued) | | 97 |
| | |
The Adviser is solely responsible for the payment of the sub-adviser’s fees, and the sub-adviser agrees not to seek payment of its fees from the Trust or the Funds.
Expense Limitation Agreement
The Funds’ Adviser has contractually agreed to waive management fees and/or reimburse the Funds for expenses it incurs but only to the extent necessary to maintain the Funds’ total annual operating expenses after fee waiver and/or reimbursement (excluding any Rule 12b-1 distribution and/or servicing fees, taxes, interest, brokerage commissions, expenses incurred in connection with any merger or reorganization, dividend expenses on short sales, swap fees, indirect expenses, expenses of other investment companies in which the Funds may invest, or extraordinary expenses such as litigation expenses and inclusive of offering and organizational costs incurred prior to the commencement of operations) at the percentages listed below:
| | Expense Limit as a Percentage of the | |
| Fund | Average Daily Net Assets of the Fund | Effective Period Through |
| LoCorr Managed Futures Strategy Fund | 2.25%* | April 30, 2017 |
| LoCorr Long/Short Commodities Strategy Fund | 1.95% | April 30, 2017 |
| LoCorr Multi-Strategy Fund | 2.04% | April 30, 2017 |
| LoCorr Market Trend Fund | 1.95% | April 30, 2017 |
| LoCorr Long/Short Equity Fund | 2.90% | April 30, 2017 |
| LoCorr Spectrum Income Fund | 1.80% | April 30, 2017 |
*In conjunction with the shareholder approval of the LoCorr Managed Futures Strategy Fund’s amended management agreement that was approved on March 11, 2016, the expense limitation has been increased from 1.95% to 2.25%. The new expense limitation went into effect beginning March 16, 2016.
Any waiver or reimbursement is subject to repayment by the respective Fund within the three fiscal years following the fiscal year in which the expenses occurred, if the Fund is able to make the repayment without exceeding its current expense limitations and the repayment is approved by the Board of Trustees. The organizational and offering costs are subject to repayment by the Funds.
The total amounts of management fees waived and/or expenses reimbursed which are subject to recovery, and their related expiration date are as follows:
| LoCorr Long/Short Commodities Strategy Fund | | | | | | | | | | |
| | | | | | | | | | | | | | | | Subject to | |
| | Fees (Waived) or Expenses (Borne) | | Recovery to Adviser | | Remaining | | | Recovery on or | |
| | by Adviser Subject to Recovery | | Year Ended December 31, | | Available | | | Before Fiscal | |
| | Management | | | | | | | | | | | Subject to | | | Year Ending | |
| Period | Fees | | Other Expenses | | Total | | 2015 | | | 2016 | | Recovery | | | December 31, | |
| Year Ended December 31, 2016 | $ | (21,779 | ) | | $ | — | | | $ | (21,779 | ) | $ | — | | | $ | — | | $ | (21,779 | ) | | 2019 | |
| Year Ended December 31, 2015 | | (154,527 | ) | | | — | | | | (154,527 | ) | | — | | | | — | | | (154,527 | ) | | 2018 | |
| Year Ended December 31, 2014 | | (226,735 | ) | | | — | | | | (226,735 | ) | | — | | | | — | | | (226,735 | ) | | 2017 | |
| Total | $ | (403,041 | ) | | $ | — | | | $ | (403,041 | ) | $ | — | | | $ | — | | $ | (403,041 | ) | | | |
| | | | | | | | | | | | | | | | | | | | | | | | | |
| LoCorr Multi-Strategy Fund | | | | | | | | | | | | | | | | | | |
| | | | | | | | | | | | | | | | | | | | | | | | Subject to | |
| | Fees (Waived) or Expenses (Borne) | | Recovery to Adviser | | Remaining | | | Recovery on or | |
| | by Adviser Subject to Recovery | | Year Ended December 31, | | Available | | | Before Fiscal | |
| | Management | | | | | | | | | | | | | | | | | Subject to | | | Year Ending | |
| Period | Fees | | Other Expenses | | Total | | | 2015 | | | | 2016 | | Recovery | | | December 31, | |
| Year Ended December 31, 2016 | $ | (181,466 | ) | | $ | — | | | $ | (181,466 | ) | $ | — | | | $ | — | | $ | (181,466 | ) | | 2019 | |
| Period Ended December 31, 2015* | | (195,479 | ) | | | — | | | | (195,479 | ) | | — | | | | — | | | (195,479 | ) | | 2018 | |
| Total | $ | (376,945 | ) | | $ | — | | | $ | (376,945 | ) | $ | — | | | $ | — | | $ | (376,945 | ) | | | |
| *Period from April 6, 2015 (commencement of operations) through December 31, 2015. | | | | | | | | | | | | | | | | | | |
| | | | | | | | | | | | | | | | | | | | | | | | | |
| LoCorr Long/Short Equity Fund | | | | | | | | | | | | | | | | | |
| | | | | | | | | | | | | | | | | | | | | | | | Subject to | |
| | Fees (Waived) or Expenses (Borne) | | Recovery to Adviser | | Remaining | | | Recovery on or | |
| | by Adviser Subject to Recovery | | Year Ended December 31, | | Available | | | Before Fiscal | |
| | Management | | | | | | | | | | | | | | | | | Subject to | | | Year Ending | |
| Period | Fees | | Other Expenses | | Total | | | 2015 | | | | 2016 | | Recovery | | | December 31, | |
| Year Ended December 31, 2016 | $ | (102,813 | ) | | $ | — | | | $ | (102,813 | ) | $ | — | | | $ | — | | $ | (102,813 | ) | | 2019 | |
| Year Ended December 31, 2015 | | (132,040 | ) | | | — | | | | (132,040 | ) | | — | | | | — | | | (132,040 | ) | | 2018 | |
| Year Ended December 31, 2014 | | (122,831 | ) | | | — | | | | (122,831 | ) | | — | | | | — | | | (122,831 | ) | | 2017 | |
| Total | $ | (357,684 | ) | | $ | — | | | $ | (357,684 | ) | $ | — | | | $ | — | | $ | (357,684 | ) | | | |
| | |
| | |
| 98 | | LoCorr Managed Futures Strategy Fund, LoCorr Long/Short Commodities Strategy Fund, LoCorr Multi-Strategy Fund and LoCorr Market Trend Fund – Notes to Consolidated Financial Statements / LoCorr Long/Short Equity Fund and LoCorr Spectrum Income Fund – Notes to Financial Statements (continued) |
| | |
| LoCorr Spectrum Income Fund | | | | | | | | | | | | | | | |
| | | | | | | | | | | | | | | Subject to | |
| | Fees (Waived) or Expenses (Borne) | | Recovery to Adviser | | Remaining | | | Recovery on or | |
| | by Adviser Subject to Recovery | | Year Ended December 31, | | Available | | | Before Fiscal | |
| | Management | | | | | | | | | | Subject to | | | Year Ending | |
| Period | Fees | | Other Expenses | | Total | | 2015 | | 2016 | | Recovery | | | December 31, | |
| Year Ended December 31, 2016 | | $ | — | | | $ | — | | | $ | — | | | $ | — | | | $ | — | | | $ | — | | | 2019 | |
| Year Ended December 31, 2015 | | | — | | | | — | | | | — | | | | — | | | | — | | | | — | | | 2018 | |
| Year Ended December 31, 2014 | | | (132,869 | ) | | | — | | | | (132,869 | ) | | | 67,000 | | | | 26,753 | | | | (39,116 | ) | | 2017 | |
| Total | | $ | (132,869 | ) | | $ | — | | | $ | (132,869 | ) | | $ | 67,000 | | | $ | 26,753 | | | $ | (39,116 | ) | | | |
At December 31, 2016, there were no fees subject to recovery for the LoCorr Managed Futures Strategy Fund or the LoCorr Market Trend Fund.
For the year ended December 31, 2013, fees and expenses waived and borne by the Adviser for the LoCorr Long/Short Commodities Strategy Fund consisting of $171,188 in management fees and $54,559 in other expenses, totaling $225,747, expired on December 31, 2016 and are no longer eligible for recovery by the Adviser.
For the LoCorr Long/Short Equity Fund, the fees waived by the Adviser for period from May 10, 2013 (the Fund’s commencement of operations) through December 31, 2013, totaling $140,599, expired on December 31, 2016 and are no longer eligible for recovery by the Adviser.
Rule 12b-1 Distribution Agreement
The Funds have entered into a Rule 12b-1 distribution agreement with Quasar Distributors, LLC (“Quasar”). Class A shareholders pay distribution expenses to Quasar at the annual rate of 0.25% of the Fund’s average daily net assets. Class C shareholders pay to Quasar an annual rate of 1.00%, which is comprised of 0.75% in distribution expenses and 0.25% in service fees, of the Fund’s average daily net assets. Class I shareholders pay no 12b-1 fees.
6. Fund Shares
At December 31, 2016, there were an unlimited number of shares of beneficial interest authorized. The following table summarizes the activity in shares and dollar amounts applicable to each class of the Funds:
| LoCorr Managed Futures Strategy Fund – Class A | | | | | | | | | | |
| | | For the Year Ended December 31, 2016 | | | For the Year Ended December 31, 2015 | |
| | | Shares | | | Amount | | | Shares | | | Amount | |
| Shares Sold | | | 16,961,784 | | | $ | 155,903,603 | | | | 8,987,226 | | | $ | 77,825,462 | |
| Dividends Reinvested | | | 551,098 | | | | 4,910,284 | | | | 622,596 | | | | 5,254,701 | |
| Shares Redeemed | | | (10,956,643 | ) | | | (99,832,561 | ) | | | (7,079,433 | ) | | | (61,059,914 | ) |
| Redemption Fees | | | — | | | | 2,040 | | | | — | | | | 1,423 | |
| | | | 6,556,239 | | | $ | 60,983,366 | | | | 2,530,389 | | | $ | 22,021,672 | |
| Beginning Shares | | | 26,855,979 | | | | | | | | 24,325,590 | | | | | |
| Ending Shares | | | 33,412,218 | | | | | | | | 26,855,979 | | | | | |
| | | | | | | | | | | | | | | | | |
| LoCorr Managed Futures Strategy Fund – Class C | | | | | | | | | | | | | |
| | | For the Year Ended December 31, 2016 | | | For the Year Ended December 31, 2015 | |
| | | Shares | | | Amount | | | Shares | | | Amount | |
| Shares Sold | | | 3,540,006 | | | $ | 31,741,634 | | | | 2,909,687 | | | $ | 24,579,972 | |
| Dividends Reinvested | | | 256,145 | | | | 2,207,972 | | | | 250,744 | | | | 2,061,119 | |
| Shares Redeemed | | | (2,445,483 | ) | | | (21,620,670 | ) | | | (2,616,414 | ) | | | (21,913,915 | ) |
| Redemption Fees | | | — | | | | 289 | | | | — | | | | 284 | |
| | | | 1,350,668 | | | $ | 12,329,225 | | | | 544,017 | | | $ | 4,727,460 | |
| Beginning Shares | | | 11,860,266 | | | | | | | | 11,316,249 | | | | | |
| Ending Shares | | | 13,210,934 | | | | | | | | 11,860,266 | | | | | |
| | | | | | | | | | | | | | | | | |
| LoCorr Managed Futures Strategy Fund – Class I | | | | | | | | | | | | | |
| | | For the Year Ended December 31, 2016 | | | For the Year Ended December 31, 2015 | |
| | | Shares | | | Amount | | | Shares | | | Amount | |
| Shares Sold | | | 38,061,171 | | | $ | 351,129,132 | | | | 9,843,336 | | | $ | 85,909,507 | |
| Dividends Reinvested | | | 779,989 | | | | 7,027,798 | | | | 594,192 | | | | 5,056,575 | |
| Shares Redeemed | | | (8,907,973 | ) | | | (81,922,066 | ) | | | (10,279,085 | ) | | | (89,366,796 | ) |
| Redemption Fees | | | — | | | | 19,839 | | | | — | | | | 8,898 | |
| | | | 29,933,187 | | | $ | 276,254,703 | | | | 158,443 | | | $ | 1,608,184 | |
| Beginning Shares | | | 22,322,234 | | | | | | | | 22,163,791 | | | | | |
| Ending Shares | | | 52,255,421 | | | | | | | | 22,322,234 | | | | | |
| LoCorr Managed Futures Strategy Fund | | | | | | | | | | | | | | | | |
| Total Net Increase | | | | | | $ | 349,567,294 | | | | | | | $ | 28,357,316 | |
| | |
| | |
LoCorr Managed Futures Strategy Fund, LoCorr Long/Short Commodities Strategy Fund, LoCorr Multi-Strategy Fund and LoCorr Market Trend Fund – Notes to Consolidated Financial Statements / LoCorr Long/Short Equity Fund and LoCorr Spectrum Income Fund – Notes to Financial Statements (continued) | | 99 |
| | |
| LoCorr Long/Short Commodities Strategy Fund – Class A | | | | | | | | | | |
| | | For the Year Ended December 31, 2016 | | | For the Year Ended December 31, 2015 | |
| | | Shares | | | Amount | | | Shares | | | Amount | |
| Shares Sold | | | 5,519,830 | | | $ | 56,215,085 | | | | 2,034,940 | | | $ | 18,817,396 | |
| Dividends Reinvested | | | 90,271 | | | | 850,348 | | | | 128,995 | | | | 1,216,428 | |
| Shares Redeemed | | | (4,322,845 | ) | | | (43,063,779 | ) | | | (4,723,247 | ) | | | (41,232,944 | ) |
| Redemption Fees | | | — | | | | 5,787 | | | | — | | | | 1,049 | |
| | | | 1,287,256 | | | $ | 14,007,441 | | | | (2,559,312 | ) | | $ | (21,198,071 | ) |
| Beginning Shares | | | 2,513,488 | | | | | | | | 5,072,800 | | | | | |
| Ending Shares | | | 3,800,744 | | | | | | | | 2,513,488 | | | | | |
| | | | | | | | | | | | | | | | | |
| LoCorr Long/Short Commodities Strategy Fund – Class C | | | | | | | | | | | | | |
| | | For the Year Ended December 31, 2016 | | | For the Year Ended December 31, 2015 | |
| | | Shares | | | Amount | | | Shares | | | Amount | |
| Shares Sold | | | 600,272 | | | $ | 5,936,288 | | | | 162,705 | | | $ | 1,482,253 | |
| Dividends Reinvested | | | 19,301 | | | | 177,569 | | | | 26,512 | | | | 244,707 | |
| Shares Redeemed | | | (250,419 | ) | | | (2,413,789 | ) | | | (90,665 | ) | | | (791,576 | ) |
| Redemption Fees | | | — | | | | 383 | | | | — | | | | — | |
| | | | 369,154 | | | $ | 3,700,451 | | | | 98,552 | | | $ | 935,384 | |
| Beginning Shares | | | 455,299 | | | | | | | | 356,747 | | | | | |
| Ending Shares | | | 824,453 | | | | | | | | 455,299 | | | | | |
| | | | | | | | | | | | | | | | | |
| LoCorr Long/Short Commodities Strategy Fund – Class I | | | | | | | | | | | | | |
| | | For the Year Ended December 31, 2016 | | | For the Year Ended December 31, 2015 | |
| | | Shares | | | Amount | | | Shares | | | Amount | |
| Shares Sold | | | 11,982,802 | | | $ | 122,350,301 | | | | 2,537,268 | | | $ | 23,925,308 | |
| Dividends Reinvested | | | 241,354 | | | | 2,290,449 | | | | 156,161 | | | | 1,483,530 | |
| Shares Redeemed | | | (6,618,317 | ) | | | (65,911,861 | ) | | | (1,002,228 | ) | | | (8,965,296 | ) |
| Redemption Fees | | | — | | | | 20,771 | | | | — | | | | 560 | |
| | | | 5,605,839 | | | $ | 58,749,660 | | | | 1,691,201 | | | $ | 16,444,102 | |
| Beginning Shares | | | 3,183,735 | | | | | | | | 1,492,534 | | | | | |
| Ending Shares | | | 8,789,574 | | | | | | | | 3,183,735 | | | | | |
| LoCorr Long/Short Commodities Strategy Fund | | | | | | | | | | | | | |
| Total Net Increase (Decrease) | | | | | | $ | 76,457,552 | | | | | | | $ | (3,818,585 | ) |
| | | | | | | | | | | | | | | | | |
| | | | | | | | | | | | | | | | | |
| LoCorr Multi-Strategy Fund – Class A | | | | | | | | | | | | | | | | |
| | | For the Year Ended December 31, 2016 | | | For the Period Ended December 31, 2015(a) | |
| | | Shares | | | Amount | | | Shares | | | Amount | |
| Shares Sold | | | 1,331,325 | | | $ | 10,927,197 | | | | 1,600,796 | | | $ | 13,751,697 | |
| Dividends Reinvested | | | 48,692 | | | | 399,332 | | | | 11,062 | | | | 94,305 | |
| Shares Redeemed | | | (730,590 | ) | | | (6,017,250 | ) | | | (156,120 | ) | | | (1,307,967 | ) |
| Redemption Fees | | | — | | | | 177 | | | | — | | | | 18 | |
| | | | 649,427 | | | $ | 5,309,456 | | | | 1,455,738 | | | $ | 12,538,053 | |
| Beginning Shares | | | 1,455,738 | | | | | | | | — | | | | | |
| Ending Shares | | | 2,105,165 | | | | | | | | 1,455,738 | | | | | |
| | | | | | | | | | | | | | | | | |
| LoCorr Multi-Strategy Fund – Class C | | | | | | | | | | | | | | | | |
| | | For the Year Ended December 31, 2016 | | | For the Period Ended December 31, 2015(a) | |
| | | Shares | | | Amount | | | Shares | | | Amount | |
| Shares Sold | | | 187,751 | | | $ | 1,553,343 | | | | 729,049 | | | $ | 6,755,532 | |
| Dividends Reinvested | | | 12,332 | | | | 100,963 | | | | 8,655 | | | | 74,857 | |
| Shares Redeemed | | | (382,843 | ) | | | (3,106,550 | ) | | | (76,754 | ) | | | (644,545 | ) |
| Redemption Fees | | | — | | | | 4 | | | | — | | | | 1 | |
| | | | (182,760 | ) | | $ | (1,452,240 | ) | | | 660,950 | | | $ | 6,185,845 | |
| Beginning Shares | | | 660,950 | | | | | | | | — | | | | | |
| Ending Shares | | | 478,190 | | | | | | | | 660,950 | | | | | |
| | | | | | | | | | | | | | | | | |
| LoCorr Multi-Strategy Fund – Class I | | | | | | | | | | | | | | | | |
| | | For the Year Ended December 31, 2016 | | | For the Period Ended December 31, 2015(a) | |
| | | Shares | | | Amount | | | Shares | | | Amount | |
| Shares Sold | | | 1,079,642 | | | $ | 8,820,649 | | | | 2,143,805 | | | $ | 20,436,449 | |
| Dividends Reinvested | | | 63,201 | | | | 517,849 | | | | 26,332 | | | | 227,847 | |
| Shares Redeemed | | | (889,163 | ) | | | (7,321,692 | ) | | | (176,153 | ) | | | (1,476,316 | ) |
| Redemption Fees | | | — | | | | 57 | | | | — | | | | 448 | |
| | | | 253,680 | | | $ | 2,016,863 | | | | 1,993,984 | | | $ | 19,188,428 | |
| Beginning Shares | | | 1,993,984 | | | | | | | | — | | | | | |
| Ending Shares | | | 2,247,664 | | | | | | | | 1,993,984 | | | | | |
| LoCorr Multi-Strategy Fund | | | | | | | | | | | | | | | | |
| Total Net Increase | | | | | | $ | 5,874,079 | | | | | | | $ | 37,912,326 | |
(a) Class A, Class C and Class I shares of the LoCorr Multi-Strategy Fund commenced operations on April 6, 2015.
| | |
| | |
| 100 | | LoCorr Managed Futures Strategy Fund, LoCorr Long/Short Commodities Strategy Fund, LoCorr Multi-Strategy Fund and LoCorr Market Trend Fund – Notes to
Consolidated Financial Statements / LoCorr Long/Short Equity Fund and LoCorr Spectrum Income Fund – Notes to Financial Statements (continued) |
| | |
| LoCorr Market Trend Fund – Class A | | | | | | | | | | | | |
| | | For the Year Ended December 31, 2016 | | | For the Year Ended December 31, 2015 | |
| | | Shares | | | Amount | | | Shares | | | Amount | |
| Shares Sold | | | 11,027,256 | | | $ | 134,082,733 | | | | 10,981,830 | | | $ | 136,204,957 | |
| Dividends Reinvested | | | 196,345 | | | | 2,120,523 | | | | 57,551 | | | | 690,031 | |
| Shares Redeemed | | | (7,913,099 | ) | | | (91,798,608 | ) | | | (3,010,766 | ) | | | (37,007,295 | ) |
| Redemption Fees | | | — | | | | 7,807 | | | | — | | | | 4,282 | |
| | | | 3,310,502 | | | $ | 44,412,455 | | | | 8,028,615 | | | $ | 99,891,975 | |
| Beginning Shares | | | 9,194,610 | | | | | | | | 1,165,995 | | | | | |
| Ending Shares | | | 12,505,112 | | | | | | | | 9,194,610 | | | | | |
| | | | | | | | | | | | | | | | | |
| LoCorr Market Trend Fund – Class C | | | | | | | | | | | | | | | | |
| | | For the Year Ended December 31, 2016 | | | For the Year Ended December 31, 2015 | |
| | | Shares | | | Amount | | | Shares | | | Amount | |
| Shares Sold | | | 4,790,065 | | | $ | 57,543,161 | | | | 7,663,453 | | | $ | 94,694,283 | |
| Dividends Reinvested | | | 123,161 | | | | 1,316,592 | | | | 29,569 | | | | 352,169 | |
| Shares Redeemed | | | (4,366,738 | ) | | | (49,694,049 | ) | | | (355,182 | ) | | | (4,295,885 | ) |
| Redemption Fees | | | — | | | | 1,131 | | | | — | | | | 1,142 | |
| | | | 546,488 | | | $ | 9,166,835 | | | | 7,337,840 | | | $ | 90,751,709 | |
| Beginning Shares | | | 7,946,957 | | | | | | | | 609,117 | | | | | |
| Ending Shares | | | 8,493,445 | | | | | | | | 7,946,957 | | | | | |
| | | | | | | | | | | | | | | | | |
| LoCorr Market Trend Fund – Class I | | | | | | | | | | | | | | | | |
| | | For the Year Ended December 31, 2016 | | | For the Year Ended December 31, 2015 | |
| | | Shares | | | Amount | | | Shares | | | Amount | |
| Shares Sold | | | 77,618,009 | | | $ | 938,193,389 | | | | 63,469,686 | | | $ | 786,278,560 | |
| Dividends Reinvested | | | 1,426,002 | | | | 15,443,598 | | | | 459,518 | | | | 5,514,198 | |
| Shares Redeemed | | | (62,230,774 | ) | | | (713,501,477 | ) | | | (9,534,760 | ) | | | (116,621,840 | ) |
| Redemption Fees | | | — | | | | 22,937 | | | | — | | | | 50,131 | |
| | | | 16,813,237 | | | $ | 240,158,447 | | | | 54,394,444 | | | $ | 675,221,049 | |
| Beginning Shares | | | 57,903,916 | | | | | | | | 3,509,472 | | | | | |
| Ending Shares | | | 74,717,153 | | | | | | | | 57,903,916 | | | | | |
| LoCorr Market Trend Fund | | | | | | | | | | | | | | | | |
| Total Net Increase | | | | | | $ | 293,737,737 | | | | | | | $ | 865,864,733 | |
| | | | | | | | | | | | | | | | | |
| | | | | | | | | | | | | | | | | |
| LoCorr Long/Short Equity Fund – Class A | | | | | | | | | | | | | |
| | | For the Year Ended December 31, 2016 | | | For the Year Ended December 31, 2015 | |
| | | Shares | | | Amount | | | Shares | | | Amount | |
| Shares Sold | | | 1,619,380 | | | $ | 18,187,352 | | | | 486,410 | | | $ | 4,888,251 | |
| Shares Redeemed | | | (568,057 | ) | | | (6,110,231 | ) | | | (948,753 | ) | | | (9,453,852 | ) |
| Redemption Fees | | | — | | | | 398 | | | | — | | | | 220 | |
| | | | 1,051,323 | | | $ | 12,077,519 | | | | (462,343 | ) | | $ | (4,565,381 | ) |
| Beginning Shares | | | 1,290,685 | | | | | | | | 1,753,028 | | | | | |
| Ending Shares | | | 2,342,008 | | | | | | | | 1,290,685 | | | | | |
| | | | | | | | | | | | | | | | | |
| LoCorr Long/Short Equity Fund – Class C | | | | | | | | | | | | | |
| | | For the Year Ended December 31, 2016 | | | For the Year Ended December 31, 2015 | |
| | | Shares | | | Amount | | | Shares | | | Amount | |
| Shares Sold | | | 442,691 | | | $ | 4,787,011 | | | | 174,848 | | | $ | 1,678,326 | |
| Shares Redeemed | | | (315,415 | ) | | | (3,114,307 | ) | | | (602,384 | ) | | | (5,921,260 | ) |
| Redemption Fees | | | — | | | | 33 | | | | — | | | | 4 | |
| | | | 127,276 | | | $ | 1,672,737 | | | | (427,536 | ) | | $ | (4,242,930 | ) |
| Beginning Shares | | | 829,393 | | | | | | | | 1,256,929 | | | | | |
| Ending Shares | | | 956,669 | | | | | | | | 829,393 | | | | | |
| | | | | | | | | | | | | | | | | |
| LoCorr Long/Short Equity Fund – Class I | | | | | | | | | | | | | |
| | | For the Year Ended December 31, 2016 | | | For the Year Ended December 31, 2015 | |
| | | Shares | | | Amount | | | Shares | | | Amount | |
| Shares Sold | | | 3,239,660 | | | $ | 36,623,262 | | | | 487,509 | | | $ | 4,759,759 | |
| Shares Redeemed | | | (586,786 | ) | | | (6,413,330 | ) | | | (709,053 | ) | | | (6,974,552 | ) |
| Redemption Fees | | | — | | | | 1,721 | | | | — | | | | 55 | |
| | | | 2,652,874 | | | $ | 30,211,653 | | | | (221,544 | ) | | $ | (2,214,738 | ) |
| Beginning Shares | | | 1,029,273 | | | | | | | | 1,250,817 | | | | | |
| Ending Shares | | | 3,682,147 | | | | | | | | 1,029,273 | | | | | |
| LoCorr Long/Short Equity Fund | | | | | | | | | | | | | | | | |
| Total Net Increase (Decrease) | | | | | | $ | 43,961,909 | | | | | | | $ | (11,023,049 | ) |
| | |
| | |
LoCorr Managed Futures Strategy Fund, LoCorr Long/Short Commodities Strategy Fund, LoCorr Multi-Strategy Fund and LoCorr Market Trend Fund – Notes to Consolidated Financial Statements / LoCorr Long/Short Equity Fund and LoCorr Spectrum Income Fund – Notes to Financial Statements (continued) | | 101 |
| | |
| LoCorr Spectrum Income Fund – Class A | | | | | | | | | | |
| | | For the Year Ended December 31, 2016 | | | For the Year Ended December 31, 2015 | |
| | | Shares | | | Amount | | | Shares | | | Amount | |
| Shares Sold | | | 1,632,393 | | | $ | 12,699,250 | | | | 2,106,932 | | | $ | 18,935,848 | |
| Dividends Reinvested | | | 235,964 | | | | 1,810,640 | | | | 226,386 | | | | 1,954,189 | |
| Shares Redeemed | | | (2,326,814 | ) | | | (17,742,010 | ) | | | (1,757,377 | ) | | | (15,153,147 | ) |
| Redemption Fees | | | — | | | | 2,666 | | | | — | | | | 3,036 | |
| | | | (458,457 | ) | | $ | (3,229,454 | ) | | | 575,941 | | | $ | 5,739,926 | |
| Beginning Shares | | | 4,749,876 | | | | | | | | 4,173,935 | | | | | |
| Ending Shares | | | 4,291,419 | | | | | | | | 4,749,876 | | | | | |
| | | | | | | | | | | | | | | | | |
| LoCorr Spectrum Income Fund – Class C | | | | | | | | | | | | | | | | |
| | | For the Year Ended December 31, 2016 | | | For the Year Ended December 31, 2015 | |
| | | Shares | | | Amount | | | Shares | | | Amount | |
| Shares Sold | | | 740,640 | | | $ | 5,722,907 | | | | 1,725,350 | | | $ | 15,797,616 | |
| Dividends Reinvested | | | 189,715 | | | | 1,459,221 | | | | 164,425 | | | | 1,418,707 | |
| Shares Redeemed | | | (1,148,184 | ) | | | (8,758,530 | ) | | | (1,129,329 | ) | | | (9,658,785 | ) |
| Redemption Fees | | | — | | | | 384 | | | | — | | | | 2,087 | |
| | | | (217,829 | ) | | $ | (1,576,018 | ) | | | 760,446 | | | $ | 7,559,625 | |
| Beginning Shares | | | 3,574,461 | | | | | | | | 2,814,015 | | | | | |
| Ending Shares | | | 3,356,632 | | | | | | | | 3,574,461 | | | | | |
| | | | | | | | | | | | | | | | | |
| LoCorr Spectrum Income Fund – Class I | | | | | | | | | | | | | | | | |
| | | For the Year Ended December 31, 2016 | | | For the Year Ended December 31, 2015 | |
| | | Shares | | | Amount | | | Shares | | | Amount | |
| Shares Sold | | | 4,225,921 | | | $ | 32,868,495 | | | | 2,681,290 | | | $ | 24,067,648 | |
| Dividends Reinvested | | | 238,899 | | | | 1,835,131 | | | | 207,541 | | | | 1,806,428 | |
| Shares Redeemed | | | (2,012,132 | ) | | | (15,252,427 | ) | | | (2,757,482 | ) | | | (23,368,089 | ) |
| Redemption Fees | | | — | | | | 5,805 | | | | — | | | | 12,782 | |
| | | | 2,452,688 | | | $ | 19,457,004 | | | | 131,349 | | | $ | 2,518,769 | |
| Beginning Shares | | | 3,635,819 | | | | | | | | 3,504,470 | | | | | |
| Ending Shares | | | 6,088,507 | | | | | | | | 3,635,819 | | | | | |
| LoCorr Spectrum Income Fund | | | | | | | | | | | | | | | | |
| Total Net Increase | | | | | | $ | 14,651,532 | | | | | | | $ | 15,818,320 | |
7. Federal Tax Information
At December 31, 2016, the components of accumulated earnings (losses) on a tax basis were as follows:
| | LoCorr Managed | | LoCorr Long/Short | | LoCorr | |
| | Futures Strategy | | Commodities Strategy | | Multi Strategy | |
| | Fund | | Fund | | Fund | |
| Tax cost of investments | $ | 792,214,600 | | $ | 106,286,260 | | $ | 32,225,286 | |
| | | | | | | | | | |
| Gross unrealized appreciation | | 10,067,249 | | | 232,856 | | | 3,633,468 | |
| Gross unrealized depreciation | | (14,834,202 | ) | | (738,665 | ) | | (1,447,748 | ) |
| Net unrealized appreciation (depreciation) | | (4,766,953 | ) | | (505,809 | ) | | 2,185,720 | |
| Undistributed ordinary income | | 6,860,245 | | | 16,544 | | | — | |
| Undistributed long-term capital gains | | 12,048,528 | | | — | | | — | |
| Total distributable earnings | $ | 18,908,773 | | $ | 16,544 | | $ | — | |
| Other accumulated earnings (losses) | $ | (593,719 | ) | $ | (19,297,172 | ) | $ | (4,547,592 | ) |
| Total accumulated earnings (losses) | $ | 13,548,101 | | $ | (19,786,437 | ) | $ | (2,361,872 | ) |
| | | | | | | | | | |
| | LoCorr Market | | LoCorr Long/Short | | LoCorr Spectrum | |
| | Trend Fund | | Equity Fund | | Income Fund | |
| Tax cost of investments | $ | 862,859,636 | | $ | 74,238,974 | | $ | 105,887,430 | |
| | | | | | | | | | |
| Gross unrealized appreciation | | 17,902,555 | | | 8,517,417 | | | 6,011,112 | |
| Gross unrealized depreciation | | (20,705,597 | ) | | (1,791,087 | ) | | (6,663,343 | ) |
| Net unrealized appreciation (depreciation) | | (2,803,042 | ) | | 6,726,330 | | | (652,231 | ) |
| Undistributed ordinary income | | — | | | — | | | — | |
| Undistributed long-term capital gains | | — | | | 1,592,481 | | | — | |
| Total distributable earnings | $ | — | | $ | 1,592,481 | | $ | — | |
| Other accumulated earnings (losses) | $ | (31,585,814 | ) | $ | 119,331 | | $ | (24,500,003 | ) |
| Total accumulated earnings (losses) | $ | (34,388,856 | ) | $ | 8,438,142 | | $ | (25,152,234 | ) |
| | |
| 102 | | LoCorr Managed Futures Strategy Fund, LoCorr Long/Short Commodities Strategy Fund, LoCorr Multi-Strategy Fund and LoCorr Market Trend Fund – Notes to Consolidated Financial Statements / LoCorr Long/Short Equity Fund and LoCorr Spectrum Income Fund – Notes to Financial Statements (continued) |
| | |
Undistributed income or net realized gains for financial statement purposes may differ from amounts recognized for federal income tax purposes due to differences in the recognition and characterization of income, expense and capital gain items. The difference between book-basis and tax-basis unrealized appreciation is attributed primarily to the tax deferral of losses on wash sales and other temporary differences.
The following reclassifications were made within the components of net assets as of December 31, 2016:
| | | | | | | | | | |
| | Accumulated Net Investment Income (Loss) | | | Accumulated Net Realized Gain (Loss) | | | Paid-in Capital | |
| LoCorr Managed Futures Strategy Fund | | $ | 6,632,970 | | | $ | 10,359,945 | | | $ | (16,992,915) | |
| LoCorr Long/Short Commodities Strategy Fund | | | 5,338,273 | | | | (8,808,863) | | | | 3,470,590 | |
| LoCorr Multi-Strategy Fund | | | 777,964 | | | | 848,429 | | | | (1,626,393) | |
| LoCorr Market Trend Fund | | | 27,853,476 | | | | 136,445,759 | | | | (164,299,235) | |
| LoCorr Long/Short Equity Fund | | | 1,250,712 | | | | (63,271) | | | | (1,187,441) | |
| LoCorr Spectrum Income Fund | | | 2,539,190 | | | | 826,683 | | | | (3,365,873) | |
The reclassifications in the LoCorr Managed Futures Strategy Fund, the LoCorr Long/Short Commodities Strategy Fund, the LoCorr Multi-Strategy Fund and the LoCorr Market Trend Fund are primarily attributable to certain reclassifications related to each Fund’s wholly-owned subsidiary, paydown and/or currency adjustments and net operating losses/reclasses. The reclassifications in the LoCorr Long/Short Equity Fund and the LoCorr Spectrum Income Fund are primarily the result of each Fund’s net operating loss/reclasses, adjustments resulting from revisions of prior year estimates and return of capital / partnership basis adjustments.
Under the current tax law, capital losses realized after October 31 may be deferred and treated as occurring on the first day of the following fiscal year. As presented in the table below, the following Funds elected to defer capital losses for the year ended December 31, 2016:
| | | | | |
| | Post October Loss Deferral | | | |
| | | | | |
| LoCorr Multi-Strategy Fund | $ | | — | | $ | | 3,716 | |
| LoCorr Market Trend Fund | | | — | | | | 411,429 | |
| LoCorr Spectrum Income Fund | | | — | | | | 130,394 | |
At December 31, 2016, accumulated net realized capital loss carryovers, if any, and the year(s) in which the capital loss carryovers expire were:
| | | Capital Loss Carryover | | Year of Expiration |
| | | Short-Term | | | Long-Term | |
| LoCorr Long/Short Commodities Strategy Fund | | $ | 221,117 | | | $ | 85,106 | | Indefinitely |
| LoCorr Multi-Strategy Fund | | | 839,325 | | | | — | | Indefinitely |
| LoCorr Market Trend Fund | | | 1,566,125 | | | | 28,510,761 | | Indefinitely |
| LoCorr Spectrum Income Fund | | | 6,775,222 | | | | 17,593,814 | | Indefinitely |
During the fiscal year ended December 31, 2016, the LoCorr Managed Futures Strategy Fund, the LoCorr Multi-Strategy Fund, the LoCorr Market Trend Fund and the LoCorr Long/Short Equity Fund utilized unlimited capital loss carryovers of $541,149, $442,465, $15,549,259 and $3,606,067, respectively. The LoCorr Long/Short Commodities Strategy Fund and the LoCorr Spectrum Income Fund did not utilize any capital loss carryovers during the fiscal year ended December 31, 2016.
8. Line of Credit
The Trust entered into an unsecured, uncommitted Loan Agreement (“Line of Credit” or “LOC”) with U.S. Bank not individually but as an umbrella facility on behalf of the Funds in the Trust. The LOC expires on March 13, 2017. The LOC was established to provide the Funds a temporary short-term liquidity source, subject to certain restrictions, covenants, and the right of setoff on the Funds’ assets, to meet unanticipated redemptions. Under terms of the LOC, borrowings for each Fund are limited to the lesser of one-third of the total unencumbered assets (including the amount borrowed) of the respective Fund, 5% of the gross assets of the respective Fund or $50 million in the aggregate for all of the Funds under this agreement. Prior to March 14, 2016, the maximum allowable borrowing for the Funds in the aggregate was $32 million. U.S. Bank charges an interest rate per annum equal to the Prime Rate (3.75% as of December 31, 2016).
| | |
LoCorr Managed Futures Strategy Fund, LoCorr Long/Short Commodities Strategy Fund, LoCorr Multi-Strategy Fund and LoCorr Market Trend Fund – Notes to Consolidated Financial Statements / LoCorr Long/Short Equity Fund and LoCorr Spectrum Income Fund – Notes to Financial Statements (continued) | | 103 |
| | |
Line of Credit activity for the period was as follows:
| | | For the Year Ended December 31, 2016 |
| | | Interest Charges | | | Average Daily | | | Weighted Average | | | Maximum Amount Borrowed |
| Fund | | Incurred | | | Loan Balance | | | % | | | $ | | Date |
| LoCorr Long/Short Commodities Strategy Fund | | | $137 | | | | $3,919 | | | | 3.50% | | | | $794,000 | | July 18, 2016 |
The LoCorr Long/Short Commodities Strategy Fund was the only Fund that utilized the Line of Credit during the year ended December 31, 2016. At December 31, 2016, the Funds did not have any outstanding borrowings.
9. Subsequent Events
In preparing the financial statements, the Adviser has evaluated events after December 31, 2016.
Declaration of Dividends
The LoCorr Multi-Strategy Fund declared the following ordinary income distributions:
| Dividend Declaration | | Shareholder of | | Distribution Amount per Share Class | |
Date (a) | | Record Date | | Class A | | | Class C | | | Class I | |
| January 31, 2017 | | January 30, 2017 | | | $0.02292 | | | | $0.01667 | | | | $0.02500 | |
| February 28, 2017 | | February 27, 2017 | | | $0.02292 | | | | $0.01667 | | | | $0.02500 | |
(a) Ex-date, reinvest date and payable date.
The LoCorr Spectrum Income Fund declared the following ordinary income distributions:
| Dividend Declaration | | Shareholder of | | Distribution Amount per Share Class | |
Date (a) | | Record Date | | Class A | | | Class C | | | Class I | |
| January 31, 2017 | | January 30, 2017 | | | $0.0479 | | | | $0.0417 | | | | $0.0500 | |
| February 28, 2017 | | February 27, 2017 | | | $0.0479 | | | | $0.0417 | | | | $0.0500 | |
(a) Ex-date, reinvest date and payable date.
The estimated characterization of the distributions paid will be an ordinary dividend, qualified dividend or return of capital. See Note 2 for additional information.
Class T shares
Post-Effective Amendment No. 27 to the Trust’s registration statement on Form N-1A was filed on January 19, 2017 for initial registration of Class T shares for each of the six Funds in the Trust.
Sub-adviser approval
At the Trust’s regular quarterly meeting of the Board of Trustees (the “Board”) held November 21, 2016, the Board approved Kettle Hill Capital Management, LLC to serve as an additional sub-adviser to the LoCorr Multi-Strategy Fund. As of the date of this filing, the effective date has not yet been determined. The Fund’s portfolio is currently sub-advised by Billings Capital Management LLC and Trust & Fiduciary Income Partners, LLC. See Note 5.
There were no additional subsequent events since December 31, 2016 through the date the financial statements were issued that would require adjustments to or additional disclosure in these financial statements.
| | |
| 104 | | Report of Independent Registered Public Accounting Firm |
| | |
Report of Independent Registered Public Accounting Firm
To the Shareholders and Board of
Trustees of LoCorr Investment Trust
We have audited the accompanying consolidated statements of assets and liabilities of LoCorr Managed Futures Strategy Fund, LoCorr Long/Short Commodities Strategy Fund, LoCorr Multi-Strategy Fund, and LoCorr Market Trend Fund, including the consolidated schedules of investments, swap contracts, securities sold short, open forward currency contracts, and open futures contracts, and the accompanying statements of assets and liabilities of LoCorr Long/Short Equity Fund and LoCorr Spectrum Income Fund, including the schedules of investments and securities sold short, each a series of LoCorr Investment Trust (the “Funds”) as of December 31, 2016, and the related consolidated statements of operations for the year then ended, the consolidated statements of changes in net assets for each of the two periods in the period then ended, and the consolidated financial highlights for each of the periods presented in the period then ended of LoCorr Managed Futures Strategy Fund, LoCorr Long/Short Commodities Strategy Fund, LoCorr Multi-Strategy Fund, and LoCorr Market Trend Fund, and the related statements of operations for the year then ended, the statements of changes in net assets for each of the two years in the period then ended, and the financial highlights for each of the periods presented in the period then ended of LoCorr Long/Short Equity Fund and LoCorr Spectrum Income Fund (collectively referred to as the financial statements). These financial statements and financial highlights are the responsibility of the Funds’ management. Our responsibility is to express an opinion on these financial statements and financial highlights based on our audits.
We conducted our audits in accordance with the standards of the Public Company Accounting Oversight Board (United States). Those standards require that we plan and perform the audit to obtain reasonable assurance about whether the financial statements and financial highlights are free of material misstatement. An audit includes examining, on a test basis, evidence supporting the amounts and disclosures in the financial statements. Our procedures included confirmation of securities owned as of December 31, 2016, by correspondence with the custodian and brokers. An audit also includes assessing the accounting principles used and significant estimates made by management, as well as evaluating the overall financial statement presentation. We believe that our audits provide a reasonable basis for our opinion.
In our opinion, the financial statements and financial highlights referred to above present fairly, in all material respects, the financial position of each of the Funds constituting LoCorr Investment Trust as of December 31, 2016, the results of their operations for the year then ended, the changes in their net assets for each of the two periods in the period then ended, and the financial highlights for the periods indicated above, in conformity with accounting principles generally accepted in the United States of America.
COHEN & COMPANY, LTD.
Cleveland, Ohio
February 28, 2017
| | |
| LoCorr Investment Trust - Expense Example (Unaudited) | | 105 |
| | |
Expense Example
December 31, 2016 (Unaudited)
As a shareholder of a mutual fund, you incur two types of costs: (1) transaction costs, including sales charges (loads) on purchase payments; redemption fees; and (2) ongoing costs, including management fees; distribution and/or service (12b-1) fees and other Fund expenses.
This Example is intended to help you understand your ongoing costs (in dollars) of investing in each of the Funds and to compare these costs with the ongoing costs of investing in other mutual funds. The Example is based on an investment of $1,000 invested at the beginning of the period and held for the entire period (July 1, 2016 through December 31, 2016).
Actual Expenses
The actual return columns in the following table provide information about account values based on actual returns and actual expenses. You may use the information in these columns, together with the amount you invested, to estimate the expenses that you paid over the period. Simply divide your account value by $1,000 (for example, an $8,600 account value divided by $1,000 = 8.6), then multiply the result by the number in the first line under the heading entitled “Expenses Paid During Period” to estimate the expenses you paid on your account during this period. The only transaction fees you may be required to pay are for outgoing wire transfers, returned checks and stop payment orders at prevailing rates charged by U.S. Bancorp Fund Services, LLC, the Funds’ transfer agent. These fees are assessed on all accounts, as applicable. If you request that a redemption be made by wire transfer, currently the Funds’ transfer agent charges a $15.00 fee. The Funds’ transfer agent charges a transaction fee of $25.00 on returned checks and stop payment orders. If you paid a transaction fee, you would add the fee amount to the expenses paid on your account this period to obtain your total expenses paid.
Hypothetical Example for Comparison Purposes
The hypothetical return columns in the following table provide information about hypothetical account values and hypothetical expenses based on the Funds’ actual expense ratio and an assumed rate of return of 5% per year before expenses, which is not the Funds’ actual return. The hypothetical account values and expenses may not be used to estimate the actual ending account balance or expenses you paid for the period. You may use this information to compare the ongoing costs of investing in the Funds and other funds. To do so, compare this 5% hypothetical example with the 5% hypothetical examples that appear in the shareholder reports of the other funds. A transaction fee of $15.00 may be assessed on outgoing wire transfers and a transaction fee of $25.00 may be assessed on returned checks and stop payment orders. To include this fee in the calculation, you would add the estimated transaction fee to the hypothetical expenses shown in the table. Please note that the expenses shown in the table are meant to highlight your ongoing costs only and do not reflect the transaction fees discussed above. Therefore, those columns are useful in comparing ongoing costs only, and will not help you determine the relative total costs of owning different funds. In addition, if these transactional costs were included, your costs would have been higher.
| | |
| 106 | | LoCorr Investment Trust - Expense Example (Unaudited) (continued) |
| | |
Actual vs Hypothetical Returns
Actual vs. Hypothetical returns for the Six Months Ended December 31, 2016 (Unaudited)
| | | | | | | | | | |
| | | | | Actual | | | Hypothetical
(5% gross annual return) |
| | | | | | | | | | |
| | Class | Fund’s
Annualized
Expense Ratio
1, 2 | Beginning
Account Value
July 01, 2016 | Ending
Account Value
December 31,
2016 | Expenses Paid
During Period
1, 2, 3 | | | Ending
Account Value
December 31,
2016 | Expenses Paid
During Period
1, 2, 3 |
| | | | | | | | | | |
| LoCorr Managed Futures Strategy Fund |
| | A | 2.41% | $1,000.00 | $954.40 | $11.84 | | | $1,013.02 | $12.19 |
| | C | 3.16% | $1,000.00 | $950.90 | $15.50 | | | $1,009.25 | $15.96 |
| | I | 2.16% | $1,000.00 | $955.90 | $10.62 | | | $1,014.28 | $10.94 |
| | | | | | | | | | |
| LoCorr Long/Short Commodities Strategy Fund |
| | A | 2.20% | $1,000.00 | $929.10 | $10.67 | | | $1,014.08 | $11.14 |
| | C | 2.95% | $1,000.00 | $926.90 | $14.29 | | | $1,010.31 | $14.91 |
| | I | 1.95% | $1,000.00 | $931.40 | $9.47 | | | $1,015.33 | $9.88 |
| | | | | | | | | | |
| LoCorr Multi-Strategy Fund |
| | A | 2.36% | $1,000.00 | $981.70 | $11.76 | | | $1,013.27 | $11.94 |
| | C | 3.11% | $1,000.00 | $976.20 | $15.45 | | | $1,009.50 | $15.71 |
| | I | 2.11% | $1,000.00 | $983.20 | $10.52 | | | $1,014.53 | $10.68 |
| | | | | | | | | | |
| LoCorr Market Trend Fund |
| | A | 2.09% | $1,000.00 | $878.70 | $9.87 | | | $1,014.63 | $10.58 |
| | C | 2.84% | $1,000.00 | $874.90 | $13.38 | | | $1,010.86 | $14.36 |
| | I | 1.84% | $1,000.00 | $879.50 | $8.69 | | | $1,015.89 | $9.32 |
| | | | | | | | | | |
| LoCorr Long/Short Equity Fund |
| | A | 3.54% | $1,000.00 | $1,184.70 | $19.44 | | | $1,007.34 | $17.86 |
| | C | 4.29% | $1,000.00 | $1,180.30 | $23.51 | | | $1,003.57 | $21.61 |
| | I | 3.29% | $1,000.00 | $1,186.20 | $18.08 | | | $1,008.60 | $16.61 |
| | | | | | | | | | |
| LoCorr Spectrum Income Fund |
| | A | 2.05% | $1,000.00 | $1,024.40 | $10.43 | | | $1,014.83 | $10.38 |
| | C | 2.80% | $1,000.00 | $1,020.80 | $14.22 | | | $1,011.06 | $14.15 |
| | I | 1.80% | $1,000.00 | $1,024.70 | $9.16 | | | $1,016.09 | $9.12 |
| 1 | Includes dividend and/or interest expense of 0.01%, 0.00%, 0.07%, 0.00%, 0.39% and 0.00% for the LoCorr Managed Futures Strategy Fund, the LoCorr Long/Short Commodities Strategy Fund, the LoCorr Multi-Strategy Fund, the LoCorr Market Trend Fund, the LoCorr Long/Short Equity Fund and the LoCorr Spectrum Income Fund, respectively. |
| 2 | Includes expenses of the wholly-owned and controlled Cayman Islands subsidiaries for the LoCorr Managed Futures Strategy Fund, the LoCorr Long/Short Commodities Strategy Fund, the LoCorr Multi-Strategy Fund and the LoCorr Market Trend Fund. |
| 3 | Expenses Paid During Period are equal to the net annualized expense ratio for the class, multiplied by the average account value over the period, multiplied by 184/366 (to reflect the one-half year period). |
| | |
| Review of Sub-Advisory Agreement (Unaudited) | | 107 |
| | |
Review of Sub-Advisory Agreement
December 31, 2016 (Unaudited)
Fund Counsel directed the Board’s attention to the Board materials for the approval sub-advisory agreement with Kettle Hill Capital Management, LLC (“Kettle Hill”) with respect to the LoCorr Multi-Strategy Fund (“the LMS Fund”).
The Board reviewed the memorandum provided by Fund Counsel which had been provided to them prior to the meeting entitled, “Duties of Trustees with Respect to Approval and Renewal of Investment Advisory and Sub-Advisory Contracts”. The Board, including a majority of the Trustees who are not “interested persons” of the Trust within the meaning of the 1940 Act (the “Independent Trustees”), reviewed the various factors relevant to its consideration of the sub-advisory agreement and the legal responsibilities of the Board related to such consideration. These factors included the following:
| • | The nature, extent and quality of the services provided by the investment adviser to the fund; |
| • | The investment performance of the fund and the investment adviser; |
| • | The costs of the services to be provided and the profits to be realized by the adviser and its affiliates from the relationship with the fund; |
| • | The extent to which economies of scale will be realized as the fund grows; and |
| • | Whether the fee levels reflect these economies of scale to the benefit of the shareholders. |
Fund counsel directed the Board to the responses provided by Kettle Hill to the 15(c) questionnaire found in Section 6 of the materials. The Board reviewed the responses and the sub-advisory agreement prior to the meeting.
Nature, Extent and Quality of Services Provided by the Sub-Adviser
The Board also considered the nature, extent and quality of services to be provided by Kettle Hill for the LMS Fund. Fund Counsel directed the Board’s attention to the 15(c) responses for Kettle Hill. The Board reviewed the responsibilities and backgrounds of Kettle Hill’s key individuals. Fund Counsel stated that the same key individuals had been previously considered by the Board with respect to their approval of Kettle Hill as a sub-advisor to the LoCorr Long/Short Equity Fund (“the LLSE Fund”). The Trustees further noted that Kettle Hill would provide equity research, financial modeling, security selection and trade execution for the LMS Fund as it does for the LLSE Fund as well as compliance services to assure assets are managed within the Fund’s investment restrictions. A representative of the Adviser confirmed that Kettle Hill would be following the same strategy for the LMS Fund as it does for the LLSE Fund.
Fund Counsel indicated that Kettle Hill reported no material compliance issues, regulatory issues or material litigations in the past 36 months. A representative of the Adviser stated that the Fund’s adviser continued to be satisfied with Kettle Hill’s execution of its strategy. The Adviser’s representative further discussed the compliance policies and procedures for Kettle Hill and detailed the changes to such policies and procedures that had been implemented since the Board’s prior approval of Kettle Hill.
Fund Counsel stated that Kettle Hill had obtained an E&O/D&O policy. The Board concluded that Kettle Hill has appropriate resources available and has sufficient insurance coverage. The Board concluded that Kettle Hill has the appropriate investment management experience and that it has provided high quality services for the LLSE Fund and is expected to provide the same to the LMS Fund.
Investment performance of the Sub-Adviser
Fund Counsel directed the Trustees to the performance of Kettle Hill with respect to its management of other similar accounts. Fund Counsel noted for the Trustees the performance of the other similar accounts including the LLSE Fund against the sub-adviser’s chosen benchmark. The Trustees considered the outperformance of the similar accounts against the benchmarks for the one, five and ten year periods as well as since inception.
After a discussion, the Board agreed that it expected Kettle Hill to provide similar satisfactory performance with respect to the LMS Fund as it has done for the LLSE Fund and its other accounts.
Costs of Services Provided and Profitability to be Realized
Fund Counsel next directed the Board’s attention to the costs of services provided by Kettle Hill to the LMS Fund. Fund Counsel noted for the Trustees the fee the Adviser would be paying Kettle Hill and the fee Kettle Hill charged other accounts. Fund Counsel pointed out to the Trustees that the subadvisory fee structure for the LMS Fund would be the same as the fee structure for LLSE Fund. The Board considered Kettle Hill’s net profits related to its services to the Fund. A representative of the Adviser indicated the subadvisory fee would be calculated on the aggregate assets managed by Kettle Hill for both the LMS Fund and the LLSE Fund which would allow each Fund to enjoy more favorable pricing more quickly. After a discussion, the Board concluded that Kettle Hill’s sub-advisory fee and profitability were within the range of reasonableness.
Other Benefits
Fund Counsel noted for the Trustees that Kettle Hill may derive certain other benefits from its relationship with the LMS Fund including soft dollars that may be generated from Fund transactions that Kettle Hill would use for brokerage and research purposes. The Adviser also noted that Kettle Hill may generally benefit from any publicity generated by Fund through coverage of the Fund by industry ranking services, media coverage and marketing materials. After a discussion, the Trustees concluded that the other benefits that may be derived by Kettle Hill from its relationship with the Fund were reasonable.
Having requested and received such information from Kettle Hill as the Trustees believed to be reasonably necessary to evaluate the terms of the Sub-Advisory Agreement, and as assisted by the advice of counsel, the Trustees, including a majority of the Independent Trustees, concluded that the fee structure is reasonable and that approval of the Sub-Advisory Agreement is in the best interests of the shareholders of the Fund.
| |
| |
| 108 | | Special Meeting of Shareholders of the LoCorr Managed Futures Strategy Fund/Notice of Privacy Policy & Practices/Quarterly Portfolio
Holdings/Proxy (Unaudited) |
| |
Special Meeting of Shareholders of the LoCorr Managed Futures Strategy Fund
(Unaudited)
At a special meeting of shareholders the LoCorr Managed Futures Strategy Fund held on March 11, 2016, the shareholders of the Fund approved an amended Management Agreement between the Adviser and the Fund. Approval of this proposal required a majority of the outstanding voting securities of the Fund. The results of the proxy solicitation on this proposal were as follows:
| Shares outstanding on record date | 60,916,179 |
| Voted for | 26,526,366 |
| Voted against | 651,259 |
| Abstained | 3,373,087 |
Notice of Privacy Policy & Practices
(Unaudited)
Your privacy is important to us. The Funds are committed to maintaining the confidentiality, integrity, and security of your personal information. When you provide personal information, the Funds believe that you should be aware of policies to protect the confidentiality of that information.
The Funds collect the following nonpublic personal information about you:
| • | Information we receive from you on or in applications or other forms, correspondence, or conversations, including, but not limited to, your name, address, phone number, social security number, assets, income, and date of birth; and |
| • | Information about your transactions with us, our affiliates, or others, including, but not limited to, your account number and balance, payments history, parties to transactions, cost basis information, and other financial information. |
The Funds do not disclose any nonpublic personal information about our current or former shareholders to affiliated or nonaffiliated third parties, except as permitted by law. For example, the Funds are permitted by law to disclose all of the information we collect, as described above, to our transfer agent to process your transactions. Furthermore, the Funds restrict access to your nonpublic personal information to those persons who require such information to provide products or services to you. The Funds maintain physical, electronic, and procedural safeguards that comply with applicable federal and state standards to guard your nonpublic personal information.
In the event that you hold shares of the Funds through a financial intermediary, including, but not limited to, a broker-dealer, bank, or trust company, the privacy policy of your financial intermediary would govern how your nonpublic personal information would be shared with affiliated or non-affiliated third parties.
Quarterly Form N-Q portfolio schedule
(Unaudited)
The Funds file their complete schedule of portfolio holdings with the Securities and Exchange Commission (“SEC”) for the first and third quarters of each fiscal year on Form N-Q. The Funds’ Forms N-Q are available on the SEC’s website at http://www.sec.gov. The Funds’ Forms N-Q may be reviewed and copied at the SEC’s Public Reference Room in Washington, D.C. Information on the operation of the SEC’s Public Reference Room may be obtained by calling 1-800-SEC-0330. Additionally, you may obtain copies of Forms N-Q from the Funds upon request by calling 1-855-523-8637.
Proxy voting policies, procedures and record
(Unaudited)
You may obtain a description of the Funds’ (1) proxy voting policies, (2) proxy voting procedures and (3) information regarding how the Funds voted any proxies related to portfolio securities during the most recent 12-month period ended June 30 for which an SEC filing has been made, without charge, upon request by contacting the Funds directly at 1-855-523-8637, or on the EDGAR Database on the SEC’s website (http:// www.sec.gov).
| |
| |
| Qualified Dividend Income (“QDI”) / Dividends Received Deduction (“DRD”) (Unaudited) | | 109 |
| |
Qualified Dividend Income (“QDI”) / Dividends Received Deduction (“DRD”)
(Unaudited)
For the fiscal year ended December 31, 2016, certain dividends paid by the Funds may be subject to a maximum tax rate of 15%, as provided for by the Jobs and Growth Tax Relief Reconciliation Act of 2003. The percentage of dividends declared from ordinary income designated as qualified income was as follows:
| Fund | | | | QDI% |
| LoCorr Managed Futures Strategy Fund | | 0.00% |
| LoCorr Long/Short Commodities Strategy Fund | | 0.00% |
| LoCorr Multi-Strategy Fund | | 100.00% |
| LoCorr Market Trend Fund | | 0.00% |
| LoCorr Long/Short Equity Fund | | 0.00% |
| LoCorr Spectrum Income Fund | | 13.59% |
For corporate shareholders, the percent of ordinary income distributions qualifying for the corporate dividends received deduction for the fiscal year ended December 31, 2016 was as follows:
| Fund | | | | DRD% |
| LoCorr Managed Futures Strategy Fund | | 0.00% |
| LoCorr Long/Short Commodities Strategy Fund | | 0.00% |
| LoCorr Multi-Strategy Fund | | 100.00% |
| LoCorr Market Trend Fund | | 0.00% |
| LoCorr Long/Short Equity Fund | | 0.00% |
| LoCorr Spectrum Income Fund | | 39.10% |
| |
| |
| 110 | | Independent Trustees/Interested Trustees and Officers |
| |
The Statement of Additional Information includes additional information about the Independent Trustees/Interested Trustees and Officers and is available, without charge, by calling 1-855-523-8637.
| Independent Trustees |
Name, Address
and Year of Birth | Position/Term
of Offce1 | Principal Occupation
During the Past 5 Years | Number of Portfolios
in Fund Complex2
Overseen by Trustee | Other Directorships
held by Trustee
During the Past 5
Years |
Gary Jarrett
Year of Birth: 1954 | Trustee/ May 2016 to present | Chief Executive Officer, Black River Asset Management LLC, investment subsidiary of Cargill, Inc., June 2002 to August 2015. | 6 | None |
James W. Morton
Year of Birth: 1939 | Trustee/ January 2011 to present | Chairman of the Board, Fidelity Bank (community bank), 2008 to 2015, President 1978 to 2008. | 6 | None |
Mark Thompson
Year of Birth: 1959 | Trustee/ December 2011 to present | Chairman and Chief Manager, Riverbridge Partners, LLC (investment management), 1987 to present. | 6 | None |
Ronald A. Tschetter
Year of Birth: 1941 | Trustee/ January 2011 to present | Mr. Tschetter is presently retired from his principal occupation; Director of the U.S. Peace Corps, September 2006 to January 2009. | 6 | None |
| Interested Trustees and Officers |
Name, Address
and Year of Birth | Position/Term
of Offce1 | Principal Occupation
During the Past 5 Years | Number of Portfolios
in Fund Complex2
Overseen by Trustee | Other Directorships
held by Trustee
During the Past 5
Years |
Jon C. Essen3 Year of Birth: 1963 | Treasurer, Secretary, Chief Compliance Officer/January 2011 to present; Trustee/November, 2010 to present | Chief Operating Officer and Chief Compliance Officer of LoCorr Fund Management, LLC, November 2010 to present; Senior Vice President, Chief Operating Officer and Registered Representative of Octavus Group, LLC (broker/dealer), April 2008 to present. | 6 | None |
Kevin M. Kinzie4 Year of Birth: 1956 | President, Trustee/ January 2011 to present | Chief Executive Officer of LoCorr Fund Management, LLC, November 2010 to present; President and Chief Executive Officer of Octavus Group, LLC (broker/dealer), March 2002 to present. | 6 | None |
1 The term of office for each Trustee listed above will continue indefinitely.
2 The term “Fund Complex” refers to the LoCorr Investment Trust.
3 Mr. Essen is an interested Trustee because he is an officer of the Funds’ Adviser.
4 Mr. Kinzie is an interested Trustee because he is an officer and indirect controlling interest holder of the Funds’ Adviser.


Item 2. Code of Ethics.
The registrant has adopted a code of ethics that applies to the registrant’s principal executive officer and principal financial officer. The registrant has not made any amendments to its code of ethics during the period covered by this report. The registrant has not granted any waivers from any provisions of the code of ethics during the period covered by this report.
A copy of the registrant’s Code of Ethics is incorporated by reference. See Item 12(a)(1).
Item 3. Audit Committee Financial Expert.
During the fiscal year, the registrant’s Board of Trustees has approved Gary Jarrett, a member of the Audit Committee, to be designated as an “audit committee financial expert” within the meaning of the rules of the SEC.
Item 4. Principal Accountant Fees and Services.
The registrant has engaged its principal accountant to perform audit services, audit-related services, tax services and other services during the past two fiscal years. “Audit services” refer to performing an audit of the registrant’s annual financial statements or services that are normally provided by the accountant in connection with statutory and regulatory filings or engagements for those fiscal years. “Audit-related services” refer to the assurance and related services by the principal accountant that are reasonably related to the performance of the audit. “Tax services” refer to professional services rendered by the principal accountant for tax compliance, tax advice, and tax planning. “Other services” provided by the principal accountant of $6,000 and $6,000 represent a cursory review of the semi-annual report for LoCorr Investment Trust for the periods ended June 30, 2016 and June 30, 2015, respectively. The following table details the aggregate fees billed or expected to be billed for each of the last two fiscal years for audit fees, audit-related fees, tax fees and other fees by the principal accountant.
| | FYE 12/31/2016 | FYE 12/31/2015 |
| Audit Fees | $135,000 | $132,000 |
| Audit-Related Fees | $0 | $0 |
| Tax Fees | $35,500 | $35,500 |
| All Other Fees | $6,000 | $6,000 |
The Audit Committee has adopted pre-approval policies and procedures that require the Audit Committee to pre‑approve all audit and non‑audit services of the registrant, including services provided to any entity affiliated with the registrant.
The percentage of fees billed by Cohen & Company, Ltd. applicable to non-audit services pursuant to waiver of pre-approval requirement were as follows:
| | FYE 12/31/2016 | FYE 12/31/2015 |
| Audit-Related Fees | 0% | 0% |
| Tax Fees | 0% | 0% |
| All Other Fees | 0% | 0% |
All of the principal accountant’s hours spent on auditing the registrant’s financial statements were attributed to work performed by full‑time permanent employees of the principal accountant.
During the last two fiscal years, there were no non-audit services, other those disclosed above under “Tax Fees” and “All Other Services”, rendered by the principal accountant to the registrant. In addition, there were no non-audit services rendered by the principal accountant to the registrant’s investment adviser or any entity controlling, controlled by or under common control with the investment adviser that provides ongoing services to the registrant.
Item 5. Audit Committee of Listed Registrants.
Not applicable to registrants who are not listed issuers (as defined in Rule 10A-3 under the Securities Exchange Act of 1934).
Item 6. Investments.
| (a) | Schedule of Investments is included as part of the report to shareholders filed under Item 1 of this Form. |
Item 7. Disclosure of Proxy Voting Policies and Procedures for Closed-End Management Investment Companies.
Not applicable to open-end investment companies.
Item 8. Portfolio Managers of Closed-End Management Investment Companies.
Not applicable to open-end investment companies.
Item 9. Purchases of Equity Securities by Closed‑End Management Investment Company and Affiliated Purchasers.
Not applicable to open-end investment companies.
Item 10. Submission of Matters to a Vote of Security Holders.
There have been no material changes to the procedures by which shareholders may recommend nominees to the registrant’s Board of Trustees.
Item 11. Controls and Procedures.
| (a) | The registrant’s President and Treasurer have reviewed the registrant’s disclosure controls and procedures (as defined in Rule 30a-3(c) under the Investment Company Act of 1940 (the “Act”)) as of a date within 90 days of the filing of this report, as required by Rule 30a-3(b) under the Act and Rules 13a-15(b) or 15d‑15(b) under the Securities Exchange Act of 1934. Based on their review, such officers have concluded that the disclosure controls and procedures are effective in ensuring that information required to be disclosed in this report is appropriately recorded, processed, summarized and reported and made known to them by others within the registrant and by the registrant’s service provider. |
| (b) | There were no changes in the registrant’s internal control over financial reporting (as defined in Rule 30a-3(d) under the Act) that occurred during the second fiscal quarter of the period covered by this report that has materially affected, or is reasonably likely to materially affect, the registrant’s internal control over financial reporting. |
Item 12. Exhibits.
| (a) | (1) Any code of ethics or amendment thereto, that is the subject of the disclosure required by Item 2, to the extent that the registrant intends to satisfy Item 2 requirements through filing an exhibit. |
Incorporated by reference to the registrant’s Form N-CSR filed March 7, 2014.
(2) A separate certification for each principal executive and principal financial officer pursuant to Section 302 of the Sarbanes-Oxley Act of 2002.
Filed herewith.
(3) Any written solicitation to purchase securities under Rule 23c‑1 under the Act sent or given during the period covered by the report by or on behalf of the registrant to 10 or more persons.
Not applicable to open-end investment companies.
| (b) | Certifications pursuant to Section 906 of the Sarbanes‑Oxley Act of 2002. |
Furnished herewith.
SIGNATURES
Pursuant to the requirements of the Securities Exchange Act of 1934 and the Investment Company Act of 1940, the registrant has duly caused this report to be signed on its behalf by the undersigned, thereunto duly authorized.
(Registrant) LoCorr Investment Trust
By (Signature and Title) /s/ Kevin Kinzie
Kevin Kinzie, President
Date 3/8/17
Pursuant to the requirements of the Securities Exchange Act of 1934 and the Investment Company Act of 1940, this report has been signed below by the following persons on behalf of the registrant and in the capacities and on the dates indicated.
By (Signature and Title) /s/ Kevin Kinzie
Kevin Kinzie, President
Date 3/8/17
By (Signature and Title) /s/ Jon Essen
Jon Essen, Treasurer
Date 3/8/17