SECURITIES AND EXCHANGE COMMISSION
Washington, D.C. 20549
(Exact name of registrant as specified in charter)
(Address of principal executive offices) (Zip code)
(Name and address of agent for service)

Shareholder Letter | 3 |
4 | Shareholder Letter | |
Shareholder Letter | 5 | |
6 | Shareholder Letter |
Shareholder Letter | 7 |
8 | Shareholder Letter |
Shareholder Letter | 9 |
10 | Shareholder Letter |
| Shareholder Letter | 11 |
LoCorr Spectrum Income Fund
The LoCorr Spectrum Income Fund (the “Spectrum Income Fund” or the “Fund”) has an objective of current income with capital appreciation as a secondary objective. The Fund is designed to fit within the “low correlation” of the LoCorr Fund family by seeking to provide relatively high levels of income with low correlation to the bond market. The Fund’s sub-adviser is TFIP. TFIP invests in pass-through securities to seek high current income, much of which the Fund distributes monthly to investors.
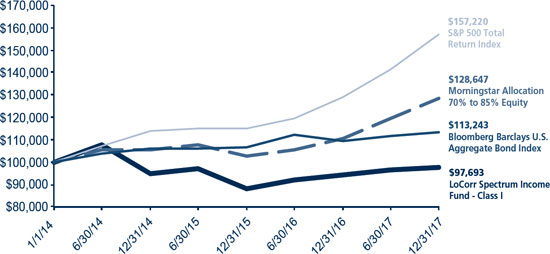
The Fund’s Class I shares gained +3.85% during the annual period ended December 31, 2017 compared with the +3.54% return for the Bloomberg Barclay’s U.S. Aggregate Bond Index. During the year, the Fund benefitted from positive contributions by holdings in CEFs, Mortgage REITs, and asset managers. These gains were partially offset by losses from Equity REITs holdings as well as Preferred Stock investments.
Market Commentary
Following the U.S. elections in November 2016, capital markets began 2017 with optimism that a pro-business, anti-regulation administration would stimulate positive returns. By the end of 2017, the performance of most major markets by and large exceeded even the staunchest of bullish forecasts. Global markets steadily climbed the wall of worry and shrugged off a myriad of geopolitical concerns ranging from North Korea’s continued development of its nuclear missile program and defiance of the global community; the snap election and Brexit in Great Britain; a more aggressive Russian military; China’s push to dominate the China South Sea; and increased protectionism. Surprisingly, volatility as measured by the CBOE VIX, remained historically low with the S&P 500 Index not experiencing a 5% or greater pullback since June 26th 2016, to this point the second longest streak on record. As advertised, the Fed raised rates three times during 2017, each by 25 basis points. The Fed has indicated that it seeks an orderly normalization of rates as gross domestic product and global growth accelerate, and unemployment decreases. Also, in the Fall the Fed began the process to shrink its balance sheet. Despite this positive economic and market backdrop, inflation remained relatively low.
Portfolio Update
For the year, the Fund’s best-performing sector, alternative asset manager Publicly Traded Partnerships (“PTPs”), benefited from both the strength in most securities markets allowing managers to monetize investments made during previous cycle lows, as well as continued growth in assets under management leading to greater fee revenue. Mortgage REITs and CEFs were also solid performers. The worst-performing sectors were Equity REITs and Preferred stocks. The Fund’s Equity REITs were hurt by exposure to retail and telecom, while Preferred holdings were negatively impacted by midstream and telecom positions. Fortunately, the Fund’s allocation to Equity REITs and Preferred Stocks in 2017 were not amongst its highest sector exposures. The largest sector exposure during the course of the year was in MLPs. While the Alerian MLP Index (a proxy for MLP performance) produced negative total return in 2017, the Fund’s MLP holdings performed significantly better, generating slightly positive returns. The sub-adviser attributes this outperformance to their adherence to cash flow analysis and focus on each individual company’s ability to generate cash flow in excess of their distributions.
The first quarter was a very positive one for the Fund, albeit tempered by a correction during March when the Fed, as expected, raised interest rates at its mid-March meeting causing bonds to rally and oil prices to fall. By month end, however, oil prices had recovered, though bond rates remained low (perhaps due to continued easy monetary policy abroad) and global economic indicators remained positive. Although most elements of the portfolio posted positive returns, the greatest gains were in financial services firms which benefit from a stronger economy. Alternative asset managers (most commonly focused on private equity or mezzanine debt) did very well, as a positive equity market supports their ability to liquidate private holdings profitably in the public markets. Also performing well were Mortgage Real Estate Investment Trusts. These entities, which invest in mortgage debt, typically prosper when bond rates increase and the yield curve steepens (the spread between their longer-term lending rates and short-term borrowing rates increase). Also contributing to a successful quarter were Business Development Companies, which lend to middle market firms.
The second quarter of the year was a rather uneventful one for the Fund, which experienced a slight net gain. Securities markets in the second quarter were, for the most part, liquidity driven, as the major central banks continued their broadly accommodative policies, though signs were beginning to emerge that their largesse would not be unending. In the U. S., the Fed raised rates as expected and gave clear guidance that it would begin to unwind its balance sheet of bonds and mortgages. With this backdrop, stocks moved gradually higher and investment grade bonds rallied, as low inflation, moderate growth, and extremely low interest rates abroad served to anchor U.S. yields. Alternative asset managers continued to benefit from robust public markets which allow them to sell private equity investments at attractive prices. Various fixed income-related holdings such as CEFs, Business Development Companies (“BDCs”), and Mortgage REITs fluctuated modestly with interest rates. Mortgage REITs continued their strong performance, although they corrected sharply in the quarter before resuming their upward trend. The weakest major group of holdings in the portfolio were midstream oil and gas pipelines, which gradually eroded in June. Holdings of renewable energy operators were strong, however.
The third quarter of the year was something of a seesaw experience for the Fund, which resulted in a small gain for the period. July was a positive month, bolstered by the recovery of oil prices from their late June lows. Although the fundamentals of the portfolio are not materially affected by the actual price of crude, the Fund’s Midstream MLP holdings tend to trade with the commodity in the short term, despite the fact that their revenues and distributions are tied primarily to volume throughputs, which depend more on the pace of the economy. August saw the portfolio fall back somewhat; principal considerations appeared to be a pullback in the oil price combined with relatively weak performance of mid and smaller cap listed securities such as those represented in the fund, which is probably attributable to the lower liquidity and volumes which usually characterize the vacation month. September saw another recovery, consistent with a return of liquidity, and further increases in oil prices. Performance through the quarter was strongest among the Fund’s asset manager holdings, while energy holdings in the midstream, liquified natural gas (“LNG”), and renewable sectors also performed well.
| 12 | Shareholder Letter |
The final quarter of 2017 was a positive one for the Spectrum Income Fund, though not without some drama. While equities continued their seemingly inexorable rise and bonds maintained their trading range, sentiment continued to trouble midstream energy pipelines through November, at which point they made an apparent bottom. Although the Fund’s midstream pipeline holdings are but one element of a diversified portfolio of pass-through securities, they represented a sufficient portion of the portfolio to cause a drag on total return. Although global demand for energy continued to grow and the price of oil continued its ascent, sentiment toward pipelines remained negative despite volume growth and the maintenance of distributions among our holdings. The investment team attributes this underperformance to a combination of tax loss selling late in the year and lack of interest in the sector by general equity managers, who were understandably drawn to growth sectors with outstanding performance this year, particularly in technology. Performance this quarter was again led by the Fund’s market sensitive asset manager holdings. Among energy-related holdings, refiners were consistently strong through the quarter, as these companies benefitted from widening crack spreads due to a shortage of refined products following storms in the Gulf Coast and outages in energy production overseas. LNG-related shippers and processors also did well. Mall Equity REITs suffered as concerns continued regarding competition from online retail, though the sub-adviser considers this sentiment vastly overdone with respect to the holdings in the portfolio. Legacy wire line companies also struggled, dealing with customer loss and questions around mergers.
Outlook
Looking ahead, TFIP remains optimistic regarding prospects for the portfolio as the investment team continues to focus on securities benefiting from a modestly faster pace of economic growth, reduced regulation, and possibly some inflation. The team remains cognizant that appreciation potential for all assets may be limited by increases in interest rates and that distributions of individual securities can be affected by operational developments. In the sub-adviser’s view, the value proposition of the portfolio is extremely attractive right now because the average holding in the portfolio is trading far below its highs of the past three years, and the portfolio’s current yield is close to its highest spread above that of traditional bond indexes.
As we enter 2018, the team at TFIP will remain vigilant regarding possible signs that the benign investment backdrop of the past year may be coming to an end. Although strong growth continues to be evident around the world, the Fed is expected to continue to raise rates and normalize its balance sheet while central banks globally also appear to be moving away from their easy monetary policies. Additionally, bond rates appear to be rising around the world, as are signs of commodity and perhaps wage inflation. Beyond the traditional risks of a maturing investment cycle, of course, there are also geopolitical risks such as trade wars or a conflict on the Korean peninsula. While timely prediction of such developments is difficult at best, the investment team will continue to construct and diversify the portfolio to minimize the potential consequences of such events.
Offsetting these concerns are the continuation of recent constructive economic fundamentals in the U.S. and abroad and the tax cut/reform bill passed by the U.S. Congress and enacted into law by the President. Coming as it did as something of a surprise, it represented a major boost to the markets. Ordinary equities will of course see a reduced corporate income tax. Pass through holdings, which of course do not pay corporate income tax, received a major boost as well. As the sub-adviser understands the new tax law, there will be a sizable deduction on the income upon which holders of pass through securities must pay tax. We believe this provision will not only increase the after-tax income from these securities on which we focus (currently, mutual funds will not benefit directly from this tax law change), but also increase investor interest in this sector. This may improve valuations of our holdings as well.
As we enter 2018, we are optimistic about the potential return of the portfolio. The investment team is finding significant values with sustainable cash flow among the mid to smaller cap securities in its income-based opportunity set. The portfolio continues to be positioned to take advantage of higher economic growth and higher interest rates, and expect increased market interest to come to this sector as equity managers weigh their value relative to last year’s high growth winners. TFIP is cognizant, however, of emerging interest rate and inflation risks, and stand ready to adjust the portfolio as needed to address such developments.
Thank you for investing in the LoCorr Funds
The S&P 500 Index is a broad based unmanaged index of 500 stocks, which is widely recognized as representative of the equity market in general. Barclays 1-5 Year Government Credit Index- Index is an index of all investment grade bonds with maturities of more than one year and less than 5 years. Barclays 1-3 Year Government Bond Index-The Barclays U.S. 1-3 Year Government/Credit Bond Index is a part of the Barclays U.S. Government/Credit Bond Index. It includes Treasury and agency securities (U.S. Government Bond Index) and publicly issued U.S. corporate and foreign debentures and secured notes (U.S. Credit Bond Index). The bonds in the index are investment-grade with a maturity between one and three years. Nikkei is Japan’s Nikkei 225 Stock Average, commonly used to measure a price-weighted index comprised of Japan’s top 225 blue-chip companies on the Tokyo Stock Exchange. Tokyo Stock Exchange is the largest stock exchange in Japan. The exchange has more than 2,200 listed companies, making it the third-largest in the world by this measure. Morningstar Global Long/Short Equity Index uses historical fund data dating back to the fund’s inception. Funds that have been liquidated or merged are included in analysis. The inception of the index is determined by the date at which the benchmark obtains five or more constituents, without falling below two constituents going forward. It includes funds with exposure to long and short positions in global equities or derivatives and is equally weighted. BofA Merrill Lynch 3-Month T-Bill Index tracks the performance of the U.S. dollar denominated U.S. Treasury Bills publicly issued in the U.S. domestic market with a remaining term to final maturity of less than 3 months. Barclays CTA Index is an unweighted index which attempts to measure the performance of the Commodity Trading Advisor (“CTA”) industry. The Index measures the combined performance of all CTAs reporting to Barclay Trading Group who have more than 4 years past performance. Fees and transaction costs are reflected. CBOE VIX Index is the Chicago Board Options Exchange Volatility Index, which shows the 30-day volatility expectations of the S&P 500 Index. The VIX is a widely used measure of market risk and is often referred to as the “investor fear gauge.” S&P GSCI Commodity Index is a composite index of commodity sector returns which represents a broadly diversified, unleveraged, long-only position in commodity futures. Russell 1000 Value Index refers to a composite of large and mid-cap companies located in the United States that also exhibit a value probability. The Russell 1000 Value is published and maintained by FTSE Russell. Russell 1000 Growth Index refers to a composite that includes large and mid-cap companies located in the United States that also exhibit a growth probability. The Russell 1000 Growth is published and maintained by FTSE Russell. SG Trend Index is a subset of the SG CTA Index, and follows traders of trend following methodologies. The SG CTA Index is equal weighted, calculates the daily rate of return for a pool of CTAs selected from the larger managers that are open to new investment. Russell 2000 Index measures the performance of approximately 2,000 small-cap companies in the Russell 3000 Index, which is made up of 3,000 of the biggest U.S. stocks. The Russell 2000 serves as a benchmark for small-cap stocks in the United States. Bloomberg Barclays U.S. Aggregate Bond Index is a broad-based bond index comprised of government, corporate, mortgage and asset-back issues rated investment grade or higher. Alerian MLP Index is a market-cap weighted, float-adjusted index created to provide a comprehensive benchmark for investors to track the performance of the energy MLP sector. Dow Jones Industrial Average (DJIA) is a price-weighted average of 30 significant stocks traded on the New York Stock Exchange and the Nasdaq. One cannot invest directly in an index.
| Shareholder Letter | 13 |
Alpha is an annualized return measure of how much better or worse a fund’s performance is relative to an index of funds in the same category, after allowing for differences in risk. Basis Points (bps) - A unit that is equal to 1/100th of 1%, and is used to denote the change in a financial instrument. The basis point is commonly used for calculating changes in interest rates, equity indexes and the yield of a fixed-income security. Duration is a commonly used measure of the potential volatility of the price of a debt security, or the aggregate market value of a portfolio of debt securities, prior to maturity. Securities with a longer duration generally have more volatile prices than securities of comparable quality with a shorter duration. Investment Grade refers to bonds that are rated BBB or higher. Bond ratings are grades given to bonds that indicate their credit quality as determined by private independent rating services such as Standard & Poor’s, Moody’s and Fitch. These firms evaluate a bond issuer’s financial strength, or its ability to pay a bond’s principal and interest in a timely fashion. Ratings are expressed as letters ranging from ‘AAA’, which is the highest grade, to ‘D’, which is the lowest grade. Spread is the percentage point difference between yields of various classes of bonds compared to treasury bonds. Yield Curve is a line that plots the interest rates, at a set point in time, of bonds having equal credit quality, but differing maturity dates. The most frequently reported yield curve compares the three-month, two-year, five-year and 30-year U.S. Treasury debt. The curve is used to predict changes in economic output and growth.
Must be preceded or accompanied by a prospectus.
Opinions expressed are those of the Investment Manager and are subject to change, are not guaranteed and should not be considered investment advice.
Any tax or legal information provided is merely a summary of our understanding and interpretation of some of the current income tax regulations and it is not exhaustive. Investors must consult their tax advisor or legal counsel for advice and information concerning their particular situation. Neither the Funds nor any of its representatives may give legal or tax advice.
Earnings growth is not representative of the Funds’ future performance.
Past performance is not a guarantee of future results.
Diversification does not assure a profit nor protect against loss in a declining market.
Mutual fund investing involves risk. Principal loss is possible. The LoCorr Macro Strategies Fund, LoCorr Long/Short Commodities Strategy Fund, LoCorr Market Trend Fund and LoCorr Spectrum Income Fund are diversified funds. The LoCorr Multi-Strategy Fund the and the LoCorr Dynamic Equity Fund are each non-diversified funds, meaning they may invest their assets in fewer individual holdings than a diversified fund. Therefore, those Funds are more exposed to individual stock volatility than a diversified fund. The Funds invest in foreign investments and foreign currencies which involve greater volatility and political, economic and currency risks and differences in accounting methods. The Funds may make short sales of securities, which involves the risk that losses may exceed the original amount invested. Investing in commodities may subject the Funds to greater risks and volatility as commodity prices may be influenced by a variety of factors including unfavorable weather, environmental factors, and changes in government regulations. The Funds may invest in derivative securities, which derive their performance from the performance of an underlying asset, index, interest rate or currency exchange rate. Derivatives can be volatile and involve various types and degrees of risks, and, depending upon the characteristics of a particular derivative, suddenly can become illiquid. Investments in debt securities typically decrease in value when interest rates rise. This risk is usually greater for longer-term debt securities. Investments in Asset Backed, Mortgage Backed, and Collateralized Mortgage Backed Securities include additional risks that investors should be aware of such as credit risk, prepayment risk, possible illiquidity and default, as well as increased susceptibility to adverse economic developments. Investments in Real Estate Investment Trusts (REITs) involve additional risks such as declines in the value of real estate and increased susceptibility to adverse economic or regulatory developments.
Derivative contracts ordinarily have leverage inherent in their terms which can magnify a Fund’s potential for gains or losses through increased long and short position exposure. A Fund may access derivatives via a swap agreement. A risk of a swap agreement is the risk that the counterparty to the agreement will default on its obligation to pay the Fund.
A Fund will incur a loss as a result of a short position if the price of the short position instrument increases in value between the date of the short position sale and the date on which an offsetting position is purchased.
Investments in small- and medium-capitalization companies involve additional risks such as limited liquidity and greater volatility. Investments in lower rated and non-rated securities presents a greater risk of loss to principal and interest than higher-rated securities. ETF investments are subject to investment advisory and other expenses, which will be indirectly paid by the Fund. As a result, the cost of investing in the Fund will be higher than the cost of investing directly in ETFs and may be higher than other mutual funds that invest directly in stocks and bonds. ETFs are subject to specific risks, depending on the nature of the ETF.
A Fund’s portfolio will be significantly impacted by the performance of the real estate market generally, and a Fund may be exposed to greater risk and experience higher volatility than would a more economically diversified portfolio. Property values may fall due to increasing vacancies or declining rents resulting from economic, legal, cultural, or technological developments. Investments in Limited Partnerships (including master limited partnerships) involve risks different from those of investing in common stock including risks related to limited control and limited rights to vote on matters affecting the Limited Partnership, risks related to potential conflicts of interest between the Limited Partnership and the Limited Partnership’s general partner, cash flow risks, dilution risks and risks related to the general partner’s limited call right. Underlying Funds are subject to management and other expenses, which will be indirectly paid by a Fund.
The LoCorr Macro Strategies Fund, LoCorr Long/Short Commodities Strategy Fund, LoCorr Multi-Strategy Fund, LoCorr Market Trend Fund, LoCorr Dynamic Equity Fund, and the LoCorr Spectrum Income Fund are distributed by Quasar Distributors, LLC.
14 | Fund Performance |
Inception Date | 6 Month | 1 Year | 5 Year | Average Annual Since Inception | |||||
| LoCorr Macro Strategies Fund - Class A (without maximum load) | 3/22/11 | 5.61% | 2.65% | 4.25% | 1.14% | ||||
| LoCorr Macro Strategies Fund - Class A (with maximum load) | 3/22/11 | -0.47% | -3.21% | 3.01% | 0.26% | ||||
| LoCorr Macro Strategies Fund - Class C | 3/24/11 | 4.23% | 0.97% | 3.49% | 0.39% | ||||
| LoCorr Macro Strategies Fund - Class I | 3/24/11 | 5.77% | 2.96% | 4.51% | 1.40% | ||||
| Bank of America Merrill Lynch 3-Month Treasury Bill Index | 0.55% | 0.86% | 0.27% | 0.22% | 1 | ||||
| S&P 500 Total Return Index | 11.42% | 21.83% | 15.79% | 13.50% | 1 | ||||
| Barclays CTA Index | 2.36% | 0.65% | 0.78% | -0.22% | 2 | ||||
LoCorr Macro Strategies Fund – Class I
For the period ended December 31, 2017 (Unaudited)

Inception Date | 6 Month | 1 Year | 5 Year | Average Annual Since Inception1 | |||||
| LoCorr Long/Short Commodities Strategy Fund - Class A (without maximum load) | 1/1/12 | 9.25% | 5.91% | 7.06% | 2.75% | ||||
| LoCorr Long/Short Commodities Strategy Fund - Class A (with maximum load) | 1/1/12 | 2.99% | -0.18% | 5.80% | 1.74% | ||||
| LoCorr Long/Short Commodities Strategy Fund - Class C | 1/1/12 | 7.81% | 4.05% | 6.23% | 1.93% | ||||
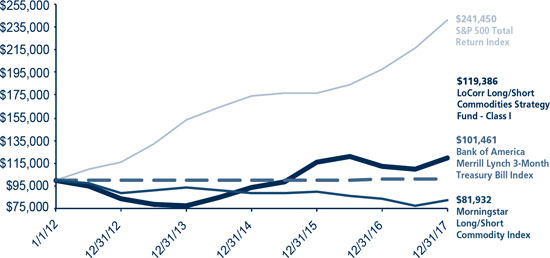
| LoCorr Long/Short Commodities Strategy Fund - Class I | 1/1/12 | 9.38% | 6.19% | 7.34% | 3.00% | ||||
| Bank of America Merrill Lynch 3-Month Treasury Bill Index | 0.55% | 0.86% | 0.27% | 0.24% | |||||
| S&P 500 Total Return Index | 11.42% | 21.83% | 15.79% | 15.82% | |||||
| Morningstar Long/Short Commodity Index | 6.54% | -1.47% | -1.55% | -3.26% | |||||
LoCorr Long/Short Commodities Strategy Fund - Class I
For the period ended December 31, 2017 (Unaudited)
Fund Performance | 15 |
Inception Date | 6 Month | 1 Year | Average Annual Since Inception1 | ||||
| LoCorr Multi-Strategy Fund - Class A (without maximum load) | 4/6/15 | 7.20% | 5.17% | -3.58% | |||
| LoCorr Multi-Strategy Fund - Class A (with maximum load) | 4/6/15 | 1.03% | -0.91% | -5.64% | |||
| LoCorr Multi-Strategy Fund - Class C | 4/6/15 | 5.80% | 3.56% | -4.30% | |||
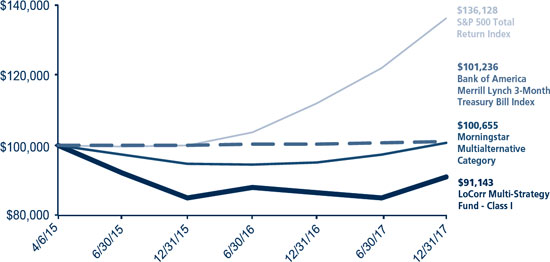
| LoCorr Multi-Strategy Fund - Class I | 4/6/15 | 7.38% | 5.51% | -3.33% | |||
| Bank of America Merrill Lynch 3-Month Treasury Bill Index | 0.55% | 0.86% | 0.45% | ||||
| S&P 500 Total Return Index | 11.42% | 21.83% | 11.93% | ||||
| Morningstar Multialternative Category | 3.29% | 5.68% | 0.24% | ||||
LoCorr Multi-Strategy Fund - Class I
For the period ended December 31, 2017 (Unaudited)
Inception Date | 6 Month | 1 Year | Average Annual Since Inception1 | ||||
| LoCorr Market Trend Fund - Class A (without maximum load) | 7/1/14 | 7.19% | 3.57% | 4.67% | |||
| LoCorr Market Trend Fund - Class A (with maximum load) | 7/1/14 | 1.01% | -2.39% | 2.91% | |||
| LoCorr Market Trend Fund - Class C | 7/1/14 | 5.80% | 1.85% | 3.88% | |||
| LoCorr Market Trend Fund - Class I | 7/1/14 | 7.25% | 3.84% | 4.93% | |||
| Bank of America Merrill Lynch 3-Month Treasury Bill Index | 0.55% | 0.86% | 0.36% | ||||
| S&P 500 Total Return Index | 11.42% | 21.83% | 11.57% | ||||
| Barclays CTA Index | 2.36% | 0.65% | 1.35% | ||||
LoCorr Market Trend Fund - Class I
For the period ended December 31, 2017 (Unaudited)

16 | Fund Performance |
Inception Date | 6 Month | 1 Year | Average Annual Since Inception1 | ||||
| LoCorr Dynamic Equity Fund - Class A (without maximum load) | 5/10/13 | 2.97% | 2.38% | 4.74% | |||
| LoCorr Dynamic Equity Fund - Class A (with maximum load) | 5/10/13 | -2.93% | -3.54% | 3.41% | |||
| LoCorr Dynamic Equity Fund - Class C | 5/10/13 | 1.66% | 0.71% | 3.94% | |||
| LoCorr Dynamic Equity Fund - Class I | 5/10/13 | 3.11% | 2.60% | 4.99% | |||
| S&P 500 Total Return Index | 11.42% | 21.83% | 13.54% | ||||
| Morningstar Long/Short Equity Fund Index | 6.17% | 10.74% | 4.36% | ||||
LoCorr Dynamic Equity Fund - Class I
For the period ended December 31, 2017 (Unaudited)

Inception Date | 6 Month | 1 Year | Average Annual Since Inception1 | ||||
| LoCorr Spectrum Income Fund - Class A (without maximum load) | 1/1/14 | 0.80% | 3.50% | -0.84% | |||
| LoCorr Spectrum Income Fund - Class A (with maximum load) | 1/1/14 | -4.94% | -2.45% | -2.30% | |||
| LoCorr Spectrum Income Fund - Class C | 1/1/14 | -0.55% | 1.66% | -1.60% | |||
| LoCorr Spectrum Income Fund - Class I | 1/1/14 | 0.96% | 3.85% | -0.58% | |||
| Bloomberg Barclays U.S. Aggregate Bond Index | 1.24% | 3.54% | 3.16% | ||||
| S&P 500 Total Return Index | 11.42% | 21.83% | 11.98% | ||||
| Morningstar Allocation - 70% to 85% Equity | 7.87% | 16.21% | 6.50% | ||||
LoCorr Spectrum Income Fund - Class I
For the period ended December 31, 2017 (Unaudited)
LoCorr Macro Strategies Fund - Consolidated Schedule of Investments | 17 |
1 | As a percentage of total investments. |
| Maturity Date | Coupon Rate | Principal Amount | Value | ||||||||||
| ASSET BACKED SECURITIES: 19.16% | |||||||||||||
| 321 Henderson Receivables I LLC | |||||||||||||
Series 2006-1A A1 (1 Month LIBOR USD + 0.200%) (a)(c) | 03/15/2041 | 1.68 | % | $ | 1,325,816 | $ | 1,297,095 | ||||||
Series 2006-4A A1 (1 Month LIBOR USD + 0.200%) (a)(c) | 12/15/2041 | 1.68 | % | 1,489,653 | 1,454,798 | ||||||||
Series 2004-A A1 (1 Month LIBOR USD + 0.350%) (a)(c) | 09/15/2045 | 1.83 | % | 199,480 | 193,989 | ||||||||
| Ally Auto Receivables Trust, 2015-1 A3 | 09/16/2019 | 1.39 | % | 1,274,289 | 1,273,183 | ||||||||
| American Express Credit Account Master Trust, 2017-6 A | 05/15/2023 | 2.04 | % | 2,710,000 | 2,696,947 | ||||||||
| Atlantic City Electric Transition Funding LLC, 2003-1 A3 | 10/20/2020 | 5.05 | % | 277,773 | 279,707 | ||||||||
| BA Credit Card Trust | |||||||||||||
Series 2015-1A A (1 Month LIBOR USD + 0.330%) (c) | 06/15/2020 | 1.81 | % | 3,975,000 | 3,975,607 | ||||||||
Series 2014-A1 A (1 Month LIBOR USD + 0.380%) (c) | 06/15/2021 | 1.86 | % | 3,000,000 | 3,008,379 | ||||||||
Bank of The West Auto Trust, 2017-1 A3 (a) | 01/15/2023 | 2.11 | % | 3,750,000 | 3,730,013 | ||||||||
| Barclays Dryrock Issuance Trust | |||||||||||||
| Series 2014-3 A | 07/15/2022 | 2.41 | % | 2,141,000 | 2,150,668 | ||||||||
Series 2017-2 A (1 Month LIBOR USD + 0.300%) (c) | 05/15/2023 | 1.78 | % | 3,225,000 | 3,227,898 | ||||||||
| Cabela’s Credit Card Master Note Trust | |||||||||||||
Series 2013-2A A2 (1 Month LIBOR USD + 0.650%) (a)(c) | 08/16/2021 | 2.13 | % | 3,885,000 | 3,898,096 | ||||||||
Series 2016-1 A1 (d) | 06/15/2022 | 1.78 | % | 5,405,000 | 5,373,486 | ||||||||
Series 2014-2 A (1 Month LIBOR USD + 0.450%) (c) | 07/15/2022 | 1.93 | % | 1,004,000 | 1,007,428 | ||||||||
| California Republic Auto Receivables Trust, 2017-1 A2 | 11/15/2019 | 1.55 | % | 1,805,938 | 1,803,790 | ||||||||
| CenterPoint Energy Restoration Bond Co. LLC, 2009-1 A2 | 08/15/2019 | 3.46 | % | 683,872 | 685,558 | ||||||||
| Chase Issuance Trust, 2012-A4 | 08/16/2021 | 1.58 | % | 4,115,000 | 4,081,002 | ||||||||
| Citibank Credit Card Issuance Trust | |||||||||||||
| Series 2014-A6 | 07/15/2021 | 2.15 | % | 2,070,000 | 2,072,144 | ||||||||
| Series 2016-A2 | 11/20/2023 | 2.19 | % | 6,730,000 | 6,677,939 | ||||||||
| Colony American Homes | |||||||||||||
Series 2014-A1 (1 Month LIBOR USD + 1.150%) (a)(c) | 05/17/2031 | 2.63 | % | 4,519,860 | 4,532,123 | ||||||||
Series 2015-A1 (1 Month LIBOR USD + 1.200%) (a)(c) | 07/17/2032 | 2.63 | % | 3,807,797 | 3,820,733 | ||||||||
Series 2015-C1 (1 Month LIBOR USD + 1.950%) (a)(c) | 07/17/2032 | 3.38 | % | 1,940,000 | 1,953,028 | ||||||||
Colony Starwood Homes, 2016-A1 (1 Month LIBOR USD + 1.500%) (a)(c) | 07/17/2033 | 2.96 | % | 3,581,047 | 3,601,036 | ||||||||
Conn Funding II LP, 2017-B A (a) | 07/15/2020 | 2.73 | % | 2,525,000 | 2,524,892 | ||||||||
| Consumers 2014 Securitization Funding LLC, 2014-A A1 | 11/01/2020 | 1.33 | % | 861,329 | 854,919 | ||||||||
18 | LoCorr Macro Strategies Fund - Consolidated Schedule of Investments (continued) |
| Maturity Date | Coupon Rate | Principal Amount | Value | ||||||||||
ASSET BACKED SECURITIES (continued) | |||||||||||||
| Discover Card Execution Note Trust | |||||||||||||
Series 2013-A1 (1 Month LIBOR USD + 0.300%) (c) | 08/17/2020 | 1.78 | % | $ | 2,850,000 | $ | 2,850,960 | ||||||
| Series 2017-A6 | 02/15/2023 | 1.88 | % | 5,000,000 | 4,956,233 | ||||||||
| Entergy Arkansas Restoration Funding LLC, 2010-A A1 | 08/01/2021 | 2.30 | % | 5,043,255 | 5,047,562 | ||||||||
Evergreen Credit Card Trust Series, 2017-1 A (1 Month LIBOR USD + 0.260%) (a)(b)(c) | 10/15/2021 | 1.74 | % | 2,250,000 | 2,253,347 | ||||||||
| Ford Credit Auto Owner Trust | |||||||||||||
| Series 2017-C A3 | 03/15/2022 | 2.01 | % | 3,450,000 | 3,439,884 | ||||||||
Series 2014-REV1 A (a) | 11/15/2025 | 2.26 | % | 6,165,000 | 6,177,530 | ||||||||
Series 2016-REV1 A (a) | 08/15/2027 | 2.31 | % | 2,150,000 | 2,142,873 | ||||||||
| Honda Auto Receivables Owner Trust, 2017-4 A2 | 01/21/2020 | 1.80 | % | 4,080,000 | 4,076,810 | ||||||||
| Invitation Homes Trust | |||||||||||||
Series 2015-SFR1 A (1 Month LIBOR USD + 1.450%) (a)(c) | 03/17/2032 | 2.91 | % | 3,598,828 | 3,615,481 | ||||||||
Series 2015-SFR3 A (1 Month LIBOR USD + 1.300%) (a)(c) | 08/17/2032 | 2.76 | % | 3,879,908 | 3,904,160 | ||||||||
Series 2017-SFR2 A (1 Month LIBOR USD + 0.850%) (a)(c) | 12/17/2036 | 2.34 | % | 1,603,272 | 1,608,418 | ||||||||
| Ocwen Master Advance Receivables Trust | |||||||||||||
Series 2017-T1 AT1 (a) | 09/15/2048 | 2.50 | % | 2,000,000 | 2,001,495 | ||||||||
Series 2016-T2 AT2 (a) | 08/16/2049 | 2.72 | % | 3,190,000 | 3,169,584 | ||||||||
OneMain Direct Auto Receivables Trust, 2016-1A A (a) | 01/15/2021 | 2.04 | % | 526,828 | 527,007 | ||||||||
Progress Residential Trust, 2017-SFR1 A (a) | 08/17/2034 | 2.77 | % | 3,284,361 | 3,258,996 | ||||||||
| Santander Drive Auto Receivables Trust, 2017-2 A2 | 03/16/2020 | 1.60 | % | 3,658,953 | 3,656,080 | ||||||||
Santander Retail Auto Lease Trust, 2017-A A2A (a) | 03/20/2020 | 2.02 | % | 4,500,000 | 4,492,412 | ||||||||
SMB Private Education Loan Trust, 2017-A A1 (1 Month LIBOR USD + 0.450%) (a)(c) | 06/17/2024 | 1.93 | % | 2,691,976 | 2,695,971 | ||||||||
SoFi Professional Loan Program LLC, 2015-C A2 (a) | 08/25/2033 | 2.51 | % | 1,379,806 | 1,374,267 | ||||||||
SPS Servicer Advance Receivables Trust, 2016-T1 AT1 (a) | 11/16/2048 | 2.53 | % | 3,300,000 | 3,271,036 | ||||||||
| Synchrony Credit Card Master Note Trust | |||||||||||||
| Series 2015-3 A | 09/15/2021 | 1.74 | % | 4,000,000 | 3,995,081 | ||||||||
| Series 2017-1 A | 06/15/2023 | 1.93 | % | 3,140,000 | 3,110,902 | ||||||||
| TCF Auto Receivables Owner Trust | |||||||||||||
Series 2015-1A A3 (a) | 12/16/2019 | 1.49 | % | 74,848 | 74,827 | ||||||||
Series 2016-1A A3 (a) | 04/15/2021 | 1.71 | % | 3,550,000 | 3,538,365 | ||||||||
Series 2016-PT1 A (a) | 06/15/2022 | 1.93 | % | 2,847,403 | 2,837,040 | ||||||||
Tricon American Homes Trust, 2017-SFR1 A (a) | 09/17/2034 | 2.72 | % | 2,840,000 | 2,804,844 | ||||||||
Verizon Owner Trust, 2017-2A A (a) | 12/20/2021 | 1.92 | % | 4,300,000 | 4,271,473 | ||||||||
| TOTAL ASSET BACKED SECURITIES (Cost $151,729,787) | 151,327,096 | ||||||||||||
| CORPORATE BONDS: 32.60% | |||||||||||||
| Finance and Insurance: 13.15% | |||||||||||||
| Aflac, Inc. | 03/16/2020 | 2.40 | % | 2,835,000 | 2,837,354 | ||||||||
| American Express Credit Corp. | 10/30/2019 | 1.70 | % | 2,000,000 | 1,979,357 | ||||||||
| American International Group, Inc. | 08/15/2020 | 3.38 | % | 3,000,000 | 3,065,577 | ||||||||
| Bank of America Corp. | 04/21/2020 | 2.25 | % | 8,155,000 | 8,160,697 | ||||||||
| BB&T Corp. | 01/15/2020 | 2.45 | % | 3,410,000 | 3,421,286 | ||||||||
| Berkshire Hathaway Finance Corp. | 01/15/2021 | 4.25 | % | 1,500,000 | 1,586,231 | ||||||||
| Capital One Financial Corp. | 05/12/2020 | 2.50 | % | 1,700,000 | 1,697,871 | ||||||||
| Chubb INA Holdings, Inc. | 11/03/2020 | 2.30 | % | 2,500,000 | 2,496,019 | ||||||||
| Citigroup, Inc. | 10/26/2020 | 2.65 | % | 4,175,000 | 4,188,975 | ||||||||
| Citigroup, Inc. | 01/14/2022 | 4.50 | % | 1,195,000 | 1,271,196 | ||||||||
| Citizens Bank NA | 03/14/2019 | 2.50 | % | 2,725,000 | 2,731,453 | ||||||||
Cooperatieve Rabobank UA (b) | 01/14/2019 | 2.25 | % | 2,000,000 | 2,002,151 | ||||||||
| Fifth Third Bancorp | 07/27/2020 | 2.88 | % | 1,965,000 | 1,985,768 | ||||||||
| General Motors Financial Co., Inc. | 05/09/2019 | 2.40 | % | 2,170,000 | 2,170,526 | ||||||||
| Goldman Sachs Group, Inc./The | 09/15/2020 | 2.75 | % | 4,135,000 | 4,155,664 | ||||||||
| Goldman Sachs Group, Inc./The | 02/25/2021 | 2.88 | % | 3,420,000 | 3,445,287 | ||||||||
| Hartford Financial Services Group, Inc./The | 03/30/2020 | 5.50 | % | 2,775,000 | 2,957,630 | ||||||||
HSBC Holdings PLC (b) | 04/05/2021 | 5.10 | % | 2,390,000 | 2,567,886 | ||||||||
| HSBC USA, Inc. | 08/07/2020 | 2.75 | % | 2,040,000 | 2,051,185 | ||||||||
ING Bank NV (a)(b) | 03/22/2019 | 2.30 | % | 2,500,000 | 2,501,339 | ||||||||
| John Deere Capital Corp. | 01/08/2021 | 2.55 | % | 2,490,000 | 2,499,608 | ||||||||
LoCorr Macro Strategies Fund - Consolidated Schedule of Investments (continued) | 19 |
| Maturity Date | Coupon Rate | Principal Amount | Value | ||||||||||
CORPORATE BONDS (continued) | |||||||||||||
| JPMorgan Chase & Co. | 01/23/2020 | 2.25 | % | $ | 7,875,000 | $ | 7,869,731 | ||||||
| Lazard Group LLC | 11/14/2020 | 4.25 | % | 1,935,000 | 2,015,456 | ||||||||
| Marsh & McLennan Cos, Inc. | 07/15/2021 | 4.80 | % | 2,000,000 | 2,138,212 | ||||||||
Metropolitan Life Global Funding (a) | 04/14/2020 | 2.00 | % | 2,000,000 | 1,984,683 | ||||||||
| Morgan Stanley | 07/24/2020 | 5.50 | % | 7,405,000 | 7,939,497 | ||||||||
| PNC Bank NA | 10/18/2019 | 2.40 | % | 2,500,000 | 2,503,691 | ||||||||
| Prudential Financial, Inc. | 06/15/2019 | 7.38 | % | 1,400,000 | 1,503,375 | ||||||||
| Prudential Financial, Inc. | 11/15/2020 | 4.50 | % | 2,000,000 | 2,113,495 | ||||||||
| State Street Corp. | 08/18/2020 | 2.55 | % | 2,500,000 | 2,516,583 | ||||||||
| SunTrust Banks, Inc. | 03/03/2021 | 2.90 | % | 2,500,000 | 2,527,986 | ||||||||
Trinity Acquisition PLC (b) | 09/15/2021 | 3.50 | % | 3,045,000 | 3,104,379 | ||||||||
| UnitedHealth Group, Inc. | 10/15/2020 | 3.88 | % | 2,280,000 | 2,367,023 | ||||||||
| Wells Fargo & Co. | 04/22/2019 | 2.13 | % | 2,790,000 | 2,789,561 | ||||||||
| Wells Fargo & Co. | 07/22/2020 | 2.60 | % | 2,725,000 | 2,741,780 | ||||||||
| 103,888,512 | |||||||||||||
| Information: 3.77% | |||||||||||||
| 21st Century Fox America, Inc. | 02/15/2021 | 4.50 | % | 2,500,000 | 2,642,303 | ||||||||
America Movil SAB de CV (b) | 03/30/2020 | 5.00 | % | 1,880,000 | 1,981,407 | ||||||||
| AT&T, Inc. | 03/11/2019 | 2.30 | % | 4,290,000 | 4,294,585 | ||||||||
| AT&T, Inc. | 02/15/2021 | 4.60 | % | 1,750,000 | 1,841,817 | ||||||||
| CBS Corp. | 08/15/2019 | 2.30 | % | 2,030,000 | 2,028,580 | ||||||||
| Charter Communications Operating LLC/Charter Communications Operating Capital | 07/23/2020 | 3.58 | % | 1,955,000 | 1,991,443 | ||||||||
Deutsche Telekom International Finance BV (b) | 07/08/2019 | 6.00 | % | 3,000,000 | 3,163,322 | ||||||||
| Discovery Communications LLC | 06/01/2020 | 5.05 | % | 2,150,000 | 2,260,202 | ||||||||
| Microsoft Corp. | 02/06/2020 | 1.85 | % | 2,640,000 | 2,632,194 | ||||||||
Orange SA (b) | 11/03/2019 | 1.63 | % | 2,000,000 | 1,975,086 | ||||||||
| Verizon Communications, Inc. | 03/15/2021 | 3.45 | % | 2,200,000 | 2,267,058 | ||||||||
Vodafone Group PLC (b) | 03/16/2021 | 4.38 | % | 2,515,000 | 2,661,320 | ||||||||
| 29,739,317 | |||||||||||||
| Manufacturing: 8.51% | |||||||||||||
| Abbott Laboratories | 11/30/2021 | 2.90 | % | 2,270,000 | 2,296,280 | ||||||||
| AbbVie, Inc. | 05/14/2020 | 2.50 | % | 1,845,000 | 1,850,686 | ||||||||
AerCap Ireland Capital Ltd./AerCap Global Aviation Trust (b) | 05/15/2019 | 3.75 | % | 2,500,000 | 2,539,566 | ||||||||
| Anheuser-Busch InBev Finance, Inc. | 02/01/2021 | 2.65 | % | 3,875,000 | 3,894,444 | ||||||||
| Apple, Inc. | 05/06/2019 | 2.10 | % | 1,910,000 | 1,914,386 | ||||||||
| Apple, Inc. | 02/23/2021 | 2.25 | % | 3,175,000 | 3,171,285 | ||||||||
| Archer-Daniels-Midland Co. | 03/01/2021 | 4.48 | % | 2,000,000 | 2,129,214 | ||||||||
| Bunge Ltd. Finance Corp. | 11/24/2020 | 3.50 | % | 2,410,000 | 2,460,276 | ||||||||
| Celgene Corp. | 08/15/2020 | 2.88 | % | 2,825,000 | 2,851,329 | ||||||||
| Chevron Corp. | 03/03/2020 | 1.96 | % | 2,280,000 | 2,271,983 | ||||||||
Daimler Finance North America LLC (a) | 07/05/2019 | 1.50 | % | 2,300,000 | 2,273,093 | ||||||||
| Dr. Pepper Snapple Group, Inc. | 11/15/2021 | 2.53 | % | 1,750,000 | 1,746,498 | ||||||||
| Eastman Chemical Co. | 01/15/2020 | 2.70 | % | 2,000,000 | 2,012,899 | ||||||||
| General Electric Co. | 01/07/2021 | 4.63 | % | 2,525,000 | 2,678,643 | ||||||||
Heineken NV (a)(b) | 04/01/2022 | 3.40 | % | 3,000,000 | 3,087,537 | ||||||||
Ingersoll-Rand Luxembourg Finance SA (b) | 05/01/2020 | 2.63 | % | 2,600,000 | 2,599,297 | ||||||||
| Kraft Heinz Foods Co. | 07/02/2020 | 2.80 | % | 2,135,000 | 2,147,309 | ||||||||
| L3 Technologies, Inc. | 02/15/2021 | 4.95 | % | 2,525,000 | 2,674,216 | ||||||||
| Newell Brands, Inc. | 03/29/2019 | 2.60 | % | 1,332,000 | 1,336,550 | ||||||||
| Packaging Corp. of America | 12/15/2020 | 2.45 | % | 1,630,000 | 1,632,286 | ||||||||
| PepsiCo, Inc. | 10/14/2020 | 2.15 | % | 2,400,000 | 2,396,435 | ||||||||
| Philip Morris International, Inc. | 02/25/2019 | 1.38 | % | 2,250,000 | 2,232,467 | ||||||||
| QUALCOMM, Inc. | 05/20/2020 | 2.10 | % | 2,515,000 | 2,504,422 | ||||||||
| Reynolds American, Inc. | 06/12/2020 | 3.25 | % | 3,965,000 | 4,028,817 | ||||||||
| Rockwell Collins, Inc. | 07/15/2019 | 1.95 | % | 2,220,000 | 2,208,624 | ||||||||
Siemens Financieringsmaatschappij NV (a)(b) | 09/13/2019 | 1.30 | % | 3,270,000 | 3,221,175 | ||||||||
| Tyson Foods, Inc. | 08/15/2019 | 2.65 | % | 3,000,000 | 3,014,452 | ||||||||
| 67,174,169 | |||||||||||||
20 | LoCorr Macro Strategies Fund - Consolidated Schedule of Investments (continued) |
| Maturity Date | Coupon Rate | Principal Amount | Value | ||||||||||
CORPORATE BONDS (continued) | |||||||||||||
| Mining, Quarrying, and Oil and Gas Extraction: 1.09% | |||||||||||||
| ConocoPhillips Co. | 03/15/2021 | 4.20 | % | $ | 1,599,000 | $ | 1,681,457 | ||||||
| Occidental Petroleum Corp. | 02/01/2021 | 4.10 | % | 1,765,000 | 1,848,550 | ||||||||
Schlumberger Holdings Corp. (a) | 12/21/2020 | 3.00 | % | 1,995,000 | 2,020,841 | ||||||||
Total Capital International SA (b) | 06/19/2021 | 2.75 | % | 3,000,000 | 3,030,137 | ||||||||
| 8,580,985 | |||||||||||||
| Professional, Scientific, and Technical Services: 0.61% | |||||||||||||
| Biogen, Inc. | 09/15/2020 | 2.90 | % | 2,250,000 | 2,280,648 | ||||||||
| eBay, Inc. | 08/01/2019 | 2.20 | % | 2,520,000 | 2,513,699 | ||||||||
| 4,794,347 | |||||||||||||
| Real Estate and Rental and Leasing: 1.29% | |||||||||||||
| Air Lease Corp. | 06/01/2021 | 3.38 | % | 2,150,000 | 2,196,207 | ||||||||
| Ford Motor Credit Company LLC | 11/04/2019 | 2.60 | % | 4,000,000 | 4,002,617 | ||||||||
| National Rural Utilities Cooperative Finance Corp. | 02/01/2019 | 2.15 | % | 2,000,000 | 2,000,892 | ||||||||
| Toyota Motor Credit Corp. | 04/17/2020 | 1.95 | % | 2,030,000 | 2,021,827 | ||||||||
| 10,221,543 | |||||||||||||
| Retail Trade: 1.68% | |||||||||||||
BP Capital Markets PLC (b) | 01/15/2020 | 2.52 | % | 1,905,000 | 1,920,993 | ||||||||
BP Capital Markets PLC (b) | 03/11/2021 | 4.74 | % | 1,000,000 | 1,070,841 | ||||||||
| CVS Health Corp. | 07/20/2020 | 2.80 | % | 2,390,000 | 2,399,956 | ||||||||
| Home Depot, Inc./The | 06/15/2019 | 2.00 | % | 2,330,000 | 2,330,986 | ||||||||
Hyundai Capital America (a) | 03/18/2021 | 3.00 | % | 2,535,000 | 2,529,055 | ||||||||
| Walgreens Boots Alliance, Inc. | 11/18/2019 | 2.70 | % | 3,000,000 | 3,018,212 | ||||||||
| 13,270,043 | |||||||||||||
| Transportation and Warehousing: 0.29% | |||||||||||||
Carnival Corp. (b) | 10/15/2020 | 3.95 | % | 2,225,000 | 2,322,910 | ||||||||
| Utilities: 1.10% | |||||||||||||
| Dominion Resources, Inc. | 08/15/2019 | 1.60 | % | 2,305,000 | 2,279,637 | ||||||||
| Exelon Generation Co., LLC | 01/15/2020 | 2.95 | % | 2,135,000 | 2,156,724 | ||||||||
| Northern States Power Co. | 08/15/2020 | 2.20 | % | 2,000,000 | 1,998,257 | ||||||||
| PG&E Corp. | 03/01/2019 | 2.40 | % | 2,260,000 | 2,261,345 | ||||||||
| 8,695,963 | |||||||||||||
| Wholesale Trade: 1.11% | |||||||||||||
| Cardinal Health, Inc. | 11/15/2019 | 2.40 | % | 1,690,000 | 1,688,991 | ||||||||
LyondellBasell Industries NV (b) | 04/15/2019 | 5.00 | % | 3,002,000 | 3,082,234 | ||||||||
| Sherwin-Williams Co./The | 05/15/2020 | 2.25 | % | 2,255,000 | 2,247,451 | ||||||||
| Sysco Corp. | 10/01/2020 | 2.60 | % | 1,760,000 | 1,767,546 | ||||||||
| 8,786,222 | |||||||||||||
| TOTAL CORPORATE BONDS (Cost $258,530,645) | 257,474,011 | ||||||||||||
| MORTGAGE BACKED SECURITIES: 15.12% | |||||||||||||
Cold Storage Trust, 2017-ICE3 A (1 Month LIBOR USD + 1.000%) (a)(c) | 04/15/2036 | 2.48 | % | 3,775,000 | 3,784,350 | ||||||||
| Commercial Mortgage Trust, 2012-CR4 A2 | 10/15/2045 | 1.80 | % | 1,123,717 | 1,122,842 | ||||||||
| CSMC Trust | |||||||||||||
Series 2015-2 A2 (a)(d) | 02/25/2045 | 3.00 | % | 1,216,259 | 1,216,211 | ||||||||
Series 2017-HL1 A3 (a)(d) | 06/25/2047 | 3.50 | % | 3,261,862 | 3,301,031 | ||||||||
Series 2017-HL2 A3 (a)(d) | 10/25/2047 | 3.50 | % | 3,246,268 | 3,275,965 | ||||||||
| Fannie Mae Aces | |||||||||||||
| Series 2015-M1 ASQ2 | 02/25/2018 | 1.63 | % | 43,433 | 43,380 | ||||||||
| Series 2015-M7 ASQ2 | 04/25/2018 | 1.55 | % | 913,350 | 912,163 | ||||||||
Series 2013-M13 FA (1 Month LIBOR USD + 0.350%) (c) | 05/25/2018 | 1.90 | % | 165,024 | 164,737 | ||||||||
Series 2013-M14 FA (1 Month LIBOR USD + 0.350%) (c) | 08/25/2018 | 1.90 | % | 1,897,080 | 1,898,977 | ||||||||
Series 2015-M6 A1 (d) | 01/25/2026 | 2.94 | % | 1,948,767 | 1,989,434 | ||||||||
| Fannie Mae Connecticut Avenue Securities | |||||||||||||
Series 2016-C03 2M1 (1 Month LIBOR USD + 2.200%) (c) | 10/25/2028 | 3.75 | % | 1,078,130 | 1,088,416 | ||||||||
Series 2017-C01 1M1 (1 Month LIBOR USD + 1.300%) (c) | 07/25/2029 | 2.85 | % | 2,635,974 | 2,663,012 | ||||||||
Series 2017-C02 2M1 (1 Month LIBOR USD + 1.150%) (c) | 09/25/2029 | 2.70 | % | 2,548,898 | 2,572,053 | ||||||||
LoCorr Macro Strategies Fund - Consolidated Schedule of Investments (continued) | 21 |
| Maturity Date | Coupon Rate | Principal Amount | Value | ||||||||||
MORTGAGE BACKED SECURITIES(continued) | |||||||||||||
| Fannie Mae Pool | 01/01/2027 | 2.50 | % | $ | 3,543,543 | $ | 3,554,724 | ||||||
| Fannie Mae Pool | 11/01/2021 | 3.00 | % | 248,106 | 252,844 | ||||||||
| Fannie Mae Pool | 09/01/2021 | 3.00 | % | 124,815 | 127,198 | ||||||||
| Fannie Mae Pool | 12/01/2027 | 2.50 | % | 3,637,569 | 3,658,056 | ||||||||
| Fannie Mae Pool | 12/01/2025 | 3.50 | % | 263,216 | 271,761 | ||||||||
| Fannie Mae Pool | 09/01/2026 | 3.50 | % | 241,323 | 249,157 | ||||||||
| Fannie Mae Pool | 02/01/2021 | 3.50 | % | 25,657 | 26,490 | ||||||||
| Fannie Mae Pool | 08/01/2021 | 3.00 | % | 101,027 | 102,956 | ||||||||
| FDIC Guaranteed Notes Trust | |||||||||||||
Series 2010-S4 A (1 Month LIBOR USD + 0.720%) (a)(c) | 12/04/2020 | 2.09 | % | 429,490 | 428,255 | ||||||||
Series 2010-S1 2A (a) | 04/25/2038 | 3.25 | % | 298,137 | 298,814 | ||||||||
| FHLMC Multifamily Structured Pass Through Certificates | |||||||||||||
| Series K-702 A2 | 02/25/2018 | 3.15 | % | 2,965,878 | 2,963,744 | ||||||||
| Series K-709 A1 | 10/25/2018 | 1.56 | % | 287,332 | 286,814 | ||||||||
Series KP04 AG2 (1 Month LIBOR USD + 0.200%) (c) | 10/25/2019 | 1.55 | % | 2,965,000 | 2,968,759 | ||||||||
| Series K-722 A1 | 05/25/2022 | 2.18 | % | 3,377,842 | 3,347,242 | ||||||||
Series K-LH1 A (1 Month LIBOR USD + 0.700%) (c) | 11/25/2022 | 2.07 | % | 3,245,000 | 3,260,680 | ||||||||
| Series K-052 A1 | 01/25/2025 | 2.60 | % | 5,239,051 | 5,266,641 | ||||||||
| Series 3855 HE | 02/15/2026 | 2.50 | % | 11,298 | 11,268 | ||||||||
Series 4181 PF (1 Month LIBOR USD + 0.250%) (c) | 11/15/2042 | 1.73 | % | 1,390,900 | 1,386,667 | ||||||||
Flagstar Mortgage Trust, 2017-2 A5 (a)(d) | 10/25/2047 | 3.50 | % | 3,047,249 | 3,079,505 | ||||||||
| Freddie Mac Structured Agency Credit Risk Debt Notes | |||||||||||||
Series 2013-DN2 M1 (1 Month LIBOR USD + 1.450%) (c) | 11/25/2023 | 3.00 | % | 156,211 | 156,377 | ||||||||
Series 2017-DNA3 M1 (1 Month LIBOR USD + 0.750%) (c) | 03/25/2030 | 2.30 | % | 3,328,124 | 3,340,949 | ||||||||
| FREMF Mortgage Trust | |||||||||||||
Series 2011-K702 B (a)(d) | 04/25/2044 | 4.77 | % | 5,595,000 | 5,596,418 | ||||||||
Series 2012-K708 B (a)(d) | 02/25/2045 | 3.75 | % | 3,250,000 | 3,286,437 | ||||||||
Series 2013-KF02 B (1 Month LIBOR USD + 3.000%) (a)(c) | 12/25/2045 | 4.37 | % | 1,276,481 | 1,281,648 | ||||||||
Series 2011-K10 B (a)(d) | 11/25/2049 | 4.62 | % | 2,220,000 | 2,309,147 | ||||||||
GAHR Commercial Mortgage Trust, 2015-NRF AFL1 (1 Month LIBOR USD + 1.300%) (a)(c) | 12/15/2034 | 2.55 | % | 411,429 | 411,557 | ||||||||
GP Portfolio Trust, 2014-GPP A (1 Month LIBOR USD + 1.200%) (a)(c) | 02/15/2027 | 2.68 | % | 3,014,577 | 3,014,917 | ||||||||
GS Mortgage Securities Trust, 2010-C2 A1 (a) | 12/10/2043 | 3.85 | % | 129,885 | 132,811 | ||||||||
| JP Morgan Mortgage Trust | |||||||||||||
Series 2016-1 A5 (a)(d) | 05/25/2046 | 3.50 | % | 1,265,158 | 1,283,690 | ||||||||
Series 2017-1 A5 (a)(d) | 01/25/2047 | 3.50 | % | 3,286,668 | 3,332,757 | ||||||||
Series 2017-2 A5 (a)(d) | 05/25/2047 | 3.50 | % | 3,692,992 | 3,746,655 | ||||||||
| JPMorgan Chase Commercial Mortgage Securities Trust | |||||||||||||
Series 2017-MAUI A (1 Month LIBOR USD + 0.830%) (a)(c) | 07/15/2034 | 2.31 | % | 4,195,000 | 4,197,647 | ||||||||
Series 2010-C2 A3 (a) | 11/15/2043 | 4.07 | % | 4,350,000 | 4,501,571 | ||||||||
Series 2011-C3 A3 (a) | 02/15/2046 | 4.39 | % | 972,487 | 977,498 | ||||||||
| MASTR Asset Securitization Trust, 2004-1 4A1 | 02/25/2019 | 4.50 | % | 37,276 | 37,310 | ||||||||
Morgan Stanley Capital I Trust, 2017-CLS A (1 Month LIBOR USD + 0.700%) (a)(c) | 11/15/2034 | 1.95 | % | 2,785,000 | 2,785,000 | ||||||||
| NCUA Guaranteed Notes Trust | |||||||||||||
Series 2011-R2 1A (1 Month LIBOR USD + 0.400%) (c) | 02/06/2020 | 1.80 | % | 1,899,853 | 1,906,314 | ||||||||
Series 2011-R3 1A (1 Month LIBOR USD + 0.400%) (c) | 03/11/2020 | 1.73 | % | 1,332,596 | 1,334,649 | ||||||||
Series 2010-R1 1A (1 Month LIBOR USD + 0.450%) (c) | 10/07/2020 | 1.78 | % | 143,823 | 144,048 | ||||||||
| New Residential Mortgage Loan Trust | |||||||||||||
Series 2015-1A A3 (a)(d) | 05/28/2052 | 3.75 | % | 1,440,038 | 1,473,371 | ||||||||
Series 2014-2A A3 (a)(d) | 05/25/2054 | 3.75 | % | 1,275,545 | 1,294,452 | ||||||||
Series 2016-1A A1 (a)(d) | 03/25/2056 | 3.75 | % | 2,648,039 | 2,693,952 | ||||||||
Series 2017-1A A1 (a)(d) | 02/25/2057 | 4.00 | % | 3,201,382 | 3,296,558 | ||||||||
Series 2017-2A A3 (a)(d) | 03/25/2057 | 4.00 | % | 3,670,107 | 3,793,444 | ||||||||
Series 2017-3A A1 (a)(d) | 04/25/2057 | 4.00 | % | 2,003,426 | 2,063,114 | ||||||||
Opteum Mortgage Acceptance Corp., 2005-1 M3 (1 Month LIBOR USD + 0.860%) (c) | 02/25/2035 | 2.41 | % | 212,263 | 212,269 | ||||||||
Sequoia Mortgage Trust, 2015-3 A4 (a)(d) | 07/25/2045 | 3.50 | % | 864,076 | 877,254 | ||||||||
VNDO Mortgage Trust, 2013-PENN (a) | 12/13/2029 | 3.81 | % | 4,185,000 | 4,314,004 | ||||||||
22 | LoCorr Macro Strategies Fund - Consolidated Schedule of Investments (continued) |
| Maturity Date | Coupon Rate | Principal Amount | Value | ||||||||||
MORTGAGE BACKED SECURITIES (continued) | |||||||||||||
| WFRBS Commercial Mortgage Trust, 2012-C8 A2 | 08/15/2045 | 1.88 | % | $ | 512 | $ | 505 | ||||||
WIMC Capital Trust, 2012-A A1 (a) | 10/16/2050 | 4.55 | % | 15,834 | 15,814 | ||||||||
| TOTAL MORTGAGE BACKED SECURITIES (Cost $120,128,675) | 119,386,283 | ||||||||||||
| MUNICIPAL BONDS: 0.39% | |||||||||||||
| Louisiana Local Government Environmental Facilities & Community Development Authority | 02/01/2021 | 3.22 | % | 350,454 | 352,168 | ||||||||
| North Carolina Eastern Municipal Power Agency | 07/01/2018 | 2.00 | % | 1,385,000 | 1,385,471 | ||||||||
| St. Paul Housing & Redevelopment Authority | 07/01/2018 | 1.84 | % | 1,385,000 | 1,383,601 | ||||||||
| TOTAL MUNICIPAL BONDS (Cost $3,128,425) | 3,121,240 | ||||||||||||
| U.S. GOVERNMENT AGENCY ISSUES: 12.48% | |||||||||||||
| Federal Farm Credit Banks | 07/24/2019 | 1.40 | % | 7,750,000 | 7,691,364 | ||||||||
| Federal Farm Credit Banks | 09/27/2019 | 1.55 | % | 4,000,000 | 3,972,768 | ||||||||
| Federal Farm Credit Banks | 10/21/2019 | 1.44 | % | 8,500,000 | 8,423,449 | ||||||||
| Federal Farm Credit Banks | 04/13/2020 | 1.55 | % | 16,775,000 | 16,609,884 | ||||||||
| Federal Farm Credit Banks | 05/08/2020 | 1.55 | % | 17,800,000 | 17,599,608 | ||||||||
| Federal Farm Credit Banks | 10/26/2020 | 1.75 | % | 3,800,000 | 3,764,196 | ||||||||
| Federal Farm Credit Banks | 11/27/2020 | 1.90 | % | 7,000,000 | 6,964,818 | ||||||||
| Federal Home Loan Banks | 06/12/2020 | 1.75 | % | 18,380,000 | 18,255,604 | ||||||||
| Federal Home Loan Mortgage Corp. | 01/17/2020 | 1.50 | % | 2,085,000 | 2,065,272 | ||||||||
| Federal Home Loan Mortgage Corp. | 04/20/2020 | 1.38 | % | 8,500,000 | 8,379,853 | ||||||||
| Federal National Mortgage Association | 10/24/2019 | 1.00 | % | 3,400,000 | 3,344,560 | ||||||||
| Federal National Mortgage Association | 02/28/2020 | 1.50 | % | 1,500,000 | 1,484,435 | ||||||||
| TOTAL U.S. GOVERNMENT AGENCY ISSUES (Cost $99,515,870) | 98,555,811 | ||||||||||||
| U.S. GOVERNMENT NOTES: 5.29% | |||||||||||||
| United States Treasury Note | 07/15/2018 | 0.88 | % | 8,000,000 | 7,971,250 | ||||||||
| United States Treasury Note | 03/31/2020 | 1.13 | % | 15,000,000 | 14,743,945 | ||||||||
| United States Treasury Note | 07/15/2020 | 1.50 | % | 10,000,000 | 9,892,969 | ||||||||
| United States Treasury Note | 09/30/2020 | 1.38 | % | 2,340,000 | 2,304,353 | ||||||||
| United States Treasury Note | 09/30/2022 | 1.88 | % | 7,000,000 | 6,898,556 | ||||||||
| TOTAL U.S. GOVERNMENT NOTES (Cost $42,074,718) | 41,811,073 | ||||||||||||
| SHORT TERM INVESTMENTS: 4.16% | |||||||||||||
| U.S. GOVERNMENT NOTE: 0.40% | |||||||||||||
| United States Treasury Note | 05/31/2018 | 0.88 | % | 3,200,000 | 3,192,751 | ||||||||
| TOTAL U.S. GOVERNMENT NOTE (Cost $3,192,828) | 3,192,751 | ||||||||||||
| MONEY MARKET FUND: 3.76% | Shares | ||||||||||||
STIT-Government & Agency Portfolio, Institutional Class, 1.18% (e)(f) | 29,668,903 | 29,668,903 | |||||||||||
| TOTAL MONEY MARKET FUND (Cost $29,668,903) | 29,668,903 | ||||||||||||
| TOTAL SHORT TERM INVESTMENTS (Cost $32,861,731) | 32,861,654 | ||||||||||||
| TOTAL INVESTMENTS (Cost $707,969,851): 89.20% | 704,537,168 | ||||||||||||
Other Assets in Excess of Liabilities: 10.80% (g) | 85,280,946 | ||||||||||||
| TOTAL NET ASSETS: 100.00% | $ | 789,818,114 | |||||||||||
| (a) | Security as defined in Rule 144(a) under the Securities Act of 1933 and determined to be liquid. Purchased in a private placement transaction; resale to the public may require registration or may extend only to qualified institutional buyers. At December 31, 2017, the value of these securities total $170,706,499 which represents 21.61% of total net assets. |
| (b) | Foreign issued security. |
| (c) | Variable rate security based on a reference index and spread. The rate reported is the rate in effect as of December 31, 2017. |
| (d) | Variable rate security. The coupon is based on an underlying pool of assets. The rate reported is the rate in effect as of December 31, 2017. |
| (e) | The rate quoted is the annualized seven-day effective yield as of December 31, 2017. |
| (f) | All or a portion of this security is held by LCMFS Fund Limited and pledged as collateral for derivative contracts. |
| (g) | Includes assets pledged as collateral for derivative contracts. |
| LIBOR | London Interbank Offered Rate |
| LoCorr Macro Strategies Fund - Consolidated Schedule of Open Forward Currency Contracts | 23 |
| Currency to be Received | Currency to be Delivered | |||||||||||||||||||||||
| Notional Amount | Counter- party | Forward Settlement Date | Curr Abbr. | U.S. $ Value at December 31, 2017 | Curr Abbr. | U.S. $ Value on Origination Date | Unrealized Appreciation | Unrealized (Depreciation) | ||||||||||||||||
See key for abbreviation | ||||||||||||||||||||||||
| Purchase Contracts: | ||||||||||||||||||||||||
| $ | 15,047,779 | DB | 01/17/2018 | AUD | $ | 15,378,890 | USD | $ | 15,047,779 | $ | 331,111 | $ | — | |||||||||||
| 3,857,280 | BAML | 03/23/2018 | AUD | 3,921,691 | USD | 3,857,280 | 64,411 | — | ||||||||||||||||
| 20,346,620 | DB | 01/17/2018 | BRL | 20,163,856 | USD | 20,346,620 | — | (182,764 | ) | |||||||||||||||
| 2,607,676 | DB | 02/21/2018 | BRL | 2,594,896 | USD | 2,607,676 | — | (12,780 | ) | |||||||||||||||
| 10,249,654 | DB | 01/17/2018 | CAD | 10,472,833 | USD | 10,249,654 | 223,179 | — | ||||||||||||||||
| 26,579,521 | BAML | 03/23/2018 | CAD | 27,108,520 | USD | 26,579,521 | 528,999 | — | ||||||||||||||||
| 14,375,070 | DB | 01/17/2018 | CHF | 14,530,907 | USD | 14,375,070 | 155,837 | — | ||||||||||||||||
| 2,312,911 | BAML | 03/23/2018 | CHF | 2,340,774 | USD | 2,312,911 | 27,863 | — | ||||||||||||||||
| 1,892,141 | DB | 01/17/2018 | CLP | 1,920,702 | USD | 1,892,141 | 28,561 | — | ||||||||||||||||
| 571,860 | DB | 01/17/2018 | COP | 572,885 | USD | 571,860 | 1,025 | — | ||||||||||||||||
| 21,123,761 | DB | 01/17/2018 | EUR | 21,334,598 | NOK | 21,123,761 | 210,837 | — | ||||||||||||||||
| 4,899,389 | DB | 01/17/2018 | EUR | 4,997,293 | PLN | 4,899,389 | 97,904 | — | ||||||||||||||||
| 21,201,947 | DB | 01/17/2018 | EUR | 21,622,903 | SEK | 21,201,947 | 420,956 | — | ||||||||||||||||
| 9,296,899 | DB | 01/17/2018 | EUR | 9,393,950 | TRY | 9,296,899 | 97,051 | — | ||||||||||||||||
| 11,250,183 | DB | 01/17/2018 | EUR | 11,352,024 | USD | 11,250,183 | 101,841 | — | ||||||||||||||||
| 93,783,249 | BAML | 03/23/2018 | EUR | 95,196,172 | USD | 93,783,249 | 1,412,923 | — | ||||||||||||||||
| 9,991,699 | DB | 01/17/2018 | GBP | 10,092,255 | USD | 9,991,699 | 100,556 | — | ||||||||||||||||
| 76,200,896 | BAML | 03/23/2018 | GBP | 76,525,424 | USD | 76,200,896 | 324,528 | — | ||||||||||||||||
| 1,919,080 | DB | 01/17/2018 | ILS | 1,924,051 | USD | 1,919,080 | 4,971 | — | ||||||||||||||||
| 4,580,639 | DB | 01/17/2018 | INR | 4,620,798 | USD | 4,580,639 | 40,159 | — | ||||||||||||||||
| 12,137,708 | DB | 01/17/2018 | JPY | 12,135,005 | USD | 12,137,708 | — | (2,703 | ) | |||||||||||||||
| 17,224,624 | BAML | 03/23/2018 | JPY | 17,240,108 | USD | 17,224,624 | 15,484 | — | ||||||||||||||||
| 3,743 | DB | 01/17/2018 | KRW | 3,738 | USD | 3,743 | — | (5 | ) | |||||||||||||||
| 18,749,898 | DB | 01/17/2018 | MXN | 18,236,843 | USD | 18,749,898 | — | (513,055 | ) | |||||||||||||||
| 345,044 | DB | 02/21/2018 | MXN | 344,399 | USD | 345,044 | — | (645 | ) | |||||||||||||||
| 2,644,897 | BAML | 03/23/2018 | MXN | 2,564,826 | USD | 2,644,897 | — | (80,071 | ) | |||||||||||||||
| 24,518,671 | DB | 01/17/2018 | NOK | 24,914,118 | EUR | 24,518,671 | 395,447 | — | ||||||||||||||||
| 5,656,402 | DB | 01/17/2018 | NOK | 5,719,191 | USD | 5,656,402 | 62,789 | — | ||||||||||||||||
| 17,160,395 | DB | 01/17/2018 | NZD | 17,521,704 | USD | 17,160,395 | 361,309 | — | ||||||||||||||||
| 488,994 | BAML | 03/23/2018 | NZD | 493,452 | USD | 488,994 | 4,458 | — | ||||||||||||||||
| 12,721,160 | DB | 01/17/2018 | PLN | 12,996,818 | EUR | 12,721,160 | 275,658 | — | ||||||||||||||||
| 1,806,309 | DB | 01/17/2018 | PLN | 1,818,506 | USD | 1,806,309 | 12,197 | — | ||||||||||||||||
| 1,586,460 | DB | 01/17/2018 | RUB | 1,631,117 | USD | 1,586,460 | 44,657 | — | ||||||||||||||||
| 7,598,798 | DB | 02/21/2018 | RUB | 7,590,990 | USD | 7,598,798 | — | (7,808 | ) | |||||||||||||||
| 14,421,164 | DB | 01/17/2018 | SEK | 14,856,847 | EUR | 14,421,164 | 435,683 | — | ||||||||||||||||
| 6,654,383 | DB | 01/17/2018 | SEK | 6,786,122 | USD | 6,654,383 | 131,739 | — | ||||||||||||||||
| 558,283 | DB | 01/17/2018 | SGD | 560,949 | USD | 558,283 | 2,666 | — | ||||||||||||||||
| 276,973 | DB | 02/21/2018 | SGD | 276,871 | USD | 276,973 | — | (102 | ) | |||||||||||||||
| 13,450,465 | DB | 01/17/2018 | TRY | 13,553,786 | EUR | 13,450,465 | 103,321 | — | ||||||||||||||||
| 1,639,326 | DB | 01/17/2018 | TRY | 1,662,827 | USD | 1,639,326 | 23,501 | — | ||||||||||||||||
| 2,190,164 | DB | 02/21/2018 | TRY | 2,191,487 | USD | 2,190,164 | 1,323 | — | ||||||||||||||||
| 2,898,228 | DB | 01/17/2018 | ZAR | 3,024,649 | USD | 2,898,228 | 126,421 | — | ||||||||||||||||
| 142,341 | DB | 02/21/2018 | ZAR | 141,879 | USD | 142,341 | — | (462 | ) | |||||||||||||||
| Total Purchase Contracts | 522,331,654 | 516,962,684 | 6,169,365 | (800,395 | ) | |||||||||||||||||||
| Sale Contracts: | ||||||||||||||||||||||||
| $ | 50,556,684 | DB | 01/17/2018 | USD | $ | 51,785,740 | AUD | $ | 50,556,684 | $ | — | $ | (1,229,056 | ) | ||||||||||
| 61,661,370 | BAML | 03/23/2018 | USD | 62,776,701 | AUD | 61,661,370 | — | (1,115,331 | ) | |||||||||||||||
| 20,253,259 | DB | 01/17/2018 | USD | 20,163,856 | BRL | 20,253,259 | 89,403 | — | ||||||||||||||||
| 38,761,535 | DB | 01/17/2018 | USD | 39,304,955 | CAD | 38,761,535 | — | (543,420 | ) | |||||||||||||||
| 36,590,076 | BAML | 03/23/2018 | USD | 37,247,734 | CAD | 36,590,076 | — | (657,658 | ) | |||||||||||||||
| 62,954,504 | DB | 01/17/2018 | USD | 63,631,806 | CHF | 62,954,504 | — | (677,302 | ) | |||||||||||||||
| 42,306,900 | BAML | 03/23/2018 | USD | 42,847,422 | CHF | 42,306,900 | — | (540,522 | ) | |||||||||||||||
| 1,665,840 | DB | 01/17/2018 | USD | 1,764,706 | CLP | 1,665,840 | — | (98,866 | ) | |||||||||||||||
| 174,516 | DB | 01/17/2018 | USD | 175,243 | COP | 174,516 | — | (727 | ) | |||||||||||||||
| 24,518,671 | DB | 01/17/2018 | NOK | 25,034,517 | EUR | 24,518,671 | — | (515,846 | ) | |||||||||||||||
| 12,721,161 | DB | 01/17/2018 | PLN | 12,913,678 | EUR | 12,721,161 | — | (192,517 | ) | |||||||||||||||
| 24 | LoCorr Macro Strategies Fund - Consolidated Schedule of Open Forward Currency Contracts (continued) |
| Currency to be Received | Currency to be Delivered | |||||||||||||||||||||||
| Notional Amount | Counter- party | Forward Settlement Date | Curr Abbr. | U.S. $ Value at December 31, 2017 | Curr Abbr. | U.S. $ Value on Origination Date | Unrealized Appreciation | Unrealized (Depreciation) | ||||||||||||||||
| See key for abbreviation | ||||||||||||||||||||||||
Sale Contracts(continued) | ||||||||||||||||||||||||
| $ | 14,421,163 | DB | 01/17/2018 | SEK | $ | 14,691,561 | EUR | $ | 14,421,163 | $ | — | $ | (270,398 | ) | ||||||||||
| 13,450,465 | DB | 01/17/2018 | TRY | 13,490,289 | EUR | 13,450,465 | — | (39,824 | ) | |||||||||||||||
| 35,796,066 | DB | 01/17/2018 | USD | 36,278,427 | EUR | 35,796,066 | — | (482,361 | ) | |||||||||||||||
| 13,195,084 | BAML | 03/23/2018 | USD | 13,351,874 | EUR | 13,195,084 | — | (156,790 | ) | |||||||||||||||
| 41,960,226 | DB | 01/17/2018 | USD | 42,152,392 | GBP | 41,960,226 | — | (192,166 | ) | |||||||||||||||
| 18,848,686 | BAML | 03/23/2018 | USD | 18,944,846 | GBP | 18,848,686 | — | (96,160 | ) | |||||||||||||||
| 2,156,424 | DB | 01/17/2018 | USD | 2,185,768 | ILS | 2,156,424 | — | (29,344 | ) | |||||||||||||||
| 1,853,225 | DB | 01/17/2018 | USD | 1,864,982 | INR | 1,853,225 | — | (11,757 | ) | |||||||||||||||
| 49,237,350 | DB | 01/17/2018 | USD | 49,224,056 | JPY | 49,237,350 | 13,294 | — | ||||||||||||||||
| 52,033,482 | BAML | 03/23/2018 | USD | 52,009,250 | JPY | 52,033,482 | 24,232 | — | ||||||||||||||||
| 1,486,227 | DB | 01/17/2018 | USD | 1,510,112 | KRW | 1,486,227 | — | (23,885 | ) | |||||||||||||||
| 18,517,506 | DB | 01/17/2018 | USD | 18,236,843 | MXN | 18,517,506 | 280,663 | — | ||||||||||||||||
| 12,506,786 | DB | 02/21/2018 | USD | 12,556,959 | MXN | 12,506,786 | — | (50,173 | ) | |||||||||||||||
| 17,905,838 | BAML | 03/23/2018 | USD | 17,748,632 | MXN | 17,905,838 | 157,206 | — | ||||||||||||||||
| 21,123,761 | DB | 01/17/2018 | EUR | 21,448,929 | NOK | 21,123,761 | — | (325,168 | ) | |||||||||||||||
| 13,130,454 | DB | 01/17/2018 | USD | 13,266,378 | NOK | 13,130,454 | — | (135,924 | ) | |||||||||||||||
| 29,782,964 | DB | 01/17/2018 | USD | 30,721,435 | NZD | 29,782,964 | — | (938,471 | ) | |||||||||||||||
| 22,440,188 | BAML | 03/23/2018 | USD | 22,739,147 | NZD | 22,440,188 | — | (298,959 | ) | |||||||||||||||
| 4,899,389 | DB | 01/17/2018 | EUR | 5,040,325 | PLN | 4,899,389 | — | (140,936 | ) | |||||||||||||||
| 5,160,010 | DB | 01/17/2018 | USD | 5,291,765 | PLN | 5,160,010 | — | (131,755 | ) | |||||||||||||||
| 1,588,994 | DB | 01/17/2018 | USD | 1,631,117 | RUB | 1,588,994 | — | (42,123 | ) | |||||||||||||||
| 43,913 | DB | 02/21/2018 | USD | 43,928 | RUB | 43,913 | — | (15 | ) | |||||||||||||||
| 21,201,947 | DB | 01/17/2018 | EUR | 21,974,855 | SEK | 21,201,947 | — | (772,908 | ) | |||||||||||||||
| 10,919,574 | DB | 01/17/2018 | USD | 11,175,131 | SEK | 10,919,574 | — | (255,557 | ) | |||||||||||||||
| 556,887 | DB | 01/17/2018 | USD | 560,949 | SGD | 556,887 | — | (4,062 | ) | |||||||||||||||
| 104,626 | DB | 02/21/2018 | USD | 104,762 | SGD | 104,626 | — | (136 | ) | |||||||||||||||
| 9,296,899 | DB | 01/17/2018 | EUR | 9,694,913 | TRY | 9,296,899 | — | (398,014 | ) | |||||||||||||||
| 1,635,385 | DB | 01/17/2018 | USD | 1,662,828 | TRY | 1,635,385 | — | (27,443 | ) | |||||||||||||||
| 2,748,881 | DB | 01/17/2018 | USD | 3,024,648 | ZAR | 2,748,881 | — | (275,767 | ) | |||||||||||||||
| 28,900 | DB | 02/21/2018 | USD | 28,857 | ZAR | 28,900 | 43 | — | ||||||||||||||||
| Total Sale Contracts | 800,302,316 | 790,195,816 | 564,841 | (10,671,341 | ) | |||||||||||||||||||
| Total Forward Currency Contracts | $ | (277,970,662 | ) | $ | (273,233,132 | ) | $ | 6,734,206 | $ | (11,471,736 | ) | |||||||||||||
| Net Unrealized Depreciation | $ | (4,737,530 | ) | |||||||||||||||||||||
Counterparty: | |
| BAML | Bank of America Merrill Lynch |
| DB | Deutsche Bank |
Currency abbreviations: | COP | COLOMBIAN PESO | KRW | SOUTH KOREAN WON | SEK | SWEDISH KRONA | |
| AUD | AUSTRALIAN DOLLAR | EUR | EURO | MXN | MEXICAN PESO | SGD | SINGAPORE DOLLAR |
| BRL | BRAZILIAN REAL | GBP | BRITISH POUND | NOK | NORWEGIAN KRONE | TRY | TURKISH LIRA |
| CAD | CANADIAN DOLLAR | ILS | ISRAELI NEW SHEQEL | NZD | NEW ZEALAND DOLLAR | USD | U.S. DOLLAR |
| CHF | SWISS FRANC | INR | INDIAN RUPEE | PLN | POLISH ZLOTY | ZAR | SOUTH AFRICAN RAND |
| CLP | CHILEAN PESO | JPY | JAPANESE YEN | RUB | RUSSIAN RUBLE | ||
| LoCorr Macro Strategies Fund - Consolidated Schedule of Open Futures Contracts | 25 |
| Number of | Current | Value | ||||||||||||||||||
| Contracts | Settlement | Notional | Value at | Unrealized | Unrealized | |||||||||||||||
| Description | Purchased (Sold) | Month-Year | Amount | Trade Date | Appreciation | (Depreciation) | ||||||||||||||
| Purchase Contracts: | ||||||||||||||||||||
| 10 Yr Mini JGB | 17 | Mar-18 | $ | 2,275,820 | $ | 2,275,164 | $ | 656 | $ | — | ||||||||||
| 3 Mo Euro Euribor | 837 | Jun-19 | 251,268,718 | 251,433,029 | — | (164,311 | ) | |||||||||||||
| 90 Day Euro | 135 | Sep-18 | 33,061,500 | 33,055,359 | 6,141 | — | ||||||||||||||
Aluminum (a)(b) | 363 | Mar-18 | 20,613,863 | 18,831,120 | 1,782,743 | — | ||||||||||||||
| Amsterdam Exchange Index | 45 | Jan-18 | 5,879,848 | 5,948,164 | — | (68,316 | ) | |||||||||||||
| Australian 3 Yr Bond | 149 | Mar-18 | 12,915,818 | 12,967,833 | — | (52,015 | ) | |||||||||||||
| Australian 10 Yr Bond | 292 | Mar-18 | 29,426,447 | 29,575,284 | — | (148,837 | ) | |||||||||||||
Brent Crude (a) | 517 | Jan-18 | 34,571,790 | 32,966,391 | 1,605,399 | — | ||||||||||||||
Brent Crude (a) | 60 | Feb-18 | 3,986,400 | 3,832,859 | 153,541 | — | ||||||||||||||
Brent Crude (a) | 19 | Mar-18 | 1,255,710 | 1,208,715 | 46,995 | — | ||||||||||||||
Brent Crude (a) | 10 | Apr-18 | 657,800 | 634,003 | 23,797 | — | ||||||||||||||
Brent Crude (a) | 5 | May-18 | 327,400 | 315,657 | 11,743 | — | ||||||||||||||
Brent Crude (a) | 3 | Jun-18 | 195,360 | 188,554 | 6,806 | — | ||||||||||||||
| CAC 40 10 Euro Index | 390 | Jan-18 | 24,849,960 | 25,250,460 | — | (400,500 | ) | |||||||||||||
| Canadian 10 Yr Bond | 25 | Mar-18 | 2,680,589 | 2,691,006 | — | (10,417 | ) | |||||||||||||
Cocoa (NYBOT) (a) | 9 | Mar-18 | 170,280 | 170,643 | — | (363 | ) | |||||||||||||
Copper (a)(b) | 192 | Mar-18 | 34,788,000 | 32,659,455 | 2,128,545 | — | ||||||||||||||
Copper (COMEX) (a) | 187 | Mar-18 | 15,429,837 | 14,490,373 | 939,464 | — | ||||||||||||||
Cotton No.2 (a) | 104 | Mar-18 | 4,088,760 | 3,799,362 | 289,398 | — | ||||||||||||||
| DAX Index | 92 | Mar-18 | 35,627,039 | 36,269,461 | — | (642,422 | ) | |||||||||||||
| Dow Jones Industrial Average Mini E-Cbot Index | 63 | Mar-18 | 7,791,525 | 7,638,535 | 152,990 | — | ||||||||||||||
| Euro-Bobl | 895 | Mar-18 | 141,331,049 | 141,919,400 | — | (588,351 | ) | |||||||||||||
| Euro-BTP | 308 | Mar-18 | 50,310,903 | 51,583,927 | — | (1,273,024 | ) | |||||||||||||
| Euro-Bund | 588 | Mar-18 | 114,066,807 | 114,638,414 | — | (571,607 | ) | |||||||||||||
| Euro-Buxl 30 Yr Bond | 95 | Mar-18 | 18,677,649 | 18,904,123 | — | (226,474 | ) | |||||||||||||
| Euro-OAT | 348 | Mar-18 | 64,794,875 | 65,521,468 | — | (726,593 | ) | |||||||||||||
| Euro-Schatz | 794 | Mar-18 | 106,676,126 | 106,782,576 | — | (106,450 | ) | |||||||||||||
| Euro-Stoxx 50 Index | 1,500 | Mar-18 | 62,865,957 | 64,399,538 | — | (1,533,581 | ) | |||||||||||||
| FTSE 100 Index | 583 | Mar-18 | 60,121,433 | 58,664,925 | 1,456,508 | — | ||||||||||||||
| FTSE/JSE Top 40 Index | 10 | Mar-18 | 429,776 | 423,912 | 5,864 | — | ||||||||||||||
Gasoline RBOB (a) | 283 | Jan-18 | 21,344,878 | 20,158,347 | 1,186,531 | — | ||||||||||||||
Gasoline RBOB (a) | 34 | Feb-18 | 2,589,392 | 2,494,945 | 94,447 | — | ||||||||||||||
Gasoline RBOB (a) | 9 | Mar-18 | 752,938 | 713,383 | 39,555 | — | ||||||||||||||
Gasoline RBOB (a) | 5 | Apr-18 | 419,601 | 401,122 | 18,479 | — | ||||||||||||||
Gold (a) | 58 | Feb-18 | 7,593,940 | 7,514,688 | 79,252 | — | ||||||||||||||
| Hang Seng Index | 166 | Jan-18 | 31,815,330 | 31,503,385 | 311,945 | — | ||||||||||||||
Heating Oil (a) | 357 | Jan-18 | 31,009,092 | 28,358,486 | 2,650,606 | — | ||||||||||||||
Heating Oil (a) | 34 | Feb-18 | 2,918,546 | 2,778,210 | 140,336 | — | ||||||||||||||
Heating Oil (a) | 7 | Mar-18 | 591,998 | 555,644 | 36,354 | — | ||||||||||||||
Heating Oil (a) | 4 | Apr-18 | 334,841 | 316,188 | 18,653 | — | ||||||||||||||
| Japanese 10 Yr Bond | 77 | Mar-18 | 103,040,248 | 103,043,464 | — | (3,216 | ) | |||||||||||||
| KOSPI 200 Index | 115 | Mar-18 | 8,758,874 | 8,594,868 | 164,006 | — | ||||||||||||||
Lead (a)(b) | 16 | Mar-18 | 995,000 | 996,505 | — | (1,505 | ) | |||||||||||||
| Long Gilt | 682 | Mar-18 | 115,247,374 | 114,762,397 | 484,977 | — | ||||||||||||||
Low Sulphur Gasoil (a) | 443 | Feb-18 | 26,657,525 | 24,896,639 | 1,760,886 | — | ||||||||||||||
Low Sulphur Gasoil (a) | 71 | Mar-18 | 4,254,675 | 4,198,418 | 56,257 | — | ||||||||||||||
Low Sulphur Gasoil (a) | 14 | Apr-18 | 831,600 | 831,618 | — | (18 | ) | |||||||||||||
| MSCI Taiwan Index | 56 | Jan-18 | 2,200,800 | 2,165,626 | 35,174 | — | ||||||||||||||
| Nasdaq 100 E-Mini Index | 315 | Mar-18 | 40,375,125 | 40,602,394 | — | (227,269 | ) | |||||||||||||
Nickel (a)(b) | 21 | Mar-18 | 1,607,760 | 1,495,648 | 112,112 | — | ||||||||||||||
| Nikkei 225 Index (OSE) | 132 | Mar-18 | 26,651,875 | 26,522,449 | 129,426 | — | ||||||||||||||
| Nikkei 225 Index (SGX) | 93 | Mar-18 | 9,390,792 | 9,285,999 | 104,793 | — | ||||||||||||||
Platinum (a) | 2 | Apr-18 | 93,830 | 92,969 | 861 | — | ||||||||||||||
| 26 | LoCorr Macro Strategies Fund - Consolidated Schedule of Open Futures Contracts (continued) |
| Number of | Current | Value | ||||||||||||||||||||
| Contracts | Settlement | Notional | Value at | Unrealized | Unrealized | |||||||||||||||||
| Description | Purchased (Sold) | Month-Year | Amount | Trade Date | Appreciation | (Depreciation) | ||||||||||||||||
Purchase Contracts (continued) | ||||||||||||||||||||||
| Russell 2000 Mini Index | 556 | Mar-18 | $ | 42,714,700 | $ | 42,625,279 | $ | 89,421 | $ | — | ||||||||||||
| S&P/TSX 60 Index | 32 | Mar-18 | 4,874,590 | 4,847,163 | 27,427 | — | ||||||||||||||||
| S&P500 E-Mini Index | 141 | Mar-18 | 18,865,800 | 18,564,501 | 301,299 | — | ||||||||||||||||
Soybean (a) | 40 | Mar-18 | 1,923,500 | 2,013,355 | — | (89,855 | ) | |||||||||||||||
Soybean Meal (a) | 120 | Mar-18 | 3,801,600 | 4,034,457 | — | (232,857 | ) | |||||||||||||||
| SPI 200 Index | 27 | Mar-18 | 3,170,547 | 3,174,406 | — | (3,859 | ) | |||||||||||||||
| Tokyo Price Index | 293 | Mar-18 | 47,249,256 | 46,567,524 | 681,732 | — | ||||||||||||||||
| U.S. 2 Yr Note | 613 | Mar-18 | 131,249,050 | 131,248,367 | 683 | — | ||||||||||||||||
| U.S. Long Bond | 377 | Mar-18 | 57,681,000 | 57,383,496 | 297,504 | — | ||||||||||||||||
| U.S. Ultra Bond | 28 | Mar-18 | 4,694,375 | 4,629,193 | 65,182 | — | ||||||||||||||||
WTI Crude (a) | 317 | Jan-18 | 19,153,140 | 18,082,708 | 1,070,432 | — | ||||||||||||||||
WTI Crude (a) | 17 | Feb-18 | 1,027,480 | 985,440 | 42,040 | — | ||||||||||||||||
WTI Crude (a) | 17 | Mar-18 | 1,026,800 | 971,140 | 55,660 | — | ||||||||||||||||
WTI Crude (a) | 11 | Apr-18 | 662,970 | 625,280 | 37,690 | — | ||||||||||||||||
WTI Crude (a) | 6 | May-18 | 360,360 | 342,041 | 18,319 | — | ||||||||||||||||
WTI Crude (a) | 3 | Jun-18 | 179,280 | 167,755 | 11,525 | — | ||||||||||||||||
Zinc (a)(b) | 230 | Mar-18 | 19,121,625 | 18,203,379 | 918,246 | — | ||||||||||||||||
| Total Purchase Contracts | 19,652,400 | (7,071,840 | ) | |||||||||||||||||||
| Sale Contracts: | ||||||||||||||||||||||
| 90 Day Euro | (144 | ) | Dec-18 | $ | 35,227,800 | $ | 35,265,513 | $ | 37,713 | $ | — | |||||||||||
| 90 Day Euro | (60 | ) | Mar-19 | 14,669,250 | 14,681,971 | 12,721 | — | |||||||||||||||
| 90 Day Euro | (1,920 | ) | Jun-19 | 469,152,000 | 469,410,248 | 258,248 | — | |||||||||||||||
| 90 Day Euro | (175 | ) | Sep-19 | 42,745,938 | 42,780,660 | 34,722 | — | |||||||||||||||
| 90 Day Euro | (322 | ) | Dec-19 | 78,624,350 | 78,724,237 | 99,887 | — | |||||||||||||||
| 90 Day Euro | (324 | ) | Mar-20 | 79,104,600 | 79,182,302 | 77,702 | — | |||||||||||||||
| 90 Day Sterling | (1,127 | ) | Jun-19 | 188,509,203 | 188,298,214 | — | (210,989 | ) | ||||||||||||||
Aluminum (a)(b) | (56 | ) | Mar-18 | 3,180,100 | 2,844,069 | — | (336,031 | ) | ||||||||||||||
| Canadian 10 Yr Bond | (216 | ) | Mar-18 | 23,160,287 | 23,494,750 | 334,463 | — | |||||||||||||||
| CBOE Volatility Index | (255 | ) | Jan-18 | 2,926,125 | 3,021,080 | 94,955 | — | |||||||||||||||
| CBOE Volatility Index | (59 | ) | Feb-18 | 736,025 | 723,177 | — | (12,848 | ) | ||||||||||||||
| CBOE Volatility Index | (12 | ) | Mar-18 | 158,700 | 158,477 | — | (223 | ) | ||||||||||||||
Cocoa (CME) (a) | (166 | ) | Mar-18 | 3,088,435 | 3,578,815 | 490,380 | — | |||||||||||||||
Coffee (a) | (103 | ) | Mar-18 | 4,874,475 | 4,894,236 | 19,761 | — | |||||||||||||||
Copper (a)(b) | (88 | ) | Mar-18 | 15,944,500 | 15,234,221 | — | (710,279 | ) | ||||||||||||||
Corn (a) | (639 | ) | Mar-18 | 11,206,463 | 11,456,620 | 250,157 | — | |||||||||||||||
| Dollar | (123 | ) | Mar-18 | 11,294,598 | 11,434,199 | 139,601 | — | |||||||||||||||
| Dow Jones Industrial Average Mini E-Cbot Index | (65 | ) | Mar-18 | 8,038,875 | 7,876,783 | — | (162,092 | ) | ||||||||||||||
Gold (a) | (113 | ) | Feb-18 | 14,795,090 | 14,276,272 | — | (518,818 | ) | ||||||||||||||
Hard Red Wheat (a) | (217 | ) | Mar-18 | 4,635,663 | 4,776,850 | 141,187 | — | |||||||||||||||
| H-Shares Index | (18 | ) | Jan-18 | 1,351,236 | 1,343,811 | — | (7,425 | ) | ||||||||||||||
| IBEX 35 Index | (11 | ) | Jan-18 | 1,322,576 | 1,335,276 | 12,700 | — | |||||||||||||||
Lead (a)(b) | (14 | ) | Mar-18 | 870,625 | 861,045 | — | (9,580 | ) | ||||||||||||||
Lean Hogs (a) | (7 | ) | Feb-18 | 200,970 | 190,383 | — | (10,587 | ) | ||||||||||||||
Live Cattle (a) | (23 | ) | Feb-18 | 1,118,260 | 1,118,983 | 723 | — | |||||||||||||||
Natural Gas (a) | (293 | ) | Jan-18 | 8,652,290 | 8,426,419 | — | (225,871 | ) | ||||||||||||||
Natural Gas (a) | (46 | ) | Feb-18 | 1,336,760 | 1,235,301 | — | (101,459 | ) | ||||||||||||||
Natural Gas (a) | (112 | ) | Mar-18 | 3,078,880 | 3,102,724 | 23,844 | — | |||||||||||||||
Natural Gas (a) | (106 | ) | Apr-18 | 2,905,459 | 2,768,435 | — | (137,024 | ) | ||||||||||||||
Nickel (a)(b) | (16 | ) | Mar-18 | 1,224,961 | 1,123,334 | — | (101,627 | ) | ||||||||||||||
| Russell 2000 Mini Index | (28 | ) | Mar-18 | 2,151,100 | 2,163,959 | 12,859 | — | |||||||||||||||
| S&P500 E-Mini Index | (58 | ) | Mar-18 | 7,760,400 | 7,805,729 | 45,329 | — | |||||||||||||||
| SGX Nifty 50 Index | (14 | ) | Jan-18 | 295,637 | 295,032 | — | (605 | ) | ||||||||||||||
Silver (a) | (272 | ) | Mar-18 | 23,317,199 | 21,994,035 | — | (1,323,164 | ) | ||||||||||||||
Soybean (a) | (236 | ) | Mar-18 | 11,348,649 | 11,333,700 | — | (14,949 | ) | ||||||||||||||
Soybean Oil (a) | (86 | ) | Mar-18 | 1,716,215 | 1,697,347 | — | (18,868 | ) | ||||||||||||||
Sugar (a) | (226 | ) | Feb-18 | 3,837,299 | 3,746,628 | — | (90,671 | ) | ||||||||||||||
| U.S. 2 Yr Note | (981 | ) | Mar-18 | 210,041,298 | 210,514,083 | 472,785 | — | |||||||||||||||
| LoCorr Macro Strategies Fund - Consolidated Schedule of Open Futures Contracts (continued) | 27 |
| Number of | Current | Value | ||||||||||||||||||||
| Contracts | Settlement | Notional | Value at | Unrealized | Unrealized | |||||||||||||||||
| Description | Purchased (Sold) | Month-Year | Amount | Trade Date | Appreciation | (Depreciation) | ||||||||||||||||
Sale Contracts (continued) | ||||||||||||||||||||||
| U.S. 5 Yr Note | (1,882 | ) | Mar-18 | $ | 218,620,767 | $ | 219,606,572 | $ | 985,805 | $ | — | |||||||||||
| U.S. 10 Yr Note | (784 | ) | Mar-18 | 97,252,750 | 97,734,464 | 481,714 | — | |||||||||||||||
Wheat (a) | (229 | ) | Mar-18 | 4,889,150 | 5,044,222 | 155,072 | — | |||||||||||||||
Zinc (a)(b) | (42 | ) | Mar-18 | 3,491,775 | 3,316,323 | — | (175,452 | ) | ||||||||||||||
| Total Sale Contracts | 4,182,328 | (4,168,562 | ) | |||||||||||||||||||
| Total Futures Contracts | $ | 23,834,728 | $ | (11,240,402 | ) | |||||||||||||||||
| Net Unrealized Appreciation | $ | 12,594,326 | ||||||||||||||||||||
(a) | Contract held by LCMFS Fund Limited. |
| (b) | London Metal Exchange (“LME”) futures contracts settle on their respective maturity date. The unrealized appreciation on these contracts is a receivable for unsettled open futures contracts and the unrealized depreciation is a payable for unsettled open futures contracts on the Fund’s consolidated statement of assets and liabilities. |
| CME | Chicago Mercantile Exchange |
| COMEX | Commodity Exchange, Inc. |
| NYBOT | New York Board of Trade |
| OSE | Osaka Securities Exchange |
| SGX | Singapore Exchange Limited |
28 | LoCorr Long/Short Commodities Strategy Fund - Consolidated Schedule of Investments |
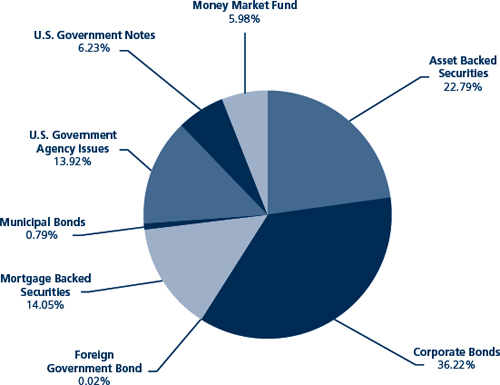
| Maturity Date | Coupon Rate | Principal Amount | Value | |||||||||
| ASSET BACKED SECURITIES: 17.14% | ||||||||||||
| 321 Henderson Receivables I LLC | ||||||||||||
Series 2006-4A A1 (1 Month LIBOR USD + 0.200%) (a)(c) | 12/15/2041 | 1.68 | % | $ | 299,015 | $ | 292,019 | |||||
Series 2004-A A1 (1 Month LIBOR USD + 0.350%) (a)(c) | 09/15/2045 | 1.83 | % | 99,014 | 96,288 | |||||||
| AEP Texas Central Transition Funding II LLC, 2006-2 A4 | 01/01/2018 | 5.17 | % | 300,180 | 300,234 | |||||||
| American Express Credit Account Master Trust | ||||||||||||
Series 2013-2 A (1 Month LIBOR USD + 0.420%) (c) | 05/17/2021 | 1.90 | % | 495,000 | 496,323 | |||||||
| Series 2017-1 A | 09/15/2022 | 1.93 | % | 365,000 | 363,319 | |||||||
Bank of The West Auto Trust, 2017-1 A3 (a) | 01/15/2023 | 2.11 | % | 335,000 | 333,214 | |||||||
Barclays Dryrock Issuance Trust, 2017-2 A (1 Month LIBOR USD + 0.300%) (c) | 05/15/2023 | 1.78 | % | 325,000 | 325,292 | |||||||
| Cabela’s Credit Card Master Note Trust, 2016-1 A1 | 06/15/2022 | 1.78 | % | 495,000 | 492,114 | |||||||
| CenterPoint Energy Restoration Bond Co. LLC, 2009-1 A2 | 08/15/2019 | 3.46 | % | 143,629 | 143,983 | |||||||
| Centerpoint Energy Transition Bond Co. III LLC, 2008-A A2 | 02/01/2023 | 5.23 | % | 293,766 | 303,307 | |||||||
Citibank Credit Card Issuance Trust, 2013-A7 (1 Month LIBOR USD + 0.430%) (c) | 09/10/2020 | 1.86 | % | 730,000 | 731,811 | |||||||
| Colony American Homes | ||||||||||||
Series 2014-1A A (1 Month LIBOR USD + 1.150%) (a)(c) | 05/17/2031 | 2.63 | % | 627,758 | 629,462 | |||||||
Series 2015-1A C (1 Month LIBOR USD + 1.950%) (a)(c) | 07/17/2032 | 3.38 | % | 470,000 | 473,156 | |||||||
Countrywide Asset-Backed Certificates, 2004-AB1 (1 Month LIBOR USD + 0.980%) (c) | 11/25/2034 | 2.53 | % | 479,225 | 479,407 | |||||||
| Discover Card Execution Note Trust, 2012-A6 | 01/18/2022 | 1.67 | % | 400,000 | 397,736 | |||||||
| Entergy Arkansas Restoration Funding LLC, 2010-A A1 | 08/01/2021 | 2.30 | % | 461,098 | 461,491 | |||||||
| FirstEnergy Ohio PIRB Special Purpose Trust, 2013-1 A2 | 01/15/2022 | 1.73 | % | 187,880 | 187,255 | |||||||
| Ford Credit Auto Owner Trust | ||||||||||||
| Series 2017-C A3 | 03/15/2022 | 2.01 | % | 300,000 | 299,120 | |||||||
Series 2014-REV1 A (a) | 11/15/2025 | 2.26 | % | 580,000 | 581,179 | |||||||
Series 2016-REV1 A (a) | 08/15/2027 | 2.31 | % | 370,000 | 368,773 | |||||||
| Invitation Homes Trust | ||||||||||||
Series 2015-SFR3 A (1 Month LIBOR USD + 1.300%) (a)(c) | 08/17/2032 | 2.76 | % | 470,148 | 473,087 | |||||||
Series 2017-SFR2 A (1 Month LIBOR USD + 0.850%) (a)(c) | 12/17/2036 | 2.34 | % | 144,394 | 144,858 | |||||||
LoCorr Long/Short Commodities Strategy Fund - Consolidated Schedule of Investments (continued) | 29 |
| Maturity Date | Coupon Rate | Principal Amount | Value | |||||||||
ASSET BACKED SECURITIES (continued) | ||||||||||||
| Ocwen Master Advance Receivables Trust | ||||||||||||
Series 2016-T1 AT1 (a) | 08/17/2048 | 2.52 | % | $ | 417,000 | $ | 416,918 | |||||
Series 2016-T2 AT2 (a) | 08/16/2049 | 2.72 | % | 625,000 | 621,000 | |||||||
OneMain Direct Auto Receivables Trust, 2016-1A A (a) | 01/15/2021 | 2.04 | % | 321,547 | 321,656 | |||||||
OneMain Financial Issuance Trust, 2015-2A A (a) | 07/18/2025 | 2.57 | % | 414,276 | 414,007 | |||||||
Progress Residential Trust, 2017-SFR1 A (a) | 08/17/2034 | 2.77 | % | 324,443 | 321,937 | |||||||
Santander Retail Auto Lease Trust, 2017-A A2A (a) | 03/20/2020 | 2.02 | % | 425,000 | 424,283 | |||||||
SMB Private Education Loan Trust, 2017-A A1 (1 Month LIBOR USD + 0.450%) (a)(c) | 06/17/2024 | 1.93 | % | 266,239 | 266,635 | |||||||
| SoFi Professional Loan Program LLC | ||||||||||||
Series 2015-C A2 (a) | 08/25/2033 | 2.51 | % | 253,341 | 252,324 | |||||||
Series 2015-D A2 (a) | 10/27/2036 | 2.72 | % | 189,517 | 189,408 | |||||||
SPS Servicer Advance Receivables Trust, 2016-T1 AT1 (a) | 11/16/2048 | 2.53 | % | 500,000 | 495,612 | |||||||
| Synchrony Credit Card Master Note Trust, 2017-1A | 06/15/2023 | 1.93 | % | 285,000 | 282,359 | |||||||
| TCF Auto Receivables Owner Trust | ||||||||||||
Series 2016-1A A3 (a) | 04/15/2021 | 1.71 | % | 600,000 | 598,034 | |||||||
Series 2016-PT1 A (a) | 06/15/2022 | 1.93 | % | 580,972 | 578,858 | |||||||
Tricon American Homes Trust, 2017-SFR1 A (a) | 09/17/2034 | 2.72 | % | 315,000 | 311,101 | |||||||
Verizon Owner Trust, 2017-2A A (a) | 12/20/2021 | 1.92 | % | 405,000 | 402,313 | |||||||
| TOTAL ASSET BACKED SECURITIES (Cost $14,279,025) | 14,269,873 | |||||||||||
| CORPORATE BONDS: 27.25% | ||||||||||||
| Administrative and Support and Waste Management and Remediation Services: 0.01% | ||||||||||||
Safina Ltd. (b) | 01/15/2022 | 1.55 | % | 11,449 | 11,274 | |||||||
| Finance and Insurance: 11.21% | ||||||||||||
| Aflac, Inc. | 03/16/2020 | 2.40 | % | 340,000 | 340,282 | |||||||
| American Express Credit Corp. | 09/14/2020 | 2.60 | % | 405,000 | 407,050 | |||||||
| American International Group, Inc. | 08/15/2020 | 3.38 | % | 330,000 | 337,214 | |||||||
| Bank of America Corp. | 04/21/2020 | 2.25 | % | 650,000 | 650,454 | |||||||
| BB&T Corp. | 01/15/2020 | 2.45 | % | 435,000 | 436,440 | |||||||
| Berkshire Hathaway Finance Corp. | 01/15/2021 | 4.25 | % | 250,000 | 264,372 | |||||||
| Capital One Financial Corp. | 04/24/2019 | 2.45 | % | 125,000 | 125,292 | |||||||
| Chubb INA Holdings, Inc. | 11/03/2020 | 2.30 | % | 165,000 | 164,737 | |||||||
| Citigroup, Inc. | 10/26/2020 | 2.65 | % | 585,000 | 586,958 | |||||||
| Citizens Bank NA | 03/14/2019 | 2.50 | % | 150,000 | 150,355 | |||||||
Cooperatieve Rabobank UA (b) | 01/14/2019 | 2.25 | % | 250,000 | 250,269 | |||||||
| Dragon 2012 LLC | 03/12/2024 | 1.97 | % | 14,043 | 13,833 | |||||||
| Fifth Third Bancorp | 07/27/2020 | 2.88 | % | 190,000 | 192,008 | |||||||
| General Motors Financial Co., Inc. | 05/09/2019 | 2.40 | % | 180,000 | 180,044 | |||||||
| Goldman Sachs Group, Inc./The | 09/15/2020 | 2.75 | % | 250,000 | 251,249 | |||||||
| Goldman Sachs Group, Inc./The | 02/25/2021 | 2.88 | % | 370,000 | 372,736 | |||||||
| Hartford Financial Services Group, Inc./The | 03/30/2020 | 5.50 | % | 250,000 | 266,453 | |||||||
HSBC Holdings PLC (b) | 04/05/2021 | 5.10 | % | 215,000 | 231,002 | |||||||
ING Bank NV (a)(b) | 03/22/2019 | 2.30 | % | 220,000 | 220,118 | |||||||
| John Deere Capital Corp. | 01/08/2021 | 2.55 | % | 230,000 | 230,888 | |||||||
| JPMorgan Chase & Co. | 03/22/2019 | 1.85 | % | 130,000 | 129,524 | |||||||
| JPMorgan Chase & Co. | 01/23/2020 | 2.25 | % | 685,000 | 684,542 | |||||||
| Lazard Group LLC | 11/14/2020 | 4.25 | % | 175,000 | 182,276 | |||||||
Metropolitan Life Global Funding (a) | 04/14/2020 | 2.00 | % | 195,000 | 193,507 | |||||||
| Morgan Stanley | 07/24/2020 | 5.50 | % | 450,000 | 482,481 | |||||||
MSN 41079 and 41084 Ltd. (b) | 07/13/2024 | 1.72 | % | 14,740 | 14,377 | |||||||
| PNC Bank NA | 10/18/2019 | 2.40 | % | 305,000 | 305,450 | |||||||
| Prudential Financial, Inc. | 06/15/2019 | 7.38 | % | 215,000 | 230,875 | |||||||
| State Street Corp. | 08/18/2020 | 2.55 | % | 305,000 | 307,023 | |||||||
| SunTrust Banks, Inc. | 03/03/2021 | 2.90 | % | 265,000 | 267,966 | |||||||
| Tagua Leasing LLC | 11/16/2024 | 1.58 | % | 15,198 | 14,727 | |||||||
Trinity Acquisition PLC (b) | 09/15/2021 | 3.50 | % | 230,000 | 234,485 | |||||||
30 | LoCorr Long/Short Commodities Strategy Fund - Consolidated Schedule of Investments (continued) |
| Maturity Date | Coupon Rate | Principal Amount | Value | |||||||||
CORPORATE BONDS (continued) | ||||||||||||
| UnitedHealth Group, Inc. | 10/15/2020 | 3.88 | % | $ | 195,000 | $ | 202,443 | |||||
| Wells Fargo & Co. | 04/22/2019 | 2.13 | % | 195,000 | 194,969 | |||||||
| Wells Fargo & Co. | 07/22/2020 | 2.60 | % | 210,000 | 211,293 | |||||||
| 9,327,692 | ||||||||||||
| Information: 2.88% | ||||||||||||
| 21st Century Fox America, Inc. | 02/15/2021 | 4.50 | % | 145,000 | 153,254 | |||||||
America Movil SAB de CV (b) | 03/30/2020 | 5.00 | % | 160,000 | 168,630 | |||||||
| AT&T, Inc. | 03/11/2019 | 2.30 | % | 535,000 | 535,572 | |||||||
| CBS Corp. | 08/15/2019 | 2.30 | % | 185,000 | 184,871 | |||||||
| Charter Communications Operating LLC/Charter Communications Operating Capital | 07/23/2020 | 3.58 | % | 155,000 | 157,889 | |||||||
Deutsche Telekom International Finance BV (b) | 07/08/2019 | 6.00 | % | 225,000 | 237,249 | |||||||
| Discovery Communications LLC | 06/01/2020 | 5.05 | % | 240,000 | 252,302 | |||||||
Orange SA (b) | 11/03/2019 | 1.63 | % | 180,000 | 177,758 | |||||||
| Verizon Communications, Inc. | 03/15/2021 | 3.45 | % | 200,000 | 206,096 | |||||||
Vodafone Group PLC (b) | 03/16/2021 | 4.38 | % | 305,000 | 322,745 | |||||||
| 2,396,366 | ||||||||||||
| Manufacturing: 6.69% | ||||||||||||
| Abbott Laboratories | 11/30/2021 | 2.90 | % | 150,000 | 151,737 | |||||||
| AbbVie, Inc. | 05/14/2020 | 2.50 | % | 240,000 | 240,740 | |||||||
AerCap Ireland Capital Ltd./AerCap Global Aviation Trust (b) | 05/15/2019 | 3.75 | % | 230,000 | 233,640 | |||||||
| Anheuser-Busch InBev Finance, Inc. | 02/01/2021 | 2.65 | % | 300,000 | 301,505 | |||||||
| Archer-Daniels-Midland Co. | 03/01/2021 | 4.48 | % | 270,000 | 287,444 | |||||||
| Bunge Ltd. Finance Corp. | 11/24/2020 | 3.50 | % | 295,000 | 301,154 | |||||||
| Celgene Corp. | 08/15/2020 | 2.88 | % | 180,000 | 181,678 | |||||||
| Chevron Corp. | 03/03/2020 | 1.96 | % | 195,000 | 194,314 | |||||||
Daimler Finance North America LLC (a) | 07/05/2019 | 1.50 | % | 190,000 | 187,777 | |||||||
| Dr. Pepper Snapple Group, Inc. | 11/15/2021 | 2.53 | % | 180,000 | 179,640 | |||||||
| Eastman Chemical Co. | 01/15/2020 | 2.70 | % | 250,000 | 251,612 | |||||||
| General Electric Co. | 01/07/2021 | 4.63 | % | 230,000 | 243,995 | |||||||
Heineken NV (a)(b) | 04/01/2022 | 3.40 | % | 280,000 | 288,170 | |||||||
Ingersoll-Rand Luxembourg Finance SA (b) | 05/01/2020 | 2.63 | % | 170,000 | 169,954 | |||||||
| Kraft Heinz Foods Co. | 07/02/2020 | 2.80 | % | 215,000 | 216,240 | |||||||
| L3 Technologies, Inc. | 02/15/2021 | 4.95 | % | 230,000 | 243,592 | |||||||
| Newell Brands, Inc. | 03/29/2019 | 2.60 | % | 180,000 | 180,615 | |||||||
| Packaging Corp. of America | 12/15/2020 | 2.45 | % | 140,000 | 140,196 | |||||||
| PepsiCo, Inc. | 10/14/2020 | 2.15 | % | 175,000 | 174,740 | |||||||
| Philip Morris International, Inc. | 02/25/2019 | 1.38 | % | 240,000 | 238,130 | |||||||
| QUALCOMM, Inc. | 05/20/2020 | 2.10 | % | 145,000 | 144,390 | |||||||
| Reynolds American, Inc. | 06/12/2020 | 3.25 | % | 335,000 | 340,392 | |||||||
| Rockwell Collins, Inc. | 07/15/2019 | 1.95 | % | 245,000 | 243,745 | |||||||
Siemens Financieringsmaatschappij NV (a)(b) | 09/13/2019 | 1.30 | % | 250,000 | 246,267 | |||||||
| Tyson Foods, Inc. | 08/15/2019 | 2.65 | % | 185,000 | 185,891 | |||||||
| 5,567,558 | ||||||||||||
| Mining, Quarrying, and Oil and Gas Extraction: 1.10% | ||||||||||||
| ConocoPhillips Co. | 03/15/2021 | 4.20 | % | 248,000 | 260,789 | |||||||
| Occidental Petroleum Corp. | 02/01/2021 | 4.10 | % | 170,000 | 178,047 | |||||||
Schlumberger Holdings Corp. (a) | 12/21/2020 | 3.00 | % | 185,000 | 187,396 | |||||||
Total Capital International SA (b) | 06/19/2021 | 2.75 | % | 290,000 | 292,913 | |||||||
| 919,145 | ||||||||||||
| Professional, Scientific, and Technical Services: 0.66% | ||||||||||||
| Biogen, Inc. | 09/15/2020 | 2.90 | % | 300,000 | 304,086 | |||||||
| eBay, Inc. | 08/01/2019 | 2.20 | % | 230,000 | 229,425 | |||||||
| Phoenix 2012 LLC | 07/03/2024 | 1.61 | % | 14,832 | 14,435 | |||||||
| 547,946 | ||||||||||||
| Real Estate and Rental and Leasing: 1.06% | ||||||||||||
| Air Lease Corp. | 06/01/2021 | 3.38 | % | 160,000 | 163,439 | |||||||
| Ford Motor Credit Company LLC | 11/04/2019 | 2.60 | % | 255,000 | 255,167 | |||||||
LoCorr Long/Short Commodities Strategy Fund - Consolidated Schedule of Investments (continued) | 31 |
| Maturity Date | Coupon Rate | Principal Amount | Value | |||||||||
CORPORATE BONDS (continued) | ||||||||||||
| Helios Leasing I LLC | 05/29/2024 | 2.02 | % | $ | 14,281 | $ | 14,079 | |||||
| Helios Leasing I LLC | 07/24/2024 | 1.73 | % | 14,758 | 14,406 | |||||||
| Helios Leasing I LLC | 09/28/2024 | 1.56 | % | 14,667 | 14,181 | |||||||
| National Rural Utilities Cooperative Finance Corp. | 02/01/2019 | 2.15 | % | 170,000 | 170,076 | |||||||
| Toyota Motor Credit Corp. | 04/17/2020 | 1.95 | % | 250,000 | 248,993 | |||||||
| 880,341 | ||||||||||||
| Retail Trade: 1.54% | ||||||||||||
BP Capital Markets PLC (b) | 03/11/2021 | 4.74 | % | 250,000 | 267,710 | |||||||
| CVS Health Corp. | 12/05/2018 | 2.25 | % | 260,000 | 260,345 | |||||||
| Home Depot, Inc./The | 06/15/2019 | 2.00 | % | 180,000 | 180,076 | |||||||
Hyundai Capital America (a) | 03/18/2021 | 3.00 | % | 310,000 | 309,273 | |||||||
| Walgreens Boots Alliance, Inc. | 11/18/2019 | 2.70 | % | 260,000 | 261,578 | |||||||
| 1,278,982 | ||||||||||||
| Transportation and Warehousing: 0.21% | ||||||||||||
Carnival Corp. (b) | 10/15/2020 | 3.95 | % | 170,000 | 177,481 | |||||||
| Utilities: 0.98% | ||||||||||||
| Dominion Resources, Inc. | 08/15/2019 | 1.60 | % | 195,000 | 192,854 | |||||||
| Exelon Generation Co., LLC | 10/01/2019 | 5.20 | % | 265,000 | 277,564 | |||||||
| Northern States Power Co. | 08/15/2020 | 2.20 | % | 170,000 | 169,852 | |||||||
| PG&E Corp. | 03/01/2019 | 2.40 | % | 175,000 | 175,104 | |||||||
| 815,374 | ||||||||||||
| Wholesale Trade: 0.91% | ||||||||||||
| Cardinal Health, Inc. | 11/15/2019 | 2.40 | % | 155,000 | 154,908 | |||||||
LyondellBasell Industries NV (b) | 04/15/2019 | 5.00 | % | 146,000 | 149,902 | |||||||
| Sherwin-Williams Co./The | 05/15/2020 | 2.25 | % | 230,000 | 229,230 | |||||||
| Sysco Corp. | 10/01/2020 | 2.60 | % | 225,000 | 225,965 | |||||||
| 760,005 | ||||||||||||
| TOTAL CORPORATE BONDS (Cost $22,797,762) | 22,682,164 | |||||||||||
| FOREIGN GOVERNMENT BOND: 0.02% | ||||||||||||
Petroleos Mexicanos (b) | 12/20/2022 | 2.00 | % | 12,500 | 12,371 | |||||||
| TOTAL FOREIGN GOVERNMENT BOND (Cost $12,500) | 12,371 | |||||||||||
| MORTGAGE BACKED SECURITIES: 10.57% | ||||||||||||
Citigroup Mortgage Loan Trust, Inc., 2004-HE1 A (1 Month LIBOR USD + 0.330%) (a)(c) | 09/25/2033 | 1.88 | % | 158,156 | 158,108 | |||||||
Cold Storage Trust, 2017-ICE3 A (1 Month LIBOR USD + 1.000%) (a)(c) | 04/15/2036 | 2.48 | % | 375,000 | 375,929 | |||||||
| Commercial Mortgage Trust, 2012-CR4 A2 | 10/15/2045 | 1.80 | % | 89,897 | 89,827 | |||||||
CSMC Trust, 2015-2 A2 (a)(d) | 02/25/2045 | 3.00 | % | 55,987 | 55,984 | |||||||
| Fannie Mae Aces | ||||||||||||
| Series 2015-M1 ASQ2 | 02/25/2018 | 1.63 | % | 22,172 | 22,145 | |||||||
| Series 2013-M7 ASQ2 | 03/26/2018 | 1.23 | % | 5,679 | 5,663 | |||||||
Series 2014-M8 FA (1 Month LIBOR USD + 0.250%) (c) | 05/25/2018 | 1.49 | % | 17,470 | 17,456 | |||||||
Series 2014-M10 ASQ2 (d) | 09/25/2019 | 2.17 | % | 243,482 | 243,479 | |||||||
Series 2010-M3 A3 (d) | 03/25/2020 | 4.33 | % | 275,655 | 284,182 | |||||||
| Fannie Mae Connecticut Avenue Securities, 2017-C02 2M1 | ||||||||||||
(1 Month LIBOR USD + 1.150%) (c) | 09/25/2029 | 2.70 | % | 306,812 | 309,599 | |||||||
| Fannie Mae Pool | 12/01/2027 | 2.50 | % | 328,460 | 330,310 | |||||||
| Fannie Mae Pool | 01/01/2027 | 2.50 | % | 377,064 | 378,254 | |||||||
| FHLMC Multifamily Structured Pass Through Certificates | ||||||||||||
| Series K-705 A2 | 09/25/2018 | 2.30 | % | 285,000 | 285,378 | |||||||
| Series K-708 A2 | 01/25/2019 | 2.13 | % | 28,280 | 28,296 | |||||||
| Series K-709 A2 | 03/25/2019 | 2.09 | % | 25,000 | 25,002 | |||||||
| Series K-710 A2 | 05/25/2019 | 1.88 | % | 50,000 | 49,895 | |||||||
Series KP04 AG2 (1 Month LIBOR USD + 0.200%) (c) | 10/25/2019 | 1.55 | % | 285,000 | 285,361 | |||||||
| Series K-722 A1 | 05/25/2022 | 2.18 | % | 360,627 | 357,360 | |||||||
| Series K-052 A1 | 01/25/2025 | 2.60 | % | 556,786 | 559,718 | |||||||
32 | LoCorr Long/Short Commodities Strategy Fund - Consolidated Schedule of Investments (continued) |
| Maturity Date | Coupon Rate | Principal Amount | Value | |||||||||
MORTGAGE BACKED SECURITIES (continued) | ||||||||||||
Flagstar Mortgage Trust, 2017-2 A5 (a)(d) | 10/25/2047 | 3.50 | % | $ | 242,828 | $ | 245,398 | |||||
| Freddie Mac Structured Agency Credit Risk Debt Notes, 2013-DN2 M1 | ||||||||||||
(1 Month LIBOR USD + 1.450%) (c) | 11/25/2023 | 3.00 | % | 10,414 | 10,425 | |||||||
| FREMF Mortgage Trust | ||||||||||||
Series 2011-K704 B (a)(d) | 10/25/2030 | 4.54 | % | 400,000 | 404,025 | |||||||
Series 2011-K702 B (a)(d) | 04/25/2044 | 4.77 | % | 715,000 | 715,181 | |||||||
Series 2012-K708 B (a)(d) | 02/25/2045 | 3.75 | % | 150,000 | 151,682 | |||||||
Series 2013-KF02 B (1 Month LIBOR USD + 3.000%) (a)(c) | 12/25/2045 | 4.37 | % | 45,874 | 46,059 | |||||||
GAHR Commercial Mortgage Trust, 2015-NRF AFL1 (1 Month LIBOR USD + 1.300%) (a)(c) | 12/15/2034 | 2.55 | % | 53,041 | 53,058 | |||||||
GP Portfolio Trust, 2014-GPP A (1 Month LIBOR USD + 1.200%) (a)(c) | 02/15/2027 | 2.68 | % | 223,237 | 223,262 | |||||||
JP Morgan Mortgage Trust, 2016-1 A5 (a)(d) | 05/25/2046 | 3.50 | % | 253,032 | 256,738 | |||||||
| JPMBB Commercial Mortgage Securities Trust, 2013-C12 A2 | 07/15/2045 | 2.42 | % | 116,372 | 116,453 | |||||||
| JPMorgan Chase Commercial Mortgage Securities Trust | ||||||||||||
Series 2017-MAUI A (1 Month LIBOR USD + 0.830%) (a)(c) | 07/15/2034 | 2.31 | % | 435,000 | 435,275 | |||||||
Series 2010-C2 A2 (a) | 11/15/2043 | 3.62 | % | 30,607 | 30,972 | |||||||
| Series 2012-C8 ASB | 10/15/2045 | 2.38 | % | 48,010 | 47,930 | |||||||
Series 2011-C3 A3 (a) | 02/15/2046 | 4.39 | % | 291,746 | 293,249 | |||||||
| MASTR Asset Securitization Trust, 2004-1 4A1 | 02/25/2019 | 4.50 | % | 25,416 | 25,438 | |||||||
Morgan Stanley Capital I Trust, 2017-CLS A (1 Month LIBOR USD + 0.700%) (a)(c) | 11/15/2034 | 1.95 | % | 255,000 | 255,000 | |||||||
| New Residential Mortgage Loan Trust | ||||||||||||
Series 2015-1A A3 (a)(d) | 05/28/2052 | 3.75 | % | 295,742 | 302,588 | |||||||
Series 2014-2A A3 (a)(d) | 05/25/2054 | 3.75 | % | 184,226 | 186,957 | |||||||
Series 2016-1A A1 (a)(d) | 03/25/2056 | 3.75 | % | 423,810 | 431,158 | |||||||
Series 2017-1A A1 (a)(d) | 02/25/2057 | 4.00 | % | 384,004 | 395,421 | |||||||
Opteum Mortgage Acceptance Corp., 2005-1 M3 (1 Month LIBOR USD + 0.860%) (c) | 02/25/2035 | 2.41 | % | 30,323 | 30,324 | |||||||
Sequoia Mortgage Trust, 2015-3 A4 (a)(d) | 07/25/2045 | 3.50 | % | 95,048 | 96,498 | |||||||
VNDO Mortgage Trust, 2013-PENN (a) | 12/13/2029 | 3.81 | % | 125,000 | 128,853 | |||||||
| Wells Fargo Commercial Mortgage Trust, 2015-C26 A1 | 02/15/2048 | 1.45 | % | 55,323 | 54,936 | |||||||
| WFRBS Commercial Mortgage Trust, 2012-C8 A2 | 08/15/2045 | 1.88 | % | 22 | 21 | |||||||
| TOTAL MORTGAGE BACKED SECURITIES (Cost $8,861,580) | 8,798,847 | |||||||||||
| MUNICIPAL BONDS: 0.59% | ||||||||||||
| City of Lubbock, TX | 02/15/2018 | 4.44 | % | 25,000 | 25,082 | |||||||
| County of Forsyth, NC | 04/01/2020 | 3.55 | % | 30,000 | 30,848 | |||||||
| Louisiana Local Government Environmental Facilities & Community Development Authority | 02/01/2021 | 3.22 | % | 206,150 | 207,158 | |||||||
| Maricopa County School District No. 28 Kyrene Elementary | 07/01/2019 | 5.38 | % | 15,000 | 15,732 | |||||||
| North Carolina Eastern Municipal Power Agency | 07/01/2018 | 2.00 | % | 60,000 | 60,020 | |||||||
| Rosemount-Apple Valley-Eagan Independent School District No. 196 | 02/01/2019 | 5.00 | % | 25,000 | 25,828 | |||||||
| St. Paul Housing & Redevelopment Authority | 07/01/2018 | 1.84 | % | 60,000 | 59,939 | |||||||
| State of Ohio | 04/01/2018 | 3.66 | % | 45,000 | 45,226 | |||||||
| University of Texas System | 08/15/2018 | 3.81 | % | 25,000 | 25,305 | |||||||
| TOTAL MUNICIPAL BONDS (Cost $494,683) | 495,138 | |||||||||||
| U.S. GOVERNMENT AGENCY ISSUES: 10.47% | ||||||||||||
| Federal Farm Credit Banks | 07/24/2019 | 1.40 | % | 450,000 | 446,595 | |||||||
| Federal Farm Credit Banks | 10/21/2019 | 1.44 | % | 250,000 | 247,749 | |||||||
| Federal Farm Credit Banks | 05/08/2020 | 1.55 | % | 1,000,000 | 988,742 | |||||||
| Federal Farm Credit Banks | 10/26/2020 | 1.75 | % | 400,000 | 396,231 | |||||||
| Federal Farm Credit Banks | 11/27/2020 | 1.90 | % | 625,000 | 621,859 | |||||||
| Federal Home Loan Banks | 06/12/2020 | 1.75 | % | 2,855,000 | 2,835,677 | |||||||
| Federal Home Loan Mortgage Corp. | 04/20/2020 | 1.38 | % | 615,000 | 606,307 | |||||||
| Federal National Mortgage Association | 08/28/2019 | 1.00 | % | 725,000 | 714,306 | |||||||
| Federal National Mortgage Association | 10/24/2019 | 1.00 | % | 570,000 | 560,706 | |||||||
| Federal National Mortgage Association | 02/28/2020 | 1.50 | % | 1,220,000 | 1,207,340 | |||||||
Ginnie Mae II Pool (d) | 07/20/2060 | 5.31 | % | 13,130 | 13,504 | |||||||
Ginnie Mae II Pool (d) | 07/20/2062 | 4.55 | % | 18,845 | 19,288 | |||||||
LoCorr Long/Short Commodities Strategy Fund - Consolidated Schedule of Investments (continued) | 33 |
| Maturity Date | Coupon Rate | Principal Amount | Value | |||||||||
U.S. GOVERNMENT AGENCY ISSUES (continued) | ||||||||||||
Ginnie Mae II Pool (d) | 08/20/2062 | 4.09 | % | $ | 40,330 | $ | 41,191 | |||||
| Small Business Administration Participation Certificates | 11/01/2032 | 2.09 | % | 15,150 | 14,786 | |||||||
| TOTAL U.S. GOVERNMENT AGENCY ISSUES (Cost $8,805,285) | 8,714,281 | |||||||||||
| U.S. GOVERNMENT NOTES: 4.68% | ||||||||||||
| United States Treasury Note | 01/31/2020 | 1.25 | % | 580,000 | 572,320 | |||||||
| United States Treasury Note | 03/31/2020 | 1.13 | % | 1,500,000 | 1,474,395 | |||||||
| United States Treasury Note | 07/15/2020 | 1.50 | % | 915,000 | 905,207 | |||||||
| United States Treasury Note | 04/30/2022 | 1.88 | % | 635,000 | 627,410 | |||||||
| United States Treasury Note | 08/31/2022 | 1.88 | % | 200,000 | 197,188 | |||||||
| United States Treasury Note | 09/30/2022 | 1.75 | % | 125,000 | 122,496 | |||||||
| TOTAL U.S. GOVERNMENT NOTES (Cost $3,932,159) | 3,899,016 | |||||||||||
| SHORT TERM INVESTMENT: 4.50% | ||||||||||||
| MONEY MARKET FUND: 4.50% | Shares | |||||||||||
STIT-Government & Agency Portfolio, Institutional Class, 1.18% (e)(f) | 3,748,612 | 3,748,612 | ||||||||||
| TOTAL MONEY MARKET FUND (Cost $3,748,612) | 3,748,612 | |||||||||||
| TOTAL SHORT TERM INVESTMENT (Cost $3,748,612) | 3,748,612 | |||||||||||
| TOTAL INVESTMENTS (Cost $62,931,606): 75.22% | 62,620,302 | |||||||||||
Other Assets in Excess of Liabilities: 24.78% (g) | 20,626,736 | |||||||||||
| TOTAL NET ASSETS: 100.00% | $ | 83,247,038 | ||||||||||
| (a) | Security as defined in Rule 144(a) under the Securities Act of 1933 and determined to be liquid. Purchased in a private placement transaction; resale to the public may require registration or may extend only to qualified institutional buyers. At December 31, 2017, the value of these securities total $15,880,025 which represents 19.08% of total net assets. |
| (b) | Foreign issued security. |
| (c) | Variable rate security based on a reference index and spread. The rate reported is the rate in effect as of December 31, 2017. |
| (d) | Variable rate security. The coupon is based on an underlying pool of assets. The rate reported is the rate in effect as of December 31, 2017. |
| (e) | The rate quoted is the annualized seven-day effective yield as of December 31, 2017. |
| (f) | All or a portion of this security is held by LCLSCS Fund Limited and pledged as collateral for derivative contracts. |
| (g) | Includes assets pledged as collateral for swap contracts. |
| LIBOR | London Interbank Offered Rate |
34 | LoCorr Long/Short Commodities Strategy Fund - Consolidated Schedule of Swap Contracts |
| Termination Date | Reference Index | Financing Rate | Payment Frequency | Notional Amount | Unrealized Appreciation (Depreciation)* | Counterparty | ||||||
| 12/16/2022 | LoCorr Commodities Index^ | 0.50% | Quarterly | $ 73,100,000 | $ (11,519,719) | Deutsche Bank AG |
| ^ | Comprised of a proprietary basket of Commodity Trading Advisor’s (“CTA”) Programs investing in various futures contracts, foreign currency and other similar investments. See Notes 2 & 3. |
| * | Unrealized depreciation is a payable on the Fund’s consolidated statement of assets and liabilities. |
| Description | Expiration Date | Number of Contracts Purchased (Sold) | Notional Amount | Concentration % of Exposure | ||||||||||||
| Futures: | ||||||||||||||||
Purchase Contracts: (1) | ||||||||||||||||
| WTI Crude (NYMEX) | 02/20/2018 | 1,588.56 | $ | 95,496,194 | 10.78 | % | ||||||||||
| Brent Crude (ICE) | 02/28/2018 | 1,253.98 | 82,800,086 | 9.35 | % | |||||||||||
| Copper (COMEX) | 07/27/2018 | 317.69 | 26,318,496 | 2.97 | % | |||||||||||
| Sugar No. 11 | 04/30/2018 | 1,371.54 | 22,988,048 | 2.60 | % | |||||||||||
| Gasoline RBOB | 02/28/2018 | 247.13 | 18,792,444 | 2.12 | % | |||||||||||
| Heating Oil | 02/28/2018 | 201.79 | 17,314,987 | 1.95 | % | |||||||||||
| WTI Crude (NYMEX) | 05/22/2018 | 258.79 | 15,479,405 | 1.75 | % | |||||||||||
| Low Sulphur Gasoil | 02/12/2018 | 239.13 | 14,434,381 | 1.63 | % | |||||||||||
| Cotton No.2 | 05/08/2018 | 286.29 | 11,279,108 | 1.27 | % | |||||||||||
| Brent Crude (ICE) | 03/29/2018 | 157.34 | 10,340,689 | 1.17 | % | |||||||||||
| WTI Crude (NYMEX) | 03/20/2018 | 166.23 | 9,989,842 | 1.13 | % | |||||||||||
| Soybean Oil | 07/13/2018 | 489.48 | 9,847,361 | 1.11 | % | |||||||||||
| Live Cattle | 06/29/2018 | 186.95 | 8,499,673 | 0.96 | % | |||||||||||
| Feeder Cattle | 01/25/2018 | 114.00 | 8,271,521 | 0.93 | % | |||||||||||
| Coffee | 09/18/2018 | 161.37 | 8,021,124 | 0.91 | % | |||||||||||
| Copper (COMEX) | 05/29/2018 | 96.90 | 7,996,935 | 0.90 | % | |||||||||||
| Live Cattle | 04/30/2018 | 142.23 | 6,977,923 | 0.79 | % | |||||||||||
| Feeder Cattle | 05/24/2018 | 93.79 | 6,651,519 | 0.75 | % | |||||||||||
| Wheat | 03/14/2018 | 296.91 | 6,307,486 | 0.71 | % | |||||||||||
| Copper (LME) | 03/21/2018 | 29.34 | 5,275,062 | 0.60 | % | |||||||||||
| Low Sulphur Gasoil | 03/12/2018 | 75.56 | 4,542,159 | 0.51 | % | |||||||||||
| Palladium | 03/27/2018 | 32.00 | 3,361,041 | 0.38 | % | |||||||||||
| Brent Crude (ICE) | 04/30/2018 | 50.67 | 3,317,132 | 0.37 | % | |||||||||||
| Zinc | 03/21/2018 | 38.22 | 3,154,515 | 0.36 | % | |||||||||||
| WTI Crude (NYMEX) | 04/20/2018 | 50.67 | 3,039,965 | 0.34 | % | |||||||||||
| Corn | 03/14/2018 | 133.34 | 2,337,668 | 0.26 | % | |||||||||||
| Total Purchase Contracts | 412,834,764 | 46.60 | % | |||||||||||||
Sale Contracts: (1) | ||||||||||||||||
| WTI Crude (NYMEX) | 01/22/2018 | 2,017.14 | $ | 121,179,474 | 13.68 | % | ||||||||||
| Brent Crude (ICE) | 01/31/2018 | 1,219.31 | 81,016,894 | 9.15 | % | |||||||||||
| Copper (COMEX) | 03/27/2018 | 332.80 | 27,349,967 | 3.09 | % | |||||||||||
| Sugar No. 11 | 02/28/2018 | 1,397.32 | 23,623,584 | 2.67 | % | |||||||||||
| Live Cattle | 02/28/2018 | 338.96 | 16,492,134 | 1.86 | % | |||||||||||
LoCorr Long/Short Commodities Strategy Fund - Consolidated Schedule of Swap Contracts (continued) | 35 |
| Description | Expiration Date | Number of Contracts Purchased (Sold) | Notional Amount | Concentration % of Exposure | ||||||||||||
Sale Contracts (continued) | ||||||||||||||||
| Gasoline RBOB | 01/31/2018 | 205.35 | $ | 15,462,217 | 1.75 | % | ||||||||||
| Feeder Cattle | 03/29/2018 | 207.79 | 14,728,571 | 1.66 | % | |||||||||||
| Silver | 03/27/2018 | 120.90 | 10,289,894 | 1.16 | % | |||||||||||
| Heating Oil | 01/31/2018 | 118.23 | 10,273,267 | 1.16 | % | |||||||||||
| Soybean Oil | 03/14/2018 | 511.70 | 10,183,931 | 1.15 | % | |||||||||||
| Low Sulphur Gasoil | 01/11/2018 | 165.35 | 9,957,915 | 1.12 | % | |||||||||||
| Cotton No.2 | 03/07/2018 | 243.62 | 9,577,928 | 1.08 | % | |||||||||||
| Gold | 02/26/2018 | 72.01 | 9,400,635 | 1.06 | % | |||||||||||
| Wheat | 05/14/2018 | 350.25 | 7,663,850 | 0.87 | % | |||||||||||
| WTI Crude (ICE) | 02/16/2018 | 107.56 | 6,466,704 | 0.73 | % | |||||||||||
| Corn | 05/14/2018 | 329.80 | 5,917,875 | 0.67 | % | |||||||||||
| Coffee | 03/19/2018 | 119.59 | 5,628,193 | 0.64 | % | |||||||||||
| Soybean | 03/14/2018 | 115.56 | 5,547,787 | 0.63 | % | |||||||||||
| Natural Gas | 02/26/2018 | 113.80 | 3,349,214 | 0.38 | % | |||||||||||
| Coffee | 05/18/2018 | 67.56 | 3,238,466 | 0.37 | % | |||||||||||
| Lean Hogs | 02/14/2018 | 92.75 | 2,675,841 | 0.30 | % | |||||||||||
Total Sale Contracts(1) | 400,024,343 | 45.18 | % | |||||||||||||
| Other Futures | 35,632,577 | 4.01 | % | |||||||||||||
| Total Futures | $ | 848,491,684 | 95.79 | % | ||||||||||||
| Cash and Foreign Currency | Quantity | Notional Amount | ||||||||||||||
Cash and Foreign Currency Purchased: (1) | ||||||||||||||||
| U.S. Dollar | 12,528,310 | $ | 12,528,310 | 1.41 | % | |||||||||||
| Malaysian Ringgit | 11,192,662 | 2,765,669 | 0.31 | % | ||||||||||||
| Total Cash and Foreign Currency Purchased | 15,293,979 | 1.72 | % | |||||||||||||
Cash and Foreign Currency Sold: (1) | ||||||||||||||||
| European Euro | 15,119,786 | $ | 18,141,421 | 2.05 | % | |||||||||||
| Other Cash and Foreign Currency | 1,844,524 | 0.21 | % | |||||||||||||
| Total Cash and Foreign Currency | 35,279,924 | 3.98 | % | |||||||||||||
| Forward Currency Contracts | 2,062,361 | 0.23 | % | |||||||||||||
| Total Underlying Positions | $ | 885,833,968 | 100.00 | % | ||||||||||||
| ^ | The investment is not a direct holding of LoCorr Long/Short Commodities Strategy Fund. The top 50 holdings and other futures, other forward currency contracts, and other cash and foreign currency were determined based on the absolute notional values of the positions within the underlying swap basket. |
| (1) | Represents the 50 largest components of the basket. |
| COMEX | Commodity Exchange, Inc. |
| ICE | Intercontinental Exchange |
| LME | London Metal Exchange |
| NYMEX | New York Mercantile Exchange |
36 | LoCorr Multi-Strategy Fund - Consolidated Schedule of Investments |
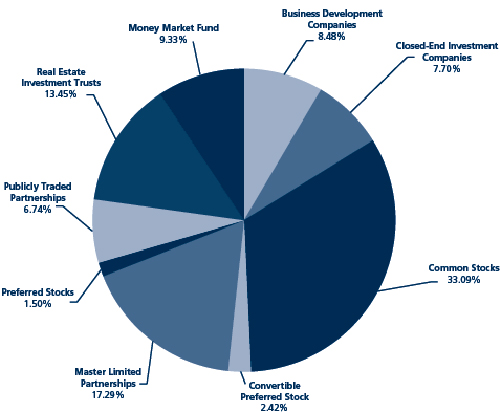
| Shares | Value | |||||||
| BUSINESS DEVELOPMENT COMPANIES: 5.63% | ||||||||
| Administrative and Support and Waste Management and Remediation Services: 0.24% | ||||||||
| TICC Capital Corp. | 10,796 | $ | 61,969 | |||||
| Finance and Insurance: 4.90% | ||||||||
| Alcentra Capital Corp. | 7,009 | 58,806 | ||||||
| Apollo Investment Corp. | 40,127 | 227,119 | ||||||
| Ares Capital Corp. | 22,294 | 350,462 | ||||||
| Capitala Finance Corp. | 8,547 | 62,222 | ||||||
| FS Investment Corp. | 8,344 | 61,328 | ||||||
| Hercules Capital, Inc. | 19,751 | 259,133 | ||||||
| New Mountain Finance Corp. | 8,661 | 117,357 | ||||||
| OFS Capital Corp. | 5,387 | 64,105 | ||||||
| THL Credit, Inc. | 6,988 | 63,241 | ||||||
| 1,263,773 | ||||||||
| Management of Companies and Enterprises: 0.49% | ||||||||
| Newtek Business Services Corp. | 6,870 | 127,026 | ||||||
| TOTAL BUSINESS DEVELOPMENT COMPANIES (Cost $1,509,894) | 1,452,768 | |||||||
| CLOSED-END INVESTMENT COMPANIES: 5.11% | ||||||||
| GAMCO Global Gold Natural Resources & Income Trust | 22,465 | 117,043 | ||||||
| Invesco Dynamic Credit Opportunities Fund | 27,768 | 325,163 | ||||||
| Nuveen Credit Strategies Income Fund | 15,019 | 123,456 | ||||||
| Nuveen Global High Income Fund | 7,307 | 123,561 | ||||||
| PIMCO Dynamic Credit and Mortgage Income Fund | 11,785 | 264,456 | ||||||
| Western Asset Emerging Markets Debt Fund, Inc. | 15,656 | 243,451 | ||||||
| Western Asset Global High Income Fund, Inc. | 12,024 | 122,885 | ||||||
| TOTAL CLOSED-END INVESTMENT COMPANIES (Cost $1,317,517) | 1,320,015 | |||||||
LoCorr Multi-Strategy Fund - Consolidated Schedule of Investments (continued) | 37 |
| Shares | Value | |||||||
| COMMON STOCKS: 21.97% | ||||||||
| Accommodation and Food Services: 0.56% | ||||||||
| DineEquity, Inc. | 2,621 | $ | 132,963 | |||||
Fogo De Chao, Inc. (a) | 1,044 | 12,110 | ||||||
| 145,073 | ||||||||
| Finance and Insurance: 2.79% | ||||||||
Credit Acceptance Corp. (a) | 2,223 | 719,096 | ||||||
| Information: 6.36% | ||||||||
| CenturyLink, Inc. | 4,888 | 81,532 | ||||||
| Frontier Communications Corp. | 6,669 | 45,082 | ||||||
Gogo, Inc. (a) | 84,171 | 949,449 | ||||||
| Nexstar Broadcasting Group, Inc. | 3,420 | 267,444 | ||||||
| Sinclair Broadcast Group, Inc. | 7,846 | 296,971 | ||||||
| 1,640,478 | ||||||||
| Manufacturing: 2.31% | ||||||||
| Lear Corp. | 1,174 | 207,399 | ||||||
| Tenneco, Inc. | 6,645 | 388,998 | ||||||
| 596,397 | ||||||||
| Mining, Quarrying, and Oil and Gas Extraction: 1.06% | ||||||||
| Pattern Energy Group, Inc. | 12,789 | 274,836 | ||||||
| Professional, Scientific, and Technical Services: 0.87% | ||||||||
| Macquarie Infrastructure Corp. | 1,712 | 109,910 | ||||||
| National CineMedia, Inc. | 16,675 | 114,390 | ||||||
| 224,300 | ||||||||
| Real Estate and Rental and Leasing: 1.83% | ||||||||
AerCap Holdings NV (a)(b) | 5,242 | 275,782 | ||||||
| Arlington Asset Investment Corp. | 5,256 | 61,916 | ||||||
| Fortress Transportation & Infrastructure Investors LLC | 6,715 | 133,830 | ||||||
| 471,528 | ||||||||
| Retail Trade: 3.54% | ||||||||
| Advance Auto Parts, Inc. | 4,215 | 420,193 | ||||||
| Macy’s, Inc. | 4,717 | 118,821 | ||||||
Signet Jewelers Ltd. (b) | 6,612 | 373,909 | ||||||
| 912,923 | ||||||||
| Transportation and Warehousing: 2.65% | ||||||||
GasLog Partners LP (b) | 7,638 | 189,041 | ||||||
Golar LNG Partners LP (b) | 10,927 | 249,136 | ||||||
Hoegh LNG Partners LP (b) | 6,246 | 116,488 | ||||||
| Targa Resources Corp. | 2,692 | 130,347 | ||||||
| 685,012 | ||||||||
| TOTAL COMMON STOCKS (Cost $4,979,377) | 5,669,643 | |||||||
| CONVERTIBLE PREFERRED STOCK: 1.60% | ||||||||
| Utilities: 1.60% | ||||||||
| Kinder Morgan, Inc., Series A, 9.750% | 10,906 | 413,992 | ||||||
| TOTAL CONVERTIBLE PREFERRED STOCK (Cost $494,913) | 413,992 | |||||||
| MASTER LIMITED PARTNERSHIPS: 11.48% | Units | |||||||
| Manufacturing: 1.33% | ||||||||
| Alon USA Partners, LP | 11,336 | 193,732 | ||||||
| CVR Refining LP | 9,043 | 149,662 | ||||||
| 343,394 | ||||||||
38 | LoCorr Multi-Strategy Fund - Consolidated Schedule of Investments (continued) |
| Units | Value | |||||||
MASTER LIMITED PARTNERSHIPS (continued) | ||||||||
| Mining, Quarrying, and Oil and Gas Extraction: 1.90% | ||||||||
| Alliance Resource Partners LP | 6,282 | $ | 123,755 | |||||
| SunCoke Energy Partners LP | 14,072 | 245,557 | ||||||
| USA Compression Partners LP | 7,240 | 119,750 | ||||||
| 489,062 | ||||||||
| Real Estate and Rental and Leasing: 1.02% | ||||||||
| Icahn Enterprises LP | 4,973 | 263,569 | ||||||
| Retail Trade: 3.10% | ||||||||
| Crestwood Equity Partners LP | 16,740 | 431,892 | ||||||
| Global Partners LP | 15,199 | 253,823 | ||||||
| Sunoco LP | 4,041 | 114,764 | ||||||
| 800,479 | ||||||||
| Transportation and Warehousing: 3.13% | ||||||||
| Energy Transfer Partners LP | 18,724 | 335,525 | ||||||
| MPLX LP | 7,134 | 253,043 | ||||||
| Summit Midstream Partners LP | 10,738 | 220,129 | ||||||
| 808,697 | ||||||||
| Wholesale Trade: 1.00% | ||||||||
| Martin Midstream Partners LP | 6,212 | 86,968 | ||||||
| NGL Energy Partners LP | 12,099 | 169,991 | ||||||
| 256,959 | ||||||||
| TOTAL MASTER LIMITED PARTNERSHIPS (Cost $2,689,534) | 2,962,160 | |||||||
| PREFERRED STOCKS: 1.00% | Shares | |||||||
| Transportation and Warehousing: 0.52% | ||||||||
Hoegh LNG Partners LP, Series A, 8.750% (a)(b) | 4,942 | 132,989 | ||||||
| Wholesale Trade: 0.48% | ||||||||
| NGL Energy Partners LP, Class B, (9.000% to 07/01/22 then 3 Month LIBOR USD + 7.213%) | 5,109 | 124,660 | ||||||
| TOTAL PREFERRED STOCKS (Cost $243,658) | 257,649 | |||||||
| PUBLICLY TRADED PARTNERSHIPS: 4.48% | Units | |||||||
| Apollo Global Management LLC | 6,612 | 221,304 | ||||||
| Blackstone Group LP/The | 11,754 | 376,363 | ||||||
| Carlyle Group LP/The | 14,694 | 336,492 | ||||||
| Oaktree Capital Group LLC | 5,269 | 221,825 | ||||||
| TOTAL PUBLICLY TRADED PARTNERSHIPS (Cost $921,948) | 1,155,984 | |||||||
| REAL ESTATE INVESTMENT TRUSTS: 8.93% | Shares | |||||||
| Administrative and Support and Waste Management and Remediation Services: 0.46% | ||||||||
| Ladder Capital Corp. | 8,764 | 119,453 | ||||||
| Finance and Insurance: 4.67% | ||||||||
| AGNC Investment Corp. | 5,750 | 116,093 | ||||||
| Apollo Commercial Real Estate Finance, Inc. | 13,299 | 245,367 | ||||||
| Chimera Investment Corp. | 6,713 | 124,056 | ||||||
| CYS Investments, Inc. | 7,958 | 63,903 | ||||||
| DDR Corp. | 12,354 | 110,692 | ||||||
| New Senior Investment Group, Inc. | 14,798 | 111,873 | ||||||
| New York Mortgage Trust, Inc. | 10,218 | 63,045 | ||||||
| Oxford Lane Capital Corp. | 6,467 | 64,993 | ||||||
| PennantPark Investment Corp. | 9,179 | 63,427 | ||||||
| Starwood Property Trust, Inc. | 11,269 | 240,593 | ||||||
| 1,204,042 | ||||||||
LoCorr Multi-Strategy Fund - Consolidated Schedule of Investments (continued) | 39 |
| Shares | Value | |||||||
REAL ESTATE INVESTMENT TRUSTS (continued) | ||||||||
| Real Estate and Rental and Leasing: 3.80% | ||||||||
| Annaly Capital Management, Inc. | 10,160 | $ | 120,802 | |||||
| CBL & Associates Properties, Inc. | 19,383 | 109,708 | ||||||
| Gaming and Leisure Properties, Inc. | 1,401 | 51,837 | ||||||
| Hospitality Properties Trust | 3,966 | 118,385 | ||||||
| New Residential Investment Corp. | 7,047 | 126,000 | ||||||
| PennyMac Mortgage Investment Trust | 3,920 | 62,994 | ||||||
| Two Harbors Investment Corp. | 6,831 | 111,072 | ||||||
| Uniti Group, Inc. | 3,825 | 68,047 | ||||||
| Washington Prime Group, Inc. | 29,896 | 212,860 | ||||||
| 981,705 | ||||||||
| TOTAL REAL ESTATE INVESTMENT TRUSTS (Cost $2,413,629) | 2,305,200 | |||||||
| SHORT TERM INVESTMENT : 6.19% | ||||||||
| MONEY MARKET FUND: 6.19% | ||||||||
STIT-Government & Agency Portfolio, Institutional Class, 1.18% (c)(d) | 1,598,157 | 1,598,157 | ||||||
| TOTAL MONEY MARKET FUND (Cost $1,598,157) | 1,598,157 | |||||||
| TOTAL SHORT TERM INVESTMENT (Cost $1,598,157) | 1,598,157 | |||||||
| TOTAL INVESTMENTS (Cost $16,168,627): 66.39% | 17,135,568 | |||||||
Other Assets in Excess of Liabilities: 33.61% (e) | 8,673,157 | |||||||
| TOTAL NET ASSETS: 100.00% | $ | 25,808,725 | ||||||
| (a) | Non-dividend expense producing security. |
| (b) | Foreign issued security. |
| (c) | The rate quoted is the annualized seven-day effective yield as of December 31, 2017. |
| (d) | All or a portion of this security is held by LCMSF Fund Limited and pledged as collateral for swap contracts. |
| (e) | Includes assets pledged as collateral for swap contracts and securities sold short. |
40 | LoCorr Multi-Strategy Fund - Consolidated Schedule of Securities Sold Short |
| Shares | Value | |||||||
| COMMON STOCKS: (0.99)% | ||||||||
| Other Services (except Public Administration): (0.56)% | ||||||||
Regis Corp. (a) | (9,439 | ) | $ | (144,983 | ) | |||
| Retail Trade: (0.43)% | ||||||||
| Tiffany & Co. | (1,059 | ) | (110,083 | ) | ||||
TOTAL COMMON STOCKS (Proceeds $221,117) | (255,066 | ) | ||||||
| TOTAL SECURITIES SOLD SHORT (Proceeds $221,117) | $ | (255,066 | ) | |||||
| (a) | Non-dividend expense producing security. |
LoCorr Multi-Strategy Fund - Consolidated Schedule of Swap Contracts | 41 |
| Termination Date | Reference Index | Financing Rate | Payment Frequency | Notional Amount | Unrealized Appreciation (Depreciation)* | Counterparty |
| 04/14/2020 | LoCorr Multi-Strategy Index^ | 0.50% | Quarterly | $ 28,101,783 | $ (460,266) | Deutsche Bank AG |
| ^ | Comprised of a proprietary basket of Commodity Trading Advisor’s (“CTA”) Programs investing in various futures, forward currency contracts, foreign currency and other similar investments. See Notes 2 & 3 |
| * | Unrealized depreciation is a payable on the Fund’s consolidated statement of assets and liabilities. |
| Description | Expiration Date | Number of Contracts Purchased (Sold) | Notional Amount | Concentration % of Exposure | |||||||||
| Futures: | |||||||||||||
Purchase Contracts: (1) | |||||||||||||
| Euro-Bobl | 03/08/2018 | 71.36 | $ | 11,269,603 | 5.27 | % | |||||||
| Euro-Bund | 03/08/2018 | 26.03 | 5,049,709 | 2.36 | % | ||||||||
| U.S. 30 Yr Note | 03/20/2018 | 26.87 | 4,105,358 | 1.92 | % | ||||||||
| Long Gilt | 03/27/2018 | 23.51 | 3,972,661 | 1.86 | % | ||||||||
| Russell 2000 Mini Index | 03/16/2018 | 42.82 | 3,315,290 | 1.55 | % | ||||||||
| Australian 10 Yr Bond | 03/15/2018 | 3.36 | 2,594,544 | 1.21 | % | ||||||||
| Euro-Stoxx 50 Index | 03/16/2018 | 56.25 | 2,353,394 | 1.10 | % | ||||||||
| DAX Index | 03/16/2018 | 5.88 | 2,262,745 | 1.06 | % | ||||||||
| Japanese 10 Yr Bond | 03/13/2018 | 1.68 | 2,246,775 | 1.05 | % | ||||||||
| WTI Crude (NYMEX) | 02/20/2018 | 37.33 | 2,244,038 | 1.05 | % | ||||||||
| Nasdaq 100 E-Mini Index | 03/16/2018 | 16.79 | 2,158,125 | 1.01 | % | ||||||||
| Tokyo Price Index | 03/08/2018 | 12.59 | 2,033,005 | 0.95 | % | ||||||||
| FTSE 100 Index | 03/16/2018 | 19.31 | 1,994,271 | 0.93 | % | ||||||||
| Low Sulphur Gasoil | 02/12/2018 | 32.48 | 1,960,848 | 0.92 | % | ||||||||
| S&P500 E-Mini Index | 03/16/2018 | 13.43 | 1,802,999 | 0.84 | % | ||||||||
| Copper | 03/21/2018 | 9.08 | 1,633,610 | 0.76 | % | ||||||||
| Hang Seng Index | 01/30/2018 | 8.40 | 1,609,859 | 0.75 | % | ||||||||
| Heating Oil | 01/31/2018 | 17.37 | 1,509,372 | 0.71 | % | ||||||||
| Euro-Schatz | 03/08/2018 | 10.91 | 1,466,332 | 0.69 | % | ||||||||
| Aluminum | 03/21/2018 | 25.83 | 1,455,816 | 0.68 | % | ||||||||
| Brent Crude (ICE) | 02/28/2018 | 21.58 | 1,424,835 | 0.67 | % | ||||||||
| Nikkei 225 Index | 03/08/2018 | 6.72 | 1,355,486 | 0.63 | % | ||||||||
| Zinc | 03/21/2018 | 16.01 | 1,321,224 | 0.62 | % | ||||||||
| Gasoline RBOB | 01/31/2018 | 16.16 | 1,217,044 | 0.57 | % | ||||||||
| 10 Yr Mini JGB | 03/12/2018 | 7.56 | 1,011,183 | 0.47 | % | ||||||||
| CAC 40 10 Euro Index | 01/19/2018 | 13.43 | 856,626 | 0.40 | % | ||||||||
| 3 Mo Euro Euribor | 06/17/2019 | 2.52 | 756,095 | 0.35 | % | ||||||||
| Total Purchase Contracts | 64,980,847 | 30.38 | % | ||||||||||
Sale Contracts: (1) | |||||||||||||
| 90 Day Euro | 06/17/2019 | 138.52 | $ | 33,846,691 | 15.84 | % | |||||||
| U.S. 2 Yr Note | 03/29/2018 | 121.73 | 26,062,384 | 12.20 | % | ||||||||
| U.S. 5 Yr Note | 03/29/2018 | 152.80 | 17,744,693 | 8.31 | % | ||||||||
| U.S. 10 Yr Note | 03/20/2018 | 74.72 | 9,262,845 | 4.34 | % | ||||||||
42 | LoCorr Multi-Strategy Fund - Consolidated Schedule of Swap Contracts (continued) |
| Description | Expiration Date | Number of Contracts Purchased (Sold) | Notional Amount | Concentration % of Exposure | |||||||||
Sale Contracts (continued) | |||||||||||||
| 90 Day Sterling | 06/19/2019 | 43.66 | $ | 7,302,206 | 3.42 | % | |||||||
| Canadian 10 Yr Bond | 03/20/2018 | 26.03 | 2,792,855 | 1.31 | % | ||||||||
| Silver | 03/27/2018 | 18.79 | 1,599,453 | 0.75 | % | ||||||||
| WTI Crude (NYMEX) | 01/22/2018 | 20.73 | 1,245,193 | 0.58 | % | ||||||||
| Total Sale Contracts | 99,856,320 | 46.75 | % | ||||||||||
| Other Futures | 8,670,382 | 4.06 | % | ||||||||||
| Total Futures | 173,507,549 | 81.19 | % | ||||||||||
| Forward Currency Contracts: | Currency to be Delivered (in USD) | Currency to be Received (in USD) | |||||||||||||
Purchase Contracts: (1) | |||||||||||||||
| USD/EUR | 03/21/2018 | U.S. Dollar | $ | 6,826,276 | European Euro | $ | 6,941,109 | 3.25 | % | ||||||
| USD/GBP | 03/21/2018 | U.S. Dollar | 4,986,944 | British Pound | 5,023,632 | 2.35 | % | ||||||||
| Total Purchase Contracts | 11,964,741 | 5.60 | % | ||||||||||||
Currency to be Delivered (in USD) | Currency to be Received (in USD) | ||||||||||||||
Sales Contracts: (1) | |||||||||||||||
| AUD/USD | 03/21/2018 | Australian Dollar | $ | 5,830,226 | U.S. Dollar | $ | 5,721,092 | 2.68 | % | ||||||
| CHF/USD | 03/21/2018 | Swiss Franc | 3,747,320 | U.S. Dollar | 3,700,857 | 1.73 | % | ||||||||
| JPY/USD | 03/22/2018 | Japanese Yen | 2,960,721 | U.S. Dollar | 2,958,846 | 1.38 | % | ||||||||
| NZD/USD | 03/21/2018 | New Zealand Dollar | 2,089,105 | U.S. Dollar | 2,053,543 | 0.96 | % | ||||||||
| MXN/USD | 03/21/2018 | Mexican Peso | 1,140,429 | U.S. Dollar | 1,142,373 | 0.53 | % | ||||||||
| CAD/USD | 03/21/2018 | Canadian Dollar | 1,007,813 | U.S. Dollar | 997,323 | 0.47 | % | ||||||||
| Total Sale Contracts | 16,574,033 | 7.75 | % | ||||||||||||
| Other Forward Currency Contracts | 164,220 | 0.09 | % | ||||||||||||
| Total Forward Currency Contracts | 28,702,994 | 13.44 | % | ||||||||||||
| Cash and Foreign Currency | Quantity | Notional Amount | ||||||||||
Cash and Foreign Currency Purchased:(1) | ||||||||||||
| British Pound | 1,220,175 | $ | 1,647,416 | 0.77 | % | |||||||
| Hong Kong Dollar | 10,602,079 | 1,357,005 | 0.64 | % | ||||||||
| Canadian Dollar | 1,436,216 | 1,142,574 | 0.53 | % | ||||||||
| Mexican Peso | 17,746,074 | 902,534 | 0.42 | % | ||||||||
| Total Cash and Foreign Currency Purchased | 5,049,529 | 2.36 | % | |||||||||
Cash and Foreign Currency Sold: (1) | 3,178,973 | |||||||||||
| U.S. Dollar | 976,368 | $ | 3,178,973 | 1.49 | % | |||||||
| European Euro | 762,070 | 1,171,492 | 0.55 | % | ||||||||
| Swiss Franc | 782,052 | 0.37 | % | |||||||||
| Total Cash and Foreign Currency Sold | 5,132,517 | 2.41 | % | |||||||||
| Other Cash and Foreign Currency | 1,259,016 | 0.60 | % | |||||||||
| Total Cash and Foreign Currency | 11,441,062 | 5.37 | % | |||||||||
| Total Underlying Positions | $ | 213,651,605 | 100.00 | % | ||||||||
| ^ | The investment is not a direct holding of LoCorr Multi-Strategy Fund. The top 50 holdings and other futures, other forward currency contracts, and other cash and foreign currency were determined based on the absolute notional values of the positions within the underlying swap basket. |
| (1) | Represents the 50 largest components of the basket. |
LoCorr Market Trend Fund - Consolidated Schedule of Investments | 43 |
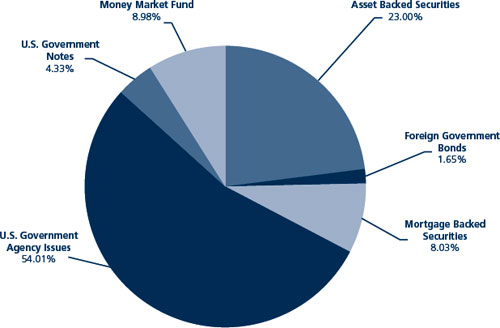
1 | As a percentage of total investments. |
| Maturity Date | Coupon Rate | Principal Amount | Value | ||||||||||
| ASSET BACKED SECURITIES: 19.89% | |||||||||||||
| AEP Texas Central Transition Funding II LLC, 2006-2 A4 | 01/01/2020 | 5.17 | % | $ | 993,717 | $ | 993,894 | ||||||
| Ally Auto Receivables Trust, 2014-2 A3 | 04/15/2019 | 1.25 | % | 166,321 | 166,286 | ||||||||
| AmeriCredit Automobile Receivables Trust, 2016-3 A2A | 11/08/2019 | 1.37 | % | 1,454,131 | 1,453,502 | ||||||||
| Cabela’s Credit Card Master Note Trust, 2016-1 A1 | 06/15/2022 | 1.78 | % | 5,240,000 | 5,209,448 | ||||||||
California Republic Auto Receivables Trust, 2015-4 A3 (a) | 01/15/2020 | 2.04 | % | 2,221,641 | 2,222,732 | ||||||||
| Capital One Multi-Asset Execution Trust | |||||||||||||
| Series 2015-5A | 05/17/2021 | 1.60 | % | 7,250,000 | 7,242,859 | ||||||||
Series 2016-A1 A1 (1 Month LIBOR USD + 0.450%) (c) | 02/15/2022 | 1.93 | % | 4,500,000 | 4,521,311 | ||||||||
| CarMax Auto Owner Trust, 2015-3 A3 | 05/15/2020 | 1.63 | % | 3,987,938 | 3,981,393 | ||||||||
| CenterPoint Energy Restoration Bond Co. LLC, 2009-1 A2 | 08/15/2019 | 3.46 | % | 1,206,880 | 1,209,856 | ||||||||
| Chase Issuance Trust | |||||||||||||
| Series 2015-A5 | 04/15/2020 | 1.36 | % | 6,575,000 | 6,567,902 | ||||||||
Series 2013-9A (1 Month LIBOR USD + 0.420%) (c) | 11/16/2020 | 1.90 | % | 4,350,841 | 4,362,652 | ||||||||
Chrysler Capital Auto Receivables Trust, 2016-B A2 (a) | 01/15/2020 | 1.36 | % | 1,483,390 | 1,481,671 | ||||||||
| Citibank Credit Card Issuance Trust | |||||||||||||
| Series 2008-A1 | 02/07/2020 | 5.35 | % | 4,270,000 | 4,285,434 | ||||||||
| Series 2017-A2 | 01/19/2021 | 1.74 | % | 6,500,000 | 6,485,499 | ||||||||
| Series 2017-A9 | 09/20/2021 | 1.80 | % | 2,875,000 | 2,860,293 | ||||||||
| Discover Card Execution Note Trust | |||||||||||||
| Series 2016-A1 | 07/15/2021 | 1.64 | % | 6,500,000 | 6,479,429 | ||||||||
| Series 2012-A6 | 01/18/2022 | 1.67 | % | 5,750,000 | 5,717,462 | ||||||||
| Entergy Arkansas Restoration Funding LLC, 2010-A A1 | 08/01/2021 | 2.30 | % | 3,984,172 | 3,987,574 | ||||||||
| Entergy Texas Restoration Funding LLC, 2009-A A2 | 08/01/2019 | 3.65 | % | 440,919 | 442,382 | ||||||||
Evergreen Credit Card Trust Series, 2017-1 A (1 Month LIBOR USD + 0.260%) (a)(b)(c) | 10/15/2021 | 1.74 | % | 1,750,000 | 1,752,603 | ||||||||
44 | LoCorr Market Trend Fund - Consolidated Schedule of Investments (continued) |
| Maturity Date | Coupon Rate | Principal Amount | Value | ||||||||||
ASSET BACKED SECURITIES (continued) | |||||||||||||
| Ford Credit Auto Owner Trust | |||||||||||||
| Series 2016-B A3 | 10/15/2020 | 1.33 | % | $ | 1,700,000 | $ | 1,692,025 | ||||||
| Series 2017-C A3 | 03/15/2022 | 2.01 | % | 2,725,000 | 2,717,010 | ||||||||
| GM Financial Automobile Leasing Trust, 2016-1 A3 | 07/20/2019 | 1.64 | % | 4,093,774 | 4,089,084 | ||||||||
| GM Financial Consumer Automobile Receivables Trust | |||||||||||||
Series 2017-1A A2A (a) | 03/16/2020 | 1.51 | % | 3,545,481 | 3,540,115 | ||||||||
Series 2017-2A A2A (a) | 05/18/2020 | 1.61 | % | 2,475,000 | 2,470,487 | ||||||||
| Honda Auto Receivables Owner Trust | |||||||||||||
| Series 2016-1 A3 | 12/18/2019 | 1.22 | % | 4,619,755 | 4,602,548 | ||||||||
| Series 2017-4 A2 | 01/21/2020 | 1.80 | % | 3,180,000 | 3,177,514 | ||||||||
| Huntington Auto Trust, 2015-1 A3 | 09/16/2019 | 1.24 | % | 2,054,635 | 2,051,636 | ||||||||
Hyundai Auto Lease Securitization Trust, 2017-C A3 (a) | 02/16/2021 | 2.12 | % | 3,500,000 | 3,490,312 | ||||||||
| Hyundai Auto Receivables Trust, 2016-B A3 | 04/15/2021 | 1.29 | % | 5,420,000 | 5,362,418 | ||||||||
| Nissan Auto Receivables Owner Trust, 2015-C | 05/15/2020 | 1.37 | % | 4,695,381 | 4,680,386 | ||||||||
Santander Retail Auto Lease Trust, 2017-A A2A (a) | 03/20/2020 | 2.02 | % | 3,575,000 | 3,568,972 | ||||||||
| Synchrony Credit Card Master Note Trust, 2016-1 A | 03/15/2022 | 2.04 | % | 3,958,000 | 3,956,678 | ||||||||
| TCF Auto Receivables Owner Trust | |||||||||||||
Series 2016-1A A3 (a) | 04/15/2021 | 1.71 | % | 7,000,000 | 6,977,058 | ||||||||
Series 2016-PT1 A (a) | 06/15/2022 | 1.93 | % | 3,064,470 | 3,053,317 | ||||||||
| Verizon Owner Trust | |||||||||||||
Series 2016-1A A (a) | 01/20/2021 | 1.42 | % | 2,613,000 | 2,595,837 | ||||||||
Series 2017-2A A (a) | 12/20/2021 | 1.92 | % | 3,145,000 | 3,124,136 | ||||||||
| TOTAL ASSET BACKED SECURITIES (Cost $132,872,304) | 132,573,715 | ||||||||||||
| FOREIGN GOVERNMENT BONDS: 1.42% | |||||||||||||
European Investment Bank (b) | 03/15/2018 | 1.00 | % | 6,000,000 | 5,992,560 | ||||||||
European Investment Bank (b) | 05/15/2018 | 1.25 | % | 1,000,000 | 998,530 | ||||||||
European Investment Bank (b) | 08/15/2018 | 1.13 | % | 2,500,000 | 2,489,095 | ||||||||
| TOTAL FOREIGN GOVERNMENT BONDS (Cost $9,476,750) | 9,480,185 | ||||||||||||
| MORTGAGE BACKED SECURITIES: 6.94% | |||||||||||||
| Fannie Mae Aces | |||||||||||||
| Series 2015-M1 ASQ2 | 02/25/2018 | 1.63 | % | 354,509 | 354,079 | ||||||||
| Series 2015-M7 ASQ2 | 04/25/2018 | 1.55 | % | 1,360,892 | 1,359,122 | ||||||||
Series 2014-M8 FA (1 Month LIBOR USD + 0.250%) (c) | 05/25/2018 | 1.49 | % | 204,403 | 204,230 | ||||||||
Series 2013-M13 FA (1 Month LIBOR USD + 0.350%) (c) | 05/25/2018 | 1.90 | % | 403,101 | 402,400 | ||||||||
Series 2013-M14 FA (1 Month LIBOR USD + 0.350%) (c) | 08/25/2018 | 1.90 | % | 993,219 | 994,211 | ||||||||
| Series 2009-M2 A3 | 01/25/2019 | 4.00 | % | 1,666,157 | 1,683,010 | ||||||||
Series 2014-M10 ASQ2 (d) | 09/25/2019 | 2.17 | % | 4,400,717 | 4,400,666 | ||||||||
| Series 2010-M1 A2 | 09/25/2019 | 4.45 | % | 2,826,054 | 2,900,875 | ||||||||
Series 2010-M3 A3 (d) | 03/25/2020 | 4.33 | % | 2,825,854 | 2,913,272 | ||||||||
| Series 2010-M7 A2 | 11/25/2020 | 3.66 | % | 1,121,242 | 1,149,180 | ||||||||
| FHLMC Multifamily Structured Pass Through Certificates | |||||||||||||
| Series K-703 A2 | 05/25/2018 | 2.70 | % | 3,721,402 | 3,724,560 | ||||||||
| Series K-705 A2 | 09/25/2018 | 2.30 | % | 4,000,000 | 4,005,308 | ||||||||
| Series K-708 A2 | 01/25/2019 | 2.13 | % | 1,319,713 | 1,320,480 | ||||||||
| Series K006 A1 | 07/25/2019 | 3.40 | % | 1,006,797 | 1,018,202 | ||||||||
Series KP04 AG2 (1 Month LIBOR USD + 0.200%) (c) | 10/25/2019 | 1.55 | % | 3,215,000 | 3,219,076 | ||||||||
| Series K-504 A1 | 10/25/2019 | 1.68 | % | 5,020,351 | 4,990,778 | ||||||||
FREMF Multifamily Aggregation Risk Transfer Trust, 2017-KT01 A (1 Month LIBOR USD + 0.320%) (c) | 02/25/2020 | 1.56 | % | 5,890,000 | 5,904,473 | ||||||||
NCUA Guaranteed Notes Trust, 2010-R1 1A (1 Month LIBOR USD + 0.450%) (c) | 10/07/2020 | 1.78 | % | 5,752,908 | 5,761,926 | ||||||||
| TOTAL MORTGAGE BACKED SECURITIES (Cost $46,250,296) | 46,305,848 | ||||||||||||
LoCorr Market Trend Fund - Consolidated Schedule of Investments (continued) | 45 |
| Maturity Date | Coupon Rate | Principal Amount | Value | ||||||||||
| U.S. GOVERNMENT AGENCY ISSUES: 46.70% | |||||||||||||
| Federal Farm Credit Banks | 09/14/2018 | 0.88 | % | $ | 12,000,000 | $ | 11,928,900 | ||||||
| Federal Farm Credit Banks | 07/24/2019 | 1.40 | % | 6,000,000 | 5,954,604 | ||||||||
| Federal Farm Credit Banks | 09/27/2019 | 1.55 | % | 13,000,000 | 12,911,496 | ||||||||
| Federal Farm Credit Banks | 10/21/2019 | 1.44 | % | 13,200,000 | 13,081,121 | ||||||||
| Federal Farm Credit Banks | 05/08/2020 | 1.55 | % | 18,590,000 | 18,380,714 | ||||||||
| Federal Farm Credit Banks | 10/13/2020 | 1.68 | % | 8,000,000 | 7,919,488 | ||||||||
| Federal Farm Credit Banks | 10/26/2020 | 1.75 | % | 21,430,000 | 21,228,087 | ||||||||
| Federal Farm Credit Banks | 11/27/2020 | 1.90 | % | 3,000,000 | 2,984,922 | ||||||||
| Federal Home Loan Banks | 06/14/2019 | 1.63 | % | 20,000,000 | 19,920,320 | ||||||||
| Federal Home Loan Banks | 08/05/2019 | 0.88 | % | 5,055,000 | 4,972,801 | ||||||||
| Federal Home Loan Banks | 06/12/2020 | 1.75 | % | 18,150,000 | 18,027,161 | ||||||||
| Federal Home Loan Banks | 09/28/2020 | 1.38 | % | 10,565,000 | 10,380,894 | ||||||||
| Federal Home Loan Mortgage Corp. | 04/15/2019 | 1.13 | % | 8,000,000 | 7,926,776 | ||||||||
| Federal Home Loan Mortgage Corp. | 07/19/2019 | 0.88 | % | 25,440,000 | 25,042,220 | ||||||||
| Federal Home Loan Mortgage Corp. | 01/17/2020 | 1.50 | % | 26,185,000 | 25,937,238 | ||||||||
| Federal Home Loan Mortgage Corp. | 09/29/2020 | 1.63 | % | 9,140,000 | 9,035,585 | ||||||||
| Federal Home Loan Mortgage Corp. | 11/17/2020 | 1.88 | % | 11,715,000 | 11,653,602 | ||||||||
| Federal National Mortgage Association | 08/02/2019 | 0.88 | % | 21,000,000 | 20,663,433 | ||||||||
| Federal National Mortgage Association | 08/28/2019 | 1.00 | % | 21,610,000 | 21,291,231 | ||||||||
| Federal National Mortgage Association | 10/24/2019 | 1.00 | % | 22,545,000 | 22,177,381 | ||||||||
| Federal National Mortgage Association | 11/26/2019 | 1.75 | % | 8,495,000 | 8,466,261 | ||||||||
| Federal National Mortgage Association | 02/28/2020 | 1.50 | % | 11,560,000 | 11,440,042 | ||||||||
| TOTAL U.S. GOVERNMENT AGENCY ISSUES (Cost $314,652,680) | 311,324,277 | ||||||||||||
| U.S. GOVERNMENT NOTES: 2.62% | |||||||||||||
| United States Treasury Note | 02/28/2019 | 1.13 | % | 6,000,000 | 5,950,781 | ||||||||
| United States Treasury Note | 01/31/2020 | 1.25 | % | 2,000,000 | 1,973,516 | ||||||||
| United States Treasury Note | 03/31/2020 | 1.13 | % | 7,000,000 | 6,880,508 | ||||||||
| United States Treasury Note | 07/15/2020 | 1.50 | % | 2,700,000 | 2,671,102 | ||||||||
| TOTAL U.S. GOVERNMENT NOTES (Cost $17,587,285) | 17,475,907 | ||||||||||||
| SHORT TERM INVESTMENTS: 8.88% | |||||||||||||
| U.S. GOVERNMENT NOTES: 1.12% | |||||||||||||
| United States Treasury Note | 05/31/2018 | 0.88 | % | 4,500,000 | 4,489,805 | ||||||||
| United States Treasury Note | 10/31/2018 | 1.75 | % | 3,000,000 | 2,999,883 | ||||||||
| TOTAL U.S. GOVERNMENT NOTES (Cost $7,495,296) | 7,489,688 | ||||||||||||
| MONEY MARKET FUND: 7.76% | Shares | ||||||||||||
STIT-Government & Agency Portfolio, Institutional Class, 1.18% (e)(f) | 51,738,453 | 51,738,453 | |||||||||||
| TOTAL MONEY MARKET FUND (Cost $51,738,453) | 51,738,453 | ||||||||||||
| TOTAL SHORT TERM INVESTMENTS (Cost $59,233,749) | 59,228,141 | ||||||||||||
| TOTAL INVESTMENTS (Cost $580,073,064): 86.45% | 576,388,073 | ||||||||||||
Other Assets in Excess of Liabilities: 13.55% (g) | 90,313,013 | ||||||||||||
| TOTAL NET ASSETS: 100.00% | $ | 666,701,086 | |||||||||||
| (a) | Security as defined in Rule 144(a) under the Securities Act of 1933 and determined to be liquid. Purchased in a private placement transaction; resale to the public may require registration or may extend only to qualified institutional buyers. At December 31, 2017, the value of these securities total $34,277,240 which represents 5.14% of total net assets. |
| (b) | Foreign issued security. |
| (c) | Variable rate security based on a reference index and spread. The rate reported is the rate in effect as of December 31, 2017. |
| (d) | Variable rate security. The coupon is based on an underlying pool of assets. The rate reported is the rate in effect as of December 31, 2017. |
| (e) | The rate quoted is the annualized seven-day effective yield as of December 31, 2017. |
| (f) | All or a portion of this security is held by LCMT Fund Limited and pledged as collateral for derivative contracts. |
| (g) | Includes assets pledged as collateral for derivative contracts. |
| LIBOR | London Interbank Offered Rate |
46 | LoCorr Market Trend Fund - Consolidated Schedule of Open Forward Currency Contracts |
| Currency to be Received | Currency to be Delivered | ||||||||||||||||||||||
Notional Amount | Forward Settlement Date | Curr Abbr. | U.S. $ Value at December 31, 2017 | Curr Abbr. | U.S. $ Value on Origination Date | Unrealized Appreciation | Unrealized (Depreciation) | ||||||||||||||||
| Purchase Contracts: | |||||||||||||||||||||||
| $ | 10,841,699 | 03/23/2018 | AUD | $ | 11,020,834 | USD | $ | 10,841,699 | $ | 179,135 | $ | — | |||||||||||
| 68,428,327 | 03/23/2018 | CAD | 69,790,223 | USD | 68,428,327 | 1,361,896 | — | ||||||||||||||||
| 6,583,066 | 03/23/2018 | CHF | 6,661,965 | USD | 6,583,066 | 78,899 | — | ||||||||||||||||
| 235,968,342 | 03/23/2018 | EUR | 239,530,519 | USD | 235,968,342 | 3,562,177 | — | ||||||||||||||||
| 195,577,957 | 03/23/2018 | GBP | 196,407,899 | USD | 195,577,957 | 829,942 | — | ||||||||||||||||
| 44,763,559 | 03/23/2018 | JPY | 44,809,409 | USD | �� | 44,763,559 | 45,850 | — | |||||||||||||||
| 6,809,097 | 03/23/2018 | MXN | 6,602,960 | USD | 6,809,097 | — | (206,137 | ) | |||||||||||||||
| 1,602,509 | 03/23/2018 | NZD | 1,619,118 | USD | 1,602,509 | 16,609 | — | ||||||||||||||||
| Total Purchase Contracts | 576,442,927 | 570,574,556 | 6,074,508 | (206,137 | ) | ||||||||||||||||||
| Sale Contracts: | |||||||||||||||||||||||
| $ | 158,306,963 | 03/23/2018 | USD | $ | 161,170,812 | AUD | $ | 158,306,963 | $ | — | $ | (2,863,849 | ) | ||||||||||
| 93,965,022 | 03/23/2018 | USD | 95,657,922 | CAD | 93,965,022 | — | (1,692,900 | ) | |||||||||||||||
| 108,614,256 | 03/23/2018 | USD | 110,001,931 | CHF | 108,614,256 | — | (1,387,675 | ) | |||||||||||||||
| 30,381,779 | 03/23/2018 | USD | 30,730,657 | EUR | 30,381,779 | — | (348,878 | ) | |||||||||||||||
| 49,250,666 | 03/23/2018 | USD | 49,510,876 | GBP | 49,250,666 | — | (260,210 | ) | |||||||||||||||
| 133,574,411 | 03/23/2018 | USD | 133,511,867 | JPY | 133,574,411 | 62,544 | — | ||||||||||||||||
| 45,744,222 | 03/23/2018 | USD | 45,339,609 | MXN | 45,744,222 | 404,613 | — | ||||||||||||||||
| 57,603,693 | 03/23/2018 | USD | 58,371,764 | NZD | 57,603,693 | — | (768,071 | ) | |||||||||||||||
| Total Sale Contracts | 684,295,438 | 677,441,012 | 467,157 | (7,321,583 | ) | ||||||||||||||||||
| Total Forward Currency Contracts | $ | (107,852,511 | ) | $ | (106,866,456 | ) | $ | 6,541,665 | $ | (7,527,720 | ) | ||||||||||||
| Net Unrealized Depreciation | $ | (986,055 | ) | ||||||||||||||||||||
| AUD | AUSTRALIAN DOLLAR |
| CAD | CANADIAN DOLLAR |
| CHF | SWISS FRANC |
| EUR | EURO |
| GBP | BRITISH POUND |
| JPY | JAPANESE YEN |
| MXN | MEXICAN PESO |
| NZD | NEW ZEALAND DOLLAR |
| USD | U.S. DOLLAR |
| (a) | Bank of America Merrill Lynch is the counterparty for all open forward currency contracts held by the Fund as of December 31, 2017. |
LoCorr Market Trend Fund - Consolidated Schedule of Open Futures Contracts | 47 |
| Value | |||||||||||||||||||||
Description | Number of Contracts Purchased (Sold) | Settlement Month-Year | Current Notional Amount | Value at Trade Date | Unrealized Appreciation | Unrealized (Depreciation) | |||||||||||||||
| Purchase Contracts: | |||||||||||||||||||||
| 10 Yr Mini JGB | 14 | Mar-18 | $ | 1,874,205 | $ | 1,873,671 | $ | 534 | $ | — | |||||||||||
| 3 Mo Euro Euribor | 2,136 | Jun-19 | 641,230,562 | 641,651,915 | — | (421,353 | ) | ||||||||||||||
Aluminum (a)(b) | 798 | Mar-18 | 45,316,425 | 41,233,250 | 4,083,175 | — | |||||||||||||||
| Australian 10 Yr Bond | 135 | Mar-18 | 13,604,690 | 13,520,106 | 84,584 | — | |||||||||||||||
Brent Crude (a) | 654 | Jan-18 | 43,732,980 | 41,400,955 | 2,332,025 | — | |||||||||||||||
| CAC 40 10 Euro Index | 481 | Jan-18 | 30,648,283 | 31,126,511 | — | (478,228 | ) | ||||||||||||||
Copper (a)(b) | 345 | Mar-18 | 62,509,688 | 58,480,584 | 4,029,104 | — | |||||||||||||||
Cotton No.2 (a) | 192 | Mar-18 | 7,548,480 | 6,901,777 | 646,703 | — | |||||||||||||||
| DAX Index | 154 | Mar-18 | 59,636,567 | 60,771,545 | — | (1,134,978 | ) | ||||||||||||||
| Dow Jones Industrial Average Mini E-Cbot Index | 160 | Mar-18 | 19,788,000 | 19,406,898 | 381,102 | — | |||||||||||||||
| Euro-Bobl | 1,572 | Mar-18 | 248,237,330 | 249,670,558 | — | (1,433,228 | ) | ||||||||||||||
| Euro-Bund | 565 | Mar-18 | 109,605,011 | 110,862,098 | — | (1,257,087 | ) | ||||||||||||||
| Euro-Schatz | 1,572 | Mar-18 | 211,202,606 | 211,442,839 | — | (240,233 | ) | ||||||||||||||
| Euro-Stoxx 50 Index | 1,296 | Mar-18 | 54,316,184 | 55,658,420 | — | (1,342,236 | ) | ||||||||||||||
| FTSE 100 Index | 558 | Mar-18 | 57,543,327 | 56,253,689 | 1,289,638 | — | |||||||||||||||
Gasoline RBOB (a) | 545 | Jan-18 | 41,105,862 | 38,626,231 | 2,479,631 | — | |||||||||||||||
Gold (a) | 148 | Feb-18 | 19,377,640 | 19,182,015 | 195,625 | — | |||||||||||||||
| Hang Seng Index | 231 | Jan-18 | 44,273,139 | 43,666,112 | 607,027 | — | |||||||||||||||
Heating Oil (a) | 565 | Jan-18 | 49,076,014 | 44,519,363 | 4,556,651 | — | |||||||||||||||
| Japanese 10 Yr Bond | 100 | Mar-18 | 133,818,505 | 133,795,325 | 23,180 | — | |||||||||||||||
| Long Gilt | 911 | Mar-18 | 153,944,806 | 153,087,566 | 857,240 | — | |||||||||||||||
Low Sulphur Gasoil (a) | 751 | Feb-18 | 45,191,425 | 41,308,029 | 3,883,396 | — | |||||||||||||||
| Nasdaq 100 E-Mini Index | 629 | Mar-18 | 80,622,074 | 81,128,135 | — | (506,061 | ) | ||||||||||||||
| Nikkei 225 Index | 192 | Mar-18 | 38,766,364 | 38,745,800 | 20,564 | — | |||||||||||||||
| Russell 2000 Mini Index | 1,418 | Mar-18 | 108,937,850 | 108,715,202 | 222,648 | — | |||||||||||||||
| S&P500 E-Mini Index | 359 | Mar-18 | 48,034,200 | 47,269,126 | 765,074 | — | |||||||||||||||
Soybean (a) | 103 | Mar-18 | 4,953,011 | 5,183,550 | — | (230,539 | ) | ||||||||||||||
Soybean Meal (a) | 269 | Mar-18 | 8,521,919 | 9,103,621 | — | (581,702 | ) | ||||||||||||||
| Tokyo Price Index | 334 | Mar-18 | 53,860,928 | 53,078,291 | 782,637 | — | |||||||||||||||
| U.S. Long Bond | 706 | Mar-18 | 108,018,000 | 107,627,061 | 390,939 | — | |||||||||||||||
WTI Crude (a) | 597 | Jan-18 | 36,070,740 | 33,903,364 | 2,167,376 | — | |||||||||||||||
Zinc (a)(b) | 457 | Mar-18 | 37,993,837 | 36,080,159 | 1,913,678 | — | |||||||||||||||
| Total Purchase Contracts | 31,712,531 | (7,625,645 | ) | ||||||||||||||||||
| Sales Contracts: | |||||||||||||||||||||
| 90 Day Euro | (4,279 | ) | Jun-19 | $ | 1,045,573,650 | $ | 1,046,066,489 | $ | 492,839 | $ | — | ||||||||||
| 90 Day Sterling | (2,874 | ) | Jun-19 | 480,723,559 | 480,188,102 | — | (535,457 | ) | |||||||||||||
Aluminum (a)(b) | (47 | ) | Mar-18 | 2,669,013 | 2,415,514 | — | (253,499 | ) | |||||||||||||
| Canadian 10 Yr Bond | (552 | ) | Mar-18 | 59,187,399 | 60,048,658 | 861,259 | — | ||||||||||||||
Cocoa (a) | (423 | ) | Mar-18 | 7,869,927 | 9,115,283 | 1,245,356 | — | ||||||||||||||
Coffee (a) | (225 | ) | Mar-18 | 10,648,125 | 10,717,918 | 69,793 | — | ||||||||||||||
Copper (a)(b) | (133 | ) | Mar-18 | 24,097,937 | 23,406,761 | — | (691,176 | ) | |||||||||||||
Corn (a) | (1,046 | ) | Mar-18 | 18,344,225 | 18,888,296 | 544,071 | — | ||||||||||||||
| Dollar | (314 | ) | Mar-18 | 28,833,364 | 29,189,733 | 356,369 | — | ||||||||||||||
Hard Red Wheat (a) | (411 | ) | Mar-18 | 8,779,987 | 9,098,688 | 318,701 | — | ||||||||||||||
Natural Gas (a) | (616 | ) | Jan-18 | 18,190,480 | 17,997,793 | — | (192,687 | ) | |||||||||||||
Silver (a) | (372 | ) | Mar-18 | 31,889,700 | 29,847,408 | — | (2,042,292 | ) | |||||||||||||
Soybean Oil (a) | (141 | ) | Mar-18 | 2,813,796 | 2,787,176 | — | (26,620 | ) | |||||||||||||
Sugar (a) | (532 | ) | Feb-18 | 9,032,934 | 8,826,444 | — | (206,490 | ) | |||||||||||||
| U.S. 2 Yr Note | (2,502 | ) | Mar-18 | 535,701,659 | 536,907,081 | 1,205,422 | — | ||||||||||||||
| U.S. 5 Yr Note | (4,279 | ) | Mar-18 | 497,066,025 | 499,603,020 | 2,536,995 | — | ||||||||||||||
| U.S. 10 Yr Note | (1,918 | ) | Mar-18 | 237,921,906 | 239,197,180 | 1,275,274 | — | ||||||||||||||
48 | LoCorr Market Trend Fund - Consolidated Schedule of Open Futures Contracts (continued) |
| Value | |||||||||||||||||||||
Description | Number of Contracts Purchased (Sold) | Settlement Month-Year | Current Notional Amount | Value at Trade Date | Unrealized Appreciation | Unrealized (Depreciation) | |||||||||||||||
Sale Contracts (continued) | |||||||||||||||||||||
Wheat (a) | (500 | ) | Mar-18 | $ | 10,675,000 | $ | 11,056,167 | $ | 381,167 | $ | — | ||||||||||
Zinc (a)(b) | (27 | ) | Mar-18 | 2,244,712 | 2,131,526 | — | (113,186 | ) | |||||||||||||
| Total Sale Contracts | 9,287,246 | (4,061,407 | ) | ||||||||||||||||||
| Total Futures Contracts | $ | 40,999,777 | $ | (11,687,052 | ) | ||||||||||||||||
| Net Unrealized Appreciation | $ | 29,312,725 | |||||||||||||||||||
| (a) | Contract held by LCMT Fund Limited. |
| (b) | London Metal Exchange (“LME”) futures contracts settle on their respective maturity date. The unrealized appreciation on these contracts is a receivable for unsettled open futures contracts and the unrealized depreciation is a payable for unsettled open futures contracts on the Fund’s consolidated statement of assets and liabilities. |
| LoCorr Dynamic Equity Fund - Schedule of Investments | 49 |
LoCorr Dynamic Equity Fund
Composition of Investment Portfolio1
December 31, 2017 (Unaudited)
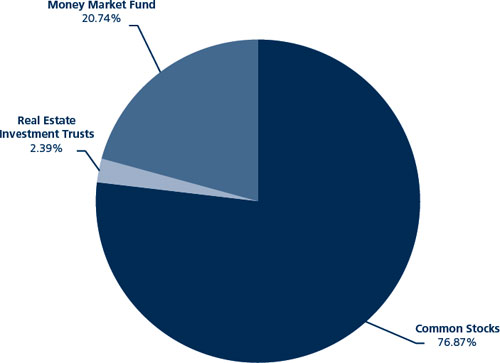
1 As a percentage of total investments.
Composition of Common Stock Portfolio1
December 31, 2017 (Unaudited)
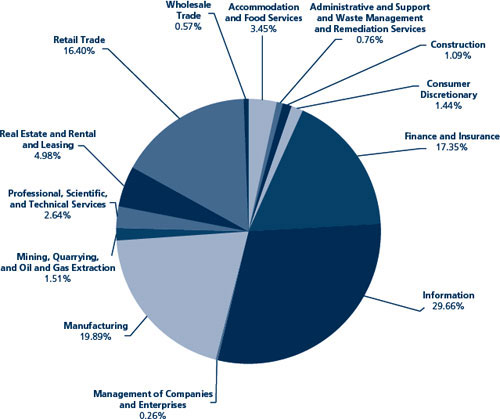
1 As a percentage of total common stocks.
Schedule of Investments
December 31, 2017
| Shares | Value | |||||||
| COMMON STOCKS: 69.79% | ||||||||
| Administrative and Support and Waste Management and Remediation Services: 2.41% | ||||||||
| Bloomin’ Brands, Inc. | 17,070 | $ | 364,273 | |||||
| Civeo Corp. (a)(b) | 16,950 | 46,273 | ||||||
| Extended Stay America, Inc. | 54,521 | 1,035,898 | ||||||
| Fogo De Chao, Inc. (a) | 7,902 | 91,663 | ||||||
| 1,538,107 | ||||||||
| Administrative Support and Waste Management: 0.53% | ||||||||
| Casella Waste Systems, Inc. (a) | 14,776 | 340,144 | ||||||
| Construction: 0.76% | ||||||||
| Forterra, Inc. (a) | 5,599 | 62,149 | ||||||
| KBR, Inc. | 21,359 | 423,549 | ||||||
| 485,698 | ||||||||
| Consumer Discretionary: 1.01% | ||||||||
| DeNA Co. Ltd. (b) | 31,200 | 643,245 | ||||||
| Finance and Insurance: 12.11% | ||||||||
| Comerica, Inc. | 6,915 | 600,291 | ||||||
| Credit Acceptance Corp. (a) | 16,350 | 5,288,898 | ||||||
| Herc Holdings, Inc. (a) | 6,041 | 378,227 | ||||||
| Zions Bancorporation | 28,769 | 1,462,328 | ||||||
| 7,729,744 | ||||||||
| Information: 20.70% | ||||||||
| Gogo, Inc. (a) | 616,284 | 6,951,684 | ||||||
| Internap Corp. (a) | 16,562 | 260,189 | ||||||
| Madison Square Garden Co./The (a) | 2,771 | 584,265 | ||||||
| Match Group, Inc. (a) | 20,587 | 644,579 | ||||||
| Nexstar Broadcasting Group, Inc. | 26,475 | 2,070,345 | ||||||
| Sinclair Broadcast Group, Inc. | 52,062 | 1,970,547 | ||||||
| Zayo Group Holdings, Inc. (a) | 19,772 | 727,610 | ||||||
| 13,209,219 | ||||||||
The accompanying notes are an integral part of these financial statements.
| 50 | LoCorr Dynamic Equity Fund - Schedule of Investments (continued) |
| Shares | Value | |||||||
| COMMON STOCKS (continued) | ||||||||
| Management of Companies and Enterprises: 0.18% | ||||||||
| Tile Shop Holdings, Inc. | 12,028 | $ | 115,469 | |||||
| Manufacturing: 13.88% | ||||||||
| AK Steel Holding Corp. (a) | 51,790 | 293,131 | ||||||
| Cray, Inc. (a) | 7,557 | 182,879 | ||||||
| Insteel Industries, Inc. | 2,727 | 77,229 | ||||||
| KapStone Paper and Packaging Corp. | 3,173 | 71,995 | ||||||
| Kennametal, Inc. | 13,404 | 648,888 | ||||||
| Lear Corp. | 12,100 | 2,137,586 | ||||||
| MACOM Technology Solutions Holdings, Inc. (a) | 19,351 | 629,682 | ||||||
| Manitowoc Co., Inc./The (a) | 6,859 | 269,833 | ||||||
| Maxwell Technologies, Inc. (a) | 5,361 | 30,879 | ||||||
| NeoPhotonics Corp. (a) | 26,253 | 172,745 | ||||||
| Nintendo Co. Ltd. - ADR (a)(b) | 12,285 | 553,686 | ||||||
| Oclaro, Inc. (a) | 21,744 | 146,555 | ||||||
| Quantenna Communications, Inc. (a) | 25,452 | 310,514 | ||||||
| Tenneco, Inc. | 43,453 | 2,543,739 | ||||||
| United States Steel Corp. | 8,224 | 289,403 | ||||||
| Visteon Corp. (a) | 4,008 | 501,561 | ||||||
| 8,860,305 | ||||||||
| Mining, Quarrying, and Oil and Gas Extraction: 1.05% | ||||||||
| Cleveland-Cliffs, Inc. (a) | 92,974 | 670,343 | ||||||
| Professional, Scientific, and Technical Services: 1.84% | ||||||||
| Cloudera, Inc. (a) | 4,229 | 69,863 | ||||||
| Instructure, Inc. (a) | 16,063 | 531,685 | ||||||
| Liberty Media Corp. - Liberty Formula One (a) | 16,762 | 572,590 | ||||||
| 1,174,138 | ||||||||
| Real Estate and Rental and Leasing: 3.47% | ||||||||
| AerCap Holdings NV (a)(b) | 42,132 | 2,216,565 | ||||||
| Retail Trade: 11.45% | ||||||||
| Advance Auto Parts, Inc. | 32,572 | 3,247,103 | ||||||
| Etsy, Inc. (a) | 38,186 | 780,904 | ||||||
| Lands’ End, Inc. (a) | 4,917 | 96,127 | ||||||
| MobileIron, Inc. (a) | 47,571 | 185,527 | ||||||
| Signet Jewelers Ltd. (b) | 51,038 | 2,886,199 | ||||||
| Straight Path Communications, Inc. (a) | 603 | 109,619 | ||||||
| 7,305,479 | ||||||||
| Wholesale Trade: 0.40% | ||||||||
| Builders FirstSource, Inc. (a) | 11,675 | 254,398 | ||||||
| TOTAL COMMON STOCKS (Cost $39,220,924) | 44,542,854 | |||||||
| REAL ESTATE INVESTMENT TRUSTS: 2.17% | ||||||||
| Gaming and Leisure Properties, Inc. | 23,731 | 878,047 | ||||||
| STORE Capital Corp. | 19,496 | 507,676 | ||||||
| TOTAL REAL ESTATE INVESTMENT TRUSTS (Cost $1,337,359) | 1,385,723 | |||||||
| SHORT TERM INVESTMENT: 18.82% | ||||||||
| MONEY MARKET FUND: 18.82% | ||||||||
STIT-Government & Agency Portfolio, Institutional Class, 1.18% (c) | 12,014,948 | 12,014,948 | ||||||
| TOTAL MONEY MARKET FUND (Cost $12,014,948) | 12,014,948 | |||||||
| TOTAL SHORT TERM INVESTMENT (Cost $12,014,948) | 12,014,948 | |||||||
| TOTAL INVESTMENTS (Cost $52,573,231): 90.78% | 57,943,525 | |||||||
| Other Assets in Excess of Liabilities: 9.22% (d) | 5,883,721 | |||||||
| TOTAL NET ASSETS: 100.00% | $ | 63,827,246 | ||||||
| (a) | Non-dividend income producing security. |
| (b) | Foreign issued security. |
| (c) | The rate quoted is the annualized seven-day effective yield as of December 31, 2017. |
| (d) | Includes assets pledged as collateral for securities sold short. |
| ADR | American Depository Receipt |
The accompanying notes are an integral part of these financial statements.
| LoCorr Dynamic Equity Fund - Schedule of Securities Sold Short | 51 |
LoCorr Dynamic Equity Fund
Schedule of Securities Sold Short
December 31, 2017
| Shares | Value | |||||||
| COMMON STOCKS: (13.57)% | ||||||||
| Accommodation and Food Services: (0.86)% | ||||||||
| Dunkin’ Brands Group, Inc. | (681 | ) | $ | (43,903 | ) | |||
| McDonald’s Corp. | (1,280 | ) | (220,313 | ) | ||||
| Papa John’s International, Inc. | (5,109 | ) | (286,666 | ) | ||||
| (550,882 | ) | |||||||
| Arts, Entertainment, and Recreation: (0.33)% | ||||||||
| Live Nation Entertainment, Inc. (a) | (4,975 | ) | (211,786 | ) | ||||
| Finance and Insurance: (0.16)% | ||||||||
| Federated Investors, Inc. | (2,859 | ) | (103,153 | ) | ||||
| Information: (2.25)% | ||||||||
| AMC Networks, Inc. (a) | (2,681 | ) | (144,988 | ) | ||||
| Blackbaud, Inc. | (1,559 | ) | (147,310 | ) | ||||
| Facebook, Inc. (a) | (828 | ) | (146,109 | ) | ||||
| Globalstar, Inc. (a) | (75,484 | ) | (98,884 | ) | ||||
| Hortonworks, Inc. (a) | (6,297 | ) | (126,633 | ) | ||||
| MSG Networks, Inc. (a) | (7,304 | ) | (147,906 | ) | ||||
| Proofpoint, Inc. (a) | (2,573 | ) | (228,508 | ) | ||||
| Qualys, Inc. (a) | (2,430 | ) | (144,221 | ) | ||||
| Upland Software, Inc. (a) | (4,744 | ) | (102,755 | ) | ||||
| Yelp, Inc. (a) | (3,481 | ) | (146,063 | ) | ||||
| (1,433,377 | ) | |||||||
| Manufacturing: (4.09)% | ||||||||
| ADTRAN, Inc. | (3,772 | ) | (72,988 | ) | ||||
| Advanced Energy Industries, Inc. (a) | (2,159 | ) | (145,689 | ) | ||||
| Ambarella, Inc. (a)(b) | (3,712 | ) | (218,080 | ) | ||||
| Apple, Inc. | (1,296 | ) | (219,322 | ) | ||||
| Boeing Co./The | (743 | ) | (219,118 | ) | ||||
| Cirrus Logic, Inc. (a) | (2,796 | ) | (145,001 | ) | ||||
| Energizer Holdings, Inc. | (2,749 | ) | (131,897 | ) | ||||
| Lam Research Corp | (1,265 | ) | (232,849 | ) | ||||
| Lumentum Holdings, Inc. (a) | (2,987 | ) | (146,064 | ) | ||||
| NETGEAR, Inc. (a) | (4,041 | ) | (237,409 | ) | ||||
| Praxair, Inc. | (1,421 | ) | (219,800 | ) | ||||
| Proto Labs, Inc. (a) | (319 | ) | (32,857 | ) | ||||
| Simpson Manufacturing Co., Inc. | (436 | ) | (25,031 | ) | ||||
| Universal Electronics, Inc. (a) | (712 | ) | (33,642 | ) | ||||
| Wabtec Corp. | (3,639 | ) | (296,324 | ) | ||||
| Western Digital Corp. | (2,914 | ) | (231,750 | ) | ||||
| (2,607,821 | ) | |||||||
| Other Services (except Public Administration): (1.59)% | ||||||||
| Regis Corp. (a) | (66,304 | ) | (1,018,429 | ) | ||||
| Professional, Scientific, and Technical Services: (1.35)% | ||||||||
| Aspen Technology, Inc. (a) | (2,179 | ) | (144,250 | ) | ||||
| FactSet Research Systems, Inc. | (1,217 | ) | (234,589 | ) | ||||
| LivePerson, Inc. (a) | (8,826 | ) | (101,499 | ) | ||||
| NetScout Systems, Inc. (a) | (9,439 | ) | (287,418 | ) | ||||
| Sotheby’s (a) | (1,804 | ) | (93,086 | ) | ||||
| (860,842 | ) | |||||||
| Real Estate and Rental and Leasing: (0.23)% | ||||||||
| AMERCO | (386 | ) | (145,873 | ) | ||||
The accompanying notes are an integral part of these financial statements.
| 52 | LoCorr Dynamic Equity Fund - Schedule of Securities Sold Short (continued) |
| Shares | Value | |||||||
| COMMON STOCKS (continued) | ||||||||
| Retail Trade: (2.00)% | ||||||||
| Dick’s Sporting Goods, Inc. | (5,013 | ) | $ | (144,074 | ) | |||
| Express, Inc. (a) | (13,488 | ) | (136,903 | ) | ||||
| Home Depot, Inc./The | (1,158 | ) | (219,476 | ) | ||||
| Tiffany & Co. | (7,452 | ) | (774,635 | ) | ||||
| (1,275,088 | ) | |||||||
| Wholesale Trade: (0.71)% | ||||||||
| 3M Company | (934 | ) | (219,836 | ) | ||||
| Impinj, Inc. (a) | (10,481 | ) | (236,137 | ) | ||||
| (455,973 | ) | |||||||
| TOTAL COMMON STOCKS (Proceeds $8,597,068) | (8,663,224 | ) | ||||||
| EXCHANGE TRADED FUNDS: (4.15)% | ||||||||
| CurrencyShares Japanese Yen Trust (a) | (13,936 | ) | (1,186,511 | ) | ||||
| iShares Russell 2000 | (9,591 | ) | (1,462,244 | ) | ||||
| TOTAL EXCHANGE TRADED FUNDS (Proceeds $2,688,333) | (2,648,755 | ) | ||||||
| TOTAL SECURITIES SOLD SHORT (Proceeds $11,285,401) | $ | (11,311,979 | ) | |||||
| (a) | Non-dividend expense producing security. |
| (b) | Foreign issued security. |
Percentages are stated as a percent of net assets.
The accompanying notes are an integral part of these financial statements.
| LoCorr Spectrum Income Fund - Schedule of Investments | 53 |
LoCorr Spectrum Income Fund
Composition of Investment Portfolio1
December 31, 2017 (Unaudited)
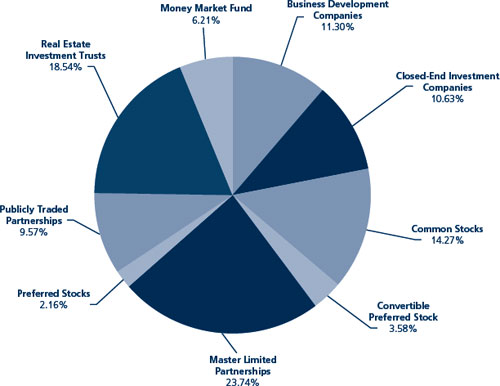
1 As a percentage of total investments.
Schedule of Investments
December 31, 2017
| Shares | Value | |||||||
| BUSINESS DEVELOPMENT COMPANIES: 11.27% | ||||||||
| Administrative and Support and Waste Management and Remediation Services: 0.45% | ||||||||
| TICC Capital Corp. | 76,886 | $ | 441,326 | |||||
| Finance and Insurance: 9.88% | ||||||||
| Alcentra Capital Corp. | 53,896 | 452,187 | ||||||
| Apollo Investment Corp. | 328,803 | 1,861,025 | ||||||
| Ares Capital Corp. | 169,246 | 2,660,547 | ||||||
| Capitala Finance Corp. | 60,870 | 443,133 | ||||||
| FS Investment Corp. | 59,422 | 436,752 | ||||||
| Hercules Capital, Inc. | 143,524 | 1,883,035 | ||||||
| New Mountain Finance Corp. | 65,673 | 889,869 | ||||||
| OFS Capital Corp. | 38,364 | 456,532 | ||||||
| THL Credit, Inc. | 49,766 | 450,382 | ||||||
| 9,533,462 | ||||||||
| Management of Companies and Enterprises: 0.94% | ||||||||
| Newtek Business Services Corp. | 48,919 | 904,512 | ||||||
| TOTAL BUSINESS DEVELOPMENT COMPANIES (Cost $11,365,973) | 10,879,300 | |||||||
| CLOSED-END INVESTMENT COMPANIES: 10.60% | ||||||||
| GAMCO Global Gold Natural Resources & Income Trust | 172,860 | 900,601 | ||||||
| Invesco Dynamic Credit Opportunities Fund | 198,991 | 2,330,185 | ||||||
| Nuveen Credit Strategies Income Fund | 112,034 | 920,919 | ||||||
| Nuveen Global High Income Fund | 55,248 | 934,244 | ||||||
| PIMCO Dynamic Credit and Mortgage Income Fund | 96,249 | 2,159,827 | ||||||
| Western Asset Emerging Markets Debt Fund, Inc. | 128,738 | 2,001,876 | ||||||
| Western Asset Global High Income Fund, Inc. | 96,209 | 983,256 | ||||||
| TOTAL CLOSED-END INVESTMENT COMPANIES (Cost $10,147,272) | 10,230,908 | |||||||
The accompanying notes are an integral part of these financial statements.
| 54 | LoCorr Spectrum Income Fund - Schedule of Investments (continued) |
| Shares | Value | |||||||
| COMMON STOCKS: 14.24% | ||||||||
| Accommodation and Food Services: 1.12% | ||||||||
| DineEquity, Inc. | 21,310 | $ | 1,081,056 | |||||
| Information: 1.03% | ||||||||
| CenturyLink, Inc. | 40,463 | 674,923 | ||||||
| Frontier Communications Corp. | 47,495 | 321,066 | ||||||
| 995,989 | ||||||||
| Mining, Quarrying, and Oil and Gas Extraction: 2.07% | ||||||||
| Pattern Energy Group, Inc. | 92,961 | 1,997,732 | ||||||
| Professional, Scientific, and Technical Services: 1.90% | ||||||||
| Macquarie Infrastructure Corp. | 13,933 | 894,499 | ||||||
| National CineMedia, Inc. | 137,139 | 940,774 | ||||||
| 1,835,273 | ||||||||
| Real Estate and Rental and Leasing: 1.51% | ||||||||
| Arlington Asset Investment Corp. | 37,030 | 436,213 | ||||||
| Fortress Transportation & Infrastructure Investors LLC | 50,840 | 1,013,241 | ||||||
| 1,449,454 | ||||||||
| Retail Trade: 0.94% | ||||||||
| Macy’s, Inc. | 35,912 | 904,623 | ||||||
| Transportation and Warehousing: 5.67% | ||||||||
| GasLog Partners LP (b) | 62,681 | 1,551,355 | ||||||
| Golar LNG Partners LP (b) | 87,541 | 1,995,935 | ||||||
| Hoegh LNG Partners LP (b) | 50,333 | 938,710 | ||||||
| Targa Resources Corp. | 20,419 | 988,688 | ||||||
| 5,474,688 | ||||||||
| TOTAL COMMON STOCKS (Cost $13,270,756) | 13,738,815 | |||||||
| CONVERTIBLE PREFERRED STOCK: 3.57% | ||||||||
| Utilities: 3.57% | ||||||||
| Kinder Morgan, Inc., Series A, 9.750% | 90,758 | 3,445,174 | ||||||
| TOTAL CONVERTIBLE PREFERRED STOCK (Cost $3,919,343) | 3,445,174 | |||||||
| MASTER LIMITED PARTNERSHIPS: 23.68% | Units | |||||||
| Manufacturing: 2.77% | ||||||||
| Alon USA Partners, LP | 93,802 | 1,603,076 | ||||||
| CVR Refining LP | 64,899 | 1,074,078 | ||||||
| 2,677,154 | ||||||||
| Mining, Quarrying, and Oil and Gas Extraction: 4.06% | ||||||||
| Alliance Resource Partners LP | 50,227 | 989,472 | ||||||
| SunCoke Energy Partners LP | 115,697 | 2,018,913 | ||||||
| USA Compression Partners LP | 55,031 | 910,213 | ||||||
| 3,918,598 | ||||||||
| Real Estate and Rental and Leasing: 2.18% | ||||||||
| Icahn Enterprises LP | 39,796 | 2,109,188 | ||||||
| Retail Trade: 6.46% | ||||||||
| Crestwood Equity Partners LP | 132,293 | 3,413,159 | ||||||
| Global Partners LP | 113,333 | 1,892,661 | ||||||
| Sunoco LP | 32,249 | 915,872 | ||||||
| 6,221,692 | ||||||||
| Transportation and Warehousing: 6.04% | ||||||||
| Energy Transfer Partners LP | 121,076 | 2,169,682 | ||||||
| MPLX LP | 51,845 | 1,838,942 | ||||||
| Summit Midstream Partners LP | 88,743 | 1,819,231 | ||||||
| 5,827,855 | ||||||||
The accompanying notes are an integral part of these financial statements.
| LoCorr Spectrum Income Fund - Schedule of Investments (continued) | 55 |
| Units | Value | |||||||
| MASTER LIMITED PARTNERSHIPS (continued) | ||||||||
| Wholesale Trade: 2.17% | ||||||||
| Martin Midstream Partners LP | 53,453 | $ | 748,342 | |||||
| NGL Energy Partners LP | 96,083 | 1,349,966 | ||||||
| 2,098,308 | ||||||||
| TOTAL MASTER LIMITED PARTNERSHIPS (Cost $20,696,397) | 22,852,795 | |||||||
| PREFERRED STOCKS: 2.15% | Shares | |||||||
| Transportation and Warehousing: 1.09% | ||||||||
| Hoegh LNG Partners LP, Series A, 8.750% (a)(b) | 39,046 | 1,050,728 | ||||||
| Wholesale Trade: 1.06% | ||||||||
| NGL Energy Partners LP, Class B, (9.000% to 07/01/22 then 3 Month LIBOR USD + 7.213%) | 42,085 | 1,026,874 | ||||||
| TOTAL PREFERRED STOCKS (Cost $1,965,860) | 2,077,602 | |||||||
| PUBLICLY TRADED PARTNERSHIPS: 9.54% | Units | |||||||
| Apollo Global Management LLC | 47,114 | 1,576,906 | ||||||
| Blackstone Group LP/The | 95,535 | 3,059,031 | ||||||
| Carlyle Group LP/The | 120,898 | 2,768,564 | ||||||
| Oaktree Capital Group LLC | 42,885 | 1,805,458 | ||||||
| TOTAL PUBLICLY TRADED PARTNERSHIPS (Cost $7,224,819) | 9,209,959 | |||||||
| Shares | ||||||||
| REAL ESTATE INVESTMENT TRUSTS: 18.49% | ||||||||
| Administrative and Support and Waste Management and Remediation Services: 1.00% | ||||||||
| Ladder Capital Corp. | 70,498 | 960,888 | ||||||
| Finance and Insurance: 9.52% | ||||||||
| AGNC Investment Corp. | 47,506 | 959,146 | ||||||
| Apollo Commercial Real Estate Finance, Inc. | 99,942 | 1,843,930 | ||||||
| Chimera Investment Corp. | 54,346 | 1,004,314 | ||||||
| CYS Investments, Inc. | 56,060 | 450,162 | ||||||
| DDR Corp. | 100,675 | 902,048 | ||||||
| New Senior Investment Group, Inc. | 112,169 | 847,998 | ||||||
| New York Mortgage Trust, Inc. | 72,767 | 448,972 | ||||||
| Oxford Lane Capital Corp. | 46,055 | 462,853 | ||||||
| PennantPark Investment Corp. | 64,675 | 446,904 | ||||||
| Starwood Property Trust, Inc. | 85,374 | 1,822,735 | ||||||
| 9,189,062 | ||||||||
| Real Estate and Rental and Leasing: 7.97% | ||||||||
| Annaly Capital Management, Inc. | 83,456 | 992,292 | ||||||
| CBL & Associates Properties, Inc. | 154,854 | 876,474 | ||||||
| Gaming and Leisure Properties, Inc. | 9,980 | 369,260 | ||||||
| Hospitality Properties Trust | 30,350 | 905,947 | ||||||
| New Residential Investment Corp. | 56,135 | 1,003,694 | ||||||
| PennyMac Mortgage Investment Trust | 28,484 | 457,738 | ||||||
| Two Harbors Investment Corp. | 55,924 | 909,324 | ||||||
| Uniti Group, Inc. | 26,944 | 479,334 | ||||||
| Washington Prime Group, Inc. | 238,580 | 1,698,689 | ||||||
| 7,692,752 | ||||||||
| TOTAL REAL ESTATE INVESTMENT TRUSTS (Cost $18,556,614) | 17,842,702 | |||||||
| SHORT TERM INVESTMENT : 6.19% | ||||||||
| MONEY MARKET FUND: 6.19% | ||||||||
| STIT-Government & Agency Portfolio, Institutional Class, 1.18% (c) | 5,973,802 | 5,973,802 | ||||||
| TOTAL MONEY MARKET FUND (Cost $5,973,802) | 5,973,802 | |||||||
| TOTAL SHORT TERM INVESTMENT (Cost $5,973,802) | 5,973,802 | |||||||
| TOTAL INVESTMENTS (Cost $93,120,836): 99.73% | 96,251,057 | |||||||
| Other Assets in Excess of Liabilities: 0.27% | 261,467 | |||||||
| TOTAL NET ASSETS: 100.00% | $ | 96,512,524 | ||||||
| (a) | Non-dividend income producing security. |
| (b) | Foreign issued security. |
| (c) | The rate quoted is the annualized seven-day effective yield as of December 31, 2017. |
| LIBOR | London Interbank Offered Rate |
The accompanying notes are an integral part of these financial statements.
56 | LoCorr Macro Strategies Fund, LoCorr Long/Short Commodities Strategy Fund, LoCorr Multi-Strategy Fund and LoCorr Market Trend Fund - Consolidated Statements of Assets & Liabilities |
LoCorr Macro Strategies Fund | LoCorr Long/Short Commodities Strategy Fund | LoCorr Multi- Strategy Fund | LoCorr Market Trend Fund | |||||||||||||
| Assets | ||||||||||||||||
| Investments, at value (Cost $707,969,851, $62,931,606, $16,168,627 and $580,073,064, respectively) | $ | 704,537,168 | $ | 62,620,302 | $ | 17,135,568 | $ | 576,388,073 | ||||||||
| Cash (Note 2) | 16,760,000 | — | — | 31,090,000 | ||||||||||||
| Foreign currency, at value (Cost $12,728,115, $0, $0 and $0, respectively) | 12,664,701 | — | — | — | ||||||||||||
| Receivable for Fund shares sold | 6,066,712 | 416,937 | 175,500 | 4,126,406 | ||||||||||||
| Receivable for securities sold | 7,741 | — | — | — | ||||||||||||
| Dividends and interest receivable | 3,271,670 | 292,095 | 72,940 | 1,594,723 | ||||||||||||
| Receivable for unsettled open futures contracts | 4,941,646 | — | — | 10,025,957 | ||||||||||||
| Deposits with broker for derivative instruments (Note 2) | 54,537,819 | 21,546,058 | 12,213,357 | 56,197,183 | ||||||||||||
| Deposits with broker for securities sold short (Note 2) | — | — | 379,628 | — | ||||||||||||
| Unrealized appreciation on forward currency contracts (Note 2) | 6,734,206 | — | — | 6,541,665 | ||||||||||||
| Advance receipt on swap contracts | — | 10,323,324 | — | — | ||||||||||||
| Prepaid expenses and other assets | 81,325 | 31,937 | 4,751 | 38,055 | ||||||||||||
| Total Assets | 809,602,988 | 95,230,653 | 29,981,744 | 686,002,062 | ||||||||||||
| Liabilities | ||||||||||||||||
| Securities sold short, at value (Proceeds, $0, $0, $221,117 and $0, respectively) | $ | — | $ | — | $ | 255,066 | $ | — | ||||||||
| Payable for Fund shares redeemed | 4,275,731 | 153,665 | 24,530 | 7,874,822 | ||||||||||||
| Payable for unsettled open futures contracts | 1,334,474 | — | — | 1,057,861 | ||||||||||||
| Payable for variation margin on futures contracts | 1,059,348 | — | — | 1,482,233 | ||||||||||||
| Payable for distributions | — | — | 5,866 | — | ||||||||||||
| Accrued management fees (Note 5) | 1,194,588 | 119,762 | 17,694 | 871,325 | ||||||||||||
| Accrued Trustees’ fees | 13,724 | 1,448 | 462 | 11,737 | ||||||||||||
| Accrued Rule 12b-1 fees | — | 96,414 | 13,729 | 145,787 | ||||||||||||
| Unrealized depreciation on swap contracts (Note 1) | — | 11,519,719 | 460,266 | — | ||||||||||||
| Unrealized depreciation on forward currency contracts (Note 2) | 11,471,736 | — | — | 7,527,720 | ||||||||||||
| Advance payment on swap contracts | — | — | 3,339,637 | — | ||||||||||||
| Accrued expenses and other liabilities | 435,273 | 92,607 | 55,769 | 329,491 | ||||||||||||
| Total Liabilities | 19,784,874 | 11,983,615 | 4,173,019 | 19,300,976 | ||||||||||||
| Net Assets | $ | 789,818,114 | $ | 83,247,038 | $ | 25,808,725 | $ | 666,701,086 | ||||||||
| Net Assets Consist of: | ||||||||||||||||
| Paid-in capital | $ | 770,743,872 | $ | 96,923,372 | $ | 24,736,991 | $ | 644,345,196 | ||||||||
| Accumulated net investment loss | — | — | (130,349 | ) | (368,813 | ) | ||||||||||
| Accumulated net realized loss | 14,713,543 | (1,845,311 | ) | 729,357 | (1,916,976 | ) | ||||||||||
| Net unrealized appreciation (depreciation) of: | ||||||||||||||||
| Investments | (3,432,683 | ) | (311,304 | ) | 966,941 | (3,684,991 | ) | |||||||||
| Securities sold short | — | — | (33,949 | ) | — | |||||||||||
| Swap contracts | — | (11,519,719 | ) | (460,266 | ) | — | ||||||||||
| Forward currency contracts | (4,737,530 | ) | — | — | (986,055 | ) | ||||||||||
| Futures contracts | 12,594,326 | — | — | 29,312,725 | ||||||||||||
| Foreign currency translation | (63,414 | ) | — | — | — | |||||||||||
| NET ASSETS | $ | 789,818,114 | $ | 83,247,038 | $ | 25,808,725 | $ | 666,701,086 | ||||||||
| Class A Shares | ||||||||||||||||
| Net assets | $ | 93,182,572 | $ | 25,574,577 | $ | 7,612,603 | $ | 61,557,480 | ||||||||
| Shares issued and outstanding (unlimited shares authorized, no par value) | 10,786,582 | 2,634,368 | 918,857 | 5,580,446 | ||||||||||||
Net asset value, redemption, and minimum offering price per share (a) | $8.64 | $9.71 | $8.28 | $11.03 | ||||||||||||
Maximum offering price per share ($8.64/0.9425), ($9.71/0.9425), ($8.28/0.9425), ($11.03/0.9425)(b) | $9.17 | $10.30 | $8.79 | $11.70 | ||||||||||||
| Class C Shares | ||||||||||||||||
| Net assets | $ | 90,652,936 | $ | 4,736,893 | $ | 2,383,371 | $ | 43,771,894 | ||||||||
| Shares issued and outstanding (unlimited shares authorized, no par value) | 10,957,482 | 503,532 | 286,782 | 4,041,664 | ||||||||||||
Net asset value, redemption, and offering price per share (a) | $8.27 | $9.41 | $8.31 | $10.83 | ||||||||||||
| Class I Shares | ||||||||||||||||
| Net assets | $ | 605,982,606 | $ | 52,935,568 | $ | 15,812,751 | $ | 561,371,712 | ||||||||
| Shares issued and outstanding (unlimited shares authorized, no par value) | 69,090,006 | 5,396,471 | 1,911,897 | 50,614,887 | ||||||||||||
| Net asset value, redemption, and offering price per share | $8.77 | $9.81 | $8.27 | $11.09 | ||||||||||||
| (a) | A 1.00% contingent deferred sales charge may apply to redemptions made within twelve months of purchase. The contingent deferred sales charge only applies to Class A share purchases of $1 million or more. |
| (b) | On investments of $25,000 or more, the offering price is reduced. |
LoCorr Dynamic Equity Fund and LoCorr Spectrum Income Fund - Statements of Assets & Liabilities | | 57 |
LoCorr Dynamic Equity Fund | LoCorr Spectrum Income Fund | |||||||
| Assets | ||||||||
| Investments, at value (Cost $52,573,231 and $93,120,836, respectively) | $ | 57,943,525 | $ | 96,251,057 | ||||
| Cash (Note 2) | 6,000,000 | — | ||||||
| Receivable for Fund shares sold | 63,621 | 186,977 | ||||||
| Receivable for securities sold | 4,619,098 | 268,021 | ||||||
| Dividends, interest and other receivables | 26,474 | 528,483 | ||||||
| Deposits with broker for securities sold short (Note 2) | 9,264,729 | — | ||||||
| Prepaid expenses and other assets | 15,742 | 29,672 | ||||||
| Total Assets | 77,933,189 | 97,264,210 | ||||||
| Liabilities | ||||||||
| Securities sold short, at value (Proceeds $11,285,401 and $0, respectively) | $ | 11,311,979 | $ | — | ||||
| Payable for Fund shares redeemed | 126,255 | 290,422 | ||||||
| Payable for securities purchased | 2,121,082 | — | ||||||
| Payable for distributions | 305,286 | 187,281 | ||||||
| Accrued management fees (Note 5) | 125,523 | 105,765 | ||||||
| Accrued Trustees' fees | 1,120 | 1,668 | ||||||
| Accrued Rule 12b-1 fees | 37,779 | 83,375 | ||||||
| Accrued expenses and other liabilities | 76,919 | 83,175 | ||||||
| Total Liabilities | 14,105,943 | 751,686 | ||||||
| Net Assets | $ | 63,827,246 | $ | 96,512,524 | ||||
Net Assets Consist of: | ||||||||
| Paid-in capital | $ | 58,482,666 | $ | 117,628,705 | ||||
| Accumulated net investment loss | 10,940 | (1,339,661 | ) | |||||
| Accumulated undistributed net realized gain (loss) | (7,614 | ) | (22,906,741 | ) | ||||
| Net unrealized appreciation (depreciation) of: | ||||||||
| Investments | 5,370,294 | 3,130,221 | ||||||
| Securities sold short | (26,578 | ) | — | |||||
| Foreign currency translation | (2,462 | ) | — | |||||
| NET ASSETS | $ | 63,827,246 | $ | 96,512,524 | ||||
Class A Shares | ||||||||
| Net assets | $ | 19,962,271 | $ | 29,969,908 | ||||
| Shares issued and outstanding (unlimited shares authorized, no par value) | 1,689,399 | 4,057,798 | ||||||
Net asset value, redemption, and minimum offering price per share (a) | $ | 11.82 | $ | 7.39 | (b) | |||
Maximum offering price per share ($11.82/0.9425), ($7.39/0.9425)(c) | $ | 12.54 | $ | 7.84 | ||||
Class C Shares | ||||||||
| Net assets | $ | 11,083,732 | $ | 23,510,336 | ||||
| Shares issued and outstanding (unlimited shares authorized, no par value) | 973,448 | 3,167,860 | ||||||
Net asset value, redemption, and offering price per share (a) | $ | 11.39 | $ | 7.42 | (b) | |||
Class I Shares | ||||||||
| Net assets | $ | 32,781,243 | $ | 43,032,280 | ||||
| Shares issued and outstanding (unlimited shares authorized, no par value) | 2,740,163 | 5,833,407 | ||||||
| Net asset value, redemption, and offering price per share | $ | 11.96 | $ | 7.38 | (b) | |||
| (a) | A 1.00% contingent deferred sales charge may apply to redemptions made within twelve months of purchase. The contingent deferred sales charge only applies to Class A share purchases of $1 million or more. |
| (b) | Redemptions made within 60 days of purchase may be assessed a redemption fee of 2.00%. |
| (c) | On investments of $25,000 or more, the offering price is reduced. |
58 | LoCorr Macro Strategies Fund, LoCorr Long/Short Commodities Strategy Fund, LoCorr Multi-Strategy Fund and LoCorr Market Trend Fund - Consolidated Statements of Operations |
LoCorr Macro Strategies Fund | LoCorr Long/Short Commodities Strategy Fund | LoCorr Multi- Strategy Fund | LoCorr Market Trend Fund | |||||||||||||
| Investment Income | ||||||||||||||||
Dividend and interest income (a) | $ | 14,423,109 | $ | 1,796,366 | $ | 845,477 | $ | 8,410,693 | ||||||||
| Distributions received from master limited partnership (“MLP”)interests | — | — | 784,504 | — | ||||||||||||
| Less: return of capital on distributions from MLP interests (Note 2) | — | — | (784,504 | ) | — | |||||||||||
| Total Investment Income | 14,423,109 | 1,796,366 | 845,477 | 8,410,693 | ||||||||||||
| Expenses | ||||||||||||||||
| Management fees (Note 5) | 16,389,019 | 1,528,013 | 610,325 | 12,188,761 | ||||||||||||
| Fund administration fees | 314,388 | 58,031 | 44,123 | 273,444 | ||||||||||||
| Fund accounting fees | 377,303 | 93,822 | 44,296 | 289,335 | ||||||||||||
| Trustees’ fees | 63,278 | 7,053 | 2,439 | 57,059 | ||||||||||||
| Transfer agent fees and expenses | 1,548,144 | 241,320 | 79,117 | 1,116,914 | ||||||||||||
| Custodian fees | 55,603 | 10,089 | 13,730 | 38,032 | ||||||||||||
| Registration expenses | 134,975 | 75,321 | 44,916 | 95,459 | ||||||||||||
| Rule 12b-1 fee - Class A (Note 5) | 344,433 | 72,397 | 36,086 | 219,051 | ||||||||||||
| Rule 12b-1 fee - Class C (Note 5) | 1,045,064 | 56,870 | 31,276 | 614,390 | ||||||||||||
| Legal and audit fees | 62,349 | 35,678 | 35,279 | 56,923 | ||||||||||||
| Printing and mailing expenses | 133,185 | 16,602 | 13,684 | 110,698 | ||||||||||||
| Other expenses | 25,988 | 4,879 | 4,154 | 29,951 | ||||||||||||
| Total expenses before interest expense | 20,493,729 | 2,200,075 | 959,425 | 15,090,017 | ||||||||||||
| Dividend expense on securities sold short (Note 2) | — | — | 7,118 | — | ||||||||||||
| Interest expense on credit line (Note 8) | — | — | 733 | — | ||||||||||||
| Total expenses before reimbursement | 20,493,729 | 2,200,075 | 967,276 | 15,090,017 | ||||||||||||
| Reimbursement from Adviser (Note 5) | (485,398 | ) | (81,840 | ) | (180,598 | ) | — | |||||||||
| Net Expenses | 20,008,331 | 2,118,235 | 786,678 | 15,090,017 | ||||||||||||
| Net Investment Income (Loss) | (5,585,222 | ) | (321,869 | ) | 58,799 | (6,679,324 | ) | |||||||||
| Realized and Unrealized Gain (Loss) on Investments, Securities Sold Short, Swap Contracts, Forward Currency Contracts, Futures Contracts and Foreign Currency Translation: | ||||||||||||||||
| Net realized gain (loss) on: | ||||||||||||||||
| Investments | (1,805,179 | ) | (247,156 | ) | 1,660,196 | (1,692,674 | ) | |||||||||
| Securities sold short | — | — | (139,128 | ) | — | |||||||||||
| Swap contracts | — | (2,104,129 | ) | (2,774,773 | ) | — | ||||||||||
| Forward currency contracts | (30,062,703 | ) | — | — | (56,013,603 | ) | ||||||||||
| Futures contracts | 56,060,698 | — | — | 70,532,267 | ||||||||||||
| Foreign currency translation | 183,992 | — | — | (155,423 | ) | |||||||||||
| Net change in unrealized appreciation (depreciation) on: | ||||||||||||||||
| Investments | 1,334,270 | 188,956 | (1,136,886 | ) | (881,949 | ) | ||||||||||
| Securities sold short | — | — | (42,734 | ) | — | |||||||||||
| Swap contracts | — | 7,471,231 | 3,244,089 | — | ||||||||||||
| Forward currency contracts | (7,594,160 | ) | — | — | (4,835,934 | ) | ||||||||||
| Futures contracts | 7,189,396 | — | — | 19,784,969 | ||||||||||||
| Foreign currency translation | (47,024 | ) | — | — | — | |||||||||||
| Net realized and unrealized gain | 25,259,290 | 5,308,902 | 810,764 | 26,737,653 | ||||||||||||
| Net Increase in Net Assets From Operations | $ | 19,674,068 | $ | 4,987,033 | $ | 869,563 | $ | 20,058,329 | ||||||||
| (a) | Net of foreign tax withheld of $0, $0, $777 and $0, respectively. |
LoCorr Dynamic Equity Fund and LoCorr Spectrum Income Fund - Statements of Operations | 59 |
LoCorr Dynamic Equity Fund | LoCorr Spectrum Income Fund | |||||||
| Investment Income | ||||||||
Dividend and interest income (a) | $ | 631,508 | $ | 4,558,200 | ||||
| Distributions received from master limited partnership (“MLP”) interests | — | 4,154,161 | ||||||
| Less: return of capital on distributions from MLP interests (Note 2) | — | (4,154,161 | ) | |||||
| Total Investment Income | 631,508 | 4,558,200 | ||||||
| Expenses | ||||||||
| Management fees (Note 5) | 1,919,260 | 1,403,519 | ||||||
| Fund administration fees | 48,354 | 59,165 | ||||||
| Fund accounting fees | 49,884 | 58,411 | ||||||
| Trustees’ fees | 5,284 | 7,381 | ||||||
| Transfer agent fees and expenses | 184,171 | 171,921 | ||||||
| Custodian fees | 36,229 | 8,527 | ||||||
| Registration expenses | 50,724 | 52,321 | ||||||
| Rule 12b-1 fee - Class A (Note 5) | 51,803 | 83,773 | ||||||
| Rule 12b-1 fee - Class C (Note 5) | 116,171 | 255,081 | ||||||
| Legal and audit fees | 19,081 | 27,828 | ||||||
| Printing and mailing expenses | 13,371 | 41,883 | ||||||
| Other expenses | 4,028 | 8,181 | ||||||
| Total expense before dividend and interest expense | 2,498,360 | 2,177,991 | ||||||
| Dividend expense on securities sold short (Note 2) | 143,111 | — | ||||||
| Interest expense | 10,593 | — | ||||||
| Total expenses before recovery (reimbursement) | 2,652,064 | 2,177,991 | ||||||
| Recovery to (Reimbursement from) Adviser (Note 5) | (58,609 | ) | 39,116 | |||||
| Net Expenses | 2,593,455 | 2,217,107 | ||||||
| Net Investment Income (Loss) | (1,961,947 | ) | 2,341,093 | |||||
| Realized and Unrealized Gain (Loss) on Investments, Securities Sold Short and Foreign Currency Translation: | ||||||||
| Net realized gain (loss) on: | ||||||||
| Investments | 7,954,654 | (2,824,448 | ) | |||||
| Securities sold short | (2,243,118 | ) | — | |||||
| Foreign currency translation | 12 | — | ||||||
| Net change in unrealized appreciation (depreciation) on: | ||||||||
| Investments | (1,881,867 | ) | 3,795,364 | |||||
| Securities sold short | (496,593 | ) | — | |||||
| Foreign currency translation | (2,462 | ) | — | |||||
| Net realized and unrealized gain | 3,330,626 | 970,916 | ||||||
| Net Increase in Net Assets From Operations | $ | 1,368,679 | $ | 3,312,009 | ||||
60 | LoCorr Macro Strategies Fund - Consolidated Statements of Changes in Net Assets |
| Year Ended December 31, | ||||||||
| 2017 | 2016 | |||||||
| Operations | ||||||||
| Net investment loss | $ | (5,585,222 | ) | $ | (6,632,771 | ) | ||
| Net realized gain on investments, swap contracts, forward currency contracts, futures contracts and foreign currency translation | 24,376,808 | 16,256,745 | ||||||
| Net change in unrealized appreciation of investments, swap contracts, forward currency contracts, futures contracts and foreign currency translation | 882,482 | 19,033,766 | ||||||
| Increase in Net Assets From Operations | 19,674,068 | 28,657,740 | ||||||
| Distributions to Shareholders From | ||||||||
| Net investment income: | ||||||||
| Class I | — | (24,016 | ) | |||||
| Net realized gain: | ||||||||
| Class A | (5,441,843 | ) | (5,711,451 | ) | ||||
| Class C | (5,525,753 | ) | (2,291,477 | ) | ||||
| Class I | (34,409,482 | ) | (8,002,729 | ) | ||||
| Total Distributions to Shareholders | (45,377,078 | ) | (16,029,673 | ) | ||||
| Capital Transactions (Note 6) | ||||||||
| Proceeds from shares sold | 789,578,567 | 538,774,369 | ||||||
| Reinvestment of distributions | 40,676,233 | 14,146,054 | ||||||
| Cost of shares redeemed | (897,405,675 | ) | (203,375,297 | ) | ||||
| Redemption fees | 11,727 | 22,168 | ||||||
| Increase (Decrease) in Net Assets From Capital Transactions | (67,139,148 | ) | 349,567,294 | |||||
| Total Increase (Decrease) in Net Assets | (92,842,158 | ) | 362,195,361 | |||||
| Net Assets | ||||||||
| Beginning of year | 882,660,272 | 520,464,911 | ||||||
| End of year (including accumulated net investment income of $0 and $0, respectively) | $ | 789,818,114 | $ | 882,660,272 | ||||
LoCorr Long/Short Commodities Strategy Fund - Consolidated Statements of Changes in Net Assets | 61 |
| Year Ended December 31, | ||||||||
| 2017 | 2016 | |||||||
| Operations | ||||||||
| Net investment loss | $ | (321,869 | ) | $ | (1,147,060 | ) | ||
| Net realized gain (loss) on investments and swap contracts | (2,351,285 | ) | 8,624,839 | |||||
| Net change in unrealized appreciation (depreciation) of investments and swap contracts | 7,660,187 | (16,234,076 | ) | |||||
| Increase (Decrease) in Net Assets From Operations | 4,987,033 | (8,756,297 | ) | |||||
| Distributions to Shareholders From | ||||||||
| Net investment income: | ||||||||
| Class A | (5,374 | ) | (1,090,668 | ) | ||||
| Class C | (1,284 | ) | (185,406 | ) | ||||
| Class I | (9,886 | ) | (2,898,594 | ) | ||||
| Total Distributions to Shareholders | (16,544 | ) | (4,174,668 | ) | ||||
| Capital Transactions (Note 6) | ||||||||
| Proceeds from shares sold | 38,229,299 | 184,501,674 | ||||||
| Reinvestment of distributions | 12,720 | 3,318,366 | ||||||
| Cost of shares redeemed | (83,412,741 | ) | (111,389,429 | ) | ||||
| Redemption fees | (124 | ) | 26,941 | |||||
| Increase (Decrease) in Net Assets From Capital Transactions | (45,170,846 | ) | 76,457,552 | |||||
| Total Increase (Decrease) in Net Assets | (40,200,357 | ) | 63,526,587 | |||||
| Net Assets | ||||||||
| Beginning of year | 123,447,395 | 59,920,808 | ||||||
| End of year (including accumulated net investment income of $0 and $16,545, respectively) | $ | 83,247,038 | $ | 123,447,395 | ||||
62 | LoCorr Multi-Strategy Fund - Consolidated Statements of Changes in Net Assets |
| Year Ended December 31, | ||||||||
| 2017 | 2016 | |||||||
| Operations | ||||||||
| Net investment income | $ | 58,799 | $ | 324,370 | ||||
| Net realized loss on investments, securities sold short and swap contracts | (1,253,705 | ) | (139,905 | ) | ||||
| Net change in unrealized appreciation of investments, securities sold short and swap contracts | 2,064,469 | 363,071 | ||||||
| Increase in Net Assets From Operations | 869,563 | 547,536 | ||||||
| Distributions to Shareholders From | ||||||||
| Net investment income: | ||||||||
| Class A | (362,158 | ) | (154,251 | ) | ||||
| Class C | (57,804 | ) | (33,115 | ) | ||||
| Class I | (487,864 | ) | (199,550 | ) | ||||
| Return of capital: | ||||||||
| Class A | (121,106 | ) | (341,141 | ) | ||||
| Class C | (19,330 | ) | (73,235 | ) | ||||
| Class I | (163,143 | ) | (441,323 | ) | ||||
| Total Distributions to Shareholders | (1,211,405 | ) | (1,242,615 | ) | ||||
| Capital Transactions (Note 6) | ||||||||
| Proceeds from shares sold | 10,685,757 | 21,301,189 | ||||||
| Reinvestment of distributions | 1,048,748 | 1,018,144 | ||||||
| Cost of shares redeemed | (24,917,170 | ) | (16,445,492 | ) | ||||
| Redemption fees | 2 | 238 | ||||||
| Increase (Decrease) in Net Assets From Capital Transactions | (13,182,663 | ) | 5,874,079 | |||||
| Total Increase (Decrease) in Net Assets | (13,524,505 | ) | 5,179,000 | |||||
| Net Assets | ||||||||
| Beginning of year | 39,333,230 | 34,154,230 | ||||||
| End of year (including accumulated net investment loss of $130,349 and $149,940, respectively) | $ | 25,808,725 | $ | 39,333,230 | ||||
LoCorr Market Trend Fund - Consolidated Statements of Changes in Net Assets | 63 |
| Year Ended December 31, | ||||||||
| 2017 | 2016 | |||||||
| Operations | ||||||||
| Net investment loss | $ | (6,679,324 | ) | $ | (14,352,202 | ) | ||
| Net realized gain (loss) on investments, forward currency contracts, futures contracts and foreign currency translation | 12,670,567 | (147,332,298 | ) | |||||
| Net change in unrealized appreciation of investments, forward currency contracts, futures contracts and foreign currency translation | 14,067,086 | 7,238,768 | ||||||
| Increase (Decrease) in Net Assets From Operations | 20,058,329 | (154,445,732 | ) | |||||
| Distributions to Shareholders From | ||||||||
| Net investment income: | ||||||||
| Class A | — | (2,324,469 | ) | |||||
| Class C | — | (1,348,021 | ) | |||||
| Class I | — | (16,192,350 | ) | |||||
| Total Distributions to Shareholders | — | (19,864,840 | ) | |||||
| Capital Transactions (Note 6) | ||||||||
| Proceeds from shares sold | 327,920,811 | 1,129,819,283 | ||||||
| Reinvestment of distributions | — | 18,880,713 | ||||||
| Cost of shares redeemed | (701,728,866 | ) | (854,994,134 | ) | ||||
| Redemption fees | 5,881 | 31,875 | ||||||
| Increase (Decrease) in Net Assets From Capital Transactions | (373,802,174 | ) | 293,737,737 | |||||
| Total Increase (Decrease) in Net Assets | (353,743,845 | ) | 119,427,165 | |||||
| Net Assets | ||||||||
| Beginning of year | 1,020,444,931 | 901,017,766 | ||||||
| End of year (including accumulated net investment loss of $368,813 and $430,397, respectively) | $ | 666,701,086 | $ | 1,020,444,931 | ||||
64 | LoCorr Dynamic Equity Fund - Statements of Changes in Net Assets |
| Year Ended December 31, | ||||||||
| 2017 | 2016 | |||||||
| Operations | ||||||||
| Net investment loss | $ | (1,961,947 | ) | $ | (1,250,712 | ) | ||
| Net realized gain on investments, securities sold short and foreign currency translation | 5,711,548 | 4,557,685 | ||||||
| Net change in unrealized appreciation (depreciation) of investments, securities sold short and foreign currency translation | (2,380,922 | ) | 6,734,680 | |||||
| Increase in Net Assets From Operations | 1,368,679 | 10,041,653 | ||||||
| Distributions to Shareholders from | ||||||||
| Net realized gain: | ||||||||
| Class A | (855,876 | ) | — | |||||
| Class C | (492,681 | ) | — | |||||
| Class I | (1,391,942 | ) | — | |||||
| Total Distributions to Shareholders | (2,740,499 | ) | — | |||||
| Capital Transactions (Note 6) | ||||||||
| Proceeds from shares sold | 53,756,244 | 59,597,625 | ||||||
| Reinvestment of distributions | 2,435,213 | — | ||||||
| Cost of shares redeemed | (75,271,431 | ) | (15,637,868 | ) | ||||
| Redemption fees | 2,283 | 2,152 | ||||||
| Increase (Decrease) in Net Assets From Capital Transactions | (19,077,691 | ) | 43,961,909 | |||||
| Total Increase (Decrease) in Net Assets | (20,449,511 | ) | 54,003,562 | |||||
| Net Assets | ||||||||
| Beginning of year | 84,276,757 | 30,273,195 | ||||||
| End of year (including accumulated net investment income of $10,940 and $0, respectively) | $ | 63,827,246 | $ | 84,276,757 | ||||
LoCorr Spectrum Income Fund - Statements of Changes in Net Assets | 65 |
| Year Ended December 31, | ||||||||
| 2017 | 2016 | |||||||
| Operations | ||||||||
| Net investment income | $ | 2,341,093 | $ | 3,408,203 | ||||
| Net realized loss on investments | (2,824,448 | ) | (4,887,348 | ) | ||||
| Net change in unrealized appreciation of investments | 3,795,364 | 6,426,460 | ||||||
| Increase in Net Assets From Operations | 3,312,009 | 4,947,315 | ||||||
| Distributions to Shareholders from | ||||||||
| Net investment income: | ||||||||
| Class A | (656,776 | ) | (1,640,399 | ) | ||||
| Class C | (434,017 | ) | (1,132,883 | ) | ||||
| Class I | (1,005,045 | ) | (1,733,891 | ) | ||||
| Return of capital: | ||||||||
| Class A | (1,857,235 | ) | (869,438 | ) | ||||
| Class C | (1,227,315 | ) | (600,446 | ) | ||||
| Class I | (2,842,070 | ) | (918,989 | ) | ||||
| Total Distributions to Shareholders | (8,022,458 | ) | (6,896,046 | ) | ||||
| Capital Transactions (Note 6) | ||||||||
| Proceeds from shares sold | 43,072,561 | 51,290,652 | ||||||
| Reinvestment of distributions | 5,356,317 | 5,104,992 | ||||||
| Cost of shares redeemed | (52,992,147 | ) | (41,752,967 | ) | ||||
| Redemption fees | 17,840 | 8,855 | ||||||
| Increase (Decrease) in Net Assets From Capital Transactions | (4,545,429 | ) | 14,651,532 | |||||
| Total Increase (Decrease) in Net Assets | (9,255,878 | ) | 12,702,801 | |||||
| Net Assets | ||||||||
| Beginning of year | 105,768,402 | 93,065,601 | ||||||
| End of year (including accumulated net investment loss of $1,339,661 and $1,508,340, respectively) | $ | 96,512,524 | $ | 105,768,402 | ||||
66 | LoCorr Macro Strategies Fund - Consolidated Financial Highlights - Class A |
| Year Ended December 31, | ||||||||||||||||||||
| 2017 | 2016 | 2015 | 2014 | 2013 | ||||||||||||||||
| Per Share | ||||||||||||||||||||
| Net asset value, beginning of year | $ | 8.91 | $ | 8.54 | $ | 8.51 | $ | 8.28 | $ | 8.77 | ||||||||||
| Income (loss) from investment operations: | ||||||||||||||||||||
Net investment income (loss)(a) | (0.06 | ) | (0.09 | ) | (0.08 | ) | (0.08 | ) | (0.07 | ) | ||||||||||
| Net realized and unrealized gain (loss) | 0.31 | 0.64 | 0.36 | 1.36 | (0.41 | ) | ||||||||||||||
| Total from Investment Operations | 0.25 | 0.55 | 0.28 | 1.28 | (0.48 | ) | ||||||||||||||
| Distributions to shareholders from: | ||||||||||||||||||||
| Net investment income | — | — | (0.25 | ) | (1.04 | ) | — | |||||||||||||
| Net realized gains | (0.52 | ) | (0.18 | ) | — | (0.01 | ) | (0.01 | ) | |||||||||||
| Total Distributions | (0.52 | ) | (0.18 | ) | (0.25 | ) | (1.05 | ) | (0.01 | ) | ||||||||||
Redemption Fees(b) | 0.00 | 0.00 | 0.00 | 0.00 | 0.00 | |||||||||||||||
| Net Asset Value, End of Year | $ | 8.64 | $ | 8.91 | $ | 8.54 | $ | 8.51 | $ | 8.28 | ||||||||||
Total Investment Return(c) | 2.77 | % | 6.39 | % | 3.27 | % | 15.42 | % | (5.53 | )% | ||||||||||
| Net Assets, End of Year, in Thousands | $ | 93,182 | $ | 297,844 | $ | 229,427 | $ | 206,931 | $ | 195,046 | ||||||||||
| Ratios/Supplemental Data: | ||||||||||||||||||||
| Ratio of expenses to average net assets: | ||||||||||||||||||||
| Before expense reimbursement or recovery | 2.33 | % | 2.34 | %(d)(e) | 2.06 | %(d)(e) | 2.11 | %(d) | 2.08 | %(d) | ||||||||||
| After expense reimbursement or recovery | 2.28 | % | 2.34 | %(d)(e) | 2.06 | %(d)(e) | 2.11 | %(d) | 2.08 | %(d) | ||||||||||
| Ratio of net investment income (loss) to average net assets: | ||||||||||||||||||||
| Before expense reimbursement or recovery | (0.76 | )% | (0.96 | )%(d) | (0.90 | )%(d) | (0.94 | )%(d) | (0.87 | )%(d) | ||||||||||
| After expense reimbursement or recovery | (0.71 | )% | (0.96 | )%(d) | (0.90 | )%(d) | (0.94 | )%(d) | (0.87 | )%(d) | ||||||||||
Portfolio turnover rate(f) | 97 | % | 62 | % | 53 | % | 57 | % | 46 | % | ||||||||||
| (a) | Net investment income (loss) per share is based on average shares outstanding. |
| (b) | Amount represents less than $0.005 per share. |
| (c) | Total investment return excludes the effect of applicable sales charges. |
| (d) | Ratios do not include the income and expenses of the CTAs included in the swap. |
| (e) | Includes interest expense of 0.01% and 0.00% for the years ended December 31, 2016 and 2015, respectively. |
| (f) | Portfolio turnover rate is calculated on the basis of the Fund as a whole without distinguishing between classes of shares issued. Consists of long-term investments only; excludes derivative instruments. |
LoCorr Macro Strategies Fund - Consolidated Financial Highlights - Class C | 67 |
| Year Ended December 31, | ||||||||||||||||||||
| 2017 | 2016 | 2015 | 2014 | 2013 | ||||||||||||||||
| Per Share | ||||||||||||||||||||
| Net asset value, beginning of year | $ | 8.62 | $ | 8.32 | $ | 8.30 | $ | 8.12 | $ | 8.65 | ||||||||||
| Income (loss) from investment operations: | ||||||||||||||||||||
Net investment income (loss)(a) | (0.13 | ) | (0.15 | ) | (0.14 | ) | (0.15 | ) | (0.14 | ) | ||||||||||
| Net realized and unrealized gain (loss) | 0.30 | 0.63 | 0.35 | 1.33 | (0.38 | ) | ||||||||||||||
| Total from Investment Operations | 0.17 | 0.48 | 0.21 | 1.18 | (0.52 | ) | ||||||||||||||
| Distributions to shareholders from: | ||||||||||||||||||||
| Net investment income | — | — | (0.19 | ) | (0.99 | ) | — | |||||||||||||
| Net realized gains | (0.52 | ) | (0.18 | ) | — | (0.01 | ) | (0.01 | ) | |||||||||||
| Total Distributions | (0.52 | ) | (0.18 | ) | (0.19 | ) | (1.00 | ) | (0.01 | ) | ||||||||||
Redemption Fees(b) | 0.00 | 0.00 | 0.00 | 0.00 | 0.00 | |||||||||||||||
| Net Asset Value, End of Year | $ | 8.27 | $ | 8.62 | $ | 8.32 | $ | 8.30 | $ | 8.12 | ||||||||||
Total Investment Return(c) | 1.93 | % | 5.72 | % | 2.51 | % | 14.39 | % | (6.07 | )% | ||||||||||
| Net Assets, End of Year, in Thousands | $ | 90,653 | $ | 113,814 | $ | 98,729 | $ | 93,924 | $ | 73,691 | ||||||||||
| Ratios/Supplemental Data: | ||||||||||||||||||||
| Ratio of expenses to average net assets: | ||||||||||||||||||||
| Before expense reimbursement or recovery | 3.08 | % | 3.09 | %(d)(e) | 2.81 | %(d)(e) | 2.86 | %(d) | 2.83 | %(d) | ||||||||||
| After expense reimbursement or recovery | 3.03 | % | 3.09 | %(d)(e) | 2.81 | %(d)(e) | 2.86 | %(d) | 2.83 | %(d) | ||||||||||
| Ratio of net investment income (loss) to average net assets: | ||||||||||||||||||||
| Before expense reimbursement or recovery | (1.51 | )% | (1.71 | )%(d) | (1.65 | )%(d) | (1.69 | )%(d) | (1.62 | )%(d) | ||||||||||
| After expense reimbursement or recovery | (1.46 | )% | (1.71 | )%(d) | (1.65 | )%(d) | (1.69 | )%(d) | (1.62 | )%(d) | ||||||||||
Portfolio turnover rate(f) | 97 | % | 62 | % | 53 | % | 57 | % | 46 | % | ||||||||||
| (a) | Net investment income (loss) per share is based on average shares outstanding. |
| (b) | Amount represents less than $0.005 per share. |
| (c) | Total investment return excludes the effect of applicable sales charges. |
| (d) | Ratios do not include the income and expenses of the CTAs included in the swap. |
| (e) | Includes interest expense of 0.01% and 0.00% for the years ended December 31, 2016 and 2015, respectively. |
| (f) | Portfolio turnover rate is calculated on the basis of the Fund as a whole without distinguishing between classes of shares issued. Consists of long-term investments only; excludes derivative instruments. |
68 | LoCorr Macro Strategies Fund - Consolidated Financial Highlights - Class I |
| Year Ended December 31, | ||||||||||||||||||||
| 2017 | 2016 | 2015 | 2014 | 2013 | ||||||||||||||||
| Per Share | ||||||||||||||||||||
| Net asset value, beginning of year | $ | 9.01 | $ | 8.62 | $ | 8.57 | $ | 8.34 | $ | 8.81 | ||||||||||
| Income (loss) from investment operations: | ||||||||||||||||||||
Net investment income (loss)(a) | (0.04 | ) | (0.07 | ) | (0.06 | ) | (0.06 | ) | (0.05 | ) | ||||||||||
| Net realized and unrealized gain (loss) | 0.32 | 0.64 | 0.38 | 1.36 | (0.41 | ) | ||||||||||||||
| Total from Investment Operations | 0.28 | 0.57 | 0.32 | 1.30 | (0.46 | ) | ||||||||||||||
| Distributions to shareholders from: | ||||||||||||||||||||
| Net investment income | — | (0.00 | )(b) | (0.27 | ) | (1.06 | ) | — | ||||||||||||
| Net realized gains | (0.52 | ) | (0.18 | ) | — | (0.01 | ) | (0.01 | ) | |||||||||||
| Total Distributions | (0.52 | ) | (0.18 | ) | (0.27 | ) | (1.07 | ) | (0.01 | ) | ||||||||||
Redemption Fees(b) | 0.00 | 0.00 | 0.00 | 0.00 | 0.00 | |||||||||||||||
| Net Asset Value, End of Year | $ | 8.77 | $ | 9.01 | $ | 8.62 | $ | 8.57 | $ | 8.34 | ||||||||||
| Total Investment Return | 3.07 | % | 6.57 | % | 3.72 | % | 15.56 | % | (5.28 | )% | ||||||||||
| Net Assets, End of Year, in Thousands | $ | 605,983 | $ | 471,002 | $ | 192,309 | $ | 190,052 | $ | 102,279 | ||||||||||
| Ratios/Supplemental Data: | ||||||||||||||||||||
| Ratio of expenses to average net assets: | ||||||||||||||||||||
| Before expense reimbursement or recovery | 2.08 | % | 2.09 | %(c)(d) | 1.81 | %(c)(d) | 1.86 | %(c) | 1.83 | %(c) | ||||||||||
| After expense reimbursement or recovery | 2.03 | % | 2.09 | %(c)(d) | 1.81 | %(c)(d) | 1.86 | %(c) | 1.83 | %(c) | ||||||||||
| Ratio of net investment income (loss) to average net assets: | ||||||||||||||||||||
| Before expense reimbursement or recovery | (0.51 | )% | (0.71 | )%(c) | (0.65 | )%(c) | (0.69 | )%(c) | (0.62 | )%(c) | ||||||||||
| After expense reimbursement or recovery | (0.46 | )% | (0.71 | )%(c) | (0.65 | )%(c) | (0.69 | )%(c) | (0.62 | )%(c) | ||||||||||
Portfolio turnover rate(e) | 97 | % | 62 | % | 53 | % | 57 | % | 46 | % | ||||||||||
| (a) | Net investment income (loss) per share is based on average shares outstanding. |
| (b) | Amount represents less than $0.005 per share. |
| (c) | Ratios do not include the income and expenses of the CTAs included in the swap. |
| (d) | Includes interest expense of 0.01% and 0.00% for the years ended December 31, 2016 and 2015, respectively. |
| (e) | Portfolio turnover rate is calculated on the basis of the Fund as a whole without distinguishing between classes of shares issued. Consists of long-term investments only; excludes derivative instruments. |
LoCorr Long/Short Commodities Strategy Fund - Consolidated Financial Highlights - Class A | 69 |
| Year Ended December 31, | ||||||||||||||||||||
| 2017 | 2016 | 2015 | 2014 | 2013 | ||||||||||||||||
| Per Share | ||||||||||||||||||||
| Net asset value, beginning of year | $ | 9.17 | $ | 9.72 | $ | 8.54 | $ | 7.67 | $ | 8.37 | ||||||||||
| Income (loss) from investment operations: | ||||||||||||||||||||
Net investment income (loss)(a) | (0.04 | ) | (0.10 | ) | (0.13 | ) | (0.14 | ) | (0.12 | ) | ||||||||||
| Net realized and unrealized gain (loss) | 0.58 | (0.18 | ) | 2.02 | 1.85 | (0.58 | ) | |||||||||||||
| Total from Investment Operations | 0.54 | (0.28 | ) | 1.89 | 1.71 | (0.70 | ) | |||||||||||||
| Distributions to shareholders from: | ||||||||||||||||||||
| Net investment income | (0.00 | )(b) | (0.27 | ) | (0.71 | ) | (0.84 | ) | — | |||||||||||
| Total Distributions | (0.00 | ) | (0.27 | ) | (0.71 | ) | (0.84 | ) | — | |||||||||||
Redemption Fees(b) | 0.00 | 0.00 | 0.00 | 0.00 | 0.00 | |||||||||||||||
| Net Asset Value, End of Year | $ | 9.71 | $ | 9.17 | $ | 9.72 | $ | 8.54 | $ | 7.67 | ||||||||||
Total Investment Return(c) | 5.91 | % | (2.98 | )% | 22.34 | % | 22.07 | % | (8.36 | )% | ||||||||||
| Net Assets, End of Year, in Thousands | $ | 25,575 | $ | 34,860 | $ | 24,425 | $ | 43,345 | $ | 3,653 | ||||||||||
Ratio/Supplemental Data:(d) | ||||||||||||||||||||
| Ratio of expenses to average net assets: | ||||||||||||||||||||
| Before expense reimbursement or recovery | 2.28 | % | 2.22 | %(e) | 2.59 | %(e) | 3.01 | %(e) | 4.18 | % | ||||||||||
| After expense reimbursement or recovery | 2.20 | % | 2.20 | %(e) | 2.20 | %(e) | 2.20 | %(e) | 2.20 | % | ||||||||||
| Ratio of net investment income (loss) to average net assets: | ||||||||||||||||||||
| Before expense reimbursement or recovery | (0.52 | )% | (0.99 | )% | (1.79 | )% | (2.39 | )% | (3.46 | )% | ||||||||||
| After expense reimbursement or recovery | (0.44 | )% | (0.97 | )% | (1.40 | )% | (1.58 | )% | (1.48 | )% | ||||||||||
Portfolio turnover rate(f) | 74 | % | 105 | % | 164 | % | 55 | % | 59 | % | ||||||||||
| (a) | Net investment income (loss) per share is based on average shares outstanding. |
| (b) | Amount represents less than $0.005 per share. |
| (c) | Total investment return excludes the effect of applicable sales charges. |
| (d) | Ratios do not include the income and expenses of the CTAs included in the swap. |
| (e) | Includes interest expense on line of credit of 0.00%, 0.00% and 0.00% for the years ended December 31, 2016, 2015 and 2014, respectively. |
| (f) | Portfolio turnover rate is calculated on the basis of the Fund as a whole without distinguishing between classes of shares issued. Consists of long-term investments only; excludes derivative instruments. |
70 | LoCorr Long/Short Commodities Strategy Fund - Consolidated Financial Highlights - Class C |
| Year Ended December 31, | ||||||||||||||||||||
| 2017 | 2016 | 2015 | 2014 | 2013 | ||||||||||||||||
| Per Share | ||||||||||||||||||||
| Net asset value, beginning of year | $ | 8.95 | $ | 9.51 | $ | 8.36 | $ | 7.54 | $ | 8.29 | ||||||||||
| Income (loss) from investment operations: | ||||||||||||||||||||
Net investment income (loss)(a) | (0.11 | ) | (0.17 | ) | (0.19 | ) | (0.20 | ) | (0.17 | ) | ||||||||||
| Net realized and unrealized gain (loss) | 0.57 | (0.18 | ) | 1.96 | 1.80 | (0.58 | ) | |||||||||||||
| Total from Investment Operations | 0.46 | (0.35 | ) | 1.77 | 1.60 | (0.75 | ) | |||||||||||||
| Distributions to shareholders from: | ||||||||||||||||||||
| Net investment income | (0.00 | )(b) | (0.21 | ) | (0.62 | ) | (0.78 | ) | — | |||||||||||
| Total Distributions | (0.00 | ) | (0.21 | ) | (0.62 | ) | (0.78 | ) | — | |||||||||||
| Redemption Fees | 0.00 | (b) | 0.00 | (b) | — | — | — | |||||||||||||
| Net Asset Value, End of Year | $ | 9.41 | $ | 8.95 | $ | 9.51 | $ | 8.36 | $ | 7.54 | ||||||||||
Total Investment Return(c) | 5.17 | % | (3.72 | )% | 21.39 | % | 21.01 | % | (9.05 | )% | ||||||||||
| Net Assets, End of Year, in Thousands | $ | 4,737 | $ | 7,383 | $ | 4,330 | $ | 2,983 | $ | 1,653 | ||||||||||
Ratio/Supplemental Data:(d) | ||||||||||||||||||||
| Ratio of expenses to average net assets: | ||||||||||||||||||||
| Before expense reimbursement or recovery | 3.03 | % | 2.97 | %(e) | 3.34 | %(e) | 3.76 | %(e) | 4.93 | % | ||||||||||
| After expense reimbursement or recovery | 2.95 | % | 2.95 | %(e) | 2.95 | %(e) | 2.95 | %(e) | 2.95 | % | ||||||||||
| Ratio of net investment income (loss) to average net assets: | ||||||||||||||||||||
| Before expense reimbursement or recovery | (1.27 | )% | (1.74 | )% | (2.54 | )% | (3.14 | )% | (4.21 | )% | ||||||||||
| After expense reimbursement or recovery | (1.19 | )% | (1.72 | )% | (2.15 | )% | (2.33 | )% | (2.23 | )% | ||||||||||
Portfolio turnover rate(f) | 74 | % | 105 | % | 164 | % | 55 | % | 59 | % | ||||||||||
| (a) | Net investment income (loss) per share is based on average shares outstanding. |
| (b) | Amount represents less than $0.005 per share. |
| (c) | Total investment return excludes the effect of applicable sales charges. |
| (d) | Ratios do not include the income and expenses of the CTAs included in the swap. |
| (e) | Includes interest expense on line of credit of 0.00%, 0.00% and 0.00% for the years ended December 31, 2016, 2015 and 2014, respectively. |
| (f) | Portfolio turnover rate is calculated on the basis of the Fund as a whole without distinguishing between classes of shares issued. Consists of long-term investments only; excludes derivative instruments. |
LoCorr Long/Short Commodities Strategy Fund - Consolidated Financial Highlights - Class I | 71 |
| Year Ended December 31, | ||||||||||||||||||||
| 2017 | 2016 | 2015 | 2014 | 2013 | ||||||||||||||||
| Per Share | ||||||||||||||||||||
| Net asset value, beginning of year | $ | 9.24 | $ | 9.79 | $ | 8.59 | $ | 7.70 | $ | 8.38 | ||||||||||
| Income (loss) from investment operations: | ||||||||||||||||||||
Net investment income (loss)(a) | (0.02 | ) | (0.07 | ) | (0.11 | ) | (0.12 | ) | (0.10 | ) | ||||||||||
| Net realized and unrealized gain (loss) | 0.59 | (0.18 | ) | 2.03 | 1.86 | (0.58 | ) | |||||||||||||
| Total from Investment Operations | 0.57 | (0.25 | ) | 1.92 | 1.74 | (0.68 | ) | |||||||||||||
| Distributions to shareholders from: | ||||||||||||||||||||
| Net investment income | (0.00 | )(b) | (0.30 | ) | (0.72 | ) | (0.85 | ) | — | |||||||||||
| Total Distributions | (0.00 | ) | (0.30 | ) | (0.72 | ) | (0.85 | ) | — | |||||||||||
Redemption Fees(b) | 0.00 | 0.00 | 0.00 | 0.00 | 0.00 | |||||||||||||||
| Net Asset Value, End of Year | $ | 9.81 | $ | 9.24 | $ | 9.79 | $ | 8.59 | $ | 7.70 | ||||||||||
| Total Investment Return | 6.19 | % | (2.67 | )% | 22.61 | % | 22.36 | % | (8.11 | )% | ||||||||||
| Net Assets, End of Year, in Thousands | $ | 52,935 | $ | 81,204 | $ | 31,166 | $ | 12,825 | $ | 5,502 | ||||||||||
Ratio/Supplemental Data:(c) | ||||||||||||||||||||
| Ratio of expenses to average net assets: | ||||||||||||||||||||
| Before expense reimbursement or recovery | 2.03 | % | 1.97 | %(d) | 2.34 | %(d) | 2.76 | %(d) | 3.93 | % | ||||||||||
| After expense reimbursement or recovery | 1.95 | % | 1.95 | %(d) | 1.95 | %(d) | 1.95 | %(d) | 1.95 | % | ||||||||||
| Ratio of net investment income (loss) to average net assets: | ||||||||||||||||||||
| Before expense reimbursement or recovery | (0.27 | )% | (0.74 | )% | (1.54 | )% | (2.14 | )% | (3.21 | )% | ||||||||||
| After expense reimbursement or recovery | (0.19 | )% | (0.72 | )% | (1.15 | )% | (1.33 | )% | (1.23 | )% | ||||||||||
Portfolio turnover rate(e) | 74 | % | 105 | % | 164 | % | 55 | % | 59 | % | ||||||||||
| (a) | Net investment income (loss) per share is based on average shares outstanding. |
| (b) | Amount represents less than $0.005 per share. |
| (c) | Ratios do not include the income and expenses of the CTAs included in the swap. |
| (d) | Includes interest expense on line of credit of 0.00%, 0.00% and 0.00% for the years ended December 31, 2016, 2015 and 2014, respectively. |
| (e) | Portfolio turnover rate is calculated on the basis of the Fund as a whole without distinguishing between classes of shares issued. Consists of long-term investments only; excludes derivative instruments. |
72 | LoCorr Multi-Strategy Fund - Consolidated Financial Highlights - Class A |
| Year Ended December 31, | Period from April 6, 2015 (commencement of operations) through | |||||||||||
| 2017 | 2016 | December 31, 2015 (a) | ||||||||||
| Per Share | ||||||||||||
| Net asset value, beginning of period | $ | 8.15 | $ | 8.31 | $ | 10.00 | ||||||
| Income (loss) from investment operations: | ||||||||||||
Net investment income (loss)(b) | 0.01 | 0.06 | 0.07 | |||||||||
| Net realized and unrealized gain (loss) | 0.40 | 0.06 | (c) | (1.58 | ) | |||||||
| Total from Investment Operations | 0.41 | 0.12 | (1.51 | ) | ||||||||
| Distributions to shareholders from: | ||||||||||||
| Net investment income | (0.21 | ) | (0.09 | ) | (0.09 | ) | ||||||
| Return of capital | (0.07 | ) | (0.19 | ) | (0.09 | ) | ||||||
| Total Distributions | (0.28 | ) | (0.28 | ) | (0.18 | ) | ||||||
| Redemption Fees | — | 0.00 | (d) | 0.00 | (d) | |||||||
| Net Asset Value, End of Period | $ | 8.28 | $ | 8.15 | $ | 8.31 | ||||||
Total Investment Return(e) | 5.17 | % | 1.41 | % | (15.14 | )% | ||||||
| Net Assets, End of Period, in Thousands | $ | 7,613 | $ | 17,149 | $ | 12,102 | ||||||
Ratio/Supplemental Data:(f)(g) | ||||||||||||
| Ratio of expenses to average net assets: | ||||||||||||
| Before expense reimbursement or recovery | 2.83 | % | 2.84 | % | 3.44 | % | ||||||
| After expense reimbursement or recovery | 2.31 | % | 2.34 | % | 2.30 | % | ||||||
| Ratio of expenses to average net assets (excluding dividend and interest expense) | ||||||||||||
| Before expense reimbursement or recovery | 2.81 | % | 2.79 | % | 3.43 | % | ||||||
| After expense reimbursement or recovery | 2.29 | % | 2.29 | % | 2.29 | % | ||||||
| Ratio of net investment income (loss) to average net assets: | ||||||||||||
| Before expense reimbursement or recovery | (0.41 | )% | 0.36 | % | (0.04 | )% | ||||||
| After expense reimbursement or recovery | 0.11 | % | 0.86 | % | 1.10 | % | ||||||
Portfolio turnover rate(h) | 85 | % | 95 | % | 38 | % | ||||||
| (a) | All ratios have been annualized except total investment return and portfolio turnover. |
| (b) | Net investment income (loss) per share is based on average shares outstanding. |
| (c) | Realized and unrealized gains and losses in this caption are balancing amounts necessary to reconcile the change in net asset value per share for the period, and may not reconcile with the Fund’s consolidated statement of operations due to share transactions for the period. |
| (d) | Amount represents less than $0.005 per share. |
| (e) | Total investment return excludes the effect of applicable sales charges. |
| (f) | Ratios do not include the income and expenses of the CTAs included in the swap. |
| (g) | Ratios do not include investment companies in which the Fund invests. |
| (h) | Portfolio turnover rate is calculated on the basis of the Fund as a whole without distinguishing between classes of shares issued. Consists of long-term investments only; excludes securities sold short and swap transactions. |
LoCorr Multi-Strategy Fund - Consolidated Financial Highlights - Class C | 73 |
| Year Ended December 31, | Period from April 6, 2015 (commencement of operations) through | |||||||||||
| 2017 | 2016 | December 31, 2015 (a) | ||||||||||
| Per Share | ||||||||||||
| Net asset value, beginning of period | $ | 8.15 | $ | 8.31 | $ | 10.00 | ||||||
| Income (loss) from investment operations: | ||||||||||||
Net investment income (loss)(b) | (0.05 | ) | 0.01 | 0.02 | ||||||||
| Net realized and unrealized gain (loss) | 0.41 | 0.03 | (c) | (1.58 | ) | |||||||
| Total from Investment Operations | 0.36 | 0.04 | (1.56 | ) | ||||||||
| Distributions to shareholders from: | ||||||||||||
| Net investment income | (0.15 | ) | (0.06 | ) | (0.06 | ) | ||||||
| Return of capital | (0.05 | ) | (0.14 | ) | (0.07 | ) | ||||||
| Total Distributions | (0.20 | ) | (0.20 | ) | (0.13 | ) | ||||||
| Redemption Fees | — | 0.00 | (d) | 0.00 | (d) | |||||||
| Net Asset Value, End of Period | $ | 8.31 | $ | 8.15 | $ | 8.31 | ||||||
Total Investment Return(e) | 4.56 | % | 0.49 | % | (15.62 | )% | ||||||
| Net Assets, End of Period, in Thousands | $ | 2,383 | $ | 3,899 | $ | 5,490 | ||||||
Ratio/Supplemental Data:(f)(g) | ||||||||||||
| Ratio of expenses to average net assets: | ||||||||||||
| Before expense reimbursement or recovery | 3.58 | % | 3.59 | % | 4.19 | % | ||||||
| After expense reimbursement or recovery | 3.06 | % | 3.09 | % | 3.05 | % | ||||||
| Ratio of expenses to average net assets (excluding dividend and interest expense) | ||||||||||||
| Before expense reimbursement or recovery | 3.56 | % | 3.54 | % | 4.18 | % | ||||||
| After expense reimbursement or recovery | 3.04 | % | 3.04 | % | 3.04 | % | ||||||
| Ratio of net investment income (loss) to average net assets: | ||||||||||||
| Before expense reimbursement or recovery | (1.16 | )% | (0.39 | )% | (0.79 | )% | ||||||
| After expense reimbursement or recovery | (0.64 | )% | 0.11 | % | 0.35 | % | ||||||
Portfolio turnover rate(h) | 85 | % | 95 | % | 38 | % | ||||||
| (a) | All ratios have been annualized except total investment return and portfolio turnover. |
| (b) | Net investment income (loss) per share is based on average shares outstanding. |
| (c) | Realized and unrealized gains and losses in this caption are balancing amounts necessary to reconcile the change in net asset value per share for the period, and may not reconcile with the Fund’s consolidated statement of operations due to share transactions for the period. |
| (d) | Amount represents less than $0.005 per share. |
| (e) | Total investment return excludes the effect of applicable sales charges. |
| (f) | Ratios do not include the income and expenses of the CTAs included in the swap. |
| (g) | Ratios do not include investment companies in which the Fund invests. |
| (h) | Portfolio turnover rate is calculated on the basis of the Fund as a whole without distinguishing between classes of shares issued. Consists of long-term investments only; excludes securities sold short and swap transactions. |
74 | LoCorr Multi-Strategy Fund - Consolidated Financial Highlights - Class I |
| Year Ended December 31, | Period from April 6, 2015 (commencement of operations) through | |||||||||||
| 2017 | 2016 | December 31, 2015 (a) | ||||||||||
| Per Share | ||||||||||||
| Net asset value, beginning of period | $ | 8.14 | $ | 8.31 | $ | 10.00 | ||||||
| Income (loss) from investment operations: | ||||||||||||
Net investment income (loss)(b) | 0.03 | 0.10 | 0.09 | |||||||||
| Net realized and unrealized gain (loss) | 0.40 | 0.03 | (c) | (1.58 | ) | |||||||
| Total from Investment Operations | 0.43 | 0.13 | (1.49 | ) | ||||||||
| Distributions to shareholders from: | ||||||||||||
| Net investment income | (0.22 | ) | (0.09 | ) | (0.10 | ) | ||||||
| Return of capital | (0.08 | ) | (0.21 | ) | (0.10 | ) | ||||||
| Total Distributions | (0.30 | ) | (0.30 | ) | (0.20 | ) | ||||||
Redemption Fees(d) | 0.00 | 0.00 | 0.00 | |||||||||
| Net Asset Value, End of Period | $ | 8.27 | $ | 8.14 | $ | 8.31 | ||||||
| Total Investment Return | 5.51 | % | 1.60 | % | (14.98 | )% | ||||||
| Net Assets, End of Period, in Thousands | $ | 15,813 | $ | 18,285 | $ | 16,562 | ||||||
Ratio/Supplemental Data:(e)(f) | ||||||||||||
| Ratio of expenses to average net assets: | ||||||||||||
| Before expense reimbursement or recovery | 2.58 | % | 2.59 | % | 3.19 | % | ||||||
| After expense reimbursement or recovery | 2.06 | % | 2.09 | % | 2.05 | % | ||||||
| Ratio of expenses to average net assets (excluding dividend and interest expense) | ||||||||||||
| Before expense reimbursement or recovery | 2.56 | % | 2.54 | % | 3.18 | % | ||||||
| After expense reimbursement or recovery | 2.04 | % | 2.04 | % | 2.04 | % | ||||||
| Ratio of net investment income (loss) to average net assets: | ||||||||||||
| Before expense reimbursement or recovery | (0.16 | )% | 0.61 | % | 0.21 | % | ||||||
| After expense reimbursement or recovery | 0.36 | % | 1.11 | % | 1.35 | % | ||||||
Portfolio turnover rate(g) | 85 | % | 95 | % | 38 | % | ||||||
| (a) | All ratios have been annualized except total investment return and portfolio turnover. |
| (b) | Net investment income (loss) per share is based on average shares outstanding. |
| (c) | Realized and unrealized gains and losses in this caption are balancing amounts necessary to reconcile the change in net asset value per share for the period, and may not reconcile with the Fund’s consolidated statement of operations due to share transactions for the period. |
| (d) | Amount represents less than $0.005 per share. |
| (e) | Ratios do not include the income and expenses of the CTAs included in the swap. |
| (f) | Ratios do not include investment companies in which the Fund invests. |
| (g) | Portfolio turnover rate is calculated on the basis of the Fund as a whole without distinguishing between classes of shares issued. Consists of long-term investments only; excludes securities sold short and swap transactions. |
LoCorr Market Trend Fund - Consolidated Financial Highlights - Class A | 75 |
| Year Ended December 31, | Period from July 1, 2014 (commencement of operations) through | |||||||||||||||
| 2017 | 2016 | 2015 | December 31, 2015 (a) | |||||||||||||
| Per Share | ||||||||||||||||
| Net asset value, beginning of period | $ | 10.65 | $ | 12.00 | $ | 11.44 | $ | 10.00 | ||||||||
| Income (loss) from investment operations: | ||||||||||||||||
Net investment income (loss)(b) | (0.10 | ) | (0.15 | ) | (0.19 | ) | (0.12 | ) | ||||||||
| Net realized and unrealized gain (loss) | 0.48 | (1.01 | ) | 0.84 | (c) | 1.99 | ||||||||||
| Total from Investment Operations | 0.38 | (1.16 | ) | 0.65 | 1.87 | |||||||||||
| Distributions to shareholders from: | ||||||||||||||||
| Net investment income | — | (0.19 | ) | (0.07 | ) | (0.25 | ) | |||||||||
| Net realized gains | — | — | (0.02 | ) | (0.18 | ) | ||||||||||
| Total Distributions | — | (0.19 | ) | (0.09 | ) | (0.43 | ) | |||||||||
Redemption Fees(d) | 0.00 | 0.00 | 0.00 | 0.00 | ||||||||||||
| Net Asset Value, End of Period | $ | 11.03 | $ | 10.65 | $ | 12.00 | $ | 11.44 | ||||||||
Total Investment Return(e) | 3.57 | % | (9.71 | )% | 5.68 | % | 18.74 | % | ||||||||
| Net Assets, End of Period, in Thousands | $ | 61,557 | $ | 133,146 | $ | 110,324 | $ | 13,337 | ||||||||
| Ratio/Supplemental Data: | ||||||||||||||||
| Ratio of expenses to average net assets: | ||||||||||||||||
| Before expense reimbursement or recovery | 2.00 | % | 2.02 | %(f) | 2.03 | % | 3.64 | % | ||||||||
| After expense reimbursement or recovery | 2.00 | % | 2.02 | %(f) | 2.06 | % | 2.20 | % | ||||||||
| Ratio of net investment income (loss) to average net assets: | ||||||||||||||||
| Before expense reimbursement or recovery | (0.97 | )% | (1.24 | )% | (1.49 | )% | (3.48 | )% | ||||||||
| After expense reimbursement or recovery | (0.97 | )% | (1.24 | )% | (1.52 | )% | (2.04 | )% | ||||||||
Portfolio turnover rate(g) | 85 | % | 83 | % | 27 | % | 6 | % | ||||||||
| (a) | All ratios have been annualized except total investment return and portfolio turnover. |
| (b) | Net investment income (loss) per share is based on average shares outstanding. |
| (c) | Realized and unrealized gains and losses per share in this caption are balancing amounts necessary to reconcile the change in net asset value per share for the period, and may not reconcile with the Fund’s consolidated statement of operations due to share transactions for the period. |
| (d) | Amount represents less than $0.005 per share. |
| (e) | Total investment return excludes the effect of applicable sales charges. |
| (f) | Includes 0.00% of interest expense for the year ended December 31, 2016. |
| (g) | Portfolio turnover rate is calculated on the basis of the Fund as a whole without distinguishing between classes of shares issued. Consists of long-term investments only; excludes derivative instruments. |
76 | LoCorr Market Trend Fund - Consolidated Financial Highlights - Class C |
| Year Ended December 31, | Period from July 1, 2014 (commencement of operations) through | |||||||||||||||
| 2017 | 2016 | 2015 | December 31, 2014 (a) | |||||||||||||
| Per Share | ||||||||||||||||
| Net asset value, beginning of period | $ | 10.53 | $ | 11.92 | $ | 11.41 | $ | 10.00 | ||||||||
| Income (loss) from investment operations: | ||||||||||||||||
Net investment income (loss)(b) | (0.18 | ) | (0.23 | ) | (0.28 | ) | (0.16 | ) | ||||||||
| Net realized and unrealized gain (loss) | 0.48 | (1.01 | ) | 0.84 | (c) | 1.99 | ||||||||||
| Total from Investment Operations | 0.30 | (1.24 | ) | 0.56 | 1.83 | |||||||||||
| Distributions to shareholders from: | ||||||||||||||||
| Net investment income | — | (0.15 | ) | (0.03 | ) | (0.24 | ) | |||||||||
| Net realized gains | — | — | (0.02 | ) | (0.18 | ) | ||||||||||
| Total Distributions | — | (0.15 | ) | (0.05 | ) | (0.42 | ) | |||||||||
Redemption Fees(d) | 0.00 | 0.00 | 0.00 | 0.00 | ||||||||||||
| Net Asset Value, End of Period | $ | 10.83 | $ | 10.53 | $ | 11.92 | $ | 11.41 | ||||||||
Total Investment Return(e) | 2.85 | % | (10.45 | )% | 4.90 | % | 18.29 | % | ||||||||
| Net Assets, End of Period, in Thousands | $ | 43,772 | $ | 89,454 | $ | 94,707 | $ | 6,949 | ||||||||
| Ratio/Supplemental Data: | ||||||||||||||||
| Ratio of expenses to average net assets: | ||||||||||||||||
| Before expense reimbursement or recovery | 2.75 | % | 2.77 | %(f) | 2.78 | % | 4.39 | % | ||||||||
| After expense reimbursement or recovery | 2.75 | % | 2.77 | %(f) | 2.81 | % | 2.95 | % | ||||||||
| Ratio of net investment income (loss) to average net assets: | ||||||||||||||||
| Before expense reimbursement or recovery | (1.72 | )% | (1.99 | )% | (2.24 | )% | (4.23 | )% | ||||||||
| After expense reimbursement or recovery | (1.72 | )% | (1.99 | )% | (2.27 | )% | (2.79 | )% | ||||||||
Portfolio turnover rate(g) | 85 | % | 83 | % | 27 | % | 6 | % | ||||||||
| (a) | All ratios have been annualized except total investment return and portfolio turnover. |
| (b) | Net investment income (loss) per share is based on average shares outstanding. |
| (c) | Realized and unrealized gains and losses per share in this caption are balancing amounts necessary to reconcile the change in net asset value per share for the period, and may not reconcile with the Fund’s consolidated statement of operations due to share transactions for the period. |
| (d) | Amount represents less than $0.005 per share. |
| (e) | Total investment return excludes the effect of applicable sales charges. |
| (f) | Includes 0.00% of interest expense for the year ended December 31, 2016. |
| (g) | Portfolio turnover rate is calculated on the basis of the Fund as a whole without distinguishing between classes of shares issued. Consists of long-term investments only; excludes derivative instruments. |
LoCorr Market Trend Fund - Consolidated Financial Highlights - Class I | 77 |
| Year Ended December 31, | Period from July 1, 2014 (commencement of operations) through | |||||||||||||||
| 2017 | 2016 | 2015 | December 31, 2014 (a) | |||||||||||||
| Per Share | ||||||||||||||||
| Net asset value, beginning of period | $ | 10.68 | $ | 12.02 | $ | 11.45 | $ | 10.00 | ||||||||
| Income (loss) from investment operations: | ||||||||||||||||
Net investment income (loss)(b) | (0.08 | ) | (0.12 | ) | (0.16 | ) | (0.10 | ) | ||||||||
| Net realized and unrealized gain (loss) | 0.49 | (1.02 | ) | 0.84 | (c) | 1.99 | ||||||||||
| Total from Investment Operations | 0.41 | (1.14 | ) | 0.68 | 1.89 | |||||||||||
| Distributions to shareholders from: | ||||||||||||||||
| Net investment income | — | (0.20 | ) | (0.09 | ) | (0.26 | ) | |||||||||
| Net realized gains | — | — | (0.02 | ) | (0.18 | ) | ||||||||||
| Total Distributions | — | (0.20 | ) | (0.11 | ) | (0.44 | ) | |||||||||
Redemption Fees(d) | 0.00 | 0.00 | 0.00 | 0.00 | ||||||||||||
| Net Asset Value, End of Period | $ | 11.09 | $ | 10.68 | $ | 12.02 | $ | 11.45 | ||||||||
| Total Investment Return | 3.84 | % | (9.49 | )% | 5.96 | % | 18.88 | % | ||||||||
| Net Assets, End of Period, in Thousands | $ | 561,372 | $ | 797,845 | $ | 695,987 | $ | 40,192 | ||||||||
| Ratio/Supplemental Data: | ||||||||||||||||
| Ratio of expenses to average net assets: | ||||||||||||||||
| Before expense reimbursement or recovery | 1.75 | % | 1.77 | %(e) | 1.78 | % | 3.39 | % | ||||||||
| After expense reimbursement or recovery | 1.75 | % | 1.77 | %(e) | 1.81 | % | 1.95 | % | ||||||||
| Ratio of net investment income (loss) to average net assets: | ||||||||||||||||
| Before expense reimbursement or recovery | (0.72 | )% | (0.99 | )% | (1.24 | )% | (3.23 | )% | ||||||||
| After expense reimbursement or recovery | (0.72 | )% | (0.99 | )% | (1.27 | )% | (1.79 | )% | ||||||||
Portfolio turnover rate(f) | 85 | % | 83 | % | 27 | % | 6 | % | ||||||||
| (a) | All ratios have been annualized except total investment return and portfolio turnover. |
| (b) | Net investment income (loss) per share is based on average shares outstanding. |
| (c) | Realized and unrealized gains and losses per share in this caption are balancing amounts necessary to reconcile the change in net asset value per share for the period, and may not reconcile with the Fund’s consolidated statement of operations due to share transactions for the period. |
| (d) | Amount represents less than $0.005 per share. |
| (e) | Includes 0.00% of interest expense for the year ended December 31, 2016. |
| (f) | Portfolio turnover rate is calculated on the basis of the Fund as a whole without distinguishing between classes of shares issued. Consists of long-term investments only; excludes derivative instruments. |
| 78 | | LoCorr Dynamic Equity Fund - Financial Highlights - Class A |
| Year Ended December 31, | Period from May 10, 2013 (commencement of operations) | |||||||||||||||||||
through December 31, 2013 (a) | ||||||||||||||||||||
| 2017 | 2016 | 2015 | 2014 | |||||||||||||||||
| Per Share | ||||||||||||||||||||
| Net asset value, beginning of period | $ | 12.06 | $ | 9.64 | $ | 9.80 | $ | 11.48 | $ | 10.00 | ||||||||||
| Income (loss) from investment operations: | ||||||||||||||||||||
Net investment income (loss)(b) | (0.30 | ) | (0.32 | ) | (0.27 | ) | (0.22 | ) | (0.13 | ) | ||||||||||
| Net realized and unrealized gain (loss) | 0.59 | 2.74 | 0.11 | (1.42 | ) | 1.61 | ||||||||||||||
| Total from Investment Operations | 0.29 | 2.42 | (0.16 | ) | (1.64 | ) | 1.48 | |||||||||||||
| Distributions to shareholders from: | ||||||||||||||||||||
| Net realized gains | (0.53 | ) | — | — | (0.04 | ) | — | |||||||||||||
| Total Distributions | (0.53 | ) | — | — | (0.04 | ) | — | |||||||||||||
Redemption Fees(c) | 0.00 | 0.00 | 0.00 | 0.00 | 0.00 | |||||||||||||||
| Net Asset Value, End of Period | $ | 11.82 | $ | 12.06 | $ | 9.64 | $ | 9.80 | $ | 11.48 | ||||||||||
Total Investment Return(d) | 2.38 | % | 25.10 | % | (1.53 | )% | (14.37 | )% | 14.80 | % | ||||||||||
| Net Assets, End of Period, in Thousands | $ | 19,962 | $ | 28,243 | $ | 12,446 | $ | 17,174 | $ | 21,256 | ||||||||||
| Ratio/Supplemental Data: | ||||||||||||||||||||
| Ratio of expenses to average net assets: | ||||||||||||||||||||
| Before expense reimbursement or recovery | 3.42 | % | 3.74 | % | 3.72 | % | 3.55 | % | 5.05 | % | ||||||||||
| After expense reimbursement or recovery | 3.35 | % | 3.49 | % | 3.35 | % | 3.30 | % | 3.26 | % | ||||||||||
| Ratio of expenses to average net assets (excluding dividend and interest expense): | ||||||||||||||||||||
| Before expense reimbursement or recovery | 3.22 | % | 3.40 | % | 3.52 | % | 3.40 | % | 4.94 | % | ||||||||||
| After expense reimbursement or recovery | 3.15 | % | 3.15 | % | 3.15 | % | 3.15 | % | 3.15 | % | ||||||||||
| Ratio of net investment income (loss) to average net assets: | ||||||||||||||||||||
| Before expense reimbursement or recovery | (2.61 | )% | (3.23 | )% | (3.06 | )% | (2.41 | )% | (3.64 | )% | ||||||||||
| After expense reimbursement or recovery | (2.54 | )% | (2.98 | )% | (2.69 | )% | (2.16 | )% | (1.85 | )% | ||||||||||
Portfolio turnover rate(e) | 363 | % | 343 | % | 269 | % | 256 | % | 66 | % | ||||||||||
| (a) | All ratios have been annualized except total investment return and portfolio turnover. |
| (b) | Net investment income (loss) per share is based on average shares outstanding. |
| (c) | Amount represents less than $0.005 per share. |
| (d) | Total investment return excludes the effect of applicable sales charges. |
| (e) | Portfolio turnover rate is calculated on the basis of the Fund as a whole without distinguishing between classes of shares issued. Consists of long-term investments only; excludes securities sold short. |
LoCorr Dynamic Equity Fund - Financial Highlights - Class C | | 79 |
Period from May 10, 2013 (commencement of operations) | ||||||||||||||||||||
| Year Ended December 31, | through December 31, 2013 (a) | |||||||||||||||||||
| 2017 | 2016 | 2015 | 2014 | |||||||||||||||||
| Per Share | ||||||||||||||||||||
| Net asset value, beginning of period | $ | 11.73 | $ | 9.45 | $ | 9.67 | $ | 11.42 | $ | 10.00 | ||||||||||
| Income (loss) from investment operations: | ||||||||||||||||||||
Net investment income (loss)(b) | (0.38 | ) | (0.38 | ) | (0.33 | ) | (0.29 | ) | (0.18 | ) | ||||||||||
| Net realized and unrealized gain (loss) | 0.57 | 2.66 | 0.11 | (1.42 | ) | 1.60 | ||||||||||||||
| Total from Investment Operations | 0.19 | 2.28 | (0.22 | ) | (1.71 | ) | 1.42 | |||||||||||||
| Distributions to shareholders from: | ||||||||||||||||||||
| Net realized gains | (0.53 | ) | — | — | (0.04 | ) | — | |||||||||||||
| Total Distributions | (0.53 | ) | — | — | (0.04 | ) | — | |||||||||||||
| Redemption Fees | 0.00 | (c) | 0.00 | (c) | 0.00 | (c) | 0.00 | (c) | — | |||||||||||
| Net Asset Value, End of Period | $ | 11.39 | $ | 11.73 | $ | 9.45 | $ | 9.67 | $ | 11.42 | ||||||||||
Total Investment Return(d) | 1.59 | % | 24.13 | % | (2.28 | )% | (14.98 | )% | 14.20 | % | ||||||||||
| Net Assets, End of Period, in Thousands | $ | 11,084 | $ | 11,218 | $ | 7,837 | $ | 12,158 | $ | 8,443 | ||||||||||
| Ratio/Supplemental Data: | ||||||||||||||||||||
| Ratio of expenses to average net assets: | ||||||||||||||||||||
| Before expense reimbursement or recovery | 4.17 | % | 4.49 | % | 4.47 | % | 4.30 | % | 5.80 | % | ||||||||||
| After expense reimbursement or recovery | 4.10 | % | 4.24 | % | 4.10 | % | 4.05 | % | 4.01 | % | ||||||||||
| Ratio of expenses to average net assets (excluding dividend and interest expense): | ||||||||||||||||||||
| Before expense reimbursement or recovery | 3.97 | % | 4.15 | % | 4.27 | % | 4.15 | % | 5.69 | % | ||||||||||
| After expense reimbursement or recovery | 3.90 | % | 3.90 | % | 3.90 | % | 3.90 | % | 3.90 | % | ||||||||||
| Ratio of net investment income (loss) to average net assets: | ||||||||||||||||||||
| Before expense reimbursement or recovery | (3.36 | )% | (3.98 | )% | (3.81 | )% | (3.16 | )% | (4.39 | )% | ||||||||||
| After expense reimbursement or recovery | (3.29 | )% | (3.73 | )% | (3.44 | )% | (2.91 | )% | (2.60 | )% | ||||||||||
Portfolio turnover rate(e) | 363 | % | 343 | % | 269 | % | 256 | % | 66 | % | ||||||||||
| (a) | All ratios have been annualized except total investment return and portfolio turnover. |
| (b) | Net investment income (loss) per share is based on average shares outstanding. |
| (c) | Amount represents less than $0.005 per share. |
| (d) | Total investment return excludes the effect of applicable sales charges. |
| (e) | Portfolio turnover rate is calculated on the basis of the Fund as a whole without distinguishing between classes of shares issued. Consists of long-term investments only; excludes securities sold short. |
| 80 | | LoCorr Dynamic Equity Fund - Financial Highlights - Class I |
| Year Ended December 31, | Period from May 10, 2013 (commencement of operations) | |||||||||||||||||||
through December 31, 2013 (a) | ||||||||||||||||||||
| 2017 | 2016 | 2015 | 2014 | |||||||||||||||||
| Per Share | ||||||||||||||||||||
| Net asset value, beginning of period | $ | 12.17 | $ | 9.71 | $ | 9.84 | $ | 11.50 | $ | 10.00 | ||||||||||
| Income (loss) from investment operations: | ||||||||||||||||||||
Net investment income (loss)(b) | (0.28 | ) | (0.30 | ) | (0.24 | ) | (0.20 | ) | (0.11 | ) | ||||||||||
| Net realized and unrealized gain (loss) | 0.60 | 2.76 | 0.11 | (1.42 | ) | 1.61 | ||||||||||||||
| Total from Investment Operations | 0.32 | 2.46 | (0.13 | ) | (1.62 | ) | 1.50 | |||||||||||||
| Distributions to shareholders from: | ||||||||||||||||||||
| Net realized gains | (0.53 | ) | — | — | (0.04 | ) | — | |||||||||||||
| Total Distributions | (0.53 | ) | — | — | (0.04 | ) | — | |||||||||||||
Redemption Fees(c) | 0.00 | 0.00 | 0.00 | 0.00 | 0.00 | |||||||||||||||
| Net Asset Value, End of Period | $ | 11.96 | $ | 12.17 | $ | 9.71 | $ | 9.84 | $ | 11.50 | ||||||||||
| Total Investment Return | 2.60 | % | 25.33 | % | (1.22 | )% | (14.18 | )% | 15.00 | % | ||||||||||
| Net Assets, End of Period, in Thousands | $ | 32,781 | $ | 44,816 | $ | 9,990 | $ | 12,304 | $ | 12,361 | ||||||||||
| Ratio/Supplemental Data: | ||||||||||||||||||||
| Ratio of expenses to average net assets: | ||||||||||||||||||||
| Before expense reimbursement or recovery | 3.17 | % | 3.49 | % | 3.47 | % | 3.30 | % | 4.80 | % | ||||||||||
| After expense reimbursement or recovery | 3.10 | % | 3.24 | % | 3.10 | % | 3.05 | % | 3.01 | % | ||||||||||
| Ratio of expenses to average net assets (excluding dividend and interest expense): | ||||||||||||||||||||
| Before expense reimbursement or recovery | 2.97 | % | 3.15 | % | 3.27 | % | 3.15 | % | 4.69 | % | ||||||||||
| After expense reimbursement or recovery | 2.90 | % | 2.90 | % | 2.90 | % | 2.90 | % | 2.90 | % | ||||||||||
| Ratio of net investment income (loss) to average net assets: | ||||||||||||||||||||
| Before expense reimbursement or recovery | (2.36 | )% | (2.98 | )% | (2.81 | )% | (2.16 | )% | (3.39 | )% | ||||||||||
| After expense reimbursement or recovery | (2.29 | )% | (2.73 | )% | (2.44 | )% | (1.91 | )% | (1.60 | )% | ||||||||||
Portfolio turnover rate(d) | 363 | % | 343 | % | 269 | % | 256 | % | 66 | % | ||||||||||
| (a) | All ratios have been annualized except total investment return and portfolio turnover. |
| (b) | Net investment income (loss) per share is based on average shares outstanding. |
| (c) | Amount represents less than $0.005 per share. |
| (d) | Portfolio turnover rate is calculated on the basis of the Fund as a whole without distinguishing between classes of shares issued. Consists of long-term investments only; excludes securities sold short. |
LoCorr Spectrum Income Fund - Financial Highlights - Class A | | 81 |
| Year Ended December 31, | ||||||||||||||||
| 2017 | 2016 | 2015 | 2014 | |||||||||||||
| Per Share | ||||||||||||||||
| Net asset value, beginning of year | $ | 7.70 | $ | 7.78 | $ | 8.97 | $ | 10.00 | ||||||||
| Income (loss) from investment operations: | ||||||||||||||||
Net investment income (loss)(a) | 0.17 | 0.29 | 0.38 | 0.41 | ||||||||||||
| Net realized and unrealized gain (loss) | 0.09 | 0.20 | (1.00 | ) | (0.91 | ) | ||||||||||
| Total from Investment Operations | 0.26 | 0.49 | (0.62 | ) | (0.50 | ) | ||||||||||
| Distributions to shareholders from: | ||||||||||||||||
| Net investment income | (0.15 | ) | (0.37 | ) | (0.39 | ) | (0.36 | ) | ||||||||
| Return of capital | (0.42 | ) | (0.20 | ) | (0.18 | ) | (0.17 | ) | ||||||||
| Total Distributions | (0.57 | ) | (0.57 | ) | (0.57 | ) | (0.53 | ) | ||||||||
Redemption Fees(b) | 0.00 | 0.00 | 0.00 | 0.00 | ||||||||||||
| Net Asset Value, End of Year | $ | 7.39 | $ | 7.70 | $ | 7.78 | $ | 8.97 | ||||||||
Total Investment Return(c) | 3.50 | % | 6.64 | % | (7.36 | )% | (5.45 | )% | ||||||||
| Net Assets, End of Year, in Thousands | $ | 29,970 | $ | 33,032 | $ | 36,957 | $ | 37,425 | ||||||||
Ratio/Supplemental Data:(d) | ||||||||||||||||
| Ratio of expenses to average net assets: | ||||||||||||||||
| Before expense reimbursement or recovery | 1.95 | % | 2.02 | % | 1.99 | %(e) | 2.28 | %(e) | ||||||||
| After expense reimbursement or recovery | 1.99 | % | 2.05 | % | 2.05 | %(e) | 2.05 | %(e) | ||||||||
| Ratio of net investment income (loss) to average net assets: | ||||||||||||||||
| Before expense reimbursement or recovery | 2.27 | % | 3.81 | % | 4.41 | % | 3.88 | % | ||||||||
| After expense reimbursement or recovery | 2.23 | % | 3.78 | % | 4.35 | % | 4.11 | % | ||||||||
Portfolio turnover rate(f) | 84 | % | 92 | % | 54 | % | 43 | % | ||||||||
| (a) | Net investment income (loss) per share is based on average shares outstanding. |
| (b) | Amount represents less than $0.005 per share. |
| (c) | Total investment return excludes the effect of applicable sales charges. |
| (d) | Ratios do not include the expenses of the investment companies in which the Fund invests. |
| (e) | Includes interest expense on line of credit of 0.00% and 0.00% for the years ended December 31, 2015 and 2014, respectively. |
| (f) | Portfolio turnover rate is calculated on the basis of the Fund as a whole without distinguishing between classes of shares issued. |
| 82 | | LoCorr Spectrum Income Fund - Financial Highlights - Class C |
| Year Ended December 31, | ||||||||||||||||
| 2017 | 2016 | 2015 | 2014 | |||||||||||||
| Per Share | ||||||||||||||||
| Net asset value, beginning of year | $ | 7.72 | $ | 7.78 | $ | 8.96 | $ | 10.00 | ||||||||
| Income (loss) from investment operations: | ||||||||||||||||
Net investment income (loss)(a) | 0.11 | 0.23 | 0.32 | 0.33 | ||||||||||||
| Net realized and unrealized gain (loss) | 0.09 | 0.21 | (1.00 | ) | (0.91 | ) | ||||||||||
| Total from Investment Operations | 0.20 | 0.44 | (0.68 | ) | (0.58 | ) | ||||||||||
| Distributions to shareholders from: | ||||||||||||||||
| Net investment income | (0.13 | ) | (0.33 | ) | (0.34 | ) | (0.31 | ) | ||||||||
| Return of capital | (0.37 | ) | (0.17 | ) | (0.16 | ) | (0.15 | ) | ||||||||
| Total Distributions | (0.50 | ) | (0.50 | ) | (0.50 | ) | (0.46 | ) | ||||||||
Redemption Fees(b) | 0.00 | 0.00 | 0.00 | 0.00 | ||||||||||||
| Net Asset Value, End of Year | $ | 7.42 | $ | 7.72 | $ | 7.78 | $ | 8.96 | ||||||||
Total Investment Return(c) | 2.62 | % | 5.88 | % | (8.05 | )% | (6.19 | )% | ||||||||
| Net Assets, End of Year, in Thousands | $ | 23,511 | $ | 25,898 | $ | 27,817 | $ | 25,210 | ||||||||
Ratio/Supplemental Data:(d) | ||||||||||||||||
| Ratio of expenses to average net assets: | ||||||||||||||||
| Before expense reimbursement or recovery | 2.70 | % | 2.77 | % | 2.74 | %(e) | 3.03 | %(e) | ||||||||
| After expense reimbursement or recovery | 2.74 | % | 2.80 | % | 2.80 | %(e) | 2.80 | %(e) | ||||||||
| Ratio of net investment income (loss) to average net assets: | ||||||||||||||||
| Before expense reimbursement or recovery | 1.52 | % | 3.06 | % | 3.66 | % | 3.13 | % | ||||||||
| After expense reimbursement or recovery | 1.48 | % | 3.03 | % | 3.60 | % | 3.36 | % | ||||||||
Portfolio turnover rate(f) | 84 | % | 92 | % | 54 | % | 43 | % | ||||||||
| (a) | Net investment income (loss) per share is based on average shares outstanding. |
| (b) | Amount represents less than $0.005 per share. |
| (c) | Total investment return excludes the effect of applicable sales charges. |
| (d) | Ratios do not include the expenses of the investment companies in which the Fund invests. |
| (e) | Includes interest expense on line of credit of 0.00% and 0.00% for the years ended December 31, 2015 and 2014, respectively. |
| (f) | Portfolio turnover rate is calculated on the basis of the Fund as a whole without distinguishing between classes of shares issued. |
LoCorr Spectrum Income Fund - Financial Highlights - Class I | | 83 |
| Year Ended December 31, | ||||||||||||||||
| 2017 | 2016 | 2015 | 2014 | |||||||||||||
| Per Share | ||||||||||||||||
| Net asset value, beginning of year | $ | 7.69 | $ | 7.78 | $ | 8.97 | $ | 10.00 | ||||||||
| Income (loss) from investment operations: | ||||||||||||||||
Net investment income (loss)(a) | 0.19 | 0.31 | 0.41 | 0.43 | ||||||||||||
| Net realized and unrealized gain (loss) | 0.10 | 0.20 | (1.00 | ) | (0.91 | ) | ||||||||||
| Total from Investment Operations | 0.29 | 0.51 | (0.59 | ) | (0.48 | ) | ||||||||||
| Distributions to shareholders from: | ||||||||||||||||
| Net investment income | (0.16 | ) | (0.39 | ) | (0.41 | ) | (0.38 | ) | ||||||||
| Return of capital | (0.44 | ) | (0.21 | ) | (0.19 | ) | (0.17 | ) | ||||||||
| Total Distributions | (0.60 | ) | (0.60 | ) | (0.60 | ) | (0.55 | ) | ||||||||
Redemption Fees(b) | 0.00 | 0.00 | 0.00 | 0.00 | ||||||||||||
| Net Asset Value, End of Year | $ | 7.38 | $ | 7.69 | $ | 7.78 | $ | 8.97 | ||||||||
| Total Investment Return | 3.85 | % | 6.85 | % | (7.10 | )% | (5.23 | )% | ||||||||
| Net Assets, End of Year, in Thousands | $ | 43,032 | $ | 46,838 | $ | 28,292 | $ | 31,428 | ||||||||
Ratio/Supplemental Data:(c) | ||||||||||||||||
| Ratio of expenses to average net assets: | ||||||||||||||||
| Before expense reimbursement or recovery | 1.70 | % | 1.77 | % | 1.74 | %(d) | 2.03 | %(d) | ||||||||
| After expense reimbursement or recovery | 1.74 | % | 1.80 | % | 1.80 | %(d) | 1.80 | %(d) | ||||||||
| Ratio of net investment income (loss) to average net assets: | ||||||||||||||||
| Before expense reimbursement or recovery | 2.52 | % | 4.06 | % | 4.66 | % | 4.13 | % | ||||||||
| After expense reimbursement or recovery | 2.48 | % | 4.03 | % | 4.60 | % | 4.36 | % | ||||||||
Portfolio turnover rate(e) | 84 | % | 92 | % | 54 | % | 43 | % | ||||||||
| (a) | Net investment income (loss) per share is based on average shares outstanding. |
| (b) | Amount represents less than $0.005 per share. |
| (c) | Ratios do not include the expenses of the investment companies in which the Fund invests. |
| (d) | Includes interest expense on line of credit of 0.00% and 0.00% for the years ended December 31, 2015 and 2014, respectively. |
| (e) | Portfolio turnover rate is calculated on the basis of the Fund as a whole without distinguishing between classes of shares issued. |
| 84 | | LoCorr Macro Strategies Fund, LoCorr Long/Short Commodities Strategy Fund, LoCorr Multi-Strategy Fund, and LoCorr Market Trend Fund – Notes to Consolidated Financial Statements / LoCorr Dynamic Equity Fund and LoCorr Spectrum Income Fund – Notes to Financial Statements |
LoCorr Macro Strategies Fund, LoCorr Long/Short Commodities Strategy Fund, LoCorr Multi-Strategy Fund, and LoCorr Market Trend Fund – Notes to Consolidated Financial Statements / LoCorr Dynamic Equity Fund and LoCorr Spectrum Income Fund – Notes to Financial Statements (continued) | | 85 |
| Commencement of Operations | ||||||
| Class A | Class C | Class I | ||||
| LoCorr Macro Strategies Fund | March 22, 2011 | March 24, 2011 | March 24, 2011 | |||
| LoCorr Long/Short Commodities Strategy Fund | January 1, 2012 | January 1, 2012 | January 1, 2012 | |||
| LoCorr Dynamic Equity Fund | May 10, 2013 | May 10, 2013 | May 10, 2013 | |||
| LoCorr Spectrum Income Fund | January 1, 2014 | January 1, 2014 | January 1, 2014 | |||
| LoCorr Market Trend Fund | July 1, 2014 | July 1, 2014 | July 1, 2014 | |||
| LoCorr Multi-Strategy Fund | April 6, 2015 | April 6, 2015 | April 6, 2015 | |||
| 86 | | LoCorr Macro Strategies Fund, LoCorr Long/Short Commodities Strategy Fund, LoCorr Multi-Strategy Fund, and LoCorr Market Trend Fund – Notes to Consolidated Financial Statements / LoCorr Dynamic Equity Fund and LoCorr Spectrum Income Fund – Notes to Financial Statements |
LoCorr Macro Strategies Fund, LoCorr Long/Short Commodities Strategy Fund, LoCorr Multi-Strategy Fund, and LoCorr Market Trend Fund – Notes to Consolidated Financial Statements / LoCorr Dynamic Equity Fund and LoCorr Spectrum Income Fund – Notes to Financial Statements (continued) | | 87 |
| • | securities for which market quotations are not readily available at the valuation time on a particular business day (including without limitation securities for which there is a short and temporary lapse in the provision of a price by the regular pricing source); |
| • | securities for which market quotations are not readily available at the valuation time on a particular business day (including without limitation securities for which there is a short and temporary lapse in the provision of a price by the regular pricing source); |
| • | securities determined to be illiquid in accordance with the Trust’s Liquidity Procedures; and |
| • | securities with respect to which an event that will affect the value thereof has occurred subsequent to the determination by the Adviser/relevant Sub-Adviser of the closing prices reported on the principal exchange on which the securities are traded, but prior to the relevant Fund’s calculation of its NAV. |
| • | For any open-end mutual funds that do not provide timely NAV information, the Adviser/relevant Sub-Adviser shall evaluate those ‘similar’ funds and determine which are most appropriate based on funds having similar benchmarks or similar objectives. The Adviser/relevant Sub-Adviser shall then calculate the NAV percentage move of those ‘similar’ funds for the day to create an aggregate average percentage move, which it shall use to calculate the price movement for the day of the Fund at issue. For closed-end funds, the aforementioned practice shall be utilized, in addition to monitoring secondary market activity during the day. |
| • | a multiple of earnings; |
| • | a discount from market of a similar freely traded security (including a derivative security or a basket of securities traded on other markets, exchanges or among dealers); or |
| • | yield to maturity with respect to debt issues, or a combination of these and other methods. |
| 88 | | LoCorr Macro Strategies Fund, LoCorr Long/Short Commodities Strategy Fund, LoCorr Multi-Strategy Fund, and LoCorr Market Trend Fund – Notes to Consolidated Financial Statements / LoCorr Dynamic Equity Fund and LoCorr Spectrum Income Fund – Notes to Financial Statements |
| • | the fundamental analytical data relating to the investment; |
| • | the nature and duration of restrictions (if any) on disposition of the securities; |
| • | evaluation of the forces that influence the market in which these securities are purchased or sold; |
| • | changes in interest rates; changes in interest rates; |
| • | government (domestic or foreign) actions or pronouncements; and |
| • | other new events other news events. |
| • | type of security;type of security; |
| • | financial statements of the issuer; |
| • | cost at date of purchase; |
| • | size of holding; size of holding; |
| • | discount from market value of unrestricted securities of the same class at time of purchase; |
| • | special reports prepared by analysts; special reports prepared by analysts; |
| • | information as to any transactions or offers with respect to the security; |
| • | existence of merger proposals or tender offers affecting the securities; |
| • | price and extent of public trading in similar securities of the issuer or comparable companies; and |
| • | other relevant matters other relevant matters. |
LoCorr Macro Strategies Fund, LoCorr Long/Short Commodities Strategy Fund, LoCorr Multi-Strategy Fund, and LoCorr Market Trend Fund – Notes to Consolidated Financial Statements / LoCorr Dynamic Equity Fund and LoCorr Spectrum Income Fund – Notes to Financial Statements (continued) | | 89 |
| Security Classification | Level 1 | Level 2 | Level 3 | Total | ||||||||||||
| Investments | ||||||||||||||||
| Asset Backed Securities | $ | — | $ | 151,327,096 | $ | — | $ | 151,327,096 | ||||||||
| Corporate Bonds | — | 257,474,011 | — | 257,474,011 | ||||||||||||
| Mortgage Backed Securities | — | 119,386,283 | — | 119,386,283 | ||||||||||||
| Municipal Bonds | — | 3,121,240 | — | 3,121,240 | ||||||||||||
| U.S. Government Agency Issues | — | 98,555,811 | — | 98,555,811 | ||||||||||||
| U.S. Government Notes | — | 41,811,073 | — | 41,811,073 | ||||||||||||
| Short Term Investments | 29,668,903 | 3,192,751 | — | 32,861,654 | ||||||||||||
| Total Investments | $ | 29,668,903 | $ | 674,868,265 | $ | — | $ | 704,537,168 | ||||||||
| Other Financial Instruments* | ||||||||||||||||
| Forward Currency Contracts | ||||||||||||||||
| Long | $ | — | $ | 5,368,970 | $ | — | $ | 5,368,970 | ||||||||
| Short | — | (10,106,500 | ) | — | (10,106,500 | ) | ||||||||||
| Total Forward Currency Contracts | — | (4,737,530 | ) | — | (4,737,530 | ) | ||||||||||
| Futures Contracts | ||||||||||||||||
| Long | 12,580,560 | — | — | 12,580,560 | ||||||||||||
| Short | 13,766 | — | — | 13,766 | ||||||||||||
| Total Futures Contracts | 12,594,326 | — | — | 12,594,326 | ||||||||||||
| Total Other Financial Instruments | $ | 12,594,326 | $ | (4,737,530 | ) | $ | — | $ | 7,856,796 | |||||||
| Security Classification | Level 1 | Level 2 | Level 3 | Total | ||||||||||||
| Investments | ||||||||||||||||
| Asset Backed Securities | $ | — | $ | 14,269,873 | $ | — | $ | 14,269,873 | ||||||||
| Corporate Bonds | — | 22,682,164 | — | 22,682,164 | ||||||||||||
| Foreign Government Bond | — | 12,371 | — | 12,371 | ||||||||||||
| Mortgage Backed Securities | — | 8,798,847 | — | 8,798,847 | ||||||||||||
| Municipal Bonds | — | 495,138 | — | 495,138 | ||||||||||||
| U.S. Government Agency Issues | — | 8,714,281 | — | 8,714,281 | ||||||||||||
| U.S. Government Notes | — | 3,899,016 | — | 3,899,016 | ||||||||||||
| Short Term Investment | 3,748,612 | — | — | 3,748,612 | ||||||||||||
| Total Investments | $ | 3,748,612 | $ | 58,871,690 | $ | — | $ | 62,620,302 | ||||||||
| Swap Contracts* | ||||||||||||||||
| Long Total Return Swap Contracts | $ | — | $ | (11,519,719 | ) | $ | — | $ | (11,519,719 | ) | ||||||
| Total Swap Contracts | $ | — | $ | (11,519,719 | ) | $ | — | $ | (11,519,719 | ) | ||||||
| 90 | | LoCorr Macro Strategies Fund, LoCorr Long/Short Commodities Strategy Fund, LoCorr Multi-Strategy Fund, and LoCorr Market Trend Fund – Notes to Consolidated Financial Statements / LoCorr Dynamic Equity Fund and LoCorr Spectrum Income Fund – Notes to Financial Statements |
| Security Classification | Level 1 | Level 2 | Level 3 | Total | ||||||||||||
| Investments | ||||||||||||||||
| Business Development Companies | $ | 1,452,768 | $ | — | $ | — | $ | 1,452,768 | ||||||||
| Closed-End Investment Companies | 1,320,015 | — | — | 1,320,015 | ||||||||||||
| Common Stocks | 5,669,643 | — | — | 5,669,643 | ||||||||||||
| Convertible Preferred Stock | 413,992 | — | — | 413,992 | ||||||||||||
| Master Limited Partnerships | 2,962,160 | — | — | 2,962,160 | ||||||||||||
| Preferred Stocks | 257,649 | — | — | 257,649 | ||||||||||||
| Publicly Traded Partnerships | 1,155,984 | — | — | 1,155,984 | ||||||||||||
| Real Estate Investment Trusts | 2,305,200 | — | — | 2,305,200 | ||||||||||||
| Short Term Investment | 1,598,157 | — | — | 1,598,157 | ||||||||||||
| Total Investments | $ | 17,135,568 | $ | — | $ | — | $ | 17,135,568 | ||||||||
| Securities Sold Short | ||||||||||||||||
| Common Stocks | $ | (255,066 | ) | $ | — | $ | — | $ | (255,066 | ) | ||||||
| Total Securities Sold Short | $ | (255,066 | ) | $ | — | $ | — | $ | (255,066 | ) | ||||||
| Swap Contracts* | ||||||||||||||||
| Long Total Return Swap Contracts | $ | — | $ | (460,266 | ) | $ | — | $ | (460,266 | ) | ||||||
| Total Swap Contracts | $ | — | $ | (460,266 | ) | $ | — | $ | (460,266 | ) | ||||||
| Security Classification | Level 1 | Level 2 | Level 3 | Total | ||||||||||||
| Investments | ||||||||||||||||
| Asset Backed Securities | $ | — | $ | 132,573,715 | $ | — | $ | 132,573,715 | ||||||||
| Foreign Government Bonds | — | 9,480,185 | — | 9,480,185 | ||||||||||||
| Mortgage Backed Securities | — | 46,305,848 | — | 46,305,848 | ||||||||||||
| U.S. Government Agency Issues | — | 311,324,277 | — | 311,324,277 | ||||||||||||
| U.S. Government Notes | — | 17,475,907 | — | 17,475,907 | ||||||||||||
| Short Term Investments | 51,738,453 | 7,489,688 | — | 59,228,141 | ||||||||||||
| Total Investments | $ | 51,738,453 | $ | 524,649,620 | $ | — | $ | 576,388,073 | ||||||||
| Other Financial Instruments* | ||||||||||||||||
| Forward Currency Contracts | ||||||||||||||||
| Long | $ | — | $ | 5,868,371 | $ | — | $ | 5,868,371 | ||||||||
| Short | — | (6,854,426 | ) | — | (6,854,426 | ) | ||||||||||
| Total Forward Currency Contracts | — | (986,055 | ) | — | (986,055 | ) | ||||||||||
| Futures Contracts | ||||||||||||||||
| Long | 24,086,886 | — | — | 24,086,886 | ||||||||||||
| Short | 5,225,839 | — | — | 5,225,839 | ||||||||||||
| Total Futures Contracts | 29,312,725 | — | — | 29,312,725 | ||||||||||||
| Total Other Financial Instruments | $ | 29,312,725 | $ | (986,055 | ) | $ | — | $ | 28,326,670 | |||||||
LoCorr Macro Strategies Fund, LoCorr Long/Short Commodities Strategy Fund, LoCorr Multi-Strategy Fund, and LoCorr Market Trend Fund – Notes to Consolidated Financial Statements / LoCorr Dynamic Equity Fund and LoCorr Spectrum Income Fund – Notes to Financial Statements (continued) | | 91 |
| Security Classification | Level 1 | Level 2 | Level 3 | Total | ||||||||||||
| Investments | ||||||||||||||||
| Common Stocks | $ | 44,542,854 | $ | — | $ | — | $ | 44,542,854 | ||||||||
| Real Estate Investment Trusts | 1,385,723 | — | — | 1,385,723 | ||||||||||||
| Short Term Investment | 12,014,948 | — | — | 12,014,948 | ||||||||||||
| Total Investments | $ | 57,943,525 | $ | — | $ | — | $ | 57,943,525 | ||||||||
| Securities Sold Short | ||||||||||||||||
| Common Stocks | $ | (8,663,224 | ) | $ | — | $ | — | $ | (8,663,224 | ) | ||||||
| Exchange Traded Funds | (2,648,755 | ) | — | — | (2,648,755 | ) | ||||||||||
| Total Securities Sold Short | $ | (11,311,979 | ) | $ | — | $ | — | $ | (11,311,979 | ) | ||||||
| Security Classification | Level 1 | Level 2 | Level 3 | Total | ||||||||||||
| Investments | ||||||||||||||||
| Business Development Companies | $ | 10,879,300 | $ | — | $ | — | $ | 10,879,300 | ||||||||
| Closed-End Investment Companies | 10,230,908 | — | — | 10,230,908 | ||||||||||||
| Common Stocks | 13,738,815 | — | — | 13,738,815 | ||||||||||||
| Convertible Preferred Stock | 3,445,174 | — | — | 3,445,174 | ||||||||||||
| Master Limited Partnerships | 22,852,795 | — | — | 22,852,795 | ||||||||||||
| Preferred Stocks | 2,077,602 | — | — | 2,077,602 | ||||||||||||
| Publicly Traded Partnerships | 9,209,959 | — | — | 9,209,959 | ||||||||||||
| Real Estate Investment Trusts | 17,842,702 | — | — | 17,842,702 | ||||||||||||
| Short Term Investment | 5,973,802 | — | — | 5,973,802 | ||||||||||||
| Total Investments | $ | 96,251,057 | $ | — | $ | — | $ | 96,251,057 | ||||||||
| 92 | | LoCorr Macro Strategies Fund, LoCorr Long/Short Commodities Strategy Fund, LoCorr Multi-Strategy Fund, and LoCorr Market Trend Fund – Notes to Consolidated Financial Statements / LoCorr Dynamic Equity Fund and LoCorr Spectrum Income Fund – Notes to Financial Statements |
LoCorr Macro Strategies Fund, LoCorr Long/Short Commodities Strategy Fund, LoCorr Multi-Strategy Fund, and LoCorr Market Trend Fund – Notes to Consolidated Financial Statements / LoCorr Dynamic Equity Fund and LoCorr Spectrum Income Fund – Notes to Financial Statements (continued) | | 93 |
| Year Ended December 31, 2017 | ||||||||||||
| Ordinary | Long-Term | Return of | ||||||||||
| Fund | Income | Capital Gains | Capital | |||||||||
| LoCorr Macro Strategies Fund | $ | 33,327,921 | $ | 12,049,157 | $ | — | ||||||
| LoCorr Long/Short Commodities Strategy Fund | 16,544 | — | — | |||||||||
| LoCorr Multi-Strategy Fund | — | 907,826 | 303,579 | |||||||||
| LoCorr Dynamic Equity Fund | — | 2,740,499 | — | |||||||||
| LoCorr Spectrum Income Fund | 2,095,838 | — | 5,926,620 | |||||||||
| Year Ended December 31, 2016 | ||||||||||||
| Ordinary | Long-Term | Return of | ||||||||||
| Fund | Income | Capital Gains | Capital | |||||||||
| LoCorr Macro Strategies Fund | $ | 3,094,731 | $ | 12,934,942 | $ | — | ||||||
| LoCorr Long/Short Commodities Strategy Fund | 4,174,668 | — | — | |||||||||
| LoCorr Multi-Strategy Fund | 386,916 | — | 855,699 | |||||||||
| LoCorr Market Trend Fund | 19,864,840 | — | — | |||||||||
| LoCorr Spectrum Income Fund | 4,507,173 | — | 2,388,873 | |||||||||
| 94 | | LoCorr Macro Strategies Fund, LoCorr Long/Short Commodities Strategy Fund, LoCorr Multi-Strategy Fund, and LoCorr Market Trend Fund – Notes to Consolidated Financial Statements / LoCorr Dynamic Equity Fund and LoCorr Spectrum Income Fund – Notes to Financial Statements |
LoCorr Macro Strategies Fund, LoCorr Long/Short Commodities Strategy Fund, LoCorr Multi-Strategy Fund, and LoCorr Market Trend Fund – Notes to Consolidated Financial Statements / LoCorr Dynamic Equity Fund and LoCorr Spectrum Income Fund – Notes to Financial Statements (continued) | | 95 |
| 96 | | LoCorr Macro Strategies Fund, LoCorr Long/Short Commodities Strategy Fund, LoCorr Multi-Strategy Fund, and LoCorr Market Trend Fund – Notes to Consolidated Financial Statements / LoCorr Dynamic Equity Fund and LoCorr Spectrum Income Fund – Notes to Financial Statements |
LoCorr Macro Strategies Fund, LoCorr Long/Short Commodities Strategy Fund, LoCorr Multi-Strategy Fund, and LoCorr Market Trend Fund – Notes to Consolidated Financial Statements / LoCorr Dynamic Equity Fund and LoCorr Spectrum Income Fund – Notes to Financial Statements (continued) | | 97 |
| LoCorr Macro Strategies Fund - December 31, 2017 | ||||||||||||||||||||||||
| Assets: | Gross Amounts not offset in the Consolidated Statement of Assets & Liabilities | |||||||||||||||||||||||
Description | Gross Amounts of Recognized Assets | Gross Amounts Offset in the Consolidated Statement of Assets & Liabilities | Net Amounts Presented in the Consolidated Statement of Assets & Liabilities | Financial Instruments | Collateral Pledged (Received) | Net Amount | ||||||||||||||||||
| Forward currency contracts | $ | 6,734,206 | $ | — | $ | 6,734,206 | $ | — | $ | — | $ | 6,734,206 | ||||||||||||
| Futures contracts | 4,941,646 | — | 4,941,646 | — | — | 4,941,646 | ||||||||||||||||||
| Total | $ | 11,675,852 | $ | — | $ | 11,675,852 | $ | — | $ | — | $ | 11,675,852 | ||||||||||||
| Liabilities: | Gross Amounts not offset in the Consolidated Statement of Assets & Liabilities | |||||||||||||||||||||||
Description | Gross Amounts of Recognized Liabilities | Gross Amounts Offset in the Consolidated Statement of Assets & Liabilities | Net Amounts Presented in the Consolidated Statement of Assets & Liabilities | Financial Instruments | Collateral Received (Pledged) | Net Amount | ||||||||||||||||||
| Forward currency contracts | $ | 11,471,736 | $ | — | $ | 11,471,736 | $ | — | $ | (11,471,736 | ) | $ | — | |||||||||||
| Futures contracts | 2,393,822 | — | 2,393,822 | — | (2,393,822 | ) | — | |||||||||||||||||
| Total | $ | 13,865,558 | $ | — | $ | $13,865,558 | $ | — | $ | (13,865,558 | ) | $ | — | |||||||||||
LoCorr Long/Short Commodities Strategy Fund - December 31, 2017 | ||||||||||||||||||||||||
| Assets: | Gross Amounts not offset in the Consolidated Statement of Assets & Liabilities | |||||||||||||||||||||||
Description | Gross Amounts of Recognized Assets | Gross Amounts Offset in the Consolidated Statement of Assets & Liabilities | Net Amounts Presented in the Consolidated Statement of Assets & Liabilities | Financial Instruments | Collateral Pledged (Received) | Net Amount | ||||||||||||||||||
| Swap Contracts* | $ | 10,323,324 | $ | — | $ | 10,323,324 | $ | — | $ | — | $ | 10,323,324 | ||||||||||||
| Total | $ | 10,323,324 | $ | — | $ | 10,323,324 | $ | — | $ | — | $ | 10,323,324 | ||||||||||||
| Liabilities: | Gross Amounts not offset in the Consolidated Statement of Assets & Liabilities | |||||||||||||||||||||||
Description | Gross Amounts of Recognized Liabilities | Gross Amounts Offset in the Consolidated Statement of Assets & Liabilities | Net Amounts Presented in the Consolidated Statement of Assets & Liabilities | Financial Instruments | Collateral Received (Pledged) | Net Amount | ||||||||||||||||||
| Swap Contracts | $ | 11,519,719 | $ | — | $ | 11,519,719 | $ | — | $ | (11,519,719 | ) | $ | — | |||||||||||
| Total | $ | 11,519,719 | $ | — | $ | 11,519,719 | $ | — | $ | (11,519,719 | ) | $ | — | |||||||||||
| LoCorr Multi-Strategy Fund - December 31, 2017 | ||||||||||||||||||||||||
| Liabilities: | Gross Amounts not offset in the Consolidated Statement of Assets & Liabilities | |||||||||||||||||||||||
Description | Gross Amounts of Recognized Liabilities | Gross Amounts Offset in the Consolidated Statement of Assets & Liabilities | Net Amounts Presented in the Consolidated Statement of Assets & Liabilities | Financial Instruments | Collateral Received (Pledged) | Net Amount | ||||||||||||||||||
| Swap Contracts* | $ | 3,799,903 | $ | — | $ | 3,799,903 | $ | — | $ | (3,799,903 | ) | $ | — | |||||||||||
| Total | $ | 3,799,903 | $ | — | $ | 3,799,903 | $ | — | $ | (3,799,903 | ) | $ | — | |||||||||||
| 98 | | LoCorr Macro Strategies Fund, LoCorr Long/Short Commodities Strategy Fund, LoCorr Multi-Strategy Fund, and LoCorr Market Trend Fund – Notes to Consolidated Financial Statements / LoCorr Dynamic Equity Fund and LoCorr Spectrum Income Fund – Notes to Financial Statements |
| LoCorr Market Trend Fund - December 31, 2017 | ||||||||||||||||||||||||
Assets: | Gross Amounts not offset in the Consolidated Statement of Assets & Liabilities | |||||||||||||||||||||||
Description | Gross Amounts of Recognized Assets | Gross Amounts Offset in the Consolidated Statement of Assets & Liabilities | Net Amounts Presented in the Consolidated Statement of Assets & Liabilities | Financial Instruments | Collateral Pledged (Received) | Net Amount | ||||||||||||||||||
| Forward currency contracts | $ | 6,541,665 | $ | — | $ | 6,541,665 | $ | — | $ | — | $ | 6,541,665 | ||||||||||||
| Futures contracts | 10,025,957 | — | 10,025,957 | — | — | 10,025,957 | ||||||||||||||||||
| Total | $ | 16,567,622 | $ | — | $ | 16,567,622 | $ | — | $ | — | $ | 16,567,622 | ||||||||||||
| Liabilities: | Gross Amounts not offset in the Consolidated Statement of Assets & Liabilities | |||||||||||||||||||||||
Description | Gross Amounts of Recognized Liabilities | Gross Amounts Offset in the Consolidated Statement of Assets & Liabilities | Net Amounts Presented in the Consolidated Statement of Assets & Liabilities | Financial Instruments | Collateral Received (Pledged) | Net Amount | ||||||||||||||||||
| Forward currency contracts | $ | 7,527,720 | $ | — | $ | 7,527,720 | $ | — | $ | (7,527,720 | ) | $ | — | |||||||||||
| Futures contracts | 2,540,094 | — | 2,540,094 | — | (2,540,094 | ) | — | |||||||||||||||||
| Total | $ | 10,067,814 | $ | — | $ | 10,067,814 | $ | — | $ | (10,067,814 | ) | $ | — | |||||||||||
| Fair Value | Net Unrealized Gain (Loss) on | |||||||||||
| Derivatives Not Accounted for as Hedging Instruments | Assets | Liabilities | Open Positions | |||||||||
| LoCorr Macro Strategies Fund | ||||||||||||
Forward Currency Contracts(a) | ||||||||||||
| Long | $ | 6,169,365 | $ | 800,395 | $ | 5,368,970 | ||||||
| Short | 564,841 | 10,671,341 | (10,106,500 | ) | ||||||||
| Total Forward Currency Contracts | 6,734,206 | 11,471,736 | (4,737,530 | ) | ||||||||
Futures Contracts(b) | ||||||||||||
| Long Contracts | ||||||||||||
| Commodity | 15,336,672 | 324,598 | 15,012,074 | |||||||||
| Equity | 3,460,585 | 2,875,947 | 584,638 | |||||||||
| Foreign exchange | — | — | — | |||||||||
| Interest rate | 855,143 | 3,871,295 | (3,016,152 | ) | ||||||||
| Total Long Contracts | 19,652,400 | 7,071,840 | 12,580,560 | |||||||||
| Short Contracts | ||||||||||||
| Commodity | 1,081,124 | 3,774,380 | (2,693,256 | ) | ||||||||
| Equity | 165,843 | 183,193 | (17,350 | ) | ||||||||
| Foreign exchange | 139,601 | — | 139,601 | |||||||||
| Interest rate | 2,795,760 | 210,989 | 2,584,771 | |||||||||
| Total Short Contracts | 4,182,328 | 4,168,562 | 13,766 | |||||||||
| Total Futures Contracts | 23,834,728 | 11,240,402 | 12,594,326 | |||||||||
| Total Forward Currency Contracts and Futures Contracts | $ | 30,568,934 | $ | 22,712,138 | $ | 7,856,796 | ||||||
LoCorr Macro Strategies Fund, LoCorr Long/Short Commodities Strategy Fund, LoCorr Multi-Strategy Fund, and LoCorr Market Trend Fund – Notes to Consolidated Financial Statements / LoCorr Dynamic Equity Fund and LoCorr Spectrum Income Fund – Notes to Financial Statements (continued) | | 99 |
Net Unrealized Gain (Loss) on Open Positions | ||||||||||||
| Fair Value | ||||||||||||
| Derivatives Not Accounted for as Hedging Instruments | Assets | Liabilities | ||||||||||
| LoCorr Long/Short Commodities Strategy Fund | ||||||||||||
| Long Total Return Swap Contracts | ||||||||||||
| LoCorr Commodities Index | $ | — | $ | 11,519,719 | $ | (11,519,719 | ) | |||||
| LoCorr Multi-Strategy Fund | ||||||||||||
| Long Total Return Swap Contracts | ||||||||||||
| LoCorr Multi-Strategy Index | $ | — | $ | 460,266 | $ | (460,266 | ) | |||||
| LoCorr Market Trend Fund | ||||||||||||
Forward Currency Contracts(a) | ||||||||||||
| Long | $ | 6,074,508 | $ | 206,137 | $ | 5,868,371 | ||||||
| Short | 467,157 | 7,321,583 | (6,854,426 | ) | ||||||||
| Total Forward Currency Contracts | 6,541,665 | 7,527,720 | (986,055 | ) | ||||||||
Futures Contracts(b) | ||||||||||||
| Long Contracts | ||||||||||||
| Commodity | 26,287,364 | 812,241 | 25,475,123 | |||||||||
| Equity | 4,068,690 | 3,461,503 | 607,187 | |||||||||
| Interest rate | 1,356,477 | 3,351,901 | (1,995,424 | ) | ||||||||
| Total Long Contracts | 31,712,531 | 7,625,645 | 24,086,886 | |||||||||
| Short Contracts | ||||||||||||
| Commodity | 2,559,088 | 3,525,950 | (966,862 | ) | ||||||||
| Foreign exchange | 356,369 | — | 356,369 | |||||||||
| Interest rate | 6,371,789 | 535,457 | 5,836,332 | |||||||||
| Total Short Contracts | 9,287,246 | 4,061,407 | 5,225,839 | |||||||||
| Total Futures Contracts | 40,999,777 | 11,687,052 | 29,312,725 | |||||||||
| Total Forward Currency Contracts and Futures Contracts | $ | 47,541,442 | $ | 19,214,772 | $ | 28,326,670 | ||||||
| Gain (Loss) from Trading | ||||||||
| Fund and Type of Derivative Instrument | Net Realized | Net Change in Unrealized | ||||||
| LoCorr Macro Strategies Fund | ||||||||
| Forward Currency Contracts | $ | (30,062,703 | ) | $ | (7,594,160 | ) | ||
| Futures Contracts | ||||||||
| Commodity | (49,316,769 | ) | 12,896,145 | |||||
| Equity | 125,811,996 | (990,583 | ) | |||||
| Foreign exchange | 4,655,550 | 51,976 | ||||||
| Interest rate | (25,090,079 | ) | (4,768,142 | ) | ||||
| Total Futures Contracts | 56,060,698 | 7,189,396 | ||||||
| Total Forward Currency Contracts and Futures Contracts | $ | 25,997,995 | $ | (404,764 | ) | |||
| LoCorr Long/Short Commodities Strategy Fund | ||||||||
| Swap Contracts | $ | (2,104,129 | ) | $ | 7,471,231 | |||
| 100 | | LoCorr Macro Strategies Fund, LoCorr Long/Short Commodities Strategy Fund, LoCorr Multi-Strategy Fund, and LoCorr Market Trend Fund – Notes to Consolidated Financial Statements / LoCorr Dynamic Equity Fund and LoCorr Spectrum Income Fund – Notes to Financial Statements |
| Gain (Loss) from Trading | ||||||||
| Fund and Type of Derivative Instrument | Net Realized | Net Change in Unrealized | ||||||
| LoCorr Multi-Strategy Fund | ||||||||
| Swap Contracts | $ | (2,774,773 | ) | $ | 3,244,089 | |||
| LoCorr Market Trend Fund | ||||||||
| Forward Currency Contracts | $ | (56,013,603 | ) | $ | (4,835,934 | ) | ||
| Futures Contracts | ||||||||
| Commodity | (32,164,205 | ) | 25,586,792 | |||||
| Equity | 145,966,369 | (2,503,921 | ) | |||||
| Foreign exchange | 924,088 | (19,519 | ) | |||||
| Interest rate | (44,193,985 | ) | (3,278,383 | ) | ||||
| Total Futures Contracts | 70,532,267 | 19,784,969 | ||||||
| Total Forward Currency Contracts and Futures Contracts | $ | 14,518,664 | $ | 14,949,035 | ||||
| Average Notional Amount | ||||||||
| Long Contracts | Short Contracts | |||||||
| LoCorr Macro Strategies Fund | ||||||||
| Forward Currency Contracts | $ | 856,997,592 | $ | 788,052,188 | ||||
| Futures Contracts | 2,992,129,762 | 1,297,891,131 | ||||||
| LoCorr Long/Short Commodities Strategy Fund | ||||||||
| Swap Contracts | $ | 97,446,154 | $ | — | ||||
| LoCorr Multi-Strategy Fund | ||||||||
| Swap Contracts | $ | 37,689,641 | $ | — | ||||
| LoCorr Market Trend Fund | ||||||||
| Forward Currency Contracts | $ | 1,325,015,033 | $ | 1,091,181,314 | ||||
| Futures Contracts | 3,839,920,352 | 2,690,169,569 | ||||||
| U.S. Government Obligations | All Other | |||||||||||||||
| Purchases | Sales | Purchases | Sales | |||||||||||||
| LoCorr Macro Strategies Fund | $ | 126,477,633 | $ | 181,337,965 | $ | 604,537,973 | $ | 618,438,452 | ||||||||
| LoCorr Long/Short Commodities Strategy Fund | 11,784,381 | 11,827,344 | 46,663,491 | 88,108,693 | ||||||||||||
| LoCorr Multi-Strategy Fund | — | — | 21,293,689 | 34,631,603 | ||||||||||||
| LoCorr Market Trend Fund | 128,986,032 | 197,254,284 | 405,367,216 | 659,996,990 | ||||||||||||
| LoCorr Dynamic Equity Fund | — | — | 177,627,130 | 187,182,252 | ||||||||||||
| LoCorr Spectrum Income Fund | — | — | 83,873,718 | 87,145,902 | ||||||||||||
LoCorr Macro Strategies Fund, LoCorr Long/Short Commodities Strategy Fund, LoCorr Multi-Strategy Fund, and LoCorr Market Trend Fund – Notes to Consolidated Financial Statements / LoCorr Dynamic Equity Fund and LoCorr Spectrum Income Fund – Notes to Financial Statements (continued) | | 101 |
| Fund | Annual Advisory Fee as a Percentage of the Average Daily Net Assets of the Fund |
| LoCorr Macro Strategies Fund | 1.75%* |
| LoCorr Multi-Strategy Fund | 1.75% |
| LoCorr Market Trend Fund | 1.50% |
| LoCorr Dynamic Equity Fund | 2.45% |
| LoCorr Spectrum Income Fund | 1.30% |
| Net Assets for the LoCorr Long/Short | Incremental** |
| Commodities Strategy Fund | Advisory Fee |
| $0.0 - $0.5 billion | 1.50% |
| $0.5 - $1.0 billion | 1.40% |
| $1.0 - $1.5 billion | 1.30% |
| $1.5 - $2.0 billion | 1.20% |
| $2.0 - $2.5 billion | 1.10% |
| Over $2.5 billion | 1.00% |
| Management Fees | Accrued Management Fees | |||||||
| Fund | For the Year Ended December 31, 2017 | as of December 31, 2017 | ||||||
| LoCorr Macro Strategies Fund* | $ | 16,389,019 | $ | 1,194,588 | ||||
| LoCorr Long/Short Commodities Strategy Fund | 1,528,013 | 119,762 | ||||||
| LoCorr Multi-Strategy Fund | 610,325 | 17,694 | ||||||
| LoCorr Market Trend Fund | 12,188,761 | 871,325 | ||||||
| LoCorr Dynamic Equity Fund | 1,919,260 | 125,523 | ||||||
| LoCorr Spectrum Income Fund | 1,403,519 | 105,765 | ||||||
| 102 | | LoCorr Macro Strategies Fund, LoCorr Long/Short Commodities Strategy Fund, LoCorr Multi-Strategy Fund, and LoCorr Market Trend Fund – Notes to Consolidated Financial Statements / LoCorr Dynamic Equity Fund and LoCorr Spectrum Income Fund – Notes to Financial Statements |
| Expense Limit as a Percentage of the | ||
| Fund | Average Daily Net Assets of the Fund | Effective Period Through |
| LoCorr Macro Strategies Fund | 1.99%* | April 30, 2018 |
| LoCorr Long/Short Commodities Strategy Fund | 1.95% | April 30, 2018 |
| LoCorr Multi-Strategy Fund | 2.04% | April 30, 2018 |
| LoCorr Market Trend Fund | 1.95% | April 30, 2018 |
| LoCorr Dynamic Equity Fund | 2.90% | April 30, 2018 |
| LoCorr Spectrum Income Fund | 1.80% | April 30, 2018 |
| LoCorr Macro Strategies Fund | ||||||||||||||||||||||||
| Period | Management Fees (Waived) by Adviser Subject to Recovery | Recovery to Adviser Year Ended December 31, | Remaining Available Subject to Recovery | Subject to Recovery on or Before Fiscal Year Ending December 31, | ||||||||||||||||||||
| 2017 | 2016 | 2015 | ||||||||||||||||||||||
| Year Ended December 31, 2017 | $ | (485,398 | ) | $ | — | $ | — | $ | — | $ | (485,398 | ) | 2020 | |||||||||||
| Total | $ | (485,398 | ) | $ | — | $ | — | $ | — | $ | (485,398 | ) | ||||||||||||
| LoCorr Long/Short Commodities Strategy Fund | ||||||||||||||||||||||||
| Period | Management Fees (Waived) by Adviser Subject to Recovery | Recovery to Adviser Year Ended December 31, | Remaining Available Subject to Recovery | Subject to Recovery on or Before Fiscal Year Ending December 31, | ||||||||||||||||||||
| 2017 | 2016 | 2015 | ||||||||||||||||||||||
| Year Ended December 31, 2017 | $ | (81,840 | ) | $ | — | $ | — | $ | — | $ | (81,840 | ) | 2020 | |||||||||||
| Year Ended December 31, 2016 | (21,779 | ) | — | — | — | (21,779 | ) | 2019 | ||||||||||||||||
| Year Ended December 31, 2015 | (154,527 | ) | — | — | — | (154,527 | ) | 2018 | ||||||||||||||||
| Total | $ | (258,146 | ) | $ | — | $ | — | $ | — | $ | (258,146 | ) | ||||||||||||
| LoCorr Multi-Strategy Fund | ||||||||||||||||||||||||
| Period | Management Fees (Waived) by Adviser Subject to Recovery | Recovery to Adviser Year Ended December 31, | Remaining Available Subject to Recovery | Subject to Recovery on or Before Fiscal Year Ending December 31, | ||||||||||||||||||||
| 2017 | 2016 | 2015 | ||||||||||||||||||||||
| Year Ended December 31, 2017 | $ | (180,598 | ) | $ | — | $ | — | $ | — | $ | (180,598 | ) | 2020 | |||||||||||
| Year Ended December 31, 2016 | (181,466 | ) | — | — | — | (181,466 | ) | 2019 | ||||||||||||||||
| Period Ended December 31, 2015* | (195,479 | ) | — | — | — | (195,479 | ) | 2018 | ||||||||||||||||
| Total | $ | (557,543 | ) | $ | — | $ | — | $ | — | $ | (557,543 | ) | ||||||||||||
LoCorr Dynamic Equity Fund | ||||||||||||||||||||||||
| Period | Management Fees (Waived) by Adviser Subject to Recovery | Recovery to Adviser Year Ended December 31, | Remaining Available Subject to Recovery | Subject to Recovery on or Before Fiscal Year Ending December 31, | ||||||||||||||||||||
| 2017 | 2016 | 2015 | ||||||||||||||||||||||
| Year Ended December 31, 2017 | $ | (58,609 | ) | $ | — | $ | — | $ | — | $ | (58,609 | ) | 2020 | |||||||||||
| Year Ended December 31, 2016 | (102,813 | ) | — | — | — | (102,813 | ) | 2019 | ||||||||||||||||
| Year Ended December 31, 2015 | (132,040 | ) | — | — | — | (132,040 | ) | 2018 | ||||||||||||||||
| Total | $ | (293,462 | ) | $ | — | $ | — | $ | — | $ | (293,462 | ) | ||||||||||||
LoCorr Macro Strategies Fund, LoCorr Long/Short Commodities Strategy Fund, LoCorr Multi-Strategy Fund, and LoCorr Market Trend Fund – Notes to Consolidated Financial Statements / LoCorr Dynamic Equity Fund and LoCorr Spectrum Income Fund – Notes to Financial Statements (continued) | | 103 |
| LoCorr Spectrum Income Fund | ||||||||||||||||||||||
| Management | Remaining | Subject to Recovery | ||||||||||||||||||||
| Fees (Waived) by | Recovery to Adviser | Available | on or Before | |||||||||||||||||||
| Adviser Subject | Year Ended December 31, | Subject to | Fiscal Year Ending | |||||||||||||||||||
| Period | to Recovery | 2017 | 2016 | 2015 | Recovery | December 31, | ||||||||||||||||
| Year Ended December 31, 2017 | $ | — | $ | — | $ | — | $ | — | $ | — | 2020 | |||||||||||
| Year Ended December 31, 2016 | — | — | — | — | — | 2019 | ||||||||||||||||
| Year Ended December 31, 2015 | — | — | — | — | — | 2018 | ||||||||||||||||
| Year Ended December 31, 2014 | (132,869 | ) | 39,116 | 26,753 | 67,000 | — | 2017 | |||||||||||||||
| Total | $ | (132,869 | ) | $ | 39,116 | $ | 26,753 | $ | 67,000 | $ | — | |||||||||||
| LoCorr Macro Strategies Fund – Class A | ||||||||||||||||
| For the Year Ended December 31, 2017 | For the Year Ended December 31, 2016 | |||||||||||||||
| Shares | Amount | Shares | Amount | |||||||||||||
| Shares Sold | 5,661,607 | $ | 50,641,256 | 16,961,784 | $ | 155,903,603 | ||||||||||
| Dividends Reinvested | 593,753 | 5,130,033 | 551,098 | 4,910,284 | ||||||||||||
| Shares Redeemed | (28,880,996 | ) | (261,068,594 | ) | (10,956,643 | ) | (99,832,561 | ) | ||||||||
| Redemption Fees | — | 382 | — | 2,040 | ||||||||||||
| (22,625,636 | ) | $ | (205,296,923 | ) | 6,556,239 | $ | 60,983,366 | |||||||||
| Beginning Shares | 33,412,218 | 26,855,979 | ||||||||||||||
| Ending Shares | 10,786,582 | 33,412,218 | ||||||||||||||
| LoCorr Macro Strategies Fund – Class C | ||||||||||||||||
| For the Year Ended December 31, 2017 | For the Year Ended December 31, 2016 | |||||||||||||||
| Shares | Amount | Shares | Amount | |||||||||||||
| Shares Sold | 2,350,906 | $ | 20,222,139 | 3,540,006 | $ | 31,741,634 | ||||||||||
| Dividends Reinvested | 639,470 | 5,294,811 | 256,145 | 2,207,972 | ||||||||||||
| Shares Redeemed | (5,243,828 | ) | (44,937,545 | ) | (2,445,483 | ) | (21,620,670 | ) | ||||||||
| Redemption Fees | — | 680 | — | 289 | ||||||||||||
| (2,253,452 | ) | $ | (19,419,915 | ) | 1,350,668 | $ | 12,329,225 | |||||||||
| Beginning Shares | 13,210,934 | 11,860,266 | ||||||||||||||
| Ending Shares | 10,957,482 | 13,210,934 | ||||||||||||||
| LoCorr Macro Strategies Fund – Class I | ||||||||||||||||
| For the Year Ended December 31, 2017 | For the Year Ended December 31, 2016 | |||||||||||||||
| Shares | Amount | Shares | Amount | |||||||||||||
| Shares Sold | 79,170,065 | $ | 718,715,172 | 38,061,171 | $ | 351,129,132 | ||||||||||
| Dividends Reinvested | 3,449,418 | 30,251,389 | 779,989 | 7,027,798 | ||||||||||||
| Shares Redeemed | (65,784,898 | ) | (591,399,536 | ) | (8,907,973 | ) | (81,922,066 | ) | ||||||||
| Redemption Fees | — | 10,665 | — | 19,839 | ||||||||||||
| 16,834,585 | $ | 157,577,690 | 29,933,187 | $ | 276,254,703 | |||||||||||
| Beginning Shares | 52,255,421 | 22,322,234 | ||||||||||||||
| Ending Shares | 69,090,006 | 52,255,421 | ||||||||||||||
LoCorr Macro Strategies Fund | ||||||||||||||||
| Total Net Increase (Decrease) | $ | (67,139,148 | ) | $ | 349,567,294 | |||||||||||
| 104 | | LoCorr Macro Strategies Fund, LoCorr Long/Short Commodities Strategy Fund, LoCorr Multi-Strategy Fund, and LoCorr Market Trend Fund – Notes to Consolidated Financial Statements / LoCorr Dynamic Equity Fund and LoCorr Spectrum Income Fund – Notes to Financial Statements |
| LoCorr Long/Short Commodities Strategy Fund – Class A | ||||||||||||||||
| For the Year Ended December 31, 2017 | For the Year Ended December 31, 2016 | |||||||||||||||
| Shares | Amount | Shares | Amount | |||||||||||||
| Shares Sold | 800,753 | $ | 7,404,023 | 5,519,830 | $ | 56,215,085 | ||||||||||
| Dividends Reinvested | 473 | 4,544 | 90,271 | 850,348 | ||||||||||||
| Shares Redeemed | (1,967,602 | ) | (18,198,293 | ) | (4,322,845 | ) | (43,063,779 | ) | ||||||||
| Redemption Fees | — | 74 | — | 5,787 | ||||||||||||
| (1,166,376 | ) | $ | (10,789,652 | ) | 1,287,256 | $ | 14,007,441 | |||||||||
| Beginning Shares | 3,800,744 | 2,513,488 | ||||||||||||||
| Ending Shares | 2,634,368 | 3,800,744 | ||||||||||||||
| LoCorr Long/Short Commodities Strategy Fund – Class C | ||||||||||||||||
| For the Year Ended December 31, 2017 | For the Year Ended December 31, 2016 | |||||||||||||||
| Shares | Amount | Shares | Amount | |||||||||||||
| Shares Sold | 193,488 | $ | 1,708,397 | 600,272 | $ | 5,936,288 | ||||||||||
| Dividends Reinvested | 127 | 1,180 | 19,301 | 177,569 | ||||||||||||
| Shares Redeemed | (514,536 | ) | (4,603,847 | ) | (250,419 | ) | (2,413,789 | ) | ||||||||
| Redemption Fees | — | 34 | — | 383 | ||||||||||||
| (320,921 | ) | $ | (2,894,236 | ) | 369,154 | $ | 3,700,451 | |||||||||
| Beginning Shares | 824,453 | 455,299 | ||||||||||||||
| Ending Shares | 503,532 | 824,453 | ||||||||||||||
| LoCorr Long/Short Commodities Strategy Fund – Class I | ||||||||||||||||
| For the Year Ended December 31, 2017 | For the Year Ended December 31, 2016 | |||||||||||||||
| Shares | Amount | Shares | Amount | |||||||||||||
| Shares Sold | 3,126,277 | $ | 29,116,879 | 11,982,802 | $ | 122,350,301 | ||||||||||
| Dividends Reinvested | 720 | 6,996 | 241,354 | 2,290,449 | ||||||||||||
| Shares Redeemed | (6,520,100 | ) | (60,610,601 | ) | (6,618,317 | ) | (65,911,861 | ) | ||||||||
| Redemption Fees | — | (232 | ) | — | 20,771 | |||||||||||
| (3,393,103 | ) | $ | (31,486,958 | ) | 5,605,839 | $ | 58,749,660 | |||||||||
| Beginning Shares | 8,789,574 | 3,183,735 | ||||||||||||||
| Ending Shares | 5,396,471 | 8,789,574 | ||||||||||||||
| LoCorr Long/Short Commodities Strategy Fund | ||||||||||||||||
| Total Net Increase (Decrease) | $ | (45,170,846 | ) | $ | 76,457,552 | |||||||||||
| LoCorr Multi-Strategy Fund – Class A | ||||||||||||||||
| For the Year Ended December 31, 2017 | For the Year Ended December 31, 2016 | |||||||||||||||
| Shares | Amount | Shares | Amount | |||||||||||||
| Shares Sold | 631,552 | $ | 5,081,081 | 1,331,325 | $ | 10,927,197 | ||||||||||
| Dividends Reinvested | 50,022 | 398,302 | 48,692 | 399,332 | ||||||||||||
| Shares Redeemed | (1,867,882 | ) | (14,420,557 | ) | (730,590 | ) | (6,017,250 | ) | ||||||||
| Redemption Fees | — | — | — | 177 | ||||||||||||
| (1,186,308 | ) | $ | (8,941,174 | ) | 649,427 | $ | 5,309,456 | |||||||||
| Beginning Shares | 2,105,165 | 1,455,738 | ||||||||||||||
| Ending Shares | 918,857 | 2,105,165 | ||||||||||||||
| LoCorr Multi-Strategy Fund – Class C | ||||||||||||||||
| For the Year Ended December 31, 2017 | For the Year Ended December 31, 2016 | |||||||||||||||
| Shares | Amount | Shares | Amount | |||||||||||||
| Shares Sold | 58,830 | $ | 472,601 | 187,751 | $ | 1,553,343 | ||||||||||
| Dividends Reinvested | 9,315 | 74,134 | 12,332 | 100,963 | ||||||||||||
| Shares Redeemed | (259,553 | ) | (2,086,741 | ) | (382,843 | ) | (3,106,550 | ) | ||||||||
| Redemption Fees | — | — | — | 4 | ||||||||||||
| (191,408 | ) | $ | (1,540,006 | ) | (182,760 | ) | $ | (1,452,240 | ) | |||||||
| Beginning Shares | 478,190 | 660,950 | ||||||||||||||
| Ending Shares | 286,782 | 478,190 | ||||||||||||||
| LoCorr Multi-Strategy Fund – Class I | ||||||||||||||||
| For the Year Ended December 31, 2017 | For the Year Ended December 31, 2016 | |||||||||||||||
| Shares | Amount | Shares | Amount | |||||||||||||
| Shares Sold | 642,183 | $ | 5,132,075 | 1,079,642 | $ | 8,820,649 | ||||||||||
| Dividends Reinvested | 72,744 | 576,312 | 63,201 | 517,849 | ||||||||||||
| Shares Redeemed | (1,050,694 | ) | (8,409,872 | ) | (889,163 | ) | (7,321,692 | ) | ||||||||
| Redemption Fees | — | 2 | — | 57 | ||||||||||||
| (335,767 | ) | $ | (2,701,483 | ) | 253,680 | $ | 2,016,863 | |||||||||
| Beginning Shares | 2,247,664 | 1,993,984 | ||||||||||||||
| Ending Shares | 1,911,897 | 2,247,664 | ||||||||||||||
| LoCorr Multi-Strategy Fund | ||||||||||||||||
| Total Net Increase (Decrease) | $ | (13,182,663 | ) | $ | 5,874,079 | |||||||||||
LoCorr Macro Strategies Fund, LoCorr Long/Short Commodities Strategy Fund, LoCorr Multi-Strategy Fund, and LoCorr Market Trend Fund – Notes to Consolidated Financial Statements / LoCorr Dynamic Equity Fund and LoCorr Spectrum Income Fund – Notes to Financial Statements (continued) | | 105 |
| LoCorr Market Trend Fund – Class A | ||||||||||||||||
| For the Year Ended December 31, 2017 | For the Year Ended December 31, 2016 | |||||||||||||||
| Shares | Amount | Shares | Amount | |||||||||||||
| Shares Sold | 2,737,484 | $ | 28,708,153 | 11,027,256 | $ | 134,082,733 | ||||||||||
| Dividends Reinvested | — | — | 196,345 | 2,120,523 | ||||||||||||
| Shares Redeemed | (9,662,150 | ) | (101,779,824 | ) | (7,913,099 | ) | (91,798,608 | ) | ||||||||
| Redemption Fees | — | 784 | — | 7,807 | ||||||||||||
| (6,924,666 | ) | $ | (73,070,887 | ) | 3,310,502 | $ | 44,412,455 | |||||||||
| Beginning Shares | 12,505,112 | 9,194,610 | ||||||||||||||
| Ending Shares | 5,580,446 | 12,505,112 | ||||||||||||||
| LoCorr Market Trend Fund – Class C | ||||||||||||||||
| For the Year Ended December 31, 2017 | For the Year Ended December 31, 2016 | |||||||||||||||
| Shares | Amount | Shares | Amount | |||||||||||||
| Shares Sold | 484,308 | $ | 5,025,256 | 4,790,065 | $ | 57,543,161 | ||||||||||
| Dividends Reinvested | — | — | 123,161 | 1,316,592 | ||||||||||||
| Shares Redeemed | (4,936,089 | ) | (51,374,646 | ) | (4,366,738 | ) | (49,694,049 | ) | ||||||||
| Redemption Fees | — | 6 | — | 1,131 | ||||||||||||
| (4,451,781 | ) | $ | (46,349,384 | ) | 546,488 | $ | 9,166,835 | |||||||||
| Beginning Shares | 8,493,445 | 7,946,957 | ||||||||||||||
| Ending Shares | 4,041,664 | 8,493,445 | ||||||||||||||
| LoCorr Market Trend Fund – Class I | ||||||||||||||||
| For the Year Ended December 31, 2017 | For the Year Ended December 31, 2016 | |||||||||||||||
| Shares | Amount | Shares | Amount | |||||||||||||
| Shares Sold | 27,701,096 | $ | 294,187,402 | 77,618,009 | $ | 938,193,389 | ||||||||||
| Dividends Reinvested | — | — | 1,426,002 | 15,443,598 | ||||||||||||
| Shares Redeemed | (51,803,362 | ) | (548,574,396 | ) | (62,230,774 | ) | (713,501,477 | ) | ||||||||
| Redemption Fees | — | 5,091 | — | 22,937 | ||||||||||||
| (24,102,266 | ) | $ | (254,381,903 | ) | 16,813,237 | $ | 240,158,447 | |||||||||
| Beginning Shares | 74,717,153 | 57,903,916 | ||||||||||||||
| Ending Shares | 50,614,887 | 74,717,153 | ||||||||||||||
| LoCorr Market Trend Fund | ||||||||||||||||
| Total Net Increase (Decrease) | $ | (373,802,174 | ) | $ | 293,737,737 | |||||||||||
| LoCorr Dynamic Equity Fund – Class A | ||||||||||||||||
| For the Year Ended December 31, 2017 | For the Year Ended December 31, 2016 | |||||||||||||||
| Shares | Amount | Shares | Amount | |||||||||||||
| Shares Sold | 1,410,774 | $ | 16,809,092 | 1,619,380 | $ | 18,187,352 | ||||||||||
| Dividends Reinvested | 65,357 | 772,526 | — | — | ||||||||||||
| Shares Redeemed | (2,128,740 | ) | (25,425,721 | ) | (568,057 | ) | (6,110,231 | ) | ||||||||
| Redemption Fees | — | 1,548 | — | 398 | ||||||||||||
| (652,609 | ) | $ | (7,842,555 | ) | 1,051,323 | $ | 12,077,519 | |||||||||
| Beginning Shares | 2,342,008 | 1,290,685 | ||||||||||||||
| Ending Shares | 1,689,399 | 2,342,008 | ||||||||||||||
| LoCorr Dynamic Equity Fund – Class C | ||||||||||||||||
| For the Year Ended December 31, 2017 | For the Year Ended December 31, 2016 | |||||||||||||||
| Shares | Amount | Shares | Amount | |||||||||||||
| Shares Sold | 377,313 | $ | 4,365,067 | 442,691 | $ | 4,787,011 | ||||||||||
| Dividends Reinvested | 38,402 | 437,395 | — | — | ||||||||||||
| Shares Redeemed | (398,936 | ) | (4,611,126 | ) | (315,415 | ) | (3,114,307 | ) | ||||||||
| Redemption Fees | — | 121 | — | 33 | ||||||||||||
| 16,779 | $ | 191,457 | 127,276 | $ | 1,672,737 | |||||||||||
| Beginning Shares | 956,669 | 829,393 | ||||||||||||||
| Ending Shares | 973,448 | 956,669 | ||||||||||||||
| LoCorr Dynamic Equity Fund – Class I | ||||||||||||||||
| For the Year Ended December 31, 2017 | For the Year Ended December 31, 2016 | |||||||||||||||
| Shares | Amount | Shares | Amount | |||||||||||||
| Shares Sold | 2,700,182 | $ | 32,582,085 | 3,239,660 | $ | 36,623,262 | ||||||||||
| Dividends Reinvested | 102,449 | 1,225,292 | — | — | ||||||||||||
| Shares Redeemed | (3,744,615 | ) | (45,234,584 | ) | (586,786 | ) | (6,413,330 | ) | ||||||||
| Redemption Fees | — | 614 | — | 1,721 | ||||||||||||
| (941,984 | ) | $ | (11,426,593 | ) | 2,652,874 | $ | 30,211,653 | |||||||||
| Beginning Shares | 3,682,147 | 1,029,273 | ||||||||||||||
| Ending Shares | 2,740,163 | 3,682,147 | ||||||||||||||
| LoCorr Dynamic Equity Fund | ||||||||||||||||
| Total Net Increase (Decrease) | $ | (19,077,691 | ) | $ | 43,961,909 | |||||||||||
| 106 | | LoCorr Macro Strategies Fund, LoCorr Long/Short Commodities Strategy Fund, LoCorr Multi-Strategy Fund, and LoCorr Market Trend Fund – Notes to Consolidated Financial Statements / LoCorr Dynamic Equity Fund and LoCorr Spectrum Income Fund – Notes to Financial Statements |
| LoCorr Spectrum Income Fund – Class A | ||||||||||||||||
| For the Year Ended December 31, 2017 | For the Year Ended December 31, 2016 | |||||||||||||||
| Shares | Amount | Shares | Amount | |||||||||||||
| Shares Sold | 1,852,628 | $ | 14,027,817 | 1,632,393 | $ | 12,699,250 | ||||||||||
| Dividends Reinvested | 212,605 | 1,613,841 | 235,964 | 1,810,640 | ||||||||||||
| Shares Redeemed | (2,298,854 | ) | (17,279,850 | ) | (2,326,814 | ) | (17,742,010 | ) | ||||||||
| Redemption Fees | — | 2,071 | — | 2,666 | ||||||||||||
| (233,621 | ) | $ | (1,636,121 | ) | (458,457 | ) | $ | (3,229,454 | ) | |||||||
| Beginning Shares | 4,291,419 | 4,749,876 | ||||||||||||||
| Ending Shares | 4,057,798 | 4,291,419 | ||||||||||||||
| LoCorr Spectrum Income Fund – Class C | ||||||||||||||||
| For the Year Ended December 31, 2017 | For the Year Ended December 31, 2016 | |||||||||||||||
| Shares | Amount | Shares | Amount | |||||||||||||
| Shares Sold | 863,495 | $ | 6,604,509 | 740,640 | $ | 5,722,907 | ||||||||||
| Dividends Reinvested | 176,185 | 1,343,087 | 189,715 | 1,459,221 | ||||||||||||
| Shares Redeemed | (1,228,452 | ) | (9,312,807 | ) | (1,148,184 | ) | (8,758,530 | ) | ||||||||
| Redemption Fees | — | 263 | — | 384 | ||||||||||||
| (188,772 | ) | $ | (1,364,948 | ) | (217,829 | ) | $ | (1,576,018 | ) | |||||||
| Beginning Shares | 3,356,632 | 3,574,461 | ||||||||||||||
| Ending Shares | 3,167,860 | 3,356,632 | ||||||||||||||
| LoCorr Spectrum Income Fund – Class I | ||||||||||||||||
| For the Year Ended December 31, 2017 | For the Year Ended December 31, 2016 | |||||||||||||||
| Shares | Amount | Shares | Amount | |||||||||||||
| Shares Sold | 2,937,706 | $ | 22,440,235 | 4,225,921 | $ | 32,868,495 | ||||||||||
| Dividends Reinvested | 316,484 | 2,399,389 | 238,899 | 1,835,131 | ||||||||||||
| Shares Redeemed | (3,509,290 | ) | (26,399,490 | ) | (2,012,132 | ) | (15,252,427 | ) | ||||||||
| Redemption Fees | — | 15,506 | — | 5,805 | ||||||||||||
| (255,100 | ) | $ | (1,544,360 | ) | 2,452,688 | $ | 19,457,004 | |||||||||
| Beginning Shares | 6,088,507 | 3,635,819 | ||||||||||||||
| Ending Shares | 5,833,407 | 6,088,507 | ||||||||||||||
| LoCorr Spectrum Income Fund | ||||||||||||||||
| Total Net Increase (Decrease) | $ | (4,545,429 | ) | $ | 14,651,532 | |||||||||||
LoCorr Macro Strategies Fund (2) | LoCorr Long/Short Commodities Strategy Fund (2) | LoCorr Multi Strategy Fund (2) | ||||||||||
| Tax cost of portfolio | $ | 733,682,592 | $ | 80,324,300 | $ | 23,074,324 | ||||||
| Gross unrealized appreciation | 44,959,764 | 3,248,769 | 4,306,084 | |||||||||
| Gross unrealized depreciation | (34,962,271 | ) | (15,080,734 | ) | (3,152,897 | ) | ||||||
| Net unrealized appreciation (depreciation) | 9,997,493 | (11,831,965 | ) | 1,153,187 | ||||||||
| Undistributed ordinary income | 9,140,163 | — | — | |||||||||
| Undistributed long-term capital gains | — | — | — | |||||||||
| Total distributable earnings | $ | 9,140,163 | $ | — | $ | — | ||||||
| Other accumulated losses | $ | (63,414 | ) | $ | (1,844,369 | ) | $ | (81,453 | ) | |||
| Total accumulated earnings (losses) | $ | 19,074,242 | $ | (13,676,334 | ) | $ | 1,071,734 | |||||
LoCorr Market Trend Fund (2) | LoCorr Dynamic Equity Fund | LoCorr Spectrum Income Fund | ||||||||||
| Tax cost of portfolio | $ | 592,369,448 | $ | 52,940,986 | $ | 89,554,915 | ||||||
| Gross unrealized appreciation | 34,757,449 | 6,407,956 | 11,766,084 | |||||||||
| Gross unrealized depreciation | (12,032,746 | ) | (1,636,517 | ) | (5,069,942 | ) | ||||||
| Net unrealized appreciation (depreciation) | 22,724,703 | 4,771,439 | 6,696,142 | |||||||||
| Undistributed ordinary income | — | — | — | |||||||||
| Undistributed long-term capital gains | — | 616,187 | — | |||||||||
| Total distributable earnings | $ | — | $ | 616,187 | $ | — | ||||||
| Other accumulated earnings (losses) | $ | (368,813 | ) | $ | (43,046 | ) | $ | (27,812,323 | ) | |||
| Total accumulated earnings (losses) | $ | 22,355,890 | $ | 5,344,580 | $ | (21,116,181 | ) | |||||
| (1) | Total Portfolio represents aggregate amounts of Fund’s investments, securities sold short, forward currency contracts and futures contracts, where applicable. |
| (2) | Tax Cost is presented on a non-consolidated basis and includes each of the Fund’s investment in the respective CFC’s and the unrealized appreciation and depreciation associated with those investments. |
LoCorr Macro Strategies Fund, LoCorr Long/Short Commodities Strategy Fund, LoCorr Multi-Strategy Fund, and LoCorr Market Trend Fund – Notes to Consolidated Financial Statements / LoCorr Dynamic Equity Fund and LoCorr Spectrum Income Fund – Notes to Financial Statements (continued) | | 107 |
Accumulated Net Investment Income (Loss) | Accumulated Net Realized Gain (Loss) | Paid-in Capital | ||||||||||
| LoCorr Macro Strategies Fund | $ | 5,585,222 | $ | 25,643,929 | $ | (31,229,151 | ) | |||||
| LoCorr Long/Short Commodities Strategy Fund | 321,868 | 817,746 | (1,139,614 | ) | ||||||||
| LoCorr Multi-Strategy Fund | 868,618 | 2,603,251 | (3,471,869 | ) | ||||||||
| LoCorr Market Trend Fund | 6,740,908 | 29,945,509 | (36,686,417 | ) | ||||||||
| LoCorr Dynamic Equity Fund | 1,972,887 | (3,694,629 | ) | 1,721,742 | ||||||||
| LoCorr Spectrum Income Fund | (76,576 | ) | 2,896,458 | (2,819,882 | ) | |||||||
| Post October Loss Deferral | Late Year Loss Deferral | |||||||
| LoCorr Multi-Strategy Fund | $ | — | $ | 18,898 | ||||
| LoCorr Market Trend Fund | — | 351,362 | ||||||
| LoCorr Spectrum Income Fund | — | 646,051 |
| Capital Loss Carryover | |||||||||
| Short-Term | Long-Term | Year of Expiration | |||||||
| LoCorr Long/Short Commodities Strategy Fund | $ | 1,002,327 | $ | 842,042 | Indefinitely | ||||
| LoCorr Spectrum Income Fund | 9,842,019 | 17,323,728 | Indefinitely | ||||||
| 108 | | LoCorr Macro Strategies Fund, LoCorr Long/Short Commodities Strategy Fund, LoCorr Multi-Strategy Fund, and LoCorr Market Trend Fund – Notes to Consolidated Financial Statements / LoCorr Dynamic Equity Fund and LoCorr Spectrum Income Fund – Notes to Financial Statements |
| For the Year Ended December 31, 2017 | |||||||||||||||||
Interest Charges Incurred | Average Daily Loan Balance | Weighted Average % | Maximum Amount Borrowed | ||||||||||||||
| $ | Date | ||||||||||||||||
| LoCorr Multi-Strategy Fund | $ | 733 | $ | 17,106 | 4.29 | % | $ | 1,050,000 | August 17, 2017 – | ||||||||
| August 21, 2017 | |||||||||||||||||
| Dividend Declaration | Shareholder of | Distribution Amount per Share Class | ||||||||||||
Date (a) | Record Date | Class A | Class C | Class I | ||||||||||
| January 31, 2018 | January 30, 2018 | $0.02292 | $0.01667 | $0.02500 | ||||||||||
| February 28, 2018 | February 27, 2018 | $0.02292 | $0.01667 | $0.02500 | ||||||||||
| Dividend Declaration | Shareholder of | Distribution Amount per Share Class | ||||||||||||
Date (a) | Record Date | Class A | Class C | Class I | ||||||||||
| January 31, 2018 | January 30, 2018 | $0.04790 | $0.04170 | $0.05000 | ||||||||||
| February 28, 2018 | February 27, 2018 | $0.04790 | $0.04170 | $0.05000 | ||||||||||
| Report of Independent Registered Public Accounting Firm | | 109 |

Milwaukee, Wisconsin
February 28, 2018
| 110 | | LoCorr Investment Trust - Expense Example (Unaudited) |
| LoCorr Investment Trust - Expense Example (Unaudited) (continued) | 111 |
| Hypothetical | ||||||||||||||||||
| Actual | (5% gross annual return) | |||||||||||||||||
| Fund’s | Ending | Ending | ||||||||||||||||
| Annualized | Beginning | Account Value | Expenses Paid | Account Value | Expenses Paid | |||||||||||||
| Expense Ratio | Account Value | December 31, | During Period | December 31, | During Period | |||||||||||||
| Class | 1, 2 | July 1, 2017 | 2017 | 1, 2, 3 | 2017 | 1, 2, 3 | ||||||||||||
| LoCorr Macro Strategies Fund | ||||||||||||||||||
| A | 2.24% | $1,000.00 | $1,056.10 | $11.61 | $1,013.91 | $11.37 | ||||||||||||
| C | 2.99% | $1,000.00 | $1,052.20 | $15.47 | $1,010.13 | $15.15 | ||||||||||||
| I | 1.99% | $1,000.00 | $1,057.70 | $10.32 | $1,015.17 | $10.11 | ||||||||||||
| LoCorr Long/Short Commodities Strategy Fund | ||||||||||||||||||
| A | 2.20% | $1,000.00 | $1,092.50 | $11.66 | $1,014.06 | $11.22 | ||||||||||||
| C | 2.95% | $1,000.00 | $1,088.10 | $15.58 | $1,010.28 | $15.00 | ||||||||||||
| I | 1.95% | $1,000.00 | $1,093.80 | $10.34 | $1,015.32 | $9.96 | ||||||||||||
| LoCorr Multi-Strategy Fund | ||||||||||||||||||
| A | 2.32% | $1,000.00 | $1,072.00 | $12.12 | $1,013.51 | $11.77 | ||||||||||||
| C | 3.07% | $1,000.00 | $1,068.00 | $16.00 | $1,009.73 | $15.55 | ||||||||||||
| I | 2.07% | $1,000.00 | $1,073.80 | $10.82 | $1,014.77 | $10.51 | ||||||||||||
| LoCorr Market Trend Fund | ||||||||||||||||||
| A | 1.90% | $1,000.00 | $1,071.90 | $9.92 | $1,015.63 | $9.65 | ||||||||||||
| C | 2.65% | $1,000.00 | $1,068.00 | $13.81 | $1,011.85 | $13.44 | ||||||||||||
| I | 1.65% | $1,000.00 | $1,072.50 | $8.62 | $1,016.89 | $8.39 | ||||||||||||
| LoCorr Dynamic Equity Fund | ||||||||||||||||||
| A | 3.30% | $1,000.00 | $1,029.70 | $16.88 | $1,008.57 | $16.71 | ||||||||||||
| C | 4.05% | $1,000.00 | $1,026.40 | $20.69 | $1,004.79 | $20.47 | ||||||||||||
| I | 3.05% | $1,000.00 | $1,031.10 | $15.61 | $1,009.83 | $15.45 | ||||||||||||
| LoCorr Spectrum Income Fund | ||||||||||||||||||
| A | 1.95% | $1,000.00 | $1,008.00 | $9.87 | $1,015.38 | $9.91 | ||||||||||||
| C | 2.70% | $1,000.00 | $1,004.20 | $13.64 | $1,011.59 | $13.69 | ||||||||||||
| I | 1.70% | $1,000.00 | $1,009.60 | $8.61 | $1,016.64 | $8.64 | ||||||||||||
| 1 | Includes dividend and/or interest expense of 0.00%, 0.00%, 0.03%, 0.00%, 0.15% and 0.00% for the LoCorr Macro Strategies Fund, the LoCorr Long/Short Commodities Strategy Fund, the LoCorr Multi-Strategy Fund, the LoCorr Market Trend Fund, the LoCorr Dynamic Equity Fund and the LoCorr Spectrum Income Fund, respectively. |
| 2 | Includes expenses of wholly-owned and controlled Cayman Islands subsidiaries for the LoCorr Macro Strategies Fund, the LoCorr Long/Short Commodities Strategy Fund, the LoCorr Multi-Strategy Fund and the LoCorr Market Trend Fund. |
| 3 | Expenses Paid During Period are equal to the net annualized expense ratio for the class, multiplied by the average account value over the period, multiplied by 184/365 (to reflect the one-half year period). |
| 112 | Approval of Advisory Agreements (Unaudited) |
| · | The nature, extent and quality of the services provided by the investment sub-adviser to the fund; |
| · | The investment performance of the fund and the investment sub-adviser; |
| · | The costs of the services to be provided and the profits to be realized by the sub-adviser and its affiliates from the relationship with the fund; |
| · | The extent to which economies of scale will be realized as the fund grows; and |
| · | Whether the fee levels reflect these economies of scale to the benefit of the shareholders. |
Notice of Privacy Policy & Practices/Quarterly Portfolio Holdings/Proxy (Unaudited) | 113 |
| · | Information we receive from you on or in applications or other forms, correspondence, or conversations, including, but not limited to, your name, address, phone number, social security number, assets, income and date of birth; and |
| · | Information about your transactions with us, our affiliates, or others, including, but not limited to, your account number and balance, payments history, parties to transactions, cost basis information and other financial information. |
| 114 | Qualified Dividend Income (“QDI”) / Dividends Received Deduction (“DRD”) (Unaudited) |
Fund | QDI% | |||
| LoCorr Macro Strategies Fund | 0.00% | |||
| LoCorr Long/Short Commodities Strategy Fund | 0.00% | |||
| LoCorr Multi-Strategy Fund | 0.00% | |||
| LoCorr Market Trend Fund | 0.00% | |||
| LoCorr Dynamic Equity Fund | 0.00% | |||
| LoCorr Spectrum Income Fund | 88.42% | |||
Fund | DRD% | |||
| LoCorr Macro Strategies Fund | 0.00% | |||
| LoCorr Long/Short Commodities Strategy Fund | 0.00% | |||
| LoCorr Multi-Strategy Fund | 0.00% | |||
| LoCorr Market Trend Fund | 0.00% | |||
| LoCorr Dynamic Equity Fund | 0.00% | |||
| LoCorr Spectrum Income Fund | 66.87% | |||
| Independent Trustees/Interested Trustees and Officers | | 115 |
| Independent Trustees | ||||
| Name and Year of Birth | Position/Term of Office1 | Principal Occupation During the Past 5 Years | Number of Portfolios in Fund Complex2 Overseen by Trustee | Other Directorships held by Trustee During the Past 5 Years |
Gary Jarrett Year of Birth: 1954 | Trustee/May 2016 to present | Chief Executive Officer, Black River Asset Management LLC, investment subsidiary of Cargill, Inc., June 2002 to August 2015. | 6 | None |
Mark Thompson Year of Birth: 1959 | Trustee/December 2011 to present | Chairman and Chief Manager, Riverbridge Partners, LLC (investment management), 1987 to present. | 6 | None |
Ronald A. Tschetter Year of Birth: 1941 | Trustee/January 2011 to present | Mr. Tschetter is presently retired from his principal occupations; Director of the U.S. Peace Corps, September 2006 to January 2009. | 6 | None |
| Interested Trustees and Officers | ||||
| Name and Year of Birth | Position/Term of Office1 | Principal Occupation During the Past 5 Years | Number of Portfolios in Fund Complex2 Overseen by Trustee | Other Directorships held by Trustee During the Past 5 Years |
Jon C. Essen3 Year of Birth: 1963 | Trustee, Treasurer, Secretary, Chief Financial Officer/2011 to present | Chief Financial Officer and Chief Compliance Officer of LoCorr Fund Management, LLC, (2010-2017), Chief Operating Officer (2010-2016); Senior Vice President, Chief Financial Officer, and Registered Representative of LoCorr Distributors, LLC (broker/dealer), 2008 to present, and Chief Operating Officer, 2008 to 2016. | 6 | None |
Kevin M. Kinzie4 Year of Birth: 1956 | President, Trustee/ January 2011 to present | Chief Executive Officer of LoCorr Fund Management, LLC, 2010 to present; President and Chief Executive Officer of LoCorr Distributors, LLC (broker/dealer), 2002 to present. | 6 | None |
Jason Roeske5 Year of Birth: 1969 | Chief Compliance Officer, September 2017 to present | Consultant at Encore Consulting Group (2013); Chief Compliance Officer of Welsh Securities, LLC (2014-2016); Chief Compliance Officer of LoCorr Fund Manage-ment, LLC, (2017-present). | 6 | Chief Compliance Officer of Welsh Securities, LLC (2014-2016) |
1 | The term of office for each Trustee listed above will continue indefinitely. |
2 | The term “Fund Complex” refers to the LoCorr Investment Trust. |
3 | Mr. Essen is an interested Trustee because he is an officer of the Funds’ Adviser. |
4 | Mr. Kinzie is an interested Trustee because he is an officer and indirect controlling interest holder of the Funds’ Adviser. |
5 | Mr. Roeske is an interested Officer because he is an officer of the Funds’ Adviser. |

| FYE 12/31/2017 | FYE 12/31/2016 | |
| Audit Fees | $139,000 | $135,000 |
| Audit-Related Fees | $0 | $0 |
| Tax Fees | $36,500 | $35,500 |
| All Other Fees | $5,000 | $6,000 |
| FYE 12/31/2017 | FYE 12/31/2016 | |
| Audit-Related Fees | 0% | 0% |
| Tax Fees | 0% | 0% |
| All Other Fees | 0% | 0% |
| (a) | Schedule of Investments is included as part of the report to shareholders filed under Item 1 of this Form. |
| (b) | Not Applicable. |
| (a) | The registrant’s President and Treasurer have reviewed the registrant's disclosure controls and procedures (as defined in Rule 30a-3(c) under the Investment Company Act of 1940 (the “Act”)) as of a date within 90 days of the filing of this report, as required by Rule 30a-3(b) under the Act and Rules 13a-15(b) or 15d‑15(b) under the Securities Exchange Act of 1934. Based on their review, such officers have concluded that the disclosure controls and procedures are effective in ensuring that information required to be disclosed in this report is appropriately recorded, processed, summarized and reported and made known to them by others within the registrant and by the registrant’s service provider. |
| (b) | There were no changes in the registrant's internal control over financial reporting (as defined in Rule 30a-3(d) under the Act) that occurred during the second fiscal quarter of the period covered by this report that has materially affected, or is reasonably likely to materially affect, the registrant's internal control over financial reporting. |
| (a) | (1) Any code of ethics or amendment thereto, that is the subject of the disclosure required by Item 2, to the extent that the registrant intends to satisfy Item 2 requirements through filing an exhibit. |
| (b) | Certifications pursuant to Section 906 of the Sarbanes‑Oxley Act of 2002. |