
Letter to Shareholders
LoCorr Funds seeks to provide investments that, over time, will have low correlation to traditional asset classes such as stocks and bonds. We believe that adding low correlating investments to portfolios can significantly reduce overall portfolio risk while enhancing returns. Correlation measures the degree to which the returns of two investments move together over time. LoCorr offers products that provide the potential for positive returns in rising or falling markets and are designed to generate returns independent of traditional stock, bond and commodity investments. In this report, LoCorr Funds are reporting on five mutual funds: LoCorr Macro Strategies Fund, LoCorr Long/Short Commodities Strategy Fund, LoCorr Market Trend Fund, LoCorr Dynamic Equity Fund and LoCorr Spectrum Income Fund (collectively, the “Funds”).
LoCorr Macro Strategies Fund
The LoCorr Macro Strategies Fund (“LMS”) seeks capital appreciation as its primary investment objective with managing volatility as a secondary objective. LMS attempts to achieve its objective by investing in two main strategies – a Managed Futures Strategy and a Fixed Income Strategy.
LMS employs three sub-advisers to manage the managed futures portion of the Fund:
| ● | Millburn Ridgefield Corporation (“Millburn”) manages a portfolio for LMS that is similar to its Millburn Diversified Program which commenced operations in 1977. Millburn invests in a diversified portfolio of global futures contracts by combining non-traditional and trend following strategies in a systematic multi-factor approach. |
| ● | Graham Capital Management, LLC (“Graham”) manages a portfolio for LMS that is similar to its Tactical Trend strategy, a systematic medium- to long-term trend following program that commenced trading in 2006. |
| ● | Revolution Capital Management (“Revolution”) manages a strategy for LMS that is similar to its Alpha Program that has been available in a managed account program since 2007. Revolution employs a short- to medium-term pattern recognition strategy that incorporates trend reversion and counter-trend signals. |
Market Commentary
Reflecting on the events of 2019, we are reminded what a remarkable difference a year can make. If we consider market dynamics heading into 2019, segments of the yield curve had inverted. Fed Chairman Jerome Powell had announced in October 2018 that U.S. policy rate was “still a long way from neutral” -- implying that the Fed would continue along its path of rate hikes in the face of deteriorating economic conditions. Investors panicked as the Fed was seemingly out-of-step with the weakening economic narrative. Finally, trade tension with China was ratcheting higher. Putting it all together, market participants raced for the exits, with equities plunging and the S&P 500 dropping -19.36% between September 21st and December 24th 2018.
With that prelude, 2019 began with investors shifting stance dramatically, embracing risk-on investments as the Fed indicated its willingness to ease. This led to stocks rocketing higher in January (S&P 500 increased by approximately +8.0% during the first month of the year). One of the key underpinnings for the equity market’s continued strength was this “Don’t Fight the Fed” mentality, as the Fed cut rates three times in 2019. Later in the year, investor confidence was further buoyed by (1) U.S./China trade war rhetoric shifting to a more positive tone as President Trump and Xi Jinping delayed implementation of higher tariffs and the two sides worked towards a phase one deal; (2) the Conservative Party win in the UK elections which relieved anxiety surrounding Brexit and policy uncertainty and; (3) signs of improvement in the health of the global economy. Despite the House of Representatives’ passage of two articles of impeachment against President Trump, equity markets continued to surge. By the end of 2019, the MSCI World PR Index, a proxy for global developed equities, jumped approximately +25.2% with many major developed markets reaching all-time highs.
In Fixed Income markets, after peaking at nearly 3.3% in late 2018, the U.S. 10-Year Treasury yield fell below 1.5% by the beginning of September 2019. While segments of the U.S. yield curve had been inverted since 2018, the highly watched 10-Year U.S. Treasury yield vs. 2-Year U.S. Treasury yield inverted during the third quarter. Elsewhere in the world, nearly $17 trillion in global government debt had negative yields during 2019. The British 30-year government bond yield fell below 1% in August for the first time in history. Global central banks adopted more dovish policies as economic conditions deteriorated, marked by the European Central Bank cutting rates for the first time since 2016 and restarting its bond repurchase quantitative easing program. Since bottoming around the end of the third quarter, global yields began to rise at a generally measured pace in response to the improvement in global economic growth. For example, the U.S. 10-Year Treasury yield climbed to approximately 1.9% by year end while the UK 10-Year Gilt had moved about 30 bps off its lows to just over 0.8%.
The trade conflict between the U.S. and China wreaked havoc in the commodity markets during the course of 2019. To understand why, one must consider the size of the Chinese economy and its seemingly insatiable appetite for commodities. China is the world’s second largest economy and consumes more than 50% of the global production of such commodities as aluminum, nickel, coal, copper, steel, and pork so its importance in supply/demand fundamentals should not be underestimated. Because of the trade war, movement in commodity markets often seemed disconnected to underlying supply/demand fundamentals. Rather, commodities were largely driven by shifting rhetoric around the trade war which proved difficult for many systematic strategies to exploit. Energy markets were particularly challenging, as a number of sizable reversals were followed by choppy/side-ways market conditions.
The U.S. Dollar Index, a proxy for the U.S. Dollar (“USD”) versus a basket of major currencies, was relatively unchanged during the year. USD strengthened during the first three quarters of the year as the Fed was behind the curve versus other central banks with respect to monetary easing and U.S. economic growth outpaced international economies. As the Fed began cutting rates and the U.S. economy showed signs of stalling, the USD weakened slightly. Though overall FX volatility was low, the British Pound saw more dramatic swings as uncertainty around Brexit shifted during the period.
Fund Performance Summary
For the calendar year ended December 31, 2019, the Fund returned +12.72% (Class I) versus +2.28% for the ICE BofAML 3-Month T-Bill Index and +3.89% for the Morningstar Managed Futures Category. This marked the fifth calendar year out of the past six where the Fund has generated positive absolute returns. While lagging the S&P 500, we are pleased that the Fund outperformed the +8.72% return for the Bloomberg Barclays U.S. Aggregate Bond Index, a proxy for the performance of fixed income investments.
The Fund’s diversified approach of allocating to three sub-advisers in its Managed Futures Strategy helped to limit the Fund’s overall volatility and drawdowns during the year, providing a smoother investment return relative to many peers. During the period, all three sub-advisers delivered positive performance, led by double-digit returns from Revolution and Graham. Revolution Capital made a number of enhancements to their systematic models at the beginning of 2019 and we were pleased to see their program respond with strong results. The favorable environment for trend followers, particularly in the Fixed Income markets, provided a boost to Graham Capital Management. Millburn who had, prior to 2019, generated the strongest returns amongst the sub-advisers over the past few years, lagged the other managers though still generated positive returns.
While blending multiple trading strategies into a single portfolio solution, the most favorable environment for the Fund is one marked by sustained directional price moves in markets attributable to fundamental factors. Fortunately, in a number of markets these types of conditions persisted for much of 2019. In Fixed Income, bonds rallied/yields fell for most of the first nine months of the year which provided robust opportunities for the sub-advisers. Equity markets also moved persistently higher for much of the year. Commodity markets on the other hand were more challenging, marked by frequent and sizable reversals.
Trading in Fixed Income was the most profitable sector followed closely by strong gains from trading in Equities. The Fund experienced losses from trading in Commodities, largely attributable to unprofitable positions in the Energy sector. Trading in Foreign Currency was slightly unprofitable during the period. The target allocation to each sub-adviser remained unchanged versus the prior year:
| ● | Millburn Ridgefield Corporation: 40% |
| ● | Graham Capital Management: 40% |
| ● | Revolution Capital Management: 20% |
Managed Futures Strategy
Fixed Income
Trading in Fixed Income was the largest contributor to Fund performance during the year. Long positions, particularly during the first three quarters of the year, benefitted from lower rates as central banks eased throughout 2019. Long positions peaked mid-year before falling as interest rates bottomed and began moving higher in response to signs of improvement in the global economy late in the year. The Fund finished the calendar year with short European and Asian Fixed Income positions while U.S. exposure remained long, albeit reduced from levels seen earlier in 2019.
Geographically, the bulk of the gains stemmed from trading in Europe with U.S. markets also highly profitable. Long positions in the Euro Bund, UK Gilt, T-Bond (U.S. 30-year Treasury) and U.S. 5-year Treasury were the most profitable markets. Trading in Asia was also profitable, though not to the same degree. While all three sub-advisers were able to take advantage of opportunities in this sector, given the magnitude and duration of the move in rates, the Fund’s trend following component was particularly profitable.
Equity Indices
Trading in Equity Indices was highly profitable during 2019, most notably in the second half of the period. While entering the year with short equity exposure, the Fund shifted long early in 2019 and remained that way throughout most of 2019. Accordingly, the Fund benefitted from the meteoric rise in global stock prices. Overall, positioning in the U.S. and Europe was consistently long while Asian exposure was somewhat more mixed. Positioning at year end was long in Europe and Asia with smaller long positions in U.S. markets. European and U.S. positions were both highly profitable during the year, led by gains from long positions in the DJ EURO STOXX 50, E-Mini S&P, and the German DAX. Asian positions, led by gains from the SIMEX Nikkei 225 were also profitable, though not to the same extent.
Foreign Currencies
Trading in Foreign Currencies was marginally unprofitable during the year. Generally, the dollar did not see significant moves versus other major currencies in 2019. An exception was the British Pound which was volatile as Brexit sentiment shifted throughout the year. Positioning in Foreign Currencies (FX) was persistently short (long USD) in the period though overall exposure fell precipitously late in the year.
The largest losses stemmed from trading in developed market currencies with smaller losses from emerging market FX. While positioning fluctuated during the year, trading in the Canadian dollar was the largest FX detractor in 2019 with smaller losses from the Brazilian Real. There were no significant contributors, though overall, trading in European currencies vs. the USD was slightly profitable.
Commodities
The largest detractor to Fund performance was trading in Commodities as conditions proved challenging for systematic strategies to navigate. Energy was particularly difficult, generating the largest losses for the Fund as positioning fluctuated during the first three quarters of the year in response to the sizable reversals and choppy conditions. Positions shifted long and were profitable during the fourth quarter as oil markets exhibited more persistent directional movement late in the year. Trading in Agricultural commodities was marginally unprofitable due to losses from positions in both Softs and Grains.
In Metals, Precious Metals were profitable as long positions in gold and silver during the second half of the year benefitted from higher prices. Base Metals detracted from Fund performance, largely due to trading in copper as positioning fluctuated during the year.
Outlook
We began our annual commentary with the phrase “what a remarkable difference a year can make” which we believe is worth reflecting upon as we set sail in 2020. Will investors enjoy 30%+ gains in the equity markets this year like in 2019? Are equity markets ripe for a correction or at least more muted returns? What is your outlook for interest rates? With rates near historical lows and trillions of dollars of global government debt with negative yields, is it likely that rates go even lower next year? Alternatively, while interest rates have been gradually climbing for the final few months of 2019, will they keep moving higher? Our belief is that it is inherently difficult to predict these outcomes with any certainty. Accordingly, adding diversifying strategies may help better diversify one’s portfolio and its ability to weather and participate in more varied market environments. Managed futures strategies have historically exhibited low correlation to both equity and fixed income investments, making them potentially strong diversifiers within a portfolio.
We are pleased with the Fund’s double-digit performance in 2019 and while not a dedicated trend following strategy, we are encouraged by the emergence of persistent trends in the market that occurred during the year. In our view, the high conviction, multi-manager structure employed by the Fund will continue to help the Fund navigate markets in a less volatile fashion than peers, making it a potentially attractive solution for investors.
Fixed Income Strategy
The Macro Strategies Fund invests most of its remaining assets in a Fixed Income Strategy comprised of investment grade corporate and government agency securities. Nuveen Asset Management (“Nuveen”) is the sub-adviser for this strategy and manages a shorter duration, high quality portfolio.
The fixed income component of the Fund is managed against the Barclays 1-5 Government/Credit Index. Returns for the fixed income portfolio were +5.21% compared to +5.01% for the benchmark during 2019. Nuveen’s defensive interest rate strategy underperformed relative to the index as the manager had positioned the duration of the portfolio short to the benchmark during 2019, mainly during the first quarter of the year. Curve positioning was a modest contributor. Sector-wise, the portfolio was positioned with a 25-35% weighting to investment grade corporate bonds along with a 30-40% aggregate weighting to high quality, short duration securitized instruments. The portfolio’s corporate bond issuer exposure was well diversified with a modest overweight to financials. Given that spreads for non-government securities tightened, the sector strategy was a contributor to investment returns during the reporting period.
Slowing growth and a benign inflation environment, prompted global central banks to ease policy and provide support. While business investment remained weak due to trade uncertainty, consumers continued to benefit from a strong labor market and rising wages. Lagged effects of interest rate cuts and easing of trade tensions looked to have stabilized the global growth picture as 2019 came to a close.
Credit spreads ended the year near cycle lows, equity markets near all-time highs; while volatility decreased throughout 2019. Rates were meaningfully lower as the Fed cut three times during the year. The 2-Year Treasury fell 92 basis points while the 10-Year Treasury fell 76 basis points causing the curve to steepen modestly. The steepening of the curve was mostly confined to the last quarter of the year after being briefly inverted during the summer. Investment-grade credit had strong returns during the year as spreads tightened significantly, finishing 2019 near cycle lows. Securitized sector spreads also tightened as they followed broader credit markets, albeit to a lesser extent. All securitized sectors had positive excess returns versus Treasuries during 2019.
The Nuveen investment team anticipates the U.S. economy to grow approximately 2% in 2020, with global growth at 3%―similar to last year, and the potential for modest upside. The global manufacturing sector appears to have bottomed, supporting risk sentiment. However, trade policy uncertainty could reemerge and geopolitical risks remain high, having the potential to moderate risk appetite and increase volatility. The Nuveen team expects the Fed to be on hold for the foreseeable future as they assess the economy’s response to previous rate cuts and monitor incoming data. Given this outlook on the Fed and growth expectations, the portfolio managers intend to keep the Funds’ duration mostly neutral versus the benchmark.
LoCorr Long/Short Commodities Strategy Fund
The LoCorr Long/Short Commodities Strategy Fund (the “Long/Short Commodities Fund” or the “Fund”) provides investors with access to a commodities futures strategy in a mutual fund structure. Historically, investors have primarily accessed exposure to long-only commodities that rely on rising commodity prices to generate positive returns. Of course, commodity prices don’t always appreciate and occasionally experience sharp declines, as was seen most recently in the fourth quarter of 2018 when oil prices collapsed. The Long/Short Commodities Fund has the potential to profit while commodity prices increase or decrease which differentiates it from most commodity-oriented mutual funds. The Fund’s primary investment objective is capital appreciation in rising and falling commodities markets. The Fund attempts to achieve its investment objective by investing in two primary strategies – a Commodities Strategy and a Fixed Income Strategy.
The Fund accesses, via a total return swap agreement, the returns of:
| ● | Millburn’s Commodity Program (“MILCOM”), which began trading in 2005. MILCOM employs a systematic trading strategy that takes outright long/short positions and relative value spread positions across 40+ commodity futures markets. |
| ● | J E Moody & Company Commodity Relative Value Program (“JEM CRV”), which began trading in 2006. JEM CRV employs a market neutral, systematic trading strategy that invests in relative value calendar spread positions across 20+ commodity markets. |
| ● | First Quadrant’s Commodities Long/Short strategy (“First Quadrant”), which began trading in 2010. First Quadrant employs a systematic long/short directional strategy that attempts to capture commercial market participant behavior across 20+ commodity markets. |
| ● | ARCOM Capital LLC (“ARCOM”), which began trading in 2015. ARCOM is led by Alastair Riach, who has over 30 years of experience trading commodities, and manages a discretionary natural gas strategy that trades primarily relative value. ARCOM was added to the Fund at the end of 2019, as LoCorr believes the introduction of a discretionary approach will complement the systematic strategies currently accessed by the Fund and will prove beneficial to shareholders. |
Following its +15.40% return in 2018, the Fund’s Class I share fell -5.97% during 2019 versus a +7.69% return for the Bloomberg Commodity Index and the +2.28% gain for the ICE BofAML 3-Month T-Bill Index. During 2019, slight positive absolute returns by MILCOM was not enough to offset losses from JEM CRV and First Quadrant. ARCOM was added in December and has generated slightly positive returns since its inclusion. Overall, the Fund benefitted from profitable trading in Softs, which was more than offset by losses in Energy, Metals, Grains and Livestock. Trading in directional long/short positions was unprofitable while relative value positions had small losses.
Conditions in the commodity markets were challenging in 2019 as the trade war between the U.S. and China wreaked havoc. To understand why this conflict was so important, one must consider the size of the Chinese economy and its seemingly insatiable appetite for commodities. China is the world’s second largest economy and consumes more than 50% of the global production of such commodities as aluminum, nickel, coal, copper, steel, and pork. It is also a massive consumer of many other commodities so its importance in supply/demand fundamentals should not be underestimated. Because of the trade war, movement in commodity markets often seemed disconnected to underlying supply/demand fundamentals. Rather, commodity markets were driven by shifting rhetoric around the trade war which proved difficult for many systematic strategies.
Energy markets were particularly challenging during the year as a number of sizable reversals were followed by choppy/side-ways market conditions. Following its epic collapse in the latter months of 2018, oil prices rocketed higher through late April as OPEC output fell early in 2019 following Saudi production cuts and U.S. sanctions against Iran and Venezuela, which reduced supply. Prices then retreated until mid-June due to concerns regarding slowing global economic growth caused by an escalation in the trade war as well as growing stockpiles. These conditions gave way to sideways markets that experienced frequent small reversals until the end of the third quarter when oil prices had a sustained upward move through the end of the year following Saudi Arabia’s announcement of its intent to stabilize oil prices and an improving economic growth outlook.
Within Metals markets, Base Metal prices were significantly impacted during the course of the year by shifting sentiment towards the trade war and outlook for economic growth. Base Metal prices were mixed, with an approximately +30% surge in nickel prices which were buoyed by the shift toward electric vehicles and Indonesia’s decision to move up its ban on exports of the commodity from 2022 to January 1, 2020. The dovish Fed helped sustain a persistent rally in Precious Metals, as gold prices moved higher. Palladium prices rocketed about 60% as demand for catalytic converters as part of the move toward cleaner emission standards globally boosted demand.
Agricultural commodities were highly affected by the trade war as well as adverse weather (flooding) in the Midwest in the Spring planting season. Though overall the sector was flattish for the year, this masked significant upward and downward moves during 2019. Grains were mixed with corn prices falling while wheat prices moved higher. Softs were also mixed, though rallied sharply during the fourth quarter in large part due to a roughly 25% surge in coffee prices which benefitted from tight demand/supply conditions. Within Livestock, lean hog prices moved higher, as demand for U.S. pork increased due to the outbreak of the African swine flu in Asia.
Commodity Strategy
Energy
The largest losses for the Fund stemmed from trading in Energy as the underlying managers had difficulty with the massive reversals experienced in oil markets during the course of the year. We are encouraged, however, that Energy trading was profitable during the fourth quarter, benefitting from more persistent directional movement in oil prices. Energy positions fluctuated between long and short in 2019, finishing the year with long positions in oil and oil-derived commodities while natural gas was short.
With challenging conditions in oil markets and exposure fluctuating between long and short during the year, the largest losses from directional trading were from positions in West Texas Intermediate (“WTI”) crude and London gas oil. Short positions in natural gas benefitted from the persistent downward move in prices rooted in high production/supply. In relative value trading, strong gains from calendar spreads in Gasoline RBOB were largely offset by losses from positions in WTI calendar spreads.
Metals
Trading in Metals was unprofitable during 2019 as gains from long positions in Precious Metals were more than offset by losses from trading in Base Metals. Relative value was not a significant factor during the period. Long positions in copper were unprofitable in the Spring as prices tumbled on U.S./China tariff concerns despite numerous fundamental supply disruptions. With nickel prices moving higher through the first nine months of the year on the back of tight supply/demand conditions and Indonesia moving forward its export ban, the Fund was positioned long as the volatile commodity’s price plunged nearly -20% during the fourth quarter, detracting from returns. In Precious Metals, long positions in palladium benefitted from an approximately +60% upward price move during the year as the market is in deficit due to strong global demand for catalytic converters.
Agricultural
The Fund had negative attribution from Agricultural commodities during 2019, as directional long/short and relative value positions detracted. Overall, trading in Grains and Livestock was unprofitable while positions in Softs generated gains. In Grains, with prices fluctuating wildly due to shifting rhetoric around the U.S./China trade deal and flooding in the Spring, short positions in soybean were unprofitable. In Softs, long positions in crude palm oil benefitted from higher oil prices and tighter supplies while long positions in cocoa were also profitable. In Livestock, trading in lean hogs was unprofitable as the market felt the effects of the trade war as well as the Asian swine flu outbreak. Live cattle positions also detracted from returns.
Outlook
While 2019 was a difficult year, the Fund has generated compelling total returns over longer annualized periods, ranking in the top 3rd, 1st, and 11th percentile in its Morningstar Managed Futures peer group for the 3-year, 5-year, and since inception periods out of 100, 82, and 40 funds, respectively. With challenging conditions in commodity markets in 2019, many systematic strategies, including the underlying managers in the Fund, struggled during the year. It is our belief, that these conditions were unusual and extreme, and not likely to persist to the same degree in the future. While sentiment surrounding the trade war has improved in recent months with the announced Phase 1 deal, we also believe that investor exhaustion with respect to comments from Chinese and U.S. leaders may lead to more muted reactions in the future. With that said, we believe the addition of a discretionary-based strategy will help diversify the Fund’s alpha drivers and improve its ability to navigate a wider range of market environments.
Overall, we believe the Fund may be highly attractive to investors seeking solutions that are uncorrelated to most investment strategies and asset classes, or, for investors that are seeking alternatives in the commodity market. Commodity markets are characterized by high volatility and while they can experience sharp surges in prices, they are also subject to sizable drawdowns as we saw in 2018. The underlying managers have the ability to take both long and short directional positions (benefit from commodities moving up or down), as well as to trade along the forward curve (relative value calendar spread trading) to capture the diverse and robust set of opportunities in the commodity markets. The Fund’s multi-manager approach has the potential to smooth the ride for investors as the underlying managers tend to zig and zag at different times which may help reduce volatility and limit drawdowns.
Fixed Income Strategy
The Long/Short Commodities Fund invests most of its remaining assets in a Fixed Income Strategy comprised of short to intermediate term investment grade corporate and government agency securities. Nuveen Asset Management (“Nuveen”) is the sub-adviser for this strategy and manages a shorter duration portfolio.
The fixed income component of the Fund is managed against the Barclays 1-5 Government Credit Index. Returns for the fixed income portion of the portfolio were +5.29% compared to +5.01% for the benchmark during 2019. Nuveen’s defensive interest rate strategy underperformed relative to the index as the manager had positioned the duration of the portfolio short to the benchmark during 2019, mainly during the first quarter of the year. Curve positioning was a modest contributor. Sector-wise, the portfolio was positioned with a 25- 35% weighting to investment grade corporate bonds along with a 30-40% aggregate weighting to high quality, short duration securitized instruments. The portfolio’s corporate bond issuer exposure was well diversified with a modest overweight to financials. Given that spreads for non-government securities tightened, the sector strategy was a contributor to investment returns during the reporting period.
LoCorr Market Trend Fund
The LoCorr Market Trend Fund (the “Market Trend Fund” or the “Fund”) was created to provide investors with access to a trend following futures strategy managed by one of the leading managers in this space—Graham Capital Management (“Graham”). Graham was founded in 1994 and manages approximately $15 billion in assets. The Market Trend Strategy is managed similarly to Graham’s Tactical Trend program, a systematic medium- to long-term trend following strategy that commenced trading in 2006. The Fund seeks capital appreciation as its primary investment objective with managing volatility as a secondary objective. The Fund attempts to achieve its objective by investing in two main strategies – a Managed Futures Strategy and a Fixed Income Strategy.
Market Commentary
See Macro Strategies Fund above.
Fund Performance Commentary
The Fund’s Class I shares gained +18.53% during the annual period ended December 31, 2019, well ahead of the +2.28% return for the ICE BofAML 3-Month T-Bill Index and the +9.60% return for the SG Trend Index. While lagging the 30%+ surge in the S&P 500, we are pleased that the Fund outperformed the +8.72% return for the Bloomberg Barclays U.S. Aggregate Bond Index, a proxy for the performance of fixed income investments.
Profitable trading in Fixed Income markets was the largest contributor to Fund returns during the period with sizable gains also generated from trading in Equity Indices. Commodity markets proved challenging, particularly trading in Energy which was the Fund’s largest detractor in 2019. Agricultural and Base Metal commodities were also unprofitable while trading in Precious Metals was a positive contributor. Trading in Foreign Currencies was not a significant factor.
Market Trend Strategy
Fixed Income
Trading in Fixed Income was the largest contributor to Fund performance during the annual period as sizable long positions during the first nine months of the year benefitted from strong trending activity. Fixed income prices rose consistently for most of the first three quarters of the year as the Federal Reserve adopted a more accommodative posture, eventually cutting interest rates in September for the first time since the Financial Crisis. With other central banks globally, including the European Central Bank also easing, interest rates moved lower overseas as well. Geographically, long positions in U.S. markets generated the largest contribution to returns, with strong performance across the term structure. Long positions in European markets were also quite profitable, with solid gains from Asian markets. The Fund exited 2019 with long Fixed Income positions (benefit from falling rates) though significantly reduced from levels seen earlier in the period.
Equity Indices
Equity Indices were the second largest contributor to performance in 2019 as the asset class experienced strong trending activity that the Fund was able to capitalize on. Overall, positioning across the U.S., Europe, and Asia were consistently long for most of the year in varying size. The Fund benefitted from strong attribution in both U.S. and European equity markets led by strong gains from long positions in the E-Mini NASDAQ 100 and DJ EURO STOXX 50. Trading in Asia was not a significant driver of returns during the period. The Fund ended 2019 with sizable long exposure in Equity Indices.
Foreign Currencies
Trading in Foreign Currencies (“FX”) was not a significant driver of returns during the period as the U.S. Dollar Index (“DXY”), a proxy for the U.S. Dollar (“USD”) versus a basket of major currencies, was relatively unchanged during the period. Overall, strong gains during the third quarter were wiped out in the final three months of the year as a small upward trend in the dollar reversed course as the Fed began cutting and signs of economic growth stalling in the U.S. emerged. The Fund was unprofitable in developed market currencies, but did enjoy small positive contributions from positions in emerging market FX. The largest losses stemmed from trading in the Canadian Dollar and British Pound, while trading in the Mexican Peso was profitable. The Funded exited the period short FX/long USD, though reduced exposure from levels seen earlier in 2019.
Commodities
The largest detractor to Fund performance was trading in Commodities as conditions proved challenging for systematic strategies to navigate. Energy was the most problematic commodity, generating the largest losses for the Fund as positioning fluctuated between long and short in response to the sizable reversals in oil experienced during the year. Trading in Agricultural commodities was unprofitable due to losses during the fourth quarter. Trading in both Softs and Grains detracted. Finally, profitable positions in Precious Metals, notably long positions in gold, were more than offset by losses from trading in Base Metals like copper. The Fund exited the year with short positions in Base Metals and Grains, and long positions in Energy and Precious Metals.
Outlook
We began our annual commentary with the phrase “what a remarkable difference a year can make” which we believe is worth reflecting upon as we set sail in 2020. Will investors enjoy 30%+ gains in the equity markets this year like in 2019? Are equity markets ripe for a correction or at least more muted returns? What is your outlook for interest rates? With rates near historical lows and trillions of dollars of global government debt with negative yields, is it likely that rates go lower next year? Alternatively, while interest rates have been gradually climbing for the final few months of 2019, will they keep moving higher? Our belief is that it is inherently difficult to accurately predict these outcomes with any certainty. Accordingly, adding diversifying strategies may help better balance one’s portfolio and its ability to weather and participate in more varied market environments. Trend following strategies have historically exhibited low correlation to both equity and fixed income investments, making them potentially strong diversifiers within your investment structure.
We are pleased with the Fund’s nearly 20% return in 2019 as Graham capitalized on strong trends in the Fixed Income and Equity markets. As we would hope, the Fund has participated nicely in this more favorable environment for trend following, outperforming the SG Trend Index and ranking in the top 5% versus 122 Morningstar managed futures mutual fund peers for the year ended 12/31/19 based on total returns. We remain highly confident in the ability of the Fund to achieve its objectives while providing diversification for investors.
Fixed Income Strategy
The Market Trend Fund invests most of its remaining assets in a Fixed Income Strategy comprised of short to intermediate term investment grade corporate and government agency securities. Nuveen Asset Management (“Nuveen”) is the sub-adviser for this strategy and manages a shorter duration, high quality portfolio.
Returns for the fixed income portion of the portfolio were +3.66% compared to +3.59% for the Barclays 1 – 3 Year Government Index during 2019. The manager’s defensive interest rate strategy underperformed relative to the Index, as duration had been positioned short to the benchmark, mainly during the first half of the year. Curve positioning was neutral to performance. The portfolio generally owned between 20-29% in non-government securities during the time frame. This was a contributor to performance as these securities outperformed government securities. The portfolio also held about 8-12% of U.S. Agency multifamily MBS; these securities also outperformed similar duration government securities and were a contributor to performance. As of December 31, 2019, portfolio duration was 1.82 years compared to 1.85 years for the benchmark, and about 80% of the portfolio was in U.S. government debt with the remainder in AAA rated non-government securities.
LoCorr Dynamic Equity Fund
The LoCorr Dynamic Equity Fund (the “Fund”) seeks long-term capital appreciation with reduced volatility compared to traditional broad-based equity market indices as a secondary objective. Consistent with the “low correlation” that our LoCorr Fund family seeks, long/short equity funds have the ability to provide positive returns when equity markets are rising, yet they offer the potential for downside protection when equity prices are falling.
The Fund employs three sub-advisers—Billings Capital Management (“Billings”), Kettle Hill Capital Management (“Kettle Hill”), and First Quadrant. Billings’ strategy is based on a value-oriented, concentrated, fundamental, bottom-up long/short equity approach. This manager seeks to maximize absolute returns, exceeding the S&P 500 index over the long term. The sub-portfolio managed by Billings is similar to a strategy that this manager has executed since 2008 with their current firm and for many years prior to that at a different entity. Kettle Hill seeks to earn superior returns over an investment cycle while focusing on capital preservation and downside volatility. The manager’s investment process combines bottom-up, fundamental analysis with a top-down opportunistic overlay. Investing primarily in small cap securities, Kettle Hill targets a conservative net exposure to the market. The sub-portfolio managed by Kettle Hill is similar to a strategy that this manager has executed since its inception in 2003. First Quadrant was added to the portfolio in January 2019 and seeks to capture opportunity through a fundamentally-based quantitative investment process with a dynamic and tactical approach to risk management. The sub-portfolio managed by First Quadrant is similar to a global long/short strategy the manager has executed since 2016 which invests in developed international and U.S. markets utilizing a systematic multi-factor approach coupled with an active beta management approach to maximize upside opportunities while reducing downside performance.
Market Commentary
Equity markets followed a dismal 2018 by surging in 2019. The S&P 500 TR Index finished the year up +31.49%, clipping off its biggest one-year gain since 2013 (S&P 500 TR Index up +32.39%).
While the S&P 500 TR Index closed 2018 down -4.38%, investors poured back into equities after the Fed paused rate hikes as it shifted to a more dovish posture, which helped boost stocks greatly in the first half of the year. A slight market retracement in May triggered by the breakdown of trade talks between the U.S. and China was offset by a solid gain in June driven by a strong jobs reports and increased conviction that the Fed would reduce rates at its July meeting. Investors remained somewhat cautious, however, and continued to closely watch the Fed for clues about future monetary policies and implications for financial markets. Even with trade tension flare-ups throughout the year, these issues seemed to abate in the fourth quarter after China and the U.S. agreed to sign a phase one trade deal. In summary, 2019 came to a close with investor sentiment remaining high due to an improving economic outlook, progress between the U.S. and China with respect to the trade negotiations, and three rate cuts by the Fed which reaffirmed investor faith that the expansion could continue.
Portfolio Update
The Fund (I share class) performed well in 2019, finishing the year up +13.68% and outperforming the Morningstar Long/Short Fund category which closed up +11.93%. The Fund jumped out to a great start and tracked alongside the S&P 500 TR Index for the first half of the year, but could not keep pace with broader equities as equities continued to surge in the second half of 2019. As of December 31, 2019, the Fund has performed well relative to its peers and to the Morningstar Long/Short Equity Category based on total returns, ranking in the top 35th percentile over a one-year period and 27th percentile over the past five-years out of 233 funds and 139 funds, respectively.
All three of the Fund’s sub-advisers closed the year in positive territory with Billings Capital leading the way, posting a stellar year and tracking alongside equity markets (S&P 500 TR Index +31.49%). First Quadrant and Kettle Hill both finished the year in the black, but trailed Billings’ returns. LoCorr believes that the high conviction, concentrated approach managed by Billings Capital is a compelling characteristic which was a significant factor to the Fund’s strong performance in 2019. The Fund’s overall net exposure shifted throughout the year, but closed 2019 within its typical 40-60% range, at 56.2% net exposure.
The Fund’s long holdings performed well throughout the year and were a contributor to the Fund’s overall positive performance for 2019. The Fund saw its strongest returns from the Industrials, Consumer Cyclicals, Financial Services, and Technology sectors. Within the Industrials sector, Air Canada (7.3% of the Fund as of 12/31/19), was a strong contributor in 2019 as the passenger airliner continued to see an improving balance sheet as well as M&A initiatives with which it acquired a competitor which was viewed positively by the Street. Another contributor in the Industrials sector, MasTec Inc. (4.7% of the Fund as of 12/31/19), which is a leading infrastructure construction company focusing on engineering and building of communications, energy, and utilities was additive to the Fund’s long book as investors reacted favorably to growth in the company’s power generation business segment. In the Consumer Cyclicals sector, Marriott Vacations Worldwide Corp. (3.6% of the Fund as of 12/31/19), an owner and manager of resorts and accommodation facilities in the leisure industry, posted strong corporate earnings throughout the year along with increasing its dividend helping to boost investor sentiment toward the stock. In the Financial Services sector, a position in Synchrony Financial (4.3% of the Fund as of 12/31/19) proved to be beneficial to the Fund as the stock moved up during the year on positive news of expansions of its corporate partnerships along with solid earnings which helped to lift the stock price. Offsetting these gains were losses in the Communication Services and Energy sectors. In the Communications Services sector, a position in Intelsat S.A. (0.1% of the Fund as of 12/31/19) struggled in 2019 as the global communications and infrastructure provider was negatively impacted by regulatory and political headwinds surrounding the 5G spectrum auction late in 2019. In the Energy sector a position in Range Resources Corp. (0.0% of the Fund as of 12/31/19), a company which engages in exploration, development, and acquisition of natural gas in the U.S. was hurt by significant price declines in the natural gas markets as a glut in natural gas inventories negatively impacted the stock.
The Fund’s short book experienced losses as broader equity markets carried strong performance momentum and hit all-time highs in 2019. The Technology sector was the Fund’s primary detractor to the short book along with losses in the Industrials and Consumer Cyclical sectors.
Outlook
U.S. equities closed 2019 on a high note as the S&P 500 TR Index finished the year up +31.49% which is its fourth best-performing year in the last thirty years. Market performance persevered even with ongoing geopolitical headwinds stemming from the Chinese/U.S. trade war, attacks in the Middle East, Brexit negotiations, Federal Reserve policy shift, and U.S. impeachments proceedings. Although the equity market has been supported by economic growth and healthy risk appetite, we remain cognizant there are “big picture risks” in 2020 that could possibly trigger a disruption to market conditions. In this type of environment, a long/short equity strategy may allow for continued participation in equity markets if they rise while their ability to benefit from stocks falling in price may potentially mitigate losses if equities were to sell off.
As we would anticipate, the Fund has participated nicely with this more favorable environment, outperforming the Morningstar Long-Short Equity Fund Category and outperforming the majority of its peers in the category. We remain highly confident in the ability of the Fund to achieve its objectives while providing diversification for investors.
LoCorr Spectrum Income Fund
The LoCorr Spectrum Income Fund (the “Spectrum Income Fund” or the “Fund”) has an objective of current income with capital appreciation as a secondary objective. The Fund is designed to fit within the “low correlation” of the LoCorr Fund family by seeking to provide relatively high levels of income with low correlation to the bond market. The Fund is sub-advised by Trust and Fiduciary Income Partners (“TFIP”). TFIP invests in a portfolio of primarily pass-through securities with an integrated covered call and hedging strategy. TFIP seeks to generate high current income, much of which the Fund distributes monthly to investors.
Market Commentary
The past year produced strong returns in most asset classes driven primarily by a sharp easing in central bank policy and an apparent bottoming in global growth. This growth came despite the ongoing U.S./China trade war and other geopolitical uncertainty. Early in 2019, the U.S. Federal Reserve reversed its plan to continue rate hikes, eventually cutting rates three times during the year which bolstered market confidence by reducing recession fears. After rocketing higher early in the year, markets largely trade sideways between April and September as trade tensions mounted and macroeconomic indicators slightly deteriorated. During the fourth quarter we saw an uptick in jobs and service sector numbers which abated fears that a recession was imminent and provided a runway for markets to ascend to all-time highs. Additionally, an agreement in place on phase one of a trade deal between the US and China in December helped further boost investor sentiment. Despite the relief this brought investors, there were some concerns. Middle East tensions boiled over with Iran in focus as a drone/ rocket attack on the major Saudi oil facility in Abquiq which preceded the much-anticipated Aramco IPO. In Europe, Brexit came closer to reality with the referendum narrowly passing under new leadership. Despite some headwinds in 2019, we saw a “rising tide lift all boats” but some question what 2020 might hold as valuations might not be as favorable as they were one year ago.
The steady inflow of central bank liquidity caused both “risk on” and “risk off” assets to rally with both equities and traditional safety assets like gold and US treasuries rallying in tandem. The yield curve briefly inverted, which can be viewed as a strong recession indicator, but swift action by the Fed caused spreads to widen which quieted many critics. Low Treasury yields can be supportive of the Fund, as it has the effect of increasing the difference in the yield offered by the Fund versus the risk-free yield, making our portfolio more attractive from a yield premium perspective. Also, a stabilization in rates is viewed as positive for certain sectors such as the Mortgage Real Estate Trust sector (“mREITs”), which can be profitable on spread lending.
Throughout the year, equity earnings growth slowed while liquidity flows enhanced market valuations. This development, however, did not significantly affect holdings in the portfolio which typically have very low operating volatility. While the street focuses on earnings outlook, the manager monitors cash flows and distribution coverage for the portfolio holdings.
Crude oil prices, which can have a significant effect on market perceptions of energy-related securities in the portfolio, rallied over 35% in 2019, albeit from unusual liquidity-driven December 2018 lows. Slowing global growth concerns along with escalating Middle East tensions, OPEC (plus Russia) curtailing production, and a weakening U.S. dollar all helped push prices higher. As energy prices continue to oscillate, the team continued to focus on traditional energy sectors and in companies which manage for profitability, while also investing aggressively in profitable providers of renewable energy forms.
Portfolio Update
The Fund’s Class I shares gained +18.74% during the annual period ending December 31, 2019 compared to the +8.72% gain for the Bloomberg Barclays U.S. Aggregate Bond Index. The Fund had a strong year experiencing only three negative months during 2019. The Fund benefited from positive contributions by Master Limited Partnerships (“MLPs”), Publicly Traded Partnerships (“PTPs”), and Closed End Funds (“CEFs”), Business Development Companies (“BDCs”), Equity Real Estate Investment Trust (“Equity REITs”) , and Mortgage Real Estate Investment Trust (“mREITs”) holdings. These gains were partially offset by losses from the Fund’s hedging strategy, which was effective in reducing portfolio volatility and drawdowns during the year.
The MLP sector was the top contributor to the Fund’s strong year. The MLP sector, as measured by the Alerian MLP Index, posted a return of +6.56%. Despite a relatively strong start to the year, the group drifted lower until the end of November when tax loss selling gave way to a December rally. Overall, the sector drew attention from investors on strong cash flow growth and increased distribution coverage. Top individual performers in this sector included Global Partners (2.2% of the Fund as of 12/31/19), a down-stream MLP which moved higher on robust cash flow growth along with Icahn Enterprises (1.8% of the Fund as of 12/31/19), which was able to increase distributions through effective activism and use of strong market conditions to monetize some of its portfolio of operating companies.
During 2019 REITs appreciated, benefitting from lower rates especially in the first half of the year. The manager used this strength to reduce exposure as some REIT holdings reached price targets. The mREITs sector also generated positive returns for the Fund, with the sector benefitting from the Fed cutting rates which ultimately reduces borrowing costs with a position in Apollo Commercial Real Estate Finance Inc. (2.7% of the Fund as of 12/31/19) performing well as the company steadily beat earnings estimates during the year elevating the stock.
BDCs positions performed well attributable to strong demand and credit quality of small business loans. Newtek Business Services (2.9% of the Fund as of 12/31/19), a “unicorn” BDC which provides a differentiated suite of business services along with traditional middle market lending continued to periodically raise its distribution and was a notable contributor for the Fund. The PTP sector was also additive to the Fund’s performance last year as a position in Blackstone Group (1.1% of the Fund as of 12/31/29) excelled as it continued to raise assets at an astounding pace and converted from a partnership to a C-Corp structure. PTPs have been an attractive allocation because of strong fundraising trends and the potential for C-Corp conversion.
C-Corp holdings were additive to performance during the period. A position in Pattern Energy Group (0.0% of the Fund as of 12/31/19), a renewable power producer that was acquired at a premium, boosted Fund returns in 2019. TFIP increased allocation to higher yielding C-Corps partly due to the fact that several partnerships converted to a C-Corp structure during the year. The manager added some higher yielding tech and cyclical positions that they feel are well positioned given their economic growth/inflation outlook. The team sees long term growth in renewable energy and has looked to increase exposure, but notes that the available pool has decreased due to acquisition.
The CEFs sector was also a positive contributor for the Fund with the team strategically reducing its exposure as opportunistic discounts to NAV that were available at the end of 2018, narrowed during 2019. A position in Nuveen Real Asset Income & Growth Fund (0.0% of the Fund as of 12/31/19) proved to be beneficial as the fund increased its distribution rate in 2019 viewed as a positive by investors helping performance for the year.
The largest detractors for 2019 came from a position in Consolidated Communications Holdings (0.0% of the Fund as of 12/31/19), which opted to forgo their distribution to reduce debt, CenturyLink (0.0% of the Fund as of 12/31/19), which cut its distribution as acquisition expectations were slower than anticipated, and Enlink Midstream (0.0% of the Fund as of 12/31/19), which moved down on fears that expected growth would not be adequate to cover future distribution and debt payments. During the course of the year, the sub-adviser hedged portfolio risk to varying degrees. Given the strength in the equity markets, this hedging activity had a modest negative effect on performance, but also served to significantly reduce the standard deviation of returns (volatility) of the Fund which we view favorably.
Outlook
Following a year which offered well above average returns for most risk assets, it is difficult to expect similar results in the coming year. In an unsettled market environment with ongoing geopolitical risks, concerns over continued growth of U.S. GDP, and possible deceleration of global manufacturing growth, TFIP will stayed focused on market fundamentals. Looking ahead, markets could be vulnerable to disruption; particularly with the US Presidential election in the near future, an impeachment trial, increased tensions in the Middle East, and further economic negotiations between the U.S. & China, all of which could interrupt upward trends in stock prices. Beyond these geopolitical risks, the late cycle environment in the U.S. presents a situation in which rising labor costs combined with slow demand could impact corporate profits, thereby triggering layoffs which could in turn build into a recessionary labor environment, reducing general economic growth, and forcing policy action by the Fed.
The portfolio’s holdings are concentrated in domestic industries and companies whose business operations, in the manager’s view, face limited impact from shifts in economic growth. TFIP will continue to monitor developments closely and adjust the risk profile of the holdings and the hedging program to offset perceived downside risk when it appears to be significant.
Thank you for investing in the LoCorr Funds
The S&P 500 Index is a broad-based unmanaged index of 500 stocks, which is widely recognized as representative of the equity market in general. ICE BofAML 3-Month T-Bill Index tracks the performance of the U.S. dollar denominated U.S. Treasury Bills publicly issued in the U.S. domestic market with a remaining term to final maturity of less than 3 months. Morningstar Managed Futures Category - these funds typically take long and short positions in futures options, swaps, and foreign exchange contracts, both listed and over-the-counter, based on market trends or momentum. (A long position is a bet an investment will gain in value, while a short position is a bet that an investment will decline in value.) A majority of these funds follow trend-following, price-momentum strategies. Other strategies included in this category are systematic mean-reversion, discretionary global macro strategies, commodity index tracking, and other futures strategies. More than 60% of these funds’ exposure is invested through derivative securities. DJ EURO STOXX 50 Index is a market capitalization-weighted stock index of 50 large, blue-chip European companies operating within eurozone nations. The universe for selection is found within the 18 Dow Jones EURO STOXX Supersector indexes, from which members are ranked by size and placed on a selection list. E-Mini S&P is an electronically-traded futures contract on the Chicago Mercantile Exchange (CME) representing one-fifth of the value of the standard S&P 500 futures contract. German DAX Index (Deutscher Aktienindex (German stock index)) is a blue chip stock market index consisting of the 30 major German companies trading on the Frankfurt Stock Exchange. Prices are taken from the Xetra trading venue. Bloomberg Commodity Index is a broadly diversified commodity price index distributed by Bloomberg Indexes. The index was originally launched in 1998 as the Dow Jones-AIG Commodity Index and renamed to Dow Jones-UBS Commodity Index in 2009, when UBS acquired the index from AIG. SG Trend Index is a subset of the SG CTA Index, and follows traders of trend following methodologies. The SG CTA Index is equal weighted, calculates the daily rate of return for a pool of CTAs selected from the larger managers that are open to new investment. E-mini Nasdaq-100 futures (NQ) offer liquid benchmark contracts to manage exposure to the 100 leading non-financial U.S. large-cap companies that make up the Nasdaq-100. The E-mini Nasdaq-100 futures contract is $20 x the Nasdaq-100 index and has a minimum tick of 0.25 index points. Alerian MLP Index is a market-cap weighted, float-adjusted index created to provide a comprehensive benchmark for investors to track the performance of the energy MLP sector. The Barclays U.S. Government/Credit 1-5 Year Index is an index of all investment grade bonds with maturities of more than one year and less than 5 years. The Barclays U.S. 1-3 Year Government/Credit Bond Index is a part of the Barclays U.S. Government/Credit Bond Index. It includes Treasury and agency securities (U.S. Government Bond Index) and publicly issued U.S. corporate and foreign debentures and secured notes (U.S. Credit Bond Index). The bonds in the index are investment-grade with a maturity between one and three years. Nikkei Index is Japan’s Nikkei 225 Stock Average, commonly used to measure a price-weighted index comprised of Japan’s top 225 blue-chip companies on the Tokyo Stock Exchange. Tokyo Stock Exchange is the largest stock exchange in Japan. The exchange has more than 2,200 listed companies, making it the third-largest in the world by this measure. Morningstar Global Long/Short Equity Index uses historical fund data dating back to the fund’s inception. Funds that have been liquidated or merged are included in analysis. The inception of the index is determined by the date at which the benchmark obtains five or more constituents, without falling below two constituents going forward. It includes funds with exposure to long and short positions in global equities or derivatives and is equally weighted. One cannot invest directly in an index.
Alpha is an annualized return measure of how much better or worse a fund’s performance is relative to an index of funds in the same category, after allowing for differences in risk.
Beta - measures the sensitivity of a stock’s return relative to the return of a selected market index. When beta is greater than one, it means a stock will rise or fall more than the market.
A credit spread is the difference in yield between two bonds of similar maturity but different credit quality. For example, if the 10-year Treasury note is trading at a yield of 6% and a 10-year corporate bond is trading at a yield of 8%, the corporate bond is said to offer a 200-basis-point spread over the Treasury.
Basis Points (bps) - A unit that is equal to 1/100th of 1%, and is used to denote the change in a financial instrument. The basis point is commonly used for calculating changes in interest rates, equity indexes and the yield of a fixed-income security.
Cash Flows refers to a company’s free cash flow which is a measure of how much cash a business generates after capital expenditures.
Duration is a commonly used measure of the potential volatility of the price of a debt security, or the aggregate market value of a portfolio of debt securities, prior to maturity. Securities with a longer duration generally have more volatile prices than securities of comparable quality with a shorter duration.
Investment Grade-Investment Grade refers to bonds that are rated BBB or higher. Bond ratings are grades given to bonds that indicate their credit quality as determined by private independent rating services such as Standard & Poor’s, Moody’s and Fitch. These firms evaluate a bond issuer’s financial strength, or its ability to pay a bond’s principal and interest in a timely fashion. Ratings are expressed as letters ranging from ‘AAA’, which is the highest grade, to ‘D’, which is the lowest grade.
Spread is the percentage point difference between yields of various classes of bonds compared to treasury bonds.
Yield Curve is a line that plots the interest rates, at a set point in time, of bonds having equal credit quality, but differing maturity dates. The most frequently reported yield curve compares the three-month, two-year, five-year and 30-year U.S. Treasury debt. The curve is used to predict changes in economic output and growth.
Morningstar Rankings represent a fund’s total-return percentile rank relative to all funds that have the same Morningstar Category. The highest percentile rank is 1 and the lowest is based on the total number of funds ranked in the category. It is based on Morningstar total return, which includes both income and capital gains or losses and is not adjusted for sales charges or redemption fees. Morningstar Managed Futures ranked the LoCorr Long/Short Commodity Strategies Fund (LCSIX) 96%, 1% and 11% out of 122, 82 and 40 funds for the one-year, five-year and since inception periods ending 12/31/2019, respectively. Morningstar Managed Futures ranked the LoCorr Market Trend Fund (LOTIX) 5%, 35% and 16% out of 122, 82 and 76 funds for the one-year, five-year and since inception periods ending 12/31/2019, respectively. Morningstar Long-Short Equity ranked the LoCorr Dynamic Equity Fund (LEQIX) 35%, 27% and 66% out of 233, 139 and 99 funds for the one-year, five-year and since inception periods ending 12/31/2019, respectively. Past performance does not guarantee future results. © 2019 Morningstar, Inc. All Rights Reserved. The information contained herein (1) is proprietary to Morningstar (2) may not be copied or distributed and (3) is not warranted to be accurate, complete or timely. Neither Morningstar nor its content providers are responsible for any damages or losses arising from any use of this information.
Must be preceded or accompanied by a prospectus.
Opinions expressed are those of the Investment Manager and are subject to change, are not guaranteed and should not be considered investment advice.
Earnings growth is not representative of the Funds’ future performance.
Past performance is not a guarantee of future results.
Diversification does not assure a profit nor protect against loss in a declining market.
Mutual fund investing involves risk. Principal loss is possible. LoCorr Macro Strategies Fund, LoCorr Long/Short Commodities Strategy Fund, LoCorr Market Trend Fund and LoCorr Spectrum Income Fund are diversified funds. LoCorr Dynamic Equity Fund is a non-diversified fund, meaning it may invest its assets in fewer individual holdings than a diversified fund. Therefore, those Funds are more exposed to individual stock volatility than a diversified fund. The Funds invest in foreign investments and foreign currencies which involve greater volatility and political, economic and currency risks and differences in accounting methods. The Funds may make short sales of securities, which involves the risk that losses may exceed the original amount invested. Investing in commodities may subject the Funds to greater risks and volatility as commodity prices may be influenced by a variety of factors including unfavorable weather, environmental factors, and changes in government regulations. The Funds may invest in derivative securities, which derive their performance from the performance of an underlying asset, index, interest rate or currency exchange rate. Derivatives can be volatile and involve various types and degrees of risks, and, depending upon the characteristics of a particular derivative, suddenly can become illiquid. Investments in debt securities typically decrease in value when interest rates rise. This risk is usually greater for longer-term debt securities. Investments in Asset Backed, Mortgage Backed, and Collateralized Mortgage Backed Securities include additional risks that investors should be aware of such as credit risk, prepayment risk, possible illiquidity and default, as well as increased susceptibility to adverse economic developments. Investments in Real Estate Investment Trusts (REITs) involve additional risks such as declines in the value of real estate and increased susceptibility to adverse economic or regulatory developments.
Derivative contracts ordinarily have leverage inherent in their terms which can magnify a Fund’s potential for gains or losses through increased long and short position exposure. A Fund may access derivatives via a swap agreement. A risk of a swap agreement is the risk that the counterparty to the agreement will default on its obligation to pay the Fund.
A Fund will incur a loss as a result of a short position if the price of the short position instrument increases in value between the date of the short position sale and the date on which an offsetting position is purchased.
Investments in small- and medium-capitalization companies involve additional risks such as limited liquidity and greater volatility. Investments in lower rated and non-rated securities presents a greater risk of loss to principal and interest than higher-rated securities. ETF investments are subject to investment advisory and other expenses, which will be indirectly paid by the Fund. As a result, the cost of investing in the Fund will be higher than the cost of investing directly in ETFs and may be higher than other mutual funds that invest directly in stocks and bonds. ETFs are subject to specific risks, depending on the nature of the ETF.
A Fund’s portfolio will be significantly impacted by the performance of the real estate market generally, and a Fund may be exposed to greater risk and experience higher volatility than would a more economically diversified portfolio. Property values may fall due to increasing vacancies or declining rents resulting from economic, legal, cultural, or technological developments. Investments in Limited Partnerships (including master limited partnerships) involve risks different from those of investing in common stock including risks related to limited control and limited rights to vote on matters affecting the Limited Partnership, risks related to potential conflicts of interest between the Limited Partnership and the Limited Partnership’s general partner, cash flow risks, dilution risks and risks related to the general partner’s limited call right. Underlying Funds are subject to management and other expenses, which will be indirectly paid by a Fund.
LoCorr Macro Strategies Fund, LoCorr Long/Short Commodities Strategy Fund, LoCorr Market Trend Fund, LoCorr Dynamic Equity Fund, and LoCorr Spectrum Income Fund are distributed by Quasar Distributors, LLC.
LoCorr Macro Strategies Fund
Rate of Return — For the period ended December 31, 2019 (Unaudited)
| | Inception |
| Average Annual |
| | Date | 6 Month | 1 Year | 5 Year | Since Inception |
| LoCorr Macro Strategies Fund - Class A (without maximum load) | 3/22/11 | 5.11% | 12.52% | 3.75% | 1.60% |
| LoCorr Macro Strategies Fund - Class A (with maximum load) | 3/22/11 | -0.94% | 5.98% | 2.53% | 0.92% |
| LoCorr Macro Strategies Fund - Class C | 3/24/11 | 3.70% | 10.57% | 2.99% | 0.85% |
| LoCorr Macro Strategies Fund - Class I | 3/24/11 | 5.16% | 12.72% | 4.04% | 1.86% |
| Bank of America Merrill Lynch 3-Month Treasury Bill Index | | 1.03% | 2.28% | 1.07% | 0.64%1 |
| Barclay CTA Index | | 0.84% | 5.21% | 0.02% | 0.07%1 |
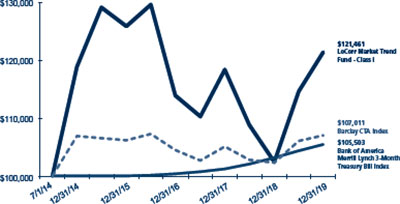
$100,000 investment in the
LoCorr Macro Strategies Fund – Class I
For the period ended December 31, 2019 (Unaudited)
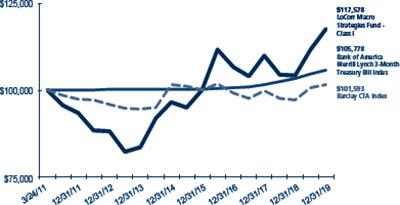
This chart illustrates the performance of a hypothetical $100,000 investment made in the Fund since inception. Assumes reinvestment of distributions, but does not reflect the effect of any applicable sales charge or redemption fees. This chart does not imply any future performance. Performance will vary from class to class based on differences in class-specific expenses and sales charges. The returns do not reflect the deduction of taxes that a shareholder would pay on Fund distributions or the redemption of Fund shares.
Performance data represents past performance; past performance does not guarantee future results. The investment return and principal value of an investment will fluctuate so that an investor’s shares, when redeemed, may be worth more or less than their original cost. Current performance of the Fund may be lower or higher than the performance quoted. Performance data current to the most recent month end may be obtained by calling 1.855.LCFUNDS, or visiting www.LoCorrFunds.com.
Performance data shown reflects the Class A maximum sales charge of 5.75% and reflects the Class C Contingent Deferred Sales Charge (CDSC) of 1.00%. Performance of the Class A without load does not reflect the deduction of the sales load or fee. If reflected, the load or fee would reduce the performance quoted.
The returns reflect the actual performance for each period and do not include the impact on trades executed on the last business day of the period that were recorded on the first business day of the next period.
Per the fee table in the Fund’s March 1, 2019 prospectus, the Fund’s annual operating expense ratio is, before fee waivers 2.18%, 2.93% and 1.93% for Class A, Class C and Class I shares, respectively.
The Bank of America Merrill Lynch U.S. 3-Month Treasury Bill Index is an unmanaged index that seeks to measure the performance of U.S. Treasury bills available in the marketplace.
The Barclay CTA Index is a leading industry benchmark of representative performance of commodity trading advisors.
One cannot invest directly in an index.
1 Since inception return as of March 24, 2011.
LoCorr Long/Short Commodities Strategy Fund
Rate of Return — For the period ended December 31, 2019 (Unaudited)
| | Inception | | Average Annual |
| | Date | 6 Month | 1 Year | 5 Year | Since Inception |
| LoCorr Long/Short Commodities Strategy Fund - Class A (without maximum load) | 12/31/11 | -6.15% | -6.24% | 6.28% | 3.03% |
| LoCorr Long/Short Commodities Strategy Fund - Class A (with maximum load) | 12/31/11 | -11.51% | -11.60% | 5.03% | 2.27% |
| LoCorr Long/Short Commodities Strategy Fund - Class C | 12/31/11 | -7.35% | -7.84% | 5.50% | 2.22% |
| LoCorr Long/Short Commodities Strategy Fund - Class I | 12/31/11 | -5.97% | -5.97% | 6.58% | 3.29% |
| Bank of America Merrill Lynch 3-Month Treasury Bill Index | | 1.03% | 2.28% | 1.07% | 0.70% |
| Morningstar Long/Short Commodity Index | | 1.05% | -0.73% | -2.03% | -2.81% |
$100,000 investment in the
LoCorr Long/Short Commodities Strategy Fund - Class I
For the period ended December 31, 2019 (Unaudited)
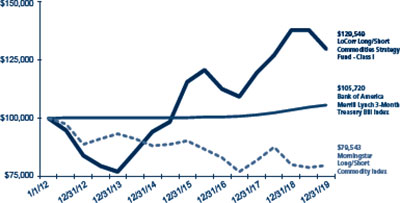
This chart illustrates the performance of a hypothetical $100,000 investment made in the Fund since inception. Assumes reinvestment of distributions, but does not reflect the effect of any applicable sales charge or redemption fees. This chart does not imply any future performance. Performance will vary from class to class based on differences in class-specific expenses and sales charges. The returns do not reflect the deduction of taxes that a shareholder would pay on Fund distributions or the redemption of Fund shares.
Performance data represents past performance; past performance does not guarantee future results. The investment return and principal value of an investment will fluctuate so that an investor’s shares, when redeemed, may be worth more or less than their original cost. Current performance of the Fund may be lower or higher than the performance quoted. Performance data current to the most recent month end may be obtained by calling 1.855.LCFUNDS, or visiting www.LoCorrFunds.com.
Performance data shown reflects the Class A maximum sales charge of 5.75% and reflects the Class C Contingent Deferred Sales Charge (CDSC) of 1.00%. Performance of the Class A without load does not reflect the deduction of the sales load or fee. If reflected, the load or fee would reduce the performance quoted.
The returns reflect the actual performance for each period and do not include the impact on trades executed on the last business day of the period that were recorded on the first business day of the next period.
Per the fee table in the Fund’s March 1, 2019 prospectus, the Fund’s annual operating expense ratio is, before fee waivers 2.67%, 3.42% and 2.42% for Class A, Class C and Class I shares, respectively.
The Bank of America Merrill Lynch U.S. 3-Month Treasury Bill Index is an unmanaged index that seeks to measure the performance of U.S. Treasury bills available in the marketplace.
The Morningstar Long/Short Commodity Index is a fully collateralized commodity futures index that uses the momentum rule to determine if each commodity is held long, short, or flat.
One cannot invest directly in an index.
LoCorr Market Trend Fund
Rate of Return — For the period ended December 31, 2019 (Unaudited)
| | Inception | | Average Annual |
| | Date | 6 Month | 1 Year | 5 Year | Since Inception |
| LoCorr Market Trend Fund - Class A (without maximum load) | 6/30/14 | 5.77% | 18.33% | 0.18% | 3.34% |
| LoCorr Market Trend Fund - Class A (with maximum load) | 6/30/14 | -0.31% | 11.53% | -1.00% | 2.24% |
| LoCorr Market Trend Fund - Class C | 6/30/14 | 4.32% | 16.35% | -0.58% | 2.56% |
| LoCorr Market Trend Fund - Class I | 6/30/14 | 5.95% | 18.53% | 0.43% | 3.60% |
| Bank of America Merrill Lynch 3-Month Treasury Bill Index | | 1.03% | 2.28% | 1.07% | 0.98% |
| Barclay CTA Index | | 0.84% | 5.21% | 0.02% | 1.25% |
$100,000 investment in the
LoCorr Market Trend Fund - Class I
For the period ended December 31, 2019 (Unaudited)
This chart illustrates the performance of a hypothetical $100,000 investment made in the Fund since inception. Assumes reinvestment of distributions, but does not reflect the effect of any applicable sales charge or redemption fees. This chart does not imply any future performance. Performance will vary from class to class based on differences in class-specific expenses and sales charges. The returns do not reflect the deduction of taxes that a shareholder would pay on Fund distributions or the redemption of Fund shares.
Performance data represents past performance; past performance does not guarantee future results. The investment return and principal value of an investment will fluctuate so that an investor’s shares, when redeemed, may be worth more or less than their original cost. Current performance of the Fund may be lower or higher than the performance quoted. Performance data current to the most recent month end may be obtained by calling 1.855.LCFUNDS, or visiting www.LoCorrFunds.com.
Performance data shown reflects the Class A maximum sales charge of 5.75% and reflects the Class C Contingent Deferred Sales Charge (CDSC) of 1.00%. Performance of the Class A without load does not reflect the deduction of the sales load or fee. If reflected, the load or fee would reduce the performance quoted.
The returns reflect the actual performance for each period and do not include the impact on trades executed on the last business day of the period that were recorded on the first business day of the next period.
Per the fee table in the Fund’s March 1, 2019 prospectus, the Fund’s annual operating expense ratio is, before fee waivers 2.00%, 2.75% and 1.75% for Class A, Class C and Class I shares, respectively.
The Bank of America Merrill Lynch U.S. 3-Month Treasury Bill Index is an unmanaged index that seeks to measure the performance of U.S. Treasury bills available in the marketplace.
The Barclay CTA Index is a leading industry benchmark of representative performance of commodity trading advisors.
One cannot invest directly in an index.
LoCorr Dynamic Equity Fund
Rate of Return — For the period ended December 31, 2019 (Unaudited)
| | Inception | | Average Annual |
| | Date | 6 Month | 1 Year | 5 Year | Since Inception |
| LoCorr Dynamic Equity Fund - Class A (without maximum load) | 5/10/13 | -0.11% | 13.40% | 4.50% | 3.10% |
| LoCorr Dynamic Equity Fund - Class A (with maximum load) | 5/10/13 | -5.88% | 6.93% | 3.26% | 2.19% |
| LoCorr Dynamic Equity Fund - Class C | 5/10/13 | -1.39% | 11.54% | 3.72% | 2.33% |
| LoCorr Dynamic Equity Fund - Class I | 5/10/13 | 0.07% | 13.68% | 4.78% | 3.37% |
| S&P 500 Total Return Index | | 10.92% | 31.49% | 11.70% | 13.11% |
| Morningstar Long/Short Equity Fund Index | | 4.00% | 11.93% | 2.92% | 3.71% |
$100,000 investment in the
LoCorr Dynamic Equity Fund - Class I
For the period ended December 31, 2019 (Unaudited)
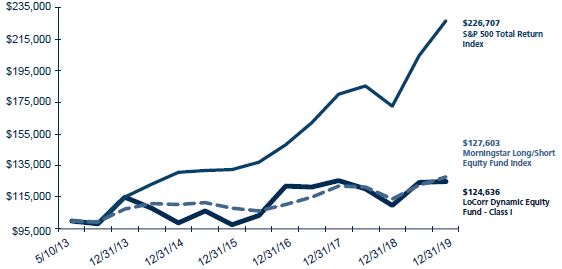
This chart illustrates the performance of a hypothetical $100,000 investment made in the Fund since inception. Assumes reinvestment of distributions, but does not reflect the effect of any applicable sales charge or redemption fees. This chart does not imply any future performance. Performance will vary from class to class based on differences in class-specific expenses and sales charges. The returns do not reflect the deduction of taxes that a shareholder would pay on Fund distributions or the redemption of Fund shares.
Performance data represents past performance; past performance does not guarantee future results. The investment return and principal value of an investment will fluctuate so that an investor’s shares, when redeemed, may be worth more or less than their original cost. Current performance of the Fund may be lower or higher than the performance quoted. Performance data current to the most recent month end may be obtained by calling 1.855.LCFUNDS, or visiting www.LoCorrFunds.com.
Performance data shown reflects the Class A maximum sales charge of 5.75% and reflects the Class C Contingent Deferred Sales Charge (CDSC) of 1.00%. Performance of the Class A without load does not reflect the deduction of the sales load or fee. If reflected, the load or fee would reduce the performance quoted.
The returns reflect the actual performance for each period and do not include the impact on trades executed on the last business day of the period that were recorded on the first business day of the next period.
Per the fee table in the Fund’s March 1, 2019 prospectus, the Fund’s annual operating expense ratio is, before fee waivers 2.61%, 3.36% and 2.36% for Class A, Class C and Class I shares, respectively.
The S&P 500 Total Return Index is an unmanaged capitalization-weighted index of 500 stocks designed to measure performance of the broad domestic economy through changes in the aggregate market value of the 500 stocks which represent all major industries.
The Morningstar Long/Short Equity Index category holds sizeable stakes in both long and short positions in equities and related derivative. At least 75% of the assets are in equity securities or derivatives.
One cannot invest directly in an index.
LoCorr Spectrum Income Fund
Rate of Return — For the period ended December 31, 2019 (Unaudited)
| | Inception | | Average Annual |
| | Date | 6 Month | 1 Year | 5 Year | Since Inception |
| LoCorr Spectrum Income Fund - Class A (without maximum load) | 12/31/13 | 3.89% | 18.37% | 2.12% | 0.82% |
| LoCorr Spectrum Income Fund - Class A (with maximum load) | 12/31/13 | -2.11% | 11.60% | 0.92% | -0.17% |
| LoCorr Spectrum Income Fund - Class C | 12/31/13 | 2.50% | 16.59% | 1.38% | 0.08% |
| LoCorr Spectrum Income Fund - Class I | 12/31/13 | 4.02% | 18.74% | 2.42% | 1.11% |
| Bloomberg Barclays U.S. Aggregate Bond Index | | 2.45% | 8.72% | 3.05% | 3.53% |
| Morningstar Allocation - 70% to 85% Equity | | 6.57% | 20.95% | 6.33% | 6.21% |
$100,000 investment in the
LoCorr Spectrum Income Fund - Class I
For the period ended December 31, 2019 (Unaudited)
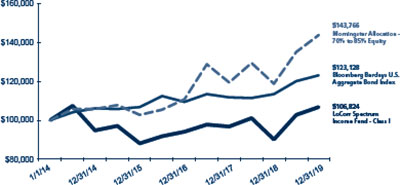
This chart illustrates the performance of a hypothetical $100,000 investment made in the Fund since inception. Assumes reinvestment of distributions, but does not reflect the effect of any applicable sales charge or redemption fees. This chart does not imply any future performance. Performance will vary from class to class based on differences in class-specific expenses and sales charges. The returns do not reflect the deduction of taxes that a shareholder would pay on Fund distributions or the redemption of Fund shares.
Performance data represents past performance; past performance does not guarantee future results. The investment return and principal value of an investment will fluctuate so that an investor’s shares, when redeemed, may be worth more or less than their original cost. Current performance of the Fund may be lower or higher than the performance quoted. Performance data current to the most recent month end may be obtained by calling 1.855.LCFUNDS, or visiting www.LoCorrFunds.com.
Performance data shown reflects the Class A maximum sales charge of 5.75% and reflects the Class C Contingent Deferred Sales Charge (CDSC) of 1.00%. Performance of the Class A without load does not reflect the deduction of the sales load or fee. If reflected, the load or fee would reduce the performance quoted.
The returns reflect the actual performance for each period and do not include the impact on trades executed on the last business day of the period that were recorded on the first business day of the next period.
Per the fee table in the Fund’s March 1, 2019 prospectus, the Fund’s annual operating expense ratio is, before fee waivers 3.54%, 4.29% and 3.29% for Class A, Class C and Class I shares, respectively.
The Bloomberg Barclays U.S. Aggregate Bond Index is a long term, market capitalization- weighted index used to represent investment grade bonds being traded in the United States.
The Morningstar Allocation - 70% to 85% Equity portfolios seek to provide both income and capital appreciation by investing in multiple asset classes, including stocks, bonds and cash. These portfolios are dominated by domestic holdings and have equity expenses between 70% and 85%.
One cannot invest directly in an index.
| | |
| | |
LoCorr Macro Strategies Fund - Consolidated Schedule of Investments | 17 | |
| | |
LoCorr Macro Strategies Fund
Composition of Consolidated Investment Portfolio1
December 31, 2019 (Unaudited)
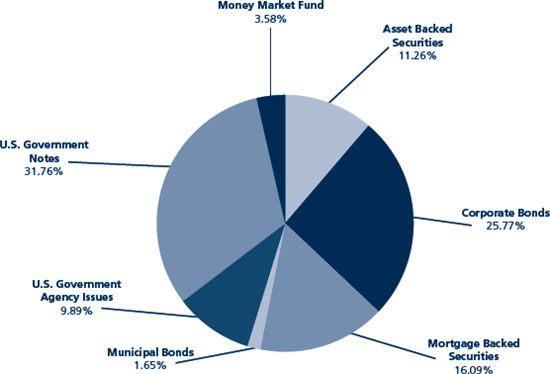
1 As a percentage of total investments.
Consolidated Schedule of Investments
December 31, 2019
| | | Maturity Date | | Coupon Rate | | Principal Amount | | | Value | |
| ASSET BACKED SECURITIES: 10.34% | | | | | | | | | | | | | | |
| 321 Henderson Receivables I LLC | | | | | | | | | | | | | | |
Series 2006-1A A1 (1 Month LIBOR USD + 0.200%) (a)(c) |
| 03/15/2041 | |
| 1.94 | % | | $ | 708,717 | | | $ | 701,117 | |
| Series 2006-4A A1 (1 Month LIBOR USD + 0.200%) (a)(c) | | 12/15/2041 | | | 1.94 | % | | | 771,154 | | | | 763,987 | |
| Series 2004-A A1 (1 Month LIBOR USD + 0.350%) (a)(c) | | 09/15/2045 | | | 2.09 | % | | | 119,684 | | | | 117,588 | |
| American Express Credit Account Master Trust, 2019-1 A | | 10/15/2024 | | | 2.87 | % | | | 2,390,000 | | | | 2,441,917 | |
| Avid Automobile Receivables Trust, 2018-1 A (a) | | 08/15/2023 | | | 2.84 | % | | | 603,646 | | | | 604,225 | |
| Barclays Dryrock Issuance Trust, 2017-2 A (1 Month LIBOR USD + 0.300%) (c) | | 05/15/2023 | | | 2.04 | % | | | 3,225,000 | | | | 3,227,629 | |
| California Republic Auto Receivables Trust, 2018-1 A3 | | 08/15/2022 | | | 3.14 | % | | | 1,018,315 | | | | 1,023,044 | |
| Carmax Auto Owner Trust, 2019-1 A3 | | 03/15/2024 | | | 3.05 | % | | | 2,450,000 | | | | 2,490,576 | |
| Citibank Credit Card Issuance Trust, 2018-A3 A3 | | 05/23/2025 | | | 3.29 | % | | | 3,500,000 | | | | 3,638,392 | |
| Connecticut Avenue Securities Trust, 2019 R06 2M1 (1 Month LIBOR USD + 0.750%) (a)(c) | | 09/25/2039 | | | 2.54 | % | | | 293,069 | | | | 293,129 | |
| Conn’s Receivables Funding LLC, 2018-A A (a) | | 01/17/2023 | | | 3.25 | % | | | 539,334 | | | | 541,279 | |
| DB Master Finance LLC, 2019-1A A2I (a) | | 05/20/2049 | | | 3.79 | % | | | 2,004,925 | | | | 2,047,730 | |
| Diamond Resorts Owner Trust, 2018-1 A (a) | | 01/21/2031 | | | 3.70 | % | | | 1,810,815 | | | | 1,853,317 | |
| Discover Card Execution Note Trust, 2018-2 A (1 Month LIBOR USD + 0.330%) (c) | | 08/15/2025 | | | 2.07 | % | | | 2,775,000 | | | | 2,773,433 | |
| Domino’s Pizza Master Issuer LLC, 2017-1A A2I (3 Month LIBOR USD + 1.250%) (a)(c) | | 07/25/2047 | | | 3.19 | % | | | 1,073,100 | | | | 1,073,883 | |
| Entergy New Orleans Storm Recovery Funding LLC, 2015-1 A | | 06/01/2027 | | | 2.67 | % | | | 1,000,855 | | | | 1,011,164 | |
| Evergreen Credit Card Trust, 2018-2 A (1 Month LIBOR USD + 0.350%) (a)(b)(c) | | 07/15/2022 | | | 2.09 | % | | | 1,975,000 | | | | 1,976,449 | |
| Ford Credit Auto Lease Trust, 2019-B A3 | | 10/15/2022 | | | 2.22 | % | | | 2,244,000 | | | | 2,252,322 | |
| Ford Credit Auto Owner Trust | | | | | | | | | | | | | | |
| Series 2016-1 A (a) |
| 08/15/2027
| | | 2.31 | % | | | 2,350,000 | | | | 2,358,562 | |
| Series 2018-2 A (a) | | 01/15/2030 | | | 3.47 | % | | | 1,400,000 | | | | 1,461,810 | |
| GLS Auto Receivables Trust, 2018-2A A (a) | | 04/18/2022 | | | 3.25 | % | | | 563,579 | | | | 564,859 | |
| Hilton Grand Vacations Trust, 2019-AA A (a) | | 07/25/2033 | | | 2.34 | % | | | 3,324,714 | | | | 3,320,736 | |
| Honda Auto Receivables Owner Trust, 2019-1 A-3 | | 03/20/2023 | | | 2.83 | % | | | 1,800,000 | | | | 1,827,600 | |
| Invitation Homes Trust | | | | | | | | | | | | | | |
| Series 2017-SFR2 A (1 Month LIBOR USD + 0.850%) (a)(c) |
| 12/19/2036
| | | 2.59 | % | | | 1,501,837 | | | | 1,496,127 | |
| Series 2018-SFR2 A (1 Month LIBOR USD + 0.900%) (a)(c) | | 06/18/2037 | | | 2.64 | % | | | 2,515,654 | | | | 2,511,750 | |
| Series 2018-SFR3 A (1 Month LIBOR USD + 1.000%) (a)(c) | | 07/17/2037 | | | 2.74 | % | | | 2,876,395 | | | | 2,877,066 | |
| Series 2018-SFR4 A (1 Month LIBOR USD + 1.100%) (a)(c) | | 01/19/2038 | | | 2.84 | % | | | 2,221,238 | | | | 2,233,780 | |
| MVW Owner Trust | | | | | | | | | | | | | | |
| Series 2019-1A A (a) | | 11/20/2036 | | | 2.89 | % | | | 1,827,375 | | | | 1,850,340 | |
| Series 2019-2A A (a) | | 10/20/2038 | | | 2.22 | % | | | 2,292,267 | | | | 2,277,916 | |
The accompanying notes are an integral part of these consolidated financial statements.
| | |
| | |
| 18 | | LoCorr Macro Strategies Fund - Consolidated Schedule of Investments (continued) |
| | |
| | Maturity Date | | Coupon Rate | | Principal Amount | | | Value | |
| ASSET BACKED SECURITIES (continued) | | | | | | | | | | | | | |
| Planet Fitness Master Issuer LLC, 2018-1A A2I (a) | 09/05/2048 | | | 4.26 | % | | $ | 2,054,000 | | | $ | 2,088,138 | |
| Progress Residential Trust | | | | | | | | | | | | | |
| Series 2017-SFR1 A (a) | 08/17/2034 | | | 2.77 | % | | | 3,277,998 | | | | 3,281,855 | |
| Series 2019-SFR4 B (a) | 10/17/2036 | | | 2.94 | % | | | 1,300,000 | | | | 1,293,065 | |
| Sierra Receivables Funding LLC, 2018 3A A (a) | 09/20/2035 | | | 3.69 | % | | | 1,983,709 | | | | 2,029,626 | |
| SMB Private Education Loan Trust, 2018-C A1 (1 Month LIBOR USD + 0.300%) (a)(c) | 09/15/2025 | | | 2.04 | % | | | 538,954 | | | | 538,701 | |
| SoFi Professional Loan Program LLC | | | | | | | | | | | | | |
| Series 2016-C A2B (a) | 12/27/2032
| | | 2.36 | % | | | 1,650,920 | | | | 1,644,316 | |
| Series 2016-D A-2B (a) | 04/25/2033 | | | 2.34 | % | | | 1,437,063 | | | | 1,437,670 | |
| Series 2015-C A2 (a) | 08/25/2033 | | | 2.51 | % | | | 836,812 | | | | 837,179 | |
| Series 2016-A A2 (a) | 12/26/2036 | | | 2.76 | % | | | 2,464,227 | | | | 2,472,439 | |
| Starwood Waypoint Homes Trust, 2017-1 A (1 Month LIBOR USD + 0.950%) (a)(c) | 01/22/2035 | | | 2.69 | % | | | 1,601,319 | | | | 1,598,208 | |
| Synchrony Card Issuance Trust, 2018-A1 A1 | 09/15/2024 | | | 3.38 | % | | | 2,935,000 | | | | 3,000,650 | |
| TCF Auto Receivables Owner Trust, 2016-PT1 A (a) | 06/15/2022 | | | 1.93 | % | | | 598,144 | | | | 597,445 | |
| Tricon American Homes Trust, 2017-SFR1 A (a) | 09/19/2034 | | | 2.72 | % | | | 2,821,642 | | | | 2,820,732 | |
| Verizon Owner Trust | | | | | | | | | | | | | |
| Series 2018-1A A1B (1 Month LIBOR USD + 0.260%) (a)(c) | 09/20/2022 | | | 2.02 | % | | | 4,525,000 | | | | 4,527,615 | |
| Series 2018-A A1A | 04/20/2023 | | | 3.23 | % | | | 3,000,000 | | | | 3,050,808 | |
| Series 2019-B A1A | 12/20/2023 | | | 2.33 | % | | | 2,597,000 | | | | 2,615,636 | |
| TOTAL ASSET BACKED SECURITIES (Cost $84,761,369) | | | | | | | | | | | | 85,445,810 | |
| | | | | | | | | | | | | | |
| CORPORATE BONDS: 23.64% | | | | | | | | | | | | | |
| Aerospace/Defense: 0.47% | | | | | | | | | | | | | |
| L3Harris Technologies, Inc. (a) | 02/15/2021 | | | 4.95 | % | | | 1,005,000 | | | | 1,029,709 | |
| United Technologies Corp. | 08/16/2023 | | | 3.65 | % | | | 2,690,000 | | | | 2,836,355 | |
| | | | | | | | | | | | | 3,866,064 | |
| Agriculture: 0.26% | | | | | | | | | | | | | |
| Altria Group, Inc. | 02/14/2024 | | | 3.80 | % | | | 2,025,000 | | | | 2,132,459 | |
| | | | | | | | | | | | | | |
| Auto Manufacturers: 0.30% | | | | | | | | | | | | | |
| General Motors Financial Co., Inc. | 05/09/2023 | | | 3.70 | % | | | 2,375,000 | | | | 2,448,602 | |
| | | | | | | | | | | | | | |
| Banks: 9.46% | | | | | | | | | | | | | |
| Banco Santander SA (b) | 02/23/2023 | | | 3.13 | % | | | 1,400,000 | | | | 1,429,060 | |
| Bank of America Corp. | 10/21/2022 | | | 2.50 | % | | | 6,155,000 | | | | 6,214,910 | |
| Bank of America Corp. | 01/11/2023 | | | 3.30 | % | | | 3,240,000 | | | | 3,349,778 | |
| Bank of Montreal (b) | 03/26/2022 | | | 2.90 | % | | | 1,770,000 | | | | 1,804,665 | |
| Bank of New York Mellon Corp. | 02/07/2022 | | | 2.60 | % | | | 1,000,000 | | | | 1,015,207 | |
| BB&T Corp. | 12/06/2023 | | | 3.75 | % | | | 1,260,000 | | | | 1,336,644 | |
| Citigroup, Inc. | 01/14/2022 | | | 4.50 | % | | | 2,515,000 | | | | 2,636,947 | |
| Citigroup, Inc. (SOFR + 0.867%) (d) | 11/04/2022 | | | 2.31 | % | | | 1,895,000 | | | | 1,900,900 | |
| Citigroup, Inc. (3 Month LIBOR USD + 0.722%) (d) | 01/24/2023 | | | 3.14 | % | | | 3,585,000 | | | | 3,655,245 | |
| Citigroup, Inc. (3 Month LIBOR USD + 1.023%) (d) | 06/01/2024 | | | 4.04 | % | | | 2,105,000 | | | | 2,226,933 | |
| Cooperatieve Rabobank UA (b) | 11/09/2022 | | | 3.95 | % | | | 2,130,000 | | | | 2,227,141 | |
| Danske Bank (a)(b) | 01/12/2022 | | | 5.00 | % | | | 2,895,000 | | | | 3,040,887 | |
| Goldman Sachs Group, Inc. | 02/25/2021 | | | 2.88 | % | | | 1,690,000 | | | | 1,706,827 | |
| Goldman Sachs Group, Inc. | 01/22/2023 | | | 3.63 | % | | | 3,685,000 | | | | 3,838,034 | |
| Goldman Sachs Group, Inc. | 02/23/2023 | | | 3.20 | % | | | 3,375,000 | | | | 3,469,891 | |
| HSBC Bank Canada (a)(b) | 09/10/2022 | | | 1.65 | % | | | 2,000,000 | | | | 1,986,328 | |
| HSBC Holdings PLC (b) | 04/05/2021 | | | 5.10 | % | | | 1,525,000 | | | | 1,581,665 | |
| Huntington National Bank | 04/01/2022 | | | 3.13 | % | | | 1,735,000 | | | | 1,773,892 | |
| ING Groep NV (b) | 04/09/2024 | | | 3.55 | % | | | 3,095,000 | | | | 3,239,399 | |
| JP Morgan Chase & Co. | 09/23/2022 | | | 3.25 | % | | | 1,565,000 | | | | 1,619,221 | |
| JP Morgan Chase & Co. | 01/25/2023 | | | 3.20 | % | | | 7,345,000 | | | | 7,580,362 | |
| Morgan Stanley | 01/23/2023 | | | 3.13 | % | | | 5,840,000 | | | | 6,004,021 | |
| PNC Bank NA (3 Month LIBOR USD + 0.420%) (d) | 12/09/2022 | | | 2.03 | % | | | 3,130,000 | | | | 3,134,301 | |
| Royal Bank of Canada (b) | 04/29/2022 | | | 2.80 | % | | | 1,555,000 | | | | 1,587,031 | |
| SunTrust Banks, Inc. | 03/03/2021 | | | 2.90 | % | | | 2,500,000 | | | | 2,526,147 | |
| SunTrust Banks, Inc. | 08/01/2022 | | | 2.45 | % | | | 1,655,000 | | | | 1,672,998 | |
| Wells Fargo & Co. | 02/13/2023 | | | 3.45 | % | | | 4,195,000 | | | | 4,344,501 | |
| Zions Bancorp NA | 03/04/2022 | | | 3.35 | % | | | 1,295,000 | | | | 1,328,803 | |
| | | | | | | | | | | | | 78,231,738 | |
The accompanying notes are an integral part of these consolidated financial statements.
| | |
| | |
| LoCorr Macro Strategies Fund - Consolidated Schedule of Investments (continued) | | 19 |
| | |
| | Maturity Date | | Coupon Rate | | Principal Amount | | | Value | |
| CORPORATE BONDS (continued) | | | | | | | | | | | | | |
| Beverages: 0.50% | | | | | | | | | | | | | |
| Anheuser-Busch InBev Finance, Inc. | 02/01/2023 | | | 3.30 | % | | $ | 2,590,000 | | | $ | 2,683,372 | |
| Heineken NV (a)(b) | 04/01/2022 | | | 3.40 | % | | | 1,425,000 | | | | 1,467,279 | |
| | | | | | | | | | | | 4,150,651 | |
| Diversified Financial Services: 1.69% | | | | | | | | | | | | | |
| AerCap Ireland Capital DAC/AerCap Global Aviation Trust (b) | 02/01/2022 | | | 3.95 | % | | | 1,220,000 | | | | 1,260,557 | |
| Air Lease Corp. | 07/03/2023 | | | 3.88 | % | | | 2,150,000 | | | | 2,265,642 | |
| American Express Co. | 05/20/2022 | | | 2.75 | % | | | 505,000 | | | | 514,256 | |
| American Express Co. | 07/30/2024 | | | 2.50 | % | | | 2,000,000 | | | | 2,023,401 | |
| Capital One Bank | 02/15/2023 | | | 3.38 | % | | | 1,700,000 | | | | 1,756,437 | |
| CDP Financial, Inc. (a)(b) | 03/07/2022 | | | 2.75 | % | | | 2,190,000 | | | | 2,235,686 | |
| Charles Schwab Corp. | 01/25/2023 | | | 2.65 | % | | | 1,905,000 | | | | 1,942,324 | |
| OMERS Finance Trust (a)(b) | 05/02/2024 | | | 2.50 | % | | | 1,930,000 | | | | 1,974,561 | |
| | | | | | | | | | | | 13,972,864 | |
| Electric: 0.53% | | | | | | | | | | | | | |
| Berkshire Hathaway Energy Co. | 01/15/2021 | | | 2.38 | % | | | 2,345,000 | | | | 2,357,535 | |
| Exelon Generation Co. LLC | 03/15/2022 | | | 3.40 | % | | | 620,000 | | | | 636,385 | |
| Nextera Energy Capital Holdings, Inc. | 04/01/2022 | | | 2.90 | % | | | 1,335,000 | | | | 1,362,520 | |
| | | | | | | | | | | | | 4,356,440 | |
| Environmental Control: 0.19% | | | | | | | | | | | | | |
| Waste Management, Inc. | 06/15/2024 | | | 2.95 | % | | | 1,530,000 | | | | 1,579,570 | |
| | | | | | | | | | | | | | |
| Food: 0.17% | | | | | | | | | | | | | |
| Tyson Foods, Inc. | 06/15/2022 | | | 4.50 | % | | | 1,365,000 | | | | 1,437,285 | |
| | | | | | | | | | | | | | |
| Household Products & Wares: 0.20% | | | | | | | | | | | | | |
| Clorox Co. | 09/15/2022 | | | 3.05 | % | | | 1,600,000 | | | | 1,638,523 | |
| | | | | | | | | | | | | | |
| Insurance: 0.51% | | | | | | | | | | | | | |
| Aon Corp. | 11/15/2022 | | | 2.20 | % | | | 2,100,000 | | | | 2,109,884 | |
| Metropolitan Life Global Funding I (a) | 01/11/2022 | | | 3.38 | % | | | 2,070,000 | | | | 2,128,245 | |
| | | | | | | | | | | | | 4,238,129 | |
| Machinery - Diversified: 0.35% | | | | | | | | | | | | | |
| John Deere Capital Corp. | 01/08/2021 | | | 2.55 | % | | | 1,495,000 | | | | 1,505,639 | |
| Roper Technologies, Inc. | 12/15/2020 | | | 3.00 | % | | | 1,395,000 | | | | 1,406,853 | |
| | | | | | | | | | | | | 2,912,492 | |
| Media: 1.24% | | | | | | | | | | | | | |
| CBS Corp. | 03/01/2022 | | | 3.38 | % | | | 1,385,000 | | | | 1,416,993 | |
| Comcast Corp. | 04/15/2024 | | | 3.70 | % | | | 4,725,000 | | | | 5,039,657 | |
| Discovery Communications LLC | 04/01/2023 | | | 3.25 | % | | | 2,150,000 | | | | 2,212,416 | |
| The Walt Disney Company | 08/16/2021 | | | 2.75 | % | | | 1,545,000 | | | | 1,569,310 | |
| | | | | | | | | | | | | 10,238,376 | |
| Miscellaneous Manufacturing: 0.54% | | | | | | | | | | | | | |
| General Electric Co. | 01/07/2021 | | | 4.63 | % | | | 1,345,000 | | | | 1,375,568 | |
| Ingersoll-Rand Global Holding Co. Ltd. | 06/15/2023 | | | 4.25 | % | | | 1,415,000 | | | | 1,515,867 | |
| Parker-Hannifin Corp. | 06/14/2024 | | | 2.70 | % | | | 1,540,000 | | | | 1,573,341 | |
| | | | | | | | | | | | | 4,464,776 | |
| Oil & Gas: 1.02% | | | | | | | | | | | | | |
| BP Capital Markets PLC (b) | 03/11/2021 | | | 4.74 | % | | | 1,000,000 | | | | 1,032,594 | |
| Diamondback Energy, Inc. | 12/01/2024 | | | 2.88 | % | | | 1,865,000 | | | | 1,886,778 | |
| Occidental Petroleum Corp. | 03/15/2021 | | | 4.85 | % | | | 1,352,000 | | | | 1,392,670 | |
| Occidental Petroleum Corp. | 08/15/2022 | | | 2.70 | % | | | 1,930,000 | | | | 1,950,062 | |
| Saudi Arabian Oil Co. (a)(b) | 04/16/2022 | | | 2.75 | % | | | 2,150,000 | | | | 2,174,275 | |
| | | | | | | | | | | | | 8,436,379 | |
| Pharmaceuticals: 1.07% | | | | | | | | | | | | | |
| AbbVie, Inc. | 11/06/2022 | | | 2.90 | % | | | 1,845,000 | | | | 1,883,041 | |
| AbbVie, Inc. (a) | 11/21/2022 | | | 2.30 | % | | | 1,805,000 | | | | 1,814,124 | |
| Bristol-Myers Squibb Co. (a) | 02/20/2023 | | | 3.25 | % | | | 2,480,000 | | | | 2,568,585 | |
| CVS HEALTH Corp. | 08/12/2024 | | | 3.38 | % | | | 2,460,000 | | | | 2,560,754 | |
| | | | | | | | | | | | | 8,826,504 | |
The accompanying notes are an integral part of these consolidated financial statements.
| | |
| | |
| 20 | | LoCorr Macro Strategies Fund - Consolidated Schedule of Investments (continued) |
| | |
| | Maturity Date | | Coupon Rate | | Principal Amount | | | Value | |
| CORPORATE BONDS (continued) | | | | | | | | | | | | | |
| Pipelines: 0.67% | | | | | | | | | | | | | |
| Enterprise Products Operating LLC | 02/15/2021 | | | 2.80 | % | | $ | 2,115,000 | | | $ | 2,135,184 | |
| ONEOK, Inc. | 09/01/2024 | | | 2.75 | % | | | 1,900,000 | | | | 1,918,050 | |
| TransCanada PipeLines Ltd. (b) | 08/01/2022 | | | 2.50 | % | | | 1,500,000 | | | | 1,516,046 | |
| | | | | | | | | | | | | 5,569,280 | |
| Real Estate Investment Trusts: 0.93% | | | | | | | | | | | | | |
| Alexandria Real Estate Equities, Inc. | 01/15/2024 | | | 4.00 | % | | | 2,515,000 | | | | 2,679,774 | |
| Digital Realty Trust LP | 10/01/2022 | | | 3.63 | % | | | 1,425,000 | | | | 1,473,395 | |
| Duke Realty LP | 06/15/2022 | | | 4.38 | % | | | 1,210,000 | | | | 1,268,403 | |
| Highwoods Realty LP | 06/15/2021 | | | 3.20 | % | | | 907,000 | | | | 918,643 | |
| Kilroy Realty LP | 01/15/2023 | | | 3.80 | % | | | 1,300,000 | | | | 1,347,369 | |
| | | | | | | | | | | | | 7,687,584 | |
| Retail: 0.67% | | | | | | | | | | | | | |
| McDonald’s Corp. | 12/09/2020 | | | 2.75 | % | | | 2,330,000 | | | | 2,345,941 | |
| Walgreens Boots Alliance, Inc. | 11/18/2024 | | | 3.80 | % | | | 1,530,000 | | | | 1,594,873 | |
| Walmart, Inc. | 12/15/2022 | | | 2.35 | % | | | 1,545,000 | | | | 1,572,042 | |
| | | | | | | | | | | | | 5,512,856 | |
| Software: 0.52% | | | | | | | | | | | | | |
| Fiserv, Inc. | 07/01/2024 | | | 2.75 | % | | | 3,060,000 | | | | 3,114,054 | |
| Microsoft Corp. | 02/06/2022 | | | 2.40 | % | | | 1,180,000 | | | | 1,196,681 | |
| | | | | | | | | | | | | 4,310,735 | |
| Telecommunications: 1.54% | | | | | | | | | | | | | |
| AT&T, Inc. | 02/17/2021 | | | 2.80 | % | | | 3,635,000 | | | | 3,667,737 | |
| AT&T, Inc. | 03/11/2024 | | | 3.90 | % | | | 3,345,000 | | | | 3,558,283 | |
| Verizon Communications, Inc. | 03/15/2021 | | | 3.45 | % | | | 2,200,000 | | | | 2,242,889 | |
| Verizon Communications, Inc. | 09/15/2023 | | | 5.15 | % | | | 2,895,000 | | | | 3,218,982 | |
| | | | | | | | | | | | | 12,687,891 | |
| Transportation: 0.81% | | | | | | | | | | | | | |
| Burlington Northern Santa Fe LLC | 09/01/2024 | | | 3.40 | % | | | 1,580,000 | | | | 1,671,276 | |
| CSX Corp. | 11/01/2023 | | | 3.70 | % | | | 2,110,000 | | | | 2,241,067 | |
| FedEx Corp. | 08/01/2022 | | | 2.63 | % | | | 1,190,000 | | | | 1,207,209 | |
| Union Pacific Corp. | 03/01/2024 | | | 3.15 | % | | | 1,525,000 | | | | 1,587,662 | |
| | | | | | | | | | | | | 6,707,214 | |
| TOTAL CORPORATE BONDS (Cost $192,249,204) | | | | | | | | | | | | 195,406,412 | |
| | | | | | | | | | | | | | |
| MORTGAGE BACKED SECURITIES: 14.77% | | | | | | | | | | | | | |
| BX Commercial Mortgage Trust, 2019-XL A (1 Month LIBOR USD + 0.920%) (a)(c) | 10/15/2036 | | | 2.66 | % | | | 2,000,000 | | | | 2,001,603 | |
| BX Trust, 2018-MCSF A (1 Month LIBOR USD + 0.577%) (a)(c) | 04/16/2035 | | | 2.32 | % | | | 3,285,000 | | | | 3,264,405 | |
| Citigroup Commercial Mortgage Trust, 2019-PRM B (a) | 05/10/2036 | | | 3.64 | % | | | 2,100,000 | | | | 2,170,219 | |
Comm Mortgage Trust
Series 2014-UBS2 AM | 03/12/2047 | | | 4.20 | % | | | 2,450,000 | | | | 2,577,617 | |
| Series 2014-LC17 A5 | 10/11/2047 | | | 3.92 | % | | | 724,000 | | | | 767,359 | |
| Series 2014-CCRE21 | 12/10/2047 | | | 3.53 | % | | | 1,705,103 | | | | 1,785,607 | |
| Series 2015-CCR27 AM | 10/13/2048 | | | 3.98 | % | | | 2,000,000 | | | | 2,128,033 | |
| CSMC Trust, 2017-HL2 A3 (a) | 10/25/2047 | | | 3.50 | % | | | 2,286,763 | | | | 2,319,814 | |
| Fannie Mae Aces, 2017-M12 A1 | 06/25/2027 | | | 2.75 | % | | | 5,869,002 | | | | 5,986,953 | |
| Fannie Mae Connecticut Avenue Securities | | | | | | | | | | | | | |
| Series 2014-C02 1M2 (1 Month LIBOR USD + 2.600%) (c) | 05/28/2024 | | | 4.39 | % | | | 1,877,498 | | | | 1,955,070 | |
| Series 2014-C03 1M2 (1 Month LIBOR USD + 3.000%) (c) | 07/25/2024 | | | 4.79 | % | | | 2,042,226 | | | | 2,148,199 | |
| Series 2017-C01 1M1 (1 Month LIBOR USD + 1.300%) (c) | 07/25/2029 | | | 3.09 | % | | | 529,305 | | | | 529,792 | |
| Series 2017-C02 2ED4 (1 Month LIBOR USD + 0.850%) (c) | 09/25/2029 | | | 2.64 | % | | | 1,430,000 | | | | 1,415,297 | |
| Series 2017-C02 2M1 (1 Month LIBOR USD + 1.150%) (c) | 09/25/2029 | | | 2.94 | % | | | 385,891 | | | | 386,189 | |
| Series 2019-R03 1M1 (1 Month LIBOR USD + 0.750%) (a)(c) | 09/25/2031 | | | 2.54 | % | | | 363,311 | | | | 363,326 | |
| Series 2019-R04 2M1 (1 Month LIBOR USD + 0.750%) (a)(c) | 06/27/2039 | | | 2.54 | % | | | 1,623,028 | | | | 1,623,027 | |
| FDIC Guaranteed Notes Trust, 2010-S4 A (1 Month LIBOR USD + 0.720%) (a)(c) | 12/04/2020 | | | 2.50 | % | | | 284,135 | | | | 284,454 | |
| FHLMC Multifamily Structured Pass Through Certificates | | | | | | | | | | | | | |
| Series K-059 A1 | 09/25/2025 | | | 2.76 | % | | | 1,925,199 | | | | 1,974,999 | |
| Series 3855 HE | 02/15/2026 | | | 2.50 | % | | | 1,015 | | | | 1,013 | |
| Series K-C06 A1 | 02/25/2026 | | | 2.17 | % | | | 4,085,000 | | | | 4,067,166 | |
The accompanying notes are an integral part of these consolidated financial statements.
| | |
| | |
| LoCorr Macro Strategies Fund - Consolidated Schedule of Investments (continued) | | 21 |
| | |
| | Maturity Date | | Coupon Rate | | Principal Amount | | | Value | |
| MORTGAGE BACKED SECURITIES (continued) | | | | | | | | | | | | | |
| Flagstar Mortgage Trust | | | | | | | | | | | | | |
| Series 2017-2 A5 (a)(d) | 10/25/2047 | | | 3.50 | % | | $ | 2,425,228 | | | $ | 2,437,631 | |
| Series 2018-4 A4 (a)(d) | 07/25/2048 | | | 4.00 | % | | | 1,100,049 | | | | 1,099,962 | |
| Freddie Mac Structured Agency Credit Risk Debt Notes | | | | | | | | | | | | | |
| Series 2017-DNA2 M1 (1 Month LIBOR USD + 1.200%) (c) | 10/25/2029 | | | 2.99 | % | | | 1,391,918 | | | | 1,396,696 | |
| Series 2017-HQA3 M2 (1 Month LIBOR USD + 2.350%) (c) | 04/25/2030 | | | 4.14 | % | | | 1,880,168 | | | | 1,912,352 | |
| Series 2018-HRP2 M3 (1 Month LIBOR USD + 2.400%) (a)(c) | 02/25/2047 | | | 4.19 | % | | | 2,000,000 | | | | 2,047,584 | |
| Series 2019-HQA3 M1 (1 Month LIBOR USD + 0.750%) (a)(c) | 09/27/2049 | | | 2.54 | % | | | 2,215,127 | | | | 2,215,422 | |
| Series 2019-HQA4 M1 (1 Month LIBOR USD + 0.770%) (a)(c) | 11/26/2049 | | | 2.56 | % | | | 3,500,000 | | | | 3,500,558 | |
| FRESB Multifamily Mortgage Pass Through Certificates | | | | | | | | | | | | | |
| Series 2016-SB17 A7F (d) | 05/25/2023 | | | 2.15 | % | | | 2,561,353 | | | | 2,558,764 | |
| Series 2016-SB22 A7F (d) | 09/25/2023 | | | 1.98 | % | | | 4,069,758 | | | | 4,050,049 | |
| Series 2017-SB32 A7F (d) | 04/25/2024 | | | 2.44 | % | | | 3,329,970 | | | | 3,341,538 | |
| Series 2019-SB67 A5F (d) | 07/25/2024 | | | 2.09 | % | | | 3,618,284 | | | | 3,602,461 | |
| Series 2019-SB69 A5F (d) | 10/25/2024 | | | 2.25 | % | | | 5,950,000 | | | | 5,960,187 | |
| GS Mortgage Securities Trust | | | | | | | | | | | | | |
| Series 2017-SLP A (a) | 10/12/2032 | | | 3.42 | % | | | 3,000,000 | | | | 3,075,851 | |
| Series 2019-600C A (a) | 09/12/2034 | | | 2.94 | % | | | 2,065,000 | | | | 2,078,810 | |
| Series 2010-C2 A1 (a) | 12/10/2043 | | | 3.85 | % | | | 39,922 | | | | 40,140 | |
| Series 2015-GC28 A5 | 02/12/2048 | | | 3.76 | % | | | 1,985,000 | | | | 2,080,996 | |
| JP Morgan Chase Commercial Mortgage Securities Trust | | | | | | | | | | | | | |
| Series 2018-BCON A (a) | 01/07/2031 | | | 3.73 | % | | | 3,630,000 | | | | 3,765,641 | |
| Series 2010-C2 A3 (a) | 11/15/2043 | | | 4.07 | % | | | 3,748,062 | | | | 3,767,988 | |
| Series 2014-C23 ASB | 09/17/2047 | | | 3.66 | % | | | 2,766,727 | | | | 2,854,597 | |
| JP Morgan Mortgage Trust | | | | | | | | | | | | | |
| Series 2016-1 A5 (a)(d) | 05/25/2046 | | | 3.50 | % | | | 810,419 | | | | 814,034 | |
| Series 2017-2 A5 (a)(d) | 05/25/2047 | | | 3.50 | % | | | 1,254,261 | | | | 1,271,573 | |
| Series 2018-1 A5 (a)(d) | 06/25/2048 | | | 3.50 | % | | | 976,387 | | | | 989,278 | |
| Series 2018-5 A5 (a)(d) | 10/25/2048 | | | 3.50 | % | | | 1,999,396 | | | | 2,025,872 | |
| Series 2018-8 A5 (a)(d) | 01/25/2049 | | | 4.00 | % | | | 1,088,239 | | | | 1,097,495 | |
| Series 2018-9 A5 (a)(d) | 02/25/2049 | | | 4.00 | % | | | 1,208,605 | | | | 1,217,434 | |
| Series 2018-9 A15 (a)(d) | 02/25/2049 | | | 4.00 | % | | | 317,758 | | | | 317,080 | |
| Ladder Capital Commercial Mortgage Trust, 2013-GCP A1 (a) | 02/15/2036 | | | 3.57 | % | | | 2,650,000 | | | | 2,755,826 | |
| Morgan Stanley Capital I Trust, 2017-CLS A (1 Month LIBOR USD + 0.700%) (a)(c) | 11/15/2034 | | | 2.44 | % | | | 2,785,000 | | | | 2,778,025 | |
| NCUA Guaranteed Notes Trust | | | | | | | | | | | | | |
| Series 2011-R2 1A (1 Month LIBOR USD + 0.400%) (c) | 02/06/2020
| | | 2.11 | % | | | 986,800 | | | | 986,800 | |
| Series 2011-R3 1A (1 Month LIBOR USD + 0.400%) (c) | 03/10/2020 | | | 2.12 | % | | | 621,922 | | | | 621,921 | |
| Series 2010-R1 1A (1 Month LIBOR USD + 0.450%) (c) | 10/07/2020 | | | 2.16 | % | | | 68,037 | | | | 68,162 | |
| New Residential Mortgage Loan Trust | | | | | | | | | | | | | |
| Series 2015-1A A3 (a)(d) | 05/28/2052 | | | 3.75 | % | | | 919,374 | | | | 948,010 | |
| Series 2014-2A A3 (a)(d) | 05/25/2054 | | | 3.75 | % | | | 830,339 | | | | 854,003 | |
| Series 2016-1A A1 (a)(d) | 03/25/2056 | | | 3.75 | % | | | 1,699,078 | | | | 1,751,157 | |
| Series 2017-1A A1 (a)(d) | 02/25/2057 | | | 4.00 | % | | | 2,236,063 | | | | 2,321,815 | |
| Series 2017-2A A3 (a)(d) | 03/25/2057 | | | 4.00 | % | | | 2,395,805 | | | | 2,499,205 | |
| Sequoia Mortgage Trust | | | | | | | | | | | | | |
| Series 2017-1 A (a)(d) | 02/25/2047 | | | 3.50 | % | | | 2,008,263 | | | | 2,032,268 | |
| Series 2018-CH4 A10 (a)(d) | 10/25/2048 | | | 4.50 | % | | | 877,576 | | | | 878,521 | |
| Series 2019-5 A4 (a)(d) | 12/25/2049 | | | 3.50 | % | | | 996,252 | | | | 1,012,518 | |
| Shellpoint Co-Originator Trust, 2017-2 A4 (a)(d) | 10/25/2047 | | | 3.50 | % | | | 943,907 | | | | 956,784 | |
| Spruce Hill Mortgage Loan Trust, 2019-SH1 A1 (a)(d) | 04/29/2049 | | | 3.40 | % | | | 852,829 | | | | 857,473 | |
| Verus Securitization Trust, 2018-3 A-1 (a)(d) | 10/25/2058 | | | 4.11 | % | | | 1,040,792 | | | | 1,051,237 | |
| WFRBS Commercial Mortgage Trust, 2011-C3 A4 (a) | 03/17/2044 | | | 4.38 | % | | | 2,338,910 | | | | 2,378,970 | |
| TOTAL MORTGAGE BACKED SECURITIES (Cost $121,878,340) | | | | | | | | | | | | 122,022,830 | |
| | | | | | | | | | | | | | |
| MUNICIPAL BONDS: 1.51% | | | | | | | | | | | | | |
| City of New York NY | 08/01/2025 | | | 2.28 | % | | | 4,180,000 | | | | 4,179,039 | |
| Massachusetts Water Resources Authority | 08/01/2025 | | | 2.08 | % | | | 4,630,000 | | | | 4,586,246 | |
| Miami Dade County Florida Aviation Refunding Taxable Series B | 10/01/2023 | | | 2.37 | % | | | 1,350,000 | | | | 1,360,935 | |
| Nebraska Public Power District | 01/01/2024 | | | 2.22 | % | | | 1,700,000 | | | | 1,697,025 | |
| Water Works Board of the City of Birmingham | 01/01/2024 | | | 2.20 | % | | | 695,000 | | | | 691,282 | |
| TOTAL MUNICIPAL BONDS (Cost $12,555,395) | | | | | | | | | | | | 12,514,527 | |
The accompanying notes are an integral part of these consolidated financial statements.
| | |
| | |
| 22 | | LoCorr Macro Strategies Fund - Consolidated Schedule of Investments (continued) |
| | |
| | Maturity Date | | Coupon Rate | | Principal Amount | | | Value | |
| U.S. GOVERNMENT AGENCY ISSUES: 9.07% | | | | | | | | | | | | | |
| Federal Farm Credit Banks | 11/27/2020 | | | 1.90 | % | | $ | 3,000,000 | | | $ | 3,008,778 | |
| Federal Farm Credit Banks | 06/26/2023 | | | 1.77 | % | | | 5,135,000 | | | | 5,158,585 | |
| Federal Farm Credit Banks | 07/17/2023 | | | 2.88 | % | | | 10,985,000 | | | | 11,452,002 | |
| Federal Home Loan Banks | 06/10/2022 | | | 2.13 | % | | | 14,115,000 | | | | 14,277,591 | |
| Federal Home Loan Banks | 06/10/2022 | | | 2.75 | % | | | 6,015,000 | | | | 6,180,074 | |
| Federal Home Loan Banks | 06/09/2023 | | | 3.25 | % | | | 15,200,000 | | | | 16,015,262 | |
| Federal Home Loan Banks | 09/08/2023 | | | 3.38 | % | | | 9,000,000 | | | | 9,548,179 | |
| Federal National Mortgage Association | 04/12/2022 | | | 2.25 | % | | | 3,500,000 | | | | 3,552,356 | |
| Federal National Mortgage Association | 09/06/2022 | | | 1.38 | % | | | 5,855,000 | | | | 5,816,480 | |
| TOTAL U.S. GOVERNMENT AGENCY ISSUES (Cost $73,179,882) | | | | | | | | | | | | 75,009,307 | |
| | | | | | | | | | | | | | |
| U.S. GOVERNMENT NOTES: 27.81% | | | | | | | | | | | | | |
| United States Treasury Floating Rate Note (3 Month US Treasury Money Market Yield + 0.300%) (c) | 10/31/2021 | | | 1.83 | % | | | 5,790,000 | | | | 5,799,728 | |
| United States Treasury Note | 01/15/2022 | | | 2.50 | % | | | 15,925,000 | | | | 16,213,019 | |
| United States Treasury Note | 03/31/2022 | | | 1.88 | % | | | 15,840,000 | | | | 15,940,856 | |
| United States Treasury Note | 05/15/2022 | | | 1.75 | % | | | 7,000,000 | | | | 7,025,703 | |
| United States Treasury Note | 07/15/2022 | | | 1.75 | % | | | 14,000,000 | | | | 14,054,141 | |
| United States Treasury Note | 08/15/2022 | | | 1.50 | % | | | 33,000,000 | | | | 32,927,812 | |
| United States Treasury Note | 09/15/2022 | | | 1.50 | % | | | 8,750,000 | | | | 8,729,834 | |
| United States Treasury Note | 10/15/2022 | | | 1.38 | % | | | 9,260,000 | | | | 9,203,572 | |
| United States Treasury Note | 10/31/2022 | | | 2.00 | % | | | 4,060,000 | | | | 4,104,565 | |
| United States Treasury Note | 09/30/2023 | | | 2.88 | % | | | 9,010,000 | | | | 9,410,171 | |
| United States Treasury Note | 12/31/2023 | | | 2.63 | % | | | 2,275,000 | | | | 2,359,868 | |
| United States Treasury Note | 01/31/2024 | | | 2.25 | % | | | 11,500,000 | | | | 11,766,387 | |
| United States Treasury Note | 02/15/2024 | | | 2.75 | % | | | 5,000,000 | | | | 5,215,430 | |
| United States Treasury Note | 02/29/2024 | | | 2.38 | % | | | 2,265,000 | | | | 2,329,588 | |
| United States Treasury Note | 03/31/2024 | | | 2.13 | % | | | 3,285,000 | | | | 3,346,080 | |
| United States Treasury Note | 04/30/2024 | | | 2.00 | % | | | 11,530,000 | | | | 11,688,087 | |
| United States Treasury Note | 05/15/2024 | | | 2.50 | % | | | 8,440,000 | | | | 8,733,092 | |
| United States Treasury Note | 06/30/2024 | | | 1.75 | % | | | 1,885,000 | | | | 1,890,964 | |
| United States Treasury Note | 09/30/2024 | | | 1.50 | % | | | 18,995,000 | | | | 18,836,956 | |
| United States Treasury Note | 11/15/2024 | | | 2.25 | % | | | 12,000,000 | | | | 12,314,531 | |
| United States Treasury Note | 12/31/2024 | | | 2.25 | % | | | 19,240,000 | | | | 19,752,565 | |
| United States Treasury Note | 02/15/2025 | | | 7.63 | % | | | 1,500,000 | | | | 1,933,828 | |
| United States Treasury Note | 05/15/2025 | | | 2.13 | % | | | 6,155,000 | | | | 6,281,948 | |
| TOTAL U.S. GOVERNMENT NOTES (Cost $228,537,687) | | | | | | | | | | | | 229,858,725 | |
| | | | | | | | | | | | | | |
| SHORT TERM INVESTMENTS: 4.61% | | | | | | | | | | | | | |
| U.S. GOVERNMENT NOTE: 1.33% | | | | | | | | | | | | | |
| United States Treasury Note | 11/15/2020 | | | 1.75 | % | | | 11,000,000 | | | | 11,009,453 | |
| TOTAL U.S. GOVERNMENT NOTE (Cost $11,010,481) | | | | | | | | | | | | 11,009,453 | |
| | | | | | | | | | | | | | |
| MONEY MARKET FUND: 3.28% | | | | | | | | Shares | | | | | |
| STIT-Government & Agency Portfolio, Institutional Class, 1.50% (e)(f) | | | | | | | | 27,128,453 | | | | 27,128,453 | |
| TOTAL MONEY MARKET FUND (Cost $27,128,453) | | | | | | | | | | | | 27,128,453 | |
| TOTAL SHORT TERM INVESTMENTS (Cost $38,138,934) | | | | | | | | | | | | 38,137,906 | |
| | | | | | | | | | | | | | |
| TOTAL INVESTMENTS (Cost $751,300,811): 91.75% | | | | | | | | | | | | 758,395,517 | |
| Other Assets in Excess of Liabilities: 8.25% (g) | | | | | | | | | | | | 68,190,233 | |
| TOTAL NET ASSETS: 100.00% | | | | | | | | | | | $ | 826,585,750 | |
| (a) | Security as defined in Rule 144A under the Securities Act of 1933 and determined to be liquid. Purchased in a private placement transaction; resale to the public may require registration or may extend only to qualified institutional buyers. At December 31, 2019, the value of these securities total $143,377,331 which represents 17.35% of total net assets. |
| (b) | Foreign issued security. |
| (c) | Variable rate security based on a reference index and spread. The rate reported is the rate in effect as of December 31, 2019. |
| (d) | Variable rate security. The coupon is based on an underlying pool of loans. The rate reported is the rate in effect as of December 31, 2019. |
| (e) | The rate quoted is the annualized seven-day effective yield as of December 31, 2019. |
| (f) | A portion of this security is held by LCMFS Fund Limited and pledged as collateral for derivative contracts. |
| (g) | Includes assets pledged as collateral for derivative contracts. |
| LIBOR London Interbank Offered Rate |
| PLC Public Limited Company |
The accompanying notes are an integral part of these consolidated financial statements.
| | |
LoCorr Macro Strategies Fund - Consolidated Schedule of Open Forward Currency Contracts | | 23 |
| | |
| | |
|
|
LoCorr Macro Strategies Fund
Consolidated Schedule of Open Forward Currency Contracts
December 31, 2019
| |
|
|
|
|
|
|
| Currency to be Received |
| Currency to be Delivered |
|
|
|
|
|
|
|
|
|
| Notional Amount |
|
| Counter- party |
| Forward
Settlement Date |
| Curr Abbr. |
|
| U.S. $ Value at December 31, 2019 |
|
| Curr Abbr. |
|
| U.S. $ Value on Origination Date |
|
|
| Unrealized Appreciation |
|
|
| Unrealized (Depreciation) |
|
|
|
|
| See key for abbreviation |
|
|
|
|
|
|
|
|
|
|
|
|
|
|
|
|
|
|
|
|
|
|
| Purchase Contracts: |
|
|
|
|
|
|
|
|
|
|
|
|
|
|
|
|
|
|
| $ | 21,934,281 |
|
| DB |
| 01/15/2020 |
| AUD |
| $ | 22,359,360 |
|
| USD |
| $ | 21,934,281 |
|
| $ | 425,079 |
|
| $ | – |
|
| 31,015,201 |
|
| BAML |
| 03/20/2020 |
| AUD |
|
| 31,354,051 |
|
| USD |
|
| 31,015,201 |
|
|
| 338,850 |
|
|
| – |
|
| 15,451,891 |
|
| DB |
| 01/15/2020 |
| BRL |
|
| 15,698,065 |
|
| USD |
|
| 15,451,891 |
|
|
| 246,174 |
|
|
| – |
|
| 13,286,849 |
|
| DB |
| 01/15/2020 |
| CAD |
|
| 13,593,258 |
|
| USD |
|
| 13,286,849 |
|
|
| 306,409 |
|
|
| – |
|
| 1,375,316 |
|
| DB |
| 01/06/2020 |
| CHF |
|
| 1,374,878 |
|
| USD |
|
| 1,375,316 |
|
|
| – |
|
|
| (438 | ) |
| 24,120,874 |
|
| DB |
| 01/15/2020 |
| CHF |
|
| 24,474,561 |
|
| USD |
|
| 24,120,874 |
|
|
| 353,687 |
|
|
| – |
|
| 22,004,358 |
|
| BAML |
| 03/20/2020 |
| CHF |
|
| 22,156,366 |
|
| USD |
|
| 22,004,358 |
|
|
| 152,008 |
|
|
| – |
|
| 638,594 |
|
| DB |
| 01/15/2020 |
| CLP |
|
| 649,130 |
|
| USD |
|
| 638,594 |
|
|
| 10,536 |
|
|
| – |
|
| 773,463 |
|
| DB |
| 01/15/2020 |
| COP |
|
| 810,838 |
|
| USD |
|
| 773,463 |
|
|
| 37,375 |
|
|
| – |
|
| 24,437,825 |
|
| DB |
| 01/15/2020 |
| EUR |
|
| 24,712,174 |
|
| NOK |
|
| 24,437,825 |
|
|
| 274,349 |
|
|
| – |
|
| 4,166,690 |
|
| DB |
| 01/15/2020 |
| EUR |
|
| 4,221,616 |
|
| PLN |
|
| 4,166,690 |
|
|
| 54,926 |
|
|
| – |
|
| 10,212,907 |
|
| DB |
| 01/15/2020 |
| EUR |
|
| 10,307,031 |
|
| SEK |
|
| 10,212,907 |
|
|
| 94,124 |
|
|
| – |
|
| 23,806,682 |
|
| DB |
| 01/15/2020 |
| EUR |
|
| 23,948,690 |
|
| USD |
|
| 23,806,682 |
|
|
| 142,008 |
|
|
| – |
|
| 40,283,723 |
|
| DB |
| 01/15/2020 |
| GBP |
|
| 40,974,855 |
|
| USD |
|
| 40,283,723 |
|
|
| 691,132 |
|
|
| – |
|
| 49,054,232 |
|
| BAML |
| 03/20/2020 |
| GBP |
|
| 49,458,478 |
|
| USD |
|
| 49,054,232 |
|
|
| 404,246 |
|
|
| – |
|
| 3,691,989 |
|
| DB |
| 01/15/2020 |
| ILS |
|
| 3,715,076 |
|
| USD |
|
| 3,691,989 |
|
|
| 23,087 |
|
|
| – |
|
| 8,302,773 |
|
| DB |
| 01/15/2020 |
| INR |
|
| 8,254,651 |
|
| USD |
|
| 8,302,773 |
|
|
| – |
|
|
| (48,122 | ) |
| 4,009,681 |
|
| DB |
| 01/06/2020 |
| JPY |
|
| 4,041,749 |
|
| USD |
|
| 4,009,681 |
|
|
| 32,068 |
|
|
| – |
|
| 7,182,183 |
|
| DB |
| 01/07/2020 |
| JPY |
|
| 7,190,873 |
|
| USD |
|
| 7,182,183 |
|
|
| 8,690 |
|
|
| – |
|
| 52,386,642 |
|
| DB |
| 01/15/2020 |
| JPY |
|
| 52,486,362 |
|
| USD |
|
| 52,386,642 |
|
|
| 99,720 |
|
|
| – |
|
| 4,356,734 |
|
| BAML |
| 03/19/2020 |
| JPY |
|
| 4,356,910 |
|
| USD |
|
| 4,356,734 |
|
|
| 176 |
|
|
| – |
|
| 5,256,265 |
|
| DB |
| 01/15/2020 |
| KRW |
|
| 5,304,339 |
|
| USD |
|
| 5,256,265 |
|
|
| 48,074 |
|
|
| – |
|
| 13,062,307 |
|
| DB |
| 01/15/2020 |
| MXN |
|
| 13,087,359 |
|
| USD |
|
| 13,062,307 |
|
|
| 25,052 |
|
|
| – |
|
| 17,656,019 |
|
| BAML |
| 03/20/2020 |
| MXN |
|
| 17,819,323 |
|
| USD |
|
| 17,656,019 |
|
|
| 163,304 |
|
|
| – |
|
| 15,488,317 |
|
| DB |
| 01/15/2020 |
| NOK |
|
| 16,028,605 |
|
| EUR |
|
| 15,488,317 |
|
|
| 540,288 |
|
|
| – |
|
| 10,937,054 |
|
| DB |
| 01/15/2020 |
| NOK |
|
| 11,393,553 |
|
| USD |
|
| 10,937,054 |
|
|
| 456,499 |
|
|
| – |
|
| 1,811,347 |
|
| DB |
| 01/06/2020 |
| NZD |
|
| 1,811,042 |
|
| USD |
|
| 1,811,347 |
|
|
| – |
|
|
| (305 | ) |
| 18,264,961 |
|
| DB |
| 01/15/2020 |
| NZD |
|
| 18,678,557 |
|
| USD |
|
| 18,264,961 |
|
|
| 413,596 |
|
|
| – |
|
| 29,812,404 |
|
| BAML |
| 03/20/2020 |
| NZD |
|
| 30,274,546 |
|
| USD |
|
| 29,812,404 |
|
|
| 462,142 |
|
|
| – |
|
| 5,701,286 |
|
| DB |
| 01/15/2020 |
| PLN |
|
| 5,797,670 |
|
| EUR |
|
| 5,701,286 |
|
|
| 96,384 |
|
|
| – |
|
| 7,532,438 |
|
| DB |
| 01/15/2020 |
| PLN |
|
| 7,717,979 |
|
| USD |
|
| 7,532,438 |
|
|
| 185,541 |
|
|
| – |
|
| 37,041,615 |
|
| DB |
| 01/15/2020 |
| RUB |
|
| 37,858,474 |
|
| USD |
|
| 37,041,615 |
|
|
| 816,859 |
|
|
| – |
|
| 11,238,453 |
|
| DB |
| 01/15/2020 |
| SEK |
|
| 11,365,270 |
|
| EUR |
|
| 11,238,453 |
|
|
| 126,817 |
|
|
| – |
|
| 47,101 |
|
| DB |
| 01/02/2020 |
| SEK |
|
| 46,982 |
|
| USD |
|
| 47,101 |
|
|
| – |
|
|
| (119 | ) |
| 15,867,556 |
|
| DB |
| 01/15/2020 |
| SEK |
|
| 16,018,494 |
|
| USD |
|
| 15,867,556 |
|
|
| 150,938 |
|
|
| – |
|
| 5,371,034 |
|
| DB |
| 01/15/2020 |
| SGD |
|
| 5,428,225 |
|
| USD |
|
| 5,371,034 |
|
|
| 57,191 |
|
|
| – |
|
| 2,310,416 |
|
| DB |
| 01/15/2020 |
| TRY |
|
| 2,265,180 |
|
| USD |
|
| 2,310,416 |
|
|
| – |
|
|
| (45,236 | ) |
| 6,188,272 |
|
| DB |
| 01/15/2020 |
| ZAR |
|
| 6,456,380 |
|
| USD |
|
| 6,188,272 |
|
|
| 268,108 |
|
|
| – |
|
| Total Purchase Contracts |
|
|
|
|
|
| 573,490,950 |
|
|
|
|
| 566,079,733 |
|
|
| 7,505,437 |
|
|
| (94,220 | ) |
| | | | | | | | | | | | | | | | | | | | |
| Sale Contracts: |
|
|
|
|
|
|
|
|
|
|
|
|
|
|
|
|
|
|
|
|
|
|
|
|
|
|
|
|
|
|
|
|
|
|
|
|
|
|
|
|
|
|
|
|
|
|
| $ | 22,487,400 |
|
| DB |
| 01/15/2020 |
| USD |
| $ | 23,054,360 |
|
| AUD |
| $ | 22,487,400 |
|
| $ | – |
|
| $ | (566,960 | ) |
| 53,360,805 |
|
| BAML |
| 03/20/2020 |
| USD |
|
| 54,264,707 |
|
| AUD |
|
| 53,360,805 |
|
|
| – |
|
|
| (903,902 | ) |
| 26,889,492 |
|
| DB |
| 01/15/2020 |
| USD |
|
| 28,094,019 |
|
| BRL |
|
| 26,889,492 |
|
|
| – |
|
|
| (1,204,527 | ) |
| 11,787,676 |
|
| DB |
| 01/15/2020 |
| USD |
|
| 11,975,930 |
|
| CAD |
|
| 11,787,676 |
|
|
| – |
|
|
| (188,254 | ) |
| 11,140,677 |
|
| BAML |
| 03/20/2020 |
| USD |
|
| 11,311,162 |
|
| CAD |
|
| 11,140,677 |
|
|
| – |
|
|
| (170,485 | ) |
| 1,374,555 |
|
| DB |
| 01/06/2020 |
| USD |
|
| 1,374,878 |
|
| CHF |
|
| 1,374,555 |
|
|
| – |
|
|
| (323 | ) |
| 23,833,081 |
|
| DB |
| 01/15/2020 |
| USD |
|
| 24,443,528 |
|
| CHF |
|
| 23,833,081 |
|
|
| – |
|
|
| (610,447 | ) |
| 42,688,281 |
|
| BAML |
| 03/20/2020 |
| USD |
|
| 43,421,073 |
|
| CHF |
|
| 42,688,281 |
|
|
| – |
|
|
| (732,792 | ) |
| 891,379 |
|
| DB |
| 01/15/2020 |
| USD |
|
| 908,516 |
|
| CLP |
|
| 891,379 |
|
|
| – |
|
|
| (17,137 | ) |
| 493,170 |
|
| DB |
| 01/15/2020 |
| USD |
|
| 527,181 |
|
| COP |
|
| 493,170 |
|
|
| – |
|
|
| (34,011 | ) |
| 15,488,317 |
|
| DB |
| 01/15/2020 |
| NOK |
|
| 15,606,507 |
|
| EUR |
|
| 15,488,317 |
|
|
| – |
|
|
| (118,190 | ) |
| 5,701,286 |
|
| DB |
| 01/15/2020 |
| PLN |
|
| 5,737,356 |
|
| EUR |
|
| 5,701,286 |
|
|
| – |
|
|
| (36,070 | ) |
| 11,238,453 |
|
| DB |
| 01/15/2020 |
| SEK |
|
| 11,351,208 |
|
| EUR |
|
| 11,238,453 |
|
|
| – |
|
|
| (112,755 | ) |
| 25,105,681 |
|
| DB |
| 01/15/2020 |
| USD |
|
| 25,329,698 |
|
| EUR |
|
| 25,105,681 |
|
|
| – |
|
|
| (224,017 | ) |
| 123,922,899 |
|
| BAML |
| 03/20/2020 |
| USD |
|
| 124,872,702 |
|
| EUR |
|
| 123,922,899 |
|
|
| – |
|
|
| (949,803 | ) |
| 45,588,760 |
|
| DB |
| 01/15/2020 |
| USD |
|
| 45,997,323 |
|
| GBP |
|
| 45,588,760 |
|
|
| – |
|
|
| (408,563 | ) |
The accompanying notes are an integral part of these consolidated financial statements.
| | |
| 24 | | LoCorr Macro Strategies Fund - Consolidated Schedule of Open Forward Currency Contracts (continued) |
| | |
| | |
|
|
| | | | | | | | | Currency to be Received | | Currency to be Delivered | | | | | | | | | |
| | Notional Amount | | | Counter-
party | | Forward
Settlement Date | | Curr Abbr. | | | U.S. $ Value at December 31, 2019 | | | Curr Abbr. | | | U.S. $ Value on Origination Date | | | | Unrealized Appreciation | | | | Unrealized (Depreciation) | |
| | | | | See key for abbreviation | | | | | | | | | | | | | | | | | | | | | | |
| Sale Contracts: (continued) | | | | | | | | | | | | | | | | | | | | |
| $ | 1,296,982 | | | DB | | 01/15/2020 | | USD | | $ | 1,304,044 | | | ILS | | $ | 1,296,982 | | | $ | – | | | $ | (7,062 | ) |
| | 5,097,254 | | | DB | | 01/15/2020 | | USD | | | 5,109,130 | | | INR | | | 5,097,254 | | | | – | | | | (11,876 | ) |
| | 4,009,975 | | | DB | | 01/06/2020 | | USD | | | 4,041,749 | | | JPY | | | 4,009,975 | | | | – | | | | (31,774 | ) |
| | 7,181,748 | | | DB | | 01/07/2020 | | USD | | | 7,190,873 | | | JPY | | | 7,181,748 | | | | – | | | | (9,125 | ) |
| | 56,511,563 | | | DB | | 01/15/2020 | | USD | | | 56,806,492 | | | JPY | | | 56,511,563 | | | | – | | | | (294,929 | ) |
| | 30,930,041 | | | BAML | | 03/19/2020 | | USD | | | 31,059,173 | | | JPY | | | 30,930,041 | | | | – | | | | (129,132 | ) |
| | 5,992,362 | | | DB | | 01/15/2020 | | USD | | | 6,126,113 | | | KRW | | | 5,992,362 | | | | – | | | | (133,751 | ) |
| | 11,468,117 | | | DB | | 01/15/2020 | | USD | | | 11,841,999 | | | MXN | | | 11,468,117 | | | | – | | | | (373,882 | ) |
| | 24,437,825 | | | DB | | 01/15/2020 | | EUR | | | 25,304,211 | | | NOK | | | 24,437,825 | | | | – | | | | (866,386 | ) |
| | 10,074,713 | | | DB | | 01/15/2020 | | USD | | | 10,337,582 | | | NOK | | | 10,074,713 | | | | – | | | | (262,869 | ) |
| | 1,811,692 | | | DB | | 01/06/2020 | | USD | | | 1,811,042 | | | NZD | | | 1,811,692 | | | | 650 | | | | – | |
| | 29,401,868 | | | DB | | 01/15/2020 | | USD | | | 30,340,872 | | | NZD | | | 29,401,868 | | | | – | | | | (939,004 | ) |
| | 21,158,685 | | | BAML | | 03/20/2020 | | USD | | | 21,621,306 | | | NZD | | | 21,158,685 | | | | – | | | | (462,621 | ) |
| | 4,166,691 | | | DB | | 01/15/2020 | | EUR | | | 4,250,316 | | | PLN | | | 4,166,691 | | | | – | | | | (83,625 | ) |
| | 4,632,877 | | | DB | | 01/15/2020 | | USD | | | 4,691,941 | | | PLN | | | 4,632,877 | | | | – | | | | (59,064 | ) |
| | 41,532,218 | | | DB | | 01/15/2020 | | USD | | | 42,184,812 | | | RUB | | | 41,532,218 | | | | – | | | | (652,594 | ) |
| | 10,212,907 | | | DB | | 01/15/2020 | | EUR | | | 10,274,524 | | | SEK | | | 10,212,907 | | | | – | | | | (61,617 | ) |
| | 46,791 | | | DB | | 01/02/2020 | | USD | | | 46,982 | | | SEK | | | 46,791 | | | | – | | | | (191 | ) |
| | 13,992,455 | | | DB | | 01/15/2020 | | USD | | | 14,248,040 | | | SEK | | | 13,992,455 | | | | – | | | | (255,585 | ) |
| | 2,297,425 | | | DB | | 01/15/2020 | | USD | | | 2,312,573 | | | SGD | | | 2,297,425 | | | | – | | | | (15,148 | ) |
| | 6,545,857 | | | DB | | 01/15/2020 | | USD | | | 6,397,081 | | | TRY | | | 6,545,857 | | | | 148,776 | | | | – | |
| | 10,649,642 | | | DB | | 01/15/2020 | | USD | | | 11,023,088 | | | ZAR | | | 10,649,642 | | | | – | | | | (373,446 | ) |
| Total Sale Contracts | | | | | | | 736,594,091 | | | | | | 725,441,600 | | | | 149,426 | | | | (11,301,917 | ) |
| Net Forward Currency Contracts | | | | $ | (163,103,141 | ) | | | | $ | (159,361,867 | ) | | $ | 7,654,863 | | | $ | (11,396,137 | ) |
| Net Unrealized Depreciation | | | | | | | | | | | | | | | | | | $ | (3,741,274 | ) |
Counterparty:
| BAML | Bank of America Merrill Lynch |
| Currency abbreviations: |
|
| AUD | AUSTRALIAN DOLLAR | EUR | EURO | MXN | MEXICAN PESO | SGD | SINGAPORE DOLLAR |
| BRL | BRAZILIAN REAL | GBP | BRITISH POUND | NOK | NORWEGIAN KRONE | TRY | TURKISH LIRA |
| CAD | CANADIAN DOLLAR | ILS | ISRAELI NEW SHEQEL | NZD | NEW ZEALAND DOLLAR | USD | U.S. DOLLAR |
| CHF | SWISS FRANC | INR | INDIAN RUPEE | PLN | POLISH ZLOTY | ZAR | SOUTH AFRICAN RAND |
| CLP | CHILEAN PESO | JPY | JAPANESE YEN | RUB | RUSSIAN RUBLE |
|
|
| COP | COLOMBIAN PESO | KRW | SOUTH KOREAN WON | SEK | SWEDISH KRONA |
|
|
The accompanying notes are an integral part of these consolidated financial statements.
| | |
LoCorr Macro Strategies Fund - Consolidated Schedule of Open Futures Contracts | | 25 |
| | |
| | |
|
|
LoCorr Macro Strategies Fund
Consolidated Schedule of Open Futures Contracts
December 31, 2019
| | | Number of | | | | | Current | | | | | | Value | |
| Description | | Contracts
Purchased (Sold) | | | Settlement
Month-Year | | Notional
Amount | | | Value at
Trade Date | | | Unrealized
Appreciation | | | Unrealized
(Depreciation) | |
| Purchase Contracts: | | | | | | | | | | | | | | | | | | | | | | |
| 90 Day Euro | | | 146 | | | Mar-21 | | $ | 35,930,600 | | | $ | 35,928,679 | | | $ | 1,921 | | | $ | – | |
| 90 Day Euro | | | 40 | | | Sep-20 | | | 9,836,500 | | | | 9,836,157 | | | | 343 | | | | – | |
| 90 Day Euro | | | 1,857 | | | Jun-21 | | | 457,007,700 | | | | 456,915,601 | | | | 92,099 | | | | – | |
| 90 Day Euro | | | 171 | | | Sep-21 | | | 42,080,963 | | | | 42,076,760 | | | | 4,203 | | | | – | |
| 90 Day Euro | | | 27 | | | Dec-21 | | | 6,641,663 | | | | 6,641,234 | | | | 429 | | | | – | |
| 90 Day Euro | | | 107 | | | Mar-22 | | | 26,317,988 | | | | 26,317,574 | | | | 414 | | | | – | |
| 90 Day Sterling | | | 1,284 | | | Dec-20 | | | 211,100,849 | | | | 211,099,517 | | | | 1,332 | | | | – | |
| 90 Day Sterling | | | 87 | | | Jun-21 | | | 14,301,401 | | | | 14,298,724 | | | | 2,677 | | | | – | |
| Aluminum - 90 Day Settlement (a)(b) | | | 1 | | | Jan-20 | | | 44,648 | | | | 43,682 | | | | 966 | | | | – | |
| Aluminum - 90 Day Settlement (a)(b) | | | 1 | | | Jan-20 | | | 44,903 | | | | 44,675 | | | | 228 | | | | – | |
| Aluminum - 90 Day Settlement (a)(b) | | | 1 | | | Mar-20 | | | 45,233 | | | | 44,386 | | | | 847 | | | | – | |
| Aluminum - 90 Day Settlement (a)(b) | | | 1 | | | Mar-20 | | | 45,225 | | | | 44,546 | | | | 679 | | | | – | |
| Aluminum (a)(b) | | | 113 | | | Mar-20 | | | 5,113,250 | | | | 5,079,665 | | | | 33,585 | | | | – | |
| Amsterdam Exchange Index | | | 12 | | | Jan-20 | | | 1,627,720 | | | | 1,638,301 | | | | – | | | | (10,581 | ) |
| Australian 10 Yr Bond | | | 313 | | | Mar-20 | | | 31,400,415 | | | | 31,992,248 | | | | – | | | | (591,833 | ) |
| Brent Crude (a) | | | 327 | | | Mar-20 | | | 21,582,000 | | | | 21,323,449 | | | | 258,551 | | | | – | |
| Brent Crude (a) | | | 16 | | | Apr-20 | | | 1,044,640 | | | | 1,055,301 | | | | – | | | | (10,661 | ) |
| Brent Crude (a) | | | 16 | | | May-20 | | | 1,034,880 | | | | 1,017,311 | | | | 17,569 | | | | – | |
| Brent Crude (a) | | | 11 | | | Jun-20 | | | 704,880 | | | | 692,294 | | | | 12,586 | | | | – | |
| Brent Crude (a) | | | 5 | | | Jul-20 | | | 317,300 | | | | 311,037 | | | | 6,263 | | | | – | |
| Brent Crude (a) | | | 3 | | | Aug-20 | | | 188,790 | | | | 185,584 | | | | 3,206 | | | | – | |
| CAC 40 10 Euro Index | | | 206 | | | Jan-20 | | | 13,794,952 | | | | 13,777,302 | | | | 17,650 | | | | – | |
| Canadian 10 Yr Bond | | | 365 | | | Mar-20 | | | 38,643,256 | | | | 39,282,822 | | | | – | | | | (639,566 | ) |
| Cocoa (ICE) (a) | | | 162 | | | Mar-20 | | | 3,903,330 | | | | 4,029,101 | | | | – | | | | (125,771 | ) |
| Cocoa (NYBOT) (a) | | | 15 | | | Mar-20 | | | 381,000 | | | | 374,089 | | | | 6,911 | | | | – | |
| Coffee (a) | | | 96 | | | Mar-20 | | | 4,669,200 | | | | 4,897,813 | | | | – | | | | (228,613 | ) |
| Copper - 90 Day Settlement (a)(b) | | | 1 | | | Jan-20 | | | 153,725 | | | | 140,582 | | | | 13,143 | | | | – | |
| Copper - 90 Day Settlement (a)(b) | | | 1 | | | Jan-20 | | | 153,935 | | | | 145,827 | | | | 8,108 | | | | – | |
| Copper - 90 Day Settlement (a)(b) | | | 1 | | | Jan-20 | | | 153,957 | | | | 147,828 | | | | 6,129 | | | | – | |
| Copper - 90 Day Settlement (a)(b) | | | 1 | | | Feb-20 | | | 154,107 | | | | 149,085 | | | | 5,022 | | | | – | |
| Copper - 90 Day Settlement (a)(b) | | | 1 | | | Mar-20 | | | 154,375 | | | | 154,192 | | | | 183 | | | | – | |
| Copper (a)(b) | | | 138 | | | Mar-20 | | | 21,303,750 | | | | 20,945,836 | | | | 357,914 | | | | – | |
| DAX Index | | | 141 | | | Mar-20 | | | 52,376,795 | | | | 52,614,074 | | | | – | | | | (237,279 | ) |
| Dollar | | | 58 | | | Mar-20 | | | 5,571,364 | | | | 5,604,386 | | | | – | | | | (33,022 | ) |
| Dow Jones Industrial Average Mini E-Cbot Index | | | 69 | | | Mar-20 | | | 9,835,260 | | | | 9,823,880 | | | | 11,380 | | | | – | |
| Euro-Schatz | | | 630 | | | Mar-20 | | | 79,080,370 | | | | 79,109,316 | | | | – | | | | (28,946 | ) |
| Euro-Stoxx 50 Index | | | 1,709 | | | Mar-20 | | | 71,484,700 | | | | 71,762,223 | | | | – | | | | (277,523 | ) |
| FTSE 100 Index | | | 192 | | | Mar-20 | | | 19,071,821 | | | | 19,114,716 | | | | – | | | | (42,895 | ) |
| FTSE China A50 Index | | | 45 | | | Jan-20 | | | 648,450 | | | | 643,296 | | | | 5,154 | | | | – | |
| FTSE MIB Index | | | 25 | | | Mar-20 | | | 3,282,389 | | | | 3,341,312 | | | | – | | | | (58,923 | ) |
| Gasoline RBOB (a) | | | 180 | | | Feb-20 | | | 12,780,180 | | | | 12,824,855 | | | | – | | | | (44,675 | ) |
| Gasoline RBOB (a) | | | 24 | | | Mar-20 | | | 1,716,624 | | | | 1,757,566 | | | | – | | | | (40,942 | ) |
| Gasoline RBOB (a) | | | 13 | | | Apr-20 | | | 1,026,043 | | | | 1,036,543 | | | | – | | | | (10,500 | ) |
| Gasoline RBOB (a) | | | 4 | | | May-20 | | | 315,941 | | | | 319,031 | | | | – | | | | (3,090 | ) |
| Gold (a) | | | 315 | | | Feb-20 | | | 47,977,650 | | | | 47,069,207 | | | | 908,443 | | | | – | |
| Hang Seng Index | | | 74 | | | Jan-20 | | | 13,423,379 | | | | 13,401,986 | | | | 21,393 | | | | – | |
| Heating Oil (a) | | | 177 | | | Feb-20 | | | 15,037,495 | | | | 15,023,252 | | | | 14,243 | | | | – | |
| Heating Oil (a) | | | 23 | | | Mar-20 | | | 1,947,939 | | | | 1,962,112 | | | | – | | | | (14,173 | ) |
| Heating Oil (a) | | | 6 | | | Apr-20 | | | 503,924 | | | | 506,611 | | | | – | | | | (2,687 | ) |
| Heating Oil (a) | | | 2 | | | May-20 | | | 166,673 | | | | 167,567 | | | | – | | | | (894 | ) |
| H-Shares Index | | | 118 | | | Jan-20 | | | 8,488,495 | | | | 8,434,502 | | | | 53,993 | | | | – | |
| KOSPI 200 Index | | | 136 | | | Mar-20 | | | 8,678,975 | | | | 8,508,144 | | | | 170,831 | | | | – | |
| Lead - 90 Day Settlement (a)(b) | | | 1 | | | Jan-20 | | | 47,927 | | | | 54,381 | | | | – | | | | (6,454 | ) |
| Lead (a)(b) | | | 11 | | | Mar-20 | | | 530,338 | | | | 547,458 | | | | – | | | | (17,120 | ) |
| Lean Hogs (a) | | | 1 | | | Feb-20 | | | 28,570 | | | | 28,402 | | | | 168 | | | | – | |
| Live Cattle (a) | | | 2 | | | Feb-20 | | | 100,740 | | | | 100,785 | | | | – | | | | (45 | ) |
| Long Gilt | | | 282 | | | Mar-20 | | | 49,075,635 | | | | 49,557,697 | | | | – | | | | (482,062 | ) |
The accompanying notes are an integral part of these consolidated financial statements.
| | |
| 26 | | LoCorr Macro Strategies Fund - Consolidated Schedule of Open Futures Contracts (continued) |
| | |
| | |
|
|
| | | Number of | | | | | Current | | | | | | Value | |
| Description | | Contracts
Purchased (Sold) | | | Settlement
Month-Year | | Notional
Amount | | | Value at
Trade Date | | | Unrealized
Appreciation | | | Unrealized
(Depreciation) | |
| Purchase Contracts: (continued) | | | | | | | | | | | | | | | | | | | | | | |
| Low Sulphur Gasoil (a) | | | 47 | | | Feb-20 | | $ | 2,884,625 | | | $ | 2,922,333 | | | $ | – | | | $ | (37,708 | ) |
| Low Sulphur Gasoil (a) | | | 34 | | | Mar-20 | | | 2,078,250 | | | | 2,095,944 | | | | – | | | | (17,694 | ) |
| Low Sulphur Gasoil (a) | | | 14 | | | Apr-20 | | | 849,450 | | | | 856,168 | | | | – | | | | (6,718 | ) |
| MSCI EAFE Index | | | 60 | | | Mar-20 | | | 6,109,500 | | | | 6,081,926 | | | | 27,574 | | | | – | |
| MSCI Emerging Markets Index | | | 103 | | | Mar-20 | | | 5,769,030 | | | | 5,757,874 | | | | 11,156 | | | | – | |
| Nasdaq 100 E-Mini Index | | | 287 | | | Mar-20 | | | 50,237,915 | | | | 49,342,645 | | | | 895,270 | | | | – | |
| Nickel - 90 Day Settlement (a)(b) | | | 2 | | | Jan-20 | | | 167,820 | | | | 200,992 | | | | – | | | | (33,172 | ) |
| Nickel (a)(b) | | | 8 | | | Mar-20 | | | 673,200 | | | | 721,497 | | | | – | | | | (48,297 | ) |
| Nikkei 225 Index (OSE) | | | 270 | | | Mar-20 | | | 58,743,730 | | | | 58,397,903 | | | | 345,827 | | | | – | |
| Nikkei 225 Index (SGX) | | | 13 | | | Mar-20 | | | 1,398,348 | | | | 1,431,636 | | | | – | | | | (33,288 | ) |
| OMX Stockholm 30 Index | | | 29 | | | Jan-20 | | | 547,484 | | | | 554,636 | | | | – | | | | (7,152 | ) |
| Platinum (a) | | | 1 | | | Apr-20 | | | 48,890 | | | | 49,287 | | | | – | | | | (397 | ) |
| Russell 2000 Mini Index | | | 394 | | | Mar-20 | | | 32,910,820 | | | | 32,676,858 | | | | 233,962 | | | | – | |
| S&P 500 E-Mini Index | | | 524 | | | Mar-20 | | | 84,654,820 | | | | 84,112,201 | | | | 542,619 | | | | – | |
| S&P/TSX 60 Index | | | 33 | | | Mar-20 | | | 5,145,616 | | | | 5,145,668 | | | | – | | | | (52 | ) |
| SET 50 Index | | | 100 | | | Mar-20 | | | 712,365 | | | | 713,414 | | | | – | | | | (1,049 | ) |
| Silver (a) | | | 216 | | | Mar-20 | | | 19,354,680 | | | | 18,719,431 | | | | 635,249 | | | | – | |
| Soybean Meal (a) | | | 29 | | | Mar-20 | | | 883,630 | | | | 882,908 | | | | 722 | | | | – | |
| Soybean Oil (a) | | | 36 | | | Mar-20 | | | 751,032 | | | | 712,441 | | | | 38,591 | | | | – | |
| SPI 200 Index | | | 2 | | | Mar-20 | | | 231,683 | | | | 236,632 | | | | – | | | | (4,949 | ) |
| Tokyo Price Index | | | 464 | | | Mar-20 | | | 73,493,535 | | | | 73,602,591 | | | | – | | | | (109,056 | ) |
| TWSE Capitalization Weighted Stock Index | | | 51 | | | Jan-20 | | | 4,081,089 | | | | 4,082,061 | | | | – | | | | (972 | ) |
| U.S. 10 Yr Note | | | 677 | | | Mar-20 | | | 86,941,610 | | | | 87,615,251 | | | | – | | | | (673,641 | ) |
| U.S. 2 Yr Note | | | 1,152 | | | Mar-20 | | | 248,256,000 | | | | 248,316,418 | | | | – | | | | (60,418 | ) |
| U.S. 5 Yr Note | | | 946 | | | Mar-20 | | | 112,204,470 | | | | 112,393,749 | | | | – | | | | (189,279 | ) |
| U.S. Long Bond | | | 224 | | | Mar-20 | | | 34,923,000 | | | | 35,332,096 | | | | – | | | | (409,096 | ) |
| Wheat (a) | | | 181 | | | Mar-20 | | | 5,056,688 | | | | 4,708,327 | | | | 348,361 | | | | – | |
| WTI Crude (a) | | | 153 | | | Feb-20 | | | 9,342,180 | | | | 9,178,111 | | | | 164,069 | | | | – | |
| WTI Crude (a) | | | 54 | | | Mar-20 | | | 3,281,580 | | | | 3,272,146 | | | | 9,434 | | | | – | |
| WTI Crude (a) | | | 21 | | | Apr-20 | | | 1,268,610 | | | | 1,266,901 | | | | 1,709 | | | | – | |
| WTI Crude (a) | | | 10 | | | May-20 | | | 599,700 | | | | 589,870 | | | | 9,830 | | | | – | |
| WTI Crude (a) | | | 6 | | | Jun-20 | | | 356,640 | | | | 359,813 | | | | – | | | | (3,173 | ) |
| WTI Crude (a) | | | 4 | | | Jul-20 | | | 235,480 | | | | 234,688 | | | | 792 | | | | – | |
| WTI Crude (a) | | | 1 | | | Aug-20 | | | 58,310 | | | | 55,682 | | | | 2,628 | | | | – | |
| Zinc - 90 Day Settlement (a)(b) | | | 1 | | | Jan-20 | | | 56,988 | | | | 57,350 | | | | – | | | | (362 | ) |
| Zinc - 90 Day Settlement (a)(b) | | | 1 | | | Jan-20 | | | 56,988 | | | | 62,207 | | | | – | | | | (5,219 | ) |
| Zinc - 90 Day Settlement (a)(b) | | | 1 | | | Feb-20 | | | 56,988 | | | | 62,357 | | | | – | | | | (5,369 | ) |
| Zinc - 90 Day Settlement (a)(b) | | | 1 | | | Feb-20 | | | 56,958 | | | | 59,093 | | | | – | | | | (2,135 | ) |
| Zinc - 90 Day Settlement (a)(b) | | | 1 | | | Feb-20 | | | 56,917 | | | | 57,418 | | | | – | | | | (501 | ) |
| Zinc - 90 Day Settlement (a)(b) | | | 1 | | | Mar-20 | | | 56,889 | | | | 55,692 | | | | 1,197 | | | | – | |
| Zinc - 90 Day Settlement (a)(b) | | | 1 | | | Mar-20 | | | 56,802 | | | | 57,752 | | | | – | | | | (950 | ) |
| Zinc (a)(b) | | | 33 | | | Mar-20 | | | 1,876,669 | | | | 1,926,420 | | | | – | | | | (49,751 | ) |
| Total Purchase Contracts | | | | | | | | | | | | | | | | | 5,307,553 | | | | (4,608,653 | ) |
| | | | | | | | | | | | | | | | | | | | | | | |
| Sale Contracts: | | | | | | | | | | | | | | | | | | | | | | |
| 10 Yr Mini JGB | | | (16 | ) | | Mar-20 | | $ | 2,237,246 | | | $ | 2,239,124 | | | $ | 1,878 | | | $ | – | |
| 3 Mo Euro Euribor | | | (872 | ) | | Jun-21 | | | 245,338,643 | | | | 245,416,476 | | | | 77,833 | | | | – | |
| 90 Day Euro | | | (32 | ) | | Dec-20 | | | 7,870,400 | | | | 7,869,632 | | | | – | | | | (768 | ) |
| Aluminum - 90 Day Settlement (a)(b) | | | (1 | ) | | Jan-20 | | | 44,648 | | | | 43,684 | | | | – | | | | (964 | ) |
| Aluminum - 90 Day Settlement (a)(b) | | | (1 | ) | | Jan-20 | | | 44,903 | | | | 43,891 | | | | – | | | | (1,012 | ) |
| Aluminum - 90 Day Settlement (a)(b) | | | (1 | ) | | Mar-20 | | | 45,233 | | | | 44,129 | | | | – | | | | (1,104 | ) |
| Aluminum - 90 Day Settlement (a)(b) | | | (1 | ) | | Mar-20 | | | 45,225 | | | | 44,685 | | | | – | | | | (540 | ) |
| Aluminum (a)(b) | | | (388 | ) | | Mar-20 | | | 17,557,000 | | | | 17,511,873 | | | | – | | | | (45,127 | ) |
| Australian 10 Yr Bond | | | (177 | ) | | Mar-20 | | | 17,756,783 | | | | 17,899,946 | | | | 143,163 | | | | – | |
| Australian 3 Yr Bond | | | (73 | ) | | Mar-20 | | | 5,891,888 | | | | 5,903,717 | | | | 11,829 | | | | – | |
| CAC 40 10 Euro Index | | | (92 | ) | | Jan-20 | | | 6,160,853 | | | | 6,194,259 | | | | 33,406 | | | | – | |
| Canadian 10 Yr Bond | | | (59 | ) | | Mar-20 | | | 6,246,444 | | | | 6,255,995 | | | | 9,551 | | | | – | |
| CBOE Volatility Index | | | (104 | ) | | Jan-20 | | | 1,521,000 | | | | 1,656,982 | | | | 135,982 | | | | – | |
| CBOE Volatility Index | | | (75 | ) | | Feb-20 | | | 1,246,875 | | | | 1,241,050 | | | | – | | | | (5,825 | ) |
| CBOE Volatility Index | | | (20 | ) | | Mar-20 | | | 338,500 | | | | 348,291 | | | | 9,791 | | | | – | |
| CBOE Volatility Index | | | (12 | ) | | Apr-20 | | | 209,100 | | | | 209,576 | | | | 476 | | | | – | |
| Coffee (a) | | | (12 | ) | | Mar-20 | | | 583,650 | | | | 573,662 | | | | – | | | | (9,988 | ) |
| Copper - 90 Day Settlement (a)(b) | | | (1 | ) | | Jan-20 | | | 153,725 | | | | 140,847 | | | | – | | | | (12,878 | ) |
The accompanying notes are an integral part of these consolidated financial statements.
| | |
LoCorr Macro Strategies Fund - Consolidated Schedule of Open Futures Contracts (continued) | | 27 |
| | |
| | |
|
|
| | | Number of | | | | | Current | | | | | | Value | |
| Description | | Contracts
Purchased (Sold) | | | Settlement
Month-Year | | Notional
Amount | | | Value at
Trade Date | | | Unrealized
Appreciation | | | Unrealized
(Depreciation) | |
| Sale Contracts: (continued) | | | | | | | | | | | | | | | | | | | | | | |
| Copper - 90 Day Settlement (a)(b) | | | (1 | ) | | Jan-20 | | $ | 153,935 | | | $ | 145,691 | | | $ | – | | | $ | (8,244 | ) |
| Copper - 90 Day Settlement (a)(b) | | | (1 | ) | | Jan-20 | | | 153,957 | | | | 147,071 | | | | – | | | | (6,886 | ) |
| Copper - 90 Day Settlement (a)(b) | | | (1 | ) | | Feb-20 | | | 154,107 | | | | 148,669 | | | | – | | | | (5,438 | ) |
| Copper - 90 Day Settlement (a)(b) | | | (1 | ) | | Mar-20 | | | 154,375 | | | | 154,431 | | | | 56 | | | | – | |
| Copper (a)(b) | | | (167 | ) | | Mar-20 | | | 25,780,625 | | | | 24,816,259 | | | | – | | | | (964,366 | ) |
| Copper (a) | | | (1 | ) | | Mar-20 | | | 69,925 | | | | 70,636 | | | | 711 | | | | – | |
| Corn (a) | | | (605 | ) | | Mar-20 | | | 11,729,438 | | | | 11,488,817 | | | | – | | | | (240,621 | ) |
| Cotton No.2 (a) | | | (82 | ) | | Mar-20 | | | 2,831,050 | | | | 2,683,598 | | | | – | | | | (147,452 | ) |
| Dow Jones Industrial Average Mini E-Cbot Index | | | (200 | ) | | Mar-20 | | | 28,508,000 | | | | 28,152,083 | | | | – | | | | (355,917 | ) |
| Euro-Bobl | | | (755 | ) | | Mar-20 | | | 113,169,547 | | | | 113,316,060 | | | | 146,513 | | | | – | |
| Euro-BTP | | | (5 | ) | | Mar-20 | | | 798,990 | | | | 799,626 | | | | 636 | | | | – | |
| Euro-Bund | | | (666 | ) | | Mar-20 | | | 127,365,495 | | | | 128,009,577 | | | | 644,082 | | | | – | |
| Euro-Buxl 30 Yr Bond | | | (23 | ) | | Mar-20 | | | 5,118,048 | | | | 5,149,620 | | | | 31,572 | | | | – | |
| Euro-OAT | | | (110 | ) | | Mar-20 | | | 20,083,791 | | | | 20,126,367 | | | | 42,576 | | | | – | |
| FTSE/JSE Top 40 Index | | | (25 | ) | | Mar-20 | | | 916,750 | | | | 923,328 | | | | 6,578 | | | | – | |
| Hang Seng Index | | | (25 | ) | | Jan-20 | | | 4,534,926 | | | | 4,539,532 | | | | 4,606 | | | | – | |
| Hard Red Wheat (a) | | | (197 | ) | | Mar-20 | | | 4,787,100 | | | | 4,247,050 | | | | – | | | | (540,050 | ) |
| IBEX 35 Index | | | (13 | ) | | Jan-20 | | | 1,389,432 | | | | 1,404,146 | | | | 14,714 | | | | – | |
| Japanese 10 Yr Bond | | | (51 | ) | | Mar-20 | | | 71,429,571 | | | | 71,311,148 | | | | – | | | | (118,423 | ) |
| Lead - 90 Day Settlement (a)(b) | | | (1 | ) | | Jan-20 | | | 47,927 | | | | 53,612 | | | | 5,685 | | | | – | |
| Lead (a)(b) | | | (12 | ) | | Mar-20 | | | 578,550 | | | | 595,164 | | | | 16,614 | | | | – | |
| Long Gilt | | | (70 | ) | | Mar-20 | | | 12,181,895 | | | | 12,127,364 | | | | – | | | | (54,531 | ) |
| MSCI Taiwan Index | | | (57 | ) | | Jan-20 | | | 2,619,720 | | | | 2,636,282 | | | | 16,562 | | | | – | |
| Natural Gas (a) | | | (53 | ) | | Mar-20 | | | 1,143,740 | | | | 1,174,155 | | | | 30,415 | | | | – | |
| Natural Gas (a) | | | (355 | ) | | Feb-20 | | | 7,770,950 | | | | 8,012,622 | | | | 241,672 | | | | – | |
| Natural Gas (a) | | | (40 | ) | | Apr-20 | | | 859,600 | | | | 867,620 | | | | 8,020 | | | | – | |
| Natural Gas (a) | | | (17 | ) | | May-20 | | | 371,960 | | | | 370,986 | | | | – | | | | (974 | ) |
| Natural Gas (a) | | | (4 | ) | | Jun-20 | | | 89,840 | | | | 89,282 | | | | – | | | | (558 | ) |
| Nickel - 90 Day Settlement (a)(b) | | | (2 | ) | | Jan-20 | | | 167,820 | | | | 199,850 | | | | 32,030 | | | | – | |
| Nickel (a)(b) | | | (15 | ) | | Mar-20 | | | 1,262,250 | | | | 1,316,369 | | | | 54,119 | | | | – | |
| S&P MidCap 400 E-Mini Index | | | (9 | ) | | Mar-20 | | | 1,858,320 | | | | 1,860,265 | | | | 1,945 | | | | – | |
| SGX Nifty 50 Index | | | (66 | ) | | Jan-20 | | | 1,616,340 | | | | 1,622,487 | | | | 6,147 | | | | – | |
| Soybean (a) | | | (225 | ) | | Mar-20 | | | 10,749,375 | | | | 10,182,175 | | | | – | | | | (567,200 | ) |
| Soybean Meal (a) | | | (112 | ) | | Mar-20 | | | 3,412,640 | | | | 3,426,683 | | | | 14,043 | | | | – | |
| Sugar (a) | | | (281 | ) | | Mar-20 | | | 4,223,542 | | | | 3,891,776 | | | | – | | | | (331,766 | ) |
| U.S. 10 Yr Note | | | (280 | ) | | Mar-20 | | | 35,958,126 | | | | 35,941,840 | | | | – | | | | (16,286 | ) |
| U.S. Ultra Bond | | | (7 | ) | | Mar-20 | | | 1,271,594 | | | | 1,274,648 | | | | 3,054 | | | | – | |
| Wheat (a) | | | (37 | ) | | Mar-20 | | | 1,033,688 | | | | 999,150 | | | | – | | | | (34,538 | ) |
| WTI Crude (a) | | | (5 | ) | | Feb-20 | | | 305,300 | | | | 293,359 | | | | – | | | | (11,941 | ) |
| Zinc - 90 Day Settlement (a)(b) | | | (1 | ) | | Jan-20 | | | 56,988 | | | | 57,126 | | | | 138 | | | | – | |
| Zinc - 90 Day Settlement (a)(b) | | | (1 | ) | | Jan-20 | | | 56,988 | | | | 62,368 | | | | 5,380 | | | | – | |
| Zinc - 90 Day Settlement (a)(b) | | | (1 | ) | | Feb-20 | | | 56,988 | | | | 61,664 | | | | 4,676 | | | | – | |
| Zinc - 90 Day Settlement (a)(b) | | | (1 | ) | | Feb-20 | | | 56,958 | | | | 58,571 | | | | 1,613 | | | | – | |
| Zinc - 90 Day Settlement (a)(b) | | | (1 | ) | | Feb-20 | | | 56,917 | | | | 57,460 | | | | 543 | | | | – | |
| Zinc - 90 Day Settlement (a)(b) | | | (1 | ) | | Mar-20 | | | 56,889 | | | | 55,655 | | | | – | | | | (1,234 | ) |
| Zinc - 90 Day Settlement (a)(b) | | | (1 | ) | | Mar-20 | | | 56,802 | | | | 57,641 | | | | 839 | | | | – | |
| Zinc (a)(b) | | | (218 | ) | | Mar-20 | | | 12,397,388 | | | | 13,253,732 | | | | 856,344 | | | | – | |
| Total Sale Contracts | | | | | | | | | | | | | | 2,615,792 | | | | (3,484,631 | ) |
| Total Futures Contracts | | | | | | | | | | | | | $ | 7,923,345 | | | $ | (8,093,284 | ) |
| Net Unrealized Depreciation | | | | | | | | | | | | | | | | | $ | (169,939 | ) |
| (a) | Contract held by LCMFS Fund Limited. |
| (b) | London Metal Exchange (‘’LME’’) futures contracts settle on their respective maturity date. The unrealized appreciation on these contracts is a receivable for unsettled open futures contracts and the unrealized depreciation is a payable for unsettled open futures contracts on the Fund’s consolidated statement of assets and liabilities. |
| ICE | Intercontinental Exchange |
| NYBOT | New York Board of Trade |
| OSE | Osaka Securities Exchange |
| SGX | Singapore Exchange Limited |
The accompanying notes are an integral part of these consolidated financial statements.
| | |
| | |
| | 28 | LoCorr Long/Short Commodities Strategy Fund - Consolidated Schedule of Investments |
| | |
LoCorr Long/Short Commodities Strategy Fund
Composition of Consolidated Investment Portfolio1
December 31, 2019 (Unaudited)
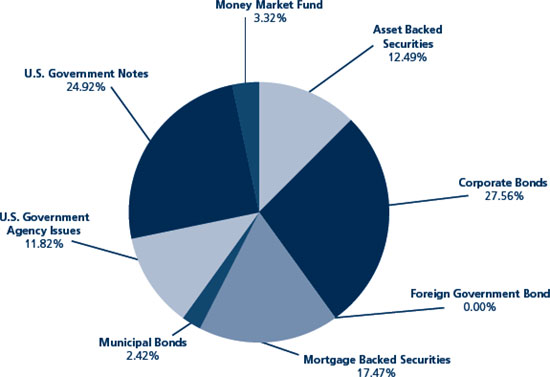
1 As a percentage of total investments.
Consolidated Schedule of Investments
December 31, 2019
| | | Maturity Date | | Coupon Rate | | Principal Amount | | | Value | |
| ASSET BACKED SECURITIES: 10.32% | | | | | | | | | | | | | | |
| 321 Henderson Receivables I LLC | | | | | | | | | | | | | | |
| Series 2006-4A A1 (1 Month LIBOR USD + 0.200%) (a)(c) | | 12/15/2041 | | | 1.94 | % | | $ | 154,792 | | | $ | 153,354 | |
| Series 2004-A A1 (1 Month LIBOR USD + 0.350%) (a)(c) | | 09/15/2045 | | | 2.09 | % | | | 59,406 | | | | 58,365 | |
| Asset Backed Securities Corp Home Equity Loan Trust Series, 2002-HE1 M1 | | | | | | | | | | | | | | |
| (1 Month LIBOR USD + 1.650%) (c) | | 03/15/2032 | | | 3.39 | % | | | 488,272 | | | | 493,254 | |
| Capital One Multi-Asset Execution Trust, 2015-A4 | | 05/15/2025 | | | 2.75 | % | | | 1,210,000 | | | | 1,236,363 | |
| CarMax Auto Owner Trust, 2018-4 A3 | | 09/15/2023 | | | 3.36 | % | | | 900,000 | | | | 918,096 | |
| Citibank Credit Card Issuance Trust | | | | | | | | | | | | | | |
| Series 2018-A6 | | 12/09/2024 | | | 3.21 | % | | | 1,500,000 | | | | 1,555,612 | |
| Series 2018-A3 A3 | | 05/23/2025 | | | 3.29 | % | | | 1,085,000 | | | | 1,127,901 | |
| Conn’s Receivables Funding LLC, 2018-A A (a) | | 01/17/2023 | | | 3.25 | % | | | 104,387 | | | | 104,764 | |
| Countrywide Asset-Backed Certificates, 2004-AB1 (1 Month LIBOR USD + 0.975%) (c) | | 11/25/2034 | | | 2.77 | % | | | 42,885 | | | | 42,913 | |
| DB Master Finance LLC, 2019-1A A2I (a) | | 05/20/2049 | | | 3.79 | % | | | 955,200 | | | | 975,593 | |
| Diamond Resorts Owner Trust, 2018-1 A (a) | | 01/21/2031 | | | 3.70 | % | | | 827,801 | | | | 847,231 | |
| Discover Card Execution Note Trust, 2018-2 A (1 Month LIBOR USD + 0.330%) (c) | | 08/15/2025 | | | 2.07 | % | | | 1,225,000 | | | | 1,224,308 | |
| Domino’s Pizza Master Issuer LLC, 2017-1A A2I (3 Month LIBOR USD + 1.250%) (a)(c) | | 07/25/2047 | | | 3.19 | % | | | 490,000 | | | | 490,358 | |
| FirstEnergy Ohio PIRB Special Purpose Trust, 2013-1 A2 | | 01/15/2022 | | | 1.73 | % | | | 20,907 | | | | 20,901 | |
| Ford Credit Auto Lease Trust, 2019-B A3 | | 10/15/2022 | | | 2.22 | % | | | 491,000 | | | | 492,821 | |
| Ford Credit Auto Owner Trust, 2016-1 A (a) | | 08/15/2027 | | | 2.31 | % | | | 795,000 | | | | 797,896 | |
| Honda Auto Receivables Owner Trust, 2017-4 A | | 03/21/2024 | | | 2.21 | % | | | 695,000 | | | | 697,539 | |
| Invitation Homes Trust | | | | | | | | | | | | | | |
| Series 2017-SFR2 A (1 Month LIBOR USD + 0.850%) (a)(c) | | 12/19/2036 | | | 2.59 | % | | | 452,417 | | | | 450,697 | |
| Series 2018-SFR1 A (1 Month LIBOR USD + 0.700%) (a)(c) | | 03/19/2037 | | | 2.44 | % | | | 611,980 | | | | 606,827 | |
| Series 2018-SFR2 A (1 Month LIBOR USD + 0.900%) (a)(c) | | 06/18/2037 | | | 2.64 | % | | | 567,035 | | | | 566,155 | |
| Series 2018-SFR3 A (1 Month LIBOR USD + 1.000%) (a)(c) | | 07/17/2037 | | | 2.74 | % | | | 463,629 | | | | 463,738 | |
| Series 2018-SFR4 A (1 Month LIBOR USD + 1.100%) (a)(c) | | 01/19/2038 | | | 2.84 | % | | | 892,513 | | | | 897,552 | |
| MVW Owner Trust | | | | | | | | | | | | | | |
| Series 2019-1A A (a) | | 11/20/2036 | | | 2.89 | % | | | 855,746 | | | | 866,501 | |
| Series 2019-2A A (a) | | 10/20/2038 | | | 2.22 | % | | | 955,111 | | | | 949,132 | |
The accompanying notes are an integral part of these consolidated financial statements.
| | |
| | |
LoCorr Long/Short Commodities Strategy Fund - Consolidated Schedule of Investments (continued) | 29 | |
| | |
| | | Maturity Date | | Coupon Rate | | Principal Amount | | | Value | |
| ASSET BACKED SECURITIES (continued) | | | | | | | | | | | | | | |
| Planet Fitness Master Issuer LLC, 2018-1A A2I (a) | | 09/05/2048 | | | 4.26 | % | | $ | 982,563 | | | $ | 998,893 | |
| Progress Residential Trust | | | | | | | | | | | | | | |
Series 2017-SFR1 A (a) | | 08/17/2034 | | | 2.77 | % | | | 323,814 | | | | 324,196 | |
Series 2019-SFR4 B (a) | | 10/17/2036 | | | 2.94 | % | | | 600,000 | | | | 596,799 | |
| SMB Private Education Loan Trust, 2018-C A1 (1 Month LIBOR USD + 0.300%) (a)(c) | | 09/15/2025 | | | 2.04 | % | | | 118,307 | | | | 118,251 | |
| SoFi Professional Loan Program LLC | | | | | | | | | | | | | | |
Series 2015-A A2 (a) | | 03/25/2030 | | | 2.42 | % | | | 134,608 | | | | 134,587 | |
Series 2016-D A-2B (a) | | 04/25/2033 | | | 2.34 | % | | | 951,248 | | | | 951,649 | |
Series 2015-C A2 (a) | | 08/25/2033 | | | 2.51 | % | | | 240,223 | | | | 240,329 | |
Series 2015-D A2 (a) | | 10/27/2036 | | | 2.72 | % | | | 93,903 | | | | 94,197 | |
Series 2016-A A2 (a) | | 12/26/2036 | | | 2.76 | % | | | 543,623 | | | | 545,434 | |
Series 2017-B A2FX (a) | | 05/25/2040 | | | 2.74 | % | | | 824,739 | | | | 827,815 | |
| Starwood Waypoint Homes Trust, 2017-1 A (1 Month LIBOR USD + 0.950%) (a)(c) | | 01/22/2035 | | | 2.69 | % | | | 600,729 | | | | 599,562 | |
| Synchrony Card Issuance Trust, 2018-A1 A1 | | 09/15/2024 | | | 3.38 | % | | | 1,035,000 | | | | 1,058,151 | |
| TCF Auto Receivables Owner Trust, 2016-PT1 A (a) | | 06/15/2022 | | | 1.93 | % | | | 122,043 | | | | 121,900 | |
| Toyota Auto Receivables Owner Trust, 2019-A A3 | | 07/17/2023 | | | 2.91 | % | | | 605,000 | | | | 613,959 | |
| Tricon American Homes Trust, 2017-SFR1 A (a) | | 09/19/2034 | | | 2.72 | % | | | 1,222,049 | | | | 1,221,655 | |
| Verizon Owner Trust | | | | | | | | | | | | | | |
| Series 2018-A A1A | | 04/20/2023 | | | 3.23 | % | | | 705,000 | | | | 716,940 | |
| Series 2019-B A1A | | 12/20/2023 | | | 2.33 | % | | | 1,215,000 | | | | 1,223,719 | |
| TOTAL ASSET BACKED SECURITIES (Cost $26,087,502) | | | | | | | | | | | | | 26,425,907 | |
| | | | | | | | | | | | | | | |
| CORPORATE BONDS: 22.77% | | | | | | | | | | | | | | |
| Aerospace/Defense: 0.34% | | | | | | | | | | | | | | |
| United Technologies Corp. | | 08/16/2023 | | | 3.65 | % | | | 825,000 | | | | 869,886 | |
| | | | | | | | | | | | | | | |
| Agriculture: 0.38% | | | | | | | | | | | | | | |
| Altria Group, Inc. | | 02/14/2024 | | | 3.80 | % | | | 915,000 | | | | 963,556 | |
| | | | | | | | | | | | | | | |
| Auto Manufacturers: 0.30% | | | | | | | | | | | | | | |
| General Motors Financial Co., Inc. | | 05/09/2023 | | | 3.70 | % | | | 745,000 | | | | 768,088 | |
| | | | | | | | | | | | | | | |
| Banks: 9.44% | | | | | | | | | | | | | | |
| Bank of America Corp. | | 10/21/2022 | | | 2.50 | % | | | 775,000 | | | | 782,543 | |
| Bank of America Corp. | | 01/11/2023 | | | 3.30 | % | | | 2,625,000 | | | | 2,713,940 | |
| Bank of Montreal (b) | | 03/26/2022 | | | 2.90 | % | | | 845,000 | | | | 861,549 | |
| BB&T Corp. | | 12/06/2023 | | | 3.75 | % | | | 720,000 | | | | 763,796 | |
| Citigroup, Inc. | | 01/14/2022 | | | 4.50 | % | | | 1,270,000 | | | | 1,331,580 | |
| Citigroup, Inc. (SOFR + 0.867%) (d) | | 11/04/2022 | | | 2.31 | % | | | 990,000 | | | | 993,082 | |
| Citigroup, Inc. (3 Month LIBOR USD + 0.722%) (d) | | 01/24/2023 | | | 3.14 | % | | | 710,000 | | | | 723,912 | |
| Cooperatieve Rabobank UA (b) | | 11/09/2022 | | | 3.95 | % | | | 895,000 | | | | 935,818 | |
| Danske Bank (a)(b) | | 01/12/2022 | | | 5.00 | % | | | 575,000 | | | | 603,976 | |
| Goldman Sachs Group, Inc. | | 02/25/2021 | | | 2.88 | % | | | 625,000 | | | | 631,223 | |
| Goldman Sachs Group, Inc. | | 01/22/2023 | | | 3.63 | % | | | 1,195,000 | | | | 1,244,627 | |
| Goldman Sachs Group, Inc. | | 02/23/2023 | | | 3.20 | % | | | 1,155,000 | | | | 1,187,474 | |
| HSBC Bank Canada (a)(b) | | 09/10/2022 | | | 1.65 | % | | | 870,000 | | | | 864,053 | |
| HSBC Holdings PLC (b) | | 04/05/2021 | | | 5.10 | % | | | 250,000 | | | | 259,289 | |
| Huntington National Bank | | 04/01/2022 | | | 3.13 | % | | | 780,000 | | | | 797,485 | |
| ING Groep NV (b) | | 04/09/2024 | | | 3.55 | % | | | 965,000 | | | | 1,010,023 | |
| JP Morgan Chase & Co. | | 09/23/2022 | | | 3.25 | % | | | 910,000 | | | | 941,528 | |
| JP Morgan Chase & Co. | | 01/25/2023 | | | 3.20 | % | | | 2,065,000 | | | | 2,131,170 | |
| Morgan Stanley | | 01/23/2023 | | | 3.13 | % | | | 1,975,000 | | | | 2,030,469 | |
| Royal Bank of Canada (b) | | 04/29/2022 | | | 2.80 | % | | | 695,000 | | | | 709,316 | |
| SunTrust Banks, Inc. | | 03/03/2021 | | | 2.90 | % | | | 915,000 | | | | 924,570 | |
| Wells Fargo & Co. | | 02/13/2023 | | | 3.45 | % | | | 1,075,000 | | | | 1,113,311 | |
| Zions Bancorp NA | | 03/04/2022 | | | 3.35 | % | | | 590,000 | | | | 605,401 | |
| | | | | | | | | | | | | 24,160,135 | |
| Beverages: 0.26% | |
| |
| | | |
| | | |
|
| |
| Anheuser-Busch InBev Finance, Inc. | | 02/01/2023 | |
| 3.30 | % | |
| 630,000 | | |
| 652,712 | |
The accompanying notes are an integral part of these consolidated financial statements.
| | |
| | |
| | 30 | LoCorr Long/Short Commodities Strategy Fund - Consolidated Schedule of Investments (continued) |
| | |
| | | Maturity Date | | Coupon Rate | | Principal Amount | | | Value | |
| CORPORATE BONDS (continued) | | | | | | | | | | | | | | |
| Diversified Financial Services: 2.15% | | | | | | | | | | | | | | |
| AerCap Ireland Capital DAC/AerCap Global Aviation Trust (b) | | 02/01/2022 | | | 3.95 | % | | $ | 595,000 | | | $ | 614,780 | |
| Air Lease Corp. | | 07/03/2023 | | | 3.88 | % | | | 540,000 | | | | 569,045 | |
| American Express Co. | | 05/20/2022 | | | 2.75 | % | | | 920,000 | | | | 936,863 | |
| Capital One Bank | | 02/15/2023 | | | 3.38 | % | | | 224,000 | | | | 231,436 | |
| Capital One Financial Corp. | | 07/15/2021 | | | 4.75 | % | | | 505,000 | | | | 525,931 | |
| CDP Financial, Inc. (a)(b) | | 03/07/2022 | | | 2.75 | % | | | 990,000 | | | | 1,010,653 | |
| Charles Schwab Corp. | | 01/25/2023 | | | 2.65 | % | | | 595,000 | | | | 606,657 | |
| Dragon 2012 LLC | | 03/12/2024 | | | 1.97 | % | | | 9,743 | | | | 9,757 | |
| Helios Leasing I LLC | | 05/29/2024 | | | 2.02 | % | | | 10,083 | | | | 10,105 | |
| Helios Leasing I LLC | | 07/24/2024 | | | 1.73 | % | | | 10,580 | | | | 10,534 | |
| Helios Leasing I LLC | | 09/28/2024 | | | 1.56 | % | | | 10,490 | | | | 10,380 | |
| MSN 41079 and 41084 Ltd. (b) | | 07/13/2024 | | | 1.72 | % | | | 10,562 | | | | 10,519 | |
| OMERS Finance Trust (a)(b) | | 05/02/2024 | | | 2.50 | % | | | 920,000 | | | | 941,241 | |
| Phoenix 2012 LLC | | 07/03/2024 | | | 1.61 | % | | | 10,574 | | | | 10,498 | |
| Safina Ltd. (b) | | 01/15/2022 | | | 1.55 | % | | | 5,990 | | | | 5,970 | |
| Tagua Leasing LLC | | 11/16/2024 | | | 1.58 | % | | | 11,038 | | | | 10,932 | |
| | | | | | | | | | | | | | 5,515,301 | |
| Electric: 0.34% | | | | | | | | | | | | | | |
| Exelon Generation Co. LLC | | 03/15/2022 | | | 3.40 | % | | | 265,000 | | | | 272,003 | |
| Nextera Energy Capital Holdings, Inc. | | 04/01/2022 | | | 2.90 | % | | | 590,000 | | | | 602,163 | |
| | | | | | | | | | | | | | 874,166 | |
| Environmental Control: 0.28% | | | | | | | | | | | | | | |
| Waste Management, Inc. | | 06/15/2024 | | | 2.95 | % | | | 700,000 | | | | 722,679 | |
| | | | | | | | | | | | | | | |
| Food: 0.25% | | | | | | | | | | | | | | |
| Tyson Foods, Inc. | | 06/15/2022 | | | 4.50 | % | | | 595,000 | | | | 626,509 | |
| | | | | | | | | | | | | | | |
Household Products & Wares: 0.20% | | | | | | | | | | | | | | |
| Clorox Co. | | 09/15/2022 | | | 3.05 | % | | | 505,000 | | | | 517,159 | |
| | | | | | | | | | | | | | | |
| Insurance: 0.48% | | | | | | | | | | | | | | |
| Aon Corp. | | 11/15/2022 | | | 2.20 | % | | | 775,000 | | | | 778,648 | |
| Metropolitan Life Global Funding I (a) | | 01/11/2022 | | | 3.38 | % | | | 450,000 | | | | 462,662 | |
| | | | | | | | | | | | | | 1,241,310 | |
| Machinery - Diversified: 0.23% | | | | | | | | | | | | | | |
| Roper Technologies, Inc. | | 12/15/2020 | | | 3.00 | % | | | 585,000 | | | | 589,971 | |
| | | | | | | | | | | | | | | |
Media: 0.80% | | | | | | | | | | | | | | |
| CBS Corp. | | 03/01/2022 | | | 3.38 | % | | | 260,000 | | | | 266,006 | |
| Comcast Corp. | | 04/15/2024 | | | 3.70 | % | | | 655,000 | | | | 698,619 | |
| Discovery Communications LLC | | 04/01/2023 | | | 3.25 | % | | | 510,000 | | | | 524,806 | |
| NBCUniversal Media LLC | | 01/15/2023 | | | 2.88 | % | | | 550,000 | | | | 565,248 | |
| | | | | | | | | | | | | | 2,054,679 | |
| Miscellaneous Manufacturing: 0.70% | | | | | | | | | | | | | | |
| General Electric Co. | | 01/07/2021 | | | 4.63 | % | | | 330,000 | | | | 337,500 | |
| General Electric Co. | | 10/09/2022 | | | 2.70 | % | | | 375,000 | | | | 380,186 | |
| Ingersoll-Rand Global Holding Co. Ltd. | | 06/15/2023 | | | 4.25 | % | | | 525,000 | | | | 562,424 | |
| Parker-Hannifin Corp. | | 06/14/2024 | | | 2.70 | % | | | 510,000 | | | | 521,041 | |
| | | | | | | | | | | | | | 1,801,151 | |
| Oil & Gas: 1.18% | | | | | | | | | | | | | | |
| BP Capital Markets PLC (b) | | 03/11/2021 | | | 4.74 | % | | | 535,000 | | | | 552,438 | |
| Diamondback Energy, Inc. | | 12/01/2024 | | | 2.88 | % | | | 335,000 | | | | 338,912 | |
| Occidental Petroleum Corp. | | 03/15/2021 | | | 4.85 | % | | | 645,000 | | | | 664,402 | |
| Occidental Petroleum Corp. | | 08/15/2022 | | | 2.70 | % | | | 455,000 | | | | 459,729 | |
| Saudi Arabian Oil Co. (a)(b) | | 04/16/2022 | | | 2.75 | % | | | 1,000,000 | | | | 1,011,291 | |
| | | | | | | | | | | | | | 3,026,772 | |
The accompanying notes are an integral part of these consolidated financial statements.
| | |
| | |
LoCorr Long/Short Commodities Strategy Fund - Consolidated Schedule of Investments (continued) | 31 | |
| | |
| | | Maturity Date | | Coupon Rate | | Principal Amount | | | Value | |
| CORPORATE BONDS (continued) | | | | | | | | | | | | | | |
| Pharmaceuticals: 1.03% | | | | | | | | | | | | | | |
| AbbVie, Inc. | | 11/06/2022 | | | 2.90 | % | | $ | 215,000 | | | $ | 219,433 | |
| AbbVie, Inc. (a) | | 11/21/2022 | | | 2.30 | % | | | 880,000 | | | | 884,448 | |
| Bristol-Myers Squibb Co. (a) | | 02/20/2023 | | | 3.25 | % | | | 735,000 | | | | 761,254 | |
| CVS HEALTH Corp. | | 08/12/2024 | | | 3.38 | % | | | 735,000 | | | | 765,103 | |
| | | | | | | | | | | | | | 2,630,238 | |
| Pipelines: 0.55% | | | | | | | | | | | | | | |
| Enterprise Products Operating LLC | | 02/15/2021 | | | 2.80 | % | | | 625,000 | | | | 630,965 | |
| ONEOK, Inc. | | 09/01/2024 | | | 2.75 | % | | | 235,000 | | | | 237,232 | |
| TransCanada PipeLines Ltd. (b) | | 08/01/2022 | | | 2.50 | % | | | 545,000 | | | | 550,830 | |
| | | | | | | | | | | | | | 1,419,027 | |
| Real Estate Investment Trusts: 0.83% | | | | | | | | | | | | | | |
| Alexandria Real Estate Equities, Inc. | | 01/15/2024 | | | 4.00 | % | | | 635,000 | | | | 676,603 | |
| Digital Realty Trust LP | | 10/01/2022 | | | 3.63 | % | | | 565,000 | | | | 584,188 | |
| Duke Realty LP | | 06/15/2022 | | | 4.38 | % | | | 355,000 | | | | 372,135 | |
| Kilroy Realty LP | | 01/15/2023 | | | 3.80 | % | | | 470,000 | | | | 487,125 | |
| | | | | | | | | | | | | | 2,120,051 | |
| Retail: 0.32% | | | | | | | | | | | | | | |
| Walgreens Boots Alliance, Inc. | | 11/18/2024 | | | 3.80 | % | | | 790,000 | | | | 823,497 | |
| | | | | | | | | | | | | | | |
Software: 0.54% | | | | | | | | | | | | | | |
| Fiserv, Inc. | | 07/01/2024 | | | 2.75 | % | | | 1,355,000 | | | | 1,378,936 | |
| | | | | | | | | | | | | | | |
Telecommunications: 1.35% | | | | | | | | | | | | | | |
| AT&T, Inc. | | 02/17/2021 | | | 2.80 | % | | | 1,310,000 | | | | 1,321,798 | |
| AT&T, Inc. | | 03/11/2024 | | | 3.90 | % | | | 680,000 | | | | 723,358 | |
| Verizon Communications, Inc. | | 03/15/2021 | | | 3.45 | % | | | 440,000 | | | | 448,577 | |
| Verizon Communications, Inc. | | 09/15/2023 | | | 5.15 | % | | | 855,000 | | | | 950,684 | |
| | | | | | | | | | | | | | 3,444,417 | |
| Transportation: 0.82% | | | | | | | | | | | | | | |
| Burlington Northern Santa Fe LLC | | 09/01/2024 | | | 3.40 | % | | | 715,000 | | | | 756,305 | |
| CSX Corp. | | 11/01/2023 | | | 3.70 | % | | | 780,000 | | | | 828,451 | |
| FedEx Corp. | | 08/01/2022 | | | 2.63 | % | | | 510,000 | | | | 517,376 | |
| | | | | | | | | | | | | | 2,102,132 | |
| TOTAL CORPORATE BONDS (Cost $56,851,520) | | | | | | | | | | | | | 58,302,372 | |
| | | | | | | | | | | | | | | |
| FOREIGN GOVERNMENT BOND: 0.00%* | | | | | | | | | | | | | | |
| Petroleos Mexicanos (b) | | 12/20/2022 | | | 2.00 | % | | | 7,500 | | | | 7,500 | |
| TOTAL FOREIGN GOVERNMENT BOND (Cost $7,500) | | | | | | | | | | | | | 7,500 | |
| | | | | | | | | | | | | | | |
| MORTGAGE BACKED SECURITIES: 14.43% | | | | | | | | | | | | | | |
| BX Trust, 2018-MCSF A (1 Month LIBOR USD + 0.577%) (a)(c) | | 04/16/2035 | | | 2.32 | % | | | 865,000 | | | | 859,577 | |
| Comm Mortgage Trust | | | | | | | | | | | | | | |
| Series 2014-UBS2 AM | | 03/12/2047 | | | 4.20 | % | | | 1,150,000 | | | | 1,209,902 | |
| Series 2015-CCR27 AM | | 10/13/2048 | | | 3.98 | % | | | 1,000,000 | | | | 1,064,016 | |
| Fannie Mae Aces, 2010-M3 A3 (d) | | 03/25/2020 | | | 4.33 | % | | | 45,985 | | | | 46,038 | |
| Fannie Mae Connecticut Avenue Securities | | | | | | | | | | | | | | |
| Series 2014-C02 1M2 (1 Month LIBOR USD + 2.600%) (c) | | 05/28/2024 | | | 4.39 | % | | | 1,481,751 | | | | 1,542,972 | |
| Series 2014-C03 1M2 (1 Month LIBOR USD + 3.000%) (c) | | 07/25/2024 | | | 4.79 | % | | | 665,087 | | | | 699,599 | |
| Series 2017-C01 1M1 (1 Month LIBOR USD + 1.300%) (c) | | 07/25/2029 | | | 3.09 | % | | | 52,930 | | | | 52,979 | |
| Series 2017-C02 2ED4 (1 Month LIBOR USD + 0.850%) (c) | | 09/25/2029 | | | 2.64 | % | | | 275,000 | | | | 272,173 | |
| Series 2017-C02 2M1 (1 Month LIBOR USD + 1.150%) (c) | | 09/25/2029 | | | 2.94 | % | | | 46,450 | | | | 46,486 | |
| Series 2019-R03 1M1 (1 Month LIBOR USD + 0.750%) (a)(c) | | 09/25/2031 | | | 2.54 | % | | | 164,188 | | | | 164,195 | |
| Series 2019-R04 2M1 (1 Month LIBOR USD + 0.750%) (a)(c) | | 06/27/2039 | | | 2.54 | % | | | 781,458 | | | | 781,457 | |
| FHLMC Multifamily Structured Pass Through Certificates | | | | | | | | | | | | | | |
| Series K-F08 A (1 Month LIBOR USD + 0.300%) (c) | | 01/25/2022 | | | 2.00 | % | | | 195,405 | | | | 194,903 | |
| Series K-052 A1 | | 01/25/2025 | | | 2.60 | % | | | 442,649 | | | | 449,635 | |
| Series K-059 A1 | | 09/25/2025 | | | 2.76 | % | | | 861,756 | | | | 884,047 | |
| Series K-C06 A1 | | 02/25/2026 | | | 2.17 | % | | | 1,510,000 | | | | 1,503,408 | |
The accompanying notes are an integral part of these consolidated financial statements.
| | |
| | |
| | 32 | LoCorr Long/Short Commodities Strategy Fund - Consolidated Schedule of Investments (continued) |
| | |
| | | Maturity Date | | Coupon Rate | | Principal Amount | | | Value | |
MORTGAGE BACKED SECURITIES (continued) | | | | | | | | | | | | | | |
| Flagstar Mortgage Trust | | | | | | | | | | | | | | |
| Series 2017-2 A5 (a)(d) | | 10/25/2047 | | | 3.50 | % | | $ | 668,729 | | | $ | 672,149 | |
| Series 2018-4 A4 (a)(d) | | 07/25/2048 | | | 4.00 | % | | | 378,838 | | | | 378,808 | |
| Freddie Mac Structured Agency Credit Risk Debt Notes | | | | | | | | | | | | | | |
| Series 2017-DNA2 M1 (1 Month LIBOR USD + 1.200%) (c) | | 10/25/2029 | | | 2.99 | % | | | 492,807 | | | | 494,498 | |
| Series 2017-HQA3 M2 (1 Month LIBOR USD + 2.350%) (c) | | 04/25/2030 | | | 4.14 | % | | | 790,902 | | | | 804,440 | |
| Series 2018-SPI2 M1 (a)(d) | | 05/25/2048 | | | 3.82 | % | | | 269,140 | | | | 269,409 | |
| Series 2019-HQA3 M1 (1 Month LIBOR USD + 0.750%) (a)(c) | | 09/27/2049 | | | 2.54 | % | | | 949,340 | | | | 949,467 | |
| FRESB Multifamily Mortgage Pass Through Certificates | | | | | | | | | | | | | | |
| Series 2016-SB17 A7F (d) | | 05/25/2023 | | | 2.15 | % | | | 1,151,334 | | | | 1,150,170 | |
| Series 2017-SB32 A7F (d) | | 04/25/2024 | | | 2.44 | % | | | 1,331,143 | | | | 1,335,767 | |
| Series 2019-SB67 A5F (d) | | 07/25/2024 | | | 2.09 | % | | | 1,434,754 | | | | 1,428,479 | |
| Series 2019-SB69 A5F (d) | | 10/25/2024 | | | 2.25 | % | | | 1,880,000 | | | | 1,883,219 | |
| Series 2016-SB23 A10F (d) | | 09/25/2026 | | | 2.31 | % | | | 1,383,076 | | | | 1,379,429 | |
GS Mortgage Securities Trust
| | | | | | | | | | | | | | |
| Series 2010-C1 A1 (a) | | 08/12/2043 | | | 3.68 | % | | | 5,002 | | | | 4,998 | |
| Series 2015-GC28 A5 | | 02/12/2048 | | | 3.76 | % | | | 885,000 | | | | 927,799 | |
| JP Morgan Chase Commercial Mortgage Securities Trust | | | | | | | | | | | | | | |
| Series 2010-C2 A3 (a) | | 11/15/2043 | | | 4.07 | % | | | 275,651 | | | | 277,116 | |
| Series 2012-C8 ASB | | 10/17/2045 | | | 2.38 | % | | | 296,440 | | | | 296,624 | |
| Series 2014-C23 ASB | | 09/17/2047 | | | 3.66 | % | | | 1,247,372 | | | | 1,286,988 | |
| JP Morgan Mortgage Trust | | | | | | | | | | | | | | |
| Series 2016-1 A5 (a)(d) | | 05/25/2046 | | | 3.50 | % | | | 162,084 | | | | 162,807 | |
| Series 2016-4 A5 (a)(d) | | 10/25/2046 | | | 3.50 | % | | | 171,620 | | | | 174,744 | |
| Series 2018-1 A5 (a)(d) | | 06/25/2048 | | | 3.50 | % | | | 345,747 | | | | 350,312 | |
| Series 2018-9 A5 (a)(d) | | 02/25/2049 | | | 4.00 | % | | | 576,255 | | | | 580,464 | |
| New Residential Mortgage Loan Trust | | | | | | | | | | | | | | |
| Series 2015-1A A3 (a)(d) | | 05/28/2052 | | | 3.75 | % | | | 737,533 | | | | 760,505 | |
| Series 2014-2A A3 (a)(d) | | 05/25/2054 | | | 3.75 | % | | | 119,925 | | | | 123,343 | |
| Series 2016-1A A1 (a)(d) | | 03/25/2056 | | | 3.75 | % | | | 271,932 | | | | 280,267 | |
| Series 2017-1A A1 (a)(d) | | 02/25/2057 | | | 4.00 | % | | | 507,368 | | | | 526,825 | |
| Series 2017-6A A1 (a)(d) | | 08/25/2057 | | | 4.00 | % | | | 228,688 | | | | 237,488 | |
| Series 2018-5 A1 (a)(d) | | 12/25/2057 | | | 4.75 | % | | | 1,106,182 | | | | 1,160,810 | |
Sequoia Mortgage Trust
| | | | | | | | | | | | | | |
| Series 2017-1 A (a)(d) | | 02/25/2047 | | | 3.50 | % | | | 606,294 | | | | 613,541 | |
| Series 2017-CH1 A11 (a)(d) | | 08/25/2047 | | | 3.50 | % | | | 288,609 | | | | 289,343 | |
| Series 2018-CH4 A10 (a)(d) | | 10/25/2048 | | | 4.50 | % | | | 196,892 | | | | 197,104 | |
| Series 2019-5 A4 (a)(d) | | 12/25/2049 | | | 3.50 | % | | | 498,126 | | | | 506,259 | |
| Shellpoint Co-Originator Trust, 2017-2 A4 (a)(d) | | 10/25/2047 | | | 3.50 | % | | | 441,342 | | | | 447,363 | |
| Spruce Hill Mortgage Loan Trust, 2019-SH1 A1 (a)(d) | | 04/29/2049 | | | 3.40 | % | | | 386,187 | | | | 388,290 | |
| UBS-Barclays Commercial Mortgage Trust, 2012-C4 A-5 | | 12/12/2045 | | | 2.85 | % | | | 870,000 | | | | 884,241 | |
Verus Securitization Trust
| | | | | | | | | | | | | | |
| Series 2018-2 A-1 (a)(d) | | 06/25/2058 | | | 3.68 | % | | | 337,281 | | | | 339,207 | |
| Series 2018-3 A-1 (a)(d) | | 10/25/2058 | | | 4.11 | % | | | 267,188 | | | | 269,870 | |
| VNDO Mortgage Trust | | | | | | | | | | | | | | |
| Series 2013-PENN A (a) | | 12/13/2029 | | | 3.81 | % | | | 605,000 | | | | 610,990 | |
| Series 2012-6AVE A (a) | | 11/15/2030 | | | 3.00 | % | | | 1,000,000 | | | | 1,017,758 | |
| WFRBS Commercial Mortgage Trust | | | | | | | | | | | | | | |
| Series 2011-C2 A4 (a)(d) | | 02/15/2044 | | | 4.87 | % | | | 1,149,056 | | | | 1,171,212 | |
| Series 2011-C3 A4 (a) | | 03/17/2044 | | | 4.38 | % | | | 1,285,000 | | | | 1,307,009 | |
| Series 2012-C10 A3 | | 12/15/2045 | | | 2.88 | % | | | 975,000 | | | | 991,317 | |
| Series 2013-C17 ABS | | 12/17/2046 | | | 3.56 | % | | | 237,962 | | | | 244,255 | |
| TOTAL MORTGAGE BACKED SECURITIES (Cost $36,683,568) | | | | | | | | | | | | | 36,946,071 | |
| | | | | | | | | | | | | | | |
| MUNICIPAL BONDS: 2.00% | | | | | | | | | | | | | | |
| City of New York NY | | 08/01/2025 | | | 2.28 | % | | | 1,660,000 | | | | 1,659,618 | |
| County of Forsyth, NC | | 04/01/2020 | | | 3.55 | % | | | 30,000 | | | | 30,134 | |
| Massachusetts Water Resources Authority | | 08/01/2025 | | | 2.08 | % | | | 1,840,000 | | | | 1,822,612 | |
| Miami Dade County Florida Aviation Refunding Taxable Series B | | 10/01/2023 | | | 2.37 | % | | | 650,000 | | | | 655,265 | |
The accompanying notes are an integral part of these consolidated financial statements.
| | |
| | |
LoCorr Long/Short Commodities Strategy Fund - Consolidated Schedule of Investments (continued) | 33 | |
| | |
| | | Maturity Date | | Coupon Rate | | Principal Amount | | | Value | |
| MUNICIPAL BONDS (continued) | | | | | | | | | | | | | | |
| Nebraska Public Power District | | 01/01/2024 | | | 2.22 | % | | $ | 675,000 | | | $ | 673,819 | |
| Water Works Board of the City of Birmingham | | 01/01/2024 | | | 2.20 | % | | | 270,000 | | | | 268,555 | |
| TOTAL MUNICIPAL BONDS (Cost $5,125,702) | | | | | | | | | | | | | 5,110,003 | |
| | | | | | | | | | | | | | | |
| U.S. GOVERNMENT AGENCY ISSUES: 9.76% | | | | | | | | | | | | | | |
| Federal Farm Credit Banks | | 11/15/2021 | | | 3.05 | % | | | 4,115,000 | | | | 4,223,165 | |
| Federal Farm Credit Banks | | 06/26/2023 | | | 1.77 | % | | | 2,450,000 | | | | 2,461,253 | |
| Federal Farm Credit Banks | | 07/17/2023 | | | 2.88 | % | | | 1,600,000 | | | | 1,668,020 | |
| Federal Home Loan Banks | | 07/07/2021 | | | 1.88 | % | | | 2,420,000 | | | | 2,430,388 | |
| Federal Home Loan Banks | | 06/10/2022 | | | 2.13 | % | | | 5,575,000 | | | | 5,639,218 | |
| Federal Home Loan Banks | | 06/10/2022 | | | 2.75 | % | | | 1,000,000 | | | | 1,027,444 | |
| Federal Home Loan Banks | | 06/09/2023 | | | 3.25 | % | | | 2,345,000 | | | | 2,470,776 | |
| Federal Home Loan Banks | | 09/08/2023 | | | 3.38 | % | | | 2,235,000 | | | | 2,371,131 | |
| Federal Home Loan Banks | | 12/08/2023 | | | 3.38 | % | | | 2,325,000 | | | | 2,469,791 | |
| Federal National Mortgage Association | | 01/19/2023 | | | 2.38 | % | | | 220,000 | | | | 224,968 | |
| Small Business Administration Participation Certificates | | 11/01/2032 | | | 2.09 | % | | | 10,636 | | | | 10,552 | |
| TOTAL U.S. GOVERNMENT AGENCY ISSUES (Cost $24,461,816) | | | | | | | | | | | | | 24,996,706 | |
| | | | | | | | | | | | | | | |
| U.S. GOVERNMENT NOTES: 19.96% | | | | | | | | | | | | | | |
| United States Treasury Floating Rate Note (3 Month US Treasury Money Market Yield + 0.300%) (c) | | 10/31/2021 | | | 1.83 | % | | | 2,350,000 | | | | 2,353,948 | |
| United States Treasury Note | | 05/15/2021 | | | 8.13 | % | | | 455,000 | | | | 495,204 | |
| United States Treasury Note | | 09/30/2021 | | | 1.13 | % | | | 1,215,000 | | | | 1,205,223 | |
| United States Treasury Note | | 05/15/2022 | | | 1.75 | % | | | 16,100,000 | | | | 16,159,117 | |
| United States Treasury Note | | 05/15/2023 | | | 1.75 | % | | | 1,700,000 | | | | 1,706,574 | |
| United States Treasury Note | | 12/31/2023 | | | 2.63 | % | | | 1,335,000 | | | | 1,384,802 | |
| United States Treasury Note | | 02/29/2024 | | | 2.38 | % | | | 2,025,000 | | | | 2,082,744 | |
| United States Treasury Note | | 03/31/2024 | | | 2.13 | % | | | 3,500,000 | | | | 3,565,078 | |
| United States Treasury Note | | 04/30/2024 | | | 2.00 | % | | | 4,195,000 | | | | 4,252,517 | |
| United States Treasury Note | | 04/30/2024 | | | 2.25 | % | | | 1,585,000 | | | | 1,623,139 | |
| United States Treasury Note | | 05/15/2024 | | | 2.50 | % | | | 12,295,000 | | | | 12,721,963 | |
| United States Treasury Note | | 09/30/2024 | | | 1.50 | % | | | 500,000 | | | | 495,840 | |
| United States Treasury Note | | 12/31/2024 | | | 2.25 | % | | | 2,990,000 | | | | 3,069,656 | |
| TOTAL U.S. GOVERNMENT NOTES (Cost $50,411,484) | | | | | | | | | | | | | 51,115,805 | |
| | | | | | | | | | | | | | | |
| SHORT TERM INVESTMENTS: 3.37% | | | | | | | | | | | | | | |
| U.S. GOVERNMENT NOTE: 0.63% | | | | | | | | | | | | | | |
| United States Treasury Note | | 03/31/2020 | | | 1.13 | % | | | 1,605,000 | | | | 1,602,868 | |
| TOTAL U.S. GOVERNMENT NOTE (Cost $1,602,181) | | | | | | | | | | | | | 1,602,868 | |
| | | | | | | | | | | | | | | |
| MONEY MARKET FUND: 2.74% | | | | | | | | | Shares | | | | | |
| STIT-Government & Agency Portfolio, Institutional Class, 1.50% (e)(f) | | | | | | | | | 7,017,627 | | | | 7,017,627 | |
| TOTAL MONEY MARKET FUND (Cost $7,017,627) | | | | | | | | | | | | | 7,017,627 | |
| TOTAL SHORT TERM INVESTMENTS (Cost $8,619,808) | | | | | | | | | | | | | 8,620,495 | |
| | | | | | | | | | | | | | | |
| TOTAL INVESTMENTS (Cost $208,248,900): 82.61% | | | | | | | | | | | | | 211,524,859 | |
| Other Assets in Excess of Liabilities: 17.39% (g) | | | | | | | | | | | | | 44,519,820 | |
| TOTAL NET ASSETS: 100.00% | | | | | | | | | | | | $ | 256,044,679 | |
| (a) | Security as defined in Rule 144A under the Securities Act of 1933 and determined to be liquid. Purchased in a private placement transaction; resale to the public may require registration or may extend only to qualified institutional buyers. At December 31, 2019, the value of these securities total $37,415,695 which represents 14.61% of total net assets. |
| (b) | Foreign issued security. |
| (c) | Variable rate security based on a reference index and spread. The rate reported is the rate in effect as of December 31, 2019. |
| (d) | Variable rate security. The coupon is based on an underlying pool of loans. The rate reported is the rate in effect as of December 31, 2019. |
| (e) | The rate quoted is the annualized seven-day effective yield as of December 31, 2019. |
| (f) | A portion of this security is held by LCLSCS Fund Limited and pledged as collateral for swap contracts. |
| (g) | Includes assets pledged as collateral for swap contracts. |
| * | Amount rounds to less than 0.005% of net assets. |
| LIBOR | London Interbank Offered Rate |
| PLC | Public Limited Company |
The accompanying notes are an integral part of these consolidated financial statements.
| | |
| | |
| | 34 | LoCorr Long/Short Commodities Strategy Fund - Consolidated Schedule of Swap Contracts |
| | |
LoCorr Long/Short Commodities Strategy Fund
Consolidated Schedule of Swap Contracts
December 31, 2019
LONG TOTAL RETURN SWAP CONTRACTS
This investment is a holding of LCLSCS Fund Limited. See Note 1.
Termination Date | Reference Index | Financing Rate | Payment
Frequency | Notional Amount | Unrealized
(Depreciation)* | Counterparty |
12/16/2022 | LoCorr Commodities Index^ | 0.50% | Quarterly | $255,945,098 | $(26,162,161) | Deutsche Bank AG |
| ^ | Comprised of a proprietary basket of Commodity Trading Advisor’s (“CTA’’) Programs investing in various futures contracts, forward currency contracts, foreign currency. See Notes 2 & 3. |
| * | Unrealized depreciation is a liability on the Fund’s consolidated statement of assets and liabilities |
The underlying components of the basket as of December 31, 2019 are shown below: ^
| Description | | Expiration Date | | Number of Contracts
Purchased (Sold) | | | Value | | | Concentration %
of Exposure | |
Futures Contracts: Purchase Contracts: (1) | | | | | | | | | | | | | | |
| WTI Crude | | Mar-20 | | | 1,964 | | | $ | 120,107,427 | | | | 9.06 | % |
| WTI Crude | | Jun-20 | | | 939 | | | | 56,210,254 | | | | 4.24 | % |
| Brent Crude | | Mar-20 | | | 598 | | | | 39,670,085 | | | | 2.99 | % |
| Gasoline RBOB | | Mar-20 | | | 434 | | | | 31,346,647 | | | | 2.36 | % |
| Live Cattle | | Apr-20 | | | 514 | | | | 26,115,057 | | | | 1.97 | % |
| Gold | | Feb-20 | | | 157 | | | | 23,854,458 | | | | 1.80 | % |
| Coffee | | May-20 | | | 431 | | | | 21,255,439 | | | | 1.60 | % |
| Copper | | May-20 | | | 286 | | | | 20,154,888 | | | | 1.52 | % |
| Copper | | Jul-20 | | | 280 | | | | 19,764,285 | | | | 1.49 | % |
| Live Cattle | | Jun-20 | | | 379 | | | | 17,999,304 | | | | 1.36 | % |
| Heating Oil | | Mar-20 | | | 197 | | | | 16,840,268 | | | | 1.27 | % |
| Soybean Oil | | Jul-20 | | | 790 | | | | 16,685,311 | | | | 1.26 | % |
| WTI Crude (NYMEX) | | Apr-20 | | | 257 | | | | 15,609,189 | | | | 1.18 | % |
| Cotton No.2 | | May-20 | | | 432 | | | | 15,143,625 | | | | 1.14 | % |
| Natural Gas | | Aug-20 | | | 619 | | | | 14,320,565 | | | | 1.08 | % |
| Feeder Cattle | | Jan-20 | | | 196 | | | | 14,194,525 | | | | 1.07 | % |
| Soybean | | May-20 | | | 275 | | | | 13,255,605 | | | | 1.00 | % |
| Copper | | May-20 | | | 510 | | | | 12,955,279 | | | | 0.98 | % |
| Hard Red Wheat | | Jul-20 | | | 512 | | | | 12,716,474 | | | | 0.96 | % |
| Wheat | | May-20 | | | 443 | | | | 12,385,904 | | | | 0.93 | % |
| Lean Hogs | | Feb-20 | | | 433 | | | | 12,348,428 | | | | 0.93 | % |
| Silver | | Mar-20 | | | 136 | | | | 12,181,894 | | | | 0.92 | % |
| WTI Crude (NYMEX) | | May-20 | | | 198 | | | | 11,967,262 | | | | 0.90 | % |
| Corn | | Dec-20 | | | 549 | | | | 11,038,331 | | | | 0.83 | % |
| Palladium | | Mar-20 | | | 56 | | | | 10,713,298 | | | | 0.81 | % |
| Sugar No.11 | | May-20 | | | 683 | | | | 10,390,541 | | | | 0.78 | % |
| Brent Crude | | Dec-20 | | | 129 | | | | 7,958,010 | | | | 0.60 | % |
| Total Purchase Contracts | | | | | | | | | 597,182,353 | | | | 45.03 | % |
| | | | | | | | | | | | | | | |
Sale Contracts: (1) | | | | | | | | | | | | | | |
| WTI Crude (NYMEX) | | Feb-20 | | | (3,202 | ) | | $ | 196,697,589 | | | | 14.84 | % |
| Live Cattle | | Feb-20 | | | (904 | ) | | | 45,484,578 | | | | 3.43 | % |
| Copper | | Mar-20 | | | (588 | ) | | | 41,251,891 | | | | 3.11 | % |
| Gasoline RBOB | | Feb-20 | | | (388 | ) | | | 27,794,969 | | | | 2.10 | % |
| Wheat | | Mar-20 | | | (747 | ) | | | 20,780,455 | | | | 1.57 | % |
The accompanying notes are an integral part of these consolidated financial statements.
| | |
| | |
LoCorr Long/Short Commodities Strategy Fund - Consolidated Schedule of Swap Contracts (continued) | 35 | |
| | |
| Description | | Expiration Date | | Number of Contracts
Purchased (Sold) | | | Value | | | Concentration %
of Exposure | |
Sale Contracts: (1) (continued) | | | | | | | | | | | | | | |
| Cotton No.2 | | Mar-20 | | | (578 | ) | | $ | 19,951,507 | | | | 1.51 | % |
| Feeder Cattle | | Mar-20 | | | (253 | ) | | | 18,177,325 | | | | 1.37 | % |
| Lean Hogs | | Apr-20 | | | (560 | ) | | | 17,533,960 | | | | 1.32 | % |
| Coffee | | Mar-20 | | | (359 | ) | | | 17,363,415 | | | | 1.31 | % |
| Hard Red Wheat | | Mar-20 | | | (696 | ) | | | 16,736,897 | | | | 1.26 | % |
| Soybean Oil | | Mar-20 | | | (782 | ) | | | 16,226,906 | | | | 1.22 | % |
| Soybean | | Mar-20 | | | (315 | ) | | | 15,004,875 | | | | 1.13 | % |
| WTI Crude (ICE) | | Mar-20 | | | (213 | ) | | | 14,002,989 | | | | 1.06 | % |
| Brent Crude | | Apr-20 | | | (229 | ) | | | 13,995,223 | | | | 1.06 | % |
| Corn | | Mar-20 | | | (721 | ) | | | 13,965,532 | | | | 1.05 | % |
| Sugar No.11 | | Mar-20 | | | (822 | ) | | | 12,400,598 | | | | 0.94 | % |
| Heating Oil | | Feb-20 | | | (133 | ) | | | 11,373,984 | | | | 0.86 | % |
| Natural Gas | | May-20 | | | (502 | ) | | | 10,955,764 | | | | 0.83 | % |
| Natural Gas | | Oct-20 | | | (377 | ) | | | 8,827,455 | | | | 0.67 | % |
| Natural Gas | | Jul-20 | | | (369 | ) | | | 8,481,465 | | | | 0.64 | % |
| Natural Gas | | Apr-20 | | | (336 | ) | | | 7,187,133 | | | | 0.54 | % |
| Total Sale Contracts | | | | | | | | | 554,194,510 | | | | 41.82 | % |
| Other Futures Contracts | | | | | | | | | 85,049,563 | | | | 6.42 | % |
| Total Futures Contracts | | | | | | | | | 1,236,426,426 | | | | 93.27 | % |
| Cash and Foreign Currency: | | Quantity | | | | | | | |
| Cash and Foreign Currency Purchased:(1) | | | | | | | | | | | | |
| Euro | | | 53,933,216 | | | $ | 53,933,216 | | | | 4.07 | % |
| U.S. Dollar | | | 30,634,271 | | | | 30,634,271 | | | | 2.31 | % |
| Total Cash and Foreign Currency Purchased | | | | | | | 84,567,487 | | | | 6.38 | % |
| | | | | | | | | | | | | |
| Other Cash and Foreign Currency | | | | | | | 2,266,838 | | | | 0.17 | % |
| Total Cash and Foreign Currency | | | | | | | 86,834,325 | | | | 6.55 | % |
| Forward Currency Contracts | | | | | | | 2,353,371 | | | | 0.18 | % |
| Total Underlying Positions | | | | | | $ | 1,325,614,122 | | | | 100.00 | % |
| ^ | The investments are not direct holdings of LoCorr Long/Short Commodities Strategy Fund. The top 50 holdings and other futures contracts, other forward currency contracts, and other cash and foreign currency were determined based on the absolute notional values of the positions within the underlying swap basket. |
| (1) | Represents the 50 largest components of the basket. |
| ICE | Intercontinental Exchange |
| NYMEX | New York Mercantile Exchange |
The accompanying notes are an integral part of these consolidated financial statements.
| | |
| | |
36 | | LoCorr Market Trend Fund - Consolidated Schedule of Investments |
| | |
LoCorr Market Trend Fund
Composition of Consolidated Investment Portfolio1
December 31, 2019 (Unaudited)

1 As a percentage of total investments.
Consolidated Schedule of Investments
December 31, 2019
| | Maturity Date | | | Coupon Rate | | | Principal Amount | | | | Value | |
| ASSET BACKED SECURITIES: 16.07% | | | | | | | | | | | | |
| Ally Auto Receivables Trust, 2018-3 A3 | 01/17/2023 | | | 3.00 | % | | $ | 1,500,000 | | | $ | 1,511,638 | |
| Barclays Dryrock Issuance Trust, 2017-2 A (1 Month LIBOR USD + 0.300%) (c) | 05/15/2023 | | | 2.04 | % | | | 3,000,000 | | | | 3,002,446 | |
| BMW Vehicle Lease Trust, 2018-1 A3 | 07/20/2021 | | | 3.26 | % | | | 2,450,000 | | | | 2,472,276 | |
| Cabela’s Credit Card Master Trust, 2015-2 A1 | 07/17/2023 | | | 2.25 | % | | | 2,500,000 | | | | 2,502,682 | |
| California Republic Auto Receivables Trust, 2018-1 A3 | 08/15/2022 | | | 3.14 | % | | | 2,221,779 | | | | 2,232,096 | |
| CarMax Auto Owner Trust, 2018-4 A3 | 09/15/2023 | | | 3.36 | % | | | 2,750,000 | | | | 2,805,293 | |
| CenterPoint Energy Residential Bond, 2009-1 A-3 | 08/15/2023 | | | 4.24 | % | | | 1,574,466 | | | | 1,622,022 | |
| Chase Issuance Trust, 2018-A1 A1 (1 Month LIBOR USD + 0.200%) (c) | 04/17/2023 | | | 1.94 | % | | | 3,050,000 | | | | 3,053,043 | |
| Citibank Credit Card Issuance Trust | | | | | | | | | | | | | |
| Series 2017-A4 A4 (1 Month LIBOR USD + 0.220%) (c) | 04/07/2022 | | | 1.93 | % | | | 1,150,000 | | | | 1,150,404 | |
| Series 2018-A1 A1 | 01/20/2023 | | | 2.49 | % | | | 1,935,000 | | | | 1,948,325 | |
| Connecticut Avenue Securities Trust, 2019 R06 2M1 (1 Month LIBOR USD + 0.750%) (a)(c) | 09/25/2039 | | | 2.54 | % | | | 492,316 | | | | 492,418 | |
| Discover Card Execution Note Trust, 2016-A3 A3 | 10/16/2023 | | | 1.85 | % | | | 2,032,000 | | | | 2,032,621 | |
| Entergy Arkansas Restoration Funding LLC, 2010-A A1 | 08/01/2021 | | | 2.30 | % | | | 808,637 | | | | 806,794 | |
| Evergreen Credit Card Trust, 2018-2 A (1 Month LIBOR USD + 0.350%) (a)(b)(c) | 07/15/2022 | | | 2.09 | % | | | 1,650,000 | | | | 1,651,211 | |
| Ford Credit Auto Lease Trust, 2019-B A3 | 10/15/2022 | | | 2.22 | % | | | 880,000 | | | | 883,264 | |
| Ford Credit Auto Owner Trust, 2018-B A-3 | 04/15/2023 | | | 3.24 | % | | | 2,000,000 | | | | 2,035,818 | |
| GM Financial Consumer Automobile Receivables Trust, 2018-4 A3 | 10/16/2023 | | | 3.21 | % | | | 2,520,000 | | | | 2,562,965 | |
| Invitation Homes Trust | | | | | | | | | | | | | |
| Series 2017-SFR2 A (1 Month LIBOR USD + 0.850%) (a)(c) | 12/19/2036 | | | 2.59 | % | | | 466,409 | | | | 464,636 | |
| Series 2018-SFR1 A (1 Month LIBOR USD + 0.700%) (a)(c) | 03/19/2037 | | | 2.44 | % | | | 463,621 | | | | 459,718 | |
| Series 2018-SFR4 A (1 Month LIBOR USD + 1.100%) (a)(c) | 01/19/2038 | | | 2.84 | % | | | 478,303 | | | | 481,003 | |
| Mercedes-Benz Auto Receivables Trust, 2018-1 A3 | 01/17/2023 | | | 3.03 | % | | | 2,625,000 | | | | 2,650,838 | |
| TCF Auto Receivables Owner Trust, 2016-PT1 A (a) | 06/15/2022 | | | 1.93 | % | | | 643,742 | | | | 642,990 | |
| Toyota Auto Receivables Owner Trust, 2018-D A-3 | 03/15/2023 | | | 3.18 | % | | | 2,010,000 | | | | 2,044,539 | |
The accompanying notes are an integral part of these consolidated financial statements.
| | |
| | |
LoCorr Market Trend Fund - Consolidated Schedule of Investments (continued)
| | 37 |
| | |
| | Maturity Date | | Coupon Rate | | Principal Amount | | | Value | |
ASSET BACKED SECURITIES (continued) Verizon Owner Trust Series 2018-1A A1B (1 Month LIBOR USD + 0.260%) (a)(c) | 09/20/2022 | | | 2.02 | % | | $ | 1,250,000 | | | $ | 1,250,722 | |
| Series 2019-B A1A | 12/20/2023 | | | 2.33 | % | | | 1,080,000 | | | | 1,087,750 | |
| World Omni Auto Trust, 2018-B A3 | 07/17/2023 | | | 2.87 | % | | | 2,025,000 | | | | 2,043,440 | |
| TOTAL ASSET BACKED SECURITIES (Cost $43,533,306) | | | | | | | | | | | | 43,890,952 | |
| | | | | | | | | | | | | | |
CORPORATE BONDS: 11.53% Aerospace and Defense: 0.32% United Technologies Corp. | 06/01/2022 | | | 3.10 | % | | | 860,000 | | | | 882,394 | |
| | | | | | | | | | | | | | |
Auto Manufacturers: 0.28% General Motors Financial Co., Inc. | 05/09/2023 | | | 3.70 | % | | | 750,000 | | | | 773,243 | |
| | | | | | | | | | | | | | |
Banks: 6.13% Banco Santander SA (b) | 02/23/2023 | | | 3.13 | % | | | 540,000 | | | | 551,209 | |
| Bank of America Corp. | 01/11/2023 | | | 3.30 | % | | | 3,205,000 | | | | 3,313,592 | |
| BB&T Corp. | 12/06/2023 | | | 3.75 | % | | | 1,040,000 | | | | 1,103,262 | |
| Citigroup, Inc. (SOFR + 0.867%) (d) | 11/04/2022 | | | 2.31 | % | | | 1,650,000 | | | | 1,655,137 | |
| Citigroup, Inc. (3 Month LIBOR USD + 1.023%) (c) | 06/01/2024 | | | 4.04 | % | | | 1,570,000 | | | | 1,660,943 | |
| Cooperatieve Rabobank UA (b) | 11/09/2022 | | | 3.95 | % | | | 635,000 | | | | 663,960 | |
| Danske Bank (a)(b) | 01/12/2022 | | | 5.00 | % | | | 630,000 | | | | 661,747 | |
| Federation des Caisses Desjardins du Quebec (a)(b) | 09/26/2022 | | | 1.95 | % | | | 700,000 | | | | 701,053 | |
| Goldman Sachs Group, Inc. | 02/23/2023 | | | 3.20 | % | | | 2,690,000 | | | | 2,765,631 | |
| HSBC Bank Canada (a)(b) | 09/10/2022 | | | 1.65 | % | | | 1,130,000 | | | | 1,122,276 | |
| JP Morgan Chase & Co. | 09/23/2022 | | | 3.25 | % | | | 745,000 | | | | 770,811 | |
| Wells Fargo & Co. | 02/13/2023 | | | 3.45 | % | | | 1,065,000 | | | | 1,102,954 | |
| Zions Bancorp NA | 03/04/2022 | | | 3.35 | % | | | 645,000 | | | | 661,837 | |
| | | | | | | | | | | | | 16,734,412 | |
Diversified Financial Services: 1.16% | | | | | | | | | | | |
| |
| AerCap Ireland Capital DAC/AerCap Global Aviation Trust (b) | 02/01/2022 | | | 3.95 | % | | | 640,000 | | | | 661,276 | |
| American Express Co. | 05/20/2022 | | | 2.75 | % | | | 865,000 | | | | 880,855 | |
| Capital One Bank | 02/15/2023 | | | 3.38 | % | | | 640,000 | | | | 661,247 | |
| Private Export Funding Corp. | 11/15/2024 | | | 1.75 | % | | | 970,000 | | | | 963,213 | |
| | | | | | | | | | | | 3,166,591 | |
| Environmental Control: 0.24% | | | | | | | | | | | | | |
| Waste Management, Inc. | 06/15/2024 | | | 2.95 | % | | | 640,000 | | | | 660,735 | |
| | | | | | | | | | | | | | |
Media: 0.57% Comcast Corp. | 04/15/2024 | | | 3.70 | % | | | 1,450,000 | | | | 1,546,561 | |
| | | | | | | | | | | | | | |
Miscellaneous Manufacturing: 0.20% General Electric Co. | 01/07/2021 | | | 4.63 | % | | | 535,000 | | | | 547,159 | |
| | | | | | | | | | | | | | |
Oil & Gas: 0.44% BP Capital Markets PLC (b) | 03/11/2021 | | | 4.74 | % | | | 530,000 | | | | 547,275 | |
| Diamondback Energy, Inc. | 12/01/2024 | | | 2.88 | % | | | 655,000 | | | | 662,649 | |
| | | | | | | | | | | | 1,209,924 | |
| Pharmaceuticals: 0.57% | | | | | | | | | | | | | |
| Bristol-Myers Squibb Co. (a) | 02/20/2023 | | | 3.25 | % | | | 745,000 | | | | 771,611 | |
| CVS HEALTH Corp. | 08/12/2024 | | | 3.38 | % | | | 740,000 | | | | 770,308 | |
| | | | | | | | | | | | | 1,541,919 | |
Pipelines: 0.44% | | | | | | | | | | | |
| |
| Enterprise Products Operating LLC | 02/15/2021 | | | 2.80 | % | | | 655,000 | | | | 661,251 | |
| TransCanada PipeLines Ltd. (b) | 08/01/2022 | | | 2.50 | % | | | 545,000 | | | | 550,830 | |
| | | | | | | | | | | | 1,212,081 | |
The accompanying notes are an integral part of these consolidated financial statements.
| | |
| | |
38 | | LoCorr Market Trend Fund - Consolidated Schedule of Investments (continued) |
| | |
| | Maturity Date | | Coupon Rate | | Principal Amount | | | Value | |
CORPORATE BONDS (continued) Real Estate Investment Trusts: 0.13% Kilroy Realty LP | 01/15/2023 | | | 3.80 | % | | $ | 335,000 | | | $ | 347,206 | |
| | | | | | | | | | | | | | |
Software: 0.40% Fiserv, Inc. | 07/01/2024 | | | 2.75 | % | | | 1,085,000 | | | | 1,104,166 | |
| | | | | | | | | | | | | | |
Telecommunications: 0.65% Verizon Communications, Inc. | 03/15/2021 | | | 3.45 | % | | | 650,000 | | | | 662,672 | |
| Verizon Communications, Inc. | 09/15/2023 | | | 5.15 | % | | | 995,000 | | | | 1,106,351 | |
| | | | | | | | | | | | | 1,769,023 | |
| TOTAL CORPORATE BONDS (Cost $31,487,358) | | | | | | | | | | | | 31,495,414 | |
| | | | | | | | | | | | | | |
MORTGAGE BACKED SECURITIES: 8.10% Comm Mortgage Trust |
| | |
|
| | |
| | | |
| |
Series 2013-GAM A1 (a)
| 02/11/2028
| | | 1.71
| % | | | 412,858
| | | | 410,941
| |
| Series 2016-GCT B (a) | 08/10/2029 | | | 3.09 | % | | | 600,000 | | | | 603,005 | |
| Fannie Mae Aces | | | | | | | | | | | | | |
| Series 2010-M3 A3 (d) | 03/25/2020 | | | 4.33 | % | | | 471,411 | | | | 471,952 | |
| Series 2010-M7 A2 | 11/25/2020 | | | 3.66 | % | | | 200,269 | | | | 201,492 | |
| Series 2015-M17 FA (1 Month LIBOR USD + 0.930%) (c) | 11/25/2022 | | | 2.78 | % | | | 956,523 | | | | 958,235 | |
| Series 2014-M11 1A (d) | 08/25/2024 | | | 3.11 | % | | | 712,305 | | | | 742,029 | |
FHLMC Multifamily Structured Pass Through Certificates
Series K-F08 A (1 Month LIBOR USD + 0.300%) (c) | 01/25/2022 | | | 2.00 | % | | | 901,867 | | | | 899,552 | |
| Series K-J22 A-1 | 03/25/2022 | | | 3.17 | % | | | 727,404 | | | | 736,122 | |
| Series K-S05 A (1 Month LIBOR USD + 0.500%) (c) | 01/25/2023 | | | 2.20 | % | | | 2,886,646 | | | | 2,883,304 | |
| Series K-J06 A | 01/25/2023 | | | 2.27 | % | | | 2,110,000 | | | | 2,120,963 | |
| Series K-102 A (1 Month LIBOR USD + 0.200%) (c) | 02/25/2023 | | | 1.90 | % | | | 957,439 | | | | 957,248 | |
| Series K-I03 A (1 Month LIBOR USD + 0.250%) (c) | 02/25/2023 | | | 1.95 | % | | | 299,705 | | | | 299,518 | |
Freddie Mac Structured Agency Credit Risk Debt Notes
Series 2019-HRP1 M2 (1 Month LIBOR USD + 1.400%) (a)(c) | 02/25/2049 | | | 3.19 | % | | | 660,000 | | | | 660,178 | |
| Series 2019-HQA3 M1 (1 Month LIBOR USD + 0.750%) (a)(c) | 09/27/2049 | | | 2.54 | % | | | 316,447 | | | | 316,489 | |
| FRESB Multifamily Mortgage Pass Through Certificates | | | | | | | | | | | | | |
| Series 2016-SB17 A7F (d) | 05/25/2023 | | | 2.15 | % | | | 1,023,813 | | | | 1,022,778 | |
| Series 2017-SB31 A7F (d) | 01/25/2024 | | | 2.46 | % | | | 1,424,110 | | | | 1,429,800 | |
| Series 2017-SB32 A7F (d) | 04/25/2024 | | | 2.44 | % | | | 1,115,625 | | | | 1,119,500 | |
| Series 2019-SB67 A5F (d) | 07/25/2024 | | | 2.09 | % | | | 1,289,829 | | | | 1,284,188 | |
| Series 2019-SB69 A5F (d) | 10/25/2024 | | | 2.25 | % | | | 1,895,000 | | | | 1,898,244 | |
| JP Morgan Mortgage Trust, 2017-3 1A5 (a)(d) | 08/25/2047 | | | 3.50 | % | | | 285,094 | | | | 288,146 | |
| NCUA Guaranteed Notes Trust, 2010-R1 1A (1 Month LIBOR USD + 0.450%) (c) | 10/07/2020 | | | 2.16 | % | | | 2,721,465 | | | | 2,726,492 | |
| Sequoia Mortgage Trust, 2017-5 A4 (a) | 08/25/2047 | | | 3.50 | % | | | 101,752 | | | | 103,859 | |
| TOTAL MORTGAGE BACKED SECURITIES (Cost $22,156,732) | | | | | | | | | | | | 22,134,035 | |
| | | | | | | | | | | | | | |
MUNICIPAL BOND: 0.41% Tennessee Valley Authority | 03/15/2020 | | | 2.25 | % | | | 1,110,000 | | | | 1,111,444 | |
| TOTAL MUNICIPAL BOND (Cost $1,107,602) | | | | | | | | | | | | 1,111,444 | |
| | | | | | | | | | | | | | |
U.S. GOVERNMENT AGENCY ISSUES: 8.40% Federal Farm Credit Banks | 11/15/2021 | | | 3.05 | % | | | 2,500,000 | | | | 2,565,713 | |
| Federal Farm Credit Banks | 08/14/2023 | | | 1.60 | % | | | 2,270,000 | | | | 2,267,165 | |
| Federal Home Loan Banks | 11/19/2021 | | | 1.63 | % | | | 1,335,000 | | | | 1,336,609 | |
| Federal Home Loan Banks | 06/10/2022 | | | 2.13 | % | | | 4,620,000 | | | | 4,673,218 | |
| Federal Home Loan Banks | 06/10/2022 | | | 2.75 | % | | | 5,000,000 | | | | 5,137,219 | |
| Federal Home Loan Banks | 12/09/2022 | | | 3.00 | % | | | 4,500,000 | | | | 4,678,455 | |
| Federal National Mortgage Association | 09/06/2022 | | | 1.38 | % | | | 2,310,000 | | | | 2,294,803 | |
| TOTAL U.S. GOVERNMENT AGENCY ISSUES (Cost $22,604,039) | | | | | | | | | | | | 22,953,182 | |
The accompanying notes are an integral part of these consolidated financial statements.
| | |
| | |
LoCorr Market Trend Fund - Consolidated Schedule of Investments (continued)
| | 39 |
| | |
| | Maturity Date | | Coupon Rate | | | Principal Amount | | | Value | |
| U.S. GOVERNMENT NOTES: 36.33% | | | | | | | | | | | | | |
| United States Treasury Floating Rate Note (3 Month US Treasury Money Market Yield + 0.300%) (c) | 10/31/2021 | | | 1.83 | % | | $ | 4,170,000 | | | $ | 4,177,006 | |
| United States Treasury Note (3 Month US Treasury Money Market Yield + 0.220%) (c) | 07/31/2021 | | | 1.75 | % | | | 3,260,000 | | | | 3,261,395 | |
| United States Treasury Note | 10/31/2021 | | | 1.50 | % | | | 2,215,000 | | | | 2,211,972 | |
| United States Treasury Note | 01/15/2022 | | | 2.50 | % | | | 15,355,000 | | | | 15,632,710 | |
| United States Treasury Note | 03/31/2022 | | | 1.88 | % | | | 1,500,000 | | | | 1,509,551 | |
| United States Treasury Note | 04/30/2022 | | | 1.88 | % | | | 1,730,000 | | | | 1,741,218 | |
| United States Treasury Note | 08/15/2022 | | | 1.50 | % | | | 4,420,000 | | | | 4,410,331 | |
| United States Treasury Note | 10/31/2022 | | | 2.00 | % | | | 4,950,000 | | | | 5,004,334 | |
| United States Treasury Note | 11/30/2022 | | | 2.00 | % | | | 10,085,000 | | | | 10,198,850 | |
| United States Treasury Note | 01/31/2023 | | | 2.38 | % | | | 6,235,000 | | | | 6,376,505 | |
| United States Treasury Note | 05/15/2023 | | | 1.75 | % | | | 2,480,000 | | | | 2,489,591 | |
| United States Treasury Note | 09/30/2023 | | | 2.88 | % | | | 4,600,000 | | | | 4,804,305 | |
| United States Treasury Note | 11/30/2023 | | | 2.88 | % | | | 560,000 | | | | 585,747 | |
| United States Treasury Note | 02/15/2024 | | | 2.75 | % | | | 2,600,000 | | | | 2,712,023 | |
| United States Treasury Note | 06/30/2024 | | | 2.00 | % | | | 8,200,000 | | | | 8,313,711 | |
| United States Treasury Note | 09/30/2024 | | | 1.50 | % | | | 10,065,000 | | | | 9,981,256 | |
| United States Treasury Note | 02/15/2025 | | | 7.63 | % | | | 1,715,000 | | | | 2,211,010 | |
| United States Treasury Note | 03/31/2025 | | | 2.63 | % | | | 3,500,000 | | | | 3,660,645 | |
| United States Treasury Note | 05/15/2025 | | | 2.13 | % | | | 9,780,000 | | | | 9,981,712 | |
| TOTAL U.S. GOVERNMENT NOTES (Cost $98,749,678) | | | | | | | | | | | | 99,263,872 | |
| | | | | | | | | | | | | | |
| SHORT TERM INVESTMENT: 4.28% | | | | | | | | | | | | | |
| MONEY MARKET FUND: 4.28% | | | | | | | | Shares | | | | | |
| STIT-Government & Agency Portfolio, Institutional Class, 1.50% (e)(f) | | | | | | | | 11,696,488 | | | | 11,696,488 | |
| TOTAL MONEY MARKET FUND (Cost $11,696,488) | | | | | | | | | | | | 11,696,488 | |
| TOTAL SHORT TERM INVESTMENT (Cost $11,696,488) | | | | | | | | | | | | 11,696,488 | |
| | | | | | | | | | | | | | |
| TOTAL INVESTMENTS (Cost $231,335,203): 85.12% | | | | | | | | | | | | 232,545,387 | |
| Other Assets in Excess of Liabilities: 14.88% (g) | | | | | | | | | | | | 40,660,108 | |
| TOTAL NET ASSETS: 100.00% | | | | | | | | | | | $ | 273,205,495 | |
| (a) | Security as defined in Rule 144A under the Securities Act of 1933 and determined to be liquid. Purchased in a private placement transaction; resale to the public may require registration or may extend only to qualified institutional buyers. At December 31, 2019, the value of these securities total $11,082,003 which represents 4.06% of total net assets. |
| (b) | Foreign issued security. |
| (c) | Variable rate security based on a reference index and spread. The rate reported is the rate in effect as of December 31,2019. |
| (d) | Variable rate security. The coupon is based on an underlying pool of loans. The rate reported is the rate in effect as of December 31, 2019. |
| (e) | The rate quoted is the annualized seven-day effective yield as of December 31, 2019. |
| (f) | A portion of this security is held by LCMT Fund Limited and pledged as collateral for derivative contracts. |
| (g) | Includes assets pledged as collateral for derivative contracts. |
| LIBOR | London Interbank Offered Rate |
The accompanying notes are an integral part of these consolidated financial statements.
| | |
| | |
40 | | LoCorr Market Trend Fund - Consolidated Schedule of Open Forward Currency Contracts |
| | |
LoCorr Market Trend Fund
Consolidated Schedule of Open Forward Currency Contracts(a)
December 31, 2019
| | | | | | | Currency to be Received | | Currency to be Delivered | | | | | | | | | | |
| | | | Notional
Amount | | Forward
Settlement Date | Curr
Abbr. | | | U.S. $ Value at December 31, 2019 | | Curr Abbr. | | | U.S. $ Value on Origination Date | | | | Unrealized Appreciation | | | | Unrealized
(Depreciation) | |
| Purchase Contracts: | | | | | | | | | | | | | | | | | | | | | | | |
| | | | | | | | | | | | | | | | | | | | | | | | |
| | | $ | 32,027,174 | | 03/20/2020 | AUD | | $ | 32,382,053 | | USD | | $ | 32,027,174 | | | $ | 354,879 | | | $ | – | |
| | | | 22,366,356 | | 03/20/2020 | CHF | | | 22,523,214 | | USD | | | 22,366,356 | | | | 156,858 | | | | – | |
| | | | 49,158,779 | | 03/20/2020 | GBP | | | 49,567,336 | | USD | | | 49,158,779 | | | | 408,557 | | | | – | |
| | | | 4,442,470 | | 03/19/2020 | JPY | | | 4,442,594 | | USD | | | 4,442,470 | | | | 124 | | | | – | |
| | | | 17,693,300 | | 03/20/2020 | MXN | | | 17,858,937 | | USD | | | 17,693,300 | | | | 165,637 | | | | – | |
| | | | 30,253,388 | | 03/20/2020 | NZD | | | 30,724,091 | | USD | | | 30,253,388 | | | | 470,703 | | | | – | |
| Total Purchase Contracts | | | | | | 157,498,225 | | | | | 155,941,467 | | | | 1,556,758 | | | | – | |
| | | | | | | | | | | | | | | | | | | | | |
| Sale Contracts: | | | | | | | | | | | | | | | | | | | | |
| | $ | 54,421,466 | | 03/20/2020 | USD | | $ | 55,343,335 | | AUD | | $ | 54,421,466 | | | $ | – | | | $ | (921,869 | ) |
| | | | 11,164,845 | | 03/20/2020 | USD | | | 11,336,581 | | CAD | | | 11,164,845 | | | | – | | | | (171,736 | ) |
| | | | 43,094,814 | | 03/20/2020 | USD | | | 43,835,726 | | CHF | | | 43,094,814 | | | | – | | | | (740,912 | ) |
| | | | 124,194,199 | | 03/20/2020 | USD | | | 125,150,034 | | EUR | | | 124,194,199 | | | | – | | | | (955,835 | ) |
| | | | 31,075,204 | | 03/19/2020 | USD | | | 31,204,164 | | JPY | | | 31,075,204 | | | | – | | | | (128,960 | ) |
| | | | 21,579,484 | | 03/20/2020 | USD | | | 22,051,306 | | NZD | | | 21,579,484 | | | | – | | | | (471,822 | ) |
| Total Sale Contracts | | | | 288,921,146 | | | | | 285,530,012 | | | | – | | | | (3,391,134 | ) |
| Net Forward Currency Contracts | | | $ | (131,422,921 | ) | | | $ | (129,588,545 | ) | | $ | 1,556,758 | | | $ | (3,391,134 | ) |
| Net Unrealized Depreciation | | | | | | | | | | | | | | | | $ | (1,834,376 | ) |
Currency abbreviations:
(a) Bank of America Merrill Lynch is the counterparty for all open forward currency exchange contracts held by the Fund as of December 31, 2019.
The accompanying notes are an integral part of these consolidated financial statements.
| | |
| | |
LoCorr Market Trend Fund - Consolidated Schedule of Open Futures Contracts | | 41 |
| | |
LoCorr Market Trend Fund
Consolidated Schedule of Open Futures Contracts
December 31, 2019
| | | Number of | | | | | Current | | | | | | Value | |
| Description | | Contracts
Purchased (Sold) | | | Settlement
Month-Year | | Notional
Amount | | | Value at
Trade Date | | | Unrealized
Appreciation | | | Unrealized
(Depreciation) | |
| | | | | | | | | | | | | | | | | |
| Purchase Contracts: | | | | | | | | | | | | | | | | |
| 90 Day Euro | | | 1,726 | | | Jun-21 | | $ | 424,768,600 | | | $ | 424,658,328 | | | $ | 110,272 | | | $ | — | |
| 90 Day Sterling | | | 1,310 | | | Dec-20 | | | 215,375,477 | | | | 215,304,931 | | | | 70,546 | | | | — | |
| 90 Day Sterling | | | 64 | | | Jun-21 | | | 10,520,571 | | | | 10,518,561 | | | | 2,010 | | | | — | |
| Aluminum (a)(b) | | | 71 | | | Mar-20 | | | 3,212,750 | | | | 3,224,940 | | | | — | | | | (12,190 | ) |
| Australian 10 Yr Bond | | | 313 | | | Mar-20 | | | 31,400,415 | | | | 31,995,343 | | | | — | | | | (594,928 | ) |
| Brent Crude (a) | | | 198 | | | Mar-20 | | | 13,068,000 | | | | 12,907,232 | | | | 160,768 | | | | — | |
| CAC 40 10 Euro Index | | | 206 | | | Jan-20 | | | 13,794,952 | | | | 13,776,109 | | | | 18,843 | | | | — | |
| Canadian 10 Yr Bond | | | 365 | | | Mar-20 | | | 38,643,256 | | | | 39,338,754 | | | | — | | | | (695,498 | ) |
| Cocoa (a) | | | 162 | | | Mar-20 | | | 3,903,330 | | | | 4,042,254 | | | | — | | | | (138,924 | ) |
| Coffee (a) | | | 96 | | | Mar-20 | | | 4,669,200 | | | | 4,900,794 | | | | — | | | | (231,594 | ) |
| Copper (a)(b) | | | 114 | | | Mar-20 | | | 17,598,750 | | | | 17,333,556 | | | | 265,194 | | | | — | |
| DAX Index | | | 137 | | | Mar-20 | | | 50,890,928 | | | | 51,146,751 | | | | — | | | | (255,823 | ) |
| Dollar | | | 58 | | | Mar-20 | | | 5,571,364 | | | | 5,604,376 | | | | — | | | | (33,012 | ) |
| Euro-Schatz | | | 610 | | | Mar-20 | | | 76,569,882 | | | | 76,594,251 | | | | — | | | | (24,369 | ) |
| Euro-Stoxx 50 Index | | | 1,333 | | | Mar-20 | | | 55,757,229 | | | | 55,923,073 | | | | — | | | | (165,844 | ) |
| FTSE 100 Index | | | 80 | | | Mar-20 | | | 7,946,592 | | | | 8,008,582 | | | | — | | | | (61,990 | ) |
| Gasoline RBOB (a) | | | 137 | | | Feb-20 | | | 9,727,137 | | | | 9,737,414 | | | | — | | | | (10,277 | ) |
| Gold (a) | | | 168 | | | Feb-20 | | | 25,588,080 | | | | 24,779,679 | | | | 808,401 | | | | — | |
| Heating Oil (a) | | | 99 | | | Feb-20 | | | 8,410,802 | | | | 8,403,510 | | | | 7,292 | | | | — | |
| Long Gilt | | | 283 | | | Mar-20 | | | 49,249,662 | | | | 49,764,593 | | | | — | | | | (514,931 | ) |
| Low Sulphur Gasoil (a) | | | 19 | | | Feb-20 | | | 1,166,125 | | | | 1,187,572 | | | | — | | | | (21,447 | ) |
| Nasdaq 100 E-Mini Index | | | 192 | | | Mar-20 | | | 33,608,640 | | | | 32,736,502 | | | | 872,138 | | | | — | |
| Nikkei 225 Index | | | 242 | | | Mar-20 | | | 52,651,788 | | | | 52,218,046 | | | | 433,742 | | | | — | |
| Russell 2000 Mini Index | | | 322 | | | Mar-20 | | | 26,896,660 | | | | 26,645,227 | | | | 251,433 | | | | — | |
| S&P 500 E-Mini Index | | | 228 | | | Mar-20 | | | 36,834,540 | | | | 36,279,442 | | | | 555,098 | | | | — | |
| Silver (a) | | | 184 | | | Mar-20 | | | 16,487,320 | | | | 15,869,024 | | | | 618,296 | | | | — | |
| Soybean Oil (a) | | | 16 | | | Mar-20 | | | 333,792 | | | | 302,672 | | | | 31,120 | | | | — | |
| Tokyo Price Index | | | 343 | | | Mar-20 | | | 54,328,195 | | | | 54,296,418 | | | | 31,777 | | | | — | |
| U.S. 10 Yr Note | | | 679 | | | Mar-20 | | | 87,198,453 | | | | 87,909,079 | | | | — | | | | (710,626 | ) |
| U.S. 2 Yr Note | | | 1,072 | | | Mar-20 | | | 231,016,000 | | | | 231,101,403 | | | | — | | | | (85,403 | ) |
| U.S. 5 Yr Note | | | 725 | | | Mar-20 | | | 85,991,797 | | | | 86,198,539 | | | | — | | | | (206,742 | ) |
| U.S. Long Bond | | | 203 | | | Mar-20 | | | 31,648,969 | | | | 32,077,444 | | | | — | | | | (428,475 | ) |
| Wheat (a) | | | 181 | | | Mar-20 | | | 5,056,688 | | | | 4,702,539 | | | | 354,149 | | | | — | |
| Zinc (a)(b) | | | 12 | | | Mar-20 | | | 682,425 | | | | 705,030 | | | | — | | | | (22,605 | ) |
| Total Purchase Contracts | | | | | | | | | | | | | | | | | 4,591,079 | | | | (4,214,678 | ) |
| | | | | | | | | | | | | | | | | | | | | | | |
| Sales Contracts: | | | | | | | | | | | | | | | | | | | | | | |
| 10 Yr Mini JGB | | | (17 | ) | | Mar-20 | | $ | 2,377,074 | | | $ | 2,377,690 | | | $ | 616 | | | $ | — | |
| 3 Mo Euro Euribor | | | (874 | ) | | Jun-21 | | | 245,901,346 | | | | 245,979,347 | | | | 78,001 | | | | — | |
| Aluminum (a)(b) | | | (329 | ) | | Mar-20 | | | 14,887,250 | | | | 14,926,178 | | | | 38,928 | | | | — | |
| Copper (a)(b) | | | (141 | ) | | Mar-20 | | | 21,766,875 | | | | 20,830,690 | | | | — | | | | (936,185 | ) |
| Corn (a) | | | (448 | ) | | Mar-20 | | | 8,685,600 | | | | 8,466,271 | | | | — | | | | (219,329 | ) |
| Cotton No.2 (a) | | | (82 | ) | | Mar-20 | | | 2,831,050 | | | | 2,680,154 | | | | — | | | | (150,896 | ) |
| Dow Jones Industrial Average Mini E-Cbot Index | | | (201 | ) | | Mar-20 | | | 28,650,540 | | | | 28,288,681 | | | | — | | | | (361,859 | ) |
| Euro-Bobl | | | (291 | ) | | Mar-20 | | | 43,618,991 | | | | 43,729,804 | | | | 110,813 | | | | — | |
| Euro-Bund | | | (313 | ) | | Mar-20 | | | 59,857,958 | | | | 60,363,964 | | | | 506,006 | | | | — | |
| Hang Seng Index | | | (25 | ) | | Jan-20 | | | 4,534,926 | | | | 4,539,564 | | | | 4,638 | | | | — | |
| Hard Red Wheat (a) | | | (176 | ) | | Mar-20 | | | 4,276,800 | | | | 3,758,028 | | | | — | | | | (518,772 | ) |
| Japanese 10 Yr Bond | | | (34 | ) | | Mar-20 | | | 47,619,714 | | | | 47,537,525 | | | | — | | | | (82,189 | ) |
The accompanying notes are an integral part of these consolidated financial statements.
| | |
| | |
| 42 | | LoCorr Market Trend Fund - Consolidated Schedule of Open Futures Contracts (continued) |
| | |
| | | Number of | | | | | Current | | | | | | Value | |
| Description | | Contracts
Purchased (Sold) | | | Settlement
Month-Year | | Notional
Amount | | | Value at
Trade Date | | | Unrealized
Appreciation | | | Unrealized
(Depreciation) | |
| | | | | | | | | | | | | | | | | |
| Sale Contracts (continued) | | | | | | | | | | | | | | | | |
| Natural Gas (a) | | | (258 | ) | | Feb-20 | | $ | 5,647,620 | | | $ | 5,835,187 | | | $ | 187,567 | | | $ | — | |
| Soybean (a) | | | (223 | ) | | Mar-20 | | | 10,653,825 | | | | 10,067,643 | | | | — | | | | (586,182 | ) |
| Soybean Meal (a) | | | (113 | ) | | Mar-20 | | | 3,443,110 | | | | 3,457,661 | | | | 14,551 | | | | — | |
| Sugar (a) | | | (228 | ) | | Mar-20 | | | 3,426,931 | | | | 3,061,593 | | | | — | | | | (365,338 | ) |
| WTI Crude (a) | | | (5 | ) | | Feb-20 | | | 305,300 | | | | 293,420 | | | | — | | | | (11,880 | ) |
| Zinc (a)(b) | | | (196 | ) | | Mar-20 | | | 11,146,275 | | | | 12,278,166 | | | | 1,131,891 | | | | — | |
| Total Sale Contracts | | | | | | | | | | | | | | | | | 2,073,011 | | | | (3,232,630 | ) |
| Total Futures Contracts | | | | | | | | | | | | | | | | $ | 6,664,090 | | | $ | (7,447,308 | ) |
| Net Unrealized Depreciation | | | | | | | | | | | | | | | | | | | | $ | (783,218 | ) |
| (a) | Contract held by LCMT Fund Limited. |
| (b) | London Metal Exchange (‘‘LME’’) futures contracts settle on their respective maturity date. The unrealized appreciation on these contracts is a receivable for unsettled open futures contracts and the unrealized depreciation is a payable for unsettled open futures contracts on the Fund’s consolidated statement of assets and liabilities. |
The accompanying notes are an integral part of these consolidated financial statements.
| | |
| | |
LoCorr Dynamic Equity Fund - Schedule of Investments | | 43 |
| | |
LoCorr Dynamic Equity Fund
Composition of Investment Portfolio1
December 31, 2019 (Unaudited)
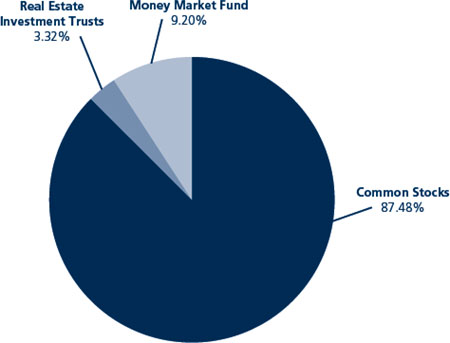
1 As a percentage of total investments.
Schedule of Investments
December 31, 2019 | |
| | | Shares | | | Value | |
| COMMON STOCKS: 75.93% | | | | | | | | |
| Advertising: 0.15% | | | | | | | | |
| Publicis Groupe SA (b) | | | 916 | | | $ | 41,469 | |
| | | | | | | | | |
| Airlines: 7.92% | | | | | | | | |
| Air Canada - ADR (a)(b) | | | 53,791 | | | | 2,009,007 | |
| JetBlue Airways Corp. (a) | | | 3,871 | | | | 72,465 | |
| Mesa Air Group, Inc. (a) | | | 6,940 | | | | 62,043 | |
| Qantas Airways Ltd. (b) | | | 9,968 | | | | 49,735 | |
| | | | | | | | 2,193,250 | |
| Apparel: 0.17% | | | | | | | | |
| Hermes International (b) | | | 64 | | | | 47,826 | |
| | | | | | | | | |
| Auto Manufacturers: 0.31% | | | | | | | | |
| Ferrari NV (b) | | | 301 | | | | 49,936 | |
| Volvo AB (b) | | | 2,063 | | | | 34,558 | |
| | | | | | | | 84,494 | |
| Auto Parts & Equipment: 1.00% | | | | | | | | |
| Allison Transmission Holdings, Inc. | | | 1,543 | | | | 74,558 | |
| Hella GmbH & Co. KGaA (b) | | | 866 | | | | 47,929 | |
| Nexteer Automotive Group Ltd. (b) | | | 56,000 | | | | 50,737 | |
| Tokai Rika Co. Ltd. (b) | | | 1,600 | | | | 31,616 | |
| TS Tech Co. Ltd. (b) | | | 2,245 | | | | 70,766 | |
| | | | | | | | 275,606 | |
| Banks: 4.20% | | | | | | | | |
| AIB Group PLC (b) | | | 4,460 | | | | 15,539 | |
| Banco Bilbao Vizcaya Argentaria SA (b) | | | 9,436 | | | | 52,742 | |
| CIT Group, Inc. | | | 7,681 | | | | 350,484 | |
| Credit Agricole SA (b) | | | 3,380 | | | | 49,003 | |
| Dah Sing Financial Holdings Ltd. (b) | | | 12,000 | | | | 47,278 | |
| DBS Group Holdings Ltd. (b) | | | 2,500 | | | | 48,106 | |
| Erste Group Bank AG (b) | | | 1,292 | | | | 48,637 | |
The accompanying notes are an integral part of these financial statements.
| | |
| | |
| 44 | | LoCorr Dynamic Equity Fund - Schedule of Investments (continued) |
| | |
| | | Shares | | | Value | |
| COMMON STOCKS (continued) | | | | | | | | |
| Raiffeisen Bank International AG (b) | | | 681 | | | $ | 17,103 | |
| TCF Financial Corp. | | | 2,034 | | | | 95,191 | |
| Texas Capital Bancshares, Inc. (a) | | | 5,879 | | | | 333,751 | |
| Umpqua Holdings Corp. | | | 3,359 | | | | 59,454 | |
| United Overseas Bank Ltd. (b) | | | 2,400 | | | | 47,127 | |
| | | | | | | | 1,164,415 | |
| Beverages: 0.36% | | | | | | | | |
| Cott Corp. (b) | | | 6,671 | | | | 91,259 | |
| Suntory Beverage & Food Ltd. (b) | | | 200 | | | | 8,366 | |
| | | | | | | | 99,625 | |
| Biotechnology: 0.11% | | | | | | | | |
| Myriad Genetics, Inc. (a) | | | 1,115 | | | | 30,361 | |
| | | | | | | | | |
| Building Materials: 0.70% | | | | | | | | |
| Builders FirstSource, Inc. (a) | | | 2,271 | | | | 57,706 | |
| Buzzi Unicem SpA (b) | | | 3,347 | | | | 51,960 | |
| Imerys SA (b) | | | 646 | | | | 27,304 | |
| Rockwool International A/S (b) | | | 237 | | | | 56,139 | |
| | | | | | | | 193,109 | |
| Chemicals: 0.57% | | | | | | | | |
| Akzo Nobel NV (b) | | | 468 | | | | 47,582 | |
| NewMarket Corp. | | | 96 | | | | 46,706 | |
| PolyOne Corp. | | | 481 | | | | 17,696 | |
| Showa Denko KK (b) | | | 1,700 | | | | 45,357 | |
| | | | | | | | 157,341 | |
| Commercial Services: 1.97% | | | | | | | | |
| Amadeus IT Group SA (b) | | | 887 | | | | 72,433 | |
| IDP Education Ltd. (b) | | | 837 | | | | 10,085 | |
| Randstad NV (b) | | | 818 | | | | 49,952 | |
| Sohgo Security Services Co. Ltd. (b) | | | 800 | | | | 43,587 | |
| TrueBlue, Inc. (a) | | | 2,048 | | | | 49,275 | |
| United Rentals, Inc. (a) | | | 1,929 | | | | 321,699 | |
| | | | | | | | 547,031 | |
| Computers: 0.60% | | | | | | | | |
| Lenovo Group Ltd. (b) | | | 72,000 | | | | 48,324 | |
| Otsuka Corp. (b) | | | 400 | | | | 16,106 | |
| Tenable Holdings, Inc. (a) | | | 4,284 | | | | 102,645 | |
| | | | | | | | 167,075 | |
| Cosmetics/Personal Care: 0.02% | | | | | | | | |
| Noevir Holdings Co. Ltd. (b) | | | 100 | | | | 5,384 | |
| | | | | | | | | |
| Distribution & Wholesale: 0.17% | | | | | | | | |
| HD Supply Holdings, Inc. (a) | | | 1,192 | | | | 47,942 | |
| | | | | | | | | |
| Diversified Financial Services: 11.46% | | | | | | | | |
| Credit Acceptance Corp. (a) | | | 3,282 | | | | 1,451,727 | |
| Curo Group Holdings Corp. (a) | | | 1,247 | | | | 15,189 | |
| DWS Group GmbH & Co. KGaA (b) | | | 1,336 | | | | 47,506 | |
| Federal National Mortgage Association (a) | | | 75,294 | | | | 234,917 | |
| Magellan Financial Group Ltd. (b) | | | 1,420 | | | | 56,750 | |
| SEI Investments Co. | | | 1,163 | | | | 76,153 | |
| Singapore Exchange Ltd. (b) | | | 7,400 | | | | 48,748 | |
| Synchrony Financial | | | 33,108 | | | | 1,192,219 | |
| Zenkoku Hosho Co. Ltd. (b) | | | 1,200 | | | | 51,355 | |
| | | | | | | | 3,174,564 | |
| Electric: 0.95% | | | | | | | | |
| AES Corp/VA | | | 2,504 | | | | 49,830 | |
| Atco Ltd. Canada (b) | | | 274 | | | | 10,502 | |
| Atlantic Power Corp. (a)(b) | | | 18,466 | | | | 42,946 | |
| Chubu Electric Power Co., Inc. (b) | | | 2,700 | | | | 38,305 | |
| Northland Power, Inc. (b) | | | 2,250 | | | | 47,129 | |
| OGE Energy Corp. | | | 1,658 | | | | 73,731 | |
| | | | | | | | 262,443 | |
The accompanying notes are an integral part of these financial statements.
| | |
| | |
LoCorr Dynamic Equity Fund - Schedule of Investments (continued) | | 45 |
| | |
| | | Shares | | | Value | |
| COMMON STOCKS (continued) | | | | | | | | |
| Electrical Components & Equipment: 0.60% | | | | | | | | |
| Brother Industries Ltd. (b) | | | 100 | | | $ | 2,090 | |
| GS Yuasa Corp. (b) | | | 2,100 | | | | 45,709 | |
| Johnson Electric Holdings Ltd. (b) | | | 7,000 | | | | 15,918 | |
| Legrand SA (b) | | | 589 | | | | 47,992 | |
| Signify NV (b) | | | 1,702 | | | | 53,189 | |
| | | | | | | | 164,898 | |
| Electronics: 0.57% | | | | | | | | |
| Atkore International Group, Inc. (a) | | | 1,148 | | | | 46,448 | |
| FIT Hon Teng Ltd. (b) | | | 102,000 | | | | 34,295 | |
| Gentex Corp. | | | 2,655 | | | | 76,942 | |
| | | | | | | | 157,685 | |
| Engineering & Construction: 7.67% | | | | | | | | |
| Aena SME SA (b) | | | 256 | | | | 48,960 | |
| Bouygues SA (b) | | | 1,106 | | | | 46,994 | |
| Eiffage SA (b) | | | 446 | | | | 51,029 | |
| Frontdoor, Inc. (a) | | | 13,074 | | | | 619,969 | |
| HOCHTIEF AG (b) | | | 398 | | | | 50,760 | |
| MasTec, Inc. (a) | | | 20,376 | | | | 1,307,324 | |
| | | | | | | | 2,125,036 | |
| Entertainment: 3.59% | | | | | | | | |
| Marriott Vacations Worldwide Corp. | | | 7,728 | | | | 995,057 | |
| | | | | | | | | |
| Food: 0.88% | | | | | | | | |
| Chocoladefabriken Lindt & Spruengli AG (b) | | | 9 | | | | 69,885 | |
| Olam International Ltd. (b) | | | 11,800 | | | | 15,880 | |
| Uni-President China Holdings Ltd. (b) | | | 10,000 | | | | 10,498 | |
| US Foods Holding Corp. (a) | | | 1,787 | | | | 74,857 | |
| Wesfarmers Ltd. (b) | | | 2,488 | | | | 72,283 | |
| | | | | | | | 243,403 | |
| Forest Products & Paper: 0.02% | | | | | | | | |
| UPM-Kymmene Oyj (b) | | | 193 | | | | 6,692 | |
| | | | | | | | | |
| Gas: 1.26% | | | | | | | | |
| Enagas SA (b) | | | 2,061 | | | | 52,571 | |
| Italgas SpA (b) | | | 5,637 | | | | 34,423 | |
| UGI Corp. | | | 5,824 | | | | 263,012 | |
| | | | | | | | 350,006 | |
| Healthcare - Products: 2.23% | | | | | | | | |
| Hologic, Inc. (a) | | | 459 | | | | 23,964 | |
| Masimo Corp. (a) | | | 224 | | | | 35,406 | |
| Natus Medical, Inc. (a) | | | 194 | | | | 6,400 | |
| Wright Medical Group NV (a)(b) | | | 18,106 | | | | 551,871 | |
| | | | | | | | 617,641 | |
| Holding Companies - Diversified: 0.16% | | | | | | | | |
| Swire Pacific Ltd. (b) | | | 30,000 | | | | 44,891 | |
| | | | | | | | | |
| Home Builders: 0.61% | | | | | | | | |
| Berkeley Group Holdings PLC (b) | | | 966 | | | | 62,174 | |
| Sekisui House Ltd. (b) | | | 2,100 | | | | 45,100 | |
| Taylor Wimpey PLC (b) | | | 23,942 | | | | 61,335 | |
| | | | | | | | 168,609 | |
| Home Furnishings: 0.42% | | | | | | | | |
| Howden Joinery Group PLC (b) | | | 6,591 | | | | 58,721 | |
| Rational AG (b) | | | 64 | | | | 51,473 | |
| Sony Corp. (b) | | | 100 | | | | 6,812 | |
| | | | | | | | 117,006 | |
| Household Products & Wares: 0.18% | | | | | | | | |
| Henkel AG & Co. KGaA (b) | | | 519 | | | | 48,902 | |
| | | | | | | | | |
| Insurance: 2.77% | | | | | | | | |
| Allianz (b) | | | 304 | | | | 74,474 | |
| Assicurazioni Generali SpA (b) | | | 2,497 | | | | 51,522 | |
| Aviva PLC (b) | | | 8,513 | | | | 47,214 | |
The accompanying notes are an integral part of these financial statements.
| | |
| | |
| 46 | | LoCorr Dynamic Equity Fund - Schedule of Investments (continued) |
| | |
| | | Shares | | | Value | |
| COMMON STOCKS (continued) | | | | | | | | |
| AXA Equitable Holdings, Inc. | | | 1,910 | | | $ | 47,330 | |
| Dai-ichi Life Holdings, Inc. (b) | | | 4,500 | | | | 75,231 | |
| Essent Group Ltd. (b) | | | 960 | | | | 49,910 | |
| First American Financial Corp. | | | 1,212 | | | | 70,684 | |
| Hannover Rueck SE (b) | | | 289 | | | | 55,855 | |
| MGIC Investment Corp. | | | 3,651 | | | | 51,735 | |
| MS&AD Insurance Group Holdings, Inc. (b) | | | 1,400 | | | | 46,527 | |
| National General Holdings Corp. | | | 1,019 | | | | 22,520 | |
| NMI Holdings, Inc. (a) | | | 1,206 | | | | 40,015 | |
| Radian Group, Inc. | | | 279 | | | | 7,020 | |
| Talanx AG (b) | | | 1,064 | | | | 52,729 | |
| Tokio Marine Holdings, Inc. (b) | | | 1,300 | | | | 73,211 | |
| | | | | | | | 765,977 | |
| Internet: 0.62% | | | | | | | | |
| Cars.com, Inc. (a) | | | 7,311 | | | | 89,341 | |
| EBAY, Inc. | | | 1,230 | | | | 44,415 | |
| NortonLifeLock, Inc. | | | 819 | | | | 20,901 | |
| TripAdvisor, Inc. | | | 566 | | | | 17,195 | |
| | | | | | | | 171,852 | |
| Investment Companies: 0.18% | | | | | | | | |
| Kinnevik AB (b) | | | 2,005 | | | | 49,021 | |
| | | | | | | | | |
| Iron & Steel: 0.47% | | | | | | | | |
| BlueScope Steel Ltd. (b) | | | 6,767 | | | | 71,516 | |
| Fortescue Metals Group Ltd. (b) | | | 7,868 | | | | 59,023 | |
| | | | | | | | 130,539 | |
| Leisure Time: 0.50% | | | | | | | | |
| Daiichikosho Co. Ltd. (b) | | | 900 | | | | 47,462 | |
| Norwegian Cruise Line Holdings Ltd. (a)(b) | | | 1,554 | | | | 90,769 | |
| | | | | | | | 138,231 | |
| Lodging: 1.18% | | | | | | | | |
| Melco International Development Ltd. (b) | | | 21,000 | | | | 59,020 | |
| NagaCorp Ltd. (b) | | | 28,000 | | | | 48,869 | |
| Wynn Resorts Ltd. | | | 1,568 | | | | 217,748 | |
| | | | | | | | 325,637 | |
| Machinery - Construction & Mining: 0.02% | | | | | | | | |
| Sandvik AB (b) | | | 348 | | | | 6,786 | |
| | | | | | | | | |
| Machinery - Diversified: 0.24% | | | | | | | | |
| KION Group AG (b) | | | 293 | | | | 20,232 | |
| Kone Oyj (b) | | | 720 | | | | 47,069 | |
| | | | | | | | 67,301 | |
| Media: 1.83% | | | | | | | | |
| DISH Network Corp.(a) | | | 10,051 | | | | 356,509 | |
| Mediaset SpA (a)(b) | | | 15,790 | | | | 47,113 | |
| ProSiebenSat.1 Media SE (b) | | | 3,573 | | | | 55,749 | |
| RTL Group SA (b) | | | 991 | | | | 48,889 | |
| | | | | | | | 508,260 | |
| Metal Fabricate & Hardware: 0.32% | | | | | | | | |
| Ryerson Holding Corp. (a) | | | 2,577 | | | | 30,486 | |
| SKF AB (b) | | | 2,844 | | | | 57,509 | |
| | | | | | | | 87,995 | |
| Mining: 0.77% | | | | | | | | |
| Boliden AB (b) | | | 641 | | | | 17,006 | |
| Freeport-McMoRan, Inc. | | | 10,898 | | | | 142,982 | |
| Rio Tinto PLC (b) | | | 874 | | | | 52,132 | |
| | | | | | | | 212,120 | |
| Miscellaneous Manufacturing: 0.25% | | | | | | | | |
| AptarGroup, Inc. | | | 173 | | | | 20,002 | |
| Glory Ltd. (b) | | | 1,600 | | | | 48,742 | |
| | | | | | | | 68,744 | |
| Office & Business Equipment: 0.03% | | | | | | | | |
| FUJIFILM Holdings Corp. (b) | | | 200 | | | | 9,627 | |
The accompanying notes are an integral part of these financial statements.
| | |
| | |
LoCorr Dynamic Equity Fund - Schedule of Investments (continued) | | 47 |
| | |
| | | Shares | | | Value | |
| COMMON STOCKS (continued) | | | | | | | | |
| Office Furnishings: 0.05% | | | | | | | | |
| Kimball International, Inc. | | | 648 | | | $ | 13,394 | |
| | | | | | | | | |
| Oil & Gas: 1.56% | | | | | | | | |
| Apache Corp. | | | 8,393 | | | | 214,777 | |
| Equinor ASA (b) | | | 2,240 | | | | 44,778 | |
| HollyFrontier Corp. | | | 1,368 | | | | 69,371 | |
| Kosmos Energy Ltd. | | | 8,639 | | | | 49,243 | |
| OMV AG (b) | | | 121 | | | | 6,797 | |
| Parex Resources, Inc. (b) | | | 755 | | | | 14,041 | |
| TOTAL SA (b) | | | 578 | | | | 31,899 | |
| | | | | | | | 430,906 | |
| Oil & Gas Services: 0.16% | | | | | | | | |
| Apergy Corp. (a) | | | 650 | | | | 21,957 | |
| Pason Systems, Inc. (b) | | | 1,442 | | | | 14,558 | |
| TETRA Technologies, Inc. (a) | | | 3,464 | | | | 6,789 | |
| | | | | | | | 43,304 | |
| Packaging & Containers: 2.45% | | | | | | | | |
| Graphic Packaging Holding Co. | | | 34,283 | | | | 570,812 | |
| O-I Glass, Inc. | | | 9,012 | | | | 107,513 | |
| | | | | | | | 678,325 | |
| Pharmaceuticals: 1.63% | | | | | | | | |
| Alfresa Holdings Corp. (b) | | | 2,200 | | | | 45,111 | |
| Collegium Pharmaceutical, Inc. (a) | | | 339 | | | | 6,977 | |
| Kaken Pharmaceutical Co. Ltd. (b) | | | 100 | | | | 5,559 | |
| Mylan NV (a)(b) | | | 8,950 | | | | 179,895 | |
| Orion Oyj (b) | | | 1,042 | | | | 48,237 | |
| Roche Holding AG (b) | | | 163 | | | | 51,807 | |
| Shionogi & Co. Ltd. (b) | | | 200 | | | | 12,456 | |
| Sumitomo Dainippon Pharma Co. Ltd. (b) | | | 2,400 | | | | 47,048 | |
| Teva Pharmaceutical Industries Ltd. - ADR (a)(b) | | | 626 | | | | 6,135 | |
| UCB SA (b) | | | 617 | | | | 49,069 | |
| | | | | | | | 452,294 | |
| Private Equity: 0.03% | | | | | | | | |
| 3i Group PLC (b) | | | 497 | | | | 7,229 | |
| | | | | | | | | |
| Real Estate: 0.34% | | | | | | | | |
| Amot Investments Ltd. (b) | | | 6,334 | | | | 45,983 | |
| RMR Group, Inc. | | | 1,031 | | | | 47,055 | |
| | | | | | | | 93,038 | |
| Retail: 5.47% | | | | | | | | |
| Advance Auto Parts, Inc. | | | 3,091 | | | | 495,055 | |
| Big Lots, Inc. | | | 749 | | | | 21,511 | |
| Chico’s FAS, Inc. | | | 10,622 | | | | 40,470 | |
| Children’s Place, Inc. | | | 2,552 | | | | 159,551 | |
| Fielmann AG (b) | | | 600 | | | | 48,458 | |
| Goldwin, Inc. (b) | | | 600 | | | | 44,287 | |
| K’s Holdings Corp. (b) | | | 4,100 | | | | 53,998 | |
| L Brands, Inc. | | | 24,069 | | | | 436,130 | |
| Sugi Holdings Co. Ltd. (b) | | | 900 | | | | 47,711 | |
| Sundrug Co. Ltd. (b) | | | 1,500 | | | | 54,599 | |
| Tsuruha Holdings, Inc. (b) | | | 400 | | | | 51,613 | |
| Urban Outfitters, Inc. (a) | | | 2,259 | | | | 62,732 | |
| | | | | | | | 1,516,115 | |
| Semiconductors: 0.60% | | | | | | | | |
| Advantest Corp. (b) | | | 1,400 | | | | 79,370 | |
| Micron Technology, Inc. (a) | | | 1,428 | | | | 76,798 | |
| Tower Semiconductor Ltd. (a)(b) | | | 438 | | | | 10,473 | |
| | | | | | | | 166,641 | |
| Software: 3.76% | | | | | | | | |
| Aspen Technology, Inc. (a) | | | 402 | | | | 48,614 | |
| Capcom Co. Ltd. (b) | | | 1,100 | | | | 30,675 | |
| Cerence, Inc. (a) | | | 300 | | | | 6,789 | |
| Electronic Arts, Inc. (a) | | | 488 | | | | 52,465 | |
The accompanying notes are an integral part of these financial statements.
| | |
| | |
| 48 | | LoCorr Dynamic Equity Fund - Schedule of Investments (continued) |
| | |
| | | Shares | | | Value | |
| COMMON STOCKS (continued) | | | | | | | | |
| New Relic, Inc. (a) | | | 6,031 | | | $ | 396,297 | |
| Sage Group PLC (b) | | | 5,137 | | | | 50,966 | |
| Take-Two Interactive Software, Inc. (a) | | | 3,398 | | | | 416,017 | |
| TIS, Inc. (b) | | | 100 | | | | 5,918 | |
| Verra Mobility Corp. (a) | | | 2,532 | | | | 35,422 | |
| | | | | | | | 1,043,163 | |
| Telecommunications: 1.59% | | | | | | | | |
| Arista Networks, Inc. (a) | | | 242 | | | | 49,223 | |
| Consolidated Communications Holdings, Inc. | | | 2,538 | | | | 9,847 | |
| Intelsat SA (a)(b) | | | 3,359 | | | | 23,614 | |
| KDDI Corp. (b) | | | 1,700 | | | | 50,896 | |
| SES SA (b) | | | 14,452 | | | | 202,636 | |
| Telekom Austria AG (b) | | | 6,055 | | | | 49,445 | |
| Vonage Holdings Corp. (a) | | | 7,407 | | | | 54,886 | |
| | | | | | | | 440,547 | |
| Transportation: 0.26% | | | | | | | | |
| Kamigumi Co. Ltd. (b) | | | 1,200 | | | | 26,495 | |
| Sankyu, Inc. (b) | | | 900 | | | | 45,557 | |
| | | | | | | | 72,052 | |
| TOTAL COMMON STOCKS (Cost $17,599,195) | | | | | | | 21,030,859 | |
| | | | | | | | | |
| REAL ESTATE INVESTMENT TRUSTS: 2.88% | | | | | | | | |
| Apple Hospitality REIT, Inc. | | | 2,923 | | | | 47,499 | |
| Ascendas Real Estate Investment Trust (b) | | | 15,800 | | | | 34,891 | |
| British Land Co. PLC (b) | | | 3,909 | | | | 33,076 | |
| Douglas Emmett, Inc. | | | 1,736 | | | | 76,210 | |
| Equity LifeStyle Properties, Inc. | | | 366 | | | | 25,763 | |
| Hersha Hospitality Trust | | | 1,531 | | | | 22,276 | |
| Host Hotels & Resorts, Inc. | | | 2,731 | | | | 50,660 | |
| Mack-Cali Realty Corp. | | | 404 | | | | 9,345 | |
| Mapletree Commercial Trust (b) | | | 18,700 | | | | 33,230 | |
| Mapletree North Asia Commercial Trust (b) | | | 50,100 | | | | 43,211 | |
| Outfront Media, Inc. | | | 8,603 | | | | 230,733 | |
| RLJ Lodging Trust | | | 7,752 | | | | 137,365 | |
| Segro PLC (b) | | | 568 | | | | 6,750 | |
| Sunstone Hotel Investors, Inc. | | | 3,384 | | | | 47,105 | |
| TOTAL REAL ESTATE INVESTMENT TRUSTS (Cost $746,867) | | | | | | | 798,114 | |
| | | | | | | | | |
| SHORT TERM INVESTMENT: 7.99% | | | | | | | | |
| MONEY MARKET FUND: 7.99% | | | | | | | | |
| STIT-Government & Agency Portfolio, Institutional Class, 1.50% (c) | | | 2,212,316 | | | | 2,212,316 | |
| TOTAL MONEY MARKET FUND (Cost $2,212,316) | | | | | | | 2,212,316 | |
| TOTAL SHORT TERM INVESTMENT (Cost $2,212,316) | | | | | | | 2,212,316 | |
| | | | | | | | | |
| TOTAL INVESTMENTS (Cost $20,558,378): 86.80% | | | | | | | 24,041,289 | |
| Other Assets in Excess of Liabilities: 13.20% (d) | | | | | | | 3,656,465 | |
| TOTAL NET ASSETS: 100.00% | | | | | | $ | 27,697,754 | |
| (a) | Non-dividend income producing security. |
| (b) | Foreign issued security. |
| (c) | The rate quoted is the annualized seven-day effective yield as of December 31, 2019. |
| (d) | Includes assets pledged as collateral for securities sold short and derivative instruments. |
ADR American Depositary Receipt
PLC Public Limited Company
The accompanying notes are an integral part of these financial statements.
| | |
| | |
LoCorr Dynamic Equity Fund - Schedule of Securities Sold Short | | 49 |
| | |
LoCorr Dynamic Equity Fund Schedule of Securities Sold Short | | |
| December 31, 2019 | | |
| | | Shares | | | Value | |
| COMMON STOCKS: (26.40)% | | | | | | | | |
| Advertising: (0.03)% | | | | | | | | |
| Dentsu, Inc. (b) | | | (200 | ) | | $ | (6,949 | ) |
| | | | | | | | | |
| Aerospace & Defense: (0.60)% | | | | | | | | |
| Boeing Co. | | | (121 | ) | | | (39,417 | ) |
| Elbit Systems Ltd. (b) | | | (252 | ) | | | (39,231 | ) |
| Rolls-Royce Holdings PLC (b) | | | (4,466 | ) | | | (40,416 | ) |
| TransDigm Group, Inc. | | | (86 | ) | | | (48,160 | ) |
| | | | | | | | (167,224 | ) |
| Agriculture: (0.14)% | | | | | | |
|
|
| Japan Tobacco, Inc. (b) | | | (1,700 | ) | | | (38,059 | ) |
| | | | | | | | | |
| Airlines: (0.05)% | | | | | | | | |
| easyJet PLC (b) | | | (687 | ) | | | (12,963 | ) |
| | | | | | | | | |
| Apparel: (0.71)% | | | | | | | | |
| ASICS Corp. (b) | | | (3,200 | ) | | | (53,483 | ) |
| Canada Goose Holdings, Inc. (a)(b) | | | (2,421 | ) | | | (87,737 | ) |
| PRADA SpA (b) | | | (13,600 | ) | | | (56,199 | ) |
| | | | | | | | (197,419 | ) |
| Auto Manufacturers: (0.27)% | | | | | | | | |
| Daimler AG (b) | | | (901 | ) | | | (49,896 | ) |
| Tesla Motors, Inc. (a) | | | (61 | ) | | | (25,518 | ) |
| | | | | | | | (75,414 | ) |
| Auto Parts & Equipment: (0.33)% | | | | | | | | |
| Motorcar Parts of America, Inc. (a) | | | (2,360 | ) | | | (51,991 | ) |
| Veoneer, Inc. (a) | | | (2,597 | ) | | | (40,565 | ) |
| | | | | | | | (92,556 | ) |
| Banks: (1.09)% | | | | | | | | |
| Banco BPM SpA (a)(b) | | | (17,609 | ) | | | (40,057 | ) |
| Banque Cantonale Vaudoise (b) | | | (51 | ) | | | (41,631 | ) |
| CYBG PLC (b) | | | (11,148 | ) | | | (27,843 | ) |
| Deutsche Bank AG (b) | | | (5,632 | ) | | | (43,698 | ) |
| Japan Post Bank Co. Ltd. (b) | | | (1,600 | ) | | | (15,462 | ) |
| Jyske Bank A/S (a)(b) | | | (1,197 | ) | | | (43,680 | ) |
| Nordea Bank ABP (b) | | | (5,623 | ) | | | (45,665 | ) |
| UBS Group (b) | | | (3,482 | ) | | | (43,984 | ) |
| | | | | | | | (302,020 | ) |
| Beverages: (0.16)% | | | | | | | | |
| Coca-Cola Bottlers Japan Holdings, Inc. (b) | | | (1,700 | ) | | | (43,668 | ) |
| | | | | | | | | |
| Biotechnology: (0.60)% | | | | | | | | |
| Argenx SE (a)(b) | | | (344 | ) | | | (55,410 | ) |
| Bluebird Bio, Inc. (a) | | | (451 | ) | | | (39,575 | ) |
| Nektar Therapeutics (a) | | | (338 | ) | | | (7,296 | ) |
| Sage Therapeutics, Inc. (a) | | | (668 | ) | | | (48,223 | ) |
| Takara Bio, Inc. (b) | | | (900 | ) | | | (17,038 | ) |
| | | | | | | | (167,542 | ) |
| Building Materials: (0.32)% | | | | | | | | |
| Armstrong World Industries, Inc. | | | (937 | ) | | | (88,050 | ) |
| | | | | | | | | |
| Chemicals: (0.33)% | | | | | | | | |
| Albemarle Corp. | | | (677 | ) | | | (49,448 | ) |
| OCI Co. Ltd. (a)(b) | | | (2,013 | ) | | | (42,337 | ) |
| | | | | | | | (91,785 | ) |
| Commercial Services: (0.53)% | | | | | | | | |
| 2U, Inc. (a) | | | (266 | ) | | | (6,381 | ) |
| Atlantia SpA (b) | | | (1,820 | ) | | | (42,443 | ) |
| G4S PLC (b) | | | (2,355 | ) | | | (6,800 | ) |
| Service Corp International, Inc. | | | (1,961 | ) | | | (90,265 | ) |
| | | | | | | | (145,889 | ) |
The accompanying notes are an integral part of these financial statements.
| | |
| | |
| 50 | | LoCorr Dynamic Equity Fund - Schedule of Securities Sold Short (continued) |
| | |
| | | Shares | | | Value | |
| COMMON STOCKS (continued) | | | | | | | | |
| Computers: (0.09)% | | | | | | | | |
| Lumentum Holdings, Inc. (a) | | | (317 | ) | | $ | (25,138 | ) |
| | | | | | | | | |
| Distribution & Wholesale: (0.34)% | | | | | | | | |
| Watsco, Inc. | | | (529 | ) | | | (95,299 | ) |
| | | | | | | | | |
| Diversified Financial Services: (1.80)% | | | | | | | | |
| Credit Saison Co. Ltd. (b) | | | (2,600 | ) | | | (45,489 | ) |
| Daiwa Securities Group, Inc. (b) | | | (8,500 | ) | | | (43,261 | ) |
| GAIN Capital Holdings, Inc. | | | (10,146 | ) | | | (40,077 | ) |
| Haitong International Securities Group Ltd. (b) | | | (139,000 | ) | | | (42,276 | ) |
| Interactive Brokers Group, Inc. | | | (989 | ) | | | (46,107 | ) |
| LendingClub Corp. (a) | | | (3,121 | ) | | | (39,387 | ) |
| LendingTree, Inc. (a) | | | (128 | ) | | | (38,840 | ) |
| Nomura Holdings, Inc. (b) | | | (12,000 | ) | | | (62,223 | ) |
| Quilter PLC (b) | | | (23,052 | ) | | | (49,176 | ) |
| St James’s Place PLC (b) | | | (3,468 | ) | | | (53,494 | ) |
| Virtu Financial, Inc. | | | (2,457 | ) | | | (39,287 | ) |
| | | | | | | | (499,617 | ) |
| Electric: (0.89)% | | | | | | | | |
| Dominion Energy, Inc. | | | (525 | ) | | | (43,481 | ) |
| E.ON SE (b) | | | (3,953 | ) | | | (42,230 | ) |
| Edison International | | | (564 | ) | | | (42,531 | ) |
| PG&E Corp. (a) | | | (634 | ) | | | (6,892 | ) |
| Power Assets Holdings Ltd. (b) | | | (5,500 | ) | | | (40,232 | ) |
| RWE (b) | | | (1,374 | ) | | | (42,152 | ) |
| Sembcorp Industries Ltd. (b) | | | (16,800 | ) | | | (28,605 | ) |
| | | | | | | | (246,123 | ) |
| Electrical Components & Equipment: (0.35)% | | | | | | | | |
| Generac Holdings, Inc. (a) | | | (435 | ) | | | (43,757 | ) |
| Prysmian SpA (b) | | | (2,217 | ) | | | (53,442 | ) |
| | | | | | | | (97,199 | ) |
| Electronics: (0.72)% | | | | | | | | |
| ABB Ltd. (b) | | | (2,001 | ) | | | (48,319 | ) |
| Applied Optoelectronics, Inc. (a) | | | (550 | ) | | | (6,534 | ) |
| Fujitsu General Ltd. (b) | | | (1,800 | ) | | | (40,736 | ) |
| Hirose Electric Co. Ltd. (b) | | | (300 | ) | | | (38,737 | ) |
| II-VI, Inc. (a) | | | (529 | ) | | | (17,885 | ) |
| SCREEN Holdings Co. Ltd. (b) | | | (700 | ) | | | (48,254 | ) |
| | | | | | | | (200,465 | ) |
| Energy - Alternate Sources: (0.06)% | | | | | | | | |
| Vivint Solar, Inc. (a) | | | (954 | ) | | | (6,926 | ) |
| Xinyi Solar Holdings Ltd. (b) | | | (14,000 | ) | | | (9,935 | ) |
| | | | | | | | (16,861 | ) |
| Engineering & Construction: (1.09)% | | | | | | | | |
| Boskalis Westminster (b) | | | (2,151 | ) | | | (55,012 | ) |
| Cellnex Telecom SA (b) | | | (1,129 | ) | | | (48,592 | ) |
| CK Infrastructure Holdings Ltd. (b) | | | (5,500 | ) | | | (39,138 | ) |
| COMSYS Holdings Corp. (b) | | | (1,500 | ) | | | (43,279 | ) |
| Ferrovial SA (b) | | | (1,600 | ) | | | (48,404 | ) |
| JGC Corp. (b) | | | (3,600 | ) | | | (58,147 | ) |
| SNC-Lavalin Group, Inc. (b) | | | (370 | ) | | | (8,534 | ) |
| | | | | | | | (301,106 | ) |
| Entertainment: (0.09)% | | | | | | | | |
| GVC Holdings PLC (b) | | | (2,103 | ) | | | (24,631 | ) |
| | | | | | | | | |
| Food: (1.26)% | | | | | | | | |
| Beyond Meat, Inc. (a) | | | (80 | ) | | | (6,048 | ) |
| Dairy Farm International Holdings Ltd. (b) | | | (6,900 | ) | | | (39,399 | ) |
| Fuji Oil Holdings, Inc. (b) | | | (700 | ) | | | (18,915 | ) |
| Kagome Co. Ltd. (b) | | | (900 | ) | | | (21,685 | ) |
| Mowi (b) | | | (1,696 | ) | | | (44,084 | ) |
| Nissin Foods Holdings Co. Ltd. (b) | | | (400 | ) | | | (29,893 | ) |
| Ocado Group PLC (a)(b) | | | (2,756 | ) | | | (46,691 | ) |
| Shufersal Ltd. (b) | | | (6,491 | ) | | | (41,315 | ) |
The accompanying notes are an integral part of these financial statements.
| | |
| | |
LoCorr Dynamic Equity Fund - Schedule of Securities Sold Short (continued) | | 51 |
| | |
| | | Shares | | | Value | |
| COMMON STOCKS (continued) | | | | | | | | |
| Suedzucker AG (b) | | | (2,905 | ) | | $ | (53,473 | ) |
| Takeaway.com NV (a)(b) | | | (502 | ) | | | (46,286 | ) |
| | | | | | | | (347,789 | ) |
| Forest Products & Paper: (0.17)% | | | | | | | | |
| Nippon Paper Industries Co. Ltd. (b) | | | (2,400 | ) | | | (40,819 | ) |
| Svenska Cellulosa AB SCA (b) | | | (674 | ) | | | (6,836 | ) |
| | | | | | | | (47,655 | ) |
| Hand & Machine Tools: (0.70)% | | | | | | | | |
| Colfax Corp. (a) | | | (1,555 | ) | | | (56,571 | ) |
| Lincoln Electric Holdings, Inc. | | | (1,409 | ) | | | (136,293 | ) |
| | | | | | | | (192,864 | ) |
| Healthcare - Products: (0.53)% | | | | | | | | |
| Align Technology, Inc. (a) | | | (317 | ) | | | (88,456 | ) |
| Cantel Medical Corp. | | | (561 | ) | | | (39,775 | ) |
| iRhythm Technologies, Inc. (a) | | | (65 | ) | | | (4,426 | ) |
| Nipro Corp. (b) | | | (1,100 | ) | | | (13,313 | ) |
| | | | | | | | (145,970 | ) |
| Home Builders: (0.15)% | | | | | | | | |
| Thor Industries, Inc. | | | (553 | ) | | | (41,082 | ) |
| | | | | | | | | |
| Household Products & Wares: (0.16)% | | | | | | | | |
| Avery Dennison Corp. | | | (335 | ) | | | (43,825 | ) |
| | | | | | | | | |
| Insurance: (0.96)% | | | | | | | | |
| American International Group, Inc. | | | (431 | ) | | | (22,123 | ) |
| Hiscox Ltd. (b) | | | (2,436 | ) | | | (45,949 | ) |
| MBIA, Inc. (a) | | | (4,344 | ) | | | (40,399 | ) |
| Migdal Insurance & Financial Holdings Ltd. (b) | | | (42,193 | ) | | | (39,831 | ) |
| Phoenix Group Holdings PLC (b) | | | (4,732 | ) | | | (46,948 | ) |
| United Insurance Holdings Corp. | | | (1,301 | ) | | | (16,406 | ) |
| White Mountains Insurance Group Ltd. (b) | | | (48 | ) | | | (53,544 | ) |
| | | | | | | | (265,200 | ) |
| Internet: (1.04)% | | | | | | | | |
| CyberAgent, Inc. (b) | | | (800 | ) | | | (28,089 | ) |
| Delivery Hero SE (a)(b) | | | (823 | ) | | | (65,138 | ) |
| GMO Internet, Inc. (b) | | | (400 | ) | | | (7,639 | ) |
| Mercari, Inc. (a)(b) | | | (2,000 | ) | | | (41,139 | ) |
| Rakuten, Inc. (b) | | | (4,700 | ) | | | (40,445 | ) |
| Wayfair, Inc. (a) | | | (503 | ) | | | (45,456 | ) |
| Zillow Group, Inc. Class A (a) | | | (249 | ) | | | (11,389 | ) |
| Zillow Group, Inc. Class C (a) | | | (1,073 | ) | | | (49,294 | ) |
| | | | | | | | (288,589 | ) |
| Investment Companies: (0.57)% | | | | | | | | |
| Aker ASA (b) | | | (806 | ) | | | (49,897 | ) |
| Investor AB (b) | | | (767 | ) | | | (41,862 | ) |
| Melrose Industries PLC (b) | | | (20,432 | ) | | | (64,982 | ) |
| | | | | | | | (156,741 | ) |
| Iron & Steel: (0.49)% | | | | | | | | |
| Hitachi Metals Ltd. (b) | | | (3,100 | ) | | | (46,020 | ) |
| Thyssenkrupp AG (b) | | | (3,529 | ) | | | (47,660 | ) |
| United States Steel Corp. | | | (3,766 | ) | | | (42,970 | ) |
| | | | | | | | (136,650 | ) |
| Leisure Time: (0.15)% | | | | | | | | |
| Drive Shack, Inc. (a) | | | (1,742 | ) | | | (6,376 | ) |
| HIS Co. Ltd. (b) | | | (1,200 | ) | | | (34,623 | ) |
| | | | | | | | (40,999 | ) |
| Lodging: (0.15)% | | | | | | | | |
| MGM China Holdings Ltd. (b) | | | (24,800 | ) | | | (40,483 | ) |
| | | | | | | | | |
| Machinery - Construction & Mining: (0.61)% | | | | | | | | |
| Argan, Inc. | | | (1,088 | ) | | | (43,672 | ) |
| Caterpillar, Inc. | | | (597 | ) | | | (88,165 | ) |
| Tadano Ltd. (b) | | | (4,000 | ) | | | (36,851 | ) |
| | | | | | | | (168,688 | ) |
The accompanying notes are an integral part of these financial statements.
| | |
| | |
| 52 | | LoCorr Dynamic Equity Fund - Schedule of Securities Sold Short (continued) |
| | |
| | | Shares | | | Value | |
| COMMON STOCKS (continued) | | | | | | | | |
| Machinery - Diversified: (0.89)% | | | | | | | | |
| Deere & Co. | | | (344 | ) | | $ | (59,601 | ) |
| Lindsay Corp. | | | (393 | ) | | | (37,724 | ) |
| Wabtec Corp. | | | (761 | ) | | | (59,206 | ) |
| Weir Group PLC (b) | | | (2,396 | ) | | | (47,908 | ) |
| Yaskawa Electric Corp. (b) | | | (1,100 | ) | | | (42,216 | ) |
| | | | | | | | (246,655 | ) |
| Media: (0.35)% | | | | | | | | |
| Walt Disney Co. | | | (613 | ) | | | (88,658 | ) |
| World Wrestling Entertainment, Inc. | | | (129 | ) | | | (8,368 | ) |
| | | | | | | | (97,026 | ) |
| Metal Fabricate & Hardware: (0.18)% | | | | | | | | |
| NTN Corp. (b) | | | (16,000 | ) | | | (50,803 | ) |
| | | | | | | | | |
| Mining: (0.32)% | | | | | | | | |
| Century Aluminum Co. (a) | | | (955 | ) | | | (7,177 | ) |
| Freeport-McMoRan, Inc. | | | (3,824 | ) | | | (50,171 | ) |
| Fresnillo PLC (b) | | | (3,665 | ) | | | (31,080 | ) |
| | | | | | | | (88,428 | ) |
| Miscellaneous Manufacturing: (0.29)% | | | | | | | | |
| Axon Enterprise, Inc. (a) | | | (521 | ) | | | (38,179 | ) |
| Toshiba Corp. (b) | | | (1,200 | ) | | | (40,919 | ) |
| | | | | | | | (79,098 | ) |
| Oil & Gas: (0.17)% | | | | | | | | |
| Drilling Co of 1972 A/S (a)(b) | | | (552 | ) | | | (36,508 | ) |
| Transocean Ltd. (a)(b) | | | (1,346 | ) | | | (9,260 | ) |
| | | | | | | | (45,768 | ) |
| Oil & Gas Services: (0.07)% | | | | | | | | |
| TechnipFMC PLC (b) | | | (940 | ) | | | (19,939 | ) |
| | | | | | | | | |
| Packaging & Containers: (0.04)% | | | | | | | | |
| DS Smith PLC (b) | | | (2,276 | ) | | | (11,583 | ) |
| | | | | | | | | |
| Pharmaceuticals: (0.67)% | | | | | | | | |
| AbbVie, Inc. | | | (492 | ) | | | (43,562 | ) |
| Sarepta Therapeutics, Inc. (a) | | | (397 | ) | | | (51,229 | ) |
| Takeda Pharmaceutical Co. Ltd. (b) | | | (1,100 | ) | | | (43,856 | ) |
| Vifor Pharma AG (b) | | | (253 | ) | | | (46,179 | ) |
| | | | | | | | (184,826 | ) |
| Pipelines: (0.18)% | | | | | | | | |
| Targa Resources Corp. | | | (1,199 | ) | | | (48,955 | ) |
| | | | | | | | | |
| Private Equity: (0.15)% | | | | | | | | |
| Eurazeo (b) | | | (596 | ) | | | (40,781 | ) |
| | | | | | | | | |
| Real Estate: (0.97)% | | | | | | | | |
| Alony Hetz Properties & Investments Ltd. (b) | | | (2,807 | ) | | | (44,381 | ) |
| Deutsche Wohnen SE (b) | | | (980 | ) | | | (40,035 | ) |
| New World Development Co. Ltd. (b) | | | (28,000 | ) | | | (38,376 | ) |
| Tokyu Fudosan Holdings Corp. (b) | | | (8,700 | ) | | | (60,453 | ) |
| Vonovia SE (b) | | | (803 | ) | | | (43,235 | ) |
| Wing Tai Holdings Ltd. (b) | | | (28,200 | ) | | | (42,354 | ) |
| | | | | | | | (268,834 | ) |
| Retail: (1.44)% | | | | | | | | |
| Carvana Co. (a) | | | (644 | ) | | | (59,280 | ) |
| Gaia, Inc. (a) | | | (3,092 | ) | | | (24,705 | ) |
| J Front Retailing Co. Ltd. (b) | | | (3,100 | ) | | | (43,652 | ) |
| Kusuri no Aoki Holdings Co. Ltd. (b) | | | (600 | ) | | | (37,771 | ) |
| Lovesac Co. (a) | | | (652 | ) | | | (10,465 | ) |
| Lumber Liquidators Holdings, Inc. (a) | | | (2,229 | ) | | | (21,777 | ) |
| Regis Corp. (a) | | | (6,590 | ) | | | (117,763 | ) |
| Ryohin Keikaku Co. Ltd. (b) | | | (1,800 | ) | | | (42,343 | ) |
| Swatch Group AG (b) | | | (151 | ) | | | (42,126 | ) |
| | | | | | | | (399,882 | ) |
| Savings & Loans: (0.17)% | | | | | | | | |
| Banc Of California, Inc. | | | (2,838 | ) | | | (48,757 | ) |
The accompanying notes are an integral part of these financial statements.
| | |
| | |
LoCorr Dynamic Equity Fund - Schedule of Securities Sold Short (continued) | | 53 |
| | |
| | | Shares | | | Value | |
| COMMON STOCKS (continued) | | | | | | | | |
| Semiconductors: (0.35)% | | | | | | | | |
| Inphi Corp. (a) | | | (90 | ) | | $ | (6,673 | ) |
| Microchip Technology, Inc. | | | (868 | ) | | | (90,897 | ) |
| | | |
|
| | | (97,570 | ) |
| Software: (0.47)% | | | | | | | | |
| Appian Corp. (a) | | | (256 | ) | | | (9,782 | ) |
| AVEVA Group PLC (b) | | | (705 | ) | | | (43,480 | ) |
| Coupa Software, Inc. (a) | | | (191 | ) | | | (27,934 | ) |
| DocuSign, Inc. (a) | | | (577 | ) | | | (42,761 | ) |
| MongoDB, Inc. (a) | | | (51 | ) | | | (6,712 | ) |
| | | |
|
| | | (130,669 | ) |
| Telecommunications: (1.12)% | | | | | | | | |
| Arista Networks, Inc. (a) | | | (217 | ) | | | (44,138 | ) |
| Millicom International Cellular SA (b) | | | (891 | ) | | | (42,674 | ) |
| Nisshinbo Holdings, Inc. (b) | | | (100 | ) | | | (962 | ) |
| Telefonaktiebolaget LM Ericsson (b) | | | (2,068 | ) | | | (18,008 | ) |
| Verizon Communications, Inc. | | | (1,444 | ) | | | (88,662 | ) |
| ViaSat, Inc. (a) | | | (415 | ) | | | (30,376 | ) |
| Viavi Solutions, Inc. (a) | | | (2,887 | ) | | | (43,305 | ) |
| Vodafone Group PLC (b) | | | (21,546 | ) | | | (41,885 | ) |
| | | | | | | | (310,010 | ) |
| Toys, Games & Hobbies: (0.14)% | | | | | | | | |
| Sanrio Co. Ltd. (b) | | | (2,000 | ) | | | (39,556 | ) |
| | | | | | | | | |
| Transportation: (0.74)% | | | | | | | | |
| C.H. Robinson Worldwide, Inc. | | | (1,128 | ) | | | (88,210 | ) |
| Kawasaki Kisen Kaisha Ltd. (a)(b) | | | (3,600 | ) | | | (61,726 | ) |
| Nishi-Nippon Railroad Co. Ltd. (b) | | | (2,200 | ) | | | (51,024 | ) |
| Seibu Holdings, Inc. (b) | | | (300 | ) | | | (4,956 | ) |
| | | | | | | | (205,916 | ) |
| Water: (0.16)% | | | | | | | | |
| Severn Trent PLC (b) | | | (1,355 | ) | | | (45,140 | ) |
| TOTAL COMMON STOCKS (Proceeds $6,785,512) | | | | | | | (7,312,708 | ) |
| | | | | | | | | |
| EXCHANGE TRADED FUNDS: (4.46)% | | | | | | | | |
| iShares Russell 2000 | | | (3,716 | ) | | | (615,630 | ) |
| SPDR S&P500 Trust | | | (1,924 | ) | | | (619,259 | ) |
| TOTAL EXCHANGE TRADED FUNDS (Proceeds $1,218,444) | | | | | | | (1,234,889 | ) |
| | | | | | | | | |
| PREFERRED STOCK: (0.00)%* | | | | | | | | |
| Rolls-Royce Holdings PLC (a)(b) | | | (197,754 | ) | | | (262 | ) |
| TOTAL PREFERRED STOCK (Proceeds $254) | | | | | | | (262 | ) |
| | | | | | | | | |
| REAL ESTATE INVESTMENT TRUSTS: (1.71)% | | | | | | | | |
| AGNC Investment Corp. | | | (2,581 | ) | | | (45,632 | ) |
| Annaly Capital Management, Inc. | | | (4,624 | ) | | | (43,558 | ) |
| Arlington Asset Investment Corp. | | | (7,318 | ) | | | (40,761 | ) |
| Cherry Hill Mortgage Investment Corp. | | | (2,757 | ) | | | (40,225 | ) |
| Chimera Investment Corp. | | | (724 | ) | | | (14,885 | ) |
| Colony Credit Real Estate, Inc. | | | (3,101 | ) | | | (40,809 | ) |
| Derwent London PLC (b) | | | (865 | ) | | | (45,946 | ) |
| Digital Realty Trust, Inc. | | | (451 | ) | | | (54,003 | ) |
| Front Yard Residential Corp. | | | (1,414 | ) | | | (17,449 | ) |
| Iron Mountain, Inc. | | | (1,241 | ) | | | (39,551 | ) |
| New Residential Investment Corp. | | | (2,799 | ) | | | (45,092 | ) |
| Omega Healthcare Investors, Inc. | | | (767 | ) | | | (32,482 | ) |
| PennyMac Mortgage Investment Trust | | | (562 | ) | | | (12,527 | ) |
| TOTAL REAL ESTATE INVESTMENT TRUSTS (Proceeds $454,671) | | | | | | | (472,920 | ) |
| TOTAL SECURITIES SOLD SHORT (Proceeds $8,458,881): (32.57)% | | | | | | $ | (9,020,779 | ) |
| Percentages are stated as a percent of net assets. |
(a) Non-dividend expense producing security.
(b) Foreign issued security.
| * Amount rounds to less than 0.005% of net assets. |
PLC Public Limited Company |
The accompanying notes are an integral part of these financial statements.
| | |
| | |
| 54 | | LoCorr Dynamic Equity Fund - Schedule of Open Futures Contracts |
| | |
LoCorr Dynamic Equity Fund
Schedule of Open Futures Contracts
December 31, 2019
| | | Number of | | | | | Current | | | | | | Value | |
| Description | | Contracts
Purchased (Sold) | | | Settlement
Month-Year | | Notional
Amount | | | Value at
Trade Date | | | Unrealized
Appreciation | | | Unrealized
(Depreciation) | |
| Purchase Contract: | | | | | | | | | | | | | | | | |
| MSCI World Index | | | 66 | | | Mar-20 | | $ | 4,570,500 | | | $ | 4,526,968 | | | $ | 43,532 | | | $ | — | |
| Total Purchase Contract | | | | | | | | | | | | | | | | | 43,532 | | | | — | |
| | | | | | | | | | | | | | | | | | | | | | | |
| Sale Contract: | | | | | | | | | | | | | | | | | | | | | | |
| S&P 500 E-Mini Index | | | (12 | ) | | Mar-20 | | $ | 1,938,660 | | | $ | 1,905,619 | | | $ | — | | | $ | (33,041 | ) |
| Total Sales Contract | | | | | | | | | | | | | | | | | — | | | | (33,041 | ) |
| Total Futures Contracts | | | | | | | | | | | | | | | | $ | 43,532 | | | $ | (33,041 | ) |
| Net Unrealized Appreciation | | | | | | | | | | | | | | | | $ | 10,491 | | | | | |
The accompanying notes are an integral part of these financial statements.
| | |
| | |
LoCorr Spectrum Income Fund - Schedule of Investments | 55 | |
| | |
LoCorr Spectrum Income Fund
Composition of Investment Portfolio1
December 31, 2019 (Unaudited)
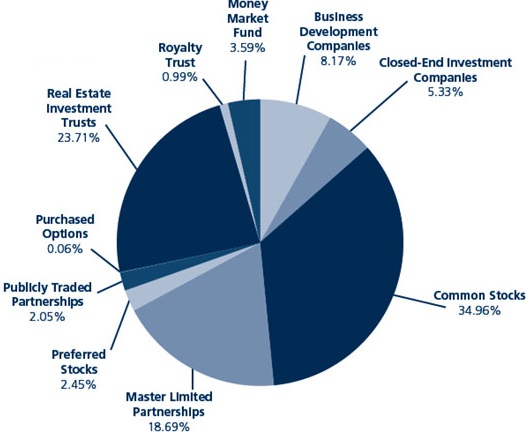
1 As a percentage of total investments.
Schedule of Investments
December 31, 2019
| | | Shares | | | Value | |
| BUSINESS DEVELOPMENT COMPANIES: 8.13% | | | | | | | | |
| Ares Capital Corp. | | | 81,233 | | | $ | 1,514,995 | |
| BlackRock TCP Capital Corp. | | | 51,024 | | | | 716,887 | |
| Hercules Capital, Inc. (f) | | | 113,528 | | | | 1,591,663 | |
| Newtek Business Services Corp. | | | 96,249 | | | | 2,180,040 | |
| TOTAL BUSINESS DEVELOPMENT COMPANIES (Cost $5,486,211) | | | | | | | 6,003,585 | |
| | | | | | | | | |
| CLOSED-END INVESTMENT COMPANIES: 5.30% | | | | | | | | |
| Aberdeen Asia-Pacific Income Fund, Inc. (c) | | | 195,748 | | | | 831,929 | |
| AllianceBernstein Global High Income Fund, Inc. | | | 60,622 | | | | 735,345 | |
| Morgan Stanley Emerging Markets Domestic Debt Fund, Inc. | | | 122,954 | | | | 859,448 | |
| Nuveen Global High Income Fund | | | 46,737 | | | | 765,552 | |
| Western Asset Emerging Markets Debt Fund, Inc. | | | 50,903 | | | | 726,386 | |
| TOTAL CLOSED-END INVESTMENT COMPANIES (Cost $3,639,917) | | | | | | | 3,918,660 | |
| | | | | | | | | |
COMMON STOCKS: 34.77% Advertising: 1.03% | | | | | | | | |
| National CineMedia, Inc. (f) | | | 104,583 | | | | 762,410 | |
| | | | | | | | | |
| Aerospace & Defense: 0.90% | | | | | | | | |
| TransDigm Group, Inc. | | | 1,185 | | | | 663,600 | |
| | | | | | | | | |
| Chemicals: 0.95% | | | | | | | | |
| Dow, Inc. (f) | | | 12,856 | | | | 703,609 | |
| | | | | | | | | |
| Commercial Services: 1.19% | | | | | | | | |
| Macquarie Infrastructure Corp. | | | 20,492 | | | | 877,877 | |
| | | | | | | | | |
| Computers: 1.92% | | | | | | | | |
| International Business Machines Corp. | | | 10,586 | | | | 1,418,948 | |
| | | | | | | | | |
| Diversified Financial Services: 1.77% | | | | | | | | |
| Moelis & Co. | | | 40,900 | | | | 1,305,528 | |
The accompanying notes are an integral part of these financial statements.
| | |
| | |
| | 56 | LoCorr Spectrum Income Fund - Schedule of Investments (continued) |
| | |
| | | Shares | | | Value | |
| COMMON STOCKS (continued) | | | | | | | | |
| Electric: 0.97% | | | | | | | | |
| Atlantica Yield PLC (a) | | | 27,219 | | | $ | 718,309 | |
| | | | | | | | | |
| Energy - Alternate Sources: 4.08% | | | | | | | | |
| NextEra Energy Partners LP | | | 30,827 | | | | 1,623,041 | |
| TerraForm Power, Inc. | | | 90,202 | | | | 1,388,209 | |
| | | | | | | | 3,011,250 | |
| Insurance: 1.16% | | | | | | | | |
| AMERISAFE, Inc. | | | 12,996 | | | | 858,126 | |
| | | | | | | | | |
| Lodging: 1.91% | | | | | | | | |
| Las Vegas Sands Corp. | | | 20,406 | | | | 1,408,830 | |
| | | | | | | | | |
| Oil & Gas: 6.88% | | | | | | | | |
| BP PLC - ADR (a)(e) | | | 34,219 | | | | 1,291,425 | |
| Chevron Corp. (e) | | | 6,000 | | | | 723,060 | |
| CVR Energy, Inc. (f) | | | 32,368 | | | | 1,308,638 | |
| Royal Dutch Shell PLC - ADR (a) | | | 11,484 | | | | 677,327 | |
| Viper Energy Partners LP (f) | | | 43,950 | | | | 1,083,807 | |
| | | | | | | 5,084,257 | |
| Pipelines: 2.74% | | | | | | | | |
| Hess Midstream LP | | | 33,882 | | | | 768,444 | |
| Williams Cos. Inc. | | | 53,084 | | | | 1,259,152 | |
| | | | | | | 2,027,596 | |
| Semiconductors: 2.97% | | | | | | | | |
| Maxim Integrated Products, Inc. | | | 11,680 | | | | 718,437 | |
| QUALCOMM, Inc. (f) | | | 8,179 | | | | 721,633 | |
| Texas Instruments, Inc. | | | 5,857 | | | | 751,395 | |
| | | | | | | 2,191,465 | |
| Transportation: 4.30% | | | | | | | | |
| GasLog Partners LP (a)(f) | | | 54,823 | | | | 857,432 | |
| Golar LNG Partners LP (a) | | | 63,200 | | | | 558,688 | |
| Hoegh LNG Partners LP (a) | | | 62,764 | | | | 981,001 | |
| SFL Corp. Ltd. (a)(f) | | | 53,570 | | | | 778,908 | |
| | | | | | | 3,176,029 | |
| Trucking & Leasing: 2.00% | | | | | | | | |
| Fortress Transportation & Infrastructure Investors LLC | | | 75,707 | | | | 1,479,315 | |
| TOTAL COMMON STOCKS (Cost $25,924,168) | | | | | | | 25,687,149 | |
| | | | | | | | | |
| MASTER LIMITED PARTNERSHIPS: 18.58% | | | Units | | | | | |
| Coal: 0.98% | | | | | | | | |
| Alliance Resource Partners LP | | | 66,693 | | | | 721,618 | |
| | | | | | | | | |
| Energy - Alternate Sources: 1.19% | | | | | | | | |
| Enviva Partners LP | | | 23,603 | | | | 880,628 | |
| | | | | | | | | |
| Entertainment: 1.03% | | | | | | | | |
| Cedar Fair LP | | | 13,715 | | | | 760,360 | |
| | | | | | | | | |
| Gas: 2.24% | | | | | | | | |
| Global Partners LP | | | 81,959 | | | | 1,652,293 | |
| | | | | | | | | |
| Oil & Gas: 1.23% | | | | | | | | |
| Sunoco LP | | | 29,717 | | | | 909,340 | |
| | | | | | | | | |
| Oil & Gas Services: 2.37% | | | | | | | | |
| CrossAmerica Partners LP | | | 48,545 | | | | 876,237 | |
| USA Compression Partners LP (f) | | | 48,414 | | | | 878,230 | |
| | | | | | | 1,754,467 | |
Pipelines: 7.79% | | | | | | | | |
| Crestwood Equity Partners LP (f) | | | 70,011 | | | | 2,157,739 | |
| Delek Logistics Partners LP | | | 28,311 | | | | 904,820 | |
| Energy Transfer LP | | | 82,138 | | | | 1,053,830 | |
| Enterprise Products Partners LP | | | 25,242 | | | | 710,815 | |
| NGL Energy Partners LP (f) | | | 81,964 | | | | 929,472 | |
| | | | | | | | 5,756,676 | |
The accompanying notes are an integral part of these financial statements.
| | |
| | |
LoCorr Spectrum Income Fund - Schedule of Investments (continued) | 57 | |
| | |
| | | Units | | | Value | |
| MASTER LIMITED PARTNERSHIPS (continued) | | | | | | | | |
| Private Equity: 1.75% | | | | | | | | |
| Icahn Enterprises LP (f) | | | 21,055 | | | $ | 1,294,883 | |
| | | | | | | | | |
| Transportation: 0.00%* | | | | | | | | |
| Capital Product Partners LP (a) | | | 98 | | | | 1,317 | |
| TOTAL MASTER LIMITED PARTNERSHIPS (Cost $10,199,423) | | | | | | | 13,731,582 | |
| | | | | | | | | |
| PREFERRED STOCKS: 2.44% | | | Shares | | | | | |
| Pipelines: 1.25% | | | | | | | | |
| Crestwood Equity Partners LP, 9.250% (e) | | | 99,680 | | | | 920,046 | |
| | | | | | | | | |
| Transportation: 1.19% | | | | | | | | |
| Hoegh LNG Partners LP, Series A, 8.750% (a) | | | 33,770 | | | | 881,735 | |
| TOTAL PREFERRED STOCKS (Cost $1,673,373) | | | | | | | 1,801,781 | |
| | | | | | | | | |
| PUBLICLY TRADED PARTNERSHIPS: 2.04% | | | Units | | | | | |
| Blackstone Group, Inc. | | | 14,634 | | | | 818,626 | |
| Brookfield Renewable Partners LP (a) | | | 14,799 | | | | 690,077 | |
| Carlyle Group LP | | | 25 | | | | 802 | |
| TOTAL PUBLICLY TRADED PARTNERSHIPS (Cost $1,158,930) | | | | | | | 1,509,505 | |
| PURCHASED OPTIONS: 0.06% | | Notional Amount | | | Number of Contracts (b) | | | | |
| Put Options: 0.06% | | | | | | | | | | | | |
| iShares Russell 2000 ETF | | | | | | | | | | | | |
| Expiration: January 2020, Exercise Price $160.00 | | $ | 6,626,800 | | | | 400 | | | | 22,800 | |
| Expiration: February 2020, Exercise Price $155.00 | | | 3,313,400 | | | | 200 | | | | 21,000 | |
| TOTAL PURCHASED OPTIONS (Cost $95,802) | | | | | | | | | | | 43,800 | |
| | | Shares | | | | |
| REAL ESTATE INVESTMENT TRUSTS: 23.58% | | | | | | | | |
| AGNC Investment Corp. | | | 121,272 | | | | 2,144,089 | |
| Annaly Capital Management, Inc. | | | 223,925 | | | | 2,109,373 | |
| Apollo Commercial Real Estate Finance, Inc. | | | 109,845 | | | | 2,009,065 | |
| CoreSite Realty Corp. (f) | | | 7,211 | | | | 808,497 | |
| EPR Properties | | | 9,128 | | | | 644,802 | |
| Gaming and Leisure Properties, Inc. | | | 19,760 | | | | 850,668 | |
| Global Net Lease, Inc. | | | 78,124 | | | | 1,584,355 | |
| Invesco Mortgage Capital, Inc. | | | 90,804 | | | | 1,511,887 | |
| Iron Mountain, Inc. | | | 22,389 | | | | 713,537 | |
| MFA Financial, Inc. | | | 91,782 | | | | 702,132 | |
| New York Mortgage Trust, Inc. | | | 228,799 | | | | 1,425,418 | |
| Two Harbors Investment Corp. | | | 145,269 | | | | 2,123,833 | |
| Weyerhaeuser Co. | | | 26,434 | | | | 798,307 | |
| TOTAL REAL ESTATE INVESTMENT TRUSTS (Cost $16,707,453) | | | | | | | 17,425,963 | |
| | | | | | | | | |
| ROYALTY TRUST: 0.98% | | | | | | | | |
| Mesabi Trust (f) | | | 30,747 | | | | 723,784 | |
| TOTAL ROYALTY TRUST (Cost $701,486) | | | | | | | 723,784 | |
| | | | | | | | | |
| SHORT TERM INVESTMENT: 3.57% | | | | | | | | |
| MONEY MARKET FUND: 3.57% | | | | | | | | |
| STIT-Government & Agency Portfolio, Institutional Class, 1.50% (c) | | | 2,635,151 | | | | 2,635,151 | |
| TOTAL MONEY MARKET FUND (Cost $2,635,151) | | | | | | | 2,635,151 | |
| TOTAL SHORT TERM INVESTMENT (Cost $2,635,151) | | | | | | | 2,635,151 | |
| | | | | | | | | |
| TOTAL INVESTMENTS (Cost $68,221,914): 99.45% | | | | | | | 73,480,960 | |
| Other Assets in Excess of Liabilities: 0.55% (d) | | | | | | | 405,150 | |
| TOTAL NET ASSETS: 100.00% | | | | | | $ | 73,886,110 | |
| (a) | Foreign issue security |
| (b) | Each contract is equivalent to 100 shares of common stock. |
| (c) | The rate quoted is the annualized seven-day effective yield as of December 31, 2019. |
| (d) | Includes assets pledged as collateral for derivative instruments. |
| (e) | All or a portion of this security is held as collateral for options written. |
| (f) | Security held in connection with options written. |
| * | Amount rounds to less than 0.005% of net assets |
| ADR | American Depositary Reciept |
| PLC | Public Limited Company |
The accompanying notes are an integral part of these financial statements.
| | |
| | |
| | 58 | LoCorr Spectrum Income Fund – Schedule of Written Options |
| | |
LoCorr Spectrum Income Fund
Schedule of Written Options
December 31, 2019
| | | Notional Amount | | | Number of Contracts (a) | | | Value | |
| WRITTEN OPTIONS: 0.17% | | | | | | | | | | | | |
| Call Options: 0.17% | | | | | | | | | | | | |
| CoreSite Realty Corp. Expiration: January 2020, Exercise Price: $125.00 | | $ | 807,264 | | | | (72 | ) | | $ | 18,000 | |
| Crestwood Equity Partners LP Expiration: January 2020, Exercise Price: $35.00 | | | 770,500 | | | | (250 | ) | | | 2,500 | |
| CVR Energy, Inc. Expiration: January 2020, Exercise Price: $50.00 | | | 1,305,889 | | | | (323 | ) | | | 1,615 | |
| Dow, Inc. Expiration: January 2020, Exercise Price: $57.50 | | | 700,544 | | | | (128 | ) | | | 2,560 | |
| GasLog Partners LP Expiration: January 2020, Exercise Price: $17.50 | | | 90,712 | | | | (58 | ) | | | 435 | |
| Hercules Capital, Inc. Expiration: January 2020, Exercise Price: $15.00 | | | 701,000 | | | | (500 | ) | | | 1,250 | |
| Icahn Enterprises LP Expiration: January 2020, Exercise Price: $65.00 | | | 1,291,500 | | | | (210 | ) | | | 4,200 | |
| Mesabi Trust Expiration: January 2020, Exercise Price: $25.00 | | | 207,152 | | | | (88 | ) | | | 1,320 | |
| National CineMedia, Inc. Expiration: January 2020, Exercise Price: $7.50 | | | 599,967 | | | | (823 | ) | | | 8,230 | |
| NGL Energy Partners LP Expiration: April 2020, Exercise Price: $12.50 | | | 928,746 | | | | (819 | ) | | | 34,808 | |
| QUALCOMM, Inc. Expiration: January 2020, Exercise Price: $90.00 | | | 714,663 | | | | (81 | ) | | | 9,557 | |
| SFL Corp Ltd. Expiration: January 2020, Exercise Price: $15.00 | | | 436,200 | | | | (300 | ) | | | 1,500 | |
| USA Compression Partners LP Expiration: January 2020, Exercise Price: $17.50 | | | 877,976 | | | | (484 | ) | | | 39,688 | |
| Viper Energy Partners LP Expiration: January 2020, Exercise Price: $27.00 | | | 394,560 | | | | (160 | | | | 801 | |
| TOTAL WRITTEN OPTIONS (Premiums received $76,969) | | | | | | | | | | $ | 126,464 | |
Percentages are stated as a percent of net assets.
(a) Each contract is equivalent to 100 shares of common stock.
The accompanying notes are an integral part of these financial statements.
| | |
| | |
LoCorr Macro Strategies Fund, LoCorr Long/Short Commodities Strategy Fund and LoCorr Market Trend Fund -
Consolidated Statements of Assets & Liabilities | | 59 |
| | |
Consolidated Statements of Assets & Liabilities
December 31, 2019
| | | | | | | | | | |
| | | LoCorr Macro Strategies Fund | | | LoCorr Long/Short Commodities
Strategy Fund | | | LoCorr Market
Trend Fund | |
| Assets | | | | | | | | | |
| Investments, at value (Cost $751,300,811, $208,248,900 and $231,335,203, respectively) | | $ | 758,395,517 | | | $ | 211,524,859 | | | $ | 232,545,387 | |
| Cash (Note 2) | | | 12,177,384 | | | | 2,729 | | | | 12,230,000 | |
| Foreign currency, at value (Cost $27,487,883, $0 and $0, respectively) | | | 27,674,246 | | | | — | | | | — | |
| Receivable for Fund shares sold | | | 6,754,910 | | | | 857,425 | | | | 2,385,268 | |
| Receivable for securities sold | | | 20,163 | | | | — | | | | 2,083,720 | |
| Interest receivable | | | 3,966,520 | | | | 1,014,976 | | | | 1,071,820 | |
| Receivable for unsettled open futures contracts | | | 1,406,038 | | | | — | | | | 1,436,013 | |
| Deposits with broker for derivative instruments (Note 2) | | | 25,014,499 | | | | 56,505,498 | | | | 29,494,076 | |
| Unrealized appreciation on forward currency contracts (Note 2) | | | 7,654,863 | | | | — | | | | 1,556,758 | |
| Advance receipt on swap contracts | | | — | | | | 13,908,302 | | | | — | |
| Prepaid expenses and other assets | | | 64,417 | | | | 44,312 | | | | 23,519 | |
| Total Assets | | | 843,128,557 | | | | 283,858,101 | | | | 282,826,561 | |
| | | | | | | | | | | | | |
| Liabilities | | | | | | | | | | | | |
| Payable for Fund shares redeemed | | $ | 1,761,378 | | | $ | 995,559 | | | $ | 626,721 | |
| Payable for securities purchased | | | — | | | | 35,784 | | | | 3,440,125 | |
| Payable for unsettled open futures contracts | | | 1,217,123 | | | | — | | | | 970,980 | |
| Payable for variation margin on futures contracts | | | 728,936 | | | | — | | | | 587,768 | |
| Accrued management fees (Note 5) | | | 1,144,265 | | | | 332,193 | | | | 341,715 | |
| Accrued Trustees’ fees | | | 14,693 | | | | 5,469 | | | | 5,457 | |
| Accrued Rule 12b-1 fees | | | — | | | | 133,746 | | | | 139,824 | |
| Unrealized depreciation on swap contracts (Note 1) | | | — | | | | 26,162,161 | | | | — | |
| Unrealized depreciation on forward currency contracts (Note 2) | | | 11,396,137 | | | | — | | | | 3,391,134 | |
| Accrued expenses and other liabilities | | | 280,275 | | | | 148,510 | | | | 117,342 | |
| Total Liabilities | | | 16,542,807 | | | | 27,813,422 | | | | 9,621,066 | |
| | | | | | | | | | | | | |
| Net Assets | | $ | 826,585,750 | | | $ | 256,044,679 | | | $ | 273,205,495 | |
| | | | | | | | | | | | | |
Net Assets Consist of: | | | | | | | | | | | | |
| Paid-in capital | | $ | 807,355,083 | | | $ | 278,864,041 | | | $ | 278,000,352 | |
| Total distributable earnings/(accumulated loss) | | | 19,230,667 | | | | (22,819,362 | ) | | | (4,794,857 | ) |
| NET ASSETS | | $ | 826,585,750 | | | $ | 256,044,679 | | | $ | 273,205,495 | |
| | | | | | | | | | | | | |
Class A Shares | | | | | | | | | | | | |
| Net assets | | $ | 53,320,295 | | | $ | 45,513,375 | | | $ | 21,966,062 | |
| Shares issued and outstanding (unlimited shares authorized, no par value) | | | 6,230,388 | | | | 4,913,521 | | | | 1,963,697 | |
| Net asset value, redemption, and minimum offering price per share (a) | | $ | 8.56 | | | $ | 9.26 | | | $ | 11.19 | |
| Maximum offering price per share ($8.56/0.9425), ($9.26/0.9425), ($11.19/0.9425), respectively(b) | | $ | 9.08 | | | $ | 9.82 | | | $ | 11.87 | |
| | | | | | | | | | | | | |
| Class C Shares | | | | | | | | | | | | |
| Net assets | | $ | 47,204,673 | | | $ | 6,644,468 | | | $ | 16,320,451 | |
| Shares issued and outstanding (unlimited shares authorized, no par value) | | | 5,789,943 | | | | 747,514 | | | | 1,498,722 | |
| Net asset value, redemption, and offering price per share (a) | | $ | 8.15 | | | $ | 8.89 | | | $ | 10.89 | |
| | | | | | | | | | | | | |
| Class I Shares | | | | | | | | | | | | |
| Net assets | | $ | 726,060,782 | | | $ | 203,886,836 | | | $ | 234,918,982 | |
| Shares issued and outstanding (unlimited shares authorized, no par value) | | | 83,531,983 | | | | 21,745,810 | | | | 20,922,885 | |
| Net asset value, redemption, and offering price per share | | $ | 8.69 | | | $ | 9.38 | | | $ | 11.23 | |
| (a) | A 1.00% contingent deferred sales charge may apply to redemptions made within twelve months of purchase. The contingent deferred sales charge only applies to Class A share purchases of $1 million or more. |
| (b) | On investments of $25,000 or more, the offering price is reduced. |
The accompanying notes are an integral part of these consolidated financial statements.
| | |
| | |
| | 60 | LoCorr Dynamic Equity Fund and LoCorr Spectrum Income Fund - Statements of Assets & Liabilities |
| | |
Statements of Assets & Liabilities
December 31, 2019
| | | | | | | |
| | | LoCorr Dynamic Equity Fund | | | LoCorr Spectrum Income Fund | |
| Assets | | | | | | | | |
| Investments, at value (Cost $20,558,378 and $68,221,914, respectively) | | $ | 24,041,289 | | | $ | 73,480,960 | |
| Cash (Note 2) | | | 3,739,341 | | | | 9,844 | |
| Foreign currency, at value (Cost $3,744,248 and $0, respectively) | | | 3,801,362 | | | | — | |
| Receivable for Fund shares sold | | | 22,215 | | | | 266,912 | |
| Receivable for securities sold | | | 548,836 | | | | 746 | |
| Dividends, interest and other receivables | | | 24,510 | | | | 396,727 | |
| Deposits with broker for future contracts | | | 381,890 | | | | — | |
| Deposits with broker for securities sold short (Note 2) | | | 4,612,612 | | | | — | |
| Deposits with broker for options | | | — | | | | 349,387 | |
| Prepaid expenses and other assets | | | 12,831 | | | | 31,093 | |
| Total Assets | | | 37,184,886 | | | | 74,535,669 | |
| | | | | | | | | |
| Liabilities | | | | | | | | |
| Securities sold short, at value (Proceeds $8,458,881 and $0, respectively) | | $ | 9,020,779 | | | $ | — | |
| Options written, at value (Premiums received $0 and $76,969, respectively) | | | — | | | | 126,464 | |
| Payable for Fund shares redeemed | | | 96,417 | | | | 196,726 | |
| Payable for securities purchased | | | 257,787 | | | | 24,712 | |
| Payable for distributions | | | 5,909 | | | | 104,768 | |
| Payable for variation margin on futures contracts | | | 4,620 | | | | — | |
| Dividend payable | | | 21,130 | | | | — | |
| Accrued management fees (Note 5) | | | 18,042 | | | | 81,159 | |
| Accrued Trustees’ fees | | | 585 | | | | 1,519 | |
| Accrued Rule 12b-1 fees | | | 16,313 | | | | 69,283 | |
| Accrued expenses and other liabilities | | | 45,550 | | | | 44,928 | |
| Total Liabilities | | | 9,487,132 | | | | 649,559 | |
| | | | | | | | | |
| Net Assets | | $ | 27,697,754 | | | $ | 73,886,110 | |
| | | | | | | | | |
| Net Assets Consist of: | | | | | | | | |
| Paid-in capital | | $ | 26,736,779 | | | $ | 95,279,713 | |
| Total distributable earnings/(accumulated loss) | | | 960,975 | | | | (21,393,603 | ) |
| NET ASSETS | | $ | 27,697,754 | | | $ | 73,886,110 | |
| | | | | | | | | |
| Class A Shares | | | | | | | | |
| Net assets | | $ | 6,743,512 | | | $ | 25,191,601 | |
| Shares issued and outstanding (unlimited shares authorized, no par value) | | | 601,952 | | | | 3,656,243 | |
| Net asset value, redemption, and minimum offering price per share (a) | | $ | 11.20 | | | $ | 6.89 | (b) |
| Maximum offering price per share ($11.20/0.9425), ($6.89/0.9425), respectively(c) | | $ | 11.88 | | | $ | 7.31 | |
| | | | | | | | | |
| Class C Shares | | | | | | | | |
| Net assets | | $ | 4,031,242 | | | $ | 18,645,357 | |
| Shares issued and outstanding (unlimited shares authorized, no par value) | | | 379,758 | | | | 2,680,691 | |
| Net asset value, redemption, and offering price per share (a) | | $ | 10.62 | | | $ | 6.96 | (b) |
| | | | | | | | | |
| Class I Shares | | | | | | | | |
| Net assets | | $ | 16,923,000 | | | $ | 30,049,152 | |
| Shares issued and outstanding (unlimited shares authorized, no par value) | | | 1,483,312 | | | | 4,370,282 | |
| Net asset value, redemption, and offering price per share | | $ | 11.41 | | | $ | 6.88 | (b) |
| (a) | A 1.00% contingent deferred sales charge may apply to redemptions made within twelve months of purchase. The contingent deferred sales charge only applies to Class A share purchases of $1 million or more. |
| (b) | Redemptions made within 60 days of purchase may be assessed a redemption fee of 2.00%. |
| (c) | On investments of $25,000 or more, the offering price is reduced. |
The accompanying notes are an integral part of these financial statements.
| | |
| | |
LoCorr Macro Strategies Fund, LoCorr Long/Short Commodities Strategy Fund and LoCorr Market Trend Fund -
Consolidated Statements of Operations | | 61 |
| | |
Consolidated Statements of Operations
Year Ended December 31, 2019
| | | LoCorr Macro Strategies Fund | | | LoCorr Long/Short Commodities
Strategy Fund | | | LoCorr Market
Trend Fund | |
| Investment Income | | | | | | | | | | | | |
| Interest income | | $ | 15,710,059 | | | $ | 7,812,101 | | | $ | 5,909,565 | |
| Total Investment Income | | | 15,710,059 | | | | 7,812,101 | | | | 5,909,565 | |
| | | | | | | | | | | | | |
| Expenses | | | | | | | | | | | | |
| Management fees (Note 5) | | | 10,444,673 | | | | 4,386,050 | | | | 4,090,179 | |
| Fund administration fees | | | 235,888 | | | | 145,866 | | | | 130,414 | |
| Fund accounting fees | | | 245,911 | | | | 167,970 | | | | 122,979 | |
| Trustees’ fees | | | 59,308 | | | | 27,343 | | | | 26,578 | |
| Transfer agent fees and expenses | | | 787,007 | | | | 484,885 | | | | 275,442 | |
| Custodian fees | | | 40,141 | | | | 19,343 | | | | 14,596 | |
| Registration expenses | | | 68,338 | | | | 71,520 | | | | 58,689 | |
| Rule 12b-1 fee - Class A (Note 5) | | | 128,497 | | | | 146,919 | | | | 55,649 | |
| Rule 12b-1 fee - Class C (Note 5) | | | 475,297 | | | | 72,013 | | | | 184,732 | |
| Legal and audit fees | | | 66,429 | | | | 45,304 | | | | 53,096 | |
| Printing and mailing expenses | | | 101,437 | | | | 51,413 | | | | 47,422 | |
| Other expenses | | | 24,814 | | | | 11,733 | | | | 15,342 | |
| Total expenses before fee recovery to Adviser | | | 12,677,740 | | | | 5,630,359 | | | | 5,075,118 | |
| Fee recovery to Adviser (Note 5) | | | 522,962 | | | | 103,619 | | | | — | |
| Net Expenses | | | 13,200,702 | | | | 5,733,978 | | | | 5,075,118 | |
| Net Investment Income | | | 2,509,357 | | | | 2,078,123 | | | | 834,447 | |
| | | | | | | | | | | | | |
Realized and Unrealized Gain (Loss) on Investments, Swap Contracts, Forward Currency
Contracts, Futures Contracts and Foreign Currency Translation: |
| Net realized gain (loss) on: | | | | | | | | | | | | |
| Investments | | | 2,680,611 | | | | 2,389,628 | | | | 747,146 | |
| Swap contracts | | | — | | | | 3,489,570 | | | | — | |
| Forward currency contracts | | | (6,401,505 | ) | | | — | | | | (2,224,153 | ) |
| Futures contracts | | | 68,085,202 | | | | — | | | | 38,058,960 | |
| Foreign currency translation | | | 1,625,144 | | | | — | | | | (140,649 | ) |
| Net change in unrealized appreciation/depreciation on: | | | | | | | | | | | | |
| Investments | | | 9,750,619 | | | | 3,348,597 | | | | 1,797,289 | |
| Swap contracts | | | — | | | | (30,526,107 | ) | | | — | |
| Forward currency contracts | | | (2,813,992 | ) | | | — | | | | 671,848 | |
| Futures contracts | | | (1,462,436 | ) | | | — | | | | 3,105,936 | |
| Foreign currency translation | | | (52,471 | ) | | | — | | | | — | |
| Net realized and unrealized gain (loss) | | | 71,411,172 | | | | (21,298,312 | ) | | | 42,016,377 | |
| Net Increase (Decrease) in Net Assets Resulting From Operations | | $ | 73,920,529 | | | $ | (19,220,189 | ) | | $ | 42,850,824 | |
The accompanying notes are an integral part of these consolidated financial statements.
| | |
| | |
| | 62 | LoCorr Dynamic Equity Fund and LoCorr Spectrum Income Fund - Statements of Operations |
| | |
Statements of Operations
Year Ended December 31, 2019
| | LoCorr Dynamic Equity Fund | | | LoCorr
Spectrum
Income Fund | |
| | | | | | | |
| Investment Income | | | | | | |
| Dividend and interest income (a) | | $ | 349,848 | | | $ | 2,936,481 | |
| Total Investment Income | | | 349,848 | | | | 2,936,481 | |
| | | | | | | | | |
| Expenses | | | | | | | | |
| Management fees (Note 5) | | | 406,449 | | | | 963,419 | |
| Fund administration fees | | | 66,103 | | | | 60,305 | |
| Fund accounting fees | | | 51,994 | | | | 42,566 | |
| Trustees’ fees | | | 2,629 | | | | 6,982 | |
| Transfer agent fees and expenses | | | 65,031 | | | | 118,046 | |
| Custodian fees | | | 54,249 | | | | 6,591 | |
| Registration expenses | | | 45,408 | | | | 48,591 | |
| Rule 12b-1 fee - Class A (Note 5) | | | 19,012 | | | | 62,467 | |
| Rule 12b-1 fee - Class C (Note 5) | | | 46,931 | | | | 192,502 | |
| Legal and audit fees | | | 30,882 | | | | 31,440 | |
| Printing and mailing expenses | | | 4,446 | | | | 29,099 | |
| Other expenses | | | 4,093 | | | | 4,894 | |
| Total expense before dividend and interest expense | | | 797,227 | | | | 1,566,902 | |
| Dividend expense on securities sold short (Note 2) | | | 198,464 | | | | — | |
| Interest expense | | | 13,052 | | | | 994 | |
| Total expenses before fee waiver from Advisor | | | 1,008,743 | | | | 1,567,896 | |
| Fee waiver from Adviser (Note 5) | | | (192,060 | ) | | | — | |
| Net Expenses | | | 816,683 | | | | 1,567,896 | |
| Net Investment Income (Loss) | | | (466,835 | ) | | | 1,368,585 | |
| | | | | | | | | |
| Realized and Unrealized Gain (Loss) on Investments, Securities Sold Short, Futures Contracts, Foreign Currency Translation and Written Options: | | | | | | | | |
| Net realized gain (loss) on: | | | | | | | | |
| Investments | | | (151,325 | ) | | | (538,876 | ) |
| Securities sold short | | | (1,341,716 | ) | | | — | |
| Futures contracts | | | 901,477 | | | | — | |
| Foreign currency translation | | | (31,457 | ) | | | — | |
| Written options | | | — | | | | 182,517 | |
| Net change in unrealized appreciation/depreciation on: | | | | | | | | |
| Investments | | | 5,287,346 | | | | 11,231,329 | |
| Securities sold short | | | (650,933 | ) | | | — | |
| Foreign currency translation | | | 57,136 | | | | — | |
| Futures contracts | | | 10,491 | | | | — | |
| Written options | | | — | | | | (49,495 | ) |
| Net realized and unrealized gain | | | 4,081,019 | | | | 10,825,475 | |
| Net Increase in Net Assets Resulting From Operations | | $ | 3,614,184 | | | $ | 12,194,060 | |
(a) Net foreign tax withheld of $11,268 and $7,700, respectively.
The accompanying notes are an integral part of these financial statements.
| | |
| | |
LoCorr Macro Strategies Fund - Consolidated Statements of Changes in Net Assets | 63 | |
| | |
LoCorr Macro Strategies Fund
Consolidated Statements of Changes in Net Assets
| | | | | | | |
| | | Year Ended December 31, |
| | 2019 | | 2018 | |
| | | | | | | |
| Operations | | | | | | |
| Net investment income | | $ | 2,509,357 | | | $ | 1,090,770 | |
Net realized gain (loss) on investments, forward currency contracts, futures contracts and
foreign currency translation | | | 65,989,452 | | | | (36,778,521 | ) |
Net change in unrealized appreciation/depreciation of investments, forward currency contracts,
futures contracts and foreign currency translation | | | 5,421,720 | | | | (6,412,563 | ) |
| Increase (Decrease) in Net Assets Resulting From Operations | | | 73,920,529 | | | | (42,100,314 | ) |
| | | | | | | | | |
| Distributions From Earnings | | | | | | | | |
| Class A | | | (2,273,098 | ) | | | (1,641,026 | ) |
| Class C | | | (1,949,391 | ) | | | (1,111,427 | ) |
| Class I | | | (27,731,042 | ) | | | (14,372,592 | ) |
| Total Distributions From Earnings | | | (31,953,531 | ) | | | (17,125,045 | ) |
| | | | | | | | | |
| Capital Transactions (Note 6) | | | | | | | | |
| Proceeds from shares sold | | | 457,926,442 | | | | 326,669,713 | |
| Reinvestment of distributions | | | 29,628,161 | | | | 15,654,959 | |
| Cost of shares redeemed | | | (257,017,118 | ) | | | (518,836,160 | ) |
| Increase (Decrease) in Net Assets From Capital Transactions | | | 230,537,485 | | | | (176,511,488 | ) |
| | | | | | | | | |
| Total Increase (Decrease) in Net Assets | | | 272,504,483 | | | | (235,736,847 | ) |
| | | | | | | | | |
| Net Assets | | | | | | | | |
| Beginning of year | | | 554,081,267 | | | | 789,818,114 | |
| End of year | | $ | 826,585,750 | | | $ | 554,081,267 | |
The accompanying notes are an integral part of these consolidated financial statements.
| | |
| | |
| | 64 | LoCorr Long/Short Commodities Strategy Fund - Consolidated Statements of Changes in Net Assets |
| | |
LoCorr Long/Short Commodities Strategy Fund
Consolidated Statements of Changes in Net Assets
| | | | | | | |
| | | Year Ended December 31, |
| | | 2019 | | 2018 | |
| | | | | | | |
| Operations | | | | | | |
| Net investment income | | $ | 2,078,123 | | | $ | 461,665 | |
| Net realized gain on investments and swap contracts | | | 5,879,198 | | | | 4,813,532 | |
| Net change in unrealized appreciation/depreciation of investments and swap contracts | | | (27,177,510 | ) | | | 16,122,331 | |
| Increase (Decrease) in Net Assets Resulting From Operations | | | (19,220,189 | ) | | | 21,397,528 | |
| | | | | | | | | |
| Distributions From Earnings | | | | | | | | |
| Class A | | | (113,252 | ) | | | (5,426,159 | ) |
| Class C | | | (451 | ) | | | (652,659 | ) |
| Class I | | | (1,133,635 | ) | | | (17,507,215 | ) |
| Total Distributions From Earnings | | | (1,247,338 | ) | | | (23,586,033 | ) |
| | | | | | | | | |
| Capital Transactions (Note 6) | | | | | | | | |
| Proceeds from shares sold | | | 184,040,413 | | | | 195,310,076 | |
| Reinvestment of distributions | | | 1,025,506 | | | | 18,672,560 | |
| Cost of shares redeemed | | | (165,579,736 | ) | | | (38,015,146 | ) |
| Increase in Net Assets From Capital Transactions | | | 19,486,183 | | | | 175,967,490 | |
| | | | | | | | | |
| Total Increase (Decrease) in Net Assets | | | (981,344 | ) | | | 173,778,985 | |
| | | | | | | | | |
| Net Assets | | | | | | | | |
| Beginning of year | | | 257,026,023 | | | | 83,247,038 | |
| End of year | | $ | 256,044,679 | | | $ | 257,026,023 | |
The accompanying notes are an integral part of these consolidated financial statements.
| | |
| | |
LoCorr Market Trend Fund - Consolidated Statements of Changes in Net Assets | 65 | |
| | |
LoCorr Market Trend Fund
Consolidated Statements of Changes in Net Assets
| | | | | | | |
| | | Year Ended December 31, |
| | | 2019 | | 2018 | |
| | | | | | | |
| Operations | | | | | | |
| Net investment income (loss) | | $ | 834,447 | | | $ | (420,639 | ) |
| Net realized gain (loss) on investments, forward currency contracts, futures contracts and foreign currency translation | | | 36,441,304 | | | | (52,236,535 | ) |
| Net change in unrealized appreciation/depreciation of investments, forward currency contracts, futures contracts and foreign currency translation | | | 5,575,073 | | | | (31,624,162 | ) |
| Increase (Decrease) in Net Assets Resulting From Operations | | | 42,850,824 | | | | (84,281,336 | ) |
| | | | | | | | | |
| Distributions From Earnings | | | | | | | | |
| Class A | | | (129,659 | ) | | | — | |
| Class I | | | (2,948,512 | ) | | | — | |
| Total Distributions to Shareholders | | | (3,078,171 | ) | | | — | |
| | | | | | | | | |
| Capital Transactions (Note 6) | | | | | | | | |
| Proceeds from shares sold | | | 98,897,248 | | | | 283,959,578 | |
| Reinvestment of distributions | | | 2,954,424 | | | | — | |
| Cost of shares redeemed | | | (211,619,382 | ) | | | (523,178,776 | ) |
| Decrease in Net Assets From Capital Transactions | | | (109,767,710 | ) | | | (239,219,198 | ) |
| | | | | | | | | |
| Total Decrease in Net Assets | | | (69,995,057 | ) | | | (323,500,534 | ) |
| | | | | | | | | |
| Net Assets | | | | | | | | |
| Beginning of year | | | 343,200,552 | | | | 666,701,086 | |
| End of year | | $ | 273,205,495 | | | $ | 343,200,552 | |
The accompanying notes are an integral part of these consolidated financial statements.
| | |
| | |
| | 66 | LoCorr Dynamic Equity Fund - Statements of Changes in Net Assets |
| | |
LoCorr Dynamic Equity Fund
Statements of Changes in Net Assets
| | | Year Ended December 31, |
| | | 2019 | | 2018 | |
| | | | | | | |
| Operations | | | | | | |
| Net investment loss | | $ | (466,835 | ) | | $ | (1,110,481 | ) |
| Net realized gain (loss) on investments, securities sold short, futures contracts and foreign currency translation | | | (623,021 | ) | | | 2,095,066 | |
| Net change in unrealized appreciation/depreciation of investments, securities sold short, futures contracts and foreign currency translation | | | 4,704,040 | | | | (7,056,676 | ) |
| Increase (Decrease) in Net Assets Resulting From Operations | | | 3,614,184 | | | | (6,072,091 | ) |
| | | | | | | | | |
| Distributions From Earnings | | | | | | | | |
| Class A | | | (23,048 | ) | | | (323,018 | ) |
| Class C | | | (14,375 | ) | | | (208,891 | ) |
| Class I | | | (56,118 | ) | | | (630,416 | ) |
| Total Distributions From Earnings | | | (93,541 | ) | | | (1,162,325 | ) |
| | | | | | | | | |
| Capital Transactions (Note 6) | | | | | | | | |
| Proceeds from shares sold | | | 10,150,264 | | | | 11,732,272 | |
| Reinvestment of distributions | | | 87,631 | | | | 1,093,095 | |
| Cost of shares redeemed | | | (16,333,680 | ) | | | (39,145,301 | ) |
| Decrease in Net Assets From Capital Transactions | | | (6,095,785 | ) | | | (26,319,934 | ) |
| | | | | | | | | |
| Total Decrease in Net Assets | | | (2,575,142 | ) | | | (33,554,350 | ) |
| | | | | | | | | |
| Net Assets | | | | | | | | |
| Beginning of year | | | 30,272,896 | | | | 63,827,246 | |
| End of year | | $ | 27,697,754 | | | $ | 30,272,896 | |
The accompanying notes are an integral part of these financial statements.
| | |
| | |
LoCorr Spectrum Income Fund - Statements of Changes in Net Assets | 67 | |
| | |
LoCorr Spectrum Income Fund
Statements of Changes in Net Assets
| | | Year Ended December 31, |
| | | 2019 | | 2018 | |
| | | | | | | |
| Operations | | | | | | |
| Net investment income | | $ | 1,368,585 | | | $ | 2,402,701 | |
| Net realized gain (loss) on investments and written options | | | (356,359 | ) | | | 2,771 | |
| Net change in unrealized appreciation/depreciation of investments and written options | | | 11,181,834 | | | | (9,102,504 | ) |
| Increase (Decrease) in Net Assets Resulting From Operations | | | 12,194,060 | | | | (6,697,032 | ) |
| | | | | | | | | |
| Distributions From Earnings | | | | | | | | |
| Net investment income: | | | | | | | | |
| Class A | | | (431,377 | ) | | | (956,505 | ) |
| Class C | | | (293,781 | ) | | | (681,277 | ) |
| Class I | | | (540,423 | ) | | | (1,262,271 | ) |
| Return of capital: | | | | | | | | |
| Class A | | | (1,380,030 | ) | | | (1,144,116 | ) |
| Class C | | | (939,845 | ) | | | (814,904 | ) |
| Class I | | | (1,728,885 | ) | | | (1,509,857 | ) |
| Total Distributions From Earnings | | | (5,314,341 | ) | | | (6,368,930 | ) |
| | | | | | | | | |
| Capital Transactions (Note 6) | | | | | | | | |
| Proceeds from shares sold | | | 24,156,953 | | | | 24,514,502 | |
| Reinvestment of distributions | | | 3,980,781 | | | | 4,713,777 | |
| Cost of shares redeemed | | | (29,452,865 | ) | | | (44,379,996 | ) |
| Redemption fees | | | 1,562 | | | | 25,115 | |
| Decrease in Net Assets From Capital Transactions | | | (1,313,569 | ) | | | (15,126,602 | ) |
| | | | | | | | | |
| Total Increase (Decrease) in Net Assets | | | 5,566,150 | | | | (28,192,564 | ) |
| | | | | | | | | |
| Net Assets | | | | | | | | |
| Beginning of year | | | 68,319,960 | | | | 96,512,524 | |
| End of year | | $ | 73,886,110 | | | $ | 68,319,960 | |
The accompanying notes are an integral part of these financial statements.
| | |
| | |
68 | | LoCorr Macro Strategies Fund - Consolidated Financial Highlights - Class A |
| | |
LoCorr Macro Strategies Fund - Class A
Consolidated Financial Highlights
Selected Data and Ratios (for a share outstanding throughout the year)
| | | Year Ended December 31, |
| | | 2019 | | | 2018 | | | 2017 | | | 2016 | | | 2015 | |
Per Share Net asset value, beginning of year | | $ | 7.95 | | | $ | 8.64 | | | $ | 8.91 | | | $ | 8.54 | | | $ | 8.51 | |
| | | | | | | | | | | | | | | | | | | | | |
Income (loss) from investment operations: | | | | | | | | | | | | | | | | | | | | |
Net investment income (loss)(a) | | | 0.02 | | | | 0.00 | (b) | | | (0.06 | ) | | | (0.09 | ) | | | (0.08 | ) |
| Net realized and unrealized gain (loss) | | | 0.98 | | | | (0.46 | ) | | | 0.31 | | | | 0.64 | | | | 0.36 | |
| Total from Investment Operations | | | 1.00 | | | | (0.46 | ) | | | 0.25 | | | | 0.55 | | | | 0.28 | |
| | | | | | | | | | | | | | | | | | | | | |
| Distributions From Earnings: | | | | | | | | | | | | | | | | | | | | |
| Net investment income | | | (0.16 | ) | | | (0.10 | ) | | | — | | | | — | | | | (0.25 | ) |
| Net realized gains | | | (0.23 | ) | | | (0.13 | ) | | | (0.52 | ) | | | (0.18 | ) | | | — | |
| Total Distributions | | | (0.39 | ) | | | (0.23 | ) | | | (0.52 | ) | | | (0.18 | ) | | | (0.25 | ) |
| | | | | | | | | | | | | | | | | | | | | |
| Redemption Fees | | | — | | | | — | | | | 0.00 | (b) | | | 0.00 | (b) | | | 0.00 | (b) |
| | | | | | | | | | | | | | | | | | | | | |
| Net Asset Value, End of Year | | $ | 8.56 | | | $ | 7.95 | | | $ | 8.64 | | | $ | 8.91 | | | $ | 8.54 | |
| | | | | | | | | | | | | | | | | | | | | |
Total Investment Return(c) | | | 12.52 | % | | | (5.36 | )% | | | 2.77 | % | | | 6.39 | % | | | 3.27 | % |
| | | | | | | | | | | | | | | | | | | | | |
| Net Assets, End of Year, in Thousands | | $ | 53,320 | | | $ | 55,075 | | | $ | 93,182 | | | $ | 297,844 | | | $ | 229,427 | |
| | | | | | | | | | | | | | | | | | | | | |
Ratios/Supplemental Data: Ratio of expenses to average net assets:
Before expense waiver or recovery | | | 2.16 | % | | | 2.25 | % | | | 2.33 | % | | | 2.34 | % (d),(e) | | | 2.06 | %(d),(e) |
| After expense waiver or recovery | | | 2.24 | % | | | 2.24 | % | | | 2.28 | % | | | 2.34 | % (d),(e) | | | 2.06 | %(d),(e) |
| | | | | | | | | | | | | | | | | | | | | |
| Ratio of net investment income (loss) to average net assets: | | | | | | | | | | | | | | | | | | | | |
| Before expense waiver or recovery | | | 0.32 | % | | | 0.03 | % | | | (0.76 | )% | | | (0.96 | )%(d) | | | (0.90 | )%(d) |
| After expense waiver or recovery | | | 0.24 | % | | | 0.04 | % | | | (0.71 | )% | | | (0.96 | )%(d) | | | (0.90 | )%(d) |
| | | | | | | | | | | | | | | | | | | | | |
| Portfolio turnover rate(f) | | | 84 | % | | | 105 | % | | | 97 | % | | | 62 | % | | | 53 | % |
| (a) | Net investment income (loss) per share is based on average shares outstanding. |
| (b) | Amount represents less than $0.005 per share. |
| (c) | Total investment return excludes the effect of applicable sales charges. |
| (d) | Ratios do not include the income and expenses of the CTAs included in the swap. |
| (e) | Includes interest expense of 0.01% and 0.00% for the years ended December 31, 2016 and 2015, respectively. |
| (f) | Portfolio turnover rate is calculated on the basis of the Fund as a whole without distinguishing between classes of shares issued. Consists of long-term investments only; excludes derivative instruments. |
The accompanying notes are an integral part of these consolidated financial statements.
| | |
| | |
| LoCorr Macro Strategies Fund - Consolidated Financial Highlights - Class C | | 69 |
| | |
LoCorr Macro Strategies Fund - Class C
Consolidated Financial Highlights
Selected Data and Ratios (for a share outstanding throughout the year)
| | | | Year Ended December 31, |
| | | | 2019 | | | | 2018 | | | | 2017 | | | | 2016 | | | | 2015 | |
| | | | | | | | | | | | | | | | | | | | | |
Per Share Net asset value, beginning of year | | $ | 7.62 | | | $ | 8.27 | | | $ | 8.62 | | | $ | 8.32 | | | $ | 8.30 | |
| | | | | | | | | | | | | | | | | | | | | |
Income (loss) from investment operations: Net investment income (loss)(a) | | | (0.04 | ) | | | (0.06 | ) | | | (0.13 | ) | | | (0.15 | ) | | | (0.14 | ) |
| Net realized and unrealized gain (loss) | | | 0.92 | | | | (0.43 | ) | | | 0.30 | | | | 0.63 | | | | 0.35 | |
| Total from Investment Operations | | | 0.88 | | | | (0.49 | ) | | | 0.17 | | | | 0.48 | | | | 0.21 | |
| | | | | | | | | | | | | | | | | | | | | |
| Distributions From Earnings: | | | | | | | | | | | | | | | | | | | | |
| Net investment income | | | (0.12 | ) | | | (0.03 | ) | | | — | | | | — | | | | (0.19 | ) |
| Net realized gains | | | (0.23 | ) | | | (0.13 | ) | | | (0.52 | ) | | | (0.18 | ) | | | — | |
| Total Distributions | | | (0.35 | ) | | | (0.16 | ) | | | (0.52 | ) | | | (0.18 | ) | | | (0.19 | ) |
| | | | | | | | | | | | | | | | | | | | | |
| Redemption Fees | | | — | | | | — | | | | 0.00 | (b) | | | 0.00 | (b) | | | 0.00 | (b) |
| | | | | | | | | | | | | | | | | | | | | |
| Net Asset Value, End of Year | | $ | 8.15 | | | $ | 7.62 | | | $ | 8.27 | | | $ | 8.62 | | | $ | 8.32 | |
| | | | | | | | | | | | | | | | | | | | | |
Total Investment Return(c) | | | 11.57 | % | | | (5.98 | )% | | | 1.93 | % | | | 5.72 | % | | | 2.51 | % |
| | | | | | | | | | | | | | | | | | | | | |
| Net Assets, End of Year, in Thousands | | $ | 47,205 | | | $ | 53,148 | | | $ | 90,653 | | | $ | 113,814 | | | $ | 98,729 | |
| | | | | | | | | | | | | | | | | | | | | |
Ratios/Supplemental Data: Ratio of expenses to average net assets:
Before expense waiver or recovery | | | 2.91 | % | | | 3.00 | % | | | 3.08 | % | | | 3.09 | %(d),(e) | | | 2.81 | %(d),(e) |
| After expense waiver or recovery | | | 2.99 | % | | | 2.99 | % | | | 3.03 | % | | | 3.09 | %(d),(e) | | | 2.81 | %(d),(e) |
| | | | | | | | | | | | | | | | | | | | | |
Ratio of net investment income (loss) to average net assets:
| | | | | | | | | | | | | | | | | | | | |
| Before expense waiver or recovery | | | (0.43 | )% | | | (0.72 | )% | | | (1.51 | )% | | | (1.71 | )%(d) | | | (1.65 | )%(d) |
| After expense waiver or recovery | | | (0.51 | )% | | | (0.71 | )% | | | (1.46 | )% | | | (1.71 | )%(d) | | | (1.65 | )%(d) |
| | | | | | | | | | | | | | | | | | | | | |
| Portfolio turnover rate(f) | | | 84 | % | | | 105 | % | | | 97 | % | | | 62 | % | | | 53 | % |
| (a) | Net investment income (loss) per share is based on average shares outstanding. |
| (b) | Amount represents less than $0.005 per share. |
| (c) | Total investment return excludes the effect of applicable sales charges. |
| (d) | Ratios do not include the income and expenses of the CTAs included in the swap. |
| (e) | Includes interest expense of 0.01% and 0.00% for the years ended December 31, 2016 and 2015, respectively. |
| (f) | Portfolio turnover rate is calculated on the basis of the Fund as a whole without distinguishing between classes of shares issued. Consists of long-term investments only; excludes derivative instruments. |
The accompanying notes are an integral part of these consolidated financial statements.
| | |
| | |
70 | | LoCorr Macro Strategies Fund - Consolidated Financial Highlights - Class I |
| | |
LoCorr Macro Strategies Fund - Class I
Consolidated Financial Highlights
Selected Data and Ratios (for a share outstanding throughout the year)
| | | | Year Ended December 31, |
| | | | 2019 | | | | 2018 | | | | 2017 | | | | 2016 | | | | 2015 | |
Per Share Net asset value, beginning of year | | $ | 8.07 | | | $ | 8.77 | | | $ | 9.01 | | | $ | 8.62 | | | $ | 8.57 | |
| | | | | | | | | | | | | | | | | | | | | |
Income (loss) from investment operations: Net investment income (loss)(a) | | | 0.04 | | | | 0.02 | | | | (0.04 | ) | | | (0.07 | ) | | | (0.06 | ) |
| Net realized and unrealized gain (loss) | | | 0.99 | | | | (0.47 | ) | | | 0.32 | | | | 0.64 | | | | 0.38 | |
| Total from Investment Operations | | | 1.03 | | | | (0.45 | ) | | | 0.28 | | | | 0.57 | | | | 0.32 | |
| | | | | | | | | | | | | | | | | | | | | |
| Distributions From Earnings: | | | | | | | | | | | | | | | | | | | | |
| Net investment income | | | (0.18 | ) | | | (0.12 | ) | | | — | | | | (0.00 | ) | | | (0.27 | ) |
| Net realized gains | | | (0.23 | ) | | | (0.13 | ) | | | (0.52 | ) | | | (0.18 | ) | | | — | |
| Total Distributions | | | (0.41 | ) | | | (0.25 | ) | | | (0.52 | ) | | | (0.18 | ) | | | (0.27 | ) |
| | | | | | | | | | | | | | | | | | | | | |
| Redemption Fees | | | — | | | | — | | | | 0.00 | (b) | | | 0.00 | (b) | | | 0.00 | (b) |
| | | | | | | | | | | | | | | | | | | | | |
| Net Asset Value, End of Year | | $ | 8.69 | | | $ | 8.07 | | | $ | 8.77 | | | $ | 9.01 | | | $ | 8. 62 | |
| | | | | | | | | | | | | | | | | | | | | |
Total Investment Return | | | 12.72 | % | | | (5.08 | )% | | | 3.07 | % | | | 6.57 | % | | | 3.72 | % |
| | | | | | | | | | | | | | | | | | | | | |
| Net Assets, End of Year, in Thousands | | $ | 726,061 | | | $ | 445,858 | | | $ | 605,983 | | | $ | 471,002 | | | $ | 192,309 | |
| | | | | | | | | | | | | | | | | | | | | |
Ratios/Supplemental Data: Ratio of expenses to average net assets:
Before expense waiver or recovery | | | 1.91 | % | | | 2.00 | % | | | 2.08 | % | | | 2.09 | %(c),(d) | | | 1.81 | %(c),(d) |
| After expense waiver or recovery | | | 1.99 | % | | | 1.99 | % | | | 2.03 | % | | | 2.09 | %(c),(d) | | | 1.81 | %(c),(d) |
| | | | | | | | | | | | | | | | | | | | | |
| Ratio of net investment income (loss) to average net assets: | | | | | | | | | | | | | | | | | | | | |
| Before expense waiver or recovery | | | 0.57 | % | | | 0.28 | % | | | (0.51 | )% | | | (0.71 | )%(c) | | | (0.65 | )%(c) |
| After expense waiver or recovery | | | 0.49 | % | | | 0.29 | % | | | (0.46 | )% | | | (0.71 | )%(c) | | | (0.65 | )%(c) |
| | | | | | | | | | | | | | | | | | | | | |
| Portfolio turnover rate(e) | | | 84 | % | | | 105 | % | | | 97 | % | | | 62 | % | | | 53 | % |
| (a) | Net investment income (loss) per share is based on average shares outstanding. |
| (b) | Amount represents less than $0.005 per share. |
| (c) | Ratios do not include the income and expenses of the CTAs included in the swap. |
| (d) | Includes interest expense of 0.01% and 0.00% for the years ended December 31, 2016 and 2015, respectively. |
| (e) | Portfolio turnover rate is calculated on the basis of the Fund as a whole without distinguishing between classes of shares issued. Consists of long-term investments only; excludes derivative instruments. |
The accompanying notes are an integral part of these consolidated financial statements.
| | |
| | |
| LoCorr Long/Short Commodities Strategy Fund - Consolidated Financial Highlights - Class A | | 71 |
| | |
LoCorr Long/Short Commodities Strategy Fund - Class A
Consolidated Financial Highlights
Selected Data and Ratios (for a share outstanding throughout the year)
| | | | Year Ended December 31, |
| | | | 2019 | | | | 2018 | | | | 2017 | | | | 2016 | | | | 2015 | |
| | | | | | | | | | | | | | | | | | | | | |
Per Share Net asset value, beginning of year | | $ | 9.90 | | | $ | 9.71 | | | $ | 9.17 | | | $ | 9.72 | | | $ | 8.54 | |
| | | | | | | | | | | | | | | | | | | | | |
Income (loss) from investment operations: Net investment income (loss)(a) | | | 0.05 | | | | 0.02 | | | | (0.04 | ) | | | (0.10 | ) | | | (0.13 | ) |
| Net realized and unrealized gain (loss) | | | (0.67 | ) | | | 1.39 | | | | 0.58 | | | | (0.18 | ) | | | 2.02 | |
| Total from Investment Operations | | | (0.62 | ) | | | 1.41 | | | | 0.54 | | | | (0.28 | ) | | | 1.89 | |
| | | | | | | | | | | | | | | | | | | | | |
| Distributions From Earnings: | | | | | | | | | | | | | | | | | | | | |
| Net investment income | | | (0.02 | ) | | | (1.22 | ) | | | 0.00 | (b) | | | (0.27 | ) | | | (0.71 | ) |
| Total Distributions | | | (0.02 | ) | | | (1.22 | ) | | | 0.00 | | | | (0.27 | ) | | | (0.71 | ) |
| | | | | | | | | | | | | | | | | | | | | |
| Redemption Fees | | | — | | | | — | | | | 0.00 | (b) | | | 0.00 | (b) | | | 0.00 | (b) |
| | | | | | | | | | | | | | | | | | | | | |
| Net Asset Value, End of Year | | $ | 9.26 | | | $ | 9.90 | | | $ | 9.71 | | | $ | 9.17 | | | $ | 9.72 | |
| | | | | | | | | | | | | | | | | | | | | |
Total Investment Return(c) | | | (6.24 | )% | | | 15.05 | % | | | 5.91 | % | | | (2.98 | )% | | | 22.34 | % |
| | | | | | | | | | | | | | | | | | | | | |
| Net Assets, End of Year, in Thousands | | $ | 45,513 | | | $ | 68,719 | | | $ | 25,575 | | | $ | 34,860 | | | $ | 24,425 | |
| | | | | | | | | | | | | | | | | | | | | |
Ratio/Supplemental Data:(d) Ratio of expenses to average net assets:
Before expense waiver or recovery | | | 2.11 | % | | | 2.16 | % | | | 2.28 | % | | | 2.22 | %(e) | | | 2.59 | %(e) |
| After expense waiver or recovery | | | 2.14 | % | | | 2.20 | % | | | 2.20 | % | | | 2.20 | %(e) | | | 2.20 | %(e) |
| | | | | | | | | | | | | | | | | | | | | |
Ratio of net investment income (loss) to average net assets:
| | | | | | | | | | | | | | | | | | | | |
| Before expense waiver or recovery | | | 0.57 | % | | | 0.22 | % | | | (0.52 | )% | | | (0.99 | )% | | | (1.79 | )% |
| After expense waiver or recovery | | | 0.54 | % | | | 0.18 | % | | | (0.44 | )% | | | (0.97 | )% | | | (1.40 | )% |
| | | | | | | | | | | | | | | | | | | | | |
Portfolio turnover rate(f)
| | | 103 | % | | | 92 | % | | | 74 | % | | | 105 | % | | | 164 | % |
| (a) | Net investment income (loss) per share is based on average shares outstanding. |
| (b) | Amount represents less than $0.005 per share. |
| (c) | Total investment return excludes the effect of applicable sales charges. |
| (d) | Ratios do not include the income and expenses of the CTAs included in the swap. |
| (e) | Includes interest expense on line of credit of 0.00% and 0.00% for the years ended December 31, 2016 and 2015, respectively. |
| (f) | Portfolio turnover rate is calculated on the basis of the Fund as a whole without distinguishing between classes of shares issued. Consists of long-term investments only; excludes derivative instruments. |
The accompanying notes are an integral part of these consolidated financial statements.
| | |
| | |
72 | | LoCorr Long/Short Commodities Strategy Fund - Consolidated Financial Highlights - Class C |
| | |
LoCorr Long/Short Commodities Strategy Fund - Class C
Consolidated Financial Highlights
Selected Data and Ratios (for a share outstanding throughout the year)
| | | | Year Ended December 31, |
| | | | 2019 | | | | 2018 | | | | 2017 | | | | 2016 | | | | 2015 | |
| | | | | | | | | | | | | | | | | | | | | |
Per Share Net asset value, beginning of year | | $ | 9.55 | | | $ | 9.41 | | | $ | 8.95 | | | $ | 9.51 | | | $ | 8.36 | |
| | | | | | | | | | | | | | | | | | | | | |
Income (loss) from investment operations: Net investment income (loss)(a) | | | (0.02 | ) | | | (0.06 | ) | | | (0.11 | ) | | | (0.17 | ) | | | (0.19 | ) |
| Net realized and unrealized gain (loss) | | | (0.64 | ) | | | 1.35 | | | | 0.57 | | | | (0.18 | ) | | | 1.96 | |
| Total from Investment Operations | | | (0.66 | ) | | | 1.29 | | | | 0.46 | | | | (0.35 | ) | | | 1.77 | |
| | | | | | | | | | | | | | | | | | | | | |
| Distributions From Earnings: | | | | | | | | | | | | | | | | | | | | |
| Net investment income | | | (0.00 | )(b) | | | (1.15 | ) | | | 0.00 | (b) | | | (0.21 | ) | | | (0.62 | ) |
| Total Distributions | | | (0.00 | ) | | | (1.15 | ) | | | 0.00 | | | | (0.21 | ) | | | (0.62 | ) |
| | | | | | | | | | | | | | | | | | | | | |
| Redemption Fees | | | — | | | | — | | | | 0.00 | (b) | | | 0.00 | (b) | | | — | |
| | | | | | | | | | | | | | | | | | | | | |
| Net Asset Value, End of Year | | $ | 8.89 | | | $ | 9.55 | | | $ | 9.41 | | | $ | 8.95 | | | $ | 9.51 | |
| | | | | | | | | | | | | | | | | | | | | |
Total Investment Return(c) | | | (6.90 | )% | | | 14.20 | % | | | 5.17 | % | | | (3.72 | )% | | | 21.39 | % |
| | | | | | | | | | | | | | | | | | | | | |
| Net Assets, End of Year, in Thousands | | $ | 6,645 | | | $ | 6,503 | | | $ | 4,737 | | | $ | 7,383 | | | $ | 4,330 | |
| | | | | | | | | | | | | | | | | | | | | |
Ratio/Supplemental Data:(d) Ratio of expenses to average net assets:
Before expense waiver or recovery | | | 2.86 | % | | | 2.91 | % | | | 3.03 | % | | | 2.97 | %(e) | | | 3.34 | %(e) |
| After expense waiver or recovery | | | 2.89 | % | | | 2.95 | % | | | 2.95 | % | | | 2.95 | %(e) | | | 2.95 | %(e) |
| | | | | | | | | | | | | | | | | | | | | |
| Ratio of net investment income (loss) to average net assets: | | | | | | | | | | | | | | | | | | | | |
| Before expense waiver or recovery | | | (0.18 | )% | | | (0.53 | )% | | | (1.27 | )% | | | (1.74 | )% | | | (2.54 | )% |
| After expense waiver or recovery | | | (0.21 | )% | | | (0.57 | )% | | | (1.19 | )% | | | (1.72 | )% | | | (2.15 | )% |
| | | | | | | | | | | | | | | | | | | | | |
| Portfolio turnover rate(f) | | | 103 | % | | | 92 | % | | | 74 | % | | | 105 | % | | | 164 | % |
| (a) | Net investment income (loss) per share is based on average shares outstanding. |
| (b) | Amount represents less than $0.005 per share. |
| (c) | Total investment return excludes the effect of applicable sales charges. |
| (d) | Ratios do not include the income and expenses of the CTAs included in the swap. |
| (e) | Includes interest expense on line of credit of 0.00% and 0.00% for the years ended December 31, 2016 and 2015, respectively. |
| (f) | Portfolio turnover rate is calculated on the basis of the Fund as a whole without distinguishing between classes of shares issued. Consists of long-term investments only; excludes derivative instruments. |
The accompanying notes are an integral part of these consolidated financial statements.
| | |
| | |
| LoCorr Long/Short Commodities Strategy Fund - Consolidated Financial Highlights - Class I | | 73 |
| | |
LoCorr Long/Short Commodities Strategy Fund - Class I
Consolidated Financial Highlights
Selected Data and Ratios (for a share outstanding throughout the year)
| | | | Year Ended December 31, |
| | | | 2019 | | | | 2018 | | | | 2017 | | | | 2016 | | | | 2015 | |
| | | | | | | | | | | | | | | | | | | | | |
Per Share Net asset value, beginning of year | | $ | 10.03 | | | $ | 9.81 | | | $ | 9.24 | | | $ | 9.79 | | | $ | 8.59 | |
| | | | | | | | | | | | | | | | | | | | | |
Income (loss) from investment operations: Net investment income (loss)(a) | | | 0.08 | | | | 0.05 | | | | (0.02 | ) | | | (0.07 | ) | | | (0.11 | ) |
| Net realized and unrealized gain (loss) | | | (0.68 | ) | | | 1.41 | | | | 0.59 | | | | (0.18 | ) | | | 2.03 | |
| Total from Investment Operations | | | (0.60 | ) | | | 1.46 | | | | 0.57 | | | | (0.25 | ) | | | 1.92 | |
| | | | | | | | | | | | | | | | | | | | | |
| Distributions From Earnings: | | | | | | | | | | | | | | | | | | | | |
| Net investment income | | | (0.05 | ) | | | (1.24 | ) | | | 0.00 | (b) | | | (0.30 | ) | | | (0.72 | ) |
| Total Distributions | | | (0.05 | ) | | | (1.24 | ) | | | 0.00 | | | | (0.30 | ) | | | (0.72 | ) |
| | | | | | | | | | | | | | | | | | | | | |
| Redemption Fees | | | — | | | | — | | | | 0.00 | (b) | | | 0.00 | (b) | | | 0.00 | (b) |
| | | | | | | | | | | | | | | | | | | | | |
| Net Asset Value, End of Year | | $ | 9.38 | | | $ | 10.03 | | | $ | 9.81 | | | $ | 9.24 | | | $ | 9.79 | |
| | | | | | | | | | | | | | | | | | | | | |
Total Investment Return | | | (5.97 | )% | | | 15.40 | % | | | 6.19 | % | | | (2.67 | )% | | | 22.61 | % |
| | | | | | | | | | | | | | | | | | | | | |
| Net Assets, End of Year, in Thousands | | $ | 203,887 | | | $ | 181,804 | | | $ | 52,935 | | | $ | 81,204 | | | $ | 31,166 | |
| | | | | | | | | | | | | | | | | | | | | |
Ratio/Supplemental Data:(c) Ratio of expenses to average net assets:
Before expense waiver or recovery | | | 1.86 | % | | | 1.91 | % | | | 2.03 | % | | | 1.97 | %(d) | | | 2.34 | %(d) |
| After expense waiver or recovery | | | 1.89 | % | | | 1.95 | % | | | 1.95 | % | | | 1.95 | %(d) | | | 1.95 | %(d) |
| | | | | | | | | | | | | | | | | | | | | |
| Ratio of net investment income (loss) to average net assets: | | | | | | | | | | | | | | | | | | | | |
| Before expense waiver or recovery | | | 0.82 | % | | | 0.47 | % | | | (0.27 | )% | | | (0.74 | )% | | | (1.54 | )% |
| After expense waiver or recovery | | | 0.79 | % | | | 0.43 | % | | | (0.19 | )% | | | (0.72 | )% | | | (1.15 | )% |
| | | | | | | | | | | | | | | | | | | | | |
| Portfolio turnover rate(e) | | | 103 | % | | | 92 | % | | | 74 | % | | | 105 | % | | | 164 | % |
| (a) | Net investment income (loss) per share is based on average shares outstanding. |
| (b) | Amount represents less than $0.005 per share. |
| (c) | Ratios do not include the income and expenses of the CTAs included in the swap. |
| (d) | Includes interest expense on line of credit of 0.00% and 0.00% for the years ended December 31, 2016 and 2015, respectively. |
| (e) | Portfolio turnover rate is calculated on the basis of the Fund as a whole without distinguishing between classes of shares issued. Consists of long-term investments only; excludes derivative instruments. |
The accompanying notes are an integral part of these consolidated financial statements.
| | |
| | |
74 | | LoCorr Market Trend Fund - Consolidated Financial Highlights - Class A |
| | |
LoCorr Market Trend Fund - Class A
Consolidated Financial Highlights
Selected Data and Ratios (for a share outstanding throughout the period)
| | | | Year Ended December 31, |
| | | | 2019 | | | | 2018 | | | | 2017 | | | | 2016 | | | | 2015 | |
Per Share Net asset value, beginning of year | | $ | 9.52 | | | $ | 11.03 | | | $ | 10.65 | | | $ | 12.00 | | | $ | 11.44 | |
| | | | | | | | | | | | | | | | | | | | | |
Income (loss) from investment operations: Net investment income (loss)(a) | | | 0.01 | | | | (0.03 | ) | | | (0.10 | ) | | | (0.15 | ) | | | (0.19 | ) |
| Net realized and unrealized gain (loss) | | | 1.74 | | | | (1.48 | ) | | | 0.48 | | | | (1.01 | ) | | | 0.84 | (b) |
| Total from Investment Operations | | | 1.75 | | | | (1.51 | ) | | | 0.38 | | | | (1.16 | ) | | | 0.65 | |
| | | | | | | | | | | | | | | | | | | | | |
| Distributions From Earnings: | | | | | | | | | | | | | | | | | | | | |
| Net investment income | | | (0.08 | ) | | | — | | | | — | | | | (0.19 | ) | | | (0.07 | ) |
| Net realized gains | | | — | | | | — | | | | — | | | | — | | | | (0.02 | ) |
| Total Distributions | | | (0.08 | ) | | | — | | | | — | | | | (0.19 | ) | | | (0.09 | ) |
| | | | | | | | | | | | | | | | | | | | | |
| Redemption Fees | | | — | | | | — | | | | 0.00 | (c) | | | 0.00 | (c) | | | 0.00 | (c) |
| | | | | | | | | | | | | | | | | | | | | |
| Net Asset Value, End of Year | | $ | 11.19 | | | $ | 9.52 | | | $ | 11.03 | | | $ | 10.65 | | | $ | 12.00 | |
| | | | | | | | | | | | | | | | | | | | | |
Total Investment Return(d) | | | 18.33 | % | | | (13.69 | )% | | | 3.57 | % | | | (9.71 | )% | | | 5.68 | % |
| | | | | | | | | | | | | | | | | | | | | |
| Net Assets, End of Year, in Thousands | | $ | 21,966 | | | $ | 32,082 | | | $ | 61,557 | | | $ | 133,146 | | | $ | 110,324 | |
| | | | | | | | | | | | | | | | | | | | | |
Ratio/Supplemental Data: Ratio of expenses to average net assets:
Before expense waiver or recovery | | | 2.02 | % | | | 1.99 | % | | | 2.00 | % | | | 2.02 | %(e) | | | 2.03 | % |
| After expense waiver or recovery | | | 2.02 | % | | | 1.99 | % | | | 2.00 | % | | | 2.02 | %(e) | | | 2.06 | % |
| | | | | | | | | | | | | | | | | | | | | |
| Ratio of net investment income (loss) to average net assets: | | | | | | | | | | | | | | | | | | | | |
| Before expense waiver or recovery | | | 0.14 | % | | | (0.24 | )% | | | (0.97 | )% | | | (1.24 | )% | | | (1.49 | )% |
| After expense waiver or recovery | | | 0.14 | % | | | (0.24 | )% | | | (0.97 | )% | | | (1.24 | )% | | | (1.52 | )% |
| | | | | | | | | | | | | | | | | | | | | |
| Portfolio turnover rate(f) | | | 119 | % | | | 91 | % | | | 85 | % | | | 83 | % | | | 27 | % |
| (a) | Net investment income (loss) per share is based on average shares outstanding. |
| (b) | Realized and unrealized gains and losses per share in this caption are balancing amounts necessary to reconcile the change in net asset value per share for the period, and may not reconcile with the Fund’s consolidated statement of operations due to share transactions for the period. |
| (c) | Amount represents less than $0.005 per share. |
| (d) | Total investment return excludes the effect of applicable sales charges. |
| (e) | Includes 0.00% of interest expense for the year ended December 31, 2016. |
| (f) | Portfolio turnover rate is calculated on the basis of the Fund as a whole without distinguishing between classes of shares issued. Consists of long-term investments only; excludes derivative instruments. |
The accompanying notes are an integral part of these consolidated financial statements.
| | |
| | |
LoCorr Market Trend Fund - Consolidated Financial Highlights - Class C | | 75 |
| | |
LoCorr Market Trend Fund - Class C
Consolidated Financial Highlights
Selected Data and Ratios (for a share outstanding throughout the period)
| | | | Year Ended December 31, |
| | | | 2019 | | | | 2018 | | | | 2017 | | | | 2016 | | | | 2015 | |
| | | | | | | | | | | | | | | | | | | | | |
Per Share Net asset value, beginning of year | | $ | 9.28 | | | $ | 10.83 | | | $ | 10.53 | | | $ | 11.92 | | | $ | 11.41 | |
| | | | | | | | | | | | | | | | | | | | | |
Income (loss) from investment operations: Net investment income (loss)(a) | | | (0.06 | ) | | | (0.10 | ) | | | (0.18 | ) | | | (0.23 | ) | | | (0.28 | ) |
| Net realized and unrealized gain (loss) | | | 1.67 | | | | (1.45 | ) | | | 0.48 | | | | (1.01 | ) | | | 0.84 | (b) |
| Total from Investment Operations | | | 1.61 | | | | (1.55 | ) | | | 0.30 | | | | (1.24 | ) | | | 0.56 | |
| | | | | | | | | | | | | | | | | | | | | |
| Distributions From Earnings: | | | | | | | | | | | | | | | | | | | | |
| Net investment income | | | — | | | | — | | | | — | | | | (0.15 | ) | | | (0.03 | ) |
| Net realized gains | | | — | | | | — | | | | — | | | | — | | | | (0.02 | ) |
| Total Distributions | | | — | | | | — | | | | — | | | | (0.15 | ) | | | (0.05 | ) |
| | | | | | | | | | | | | | | | | | | | | |
| Redemption Fees | | | — | | | | — | | | | 0.00 | (c) | | | 0.00 | (c) | | | 0.00 | (c) |
| | | | | | | | | | | | | | | | | | | | | |
| Net Asset Value, End of Year | | $ | 10.89 | | | $ | 9.28 | | | $ | 10.83 | | | $ | 10.53 | | | $ | 11.92 | |
| | | | | | | | | | | | | | | | | | | | | |
Total Investment Return(d) | | | 17.35 | % | | | (14.31 | )% | | | 2.85 | % | | | (10.45 | )% | | | 4.90 | % |
| | | | | | | | | | | | | | | | | | | | | |
| Net Assets, End of Year, in Thousands | | $ | 16,320 | | | $ | 23,417 | | | $ | 43,772 | | | $ | 89,454 | | | $ | 94,707 | |
| | | | | | | | | | | | | | | | | | | | | |
Ratio/Supplemental Data: Ratio of expenses to average net assets:
Before expense waiver or recovery | | | 2.77 | % | | | 2.74 | % | | | 2.75 | % | | | 2.77 | %(e) | | | 2.78 | % |
| After expense waiver or recovery | | | 2.77 | % | | | 2.74 | % | | | 2.75 | % | | | 2.77 | %(e) | | | 2.81 | % |
| | | | | | | | | | | | | | | | | | | | | |
| Ratio of net investment income (loss) to average net assets: | | | | | | | | | | | | | | | | | | | | |
| Before expense waiver or recovery | | | (0.61 | )% | | | (0.99 | )% | | | (1.72 | )% | | | (1.99 | )% | | | (2.24 | )% |
| After expense waiver or recovery | | | (0.61 | )% | | | (0.99 | )% | | | (1.72 | )% | | | (1.99 | )% | | | (2.27 | )% |
| | | | | | | | | | | | | | | | | | | | | |
| Portfolio turnover rate(f) | | | 119 | % | | | 91 | % | | | 85 | % | | | 83 | % | | | 27 | % |
| (a) | Net investment income (loss) per share is based on average shares outstanding. |
| (b) | Realized and unrealized gains and losses per share in this caption are balancing amounts necessary to reconcile the change in net asset value per share for the period, and may not reconcile with the Fund’s consolidated statement of operations due to share transactions for the period. |
| (c) | Amount represents less than $0.005 per share. |
| (d) | Total investment return excludes the effect of applicable sales charges. |
| (e) | Includes 0.00% of interest expense for the year ended December 31, 2016. |
| (f) | Portfolio turnover rate is calculated on the basis of the Fund as a whole without distinguishing between classes of shares issued. Consists of long-term investments only; excludes derivative instruments. |
The accompanying notes are an integral part of these consolidated financial statements.
| | |
| | |
76 | | LoCorr Market Trend Fund - Consolidated Financial Highlights - Class I |
| | |
LoCorr Market Trend Fund - Class I
Consolidated Financial Highlights
Selected Data and Ratios (for a share outstanding throughout the period)
| | | | Year Ended December 31, |
| | | | 2019 | | | | 2018 | | | | 2017 | | | | 2016 | | | | 2015 | |
| | | | | | | | | | | | | | | | | | | | | |
| Per Share | | | | | | | | | | | | | | | | | | | | |
| Net asset value, beginning of year | | $ | 9.60 | | | $ | 11.09 | | | $ | 10.68 | | | $ | 12.02 | | | $ | 11.45 | |
| | | | | | | | | | | | | | | | | | | | | |
Income (loss) from investment operations: Net investment income (loss)(a) | | | 0.04 | | | | 0.00 | (c) | | | (0.08 | ) | | | (0.12 | ) | | | (0.16 | ) |
| Net realized and unrealized gain (loss) | | | 1.74 | | | | (1.49 | ) | | | 0.49 | | | | (1.02 | ) | | | 0.84 | (b) |
| Total from Investment Operations | | | 1.78 | | | | (1.49 | ) | | | 0.41 | | | | (1.14 | ) | | | 0.68 | |
| | | | | | | | | | | | | | | | | | | | | |
| Distributions From Earnings: | | | | | | | | | | | | | | | | | | | | |
| Net investment income | | | (0.15 | ) | | | — | | | | — | | | | (0.20 | ) | | | (0.09 | ) |
| Net realized gains | | | — | | | | — | | | | — | | | | — | | | | (0.02 | ) |
| Total Distributions | | | (0.15 | ) | | | — | | | | — | | | | (0.20 | ) | | | (0.11 | ) |
| | | | | | | | | | | | | | | | | | | | | |
| Redemption Fees | | | — | | | | — | | | | 0.00 | (c) | | | 0.00 | (c) | | | 0.00 | (c) |
| | | | | | | | | | | | | | | | | | | | | |
| Net Asset Value, End of Year | | $ | 11.23 | | | $ | 9.60 | | | $ | 11.09 | | | $ | 10.68 | | | $ | 12.02 | |
| | | | | | | | | | | | | | | | | | | | | |
Total Investment Return | | | 18.53 | % | | | (13.44 | )% | | | 3.84 | % | | | (9.49 | )% | | | 5.96 | % |
| | | | | | | | | | | | | | | | | | | | | |
| Net Assets, End of Year, in Thousands | | $ | 234,919 | | | $ | 287,702 | | | $ | 561,372 | | | $ | 797,845 | | | $ | 695,987 | |
| | | | | | | | | | | | | | | | | | | | | |
| Ratio/Supplemental Data: | | | | | | | | | | | | | | | | | | | | |
| Ratio of expenses to average net assets: | | | | | | | | | | | | | | | | | | | | |
| Before expense waiver or recovery | | | 1.77 | % | | | 1.74 | % | | | 1.75 | % | | | 1.77 | %(d) | | | 1.78 | % |
| After expense waiver or recovery | | | 1.77 | % | | | 1.74 | % | | | 1.75 | % | | | 1.77 | %(d) | | | 1.81 | % |
| | | | | | | | | | | | | | | | | | | | | |
| Ratio of net investment income (loss) to average net assets: | | | | | | | | | | | | | | | | | | | | |
| Before expense waiver or recovery | | | 0.39 | % | | | 0.01 | % | | | (0.72 | )% | | | (0.99 | )% | | | (1.24 | )% |
| After expense waiver or recovery | | | 0.39 | % | | | 0.01 | % | | | (0.72 | )% | | | (0.99 | )% | | | (1.27 | )% |
| | | | | | | | | | | | | | | | | | | | | |
| Portfolio turnover rate(e) | | | 119 | % | | | 91 | % | | | 85 | % | | | 83 | % | | | 27 | % |
| (a) | Net investment income (loss) per share is based on average shares outstanding. |
| (b) | Realized and unrealized gains and losses per share in this caption are balancing amounts necessary to reconcile the change in net asset value per share for the period, and may not reconcile with the Fund’s consolidated statement of operations due to share transactions for the period. |
| (c) | Amount represents less than $0.005 per share. |
| (d) | Includes 0.00% of interest expense for the year ended December 31, 2016. |
| (e) | Portfolio turnover rate is calculated on the basis of the Fund as a whole without distinguishing between classes of shares issued. Consists of long-term investments only; excludes derivative instruments. |
The accompanying notes are an integral part of these consolidated financial statements.
| | |
| | |
LoCorr Dynamic Equity Fund - Financial Highlights - Class A | | 77 |
| | |
LoCorr Dynamic Equity Fund - Class A
Financial Highlights
Selected Data and Ratios (for a share outstanding throughout the year)
| | | Year Ended December 31, | |
| | | 2019 | | | 2018 | | | 2017 | | | 2016 | | | 2015 | |
| | | | | | | | | | | | | | | | |
| Per Share | | | | | | | | | | | | | | | |
| Net asset value, beginning of year | | $ | 9.92 | | | $ | 11.82 | | | $ | 12.06 | | | $ | 9.64 | | | $ | 9.80 | |
| | | | | | | | | | | | | | | | | | | | | |
| Income (loss) from investment operations: | | | | | | | | | | | | | | | | | | | | |
| Net investment income (loss)(a) | | | (0.19 | ) | | | (0.25 | ) | | | (0.30 | ) | | | (0.32 | ) | | | (0.27 | ) |
| Net realized and unrealized gain (loss) | | | 1.51 | | | | (1.26 | ) | | | 0.59 | | | | 2.74 | | | | 0.11 | |
| Total from Investment Operations | | | 1.32 | | | | (1.51 | ) | | | 0.29 | | | | 2.42 | | | | (0.16 | ) |
| | | | | | | | | | | | | | | | | | | | | |
| Distributions From Earnings: | | | | | | | | | | | | | | | | | | | | |
| Net realized gains | | | (0.04 | ) | | | (0.39 | ) | | | (0.53 | ) | | | — | | | | — | |
| Total Distributions | | | (0.04 | ) | | | (0.39 | ) | | | (0.53 | ) | | | — | | | | — | |
| | | | | | | | | | | | | | | | | | | | | |
| Redemption Fees | | | — | | | | — | | | | 0.00 | (b) | | | 0.00 | (b) | | | 0.00 | (b) |
| | | | | | | | | | | | | | | | | | | | | |
| Net Asset Value, End of Year | | $ | 11.20 | | | $ | 9.92 | | | $ | 11.82 | | | $ | 12.06 | | | $ | 9.64 | |
| | | | | | | | | | | | | | | | | | | | | |
| Total Investment Return(c) | | | 13.40 | % | | | (12.87 | )% | | | 2.38 | % | | | 25.10 | % | | | (1.53 | )% |
| | | | | | | | | | | | | | | | | | | | | |
| Net Assets, End of Year, in Thousands | | $ | 6,744 | | | $ | 8,473 | | | $ | 19,962 | | | $ | 28,243 | | | $ | 12,446 | |
| | | | | | | | | | | | | | | | | | | | | |
Ratio/Supplemental Data: | | | | | | | | | | | | | | | | | | | | |
| Ratio of expenses to average net assets: | | | | | | | | | | | | | | | | | | | | |
| Before expense waiver or recovery | | | 3.73 | % | | | 3.40 | % | | | 3.42 | % | | | 3.74 | % | | | 3.72 | % |
| After expense waiver or recovery | | | 3.02 | % | | | 3.21 | % | | | 3.35 | % | | | 3.49 | % | | | 3.35 | % |
| | | | | | | | | | | | | | | | | | | | | |
| Ratio of expenses to average net assets (excluding dividend and interest expense): |
| Before expense waiver or recovery | | | 2.95 | % | | | 3.20 | % | | | 3.22 | % | | | 3.40 | % | | | 3.52 | % |
| After expense waiver or recovery | | | 2.24 | % | | | 3.01 | % | | | 3.15 | % | | | 3.15 | % | | | 3.15 | % |
| | | | | | | | | | | | | | | | | | | | | |
| Ratio of net investment income (loss) to average net assets: | | | | | | | | | | | | | | | | | |
| Before expense waiver or recovery | | | (2.44 | )% | | | (2.39 | )% | | | (2.61 | )% | | | (3.23 | )% | | | (3.06 | )% |
| After expense waiver or recovery | | | (1.73 | )% | | | (2.20 | )% | | | (2.54 | )% | | | (2.98 | )% | | | (2.69 | )% |
| | | | | | | | | | | | | | | | | | | | | |
| Portfolio turnover rate(d) | | | 300 | % | | | 449 | % | | | 363 | % | | | 343 | % | | | 269 | % |
| (a) | Net investment income (loss) per share is based on average shares outstanding. |
| (b) | Amount represents less than $0.005 per share. |
| (c) | Total investment return excludes the effect of applicable sales charges. |
| (d) | Portfolio turnover rate is calculated on the basis of the Fund as a whole without distinguishing between classes of shares issued. Consists of long-term investments only; excludes securities sold short. |
The accompanying notes are an integral part of these financial statements.
| | |
| | |
| 78 | | LoCorr Dynamic Equity Fund - Financial Highlights - Class C |
| | |
LoCorr Dynamic Equity Fund - Class C
Financial Highlights
Selected Data and Ratios (for a share outstanding throughout the year)
| | | Year Ended December 31, | |
| | | 2019 | | | 2018 | | | 2017 | | | 2016 | | | 2015 | |
| | | | | | | | | | | | | | | | |
Per Share | | | | | | | | | | | | | | | |
| Net asset value, beginning of year | | $ | 9.47 | | | $ | 11.39 | | | $ | 11.73 | | | $ | 9.45 | | | $ | 9.67 | |
| | | | | | | | | | | | | | | | | | | | | |
Income (loss) from investment operations: | | | | | | | | | | | | | | | | | | | | |
| Net investment income (loss)(a) | | | (0.26 | ) | | | (0.32 | ) | | | (0.38 | ) | | | (0.38 | ) | | | (0.33 | ) |
| Net realized and unrealized gain (loss) | | | 1.45 | | | | (1.21 | ) | | | 0.57 | | | | 2.66 | | | | 0.11 | |
| Total from Investment Operations | | | 1.19 | | | | (1.53 | ) | | | 0.19 | | | | 2.28 | | | | (0.22 | ) |
| | | | | | | | | | | | | | | | | | | | | |
| Distributions From Earnings: | | | | | | | | | | | | | | | | | | | | |
| Net realized gains | | | (0.04 | ) | | | (0.39 | ) | | | (0.53 | ) | | | — | | | | — | |
| Total Distributions | | | (0.04 | ) | | | (0.39 | ) | | | (0.53 | ) | | | — | | | | — | |
| | | | | | | | | | | | | | | | | | | | | |
| Redemption Fees | | | — | | | | — | | | | 0.00 | (b) | | | 0.00 | (b) | | | 0.00 | (b) |
| | | | | | | | | | | | | | | | | | | | | |
| Net Asset Value, End of Year | | $ | 10.62 | | | $ | 9.47 | | | $ | 11.39 | | | $ | 11.73 | | | $ | 9.45 | |
| | | | | | | | | | | | | | | | | | | | | |
| Total Investment Return(c) | | | 12.54 | % | | | (13.45 | )% | | | 1.59 | % | | | 24.13 | % | | | (2.28 | )% |
| | | | | | | | | | | | | | | | | | | | | |
| Net Assets, End of Year, in Thousands | | $ | 4,031 | | | $ | 5,255 | | | $ | 11,084 | | | $ | 11,218 | | | $ | 7,837 | |
| | | | | | | | | | | | | | | | | | | | | |
Ratio/Supplemental Data: | | | | | | | | | | | | | | | | | | | | |
| Ratio of expenses to average net assets: | | | | | | | | | | | | | | | | | | | | |
| Before expense waiver or recovery | | | 4.48 | % | | | 4.15 | % | | | 4.17 | % | | | 4.49 | % | | | 4.47 | % |
| After expense waiver or recovery | | | 3.77 | % | | | 3.96 | % | | | 4.10 | % | | | 4.24 | % | | | 4.10 | % |
| | | | | | | | | | | | | | | | | | | | | |
| Ratio of expenses to average net assets (excluding dividend and interest expense): |
| Before expense waiver or recovery | | | 3.70 | % | | | 3.95 | % | | | 3.97 | % | | | 4.15 | % | | | 4.27 | % |
| After expense waiver or recovery | | | 2.99 | % | | | 3.76 | % | | | 3.90 | % | | | 3.90 | % | | | 3.90 | % |
| | | | | | | | | | | | | | | | | | | | | |
| Ratio of net investment income (loss) to average net assets: | | | | | | | | | | | | | | | | | |
| Before expense waiver or recovery | | | (3.19 | )% | | | (3.14 | )% | | | (3.36 | )% | | | (3.98 | )% | | | (3.81 | )% |
| After expense waiver or recovery | | | (2.48 | )% | | | (2.95 | )% | | | (3.29 | )% | | | (3.73 | )% | | | (3.44 | )% |
| | | | | | | | | | | | | | | | | | | | | |
| Portfolio turnover rate(d) | | | 300 | % | | | 449 | % | | | 363 | % | | | 343 | % | | | 269 | % |
| (a) | Net investment income (loss) per share is based on average shares outstanding. |
| (b) | Amount represents less than $0.005 per share. |
| (c) | Total investment return excludes the effect of applicable sales charges. |
| (d) | Portfolio turnover rate is calculated on the basis of the Fund as a whole without distinguishing between classes of shares issued. Consists of long-term investments only; excludes securities sold short. |
The accompanying notes are an integral part of these financial statements.
| | |
| | |
LoCorr Dynamic Equity Fund - Financial Highlights - Class I | | 79 |
| | |
LoCorr Dynamic Equity Fund - Class I
Financial Highlights
Selected Data and Ratios (for a share outstanding throughout the year)
| | | Year Ended December 31, | |
| | | 2019 | | | 2018 | | | 2017 | | | 2016 | | | 2015 | |
| | | | | | | | | | | | | | | | |
Per Share | | | | | | | | | | | | | | | |
| Net asset value, beginning of year | | $ | 10.07 | | | $ | 11.96 | | | $ | 12.17 | | | $ | 9.71 | | | $ | 9.84 | |
| | | | | | | | | | | | | | | | | | | | | |
Income (loss) from investment operations: | | | | | | | | | | | | | | | | | | | | |
| Net investment income (loss)(a) | | | (0.17 | ) | | | (0.23 | ) | | | (0.28 | ) | | | (0.30 | ) | | | (0.24 | ) |
| Net realized and unrealized gain (loss) | | | 1.55 | | | | (1.27 | ) | | | 0.60 | | | | 2.76 | | | | 0.11 | |
| Total from Investment Operations | | | 1.38 | | | | (1.50 | ) | | | 0.32 | | | | 2.46 | | | | (0.13 | ) |
| | | | | | | | | | | | | | | | | | | | | |
| Distributions From Earnings: | | | | | | | | | | | | | | | | | | | | |
| Net realized gains | | | (0.04 | ) | | | (0.39 | ) | | | (0.53 | ) | | | — | | | | — | |
| Total Distributions | | | (0.04 | ) | | | (0.39 | ) | | | (0.53 | ) | | | — | | | | — | |
| | | | | | | | | | | | | | | | | | | | | |
| Redemption Fees | | | — | | | | — | | | | 0.00 | (b) | | | 0.00 | (b) | | | 0.00 | (b) |
| | | | | | | | | | | | | | | | | | | | | |
| Net Asset Value, End of Year | | $ | 11.41 | | | $ | 10.07 | | | $ | 11.96 | | | $ | 12.17 | | | $ | 9.71 | |
| | | | | | | | | | | | | | | | | | | | | |
| Total Investment Return | | | 13.68 | % | | | (12.55 | )% | | | 2.60 | % | | | 25.33 | % | | | (1.22 | )% |
| | | | | | | | | | | | | | | | | | | | | |
| Net Assets, End of Year, in Thousands | | $ | 16,923 | | | $ | 16,545 | | | $ | 32,781 | | | $ | 44,816 | | | $ | 9,990 | |
| | | | | | | | | | | | | | | | | | | | | |
Ratio/Supplemental Data: | | | | | | | | | | | | | | | | | | | | |
| Ratio of expenses to average net assets: | | | | | | | | | | | | | | | | | | | | |
| Before expense waiver or recovery | | | 3.48 | % | | | 3.15 | % | | | 3.17 | % | | | 3.49 | % | | | 3.47 | % |
| After expense waiver or recovery | | | 2.77 | % | | | 2.96 | % | | | 3.10 | % | | | 3.24 | % | | | 3.10 | % |
| | | | | | | | | | | | | | | | | | | | | |
| Ratio of expenses to average net assets (excluding dividend and interest expense): |
| Before expense waiver or recovery | | | 2.70 | % | | | 2.95 | % | | | 2.97 | % | | | 3.15 | % | | | 3.27 | % |
| After expense waiver or recovery | | | 1.99 | % | | | 2.76 | % | | | 2.90 | % | | | 2.90 | % | | | 2.90 | % |
| | | | | | | | | | | | | | | | | | | | | |
| Ratio of net investment income (loss) to average net assets: | | | | | | | | | | | | | | | | | |
| Before expense waiver or recovery | | | (2.19 | )% | | | (2.14 | )% | | | (2.36 | )% | | | (2.98 | )% | | | (2.81 | )% |
| After expense waiver or recovery | | | (1.48 | )% | | | (1.95 | )% | | | (2.29 | )% | | | (2.73 | )% | | | (2.44 | )% |
| | | | | | | | | | | | | | | | | | | | | |
| Portfolio turnover rate(c) | | | 300 | % | | | 449 | % | | | 363 | % | | | 343 | % | | | 269 | % |
| (a) | Net investment income (loss) per share is based on average shares outstanding. |
| (b) | Amount represents less than $0.005 per share. |
| (c) | Portfolio turnover rate is calculated on the basis of the Fund as a whole without distinguishing between classes of shares issued. Consists of long-term investments only; excludes securities sold short. |
The accompanying notes are an integral part of these financial statements.
| | |
| | |
| 80 | | LoCorr Spectrum Income Fund - Financial Highlights - Class A |
| | |
LoCorr Spectrum Income Fund - Class A
Financial Highlights
Selected Data and Ratios (for a share outstanding throughout the year)
| | | Year Ended December 31, | |
| | | 2019 | | | 2018 | | | 2017 | | | 2016 | | | 2015 | |
| | | | | | | | | | | | | | | | |
| Per Share | | | | | | | | | | | | | | | |
| Net asset value, beginning of year | | $ | 6.26 | | | $ | 7.39 | | | $ | 7.70 | | | $ | 7.78 | | | $ | 8.97 | |
| | | | | | | | | | | | | | | | | | | | | |
| Income (loss) from investment operations: | | | | | | | | | | | | | | | | | | | | |
| Net investment income (loss)(a) | | | 0.13 | | | | 0.22 | | | | 0.17 | | | | 0.29 | | | | 0.38 | |
| Net realized and unrealized gain (loss) | | | 1.00 | | | | (0.78 | ) | | | 0.09 | | | | 0.20 | | | | (1.00 | ) |
| Total from Investment Operations | | | 1.13 | | | | (0.56 | ) | | | 0.26 | | | | 0.49 | | | | (0.62 | ) |
| | | | | | | | | | | | | | | | | | | | | |
| Distributions From Earnings: | | | | | | | | | | | | | | | | | | | | |
| Net investment income | | | (0.12 | ) | | | (0.26 | ) | | | (0.15 | ) | | | (0.37 | ) | | | (0.39 | ) |
| Return of capital | | | (0.38 | ) | | | (0.31 | ) | | | (0.42 | ) | | | (0.20 | ) | | | (0.18 | ) |
| Total Distributions | | | (0.50 | ) | | | (0.57 | ) | | | (0.57 | ) | | | (0.57 | ) | | | (0.57 | ) |
| | | | | | | | | | | | | | | | | | | | | |
| Redemption Fees(b) | | | 0.00 | | | | 0.00 | | | | 0.00 | | | | 0.00 | | | | 0.00 | |
| | | | | | | | | | | | | | | | | | | | | |
| Net Asset Value, End of Year | | $ | 6.89 | | | $ | 6.26 | | | $ | 7.39 | | | $ | 7.70 | | | $ | 7.78 | |
| | | | | | | | | | | | | | | | | | | | | |
| Total Investment Return(c) | | | 18.37 | % | | | (8.22 | )% | | | 3.50 | % | | | 6.64 | % | | | (7.36 | )% |
| | | | | | | | | | | | | | | | | | | | | |
| Net Assets, End of Year, in Thousands | | $ | 25,192 | | | $ | 22,610 | | | $ | 29,970 | | | $ | 33,032 | | | $ | 36,957 | |
| | | | | | | | | | | | | | | | | | | | | |
| Ratio/Supplemental Data:(d) | | | | | | | | | | | | | | | | | | | | |
| Ratio of expenses to average net assets: | | | | | | | | | | | | | | | | | | | | |
| Before expense waiver or recovery | | | 2.02 | %(e) | | | 1.98 | % | | | 1.95 | % | | | 2.02 | % | | | 1.99 | %(f) |
| After expense waiver or recovery | | | 2.02 | %(e) | | | 1.98 | % | | | 1.99 | % | | | 2.05 | % | | | 2.05 | %(f) |
| | | | | | | | | | | | | | | | | | | | | |
| Ratio of net investment income (loss) to average net assets: | | | | | | | | | | | | | | | | |
| Before expense waiver or recovery | | | 1.94 | % | | | 3.01 | % | | | 2.27 | % | | | 3.81 | % | | | 4.41 | % |
| After expense waiver or recovery | | | 1.94 | % | | | 3.01 | % | | | 2.23 | % | | | 3.78 | % | | | 4.35 | % |
| | | | | | | | | | | | | | | | | | | | | |
| Portfolio turnover rate(g) | | | 75 | % | | | 82 | % | | | 84 | % | | | 92 | % | | | 54 | % |
| (a) | Net investment income (loss) per share is based on average shares outstanding. |
| (b) | Amount represents less than $0.005 per share. |
| (c) | Total investment return excludes the effect of applicable sales charges. |
| (d) | Ratios do not include the expenses of the investment companies in which the Fund invests. |
| (e) | Includes 0.00% of interest expense for the year ended December 31, 2019. |
| (f) | Includes interest expense on line of credit of 0.00% for the year ended December 31, 2015. |
| (g) | Portfolio turnover rate is calculated on the basis of the Fund as a whole without distinguishing between classes of shares issued. |
The accompanying notes are an integral part of these financial statements.
| | |
| | |
LoCorr Spectrum Income Fund - Financial Highlights - Class C | | 81 |
| | |
LoCorr Spectrum Income Fund - Class C
Financial Highlights
Selected Data and Ratios (for a share outstanding throughout the year)
| | | Year Ended December 31, | |
| | | 2019 | | | 2018 | | | 2017 | | | 2016 | | | 2015 | |
| | | | | | | | | | | | | | | | |
Per Share | | | | | | | | | | | | | | | |
| Net asset value, beginning of year | | $ | 6.31 | | | $ | 7.42 | | | $ | 7.72 | | | $ | 7.78 | | | $ | 8.96 | |
| | | | | | | | | | | | | | | | | | | | | |
Income (loss) from investment operations: | | | | | | | | | | | | | | | | | | | | |
| Net investment income (loss)(a) | | | 0.08 | | | | 0.16 | | | | 0.11 | | | | 0.23 | | | | 0.32 | |
| Net realized and unrealized gain (loss) | | | 1.01 | | | | (0.77 | ) | | | 0.09 | | | | 0.21 | | | | (1.00 | ) |
| Total from Investment Operations | | | 1.09 | | | | (0.61 | ) | | | 0.20 | | | | 0.44 | | | | (0.68 | ) |
| | | | | | | | | | | | | | | | | | | | | |
| Distributions From Earnings: | | | | | | | | | | | | | | | | | | | | |
| Net investment income | | | (0.10 | ) | | | (0.23 | ) | | | (0.13 | ) | | | (0.33 | ) | | | (0.34 | ) |
| Return of capital | | | (0.34 | ) | | | (0.27 | ) | | | (0.37 | ) | | | (0.17 | ) | | | (0.16 | ) |
| Total Distributions | | | (0.44 | ) | | | (0.50 | ) | | | (0.50 | ) | | | (0.50 | ) | | | (0.50 | ) |
| | | | | | | | | | | | | | | | | | | | | |
| Redemption Fees(b) | | | 0.00 | | | | 0.00 | | | | 0.00 | | | | 0.00 | | | | 0.00 | |
| | | | | | | | | | | | | | | | | | | | | |
| Net Asset Value, End of Year | | $ | 6.96 | | | $ | 6.31 | | | $ | 7.42 | | | $ | 7.72 | | | $ | 7.78 | |
| | | | | | | | | | | | | | | | | | | | | |
| Total Investment Return(c) | | | 17.59 | % | | | (8.85 | )% | | | 2.62 | % | | | 5.88 | % | | | (8.05 | )% |
| | | | | | | | | | | | | | | | | | | | | |
| Net Assets, End of Year, in Thousands | | $ | 18,645 | | | $ | 18,092 | | | $ | 23,511 | | | $ | 25,898 | | | $ | 27,817 | |
| | | | | | | | | | | | | | | | | | | | | |
Ratio/Supplemental Data:(d) | | | | | | | | | | | | | | | | | | | | |
| Ratio of expenses to average net assets: | | | | | | | | | | | | | | | | | | | | |
Before expense waiver or recovery | | | 2.77 | %(e) | | | 2.73 | % | | | 2.70 | % | | | 2.77 | % | | | 2.74 | %(f) |
| After expense waiver or recovery | | | 2.77 | %(e) | | | 2.73 | % | | | 2.74 | % | | | 2.80 | % | | | 2.80 | %(f) |
| | | | | | | | | | | | | | | | | | | | | |
| Ratio of net investment income (loss) to average net assets: | | | | | | | | | | | | | | | | | |
| Before expense waiver or recovery | | | 1.19 | % | | | 2.26 | % | | | 1.52 | % | | | 3.06 | % | | | 3.66 | % |
| After expense waiver or recovery | | | 1.19 | % | | | 2.26 | % | | | 1.48 | % | | | 3.03 | % | | | 3.60 | % |
| | | | | | | | | | | | | | | | | | | | | |
| Portfolio turnover rate(g) | | | 75 | % | | | 82 | % | | | 84 | % | | | 92 | % | | | 54 | % |
| (a) | Net investment income (loss) per share is based on average shares outstanding. |
| (b) | Amount represents less than $0.005 per share. |
| (c) | Total investment return excludes the effect of applicable sales charges. |
| (d) | Ratios do not include the expenses of the investment companies in which the Fund invests. |
| (e) | Includes 0.00% of interest expense for the year ended December 31, 2019. |
| (f) | Includes interest expense on line of credit of 0.00% for the year ended December 31, 2015. |
| (g) | Portfolio turnover rate is calculated on the basis of the Fund as a whole without distinguishing between classes of shares issued. |
The accompanying notes are an integral part of these financial statements.
| | |
| | |
| 82 | | LoCorr Spectrum Income Fund - Financial Highlights - Class I |
| | |
LoCorr Spectrum Income Fund - Class I
Financial Highlights
Selected Data and Ratios (for a share outstanding throughout the year)
| | | Year Ended December 31, | |
| | | 2019 | | | 2018 | | | 2017 | | | 2016 | | | 2015 | |
| | | | | | | | | | | | | | | | |
Per Share | | | | | | | | | | | | | | | |
| Net asset value, beginning of year | | $ | 6.25 | | | $ | 7.38 | | | $ | 7.69 | | | $ | 7.78 | | | $ | 8.97 | |
| | | | | | | | | | | | | | | | | | | | | |
Income (loss) from investment operations: | | | | | | | | | | | | | | | | | | | | |
| Net investment income (loss)(a) | | | 0.15 | | | | 0.24 | | | | 0.19 | | | | 0.31 | | | | 0.41 | |
| Net realized and unrealized gain (loss) | | | 1.00 | | | | (0.77 | ) | | | 0.10 | | | | 0.20 | | | | (1.00 | ) |
| Total from Investment Operations | | | 1.15 | | | | (0.53 | ) | | | 0.29 | | | | 0.51 | | | | (0.59 | ) |
| | | | | | | | | | | | | | | | | | | | | |
| Distributions From Earnings: | | | | | | | | | | | | | | | | | | | | |
| Net investment income | | | (0.12 | ) | | | (0.27 | ) | | | (0.16 | ) | | | (0.39 | ) | | | (0.41 | ) |
| Return of capital | | | (0.40 | ) | | | (0.33 | ) | | | (0.44 | ) | | | (0.21 | ) | | | (0.19 | ) |
| Total Distributions | | | (0.52 | ) | | | (0.60 | ) | | | (0.60 | ) | | | (0.60 | ) | | | (0.60 | ) |
| | | | | | | | | | | | | | | | | | | | | |
| Redemption Fees(b) | | | 0.00 | | | | 0.00 | | | | 0.00 | | | | 0.00 | | | | 0.00 | |
| | | | | | | | | | | | | | | | | | | | | |
| Net Asset Value, End of Year | | $ | 6.88 | | | $ | 6.25 | | | $ | 7.38 | | | $ | 7.69 | | | $ | 7.78 | |
| | | | | | | | | | | | | | | | | | | | | |
| Total Investment Return | | | 18.74 | % | | | (7.91 | )% | | | 3.85 | % | | | 6.85 | % | | | (7.10 | )% |
| | | | | | | | | | | | | | | | | | | | | |
| Net Assets, End of Year, in Thousands | | $ | 30,049 | | | $ | 27,618 | | | $ | 43,032 | | | $ | 46,838 | | | $ | 28,292 | |
| | | | | | | | | | | | | | | | | | | | | |
Ratio/Supplemental Data:(c) | | | | | | | | | | | | | | | | | | | | |
| Ratio of expenses to average net assets: | | | | | | | | | | | | | | | | | | | | |
| Before expense waiver or recovery | | | 1.77 | %(d) | | | 1.73 | % | | | 1.70 | % | | | 1.77 | % | | | 1.74 | %(e) |
| After expense waiver or recovery | | | 1.77 | %(d) | | | 1.73 | % | | | 1.74 | % | | | 1.80 | % | | | 1.80 | %(e) |
| | | | | | | | | | | | | | | | | | | | | |
| Ratio of net investment income (loss) to average net assets: | | | | | | | | | | | | | | | | | |
| Before expense waiver or recovery | | | 2.19 | % | | | 3.26 | % | | | 2.52 | % | | | 4.06 | % | | | 4.66 | % |
| After expense waiver or recovery | | | 2.19 | % | | | 3.26 | % | | | 2.48 | % | | | 4.03 | % | | | 4.60 | % |
| | | | | | | | | | | | | | | | | | | | | |
| Portfolio turnover rate(f) | | | 75 | % | | | 82 | % | | | 84 | % | | | 92 | % | | | 54 | % |
| (a) | Net investment income (loss) per share is based on average shares outstanding. |
| (b) | Amount represents less than $0.005 per share. |
| (c) | Ratios do not include the expenses of the investment companies in which the Fund invests. |
| (d) | Includes 0.00% of interest expense for the year ended December 31, 2019. |
| (e) | Includes interest expense on line of credit of 0.00% for the years ended December 31, 2015. |
| (f) | Portfolio turnover rate is calculated on the basis of the Fund as a whole without distinguishing between classes of shares issued. |
The accompanying notes are an integral part of these financial statements.
| | |
| | |
LoCorr Macro Strategies Fund, LoCorr Long/Short Commodities Strategy Fund and LoCorr Market Trend Fund – Notes to Consolidated Financial Statements / LoCorr Dynamic Equity Fund and LoCorr Spectrum Income Fund – Notes to Financial Statements | | 83 |
| | |
LoCorr Investment Trust
Notes
December 31, 2019
1. Organization
LoCorr Investment Trust (the “Trust”), an Ohio business trust, was formed on November 15, 2010 and is an open-end management investment company registered under the Investment Company Act of 1940, as amended (“1940 Act”). Each fund is an investment company and accordingly follows the investment company accounting and reporting guidance of the Financial Accounting Standards Board (“FASB”) Accounting Standards Codification (“ASC”) Topic 946, Financial Services- Investment Companies. The LoCorr Macro Strategies Fund, LoCorr Long/Short Commodities Strategy Fund, LoCorr Market Trend Fund, LoCorr Dynamic Equity Fund and the LoCorr Spectrum Income Fund (individually a “Fund” and collectively the “Funds”) are series within the Trust. The Funds are each diversified funds.
The LoCorr Macro Strategies Fund’s primary investment objective is capital appreciation in rising and falling equity markets with managing volatility as a secondary objective.
The LoCorr Long/Short Commodities Strategy Fund’s primary investment objective is capital appreciation in rising and falling commodities markets with managing volatility as a secondary objective.
The LoCorr Market Trend Fund’s primary investment objective is capital appreciation in rising and falling equity markets with managing volatility as a secondary objective.
The LoCorr Dynamic Equity Fund’s primary investment objective is long-term capital appreciation with reduced volatility compared to traditional broad-based equity market indices as a secondary objective.
The LoCorr Spectrum Income Fund’s primary investment objective is current income with capital appreciation as a secondary objective.
Wholly-owned and Controlled Subsidiaries
In order to achieve their investment objectives, the LoCorr Macro Strategies Fund, the LoCorr Long/Short Commodities Strategy Fund and the LoCorr Market Trend Fund each invest up to 25% of their total assets (measured at the time of purchase) in wholly-owned subsidiaries, LCMFS Fund Limited (“LCMFS”), LCLSCS Fund Limited (“LCLSCS”) and LCMT Fund Limited (“LCMT”), respectively; each company is incorporated under the laws of the Cayman Islands. LCMFS, LCLSCS and LCMT act as investment vehicles in order to enter into certain investments for the LoCorr Macro Strategies Fund, the LoCorr Long/Short Commodities Strategy Fund and the LoCorr Market Trend Fund, respectively, consistent with their investment objectives and policies specified in the Prospectuses and Statement of Additional Information.
At December 31, 2019, investments in LCMFS, LCLSCS and LCMT represented 1.51%, 17.47% and 3.21% of the total net assets of LoCorr Macro Strategies Fund, LoCorr Long/Short Commodities Strategy Fund and LoCorr Market Trend Fund, respectively. See Note 2.
The consolidated financial statements of the LoCorr Macro Strategies Fund, LoCorr Long/Short Commodities Strategy Fund and the LoCorr Market Trend Fund each include the investment activity and financial statements of LCMFS, LCLSCS and LCMT, respectively. All intercompany accounts and transactions have been eliminated in consolidation. Because each Fund may invest a substantial portion of its assets in its respective subsidiary, the Fund may be considered to be investing indirectly in some of those investments through its subsidiary. For that reason, references to the Fund may also encompass its subsidiary. The subsidiary will be subject to the same investment restrictions and limitations, and follow the same compliance policies and procedures, as the Fund when viewed on a consolidated basis. Each Fund and its subsidiary are a “commodity pool” under the U.S. Commodity Exchange Act and LoCorr Fund Management, LLC (the “Adviser” or “Management”) is a “commodity pool operator” registered with and regulated by the Commodity Futures Trading Commission (“CFTC”). As a result, additional CFTC-mandated disclosure, reporting and recordkeeping obligations apply with respect to each Fund and its respective subsidiary under CFTC and the U.S. Securities and Exchange Commission (the “SEC”) harmonized regulations.
At December 31, 2019, the only investment held by LCLSCS is a swap contract, for which the notional amount was $255,945,098. At December 31, 2019, LCLSCS reported unrealized depreciation on the swap contract of $26,162,161. In addition, LCLSCS holds cash and cash equivalents as collateral on the swap contract.
At December 31, 2019, investments held by LCMFS and LCMT include open futures contracts and other investments intended to serve as margin or collateral for futures positions. At December 31, 2019, LCMFS held long open futures contracts with a total notional amount of $193,539,136 and net unrealized appreciation of $2,150,255 and short open futures contracts with a total notional amount of $109,101,996 and net unrealized depreciation of $1,659,983. At December 31, 2019, LCMT held long open futures contracts with a total notional amount of $109,904,399 and net unrealized appreciation of $1,808,183 and short open futures contracts with a total notional amount of $87,070,636 and net unrealized depreciation of $1,415,645.
Share Classes
The Funds currently offer three classes of shares: Class A, Class C and Class I shares. Each share class represents an interest in the same assets of the Fund, has the same rights and is identical in all material respects except that (i) Class A shares have a maximum front end sales load of 5.75% and maximum deferred sales charge of 1.00% and Class C shares have a maximum deferred sales charge of 1.00%, (ii) Class A shares have a 12b-1 fee of 0.25% and Class C shares have a 12b-1 fee of 1.00%; (iii) certain other class-specific expenses will be borne solely by the class to which such expenses are attributable and (iv) each class will have exclusive voting rights with respect to matters relating to its own distribution arrangements.
| | |
| | |
| 84 | | LoCorr Macro Strategies Fund, LoCorr Long/Short Commodities Strategy Fund and LoCorr Market Trend Fund – Notes to Consolidated Financial Statements / LoCorr Dynamic Equity Fund and LoCorr Spectrum Income Fund – Notes to Financial Statements (continued) |
| | |
All classes with respect to the LoCorr Spectrum Income Fund are subject to a 2.00% redemption fee on redemptions made within 60 days of the original purchase. As of May 1, 2017, none of the other Funds are subject to a redemption fee.
The following table presents the class-specific commencement of operations dates for each of the Funds:
| | Commencement of Operations |
| | Class A | | Class C | | Class I |
LoCorr Macro Strategies Fund | March 22, 2011 | | March 24, 2011 | | March 24, 2011 |
| LoCorr Long/Short Commodities Strategy Fund | January 1, 2012 | | January 1, 2012 | | January 1, 2012 |
| LoCorr Dynamic Equity Fund | May 10, 2013 | | May 10, 2013 | | May 10, 2013 |
| LoCorr Spectrum Income Fund | January 1, 2014 | | January 1, 2014 | | January 1, 2014 |
| LoCorr Market Trend Fund | July 1, 2014 | | July 1, 2014 | | July 1, 2014 |
The Funds may issue an unlimited number of shares of beneficial interest, with no par value. All shares of the Funds have equal rights and privileges, except as to class-specific rights and privileges described above.
2. Significant Accounting Policies
The following is a summary of significant accounting policies consistently followed by the Funds in the preparation of the financial statements. These policies are in conformity with generally accepted accounting principles in the United States of America (“GAAP”).
Investment Valuation
The Funds follow fair valuation accounting standards in accordance with GAAP, which establish a definition of fair value and set out a hierarchy for measuring fair value. These standards require additional disclosures about the various inputs and valuation techniques used to develop the measurements of fair value and changes in valuation techniques and related inputs during the period. These inputs are summarized in three broad levels listed below:
Level 1– Unadjusted quoted prices in active markets for identical assets or liabilities that the Funds have the ability to access.
Level 2– Observable inputs other than quoted prices included in Level 1 that are observable for the asset or liability, either directly or indirectly. These inputs may include quoted prices for the identical instrument on an inactive market, prices for similar instruments, interest rates, prepayment speeds, credit risk, yield curves, default rates and similar data.
Level 3– Unobservable inputs for the asset or liability, to the extent relevant observable inputs are not available; representing the Funds’ own assumptions about the assumptions a market participant would use in valuing the asset or liability and would be based on the best information available.
Generally, the Funds’ investments are valued each day at the last quoted sales price on each investment’s primary exchange. Investments traded or dealt in one or more exchanges (whether domestic or foreign) for which market quotations are readily available and not subject to restrictions against resale shall be valued at the last quoted sales price on the primary exchange or, in the absence of a sale on the primary exchange, at the last bid on the primary exchange. Investments primarily traded in the National Association of Securities Dealers’ Automated Quotation System (“NASDAQ”) National Market System for which market quotations are readily available shall be valued using the NASDAQ Official Closing Price.
The Funds may use independent pricing services to assist in calculating the value of the Funds’ investments. In addition, market prices for foreign investments are not determined at the same time of day as the net asset value (“NAV”) for the Funds. Because the Funds may invest in portfolio investments primarily listed on foreign exchanges and these exchanges may trade on weekends or other days when the Funds do not price their shares, the value of some of the Funds’ portfolio investments may change on days when you may not be able to buy or sell the Funds’ shares. In computing the NAV, the Funds value foreign investments held by the Funds at the latest closing price on the exchange in which they are traded immediately prior to closing of the New York Stock Exchange. Prices of foreign investments quoted in foreign currencies are translated into U.S. dollars at current rates. If events materially affecting the value of an investment in the Funds’ portfolio, particularly foreign investments, occur after the close of trading on a foreign market but before the Funds price their shares, the investment will be valued at fair value.
American Depositary Receipts
The Funds may invest in sponsored and unsponsored American Depositary Receipts (“ADRs”), which are receipts issued by an American bank or trust company evidencing ownership of underlying securities issued by a foreign issuer. ADRs, in registered form, are designed for use in U.S. securities markets. Unsponsored ADRs may be created without the participation of the foreign issuer. Holders of unsponsored ADRs generally bear all the costs of the ADR facility, whereas foreign issuers typically bear certain costs in a sponsored ADR. The bank or trust company depositary of an unsponsored ADR may be under no obligation to distribute shareholder communications received from the foreign issuer or to pass through voting rights. ADRs are generally categorized in Level 1 or Level 2 of the fair value hierarchy depending on inputs used and market activity levels for specific securities.
Equity Securities
Equity securities, including common stocks, preferred stocks, securities convertible into common stocks such as convertible bonds, warrants, rights, options, master limited partnership (“MLP”) interests, real estate investment trusts (“REITs”), business development companies (“BDCs”) and royalty trusts are generally valued by using market quotations, but may be valued on the basis of prices furnished by a pricing service when the Adviser believes such prices accurately reflect the fair market value of such securities. MLP interests are limited partnerships, the interests in which (known as “units”) typically trade publicly, like stock. MLPs are also called publicly traded partnerships and public limited partnerships.
| | |
| | |
LoCorr Macro Strategies Fund, LoCorr Long/Short Commodities Strategy Fund and LoCorr Market Trend Fund – Notes to Consolidated Financial Statements / LoCorr Dynamic Equity Fund and LoCorr Spectrum Income Fund – Notes to Financial Statements (continued) | | 85 |
| | |
Securities that are traded on any stock exchange or on the NASDAQ over-the-counter market are generally valued by the pricing service at the last quoted sale price. Lacking a last sale price, an equity security is generally valued by the pricing service at its last bid price. Equity securities are generally categorized in Level 1 or Level 2 of the fair value hierarchy depending on inputs used and market activity levels for specific securities.
Exchange Traded Funds
The Funds may invest in Exchange Traded Funds (“ETFs”). They are managed by professionals and provide the investor with diversification, cost and tax efficiency, liquidity, marginability, usability for hedging, the ability to go long and short, and (for some ETFs) the provision of periodic distributions. Additionally, some ETFs are unit investment trusts (“UITs”), which are unmanaged portfolios overseen by trustees. ETFs generally have two markets. The primary market is where institutions swap “creation units” in block-multiples of shares, typically 25,000 or 50,000, for in-kind securities and cash in the form of dividends. The secondary market is where individual investors can trade as little as a single share during trading hours on the exchange. This is different from open-ended mutual funds that are traded after hours once the NAV is calculated. ETF shares may trade at a premium or discount to NAV per share. ETFs share many similar risks with open-end and closed-end funds. ETFs are generally categorized in Level 1 of the fair value hierarchy.
The Funds may invest in ETFs and other investment companies that hold a portfolio of foreign securities. Investing in securities of foreign companies and countries involves certain considerations and risks that are not typically associated with investing in U.S. government securities and securities of domestic companies. There may be less publicly available information about a foreign issuer than a domestic one, and foreign companies are not generally subject to uniform accounting, auditing and financial standards and requirements comparable to those applicable to U.S. companies. There may also be less government supervision and regulation of foreign securities exchanges, brokers and listed companies than exists in the United States. Interest and dividends paid by foreign issuers may be subject to withholding and other foreign taxes, which may decrease the net return on such investments as compared to dividends and interest paid to the Funds by domestic companies or the U.S. government. There may be the possibility of expropriations, seizure or nationalization of foreign deposits, confiscatory taxation, political, economic or social instability, or diplomatic developments that could affect assets of the Funds held in foreign countries. Finally, the establishment of exchange controls or other foreign governmental laws or restrictions could adversely affect the payment of obligations.
Fixed Income Securities
Fixed income securities and certificates of deposit with maturities more than 60 days when acquired generally are valued using an evaluated price supplied by an independent pricing service. Inputs used by the pricing service for U.S. government and treasury securities are normally valued using a model that incorporates market observable data such as reported sales of similar securities, broker dealer quotes, yields, bids, offers and reference data. Agency issued debt securities, foreign issued bonds and municipal bonds are generally valued in a manner similar to U.S. government securities. Evaluations for corporate bonds are typically based on valuation methodologies such as market pricing and other analytical pricing models as well as market transactions and dealer quotations based on observable inputs. Fixed income securities are generally categorized in Level 1 or Level 2 of the fair value hierarchy depending on inputs used and market activity levels for specific securities.
The fair value of asset backed securities and mortgage backed securities is estimated on models that consider the estimated cash flows of each tranche of the entity, establish a benchmark yield, and develop an estimated tranche-specific spread to the benchmark yield based on the unique attributes of the tranche. Additional inputs such as creditworthiness of the underlying collateral and quotes from outside brokers for the same or similar issuance may also be considered in the development of fair value. Asset backed and mortgage backed securities are generally categorized in Level 2 of the fair value hierarchy.
Short-term investments in fixed income securities and certificates of deposit with maturities of less than 60 days when acquired, or which subsequently are within 60 days of maturity, are valued using an amortized cost method of valuation, and are generally categorized in Level 2.
Investment Companies
With respect to any portion of the Funds’ assets that are invested in one or more open-end management investment companies, including money market funds, registered under the 1940 Act, the Funds’ NAV is calculated based upon the NAVs of those open-end management investment companies, and the prospectuses for these companies explain the circumstances under which those companies will use fair value pricing and the effects of using fair value pricing.
The Funds generally will purchase shares of closed-end investment companies only in the secondary market. The shares of many closed-end investment companies, after their initial public offering, frequently trade at a price per share that is less than the NAV per share, the difference representing the “market discount” of such shares. This market discount may be due in part to the investment objective of long-term appreciation, which is sought by many closed-end investment companies, as well as to the fact that the shares of closed-end investment companies are not redeemable by the holder upon demand to the issuer at the next determined NAV but rather are subject to the principles of supply and demand in the secondary market. A relative lack of secondary market purchasers of closed-end investment company shares also may contribute to such shares trading at a discount to their NAV. Closed-end investment companies are generally categorized in Level 1 or Level 2 of the fair value hierarchy depending on inputs used and market activity levels for specific securities.
Financial Derivative Instruments
Financial derivative instruments, such as forward currency contracts, futures contracts or swap agreements, derive their value from underlying asset prices, indices, reference rates and other inputs or a combination of these factors. These contracts are normally valued on the basis of broker-dealer quotations or a pricing service at the settlement price determined by the relevant exchange. Depending on the product and the terms of the transaction, the value of the derivative contracts can be estimated by a pricing service provider using a series of techniques, including simulation pricing models. The pricing models use inputs that are observed from actively quoted markets such as issuer details, indices, spreads, interest rates, curves, dividends and exchange rates.
| | |
| | |
| 86 | | LoCorr Macro Strategies Fund, LoCorr Long/Short Commodities Strategy Fund and LoCorr Market Trend Fund – Notes to Consolidated Financial Statements / LoCorr Dynamic Equity Fund and LoCorr Spectrum Income Fund – Notes to Financial Statements (continued) |
| | |
|
|
Forward currency contracts represent the purchase or sale of a specific quantity of a foreign currency at the current or spot price, with delivery and settlement at a specified future date. Forward currency contracts are presented at fair value using spot currency rates and are adjusted for the time value of money (forward points) and contractual prices of the underlying financial instruments. Forward currency contracts are generally categorized in Level 2.
Futures contracts are carried at fair value using the primary exchange’s closing (settlement) price and are generally categorized in Level 1.
Total return swap contracts are stated at fair value daily based on the fair value of the underlying futures, forward currency and foreign currency contracts constituting the contract’s stated index, taking into account any fees and expenses associated with the swap agreement. Total return swap contracts are generally categorized in Level 2.
Fair Value Pricing
If market quotations are not readily available, investments will be valued at their fair value as determined in good faith by the Adviser in accordance with procedures approved by the Board of Trustees (the “Board”) and evaluated by the Board as to the reliability of the fair value method used.
In these cases, a Fund’s NAV will reflect certain portfolio investments’ fair value rather than their market price. Fair value pricing involves subjective judgments and it is possible that the fair value determined for an investment is materially different than the value that could be realized upon the sale of that investment. The fair value prices can differ from market prices when they become available or when a price becomes available.
Fair value determinations are required for the following securities:
| • | securities for which market quotations are not readily available at the valuation time on a particular business day (including without limitation securities for which there is a short and temporary lapse in the provision of a price by the regular pricing source); |
| • | securities determined to be illiquid in accordance with the Trust’s Liquidity Procedures; and |
| • | securities with respect to which an event that will affect the value thereof has occurred subsequent to the determination by the Adviser/ relevant Sub-Adviser of the closing prices reported on the principal exchange on which the securities are traded, but prior to the relevant Fund’s calculation of its NAV. |
| • | For any open-end mutual funds that do not provide timely NAV information, the Adviser/relevant Sub-Adviser shall evaluate those ‘similar’ funds and determine which are most appropriate based on funds having similar benchmarks or similar objectives. The Adviser/relevant Sub-Adviser shall then calculate the NAV percentage move of those ‘similar’ funds for the day to create an aggregate average percentage move, which it shall use to calculate the price movement for the day of the Fund at issue. For closed-end funds, the aforementioned practice shall be utilized, in addition to monitoring secondary market activity during the day. |
Performing Fair Value Pricing
The Adviser considers all appropriate factors relevant to the value of securities for which market quotations are not readily available. No single standard for determining fair value can be established, since fair value depends upon the circumstances of each individual case. As a general principle, the current fair value of an issue of securities being valued by the Adviser would appear to be the amount that the owner might reasonably expect to receive for them upon their current sale. Methods that are in accord with this principle may, for example, be based on:
| • | a discount from market of a similar freely traded security (including a derivative security or a basket of securities traded on other markets, exchanges or among dealers); or |
| • | yield to maturity with respect to debt issues, or a combination of these and other methods. |
Fair value determinations are not based on what the Adviser believes that a buyer may pay at a later time, such as when market conditions change or when the market ultimately recognizes a security’s true value as perceived by the Adviser. Similarly, bonds and other instruments may not be fair valued at par based on the expectation that the Funds will hold the investment until maturity.
Some of the general factors that the Adviser considers in determining a valuation method for an individual issue of securities include, but shall not be limited to:
| • | the fundamental analytical data relating to the investment; |
| • | the nature and duration of restrictions (if any) on disposition of the securities; |
| • | evaluation of the forces that influence the market in which these securities are purchased or sold; |
| • | changes in interest rates; |
| • | government (domestic or foreign) actions or pronouncements; and |
With respect to securities traded on foreign markets, the Adviser considers the value of foreign securities traded on other foreign markets, ADR trading, closed-end fund trading, foreign currency exchange activity and the trading prices of financial products that are tied to baskets of foreign securities, such as World Equity Benchmark Series (“WEBS”).
| | |
| | |
LoCorr Macro Strategies Fund, LoCorr Long/Short Commodities Strategy Fund and LoCorr Market Trend Fund – Notes to Consolidated Financial Statements / LoCorr Dynamic Equity Fund and LoCorr Spectrum Income Fund – Notes to Financial Statements (continued) | | 87 |
| | |
|
|
Among the more specific factors that the Funds’ Adviser considers (if applicable) in determining a valuation method for an individual issue of securities are:
| • | financial statements of the issuer; |
| • | cost at date of purchase; |
| • | discount from market value of unrestricted securities of the same class at time of purchase; |
| • | special reports prepared by analysts; |
| • | information as to any transactions or offers with respect to the security; |
| • | existence of merger proposals or tender offers affecting the securities; |
| • | price and extent of public trading in similar securities of the issuer or comparable companies; and |
As a general matter, the Funds’ Adviser will value the portfolio security or other asset primarily by reference to the public market if there isa public market for securities of the same class or similar securities; primarily by reference to private transactions if public market reference is not available and private transaction reports are available; and primarily by use of one or more analytical methods or models if public and private market references are not available or not reliable. The Adviser will use cost only if no better method of valuation is available.
The Adviser regularly evaluates whether its pricing methodologies continue to result in values that the Funds might reasonably expect to receive upon a current sale. In order to do this, the Adviser compares its fair value prices with values that are available from other sources (if there are any). The next actual sales price of a security might be one such source. However, the next-day opening prices or next actual sales prices for a security may differ from the fair value of that security as of the time for NAV calculation, given the subjectivity inherent in fair valuation and the fact that events could occur after NAV calculation. Thus, discrepancies between fair values and next-day opening prices or next actual sales prices may occur on a regular and recurring basis. These discrepancies do not necessarily indicate that the Adviser’s fair value methodology is inappropriate. Nonetheless, systematic comparisons of fair values to the next-day opening prices or next actual sales prices are useful to assist the Adviser with ongoing monitoring and evaluation of the appropriateness of its fair value methodologies.
The above guidance does not purport to delineate all factors that may be considered. The Adviser takes into consideration all indications of value available to it in determining the fair value assigned to a particular security.
The following table summarizes LoCorr Macro Strategies Fund’s consolidated investments and other financial instruments as of December 31, 2019:
| Security Classification | | Level 1 | | | Level 2 | | | Level 3 | | | Total | |
| Investments | | | | | | | | | | | | | | | | |
| Asset Backed Securities | | $ | — | | | $ | 85,445,810 | | | $ | — | | | $ | 85,445,810 | |
| Corporate Bonds | | | — | | | | 195,406,412 | | | | — | | | | 195,406,412 | |
| Mortgage Backed Securities | | | — | | | | 122,022,830 | | | | — | | | | 122,022,830 | |
| Municipal Bonds | | | — | | | | 12,514,527 | | | | — | | | | 12,514,527 | |
| U.S. Government Agency Issues | | | — | | | | 75,009,307 | | | | — | | | | 75,009,307 | |
| U.S. Government Notes | | | — | | | | 229,858,725 | | | | — | | | | 229,858,725 | |
| Short Term Investments | | | 27,128,453 | | | | 11,009,453 | | | | — | | | | 38,137,906 | |
| Total Investments | | $ | 27,128,453 | | | $ | 731,267,064 | | | $ | — | | | $ | 758,395,517 | |
Other Financial Instruments* | | | | | | | | | | | | | | | | |
| Forward Currency Contracts | | | | | | | | | | | | | | | | |
| Purchase | | $ | — | | | $ | 7,411,217 | | | $ | — | | | $ | 7,411,217 | |
| Sale | | | — | | | | (11,152,491 | ) | | | — | | | | (11,152,491 | ) |
| Total Forward Currency Contracts | | | — | | | | (3,741,274 | ) | | | — | | | | (3,741,274 | ) |
| Futures Contracts | | | | | | | | | | | | | | | | |
| Long | | | 698,900 | | | | — | | | | — | | | | 698,900 | |
| Short | | | (868,839 | ) | | | — | | | | — | | | | (868,839 | ) |
| Total Futures Contracts | | | (169,939 | ) | | | — | | | | — | | | | (169,939 | ) |
| Total Other Financial Instruments | | $ | (169,939 | ) | | $ | (3,741,274 | ) | | $ | — | | | $ | (3,911,213 | ) |
See the Fund’s consolidated schedule of investments for the investments detailed by industry classification.
*The fair value of the Fund’s other financial instruments represent the net unrealized appreciation (depreciation) at December 31, 2019.
The LoCorr Macro Strategies Fund did not hold any Level 3 assets during the year.
| | |
| | |
| 88 | | LoCorr Macro Strategies Fund, LoCorr Long/Short Commodities Strategy Fund and LoCorr Market Trend Fund – Notes to Consolidated Financial Statements / LoCorr Dynamic Equity Fund and LoCorr Spectrum Income Fund – Notes to Financial Statements (continued) |
| | |
|
|
The following table summarizes LoCorr Long/Short Commodities Strategy Fund’s consolidated investments and swap contracts as of December 31, 2019:
| Security Classification | | Level 1 | | | Level 2 | | | Level 3 | | | Total | |
| Investments | | | | | | | | | | | | | | | | |
| Asset Backed Securities | | $ | — | | | $ | 26,425,907 | | | $ | — | | | $ | 26,425,907 | |
| Corporate Bonds | | | — | | | | 58,302,372 | | | | — | | | | 58,302,372 | |
| Foreign Government Bond | | | — | | | | 7,500 | | | | — | | | | 7,500 | |
| Mortgage Backed Securities | | | — | | | | 36,946,071 | | | | — | | | | 36,946,071 | |
| Municipal Bonds | | | — | | | | 5,110,003 | | | | — | | | | 5,110,003 | |
| U.S. Government Agency Issues | | | — | | | | 24,996,706 | | | | — | | | | 24,996,706 | |
| U.S. Government Notes | | | — | | | | 51,115,805 | | | | — | | | | 51,115,805 | |
| Short Term Investments | | | 7,017,627 | | | | 1,602,868 | | | | — | | | | 8,620,495 | |
| Total Investments | | $ | 7,017,627 | | | $ | 204,507,232 | | | $ | — | | | $ | 211,524,859 | |
| | | | | | | | | | | | | | | | | |
Swap Contracts* | | | | | | | | | | | | | | | | |
| Long Total Return Swap Contracts | | $ | — | | | $ | (26,162,161 | ) | | $ | — | | | $ | (26,162,161 | ) |
| Total Swap Contracts | | $ | — | | | $ | (26,162,161 | ) | | $ | — | | | $ | (26,162,161 | ) |
See the Fund’s consolidated schedule of investments for the investments detailed by industry classification.
*The fair value of the Fund’s investment in swap contracts represents the net unrealized depreciation at December 31, 2019.
The LoCorr Long/Short Commodities Strategy Fund did not hold any Level 3 assets during the year.
The following table summarizes LoCorr Market Trend Fund’s consolidated investments and other financial instruments as of December 31, 2019:
| Security Classification | | Level 1 | | | Level 2 | | | Level 3 | | | Total | |
| Investments | | | | | | | | | | | | | | | | |
| Asset Backed Securities | | $ | — | | | $ | 43,890,952 | | | $ | — | | | $ | 43,890,952 | |
| Corporate Bonds | | | — | | | | 31,495,414 | | | | — | | | | 31,495,414 | |
| Mortgage Backed Securities | | | — | | | | 22,134,035 | | | | — | | | | 22,134,035 | |
| Municipal Bond | | | — | | | | 1,111,444 | | | | — | | | | 1,111,444 | |
| U.S. Government Agency Issues | | | — | | | | 22,953,182 | | | | — | | | | 22,953,182 | |
| U.S. Government Notes | | | — | | | | 99,263,872 | | | | — | | | | 99,263,872 | |
| Short Term Investment | | | 11,696,488 | | | | — | | | | — | | | | 11,696,488 | |
| Total Investments | | $ | 11,696,488 | | | $ | 220,848,899 | | | $ | — | | | $ | 232,545,387 | |
| | | | | | | | | | | | | | | | | |
Other Financial Instruments* | | | | | | | | | | | | | | | | |
| Forward Currency Contracts | | | | | | | | | | | | | | | | |
| Purchase | | $ | — | | | $ | 1,556,758 | | | $ | — | | | $ | 1,556,758 | |
| Sale | | | — | | | | (3,391,134 | ) | | | — | | | | (3,391,134 | ) |
| Total Forward Currency Contracts | | | — | | | | (1,834,376 | ) | | | — | | | | (1,834,376 | ) |
| Futures Contracts | | | | | | | | | | | | | | | | |
| Long | | | 376,401 | | | | — | | | | — | | | | 376,401 | |
| Short | | | (1,159,619 | ) | | | — | | | | — | | | | (1,159,619 | ) |
| Total Futures Contracts | | | (783,218 | ) | | | — | | | | — | | | | (783,218 | ) |
| Total Other Financial Instruments | | $ | (783,218 | ) | | $ | (1,834,376 | ) | | $ | — | | | $ | (2,617,594 | ) |
See the Fund’s consolidated schedule of investments for the investments detailed by industry classification.
*The fair value of the Fund’s other financial instruments represent the net unrealized appreciation (depreciation) at December 31, 2019.
The LoCorr Market Trend Fund did not hold any Level 3 assets during the year.
| | |
| | |
LoCorr Macro Strategies Fund, LoCorr Long/Short Commodities Strategy Fund and LoCorr Market Trend Fund – Notes to Consolidated Financial Statements / LoCorr Dynamic Equity Fund and LoCorr Spectrum Income Fund – Notes to Financial Statements (continued) | | 89 |
| | |
|
|
The following table summarizes LoCorr Dynamic Equity Fund’s investments, securities sold short and futures contracts as of December 31, 2019:
| Security Classification | | Level 1 | | | Level 2 | | | Level 3 | | | Total | |
| Investments | | | | | | | | | | | | | | | | |
| Common Stocks | | $ | 21,030,859 | | | $ | — | | | $ | — | | | $ | 21,030,859 | |
| Real Estate Investment Trusts | | | 798,114 | | | | — | | | | — | | | | 798,114 | |
| Short Term Investment | | | 2,212,316 | | | | — | | | | — | | | | 2,212,316 | |
| Total Investments | | $ | 24,041,289 | | | $ | — | | | $ | — | | | $ | 24,041,289 | |
| | | | | | | | | | | | | | | | | |
Securities Sold Short | | | | | | | | | | | | | | | | |
| Common Stocks | | $ | (7,312,708 | ) | | $ | — | | | $ | — | | | $ | (7,312,708 | ) |
| Exchange Traded Funds | | | (1,234,889 | ) | | | — | | | | — | | | | (1,234,889 | ) |
| Preferred Stock | | | — | | | | (262 | ) | | | — | | | | (262 | ) |
| Real Estate Investment Trusts | | | (472,920 | ) | | | — | | | | — | | | | (472,920 | ) |
| Total Securities Sold Short | | $ | (9,020,517 | ) | | $ | (262 | ) | | $ | — | | | $ | (9,020,779 | ) |
| | | | | | | | | | | | | | | | | |
Futures Contracts* | | | | | | | | | | | | | | | | |
| Long | | $ | 43,532 | | | $ | — | | | $ | — | | | $ | 43,532 | |
| Short | | | (33,041 | ) | | | — | | | | — | | | | (33,041 | ) |
| Total Futures Contracts | | $ | 10,491 | | | $ | — | | | $ | — | | | $ | 10,491 | |
See the Fund’s schedule of investments and schedule of securities sold short for detail by industry classification.
*The fair value of the Fund’s investment in futures contracts represent the net unrealized appreciation (depreciation) at December 31, 2019.
The LoCorr Dynamic Equity Fund did not hold any Level 3 assets or liabilities during the year.
The following table summarizes LoCorr Spectrum Income Fund’s investments and written options as of December 31, 2019:
| Security Classification | | Level 1 | | | Level 2 | | | Level 3 | | | Total | |
| Investments | | | | | | | | | | | | | | | | |
| Business Development Companies | | $ | 6,003,585 | | | $ | — | | | $ | — | | | $ | 6,003,585 | |
| Closed-End Investment Companies | | | 3,918,660 | | | | — | | | | — | | | | 3,918,660 | |
| Common Stocks | | | 25,687,149 | | | | — | | | | — | | | | 25,687,149 | |
| Master Limited Partnerships | | | 13,731,582 | | | | — | | | | — | | | | 13,731,582 | |
| Preferred Stocks | | | 1,801,781 | | | | — | | | | — | | | | 1,801,781 | |
| Publicly Traded Partnerships | | | 1,509,505 | | | | — | | | | — | | | | 1,509,505 | |
| Purchased Put Options | | | 43,800 | | | | — | | | | — | | | | 43,800 | |
| Real Estate Investment Trusts | | | 17,425,963 | | | | — | | | | — | | | | 17,425,963 | |
| Royalty Trust | | | 723,784 | | | | — | | | | — | | | | 723,784 | |
| Short Term Investment | | | 2,635,151 | | | | — | | | | — | | | | 2,635,151 | |
| Total Investments | | $ | 73,480,960 | | | $ | — | | | $ | — | | | $ | 73,480,960 | |
| | | | | | | | | | | | | | | | | |
Written Options | | | | | | | | | | | | | | | | |
| Written Call Options | | $ | (126,464 | ) | | $ | — | | | $ | — | | | $ | (126,464 | ) |
| Total Written Options | | $ | (126,464 | ) | | $ | — | | | $ | — | | | $ | (126,464 | ) |
See the Fund’s schedule of investments for detail by industry classification.
The LoCorr Spectrum Income Fund did not hold any Level 3 assets during the year.
Allocation of Income and Expenses
Net investment income, other than class specific expenses, and realized and unrealized gains and losses are allocated daily to each class of shares based upon the relative NAV of outstanding shares of each class of shares at the beginning of the day (after adjusting for the current capital shares activity of the respective class). Expenses associated with a specific Fund in the Trust are charged to that Fund. Common expenses are typically allocated based upon the relative net assets of each Fund, or by other equitable means.
Deposits with Broker
Forward Currency and Futures Contracts
When trading derivative instruments, such as forward or futures contracts, a Fund is only required to post initial or variation margin with the exchange or clearing broker. The use of margin in trading these instruments has the effect of creating leverage, which can expose the Fund to substantial gains or losses occurring from relatively small price changes in the value of the underlying instrument and can increase the volatility of the Fund’s returns. Volatility is a statistical measure of the dispersion of returns of an investment, where higher volatility generally indicates greater risk. At December 31, 2019, the LoCorr Macro Strategies Fund and the LoCorr Market Trend Fund pledged cash and cash equivalents, defined as short-term, highly liquid investments that are readily convertible to known amounts of cash, at U.S. Bank, N.A. (“U.S. Bank”) of $12,170,000 and $12,230,000, respectively, to Bank of America Merrill Lynch for each Fund’s investment in forward currency contracts.
| | |
| | |
| 90 | | LoCorr Macro Strategies Fund, LoCorr Long/Short Commodities Strategy Fund and LoCorr Market Trend Fund – Notes to Consolidated Financial Statements / LoCorr Dynamic Equity Fund and LoCorr Spectrum Income Fund – Notes to Financial Statements (continued) |
| | |
|
|
Upon entering into a futures contract, and to maintain the Fund’s open positions in futures contracts, the Fund is required to deposit with its custodian or futures broker in a segregated account in the name of the futures broker an amount of cash, U.S. government securities, suitable money market instruments, or other liquid securities, known as “initial margin.” The margin required for a particular futures contract is set by the exchange on which the contract is traded and may be significantly modified from time to time by the exchange during the term of the contract. Futures contracts are customarily purchased and sold on margins that may range upward from less than 5% of the value of the contract being traded.
At December 31, 2019, the LoCorr Macro Strategies Fund and LCMFS, collectively, had $25,014,499 in net cash and cash equivalents including foreign currency on deposit with the broker for derivative instruments which is presented on the Fund’s consolidated statement of assets and liabilities. In addition, LCMFS pledged securities with a fair value of $12,168 as collateral for derivative instruments.
At December 31, 2019, the LoCorr Market Trend Fund and LCMT, collectively, had $29,494,076 in net cash and cash equivalents including foreign currency on deposit with the broker for derivative instruments which is presented on the Fund’s consolidated statements of assets and liabilities. In addition, LCMT pledged securities with a fair value of $367,819 as collateral for derivative instruments.
At December 31, 2019, the LoCorr Dynamic Equity Fund had $381,890 in cash and cash equivalents on deposit with the broker for futures contracts which is presented on the Fund’s statements of assets and liabilities.
If the price of an open futures contract changes (by increase in underlying instrument or index in the case of a sale or by decrease in the case of a purchase) so that the loss on the futures contract reaches a point at which the margin on deposit does not satisfy margin requirements, the broker will require an increase in the margin. However, if the value of a position increases because of favorable price changes in the futures contract so that the margin deposit exceeds the required margin, the broker will pay the excess to the Fund.
These subsequent payments, called “variation margin,” to and from the futures broker (with the exception of futures contracts traded on the London Metal Exchange (“LME”)), are made on a daily basis as the price of the underlying assets fluctuate making the long and short positions in the futures contract more or less valuable, a process known as “marking to the market.” The variation margin on LME futures contracts do not settle daily, but rather settle at their respective maturity dates. At period end, the unrealized appreciation and depreciation on LME futures contracts is shown as receivable for unsettled open futures contracts and payable for unsettled open futures contracts, respectively, on the Funds’ consolidated statements of assets and liabilities. The Funds expect to earn interest income on any margin deposits.
Securities Sold Short
At December 31, 2019, the LoCorr Dynamic Equity Fund had cash on deposit with Morgan Stanley and J.P. Morgan in the amount of $4,612,612. In addition, at December 31, 2019, the LoCorr Dynamic Equity Fund pledged cash of $3,739,269 and foreign currency of $3,527,293 as collateral for securities sold short.
Swap Contracts
LCLSCS has a substantial portion of its assets on deposit with Deutsche Bank in connection with its trading of its swap contract. Assets deposited with Deutsche Bank in connection with the trading of the swap contract for LCLSCS are partially restricted due to deposit requirements. At December 31, 2019, the LoCorr Long/Short Commodities Strategy Fund had cash and cash equivalents on deposit with Deutsche Bank in the amount of $56,505,498, which is presented on the consolidated statements of assets and liabilities. In addition, at December 31, 2019, LCLSCS pledged securities with a fair value of $477,589 as collateral for the swap contract. Risks arise from the possible inability of the counterparty to meet the terms of its contract and may increase if the counterparty’s financial condition worsens.
Options
At December 31, 2019, the LoCorr Spectrum Income Fund had $349,387 in cash and cash equivalents on deposit with Pershing, LLC for options contracts which is presented on the Fund’s statement of assets and liabilities. In addition, at December 31, 2019, the LoCorr Spectrum Income Fund pledged securities with a value of $3,155,240 as collateral for options contracts.
Distributable Earnings and Investment Transactions
Net investment income and net realized gains (losses) may differ for financial reporting and tax purposes because of temporary or permanent book/tax differences. To the extent these differences are permanent; reclassifications are made to the appropriate equity accounts in the period that the difference arises.
Additionally, GAAP requires that certain components of net assets relating to permanent differences be reclassified between financial and tax reporting. These reclassifications have no effect on net assets or NAV per share. See Note 7.
Distributions from Earnings
Shareholder transactions are recorded on trade date. Dividends from net investment income are declared and paid at least annually by the Funds. Distribution of net realized capital gains, if any, are declared and paid at least annually. Distributions to shareholders are recorded on the ex-dividend date. The character of distributions made during the periods from net investment income or net realized gains may differ from the characterization for federal income tax purposes due to the difference in the recognition of income, expense and gain items for financial statement and tax purposes.
During the year ended December 31, 2019, dividends for the LoCorr Spectrum Income Fund were distributed monthly. The estimated characterization of the distributions paid will be an ordinary dividend, qualified dividend or return of capital. This estimate is based on the Fund’s operating results during the period. It is anticipated that a significant portion of the distributions of the Fund’s investments in MLP and certain investments in REITs and royalty trusts will be comprised of return of capital as a result of the tax character of cash distributions made by each Fund’s investments. The actual characterization of the distributions made during the year is not determined until after the end of the fiscal year.
| | |
| | |
LoCorr Macro Strategies Fund, LoCorr Long/Short Commodities Strategy Fund and LoCorr Market Trend Fund – Notes to Consolidated Financial Statements / LoCorr Dynamic Equity Fund and LoCorr Spectrum Income Fund – Notes to Financial Statements (continued) | | 91 |
| | |
|
|
The tax character of distributions paid during the year were as follows:
| | | Year Ended December 31, 2019 | |
Fund | | Ordinary Income | | | Long-Term Capital Gains | | | Return of Capital | |
| LoCorr Macro Strategies Fund | | $ | 22,150,428 | | | $ | 9,803,103 | | | $ | — | |
| LoCorr Long/Short Commodities Strategy Fund | | | 1,247,338 | | | | — | | | | — | |
| LoCorr Market Trend Fund | | | 3,078,171 | | | | — | | | | — | |
| LoCorr Dynamic Equity Fund | | | — | | | | 93,541 | | | | — | |
| LoCorr Spectrum Income Fund | | | 1,265,581 | | | | — | | | | 4,048,760 | |
| | | Year Ended December 31, 2018 | |
Fund | | Ordinary Income | | | Long-Term Capital Gains | | | Return of Capital | |
| LoCorr Macro Strategies Fund | | $ | 17,125,045 | | | $ | — | | | $ | — | |
| LoCorr Long/Short Commodities Strategy Fund | | | 23,586,033 | | | | — | | | | — | |
| LoCorr Dynamic Equity Fund | | | — | | | | 1,162,325 | | | | — | |
| LoCorr Spectrum Income Fund | | | 2,900,053 | | | | — | | | | 3,468,877 | |
Federal Income Taxes
The Funds intend to qualify as regulated investment companies pursuant to Subchapter M of the Internal Revenue Code of 1986, as amended. The Funds intend to distribute substantially all of their investment company net taxable income and net capital gains to shareholders. Therefore, no federal income tax provision is required.
As of and during the year ended December 31, 2019, the Funds did not have any tax positions that did not meet the “more-likely-than-not” threshold of being sustained by applicable tax authorities. The Funds recognize interest and penalties, if any, related to unrecognized tax benefits on uncertain tax positions as interest or other expense in the statements of operations. During the year ended December 31, 2019, the Funds did not incur any interest or penalties.
For tax purposes, LCMFS, LCLSCS and LCMT are exempted Cayman Islands investment companies. LCMFS, LCLSCS and LCMT have each received an undertaking from the Government of the Cayman Islands exempting them from all local income, profits, and capital gains taxes. No such taxes are levied in the Cayman Islands at the present time. For U.S. income tax purposes, LCMFS, LCLSCS and LCMT are controlled foreign corporations (“CFCs”) and as such are not subject to U.S. income tax. However, as a wholly-owned CFC, the net income and capital gain of each CFC, to the extent of its earnings and profits, will be included each year in the respective Funds’ investment company taxable income.
Foreign Securities and Currency
Investment securities and other assets and liabilities denominated in foreign currencies are translated into U.S. dollar amounts at the date of valuation. Purchases and sales of investment securities and income and expense items denominated in foreign currencies are translated into U.S. dollar amounts on the respective dates of such transactions.
The Funds do not isolate that portion of the results of operations resulting from changes in foreign exchange rates on investments from the fluctuations arising from changes in market prices of securities held. Such fluctuations are included with the net realized and unrealized gain or loss from investments.
Reported net realized foreign exchange gains or losses arise from sales of foreign currencies, currency gains or losses realized between the trade and settlement dates on securities transactions, and the difference between the amounts of dividends, interest, and foreign withholding taxes recorded on the Funds’ books and the U.S. dollar equivalent of the amounts actually received or paid. Net unrealized foreign exchange gains and losses arise from changes in the fair values of assets and liabilities, other than investments in securities at year end, resulting from changes in exchange rates.
Forward Currency Contracts
Gains or losses are realized when foreign currency contracts are liquidated. Any change in net unrealized gain or loss is reported in the statements of operations.
Futures Contracts
A futures contract provides for the future sale by one party and purchase by another party of a specified amount of a specific financial instrument (e.g., units of a stock index) for a specified price, date, time and place designated at the time the contract is made. Brokerage fees are incurred when a futures contract is bought or sold and margin deposits must be maintained. Entering into a contract to buy is commonly referred to as buying or purchasing a contract or holding a long position. Entering into a contract to sell is commonly referred to as selling a contract or holding a short position.
| | |
| | |
| 92 | | LoCorr Macro Strategies Fund, LoCorr Long/Short Commodities Strategy Fund and LoCorr Market Trend Fund – Notes to Consolidated Financial Statements / LoCorr Dynamic Equity Fund and LoCorr Spectrum Income Fund – Notes to Financial Statements (continued) |
| | |
|
|
Unlike when a Fund purchases or sells a security, no price would be paid or received by the Fund upon the purchase or sale of a futures contract.
Although certain futures contracts, by their terms, require actual future delivery of and payment for the underlying instruments, in practice most futures contracts are usually closed out before the delivery date. Gains or losses are realized when contracts are liquidated. Closing out an open futures contract purchase or sale is affected by entering into an offsetting futures contract sale or purchase, respectively, for the same aggregate amount of the identical underlying instrument or index and the same delivery date. If the offsetting purchase price is less than the original sale price, the Fund realizes a gain; if it is more, the Fund realizes a loss. Conversely, if the offsetting sale price is more than the original purchase price, the Fund realizes a gain; if it is less, the Fund realizes a loss.
The transaction costs must also be included in these calculations. There can be no assurance, however, that a Fund will be able to enter into an offsetting transaction with respect to a particular futures contract at a particular time. If a Fund is not able to enter into an offsetting transaction, the Fund will continue to be required to maintain the margin deposits on the futures contract.
Any change in net unrealized gain or loss is reported in the statements of operations.
Indemnifications
In the normal course of business, the Funds enter into contracts that contain general indemnifications to other parties. The Funds’ maximum exposure under these contracts is unknown as this would involve future claims that may be made against the Funds that have not yet occurred. However, based on experience, the Funds expect the risk of loss to be remote.
Market and Credit Risks
The Funds may engage in the speculative trading of U.S. and foreign futures, forward currency and swap contracts (collectively, “derivatives”). The Funds are exposed to both market risk, which is the risk arising from changes in the fair value of the contracts and credit risk, which is the risk of failure by another party to perform according to the terms of a contract.
Purchase and sale of futures contracts requires margin deposits with the broker. Additional deposits may be necessary for any loss on contract value. The Commodity Exchange Act requires a broker to segregate all customer transactions and assets from such broker’s proprietary activities. A customer’s cash and other property (for example, U.S. government securities) deposited with a broker are considered commingled with all other customer funds subject to the broker’s segregation requirements. In the event of a broker’s insolvency, recovery may be limited to a pro rata share of segregated funds available. It is possible that the recovered amount could be less than total cash and other property deposited.
For derivatives, risks arise from changes in the fair value of the contracts. Theoretically, the Funds are exposed to a market risk equal to the notional contract value of swap, futures and forward currency contracts purchased and unlimited liability on such contracts sold short.
The Funds also engage in investing its assets in U.S. government securities. Risks arise from investments in U.S. government securities due to possible market illiquidity. U.S. government securities are also sensitive to changes in interest rates and economic conditions.
The Funds have established procedures to actively monitor market risk and minimize credit risk, although there can be no assurance that they will, in fact, succeed in doing so.
New Accounting Pronouncements and/or SEC Regulatory Updates
In August 2018, FASB issued Accounting Standards Update No. 2018-13, Fair Value Measurement (Topic 820): Disclosure Framework—Changes to the Disclosure Requirements for Fair Value Measurement (“ASU 2018-13”). The primary focus of ASU No. 2018-13 is to improve the effectiveness of the disclosure requirements for fair value measurements. The changes affect all companies that are required to include fair value measurement disclosures. In general, the amendments in ASU 2018-13 are effective for all entities for fiscal years and interim periods within those fiscal years, beginning after December 15, 2019. An entity is permitted to early adopt the removed or modified disclosures upon the issuance of ASU No. 2018-13 and may delay adoption of the additional disclosures, which are required for public companies only, until their effective date. Management has assessed these changes and elected to adopt them early.
In March 2017, FASB issued Accounting Standards Update (“ASU”) No. 2017-08, Receivables—Nonrefundable Fees and Other Costs (Subtopic 310-20): Premium Amortization of Purchased Callable Debt Securities. The amendments in the ASU shorten the amortization period for certain callable debt securities, held at a premium, to be amortized to the earliest call date. The ASU does not require an accounting change for securities held at a discount; which continues to be amortized to maturity. The ASU was effective for fiscal years and interim periods within those fiscal years beginning after December 15, 2018. Management has assessed these changes and concluded these changes do not have a material impact on the Funds’ financial statements.
Options on Securities
The Funds may purchase and write (i.e., sell) put and call options. Such options may relate to particular securities or stock indices and may or may not be listed on a domestic or foreign securities exchange and may or may not be issued by the Options Clearing Corporation. Option trading is a highly specialized activity that entails greater than ordinary investment risk. Options may be more volatile than the underlying instruments, and therefore, on a percentage basis, an investment in options may be subject to greater fluctuation than an investment in the underlying instruments themselves.
A call option for a particular security gives the purchaser of the option the right to buy, and the writer (seller) the obligation to sell, the underlying security at the stated exercise price at any time prior to the expiration of the option, regardless of the market price of the security. The premium paid to the writer is in consideration for undertaking the obligation under the option contract. A put option for a particular security gives the purchaser the right to sell the security at the stated exercise price at any time prior to the expiration date of the option, regardless of the market price of the security.
| | |
| | |
LoCorr Macro Strategies Fund, LoCorr Long/Short Commodities Strategy Fund and LoCorr Market Trend Fund – Notes to Consolidated Financial Statements / LoCorr Dynamic Equity Fund and LoCorr Spectrum Income Fund – Notes to Financial Statements (continued) | | 93 |
| | |
|
|
A Fund’s obligation to sell an instrument subject to a call option written by it, or to purchase an instrument subject to a put option written by it, may be terminated prior to the expiration date of the option by the Fund’s execution of a closing purchase transaction, which is effected by purchasing on an exchange an option of the same series (i.e., same underlying instrument, exercise price and expiration date) as the option previously written. A closing purchase transaction will ordinarily be effected to realize a profit on an outstanding option, to prevent an underlying instrument from being called, to permit the sale of the underlying instrument or to permit the writing of a new option containing different terms on such underlying instrument. The cost of such a liquidation purchase plus transactions costs may be greater than the premium received upon the original option, in which event the Fund will have incurred a loss in the transaction. There is no assurance that a liquid secondary market will exist for any particular option. An option writer unable to effect a closing purchase transaction will not be able to sell the underlying instrument or liquidate the assets held in a segregated account, as described below, until the option expires or the optioned instrument is delivered upon exercise. In such circumstances, the writer will be subject to the risk of market decline or appreciation in the instrument during such period.
If an option purchased by a Fund expires unexercised, the Fund realizes a loss equal to the premium paid. If a Fund enters into a closing sale transaction on an option purchased by it, the Fund will realize a gain if the premium received by the Fund on the closing transaction is more than the premium paid to purchase the option or a loss if it is less. If an option written by a Fund expires on the stipulated expiration date or if the Fund enters into a closing purchase transaction, it will realize a gain (or loss if the cost of a closing purchase transaction exceeds the net premium received when the option is sold). If an option written by the Fund is exercised, the proceeds of the sale will be increased by the net premium originally received and the Fund will realize a gain or loss.
Security Transactions and Investment Income
Security transactions are recorded on trade date. Generally, realized gains and losses on sales of investments are calculated on the specifically identified cost basis of the securities.
In accordance with the investment restrictions outlined within the Funds’ respective prospectuses, each Fund may invest up to 15% of its net assets in illiquid securities. Illiquid securities may include securities subject to contractual or legal restrictions on resale (e.g., because they have not been registered under the Securities Act) and securities that are otherwise not readily marketable (e.g., because trading in the security is suspended or because market makers do not exist or will not entertain bids or offers). Securities that have not been registered under the Securities Act are referred to as private investments or restricted securities and are purchased directly from the issuer or in the secondary market. Foreign securities that are freely tradable in their principal markets are not considered to be illiquid. Under guidelines adopted by the Trust’s Board, the Adviser of the Funds may determine that particular Rule 144A securities, and commercial paper issued in reliance on the private placement exemption from registration afforded by Section 4(a)(2) of the Securities Act, are liquid even though they are not registered. At December 31, 2019, the Adviser deemed all of the 144A securities held in the LoCorr Macro Strategies Fund, the LoCorr Long/Short Commodities Strategy Fund and the LoCorr Market Trend Fund to be liquid. At December 31, 2019, there were no illiquid or restricted securities held in the LoCorr Dynamic Equity Fund or the LoCorr Spectrum Income Fund.
Dividend income, less foreign taxes withheld, if any, are recorded on the ex-dividend date.
Distributions received from the investments in MLP interests, REITs, private investments, closed end funds, business development companies and royalty trusts generally are comprised of ordinary income, capital gains and return of capital. For financial statement purposes, the Funds use estimates to characterize these distributions received as return of capital, capital gains or ordinary income. Such estimates are based on historical information available from each MLP, REIT, private investment, closed end fund, BDC or royalty trust and other industry sources. These estimates may subsequently be revised based on information received from the MLP, REIT, private investment, closed end fund, BDC or royalty trust after their tax reporting periods are concluded, as the actual character of these distributions is not known until after the fiscal year end of the Funds. The distributions received from the MLP, REIT, private investment, closed end fund, business development company and royalty trust securities that have been classified as income and capital gains are included in investment income and net realized gain (loss) on investments, respectively, on the statements of operations. The distributions received that are classified as return of capital reduce the cost of investments on the statements of assets and liabilities.
Interest income and expense are recognized on the accrual basis. Market discounts, premiums and original issue discounts on fixed-income securities are amortized daily over the expected life of the security using the effective yield method.
Short Sales
The Funds may sell securities short. A short sale is a transaction in which a Fund sells a security it does not own or have the right to acquire (or that it owns but does not wish to deliver) in anticipation that the market price of that security will decline.
When a Fund makes a short sale, the broker-dealer through which the short sale is made must borrow the security sold short and deliver it to the party purchasing the security. The Funds are required to make a margin deposit in connection with such short sales; the Funds may have to pay a fee to borrow particular securities and will often be obligated to pay over any dividends and accrued interest on borrowed securities.
If the price of the security sold short increases between the time of the short sale and the time a Fund covers its short position, the Fund will incur a loss; conversely, if the price declines, the Fund will realize a gain. A gain, limited to the price at which the Fund sold the security short, or a loss, unlimited in size, will be recognized upon the close of a short sale. Any gain will be decreased, and any loss increased, by the transaction costs described above. The successful use of short selling may be adversely affected by imperfect correlation between movements in the price of the security sold short and the securities being hedged. Gains or losses from closed positions of securities sold short are presented as net realized gain or loss on securities sold short on the statements of operations.
| | |
| | |
| 94 | | LoCorr Macro Strategies Fund, LoCorr Long/Short Commodities Strategy Fund and LoCorr Market Trend Fund – Notes to Consolidated Financial Statements / LoCorr Dynamic Equity Fund and LoCorr Spectrum Income Fund – Notes to Financial Statements (continued) |
| | |
|
|
In addition, the Funds are required to pay the lender any dividends declared on short positions. Dividends declared on open short positions are recorded on ex-date and shown as an expense for financial reporting purposes. To borrow the security, the Funds also may be required to pay fees, which are shown as an expense for financial reporting purposes.
To the extent the Funds sell securities short, it will provide collateral to the broker-dealer and (except in the case of short sales “against the box”) will maintain additional asset coverage in the form of cash, U.S. government securities or other liquid securities with its custodian in a segregated account in an amount at least equal to the difference between the current fair value of the securities sold short and any amounts required to be deposited as collateral with the selling broker (not including the proceeds of the short sale). A short sale is “against the box” to the extent the Funds contemporaneously own, or have the right to obtain at no added cost, securities identical to those sold short. Short sales are collateralized by cash deposits with the counterparty broker and pledged securities held at the custodian, U.S. Bank. The collateral required is determined daily by reference to the fair value of the short positions.
Total Return Swap Contracts
The Funds may enter into total return swap agreements. A total return swap entered into by the Funds is a derivative contract that transfers the market risk of underlying portfolios of futures contracts, forward currency contracts and foreign currencies (considered the “index” within each total return swap contract) between counterparties. The “notional amount” of each total return swap agreement is the agreed upon amount or value of the index used for calculating the returns that the parties to a swap agreement have agreed to exchange. The total return swaps are marked to market daily and any change is recorded in unrealized gain/loss on the consolidated statements of operations based on the value of the index on which the total return swap is referenced, as defined within the total return swap agreement between the counterparties. The composition of the index may vary based on how the underlying portfolio of futures contracts, forward currency contracts and foreign currencies is traded. A Fund’s obligation under total return swap agreement, including any related fees, offset against amounts owed to the Fund in the case of positive performance, will be covered by designating liquid assets on the Fund’s books and records (see the consolidated statement of assets and liabilities for deposits with broker for derivative instruments). Gains or losses will be realized when the total return swap contracts are liquidated and will be presented as net realized gain or loss on swap contracts on the consolidated statements of operations. Changes in notional value and any cash holding adjustments, which represent voluntary realizations by a Fund of swap value at any point in time, are also presented as net realized gain or loss on swap contracts on the consolidated statements of operations. Further, any cash holding adjustments realized by a Fund are subject to interest charges, which are recorded as part of unrealized gain/loss on the consolidated statements of operations. A corresponding asset or liability for “advance receipt on swap contracts” or “advance payment on swap contracts,” respectively, is recorded on the consolidated statements of assets and liabilities for the gain or loss realized on changes in notional value. Total return swaps outstanding at year end, if any, are listed after the Funds’ consolidated schedules of investments.
Use of Estimates
The preparation of financial statements in conformity with GAAP requires management to make estimates and assumptions that affect the reported amounts of assets and liabilities, disclosure of contingent assets and liabilities at the date of the financial statements and the reported revenues and expenses during the reporting period. Actual results could differ from those estimates.
Warrants
The Funds may invest in warrants. Warrants are options to purchase common stock at a specific price (usually at a premium above the market value of the optioned common stock at issuance) valid for a specific period of time. Warrants may have a life ranging from less than one year to twenty years, or they may be perpetual. However, most warrants have expiration dates after which they are worthless. In addition, a warrant is worthless if the market price of the common stock does not exceed the warrant’s exercise price during the life of the warrant. Warrants have no voting rights, pay no dividends and have no rights with respect to the assets of the corporation issuing them. The percentage increase or decrease in the market price of the warrant may tend to be greater than the percentage increase or decrease in the market price of the optioned common stock.
| 3. | Derivative and Other Financial Instruments |
The Funds may invest in derivatives such as futures, forward currency and swap contracts, in order to hedge against market movements while liquidating certain positions and buying other securities or as substitutes for securities, as well as for speculative purposes to gain exposure to such market movements.
The Funds’ market risk related to their derivatives trading is influenced by a wide variety of factors, including the level and volatility of interest rates, exchange rates, weather, supply and demand of commodities, the market value of futures and forward currency contracts, the diversification effects among the Funds’ open positions and the liquidity of the markets in which they trade.
The following are the primary trading risk exposures by market sector of the Funds as encompassed in the total return swap contracts:
Agricultural. (grains, livestock and softs). The Funds’ primary exposure is to agricultural price movements which are often directly affected by severe or unexpected weather conditions.
Currencies. Exchange rate risk is a principal market exposure of the Funds. The Funds’ currency exposure is to exchange rate fluctuations, primarily fluctuations which disrupt the historical pricing relationships between different currencies and currency pairs. The fluctuations are influenced by interest rate changes as well as political and general economic conditions. The Funds trade in a large number of currencies including cross-rates– e.g., positions between two currencies other than the U.S. dollar.
Energy. The Funds’ primary energy market exposure is to gas and oil price movements, often resulting from political developments in the Middle East and economic conditions worldwide. Energy prices are volatile and substantial profits and losses have been and are expected to continue to be experienced in this market.
| | |
| | |
| LoCorr Macro Strategies Fund, LoCorr Long/Short Commodities Strategy Fund and LoCorr Market Trend Fund – Notes to Consolidated Financial | | 95 |
| Statements / LoCorr Dynamic Equity Fund and LoCorr Spectrum Income Fund – Notes to Financial Statements (continued) |
| | |
Interest rates. Interest rate movements directly affect the price of the sovereign bond futures positions held by the Funds and indirectly the value of its stock index currency positions. Interest rate movements in one country as well as relative interest rate movements between countries may materially impact the Funds’ profitability. The Funds’ primary interest rate exposure is to interest rate fluctuations in countries or regions including Australia, Canada, Japan, Switzerland, the United Kingdom, the United States and the Eurozone. However, the Funds also may take positions in futures contracts on the government debt of other nations. The Funds anticipate that interest rates in these industrialized countries or areas, both long-term and short-term, will remain a primary market exposure of the Funds for the foreseeable future.
Metals. The Funds’ metals market exposure is to fluctuations in the price of aluminum, copper, gold, lead, nickel, palladium, tin, silver and zinc.
Stock index. The Funds’ equity exposure, through stock index futures, is to equity price risk in the major industrialized countries as well as other countries.
At December 31, 2019, LoCorr Macro Strategies Fund, LoCorr Long/Short Commodities Strategy Fund, LoCorr Market Trend Fund, LoCorr Dynamic Equity Fund and LoCorr Spectrum Income Fund held derivative and other financial instruments which are not subject to a master netting arrangement. As the tables below illustrate, no positions are netted in these consolidated and non-consolidated financial statements.
| LoCorr Macro Strategies Fund - December 31, 2019 |
| Assets: | | | | | | | | | | Gross Amounts not offset in the Consolidated Statement of Assets & Liabilities | | | | |
| Description | | Gross Amounts of Recognized Assets | | | Gross Amounts Offset in the Consolidated Statement of Assets & Liabilities | | | Net Amounts Presented in the Consolidated Statement of Assets & Liabilities | | | Financial Instruments | | | Collateral Pledged (Received) | | | Net Amount | |
| Forward currency contracts | | $ | 7,654,863 | | | $ | — | | | $ | 7,654,863 | | | $ | — | | | $ | — | | | $ | 7,654,863 | |
| Futures contracts (a) | | | 1,406,038 | | | | — | | | | 1,406,038 | | | | — | | | | — | | | | 1,406,038 | |
| Total | | $ | 9,060,901 | | | $ | — | | | $ | 9,060,901 | | | $ | — | | | $ | — | | | $ | 9,060,901 | |
| | | | | | | | | | | | | | | | | | | | | | | | | |
| Liabilities: | | | | | | | | | | | | | | Gross Amounts not offset in the Consolidated Statement of Assets & Liabilities | | | | | |
| Description | | | Gross Amounts of Recognized Liabilities | | | | Gross Amounts Offset in the Consolidated Statement of Assets & Liabilities | | | | Net Amounts Presented in the Consolidated Statement of Assets & Liabilities | | | | Financial Instruments | | | | Collateral Received (Pledged) | | | | Net Amount | |
| Forward currency contracts | | $ | 11,396,137 | | | $ | — | | | $ | 11,396,137 | | | $ | — | | | $ | (11,396,137 | ) | | $ | — | |
| Futures contracts (a) | | | 1,946,059 | | | | — | | | | 1,946,059 | | | | — | | | | (1,946,059 | ) | | | — | |
| Total | | $ | 13,342,196 | | | $ | — | | | $ | 13,342,196 | | | $ | — | | | $ | (13,342,196 | ) | | $ | — | |
| LoCorr Long/Short Commodities Strategy Fund - December 31, 2019 |
| Assets: | | | | | | | | | | | Gross Amounts not offset in the Consolidated Statement of Assets & Liabilities | | | | |
| Description | | Gross Amounts of Recognized Assets | | | Gross Amounts Offset in the Consolidated Statement of Assets & Liabilities | | | Net Amounts Presented in the Consolidated Statement of Assets & Liabilities | | | Financial Instruments | | | Collateral Pledged (Received) | | | Net Amount | |
| Swap Contracts* | | $ | 13,908,302 | | | $ | — | | | $ | 13,908,302 | | | $ | — | | | $ | — | | | $ | 13,908,302 | |
| Total | | $ | 13,908,302 | | | $ | — | | | $ | 13,908,302 | | | $ | — | | | $ | — | | | $ | 13,908,302 | |
| | | | | | | | | | | | | | | | | | | | | | | | | |
| Liabilities: | | | | | | | | | | | | | | Gross Amounts not offset in the Consolidated Statement of Assets & Liabilities | | | | | |
| Description | | | Gross Amounts of Recognized Liabilities | | | | Gross Amounts Offset in the Consolidated Statement of Assets & Liabilities | | | | Net Amounts Presented in the Consolidated Statement of Assets & Liabilities | | | | Financial Instruments | | | | Collateral Received (Pledged) | | | | Net Amount | |
| Swap Contracts | | $ | 26,162,161 | | | $ | — | | | $ | 26,162,161 | | | $ | — | | | $ | (26,162,161 | ) | | $ | — | |
| Total | | $ | 26,162,161 | | | $ | — | | | $ | 26,162,161 | | | $ | — | | | $ | (26,162,161 | ) | | $ | — | |
*Represents advance receipt on swap contracts.
| | |
| | |
| 95 | | LoCorr Macro Strategies Fund, LoCorr Long/Short Commodities Strategy Fund and LoCorr Market Trend Fund – Notes to Consolidated Financial |
| Statements / LoCorr Dynamic Equity Fund and LoCorr Spectrum Income Fund – Notes to Financial Statements (continued) |
| | |
| LoCorr Market Trend Fund - December 31, 2019 |
| Assets: | | | | | | | | | | Gross Amounts not offset in the Consolidated Statement of Assets & Liabilities | | | | |
| Description | | Gross Amounts of Recognized Assets | | | Gross Amounts Offset in the Consolidated Statement of Assets & Liabilities | | | Net Amounts Presented in the Consolidated Statement of Assets & Liabilities | | | Financial Instruments | | | Collateral Pledged (Received) | | | Net Amount | |
| Forward currency contracts | | $ | 1,556,758 | | | $ | — | | | $ | 1,556,758 | | | $ | — | | | $ | — | | | $ | 1,556,758 | |
| Futures contracts (a) | | | 1,436,013 | | | | — | | | | 1,436,013 | | | | — | | | | — | | | | 1,436,013 | |
| Total | | $ | 2,992,771 | | | $ | — | | | $ | 2,992,771 | | | $ | — | | | $ | — | | | $ | 2,992,771 | |
| | | | | | | | | | | | | | | | | | | | | | | | |
| Liabilities: | | | | | | | | | | | | | | Gross Amounts not offset in the Consolidated Statement of Assets & Liabilities | | | | | |
| Description | | | Gross Amounts of Recognized Liabilities | | | | Gross Amounts Offset in the Consolidated Statement of Assets & Liabilities | | | | Net Amounts Presented in the Consolidated Statement of Assets & Liabilities | | | | Financial Instruments | | | | Collateral Received (Pledged) | | | | Net Amount | |
| Forward currency contracts | | $ | 3,391,134 | | | $ | — | | | $ | 3,391,134 | | | $ | — | | | $ | (3,391,134 | ) | | $ | — | |
| Futures contracts (a) | | | 1,558,748 | | | | — | | | | 1,558,748 | | | | — | | | | (1,558,748 | ) | | | — | |
| Total | | $ | 4,949,882 | | | $ | — | | | $ | 4,949,882 | | | $ | — | | | $ | (4,949,882 | ) | | $ | — | |
| LoCorr Dynamic Equity Fund - December 31, 2019 |
| Liabilities: | | | | | | | | | | | Gross Amounts not offset in the Statement of Assets & Liabilities | | | | |
| Description | | Gross Amounts of Recognized Liabilities | | | Gross Amounts Offset in the Statement of Assets & Liabilities | | | Net Amounts Presented in the Statement of Assets & Liabilities | | | Financial
Instruments | | | Collateral Pledged (Pledged) | | | Net Amount | |
| Futures contracts (a) | | $ | 4,620 | | | $ | — | | | $ | 4,620 | | | $ | — | | | $ | (4,620 | ) | | $ | — | |
| Total | | $ | 4,620 | | | $ | — | | | $ | 4,620 | | | $ | — | | | $ | (4,620 | ) | | $ | — | |
| LoCorr Spectrum Income Fund - December 31, 2019 |
| Liabilities: | | | | | | | | | | | Gross Amounts not offset in the Statement of Assets & Liabilities | | | | |
| Description | | Gross Amounts of Recognized Liabilities | | | Gross Amounts Offset in the Statement of Assets & Liabilities | | | Net Amounts Presented in the Statement of Assets & Liabilities | | | Financial
Instruments | | | Collateral Pledged (Pledged) | | | Net Amount | |
| Written options | | $ | 126,464 | | | $ | — | | | $ | 126,464 | | | $ | — | | | $ | (126,464 | ) | | $ | — | |
| Total | | $ | 126,464 | | | $ | — | | | $ | 126,464 | | | $ | — | | | $ | (126,464 | ) | | $ | — | |
| (a) | Reflects the cumulative unrealized appreciation (depreciation) of futures contracts as reported in the Fund’s consolidated and non-consolidated schedule of open futures contracts. Only the current day variation margin and unsettled open futures contracts are separately reported within the Fund’s consolidated and non-consolidated statement of assets and liabilities. |
The Funds have adopted authoritative standards regarding disclosure about derivatives and hedging activities and how they affect the Funds’ consolidated statements of assets and liabilities and consolidated statements of operations. Fair value of swap contracts are recorded in the consolidated statements of assets and liabilities as net unrealized gain on swap contracts or net unrealized loss on swap contracts and net unrealized appreciation of swap contracts or net unrealized depreciation of swap contracts.
Since the derivatives held long or short are for speculative trading purposes, the derivative instruments are not designated as hedging instruments. Accordingly, all realized gains and losses, as well as any change in net unrealized gains or losses on open contracts from the preceding period, are recognized as part of realized and unrealized gain (loss) in the consolidated statements of operations.
The following table presents the fair value of consolidated derivative instruments for the LoCorr Macro Strategies Fund, the LoCorr Long/Short Commodities Strategy Fund, the LoCorr Market Trend Fund and the non-consolidated derivative instruments for the LoCorr Dynamic Equity Fund and the LoCorr Spectrum Income Fund as of December 31, 2019 as presented on each Fund’s consolidated and non-consolidated statements of assets and liabilities:
| | | Fair Value | | | Net Unrealized Gain (Loss) on
Open | |
| Derivatives Not Accounted for as Hedging Instruments | | Assets | | | Liabilities | | | Positions | |
| LoCorr Macro Strategies Fund | | | | | | | | | | | | |
| Forward Currency Contracts(a) | | | | | | | | | | | | |
| Long | | $ | 7,505,437 | | | $ | 94,220 | | | $ | 7,411,217 | |
| Short | | | 149,426 | | | | 11,301,917 | | | | (11,152,491 | ) |
| Total Forward Currency Contracts | | | 7,654,863 | | | | 11,396,137 | | | | (3,741,274 | ) |
| | |
| | |
| LoCorr Macro Strategies Fund, LoCorr Long/Short Commodities Strategy Fund and LoCorr Market Trend Fund – Notes to Consolidated Financial | | 97 |
| Statements / LoCorr Dynamic Equity Fund and LoCorr Spectrum Income Fund – Notes to Financial Statements (continued) |
| | |
| | | Fair Value | | | Net Unrealized Gain (Loss) on
Open | |
| Derivatives Not Accounted for as Hedging Instruments | | Assets | | | Liabilities | | | Positions | |
| LoCorr Macro Strategies Fund (continued) | | | | | | | | | | | | |
Futures Contracts(b)
Long Contracts | | | | | | | | | | | | |
| Commodity | | $ | 2,867,326 | | | $ | 717,071 | | | $ | 2,150,255 | |
| Equity | | | 2,336,809 | | | | 783,719 | | | | 1,553,090 | |
| Foreign exchange | | | — | | | | 33,022 | | | | (33,022 | ) |
| Interest rate | | | 103,418 | | | | 3,074,841 | | | | (2,971,423 | ) |
| Total Long Contracts | | | 5,307,553 | | | | 4,608,653 | | | | 698,900 | |
| | | | | | | | | | | | | |
| Short Contracts | | | | | | | | | | | | |
| Commodity | | | 1,272,898 | | | | 2,932,881 | | | | (1,659,983 | ) |
| Equity | | | 230,207 | | | | 361,742 | | | | (131,535 | ) |
| Interest rate | | | 1,112,687 | | | | 190,008 | | | | 922,679 | |
| Total Short Contracts | | | 2,615,792 | | | | 3,484,631 | | | | (868,839 | ) |
| Total Futures Contracts | | | 7,923,345 | | | | 8,093,284 | | | | (169,939 | ) |
| Total Forward Currency Contracts and Futures Contracts | | $ | 15,578,208 | | | $ | 19,489,421 | | | $ | (3,911,213 | ) |
| | | | | | | | | | | | | |
| LoCorr Long/Short Commodities Strategy Fund | | | | | | | | | | | | |
| Long Total Return Swap Contracts | | | | | | | | | | | | |
| LoCorr Commodities Index | | $ | — | | | $ | 26,162,161 | | | $ | (26,162,161 | ) |
| | | | | | | | | | | | | |
| LoCorr Market Trend Fund | | | | | | | | | | | | |
| Forward Currency Contracts(a) | | | | | | | | | | | | |
| Long | | $ | 1,556,758 | | | $ | — | | | $ | 1,556,758 | |
| Short | | | — | | | | 3,391,134 | | | | (3,391,134 | ) |
| Total Forward Currency Contracts | | | 1,556,758 | | | | 3,391,134 | | | | (1,834,376 | ) |
| | | | | | | | | | | | | |
| Futures Contracts(b) | | | | | | | | | | | | |
| Long Contracts | | | | | | | | | | | | |
| Commodity | | | 2,245,220 | | | | 437,037 | | | | 1,808,183 | |
| Equity | | | 2,163,031 | | | | 483,657 | | | | 1,679,374 | |
| Foreign exchange | | | — | | | | 33,012 | | | | (33,012 | ) |
| Interest rate | | | 182,828 | | | | 3,260,972 | | | | (3,078,144 | ) |
| Total Long Contracts | | | 4,591,079 | | | | 4,214,678 | | | | 376,401 | |
| | | | | | | | | | | | | |
| Short Contracts | | | | | | | | | | | | |
| Commodity | | | 1,372,937 | | | | 2,788,582 | | | | (1,415,645 | ) |
| Equity | | | 4,638 | | | | 361,859 | | | | (357,221 | ) |
| Interest rate | | | 695,436 | | | | 82,189 | | | | 613,247 | |
| Total Short Contracts | | | 2,073,011 | | | | 3,232,630 | | | | (1,159,619 | ) |
| Total Futures Contracts | | | 6,664,090 | | | | 7,447,308 | | | | (783,218 | ) |
| Total Forward Currency Contracts and Futures Contracts | | $ | 8,220,848 | | | $ | 10,838,442 | | | $ | (2,617,594 | ) |
| | | | | | | | | | | | | |
| LoCorr Dynamic Equity Fund | | | | | | | | | | | | |
| Futures Contracts(b) | | | | | | | | | | | | |
| Long Contracts | | | | | | | | | | | | |
| Equity | | $ | 43,532 | | | $ | — | | | $ | 43,532 | |
| Total Long Contracts | | | 43,532 | | | | — | | | | 43,532 | |
| | | | | | | | | | | | | |
| Short Contracts | | | | | | | | | | | | |
| Equity | | | — | | | | 33,041 | | | | (33,041 | ) |
| Total Short Contracts | | | — | | | | 33,041 | | | | (33,041 | ) |
| Total Futures Contracts | | $ | 43,532 | | | $ | 33,041 | | | $ | 10,491 | |
| | |
| | |
| 98 | | LoCorr Macro Strategies Fund, LoCorr Long/Short Commodities Strategy Fund and LoCorr Market Trend Fund – Notes to Consolidated Financial
Statements / LoCorr Dynamic Equity Fund and LoCorr Spectrum Income Fund – Notes to Financial Statements (continued) |
| | |
| | | Fair Value | | | Net Unrealized Gain (Loss) on Open | |
| Derivatives Not Accounted for as Hedging Instruments | | Assets | | | Liabilities | | | Positions | |
| LoCorr Spectrum Income Fund | | | | | | | | | | | | |
| Options (c) | | | | | | | | | | | | |
| Purchased Options | | | | | | | | | | | | |
| Put Options | | $ | 43,800 | | | $ | — | | | $ | 43,800 | |
| Written Options | | | | | | | | | | | | |
| Call Options | | | — | | | | 126,464 | | | | (126,464 | ) |
| Total Options | | $ | 43,800 | | | $ | (126,464 | ) | | $ | (82,664 | ) |
| (a) | Unrealized appreciation on forward currency contracts is a receivable and unrealized depreciation on forward currency contracts is a payable on the Fund’s consolidated statement of assets and liabilities. |
| (b) | Reflects the cumulative unrealized appreciation (depreciation) of futures contracts as reported in the Fund’s consolidated and non-consolidated schedule of open futures contracts. Only the current day variation margin and unsettled open futures contracts is separately reported within the Fund’s consolidated and non-consolidated statement of assets and liabilities. |
| (c) | Purchased options are included within Investments at value, and written options are reported as liabilities on the Fund’s statements of assets and liabilities. |
The following table presents the results of the derivative trading and information related to volume for the year ended December 31, 2019 for the LoCorr Macro Strategies Fund, the LoCorr Long/Short Commodities Strategy Fund, the LoCorr Market Trend Fund, the LoCorr Dynamic Equity Fund and the LoCorr Spectrum Income Fund. The below captions of “Net Realized” and “Net Change in Unrealized” correspond to the captions in each Fund’s consolidated and non-consolidated statement of operations.
| | | Gain (Loss) from Trading | |
| Fund and Type of Derivative Instrument | | Net Realized | | | Net Change in Unrealized | |
| LoCorr Macro Strategies Fund | | | | | | |
| Forward Currency Contracts | | $ | (6,401,505 | ) | | $ | (2,813,992 | ) |
| Futures Contracts | | | | | | | | |
| Commodity | | | (18,072,257 | ) | | | (3,289,901 | ) |
| Equity | | | 42,732,522 | | | | 2,085,194 | |
| Foreign exchange | | | 1,279,106 | | | | 79,865 | |
| Interest rate | | | 42,145,831 | | | | (337,594 | ) |
| Total Futures Contracts | | | 68,085,202 | | | | (1,462,436 | ) |
| Total Forward Currency Contracts and Futures Contracts | | $ | 61,683,697 | | | $ | (4,276,428 | ) |
| | | | | | | | | |
| LoCorr Long/Short Commodities Strategy Fund | | | | | | | | |
| Swap Contracts | | $ | 3,489,570 | | | $ | (30,526,107 | ) |
| | | | | | | | | |
| LoCorr Market Trend Fund | | | | | | | | |
| Forward Currency Contracts | | $ | (2,224,153 | ) | | $ | 671,848 | |
| Futures Contracts | | | | | | | | |
| Commodity | | | (18,471,523 | ) | | | 214,801 | |
| Equity | | | 21,728,180 | | | | 2,150,150 | |
| Foreign exchange | | | 102,991 | | | | 181,763 | |
| Interest rate | | | 34,699,312 | | | | 559,222 | |
| Total Futures Contracts | | | 38,058,960 | | | | 3,105,936 | |
| Total Forward Currency Contracts and Futures Contracts | | $ | 35,834,807 | | | $ | 3,777,784 | |
| | | | | | | | | |
| LoCorr Dynamic Equity Fund | | | | | | | | |
| Futures Contracts | | | | | | | | |
| Equity | | $ | 901,477 | | | $ | 10,491 | |
| Total Futures Contracts | | $ | 901,477 | | | $ | 10,491 | |
| | | | | | | | | |
| LoCorr Spectrum Income Fund | | | | | | | | |
| Options | | | | | | | | |
| Purchased Options (d) | | | | | | | | |
| Put Options | | $ | (420,156 | ) | | $ | (52,002 | ) |
| Written Options | | | | | | | | |
| Call Options | | | 182,517 | | | | (49,495 | ) |
| Total Options | | $ | (237,639 | ) | | $ | (101,497 | ) |
(d) Purchased options are included within net realized gain (loss) on investments and net change in unrealized appreciation/depreciation on investments.
| | |
| | |
LoCorr Macro Strategies Fund, LoCorr Long/Short Commodities Strategy Fund and LoCorr Market Trend Fund – Notes to Consolidated Financial
Statements / LoCorr Dynamic Equity Fund and LoCorr Spectrum Income Fund – Notes to Financial Statements (continued) | | 99 |
| | |
The average monthly notional amount is shown as an indicator of volume. The average monthly notional amounts during the year ended December 31, 2019 were:
| | | Average Notional Amount | |
| | | Long Contracts | | | Short Contracts | |
| LoCorr Macro Strategies Fund | | | | | | | | |
| Forward Currency Contracts | | $ | 673,983,416 | | | $ | 956,048,648 | |
| Futures Contracts | | | 1,984,813,066 | | | | 702,462,134 | |
| | | | | | | | | |
| LoCorr Long/Short Commodities Strategy Fund | | | | | | | | |
| Swap Contracts | | $ | 249,252,790 | | | $ | — | |
| | | | | | | | | |
| LoCorr Market Trend Fund | | | | | | | | |
| Forward Currency Contracts | | $ | 292,871,676 | | | $ | 567,355,177 | |
| Futures Contracts | | | 1,787,549,927 | | | | 471,149,899 | |
| | | | | | | | | |
| LoCorr Dynamic Equity Fund | | | | | | | | |
| Futures Contracts | | $ | 4,552,124 | | | $ | 433,268 | |
| | | | | | | | | |
| LoCorr Spectrum Income Fund | | | | | | | | |
| Options | | $ | 16,739,938 | | | $ | 6,179,479 | |
The swap contracts and the commodity-related futures contracts reported in the tables in Note 3 represent balances and activity of each Fund’s respective wholly-owned and controlled subsidiary. See Note 2.
Please refer to the Funds’ prospectuses for a full listing of risks associated with these investments.
4. Investment Transactions
The cost of security purchases and proceeds from security sales, excluding short-term investments, derivative instruments, short sales and purchases to cover short sales for the year ended December 31, 2019 were as follows:
| | | U.S. Government Obligations | | | All Other | |
| | | Purchases | | | Sales | | | Purchases | | | Sales | |
| LoCorr Macro Strategies Fund | | $ | 337,801,425 | | | $ | 145,399,370 | | | $ | 339,463,801 | | | $ | 309,209,225 | |
| LoCorr Long/Short Commodities Strategy Fund | | | 86,075,097 | | | | 57,365,478 | | | | 153,067,660 | | | | 165,999,927 | |
| LoCorr Market Trend Fund | | | 172,911,391 | | | | 102,062,007 | | | | 83,220,914 | | | | 223,254,104 | |
| LoCorr Dynamic Equity Fund | | | — | | | | — | | | | 60,098,271 | | | | 66,487,932 | |
| LoCorr Spectrum Income Fund | | | — | | | | — | | | | 51,440,246 | | | | 55,038,210 | |
5. Management Fees and Other Transactions with Affiliates
Management Agreement
The Trust has a Management Agreement with the Adviser, with whom certain officers and Trustees of the Funds are affiliated, to furnish investment advisory services to the Funds. Pursuant to the amended Management Agreement, the Adviser is entitled to receive a fee as follows:
| Fund | Annual Advisory Fee as a Percentage of the Average Daily Net Assets of the Fund |
| LoCorr Macro Strategies Fund | 1.65% |
| LoCorr Market Trend Fund | 1.50% |
| LoCorr Dynamic Equity Fund | 1.50% |
| LoCorr Spectrum Income Fund | 1.30% |
| | |
| | |
| 100 | | LoCorr Macro Strategies Fund, LoCorr Long/Short Commodities Strategy Fund and LoCorr Market Trend Fund – Notes to Consolidated Financial
Statements / LoCorr Dynamic Equity Fund and LoCorr Spectrum Income Fund – Notes to Financial Statements (continued) |
| | |
Pursuant to the amended Management Agreement, the Adviser is entitled to receive a fee, in accordance with the Incremental Advisory Fee schedule below based on the LoCorr Long/Short Commodities Strategy Fund’s average daily net assets.
Net Assets for the LoCorr Long/Short Commodities Strategy Fund | Incremental Advisory Fee* |
| $0.0 - $0.5 billion | 1.50% |
| $0.5 - $1.0 billion | 1.40% |
| $1.0 - $1.5 billion | 1.30% |
| $1.5 - $2.0 billion | 1.20% |
| $2.0 - $2.5 billion | 1.10% |
| Over $2.5 billion | 1.00% |
*Incremental advisory fee represents the fees paid on net assets at the related net asset level. For example, with $3 billion in net assets in the Fund, the Adviser would earn 1.50% on the first $500 million, plus 1.40% on the next $500 million, plus 1.30% on the next $500 million, plus 1.20% on the next $500 million, plus 1.10% on the next $500 million, plus 1.00% on the final $500 million.
As of and for the year ended December 31, 2019, the Funds reported the following in regards to management fees:
| Fund | | Management Fees For the Year Ended December 31, 2019 | | | Accrued Net Management Fees as of December 31, 2019 | |
| LoCorr Macro Strategies Fund | | $ | 10,444,673 | | | $ | 1,144,265 | |
| LoCorr Long/Short Commodities Strategy Fund | | | 4,386,050 | | | | 332,193 | |
| LoCorr Market Trend Fund | | | 4,090,179 | | | | 341,715 | |
| LoCorr Dynamic Equity Fund | | | 406,449 | | | | 18,042 | |
| LoCorr Spectrum Income Fund | | | 963,419 | | | | 81,159 | |
Sub-Advisory Agreements
Sub-advisory services are provided to the Funds, pursuant to agreements between the Adviser and the below listed sub-advisers. Under the terms of these sub-advisory agreements, the Adviser compensates the sub-advisers based on the portion of each Fund’s average daily net assets which they have been allocated to manage.
LoCorr Macro Strategies Fund:
Graham Capital Management, L.P.
Millburn Ridgefield Corporation
Nuveen Asset Management, LLC
Revolution Capital Management LLC
LoCorr Long/Short Commodities Strategy Fund:
Nuveen Asset Management, LLC
LoCorr Market Trend Fund:
Graham Capital Management, L.P.
Nuveen Asset Management, LLC
LoCorr Dynamic Equity Fund:
Billings Capital Management LLC
First Quadrant, L.P.
Kettle Hill Capital Management, LLC
LoCorr Spectrum Income Fund:
Trust & Fiduciary Income Partners, LLC
The Adviser is solely responsible for the payment of the sub-adviser’s fees, and the sub-adviser agrees not to seek payment of its fees from the Trust or the Funds.
Expense Limitation Agreement
The Funds’ Adviser has contractually agreed to waive management fees and/or reimburse the Funds for expenses they incur, but only to the extent necessary to maintain the Funds’ total annual operating expenses after fee waiver and/or reimbursement (excluding any Rule 12b-1 distribution and/or servicing fees, taxes, interest, brokerage commissions, expenses incurred in connection with any merger or reorganization, dividend expenses on short sales, swap fees, indirect expenses, expenses of other investment companies in which the Funds may invest, or extraordinary expenses such as litigation expenses and inclusive of offering and organizational costs incurred prior to the commencement of operations) at the percentages listed below:
| Fund | Expense Limit as a Percentage of the Average Daily Net Assets of the Fund | Effective Period Through |
| LoCorr Macro Strategies Fund | 1.99% | April 30, 2020 |
| LoCorr Long/Short Commodities Strategy Fund | 1.95% | April 30, 2020 |
| LoCorr Market Trend Fund | 1.95% | April 30, 2020 |
| LoCorr Dynamic Equity Fund | 1.99% | April 30, 2020 |
| LoCorr Spectrum Income Fund | 1.80% | April 30, 2020 |
| | |
| | |
LoCorr Macro Strategies Fund, LoCorr Long/Short Commodities Strategy Fund and LoCorr Market Trend Fund – Notes to Consolidated Financial
Statements / LoCorr Dynamic Equity Fund and LoCorr Spectrum Income Fund – Notes to Financial Statements (continued) | | 101 |
| | |
Any waiver or reimbursement is subject to repayment by the respective Fund within the three fiscal years following the fiscal year in which the expenses occurred, if the Fund is able to make the repayment without exceeding its current expense limitations and the repayment is approved by the Board. The organizational and offering costs are subject to repayment by the Funds.
The total amounts of management fees waived and/or expenses reimbursed which are subject to recovery, and their related expiration date are as follows:
| | | | | | | | | | | | | | | | | |
| LoCorr Macro Strategies Fund |
| | | | | | | | | | | | | |
| | | Management Fees (Waived) by Adviser Subject to Recovery | | | Recovery to Adviser | | | Remaining Available Subject to Recovery | | | Subject to Recovery on or Before Fiscal Year Ending December 31, | |
| Period | | | | Year Ended December 31, 2019 | | | | | |
| Year Ended December 31, 2019 | | $ | — | | | $ | — | | | $ | — | | | | 2022 | |
| Year Ended December 31, 2018 | | | (67,297 | ) | | | 37,564 | | | | (29,733 | ) | | | 2021 | |
| Year Ended December 31, 2017 | | | (485,398 | ) | | | 485,398 | | | | — | | | | 2020 | |
| Total | | $ | (552,695 | ) | | $ | 522,962 | | | $ | (29,733 | ) | | | | |
| | | | | | | | | | | | | | | | | |
| LoCorr Long/Short Commodities Strategy Fund |
| | | | | | | | | | | | | |
| | | Management Fees (Waived) by Adviser Subject to Recovery | | | Recovery to Adviser - Net | | | Remaining Available Subject to Recovery | | | Subject to Recovery on or Before Fiscal Year Ending December 31, | |
| Period | | | | Year Ended December 31, 2019 | | | | | |
| Year Ended December 31, 2019 | | $ | — | | | $ | — | | | $ | — | | | | 2022 | |
| Year Ended December 31, 2018 | | | — | | | | — | | | | — | | | | 2021 | |
| Year Ended December 31, 2017 | | | (81,840 | ) | | | 81,840 | | | | — | | | | 2020 | |
| Total | | $ | (81,840 | ) | | $ | 81,840 | | | $ | — | | | | | |
| | | | | | | | | | | | | | | | | |
| LoCorr Dynamic Equity Fund |
| | | | | | | | | | | | | |
| | | Management Fees (Waived) by Adviser Subject to Recovery | | | Recovery to Adviser | | | Remaining Available Subject to Recovery | | | Subject to Recovery on or Before Fiscal Year Ending December 31, | |
| Period | | | | Year Ended December 31, 2019 | | | | | |
| Year Ended December 31, 2019 | | $ | (192,060 | ) | | $ | — | | | $ | (192,060 | ) | | | 2022 | |
| Year Ended December 31, 2018 | | | (95,089 | ) | | | — | | | | (95,089 | ) | | | 2021 | |
| Year Ended December 31, 2017 | | | (58,609 | ) | | | — | | | | (58,609 | ) | | | 2020 | |
| Total | | $ | (345,758 | ) | | $ | — | | | $ | (345,758 | ) | | | | |
For the year ended December 31, 2016, fees waived by the Adviser for the LoCorr Long/Short Commodities Strategy Fund totaled $21,779, which was recovered during the year.
For the year ended December 31, 2016, fees waived by the Adviser for the LoCorr Dynamic Equity Fund totaling $102,813, expired on December 31, 2019 and are no longer eligible for recovery by the Adviser.
At December 31, 2019, there were no fees subject to recovery for the LoCorr Long/Short Commodities Strategy Fund, LoCorr Market Trend Fund or the LoCorr Spectrum Income Fund.
Rule 12b-1 Distribution Agreement
The Funds have entered into a Rule 12b-1 distribution agreement with Quasar Distributors, LLC (“Quasar”). Class A shareholders pay distribution expenses to Quasar at the annual rate of 0.25% of the Fund’s average daily net assets. Class C shareholders pay to Quasar an annual rate of 1.00%, which is comprised of 0.75% in distribution expenses and 0.25% in service fees, of the Fund’s average daily net assets. Class I shareholders pay no 12b-1 fees.
| | |
| | |
| 102 | | LoCorr Macro Strategies Fund, LoCorr Long/Short Commodities Strategy Fund and LoCorr Market Trend Fund – Notes to Consolidated Financial
Statements / LoCorr Dynamic Equity Fund and LoCorr Spectrum Income Fund – Notes to Financial Statements (continued) |
| | |
6. Fund Shares
At December 31, 2019, there were an unlimited number of shares of beneficial interest authorized. The following table summarizes the activity in shares and dollar amounts applicable to each class of the Funds:
| | | | | | | | | | | | | | |
| LoCorr Macro Strategies Fund – Class A |
| | | For the Year Ended December 31, 2019 | | For the Year Ended December 31, 2018 | |
| | | Shares | | Amount | | Shares | | Amount | |
| Shares Sold | | | 2,144,444 | | $ | 18,148,825 | | | 2,896,743 | | $ | 24,405,481 | |
| Reinvestment of Distributions | | | 254,760 | | | 2,173,104 | | | 199,801 | | | 1,570,436 | |
| Shares Redeemed | | | (3,095,461 | ) | | (25,657,370 | ) | | (6,956,481 | ) | | (57,264,468 | ) |
| | | | (696,257 | ) | $ | (5,335,441 | ) | | (3,859,937 | ) | $ | (31,288,551 | ) |
| Beginning Shares | | | 6,926,645 | | | | | | 10,786,582 | | | | |
| Ending Shares | | | 6,230,388 | | | | | | 6,926,645 | | | | |
| | | | | | | | | | | | | | |
| LoCorr Macro Strategies Fund – Class C |
| | | For the Year Ended December 31, 2019 | | For the Year Ended December 31, 2018 | |
| | | | Shares | | | Amount | | | Shares | | | Amount | |
| Shares Sold | | | 957,663 | | $ | 7,841,829 | | | 780,250 | | $ | 6,256,139 | |
| Reinvestment of Distributions | | | 232,778 | | | 1,892,487 | | | 143,755 | | | 1,082,469 | |
| Shares Redeemed | | | (2,377,030 | ) | | (18,811,574 | ) | | (4,904,955 | ) | | (38,557,306 | ) |
| | | | (1,186,589 | ) | $ | (9,077,258 | ) | | (3,980,950 | ) | $ | (31,218,698 | ) |
| Beginning Shares | | | 6,976,532 | | | | | | 10,957,482 | | | | |
| Ending Shares | | | 5,789,943 | | | | | | 6,976,532 | | | | |
| | | | | | | | | | | | | | |
| LoCorr Macro Strategies Fund – Class I |
| | | For the Year Ended December 31, 2019 | | For the Year Ended December 31, 2018 | |
| | | | Shares | | | Amount | | | Shares | | | Amount | |
| Shares Sold | | | 50,459,501 | | $ | 431,935,788 | | | 35,161,086 | | $ | 296,008,093 | |
| Reinvestment of Distributions | | | 2,951,798 | | | 25,562,570 | | | 1,631,374 | | | 13,002,054 | |
| Shares Redeemed | | | (25,132,053 | ) | | (212,548,174 | ) | | (50,629,729 | ) | | (423,014,386 | ) |
| | | | 28,279,246 | | $ | 244,950,184 | | | (13,837,269 | ) | $ | (114,004,239 | ) |
| Beginning Shares | | | 55,252,737 | | | | | | 69,090,006 | | | | |
| Ending Shares | | | 83,531,983 | | | | | | 55,252,737 | | | | |
| LoCorr Macro Strategies Fund |
| Total Net Increase (Decrease) | | | | | $ | 230,537,485 | | | | | $ | (176,511,488 | ) |
| | | | | | | | | | | | | | |
| | | | | | | | | | | | | | |
| LoCorr Long/Short Commodities Strategy Fund – Class A |
| | | For the Year Ended December 31, 2019 | | For the Year Ended December 31, 2018 | |
| | | | Shares | | | Amount | | | Shares | | | Amount | |
| Shares Sold | | | 2,208,398 | | $ | 21,399,126 | | | 4,847,619 | | $ | 49,396,793 | |
| Reinvestment of Distributions | | | 11,010 | | | 101,404 | | | 513,483 | | | 4,883,224 | |
| Shares Redeemed | | | (4,245,464 | ) | | (40,458,908 | ) | | (1,055,893 | ) | | (10,813,133 | ) |
| | | | (2,026,056 | ) | $ | (18,958,378 | ) | | 4,305,209 | | $ | 43,466,884 | |
| Beginning Shares | | | 6,939,577 | | | | | | 2,634,368 | | | | |
| Ending Shares | | | 4,913,521 | | | | | | 6,939,577 | | | | |
| | | | | | | | | | | | | | |
| LoCorr Long/Short Commodities Strategy Fund – Class C |
| | | For the Year Ended December 31, 2019 | | For the Year Ended December 31, 2018 | |
| | | | Shares | | | Amount | | | Shares | | | Amount | |
| Shares Sold | | | 306,455 | | $ | 2,836,546 | | | 257,769 | | $ | 2,549,916 | |
| Reinvestment of Distributions | | | 49 | | | 436 | | | 69,279 | | | 635,984 | |
| Shares Redeemed | | | (239,752 | ) | | (2,202,571 | ) | | (149,818 | ) | | (1,446,429 | ) |
| | | | 66,752 | | $ | 634,411 | | | 177,230 | | $ | 1,739,471 | |
| Beginning Shares | | | 680,762 | | | | | | 503,532 | | | | |
| Ending Shares | | | 747,514 | | | | | | 680,762 | | | | |
| | | | | | | | | | | | | | |
| LoCorr Long/Short Commodities Strategy Fund – Class I |
| | | For the Year Ended December 31, 2019 | | For the Year Ended December 31, 2018 | |
| | | | Shares | | | Amount | | | Shares | | | Amount | |
| Shares Sold | | | 16,269,252 | | $ | 159,804,741 | | | 13,864,200 | | $ | 143,363,367 | |
| Reinvestment of Distributions | | | 99,106 | | | 923,666 | | | 1,365,873 | | | 13,153,352 | |
| Shares Redeemed | | | (12,750,256 | ) | | (122,918,257 | ) | | (2,498,836 | ) | | (25,755,584 | ) |
| | | | 3,618,102 | | $ | 37,810,150 | | | 12,731,237 | | $ | 130,761,135 | |
| Beginning Shares | | | 18,127,708 | | | | | | 5,396,471 | | | | |
| Ending Shares | | | 21,745,810 | | | | | | 18,127,708 | | | | |
| LoCorr Long/Short Commodities Strategy Fund |
| Total Net Increase | | | | | $ | 19,486,183 | | | | | $ | 175,967,490 | |
| | |
| | |
LoCorr Macro Strategies Fund, LoCorr Long/Short Commodities Strategy Fund and LoCorr Market Trend Fund – Notes to Consolidated Financial Statements / LoCorr Dynamic Equity Fund and LoCorr Spectrum Income Fund – Notes to Financial Statements (continued) | | 103 |
| | |
| LoCorr Market Trend Fund – Class A |
| | | For the Year Ended December 31, 2019 | | For the Year Ended December 31, 2018 | |
| | | | Shares | | | Amount | | | Shares | | | Amount | |
| Shares Sold | | | 627,962 | | $ | 6,723,844 | | | 2,041,593 | | $ | 21,534,780 | |
| Reinvestment of Distributions | | | 10,896 | | | 122,254 | | | — | | | — | |
| Shares Redeemed | | | (2,043,409 | ) | | (20,267,323 | ) | | (4,253,791 | ) | | (44,013,360 | ) |
| | | | (1,404,551 | ) | $ | (13,421,225 | ) | | (2,212,198 | ) | $ | (22,478,580 | ) |
| Beginning Shares | | | 3,368,248 | | | | | | 5,580,446 | | | | |
| Ending Shares | | | 1,963,697 | | | | | | 3,368,248 | | | | |
| | | | | | | | | | | | | | |
| LoCorr Market Trend Fund – Class C |
| | | For the Year Ended December 31, 2019 | | For the Year Ended December 31, 2018 | |
| | | | Shares | | | Amount | | | Shares | | | Amount | |
| Shares Sold | | | 77,522 | | $ | 846,098 | | | 354,298 | | $ | 3,626,237 | |
| Shares Redeemed | | | (1,102,095 | ) | | (10,783,418 | ) | | (1,872,667 | ) | | (18,856,227 | ) |
| | | | (1,024,573 | ) | $ | (9,937,320 | ) | | (1,518,369 | ) | $ | (15,229,990 | ) |
| Beginning Shares | | | 2,523,295 | | | | | | 4,041,664 | | | | |
| Ending Shares | | | 1,498,722 | | | | | | 2,523,295 | | | | |
| | | | | | | | | | | | | | |
| LoCorr Market Trend Fund – Class I |
| | | For the Year Ended December 31, 2019 | | For the Year Ended December 31, 2018 | |
| | | | Shares | | | Amount | | | Shares | | | Amount | |
| Shares Sold | | | 8,839,130 | | $ | 91,327,306 | | | 24,293,597 | | $ | 258,798,561 | |
| Reinvestment of Distributions | | | 251,525 | | | 2,832,170 | | | — | | | — | |
| Shares Redeemed | | | (18,138,179 | ) | | (180,568,641 | ) | | (44,938,075 | ) | | (460,309,189 | ) |
| | | | (9,047,524 | ) | $ | (86,409,165 | ) | | (20,644,478 | ) | $ | (201,510,628 | ) |
| Beginning Shares | | | 29,970,409 | | | | | | 50,614,887 | | | | |
| Ending Shares | | | 20,922,885 | | | | | | 29,970,409 | | | | |
| LoCorr Market Trend Fund |
| Total Net Decrease | | | | | $ | (109,767,710 | ) | | | | $ | (239,219,198 | ) |
| | | | | | | | | | | | | | |
| | | | | | | | | | | | | | |
| LoCorr Dynamic Equity Fund - Class A |
| | | For the Year Ended December 31, 2019 | | For the Year Ended December 31, 2018 | |
| | | | Shares | | | Amount | | | Shares | | | Amount | |
| Shares Sold | | | 189,196 | | $ | 2,062,456 | | | 204,446 | | $ | 2,334,198 | |
| Reinvestment of Distributions | | | 1,895 | | | 21,229 | | | 30,595 | | | 303,192 | |
| Shares Redeemed | | | (443,541 | ) | | (4,841,813 | ) | | (1,070,038 | ) | | (11,843,915 | ) |
| | | | (252,450 | ) | $ | (2,758,128 | ) | | (834,997 | ) | $ | (9,206,525 | ) |
| Beginning Shares | | | 854,402 | | | | | | 1,689,399 | | | | |
| Ending Shares | | | 601,952 | | | | | | 854,402 | | | | |
| | | | | | | | | | | | | | |
| LoCorr Dynamic Equity Fund – Class C |
| | | For the Year Ended December 31, 2019 | | For the Year Ended December 31, 2018 | |
| | | | Shares | | | Amount | | | Shares | | | Amount | |
| Shares Sold | | | 22,329 | | $ | 233,664 | | | 12,061 | | $ | 129,613 | |
| Reinvestment of Distributions | | | 1,253 | | | 13,311 | | | 20,409 | | | 193,276 | |
| Shares Redeemed | | | (198,688 | ) | | (2,074,232 | ) | | (451,054 | ) | | (4,895,777 | ) |
| | | | (175,106 | ) | $ | (1,827,257 | ) | | (418,584 | ) | $ | (4,572,888 | ) |
| Beginning Shares | | | 554,864 | | | | | | 973,448 | | | | |
| Ending Shares | | | 379,758 | | | | | | 554,864 | | | | |
| | | | | | | | | | | | | | |
| LoCorr Dynamic Equity Fund – Class I |
| | | For the Year Ended December 31, 2019 | | For the Year Ended December 31, 2018 | |
| | | | Shares | | | Amount | | | Shares | | | Amount | |
| Shares Sold | | | 697,873 | | $ | 7,854,144 | | | 808,578 | | $ | 9,268,461 | |
| Reinvestment of Distributions | | | 4,653 | | | 53,091 | | | 59,248 | | | 596,627 | |
| Shares Redeemed | | | (861,590 | ) | | (9,417,635 | ) | | (1,965,613 | ) | | (22,405,609 | ) |
| | | | (159,064 | ) | $ | (1,510,400 | ) | | (1,097,787 | ) | $ | (12,540,521 | ) |
| Beginning Shares | | | 1,642,376 | | |
| | | 2,740,163 | | | | |
| Ending Shares | | | 1,483,312 | | |
| | | 1,642,376 | | | | |
| LoCorr Dynamic Equity Fund |
| Total Net Decrease | | | | | $ | (6,095,785 | ) | | | | $ | (26,319,934 | ) |
| | |
| | |
| 104 | | LoCorr Macro Strategies Fund, LoCorr Long/Short Commodities Strategy Fund and LoCorr Market Trend Fund – Notes to Consolidated Financial Statements / LoCorr Dynamic Equity Fund and LoCorr Spectrum Income Fund – Notes to Financial Statements (continued) |
| | |
| LoCorr Spectrum Income Fund – Class A | |
| | | For the Year Ended December 31, 2019 | | | For the Year Ended December 31, 2018 | |
| | | Shares | | | Amount | | | Shares | | | Amount | |
| Shares Sold | | | 1,099,641 | | | $ | 7,558,681 | | | | 1,001,209 | | | $ | 7,351,429 | |
| Reinvestment of Distributions | | | 189,433 | | | | 1,298,660 | | | | 202,320 | | | | 1,445,202 | |
| Shares Redeemed | | | (1,245,746 | ) | | | (8,548,540 | ) | | | (1,648,412 | ) | | | (11,964,611 | ) |
| Redemption Fees | | | — | | | | 483 | | | | — | | | | 523 | |
| | | | 43,328 | | | $ | 309,284 | | | | (444,883 | ) | | $ | (3,167,457 | ) |
| Beginning Shares | | | 3,612,915 | | | | | | | | 4,057,798 | | | | | |
| Ending Shares | | | 3,656,243 | | | | | | | | 3,612,915 | | | | | |
| | | | | | | | | | | | | | | | | |
| LoCorr Spectrum Income Fund – Class C | |
| | | For the Year Ended December 31, 2019 | | | For the Year Ended December 31, 2018 | |
| | | Shares | | | Amount | | | Shares | | | Amount | |
| Shares Sold | | | 428,428 | | | $ | 2,971,366 | | | | 560,060 | | | $ | 4,179,406 | |
| Reinvestment of Distributions | | | 141,182 | | | | 977,534 | | | | 156,310 | | | | 1,123,445 | |
| Shares Redeemed | | | (756,070 | ) | | | (5,246,921 | ) | | | (1,017,079 | ) | | | (7,360,766 | ) |
| Redemption Fees | | | — | | | | 63 | | | | — | | | | 408 | |
| | | | (186,460 | ) | | $ | (1,297,958 | ) | | | (300,709 | ) | | $ | (2,057,507 | ) |
| Beginning Shares | | | 2,867,151 | | | | | | | | 3,167,860 | | | | | |
| Ending Shares | | | 2,680,691 | | | | | | | | 2,867,151 | | | | | |
| | | | | | | | | | | | | | | | | |
| LoCorr Spectrum Income Fund – Class I | |
| | | For the Year Ended December 31, 2019 | | | For the Year Ended December 31, 2018 | |
| | | Shares | | | Amount | | | Shares | | | Amount | |
| Shares Sold | | | 1,980,491 | | | $ | 13,626,906 | | | | 1,790,254 | | | $ | 12,983,667 | |
| Reinvestment of Distributions | | | 248,951 | | | | 1,704,587 | | | | 300,481 | | | | 2,145,130 | |
| Shares Redeemed | | | (2,279,259 | ) | | | (15,657,404 | ) | | | (3,504,043 | ) | | | (25,054,619 | ) |
| Redemption Fees | | | — | | | | 1,016 | | | | — | | | | 24,184 | |
| | | | (49,817 | ) | | $ | (324,895 | ) | | | (1,413,308 | ) | | $ | (9,901,638 | ) |
| Beginning Shares | | | 4,420,099 | | | | | | | | 5,833,407 | | | | | |
| Ending Shares | | | 4,370,282 | | | | | | | | 4,420,099 | | | | | |
| LoCorr Spectrum Income Fund | |
| Total Net Decrease | | | | | | $ | (1,313,569 | ) | | | | | | $ | (15,126,602 | ) |
7. Federal Tax Information
At December 31, 2019, the components of accumulated earnings (losses) on a tax basis were as follows(1):
| | | LoCorr Macro Strategies Fund(2) | | | LoCorr Long/Short Commodities Strategy Fund(2) | | | LoCorr Market Trend Fund(2) | |
| Tax cost of portfolio | | $ | 824,957,787 | | | $ | 272,376,940 | | | $ | 239,205,635 | |
| | | | | | | | | | | | | |
| Gross unrealized appreciation | | $ | 10,799,928 | | | $ | 3,433,566 | | | $ | 3,276,117 | |
| Gross unrealized depreciation | | | (3,885,463 | ) | | | (26,320,271 | ) | | | (2,556,394 | ) |
| Net unrealized appreciation (depreciation) | | | 6,914,465 | | | | (22,886,705 | ) | | | 719,723 | |
| Undistributed ordinary income | | | 8,679,630 | | | | 67,343 | | | | 570,347 | |
| Undistributed long-term capital gains | | | 3,450,209 | | | | — | | | | — | |
| Total distributable earnings | | | 12,129,839 | | | | 67,343 | | | | 570,347 | |
| Other accumulated earnings (losses) | | | 186,363 | | | | — | | | | (6,084,927 | ) |
| Total accumulated earnings (losses) | | $ | 19,230,667 | | | $ | (22,819,362 | ) | | $ | (4,794,857 | ) |
| | | LoCorr Dynamic Equity Fund | | | LoCorr Spectrum Income Fund | | | | | |
| Tax cost of portfolio | | $ | 20,939,123 | | | $ | 67,466,611 | | | | | |
| Gross unrealized appreciation | | $ | 3,854,942 | | | $ | 10,049,896 | | | | | |
| Gross unrealized depreciation | | | (1,587,392 | ) | | | (4,015,547 | ) | | | | |
| Net unrealized appreciation | | | 2,267,550 | | | | 6,034,349 | | | | | |
| Undistributed ordinary income | | | — | | | | — | | | | | |
| Undistributed long-term capital gains | | | — | | | | — | | | | | |
| Total distributable earnings | | | — | | | | — | | | | | |
| Other accumulated losses | | | (1,306,575 | ) | | | (27,427,952 | ) | | | | |
| Total accumulated earnings (losses) | | $ | 960,975 | | | $ | (21,393,603 | ) | | | | |
| (1) | Total Portfolio represents aggregate amounts of Fund’s investments, securities sold short, forward currency contracts and futures contracts, where applicable. |
| (2) | Tax Cost is presented on a non-consolidated basis and includes each of the Fund’s investment in the respective CFC’s and the unrealized appreciation and depreciation associated with those investments. |
| | |
| | |
LoCorr Macro Strategies Fund, LoCorr Long/Short Commodities Strategy Fund and LoCorr Market Trend Fund – Notes to Consolidated Financial Statements / LoCorr Dynamic Equity Fund and LoCorr Spectrum Income Fund – Notes to Financial Statements (continued) | | 105 |
| | |
Undistributed income or net realized gains for financial statement purposes may differ from amounts recognized for federal income tax purposes due to differences in the recognition and characterization of income, expense and capital gain items. The difference between book-basis and tax-basis unrealized appreciation (depreciation) is attributed primarily to the tax deferral of losses on wash sales, mark to market, investments in partnerships and other temporary differences.
The following reclassifications were made within the components of net assets as of December 31, 2019:
| | | Total Distributable
Earnings/(Accumulated Loss) | | | Paid-in Capital | | |
| LoCorr Macro Strategies Fund | | $ | 15,126,153 | | | $ | (15,126,153 | ) | |
| LoCorr Long/Short Commodities Strategy Fund | | | (4,456,930 | ) | | | 4,456,930 | | |
| LoCorr Market Trend Fund | | | 18,311,286 | | | | (18,311,286 | ) | |
| LoCorr Dynamic Equity Fund | | | 475,403 | | | | (475,403 | ) | |
| LoCorr Spectrum Income Fund | | | 813,430 | | | | (813,430 | ) | |
The LoCorr Macro Strategies Fund’s reclassifications are primarily attributable to certain reclassifications related to the Fund’s wholly-owned subsidiary and equalization.
The LoCorr Long/Short Commodities Strategy Fund’s reclassifications are primarily attributable to certain reclassifications related to the Fund’s wholly-owned subsidiary.
The LoCorr Market Trend Fund’s reclassifications are primarily attributable to certain reclassifications related to the Fund’s wholly-owned subsidiary.
The LoCorr Dynamic Equity Fund’s reclassifications are primarily the result of the Fund’s net operating losses/reclasses.
The LoCorr Spectrum Income Fund’s reclassifications are primarily attributable to certain reclassifications related to return of capital, partnership basis adjustments.
Under the current tax law, capital losses realized after October 31 may be deferred and treated as occurring on the first day of the following fiscal year. The Funds elected to defer no capital losses for the fiscal year ended December 31, 2019.
At December 31, 2019, accumulated net realized capital loss carryovers, if any, and the year(s) in which the capital loss carryovers expire were:
| | | Capital Loss Carryover | | Year of Expiration |
| | | Short-Term | | | Long-Term | |
| LoCorr Market Trend Fund | |
| 2,413,573 | | |
| 3,656,937 | | Indefinitely |
| LoCorr Dynamic Equity Fund | | | 1,274,721 | | | | — | | Indefinitely |
| LoCorr Spectrum Income Fund | | | 11,284,727 | | | | 15,810,599 | | Indefinitely |
During the year ended December 31, 2019, the LoCorr Macro Strategies Fund, the LoCorr Long/Short Commodities Strategy Fund and the LoCorr Market Trend Fund utilized unlimited capital loss carryovers of $49,818,608, $2,201,229 and $60,242,511, respectively. The LoCorr Dynamic Equity Fund and the LoCorr Spectrum Income Fund did not utilize any capital loss carryovers during the year ended December 31, 2019.
8. Line of Credit
The Trust entered into an unsecured, uncommitted Loan Agreement (“Line of Credit” or “LOC”) with U.S. Bank not individually but as an umbrella facility on behalf of the Funds in the Trust. The LOC expires on March 10, 2020. The LOC was established to provide the Funds a temporary short-term liquidity source, subject to certain restrictions, covenants and the right of setoff on the Funds’ assets, to meet unanticipated redemptions. Under terms of the LOC, borrowings for each Fund are limited to the lesser of one-third of the net unencumbered assets (including the amount borrowed) of the respective Fund, 5% of the gross assets of the respective Fund or $50 million in the aggregate for all of the Funds under this agreement. U.S. Bank, N.A. charges an interest rate per annum equal to the Prime Rate (4.75% as of December 31, 2019).
The Funds did not utilize the Line of Credit during the year ended December 31, 2019.
| | |
| | |
| 106 | | LoCorr Macro Strategies Fund, LoCorr Long/Short Commodities Strategy Fund and LoCorr Market Trend Fund – Notes to Consolidated Financial Statements / LoCorr Dynamic Equity Fund and LoCorr Spectrum Income Fund – Notes to Financial Statements (continued) |
| | |
9. Subsequent Events
In preparing the financial statements, the Adviser has evaluated events after December 31, 2019.
On September 16, 2019, Octavus Group, LLC (the “buyer”), the parent company of LoCorr Fund Management, LLC, which serves as the investment adviser to the LoCorr Investment Trust, entered into a purchase and sale agreement pursuant to which the buyer would acquire Steben & Company, Inc., the investment adviser to the Steben Managed Futures Strategy Fund. As part of the transaction, it was expected that the Steben Managed Futures Strategy Fund would reorganize into the LoCorr Macro Strategies Fund. The reorganization was largely based on the similar investment objectives of the LoCorr Macro Strategies Fund and the benefit to shareholders including opportunity to benefit from long-term economies of scale. In addition, the shareholders of the Steben Managed Futures Strategy Fund will benefit from the expertise and experience of LoCorr Fund Management, LLC. At a special meeting of the Board of Trustees, the Board approved an Agreement and Plan of Reorganization (the “Plan”). The sale closed on October 31, 2019. The Plan was voted on and approved at a meeting of shareholders held on January 17, 2020.
The Steben Managed Futures Strategy Fund reorganized into the LoCorr Macro Strategies Fund as of the close of business of January 24, 2020. Under the terms of the Plan, LoCorr Fund Management, LLC will pay all expenses associated with the reorganization. In addition, under the terms of the Plan, shareholders of the Steben Managed Futures Strategy Fund received shares of the LoCorr Macro Strategies Fund equal in U.S. dollar value to the interests of such shareholders in the Steben Managed Futures Strategy Fund with each LoCorr Macro Strategies Fund’s shares ordinarily valued as of the close of regular trading on the NYSE on the business day immediately prior to the closing date. The following table illustrates the specifics of the reorganization:
| | | Pre-
Reorganization
Net Assets | | | Pre-
Reorganization
Shares
Outstanding | | | Pre-
Reorganization
Net Asset Value | | | Post-
Reorganization
Net Assets | | | Post-
Reorganization
Shares
Outstanding* | | | Post-
Reorganization
Exchange Ratio* | |
| LoCorr Macro Strategies Fund - Class A | | $ | 52,981,719 | | | $ | 6,079,973 | | | $ | 8.71 | | | $ | 60,136,115 | | | | 6,901,237 | | | | 1.00229621 | |
| LoCorr Macro Strategies Fund - Class C | | | 48,056,434 | | | | 5,791,792 | | | | 8.30 | | | | 49,026,785 | | | | 5,908,701 | | | | 1.01445783 | |
| LoCorr Macro Strategies Fund - Class I | | | 770,518,733 | | | | 87,046,500 | | | | 8.85 | | | | 820,269,134 | | | | 92,668,364 | | | | 0.99548023 | |
| Steben Managed Futures Strategy Fund - Class A | | | 1,731,441 | | | | 198,241 | | | | 8.73 | | | | — | | | | — | | | | — | |
| Steben Managed Futures Strategy Fund - Class C | | | 970,352 | | | | 115,243 | | | | 8.42 | | | | — | | | | — | | | | — | |
| Steben Managed Futures Strategy Fund - Class I | | | 49,750,401 | | | | 5,647,389 | | | | 8.81 | | | | — | | | | — | | | | — | |
| Steben Managed Futures Strategy Fund - Class N | | | 5,422,955 | | | | 620,431 | | | | 8.74 | | | | — | | | | — | | | | — | |
* | Class N of the Steben Managed Futures Strategy Fund merged into Class A of the LoCorr Macro Strategies Fund with an exchange ratio of 1.00344432 as of the close of business on January 24, 2020 resulting in the addition of 622,567 shares outstanding in the LoCorr Macro Strategies Fund. |
On November 25, 2019, U.S. Bancorp, the parent company of Quasar Distributors, LLC (“Quasar”), the Fund’s distributor, announced that it had signed a purchase agreement to sell Quasar to Foreside Financial Group, LLC (“Foreside”) such that Quasar will become a wholly-owned broker-dealer subsidiary of Foreside. The transaction is expected to close by the end of March 2020. Quasar will remain the Fund’s distributor at the close of the transaction, subject to Board approval.
Declaration of Dividends
The LoCorr Spectrum Income Fund declared the following ordinary income distributions:
Dividend Declaration Date (a) | | Shareholder of Record Date | | Distribution Amount per Share Class |
| | | Class A | Class C | Class I |
| January 31, 2020 | | January 30, 2020 | | $0.03860 | $0.03470 | $0.04000 |
(a) Ex-date, reinvest date and payable date.
The estimated characterization of the distributions paid will be an ordinary dividend, qualified dividend or return of capital. See Note 2 for additional information.
There were no additional subsequent events since December 31, 2019 through the date the financial statements were issued that would require adjustments to or additional disclosure in these financial statements.
| | |
| | |
| Report of Independent Registered Public Accounting Firm | | 107 |
| | |
Report of Independent Registered Public Accounting Firm
To the Shareholders and Board of Trustees of
LoCorr Investment Trust
Opinion on the Financial Statements
We have audited the accompanying consolidated statements of assets and liabilities, including the consolidated schedules of investments, open forward currency contracts, swap contracts, and open futures contracts of LoCorr Macro Strategies Fund, LoCorr Long/Short Commodities Strategy Fund, and LoCorr Market Trend Fund, and the accompanying statements of assets and liabilities, including the schedules of investments, securities sold short, open futures contracts, and written options of LoCorr Dynamic Equity Fund and LoCorr Spectrum Income Fund (the “Funds”), each a series of LoCorr Investment Trust, as of December 31, 2019, and the related consolidated statements of operations for the year then ended, the consolidated statements of changes in net assets for each of the two years in the period then ended, including the related notes, and the consolidated financial highlights for each of the five years presented in the period then ended of LoCorr Macro Strategies Fund, LoCorr Long/Short Commodities Strategy Fund, and LoCorr Market Trend Fund, and the related statements of operations for the year then ended, the statements of changes in net assets for each of the two years in the period then ended, including the related notes, and the financial highlights for each of the five years in the period then ended of LoCorr Dynamic Equity Fund and LoCorr Spectrum Income Fund (collectively referred to as the “financial statements”). In our opinion, the financial statements present fairly, in all material respects, the financial position of each of the Funds as of December 31, 2019, the results of their operations for the year then ended, the changes in their net assets for each of the two years in the period then ended, and the financial highlights for each of the five years presented in the period then ended, in conformity with accounting principles generally accepted in the United States of America.
Basis for Opinion
These financial statements are the responsibility of the Funds’ management. Our responsibility is to express an opinion on the Funds’ financial statements based on our audits. We are a public accounting firm registered with the Public Company Accounting Oversight Board (United States) (“PCAOB”) and are required to be independent with respect to the Funds in accordance with the U.S. federal securities laws and the applicable rules and regulations of the Securities and Exchange Commission and the PCAOB.
We conducted our audits in accordance with the standards of the PCAOB. Those standards require that we plan and perform the audit to obtain reasonable assurance about whether the financial statements are free of material misstatement, whether due to error or fraud.
Our audits included performing procedures to assess the risks of material misstatement of the financial statements, whether due to error or fraud, and performing procedures that respond to those risks. Such procedures included examining, on a test basis, evidence regarding the amounts and disclosures in the financial statements. Our procedures included confirmation of securities owned as of December 31, 2019, by correspondence with the custodian and brokers or by other appropriate auditing procedures where replies from brokers were not received. Our audits also included evaluating the accounting principles used and significant estimates made by management, as well as evaluating the overall presentation of the financial statements. We believe that our audits provide a reasonable basis for our opinion.
We have served as the Funds’ auditor since 2011.

COHEN & COMPANY, LTD.
Milwaukee, Wisconsin
February 26, 2020
| | |
| | |
| 108 | | LoCorr Investment Trust - Expense Example (Unaudited) |
| | |
Expense Example
December 31, 2019 (Unaudited)
As a shareholder of a mutual fund, you incur two types of costs: (1) transaction costs, including sales charges (loads) on purchase payments; redemption fees; and (2) ongoing costs, including management fees; distribution and/or service (12b-1) fees and other Fund expenses.
This Example is intended to help you understand your ongoing costs (in dollars) of investing in each of the Funds and to compare these costs with the ongoing costs of investing in other mutual funds. The Example is based on an investment of $1,000 invested at the beginning of the period and held for the entire period (July 1, 2019 through December 31, 2019).
Actual Expenses
The actual return columns in the following table provide information about account values based on actual returns and actual expenses. You may use the information in these columns, together with the amount you invested, to estimate the expenses that you paid over the period. Simply divide your account value by $1,000 (for example, an $8,600 account value divided by $1,000 = 8.6), then multiply the result by the number in the first line under the heading entitled “Expenses Paid During Period” to estimate the expenses you paid on your account during this period. The only transaction fees you may be required to pay are for outgoing wire transfers, returned checks and stop payment orders at prevailing rates charged by U.S. Bancorp Fund Services, LLC, doing business as U.S. Bank Global Fund Services, the Funds’ transfer agent. These fees are assessed on all accounts, as applicable. If you request that a redemption be made by wire transfer, currently the Funds’ transfer agent charges a $15.00 fee. The Funds’ transfer agent charges a transaction fee of $25.00 on returned checks and stop payment orders. If you paid a transaction fee, you would add the fee amount to the expenses paid on your account this period to obtain your total expenses paid.
Hypothetical Example for Comparison Purposes
The hypothetical return columns in the following table provide information about hypothetical account values and hypothetical expenses based on the Funds’ actual expense ratio and an assumed rate of return of 5% per year before expenses, which is not the Funds’ actual return. The hypothetical account values and expenses may not be used to estimate the actual ending account balance or expenses you paid for the period. You may use this information to compare the ongoing costs of investing in the Funds and other funds. To do so, compare this 5% hypothetical example with the 5% hypothetical examples that appear in the shareholder reports of the other funds. A transaction fee of $15.00 may be assessed on outgoing wire transfers and a transaction fee of $25.00 may be assessed on returned checks and stop payment orders. To include this fee in the calculation, you would add the estimated transaction fee to the hypothetical expenses shown in the table. Please note that the expenses shown in the table are meant to highlight your ongoing costs only and do not reflect the transaction fees discussed above. Therefore, those columns are useful in comparing ongoing costs only, and will not help you determine the relative total costs of owning different funds. In addition, if these transactional costs were included, your costs would have been higher.
| | |
| | |
| LoCorr Investment Trust - Expense Example (Unaudited) (continued) | | 109 |
| | |
Actual vs Hypothetical Returns
Actual vs. Hypothetical returns for the Six Months Ended December 31, 2019 (Unaudited)
| | | | | | | | | | | | | Actual | | | Hypothetical
(5% gross annual return) |
| | | | Class | | | Fund’s
Annualized
Expense Ratio
1, 2 | | | Beginning
Account Value
July 1, 2019 | | | Ending
Account Value
December 31,
2019 | | | Expenses Paid
During Period
1, 2, 3 | | | Ending
Account Value
December 31,
2019 | | | Expenses Paid
During Period
1, 2, 3 | |
| | | | | | | | | | | | | | | | | | | | | | | |
| LoCorr Macro Strategies Fund |
| | | | A | | | 2.24% | | | $1,000.00 | | | $1,051.10 | | | $11.58 | | | $1,013.91 | | | $11.37 | |
| | | | C | | | 2.99% | | | $1,000.00 | | | $1,047.00 | | | $15.43 | | | $1,010.13 | | | $15.15 | |
| | | | I | | | 1.99% | | | $1,000.00 | | | $1,051.60 | | | $10.29 | | | $1,015.17 | | | $10.11 | |
| | | | | | | | | | | | | | | | | | | | | | | |
| LoCorr Long/Short Commodities Strategy Fund |
| | | | A | | | 2.15% | | | $1,000.00 | | | $938.50 | | | $10.51 | | | $1,014.37 | | | $10.92 | |
| | | | C | | | 2.90% | | | $1,000.00 | | | $935.90 | | | $14.15 | | | $1,010.59 | | | $14.70 | |
| | | | I | | | 1.90% | | | $1,000.00 | | | $940.30 | | | $9.29 | | | $1,015.63 | | | $9.65 | |
| | | | | | | | | | | | | | | | | | | | | | | |
| LoCorr Market Trend Fund |
| | | | A | | | 1.94% | | | $1,000.00 | | | $1,057.70 | | | $10.06 | | | $1,015.43 | | | $9.86 | |
| | | | C | | | 2.69% | | | $1,000.00 | | | $1,053.20 | | | $13.92 | | | $1,011.64 | | | $13.64 | |
| | | | I | | | 1.69% | | | $1,000.00 | | | $1,059.50 | | | $8.77 | | | $1,016.69 | | | $8.59 | |
| | | | | | | | | | | | | | | | | | | | | | | |
| LoCorr Dynamic Equity Fund |
| | | | A | | | 3.03% | | | $1,000.00 | | | $998.90 | | | $15.27 | | | $1,009.93 | | | $15.35 | |
| | | | C | | | 3.78% | | | $1,000.00 | | | $996.10 | | | $19.02 | | | $1,006.15 | | | $19.11 | |
| | | | I | | | 2.78% | | | $1,000.00 | | | $1,000.70 | | | $14.02 | | | $1,011.19 | | | $14.09 | |
| | | | | | | | | | | | | | | | | | | | | | | |
| LoCorr Spectrum Income Fund |
| | | | A | | | 2.01% | | | $1,000.00 | | | $1,038.90 | | | $10.33 | | | $1,015.07 | | | $10.21 | |
| | | | C | | | 2.76% | | | $1,000.00 | | | $1,035.00 | | | $14.16 | | | $1,011.29 | | | $13.99 | |
| | | | I | | | 1.76% | | | $1,000.00 | | | $1,040.20 | | | $9.05 | | | $1,016.33 | | | $8.94 | |
| 1 | Includes dividend and/or interest expense of 0.00%, 0.00%, 0.00%, 0.79% and 0.00% for the LoCorr Macro Strategies Fund, the LoCorr Long/Short Commodities Strategy Fund, the LoCorr Market Trend Fund, the LoCorr Dynamic Equity Fund and the LoCorr Spectrum Income Fund, respectively. |
| 2 | Includes expenses of wholly-owned and controlled Cayman Islands subsidiaries for the LoCorr Macro Strategies Fund, the LoCorr Long/Short Commodities Strategy Fund and the LoCorr Market Trend Fund. |
| 3 | Expenses Paid During Period are equal to the net annualized expense ratio for the class, multiplied by the average account value over the period, multiplied by 184/365 (to reflect the one-half year period). |
| | |
| | |
| 110 | | Approval of Advisory Agreements (Unaudited) |
| | |
LoCorr Investment Trust
December 31, 2019 (Unaudited)
Review of Management and Sub-Advisory Agreements
Counsel directed the Board’s attention to the Board materials for the renewal of the investment sub-advisory agreement for the LoCorr Dynamic Equity Fund (the “LDE Fund”).
The Board reviewed the memorandum provided by Counsel which had been provided to them prior to the meeting entitled, “Duties of Trustees with Respect to Approval and Renewal of Investment Advisory and Sub-Advisory Contracts”. The Board, including a majority of the Trustees who are not “interested persons” of the Trust within the meaning of the 1940 Act (the “Independent Trustees”), reviewed the various factors relevant to its consideration of the subadvisory agreement and the legal responsibilities of the Board related to such consideration. These factors included the following:
| ● | The nature, extent and quality of the services provided by the investment sub-adviser to the fund; |
| ● | The investment performance of the fund and the investment sub-adviser; |
| ● | The costs of the services to be provided and the profits to be realized by the sub-adviser and its affiliates from the relationship with the fund; |
| ● | The extent to which economies of scale will be realized as the fund grows; and |
| ● | Whether the fee levels reflect these economies of scale to the benefit of the shareholders. |
The Board reviewed the responses to the 15(c) questionnaire and the sub-advisory agreement prior to the meeting.
Nature, Extent and Quality of Services Provided by the Sub-Adviser
The Board reviewed the subadvisory services provided by Kettle Hill Capital Management, LLC (“Kettle Hill”) for the LDE Fund. For the benefit of the Trustees, Counsel and Management noted the responsibilities and backgrounds of Kettle Hill’s key individuals. Counsel further noted that there were no changes in the key personnel of Kettle Hill since the Board’s last approval. The Trustees further noted that Kettle Hill provides equity research, financial modeling, investment risk oversight, security selection and trade execution for the LDE Fund and compliance services to assure assets are managed within the Fund’s investment guidelines and restrictions.
Counsel discussed Kettle Hill’s responses in the 15c questionnaire, noting that Kettle Hill reported no material compliance issues, regulatory issues or material litigations in the past 36 months. Counsel noted for the Board’s benefit that Kettle Hill maintains an Errors & Omissions insurance policy in an appropriate amount.
After a discussion, the Board concluded that Kettle Hill has the appropriate investment management experience and resources to continue to provide satisfactory services for the LDE Fund.
Investment performance of the Sub-Adviser
Counsel directed the Trustees to the performance of Kettle Hill with respect to its allocation of the LDE Fund. Fund Counsel noted for the Trustees the sub-adviser’s performance compared to the Fund’s benchmark and the overall LDE Fund. The Board noted that Kettle Hill’s 1-year performance lagged both the benchmark and the overall performance of the Fund. A representative of the Adviser reviewed Kettle Hill’s recent performance, noting the volatility of the equity markets over the past 12-month period. In response to a question from Counsel, a representative of the Adviser stated that the Fund’s adviser continued to be satisfied with Kettle Hill’s performance and the execution of its strategy
After a discussion, the Board concluded that Kettle Hill’s performance was not unreasonable.
Costs of Services Provided and Profitability to be Realized
Counsel then directed the Board’s attention to the costs of services provided by Kettle Hill to the LDE Fund. Counsel reviewed for the Trustees the fees charged by Kettle Hill to other accounts including other registered investment companies.
The Board next reviewed Kettle Hill’s net profits related to its services to the LDE Fund. The Board discussed the level of Kettle Hill’s profitability and found it to be not excessive After further discussion, the Board concluded that Kettle Hill’s sub-advisory fee and profitability were reasonable.
Other Benefits
The Trustees noted that Kettle Hill continues to receive soft-dollar benefits from its relationship with the LDE Fund that Kettle Hill uses for brokerage and research purposes. After a discussion, the Trustees concluded that the other benefits that may be derived by Kettle Hill from its relationship with the Fund were reasonable.
Conclusion
Having requested and received such information from the Adviser as the Trustees believed to be reasonably necessary to evaluate the terms of the sub-advisory agreement with Kettle Hill, and as assisted by the advice of Counsel, the Trustees concluded that the subadvisory fee was not unreasonable and that renewal of the sub-advisory agreement with Kettle Hill was in the best interests of the shareholders of the LDE Fund.
| | |
| | |
| Notice of Privacy Policy & Practices/Quarterly Portfolio Holdings/Proxy (Unaudited) | | 111 |
| | |
Notice of Privacy Policy & Practices
(Unaudited)
Your privacy is important to us. The Funds are committed to maintaining the confidentiality, integrity, and security of your personal information. When you provide personal information, the Funds believe that you should be aware of policies to protect the confidentiality of that information.
The Funds collect the following nonpublic personal information about you:
| ● | Information we receive from you on or in applications or other forms, correspondence, or conversations, including, but not limited to, your name, address, phone number, social security number, assets, income and date of birth; and |
| ● | Information about your transactions with us, our affiliates, or others, including, but not limited to, your account number and balance, payments history, parties to transactions, cost basis information and other financial information. |
The Funds do not disclose any nonpublic personal information about our current or former shareholders to affiliated or nonaffiliated third parties, except as permitted by law. For example, the Funds are permitted by law to disclose all of the information we collect, as described above, to our transfer agent to process your transactions. Furthermore, the Funds restrict access to your nonpublic personal information to those persons who require such information to provide products or services to you. The Funds maintain physical, electronic and procedural safeguards that comply with applicable federal and state standards to guard your nonpublic personal information.
In the event that you hold shares of the Funds through a financial intermediary, including, but not limited to, a broker-dealer, bank, or trust company, the privacy policy of your financial intermediary would govern how your nonpublic personal information would be shared with affiliated or non-affiliated third parties.
Portfolio Holdings Disclosure
(Unaudited)
The Funds file a complete schedule of portfolio holdings with the U.S. Securities and Exchange Commission (the “SEC”) for the first and third quarters of each fiscal year on Part F of Form N-PORT. The Funds’ Part F of Form N-PORT are available on the SEC’s website at www.sec.gov and may be reviewed and copied at the SEC’s Public Reference Room in Washington, D.C. Information on the operation of the Public Reference Room may be obtained by calling 1-800-SEC-0330. The Funds’ Part F of Form N-PORT may also be obtained by calling toll-free 1-855-523-8637.
Proxy voting policies, procedures and record
(Unaudited)
You may obtain a description of the Funds’ (1) proxy voting policies, (2) proxy voting procedures and (3) information regarding how the Funds voted any proxies related to portfolio securities during the most recent 12-month period ended June 30 for which an SEC filing has been made, without charge, upon request by contacting the Funds directly at 1-855-523-8637, or on the EDGAR Database on the SEC’s website (http:// www.sec.gov).
| | |
| | |
| 112 | | Qualified Dividend Income (“QDI”) / Dividends Received Deduction (“DRD”) (Unaudited) |
| | |
Qualified Dividend Income (“QDI”) / Dividends Received Deduction (“DRD”)
(Unaudited)
For the fiscal year ended December 31, 2019, certain dividends paid by the Funds may be subject to a maximum tax rate of 15%, as provided for by the Jobs and Growth Tax Relief Reconciliation Act of 2003. The percentage of dividends declared from ordinary income designated as qualified income was as follows:
| Fund | | QDI% |
| LoCorr Macro Strategies Fund | | 0.00% |
| LoCorr Long/Short Commodities Strategy Fund | | 0.00% |
| LoCorr Market Trend Fund | | 0.00% |
| LoCorr Dynamic Equity Fund | | 0.00% |
| LoCorr Spectrum Income Fund | | 73.35% |
For corporate shareholders, the percent of ordinary income distributions qualifying for the corporate dividends received deduction for the fiscal year ended December 31, 2019 was as follows:
| Fund | | DRD% |
| LoCorr Macro Strategies Fund | | 0.00% |
| LoCorr Long/Short Commodities Strategy Fund | | 0.00% |
| LoCorr Market Trend Fund | | 0.00% |
| LoCorr Dynamic Equity Fund | | 0.00% |
| LoCorr Spectrum Income Fund | | 58.13% |
| | |
| | |
| Independent Trustees/Interested Trustees and Officers | | 113 |
| | |
The Statement of Additional Information includes additional information about the Independent Trustees/Interested Trustees and Officers and is available, without charge, by calling 1-855-523-8637.
| Independent Trustees |
Name and
Year of Birth | Position/Term
of Office1 | Principal Occupation During the Past 5 Years | Number of Portfolios in Fund Complex2 Overseen by Trustee | Other Directorships Held by Trustee During the Past 5 Years |
Gary Jarrett Year of Birth: 1954 | Trustee/
2016 to present | Chief Executive Officer, Black
River Asset Management LLC,
investment subsidiary of
Cargill, Inc., 2002 to 2015. | 5 | None |
Mark Thompson Year of Birth: 1959 | Trustee/ 2011 to present | Chairman and Chief Manager,
Riverbridge Partners, LLC
(investment management),
1987 to present. | 5 | None |
Ronald A. Tschetter Year of Birth: 1941 | Trustee/ 2011 to present | Mr. Tschetter is presently retired
from his principal occupations;
Director of the U.S. Peace Corps,
2006 to 2009. | 5 | None |
| Interested Trustees and Officers |
Name and Year of Birth | Position/Term of Office1 | Principal Occupation During the Past 5 Years | Number of Portfolios in Fund Complex2 Overseen by Trustee | Other Directorships Held by Trustee During the Past 5 Years |
Jon C. Essen3 Year of Birth: 1963 | Treasurer,
Secretary, Chief
Financial Officer/
2011 to present;
Trustee/ 2010
to present | LoCorr Fund Management, LLC:
Chief Operating Officer
(2010-2016), Chief Compliance
Officer, (2010-2017); LoCorr
Distributors, LLC: Principal, Chief
Financial Officer, and Registered
Representative (2008 to present)
Chief Compliance Officer
(2008-2017) | 5 | None |
Kevin M. Kinzie4 Year of Birth: 1956 | President,
Trustee/
2011 to present | Chief Executive Officer of LoCorr
Fund Management, LLC, 2010
to present; President and Chief
Executive Officer of LoCorr
Distributors, LLC (broker/dealer),
2002 to present. | 5 | None |
Brian Hull5 Year of Birth: 1968 | Chief Compliance
Officer/2019
to present | Steben & Company, Inc. (broker/
dealer): Chief Compliance Officer
2002-2007 and 2012 to Present;
Financial & Operations Principal
(FINOP) 2002-Present; Registered
Representative 2002-Present. | 5 | None |
1 The term of office for each Trustee listed above will continue indefinitely.
2 The term “Fund Complex” refers to the LoCorr Investment Trust.
3 Mr. Essen is an interested Trustee because he is an officer of the Funds’ Adviser.
4 Mr. Kinzie is an interested Trustee because he is an officer and indirect controlling interest holder of the Funds’ Adviser.
5 Mr. Hull is an interested person because he is an officer of the Funds’ Adviser.
This page left intentionally blank.