UNITED STATES
SECURITIES AND EXCHANGE COMMISSION
Washington, D.C. 20549
FORM N-CSR
CERTIFIED SHAREHOLDER REPORT OF REGISTERED
MANAGEMENT INVESTMENT COMPANIES
Investment Company Act file number 811-22509
LoCorr Investment Trust
(Exact name of registrant as specified in charter)
687 Excelsior Blvd
Excelsior, MN 55331
(Address of principal executive offices) (Zip code)
CT Corporation System
1300 East Ninth Street
Cleveland, OH 44114
(Name and address of agent for service)
952.767.2920
Registrant's telephone number, including area code
Date of fiscal year end: December 31
Date of reporting period: December 31, 2021
Item 1. Reports to Stockholders.
(a)

Letter to Shareholders
LoCorr Funds seeks to provide investments that, over time, will have low correlation to traditional asset classes such as stocks and bonds. We believe that adding low correlating investments to portfolios can significantly reduce overall portfolio risk while enhancing returns. Correlation measures the degree to which the returns of two investments move together over time. LoCorr offers products that provide the potential for positive returns in rising or falling markets and are designed to generate returns independent of traditional stock, bond and commodity investments. In this report, LoCorr Funds is reporting on five mutual funds: LoCorr Macro Strategies Fund, LoCorr Long/Short Commodities Strategy Fund, LoCorr Market Trend Fund, LoCorr Dynamic Equity Fund and LoCorr Spectrum Income Fund (collectively, the “Funds”).
Market Commentary
COVID
In early 2021, new COVID-19 infections were surging, an increasing number of hospitals were at or near capacity, while the number of deaths in the U.S. surpassed 4,000 per day. At the same time, the first vaccines were rolling out and providing a sense of optimism that the worst of the pandemic may be behind us. While governments around the globe would continue to respond to surges in cases and new variants in diverse ways, in the U.S., the vaccine rollout largely signaled the end of broad-based lockdowns.
While COVID would recede from the forefront of investor minds, later in the Spring the growing threat of the Delta variant would rekindle concerns as infections began rising again. Concerns regarding Delta, along with the emergence of the more contagious yet seemingly less deadly Omicron variant late in the year, would cause bouts of volatility in risk assets. The effectiveness of the vaccines and the willingness of many, though not all, governments to manage through the pandemic without wide-scale shutdowns contributed to quick rebounds by risk assets following any sell-off. There seemed to exist a pattern of reduced negative economic and market impact from each COVID variant, providing a sense of optimism looking forward.
Economic Recovery & Inflation
Meanwhile, during the first half of the year, supported by fiscal and monetary stimulus, the global economy continued its recovery from the pandemic shutdowns. The U.S. economy, as measured by real GDP, reached new heights in Q2 2021, climbing +6.7%. The rapid recovery was beginning to feel the strain of stressed supply chains and labor market constraints which began disrupting economic activity. Q3 2021 U.S. GDP growth would decelerate to +2.3%, its slowest pace since the recovery began, though fourth quarter activity appeared to rebound. Unemployment rates continued to decline over the course of 2021, falling to 3.9% by the end of the year. Unfortunately, the labor participation rate remained low as many workers were unwilling or unable to rejoin the workforce. Coupled with strong demand and supply chain disruptions, the labor shortage helped exacerbate the rising cost issue. Inflationary pressure continued to build as the year progressed, with the Consumer Price Index surging an astonishing +7.0% year-over-year in December, its fastest pace in four decades.
Fed Policy Shifts
Federal Reserve policy, which had been so stimulative since the pandemic began in early 2020, began to shift in the second half of 2021 as the Fed began moving toward a withdrawal of its accommodative monetary policy in response to the strong increase in demand and persistently high inflation. At its September meeting, the Fed signaled that it would likely announce the start of tapering in Q4. It would begin the taper in November and accelerated the pace at its December meeting. Fed Chairman Powell famously indicated that it was a good time to “retire” the word transitory to describe the inflation that was more persistent than originally expected. Central banks moved forward the timetable for completing its taper to March 2022 and the Fed’s dot plot now shows three rate hikes for 2022. Thus, the Fed’s stance exiting 2021 was increasingly hawkish and represented a massive change from the supportive policy that had boosted prices for risk assets since the pandemic shutdowns in March 2020.
Equities
Major equity markets marched upward during the year, exhibiting persistent strength with only brief bouts of volatility. Supported by the accommodative Federal Reserve, robust economic growth, strong corporate earnings, U.S. stock indices reached record highs during the year. The S&P 500 finished 2021 up a staggering +28.71%. This strength in stocks was evident outside the U.S. as developed international markets also performed well, though emerging markets had slightly negative returns. In aggregate, equity markets provided robust opportunities for managed futures strategies in 2021. All eleven S&P 500 sectors made gains in 2021 led by the Energy sector, which was up +53.43%, and Real Estate, up +33.30%. For the first time in
the past ten years, all sectors in the S&P 500 gained over +15% in the calendar year. Valuation for the S&P 500 skyrocketed into the end of 2021 as the Cyclically Adjusted S&P 500 P/E (price-earnings ratio) closed the year at 38.68, the highest level in the past twenty years. This is well above 33.77 at the end of 2020.
Fixed Income
Conditions in global fixed income markets were more challenging in 2021, leading to a -1.54% decline in the Bloomberg U.S. Aggregate Bond Index. While yields at the short end of the curve moved higher, particularly in the second half of the year, the long end of the curve was choppier and experienced sizable reversals that were difficult to navigate. The U.S. Treasury 10-Year yield increased from approximately 0.9% to finish 2021 near 1.5%. This sizable increase masked underlying choppiness, however. Yields moved higher through the first quarter of 2021 on optimism surrounding the rollout of the vaccines and continued economic recovery. As the Delta variant emerged and concerns began to mount about an economic slowdown, bonds rallied and yields fell. These conditions did not persist, however, as surging inflation prompted the Fed to shift its posture with yields moving higher again beginning in August. Global bond yields followed a similar winding pattern over the course of the year, ending 2021 substantially higher than where they started.
Commodities
The Bloomberg Commodity Index rose an impressive +27.11% in 2021 as commodity prices continued to move higher, though the bulk of the upward move came in the first six months of the year. After lagging other commodities in the prior year, oil prices moved sharply higher, exhibiting strength for most of 2021 except for brief periods including a sharp drop in November. Overall for the year, rising demand, low inventories, and constrained production led West Texas Intermediate crude (“WTI”) to climb nearly $30, finishing 2021 near $77 per barrel. The volatility in oil in November was notable, however, as Omicron and Fed tightening related concerns caused a dramatic $10+ one-day plunge in crude oil. In metals, precious metal prices moved lower despite negative real rates and high inflation. Base metal prices moved higher with copper, nickel, aluminum, and zinc prices rising more than +25% during the year. Agricultural commodities also moved sharply higher, led by sizable gains in grains and soft prices. Overall, the persistent upward movement in commodities produced robust opportunities for the Fund’s managed futures strategies.
Foreign Currency
The U.S. Dollar Index appreciated +6.71% during the year. While the greenback experienced choppy conditions through May, it strengthened persistently from early June through the end of 2021. The strength in the U.S. dollar (“USD”) was attributable to strong relative economic growth and interest rates in the U.S. and the Federal Reserve’s shift to a more hawkish posture. During the year, the Euro declined just over -7% while the Japanese Yen lost more than -11%. The Turkish Lira plunged more than -40% as President Erdogan maintained low interest rates despite hyper-inflation and is at risk of defaulting on Turkey’s debt. The Chinese yuan and Canadian dollar were the only major currencies that had a positive return vs. the dollar.
LoCorr Macro Strategies Fund
The LoCorr Macro Strategies Fund (the “Fund”) seeks capital appreciation as its primary investment objective with managing volatility as a secondary objective. The Fund attempts to achieve its objective by investing in two main strategies – a Managed Futures Strategy and a Fixed Income Strategy.
The Fund employs three sub-advisers to manage the Managed Futures Strategy of the Fund:
● | Millburn Ridgefield Corporation (“Millburn”) manages a portfolio for the Fund that is similar to its Millburn Diversified Program which commenced operations in 1977. Millburn invests in a diversified portfolio of global futures contracts by employing a systematic, statistical learning-based, multi-factor approach. |
● | Graham Capital Management, LLC (“Graham”) manages a portfolio for the Fund that is similar to its Tactical Trend strategy, a systematic medium- to long-term trend-following program that commenced trading in 2006. |
● | Revolution Capital Management (“Revolution”) manages a strategy for the Fund that is similar to its Alpha Program that has been available in a managed account program since 2007. Revolution employs a short-term pattern recognition strategy. |
Fund Performance Summary
For the annual period ended December 31st, 2021, the Fund’s Class I shares gained +0.08% as gains in the first half of the year were largely offset in the second half. The Fund underperformed the +4.72% return for the Morningstar Systematic Trend Futures category. While performance for the year lagged, we would note this is the first year since 2013 that the Fund was not ranked in the top half of its Morningstar peer group. Similarly, the Fund has only had one year in the past eight with a negative return, demonstrating its consistent track record.
During 2021, the Fund’s allocation to the short-term pattern recognition strategy utilized by Revolution was the largest detractor, a reversal from 2020 when this was its strongest performing allocation. Overall, markets, and equities in particular, exhibited strong mean reverting tendencies over short time scales which challenged this sub-adviser whose models tend to follow short-term price momentum. These conditions were particularly prevalent during the second half of the year.
Graham, on the other hand, utilizes a trend-following strategy which generated slightly positive returns during the year, while Millburn’s statistical learning-based, multi-factor strategy produced the strongest positive returns.
For the second year in a row, trading in commodities produced the largest gains for the Fund, led by energies. Trading in equities also produced healthy gains while positions in currencies and fixed income markets were detractors. The target allocation to each sub-adviser at the end of the period was as follows:
● | Millburn Ridgefield Corporation: 40% |
● | Graham Capital Management: 40% |
● | Revolution Capital Management: 20% |
Managed Futures Strategy
Commodities
Trading in commodities produced the largest profits for the Fund as the bull market in commodities continued. The largest gains stemmed from energy trading. Positions in agricultural and base metal markets were also profitable while precious metals produced losses. In energy, prolonged long exposure benefitted from the upward climb in most oil and oil-related commodities. The largest winners in the energy sector included long positions in brent crude and reformulated blendstock for oxygenate blending (RBOB) gasoline. In agricultural markets, the Fund benefitted from solid positive contributions from long grain and soft positions, notably long corn and coffee exposure. Metal markets were mixed as gains from long positions in copper and aluminum were offset by losses in precious metals commodities including gold and silver. The Fund ended the year with long positions in energy, agriculture, and base metals while precious metal exposure was slightly short.
Fixed Income
Trading in fixed income markets produced the largest losses during the period, particularly exposure at the longer end of the curve. Positions in shorter duration maturities produced small profits for the Fund. The bulk of the losses occurred in the third quarter as positioning turned long in response to the downward move in global rates from April/May though early August. Building inflationary pressure and the hawkish rhetoric from the Fed caused rates to reverse course, climbing higher which hurt the Fund’s long-biased exposure. The largest losses were outside the U.S., particularly in Europe led by unprofitable trading in the Euro Bobl and Euro Bund. Trading in Asia and Canada debt produced smaller losses while positions in the U.S. were modestly profitable. The Fund ended 2021 with modest long exposure in fixed income, notably in the U.S., while European positions were slightly short. Asian fixed income positions were also slightly long. Overall, medium- and long-maturity instruments were positioned long while exposure at the front end of the curve was short at year end.
Equity Indices
Trading in global equities was the second largest positive contributor during 2021 behind commodities, as the Fund was able to benefit from the strong returns in stocks. The Fund’s equity trading has now been profitable in six of the past seven quarters. Profits during the year were concentrated in the U.S., as long positions in the E-Mini NASDAQ and S&P 500 produced the biggest gains. Elsewhere, trading was more muted with notable losses from positions in the Nikkei, Euro Stoxx 50, and Hang Seng. Positives outside the U.S. included positions in the CAC 40 and the Canadian TSE 60. The Fund’s equity exposure finished 2021 modestly long with the largest positions in U.S. markets. Europe was slightly long while Asian markets were short.
Foreign Currencies
Trading in currencies was unprofitable in 2021 as conditions proved challenging throughout the year. Positioning vacillated between long and short during the first half of the year as currency markets experienced sizable reversals. As the USD began strengthening persistently during the second half of the year, the Fund’s exposure shifted long USD/short FX beginning in the third quarter and remained that way through the end of 2021. The largest losses occurred in European currencies, notably from trading in the Swiss Franc. Asian trading was mixed, with gains in the Japanese Yen more than offset by losses in the New Zealand and Australian dollar. Finally, trading in the Canadian dollar was also unprofitable. Overall, foreign currency exposure finished the year short versus the USD, notably the Euro, Yen, British Pound, and Canadian dollar.
Outlook
As we turn the page on 2021, we believe the outlook for managed futures/macro is compelling and expect robust market opportunities for the Fund. With persistently high inflation, the Federal Reserve’s acceleration of its tapering program, and expected interest rate hikes, the potential exists for powerful moves across multiple asset classes including currencies, commodities, and fixed income. Given this backdrop along with high valuations, the potential exists for sustained periods of heightened volatility in equities as well. Finally, our expectation is for considerable divergence in economic growth and central bank policy around the globe in 2022 which may further contribute to opportunities for profits.
In our view, this favorable outlook coincides with a murky outlook for bonds. True, the 60/40 asset allocation model has served the investment community well for the past 40 years. Our belief, however, is with the tailwind of declining rates since the 1970s in the rearview mirror, we have entered a new era for the bond market. With the current environment marked by low interest rates which are likely to rise along with near historically tight credit spreads, the likelihood of bonds performing well over the short- to intermediate-terms seems remote. Of course, evidence of this more challenging environment for bonds emerged in 2021, as evidenced by the negative return for the Bloomberg U.S. Aggregate Bond Index. We believe the challenging outlook for bonds is just beginning and recommend investors consider the broader use of alternative diversifying strategies like managed futures which have the flexibility to invest long or short across multiple asset classes and markets.
Fixed Income Strategy
The Fund invests most of its excess cash not needed for futures margin requirements in a Fixed Income Strategy comprised of high quality, short to intermediate term investment grade corporate (“IG”) and government agency securities managed by Nuveen Asset Management (“Nuveen”).
The fixed income component of the Fund is managed against the Barclay’s 1-5 Government Credit Index. Returns for the fixed income portfolio were -0.52% compared to -0.97% for the benchmark during 2021. The duration of the portfolio was managed between 1.7 and 2.5 years. The shorter duration and yield curve positioning had a positive impact on performance. During the year, the Fund’s fixed income allocation was between 25-28% in investment grade corporate bonds and 22-28% in high quality, short duration securitized sectors. The Fund maintained broad corporate bond diversification with a modest overweight in financials. Given that spreads for non-government securities tightened, Nuveen’s sector strategy was a positive contributor to returns during the period.
In 2022, Nuveen expects the U.S. and global economies to continue expanding at an above trend pace, though growth is likely to slow in most major regions. The U.S. labor market is likely to reach “full employment” this year which, when paired with still present support from prior fiscal stimulus, should drive robust growth in consumer spending. Supply chain challenges will remain in the near term, but are likely to unwind as the year progresses, resulting in a decelerated rate of inflation by year end. That said, Nuveen still anticipate prices to be rising by about +3% year-on-year by the end of 2022, above the Fed’s long-term target. After providing substantial support in 2021, fiscal policy will become a headwind to headline growth this year, a direct result of lower spending. The portfolio managers believe the first Fed rate hike will occur during the first half of the year, with the potential for more depending on incoming economic data. Given this outlook, Nuveen expects to manage the Fund’s duration underweight versus the benchmark.
Nuveen expects Investment grade credit spread tightening in the near term to offset the widening seen in the fourth quarter of 2021, with spreads remaining range bound in 2022. Overall, 2022 will likely look a lot like 2021 for investment grade credit. Strong technical indicators and above-trend growth should help keep a lid on major spread moves in 2022. Investors and corporations are flush with cash, and company fundamentals are improving as debt reduction continues. Among sectors, Nuveen still favors banking, communications, and energy.
Considering favorable volatility-adjusted return potential, the team at Nuveen expects to continue to position the portfolio broadly across the securitized sectors. Mortgaged-backed Securities’ credit is expected to continue positive performance given the strength of the residential housing market and improving delinquency picture. Strong economic growth in the year ahead could benefit commercial real estate fundamentals, with all property types expected to show an improvement in 2022. New
issue underwriting remains conservative, so Nuveen expects some loosening, though not to a worrying degree. Asset-backed Securities’ (“ABS”) fundamentals are expected to continue improving as unemployment remains low and consumer savings remain elevated. The team continues to view Consumer ABS as a potential source of stable returns.
LoCorr Long/Short Commodities Strategy Fund
The LoCorr Long/Short Commodities Strategy Fund (the “Long/Short Commodities Fund” or the “Fund”) provides investors with access to a commodities futures strategy in a mutual fund structure. Generally speaking, an investment in commodities relies on rising prices to generate positive returns. Of course, commodity prices do not always appreciate and occasionally experience sharp declines, as was seen in 2020, 2018, 2014/2015 and 2008. The Long/Short Commodities Fund has the potential to profit while commodity prices increase or decrease which differentiates it from most commodity-oriented mutual funds. The Fund’s primary investment objective is capital appreciation in rising and falling commodities markets. The Fund attempts to achieve this objective by investing in two primary strategies – a Commodities Strategy and a Fixed Income Strategy.
The Fund’s Commodities Strategy is comprised of:
● | ARCOM Capital LLC (“ARCOM”), which began trading in 2015. ARCOM is led by Alastair Riach, who has over 30 years of experience trading commodities, and manages a discretionary natural gas specialist strategy that trades primarily relative value. |
● | CoreCommodity, which began trading its current strategy in 2017 but traces its roots back to the firm’s inception in 2003. CoreCommodity utilizes a discretionary approach based on a microeconomic analysis centered on four dimensions; quantitative, fundamental, market dynamics, and manager discretion. The portfolio will hold long/short directional, relative value (inter-market), and structural (calendar spread) positions. |
● | East X, which was founded in 2017 and manages a strategy that traces its roots back to 2014. East Alpha manages a systematic approach that combines fundamental insights gleaned from discretionary traders with pattern recognition technique in a rigorous systematic framework. The portfolio will hold long/short directional, relative value (inter-market), and structural (calendar spread) positions. |
● | First Quadrant’s Long/Short Commodities strategy, which began trading in 2010, employs a systematic long/short directional strategy that attempts to capture commercial market participant behavior across 20+ commodity markets. |
● | J E Moody & Company Commodity Relative Value Program (“JEM CRV”), which began trading in 2006. JEM CRV employs a market neutral, systematic trading strategy that invests in relative value calendar spread positions across 20+ commodity markets. |
● | Millburn’s Commodity Program (“Millburn”), which began trading in 2005. Millburn employs a systematic trading strategy that takes outright long/short positions and relative value spread positions across 40+ commodity futures markets. |
Fund Performance Summary
The Fund’s Class I shares gained +14.82% during the year ended December 31, 2021, versus the +27.11% return for the Bloomberg Commodity Total Return Index and the +0.05% gain for the Bank of America Merrill Lynch 3-Month Treasury Bill Index (“ICE BofAML T-Bill Index”). We are pleased with the performance of the Fund in 2021 as it has demonstrated the ability to participate in the strong upward movement of commodity prices. However, due to the Fund’s long/short philosophy, we wouldn’t expect it to fully keep pace with a long-only index. All the Fund’s managers in the Commodities Strategy finished 2021 in positive territory with East X and ARCOM leading the way. Trading in energy was the largest driver of the Fund’s positive returns while grains, metals, and livestock positions also contributed positively. The Fund had modest losses from trading in softs, specifically in coffee.
Energy
For the second year in a row, trading in energy produced the largest gains for the Fund. With oil market fundamentals improving from pandemic lows, the Fund’s exposure remained long most of the year, however, briefly moving to a short posture for about one week at the end of November. Overall, the largest contributors in 2021 were from trading in natural gas, with smaller gains from positions in Brent crude. The Fund finished 2021 with long exposure in oil, natural gas, and power markets.
Agricultural
Trading in agricultural commodities was profitable as gains from positions in grain and livestock markets were partially offset by modest losses in softs. In livestock markets, the Fund experienced gains from both feeder and live cattle markets. The Fund was able to take advantage of strong fundamentals in grain markets, particularly corn and soybeans, as aforementioned reasons drove grain prices higher during the first half of the year. Finally, trading in soft markets was more challenging with positions in cocoa and coffee producing the largest losses. While coffee prices surged, we do not expect the fund to participate in each upward trending market due to the Fund’s long/short strategy. At the end of 2021, positions in grain and livestock markets were long while softs exposure was marginally short.
Metals
Trading in metals was a modest contributor to Fund performance during the period as positions in base metals experienced gains and trading in precious metal markets suffered small losses. In base metals, consistent long positions during the year were profitable as global demand mixed with supply concerns caused widespread price appreciation. The largest gains in base metals came from long copper and aluminum positioning. In precious metals, small losses were driven by varying exposure in gold as prices remained fairly range bound in 2021. This tight trading range market proved difficult for the Fund’s managers as infrequent opportunities were presented. The Fund finished the period with long exposure in both base and precious metals.
Outlook
As we turn the page on 2021, we believe the outlook for long/short commodity exposure in investor portfolio’s is compelling. We expect robust market opportunities for the Fund. With persistently high inflation, the Federal Reserve’s acceleration of its tapering program, and rising expectations for earlier-than-expected interest rate hikes, the potential exists for powerful moves across multiple asset classes including commodities.
Finally, there is increasing discussion about the potential for a commodity super cycle. In the metal markets for example, with weaker prices there has been a lack of new investment over the past decade which is potentially bullish as demand improves. Further, many are pointing to the growth in the electric vehicle market and overall green movement as new secular growth drivers, given how metal-intensive these developments are, further fueling the bullish sentiment. Finally, prices for most cyclical commodity prices have rallied sharply from their lows and, in some cases like copper, have moved to multi-year highs adding support to this outlook.
Overall, we are pleased with the Fund’s performance in 2021, providing welcomed diversification to investors. We believe the Fund may be highly attractive to investors seeking uncorrelated solutions to most investment strategies and asset classes, or for investors seeking alternatives in the commodity market. While commodity prices have been surging higher, they are also characterized by high volatility and sizable drawdowns. This volatility may create tremendous opportunities which we believe the Fund can take advantage of. The underlying managers in the Fund can take both long and short directional positions (benefit from commodities moving up or down), as well as relative value positions (calendar, geographic, and inter-market spreads) to capture this diverse and robust set of opportunities over time, making it a potentially ideal solution regardless of the market environment for commodities. Finally, the Fund’s multi-manager approach has the potential to smooth the ride for investors as the underlying managers tend to zig and zag at different times which may help reduce volatility and limit drawdowns. We remain confident in the outlook for the Fund and the underlying managers and strategies.
Fixed Income Strategy
The Fund invests most of its excess cash not needed for margin requirements in a Fixed Income Strategy comprised of high quality, short to intermediate term investment grade corporate (“IG”) and government agency securities managed by Nuveen Asset Management (“Nuveen”).
The fixed income component of the Fund is managed against the Barclay’s 1-5 Government Credit Index. Returns for the fixed income portfolio were -0.55% compared to -0.97% for the benchmark during 2021. The duration of the portfolio was managed between 1.7 and 2.5 years. The short duration and yield curve positioning had a positive impact on performance. The During the year, the Fund’s fixed income allocation was between 25-28% in investment grade corporate bonds and 22-28% in high quality, short duration securitized sectors. The Fund maintained broad corporate bond diversification with a modest overweight in financials. Given that spreads for non-government securities tightened, Nuveen’s sector strategy was a positive contributor to investment returns during the reporting period.
LoCorr Market Trend Fund
The LoCorr Market Trend Fund (“Market Trend Fund” or the “Fund”) was created to provide investors with access to a trend-following futures strategy managed by one of the leading managers in this space—Graham Capital Management. Graham was founded in 1994 and manages approximately $15.4 billion in assets. The Market Trend Strategy is managed similarly to Graham’s Tactical Trend program, a systematic medium- to long-term trend-following strategy that commenced trading in 2006. The Fund seeks capital appreciation as its primary investment objective with managing volatility as a secondary objective. The Fund attempts to achieve its objective by investing in two main strategies – a Managed Futures Strategy and a Fixed Income Strategy.
Fund Performance Summary
The Fund’s Class I shares gained +1.04% during the year ended December 31, 2021 versus +4.72% for the Morningstar Systematic Trend category. Overall, the Fund had a strong first half of the year, gaining +5.71% but lost ground in the second half as more challenging market conditions emerged. Gains for the year were led by trading in commodities and equities, while fixed income positions were unprofitable. While performance overall lagged, this was the Fund’s third consecutive year of positive returns, annualizing at a rate of +7.87% over that period and ranking in the top 18th percentile of its Morningstar peer group.
Market Trend Strategy
Fixed Income
Fixed income trading produced the largest losses during the period, particularly from exposure at the longer end of the curve. The environment was particularly challenging for trend followers and the Fund experienced losses in each quarter during the year. Over the course of 2021, the Fund’s positioning in fixed income shifted between long and short as interest rates, which finished higher overall during the year, experienced sizable reversals. It’s these reversals that challenged trend followers including Graham. Seemingly as the Fund’s positioning adapted to prevailing trends, those trends reversed negatively impacting returns. Trading across all major regions was unprofitable, though positions in Europe produced the largest losses led by losses in the 10-Year UK Gilt and Euro Bund. Losses occurred in U.S. markets as well, led by trading in the 5-Year U.S. Treasury. Positions at the front end of the curve were modestly profitable as persistent short exposure in the second half of the year benefited from the rise in rates. The Fund ended 2021 with a modest long exposure in medium- to long-term fixed income markets, notably in the U.S. and, to a lesser extent Asia, while European positions were short. In short-term instruments, positioning was short at the end of 2021.
Commodities
Trading in commodities produced sizable profits as the Fund was able to capture the powerful upward trend across most segments of the commodity markets. The largest gains stemmed from energy trading, though positions in agricultural and base metals were also profitable. Trading in precious metals on the other hand was unprofitable. In energy, prolonged long exposure benefitted from the upward climb in most oil and oil-related commodities, notably long RBOB gasoline and heating oil positions. In agricultural markets, the Fund benefitted from robust gains from long grain, notably corn; and long soft, notably coffee, positions. Metal markets were mixed as gains from long positions in base metals including copper and aluminum were offset by losses in precious metals, notably gold. The Fund ended the year with long positions in energy, agriculture, and base metals while precious metal exposure was short.
Equity Indices
Trading in global equities was the second largest positive contributor during 2021 behind commodities, as the Fund was able to benefit from the strong returns in stocks. The Fund’s equity trading has now been profitable in six of the past seven quarters. Profits during the year were concentrated in the U.S., as long positions in the E-Mini NASDAQ and S&P 500 produced the biggest gains. Elsewhere, trading was more muted with notable losses from positions in the Nikkei, Euro Stoxx 50, and Hang Seng. Positives outside the U.S. included positions in the CAC 40 and the Canadian TSE 60. The Fund’s equity exposure finished 2021 modestly long with the largest positions in U.S. markets. Europe was slightly long while Asian markets were short.
Foreign Currencies
Trading in currencies was unprofitable in 2021 as conditions proved challenging in the first half of the year, though the Fund was able to profit from the upward trending USD in the second half. Positioning shifted from short USD in the first quarter to long USD in the second half of the year in response to the strengthening dollar. The largest losses occurred in European currencies, notably from trading in the Swiss Franc that was partially offset by gains from positions in the Euro. Asian currency markets were profitable led by gains in the Japanese Yen. Overall, the USD finished 2021 significantly long, notably against the Japanese Yen, Euro, and British Pound.
Outlook
As we turn the page on 2021, we believe the outlook for managed futures/macro is compelling and expect robust market opportunities for the Fund. With persistently high inflation, the Federal Reserve’s acceleration of its tapering program, and expected interest rate hikes, the potential exists for powerful moves across multiple asset classes including currencies, commodities, and fixed income. Given this backdrop along with high valuations, the potential exists for sustained periods of heightened volatility in equities as well. Finally, our expectation is for considerable divergence in economic growth and central bank policy around the globe in 2022 which may further contribute to opportunities for profits.
In our view, this favorable outlook coincides with a murky outlook for bonds. True, the 60/40 asset allocation model has served the investment community well for the past 40 years. Our belief, however, is with the tailwind of declining rates since the 1970s in the rearview mirror, we have entered a new era for the bond market. With the current environment marked by low interest rates which are likely to rise along with near historically tight credit spreads, the likelihood of bonds performing well over the short- to intermediate-terms seems remote. Of course, evidence of this more challenging environment for bonds emerged in 2021, as evidenced by the negative return for the Bloomberg U.S. Aggregate Bond Index. We believe the challenging outlook for bonds is just beginning and recommend investors consider the broader use of alternative diversifying strategies like managed futures which have the flexibility to invest long or short across multiple asset classes and markets.
Fixed Income Strategy
The Fund invests most of its excess cash not needed for margin requirements in a Fixed Income Strategy comprised of high quality, short to intermediate term investment grade corporate (“IG”) and government agency securities managed by Nuveen Asset Management (“Nuveen”).
The fixed income component of the Fund is managed against the Barclay’s 1-5 Government Credit Index. Returns for the fixed income portfolio were -0.50% compared to -0.97% for the benchmark during 2021. The duration of the portfolio was managed between 1.7 and 2.5 years. The short duration and yield curve positioning had a positive impact on performance. The During the year, the Fund’s fixed income allocation was between 25-28% in investment grade corporate bonds and 22-28% in high quality, short duration securitized sectors. The Fund maintained broad corporate bond diversification with a modest overweight in financials. Given that spreads for non-government securities tightened, Nuveen’s sector strategy was a positive contributor to investment returns during the reporting period.
LoCorr Dynamic Equity Fund
The LoCorr Dynamic Equity Fund (“Dynamic Equity Fund” or the “Fund”) seeks long-term capital appreciation with reduced volatility compared to traditional broad-based equity market indices as a secondary objective. Consistent with the “low correlation” our LoCorr Fund family seeks, long/short equity funds have the ability to provide positive returns when equity markets are rising, yet they offer the potential for downside protection when equity prices are falling.
The Fund employs three sub-advisers to manage the Fund’s long/short equity strategy:
● | Billings Capital Management (“Billings”) manages a strategy which is based on a value-oriented, concentrated, fundamental, bottom-up long/short equity approach. This manager seeks to outperform the S&P 500 over the long term. The sub-portfolio managed by Billings is similar to a strategy that this manager has executed since 2008 with their current firm and for many years prior to that at a different entity. |
● | Kettle Hill Capital Management (“Kettle Hill”) seeks to generate alpha by combining a bottom-up, fundamental analysis with a top-down opportunistic overlay. Investing primarily in small cap securities, Kettle Hill targets a conservative net exposure to the market. The sub-portfolio managed by Kettle Hill is similar to a strategy that this manager has executed since its inception in 2003. |
● | First Quadrant (“FQ”) manages a strategy for the Fund which is similar to a global long/short strategy that they have traded since 2016. They utilize a systematic multi-factor approach coupled with an active beta management approach to maximize upside opportunities while reducing downside performance. The strategy invests in developed international and U.S. markets and was added to the portfolio in 2019. |
Fund Performance Summary
The Fund’s Class I shares finished 2021 in positive territory, up +14.58%, outperforming the Morningstar Long/Short Equity Fund Index which closed up +12.55%. The Fund’s small cap bias was a headwind during the period as the Russell 2000 Index finished 2021 up +14.82% versus the +28.71% gain for the S&P 500. The Fund continued to outperform the category on a 3-year trailing basis by a margin of +0.70%.
Billings led the way for the Fund, posting stellar 2021 returns and finishing well in the black. First Quadrant ended the year closely behind Billings, while Kettle Hill had only modest gains. The Fund’s overall net exposure oscillated throughout 2021, ending the year on the higher end of its typical 40-60% range, at 55% net exposure.
The Fund’s long book was a positive contributor in three out of four quarters in 2021 with the bulk of the gains recorded in the first quarter. During the year, the Fund saw its strongest returns from the Financial Services, Industrials, and Communication Services sectors. Within the Financial Services sector, Credit Acceptance Corp (6.3% of the Fund’s net assets as of 12/31/2021), a specialized consumer finance company within the auto industry, was the top performer for the year. The company was the largest holding in the portfolio throughout the year and consequentially was the largest contributor to performance. Another contributor within the Financial Services sector, Wells Fargo (1.1% of the Fund as of 12/31/2021), traded higher after the Fed’s outlook turned more hawkish. In the Industrials sector, Mastec (2.69% of the Fund as of 12/31/2021), a multinational infrastructure engineering and construction company, traded higher in the second quarter on news that President Biden secured a deal on an infrastructure bill that was intended to expand roads, bridges and broadband networks. In the Communication Services sector, Nexstar Media Group Inc (2.27% of the Fund as of 12/31/2021), a media company with significant television station ownership in the US, trended higher with better-than-expected earnings and strong forward guidance. Offsetting these gains were losses in the Consumer Cyclical, Communication Services, and Technology sectors. In the Consumer Cyclical sector, a position in Frontdoor (3.63% of the Fund as of 12/31/2021), a home service plan and appliance company, was negatively impacted by the spread of COVID-19 in 2021. In the Communication Services sector, Media and Games Invest (2.00% of the Fund as of 12/31/2021), a multinational digitally integrated games and media company, traded lower with the sell-off in high multiple technology-related stocks in the fourth quarter.
The Fund’s short book faced losses in the first half of the year but experienced gains in the second half. Overall, these losses during the year were led by Consumer Cyclical and Communication Services sectors as broader equity markets rallied in 2021. In the Consumer Cyclical sector, a short position in Express, Inc. (0.00% of the Fund as of 12/31/2021), an American fashion retailer, was caught up in the “meme stock craze” in the first quarter of the year, and the Fund’s short position was negatively impacted. Fortunately, the Fund avoided significant losses in other “meme stocks” in 2021. In the Communication Services sector, a short position in Live Nation Entertainment Inc. (-0.34% of the Fund as of 12/31/2021), a global entertainment company, detracted as the stock moved higher in 2021 due to general market optimism. The short book had gains within the Financial Services and Consumer Cyclical sectors. In the Financial Services sector, a short position in Lemonade Inc. (0.00% of the Fund as of 12/31/2021), a multinational insurance company, benefitted the Fund as the stock fell dramatically due to negative sentiment in the insurance market as well as reporting disappointing earnings during the quarter. The Fund also benefited from a short position in Peloton Interactive (0.00% of the Fund as of 12/31/2021), an exercise equipment and media company, after the company reported disappointing earnings results in November.
Outlook
As we enter 2022, many questions remain unanswered. Investors will need to continue to assess the long-term implications of the COVID-19 virus and potentially new variants on economies around the globe and what a “return-to-normal” environment may look like. All these questions must be considered against the increasingly hawkish view of the Fed that had previously been stimulative and supportive to the prices of risk assets yet must now deal with persistently high inflation. The equity market proved its robustness in 2021, pushing higher through the final weeks of the year in the face of the omicron variant emergence and a shift in Federal Reserve policy. However, if these concerns continue or worsen, it could foster heightened market volatility and possibly put an end to the current bull market.
Amid continued uncertainty, a long/short equity strategy may allow for continued participation in rising equity markets while the strategy’s hedged approach and ability to benefit from falling stock prices could mitigate losses if equities were to sell off. With the Cyclically Adjusted S&P 500 P/E ratio at the highest level in twenty years coupled with the recent shift to a hawkish Federal Reserve, a turbulent equity market is a strong possibility in 2022. We remain highly confident in the ability of the Fund to provide positive absolute returns and compelling diversification for investors’ portfolios.
LoCorr Spectrum Income Fund
The LoCorr Spectrum Income Fund (“Spectrum Income Fund” or the “Fund”) has an objective of current income with capital appreciation as a secondary objective. The Fund is designed to fit within the “low correlation” of the LoCorr Fund family by seeking to provide relatively high levels of income with low correlation to the bond market. The Fund is sub-advised by Bramshill Investments. Bramshill invests in a portfolio of primarily pass-through securities with an integrated covered call and hedging strategy. Bramshill seeks to generate high current income, much of which the Fund distributes monthly to investors.
Fund Performance Summary
The Fund’s Class I shares were up +21.53% in 2021 compared to the -1.54% loss for the Bloomberg U.S. Aggregate Bond Index. In a year where bonds were challenged by rising rates, The Fund benefited from positive contributions in all but one sector with the largest contributions from Master Limited Partnerships (“MLPs”), Business Development Companies (“BDCs”), C-Corporations, and Real Estate Investment Trusts (“REITs”). The only detracting sector was Mortgage Real Estate Investment Trusts (“mREITs”), and the losses in this sector were comparatively modest.
The Master Limited Partnerships sector was the top contributor to the Fund’s 2021 performance. The broad sector rebounded from a rough 2020 and gained +39.9%, as measured by the Alerian MLP Index. The largest contributor within the sector was Crestwood Equity Partners (2.28% of the Fund as of 12/31/21), a midstream MLP, which rallied on news that it bought out its General Partner interest simplifying its structure, as well as benefiting from a generally strong energy market. Also contributing were the Crestwood preferred shares (1.49% of the Fund as of 12/31/21), where the market seems to be realizing the value of the high and stable nature of distributions in this part of the company’s capital structure. Global Partners (2.18% of the Fund as of 12/31/21), a downstream MLP, consistently beat analyst estimates during 2021 and continues to raise its distribution. The company’s plans to ramp up its renewable fuels capabilities was also well received by the market.
Business Development companies, which rallied +37.38% in 2021, as measured by the MVIS U.S. Business Development Companies Index, were also strong contributors to the Fund. The Fund maintained exposure to this sector in Q1, but tactically reduced positions through the remainder of the year as completion for loans increased and credit quality deteriorated despite lower default rates. The top performing BDC holding within the Fund was Newtek Business Services (0.87% of the Fund as of 12/31/21), a BDC which engages in the provision of business and financial solutions, reported solid earnings, increased its distribution guidance, and benefited from a strong credit environment.
Equity Real Estate Investment Trusts, as measured by the MSCI U.S. IMI Real Estate 25/50 Index, rallied +40.78% in 2021. The sector was aided by rent relief programs provided by the federal government early in the year and was further propelled by the reopening of the economy and strong economic growth. Real estate has historically been considered an inflation hedge, and with increasing concerns of inflation, the sub-adviser, Bramshill, has maintained exposure to the sector and opportunistically added in the second half of the year. The top performer in the Equity REITs sector was Iron Mountain (0.97% of the Fund as of 12/31/21), an enterprise information management services company. Iron Mountain benefited from an expansion of its data center business segment and overall growth in this area of the market.
In C-Corps, the Fund began the year heavily weighted towards reflation beneficiaries. Bramshill changed their stance in the third quarter to a more defensive approach when growth stocks began to wane as the sub-adviser became more concerned that the Fed posture was shifting. Allocations to securities in the Utilities and Consumer Staples sectors increased during this time. When growth stocks began to re-accelerate in the fourth quarter, these defensive positions were exited and Bramshill began cautiously entering into more cyclical securities and identifying companies that were paying large, special year-end distributions to add to the portfolio. One example of a cyclical security that paid a special distribution in 2021 is Boise Cascade (1.09% of the Fund as of 12/31/21), a North American manufacturer of wood products and a wholesale distributor of building materials. The company raised its quarterly dividend by 20% and paid a supplemental dividend of $3.00 per share to common stockholders in the fourth quarter.
The only sector that was a detractor for the Fund in 2021 was Mortgage REITs. The broad sector gained +15.64%, as measured by the FTSE Nareit Mortgage REITs index. The Fund’s allocation to mREITs was increased in the second and third quarter, then reduced in in the fourth quarter as concerns about spread tightening began to manifest. The largest detracting mREIT in the Fund in 2021 was Invesco Mortgage Capital (1.18% of the fund as of 12/31/21). The security was hampered by the increasing concerns regarding the Fed rate hikes and tapering expectations, as these events tend to have negative effects on spreads.
Outlook
As Bramshill looks toward 2022, caution is indicated as the Fed faces a longer-term process of tightening in an environment of extended financial markets and a potentially fragile national economy that is still dealing with COVID-19 impacts and uncertain degrees of labor market participation.
Bramshill has high confidence that the portfolio holdings’ cash flow and distributions will be sustainable in this environment. However, investor skepticism regarding the Fed’s ability to tighten policy without negatively impacting the economy could produce meaningful increases in volatility. Given this expectation for heightened volatility over the near-term, Bramshill began selling covered calls late in 2021 to help fund a partial hedge that it added to in the early days of 2022. Bramshill anticipates that visibility concerning longer term macroeconomics conditions could support reasonable growth but may include somewhat greater inflation than the market has experienced over the past few decades. Bramshill expects that this environment will benefit the Fund’s opportunity set relative to many other investment options.
Thank you for investing in the LoCorr Funds
The S&P 500 Index is a broad-based unmanaged index of 500 stocks, which is widely recognized as representative of the equity market in general. Barclays 1-5 Year Government Credit Index-The Barclays U.S. Government/Credit 1-5 Year Index is an index of all investment grade bonds with maturities of more than one year and less than 5 years. The MSCI EAFE Index was designed to measure the equity market performance of developed markets outside of the U.S. & Canada. VIX - Chicago Board Options Exchange (CBOE), the Volatility Index, or VIX, is a real-time market index that represents the market’s expectation of 30-day forward-looking volatility. Derived from the price inputs of the S&P 500 index options, it provides a measure of market risk and investors’ sentiments. It is also known by other names like “Fear Gauge” or “Fear Index.” Investors, research analysts and portfolio managers look to VIX values as a way to measure market risk, fear and stress before they take investment decisions. The ICE BofAML 3-M T-Bill Index tracks the performance of the U.S. dollar denominated U.S. Treasury Bills publicly issued in the U.S. domestic market with a remaining term to final maturity of less than 3 months. The Morningstar Managed Futures Category is an average monthly return of all funds in the Morningstar Managed Futures Category. These funds typically take long and short positions in futures options, swaps, and foreign exchange contracts, both listed and over the counter, based on market trends or momentum. (A long position is a bet an investment will gain in value, while a short position is a bet that an investment will decline in value.) A majority of these funds follow trend-following, price-momentum strategies. Other strategies included in this category are systematic mean-reversion, discretionary global macro strategies, commodity index tracking, and other futures strategies. More than 60% of these funds’ exposure is invested through derivative securities. The TOPIX Index (Tokyo Stock Price Index) is an important stock market index for the Tokyo Stock Exchange (TSE) in Japan, tracking all domestic companies of the exchange’s First Section. The Dow Jones EURO STOXX 50 Index is a market capitalization-weighted stock index of 50 large, blue-chip European companies operating within eurozone nations. The Bloomberg Commodity Index is a broadly diversified commodity price index distributed by Bloomberg Indexes. The index was originally launched in 1998 as the Dow Jones-AIG Commodity Index and renamed to Dow Jones-UBS Commodity Index in 2009, when UBS acquired the index from AIG. The SG Trend Index is a subset of the SG CTA Index and follows traders of trend-following methodologies. The SG CTA Index is equal weighted, calculates the daily rate of return for a pool of CTAs selected from the larger managers that are open to new investment. The Morningstar Long/Short Equity Category is an average monthly return of all funds in the Morningstar Long-Short Equity Category. The category contains a universe of funds with similar investment objectives and investment style, as defined by Morningstar. Performance of the indices and Morningstar Category Average is generated on the first business day of the month. The Bloomberg Barclays U.S. Aggregate Bond Index is a broad-based bond index comprised of government, corporate, mortgage and asset-back issues rated investment grade or higher. West Texas Intermediate is a crude oil that serves as one of the main global oil benchmarks. It is sourced primarily from Texas and is one of the highest quality oils in the world, which is easy to refine. WTI is the underlying commodity for the NYMEX’s oil futures contract. One cannot invest directly in an index.
Please refer to the Schedule of Investments in this report for full holdings information. Fund holdings and sector allocations are subject to change and should not be considered recommendations to buy or sell any security.
Alpha is an annualized return measure of how much better or worse a fund’s performance is relative to an index of funds in the same category, after allowing for differences in risk. Basis Points (bps) - A unit that is equal to 1/100th of 1% and is used to denote the change in a financial instrument. The basis point is commonly used for calculating changes in interest rates, equity indexes and the yield of a fixed-income security. Beta measures the sensitivity of a stock’s return relative to the return of a selected market index. When beta is greater than one, it means a stock will rise or fall more than the market. Cash Flows refers to a company’s free cash flow which is a measure of how much cash a business generates after capital expenditures.
Duration is a commonly used measure of the potential volatility of the price of a debt security, or the aggregate market value of a portfolio of debt securities, prior to maturity. Securities with a longer duration generally have more volatile prices than securities of comparable quality with a shorter duration. Investment Grade refers to bonds that are rated BBB or higher. Bond ratings are grades given to bonds that indicate their credit quality as determined by private independent rating services such as Standard & Poor’s, Moody’s and Fitch. These firms evaluate a bond issuer’s financial strength, or its ability to pay a bond’s principal and interest in a timely fashion. Ratings are expressed as letters ranging from ‘AAA’, which is the highest grade, to ‘D’, which is the lowest grade. Spread is the percentage point difference between yields of various classes of bonds compared to treasury bonds. Calendar spread is an options or futures spread established by simultaneously entering a long and short position on the same underlying asset at the same strike price but with different delivery months. It is sometimes referred to as an inter-delivery, intra-market, time, or horizontal spread. Yield Curve is a line that plots the interest rates, at a set point in time, of bonds having equal credit quality, but differing maturity dates. The most frequently reported yield curve compares the three-month, two-year, five-year and 30-year U.S. Treasury debt. The curve is used to predict changes in economic output and growth. Mortgage-backed securities (MBS)_ are an investment similar to a bond that is made up of a bundle of home loans bought from the banks that issued them. Asset-backed securities (ABC) are a type of financial investment that is collateralized by an underlying pool of assets – usually ones that generate a cash flow from debt, such as loans, leases, credit card balances, or receivables. It takes the form of a bond or note, paying income at a fixed rate for a set amount of time, until maturity.
Must be preceded or accompanied by a prospectus.
Opinions expressed are those of the Investment Manager and are subject to change, are not guaranteed and should not be considered investment advice.
Earnings growth is not representative of the Funds’ future performance.
Past performance is not a guarantee of future results.
Diversification does not assure a profit nor protect against loss in a declining market.
Mutual fund investing involves risk. Principal loss is possible. Macro Strategies Fund, Long/Short Commodities Strategy Fund, Market Trend Fund and Spectrum Income Fund are diversified funds. Dynamic Equity Fund is a non-diversified fund, meaning it may invest its assets in fewer individual holdings than a diversified fund. Therefore, Dynamic Equity Fund is more exposed to individual stock volatility than a diversified fund. The Funds invest in foreign investments and foreign currencies which involve greater volatility and political, economic and currency risks and differences in accounting methods. The Funds may make short sales of securities, which involves the risk that losses may exceed the original amount invested. Investing in commodities may subject the Funds to greater risks and volatility as commodity prices may be influenced by a variety of factors including unfavorable weather, environmental factors, and changes in government regulations. The Funds may invest in derivative securities, which derive their performance from the performance of an underlying asset, index, interest rate or currency exchange rate. Derivatives can be
volatile and involve various types and degrees of risks, and, depending upon the characteristics of a particular derivative, suddenly can become illiquid. Investments in debt securities typically decrease in value when interest rates rise. This risk is usually greater for longer-term debt securities. Investments in Asset Backed, Mortgage Backed, and Collateralized Mortgage-Backed Securities include additional risks that investors should be aware of such as credit risk, prepayment risk, possible illiquidity and default, as well as increased susceptibility to adverse economic developments. Investments in Real Estate Investment Trusts (REITs) involve additional risks such as declines in the value of real estate and increased susceptibility to adverse economic or regulatory developments.
Derivative contracts ordinarily have leverage inherent in their terms which can magnify a Fund’s potential for gains or losses through increased long and short position exposure. A Fund may access derivatives via a swap agreement. A risk of a swap agreement is the risk that the counterparty to the agreement will default on its obligation to pay the Fund.
A Fund will incur a loss as a result of a short position if the price of the short position instrument increases in value between the date of the short position sale and the date on which an offsetting position is purchased.
Investments in small- and medium-capitalization companies involve additional risks such as limited liquidity and greater volatility. Investments in lower rated and non-rated securities presents a greater risk of loss to principal and interest than higher-rated securities. ETF investments are subject to investment advisory and other expenses, which will be indirectly paid by the Fund. As a result, the cost of investing in the Fund will be higher than the cost of investing directly in ETFs and may be higher than other mutual funds that invest directly in stocks and bonds. ETFs are subject to specific risks, depending on the nature of the ETF.
A Fund’s portfolio will be significantly impacted by the performance of the real estate market generally, and a Fund may be exposed to greater risk and experience higher volatility than would a more economically diversified portfolio. Property values may fall due to increasing vacancies or declining rents resulting from economic, legal, cultural, or technological developments. Investments in Limited Partnerships (including master limited partnerships) involve risks different from those of investing in common stock including risks related to limited control and limited rights to vote on matters affecting the Limited Partnership, risks related to potential conflicts of interest between the Limited Partnership and the Limited Partnership’s general partner, cash flow risks, dilution risks and risks related to the general partner’s limited call right. Underlying Funds are subject to management and other expenses, which will be indirectly paid by a Fund.
The LoCorr Funds are distributed by Quasar Distributors, LLC.
LoCorr Macro Strategies Fund
Rate of Return — For the period ended December 31, 2021 (Unaudited)
| | Inception | | Average Annual |
| | Date | 6 Month | 1 Year | 5 Year | 10 Year | Since Inception |
LoCorr Macro Strategies Fund - Class A (without maximum load) | 3/22/11 | -4.41% | -0.15% | 2.84% | 2.64% | 1.79% |
LoCorr Macro Strategies Fund - Class A (with maximum load) | 3/22/11 | -9.87% | -5.89% | 1.64% | 2.03% | 1.23% |
LoCorr Macro Strategies Fund - Class C | 3/24/11 | -5.70% | -1.86% | 2.09% | 1.87% | 1.04% |
LoCorr Macro Strategies Fund - Class I | 3/24/11 | -4.33% | 0.08% | 3.11% | 2.89% | 2.05% |
Bank of America Merrill Lynch 3-Month Treasury Bill Index | | 0.02% | 0.05% | 1.14% | 0.63% | 0.59% |
Barclay CTA Index | | 0.58% | 5.07% | 2.63% | 0.65% | 1.01% |
$100,000 investment in the
LoCorr Macro Strategies Fund – Class I
For the period ended December 31, 2021 (Unaudited)
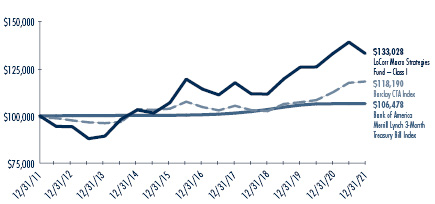
This chart illustrates the performance of a hypothetical $100,000 investment made in the Fund since inception. Assumes reinvestment of distributions, but does not reflect the effect of any applicable sales charge or redemption fees. This chart does not imply any future performance. Performance will vary from class to class based on differences in class-specific expenses and sales charges. The returns do not reflect the deduction of taxes that a shareholder would pay on Fund distributions or the redemption of Fund shares.
Performance data represents past performance; past performance does not guarantee future results. The investment return and principal value of an investment will fluctuate so that an investor’s shares, when redeemed, may be worth more or less than their original cost. Current performance of the Fund may be lower or higher than the performance quoted. Performance data current to the most recent month end may be obtained by calling 1.855.LCFUNDS, or visiting www.LoCorrFunds.com.
Performance data shown reflects the Class A maximum sales charge of 5.75% and reflects the Class C Contingent Deferred Sales Charge (CDSC) of 1.00%. Performance of the Class A without load does not reflect the deduction of the sales load or fee. If reflected, the load or fee would reduce the performance quoted.
The returns reflect the actual performance for each period and do not include the impact on trades executed on the last business day of the period that were recorded on the first business day of the next period.
Per the fee table in the Fund’s April 30, 2021 prospectus, the Fund’s annual operating expense ratio is, before fee waivers 2.18%, 2.93% and 1.93% for Class A, Class C and Class I shares, respectively.
The Bank of America Merrill Lynch U.S. 3-Month Treasury Bill Index is an unmanaged index that seeks to measure the performance of U.S. Treasury bills available in the marketplace.
The Barclay CTA Index is a leading industry benchmark of representative performance of commodity trading advisors.
One cannot invest directly in an index.
LoCorr Long/Short Commodities Strategy Fund
Rate of Return — For the period ended December 31, 2021 (Unaudited)
| | Inception | | Average Annual |
| | Date | 6 Month | 1 Year | 5 Year | 10 Year | Since Inception |
LoCorr Long/Short Commodities Strategy Fund - Class A (without maximum load) | 12/31/11 | 5.48% | 14.55% | 7.49% | 4.78% | 4.78% |
LoCorr Long/Short Commodities Strategy Fund - Class A (with maximum load) | 12/31/11 | -0.63% | 7.99% | 6.22% | 4.16% | 4.16% |
LoCorr Long/Short Commodities Strategy Fund - Class C | 12/31/11 | 4.02% | 12.66% | 6.68% | 3.96% | 3.96% |
LoCorr Long/Short Commodities Strategy Fund - Class I | 12/31/11 | 5.64% | 14.82% | 7.78% | 5.04% | 5.04% |
Bank of America Merrill Lynch 3-Month Treasury Bill Index | | 0.02% | 0.05% | 1.14% | 0.63% | 0.63% |
HFRI Macro Commodity Index* | | 8.28% | 23.98% | 6.13% | 2.77% | 2.77% |
$100,000 investment in the
LoCorr Long/Short Commodities Strategy Fund – Class I
For the period ended December 31, 2021 (Unaudited)

This chart illustrates the performance of a hypothetical $100,000 investment made in the Fund since inception. Assumes reinvestment of distributions, but does not reflect the effect of any applicable sales charge or redemption fees. This chart does not imply any future performance. Performance will vary from class to class based on differences in class-specific expenses and sales charges. The returns do not reflect the deduction of taxes that a shareholder would pay on Fund distributions or the redemption of Fund shares.
Performance data represents past performance; past performance does not guarantee future results. The investment return and principal value of an investment will fluctuate so that an investor’s shares, when redeemed, may be worth more or less than their original cost. Current performance of the Fund may be lower or higher than the performance quoted. Performance data current to the most recent month end may be obtained by calling 1.855.LCFUNDS, or visiting www.LoCorrFunds.com.
Performance data shown reflects the Class A maximum sales charge of 5.75% and reflects the Class C Contingent Deferred Sales Charge (CDSC) of 1.00%. Performance of the Class A without load does not reflect the deduction of the sales load or fee. If reflected, the load or fee would reduce the performance quoted.
The returns reflect the actual performance for each period and do not include the impact on trades executed on the last business day of the period that were recorded on the first business day of the next period.
Per the fee table in the Fund’s April 30, 2021 prospectus, the Fund’s annual operating expense ratio is, before fee waivers 2.57%, 3.32% and 2.32% for Class A, Class C and Class I shares, respectively.
The Bank of America Merrill Lynch U.S. 3-Month Treasury Bill Index is an unmanaged index that seeks to measure the performance of U.S. Treasury bills available in the marketplace.
The HFRI Macro Commodity Index employs an investment process designed to identify opportunities in markets exhibiting trending or momentum characteristics across commodity assets classes, frequently with related ancillary exposure in commodity sensitive equities or other derivative instruments.
* Prior to May 3, 2021, the LLSCS Fund utilized the Morningstar Long/Short Commodity Index as a primary benchmark. The Index was discontinued as of May 3, 2021 and replaced by the HFRI Macro Commodity Index. The Morningstar Long/Short Commodity Index is a fully collateralized commodity futures index that uses the momentum rule to determine if each commodity is held long, short, or flat.
One cannot invest directly in an index.
LoCorr Market Trend Fund
Rate of Return — For the period ended December 31, 2021 (Unaudited)
| | Inception | | Average Annual |
| | Date | 6 Month | 1 Year | 5 Year | Since Inception |
LoCorr Market Trend Fund - Class A (without maximum load) | 6/30/14 | -4.52% | 0.87% | 2.19% | 3.16% |
LoCorr Market Trend Fund - Class A (with maximum load) | 6/30/14 | -9.99% | -4.91% | 0.99% | 2.35% |
LoCorr Market Trend Fund - Class C | 6/30/14 | -5.84% | -0.92% | 1.43% | 2.38% |
LoCorr Market Trend Fund - Class I | 6/30/14 | -4.42% | 1.04% | 2.44% | 3.41% |
Bank of America Merrill Lynch 3-Month Treasury Bill Index | | 0.02% | 0.05% | 1.14% | 0.81% |
Barclay CTA Index | | 0.58% | 5.07% | 2.63% | 2.30% |
$100,000 investment in the
LoCorr Market Trend Fund - Class I
For the period ended December 31, 2021 (Unaudited)
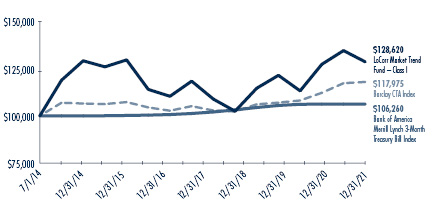
This chart illustrates the performance of a hypothetical $100,000 investment made in the Fund since inception. Assumes reinvestment of distributions, but does not reflect the effect of any applicable sales charge or redemption fees. This chart does not imply any future performance. Performance will vary from class to class based on differences in class-specific expenses and sales charges. The returns do not reflect the deduction of taxes that a shareholder would pay on Fund distributions or the redemption of Fund shares.
Performance data represents past performance; past performance does not guarantee future results. The investment return and principal value of an investment will fluctuate so that an investor’s shares, when redeemed, may be worth more or less than their original cost. Current performance of the Fund may be lower or higher than the performance quoted. Performance data current to the most recent month end may be obtained by calling 1.855.LCFUNDS, or visiting www.LoCorrFunds.com.
Performance data shown reflects the Class A maximum sales charge of 5.75% and reflects the Class C Contingent Deferred Sales Charge (CDSC) of 1.00%. Performance of the Class A without load does not reflect the deduction of the sales load or fee. If reflected, the load or fee would reduce the performance quoted.
The returns reflect the actual performance for each period and do not include the impact on trades executed on the last business day of the period that were recorded on the first business day of the next period.
Per the fee table in the Fund’s April 30, 2021 prospectus, the Fund’s annual operating expense ratio is, before fee waivers 2.05%, 2.80% and 1.80% for Class A, Class C and Class I shares, respectively.
The Bank of America Merrill Lynch U.S. 3-Month Treasury Bill Index is an unmanaged index that seeks to measure the performance of U.S. Treasury bills available in the marketplace.
The Barclay CTA Index is a leading industry benchmark of representative performance of commodity trading advisors.
One cannot invest directly in an index.
LoCorr Dynamic Equity Fund
Rate of Return — For the period ended December 31, 2021 (Unaudited)
| | Inception | | Average Annual |
| | Date | 6 Month | 1 Year | 5 Year | Since Inception |
LoCorr Dynamic Equity Fund - Class A (without maximum load) | 5/10/13 | 2.24% | 14.38% | 3.72% | 4.42% |
LoCorr Dynamic Equity Fund - Class A (with maximum load) | 5/10/13 | -3.62% | 7.79% | 2.49% | 3.71% |
LoCorr Dynamic Equity Fund - Class C | 5/10/13 | 0.86% | 12.46% | 2.95% | 3.63% |
LoCorr Dynamic Equity Fund - Class I | 5/10/13 | 2.34% | 14.58% | 3.99% | 4.69% |
S&P 500 Total Return Index | | 11.67% | 28.71% | 18.47% | 15.42% |
Morningstar Long/Short Equity Fund Index | | 3.22% | 12.55% | 6.54% | 4.89% |
$100,000 investment in the
LoCorr Dynamic Equity Fund - Class I
For the period ended December 31, 2021 (Unaudited)

This chart illustrates the performance of a hypothetical $100,000 investment made in the Fund since inception. Assumes reinvestment of distributions, but does not reflect the effect of any applicable sales charge or redemption fees. This chart does not imply any future performance. Performance will vary from class to class based on differences in class-specific expenses and sales charges. The returns do not reflect the deduction of taxes that a shareholder would pay on Fund distributions or the redemption of Fund shares.
Performance data represents past performance; past performance does not guarantee future results. The investment return and principal value of an investment will fluctuate so that an investor’s shares, when redeemed, may be worth more or less than their original cost. Current performance of the Fund may be lower or higher than the performance quoted. Performance data current to the most recent month end may be obtained by calling 1.855.LCFUNDS, or visiting www.LoCorrFunds.com.
Performance data shown reflects the Class A maximum sales charge of 5.75% and reflects the Class C Contingent Deferred Sales Charge (CDSC) of 1.00%. Performance of the Class A without load does not reflect the deduction of the sales load or fee. If reflected, the load or fee would reduce the performance quoted.
The returns reflect the actual performance for each period and do not include the impact on trades executed on the last business day of the period that were recorded on the first business day of the next period.
Per the fee table in the Fund’s April 30, 2021 prospectus, the Fund’s annual operating expense ratio is, before fee waivers 4.53%, 5.28% and 4.28% for Class A, Class C and Class I shares, respectively.
The S&P 500 Total Return Index is an unmanaged capitalization-weighted index of 500 stocks designed to measure performance of the broad domestic economy through changes in the aggregate market value of the 500 stocks which represent all major industries.
The Morningstar Long/Short Equity Index category holds sizeable stakes in both long and short positions in equities and related derivative. At least 75% of the assets are in equity securities or derivatives.
One cannot invest directly in an index.
LoCorr Spectrum Income Fund
Rate of Return — For the period ended December 31, 2021 (Unaudited)
| | Inception | | Average Annual |
| | Date | 6 Month | 1 Year | 5 Year | Since Inception |
LoCorr Spectrum Income Fund - Class A (without maximum load) | 12/31/13 | -0.89% | 21.33% | 5.82% | 2.72% |
LoCorr Spectrum Income Fund - Class A (with maximum load) | 12/31/13 | -6.54% | 14.27% | 4.57% | 1.96% |
LoCorr Spectrum Income Fund - Class C | 12/31/13 | -2.30% | 19.47% | 5.00% | 1.93% |
LoCorr Spectrum Income Fund - Class I | 12/31/13 | -0.78% | 21.53% | 6.09% | 2.98% |
Bloomberg U.S. Aggregate Bond Index | | 0.06% | -1.54% | 3.57% | 3.37% |
Morningstar Allocation - 70% to 85% Equity | | 4.49% | 16.33% | 10.86% | 8.01% |
$100,000 investment in the
LoCorr Spectrum Income Fund - Class I
For the period ended December 31, 2021 (Unaudited)

This chart illustrates the performance of a hypothetical $100,000 investment made in the Fund since inception. Assumes reinvestment of distributions, but does not reflect the effect of any applicable sales charge or redemption fees. This chart does not imply any future performance. Performance will vary from class to class based on differences in class-specific expenses and sales charges. The returns do not reflect the deduction of taxes that a shareholder would pay on Fund distributions or the redemption of Fund shares.
Performance data represents past performance; past performance does not guarantee future results. The investment return and principal value of an investment will fluctuate so that an investor’s shares, when redeemed, may be worth more or less than their original cost. Current performance of the Fund may be lower or higher than the performance quoted. Performance data current to the most recent month end may be obtained by calling 1.855.LCFUNDS, or visiting www.LoCorrFunds.com.
Performance data shown reflects the Class A maximum sales charge of 5.75% and reflects the Class C Contingent Deferred Sales Charge (CDSC) of 1.00%. Performance of the Class A without load does not reflect the deduction of the sales load or fee. If reflected, the load or fee would reduce the performance quoted.
The returns reflect the actual performance for each period and do not include the impact on trades executed on the last business day of the period that were recorded on the first business day of the next period.
Per the fee table in the Fund’s April 30, 2021 prospectus, the Fund’s annual operating expense ratio is, before fee waivers 3.57%, 4.32% and 3.32% for Class A, Class C and Class I shares, respectively.
The Bloomberg Barclay U.S. Aggregate Bond Index is a long term, market capitalization-weighted index used to represent investment grade bonds being traded in the United States.
The Morningstar Allocation - 70% to 85% Equity portfolios seek to provide both income and capital appreciation by investing in multiple asset classes, including stocks, bonds and cash. These portfolios are dominated by domestic holdings and have equity expenses between 70% and 85%.
One cannot invest directly in an index.
LoCorr Macro Strategies Fund – Consolidated Schedule of Investments |
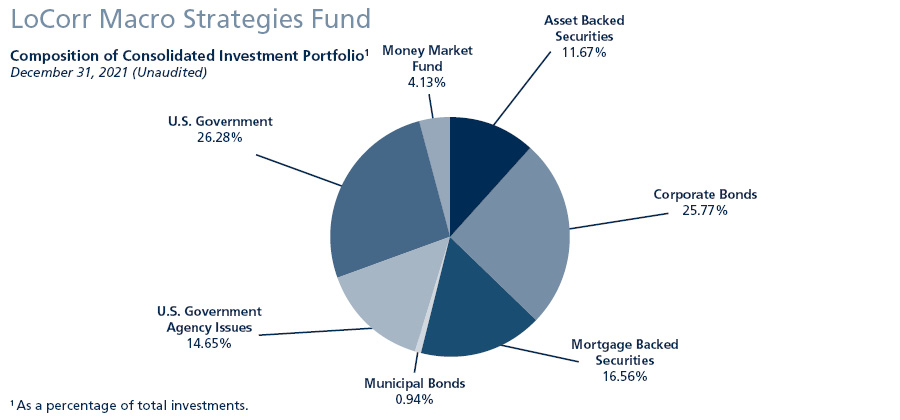
Consolidated Schedule of Investments
December 31, 2021
| | Maturity Date | | | Coupon Rate | | | Principal Amount | | | Value | |
ASSET BACKED SECURITIES: 10.72% |
321 Henderson Receivables I LLC | | | | | | | | | | | | | | | | |
Series 2006-1A A1 (1 Month LIBOR USD + 0.200%) (a)(c) | | | 03/15/2041 | | | | 0.31% | | | $ | 229,054 | | | $ | 228,143 | |
Series 2006-4A A1 (1 Month LIBOR USD + 0.200%) (a)(c) | | | 12/15/2041 | | | | 0.31% | | | | 190,323 | | | | 190,044 | |
Series 2004-A A1 (1 Month LIBOR USD + 0.350%) (a)(c) | | | 09/15/2045 | | | | 0.46% | | | | 61,036 | | | | 60,453 | |
American Express Credit Account Master Trust, 2019-1 A | | | 10/15/2024 | | | | 2.87% | | | | 2,390,000 | | | | 2,402,747 | |
American Homes 4 Rent Trust, 2014-SFR2 A (a) | | | 10/17/2036 | | | | 3.79% | | | | 729,940 | | | | 757,468 | |
AmeriCredit Automobile Receivables Trust | | | | | | | | | | | | | | | | |
Series 2020-3 A-3 | | | 06/18/2025 | | | | 0.53% | | | | 5,420,000 | | | | 5,416,137 | |
Series 2021-2 A3 | | | 12/18/2026 | | | | 0.34% | | | | 5,010,000 | | | | 4,968,578 | |
AMSR Trust, 2020-SFR1 A (a) | | | 04/17/2037 | | | | 1.82% | | | | 499,521 | | | | 499,408 | |
Angel Oak Mortgage Trust LLC, 2020-5 A3 (a)(d) | | | 05/25/2065 | | | | 2.04% | | | | 249,957 | | | | 249,959 | |
Bank of America Credit Card Trust, 2021-A1 A1 | | | 09/15/2026 | | | | 0.44% | | | | 2,120,000 | | | | 2,089,221 | |
Carmax Auto Owner Trust | | | | | | | | | | | | | | | | |
Series 2019-1 A3 | | | 03/15/2024 | | | | 3.05% | | | | 784,455 | | | | 791,030 | |
Series 2020-1 A3 | | | 12/16/2024 | | | | 1.89% | | | | 3,818,507 | | | | 3,852,686 | |
Series 2021-4 A3 | | | 09/15/2026 | | | | 0.56% | | | | 3,805,000 | | | | 3,751,808 | |
Carvana Auto Receivables Trust | | | | | | | | | | | | | | | | |
Series 2021-P2 A3 | | | 03/10/2026 | | | | 0.49% | | | | 6,120,000 | | | | 6,076,582 | |
Series 2021-P4 A-3 | | | 01/10/2027 | | | | 1.31% | | | | 7,270,000 | | | | 7,265,438 | |
Chase Issuance Trust, 2020-A1 A1 | | | 01/15/2025 | | | | 1.53% | | | | 3,850,000 | | | | 3,886,884 | |
Citibank Credit Card Issuance Trust, 2018-A3 A3 | | | 05/23/2025 | | | | 3.29% | | | | 3,500,000 | | | | 3,623,201 | |
Corevest American Finance Trust, 2020-1 A1 (a) | | | 03/17/2050 | | �� | | 1.83% | | | | 407,187 | | | | 406,583 | |
DB Master Finance LLC, 2021-1a A2I (a) | | | 11/20/2051 | | | | 2.05% | | | | 4,100,000 | | | | 4,006,110 | |
Diamond Resorts Owner Trust | | | | | | | | | | | | | | | | |
Series 2018-1 A (a) | | | 01/21/2031 | | | | 3.70% | | | | 805,674 | | | | 820,177 | |
Series 2021-1A A (a) | | | 11/21/2033 | | | | 1.51% | | | | 1,996,463 | | | | 1,977,413 | |
Discover Card Execution Note Trust, 2018-A2 A2 (1 Month LIBOR USD + 0.330%) (c) | | | 08/15/2025 | | | | 0.44% | | | | 2,775,000 | | | | 2,782,930 | |
Elara HGV Timeshare Issuer, 2021-A A (a) | | | 08/27/2035 | | | | 1.36% | | | | 2,695,355 | | | | 2,662,664 | |
18 | The accompanying notes are an integral part of these consolidated financial statements. |
LoCorr Macro Strategies Fund – Consolidated Schedule of Investments (continued) |
| | Maturity Date | | | Coupon Rate | | | Principal Amount | | | Value | |
ASSET BACKED SECURITIES (continued) |
Entergy New Orleans Storm Recovery Funding LLC, 2015-1 A | | | 06/01/2027 | | | | 2.67% | | | $ | 569,462 | | | $ | 574,066 | |
Ford Credit Auto Owner Trust, 2018-2 A (a) | | | 01/15/2030 | | | | 3.47% | | | | 1,400,000 | | | | 1,454,718 | |
Freddie Mac STACR REMIC Trust, 2021-HQA4 M1 (SOFR30A + 0.950%) (a)(c) | | | 12/26/2041 | | | | 1.00% | | | | 5,950,000 | | | | 5,949,998 | |
GM Financial Consumer Automobile Receivables Trust | | | | | | | | | | | | | | | | |
Series 2020-1 A3 | | | 09/16/2024 | | | | 1.84% | | | | 1,076,445 | | | | 1,085,317 | |
Series 2021-1 A3 | | | 10/16/2025 | | | | 0.35% | | | | 3,640,000 | | | | 3,616,874 | |
Series 2021-3 A3 | | | 06/16/2026 | | | | 0.48% | | | | 5,370,000 | | | | 5,313,128 | |
Hilton Grand Vacations Trust, 2019-AA A (a) | | | 07/25/2033 | | | | 2.34% | | | | 1,759,250 | | | | 1,782,055 | |
Honda Auto Receivables Owner Trust | | | | | | | | | | | | | | | | |
Series 2019-1 A3 | | | 03/20/2023 | | | | 2.83% | | | | 1,116,077 | | | | 1,123,707 | |
Series 2020-3 A3 | | | 10/18/2024 | | | | 0.37% | | | | 6,550,000 | | | | 6,531,694 | |
Hyundai Auto Receivables Trust, 2020-C A3 | | | 05/15/2025 | | | | 0.38% | | | | 5,520,000 | | | | 5,496,313 | |
Invitation Homes Trust | | | | | | | | | | | | | | | | |
Series 2018-SFR2 A (1 Month LIBOR USD + 0.900%) (a)(c) | | | 06/18/2037 | | | �� | 1.01% | | | | 2,378,801 | | | | 2,379,172 | |
Series 2018-SFR3 A (1 Month LIBOR USD + 1.000%) (a)(c) | | | 07/17/2037 | | | | 1.11% | | | | 685,206 | | | | 684,843 | |
Series 2018-SFR4 A (1 Month LIBOR USD + 1.100%) (a)(c) | | | 01/19/2038 | | | | 1.21% | | | | 903,645 | | | | 902,630 | |
Morgan Stanley Capital I Trust, 2004-HE6 M1 (1 Month LIBOR USD + 0.825%) (c) | | | 08/25/2034 | | | | 0.93% | | | | 401,281 | | | | 397,693 | |
MVW Owner Trust | | | | | | | | | | | | | | | | |
Series 2019-1A A (a) | | | 11/20/2036 | | | | 2.89% | | | | 770,068 | | | | 780,766 | |
Series 2019-2A A (a) | | | 10/20/2038 | | | | 2.22% | | | | 1,108,655 | | | | 1,120,681 | |
Series 2021-1WA A (a) | | | 01/22/2041 | | | | 1.14% | | | | 3,022,482 | | | | 2,964,726 | |
Navient Student Loan Trust, 2021-A A (a) | | | 05/15/2069 | | | | 0.84% | | | | 2,778,586 | | | | 2,743,747 | |
PFS Financing Corp. | | | | | | | | | | | | | | | | |
Series 2020-F A (a) | | | 08/15/2024 | | | | 0.93% | | | | 3,150,000 | | | | 3,157,342 | |
Series 2020-G A (a) | | | 02/17/2026 | | | | 0.97% | | | | 2,288,000 | | | | 2,274,996 | |
Series 2021-B A (a) | | | 08/17/2026 | | | | 0.77% | | | | 3,550,000 | | | | 3,494,375 | |
Progress Residential Trust, 2019-SFR4 B (a) | | | 11/17/2036 | | | | 2.94% | | | | 1,300,000 | | | | 1,313,453 | |
Santander Drive Auto Receivables Trust, 2020-4 A3 | | | 07/15/2024 | | | | 0.48% | | | | 3,530,147 | | | | 3,530,976 | |
Sierra Receivables Funding LLC, 2018-3A A (a) | | | 09/20/2035 | | | | 3.69% | | | | 839,230 | | | | 863,790 | |
SoFi Professional Loan Program LLC | | | | | | | | | | | | | | | | |
Series 2016-C A2B (a) | | | 12/27/2032 | | | | 2.36% | | | | 227,544 | | | | 228,702 | |
Series 2016-D A2B (a) | | | 04/25/2033 | | | | 2.34% | | | | 348,903 | | | | 352,632 | |
Series 2016-A A2 (a) | | | 12/26/2036 | | | | 2.76% | | | | 832,275 | | | | 835,311 | |
SoFi Professional Loan Program Trust, 2021-B AFX (a) | | | 02/15/2047 | | | | 1.14% | | | | 2,133,301 | | | | 2,096,256 | |
Taco Bell Funding LLC, 2021-1A A21 (a) | | | 08/25/2051 | | | | 1.95% | | | | 5,870,000 | | | | 5,754,138 | |
Tesla Auto Lease Trust | | | | | | | | | | | | | | | | |
Series 2020-A A2 (a) | | | 05/20/2023 | | | | 0.55% | | | | 991,989 | | | | 992,191 | |
Series 2021-A B (a) | | | 03/20/2025 | | | | 1.02% | | | | 2,900,000 | | | | 2,888,182 | |
Toyota Lease Owner Trust, 2021-B A3 (a) | | | 10/21/2024 | | | | 0.42% | | | | 6,185,000 | | | | 6,132,469 | |
Tricon American Homes Trust | | | | | | | | | | | | | | | | |
Series 2017-SFR2 A (a) | | | 01/18/2036 | | | | 2.93% | | | | 483,833 | | | | 486,463 | |
Series 2017-SFR2 B (a) | | | 01/18/2036 | | | | 3.28% | | | | 650,000 | | | | 653,423 | |
Verizon Owner Trust | | | | | | | | | | | | | | | | |
Series 2018-A A1A | | | 04/20/2023 | | | | 3.23% | | | | 19,075 | | | | 19,105 | |
Series 2019-B A1A | | | 12/20/2023 | | | | 2.33% | | | | 1,194,175 | | | | 1,202,167 | |
Series 2019-C A1A | | | 04/20/2024 | | | | 1.94% | | | | 552,289 | | | | 556,074 | |
Series 2020-A A1A | | | 07/20/2024 | | | | 1.85% | | | | 6,765,000 | | | | 6,815,696 | |
Volkswagen Auto Loan Enhanced Trust, 2021-1 A-3 | | | 06/22/2026 | | | | 1.02% | | | | 5,570,000 | | | | 5,569,763 | |
TOTAL ASSET BACKED SECURITIES (Cost $153,253,080) | | | | | | | | | | | | | | | 152,885,296 | |
| | | | | | | | | | | | | | | | | |
CORPORATE BONDS: 23.68% | | | | | | | | | | | | | | | | |
Agriculture: 0.36% | | | | | | | | | | | | | | | | |
BAT Capital Corp. | | | 08/15/2024 | | | | 3.22% | | | | 1,125,000 | | | | 1,169,484 | |
The accompanying notes are an integral part of these consolidated financial statements. | 19 |
LoCorr Macro Strategies Fund – Consolidated Schedule of Investments (continued) |
| | Maturity Date | | | Coupon Rate | | | Principal Amount | | | Value | |
CORPORATE BONDS (continued) |
BAT International Finance PLC (b) | | | 03/25/2026 | | | | 1.67% | | | $ | 4,085,000 | | | $ | 4,012,179 | |
| | | | | | | | | | | | | | | | 5,181,663 | |
Auto Manufacturers: 0.58% | | | | | | | | | | | | | | | | |
Daimler Finance North America LLC (a) | | | 03/01/2024 | | | | 0.75% | | | | 1,275,000 | | | | 1,263,339 | |
General Motors Financial Co., Inc. | | | 10/15/2024 | | | | 1.20% | | | | 1,285,000 | | | | 1,275,830 | |
General Motors Financial Co., Inc. | | | 06/20/2025 | | | | 2.75% | | | | 3,845,000 | | | | 3,969,251 | |
Volkswagen Group of America Finance LLC (a) | | | 11/24/2025 | | | | 1.25% | | | | 1,800,000 | | | | 1,761,447 | |
| | | | | | | | | | | | | | | | 8,269,867 | |
Banks: 12.15% | | | | | | | | | | | | | | | | |
Banco Santander SA (b) | | | 02/23/2023 | | | | 3.13% | | | | 2,800,000 | | | | 2,866,076 | |
Banco Santander SA (b) | | | 05/28/2025 | | | | 2.75% | | | | 1,015,000 | | | | 1,049,543 | |
Bank of America Corp. | | | 01/11/2023 | | | | 3.30% | | | | 4,240,000 | | | | 4,356,324 | |
Bank of America Corp. (3 Month LIBOR USD + 0.930%) (c) | | | 07/21/2023 | | | | 2.82% | | | | 2,150,000 | | | | 2,173,799 | |
Bank of America Corp. (SOFR + 0.740%) (c) | | | 10/24/2024 | | | | 0.81% | | | | 3,765,000 | | | | 3,740,314 | |
Bank of America Corp. (SOFR + 0.690%) (c) | | | 04/22/2025 | | | | 0.98% | | | | 12,160,000 | | | | 12,064,723 | |
Bank of America Corp. (SOFR + 1.150%) (c) | | | 06/19/2026 | | | | 1.32% | | | | 6,095,000 | | | | 6,032,938 | |
Bank of America Corp. (SOFR + 1.010%) (c) | | | 10/24/2026 | | | | 1.20% | | | | 3,925,000 | | | | 3,848,541 | |
Barclays PLC (1 Year CMT Rate + 0.800%) (b)(c) | | | 12/10/2024 | | | | 1.01% | | | | 3,025,000 | | | | 3,003,286 | |
BNP Paribas SA (3 Month LIBOR USD + 1.111%) (a)(b)(c) | | | 11/19/2025 | | | | 2.82% | | | | 2,740,000 | | | | 2,820,481 | |
Citigroup, Inc. (3 Month LIBOR USD + 0.722%) (c) | | | 01/24/2023 | | | | 3.14% | | | | 2,535,000 | | | | 2,538,214 | |
Citigroup, Inc. (3 Month LIBOR USD + 1.023%) (c) | | | 06/01/2024 | | | | 4.04% | | | | 4,140,000 | | | | 4,315,054 | |
Citigroup, Inc. (SOFR + 0.686%) (c) | | | 10/30/2024 | | | | 0.78% | | | | 2,490,000 | | | | 2,474,221 | |
Citigroup, Inc. (SOFR + 0.669%) (c) | | | 05/01/2025 | | | | 0.98% | | | | 5,530,000 | | | | 5,487,405 | |
Citigroup, Inc. (SOFR + 0.765%) (c) | | | 01/28/2027 | | | | 1.12% | | | | 1,610,000 | | | | 1,568,931 | |
Credit Suisse AG (b) | | | 05/05/2023 | | | | 1.00% | | | | 2,610,000 | | | | 2,617,049 | |
Credit Suisse AG (b) | | | 08/09/2023 | | | | 0.52% | | | | 1,975,000 | | | | 1,961,156 | |
Danske Bank A/S (1 Year CMT Rate + 1.730%) (a)(b)(c) | | | 01/12/2023 | | | | 5.00% | | | | 2,895,000 | | | | 2,897,495 | |
Deutsche Bank NY (b) | | | 05/28/2024 | | | | 0.90% | | | | 1,670,000 | | | | 1,655,730 | |
Federation des Caisses Desjardins du Quebec (a)(b) | | | 05/21/2024 | | | | 0.70% | | | | 2,935,000 | | | | 2,892,011 | |
Goldman Sachs Group, Inc. | | | 01/22/2023 | | | | 3.63% | | | | 3,685,000 | | | | 3,795,240 | |
Goldman Sachs Group, Inc. | | | 02/23/2023 | | | | 3.20% | | | | 4,935,000 | | | | 5,061,544 | |
Goldman Sachs Group, Inc. (SOFR + 0.572%) (c) | | | 03/08/2024 | | | | 0.67% | | | | 21,630,000 | | | | 21,533,837 | |
Goldman Sachs Group, Inc. | | | 04/01/2025 | | | | 3.50% | | | | 1,925,000 | | | | 2,036,205 | |
HSBC Bank Canada (a)(b) | | | 09/10/2023 | | | | 1.65% | | | | 2,000,000 | | | | 2,016,095 | |
HSBC Holdings PLC (SOFR + 1.538%) (b)(c) | | | 04/18/2026 | | | | 1.65% | | | | 750,000 | | | | 744,095 | |
HSBC Holdings PLC (SOFR + 1.929%) (b)(c) | | | 06/04/2026 | | | | 2.10% | | | | 4,900,000 | | | | 4,933,890 | |
ING Groep NV (b) | | | 04/09/2024 | | | | 3.55% | | | | 3,095,000 | | | | 3,244,877 | |
JP Morgan Chase & Co. | | | 01/25/2023 | | | | 3.20% | | | | 5,845,000 | | | | 6,003,906 | |
JP Morgan Chase & Co. (SOFR + 0.600%) (c) | | | 09/16/2024 | | | | 0.65% | | | | 450,000 | | | | 447,933 | |
JP Morgan Chase & Co. (SOFR + 0.420%) (c) | | | 02/16/2025 | | | | 0.56% | | | | 1,650,000 | | | | 1,626,380 | |
JP Morgan Chase & Co. (SOFR + 0.540%) (c) | | | 06/01/2025 | | | | 0.82% | | | | 5,535,000 | | | | 5,471,424 | |
JP Morgan Chase & Co. (SOFR + 0.800%) (c) | | | 11/19/2026 | | | | 1.05% | | | | 2,000,000 | | | | 1,949,385 | |
JP Morgan Chase & Co. (SOFR + 0.695%) (c) | | | 02/04/2027 | | | | 1.04% | | | | 2,120,000 | | | | 2,052,918 | |
Mitsubishi UFJ Financial Group, Inc. (1 Year CMT Rate + 0.680%) (b)(c) | | | 09/15/2024 | | | | 0.85% | | | | 3,025,000 | | | | 3,010,334 | |
Morgan Stanley | | | 01/23/2023 | | | | 3.13% | | | | 4,775,000 | | | | 4,896,229 | |
Morgan Stanley (SOFR + 0.455%) (c) | | | 01/25/2024 | | | | 0.53% | | | | 4,700,000 | | | | 4,684,150 | |
Morgan Stanley (SOFR + 0.616%) (c) | | | 04/05/2024 | | | | 0.73% | | | | 5,590,000 | | | | 5,573,094 | |
Morgan Stanley (SOFR + 0.525%) (c) | | | 05/30/2025 | | | | 0.79% | | | | 2,440,000 | | | | 2,408,573 | |
NatWest Markets PLC (a)(b) | | | 05/21/2023 | | | | 2.38% | | | | 2,620,000 | | | | 2,669,897 | |
NatWest Markets PLC (a)(b) | | | 08/12/2024 | | | | 0.80% | | | | 1,500,000 | | | | 1,475,509 | |
Standard Chartered PLC (3 Month LIBOR USD + 1.080%) (a)(b)(c) | | | 03/15/2024 | | | | 3.89% | | | | 1,450,000 | | | | 1,494,563 | |
Svenska Handelsbanken AB (a)(b) | | | 06/30/2023 | | | | 0.63% | | | | 1,860,000 | | | | 1,854,782 | |
Svenska Handelsbanken AB (a)(b) | | | 06/11/2024 | | | | 0.55% | | | | 1,750,000 | | | | 1,725,915 | |
20 | The accompanying notes are an integral part of these consolidated financial statements. |
LoCorr Macro Strategies Fund – Consolidated Schedule of Investments (continued) |
| | Maturity Date | | | Coupon Rate | | | Principal Amount | | | Value | |
CORPORATE BONDS (continued) |
Toronto-Dominion Bank (b) | | | 09/10/2024 | | | | 0.70% | | | $ | 2,575,000 | | | $ | 2,542,049 | |
Truist Financial Corp. | | | 08/05/2025 | | | | 1.20% | | | | 655,000 | | | | 649,911 | |
UBS AG/London (a)(b) | | | 06/01/2023 | | | | 0.38% | | | | 2,410,000 | | | | 2,391,326 | |
UBS AG/London (a)(b) | | | 08/09/2024 | | | | 0.70% | | | | 2,500,000 | | | | 2,471,475 | |
UBS Group AG (1 Year CMT Rate + 0.830%) (a)(b)(c) | | | 07/30/2024 | | | | 1.01% | | | | 600,000 | | | | 598,142 | |
Wells Fargo & Co. | | | 02/13/2023 | | | | 3.45% | | | | 3,420,000 | | | | 3,518,952 | |
| | | | | | | | | | | | | | | | 173,245,921 | |
Biotechnology: 0.35% | | | | | | | | | | | | | | | | |
Gilead Sciences, Inc. | | | 09/29/2023 | | | | 0.75% | | | | 1,522,000 | | | | 1,515,750 | |
Royalty Pharma PLC (b) | | | 09/02/2023 | | | | 0.75% | | | | 3,525,000 | | | | 3,503,155 | |
| | | | | | | | | | | | | | | | 5,018,905 | |
Chemicals: 0.06% | | | | | | | | | | | | | | | | |
Westlake Chemical Corp. | | | 08/15/2024 | | | | 0.88% | | | | 895,000 | | | | 881,613 | |
| | | | | | | | | | | | | | | | | |
Diversified Financial Services: 1.54% | | | | | | | | | | | | | | | | |
AerCap Ireland Capital /Global Aviation Trust (b) | | | 10/29/2024 | | | | 1.65% | | | | 5,965,000 | | | | 5,955,500 | |
AerCap Ireland Capital/Global Aviation Trust (b) | | | 01/15/2025 | | | | 3.50% | | | | 4,420,000 | | | | 4,615,112 | |
AerCap Ireland Capital/Global Aviation Trust (b) | | | 01/30/2026 | | | | 1.75% | | | | 1,790,000 | | | | 1,756,556 | |
Air Lease Corp. | | | 07/03/2023 | | | | 3.88% | | | | 1,405,000 | | | | 1,455,249 | |
Air Lease Corp. | | | 02/01/2024 | | | | 4.25% | | | | 925,000 | | | | 974,699 | |
Capital One Bank | | | 02/15/2023 | | | | 3.38% | | | | 1,700,000 | | | | 1,747,127 | |
CDP Financial, Inc. (a)(b) | | | 03/07/2022 | | | | 2.75% | | | | 2,190,000 | | | | 2,199,696 | |
OMERS Finance Trust (a)(b) | | | 05/02/2024 | | | | 2.50% | | | | 1,930,000 | | | | 1,998,142 | |
Private Export Funding Corp. | | | 06/15/2025 | | | | 3.25% | | | | 1,255,000 | | | | 1,329,320 | |
| | | | | | | | | | | | | | | | 22,031,401 | |
Electric: 0.57% | | | | | | | | | | | | | | | | |
Eversource Energy | | | 08/15/2025 | | | | 0.80% | | | | 350,000 | | | | 340,060 | |
Exelon Generation Co. LLC | | | 03/15/2022 | | | | 3.40% | | | | 620,000 | | | | 621,916 | |
Exelon Generation Co. LLC | | | 06/01/2025 | | | | 3.25% | | | | 460,000 | | | | 482,153 | |
Southern California Edison Co. | | | 08/01/2023 | | | | 0.70% | | | | 2,550,000 | | | | 2,534,449 | |
Southern California Edison Co. | | | 04/01/2024 | | | | 1.10% | | | | 3,415,000 | | | | 3,402,633 | |
Southern California Edison Co. | | | 02/01/2026 | | | | 1.20% | | | | 700,000 | | | | 685,951 | |
| | | | | | | | | | | | | | | | 8,067,162 | |
Food: 0.09% | | | | | | | | | | | | | | | | |
Conagra Brands, Inc. | | | 08/11/2023 | | | | 0.50% | | | | 1,285,000 | | | | 1,274,063 | |
| | | | | | | | | | | | | | | | | |
Healthcare - Products: 1.24% | | | | | | | | | | | | | | | | |
Baxter International, Inc. (a) | | | 11/29/2024 | | | | 1.32% | | | | 6,660,000 | | | | 6,652,199 | |
DH Europe Finance II Sarl (b) | | | 11/15/2024 | | | | 2.20% | | | | 2,455,000 | | | | 2,509,241 | |
PerkinElmer, Inc. | | | 09/15/2024 | | | | 0.85% | | | | 3,130,000 | | | | 3,086,125 | |
Thermo Fisher Scientific, Inc. | | | 10/18/2024 | | | | 1.22% | | | | 3,840,000 | | | | 3,836,390 | |
Zimmer Biomet Holdings, Inc. | | | 11/22/2024 | | | | 1.45% | | | | 1,545,000 | | | | 1,540,926 | |
| | | | | | | | | | | | | | | | 17,624,881 | |
Healthcare - Services: 0.55% | | | | | | | | | | | | | | | | |
Humana, Inc. | | | 08/03/2023 | | | | 0.65% | | | | 5,230,000 | | | | 5,203,345 | |
UnitedHealth Group, Inc. | | | 05/15/2024 | | | | 0.55% | | | | 2,645,000 | | | | 2,624,422 | |
| | | | | | | | | | | | | | | | 7,827,767 | |
Insurance: 1.06% | | | | | | | | | | | | | | | | |
Equitable Financial Life Global (a) | | | 11/17/2023 | | | | 0.50% | | | | 625,000 | | | | 618,979 | |
Equitable Financial Life Global (a) | | | 07/07/2025 | | | | 1.40% | | | | 2,435,000 | | | | 2,413,722 | |
Metropolitan Life Global Funding I (a) | | | 06/07/2024 | | | | 0.55% | | | | 3,170,000 | | | | 3,121,756 | |
Metropolitan Life Global Funding I (a) | | | 07/02/2025 | | | | 0.95% | | | | 2,355,000 | | | | 2,322,586 | |
Principal Life Global Funding II (a) | | | 04/12/2024 | | | | 0.75% | | | | 3,340,000 | | | | 3,316,454 | |
The accompanying notes are an integral part of these consolidated financial statements. | 21 |
LoCorr Macro Strategies Fund – Consolidated Schedule of Investments (continued) |
| | Maturity Date | | | Coupon Rate | | | Principal Amount | | | Value | |
CORPORATE BONDS (continued) |
Protective Life Global Funding (a) | | | 07/05/2024 | | | | 0.78% | | | $ | 3,335,000 | | | $ | 3,291,743 | |
| | | | | | | | | | | | | | | | 15,085,240 | |
Miscellaneous Manufacturing: 0.20% | | | | | | | | | | | | | | | | |
Parker-Hannifin Corp. | | | 06/14/2024 | | | | 2.70% | | | | 1,540,000 | | | | 1,591,322 | |
Trane Technologies Luxembourg Finance SA (b) | | | 03/21/2026 | | | | 3.50% | | | | 1,245,000 | | | | 1,320,910 | |
| | | | | | | | | | | | | | | | 2,912,232 | |
Oil & Gas: 0.45% | | | | | | | | | | | | | | | | |
Diamondback Energy, Inc. | | | 12/01/2024 | | | | 2.88% | | | | 1,865,000 | | | | 1,935,200 | |
Phillips 66 | | | 02/15/2024 | | | | 0.90% | | | | 2,280,000 | | | | 2,263,457 | |
Saudi Arabian Oil Co. (a)(b) | | | 04/16/2022 | | | | 2.75% | | | | 2,150,000 | | | | 2,163,438 | |
| | | | | | | | | | | | | | | | 6,362,095 | |
Packaging & Containers: 0.42% | | | | | | | | | | | | | | | | |
Amcor Finance, Inc. | | | 04/28/2026 | | | | 3.63% | | | | 3,125,000 | | | | 3,324,717 | |
Berry Global, Inc. | | | 02/15/2024 | | | | 0.95% | | | | 2,655,000 | | | | 2,631,105 | |
| | | | | | | | | | | | | | | | 5,955,822 | |
Pharmaceuticals: 1.17% | | | | | | | | | | | | | | | | |
AbbVie, Inc. | | | 11/21/2022 | | | | 2.30% | | | | 1,805,000 | | | | 1,830,353 | |
AbbVie, Inc. | | | 11/21/2024 | | | | 2.60% | | | | 5,555,000 | | | | 5,765,451 | |
AbbVie, Inc. | | | 05/14/2026 | | | | 3.20% | | | | 1,260,000 | | | | 1,336,262 | |
Astrazeneca Finance LLC | | | 05/28/2024 | | | | 0.70% | | | | 4,025,000 | | | | 3,993,722 | |
CVS Health Corp. | | | 08/12/2024 | | | | 3.38% | | | | 3,630,000 | | | | 3,815,624 | |
| | | | | | | | | | | | | | | | 16,741,412 | |
Pipelines: 0.57% | | | | | | | | | | | | | | | | |
Energy Transfer Operating LP | | | 05/15/2025 | | | | 2.90% | | | | 790,000 | | | | 815,471 | |
MPLX LP | | | 03/01/2026 | | | | 1.75% | | | | 2,935,000 | | | | 2,907,000 | |
ONEOK, Inc. | | | 09/01/2024 | | | | 2.75% | | | | 1,175,000 | | | | 1,207,798 | |
TransCanada PipeLines Ltd. (b) | | | 10/12/2024 | | | | 1.00% | | | | 3,155,000 | | | | 3,127,867 | |
| | | | | | | | | | | | | | | | 8,058,136 | |
Real Estate Investment Trusts: 0.54% | | | | | | | | | | | | | | | | |
American Tower Corp. | | | 09/15/2025 | | | | 1.30% | | | | 4,860,000 | | | | 4,788,182 | |
Camden Property Trust | | | 12/15/2022 | | | | 2.95% | | | | 732,000 | | | | 743,685 | |
Crown Castle International Corp. | | | 07/15/2025 | | | | 1.35% | | | | 1,010,000 | | | | 996,779 | |
SITE Centers Corp. | | | 02/01/2025 | | | | 3.63% | | | | 1,115,000 | | | | 1,167,672 | |
| | | | | | | | | | | | | | | | 7,696,318 | |
Software: 0.28% | | | | | | | | | | | | | | | | |
Roper Technologies, Inc. | | | 09/15/2024 | | | | 2.35% | | | | 960,000 | | | | 984,509 | |
VMware, Inc. | | | 08/15/2024 | | | | 1.00% | | | | 2,990,000 | | | | 2,961,748 | |
| | | | | | | | | | | | | | | | 3,946,257 | |
Telecommunications: 1.27% | | | | | | | | | | | | | | | | |
NBN Co. Ltd. (a)(b) | | | 10/08/2024 | | | | 0.88% | | | | 2,585,000 | | | | 2,548,939 | |
NTT Finance Corp. (a)(b) | | | 04/03/2026 | | | | 1.16% | | | | 2,695,000 | | | | 2,645,354 | |
T-Mobile USA, Inc. | | | 04/15/2025 | | | | 3.50% | | | | 5,770,000 | | | | 6,115,608 | |
Verizon Communications, Inc. | | | 11/20/2025 | | | | 0.85% | | | | 5,205,000 | | | | 5,070,564 | |
Verizon Communications, Inc. | | | 03/20/2026 | | | | 1.45% | | | | 1,790,000 | | | | 1,781,879 | |
| | | | | | | | | | | | | | | | 18,162,344 | |
Transportation: 0.23% | | | | | | | | | | | | | | | | |
Canadian Pacific Railway Co. (b) | | | 12/02/2024 | | | | 1.35% | | | | 3,305,000 | | | | 3,309,214 | |
TOTAL CORPORATE BONDS (Cost $338,572,301) | | | | | | | | | | | | | | | 337,652,313 | |
| | | | | | | | | | | | | | | | | |
MORTGAGE BACKED SECURITIES: 15.21% | | | | | | | | | | | | | | | | |
ACRE Commercial Mortgage Trust, 2021-FL4 A (1 Month LIBOR USD + 0.830%) (a)(b)(c) | | | 12/18/2037 | | | | 0.93% | | | | 1,636,864 | | | | 1,629,495 | |
Alen Mortgage Trust, 2021-ACEN A (1 Month LIBOR USD + 1.150%) (a)(c) | | | 04/15/2038 | | | | 1.26% | | | | 3,150,000 | | | | 3,146,209 | |
Angel Oak Mortgage Trust, 2020-1 M1 (a)(d) | | | 12/25/2059 | | | | 3.16% | | | | 1,915,000 | | | | 1,913,134 | |
Barclays Commercial Mortgage Securities LLC, 2015-VFM A1 (a) | | | 03/12/2036 | | | | 2.47% | | | | 1,047,736 | | | | 1,052,907 | |
22 | The accompanying notes are an integral part of these consolidated financial statements. |
LoCorr Macro Strategies Fund – Consolidated Schedule of Investments (continued) |
| | Maturity Date | | | Coupon Rate | | | Principal Amount | | | Value | |
MORTGAGE BACKED SECURITIES (continued) |
BHP Trust, 2019-BXHP A (1 Month LIBOR USD + 0.975%) (a)(c) | | | 08/15/2036 | | | | 1.09% | | | $ | 2,366,383 | | | $ | 2,361,931 | |
BSREP Commercial Mortgage Trust, 2021-DC A (1 Month LIBOR USD + 0.950%) (a)(c) | | | 08/16/2038 | | | | 1.06% | | | | 4,330,000 | | | | 4,324,788 | |
BX Commercial Mortgage Trust | | | | | | | | | | | | | | | | |
Series 2020-FOX A (1 Month LIBOR USD + 1.000%) (a)(c) | | | 11/15/2032 | | | | 1.11% | | | | 4,214,018 | | | | 4,212,743 | |
Series 2021-21M A (1 Month LIBOR USD + 0.730%) (a)(c) | | | 10/15/2036 | | | | 0.84% | | | | 2,340,000 | | | | 2,323,724 | |
Series 2019-XL A (1 Month LIBOR USD + 0.920%) (a)(c) | | | 10/15/2036 | | | | 1.03% | | | | 2,502,712 | | | | 2,503,403 | |
Series 2021-XL2 B (1 Month LIBOR USD + 0.998%) (a)(c) | | | 10/15/2038 | | | | 1.11% | | | | 5,500,000 | | | | 5,465,880 | |
Series 2021-CIP A (1 Month LIBOR USD + 0.921%) (a)(c) | | | 12/15/2038 | | | | 1.02% | | | | 6,050,000 | | | | 6,048,176 | |
Citigroup Commercial Mortgage Trust | | | | | | | | | | | | | | | | |
Series 2019-PRM B (a) | | | 05/10/2035 | | | | 3.64% | | | | 2,100,000 | | | | 2,166,665 | |
Series 2021-PRM2 A (1 Month LIBOR USD + 0.950%) (a)(c) | | | 10/15/2038 | | | | 1.06% | | | | 5,250,000 | | | | 5,252,430 | |
Comm Mortgage Trust | | | | | | | | | | | | | | | | |
Series 2015-3BP A (a) | | | 02/12/2035 | | | | 3.18% | | | | 1,030,000 | | | | 1,071,476 | |
Series 2013-CR6 A4 | | | 03/10/2046 | | | | 3.10% | | | | 615,000 | | | | 621,176 | |
Series 2013-CR10 A4 (d) | | | 08/10/2046 | | | | 4.21% | | | | 615,000 | | | | 639,025 | |
Series 2014-UBS2 AM | | | 03/12/2047 | | | | 4.20% | | | | 2,450,000 | | | | 2,562,257 | |
Series 2014-CR19 A5 | | | 08/12/2047 | | | | 3.80% | | | | 1,380,133 | | | | 1,456,231 | |
Series 2014-LC17 A5 | | | 10/11/2047 | | | | 3.92% | | | | 724,000 | | | | 768,566 | |
Series 2014-CR21 A3 | | | 12/10/2047 | | | | 3.53% | | | | 1,667,396 | | | | 1,732,323 | |
Series 2015-CR27 AM | | | 10/13/2048 | | | | 3.98% | | | | 2,000,000 | | | | 2,132,723 | |
Connecticut Avenue Securities Trust | | | | | | | | | | | | | | | | |
Series 2021-R01 1M2 (SOFR30A + 1.550%) (a)(c) | | | 10/25/2041 | | | | 1.60% | | | | 1,820,000 | | | | 1,822,196 | |
Series 2021-R03 1M1 (SOFR30A + 0.850%) (a)(c) | | | 12/26/2041 | | | | 0.90% | | | | 6,725,000 | | | | 6,722,638 | |
Credit Suisse Mortgage Capital Certificates, 2019-ICE4 A (1 Month LIBOR USD + 0.980%) (a)(c) | | | 05/15/2036 | | | | 1.09% | | | | 3,500,000 | | | | 3,498,945 | |
ELP Commercial Mortgage Trust, 2021-ELP B (1 Month LIBOR USD + 1.120%) (a)(c) | | | 11/15/2038 | | | | 1.23% | | | | 5,400,000 | | | | 5,368,057 | |
EQUS Mortgage Trust, 2021-EQAZ A (1 Month LIBOR USD + 0.755%) (a)(c) | | | 10/15/2036 | | | | 0.86% | | | | 5,400,000 | | | | 5,374,581 | |
Extended Stay America Trust, 2021-ESH A (1 Month LIBOR USD + 1.080%) (a)(c) | | | 07/15/2038 | | | | 1.19% | | | | 1,193,789 | | | | 1,195,361 | |
Fannie Mae Aces | | | | | | | | | | | | | | | | |
Series 2017-M7 A1 | | | 02/25/2027 | | | | 2.60% | | | | 461,659 | | | | 465,270 | |
Series 2019-M6 A1 | | | 08/25/2028 | | | | 3.30% | | | | 1,895,111 | | | | 1,929,962 | |
Fannie Mae Connecticut Avenue Securities | | | | | | | | | | | | | | | | |
Series 2014-C02 1M2 (1 Month LIBOR USD + 2.600%) (c) | | | 05/28/2024 | | | | 2.70% | | | | 886,030 | | | | 902,541 | |
Series 2014-C03 1M2 (1 Month LIBOR USD + 3.000%)(c) | | | 07/25/2024 | | | | 3.10% | | | | 952,862 | | | | 967,510 | |
Series 2017-C05 1M2 (1 Month LIBOR USD + 2.200%) (c) | | | 01/25/2030 | | | | 2.30% | | | | 1,785,934 | | | | 1,816,441 | |
Series 2018-C01 1EB1 (1 Month LIBOR USD + 0.450%) (c) | | | 07/25/2030 | | | | 0.55% | | | | 1,738,000 | | | | 1,726,294 | |
Series 2021-R02 2M1 (SOFR30A + 0.900%) (a)(c) | | | 11/25/2041 | | | | 0.95% | | | | 3,595,349 | | | | 3,597,599 | |
FHLMC Multifamily Structured Pass Through Certificates | | | | | | | | | | | | | | | | |
Series K059 A1 | | | 09/25/2025 | | | | 2.76% | | | | 1,638,383 | | | | 1,699,171 | |
Series KC06 A1 | | | 02/25/2026 | | | | 2.17% | | | | 4,013,376 | | | | 4,063,418 | |
Freddie Mac STACR REMIC Trust | | | | | | | | | | | | | | | | |
Series 2021-DNA5 M2 (SOFR30A + 1.650%) (a)(c) | | | 01/25/2034 | | | | 1.70% | | | | 1,885,000 | | | | 1,893,071 | |
Series 2021-DNA6 M1 (SOFR30A + 0.800%) (a)(c) | | | 10/25/2041 | | | | 0.85% | | | | 5,250,000 | | | | 5,245,244 | |
Freddie Mac STACR Trust | | | | | | | | | | | | | | | | |
Series 2018-DNA2 M2A (1 Month LIBOR USD + 2.150%) (a)(c) | | | 12/26/2030 | | | | 2.25% | | | | 1,900,000 | | | | 1,914,765 | |
Series 2018-HRP2 M3AS (1 Month LIBOR USD + 1.000%) (a)(c) | | | 02/25/2047 | | | | 1.10% | | | | 4,650,000 | | | | 4,636,570 | |
Series 2018-DNA3 M2A (1 Month LIBOR USD + 2.100%) (a)(c) | | | 09/25/2048 | | | | 2.20% | | | | 1,950,000 | | | | 1,956,081 | |
Freddie Mac Structured Agency Credit Risk Debt Notes | | | | | | | | | | | | | | | | |
Series 2017-DNA2 M1 (1 Month LIBOR USD + 1.200%) (c) | | | 10/25/2029 | | | | 1.30% | | | | 208,953 | | | | 208,953 | |
Series 2021-DNA7 M1 (SOFR30A + 0.850%) (a)(c) | | | 11/25/2041 | | | | 0.90% | | | | 5,150,000 | | | | 5,148,385 | |
Series 2018-HRP2 M3 (1 Month LIBOR USD + 2.400%) (a)(c) | | | 02/25/2047 | | | | 2.50% | | | | 2,000,000 | | | | 2,031,602 | |
Series 2019-HRP1 M2 (1 Month LIBOR USD + 1.400%) (a)(c) | | | 02/25/2049 | | | | 1.50% | | | | 947,596 | | | | 949,976 | |
FRESB Multifamily Mortgage Pass Through Certificates | | | | | | | | | | | | | | | | |
The accompanying notes are an integral part of these consolidated financial statements. | 23 |
LoCorr Macro Strategies Fund – Consolidated Schedule of Investments (continued) |
| | Maturity Date | | | Coupon Rate | | | Principal Amount | | | Value | |
MORTGAGE BACKED SECURITIES (continued) |
Series 2016-SB17 A7F (d) | | | 05/25/2023 | | | | 2.15% | | | $ | 1,200,213 | | | $ | 1,207,256 | |
Series 2016-SB22 A7F (d) | | | 09/25/2023 | | | | 1.98% | | | | 2,868,770 | | | | 2,891,234 | |
Series 2017-SB32 A7F (d) | | | 04/25/2024 | | | | 2.44% | | | | 1,153,833 | | | | 1,164,994 | |
Series 2019-SB67 A5F (d) | | | 07/25/2024 | | | | 2.09% | | | | 2,184,535 | | | | 2,198,945 | |
Series 2019-SB69 A5F (d) | | | 10/25/2024 | | | | 2.25% | | | | 4,797,146 | | | | 4,881,682 | |
Series 2016-SB23 A10F (d) | | | 09/25/2026 | | | | 2.31% | | | | 1,477,395 | | | | 1,490,272 | |
GCT Commercial Mortgage Trust, 2021-GCT A (1 Month LIBOR USD + 0.800%) (a)(c) | | | 02/15/2038 | | | | 0.91% | | | | 3,850,000 | | | | 3,845,378 | |
GS Mortgage Securities Corp II, 2021-ARDN A (1 Month LIBOR USD + 1.250%) (a)(c) | | | 11/17/2036 | | | | 1.36% | | | | 5,400,000 | | | | 5,342,201 | |
GS Mortgage Securities Trust | | | | | | | | | | | | | | | | |
Series 2017-SLP A (a) | | | 10/12/2032 | | | | 3.42% | | | | 3,000,000 | | | | 3,041,302 | |
Series 2019-600C A (a) | | | 09/12/2034 | | | | 2.94% | | | | 2,065,000 | | | | 2,114,830 | |
Series 2021-ROSS A (1 Month LIBOR USD + 1.150%) (a)(c) | | | 06/16/2036 | | | | 1.26% | | | | 5,000,000 | | | | 4,972,074 | |
Series 2013-GC16 B (d) | | | 11/10/2046 | | | | 5.16% | | | | 206,000 | | | | 214,150 | |
Series 2015-GC28 A5 | | | 02/10/2048 | | | | 3.40% | | | | 1,000,000 | | | | 1,048,439 | |
Series 2015-GC28 AS | | | 02/12/2048 | | | | 3.76% | | | | 1,985,000 | | | | 2,085,721 | |
Series 2021-NQM1 A3 (a)(d) | | | 07/25/2061 | | | | 1.53% | | | | 2,222,668 | | | | 2,203,145 | |
JP Morgan Chase Commercial Mortgage Securities Trust | | | | | | | | | | | | | | | | |
Series 2018-BCON A (a) | | | 01/07/2031 | | | | 3.73% | | | | 3,630,000 | | | | 3,709,083 | |
Series 2021-MHC A (1 Month LIBOR USD + 0.800%) (a)(c) | | | 04/15/2038 | | | | 0.91% | | | | 4,157,546 | | | | 4,149,671 | |
Series 2013-C15 A-S | | | 11/17/2045 | | | | 4.42% | | | | 3,325,000 | | | | 3,488,479 | |
Series 2013-C13 A4 (d) | | | 01/18/2046 | | | | 3.99% | | | | 513,180 | | | | 530,249 | |
Series 2014-C23 ASB | | | 09/17/2047 | | | | 3.66% | | | | 1,609,834 | | | | 1,665,380 | |
Series 2014-C22 AS | | | 09/17/2047 | | | | 4.11% | | | | 3,650,000 | | | | 3,807,488 | |
Series 2013-C10 AS | | | 12/17/2047 | | | | 3.37% | | | | 200,000 | | | | 203,987 | |
Series 2016-JP3 A-5 | | | 08/15/2049 | | | | 2.87% | | | | 1,000,000 | | | | 1,040,262 | |
Ladder Capital Commercial Mortgage Trust, 2013-GCP A1 (a) | | | 02/15/2036 | | | | 3.57% | | | | 2,132,646 | | | | 2,229,471 | |
Merit, 2020-HILL A (1 Month LIBOR USD + 1.150%) (a)(c) | | | 08/17/2037 | | | | 1.26% | | | | 5,941,113 | | | | 5,939,326 | |
Morgan Stanley Capital I Trust, 2017-CLS A (1 Month LIBOR USD + 0.700%) (a)(c) | | | 11/15/2034 | | | | 0.81% | | | | 2,785,000 | | | | 2,784,122 | |
Natixis Commercial Mortgage Securities Trust, 2018-285M A (a)(d) | | | 11/15/2032 | | | | 3.79% | | | | 1,000,000 | | | | 1,015,303 | |
New Residential Mortgage Loan Trust | | | | | | | | | | | | | | | | |
Series 2015-1A A3 (a)(d) | | | 05/28/2052 | | | | 3.75% | | | | 435,164 | | | | 450,372 | |
Series 2014-2A A3 (a)(d) | | | 05/25/2054 | | | | 3.75% | | | | 456,266 | | | | 474,284 | |
Series 2016-1A A1 (a)(d) | | | 03/25/2056 | | | | 3.75% | | | | 933,306 | | | | 974,383 | |
Series 2017-1A A1 (a)(d) | | | 02/25/2057 | | | | 4.00% | | | | 1,279,031 | | | | 1,347,907 | |
Series 2017-2A A3 (a)(d) | | | 03/25/2057 | | | | 4.00% | | | | 1,391,543 | | | | 1,464,361 | |
OBX Trust, 2018-1 A2 (1 Month LIBOR USD + 0.650%) (a)(c) | | | 06/25/2057 | | | | 0.75% | | | | 848,078 | | | | 848,687 | |
OPG TRUST, 2021-PORT B (1 Month LIBOR USD + 0.713%) (a)(c) | | | 10/15/2036 | | | | 0.82% | | | | 5,550,000 | | | | 5,470,827 | |
PKHL Commercial Mortgage Trust, 2021-MF A (1 Month LIBOR USD + 0.880%) (a)(c) | | | 07/15/2038 | | | | 0.99% | | | | 5,750,000 | | | | 5,746,555 | |
Sequoia Mortgage Trust | | | | | | | | | | | | | | | | |
Series 2019-5 A4 (a)(d) | | | 12/25/2049 | | | | 3.50% | | | | 29,546 | | | | 29,521 | |
Series 2020-1 A4 (a)(d) | | | 02/25/2050 | | | | 3.50% | | | | 30,399 | | | | 30,385 | |
Series 2020-2 A4 (a)(d) | | | 03/25/2050 | | | | 3.50% | | | | 192,006 | | | | 192,467 | |
SREIT Trust, 2021-MFP2 A (1 Month LIBOR USD + 0.822%) (a)(c) | | | 11/17/2036 | | | | 0.92% | | | | 5,000,000 | | | | 4,974,947 | |
UBS Commercial Mortgage Trust, 2012-C1 A3 | | | 05/12/2045 | | | | 3.40% | | | | 15,973 | | | | 15,959 | |
UBS-Barclays Commercial Mortgage Trust | | | | | | | | | | | | | | | | |
Series 2013-C5 B (a)(d) | | | 03/12/2046 | | | | 3.65% | | | | 265,000 | | | | 265,416 | |
Series 2013-C6 B (a)(d) | | | 04/12/2046 | | | | 3.88% | | | | 700,000 | | | | 703,861 | |
Verus Securitization Trust | | | | | | | | | | | | | | | | |
Series 2020-1 A1 (a)(d) | | | 01/25/2060 | | | | 2.42% | | | | 884,142 | | | | 886,236 | |
Series 2020-1 A3 (a)(d) | | | 01/25/2060 | | | | 2.72% | | | | 1,804,621 | | | | 1,806,891 | |
Wells Fargo Commercial Mortgage Trust, 2012-LC5 AS | | | 10/17/2045 | | | | 3.54% | | | | 650,000 | | | | 658,313 | |
WFRBS Commercial Mortgage Trust | | | | | | | | | | | | | | | | |
24 | The accompanying notes are an integral part of these consolidated financial statements. |
LoCorr Macro Strategies Fund – Consolidated Schedule of Investments (continued) |
| | Maturity Date | | | Coupon Rate | | | Principal Amount | | | Value | |
MORTGAGE BACKED SECURITIES: (continued) |
Series 2013-C13 AS | | | 05/17/2045 | | | | 3.35% | | | $ | 650,000 | | | $ | 663,888 | |
Series 2013-C14 A5 | | | 06/15/2046 | | | | 3.34% | | | | 727,218 | | | | 747,344 | |
Series 2014-C24 A5 | | | 11/18/2047 | | | | 3.61% | | | | 1,000,000 | | | | 1,051,487 | |
Series 2014-C22 AS (d) | | | 09/17/2057 | | | | 4.07% | | | | 350,000 | | | | 368,884 | |
TOTAL MORTGAGE BACKED SECURITIES (Cost $216,772,935) | | | | | | | | | | | | | | | 216,957,312 | |
| | | | | | | | | | | | | | | | | |
MUNICIPAL BONDS: 0.86% | | | | | | | | | | | | | | | | |
Forsyth County School District | | | 02/01/2024 | | | | 0.92% | | | | 1,330,000 | | | | 1,331,236 | |
Miami Dade County Florida Aviation Refunding Taxable Series B | | | 10/01/2023 | | | | 2.37% | | | | 1,350,000 | | | | 1,381,513 | |
Nebraska Public Power District | | | 01/01/2024 | | | | 2.22% | | | | 1,700,000 | | | | 1,741,308 | |
Pennsylvania State University | | | 09/01/2023 | | | | 1.35% | | | | 2,945,000 | | | | 2,968,620 | |
State of Hawaii | | | 08/01/2025 | | | | 1.03% | | | | 4,220,000 | | | | 4,182,851 | |
Water Works Board of the City of Birmingham | | | 01/01/2024 | | | | 2.20% | | | | 695,000 | | | | 712,794 | |
TOTAL MUNICIPAL BONDS (Cost $12,242,479) | | | | | | | | | | | | | | | 12,318,322 | |
| | | | | | | | | | | | | | | | | |
U.S. GOVERNMENT AGENCY ISSUES: 13.46% | | | | | | | | | | | | | | | | |
Federal Farm Credit Banks | | | 05/10/2023 | | | | 0.13% | | | | 19,410,000 | | | | 19,295,475 | |
Federal Farm Credit Banks | | | 06/26/2023 | | | | 1.77% | | | | 5,135,000 | | | | 5,243,501 | |
Federal Farm Credit Banks | | | 07/17/2023 | | | | 2.88% | | | | 10,985,000 | | | | 11,408,688 | |
Federal Farm Credit Banks | | | 12/01/2023 | | | | 0.50% | | | | 18,830,000 | | | | 18,753,741 | |
Federal Home Loan Banks | | | 06/10/2022 | | | | 2.13% | | | | 14,115,000 | | | | 14,231,626 | |
Federal Home Loan Banks | | | 06/10/2022 | | | | 2.75% | | | | 6,015,000 | | | | 6,083,854 | |
Federal Home Loan Banks | | | 06/09/2023 | | | | 3.25% | | | | 15,200,000 | | | | 15,786,092 | |
Federal Home Loan Banks | | | 08/28/2023 | | | | 0.13% | | | | 14,000,000 | | | | 13,878,804 | |
Federal Home Loan Banks | | | 09/08/2023 | | | | 3.38% | | | | 9,000,000 | | | | 9,411,250 | |
Federal Home Loan Banks | | | 06/14/2024 | | | | 1.75% | | | | 12,435,000 | | | | 12,705,122 | |
Federal Home Loan Banks | | | 12/20/2024 | | | | 1.00% | | | | 11,775,000 | | | | 11,784,977 | |
Federal Home Loan Banks | | | 04/14/2025 | | | | 0.50% | | | | 9,350,000 | | | | 9,188,505 | |
Federal Home Loan Mortgage Corp. | | | 05/19/2023 | | | | 0.25% | | | | 7,210,000 | | | | 7,163,936 | |
Federal Home Loan Mortgage Corp. | | | 09/08/2023 | | | | 0.25% | | | | 2,000,000 | | | | 1,986,621 | |
Federal Home Loan Mortgage Corp. | | | 02/12/2025 | | | | 1.50% | | | | 11,395,000 | | | | 11,561,841 | |
Federal National Mortgage Association | | | 04/12/2022 | | | | 2.25% | | | | 3,500,000 | | | | 3,520,447 | |
Federal National Mortgage Association | | | 09/06/2022 | | | | 1.38% | | | | 5,855,000 | | | | 5,899,184 | |
Federal National Mortgage Association | | | 07/10/2023 | | | | 0.25% | | | | 9,000,000 | | | | 8,951,764 | |
Federal National Mortgage Association | | | 07/02/2024 | | | | 1.75% | | | | 5,000,000 | | | | 5,110,547 | |
TOTAL U.S. GOVERNMENT AGENCY ISSUES (Cost $190,993,128) | | | | | | | | | | | | | | | 191,965,975 | |
| | | | | | | | | | | | | | | | | |
U.S. GOVERNMENT NOTES: 22.62% | | | | | | | | | | | | | | | | |
United States Treasury Note | | | 03/31/2022 | | | | 1.88% | | | | 955,000 | | | | 959,070 | |
United States Treasury Note | | | 07/15/2022 | | | | 1.75% | | | | 4,615,000 | | | | 4,651,956 | |
United States Treasury Note | | | 08/15/2022 | | | | 1.50% | | | | 7,685,000 | | | | 7,744,138 | |
United States Treasury Note | | | 09/15/2022 | | | | 1.50% | | | | 6,785,000 | | | | 6,843,044 | |
United States Treasury Note | | | 10/15/2022 | | | | 1.38% | | | | 9,085,000 | | | | 9,158,106 | |
United States Treasury Note | | | 10/31/2022 | | | | 2.00% | | | | 5,210,000 | | | | 5,280,213 | |
United States Treasury Note | | | 03/31/2023 | | | | 0.13% | | | | 20,340,000 | | | | 20,247,040 | |
United States Treasury Note | | | 03/31/2023 | | | | 1.50% | | | | 22,840,000 | | | | 23,120,147 | |
United States Treasury Note | | | 06/30/2023 | | | | 0.13% | | | | 3,335,000 | | | | 3,312,593 | |
United States Treasury Note | | | 08/31/2023 | | | | 0.13% | | | | 9,260,000 | | | | 9,179,337 | |
United States Treasury Note | | | 09/30/2023 | | | | 2.88% | | | | 36,730,000 | | | | 38,133,201 | |
United States Treasury Note | | | 12/31/2023 | | | | 2.63% | | | | 10,545,000 | | | | 10,939,202 | |
United States Treasury Note | | | 01/15/2024 | | | | 0.13% | | | | 19,775,000 | | | | 19,528,585 | |
United States Treasury Note | | | 02/15/2024 | | | | 2.75% | | | | 5,000,000 | | | | 5,208,398 | |
United States Treasury Note | | | 02/29/2024 | | | | 2.38% | | | | 2,265,000 | | | | 2,342,152 | |
The accompanying notes are an integral part of these consolidated financial statements. | 25 |
LoCorr Macro Strategies Fund – Consolidated Schedule of Investments (continued) |
| | Maturity Date | | | Coupon Rate | | | Principal Amount | | | Value | |
U.S. GOVERNMENT NOTES (continued) |
United States Treasury Note | | | 03/31/2024 | | | | 2.13% | | | $ | 4,320,000 | | | $ | 4,446,900 | |
United States Treasury Note | | | 04/30/2024 | | | | 2.00% | | | | 11,530,000 | | | | 11,844,823 | |
United States Treasury Note | | | 05/15/2024 | | | | 0.25% | | | | 9,240,000 | | | | 9,115,837 | |
United States Treasury Note | | | 06/15/2024 | | | | 0.25% | | | | 11,640,000 | | | | 11,470,856 | |
United States Treasury Note | | | 06/30/2024 | | | | 1.75% | | | | 1,885,000 | | | | 1,926,455 | |
United States Treasury Note | | | 08/15/2024 | | | | 0.38% | | | | 51,245,000 | | | | 50,580,416 | |
United States Treasury Note | | | 09/15/2024 | | | | 0.38% | | | | 48,300,000 | | | | 47,628,328 | |
United States Treasury Note | | | 09/30/2024 | | | | 1.50% | | | | 16,795,000 | | | | 17,063,982 | |
United States Treasury Note | | | 02/15/2025 | | | | 7.63% | | | | 1,500,000 | | | | 1,807,676 | |
TOTAL U.S. GOVERNMENT NOTES (Cost $322,575,922) | | | | | | | | | | | | | | | 322,532,455 | |
| | | | | | | | | | | | | | | | | |
SHORT TERM INVESTMENTS: 5.32% | | | | | | | | | | | | | | | | |
U.S. GOVERNMENT NOTE: 1.53% | | | | | | | | | | | | | | | | |
United States Treasury Note | | | 11/30/2022 | | | | 0.13% | | | | 21,840,000 | | | | 21,790,519 | |
TOTAL U.S. GOVERNMENT NOTE (Cost $21,797,726) | | | | | | | | | | | | | | | 21,790,519 | |
| | | | | | | | | | | | | | | | | |
MONEY MARKET FUND: 3.79% | | | | | | | | | | Shares | | | | | |
STIT-Government & Agency Portfolio, Institutional Class, 0.03% (e)(f) | | | | | | | | | | | 54,024,813 | | | | 54,024,813 | |
TOTAL MONEY MARKET FUND (Cost $54,024,813) | | | | | | | | | | | | | | | 54,024,813 | |
TOTAL SHORT TERM INVESTMENTS (Cost $75,822,539) | | | | | | | | | | | | | | | 75,815,332 | |
| | | | | | | | | | | | | | | | | |
TOTAL INVESTMENTS (Cost $1,310,232,384): 91.87% | | | | | | | | | | | | | | | 1,310,127,005 | |
Other Assets in Excess of Liabilities: 8.13% (g) | | | | | | | | | | | | | | | 115,898,060 | |
TOTAL NET ASSETS: 100.00% | | | | | | | | | | | | | | $ | 1,426,025,065 | |
(a) | Security as defined in Rule 144A under the Securities Act of 1933 and determined to be liquid. Purchased in a private placement transaction; resale to the public may require registration or may extend only to qualified institutional buyers. At December 31, 2021, the value of these securities total $287,612,004 which represents 20.17% of total net assets. |
(b) | Foreign issued security. |
(c) | Variable rate security based on a reference index and spread. The rate reported is the rate in effect as of December 31, 2021. |
(d) | Variable rate security. The coupon is based on an underlying pool of loans. The rate reported is the rate in effect as of December 31, 2021. |
(e) | The rate quoted is the annualized seven-day effective yield as of December 31, 2021. |
(f) | All or a portion of this security is pledged as collateral for derivative contracts. At December 31, 2021, the value of this collateral totals $12,232. |
(g) | Includes assets and deposits with broker pledged as collateral for derivative contracts. At December 31, 2021, the value of these assets totals $136,018,996. |
CMT | Constant Maturity Treasury | PLC | Public Limited Company |
LIBOR | London Interbank Offered Rate | SOFR | Secured Overnight Financing Rate |
26 | The accompanying notes are an integral part of these consolidated financial statements. |
LoCorr Macro Strategies Fund – Consolidated Schedule of Open Forward Currency Contracts |
LoCorr Macro Strategies Fund
Consolidated Schedule of Open Forward Currency Contracts
December 31, 2021
| | | | | | | | | | | | | | | Currency to be Received | | | Currency to be Delivered | | | | | | | | | |
| | | Notional
Amount | | | Counterparty
Abbreviation | | | Forward
Settlement
Date | | | Currency
Abbreviation | | | U.S. $ Notional
Amount at
December 31,
2021 | | | Currency
Abbreviation | | | U.S. $ Notional
Amount on
Origination
Date | | | Unrealized
Appreciation | | | Unrealized
(Depreciation) | |
| | | | See key for abbreviation | | | | | | | | | | | | | | | | | | | | | | | | | | | | | |
Purchase Contracts: | | | | | | | | | | | | | | | | | | | | | | | | | | | | | | | | |
| | | $ | 72,888,582 | | | | DB | | | | 01/19/2022 | | | | AUD | | | $ | 74,134,566 | | | | USD | | | $ | 72,888,582 | | | $ | 1,245,984 | | | $ | — | |
| | | | 1,655,504 | | | | BAML | | | | 03/18/2022 | | | | AUD | | | | 1,667,880 | | | | USD | | | | 1,655,504 | | | | 12,376 | | | | — | |
| | | | 26,779,313 | | | | DB | | | | 01/19/2022 | | | | BRL | | | | 27,050,602 | | | | USD | | | | 26,779,313 | | | | 271,289 | | | | — | |
| | | | 84,076,506 | | | | DB | | | | 01/19/2022 | | | | CAD | | | | 84,507,715 | | | | USD | | | | 84,076,506 | | | | 431,209 | | | | — | |
| | | | 1,461,671 | | | | BAML | | | | 03/18/2022 | | | | CAD | | | | 1,481,228 | | | | USD | | | | 1,461,671 | | | | 19,557 | | | | — | |
| | | | 91,853,947 | | | | DB | | | | 01/19/2022 | | | | CHF | | | | 92,824,914 | | | | USD | | | | 91,853,947 | | | | 970,967 | | | | — | |
| | | | 92,151,196 | | | | BAML | | | | 03/18/2022 | | | | CHF | | | | 92,912,543 | | | | USD | | | | 92,151,196 | | | | 761,347 | | | | — | |
| | | | 4,420,113 | | | | DB | | | | 01/19/2022 | | | | CLP | | | | 4,419,306 | | | | USD | | | | 4,420,113 | | | | — | | | | (807 | ) |
| | | | 36,044,132 | | | | DB | | | | 01/19/2022 | | | | EUR | | | | 36,298,064 | | | | NOK | | | | 36,044,132 | | | | 253,932 | | | | — | |
| | | | 3,106,824 | | | | DB | | | | 01/19/2022 | | | | EUR | | | | 3,132,089 | | | | PLN | | | | 3,106,824 | | | | 25,265 | | | | — | |
| | | | 50,689,922 | | | | DB | | | | 01/19/2022 | | | | EUR | | | | 51,092,913 | | | | SEK | | | | 50,689,922 | | | | 402,991 | | | | — | |
| | | | 83,645,090 | | | | DB | | | | 01/19/2022 | | | | EUR | | | | 84,179,162 | | | | USD | | | | 83,645,090 | | | | 534,072 | | | | — | |
| | | | 4,245,208 | | | | BAML | | | | 03/18/2022 | | | | EUR | | | | 4,280,773 | | | | USD | | | | 4,245,208 | | | | 35,565 | | | | — | |
| | | | 86,608,795 | | | | DB | | | | 01/19/2022 | | | | GBP | | | | 88,071,577 | | | | USD | | | | 86,608,795 | | | | 1,462,782 | | | | — | |
| | | | 3,546,180 | | | | DB | | | | 02/16/2022 | | | | GBP | | | | 3,559,204 | | | | USD | | | | 3,546,180 | | | | 13,024 | | | | — | |
| | | | 2,353,557 | | | | BAML | | | | 03/18/2022 | | | | GBP | | | | 2,374,663 | | | | USD | | | | 2,353,557 | | | | 21,106 | | | | — | |
| | | | 4,001,502 | | | | DB | | | | 01/19/2022 | | | | ILS | | | | 4,014,491 | | | | USD | | | | 4,001,502 | | | | 12,989 | | | | — | |
| | | | 11,692,348 | | | | DB | | | | 01/19/2022 | | | | INR | | | | 11,864,117 | | | | USD | | | | 11,692,348 | | | | 171,769 | | | | — | |
| | | | 2,173,777 | | | | DB | | | | 02/16/2022 | | | | INR | | | | 2,182,576 | | | | USD | | | | 2,173,777 | | | | 8,799 | | | | — | |
| | | | 9,515,957 | | | | DB | | | | 01/04/2022 | | | | JPY | | | | 9,510,818 | | | | USD | | | | 9,515,957 | | | | — | | | | (5,139 | ) |
| | | | 8,942,803 | | | | DB | | | | 01/05/2022 | | | | JPY | | | | 8,954,486 | | | | USD | | | | 8,942,803 | | | | 11,683 | | | | — | |
| | | | 65,526,326 | | | | DB | | | | 01/19/2022 | | | | JPY | | | | 64,566,722 | | | | USD | | | | 65,526,326 | | | | — | | | | (959,604 | ) |
| | | | 145,378,088 | | | | BAML | | | | 03/18/2022 | | | | JPY | | | | 143,919,864 | | | | USD | | | | 145,378,088 | | | | — | | | | (1,458,224 | ) |
| | | | 7,094,495 | | | | DB | | | | 01/19/2022 | | | | KRW | | | | 7,048,749 | | | | USD | | | | 7,094,495 | | | | — | | | | (45,746 | ) |
| | | | 34,567,098 | | | | DB | | | | 01/19/2022 | | | | MXN | | | | 35,540,279 | | | | USD | | | | 34,567,098 | | | | 973,181 | | | | — | |
| | | | 11,801,612 | | | | BAML | | | | 03/18/2022 | | | | MXN | | | | 12,104,863 | | | | USD | | | | 11,801,612 | | | | 303,251 | | | | — | |
| | | | 43,082,177 | | | | DB | | | | 01/19/2022 | | | | NOK | | | | 44,094,601 | | | | EUR | | | | 43,082,177 | | | | 1,012,424 | | | | — | |
| | | | 30,871,303 | | | | DB | | | | 01/19/2022 | | | | NOK | | | | 31,475,766 | | | | USD | | | | 30,871,303 | | | | 604,463 | | | | — | |
| | | | 3,815,604 | | | | DB | | | | 01/05/2022 | | | | NZD | | | | 3,821,538 | | | | USD | | | | 3,815,604 | | | | 5,934 | | | | — | |
| | | | 42,347,741 | | | | DB | | | | 01/19/2022 | | | | NZD | | | | 42,843,757 | | | | USD | | | | 42,347,741 | | | | 496,016 | | | | — | |
| | | | 1,379,753 | | | | BAML | | | | 03/18/2022 | | | | NZD | | | | 1,385,176 | | | | USD | | | | 1,379,753 | | | | 5,423 | | | | — | |
| | | | 9,502,027 | | | | DB | | | | 01/19/2022 | | | | PLN | | | | 9,605,253 | | | | EUR | | | | 9,502,027 | | | | 103,226 | | | | — | |
| | | | 9,215,165 | | | | DB | | | | 01/19/2022 | | | | PLN | | | | 9,337,492 | | | | USD | | | | 9,215,165 | | | | 122,327 | | | | — | |
| | | | 25,325,621 | | | | DB | | | | 01/19/2022 | | | | RUB | | | | 24,905,128 | | | | USD | | | | 25,325,621 | | | | — | | | | (420,493 | ) |
| | | | 14,901,385 | | | | DB | | | | 02/16/2022 | | | | RUB | | | | 14,681,511 | | | | USD | | | | 14,901,385 | | | | — | | | | (219,874 | ) |
| | | | 60,780,649 | | | | DB | | | | 01/19/2022 | | | | SEK | | | | 61,136,137 | | | | EUR | | | | 60,780,649 | | | | 355,488 | | | | — | |
| | | | 51,477,482 | | | | DB | | | | 01/19/2022 | | | | SEK | | | | 51,754,058 | | | | USD | | | | 51,477,482 | | | | 276,576 | | | | — | |
| | | | 10,803,225 | | | | DB | | | | 01/19/2022 | | | | SGD | | | | 10,944,035 | | | | USD | | | | 10,803,225 | | | | 140,810 | | | | — | |
| | | | 6,346,166 | | | | DB | | | | 01/19/2022 | | | | ZAR | | | | 6,360,826 | | | | USD | | | | 6,346,166 | | | | 14,660 | | | | — | |
Total Purchase Contracts | | | | | | | | | | | | | | | 1,264,039,442 | | | | | | | | 1,256,068,844 | | | | 11,080,485 | | | | (3,109,887 | ) |
| | | | | | | | | | | | | | | | | | | | | | | | | | | | | | | | | | | | | |
The accompanying notes are an integral part of these consolidated financial statements. | 27 |
LoCorr Macro Strategies Fund – Consolidated Schedule of Open Forward Currency Contracts (continued) |
| | | | | | | | | | | | | | | Currency to be Received | | | Currency to be Delivered | | | | | | | | | |
| | | Notional
Amount | | | Counterparty
Abbreviation | | | Forward
Settlement
Date | | | Currency
Abbreviation | | | U.S. $ Notional
Amount at
December 31,
2021 | | | Currency
Abbreviation | | | U.S. $ Notional
Amount on
Origination
Date | | | Unrealized
Appreciation | | | Unrealized
(Depreciation) | |
| | | | See key for abbreviation | | | | | | | | | | | | | | | | | | | | | | | | | | | | | |
Sale Contracts: | | | | | | | | | | | | | | | | | | | | | | | | | | | | | | | | |
| | | $ | 84,986,390 | | | | DB | | | | 01/19/2022 | | | | USD | | | $ | 87,136,675 | | | | AUD | | | $ | 84,986,390 | | | $ | — | | | $ | (2,150,285 | ) |
| | | | 101,592,869 | | | | BAML | | | | 03/18/2022 | | | | USD | | | | 103,426,043 | | | | AUD | | | | 101,592,869 | | | | — | | | | (1,833,174 | ) |
| | | | 42,358,101 | | | | DB | | | | 01/19/2022 | | | | USD | | | | 43,279,176 | | | | BRL | | | | 42,358,101 | | | | — | | | | (921,075 | ) |
| | | | 97,567,567 | | | | DB | | | | 01/19/2022 | | | | USD | | | | 98,721,454 | | | | CAD | | | | 97,567,567 | | | | — | | | | (1,153,887 | ) |
| | | | 115,359,755 | | | | BAML | | | | 03/18/2022 | | | | USD | | | | 115,702,529 | | | | CAD | | | | 115,359,755 | | | | — | | | | (342,774 | ) |
| | | | 74,137,254 | | | | DB | | | | 01/19/2022 | | | | USD | | | | 74,850,655 | | | | CHF | | | | 74,137,254 | | | | — | | | | (713,401 | ) |
| | | | 15,002,125 | | | | BAML | | | | 03/18/2022 | | | | USD | | | | 15,184,297 | | | | CHF | | | | 15,002,125 | | | | — | | | | (182,172 | ) |
| | | | 4,335,900 | | | | DB | | | | 01/19/2022 | | | | USD | | | | 4,352,577 | | | | CLP | | | | 4,335,900 | | | | — | | | | (16,677 | ) |
| | | | 43,082,177 | | | | DB | | | | 01/19/2022 | | | | NOK | | | | 43,313,943 | | | | EUR | | | | 43,082,177 | | | | — | | | | (231,766 | ) |
| | | | 9,502,027 | | | | DB | | | | 01/19/2022 | | | | PLN | | | | 9,521,551 | | | | EUR | | | | 9,502,027 | | | | — | | | | (19,524 | ) |
| | | | 60,780,649 | | | | DB | | | | 01/19/2022 | | | | SEK | | | | 61,195,324 | | | | EUR | | | | 60,780,649 | | | | — | | | | (414,675 | ) |
| | | | 105,612,793 | | | | DB | | | | 01/19/2022 | | | | USD | | | | 106,399,910 | | | | EUR | | | | 105,612,793 | | | | — | | | | (787,117 | ) |
| | | | 199,363,736 | | | | BAML | | | | 03/18/2022 | | | | USD | | | | 200,671,764 | | | | EUR | | | | 199,363,736 | | | | — | | | | (1,308,028 | ) |
| | | | 86,535,475 | | | | DB | | | | 01/19/2022 | | | | USD | | | | 88,071,577 | | | | GBP | | | | 86,535,475 | | | | — | | | | (1,536,102 | ) |
| | | | 147,457,579 | | | | BAML | | | | 03/18/2022 | | | | USD | | | | 150,764,696 | | | | GBP | | | | 147,457,579 | | | | — | | | | (3,307,117 | ) |
| | | | 6,613,413 | | | | DB | | | | 01/19/2022 | | | | USD | | | | 6,719,769 | | | | ILS | | | | 6,613,413 | | | | — | | | | (106,356 | ) |
| | | | 11,611,513 | | | | DB | | | | 01/19/2022 | | | | USD | | | | 11,864,117 | | | | INR | | | | 11,611,513 | | | | — | | | | (252,604 | ) |
| | | | 9,525,405 | | | | DB | | | | 01/04/2022 | | | | USD | | | | 9,510,818 | | | | JPY | | | | 9,525,405 | | | | 14,587 | | | | — | |
| | | | 8,948,596 | | | | DB | | | | 01/05/2022 | | | | USD | | | | 8,954,486 | | | | JPY | | | | 8,948,596 | | | | — | | | | (5,890 | ) |
| | | | 99,434,167 | | | | DB | | | | 01/19/2022 | | | | USD | | | | 98,336,873 | | | | JPY | | | | 99,434,167 | | | | 1,097,294 | | | | — | |
| | | | 343,282,916 | | | | BAML | | | | 03/18/2022 | | | | USD | | | | 339,870,936 | | | | JPY | | | | 343,282,916 | | | | 3,411,980 | | | | — | |
| | | | 5,860,761 | | | | DB | | | | 01/19/2022 | | | | USD | | | | 5,837,941 | | | | KRW | | | | 5,860,761 | | | | 22,820 | | | | — | |
| | | | 1,756,060 | | | | DB | | | | 01/19/2022 | | | | USD | | | | 1,777,306 | | | | MXN | | | | 1,756,060 | | | | — | | | | (21,246 | ) |
| | | | 2,633,605 | | | | BAML | | | | 03/18/2022 | | | | USD | | | | 2,644,085 | | | | MXN | | | | 2,633,605 | | | | — | | | | (10,480 | ) |
| | | | 36,044,132 | | | | DB | | | | 01/19/2022 | | | | EUR | | | | 36,980,443 | | | | NOK | | | | 36,044,132 | | | | — | | | | (936,311 | ) |
| | | | 31,533,276 | | | | DB | | | | 01/19/2022 | | | | USD | | | | 32,321,431 | | | | NOK | | | | 31,533,276 | | | | — | | | | (788,155 | ) |
| | | | 3,813,793 | | | | DB | | | | 01/05/2022 | | | | USD | | | | 3,821,538 | | | | NZD | | | | 3,813,793 | | | | — | | | | (7,745 | ) |
| | | | 24,300,971 | | | | DB | | | | 01/19/2022 | | | | USD | | | | 24,520,296 | | | | NZD | | | | 24,300,971 | | | | — | | | | (219,325 | ) |
| | | | 46,742,036 | | | | BAML | | | | 03/18/2022 | | | | USD | | | | 47,278,636 | | | | NZD | | | | 46,742,036 | | | | — | | | | (536,600 | ) |
| | | | 3,106,824 | | | | DB | | | | 01/19/2022 | | | | EUR | | | | 3,163,056 | | | | PLN | | | | 3,106,824 | | | | — | | | | (56,232 | ) |
| | | | 6,989,248 | | | | DB | | | | 01/19/2022 | | | | USD | | | | 7,116,522 | | | | PLN | | | | 6,989,248 | | | | — | | | | (127,274 | ) |
| | | | 25,216,773 | | | | DB | | | | 01/19/2022 | | | | USD | | | | 24,905,128 | | | | RUB | | | | 25,216,773 | | | | 311,645 | | | | — | |
| | | | 3,624,582 | | | | DB | | | | 02/16/2022 | | | | USD | | | | 3,585,616 | | | | RUB | | | | 3,624,582 | | | | 38,966 | | | | — | |
| | | | 50,689,922 | | | | DB | | | | 01/19/2022 | | | | EUR | | | | 50,827,165 | | | | SEK | | | | 50,689,922 | | | | — | | | | (137,243 | ) |
| | | | 51,577,645 | | | | DB | | | | 01/19/2022 | | | | USD | | | | 51,754,058 | | | | SEK | | | | 51,577,645 | | | | — | | | | (176,413 | ) |
| | | | 57,478 | | | | DB | | | | 02/16/2022 | | | | USD | | | | 57,567 | | | | SEK | | | | 57,478 | | | | — | | | | (89 | ) |
| | | | 6,770,948 | | | | DB | | | | 01/19/2022 | | | | USD | | | | 6,870,628 | | | | SGD | | | | 6,770,948 | | | | — | | | | (99,680 | ) |
| | | | 4,503,229 | | | | DB | | | | 01/19/2022 | | | | USD | | | | 4,514,034 | | | | ZAR | | | | 4,503,229 | | | | — | | | | (10,805 | ) |
Total Sale Contracts | | | | | | | | | | | | | | | 1,985,824,620 | | | | | | | | 1,972,311,690 | | | | 4,897,292 | | | | (18,410,222 | ) |
Net Forward Currency Contracts | | | | | | | | | | $ | (721,785,178 | ) | | | | | | $ | (716,242,846 | ) | | $ | 15,977,777 | | | $ | (21,520,109 | ) |
Net Unrealized Depreciation | | | | | | | | | | | | | | | | | | | | | | | | | | | | | | $ | (5,542,332 | ) |
Counterparty Abbreviations:
BAML | Bank of America Merrill Lynch |
DB | Deutsche Bank |
28 | The accompanying notes are an integral part of these consolidated financial statements. |
LoCorr Macro Strategies Fund – Consolidated Schedule of Open Forward Currency Contracts (continued) |
Currency Abbreviations:
AUD | AUSTRALIAN DOLLAR | INR | INDIAN RUPEE | SEK | SWEDISH KRONA |
BRL | BRAZILIAN REAL | JPY | JAPANESE YEN | SGD | SINGAPORE DOLLAR |
CAD | CANADIAN DOLLAR | KRW | SOUTH KOREAN WON | USD | U.S. DOLLAR |
CHF | SWISS FRANC | MXN | MEXICAN PESO | ZAR | SOUTH AFRICAN RAND |
CLP | CHILEAN PESO | NOK | NORWEGIAN KRONE | | |
EUR | EURO | NZD | NEW ZEALAND DOLLAR | | |
GBP | BRITISH POUND | PLN | POLISH ZLOTY | | |
ILS | ISRAELI NEW SHEQEL | RUB | RUSSIAN RUBLE | | |
The accompanying notes are an integral part of these consolidated financial statements. | 29 |
LoCorr Macro Strategies Fund – Consolidated Schedule of Open Futures Contracts |
LoCorr Macro Strategies Fund
Consolidated Schedule of Open Futures Contracts
December 31, 2021
| | | Number of
Contracts | | | | | | | Current | | | Notional | | | Value | |
Description | | Purchased
(Sold) | | | Settlement
Month-Year | | | Notional
Amount | | | Amount At
Trade Date | | | Unrealized
Appreciation | | | Unrealized
(Depreciation) | |
Purchase Contracts: | | | | | | | | | | | | | | | | | | | | | | | | |
10 Yr Mini JGB | | | 10 | | | | Mar-22 | | | $ | 1,318,004 | | | $ | 1,322,122 | | | $ | — | | | $ | (4,118 | ) |
90 Day Euro | | | 112 | | | | Jun-23 | | | | 27,616,400 | | | | 27,613,607 | | | | 2,793 | | | | — | |
Aluminum - 90 Day Settlement (a) | | | 1 | | | | Jan-22 | | | | 70,090 | | | | 79,396 | | | | — | | | | (9,306 | ) |
Aluminum - 90 Day Settlement (a) | | | 2 | | | | Jan-22 | | | | 140,100 | | | | 145,804 | | | | — | | | | (5,704 | ) |
Aluminum - 90 Day Settlement (a) | | | 8 | | | | Jan-22 | | | | 560,542 | | | | 547,831 | | | | 12,711 | | | | — | |
Aluminum - 90 Day Settlement (a) | | | 5 | | | | Jan-22 | | | | 350,353 | | | | 341,540 | | | | 8,813 | | | | — | |
Aluminum - 90 Day Settlement (a) | | | 5 | | | | Feb-22 | | | | 350,457 | | | | 328,718 | | | | 21,739 | | | | — | |
Aluminum - 90 Day Settlement (a) | | | 1 | | | | Feb-22 | | | | 70,108 | | | | 64,687 | | | | 5,421 | | | | — | |
Aluminum - 90 Day Settlement (a) | | | 2 | | | | Feb-22 | | | | 140,222 | | | | 134,904 | | | | 5,318 | | | | — | |
Aluminum - 90 Day Settlement (a) | | | 1 | | | | Feb-22 | | | | 70,122 | | | | 66,371 | | | | 3,751 | | | | — | |
Aluminum - 90 Day Settlement (a) | | | 2 | | | | Feb-22 | | | | 140,250 | | | | 130,681 | | | | 9,569 | | | | — | |
Aluminum - 90 Day Settlement (a) | | | 1 | | | | Mar-22 | | | | 70,181 | | | | 64,837 | | | | 5,344 | | | | — | |
Aluminum - 90 Day Settlement (a) | | | 4 | | | | Mar-22 | | | | 280,900 | | | | 264,617 | | | | 16,283 | | | | — | |
Aluminum - 90 Day Settlement (a) | | | 1 | | | | Mar-22 | | | | 70,150 | | | | 68,979 | | | | 1,171 | | | | — | |
Aluminum - 90 Day Settlement (a) | | | 4 | | | | Mar-22 | | | | 280,631 | | | | 282,728 | | | | — | | | | (2,097 | ) |
Aluminum (a) | | | 372 | | | | Mar-22 | | | | 26,114,400 | | | | 24,496,736 | | | | 1,617,664 | | | | — | |
Amsterdam Exchange Index | | | 38 | | | | Jan-22 | | | | 6,902,083 | | | | 6,836,863 | | | | 65,220 | | | | — | |
Australian 10 Yr Bond | | | 297 | | | | Mar-22 | | | | 30,071,515 | | | | 30,269,244 | | | | — | | | | (197,729 | ) |
Australian 3 Yr Bond | | | 165 | | | | Mar-22 | | | | 13,703,197 | | | | 13,697,546 | | | | 5,651 | | | | — | |
Brent Crude | | | 391 | | | | Jan-22 | | | | 30,411,980 | | | | 30,096,632 | | | | 315,348 | | | | — | |
Brent Crude | | | 40 | | | | Feb-22 | | | | 3,094,000 | | | | 3,119,250 | | | | — | | | | (25,250 | ) |
Brent Crude | | | 22 | | | | Mar-22 | | | | 1,691,800 | | | | 1,666,458 | | | | 25,342 | | | | — | |
Brent Crude | | | 11 | | | | Apr-22 | | | | 840,290 | | | | 829,174 | | | | 11,116 | | | | — | |
Brent Crude | | | 6 | | | | May-22 | | | | 455,040 | | | | 443,898 | | | | 11,142 | | | | — | |
Brent Crude | | | 4 | | | | Jun-22 | | | | 301,280 | | | | 291,505 | | | | 9,775 | | | | — | |
British Pound | | | 27 | | | | Mar-22 | | | | 2,283,356 | | | | 2,269,373 | | | | 13,983 | | | | — | |
CAC 40 10 Euro Index | | | 390 | | | | Jan-22 | | | | 31,715,945 | | | | 30,905,011 | | | | 810,934 | | | | — | |
Canadian 10 Yr Bond | | | 766 | | | | Mar-22 | | | | 86,364,616 | | | | 86,059,137 | | | | 305,479 | | | | — | |
Cocoa | | | 3 | | | | Mar-22 | | | | 75,600 | | | | 74,058 | | | | 1,542 | | | | — | |
Coffee | | | 183 | | | | Mar-22 | | | | 15,516,113 | | | | 14,636,422 | | | | 879,691 | | | | — | |
Copper - 90 Day Settlement (a) | | | 2 | | | | Jan-22 | | | | 487,363 | | | | 493,077 | | | | — | | | | (5,714 | ) |
Copper - 90 Day Settlement (a) | | | 1 | | | | Feb-22 | | | | 243,502 | | | | 238,412 | | | | 5,090 | | | | — | |
Copper - 90 Day Settlement (a) | | | 1 | | | | Feb-22 | | | | 243,497 | | | | 241,737 | | | | 1,760 | | | | — | |
Copper - 90 Day Settlement (a) | | | 1 | | | | Feb-22 | | | | 243,500 | | | | 241,074 | | | | 2,426 | | | | — | |
Copper - 90 Day Settlement (a) | | | 1 | | | | Feb-22 | | | | 243,488 | | | | 240,549 | | | | 2,939 | | | | — | |
Copper - 90 Day Settlement (a) | | | 2 | | | | Feb-22 | | | | 486,575 | | | | 478,795 | | | | 7,780 | | | | — | |
Copper - 90 Day Settlement (a) | | | 1 | | | | Mar-22 | | | | 243,288 | | | | 238,946 | | | | 4,342 | | | | — | |
Copper - 90 Day Settlement (a) | | | 1 | | | | Mar-22 | | | | 243,288 | | | | 238,477 | | | | 4,811 | | | | — | |
Copper - 90 Day Settlement (a) | | | 1 | | | | Mar-22 | | | | 243,288 | | | | 237,596 | | | | 5,692 | | | | — | |
Copper - 90 Day Settlement (a) | | | 1 | | | | Mar-22 | | | | 243,025 | | | | 241,825 | | | | 1,200 | | | | — | |
Copper - 90 Day Settlement (a) | | | 1 | | | | Mar-22 | | | | 242,502 | | | | 242,502 | | | | — | | | | — | |
Copper - 90 Day Settlement (a) | | | 1 | | | | Feb-22 | | | | 89,165 | | | | 83,517 | | | | 5,648 | | | | — | |
Copper (a) | | | 133 | | | | Mar-22 | | | | 32,357,238 | | | | 31,796,635 | | | | 560,603 | | | | — | |
Copper | | | 70 | | | | Mar-22 | | | | 7,811,125 | | | | 7,698,203 | | | | 112,922 | | | | — | |
Corn | | | 850 | | | | Mar-22 | | | | 25,213,125 | | | | 24,504,557 | | | | 708,568 | | | | — | |
Cotton No.2 | | | 146 | | | | Mar-22 | | | | 8,219,800 | | | | 8,277,931 | | | | — | | | | (58,131 | ) |
30 | The accompanying notes are an integral part of these consolidated financial statements. |
LoCorr Macro Strategies Fund – Consolidated Schedule of Open Futures Contracts (continued) |
| | | Number of
Contracts | | | | | | | Current | | | Notional | | | Value | |
Description | | Purchased
(Sold) | | | Settlement
Month-Year | | | Notional
Amount | | | Amount At
Trade Date | | | Unrealized
Appreciation | | | Unrealized
(Depreciation) | |
Purchase Contracts: (continued) |
Dollar | | | 241 | | | | Mar-22 | | | $ | 23,037,913 | | | $ | 23,195,725 | | | $ | — | | | $ | (157,812 | ) |
Dow Jones Industrial Average Mini E-Cbot Index | | | 358 | | | | Mar-22 | | | | 64,844,540 | | | | 64,308,004 | | | | 536,536 | | | | — | |
Euro-Bund | | | 82 | | | | Mar-22 | | | | 15,998,566 | | | | 16,163,083 | | | | — | | | | (164,517 | ) |
Euro-Buxl 30 Yr Bond | | | 66 | | | | Mar-22 | | | | 15,534,627 | | | | 15,683,974 | | | | — | | | | (149,347 | ) |
Euro-OAT | | | 154 | | | | Mar-22 | | | | 28,604,884 | | | | 29,023,488 | | | | — | | | | (418,604 | ) |
Euro-Schatz | | | 475 | | | | Mar-22 | | | | 60,584,334 | | | | 60,688,259 | | | | — | | | | (103,925 | ) |
Euro-Stoxx 50 Index | | | 946 | | | | Mar-22 | | | | 46,177,209 | | | | 45,149,632 | | | | 1,027,577 | | | | — | |
FTSE 100 Index | | | 289 | | | | Mar-22 | | | | 28,649,648 | | | | 28,158,202 | | | | 491,446 | | | | — | |
FTSE MIB Index | | | 76 | | | | Mar-22 | | | | 11,788,285 | | | | 11,567,814 | | | | 220,471 | | | | — | |
Gasoline RBOB | | | 252 | | | | Jan-22 | | | | 23,545,166 | | | | 23,343,198 | | | | 201,968 | | | | — | |
Gasoline RBOB | | | 30 | | | | Feb-22 | | | | 2,808,036 | | | | 2,791,333 | | | | 16,703 | | | | — | |
Gasoline RBOB | | | 13 | | | | Mar-22 | | | | 1,272,944 | | | | 1,235,161 | | | | 37,783 | | | | — | |
Gasoline RBOB | | | 7 | | | | Apr-22 | | | | 683,285 | | | | 653,651 | | | | 29,634 | | | | — | |
Gold | | | 123 | | | | Feb-22 | | | | 22,491,780 | | | | 22,279,437 | | | | 212,343 | | | | — | |
Hang Seng Index | | | 5 | | | | Jan-22 | | | | 751,871 | | | | 741,197 | | | | 10,674 | | | | — | |
Hard Red Wheat | | | 192 | | | | Mar-22 | | | | 7,694,400 | | | | 7,937,333 | | | | — | | | | (242,933 | ) |
Heating Oil | | | 315 | | | | Jan-22 | | | | 30,763,719 | | | | 29,528,349 | | | | 1,235,370 | | | | — | |
Heating Oil | | | 37 | | | | Feb-22 | | | | 3,587,254 | | | | 3,484,103 | | | | 103,151 | | | | — | |
Heating Oil | | | 9 | | | | Mar-22 | | | | 863,654 | | | | 832,466 | | | | 31,188 | | | | — | |
Heating Oil | | | 4 | | | | Apr-22 | | | | 381,142 | | | | 379,411 | | | | 1,731 | | | | — | |
Japanese 10 Yr Bond | | | 119 | | | | Mar-22 | | | | 156,821,786 | | | | 157,248,121 | | | | — | | | | (426,335 | ) |
Lead (a) | | | 17 | | | | Mar-22 | | | | 983,450 | | | | 966,979 | | | | 16,471 | | | | — | |
Lead Based Metal - 90 Day Settlement (a) | | | 1 | | | | Feb-22 | | | | 58,038 | | | | 59,313 | | | | — | | | | (1,275 | ) |
Lead Based Metal - 90 Day Settlement (a) | | | 1 | | | | Feb-22 | | | | 57,900 | | | | 56,612 | | | | 1,288 | | | | — | |
Lead Based Metal - 90 Day Settlement (a) | | | 1 | | | | Mar-22 | | | | 57,850 | | | | 57,853 | | | | — | | | | (3 | ) |
Live Cattle | | | 25 | | | | Feb-22 | | | | 1,397,000 | | | | 1,411,482 | | | | — | | | | (14,482 | ) |
Long Gilt | | | 388 | | | | Mar-22 | | | | 65,594,477 | | | | 66,297,666 | | | | — | | | | (703,189 | ) |
Low Sulphur Gasoil | | | 333 | | | | Feb-22 | | | | 22,186,125 | | | | 21,913,752 | | | | 272,373 | | | | — | |
Low Sulphur Gasoil | | | 73 | | | | Mar-22 | | | | 4,839,900 | | | | 4,909,767 | | | | — | | | | (69,867 | ) |
Low Sulphur Gasoil | | | 17 | | | | Apr-22 | | | | 1,119,875 | | | | 1,134,346 | | | | — | | | | (14,471 | ) |
MSCI EAFE Index | | | 59 | | | | Mar-22 | | | | 6,849,310 | | | | 6,859,700 | | | | — | | | | (10,390 | ) |
MSCI Taiwan Index | | | 79 | | | | Jan-22 | | | | 5,067,060 | | | | 5,052,108 | | | | 14,952 | | | | — | |
Nasdaq 100 E-Mini Index | | | 282 | | | | Mar-22 | | | | 92,049,030 | | | | 91,809,029 | | | | 240,001 | | | | — | |
Natural Gas | | | 91 | | | | Jan-22 | | | | 3,394,300 | | | | 3,426,985 | | | | — | | | | (32,685 | ) |
Nickel - 90 Day Settlement (a) | | | 1 | | | | Feb-22 | | | | 125,071 | | | | 117,898 | | | | 7,173 | | | | — | |
Nickel - 90 Day Settlement (a) | | | 1 | | | | Feb-22 | | | | 125,024 | | | | 118,085 | | | | 6,939 | | | | — | |
Nickel - 90 Day Settlement (a) | | | 1 | | | | Feb-22 | | | | 124,893 | | | | 116,253 | | | | 8,640 | | | | — | |
Nickel - 90 Day Settlement (a) | | | 1 | | | | Feb-22 | | | | 124,785 | | | | 119,813 | | | | 4,972 | | | | — | |
Nickel - 90 Day Settlement (a) | | | 1 | | | | Feb-22 | | | | 124,746 | | | | 124,095 | | | | 651 | | | | — | |
Nickel - 90 Day Settlement (a) | | | 1 | | | | Mar-22 | | | | 124,771 | | | | 120,798 | | | | 3,973 | | | | — | |
Nickel - 90 Day Settlement (a) | | | 1 | | | | Mar-22 | | | | 124,761 | | | | 117,657 | | | | 7,104 | | | | — | |
Nickel - 90 Day Settlement (a) | | | 2 | | | | Mar-22 | | | | 249,240 | | | | 233,247 | | | | 15,993 | | | | — | |
Nickel - 90 Day Settlement (a) | | | 1 | | | | Mar-22 | | | | 124,542 | | | | 121,649 | | | | 2,893 | | | | — | |
Nickel (a) | | | 36 | | | | Mar-22 | | | | 4,491,396 | | | | 4,260,412 | | | | 230,984 | | | | — | |
Nikkei 225 Index | | | 9 | | | | Mar-22 | | | | 2,251,760 | | | | 2,269,004 | | | | — | | | | (17,244 | ) |
Nikkei 225 Index | | | 8 | | | | Mar-22 | | | | 1,000,087 | | | | 1,004,270 | | | | — | | | | (4,183 | ) |
OMX Stockholm 30 Index | | | 376 | | | | Jan-22 | | | | 10,066,599 | | | | 9,817,107 | | | | 249,492 | | | | — | |
Platinum | | | 6 | | | | Apr-22 | | | | 289,860 | | | | 284,242 | | | | 5,618 | | | | — | |
Russell 2000 Mini Index | | | 214 | | | | Mar-22 | | | | 23,997,960 | | | | 24,063,452 | | | | — | | | | (65,492 | ) |
S&P 500 E-Mini Index | | | 530 | | | | Mar-22 | | | | 126,100,250 | | | | 124,574,809 | | | | 1,525,441 | | | | — | |
S&P MidCap 400 E-Mini Index | | | 5 | | | | Mar-22 | | | | 1,418,850 | | | | 1,421,139 | | | | — | | | | (2,289 | ) |
The accompanying notes are an integral part of these consolidated financial statements. | 31 |
LoCorr Macro Strategies Fund – Consolidated Schedule of Open Futures Contracts (continued) |
| | | Number of
Contracts | | | | | | | Current | | | Notional | | | Value | |
Description | | Purchased
(Sold) | | | Settlement
Month-Year | | | Notional
Amount | | | Amount At
Trade Date | | | Unrealized
Appreciation | | | Unrealized
(Depreciation) | |
Purchase Contracts: (continued) |
S&P/TSX 60 Index | | | 35 | | | | Mar-22 | | | $ | 7,088,264 | | | $ | 7,097,301 | | | $ | — | | | $ | (9,037 | ) |
Silver | | | 32 | | | | Mar-22 | | | | 3,736,320 | | | | 3,695,014 | | | | 41,306 | | | | — | |
Soybean | | | 53 | | | | Mar-22 | | | | 3,549,013 | | | | 3,623,278 | | | | — | | | | (74,265 | ) |
Soybean Meal | | | 116 | | | | Mar-22 | | | | 4,629,560 | | | | 4,477,330 | | | | 152,230 | | | | — | |
SPI 200 Index | | | 77 | | | | Mar-22 | | | | 10,289,692 | | | | 10,324,854 | | | | — | | | | (35,162 | ) |
Sugar | | | 371 | | | | Feb-22 | | | | 7,845,018 | | | | 8,138,336 | | | | — | | | | (293,318 | ) |
Tokyo Price Index | | | 15 | | | | Mar-22 | | | | 2,597,583 | | | | 2,607,625 | | | | — | | | | (10,042 | ) |
U.S. 10 Yr Note | | | 739 | | | | Mar-22 | | | | 96,416,406 | | | | 96,618,963 | | | | — | | | | (202,557 | ) |
U.S. 2 Yr Note | | | 483 | | | | Mar-22 | | | | 105,377,018 | | | | 105,418,863 | | | | — | | | | (41,845 | ) |
U.S. 5 Yr Note | | | 947 | | | | Mar-22 | | | | 114,564,802 | | | | 114,598,184 | | | | — | | | | (33,382 | ) |
U.S. Long Bond | | | 1157 | | | | Mar-22 | | | | 185,626,188 | | | | 186,158,327 | | | | — | | | | (532,139 | ) |
U.S. Ultra Bond | | | 158 | | | | Mar-22 | | | | 31,145,750 | | | | 31,295,633 | | | | — | | | | (149,883 | ) |
Wheat | | | 289 | | | | Mar-22 | | | | 11,137,338 | | | | 11,796,272 | | | | — | | | | (658,934 | ) |
WTI Crude | | | 449 | | | | Jan-22 | | | | 33,769,290 | | | | 32,269,507 | | | | 1,499,783 | | | | — | |
WTI Crude | | | 49 | | | | Feb-22 | | | | 3,669,120 | | | | 3,651,496 | | | | 17,624 | | | | — | |
WTI Crude | | | 19 | | | | Mar-22 | | | | 1,414,550 | | | | 1,335,387 | | | | 79,163 | | | | — | |
WTI Crude | | | 10 | | | | Apr-22 | | | | 739,400 | | | | 700,910 | | | | 38,490 | | | | — | |
WTI Crude | | | 6 | | | | May-22 | | | | 440,220 | | | | 410,312 | | | | 29,908 | | | | — | |
WTI Crude | | | 3 | | | | Jun-22 | | | | 218,340 | | | | 211,846 | | | | 6,494 | | | | — | |
Zinc - 90 Day Settlement (a) | | | 1 | | | | Feb-22 | | | | 89,154 | | | | 82,655 | | | | 6,499 | | | | — | |
Zinc - 90 Day Settlement (a) | | | 1 | | | | Feb-22 | | | | 88,950 | | | | 80,174 | | | | 8,776 | | | | — | |
Zinc - 90 Day Settlement (a) | | | 1 | | | | Feb-22 | | | | 88,818 | | | | 83,345 | | | | 5,473 | | | | — | |
Zinc - 90 Day Settlement (a) | | | 1 | | | | Feb-22 | | | | 88,807 | | | | 80,112 | | | | 8,695 | | | | — | |
Zinc - 90 Day Settlement (a) | | | 1 | | | | Mar-22 | | | | 88,700 | | | | 85,813 | | | | 2,887 | | | | — | |
Zinc - 90 Day Settlement (a) | | | 1 | | | | Mar-22 | | | | 88,542 | | | | 86,034 | | | | 2,508 | | | | — | |
Zinc - 90 Day Settlement (a) | | | 1 | | | | Mar-22 | | | | 88,375 | | | | 88,490 | | | | — | | | | (115 | ) |
Zinc (a) | | | 198 | | | | Mar-22 | | | | 17,562,600 | | | | 16,268,769 | | | | 1,293,831 | | | | — | |
Total Purchase Contracts | | | | | | | | | | | | | | | | | | | 15,554,781 | | | | (4,947,771 | ) |
| | | | | | | | | | | | | | | | | | | | | | | | | |
Sale Contracts: | | | | | | | | | | | | | | | | | | | | | | | | |
3 Mo Euro Euribor | | | (1,569) | | | | Jun-23 | | | $ | 446,888,569 | | | $ | 447,432,816 | | | $ | 544,247 | | | $ | — | |
90 Day Euro | | | (12) | | | | Mar-23 | | | | 2,963,700 | | | | 2,961,879 | | | | — | | | | (1,821 | ) |
90 Day Euro | | | (86) | | | | Sep-22 | | | | 21,326,925 | | | | 21,322,263 | | | | — | | | | (4,662 | ) |
90 Day Euro | | | (9) | | | | Sep-23 | | | | 2,216,025 | | | | 2,214,884 | | | | — | | | | (1,141 | ) |
90 Day Euro | | | (4,195) | | | | Dec-22 | | | | 1,037,790,563 | | | | 1,039,541,238 | | | | 1,750,675 | | | | — | |
90 Day Euro | | | (29) | | | | Dec-23 | | | | 7,134,725 | | | | 7,131,862 | | | | — | | | | (2,863 | ) |
90 Day Euro | | | (98) | | | | Mar-24 | | | | 24,103,100 | | | | 24,095,829 | | | | — | | | | (7,271 | ) |
Aluminum - 90 Day Settlement (a) | | | (1) | | | | Jan-22 | | | | 70,090 | | | | 79,717 | | | | 9,627 | | | | — | |
Aluminum - 90 Day Settlement (a) | | | (2) | | | | Jan-22 | | | | 140,100 | | | | 148,009 | | | | 7,909 | | | | — | |
Aluminum - 90 Day Settlement (a) | | | (8) | | | | Jan-22 | | | | 560,542 | | | | 535,955 | | | | — | | | | (24,587 | ) |
Aluminum - 90 Day Settlement (a) | | | (5) | | | | Jan-22 | | | | 350,353 | | | | 336,194 | | | | — | | | | (14,159 | ) |
Aluminum - 90 Day Settlement (a) | | | (5) | | | | Feb-22 | | | | 350,456 | | | | 319,163 | | | | — | | | | (31,293 | ) |
Aluminum - 90 Day Settlement (a) | | | (1) | | | | Feb-22 | | | | 70,108 | | | | 64,815 | | | | — | | | | (5,293 | ) |
Aluminum - 90 Day Settlement (a) | | | (2) | | | | Feb-22 | | | | 140,222 | | | | 133,873 | | | | — | | | | (6,349 | ) |
Aluminum - 90 Day Settlement (a) | | | (1) | | | | Feb-22 | | | | 70,122 | | | | 66,965 | | | | — | | | | (3,157 | ) |
Aluminum - 90 Day Settlement (a) | | | (2) | | | | Feb-22 | | | | 140,250 | | | | 128,725 | | | | — | | | | (11,525 | ) |
Aluminum - 90 Day Settlement (a) | | | (1) | | | | Mar-22 | | | | 70,181 | | | | 64,687 | | | | — | | | | (5,494 | ) |
Aluminum - 90 Day Settlement (a) | | | (4) | | | | Mar-22 | | | | 280,900 | | | | 263,364 | | | | — | | | | (17,536 | ) |
Aluminum - 90 Day Settlement (a) | | | (1) | | | | Mar-22 | | | | 70,150 | | | | 67,613 | | | | — | | | | (2,537 | ) |
Aluminum - 90 Day Settlement (a) | | | (4) | | | | Mar-22 | | | | 280,631 | | | | 282,501 | | | | 1,870 | | | | — | |
Aluminum (a) | | | (174) | | | | Mar-22 | | | | 12,214,804 | | | | 11,631,562 | | | | — | | | | (583,242 | ) |
32 | The accompanying notes are an integral part of these consolidated financial statements. |
LoCorr Macro Strategies Fund – Consolidated Schedule of Open Futures Contracts (continued) |
| | | Number of
Contracts | | | | | | | Current | | | Notional | | | Value | |
Description | | Purchased
(Sold) | | | Settlement
Month-Year | | | Notional
Amount | | | Amount At
Trade Date | | | Unrealized
Appreciation | | | Unrealized
(Depreciation) | |
Sale Contracts: (continued) |
Australian 10 Yr Bond | | | (135) | | | | Mar-22 | | | $ | 13,668,871 | | | $ | 13,681,794 | | | $ | 12,923 | | | $ | — | |
Australian Dollar | | | (8) | | | | Mar-22 | | | | 582,240 | | | | 579,789 | | | | — | | | | (2,451 | ) |
Bovespa Index | | | (310) | | | | Feb-22 | | | | 5,889,165 | | | | 5,891,440 | | | | 2,275 | | | | — | |
CAC 40 10 Euro Index | | | (92) | | | | Jan-22 | | | | 7,481,710 | | | | 7,475,293 | | | | — | | | | (6,417 | ) |
Carbon Emission | | | (2) | | | | Dec-22 | | | | 183,640 | | | | 177,459 | | | | — | | | | (6,181 | ) |
CBOE Volatility Index | | | (166) | | | | Jan-22 | | | | 3,265,967 | | | | 3,273,557 | | | | 7,590 | | | | — | |
CBOE Volatility Index | | | (79) | | | | Feb-22 | | | | 1,735,670 | | | | 1,817,803 | | | | 82,133 | | | | — | |
CBOE Volatility Index | | | (18) | | | | Mar-22 | | | | 422,433 | | | | 432,307 | | | | 9,874 | | | | — | |
Copper - 90 Day Settlement (a) | | | (2) | | | | Jan-22 | | | | 487,363 | | | | 498,923 | | | | 11,560 | | | | — | |
Copper - 90 Day Settlement (a) | | | (1) | | | | Feb-22 | | | | 243,502 | | | | 236,655 | | | | — | | | | (6,847 | ) |
Copper - 90 Day Settlement (a) | | | (1) | | | | Feb-22 | | | | 243,497 | | | | 238,578 | | | | — | | | | (4,919 | ) |
Copper - 90 Day Settlement (a) | | | (1) | | | | Feb-22 | | | | 243,500 | | | | 240,169 | | | | — | | | | (3,331 | ) |
Copper - 90 Day Settlement (a) | | | (1) | | | | Feb-22 | | | | 243,488 | | | | 238,324 | | | | — | | | | (5,164 | ) |
Copper - 90 Day Settlement (a) | | | (2) | | | | Feb-22 | | | | 486,575 | | | | 479,286 | | | | — | | | | (7,289 | ) |
Copper - 90 Day Settlement (a) | | | (1) | | | | Mar-22 | | | | 243,288 | | | | 238,892 | | | | — | | | | (4,396 | ) |
Copper - 90 Day Settlement (a) | | | (1) | | | | Mar-22 | | | | 243,288 | | | | 239,243 | | | | — | | | | (4,045 | ) |
Copper - 90 Day Settlement (a) | | | (1) | | | | Mar-22 | | | | 243,288 | | | | 236,537 | | | | — | | | | (6,751 | ) |
Copper - 90 Day Settlement (a) | | | (1) | | | | Mar-22 | | | | 243,025 | | | | 241,253 | | | | — | | | | (1,772 | ) |
Copper - 90 Day Settlement (a) | | | (1) | | | | Mar-22 | | | | 242,539 | | | | 242,539 | | | | — | | | | — | |
Copper (a) | | | (88) | | | | Mar-22 | | | | 21,409,300 | | | | 20,790,897 | | | | — | | | | (618,403 | ) |
DAX Index | | | (60) | | | | Mar-22 | | | | 27,078,044 | | | | 27,048,242 | | | | — | | | | (29,802 | ) |
Euro | | | (13) | | | | Mar-22 | | | | 1,852,906 | | | | 1,837,386 | | | | — | | | | (15,520 | ) |
Euro-Bobl | | | (2,241) | | | | Mar-22 | | | | 339,945,171 | | | | 341,071,976 | | | | 1,126,805 | | | | — | |
Euro-BTP | | | (215) | | | | Mar-22 | | | | 35,984,688 | | | | 36,060,678 | | | | 75,990 | | | | — | |
Euro-Bund | | | (10) | | | | Mar-22 | | | | 1,951,044 | | | | 1,954,066 | | | | 3,022 | | | | — | |
FTSE 100 Index | | | (15) | | | | Mar-22 | | | | 1,487,006 | | | | 1,486,296 | | | | — | | | | (710 | ) |
FTSE China A50 Index | | | (683) | | | | Jan-22 | | | | 10,722,417 | | | | 10,817,867 | | | | 95,450 | | | | — | |
FTSE/JSE Top 40 Index | | | (65) | | | | Mar-22 | | | | 2,732,651 | | | | 2,664,853 | | | | — | | | | (67,798 | ) |
Gold | | | (130) | | | | Feb-22 | | | | 23,771,800 | | | | 23,133,126 | | | | — | | | | (638,674 | ) |
Hang Seng Index | | | (337) | | | | Jan-22 | | | | 50,676,091 | | | | 50,212,192 | | | | — | | | | (463,899 | ) |
Hard Red Wheat | | | (23) | | | | Mar-22 | | | | 921,725 | | | | 934,982 | | | | 13,257 | | | | — | |
H-Shares Index | | | (49) | | | | Jan-22 | | | | 2,597,502 | | | | 2,561,669 | | | | — | | | | (35,833 | ) |
IBEX 35 Index | | | (29) | | | | Jan-22 | | | | 2,867,281 | | | | 2,834,555 | | | | — | | | | (32,726 | ) |
Japanese Yen | | | (40) | | | | Mar-22 | | | | 4,349,000 | | | | 4,364,507 | | | | 15,507 | | | | — | |
KOSPI 200 Index | | | (232) | | | | Mar-22 | | | | 19,235,751 | | | | 19,283,801 | | | | 48,050 | | | | — | |
Lead (a) | | | (16) | | | | Mar-22 | | | | 925,600 | | | | 900,759 | | | | — | | | | (24,841 | ) |
Lead Based Metal - 90 Day Settlement (a) | | | (1) | | | | Feb-22 | | | | 58,038 | | | | 59,438 | | | | 1,400 | | | | — | |
Lead Based Metal - 90 Day Settlement (a) | | | (1) | | | | Feb-22 | | | | 57,900 | | | | 56,150 | | | | — | | | | (1,750 | ) |
Lead Based Metal - 90 Day Settlement (a) | | | (1) | | | | Mar-22 | | | | 57,850 | | | | 57,823 | | | | — | | | | (27 | ) |
Lean Hogs | | | (33) | | | | Feb-22 | | | | 1,075,470 | | | | 1,085,528 | | | | 10,058 | | | | — | |
Long Gilt | | | (144) | | | | Mar-22 | | | | 24,344,342 | | | | 24,327,532 | | | | — | | | | (16,810 | ) |
MSCI Emerging Markets Index | | | (196) | | | | Mar-22 | | | | 12,017,740 | | | | 11,929,253 | | | | — | | | | (88,487 | ) |
Natural Gas | | | (110) | | | | Jan-22 | | | | 4,103,000 | | | | 4,249,794 | | | | 146,794 | | | | — | |
Natural Gas | | | (73) | | | | Feb-22 | | | | 2,596,610 | | | | 2,651,197 | | | | 54,587 | | | | — | |
Natural Gas | | | (44) | | | | Mar-22 | | | | 1,543,080 | | | | 1,587,064 | | | | 43,984 | | | | — | |
Natural Gas | | | (27) | | | | Apr-22 | | | | 951,750 | | | | 977,047 | | | | 25,297 | | | | — | |
Natural Gas | | | (7) | | | | May-22 | | | | 250,530 | | | | 254,676 | | | | 4,146 | | | | — | |
Nickel - 90 Day Settlement (a) | | | (1) | | | | Feb-22 | | | | 125,071 | | | | 117,090 | | | | — | | | | (7,981 | ) |
Nickel - 90 Day Settlement (a) | | | (1) | | | | Feb-22 | | | | 125,024 | | | | 116,940 | | | | — | | | | (8,084 | ) |
Nickel - 90 Day Settlement (a) | | | (1) | | | | Feb-22 | | | | 124,893 | | | | 116,412 | | | | — | | | | (8,481 | ) |
Nickel - 90 Day Settlement (a) | | | (1) | | | | Feb-22 | | | | 124,785 | | | | 119,153 | | | | — | | | | (5,632 | ) |
The accompanying notes are an integral part of these consolidated financial statements. | 33 |
LoCorr Macro Strategies Fund – Consolidated Schedule of Open Futures Contracts (continued) |
| | | Number of
Contracts | | | | | | | Current | | | Notional | | | Value | |
Description | | Purchased
(Sold) | | | Settlement
Month-Year | | | Notional
Amount | | | Amount At
Trade Date | | | Unrealized
Appreciation | | | Unrealized
(Depreciation) | |
Sale Contracts: (continued) |
Nickel - 90 Day Settlement (a) | | | (1) | | | | Feb-22 | | | $ | 124,746 | | | $ | 125,615 | | | $ | 869 | | | $ | — | |
Nickel - 90 Day Settlement (a) | | | (1) | | | | Mar-22 | | | | 124,771 | | | | 120,363 | | | | — | | | | (4,408 | ) |
Nickel - 90 Day Settlement (a) | | | (1) | | | | Mar-22 | | | | 124,761 | | | | 116,356 | | | | — | | | | (8,405 | ) |
Nickel - 90 Day Settlement (a) | | | (2) | | | | Mar-22 | | | | 249,240 | | | | 233,409 | | | | — | | | | (15,831 | ) |
Nickel - 90 Day Settlement (a) | | | (1) | | | | Mar-22 | | | | 124,542 | | | | 121,335 | | | | — | | | | (3,207 | ) |
Nickel (a) | | | (22) | | | | Mar-22 | | | | 2,744,742 | | | | 2,579,358 | | | | — | | | | (165,384 | ) |
Nikkei 225 Index | | | (144) | | | | Mar-22 | | | | 36,028,167 | | | | 35,811,486 | | | | — | | | | (216,681 | ) |
OMX Stockholm 30 Index | | | (72) | | | | Mar-22 | | | | 1,657,715 | | | | 1,640,391 | | | | — | | | | (17,324 | ) |
Russell 2000 Mini Index | | | (467) | | | | Mar-22 | | | | 52,369,380 | | | | 50,899,031 | | | | — | | | | (1,470,349 | ) |
SET 50 Index | | | (23) | | | | Mar-22 | | | | 135,886 | | | | 133,527 | | | | — | | | | (2,359 | ) |
SGX Nifty 50 Index | | | (83) | | | | Jan-22 | | | | 2,894,957 | | | | 2,869,242 | | | | — | | | | (25,715 | ) |
Silver | | | (221) | | | | Mar-22 | | | | 25,803,960 | | | | 25,796,771 | | | | — | | | | (7,189 | ) |
Soybean | | | (10) | | | | Mar-22 | | | | 669,625 | | | | 638,477 | | | | — | | | | (31,148 | ) |
Soybean Meal | | | (82) | | | | Mar-22 | | | | 3,272,620 | | | | 2,916,025 | | | | — | | | | (356,595 | ) |
Soybean Oil | | | (74) | | | | Mar-22 | | | | 2,509,932 | | | | 2,397,698 | | | | — | | | | (112,234 | ) |
Sugar | | | (180) | | | | Feb-22 | | | | 3,806,208 | | | | 3,820,509 | | | | 14,301 | | | | — | |
Tokyo Price Index | | | (58) | | | | Mar-22 | | | | 10,043,988 | | | | 10,021,967 | | | | — | | | | (22,021 | ) |
U.S. 10 Yr Note | | | (29) | | | | Mar-22 | | | | 3,783,593 | | | | 3,797,553 | | | | 13,960 | | | | — | |
U.S. 2 Yr Note | | | (38) | | | | Mar-22 | | | | 8,290,531 | | | | 8,291,414 | | | | 883 | | | | — | |
U.S. 5 Yr Note | | | (1,222) | | | | Mar-22 | | | | 147,833,360 | | | | 147,910,053 | | | | 76,693 | | | | — | |
Wheat | | | (39) | | | | Mar-22 | | | | 1,502,962 | | | | 1,527,031 | | | | 24,069 | | | | — | |
Zinc - 90 Day Settlement (a) | | | (1) | | | | Feb-22 | | | | 89,165 | | | | 82,587 | | | | — | | | | (6,578 | ) |
Zinc - 90 Day Settlement (a) | | | (1) | | | | Feb-22 | | | | 89,154 | | | | 80,864 | | | | — | | | | (8,290 | ) |
Zinc - 90 Day Settlement (a) | | | (1) | | | | Feb-22 | | | | 88,950 | | | | 80,200 | | | | — | | | | (8,750 | ) |
Zinc - 90 Day Settlement (a) | | | (1) | | | | Feb-22 | | | | 88,818 | | | | 82,982 | | | | — | | | | (5,836 | ) |
Zinc - 90 Day Settlement (a) | | | (1) | | | | Feb-22 | | | | 88,807 | | | | 79,993 | | | | — | | | | (8,814 | ) |
Zinc - 90 Day Settlement (a) | | | (1) | | | | Mar-22 | | | | 88,700 | | | | 83,474 | | | | — | | | | (5,226 | ) |
Zinc - 90 Day Settlement (a) | | | (1) | | | | Mar-22 | | | | 88,542 | | | | 84,776 | | | | — | | | | (3,766 | ) |
Zinc - 90 Day Settlement (a) | | | (1) | | | | Mar-22 | | | | 88,375 | | | | 87,871 | | | | — | | | | (504 | ) |
Zinc (a) | | | (43) | | | | Mar-22 | | | | 3,814,100 | | | | 3,494,322 | | | | — | | | | (319,778 | ) |
Total Sale Contracts | | | | | | | | | | | | | | | | | | | 4,235,805 | | | | (5,674,343 | ) |
Total Futures Contracts | | | | | | | | | | | | | | | | | | $ | 19,790,586 | | | $ | (10,622,114 | ) |
Net Unrealized Appreciation | | | | | | | | | | | | | | | | | | $ | 9,168,472 | | | | | |
(a) | London Metal Exchange (‘’LME’’) futures contracts settle on their respective maturity date. The unrealized appreciation on these contracts is a receivable for unsettled open futures contracts and the unrealized depreciation is a payable for unsettled open futures contracts on the Fund’s consolidated statement of assets and liabilities. |
34 | The accompanying notes are an integral part of these consolidated financial statements. |
LoCorr Long/Short Commodities Strategy Fund - Consolidated Schedule of Investments |
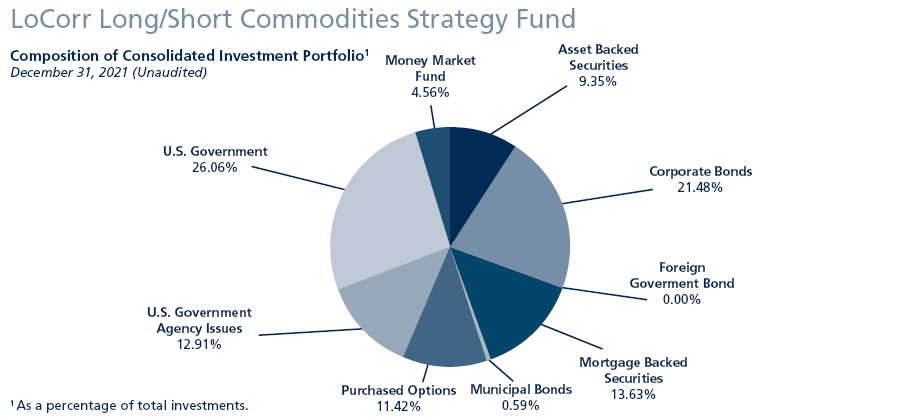
Consolidated Schedule of Investments
December 31, 2021
| | Maturity Date | | | Coupon Rate | | | Principal Amount | | | Value | |
ASSET BACKED SECURITIES: 8.02% |
321 Henderson Receivables I LLC | | | | | | | | | | | | | | | | |
Series 2006-4A A1 (1 Month LIBOR USD + 0.200%) (a)(c) | | | 12/15/2041 | | | | 0.31% | | | $ | 38,203 | | | $ | 38,147 | |
Series 2004-A A1 (1 Month LIBOR USD + 0.350%) (a)(c) | | | 09/15/2045 | | | | 0.46% | | | | 30,296 | | | | 30,007 | |
American Homes 4 Rent Trust, 2014-SFR2 A (a) | | | 10/17/2036 | | | | 3.79% | | | | 280,612 | | | | 291,194 | |
AmeriCredit Automobile Receivables Trust | | | | | | | | | | | | | | | | |
Series 2020-3 A-3 | | | 06/18/2025 | | | | 0.53% | | | | 2,150,000 | | | | 2,148,468 | |
Series 2021-2 A3 | | | 12/18/2026 | | | | 0.34% | | | | 2,010,000 | | | | 1,993,381 | |
Angel Oak Mortgage Trust LLC, 2020-5 A3 (a)(d) | | | 05/25/2065 | | | | 2.04% | | | | 104,149 | | | | 104,150 | |
Asset Backed Securities Corp Home Equity Loan Trust, 2002-HE1 M1 (1 Month LIBOR USD + 1.650%) (c) | | | 03/15/2032 | | | | 1.76% | | | | 330,998 | | | | 331,758 | |
Bank of America Credit Card Trust, 2021-A1 A1 | | | 09/15/2026 | | | | 0.44% | | | | 850,000 | | | | 837,659 | |
Capital One Multi-Asset Execution Trust, 2015-A4 A4 | | | 05/15/2025 | | | | 2.75% | | | | 1,210,000 | | | | 1,225,725 | |
Carmax Auto Owner Trust, 2021-4 A3 | | | 09/15/2026 | | | | 0.56% | | | | 2,620,000 | | | | 2,583,374 | |
CarMax Auto Owner Trust, 2018-4 A3 | | | 09/15/2023 | | | | 3.36% | | | | 216,197 | | | | 217,723 | |
Carvana Auto Receivables Trust | | | | | | | | | | | | | | | | |
Series 2021-P2 A3 | | | 03/10/2026 | | | | 0.49% | | | | 2,630,000 | | | | 2,611,342 | |
Series 2021-P4 A-3 | | | 01/10/2027 | | | | 1.31% | | | | 3,620,000 | | | | 3,617,728 | |
Chase Issuance Trust, 2020-A1 A1 | | | 01/15/2025 | | | | 1.53% | | | | 1,050,000 | | | | 1,060,059 | |
Citibank Credit Card Issuance Trust | | | | | | | | | | | | | | | | |
Series 2018-A6 A6 | | | 12/09/2024 | | | | 3.21% | | | | 1,500,000 | | | | 1,537,250 | |
Series 2018-A3 A3 | | | 05/23/2025 | | | | 3.29% | | | | 1,085,000 | | | | 1,123,192 | |
DB Master Finance LLC, 2021-1a A2I (a) | | | 11/20/2051 | | | | 2.05% | | | | 2,050,000 | | | | 2,003,055 | |
Diamond Resorts Owner Trust | | | | | | | | | | | | | | | | |
Series 2018-1 A (a) | | | 01/21/2031 | | | | 3.70% | | | | 368,308 | | | | 374,938 | |
Series 2021-1A A (a) | | | 11/21/2033 | | | | 1.51% | | | | 805,590 | | | | 797,903 | |
Discover Card Execution Note Trust, 2018-A2 A2 (1 Month LIBOR USD + 0.330%) (c) | | | 08/15/2025 | | | | 0.44% | | | | 1,225,000 | | | | 1,228,501 | |
Elara HGV Timeshare Issuer, 2021-A A (a) | | | 08/27/2035 | | | | 1.36% | | | | 2,695,355 | | | | 2,662,664 | |
The accompanying notes are an integral part of these consolidated financial statements. | 35 |
LoCorr Long/Short Commodities Strategy Fund - Consolidated Schedule of Investments (continued) |
| | Maturity Date | | | Coupon Rate | | | Principal Amount | | | Value | |
ASSET BACKED SECURITIES: (continued) |
Freddie Mac STACR REMIC Trust, 2021-HQA4 M1 (SOFR30A + 0.950%) (a)(c) | | | 12/26/2041 | | | | 1.00% | | | $ | 3,250,000 | | | $ | 3,249,999 | |
GM Financial Automobile Leasing Trust, 2021-2 A4 | | | 05/20/2025 | | | | 0.41% | | | | 2,182,000 | | | | 2,157,608 | |
GM Financial Consumer Automobile Receivables Trust | | | | | | | | | | | | | | | | |
Series 2021-1 A3 | | | 10/16/2025 | | | | 0.35% | | | | 1,400,000 | | | | 1,391,105 | |
Series 2021-3 A3 | | | 06/16/2026 | | | | 0.48% | | | | 2,310,000 | | | | 2,285,536 | |
Series 2021-4 A3 | | | 09/16/2026 | | | | 0.68% | | | | 1,736,000 | | | | 1,722,960 | |
Honda Auto Receivables Owner Trust | | | | | | | | | | | | | | | | |
Series 2019-1 A3 | | | 03/20/2023 | | | | 2.83% | | | | 185,742 | | | | 187,012 | |
Series 2020-3 A3 | | | 10/18/2024 | | | | 0.37% | | | | 2,350,000 | | | | 2,343,432 | |
Hyundai Auto Receivables Trust, 2020-C A3 | | | 05/15/2025 | | | | 0.38% | | | | 2,150,000 | | | | 2,140,774 | |
Invitation Homes Trust | | | | | | | | | | | | | | | | |
Series 2018-SFR1 A (1 Month LIBOR USD + 0.700%) (a)(c) | | | 03/19/2037 | | | | 0.81% | | | | 561,510 | | | | 561,510 | |
Series 2018-SFR2 A (1 Month LIBOR USD + 0.900%) (a)(c) | | | 06/18/2037 | | | | 1.01% | | | | 536,188 | | | | 536,271 | |
Series 2018-SFR3 A (1 Month LIBOR USD + 1.000%) (a)(c) | | | 07/17/2037 | | | | 1.11% | | | | 110,444 | | | | 110,386 | |
Morgan Stanley Capital I Trust, 2004-HE6 M1 (1 Month LIBOR USD + 0.825%) (c) | | | 08/25/2034 | | | | 0.93% | | | | 133,760 | | | | 132,564 | |
MVW Owner Trust | | | | | | | | | | | | | | | | |
Series 2018-1A A (a) | | | 01/21/2036 | | | | 3.45% | | | | 778,611 | | | | 800,519 | |
Series 2019-1A A (a) | | | 11/20/2036 | | | | 2.89% | | | | 360,617 | | | | 365,627 | |
Series 2019-2A A (a) | | | 10/20/2038 | | | | 2.22% | | | | 461,940 | | | | 466,950 | |
Series 2021-1WA A (a) | | | 01/22/2041 | | | | 1.14% | | | | 1,234,535 | | | | 1,210,945 | |
Navient Student Loan Trust, 2021-A A (a) | | | 05/15/2069 | | | | 0.84% | | | | 1,010,395 | | | | 997,726 | |
OneMain Financial Issuance Trust | | | | | | | | | | | | | | | | |
Series 2016-3A A (a) | | | 06/18/2031 | | | | 3.83% | | | | 257,882 | | | | 258,857 | |
Series 2018-2A A (a) | | | 03/14/2033 | | | | 3.57% | | | | 500,000 | | | | 515,853 | |
PFS Financing Corp. | | | | | | | | | | | | | | | | |
Series 2020-F A (a) | | | 08/15/2024 | | | | 0.93% | | | | 1,150,000 | | | | 1,152,680 | |
Series 2020-G A (a) | | | 02/17/2026 | | | | 0.97% | | | | 900,000 | | | | 894,885 | |
Series 2021-B A (a) | | | 08/17/2026 | | | | 0.77% | | | | 1,450,000 | | | | 1,427,280 | |
Progress Residential Trust, 2019-SFR4 B (a) | | | 11/17/2036 | | | | 2.94% | | | | 600,000 | | | | 606,209 | |
Santander Drive Auto Receivables Trust | | | | | | | | | | | | | | | | |
Series 2020-4 A3 | | | 07/15/2024 | | | | 0.48% | | | | 1,369,454 | | | | 1,369,775 | |
Series 2021-4 A3 | | | 08/15/2025 | | | | 0.51% | | | | 2,950,000 | | | | 2,939,255 | |
SoFi Professional Loan Program LLC | | | | | | | | | | | | | | | | |
Series 2016-D A2B (a) | | | 04/25/2033 | | | | 2.34% | | | | 230,953 | | | | 233,420 | |
Series 2015-D A2 (a) | | | 10/27/2036 | | | | 2.72% | | | | 34,082 | | | | 34,188 | |
Series 2016-A A2 (a) | | | 12/26/2036 | | | | 2.76% | | | | 183,605 | | | | 184,275 | |
Series 2017-B A2FX (a) | | | 05/25/2040 | | | | 2.74% | | | | 158,389 | | | | 159,980 | |
SoFi Professional Loan Program Trust, 2021-B AFX (a) | | | 02/15/2047 | | | | 1.14% | | | | 2,133,301 | | | | 2,096,256 | |
Taco Bell Funding LLC, 2021-1A A21 (a) | | | 08/25/2051 | | | | 1.95% | | | | 2,525,000 | | | | 2,475,162 | |
Tesla Auto Lease Trust | | | | | | | | | | | | | | | | |
Series 2020-A A2 (a) | | | 05/20/2023 | | | | 0.55% | | | | 661,326 | | | | 661,461 | |
Series 2021-A B (a) | | | 03/20/2025 | | | | 1.02% | | | | 1,100,000 | | | | 1,095,517 | |
Toyota Auto Receivables Owner Trust, 2019-A A3 | | | 07/17/2023 | | | | 2.91% | | | | 174,787 | | | | 176,152 | |
Toyota Lease Owner Trust, 2021-B A3 (a) | | | 10/21/2024 | | | | 0.42% | | | | 2,640,000 | | | | 2,617,578 | |
Tricon American Homes Trust | | | | | | | | | | | | | | | | |
Series 2017-SFR2 A (a) | | | 01/18/2036 | | | | 2.93% | | | | 193,533 | | | | 194,585 | |
Series 2017-SFR2 B (a) | | | 01/18/2036 | | | | 3.28% | | | | 250,000 | | | | 251,317 | |
Verizon Owner Trust | | | | | | | | | | | | | | | | |
Series 2018-A A1A | | | 04/20/2023 | | | | 3.23% | | | | 4,786 | | | | 4,793 | |
Series 2019-B A1A | | | 12/20/2023 | | | | 2.33% | | | | 558,692 | | | | 562,431 | |
Series 2019-C A1A | | | 04/20/2024 | | | | 1.94% | | | | 156,678 | | | | 157,751 | |
Series 2020-A A1A | | | 07/20/2024 | | | | 1.85% | | | | 1,715,000 | | | | 1,727,852 | |
36 | The accompanying notes are an integral part of these consolidated financial statements. |
LoCorr Long/Short Commodities Strategy Fund - Consolidated Schedule of Investments (continued) |
| | Maturity Date | | | Coupon Rate | | | Principal Amount | | | Value | |
ASSET BACKED SECURITIES: (continued) |
Volkswagen Auto Loan Enhanced Trust, 2021-1 A-3 | | | 06/22/2026 | | | | 1.02% | | | $ | 2,790,000 | | | $ | 2,789,881 | |
TOTAL ASSET BACKED SECURITIES (Cost $72,327,421) | | | | | | | | | | | | | | | 72,066,535 | |
| | | | | | | | | | | | | | | | | |
CORPORATE BONDS: 18.43% | | | | | | | | | | | | | | | | |
Agriculture: 0.28% | | | | | | | | | | | | | | | | |
BAT Capital Corp. | | | 08/15/2024 | | | | 3.22% | | | | 765,000 | | | | 795,250 | |
BAT International Finance PLC (b) | | | 03/25/2026 | | | | 1.67% | | | | 1,770,000 | | | | 1,738,447 | |
| | | | | | | | | | | | | | | | 2,533,697 | |
Auto Manufacturers: 0.63% | | | | | | | | | | | | | | | | |
Daimler Finance North America LLC (a) | | | 03/01/2024 | | | | 0.75% | | | | 725,000 | | | | 718,369 | |
General Motors Financial Co, Inc. | | | 10/15/2024 | | | | 1.20% | | | | 620,000 | | | | 615,576 | |
General Motors Financial Co., Inc. | | | 08/18/2023 | | | | 1.70% | | | | 1,000,000 | | | | 1,009,606 | |
General Motors Financial Co., Inc. | | | 06/20/2025 | | | | 2.75% | | | | 1,375,000 | | | | 1,419,433 | |
Volkswagen Group of America Finance LLC (a) | | | 11/22/2023 | | | | 0.88% | | | | 1,925,000 | | | | 1,912,364 | |
| | | | | | | | | | | | | | | | 5,675,348 | |
Banks: 9.31% | | | | | | | | | | | | | | | | |
Banco Santander SA (b) | | | 05/28/2025 | | | | 2.75% | | | | 885,000 | | | | 915,118 | |
Bank of America Corp. | | | 01/11/2023 | | | | 3.30% | | | | 2,525,000 | | | | 2,594,274 | |
Bank of America Corp. (3 Month LIBOR USD + 0.930%) (c) | | | 07/21/2023 | | | | 2.82% | | | | 625,000 | | | | 631,918 | |
Bank of America Corp. (SOFR + 1.460%) (c) | | | 05/19/2024 | | | | 1.49% | | | | 2,000,000 | | | | 2,014,655 | |
Bank of America Corp. (SOFR + 0.740%) (c) | | | 10/24/2024 | | | | 0.81% | | | | 2,935,000 | | | | 2,915,756 | |
Bank of America Corp. (SOFR + 0.690%) (c) | | | 04/22/2025 | | | | 0.98% | | | | 5,255,000 | | | | 5,213,826 | |
Bank of America Corp. (SOFR + 1.150%) (c) | | | 06/19/2026 | | | | 1.32% | | | | 3,845,000 | | | | 3,805,848 | |
Bank of America Corp. (SOFR + 1.010%) (c) | | | 10/24/2026 | | | | 1.20% | | | | 250,000 | | | | 245,130 | |
Barclays PLC (1 Year CMT Rate + 0.800%) (b)(c) | | | 12/10/2024 | | | | 1.01% | | | | 1,600,000 | | | | 1,588,515 | |
BNP Paribas SA (3 Month LIBOR USD + 1.111%) (a)(b)(c) | | | 11/19/2025 | | | | 2.82% | | | | 1,475,000 | | | | 1,518,324 | |
Citigroup, Inc. (3 Month LIBOR USD + 0.722%) (c) | | | 01/24/2023 | | | | 3.14% | | | | 1,205,000 | | | | 1,206,528 | |
Citigroup, Inc. (3 Month LIBOR USD + 1.023%) (c) | | | 06/01/2024 | | | | 4.04% | | | | 1,425,000 | | | | 1,485,254 | |
Citigroup, Inc. (SOFR + 0.686%) (c) | | | 10/30/2024 | | | | 0.78% | | | | 1,860,000 | | | | 1,848,213 | |
Citigroup, Inc. (SOFR + 0.669%) (c) | | | 05/01/2025 | | | | 0.98% | | | | 2,650,000 | | | | 2,629,588 | |
Citigroup, Inc. (SOFR + 0.765%) (c) | | | 01/28/2027 | | | | 1.12% | | | | 725,000 | | | | 706,506 | |
Credit Suisse AG (b) | | | 05/05/2023 | | | | 1.00% | | | | 900,000 | | | | 902,431 | |
Credit Suisse AG (b) | | | 08/09/2023 | | | | 0.52% | | | | 1,125,000 | | | | 1,117,114 | |
Danske Bank A/S (1 Year CMT Rate + 1.730%) (a)(b)(c) | | | 01/12/2023 | | | | 5.00% | | | | 815,000 | | | | 815,702 | |
Deutsche Bank NY (b) | | | 05/28/2024 | | | | 0.90% | | | | 660,000 | | | | 654,360 | |
Federation des Caisses Desjardins du Quebec (a)(b) | | | 05/21/2024 | | | | 0.70% | | | | 1,440,000 | | | | 1,418,909 | |
Goldman Sachs Group, Inc. | | | 01/22/2023 | | | | 3.63% | | | | 1,195,000 | | | | 1,230,750 | |
Goldman Sachs Group, Inc. | | | 02/23/2023 | | | | 3.20% | | | | 3,385,000 | | | | 3,471,799 | |
Goldman Sachs Group, Inc. (SOFR + 0.572%) (c) | | | 03/08/2024 | | | | 0.67% | | | | 11,675,000 | | | | 11,623,095 | |
Goldman Sachs Group, Inc. (SOFR + 0.789%) (c) | | | 12/09/2026 | | | | 1.09% | | | | 235,000 | | | | 229,113 | |
HSBC Bank Canada (a)(b) | | | 09/10/2023 | | | | 1.65% | | | | 870,000 | | | | 877,001 | |
HSBC Holdings PLC (SOFR + 0.708%) (b)(c) | | | 05/24/2025 | | | | 0.98% | | | | 1,155,000 | | | | 1,141,252 | |
HSBC Holdings PLC (SOFR + 1.538%) (b)(c) | | | 04/18/2026 | | | | 1.65% | | | | 675,000 | | | | 669,686 | |
HSBC Holdings PLC (SOFR + 1.929%) (b)(c) | | | 06/04/2026 | | | | 2.10% | | | | 1,245,000 | | | | 1,253,611 | |
ING Groep NV (b) | | | 04/09/2024 | | | | 3.55% | | | | 965,000 | | | | 1,011,731 | |
JP Morgan Chase & Co. | | | 01/25/2023 | | | | 3.20% | | | | 2,650,000 | | | | 2,722,044 | |
JP Morgan Chase & Co. (SOFR + 0.600%) (c) | | | 09/16/2024 | | | | 0.65% | | | | 1,050,000 | | | | 1,045,177 | |
JP Morgan Chase & Co. (SOFR + 0.540%) (c) | | | 06/01/2025 | | | | 0.82% | | | | 1,925,000 | | | | 1,902,889 | |
JP Morgan Chase & Co. (SOFR + 0.695%) (c) | | | 02/04/2027 | | | | 1.04% | | | | 2,530,000 | | | | 2,449,945 | |
Mitsubishi UFJ Financial Group, Inc. (1 Year CMT Rate + 0.680%) (b)(c) | | | 09/15/2024 | | | | 0.85% | | | | 1,295,000 | | | | 1,288,722 | |
Morgan Stanley | | | 01/23/2023 | | | | 3.13% | | | | 2,440,000 | | | | 2,501,947 | |
Morgan Stanley (SOFR + 0.466%) (c) | | | 11/10/2023 | | | | 0.56% | | | | 300,000 | | | | 299,599 | |
Morgan Stanley (SOFR + 0.455%) (c) | | | 01/25/2024 | | | | 0.53% | | | | 1,650,000 | | | | 1,644,436 | |
The accompanying notes are an integral part of these consolidated financial statements. | 37 |
LoCorr Long/Short Commodities Strategy Fund - Consolidated Schedule of Investments (continued) |
| | Maturity Date | | | Coupon Rate | | | Principal Amount | | | Value | |
CORPORATE BONDS: (continued) |
Morgan Stanley (SOFR + 0.616%) (c) | | | 04/05/2024 | | | | 0.73% | | | $ | 1,680,000 | | | $ | 1,674,919 | |
Morgan Stanley | | | 04/29/2024 | | | | 3.88% | | | | 640,000 | | | | 678,580 | |
Morgan Stanley (SOFR + 0.525%) (c) | | | 05/30/2025 | | | | 0.79% | | | | 425,000 | | | | 419,526 | |
Morgan Stanley (SOFR + 1.152%) (c) | | | 07/22/2025 | | | | 2.72% | | | | 1,000,000 | | | | 1,030,701 | |
NatWest Markets PLC (a)(b) | | | 05/21/2023 | | | | 2.38% | | | | 955,000 | | | | 973,188 | |
NatWest Markets PLC (a)(b) | | | 08/12/2024 | | | | 0.80% | | | | 1,050,000 | | | | 1,032,857 | |
Standard Chartered PLC (3 Month LIBOR USD + 1.080%) (a)(b)(c) | | | 03/15/2024 | | | | 3.89% | | | | 675,000 | | | | 695,745 | |
Svenska Handelsbanken AB (a)(b) | | | 06/30/2023 | | | | 0.63% | | | | 610,000 | | | | 608,289 | |
Svenska Handelsbanken AB (a)(b) | | | 06/11/2024 | | | | 0.55% | | | | 1,000,000 | | | | 986,237 | |
Toronto-Dominion Bank (b) | | | 09/10/2024 | | | | 0.70% | | | | 1,130,000 | | | | 1,115,540 | |
Truist Financial Corp. | | | 08/05/2025 | | | | 1.20% | | | | 910,000 | | | | 902,929 | |
UBS AG/London (a)(b) | | | 06/01/2023 | | | | 0.38% | | | | 950,000 | | | | 942,639 | |
UBS AG/London (a)(b) | | | 08/09/2024 | | | | 0.70% | | | | 1,400,000 | | | | 1,384,026 | |
UBS Group AG (1 Year CMT Rate + 0.830%) (a)(b)(c) | | | 07/30/2024 | | | | 1.01% | | | | 525,000 | | | | 523,374 | |
Wells Fargo & Co. | | | 02/13/2023 | | | | 3.45% | | | | 1,075,000 | | | | 1,106,103 | |
| | | | | | | | | | | | | | | | 83,665,419 | |
Beverage: 0.06% | | | | | | | | | | | | | | | | |
Diageo Capital PLC (b) | | | 09/29/2025 | | | | 1.38% | | | | 575,000 | | | | 572,090 | |
| | | | | | | | | | | | | | | | | |
Biotechnology: 0.24% | | | | | | | | | | | | | | | | |
Gilead Sciences, Inc. | | | 09/29/2023 | | | | 0.75% | | | | 750,000 | | | | 746,920 | |
Royalty Pharma PLC (b) | | | 09/02/2023 | | | | 0.75% | | | | 1,400,000 | | | | 1,391,324 | |
| | | | | | | | | | | | | | | | 2,138,244 | |
Chemicals: 0.05% | | | | | | | | | | | | | | | | |
Westlake Chemical Corp. | | | 08/15/2024 | | | | 0.88% | | | | 455,000 | | | | 448,194 | |
| | | | | | | | | | | | | | | | | |
Diversified Financial Services: 1.15% | | | | | | | | | | | | | | | | |
AerCap Ireland Capital /Global Aviation Trust (b) | | | 10/29/2024 | | | | 1.65% | | | | 2,970,000 | | | | 2,965,270 | |
AerCap Ireland Capital/Global Aviation Trust (b) | | | 01/15/2025 | | | | 3.50% | | | | 2,105,000 | | | | 2,197,921 | |
AerCap Ireland Capital/Global Aviation Trust (b) | | | 01/30/2026 | | | | 1.75% | | | | 725,000 | | | | 711,454 | |
Air Lease Corp. | | | 07/03/2023 | | | | 3.88% | | | | 675,000 | | | | 699,141 | |
Air Lease Corp. | | | 02/01/2024 | | | | 4.25% | | | | 350,000 | | | | 368,805 | |
Capital One Bank | | | 02/15/2023 | | | | 3.38% | | | | 799,000 | | | | 821,150 | |
CDP Financial, Inc. (a)(b) | | | 03/07/2022 | | | | 2.75% | | | | 990,000 | | | | 994,383 | |
Dragon 2012 LLC | | | 03/12/2024 | | | | 1.97% | | | | 5,263 | | | | 5,325 | |
Export-Import Bank of U.S. (c) | | | 11/16/2024 | | | | 1.58% | | | | 6,735 | | | | 6,791 | |
Helios Leasing I LLC | | | 05/29/2024 | | | | 2.02% | | | | 5,713 | | | | 5,791 | |
Helios Leasing I LLC | | | 07/24/2024 | | | | 1.73% | | | | 6,241 | | | | 6,304 | |
Helios Leasing I LLC | | | 09/28/2024 | | | | 1.56% | | | | 6,173 | | | | 6,228 | |
MSN 41079 and 41084 Ltd. (b) | | | 07/13/2024 | | | | 1.72% | | | | 6,228 | | | | 6,291 | |
OMERS Finance Trust (a)(b) | | | 05/02/2024 | | | | 2.50% | | | | 920,000 | | | | 952,482 | |
Phoenix 2012 LLC | | | 07/03/2024 | | | | 1.61% | | | | 6,202 | | | | 6,257 | |
Private Export Funding Corp. | | | 06/15/2025 | | | | 3.25% | | | | 510,000 | | | | 540,202 | |
Safina Ltd. (b) | | | 01/15/2022 | | | | 1.55% | | | | 360 | | | | 360 | |
| | | | | | | | | | | | | | | | 10,294,155 | |
Electric: 0.42% | | | | | | | | | | | | | | | | |
Eversource Energy | | | 08/15/2025 | | | | 0.80% | | | | 300,000 | | | | 291,480 | |
Exelon Generation Co. LLC | | | 03/15/2022 | | | | 3.40% | | | | 265,000 | | | | 265,819 | |
Exelon Generation Co. LLC | | | 06/01/2025 | | | | 3.25% | | | | 220,000 | | | | 230,595 | |
Southern California Edison Co. | | | 08/01/2023 | | | | 0.70% | | | | 1,120,000 | | | | 1,113,170 | |
Southern California Edison Co. | | | 04/01/2024 | | | | 1.10% | | | | 1,850,000 | | | | 1,843,300 | |
| | | | | | | | | | | | | | | | 3,744,364 | |
38 | The accompanying notes are an integral part of these consolidated financial statements. |
LoCorr Long/Short Commodities Strategy Fund - Consolidated Schedule of Investments (continued) |
| | Maturity Date | | | Coupon Rate | | | Principal Amount | | | Value | |
CORPORATE BONDS: (continued) |
Food: 0.06% | | | | | | | | | | | | | | | | |
Conagra Brands, Inc. | | | 08/11/2023 | | | | 0.50% | | | $ | 550,000 | | | $ | 545,319 | |
| | | | | | | | | | | | | | | | | |
Healthcare - Products: 0.96% | | | | | | | | | | | | | | | | |
Baxter International, Inc. (a) | | | 11/29/2024 | | | | 1.32% | | | | 3,290,000 | | | | 3,286,146 | |
DH Europe Finance II Sarl (b) | | | 11/15/2024 | | | | 2.20% | | | | 1,275,000 | | | | 1,303,170 | |
PerkinElmer, Inc. | | | 09/15/2024 | | | | 0.85% | | | | 1,420,000 | | | | 1,400,095 | |
Thermo Fisher Scientific, Inc. | | | 10/18/2024 | | | | 1.22% | | | | 1,880,000 | | | | 1,878,233 | |
Zimmer Biomet Holdings, Inc. | | | 11/22/2024 | | | | 1.45% | | | | 765,000 | | | | 762,983 | |
| | | | | | | | | | | | | | | | 8,630,627 | |
Healthcare - Services: 0.38% | | | | | | | | | | | | | | | | |
Humana, Inc. | | | 08/03/2023 | | | | 0.65% | | | | 2,225,000 | | | | 2,213,660 | |
UnitedHealth Group, Inc. | | | 05/15/2024 | | | | 0.55% | | | | 1,190,000 | | | | 1,180,742 | |
| | | | | | | | | | | | | | | | 3,394,402 | |
Insurance: 0.83% | | | | | | | | | | | | | | | | |
Equitable Financial Life Global (a) | | | 11/17/2023 | | | | 0.50% | | | | 475,000 | | | | 470,424 | |
Equitable Financial Life Global (a) | | | 07/07/2025 | | | | 1.40% | | | | 1,175,000 | | | | 1,164,733 | |
Metropolitan Life Global Funding I (a) | | | 06/07/2024 | | | | 0.55% | | | | 1,510,000 | | | | 1,487,019 | |
Metropolitan Life Global Funding I (a) | | | 07/02/2025 | | | | 0.95% | | | | 1,145,000 | | | | 1,129,241 | |
Principal Life Global Funding II (a) | | | 04/12/2024 | | | | 0.75% | | | | 1,485,000 | | | | 1,474,531 | |
Protective Life Global Funding (a) | | | 07/05/2024 | | | | 0.78% | | | | 1,740,000 | | | | 1,717,431 | |
| | | | | | | | | | | | | | | | 7,443,379 | |
Miscellaneous Manufacturing: 0.14% | | | | | | | | | | | | | | | | |
Parker-Hannifin Corp. | | | 06/14/2024 | | | | 2.70% | | | | 610,000 | | | | 630,329 | |
Trane Technologies Luxembourg Finance SA (b) | | | 03/21/2026 | | | | 3.50% | | | | 615,000 | | | | 652,497 | |
| | | | | | | | | | | | | | | | 1,282,826 | |
Oil & Gas: 0.31% | | | | | | | | | | | | | | | | |
Diamondback Energy, Inc. | | | 12/01/2024 | | | | 2.88% | | | | 860,000 | | | | 892,371 | |
Phillips 66 | | | 02/15/2024 | | | | 0.90% | | | | 890,000 | | | | 883,543 | |
Saudi Arabian Oil Co. (a)(b) | | | 04/16/2022 | | | | 2.75% | | | | 1,000,000 | | | | 1,006,250 | |
| | | | | | | | | | | | | | | | 2,782,164 | |
Packaging & Containers: 0.33% | | | | | | | | | | | | | | | | |
Amcor Finance, Inc. | | | 04/28/2026 | | | | 3.63% | | | | 1,535,000 | | | | 1,633,101 | |
Berry Global, Inc. | | | 02/15/2024 | | | | 0.95% | | | | 1,325,000 | | | | 1,313,075 | |
| | | | | | | | | | | | | | | | 2,946,176 | |
Pharmaceuticals: 0.98% | | | | | | | | | | | | | | | | |
AbbVie, Inc. | | | 11/21/2022 | | | | 2.30% | | | | 1,600,000 | | | | 1,622,474 | |
AbbVie, Inc. | | | 11/21/2024 | | | | 2.60% | | | | 2,495,000 | | | | 2,589,523 | |
AbbVie, Inc. | | | 05/14/2026 | | | | 3.20% | | | | 860,000 | | | | 912,051 | |
Astrazeneca Finance LLC | | | 05/28/2024 | | | | 0.70% | | | | 1,925,000 | | | | 1,910,041 | |
CVS Health Corp. | | | 08/12/2024 | | | | 3.38% | | | | 1,690,000 | | | | 1,776,420 | |
| | | | | | | | | | | | | | | | 8,810,509 | |
Pipelines: 0.46% | | | | | | | | | | | | | | | | |
Energy Transfer Operating LP | | | 05/15/2025 | | | | 2.90% | | | | 520,000 | | | | 536,766 | |
MPLX LP | | | 03/01/2026 | | | | 1.75% | | | | 1,460,000 | | | | 1,446,071 | |
ONEOK, Inc. | | | 09/01/2024 | | | | 2.75% | | | | 560,000 | | | | 575,632 | |
TransCanada PipeLines Ltd. (b) | | | 10/12/2024 | | | | 1.00% | | | | 1,535,000 | | | | 1,521,799 | |
| | | | | | | | | | | | | | | | 4,080,268 | |
Real Estate Investment Trusts: 0.49% | | | | | | | | | | | | | | | | |
American Tower Corp. | | | 09/15/2025 | | | | 1.30% | | | | 2,360,000 | | | | 2,325,125 | |
Brixmor Operating Partnership LP | | | 06/15/2024 | | | | 3.65% | | | | 650,000 | | | | 681,123 | |
Camden Property Trust | | | 12/15/2022 | | | | 2.95% | | | | 375,000 | | | | 380,986 | |
Crown Castle International Corp. | | | 07/15/2025 | | | | 1.35% | | | | 505,000 | | | | 498,389 | |
The accompanying notes are an integral part of these consolidated financial statements. | 39 |
LoCorr Long/Short Commodities Strategy Fund - Consolidated Schedule of Investments (continued) |
| | Maturity Date | | | Coupon Rate | | | Principal Amount | | | Value | |
CORPORATE BONDS: (continued) | | | | | | | | | | | | | | | | |
SITE Centers Corp. | | | 02/01/2025 | | | | 3.63% | | | $ | 525,000 | | | $ | 549,801 | |
| | | | | | | | | | | | | | | | 4,435,424 | |
Software: 0.19% | | | | | | | | | | | | | | | | |
Roper Technologies, Inc. | | | 09/15/2024 | | | | 2.35% | | | | 425,000 | | | | 435,850 | |
VMware, Inc. | | | 08/15/2024 | | | | 1.00% | | | | 1,310,000 | | | | 1,297,622 | |
| | | | | | | | | | | | | | | | 1,733,472 | |
Telecommunications: 0.98% | | | | | | | | | | | | | | | | |
NBN Co. Ltd. (a)(b) | | | 10/08/2024 | | | | 0.88% | | | | 1,180,000 | | | | 1,163,539 | |
NTT Finance Corp. (a)(b) | | | 04/03/2026 | | | | 1.16% | | | | 1,270,000 | | | | 1,246,605 | |
T-Mobile USA, Inc. | | | 04/15/2025 | | | | 3.50% | | | | 2,780,000 | | | | 2,946,515 | |
Verizon Communications, Inc. | | | 11/20/2025 | | | | 0.85% | | | | 2,605,000 | | | | 2,537,717 | |
Verizon Communications, Inc. | | | 03/20/2026 | | | | 1.45% | | | | 870,000 | | | | 866,053 | |
| | | | | | | | | | | | | | | | 8,760,429 | |
Transportation: 0.18% | | | | | | | | | | | | | | | | |
Canadian Pacific Railway Co. (b) | | | 12/02/2024 | | | | 1.35% | | | | 1,640,000 | | | | 1,642,091 | |
TOTAL CORPORATE BONDS (Cost $166,173,424) | | | | | | | | | | | | | | | 165,558,597 | |
| | | | | | | | | | | | | | | | | |
FOREIGN GOVERNMENT BOND: 0.00%* | | | | | | | | | | | | | | | | |
Petroleos Mexicanos (b) | | | 12/20/2022 | | | | 2.00% | | | | 2,500 | | | | 2,520 | |
TOTAL FOREIGN GOVERNMENT BOND (Cost $2,500) | | | | | | | | | | | | | | | 2,520 | |
| | | | | | | | | | | | | | | | | |
MORTGAGE BACKED SECURITIES: 11.70% | | | | | | | | | | | | | | | | |
ACRE Commercial Mortgage Trust, 2021-FL4 A (1 Month LIBOR USD + 0.830%) (a)(b)(c) | | | 12/18/2037 | | | | 0.93% | | | | 567,891 | | | | 565,335 | |
Alen Mortgage Trust, 2021-ACEN A (1 Month LIBOR USD + 1.150%) (a)(c) | | | 04/15/2038 | | | | 1.26% | | | | 1,250,000 | | | | 1,248,496 | |
Angel Oak Mortgage Trust, 2020-1 M1 (a)(d) | | | 12/25/2059 | | | | 3.16% | | | | 877,000 | | | | 876,145 | |
BHP Trust, 2019-BXHP A (1 Month LIBOR USD + 0.975%) (a)(c) | | | 08/15/2036 | | | | 1.09% | | | | 1,920,766 | | | | 1,917,152 | |
BSREP Commercial Mortgage Trust, 2021-DC A (1 Month LIBOR USD + 0.950%) (a)(c) | | | 08/16/2038 | | | | 1.06% | | | | 2,000,000 | | | | 1,997,593 | |
BX Commercial Mortgage Trust | | | | | | | | | | | | | | | | |
Series 2020-FOX A (1 Month LIBOR USD + 1.000%) (a)(c) | | | 11/15/2032 | | | | 1.11% | | | | 1,685,607 | | | | 1,685,097 | |
Series 2021-21M A (1 Month LIBOR USD + 0.730%) (a)(c) | | | 10/15/2036 | | | | 0.84% | | | | 1,150,000 | | | | 1,142,001 | |
Series 2021-XL2 B (1 Month LIBOR USD + 0.998%) (a)(c) | | | 10/15/2038 | | | | 1.11% | | | | 3,500,000 | | | | 3,478,288 | |
Series 2021-CIP A (1 Month LIBOR USD + 0.921%) (a)(c) | | | 12/15/2038 | | | | 1.02% | | | | 2,950,000 | | | | 2,949,111 | |
Citigroup Commercial Mortgage Trust, 2021-PRM2 A (1 Month LIBOR USD + 0.950%) (a)(c) | | | 10/15/2038 | | | | 1.06% | | | | 3,750,000 | | | | 3,751,735 | |
Comm Mortgage Trust | | | | | | | | | | | | | | | | |
Series 2015-3BP A (a) | | | 02/12/2035 | | | | 3.18% | | | | 1,030,000 | | | | 1,071,476 | |
Series 2013-CR9 A4 (d) | | | 07/12/2045 | | | | 4.25% | | | | 946,086 | | | | 981,703 | |
Series 2013-CR6 A4 | | | 03/10/2046 | | | | 3.10% | | | | 440,000 | | | | 444,419 | |
Series 2013-CR10 A4 (d) | | | 08/10/2046 | | | | 4.21% | | | | 200,000 | | | | 207,813 | |
Series 2014-UBS2 A5 | | | 03/10/2047 | | | | 3.96% | | | | 1,150,000 | | | | 1,205,907 | |
Series 2014-UBS2 AM | | | 03/12/2047 | | | | 4.20% | | | | 1,150,000 | | | | 1,202,692 | |
Series 2015-CR27 AM | | | 10/13/2048 | | | | 3.98% | | | | 1,000,000 | | | | 1,066,361 | |
Connecticut Avenue Securities Trust | | | | | | | | | | | | | | | | |
Series 2021-R01 1M2 (SOFR30A + 1.550%) (a)(c) | | | 10/25/2041 | | | | 1.60% | | | | 1,570,000 | | | | 1,571,894 | |
Series 2021-R03 1M1 (SOFR30A + 0.850%) (a)(c) | | | 12/26/2041 | | | | 0.90% | | | | 3,300,000 | | | | 3,298,841 | |
CSMC Trust, 2017-CALI A (a) | | | 11/12/2032 | | | | 3.43% | | | | 1,750,000 | | | | 1,804,649 | |
ELP Commercial Mortgage Trust, 2021-ELP B (1 Month LIBOR USD + 1.120%) (a)(c) | | | 11/15/2038 | | | | 1.23% | | | | 2,650,000 | | | | 2,634,324 | |
EQUS Mortgage Trust, 2021-EQAZ A (1 Month LIBOR USD + 0.755%) (a)(c) | | | 10/15/2036 | | | | 0.86% | | | | 2,650,000 | | | | 2,637,526 | |
Extended Stay America Trust, 2021-ESH A (1 Month LIBOR USD + 1.080%) (a)(c) | | | 07/15/2038 | | | | 1.19% | | | | 1,193,789 | | | | 1,195,361 | |
Fannie Mae Aces, 2017-M7 A1 | | | 02/25/2027 | | | | 2.60% | | | | 373,724 | | | | 376,647 | |
Fannie Mae Connecticut Avenue Securities | | | | | | | | | | | | | | | | |
Series 2014-C02 1M2 (1 Month LIBOR USD + 2.600%) (c) | | | 05/28/2024 | | | | 2.70% | | | | 699,269 | | | | 712,300 | |
Series 2014-C03 1M2 (1 Month LIBOR USD + 3.000%) (c) | | | 07/25/2024 | | | | 3.10% | | | | 310,316 | | | | 315,087 | |
40 | The accompanying notes are an integral part of these consolidated financial statements. |
LoCorr Long/Short Commodities Strategy Fund - Consolidated Schedule of Investments (continued) |
| | Maturity Date | | | Coupon Rate | | | Principal Amount | | | Value | |
MORTGAGE BACKED SECURITIES: (continued) | | | | | | | | | | | | | | | | |
Series 2017-C05 1M2A (1 Month LIBOR USD + 2.200%) (c) | | | 01/25/2030 | | | | 2.30% | | | $ | 81,345 | | | $ | 81,345 | |
Series 2017-C05 1M2 (1 Month LIBOR USD + 2.200%) (c) | | | 01/25/2030 | | | | 2.30% | | | | 665,348 | | | | 676,713 | |
Series 2018-C01 1EB1 (1 Month LIBOR USD + 0.450%) (c) | | | 07/25/2030 | | | | 0.55% | | | | 385,000 | | | | 382,407 | |
Series 2021-R02 2M1 (SOFR30A + 0.900%) (a)(c) | | | 11/25/2041 | | | | 0.95% | | | | 2,641,289 | | | | 2,642,942 | |
FHLMC Multifamily Structured Pass Through Certificates | | | | | | | | | | | | | | | | |
Series KF08 A (1 Month LIBOR USD + 0.300%) (c) | | | 01/25/2022 | | | | 0.39% | | | | 24,343 | | | | 24,339 | |
Series K052 A1 | | | 01/25/2025 | | | | 2.60% | | | | 283,844 | | | | 290,780 | |
Series K050 A1 | | | 01/25/2025 | | | | 2.80% | | | | 2,051,271 | | | | 2,113,457 | |
Series K059 A1 | | | 09/25/2025 | | | | 2.76% | | | | 733,371 | | | | 760,581 | |
Series KC06 A1 | | | 02/25/2026 | | | | 2.17% | | | | 1,483,524 | | | | 1,502,022 | |
Freddie Mac STACR REMIC Trust | | | | | | | | | | | | | | | | |
Series 2021-DNA5 M2 (SOFR30A + 1.650%) (a)(c) | | | 01/25/2034 | | | | 1.70% | | | | 555,000 | | | | 557,376 | |
Series 2021-DNA6 M1 (SOFR30A + 0.800%) (a)(c) | | | 10/25/2041 | | | | 0.85% | | | | 3,250,000 | | | | 3,247,056 | |
Freddie Mac STACR Trust | | | | | | | | | | | | | | | | |
Series 2018-DNA2 M2A (1 Month LIBOR USD + 2.150%) (a)(c) | | | 12/26/2030 | | | | 2.25% | | | | 700,000 | | | | 705,440 | |
Series 2018-HRP2 M3AS (1 Month LIBOR USD + 1.000%) (a)(c) | | | 02/25/2047 | | | | 1.10% | | | | 2,750,000 | | | | 2,742,058 | |
Series 2018-DNA3 M2A (1 Month LIBOR USD + 2.100%) (a)(c) | | | 09/25/2048 | | | | 2.20% | | | | 855,000 | | | | 857,666 | |
Freddie Mac Structured Agency Credit Risk Debt Notes | | | | | | | | | | | | | | | | |
Series 2017-DNA2 M1 (1 Month LIBOR USD + 1.200%) (c) | | | 10/25/2029 | | | | 1.30% | | | | 140,468 | | | | 140,469 | |
Series 2021-DNA7 M1 (SOFR30A + 0.850%) (a)(c) | | | 11/25/2041 | | | | 0.90% | | | | 3,750,000 | | | | 3,748,824 | |
FRESB Multifamily Mortgage Pass Through Certificates | | | | | | | | | | | | | | | | |
Series 2016-SB17 A7F (d) | | | 05/25/2023 | | | | 2.15% | | | | 539,498 | | | | 542,664 | |
Series 2017-SB32 A7F (d) | | | 04/25/2024 | | | | 2.44% | | | | 461,241 | | | | 465,702 | |
Series 2019-SB67 A5F (d) | | | 07/25/2024 | | | | 2.09% | | | | 866,231 | | | | 871,945 | |
Series 2019-SB69 A5F (d) | | | 10/25/2024 | | | | 2.25% | | | | 1,515,737 | | | | 1,542,447 | |
Series 2016-SB23 A10F (d) | | | 09/25/2026 | | | | 2.31% | | | | 719,474 | | | | 725,745 | |
GCT Commercial Mortgage Trust, 2021-GCT A (1 Month LIBOR USD + 0.800%) (a)(c) | | | 02/15/2038 | | | | 0.91% | | | | 1,400,000 | | | | 1,398,319 | |
GS Mortgage Securities Corp II, 2021-ARDN A (1 Month LIBOR USD + 1.250%) (a)(c) | | | 11/17/2036 | | | | 1.36% | | | | 2,650,000 | | | | 2,621,636 | |
GS Mortgage Securities Trust | | | | | | | | | | | | | | | | |
Series 2021-ROSS A (1 Month LIBOR USD + 1.150%) (a)(c) | | | 06/16/2036 | | | | 1.26% | | | | 2,000,000 | | | | 1,988,830 | |
Series 2013-GC10 AS | | | 02/12/2046 | | | | 2.94% | | | | 1,720,000 | | | | 1,748,695 | |
Series 2015-GC28 AS | | | 02/12/2048 | | | | 3.76% | | | | 885,000 | | | | 929,906 | |
Series 2021-NQM1 A3 (a)(d) | | | 07/25/2061 | | | | 1.53% | | | | 1,538,770 | | | | 1,525,254 | |
JP Morgan Chase Commercial Mortgage Securities Trust | | | | | | | | | | | | | | | | |
Series 2021-MHC A (1 Month LIBOR USD + 0.800%) (a)(c) | | | 04/15/2038 | | | | 0.91% | | | | 1,653,569 | | | | 1,650,437 | |
Series 2012-C8 ASB | | | 10/17/2045 | | | | 2.38% | | | | 64,567 | | | | 64,785 | |
Series 2013-C15 A-S | | | 11/17/2045 | | | | 4.42% | | | | 1,250,000 | | | | 1,311,459 | |
Series 2014-C23 ASB | | | 09/17/2047 | | | | 3.66% | | | | 725,789 | | | | 750,832 | |
Series 2014-C22 AS | | | 09/17/2047 | | | | 4.11% | | | | 1,350,000 | | | | 1,408,249 | |
Series 2013-C10 AS | | | 12/17/2047 | | | | 3.37% | | | | 762,000 | | | | 777,191 | |
Series 2016-JP3 A-5 | | | 08/15/2049 | | | | 2.87% | | | | 1,500,000 | | | | 1,560,392 | |
Merit, 2020-HILL A (1 Month LIBOR USD + 1.150%) (a)(c) | | | 08/17/2037 | | | | 1.26% | | | | 2,216,129 | | | | 2,215,463 | |
MHC Commercial Mortgage Trust, 2021-MHC A (1 Month LIBOR USD + 0.801%) (a)(c) | | | 04/15/2038 | | | | 0.91% | | | | 2,000,000 | | | | 1,995,614 | |
New Residential Mortgage Loan Trust | | | | | | | | | | | | | | | | |
Series 2015-1A A3 (a)(d) | | | 05/28/2052 | | | | 3.75% | | | | 349,093 | | | | 361,293 | |
Series 2014-2A A3 (a)(d) | | | 05/25/2054 | | | | 3.75% | | | | 65,898 | | | | 68,501 | |
Series 2016-1A A1 (a)(d) | | | 03/25/2056 | | | | 3.75% | | | | 149,373 | | | | 155,947 | |
Series 2017-1A A1 (a)(d) | | | 02/25/2057 | | | | 4.00% | | | | 290,215 | | | | 305,843 | |
Series 2017-6A A1 (a)(d) | | | 08/25/2057 | | | | 4.00% | | | | 139,882 | | | | 146,479 | |
Series 2018-5A A1 (a)(d) | | | 12/25/2057 | | | | 4.75% | | | | 517,387 | | | | 536,815 | |
OBX Trust, 2018-1 A2 (1 Month LIBOR USD + 0.650%) (a)(c) | | | 06/25/2057 | | | | 0.75% | | | | 318,029 | | | | 318,257 | |
OPG TRUST, 2021-PORT B (1 Month LIBOR USD + 0.713%) (a)(c) | | | 10/15/2036 | | | | 0.82% | | | | 2,700,000 | | | | 2,661,483 | |
PKHL Commercial Mortgage Trust, 2021-MF A (1 Month LIBOR USD + 0.880%) (a)(c) | | | 07/15/2038 | | | | 0.99% | | | | 3,250,000 | | | | 3,248,053 | |
The accompanying notes are an integral part of these consolidated financial statements. | 41 |
LoCorr Long/Short Commodities Strategy Fund - Consolidated Schedule of Investments (continued) |
| | Maturity Date | | | Coupon Rate | | | Principal Amount | | | Value | |
MORTGAGE BACKED SECURITIES: (continued) | | | | | | | | | | | | | | | | |
Sequoia Mortgage Trust | | | | | | | | | | | | | | | | |
Series 2019-5 A4 (a)(d) | | | 12/25/2049 | | | | 3.50% | | | $ | 14,773 | | | $ | 14,760 | |
Series 2020-1 A4 (a)(d) | | | 02/25/2050 | | | | 3.50% | | | | 10,236 | | | | 10,232 | |
SREIT Trust, 2021-MFP2 A (1 Month LIBOR USD + 0.822%) (a)(c) | | | 11/17/2036 | | | | 0.92% | | | | 3,750,000 | | | | 3,731,211 | |
STACR Trust, 2018-DNA2 M1 (1 Month LIBOR USD + 0.800%) (a)(c) | | | 12/26/2030 | | | | 0.90% | | | | 197,741 | | | | 197,741 | |
UBS Commercial Mortgage Trust, 2017-C6 ASB | | | 12/16/2050 | | | | 3.50% | | | | 1,000,000 | | | | 1,057,478 | |
UBS-Barclays Commercial Mortgage Trust, 2012-C4 A5 | | | 12/12/2045 | | | | 2.85% | | | | 870,000 | | | | 876,366 | |
Verus Securitization Trust | | | | | | | | | | | | | | | | |
Series 2020-1 A1 (a)(d) | | | 01/25/2060 | | | | 2.42% | | | | 353,657 | | | | 354,494 | |
Series 2020-1 A3 (a)(d) | | | 01/25/2060 | | | | 2.72% | | | | 664,860 | | | | 665,697 | |
VNDO Mortgage Trust, 2012-6AVE A (a) | | | 11/15/2030 | | | | 3.00% | | | | 1,000,000 | | | | 1,013,813 | |
Wells Fargo Commercial Mortgage Trust, 2012-LC5 AS | | | 10/17/2045 | | | | 3.54% | | | | 185,000 | | | | 187,366 | |
WFRBS Commercial Mortgage Trust | | | | | | | | | | | | | | | | |
Series 2013-C13 AS | | | 05/17/2045 | | | | 3.35% | | | | 185,000 | | | | 188,953 | |
Series 2012-C10 A3 | | | 12/15/2045 | | | | 2.88% | | | | 975,000 | | | | 986,017 | |
Series 2013-UBS1 A4 (d) | | | 03/16/2046 | | | | 4.08% | | | | 771,811 | | | | 804,897 | |
Series 2013-C14 A5 | | | 06/15/2046 | | | | 3.34% | | | | 200,000 | | | | 205,535 | |
Series 2013-C17 ASB | | | 12/17/2046 | | | | 3.56% | | | | 117,997 | | | | 120,753 | |
TOTAL MORTGAGE BACKED SECURITIES (Cost $105,117,890) | | | | | | | | | | | | | | | 105,124,977 | |
| | | | | | | | | | | | | | | | | |
MUNICIPAL BONDS: 0.51% | | | | | | | | | | | | | | | | |
County of King WA Sewer Revenue | | | 07/01/2025 | | | | 0.80% | | | | 320,000 | | | | 315,034 | |
Forsyth County School District | | | 02/01/2024 | | | | 0.92% | | | | 660,000 | | | | 660,613 | |
Miami Dade County Florida Aviation Refunding Taxable Series B | | | 10/01/2023 | | | | 2.37% | | | | 650,000 | | | | 665,173 | |
Nebraska Public Power District | | | 01/01/2024 | | | | 2.22% | | | | 675,000 | | | | 691,402 | |
State of Hawaii | | | 08/01/2025 | | | | 1.03% | | | | 1,955,000 | | | | 1,937,790 | |
Water Works Board of the City of Birmingham | | | 01/01/2024 | | | | 2.20% | | | | 270,000 | | | | 276,913 | |
TOTAL MUNICIPAL BONDS (Cost $4,531,193) | | | | | | | | | | | | | | | 4,546,925 | |
| | | | | | | | | | | | | | | | | |
PURCHASED OPTIONS: 9.80% | | | | | | Counterparty | | | Number of
Contracts | | | | | |
Call Options: 9.80% | | | | | | | | | | | | | | | | |
Nomura Galaxy Option- CoreCommodity, Expiration: July 2023, Current Price: $1,219.64, Exercise Price: $0.0001 (h) | | | | | | | Nomura Securities | | | | 25,231 | | | | 30,772,733 | |
Nomura Galaxy Option- East Alpha, Expiration: August 2022, Current Price: $5,967.43, Exercise Price: $0.0001 (i) | | | | | | | Nomura Securities | | | | 9,593 | | | | 57,244,189 | |
TOTAL PURCHASED OPTIONS (Cost $47,414,203) | | | | | | | | | | | | | | | 88,016,922 | |
| | | | | | | | | | | | | | | | | |
U.S. GOVERNMENT AGENCY ISSUES: 11.08% | | Maturity Date | | | Coupon Rate | | | Principal Amount | | | | | |
Federal Farm Credit Banks | | | 05/10/2023 | | | | 0.13% | | | | 8,180,000 | | | | 8,131,736 | |
Federal Farm Credit Banks | | | 06/14/2023 | | | | 0.13% | | | | 10,000,000 | | | | 9,970,548 | |
Federal Farm Credit Banks | | | 06/26/2023 | | | | 1.77% | | | | 2,450,000 | | | | 2,501,768 | |
Federal Farm Credit Banks | | | 07/17/2023 | | | | 2.88% | | | | 1,600,000 | | | | 1,661,711 | |
Federal Farm Credit Banks | | | 11/09/2023 | | | | 0.40% | | | | 5,900,000 | | | | 5,867,864 | |
Federal Farm Credit Banks | | | 12/01/2023 | | | | 0.50% | | | | 10,270,000 | | | | 10,228,408 | |
Federal Home Loan Banks | | | 06/10/2022 | | | | 2.13% | | | | 5,575,000 | | | | 5,621,064 | |
Federal Home Loan Banks | | | 06/10/2022 | | | | 2.75% | | | | 1,000,000 | | | | 1,011,447 | |
Federal Home Loan Banks | | | 06/09/2023 | | | | 3.25% | | | | 2,345,000 | | | | 2,435,420 | |
Federal Home Loan Banks | | | 08/28/2023 | | | | 0.13% | | | | 7,000,000 | | | | 6,939,402 | |
Federal Home Loan Banks | | | 09/08/2023 | | | | 3.38% | | | | 2,235,000 | | | | 2,337,127 | |
Federal Home Loan Banks | | | 12/08/2023 | | | | 3.38% | | | | 2,325,000 | | | | 2,442,955 | |
Federal Home Loan Banks | | | 06/14/2024 | | | | 1.75% | | | | 5,365,000 | | | | 5,481,542 | |
Federal Home Loan Banks | | | 12/20/2024 | | | | 1.00% | | | | 5,835,000 | | | | 5,839,944 | |
Federal Home Loan Banks | | | 04/14/2025 | | | | 0.50% | | | | 3,950,000 | | | | 3,881,775 | |
42 | The accompanying notes are an integral part of these consolidated financial statements. |
LoCorr Long/Short Commodities Strategy Fund - Consolidated Schedule of Investments (continued) |
| | Maturity Date | | | Coupon Rate | | | Principal Amount | | | Value | |
U.S. GOVERNMENT AGENCY ISSUES: (continued) | | | | | | | | | | | | | | | | |
Federal Home Loan Mortgage Corp. | | | 05/19/2023 | | | | 0.25% | | | $ | 2,730,000 | | | $ | 2,712,558 | |
Federal Home Loan Mortgage Corp. | | | 06/26/2023 | | | | 0.25% | | | | 3,000,000 | | | | 2,985,816 | |
Federal Home Loan Mortgage Corp. | | | 09/08/2023 | | | | 0.25% | | | | 885,000 | | | | 879,080 | |
Federal Home Loan Mortgage Corp. | | | 11/06/2023 | | | | 0.25% | | | | 4,000,000 | | | | 3,965,021 | |
Federal Home Loan Mortgage Corp. | | | 02/12/2025 | | | | 1.50% | | | | 4,850,000 | | | | 4,921,012 | |
Federal National Mortgage Association | | | 01/19/2023 | | | | 2.38% | | | | 220,000 | | | | 224,519 | |
Federal National Mortgage Association | | | 07/10/2023 | | | | 0.25% | | | | 3,350,000 | | | | 3,332,045 | |
Federal National Mortgage Association | | | 07/02/2024 | | | | 1.75% | | | | 6,000,000 | | | | 6,132,656 | |
Small Business Administration Participation Certificates | | | 11/01/2032 | | | | 2.09% | | | | 7,271 | | | | 7,389 | |
TOTAL U.S. GOVERNMENT AGENCY ISSUES (Cost $99,495,541) | | | | | | | | | | | | | | | 99,512,807 | |
| | | | | | | | | | | | | | | | | |
U.S. GOVERNMENT NOTES: 22.36% | | | | | | | | | | | | | | | | |
United States Treasury Note | | | 11/30/2022 | | | | 0.13% | | | | 30,295,000 | | | | 30,226,363 | |
United States Treasury Note | | | 02/15/2023 | | | | 2.00% | | | | 11,500,000 | | | | 11,698,555 | |
United States Treasury Note | | | 03/31/2023 | | | | 0.13% | | | | 21,260,000 | | | | 21,162,835 | |
United States Treasury Note | | | 03/31/2023 | | | | 1.50% | | | | 24,690,000 | | | | 24,992,838 | |
United States Treasury Note | | | 05/15/2023 | | | | 1.75% | | | | 5,975,000 | | | | 6,073,728 | |
United States Treasury Note | | | 12/31/2023 | | | | 2.63% | | | | 10,445,000 | | | | 10,835,463 | |
United States Treasury Note | | | 01/15/2024 | | | | 0.13% | | | | 20,565,000 | | | | 20,308,741 | |
United States Treasury Note | | | 04/30/2024 | | | | 2.00% | | | | 6,020,000 | | | | 6,184,374 | |
United States Treasury Note | | | 04/30/2024 | | | | 2.25% | | | | 1,585,000 | | | | 1,637,132 | |
United States Treasury Note | | | 05/15/2024 | | | | 0.25% | | | | 3,585,000 | | | | 3,536,827 | |
United States Treasury Note | | | 05/15/2024 | | | | 2.50% | | | | 6,030,000 | | | | 6,265,311 | |
United States Treasury Note | | | 06/15/2024 | | | | 0.25% | | | | 8,065,000 | | | | 7,947,805 | |
United States Treasury Note | | | 08/15/2024 | | | | 0.38% | | | | 33,930,000 | | | | 33,489,970 | |
United States Treasury Note | | | 09/15/2024 | | | | 0.38% | | | | 16,255,000 | | | | 16,028,954 | |
United States Treasury Note | | | 09/30/2024 | | | | 1.50% | | | | 500,000 | | | | 508,008 | |
TOTAL U.S. GOVERNMENT NOTES (Cost $201,808,371) | | | | | | | | | | | | | | | 200,896,904 | |
| | | | | | | | | | | | | | | | | |
SHORT TERM INVESTMENT: 3.91% | | | | | | | | | | | | | | | | |
MONEY MARKET FUND: 3.91% | | | | | | | | | | Shares | | | | | |
STIT-Government & Agency Portfolio, Institutional Class, 0.03% (e)(f) | | | | | | | | | | | 35,136,978 | | | | 35,136,978 | |
TOTAL MONEY MARKET FUND (Cost $35,136,978) | | | | | | | | | | | | | | | 35,136,978 | |
TOTAL SHORT TERM INVESTMENT (Cost $35,136,978) | | | | | | | | | | | | | | | 35,136,978 | |
| | | | | | | | | | | | | | | | | |
TOTAL INVESTMENTS (Cost $732,007,522): 85.81% | | | | | | | | | | | | | | | 770,863,165 | |
Other Assets in Excess of Liabilities: 14.84% (g) | | | | | | | | | | | | | | | 127,495,712 | |
TOTAL NET ASSETS: 100.00% | | | | | | | | | | | | | | $ | 898,358,877 | |
(a) | Security as defined in Rule 144A under the Securities Act of 1933 and determined to be liquid. Purchased in a private placement transaction; resale to the public may require registration or may extend only to qualified institutional buyers. At December 31, 2021, the value of these securities total $135,473,860 which represents 15.08% of total net assets. |
(b) | Foreign issued security. |
(c) | Variable rate security based on a reference index and spread. The rate reported is the rate in effect as of December 31, 2021. |
(d) | Variable rate security. The coupon is based on an underlying pool of loans. The rate reported is the rate in effect as of December 31, 2021. |
(e) | The rate quoted is the annualized seven-day effective yield as of December 31, 2021. |
(f) | A portion of this security is pledged as collateral for swap contracts. At December 31, 2021, the value of this collateral totals $436,043. |
(g) | Includes deposits with broker for swap contracts. At December 31, 2021, the value of these assets total $72,006,860. |
(h) | The Nomura Call option is issued by Nomura Securities Ltd. and provides LoCorr Long/Short Commodities Strategy Fund access to the performance of the Galaxy Plus Fund – CoreCommodity Feeder Fund (558) LLC, which effectuates its trading strategy through the Galaxy Plus Fund – CoreCommodity Master Fund (558) LLC. The underlying strategy is a quantitative trading program specializing in commodity futures contracts. |
(i) | The Nomura Call option is issued by Nomura Securities Ltd. and provides LoCorr Long/Short Commodities Strategy Fund access to the performance of the Galaxy Plus Fund – East Alpha Feeder Fund (548) LLC, which effectuates its trading strategy through the Galaxy Plus Fund – East Alpha Master Fund (548) LLC. The underlying strategy is a quantitative trading program specializing in commodity futures contracts. |
* | Amount rounds to less than 0.005% of net assets. |
CMT | Constant Maturity Treasury | PLC | Public Limited Company |
LIBOR | London Interbank Offered Rate | SOFR | Secured Overnight Financing Rate |
The accompanying notes are an integral part of these consolidated financial statements. | 43 |
LoCorr Long/Short Commodities Strategy Fund – Consolidated Schedule of Swap Contracts |
LoCorr Long/Short Commodities Strategy Fund
Consolidated Schedule of Swap Contracts
December 31, 2021
LONG TOTAL RETURN SWAP CONTRACTS
Termination Date | Reference Index | Financing Rate | Payment Frequency | Notional Amount | Unrealized Appreciation | Counterparty |
12/16/2022 | LoCorr Commodities Index# | 0.50% | Quarterly | $425,945,098 | $37,256,061 | Deutsche Bank AG |
# | Comprised of a proprietary basket of Commodity Trading Advisor’s ‘’CTA’’) Programs investing in various futures contracts, forward currency contracts, foreign currency and other similar investments. See Notes 2 & 3. |
The underlying components of the basket as of December 31, 2021 are shown below:#
Description | | Expiration Date | | | Number of Contracts
Purchased (Sold) | | | Notional Amount | | | Concentration %
of Exposure | |
Futures Contracts: | | | | | | | | | | | | | | | | |
Purchase Contracts:(1) | | | | | | | | | | | | | | | | |
Brent Crude | | | Feb-22 | | | | 2,377 | | | $ | 186,537,474 | | | | 7.66 | % |
Natural Gas | | | May-22 | | | | 2,463 | | | | 87,268,246 | | | | 3.59 | % |
WTI Crude | | | May-22 | | | | 1,142 | | | | 85,087,103 | | | | 3.50 | % |
Live Cattle | | | Jun-22 | | | | 1,184 | | | | 65,854,874 | | | | 2.71 | % |
Gasoline RBOB | | | Feb-22 | | | | 532 | | | | 50,580,145 | | | | 2.08 | % |
Coffee | | | May-22 | | | | 591 | | | | 49,885,540 | | | | 2.05 | % |
Sugar No.11 | | | Apr-22 | | | | 2,355 | | | | 48,885,977 | | | | 2.01 | % |
Live Cattle | | | Apr-22 | | | | 807 | | | | 46,685,169 | | | | 1.92 | % |
Brent Crude | | | Apr-22 | | | | 587 | | | | 45,485,928 | | | | 1.87 | % |
Hard Red Wheat | | | Jul-22 | | | | 1,023 | | | | 41,074,321 | | | | 1.69 | % |
Natural Gas | | | Feb-22 | | | | 1,079 | | | | 37,919,840 | | | | 1.56 | % |
Soybean Oil | | | May-22 | | | | 924 | | | | 31,432,076 | | | | 1.29 | % |
Copper | | | May-22 | | | | 282 | | | | 31,329,561 | | | | 1.29 | % |
Corn | | | Mar-22 | | | | 924 | | | | 27,625,187 | | | | 1.14 | % |
Platinum | | | Apr-22 | | | | 532 | | | | 25,495,065 | | | | 1.05 | % |
Soybean Oil | | | Jul-22 | | | | 672 | | | | 22,821,816 | | | | 0.94 | % |
Corn | | | May-22 | | | | 668 | | | | 20,004,352 | | | | 0.82 | % |
Gasoline RBOB | | | Mar-22 | | | | 197 | | | | 19,626,832 | | | | 0.81 | % |
Cotton No.2 | | | May-22 | | | | 270 | | | | 14,881,096 | | | | 0.61 | % |
Silver | | | Mar-22 | | | | 126 | | | | 14,678,925 | | | | 0.60 | % |
Nickel | | | Mar-22 | | | | 84 | | | | 10,499,134 | | | | 0.43 | % |
Cotton No.2 | | | Dec-22 | | | | 219 | | | | 10,152,293 | | | | 0.42 | % |
WTI Crude | | | Feb-22 | | | | 130 | | | | 9,892,649 | | | | 0.41 | % |
Zinc | | | Mar-22 | | | | 109 | | | | 9,670,066 | | | | 0.40 | % |
Coffee | | | Jul-22 | | | | 107 | | | | 9,029,631 | | | | 0.37 | % |
Gold | | | Feb-22 | | | | 47 | | | | 8,629,909 | | | | 0.35 | % |
Low Sulphur Gasoil | | | Feb-22 | | | | 124 | | | | 8,377,492 | | | | 0.34 | % |
Total Purchase Contracts | | | | | | | | | | | 1,019,410,701 | | | | 41.91 | % |
| | | | | | | | | | | | | | | | | |
Sale Contracts:(1) | | | | | | | | | | | | | | | | |
Brent Crude | | | Jan-22 | | | | (2,835) | | | $ | 223,644,553 | | | | 9.19 | % |
Live Cattle | | | Feb-22 | | | | (2,077) | | | | 115,940,724 | | | | 4.77 | % |
Natural Gas | | | Apr-22 | | | | (2,001) | | | | 69,814,890 | | | | 2.87 | % |
Sugar No.11 | | | Feb-22 | | | | (2,960) | | | | 62,383,951 | | | | 2.56 | % |
WTI Crude | | | Feb-22 | | | | (682) | | | | 51,754,060 | | | | 2.13 | % |
Hard Red Wheat | | | Mar-22 | | | | (1,223) | | | | 49,362,278 | | | | 2.03 | % |
Soybean Oil | | | Mar-22 | | | | (1,437) | | | | 48,871,882 | | | | 2.01 | % |
44 | The accompanying notes are an integral part of these consolidated financial statements. |
LoCorr Long/Short Commodities Strategy Fund – Consolidated Schedule of Swap Contracts (continued) |
Description | | Expiration Date | | | Number of Contracts
Purchased (Sold) | | | Notional Amount | | | Concentration %
of Exposure | |
Coffee | | | Mar-22 | | | | (557) | | | $ | 47,014,987 | | | | 1.93 | % |
Natural Gas | | | Jan-22 | | | | (1,152) | | | | 42,284,239 | | | | 1.73 | % |
WTI Crude | | | Jan-22 | | | | (462) | | | | 35,220,740 | | | | 1.45 | % |
Soybean | | | Mar-22 | | | | (427) | | | | 28,713,489 | | | | 1.18 | % |
Copper | | | Mar-22 | | | | (224) | | | | 24,974,260 | | | | 1.03 | % |
Gasoline RBOB | | | Jan-22 | | | | (256) | | | | 24,291,443 | | | | 1.00 | % |
Wheat | | | Mar-22 | | | | (527) | | | | 20,344,277 | | | | 0.84 | % |
Feeder Cattle | | | Mar-22 | | | | (171) | | | | 14,522,033 | | | | 0.60 | % |
Gold | | | Apr-22 | | | | (68) | | | | 12,440,157 | | | | 0.51 | % |
Heating Oil | | | Jan-22 | | | | (117) | | | | 11,640,617 | | | | 0.48 | % |
Lean Hogs | | | Apr-22 | | | | (329) | | | | 11,470,631 | | | | 0.47 | % |
Cocoa | | | May-22 | | | | (423) | | | | 10,824,043 | | | | 0.44 | % |
WTI Crude | | | Mar-22 | | | | (114) | | | | 8,646,598 | | | | 0.36 | % |
Total Sale Contracts | | | | | | | | | | | 914,159,852 | | | | 37.58 | % |
Other Futures Contracts | | | | | | | | | | | 201,360,164 | | | | 8.28 | % |
Total Futures Contracts | | | | | | | | | | | 2,134,930,717 | | | | 87.77 | % |
Forward Currency Contracts: | | | | | | | | | | Delivered
(in USD) | | | | | | | Received
(in USD) | | | | | |
Sales Contracts:(1) | | | | | | | | | | | | | | | | | | | | | | | | |
USD/EUR | | | 12/31/2021 | | | | U.S. Dollar | | | $ | (10,385,716 | ) | Euro | | $ | 10,404,571 | | | | 0.43 | % |
Total Forward Currency Contracts Sold | | | | | | | | | | | | | | | | | | | 10,404,571 | | | | 0.43 | % |
Total Forward Currency Contracts | | | | | | | | | | | | | | | | | | | 10,404,571 | | | | 0.43 | % |
| | | | | | | | | | | | | | | | | | | | | | | | | |
Cash and Foreign Currency: | | | | | | Quantity | | | | | | | | | | | | | |
Cash and Foreign Currency Purchased:(1) | | | | | | | | | | | | | | | | | | | | | | | | |
U.S. Dollar | | | | | | | | | | | 128,501,174 | | | | | | | $ | 128,501,174 | | | | 5.28 | % |
Total Cash and Foreign Currency Purchased | | | | | | | | | | | | | | | | | | | 128,501,174 | | | | 5.28 | % |
| | | | | | | | | | | | | | | | | | | | | | | | | |
Cash and Foreign Currency Sold:(1) | | | | | | | | | | | | | | | | | | | | | | | | |
Euro | | | | | | | | | | | 132,782,255 | | | | | | | $ | 151,172,374 | | | | 6.21 | % |
Total Cash and Foreign Currency Sold | | | | | | | | | | | | | | | | | | | 151,172,374 | | | | 6.21 | % |
Other Cash and Foreign Currency | | | | | | | | | | | | | | | | | | | 7,431,057 | | | | 0.31 | % |
Total Cash and Foreign Currency | | | | | | | | | | | | | | | | | | | 287,104,605 | | | | 11.80 | % |
Total Underlying Positions | | | | | | | | | | | | | | | | | | $ | 2,432,439,893 | | | | 100.00 | % |
# | The investment is not a direct holding of LoCorr Long/Short Commodities Strategy Fund. The top 50 holdings and other futures contracts, other forward currency contracts, and other cash and foreign currency were determined based on the absolute notional amount of the positions within the underlying swap basket. |
(1) | Represents the 50 largest components of the basket. |
The accompanying notes are an integral part of these consolidated financial statements. | 45 |
LoCorr Market Trend Fund – Consolidated Schedule of Investments |

Consolidated Schedule of Investments
December 31, 2021
| | Maturity Date | | | Coupon Rate | | | Principal Amount | | | Value | |
ASSET BACKED SECURITIES: 9.31% |
American Homes 4 Rent Trust, 2014-SFR2 A (a) | | | 10/17/2036 | | | | 3.79% | | | $ | 384,639 | | | $ | 399,145 | |
AmeriCredit Automobile Receivables Trust | | | | | | | | | | | | | | | | |
Series 2021-3 A-3 | | | 08/18/2026 | | | | 0.76% | | | | 1,000,000 | | | | 994,390 | |
Series 2021-2 A3 | | | 12/18/2026 | | | | 0.34% | | | | 930,000 | | | | 922,311 | |
AMSR Trust, 2020-SFR1 A (a) | | | 04/17/2037 | | | | 1.82% | | | | 324,688 | | | | 324,615 | |
Angel Oak Mortgage Trust LLC, 2020-5 A3 (a)(d) | | | 05/25/2065 | | | | 2.04% | | | | 41,660 | | | | 41,660 | |
Carmax Auto Owner Trust, 2021-4 A3 | | | 09/15/2026 | | | | 0.56% | | | | 595,000 | | | | 586,682 | |
CarMax Auto Owner Trust, 2018-4 A3 | | | 09/15/2023 | | | | 3.36% | | | | 660,601 | | | | 665,264 | |
Carvana Auto Receivables Trust | | | | | | | | | | | | | | | | |
Series 2021-P2 A3 | | | 03/10/2026 | | | | 0.49% | | | | 900,000 | | | | 893,615 | |
Series 2021-P4 A-3 | | | 01/10/2027 | | | | 1.31% | | | | 1,230,000 | | | | 1,229,228 | |
CenterPoint Energy Residential Bond, 2009-1 A3 | | | 08/15/2023 | | | | 4.24% | | | | 552,840 | | | | 560,006 | |
Corevest American Finance Trust, 2020-1 A1 (a) | | | 03/17/2050 | | | | 1.83% | | | | 346,109 | | | | 345,596 | |
DB Master Finance LLC, 2021-1a A2I (a) | | | 11/20/2051 | | | | 2.05% | | | | 650,000 | | | | 635,115 | |
Freddie Mac STACR REMIC Trust, 2021-HQA4 M1 (SOFR30A + 0.950%) (a)(c) | | | 12/26/2041 | | | | 1.00% | | | | 800,000 | | | | 800,000 | |
GM Financial Automobile Leasing Trust, 2021-2 A4 | | | 05/20/2025 | | | | 0.41% | | | | 1,050,000 | | | | 1,038,262 | |
GM Financial Consumer Automobile Receivables Trust | | | | | | | | | | | | | | | | |
Series 2018-4 A3 | | | 10/16/2023 | | | | 3.21% | | | | 406,760 | | | | 409,017 | |
Series 2021-1 A3 | | | 10/16/2025 | | | | 0.35% | | | | 750,000 | | | | 745,235 | |
Series 2021-3 A3 | | | 06/16/2026 | | | | 0.48% | | | | 1,000,000 | | | | 989,409 | |
Hilton Grand Vacations Trust, 2019-AA A (a) | | | 07/25/2033 | | | | 2.34% | | | | 502,643 | | | | 509,158 | |
Honda Auto Receivables Owner Trust | | | | | | | | | | | | | | | | |
Series 2019-1 A3 | | | 03/20/2023 | | | | 2.83% | | | | 174,133 | | | | 175,324 | |
Series 2020-3 A3 | | | 10/18/2024 | | | | 0.37% | | | | 1,400,000 | | | | 1,396,087 | |
Hyundai Auto Receivables Trust, 2020-C A3 | | | 05/15/2025 | | | | 0.38% | | | | 1,150,000 | | | | 1,145,065 | |
Invitation Homes Trust | | | | | | | | | | | | | | | | |
Series 2018-SFR1 A (1 Month LIBOR USD + 0.700%) (a)(c) | | | 03/19/2037 | | | | 0.81% | | | | 425,387 | | | | 425,386 | |
Series 2018-SFR2 A (1 Month LIBOR USD + 0.900%) (a)(c) | | | 06/18/2037 | | | | 1.01% | | | | 425,546 | | | | 425,612 | |
46 | The accompanying notes are an integral part of these consolidated financial statements. |
LoCorr Market Trend Fund – Consolidated Schedule of Investments (continued) |
| | Maturity Date | | | Coupon Rate | | | Principal Amount | | | Value | |
ASSET BACKED SECURITIES (continued) |
Series 2018-SFR3 A (1 Month LIBOR USD + 1.000%) (a)(c) | | | 07/17/2037 | | | | 1.11% | | | $ | 112,698 | | | $ | 112,639 | |
Series 2018-SFR4 A (1 Month LIBOR USD + 1.100%) (a)(c) | | | 01/19/2038 | | | | 1.21% | | | | 677,734 | | | | 676,973 | |
Morgan Stanley Capital I Trust, 2004-HE6 M1 (1 Month LIBOR USD + 0.825%) (c) | | | 08/25/2034 | | | | 0.93% | | | | 133,760 | | | | 132,564 | |
MVW Owner Trust, 2019-1A A (a) | | | 11/20/2036 | | | | 2.89% | | | | 450,771 | | | | 457,034 | |
PFS Financing Corp. | | | | | | | | | | | | | | | | |
Series 2020-F A (a) | | | 08/15/2024 | | | | 0.93% | | | | 700,000 | | | | 701,632 | |
Series 2020-G A (a) | | | 02/17/2026 | | | | 0.97% | | | | 500,000 | | | | 497,158 | |
Santander Drive Auto Receivables Trust, 2021-4 A3 | | | 08/15/2025 | | | | 0.51% | | | | 1,030,000 | | | | 1,026,248 | |
Taco Bell Funding LLC, 2021-1A A21 (a) | | | 08/25/2051 | | | | 1.95% | | | | 1,025,000 | | | | 1,004,769 | |
Toyota Lease Owner Trust, 2021-B A3 (a) | | | 10/21/2024 | | | | 0.42% | | | | 1,090,000 | | | | 1,080,742 | |
Tricon American Homes Trust | | | | | | | | | | | | | | | | |
Series 2017-SFR2 A (a) | | | 01/18/2036 | | | | 2.93% | | | | 96,767 | | | | 97,292 | |
Series 2017-SFR2 B (a) | | | 01/18/2036 | | | | 3.28% | | | | 400,000 | | | | 402,107 | |
Verizon Owner Trust | | | | | | | | | | | | | | | | |
Series 2018-A A1A | | | 04/20/2023 | | | | 3.23% | | | | 2,282 | | | | 2,286 | |
Series 2019-B A1A | | | 12/20/2023 | | | | 2.33% | | | | 496,615 | | | | 499,938 | |
Series 2020-A A1A | | | 07/20/2024 | | | | 1.85% | | | | 1,180,000 | | | | 1,188,843 | |
Volkswagen Auto Loan Enhanced Trust, 2021-1 A-3 | | | 06/22/2026 | | | | 1.02% | | | | 950,000 | | | | 949,960 | |
VSE VOI Mortgage LLC, 2018-A A (a) | | | 02/20/2036 | | | | 3.56% | | | | 315,675 | | | | 324,759 | |
TOTAL ASSET BACKED SECURITIES (Cost $24,893,450) | | | | | | | | | | | | | | | 24,811,126 | |
| | | | | | | | | | | | | | | | | |
CORPORATE BONDS: 21.50% | | | | | | | | | | | | | | | | |
Agriculture: 0.34% | | | | | | | | | | | | | | | | |
BAT Capital Corp. | | | 08/15/2024 | | | | 3.22% | | | | 225,000 | | | | 233,897 | |
BAT International Finance PLC (b) | | | 03/25/2026 | | | | 1.67% | | | | 675,000 | | | | 662,967 | |
| | | | | | | | | | | | | | | | 896,864 | |
Auto Manufacturers: 0.74% | | | | | | | | | | | | | | | | |
Daimler Finance North America LLC (a) | | | 03/10/2023 | | | | 1.75% | | | | 500,000 | | | | 505,035 | |
General Motors Financial Co., Inc. | | | 10/15/2024 | | | | 1.20% | | | | 200,000 | | | | 198,573 | |
General Motors Financial Co., Inc. | | | 06/20/2025 | | | | 2.75% | | | | 620,000 | | | | 640,035 | |
Volkswagen Group of America Finance LLC (a) | | | 11/22/2023 | | | | 0.88% | | | | 625,000 | | | | 620,897 | |
| | | | | | | | | | | | | | | | 1,964,540 | |
Banks: 11.37% | | | | | | | | | | | | | | | | |
Banco Santander SA (b) | | | 02/23/2023 | | | | 3.13% | | | | 340,000 | | | | 348,023 | |
Banco Santander SA (b) | | | 05/28/2025 | | | | 2.75% | | | | 230,000 | | | | 237,827 | |
Bank of America Corp. | | | 01/11/2023 | | | | 3.30% | | | | 540,000 | | | | 554,815 | |
Bank of America Corp. (SOFR + 1.460%) (c) | | | 05/19/2024 | | | | 1.49% | | | | 800,000 | | | | 805,862 | |
Bank of America Corp. (SOFR + 0.740%) (c) | | | 10/24/2024 | | | | 0.81% | | | | 800,000 | | | | 794,755 | |
Bank of America Corp. (SOFR + 0.690%) (c) | | | 04/22/2025 | | | | 0.98% | | | | 1,035,000 | | | | 1,026,890 | |
Bank of America Corp. (SOFR + 1.150%) (c) | | | 06/19/2026 | | | | 1.32% | | | | 1,070,000 | | | | 1,059,105 | |
Bank of America Corp. (SOFR + 1.010%) (c) | | | 10/24/2026 | | | | 1.20% | | | | 825,000 | | | | 808,929 | |
Barclays PLC (1 Year CMT Rate + 0.800%) (b)(c) | | | 12/10/2024 | | | | 1.01% | | | | 625,000 | | | | 620,513 | |
BNP Paribas SA (3 Month LIBOR USD + 1.111%) (a)(b)(c) | | | 11/19/2025 | | | | 2.82% | | | | 550,000 | | | | 566,155 | |
Citigroup, Inc. (3 Month LIBOR USD + 0.722%) (c) | | | 01/24/2023 | | | | 3.14% | | | | 495,000 | | | | 495,628 | |
Citigroup, Inc. (3 Month LIBOR USD + 1.023%) (c) | | | 06/01/2024 | | | | 4.04% | | | | 435,000 | | | | 453,393 | |
Citigroup, Inc. (SOFR + 0.686%) (c) | | | 10/30/2024 | | | | 0.78% | | | | 965,000 | | | | 958,885 | |
Citigroup, Inc. (SOFR + 0.669%) (c) | | | 05/01/2025 | | | | 0.98% | | | | 550,000 | | | | 545,764 | |
Citigroup, Inc. (SOFR + 0.765%) (c) | | | 01/28/2027 | | | | 1.12% | | | | 350,000 | | | | 341,072 | |
Credit Suisse AG (b) | | | 05/05/2023 | | | | 1.00% | | | | 565,000 | | | | 566,526 | |
Credit Suisse AG (b) | | | 08/09/2023 | | | | 0.52% | | | | 200,000 | | | | 198,598 | |
Danske Bank A/S (1 Year CMT Rate + 1.730%) (a)(b)(c) | | | 01/12/2023 | | | | 5.00% | | | | 630,000 | | | | 630,543 | |
Deutsche Bank NY (b) | | | 05/28/2024 | | | | 0.90% | | | | 310,000 | | | | 307,351 | |
Federation des Caisses Desjardins du Quebec (a)(b) | | | 09/26/2023 | | | | 1.95% | | | | 700,000 | | | | 707,911 | |
The accompanying notes are an integral part of these consolidated financial statements. | 47 |
LoCorr Market Trend Fund – Consolidated Schedule of Investments (continued) |
| | Maturity Date | | | Coupon Rate | | | Principal Amount | | | Value | |
CORPORATE BONDS (continued) |
Federation des Caisses Desjardins du Quebec (a)(b) | | | 05/21/2024 | | | | 0.70% | | | $ | 550,000 | | | $ | 541,944 | |
Goldman Sachs Group, Inc. | | | 02/23/2023 | | | | 3.20% | | | | 1,755,000 | | | | 1,800,002 | |
Goldman Sachs Group, Inc. (SOFR + 0.572%) (c) | | | 03/08/2024 | | | | 0.67% | | | | 3,285,000 | | | | 3,270,395 | |
Goldman Sachs Group, Inc. | | | 04/01/2025 | | | | 3.50% | | | | 225,000 | | | | 237,998 | |
Goldman Sachs Group, Inc. (SOFR + 0.789%) (c) | | | 12/09/2026 | | | | 1.09% | | | | 165,000 | | | | 160,867 | |
HSBC Bank Canada (a)(b) | | | 09/10/2023 | | | | 1.65% | | | | 930,000 | | | | 937,484 | |
HSBC Holdings PLC (SOFR + 1.929%) (b)(c) | | | 06/04/2026 | | | | 2.10% | | | | 965,000 | | | | 971,674 | |
ING Groep NV (b) | | | 04/09/2024 | | | | 3.55% | | | | 540,000 | | | | 566,150 | |
JP Morgan Chase & Co. | | | 01/25/2023 | | | | 3.20% | | | | 435,000 | | | | 446,826 | |
JP Morgan Chase & Co. (SOFR + 0.420%) (c) | | | 02/16/2025 | | | | 0.56% | | | | 325,000 | | | | 320,347 | |
JP Morgan Chase & Co. (SOFR + 0.540%) (c) | | | 06/01/2025 | | | | 0.82% | | | | 735,000 | | | | 726,558 | |
JP Morgan Chase & Co. (SOFR + 0.800%) (c) | | | 11/19/2026 | | | | 1.05% | | | | 350,000 | | | | 341,142 | |
JP Morgan Chase & Co. (SOFR + 0.695%) (c) | | | 02/04/2027 | | | | 1.04% | | | | 590,000 | | | | 571,331 | |
Mitsubishi UFJ Financial Group, Inc. (1 Year CMT Rate + 0.680%) (b)(c) | | | 09/15/2024 | | | | 0.85% | | | | 460,000 | | | | 457,770 | |
Morgan Stanley | | | 01/23/2023 | | | | 3.13% | | | | 880,000 | | | | 902,342 | |
Morgan Stanley (SOFR + 0.455%) (c) | | | 01/25/2024 | | | | 0.53% | | | | 1,215,000 | | | | 1,210,903 | |
Morgan Stanley (SOFR + 0.616%) (c) | | | 04/05/2024 | | | | 0.73% | | | | 960,000 | | | | 957,097 | |
Morgan Stanley (SOFR + 0.525%) (c) | | | 05/30/2025 | | | | 0.79% | | | | 175,000 | | | | 172,746 | |
NatWest Markets PLC (a)(b) | | | 05/21/2023 | | | | 2.38% | | | | 370,000 | | | | 377,046 | |
NatWest Markets PLC (a)(b) | | | 08/12/2024 | | | | 0.80% | | | | 200,000 | | | | 196,735 | |
Svenska Handelsbanken AB (a)(b) | | | 06/30/2023 | | | | 0.63% | | | | 405,000 | | | | 403,864 | |
Svenska Handelsbanken AB (a)(b) | | | 06/11/2024 | | | | 0.55% | | | | 250,000 | | | | 246,559 | |
Toronto-Dominion Bank (b) | | | 09/10/2024 | | | | 0.70% | | | | 390,000 | | | | 385,009 | |
UBS AG/London (a)(b) | | | 04/21/2022 | | | | 1.75% | | | | 440,000 | | | | 441,381 | |
UBS AG/London (a)(b) | | | 06/01/2023 | | | | 0.38% | | | | 440,000 | | | | 436,591 | |
UBS AG/London (a)(b) | | | 08/09/2024 | | | | 0.70% | | | | 400,000 | | | | 395,436 | |
UBS Group AG (1 Year CMT Rate + 0.830%) (a)(b)(c) | | | 07/30/2024 | | | | 1.01% | | | | 200,000 | | | | 199,381 | |
Wells Fargo & Co. | | | 02/13/2023 | | | | 3.45% | | | | 585,000 | | | | 601,926 | |
| | | | | | | | | | | | | | | | 30,306,049 | |
Biotechnology: 0.30% | | | | | | | | | | | | | | | | |
Gilead Sciences, Inc. | | | 09/29/2023 | | | | 0.75% | | | | 260,000 | | | | 258,932 | |
Royalty Pharma PLC (b) | | | 09/02/2023 | | | | 0.75% | | | | 550,000 | | | | 546,592 | |
| | | | | | | | | | | | | | | | 805,524 | |
Chemicals: 0.05% | | | | | | | | | | | | | | | | |
Westlake Chemical Corp. | | | 08/15/2024 | | | | 0.88% | | | | 140,000 | | | | 137,906 | |
| | | | | | | | | | | | | | | | | |
Diversified Financial Services: 1.15% | | | | | | | | | | | | | | | | |
AerCap Ireland Capital /Global Aviation Trust (b) | | | 10/29/2024 | | | | 1.65% | | | | 1,190,000 | | | | 1,188,105 | |
AerCap Ireland Capital/Global Aviation Trust (b) | | | 01/15/2025 | | | | 3.50% | | | | 700,000 | | | | 730,900 | |
AerCap Ireland Capital/Global Aviation Trust (b) | | | 01/30/2026 | | | | 1.75% | | | | 235,000 | | | | 230,609 | |
Air Lease Corp. | | | 07/03/2023 | | | | 3.88% | | | | 230,000 | | | | 238,226 | |
Air Lease Corp. | | | 02/01/2024 | | | | 4.25% | | | | 150,000 | | | | 158,059 | |
Capital One Bank | | | 02/15/2023 | | | | 3.38% | | | | 290,000 | | | | 298,039 | |
Private Export Funding Corp. | | | 06/15/2025 | | | | 3.25% | | | | 200,000 | | | | 211,844 | |
| | | | | | | | | | | | | | | | 3,055,782 | |
Electric: 0.48% | | | | | | | | | | | | | | | | |
Eversource Energy | | | 08/15/2025 | | | | 0.80% | | | | 75,000 | | | | 72,870 | |
Exelon Generation Co. LLC | | | 03/15/2022 | | | | 3.40% | | | | 95,000 | | | | 95,294 | |
Exelon Generation Co. LLC | | | 06/01/2025 | | | | 3.25% | | | | 70,000 | | | | 73,371 | |
Southern California Edison Co. | | | 08/01/2023 | | | | 0.70% | | | | 410,000 | | | | 407,500 | |
Southern California Edison Co. | | | 04/01/2024 | | | | 1.10% | | | | 635,000 | | | | 632,700 | |
| | | | | | | | | | | | | | | | 1,281,735 | |
48 | The accompanying notes are an integral part of these consolidated financial statements. |
LoCorr Market Trend Fund – Consolidated Schedule of Investments (continued) |
| | Maturity Date | | | Coupon Rate | | | Principal Amount | | | Value | |
CORPORATE BONDS (continued) |
Food: 0.08% | | | | | | | | | | | | | | | | |
Conagra Brands, Inc. | | | 08/11/2023 | | | | 0.50% | | | $ | 220,000 | | | $ | 218,128 | |
| | | | | | | | | | | | | | | | | |
Healthcare - Products: 1.11% | | | | | | | | | | | | | | | | |
Baxter International, Inc. (a) | | | 11/29/2024 | | | | 1.32% | | | | 1,140,000 | | | | 1,138,665 | |
DH Europe Finance II Sarl (b) | | | 11/15/2024 | | | | 2.20% | | | | 405,000 | | | | 413,948 | |
PerkinElmer, Inc. | | | 09/15/2024 | | | | 0.85% | | | | 485,000 | | | | 478,201 | |
Thermo Fisher Scientific, Inc. | | | 10/18/2024 | | | | 1.22% | | | | 645,000 | | | | 644,394 | |
Zimmer Biomet Holdings, Inc. | | | 11/22/2024 | | | | 1.45% | | | | 270,000 | | | | 269,288 | |
| | | | | | | | | | | | | | | | 2,944,496 | |
Healthcare - Services: 0.48% | | | | | | | | | | | | | | | | |
Humana, Inc. | | | 08/03/2023 | | | | 0.65% | | | | 885,000 | | | | 880,490 | |
UnitedHealth Group, Inc. | | | 05/15/2024 | | | | 0.55% | | | | 400,000 | | | | 396,888 | |
| | | | | | | | | | | | | | | | 1,277,378 | |
Insurance: 0.92% | | | | | | | | | | | | | | | | |
Equitable Financial Life Global (a) | | | 11/17/2023 | | | | 0.50% | | | | 150,000 | | | | 148,555 | |
Equitable Financial Life Global (a) | | | 07/07/2025 | | | | 1.40% | | | | 380,000 | | | | 376,679 | |
Metropolitan Life Global Funding I (a) | | | 06/07/2024 | | | | 0.55% | | | | 570,000 | | | | 561,325 | |
Metropolitan Life Global Funding I (a) | | | 07/02/2025 | | | | 0.95% | | | | 325,000 | | | | 320,527 | |
Principal Life Global Funding II (a) | | | 04/12/2024 | | | | 0.75% | | | | 510,000 | | | | 506,405 | |
Protective Life Global Funding (a) | | | 07/05/2024 | | | | 0.78% | | | | 550,000 | | | | 542,866 | |
| | | | | | | | | | | | | | | | 2,456,357 | |
Miscellaneous Manufacturing: 0.17% | | | | | | | | | | | | | | | | |
Parker-Hannifin Corp. | | | 06/14/2024 | | | | 2.70% | | | | 230,000 | | | | 237,665 | |
Trane Technologies Luxembourg Finance SA (b) | | | 03/21/2026 | | | | 3.50% | | | | 210,000 | | | | 222,804 | |
| | | | | | | | | | | | | | | | 460,469 | |
Oil & Gas: 0.24% | | | | | | | | | | | | | | | | |
Diamondback Energy, Inc. | | | 12/01/2024 | | | | 2.88% | | | | 280,000 | | | | 290,539 | |
Phillips 66 | | | 02/15/2024 | | | | 0.90% | | | | 345,000 | | | | 342,497 | |
| | | | | | | | | | | | | | | | 633,036 | |
Packaging & Containers: 0.33% | | | | | | | | | | | | | | | | |
Amcor Finance, Inc. | | | 04/28/2026 | | | | 3.63% | | | | 515,000 | | | | 547,913 | |
Berry Global, Inc. | | | 02/15/2024 | | | | 0.95% | | | | 330,000 | | | | 327,030 | |
| | | | | | | | | | | | | | | | 874,943 | |
Pharmaceuticals: 1.08% | | | | | | | | | | | | | | | | |
AbbVie, Inc. | | | 11/21/2022 | | | | 2.30% | | | | 350,000 | | | | 354,916 | |
AbbVie, Inc. | | | 11/21/2024 | | | | 2.60% | | | | 985,000 | | | | 1,022,317 | |
AbbVie, Inc. | | | 05/14/2026 | | | | 3.20% | | | | 200,000 | | | | 212,105 | |
Astrazeneca Finance LLC | | | 05/28/2024 | | | | 0.70% | | | | 670,000 | | | | 664,794 | |
CVS Health Corp. | | | 08/12/2024 | | | | 3.38% | | | | 590,000 | | | | 620,170 | |
| | | | | | | | | | | | | | | | 2,874,302 | |
Pipelines: 0.52% | | | | | | | | | | | | | | | | |
Energy Transfer Operating LP | | | 05/15/2025 | | | | 2.90% | | | | 165,000 | | | | 170,320 | |
MPLX LP | | | 03/01/2026 | | | | 1.75% | | | | 490,000 | | | | 485,325 | |
ONEOK, Inc. | | | 09/01/2024 | | | | 2.75% | | | | 195,000 | | | | 200,443 | |
TransCanada PipeLines Ltd. (b) | | | 10/12/2024 | | | | 1.00% | | | | 530,000 | | | | 525,442 | |
| | | | | | | | | | | | | | | | 1,381,530 | |
Real Estate Investment Trusts: 0.60% | | | | | | | | | | | | | | | | |
American Tower Corp. | | | 09/15/2025 | | | | 1.30% | | | | 880,000 | | | | 866,996 | |
Brixmor Operating Partnership LP | | | 06/15/2024 | | | | 3.65% | | | | 225,000 | | | | 235,773 | |
Camden Property Trust | | | 12/15/2022 | | | | 2.95% | | | | 120,000 | | | | 121,915 | |
Crown Castle International Corp. | | | 07/15/2025 | | | | 1.35% | | | | 170,000 | | | | 167,775 | |
SITE Centers Corp. | | | 02/01/2025 | | | | 3.63% | | | | 190,000 | | | | 198,976 | |
| | | | | | | | | | | | | | | | 1,591,435 | |
The accompanying notes are an integral part of these consolidated financial statements. | 49 |
LoCorr Market Trend Fund – Consolidated Schedule of Investments (continued) |
| | Maturity Date | | | Coupon Rate | | | Principal Amount | | | Value | |
CORPORATE BONDS (continued) |
Software: 0.24% | | | | | | | | | | | | | | | | |
Roper Technologies, Inc. | | | 09/15/2024 | | | | 2.35% | | | $ | 205,000 | | | $ | 210,233 | |
VMware, Inc. | | | 08/15/2024 | | | | 1.00% | | | | 435,000 | | | | 430,890 | |
| | | | | | | | | | | | | | | | 641,123 | |
Telecommunications: 1.08% | | | | | | | | | | | | | | | | |
NBN Co. Ltd. (a)(b) | | | 10/08/2024 | | | | 0.88% | | | | 435,000 | | | | 428,932 | |
NTT Finance Corp. (a)(b) | | | 04/03/2026 | | | | 1.16% | | | | 360,000 | | | | 353,368 | |
T-Mobile USA, Inc. | | | 04/15/2025 | | | | 3.50% | | | | 970,000 | | | | 1,028,101 | |
Verizon Communications, Inc. | | | 11/20/2025 | | | | 0.85% | | | | 670,000 | | | | 652,695 | |
Verizon Communications, Inc. | | | 03/20/2026 | | | | 1.45% | | | | 425,000 | | | | 423,072 | |
| | | | | | | | | | | | | | | | 2,886,168 | |
Transportation: 0.22% | | | | | | | | | | | | | | | | |
Canadian Pacific Railway Co. (b) | | | 12/02/2024 | | | | 1.35% | | | | 575,000 | | | | 575,733 | |
TOTAL CORPORATE BONDS (Cost $57,467,566) | | | | | | | | | | | | | | | 57,263,498 | |
| | | | | | | | | | | | | | | | | |
MORTGAGE BACKED SECURITIES: 12.69% | | | | | | | | | | | | | | | | |
ACRE Commercial Mortgage Trust, 2021-FL4 A (1 Month LIBOR USD + 0.830%) (a)(b)(c) | | | 12/18/2037 | | | | 0.93% | | | | 334,054 | | | | 332,550 | |
Alen Mortgage Trust, 2021-ACEN A (1 Month LIBOR USD + 1.150%) (a)(c) | | | 04/15/2038 | | | | 1.26% | | | | 600,000 | | | | 599,278 | |
Angel Oak Mortgage Trust, 2020-1 M1 (a)(d) | | | 12/25/2059 | | | | 3.16% | | | | 418,000 | | | | 417,593 | |
BSREP Commercial Mortgage Trust, 2021-DC A (1 Month LIBOR USD + 0.950%) (a)(c) | | | 08/16/2038 | | | | 1.06% | | | | 335,000 | | | | 334,597 | |
BX Commercial Mortgage Trust | | | | | | | | | | | | | | | | |
Series 2021-21M A (1 Month LIBOR USD + 0.730%) (a)(c) | | | 10/15/2036 | | | | 0.84% | | | | 410,000 | | | | 407,148 | |
Series 2019-XL A (1 Month LIBOR USD + 0.920%) (a)(c) | | | 10/15/2036 | | | | 1.03% | | | | 429,632 | | | | 429,751 | |
Series 2021-CIP A (1 Month LIBOR USD + 0.921%) (a)(c) | | | 12/15/2038 | | | | 1.02% | | | | 1,000,000 | | | | 999,699 | |
Comm Mortgage Trust | | | | | | | | | | | | | | | | |
Series 2013-CR6 A4 | | | 03/10/2046 | | | | 3.10% | | | | 185,000 | | | | 186,858 | |
Series 2013-CR6 AM (a) | | | 03/12/2046 | | | | 3.15% | | | | 1,000,000 | | | | 1,018,024 | |
Series 2013-CR10 A4 (d) | | | 08/10/2046 | | | | 4.21% | | | | 185,000 | | | | 192,227 | |
Series 2013-CR11 B (d) | | | 08/12/2050 | | | | 5.11% | | | | 575,000 | | | | 604,466 | |
Connecticut Avenue Securities Trust, 2021-R03 1M1 (SOFR30A + 0.850%) (a)(c) | | | 12/26/2041 | | | | 0.90% | | | | 1,175,000 | | | | 1,174,587 | |
Credit Suisse Mortgage Capital Certificates, 2019-ICE4 A (1 Month LIBOR USD + 0.980%) (a)(c) | | | 05/15/2036 | | | | 1.09% | | | | 1,000,000 | | | | 999,699 | |
ELP Commercial Mortgage Trust, 2021-ELP B (1 Month LIBOR USD + 1.120%) (a)(c) | | | 11/15/2038 | | | | 1.23% | | | | 950,000 | | | | 944,380 | |
EQUS Mortgage Trust, 2021-EQAZ A (1 Month LIBOR USD + 0.755%) (a)(c) | | | 10/15/2036 | | | | 0.86% | | | | 950,000 | | | | 945,528 | |
Fannie Mae Aces | | | | | | | | | | | | | | | | |
Series 2015-M17 FA (1 Month LIBOR USD + 0.930%) (c) | | | 11/25/2022 | | | | 1.02% | | | | 536,847 | | | | 536,903 | |
Series 2014-M11 1A (d) | | | 08/25/2024 | | | | 3.12% | | | | 503,788 | | | | 525,022 | |
Fannie Mae Connecticut Avenue Securities | | | | | | | | | | | | | | | | |
Series 2014-C03 1M2 (1 Month LIBOR USD + 3.000%) (c) | | | 07/25/2024 | | | | 3.10% | | | | 44,179 | | | | 44,858 | |
Series 2017-C05 1M2 (1 Month LIBOR USD + 2.200%) (c) | | | 01/25/2030 | | | | 2.30% | | | | 350,183 | | | | 356,165 | |
Series 2018-C01 1EB1 (1 Month LIBOR USD + 0.450%) (c) | | | 07/25/2030 | | | | 0.55% | | | | 400,000 | | | | 397,306 | |
Series 2021-R02 2M1 (SOFR30A + 0.900%) (a)(c) | | | 11/25/2041 | | | | 0.95% | | | | 813,066 | | | | 813,575 | |
FHLMC Multifamily Structured Pass Through Certificates, KF08 A (1 Month LIBOR USD + 0.300%) (c) | | | 01/25/2022 | | | | 0.39% | | | | 112,351 | | | | 112,332 | |
Freddie Mac STACR REMIC Trust, 2021-DNA5 M2 (SOFR30A + 1.650%) (a)(c) | | | 01/25/2034 | | | | 1.70% | | | | 210,000 | | | | 210,899 | |
Freddie Mac STACR Trust | | | | | | | | | | | | | | | | |
Series 2018-DNA2 M2A (1 Month LIBOR USD + 2.150%) (a)(c) | | | 12/26/2030 | | | | 2.25% | | | | 400,000 | | | | 403,109 | |
Series 2018-HRP2 M3AS (1 Month LIBOR USD + 1.000%) (a)(c) | | | 02/25/2047 | | | | 1.10% | | | | 600,000 | | | | 598,267 | |
Series 2018-DNA3 M2A (1 Month LIBOR USD + 2.100%) (a)(c) | | | 09/25/2048 | | | | 2.20% | | | | 300,000 | | | | 300,935 | |
Freddie Mac Structured Agency Credit Risk Debt Notes | | | | | | | | | | | | | | | | |
Series 2017-DNA2 M1 (1 Month LIBOR USD + 1.200%) (c) | | | 10/25/2029 | | | | 1.30% | | | | 52,238 | | | | 52,238 | |
Series 2021-DNA7 M1 (SOFR30A + 0.850%) (a)(c) | | | 11/25/2041 | | | | 0.90% | | | | 1,100,000 | | | | 1,099,655 | |
Series 2018-HRP2 M3 (1 Month LIBOR USD + 2.400%) (a)(c) | | | 02/25/2047 | | | | 2.50% | | | | 400,000 | | | | 406,321 | |
50 | The accompanying notes are an integral part of these consolidated financial statements. |
LoCorr Market Trend Fund – Consolidated Schedule of Investments (continued) |
| | Maturity Date | | | Coupon Rate | | | Principal Amount | | | Value | |
MORTGAGE BACKED SECURITIES (continued) |
Series 2019-HRP1 M2 (1 Month LIBOR USD + 1.400%) (a)(c) | | | 02/25/2049 | | | | 1.50% | | | $ | 658,330 | | | $ | 659,983 | |
FRESB Multifamily Mortgage Pass Through Certificates | | | | | | | | | | | | | | | | |
Series 2016-SB17 A7F (d) | | | 05/25/2023 | | | | 2.15% | | | | 479,744 | | | | 482,559 | |
Series 2017-SB31 A7F (d) | | | 01/25/2024 | | | | 2.46% | | | | 632,858 | | | | 644,052 | |
Series 2017-SB32 A7F (d) | | | 04/25/2024 | | | | 2.44% | | | | 386,563 | | | | 390,302 | |
Series 2019-SB67 A5F (d) | | | 07/25/2024 | | | | 2.09% | | | | 778,733 | | | | 783,870 | |
GCT Commercial Mortgage Trust, 2021-GCT A (1 Month LIBOR USD + 0.800%) (a)(c) | | | 02/15/2038 | | | | 0.91% | | | | 750,000 | | | | 749,099 | |
GS Mortgage Securities Corp II, 2021-ARDN A (1 Month LIBOR USD + 1.250%) (a)(c) | | | 11/17/2036 | | | | 1.36% | | | | 950,000 | | | | 939,832 | |
GS Mortgage Securities Trust | | | | | | | | | | | | | | | | |
Series 2015-GC28 A5 | | | 02/10/2048 | | | | 3.40% | | | | 1,000,000 | | | | 1,048,439 | |
Series 2015-GC32 AS (d) | | | 07/10/2048 | | | | 4.02% | | | | 1,000,000 | | | | 1,065,278 | |
JP Morgan Chase Commercial Mortgage Securities Trust | | | | | | | | | | | | | | | | |
Series 2021-MHC A (1 Month LIBOR USD + 0.800%) (a)(c) | | | 04/15/2038 | | | | 0.91% | | | | 803,162 | | | | 801,641 | |
Series 2013-C13 A4 (d) | | | 01/18/2046 | | | | 3.99% | | | | 513,180 | | | | 530,249 | |
Series 2014-C22 AS | | | 09/17/2047 | | | | 4.11% | | | | 685,000 | | | | 714,556 | |
Series 2013-C10 AS | | | 12/17/2047 | | | | 3.37% | | | | 200,000 | | | | 203,987 | |
Merit, 2020-HILL A (1 Month LIBOR USD + 1.150%) (a)(c) | | | 08/17/2037 | | | | 1.26% | | | | 1,273,096 | | | | 1,272,713 | |
Natixis Commercial Mortgage Securities Trust, 2018-285M A (a)(d) | | | 11/15/2032 | | | | 3.79% | | | | 1,000,000 | | | | 1,015,303 | |
OPG TRUST, 2021-PORT B (1 Month LIBOR USD + 0.713%) (a)(c) | | | 10/15/2036 | | | | 0.82% | | | | 750,000 | | | | 739,301 | |
PKHL Commercial Mortgage Trust, 2021-MF A (1 Month LIBOR USD + 0.880%) (a)(c) | | | 07/15/2038 | | | | 0.99% | | | | 1,000,000 | | | | 999,401 | |
Sequoia Mortgage Trust | | | | | | | | | | | | | | | | |
Series 2020-1 A4 (a)(d) | | | 02/25/2050 | | | | 3.50% | | | | 10,236 | | | | 10,232 | |
Series 2020-2 A4 (a)(d) | | | 03/25/2050 | | | | 3.50% | | | | 87,275 | | | | 87,484 | |
SREIT Trust, 2021-MFP2 A (1 Month LIBOR USD + 0.822%) (a)(c) | | | 11/17/2036 | | | | 0.92% | | | | 1,250,000 | | | | 1,243,737 | |
UBS Commercial Mortgage Trust, 2012-C1 A3 | | | 05/12/2045 | | | | 3.40% | | | | 15,973 | | | | 15,959 | |
Verus Securitization Trust | | | | | | | | | | | | | | | | |
Series 2020-1 A1 (a)(d) | | | 01/25/2060 | | | | 2.42% | | | | 166,427 | | | | 166,821 | |
Series 2020-1 A3 (a)(d) | | | 01/25/2060 | | | | 2.72% | | | | 379,920 | | | | 380,398 | |
Wells Fargo Commercial Mortgage Trust | | | | | | | | | | | | | | | | |
Series 2012-LC5 AS | | | 10/17/2045 | | | | 3.54% | | | | 165,000 | | | | 167,110 | |
Series 2015-NXS2 A-4 | | | 07/17/2058 | | | | 3.50% | | | | 1,000,000 | | | | 1,040,944 | |
WFRBS Commercial Mortgage Trust | | | | | | | | | | | | | | | | |
Series 2013-C13 AS | | | 05/17/2045 | | | | 3.35% | | | | 165,000 | | | | 168,525 | |
Series 2013-C14 A5 | | | 06/15/2046 | | | | 3.34% | | | | 185,000 | | | | 190,120 | |
Series 2014-C24 A5 | | | 11/18/2047 | | | | 3.61% | | | | 1,000,000 | | | | 1,051,487 | |
Series 2013-C12 AS | | | 03/17/2048 | | | | 3.56% | | | | 780,000 | | | | 797,799 | |
TOTAL MORTGAGE BACKED SECURITIES (Cost $33,803,456) | | | | | | | | | | | | | | | 33,805,151 | |
| | | | | | | | | | | | | | | | | |
MUNICIPAL BONDS: 0.92% | | | | | | | | | | | | | | | | |
City of Sacramento CA Water Revenue | | | 09/01/2023 | | | | 1.61% | | | | 555,000 | | | | 562,631 | |
Forsyth County School District | | | 02/01/2024 | | | | 0.92% | | | | 230,000 | | | | 230,214 | |
Pennsylvania State University | | | 09/01/2023 | | | | 1.35% | | | | 940,000 | | | | 947,539 | |
State of Hawaii | | | 08/01/2025 | | | | 1.03% | | | | 720,000 | | | | 713,662 | |
TOTAL MUNICIPAL BONDS (Cost $2,445,000) | | | | | | | | | | | | | | | 2,454,046 | |
| | | | | | | | | | | | | | | | | |
U.S. GOVERNMENT AGENCY ISSUES: 12.84% | | | | | | | | | | | | | | | | |
Federal Farm Credit Banks | | | 05/10/2023 | | | | 0.13% | | | | 1,105,000 | | | | 1,098,480 | |
Federal Farm Credit Banks | | | 08/14/2023 | | | | 1.60% | | | | 2,270,000 | | | | 2,314,400 | |
Federal Farm Credit Banks | | | 11/09/2023 | | | | 0.40% | | | | 2,100,000 | | | | 2,088,562 | |
Federal Farm Credit Banks | | | 12/01/2023 | | | | 0.50% | | | | 3,480,000 | | | | 3,465,907 | |
Federal Home Loan Banks | | | 06/10/2022 | | | | 2.13% | | | | 2,620,000 | | | | 2,641,648 | |
Federal Home Loan Banks | | | 06/10/2022 | | | | 2.75% | | | | 3,180,000 | | | | 3,216,401 | |
Federal Home Loan Banks | | | 12/09/2022 | | | | 3.00% | | | | 4,500,000 | | | | 4,610,247 | |
The accompanying notes are an integral part of these consolidated financial statements. | 51 |
LoCorr Market Trend Fund – Consolidated Schedule of Investments (continued) |
| | Maturity Date | | | Coupon Rate | | | Principal Amount | | | Value | |
U.S. GOVERNMENT AGENCY ISSUES (continued) |
Federal Home Loan Banks | | | 06/14/2024 | | | | 1.75% | | | $ | 2,200,000 | | | $ | 2,247,790 | |
Federal Home Loan Banks | | | 12/20/2024 | | | | 1.00% | | | | 1,980,000 | | | | 1,981,678 | |
Federal Home Loan Banks | | | 04/14/2025 | | | | 0.50% | | | | 1,700,000 | | | | 1,670,637 | |
Federal Home Loan Mortgage Corp. | | | 05/19/2023 | | | | 0.25% | | | | 1,330,000 | | | | 1,321,503 | |
Federal Home Loan Mortgage Corp. | | | 08/24/2023 | | | | 0.25% | | | | 1,700,000 | | | | 1,689,126 | |
Federal Home Loan Mortgage Corp. | | | 09/08/2023 | | | | 0.25% | | | | 535,000 | | | | 531,421 | |
Federal National Mortgage Association | | | 09/06/2022 | | | | 1.38% | | | | 2,310,000 | | | | 2,327,432 | |
Federal National Mortgage Association | | | 07/10/2023 | | | | 0.25% | | | | 2,000,000 | | | | 1,989,281 | |
Federal National Mortgage Association | | | 07/02/2024 | | | | 1.75% | | | | 1,000,000 | | | | 1,022,109 | |
TOTAL U.S. GOVERNMENT AGENCY ISSUES (Cost $34,088,004) | | | | | | | | | | | | | | | 34,216,622 | |
| | | | | | | | | | | | | | | | | |
U.S. GOVERNMENT NOTES: 21.39% | | | | | | | | | | | | | | | | |
United States Treasury Note | | | 03/31/2023 | | | | 0.13% | | | | 6,070,000 | | | | 6,042,258 | |
United States Treasury Note | | | 03/31/2023 | | | | 1.50% | | | | 3,395,000 | | | | 3,436,642 | |
United States Treasury Note | | | 05/15/2023 | | | | 1.75% | | | | 2,130,000 | | | | 2,165,195 | |
United States Treasury Note | | | 06/30/2023 | | | | 2.63% | | | | 3,170,000 | | | | 3,266,091 | |
United States Treasury Note | | | 08/31/2023 | | | | 0.13% | | | | 3,800,000 | | | | 3,766,898 | |
United States Treasury Note | | | 11/30/2023 | | | | 0.50% | | | | 5,105,000 | | | | 5,086,056 | |
United States Treasury Note | | | 05/15/2024 | | | | 0.25% | | | | 15,000 | | | | 14,798 | |
United States Treasury Note | | | 06/15/2024 | | | | 0.25% | | | | 3,860,000 | | | | 3,803,909 | |
United States Treasury Note | | | 06/30/2024 | | | | 2.00% | | | | 2,390,000 | | | | 2,457,219 | |
United States Treasury Note | | | 08/15/2024 | | | | 0.38% | | | | 8,125,000 | | | | 8,019,629 | |
United States Treasury Note | | | 09/15/2024 | | | | 0.38% | | | | 9,220,000 | | | | 9,091,784 | |
United States Treasury Note | | | 09/30/2024 | | | | 1.50% | | | | 8,620,000 | | | | 8,758,055 | |
United States Treasury Note | | | 02/15/2025 | | | | 7.63% | | | | 900,000 | | | | 1,084,606 | |
TOTAL U.S. GOVERNMENT NOTES (Cost $57,142,632) | | | | | | | | | | | | | | | 56,993,140 | |
| | | | | | | | | | | | | | | | | |
SHORT TERM INVESTMENTS: 6.88% | | | | | | | | | | | | | | | | |
U.S. GOVERNMENT NOTE: 2.44% | | | | | | | | | | | | | | | | |
United States Treasury Note | | | 11/30/2022 | | | | 0.13% | | | | 6,510,000 | | | | 6,495,251 | |
TOTAL U.S. GOVERNMENT NOTE (Cost $6,497,399) | | | | | | | | | | | | | | | 6,495,251 | |
| | | | | | | | | | | | | | | | | |
MONEY MARKET FUND: 4.44% | | | | | | | | | | Shares | | | | | |
STIT-Government & Agency Portfolio, Institutional Class, 0.03% (e)(f) | | | | | | | | | | | 11,841,533 | | | | 11,841,533 | |
TOTAL MONEY MARKET FUND (Cost $11,841,533) | | | | | | | | | | | | | | | 11,841,533 | |
TOTAL SHORT TERM INVESTMENTS (Cost $18,338,932) | | | | | | | | | | | | | | | 18,336,784 | |
| | | | | | | | | | | | | | | | | |
TOTAL INVESTMENTS (Cost $228,179,040): 85.53% | | | | | | | | | | | | | | | 227,880,367 | |
Other Assets in Excess of Liabilities: 14.47% (g) | | | | | | | | | | | | | | | 38,560,677 | |
TOTAL NET ASSETS: 100.00% | | | | | | | | | | | | | | $ | 266,441,044 | |
(a) | Security as defined in Rule 144A under the Securities Act of 1933 and determined to be liquid. Purchased in a private placement transaction; resale to the public may require registration or may extend only to qualified institutional buyers. At December 31, 2021, the value of these securities total $42,347,216 which represents 15.89% of total net assets. |
(b) | Foreign issued security. |
(c) | Variable rate security based on a reference index and spread. The rate reported is the rate in effect as of December 31, 2021. |
(d) | Variable rate security. The coupon is based on an underlying pool of loans. The rate reported is the rate in effect as of December 31, 2021. |
(e) | The rate quoted is the annualized seven-day effective yield as of December 31, 2021. |
(f) | All or a portion of this security is pledged as collateral for derivative contracts. At December 31, 2021, the value of this collateral totals $369,775. |
(g) | Includes assets pledged as collateral and deposits with broker for derivative contracts. At December 31, 2021, the value of these assets totals $42,147,436. |
CMT | Constant Maturity Treasury | SOFR | Secured Overnight Financing Rate |
LIBOR | London Interbank Offered Rate | SOFR30A | 30 Day Average Secured Overnight Financing Rate |
PLC | Public Limited Company | | |
52 | The accompanying notes are an integral part of these consolidated financial statements. |
LoCorr Market Trend Fund - Consolidated Schedule of Open Forward Currency Contracts |
LoCorr Market Trend Fund
Consolidated Schedule of Open Forward Currency Contracts(a)
December 31, 2021
| | | | | | | | | | | Currency to be Received | | | Currency to be Delivered | | | | | | | | | |
| | | Notional
Amount | | | Forward
Settlement
Date | | | Currency
Abbreviation | | | U.S. $ Notional
Amount at
December 31,
2021 | | | Currency
Abbreviation | | | U.S. $ Notional
Amount on
Origination
Date | | | Unrealized
Appreciation | | | Unrealized
(Depreciation) | |
Purchase Contracts: | | | | | | | | | | | | | | | | | | | | | | | | | | | | |
| | | $ | 1,182,436 | | | | 03/18/2022 | | | | AUD | | | $ | 1,200,699 | | | | USD | | | $ | 1,182,436 | | | $ | 18,263 | | | $ | — | |
| | | | 1,893,755 | | | | 03/18/2022 | | | | CAD | | | | 1,915,953 | | | | USD | | | | 1,893,755 | | | | 22,198 | | | | — | |
| | | | 50,764,923 | | | | 03/18/2022 | | | | CHF | | | | 51,182,120 | | | | USD | | | | 50,764,923 | | | | 417,197 | | | | — | |
| | | | 3,417,004 | | | | 03/18/2022 | | | | EUR | | | | 3,439,214 | | | | USD | | | | 3,417,004 | | | | 22,210 | | | | — | |
| | | | 78,661,890 | | | | 03/18/2022 | | | | JPN | | | | 77,872,867 | | | | USD | | | | 78,661,890 | | | | — | | | | (789,023 | ) |
| | | | 6,445,927 | | | | 03/18/2022 | | | | MXN | | | | 6,611,176 | | | | USD | | | | 6,445,927 | | | | 165,249 | | | | — | |
| | | | 343,796 | | | | 03/18/2022 | | | | NZD | | | | 344,755 | | | | USD | | | | 343,796 | | | | 959 | | | | — | |
Total Purchase Contracts | | | | | | | | | | | | | | | 142,566,784 | | | | | | | | 142,709,731 | | | | 646,076 | | | | (789,023 | ) |
| | | | | | | | | | | | | | | | | | | | | | | | | | | | | | | | | |
Sale Contracts: | | | | | | | | | | | | | | | | | | | | | | | | | | | | | | | | |
| | | $ | 56,458,080 | | | | 03/18/2022 | | | | USD | | | $ | 57,478,562 | | | | AUD | | | $ | 56,458,080 | | | $ | — | | | $ | (1,020,482 | ) |
| | | | 64,863,745 | | | | 03/18/2022 | | | | USD | | | | 65,086,279 | | | | CAD | | | | 64,863,745 | | | | — | | | | (222,534 | ) |
| | | | 8,096,574 | | | | 03/18/2022 | | | | USD | | | | 8,194,770 | | | | CHF | | | | 8,096,574 | | | | — | | | | (98,196 | ) |
| | | | 111,316,052 | | | | 03/18/2022 | | | | USD | | | | 112,053,841 | | | | EUR | | | | 111,316,052 | | | | — | | | | (737,789 | ) |
| | | | 80,260,637 | | | | 03/18/2022 | | | | USD | | | | 82,067,260 | | | | GBP | | | | 80,260,637 | | | | — | | | | (1,806,623 | ) |
| | | | 188,097,711 | | | | 03/18/2022 | | | | USD | | | | 186,244,020 | | | | JPY | | | | 188,097,711 | | | | 1,853,691 | | | | — | |
| | | | 1,372,794 | | | | 03/18/2022 | | | | USD | | | | 1,378,842 | | | | MXN | | | | 1,372,794 | | | | — | | | | (6,048 | ) |
| | | | 25,431,496 | | | | 03/18/2022 | | | | USD | | | | 25,725,975 | | | | NZD | | | | 25,431,496 | | | | — | | | | (294,479 | ) |
Total Sale Contracts | | | | | | | | | | | | | | | 538,229,549 | | | | | | | | 535,897,089 | | | | 1,853,691 | | | | (4,186,151 | ) |
Net Forward Currency Contracts | | | | | | | | | | $ | (395,662,765 | ) | | | | | | $ | (393,187,358 | ) | | $ | 2,499,767 | | | $ | (4,975,174 | ) |
Net Unrealized Depreciation | | | | | | | | | | | | | | | | | | | | | | | | | | | | | | $ | (2,475,407 | ) |
Currency Abbreviations:
AUD | AUSTRALIAN DOLLAR |
CAD | CANADIAN DOLLAR |
CHF | SWISS FRANC |
EUR | EURO |
GBP | BRITISH POUND |
JPY | JAPANESE YEN |
MXN | MEXICAN PESO |
NZD | NEW ZEALAND DOLLAR |
USD | U.S. DOLLAR |
(a) | Bank of America Merrill Lynch is the counterparty for all open forward currency exchange contracts held by the Fund as of December 31, 2021. |
The accompanying notes are an integral part of these consolidated financial statements. | 53 |
LoCorr Market Trend Fund – Consolidated Schedule of Open Futures Contracts |
LoCorr Market Trend Fund
Consolidated Schedule of Open Futures Contracts
December 31, 2021
| | | Number of
Contracts | | | | | | | Current | | | Notional | | | Value | |
Description | | Purchased
(Sold) | | | Settlement
Month-Year | | | Notional
Amount | | | Amount At
Trade Date | | | Unrealized
Appreciation | | | Unrealized
(Depreciation) | |
Purchase Contracts: | | | | | | | | | | | | | | | | | | | | | | | | |
10 Yr Mini JGB | | | 11 | | | | Mar-22 | | | $ | 1,449,804 | | | $ | 1,454,870 | | | $ | — | | | $ | (5,066 | ) |
Aluminum (a) | | | 135 | | | | Mar-22 | | | | 9,477,000 | | | | 8,865,104 | | | | 611,896 | | | | — | |
Brent Crude | | | 128 | | | | Jan-22 | | | | 9,955,840 | | | | 9,898,690 | | | | 57,150 | | | | — | |
CAC 40 10 Euro Index | | | 216 | | | | Jan-22 | | | | 17,565,755 | | | | 17,116,208 | | | | 449,547 | | | | — | |
Canadian 10 Yr Bond | | | 293 | | | | Mar-22 | | | | 33,035,029 | | | | 32,964,097 | | | | 70,932 | | | | — | |
Coffee | | | 93 | | | | Mar-22 | | | | 7,885,238 | | | | 7,406,227 | | | | 479,011 | | | | — | |
Copper (a) | | | 33 | | | | Mar-22 | | | | 8,028,488 | | | | 7,859,548 | | | | 168,940 | | | | — | |
Corn | | | 436 | | | | Mar-22 | | | | 12,932,850 | | | | 12,547,139 | | | | 385,711 | | | | — | |
Cotton No.2 | | | 75 | | | | Mar-22 | | | | 4,222,500 | | | | 4,259,513 | | | | — | | | | (37,013 | ) |
Dollar | | | 133 | | | | Mar-22 | | | | 12,713,869 | | | | 12,801,118 | | | | — | | | | (87,249 | ) |
Dow Jones Industrial Average Mini E-Cbot Index | | | 112 | | | | Mar-22 | | | | 20,286,560 | | | | 19,958,446 | | | | 328,114 | | | | — | |
Euro-Bund | | | 45 | | | | Mar-22 | | | | 8,779,701 | | | | 8,869,277 | | | | — | | | | (89,576 | ) |
Euro-Schatz | | | 258 | | | | Mar-22 | | | | 32,906,859 | | | | 32,963,356 | | | | — | | | | (56,497 | ) |
Euro-Stoxx 50 Index | | | 287 | | | | Mar-22 | | | | 14,009,364 | | | | 13,609,267 | | | | 400,097 | | | | — | |
FTSE 100 Index | | | 160 | | | | Mar-22 | | | | 15,861,397 | | | | 15,595,048 | | | | 266,349 | | | | — | |
Gasoline RBOB | | | 112 | | | | Jan-22 | | | | 10,464,518 | | | | 10,375,520 | | | | 88,998 | | | | — | |
Hard Red Wheat | | | 106 | | | | Mar-22 | | | | 4,247,950 | | | | 4,390,608 | | | | — | | | | (142,658 | ) |
Heating Oil | | | 122 | | | | Jan-22 | | | | 11,914,837 | | | | 11,444,611 | | | | 470,226 | | | | — | |
Japanese 10 Yr Bond | | | 41 | | | | Mar-22 | | | | 54,031,035 | | | | 54,188,977 | | | | — | | | | (157,942 | ) |
Low Sulphur Gasoil | | | 109 | | | | Feb-22 | | | | 7,262,125 | | | | 7,076,553 | | | | 185,572 | | | | — | |
Nasdaq 100 E-Mini Index | | | 112 | | | | Mar-22 | | | | 36,558,480 | | | | 36,298,221 | | | | 260,259 | | | | — | |
Natural Gas | | | 51 | | | | Jan-22 | | | | 1,902,300 | | | | 1,922,948 | | | | — | | | | (20,648 | ) |
S&P 500 E-Mini Index | | | 208 | | | | Mar-22 | | | | 49,488,400 | | | | 48,606,988 | | | | 881,412 | | | | — | |
Sugar | | | 205 | | | | Feb-22 | | | | 4,334,848 | | | | 4,510,722 | | | | — | | | | (175,874 | ) |
U.S. Long Bond | | | 490 | | | | Mar-22 | | | | 78,614,375 | | | | 78,815,776 | | | | — | | | | (201,401 | ) |
Wheat | | | 160 | | | | Mar-22 | | | | 6,166,000 | | | | 6,542,184 | | | | — | | | | (376,184 | ) |
WTI Crude | | | 160 | | | | Jan-22 | | | | 12,033,600 | | | | 11,321,286 | | | | 712,314 | | | | — | |
Zinc (a) | | | 91 | | | | Mar-22 | | | | 8,071,700 | | | | 7,466,487 | | | | 605,213 | | | | — | |
Total Purchase Contracts | | | | | | | | | | | | | | | | | | | 6,421,741 | | | | (1,350,108 | ) |
| | | | | | | | | | | | | | | | | | | | | | | | | |
Sale Contracts: | | | | | | | | | | | | | | | | | | | | | | | | |
3 Mo Euro Euribor | | | (868) | | | | Jun-23 | | | $ | 247,227,073 | | | $ | 247,522,106 | | | $ | 295,033 | | | $ | — | |
90 Day Euro | | | (2,265) | | | | Dec-22 | | | | 560,332,688 | | | | 561,282,178 | | | | 949,490 | | | | — | |
Aluminum (a) | | | (23) | | | | Mar-22 | | | | 1,614,600 | | | | 1,511,326 | | | | — | | | | (103,274 | ) |
Australian 10 Yr Bond | | | (75) | | | | Mar-22 | | | | 7,593,817 | | | | 7,602,512 | | | | 8,695 | | | | — | |
Cocoa | | | (40) | | | | Mar-22 | | | | 920,953 | | | | 912,718 | | | | — | | | | (8,235 | ) |
Copper (a) | | | (14) | | | | Mar-22 | | | | 3,406,025 | | | | 3,344,872 | | | | — | | | | (61,153 | ) |
DAX Index | | | (19) | | | | Mar-22 | | | | 8,574,714 | | | | 8,544,062 | | | | — | | | | (30,652 | ) |
Euro-Bobl | | | (1,041) | | | | Mar-22 | | | | 157,912,951 | | | | 158,492,708 | | | | 579,757 | | | | — | |
Gold | | | (72) | | | | Feb-22 | | | | 13,165,920 | | | | 12,814,689 | | | | — | | | | (351,231 | ) |
Hang Seng Index | | | (186) | | | | Jan-22 | | | | 27,969,593 | | | | 27,714,082 | | | | — | | | | (255,511 | ) |
Long Gilt | | | (80) | | | | Mar-22 | | | | 13,524,635 | | | | 13,487,109 | | | | — | | | | (37,526 | ) |
Nikkei 225 Index | | | (80) | | | | Mar-22 | | | | 20,015,648 | | | | 19,894,170 | | | | — | | | | (121,478 | ) |
Russell 2000 Mini Index | | | (258) | | | | Mar-22 | | | | 28,932,120 | | | | 28,143,892 | | | | — | | | | (788,228 | ) |
Silver | | | (122) | | | | Mar-22 | | | | 14,244,720 | | | | 14,236,641 | | | | — | | | | (8,079 | ) |
Soybean | | | (5) | | | | Mar-22 | | | | 334,813 | | | | 319,826 | | | | — | | | | (14,987 | ) |
Soybean Meal | | | (45) | | | | Mar-22 | | | | 1,795,950 | | | | 1,608,823 | | | | — | | | | (187,127 | ) |
Soybean Oil | | | (13) | | | | Mar-22 | | | | 440,934 | | | | 403,865 | | | | — | | | | (37,069 | ) |
54 | The accompanying notes are an integral part of these consolidated financial statements. |
LoCorr Market Trend Fund – Consolidated Schedule of Open Futures Contracts |
| | | Number of
Contracts | | | | | | | Current | | | Notional | | | Value | |
Description | | Purchased
(Sold) | | | Settlement
Month-Year | | | Notional
Amount | | | Amount At
Trade Date | | | Unrealized
Appreciation | | | Unrealized
(Depreciation) | |
Sale Contracts: (continued) | | | | | | | | | | | | | | | | | | | | | | | | |
Tokyo Price Index | | | (32) | | | | Mar-22 | | | $ | 5,541,511 | | | $ | 5,528,543 | | | $ | — | | | $ | (12,968 | ) |
U.S. 10 Yr Note | | | (16) | | | | Mar-22 | | | | 2,087,500 | | | | 2,066,270 | | | | — | | | | (21,230 | ) |
U.S. 2 Yr Note | | | (21) | | | | Mar-22 | | | | 4,581,609 | | | | 4,582,126 | | | | 517 | | | | — | |
U.S. 5 Yr Note | | | (676) | | | | Mar-22 | | | | 81,780,157 | | | | 81,783,958 | | | | 3,801 | | | | — | |
Zinc (a) | | | (11) | | | | Mar-22 | | | | 975,700 | | | | 894,158 | | | | — | | | | (81,542 | ) |
Total Sale Contracts | | | | | | | | | | | | | | | | | | | 1,837,293 | | | | (2,120,290 | ) |
Total Futures Contracts | | | | | | | | | | | | | | | | | | $ | 8,259,034 | | | $ | (3,470,398 | ) |
Net Unrealized Appreciation | | | | | | | | | | | | | | | | | | $ | 4,788,636 | | | | | |
(a) | London Metal Exchange (‘’LME’’) futures contracts settle on their respective maturity date. The unrealized appreciation on these contracts is a receivable for unsettled open futures contracts and the unrealized depreciation is a payable for unsettled open futures contracts on the Fund’s consolidated statement of assets and liabilities. |
The accompanying notes are an integral part of these consolidated financial statements. | 55 |
LoCorr Dynamic Equity Fund - Schedule of Investments |

Schedule of Investments
December 31, 2021
| | Shares | | | Value | |
COMMON STOCKS: 73.30% |
Advertising: 0.47% | | | | | | | | |
DKSH Holding AG (b) | | | 423 | | | $ | 34,956 | |
Hakuhodo DY Holdings, Inc. (b) | | | 2,300 | | | | 38,310 | |
Publicis Groupe SA (b) | | | 632 | | | | 42,596 | |
| | | | | | | | 115,862 | |
Aerospace & Defense: 0.16% | | | | | | | | |
Thales SA (b) | | | 465 | | | | 39,599 | |
| | | | | | | | | |
Agriculture: 1.86% | | | | | | | | |
Bunge Ltd. - ADR (b) | | | 488 | | | | 45,560 | |
Japan Tobacco, Inc. (b) | | | 2,200 | | | | 44,419 | |
Turning Point Brands, Inc. | | | 9,691 | | | | 366,126 | |
| | | | | | | | 456,105 | |
Airlines: 3.17% | | | | | | | | |
Allegiant Travel Co. (a) | | | 4,153 | | | | 776,777 | |
| | | | | | | | | |
Apparel: 0.88% | | | | | | | | |
Hermes International (b) | | | 26 | | | | 45,467 | |
LVMH Moet Hennessy Louis Vuitton SE (b) | | | 12 | | | | 9,932 | |
Oxford Industries, Inc. | | | 385 | | | | 39,085 | |
Puma SE (b) | | | 363 | | | | 44,427 | |
Tapestry, Inc. | | | 1,894 | | | | 76,897 | |
| | | | | | | | 215,808 | |
Auto Manufacturers: 0.32% | | | | | | | | |
Isuzu Motors Ltd. (b) | | | 900 | | | | 11,196 | |
Tesla Motors, Inc. (a) | | | 11 | | | | 11,625 | |
Toyota Motor Corp. (b) | | | 3,100 | | | | 56,742 | |
| | | | | | | | 79,563 | |
56 | The accompanying notes are an integral part of these financial statements. |
LoCorr Dynamic Equity Fund – Schedule of Investments (continued) |
| | Shares | | | Value | |
COMMON STOCKS: (continued) |
Auto Parts & Equipment: 0.33% | | | | | | | | |
American Axle & Manufacturing Holdings, Inc. (a) | | | 8,603 | | | $ | 80,266 | |
| | | | | | | | | |
Banks: 3.74% | | | | | | | | |
Aozora Bank Ltd. (b) | | | 1,600 | | | | 35,024 | |
Bank of Queensland Ltd. (b) | | | 4,849 | | | | 28,541 | |
Comerica, Inc. | | | 2,162 | | | | 188,094 | |
CYBG PLC (b) | | | 13,058 | | | | 31,425 | |
Israel Discount Bank Ltd. (b) | | | 1,505 | | | | 10,137 | |
National Bank of Canada (a)(b) | | | 501 | | | | 38,196 | |
Regions Financial Corp. | | | 1,599 | | | | 34,858 | |
Silvergate Capital Corp. (a) | | | 269 | | | | 39,866 | |
State Street Corp. | | | 470 | | | | 43,710 | |
Toronto-Dominion Bank (a)(b) | | | 535 | | | | 41,017 | |
Wells Fargo & Co. | | | 5,177 | | | | 248,392 | |
Zions Bancorporation | | | 2,798 | | | | 176,722 | |
| | | | | | | | 915,982 | |
Beverages: 0.25% | | | | | | | | |
Celsius Holdings, Inc. (a) | | | 147 | | | | 10,962 | |
Coca-Cola Co. | | | 169 | | | | 10,006 | |
Coca-Cola HBC AG (b) | | | 1,187 | | | | 41,050 | |
| | | | | | | | 62,018 | |
Biotechnology: 0.21% | | | | | | | | |
CSL Ltd. (b) | | | 66 | | | | 13,960 | |
Innoviva, Inc. (a) | | | 2,224 | | | | 38,364 | |
| | | | | | | | 52,324 | |
Building Materials: 0.44% | | | | | | | | |
AGC, Inc. (b) | | | 600 | | | | 28,636 | |
Carrier Global Corp. | | | 718 | | | | 38,944 | |
James Hardie Industries PLC (b) | | | 1,016 | | | | 40,877 | |
| | | | | | | | 108,457 | |
Chemicals: 1.87% | | | | | | | | |
AdvanSix, Inc. | | | 855 | | | | 40,399 | |
Air Water, Inc. (b) | | | 2,500 | | | | 38,598 | |
Asahi Kasei Corp. (b) | | | 4,000 | | | | 37,590 | |
CF Industries Holdings, Inc. | | | 637 | | | | 45,087 | |
FMC Corp. | | | 1,446 | | | | 158,901 | |
Intrepid Potash, Inc. (a) | | | 867 | | | | 37,047 | |
Kuraray Co. Ltd. (b) | | | 4,100 | | | | 35,607 | |
NOF Corp. (b) | | | 700 | | | | 35,356 | |
Sumitomo Chemical Co. Ltd. (b) | | | 6,500 | | | | 30,627 | |
| | | | | | | | 459,212 | |
Commercial Services: 1.31% | | | | | | | | |
AMERCO | | | 55 | | | | 39,943 | |
AMN Healthcare Services, Inc. (a) | | | 346 | | | | 42,326 | |
Brambles Ltd. (a)(b) | | | 4,979 | | | | 38,507 | |
Bureau Veritas SA (b) | | | 1,331 | | | | 44,218 | |
Cross Country Healthcare, Inc. (a) | | | 1,508 | | | | 41,862 | |
Recruit Holdings Co. Ltd. (b) | | | 600 | | | | 36,366 | |
Sohgo Security Services Co. Ltd. (b) | | | 800 | | | | 31,783 | |
Terminix Global Holdings, Inc. (a) | | | 1,000 | | | | 45,230 | |
| | | | | | | | 320,235 | |
Computers: 1.65% | | | | | | | | |
Apple, Inc. | | | 78 | | | | 13,851 | |
The accompanying notes are an integral part of these financial statements. | 57 |
LoCorr Dynamic Equity Fund – Schedule of Investments (continued) |
| | Shares | | | Value | |
COMMON STOCKS: (continued) |
Computershare Ltd. (b) | | | 2,762 | | | $ | 40,190 | |
Dell Technologies, Inc. (a) | | | 650 | | | | 36,511 | |
HP, Inc. | | | 1,313 | | | | 49,461 | |
NTT Data Corp. (b) | | | 1,800 | | | | 38,588 | |
Seagate Technology Holdings PLC - ADR (b) | | | 396 | | | | 44,740 | |
TietoEVRY Oyj (b) | | | 928 | | | | 29,033 | |
Western Digital Corp. (a) | | | 2,345 | | | | 152,917 | |
| | | | | | | | 405,291 | |
Cosmetics & Personal Care: 0.56% | | | | | | | | |
Colgate-Palmolive Co. | | | 429 | | | | 36,611 | |
Coty, Inc. (a) | | | 2,605 | | | | 27,352 | |
Inter Parfums, Inc. | | | 494 | | | | 52,809 | |
Procter & Gamble Company | | | 122 | | | | 19,957 | |
| | | | | | | | 136,729 | |
Distribution/Wholesale: 0.98% | | | | | | | | |
Inchcape PLC (b) | | | 3,661 | | | | 45,069 | |
LKQ Corp. | | | 665 | | | | 39,920 | |
Mitsubishi Corp. (b) | | | 1,300 | | | | 41,272 | |
Sojitz Corp. (b) | | | 2,380 | | | | 35,753 | |
Sumitomo Corp. (b) | | | 2,500 | | | | 36,958 | |
Toyota Tsusho Corp. (b) | | | 900 | | | | 41,467 | |
| | | | | | | | 240,439 | |
Diversified Financial Services: 6.72% | | | | | | | | |
Close Brothers Group PLC (b) | | | 1,793 | | | | 34,074 | |
Credit Acceptance Corp. (a) | | | 2,137 | | | | 1,469,572 | |
Evercore Partners, Inc. | | | 242 | | | | 32,876 | |
Moelis & Co. | | | 606 | | | | 37,881 | |
Raymond James Financial, Inc. | | | 372 | | | | 37,349 | |
Virtus Investment Partners, Inc. | | | 116 | | | | 34,463 | |
| | | | | | | | 1,646,215 | |
Electric: 1.28% | | | | | | | | |
AES Corp. VA | | | 921 | | | | 22,380 | |
Canadian Utilities Ltd. (a)(b) | | | 503 | | | | 14,589 | |
CLP Holdings Ltd. (b) | | | 1,500 | | | | 15,149 | |
Electric Power Development Co. Ltd. (b) | | | 2,800 | | | | 37,169 | |
Enel SpA (b) | | | 1,310 | | | | 10,509 | |
Hera SpA (b) | | | 8,984 | | | | 37,446 | |
Iberdrola SA (b) | | | 938 | | | | 11,117 | |
NextEra Energy, Inc. | | | 163 | | | | 15,218 | |
NRG Energy, Inc. | | | 967 | | | | 41,658 | |
PPL Corp. | | | 1,362 | | | | 40,942 | |
SSE PLC (b) | | | 739 | | | | 16,494 | |
Vistra Energy Corp. | | | 2,284 | | | | 52,007 | |
| | | | | | | | 314,678 | |
Electrical Components & Equipment: 0.33% | | | | | | | | |
Brother Industries Ltd. (b) | | | 2,000 | | | | 38,442 | |
Encore Wire Corp. | | | 288 | | | | 41,213 | |
| | | | | | | | 79,655 | |
Electronics: 1.72% | | | | | | | | |
Arrow Electronics, Inc. (a) | | | 274 | | | | 36,790 | |
Flex Ltd. - ADR (a)(b) | | | 6,280 | | | | 115,113 | |
Screen Holdings Co. Ltd. (b) | | | 400 | | | | 43,015 | |
Spectris PLC (b) | | | 691 | | | | 34,213 | |
58 | The accompanying notes are an integral part of these financial statements. |
LoCorr Dynamic Equity Fund – Schedule of Investments (continued) |
| | Shares | | | Value | |
COMMON STOCKS: (continued) |
Vontier Corp. | | | 6,247 | | | $ | 191,970 | |
| | | | | | | | 421,101 | |
Engineering & Construction: 6.58% | | | | | | | | |
Ackermans & Van Haaren NV (b) | | | 168 | | | | 32,267 | |
COMSYS Holdings Corp. (b) | | | 400 | | | | 8,906 | |
Downer EDI Ltd. (b) | | | 6,087 | | | | 26,394 | |
Frontdoor, Inc. (a) | | | 23,078 | | | | 845,809 | |
Kyowa Exeo Corp. (b) | | | 1,600 | | | | 33,716 | |
MasTec, Inc. (a) | | | 6,808 | | | | 628,242 | |
Singapore Technologies Engineering Ltd. (b) | | | 13,700 | | | | 38,225 | |
| | | | | | | | 1,613,559 | |
Entertainment: 0.16% | | | | | | | | |
Golden Entertainment, Inc. (a) | | | 765 | | | | 38,655 | |
| | | | | | | | | |
Environmental Control: 0.15% | | | | | | | | |
Heritage-Crystal Clean, Inc. (a) | | | 1,180 | | | | 37,784 | |
| | | | | | | | | |
Food: 1.52% | | | | | | | | |
Ajinomoto Co., Inc. (b) | | | 1,400 | | | | 42,561 | |
Axfood AB (b) | | | 1,426 | | | | 41,094 | |
Chocoladefabriken Lindt & Spruengli AG (b) | | | 3 | | | | 41,583 | |
Greggs PLC (b) | | | 990 | | | | 44,716 | |
J Sainsbury PLC (b) | | | 2,691 | | | | 10,046 | |
Kewpie Corp. (b) | | | 1,700 | | | | 36,651 | |
Loblaw Cos. Ltd. (a)(b) | | | 484 | | | | 39,655 | |
Marks & Spencer Group PLC (a)(b) | | | 14,862 | | | | 46,549 | |
Nestle SA (b) | | | 256 | | | | 35,804 | |
Nisshin Seifun Group, Inc. (b) | | | 2,400 | | | | 34,593 | |
| | | | | | | | 373,252 | |
Gas: 0.48% | | | | | | | | |
Centrica PLC (a)(b) | | | 46,315 | | | | 44,823 | |
Enagas SA (b) | | | 1,695 | | | | 39,367 | |
Hong Kong & China Gas Co. Ltd. (b) | | | 22,250 | | | | 34,641 | |
| | | | | | | | 118,831 | |
Hand & Machine Tools: 0.15% | | | | | | | | |
Amada Holdings Co. Ltd. (b) | | | 3,600 | | | | 35,646 | |
| | | | | | | | | |
Healthcare - Products: 1.45% | | | | | | | | |
Apria, Inc. (a) | | | 1,151 | | | | 37,522 | |
Avanos Medical, Inc. (a) | | | 1,194 | | | | 41,396 | |
Demant AS (a)(b) | | | 783 | | | | 40,168 | |
Henry Schein, Inc. (a) | | | 488 | | | | 37,835 | |
Medibank Pvt Ltd. (b) | | | 15,527 | | | | 37,844 | |
Nihon Kohden Corp. (b) | | | 1,200 | | | | 32,913 | |
Orthofix Medical, Inc. (a) | | | 98 | | | | 3,047 | |
QIAGEN NV (a)(b) | | | 704 | | | | 39,266 | |
Straumann Holding AG (b) | | | 18 | | | | 38,264 | |
Varex Imaging Corp. (a) | | | 1,496 | | | | 47,199 | |
| | | | | | | | 355,454 | |
Healthcare - Services: 0.20% | | | | | | | | |
Sonic Healthcare Ltd. (b) | | | 1,425 | | | | 48,344 | |
| | | | | | | | | |
Holding Companies - Diversified: 0.37% | | | | | | | | |
Black Spade Acquisition Co. - ADR (a)(b) | | | 4,800 | | | | 48,000 | |
The accompanying notes are an integral part of these financial statements. | 59 |
LoCorr Dynamic Equity Fund – Schedule of Investments (continued) |
| | Shares | | | Value | |
COMMON STOCKS: (continued) |
Mission Advancement Corp. (a) | | | 4,376 | | | $ | 42,579 | |
| | | | | | | | 90,579 | |
Home Builders: 0.89% | | | | | | | | |
Bellway PLC (b) | | | 873 | | | | 39,419 | |
Haseko Corp. (b) | | | 2,800 | | | | 34,711 | |
NVR, Inc. (a) | | | 7 | | | | 41,362 | |
Open House Co. Ltd. (b) | | | 500 | | | | 26,167 | |
Sekisui House Ltd. (b) | | | 1,700 | | | | 36,489 | |
Vistry Group PLC (b) | | | 2,495 | | | | 39,985 | |
| | | | | | | | 218,133 | |
Home Furnishings: 0.37% | | | | | | | | |
Howden Joinery Group PLC (b) | | | 3,283 | | | | 40,046 | |
Rational AG (b) | | | 38 | | | | 38,954 | |
Sony Corp. (b) | | | 100 | | | | 12,584 | |
| | | | | | | | 91,584 | |
Industirals: 0.16% | | | | | | | | |
LIFCO AB (b) | | | 1,337 | | | | 40,053 | |
| | | | | | | | | |
Insurance: 0.28% | | | | | | | | |
Allstate Corp. | | | 244 | | | | 28,706 | |
Helvetia Holding AG (b) | | | 332 | | | | 39,132 | |
| | | | | | | | 67,838 | |
Internet: 3.76% | | | | | | | | |
Alphabet, Inc. (a) | | | 8 | | | | 23,149 | |
Alphabet, Inc. (a) | | | 9 | | | | 26,073 | |
Amazon.com, Inc. (a) | | | 7 | | | | 23,340 | |
Auto Trader Group PLC (b) | | | 4,177 | | | | 41,838 | |
Cargurus, Inc. (a) | | | 1,195 | | | | 40,200 | |
eBay, Inc. | | | 578 | | | | 38,437 | |
Facebook, Inc. (a) | | | 35 | | | | 11,772 | |
Mandiant, Inc. (a) | | | 22,029 | | | | 386,389 | |
Netflix, Inc. (a) | | | 15 | | | | 9,037 | |
Opendoor Technologies, Inc. (a) | | | 8,366 | | | | 122,227 | |
Yelp, Inc. (a) | | | 1,075 | | | | 38,958 | |
Zillow Group, Inc. Class C (a) | | | 2,488 | | | | 158,859 | |
| | | | | | | | 920,279 | |
Iron & Steel: 0.18% | | | | | | | | |
ArcelorMittal SA (b) | | | 1,399 | | | | 44,828 | |
| | | | | | | | | |
Leisure Time: 0.14% | | | | | | | | |
Yamaha Motor Co. Ltd. (b) | | | 1,400 | | | | 33,579 | |
| | | | | | | | | |
Lodging: 0.75% | | | | | | | | |
Full House Resorts, Inc. (a) | | | 8,685 | | | | 105,175 | |
Wynn Resorts Ltd. (a) | | | 912 | | | | 77,557 | |
| | | | | | | | 182,732 | |
Machinery - Construction & Mining: 0.36% | | | | | | | | |
Hitachi Construction Machinery Co. Ltd. (b) | | | 1,200 | | | | 34,687 | |
Komatsu Ltd. (b) | | | 1,500 | | | | 35,123 | |
Manitowoc Co., Inc. (a) | | | 1,013 | | | | 18,832 | |
| | | | | | | | 88,642 | |
Machinery - Diversified: 0.58% | | | | | | | | |
CNH Industrial NV (b) | | | 1,197 | | | | 23,263 | |
Ebara Corp. (b) | | | 800 | | | | 44,441 | |
60 | The accompanying notes are an integral part of these financial statements. |
LoCorr Dynamic Equity Fund – Schedule of Investments (continued) |
| | Shares | | | Value | |
COMMON STOCKS: (continued) |
IMI PLC (b) | | | 1,659 | | | $ | 38,982 | |
Sumitomo Heavy Industries Ltd. (b) | | | 1,500 | | | | 36,369 | |
| | | | | | | | 143,055 | |
Media: 4.89% | | | | | | | | |
DISH Network Corp. (a) | | | 11,907 | | | | 386,263 | |
News Corporation | | | 8,687 | | | | 193,807 | |
Nexstar Broadcasting Group, Inc. | | | 3,507 | | | | 529,487 | |
ViacomCBS, Inc. | | | 2,643 | | | | 79,766 | |
Walt Disney Co. (a) | | | 63 | | | | 9,758 | |
| | | | | | | | 1,199,081 | |
Metal Fabricate/Hardware: 0.82% | | | | | | | | |
MISUMI Group, Inc. (b) | | | 900 | | | | 36,929 | |
Timken Co. | | | 2,351 | | | | 162,901 | |
| | | | | | | | 199,830 | |
Mining: 0.41% | | | | | | | | |
BHP Group Ltd. (b) | | | 352 | | | | 10,628 | |
Gatos Silver, Inc. (a) | | | 4,183 | | | | 43,420 | |
South32 Ltd. (b) | | | 15,503 | | | | 45,229 | |
| | | | | | | | 99,277 | |
Miscellaneous Manufacturing: 0.77% | | | | | | | | |
AMMO, Inc. (a) | | | 12,886 | | | | 70,229 | |
General Electric Co. | | | 367 | | | | 34,671 | |
Nikon Corp. (b) | | | 3,500 | | | | 37,729 | |
Textron, Inc. | | | 586 | | | | 45,239 | |
| | | | | | | | 187,868 | |
Office & Business Equipment: 0.25% | | | | | | | | |
FUJIFILM Holdings Corp. (b) | | | 300 | | | | 22,236 | |
Seiko Epson Corp. (b) | | | 2,100 | | | | 37,808 | |
| | | | | | | | 60,044 | |
Oil & Gas: 1.00% | | | | | | | | |
APA Corp. | | | 5,292 | | | | 142,302 | |
Exxon Mobil Corp. | | | 155 | | | | 9,484 | |
Marathon Petroleum Corp. | | | 372 | | | | 23,804 | |
Oasis Petroleum, Inc. | | | 322 | | | | 40,569 | |
Santos Ltd. (b) | | | 2,000 | | | | 9,182 | |
TOTAL SA (b) | | | 201 | | | | 10,213 | |
Woodside Petroleum Ltd. (b) | | | 619 | | | | 9,876 | |
| | | | | | | | 245,430 | |
Oil & Gas Services: 0.16% | | | | | | | | |
NOW, Inc. (a) | | | 4,519 | | | | 38,592 | |
| | | | | | | | | |
Packaging & Containers: 0.36% | | | | | | | | |
DS Smith PLC (b) | | | 7,088 | | | | 36,821 | |
O-I Glass, Inc. (a) | | | 4,198 | | | | 50,502 | |
| | | | | | | | 87,323 | |
Pharmaceuticals: 3.79% | | | | | | | | |
Amphastar Pharmaceuticals, Inc. (a) | | | 1,562 | | | | 36,379 | |
Arvinas, Inc. (a) | | | 572 | | | | 46,984 | |
Bausch Health Cos., Inc. - ADR (a)(b) | | | 5,598 | | | | 154,561 | |
Cardinal Health, Inc. | | | 757 | | | | 38,978 | |
Galenica AG (b) | | | 585 | | | | 44,010 | |
Jazz Pharmaceuticals PLC - ADR (a)(b) | | | 304 | | | | 38,729 | |
Novo Nordisk AS (b) | | | 461 | | | | 51,873 | |
Otsuka Holdings Co. Ltd. (b) | | | 1,000 | | | | 36,243 | |
The accompanying notes are an integral part of these financial statements. | 61 |
LoCorr Dynamic Equity Fund – Schedule of Investments (continued) |
| | Shares | | | Value | |
COMMON STOCKS: (continued) |
Pacira Pharmaceuticals, Inc. (a) | | | 651 | | | $ | 39,171 | |
Roche Holding AG (b) | | | 33 | | | | 13,729 | |
Rohto Pharmaceutical Co. Ltd. (b) | | | 1,300 | | | | 39,272 | |
Viatris, Inc. | | | 28,753 | | | | 389,028 | |
| | | | | | | | 928,957 | |
Private Equity: 0.26% | | | | | | | | |
Eurazeo (b) | | | 387 | | | | 33,838 | |
Intermediate Capital Group PLC (b) | | | 1,037 | | | | 30,796 | |
| | | | | | | | 64,634 | |
Real Estate: 0.19% | | | | | | | | |
Tokyo Tatemono Co. Ltd. (b) | | | 2,500 | | | | 36,512 | |
Vonovia SE (b) | | | 201 | | | | 11,099 | |
| | | | | | | | 47,611 | |
Retail: 4.44% | | | | | | | | |
AutoNation, Inc. (a) | | | 327 | | | | 38,210 | |
AutoZone, Inc. (a) | | | 21 | | | | 44,024 | |
B&M European Value Retail SA (b) | | | 4,463 | | | | 38,299 | |
Bloomin’ Brands, Inc. (a) | | | 7,481 | | | | 156,951 | |
Brinker International, Inc. (a) | | | 4,182 | | | | 153,019 | |
Chow Tai Fook Jewellery Group Ltd. (b) | | | 20,800 | | | | 37,399 | |
Costco Wholesale Corp. | | | 19 | | | | 10,786 | |
Domino’s Pizza Enterprises Ltd. (b) | | | 373 | | | | 32,031 | |
Domino’s Pizza, Inc. | | | 88 | | | | 49,661 | |
Grafton Group PLC (b) | | | 2,455 | | | | 40,972 | |
HUGO BOSS AG (b) | | | 551 | | | | 33,561 | |
Lawson, Inc. (b) | | | 800 | | | | 37,903 | |
Pets at Home Group PLC (b) | | | 5,432 | | | | 34,189 | |
Reece Ltd. (b) | | | 2,611 | | | | 51,347 | |
Signet Jewelers Ltd. - ADR (b) | | | 455 | | | | 39,599 | |
Target Corp. | | | 166 | | | | 38,419 | |
Texas Roadhouse, Inc. | | | 1,762 | | | | 157,311 | |
Tilly’s, Inc. | | | 2,668 | | | | 42,982 | |
Ulta Beauty, Inc. (a) | | | 100 | | | | 41,234 | |
Walmart, Inc. | | | 69 | | | | 9,984 | |
| | | | | | | | 1,087,881 | |
Semiconductors: 0.39% | | | | | | | | |
ASML Holding NV (b) | | | 22 | | | | 17,701 | |
Cirrus Logic, Inc. (a) | | | 851 | | | | 78,309 | |
| | | | | | | | 96,010 | |
Software: 5.74% | | | | | | | | |
Computer Programs and Systems, Inc. (a) | | | 1,148 | | | | 33,637 | |
Dropbox, Inc. (a) | | | 1,410 | | | | 34,601 | |
Dynatrace, Inc. (a) | | | 523 | | | | 31,563 | |
Evolent Health, Inc. (a) | | | 650 | | | | 17,986 | |
Media and Games Invest SE (a)(b) | | | 95,568 | | | | 467,857 | |
Microsoft Corp. | | | 34 | | | | 11,435 | |
MicroStrategy, Inc. (a) | | | 141 | | | | 76,773 | |
Paycom Software, Inc. (a) | | | 71 | | | | 29,479 | |
Sailpoint Technologies Holdings, Inc. (a) | | | 3,268 | | | | 157,975 | |
Sciplay Corp. (a) | | | 2,099 | | | | 28,924 | |
SS&C Technologies Holdings, Inc. | | | 1,930 | | | | 158,221 | |
Take-Two Interactive Software, Inc. (a) | | | 868 | | | | 154,261 | |
TIS, Inc. (b) | | | 1,100 | | | | 32,752 | |
VMware, Inc. | | | 141 | | | | 16,339 | |
62 | The accompanying notes are an integral part of these financial statements. |
LoCorr Dynamic Equity Fund – Schedule of Investments (continued) |
| | Shares | | | Value | |
COMMON STOCKS: (continued) |
Zynga, Inc. (a) | | | 24,229 | | | $ | 155,066 | |
| | | | | | | | 1,406,869 | |
Telecommunications: 2.01% | | | | | �� | | | |
A10 Networks, Inc. | | | 755 | | | | 12,518 | |
CommScope Holding Co., Inc. (a) | | | 7,218 | | | | 79,687 | |
Extreme Networks, Inc. (a) | | | 1,707 | | | | 26,800 | |
Juniper Networks, Inc. | | | 1,331 | | | | 47,530 | |
Motorola Solutions, Inc. | | | 145 | | | | 39,396 | |
Nippon Telegraph & Telephone Corp. (b) | | | 1,500 | | | | 41,076 | |
SoftBank Corp. (b) | | | 3,400 | | | | 42,991 | |
SoftBank Group Corp. (b) | | | 200 | | | | 9,448 | |
Tele2 AB (b) | | | 2,735 | | | | 39,075 | |
Vonage Holdings Corp. (a) | | | 7,396 | | | | 153,763 | |
| | | | | | | | 492,284 | |
Transportation: 0.90% | | | | | | | | |
Aurizon Holdings Ltd. (b) | | | 14,915 | | | | 37,871 | |
ComfortDelGro Corp. Ltd. (b) | | | 9,200 | | | | 9,558 | |
Expeditors International of Washington, Inc. | | | 241 | | | | 32,364 | |
Kuehne + Nagel International AG (b) | | | 120 | | | | 38,771 | |
Nippon Express Co. Ltd. (b) | | | 600 | | | | 36,043 | |
Sankyu, Inc. (b) | | | 800 | | | | 33,174 | |
SITC International Holdings Co. Ltd. (b) | | | 9,000 | | | | 32,548 | |
| | | | | | | | 220,329 | |
Water: 0.14% | | | | | | | | |
Global Water Resources, Inc. | | | 2,000 | | | | 34,200 | |
TOTAL COMMON STOCKS (Cost $16,481,222) | | | | | | | 17,965,363 | |
| | | | | | | | | |
REAL ESTATE INVESTMENT TRUSTS: 4.21% | | | | | | | | |
Camden Property Trust | | | 53 | | | | 9,470 | |
Derwent London PLC (b) | | | 846 | | | | 39,105 | |
Equity LifeStyle Properties, Inc. | | | 122 | | | | 10,694 | |
Invitation Homes, Inc. | | | 1,021 | | | | 46,292 | |
Japan Prime Realty Investment Corp. (b) | | | 10 | | | | 34,687 | |
Kenedix Office Investment Corp. (b) | | | 6 | | | | 37,086 | |
Kimco Realty Corp. | | | 13,007 | | | | 320,623 | |
Mori Hills REIT Investment Corp. (b) | | | 19 | | | | 25,784 | |
Park Hotels & Resorts, Inc. (a) | | | 20,492 | | | | 386,889 | |
Realty Income Corp. | | | 462 | | | | 33,075 | |
RPT Realty | | | 3,267 | | | | 43,712 | |
Tritax Big Box REIT PLC (b) | | | 12,741 | | | | 42,941 | |
TOTAL REAL ESTATE INVESTMENT TRUSTS (Cost $985,630) | | | | | | | 1,030,358 | |
| | | | | | | | | |
WARRANT: 0.00%* | | | | | | | | |
Mission Advancement Corp., Exercise Price: $11.50, 03/05/2026 (Acquired 03/03/2021, Cost $973) (a) | | | 1,624 | | | | 828 | |
TOTAL WARRANT (Cost $973) | | | | | | | 828 | |
| | | | | | | | | |
The accompanying notes are an integral part of these financial statements. | 63 |
LoCorr Dynamic Equity Fund – Schedule of Investments (continued) |
| | Shares | | | Value | |
SHORT TERM INVESTMENT: 16.27% | | | | | | | | |
MONEY MARKET FUND: 16.27% | | | | | | | | |
STIT-Government & Agency Portfolio, Institutional Class, 0.03% (c) | | | 3,987,544 | | | $ | 3,987,544 | |
TOTAL MONEY MARKET FUND (Cost $3,987,544) | | | | | | | 3,987,544 | |
TOTAL SHORT TERM INVESTMENT (Cost $3,987,544) | | | | | | | 3,987,544 | |
| | | | | | | | | |
TOTAL INVESTMENTS (Cost $21,455,369): 93.78% | | | | | | | 22,984,093 | |
Other Assets in Excess of Liabilities: 6.22% (d) | | | | | | | 1,524,598 | |
TOTAL NET ASSETS: 100.00% | | | | | | $ | 24,508,691 | |
(a) | Non-dividend income producing security. |
(b) | Foreign issued security. |
(c) | The rate quoted is the annualized seven-day effective yield as of December 31, 2021. |
(d) | Includes assets pledged as collateral and deposits with broker for securities sold short and derivative instruments. At December 31, 2021 the value of these assets total $8,041,478. |
* | Amount rounds to less than 0.005% of net assets. |
ADR | American Depositary Reciept |
PLC | Public Limited Company |
64 | The accompanying notes are an integral part of these financial statements. |
LoCorr Dynamic Equity Fund – Schedule of Securities Sold Short |
LoCorr Dynamic Equity Fund
Schedule of Securities Sold Short
December 31, 2021
| | Shares | | | Value | |
COMMON STOCKS: (21.16)% |
Aerospace & Defense: (0.29)% | | | | | | | | |
Boeing Co. (a) | | | (175 | ) | | $ | (35,231 | ) |
Safran SA (b) | | | (284 | ) | | | (34,810 | ) |
| | | | | | | | (70,041 | ) |
Agriculture: (0.08)% | | | | | | | | |
British American Tobacco PLC (b) | | | (518 | ) | | | (19,166 | ) |
| | | | | | | | | |
Airlines: (0.45)% | | | | | | | | |
ANA Holdings, Inc. (a)(b) | | | (1,600 | ) | | | (33,445 | ) |
Deutsche Lufthansa AG (a)(b) | | | (5,601 | ) | | | (39,408 | ) |
Japan Airlines Co. Ltd. (a)(b) | | | (2,000 | ) | | | (38,181 | ) |
| | | | | | | | (111,034 | ) |
Apparel: (0.14)% | | | | | | | | |
VF Corp. | | | (465 | ) | | | (34,047 | ) |
| | | | | | | | | |
Auto Manufacturers: (0.47)% | | | | | | | | |
Fisker, Inc. (a) | | | (1,465 | ) | | | (23,044 | ) |
Tesla Motors, Inc. (a) | | | (55 | ) | | | (58,123 | ) |
Volvo AB (b) | | | (1,511 | ) | | | (35,057 | ) |
| | | | | | | | (116,224 | ) |
Auto Parts & Equipment: (0.34)% | | | | | | | | |
Cooper-Standard Holdings, Inc. (a) | | | (440 | ) | | | (9,860 | ) |
Koito Manufacturing Co. Ltd. (b) | | | (200 | ) | | | (10,589 | ) |
Luminar Technologies, Inc. (a) | | | (2,182 | ) | | | (36,898 | ) |
Stanley Electric Co. Ltd. (b) | | | (1,000 | ) | | | (25,028 | ) |
| | | | | | | | (82,375 | ) |
Banks: (0.63)% | | | | | | | | |
Cembra Money Bank AG (b) | | | (530 | ) | | | (38,651 | ) |
Goldman Sachs Group, Inc. | | | (304 | ) | | | (116,294 | ) |
| | | | | | | | (154,945 | ) |
Biotechnology: (0.14)% | | | | | | | | |
Cassava Sciences, Inc. (a) | | | (785 | ) | | | (34,305 | ) |
| | | | | | | | | |
Chemicals: (0.42)% | | | | | | | | |
International Flavors & Fragrances, Inc. | | | (198 | ) | | | (29,829 | ) |
Nippon Paint Holdings Co. Ltd. (b) | | | (3,700 | ) | | | (40,336 | ) |
Showa Denko KK (b) | | | (1,600 | ) | | | (33,591 | ) |
| | | | | | | | (103,756 | ) |
Commercial Services: (0.68)% | | | | | | | | |
Adecco Group AG (b) | | | (742 | ) | | | (37,947 | ) |
Grand Canyon Education, Inc. (a) | | | (458 | ) | | | (39,255 | ) |
MarketAxess Holdings, Inc. | | | (92 | ) | | | (37,837 | ) |
QinetiQ Group PLC (b) | | | (11,390 | ) | | | (41,009 | ) |
WW International, Inc. (a) | | | (574 | ) | | | (9,259 | ) |
| | | | | | | | (165,307 | ) |
Computers: (0.63)% | | | | | | | | |
Apple, Inc. | | | (439 | ) | | | (77,953 | ) |
DXC Technology Co. (a) | | | (1,196 | ) | | | (38,499 | ) |
Lumentum Holdings, Inc. (a) | | | (367 | ) | | | (38,818 | ) |
| | | | | | | | (155,270 | ) |
The accompanying notes are an integral part of these financial statements. | 65 |
LoCorr Dynamic Equity Fund – Schedule of Securities Sold Short (continued) |
| | Shares | | | Value | |
COMMON STOCKS: (continued) |
Cosmetics & Personal Care: (0.65)% | | | | | | | | |
Estee Lauder Cos., Inc. | | | (316 | ) | | $ | (116,983 | ) |
Fancl Corp. (b) | | | (1,000 | ) | | | (29,818 | ) |
Kose Corp. (b) | | | (100 | ) | | | (11,345 | ) |
| | | | | | | | (158,146 | ) |
Diversified Financial Services: (0.75)% | | | | | | | | |
Charles Schwab Corp. | | | (915 | ) | | | (76,952 | ) |
Futu Holdings Ltd. - ADR (a)(b) | | | (300 | ) | | | (12,990 | ) |
Janus Henderson Group PLC - ADR (b) | | | (598 | ) | | | (25,080 | ) |
Nomura Holdings, Inc. (b) | | | (8,100 | ) | | | (35,328 | ) |
Tokyo Century Corp. (b) | | | (700 | ) | | | (33,956 | ) |
| | | | | | | | (184,306 | ) |
Electric: (0.31)% | | | | | | | | |
PG&E Corp. (a) | | | (3,539 | ) | | | (42,963 | ) |
Tokyo Electric Power Co. Holdings, Inc. (a)(b) | | | (12,700 | ) | | | (32,791 | ) |
| | | | | | | | (75,754 | ) |
Electronics: (0.36)% | | | | | | | | |
Akoustis Technologies, Inc. (a) | | | (1,367 | ) | | | (9,132 | ) |
II-VI, Inc. (a) | | | (572 | ) | | | (39,085 | ) |
Renishaw PLC (b) | | | (615 | ) | | | (39,790 | ) |
| | | | | | | | (88,007 | ) |
Energy - Alternate Sources: (0.58)% | | | | | | | | |
Ballard Power Systems, Inc. (a)(b) | | | (2,567 | ) | | | (32,246 | ) |
Siemens Gamesa Renewable Energy SA (a)(b) | | | (1,581 | ) | | | (37,925 | ) |
Sunrun, Inc. (a) | | | (1,042 | ) | | | (35,741 | ) |
Vestas Wind System (b) | | | (1,213 | ) | | | (37,140 | ) |
| | | | | | | | (143,052 | ) |
Engineering & Construction: (0.66)% | | | | | | | | |
Aeroports de Paris (a)(b) | | | (256 | ) | | | (33,022 | ) |
HomeServe PLC (b) | | | (3,298 | ) | | | (39,038 | ) |
Japan Airport Terminal Co. Ltd. (a)(b) | | | (800 | ) | | | (33,383 | ) |
Obayashi Corp. (b) | | | (1,800 | ) | | | (13,927 | ) |
SWECO AB (b) | | | (2,298 | ) | | | (43,284 | ) |
| | | | | | | | (162,654 | ) |
Entertainment: (0.79)% | | | | | | | | |
Caesars Entertainment, Inc. (a) | | | (110 | ) | | | (10,288 | ) |
DraftKings, Inc. (a) | | | (1,141 | ) | | | (31,343 | ) |
Live Nation Entertainment, Inc. (a) | | | (981 | ) | | | (117,416 | ) |
Oriental Land Co. Ltd. Japan (b) | | | (200 | ) | | | (33,722 | ) |
| | | | | | | | (192,769 | ) |
Food: (0.32)% | | | | | | | | |
Ocado Group PLC (a)(b) | | | (1,670 | ) | | | (37,930 | ) |
SSP Group PLC (a)(b) | | | (12,478 | ) | | | (40,552 | ) |
| | | | | | | | (78,482 | ) |
Food Service: (0.16)% | | | | | | | | |
Compass Group PLC (b) | | | (1,705 | ) | | | (38,102 | ) |
| | | | | | | | | |
Healthcare - Products: (0.39)% | | | | | | | | |
Ambu (b) | | | (1,426 | ) | | | (37,767 | ) |
Bruker Corp. | | | (695 | ) | | | (58,317 | ) |
| | | | | | | | (96,084 | ) |
Healthcare - Services: (0.18)% | | | | | | | | |
Joint Corp. (a) | | | (109 | ) | | | (7,160 | ) |
Oak Street Health, Inc. (a) | | | (1,139 | ) | | | (37,746 | ) |
| | | | | | | | (44,906 | ) |
66 | The accompanying notes are an integral part of these financial statements. |
LoCorr Dynamic Equity Fund – Schedule of Securities Sold Short (continued) |
| | Shares | | | Value | |
COMMON STOCKS: (continued) |
Home Builders: (0.64)% | | | | | | | | |
Countryside Properties PLC (a)(b) | | | (6,315 | ) | | $ | (38,464 | ) |
D R Horton, Inc. | | | (732 | ) | | | (79,385 | ) |
Tri Pointe Homes, Inc. (a) | | | (1,405 | ) | | | (39,185 | ) |
| | | | | | | | (157,034 | ) |
Housewares: (0.17)% | | | | | | | | |
Reckitt Benckiser Group PLC (b) | | | (469 | ) | | | (40,260 | ) |
| | | | | | | | | |
Insurance: (0.29)% | | | | | | | | |
Hiscox Ltd. (b) | | | (3,198 | ) | | | (37,261 | ) |
United Insurance Holdings Corp. | | | (7,802 | ) | | | (33,861 | ) |
| | | | | | | | (71,122 | ) |
Internet: (1.54)% | | | | | | | | |
Alphabet, Inc. (a) | | | (26 | ) | | | (75,323 | ) |
ASOS PLC (a)(b) | | | (1,214 | ) | | | (39,289 | ) |
CarParts.com, Inc. (a) | | | (1,523 | ) | | | (17,058 | ) |
Cogent Communications Holdings, Inc. | | | (247 | ) | | | (18,075 | ) |
Delivery Hero SE (a)(b) | | | (268 | ) | | | (29,902 | ) |
Expedia, Inc. (a) | | | (215 | ) | | | (38,855 | ) |
Mercari, Inc. (a)(b) | | | (600 | ) | | | (30,566 | ) |
Okta, Inc. (a) | | | (261 | ) | | | (58,508 | ) |
Rakuten, Inc. (b) | | | (3,900 | ) | | | (39,125 | ) |
Trainline PLC (a)(b) | | | (8,054 | ) | | | (30,415 | ) |
| | | | | | | | (377,116 | ) |
Lodging: (0.63)% | | | | | | | | |
Galaxy Entertainment Group Ltd. (a)(b) | | | (6,000 | ) | | | (31,087 | ) |
Hilton Worldwide Holdings, Inc. (a) | | | (281 | ) | | | (43,833 | ) |
Marriott International, Inc. MD (a) | | | (251 | ) | | | (41,475 | ) |
Wynn Resorts Ltd. (a) | | | (444 | ) | | | (37,758 | ) |
| | | | | | | | (154,153 | ) |
Machinery - Construction & Mining: (0.15)% | | | | | | | | |
Siemens Energy AG (b) | | | (1,455 | ) | | | (37,255 | ) |
| | | | | | | | | |
Machinery - Diversified: (0.41)% | | | | | | | | |
Daifuku Co. Ltd. (b) | | | (300 | ) | | | (24,515 | ) |
Nordson Corporation | | | (293 | ) | | | (74,794 | ) |
| | | | | | | | (99,309 | ) |
Media: (0.82)% | | | | | | | | |
Charter Communications, Inc. (a) | | | (90 | ) | | | (58,677 | ) |
FactSet Research Systems, Inc. | | | (120 | ) | | | (58,321 | ) |
New York Times Co. | | | (542 | ) | | | (26,179 | ) |
Nexstar Broadcasting Group, Inc. | | | (258 | ) | | | (38,953 | ) |
Sinclair Broadcast Group, Inc. | | | (748 | ) | | | (19,770 | ) |
| | | | | | | | (201,900 | ) |
Miscellaneous Manufacturing: (0.32)% | | | | | | | | |
Alstom SA (b) | | | (1,041 | ) | | | (37,001 | ) |
LiqTech International, Inc. (a) | | | (7,340 | ) | | | (41,985 | ) |
| | | | | | | | (78,986 | ) |
Pharmaceuticals: (0.15)% | | | | | | | | |
Alfresa Holdings Corp. (b) | | | (600 | ) | | | (7,996 | ) |
Viatris, Inc. | | | (2,169 | ) | | | (29,347 | ) |
| | | | | | | | (37,343 | ) |
Real Estate: (0.45)% | | | | | | | | |
Jones Lang LaSalle, Inc. (a) | | | (290 | ) | | | (78,109 | ) |
The accompanying notes are an integral part of these financial statements. | 67 |
LoCorr Dynamic Equity Fund – Schedule of Securities Sold Short (continued) |
| | Shares | | | Value | |
COMMON STOCKS: (continued) |
Relo Group, Inc. (b) | | | (1,800 | ) | | $ | (32,532 | ) |
| | | | | | | | (110,641 | ) |
Retail: (1.64)% | | | | | | | | |
Cheesecake Factory, Inc. (a) | | | (1,527 | ) | | | (59,782 | ) |
Darden Restaurants, Inc. | | | (518 | ) | | | (78,032 | ) |
Domino’s Pizza, Inc. | | | (140 | ) | | | (79,006 | ) |
PetMed Express, Inc. | | | (1,204 | ) | | | (30,413 | ) |
RH (a) | | | (70 | ) | | | (37,516 | ) |
Ulta Beauty, Inc. (a) | | | (285 | ) | | | (117,517 | ) |
| | | | | | | | (402,266 | ) |
Semiconductors: (1.11)% | | | | | | | | |
Diodes, Inc. (a) | | | (355 | ) | | | (38,983 | ) |
Microchip Technology, Inc. | | | (1,347 | ) | | | (117,270 | ) |
ON Semiconductor Corp. (a) | | | (1,720 | ) | | | (116,822 | ) |
| | | | | | | | (273,075 | ) |
Software: (1.36)% | | | | | | | | |
Alteryx, Inc. (a) | | | (353 | ) | | | (21,357 | ) |
Electronic Arts, Inc. | | | (441 | ) | | | (58,168 | ) |
Microsoft Corp. | | | (229 | ) | | | (77,017 | ) |
Nexon Co. Ltd. (b) | | | (1,900 | ) | | | (36,735 | ) |
Oracle Corp. Japan (b) | | | (400 | ) | | | (30,392 | ) |
Radware Ltd. - ADR (a)(b) | | | (490 | ) | | | (20,404 | ) |
Snowflake, Inc. (a) | | | (112 | ) | | | (37,940 | ) |
Twilio, Inc. (a) | | | (144 | ) | | | (37,921 | ) |
Zeta Global Holdings Corp. (a) | | | (1,694 | ) | | | (14,263 | ) |
| | | | | | | | (334,197 | ) |
Telecommunications: (0.69)% | | | | | | | | |
Airgain, Inc. (a) | | | (1,061 | ) | | | (11,278 | ) |
AT&T, Inc. | | | (2,381 | ) | | | (58,573 | ) |
Frontier Communications Parent, Inc. (a) | | | (658 | ) | | | (19,404 | ) |
Lumen Technologies, Inc. | | | (1,679 | ) | | | (21,071 | ) |
Verizon Communications, Inc. | | | (1,128 | ) | | | (58,611 | ) |
| | | | | | | | (168,937 | ) |
Transportation: (1.37)% | | | | | | | | |
Central Japan Railway Co. (b) | | | (200 | ) | | | (26,680 | ) |
East Japan Railway Co. (b) | | | (600 | ) | | | (36,893 | ) |
Keihan Holdings Co. Ltd. (b) | | | (1,500 | ) | | | (34,504 | ) |
Keikyu Corp. (b) | | | (3,700 | ) | | | (36,990 | ) |
Keio Corp. (b) | | | (700 | ) | | | (30,853 | ) |
Keisei Electric Railway Co. Ltd. (b) | | | (1,200 | ) | | | (32,444 | ) |
Kintetsu Group Holdings Co. Ltd. (a)(b) | | | (1,100 | ) | | | (30,744 | ) |
Nagoya Railroad Co. Ltd. (b) | | | (2,400 | ) | | | (36,512 | ) |
Odakyu Electric Railway Co. Ltd. (b) | | | (1,900 | ) | | | (35,281 | ) |
West Japan Railway Co. (b) | | | (800 | ) | | | (33,452 | ) |
| | | | | | | | (334,353 | ) |
TOTAL COMMON STOCKS (Proceeds $5,296,054) | | | | | | | (5,186,679 | ) |
| | | | | | | | | |
68 | The accompanying notes are an integral part of these financial statements. |
LoCorr Dynamic Equity Fund – Schedule of Securities Sold Short (continued) |
| | Shares | | | Value | |
REAL ESTATE INVESTMENT TRUSTS: (1.12)% | | | | | | | | |
Federal Realty Investment Trust | | | (580 | ) | | $ | (79,066 | ) |
Hudson Pacific Properties, Inc. | | | (3,191 | ) | | | (78,850 | ) |
Regency Centers Corp. | | | (1,066 | ) | | | (80,323 | ) |
Seritage Growth Properties (a) | | | (2,678 | ) | | | (35,537 | ) |
TOTAL REAL ESTATE INVESTMENT TRUSTS (Proceeds $270,542) | | | | | | | (273,776 | ) |
TOTAL SECURITIES SOLD SHORT (Proceeds $5,566,596): (22.28)% | | | | | | $ | (5,460,455 | ) |
| | | | | | | | | |
Percentages are stated as a percent of net assets.
(a) | Non-dividend expense producing security. |
(b) | Foreign issued security. |
ADR | American Depositary Reciept |
PLC | Public Limited Company |
The accompanying notes are an integral part of these financial statements. | 69 |
LoCorr Spectrum Income Fund – Schedule of Investments |
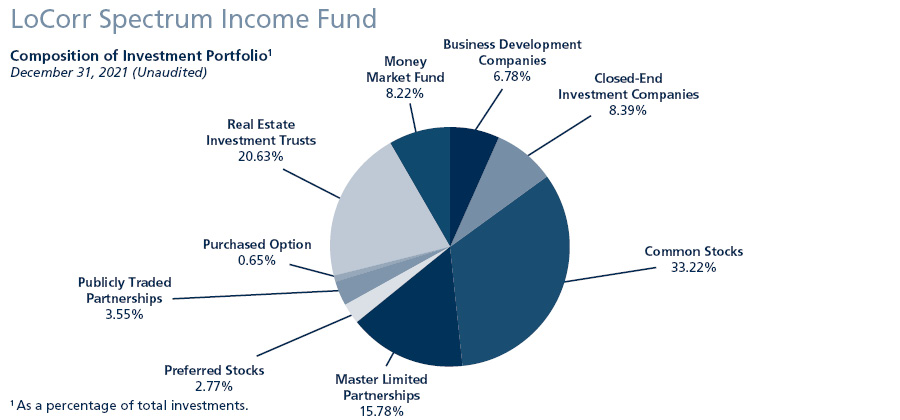
Schedule of Investments
December 31, 2021
| | | | | Shares | | | Value | |
BUSINESS DEVELOPMENT COMPANIES: 6.76% |
Ares Capital Corp. | | | | | | | 65,671 | | | $ | 1,391,568 | |
BlackRock TCP Capital Corp. | | | | | | | 49,078 | | | | 663,044 | |
Hercules Capital, Inc. (d) | | | | | | | 75,966 | | | | 1,260,276 | |
New Mountain Finance Corp. | | | | | | | 83,813 | | | | 1,148,238 | |
Newtek Business Services Corp. | | | | | | | 23,839 | | | | 658,672 | |
TOTAL BUSINESS DEVELOPMENT COMPANIES (Cost $4,660,853) | | | | | | | | | | | 5,121,798 | |
| | | | | | | | | | | | | |
CLOSED-END INVESTMENT COMPANIES: 8.37% | | | | | | | | | | | | |
Aberdeen Global Premier Properties Fund | | | | | | | 103,354 | | | | 706,941 | |
Nuveen Credit Strategies Income Fund(d) | | | | | | | 179,120 | | | | 1,162,489 | |
Oaktree Specialty Lending Corp. | | | | | | | 90,809 | | | | 677,435 | |
Sixth Street Specialty Lending, Inc. | | | | | | | 23,739 | | | | 555,255 | |
TriplePoint Venture Growth BDC Corp. | | | | | | | 36,633 | | | | 657,929 | |
Virtus AllianzGI Convertible & Income Fund(d) | | | | | | | 222,002 | | | | 1,294,272 | |
Virtus AllianzGI Convertible & Income Fund II(d) | | | | | | | 252,588 | | | | 1,288,199 | |
TOTAL CLOSED-END INVESTMENT COMPANIES (Cost $5,677,928) | | | | | | | | | | | 6,342,520 | |
| | | | | | | | | | | | | |
COMMON STOCKS: 33.12% | | | | | | | | | | | | |
Building Materials: 1.08% | | | | | | | | | | | | |
Boise Cascade Co. | | | | | | | 11,521 | | | | 820,295 | |
| | | | | | | | | | | | | |
Chemicals: 0.93% | | | | | | | | | | | | |
CVR Partners LP | | | | | | | 8,490 | | | | 702,038 | |
| | | | | | | | | | | | | |
Commercial Services: 1.02% | | | | | | | | | | | | |
Triton International Ltd. - ADR (a) | | | | | | | 12,794 | | | | 770,583 | |
| | | | | | | | | | | | | |
Computers: 2.82% | | | | | | | | | | | | |
International Business Machines Corp. | | | | | | | 9,495 | | | | 1,269,102 | |
70 | The accompanying notes are an integral part of these financial statements. |
LoCorr Spectrum Income Fund – Schedule of Investments (continued) |
| | | | | Shares | | | Value | |
COMMON STOCKS: (continued) |
Seagate Technology Holdings PLC - ADR (a) | | | | | | | 7,696 | | | $ | 869,494 | |
| | | | | | | | | | | | 2,138,596 | |
Diversified Financial Services: 2.47% | | | | | | | | | | | | |
Moelis & Co. | | | | | | | 11,694 | | | | 730,992 | |
OneMain Holdings, Inc. | | | | | | | 22,789 | | | | 1,140,361 | |
| | | | | | | | | | | | 1,871,353 | |
Electric: 5.27% | | | | | | | | | | | | |
Algonquin Power & Utilities Corp. - ADR (a) | | | | | | | 84,962 | | | | 1,227,701 | |
Avangrid, Inc. | | | | | | | 24,739 | | | | 1,233,981 | |
Clearway Energy, Inc. | | | | | | | 42,476 | | | | 1,530,410 | |
| | | | | | | | | | | | 3,992,092 | |
Energy - Alternate Sources: 4.13% | | | | | | | | | | | | |
Atlantica Yield PLC - ADR (a) | | | | | | | 50,377 | | | | 1,801,482 | |
NextEra Energy Partners LP (d) | | | | | | | 15,743 | | | | 1,328,709 | |
| | | | | | | | | | | | 3,130,191 | |
Entertainment: 1.01% | | | | | | | | | | | | |
Red Rock Resorts, Inc. | | | | | | | 13,873 | | | | 763,154 | |
| | | | | | | | | | | | | |
Insurance: 0.85% | | | | | | | | | | | | |
AMERISAFE, Inc. | | | | | | | 11,989 | | | | 645,368 | |
| | | | | | | | | | | | | |
Mining: 3.98% | | | | | | | | | | | | |
Rio Tinto PLC - ADR (a) | | | | | | | 16,666 | | | | 1,115,622 | |
Sibanye Stillwater Ltd. - ADR (a) | | | | | | | 46,679 | | | | 585,355 | |
Southern Copper Corp. | | | | | | | 21,290 | | | | 1,313,806 | |
| | | | | | | | | | | | 3,014,783 | |
Pipelines: 4.14% | | | | | | | | | | | | |
Antero Midstream Corp. | | | | | | | 127,693 | | | | 1,236,068 | |
Hess Midstream LP | | | | | | | 24,988 | | | | 690,419 | |
Williams Cos., Inc. | | | | | | | 46,679 | | | | 1,215,521 | |
| | | | | | | | | | | | 3,142,008 | |
Real Estate Invesmtment Trusts: 0.89% | | | | | | | | | | | | |
American Finance Trust, Inc. | | | | | | | 74,117 | | | | 676,688 | |
| | | | | | | | | | | | | |
Retail: 1.55% | | | | | | | | | | | | |
Buckle, Inc. | | | | | | | 13,606 | | | | 575,670 | |
Haverty Furniture Cos., Inc. | | | | | | | 19,741 | | | | 603,482 | |
| | | | | | | | | | | | 1,179,152 | |
Transportation: 1.98% | | | | | | | | | | | | |
Golden Ocean Group Ltd. - ADR (a) | | | | | | | 74,737 | | | | 695,054 | |
Schneider National, Inc. | | | | | | | 29,886 | | | | 804,232 | |
| | | | | | | | | | | | 1,499,286 | |
Trucking & Leasing: 1.00% | | | | | | | | | | | | |
Fortress Transportation & Infrastructure Investors LLC | | | | | | | 26,338 | | | | 761,695 | |
TOTAL COMMON STOCKS (Cost $22,478,178) | | | | | | | | | | | 25,107,282 | |
| | | | | | | | | | | | | |
MASTER LIMITED PARTNERSHIPS: 15.73% | | | | | | Units | | | | | |
Energy - Alternate Sources: 1.85% | | | | | | | | | | | | |
Enviva Partners LP | | | | | | | 19,886 | | | | 1,400,372 | |
| | | | | | | | | | | | | |
Gas: 2.17% | | | | | | | | | | | | |
Global Partners LP | | | | | | | 69,983 | | | | 1,643,901 | |
| | | | | | | | | | | | | |
Oil & Gas: 1.31% | | | | | | | | | | | | |
Sunoco LP | | | | | | | 24,389 | | | | 995,803 | |
The accompanying notes are an integral part of these financial statements. | 71 |
LoCorr Spectrum Income Fund – Schedule of Investments (continued) |
| | | | | Units | | | Values | |
MASTER LIMITED PARTNERSHIPS: (continued) |
Oil & Gas Services: 2.73% | | | | | | | | | | | | |
CrossAmerica Partners LP | | | | | | | 42,481 | | | $ | 809,688 | |
USA Compression Partners LP | | | | | | | 72,368 | | | | 1,262,821 | |
| | | | | | | | | | | | 2,072,509 | |
Pipelines: 5.53% | | | | | | | | | | | | |
Crestwood Equity Partners LP | | | | | | | 62,272 | | | | 1,718,084 | |
Delek Logistics Partners LP | | | | | | | 14,643 | | | | 625,695 | |
Magellan Midstream Partners LP | | | | | | | 26,138 | | | | 1,213,849 | |
Oasis Midstream Partners LP | | | | | | | 26,538 | | | | 634,524 | |
| | | | | | | | | | | | 4,192,152 | |
Private Equity: 2.14% | | | | | | | | | | | | |
Icahn Enterprises LP | | | | | | | 32,785 | | | | 1,625,808 | |
TOTAL MASTER LIMITED PARTNERSHIPS (Cost $7,723,192) | | | | | | | | | | | 11,930,545 | |
| | | | | | | | | | | | | |
PREFERRED STOCKS: 2.77% | | | | | | | | | | | | |
Pipelines: 2.77% | | | | | | Shares | | | | | |
Crestwood Equity Partners LP, 9.250% | | | | | | | 113,962 | | | | 1,121,386 | |
NuStar Energy LP, 7.625% | | | | | | | 43,362 | | | | 975,645 | |
TOTAL PREFERRED STOCKS (Cost $1,009,013) | | | | | | | | | | | 2,097,031 | |
| | | | | | | | | | | | | |
PUBLICLY TRADED PARTNERSHIPS: 3.54% | | | | | | Units | | | | | |
Brookfield Renewable Partners LP (a)(d) | | | | | | | 50,727 | | | | 1,815,519 | |
KNOT Offshore Partners LP (a) | | | | | | | 65,121 | | | | 870,017 | |
TOTAL PUBLICLY TRADED PARTNERSHIPS (Cost $2,698,131) | | | | | | | | | | | 2,685,536 | |
| | | | | | | | | | | | | |
PURCHASED OPTION: 0.65% | | Notional Amount | | | Number of
Contracts (b) | | | | | |
Put Option: 0.65% | | | | | | | | | | | | |
SPDR S&P Oil & Gas Exploration & Production ETF Expiration: January 2022, Exercise Price: $92.00 | | | 23,967,500 | | | | 2,500 | | | | 492,500 | |
TOTAL PURCHASED OPTION (Cost $1,059,779) | | | | | | | | | | | | |
| | | | | | | | | | | | | |
REAL ESTATE INVESTMENT TRUSTS: 20.57% | | | | | | Shares | | | | | |
AGNC Investment Corp. (d) | | | | | | | 122,096 | | | | 1,836,324 | |
Annaly Capital Management, Inc. | | | | | | | 191,879 | | | | 1,500,494 | |
Apollo Commercial Real Estate Finance, Inc. | | | | | | | 123,535 | | | | 1,625,721 | |
Crown Castle International Corp. | | | | | | | 3,298 | | | | 688,424 | |
Equity Commonwealth | | | | | | | 14,978 | | | | 387,930 | |
Gaming and Leisure Properties, Inc. | | | | | | | 13,244 | | | | 644,453 | |
Global Net Lease, Inc. | | | | | | | 105,603 | | | | 1,613,614 | |
Hannon Armstrong Sustainable Infrastructure Capital, Inc. | | | | | | | 21,540 | | | | 1,144,205 | |
Invesco Mortgage Capital, Inc. | | | | | | | 320,893 | | | | 892,083 | |
Iron Mountain, Inc. | | | | | | | 13,943 | | | | 729,637 | |
Sabra Health Care, Inc. | | | | | | | 30,586 | | | | 414,134 | |
Simon Property Group, Inc. | | | | | | | 4,520 | | | | 722,160 | |
SL Green Realty Corp. | | | | | | | 9,593 | | | | 687,818 | |
Starwood Property Trust, Inc. | | | | | | | 53,076 | | | | 1,289,747 | |
W.P. CAREY, Inc. | | | | | | | 17,292 | | | | 1,418,809 | |
TOTAL REAL ESTATE INVESTMENT TRUSTS (Cost $15,340,777) | | | | | | | | | | | 15,595,553 | |
| | | | | | | | | | | | | |
72 | The accompanying notes are an integral part of these financial statements. |
LoCorr Spectrum Income Fund – Schedule of Investments (continued) |
| | | | | Shares | | | Value | |
SHORT TERM INVESTMENT: 8.19% | | | | | | | | | | | | |
MONEY MARKET FUND: 8.19% | | | | | | | | | | | | |
STIT-Government & Agency Portfolio, Institutional Class, 0.03% (c) | | | | | | | 6,210,065 | | | $ | 6,210,065 | |
TOTAL MONEY MARKET FUND (Cost $6,210,065) | | | | | | | | | | | 6,210,065 | |
TOTAL SHORT TERM INVESTMENT (Cost $6,210,065) | | | | | | | | | | | 6,210,065 | |
| | | | | | | | | | | | | |
TOTAL INVESTMENTS (Cost $66,857,916): 99.70% | | | | | | | | | | | 75,582,830 | |
Other Assets in Excess of Liabilities: 0.30% (e) | | | | | | | | | | | 224,268 | |
TOTAL NET ASSETS: 100.00% | | | | | | | | | | $ | 75,807,098 | |
(a) | Foreign issued security. |
(b) | Each contract is equivalent to 100 shares of common stock. |
(c) | The rate quoted is the annualized seven-day effective yield as of December 31, 2021 |
(d) | All of a portion of this security is held as collateral for options written. At December 31, 2021, the value of this collateral is $6,736,067. |
(e) | Includes deposits at broker for derivative instruments. At December 31, 2021, the value of these assets total $673,121. |
ADR | American Depositary Receipts |
PLC | Public Limited Company |
The accompanying notes are an integral part of these financial statements. | 73 |
LoCorr Spectrum Income Fund – Schedule of Written Options |
LoCorr Spectrum Income Fund
Schedule of Written Options
December 31, 2021
| | | Notional
Amount | | | Number of
Contracts (b) | | | Value | |
WRITTEN OPTIONS: (0.91)% | | | | | | | | | | | | |
Call Options: (0.50)% | | | | | | | | | | | | |
Apollo Commercial Real Estate Finance, Inc. Expiration: February 2022, Exercise Price: $15.00 | | $ | 61,852 | | | | (47 | ) | | $ | (470 | ) |
Boise Cascade Co. Expiration: February 2022, Exercise Price: $75.00 | | | 818,800 | | | | (115 | ) | | | (25,300 | ) |
Buckle Inc. Expiration: February 2022, Exercise Price: $46.85 | | | 575,416 | | | | (136 | ) | | | (14,280 | ) |
Clearway Energy, Inc. Expiration: February 2022, Exercise Price: $40.00 | | | 446,772 | | | | (124 | ) | | | (3,100 | ) |
Crestwood Equity Partners LP Expiration: February 2022, Exercise Price: $30.00 | | | 1,716,098 | | | | (622 | ) | | | (15,550 | ) |
Crown Castle International Corp. Expiration: February 2022, Exercise Price: $220.00 | | | 667,968 | | | | (32 | ) | | | (8,160 | ) |
CVR Partners LP Expiration: February 2022, Exercise Price: $90.00 | | | 694,596 | | | | (84 | ) | | | (37,632 | ) |
Delek Logistics Partners LP Expiration: February 2022, Exercise Price: $45.00 | | | 623,858 | | | | (146 | ) | | | (13,870 | ) |
Enviva Partners LP Expiration: February 2022, Exercise Price: $75.00 | | | 1,394,316 | | | | (198 | ) | | | (21,186 | ) |
Fortress Transportation and Infrastructure Investors LLC Expiration: February 2022, Exercise Price: $32.00 | | | 760,596 | | | | (263 | ) | | | (18,410 | ) |
Global Partners LP Expiration: February 2022, Exercise Price: $25.00 | | | 232,551 | | | | (99 | ) | | | (1,980 | ) |
Golden Ocean Group Ltd. Expiration: February 2022, Exercise Price: $10.00 | | | 694,710 | | | | (747 | ) | | | (33,615 | ) |
Haverty Furniture Cos, Inc. Expiration: February 2022, Exercise Price: $33.00 | | | 357,669 | | | | (117 | ) | | | (8,775 | ) |
International Business Machines Corp. Expiration: February 2022, Exercise Price: $145.00 | | | 1,256,404 | | | | (94 | ) | | | (9,870 | ) |
Invesco Mortgage Capital, Inc. Expiration: February 2022, Exercise Price: $3.00 | | | 278,000 | | | | (1,000 | ) | | | (9,000 | ) |
NextEra Energy Partners LP Expiration: February 2022, Exercise Price: $90.00 | | | 1,325,080 | | | | (157 | ) | | | (18,840 | ) |
Oasis Midstream Partners LP Expiration: February 2022, Exercise Price: $25.00 | | | 633,615 | | | | (265 | ) | | | (10,600 | ) |
OneMain Holdings, Inc. Expiration: February 2022, Exercise Price: $55.00 | | | 1,135,908 | | | | (227 | ) | | | (15,890 | ) |
Red Rock Resorts, Inc. Expiration: February 2022, Exercise Price: $60.00 | | | 759,138 | | | | (138 | ) | | | (21,942 | ) |
Rio Tinto PLC Expiration: February 2022, Exercise Price: $72.50 | | | 1,111,204 | | | | (166 | ) | | | (14,276 | ) |
Seagate Technology Holdings PLC Expiration: February 2022, Exercise Price: $125.00 | | | 858,648 | | | | (76 | ) | | | (17,556 | ) |
Sibanye Stillwater Ltd. Expiration: February 2022, Exercise Price: $15.00 | | | 584,364 | | | | (466 | ) | | | (9,320 | ) |
Simon Property Group, Inc. Expiration: February 2022, Exercise Price: $175.00 | | | 718,965 | | | | (45 | ) | | | (9,000 | ) |
Triton International Ltd. Expiration: February 2022, Exercise Price: $65.00 | | | 764,921 | | | | (127 | ) | | | (11,557 | ) |
USA Compression Partners LP Expiration: February 2022, Exercise Price: $17.50 | | | 1,261,635 | | | | (723 | ) | | | (28,920 | ) |
| | | | | | | | | | | | (379,099 | ) |
Put Option: (0.41)% | | | | | | | | | | | | |
SPDR S&P Oil & Gas Exploration & Production ETF Expiration: January 2022, Exercise Price: $89.00 | | | 23,967,500 | | | | (2,500 | ) | | | (310,000 | ) |
TOTAL WRITTEN OPTIONS (Premiums received $1,125,259) (0.91)% | | | | | | | | | | $ | (689,099 | ) |
Percentages are stated as a percent of net assets.
(a) | Each contract is equivalent to 100 shares of common stock. |
74 | The accompanying notes are an integral part of these financial statements. |
LoCorr Macro Strategies Fund, LoCorr Long/Short Commodities Strategy Fund and LoCorr Market Trend Fund
Consolidated Statements of Assets & Liabilities |
Consolidated Statements of Assets & Liabilities
December 31, 2021
| | | LoCorr Macro
Strategies Fund | | | LoCorr Long/Short
Commodities
Strategy Fund | | | LoCorr Market Trend
Fund | |
Assets | | | | | | | | | | | | |
Investments, at value (Cost $1,310,232,384, $732,007,522 and $228,179,040, respectively) | | $ | 1,310,127,005 | | | $ | 770,863,165 | | | $ | 227,880,367 | |
Cash held as collateral for forward currency contracts (Note 2) | | | 30,620,000 | | | | — | | | | 16,970,000 | |
Deposits with broker for derivative instruments (Note 2) | | | 105,398,996 | | | | 72,006,860 | | | | 25,177,436 | |
Unrealized appreciation on swap contracts (Note 1) | | | — | | | | 37,256,061 | | | | — | |
Unrealized appreciation on forward currency contracts (Note 2) | | | 15,977,777 | | | | — | | | | 2,499,767 | |
Receivable for Fund shares sold | | | 7,798,990 | | | | 4,728,244 | | | | 836,192 | |
Interest receivable | | | 3,371,428 | | | | 1,420,830 | | | | 480,718 | |
Receivable for unsettled open futures contracts | | | 3,979,060 | | | | — | | | | 1,386,049 | |
Advance receipt on swap contracts | | | — | | | | 14,113,147 | | | | — | |
Prepaid expenses and other assets | | | 50,973 | | | | 228,631 | | | | 29,444 | |
Total Assets | | | 1,477,324,229 | | | | 900,616,938 | | | | 275,259,973 | |
| | | | | | | | | | | | | |
Liabilities | | | | | | | | | | | | |
Foreign currency, due to broker (Cost $11,343,215, $0 and $380,296, respectively) | | | 11,572,873 | | | | — | | | | 380,279 | |
Payable for Fund shares redeemed | | | 7,117,014 | | | | 660,737 | | | | 292,509 | |
Unrealized depreciation on forward currency contracts (Note 2) | | | 21,520,109 | | | | — | | | | 4,975,174 | |
Payable for unsettled open futures contracts | | | 2,013,876 | | | | — | | | | 245,969 | |
Payable for variation margin on futures contracts | | | 6,156,465 | | | | — | | | | 2,300,229 | |
Accrued management fees (Note 5) | | | 2,063,287 | | | | 1,093,147 | | | | 341,955 | |
Accrued Trustees’ fees | | | 24,474 | | | | 14,461 | | | | 4,480 | |
Accrued Rule 12b-1 fees | | | 185,889 | | | | 143,813 | | | | 130,989 | |
Accrued expenses and other liabilities | | | 645,177 | | | | 345,903 | | | | 147,345 | |
Total Liabilities | | | 51,299,164 | | | | 2,258,061 | | | | 8,818,929 | |
| | | | | | | | | | | | | |
Net Assets | | $ | 1,426,025,065 | | | $ | 898,358,877 | | | $ | 266,441,044 | |
| | | | | | | | | | | | | |
Net Assets Consist of: | | | | | | | | | | | | |
Paid-in capital | | $ | 1,459,335,806 | | | $ | 822,300,327 | | | $ | 268,748,078 | |
Total distributable earnings/(accumulated loss) | | | (33,310,741 | ) | | | 76,058,550 | | | | (2,307,034 | ) |
NET ASSETS | | $ | 1,426,025,065 | | | $ | 898,358,877 | | | $ | 266,441,044 | |
| | | | | | | | | | | | | |
Class A Shares | | | | | | | | | | | | |
Net assets | | $ | 84,980,562 | | | $ | 35,149,154 | | | $ | 15,108,682 | |
Shares issued and outstanding (unlimited shares authorized, no par value) | | | 10,452,228 | | | | 3,320,952 | | | | 1,324,409 | |
Net asset value, redemption, and minimum offering price per share (a) | | $ | 8.13 | | | $ | 10.58 | | | $ | 11.41 | |
Maximum offering price per share ($8.13/0.9425) ($10.58/0.9425) ($11.41/0.9425)(b) | | $ | 8.63 | | | $ | 11.23 | | | $ | 12.10 | |
| | | | | | | | | | | | | |
Class C Shares | | | | | | | | | | | | |
Net assets | | $ | 34,789,241 | | | $ | 11,057,908 | | | $ | 10,825,490 | |
Shares issued and outstanding (unlimited shares authorized, no par value) | | | 4,505,888 | | | | 1,096,501 | | | | 982,334 | |
Net asset value, redemption, and offering price per share (a) | | $ | 7.72 | | | $ | 10.08 | | | $ | 11.02 | |
| | | | | | | | | | | | | |
Class I Shares | | | | | | | | | | | | |
Net assets | | $ | 1,306,255,262 | | | $ | 852,151,815 | | | $ | 240,506,872 | |
Shares issued and outstanding (unlimited shares authorized, no par value) | | | 157,890,774 | | | | 79,482,566 | | | | 21,004,057 | |
Net asset value, redemption, and offering price per share | | $ | 8.27 | | | $ | 10.72 | | | $ | 11.45 | |
(a) | A 1.00% contingent deferred sales charge may apply to redemptions made within twelve months of purchase. The contingent deferred sales charge only applies to Class A share purchases of $1 million or more. |
(b) | On investments of $25,000 or more, the offering price is reduced. |
The accompanying notes are an integral part of these consolidated financial statements. | 75 |
LoCorr Dynamic Equity Fund and LoCorr Spectrum Income Fund - Statements of Assets & Liabilities |
Statements of Assets & Liabilities
December 31, 2021
| | | LoCorr Dynamic
Equity Fund | | | LoCorr Spectrum
Income Fund | |
Assets | | | | | | | | |
Investments, at value (Cost $21,455,369 and $66,857,916, respectively) | | $ | 22,984,093 | | | $ | 75,582,830 | |
Cash | | | — | | | | 4,639 | |
Cash held as collateral for securities sold short (Note 2) | | | 816,516 | | | | — | |
Cash pledged as collateral for options contracts (Note 2) | | | — | | | | 6,655 | |
Foreign currency, at value (Cost $368,895 and $0, respectively)^ | | | 368,949 | | | | — | |
Deposits with broker for securities sold short (Note 2) | | | 5,928,140 | | | | — | |
Receivable for Fund shares sold | | | 30,571 | | | | 331,882 | |
Receivable for securities sold | | | 486,283 | | | | 18,808 | |
Dividends, interest and other receivables | | | 18,606 | | | | 256,701 | |
Deposits with broker for derivative instruments (Note 2) | | | 931,333 | | | | — | |
Deposits with broker for options | | | — | | | | 673,121 | |
Prepaid expenses and other assets | | | 17,745 | | | | 39,952 | |
Total Assets | | | 31,582,236 | | | | 76,914,588 | |
| | | | | | | | | |
Liabilities | | | | | | | | |
Securities sold short, at value (Proceeds $5,566,596 and $0, respectively) | | $ | 5,460,455 | | | $ | — | |
Options written, at value (Premiums received $0 and $1,125,259, respectively) | | | — | | | | 689,099 | |
Payable for securities purchased | | | 1,344,859 | | | | — | |
Payable for Fund shares redeemed | | | 55,968 | | | | 89,360 | |
Payable for distributions | | | 107,057 | | | | 102,725 | |
Dividends payable | | | 5,675 | | | | 2,174 | |
Accrued management fees (Note 5) | | | 15,572 | | | | 84,146 | |
Accrued Trustees’ fees | | | 397 | | | | 1,088 | |
Accrued Rule 12b-1 fees | | | 11,393 | | | | 69,504 | |
Accrued expenses and other liabilities | | | 72,169 | | | | 69,394 | |
Total Liabilities | | | 7,073,545 | | | | 1,107,490 | |
| | | | | | | | | |
Net Assets | | $ | 24,508,691 | | | $ | 75,807,098 | |
| | | | | | | | | |
Net Assets Consist of: | | | | | | | | |
Paid-in capital | | $ | 23,530,682 | | | $ | 98,065,314 | |
Total distributable earnings/(accumulated loss) | | | 978,009 | | | | (22,258,216 | ) |
NET ASSETS | | $ | 24,508,691 | | | $ | 75,807,098 | |
| | | | | | | | | |
Class A Shares | | | | | | | | |
Net assets | | $ | 4,009,520 | | | $ | 13,837,930 | |
Shares issued and outstanding (unlimited shares authorized, no par value) | | | 321,903 | | | | 1,983,746 | |
Net asset value, redemption, and minimum offering price per share (a) | | $ | 12.46 | | | $ | 6.98 | (b) |
Maximum offering price per share ($12.46/0.9425), ($6.98/0.9425), respectively(c) | | $ | 13.22 | | | $ | 7.40 | |
| | | | | | | | | |
Class C Shares | | | | | | | | |
Net assets | | $ | 2,785,677 | | | $ | 17,776,936 | |
Shares issued and outstanding (unlimited shares authorized, no par value) | | | 240,648 | | | | 2,520,766 | |
Net asset value, redemption, and offering price per share (a) | | $ | 11.58 | | | $ | 7.05 | (b) |
| | | | | | | | | |
Class I Shares | | | | | | | | |
Net assets | | $ | 17,713,494 | | | $ | 44,192,232 | |
Shares issued and outstanding (unlimited shares authorized, no par value) | | | 1,387,208 | | | | 6,357,108 | |
Net asset value, redemption, and offering price per share | | $ | 12.77 | | | $ | 6.95 | (b) |
^ | Includes $365,489 of foreign currency as collateral for securities sold short. |
(a) | A 1.00% contingent deferred sales charge may apply to redemptions made within twelve months of purchase. The contingent deferred sales charge only applies to Class A share purchases of $1 million or more. |
(b) | Redemptions made within 60 days of purchase may be assessed a redemption fee of 2.00%. |
(c) | On investments of $25,000 or more, the offering price is reduced. |
76 | The accompanying notes are an integral part of these financial statements. |
LoCorr Macro Strategies Fund, LoCorr Long/Short Commodities Strategy Fund and LoCorr Market Trend Fund –
Consolidated Statements of Operations |
Consolidated Statements of Operations
Year Ended December 31, 2021
| | LoCorr Macro
Strategies Fund | | | LoCorr Long/Short
Commodities
Strategy Fund | | | LoCorr Market
Trend Fund | |
Investment Income | | | | | | | | | | | | |
Interest income | | $ | 14,640,634 | | | $ | 5,323,895 | | | $ | 2,455,290 | |
Total Investment Income | | | 14,640,634 | | | | 5,323,895 | | | | 2,455,290 | |
| | | | | | | | | | | | | |
Expenses | | | | | | | | | | | | |
Management fees (Note 5) | | | 22,897,967 | | | | 10,161,464 | | | | 4,033,497 | |
Transfer agent fees and expenses | | | 1,988,387 | | | | 1,036,227 | | | | 252,094 | |
Fund accounting fees | | | 471,302 | | | | 281,270 | | | | 150,296 | |
Fund administration fees | | | 447,615 | | | | 248,942 | | | | 136,847 | |
Rule 12b-1 fee - Class A (Note 5) | | | 214,765 | | | | 73,536 | | | | 40,545 | |
Rule 12b-1 fee - Class C (Note 5) | | | 397,947 | | | | 89,002 | | | | 122,979 | |
Registration expenses | | | 159,942 | | | | 134,668 | | | | 64,466 | |
Printing and mailing expenses | | | 155,614 | | | | 69,269 | | | | 22,802 | |
Trustees’ fees | | | 103,758 | | | | 51,161 | | | | 20,241 | |
Legal and audit fees | | | 79,614 | | | | 59,934 | | | | 48,875 | |
Custodian fees | | | 79,594 | | | | 33,788 | | | | 17,758 | |
Service fees paid for options | | | — | | | | 527,304 | | | | — | |
Other expenses | | | 28,512 | | | | 9,634 | | | | 5,090 | |
Total Expenses | | | 27,025,017 | | | | 12,776,199 | | | | 4,915,490 | |
Net Investment Income (Loss) | | | (12,384,383 | ) | | | (7,452,304 | ) | | | (2,460,200 | ) |
| | | | | | | | | | | | | |
Realized and Unrealized Gain (Loss) on Investments, Swap Contracts, Forward Currency Contracts, Futures Contracts and Foreign Currency: | | | | | | | | | | | | |
Net realized gain (loss) on: | | | | | | | | | | | | |
Investments | | | 2,595,181 | | | | 24,366,282 | | | | 972,156 | |
Forward currency contracts | | | (20,552,427 | ) | | | — | | | | 4,196,930 | |
Futures contracts | | | 66,975,663 | | | | — | | | | 19,021,034 | |
Foreign currency transactions | | | 7,205,917 | | | | — | | | | 76,073 | |
Net change in unrealized appreciation/depreciation on: | | | | | | | | | | | | |
Investments | | | (23,673,972 | ) | | | 26,881,957 | | | | (4,628,001 | ) |
Swap contracts | | | — | | | | 50,355,280 | | | | — | |
Forward currency contracts | | | (10,609,131 | ) | | | — | | | | (5,765,152 | ) |
Futures contracts | | | (19,605,102 | ) | | | — | | | | (9,825,335 | ) |
Foreign currency translation | | | (482,502 | ) | | | — | | | | 18 | |
Net realized and unrealized gain (loss) | | | 1,853,627 | | | | 101,603,519 | | | | 4,047,723 | |
Net Increase (Decrease) in Net Assets Resulting From Operations | | $ | (10,530,756 | ) | | $ | 94,151,215 | | | $ | 1,587,523 | |
The accompanying notes are an integral part of these consolidated financial statements. | 77 |
LoCorr Dynamic Equity Fund and LoCorr Spectrum Income Fund – Statements of Operations |
Statements of Operations
Year Ended December 31, 2021
| | LoCorr Dynamic
Equity Fund | | | LoCorr Spectrum
Income Fund | |
Investment Income | | | | | | | | |
Dividend and interest income (a) | | $ | 188,848 | | | $ | 2,026,624 | |
Total Investment Income | | | 188,848 | | | | 2,026,624 | |
| | | | | | | | | |
Expenses | | | | | | | | |
Management fees (Note 5) | | | 324,317 | | | | 805,295 | |
Fund administration fees | | | 70,421 | | | | 60,889 | |
Fund accounting fees | | | 56,521 | | | | 42,097 | |
Trustees’ fees | | | 1,608 | | | | 4,481 | |
Transfer agent fees and expenses | | | 70,060 | | | | 104,674 | |
Custodian fees | | | 91,714 | | | | 9,984 | |
Registration expenses | | | 48,281 | | | | 40,636 | |
Rule 12b-1 fee - Class A (Note 5) | | | 9,844 | | | | 36,082 | |
Rule 12b-1 fee - Class C (Note 5) | | | 24,730 | | | | 158,843 | |
Legal and audit fees | | | 26,633 | | | | 31,523 | |
Printing and mailing expenses | | | 1,255 | | | | 18,439 | |
Other expenses | | | 4,423 | | | | 3,174 | |
Total expenses before dividend and interest expense | | | 729,807 | | | | 1,316,117 | |
Dividend expense on securities sold short (Note 2) | | | 65,371 | | | | — | |
Interest expense | | | 27,434 | | | | 1,001 | |
Interest expense on credit line (Note 8) | | | 167 | | | | — | |
Total expenses before fee waiver from Advisor | | | 822,779 | | | | 1,317,118 | |
Fee waiver from Adviser (Note 5) | | | (263,217 | ) | | | (6,179 | ) |
Net Expenses | | | 559,562 | | | | 1,310,939 | |
Net Investment Income (Loss) | | | (370,714 | ) | | | 715,685 | |
| | | | | | | | | |
Realized and Unrealized Gain (Loss) on Investments, Securities Sold Short, Futures Contracts, Foreign Currency and Written Options: | | | | | | | | |
Net realized gain (loss) on: | | | | | | | | |
Investments | | | 4,034,517 | | | | 6,164,530 | |
Securities sold short | | | (1,136,780 | ) | | | — | |
Futures contracts | | | 689,103 | | | | — | |
Foreign currency transactions | | | (15,090 | ) | | | — | |
Written options | | | — | | | | 171,286 | |
Net change in unrealized appreciation/depreciation on: | | | | | | | | |
Investments | | | (1,127,391 | ) | | | 2,944,342 | |
Securities sold short | | | 521,688 | | | | — | |
Futures contracts | | | (39,152 | ) | | | — | |
Foreign currency translation | | | (6,002 | ) | | | — | |
Written options | | | — | | | | 436,160 | |
Net realized and unrealized gain (loss) | | | 2,920,893 | | | | 9,716,318 | |
Net Increase (Decrease) in Net Assets Resulting From Operations | | $ | 2,550,179 | | | $ | 10,432,003 | |
(a) | Net foreign tax withheld of $11,720 and $12,324, respectively. |
78 | The accompanying notes are an integral part of these financial statements. |
LoCorr Macro Strategies Fund – Consolidated Statements of Changes in Net Assets |
LoCorr Macro Strategies Fund
Consolidated Statements of Changes in Net Assets
| | Year Ended
December 31,
2021 | | | Year Ended
December 31,
2020 | |
Operations | | | | | | | | |
Net investment income (loss) | | $ | (12,384,383 | ) | | $ | (3,108,934 | ) |
Net realized gain (loss) on investments, forward currency contracts, futures contracts and foreign currency transactions | | | 56,224,334 | | | | 6,907,586 | |
Net change in unrealized appreciation/depreciation of investments, forward currency contracts, futures contracts and foreign currency translation | | | (54,370,707 | ) | | | 54,310,602 | |
Increase (Decrease) in Net Assets Resulting From Operations | | | (10,530,756 | ) | | | 58,109,254 | |
| | | | | | | | | |
Distributions From Earnings | | | | | | | | |
Class A | | | (4,127,819 | ) | | | (3,044,869 | ) |
Class C | | | (1,383,724 | ) | | | (2,143,479 | ) |
Class I | | | (64,619,838 | ) | | | (58,170,598 | ) |
Total Distributions From Earnings | | | (70,131,381 | ) | | | (63,358,946 | ) |
| | | | | | | | | |
Capital Transactions (Note 6) | | | | | | | | |
Proceeds from shares sold | | | 696,943,275 | | | | 686,900,731 | |
Proceeds from shares issued in connection with reorganization (a) | | | — | | | | 57,875,149 | |
Reinvestment of distributions | | | 60,719,026 | | | | 56,490,383 | |
Cost of shares redeemed | | | (435,141,347 | ) | | | (438,436,073 | ) |
Increase (Decrease) in Net Assets From Capital Transactions | | | 322,520,954 | | | | 362,830,190 | |
| | | | | | | | | |
Total Increase (Decrease) in Net Assets | | | 241,858,817 | | | | 357,580,498 | |
| | | | | | | | | |
Net Assets | | | | | | | | |
Beginning of year | | | 1,184,166,248 | | | | 826,585,750 | |
End of year | | $ | 1,426,025,065 | | | $ | 1,184,166,248 | |
(a) | Shares of the Steben Managed Futures Strategy Fund converted into shares of the LoCorr Macro Strategies Fund on January 24, 2020. See Note 1. |
The accompanying notes are an integral part of these consolidated financial statements. | 79 |
LoCorr Long/Short Commodities Strategy Fund – Consolidated Statements of Changes in Net Assets |
LoCorr Long/Short Commodities Strategy Fund
Consolidated Statements of Changes in Net Assets
| | Year Ended
December 31,
2021 | | | Year Ended
December 31,
2020 | |
Operations | | | | | | | | |
Net investment income (loss) | | $ | (7,452,304 | ) | | $ | (1,734,973 | ) |
Net realized gain (loss) on investments and swap contracts | | | 24,366,282 | | | | 2,871,953 | |
Net change in unrealized appreciation/depreciation of investments and swap contracts | | | 77,237,237 | | | | 21,760,669 | |
Increase (Decrease) in Net Assets Resulting From Operations | | | 94,151,215 | | | | 22,897,649 | |
| | | | | | | | | |
Distributions From Earnings | | | | | | | | |
Class A | | | (2,253,811 | ) | | | (687,537 | ) |
Class C | | | (680,758 | ) | | | (165,370 | ) |
Class I | | | (57,133,795 | ) | | | (12,840,661 | ) |
Total Distributions From Earnings | | | (60,068,364 | ) | | | (13,693,568 | ) |
| | | | | | | | | |
Capital Transactions (Note 6) | | | | | | | | |
Proceeds from shares sold | | | 516,986,498 | | | | 425,232,265 | |
Reinvestment of distributions | | | 47,195,180 | | | | 10,893,359 | |
Cost of shares redeemed | | | (177,740,338 | ) | | | (223,539,698 | ) |
Increase (Decrease) in Net Assets From Capital Transactions | | | 386,441,340 | | | | 212,585,926 | |
| | | | | | | | | |
Total Increase (Decrease) in Net Assets | | | 420,524,191 | | | | 221,790,007 | |
| | | | | | | | | |
Net Assets | | | | | | | | |
Beginning of year | | | 477,834,686 | | | | 256,044,679 | |
End of year | | $ | 898,358,877 | | | $ | 477,834,686 | |
80 | The accompanying notes are an integral part of these consolidated financial statements. |
LoCorr Market Trend Fund – Consolidated Statements of Changes in Net Assets |
LoCorr Market Trend Fund
Consolidated Statements of Changes in Net Assets
| | Year Ended
December 31,
2021 | | | Year Ended
December 31,
2020 | |
Operations | | | | | | | | |
Net investment income (loss) | | $ | (2,460,200 | ) | | $ | (884,021 | ) |
Net realized gain (loss) on investments, forward currency contracts, futures contracts and foreign currency transactions | | | 24,266,193 | | | | (13,247,099 | ) |
Net change in unrealized appreciation/depreciation of investments, forward currency contracts, futures contracts and foreign currency translation | | | (20,218,470 | ) | | | 23,640,454 | |
Increase (Decrease) in Net Assets Resulting From Operations | | | 1,587,523 | | | | 9,509,334 | |
| | | | | | | | | |
Distributions From Earnings | | | | | | | | |
Class A | | | (502,242 | ) | | | — | |
Class C | | | (279,635 | ) | | | — | |
Class I | | | (8,675,899 | ) | | | (570,347 | ) |
Total Distributions to Shareholders | | | (9,457,776 | ) | | | (570,347 | ) |
| | | | | | | | | |
Capital Transactions (Note 6) | | | | | | | | |
Proceeds from shares sold | | | 90,011,450 | | | | 100,733,510 | |
Reinvestment of distributions | | | 9,157,589 | | | | 551,952 | |
Cost of shares redeemed | | | (80,974,775 | ) | | | (127,312,911 | ) |
Increase (Decrease) in Net Assets From Capital Transactions | | | 18,194,264 | | | | (26,027,449 | ) |
| | | | | | | | | |
Total Increase (Decrease) in Net Assets | | | 10,324,011 | | | | (17,088,462 | ) |
| | | | | | | | | |
Net Assets | | | | | | | | |
Beginning of year | | | 256,117,033 | | | | 273,205,495 | |
End of year | | $ | 266,441,044 | | | $ | 256,117,033 | |
The accompanying notes are an integral part of these consolidated financial statements. | 81 |
LoCorr Dynamic Equity Fund – Statements of Changes in Net Assets |
LoCorr Dynamic Equity Fund
Statements of Changes in Net Assets
| | Year Ended
December 31,
2021 | | | Year Ended
December 31,
2020 | |
Operations | | | | | | | | |
Net investment income (loss) | | $ | (370,714 | ) | | $ | (384,911 | ) |
Net realized gain (loss) on investments, securities sold short, futures contracts and foreign currency transactions | | | 3,571,750 | | | | (19,925 | ) |
Net change in unrealized appreciation/depreciation of investments, securities sold short, futures contracts and foreign currency translation | | | (650,857 | ) | | | (702,798 | ) |
Increase (Decrease) in Net Assets Resulting From Operations | | | 2,550,179 | | | | (1,107,634 | ) |
| | | | | | | | | |
Distributions From Earnings | | | | | | | | |
Class A | | | (240,081 | ) | | | — | |
Class C | | | (177,259 | ) | | | — | |
Class I | | | (1,025,665 | ) | | | — | |
Total Distributions From Earnings | | | (1,443,005 | ) | | | — | |
| | | | | | | | | |
Capital Transactions (Note 6) | | | | | | | | |
Proceeds from shares sold | | | 10,887,135 | | | | 6,264,879 | |
Reinvestment of distributions | | | 1,335,949 | | | | — | |
Cost of shares redeemed | | | (6,894,102 | ) | | | (14,782,464 | ) |
Increase (Decrease) in Net Assets From Capital Transactions | | | 5,328,982 | | | | (8,517,585 | ) |
| | | | | | | | | |
Total Increase (Decrease) in Net Assets | | | 6,436,156 | | | | (9,625,219 | ) |
| | | | | | | | | |
Net Assets | | | | | | | | |
Beginning of year | | | 18,072,535 | | | | 27,697,754 | |
End of year | | $ | 24,508,691 | | | $ | 18,072,535 | |
82 | The accompanying notes are an integral part of these financial statements. |
LoCorr Spectrum Income Fund – Statements of Changes in Net Assets |
LoCorr Spectrum Income Fund |
Statements of Changes in Net Assets
| | Year Ended
December 31,
2021 | | | Year Ended
December 31,
2020 | |
Operations | | | | | | | | |
Net investment income (loss) | | $ | 715,685 | | | $ | 1,033,961 | |
Net realized gain (loss) on investments and written options | | | 6,335,816 | | | | (8,616,208 | ) |
Net change in unrealized appreciation/depreciation of investments and written options | | | 3,380,502 | | | | 571,050 | |
Increase (Decrease) in Net Assets Resulting From Operations | | | 10,432,003 | | | | (7,011,197 | ) |
| | | | | | | | | |
Distributions From: | | | | | | | | |
Earnings: | | | | | | | | |
Class A | | | (581,259 | ) | | | (524,026 | ) |
Class C | | | (573,863 | ) | | | (394,734 | ) |
Class I | | | (1,362,103 | ) | | | (757,177 | ) |
Return of capital: | | | | | | | | |
Class A | | | (373,680 | ) | | | (801,917 | ) |
Class C | | | (368,925 | ) | | | (604,063 | ) |
Class I | | | (875,669 | ) | | | (1,158,708 | ) |
Total Distributions From Earnings | | | (4,135,499 | ) | | | (4,240,625 | ) |
| | | | | | | | | |
Capital Transactions (Note 6) | | | | | | | | |
Proceeds from shares sold | | | 32,470,780 | | | | 10,635,063 | |
Reinvestment of distributions | | | 3,075,791 | | | | 3,001,128 | |
Cost of shares redeemed | | | (14,181,847 | ) | | | (28,130,066 | ) |
Redemption fees | | | 515 | | | | 4,942 | |
Increase (Decrease) in Net Assets From Capital Transactions | | | 21,365,239 | | | | (14,488,933 | ) |
| | | | | | | | | |
Total Increase (Decrease) in Net Assets | | | 27,661,743 | | | | (25,740,755 | ) |
| | | | | | | | | |
Net Assets | | | | | | | | |
Beginning of year | | | 48,145,355 | | | | 73,886,110 | |
End of year | | $ | 75,807,098 | | | $ | 48,145,355 | |
The accompanying notes are an integral part of these financial statements. | 83 |
LoCorr Macro Strategies Fund – Consolidated Financial Highlights – Class A |
LoCorr Macro Strategies Fund - Class A
Consolidated Financial Highlights
Selected Data and Ratios (for a share outstanding throughout the year)
| | | Year Ended December 31, | |
| | | 2021 | | | 2020 | | | 2019 | | | 2018 | | | 2017 | |
Per Share | | | | | | | | | | | | | | | | | | | | |
Net asset value, beginning of year | | $ | 8.53 | | | $ | 8.56 | | | $ | 7.95 | | | $ | 8.64 | | | $ | 8.91 | |
| | | | | | | | | | | | | | | | | | | | | |
Income (loss) from investment operations: | | | | | | | | | | | | | | | | | | | | |
Net investment income (loss)(a) | | | (0.10 | ) | | | (0.04 | ) | | | 0.02 | | | | 0.00 | (b) | | | (0.06 | ) |
Net realized and unrealized gain (loss) | | | 0.09 | | | | 0.49 | | | | 0.98 | | | | (0.46 | ) | | | 0.31 | |
Total from Investment Operations | | | (0.01 | ) | | | 0.45 | | | | 1.00 | | | | (0.46 | ) | | | 0.25 | |
| | | | | | | | | | | | | | | | | | | | | |
Distributions From Earnings: | | | | | | | | | | | | | | | | | | | | |
Net investment income | | | (0.39 | ) | | | (0.39 | ) | | | (0.16 | ) | | | (0.10 | ) | | | — | |
Net realized gains | | | — | | | | (0.09 | ) | | | (0.23 | ) | | | (0.13 | ) | | | (0.52 | ) |
Total Distributions | | | (0.39 | ) | | | (0.48 | ) | | | (0.39 | ) | | | (0.23 | ) | | | (0.52 | ) |
| | | | | | | | | | | | | | | | | | | | | |
Redemption Fees | | | — | | | | — | | | | — | | | | — | | | | 0.00 | (b) |
| | | | | | | | | | | | | | | | | | | | | |
Net Asset Value, End of Year | | $ | 8.13 | | | $ | 8.53 | | | $ | 8.56 | | | $ | 7.95 | | | $ | 8.64 | |
| | | | | | | | | | | | | | | | | | | | | |
Total Investment Return(c) | | | (0.15 | )% | | | 5.41 | % | | | 12.52 | % | | | (5.36 | )% | | | 2.77 | % |
| | | | | | | | | | | | | | | | | | | | | |
Net Assets, End of Year, in Thousands | | $ | 84,981 | | | $ | 77,035 | | | $ | 53,320 | | | $ | 55,075 | | | $ | 93,182 | |
| | | | | | | | | | | | | | | | | | | | | |
Ratios/Supplemental Data: | | | | | | | | | | | | | | | | | | | | |
Ratio of expenses to average net assets: | | | | | | | | | | | | | | | | | | | | |
Before expense waiver or recovery | | | 2.15 | % | | | 2.17 | % | | | 2.16 | % | | | 2.25 | % | | | 2.33 | % |
After expense waiver or recovery | | | 2.15 | % | | | 2.18 | % | | | 2.24 | % | | | 2.24 | % | | | 2.28 | % |
| | | | | | | | | | | | | | | | | | | | | |
Ratio of net investment income (loss) to average net assets: | | | | | | | | | | | | | | | | | | | | |
Before expense waiver or recovery | | | (1.10 | )% | | | (0.49 | )% | | | 0.32 | % | | | 0.03 | % | | | (0.76 | )% |
After expense waiver or recovery | | | (1.10 | )% | | | (0.50 | )% | | | 0.24 | % | | | 0.04 | % | | | (0.71 | )% |
| | | | | | | | | | | | | | | | | | | | | |
Portfolio turnover rate(d) | | | 75 | % | | | 56 | % | | | 84 | % | | | 105 | % | | | 97 | % |
(a) | Net investment income (loss) per share is based on average shares outstanding. |
(b) | Amount represents less than $0.005 per share. |
(c) | Total investment return excludes the effect of applicable sales charges. |
(d) | Portfolio turnover rate is calculated on the basis of the Fund as a whole without distinguishing between classes of shares issued. Consists of long-term investments only; excludes derivative instruments. |
84 | The accompanying notes are an integral part of these consolidated financial statements. |
LoCorr Macro Strategies Fund – Consolidated Financial Highlights – Class C |
LoCorr Macro Strategies Fund - Class C
Consolidated Financial Highlights
Selected Data and Ratios (for a share outstanding throughout the year)
| | | Year Ended December 31, | |
| | | 2021 | | | 2020 | | | 2019 | | | 2018 | | | 2017 | |
Per Share | | | | | | | | | | | | | | | | | | | | |
Net asset value, beginning of year | | $ | 8.11 | | | $ | 8.15 | | | $ | 7.62 | | | $ | 8.27 | | | $ | 8.62 | |
| | | | | | | | | | | | | | | | | | | | | |
Income (loss) from investment operations: | | | | | | | | | | | | | | | | | | | | |
Net investment income (loss)(a) | | | (0.15 | ) | | | (0.10 | ) | | | (0.04 | ) | | | (0.06 | ) | | | (0.13 | ) |
Net realized and unrealized gain (loss) | | | 0.08 | | | | 0.47 | | | | 0.92 | | | | (0.43 | ) | | | 0.30 | |
Total from Investment Operations | | | (0.07 | ) | | | 0.37 | | | | 0.88 | | | | (0.49 | ) | | | 0.17 | |
| | | | | | | | | | | | | | | | | | | | | |
Distributions From Earnings: | | | | | | | | | | | | | | | | | | | | |
Net investment income | | | (0.32 | ) | | | (0.32 | ) | | | (0.12 | ) | | | (0.03 | ) | | | — | |
Net realized gains | | | — | | | | (0.09 | ) | | | (0.23 | ) | | | (0.13 | ) | | | (0.52 | ) |
Total Distributions | | | (0.32 | ) | | | (0.41 | ) | | | (0.35 | ) | | | (0.16 | ) | | | (0.52 | ) |
| | | | | | | | | | | | | | | | | | | | | |
Redemption Fees | | | — | | | | — | | | | — | | | | — | | | | 0.00 | (b) |
| | | | | | | | | | | | | | | | | | | | | |
Net Asset Value, End of Year | | $ | 7.72 | | | $ | 8.11 | | | $ | 8.15 | | | $ | 7.62 | | | $ | 8.27 | |
| | | | | | | | | | | | | | | | | | | | | |
Total Investment Return(c) | | | (0.91 | )% | | | 4.69 | % | | | 11.57 | % | | | (5.98 | )% | | | 1.93 | % |
| | | | | | | | | | | | | | | | | | | | | |
Net Assets, End of Year, in Thousands | | $ | 34,789 | | | $ | 43,684 | | | $ | 47,205 | | | $ | 53,148 | | | $ | 90,653 | |
| | | | | | | | | | | | | | | | | | | | | |
Ratios/Supplemental Data: | | | | | | | | | | | | | | | | | | | | |
Ratio of expenses to average net assets: | | | | | | | | | | | | | | | | | | | | |
Before expense waiver or recovery | | | 2.90 | % | | | 2.92 | % | | | 2.91 | % | | | 3.00 | % | | | 3.08 | % |
After expense waiver or recovery | | | 2.90 | % | | | 2.93 | % | | | 2.99 | % | | | 2.99 | % | | | 3.03 | % |
| | | | | | | | | | | | | | | | | | | | | |
Ratio of net investment income (loss) to average net assets: | | | | | | | | | | | | | | | | | | | | |
Before expense waiver or recovery | | | (1.85 | )% | | | (1.24 | )% | | | (0.43 | )% | | | (0.72 | )% | | | (1.51 | )% |
After expense waiver or recovery | | | (1.85 | )% | | | (1.25 | )% | | | (0.51 | )% | | | (0.71 | )% | | | (1.46 | )% |
| | | | | | | | | | | | | | | | | | | | | |
Portfolio turnover rate(d) | | | 75 | % | | | 56 | % | | | 84 | % | | | 105 | % | | | 97 | % |
(a) | Net investment income (loss) per share is based on average shares outstanding. |
(b) | Amount represents less than $0.005 per share. |
(c) | Total investment return excludes the effect of applicable sales charges. |
(d) | Portfolio turnover rate is calculated on the basis of the Fund as a whole without distinguishing between classes of shares issued. Consists of long-term investments only; excludes derivative instruments. |
The accompanying notes are an integral part of these consolidated financial statements. | 85 |
LoCorr Macro Strategies Fund – Consolidated Financial Highlights – Class I |
LoCorr Macro Strategies Fund - Class I
Consolidated Financial Highlights
Selected Data and Ratios (for a share outstanding throughout the year)
| | | Year Ended December 31, | |
| | | 2021 | | | 2020 | | | 2019 | | | 2018 | | | 2017 | |
Per Share | | | | | | | | | | | | | | | | | | | | |
Net asset value, beginning of year | | $ | 8.67 | | | $ | 8.69 | | | $ | 8.07 | | | $ | 8.77 | | | $ | 9.01 | |
| | | | | | | | | | | | | | | | | | | | | |
Income (loss) from investment operations: | | | | | | | | | | | | | | | | | | | | |
Net investment income (loss)(a) | | | (0.08 | ) | | | (0.02 | ) | | | 0.04 | | | | 0.02 | | | | (0.04 | ) |
Net realized and unrealized gain (loss) | | | 0.09 | | | | 0.50 | | | | 0.99 | | | | (0.47 | ) | | | 0.32 | |
Total from Investment Operations | | | 0.01 | | | | 0.48 | | | | 1.03 | | | | (0.45 | ) | | | 0.28 | |
| | | | | | | | | | | | | | | | | | | | | |
Distributions From Earnings: | | | | | | | | | | | | | | | | | | | | |
Net investment income | | | (0.41 | ) | | | (0.41 | ) | | | (0.18 | ) | | | (0.12 | ) | | | — | |
Net realized gains | | | — | | | | (0.09 | ) | | | (0.23 | ) | | | (0.13 | ) | | | (0.52 | ) |
Total Distributions | | | (0.41 | ) | | | (0.50 | ) | | | (0.41 | ) | | | (0.25 | ) | | | (0.52 | ) |
| | | | | | | | | | | | | | | | | | | | | |
Redemption Fees | | | — | | | | — | | | | — | | | | — | | | | 0.00 | (b) |
| | | | | | | | | | | | | | | | | | | | | |
Net Asset Value, End of Year | | $ | 8.27 | | | $ | 8.67 | | | $ | 8.69 | | | $ | 8.07 | | | $ | 8.77 | |
| | | | | | | | | | | | | | | | | | | | | |
Total Investment Return | | | 0.08 | % | | | 5.70 | % | | | 12.72 | % | | | (5.08 | )% | | | 3.07 | % |
| | | | | | | | | | | | | | | | | | | | | |
Net Assets, End of Year, in Thousands | | $ | 1,306,255 | | | $ | 1,063,447 | | | $ | 726,061 | | | $ | 445,858 | | | $ | 605,983 | |
| | | | | | | | | | | | | | | | | | | | | |
Ratios/Supplemental Data: | | | | | | | | | | | | | | | | | | | | |
Ratio of expenses to average net assets: | | | | | | | | | | | | | | | | | | | | |
Before expense waiver or recovery | | | 1.90 | % | | | 1.92 | % | | | 1.91 | % | | | 2.00 | % | | | 2.08 | % |
After expense waiver or recovery | | | 1.90 | % | | | 1.93 | % | | | 1.99 | % | | | 1.99 | % | | | 2.03 | % |
| | | | | | | | | | | | | | | | | | | | | |
Ratio of net investment income (loss) to average net assets: | | | | | | | | | | | | | | | | | | | | |
Before expense waiver or recovery | | | (0.85 | )% | | | (0.24 | )% | | | 0.57 | % | | | 0.28 | % | | | (0.51 | )% |
After expense waiver or recovery | | | (0.85 | )% | | | (0.25 | )% | | | 0.49 | % | | | 0.29 | % | | | (0.46 | )% |
| | | | | | | | | | | | | | | | | | | | | |
Portfolio turnover rate(c) | | | 75 | % | | | 56 | % | | | 84 | % | | | 105 | % | | | 97 | % |
(a) | Net investment income (loss) per share is based on average shares outstanding. |
(b) | Amount represents less than $0.005 per share. |
(c) | Portfolio turnover rate is calculated on the basis of the Fund as a whole without distinguishing between classes of shares issued. Consists of long-term investments only; excludes derivative instruments. |
86 | The accompanying notes are an integral part of these consolidated financial statements. |
LoCorr Long/Short Commodities Strategy Fund – Consolidated Financial Highlights – Class A |
LoCorr Long/Short Commodities Strategy Fund - Class A
Consolidated Financial Highlights
Selected Data and Ratios (for a share outstanding throughout the year)
| | | Year Ended December 31, | |
| | | 2021 | | | 2020 | | | 2019 | | | 2018 | | | 2017 | |
Per Share | | | | | | | | | | | | | | | | | | | | |
Net asset value, beginning of year | | $ | 9.89 | | | $ | 9.26 | | | $ | 9.90 | | | $ | 9.71 | | | $ | 9.17 | |
| | | | | | | | | | | | | | | | | | | | | |
Income (loss) from investment operations: | | | | | | | | | | | | | | | | | | | | |
Net investment income (loss)(a) | | | (0.14 | ) | | | (0.07 | ) | | | 0.05 | | | | 0.02 | | | | (0.04 | ) |
Net realized and unrealized gain (loss) | | | 1.57 | | | | 0.96 | | | | (0.67 | ) | | | 1.39 | | | | 0.58 | |
Total from Investment Operations | | | 1.43 | | | | 0.89 | | | | (0.62 | ) | | | 1.41 | | | | 0.54 | |
| | | | | | | | | | | | | | | | | | | | | |
Distributions From Earnings: | | | | | | | | | | | | | | | | | | | | |
Net investment income | | | (0.74 | ) | | | (0.26 | ) | | | (0.02 | ) | | | (1.22 | ) | | | 0.00 | (b) |
Net realized gains | | | — | | | | (0.00 | )(b) | | | — | | | | — | | | | — | |
Total Distributions | | | (0.74 | ) | | | (0.26 | ) | | | (0.02 | ) | | | (1.22 | ) | | | 0.00 | |
| | | | | | | | | | | | | | | | | | | | | |
Redemption Fees | | | — | | | | — | | | | — | | | | — | | | | 0.00 | (b) |
| | | | | | | | | | | | | | | | | | | | | |
Net Asset Value, End of Year | | $ | 10.58 | | | $ | 9.89 | | | $ | 9.26 | | | $ | 9.90 | | | $ | 9.71 | |
| | | | | | | | | | | | | | | | | | | | | |
Total Investment Return(c) | | | 14.55 | % | | | 9.66 | % | | | (6.24 | )% | | | 15.05 | % | | | 5.91 | % |
| | | | | | | | | | | | | | | | | | | | | |
Net Assets, End of Year, in Thousands | | $ | 35,149 | | | $ | 26,546 | | | $ | 45,513 | | | $ | 68,719 | | | $ | 25,575 | |
| | | | | | | | | | | | | | | | | | | | | |
Ratio/Supplemental Data:(d) | | | | | | | | | | | | | | | | | | | | |
Ratio of expenses to average net assets: | | | | | | | | | | | | | | | | | | | | |
Before expense waiver or recovery | | | 2.08 | %(e) | | | 2.08 | %(e) | | | 2.11 | % | | | 2.16 | % | | | 2.28 | % |
After expense waiver or recovery | | | 2.08 | %(e) | | | 2.08 | %(e) | | | 2.14 | % | | | 2.20 | % | | | 2.20 | % |
| | | | | | | | | | | | | | | | | | | | | |
Ratio of net investment income (loss) to average net assets: | | | | | | | | | | | | | | | | | | | | |
Before expense waiver or recovery | | | (1.31 | )%(e) | | | (0.65 | )%(e) | | | 0.57 | % | | | 0.22 | % | | | (0.52 | )% |
After expense waiver or recovery | | | (1.31 | )%(e) | | | (0.65 | )%(e) | | | 0.54 | % | | | 0.18 | % | | | (0.44 | )% |
| | | | | | | | | | | | | | | | | | | | | |
Portfolio turnover rate(f) | | | 66 | % | | | 60 | % | | | 103 | % | | | 92 | % | | | 74 | % |
(a) | Net investment income (loss) per share is based on average shares outstanding. |
(b) | Amount represents less than $0.005 per share. |
(c) | Total investment return excludes the effect of applicable sales charges. |
(d) | Ratios do not include the income and expenses of the CTAs included in the swap. |
(e) | Includes 0.02% and 0.08% of service fees paid for options for the years ended December 31, 2020 and December 31, 2021, respectively. |
(f) | Portfolio turnover rate is calculated on the basis of the Fund as a whole without distinguishing between classes of shares issued. Consists of long-term investments only; excludes derivative instruments. |
The accompanying notes are an integral part of these consolidated financial statements. | 87 |
LoCorr Long/Short Commodities Strategy Fund – Consolidated Financial Highlights – Class C |
LoCorr Long/Short Commodities Strategy Fund - Class C
Consolidated Financial Highlights
Selected Data and Ratios (for a share outstanding throughout the year)
| | | Year Ended December 31, | |
| | | 2021 | | | 2020 | | | 2019 | | | 2018 | | | 2017 | |
Per Share | | | | | | | | | | | | | | | | | | | | |
Net asset value, beginning of year | | $ | 9.47 | | | $ | 8.89 | | | $ | 9.55 | | | $ | 9.41 | | | $ | 8.95 | |
| | | | | | | | | | | | | | | | | | | | | |
Income (loss) from investment operations: | | | | | | | | | | | | | | | | | | | | |
Net investment income (loss)(a) | | | (0.21 | ) | | | (0.13 | ) | | | (0.02 | ) | | | (0.06 | ) | | | (0.11 | ) |
Net realized and unrealized gain (loss) | | | 1.50 | | | | 0.91 | | | | (0.64 | ) | | | 1.35 | | | | 0.57 | |
Total from Investment Operations | | | 1.29 | | | | 0.78 | | | | (0.66 | ) | | | 1.29 | | | | 0.46 | |
| | | | | | | | | | | | | | | | | | | | | |
Distributions From Earnings: | | | | | | | | | | | | | | | | | | | | |
Net investment income | | | (0.68 | ) | | | (0.20 | ) | | | (0.00 | )(b) | | | (1.15 | ) | | | 0.00 | (b) |
Net realized gains | | | — | | | | (0.00 | )(b) | | | — | | | | — | | | | — | |
Total Distributions | | | (0.68 | ) | | | (0.20 | ) | | | (0.00 | ) | | | (1.15 | ) | | | 0.00 | |
| | | | | | | | | | | | | | | | | | | | | |
Redemption Fees | | | — | | | | — | | | | — | | | | — | | | | 0.00 | (b) |
| | | | | | | | | | | | | | | | | | | | | |
Net Asset Value, End of Year | | $ | 10.08 | | | $ | 9.47 | | | $ | 8.89 | | | $ | 9.55 | | | $ | 9.41 | |
| | | | | | | | | | | | | | | | | | | | | |
Total Investment Return(c) | | | 13.66 | % | | | 8.83 | % | | | (6.90 | )% | | | 14.20 | % | | | 5.17 | % |
| | | | | | | | | | | | | | | | | | | | | |
Net Assets, End of Year, in Thousands | | $ | 11,058 | | | $ | 7,938 | | | $ | 6,645 | | | $ | 6,503 | | | $ | 4,737 | |
| | | | | | | | | | | | | | | | | | | | | |
Ratio/Supplemental Data:(d) | | | | | | | | | | | | | | | | | | | | |
Ratio of expenses to average net assets: | | | | | | | | | | | | | | | | | | | | |
Before expense waiver or recovery | | | 2.83 | %(e) | | | 2.83 | %(e) | | | 2.86 | % | | | 2.91 | % | | | 3.03 | % |
After expense waiver or recovery | | | 2.83 | %(e) | | | 2.83 | %(e) | | | 2.89 | % | | | 2.95 | % | | | 2.95 | % |
| | | | | | | | | | | | | | | | | | | | | |
Ratio of net investment income (loss) to average net assets: | | | | | | | | | | | | | | | | | | | | |
Before expense waiver or recovery | | | (2.06 | )%(e) | | | (1.40 | )%(e) | | | (0.18 | )% | | | (0.53 | )% | | | (1.27 | )% |
After expense waiver or recovery | | | (2.06 | )%(e) | | | (1.40 | )%(e) | | | (0.21 | )% | | | (0.57 | )% | | | (1.19 | )% |
| | | | | | | | | | | | | | | | | | | | | |
Portfolio turnover rate(f) | | | 66 | % | | | 60 | % | | | 103 | % | | | 92 | % | | | 74 | % |
(a) | Net investment income (loss) per share is based on average shares outstanding. |
(b) | Amount represents less than $0.005 per share. |
(c) | Total investment return excludes the effect of applicable sales charges. |
(d) | Ratios do not include the income and expenses of the CTAs included in the swap. |
(e) | Includes 0.02% and 0.08% of service fees paid for options for the years ended December 31, 2020 and December 31, 2021, respectively. |
(f) | Portfolio turnover rate is calculated on the basis of the Fund as a whole without distinguishing between classes of shares issued. Consists of long-term investments only; excludes derivative instruments. |
88 | The accompanying notes are an integral part of these consolidated financial statements. |
LoCorr Long/Short Commodities Strategy Fund – Consolidated Financial Highlights – Class I |
LoCorr Long/Short Commodities Strategy Fund - Class I
Consolidated Financial Highlights
Selected Data and Ratios (for a share outstanding throughout the year)
| | | Year Ended December 31, | |
| | | 2021 | | | 2020 | | | 2019 | | | 2018 | | | 2017 | |
Per Share | | | | | | | | | | | | | | | | | | | | |
Net asset value, beginning of year | | $ | 10.00 | | | $ | 9.38 | | | $ | 10.03 | | | $ | 9.81 | | | $ | 9.24 | |
| | | | | | | | | | | | | | | | | | | | | |
Income (loss) from investment operations: | | | | | | | | | | | | | | | | | | | | |
Net investment income (loss)(a) | | | (0.11 | ) | | | (0.04 | ) | | | 0.08 | | | | 0.05 | | | | (0.02 | ) |
Net realized and unrealized gain (loss) | | | 1.59 | | | | 0.95 | | | | (0.68 | ) | | | 1.41 | | | | 0.59 | |
Total from Investment Operations | | | 1.48 | | | | 0.91 | | | | (0.60 | ) | | | 1.46 | | | | 0.57 | |
| | | | | | | | | | | | | | | | | | | | | |
Distributions From Earnings: | | | | | | | | | | | | | | | | | | | | |
Net investment income | | | (0.76 | ) | | | (0.29 | ) | | | (0.05 | ) | | | (1.24 | ) | | | (0.00 | )(b) |
Net realized gains | | | — | | | | (0.00 | )(b) | | | — | | | | — | | | | — | |
Total Distributions | | | (0.76 | ) | | | (0.29 | ) | | | (0.05 | ) | | | (1.24 | ) | | | (0.00 | ) |
| | | | | | | | | | | | | | | | | | | | | |
Redemption Fees | | | — | | | | — | | | | — | | | | — | | | | 0.00 | (b) |
| | | | | | | | | | | | | | | | | | | | | |
Net Asset Value, End of Year | | $ | 10.72 | | | $ | 10.00 | | | $ | 9.38 | | | $ | 10.03 | | | $ | 9.81 | |
| | | | | | | | | | | | | | | | | | | | | |
Total Investment Return | | | 14.82 | % | | | 9.91 | % | | | (5.97 | )% | | | 15.40 | % | | | 6.19 | % |
| | | | | | | | | | | | | | | | | | | | | |
Net Assets, End of Year, in Thousands | | $ | 852,152 | | | $ | 443,351 | | | $ | 203,887 | | | $ | 181,804 | | | $ | 52,935 | |
| | | | | | | | | | | | | | | | | | | | | |
Ratio/Supplemental Data:(c) | | | | | | | | | | | | | | | | | | | | |
Ratio of expenses to average net assets: | | | | | | | | | | | | | | | | | | | | |
Before expense waiver or recovery | | | 1.83 | %(d) | | | 1.83 | %(d) | | | 1.86 | % | | | 1.91 | % | | | 2.03 | % |
After expense waiver or recovery | | | 1.83 | %(d) | | | 1.83 | %(d) | | | 1.89 | % | | | 1.95 | % | | | 1.95 | % |
| | | | | | | | | | | | | | | | | | | | | |
Ratio of net investment income (loss) to average net assets: | | | | | | | | | | | | | | | | | | | | |
Before expense waiver or recovery | | | (1.06 | )%(d) | | | (0.40 | )%(d) | | | 0.82 | % | | | 0.47 | % | | | (0.27 | )% |
After expense waiver or recovery | | | (1.06 | )%(d) | | | (0.40 | )%(d) | | | 0.79 | % | | | 0.43 | % | | | (0.19 | )% |
| | | | | | | | | | | | | | | | | | | | | |
Portfolio turnover rate(d) | | | 66 | % | | | 60 | % | | | 103 | % | | | 92 | % | | | 74 | % |
(a) | Net investment income (loss) per share is based on average shares outstanding. |
(b) | Amount represents less than $0.005 per share. |
(c) | Ratios do not include the income and expenses of the CTAs included in the swap. |
(d) | Includes 0.02% and 0.08% of service fees paid for options for the years ended December 31, 2020 and December 31, 2021, respectively. |
(e) | Portfolio turnover rate is calculated on the basis of the Fund as a whole without distinguishing between classes of shares issued. Consists of long-term investments only; excludes derivative instruments. |
The accompanying notes are an integral part of these consolidated financial statements. | 89 |
LoCorr Market Trend Fund – Consolidated Financial Highlights – Class A |
LoCorr Market Trend Fund - Class A
Consolidated Financial Highlights
Selected Data and Ratios (for a share outstanding throughout the period)
| | | Year Ended December 31, | |
| | | 2021 | | | 2020 | | | 2019 | | | 2018 | | | 2017 | |
Per Share | | | | | | | | | | | | | | | | | | | | |
Net asset value, beginning of year | | $ | 11.70 | | | $ | 11.19 | | | $ | 9.52 | | | $ | 11.03 | | | $ | 10.65 | |
| | | | | | | | | | | | | | | | | | | | | |
Income (loss) from investment operations: | | | | | | | | | | | | | | | | | | | | |
Net investment income (loss)(a) | | | (0.13 | ) | | | (0.06 | ) | | | 0.01 | | | | (0.03 | ) | | | (0.10 | ) |
Net realized and unrealized gain (loss) | | | 0.22 | | | | 0.57 | | | | 1.74 | | | | (1.48 | ) | | | 0.48 | |
Total from Investment Operations | | | 0.09 | | | | 0.51 | | | | 1.75 | | | | (1.51 | ) | | | 0.38 | |
| | | | | | | | | | | | | | | | | | | | | |
Distributions From Earnings: | | | | | | | | | | | | | | | | | | | | |
Net investment income | | | (0.38 | ) | | | — | | | | (0.08 | ) | | | — | | | | — | |
Total Distributions | | | (0.38 | ) | | | — | | | | (0.08 | ) | | | — | | | | — | |
| | | | | | | | | | | | | | | | | | | | | |
Redemption Fees | | | — | | | | — | | | | — | | | | — | | | | 0.00 | (b) |
| | | | | | | | | | | | | | | | | | | | | |
Net Asset Value, End of Year | | $ | 11.41 | | | $ | 11.70 | | | $ | 11.19 | | | $ | 9.52 | | | $ | 11.03 | |
| | | | | | | | | | | | | | | | | | | | | |
Total Investment Return(c) | | | 0.87 | % | | | 4.47 | % | | | 18.33 | % | | | (13.69 | )% | | | 3.57 | % |
| | | | | | | | | | | | | | | | | | | | | |
Net Assets, End of Year, in Thousands | | $ | 15,109 | | | $ | 16,952 | | | $ | 21,966 | | | $ | 32,082 | | | $ | 61,557 | |
| | | | | | | | | | | | | | | | | | | | | |
Ratio/Supplemental Data: | | | | | | | | | | | | | | | | | | | | |
Ratio of expenses to average net assets | | | 2.02 | % | | | 2.04 | % | | | 2.02 | % | | | 1.99 | % | | | 2.00 | % |
| | | | | | | | | | | | | | | | | | | | | |
Ratio of net investment income (loss) to average net assets | | | (1.10 | )% | | | (0.52 | )% | | | 0.14 | % | | | (0.24 | )% | | | (0.97 | )% |
| | | | | | | | | | | | | | | | | | | | | |
Portfolio turnover rate(d) | | | 110 | % | | | 125 | % | | | 119 | % | | | 91 | % | | | 85 | % |
| | | | | | | | | | | | | | | | | | | | | |
(a) | Net investment income (loss) per share is based on average shares outstanding. |
(b) | Amount represents less than $0.005 per share. |
(c) | Total investment return excludes the effect of applicable sales charges. |
(d) | Portfolio turnover rate is calculated on the basis of the Fund as a whole without distinguishing between classes of shares issued. Consists of long-term investments only; excludes derivative instruments. |
90 | The accompanying notes are an integral part of these consolidated financial statements. |
LoCorr Market Trend Fund - Consolidated Financial Highlights – Class C |
LoCorr Market Trend Fund - Class C
Consolidated Financial Highlights
Selected Data and Ratios (for a share outstanding throughout the period)
| | | Year Ended December 31, | |
| | | 2021 | | | 2020 | | | 2019 | | | 2018 | | | 2017 | |
Per Share | | | | | | | | | | | | | | | | | | | | |
Net asset value, beginning of year | | $ | 11.30 | | | $ | 10.89 | | | $ | 9.28 | | | $ | 10.83 | | | $ | 10.53 | |
| | | | | | | | | | | | | | | | | | | | | |
Income (loss) from investment operations: | | | | | | | | | | | | | | | | | | | | |
Net investment income (loss)(a) | | | (0.22 | ) | | | (0.13 | ) | | | (0.06 | ) | | | (0.10 | ) | | | (0.18 | ) |
Net realized and unrealized gain (loss) | | | 0.23 | | | | 0.54 | | | | 1.67 | | | | (1.45 | ) | | | 0.48 | |
Total from Investment Operations | | | 0.01 | | | | 0.41 | | | | 1.61 | | | | (1.55 | ) | | | 0.30 | |
| | | | | | | | | | | | | | | | | | | | | |
Distributions From Earnings: | | | | | | | | | | | | | | | | | | | | |
Net investment income | | | (0.29 | ) | | | — | | | | — | | | | — | | | | — | |
Total Distributions | | | (0.29 | ) | | | — | | | | — | | | | — | | | | — | |
| | | | | | | | | | | | | | | | | | | | | |
Redemption Fees | | | — | | | | — | | | | — | | | | — | | | | 0.00 | (b) |
| | | | | | | | | | | | | | | | | | | | | |
Net Asset Value, End of Year | | $ | 11.02 | | | $ | 11.30 | | | $ | 10.89 | | | $ | 9.28 | | | $ | 10.83 | |
| | | | | | | | | | | | | | | | | | | | | |
Total Investment Return(c) | | | 0.05 | % | | | 3.76 | % | | | 17.35 | % | | | (14.31 | )% | | | 2.85 | % |
| | | | | | | | | | | | | | | | | | | | | |
Net Assets, End of Year, in Thousands | | $ | 10,825 | | | $ | 13,170 | | | $ | 16,320 | | | $ | 23,417 | | | $ | 43,772 | |
| | | | | | | | | | | | | | | | | | | | | |
Ratio/Supplemental Data: | | | | | | | | | | | | | | | | | | | | |
Ratio of expenses to average net assets | | | 2.77 | % | | | 2.79 | % | | | 2.77 | % | | | 2.74 | % | | | 2.75 | % |
| | | | | | | | | | | | | | | | | | | | | |
Ratio of net investment income (loss) to average net assets | | | (1.85 | )% | | | (1.27 | )% | | | (0.61 | )% | | | (0.99 | )% | | | (1.72 | )% |
| | | | | | | | | | | | | | | | | | | | | |
Portfolio turnover rate(d) | | | 110 | % | | | 125 | % | | | 119 | % | | | 91 | % | | | 85 | % |
(a) | Net investment income (loss) per share is based on average shares outstanding. |
(b) | Amount represents less than $0.005 per share. |
(c) | Total investment return excludes the effect of applicable sales charges. |
(d) | Portfolio turnover rate is calculated on the basis of the Fund as a whole without distinguishing between classes of shares issued. Consists of long-term investments only; excludes derivative instruments. |
The accompanying notes are an integral part of these consolidated financial statements. | 91 |
LoCorr Market Trend Fund - Consolidated Financial Highlights – Class I |
LoCorr Market Trend Fund - Class I
Consolidated Financial Highlights
Selected Data and Ratios (for a share outstanding throughout the period)
| | | Year Ended December 31, | |
| | | 2021 | | | 2020 | | | 2019 | | | 2018 | | | 2017 | |
Per Share | | | | | | | | | | | | | | | | | | | | |
Net asset value, beginning of year | | $ | 11.74 | | | $ | 11.23 | | | $ | 9.60 | | | $ | 11.09 | | | $ | 10.68 | |
| | | | | | | | | | | | | | | | | | | | | |
Income (loss) from investment operations: | | | | | | | | | | | | | | | | | | | | |
Net investment income (loss)(a) | | | (0.10 | ) | | | (0.03 | ) | | | 0.04 | | | | 0.00 | (b) | | | (0.08 | ) |
Net realized and unrealized gain (loss) | | | 0.22 | | | | 0.57 | | | | 1.74 | | | | (1.49 | ) | | | 0.49 | |
Total from Investment Operations | | | 0.12 | | | | 0.54 | | | | 1.78 | | | | (1.49 | ) | | | 0.41 | |
| | | | | | | | | | | | | | | | | | | | | |
Distributions From Earnings: | | | | | | | | | | | | | | | | | | | | |
Net investment income | | | (0.41 | ) | | | (0.03 | ) | | | (0.15 | ) | | | — | | | | — | |
Total Distributions | | | (0.41 | ) | | | (0.03 | ) | | | (0.15 | ) | | | — | | | | — | |
| | | | | | | | | | | | | | | | | | | | | |
Redemption Fees | | | — | | | | — | | | | — | | | | — | | | | 0.00 | (b) |
| | | | | | | | | | | | | | | | | | | | | |
Net Asset Value, End of Year | | $ | 11.45 | | | $ | 11.74 | | | $ | 11.23 | | | $ | 9.60 | | | $ | 11.09 | |
| | | | | | | | | | | | | | | | | | | | | |
Total Investment Return | | | 1.04 | % | | | 4.81 | % | | | 18.53 | % | | | (13.44 | )% | | | 3.84 | % |
| | | | | | | | | | | | | | | | | | | | | |
Net Assets, End of Year, in Thousands | | $ | 240,507 | | | $ | 225,995 | | | $ | 234,919 | | | $ | 287,702 | | | $ | 561,372 | |
| | | | | | | | | | | | | | | | | | | | | |
Ratio/Supplemental Data: | | | | | | | | | | | | | | | | | | | | |
Ratio of expenses to average net assets | | | 1.77 | % | | | 1.79 | % | | | 1.77 | % | | | 1.74 | % | | | 1.75 | % |
| | | | | | | | | | | | | | | | | | | | | |
Ratio of net investment income (loss) to average net assets | | | (0.85 | )% | | | (0.27 | )% | | | 0.39 | % | | | 0.01 | % | | | (0.72 | )% |
| | | | | | | | | | | | | | | | | | | | | |
Portfolio turnover rate(c) | | | 110 | % | | | 125 | % | | | 119 | % | | | 91 | % | | | 85 | % |
| | | | | | | | | | | | | | | | | | | | | |
(a) | Net investment income (loss) per share is based on average shares outstanding. |
(b) | Amount represents less than $0.005 per share. |
(c) | Portfolio turnover rate is calculated on the basis of the Fund as a whole without distinguishing between classes of shares issued. Consists of long-term investments only; excludes derivative instruments. |
92 | The accompanying notes are an integral part of these consolidated financial statements. |
LoCorr Dynamic Equity Fund - Financial Highlights – Class A |
LoCorr Dynamic Equity Fund - Class A
Financial Highlights
Selected Data and Ratios (for a share outstanding throughout the year)
| | | Year Ended December 31, | |
| | | 2021 | | | 2020 | | | 2019 | | | 2018 | | | 2017 | |
Per Share | | | | | | | | | | | | | | | | | | | | |
Net asset value, beginning of year | | $ | 11.62 | | | $ | 11.20 | | | $ | 9.92 | | | $ | 11.82 | | | $ | 12.06 | |
| | | | | | | | | | | | | | | | | | | | | |
Income (loss) from investment operations: | | | | | | | | | | | | | | | | | | | | |
Net investment income (loss)(a) | | | (0.23 | ) | | | (0.20 | ) | | | (0.19 | ) | | | (0.25 | ) | | | (0.30 | ) |
Net realized and unrealized gain (loss) | | | 1.85 | | | | 0.62 | (b) | | | 1.51 | | | | (1.26 | ) | | | 0.59 | |
Total from Investment Operations | | | 1.62 | | | | 0.42 | | | | 1.32 | | | | (1.51 | ) | | | 0.29 | |
| | | | | | | | | | | | | | | | | | | | | |
Distributions From Earnings: | | | | | | | | | | | | | | | | | | | | |
Net realized gains | | | (0.78 | ) | | | — | | | | (0.04 | ) | | | (0.39 | ) | | | (0.53 | ) |
Total Distributions | | | (0.78 | ) | | | — | | | | (0.04 | ) | | | (0.39 | ) | | | (0.53 | ) |
| | | | | | | | | | | | | | | | | | | | | |
Redemption Fees | | | — | | | | — | | | | — | | | | — | | | | 0.00 | (c) |
| | | | | | | | | | | | | | | | | | | | | |
Net Asset Value, End of Year | | $ | 12.46 | | | $ | 11.62 | | | $ | 11.20 | | | $ | 9.92 | | | $ | 11.82 | |
| | | | | | | | | | | | | | | | | | | | | |
Total Investment Return(d) | | | 14.38 | % | | | 3.75 | % | | | 13.40 | % | | | (12.87 | )% | | | 2.38 | % |
| | | | | | | | | | | | | | | | | | | | | |
Net Assets, End of Year, in Thousands | | $ | 4,010 | | | $ | 3,828 | | | $ | 6,744 | | | $ | 8,473 | | | $ | 19,962 | |
| | | | | | | | | | | | | | | | | | | | | |
Ratio/Supplemental Data: | | | | | | | | | | | | | | | | | | | | |
Ratio of expenses to average net assets: | | | | | | | | | | | | | | | | | | | | |
Before expense waiver or recovery | | | 3.90 | % | | | 4.51 | % | | | 3.73 | % | | | 3.40 | % | | | 3.42 | % |
After expense waiver or recovery | | | 2.67 | % | | | 3.15 | % | | | 3.02 | % | | | 3.21 | % | | | 3.35 | % |
| | | | | | | | | | | | | | | | | | | | | |
Ratio of expenses to average net assets (excluding dividend and interest expense): | | | | | | | | | | | | | | | | | | | | |
Before expense waiver or recovery | | | 3.47 | % | | | 3.60 | % | | | 2.95 | % | | | 3.20 | % | | | 3.22 | % |
After expense waiver or recovery | | | 2.24 | % | | | 2.24 | % | | | 2.24 | % | | | 3.01 | % | | | 3.15 | % |
| | | | | | | | | | | | | | | | | | | | | |
Ratio of net investment income (loss) to average net assets: | | | | | | | | | | | | | | | | | | | | |
Before expense waiver or recovery | | | (3.02 | )% | | | (3.31 | )% | | | (2.44 | )% | | | (2.39 | )% | | | (2.61 | )% |
After expense waiver or recovery | | | (1.79 | )% | | | (1.95 | )% | | | (1.73 | )% | | | (2.20 | )% | | | (2.54 | )% |
| | | | | | | | | | | | | | | | | | | | | |
Portfolio turnover rate(e) | | | 506 | % | | | 953 | % | | | 300 | % | | | 449 | % | | | 363 | % |
(a) | Net investment income (loss) per share is based on average shares outstanding. |
(b) | Realized and unrealized gains and losses per share in this caption are balancing amounts necessary to reconcile the change in net asset value per share for the period, and may not reconcile with the Fund’s statement of operations due to share transactions for the period. |
(c) | Amount represents less than $0.005 per share. |
(d) | Total investment return excludes the effect of applicable sales charges. |
(e) | Portfolio turnover rate is calculated on the basis of the Fund as a whole without distinguishing between classes of shares issued. Consists of long-term investments only; excludes securities sold short. |
The accompanying notes are an integral part of these financial statements. | 93 |
LoCorr Dynamic Equity Fund - Financial Highlights – Class C |
LoCorr Dynamic Equity Fund - Class C
Financial Highlights
Selected Data and Ratios (for a share outstanding throughout the year)
| | | Year Ended December 31, | |
| | | 2021 | | | 2020 | | | 2019 | | | 2018 | | | 2017 | |
Per Share | | | | | | | | | | | | | | | | | | | | |
Net asset value, beginning of year | | $ | 10.93 | | | $ | 10.62 | | | $ | 9.47 | | | $ | 11.39 | | | $ | 11.73 | |
| | | | | | | | | | | | | | | | | | | | | |
Income (loss) from investment operations: | | | | | | | | | | | | | | | | | | | | |
Net investment income (loss)(a) | | | (0.31 | ) | | | (0.26 | ) | | | (0.26 | ) | | | (0.32 | ) | | | (0.38 | ) |
Net realized and unrealized gain (loss) | | | 1.74 | | | | 0.57 | (b) | | | 1.45 | | | | (1.21 | ) | | | 0.57 | |
Total from Investment Operations | | | 1.43 | | | | 0.31 | | | | 1.19 | | | | (1.53 | ) | | | 0.19 | |
| | | | | | | | | | | | | | | | | | | | | |
Distributions From Earnings: | | | | | | | | | | | | | | | | | | | | |
Net realized gains | | | (0.78 | ) | | | — | | | | (0.04 | ) | | | (0.39 | ) | | | (0.53 | ) |
Total Distributions | | | (0.78 | ) | | | — | | | | (0.04 | ) | | | (0.39 | ) | | | (0.53 | ) |
| | | | | | | | | | | | | | | | | | | | | |
Redemption Fees | | | — | | | | — | | | | — | | | | — | | | | 0.00 | (c) |
| | | | | | | | | | | | | | | | | | | | | |
Net Asset Value, End of Year | | $ | 11.58 | | | $ | 10.93 | | | $ | 10.62 | | | $ | 9.47 | | | $ | 11.39 | |
| | | | | | | | | | | | | | | | | | | | | |
Total Investment Return(d) | | | 13.46 | % | | | 2.92 | % | | | 12.54 | % | | | (13.45 | )% | | | 1.59 | % |
| | | | | | �� | | | | | | | | | | | | | | | |
Net Assets, End of Year, in Thousands | | $ | 2,786 | | | $ | 2,436 | | | $ | 4,031 | | | $ | 5,255 | | | $ | 11,084 | |
| | | | | | | | | | | | | | | | | | | | | |
Ratio/Supplemental Data: | | | | | | | | | | | | | | | | | | | | |
Ratio of expenses to average net assets: | | | | | | | | | | | | | | | | | | | | |
Before expense waiver or recovery | | | 4.65 | % | | | 5.26 | % | | | 4.48 | % | | | 4.15 | % | | | 4.17 | % |
After expense waiver or recovery | | | 3.42 | % | | | 3.90 | % | | | 3.77 | % | | | 3.96 | % | | | 4.10 | % |
| | | | | | | | | | | | | | | | | | | | | |
Ratio of expenses to average net assets (excluding dividend and interest expense): | | | | | | | | | | | | | | | | | | | | |
Before expense waiver or recovery | | | 4.22 | % | | | 4.35 | % | | | 3.70 | % | | | 3.95 | % | | | 3.97 | % |
After expense waiver or recovery | | | 2.99 | % | | | 2.99 | % | | | 2.99 | % | | | 3.76 | % | | | 3.90 | % |
| | | | | | | | | | | | | | | | | | | | | |
Ratio of net investment income (loss) to average net assets: | | | | | | | | | | | | | | | | | | | | |
Before expense waiver or recovery | | | (3.77 | )% | | | (4.06 | )% | | | (3.19 | )% | | | (3.14 | )% | | | (3.36 | )% |
After expense waiver or recovery | | | (2.54 | )% | | | (2.70 | )% | | | (2.48 | )% | | | (2.95 | )% | | | (3.29 | )% |
| | | | | | | | | | | | | | | | | | | | | |
Portfolio turnover rate(e) | | | 506 | % | | | 953 | % | | | 300 | % | | | 449 | % | | | 363 | % |
(a) | Net investment income (loss) per share is based on average shares outstanding. |
(b) | Realized and unrealized gains and losses per share in this caption are balancing amounts necessary to reconcile the change in net asset value per share for the period, and may not reconcile with the Fund’s statement of operations due to share transactions for the period. |
(c) | Amount represents less than $0.005 per share. |
(d) | Total investment return excludes the effect of applicable sales charges. |
(e) | Portfolio turnover rate is calculated on the basis of the Fund as a whole without distinguishing between classes of shares issued. Consists of long-term investments only; excludes securities sold short. |
94 | The accompanying notes are an integral part of these financial statements. |
LoCorr Dynamic Equity Fund - Financial Highlights – Class I |
LoCorr Dynamic Equity Fund - Class I
Financial Highlights
Selected Data and Ratios (for a share outstanding throughout the year)
| | | Year Ended December 31, | |
| | | 2021 | | | 2020 | | | 2019 | | | 2018 | | | 2017 | |
Per Share | | | | | | | | | | | | | | | | | | | | |
Net asset value, beginning of year | | $ | 11.86 | | | $ | 11.41 | | | $ | 10.07 | | | $ | 11.96 | | | $ | 12.17 | |
| | | | | | | | | | | | | | | | | | | | | |
Income (loss) from investment operations: | | | | | | | | | | | | | | | | | | | | |
Net investment income (loss)(a) | | | (0.20 | ) | | | (0.17 | ) | | | (0.17 | ) | | | (0.23 | ) | | | (0.28 | ) |
Net realized and unrealized gain (loss) | | | 1.89 | | | | 0.62 | (b) | | | 1.55 | | | | (1.27 | ) | | | 0.60 | |
Total from Investment Operations | | | 1.69 | | | | 0.45 | | | | 1.38 | | | | (1.50 | ) | | | 0.32 | |
| | | | | | | | | | | | | | | | | | | | | |
Distributions From Earnings: | | | | | | | | | | | | | | | | | | | | |
Net realized gains | | | (0.78 | ) | | | — | | | | (0.04 | ) | | | (0.39 | ) | | | (0.53 | ) |
Total Distributions | | | (0.78 | ) | | | — | | | | (0.04 | ) | | | (0.39 | ) | | | (0.53 | ) |
| | | | | | | | | | | | | | | | | | | | | |
Redemption Fees | | | — | | | | — | | | | — | | | | — | | | | 0.00 | (c) |
| | | | | | | | | | | | | | | | | | | | | |
Net Asset Value, End of Year | | $ | 12.77 | | | $ | 11.86 | | | $ | 11.41 | | | $ | 10.07 | | | $ | 11.96 | |
| | | | | | | | | | | | | | | | | | | | | |
Total Investment Return | | | 14.58 | % | | | 4.03 | % | | | 13.68 | % | | | (12.55 | )% | | | 2.60 | % |
| | | | | | | | | | | | | | | | | | | | | |
Net Assets, End of Year, in Thousands | | $ | 17,713 | | | $ | 11,809 | | | $ | 16,923 | | | $ | 16,545 | | | $ | 32,781 | |
| | | | | | | | | | | | | | | | | | | | | |
Ratio/Supplemental Data: | | | | | | | | | | | | | | | | | | | | |
Ratio of expenses to average net assets: | | | | | | | | | | | | | | | | | | | | |
Before expense waiver or recovery | | | 3.65 | % | | | 4.26 | % | | | 3.48 | % | | | 3.15 | % | | | 3.17 | % |
After expense waiver or recovery | | | 2.42 | % | | | 2.90 | % | | | 2.77 | % | | | 2.96 | % | | | 3.10 | % |
| | | | | | | | | | | | | | | | | | | | | |
Ratio of expenses to average net assets (excluding dividend and interest expense): | | | | | | | | | | | | | | | | | | | | |
Before expense waiver or recovery | | | 3.22 | % | | | 3.35 | % | | | 2.70 | % | | | 2.95 | % | | | 2.97 | % |
After expense waiver or recovery | | | 1.99 | % | | | 1.99 | % | | | 1.99 | % | | | 2.76 | % | | | 2.90 | % |
| | | | | | | | | | | | | | | | | | | | | |
Ratio of net investment income (loss) to average net assets: | | | | | | | | | | | | | | | | | | | | |
Before expense waiver or recovery | | | (2.77 | )% | | | (3.06 | )% | | | (2.19 | )% | | | (2.14 | )% | | | (2.36 | )% |
After expense waiver or recovery | | | (1.54 | )% | | | (1.70 | )% | | | (1.48 | )% | | | (1.95 | )% | | | (2.29 | )% |
| | | | | | | | | | | | | | | | | | | | | |
Portfolio turnover rate(d) | | | 506 | % | | | 953 | % | | | 300 | % | | | 449 | % | | | 363 | % |
(a) | Net investment income (loss) per share is based on average shares outstanding. |
(b) | Realized and unrealized gains and losses per share in this caption are balancing amounts necessary to reconcile the change in net asset value per share for the period, and may not reconcile with the Fund’s statement of operations due to share transactions for the period. |
(c) | Amount represents less than $0.005 per share. |
(d) | Portfolio turnover rate is calculated on the basis of the Fund as a whole without distinguishing between classes of shares issued. Consists of long-term investments only; excludes securities sold short. |
The accompanying notes are an integral part of these financial statements. | 95 |
LoCorr Spectrum Income Fund – Financial Highlights – Class A |
LoCorr Spectrum Income Fund - Class A
Financial Highlights
Selected Data and Ratios (for a share outstanding throughout the year)
| | | Year Ended December 31, | |
| | | 2021 | | | 2020 | | | 2019 | | | 2018 | | | 2017 | |
Per Share | | | | | | | | | | | | | | | | | | | | |
Net asset value, beginning of year | | $ | 6.15 | | | $ | 6.89 | | | $ | 6.26 | | | $ | 7.39 | | | $ | 7.70 | |
| | | | | | | | | | | | | | | | | | | | | |
Income (loss) from investment operations: | | | | | | | | | | | | | | | | | | | | |
Net investment income (loss)(a) | | | 0.08 | | | | 0.12 | | | | 0.13 | | | | 0.22 | | | | 0.17 | |
Net realized and unrealized gain (loss) | | | 1.21 | | | | (0.40 | ) | | | 1.00 | | | | (0.78 | ) | | | 0.09 | |
Total from Investment Operations | | | 1.29 | | | | (0.28 | ) | | | 1.13 | | | | (0.56 | ) | | | 0.26 | |
| | | | | | | | | | | | | | | | | | | | | |
Distributions From: | | | | | | | | | | | | | | | | | | | | |
Net investment income | | | (0.28 | ) | | | (0.18 | ) | | | (0.12 | ) | | | (0.26 | ) | | | (0.15 | ) |
Return of capital | | | (0.18 | ) | | | (0.28 | ) | | | (0.38 | ) | | | (0.31 | ) | | | (0.42 | ) |
Total Distributions | | | (0.46 | ) | | | (0.46 | ) | | | (0.50 | ) | | | (0.57 | ) | | | (0.57 | ) |
| | | | | | | | | | | | | | | | | | | | | |
Redemption Fees (b) | | | 0.00 | | | | 0.00 | | | | 0.00 | | | | 0.00 | | | | 0.00 | |
| | | | | | | | | | | | | | | | | | | | | |
Net Asset Value, End of Year | | $ | 6.98 | | | $ | 6.15 | | | $ | 6.89 | | | $ | 6.26 | | | $ | 7.39 | |
| | | | | | | | | | | | | | | | | | | | | |
Total Investment Return(c) | | | 21.33 | % | | | (2.75 | )% | | | 18.37 | % | | | (8.22 | )% | | | 3.50 | % |
| | | | | | | | | | | | | | | | | | | | | |
Net Assets, End of Year, in Thousands | | $ | 13,838 | | | $ | 13,635 | | | $ | 25,192 | | | $ | 22,610 | | | $ | 29,970 | |
| | | | | | | | | | | | | | | | | | | | | |
Ratio/Supplemental Data:(d) | | | | | | | | | | | | | | | | | | | | |
Ratio of expenses to average net assets: | | | | | | | | | | | | | | | | | | | | |
Before expense waiver or recovery | | | 2.06 | % | | | 2.19 | % | | | 2.02 | % | | | 1.98 | % | | | 1.95 | % |
After expense waiver or recovery | | | 2.05 | % | | | 2.06 | % | | | 2.02 | % | | | 1.98 | % | | | 1.99 | % |
| | | | | | | | | | | | | | | | | | | | | |
Ratio of expenses to average net assets (excluding dividend and interest expense): | | | | | | | | | | | | | | | | | | | | |
Before expense waiver or recovery | | | 2.06 | % | | | 2.18 | % | | | 2.02 | % | | | 1.98 | % | | | 1.95 | % |
After expense waiver or recovery | | | 2.05 | % | | | 2.04 | % | | | 2.02 | % | | | 1.98 | % | | | 1.99 | % |
| | | | | | | | | | | | | | | | | | | | | |
Ratio of net investment income (loss) to average net assets: | | | | | | | | | | | | | | | | | | | | |
Before expense waiver or recovery | | | 1.21 | % | | | 1.93 | % | | | 1.94 | % | | | 3.01 | % | | | 2.27 | % |
After expense waiver or recovery | | | 1.22 | % | | | 2.07 | % | | | 1.94 | % | | | 3.01 | % | | | 2.23 | % |
| | | | | | | | | | | | | | | | | | | | | |
Portfolio turnover rate(e) | | | 53 | % | | | 88 | % | | | 75 | % | | | 82 | % | | | 84 | % |
(a) | Net investment income (loss) per share is based on average shares outstanding. |
(b) | Amount represents less than $0.005 per share. |
(c) | Total investment return excludes the effect of applicable sales charges. |
(d) | Ratios do not include the expenses of the investment companies in which the Fund invests. |
(e) | Portfolio turnover rate is calculated on the basis of the Fund as a whole without distinguishing between classes of shares issued. |
96 | The accompanying notes are an integral part of these financial statements. |
LoCorr Spectrum Income Fund – Financial Highlights – Class C |
LoCorr Spectrum Income Fund - Class C
Financial Highlights
Selected Data and Ratios (for a share outstanding throughout the year)
| | | Year Ended December 31, | |
| | | 2021 | | | 2020 | | | 2019 | | | 2018 | | | 2017 | |
Per Share | | | | | | | | | | | | | | | | | | | | |
Net asset value, beginning of year | | $ | 6.21 | | | $ | 6.96 | | | $ | 6.31 | | | $ | 7.42 | | | $ | 7.72 | |
| | | | | | | | | | | | | | | | | | | | | |
Income (loss) from investment operations: | | | | | | | | | | | | | | | | | | | | |
Net investment income (loss)(a) | | | 0.03 | | | | 0.07 | | | | 0.08 | | | | 0.16 | | | | 0.11 | |
Net realized and unrealized gain (loss) | | | 1.23 | | | | (0.40 | ) | | | 1.01 | | | | (0.77 | ) | | | 0.09 | |
Total from Investment Operations | | | 1.26 | | | | (0.33 | ) | | | 1.09 | | | | (0.61 | ) | | | 0.20 | |
| | | | | | | | | | | | | | | | | | | | | |
Distributions From: | | | | | | | | | | | | | | | | | | | | |
Net investment income | | | (0.26 | ) | | | (0.17 | ) | | | (0.10 | ) | | | (0.23 | ) | | | (0.13 | ) |
Return of capital | | | (0.16 | ) | | | (0.25 | ) | | | (0.34 | ) | | | (0.27 | ) | | | (0.37 | ) |
Total Distributions | | | (0.42 | ) | | | (0.42 | ) | | | (0.44 | ) | | | (0.50 | ) | | | (0.50 | ) |
| | | | | | | | | | | | | | | | | | | | | |
Redemption Fees (b) | | | 0.00 | | | | 0.00 | | | | 0.00 | | | | 0.00 | | | | 0.00 | |
| | | | | | | | | | | | | | | | | | | | | |
Net Asset Value, End of Year | | $ | 7.05 | | | $ | 6.21 | | | $ | 6.96 | | | $ | 6.31 | | | $ | 7.42 | |
| | | | | | | | | | | | | | | | | | | | | |
Total Investment Return(c) | | | 20.47 | % | | | (3.70 | )% | | | 17.59 | % | | | (8.85 | )% | | | 2.62 | % |
| | | | | | | | | | | | | | | | | | | | | |
Net Assets, End of Year, in Thousands | | $ | 17,777 | | | $ | 13,295 | | | $ | 18,645 | | | $ | 18,092 | | | $ | 23,511 | |
| | | | | | | | | | | | | | | | | | | | | |
Ratio/Supplemental Data:(d) | | | | | | | | | | | | | | | | | | | | |
Ratio of expenses to average net assets: | | | | | | | | | | | | | | | | | | | | |
Before expense waiver or recovery | | | 2.81 | % | | | 2.94 | % | | | 2.77 | % | | | 2.73 | % | | | 2.70 | % |
After expense waiver or recovery | | | 2.80 | % | | | 2.81 | % | | | 2.77 | % | | | 2.73 | % | | | 2.74 | % |
| | | | | | | | | | | | | | | | | | | | | |
Ratio of expenses to average net assets (excluding dividend and interest expense): | | | | | | | | | | | | | | | | | | | | |
Before expense waiver or recovery | | | 2.81 | % | | | 2.93 | % | | | 2.77 | % | | | 2.73 | % | | | 2.70 | % |
After expense waiver or recovery | | | 2.80 | % | | | 2.79 | % | | | 2.77 | % | | | 2.73 | % | | | 2.74 | % |
| | | | | | | | | | | | | | | | | | | | | |
Ratio of net investment income (loss) to average net assets: | | | | | | | | | | | | | | | | | | | | |
Before expense waiver or recovery | | | 0.46 | % | | | 1.18 | % | | | 1.19 | % | | | 2.26 | % | | | 1.52 | % |
After expense waiver or recovery | | | 0.47 | % | | | 1.32 | % | | | 1.19 | % | | | 2.26 | % | | | 1.48 | % |
| | | | | | | | | | | | | | | | | | | | | |
Portfolio turnover rate(e) | | | 53 | % | | | 88 | % | | | 75 | % | | | 82 | % | | | 84 | % |
(a) | Net investment income (loss) per share is based on average shares outstanding. |
(b) | Amount represents less than $0.005 per share. |
(c) | Total investment return excludes the effect of applicable sales charges. |
(d) | Ratios do not include the expenses of the investment companies in which the Fund invests. |
(e) | Portfolio turnover rate is calculated on the basis of the Fund as a whole without distinguishing between classes of shares issued. |
The accompanying notes are an integral part of these financial statements. | 97 |
LoCorr Spectrum Income Fund - Financial Highlights – Class I |
LoCorr Spectrum Income Fund - Class I
Financial Highlights
Selected Data and Ratios (for a share outstanding throughout the year)
| | | Year Ended December 31, | |
| | | 2021 | | | 2020 | | | 2019 | | | 2018 | | | 2017 | |
Per Share | | | | | | | | | | | | | | | | | | | | |
Net asset value, beginning of year | | $ | 6.13 | | | $ | 6.88 | | | $ | 6.25 | | | $ | 7.38 | | | $ | 7.69 | |
| | | | | | | | | | | | | | | | | | | | | |
Income (loss) from investment operations: | | | | | | | | | | | | | | | | | | | | |
Net investment income (loss)(a) | | | 0.10 | | | | 0.13 | | | | 0.15 | | | | 0.24 | | | | 0.19 | |
Net realized and unrealized gain (loss) | | | 1.20 | | | | (0.40 | ) | | | 1.00 | | | | (0.77 | ) | | | 0.10 | |
Total from Investment Operations | | | 1.30 | | | | (0.27 | ) | | | 1.15 | | | | (0.53 | ) | | | 0.29 | |
| | | | | | | | | | | | | | | | | | | | | |
Distributions From: | | | | | | | | | | | | | | | | | | | | |
Net investment income | | | (0.29 | ) | | | (0.19 | ) | | | (0.12 | ) | | | (0.27 | ) | | | (0.16 | ) |
Return of capital | | | (0.19 | ) | | | (0.29 | ) | | | (0.40 | ) | | | (0.33 | ) | | | (0.44 | ) |
Total Distributions | | | (0.48 | ) | | | (0.48 | ) | | | (0.52 | ) | | | (0.60 | ) | | | (0.60 | ) |
| | | | | | | | | | | | | | | | | | | | | |
Redemption Fees (b) | | | 0.00 | | | | 0.00 | | | | 0.00 | | | | 0.00 | | | | 0.00 | |
| | | | | | | | | | | | | | | | | | | | | |
Net Asset Value, End of Year | | $ | 6.95 | | | $ | 6.13 | | | $ | 6.88 | | | $ | 6.25 | | | $ | 7.38 | |
| | | | | | | | | | | | | | | | | | | | | |
Total Investment Return | | | 21.53 | % | | | (2.60 | )% | | | 18.74 | % | | | (7.91 | )% | | | 3.85 | % |
| | | | | | | | | | | | | | | | | | | | | |
Net Assets, End of Year, in Thousands | | $ | 44,192 | | | $ | 21,215 | | | $ | 30,049 | | | $ | 27,618 | | | $ | 43,032 | |
| | | | | | | | | | | | | | | | | | | | | |
Ratio/Supplemental Data:(c) | | | | | | | | | | | | | | | | | | | | |
Ratio of expenses to average net assets: | | | | | | | | | | | | | | | | | | | | |
Before expense waiver or recovery | | | 1.81 | % | | | 1.94 | % | | | 1.77 | % | | | 1.73 | % | | | 1.70 | % |
After expense waiver or recovery | | | 1.80 | % | | | 1.81 | % | | | 1.77 | % | | | 1.73 | % | | | 1.74 | % |
| | | | | | | | | | | | | | | | | | | | | |
Ratio of expenses to average net assets (excluding dividend and interest expense): | | | | | | | | | | | | | | | | | | | | |
Before expense waiver or recovery | | | 1.81 | % | | | 1.93 | % | | | 1.77 | % | | | 1.73 | % | | | 1.70 | % |
After expense waiver or recovery | | | 1.80 | % | | | 1.79 | % | | | 1.77 | % | | | 1.73 | % | | | 1.74 | % |
| | | | | | | | | | | | | | | | | | | | | |
Ratio of net investment income (loss) to average net assets: | | | | | | | | | | | | | | | | | | | | |
Before expense waiver or recovery | | | 1.46 | % | | | 2.18 | % | | | 2.19 | % | | | 3.26 | % | | | 2.52 | % |
After expense waiver or recovery | | | 1.47 | % | | | 2.32 | % | | | 2.19 | % | | | 3.26 | % | | | 2.48 | % |
| | | | | | | | | | | | | | | | | | | | | |
Portfolio turnover rate(d) | | | 53 | % | | | 88 | % | | | 75 | % | | | 82 | % | | | 84 | % |
(a) | Net investment income (loss) per share is based on average shares outstanding. |
(b) | Amount represents less than $0.005 per share. |
(c) | Ratios do not include the expenses of the investment companies in which the Fund invests. |
(d) | Portfolio turnover rate is calculated on the basis of the Fund as a whole without distinguishing between classes of shares issued. |
98 | The accompanying notes are an integral part of these financial statements. |
LoCorr Macro Strategies Fund, LoCorr Long/Short Commodities Strategy Fund and LoCorr Market Trend Fund – Notes to Consolidated Financial
Statements / LoCorr Dynamic Equity Fund and LoCorr Spectrum Income Fund – Notes to Financial Statements |
LoCorr Investment Trust
Notes
December 31, 2021
1. Organization
LoCorr Investment Trust (the “Trust”), an Ohio business trust, was formed on November 15, 2010 and is an open-end management investment company registered under the Investment Company Act of 1940, as amended (“1940 Act”). Each fund is an investment company and accordingly follows the investment company accounting and reporting guidance of the Financial Accounting Standards Board (“FASB”) Accounting Standards Codification (“ASC”) Topic 946, Financial Services- Investment Companies. The LoCorr Macro Strategies Fund, LoCorr Long/Short Commodities Strategy Fund, LoCorr Market Trend Fund, LoCorr Dynamic Equity Fund and the LoCorr Spectrum Income Fund (individually a “Fund” and collectively the “Funds”) are series within the Trust. The Funds are each diversified funds.
The LoCorr Macro Strategies Fund’s primary investment objective is capital appreciation in rising and falling equity markets with managing volatility as a secondary objective.
The LoCorr Long/Short Commodities Strategy Fund’s primary investment objective is capital appreciation in rising and falling commodities markets with managing volatility as a secondary objective.
The LoCorr Market Trend Fund’s primary investment objective is capital appreciation in rising and falling equity markets with managing volatility as a secondary objective.
The LoCorr Dynamic Equity Fund’s primary investment objective is long-term capital appreciation with reduced volatility compared to traditional broad-based equity market indices as a secondary objective.
The LoCorr Spectrum Income Fund’s primary investment objective is current income with capital appreciation as a secondary objective.
The Steben Managed Futures Strategy Fund reorganized into the LoCorr Macro Strategies Fund as of the close of business on January 24, 2020. Under the terms of the Plan, the Adviser paid all expenses associated with the reorganization. In addition, under the terms of the Plan, shareholders of the Steben Managed Futures Strategy Fund received shares of the LoCorr Macro Strategies Fund equal in U.S. dollar value to the interests of such shareholders in the Steben Managed Futures Strategy Fund with each LoCorr Macro Strategies Fund’s shares ordinarily valued as of the close of regular trading on the NYSE on the business day immediately prior to the closing date. This was accomplished as a tax free exchange. For financial reporting purposes, assets received, and shares issued by the LoCorr Macro Strategies Fund were recorded at fair value; however, the cost basis of the investments received from the Steben Managed Futures Strategy Fund was carried forward to align ongoing reporting of the LoCorr Macro Strategies Fund’s realized and unrealized gains and losses with amounts distributable to shareholders for tax purposes.
Wholly-owned and Controlled Subsidiaries
In order to achieve their investment objectives, the LoCorr Macro Strategies Fund, the LoCorr Long/Short Commodities Strategy Fund and the LoCorr Market Trend Fund each invest up to 25% of their total assets (measured at the time of purchase) in wholly-owned subsidiaries, LCMFS Fund Limited (“LCMFS”), LCLSCS Fund Limited (“LCLSCS”) and LCMT Fund Limited (“LCMT”), respectively; each company is incorporated under the laws of the Cayman Islands. LCMFS, LCLSCS and LCMT act as investment vehicles in order to enter into certain investments for the LoCorr Macro Strategies Fund, the LoCorr Long/Short Commodities Strategy Fund and the LoCorr Market Trend Fund, respectively, consistent with their investment objectives and policies specified in the Prospectuses and Statement of Additional Information.
At December 31, 2021 investments in LCMFS, LCLSCS and LCMT represented 1.83%, 23.60% and 3.27% of the total net assets of LoCorr Macro Strategies Fund, LoCorr Long/Short Commodities Strategy Fund and LoCorr Market Trend Fund, respectively. See Note 2.
The consolidated financial statements of the LoCorr Macro Strategies Fund, LoCorr Long/Short Commodities Strategy Fund and the LoCorr Market Trend Fund each include the investment activity and financial statements of LCMFS, LCLSCS and LCMT, respectively. All intercompany accounts and transactions have been eliminated in consolidation. Because each Fund may invest a substantial portion of its assets in its respective subsidiary, the Fund may be considered to be investing indirectly in some of those investments through its subsidiary. For that reason, references to the Fund may also encompass its subsidiary. The subsidiary will be subject to the same investment restrictions and limitations, and follow the same compliance policies and procedures, as the Fund when viewed on a consolidated basis. Each Fund and its subsidiary area “commodity pool” under the
LoCorr Macro Strategies Fund, LoCorr Long/Short Commodities Strategy Fund and LoCorr Market Trend Fund – Notes to Consolidated Financial
Statements / LoCorr Dynamic Equity Fund and LoCorr Spectrum Income Fund – Notes to Financial Statements (continued) |
U.S. Commodity Exchange Act and LoCorr Fund Management, LLC (the “Adviser” or “Management”) is a “commodity pool operator” registered with and regulated by the Commodity Futures Trading Commission (“CFTC”). As a result, additional CFTC-mandated disclosure, reporting and recordkeeping obligations apply with respect to each Fund and its respective subsidiary under CFTC and the U.S. Securities and Exchange Commission (the “SEC”) harmonized regulations.
Share Classes
The Funds currently offer three classes of shares: Class A, Class C and Class I shares. Each share class represents an interest in the same assets of the Fund, has the same rights and is identical in all material respects except that (i) Class A shares have a maximum front end sales load of 5.75% and maximum deferred sales charge of 1.00% and Class C shares have a maximum deferred sales charge of 1.00%, (ii) Class A shares have a 12b-1 fee of 0.25% and Class C shares have a 12b-1 fee of 1.00%; (iii) certain other class-specific expenses will be borne solely by the class to which such expenses are attributable and (iv) each class will have exclusive voting rights with respect to matters relating to its own distribution arrangements.
All classes with respect to the LoCorr Spectrum Income Fund are subject to a 2.00% redemption fee on redemptions made within 60 days of the original purchase. As of May 1, 2017, none of the other Funds are subject to a redemption fee.
The following table presents the class-specific commencement of operations dates for each of the Funds:
| | Commencement of Operations |
| | Class A | Class C | Class I |
LoCorr Macro Strategies Fund | March 22, 2011 | March 24, 2011 | March 24, 2011 |
LoCorr Long/Short Commodities Strategy Fund | January 1, 2012 | January 1, 2012 | January 1, 2012 |
LoCorr Dynamic Equity Fund | May 10, 2013 | May 10, 2013 | May 10, 2013 |
LoCorr Spectrum Income Fund | January 1, 2014 | January 1, 2014 | January 1, 2014 |
LoCorr Market Trend Fund | July 1, 2014 | July 1, 2014 | July 1, 2014 |
The Funds may issue an unlimited number of shares of beneficial interest, with no par value. All shares of the Funds have equal rights and privileges, except as to class-specific rights and privileges described above.
2. Significant Accounting Policies
The following is a summary of significant accounting policies consistently followed by the Funds in the preparation of the financial statements. These policies are in conformity with generally accepted accounting principles in the United States of America (“GAAP”).
Investment Valuation
The Funds follow fair valuation accounting standards in accordance with GAAP, which establish a definition of fair value and set out a hierarchy for measuring fair value. These standards require additional disclosures about the various inputs and valuation techniques used to develop the measurements of fair value and changes in valuation techniques and related inputs during the period. These inputs are summarized in three broad levels listed below:
Level 1 – Unadjusted quoted prices in active markets for identical assets or liabilities that the Funds have the ability to access.
Level 2 – Observable inputs other than quoted prices included in Level 1 that are observable for the asset or liability, either directly or indirectly. These inputs may include quoted prices for the identical instrument on an inactive market, prices for similar instruments, interest rates, prepayment speeds, credit risk, yield curves, default rates and similar data.
Level 3 – Unobservable inputs for the asset or liability, to the extent relevant observable inputs are not available; representing the Funds’ own assumptions about the assumptions a market participant would use in valuing the asset or liability and would be based on the best information available.
Generally, the Funds’ investments are valued each day at the last quoted sales price on each investment’s primary exchange. Investments traded or dealt in one or more exchanges (whether domestic or foreign) for which market quotations are readily available and not subject to restrictions against resale shall be valued at the last quoted sales price on the primary exchange or, in the absence of a sale on the primary exchange, at the last bid on the primary exchange. Investments primarily traded in the National Association of Securities Dealers’ Automated Quotation System (“NASDAQ”) National Market System for which market quotations are readily available shall be valued using the NASDAQ Official Closing Price.
LoCorr Macro Strategies Fund, LoCorr Long/Short Commodities Strategy Fund and LoCorr Market Trend Fund – Notes to Consolidated Financial
Statements / LoCorr Dynamic Equity Fund and LoCorr Spectrum Income Fund – Notes to Financial Statements (continued) |
The Funds may use independent pricing services to assist in calculating the value of the Funds’ investments. In addition, market prices for foreign investments are not determined at the same time of day as the net asset value (“NAV”) for the Funds. Because the Funds may invest in portfolio investments primarily listed on foreign exchanges and these exchanges may trade on weekends or other days when the Funds do not price their shares, the value of some of the Funds’ portfolio investments may change on days when you may not be able to buy or sell the Funds’ shares. In computing the NAV, the Funds value foreign investments held by the Funds at the latest closing price on the exchange in which they are traded immediately prior to closing of the New York Stock Exchange. Prices of foreign investments quoted in foreign currencies are translated into U.S. dollars at current rates. If events materially affecting the value of an investment in the Funds’ portfolio, particularly foreign investments, occur after the close of trading on a foreign market but before the Funds price their shares, the investment will be valued at fair value.
American Depositary Receipts
The Funds may invest in sponsored and unsponsored American Depositary Receipts (“ADRs”), which are receipts issued by an American bank or trust company evidencing ownership of underlying securities issued by a foreign issuer. ADRs, in registered form, are designed for use in U.S. securities markets. Unsponsored ADRs may be created without the participation of the foreign issuer. Holders of unsponsored ADRs generally bear all the costs of the ADR facility, whereas foreign issuers typically bear certain costs in a sponsored ADR. The bank or trust company depositary of an unsponsored ADR may be under no obligation to distribute shareholder communications received from the foreign issuer or to pass through voting rights. ADRs are generally categorized in Level 1 or Level 2 of the fair value hierarchy depending on inputs used and market activity levels for specific securities.
Equity Securities
Equity securities, including common stocks, preferred stocks, securities convertible into common stocks such as convertible bonds, warrants, rights, options, master limited partnership (“MLP”) interests, real estate investment trusts (“REITs”), business development companies (“BDCs”) and royalty trusts are generally valued by using market quotations, but may be valued on the basis of prices furnished by a pricing service when the Adviser believes such prices accurately reflect the fair market value of such securities. MLP interests are limited partnerships, the interests in which (known as “units”) typically trade publicly, like stock. MLPs are also called publicly traded partnerships and public limited partnerships. Securities that are traded on any stock exchange or on the NASDAQ over-the-counter market are generally valued by the pricing service at the last quoted sale price. Lacking a last sale price, an equity security is generally valued by the pricing service at its last bid price. Equity securities are generally categorized in Level 1 or Level 2 of the fair value hierarchy depending on inputs used and market activity levels for specific securities.
Exchange Traded Funds
The Funds may invest in Exchange Traded Funds (“ETFs”). They are managed by professionals and provide the investor with diversification, cost and tax efficiency, liquidity, marginability, usability for hedging, the ability to go long and short, and (for some ETFs) the provision of periodic distributions. Additionally, some ETFs are unit investment trusts (“UITs”), which are unmanaged portfolios overseen by trustees. ETFs generally have two markets. The primary market is where institutions swap “creation units” in block-multiples of shares, typically 25,000 or 50,000, for in-kind securities and cash in the form of dividends. The secondary market is where individual investors can trade as little as a single share during trading hours on the exchange. This is different from open-ended mutual funds that are traded after hours once the NAV is calculated. ETF shares may trade at a premium or discount to NAV per share. ETFs share many similar risks with open-end and closed-end funds. ETFs are generally categorized in Level 1 of the fair value hierarchy.
The Funds may invest in ETFs and other investment companies that hold a portfolio of foreign securities. Investing in securities of foreign companies and countries involves certain considerations and risks that are not typically associated with investing in U.S. government securities and securities of domestic companies. There may be less publicly available information about a foreign issuer than a domestic one, and foreign companies are not generally subject to uniform accounting, auditing and financial standards and requirements comparable to those applicable to U.S. companies. There may also be less government supervision and regulation of foreign securities exchanges, brokers and listed companies than exists in the United States. Interest and dividends paid by foreign issuers may be subject to withholding and other foreign taxes, which may decrease the net return on such investments as compared to dividends and interest paid to the Funds by domestic companies or the U.S. government. There may be the possibility of expropriations, seizure or nationalization of foreign deposits, confiscatory taxation, political, economic or social instability, or diplomatic developments that could affect assets of the Funds held in foreign countries. Finally, the establishment of exchange controls or other foreign governmental laws or restrictions could adversely affect the payment of obligations.
LoCorr Macro Strategies Fund, LoCorr Long/Short Commodities Strategy Fund and LoCorr Market Trend Fund – Notes to Consolidated Financial
Statements / LoCorr Dynamic Equity Fund and LoCorr Spectrum Income Fund – Notes to Financial Statements (continued) |
Financial Derivative Instruments
Financial derivative instruments, such as forward currency contracts, futures contracts or swap agreements, derive their value from underlying asset prices, indices, reference rates and other inputs or a combination of these factors. These contracts are normally valued on the basis of broker- dealer quotations or a pricing service at the settlement price determined by the relevant exchange. Depending on the product and the terms of the transaction, the value of the derivative contracts can be estimated by a pricing service provider using a series of techniques, including simulation pricing models. The pricing models use inputs that are observed from actively quoted markets such as issuer details, indices, spreads, interest rates, curves, dividends and exchange rates.
Forward currency contracts represent the purchase or sale of a specific quantity of a foreign currency at the current or spot price, with delivery and settlement at a specified future date. Forward currency contracts are presented at fair value using spot currency rates and are adjusted for the time value of money (forward points) and contractual prices of the underlying financial instruments. Forward currency contracts are generally categorized in Level 2.
Futures contracts are carried at fair value using the primary exchange’s closing (settlement) price and are generally categorized in Level 1.
Total return swap contracts are stated at fair value daily based on the fair value of the underlying futures, forward currency and foreign currency contracts constituting the contract’s stated index, taking into account any fees and expenses associated with the swap agreement. Total return swap contracts are generally categorized in Level 2.
Fund-linked options are stated at fair value based on the fair value of Galaxy Plus Fund – East Alpha Feeder Fund (548) LLC, taking into account any fees and expenses associated with the fund-linked option. Fund-linked options are generally categorized in Level 2.
Fair Value Pricing
If market quotations are not readily available, investments will be valued at their fair value as determined in good faith by the Adviser in accordance with procedures approved by the Board of Trustees (the “Board”) and evaluated by the Board as to the reliability of the fair value method used.
In these cases, a Fund’s NAV will reflect certain portfolio investments’ fair value rather than their market price. Fair value pricing involves subjective judgments and it is possible that the fair value determined for an investment is materially different than the value that could be realized upon the sale of that investment. The fair value prices can differ from market prices when they become available or when a price becomes available.
Fair value determinations are required for the following securities:
● | securities for which market quotations are not readily available at the valuation time on a particular business day (including without limitation securities for which there is a short and temporary lapse in the provision of a price by the regular pricing source); |
● | securities determined to be illiquid in accordance with the Trust’s Liquidity Procedures; and |
● | securities with respect to which an event that will affect the value thereof has occurred subsequent to the determination by the Adviser/relevant Sub-Adviser of the closing prices reported on the principal exchange on which the securities are traded, but prior to the relevant Fund’s calculation of its NAV. |
● | For any open-end mutual funds that do not provide timely NAV information, the Adviser/relevant Sub-Adviser shall evaluate those ‘similar’ funds and determine which are most appropriate based on funds having similar benchmarks or similar objectives. The Adviser/relevant Sub-Adviser shall then calculate the NAV percentage move of those ‘similar’ funds for the day to create an aggregate average percentage move, which it shall use to calculate the price movement for the day of the Fund at issue. For closed-end funds, the aforementioned practice shall be utilized, in addition to monitoring secondary market activity during the day. |
Performing Fair Value Pricing
The Adviser considers all appropriate factors relevant to the value of securities for which market quotations are not readily available. No single standard for determining fair value can be established, since fair value depends upon the circumstances of each individual case. As a general principle, the current fair value of an issue of securities being valued by the Adviser would appear to be the amount that the owner might reasonably expect to receive for them upon their current sale.
LoCorr Macro Strategies Fund, LoCorr Long/Short Commodities Strategy Fund and LoCorr Market Trend Fund – Notes to Consolidated Financial
Statements / LoCorr Dynamic Equity Fund and LoCorr Spectrum Income Fund – Notes to Financial Statements (continued) |
As a general matter, the Funds’ Adviser will value the portfolio security or other asset primarily by reference to the public market if there is a public market for securities of the same class or similar securities; primarily by reference to private transactions if public market reference is not available and private transaction reports are available; and primarily by use of one or more analytical methods or models if public and private market references are not available or not reliable. The Adviser will use cost only if no better method of valuation is available.
The Adviser regularly evaluates whether its pricing methodologies continue to result in values that the Funds might reasonably expect to receive upon a current sale. In order to do this, the Adviser compares its fair value prices with values that are available from other sources (if there are any). The next actual sales price of a security might be one such source. However, the next-day opening prices or next actual sales prices for a security may differ from the fair value of that security as of the time for NAV calculation, given the subjectivity inherent in fair valuation and the fact that events could occur after NAV calculation. Thus, discrepancies between fair values and next-day opening prices or next actual sales prices may occur on a regular and recurring basis. These discrepancies do not necessarily indicate that the Adviser’s fair value methodology is inappropriate. Nonetheless, systematic comparisons of fair values to the next-day opening prices or next actual sales prices are useful to assist the Adviser with ongoing monitoring and evaluation of the appropriateness of its fair value methodologies. The above guidance does not purport to delineate all factors that may be considered. The Adviser takes into consideration all indications of value available to it in determining the fair value assigned to a particular security.
The following table summarizes LoCorr Macro Strategies Fund’s consolidated investments and other financial instruments as of December 31, 2021:
Security Classification | | Level 1 | | | Level 2 | | | Level 3 | | | Total | |
Investments | | | | | | | | | | | | | | | | |
Asset Backed Securities | | $ | — | | | $ | 152,885,296 | | | $ | — | | | $ | 152,885,296 | |
Corporate Bonds | | | — | | | | 337,652,313 | | | | — | | | | 337,652,313 | |
Mortgage Backed Securities | | | — | | | | 216,957,312 | | | | — | | | | 216,957,312 | |
Municipal Bonds | | | — | | | | 12,318,322 | | | | — | | | | 12,318,322 | |
U.S. Government Agency Issues | | | — | | | | 191,965,975 | | | | — | | | | 191,965,975 | |
U.S. Government Notes | | | — | | | | 322,532,455 | | | | — | | | | 322,532,455 | |
Short Term Investments | | | 54,024,813 | | | | 21,790,519 | | | | — | | | | 75,815,332 | |
Total Investments | | $ | 54,024,813 | | | $ | 1,256,102,192 | | | $ | — | | | $ | 1,310,127,005 | |
| | | | | | | | | | | | | | | | | |
Other Financial Instruments* | | | | | | | | | | | | | | | | |
Forward Currency Contracts | | | | | | | | | | | | | | | | |
Purchase | | $ | — | | | $ | 7,970,598 | | | $ | — | | | $ | 7,970,598 | |
Sale | | | — | | | | (13,512,930 | ) | | | — | | | | (13,512,930 | ) |
Total Forward Currency Contracts | | | — | | | | (5,542,332 | ) | | | — | | | | (5,542,332 | ) |
Futures Contracts | | | | | | | | | | | | | | | | |
Long | | $ | 10,607,010 | | | | | | | $ | — | | | $ | 10,607,010 | |
Short | | | (1,438,538 | ) | | | | | | | — | | | | (1,438,538 | ) |
Total Futures Contracts | | | 9,168,472 | | | | — | | | | — | | | | 9,168,472 | |
Total Other Financial Instruments | | $ | 9,168,472 | | | $ | (5,542,332 | ) | | $ | — | | | $ | 3,626,140 | |
See the Fund’s consolidated schedule of investments for the investments detailed by industry classification.
* | The fair value of the Fund’s other financial instruments represent the net unrealized appreciation (depreciation) at December 31, 2021. |
The LoCorr Macro Strategies Fund did not hold any Level 3 assets during the year.
LoCorr Macro Strategies Fund, LoCorr Long/Short Commodities Strategy Fund and LoCorr Market Trend Fund – Notes to Consolidated Financial
Statements / LoCorr Dynamic Equity Fund and LoCorr Spectrum Income Fund – Notes to Financial Statements (continued) |
The following table summarizes LoCorr Long/Short Commodities Strategy Fund’s consolidated investments and swap contracts as of December 31, 2021:
Security Classification | | Level 1 | | | Level 2 | | | Level 3 | | | Total | |
Investments | | | | | | | | | | | | | | | | |
Asset Backed Securities | | $ | — | | | $ | 72,066,535 | | | $ | — | | | $ | 72,066,535 | |
Corporate Bonds | | | — | | | | 165,558,597 | | | | — | | | | 165,558,597 | |
Foreign Government Bond | | | — | | | | 2,520 | | | | — | | | | 2,520 | |
Mortgage Backed Securities | | | — | | | | 105,124,977 | | | | — | | | | 105,124,977 | |
Municipal Bonds | | | — | | | | 4,546,925 | | | | — | | | | 4,546,925 | |
Purchased Call Options | | | — | | | | 88,016,922 | | | | — | | | | 88,016,922 | |
U.S. Government Agency Issues | | | — | | | | 99,512,807 | | | | — | | | | 99,512,807 | |
U.S. Government Notes | | | — | | | | 200,896,904 | | | | — | | | | 200,896,904 | |
Short Term Investment | | | 35,136,978 | | | | — | | | | — | | | | 35,136,978 | |
Total Investments | | $ | 35,136,978 | | | $ | 735,726,187 | | | $ | — | | | $ | 770,863,165 | |
| | | | | | | | | | | | | | | | | |
Swap Contracts* | | | | | | | | | | | | | | | | |
Long Total Return Swap Contracts | | $ | — | | | $ | 37,256,061 | | | $ | — | | | $ | 37,256,061 | |
Total Swap Contracts | | $ | — | | | $ | 37,256,061 | | | $ | — | | | $ | 37,256,061 | |
See the Fund’s consolidated schedule of investments for the investments detailed by industry classification.
* | The fair value of the Fund’s investment in swap contracts represents the net unrealized appreciation at December 31, 2021. |
The LoCorr Long/Short Commodities Strategy Fund did not hold any Level 3 assets during the year.
The following table summarizes LoCorr Market Trend Fund’s consolidated investments and other financial instruments as of December 31, 2021:
Security Classification | | Level 1 | | | Level 2 | | | Level 3 | | | Total | |
Investments | | | | | | | | | | | | | | | | |
Asset Backed Securities | | $ | — | | | $ | 24,811,126 | | | $ | — | | | $ | 24,811,126 | |
Corporate Bonds | | | — | | | | 57,263,498 | | | | — | | | | 57,263,498 | |
Mortgage Backed Securities | | | — | | | | 33,805,151 | | | | — | | | | 33,805,151 | |
Municipal Bonds | | | — | | | | 2,454,046 | | | | — | | | | 2,454,046 | |
U.S. Government Agency Issues | | | — | | | | 34,216,622 | | | | — | | | | 34,216,622 | |
U.S. Government Notes | | | — | | | | 56,993,140 | | | | — | | | | 56,993,140 | |
Short Term Investments | | | 11,841,533 | | | | 6,495,251 | | | | — | | | | 18,336,784 | |
Total Investments | | $ | 11,841,533 | | | $ | 216,038,834 | | | $ | — | | | $ | 227,880,367 | |
| | | | | | | | | | | | | | | | | |
Other Financial Instruments* | | | | | | | | | | | | | | | | |
Forward Currency Contracts | | | | | | | | | | | | | | | | |
Purchase | | $ | — | | | $ | (142,947 | ) | | $ | — | | | $ | (142,947 | ) |
Sale | | | — | | | | (2,332,460 | ) | | | — | | | | (2,332,460 | ) |
Total Forward Currency Contracts | | | — | | | | (2,475,407 | ) | | | — | | | | (2,475,407 | ) |
Futures Contracts | | | | | | | | | | | | | | | | |
Long | | $ | 5,071,633 | | | $ | — | | | $ | — | | | $ | 5,071,633 | |
Short | | | (282,997 | ) | | | — | | | | — | | | | (282,997 | ) |
Total Futures Contracts | | | 4,788,636 | | | | — | | | | — | | | | 4,788,636 | |
Total Other Financial Instruments | | $ | 4,788,636 | | | $ | (2,475,407 | ) | | $ | — | | | $ | 2,313,229 | |
See the Fund’s consolidated schedule of investments for the investments detailed by industry classification.
* | The fair value of the Fund’s other financial instruments represent the net unrealized appreciation (depreciation) at December 31, 2021 |
The LoCorr Market Trend Fund did not hold any Level 3 assets during the year.
LoCorr Macro Strategies Fund, LoCorr Long/Short Commodities Strategy Fund and LoCorr Market Trend Fund – Notes to Consolidated Financial
Statements / LoCorr Dynamic Equity Fund and LoCorr Spectrum Income Fund – Notes to Financial Statements (continued) |
The following table summarizes LoCorr Dynamic Equity Fund’s investments and securities sold short as of December 31, 2021:
Security Classification | | Level 1 | | | Level 2 | | | Level 3 | | | Total | |
Investments | | | | | | | | | | | | | | | | |
Common Stocks | | $ | 17,965,363 | | | $ | — | | | $ | — | | | $ | 17,965,363 | |
Real Estate Investment Trusts | | | 1,030,358 | | | | — | | | | — | | | | 1,030,358 | |
Warrant | | | 828 | | | | — | | | | — | | | | 828 | |
Short Term Investment | | | 3,987,544 | | | | — | | | | — | | | | 3,987,544 | |
Total Investments | | $ | 22,984,093 | | | $ | — | | | $ | — | | | $ | 22,984,093 | |
| | | | | | | | | | | | | | | | | |
Securities Sold Short | | | | | | | | | | | | | | | | |
Common Stocks | | $ | (5,186,679 | ) | | $ | — | | | $ | — | | | $ | (5,186,679 | ) |
Real Estate Investment Trusts | | | (273,776 | ) | | | — | | | | — | | | | (273,776 | ) |
Total Securities Sold Short | | $ | (5,460,455 | ) | | $ | — | | | $ | — | | | $ | (5,460,455 | ) |
See the Fund’s schedule of investments and schedule of securities sold short for detail by industry classification.
The LoCorr Dynamic Equity Fund did not hold any Level 3 assets during the year.
The following table summarizes LoCorr Spectrum Income Fund’s investments and written options as of December 31, 2021:
Security Classification | | Level 1 | | | Level 2 | | | Level 3 | | | Total | |
Investments | | | | | | | | | | | | | | | | |
Business Development Companies | | $ | 5,121,798 | | | $ | — | | | $ | — | | | $ | 5,121,798 | |
Closed-End Investment Companies | | | 6,342,520 | | | | — | | | | — | | | | 6,342,520 | |
Common Stocks | | | 25,107,282 | | | | — | | | | — | | | | 25,107,282 | |
Master Limited Partnerships | | | 11,930,545 | | | | — | | | | — | | | | 11,930,545 | |
Preferred Stocks | | | 2,097,031 | | | | — | | | | — | | | | 2,097,031 | |
Publicly Traded Partnerships | | | 2,685,536 | | | | — | | | | — | | | | 2,685,536 | |
Purchased Put Option | | | 492,500 | | | | — | | | | — | | | | 492,500 | |
Real Estate Investment Trusts | | | 15,595,553 | | | | — | | | | — | | | | 15,595,553 | |
Short Term Investment | | | 6,210,065 | | | | — | | | | — | | | | 6,210,065 | |
Total Investments | | $ | 75,582,830 | | | $ | — | | | $ | — | | | $ | 75,582,830 | |
| | | | | | | | | | | | | | | | | |
Written Options | | | | | | | | | | | | | | | | |
Written Call Options | | $ | (650,844 | ) | | $ | (38,255 | ) | | $ | — | | | $ | (689,099 | ) |
Total Written Options | | $ | (650,844 | ) | | $ | (38,255 | ) | | $ | — | | | $ | (689,099 | ) |
See the Fund’s schedule of investments for detail by industry classification.
The LoCorr Spectrum Income Fund did not hold any Level 3 assets during the year.
Allocation of Income and Expenses
Net investment income, other than class specific expenses, and realized and unrealized gains and losses are allocated daily to each class of shares based upon the relative NAV of outstanding shares of each class of shares at the beginning of the day (after adjusting for the current capital shares activity of the respective class). Expenses associated with a specific Fund in the Trust are charged to that Fund. Common expenses are typically allocated based upon the relative net assets of each Fund, or by other equitable means.
Deposits with Broker
Forward Currency and Futures Contracts
When trading derivative instruments, such as forward or futures contracts, a Fund is only required to post initial or variation margin with the exchange or clearing broker. The use of margin in trading these instruments has the effect of creating leverage, which can expose the Fund to substantial gains or losses occurring from relatively small price changes in the value
LoCorr Macro Strategies Fund, LoCorr Long/Short Commodities Strategy Fund and LoCorr Market Trend Fund – Notes to Consolidated Financial
Statements / LoCorr Dynamic Equity Fund and LoCorr Spectrum Income Fund – Notes to Financial Statements (continued) |
of the underlying instrument and can increase the volatility of the Fund’s returns. Volatility is a statistical measure of the dispersion of returns of an investment, where higher volatility generally indicates greater risk. At December 31, 2021, the LoCorr Macro Strategies Fund and the LoCorr Market Trend Fund pledged cash and cash equivalents, defined as short-term, highly liquid investments that are readily convertible to known amounts of cash at U.S. Bank, N.A. (“U.S. Bank”) to Bank of America Merrill Lynch for each Fund’s investment in forward currency contracts. See the Funds’ consolidated statements of assets and liabilities for these amounts.
Upon entering into a futures contract, and to maintain the Fund’s open positions in futures contracts, the Fund is required to deposit with its custodian or futures broker in a segregated account in the name of the futures broker an amount of cash, U.S. government securities, suitable money market instruments, or other liquid securities, known as “initial margin.” The margin required fora particular futures contract is set by the exchange on which the contract is traded and may be significantly modified from time to time by the exchange during the term of the contract. Futures contracts are customarily purchased and sold on margins that may range upward from less than 5% of the value of the contract being traded.
At December 31, 2021, the LoCorr Macro Strategies Fund and LCMFS, collectively, had cash and cash equivalents including foreign currency on deposit with the broker for derivative instruments which is presented on the Fund’s consolidated statement of assets and liabilities. In addition, LCMFS pledged securities collateral for derivative instruments. See the Fund’s consolidated schedule of investments for the fair value of securities pledged as collateral.
At December 31, 2021, the LoCorr Market Trend Fund and LCMT, collectively, cash and cash equivalents including foreign currency on deposit with the broker for derivative instruments which is presented on the Fund’s consolidated statement of assets and liabilities. In addition, LCMT pledged cash at U.S. Bank as collateral for derivative instruments. See the Fund’s consolidated schedule of investments for the fair value of securities pledged as collateral.
At December 31, 2021 the LoCorr Dynamic Equity Fund had cash and cash equivalents on deposit with the broker for futures contracts which is presented on the Fund’s statement of assets and liabilities.
If the price of an open futures contract changes (by increase in underlying instrument or index in the case of a sale or by decrease in the case of a purchase) so that the loss on the futures contract reaches a point at which the margin on deposit does not satisfy margin requirements, the broker will require an increase in the margin. However, if the value of a position increases because of favorable price changes in the futures contract so that the margin deposit exceeds the required margin, the broker will pay the excess to the Fund.
These subsequent payments, called “variation margin,” to and from the futures broker (with the exception of futures contracts traded on the London Metal Exchange (“LME”)), are made on a daily basis as the price of the underlying assets fluctuate making the long and short positions in the futures contract more or less valuable, a process known as “marking to the market.” The variation margin on LME futures contracts do not settle daily, but rather settle at their respective maturity dates. At period end, the unrealized appreciation and depreciation on LME futures contracts is shown as receivable for unsettled open futures contracts and payable for unsettled open futures contracts, respectively, on the Funds’ consolidated statements of assets and liabilities. The Funds expect to earn interest income on any margin deposits.
Securities Sold Short
At December 31, 2021, the LoCorr Dynamic Equity Fund had cash on deposit with Morgan Stanley and J.P. Morgan. In addition, at December 31, 2021, the LoCorr Dynamic Equity Fund pledged cash with U.S. Bank and foreign currency with Morgan Stanley as collateral for securities sold short. See the Fund’s statement of assets and liabilities for amounts.
Swap Contracts
LCLSCS has a substantial portion of its assets on deposit with Deutsche Bank in connection with its trading of its swap contract. Assets deposited with Deutsche Bank in connection with the trading of the swap contract for LCLSCS are partially restricted due to deposit requirements. At December 31, 2021, the LoCorr Long/Short Commodities Strategy Fund had cash and cash equivalents on deposit with Deutsche Bank which is presented on the consolidated statements of assets and liabilities. In addition, at December 31, 2021, LCLSCS pledged securities as collateral for the swap contract. See the Fund’s consolidated schedule of investments for the fair value of securities pledged as collateral. Risks arise from the possible inability of the counterparty to meet the terms of its contract and may increase if the counterparty’s financial condition worsens.
LoCorr Macro Strategies Fund, LoCorr Long/Short Commodities Strategy Fund and LoCorr Market Trend Fund – Notes to Consolidated Financial
Statements / LoCorr Dynamic Equity Fund and LoCorr Spectrum Income Fund – Notes to Financial Statements (continued) |
Options
At December 31, 2021, the LoCorr Spectrum Income Fund had cash and cash equivalents on deposit with Pershing, LLC for options contracts which is presented on the Fund’s statement of assets and liabilities. In addition, the LoCorr Spectrum Income Fund pledged securities as collateral for options. See the Fund’s consolidated schedule of investments for the fair value of securities pledged as collateral.
Distributable Earnings and Investment Transactions
Net investment income and net realized gains (losses) may differ for financial reporting and tax purposes because of temporary or permanent book/tax differences. To the extent these differences are permanent; reclassifications are made to the appropriate equity accounts in the period that the difference arises.
Additionally, GAAP requires that certain components of net assets relating to permanent differences be reclassified between financial and tax reporting. These reclassifications have no effect on net assets or NAV per share. See Note 7.
Distributions from Earnings
Shareholder transactions are recorded on trade date. Dividends from net investment income are declared and paid at least annually by the Funds. Distribution of net realized capital gains, if any, are declared and paid at least annually. Distributions to shareholders are recorded on the ex-dividend date. The character of distributions made during the periods from net investment income or net realized gains may differ from the characterization for federal income tax purposes due to the difference in the recognition of income, expense and gain items for financial statement and tax purposes.
During the year ended December 31, 2021, dividends for the LoCorr Spectrum Income Fund were distributed monthly. The estimated characterization of the distributions paid will be an ordinary dividend, qualified dividend or return of capital. This estimate is based on the Fund’s operating results during the period. It is anticipated that a significant portion of the distributions of the Fund’s investments in MLP and certain investments in REITs and royalty trusts will be comprised of return of capital as a result of the tax character of cash distributions made by each Fund’s investments. The actual characterization of the distributions made during the period is not determined until after the end of the fiscal year.
The tax character of distributions paid during the periods was as follows:
| | | Year Ended December 31, 2021 | |
Fund | | Ordinary
Income | | | Long-Term
Capital Gains | | | Return of
Capital | |
LoCorr Macro Strategies Fund | | $ | 70,131,381 | | | $ | — | | | $ | — | |
LoCorr Long/Short Commodities Strategy Fund | | | 60,068,364 | | | | — | | | | — | |
LoCorr Market Trend Fund | | | 9,457,776 | | | | — | | | | — | |
LoCorr Dynamic Equity Fund | | | 431,821 | | | | 1,011,184 | | | | — | |
LoCorr Spectrum Income Fund | | | 2,517,225 | | | | — | | | | 1,618,274 | |
| | | Year Ended December 31, 2020 | |
Fund | | Ordinary
Income | | | Long-Term
Capital Gains | | | Return of
Capital | |
LoCorr Macro Strategies Fund | | $ | 59,908,737 | | | $ | 3,450,209 | | | $ | — | |
LoCorr Long/Short Commodities Strategy Fund | | | 13,693,568 | | | | — | | | | — | |
LoCorr Market Trend Fund | | | 570,347 | | | | — | | | | — | |
LoCorr Spectrum Income Fund | | | 1,675,937 | | | | — | | | | 2,564,688 | |
Federal Income Taxes
The Funds intend to qualify as regulated investment companies pursuant to Subchapter M of the Internal Revenue Code of 1986, as amended. The Funds intend to distribute substantially all of their investment company net taxable income and net capital gains to shareholders. Therefore, no federal income tax provision is required.
LoCorr Macro Strategies Fund, LoCorr Long/Short Commodities Strategy Fund and LoCorr Market Trend Fund – Notes to Consolidated Financial
Statements / LoCorr Dynamic Equity Fund and LoCorr Spectrum Income Fund – Notes to Financial Statements (continued) |
As of and during the year ended December 31, 2021, the Funds did not have any tax positions that did not meet the “more-likely-than-not” threshold of being sustained by applicable tax authorities. The Funds recognize interest and penalties, if any, related to unrecognized tax benefits on uncertain tax positions as interest or other expense in the statements of operations. During the year ended December 31, 2021, the Funds did not incur any interest or penalties.
For tax purposes, LCMFS, LCLSCS and LCMT are exempted Cayman Islands investment companies. LCMFS, LCLSCS and LCMT have each received an undertaking from the Government of the Cayman Islands exempting them from all local income, profits, and capital gains taxes. No such taxes are levied in the Cayman Islands at the present time. For U.S. income tax purposes, LCMFS, LCLSCS and LCMT are controlled foreign corporations (“CFCs”) and as such are not subject to U.S. income tax. However, as a wholly-owned CFC, the net income and capital gain of each CFC, to the extent of its earnings and profits, will be included each year in the respective Funds’ investment company taxable income.
Foreign Securities and Currency
Investment securities and other assets and liabilities denominated in foreign currencies are translated into U.S. dollar amounts at the date of valuation. Purchases and sales of investment securities and income and expense items denominated in foreign currencies are translated into U.S. dollar amounts on the respective dates of such transactions.
The Funds do not isolate that portion of the results of operations resulting from changes in foreign exchange rates on investments from the fluctuations arising from changes in market prices of securities held. Such fluctuations are included with the net realized and unrealized gain or loss from investments.
Reported net realized foreign exchange gains or losses arise from sales of foreign currencies, currency gains or losses realized between the trade and settlement dates on securities transactions, and the difference between the amounts of dividends, interest, and foreign withholding taxes recorded on the Funds’ books and the U.S. dollar equivalent of the amounts actually received or paid. Net unrealized foreign exchange gains and losses arise from changes in the fair values of assets and liabilities, other than investments in securities at period end, resulting from changes in exchange rates.
Forward Currency Contracts
Gains or losses are realized when foreign currency contracts are liquidated. Any change in net unrealized gain or loss is reported in the statements of operations.
Futures Contracts
A futures contract provides for the future sale by one party and purchase by another party of a specified amount of a specific financial instrument (e.g., units of a stock index) for a specified price, date, time and place designated at the time the contract is made. Brokerage fees are incurred when a futures contract is bought or sold and margin deposits must be maintained. Entering into a contract to buy is commonly referred to as buying or purchasing a contract or holding a long position. Entering into a contract to sell is commonly referred to as selling a contract or holding a short position. Unlike when a Fund purchases or sells a security, no price would be paid or received by the Fund upon the purchase or sale of a futures contract.
Although certain futures contracts, by their terms, require actual future delivery of and payment for the underlying instruments, in practice most futures contracts are usually closed out before the delivery date. Gains or losses are realized when contracts are liquidated. Closing out an open futures contract purchase or sale is affected by entering into an offsetting futures contract sale or purchase, respectively, for the same aggregate amount of the identical underlying instrument or index and the same delivery date. If the offsetting purchase price is less than the original sale price, the Fund realizes a gain; if it is more, the Fund realizes a loss. Conversely, if the offsetting sale price is more than the original purchase price, the Fund realizes a gain; if it is less, the Fund realizes a loss.
The transaction costs must also be included in these calculations. There can be no assurance, however, that a Fund will be able to enter into an offsetting transaction with respect to a particular futures contract at a particular time. If a Fund is not able to enter into an offsetting transaction, the Fund will continue to be required to maintain the margin deposits on the futures contract. Any change in net unrealized gain or loss is reported in the statements of operations.
Indemnifications
In the normal course of business, the Funds enter into contracts that contain general indemnifications to other parties. The Funds’ maximum exposure under these contracts is unknown as this would involve future claims that may be made against the Funds that have not yet occurred. However, based on experience, the Funds expect the risk of loss to be remote.
LoCorr Macro Strategies Fund, LoCorr Long/Short Commodities Strategy Fund and LoCorr Market Trend Fund – Notes to Consolidated Financial
Statements / LoCorr Dynamic Equity Fund and LoCorr Spectrum Income Fund – Notes to Financial Statements (continued) |
Market and Credit Risks
The Funds may engage in the speculative trading of U.S. and foreign futures, forward currency and swap contracts (collectively, “derivatives”). The Funds are exposed to both market risk, which is the risk arising from changes in the fair value of the contracts and credit risk, which is the risk of failure by another party to perform according to the terms of a contract.
Purchase and sale of futures contracts requires margin deposits with the broker. Additional deposits may be necessary for any loss on contract value. The Commodity Exchange Act requires a broker to segregate all customer transactions and assets from such broker’s proprietary activities. A customer’s cash and other property (for example, U.S. government securities) deposited with a broker are considered commingled with all other customer funds subject to the broker’s segregation requirements. In the event of a broker’s insolvency, recovery may be limited to a pro rata share of segregated funds available. It is possible that the recovered amount could be less than total cash and other property deposited.
For derivatives, risks arise from changes in the fair value of the contracts. Theoretically, the Funds are exposed to a market risk equal to the notional contract value of swap, futures and forward currency contracts purchased and unlimited liability on such contracts sold short.
The Funds also engage in investing its assets in U.S. government securities. Risks arise from investments in U.S. government securities due to possible market illiquidity. U.S. government securities are also sensitive to changes in interest rates and economic conditions.
The Funds have established procedures to actively monitor market risk and minimize credit risk, although there can be no assurance that they will, in fact, succeed in doing so.
The global outbreak of COVID-19 (commonly referred to as “coronavirus”) has disrupted economic markets and the prolonged economic impact is uncertain. The ultimate economic fallout from the pandemic, and the long-term impact on economies, markets, industries and individual issuers, are not known. The operational and financial performance of the issuers of securities in which the Funds invest depends on future developments, including the duration and spread of the outbreak, and such uncertainty may in turn adversely affect the value and liquidity of the Funds’ investments, impair the Funds’ ability to satisfy redemption requests, and negatively impact the Funds’ performance.
New Accounting Pronouncements and/or SEC Regulatory Updates
In March 2020, FASB issued Accounting Standards Update 2020-04, Reference Rate Reform: Facilitation of the Effects of Reference Rate Reform on Financial Reporting (“ASU 2020-04”) and in January 2021, the FASB issued Accounting Standards Update 2021-01, Reference Rate Reform (Topic 848): Scope (“ASU 2021-01”), which provides optional, temporary relief with respect to the financial reporting of contracts subject to certain types of modifications due to the planned discontinuation of the London Interbank Offered Rate (“LIBOR”) and other interbank offered rates as of the end of 2021. The temporary relief provided by ASU 2020-04 and ASU 2021-01 is effective for certain reference rate-related contract modifications that occur during the period from March 12, 2020 through December 31, 2022. Management is evaluating the impact of ASU 2020-04 and ASU 2021-01 on the Funds’ investments, derivatives, debt and other contracts that will undergo reference rate-related modifications as a result of the reference rate reform. Management is also currently actively working with other financial institutions and counterparties to modify contracts as required by applicable regulation and within the regulatory deadlines.
In October 2020, the SEC adopted new regulations governing the use of derivatives by registered investment companies (“Rule 18f-4”). Rule 18f-4 will impose limits on the amount of derivatives a Fund can enter into, eliminate the asset segregation framework currently used by funds to comply with Section 18 of the 1940 Act, and require funds whose use of derivatives is greater than a limited specified amount to establish and maintain a comprehensive derivatives risk management program and appoint a derivatives risk manager. Funds will be required to comply with Rule 18f-4 by August 19, 2022. It is not currently clear what impact, if any, Rule 18f-4 will have on the availability, liquidity or performance of derivatives. Management is currently evaluating the potential impact of Rule 18f-4 on the Fund(s). When fully implemented, Rule 18f-4 may require changes in how a Fund uses derivatives, adversely affect the Fund’s performance and increase costs related to the Fund’s use of derivatives.
In October 2020, the SEC adopted new Rule 12d1-4 under the 1940 Act and other regulatory changes which are expected to be effective on or about January 19, 2022. Those changes are intended to streamline and enhance the regulatory framework for investments by one fund into another fund or `fund-of-funds arrangements.’ These regulatory changes may limit a Fund’s ability to pursue its principal investment strategies by investing in other investment companies or pooled investment vehicles or to invest in those investment companies or pooled investment vehicles it believes are most desirable. Management is currently assessing the potential impact of the new rule on the Funds’ financial statements.
LoCorr Macro Strategies Fund, LoCorr Long/Short Commodities Strategy Fund and LoCorr Market Trend Fund – Notes to Consolidated Financial
Statements / LoCorr Dynamic Equity Fund and LoCorr Spectrum Income Fund – Notes to Financial Statements (continued) |
In December 2020, the SEC adopted a new rule providing a framework for fund valuation practices (“Rule 2a-5”). Rule 2a-5 establishes requirements for determining fair value in good faith for purposes of the 1940 Act. Rule 2a-5 will permit fund boards to designate certain parties to perform fair value determinations, subject to board oversight and certain other conditions. Rule 2a-5 also defines when market quotations are “readily available” for purposes of the 1940 Act and the threshold for determining whether a fund must fair value a security. In connection with Rule 2a-5, the SEC also adopted related recordkeeping requirements and is rescinding previously issued guidance, including with respect to the role of a board in determining fair value and the accounting and auditing of fund investments. The Funds will be required to comply with the rules by September 8, 2022. Management is currently assessing the potential impact of the new rule on the Funds’ financial statements.
Options on Securities
The Funds may purchase and write (i.e., sell) put and call options. Such options may relate to particular securities or stock indices and may or may not be listed on a domestic or foreign securities exchange and may or may not be issued by the Options Clearing Corporation. Option trading is a highly specialized activity that entails greater than ordinary investment risk. Options may be more volatile than the underlying instruments, and therefore, on a percentage basis, an investment in options may be subject to greater fluctuation than an investment in the underlying instruments themselves.
A call option for a particular security gives the purchaser of the option the right to buy, and the writer (seller) the obligation to sell, the underlying security at the stated exercise price at any time prior to the expiration of the option, regardless of the market price of the security. The premium paid to the writer is in consideration for undertaking the obligation under the option contract. A put option for a particular security gives the purchaser the right to sell the security at the stated exercise price at any time prior to the expiration date of the option, regardless of the market price of the security.
A Fund’s obligation to sell an instrument subject to a call option written by it, or to purchase an instrument subject to a put option written by it, may be terminated prior to the expiration date of the option by the Fund’s execution of a closing purchase transaction, which is effected by purchasing on an exchange an option of the same series (i.e., same underlying instrument, exercise price and expiration date) as the option previously written. A closing purchase transaction will ordinarily be effected to realize a profit on an outstanding option, to prevent an underlying instrument from being called, to permit the sale of the underlying instrument or to permit the writing of a new option containing different terms on such underlying instrument. The cost of such a liquidation purchase plus transactions costs may be greater than the premium received upon the original option, in which event the Fund will have incurred a loss in the transaction. There is no assurance that a liquid secondary market will exist for any particular option. An option writer unable to effect a closing purchase transaction will not be able to sell the underlying instrument or liquidate the assets held in a segregated account, as described below, until the option expires or the optioned instrument is delivered upon exercise. In such circumstances, the writer will be subject to the risk of market decline or appreciation in the instrument during such period.
If an option purchased by a Fund expires unexercised, the Fund realizes a loss equal to the premium paid. If a Fund enters into a closing sale transaction on an option purchased by it, the Fund will realize a gain if the premium received by the Fund on the closing transaction is more than the premium paid to purchase the option or a loss if it is less. If an option written by a Fund expires on the stipulated expiration date or if the Fund enters into a closing purchase transaction, it will realize a gain (or loss if the cost of a closing purchase transaction exceeds the net premium received when the option is sold). If an option written by the Fund is exercised, the proceeds of the sale will be increased by the net premium originally received and the Fund will realize a gain or loss.
Security Transactions and Investment Income
Security transactions are recorded on trade date. Generally, realized gains and losses on sales of investments are calculated on the specifically identified cost basis of the securities.
In accordance with the investment restrictions outlined within the Funds’ prospectus, each Fund may invest up to 15% of its net assets in illiquid securities. Illiquid securities may include securities subject to contractual or legal restrictions on resale (e.g., because they have not been registered under the Securities Act) and securities that are otherwise not readily marketable (e.g., because trading in the security is suspended or because market makers do not exist or will not entertain bids or offers). Securities that have not been registered under the Securities Act are referred to as private investments or restricted securities and are purchased directly from the issuer or in the secondary market. Foreign securities that are freely tradable in their principal markets are not considered to be illiquid. Under guidelines adopted by the Trust’s Board, the Adviser of the Funds may determine that particular Rule 144A securities, and commercial paper issued in reliance on the private placement exemption from registration afforded by Section 4(a)(2) of the Securities Act, are liquid even though they are not registered. At
LoCorr Macro Strategies Fund, LoCorr Long/Short Commodities Strategy Fund and LoCorr Market Trend Fund – Notes to Consolidated Financial
Statements / LoCorr Dynamic Equity Fund and LoCorr Spectrum Income Fund – Notes to Financial Statements (continued) |
December 31, 2021, the Adviser deemed all of the 144A securities held in the LoCorr Macro Strategies Fund, the LoCorr Long/Short Commodities Strategy Fund and the LoCorr Market Trend Fund to be liquid. At December 31, 2021, there were no illiquid or restricted securities held in the LoCorr Dynamic Equity Fund or the LoCorr Spectrum Income Fund.
Dividend income, less foreign taxes withheld, if any, are recorded on the ex-dividend date.
Distributions received from the investments in MLP interests, REITs, private investments, closed end funds, business development companies and royalty trusts generally are comprised of ordinary income, capital gains and return of capital. For financial statement purposes, the Funds use estimates to characterize these distributions received as return of capital, capital gains or ordinary income. Such estimates are based on historical information available from each MLP, REIT, private investment, closed end fund, business development company or royalty trust and other industry sources. These estimates may subsequently be revised based on information received from the MLP, REIT, private investment, closed end fund, business development company or royalty trust after their tax reporting periods are concluded, as the actual character of these distributions is not known until after the fiscal year end of the Funds. The distributions received from the MLP, REIT, private investment, closed end fund, business development company and royalty trust securities that have been classified as income and capital gains are included in investment income and net realized gain (loss) on investments, respectively, on the statements of operations. The distributions received that are classified as return of capital reduce the cost of investments on the statements of assets and liabilities.
Interest income and expense are recognized on the accrual basis. Market discounts, premiums and original issue discounts on fixed-income securities are amortized daily over the expected life of the security using the effective yield method.
Short Sales
The Funds may sell securities short. A short sale is a transaction in which a Fund sells a security it does not own or have the right to acquire (or that it owns but does not wish to deliver) in anticipation that the market price of that security will decline. When a Fund makes a short sale, the broker-dealer through which the short sale is made must borrow the security sold short and deliver it to the party purchasing the security. The Funds are required to make a margin deposit in connection with such short sales; the Funds may have to pay a fee to borrow particular securities and will often be obligated to pay over any dividends and accrued interest on borrowed securities.
If the price of the security sold short increases between the time of the short sale and the time a Fund covers its short position, the Fund will incur a loss; conversely, if the price declines, the Fund will realize a gain. A gain, limited to the price at which the Fund sold the security short, or a loss, unlimited in size, will be recognized upon the close of a short sale. Any gain will be decreased, and any loss increased, by the transaction costs described above. The successful use of short selling may be adversely affected by imperfect correlation between movements in the price of the security sold short and the securities being hedged. Gains or losses from closed positions of securities sold short are presented as net realized gain or loss on securities sold short on the statements of operations.
In addition, the Funds are required to pay the lender any dividends declared on short positions. Dividends declared on open short positions are recorded on ex-date and shown as an expense for financial reporting purposes. To borrow the security, the Funds also may be required to pay fees, which are shown as an expense for financial reporting purposes.
To the extent the Funds sell securities short, it will provide collateral to the broker-dealer and (except in the case of short sales “against the box”) will maintain additional asset coverage in the form of cash, U.S. government securities or other liquid securities with its custodian in a segregated account in an amount at least equal to the difference between the current fair value of the securities sold short and any amounts required to be deposited as collateral with the selling broker (not including the proceeds of the short sale). A short sale is “against the box” to the extent the Funds contemporaneously own or have the right to obtain at no added cost, securities identical to those sold short. Short sales are collateralized by cash deposits with the counterparty broker and pledged securities held at the custodian, U.S. Bank. The collateral required is determined daily by reference to the fair value of the short positions.
Total Return Swap Contracts
The Funds may enter into total return swap agreements. A total return swap entered into by the Funds is a derivative contract that transfers the market risk of underlying portfolios of futures contracts, forward currency contracts and foreign currencies (considered the “index” within each total return swap contract) between counterparties. The “notional amount” of each total return swap agreement is the agreed upon amount or value of the index used for calculating the returns that the parties to a swap agreement have agreed to exchange. The total return swaps are marked to market daily and any change is recorded in unrealized gain/loss on the consolidated statements of operations based on the value of the index on which the total return swap is referenced, as defined within the total return swap agreement between the counterparties. The composition of the
LoCorr Macro Strategies Fund, LoCorr Long/Short Commodities Strategy Fund and LoCorr Market Trend Fund – Notes to Consolidated Financial
Statements / LoCorr Dynamic Equity Fund and LoCorr Spectrum Income Fund – Notes to Financial Statements (continued) |
index may vary based on how the underlying portfolio of futures contracts, forward currency contracts and foreign currencies is traded. A Fund’s obligation under total return swap agreement, including any related fees, offset against amounts owed to the Fund in the case of positive performance, will be covered by designating liquid assets on the Fund’s books and records (see the consolidated statement of assets and liabilities for deposits with broker for derivative instruments). Gains or losses will be realized when the total return swap contracts are liquidated and will be presented as net realized gain or loss on swap contracts on the consolidated statements of operations. Changes in notional value and any cash holding adjustments, which represent voluntary realizations by a Fund of swap value at any point in time, are also presented as net realized gain or loss on swap contracts on the consolidated statements of operations. Further, any cash holding adjustments realized by a Fund are subject to interest charges, which are recorded as part of unrealized gain/loss on the consolidated statements of operations. A corresponding asset or liability for “advance receipt on swap contracts” or “advance payment on swap contracts,” respectively, is recorded on the consolidated statements of assets and liabilities for the gain or loss realized on changes in notional value. Total return swaps outstanding at period end, if any, are listed after the Funds’ consolidated schedules of investments.
Use of Estimates
The preparation of financial statements in conformity with GAAP requires management to make estimates and assumptions that affect the reported amounts of assets and liabilities, disclosure of contingent assets and liabilities at the date of the financial statements and the reported revenues and expenses during the reporting period. Actual results could differ from those estimates.
Warrants
The Funds may invest in warrants. Warrants are options to purchase common stock at a specific price (usually at a premium above the market value of the optioned common stock at issuance) valid for a specific period of time. Warrants may have a life ranging from less than one year to twenty years, or they may be perpetual. However, most warrants have expiration dates after which they are worthless. In addition, a warrant is worthless if the market price of the common stock does not exceed the warrant’s exercise price during the life of the warrant. Warrants have no voting rights, pay no dividends and have no rights with respect to the assets of the corporation issuing them. The percentage increase or decrease in the market price of the warrant may tend to be greater than the percentage increase or decrease in the market price of the optioned common stock.
3. Derivative and Other Financial Instruments
The Funds may invest in derivatives such as futures, forward currency and swap contracts, in order to hedge against market movements while liquidating certain positions and buying other securities or as substitutes for securities, as well as for speculative purposes to gain exposure to such market movements.
The Funds’ market risk related to their derivatives trading is influenced by a wide variety of factors, including the level and volatility of interest rates, exchange rates, weather, supply and demand of commodities, the market value of futures and forward currency contracts, the diversification effects among the Funds’ open positions and the liquidity of the markets in which they trade.
The following are the primary trading risk exposures by market sector of the Funds as encompassed in the total return swap contracts:
Agricultural. (grains, livestock and softs). The Funds’ primary exposure is to agricultural price movements which are often directly affected by severe or unexpected weather conditions.
Currencies. Exchange rate risk is a principal market exposure of the Funds. The Funds’ currency exposure is to exchange rate fluctuations, primarily fluctuations which disrupt the historical pricing relationships between different currencies and currency pairs. The fluctuations are influenced by interest rate changes as well as political and general economic conditions. The Funds trade in a large number of currencies including cross-rates– e.g., positions between two currencies other than the U.S. dollar.
Energy. The Funds’ primary energy market exposure is to gas and oil price movements, often resulting from political developments in the Middle East and economic conditions worldwide. Energy prices are volatile and substantial profits and losses have been and are expected to continue to be experienced in this market.
Interest Rates. Interest rate movements directly affect the price of the sovereign bond futures positions held by the Funds and indirectly the value of its stock index currency positions. Interest rate movements in one country as well as relative interest rate movements between countries may materially impact the Funds’ profitability. The Funds’ primary interest rate exposure is to interest rate fluctuations in countries or regions including Australia, Canada, Japan, Switzerland, the United Kingdom, the
LoCorr Macro Strategies Fund, LoCorr Long/Short Commodities Strategy Fund and LoCorr Market Trend Fund – Notes to Consolidated Financial
Statements / LoCorr Dynamic Equity Fund and LoCorr Spectrum Income Fund – Notes to Financial Statements (continued) |
United States and the Eurozone. However, the Funds also may take positions in futures contracts on the government debt of other nations. The Funds anticipate that interest rates in these industrialized countries or areas, both long-term and short-term, will remain a primary market exposure of the Funds for the foreseeable future.
Metals. The Funds’ metals market exposure is to fluctuations in the price of aluminum, copper, gold, lead, nickel, palladium, tin, silver and zinc.
Stock Index. The Funds’ equity exposure, through stock index futures, is to equity price risk in the major industrialized countries as well as other countries.
The Fund invests in options which are not traded on an exchange. In doing so, it is assuming a credit risk with regard to the party with which it trades and also bears the risk of settlement default. These risks may differ materially from risks associated with transactions effected on an exchange, which generally are backed by clearing organization guarantees, daily mark-to market and settlement, segregation and minimum capital requirements applicable to intermediaries. Relying on a counterparty exposes the Fund to the risk that a counterparty will not settle a transaction in accordance with its terms and conditions because of a dispute over the terms of the contract (whether or not bona fide) or because of a credit or liquidity problem, thus causing the Fund to suffer a loss. If a counterparty defaults on its payment obligations to the Fund, this default will cause the value of an investment in the Fund to decrease.
At December 31, 2021, the LoCorr Macro Strategies Fund, the LoCorr Long/Short Commodities Strategy Fund and the LoCorr Market Trend Fund held derivative and other financial instruments which are not subject to a master netting arrangement. As the tables below illustrate, no positions are netted in these consolidated financial statements.
LoCorr Macro Strategies Fund - December 31, 2021 | | | | | | | | | | | | |
Assets: | | | | | | | | | | | | | | Gross Amounts
not offset in the Consolidated
Statement of Assets & Liabilities | | | | | |
Description | | Gross Amounts of
Recognized Assets | | | Gross Amounts
Offset in the
Consolidated
Statement of
Assets & Liabilities | | | Net Amounts
Presented in the
Consolidated
Statement of
Assets & Liabilities | | | Financial
Instruments | | | Collateral Pledged
(Received) | | | Net Amount | |
Forward currency contracts | | $ | 15,977,777 | | | $ | — | | | $ | 15,977,777 | | | $ | — | | | $ | — | | | $ | 15,977,777 | |
Futures contracts (a) | | | 3,979,060 | | | | — | | | | 3,979,060 | | | | — | | | | — | | | | 3,979,060 | |
Total | | $ | 19,956,837 | | | $ | — | | | $ | 19,956,837 | | | $ | — | | | $ | — | | | $ | 19,956,837 | |
Liabilities: | | | | | | | | | | | | | | Gross Amounts
not offset in the Consolidated
Statement of Assets & Liabilities | | | | | |
Description | | Gross Amounts
of Recognized
Liabilities | | | Gross Amounts
Offset in the
Consolidated
Statement of
Assets & Liabilities | | | Net Amounts
Presented in the
Consolidated
Statement of
Assets & Liabilities | | | Financial
Instruments | | | Collateral Received
(Pledged) | | | Net Amount | |
Forward currency contracts | | $ | 21,520,109 | | | $ | — | | | $ | 21,520,109 | | | $ | — | | | $ | (21,520,109 | ) | | $ | — | |
Futures contracts (a) | | | 8,170,341 | | | | — | | | | 8,170,341 | | | | — | | | | (8,170,341 | ) | | | — | |
Total | | $ | 29,690,450 | | | $ | — | | | $ | 29,690,450 | | | $ | — | | | $ | (29,690,450 | ) | | $ | — | |
LoCorr Long/Short Commodities Strategy Fund - December 31, 2021 | | | | | | | | | | | | |
Assets: | | | | | | | | | | | | | | Gross Amounts
not offset in the Consolidated
Statement of Assets & Liabilities | | | | | |
Description | | Gross Amounts of
Recognized Assets | | | Gross Amounts
Offset in the
Consolidated
Statement of
Assets & Liabilities | | | Net Amounts
Presented in the
Consolidated
Statement of
Assets & Liabilities | | | Financial
Instruments | | | Collateral Pledged
(Received) | | | Net Amount | |
Swap Contracts* | | $ | 51,369,208 | | | $ | — | | | $ | 51,369,208 | | | $ | — | | | $ | — | | | $ | 51,369,208 | |
Total | | $ | 51,369,208 | | | $ | — | | | $ | 51,369,208 | | | $ | — | | | $ | — | | | $ | 51,369,208 | |
* | $14,113,147 Represents advance receipt on swap contracts. |
LoCorr Macro Strategies Fund, LoCorr Long/Short Commodities Strategy Fund and LoCorr Market Trend Fund – Notes to Consolidated Financial
Statements / LoCorr Dynamic Equity Fund and LoCorr Spectrum Income Fund – Notes to Financial Statements (continued) |
LoCorr Market Trend Fund - December 31, 2021 | | | | | | | | | | | | |
Assets: | | | | | | | | | | | | | | Gross Amounts
not offset in the Consolidated
Statement of Assets & Liabilities | | | | | |
Description | | Gross Amounts of
Recognized Assets | | | Gross Amounts
Offset in the
Consolidated
Statement of
Assets & Liabilities | | | Net Amounts
Presented in the
Consolidated
Statement of
Assets & Liabilities | | | Financial
Instruments | | | Collateral Pledged
(Received) | | | Net Amount | |
Forward currency contracts | | $ | 2,499,767 | | | $ | — | | | $ | 2,499,767 | | | $ | — | | | $ | — | | | $ | 2,499,767 | |
Futures contracts (a) | | | 1,386,049 | | | | — | | | | 1,386,049 | | | | — | | | | — | | | | 1,386,049 | |
Total | | $ | 3,885,816 | | | $ | — | | | $ | 3,885,816 | | | $ | — | | | $ | — | | | $ | 3,885,816 | |
Liabilities: | | | | | | | | | | | | | | Gross Amounts
not offset in the Consolidated
Statement of Assets & Liabilities | | | | | |
Description | | Gross Amounts
of Recognized
Liabilities | | | Gross Amounts
Offset in the
Consolidated
Statement of
Assets & Liabilities | | | Net Amounts
Presented in the
Consolidated
Statement of
Assets & Liabilities | | | Financial
Instruments | | | Collateral Received
(Pledged) | | | Net Amount | |
Forward currency contracts | | $ | 4,975,174 | | | $ | — | | | $ | 4,975,174 | | | $ | — | | | $ | (4,975,174 | ) | | $ | — | |
Futures contracts (a) | | | 2,546,198 | | | | — | | | | 2,546,198 | | | | — | | | | (2,546,198 | ) | | | — | |
Total | | $ | 7,521,372 | | | $ | — | | | $ | 7,521,372 | | | $ | — | | | $ | (7,521,372 | ) | | $ | — | |
(a) | Reflects the current day variation margin and unsettled open futures contracts as separately reported within the Fund’s consolidated statement of assets and liabilities. |
The Funds have adopted authoritative standards regarding disclosure about derivatives and hedging activities and how they affect the Funds’ consolidated statements of assets and liabilities and consolidated statements of operations. Fair value of swap contracts are recorded in the consolidated statements of assets and liabilities as net unrealized appreciation on swap contracts or net unrealized depreciation on swap contracts.
Since the derivatives held long or short are for speculative trading purposes, the derivative instruments are not designated as hedging instruments. Accordingly, all realized gains and losses, as well as any change in net unrealized gains or losses on open contracts from the preceding period, are recognized as part of realized and unrealized gain (loss) in the consolidated statements of operations.
The following table presents the fair value of consolidated derivative instruments for the LoCorr Macro Strategies Fund, LoCorr Long/Short Commodities Strategy Fund, LoCorr Market Trend Fund and the non-consolidated derivative instruments for LoCorr Spectrum Income Fund as of December 31, 2021 as presented on each Fund’s consolidated and non-consolidated statements of assets and liabilities:
| | | Fair Value | | | Net Unrealized
Gain (Loss) on | |
Derivatives Not Accounted for as Hedging Instruments | | Assets | | | Liabilities | | | Open Positions | |
LoCorr Macro Strategies Fund | | | | | | | | | | | | |
Forward Currency Contracts(a) | | | | | | | | | | | | |
Long | | $ | 11,080,485 | | | $ | 3,109,887 | | | $ | 7,970,598 | |
Short | | | 4,897,292 | | | | 18,410,222 | | | | (13,512,930 | ) |
Total Forward Currency Contracts | | | 15,977,777 | | | | 21,520,109 | | | | (5,542,332 | ) |
| | | | | | | | | | | | | |
Futures Contracts(b) | | | | | | | | | | | | |
Long Contracts | | | | | | | | | | | | |
Commodity | | | 10,034,131 | | | | 1,508,550 | | | | 8,525,581 | |
Equity | | | 5,192,744 | | | | 153,839 | | | | 5,038,905 | |
Foreign exchange | | | 13,983 | | | | 157,812 | | | | (143,829 | ) |
Interest rate | | | 313,923 | | | | 3,127,570 | | | | (2,813,647 | ) |
Total Long Contracts | | | 15,554,781 | | | | 4,947,771 | | | | 10,607,010 | |
LoCorr Macro Strategies Fund, LoCorr Long/Short Commodities Strategy Fund and LoCorr Market Trend Fund – Notes to Consolidated Financial
Statements / LoCorr Dynamic Equity Fund and LoCorr Spectrum Income Fund – Notes to Financial Statements (continued) |
| | | Fair Value | | | Net Unrealized
Gain (Loss) on | |
Derivatives Not Accounted for as Hedging Instruments | | Assets | | | Liabilities | | | Open Positions | |
LoCorr Macro Strategies Fund (continued) | | | | | | | | | | | | |
Short Contracts | | | | | | | | | | | | |
Commodity | | $ | 369,728 | | | $ | 3,159,007 | | | $ | (2,789,279 | ) |
Equity | | | 245,372 | | | | 2,462,797 | | | | (2,217,425 | ) |
Foreign exchange | | | 15,507 | | | | 17,971 | | | | (2,464 | ) |
Interest rate | | | 3,605,198 | | | | 34,568 | | | | 3,570,630 | |
Total Short Contracts | | | 4,235,805 | | | | 5,674,343 | | | | (1,438,538 | ) |
Total Futures Contracts | | | 19,790,586 | | | | 10,622,114 | | | | 9,168,472 | |
Total Forward Currency Contracts and Futures Contracts | | $ | 35,768,363 | | | $ | 32,142,223 | | | $ | 3,626,140 | |
| | | | | | | | | | | | | |
LoCorr Long/Short Commodities Strategy Fund | | | | | | | | | | | | |
Long Total Return Swap Contracts | | | | | | | | | | | | |
LoCorr Commodities Index | | $ | 37,256,061 | | | $ | — | | | $ | 37,256,061 | |
Purchased Call Options | | | 88,016,922 | | | | — | | | | 40,602,719 | |
| | | | | | | | | | | | | |
LoCorr Market Trend Fund | | | | | | | | | | | | |
Forward Currency Contracts(a) | | | | | | | | | | | | |
Long | | | 646,076 | | | | 789,023 | | | | (142,947 | ) |
Short | | | 1,853,691 | | | | 4,186,151 | | | | (2,332,460 | ) |
Total Forward Currency Contracts | | | 2,499,767 | | | | 4,975,174 | | | | (2,475,407 | ) |
| | | | | | | | | | | | | |
Futures Contracts(b) | | | | | | | | | | | | |
Long Contracts | | | | | | | | | | | | |
Commodity | | | 3,765,031 | | | | 752,377 | | | | 3,012,654 | |
Equity | | | 2,585,778 | | | | — | | | | 2,585,778 | |
Foreign exchange | | | — | | | | 87,249 | | | | (87,249 | ) |
Interest rate | | | 70,932 | | | | 510,482 | | | | (439,550 | ) |
Total Long Contracts | | | 6,421,741 | | | | 1,350,108 | | | | 5,071,633 | |
| | | | | | | | | | | | | |
Short Contracts | | | | | | | | | | | | |
Commodity | | | — | | | | 852,697 | | | | (852,697 | ) |
Equity | | | — | | | | 1,208,837 | | | | (1,208,837 | ) |
Interest rate | | | 1,837,293 | | | | 58,756 | | | | 1,778,537 | |
Total Short Contracts | | | 1,837,293 | | | | 2,120,290 | | | | (282,997 | ) |
Total Futures Contracts | | | 8,259,034 | | | | 3,470,398 | | | | 4,788,636 | |
Total Forward Currency Contracts and Futures Contracts | | $ | 10,758,801 | | | $ | 8,445,572 | | | $ | 2,313,229 | |
| | | | | | | | | | | | | |
LoCorr Spectrum Income Fund | | | | | | | | | | | | |
Options | | | | | | | | | | | | |
Purchased Options | | $ | 492,500 | | | $ | — | | | $ | (567,279 | ) |
Written Options | | | — | | | | 689,099 | | | | 436,160 | |
Total Options | | $ | 492,500 | | | $ | 689,099 | | | $ | (131,119 | ) |
(a) | Unrealized appreciation on forward currency contracts is a receivable and unrealized depreciation on forward currency contracts is a payable on the Fund’s consolidated statement of assets and liabilities. |
(b) | Reflects the cumulative unrealized appreciation (depreciation) of futures contracts as reported in the Fund’s consolidated schedule of open futures contracts. Only the current day variation margin and unsettled open futures contracts is separately reported within the Fund’s consolidated statement of assets and liabilities. |
LoCorr Macro Strategies Fund, LoCorr Long/Short Commodities Strategy Fund and LoCorr Market Trend Fund – Notes to Consolidated Financial
Statements / LoCorr Dynamic Equity Fund and LoCorr Spectrum Income Fund – Notes to Financial Statements (continued) |
The following table presents the results of the derivative trading and information related to volume for the year ended December 31, 2021. The below captions of “Net Realized” and “Net Change in Unrealized” correspond to the captions in each Fund’s consolidated and non-consolidated statement of operations.
| | | Gain (Loss) from Trading | |
Fund and Type of Derivative Instrument | | Net Realized | | | Net Change in
Unrealized | |
LoCorr Macro Strategies Fund | | | | | | | | |
Forward Currency Contracts | | $ | (20,552,427 | ) | | $ | (10,609,131 | ) |
Futures Contracts | | | | | | | | |
Commodity | | | 72,996,569 | | | | (13,342,637 | ) |
Equity | | | 37,218,409 | | | | (2,720,053 | ) |
Foreign exchange | | | (4,042,103 | ) | | | (204,575 | ) |
Interest rate | | | (39,197,212 | ) | | | (3,337,837 | ) |
Total Futures Contracts | | | 66,975,663 | | | | (19,605,102 | ) |
Total Forward Currency Contracts and Futures Contracts | | $ | 46,423,236 | | | $ | (30,214,233 | ) |
| | | | | | | | | |
LoCorr Long/Short Commodities Strategy Fund | | | | | | | | |
Swap Contracts | | $ | — | | | $ | 50,355,280 | |
Purchased Call Options (d) | | | 23,504,256 | | | | 36,240,825 | |
| | | | | | | | | |
LoCorr Market Trend Fund | | | | | | | | |
Forward Currency Contracts | | $ | 4,196,930 | | | $ | (5,765,152 | ) |
Futures Contracts | | | | | | | | |
Commodity | | | 33,135,010 | | | | (8,538,737 | ) |
Equity | | | 18,618,104 | | | | (573,714 | ) |
Foreign exchange | | | (239,984 | ) | | | (123,552 | ) |
Interest rate | | | (32,492,096 | ) | | | (589,332 | ) |
Total Futures Contracts | | | 19,021,034 | | | | (9,825,335 | ) |
Total Forward Currency Contracts and Futures Contracts | | $ | 23,217,964 | | | $ | (15,590,487 | ) |
| | | | | | | | | |
LoCorr Dynamic Equity Fund | | | | | | | | |
Futures Contract | | | | | | | | |
Equity | | $ | 689,103 | | | $ | (39,152 | ) |
Total Futures Contract | | $ | 689,103 | | | $ | (39,152 | ) |
| | | | | | | | | |
LoCorr Spectrum Income Fund | | | | | | | | |
Options | | | | | | | | |
Purchased Options (d) | | $ | 333,631 | | | $ | (567,279 | ) |
Written Options | | | 171,286 | | | | 436,160 | |
Total Options | | $ | 504,917 | | | $ | (131,119 | ) |
(d) | Purchased options are included within net realized gain (loss) on investments and net change in unrealized appreciation/depreciation on investments. |
LoCorr Macro Strategies Fund, LoCorr Long/Short Commodities Strategy Fund and LoCorr Market Trend Fund – Notes to Consolidated Financial
Statements / LoCorr Dynamic Equity Fund and LoCorr Spectrum Income Fund – Notes to Financial Statements (continued) |
The average monthly notional amount is shown as an indicator of volume. The average monthly notional amounts during the year ended December 31, 2021 were:
| | | Average Notional Amount | |
Fund and Type of Derivative Instrument | | Long Contracts | | | Short Contracts | |
LoCorr Macro Strategies Fund | | | | | | | | |
Forward Currency Contracts | | $ | 1,754,237,597 | | | $ | 1,954,700,804 | |
Futures Contracts | | | 3,843,509,112 | | | | 1,828,734,666 | |
| | | | | | | | | |
LoCorr Long/Short Commodities Strategy Fund | | | | | | | | |
Swap Contracts | | $ | 403,560,483 | | | $ | — | |
Purchased Call Options | | | 93,858,868 | | | | — | |
| | | | | | | | | |
LoCorr Market Trend Fund | | | | | | | | |
Forward Currency Contracts | | $ | 289,472,547 | | | $ | 389,512,751 | |
Futures Contracts | | | 1,260,591,896 | | | | 612,875,646 | |
| | | | | | | | | |
LoCorr Dynamic Equity Fund | | | | | | | | |
Futures Contracts | | $ | 1,125,117 | | | $ | 316,125 | |
| | | | | | | | | |
LoCorr Spectrum Income Fund | | | | | | | | |
Options | | $ | 47,119,333 | | | $ | 24,799,467 | |
The swap contracts and the commodity-related futures contracts reported in the tables in Note 3 represent balances and activity of each Fund’s respective wholly-owned and controlled subsidiary. See Note 2.
Please refer to the Funds’ prospectus for a full listing of risks associated with these investments.
4. Investment Transactions
The cost of security purchases and proceeds from security sales, excluding short-term investments, derivative instruments, short sales and purchases to cover short sales, for the year ended December 31, 2021 were as follows:
| | | U.S. Government Obligations | | | All Other | |
| | Purchases | | | Sales | | | Purchases | | | Sales | |
LoCorr Macro Strategies Fund | | $ | 575,348,853 | | | $ | 600,964,927 | | | $ | 564,066,949 | | | $ | 300,412,688 | |
LoCorr Long/Short Commodities Strategy Fund | | | 266,755,625 | | | | 207,477,805 | | | | 361,738,520 | | | | 160,328,146 | |
LoCorr Market Trend Fund | | | 163,344,532 | | | | 169,461,177 | | | | 85,708,479 | | | | 66,322,915 | |
LoCorr Dynamic Equity Fund | | | — | | | | — | | | | 85,385,974 | | | | 83,516,715 | |
LoCorr Spectrum Income Fund | | | — | | | | — | | | | 47,830,807 | | | | 30,644,320 | |
5. Management Fees and Other Transactions with Affiliates
Management Agreement
The Trust has a Management Agreement with the Adviser, with whom certain officers and Trustees of the Funds are affiliated, to furnish investment advisory services to the Funds. Pursuant to the amended Management Agreement, the Adviser is entitled to receive a fee as follows:
Fund | Annual Advisory Fee as a Percentage of
the Average Daily Net Assets of the Fund |
LoCorr Macro Strategies Fund | 1.65% |
LoCorr Market Trend Fund | 1.50% |
LoCorr Dynamic Equity Fund | 1.50% |
LoCorr Spectrum Income Fund | 1.30% |
LoCorr Macro Strategies Fund, LoCorr Long/Short Commodities Strategy Fund and LoCorr Market Trend Fund – Notes to Consolidated Financial
Statements / LoCorr Dynamic Equity Fund and LoCorr Spectrum Income Fund – Notes to Financial Statements (continued) |
Pursuant to the amended Management Agreement, the Adviser is entitled to receive a fee, in accordance with the Incremental Advisory Fee schedule below based on the LoCorr Long/Short Commodities Strategy Fund’s average daily net assets.
Net Assets for the LoCorr Long/Short Commodities
Strategy Fund | Incremental
Advisory Fee* |
$0.0 - $0.5 billion | 1.50% |
$0.5 - $1.0 billion | 1.40% |
$1.0 - $1.5 billion | 1.30% |
$1.5 - $2.0 billion | 1.20% |
$2.0 - $2.5 billion | 1.10% |
Over $2.5 billion | 1.00% |
* | Incremental advisory fee represents the fees paid on net assets at the related net asset level. For example, with $3 billion in net assets in the Fund, the Adviser would earn 1.50% on the first $500 million, plus 1.40% on the next $500 million, plus 1.30% on the next $500 million, plus 1.20% on the next $500 million, plus 1.10% on the next $500 million, plus 1.00% on the final $500 million. |
As of and for the year ended December 31, 2021, the Funds reported the following in regards to management fees:
Fund | | Management Fees
For the Year Ended
December 31, 2021 | | | Accrued Net
Management
Fees as of
December 31, 2021 | |
LoCorr Macro Strategies Fund | | $ | 22,897,967 | | | $ | 2,063,287 | |
LoCorr Long/Short Commodities Strategy Fund | | | 10,161,464 | | | | 1,093,147 | |
LoCorr Market Trend Fund | | | 4,033,497 | | | | 341,955 | |
LoCorr Dynamic Equity Fund | | | 324,317 | | | | 15,572 | |
LoCorr Spectrum Income Fund | | | 805,295 | | | | 84,146 | |
Sub-Advisory Agreements
Sub-advisory services are provided to the Funds, pursuant to agreements between the Adviser and the below listed sub-advisers. Under the terms of these sub-advisory agreements, the Adviser compensates the sub-advisers based on the portion of each Fund’s average daily net assets which they have been allocated to manage.
LoCorr Macro Strategies Fund: | LoCorr Dynamic Equity Fund: |
Graham Capital Management, L.P. | Billings Capital Management LLC |
Millburn Ridgefield Corporation | First Quadrant, L.P. |
Nuveen Asset Management, LLC | Kettle Hill Capital Management, LLC |
Revolution Capital Management LLC | |
R.G. Niederhoffer Capital Management | |
| | |
LoCorr Long/Short Commodities Strategy Fund: | LoCorr Spectrum Income Fund: |
Nuveen Asset Management, LLC | Bramshill Investments, LLC |
| | |
LoCorr Market Trend Fund: | |
Graham Capital Management, L.P. | |
Nuveen Asset Management, LLC | |
The Adviser is solely responsible for the payment of the sub-adviser’s fees, and the sub-adviser agrees not to seek payment of its fees from the Trust or the Funds.
Expense Limitation Agreement
The Funds’ Adviser has contractually agreed to waive management fees and/or reimburse the Funds for expenses they incur, but only to the extent necessary to maintain the Funds’ total annual operating expenses after fee waiver and/or reimbursement (excluding any Rule 12b-1 distribution and/or servicing fees, taxes, interest, brokerage commissions, expenses
LoCorr Macro Strategies Fund, LoCorr Long/Short Commodities Strategy Fund and LoCorr Market Trend Fund – Notes to Consolidated Financial
Statements / LoCorr Dynamic Equity Fund and LoCorr Spectrum Income Fund – Notes to Financial Statements (continued) |
incurred in connection with any merger or reorganization, dividend expenses on short sales, swap fees, indirect expenses, expenses of other investment companies in which the Funds may invest, or extraordinary expenses such as litigation expenses and inclusive of offering and organizational costs incurred prior to the commencement of operations) at the percentages listed below:
Fund | Expense Limit as a
Percentage of the Average Daily
Net Assets of the Fund | Effective Period Through |
LoCorr Macro Strategies Fund | 1.99% | April 30, 2022 |
LoCorr Long/Short Commodities Strategy Fund | 1.95% | April 30, 2022 |
LoCorr Market Trend Fund | 1.95% | April 30, 2022 |
LoCorr Dynamic Equity Fund | 1.99% | April 30, 2022 |
LoCorr Spectrum Income Fund | 1.80% | April 30, 2022 |
Any waiver or reimbursement is subject to repayment by the respective Fund within the three fiscal years following the fiscal year in which the expenses occurred if the Fund is able to make the repayment without exceeding its current expense limitations and the repayment is approved by the Board.
The total amounts of management fees waived and/or expenses reimbursed which are subject to recovery, and their related expiration date are as follows:
LoCorr Dynamic Equity Fund | | | | | | | | |
| | | Management Fees | | | Recovery to
Adviser | | | | | | | Subject to
Recovery on or
Before | |
Period | | (Waived) by
Adviser Subject to
Recovery | | | Year Ended
December 31,
2021 | | | Remaining
Available Subject
to Recovery | | | Fiscal Year Ending
December 31, | |
Year Ended December 31, 2021 | | $ | (263,217 | ) | | $ | — | | | $ | (263,217 | ) | | | 2024 | |
Year Ended December 31, 2020 | | | (278,103 | ) | | | — | | | | (278,103 | ) | | | 2023 | |
Year Ended December 31, 2019 | | | (192,060 | ) | | | — | | | | (192,060 | ) | | | 2022 | |
Total | | $ | (733,380 | ) | | $ | — | | | $ | (733,380 | ) | | | | |
LoCorr Spectrum Income Fund | | | | | | | | |
| | | Management Fees | | | Recovery to
Adviser | | | | | | | Subject to
Recovery on or
Before | |
Period | | (Waived) by
Adviser Subject to
Recovery | | | Year Ended
December 31,
2021 | | | Remaining
Available Subject
to Recovery | | | Fiscal Year Ending
December 31, | |
Year Ended December 31, 2021 | | $ | (17,766 | ) | | $ | — | | | $ | (17,766 | ) | | | 2024 | |
Year Ended December 31, 2020 | | | (70,114 | ) | | | 11,587 | | | | (58,527 | ) | | | 2023 | |
Year Ended December 31, 2019 | | | — | | | | — | | | | — | | | | 2022 | |
Total | | $ | (87,880 | ) | | $ | 11,587 | | | $ | (76,293 | ) | | | | |
For the year ended December 31, 2018, fees waived by the Adviser for the LoCorr Dynamic Equity Fund totaling $95,089, expired on December 31, 2021 and are no longer eligible for recovery by the Adviser.
At December 31, 2021, there were no fees subject to recovery for the LoCorr Macro Strategies Fund, the LoCorr Long/Short Commodities Strategy Fund or the LoCorr Market Trend Fund.
Rule 12b-1 Distribution Agreement
The Funds have entered into a Rule 12b-1 distribution agreement with Quasar Distributors, LLC (“Quasar”). Class A shareholders pay distribution expenses to Quasar at the annual rate not to exceed 0.25% of the Fund’s average daily net assets. Class C shareholders pay to Quasar an annual rate not to exceed 1.00%, which is comprised of 0.75% in distribution expenses and 0.25% in service fees, of the Fund’s average daily net assets. Class I shareholders pay no 12b-1 fees.
LoCorr Macro Strategies Fund, LoCorr Long/Short Commodities Strategy Fund and LoCorr Market Trend Fund – Notes to Consolidated Financial
Statements / LoCorr Dynamic Equity Fund and LoCorr Spectrum Income Fund – Notes to Financial Statements (continued) |
6. Fund Shares
At December 31, 2021 there were an unlimited number of shares of beneficial interest authorized. The following table summarizes the activity in shares and dollar amounts applicable to each class of the Funds:
LoCorr Macro Strategies Fund - Class A | | | | | | | | |
| | | For the Year Ended December 31, 2021 | | | For the Year Ended December 31, 2020 | |
| | Shares | | | Amount | | | Shares | | | Amount | |
Shares Sold | | | 3,801,615 | | | $ | 33,278,684 | | | | 4,716,157 | | | $ | 40,079,233 | |
Shares Issued in Connection with Reorganization | | | — | | | | — | | | | 818,672 | | | | 7,154,396 | |
Reinvestment of Distributions | | | 486,441 | | | | 3,979,091 | | | | 351,493 | | | | 2,927,933 | |
Shares Redeemed | | | (2,866,304 | ) | | | (24,670,429 | ) | | | (3,086,234 | ) | | | (26,552,310 | ) |
| | | | 1,421,752 | | | $ | 12,587,346 | | | | 2,800,088 | | | $ | 23,609,252 | |
Beginning Shares | | | 9,030,476 | | | | | | | | 6,230,388 | | | | | |
Ending Shares | | | 10,452,228 | | | | | | | | 9,030,476 | | | | | |
LoCorr Macro Strategies Fund - Class C | | | | | | | | |
| | For the Year Ended December 31, 2021 | | | For the Year Ended December 31, 2020 | |
| | Shares | | | Amount | | | Shares | | | Amount | |
Shares Sold | | | 886,701 | | | $ | 7,352,721 | | | | 735,024 | | | $ | 6,010,955 | |
Shares Issued in Connection with Reorganization | | | — | | | | — | | | | 115,243 | | | | 970,352 | |
Reinvestment of Distributions | | | 168,958 | | | | 1,312,807 | | | | 259,232 | | | | 2,053,116 | |
Shares Redeemed | | | (1,936,406 | ) | | | (16,082,903 | ) | | | (1,512,807 | ) | | | (12,342,406 | ) |
| | | | (880,747 | ) | | $ | (7,417,375 | ) | | | (403,308 | ) | | $ | (3,307,983 | ) |
Beginning Shares | | | 5,386,635 | | | | | | | | 5,789,943 | | | | | |
Ending Shares | | | 4,505,888 | | | | | | | | 5,386,635 | | | | | |
LoCorr Macro Strategies Fund - Class I | | | | | | | | |
| | For the Year Ended December 31, 2021 | | | For the Year Ended December 31, 2020 | |
| | Shares | | | Amount | | | Shares | | | Amount | |
Shares Sold | | | 73,777,122 | | | $ | 656,311,870 | | | | 73,017,857 | | | $ | 640,810,543 | |
Shares Issued in Connection with Reorganization | | | — | | | | — | | | | 5,647,389 | | | | 49,750,401 | |
Reinvestment of Distributions | | | 6,661,915 | �� | | | 55,427,128 | | | | 6,081,373 | | | | 51,509,334 | |
Shares Redeemed | | | (45,173,806 | ) | | | (394,388,015 | ) | | | (45,653,059 | ) | | | (399,541,357 | ) |
| | | | 35,265,231 | | | $ | 317,350,983 | | | | 39,093,560 | | | $ | 342,528,921 | |
Beginning Shares | | | 122,625,543 | | | | | | | | 83,531,983 | | | | | |
Ending Shares | | | 157,890,774 | | | | | | | | 122,625,543 | | | | | |
LoCorr Macro Strategies Fund | | | | | | | | |
Total Net Increase (Decrease) | | | | | | $ | 322,520,954 | | | | | | | $ | 362,830,190 | |
LoCorr Long/Short Commodities Strategy Fund - Class A | | | | | | | | |
| | | For the Year Ended December 31, 2021 | | | For the Year Ended December 31, 2020 | |
| | Shares | | | Amount | | | Shares | | | Amount | |
Shares Sold | | | 1,667,484 | | | $ | 17,812,643 | | | | 2,181,652 | | | $ | 21,959,749 | |
Reinvestment of Distributions | | | 203,898 | | | | 2,134,816 | | | | 63,271 | | | | 616,890 | |
Shares Redeemed | | | (1,234,990 | ) | | | (13,046,493 | ) | | | (4,473,884 | ) | | | (45,549,248 | ) |
| | | | 636,392 | | | $ | 6,900,966 | | | | (2,228,961 | ) | | $ | (22,972,609 | ) |
Beginning Shares | | | 2,684,560 | | | | | | | | 4,913,521 | | | | | |
Ending Shares | | | 3,320,952 | | | | | | | | 2,684,560 | | | | | |
LoCorr Macro Strategies Fund, LoCorr Long/Short Commodities Strategy Fund and LoCorr Market Trend Fund – Notes to Consolidated Financial
Statements / LoCorr Dynamic Equity Fund and LoCorr Spectrum Income Fund – Notes to Financial Statements (continued) |
LoCorr Long/Short Commodities Strategy Fund - Class C | | | | | | | | |
| | For the Year Ended December 31, 2021 | | | For the Year Ended December 31, 2020 | |
| | Shares | | | Amount | | | Shares | | | Amount | |
Shares Sold | | | 467,896 | | | $ | 4,757,926 | | | | 251,310 | | | $ | 2,442,849 | |
Reinvestment of Distributions | | | 64,706 | | | | 645,764 | | | | 17,021 | | | | 158,973 | |
Shares Redeemed | | | (274,590 | ) | | | (2,738,196 | ) | | | (177,356 | ) | | | (1,707,358 | ) |
| | | | 258,012 | | | $ | 2,665,494 | | | | 90,975 | | | $ | 894,464 | |
Beginning Shares | | | 838,489 | | | | | | | | 747,514 | | | | | |
Ending Shares | | | 1,096,501 | | | | | | | | 838,489 | | | | | |
LoCorr Long/Short Commodities Strategy Fund - Class I | | | | | | | | |
| | For the Year Ended December 31, 2021 | | | For the Year Ended December 31, 2020 | |
| | Shares | | | Amount | | | Shares | | | Amount | |
Shares Sold | | | 46,260,270 | | | $ | 494,415,929 | | | | 38,743,237 | | | $ | 400,829,667 | |
Reinvestment of Distributions | | | 4,190,057 | | | | 44,414,600 | | | | 1,026,115 | | | | 10,117,496 | |
Shares Redeemed | | | (15,282,846 | ) | | | (161,955,649 | ) | | | (17,200,077 | ) | | | (176,283,092 | ) |
| | | | 35,167,481 | | | $ | 376,874,880 | | | | 22,569,275 | | | $ | 234,664,071 | |
Beginning Shares | | | 44,315,085 | | | | | | | | 21,745,810 | | | | | |
Ending Shares | | | 79,482,566 | | | | | | | | 44,315,085 | | | | | |
LoCorr Long/Short Commodities Strategy Fund | | | | | | | | |
Total Net Increase (Decrease) | | | | | | $ | 386,441,340 | | | | | | | $ | 212,585,926 | |
LoCorr Market Trend Fund - Class A | | | | | | | | |
| | | For the Year Ended December 31, 2021 | | | For the Year Ended December 31, 2020 | |
| | Shares | | | Amount | | | Shares | | | Amount | |
Shares Sold | | | 504,953 | | | $ | 6,130,437 | | | | 298,426 | | | $ | 3,250,712 | |
Reinvestment of Distributions | | | 42,073 | | | | 482,993 | | | | — | | | | — | |
Shares Redeemed | | | (672,087 | ) | | | (8,089,327 | ) | | | (812,653 | ) | | | (8,875,621 | ) |
| | | | (125,061 | ) | | $ | (1,475,897 | ) | | | (514,227 | ) | | $ | (5,624,909 | ) |
Beginning Shares | | | 1,449,470 | | | | | | | | 1,963,697 | | | | | |
Ending Shares | | | 1,324,409 | | | | | | | | 1,449,470 | | | | | |
LoCorr Market Trend Fund - Class C | | | | | | | | |
| | For the Year Ended December 31, 2021 | | | For the Year Ended December 31, 2020 | |
| | Shares | | | Amount | | | Shares | | | Amount | |
Shares Sold | | | 124,588 | | | $ | 1,476,798 | | | | 59,186 | | | $ | 633,263 | |
Dividends Reinvested | | | 24,223 | | | | 268,880 | | | | — | | | | — | |
Shares Redeemed | | | (331,933 | ) | | | (3,905,783 | ) | | | (392,452 | ) | | | (4,127,730 | ) |
| | | | (183,122 | ) | | $ | (2,160,105 | ) | | | (333,266 | ) | | $ | (3,494,467 | ) |
Beginning Shares | | | 1,165,456 | | | | | | | | 1,498,722 | | | | | |
Ending Shares | | | 982,334 | | | | | | | | 1,165,456 | | | | | |
LoCorr Market Trend Fund - Class I | | | | | | | | |
| | For the Year Ended December 31, 2021 | | | For the Year Ended December 31, 2020 | |
| | Shares | | | Amount | | | Shares | | | Amount | |
Shares Sold | | | 6,776,071 | | | $ | 82,404,215 | | | | 8,851,198 | | | $ | 96,849,535 | |
Reinvestment of Distributions | | | 729,663 | | | | 8,405,716 | | | | 49,414 | | | | 551,952 | |
Shares Redeemed | | | (5,753,991 | ) | | | (68,979,665 | ) | | | (10,571,183 | ) | | | (114,309,560 | ) |
| | | | 1,751,743 | | | $ | 21,830,266 | | | | (1,670,571 | ) | | $ | (16,908,073 | ) |
Beginning Shares | | | 19,252,314 | | | | | | | | 20,922,885 | | | | | |
Ending Shares | | | 21,004,057 | | | | | | | | 19,252,314 | | | | | |
LoCorr Market Trend Fund | | | | | | | | |
Total Net Increase (Decrease) | | | | | | $ | 18,194,264 | | | | | | | $ | (26,027,449 | ) |
LoCorr Macro Strategies Fund, LoCorr Long/Short Commodities Strategy Fund and LoCorr Market Trend Fund – Notes to Consolidated Financial
Statements / LoCorr Dynamic Equity Fund and LoCorr Spectrum Income Fund – Notes to Financial Statements (continued) |
LoCorr Dynamic Equity Fund - Class A | | | | | | | | |
| | | For the Year Ended December 31, 2021 | | | For the Year Ended December 31, 2020 | |
| | Shares | | | Amount | | | Shares | | | Amount | |
Shares Sold | | | 102,566 | | | $ | 1,323,999 | | | | 50,164 | | | $ | 499,777 | |
Reinvestment of Distributions | | | 15,874 | | | | 198,590 | | | | — | | | | — | |
Shares Redeemed | | | (125,982 | ) | | | (1,600,048 | ) | | | (322,671 | ) | | | (3,199,298 | ) |
| | | | (7,542 | ) | | $ | (77,459 | ) | | | (272,507 | ) | | $ | (2,699,521 | ) |
Beginning Shares | | | 329,445 | | | | | | | | 601,952 | | | | | |
Ending Shares | | | 321,903 | | | | | | | | 329,445 | | | | | |
LoCorr Dynamic Equity Fund - Class C | | | | | | | | |
| | For the Year Ended December 31, 2021 | | | For the Year Ended December 31, 2020 | |
| | Shares | | | Amount | | | Shares | | | Amount | |
Shares Sold | | | 70,466 | | | $ | 859,097 | | | | 4,223 | | | $ | 36,979 | |
Reinvestment of Distributions | | | 14,422 | | | | 167,585 | | | | — | | | | — | |
Shares Redeemed | | | (67,143 | ) | | | (802,281 | ) | | | (161,078 | ) | | | (1,472,858 | ) |
| | | | 17,745 | | | $ | 224,401 | | | | (156,855 | ) | | $ | (1,435,879 | ) |
Beginning Shares | | | 222,903 | | | | | | | | 379,758 | | | | | |
Ending Shares | | | 240,648 | | | | | | | | 222,903 | | | | | |
LoCorr Dynamic Equity Fund - Class I | | | | | | | | |
| | For the Year Ended December 31, 2021 | | | For the Year Ended December 31, 2020 | |
| | Shares | | | Amount | | | Shares | | | Amount | |
Shares Sold | | | 659,035 | | | $ | 8,704,039 | | | | 544,142 | | | $ | 5,728,123 | |
Reinvestment of Distributions | | | 75,645 | | | | 969,774 | | | | — | | | | — | |
Shares Redeemed | | | (342,978 | ) | | | (4,491,773 | ) | | | (1,031,948 | ) | | | (10,110,308 | ) |
| | | | 391,702 | | | $ | 5,182,040 | | | | (487,806 | ) | | $ | (4,382,185 | ) |
Beginning Shares | | | 995,506 | | | | | | | | 1,483,312 | | | | | |
Ending Shares | | | 1,387,208 | | | | | | | | 995,506 | | | | | |
LoCorr Dynamic Equity Fund | | | | | | | | |
Total Net Increase (Decrease) | | | | | | $ | 5,328,982 | | | | | | | $ | (8,517,585 | ) |
LoCorr Spectrum Income Fund - Class A | | | | | | | | |
| | | For the Year Ended December 31, 2021 | | | For the Year Ended December 31, 2020 | |
| | Shares | | | Amount | | | Shares | | | Amount | |
Shares Sold | | | 341,419 | | | $ | 2,415,690 | | | | 284,686 | | | $ | 1,707,329 | |
Reinvestment of Distributions | | | 96,107 | | | | 664,027 | | | | 171,555 | | | | 926,014 | |
Shares Redeemed | | | (672,361 | ) | | | (4,649,336 | ) | | | (1,893,903 | ) | | | (10,310,359 | ) |
Redemption Fees | | | — | | | | 113 | | | | — | | | | 4,449 | |
| | | | (234,835 | ) | | $ | (1,569,506 | ) | | | (1,437,662 | ) | | $ | (7,672,567 | ) |
Beginning Shares | | | 2,218,581 | | | | | | | | 3,656,243 | | | | | |
Ending Shares | | | 1,983,746 | | | | | | | | 2,218,581 | | | | | |
LoCorr Spectrum Income Fund - Class C | | | | | | | | |
| | For the Year Ended December 31, 2021 | | | For the Year Ended December 31, 2020 | |
| | Shares | | | Amount | | | Shares | | | Amount | |
Shares Sold | | | 608,586 | | | $ | 4,302,885 | | | | 96,324 | | | $ | 617,906 | |
Reinvestment of Distributions | | | 103,688 | | | | 725,686 | | | | 144,053 | | | | 784,112 | |
Shares Redeemed | | | (331,191 | ) | | | (2,315,660 | ) | | | (781,385 | ) | | | (4,311,479 | ) |
Redemption Fees | | | — | | | | 128 | | | | — | | | | 218 | |
| | | | 381,083 | | | $ | 2,713,039 | | | | (541,008 | ) | | $ | (2,909,243 | ) |
Beginning Shares | | | 2,139,683 | | | | | | | | 2,680,691 | | | | | |
Ending Shares | | | 2,520,766 | | | | | | | | 2,139,683 | | | | | |
LoCorr Macro Strategies Fund, LoCorr Long/Short Commodities Strategy Fund and LoCorr Market Trend Fund – Notes to Consolidated Financial
Statements / LoCorr Dynamic Equity Fund and LoCorr Spectrum Income Fund – Notes to Financial Statements (continued) |
LoCorr Spectrum Income Fund - Class I | | | | | | | | |
| | For the Year Ended December 31, 2021 | | | For the Year Ended December 31, 2020 | |
| | Shares | | | Amount | | | Shares | | | Amount | |
Shares Sold | | | 3,695,955 | | | $ | 25,752,205 | | | | 1,412,246 | | | $ | 8,309,828 | |
Reinvestment of Distributions | | | 243,713 | | | | 1,686,078 | | | | 239,666 | | | | 1,291,002 | |
Shares Redeemed | | | (1,045,875 | ) | | | (7,216,851 | ) | | | (2,558,879 | ) | | | (13,508,228 | ) |
Redemption Fees | | | — | | | | 274 | | | | — | | | | 275 | |
| | | | 2,893,793 | | | $ | 20,221,706 | | | | (906,967 | ) | | $ | (3,907,123 | ) |
Beginning Shares | | | 3,463,315 | | | | | | | | 4,370,282 | | | | | |
Ending Shares | | | 6,357,108 | | | | | | | | 3,463,315 | | | | | |
LoCorr Spectrum Income Fund | | | | | | | | |
Total Net Increase (Decrease) | | | | | | $ | 21,365,239 | | | | | | | $ | (14,488,933 | ) |
Conversion Feature
Class C shares purchased directly from the Funds or through a financial intermediary, except as otherwise disclosed in the Funds’ prospectus, automatically convert to Class A shares in the month of the 8-year anniversary date of the purchase of the Class C shares, based on the relative NAV of each such class without the imposition of any sales charge, fee or other charge.
7. Federal Tax Information
At December 31, 2021, the components of accumulated earnings (losses) on a tax basis were as follows(1):
| | | LoCorr Macro Strategies
Fund(2) | | | LoCorr Long/Short
Commodities
Strategy Fund(2) | | | LoCorr Market
Trend Fund(2) | |
Tax cost of portfolio | | $ | 1,365,872,436 | | | $ | 852,506,664 | | | $ | 235,994,190 | |
| | | | | | | | | | | | |
Gross unrealized appreciation | | $ | 15,884,479 | | | $ | 79,810,333 | | | $ | 3,396,239 | |
Gross unrealized depreciation | | | (9,936,573 | ) | | | (3,751,783 | ) | | | (1,579,513 | ) |
Net unrealized appreciation (depreciation) | | | 5,947,906 | | | | 76,058,550 | | | | 1,816,726 | |
Undistributed ordinary income | | | 14,070,824 | | | | — | | | | 19,346,938 | |
Undistributed long-term capital gains | | | — | | | | — | | | | — | |
Total earnings accumulated | | | 14,070,824 | | | | — | | | | 19,346,938 | |
Other accumulated losses | | | (53,329,471 | ) | | | — | | | | (23,470,698 | ) |
Total accumulated earnings ( accumulated losses) | | $ | (33,310,741 | ) | | $ | 76,058,550 | | | $ | (2,307,034 | ) |
| | | LoCorr Dynamic Equity
Fund | | | LoCorr Spectrum Income
Fund | |
Tax cost of portfolio | | $ | 27,763,020 | | | $ | 66,656,853 | |
| | | | | | | | |
Gross unrealized appreciation | | $ | 2,681,807 | | | $ | 13,997,428 | |
Gross unrealized depreciation | | | (1,894,138 | ) | | | (3,946,192 | ) |
Net unrealized appreciation | | | 787,669 | | | | 10,051,236 | |
Undistributed ordinary income | | | 54,493 | | | | — | |
Undistributed long-term capital gains | | | 241,693 | | | | — | |
Total earnings accumulated | | | 296,186 | | | | — | |
Other accumulated losses | | | (105,846 | ) | | | (32,309,452 | ) |
Total accumulated earnings ( accumulated losses) | | $ | 978,009 | | | $ | (22,258,216 | ) |
(1) | Total Portfolio represents aggregate amounts of each Fund’s investments, securities sold short, forward currency contracts and futures contracts, where applicable. |
(2) | Tax Cost is presented on a non-consolidated basis and includes each Fund’s investment in the respective CFC and the unrealized appreciation and depreciation associated with those investments. |
LoCorr Macro Strategies Fund, LoCorr Long/Short Commodities Strategy Fund and LoCorr Market Trend Fund – Notes to Consolidated Financial
Statements / LoCorr Dynamic Equity Fund and LoCorr Spectrum Income Fund – Notes to Financial Statements (continued) |
Undistributed income or net realized gains for financial statement purposes may differ from amounts recognized for federal income tax purposes due to differences in the recognition and characterization of income, expense and capital gain items. The difference between book-basis and tax-basis unrealized appreciation (depreciation) is attributed primarily to the tax deferral of losses on wash sales, mark to market, investments in partnerships and other temporary differences.
The following reclassifications were made within the components of net assets as of December 31, 2021:
| | | Total Distributable
Earnings/(Accumulated
Loss) | | | Paid-in Capital | |
LoCorr Macro Strategies Fund | | $ | 2,723,213 | | | $ | (2,723,213 | ) |
LoCorr Long/Short Commodities Strategy Fund | | | 43,057,584 | | | | (43,057,584 | ) |
LoCorr Market Trend Fund | | | (2,008,472 | ) | | | 2,008,472 | |
LoCorr Dynamic Equity Fund | | | (207,865 | ) | | | 207,865 | |
LoCorr Spectrum Income Fund | | | (624,837 | ) | | | 624,837 | |
The LoCorr Macro Strategies Fund’s reclassifications are primarily attributable to certain reclassifications related to the Fund’s wholly-owned subsidiary and equalization.
The LoCorr Long/Short Commodities Strategy Fund’s reclassifications are primarily attributable to certain reclassifications related to the Fund’s wholly-owned subsidiary and equalization.
The LoCorr Market Trend Fund’s reclassifications are primarily attributable to certain reclassifications related to the Fund’s wholly-owned subsidiary and equalization.
The LoCorr Dynamic Equity Fund’s reclassifications are primarily the result of equalization.
The LoCorr Spectrum Income Fund’s reclassifications are primarily attributable to certain reclassifications related to partnership basis adjustments and prior year true-ups.
Under the current tax law, capital losses realized after October 31 may be deferred and treated as occurring on the first day of the following fiscal year. The Funds elected to defer no capital losses for the fiscal year ended December 31, 2021.
At December 31, 2021, accumulated net realized capital loss carryovers, if any, and the year(s) in which the capital loss carryovers expire were:
| | | Capital Loss Carryover | | | | | |
| | | Short-Term | | | Long-Term | | | Year of
Expiration | |
LoCorr Macro Strategies Fund | | $ | 41,066,331 | | | $ | 12,052,130 | | | | Indefinitely | |
LoCorr Market Trend Fund | | | 21,379,634 | | | | 2,079,699 | | | | Indefinitely | |
LoCorr Spectrum Income Fund | | | 10,561,718 | | | | 21,159,411 | | | | Indefinitely | |
During the year ended December 31, 2021, the LoCorr Dynamic Equity Fund and the LoCorr Spectrum Income Fund utilized unlimited capital loss carryover of $890,609 and $4,171,140, respectively. The LoCorr Macro Strategies Fund, the LoCorr Long/Short Commodities Strategy Fund and the LoCorr Market Trend Fund did not utilize any capital loss carryovers during the year ended December 31, 2021.
8. Line of Credit
The Trust entered into an unsecured, uncommitted Loan Agreement (“Line of Credit” or “LOC”) with U.S. Bank not individually but as an umbrella facility on behalf of the Funds in the Trust. The LOC expires on March 8, 2022. The LOC was established to provide the Funds a temporary short-term liquidity source, subject to certain restrictions, covenants and the right of setoff on the Funds’ assets, to meet unanticipated redemptions. Under terms of the LOC, borrowings for each Fund are limited to the lesser of one-third of the net unencumbered assets (including the amount borrowed) of the respective Fund, 5% of the gross assets of the respective Fund or $50 million in the aggregate for all of the Funds under this agreement. U.S. Bank, N.A. charges an interest rate per annum equal to the Prime Rate (3.25% as of December 31, 2021).
LoCorr Macro Strategies Fund, LoCorr Long/Short Commodities Strategy Fund and LoCorr Market Trend Fund – Notes to Consolidated Financial
Statements / LoCorr Dynamic Equity Fund and LoCorr Spectrum Income Fund – Notes to Financial Statements (continued) |
Line of Credit activity for the year was as follows:
| | | For the Year Ended December 31, 2021 | |
| | | | | | | | | | | Maximum Amount Borrowed | |
Fund | | Interest Charges
Incurred | | | Average Daily
Loan Balance | | | Weighted
Average % | | | $ | | | Date | |
LoCorr Dynamic Equity Fund | | $ | 167 | | | $ | 5,131 | | | | 3.25% | | | | 479,000 | | | | June 25, 2021 -
June 27, 2021 | |
The LoCorr Dynamic Equity Fund was the only Fund that utilized the Line of Credit during the year ended December 31, 2021. At December 31, 2021, the Funds did not have any outstanding borrowings.
9. Subsequent Events
In preparing the financial statements, the Adviser has evaluated events after December 31, 2021.
Declaration of Dividends
The LoCorr Spectrum Income Fund declared the following ordinary income distributions:
| | | Distribution Amount per Share Class |
Dividend Declaration
Date (a) | Shareholder of
Record Date | Class A | Class C | Class I |
January 31, 2022 | January 28, 2022 | $0.0386 | $0.03470 | $0.04000 |
February 28, 2022 | February 25, 2022 | $0.0386 | $0.03470 | $0.04000 |
(a) | Ex-date, reinvest date and payable date. |
The estimated characterization of the distributions paid will be an ordinary dividend, qualified dividend or return of capital. See Note 2 for additional information.
There were no additional subsequent events since December 31, 2021 through the date the financial statements were issued that would require adjustments to or additional disclosure in these financial statements.
Report of Independent Registered Public Accounting Firm |
Report of Independent Registered Public Accounting Firm
To the Shareholders and Board of Trustees of
LoCorr Investment Trust
Opinion on the Financial Statements
We have audited the accompanying statements of assets and liabilities, including the schedules of investments, open forward currency contracts, open futures contracts, swap contracts, and written options (as applicable), of LoCorr Investment Trust comprising the funds listed below (the “Funds”) as of December 31, 2021, the related statements of operations, the statements of changes in net assets, the related notes, and the financial highlights for each of the periods indicated below (collectively referred to as the “financial statements”). In our opinion, the financial statements present fairly, in all material respects, the financial position of each of the Funds as of December 31, 2021, the results of their operations, the changes in net assets, and the financial highlights for each of the periods indicated below in conformity with accounting principles generally accepted in the United States of America.
Fund Name | Statements of
Operations | Statements of
Changes in Net Assets | Financial Highlights |
LoCorr Macro Strategies Fund, LoCorr Long/Short Commodities Strategy Fund, and LoCorr Market Trend Fund* | For the year ended December 31, 2021 | For the years ended December 31, 2021 and 2020 | For the years ended December 31, 2021, 2020, 2019, 2018, and 2017 |
LoCorr Dynamic Equity Fund and LoCorr Spectrum Income Fund | For the year ended December 31, 2021 | For the years ended December 31, 2021 and 2020 | For the years ended December 31, 2021, 2020, 2019, 2018, and 2017 |
* | The financial statements referred to throughout are consolidated. |
Basis for Opinion
These financial statements are the responsibility of the Funds’ management. Our responsibility is to express an opinion on the Funds’ financial statements based on our audits. We are a public accounting firm registered with the Public Company Accounting Oversight Board (United States) (“PCAOB”) and are required to be independent with respect to the Funds in accordance with the U.S. federal securities laws and the applicable rules and regulations of the Securities and Exchange Commission and the PCAOB.
We conducted our audits in accordance with the standards of the PCAOB. Those standards require that we plan and perform the audit to obtain reasonable assurance about whether the financial statements are free of material misstatement whether due to error or fraud.
Our audits included performing procedures to assess the risks of material misstatement of the financial statements, whether due to error or fraud, and performing procedures that respond to those risks. Such procedures included examining, on a test basis, evidence regarding the amounts and disclosures in the financial statements. Our procedures included confirmation of securities owned as of December 31, 2021, by correspondence with the custodian, counterparties and brokers; when replies were not received from brokers, we performed other auditing procedures. Our audits also included evaluating the accounting principles used and significant estimates made by management, as well as evaluating the overall presentation of the financial statements. We believe that our audits provide a reasonable basis for our opinion.
We have served as the Funds’ auditor since 2011.

COHEN & COMPANY, LTD.
Milwaukee, Wisconsin
February 28, 2022
LoCorr Investment Trust - Expense Example (Unaudited) |
Expense Example
December 31, 2021 (Unaudited)
As a shareholder of a mutual fund, you incur two types of costs: (1) transaction costs, including sales charges (loads) on purchase payments; redemption fees; and (2) ongoing costs, including management fees; distribution and/or service (12b-1) fees and other Fund expenses.
This Example is intended to help you understand your ongoing costs (in dollars) of investing in each of the Funds and to compare these costs with the ongoing costs of investing in other mutual funds. The Example is based on an investment of $1,000 invested at the beginning of the period and held for the entire period (July 1, 2021 through December 31, 2021).
Actual Expenses
The actual return columns in the following table provide information about account values based on actual returns and actual expenses. You may use the information in these columns, together with the amount you invested, to estimate the expenses that you paid over the period. Simply divide your account value by $1,000 (for example, an $8,600 account value divided by $1,000 = 8.6), then multiply the result by the number in the first line under the heading entitled “Expenses Paid During Period” to estimate the expenses you paid on your account during this period. The only transaction fees you may be required to pay are for outgoing wire transfers, returned checks and stop payment orders at prevailing rates charged by U.S. Bancorp Fund Services, LLC, doing business as U.S. Bank Global Fund Services, the Funds’ transfer agent. These fees are assessed on all accounts, as applicable. If you request that a redemption be made by wire transfer, currently the Funds’ transfer agent charges a $15.00 fee. The Funds’ transfer agent charges a transaction fee of $25.00 on returned checks and stop payment orders. If you paid a transaction fee, you would add the fee amount to the expenses paid on your account this period to obtain your total expenses paid.
Hypothetical Example for Comparison Purposes
The hypothetical return columns in the following table provide information about hypothetical account values and hypothetical expenses based on the Funds’ actual expense ratio and an assumed rate of return of 5% per year before expenses, which is not the Funds’ actual return. The hypothetical account values and expenses may not be used to estimate the actual ending account balance or expenses you paid for the period. You may use this information to compare the ongoing costs of investing in the Funds and other funds. To do so, compare this 5% hypothetical example with the 5% hypothetical examples that appear in the shareholder reports of the other funds. A transaction fee of $15.00 may be assessed on outgoing wire transfers and a transaction fee of $25.00 may be assessed on returned checks and stop payment orders. To include this fee in the calculation, you would add the estimated transaction fee to the hypothetical expenses shown in the table. Please note that the expenses shown in the table are meant to highlight your ongoing costs only and do not reflect the transaction fees discussed above. Therefore, those columns are useful in comparing ongoing costs only, and will not help you determine the relative total costs of owning different funds. In addition, if these transactional costs were included, your costs would have been higher.
LoCorr Investment Trust - Expense Example (Unaudited) (continued) |
Actual vs Hypothetical Returns
Actual vs. Hypothetical returns for the Six Months Ended December 31, 2021 (Unaudited)
| | | | | | | | | | | | | | | Actual | | | Hypothetical
(5% gross annual return) | |
Fund | | Class | | | Fund’s Annualized
Expense Ratio 1, 2 | | | Beginning Account
Value July 1, 2021 | | | Ending
Account Value
December 31,
2021 | | | Expenses Paid
During Period 1, 2, 3 | | | Ending
Account Value
December 31,
2021 | | | Expenses Paid
During Period 1, 2, 3 | |
| | | | | | | | | | | | | | | | | | | | | | | | | | | | | |
LoCorr Macro Strategies Fund | | | | | | | | | | | | | | | | |
| | | | A | | | | 2.16 | % | | $ | 1,000.00 | | | $ | 955.90 | | | $ | 10.68 | | | $ | 1,014.36 | | | $ | 11.00 | |
| | | | C | | | | 2.91 | % | | $ | 1,000.00 | | | $ | 952.10 | | | $ | 14.36 | | | $ | 1,010.56 | | | $ | 14.79 | |
| | | | I | | | | 1.91 | % | | $ | 1,000.00 | | | $ | 956.70 | | | $ | 9.45 | | | $ | 1,015.62 | | | $ | 9.73 | |
| | | | | | | | | | | | | | | | | | | | | | | | | | | | | |
LoCorr Long/Short Commodities Strategy Fund | | | | | | | | | | | | |
| | | | A | | | | 2.06 | % | | $ | 1,000.00 | | | $ | 1,054.80 | | | $ | 10.70 | | | $ | 1,014.86 | | | $ | 10.49 | |
| | | | C | | | | 2.81 | % | | $ | 1,000.00 | | | $ | 1,050.10 | | | $ | 14.56 | | | $ | 1,011.07 | | | $ | 14.28 | |
| | | | I | | | | 1.81 | % | | $ | 1,000.00 | | | $ | 1,056.40 | | | $ | 9.41 | | | $ | 1,016.13 | | | $ | 9.22 | |
| | | | | | | | | | | | | | | | | | | | | | | | | | | | | |
LoCorr Market Trend Fund | | | | | | | | | | | | |
| | | | A | | | | 2.01 | % | | $ | 1,000.00 | | | $ | 954.80 | | | $ | 9.93 | | | $ | 1,015.11 | | | $ | 10.24 | |
| | | | C | | | | 2.76 | % | | $ | 1,000.00 | | | $ | 950.90 | | | $ | 13.61 | | | $ | 1,011.32 | | | $ | 14.03 | |
| | | | I | | | | 1.76 | % | | $ | 1,000.00 | | | $ | 955.80 | | | $ | 8.70 | | | $ | 1,016.38 | | | $ | 8.97 | |
| | | | | | | | | | | | | | | | | | | | | | | | | | | | | |
LoCorr Dynamic Equity Fund | | | | | | | | | | | | | | | | |
| | | | A | | | | 2.59 | % | | $ | 1,000.00 | | | $ | 1,022.40 | | | $ | 13.24 | | | $ | 1,012.18 | | | $ | 13.17 | |
| | | | C | | | | 3.34 | % | | $ | 1,000.00 | | | $ | 1,018.10 | | | $ | 17.04 | | | $ | 1,008.39 | | | $ | 16.95 | |
| | | | I | | | | 2.34 | % | | $ | 1,000.00 | | | $ | 1,023.40 | | | $ | 11.97 | | | $ | 1,013.45 | | | $ | 11.91 | |
| | | | | | | | | | | | | | | | | | | | | | | | | | | | | |
LoCorr Spectrum Income Fund | | | | | | | | | | | | |
| | | | A | | | | 2.05 | % | | $ | 1,000.00 | | | $ | 991.10 | | | $ | 10.32 | | | $ | 1,014.91 | | | $ | 10.44 | |
| | | | C | | | | 2.80 | % | | $ | 1,000.00 | | | $ | 986.50 | | | $ | 14.06 | | | $ | 1,011.12 | | | $ | 14.23 | |
| | | | I | | | | 1.80 | % | | $ | 1,000.00 | | | $ | 992.20 | | | $ | 9.06 | | | $ | 1,016.18 | | | $ | 9.17 | |
1 | Includes dividend and/or interest expense of 0.00%, 0.00%, 0.00%, 0.35% and 0.00% for the LoCorr Macro Strategies Fund, the LoCorr Long/Short Commodities Strategy Fund, the LoCorr Market Trend Fund, the LoCorr Dynamic Equity Fund and the LoCorr Spectrum Income Fund, respectively. |
2 | Includes expenses of wholly-owned and controlled Cayman Islands subsidiaries for the LoCorr Macro Strategies Fund, the LoCorr Long/Short Commodities Strategy Fund and the LoCorr Market Trend Fund. |
3 | Expenses Paid During Period are equal to the net annualized expense ratio for the class, multiplied by the average account value over the period, multiplied by 184/364 (to reflect the one-half year period). |
Approval of Advisory Agreements (Unaudited) |
LoCorr Investment Trust
December 31, 2021 (Unaudited)
Review of Management and Sub-Advisory Agreements
Counsel directed the Board’s attention to Section 5 of the Board materials for the renewal of the investment sub-advisory agreement for the LoCorr Dynamic Equity Fund (“LDE Fund”).
The Board reviewed the memorandum provided by Counsel which had been provided to them prior to the meeting entitled, “Duties of Trustees with Respect to Approval and Renewal of Investment Advisory and Sub-Advisory Contracts”. The Board, including a majority of the Trustees who are not “interested persons” of the Trust within the meaning of the 1940 Act (the “Independent Trustees”), reviewed the various factors relevant to its consideration of the subadvisory agreement and the legal responsibilities of the Board related to such consideration. These factors included the following:
● | The nature, extent and quality of the services provided by the investment sub-adviser to the fund; |
● | The investment performance of the fund and the investment sub-adviser; |
● | The costs of the services to be provided and the profits to be realized by the sub-adviser and its affiliates from the relationship with the fund; |
● | The extent to which economies of scale will be realized as the fund grows; and |
● | Whether the fee levels reflect these economies of scale to the benefit of the shareholders. |
The Board reviewed the responses to the 15(c) questionnaire and the sub-advisory agreement prior to the meeting.
Kettle Hill Capital Management, LLC (“Kettle Hill”), Sub-Adviser (LDE Fund)
Counsel and Management noted the sub-advisory services provided by Kettle Hill for the LDE Fund with the Board. Counsel reviewed the responsibilities and experience of Kettle Hill’s key individuals and the resources of Kettle Hill. Counsel further noted that there were no changes in the key personnel of Kettle Hill since the Board’s last approval. The Trustees further discussed the services provided by Kettle Hill including equity research, financial modeling, investment risk oversight, security selection, trade execution and compliance testing for the LDE Fund.
Counsel indicated that Kettle Hill reported no material compliance issues, regulatory issues or material litigations in the past year. Counsel stated that Kettle Hill continued to maintain an Errors & Omissions insurance policy in an appropriate amount. After a discussion, the Board concluded that Kettle Hill has extensive investment management experience and appropriate resources to continue to provide satisfactory services for the LDE Fund.
The Trustees next reviewed the performance of Kettle Hill with respect to its allocation of the LDE Fund. Fund Counsel noted for the Trustees the sub-adviser’s performance compared to the overall LDE Fund. The Board noted that Kettle Hill’s 1 and 5-year performance had exceeded the overall performance of the Fund. The Trustees also discussed Kettle Hill’s performance relative to the Fund’s benchmark and the sub-adviser’s own benchmark. A representative of the Adviser indicated the Adviser’s satisfaction with Kettle Hill’s recent strong performance and the overall relationship with Kettle Hill. After a discussion, the Board concluded that Kettle Hill’s performance remained satisfactory.
Counsel then directed the Board’s attention to the costs of services provided by Kettle Hill to the LDE Fund. Counsel reviewed for the Trustees the fees charged by Kettle Hill to its other advisory accounts including other registered investment companies. The Board noted Kettle Hill’s net profits related to its services to the LDE Fund. The Board reviewed and discussed the level of Kettle Hill’s profitability and found it to be not excessive After further discussion, the Board concluded that Kettle Hill’s sub-advisory fee and profitability were reasonable.
The Trustees reviewed and discussed that Kettle Hill continues to receive soft-dollar benefits from its relationship with the LDE Fund that Kettle Hill uses for brokerage and research purposes. After a discussion, the Trustees concluded that the other benefits that may be derived by Kettle Hill from its relationship with the Fund were not unreasonable.
Having requested and received such information from the Adviser as the Trustees believed to be reasonably necessary to evaluate the terms of the sub-advisory agreement with Kettle Hill, and as assisted by the advice of Counsel, the Trustees concluded that the subadvisory fee was not unreasonable and that renewal of the sub-advisory agreement with Kettle Hill was in the best interests of the shareholders of the LDE Fund.
Approval of Advisory Agreements (Unaudited) (continued) |
First Quadrant LLC (“First Quadrant”), Sub-Adviser (LDE Fund)
The Trustees noted that, as a sub-adviser to the Fund, First Quadrant provides quantitative research, security selection and trade execution for the Fund’s portfolio as well as compliance services to assure assets are managed within the Fund’s investment restrictions. The Trustees reviewed the experience and backgrounds of the personnel at First Quadrant that provide services to the Fund.
The Trustees further reviewed First Quadrant’s investment strategy and risks, its compliance approach and risk controls. The Trustees noted First Quadrant’s compliance controls including its monitoring of restrictions as well as its technology and infrastructure. Counsel noted that First Quadrant did not report any material compliance issues, regulatory examinations or material litigations in the past 36 months. The Trustees concluded that First Quadrant has the appropriate personnel and resources to continue to serve as a sub-adviser to the Fund.
The Trustees considered the investment performance of First Quadrant’s allocation of the Fund, noting that it underperformed the Fund as a whole. A representative of the Adviser noted that the Adviser believed that First Quadrant was following its investment strategy as intended and that the Adviser was satisfied with the sub-adviser’s performance during the period. After a discussion, the Trustees concluded that First Quadrant’s performance was not unreasonable.
The Trustees considered the sub-advisory fee was slightly lower than the average fee charged by First Quadrant to its separately managed account clients. After further discussion, the Trustees concluded that the proposed sub-advisory fee was reasonable. The Trustees noted that any breakpoints in the fee schedule was a more appropriate consideration for the Trustees’ evaluation of the Adviser’s investment advisory agreement with the Fund.
The Trustees considered the profits realized by First Quadrant in connection with its relationship with the Fund and whether the amount of profit is reasonable with respect to the sub-advisory services provided to the Fund. The Trustees noted First Quadrant reported a small profit as a result of its subadvisory relationship with the Fund, both in terms of actual dollars and as a percentage of gross revenues. After a discussion, the Trustees concluded that the level of profit was not excessive.
Having requested and received such information from First Quadrant as the Trustees believed to be reasonably necessary to evaluate the terms of the Sub-Advisory Agreement, and as assisted by the advice of counsel, the Trustees concluded that the fee structure is reasonable and that renewal and approval of the Sub-Advisory Agreement is in the best interests of the shareholders of the Fund.
Millrace Asset Group (“Millrace”), Sub-Adviser (LDE Fund)
The Trustees noted that, as a sub-adviser to the Fund, Millrace will research investment opportunities, select investments, provide compliance services and trade execution for its allocation of the Fund’s portfolio. The Trustees also noted that Millrace managed approximately $184 million in assets through two investment partnerships. The Trustees reviewed the responsibilities of Millrace’s key individuals, noting the experience and backgrounds of these individuals. The Trustees noted that Millrace has certified that it adopted a code of ethics under Rule 17j-1 of the 1940 Act. A representative of the Adviser explained to the Trustees that the Adviser had identified Millrace as a potential sub-adviser after conducting significant due diligence on Millrace’s investment, operational and compliance resources and capabilities.
The Trustees further noted Millrace’s overall long/short equity strategy and corresponding investment risks. The Trustees reviewed Millrace’s compliance process including its monitoring of Investment Company Act restrictions as diversification, leverage and liquidity. Counsel noted that Millrace did not report any material compliance issues or material litigations in the past 36 months. Counsel and the CCO did note that Millrace did have a routine examination conducted by the SEC which concluded in June 2021 with no material findings. After a discussion, the Trustees concluded that Millrace was well-suited to perform the services as a sub-adviser to the Fund.
The Trustees noted that Millrace was in the process of obtaining an Officers’ (“E&O/D&O”) policy. The Trustees concluded that Millrace was appropriately resourced and has a depth of experienced personnel and the investment expertise to provide high quality services to the Fund.
The Trustees considered the investment performance of Millrace’s representative account for its long/short equity strategy, which the Trustees noted is a reasonable substitute as a reference performance record. Counsel indicated that the representative fund account reported 1, 5 and 10-year and since inception returns that outperformed the Russell 2000 Growth Index and the HFRI Equity Hedge Index. After a discussion, the Trustees concluded that it was reasonable that Millrace would provide satisfactory performance.
Approval of Advisory Agreements (Unaudited) (continued) |
The Trustees considered the proposed sub-advisory fee was lower than the fee charged by Millrace to its investment partnerships. After further discussion, the Trustees concluded that the proposed sub-advisory fee was reasonable. The Trustees considered whether there will be economies of scale with respect to the management of the Fund. The Trustees agreed that this was primarily an adviser-level issue and should be considered with respect to the overall advisory contract, taking into consideration the impact of the sub-advisory expense. After discussion, it was the consensus of the Trustees that a lack of breakpoints was acceptable.
The Trustees considered the anticipated profits to be realized by Millrace in connection with its relationship with the Fund and whether the amount of profit is reasonable with respect to the sub-advisory services to be provided to the Fund. The Trustees noted that Millrace estimates realizing a small profit, both in terms of percentage of revenue as well as actual dollars, based on the amount of assets that Millrace is expected to manage initially. After a discussion, the Trustees concluded that the anticipated level of profit was not excessive.
Having requested and received such information from Millrace as the Trustees believed to be reasonably necessary to evaluate the terms of the Sub-Advisory Agreement, and as assisted by the advice of counsel, the Trustees concluded that the fee structure is reasonable and that approval of the Sub-Advisory Agreement is in the best interests of the shareholders of the Fund.
Millburn Ridgefield Corp. (“Millburn”), Sub-Adviser (LCMFS Fund Limited (“LCMFS Fund”))
The Trustees reviewed the nature, extent and quality of subadvisory services provided by Millburn to the Fund. Counsel directed the Trustees’ attention to the 15(c) responses for Millburn. The Trustees reviewed the responsibilities of Millburn’s personnel providing services to the Fund, noting that there were no material changes in key personnel. A representative of the Adviser further noted that Millburn provides portfolio management, investment strategy development and trade execution for the Fund’s portfolio as well as compliance services to assure the assets allocated to it are managed within the Fund’s investment restrictions. Counsel noted for the Trustees’ benefit that they were considering the approval of a new subadvisory agreement with Millburn as a result of a potential change in control of Millburn, which would terminate the existing subadvisory agreement with the Fund. A representative of the Adviser further explained that the Adviser did not expect that the potential change in control of Millburn would have any effect on the level or quality of the services to be provided by Millburn to the Fund.
Counsel reported to the Trustees that Millburn did not have any material compliance issues in the past year nor any material litigation issues. The Trustees reviewed Millburn’s compliance and risk controls including its investment risk management processes and portfolio limitation monitoring. Counsel stated that Millburn carried an appropriate E&O/D&O policy. The Trustees noted that Millburn had recently undergone a routine examination by the SEC in 2021 with no material findings reported by Millburn. The Trustees concluded that Millburn is well-resourced and has experienced portfolio management personnel. The Trustees deduced that the services provided by Millburn to the Fund have been satisfactory and that the Trustees expects Millburn to continue to provide quality services in the future.
The Trustees then reviewed the investment performance of Millburn’s allocation of the Fund’s portfolio. A representative of the Adviser discussed Millburn’s recent relative solid performance compared to the benchmark and that the Adviser continued to be satisfied with the execution of Millburn’s strategy. After a discussion, the Trustees concluded that they were satisfied with Millburn’s performance for the Fund.
Counsel noted that the sub-advisory fee structure was lower than the fee charged by Millburn to its separately managed account clients. The Trustees also noted that Millburn’s fee did not include an incentive fee. After further discussion, the Trustees concluded that the sub-advisory fee was reasonable.
The Trustees considered whether there were any economies of scale with respect to the management of the Fund. The Trustees agreed that this was primarily an adviser level issue and should be considered with respect to the overall advisory contract, taking into consideration the impact of the sub-advisory expense. After a discussion, the Trustees concluded that a lack of breakpoints was acceptable.
The Trustees next considered the profits realized by Millburn in connection with its relationship with the Fund and whether the amount of profit is a fair profit with respect to the sub-advisory services provided to the Fund. After a discussion, it was the consensus of the Trustees that the level of profit was reasonable.
Having requested and received such information from Millburn as the Trustees believed to be reasonably necessary to evaluate the terms of the Sub-Advisory Agreement, and as assisted by the advice of Counsel, the Trustees concluded that Millburn’s fee structure was not unreasonable and that approval of the Sub-Advisory Agreement is in the best interests of the shareholders of the LCMFS Fund.
Notice of Privacy Policy & Practices/Quarterly Portfolio Holdings/Proxy (Unaudited) |
Notice of Privacy Policy & Practices
(Unaudited)
Your privacy is important to us. The Funds are committed to maintaining the confidentiality, integrity, and security of your personal information. When you provide personal information, the Funds believe that you should be aware of policies to protect the confidentiality of that information.
The Funds collect the following nonpublic personal information about you:
● | Information we receive from you on or in applications or other forms, correspondence, or conversations, including, but not limited to, your name, address, phone number, social security number, assets, income and date of birth; and |
● | Information about your transactions with us, our affiliates, or others, including, but not limited to, your account number and balance, payments history, parties to transactions, cost basis information and other financial information. |
The Funds do not disclose any nonpublic personal information about our current or former shareholders to affiliated or nonaffiliated third parties, except as permitted by law. For example, the Funds are permitted by law to disclose all of the information we collect, as described above, to our transfer agent to process your transactions. Furthermore, the Funds restrict access to your nonpublic personal information to those persons who require such information to provide products or services to you. The Funds maintain physical, electronic and procedural safeguards that comply with applicable federal and state standards to guard your nonpublic personal information.
In the event that you hold shares of the Funds through a financial intermediary, including, but not limited to, a broker-dealer, bank, or trust company, the privacy policy of your financial intermediary would govern how your nonpublic personal information would be shared with affiliated or non-affiliated third parties.
Portfolio Holdings Disclosure
(Unaudited)
The Funds file a complete schedule of portfolio holdings with the U.S. Securities and Exchange Commission (the “SEC”) for the first and third quarters of each fiscal year on Part F of Form N-PORT. The Funds’ Part F of Form N-PORT are available on the SEC’s website at www.sec.gov and may be reviewed and copied at the SEC’s Public Reference Room in Washington, D.C. Information on the operation of the Public Reference Room may be obtained by calling 1-800-SEC-0330. The Funds’ Part F of Form N-PORT may also be obtained by calling toll-free 1-855-523-8637.
Proxy voting policies, procedures and record
(Unaudited)
You may obtain a description of the Funds’ (1) proxy voting policies, (2) proxy voting procedures and (3) information regarding how the Funds voted any proxies related to portfolio securities during the most recent 12-month period ended June 30 for which an SEC filing has been made, without charge, upon request by contacting the Funds directly at 1-855-523-8637, or on the EDGAR Database on the SEC’s website (http:// www.sec.gov).
Qualified Dividend Income (“QDI”) / Dividends Received Deduction (“DRD”) (Unaudited) |
Qualified Dividend Income (“QDI”) / Dividends Received Deduction (“DRD”)
(Unaudited)
For the fiscal year ended December 31, 2021, certain dividends paid by the Funds may be subject to a maximum tax rate of 15%, as provided for by the Jobs and Growth Tax Relief Reconciliation Act of 2003. The percentage of dividends declared from ordinary income designated as qualified income was as follows:
Fund | QDI% |
LoCorr Macro Strategies Fund | 0.00% |
LoCorr Long/Short Commodities Strategy Fund | 0.00% |
LoCorr Market Trend Fund | 0.00% |
LoCorr Dynamic Equity Fund | 18.71% |
LoCorr Spectrum Income Fund | 29.42% |
For corporate shareholders, the percent of ordinary income distributions qualifying for the corporate dividends received deduction for the fiscal year ended December 31, 2021 was as follows:
Fund | DRD% |
LoCorr Macro Strategies Fund | 0.00% |
LoCorr Long/Short Commodities Strategy Fund | 0.00% |
LoCorr Market Trend Fund | 0.00% |
LoCorr Dynamic Equity Fund | 11.83% |
LoCorr Spectrum Income Fund | 24.92% |
Independent Trustees/Interested Trustees and Officers |
The Statement of Additional Information includes additional information about the Independent Trustees/Interested Trustees and Officers and is available, without charge, by calling 1-855-523-8637.
Independent Trustees | | | |
Name and
Year of Birth | Position/Term
of Office1 | Principal Occupation
During the Past 5 Years | Number of
Portfolios in
Fund Complex2
Overseen by
Trustee | Other
Directorships
Held by Trustee
During the Past
5 Years |
Gary Jarrett
Year of Birth: 1954 | Trustee/
2016–present | Chief Executive Officer, Black River Asset Management LLC, investment subsidiary of Cargill, Inc., 2002–2015. | 5 | None |
Mark Thompson
Year of Birth: 1959 | Trustee/
2011–present | Chairman and Chief Manager, Riverbridge Partners, LLC (investment management), 1987–present. | 5 | None |
Ronald A. Tschetter
Year of Birth: 1941 | Trustee/
2011–present | Mr. Tschetter is presently retired from his principal occupations; Director of the U.S. Peace Corps, 2006–2009. | 5 | None |
| | | | | |
Interested Trustees and Officers | | | |
Name and
Year of Birth | Position/Term
of Office1 | Principal Occupation
During the Past 5 Years | Number of
Portfolios in
Fund Complex2
Overseen by
Trustee | Other
Directorships
Held by Trustee
During the Past
5 Years |
Jon C. Essen3
Year of Birth: 1963 | Treasurer,
Secretary, Chief Financial Officer/ 2011–present; Trustee/
2010–present | LoCorr Fund Management, LLC: Chief Operating Officer (2010–2016), Chief Compliance Officer, (2010–2017); LoCorr Distributors, LLC: Principal, Chief Financial Officer, and Registered Representative (2008–present) Chief Compliance Officer (2008–2017); Steben & Company (broker/dealer and registered investment adviser): Principal and Chief Financial Officer (2020–present) | 5 | None |
Kevin M. Kinzie4
Year of Birth: 1956 | President, Trustee/ 2011–present | Chief Executive Officer of LoCorr Fund Management, LLC, 2010 to present; President and Chief Executive Officer of LoCorr Distributors, LLC (broker/dealer), 2002– present. President and Chief Executive Officer of Steben & Company (broker/dealer and registered investment adviser), (2019–present). | 5 | None |
Brian Hull5
Year of Birth: 1968 | Chief Compliance Officer/
2019–present | Steben & Company (broker/dealer and registered investment adviser): Chief Compliance Officer 2002–2007 and 2012–Present; Financial & Operations Principal (FINOP) 2002–Present; Registered Representative 2002–Present. | 5 | None |
1 | The term of office for each Trustee listed above will continue indefinitely. |
2 | The term “Fund Complex” refers to the LoCorr Investment Trust. |
3 | Mr. Essen is an interested Trustee because he is an officer of the Funds’ Adviser. |
4 | Mr. Kinzie is an interested Trustee because he is an officer and indirect controlling interest holder of the Funds’ Adviser. |
5 | Mr. Hull is an interested person because he is an officer of the Funds’ Adviser. |

Item 2. Code of Ethics.
The registrant has adopted a code of ethics that applies to the registrant’s principal executive officer and principal financial officer. The registrant has not made any amendments to its code of ethics during the period covered by this report. The registrant has not granted any waivers from any provisions of the code of ethics during the period covered by this report.
A copy of the registrant’s Code of Ethics is incorporated by reference. See Item 13(a)(1).
Item 3. Audit Committee Financial Expert.
The registrant’s board of directors has determined that there is at least one audit committee financial expert serving on its audit committee. Gary Jarrett is the “audit committee financial expert” and is considered to be “independent” as each term is defined in Item 3 of Form N-CSR.
Item 4. Principal Accountant Fees and Services.
The registrant has engaged its principal accountant to perform audit services, audit-related services, tax services and other services during the past two fiscal years. “Audit services” refer to performing an audit of the registrant's annual financial statements or services that are normally provided by the accountant in connection with statutory and regulatory filings or engagements for those fiscal years. “Audit-related services” refer to the assurance and related services by the principal accountant that are reasonably related to the performance of the audit. “Tax services” refer to professional services rendered by the principal accountant for tax compliance, tax advice, and tax planning. “Other services” provided by the principal accountant of $6,500 and $5,000 represent a cursory review of the semi-annual report for LoCorr Investment Trust for the periods ended June 30, 2021 and June 30, 2020, respectively. The following table details the aggregate fees billed or expected to be billed for each of the last two fiscal years for audit fees, audit-related fees, tax fees and other fees by the principal accountant.
| | FYE 12/31/2021 | FYE 12/31/2020 |
| (a) Audit Fees | $130,000 | $135,000 |
| (b) Audit-Related Fees | $0 | $0 |
| (c) Tax Fees | $30,000 | $30,000 |
| (d) All Other Fees | $6,500 | $5,000 |
(e)(1) The Audit Committee has adopted pre-approval policies and procedures that require the Audit Committee to pre-approve all audit and non-audit services of the registrant, including services provided to any entity affiliated with the registrant.
(e)(2) The percentage of fees billed by Cohen & Company, Ltd. applicable to non-audit services pursuant to waiver of pre-approval requirement were as follows:
| | FYE 12/31/2021 | FYE 12/31/2020 |
| Audit-Related Fees | 0% | 0% |
| Tax Fees | 0% | 0% |
| All Other Fees | 0% | 0% |
| (f) | The percentage of hours expended on the principal accountant’s engagement to audit the registrant’s financial statements for the most recent fiscal year that were attributed to work performed by persons other than the principal accountant’s full-time, permanent employees was less than fifty percent. |
| (g) | The aggregate non-audit fees billed by the registrant’s accountant for services rendered to the registrant, and rendered to the registrant’s investment adviser (not including any sub-adviser whose role is primarily portfolio management and is subcontracted with or overseen by another investment adviser), and any entity controlling, controlled by, or under common control with the adviser that provides ongoing services to the registrant for each of the last two fiscal years of the registrant was $0 for 2021 and $0 for 2020. |
Item 5. Audit Committee of Listed Registrants.
Not applicable to registrants who are not listed issuers (as defined in Rule 10A-3 under the Securities Exchange Act of 1934).
Item 6. Investments.
| (a) | Schedule of Investments is included as part of the report to shareholders filed under Item 1 of this Form. |
Item 7. Disclosure of Proxy Voting Policies and Procedures for Closed-End Management Investment Companies.
Not applicable to open-end investment companies.
Item 8. Portfolio Managers of Closed-End Management Investment Companies.
Not applicable to open-end investment companies.
Item 9. Purchases of Equity Securities by Closed-End Management Investment Company and Affiliated Purchasers.
Not applicable to open-end investment companies.
Item 10. Submission of Matters to a Vote of Security Holders.
There have been no material changes to the procedures by which shareholders may recommend nominees to the registrant’s Board of Trustees.
Item 11. Controls and Procedures.
| (a) | The registrant’s President and Treasurer have reviewed the registrant's disclosure controls and procedures (as defined in Rule 30a-3(c) under the Investment Company Act of 1940 (the “Act”)) as of a date within 90 days of the filing of this report, as required by Rule 30a-3(b) under the Act and Rules 13a-15(b) or 15d-15(b) under the Securities Exchange Act of 1934. Based on their review, such officers have concluded that the disclosure controls and procedures are effective in ensuring that information required to be disclosed in this report is appropriately recorded, processed, summarized and reported and made known to them by others within the registrant and by the registrant’s service provider. |
| (b) | There were no changes in the registrant's internal control over financial reporting (as defined in Rule 30a-3(d) under the Act) that occurred during the period covered by this report that has materially affected, or is reasonably likely to materially affect, the registrant's internal control over financial reporting. |
Item 12. Disclosure of Securities Lending Activities for Closed-End Management Investment Companies
Not applicable to open-end investment companies.
Item 13. Exhibits.
| (a) | (1) Any code of ethics or amendment thereto, that is the subject of the disclosure required by Item 2, to the extent that the registrant intends to satisfy Item 2 requirements through filing an exhibit. |
Incorporated by reference to the registrant’s Form N-CSR filed March 7, 2014.
(2) A separate certification for each principal executive and principal financial officer pursuant to Section 302 of the Sarbanes-Oxley Act of 2002.
Filed herewith.
(3) Any written solicitation to purchase securities under Rule 23c-1 under the Act sent or given during the period covered by the report by or on behalf of the registrant to 10 or more persons.
Not applicable to open-end investment companies.
(4) Changes in the registrant’s independent public accountant.
There was no change in the registrant’s independent public accountant for the period covered by the report.
| (b) | Certifications pursuant to Section 906 of the Sarbanes-Oxley Act of 2002. |
Furnished herewith.
SIGNATURES
Pursuant to the requirements of the Securities Exchange Act of 1934 and the Investment Company Act of 1940, the registrant has duly caused this report to be signed on its behalf by the undersigned, thereunto duly authorized.
| | (Registrant) | LoCorr Investment Trust | |
| | | | |
| | By (Signature and Title) | /s/ Kevin Kinzie | |
| | | Kevin Kinzie, President | |
| | | | |
| | Date | 3/4/2022 | |
Pursuant to the requirements of the Securities Exchange Act of 1934 and the Investment Company Act of 1940, this report has been signed below by the following persons on behalf of the registrant and in the capacities and on the dates indicated.
| | By (Signature and Title) | /s/ Kevin Kinzie | |
| | | Kevin Kinzie, President | |
| | | | |
| | Date | 3/4/2022 | |
| | | | |
| | By (Signature and Title) | /s/ Jon Essen | |
| | | Jon Essen, Treasurer | |
| | | | |
| | Date | 3/4/2022 | |