UNITED STATES
SECURITIES AND EXCHANGE COMMISSION
Washington, D.C. 20549
FORM N-CSR
CERTIFIED SHAREHOLDER REPORT OF REGISTERED
MANAGEMENT INVESTMENT COMPANIES
Investment Company Act file number 811-22509
LoCorr Investment Trust
(Exact name of registrant as specified in charter)
687 Excelsior Blvd
Excelsior, MN 55331
(Address of principal executive offices) (Zip code)
CT Corporation System
1300 East Ninth Street
Cleveland, OH 44114
(Name and address of agent for service)
952.767.2920
Registrant's telephone number, including area code
Date of fiscal year end: December 31
Date of reporting period: December 31, 2018
Item 1. Reports to Stockholders.
Letter to Shareholders
LoCorr Funds seeks to provide investments that, over time, will have low correlation to traditional asset classes such as stocks and bonds. We believe that adding low correlating investments to portfolios can significantly reduce overall portfolio risk while enhancing returns. Correlation measures the degree to which the returns of two investments move together over time. LoCorr offers products that provide the potential for positive returns in rising or falling markets and are designed to generate returns independent of traditional stock, bond and commodity investments. In this report, LoCorr Funds are reporting on five mutual funds: LoCorr Macro Strategies Fund, LoCorr Long/Short Commodities Strategy Fund, LoCorr Market Trend Fund, LoCorr Dynamic Equity Fund and LoCorr Spectrum Income Fund (collectively, the “Funds”).
LoCorr Macro Strategies Fund
The LoCorr Macro Strategies Fund (the “Fund”) seeks capital appreciation as its primary investment objective with managing volatility as a secondary objective. The Fund attempts to achieve its objective by investing in two main strategies - a Managed Futures Strategy and a Fixed Income Strategy.
The Fund employs three sub-advisers to manage the managed futures portion of the Fund: Millburn Ridgefield Corporation (Millburn), Graham Capital Management (Graham), and Revolution Capital Management (Revolution). Millburn traces its roots back to 1971 and manages approximately $6.2 billion in assets. Graham was founded in 1994 and manages about $13.1 billion in assets. Revolution was founded in 2004 and manages approximately $470 million in assets.
Millburn manages a portfolio for the Fund that is similar to its Millburn Diversified Program, which commenced operations in 1977. They invest in a diversified portfolio of global futures contracts, by combining non-traditional and trend-following strategies in a systematic multi-factor approach. Graham manages a portfolio for the Fund that is similar to its Tactical Trend strategy, a systematic medium- to longterm trend following program that commenced trading in 2006. Revolution manages a strategy for the Fund that is similar to its Alpha Program, that has been available in a managed account program since 2007. They employ a short- to medium-term pattern recognition strategy that incorporates trend reversion and counter-trend signals.
Market Commentary
In 2018, markets in most asset classes and sectors experienced frequent reversals. These conditions challenged managed futures strategies, particularly trend following, which typically performs better when there are more persistent directional movements in markets. While the sub-advisers employ multiple investment strategies and disciplines, the Fund was challenged by these conditions.
Geopolitical influences such as the U.S./China trade war, Brexit, and Federal Reserve interest rate hikes created considerable volatility over the course of the year. Despite the upward move in the U.S. Dollar, for example, individual markets including the Euro and Japanese Yen experienced sizable reversals. Within Equities, the powerful up-trend that had been firmly entrenched stopped abruptly in late January. It then began moving higher until late September before selling-off sharply through year-end, with many individual equity indices entering “official” bear market territory (marked by a decline of greater than 20%). Commodities were heavily influenced by the trade war with China, while Fixed Income reversals were frequent throughout the year. In aggregate, there were few gradual and persistent directional moves during the course of the year that did not experience painful reversals.
For the calendar year ended December 31, 2018, the Fund’s Class I shares returned -5.08% versus +1.87% for the ICE BofAML 3M U.S. Treasury Bill Index, and -4.38% for the S&P 500 Index. The Fund outperformed the Morningstar US Fund Managed Futures category, which declined -6.02% during the year. The negative performance in 2018 broke a string of four consecutive calendar years of positive absolute returns. From a performance perspective for the year, the Fund was not able to overcome a difficult February. At that time, volatility spiked and markets corrected rapidly, as exhibited by the Dow Jones Industrial Average’s largest-ever intraday decline of nearly 1,600 points on February 5, during a massive flight-to-safety move. The speed of this shock was so rapid that the sub-adviser’s models were challenged to adapt quickly enough. The Fund was more successful in “protecting” capital during the equity market correction later in the year (9/21/18 - 12/24/18), which was longer in duration. During the period, the Fund remained essentially unchanged -0.30% versus the -19.36% decline for the S&P 500 Index.
The Fund’s diversified approach of allocating to three complementary sub-advisers helped to limit the Fund’s overall volatility and drawdowns during the year, providing a smoother ride relative to many peers. The Fund benefitted from its allocation to Millburn, whose machine-learning based, multi-factor model generated positive absolute returns. Revolution’s returns were negative in 2018, while the Fund’s trend following component managed by Graham produced the largest losses. By sector, trading in Commodities was the most profitable sector, led by gains in Energy. The largest losses during the period stemmed from trading in Equities, with smaller losses in Foreign Currency and Fixed Income. The target allocation to each sub-adviser remained unchanged versus the prior year:
• Millburn Ridgefield Corporation: 40%
• Graham Capital Management: 40%
• Revolution Capital Management: 20%
Managed Futures Strategy
Equity Indices
The environment in 2018 shifted dramatically, as volatility surged and the longest bull run in history that began in 2009 following the end of the financial crisis came to an abrupt end. To illustrate the extent of the volatility experienced in the equity markets, the S&P 500 had a daily percentage change in excess of 1% sixty-four times in 2018 versus eight times in 2017. Intra-day, the S&P 500 Index peaked on September 21 and entered bear market territory (a decline of at least -20%) by the close of trading on December 24. Other equity markets such as the Russell 2000 Index, a proxy for U.S. small cap stocks, experienced even larger drawdowns of -26.07% from September 21 through December 24. Further, the violent and sustained downward move in equities occurring during the final months of the year were the second major bout of sharp declines seen during 2018. In late January/early February 2018, risk assets including equities and oil corrected sharply as volatility rocketed higher, though that sell-off was relatively short-lived. Certainly, the equity market environment was far different in 2018 than it had been in recent memory.
Trading in Equity Indices was unprofitable during 2018, as the markets experienced sizable reversals from prevailing conditions in both late January/early February 2018 and again beginning late September 2018, which proved challenging. With upward-moving equity markets in 2017, the Fund entered 2018 with sizable long positions, which were hurt by the late January/early February sell-off before positioning shifted short. As equity markets corrected in the fourth quarter, the Fund experienced losses in October and November as long positions were hurt. The Fund’s exposure shifted to short during the quarter, particularly in European equities, leading to profitable trading in December as the sell-off intensified.
Fixed Income
Yields in the U.S. continued their climb early in the year as economic growth remained robust, expectations for inflation moved higher, and the Fed signaled its intent to continue on the path of hiking interest rates. U.S. rates were range-bound and trendless, moving higher and lower within that range. This dynamic shifted in September 2018, as rates pushed higher leading up to the Fed’s third hike of the year at the Federal Reserve Bank (Fed) meeting on the 26. The U.S. 10-year yield reached 3.23% in November 2018, before plummeting due to a rapid shift in sentiment, as concerns regarding slowing economic growth and the potential for a Fed- and trade war-induced recession surfaced, as well as the flight-to-safety caused by the sell-off in equities. The rally in Treasuries pushed the U.S. 10-year yield to 2.69% by the end of the year. The Treasury Curve also reached its flattest point in over a decade.
Activity outside the U.S. was sluggish amid global trade tensions and a continued slowdown in China. Yields outside the U.S. also wavered over the course of the year. The German 10-year Bund yield fell, with the period marked by sizable reversals. The Japanese 10-Year Government Bonds (10-Year JGB) moved higher beginning in July 2018, before peaking in October and reaching its lowest levels of the year during December, due to geopolitical fears and the general flight-to-safety environment.
Trading in Fixed Income was unprofitable in 2018. The bulk of the losses were attributable to unprofitable trading in long- and intermediate-term contracts. With interest rates in the U.S. moving higher for most of the year, the Fund was hurt by the sharp reversal late in 2018. As interest rates moved lower in November/December 2018 during the flight-to-safety rally, short U.S. positions were unprofitable.
Foreign Currencies
After peaking in December 2016, the U.S. Dollar Currency Index (DXY), a proxy for the U.S. Dollar versus a basket of major currencies, generally trended lower (U.S. Dollar weakening) as economic growth in the Euro zone and Asia strengthened, and prospects for interest rate hikes looked to be on the horizon. These trends reversed towards the end of the first quarter in 2018, with the U.S. Dollar strengthening as foreign economic data started to soften. European currency markets were also impacted by a brief Italian political crisis created by a hung parliament, though a coalition was eventually formed, resulting in fears of an Italian exit from the European Union as well as concerns regarding Italy’s excessive debt. The BOE (Bank of England) also backed away from an expected rate hike, while the Fed continued on its more hawkish path, which also contributed to the reversal in the currency markets. During the second half of the year, DXY was generally trendless and characterized by frequent small reversals, conditions that proved challenging for trend following strategies. The inability of the British government to reach a consensus on the specifics of its extraction from the EU (Brexit) further contributed to volatility in the currency market during 2018, particularly for the British Pound and Euro. After weakening against the Japanese Yen (Yen) in the first quarter, the U.S. Dollar reversed, strengthening against the Yen until late in the year, when the Yen recovered sharply on the flight-to-safety trade. Overall, the DXY increased approximately 4.4% during the year.
Trading in Foreign Currencies (FX) was unprofitable in 2018 due to losses during the first half of the year, which offset small gains from trading during the second half, as positioning shifted from long FX vs. U.S. Dollar to short FX vs. U.S. Dollar. Trading in the Japanese Yen was unprofitable, as positioning shifted between long and short at inopportune times. For example, late in the year, the Fund was short Japanese Yen vs. U.S. Dollar when the safe-haven Yen rallied sharply, as risk assets sold-off. Trading in the New Zealand Dollar was also significantly unprofitable during the year.
Commodities
Volatility in the commodity markets stemming from geopolitical factors, including the trade war with China, global growth concerns, OPEC production cuts, Fed rate hikes, etc., wreaked havoc in the commodity complex, leading to massive price movement and elevated volatility in a number of commodities. In the fourth quarter, oil prices were the poster child for this volatility, but agricultural and metal commodities, including soybean and copper, were also rocked by the U.S./China trade wars. China is a massive consumer of industrial metals and agricultural commodities, so its demand has a huge influence on these commodity prices given its massive economy.
Commodity trading was profitable during the year, as sizable gains from Energy positions and marginal gains from Precious Metals more than offset losses in Base Metals and Agricultural markets. In Energy, long positions in oil benefitted from rising prices, as represented by West Texas Intermediate crude (WTI), which moved from about $60/barrel at the end of 2017 to $75/barrel by the end of June. This strength in crude was attributable to geopolitical tension in the Middle East and uncertainty regarding the Iran nuclear deal, along with strong demand and OPEC/Russia production cuts. After peaking at nearly $77/barrel in early October 2018, WTI declined to a low near $42/barrel on December 24, 2018. This collapse came following OPEC’s decision to increase production at a June meeting, increased U.S. production, slowing global economic growth, and perhaps President Trump’s lobbying of Saudi Arabia for lower prices pressured crude and oil-derived commodities during the quarter. The Fund’s long positions in October 2018 were hurt by this sharp reversal, but positioning shifted short during November, resulting in profitable trading during the final two months of the year. Overall, the largest gains during the year came from trading in WTI and Brent crude.
Within Commodities, trading in Base Metals generated the largest losses for the Fund, as long positions from February through June were unprofitable as prices moved lower in commodities such as aluminum, copper, and zinc, primarily attributable to the U.S./China trade war. While base metal prices declined further during the second half of the year (with many falling approximately -20% for the year), the Fund’s positions moved short by July 2018, resulting in slightly profitable trading in the second half of the year. The largest losses in Base Metals trading were in aluminum and copper. Positions in Agricultural commodities were slightly unprofitable due to losses occurring during February 2018 and March 2018.
Outlook
2018 was a difficult period for the broader managed futures industry as the environment was characterized by a lack of directionality and trendless conditions in most asset classes. As we look forward to 2019, macro conditions have shifted considerably in comparison with the prior few years, which were marked by historically low volatility. With volatility returning to more historical norms and many equity indices entering bear markets (>20% decline), we believe the need for diversification and low correlating investment strategies like managed futures remains high.
Entering 2019, macro concerns remain abundant, ranging from the Chinese/U.S. trade war, the end game for a Brexit resolution, and the impact of Federal Reserve policy as global economic growth cools. While difficult to predict how these and other major geopolitical issues will be resolved, LoCorr believes we are likely to remain in a higher volatility regime and continue to see market corrections with more frequency than what we’ve experienced in the post-global financial crisis world.
We remain highly confident in the ability of the Fund to provide positive absolute returns and compelling diversification for investors. We believe the multi-manager structure that combines complementary investment strategies will help the Fund navigate markets in a smoother and less volatile fashion. Finally, the Fund has demonstrated an ability to perform in a variety of market environments, including periods of both rising and falling equity prices. This was most recently demonstrated during the September through December 2018 sell-off in equities, as the Fund returned -0.30% versus -19.36% for the S&P 500 Index.
Fixed Income Strategy
The Macro Strategies Fund invests most of its remaining assets in a Fixed Income Strategy comprised of short- to intermediate-term, investment grade corporate and government agency securities. Nuveen Asset Management (Nuveen) is the sub-adviser for this strategy and manages a shorter duration, high quality portfolio.
The fixed income component of the Fund is managed against the Barlcay 1-5 Government/Credit Index. Returns for the fixed income portfolio in 2018 were +1.81% compared to +1.38% for the benchmark. Given that the sub-adviser expected short term rates to be gradually pressured higher as the Fed continued to normalize policy, the fixed income portfolio was focused on generating income, while maintaining a defensive interest rate posture. Accordingly, the portfolio was overweight non-government sectors of the bond market and had duration, or interest rate sensitivity, lower than the benchmark.
The duration of the portfolio was managed between 2.0 and 2.3 years during the period, versus approximately 2.6 years for the benchmark. The team’s decision to position duration defensively over the time period was a positive contributor versus the benchmark, however, curve position was a moderate detractor. Sector-wise, the portfolio was positioned with approximately 35% weighting to investment grade corporate bonds, along with 35-40% aggregate weighting to high-quality, short duration securitized instruments. The portfolio’s corporate bond issuer exposure was well diversified, with modest overweighting to both Financials and Industrials. An overweight to non-government sectors didn’t have a material impact on performance, as wider spreads were offset by security selection relative to the benchmark and the additional income these sectors provided.
U.S. economic growth accelerated during the year, with employment and income gains robust as fiscal stimulus impacted the domestic economy. Although U.S. inflation finally ticked up in the first half of the year, broader inflation risk remained benign. The Federal Reserve raised rates 100 basis points during the year as it continues to normalize monetary policy. Activity outside the U.S. was sluggish, amid global trade tensions and a continued slowdown in China.
Financial markets were volatile during the year as investors focused on growth and trade worries, equity market volatility, and Fed action. Risk assets finished the year down as Equities had a significant fourth quarter sell-off, while credit spreads widened to multi-year highs. The short end of the Treasury yield curve rose on solid economic growth and the Federal Reserve hiking four times, while the long end showed a more subdued increase as inflation remained benign and risk sectors struggled. Given this dynamic, the Treasury Curve is at its flattest point in over a decade.
Nuveen expects U.S. growth to stabilize near trend, with risks from geopolitical and trade developments. The Fed is likely to move rates higher in 2019, but with a policy rate now around neutral and tightening financial conditions, it will be responsive to incoming economic data. Nuveen’s current base case expectation is for more Fed rate hikes in 2019. Given this Fed outlook and expectation for higher rates, the investment team is looking to manage the Funds’ duration defensively versus the benchmark. However, the team also expects to cover the duration underweight over time as the Fed nears a neutral policy rate. Nuveen expects investment grade credit fundamentals to remain solid, and see a positive technical picture as new-issue supply is expected to decrease. In securitized sectors, Nuveen continues to focus the portfolio’s sector exposure on the consumer related asset-backed securities and residential mortgage segments of the securitized sector.
LoCorr Long/Short Commodities Strategy Fund
The LoCorr Long/Short Commodities Strategy Fund (the “Long/Short Commodities Fund” or the “Fund”) provides investors with access to a Commodities Strategy in a mutual fund structure. Historically, investors have primarily accessed exposure to long-only commodities that rely on rising commodity prices to generate positive returns. Of course, commodity prices don’t always appreciate and occasionally experience sharp declines, as was seen most recently in the fourth quarter of 2018 when oil prices collapsed. The Long/Short Commodities Fund has the potential to profit while commodity prices increase or decrease. The Fund’s primary investment objective is capital appreciation in rising and falling commodities markets. The Fund attempts to achieve its investment objective by investing in two primary strategies - a Commodities Strategy and a Fixed Income Strategy.
The Fund accesses, via a total return swap agreement, the returns of Millburn’s Commodity Program (MILCOM), which began trading in 2005 and the returns of J E Moody & Company Commodity Relative Value Program (JEM CRV), which began trading in 2006. MILCOM employs a systematic trading strategy that takes outright long/short positions and relative value spread positions across 40+ commodity futures markets. JEM CRV employs a market neutral, systematic trading strategy that invests in relative value calendar spread positions across 20+ commodity markets.
During 2018, the Fund’s Class I shares gained +15.40%, well ahead of the -13.82% decline for the S&P GSCI Index and the +1.87% return for the ICE BofAML Treasury Bill Index. The Fund also protected capital relative to the S&P 500 Index which fell -4.38% during the year. During the equity market correction from 9/21/18 - 12/24/18, the Fund’s compelling diversification attributes were in full force, as it gained +4.39% versus the -19.36% decline for the S&P 500 Index. Both underlying commodity programs, JEM CRV and MILCOM, generated positive absolute returns during 2018. The largest gains for the year stemmed from Energy trading with smaller positive contributions from trading in Livestock and Grain markets. Trading in Metal markets was unprofitable during the year. Both directional long/short and relative value positions were significant contributors to the Fund’s double-digit gains.
Volatility in the commodity markets stemming from geopolitical factors including the trade war with China, global growth concerns, OPEC production cuts, Fed rate hikes, etc. wreaked havoc in the commodity complex, leading to sizable price movement and elevated volatility in a number of commodities over the course of the year. Oil prices were the poster child for this volatility during the fourth quarter, but agricultural and metal commodities, including soybean and copper, were rocked by the U.S./China trade wars. This type of volatility, in LoCorr’s view, provided robust opportunities for the Fund.
Commodities Strategy
Energy
Energy trading was highly profitable during 2018, accounting for the bulk of the Fund’s gains, with significant contributions from both
directional long/short positions as well as from relative value trading. Over the course of the year, directional positions in Brent crude oil and West Texas Intermediate crude (WTI) were highly profitable, while the Fund had small losses from trading in heating oil. In directional trading, positioning was long through early July 2018 as the Fund benefitted from rising oil prices, as represented by WTI, which moved from about $61/barrel at the end of 2017 to $74/barrel by the end of June. This strength in crude was attributable to geopolitical tension in the Middle East and uncertainty regarding the Iran nuclear deal, along with strong demand and OPEC/Russia production cuts.
The Fund’s positioning was long in October 2018 when oil prices collapsed. After peaking in early October, WTI declined to about $65/barrel by the end of the month and to a low just near $42/barrel on December 24, 2018. This collapse came following OPEC’s decision to increase production at a June meeting, while increased U.S. production, slowing global economic growth, and perhaps President Trump’s lobbying of Saudi Arabia for lower prices, pressured crude and oil-derived commodities during the quarter. While the Fund experienced losses from directional Energy trading in October, these were more than offset by gains from short positions in November and December, as positioning adjusted and benefitted from the plunging oil prices.
Relative value trading was profitable each quarter in 2018, as the managers were able to benefit from volatility and shifts along the forward curve. Calendar spread positions in Reformulated Blendstock for Oxygenate Blending gasoline was particularly profitable during the year.
Metals
Trading in Metals was unprofitable in 2018, attributable to losses from directional trading while relative value was not a significant driver. Generally, base metal prices fell in 2018, led by substantial declines in copper and zinc, which were weighed down by higher interest rates, a stronger dollar, and the trade war with China, given that country’s global prominence as a consumer of these commodities. Directional trading in London Nickel was the largest positive contributor, as short positions benefitted from price declines late in the year. This was offset by losses from positions in London Copper and London Aluminum HG. During the fourth quarter, short positions in gold and silver were hurt as prices rallied during the flight-to-safety trade as the U.S. dollar and stock market retreated.
Softs
Trading in softs was slightly profitable in 2018, led by modest gains from relative value positions which were largely offset by small losses in directional trading. Profitable short positions in coffee and sugar were the largest positive contributors from directional trading, while losses from cocoa positions were the largest detractor. Plunging coffee prices in the third quarter helped short positions, as the commodity reached its lowest level since 2005 due to record crop and the weak Brazilian Real (largest global coffee producer). Cocoa prices were particularly volatile over the course of the year, as prices soared +35.1% during the first quarter due to supply concerns in the Ivory Coast and Ghana, the largest cocoa producers in the world. Cocoa prices then declined from May through August 2018, hurting long positions, as the production forecast from the Ivory Coast was larger than expected.
Livestock and Grains
Trading in Livestock was the second largest contributor to the Fund’s gains, from a sector perspective, driven by strong gains from relative value positions. Calendar spread positions in cattle and hog were both highly profitable, particularly during the first quarter, with smaller gains over the course of Q2 2018 through Q4 2018. Trading in Grains was profitable during the year, led by gains from directional positions, while contributions from relative value trading was also slightly positive. The largest gains came from short positions in soybean as the trade war with China caused prices to decline. China is a major consumer of U.S. soybean, importing an estimated 60% of U.S. soybean exports. Trading in corn was also profitable as prices declined nearly 10% during the second quarter, benefitting short positions. Relative value calendar spread trading in wheat was also profitable, as the Fund was able to benefit from favorable shifts in the forward curve. Calendar spread positions in soybean were unprofitable.
Outlook
We believe the Fund may be highly attractive to investors seeking solutions that are uncorrelated to most investment strategies and asset classes, or for investors that are seeking alternatives in the commodity market. Commodity markets are characterized by high volatility and subject to sizable drawdowns, as we saw in 2018. This volatility can also create tremendous opportunities. We believe the Fund has the potential to capture these opportunities, as the underlying managers have the ability to take both long and short directional positions (benefit from commodities moving up or down), as well as to trade along the forward curve (relative value calendar spread trading). Finally, the Fund’s multi-manager approach has the potential reduce risk for investors, as the underlying managers tend to perform at different times, which may help reduce volatility and limit drawdowns.
Fixed Income Strategy
The Managed Futures Fund invests most of its remaining assets in a Fixed Income Strategy comprised of short- to intermediate-term investment grade corporate and government agency securities. Nuveen Asset Management (Nuveen) is the sub-adviser for this strategy and manages a shorter duration, high quality portfolio.
The fixed income component of the LoCorr Long/Short Commodity (LCSIX) portfolio is managed against the Barclay 1-5 Year Government/ Credit Index. Returns for the fixed income portion of the Fund were +1.77%, compared to +1.38% for the benchmark during 2018. The duration of the fixed income component of the Fund was managed between 2.0 and 2.3 years during the period, compared to about 2.6 years for the benchmark. The sub-adviser’s decision to position duration defensively over the period accounted for the outperformance versus the benchmark, while curve positioning was a detractor. The Fund held approximately 35% exposure to investment grade corporate bonds and about 35-40% aggregate weighting to high quality, short duration securitized instruments. The Fund’s corporate bond issuer exposure was well diversified, with a modest overweight in both Financials and Industrials. The overweight to non-government sectors didn’t have a material impact on performance, as wider spreads were offset by security selection relative to the benchmark and the additional income these sectors provided.
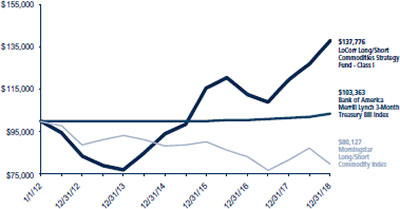
LoCorr Market Trend Fund
The LoCorr Market Trend Fund (the “Market Trend Fund” or the “Fund”) was created to provide investors with access to a trend-following futures strategy, managed by one of the leading managers in this space—Graham Capital Management. Graham was founded in 1994 and manages approximately $13.1 billion in assets. The Market Trend Strategy is managed similarly to Graham’s Tactical Trend program, a systematic medium- to long-term trend following strategy that commenced trading in 2006. The Fund seeks capital appreciation as its primary investment objective, with managing volatility as a secondary objective. The Fund attempts to achieve its objective by investing in two main strategies – a Market Trend Strategy and a Fixed Income Strategy.
In 2018, the environment for trend following strategies was challenging, as evidenced by the -8.10% decline for the SG Trend Index. Markets in most asset classes and sectors experienced frequent reversals during 2018, conditions that historically have challenged trend following strategies, which typically perform better when there is more persistent directional movement in markets. Geopolitical influences such as the U.S./China trade war, Brexit, and Federal Reserve interest rate hikes created considerable volatility over the course of the year. Despite the strength in the U.S. Dollar, for example, individual markets, including the Euro and Japanese Yen, experienced sizable reversals. Within Equities, the powerful up-trend that had been firmly entrenched stopped on a dime in late January, then began moving higher until late September, before selling-off sharply through year end. Many individual equity indices entered “official” bear market territory, marked by a decline of greater than 20%. Commodities were heavily influenced by the trade war with China, while Fixed Income reversals were frequent throughout the year. In aggregate, there were few gradual and persistent directional moves during the course of the year that did not experience painful reversals.
The Fund’s Class I shares fell -13.44% during the annual period ended December 31, 2018, trailing the +1.87% return for the ICE BofAML Treasury Bill Index and the -8.10% return for the SG Trend Index. The Fund was approximately flat (-0.27%) from a performance perspective year-to-date through October 3, but experienced sizable losses in the fourth quarter. Despite the negative returns in 2018, the Fund exhibited some of its diversification attributes during the last few months of the year. From the close on September 21 through December 24, the Fund outperformed the S&P 500 by approximately 12% as equity markets collapsed.
Market Trend Strategy
Equity Indices
The environment in 2018 shifted dramatically, as volatility surged, and the longest bull run in history that began in 2009 following the end of the great financial crisis came to an abrupt end. To illustrate the extent of the volatility experienced in the equity markets, the S&P 500 had a daily change in excess of 1% sixty-four times in 2018 versus eight times in 2017. Intra-day, the S&P 500 Index peaked on September 21 and entered bear market territory (decline of at least -20%) by the close of trading on December 24. Other equity markets experienced even larger drawdowns, such as the Russell 2000 Index, a proxy for U.S. small cap stocks, which declined -26.07% from September 21 through December 24. Further, the violent and sustained downward move in equities occurring during the final months of the year were the second major bout of sharp declines seen during 2018. In late January/early February, risk assets, including equities and oil, corrected sharply as volatility rocketed higher, though that sell-off was relatively short-lived. Certainly, the equity market environment was far different in 2018 than it had been in recent memory.
Trading for the Fund in Equities was unprofitable over the course of 2018. Entering the fourth quarter the Fund had gains in Equity trading, but those gains were more than offset by losses during the final quarter. The Fund entered the year with sizable long positions that shifted short as equity markets corrected in late January/early February. As markets reversed course again, positioning shifted, and were long when the equity markets imploded. While positioning shifted short during the fourth quarter, the Fund experienced losses before exposure adjusted. Losses were largest in U.S. markets, as long positions in the fourth quarter were hurt during the equity market correction. Trading in Asian markets was also unprofitable. European trading was marginally unprofitable, despite solid gains from short positions during the fourth quarter.
Fixed Income
Yields in the U.S. continued their climb early in the year as economic growth remained robust, expectations for inflation moved higher, and the Fed signaled its intent to continue on the path of hiking interest rates. U.S. rates were range-bound and trendless, moving higher and lower within that range. This dynamic shifted in September, as rates pushed higher leading up to the Fed’s third hike of the year at the FOMC meeting on the 26. The U.S. 10-year yield reached 3.23% in November, before plummeting due to a rapid shift in sentiment as concerns regarding slowing economic growth and the potential for a Fed- and trade war-induced recession surfaced, as well as the flight-to-safety caused by the sell-off in equities. The rally in Treasuries pushed the U.S. 10-year yield to 2.69% by the end of the year. The Treasury Curve also reached its flattest level in over a decade.
Activity outside the U.S. was sluggish, amid global trade tensions and a continued slowdown in China. Yields outside the U.S. also wavered over the course of the year. The German 10-year Bund yield fell, with the period marked by sizable reversals. The Japanese 10-Year Government Bonds (10-Year JGB) moved higher beginning in July, before peaking in October and reaching its lowest levels of the year during December, due to geopolitical fears and the general flight-to-safety environment.
Fixed Income trading was unprofitable, generating the largest losses for the Fund. These losses were primarily attributable to the intermediate and long end of the curve, while trading in short-term fixed income markets was only marginally unprofitable. The bulk of the performance difficulties came in the fourth quarter, as short positions (benefit from rising rates) in U.S. markets were hurt by falling interest rates caused by the aforementioned issues. Trading in European fixed income markets was also unprofitable, particularly early in the year, as yields on European instruments surged higher until mid-February before reversing course sharply, conditions that proved difficult for the sub-adviser’s trend-following models.
Foreign Currencies
After peaking in December 2016, the U.S. Dollar Currency Index (DXY), a proxy for the U.S. Dollar versus a basket of major currencies, generally trended lower (U.S. Dollar weakening) as economic growth in the Euro zone and Asia strengthened and prospects for interest rate hikes looked to be on the horizon. These trends reversed towards the end of the first quarter in 2018, with the U.S. Dollar strengthening as foreign economic data started to soften. European currency markets were also impacted by a brief Italian political crisis created by a hung parliament, though a coalition was eventually formed, resulting in fears of an Italian exit from the European Union as well as concerns regarding Italy’s excessive debt. The BOE (Bank of England) also backed away from an expected rate hike, while the Fed continued on its more hawkish path, which also contributed to the reversal in the currency markets. During the second half of the year, DXY was generally trendless and characterized by frequent small reversals, conditions that proved challenging for trend-following strategies. The inability of the British government to reach a consensus on the specifics of its extraction from the EU (Brexit) further contributed to volatility in the currency market during 2018, particularly for the British Pound and Euro. After weakening against the Japanese Yen (Yen) in the first quarter, the U.S. Dollar reversed, strengthening against the Yen until late in the year when the Yen recovered sharply on the flight-to-safety trade. Overall, the DXY increased approximately 4.4% during the year.
Trading in Foreign Currencies was unprofitable in 2018, as losses during the second quarter more than offset gains from the rest of the year. Short positions in the Canadian and Australian Dollar were the largest positive contributors, benefitting from the strength of the U.S. Dollar versus those currencies. These gains were more than offset, however, by losses from trading in the Yen and New Zealand Dollar. The sizable reversals in the Yen, for example, created particularly difficult trading conditions as positioning fluctuated over the course of the year.
Commodities
Volatility in the commodity markets, stemming from geopolitical factors including the trade war with China, global growth concerns, OPEC production cuts, Fed rate hikes, etc. wreaked havoc in the commodity complex, leading to massive price movement and elevated volatility in a number of commodities. In the fourth quarter, oil prices were quite volatile but agricultural and metal commodities, including soybean and copper, were also rocked by the U.S./China trade wars. China is a massive consumer of industrial metals and agricultural commodities, so its demand has a huge influence on these commodity prices given its massive economy.
Commodity positions were unprofitable in 2018 as gains from trading in Energy were offset by losses in Metal and Agricultural sectors. In Energy, long positions in oil during the first three quarters of the year benefitted from rising prices, as represented by West Texas Intermediate crude (WTI), which moved from about $60/barrel at the end of 2017 to $75/barrel by the end of June. This strength in crude was attributable to geopolitical tension in the Middle East and uncertainty regarding the Iran nuclear deal, along with strong demand and OPEC/Russia production cuts. After peaking at nearly $77/barrel in early October, WTI declined to a low near $42/barrel on December 24. This collapse came following OPEC’s decision to increase production at a June meeting, increased U.S. production, slowing global economic growth, and perhaps President Trump’s lobbying of Saudi Arabia for lower prices pressured crude and oil-derived commodities during the quarter. The Fund’s long positions in October were hurt by this sharp reversal, but overall for the year Energy trading remained profitable
Long positions in Base Metals during the first half of the year were unprofitable as prices moved lower in commodities such as aluminum, copper, and zinc, primarily attributable to the U.S./China trade war. While base metal prices declined further during the second half of the year (with many falling approximately -20% for the year), the Fund’s positions had moved short, resulting in profitable trading in the fourth quarter, albeit not enough to offset the aforementioned losses. Positions in Agricultural commodities were unprofitable, led by losses in trading Grains, while trading in Softs was marginally profitable.
Outlook
Similar to the last few years, 2018 was a difficult period for trend following as the environment was characterized by a lack of directionality
and trendless conditions in most asset classes. Where there had been some stronger directional moves like Equities, Energy, and Fixed income, these directional moves were followed by sharp reversals that have been difficult for trend followers to navigate. For example, interest rates had generally moved higher since mid-2016, as the Federal Reserve hiked and strong economic growth. This trend reversed sharply in November as the Fed adopted a more neutral stance and the outlook for economic growth quickly changed. Oil (WTI) experienced a similar rising trend that began in early 2016, also experiencing a dramatic reversal as WTI collapsed approximately 40% following its early October high.
Despite being out-of-favor over recent time periods, trend following has been a highly successful long-term approach. As we enter 2019, the macro environment looks considerably different than the beginning of 2018, as investors grapple with global growth concerns, tighter monetary policy, and heightened volatility across financial markets. We are hopeful that the difficult conditions plaguing trend following will abate, as geopolitical tensions, including the trade wars and Brexit, and the impact of Federal Reserve policy as it reaches a neutral stance, are resolved and diminish. We remain highly confident that the Fund will benefit from a favorable environment for trend following. We also remain confident in Graham Capital, who has a long and successful history in trend following.
Fixed Income Strategy
The Fund invests most of its remaining assets in a high quality, short-duration fixed income portfolio comprised of primarily government securities and very highly rated corporate fixed income securities. Nuveen Asset Management (Nuveen) is the sub-adviser for this strategy.
The fixed income portion of LoCorr Market Trend is conservatively managed as a short duration portfolio of the highest credit quality. It is benchmarked against the Barclay 1-3 Year Government Index, and focuses primarily on U.S. Treasuries and U.S. Government securities, but may own up to 30% in aggregate in corporate, municipal, and asset-backed securities of the highest credit quality. Returns for the fixed income portion of the Fund were +1.80%, compared to +1.58% for the benchmark during 2018. Nuveen’s defensive interest-rate strategy accounted for a portion of the outperformance relative to the Index, as the sub-adviser had positioned the duration of the portfolio short to the benchmark by between .30 and .40 years. Curve positioning was a slight detractor to performance. The portfolio generally owned about 27-29% in non-government securities during the time frame. This was a slight detractor to performance, as these securities underperformed government securities over the time period. The portfolio also held about 8-10% of U.S. Agency multifamily mortgage-backed securities (MBS); these securities underperformed similar-duration government securities and were a detractor to performance. As of December 31, 2018, portfolio duration was 1.50 years compared to 1.85 years for the benchmark, and about 71% of the portfolio was in U.S. government debt with the remainder in AAA rated non-government securities.
LoCorr Dynamic Equity Fund
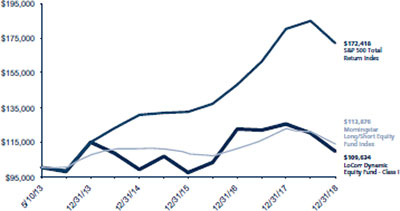
The LoCorr Dynamic Equity Fund (the “Fund”) seeks long-term capital appreciation with reduced volatility, compared to traditional broad-based equity market indices, as a secondary objective. Consistent with the “low correlation” our LoCorr Fund family seeks, long/short equity funds have the ability to provide positive returns when equity markets are rising, yet they offer the potential for “downside protection” when equity prices are falling.
The Fund employs three sub-advisers—Billings Capital Management (Billings), Kettle Hill Capital Management (Kettle Hill), and First Quadrant. Billings’ strategy is based on a value-oriented, concentrated, fundamental, bottom-up long/short equity approach. This manager seeks to maximize absolute returns, exceeding the S&P 500 index over the long term. The sub-portfolio managed by Billings is similar to a strategy that this manager has executed since 2008 with their current firm, and for many years prior to that at a different entity. Kettle Hill seeks to earn superior returns over an investment cycle, while focusing on capital preservation and downside volatility. The manager’s investment process combines bottom-up, fundamental analysis with a top-down, opportunistic overlay. Investing primarily in small cap securities, Kettle Hill targets a conservative net exposure to the market. The sub-portfolio managed by Kettle Hill is similar to a strategy that this manager has executed since its inception in 2003. First Quadrant was added to the portfolio in January 2019, and seeks to capture opportunity through a fundamentally-based, quantitative investment process with a dynamic and tactical approach to risk management. The sub-portfolio managed by First Quadrant is similar to a global long/short strategy the manager has executed since 2016, which invests in developed international and U.S. markets utilizing a systematic multi-factor approach, coupled with a target active beta management approach to maximize upside opportunities while reducing downside performance.
Market Commentary
The S&P 500 TR Index limped to the finish line, finishing an ugly year down -4.38% for 2018. This marked its first negative calendar year since 2008. Prominent themes for 2018 included tariffs and trade wars news, higher interest rate and Fed rate hikes, along with an unpredictable U.S. and global political climate. All of these factors contributed to an elevated level of volatility characterized by periodic spikes during the year.
While 2018 started out strong, in late January/early February inflation concerns, a hawkish Fed, and a spike in bond yields contributed to a massive market selloff and a dramatic rise in volatility. This negative market sentiment did not persist, however, as investors poured back into the markets after a strong jobs reports in March caused some relief after the February selloff. Following the market collapse that saw the S&P 500 fall -19.36% from September 21 to December 24, the Fed took a more dovish tone with respect to interest rates, causing the equity markets to rally during the final days of the year and into January 2019.
Portfolio Update
The Fund (LEQIX class I shares) struggled along with the broader equity markets, closing 2018 in the red, down -12.55%. The Fund underperformed both the Morningstar Long/Short Equity Fund Category, which was down -6.61%, and the S&P 500 TR, which was down -4.38%.
As market sentiment oscillated throughout 2018, albeit finishing in the red, the Fund’s market capitalization bias and stylistic approach both proved to be problematic in 2018. In more detail, the Fund’s small-to-mid capitalization market bias and stylistic value approach created headwinds as large cap stocks (Russell 1000 Index down -4.78%) outperformed small cap stocks (Russell 2000 Index down -11.01%). Headwinds from the Fund’s value bias were evidenced by the outperformance of growth (Russell 1000 Growth Index down -1.51%) versus value stocks (Russell 1000 Value Index down -8.27%). The Fund’s net exposure shifted throughout the year, but closed 2018 on the high end of its typical 40-60% range, at 62% net exposure.
The Fund’s long book was a detractor in 2018 as it struggled alongside the decline in the equity markets, but did see positive returns from the Financial Services, Healthcare, and Technology sectors. Within the Financial Services sector, Credit Acceptance Corp., a specialized auto financing company, benefited from better-than-estimated earnings along with strong loan growth, which was viewed favorably by investors. In the Healthcare sector, Syneos Health, a global contract research and outsourced commercialization organization that provides services to pharmaceutical and biotechnology firms, contributed positively to the Fund’s long book. Growth from its commercial solutions segment boosted revenues, along with an improving regulatory environment, helping the overall sector. In the Technology sector, Match Group, a provider of online dating services, was also a contributor to the Fund. The company has steadily created and acquired online dating products, as well as grown its advertising revenues, which has improved the Street’s sentiment towards the stock. A position in Advance Auto Parts, a supplier and distributor of automotive products, also proved to be beneficial to the Fund’s long book. The stock moved higher due to delivering better-than-expected earnings, as well as being a beneficiary of lower tax rates. Offsetting these gains were larger losses in the Communication Services sector and Consumer Cyclical sector. Within the Communication Services sector a concentrated position in Gogo, a U.S.-based in-flight connectivity systems and service provider, was the Fund’s largest detractor. The stock was hurt by ongoing operational execution issues, increasing costs with developing its air-to-ground network, and a shakeup in management, which all negatively impacted the stock. The position was exited in August as the stock had become too speculative and volatile in the sub-adviser’s opinion. In the Consumer Cyclical sector, positions in REV Group and Lear were also detractors, as both stocks were beaten up due to ongoing global trade tariff threats crippling their stock prices, and triggering negative sentiment from the Street. The Fund also had losses in the Industrials, Basic Materials, Consumer Defensive, and Utilities sectors.
Despite the significant market selloff towards the end of Q4 2018, the Fund’s short book finished slightly in the red and was a detractor to absolute returns. Short positions within the Financials Services and Consumer Defensive sectors were positive contributors, as both sectors came under downward pressure in 2018, though not enough to offset losses from the Consumer Cyclical sector. A position in an owner/ operator of retail beauty franchises, whose stock price moved higher as the company steadily beat earnings estimates, negatively impacted the Fund’s short position. The Fund’s short book also saw nominal losses from the Utilities, Real Estate, and Healthcare sectors.
Outlook
Given the 2018 market conditions, the Fund’s stylistic small-to-mid cap and value biases created headwinds. LoCorr remains confident in the outlook for this Fund, and believes the addition of First Quadrant will enhance the portfolio, can positively impact future risk-adjusted returns, and has been highly complementary to Billings and Kettle Hill.
Looking forward, we remain cautiously optimistic and expect volatile equity markets to continue in 2019. After the fourth quarter selloff, valuations have improved courtesy of the market’s correction, yet we do not believe that markets are necessarily “out of the woods”. On a positive note, the Fed has indicated a slowing of their recent tightening posture, trade war talks have dampened, and if temporary policy scares die down, positive sentiment could boost consumer and corporate spending in 2019. Conversely, if corporate earnings under-deliver, geopolitics and trade war discussions flare up, and the Fed makes unexpected moves, it could trigger volatility and sharp market moves causing negative sentiment. Knowing this to be true, we remain confident in the Fund’s multi-manager investment approach as sub-advisers seek to take advantage of the volatility and opportunity set in 2019.
LoCorr Spectrum Income Fund
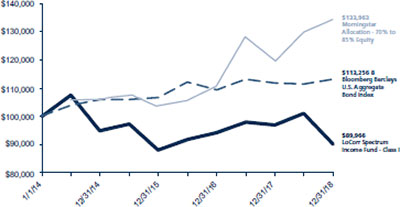
The LoCorr Spectrum Income Fund (the “Spectrum Income Fund” or the “Fund”) has an objective of current income with capital appreciation as a secondary objective. The Fund is designed to fit within the “low correlation” of the LoCorr Fund family by seeking to provide relatively high levels of income with low correlation to the bond market. The Fund’s sub-adviser is Trust and Fiduciary Income Partners (TFIP). TFIP invests in pass-through securities to seek high current income, much of which the Fund distributes monthly to investors.
The Fund’s Class I shares fell -7.91% during the annual period ending December 31, 2018 compared with the +0.01% return for the Barclay U.S. Aggregate Bond Index. Through the first nine months of the year, the Fund was up +8.37% versus the -1.60% decline for the Barclay U.S. Aggregate Bond Index, seemingly on its way to a solid year. In the manager’s view, the Fund’s challenging performance in the fourth quarter (which was enough to drag returns into negative territory for the year) is attributable primarily to the fact that portfolio positions are small- to mid-cap equities from a trading point of view. There were no significant issues in operating results for the Fund’s holdings. Indeed, many did quite well fundamentally, as they are not highly dependent upon strong economic growth.
Market Commentary
Capital markets in 2018 were characterized by the return of volatility, as U.S. equity markets posted their worst return since 2008. Despite moderate volatility early in the year, markets generally rose steadily to new all-time highs at the end of the third quarter, when the environment abruptly changed from one of coordinated global growth to one of fears of a growth slowdown or even a recession. Known factors, which had been in play well before the fourth quarter sell-off, such as trade tensions and retaliatory tariffs between the U.S. and China, were joined by a Federal Reserve stance seemingly unaware of the magnitude of economic slowdown. This led to a quarter-long decline, culminating in late December, that saw the S&P 500 decline by -19.36% from September 21 to December 24. The steepest declines were felt in Energy, Cyclicals, and smaller capitalization stocks, while defensive sectors generally outperformed.
Portfolio Update
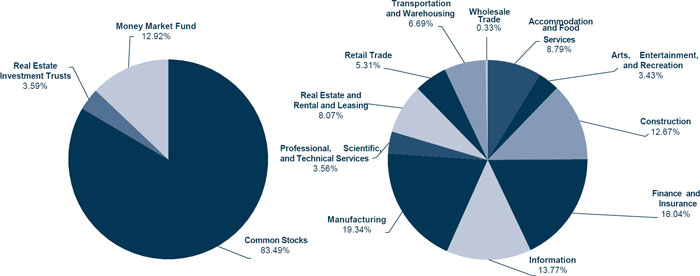
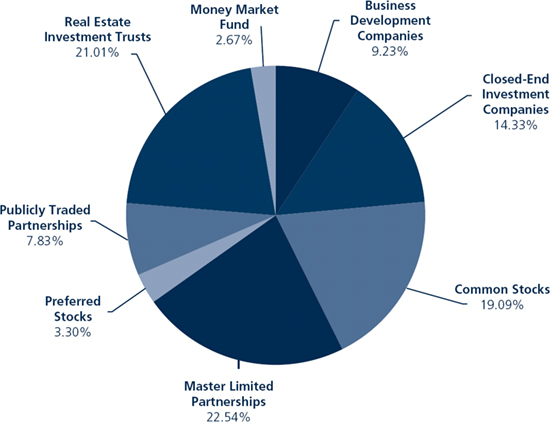
For the year, the Fund’s best performing sectors included Business Development Companies (BDCs), Master Limited Partnerships (MLPs), and Mortgage Real Estate Investment Trusts (Mortgage REITs). During 2018, BDCs initially benefitted from low levels of corporate default and a strong economy, as well as a law enacted in the second quarter allowing these companies to increase leverage from 1:1 to 2:1. MLPs, as measured by the Alerian Index, fell nearly -12.5% in 2018, with the worst price action occurring in the fourth quarter as crude oil prices fell nearly -40%. The Fund’s Equity REIT holdings struggled during the year, particularly during the fourth quarter, as the concern that the Fed would allow rates to rise above equilibrium hurt sentiment for the group. Holdings in the Fund’s more cyclical or energy-sensitive common stocks struggled during 2018, caught up in concerns regarding slowing economic growth and the collapse in oil prices. Finally, Publicly Traded Partnerships (PTPs) detracted from results as market conditions soured.
The first quarter of 2018 initially saw the continuation of late 2017 tax reform stimulus, until signs of inflation and growth expectations drove yields sharply higher and the market sold-off violently in late January/early February. The Fund experienced losses during the quarter, but benefitted from a position in DineEquity, whose execution of its turnaround strategy was proceeding well, and general strength in the fast-casual dining sector. Icahn Enterprises rose on the back of strong first quarter earnings which drove a distribution increase. Macy’s also gained, driven by positive results by the continued execution in its turnaround plan, and supported by strengthening consumer demand. The Fund’s more defensive Closed End Fund (CEF) holdings also held up better during the market turmoil. MLPs were hit hard as investors combed through the fine print of the Tax Reform Bill, though the sub-adviser’s view is that individual MLP unit holder’s tax burden became significantly less onerous. Nevertheless, the Fund’s MLP holdings hurt returns, particularly in mid-stream positions, including Summit Midstream Partners LP, which reported weaker-than-expected earnings despite maintaining a healthy distribution. Other notable detractors included Macquarie Infrastructure Corp., which cut its distribution causing the TFIP team to reduce the position size. The most significant portfolio addition during the first quarter was to a group of data center Real Estate Investment Trusts (REITs) which had sold-off due to the two-fold impact of negative rate-driven REIT sentiment and technology sector volatility, driven by user data-privacy concerns.
In the second quarter, the Fund experienced sizable gains. Cross-currents abounded, with tailwinds coming from strong earnings growth and tighter labor markets, while headwinds came from brewing trade wars, a hawkish U.S. Federal Reserve, rising interest rates and a strengthening U.S. Dollar. OPEC agreed to boost production at their June meeting, and oil rallied as the increase was generally less than feared. MLP holdings were the strongest contributors during the second quarter, most notably mid-stream positions. Crestwood Equity Partners LP was a significant contributor, moving higher due to strength in its midstream operations, as well as having a clean structure and growing distribution coverage. Icahn Enterprise, a non-Energy MLP, also rose sharply, buoyed by favorable market conditions for its portfolio holdings. BDC holdings performed well on small business optimism and the favorable interest rate environment for the type of loans these companies originate. The Fund also benefitted from strong performance by its Equity REIT positions, including Washington Prime Group, a retail REIT, and a number of data center REIT holdings. Thematically, the most significant portfolio shifts occurred as the sub-adviser increased exposure to consumer spending and energy-related names, while reducing exposure to holdings that benefit from a weaker dollar, credit sensitivity and a steepening Yield Curve.
In the third quarter, the Fund performed well as the U.S. economy continued its strong growth, prompting the Fed to maintain its upward path with respect to interest rates. MLPs, as measured by the Alerian Index, rallied in the quarter, providing a nice tailwind for the Fund. Crestwood Equity Partners was a notable mid-stream MLP performer, moving higher as it continued to execute on their growth initiatives, while maintaining financial discipline. Energy Transfer Partners, another mid-stream position, rallied on the announcement that the firm was conducting a simplification transaction, eliminating incentive distribution rights (IDRs) and emerging with a cleaner structure. PTP positions were also strong as asset managers rallied on the favorable market backdrop. Detractors from performance included: L Brands, which suffered from weakness in some core product lines; Seagate Technology, which sold-off on NAND pricing deterioration; and Washington Prime, a mall REIT which tends to react unfavorably to sharp moves higher in rates. TFIP added to the Fund’s exposure to gold, as the underlying commodity rallied off of technical support, and the underlying economic environment may create conditions that are conducive to higher prices. The team reduced exposure to data center REITs early in the quarter after a significant run up in price, avoiding a correction as rates rose. Finally, TFIP added several mid-stream energy positions that generate strong cash flows, which support high levels of distribution coverage.
In the fourth quarter of 2018, most equity-related markets experienced a dramatic decline, culminating in a meltdown in late December. The decline began following a speech by Fed Chair Jerome Powell in early October, when he expressed an ebullient tone regarding U.S. economic strength, and implicitly reaffirmed the Fed’s prior guidance that three rate hikes would be required in 2019, apparently ignoring the fact that prior monetary tightening acts with a lag and was nonetheless producing a slowdown. The Fund struggled during this quarter, as negative returns were more than enough to offset gains from the first nine months of the year. MLP positions were hit hard, falling in sympathy with the approximately -40% drop in WTI crude. The Fund’s mid-stream MLP holdings, in particular, experienced significant declines. Dominion Energy Midstream Partners was an exception, gaining slightly, but significant losers included Crestwood Equity Partners, Summit Midstream Partners, and EnLink Midstream Partners, which got caught up in the oil price volatility. In REITs, detractors included Washington Prime, a retail REIT, which suffered from headlines concerning store closures such as Sears. The Fund was also hurt by some if its PTP asset manager positions, along with more cyclical and energy-sensitive C-Corp positions. BDC positions were also weak as concerns regarding the leverage loan market surfaced during the market collapse. More defensive Closed End Funds held up relatively well during the market onslaught. The Fund was also buoyed by Mortgage REIT holdings including Chimera Investment Corp, which was sold before year-end, and New York Mortgage Trust Inc. The most significant thematic portfolio shift in the quarter was to move away from economically sensitive issues such as BDCs tied to leveraged loans, and into more defensive sectors that were trading at wide discounts to what we consider fair value, such as municipal and utility CEFs.
Outlook
Subsequent to the December 24 sharp sell-off, Fed Chair Powell and other members of the Fed leadership have frequently spoken in public and appeared to “walk back” the public perception of their stance following the December meeting. Major talking points in these presentations have included acknowledging weakness in the economy; emphasizing their flexibility in responding to actual incoming data; noting that they emphasize communications with business leaders and financial markets regarding current economic conditions; and communicating that they are aware of limited actual current inflation and that they have no desire to cause a recession. Additionally, the recent release of the minutes from the December meeting had a notably more “dovish” tone than the prior press conference. In addition to the apparent adjustment in the Fed stance, Saudi Arabia and OPEC announced cuts in output, which may have been sufficient to place a bottom on oil prices for the coming year.
Although the Fund suffered in the fourth quarter, which offset solid gains during the first nine months, the investment team continues to see improving fundamentals with growing distributable cash flow, simplified organizational structures, and improving fundamentals. TFIP is concerned about negative conditions in the corporate credit market, which emerged in the fourth quarter; however, they have been reducing affected holdings and placing more emphasis on municipal and mortgage issuers, to avoid risk in this area as the economy slows. Absent an actual recession, however, TFIP believes the Fund is well positioned for a positive result in the coming year and will adjust positions as necessary, as economic and market conditions evolve.
Thank you for investing in the LoCorr Funds
The S&P 500 Index is a broad based unmanaged index of 500 stocks, which is widely recognized as representative of the equity market in general. Barclays 1-5 Year Government Credit Index-The Barclays U.S. Government/Credit 1-5 Year Index is an index of all investment grade bonds with maturities of more than one year and less than 5 years. Barclays 1-3 Year Government Bond Index-The Barclays U.S. 1-3 Year Government/Credit Bond Index is a part of the Barclays U.S. Government/Credit Bond Index. It includes Treasury and agency securities (U.S. Government Bond Index) and publicly issued U.S. corporate and foreign debentures and secured notes (U.S. Credit Bond Index). The bonds in the index are investment-grade with a maturity between one and three years. Nikkei is Japan’s Nikkei 225 Stock Average, commonly used to measure a price-weighted index comprised of Japan’s top 225 blue-chip companies on the Tokyo Stock Exchange. Tokyo Stock Exchange is the largest stock exchange in Japan. The exchange has more than 2,200 listed companies, making it the third-largest in the world by this measure. Morningstar Global Long/Short Equity Index uses historical fund data dating back to the fund’s inception. Funds that have been liquidated or merged are included in analysis. The inception of the index is determined by the date at which the benchmark obtains five or more constituents, without falling below two constituents going forward. It includes funds with exposure to long and short positions in global equities or derivatives and is equally weighted. One cannot invest directly in an index.
Alerian MLP Index is a market-cap weighted, float-adjusted index created to provide a comprehensive benchmark for investors to track the performance of the energy MLP sector.
Alpha is an annualized return measure of how much better or worse a fund’s performance is relative to an index of funds in the same category, after allowing for differences in risk.
Basis Points (bps) - A unit that is equal to 1/100th of 1%, and is used to denote the change in a financial instrument. The basis point is commonly used for calculating changes in interest rates, equity indexes and the yield of a fixed-income security.
Beta - measures the sensitivity of a stock’s return relative to the return of a selected market index. When beta is greater than one, it means a stock will rise or fall more than the market.
Bloomberg Barclays U.S. Aggregate Bond Index is a broad-based bond index comprised of government, corporate, mortgage and asset-back issues rated investment grade or higher.
Dow Jones Industrial Average (DJIA) is a price-weighted average of 30 significant stocks traded on the New York Stock Exchange and the Nasdaq.
Duration is a commonly used measure of the potential volatility of the price of a debt security, or the aggregate market value of a portfolio of debt securities, prior to maturity. Securities with a longer duration generally have more volatile prices than securities of comparable quality with a shorter duration.
ICE BofA Merrill Lynch 3-Month T-Bill Index tracks the performance of the U.S. dollar denominated U.S. Treasury Bills publicly issued in the U.S. domestic market with a remaining term to final maturity of less than 3 months.
Investment Grade refers to bonds that are rated BBB or higher. Bond ratings are grades given to bonds that indicate their credit quality as determined by private
independent rating services such as Standard & Poor’s, Moody’s and Fitch. These firms evaluate a bond issuer’s financial strength, or its ability to pay a bond’s principal and interest in a timely fashion. Ratings are expressed as letters ranging from ‘AAA’, which is the highest grade, to ‘D’, which is the lowest grade.
Russell 1000 Growth Index refers to a composite that includes large and mid-cap companies located in the United States that also exhibit a growth probability. The Russell 1000 Growth is published and maintained by FTSE Russell.
Russell 1000 Index is a stock market index that represents the highest-ranking 1,000 stocks in the Russell 3000 Index, which represents about 90% of the total market capitalization of that index.
Russell 1000 Value Index refers to a composite of large and mid-cap companies located in the United States that also exhibit a value probability. The Russell 1000 Value is published and maintained by FTSE Russell.
Russell 2000 Index measures the performance of approximately 2,000 small-cap companies in the Russell 3000 Index, which is made up of 3,000 of the biggest U.S. stocks. The Russell 2000 serves as a benchmark for small-cap stocks in the United States.
S&P GSCI Commodity Index is a total return index currently comprised of 24 basic commodities. The performance statistics presented for the index do not reflect any trading or administrative costs of investing in the index.
SG CTA Trend Sub-Index is a subset of the SG CTA Index, and follows traders of trend following methodologies. The SG CTA Index is equal weighted, calculates the daily rate of return for a pool of CTAs selected from the larger managers that are open to new investment.
Spread is the percentage point difference between yields of various classes of bonds compared to treasury bonds.
Yield Curve is a line that plots the interest rates, at a set point in time, of bonds having equal credit quality, but differing maturity dates. The most frequently reported yield curve compares the three-month, two-year, five-year and 30-year U.S. Treasury debt. The curve is used to predict changes in economic output and growth.
Must be preceded or accompanied by a prospectus.
Opinions expressed are those of the Investment Manager and are subject to change, are not guaranteed and should not be considered investment advice.
Past performance is not a guarantee of future results.
Diversification does not assure a profit nor protect against loss in a declining market.
Mutual fund investing involves risk. Principal loss is possible. LoCorr Macro Strategies Fund, LoCorr Long/Short Commodities Strategy Fund, LoCorr Market Trend Fund and LoCorr Spectrum Income Fund are diversified funds. LoCorr Dynamic Equity Fund is a non-diversified fund, meaning it may invest its assets in fewer individual holdings than a diversified fund. Therefore, those Funds are more exposed to individual stock volatility than a diversified fund. The Funds invest in foreign investments and foreign currencies which involve greater volatility and political, economic and currency risks and differences in accounting methods. The Funds may make short sales of securities, which involves the risk that losses may exceed the original amount invested. Investing in commodities may subject the Funds to greater risks and volatility as commodity prices may be influenced by a variety of factors including unfavorable weather, environmental factors, and changes in government regulations. The Funds may invest in derivative securities, which derive their performance from the performance of an underlying asset, index, interest rate or currency exchange rate. Derivatives can be volatile and involve various types and degrees of risks, and, depending upon the characteristics of a particular derivative, suddenly can become illiquid. Investments in debt securities typically decrease in value when interest rates rise. This risk is usually greater for longer-term debt securities. Investments in Asset Backed, Mortgage Backed, and Collateralized Mortgage Backed Securities include additional risks that investors should be aware of such as credit risk, prepayment risk, possible illiquidity and default, as well as increased susceptibility to adverse economic developments. Investments in Real Estate Investment Trusts (REITs) involve additional risks such as declines in the value of real estate and increased susceptibility to adverse economic or regulatory developments.
Derivative contracts ordinarily have leverage inherent in their terms which can magnify a Fund’s potential for gains or losses through increased long and short position exposure. A Fund may access derivatives via a swap agreement. A risk of a swap agreement is the risk that the counterparty to the agreement will default on its obligation to pay the Fund.
A Fund will incur a loss as a result of a short position if the price of the short position instrument increases in value between the date of the short position sale and the date on which an offsetting position is purchased.
Investments in small- and medium-capitalization companies involve additional risks such as limited liquidity and greater volatility. Investments in lower rated and non-rated securities presents a greater risk of loss to principal and interest than higher-rated securities. ETF investments are subject to investment advisory and other expenses, which will be indirectly paid by the Fund. As a result, the cost of investing in the Fund will be higher than the cost of investing directly in ETFs and may be higher than other mutual funds that invest directly in stocks and bonds. ETFs are subject to specific risks, depending on the nature of the ETF.
A Fund’s portfolio will be significantly impacted by the performance of the real estate market generally, and a Fund may be exposed to greater risk and experience higher volatility than would a more economically diversified portfolio. Property values may fall due to increasing vacancies or declining rents resulting from economic, legal, cultural, or technological developments. Investments in Limited Partnerships (including master limited partnerships) involve risks different from those of investing in common stock including risks related to limited control and limited rights to vote on matters affecting the Limited Partnership, risks related to potential conflicts of interest between the Limited Partnership and the Limited Partnership’s general partner, cash flow risks, dilution risks and risks related to the general partner’s limited call right. Underlying Funds are subject to management and other expenses, which will be indirectly paid by a Fund.
LoCorr Macro Strategies Fund, LoCorr Long/Short Commodities Strategy Fund, LoCorr Market Trend Fund, LoCorr Dynamic Equity Fund, and LoCorr Spectrum Income Fund are distributed by Quasar Distributors, LLC.
Please see the Schedule of Investments for a complete list of Fund holdings. Fund holdings and sector allocations are subject to change and are not a recommendation to buy or sell any security.
LoCorr Macro Strategies Fund
Rate of Return — For the period ended December 31, 2018 (Unaudited)
| | Inception
Date | 6 Month | 1 Year | 5 Year | Average Annual
Since Inception |
| LoCorr Macro Strategies Fund - Class A (without maximum load) | 3/22/11 | -0.15% | | -5.36% | | 4.28% | 0.28% | |
| LoCorr Macro Strategies Fund - Class A (with maximum load) | 3/22/11 | -5.90% | | -10.83% | | 3.04% | -0.48% | |
| LoCorr Macro Strategies Fund - Class C | 3/24/11 | -1.55% | | -6.91% | | 3.50% | -0.45% | |
| LoCorr Macro Strategies Fund - Class I | 3/24/11 | -0.06% | | -5.08% | | 4.56% | 0.54% | |
| Bank of America Merrill Lynch 3-Month Treasury Bill Index | | 1.06% | | 1.87% | | 0.63% | 0.43% | 1 |
| Barclay CTA Index | | -0.52% | | -2.69% | | 0.55% | -0.52% | 1 |
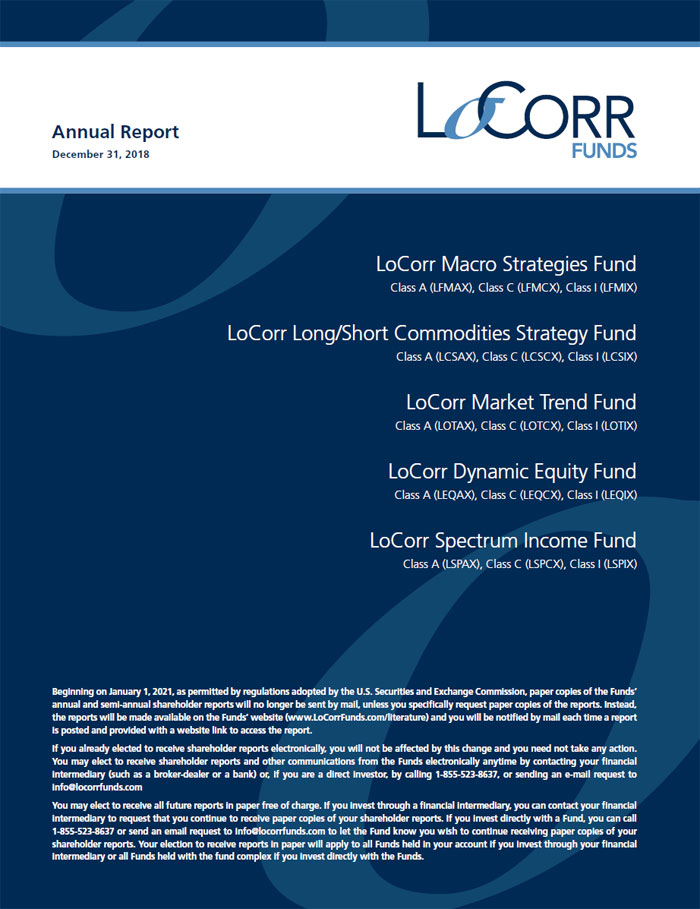
$100,000 investment in the
LoCorr Macro Strategies Fund – Class I
For the period ended December 31, 2018 (Unaudited)
This chart illustrates the performance of a hypothetical $100,000 investment made in the Fund since inception. Assumes reinvestment of distributions, but does not reflect the effect of any applicable sales charge or redemption fees. This chart does not imply any future performance. Performance will vary from class to class based on differences in class-specific expenses and sales charges. The returns do not reflect the deduction of taxes that a shareholder would pay on Fund distributions or the redemption of Fund shares.
Performance data represents past performance; past performance does not guarantee future results. The investment return and principal value of an investment will fluctuate so that an investor’s shares, when redeemed, may be worth more or less than their original cost. Current performance of the Fund may be lower or higher than the performance quoted. Performance data current to the most recent month end may be obtained by calling 1.855.LCFUNDS, or visiting www.LoCorrFunds.com.
Performance data shown reflects the Class A maximum sales charge of 5.75% and reflects the Class C Contingent Deferred Sales Charge (CDSC) of 1.00%. Performance of the Class A without load does not reflect the deduction of the sales load or fee. If reflected, the load or fee would reduce the performance quoted.
The returns reflect the actual performance for each period and do not include the impact on trades executed on the last business day of the period that were recorded on the first business day of the next period.
Per the fee table in the Fund’s July 1, 2018 prospectus, the Fund’s annual operating expense ratio is, before fee waivers 2.31%, 3.06% and 2.06% for Class A, Class C and Class I shares, respectively.
The Bank of America Merrill Lynch U.S. 3-Month Treasury Bill Index is an unmanaged index that seeks to measure the performance of U.S. Treasury bills available in the marketplace.
The Barclays CTA Index is a leading industry benchmark of representative performance of commodity trading advisors.
One cannot invest directly in an index.
| 1 | Since inception return as of March 24, 2011. |
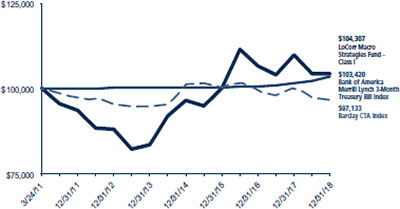
LoCorr Long/Short Commodities Strategy Fund
Rate of Return — For the period ended December 31, 2018 (Unaudited)
| | Inception
Date | 6 Month | 1 Year | 5 Year | Average Annual
Since Inception |
| LoCorr Long/Short Commodities Strategy Fund - Class A (without maximum load) | 12/31/11 | 8.25% | | 15.05% | | 12.04% | | 4.42% | |
| LoCorr Long/Short Commodities Strategy Fund - Class A (with maximum load) | 12/31/11 | 2.02% | | 8.46% | | 10.72% | | 3.54% | |
| LoCorr Long/Short Commodities Strategy Fund - Class C | 12/31/11 | 6.93% | | 13.20% | | 11.18% | | 3.60% | |
| LoCorr Long/Short Commodities Strategy Fund - Class I | 12/31/11 | 8.44% | | 15.40% | | 12.34% | | 4.68% | |
| Bank of America Merrill Lynch 3-Month Treasury Bill Index | | 1.06% | | 1.87% | | 0.63% | | 0.47% | |
| Morningstar Long/Short Commodity Index | | -8.31% | | -2.20% | | -2.98% | | -3.11% | |
$100,000 investment in the
LoCorr Long/Short Commodities Strategy Fund - Class I
For the period ended December 31, 2018 (Unaudited)
This chart illustrates the performance of a hypothetical $100,000 investment made in the Fund since inception. Assumes reinvestment of distributions, but does not reflect the effect of any applicable sales charge or redemption fees. This chart does not imply any future performance. Performance will vary from class to class based on differences in class-specific expenses and sales charges. The returns do not reflect the deduction of taxes that a shareholder would pay on Fund distributions or the redemption of Fund shares.
Performance data represents past performance; past performance does not guarantee future results. The investment return and principal value of an investment will fluctuate so that an investor’s shares, when redeemed, may be worth more or less than their original cost. Current performance of the Fund may be lower or higher than the performance quoted. Performance data current to the most recent month end may be obtained by calling 1.855.LCFUNDS, or visiting www.LoCorrFunds.com.
Performance data shown reflects the Class A maximum sales charge of 5.75% and reflects the Class C Contingent Deferred Sales Charge (CDSC) of 1.00%. Performance of the Class A without load does not reflect the deduction of the sales load or fee. If reflected, the load or fee would reduce the performance quoted.
The returns reflect the actual performance for each period and do not include the impact on trades executed on the last business day of the period that were recorded on the first business day of the next period.
Per the fee table in the Fund’s July 1, 2018 prospectus, the Fund’s annual operating expense ratio, before fee waivers is 2.79%, 3.54% and 2.54% for Class A, Class C and Class I shares, respectively.
The Bank of America Merrill Lynch U.S. 3-Month Treasury Bill Index is an unmanaged index that seeks to measure the performance of U.S. Treasury bills available in the marketplace.
The Morningstar Long/Short Commodity Index is a fully collateralized commodity futures index that uses the momentum rule to determine if each commodity is held long, short, or flat.
One cannot invest directly in an index.
LoCorr Market Trend Fund
Rate of Return — For the period ended December 31, 2018 (Unaudited)
| | Inception Date | 6 Month | 1 Year | Average Annual
Since Inception |
| LoCorr Market Trend Fund - Class A (without maximum load) | 6/30/14 | -6.02% | | -13.69% | | 0.28% | |
| LoCorr Market Trend Fund - Class A (with maximum load) | 6/30/14 | -11.44% | | -18.63% | | -1.03% | |
| LoCorr Market Trend Fund - Class C | 6/30/14 | -7.29% | | -15.17% | | -0.46% | |
| LoCorr Market Trend Fund - Class I | 6/30/14 | -5.88% | | -13.44% | | 0.54% | |
| Bank of America Merrill Lynch 3-Month Treasury Bill Index | | 1.06% | | 1.87% | | 0.69% | |
| Barclay CTA Index | | -0.52% | | -2.69% | | 0.47% | |
$100,000 investment in the
LoCorr Market Trend Fund - Class I
For the period ended December 31, 2018 (Unaudited)
This chart illustrates the performance of a hypothetical $100,000 investment made in the Fund since inception. Assumes reinvestment of distributions, but does not reflect the effect of any applicable sales charge or redemption fees. This chart does not imply any future performance. Performance will vary from class to class based on differences in class-specific expenses and sales charges. The returns do not reflect the deduction of taxes that a shareholder would pay on Fund distributions or the redemption of Fund shares.
Performance data represents past performance; past performance does not guarantee future results. The investment return and principal value of an investment will fluctuate so that an investor’s shares, when redeemed, may be worth more or less than their original cost. Current performance of the Fund may be lower or higher than the performance quoted. Performance data current to the most recent month end may be obtained by calling 1.855.LCFUNDS, or visiting www.LoCorrFunds.com.
Performance data shown reflects the Class A maximum sales charge of 5.75% and reflects the Class C Contingent Deferred Sales Charge (CDSC) of 1.00%. Performance of the Class A without load does not reflect the deduction of the sales load or fee. If reflected, the load or fee would reduce the performance quoted.
The returns reflect the actual performance for each period and do not include the impact on trades executed on the last business day of the period that were recorded on the first business day of the next period.
Per the fee table in the Fund’s July 1, 2018 prospectus, the Fund’s annual operating expense ratio is 2.01%, 2.76% and 1.76% for Class A, Class C and Class I shares, respectively.
The Bank of America Merrill Lynch U.S. 3-Month Treasury Bill Index is an unmanaged index that seeks to measure the performance of U.S. Treasury bills available in the marketplace.
The Barclays CTA Index is a leading industry benchmark of representative performance of commodity trading advisors.
One cannot invest directly in an index.
LoCorr Dynamic Equity Fund
Rate of Return — For the period ended December 31, 2018 (Unaudited)
| | Inception
Date | 6 Month | 1 Year | 5 Year | Average Annual
Since Inception |
| LoCorr Dynamic Equity Fund - Class A (without maximum load) | 5/10/13 | -8.86% | | -12.87% | | -1.21% | | 1.38% | |
| LoCorr Dynamic Equity Fund - Class A (with maximum load) | 5/10/13 | -14.11% | | -17.87% | | -2.37% | | 0.32% | |
| LoCorr Dynamic Equity Fund - Class C | 5/10/13 | -10.01% | | -14.28% | | -1.94% | | 0.62% | |
| LoCorr Dynamic Equity Fund - Class I | 5/10/13 | -8.74% | | -12.55% | | -0.95% | | 1.64% | |
| S&P 500 Total Return Index | | -6.85% | | -4.38% | | 8.49% | | 10.13% | |
| Morningstar Long/Short Equity Fund Index | | -6.00% | | -6.61% | | 1.17% | | 2.32% | |
$100,000 investment in the
LoCorr Dynamic Equity Fund - Class I
For the period ended December 31, 2018 (Unaudited)
This chart illustrates the performance of a hypothetical $100,000 investment made in the Fund since inception. Assumes reinvestment of distributions, but does not reflect the effect of any applicable sales charge or redemption fees. This chart does not imply any future performance. Performance will vary from class to class based on differences in class-specific expenses and sales charges. The returns do not reflect the deduction of taxes that a shareholder would pay on Fund distributions or the redemption of Fund shares.
Performance data represents past performance; past performance does not guarantee future results. The investment return and principal value of an investment will fluctuate so that an investor’s shares, when redeemed, may be worth more or less than their original cost. Current performance of the Fund may be lower or higher than the performance quoted. Performance data current to the most recent month end may be obtained by calling 1.855.LCFUNDS, or visiting www.LoCorrFunds.com.
Performance data shown reflects the Class A maximum sales charge of 5.75% and reflects the Class C Contingent Deferred Sales Charge (CDSC) of 1.00%. Performance of the Class A without load does not reflect the deduction of the sales load or fee. If reflected, the load or fee would reduce the performance quoted.
The returns reflect the actual performance for each period and do not include the impact on trades executed on the last business day of the period that were recorded on the first business day of the next period.
Per the fee table in the Fund’s July 1, 2018 prospectus, the Fund’s annual operating expense ratio, before fee waivers is 3.46%, 4.21% and 3.21% for Class A, Class C and Class I shares, respectively.
The S&P 500 Total Return Index is an unmanaged capitalization-weighted index of 500 stocks designed to measure performance of the broad domestic economy through changes in the aggregate market value of the 500 stocks which represent all major industries.
The Morningstar Long/Short Equity Index category holds sizeable stakes in both long and short positions in equities and related derivative. At least 75% of the assets are in equity securities or derivatives.
One cannot invest directly in an index.
LoCorr Spectrum Income Fund
Rate of Return — For the period ended December 31, 2018 (Unaudited)
| | Inception
Date | 6 Month | 1 Year | 5 Year | Average Annual
Since Inception |
| LoCorr Spectrum Income Fund - Class A (without maximum load) | 12/31/13 | -11.10% | | -8.22% | | -2.36% | | -2.36% | |
| LoCorr Spectrum Income Fund - Class A (with maximum load) | 12/31/13 | -16.24% | | -13.49% | | -3.51% | | -3.51% | |
| LoCorr Spectrum Income Fund - Class C | 12/31/13 | -12.22% | | -9.70% | | -3.10% | | -3.10% | |
| LoCorr Spectrum Income Fund - Class I | 12/31/13 | -10.96% | | -7.91% | | -2.09% | | -2.09% | |
| Bloomberg Barclays U.S. Aggregate Bond Index | | 1.65% | | 0.01% | | 2.52% | | 2.52% | |
| Morningstar Allocation - 70% to 85% Equity | | -8.19% | | -7.60% | | 3.48% | | 3.48% | |
$100,000 investment in the
LoCorr Spectrum Income Fund - Class I
For the period ended December 31, 2018 (Unaudited)
This chart illustrates the performance of a hypothetical $100,000 investment made in the Fund since inception. Assumes reinvestment of distributions, but does not reflect the effect of any applicable sales charge or redemption fees. This chart does not imply any future performance. Performance will vary from class to class based on differences in class-specific expenses and sales charges. The returns do not reflect the deduction of taxes that a shareholder would pay on Fund distributions or the redemption of Fund shares.
Performance data represents past performance; past performance does not guarantee future results. The investment return and principal value of an investment will fluctuate so that an investor’s shares, when redeemed, may be worth more or less than their original cost. Current performance of the Fund may be lower or higher than the performance quoted. Performance data current to the most recent month end may be obtained by calling 1.855.LCFUNDS, or visiting www.LoCorrFunds.com.
Performance data shown reflects the Class A maximum sales charge of 5.75% and reflects the Class C Contingent Deferred Sales Charge (CDSC) of 1.00%. Performance of the Class A without load does not reflect the deduction of the sales load or fee. If reflected, the load or fee would reduce the performance quoted.
The returns reflect the actual performance for each period and do not include the impact on trades executed on the last business day of the period that were recorded on the first business day of the next period.
The Fund imposes a 2.00% redemption fee on shares held for less than 60 days. Performance data does not reflect the redemption fee. If it had, return would be reduced.
Per the fee table in the Fund’s July 1, 2018 prospectus, the Fund’s annual operating expense ratio is 2.99%, 3.74% and 2.74% for Class A, Class C and Class I shares, respectively.
The Bloomberg Barclays U.S. Aggregate Bond Index is a long term, market capitalization- weighted index used to represent investment grade bonds being traded in the United States.
The Morningstar Allocation - 70% to 85% Equity portfolios seek to provide both income and capital appreciation by investing in multiple asset classes, including stocks, bonds and cash. These portolios are dominated by domestic holdings and have equity expenses between 70% and 85%.
One cannot invest directly in an index.
| | |
| | |
| LoCorr Macro Strategies Fund - Consolidated Schedule of Investments | | 17 |
| | |
LoCorr Macro Strategies Fund
Composition of Consolidated Investment Portfolio1
December 31, 2018 (Unaudited)
1 As a percentage of total investments.
Consolidated Schedule of Investments
December 31, 2018
| | Maturity Date | | Coupon Rate | | Principal Amount | | | Value | |
| ASSET BACKED SECURITIES: 17.56% | | | | | | | | | | |
| 321 Henderson Receivables I LLC | | | | | | | | | | |
Series 2006-1A A1 (1 Month LIBOR USD + 0.200%)(a)(c) | 03/15/2041 | | | 2.66 | % | | $ | 1,003,930 | | | $ | 987,403 | |
Series 2006-4A A1 (1 Month LIBOR USD + 0.200%) (a)(c) | 12/15/2041 | | | 2.66 | % | | | 1,097,667 | | | | 1,077,176 | |
Series 2004-A A1 (1 Month LIBOR USD + 0.350%) (a)(c) | 09/15/2045 | | | 2.81 | % | | | 156,385 | | | | 152,738 | |
Avid Automobile Receivables Trust, 2018-1 (a) | 08/15/2023 | | | 2.84 | % | | | 1,616,251 | | | | 1,605,198 | |
| BA Credit Card Trust, 2018-A3 A3 | 12/15/2023 | | | 3.10 | % | | | 2,525,000 | | | | 2,540,807 | |
Bank of The West Auto Trust, 2017-1 A3 (a) | 01/15/2023 | | | 2.11 | % | | | 4,500,000 | | | | 4,445,124 | |
| Barclays Dryrock Issuance Trust | | | | | | | | | | | | | |
| Series 2014-3 A | 07/15/2022 | | | 2.41 | % | | | 2,141,000 | | | | 2,131,426 | |
Series 2017-2 A (1 Month LIBOR USD + 0.300%) (c) | 05/15/2023 | | | 2.76 | % | | | 3,225,000 | | | | 3,219,903 | |
Cabela’s Credit Card Master Note Trust, 2014-2 A (1 Month LIBOR USD + 0.450%) (c) | 07/15/2022 | | | 2.91 | % | | | 1,004,000 | | | | 1,004,490 | |
| California Republic Auto Receivables Trust, 2018-1 A3 | 08/15/2022 | | | 3.14 | % | | | 1,100,000 | | | | 1,102,517 | |
| Citibank Credit Card Issuance Trust | | | | | | | | | | | | | |
| Series 2016-A2 | 11/20/2023 | | | 2.19 | % | | | 4,730,000 | | | | 4,644,674 | |
| Series 2018-A3 | 05/23/2025 | | | 3.29 | % | | | 3,500,000 | | | | 3,549,496 | |
Conn’s Receivables Funding LLC, 2018-A A (a) | 07/17/2023 | | | 3.25 | % | | | 1,630,988 | | | | 1,631,270 | |
| Consumers Securitization Funding LLC, 2014-A A1 | 11/01/2020 | | | 1.33 | % | | | 416,850 | | | | 414,556 | |
| Entergy New Orleans Storm Recovery Funding LLC, 2015 A | 06/01/2027 | | | 2.67 | % | | | 1,207,163 | | | | 1,187,729 | |
Evergreen Credit Card Trust, 2018-2 A (1 Month LIBOR USD + 0.350%) (a)(b)(c) | 07/15/2022 | | | 2.81 | % | | | 1,975,000 | | | | 1,974,055 | |
Ford Credit Auto Owner Trust, 2016-1 A (a) | 08/15/2027 | | | 2.31 | % | | | 2,350,000 | | | | 2,317,970 | |
GLS Auto Receivables Trust, 2018-2A A (a) | 04/18/2022 | | | 3.25 | % | | | 2,144,895 | | | | 2,139,886 | |
| Invitation Homes Trust | | | | | | | | | | | | | |
Series 2017-SFR2 A (1 Month LIBOR USD + 0.850%) (a)(c) | 12/19/2036 | | | 3.28 | % | | | 1,576,355 | | | | 1,557,111 | |
Series 2018-SFR2 A (1 Month LIBOR USD + 0.900%) (a)(c) | 06/18/2037 | | | 3.36 | % | | | 2,668,311 | | | | 2,637,253 | |
Series 2018-SFR3 A (1 Month LIBOR USD + 1.000%) (a)(c) | 07/17/2037 | | | 3.46 | % | | | 3,028,501 | | | | 3,010,995 | |
Series 2018-SFR4 A (1 Month LIBOR USD + 1.100%) (a)(c) | 01/19/2038 | | | 3.56 | % | | | 1,912,148 | | | | 1,927,823 | |
| Mercedes-Benz Auto Receivables Trust, 2018-1 A3 | 01/17/2023 | | | 3.03 | % | | | 3,125,000 | | | | 3,130,635 | |
NRZ Advance Receivables Trust Advance Receivables Backed, 2016-T3 AT3 (a) | 10/16/2051 | | | 2.83 | % | | | 3,210,000 | | | | 3,166,679 | |
Ocwen Master Advance Receivables Trust, 2016-T2 AT2 (a) | 08/16/2049 | | | 2.72 | % | | | 3,190,000 | | | | 3,176,921 | |
The accompanying notes are an integral part of these consolidated financial statements.
| | |
| | |
18 | | LoCorr Macro Strategies Fund - Consolidated Schedule of Investments (continued) |
| | |
| Maturity Date | | Coupon Rate | | Principal Amount | | | Value | |
ASSET BACKED SECURITIES (continued) | | | | | | | | | | |
| OneMain Financial Issuance Trust | | | | | | | | | | |
Series 2015-2A B (a) | 07/18/2025 | | | 3.10 | % | | $ | 802,831 | | | $ | 802,421 | |
Series 2015-2 C (a) | 07/18/2025 | | | 4.32 | % | | | 1,600,000 | | | | 1,601,111 | |
Series 2016-2 B (a) | 03/20/2028 | | | 5.94 | % | | | 2,425,000 | | | | 2,462,857 | |
Progress Residential Trust, 2017-SFR1 A (a) | 08/17/2034 | | | 2.77 | % | | | 3,279,465 | | | | 3,217,165 | |
Prosper Marketplace Issuance Trust, 2018-1A A (a) | 06/17/2024 | | | 3.11 | % | | | 1,993,254 | | | | 1,989,736 | |
| SMB Private Education Loan Trust | | | | | | | | | | | | | |
Series 2017-AA1 (1 Month LIBOR USD + 0.450%) (a)(c) | 06/17/2024 | | | 2.91 | % | | | 450,968 | | | | 450,968 | |
Series 2018-C A1 (1 Month LIBOR USD + 0.300%) (a)(c) | 09/15/2025 | | | 2.76 | % | | | 1,706,012 | | | | 1,703,139 | |
| SoFi Professional Loan Program LLC | | | | | | | | | | | | | |
Series 2016-C (a) | 12/27/2032 | | | 2.36 | % | | | 2,690,000 | | | | 2,636,262 | |
Series 2015-C A2 (a) | 08/25/2033 | | | 2.51 | % | | | 1,274,742 | | | | 1,256,453 | |
Series 2016-A A2 (a) | 12/26/2036 | | | 2.76 | % | | | 3,648,383 | | | | 3,595,909 | |
Series 2017-C A2A (a) | 07/25/2040 | | | 1.75 | % | | | 1,763,077 | | | | 1,748,911 | |
| Synchrony Card Issuance Trust, 2018-A1 A1 | 09/15/2024 | | | 3.38 | % | | | 2,935,000 | | | | 2,961,668 | |
| Synchrony Credit Card Master Note Trust, 2018-1 A | 03/15/2024 | | | 2.97 | % | | | 3,100,000 | | | | 3,095,597 | |
| TCF Auto Receivables Owner Trust | | | | | | | | | | | | | |
Series 2016-1A A3 (a) | 04/15/2021 | | | 1.71 | % | | | 1,302,848 | | | | 1,297,315 | |
Series 2016-PT1 A (a) | 06/15/2022 | | | 1.93 | % | | | 1,559,779 | | | | 1,544,179 | |
| Toyota Auto Receivables Owner Trust, 2017-B A-4 | 09/15/2022 | | | 2.05 | % | | | 1,950,000 | | | | 1,914,999 | |
Tricon American Homes Trust, 2017-SFR1 A (a) | 09/19/2034 | | | 2.72 | % | | | 2,840,000 | | | | 2,744,542 | |
| Verizon Owner Trust | | | | | | | | | | | | | |
Series 2018-1A A1B (1 Month LIBOR USD + 0.260%) (a)(c) | 09/20/2022 | | | 2.73 | % | | | 4,525,000 | | | | 4,518,184 | |
| Series 2018-A | 04/20/2023 | | | 3.23 | % | | | 3,000,000 | | | | 3,018,396 | |
| TOTAL ASSET BACKED SECURITIES (Cost $97,535,979) | | | | | | | | | | | | 97,293,647 | |
| | | | | | | | | | | | | | |
| CORPORATE BONDS: 31.62% | | | | | | | | | | | | | |
| Finance and Insurance: 15.18% | | | | | | | | | | | | | |
| American Express Co. | 12/02/2022 | | | 2.65 | % | | | 2,000,000 | | | | 1,934,802 | |
| American Honda Finance Corp. | 02/12/2021 | | | 2.65 | % | | | 2,020,000 | | | | 1,997,247 | |
| American International Group, Inc. | 08/15/2020 | | | 3.38 | % | | | 1,365,000 | | | | 1,368,070 | |
| Bank of America Corp. | 04/21/2020 | | | 2.25 | % | | | 6,155,000 | | | | 6,089,218 | |
| Bank of America Corp. | 01/11/2023 | | | 3.30 | % | | | 1,650,000 | | | | 1,625,017 | |
| Bank of New York Mellon Corp. | 02/07/2022 | | | 2.60 | % | | | 1,000,000 | | | | 982,299 | |
| BB&T Corp. | 01/15/2020 | | | 2.45 | % | | | 1,260,000 | | | | 1,251,207 | |
| Capital One Financial Corp. | 05/12/2020 | | | 2.50 | % | | | 1,700,000 | | | | 1,678,001 | |
| Charles Schwab Corp. | 01/25/2023 | | | 2.65 | % | | | 1,905,000 | | | | 1,859,610 | |
| Chubb INA Holdings, Inc. | 11/03/2020 | | | 2.30 | % | | | 2,500,000 | | | | 2,464,247 | |
| Citigroup, Inc. | 10/26/2020 | | | 2.65 | % | | | 2,175,000 | | | | 2,146,084 | |
| Citigroup, Inc. | 01/14/2022 | | | 4.50 | % | | | 3,315,000 | | | | 3,387,049 | |
Citigroup, Inc. (3 Month LIBOR USD + 0.722%) (c) | 01/24/2023 | | | 3.14 | % | | | 2,000,000 | | | | 1,964,502 | |
Cooperatieve Rabobank UA (b) | 11/09/2022 | | | 3.95 | % | | | 3,180,000 | | | | 3,169,626 | |
| Fifth Third Bancorp | 07/27/2020 | | | 2.88 | % | | | 1,965,000 | | | | 1,953,667 | |
| General Motors Financial Co., Inc. | 05/09/2023 | | | 3.70 | % | | | 2,375,000 | | | | 2,259,645 | |
| Goldman Sachs Group, Inc. | 02/25/2021 | | | 2.88 | % | | | 1,690,000 | | | | 1,661,105 | |
| Goldman Sachs Group, Inc. | 01/22/2023 | | | 3.63 | % | | | 2,140,000 | | | | 2,106,328 | |
| Goldman Sachs Group, Inc. | 02/23/2023 | | | 3.20 | % | | | 1,885,000 | | | | 1,828,382 | |
| Hartford Financial Services Group, Inc. | 03/30/2020 | | | 5.50 | % | | | 1,685,000 | | | | 1,729,031 | |
HSBC Holdings PLC (b) | 04/05/2021 | | | 5.10 | % | | | 2,390,000 | | | | 2,471,523 | |
| John Deere Capital Corp. | 01/08/2021 | | | 2.55 | % | | | 1,495,000 | | | | 1,481,491 | |
| JP Morgan Chase & Co. | 09/23/2022 | | | 3.25 | % | | | 1,565,000 | | | | 1,552,573 | |
| JP Morgan Chase & Co. | 01/25/2023 | | | 3.20 | % | | | 5,705,000 | | | | 5,621,882 | |
| Lazard Group LLC | 11/14/2020 | | | 4.25 | % | | | 743,000 | | | | 752,884 | |
| Lincoln National Corp. | 09/01/2023 | | | 4.00 | % | | | 1,500,000 | | | | 1,529,134 | |
Metropolitan Life Global Funding (a) | 04/14/2020 | | | 2.00 | % | | | 2,000,000 | | | | 1,971,405 | |
| Morgan Stanley | 07/24/2020 | | | 5.50 | % | | | 5,455,000 | | | | 5,623,429 | |
| Morgan Stanley | 01/23/2023 | | | 3.13 | % | | | 2,115,000 | | | | 2,066,237 | |
The accompanying notes are an integral part of these consolidated financial statements.
| | |
| | |
LoCorr Macro Strategies Fund - Consolidated Schedule of Investments (continued)
| | 19 |
| | |
| Maturity Date | | Coupon Rate | | Principal Amount | | | Value | |
CORPORATE BONDS (continued) | | | | | | | | | | |
| PNC Bank NA | 01/22/2021 | | | 2.50 | % | | $ | 2,430,000 | | | $ | 2,397,782 | |
| Prudential Financial, Inc. | 11/15/2020 | | | 4.50 | % | | | 2,000,000 | | | | 2,045,747 | |
| State Street Corp. | 08/18/2020 | | | 2.55 | % | | | 1,410,000 | | | | 1,398,162 | |
| SunTrust Banks, Inc. | 03/03/2021 | | | 2.90 | % | | | 2,500,000 | | | | 2,478,374 | |
Trinity Acquisition PLC (b) | 09/15/2021 | | | 3.50 | % | | | 1,915,000 | | | | 1,896,394 | |
| UnitedHealth Group, Inc. | 10/15/2020 | | | 3.88 | % | | | 1,435,000 | | | | 1,454,150 | |
| Unum Group | 05/15/2021 | | | 3.00 | % | | | 1,820,000 | | | | 1,799,214 | |
| Wells Fargo & Co. | 07/22/2020 | | | 2.60 | % | | | 2,725,000 | | | | 2,698,587 | |
Westpac Banking Corp. (b) | 05/15/2023 | | | 3.65 | % | | | 1,385,000 | | | | 1,393,327 | |
| | | | | | | | | | | | | 84,087,432 | |
| Information: 3.96% | | | | | | | | | | | | | |
| 21st Century Fox America, Inc. | 02/15/2021 | | | 4.50 | % | | | 2,500,000 | | | | 2,566,731 | |
America Movil SAB de CV (b) | 03/30/2020 | | | 5.00 | % | | | 1,880,000 | | | | 1,912,628 | |
| AT&T, Inc. | 02/17/2021 | | | 2.80 | % | | | 2,290,000 | | | | 2,261,397 | |
| Charter Communications Operating LLC/Charter Communications Operating Capital | 07/23/2020 | | | 3.58 | % | | | 1,955,000 | | | | 1,952,892 | |
| Discovery Communications LLC | 04/01/2023 | | | 3.25 | % | | | 2,150,000 | | | | 2,078,065 | |
| Microsoft Corp. | 02/06/2022 | | | 2.40 | % | | | 2,835,000 | | | | 2,802,337 | |
| Oracle Corp. | 10/15/2022 | | | 2.50 | % | | | 1,825,000 | | | | 1,776,190 | |
| Verizon Communications, Inc. | 03/15/2021 | | | 3.45 | % | | | 2,200,000 | | | | 2,214,506 | |
| Visa, Inc. | 12/14/2022 | | | 2.80 | % | | | 1,800,000 | | | | 1,777,417 | |
Vodafone Group PLC (b) | 03/16/2021 | | | 4.38 | % | | | 2,515,000 | | | | 2,573,898 | |
| | | | | | | | | | | | | 21,916,061 | |
| Manufacturing: 6.77% | | | | | | | | | | | | | |
| Abbott Laboratories | 11/30/2021 | | | 2.90 | % | | | 2,270,000 | | | | 2,250,279 | |
| AbbVie, Inc. | 05/14/2020 | | | 2.50 | % | | | 1,845,000 | | | | 1,827,489 | |
AerCap Ireland Capital DAC/AerCap Global Aviation Trust (b) | 02/01/2022 | | | 3.95 | % | | | 2,500,000 | | | | 2,456,092 | |
| Anheuser-Busch InBev Finance, Inc. | 02/01/2021 | | | 2.65 | % | | | 1,340,000 | | | | 1,317,751 | |
| Apple, Inc. | 02/23/2021 | | | 2.25 | % | | | 1,540,000 | | | | 1,521,957 | |
| Applied Materials, Inc. | 06/15/2021 | | | 4.30 | % | | | 2,000,000 | | | | 2,058,931 | |
| Archer-Daniels-Midland Co. | 03/01/2021 | | | 4.48 | % | | | 2,000,000 | | | | 2,063,782 | |
| Bunge Ltd. Finance Corp. | 11/24/2020 | | | 3.50 | % | | | 1,435,000 | | | | 1,431,529 | |
| Caterpillar, Inc. | 06/26/2022 | | | 2.60 | % | | | 1,840,000 | | | | 1,794,045 | |
| Celgene Corp. | 02/20/2023 | | | 3.25 | % | | | 2,480,000 | | | | 2,421,602 | |
| Chevron Corp. | 03/03/2020 | | | 1.96 | % | | | 1,280,000 | | | | 1,267,149 | |
Daimler Finance North America LLC (a) | 05/04/2023 | | | 3.70 | % | | | 1,200,000 | | | | 1,194,499 | |
| Dr. Pepper Snapple Group, Inc. | 11/15/2021 | | | 2.53 | % | | | 1,345,000 | | | | 1,301,321 | |
| Eastman Chemical Co. | 01/15/2020 | | | 2.70 | % | | | 662,000 | | | | 657,120 | |
| General Electric Co. | 01/07/2021 | | | 4.63 | % | | | 1,345,000 | | | | 1,348,473 | |
Heineken NV (a)(b) | 04/01/2022 | | | 3.40 | % | | | 1,425,000 | | | | 1,427,403 | |
| Ingersoll-Rand Global Holding Co. Ltd. | 06/15/2023 | | | 4.25 | % | | | 1,415,000 | | | | 1,449,988 | |
| Intel Corp. | 12/15/2022 | | | 2.70 | % | | | 1,590,000 | | | | 1,566,094 | |
| Kraft Heinz Foods Co. | 07/02/2020 | | | 2.80 | % | | | 2,135,000 | | | | 2,119,481 | |
| L3 Technologies, Inc. | 02/15/2021 | | | 4.95 | % | | | 1,005,000 | | | | 1,028,421 | |
| Packaging Corp. of America | 12/15/2020 | | | 2.45 | % | | | 1,630,000 | | | | 1,600,426 | |
| Reynolds American, Inc. | 06/12/2020 | | | 3.25 | % | | | 2,330,000 | | | | 2,315,691 | |
| Rockwell Collins, Inc. | 07/15/2019 | | | 1.95 | % | | | 1,085,000 | | | | 1,077,012 | |
| | | | | | | | | | | | | 37,496,535 | |
| Mining, Quarrying, and Oil and Gas Extraction: 1.40% | | | | | | | | | | | | | |
| Enterprise Products Operating LLC | 02/15/2021 | | | 2.80 | % | | | 2,115,000 | | | | 2,092,809 | |
| Occidental Petroleum Corp. | 02/01/2021 | | | 4.10 | % | | | 1,765,000 | | | | 1,795,502 | |
Schlumberger Holdings Corp. (a) | 12/21/2020 | | | 3.00 | % | | | 1,995,000 | | | | 1,977,708 | |
Total Capital International SA (b) | 06/19/2021 | | | 2.75 | % | | | 1,915,000 | | | | 1,901,056 | |
| | | | | | | | | | | | | 7,767,075 | |
| Professional, Scientific, and Technical Services: 0.40% | | | | | | | | | | | | | |
| Biogen, Inc. | 09/15/2020 | | | 2.90 | % | | | 2,250,000 | | | | 2,233,245 | |
The accompanying notes are an integral part of these consolidated financial statements.
| | |
| | |
20 | | LoCorr Macro Strategies Fund - Consolidated Schedule of Investments (continued) |
| | |
| Maturity Date | | Coupon Rate | | Principal Amount | | | Value | |
CORPORATE BONDS (continued) | | | | | | | | | | |
| Real Estate and Rental and Leasing: 0.57% | | | | | | | | | | |
| Air Lease Corp. | 06/01/2021 | | | 3.38 | % | | $ | 2,150,000 | | | $ | 2,129,486 | |
| Toyota Motor Credit Corp. | 04/17/2020 | | | 1.95 | % | | | 1,030,000 | | | | 1,017,208 | |
| | | | | | | | | | | | | 3,146,694 | |
| Retail Trade: 1.86% | | | | | | | | | | | | | |
| Amazon.com, Inc. | 02/22/2023 | | | 2.40 | % | | | 1,385,000 | | | | 1,340,929 | |
BMW U.S. Capital LLC (a) | 04/12/2021 | | | 3.10 | % | | | 3,245,000 | | | | 3,213,812 | |
BP Capital Markets PLC (b) | 01/15/2020 | | | 2.52 | % | | | 1,905,000 | | | | 1,898,998 | |
BP Capital Markets PLC (b) | 03/11/2021 | | | 4.74 | % | | | 1,000,000 | | | | 1,031,233 | |
| CVS Health Corp. | 07/20/2020 | | | 2.80 | % | | | 1,455,000 | | | | 1,441,872 | |
Hyundai Capital America (a) | 03/18/2021 | | | 3.00 | % | | | 1,425,000 | | | | 1,402,992 | |
| | | | | | | | | | | | | 10,329,836 | |
| Utilities: 1.17% | | | | | | | | | | | | | |
| Berkshire Hathaway Energy Co. | 01/15/2021 | | | 2.38 | % | | | 2,345,000 | | | | 2,312,940 | |
| Exelon Generation Co., LLC | 01/15/2020 | | | 2.95 | % | | | 2,135,000 | | | | 2,124,723 | |
| Sempra Energy | 02/01/2023 | | | 2.90 | % | | | 2,120,000 | | | | 2,060,005 | |
| | | | | | | | | | | | | 6,497,668 | |
| Wholesale Trade: 0.31% | | | | | | | | | | | | | |
| Sysco Corp. | 10/01/2020 | | | 2.60 | % | | | 1,760,000 | | | | 1,741,031 | |
| TOTAL CORPORATE BONDS (Cost $177,348,751) | | | | | | | | | | | | 175,215,577 | |
| | | | | | | | | | | | | | |
| MORTGAGE BACKED SECURITIES: 16.00% | | | | | | | | | | | | | |
BX Trust, 2018-MCSF A (1 Month LIBOR USD + 0.577%) (a)(c) | 04/16/2035 | | | 2.98 | % | | | 3,285,000 | | | | 3,221,469 | |
Cold Storage Trust, 2017-ICE3 A (1 Month LIBOR USD + 1.000%) (a)(c) | 04/15/2036 | | | 3.46 | % | | | 3,775,000 | | | | 3,707,506 | |
CSMC Trust, 2017-HL2 A3 (a)(d) | 10/25/2047 | | | 3.50 | % | | | 2,897,951 | | | | 2,858,038 | |
| Fannie Mae Connecticut Avenue Securities | | | | | | | | | | | | | |
Series 2017-C01 1M1 (1 Month LIBOR USD + 1.300%) (c) | 07/25/2029 | | | 3.81 | % | | | 2,523,358 | | | | 2,530,970 | |
Series 2017-C02 2M1 (1 Month LIBOR USD + 1.150%) (a)(c) | 09/25/2029 | | | 3.66 | % | | | 1,680,603 | | | | 1,684,369 | |
Series 2018-C02 2M1 (1 Month LIBOR USD + 0.650%) (c)
| 08/26/2030 | | | 3.16 | % | | | 1,669,072 | | | | 1,667,194 | |
Series 2018-C03 1M1 (1 Month LIBOR USD + 0.680%) (c) | 10/25/2030 | | | 3.19 | % | | | 1,463,667 | | | | 1,459,936 | |
Series 2018-C05 1M1 (1 Month LIBOR USD + 0.720%) (a)(c) | 01/27/2031 | | | 3.23 | % | | | 3,698,754 | | | | 3,689,988 | |
| Fannie Mae Pool | 02/01/2021 | | | 3.50 | % | | | 13,634 | | | | 13,800 | |
| Fannie Mae Pool | 08/01/2021 | | | 3.00 | % | | | 57,688 | | | | 57,573 | |
| Fannie Mae Pool | 09/01/2021 | | | 3.00 | % | | | 70,949 | | | | 70,808 | |
| Fannie Mae Pool | 11/01/2021 | | | 3.00 | % | | | 147,814 | | | | 147,521 | |
| Fannie Mae Pool | 12/01/2025 | | | 3.50 | % | | | 212,042 | | | | 214,633 | |
| Fannie Mae Pool | 09/01/2026 | | | 3.50 | % | | | 188,796 | | | | 191,103 | |
| Fannie Mae Pool | 12/01/2027 | | | 2.50 | % | | | 2,976,445 | | | | 2,945,469 | |
FDIC Guaranteed Notes Trust, 2010-S4 A (1 Month LIBOR USD + 0.720%) (a)(c) | 12/04/2020 | | | 3.03 | % | | | 344,272 | | | | 341,890 | |
| FHLMC Multifamily Structured Pass Through Certificates | | | | | | | | | | | | | |
Series K-LH1 A (1 Month LIBOR USD + 0.700%) (c) | 11/25/2022 | | | 3.05 | % | | | 2,862,404 | | | | 2,871,589 | |
| Series 3855 HE | 02/15/2026 | | | 2.50 | % | | | 5,646 | | | | 5,602 | |
| Flagstar Mortgage Trust | | | | | | | | | | | | | |
Series 2017-2 A5 (a)(d) | 10/25/2047 | | | 3.50 | % | | | 2,576,228 | | | | 2,561,355 | |
Series 2018-4 A4 (a)(d) | 07/25/2048 | | | 4.00 | % | | | 2,503,347 | | | | 2,517,893 | |
FREMF Mortgage Trust, 2012-K708 B (a)(d) | 02/25/2045 | | | 3.72 | % | | | 3,250,000 | | | | 3,242,376 | |
GS Mortgage Securities Corp. Trust, 2018-CHLLA (1 Month LIBOR USD + 0.750%) (a)(c) | 02/17/2037 | | | 3.21 | % | | | 3,830,000 | | | | 3,778,106 | |
GS Mortgage Securities Trust, 2010-C2 A1 (a) | 12/10/2043 | | | 3.85 | % | | | 86,118 | | | | 86,653 | |
| JP Morgan Chase Commercial Mortgage Securities Trust | | | | | | | | | | | | | |
Series 2018-BCON A (a) | 01/07/2031 | | | 3.73 | % | | | 3,630,000 | | | | 3,689,252 | |
Series 2017-MAUIA (1 Month LIBOR USD + 0.830%) (a)(c) | 07/17/2034 | | | 3.22 | % | | | 4,195,000 | | | | 4,149,155 | |
Series 2010-C2 A3 (a) | 11/15/2043 | | | 4.07 | % | | | 4,167,761 | | | | 4,216,839 | |
JP Morgan Mortgage Trust, 2016-1 A5 (a)(d) | 05/25/2046 | | | 3.50 | % | | | 1,034,143 | | | | 1,023,520 | |
| JPMBB Commercial Mortgage Securities Trust, 2014-C23 | 09/17/2047 | | �� | 3.66 | % | | | 2,950,000 | | | | 2,978,329 | |
The accompanying notes are an integral part of these consolidated financial statements.
| | |
| | |
| LoCorr Macro Strategies Fund - Consolidated Schedule of Investments (continued) | | 21 |
| | |
| Maturity Date | | Coupon Rate | | Principal Amount | | | Value | |
MORTGAGE BACKED SECURITIES (continued) | | | | | | | | | | |
Morgan Stanley Capital I Trust, 2017-CLS A (1 Month LIBOR USD + 0.700%) (a)(c) | 11/15/2034 | | | 3.16 | % | | $ | 2,785,000 | | | $ | 2,742,247 | |
| NCUA Guaranteed Notes Trust | | | | | | | | | | | | | |
Series 2011-R2 1A (1 Month LIBOR USD + 0.400%) (c) | 02/06/2020 | | | 2.78 | % | | | 1,383,613 | | | | 1,383,629 | |
Series 2011-R3 1A (1 Month LIBOR USD + 0.400%)(c) | 04/09/2020 | | | 2.80 | % | | | 925,045 | | | | 926,179 | |
Series 2010-R1 1A (1 Month LIBOR USD + 0.450%) (c) | 10/07/2020 | | | 2.83 | % | | | 102,446 | | | | 102,574 | |
| New Residential Mortgage Loan Trust | | | | | | | | | | | | | |
Series 2018-NQM1 (a)(d) | 11/25/2048 | | | 3.99 | % | | | 3,257,148 | | | | 3,306,593 | |
Series 2015-1A A3 (a)(d) | 05/28/2052 | | | 3.75 | % | | | 1,118,355 | | | | 1,120,440 | |
Series 2014-2A A3 (a)(d) | 05/25/2054 | | | 3.75 | % | | | 1,006,447 | | | | 1,009,049 | |
Series 2016-1A A1 (a)(d) | 03/25/2056 | | | 3.75 | % | | | 2,088,122 | | | | 2,081,989 | |
Series 2017-1A A1 (a)(d) | 02/25/2057 | | | 4.00 | % | | | 2,753,259 | | | | 2,770,367 | |
Series 2017-2A A3 (a)(d) | 03/25/2057 | | | 4.00 | % | | | 2,927,573 | | | | 2,954,591 | |
Series 2017-3A A1 (a)(d) | 04/25/2057 | | | 4.00 | % | | | 2,156,309 | | | | 2,169,316 | |
| OBX Trust | | | | | | | | | | | | | |
Series 2018-EXP1 (a)(d) | 04/25/2048 | | | 4.50 | % | | | 1,430,072 | | | | 1,450,294 | |
Series 2018-EXP2 (a)(d) | 07/25/2058 | | | 4.00 | % | | | 2,488,680 | | | | 2,485,023 | |
Sequoia Mortgage Trust, 2018-CH4 A10 (a)(d) | 10/25/2048 | | | 4.50 | % | | | 2,161,551 | | | | 2,203,879 | |
STACR Trust, 2018-DNA3 M1 (1 Month LIBOR USD + 0.750%) (a)(c) | 09/25/2048 | | | 3.26 | % | | | 2,050,000 | | | | 2,046,048 | |
Verus Securitization Trust, 2018-3 A-1 (a)(d) | 10/25/2058 | | | 4.11 | % | | | 1,628,469 | | | | 1,618,010 | |
WFRBS Commercial Mortgage Trust, 2011-C3 (a) | 03/17/2044 | | | 4.38 | % | | | 2,338,910 | | | | 2,386,505 | |
| TOTAL MORTGAGE BACKED SECURITIES (Cost $89,580,081) | | | | | | | | | | | | 88,679,669 | |
| | | | | | | | | | | | | | |
| MUNICIPAL BOND: 0.01% | | | | | | | | | | | | | |
| Louisiana Local Government Environmental Facilities & Community Development Authority | 02/01/2021 | | | 3.22 | % | | | 55,515 | | | | 55,515 | |
| TOTAL MUNICIPAL BOND (Cost $56,381) | | | | | | | | | | | | 55,515 | |
| | | | | | | | | | | | | | |
| U.S. GOVERNMENT AGENCY ISSUES: 16.33% | | | | | | | | | | | | | |
| Federal Farm Credit Banks | 10/26/2020 | | | 1.75 | % | | | 3,800,000 | | | | 3,743,456 | |
| Federal Farm Credit Banks | 11/27/2020 | | | 1.90 | % | | | 7,000,000 | | | | 6,910,722 | |
| Federal Farm Credit Banks | 04/05/2021 | | | 2.54 | % | | | 19,410,000 | | | | 19,398,257 | |
| Federal Farm Credit Banks | 07/17/2023 | | | 2.88 | % | | | 10,985,000 | | | | 11,103,473 | |
| Federal Home Loan Banks | 06/11/2021 | | | 3.63 | % | | | 7,000,000 | | | | 7,170,471 | |
| Federal Home Loan Banks | 06/10/2022 | | | 2.75 | % | | | 6,015,000 | | | | 6,040,371 | |
| Federal Home Loan Banks | 06/09/2023 | | | 3.25 | % | | | 12,000,000 | | | | 12,304,104 | |
| Federal Home Loan Banks | 09/08/2023 | | | 3.38 | % | | | 9,000,000 | | | | 9,270,135 | |
| Federal Home Loan Banks | 12/08/2023 | | | 3.38 | % | | | 6,220,000 | | | | 6,410,015 | |
| Federal National Mortgage Association | 04/13/2021 | | | 2.50 | % | | | 4,555,000 | | | | 4,551,283 | |
| Federal National Mortgage Association | 09/12/2023 | | | 2.88 | % | | | 3,545,000 | | | | 3,586,739 | |
| TOTAL U.S. GOVERNMENT AGENCY ISSUES (Cost $90,048,150) | | | | | | | | | | | | 90,489,026 | |
| | | | | | | | | | | | | | |
| U.S. GOVERNMENT NOTES: 6.27% | | | | | | | | | | | | | |
| United States Treasury Note | 10/31/2022 | | | 2.00 | % | | | 7,660,000 | | | | 7,524,155 | |
| United States Treasury Note | 11/15/2022 | | | 1.63 | % | | | 9,640,000 | | | | 9,332,348 | |
| United States Treasury Note | 08/15/2023 | | | 2.50 | % | | | 3,000,000 | | | | 2,999,063 | |
| United States Treasury Note | 09/30/2023 | | | 2.88 | % | | | 2,305,000 | | | | 2,342,456 | |
| United States Treasury Note | 05/15/2024 | | | 2.50 | % | | | 12,570,000 | | | | 12,546,923 | |
| TOTAL U.S. GOVERNMENT NOTES (Cost $34,564,552) | | | | | | | | | | | | 34,744,945 | |
| | | | | | | | | | | | | | |
| SHORT TERM INVESTMENTS: 4.24% | | | | | | | | | | | | | |
| U.S. GOVERNMENT NOTE: 0.41% | | | | | | | | | | | | | |
| United States Treasury Note | 08/31/2019 | | | 1.00 | % | | | 2,250,000 | | | | 2,226,094 | |
| TOTAL U.S. GOVERNMENT NOTE (Cost $2,226,492) | | | | | | | | | | | | 2,226,094 | |
The accompanying notes are an integral part of these consolidated financial statements.
| | |
| | |
22 | | LoCorr Macro Strategies Fund - Consolidated Schedule of Investments (continued) |
| | |
| Maturity Date | | Coupon Rate | | Shares | | | Value | |
SHORT TERM INVESTMENTS (continued) | | | | | | | | | | |
| MONEY MARKET FUND: 3.83% | | | | | | | | | | |
STIT-Government & Agency Portfolio, Institutional Class, 2.30% (e)(f) |
| | |
|
| | | 21,240,233 | | | $ | 21,240,233 | |
| TOTAL MONEY MARKET FUND (Cost $21,240,233) | | | | | | | | | | | | 21,240,233 | |
| TOTAL SHORT TERM INVESTMENTS (Cost $23,466,725) | | | | | | | | | | | | 23,466,327 | |
| | | | | | | | | | | | | | |
| TOTAL INVESTMENTS (Cost $512,600,619): 92.03% | | | | | | | | | | | | 509,944,706 | |
Other Assets in Excess of Liabilities: 7.97% (g) | | | | | | | | | | | | 44,136,561 | |
| TOTAL NET ASSETS: 100.00% | | | | | | | | | | | $ | 554,081,267 | |
| (a) | Security as defined in Rule 144A under the Securities Act of 1933 and determined to be liquid. Purchased in a private placement transaction; resale to the public may require registration or may extend only to qualified institutional buyers. At December 31, 2018, the value of these securities total $145,677,333 which represents 26.29% of total net assets. |
| (b) | Foreign issued security. |
| (c) | Variable rate security based on a reference index and spread. The rate reported is the rate in effect as of December 31, 2018. |
| (d) | Variable rate security. The coupon is based on an underlying pool of loans. The rate reported is the rate in effect as of December 31, 2018. |
| (e) | The rate quoted is the annualized seven-day effective yield as of December 31, 2018. |
| (f) | All or a portion of this security is held by LCMFS Fund Limited and pledged as collateral for derivative contracts. |
| (g) | Includes assets pledged as collateral for derivative contracts. |
| LIBOR | London Interbank Offered Rate |
The accompanying notes are an integral part of these consolidated financial statements.
| | |
| | |
| LoCorr Macro Strategies Fund - Consolidated Schedule of Open Forward Currency Contracts | | 23 |
| | |
LoCorr Macro Strategies Fund
Consolidated Schedule of Open Forward Currency Contracts
December 31, 2018
| | | | | | | | | | | | | | | | | | | | | | | | | | | | |
| | | | | | | | | | | Currency to be Received | | Currency to be Delivered | | | | | | | |
| | Notional
Amount | | Counter-
party | | Forward
Settlement Date | | Curr
Abbr. | | U.S. $ Value at
December 31, 2018 | | Curr
Abbr. | | U.S. $ Value on
Origination Date | | Unrealized
Appreciation | | Unrealized
(Depreciation) | |
| | | | | See key for
abbreviation | | | | | | | | | | | | | | | | | | | | | | |
| Purchase Contracts: | | | | | | | | | | | | | | | | | | | | | | | | | |
| | $ | 21,566,368 | | | DB | | | 01/16/2019 | | | AUD | | $ | 21,187,110 | | | USD | | $ | 21,566,368 | | $ | — | | $ | (379,258 | ) |
| | | 509,721 | | | BAML | | | 03/22/2019 | | | AUD | | | 500,073 | | | USD | | | 509,721 | | | — | | | (9,648 | ) |
| | | 9,684,446 | | | DB | | | 01/16/2019 | | | BRL | | | 9,680,309 | | | USD | | | 9,684,446 | | | — | | | (4,137 | ) |
| | | 12,324,680 | | | DB | | | 01/16/2019 | | | CAD | | | 12,091,504 | | | USD | | | 12,324,680 | | | — | | | (233,176 | ) |
| | | 458,717 | | | BAML | | | 03/22/2019 | | | CAD | | | 449,865 | | | USD | | | 458,717 | | | — | | | (8,852 | ) |
| | | 1,516,403 | | | DB | | | 01/03/2019 | | | CHF | | | 1,516,326 | | | USD | | | 1,516,403 | | | — | | | (77 | ) |
| | | 15,447,262 | | | DB | | | 01/16/2019 | | | CHF | | | 15,558,881 | | | USD | | | 15,447,262 | | | 111,619 | | | — | |
| | | 527,034 | | | BAML | | | 03/22/2019 | | | CHF | | | 532,104 | | | USD | | | 527,034 | | | 5,070 | | | — | |
| | | 82,480 | | | DB | | | 01/16/2019 | | | CLP | | | 82,164 | | | USD | | | 82,480 | | | — | | | (316 | ) |
| | | 3,768 | | | DB | | | 01/16/2019 | | | COP | | | 3,692 | | | USD | | | 3,768 | | | — | | | (76 | ) |
| | | 6,487,855 | | | DB | | | 01/16/2019 | | | EUR | | | 6,551,314 | | | NOK | | | 6,487,855 | | | 63,459 | | | — | |
| | | 1,399,700 | | | DB | | | 01/16/2019 | | | EUR | | | 1,411,229 | | | PLN | | | 1,399,700 | | | 11,529 | | | — | |
| | | 11,813,250 | | | DB | | | 01/16/2019 | | | EUR | | | 11,943,814 | | | SEK | | | 11,813,250 | | | 130,564 | | | — | |
| | | 17,194,483 | | | DB | | | 01/16/2019 | | | EUR | | | 17,278,947 | | | USD | | | 17,194,483 | | | 84,464 | | | — | |
| | | 2,535,000 | | | BAML | | | 03/22/2019 | | | EUR | | | 2,548,442 | | | USD | | | 2,535,000 | | | 13,442 | | | — | |
| | | 38,078,048 | | | DB | | | 01/16/2019 | | | GBP | | | 38,307,799 | | | USD | | | 38,078,048 | | | 229,751 | | | — | |
| | | 1,855,709 | | | BAML | | | 03/22/2019 | | | GBP | | | 1,860,625 | | | USD | | | 1,855,709 | | | 4,916 | | | — | |
| | | 464,623 | | | DB | | | 01/16/2019 | | | ILS | | | 465,958 | | | USD | | | 464,623 | | | 1,335 | | | — | |
| | | 3,253,248 | | | DB | | | 01/16/2019 | | | INR | | | 3,305,965 | | | USD | | | 3,253,248 | | | 52,717 | | | — | |
| | | 4,342,039 | | | DB | | | 01/04/2019 | | | JPY | | | 4,399,230 | | | USD | | | 4,342,039 | | | 57,191 | | | — | |
| | | 9,681,101 | | | DB | | | 01/07/2019 | | | JPY | | | 9,750,366 | | | USD | | | 9,681,101 | | | 69,265 | | | — | |
| | | 36,443,451 | | | DB | | | 01/16/2019 | | | JPY | | | 37,183,721 | | | USD | | | 36,443,451 | | | 740,270 | | | — | |
| | | 12,810,052 | | | BAML | | | 03/22/2019 | | | JPY | | | 12,955,902 | | | USD | | | 12,810,052 | | | 145,850 | | | — | |
| | | 3,273,111 | | | DB | | | 01/16/2019 | | | KRW | | | 3,280,042 | | | USD | | | 3,273,111 | | | 6,931 | | | — | |
| | | 11,113,382 | | | DB | | | 01/16/2019 | | | MXN | | | 11,321,818 | | | USD | | | 11,113,382 | | | 208,436 | | | — | |
| | | 8,792,474 | | | BAML | | | 03/22/2019 | | | MXN | | | 8,983,857 | | | USD | | | 8,792,474 | | | 191,383 | | | — | |
| | | 4,705,293 | | | DB | | | 01/16/2019 | | | NOK | | | 4,749,661 | | | EUR | | | 4,705,293 | | | 44,368 | | | — | |
| | | 4,063,203 | | | DB | | | 01/16/2019 | | | NOK | | | 4,081,100 | | | USD | | | 4,063,203 | | | 17,897 | | | — | |
| | | 422,492 | | | DB | | | 01/03/2019 | | | NZD | | | 422,880 | | | USD | | | 422,492 | | | 388 | | | — | |
| | | 15,013,811 | | | DB | | | 01/16/2019 | | | NZD | | | 14,844,689 | | | USD | | | 15,013,811 | | | — | | | (169,122 | ) |
| | | 5,287,432 | | | BAML | | | 03/22/2019 | | | NZD | | | 5,230,744 | | | USD | | | 5,287,432 | | | — | | | (56,688 | ) |
| | | 2,728,814 | | | DB | | | 01/16/2019 | | | PLN | | | 2,752,319 | | | EUR | | | 2,728,814 | | | 23,505 | | | — | |
| | | 2,807,584 | | | DB | | | 01/16/2019 | | | PLN | | | 2,825,223 | | | USD | | | 2,807,584 | | | 17,639 | | | — | |
| | | 7,105,983 | | | DB | | | 01/16/2019 | | | RUB | | | 6,827,593 | | | USD | | | 7,105,983 | | | — | | | (278,390 | ) |
| | | 13,187,721 | | | DB | | | 01/16/2019 | | | SEK | | | 13,457,369 | | | EUR | | | 13,187,721 | | | 269,648 | | | — | |
| | | 793,404 | | | DB | | | 01/02/2019 | | | SEK | | | 806,871 | | | USD | | | 793,404 | | | 13,467 | | | — | |
| | | 623,846 | | | DB | | | 01/03/2019 | | | SEK | | | 630,882 | | | USD | | | 623,846 | | | 7,036 | | | — | |
| | | 7,128,397 | | | DB | | | 01/16/2019 | | | SEK | | | 7,252,555 | | | USD | | | 7,128,397 | | | 124,158 | | | — | |
| | | 2,732,885 | | | DB | | | 01/16/2019 | | | SGD | | | 2,745,041 | | | USD | | | 2,732,885 | | | 12,156 | | | — | |
| | | 5,758,672 | | | DB | | | 01/16/2019 | | | TRY | | | 5,869,495 | | | USD | | | 5,758,672 | | | 110,823 | | | — | |
| | | 6,386,629 | | | DB | | | 01/16/2019 | | | ZAR | | | 6,325,021 | | | USD | | | 6,386,629 | | | — | | | (61,608 | ) |
| Total Purchase Contracts | | | 311,972,500 | | | | | | 310,404,571 | | | 2,769,277 | | | (1,201,348 | ) |
| | | | | | | | | | | | | | | | | | | | | | | | | | | | |
| Sale Contracts: | | | | | | | | | | | | | | | | | | | | | | | | | |
| | $ | 32,388,367 | | | DB | | | 01/16/2019 | | | USD | | $ | 31,840,556 | | | AUD | | $ | 32,388,367 | | $ | 547,811 | | $ | — | |
| | | 30,172,159 | | | BAML | | | 03/22/2019 | | | USD | | | 29,439,428 | | | AUD | | | 30,172,159 | | | 732,731 | | | — | |
| | | 10,690,562 | | | DB | | | 01/16/2019 | | | USD | | | 10,783,390 | | | BRL | | | 10,690,562 | | | — | | | (92,828 | ) |
| | | 41,095,170 | | | DB | | | 01/16/2019 | | | USD | | | 40,231,730 | | | CAD | | | 41,095,170 | | | 863,440 | | | — | |
| | | 26,985,240 | | | BAML | | | 03/22/2019 | | | USD | | | 26,340,963 | | | CAD | | | 26,985,240 | | | 644,277 | | | — | |
| | | 1,512,475 | | | DB | | | 01/03/2019 | | | USD | | | 1,516,326 | | | CHF | | | 1,512,475 | | | — | | | (3,851 | ) |
| | | 25,732,304 | | | DB | | | 01/16/2019 | | | USD | | | 25,972,225 | | | CHF | | | 25,732,304 | | | — | | | (239,921 | ) |
| | | 31,075,404 | | | BAML | | | 03/22/2019 | | | USD | | | 31,316,225 | | | CHF | | | 31,075,404 | | | — | | | (240,821 | ) |
| | | 679,139 | | | DB | | | 01/16/2019 | | | USD | | | 665,962 | | | CLP | | | 679,139 | | | 13,177 | | | — | |
| | | 88,733 | | | DB | | | 01/16/2019 | | | USD | | | 86,146 | | | COP | | | 88,733 | | | 2,587 | | | — | |
| | | 4,705,292 | | | DB | | | 01/16/2019 | | | NOK | | | 4,738,516 | | | EUR | | | 4,705,292 | | | — | | | (33,224 | ) |
| | | 2,728,814 | | | DB | | | 01/16/2019 | | | PLN | | | 2,753,617 | | | EUR | | | 2,728,814 | | | — | | | (24,803 | ) |
| | | 13,187,721 | | | DB | | | 01/16/2019 | | | SEK | | | 13,297,676 | | | EUR | | | 13,187,721 | | | — | | | (109,955 | ) |
The accompanying notes are an integral part of these consolidated financial statements.
| | |
| | |
24 | | LoCorr Macro Strategies Fund - Consolidated Schedule of Open Forward Currency Contracts (continued) |
| | |
| | | | | | | | | | | | | | | | | | | | | | | | | | | | |
| | | | | | | | | | | Currency to be Received | | Currency to be Delivered | | | | | | | |
| | Notional
Amount | | Counter-
party | | Forward
Settlement Date | | Curr
Abbr. | | U.S. $ Value at
December 31, 2018 | | Curr
Abbr. | | U.S. $ Value on
Origination Date | | Unrealized
Appreciation | | Unrealized
(Depreciation) | |
| | | | | See key for
abbreviation | | | | | | | | | | | | | | | | | | | | | | |
Sale Contracts: (continued) | | | | | | | | | | | | | | | | | | | | | | | | | |
| | $ | 31,371,600 | | | DB | | | 01/16/2019 | | | USD | | $ | 31,574,810 | | | EUR | | $ | 31,371,600 | | $ | — | | $ | (203,210 | ) |
| | | 46,843,801 | | | BAML | | | 03/22/2019 | | | USD | | | 47,142,145 | | | EUR | | | 46,843,801 | | | — | | | (298,344 | ) |
| | | 45,954,218 | | | DB | | | 01/16/2019 | | | USD | | | 46,318,887 | | | GBP | | | 45,954,218 | | | — | | | (364,669 | ) |
| | | 49,624,660 | | | BAML | | | 03/22/2019 | | | USD | | | 49,960,459 | | | GBP | | | 49,624,660 | | | — | | | (335,799 | ) |
| | | 1,979,513 | | | DB | | | 01/16/2019 | | | USD | | | 1,976,303 | | | ILS | | | 1,979,513 | | | 3,210 | | | — | |
| | | 2,106,507 | | | DB | | | 01/16/2019 | | | USD | | | 2,148,648 | | | INR | | | 2,106,507 | | | — | | | (42,141 | ) |
| | | 4,356,090 | | | DB | | | 01/04/2019 | | | USD | | | 4,399,230 | | | JPY | | | 4,356,090 | | | — | | | (43,140 | ) |
| | | 9,686,103 | | | DB | | | 01/07/2019 | | | USD | | | 9,750,366 | | | JPY | | | 9,686,103 | | | — | | | (64,263 | ) |
| | | 46,359,650 | | | DB | | | 01/16/2019 | | | USD | | | 47,671,906 | | | JPY | | | 46,359,650 | | | — | | | (1,312,256 | ) |
| | | 73,873,651 | | | BAML | | | 03/22/2019 | | | USD | | | 76,149,100 | | | JPY | | | 73,873,651 | | | — | | | (2,275,449 | ) |
| | | 2,469,054 | | | DB | | | 01/16/2019 | | | USD | | | 2,478,414 | | | KRW | | | 2,469,054 | | | — | | | (9,360 | ) |
| | | 10,837,875 | | | DB | | | 01/16/2019 | | | USD | | | 11,228,929 | | | MXN | | | 10,837,875 | | | — | | | (391,054 | ) |
| | | 156,248 | | | BAML | | | 03/22/2019 | | | USD | | | 160,118 | | | MXN | | | 156,248 | | | — | | | (3,870 | ) |
| | | 6,487,855 | | | DB | | | 01/16/2019 | | | EUR | | | 6,472,874 | | | NOK | | | 6,487,855 | | | 14,981 | | | — | |
| | | 12,548,297 | | | DB | | | 01/16/2019 | | | USD | | | 12,343,996 | | | NOK | | | 12,548,297 | | | 204,301 | | | — | |
| | | 422,113 | | | DB | | | 01/03/2019 | | | USD | | | 422,880 | | | NZD | | | 422,113 | | | — | | | (767 | ) |
| | | 16,875,388 | | | DB | | | 01/16/2019 | | | USD | | | 16,375,485 | | | NZD | | | 16,875,388 | | | 499,903 | | | — | |
| | | 14,121,261 | | | BAML | | | 03/22/2019 | | | USD | | | 13,888,828 | | | NZD | | | 14,121,261 | | | 232,433 | | | — | |
| | | 1,399,700 | | | DB | | | 01/16/2019 | | | EUR | | | 1,414,780 | | | PLN | | | 1,399,700 | | | — | | | (15,080 | ) |
| | | 3,995,957 | | | DB | | | 01/16/2019 | | | USD | | | 4,019,996 | | | PLN | | | 3,995,957 | | | — | | | (24,039 | ) |
| | | 13,625,446 | | | DB | | | 01/16/2019 | | | USD | | | 13,269,591 | | | RUB | | | 13,625,446 | | | 355,855 | | | — | |
| | | 11,813,250 | | | DB | | | 01/16/2019 | | | EUR | | | 12,074,494 | | | SEK | | | 11,813,250 | | | — | | | (261,244 | ) |
| | | 791,134 | | | DB | | | 01/02/2019 | | | USD | | | 806,871 | | | SEK | | | 791,134 | | | — | | | (15,737 | ) |
| | | 623,383 | | | DB | | | 01/03/2019 | | | USD | | | 630,882 | | | SEK | | | 623,383 | | | — | | | (7,499 | ) |
| | | 8,902,243 | | | DB | | | 01/16/2019 | | | USD | | | 9,067,106 | | | SEK | | | 8,902,243 | | | — | | | (164,863 | ) |
| | | 1,625,558 | | | DB | | | 01/16/2019 | | | USD | | | 1,636,749 | | | SGD | | | 1,625,558 | | | — | | | (11,191 | ) |
| | | 2,845,007 | | | DB | | | 01/16/2019 | | | USD | | | 2,854,266 | | | TRY | | | 2,845,007 | | | — | | | (9,259 | ) |
| | | 3,031,917 | | | DB | | | 01/16/2019 | | | USD | | | 3,043,197 | | | ZAR | | | 3,031,917 | | | — | | | (11,280 | ) |
| Total Sale Contracts | | | 648,264,070 | | | | | | 645,768,859 | | | 4,114,706 | | | (6,609,917 | ) |
| Net Forward Currency Contracts | | $ | (336,291,570 | ) | | | | $ | (335,364,288 | ) | $ | 6,883,983 | | $ | (7,811,265 | ) |
| Net Unrealized Depreciation | | | | | | | | | | | | | | $ | (927,282 | ) |
Counterparty: |
| BAML | Bank of America Merrill Lynch |
| DB | Deutsche Bank |
Currency abbreviations: | | | | | | |
| AUD | AUSTRALIAN DOLLAR | EUR | EURO | MXN | MEXICAN PESO | SGD | SINGAPORE DOLLAR |
| BRL | BRAZILIAN REAL | GBP | BRITISH POUND | NOK | NORWEGIAN KRONE | TRY | TURKISH LIRA |
| CAD | CANADIAN DOLLAR | ILS | ISRAELI NEW SHEQEL | NZD | NEW ZEALAND DOLLAR | USD | U.S. DOLLAR |
| CHF | SWISS FRANC | INR | INDIAN RUPEE | PLN | POLISH ZLOTY | ZAR | SOUTH AFRICAN RAND |
| CLP | CHILEAN PESO | JPY | JAPANESE YEN | RUB | RUSSIAN RUBLE | | |
| COP | COLOMBIAN PESO | KRW | SOUTH KOREAN WON | SEK | SWEDISH KRONA | | |
The accompanying notes are an integral part of these consolidated financial statements.
| | |
| | |
| LoCorr Macro Strategies Fund - Consolidated Schedule of Open Futures Contracts | | 25 |
| | |
LoCorr Macro Strategies Fund
Consolidated Schedule of Open Futures Contracts
December 31, 2018
| | | | | | | | | | | | | | | | | | | | |
| | | Number of
| | | | Current
| | | | Value | |
| Description | | Contracts
Purchased (Sold) | | Settlement
Month-Year | | Notional
Amount | | Value at
Trade Date | | Unrealized
Appreciation | | Unrealized
(Depreciation) | |
| | | | | | | | | | | | | | | | | | | | |
| Purchase Contracts: | | | | | | | | | | | | | | | | | | | |
| 10 Yr Mini JGB | | | 15 | | | Mar-19 | | $ | 2,088,819 | | $ | 2,079,604 | | $ | 9,215 | | $ | — | |
| 3 Mo Euro Euribor | | | 494 | | | Jun-20 | | | 141,740,797 | | | 141,625,962 | | | 114,835 | | | — | |
| 90 Day Euro | | | 12 | | | Dec-19 | | | 2,920,500 | | | 2,920,371 | | | 129 | | | — | |
| 90 Day Euro | | | 84 | | | Jun-20 | | | 20,476,050 | | | 20,469,721 | | | 6,329 | | | — | |
| 90 Day Euro | | | 227 | | | Sep-20 | | | 55,356,788 | | | 55,224,920 | | | 131,868 | | | — | |
| 90 Day Euro | | | 139 | | | Dec-20 | | | 33,891,675 | | | 33,869,942 | | | 21,733 | | | — | |
| 90 Day Euro | | | 220 | | | Mar-21 | | | 53,658,000 | | | 53,587,795 | | | 70,205 | | | — | |
Aluminum (a)(b) | | | 74 | | | Mar-19 | | | 3,418,800 | | | 3,620,286 | | | — | | | (201,486 | ) |
| Amsterdam Exchange Index | | | 5 | | | Jan-19 | | | 558,806 | | | 551,652 | | | 7,154 | | | — | |
| Australian 3 Yr Bond | | | 85 | | | Mar-19 | | | 6,718,125 | | | 6,688,238 | | | 29,887 | | | — | |
| Australian 10 Yr Bond | | | 533 | | | Mar-19 | | | 49,808,599 | | | 49,348,046 | | | 460,553 | | | — | |
| Canadian 10 Yr Bond | | | 138 | | | Mar-19 | | | 13,825,271 | | | 13,827,982 | | | — | | | (2,711 | ) |
| CBOE Volatility Index | | | 47 | | | Jan-19 | | | 1,136,225 | | | 1,204,741 | | | — | | | (68,516 | ) |
| CBOE Volatility Index | | | 25 | | | Feb-19 | | | 556,875 | | | 581,248 | | | — | | | (24,373 | ) |
| CBOE Volatility Index | | | 6 | | | Mar-19 | | | 129,450 | | | 128,462 | | | 988 | | | — | |
| CBOE Volatility Index | | | 4 | | | Apr-19 | | | 83,900 | | | 84,958 | | | — | | | (1,058 | ) |
Copper (a)(b) | | | 93 | | | Mar-19 | | | 13,879,669 | | | 14,453,336 | | | — | | | (573,667 | ) |
| Dollar | | | 102 | | | Mar-19 | | | 9,764,970 | | | 9,877,857 | | | — | | | (112,887 | ) |
| Dow Jones Industrial Average Mini E-Cbot Index | | | 94 | | | Mar-19 | | | 10,935,960 | | | 11,501,539 | | | — | | | (565,579 | ) |
| Euro-Bobl | | | 1,512 | | | Mar-19 | | | 229,574,399 | | | 229,191,901 | | | 382,498 | | | — | |
| Euro-BTP | | | 88 | | | Mar-19 | | | 12,887,590 | | | 12,605,679 | | | 281,911 | | | — | |
| Euro-Bund | | | 633 | | | Mar-19 | | | 118,609,083 | | | 118,073,163 | | | 535,920 | | | — | |
| Euro-Buxl 30 Yr Bond | | | 82 | | | Mar-19 | | | 16,969,534 | | | 17,017,573 | | | — | | | (48,039 | ) |
| Euro-OAT | | | 326 | | | Mar-19 | | | 56,326,036 | | | 56,379,828 | | | — | | | (53,792 | ) |
| Euro-Schatz | | | 737 | | | Mar-19 | | | 94,524,202 | | | 94,493,722 | | | 30,480 | | | — | |
| FTSE 100 Index | | | 70 | | | Mar-19 | | | 5,941,292 | | | 5,956,112 | | | — | | | (14,820 | ) |
| FTSE/JSE Top 40 Index | | | 8 | | | Mar-19 | | | 261,660 | | | 257,600 | | | 4,060 | | | — | |
| Japanese 10 Yr Bond | | | 35 | | | Mar-19 | | | 48,691,209 | | | 48,507,905 | | | 183,304 | | | — | |
Lead (a)(b) | | | 11 | | | Mar-19 | | | 556,050 | | | 546,454 | | | 9,596 | | | — | |
| Long Gilt | | | 381 | | | Mar-19 | | | 59,814,124 | | | 59,833,366 | | | — | | | (19,242 | ) |
| MSCI EAFE Index | | | 1 | | | Mar-19 | | | 85,800 | | | 85,897 | | | — | | | (97 | ) |
| MSCI Emerging Markets Index | | | 55 | | | Mar-19 | | | 2,658,700 | | | 2,649,558 | | | 9,142 | | | — | |
| MSCI Taiwan Index | | | 10 | | | Jan-19 | | | 359,400 | | | 352,365 | | | 7,035 | | | — | |
| Nasdaq 100 E-Mini Index | | | 42 | | | Mar-19 | | | 5,319,930 | | | 5,690,893 | | | — | | | (370,963 | ) |
Natural Gas (a) | | | 111 | | | Feb-19 | | | 3,263,400 | | | 4,841,638 | | | — | | | (1,578,238 | ) |
Natural Gas (a) | | | 17 | | | Apr-19 | | | 456,110 | | | 477,824 | | | — | | | (21,714 | ) |
Natural Gas (a) | | | 23 | | | May-19 | | | 614,560 | | | 642,813 | | | — | | | (28,253 | ) |
Natural Gas (a) | | | 1 | | | Jun-19 | | | 27,170 | | | 27,732 | | | — | | | (562 | ) |
Nickel (a)(b) | | | 10 | | | Mar-19 | | | 640,890 | | | 667,454 | | | — | | | (26,564 | ) |
| Nikkei 225 Index (OSE) | | | 64 | | | Mar-19 | | | 11,678,299 | | | 11,913,987 | | | — | | | (235,688 | ) |
| Nikkei 225 Index (SGX) | | | 1 | | | Mar-19 | | | 90,940 | | | 86,516 | | | 4,424 | | | — | |
| SET 50 Index | | | 8 | | | Mar-19 | | | 51,253 | | | 50,878 | | | 375 | | | — | |
Soybean Meal (a) | | | 46 | | | Mar-19 | | | 1,425,540 | | | 1,437,618 | | | — | | | (12,078 | ) |
| U.S. 10 Yr Note | | | 221 | | | Mar-19 | | | 26,965,453 | | | 26,866,948 | | | 98,505 | | | — | |
| U.S. Long Bond | | | 142 | | | Mar-19 | | | 20,732,000 | | | 20,662,645 | | | 69,355 | | | — | |
| U.S. Ultra Bond | | | 31 | | | Mar-19 | | | 4,980,344 | | | 4,977,195 | | | 3,149 | | | — | |
Zinc (a)(b) | | | 25 | | | Mar-19 | | | 1,544,063 | | | 1,593,882 | | | — | | | (49,819 | ) |
| Total Purchase Contracts | | | | | | | | | | | | | | | 2,472,650 | | | (4,010,146 | ) |
The accompanying notes are an integral part of these consolidated financial statements.
| | |
| | |
26 | | LoCorr Macro Strategies Fund - Consolidated Schedule of Open Futures Contracts (continued) |
| | |
| | | | | | | | | | | | | | | | | | | | |
| | | Number of
| | | | | Current
| | | | | Value | |
| Description | | Contracts
Purchased (Sold) | | Settlement
Month-Year | | Notional
Amount | | Value at
Trade Date | | Unrealized
Appreciation | | Unrealized
(Depreciation) | |
| | | | | | | | | | | | | | | | | | | | |
| Sale Contracts: | | | | | | | | | | | | | | | | | | | |
| 90 Day Euro | | | (93 | ) | | Sep-19 | | $ | 22,631,550 | | $ | 22,555,088 | | $ | — | | $ | (76,462 | ) |
| 90 Day Euro | | | (51 | ) | | Mar-20 | | | 12,424,238 | | | 12,361,149 | | | — | | | (63,089 | ) |
| 90 Day Euro | | | (1,170 | ) | | Jun-20 | | | 285,202,125 | | | 284,109,789 | | | — | | | (1,092,336 | ) |
| 90 Day Sterling | | | (851 | ) | | Jun-20 | | | 133,999,200 | | | 133,946,372 | | | — | | | (52,828 | ) |
Aluminum (a)(b) | | | (288 | ) | | Mar-19 | | | 13,305,600 | | | 14,187,377 | | | 881,777 | | | — | |
Brent Crude (a) | | | (168 | ) | | Mar-19 | | | 9,038,400 | | | 9,793,001 | | | 754,601 | | | — | |
Brent Crude (a) | | | (31 | ) | | Apr-19 | | | 1,674,620 | | | 1,841,593 | | | 166,973 | | | — | |
Brent Crude (a) | | | (10 | ) | | May-19 | | | 543,100 | | | 578,718 | | | 35,618 | | | — | |
Brent Crude (a) | | | (5 | ) | | Jun-19 | | | 272,850 | | | 276,594 | | | 3,744 | | | — | |
Brent Crude (a) | | | (3 | ) | | Jul-19 | | | 164,280 | | | 176,286 | | | 12,006 | | | — | |
Brent Crude (a) | | | (2 | ) | | Aug-19 | | | 109,760 | | | 108,907 | | | — | | | (853 | ) |
| CAC 40 10 Euro Index | | | (208 | ) | | Jan-19 | | | 11,268,782 | | | 11,303,321 | | | 34,539 | | | — | |
| Canadian 10 Yr Bond | | | (1 | ) | | Mar-19 | | | 100,183 | | | 100,197 | | | 14 | | | — | |
Cocoa (ICE) (a) | | | (111 | ) | | Mar-19 | | | 2,498,547 | | | 2,410,025 | | | — | | | (88,522 | ) |
Cocoa (NYBOT) (a) | | | (5 | ) | | Mar-19 | | | 120,800 | | | 118,697 | | | — | | | (2,103 | ) |
Coffee (a) | | | (73 | ) | | Mar-19 | | | 2,788,144 | | | 3,308,137 | | | 519,993 | | | — | |
Copper (a)(b) | | | (124 | ) | | Mar-19 | | | 18,506,225 | | | 19,032,018 | | | 525,793 | | | — | |
Copper (COMEX) (a) | | | (2 | ) | | Mar-19 | | | 131,550 | | | 131,634 | | | 84 | | | — | |
Corn (a) | | | (317 | ) | | Mar-19 | | | 5,943,750 | | | 6,060,637 | | | 116,887 | | | — | |
Cotton No.2 (a) | | | (72 | ) | | Mar-19 | | | 2,599,200 | | | 2,681,845 | | | 82,645 | | | — | |
| DAX Index | | | (113 | ) | | Mar-19 | | | 34,184,899 | | | 34,464,761 | | | 279,862 | | | — | |
| Dow Jones Industrial Average Mini E-Cbot Index | | | (13 | ) | | Mar-19 | | | 1,512,420 | | | 1,508,994 | | | — | | | (3,426 | ) |
| Euro-Stoxx 50 Index | | | (514 | ) | | Mar-19 | | | 17,514,362 | | | 17,760,138 | | | 245,776 | | | — | |
| FTSE 100 Index | | | (108 | ) | | Mar-19 | | | 9,166,565 | | | 9,150,785 | | | — | | | (15,780 | ) |
| FTSE China A50 Index | | | (62 | ) | | Jan-19 | | | 645,575 | | | 647,132 | | | 1,557 | | | — | |
| FTSE MIB Index | | | (2 | ) | | Mar-19 | | | 208,595 | | | 207,636 | | | — | | | (959 | ) |
Gasoline RBOB (a) | | | (173 | ) | | Feb-19 | | | 9,461,059 | | | 10,410,196 | | | 949,137 | | | — | |
Gasoline RBOB (a) | | | (34 | ) | | Mar-19 | | | 1,873,536 | | | 2,024,657 | | | 151,121 | | | — | |
Gasoline RBOB (a) | | | (9 | ) | | Apr-19 | | | 563,787 | | | 600,276 | | | 36,489 | | | — | |
Gasoline RBOB (a) | | | (5 | ) | | May-19 | | | 315,483 | | | 337,297 | | | 21,814 | | | — | |
Gold (a) | | | (50 | ) | | Feb-19 | | | 6,406,500 | | | 6,391,833 | | | — | | | (14,667 | ) |
| Hang Seng Index | | | (26 | ) | | Jan-19 | | | 4,292,216 | | | 4,262,662 | | | — | | | (29,554 | ) |
Hard Red Wheat (a) | | | (112 | ) | | Mar-19 | | | 2,737,000 | | | 2,873,058 | | | 136,058 | | | — | |
Heating Oil (a) | | | (78 | ) | | Feb-19 | | | 5,501,714 | | | 5,732,976 | | | 231,262 | | | — | |
Heating Oil (a) | | | (28 | ) | | Mar-19 | | | 1,963,802 | | | 2,099,395 | | | 135,593 | | | — | |
Heating Oil (a) | | | (6 | ) | | Apr-19 | | | 417,337 | | | 443,424 | | | 26,087 | | | — | |
Heating Oil (a) | | | (3 | ) | | May-19 | | | 208,517 | | | 230,616 | | | 22,099 | | | — | |
| H-Shares Index | | | (99 | ) | | Jan-19 | | | 6,385,914 | | | 6,318,171 | | | — | | | (67,743 | ) |
| IBEX 35 Index | | | (10 | ) | | Jan-19 | | | 975,848 | | | 969,977 | | | — | | | (5,871 | ) |
| KOSPI 200 Index | | | (15 | ) | | Mar-19 | | | 880,534 | | | 875,818 | | | — | | | (4,716 | ) |
Lead (a)(b) | | | (11 | ) | | Mar-19 | | | 556,050 | | | 546,045 | | | — | | | (10,005 | ) |
Lean Hogs (a) | | | (1 | ) | | Feb-19 | | | 24,390 | | | 24,268 | | | — | | | (122 | ) |
Live Cattle (a) | | | (15 | ) | | Feb-19 | | | 743,250 | | | 744,583 | | | 1,333 | | | — | |
Low Sulphur Gasoil (a) | | | (117 | ) | | Feb-19 | | | 5,981,625 | | | 6,092,305 | | | 110,680 | | | — | |
Low Sulphur Gasoil (a) | | | (43 | ) | | Mar-19 | | | 2,200,525 | | | 2,206,995 | | | 6,470 | | | — | |
Low Sulphur Gasoil (a) | | | (11 | ) | | Apr-19 | | | 562,650 | | | 559,061 | | | — | | | (3,589 | ) |
| Nasdaq 100 E-Mini Index | | | (25 | ) | | Mar-19 | | | 3,166,625 | | | 3,160,034 | | | — | | | (6,591 | ) |
Natural Gas (a) | | | (27 | ) | | Feb-19 | | | 793,800 | | | 906,636 | | | 112,836 | | | — | |
Natural Gas (a) | | | (20 | ) | | Mar-19 | | | 570,200 | | | 655,650 | | | 85,450 | | | — | |
Nickel (a)(b) | | | (17 | ) | | Mar-19 | | | 1,089,513 | | | 1,157,898 | | | 68,385 | | | — | |
| OMX Stockholm 30 Index | | | (47 | ) | | Jan-19 | | | 746,791 | | | 747,260 | | | 469 | | | — | |
| Russell 2000 Mini Index | | | (201 | ) | | Mar-19 | | | 13,557,450 | | | 13,400,700 | | | — | | | (156,750 | ) |
| S&P 500 E-Mini Index | | | (67 | ) | | Mar-19 | | | 8,392,420 | | | 8,292,326 | | | — | | | (100,094 | ) |
| S&P MidCap 400 E-Mini Index | | | (8 | ) | | Mar-19 | | | 1,329,760 | | | 1,317,517 | | | — | | | (12,243 | ) |
| S&P/TSX 60 Index | | | (1 | ) | | Mar-19 | | | 125,593 | | | 125,137 | | | — | | | (456 | ) |
Silver (a) | | | (155 | ) | | Mar-19 | | | 12,043,500 | | | 11,299,093 | | | — | | | (744,407 | ) |
Soybean (a) | | | (134 | ) | | Mar-19 | | | 5,996,500 | | | 5,948,518 | | | — | | | (47,982 | ) |
Soybean Meal (a) | | | (75 | ) | | Mar-19 | | | 2,324,250 | | | 2,352,962 | | | 28,712 | | | — | |
The accompanying notes are an integral part of these consolidated financial statements.
| | |
| | |
| LoCorr Macro Strategies Fund - Consolidated Schedule of Open Futures Contracts (continued) | | 27 |
| | |
| | | | | | | | | | | | | | | | | | | | |
| | | Number of
| | | | Current
| | | | Value | |
| Description | | Contracts
Purchased (Sold) | | Settlement
Month-Year | | Notional
Amount | | Value at
Trade Date | | Unrealized
Appreciation | | Unrealized
(Depreciation) | |
| | | | | | | | | | | | | | | | | | | | |
Sale Contracts: (continued) | | | | | | | | | | | | | | | | | | | |
Soybean Oil (a) | | | (72 | ) | | Mar-19 | | $ | 1,203,120 | | $ | 1,238,031 | | $ | 34,911 | | $ | — | |
| SPI 200 Index | | | (2 | ) | | Mar-19 | | | 195,844 | | | 197,708 | | | 1,864 | | | — | |
Sugar (a) | | | (214 | ) | | Mar-19 | | | 2,883,350 | | | 2,784,540 | | | — | | | (98,810 | ) |
| Tokyo Price Index | | | (80 | ) | | Mar-19 | | | 10,900,963 | | | 11,325,356 | | | 424,393 | | | — | |
| U.S. 2 Yr Note | | | (1,303 | ) | | Mar-19 | | | 276,643,188 | | | 274,835,373 | | | — | | | (1,807,815 | ) |
| U.S. 5 Yr Note | | | (476 | ) | | Mar-19 | | | 54,591,250 | | | 53,834,377 | | | — | | | (756,873 | ) |
| U.S. 10 Yr Note | | | (187 | ) | | Mar-19 | | | 22,816,923 | | | 22,649,070 | | | — | | | (167,853 | ) |
Wheat (a) | | | (190 | ) | | Mar-19 | | | 4,780,875 | | | 4,900,979 | | | 120,104 | | | — | |
WTI Crude (a) | | | (270 | ) | | Feb-19 | | | 12,260,700 | | | 13,875,606 | | | 1,614,906 | | | — | |
WTI Crude (a) | | | (42 | ) | | Mar-19 | | | 1,920,240 | | | 2,119,620 | | | 199,380 | | | — | |
WTI Crude (a) | | | (13 | ) | | Apr-19 | | | 599,040 | | | 653,395 | | | 54,355 | | | — | |
WTI Crude (a) | | | (6 | ) | | May-19 | | | 279,060 | | | 293,728 | | | 14,668 | | | — | |
WTI Crude (a) | | | (4 | ) | | Jun-19 | | | 187,720 | | | 194,362 | | | 6,642 | | | — | |
WTI Crude (a) | | | (2 | ) | | Jul-19 | | | 94,600 | | | 110,296 | | | 15,696 | | | — | |
Zinc (a)(b) | | | (161 | ) | | Mar-19 | | | 9,943,763 | | | 9,933,472 | | | — | | | (10,291 | ) |
| Total Sale Contracts | | | | | | | | | | | | | | | 8,272,783 | | | (5,442,790 | ) |
| Total Futures Contracts | | | | | | | | | | | | | | $ | 10,745,433 | | $ | (9,452,936 | ) |
| Net Unrealized Appreciation | | | | | | | | | | | | | | $ | 1,292,497 | | | | |
| (a) | Contract held by LCMFS Fund Limited. |
| (b) | London Metal Exchange (“LME”) futures contracts settle on their respective maturity date. The unrealized appreciation on these contracts is a receivable for unsettled open futures contracts and the unrealized depreciation is a payable for unsettled open futures contracts on the Fund’s consolidated statement of assets and liabilities. |
| COMEX | Commodity Exchange, Inc. |
| ICE | Intercontinental Exchange |
| NYBOT | New York Board of Trade |
| OSE | Osaka Securities Exchange |
| SGX | Singapore Exchange Limited |
The accompanying notes are an integral part of these consolidated financial statements.
| | |
| | |
28 | | LoCorr Long/Short Commodities Strategy Fund - Consolidated Schedule of Investments |
| | |
LoCorr Long/Short Commodities Strategy Fund
Composition of Consolidated Investment Portfolio1
December 31, 2018 (Unaudited)
1 As a percentage of total investments.
Consolidated Schedule of Investments
December 31, 2018
| Maturity Date | | Coupon Rate | | Principal Amount | | | Value | |
| ASSET BACKED SECURITIES: 15.62% | | | | | | | | | | |
| 321 Henderson Receivables I LLC | | | | | | | | | | |
Series 2006-4A A1 (1 Month LIBOR USD + 0.200%) (a)(c) | 12/15/2041 | | | 2.66 | % | | $ | 220,332 | | | $ | 216,219 | |
Series 2004-A A1 (1 Month LIBOR USD + 0.350%) (a)(c) | 09/15/2045 | | | 2.81 | % | | | 77,623 | | | | 75,813 | |
| Ally Auto Receivables Trust | | | | | | | | | | | | | |
| Series 2017-3 A4 | 03/15/2022 | | | 2.01 | % | | | 225,000 | | | | 221,610 | |
| Series 2018-2 A3 | 11/15/2022 | | | 2.92 | % | | | 330,000 | | | | 329,426 | |
| American Express Credit Account Master Trust, 2017-6 A | 05/15/2023 | | | 2.04 | % | | | 400,000 | | | | 393,832 | |
| BA Credit Card Trust, 2018-A3 A3 | 12/15/2023 | | | 3.10 | % | | | 475,000 | | | | 477,974 | |
Bank of The West Auto Trust, 2017-1 A3 (a) | 01/15/2023 | | | 2.11 | % | | | 750,000 | | | | 740,854 | |
| Barclays Dryrock Issuance Trust | | | | | | | | | | | | | |
| Series 2015-1 A | 12/15/2022 | | | 2.20 | % | | | 460,000 | | | | 455,615 | |
Series 2017-2 A (1 Month LIBOR USD + 0.300%) (c) | 05/15/2023 | | | 2.76 | % | | | 725,000 | | | | 723,854 | |
| Cabela’s Credit Card Master Note Trust | | | | | | | | | | | | | |
| Series 2016-1 A1 | 06/15/2022 | | | 1.78 | % | | | 495,000 | | | | 492,128 | |
| Series 2015-1AA1 | 03/15/2023 | | | 2.26 | % | | | 1,200,000 | | | | 1,187,565 | |
| California Republic Auto Receivables Trust, 2018-1 A3 | 08/15/2022 | | | 3.14 | % | | | 290,000 | | | | 290,664 | |
| Capital One Multi-Asset Execution Trust | | | | | | | | | | | | | |
| Series 2015-2A | 03/15/2023 | | | 2.08 | % | | | 660,000 | | | | 652,072 | |
Series 2016-A7 (1 Month LIBOR USD + 0.510%) (c) | 09/16/2024 | | | 2.97 | % | | | 526,000 | | | | 528,225 | |
| Series 2015-A4 | 05/15/2025 | | | 2.75 | % | | | 1,210,000 | | | | 1,206,902 | |
| CarMax Auto Owner Trust | | | | | | | | | | | | | |
| Series 2018-1 | 11/15/2022 | | | 2.48 | % | | | 496,000 | | | | 492,278 | |
| Series 2018-2 A3 | 01/17/2023 | | | 2.98 | % | | | 1,000,000 | | | | 1,005,829 | |
| Series 2018-4 | 09/15/2023 | | | 3.36 | % | | | 900,000 | | | | 906,165 | |
| CenterPoint Energy Transition Bond Co. III LLC, 2008-A A2 | 02/01/2023 | | | 5.23 | % | | | 318,821 | | | | 322,836 | |
| Citibank Credit Card Issuance Trust, 2018-A3 | 05/23/2025 | | | 3.29 | % | | | 1,085,000 | | | | 1,100,344 | |
Conn’s Receivables Funding LLC, 2018-A A (a) | 07/17/2023 | | | 3.25 | % | | | 315,675 | | | | 315,730 | |
The accompanying notes are an integral part of these consolidated financial statements.
| | |
| | |
| LoCorr Long/Short Commodities Strategy Fund - Consolidated Schedule of Investments (continued) | | 29 |
| | |
| Maturity Date | | Coupon Rate | | Principal Amount | | | Value | |
ASSET BACKED SECURITIES (continued) | | | | | | | | | | |
Countrywide Asset-Backed Certificates, 2004-AB1 (1 Month LIBOR USD + 0.975%) (c) | 11/25/2034 | | | 3.48 | % | | $ | 308,275 | | | $ | 307,939 | |
Deephaven Residential Mortgage Trust, 2018-3 (a)(d) | 08/25/2058 | | | 3.79 | % | | | 462,503 | | | | 463,432 | |
| Discover Card Execution Note Trust | | | | | | | | | | | | | |
| Series 2017-A6 | 02/15/2023 | | | 1.88 | % | | | 550,000 | | | | 541,100 | |
| Series 2018-4 | 01/16/2024 | | | 3.11 | % | | | 1,000,000 | | | | 1,006,019 | |
Evergreen Credit Card Trust, 2018-2 A (1 Month LIBOR USD + 0.350%) (a)(b)(c)
| 07/15/2022 | | | 2.81 | % | | | 375,000 | | | | 374,821 | |
| Fifth Third Auto Trust, 2017-1 A3 | 02/15/2022 | | | 1.80 | % | | | 170,000 | | | | 168,148 | |
| FirstEnergy Ohio PIRB Special Purpose Trust, 2013-1 A2 | 01/15/2022 | | | 1.73 | % | | | 104,703 | | | | 104,330 | |
| Ford Credit Auto Owner Trust | | | | | | | | | | | | | |
| Series 2018-A A3 | 11/15/2022 | | | 3.03 | % | | | 500,000 | | | | 500,233 | |
Series 2015-2 A (a) | 01/15/2027 | | | 2.44 | % | | | 850,000 | | | | 842,857 | |
Series 2016-1 A (a) | 08/15/2027 | | | 2.31 | % | | | 760,000 | | | | 749,641 | |
GLS Auto Receivables Trust, 2018-2A A (a) | 04/18/2022 | | | 3.25 | % | | | 357,482 | | | | 356,648 | |
| GM Financial Automobile Leasing Trust, 2018-1 A2A | 04/20/2020 | | | 2.39 | % | | | 340,832 | | | | 339,888 | |
GM Financial Consumer Automobile Receivables Trust, 2018-1 A3
| 07/18/2022 | | | 2.32 | % | | | 445,000 | | | | 440,416 | |
| Honda Auto Receivables Owner Trust, 2017-4 | 03/21/2024 | | | 2.21 | % | | | 760,000 | | | | 748,782 | |
| Hyundai Auto Receivables Trust, 2018-B | 12/15/2022 | | | 3.20 | % | | | 1,500,000 | | | | 1,508,484 | |
| Invitation Homes Trust | | | | | | | | | | | | | |
Series 2017-SFR2 A (1 Month LIBOR USD + 0.850%) (a)(c) | 12/19/2036 | | | 3.28 | % | | | 474,865 | | | | 469,068 | |
Series 2018-SFR1 A (1 Month LIBOR USD + 0.700%) (a)(c) | 03/19/2037 | | | 3.16 | % | | | 653,480 | | | | 639,822 | |
Series 2018-SFR2 A (1 Month LIBOR USD + 0.900%) (a)(c) | 06/18/2037 | | | 3.36 | % | | | 601,444 | | | | 594,443 | |
Series 2018-SFR3 A (1 Month LIBOR USD + 1.000%) (a)(c) | 07/17/2037 | | | 3.46 | % | | | 488,147 | | | | 485,325 | |
Series 2018-SFR4 A (1 Month LIBOR USD + 1.100%) (a)(c) | 01/19/2038 | | | 3.56 | % | | | 489,270 | | | | 493,281 | |
| Mercedes-Benz Auto Lease Trust, 2018-A A2 | 04/15/2020 | | | 2.20 | % | | | 306,857 | | | | 306,188 | |
| Mercedes-Benz Auto Receivables Trust, 2018-1 A3 | 01/17/2023 | | | 3.03 | % | | | 845,000 | | | | 846,524 | |
| NRZ Advance Receivables Trust Advance Receivables Backed | | | | | | | | | | | | | |
Series 2017-T1 AT1 (a) | 02/15/2051 | | | 3.21 | % | | | 848,000 | | | | 846,281 | |
Series 2016-T3 AT3 (a) | 10/16/2051 | | | 2.83 | % | | | 1,110,000 | | | | 1,095,019 | |
| Ocwen Master Advance Receivables Trust | | | | | | | | | | | | | |
Series 2016-T2 AT2 (a) | 08/16/2049 | | | 2.72 | % | | | 725,000 | | | | 722,028 | |
Series 2018-T2 AT2 (a) | 08/15/2050 | | | 3.60 | % | | | 735,000 | | | | 736,771 | |
| OneMain Financial Issuance Trust | | | | | | | | | | | | | |
Series 2015-2A B (a) | 07/18/2025 | | | 3.10 | % | | | 242,439 | | | | 242,315 | |
Series 2015-2 C (a) | 07/18/2025 | | | 4.32 | % | | | 400,000 | | | | 400,278 | |
Series 2016-2 B (a) | 03/20/2028 | | | 5.94 | % | | | 575,000 | | | | 583,976 | |
Progress Residential Trust, 2017-SFR1 A (a) | 08/17/2034 | | | 2.77 | % | | | 323,959 | | | | 317,805 | |
Prosper Marketplace Issuance Trust, 2018-1A A (a) | 06/17/2024 | | | 3.11 | % | | | 343,283 | | | | 342,677 | |
Santander Retail Auto Lease Trust, 2017-A A2A (a) | 03/20/2020 | | | 2.02 | % | | | 252,763 | | | | 251,831 | |
| SMB Private Education Loan Trust | | | | | | | | | | | | | |
Series 2017-A A1 (1 Month LIBOR USD + 0.450%) (a)(c) | 06/17/2024 | | | 2.91 | % | | | 44,601 | | | | 44,601 | |
Series 2018-C A1 (1 Month LIBOR USD + 0.300%) (a)(c) | 09/15/2025 | | | 2.76 | % | | | 374,490 | | | | 373,860 | |
| SoFi Professional Loan Program LLC | | | | | | | | | | | | | |
Series 2015-AA2 (a) | 03/25/2030 | | | 2.42 | % | | | 247,257 | | | | 244,824 | |
Series 2015-C A2 (a) | 08/25/2033 | | | 2.51 | % | | | 365,940 | | | | 360,690 | |
Series 2015-DA2 (a) | 10/27/2036 | | | 2.72 | % | | | 135,505 | | | | 133,253 | |
Series 2016-A A2 (a) | 12/26/2036 | | | 2.76 | % | | | 804,854 | | | | 793,278 | |
Series 2017-B A2FX (a) | 05/25/2040 | | | 2.74 | % | | | 924,000 | | | | 908,096 | |
Series 2017-D A1FX (a) | 09/25/2040 | | | 1.72 | % | | | 80,669 | | | | 80,100 | |
SPS Servicer Advance Receivables Trust, 2018-T1 (a) | 10/17/2050 | | | 3.62 | % | | | 595,000 | | | | 597,445 | |
Starwood Waypoint Homes Trust, 2017-1 A (1 Month LIBOR USD + 0.950%) (a)(c) | 01/22/2035 | | | 3.41 | % | | | 630,756 | | | | 627,393 | |
| Synchrony Card Issuance Trust, 2018-A1 A1 | 09/15/2024 | | | 3.38 | % | | | 1,035,000 | | | | 1,044,403 | |
| Synchrony Credit Card Master Note Trust, 2018-1 A | 03/15/2024 | | | 2.97 | % | | | 800,000 | | | | 798,864 | |
| TCF Auto Receivables Owner Trust | | | | | | | | | | | | | |
Series 2016-1A A3 (a) | 04/15/2021 | | | 1.71 | % | | | 234,880 | | | | 233,882 | |
Series 2016-PT1 A (a) | 06/15/2022 | | | 1.93 | % | | | 318,251 | | | | 315,068 | |
| Toyota Auto Receivables Owner Trust, 2017-B A-4 | 09/15/2022 | | | 2.05 | % | | | 650,000 | | | | 638,333 | |
Tricon American Homes Trust, 2017-SFR1 A (a) | 09/19/2034 | | | 2.72 | % | | | 315,000 | | | | 304,412 | |
The accompanying notes are an integral part of these consolidated financial statements.
| | |
| | |
30 | | LoCorr Long/Short Commodities Strategy Fund - Consolidated Schedule of Investments (continued)
|
| | |
| Maturity Date | | Coupon Rate | | Principal Amount | | | Value | |
ASSET BACKED SECURITIES (continued) | | | | | | | | | | |
| Verizon Owner Trust | | | | | | | | | | |
Series 2018-1A A1B (1 Month LIBOR USD + 0.260%) (a)(c) | 09/20/2022 | | | 2.73 | % | | $ | 475,000 | | | $ | 474,285 | |
| Series 2018-A | 04/20/2023 | | | 3.23 | % | | | 705,000 | | | | 709,323 | |
| Volkswagen Auto Loan Enhanced Trust | | | | | | | | | | | | | |
| Series 2018-1 A2A | 07/20/2021 | | | 2.81 | % | | | 430,000 | | | | 429,420 | |
| Series 2018-1 | 11/21/2022 | | | 3.02 | % | | | 719,000 | | | | 719,134 | |
| World Omni Auto Receivables Trust, 2016-B A3 | 02/15/2022 | | | 1.30 | % | | | 351,651 | | | | 347,564 | |
| TOTAL ASSET BACKED SECURITIES (Cost $40,102,150) | | | | | | | | | | | | 40,140,533 | |
| | | | | | | | | | | | | | |
| CORPORATE BONDS: 25.52% | | | | | | | | | | | | | |
| Administrative Support, Waste Management: 0.17% | | | | | | | | | | | | | |
| Mastercard, Inc. | 11/21/2021 | | | 2.00 | % | | | 450,000 | | | | 437,844 | |
Safina Ltd. (b) | 01/15/2022 | | | 1.55 | % | | | 8,741 | | | | 8,584 | |
| | | | | | | | | | | | | 446,428 | |
| Finance and Insurance: 10.72% | | | | | | | | | | | | | |
| Aflac, Inc. | 06/15/2023 | | | 3.63 | % | | | 250,000 | | | | 250,830 | |
| American Express Credit Corp. | 05/26/2020 | | | 2.38 | % | | | 405,000 | | | | 400,753 | |
| American Honda Finance Corp. | 02/12/2021 | | | 2.65 | % | | | 520,000 | | | | 514,143 | |
| American International Group, Inc. | 08/15/2020 | | | 3.38 | % | | | 685,000 | | | | 686,541 | |
| Bank of America Corp. | 04/21/2020 | | | 2.25 | % | | | 810,000 | | | | 801,343 | |
Bank of America Corp. (3 Month LIBOR USD + 0.660%) (c) | 07/21/2021 | | | 2.37 | % | | | 775,000 | | | | 761,131 | |
| Bank of America Corp. | 01/11/2023 | | | 3.30 | % | | | 790,000 | | | | 778,039 | |
| Bank of New York Mellon Corp. | 02/07/2022 | | | 2.60 | % | | | 385,000 | | | | 378,185 | |
| BB&T Corp. | 01/15/2020 | | | 2.45 | % | | | 435,000 | | | | 431,964 | |
| Berkshire Hathaway Finance Corp. | 01/15/2021 | | | 4.25 | % | | | 250,000 | | | | 256,428 | |
BNP Paribas SA (b) | 05/21/2020 | | | 2.38 | % | | | 230,000 | | | | 227,489 | |
| Capital One Financial Corp. | 07/15/2021 | | | 4.75 | % | | | 505,000 | | | | 517,510 | |
| Charles Schwab Corp. | 01/25/2023 | | | 2.65 | % | | | 490,000 | | | | 478,325 | |
| Chubb INA Holdings, Inc. | 11/03/2020 | | | 2.30 | % | | | 165,000 | | | | 162,640 | |
| Chubb INA Holdings, Inc. | 03/13/2023 | | | 2.70 | % | | | 220,000 | | | | 214,984 | |
| Citigroup, Inc. | 10/26/2020 | | | 2.65 | % | | | 805,000 | | | | 794,298 | |
| Citigroup, Inc. | 01/14/2022 | | | 4.50 | % | | | 770,000 | | | | 786,735 | |
Citigroup, Inc. (3 Month LIBOR USD + 0.722%) (c) | 01/24/2023 | | | 3.14 | % | | | 710,000 | | | | 697,398 | |
Cooperatieve Rabobank UA (b) | 11/09/2022 | | | 3.95 | % | | | 895,000 | | | | 892,080 | |
Credit Suisse Group Funding Guernsey Ltd. (b) | 09/15/2022 | | | 3.80 | % | | | 370,000 | | | | 367,301 | |
| Dragon 2012 LLC | 03/12/2024 | | | 1.97 | % | | | 11,915 | | | | 11,671 | |
| Fifth Third Bancorp | 07/27/2020 | | | 2.88 | % | | | 190,000 | | | | 188,904 | |
| Fifth Third Bancorp | 03/15/2022 | | | 3.50 | % | | | 190,000 | | | | 190,335 | |
| General Motors Financial Co., Inc. | 04/09/2021 | | | 3.55 | % | | | 195,000 | | | | 192,315 | |
| General Motors Financial Co., Inc. | 05/09/2023 | | | 3.70 | % | | | 290,000 | | | | 275,915 | |
| Goldman Sachs Group, Inc. | 09/15/2020 | | | 2.75 | % | | | 250,000 | | | | 247,415 | |
| Goldman Sachs Group, Inc. | 02/25/2021 | | | 2.88 | % | | | 1,125,000 | | | | 1,105,765 | |
| Goldman Sachs Group, Inc. | 02/23/2023 | | | 3.20 | % | | | 590,000 | | | | 572,279 | |
| Hartford Financial Services Group, Inc. | 03/30/2020 | | | 5.50 | % | | | 745,000 | | | | 764,468 | |
HSBC Holdings PLC (b) | 04/05/2021 | | | 5.10 | % | | | 580,000 | | | | 599,784 | |
| John Deere Capital Corp. | 01/08/2021 | | | 2.55 | % | | | 480,000 | | | | 475,663 | |
| JP Morgan Chase & Co. | 01/23/2020 | | | 2.25 | % | | | 685,000 | | | | 678,177 | |
| JP Morgan Chase & Co. | 05/10/2021 | | | 4.63 | % | | | 130,000 | | | | 133,786 | |
| JP Morgan Chase & Co. | 01/25/2023 | | | 3.20 | % | | | 1,765,000 | | | | 1,739,285 | |
| Lazard Group LLC | 11/14/2020 | | | 4.25 | % | | | 158,000 | | | | 160,102 | |
| Lincoln National Corp. | 09/01/2023 | | | 4.00 | % | | | 650,000 | | | | 662,625 | |
| Marsh & McLennan Companies, Inc. | 07/15/2021 | | | 4.80 | % | | | 390,000 | | | | 401,923 | |
| MetLife, Inc. | 02/08/2021 | | | 4.75 | % | | | 60,000 | | | | 61,910 | |
Metropolitan Life Global Funding (a) | 04/14/2020 | | | 2.00 | % | | | 195,000 | | | | 192,212 | |
| Morgan Stanley | 07/24/2020 | | | 5.50 | % | | | 450,000 | | | | 463,894 | |
| Morgan Stanley | 07/28/2021 | | | 5.50 | % | | | 910,000 | | | | 953,666 | |
The accompanying notes are an integral part of these consolidated financial statements.
| | |
| | |
| LoCorr Long/Short Commodities Strategy Fund - Consolidated Schedule of Investments (continued) | | 31 |
| | |
| Maturity Date | | Coupon Rate | | Principal Amount | | | Value | |
CORPORATE BONDS (continued) | | | | | | | | | | |
| Morgan Stanley | 01/23/2023 | | | 3.13 | % | | $ | 865,000 | | | $ | 845,057 | |
MSN 41079 and 41084 Ltd. (b) | 07/13/2024 | | | 1.72 | % | | | 12,670 | | | | 12,303 | |
| PNC Bank NA | 01/22/2021 | | | 2.50 | % | | | 705,000 | | | | 695,653 | |
| Prudential Financial, Inc. | 06/15/2019 | | | 7.38 | % | | | 215,000 | | | | 218,900 | |
| Prudential Financial, Inc. | 11/15/2020 | | | 4.50 | % | | | 680,000 | | | | 695,554 | |
| State Street Corp. | 08/18/2020 | | | 2.55 | % | | | 305,000 | | | | 302,439 | |
| State Street Corp. | 05/15/2023 | | | 3.10 | % | | | 220,000 | | | | 216,178 | |
| SunTrust Banks, Inc. | 03/03/2021 | | | 2.90 | % | | | 915,000 | | | | 907,085 | |
| SunTrust Banks, Inc. | 08/01/2022 | | | 2.45 | % | | | 305,000 | | | | 294,038 | |
| Tagua Leasing LLC | 11/16/2024 | | | 1.58 | % | | | 13,136 | | | | 12,682 | |
Trinity Acquisition PLC (b) | 09/15/2021 | | | 3.50 | % | | | 385,000 | | | | 381,259 | |
| UnitedHealth Group, Inc. | 10/15/2020 | | | 3.88 | % | | | 195,000 | | | | 197,602 | |
| UnitedHealth Group, Inc. | 03/15/2022 | | | 2.88 | % | | | 300,000 | | | | 297,614 | |
| Unum Group | 05/15/2021 | | | 3.00 | % | | | 325,000 | | | | 321,288 | |
| Wells Fargo & Co. | 07/22/2020 | | | 2.60 | % | | | 565,000 | | | | 559,523 | |
| Wells Fargo & Co. | 02/13/2023 | | | 3.45 | % | | | 785,000 | | | | 768,529 | |
Westpac Banking Corp. (b) | 05/15/2023 | | | 3.65 | % | | | 350,000 | | | | 352,104 | |
| | | | | | | | | | | | | 27,548,019 | |
| Information: 3.20% | | | | | | | | | | | | | |
| 21st Century Fox America, Inc. | 02/15/2021 | | | 4.50 | % | | | 830,000 | | | | 852,155 | |
America Movil SAB de CV (b) | 03/30/2020 | | | 5.00 | % | | | 160,000 | | | | 162,777 | |
| AT&T, Inc. | 02/17/2021 | | | 2.80 | % | | | 1,310,000 | | | | 1,293,638 | |
| CBS Corp. | 08/15/2019 | | | 2.30 | % | | | 185,000 | | | | 183,628 | |
| Charter Communications Operating LLC/Charter Communications Operating Capital | 07/23/2020 | | | 3.58 | % | | | 695,000 | | | | 694,251 | |
| Discovery Communications LLC | 04/01/2023 | | | 3.25 | % | | | 510,000 | | | | 492,936 | |
| Microsoft Corp. | 02/06/2022 | | | 2.40 | % | | | 1,060,000 | | | | 1,047,788 | |
| NBCUniversal Media LLC | 01/15/2023 | | | 2.88 | % | | | 550,000 | | | | 539,947 | |
| Oracle Corp. | 10/15/2022 | | | 2.50 | % | | | 640,000 | | | | 622,883 | |
Orange SA (b) | 11/03/2019 | | | 1.63 | % | | | 180,000 | | | | 177,748 | |
| Verizon Communications, Inc. | 03/15/2021 | | | 3.45 | % | | | 440,000 | | | | 442,901 | |
| Verizon Communications, Inc. | 11/01/2021 | | | 3.50 | % | | | 185,000 | | | | 186,982 | |
| Visa, Inc. | 12/14/2022 | | | 2.80 | % | | | 485,000 | | | | 478,915 | |
Vodafone Group PLC (b) | 03/16/2021 | | | 4.38 | % | | | 1,020,000 | | | | 1,043,887 | |
| | | | | | | | | | | | | 8,220,436 | |
| Manufacturing: 5.48% | | | | | | | | | | | | | |
| Abbott Laboratories | 11/30/2021 | | | 2.90 | % | | | 710,000 | | | | 703,832 | |
| AbbVie, Inc. | 05/14/2020 | | | 2.50 | % | | | 685,000 | | | | 678,499 | |
AerCap Ireland Capital DAC/AerCap Global Aviation Trust (b) | 02/01/2022 | | | 3.95 | % | | | 430,000 | | | | 422,448 | |
| Anheuser-Busch InBev Finance, Inc. | 02/01/2021 | | | 2.65 | % | | | 480,000 | | | | 472,030 | |
| Apple, Inc. | 02/23/2021 | | | 2.25 | % | | | 485,000 | | | | 479,318 | |
| Applied Materials, Inc. | 06/15/2021 | | | 4.30 | % | | | 880,000 | | | | 905,929 | |
| Archer-Daniels-Midland Co. | 03/01/2021 | | | 4.48 | % | | | 825,000 | | | | 851,310 | |
| Bunge Ltd. Finance Corp. | 11/24/2020 | | | 3.50 | % | | | 595,000 | | | | 593,561 | |
| Caterpillar, Inc. | 06/26/2022 | | | 2.60 | % | | | 405,000 | | | | 394,885 | |
| Celgene Corp. | 02/20/2023 | | | 3.25 | % | | | 735,000 | | | | 717,693 | |
| Chevron Corp. | 03/03/2020 | | | 1.96 | % | | | 195,000 | | | | 193,042 | |
| Chevron Corp. | 12/05/2022 | | | 2.36 | % | | | 370,000 | | | | 358,304 | |
| Cisco Systems, Inc. | 03/04/2024 | | | 3.63 | % | | | 500,000 | | | | 509,937 | |
Daimler Finance North America LLC (a) | 05/04/2023 | | | 3.70 | % | | | 310,000 | | | | 308,579 | |
| Dr. Pepper Snapple Group, Inc. | 11/15/2021 | | | 2.53 | % | | | 180,000 | | | | 174,155 | |
| Eastman Chemical Co. | 01/15/2020 | | | 2.70 | % | | | 78,000 | | | | 77,425 | |
| General Electric Co. | 01/07/2021 | | | 4.63 | % | | | 330,000 | | | | 330,852 | |
| General Electric Co. | 10/09/2022 | | | 2.70 | % | | | 375,000 | | | | 347,972 | |
| General Mills, Inc. | 04/16/2021 | | | 3.20 | % | | | 395,000 | | | | 392,831 | |
Heineken NV (a)(b) | 04/01/2022 | | | 3.40 | % | | | 280,000 | | | | 280,472 | |
| Ingersoll-Rand Global Holding Co. Ltd. | 06/15/2023 | | | 4.25 | % | | | 525,000 | | | | 537,981 | |
| Intel Corp. | 12/15/2022 | | | 2.70 | % | | | 505,000 | | | | 497,407 | |
The accompanying notes are an integral part of these consolidated financial statements.
| | |
| | |
32 | | LoCorr Long/Short Commodities Strategy Fund - Consolidated Schedule of Investments (continued) |
| | |
| Maturity Date | | Coupon Rate | | Principal Amount | | | Value | |
CORPORATE BONDS (continued) | | | | | | | | | | |
Keurig Dr Pepper, Inc. (a) | 05/25/2021 | | | 3.55 | % | | $ | 630,000 | | | $ | 629,046 | |
| Kraft Heinz Foods Co. | 07/02/2020 | | | 2.80 | % | | | 420,000 | | | | 416,947 | |
| L3 Technologies, Inc. | 02/15/2021 | | | 4.95 | % | | | 515,000 | | | | 527,002 | |
| Packaging Corp. of America | 12/15/2020 | | | 2.45 | % | | | 360,000 | | | | 353,468 | |
| PepsiCo, Inc. | 10/14/2020 | | | 2.15 | % | | | 175,000 | | | | 172,819 | |
| Reynolds American, Inc. | 06/12/2020 | | | 3.25 | % | | | 335,000 | | | | 332,943 | |
| Rockwell Collins, Inc. | 07/15/2019 | | | 1.95 | % | | | 245,000 | | | | 243,196 | |
| Tyson Foods, Inc. | 08/15/2019 | | | 2.65 | % | | | 595,000 | | | | 591,920 | |
| United Technologies Corp. | 06/01/2022 | | | 3.10 | % | | | 600,000 | | | | 587,546 | |
| | | | | | | | | | | | | 14,083,349 | |
| Mining, Quarrying, and Oil and Gas Extraction: 1.08% | | | | | | | | | | | | | |
| ConocoPhillips Co. | 12/15/2022 | | | 2.40 | % | | | 440,000 | | | | 425,085 | |
| Enterprise Products Operating LLC | 02/15/2021 | | | 2.80 | % | | | 625,000 | | | | 618,442 | |
| Occidental Petroleum Corp. | 02/01/2021 | | | 4.10 | % | | | 605,000 | | | | 615,455 | |
Schlumberger Holdings Corp. (a) | 12/21/2020 | | | 3.00 | % | | | 625,000 | | | | 619,583 | |
Total Capital International SA (b) | 06/19/2021 | | | 2.75 | % | | | 505,000 | | | | 501,323 | |
| | | | | | | | | | | | | 2,779,888 | |
| Professional, Scientific, and Technical Services: 0.80% | | | | | | | | | | | | | |
| Biogen, Inc. | 09/15/2020 | | | 2.90 | % | | | 770,000 | | | | 764,266 | |
| eBay, Inc. | 03/09/2022 | | | 3.80 | % | | | 470,000 | | | | 471,959 | |
| International Business Machines Corp. | 08/01/2022 | | | 1.88 | % | | | 855,000 | | | | 807,157 | |
| Phoenix 2012 LLC | 07/03/2024 | | | 1.61 | % | | | 12,717 | | | | 12,325 | |
| | | | | | | | | | | | | 2,055,707 | |
| Real Estate and Rental and Leasing: 0.47% | | | | | | | | | | | | | |
| Air Lease Corp. | 06/01/2021 | | | 3.38 | % | | | 300,000 | | | | 297,138 | |
| Helios Leasing I LLC | 05/29/2024 | | | 2.02 | % | | | 12,203 | | | | 11,959 | |
| Helios Leasing I LLC | 07/24/2024 | | | 1.73 | % | | | 12,689 | | | | 12,331 | |
| Helios Leasing I LLC | 09/28/2024 | | | 1.56 | % | | | 12,596 | | | | 12,128 | |
| National Rural Utilities Cooperative Finance Corp. | 04/25/2022 | | | 2.40 | % | | | 295,000 | | | | 287,066 | |
| Toyota Motor Credit Corp. | 04/17/2020 | | | 1.95 | % | | | 600,000 | | | | 592,548 | |
| | | | | | | | | | | | | 1,213,170 | |
| Retail Trade: 2.06% | | | | | | | | | | | | | |
| Amazon.com, Inc. | 02/22/2023 | | | 2.40 | % | | | 720,000 | | | | 697,089 | |
BMW U.S. Capital LLC (a) | 04/12/2021 | | | 3.10 | % | | | 875,000 | | | | 866,590 | |
BP Capital Markets PLC (b) | 01/15/2020 | | | 2.52 | % | | | 635,000 | | | | 632,999 | |
BP Capital Markets PLC (b) | 03/11/2021 | | | 4.74 | % | | | 535,000 | | | | 551,709 | |
| CVS Health Corp. | 07/20/2020 | | | 2.80 | % | | | 540,000 | | | | 535,128 | |
| Home Depot Inc. | 06/01/2022 | | | 2.63 | % | | | 445,000 | | | | 440,334 | |
Hyundai Capital America (a) | 03/18/2021 | | | 3.00 | % | | | 690,000 | | | | 679,344 | |
| Walgreens Boots Alliance, Inc. | 11/18/2019 | | | 2.70 | % | | | 360,000 | | | | 357,945 | |
| Walmart, Inc. | 10/25/2020 | | | 3.25 | % | | | 535,000 | | | | 540,221 | |
| | | | | | | | | | | | | 5,301,359 | |
| Transportation and Warehousing: 0.22% | | | | | | | | | | | | | |
| Burlington Northern Santa Fe LLC | 09/15/2021 | | | 3.45 | % | | | 375,000 | | | | 378,812 | |
Carnival Corp. (b) | 10/15/2020 | | | 3.95 | % | | | 170,000 | | | | 172,192 | |
| | | | | | | | | | | | | 551,004 | |
| Utilities: 0.85% | | | | | | | | | | | | | |
| Berkshire Hathaway Energy Co. | 01/15/2021 | | | 2.38 | % | | | 210,000 | | | | 207,129 | |
| Dominion Energy, Inc. | 08/15/2021 | | | 2.00 | % | | | 440,000 | | | | 422,807 | |
| Dominion Resources, Inc. | 08/15/2019 | | | 1.60 | % | | | 195,000 | | | | 192,829 | |
| Duke Energy Corp. | 09/15/2021 | | | 3.55 | % | | | 575,000 | | | | 576,561 | |
| Exelon Generation Co., LLC | 10/01/2019 | | | 5.20 | % | | | 265,000 | | | | 268,413 | |
| Northern States Power Co. | 08/15/2020 | | | 2.20 | % | | | 170,000 | | | | 167,697 | |
| Sempra Energy | 02/01/2023 | | | 2.90 | % | | | 360,000 | | | | 349,812 | |
| | | | | | | | | | | | | 2,185,248 | |
The accompanying notes are an integral part of these consolidated financial statements.
| | |
| | |
| LoCorr Long/Short Commodities Strategy Fund - Consolidated Schedule of Investments (continued) | | 33 |
| | |
| Maturity Date | | Coupon Rate | | Principal Amount | | | Value | |
CORPORATE BONDS (continued) | | | | | | | | | | |
| Wholesale Trade: 0.47% | | | | | | | | | | |
LyondellBasell Industries NV (b) | 04/15/2019 | | | 5.00 | % | | $ | 591,000 | | | $ | 591,643 | |
| Sysco Corp. | 10/01/2020 | | | 2.60 | % | | | 625,000 | | | | 618,264 | |
| | | | | | | | | | | | | 1,209,907 | |
| TOTAL CORPORATE BONDS (Cost $65,927,672) | | | | | | | | | | | | 65,594,515 | |
| | | | | | | | | | | | | | |
| FOREIGN GOVERNMENT BOND: 0.00% | | | | | | | | | | | | | |
Petroleos Mexicanos (b) | 12/20/2022 | | | 2.00 | % | | | 10,000 | | | | 9,827 | |
| TOTAL FOREIGN GOVERNMENT BOND (Cost $10,000) | | | | | | | | | | | | 9,827 | |
| | | | | | | | | | | | | | |
| MORTGAGE BACKED SECURITIES: 10.54% | | | | | | | | | | | | | |
BX Trust, 2018-MCSF A (1 Month LIBOR USD + 0.577%) (a)(c) | 04/16/2035 | | | 2.98 | % | | | 865,000 | | | | 848,271 | |
| Citigroup Commercial Mortgage Trust, 2012-GC8 A4A-4 | 09/12/2045 | | | 3.02 | % | | | 500,000 | | | | 497,820 | |
Cold Storage Trust, 2017-ICE3 A (1 Month LIBOR USD + 1.000%) (a)(c) | 04/15/2036 | | | 3.46 | % | | | 875,000 | | | | 859,356 | |
| Fannie Mae Aces | | | | | | | | | | | | | |
Series 2014-M10 ASQ2 (d) | 09/25/2019 | | | 2.17 | % | | | 221,685 | | | | 220,282 | |
Series 2010-M3 A3 (d) | 03/25/2020 | | | 4.33 | % | | | 178,008 | | | | 179,677 | |
| Fannie Mae Connecticut Avenue Securities | | | | | | | | | | | | | |
Series 2017-C01 1M1 (1 Month LIBOR USD + 1.300%) (c) | 07/25/2029 | | | 3.81 | % | | | 252,336 | | | | 253,097 | |
Series 2017-C02 2M1 (1 Month LIBOR USD + 1.150%) (a)(c) | 09/25/2029 | | | 3.66 | % | | | 202,295 | | | | 202,748 | |
Series 2018-C02 2M1 (1 Month LIBOR USD + 0.650%) (c) | 08/26/2030 | | | 3.16 | % | | | 333,814 | | | | 333,439 | |
Series 2018-C03 1M1 (1 Month LIBOR USD + 0.680%) (c) | 10/25/2030 | | | 3.19 | % | | | 424,936 | | | | 423,853 | |
Series 2018-C05 1M1 (1 Month LIBOR USD + 0.720%) (a)(c) | 01/27/2031 | | | 3.23 | % | | | 720,537 | | | | 718,829 | |
| Fannie Mae Pool | 12/01/2027 | | | 2.50 | % | | | 268,763 | | | | 265,966 | |
| FHLMC Multifamily Structured Pass Through Certificates | | | | | | | | | | | | | |
| Series K-708 A2 | 01/25/2019 | | | 2.13 | % | | | 7,521 | | | | 7,505 | |
| Series K-709 A2 | 03/25/2019 | | | 2.09 | % | | | 17,899 | | | | 17,853 | |
| Series K-710 A2 | 05/25/2019 | | | 1.88 | % | | | 45,841 | | | | 45,674 | |
Series K-F08 A (1 Month LIBOR USD + 0.300%) (c) | 01/25/2022 | | | 2.65 | % | | | 394,565 | | | | 392,967 | |
| Series K-052 A1 | 01/25/2025 | | | 2.60 | % | | | 506,011 | | | | 500,234 | |
| Flagstar Mortgage Trust | | | | | | | | | | | | | |
Series 2017-2 A5 (a)(d) | 10/25/2047 | | | 3.50 | % | | | 515,246 | | | | 512,271 | |
Series 2018-4 A4 (a)(d) | 07/25/2048 | | | 4.00 | % | | | 862,110 | | | | 867,120 | |
Freddie Mac Structured Agency Credit Risk Debt Notes, 2018-SPI2 M1 (d) | 05/25/2048 | | | 3.82 | % | | | 429,445 | | | | 427,604 | |
FREMF Mortgage Trust, 2012-K708 B (a)(d) | 02/25/2045 | | | 3.72 | % | | | 150,000 | | | | 149,648 | |
GS Mortgage Securities Corp. Trust, 2018-CHLL A (1 Month LIBOR USD + 0.750%) (a)(c) | 02/17/2037 | | | 3.21 | % | | | 855,000 | | | | 843,415 | |
GS Mortgage Securities Trust, 2010-C1 A1 (a) | 08/12/2043 | | | 3.68 | % | | �� | 80,552 | | | | 80,708 | |
| JP Morgan Chase Commercial Mortgage Securities Trust | | | | | | | | | | | | | |
Series 2018-BCON A (a) | 01/07/2031 | | | 3.73 | % | | | 335,000 | | | | 340,468 | |
Series 2017-MAUI A (1 Month LIBOR USD + 0.830%) (a)(c) | 07/17/2034 | | | 3.22 | % | | | 435,000 | | | | 430,246 | |
Series 2010-C2 A3 (a) | 11/15/2043 | | | 4.07 | % | | | 306,517 | | | | 310,127 | |
| Series 2012-C8 ASB | 10/17/2045 | | | 2.38 | % | | | 378,383 | | | | 372,222 | |
| JP Morgan Mortgage Trust | | | | | | | | | | | | | |
Series 2016-1 A5 (a)(d) | 05/25/2046 | | | 3.50 | % | | | 206,829 | | | | 204,704 | |
Series 2016-4 A5 (a)(d) | 10/25/2046 | | | 3.50 | % | | | 221,106 | | | | 218,702 | |
| JPMBB Commercial Mortgage Securities Trust | | | | | | | | | | | | | |
| Series 2014-C18 | 02/15/2047 | | | 3.57 | % | | | 1,000,000 | | | | 1,005,157 | |
| Series 2014-C23 | 09/17/2047 | | | 3.66 | % | | | 830,000 | | | | 837,971 | |
Morgan Stanley Bank of America Merrill Lynch Trust, 2013-C10 (d) | 07/17/2046 | | | 3.91 | % | | | 541,988 | | | | 551,572 | |
Morgan Stanley Capital I Trust, 2017-CLS A (1 Month LIBOR USD + 0.700%) (a)(c) | 11/15/2034 | | | 3.16 | % | | | 560,000 | | | | 551,403 | |
The accompanying notes are an integral part of these consolidated financial statements.
| | |
| | |
34 | | LoCorr Long/Short Commodities Strategy Fund - Consolidated Schedule of Investments (continued) |
| | |
| Maturity Date | | Coupon Rate | | Principal Amount | | | Value | |
MORTGAGE BACKED SECURITIES (continued) | | | | | | | | | | |
| New Residential Mortgage Loan Trust | | | | | | | | | | |
Series 2018-NQM1 (a)(d) | 11/25/2048 | | | 3.99 | % | | $ | 819,134 | | | $ | 831,569 | |
Series 2015-1A A3 (a)(d) | 05/28/2052 | | | 3.75 | % | | | 897,158 | | | | 898,830 | |
Series 2014-2A A3 (a)(d) | 05/25/2054 | | | 3.75 | % | | | 145,360 | | | | 145,736 | |
Series 2016-1A A1 (a)(d) | 03/25/2056 | | | 3.75 | % | | | 334,197 | | | | 333,216 | |
Series 2017-1A A1 (a)(d) | 02/25/2057 | | | 4.00 | % | | | 624,721 | | | | 628,603 | |
Series 2017-6A A1 (a)(d) | 08/25/2057 | | | 4.00 | % | | | 279,042 | | | | 280,485 | |
Series 2018-5 (a)(d) | 12/25/2057 | | | 4.75 | % | | | 742,403 | | | | 760,771 | |
| OBX Trust | | | | | | | | | | | | | |
Series 2018-EXP1 (a)(d) | 04/25/2048 | | | 4.50 | % | | | 490,310 | | | | 497,244 | |
Series 2018-EXP2 (a)(d) | 07/25/2058 | | | 4.00 | % | | | 619,749 | | | | 618,838 | |
| Sequoia Mortgage Trust | | | | | | | | | | | | | |
Series 2017-CH1 (a)(d) | 08/25/2047 | | | 3.50 | % | | | 470,898 | | | | 468,939 | |
Series 2017-CH2 (a)(d) | 12/25/2047 | | | 4.00 | % | | | 419,148 | | | | 420,578 | |
Series 2018-CH4 A10 (a)(d) | 10/25/2048 | | | 4.50 | % | | | 484,963 | | | | 494,460 | |
| STACR Trust | | | | | | | | | | | | | |
Series 2018-DNA2 M1 (1 Month LIBOR USD + 0.800%) (a)(c) | 12/26/2030 | | | 3.31 | % | | | 900,000 | | | | 898,959 | |
Series 2018-DNA3 M1 (1 Month LIBOR USD + 0.750%) (a)(c) | 09/25/2048 | | | 3.26 | % | | | 650,000 | | | | 648,747 | |
| UBS-Barclays Commercial Mortgage Trust, 2012-C4 A-5 | 12/12/2045 | | | 2.85 | % | | | 870,000 | | | | 860,158 | |
| Verus Securitization Trust | | | | | | | | | | | | | |
Series 2018-2 (a)(d) | 07/25/2058 | | | 3.68 | % | | | 529,314 | | | | 528,433 | |
Series 2018-3 A-1 (a)(d) | 10/25/2058 | | | 4.11 | % | | | 418,055 | | | | 415,370 | |
VNDO Mortgage Trust, 2013-PENN (a) | 12/13/2029 | | | 3.81 | % | | | 605,000 | | | | 610,548 | |
| Wells Fargo Commercial Mortgage Trust, 2015-C26 A1 | 02/18/2048 | | | 1.45 | % | | | 6,643 | | | | 6,626 | |
| WFRBS Commercial Mortgage Trust | | | | | | | | | | | | | |
Series 2011-C2 A4 (a)(d) | 02/15/2044 | | | 4.87 | % | | | 1,187,742 | | | | 1,219,252 | |
Series 2011-C3 (a) | 03/17/2044 | | | 4.38 | % | | | 785,000 | | | | 800,974 | |
| Series 2012-C10 | 12/15/2045 | | | 2.88 | % | | | 975,000 | | | | 959,930 | |
| Series 2013-C17 | 12/17/2046 | | | 3.56 | % | | | 295,124 | | | | 298,244 | |
| TOTAL MORTGAGE BACKED SECURITIES (Cost $27,151,629) | | | | | | | | | | | | 27,097,419 | |
| | | | | | | | | | | | | | |
| MUNICIPAL BONDS: 0.04% | | | | | | | | | | | | | |
| County of Forsyth, NC | 04/01/2020 | | | 3.55 | % | | | 30,000 | | | | 30,230 | |
| Louisiana Local Government Environmental Facilities & Community Development Authority | 02/01/2021 | | | 3.22 | % | | | 32,656 | | | | 32,656 | |
| Maricopa County School District No. 28 | 07/01/2019 | | | 5.38 | % | | | 15,000 | | | | 15,182 | |
| Rosemount-Apple Valley-Eagan Independent School District No. 196 | 02/01/2019 | | | 5.00 | % | | | 25,000 | | | | 25,047 | |
| TOTAL MUNICIPAL BONDS (Cost $103,502) | | | | | | | | | | | | 103,115 | |
| | | | | | | | | | | | | | |
| U.S. GOVERNMENT AGENCY ISSUES: 11.08% | | | | | | | | | | | | | |
| Federal Farm Credit Banks | 07/24/2019 | | | 1.40 | % | | | 450,000 | | | | 447,093 | |
| Federal Farm Credit Banks | 10/26/2020 | | | 1.75 | % | | | 400,000 | | | | 394,048 | |
| Federal Farm Credit Banks | 11/27/2020 | | | 1.90 | % | | | 625,000 | | | | 617,029 | |
| Federal Farm Credit Banks | 04/05/2021 | | | 2.54 | % | | | 2,895,000 | | | | 2,893,248 | |
| Federal Farm Credit Banks | 11/15/2021 | | | 3.05 | % | | | 6,000,000 | | | | 6,078,767 | |
| Federal Farm Credit Banks | 07/17/2023 | | | 2.88 | % | | | 1,600,000 | | | | 1,617,256 | |
| Federal Home Loan Banks | 06/11/2021 | | | 3.63 | % | | | 3,000,000 | | | | 3,073,059 | |
| Federal Home Loan Banks | 06/10/2022 | | | 2.75 | % | | | 1,000,000 | | | | 1,004,218 | |
| Federal Home Loan Banks | 06/09/2023 | | | 3.25 | % | | | 1,000,000 | | | | 1,025,342 | |
| Federal Home Loan Banks | 09/08/2023 | | | 3.38 | % | | | 4,235,000 | | | | 4,362,114 | |
| Federal Home Loan Banks | 12/08/2023 | | | 3.38 | % | | | 4,150,000 | | | | 4,276,778 | |
| Federal National Mortgage Association | 04/13/2021 | | | 2.50 | % | | | 1,150,000 | | | | 1,149,062 | |
| Federal National Mortgage Association | 01/19/2023 | | | 2.38 | % | | | 220,000 | | | | 218,354 | |
| Federal National Mortgage Association | 09/12/2023 | | | 2.88 | % | | | 1,240,000 | | | | 1,254,600 | |
Ginnie Mae II Pool (d) | 07/20/2060 | | | 5.31 | % | | | 6,530 | | | | 6,593 | |
Ginnie Mae II Pool (d) | 07/20/2062 | | | 4.56 | % | | | 11,210 | | | | 11,285 | |
Ginnie Mae II Pool (d) | 08/20/2062 | | | 4.10 | % | | | 24,154 | | | | 24,270 | |
The accompanying notes are an integral part of these consolidated financial statements.
| | |
| | |
| LoCorr Long/Short Commodities Strategy Fund - Consolidated Schedule of Investments (continued) | | 35 |
| | |
| Maturity Date | | Coupon Rate | | Principal Amount | | | Value | |
U.S. GOVERNMENT AGENCY ISSUES (continued) | | | | | | | | | | |
| Small Business Administration Participation Certificates | 11/01/2032 | | | 2.09 | % | | $ | 12,621 | | | $ | 12,198 | |
| TOTAL U.S. GOVERNMENT AGENCY ISSUES (Cost $28,251,923) | | | | | | | | | | | | 28,465,314 | |
| | | | | | | | | | | | | | |
| U.S. GOVERNMENT NOTES: 8.25% | | | | | | | | | | | | | |
| United States Treasury Note | 11/30/2020 | | | 2.75 | % | | | 2,500,000 | | | | 2,511,327 | |
| United States Treasury Note | 05/15/2021 | | | 8.13 | % | | | 3,165,000 | | | | 3,569,527 | |
| United States Treasury Note | 08/31/2021 | | | 1.13 | % | | | 2,300,000 | | | | 2,220,039 | |
| United States Treasury Note | 04/30/2022 | | | 1.88 | % | | | 635,000 | | | | 622,846 | |
| United States Treasury Note | 05/15/2022 | | | 1.75 | % | | | 1,300,000 | | | | 1,269,480 | |
| United States Treasury Note | 06/30/2022 | | | 1.75 | % | | | 280,000 | | | | 273,219 | |
| United States Treasury Note | 08/31/2022 | | | 1.88 | % | | | 200,000 | | | | 195,719 | |
| United States Treasury Note | 10/31/2022 | | | 2.00 | % | | | 710,000 | | | | 697,409 | |
| United States Treasury Note | 11/15/2022 | | | 1.63 | % | | | 750,000 | | | | 726,064 | |
| United States Treasury Note | 07/31/2023 | | | 2.75 | % | | | 525,000 | | | | 530,599 | |
| United States Treasury Note | 05/15/2024 | | | 2.50 | % | | | 8,595,000 | | | | 8,579,220 | |
| TOTAL U.S. GOVERNMENT NOTES (Cost $21,128,495) | | | | | | | | | | | | 21,195,449 | |
| | | | | | | | | | | | | | |
| SHORT TERM INVESTMENTS: 9.70% | | | | | | | | | | | | | |
| U.S. GOVERNMENT NOTE: 5.33% | | | | | | | | | | | | | |
| United States Treasury Note | 08/31/2019 | | | 1.00 | % | | | 13,850,000 | | | | 13,702,844 | |
| TOTAL U.S. GOVERNMENT NOTE (Cost $13,706,283) | | | | | | | | | | | | 13,702,844 | |
| | | | | | | | | | | | | |
| MONEY MARKET FUND: 4.37% | | | | | | | Shares | | | | | |
STIT-Government & Agency Portfolio, Institutional Class, 2.30% (e)(f) | | | | | | | | 11,227,652 | | | | 11,227,652 | |
| TOTAL MONEY MARKET FUND (Cost $11,227,652) | | | | | | | | | | | | 11,227,652 | |
| TOTAL SHORT TERM INVESTMENTS (Cost $24,933,935) | | | | | | | | | | | | 24,930,496 | |
| | | | | | | | | | | | | | |
| TOTAL INVESTMENTS (Cost $207,609,306): 80.75% | | | | | | | | | | | | 207,536,668 | |
Other Assets in Excess of Liabilities: 19.25% (g) | | | | | | | | | | | | 49,489,355 | |
| TOTAL NET ASSETS: 100.00% | | | | | | | | | | | $ | 257,026,023 | |
| (a) | Security as defined in Rule 144A under the Securities Act of 1933 and determined to be liquid. Purchased in a private placement transaction; resale to the public may require registration or may extend only to qualified institutional buyers. At December 31, 2018, the value of these securities total $40,063,516 which represents 15.59% of total net assets. |
| (b) | Foreign issued security. |
| (c) | Variable rate security based on a reference index and spread. The rate reported is the rate in effect as of December 31, 2018. |
| (d) | Variable rate security. The coupon is based on an underlying pool of loans. The rate reported is the rate in effect as of December 31, 2018. |
| (e) | The rate quoted is the annualized seven-day effective yield as of December 31, 2018. |
| (f) | All or a portion of this security is held by LCLSCS Fund Limited and pledged as collateral for swap contracts. |
| (g) | Includes assets pledged as collateral for swap contracts. |
| LIBOR | London Interbank Offered Rate |
The accompanying notes are an integral part of these consolidated financial statements.
| | |
| | |
36 | | LoCorr Long/Short Commodities Strategy Fund - Consolidated Scchedule of Swap Contracts
|
| | |
LoCorr Long/Short Commodities Strategy Fund
Consolidated Schedule of Swap Contracts
December 31, 2018
LONG TOTAL RETURN SWAP CONTRACTS
This investment is a holding of LCLSCS Fund Limited. See Note 1.
| Termination Date | Reference Index | Financing Rate | Payment
Frequency | Notional Amount | Unrealized
Appreciation
(Depreciation)* | Counterparty |
| 12/16/2022 | LoCorr Commodities Index^ | 0.50% | Quarterly | $ 168,945,098 | $4,363,946 | Deutsche Bank AG |
| ^ | Comprised of a proprietary basket of Commodity Trading Advisor’s (“CTA”) Programs investing in various futures contracts, forward currency contracts, foreign currency and other similar investments. See Notes 2 & 3. |
| * | Unrealized appreciation is a receivable on the Fund’s consolidated statement of assets and liabilities. |
The underlying components of the basket as of December 31, 2018 are shown below:^
| Description | Expiration Date | | Number of Contracts Purchased (Sold) | | | Value | | | Concentration % of Exposure | |
| | | | | | | | | | | |
| Futures: | | | | | | | | | | |
| | | | | | | | | | | |
Purchase Contracts:(1) | | | | | | | | | | |
| Brent Crude | 04/30/2019 | | | 2,385.09 | | | $ | 127,649,788 | | | | 10.23 | % |
| WTI Crude (NYMEX) | 05/21/2019 | | | 1,772.18 | | | | 81,918,869 | | | | 6.57 | % |
| WTI Crude (NYMEX) | 02/20/2019 | | | 1,510.61 | | | | 68,143,598 | | | | 5.46 | % |
| Sugar No.11 | 04/30/2019 | | | 3,540.91 | | | | 48,085,520 | | | | 3.85 | % |
| Copper | 07/29/2019 | | | 369.32 | | | | 24,398,464 | | | | 1.96 | % |
| Soybean Oil | 07/12/2019 | | | 1,392.98 | | | | 23,828,290 | | | | 1.91 | % |
| Live Cattle | 06/28/2019 | | | 459.22 | | | | 21,482,125 | | | | 1.72 | % |
| Hard Red Wheat | 07/12/2019 | | | 740.04 | | | | 18,954,315 | | | | 1.52 | % |
| Feeder Cattle | 01/31/2019 | | | 203.48 | | | | 15,169,180 | | | | 1.22 | % |
| Coffee | 12/18/2019 | | | 244.59 | | | | 10,369,088 | | | | 0.83 | % |
| Heating Oil | 01/31/2019 | | | 123.41 | | | | 8,585,154 | | | | 0.69 | % |
| Low Sulphur Gasoil | 01/10/2019 | | | 156.90 | | | | 7,768,350 | | | | 0.62 | % |
| Natural Gas | 02/26/2019 | | | 262.13 | | | | 7,713,245 | | | | 0.62 | % |
| WTI Crude (NYMEX) | 03/20/2019 | | | 152.11 | | | | 6,910,508 | | | | 0.55 | % |
| Palladium | 03/27/2019 | | | 48.79 | | | | 5,833,947 | | | | 0.47 | % |
| Lean Hogs | 06/14/2019 | | | 156.79 | | | | 5,099,545 | | | | 0.41 | % |
| Live Cattle | 04/30/2019 | | | 94.71 | | | | 4,791,010 | | | | 0.38 | % |
| Soybean Meal | 03/14/2019 | | | 147.33 | | | | 4,585,642 | | | | 0.37 | % |
| WTI Crude (ICE) | 02/19/2019 | | | 80.36 | | | | 3,625,119 | | | | 0.29 | % |
| Cotton No.2 | 03/07/2019 | | | 91.84 | | | | 3,314,119 | | | | 0.27 | % |
| Total Purchase Contracts | | | | | | | | 498,225,876 | | | | 39.94 | % |
| | | | | | | | | | | | | | |
Sale Contracts:(1) | | | | | | | | | | | | | |
| WTI Crude (NYMEX) | 01/22/2019 | | | (3,795.57 | ) | | $ | 170,136,461 | | | | 13.64 | % |
| Brent Crude | 01/31/2019 | | | (2,000.72 | ) | | | 105,538,238 | | | | 8.46 | % |
| Sugar No.11 | 02/28/2019 | | | (3,746.60 | ) | | | 50,606,009 | | | | 4.06 | % |
| Brent Crude | 02/28/2019 | | | (540.30 | ) | | | 28,625,141 | | | | 2.29 | % |
| Live Cattle | 02/28/2019 | | | (572.11 | ) | | | 28,402,160 | | | | 2.27 | % |
| Soybean Oil | 03/14/2019 | | | (1,423.59 | ) | | | 23,907,812 | | | | 1.92 | % |
| Hard Red Wheat | 03/14/2019 | | | (751.52 | ) | | | 18,351,224 | | | | 1.47 | % |
| Heating Oil | 02/28/2019 | | | (225.78 | ) | | | 15,620,356 | | | | 1.25 | % |
| Feeder Cattle | 03/28/2019 | | | (203.48 | ) | | | 14,952,986 | | | | 1.20 | % |
| Low Sulphur Gasoil | 02/12/2019 | | | (291.79 | ) | | | 14,461,827 | | | | 1.16 | % |
The accompanying notes are an integral part of these consolidated financial statements.
| | |
| | |
LoCorr Long/Short Commodities Strategy Fund - Consolidated Schedule of Swap Contracts (continued)
| | 37 |
| | |
| Description | Expiration Date | | Number of Contracts Purchased (Sold) | | | Value | | | Concentration % of Exposure | |
| | | | | | | | | | | |
Sale Contracts:(1) (continued) | | | | | | | | | | |
| Copper | 03/27/2019 | | | (218.17 | ) | | $ | 14,362,227 | | | | 1.15 | % |
| Gold | 02/26/2019 | | | (107.15 | ) | | | 13,756,325 | | | | 1.10 | % |
| Natural Gas | 01/29/2019 | | | (422.86 | ) | | | 12,916,133 | | | | 1.04 | % |
| Silver | 03/27/2019 | | | (149.24 | ) | | | 11,564,486 | | | | 0.93 | % |
| Gasoline RBOB | 02/28/2019 | | | (203.77 | ) | | | 11,042,211 | | | | 0.89 | % |
| Coffee | 03/19/2019 | | | (235.02 | ) | | | 8,855,231 | | | | 0.71 | % |
| Copper | 05/29/2019 | | | (129.15 | ) | | | 8,519,243 | | | | 0.68 | % |
| Brent Crude | 03/29/2019 | | | (112.89 | ) | | | 6,013,604 | | | | 0.48 | % |
| Cotton No.2 | 05/08/2019 | | | (166.46 | ) | | | 6,112,544 | | | | 0.49 | % |
| Nickel | 03/20/2019 | | | (67.92 | ) | | | 4,350,381 | | | | 0.35 | % |
| Low Sulphur Gasoil | 03/12/2019 | | | (88.02 | ) | | | 4,371,057 | | | | 0.35 | % |
| Wheat | 03/14/2019 | | | (171.25 | ) | | | 4,316,496 | | | | 0.35 | % |
| Lean Hogs | 02/14/2019 | | | (151.05 | ) | | | 3,701,440 | | | | 0.30 | % |
| Cocoa | 03/14/2019 | | | (152.11 | ) | | | 3,686,466 | | | | 0.30 | % |
| Corn | 03/14/2019 | | | (197.08 | ) | | | 3,674,266 | | | | 0.29 | % |
| Zinc | 03/20/2019 | | | (53.57 | ) | | | 3,301,529 | | | | 0.26 | % |
| Wheat | 05/14/2019 | | | (129.15 | ) | | | 3,301,469 | | | | 0.26 | % |
| Total Sale Contracts | | | | | | | | 594,447,322 | | | | 47.65 | % |
| Other Futures Contracts | | | | | | | | 38,632,005 | | | | 3.10 | % |
| Total Futures Contracts | | | | | | | | 1,131,305,203 | | | | 90.69 | % |
Forward Currency Contracts: | | | Delivered (in USD) | |
| Received (in USD)
| | | | |
Purchase Contracts:(1) | | U.S. | | | | | | | | |
USD/EUR | 12/31/2018 | Dollar | | $ | 9,946,037 | | Euro | | $ | 9,981,699 | | | | 0.80 | % |
Total Forward Currency Contracts | | | | | | | | | | 9,981,699 | | | | 0.80 | % |
| | | | | | | | | | | | | | | |
Cash and Foreign Currency: | | |
| Quantity | | |
| Value | | | | | |
Cash and Foreign Currency Purchased:(1) | | | | | | | | | | | | | | | |
U.S. Dollar | | | | | 51,605,870 | | | | $ | 51,605,870 | | | | 4.14 | % |
Total Cash and Foreign Currency Purchased | | | | | | | | | | 51,605,870 | | | | 4.14 | % |
| | | | | | | | | | | | | | | |
Cash and Foreign Currency Sold:(1) | | | | | | | | | | | | | | | |
Euro | | | | | 45,956,863 | | | | $ | 52,655,121 | | | | 4.22 | % |
Total Cash and Foreign Currency Sold | | | | | | | | | | 52,655,121 | | | | 4.22 | % |
Other Cash and Foreign Currency | | | | | | | | | | 1,825,778 | | | | 0.15 | % |
Total Cash and Foreign Currency | | | | | | | | | | 106,086,769 | | | | 8.51 | % |
Total Underlying Positions | | | | | | | | | $ | 1,247,373,671 | | | | 100.00 | % |
| ^ | The investment is not a direct holding of LoCorr Long/Short Commodities Strategy Fund. The top 50 holdings and other futures contracts, other forward currency contracts, and other cash and foreign currency were determined based on the absolute notional values of the positions within the underlying swap basket. |
| (1) | Represents the 50 largest components of the basket. |
| ICE | Intercontinental Exchange |
| NYMEX | New York Mercantile Exchange |
The accompanying notes are an integral part of these consolidated financial statements.
| | |
| | |
38 | | LoCorr Market Trend Fund - Consolidated Schedule of Investments
|
| | |
LoCorr Market Trend Fund
Composition of Consolidated Investment Portfolio1
December 31, 2018 (Unaudited)
1 As a percentage of total investments.
Consolidated Schedule of Investments
December 31, 2018
| Maturity Date | | Coupon Rate | | Principal Amount | | | Value | |
| ASSET BACKED SECURITIES: 24.73% | | | | | | | | | | |
| Ally Auto Receivables Trust, 2018-3 | 01/17/2023 | | | 3.00 | % | | $ | 2,500,000 | | | $ | 2,497,949 | |
American Express Credit Account Master Trust, 2017-8 A (1 Month LIBOR USD + 0.120%) (c) | 05/16/2022 | | | 2.58 | % | | | 4,350,000 | | | | 4,347,071 | |
| BA Credit Card Trust, 2017-A1 A1 | 08/15/2022 | | | 1.95 | % | | | 2,000,000 | | | | 1,976,129 | |
Bank of The West Auto Trust, 2017-1 A3 (a) | 01/15/2023 | | | 2.11 | % | | | 4,000,000 | | | | 3,951,220 | |
| Barclays Dryrock Issuance Trust | | | | | | | | | | | | | |
| Series 2016-1 A | 05/16/2022 | | | 1.52 | % | | | 2,950,000 | | | | 2,926,056 | |
Series 2017-2 A (1 Month LIBOR USD + 0.300%) (c) | 05/15/2023 | | | 2.76 | % | | | 4,000,000 | | | | 3,993,678 | |
| BMW Vehicle Lease Trust, 2018-1 | 07/20/2021 | | | 3.26 | % | | | 2,450,000 | | | | 2,461,585 | |
| Cabela’s Credit Card Master Note Trust | | | | | | | | | | | | | |
| Series 2016-1 A1 | 06/15/2022 | | | 1.78 | % | | | 5,240,000 | | | | 5,209,600 | |
| Series 2015-II | 07/17/2023 | | | 2.25 | % | | | 2,500,000 | | | | 2,470,012 | |
| California Republic Auto Receivables Trust, 2018-1 A3 | 08/15/2022 | | | 3.14 | % | | | 2,400,000 | | | | 2,405,493 | |
| CarMax Auto Owner Trust | | | | | | | | | | | | | |
| Series 2015-3 A3 | 05/15/2020 | | | 1.63 | % | | | 552,557 | | | | 551,872 | |
| Series 2018-4 | 09/15/2023 | | | 3.36 | % | | | 2,750,000 | | | | 2,768,837 | |
| CenterPoint Energy Residential Bond, 2009-1 A-3 | 08/15/2023 | | | 4.24 | % | | | 2,044,451 | | | | 2,094,292 | |
Chase Issuance Trust, 2018-A1 A1 (1 Month LIBOR USD + 0.200%) (c) | 04/17/2023 | | | 2.66 | % | | | 3,050,000 | | | | 3,040,610 | |
| Citibank Credit Card Issuance Trust | | | | | | | | | | | | | |
Series 2017-A4 A4 (1 Month LIBOR USD + 0.220%) (c) | 04/07/2022 | | | 2.60 | % | | | 4,650,000 | | | | 4,650,002 | |
| Series 2018-A1 A1 | 01/20/2023 | | | 2.49 | % | | | 3,000,000 | | | | 2,975,808 | |
| Drive Auto Receivables Trust, 2018-2 A2 | 09/15/2020 | | | 2.64 | % | | | 838,104 | | | | 837,736 | |
| Entergy Arkansas Restoration Funding LLC, 2010-A A1 | 08/01/2021 | | | 2.30 | % | | | 2,416,580 | | | | 2,403,989 | |
Evergreen Credit Card Trust, 2018-2 A (1 Month LIBOR USD +0.350%) (a)(b)(c) | 07/15/2022 | | | 2.81 | % | | | 1,650,000 | | | | 1,649,211 | |
| Ford Credit Auto Owner Trust, 2018-B A-3 | 04/15/2023 | | | 3.24 | % | | | 2,000,000 | | | | 2,010,464 | |
The accompanying notes are an integral part of these consolidated financial statements. | |
| | |
LoCorr Market Trend Fund - Consolidated Schedule of Investments (continued)
| | 39 |
| | |
| Maturity Date | | Coupon Rate | | Principal Amount | | | Value | |
ASSET BACKED SECURITIES (continued) | | | | | | | | | | |
| GM Financial Consumer Automobile Receivables Trust | | | | | | | | | | |
Series 2017-1A A2A (a) | 03/16/2020 | | | 1.51 | % | | $ | 130,500 | | | $ | 130,412 | |
| Series 2018-1 A3 | 07/18/2022 | | | 2.32 | % | | | 2,380,000 | | | | 2,355,485 | |
| Series 2018-4 | 10/16/2023 | | | 3.21 | % | | | 2,520,000 | | | | 2,533,932 | |
| Mercedes-Benz Auto Receivables Trust, 2018-1 A3 | 01/17/2023 | | | 3.03 | % | | | 2,625,000 | | | | 2,629,733 | |
| Nissan Auto Lease Trust, 2018-A | 09/15/2021 | | | 3.25 | % | | | 3,450,000 | | | | 3,454,093 | |
| Santander Retail Auto Lease Trust | | | | | | | | | | | | | |
Series 2017-AA2A (a) | 03/20/2020 | | | 2.02 | % | | | 868,315 | | | | 865,112 | |
Series 2018-A A2A (a) | 10/20/2020 | | | 2.71 | % | | | 2,608,556 | | | | 2,603,333 | |
SCF Equipment Leasing LLC, 2018-1A A1 (a) | 04/20/2021 | | | 2.81 | % | | | 922,809 | | | | 922,426 | |
| TCF Auto Receivables Owner Trust | | | | | | | | | | | | | |
Series 2016-1A A3 (a) | 04/15/2021 | | | 1.71 | % | | | 2,568,997 | | | | 2,558,085 | |
Series 2016-PT1 A (a) | 06/15/2022 | | | 1.93 | % | | | 1,678,686 | | | | 1,661,897 | |
| Toyota Auto Receivables Owner Trust | | | | | | | | | | | | | |
| Series 2017-AA-4 | 09/15/2022 | | | 2.10 | % | | | 2,170,000 | | | | 2,146,425 | |
| Series 2018-D | 03/15/2023 | | | 3.18 | % | | | 2,010,000 | | | | 2,026,047 | |
Verizon Owner Trust, 2018-1A A1B (1 Month LIBOR USD + 0.260%) (a)(c) | 09/20/2022 | | | 2.73 | % | | | 3,750,000 | | | | 3,744,352 | |
| World Omni Auto Trust, 2018-B | 07/17/2023 | | | 2.87 | % | | | 2,025,000 | | | | 2,020,516 | |
| TOTAL ASSET BACKED SECURITIES (Cost $84,897,828) | | | | | | | | | | | | 84,873,462 | |
| MORTGAGE BACKED SECURITIES: 10.57% | | | | | | | | | | |
| Fannie Mae Aces | | | | | | | | | | |
| Series 2009-M2 A3 | 01/25/2019 | | | 4.00 | % | |
| 160,770 | | |
| 160,396 | |
Series 2014-M10ASQ2 (d) | 09/25/2019 | | | 2.17 | % | | | 4,006,750 | | | | 3,981,387 | |
| Series 2010-M1 A2 | 09/25/2019 | | | 4.45 | % | | | 1,661,580 | | | | 1,669,755 | |
Series 2010-M3 A3 (d) | 03/25/2020 | | | 4.33 | % | | | 1,824,841 | | | | 1,841,948 | |
| Series 2010-M7A2 | 11/25/2020 | | | 3.66 | % | | | 456,025 | | | | 459,499 | |
Series 2015-M17 FA (1 Month LIBOR USD + 0.930%) (c) | 11/25/2022 | | | 3.23 | % | | | 1,946,019 | | | | 1,962,413 | |
| FHLMC Multifamily Structured Pass Through Certificates | | | | | | | | | | | | | |
| Series K-708 A2 | 01/25/2019 | | | 2.13 | % | | | 351,001 | | | | 350,241 | |
| Series K-006 A1 | 07/25/2019 | | | 3.40 | % | | | 526,662 | | | | 526,575 | |
Series K-P04 AG1 (1 Month LIBOR USD + 0.220%) (c) | 07/25/2020 | | | 2.57 | % | | | 3,450,000 | | | | 3,447,924 | |
Series K-I03 (1 Month LIBOR USD + 0.250%) (c) | 02/25/2021 | | | 2.60 | % | | | 2,425,000 | | | | 2,418,283 | |
Series K-F08 A (1 Month LIBOR USD + 0.300%) (c) | 01/25/2022 | | | 2.65 | % | | | 1,821,069 | | | | 1,813,696 | |
| Series K-J22 | 03/25/2022 | | | 3.17 | % | | | 2,665,000 | | | | 2,681,615 | |
Series K-S05 A (1 Month LIBOR USD + 0.500%) (c) | 01/25/2023 | | | 2.85 | % | | | 2,952,015 | | | | 2,946,484 | |
Series K-102 A (1 Month LIBOR USD + 0.200%) (c) | 02/25/2023 | | | 2.55 | % | | | 2,028,137 | | | | 2,025,992 | |
| FREMF Multifamily Aggregation Risk Transfer Trust, 2017-KT01 A | | | | | | | | | | | | | |
(1 Month LIBOR USD + 0.320%) (c) | 02/25/2020 | | | 2.82 | % | | | 5,890,000 | | | | 5,882,717 | |
NCUA Guaranteed Notes Trust, 2010-R1 1A (1 Month LIBOR USD + 0.450%) (c) | 10/07/2020 | | | 2.83 | % | | | 4,097,859 | | | | 4,102,942 | |
| TOTAL MORTGAGE BACKED SECURITIES (Cost $36,309,882) | | | | | | | | | | | | 36,271,867 | |
| MUNICIPAL BOND: 0.32% | | | | | | | | | | |
| Tennessee Valley Authority | 03/15/2020 | | | 2.25 | % | | | 1,110,000 | | | | 1,106,229 | |
| TOTAL MUNICIPAL BOND (Cost $1,107,602) | | | | | | | | | | 1,106,229 | |
| | | | | | | | | | | | |
| U.S. GOVERNMENT AGENCY ISSUES: 39.90% | | | | | | | | | | | |
| Federal Farm Credit Banks | 10/13/2020 | | | 1.68 | % | | | 8,000,000 | | | | 7,873,632 | |
| Federal Farm Credit Banks | 10/26/2020 | | | 1.75 | % | | | 19,095,000 | | | | 18,810,866 | |
| Federal Farm Credit Banks | 04/05/2021 | | | 2.54 | % | | | 16,255,000 | | | | 16,245,166 | |
| Federal Farm Credit Banks | 11/15/2021 | | | 3.05 | % | | | 5,000,000 | | | | 5,065,640 | |
| Federal Home Loan Banks | 06/12/2020 | | | 1.75 | % | | | 12,150,000 | | | | 12,009,838 | |
| Federal Home Loan Banks | 06/12/2020 | | | 3.38 | % | | | 3,330,000 | | | | 3,369,660 | |
| Federal Home Loan Banks | 09/11/2020 | | | 2.88 | % | | | 6,000,000 | | | | 6,031,740 | |
| Federal Home Loan Banks | 09/28/2020 | | | 1.38 | % | | | 10,565,000 | | | | 10,351,376 | |
| Federal Home Loan Banks | 06/11/2021 | | | 3.63 | % | | | 24,895,000 | | | | 25,501,268 | |
The accompanying notes are an integral part of these consolidated financial statements.
| | |
| | |
40 | | LoCorr Market Trend Fund - Consolidated Schedule of Investments (continued) |
| | |
| Maturity Date | | Coupon Rate | | Principal Amount | | | Value | |
U.S. GOVERNMENT AGENCY ISSUES (continued) | | | | | | | | | | |
| Federal Home Loan Banks | 06/10/2022 | | | 2.75 | % | | $ | 5,000,000 | | | $ | 5,021,090 | |
| Federal Home Loan Mortgage Corp. | 09/29/2020 | | | 1.63 | % | | | 9,140,000 | | | | 8,996,913 | |
| Federal Home Loan Mortgage Corp. | 11/17/2020 | | | 1.88 | % | | | 3,715,000 | | | | 3,668,741 | |
| Federal Home Loan Mortgage Corp. | 02/16/2021 | | | 2.38 | % | | | 10,000,000 | | | | 9,965,280 | |
| Federal National Mortgage Association | 10/30/2020 | | | 2.88 | % | | | 4,000,000 | | | | 4,021,944 | |
| TOTAL U.S. GOVERNMENT AGENCY ISSUES (Cost $137,632,730) | | | | | | | | | | | | 136,933,154 | |
| U.S. GOVERNMENT NOTES: 8.28% | | | | | | | | | | |
| United States Treasury Note | 07/15/2020 | | | 1.50 | % | | | 4,820,000 | | | | 4,744,499 | |
| United States Treasury Note | 02/15/2021 | | | 2.25 | % | | | 3,055,000 | | | | 3,038,412 | |
| United States Treasury Note | 04/15/2021 | | | 2.38 | % | | | 11,575,000 | | | | 11,546,063 | |
| United States Treasury Note | 07/31/2021 | | | 2.25 | % | | | 6,330,000 | | | | 6,294,888 | |
| United States Treasury Note | 11/30/2022 | | | 2.00 | % | | | 2,825,000 | | | | 2,773,576 | |
| TOTAL U.S. GOVERNMENT NOTES (Cost $28,221,213) | | | | | | | | | | | | 28,397,438 | |
| | | | | | | | | | | | | | |
| SHORT TERM INVESTMENT: 4.39% | | | | | | | | | |
| MONEY MARKET FUND: 4.39% | | Shares | | | | |
STIT-Government & Agency Portfolio, Institutional Class, 2.30% (e)(f) | | | 15,074,667 | | | | 15,074,667 | |
| TOTAL MONEY MARKET FUND (Cost $15,074,667) | | | | | | | 15,074,667 | |
| TOTAL SHORT TERM INVESTMENT (Cost $15,074,667) | | | | | | | 15,074,667 | |
| | | | | | | | | |
| TOTAL INVESTMENTS (Cost $303,243,922): 88.19% | | | | | | | 302,656,817 | |
Other Assets in Excess of Liabilities: 11.81% (g) | | | | | | | 40,543,735 | |
| TOTAL NET ASSETS: 100.00% | | | | | | $ | 343,200,552 | |
| (a) | Security as defined in Rule 144A under the Securities Act of 1933 and determined to be liquid. Purchased in a private placement transaction; resale to the public may require registration or may extend only to qualified institutional buyers. At December 31, 2018, the value of these securities total $18,086,048 which represents 5.27% of total net assets. |
| (b) | Foreign issued security. |
| (c) | Variable rate security based on a reference index and spread. The rate reported is the rate in effect as of December 31, 2018. |
| (d) | Variable rate security. The coupon is based on an underlying pool of loans. The rate reported is the rate in effect as of December 31, 2018. |
| (e) | The rate quoted is the annualized seven-day effective yield as of December 31, 2018. |
| (f) | All or a portion of this security is held by LCMT Fund Limited and pledged as collateral for derivative contracts. |
| (g) | Includes assets pledged as collateral for derivative contracts. |
| LIBOR | London Interbank Offered Rate |
The accompanying notes are an integral part of these consolidated financial statements.| | |
| | |
LoCorr Market Trend Fund - Consolidated Schedule of Open Forward Currency Contracts
| | 41 |
| | |
LoCorr Market Trend Fund
Consolidated Schedule of Open Forward Currency Contracts (a)
December 31, 2018
| | | |
| Currency to be Received | | Currency to be Delivered | | | | | |
| |
| | | Notional | | Forward | Curr | | U.S. $ Value at | | Curr | | U.S. $ Value on | | | Unrealized | | | Unrealized | |
| | | Amount | | Settlement Date | Abbr. | | December 31, 2018 | | Abbr. | | Origination Date | | | Appreciation | | | (Depreciation) | |
| | |
| Purchase Contracts: | |
| | | $ | 11,994,606 | | 03/22/2019 | AUD | | $ | 11,876,209 | | USD | | $ | 11,994,606 | | | $ | — | | | $ | (118,397 | ) |
| | | | 11,748,279 | | 03/22/2019 | CAD | | | 11,621,639 | | USD | | | 11,748,279 | | | | — | | | | (126,640 | ) |
| | | | 13,549,110 | | 03/22/2019 | CHF | | | 13,646,062 | | USD | | | 13,549,110 | | | | 96,952 | | | | — | |
| | | | 19,653,383 | | 03/22/2019 | EUR | | | 19,731,104 | | USD | | | 19,653,383 | | | | 77,721 | | | | — | |
| | | | 16,950,855 | | 03/22/2019 | GBP | | | 17,010,511 | | USD | | | 16,950,855 | | | | 59,656 | | | | — | |
| | | | 48,690,765 | | 03/22/2019 | JPY | | | 49,288,331 | | USD | | | 48,690,765 | | | | 597,566 | | | | — | |
| | | | 20,312,251 | | 03/22/2019 | MXN | | | 20,756,545 | | USD | | | 20,312,251 | | | | 444,294 | | | | — | |
| | | | 15,030,925 | | 03/22/2019 | NZD | | | 14,864,803 | | USD | | | 15,030,925 | | | | — | | | | (166,122 | ) |
| Total Purchase Contracts | | | | | | 158,795,204 | | | | | 157,930,174 | | | | 1,276,189 | | | | (411,159 | ) |
| | | | | | | | | | | | | | | | | | | | | |
| Sale Contracts: | |
| | | $ | 68,590,949 | | 03/22/2019 | USD | | $ | 66,910,355 | | AUD | | $ | 68,590,949 | | | $ | 1,680,594 | | | $ | — | |
| | | | 62,359,196 | | 03/22/2019 | USD | | | 60,859,492 | | CAD | | | 62,359,196 | | | | 1,499,704 | | | | — | |
| | | | 71,633,803 | | 03/22/2019 | USD | | | 72,187,769 | | CHF | | | 71,633,803 | | | | — | | | | (553,966 | ) |
| | | | 103,872,606 | | 03/22/2019 | USD | | | 104,534,589 | | EUR | | | 103,872,606 | | | | — | | | | (661,983 | ) |
| | | | 107,757,098 | | 03/22/2019 | USD | | | 108,481,837 | | GBP | | | 107,757,098 | | | | — | | | | (724,739 | ) |
| | | | 164,371,294 | | 03/22/2019 | USD | | | 169,462,967 | | JPY | | | 164,371,294 | | | | — | | | | (5,091,673 | ) |
| | | | 3,914,073 | | 03/22/2019 | USD | | | 3,976,480 | | MXN | | | 3,914,073 | | | | — | | | | (62,407 | ) |
| | | | 31,873,235 | | 03/22/2019 | USD | | | 31,330,019 | | NZD | | | 31,873,235 | | | | 543,216 | | | | — | |
| Total Sale Contracts | | | | | | 617,743,508 | | | | | 614,372,254 | | | | 3,723,514 | | | | (7,094,768 | ) |
| Net Forward Currency Contracts | | | | | $ | (458,948,304 | ) | | | $ | (456,442,080 | ) | | $ | 4,999,703 | | | $ | (7,505,927 | ) |
| Net Unrealized Depreciation | | | | | | | | | | | | | | | | | | $ | (2,506,224 | ) |
Currency abbreviations:
| AUD | AUSTRALIAN DOLLAR |
| CAD | CANADIAN DOLLAR |
| CHF | SWISS FRANC |
| EUR | EURO |
| GBP | BRITISH POUND |
| JPY | JAPANESE YEN |
| MXN | MEXICAN PESO |
| NZD | NEW ZEALAND DOLLAR |
| USD | U.S. DOLLAR |
| (a) | Bank of America Merrill Lynch is the counterparty for all open forward currency exchange contracts held by the Fund as of December 31,2018. |
The accompanying notes are an integral part of these consolidated financial statements.
| | |
| | |
42 | | LoCorr Market Trend Fund - Consolidated Schedule of Open Futures Contracts |
| | |
LoCorr Market Trend Fund
Consolidated Schedule of Open Futures Contracts
December 31, 2018
| | Number of
| | | | | | |
| | | Value | |
| | | Contracts | | Settlement | | Current Notional | | | Value at | | | Unrealized | | | Unrealized | |
| Description | | Purchased (Sold) | | Month-Year | | Amount | | | Trade Date | | | Appreciation | | | (Depreciation) | |
| | | | | | | | | | | | | | | | | |
| Purchase Contracts: | | | | | | | | | | | | | | | | |
| 10 Yr Mini JGB | | | 11 | | Mar-19 | | $ | 1,531,801 | | | $ | 1,525,375 | | | $ | 6,426 | | | $ | | |
| 3 Mo Euro Euribor | | | 939 | | Jun-20 | | | 269,422,284 | | | | 269,204,481 | | | | 217,803 | | | | — | |
Aluminum (a)(b) | | | 183 | | Mar-19 | | | 8,454,600 | | | | 8,842,851 | | | | — | | | | (388,251 | ) |
| Australian 10 Yr Bond | | | 595 | | Mar-19 | | | 55,602,469 | | | | 55,217,863 | | | | 384,606 | | | | — | |
| Canadian 10 Yr Bond | | | 263 | | Mar-19 | | | 26,348,161 | | | | 26,352,669 | | | | — | | | | (4,508 | ) |
Copper(a)(b) | | | 190 | | Mar-19 | | | 28,356,313 | | | | 29,672,907 | | | | — | | | | (1,316,594 | ) |
| Dollar | | | 194 | | Mar-19 | | | 18,572,590 | | | | 18,787,365 | | | | — | | | | (214,775 | ) |
| Dow Jones Industrial Average Mini E-Cbot Index | | | 179 | | Mar-19 | | | 20,824,860 | | | | 21,943,380 | | | | — | | | | (1,118,520 | ) |
| Euro-Bobl | | | 870 | | Mar-19 | | | 132,096,381 | | | | 131,793,756 | | | | 302,625 | | | | — | |
| Euro-Bund | | | 408 | | Mar-19 | | | 76,449,455 | | | | 75,923,294 | | | | 526,161 | | | | — | |
| Euro-Schatz | | | 805 | | Mar-19 | | | 103,245,569 | | | | 103,206,635 | | | | 38,934 | | | | — | |
| Japanese 10 Yr Bond | | | 53 | | Mar-19 | | | 73,732,403 | | | | 73,425,760 | | | | 306,643 | | | | — | |
| Long Gilt | | | 391 | | Mar-19 | | | 61,384,049 | | | | 61,403,927 | | | | — | | | | (19,878 | ) |
| Nasdaq 100 E-Mini Index | | | 80 | | Mar-19 | | | 10,133,200 | | | | 10,839,773 | | | | — | | | | (706,573 | ) |
Natural Gas (a) | | | 212 | | Feb-19 | | | 6,232,800 | | | | 9,249,336 | | | | — | | | | (3,016,536 | ) |
| Nikkei 225 Index | | | 83 | | Mar-19 | | | 15,145,295 | | | | 16,005,940 | | | | — | | | | (860,645 | ) |
| U.S. 10 Yr Note | | | 420 | | Mar-19 | | | 51,246,563 | | | | 51,056,418 | | | | 190,145 | | | | — | |
| U.S. Long Bond | | | 226 | | Mar-19 | | | 32,996,000 | | | | 32,883,934 | | | | 112,066 | | | | — | |
Zinc (a)(b) | | | 107 | | Mar-19 | | | 6,608,588 | | | | 6,804,268 | | | | — | | | | (195,680 | ) |
| Total Purchase Contracts | | | | | | | | | | | | | | | | 2,085,409 | | | | (7,841,960 | ) |
| | | | | | | | | | | | | | | | | | | | | | |
| Sales Contracts: | | | | | | | | | | | | | | | | | | | | | |
| 90 Day Euro | | | (2,225 | ) | Jun-20 | | $ | 542,371,563 | | | $ | 540,352,608 | | | $ | | | | $ | (2,018,955 | ) |
| 90 Day Sterling | | | (1,618 | ) | Jun-20 | | | 254,771,687 | | | | 254,671,257 | | | | — | | | | (100,430 | ) |
Aluminum (a)(b) | | | (599 | ) | Mar-19 | | | 27,673,800 | | | | 29,600,526 | | | | 1,926,726 | | | | — | |
Brent Crude (a) | | | (55 | ) | Mar-19 | | | 2,959,000 | | | | 2,981,926 | | | | 22,926 | | | | — | |
| CAC40 10 Euro Index | | | (274 | ) | Jan-19 | | | 14,844,453 | | | | 14,992,774 | | | | 148,321 | | | | — | |
Cocoa (a) | | | (212 | ) | Mar-19 | | | 4,772,000 | | | | 4,612,571 | | | | — | | | | (159,429 | ) |
Coffee (a) | | | (124 | ) | Mar-19 | | | 4,736,025 | | | | 5,733,375 | | | | 997,350 | | | | — | |
Copper(a)(b) | | | (241 | ) | Mar-19 | | | 35,967,744 | | | | 37,088,716 | | | | 1,120,972 | | | | — | |
Corn (a) | | | (511 | ) | Mar-19 | | | 9,581,250 | | | | 9,783,909 | | | | 202,659 | | | | — | |
Cotton No.2 (a) | | | (102 | ) | Mar-19 | | | 3,682,200 | | | | 3,836,703 | | | | 154,503 | | | | — | |
| DAX Index | | | (129 | ) | Mar-19 | | | 39,025,238 | | | | 39,705,093 | | | | 679,855 | | | | — | |
| Euro-Stoxx 50 Index | | | (866 | ) | Mar-19 | | | 29,508,633 | | | | 30,080,188 | | | | 571,555 | | | | — | |
| FTSE 100 Index | | | (205 | ) | Mar-19 | | | 17,399,498 | | | | 17,371,215 | | | | — | | | | (28,283 | ) |
Gasoline RBOB (a) | | | (201 | ) | Feb-19 | | | 10,992,328 | | | | 12,123,735 | | | | 1,131,407 | | | | — | |
Gold (a) | | | (4 | ) | Feb-19 | | | 512,520 | | | | 501,803 | | | | — | | | | (10,717 | ) |
| Hang Seng Index | | | (29 | ) | Jan-19 | | | 4,787,472 | | | | 4,755,920 | | | | — | | | | (31,552 | ) |
Hard Red Wheat (a) | | | (194 | ) | Mar-19 | | | 4,740,875 | | | | 4,960,313 | | | | 219,438 | | | | — | |
Heating Oil (a) | | | (15 | ) | Feb-19 | | | 1,058,022 | | | | 1,052,037 | | | | — | | | | (5,985 | ) |
Low Sulphur Gasoil (a) | | | (40 | ) | Feb-19 | | | 2,045,000 | | | | 2,023,103 | | | | — | | | | (21,897 | ) |
| Russell 2000 Mini Index | | | (197 | ) | Mar-19 | | | 13,287,650 | | | | 13,099,855 | | | | — | | | | (187,795 | ) |
| S&P 500 E-Mini Index | | | (47 | ) | Mar-19 | | | 5,887,220 | | | | 5,737,312 | | | | — | | | | (149,908 | ) |
Silver(a) | | | (241 | ) | Mar-19 | | | 18,725,700 | | | | 17,500,229 | | | | — | | | | (1,225,471 | ) |
Soybean (a) | | | (190 | ) | Mar-19 | | | 8,502,500 | | | | 8,412,073 | | | | — | | | | (90,427 | ) |
Soybean Meal (a) | | | (142 | ) | Mar-19 | | | 4,400,580 | | | | 4,456,302 | | | | 55,722 | | | | — | |
Soybean Oil (a) | | | (117 | ) | Mar-19 | | | 1,955,070 | | | | 2,013,976 | | | | 58,906 | | | | — | |
Sugar (a) | | | (292 | ) | Mar-19 | | | 3,934,291 | | | | 3,710,448 | | | | — | | | | (223,843 | ) |
| Tokyo Price Index | | | (121 | ) | Mar-19 | | | 16,487,706 | | | | 17,343,254 | | | | 855,548 | | | | — | |
| U.S. 2 Yr Note | | | (1,384 | ) | Mar-19 | | | 293,840,500 | | | | 291,892,824 | | | | — | | | | (1,947,676 | ) |
| U.S. 5 Yr Note | | | (559 | ) | Mar-19 | | | 64,110,313 | | | | 63,092,232 | | | | — | | | | (1,018,081 | ) |
Wheat (a) | | | (296 | ) | Mar-19 | | | 7,448,100 | | | | 7,563,560 | | | | 115,460 | | | | — | |
The accompanying notes are an integral part of these consolidated financial statements.
| | |
| | |
LoCorr Market Trend Fund - Consolidated Schedule of Open Futures Contracts (continued)
| | 43 |
| | |
|
| Number of |
|
|
| |
|
|
|
|
| Value | |
| | | Contracts | | Settlement | | Current Notional | | | Value at | | | Unrealized | | | Unrealized | |
| Description | | Purchased (Sold) | | Month-Year | | Amount | | | Trade Date | | | Appreciation | | | (Depreciation) | |
| | | | | | | | | | | | | | | | | |
Sale Contracts (continued) | | | | | | | | | | | | | | | | |
WTI Crude (a) |
| (197 | ) | Feb-19 | | $ | 8,945,770 | | | $ | 9,882,622 | | | $ | 936,852 | | | $ | — | |
Zinc (a)(b) | | | (352 | ) | Mar-19 | | | 21,740,400 | | | | 21,630,046 | | | | — | | | | (110,354 | ) |
| Total Sale Contracts | | | | | | | | | | | | | | | | 9,198,200 | | | | (7,330,803 | ) |
| Total Futures Contracts | | | | | | | | | | | | | | | $ | 11,283,609 | | | $ | (15,172,763 | ) |
| Net Unrealized Depreciation | | | | | | | | | | | | | | | | | | | $ | (3,889,154 | ) |
| (a) | Contract held by LCMT Fund Limited. |
| (b) | London Metal Exchange ("LME") futures contracts settle on their respective maturity date. The unrealized appreciation on these contracts is a receivable for unsettled open futures contracts and the unrealized depreciation is a payable for unsettled open futures contracts on the Fund's consolidated statement of assets and liabilities. |
The accompanying notes are an integral part of these consolidated financial statements.
| | |
| | |
44 | | LoCorr Dynamic Equity Fund - Schedule of investment
|
| | |
LoCorr Dynamic Equity Fund
Composition of Investment Portfolio1 | Composition of Common Stock Portfolio1 |
| December 31, 2018 (Unaudited) | December 31, 2018 (Unaudited) |
1 As a percentage of total investments.
1 As a percentage of total common stocks.
Schedule of Investments
December 31, 2018
| | Shares | | | Value | |
COMMON STOCKS: 73.14%
| | | | | | |
| Accommodation and Food Services: 6.43% | | | | | | |
| Bloomin’ Brands, Inc. | | | 16,353 | | | $ | 292,555 | |
| Extended Stay America, Inc. | | | 24,247 | | | | 375,829 | |
| Marriott Vacations Worldwide Corp. | | | 16,883 | | | | 1,190,421 | |
| Papa John’s International, Inc. | | | 2,200 | | | | 87,582 | |
| | | | | | | 1,946,387
| |
| Arts, Entertainment, and Recreation: 2.51% | | | | | | | | |
| Wynn Resorts Ltd. | | | 7,678 | | | | 759,431 | |
| | | | | | | | | |
| Construction: 9.27% | | | | | | | | |
Frontdoor, Inc. (a) | | | 23,013 | | | | 612,376 | |
MasTec, Inc. (a) | | | 44,515 | | | | 1,805,529 | |
Meritage Homes Corp. (a) | | | 5,561 | | | | 204,200 | |
Taylor Morrison Home Corp. (a) | | | 11,538 | | | | 183,454 | |
| | | | | | | 2,805,559
| |
| Finance and Insurance: 13.19% | | | | | | | | |
Credit Acceptance Corp. (a) | | | 7,169 | | | | 2,736,837 | |
| Evercore Partners, Inc. | | | 312 | | | | 22,327 | |
Syneos Health, Inc. (a) | | | 19,914 | | | | 783,616 | |
Texas Capital Bancshares, Inc. (a) | | | 7,960 | | | | 406,676 | |
Willscot Corp. (a) | | | 4,761 | | | | 44,849 | |
| | | | | | | 3,994,305
| |
| Information: 10.07% | | | | | | | | |
DISH Network Corp. (a) | | | 22,434 | | | | 560,177 | |
Intelsat SA (a)(b) | | | 34,080 | | | | 728,971 | |
Lions Gate Entertainment Corp. (b) | | | 5,934 | | | | 95,537 | |
Madison Square Garden Co. (a) | | | 2,668 | | | | 714,224 | |
| New York Times Co. | | | 6,249 | | | | 139,290 | |
| News Corporation | | | 18,549 | | | | 210,531 | |
Pivotal Software, Inc. (a) | | | 2,600 | | | | 42,510 | |
Shopify, Inc. (a)(b) | | | 479 | | | | 66,318 | |
The accompanying notes are an integral part of these financial statements.
| | |
| | |
LoCorr Dynamic Equity Fund - Schedule of investments (continued)
| | 45 |
| | |
| | | Shares
| | | Value | |
COMMON STOCKS (continued) | |
| | |
| |
Stars Group, Inc. (a)(b) | | | 12,137 | | | $ | 200,503 | |
Zayo Group Holdings, Inc. (a) | | | 8,410 | | | | 192,084 | |
Zillow Group, Inc. (a) | | | 3,143 | | | | 99,256 | |
| | | | | | | 3,049,401
| |
| Manufacturing: 14.14% | | | | | | | | |
| Commercial Metals Co. | | | 10,510 | | | | 168,370 | |
| Lear Corp. | | | 14,677 | | | | 1,803,216 | |
| Microchip Technology, Inc. | | | 5,862 | | | | 421,595 | |
Nintendo Co. Ltd. - ADR(a)(b) | | | 3,766 | | | | 124,655 | |
| REV Group, Inc. | | | 117,354 | | | | 881,329 | |
| Skyworks Solutions, Inc. | | | 1,418 | | | | 95,034 | |
| Versum Materials, Inc. | | | 3,522 | | | | 97,630 | |
ViaSat, Inc. (a) | | | 3,814 | | | | 224,835 | |
Zynga, Inc. (a) | | | 118,296 | | | | 464,903 | |
| | | | | | | 4,281,567
| |
| Professional, Scientific, and Technical Services: 2.61% | | | | | | | | |
| ADT, Inc. | | | 26,284 | | | | 157,967 | |
Liberty Media Corp. - Liberty Formula One(a) | | | 14,106 | | | | 433,054 | |
Quotient Technology, Inc. (a) | | | 6,155 | | | | 65,735 | |
Shake Shack, Inc. (a) | | | 2,917 | | | | 132,490 | |
| | | | | | | 789,246
| |
| Real Estate and Rental and Leasing: 5.90% | | | | | | | | |
| Newmark Group, Inc. | | | 11,201 | | | | 89,832 | |
| Synchrony Financial | | | 72,333 | | | | 1,696,932 | |
| | | | | | | 1,786,764
| |
| Retail Trade: 3.88% | | | | | | | | |
| Advance Auto Parts, Inc. | | | 6,753 | | | | 1,063,327 | |
| Lithia Motors, Inc. | | | 1,475 | | | | 112,587 | |
| | | | | | | 1,175,914
| |
| Transportation and Warehousing: 4.90% | | | | | | | | |
Air Canada - ADR(a)(b) | | | 77,997 | | | | 1,481,944 | |
| | | | | | | | | |
| Wholesale Trade: 0.24% | | | | | | | | |
American Axle & Manufacturing Holdings, Inc. (a) | | | 6,501 | | | | 72,161 | |
| TOTAL COMMON STOCKS (Cost $23,909,032) | | |
| | | | 22,142,679 | |
| | | | | | | | | |
| REAL ESTATE INVESTMENT TRUSTS: 3.14% | | | | | | | | |
| Finance and Insurance: 1.97% | | | | | | | | |
| Kimco Realty Corp. | | | 40,657 | | | | 595,625 | |
| | | | | | | | | |
| Real Estate and Rental and Leasing: 1.17% | | | | | | | | |
| Gaming and Leisure Properties, Inc. | | | 11,000 | | | | 355,410 | |
| TOTAL REAL ESTATE INVESTMENT TRUSTS (Cost $989,117) | | |
| | | | 951,035 | |
| | | | | | | | | |
| SHORT TERM INVESTMENT: 11.32% | | | | | | | | |
| MONEY MARKET FUND: 11.32% | | | | | | | | |
STIT-Government & Agency Portfolio, Institutional Class, 2.30%(c) | | | 3,425,866 | | | | 3,425,866 | |
| TOTAL MONEY MARKET FUND (Cost $3,425,866) | | |
| | | | 3,425,866 | |
| TOTAL SHORT TERM INVESTMENT (Cost $3,425,866) | | |
| | | | 3,425,866 | |
| | | | | | | | | |
| TOTAL INVESTMENTS (Cost $28,324,015): 87.60% | | |
| | | | 26,519,580 | |
Other Assets in Excess of Liabilities: 12.40%(d) | | |
| | | | 3,753,316 | |
| TOTAL NET ASSETS: 100.00% | |
|
| | | $ | 30,272,896
| |
(a) Non-dividend income producing security.
(b) Foreign issued security.
(c) The rate quoted is the annualized seven-day effective yield as of December 31, 2018.
(d) Includes assets pledged as collateral for securities sold short.
ADR American Depositary Receipt
The accompanying notes are an integral part of these financial statements.
| | |
| | |
46 | | LoCorr Dynamic Equity Fund - Schedule of Securities Sold Short
|
| | |
LoCorr Dynamic Equity Fund
Schedule of Securities Sold Short
December 31, 2018
| | | Shares | | | Value |
|
| COMMON STOCKS: (11.76)% | | | | | |
|
| Accommodation and Food Services: (0.29)% | | | | | |
|
| Cracker Barrel Old Country Store, Inc. | | | (542) |
| | $ | (86,644) |
|
| | | | | | | | |
|
| Arts, Entertainment, and Recreation: (0.73)% | | | | | | | |
|
Live Nation Entertainment, Inc. (a) | | | (4,482) |
| | | (220,738) |
|
| | | | | | | | |
|
| Construction: (0.30)% | | | | | | | |
|
| D R Horton, Inc. | | | (2,649) |
| | | (91,814) |
|
| | | | | | | | |
|
| Finance and Insurance: (0.44)% | | | | | | | |
|
| Western Union Co. | | | (7,730) |
| | | (131,874) |
|
| | | | | | | | |
|
| Information: (1.76)% | | | | | | | |
|
| CenturyLink, Inc. | | | (6,612) |
| | | (100,172) |
|
Charter Communications, Inc. (a) | | | (316) |
| | | (90,051) |
|
Glu Mobile, Inc. (a) | | | (12,608) |
| | | (101,747) |
|
Medidata Solutions, Inc. (a) | | | (2,062) |
| | | (139,020) |
|
MSG Networks, Inc. (a) | | | (2,857) |
| | | (67,311) |
|
| SS&C Technologies Holdings, Inc. | | | (729) |
| | | (32,885) |
|
| | | | | | | (531,186) |
|
| Manufacturing: (6.33)% | | | | | | | |
|
Align Technology, Inc. (a) | | | (566) |
| | | (118,537) |
|
| AO Smith Corp. | | | (3,176) |
| | | (135,615) |
|
| Cisco Systems, Inc. | | | (4,225) |
| | | (183,069) |
|
Diodes, Inc. (a) | | | (2,776) |
| | | (89,554) |
|
| Emerson Electric Co. | | | (3,208) |
| | | (191,678) |
|
| Graco, Inc. | | | (3,330) |
| | | (139,361) |
|
iRhythm Technologies, Inc. (a) | | | (1,147) |
| | | (79,694) |
|
| Kennametal, Inc. | | | (2,830) |
| | | (94,182) |
|
Mercury Systems, Inc. (a) | | | (404) |
| | | (19,105) |
|
| NetApp, Inc. | | | (2,376) |
| | | (141,776) |
|
| Nucor Corp. | | | (2,740) |
| | | (141,959) |
|
| NVIDIA Corp. | | | (1,731) |
| | | (231,089) |
|
| PACCAR, Inc. | | | (2,456) |
| | | (140,336) |
|
| Teradyne, Inc. | | | (6,122) |
| | | (192,108) |
|
WABCO Holdings Inc. (a) | | | (182) |
| | | (19,536) |
|
| | | | | | | (1,917,599) |
|
| Other Services (except Public Administration): (0.81)% | | | | | | | |
|
Regis Corp. (a) | | | (14,467) |
| | | (245,216) |
|
| | | | | | | | |
|
| Professional, Scientific, and Technical Services: (0.63)% | | | | | | | |
|
| FactSet Research Systems, Inc. | | | (231) |
| | | (46,230) |
|
Waters Corp. (a) | | | (767) |
| | | (144,695) |
|
| | | | | | | (190,925) |
|
| Real Estate and Rental and Leasing: (0.15)% | | | | | | | |
|
REA Group Ltd. (b) | | | (888) |
| | | (46,272) |
|
| | | | | | | | |
|
| Wholesale Trade: (0.32)% | | | | | | | |
|
| Illinois Tool Works, Inc. | | | (590) |
| | | (74,747) |
|
| Lennox International, Inc. | | | (107) |
| | | (23,418) |
|
| | | | | | | (98,165) |
|
| TOTAL COMMON STOCKS (Proceeds $3,657,710) | | | | | | | (3,560,433) |
|
The accompanying notes are an integral part of these financial statements.
| | |
| | |
LoCorr Dynamic Equity Fund - Schedule of Securities Sold Short (continued)
| | 47 |
| | |
LoCorr Dynamic Equity Fund - Schedule of Securities Sold Short (continued) | 4
| | | Shares | | | Value | |
| EXCHANGE TRADED FUNDS: (3.72)% | | | | | | |
| iShares Russell 2000 | | | (4,211) |
| | $ | (563,853) |
|
| SPDR S&P500 Trust | | | (2,249) |
| | | (562,069) |
|
| TOTAL EXCHANGE TRADED FUNDS (Proceeds $1,117,680) | | |
|
| | | (1,125,922) | |
| TOTAL SECURITIES SOLD SHORT (Proceeds $4,775,390): (15.48)% | | | | | | $ | (4,686,355) |
|
Percentages are stated as a percent of net assets.
(a) Non-dividend expense producing security.
(b) Foreign issued security.
The accompanying notes are an integral part of these financial statements.
| | |
| | |
48 | | LoCorr Spectrum Income Fund - Schedule of Investments |
| | |
LoCorr Spectrum Income Fund
Composition of Investment Portfolio1
December 31, 2018 (Unaudited)
1 As a percentage of total investments.
Schedule of Investments
December 31, 2018
| | | Shares | | | Value | |
| BUSINESS DEVELOPMENT COMPANIES: 9.26% | | | | | | |
| Finance and Insurance: 7.20% | | | | | | |
| Ares Capital Corp. | | | 92,040 | | | $ | 1,433,983 | |
| BlackRock TCP Capital Corp. | | | 104,693 | | | | 1,365,197 | |
| Hercules Capital, Inc. | | | 63,723 | | | | 704,139 | |
| New Mountain Finance Corp. | | | 59,373 | | | | 746,912 | |
| PennantPark Investment Corp. | | | 104,574 | | | | 666,136 | |
| | | | | | | | 4,916,367 | |
| Management of Companies and Enterprises: 2.06% | | | | | | | | |
| Newtek Business Services Corp. | | | 80,744 | | | | 1,408,175 | |
| TOTAL BUSINESS DEVELOPMENT COMPANIES (Cost $7,023,669) | | | | | | | 6,324,542 | |
| | | | | | | | | |
| CLOSED-END INVESTMENT COMPANIES: 14.36% | | | | | | | | |
| Aberdeen Asia-Pacific Income Fund, Inc. | | | 195,748 | | | | 757,545 | |
| Adams Natural Resources Fund, Inc. | | | 46,982 | | | | 684,528 | |
| BlackRock Corporate High Yield Fund, Inc. | | | 78,322 | | | | 726,828 | |
| Eaton Vance Municipal Bond Fund | | | 89,815 | | | | 1,014,011 | |
| Invesco Trust for Investment Grade Municipals | | | 110,515 | | | | 1,268,712 | |
| Morgan Stanley Emerging Markets Domestic Debt Fund, Inc. | | | 122,954 | | | | 745,101 | |
| Nuveen Quality Municipal Income Fund | | | 143,893 | | | | 1,804,418 | |
| Nuveen Real Asset Income and Growth Fund | | | 101,781 | | | | 1,387,275 | |
| PIMCO Dynamic Credit and Mortgage Income Fund | | | 33,579 | | | | 706,838 | |
| Reaves Utility Income Fund | | | 24,446 | | | | 719,446 | |
| TOTAL CLOSED-END INVESTMENT COMPANIES (Cost $9,995,567) | | | | | | | 9,814,702 | |
| | | | | | | | | |
| COMMON STOCKS: 19.15% | | | | | | | | |
| Finance and Insurance: 1.08% | | | | | | | | |
| AMERISAFE, Inc. | | | 12,996 | | | | 736,743 | |
The accompanying notes are an integral part of these financial statements.
| | |
| | |
| LoCorr Spectrum Income Fund - Schedule of Investments (continued) | | 49 |
| | |
| | | Shares | | | Value | |
COMMON STOCKS (continued) | | | | | | |
| Information: 3.67% | | | | | | |
| CenturyLink, Inc. | | | 83,028 | | | $ | 1,257,874 | |
| Consolidated Communications Holdings, Inc. | | | 126,807 | | | | 1,252,853 | |
| | | | | | | | 2,510,727 | |
| Manufacturing: 3.04% | | | | | | | | |
| CVR Energy, Inc. | | | 23,221 | | | | 800,654 | |
| Marathon Petroleum Corp. | | | 12,121 | | | | 715,260 | |
Ship Finance International Ltd. (a) | | | 53,570 | | | | 564,092 | |
| | | | | | | | 2,080,006 | |
| Mining, Quarrying, and Oil and Gas Extraction: 2.35% | | | | | | | | |
| Pattern Energy Group, Inc. | | | 86,247 | | | | 1,605,919 | |
| | | | | | | | | |
| Professional, Scientific, and Technical Services: 1.88% | | | | | | | | |
| Macquarie Infrastructure Corp. | | | 20,492 | | | | 749,188 | |
| National CineMedia, Inc. | | | 82,353 | | | | 533,647 | |
| | | | | | | | 1,282,835 | |
| Real Estate and Rental and Leasing: 0.96% | | | | | | | | |
| Fortress Transportation & Infrastructure Investors LLC | | | 45,520 | | | | 652,757 | |
| | | | | | | | | |
| Transportation and Warehousing: 6.17% | | | | | | | | |
GasLog Partners LP (a) | | | 54,823 | | | | 1,085,496 | |
Golar LNG Partners LP (a) | | | 63,200 | | | | 682,560 | |
Hoegh LNG Partners LP (a) | | | 62,764 | | | | 963,427 | |
| Targa Resources Corp. | | | 41,118 | | | | 1,481,071 | |
| | | | | | | | 4,212,554 | |
| TOTAL COMMON STOCKS (Cost $15,354,279) | | | | | | | 13,081,541 | |
| | | | | | | | | |
| MASTER LIMITED PARTNERSHIPS: 22.60% | | Units | | | | | |
| Mining, Quarrying, and Oil and Gas Extraction: 4.60% | | | | | | | | |
| Alliance Resource Partners LP | | | 45,514 | | | | 789,213 | |
| EnLink Midstream Partners LP | | | 44,970 | | | | 495,120 | |
| SunCoke Energy Partners LP | | | 52,733 | | | | 561,079 | |
| USA Compression Partners LP | | | 48,414 | | | | 628,414 | |
| Viper Energy Partners LP | | | 25,627 | | | | 667,327 | |
| | | | | | | | 3,141,153 | |
| Real Estate and Rental and Leasing: 3.13% | | | | | | | | |
| Icahn Enterprises LP | | | 37,522 | | | | 2,141,756 | |
| | | | | | | | | |
| Retail Trade: 6.24% | | | | | | | | |
| Crestwood Equity Partners LP | | | 70,011 | | | | 1,954,007 | |
| Global Partners LP | | | 91,958 | | | | 1,498,915 | |
| Sunoco LP | | | 29,717 | | | | 808,005 | |
| | | | | | | | 4,260,927 | |
| Transportation and Warehousing: 6.77% | | | | | | | | |
Capital Product Partners LP (a) | | | 233,451 | | | | 487,913 | |
| Delek Logistics Partners LP | | | 28,311 | | | | 828,097 | |
| Dominion Energy Midstream Partners LP | | | 53,850 | | | | 971,454 | |
| MPLX LP | | | 45,865 | | | | 1,389,710 | |
| Summit Midstream Partners LP | | | 94,519 | | | | 949,916 | |
| | | | | | | | 4,627,090 | |
| Wholesale Trade: 1.86% | | | | | | | | |
| Martin Midstream Partners LP | | | 47,155 | | | | 484,753 | |
| NGL Energy Partners LP | | | 81,964 | | | | 786,035 | |
| | | | | | | | 1,270,788 | |
| TOTAL MASTER LIMITED PARTNERSHIPS (Cost $16,005,130) | | | | | | | 15,441,714 | |
| | | | | | | | |
| PREFERRED STOCKS: 3.31% | | Shares | | | | | |
| Finance and Insurance: 0.83% | | | | | | | | |
| Oaktree Capital Group LLC, Series B, 6.550% | | | 25,000 | | | | 567,500 | |
The accompanying notes are an integral part of these financial statements.
| | |
| | |
50 | | LoCorr Spectrum Income Fund - Schedule of Investments (continued)
|
| | |
| | | Shares | | | Value | |
PREFERRED STOCKS (continued) | | | | | | |
| Retail Trade: 1.28% | | | | | | |
| Crestwood Equity Partners LP, 9.250% | | | 99,680 | | | $ | 872,200 | |
| | | | | | | | | |
| Transportation and Warehousing: 1.20% | | | | | | | | |
Hoegh LNG Partners LP, Series A, 8.750% (a) | | | 33,770 | | | | 823,988 | |
| TOTAL PREFERRED STOCKS (Cost $2,376,292) | | | | | | | 2,263,688 | |
| | | | | | | | | |
| PUBLICLY TRADED PARTNERSHIPS: 7.85% | | Units | | | | | |
| Finance and Insurance: 6.99% | | | | | | | | |
| Apollo Global Management LLC | | | 43,156 | | | | 1,059,048 | |
| Blackstone Group LP | | | 40,542 | | | | 1,208,557 | |
| Carlyle Group LP | | | 60,345 | | | | 950,434 | |
| Oaktree Capital Group LLC | | | 39,225 | | | | 1,559,194 | |
| | | | | | | | 4,777,233 | |
| Management of Companies and Enterprises: 0.86% | | | | | | | | |
| Compass Diversified Holdings | | | 47,104 | | | | 586,445 | |
| TOTAL PUBLICLY TRADED PARTNERSHIPS (Cost $5,487,877) | | | | | | | 5,363,678 | |
| | | | | | | | | |
| | | Shares | | | | | |
| REAL ESTATE INVESTMENT TRUSTS: 21.07% | | | | | | | | |
| Finance and Insurance: 6.58% | | | | | | | | |
| AGNC Investment Corp. | | | 84,418 | | | | 1,480,692 | |
| Apollo Commercial Real Estate Finance, Inc. | | | 89,434 | | | | 1,489,970 | |
| Invesco Mortgage Capital, Inc. | | | 51,417 | | | | 744,518 | |
| New York Mortgage Trust, Inc. | | | 132,404 | | | | 779,860 | |
| | | | | | | | 4,495,040 | |
| Information: 1.01% | | | | | | | | |
| CyrusOne, Inc. | | | 13,085 | | | | 691,935 | |
| | | | | | | | | |
| Real Estate and Rental and Leasing: 12.35% | | | | | | | | |
| Annaly Capital Management, Inc. | | | 224,912 | | | | 2,208,636 | |
| CoreSite Realty Corp. | | | 7,211 | | | | 629,016 | |
| Digital Realty Trust, Inc. | | | 6,998 | | | | 745,637 | |
| Gaming and Leisure Properties, Inc. | | | 22,879 | | | | 739,220 | |
| Global Net Lease, Inc. | | | 37,877 | | | | 667,393 | |
| Sabra Health Care REIT, Inc. | | | 40,507 | | | | 667,555 | |
| Two Harbors Investment Corp. | | | 51,756 | | | | 664,547 | |
| Uniti Group, Inc. | | | 36,264 | | | | 564,630 | |
| Washington Prime Group, Inc. | | | 319,058 | | | | 1,550,622 | |
| | | | | | | | 8,437,256 | |
| Transportation and Warehousing: 1.13% | | | | | | | | |
| Iron Mountain, Inc. | | | 23,781 | | | | 770,742 | |
| TOTAL REAL ESTATE INVESTMENT TRUSTS (Cost $16,414,307) | | | | | | | 14,394,973 | |
| | | | | | | | | |
| SHORT TERM INVESTMENT: 2.68% | | | | | | | | |
| MONEY MARKET FUND: 2.68% | | | | | | | | |
STIT-Government & Agency Portfolio, Institutional Class, 2.30% (b) | | | 1,829,205 | | | | 1,829,205 | |
| TOTAL MONEY MARKET FUND (Cost $1,829,205) | | | | | | | 1,829,205 | |
| TOTAL SHORT TERM INVESTMENT (Cost $1,829,205) | | | | | | | 1,829,205 | |
| | | | | | | | | |
| TOTAL INVESTMENTS (Cost $74,486,326): 100.28% | | | | | | | 68,514,043 | |
| Liabilities in Excess of Other Assets: (0.28)% | | | | | | | (194,083 | ) |
| TOTAL NET ASSETS: 100.00% | | | | | | $ | 68,319,960 | |
| (a) | Foreign issued security. |
| (b) | The rate quoted is the annualized seven-day effective yield as of December 31,2018. |
The accompanying notes are an integral part of these financial statements.
| | |
| | |
LoCorr Macro Strategies Fund, LoCorr Long/Short Commodities Strategy Fund and LoCorr Market Trend Fund -
Consolidated Statements of Assets & Liabilities | | 51 |
| | |
Consolidated Statements of Assets & Liabilities
December 31, 2018
| | | LoCorr Macro Strategies Fund | | | LoCorr Long/Short Commodities Strategy Fund | | | LoCorr Market Trend Fund | |
| Assets | | | | | | | | | |
| Investments, at value (Cost $512,600,619, $207,609,306 and $303,243,922, respectively) | | $ | 509,944,706 | | | $ | 207,536,668 | | | $ | 302,656,817 | |
| Cash (Note 2) | | | 15,858,788 | | | | — | | | | 19,110,000 | |
| Foreign currency, at value (Cost $6,140,594, $0 and $0, respectively) | | | 6,379,428 | | | | — | | | | — | |
| Receivable for Fund shares sold | | | 5,056,888 | | | | 8,550,654 | | | | 3,644,417 | |
| Receivable for securities sold | | | 5,212,407 | | | | — | | | | 15,621,890 | |
| Interest receivable | | | 2,718,899 | | | | 1,073,769 | | | | 1,020,894 | |
| Receivable for unsettled open futures contracts | | | 1,485,551 | | | | — | | | | 3,047,698 | |
| Deposits with broker for derivative instruments (Note 2) | | | 25,019,912 | | | | 26,547,996 | | | | 25,518,097 | |
| Unrealized appreciation on swap contracts (Note 1) | | | — | | | | 4,363,946 | | | | — | |
| Unrealized appreciation on forward currency contracts (Note 2) | | | 6,883,983 | | | | — | | | | 4,999,703 | |
| Advance receipt on swap contracts | | | — | | | | 10,418,732 | | | | — | |
| Prepaid expenses and other assets | | | 58,640 | | | | 33,423 | | | | 24,884 | |
| Total Assets | | | 578,619,202 | | | | 258,525,188 | | | | 375,644,400 | |
| | | | | | | | | | | | | |
| Liabilities | | | | | | | | | | | | |
| Payable for Fund shares redeemed | | | 13,486,067 | | | | 484,624 | | | | 20,957,423 | |
| Payable for securities purchased | | | — | | | | 461,974 | | | | — | |
| Payable for unsettled open futures contracts | | | 871,832 | | | | — | | | | 2,010,879 | |
| Payable for variation margin on futures contracts | | | 1,072,396 | | | | — | | | | 933,788 | |
| Accrued management fees (Note 5) | | | 845,075 | | | | 264,910 | | | | 540,441 | |
| Accrued Trustees’ fees | | | 12,927 | | | | 4,178 | | | | 10,302 | |
| Accrued Rule 12b-1 fees | | | — | | | | 117,585 | | | | 168,465 | |
| Unrealized depreciation on forward currency contracts (Note 2) | | | 7,811,265 | | | | — | | | | 7,505,927 | |
| Accrued expenses and other liabilities | | | 438,373 | | | | 165,894 | | | | 316,623 | |
| Total Liabilities | | | 24,537,935 | | | | 1,499,165 | | | | 32,443,848 | |
| | | | | | | | | | | | | |
| Net Assets | | $ | 554,081,267 | | | $ | 257,026,023 | | | $ | 343,200,552 | |
| | | | | | | | | | | | | |
| Net Assets Consist of: | | | | | | | | | | | | |
| Paid-in capital | | $ | 591,943,751 | | | $ | 254,920,928 | | | $ | 406,079,348 | |
| Total accumulated earnings/(losses) | | | (37,862,484 | ) | | | 2,105,095 | | | | (62,878,796 | ) |
| NET ASSETS | | $ | 554,081,267 | | | $ | 257,026,023 | | | $ | 343,200,552 | |
| | | | | | | | | | | | | |
| Class A Shares | | | | | | | | | | | | |
| Net assets | | $ | 55,074,895 | | | $ | 68,718,948 | | | $ | 32,081,865 | |
| Shares issued and outstanding (unlimited shares authorized, no par value) | | | 6,926,645 | | | | 6,939,577 | | | | 3,368,248 | |
Net asset value, redemption, and minimum offering price per share (a) | | $ | 7.95 | | | $ | 9.90 | | | $ | 9.52 | |
Maximum offering price per share ($7.95/0.9425), ($9.90/0.9425), ($9.52/0.9425), respectively(b) | | $ | 8.44 | | | $ | 10.50 | | | $ | 10.10 | |
| | | | | | | | | | | | | |
| Class C Shares | | | | | | | | | | | | |
| Net assets | | $ | 53,148,646 | | | $ | 6,502,642 | | | $ | 23,417,282 | |
| Shares issued and outstanding (unlimited shares authorized, no par value) | | | 6,976,532 | | | | 680,762 | | | | 2,523,295 | |
Net asset value, redemption, and offering price per share (a) | | $ | 7.62 | | | $ | 9.55 | | | $ | 9.28 | |
| | | | | | | | | | | | | |
| Class I Shares | | | | | | | | | | | | |
| Net assets | | $ | 445,857,726 | | | $ | 181,804,433 | | | $ | 287,701,405 | |
| Shares issued and outstanding (unlimited shares authorized, no par value) | | | 55,252,737 | | | | 18,127,708 | | | | 29,970,409 | |
| Net asset value, redemption, and offering price per share | | $ | 8.07 | | | $ | 10.03 | | | $ | 9.60 | |
| (a) | A 1.00% contingent deferred sales charge may apply to redemptions made within twelve months of purchase. The contingent deferred sales charge only applies to Class A share purchases of $1 million or more. |
| (b) | On investments of $25,000 or more, the offering price is reduced. |
The accompanying notes are an integral part of these financial statements.
| | |
| | |
52 | | LoCorr Dynamic Equity Fund and LoCorr Spectrum Income Fund - Statements of Assets & Liabilities |
| | |
Statements of Assets & Liabilities
December 31, 2018
| | | LoCorr Dynamic Equity Fund | | | LoCorr Spectrum Income Fund | |
| | | | | | | |
| Assets | | | | | | |
| Investments, at value (Cost $28,324,015 and $74,486,326, respectively) | | $ | 26,519,580 | | | $ | 68,514,043 | |
| Cash (Note 2) | | | 3,500,000 | | | | — | |
| Receivable for Fund shares sold | | | 174,002 | | | | 397,944 | |
| Receivable for securities sold | | | 2,697,919 | | | | — | |
| Dividends, interest and other receivables | | | 32,551 | | | | 378,148 | |
| Deposits with broker for securities sold short (Note 2) | | | 4,007,728 | | | | — | |
| Prepaid expenses and other assets | | | 17,726 | | | | 24,928 | |
| Total Assets | | | 36,949,506 | | | | 69,315,063 | |
| | | | | | | | | |
| Liabilities | | | | | | | | |
| Securities sold short, at value (Proceeds $4,775,390 and $0, respectively) | | $ | 4,686,355 | | | $ | — | |
| Payable for Fund shares redeemed | | | 693,901 | | | | 616,751 | |
| Payable for securities purchased | | | 1,088,070 | | | | — | |
| Payable for distributions | | | 69,231 | | | | 124,970 | |
| Dividend payable | | | 12,589 | | | | — | |
| Accrued management fees (Note 5) | | | 23,398 | | | | 82,223 | |
| Accrued Trustees’ fees | | | 822 | | | | 1,772 | |
| Accrued Rule 12b-1 fees | | | 26,284 | | | | 78,427 | |
| Accrued expenses and other liabilities | | | 75,960 | | | | 90,960 | |
| Total Liabilities | | | 6,676,610 | | | | 995,103 | |
| | | | | | | | | |
| Net Assets | | $ | 30,272,896 | | | $ | 68,319,960 | |
| | | | | | | | | |
| Net Assets Consist of: | | | | | | | | |
| Paid-in capital | | $ | 33,307,967 | | | $ | 101,455,472 | |
| Total accumulated losses | | | (3,035,071 | ) | | | (33,135,512 | ) |
| NET ASSETS | | $ | 30,272,896 | | | $ | 68,319,960 | |
| | | | | | | | | |
| Class A Shares | | | | | | | | |
| Net assets | | $ | 8,473,113 | | | $ | 22,610,129 | |
| Shares issued and outstanding (unlimited shares authorized, no par value) | | | 854,402 | | | | 3,612,915 | |
Net asset value, redemption, and minimum offering price per share (a) | | $ | 9.92 | | | $ | 6.26 | (b) |
Maximum offering price per share ($9.92/0.9425), ($6.26/0.9425), respectively(c) | | $ | 10.53 | | | $ | 6.64 | |
| | | | | | | | | |
| Class C Shares | | | | | | | | |
| Net assets | | $ | 5,254,412 | | | $ | 18,091,542 | |
| Shares issued and outstanding (unlimited shares authorized, no par value) | | | 554,864 | | | | 2,867,151 | |
Net asset value, redemption, and offering price per share (a) | | $ | 9.47 | | | $ | 6.31 | (b)
|
| | | | | | | | | |
| Class I Shares | | | | | | | | |
| Net assets | | $ | 16,545,371 | | | $ | 27,618,289 | |
| Shares issued and outstanding (unlimited shares authorized, no par value) | | | 1,642,376 | | | | 4,420,099 | |
| Net asset value, redemption, and offering price per share | | $ | 10.07 | | | $ | 6.25 | (b) |
| (a) | A 1.00% contingent deferred sales charge may apply to redemptions made within twelve months of purchase. The contingent deferred sales charge only applies to Class A share purchases of $1 million or more. |
| (b) | Redemptions made within 60 days of purchase may be assessed a redemption fee of 2.00%. |
| (c) | On investments of $25,000 or more, the offering price is reduced. |
The accompanying notes are an integral part of these financial statements.
| | |
| | |
LoCorr Macro Strategies Fund, LoCorr Long/Short Commodities Strategy Fund and LoCorr Market Trend Fund -Consolidated Statements of Operations | | 53 |
| | |
Consolidated Statements of Operations
Year Ended December 31, 2018
| | | LoCorr Macro Strategies Fund | | | LoCorr Long/Short Commodities Strategy Fund | | | LoCorr Market Trend Fund | |
| | | | | | | | | | |
| Investment Income | | | | | | | | | |
| Interest income | | $ | 15,620,053 | | | $ | 3,267,448 | | | $ | 10,476,476 | |
| Total Investment Income | | | 15,620,053 | | | | 3,267,448 | | | | 10,476,476 | |
| | | | | | | | | | | | | |
| Expenses | | | | | | | | | | | | |
| Management fees (Note 5) | | | 11,858,033 | | | | 2,056,058 | | | | 9,003,592 | |
| Fund administration fees | | | 252,132 | | | | 77,862 | | | | 221,186 | |
| Fund accounting fees | | | 256,417 | | | | 101,766 | | | | 214,024 | |
| Trustees’ fees | | | 54,194 | | | | 10,979 | | | | 46,979 | |
| Transfer agent fees and expenses | | | 934,530 | | | | 247,224 | | | | 662,141 | |
| Custodian fees | | | 44,927 | | | | 10,383 | | | | 31,777 | |
| Registration expenses | | | 85,360 | | | | 56,348 | | | | 69,482 | |
| Rule 12b-1 fee - Class A (Note 5) | | | 194,673 | | | | 81,915 | | | | 127,761 | |
| Rule 12b-1 fee - Class C (Note 5) | | | 711,447 | | | | 50,993 | | | | 349,262 | |
| Legal and audit fees | | | 71,053 | | | | 36,919 | | | | 61,752 | |
| Printing and mailing expenses | | | 106,427 | | | | 18,845 | | | | 84,776 | |
| Other expenses | | | 27,387 | | | | 6,238 | | | | 24,383 | |
| Total expenses before fee (waiver) / recovery from Adviser | | | 14,596,580 | | | | 2,755,530 | | | | 10,897,115 | |
| Fee (waiver) recovery from Adviser (Note 5) | | | (67,297 | ) | | | 50,253 | | | | — | |
| Net Expenses | | | 14,529,283 | | | | 2,805,783 | | | | 10,897,115 | |
| Net Investment Income (Loss) | | | 1,090,770 | | | | 461,665 | | | | (420,639 | ) |
| | | | | | | | | | | | |
Realized and Unrealized Gain (Loss) on Investments, Swap Contracts, Forward Currency
Contracts, Futures Contracts and Foreign Currency Translation: | | | | | | | | | | | | |
| Net realized gain (loss) on: | | | | | | | | | | | | |
| Investments | | | (5,903,009 | ) | | | (281,876 | ) | | | (4,786,244 | ) |
| Swap contracts | | | — | | | | 5,095,408 | | | | — | |
| Forward currency contracts | | | (10,601,438 | ) | | | — | | | | (19,219,843 | ) |
| Futures contracts | | | (19,762,043 | ) | | | — | | | | (28,102,541 | ) |
| Foreign currency translation | | | (512,031 | ) | | | — | | | | (127,907 | ) |
| Net change in unrealized appreciation (depreciation) on: | | | | | | | | | | | | |
| Investments | | | 776,770 | | | | 238,666 | | | | 3,097,886 | |
| Swap contracts | | | — | | | | 15,883,665 | | | | — | |
| Forward currency contracts | | | 3,810,248 | | | | — | | | | (1,520,169 | ) |
| Futures contracts | | | (11,301,829 | ) | | | — | | | | (33,201,879 | ) |
| Foreign currency translation | | | 302,248 | | | | — | | | | — | |
| Net realized and unrealized gain (loss) | | | (43,191,084 | ) | | | 20,935,863 | | | | (83,860,697 | ) |
| Net Increase (Decrease) in Net Assets Resulting From Operations | | $ | (42,100,314 | ) | | $ | 21,397,528 | | | $ | (84,281,336 | ) |
The accompanying notes are an integral part of these financial statements.
| | |
| | |
54 | | LoCorr Dynamic Equity Fund and LoCorr Spectrum Income Fund - Statements of Operations |
| | |
Statements of Operations
Year Ended December 31, 2018
| | | LoCorr Dynamic Equity Fund | | | LoCorr Spectrum Income Fund | |
| | | | | | | |
| Investment Income | | | | | | |
Dividend and interest income (a) | | $ | 511,888 | | | $ | 4,118,931 | |
| Total Investment Income | | | 511,888 | | | | 4,118,931 | |
| | | | | | | | | |
| Expenses | | | | | | | | |
| Management fees (Note 5) | | | 1,163,284 | | | | 1,071,778 | |
| Fund administration fees | | | 48,496 | | | | 53,371 | |
| Fund accounting fees | | | 39,851 | | | | 43,877 | |
| Trustees’ fees | | | 3,957 | | | | 6,629 | |
| Transfer agent fees and expenses | | | 105,704 | | | | 128,041 | |
| Custodian fees | | | 40,821 | | | | 7,478 | |
| Registration expenses | | | 50,343 | | | | 53,038 | |
| Rule 12b-1 fee-Class A (Note 5) | | | 42,552 | | | | 66,771 | |
| Rule 12b-1 fee - Class C (Note 5) | | | 84,134 | | | | 219,177 | |
| Legal and audit fees | | | 23,854 | | | | 28,310 | |
| Printing and mailing expenses | | | 8,480 | | | | 33,821 | |
| Other expenses | | | 4,082 | | | | 3,939 | |
| Total expense before dividend expense | | | 1,615,558 | | | | 1,716,230 | |
| Dividend expense on securities sold short (Note 2) | | | 101,900 | | | | — | |
| Total expenses before fee waiver | | | 1,717,458 | | | | 1,716,230 | |
| Fee waiver from Adviser (Note 5) | | | (95,089 | ) | | | — | |
| Net Expenses | | | 1,622,369 | | | | 1,716,230 | |
| Net Investment Income (Loss) | | | (1,110,481 | ) | | | 2,402,701 | |
| | | | | | | | | |
| Realized and Unrealized Gain (Loss) on Investments, Securities Sold Short and Foreign Currency Translation: | | | | | |
| Net realized gain (loss) on: | | | | | | | | |
| Investments | | | 2,554,752 | | | | 2,771 | |
| Securities sold short | | | (459,269 | ) | | | — | |
Foreign currency translation | | | (417 | ) | | | — | |
| Net change in unrealized appreciation (depreciation) on: | | | | | | | | |
| Investments | | | (7,174,729 | ) | | | (9,102,504 | ) |
Securities sold short | | | 115,613 | | | | — | |
Foreign currency translation | | | 2,440 | | | | — | |
| Net realized and unrealized gain (loss) | | | (4,961,610 | ) | | | (9,491,620 | ) |
| Net Decrease in Net Assets Resulting From Operations | | $ | (6,072,091 | ) | | $ | (6,697,032 | ) |
(a) Net foreign tax withheld of $1,842 and $0, respectively.
The accompanying notes are an integral part of these financial statements.
| | |
| | |
| LoCorr Macro Strategies Fund - Consolidated Statements of Changes in Net Assets | | 55 |
| | |
LoCorr Macro Strategies Fund
Consolidated Statements of Changes in Net Assets
| | | Year Ended December 31, | |
| | | 2018 | | | 2017 | |
| | | | | | | |
| Operations | | | | | | |
| Net investment income (loss) | | $ | 1,090,770 | | | $ | (5,585,222 | ) |
| Net realized gain (loss) on investments, forward currency contracts, futures contracts and foreign currency translation | | | (36,778,521 | ) | | | 24,376,808 | |
| Net change in unrealized appreciation (depreciation) of investments, forward currency contracts, futures contracts and foreign currency translation | | | (6,412,563 | ) | | | 882,482 | |
| Increase (Decrease) in Net Assets Resulting From Operations | | | (42,100,314 | ) | | | 19,674,068 | |
| | | | | | | | | |
| Distributions From Earnings | | | | | | | | |
| Class A | | | (1,641,026 | ) | | | (5,441,843 | ) |
| Class C | | | (1,111,427 | ) | | | (5,525,753 | ) |
| Class I | | | (14,372,592 | ) | | | (34,409,482 | ) |
Total Distributions From Earnings (a) | | | (17,125,045 | ) | | | (45,377,078 | ) |
| | | | | | | | | |
| Capital Transactions (Note 6) | | | | | | | | |
| Proceeds from shares sold | | | 326,669,713 | | | | 789,578,567 | |
| Reinvestment of distributions | | | 15,654,959 | | | | 40,676,233 | |
| Cost of shares redeemed | | | (518,836,160 | ) | | | (897,405,675 | ) |
| Redemption fees | | | — | | | | 11,727 | |
| Decrease in Net Assets From Capital Transactions | | | (176,511,488 | ) | | | (67,139,148 | ) |
| | | | | | | | | |
| Total Decrease in Net Assets | | | (235,736,847 | ) | | | (92,842,158 | ) |
| | | | | | | | | |
| Net Assets | | | | | | | | |
| Beginning of year | | | 789,818,114 | | | | 882,660,272 | |
End of year(b) | | $ | 554,081,267 | | | $ | 789,818,114 | |
| (a) | Distributions from net investment income and net realized gain are no longer required to be separately disclosed. See Note 2. For the year ended December 31, 2017, total distributions from earnings include distributions from net realized gain of $45,377,078. |
| (b) | Parenthetical disclosure of accumulated net investment income is no longer required. See Note 2. For the year ended December 31, 2017, end of year net assets includes accumulated undistributed net investment income of $0. |
The accompanying notes are an integral part of these consolidated financial statements.
| | |
| | |
56 | | LoCorr Long/Short Commodities Strategy Fund - Consolidated Statements of Changes in Net Assets |
| | |
LoCorr Long/Short Commodities Strategy Fund
Consolidated Statements of Changes in Net Assets
| | | Year Ended December 31, | |
| | | 2018 | | | 2017 | |
| | | | | | | |
| Operations | | | | | | |
| Net investment income (loss) | | $ | 461,665 | | | $ | (321,869 | ) |
| Net realized gain (loss) on investments and swap contracts | | | 4,813,532 | | | | (2,351,285 | ) |
| Net change in unrealized appreciation of investments and swap contracts | | | 16,122,331 | | | | 7,660,187 | |
| Increase in Net Assets Resulting From Operations | | | 21,397,528 | | | | 4,987,033 | |
| | | | | | | | | |
| Distributions From Earnings | | | | | | | | |
| Class A | | | (5,426,159 | ) | | | (5,374 | ) |
| Class C | | | (652,659 | ) | | | (1,284 | ) |
| Class I | | | (17,507,215 | ) | | | (9,886 | ) |
Total Distributions From Earnings (a) | | | (23,586,033 | ) | | | (16,544 | ) |
| | | | | | | | | |
| Capital Transactions (Note 6) | | | | | | | | |
| Proceeds from shares sold | | | 195,310,076 | | | | 38,229,299 | |
| Reinvestment of distributions | | | 18,672,560 | | | | 12,720 | |
| Cost of shares redeemed | | | (38,015,146 | ) | | | (83,412,741 | ) |
| Redemption fees | | | — | | | | (124 | ) |
| Increase (Decrease) in Net Assets From Capital Transactions | | | 175,967,490 | | | | (45,170,846 | ) |
| | | | | | | | | |
| Total Increase (Decrease) in Net Assets | | | 173,778,985 | | | | (40,200,357 | ) |
| | | | | | | | | |
| Net Assets | | | | | | | | |
| Beginning of year | | | 83,247,038 | | | | 123,447,395 | |
End of year (b) | | $ | 257,026,023 | | | $ | 83,247,038 | |
| (a) | Distributions from net investment income and net realized gain are no longer required to be separately disclosed. See Note 2. For the year ended December 31, 2017, total distributions from earnings include distributions from net investment income of $16,544. |
| (b) | Parenthetical disclosure of accumulated net investment income is no longer required. See Note 2. For the year ended December 31, 2017, end of year net assets includes accumulated undistributed net investment income of $0. |
The accompanying notes are an integral part of these consolidated financial statements.
| | |
| | |
| LoCorr Market Trend Fund - Consolidated Statements of Changes in Net Assets | | 57 |
| | |
LoCorr Market Trend Fund
Consolidated Statements of Changes in Net Assets
| | | Year Ended December 31, | |
| | | 2018 | | | 2017 | |
| | | | | | | |
| Operations | | | | | | |
| Net investment loss | | $ | (420,639 | ) | | $ | (6,679,324 | ) |
| Net realized gain (loss) on investments, forward currency contracts, futures contracts and foreign currency translation | | | (52,236,535 | ) | | | 12,670,567 | |
| Net change in unrealized appreciation (depreciation) of investments, forward currency contracts, futures contracts and foreign currency translation | | | (31,624,162 | ) | | | 14,067,086 | |
| Increase (Decrease) in Net Assets Resulting From Operations | | | (84,281,336 | ) | | | 20,058,329 | |
| | | | | | | | | |
| Capital Transactions (Note 6) | | | | | | | | |
| Proceeds from shares sold | | | 283,959,578 | | | | 327,920,811 | |
| Cost of shares redeemed | | | (523,178,776 | ) | | | (701,728,866 | ) |
| Redemption fees | | | — | | | | 5,881 | |
| Decrease in Net Assets From Capital Transactions | | | (239,219,198 | ) | | | (373,802,174 | ) |
| | | | | | | | | |
| Total Decrease in Net Assets | | | (323,500,534 | ) | | | (353,743,845 | ) |
| | | | | | | | | |
| Net Assets | | | | | | | | |
| Beginning of year | | | 666,701,086 | | | | 1,020,444,931 | |
End of year (a) | | $ | 343,200,552 | | | $ | 666,701,086 | |
| (a) | Parenthetical disclosure of accumulated net investment loss is no longer required. See Note 2. For the year ended December 31, 2017, end of year net assets includes accumulated undistributed net investment loss of $368,813. |
The accompanying notes are an integral part of these consolidated financial statements.
| | |
| | |
58 | | LoCorr Dynamic Equity Fund - Statements of Changes in Net Assets |
| | |
LoCorr Dynamic Equity Fund
Statements of Changes in Net Assets
| | | Year Ended December 31, | |
| | | 2018 | | | 2017 | |
| | | | | | | |
| Operations | | | | | | |
| Net investment loss | | $ | (1,110,481 | ) | | $ | (1,961,947 | ) |
| Net realized gain on investments, securities sold short and foreign currency translation | | | 2,095,066 | | | | 5,711,548 | |
| Net change in unrealized depreciation of investments, securities sold short and foreign currency translation | | | (7,056,659 | ) | | | (2,380,922 | ) |
| Increase (Decrease) in Net Assets Resulting From Operations | | | (6,072,091 | ) | | | 1,368,679 | |
| | | | | | | | | |
| Distributions From Earnings | | | | | | | | |
| Class A | | | (323,018 | ) | | | (855,876 | ) |
| Class C | | | (208,891 | ) | | | (492,681 | ) |
| Class I | | | (630,416 | ) | | | (1,391,942 | ) |
Total Distributions From Earnings (a) | | | (1,162,325 | ) | | | (2,740,499 | ) |
| | | | | | | | | |
| Capital Transactions (Note 6) | | | | | | | | |
| Proceeds from shares sold | | | 11,732,272 | | | | 53,756,244 | |
| Reinvestment of distributions | | | 1,093,095 | | | | 2,435,213 | |
| Cost of shares redeemed | | | (39,145,301 | ) | | | (75,271,431 | ) |
| Redemption fees | | | — | | | | 2,283 | |
| Decrease in Net Assets From Capital Transactions | | | (26,319,934 | ) | | | (19,077,691 | ) |
| | | | | | | | | |
| Total Decrease in Net Assets | | | (33,554,350 | ) | | | (20,449,511 | ) |
| | | | | | | | | |
| Net Assets | | | | | | | | |
| Beginning of year | | | 63,827,246 | | | | 84,276,757 | |
End of year (b) | | $ | 30,272,896 | | | $ | 63,827,246 | |
| (a) | Distributions from net investment income and net realized gain are no longer required to be separately disclosed. See Note 2. For the year ended December 31, 2017, total distributions from earnings include distributions from net realized gain of $2,740,499. |
| (b) | Parenthetical disclosure of accumulated net investment income is no longer required. See Note 2. For the year ended December 31, 2017, end of year net assets includes accumulated undistributed net investment income of $10,940. |
The accompanying notes are an integral part of these financial statements.
| | |
| | |
| LoCorr Spectrum Income Fund - Statements of Changes in Net Assets | | 59 |
| | |
LoCorr Spectrum Income Fund
Statements of Changes in Net Assets
| | | Year Ended December 31, | |
| | | 2018 | | | 2017 | |
| | | | | | | |
| Operations | | | | | | |
| Net investment income | | $ | 2,402,701 | | | $ | 2,341,093 | |
| Net realized loss on investments | | | 2,771 | | | | (2,824,448 | ) |
| Net change in unrealized appreciation (depreciation) of investments | | | (9,102,504 | ) | | | 3,795,364 | |
| Increase (Decrease) in Net Assets Resulting From Operations | | | (6,697,032 | ) | | | 3,312,009 | |
| | | | | | | | | |
| Distributions From Earnings | | | | | | | | |
| Net investment income: | | | | | | | | |
| Class A | | | (956,505 | ) | | | (656,776 | ) |
| Class C | | | (681,277 | ) | | | (434,017 | ) |
| Class I | | | (1,262,271 | ) | | | (1,005,045 | ) |
| Return of capital: | | | | | | | | |
| Class A | | | (1,144,116 | ) | | | (1,857,235 | ) |
| Class C | | | (814,904 | ) | | | (1,227,315 | ) |
| Class I | | | (1,509,857 | ) | | | (2,842,070 | ) |
Total Distributions From Earnings (a) | | | (6,368,930 | ) | | | (8,022,458 | ) |
| | | | | | | | | |
| Capital Transactions (Note 6) | | | | | | | | |
| Proceeds from shares sold | | | 24,514,502 | | | | 43,072,561 | |
| Reinvestment of distributions | | | 4,713,777 | | | | 5,356,317 | |
| Cost of shares redeemed | | | (44,379,996 | ) | | | (52,992,147 | ) |
| Redemption fees | | | 25,115 | | | | 17,840 | |
| Decrease in Net Assets From Capital Transactions | | | (15,126,602 | ) | | | (4,545,429 | ) |
| | | | | | | | | |
| Total Decrease in Net Assets | | | (28,192,564 | ) | | | (9,255,878 | ) |
| | | | | | | | | |
| Net Assets | | | | | | | | |
| Beginning of year | | | 96,512,524 | | | | 105,768,402 | |
End of year (b) | | $ | 68,319,960 | | | $ | 96,512,524 | |
| (a) | Distributions from net investment income and net realized gain are no longer required to be separately disclosed. See Note 2. For the year ended December 31, 2017, total distributions from earnings include distributions from net investment income of $2,095,838 and return of capital of $5,926,620. |
| (b) | Parenthetical disclosure of accumulated net investment loss is no longer required. See Note 2. For the year ended December 31, 2017, end of year net assets includes accumulated undistributed net investment loss of $1,339,661. |
The accompanying notes are an integral part of these financial statements.
| | |
| | |
60 | | LoCorr Macro Strategies Fund - Consolidated Financial Highlights - Class A |
| | |
LoCorr Macro Strategies Fund - Class A
Consolidated Financial Highlights
Selected Data and Ratios (for a share outstanding throughout the year)
| | | Year Ended December 31, | |
| | | 2018 | | | 2017 | | | 2016 | | | 2015 | | | 2014 | |
| | | | | | | | | | | | | | | | |
| Per Share | | | | | | | | | | | | | | | |
| Net asset value, beginning of year | | $ | 8.64 | | | $ | 8.91 | | | $ | 8.54 | | | $ | 8.51 | | | $ | 8.28 | |
| | | | | | | | | | | | | | | | | | | | | |
| Income (loss) from investment operations: | | | | | | | | | | | | | | | | | | | | |
Net investment income (loss)(a) | | | 0.00 | (b) | | | (0.06 | ) | | | (0.09 | ) | | | (0.08 | ) | | | (0.08 | ) |
| Net realized and unrealized gain (loss) | | | (0.46 | ) | | | 0.31 | | | | 0.64 | | | | 0.36 | | | | 1.36 | |
| Total from Investment Operations | | | (0.46 | ) | | | 0.25 | | | | 0.55 | | | | 0.28 | | | | 1.28 | |
| | | | | | | | | | | | | | | | | | | | | |
| Distributions From Earnings: | | | | | | | | | | | | | | | | | | | | |
| Net investment income | | | (0.10 | ) | | | — | | | | — | | | | (0.25 | ) | | | (1.04 | ) |
| Net realized gains | | | (0.13 | ) | | | (0.52 | ) | | | (0.18 | ) | | | — | | | | (0.01 | ) |
| Total Distributions | | | (0.23 | ) | | | (0.52 | ) | | | (0.18 | ) | | | (0.25 | ) | | | (1.05 | ) |
| | | | | | | | | | | | | | | | | | | | | |
| Redemption Fees | | | — | | | | 0.00 | (b) | | | 0.00 | (b) | | | 0.00 | (b) | | | 0.00 | (b) |
| | | | | | | | | | | | | | | | | | | | | |
| Net Asset Value, End of Year | | $ | 7.95 | | | $ | 8.64 | | | $ | 8.91 | | | $ | 8.54 | | | $ | 8.51 | |
| | | | | | | | | | | | | | | | | | | | | |
Total Investment Return(c) | | | (5.36 | )% | | | 2.77 | % | | | 6.39 | % | | | 3.27 | % | | | 15.42 | % |
| | | | | | | | | | | | | | | | | | | | | |
| Net Assets, End of Year, in Thousands | | $ | 55,075 | | | $ | 93,182 | | | $ | 297,844 | | | $ | 229,427 | | | $ | 206,931 | |
| | | | | | | | | | | | | | | | | | | | | |
| Ratios/Supplemental Data: | | | | | | | | | | | | | | | | | | | | |
| Ratio of expenses to average net assets: | | | | | | | | | | | | | | | | | | | | |
| Before expense waiver or recovery | | | 2.25 | % | | | 2.33 | % | | | 2.34 | %(d)(e) | | | 2.06 | %(d)(e) | | | 2.11 | %(d) |
| After expense waiver or recovery | | | 2.24 | % | | | 2.28 | % | | | 2.34 | %(d)(e) | | | 2.06 | %(d)(e) | | | 2.11 | %(d) |
| | | | | | | | | | | | | | | | | | | | | |
| | | | | | | | | | | | | | | | | | | | | |
| Ratio of net investment income (loss) to average net assets: | | | | | | | | | | | | | | | | | | | | |
| Before expense waiver or recovery | | | 0.03 | % | | | (0.76 | )% | | | (0.96 | )%(d) | | | (0.90 | )%(d) | | | (0.94 | )%(d) |
| After expense waiver or recovery | | | 0.04 | % | | | (0.71 | )% | | | (0.96 | )%(d) | | | (0.90 | )%(d) | | | (0.94 | )%(d) |
| | | | | | | | | | | | | | | | | | | | | |
Portfolio turnover rate(f) | | | 105 | % | | | 97 | % | | | 62 | % | | | 53 | % | | | 57 | % |
| (a) | Net investment income (loss) per share is based on average shares outstanding. |
| (b) | Amount represents less than $0.005 per share. |
| (c) | Total investment return excludes the effect of applicable sales charges. |
| (d) | Ratios do not include the income and expenses of the CTAs included in the swap. |
| (e) | Includes interest expense of 0.01% and 0.00% for the years ended December 31, 2016 and 2015, respectively. |
| (f) | Portfolio turnover rate is calculated on the basis of the Fund as a whole without distinguishing between classes of shares issued. Consists of long-term investments only; excludes derivative instruments. |
The accompanying notes are an integral part of these consolidated financial statements.
| | |
| | |
| LoCorr Macro Strategies Fund - Consolidated Financial Highlights - Class C | | 61 |
| | |
LoCorr Macro Strategies Fund - Class C
Consolidated Financial Highlights
Selected Data and Ratios (for a share outstanding throughout the year)
| | | Year Ended December 31, | |
| | | 2018 | | | 2017 | | | 2016 | | | 2015 | | | 2014 | |
| | | | | | | | | | | | | | | | |
| Per Share | | | | | | | | | | | | | | | |
| Net asset value, beginning of year | | $ | 8.27 | | | $ | 8.62 | | | $ | 8.32 | | | $ | 8.30 | | | $ | 8.12 | |
| | | | | | | | | | | | | | | | | | | | | |
| Income (loss) from investment operations: | | | | | | | | | | | | | | | | | | | | |
Net investment income (loss)(a) | | | (0.06 | ) | | | (0.13 | ) | | | (0.15 | ) | | | (0.14 | ) | | | (0.15 | ) |
| Net realized and unrealized gain (loss) | | | (0.43 | ) | | | 0.30 | | | | 0.63 | | | | 0.35 | | | | 1.33 | |
| Total from Investment Operations | | | (0.49 | ) | | | 0.17 | | | | 0.48 | | | | 0.21 | | | | 1.18 | |
| | | | | | | | | | | | | | | | | | | | | |
| Distributions From Earnings: | | | | | | | | | | | | | | | | | | | | |
| Net investment income | | | (0.03 | ) | | | — | | | | — | | | | (0.19 | ) | | | (0.99 | ) |
| Net realized gains | | | (0.13 | ) | | | (0.52 | ) | | | (0.18 | ) | | | — | | | | (0.01 | ) |
| Total Distributions | | | (0.16 | ) | | | (0.52 | ) | | | (0.18 | ) | | | (0.19 | ) | | | (1.00 | ) |
| | | | | | | | | | | | | | | | | | | | | |
| Redemption Fees | | | — | | | | 0.00 | (b) | | | 0.00 | (b) | | | 0.00 | (b) | | | 0.00 | (b) |
| | | | | | | | | | | | | | | | | | | | | |
| Net Asset Value, End of Year | | $ | 7.62 | | | $ | 8.27 | | | $ | 8.62 | | | $ | 8.32 | | | $ | 8.30 | |
| | | | | | | | | | | | | | | | | | | | | |
Total Investment Return(c) | | | (5.98 | )% | | | 1.93 | % | | | 5.72 | % | | | 2.51 | % | | | 14.39 | % |
| | | | | | | | | | | | | | | | | | | | | |
| Net Assets, End of Year, in Thousands | | $ | 53,148 | | | $ | 90,653 | | | $ | 113,814 | | | $ | 98,729 | | | $ | 93,924 | |
| | | | | | | | | | | | | | | | | | | | | |
| Ratios/Supplemental Data: | | | | | | | | | | | | | | | | | | | | |
| Ratio of expenses to average net assets: | | | | | | | | | | | | | | | | | | | | |
| Before expense waiver or recovery | | | 3.00 | % | | | 3.08 | % | | | 3.09 | %(d)(e) | | | 2.81 | %(d)(e) | | | 2.86 | %(d) |
| After expense waiver or recovery | | | 2.99 | % | | | 3.03 | % | | | 3.09 | %(d)(e) | | | 2.81 | %(d)(e) | | | 2.86 | %(d) |
| | | | | | | | | | | | | | | | | | | | | |
| | | | | | | | | | | | | | | | | | | | | |
| Ratio of net investment income (loss) to average net assets: | | | | | | | | | | | | | | | | | | | | |
| Before expense waiver or recovery | | | (0.72 | )% | | | (1.51 | )% | | | (1.71 | )%(d) | | | (1.65 | )%(d) | | | (1.69 | )%(d) |
| After expense waiver or recovery | | | (0.71 | )% | | | (1.46 | )% | | | (1.71 | )%(d) | | | (1.65 | )%(d) | | | (1.69 | )%(d) |
| | | | | | | | | | | | | | | | | | | | | |
Portfolio turnover rate(f) | | | 105 | % | | | 97 | % | | | 62 | % | | | 53 | % | | | 57 | % |
| (a) | Net investment income (loss) per share is based on average shares outstanding. |
| (b) | Amount represents less than $0.005 per share. |
| (c) | Total investment return excludes the effect of applicable sales charges. |
| (d) | Ratios do not include the income and expenses of the CTAs included in the swap. |
| (e) | Includes interest expense of 0.01% and 0.00% for the years ended December 31, 2016 and 2015, respectively. |
| (f) | Portfolio turnover rate is calculated on the basis of the Fund as a whole without distinguishing between classes of shares issued. Consists of long-term investments only; excludes derivative instruments. |
The accompanying notes are an integral part of these consolidated financial statements.
| | |
| | |
62 | | LoCorr Macro Strategies Fund - Consolidated Financial Highlights - Class I |
| | |
LoCorr Macro Strategies Fund - Class I
Consolidated Financial Highlights
Selected Data and Ratios (for a share outstanding throughout the year)
| | | Year Ended December 31, | |
| | | 2018 | | | 2017 | | | 2016 | | | 2015 | | | 2014 | |
| | | | | | | | | | | | | | | | |
| Per Share | | | | | | | | | | | | | | | |
| Net asset value, beginning of year | | $ | 8.77 | | | $ | 9.01 | | | $ | 8.62 | | | $ | 8.57 | | | $ | 8.34 | |
| | | | | | | | | | | | | | | | | | | | | |
| Income (loss) from investment operations: | | | | | | | | | | | | | | | | | | | | |
Net investment income (loss)(a) | | | 0.02 | | | | (0.04 | ) | | | (0.07 | ) | | | (0.06 | ) | | | (0.06 | ) |
| Net realized and unrealized gain (loss) | | | (0.47 | ) | | | 0.32 | | | | 0.64 | | | | 0.38 | | | | 1.36 | |
| Total from Investment Operations | | | (0.45 | ) | | | 0.28 | | | | 0.57 | | | | 0.32 | | | | 1.30 | |
| | | | | | | | | | | | | | | | | | | | | |
| Distributions From Earnings: | | | | | | | | | | | | | | | | | | | | |
| Net investment income | | | (0.12 | ) | | | — | | | | (0.00 | )(b) | | | (0.27 | ) | | | (1.06 | ) |
| Net realized gains | | | (0.13 | ) | | | (0.52 | ) | | | (0.18 | ) | | | — | | | | (0.01 | ) |
| Total Distributions | | | (0.25 | ) | | | (0.52 | ) | | | (0.18 | ) | | | (0.27 | ) | | | (1.07 | ) |
| | | | | | | | | | | | | | | | | | | | | |
| Redemption Fees | | | — | | | | 0.00 | (b) | | | 0.00 | (b) | | | 0.00 | (b) | | | 0.00 | (b) |
| | | | | | | | | | | | | | | | | | | | | |
| Net Asset Value, End of Year | | $ | 8.07 | | | $ | 8.77 | | | $ | 9.01 | | | $ | 8.62 | | | $ | 8.57 | |
| | | | | | | | | | | | | | | | | | | | | |
| Total Investment Return | | | (5.08 | )% | | | 3.07 | % | | | 6.57 | % | | | 3.72 | % | | | 15.56 | % |
| | | | | | | | | | | | | | | | | | | | | |
| Net Assets, End of Year, in Thousands | | $ | 445,858 | | | $ | 605,983 | | | $ | 471,002 | | | $ | 192,309 | | | $ | 190,052 | |
| | | | | | | | | | | | | | | | | | | | | |
| Ratios/Supplemental Data: | | | | | | | | | | | | | | | | | | | | |
| Ratio of expenses to average net assets: | | | | | | | | | | | | | | | | | | | | |
| Before expense waiver or recovery | | | 2.00 | % | | | 2.08 | % | | | 2.09 | %(c)(d) | | | 1.81 | %(c)(d) | | | 1.86 | %(c) |
| After expense waiver or recovery | | | 1.99 | % | | | 2.03 | % | | | 2.09 | %(c)(d) | | | 1.81 | %(c)(d) | | | 1.86 | %(c) |
| | | | | | | | | | | | | | | | | | | | | |
| | | | | | | | | | | | | | | | | | | | | |
| Ratio of net investment income (loss) to average net assets: | | | | | | | | | | | | | | | | | | | | |
| Before expense waiver or recovery | | | 0.28 | % | | | (0.51 | )% | | | (0.71 | )%(c) | | | (0.65 | )%(c) | | | (0.69 | )%(c) |
| After expense waiver or recovery | | | 0.29 | % | | | (0.46 | )% | | | (0.71 | )%(c) | | | (0.65 | )%(c) | | | (0.69 | )%(c) |
| | | | | | | | | | | | | | | | | | | | | |
Portfolio turnover rate(e) | | | 105 | % | | | 97 | % | | | 62 | % | | | 53 | % | | | 57 | % |
| (a) | Net investment income (loss) per share is based on average shares outstanding. |
| (b) | Amount represents less than $0.005 per share. |
| (c) | Ratios do not include the income and expenses of the CTAs included in the swap. |
| (d) | Includes interest expense of 0.01% and 0.00% for the years ended December 31, 2016 and 2015, respectively. |
| (e) | Portfolio turnover rate is calculated on the basis of the Fund as a whole without distinguishing between classes of shares issued. Consists of long-term investments only; excludes derivative instruments. |
The accompanying notes are an integral part of these consolidated financial statements.
| | |
| | |
| LoCorr Long/Short Commodities Strategy Fund - Consolidated Financial Highlights - Class A | | 63 |
| | |
LoCorr Long/Short Commodities Strategy Fund - Class A
Consolidated Financial Highlights
Selected Data and Ratios (for a share outstanding throughout the year)
| | | Year Ended December 31, | |
| | | 2018 | | | 2017 | | | 2016 | | | 2015 | | | 2014 | |
| | | | | | | | | | | | | | | | |
| Per Share | | | | | | | | | | | | | | | |
| Net asset value, beginning of year | | $ | 9.71 | | | $ | 9.17 | | | $ | 9.72 | | | $ | 8.54 | | | $ | 7.67 | |
| | | | | | | | | | | | | | | | | | | | | |
| Income (loss) from investment operations: | | | | | | | | | | | | | | | | | | | | |
Net investment income (loss)(a) | | | 0.02 | | | | (0.04 | ) | | | (0.10 | ) | | | (0.13 | ) | | | (0.14 | ) |
| Net realized and unrealized gain (loss) | | | 1.39 | | | | 0.58 | | | | (0.18 | ) | | | 2.02 | | | | 1.85 | |
| Total from Investment Operations | | | 1.41 | | | | 0.54 | | | | (0.28 | ) | | | 1.89 | | | | 1.71 | |
| | | | | | | | | | | | | | | | | | | | | |
| Distributions From Earnings: | | | | | | | | | | | | | | | | | | | | |
| Net investment income | | | (1.22 | ) | | | 0.00 | (b) | | | (0.27 | ) | | | (0.71 | ) | | | (0.84 | ) |
| Total Distributions | | | (1.22 | ) | | | 0.00 | | | | (0.27 | ) | | | (0.71 | ) | | | (0.84 | ) |
| | | | | | | | | | | | | | | | | | | | | |
| Redemption Fees | | | — | | | | 0.00 | (b) | | | 0.00 | (b) | | | 0.00 | (b) | | | 0.00 | (b) |
| | | | | | | | | | | | | | | | | | | | | |
| Net Asset Value, End of Year | | $ | 9.90 | | | $ | 9.71 | | | $ | 9.17 | | | $ | 9.72 | | | $ | 8.54 | |
| | | | | | | | | | | | | | | | | | | | | |
Total Investment Return(c) | | | 15.05 | % | | | 5.91 | % | | | (2.98 | )% | | | 22.34 | % | | | 22.07 | % |
| | | | | | | | | | | | | | | | | | | | | |
| Net Assets, End of Year, in Thousands | | $ | 68,719 | | | $ | 25,575 | | | $ | 34,860 | | | $ | 24,425 | | | $ | 43,345 | |
| | | | | | | | | | | | | | | | | | | | | |
Ratio/Supplemental Data:(d) | | | | | | | | | | | | | | | | | | | | |
| Ratio of expenses to average net assets: | | | | | | | | | | | | | | | | | | | | |
| Before expense waiver or recovery | | | 2.16 | % | | | 2.28 | % | | | 2.22 | %(e) | | | 2.59 | %(e) | | | 3.01 | %(e) |
| After expense waiver or recovery | | | 2.20 | % | | | 2.20 | % | | | 2.20 | %(e) | | | 2.20 | %(e) | | | 2.20 | %(e) |
| | | | | | | | | | | | | | | | | | | | | |
| | | | | | | | | | | | | | | | | | | | | |
| Ratio of net investment income (loss) to average net assets: | | | | | | | | | | | | | | | | | | | | |
| Before expense waiver or recovery | | | 0.22 | % | | | (0.52 | )% | | | (0.99 | )% | | | (1.79 | )% | | | (2.39 | )% |
| After expense waiver or recovery | | | 0.18 | % | | | (0.44 | )% | | | (0.97 | )% | | | (1.40 | )% | | | (1.58 | )% |
| | | | | | | | | | | | | | | | | | | | | |
Portfolio turnover rate(f) | | | 92 | % | | | 74 | % | | | 105 | % | | | 164 | % | | | 55 | % |
| (a) | Net investment income (loss) per share is based on average shares outstanding. |
| (b) | Amount represents less than $0.005 per share. |
| (c) | Total investment return excludes the effect of applicable sales charges. |
| (d) | Ratios do not include the income and expenses of the CTAs included in the swap. |
| (e) | Includes interest expense on line of credit of 0.00%, 0.00% and 0.00% for the years ended December 31, 2016, 2015 and 2014, respectively. |
| (f) | Portfolio turnover rate is calculated on the basis of the Fund as a whole without distinguishing between classes of shares issued. Consists of long-term investments only; excludes derivative instruments. |
The accompanying notes are an integral part of these consolidated financial statements.
| | |
| | |
64 | | LoCorr Long/Short Commodities Strategy Fund - Consolidated Financial Highlights - Class C |
| | |
LoCorr Long/Short Commodities Strategy Fund - Class C
Consolidated Financial Highlights
Selected Data and Ratios (for a share outstanding throughout the year)
| | | Year Ended December 31, | |
| | | 2018 | | | 2017 | | | 2016 | | | 2015 | | | 2014 | |
| | | | | | | | | | | | | | | | |
| Per Share | | | | | | | | | | | | | | | |
| Net asset value, beginning of year | | $ | 9.41 | | | $ | 8.95 | | | $ | 9.51 | | | $ | 8.36 | | | $ | 7.54 | |
| | | | | | | | | | | | | | | | | | | | | |
| Income (loss) from investment operations: | | | | | | | | | | | | | | | | | | | | |
Net investment income (loss)(a) | | | (0.06 | ) | | | (0.11 | ) | | | (0.17 | ) | | | (0.19 | ) | | | (0.20 | ) |
| Net realized and unrealized gain (loss) | | | 1.35 | | | | 0.57 | | | | (0.18 | ) | | | 1.96 | | | | 1.80 | |
| Total from Investment Operations | | | 1.29 | | | | 0.46 | | | | (0.35 | ) | | | 1.77 | | | | 1.60 | |
| | | | | | | | | | | | | | | | | | | | | |
| Distributions From Earnings: | | | | | | | | | | | | | | | | | | | | |
| Net investment income | | | (1.15 | ) | | | 0.00 | (b) | | | (0.21 | ) | | | (0.62 | ) | | | (0.78 | ) |
| Total Distributions | | | (1.15 | ) | | | 0.00 | | | | (0.21 | ) | | | (0.62 | ) | | | (0.78 | ) |
| | | | | | | | | | | | | | | | | | | | | |
| Redemption Fees | | | — | | | | 0.00 | (b) | | | 0.00 | (b) | | | — | | | | — | |
| | | | | | | | | | | | | | | | | | | | | |
| Net Asset Value, End of Year | | $ | 9.55 | | | $ | 9.41 | | | $ | 8.95 | | | $ | 9.51 | | | $ | 8.36 | |
| | | | | | | | | | | | | | | | | | | | | |
Total Investment Return(c) | | | 14.20 | % | | | 5.17 | % | | | (3.72 | )% | | | 21.39 | % | | | 21.01 | % |
| | | | | | | | | | | | | | | | | | | | | |
| Net Assets, End of Year, in Thousands | | $ | 6,503 | | | $ | 4,737 | | | $ | 7,383 | | | $ | 4,330 | | | $ | 2,983 | |
| | | | | | | | | | | | | | | | | | | | | |
Ratio/Supplemental Data:(d) | | | | | | | | | | | | | | | | | | | | |
| Ratio of expenses to average net assets: | | | | | | | | | | | | | | | | | | | | |
| Before expense waiver or recovery | | | 2.91 | % | | | 3.03 | % | | | 2.97 | %(e) | | | 3.34 | %(e) | | | 3.76 | %(e) |
| After expense waiver or recovery | | | 2.95 | % | | | 2.95 | % | | | 2.95 | %(e) | | | 2.95 | %(e) | | | 2.95 | %(e) |
| | | | | | | | | | | | | | | | | | | | | |
| | | | | | | | | | | | | | | | | | | | | |
| Ratio of net investment income (loss) to average net assets: | | | | | | | | | | | | | | | | | | | | |
| Before expense waiver or recovery | | | (0.53 | )% | | | (1.27 | )% | | | (1.74 | )% | | | (2.54 | )% | | | (3.14 | )% |
| After expense waiver or recovery | | | (0.57 | )% | | | (1.19 | )% | | | (1.72 | )% | | | (2.15 | )% | | | (2.33 | )% |
| | | | | | | | | | | | | | | | | | | | | |
Portfolio turnover rate(f) | | | 92 | % | | | 74 | % | | | 105 | % | | | 164 | % | | | 55 | % |
| (a) | Net investment income (loss) per share is based on average shares outstanding. |
| (b) | Amount represents less than $0.005 per share. |
| (c) | Total investment return excludes the effect of applicable sales charges. |
| (d) | Ratios do not include the income and expenses of the CTAs included in the swap. |
| (e) | Includes interest expense on line of credit of 0.00%, 0.00% and 0.00% for the years ended December 31, 2016, 2015 and 2014, respectively. |
| (f) | Portfolio turnover rate is calculated on the basis of the Fund as a whole without distinguishing between classes of shares issued. Consists of long-term investments only; excludes derivative instruments. |
The accompanying notes are an integral part of these consolidated financial statements.
| | |
| | |
| LoCorr Long/Short Commodities Strategy Fund - Consolidated Financial Highlights - Class | | 65 |
| | |
LoCorr Long/Short Commodities Strategy Fund - Class I
Consolidated Financial Highlights
Selected Data and Ratios (for a share outstanding throughout the year)
| | | Year Ended December 31, | |
| | | 2018 | | | 2017
| | | 2016 | | | 2015 | | | 2014 | |
| | | | | | | | | | | | | | | | |
| Per Share | | | | | | | | | | | | | | | |
| Net asset value, beginning of year | | $ | 9.81 | | | $ | 9.24 | | | $ | 9.79 | | | $ | 8.59 | | | $ | 7.70 | |
| | | | | | | | | | | | | | | | | | | | | |
| Income (loss) from investment operations: | | | | | | | | | | | | | | | | | | | | |
Net investment income (loss)(a) | | | 0.05 | | | | (0.02 | ) | | | (0.07 | ) | | | (0.11 | ) | | | (0.12 | ) |
| Net realized and unrealized gain (loss) | | | 1.41 | | | | 0.59 | | | | (0.18 | ) | | | 2.03 | | | | 1.86 | ) |
| Total from Investment Operations | | | 1.46 | | | | 0.57 | | | | (0.25) |
| | | 1.92 | | | | 1.74 | |
| | | | | | | | | | | | | | | | | | | | | |
| Distributions From Earnings: | | | | | | | | | | | | | | | | | | | | |
| Net investment income | | | (1.24 | ) | | | 0.00 | (b) | | | (0.30 | ) | | | (0.72 | ) | | | (0.85 | ) |
| Total Distributions | | | (1.24 | ) | | | 0.00 | | | | (0.30 | ) | | | (0.72 | ) | | | (0.85 | ) |
| | | | | | | | | | | | | | | | | | | | | |
| Redemption Fees | | | — | | | | 0.00 | (b)
| | | 0.00 | (b) | | | 0.00 | (b) | | | 0.00 | (b) |
| | | | | | | | | | | | | | | | | | | | | |
| Net Asset Value, End of Year | | $ | 10.03 | | | $ | 9.81 | | | $ | 9.24 | | | $ | 9.79 | | | $ | 8.59 | |
| | | | | | | | | | | | | | | | | | | | | |
| Total Investment Return | | | 15.40 | % | | | 6.19 | % | | | (2.67 | )% | | | 22.61 | % | | | 22.36 | % |
| | | | | | | | | | | | | | | | | | | | | |
| Net Assets, End of Year, in Thousands | | $ | 181,804 | | | $ | 52,935 | | | $ | 81,204 | | | $ | 31,166 | | | $ | 12,825 | |
| | | | | | | | | | | | | | | | | | | | | |
Ratio/Supplemental Data:(c) | | | | | | | | | | | | | | | | | | | | |
| Ratio of expenses to average net assets: | | | | | | | | | | | | | | | | | | | | |
| Before expense waiver or recovery | | | 1.91 | % | | | 2.03 | % | | | 1.97 | %(d) | | | 2.34 | %(d) | | | 2.76 | %(d) |
| After expense waiver or recovery | | | 1.95 | % | | | 1.95 | % | | | 1.95 | %(d) | | | 1.95 | %(d) | | | 1.95 | %(d) |
| | | | | | | | | | | | | | | | | | | | | |
| Ratio of net investment income (loss) to average net assets: | | | | | | | | | | | | | | | | | | | | |
| Before expense waiver or recovery | | | 0.47 | % | | | (0.27 | )% | | | (0.74 | )% | | | (1.54 | )% | | | (2.14 | )% |
| After expense waiver or recovery | | | 0.43 | % | | | (0.19 | )% | | | (0.72 | )% | | | (1.15 | )% | | | (1.33 | )% |
| | | | | | | | | | | | | | | | | | | | | |
Portfolio turnover rate(e) | | | 92 | % | | | 74 | % | | | 105 | % | | | 164 | % | | | 55 | % |
| (a) | Net investment income (loss) per share is based on average shares outstanding. |
| (b) | Amount represents less than $0.005 per share. |
| (c) | Ratios do not include the income and expenses of the CTAs included in the swap. |
| (d) | Includes interest expense on line of credit of 0.00%, 0.00% and 0.00% for the years ended December 31, 2016, 2015 and 2014, respectively. |
| (e) | Portfolio turnover rate is calculated on the basis of the Fund as a whole without distinguishing between classes of shares issued. Consists of long-term investments only; excludes derivative instruments. |
The accompanying notes are an integral part of these consolidated financial statements.
| | |
| | |
66 | | LoCorr Market Trend Fund - Consolidated Financial Highlights - Class A
|
| | |
LoCorr Market Trend Fund - Class A
Consolidated Financial Highlights
Selected Data and Ratios (for a share outstanding throughout the period)
| |
Year Ended December 31,
| | Period from July 1, 2014
(commencement of operations) through
December 31, 2014* | |
| | | 2018
| | | 2017
| | | 2016
| | | 2015
| | | |
| | | | | | | | | | | | | | | | |
| Per Share | | | | | | | | | | | | | | | |
| Net asset value, beginning of period | | $ | 11.03 | | | $ | 10.65 | | | $ | 12.00 | | | $ | 11.44 | | | $ | 10.00 | |
| | | | | | | | | | | | | | | | | | | | | |
| Income (loss) from investment operations: | | | | | | | | | | | | | | | | | | | | |
Net investment income (loss)(a) | | | (0.03 | ) | | | (0.10 | ) | | | (0.15 | ) | | | (0.19 | ) | | | (0.12 | ) |
| Net realized and unrealized gain (loss) | | | (1.48 | ) | | | 0.48 | | | | (1.01 | ) | | | 0.84 | (b) | | | 1.99 | |
| Total from Investment Operations | | | (1.51 | ) | | | 0.38 | | | | (1.16 | ) | | | 0.65 | | | | 1.87 | |
| | | | | | | | | | | | | | | | | | | | | |
| Distributions From Earnings: | | | | | | | | | | | | | | | | | | | | |
| Net investment income | | | —
| | | | — | | | | (0.19 | ) | | | (0.07 | ) | | | (0.25 | ) |
| Net realized gains | | | — | | | | — | | | | — | | | | (0.02 | ) | | | (0.18 | ) |
| Total Distributions | | | — | | | | — | | | | (0.19 | ) | | | (0.09 | ) | | | (0.43 | ) |
| | | | | | | | | | | | | | | | | | | | | |
| Redemption Fees | | | — | | | | 0.00 | (c) | | | 0.00 | (c) | | | 0.00 | (c) | | | 0.00 | (c) |
| | | | | | | | | | | | | | | | | | | | | |
| Net Asset Value, End of Period | | $ | 9.52 | | | $ | 11.03 | | | $ | 10.65 | | | $ | 12.00 | | | $ | 11.44 | |
| | | | | | | | | | | | | | | | | | | | | |
Total Investment Return(d) | | | (13.69 | )% | | | 3.57 | % | | | (9.71 | )% | | | 5.68 | % | | | 18.74 | % |
| | | | | | | | | | | | | | | | | | | | | |
| Net Assets, End of Period, in Thousands | | $ | 32,082 | | | $ | 61,557 | | | $ | 133,146 | | | $ | 110,324 | | | $ | 13,337 | |
| | | | | | | | | | | | | | | | | | | | | |
| Ratio/Supplemental Data: | | | | | | | | | | | | | | | | | | | | |
| Ratio of expenses to average net assets: | | | | | | | | | | | | | | | | | | | | |
| Before expense waiver or recovery | | | 1.99 | % | | | 2.00 | % | | | 2.02 | %(e) | | | 2.03 | % | | | 3.64 | % |
| After expense waiver or recovery | | | 1.99 | % | | | 2.00 | % | | | 2.02 | %(e) | | | 2.06 | % | | | 2.20 | % |
| | | | | | | | | | | | | | | | | | | | | |
| Ratio of net investment income (loss) to average net assets: | | | | | | | | | | | | | | | | | | | | |
| Before expense waiver or recovery | | | (0.24 | )% | | | (0.97 | )% | | | (1.24 | )% | | | (1.49 | )% | | | (3.48 | )% |
| After expense waiver or recovery | | | (0.24 | )% | | | (0.97 | )% | | | (1.24 | )% | | | (1.52 | )% | | | (2.04 | )% |
| | | | | | | | | | | | | | | | | | | | | |
Portfolio turnover rate(f) | | | 91 | % | | | 85 | % | | | 83 | % | | | 27 | % | | | 6 | % |
* All ratios have been annualized except total investment return and portfolio turnover.
| (a) | Net investment income (loss) per share is based on average shares outstanding. |
| (b) | Realized and unrealized gains and losses per share in this caption are balancing amounts necessary to reconcile the change in net asset value per share for the period, and may not reconcile with the Fund’s consolidated statement of operations due to share transactions for the period. |
| (c) | Amount represents less than $0.005 per share. |
| (d) | Total investment return excludes the effect of applicable sales charges. |
| (e) | Includes 0.00% of interest expense for the year ended December 31, 2016. |
| (f) | Portfolio turnover rate is calculated on the basis of the Fund as a whole without distinguishing between classes of shares issued. Consists of long-term investments only; excludes derivative instruments. |
The accompanying notes are an integral part of these consolidated financial statements.
| | |
| | |
LoCorr Market Trend Fund - Consolidated Financial Highlights - Class C
| | 67 |
| | |
LoCorr Market Trend Fund - Class CConsolidated Financial Highlights
Selected Data and Ratios (for a share outstanding throughout the period)
| | |
Year Ended December 31,
| | Period from July 1, 2014 (commencement of operations) through December 31, 2014* | |
| | | 2018
| | | 2017 | | | 2016
| | | 2015
| | | |
| | | | | | | | | | | | | | | | |
| Per Share | | | | | | | | | | | | | | | |
| Net asset value, beginning of period | | $ | 10.83 | | | $ | 10.53 | | | $ | 11.92 | | | $ | 11.41 | | | $ | 10.00 | |
| | | | | | | | | | | | | | | | | | | | | |
| Income (loss) from investment operations: | | | | | | | | | | | | | | | | | | | | |
Net investment income (loss)(a) | | | (0.10 | ) | | | (0.18 | ) | | | (0.23 | ) | | | (0.28 | ) | | | (0.16 | ) |
| Net realized and unrealized gain (loss) | | | (1.45 | ) | | | 0.48 | | | | (1.01 | ) | | | 0.84 | (b) | | | 1.99 | |
| Total from Investment Operations | | | (1.55 | ) | | | 0.30 | | | | (1.24 | ) | | | 0.56 | | | | 1.83 | |
| | | | | | | | | | | | | | | | | | | | | |
| Distributions From Earnings: | | | | | | | | | | | | | | | | | | | | |
| Net investment income | | | — | | | | — | | | | (0.15 | ) | | | (0.03 | ) | | | (0.24 | ) |
| Net realized gains | | | — | | | | — | | | | — | | | | (0.02 | ) | | | (0.18 | ) |
| Total Distributions | | | — | | | | — | | | | (0.15 | ) | | | (0.05 | ) | | | (0.42 | ) |
| | | | | | | | | | | | | | | | | | | | | |
| Redemption Fees | | | — | | | | 0.00 | (c) | | | 0.00 | (c) | | | 0.00 | (c) | | | 0.00 | (c) |
| | | | | | | | | | | | | | | | | | | | | |
| Net Asset Value, End of Period | | $ | 9.28 | | | $ | 10.83 | | | $ | 10.53 | | | $ | 11.92 | | | $ | 11.41 | |
| | | | | | | | | | | | | | | | | | | | | |
Total Investment Return(d) | | | (14.31 | )% | | | 2.85 | % | | | (10.45 | )% | | | 4.90 | % | | | 18.29 | % |
| | | | | | | | | | | | | | | | | | | | | |
| Net Assets, End of Period, in Thousands | | $ | 23,417 | | | $ | 43,772 | | | $ | 89,454 | | | $ | 94,707 | | | $ | 6,949 | |
| | | | | | | | | | | | | | | | | | | | | |
| Ratio/Supplemental Data: | | | | | | | | | | | | | | | | | | | | |
| Ratio of expenses to average net assets: | | | | | | | | | | | | | | | | | | | | |
| Before expense waiver or recovery | | | 2.74 | % | | | 2.75 | % | | | 2.77 | %(e) | | | 2.78 | % | | | 4.39 | % |
| After expense waiver or recovery | | | 2.74 | % | | | 2.75 | % | | | 2.77 | %(e) | | | 2.81 | % | | | 2.95 | % |
| | | | | | | | | | | | | | | | | | | | | |
| Ratio of net investment income (loss) to average net assets: | | | | | | | | | | | | | | | | | | | | |
| Before expense waiver or recovery | | | (0.99 | )% | | | (1.72 | )% | | | (1.99 | )% | | | (2.24 | )% | | | (4.23 | )% |
| After expense waiver or recovery | | | (0.99 | )% | | | (1.72 | )% | | | (1.99 | )% | | | (2.27 | )% | | | (2.79 | )% |
| | | | | | | | | | | | | | | | | | | | | |
Portfolio turnover rate(f) | | | 91 | % | | | 85 | % | | | 83 | % | | | 27 | % | | | 6 | % |
* All ratios have been annualized except total investment return and portfolio turnover.
| (a) | Net investment income (loss) per share is based on average shares outstanding. |
| (b) | Realized and unrealized gains and losses per share in this caption are balancing amounts necessary to reconcile the change in net asset value per share for the period, and may not reconcile with the Fund’s consolidated statement of operations due to share transactions for the period. |
| (c) | Amount represents less than $0.005 per share. |
| (d) | Total investment return excludes the effect of applicable sales charges. |
| (e) | Includes 0.00% of interest expense for the year ended December 31, 2016. |
| (f) | Portfolio turnover rate is calculated on the basis of the Fund as a whole without distinguishing between classes of shares issued. Consists of long-term investments only; excludes derivative instruments. |
The accompanying notes are an integral part of these consolidated financial statements.
| | |
| | |
68 | | LoCorr Market Trend Fund - Consolidated Financial Highlights - Class I |
| | |
LoCorr Market Trend Fund - Class I
Consolidated Financial Highlights
Selected Data and Ratios (for a share outstanding throughout the period)
| | | | | | Period from July 1, 2014 (commencement of operations) through
December 31, 2014* | |
| | Year Ended December 31, | | | |
| | | 2018 | | | 2017 | | | 2016 | | | 2015 | | | |
| | | | | | | | | | | | | | | | |
| Per Share | | | | | | | | | | | | | | | |
| Net asset value, beginning of period | | $ | 11.09 | | | $ | 10.68 | | | $ | 12.02 | | | $ | 11.45 | | | $ | 10.00 | |
| | | | | | | | | | | | | | | | | | | | | |
| Income (loss) from investment operations: | | | | | | | | | | | | | | | | | | | | |
Net investment income (loss)(a) | | | 0.00 | (c) | | | (0.08 | ) | | | (0.12 | ) | | | (0.16 | ) | | | (0.10 | ) |
| Net realized and unrealized gain (loss) | | | (1.49 | ) | | | 0.49 | | | | (1.02 | ) | | | 0.84 | (b) | | | 1.99 | |
| Total from Investment Operations | | | (1.49 | ) | | | 0.41 | | | | (1.14 | ) | | | 0.68 | | | | 1.89 | |
| | | | | | | | | | | | | | | | | | | | | |
| Distributions From Earnings: | | | | | | | | | | | | | | | | | | | | |
| Net investment income | | | — | | | | — | | | | (0.20 | ) | | | (0.09 | ) | | | (0.26 | ) |
| Net realized gains | | | — | | | | — | | | | — | | | | (0.02 | ) | | | (0.18 | ) |
| Total Distributions | | | — | | | | — | | | | (0.20 | ) | | | (0.11 | ) | | | (0.44 | ) |
| | | | | | | | | | | | | | | | | | | | | |
| Redemption Fees | | | — | | | | 0.00 | (c) | | | 0.00 | (c) | | | 0.00 | (c) | | | 0.00 | (c) |
| | | | | | | | | | | | | | | | | | | | | |
| Net Asset Value, End of Period | | $ | 9.60 | | | $ | 11.09 | | | $ | 10.68 | | | $ | 12.02 | | | $ | 11.45 | |
| | | | | | | | | | | | | | | | | | | | | |
| Total Investment Return | | | (13.44 | )% | | | 3.84 | % | | | (9.49 | )% | | | 5.96 | % | | | 18.88 | % |
| | | | | | | | | | | | | | | | | | | | | |
| Net Assets, End of Period, in Thousands | | $ | 287,702 | | | $ | 561,372 | | | $ | 797,845 | | | $ | 695,987 | | | $ | 40,192 | |
| | | | | | | | | | | | | | | | | | | | | |
| Ratio/Supplemental Data: | | | | | | | | | | | | | | | | | | | | |
| Ratio of expenses to average net assets: | | | | | | | | | | | | | | | | | | | | |
| Before expense waiver or recovery | | | 1.74 | % | | | 1.75 | % | | | 1.77 | %(d) | | | 1.78 | % | | | 3.39 | % |
| After expense waiver or recovery | | | 1.74 | % | | | 1.75 | % | | | 1.77 | %(d) | | | 1.81 | % | | | 1.95 | % |
| | | | | | | | | | | | | | | | | | | | | |
| Ratio of net investment income (loss) to average net assets: | | | | | | | | | | | | | | | | | | | | |
| Before expense waiver or recovery | | | 0.01 | % | | | (0.72 | )% | | | (0.99 | )% | | | (1.24 | )% | | | (3.23 | )% |
| After expense waiver or recovery | | | 0.01 | % | | | (0.72 | )% | | | (0.99 | )% | | | (1.27 | )% | | | (1.79 | )% |
| | | | | | | | | | | | | | | | | | | | | |
Portfolio turnover rate(e) | | | 91 | % | | | 85 | % | | | 83 | % | | | 27 | % | | | 6 | % |
* All ratios have been annualized except total investment return and portfolio turnover.
| (a) | Net investment income (loss) per share is based on average shares outstanding. |
| (b) | Realized and unrealized gains and losses per share in this caption are balancing amounts necessary to reconcile the change in net asset value per share for the period, and may not reconcile with the Fund’s consolidated statement of operations due to share transactions for the period. |
| (c) | Amount represents less than $0.005 per share. |
| (d) | Includes 0.00% of interest expense for the year ended December 31, 2016. |
| (e) | Portfolio turnover rate is calculated on the basis of the Fund as a whole without distinguishing between classes of shares issued. Consists of long-term investments only; excludes derivative instruments. |
The accompanying notes are an integral part of these consolidated financial statements.
| | |
| | |
| LoCorr Dynamic Equity Fund - Financial Highlights - Class A | | 69 |
| | |
LoCorr Dynamic Equity Fund - Class A
Financial Highlights
Selected Data and Ratios (for a share outstanding throughout the year)
| | | Year Ended December 31, | |
| | | 2018 | | | | 2017 | | | | 2016 | | | | 2015 | | | | 2014 | |
| | | | | | | | | | | | | | | | | | | | |
| Per Share | | | | | | | | | | | | | | | | | | | |
| Net asset value, beginning of year | | $ | 11.82 | | | $ | 12.06 | | | $ | 9.64 | | | $ | 9.80 | | | $ | 11.48 | |
| | | | | | | | | | | | | | | | | | | | | |
| Income (loss) from investment operations: | | | | | | | | | | | | | | | | | | | | |
Net investment income (loss)(a) | | | (0.25 | ) | | | (0.30 | ) | | | (0.32 | ) | | | (0.27 | ) | | | (0.22 | ) |
| Net realized and unrealized gain (loss) | | | (1.26 | ) | | | 0.59 | | | | 2.74 | | | | 0.11 | | | | (1.42 | ) |
| Total from Investment Operations | | | (1.51 | ) | | | 0.29 | | | | 2.42 | | | | (0.16 | ) | | | (1.64 | ) |
| | | | | | | | | | | | | | | | | | | | | |
| Distributions From Earnings: | | | | | | | | | | | | | | | | | | | | |
| Net realized gains | | | (0.39 | ) | | | (0.53 | ) | | | — | | | | — | | | | (0.04 | ) |
| Total Distributions | | | (0.39 | ) | | | (0.53 | ) | | | — | | | | — | | | | (0.04 | ) |
| | | | | | | | | | | | | | | | | | | | | |
| Redemption Fees | | | — | | | | 0.00 | (b) | | | 0.00 | (b) | | | 0.00 | (b) | | | 0.00 | (b) |
| | | | | | | | | | | | | | | | | | | | | |
| Net Asset Value, End of Year | | $ | 9.92 | | | $ | 11.82 | | | $ | 12.06 | | | $ | 9.64 | | | $ | 9.80 | |
| | | | | | | | | | | | | | | | | | | | | |
Total Investment Return(c) | | | (12.87 | )% | | | 2.38 | % | | | 25.10 | % | | | (1.53 | )% | | | (14.37 | )% |
| | | | | | | | | | | | | | | | | | | | | |
| Net Assets, End of Year, in Thousands | | $ | 8,473 | | | $ | 19,962 | | | $ | 28,243 | | | $ | 12,446 | | | $ | 17,174 | |
| | | | | | | | | | | | | | | | | | | | | |
| Ratio/Supplemental Data: | | | | | | | | | | | | | | | | | | | | |
| Ratio of expenses to average net assets: | | | | | | | | | | | | | | | | | | | | |
| Before expense waiver or recovery | | | 3.40 | % | | | 3.42 | % | | | 3.74 | % | | | 3.72 | % | | | 3.55 | % |
| After expense waiver or recovery | | | 3.21 | % | | | 3.35 | % | | | 3.49 | % | | | 3.35 | % | | | 3.30 | % |
| | | | | | | | | | | | | | | | | | | | | |
| Ratio of expenses to average net assets (excluding dividend and interest expense): | | | | | | | | | | | | |
| Before expense waiver or recovery | | | 3.20 | % | | | 3.22 | % | | | 3.40 | % | | | 3.52 | % | | | 3.40 | % |
| After expense waiver or recovery | | | 3.01 | % | | | 3.15 | % | | | 3.15 | % | | | 3.15 | % | | | 3.15 | % |
| | | | | | | | | | | | | | | | | | | | | |
| Ratio of net investment income (loss) to average net assets: | | | | | | | | | | | | | | | | | | | | |
| Before expense waiver or recovery | | | (2.39 | )% | | | (2.61 | )% | | | (3.23 | )% | | | (3.06 | )% | | | (2.41 | )% |
| After expense waiver or recovery | | | (2.20 | )% | | | (2.54 | )% | | | (2.98 | )% | | | (2.69 | )% | | | (2.16 | )% |
| | | | | | | | | | | | | | | | | | | | | |
Portfolio turnover rate(d) | | | 449 | % | | | 363 | % | | | 343 | % | | | 269 | % | | | 256 | % |
| (a) | Net investment income (loss) per share is based on average shares outstanding. |
| (b) | Amount represents less than $0.005 per share. |
| (c) | Total investment return excludes the effect of applicable sales charges. |
| (d) | Portfolio turnover rate is calculated on the basis of the Fund as a whole without distinguishing between classes of shares issued. Consists of long-term investments only; excludes securities sold short. |
The accompanying notes are an integral part of these consolidated financial statements.
| | |
| | |
70 | | LoCorr Dynamic Equity Fund - Financial Highlights - Class C |
| | |
LoCorr Dynamic Equity Fund - Class C
Selected Data and Ratios (for a share outstanding throughout the year)
| | | Year Ended December 31, | |
| | | 2018 | | | 2017 | | | 2016 | | | 2015 | | | 2014 | |
| | | | | | | | | | | | | | | | |
| Per Share | | | | | | | | | | | | | | | |
| Net asset value, beginning of year | | $ | 11.39 | | | $ | 11.73 | | | $ | 9.45 | | | $ | 9.67 | | | $ | 11.42 | |
| | | | | | | | | | | | | | | | | | | | | |
| Income (loss) from investment operations: | | | | | | | | | | | | | | | | | | | | |
Net investment income (loss)(a) | | | (0.32 | ) | | | (0.38 | ) | | | (0.38 | ) | | | (0.33 | ) | | | (0.29 | ) |
| Net realized and unrealized gain (loss) | | | (1.21 | ) | | | 0.57 | | | | 2.66 | | | | 0.11 | | | | (1.42 | ) |
| Total from Investment Operations | | | (1.53 | ) | | | 0.19 | | | | 2.28 | | | | (0.22 | ) | | | (1.71 | ) |
| | | | | | | | | | | | | | | | | | | | | |
| Distributions From Earnings: | | | | | | | | | | | | | | | | | | | | |
| Net realized gains | | | (0.39 | ) | | | (0.53 | ) | | | — | | | | — | | | | (0.04 | ) |
| Total Distributions | | | (0.39 | ) | | | (0.53 | ) | | | — | | | | — | | | | (0.04 | ) |
| | | | | | | | | | | | | | | | | | | | | |
| Redemption Fees | | | — | | | | 0.00 | (b) | | | 0.00 | (b) | | | 0.00 | (b) | | | 0.00 | (b) |
| | | | | | | | | | | | | | | | | | | | | |
| Net Asset Value, End of Year | | $ | 9.47 | | | $ | 11.39 | | | $ | 11.73 | | | $ | 9.45 | | | $ | 9.67 | |
| | | | | | | | | | | | | | | | | | | | | |
Total Investment Return(c) | | | (13.45 | )% | | | 1.59 | % | | | 24.13 | % | | | (2.28 | )% | | | (14.98 | )% |
| | | | | | | | | | | | | | | | | | | | | |
| Net Assets, End of Year, in Thousands | | $ | 5,255 | | | $ | 11,084 | | | $ | 11,218 | | | $ | 7,837 | | | $ | 12,158 | |
| | | | | | | | | | | | | | | | | | | | | |
| Ratio/Supplemental Data: | | | | | | | | | | | | | | | | | | | | |
| Ratio of expenses to average net assets: | | | | | | | | | | | | | | | | | | | | |
| Before expense waiver or recovery | | | 4.15 | % | | | 4.17 | % | | | 4.49 | % | | | 4.47 | % | | | 4.30 | % |
| After expense waiver or recovery | | | 3.96 | % | | | 4.10 | % | | | 4.24 | % | | | 4.10 | % | | | 4.05 | % |
| | | | | | | | | | | | | | | | | | | | | |
| Ratio of expenses to average net assets (excluding dividend and interest expense): | | | | | | | | | | | | |
| Before expense waiver or recovery | | | 3.95 | % | | | 3.97 | % | | | 4.15 | % | | | 4.27 | % | | | 4.15 | % |
| After expense waiver or recovery | | | 3.76 | % | | | 3.90 | % | | | 3.90 | % | | | 3.90 | % | | | 3.90 | % |
| | | | | | | | | | | | | | | | | | | | | |
| Ratio of net investment income (loss) to average net assets: | | | | | | | | | | | | | | | | | |
| Before expense waiver or recovery | | | (3.14 | )% | | | (3.36 | )% | | | (3.98 | )% | | | (3.81 | )% | | | (3.16 | )% |
| After expense waiver or recovery | | | (2.95 | )% | | | (3.29 | )% | | | (3.73 | )% | | | (3.44 | )% | | | (2.91 | )% |
| | | | | | | | | | | | | | | | | | | | | |
Portfolio turnover rate(d) | | | 449 | % | | | 363 | % | | | 343 | % | | | 269 | % | | | 256 | % |
| (a) | Net investment income (loss) per share is based on average shares outstanding. |
| (b) | Amount represents less than $0.005 per share. |
| (c) | Total investment return excludes the effect of applicable sales charges. |
| (d) | Portfolio turnover rate is calculated on the basis of the Fund as a whole without distinguishing between classes of shares issued. Consists of long-term investments only; excludes securities sold short. |
The accompanying notes are an integral part of these consolidated financial statements.
| | |
| | |
| LoCorr Dynamic Equity Fund - Financial Highlights - Class I | | 71 |
| | |
LoCorr Dynamic Equity Fund - Class I
Financial Highlights
Selected Data and Ratios (for a share outstanding throughout the year)
| | | Year Ended December 31, |
| | | 2018 | | | 2017 | | | 2016 | | | 2015 | | | 2014 | |
| | | | | | | | | | | | | | | | |
| Per Share | | | | | | | | | | | | | | | |
| Net asset value, beginning of year | | $ | 11.96 | | | $ | 12.17 | | | $ | 9.71 | | | $ | 9.84 | | | $ | 11.50 | |
| | | | | | | | | | | | | | | | | | | | | |
| Income (loss) from investment operations: | | | | | | | | | | | | | | | | | | | | |
Net investment income (loss)(a) | | | (0.23 | ) | | | (0.28 | ) | | | (0.30 | ) | | | (0.24 | ) | | | (0.20 | ) |
| Net realized and unrealized gain (loss) | | | (1.27 | ) | | | 0.60 | | | | 2.76 | | | | 0.11 | | | | (1.42 | ) |
| Total from Investment Operations | | | (1.50 | ) | | | 0.32 | | | | 2.46 | | | | (0.13 | ) | | | (1.62 | ) |
| | | | | | | | | | | | | | | | | | | | | |
| Distributions From Earnings: | | | | | | | | | | | | | | | | | | | | |
| Net realized gains | | | (0.39 | ) | | | (0.53 | ) | | | — | | | | — | | | | (0.04 | ) |
| Total Distributions | | | (0.39 | ) | | | (0.53 | ) | | | — | | | | — | | | | (0.04 | ) |
| | | | | | | | | | | | | | | | | | | | | |
| Redemption Fees | | | — | | | | 0.00 | (b) | | | 0.00 | (b) | | | 0.00 | (b) | | | 0.00 | (b) |
| | | | | | | | | | | | | | | | | | | | | |
| Net Asset Value, End of Year | | $ | 10.07 | | | $ | 11.96 | | | $ | 12.17 | | | $ | 9.71 | | | $ | 9.84 | |
| | | | | | | | | | | | | | | | | | | | | |
| Total Investment Return | | | (12.55 | )% | | | 2.60 | % | | | 25.33 | % | | | (1.22 | )% | | | (14.18 | )% |
| | | | | | | | | | | | | | | | | | | | | |
| Net Assets, End of Year, in Thousands | | $ | 16,545 | | | $ | 32,781 | | | $ | 44,816 | | | $ | 9,990 | | | $ | 12,304 | |
| | | | | | | | | | | | | | | | | | | | | |
| Ratio/Supplemental Data: | | | | | | | | | | | | | | | | | | | | |
| Ratio of expenses to average net assets: | | | | | | | | | | | | | | | | | | | | |
| Before expense waiver or recovery | | | 3.15 | % | | | 3.17 | % | | | 3.49 | % | | | 3.47 | % | | | 3.30 | % |
| After expense waiver or recovery | | | 2.96 | % | | | 3.10 | % | | | 3.24 | % | | | 3.10 | % | | | 3.05 | % |
| | | | | | | | | | | | | | | | | | | | | |
| Ratio of expenses to average net assets (excluding dividend and interest expense): | | | | | | | | | | | | | | | | | �� |
| Before expense waiver or recovery | | | 2.95 | % | | | 2.97 | % | | | 3.15 | % | | | 3.27 | % | | | 3.15 | % |
| After expense waiver or recovery | | | 2.76 | % | | | 2.90 | % | | | 2.90 | % | | | 2.90 | % | | | 2.90 | % |
| | | | | | | | | | | | | | | | | | | | | |
| Ratio of net investment income (loss) to average net assets: | | | | | | | | | | | | | | | | | | | | |
| Before expense waiver or recovery | | | (2.14 | )% | | | (2.36 | )% | | | (2.98 | )% | | | (2.81 | )% | | | (2.16 | )% |
| After expense waiver or recovery | | | (1.95 | )% | | | (2.29 | )% | | | (2.73 | )% | | | (2.44 | )% | | | (1.91 | )% |
| | | | | | | | | | | | | | | | | | | | | |
Portfolio turnover rate(c) | | | 449 | % | | | 363 | % | | | 343 | % | | | 269 | % | | | 256 | % |
| (a) | Net investment income (loss) per share is based on average shares outstanding. |
| (b) | Amount represents less than $0.005 per share. |
| (c) | Portfolio turnover rate is calculated on the basis of the Fund as a whole without distinguishing between classes of shares issued. Consists of long-term investments only; excludes securities sold short. |
The accompanying notes are an integral part of these financial statements.
| | |
| | |
72 | | LoCorr Spectrum Income Fund - Financial Highlights - Class A |
| | |
LoCorr Spectrum Income Fund - Class A
Financial Highlights
Selected Data and Ratios (for a share outstanding throughout the year)
| | | Year Ended December 31, | |
| | | 2018 | | | 2017 | | | 2016 | | | 2015 | | | 2014 | |
| | | | | | | | | | | | | | | | |
| Per Share | | | | | | | | | | | | | | | |
| Net asset value, beginning of year | | $ | 7.39 | | | $ | 7.70 | | | $ | 7.78 | | | $ | 8.97 | | | $ | 10.00 | |
| | | | | | | | | | | | | | | | | | | | | |
| Income (loss) from investment operations: | | | | | | | | | | | | | | | | | | | | |
Net investment income (loss)(a) | | | 0.22 | | | | 0.17 | | | | 0.29 | | | | 0.38 | | | | 0.41 | |
| Net realized and unrealized gain (loss) | | | (0.78 | ) | | | 0.09 | | | | 0.20 | | | | (1.00 | ) | | | (0.91 | ) |
| Total from Investment Operations | | | (0.56 | ) | | | 0.26 | | | | 0.49 | | | | (0.62 | ) | | | (0.50 | ) |
| | | | | | | | | | | | | | | | | | | | | |
| Distributions From Earnings: | | | | | | | | | | | | | | | | | | | | |
| Net investment income | | | (0.26 | ) | | | (0.15 | ) | | | (0.37 | ) | | | (0.39 | ) | | | (0.36 | ) |
| Return of capital | | | (0.31 | ) | | | (0.42 | ) | | | (0.20 | ) | | | (0.18 | ) | | | (0.17 | ) |
| Total Distributions | | | (0.57 | ) | | | (0.57 | ) | | | (0.57 | ) | | | (0.57 | ) | | | (0.53 | ) |
| | | | | | | | | | | | | | | | | | | | | |
Redemption Fees (b) | | | 0.00 | | | | 0.00 | | | | 0.00 | | | | 0.00 | | | | 0.00 | |
| | | | | | | | | | | | | | | | | | | | | |
| Net Asset Value, End of Year | | $ | 6.26 | | | $ | 7.39 | | | $ | 7.70 | | | $ | 7.78 | | | $ | 8.97 | |
| | | | | | | | | | | | | | | | | | | | | |
Total Investment Return(c) | | | (8.22 | )% | | | 3.50 | % | | | 6.64 | % | | | (7.36 | )% | | | (5.45 | )% |
| | | | | | | | | | | | | | | | | | | | | |
| Net Assets, End of Year, in Thousands | | $ | 22,610 | | | $ | 29,970 | | | $ | 33,032 | | | $ | 36,957 | | | $ | 37,425 | |
| | | | | | | | | | | | | | | | | | | | | |
Ratio/Supplemental Data:(d) | | | | | | | | | | | | | | | | | | | | |
| Ratio of expenses to average net assets: | | | | | | | | | | | | | | | | | | | | |
| Before expense waiver or recovery | | | 1.98 | % | | | 1.95 | % | | | 2.02 | % | | | 1.99 | %(e) | | | 2.28 | %(e) |
| After expense waiver or recovery | | | 1.98 | % | | | 1.99 | % | | | 2.05 | % | | | 2.05 | %(e) | | | 2.05 | %(e) |
| | | | | | | | | | | | | | | | | | | | | |
| Ratio of net investment income (loss) to average net assets: | | | | | | | | | | | | | | | | | | | | |
| Before expense waiver or recovery | | | 3.01 | % | | | 2.27 | % | | | 3.81 | % | | | 4.41 | % | | | 3.88 | % |
| After expense waiver or recovery | | | 3.01 | % | | | 2.23 | % | | | 3.78 | % | | | 4.35 | % | | | 4.11 | % |
| | | | | | | | | | | | | | | | | | | | | |
Portfolio turnover rate(f) | | | 82 | % | | | 84 | % | | | 92 | % | | | 54 | % | | | 43 | % |
| (a) | Net investment income (loss) per share is based on average shares outstanding. |
| (b) | Amount represents less than $0.005 per share. |
| (c) | Total investment return excludes the effect of applicable sales charges. |
| (d) | Ratios do not include the expenses of the investment companies in which the Fund invests. |
| (e) | Includes interest expense on line of credit of 0.00% and 0.00% for the years ended December 31, 2015 and 2014, respectively. |
| (f) | Portfolio turnover rate is calculated on the basis of the Fund as a whole without distinguishing between classes of shares issued. |
The accompanying notes are an integral part of these financial statements.
| | |
| | |
| LoCorr Spectrum Income Fund - Financial Highlights - Class C | | 73 |
| | |
LoCorr Spectrum Income Fund - Class C
Financial Highlights
Selected Data and Ratios (for a share outstanding throughout the year)
| | | Year Ended December 31, | |
| | | 2018 | | | 2017 | | | 2016 | | | 2015 | | | 2014 | |
| | | | | | | | | | | | | | | | |
| Per Share | | | | | | | | | | | | | | | |
| Net asset value, beginning of year | | $ | 7.42 | | | $ | 7.72 | | | $ | 7.78 | | | $ | 8.96 | | | $ | 10.00 | |
| | | | | | | | | | | | | | | | | | | | | |
| Income (loss) from investment operations: | | | | | | | | | | | | | | | | | | | | |
Net investment income (loss)(a) | | | 0.16 | | | | 0.11 | | | | 0.23 | | | | 0.32 | | | | 0.33 | |
| Net realized and unrealized gain (loss) | | | (0.77 | ) | | | 0.09 | | | | 0.21 | | | | (1.00 | ) | | | (0.91 | ) |
| Total from Investment Operations | | | (0.61 | ) | | | 0.20 | | | | 0.44 | | | | (0.68 | ) | | | (0.58 | ) |
| | | | | | | | | | | | | | | | | | | | | |
| Distributions From Earnings: | | | | | | | | | | | | | | | | | | | | |
| Net investment income | | | (0.23 | ) | | | (0.13 | ) | | | (0.33 | ) | | | (0.34 | ) | | | (0.31 | ) |
| Return of capital | | | (0.27 | ) | | | (0.37 | ) | | | (0.17 | ) | | | (0.16 | ) | | | (0.15 | ) |
| Total Distributions | | | (0.50 | ) | | | (0.50 | ) | | | (0.50 | ) | | | (0.50 | ) | | | (0.46 | ) |
| | | | | | | | | | | | | | | | | | | | | |
Redemption Fees (b) | | | 0.00 | | | | 0.00 | | | | 0.00 | | | | 0.00 | | | | 0.00 | |
| | | | | | | | | | | | | | | | | | | | | |
| Net Asset Value, End of Year | | $ | 6.31 | | | $ | 7.42 | | | $ | 7.72 | | | $ | 7.78 | | | $ | 8.96 | |
| | | | | | | | | | | | | | | | | | | | | |
Total Investment Return(c) | | | (8.85 | )% | | | 2.62 | % | | | 5.88 | % | | | (8.05 | )% | | | (6.19 | )% |
| | | | | | | | | | | | | | | | | | | | | |
| Net Assets, End of Year, in Thousands | | $ | 18,092 | | | $ | 23,511 | | | $ | 25,898 | | | $ | 27,817 | | | $ | 25,210 | |
| | | | | | | | | | | | | | | | | | | | | |
Ratio/Supplemental Data:(d) | | | | | | | | | | | | | | | | | | | | |
| Ratio of expenses to average net assets: | | | | | | | | | | | | | | | | | | | | |
| Before expense waiver or recovery | | | 2.73 | % | | | 2.70 | % | | | 2.77 | % | | | 2.74 | %(e) | | | 3.03 | %(e) |
| After expense waiver or recovery | | | 2.73 | % | | | 2.74 | % | | | 2.80 | % | | | 2.80 | %(e) | | | 2.80 | %(e) |
| | | | | | | | | | | | | | | | | | | | | |
| Ratio of net investment income (loss) to average net assets: | | | | | | | | | | | | | | | | | | | | |
| Before expense waiver or recovery | | | 2.26 | % | | | 1.52 | % | | | 3.06 | % | | | 3.66 | % | | | 3.13 | % |
| After expense waiver or recovery | | | 2.26 | % | | | 1.48 | % | | | 3.03 | % | | | 3.60 | % | | | 3.36 | % |
| | | | | | | | | | | | | | | | | | | | | |
Portfolio turnover rate(f) | | | 82 | % | | | 84 | % | | | 92 | % | | | 54 | % | | | 43 | % |
| (a) | Net investment income (loss) per share is based on average shares outstanding. |
| (b) | Amount represents less than $0.005 per share. |
| (c) | Total investment return excludes the effect of applicable sales charges. |
| (d) | Ratios do not include the expenses of the investment companies in which the Fund invests. |
| (e) | Includes interest expense on line of credit of 0.00% and 0.00% for the years ended December 31, 2015 and 2014, respectively. |
| (f) | Portfolio turnover rate is calculated on the basis of the Fund as a whole without distinguishing between classes of shares issued. |
The accompanying notes are an integral part of these financial statements.
| | |
| | |
74 | | LoCorr Spectrum Income Fund - Financial Highlights - Class I |
| | |
LoCorr Spectrum Income Fund - Class I
Financial Highlights
Selected Data and Ratios (for a share outstanding throughout the year)
| | | Year Ended December 31, | |
| | | 2018 | | | 2017 | | | 2016 | | | 2015 | | | 2014 | |
| | | | | | | | | | | | | | | | |
| Per Share | | | | | | | | | | | | | | | |
| Net asset value, beginning of year | | $ | 7.38 | | | $ | 7.69 | | | $ | 7.78 | | | $ | 8.97 | | | $ | 10.00 | |
| | | | | | | | | | | | | | | | | | | | | |
| Income (loss) from investment operations: | | | | | | | | | | | | | | | | | | | | |
Net investment income (loss)(a) | | | 0.24 | | | | 0.19 | | | | 0.31 | | | | 0.41 | | | | 0.43 | |
| Net realized and unrealized gain (loss) | | | (0.77 | ) | | | 0.10 | | | | 0.20 | | | | (1.00 | ) | | | (0.91 | ) |
| Total from Investment Operations | | | (0.53 | ) | | | 0.29 | | | | 0.51 | | | | (0.59 | ) | | | (0.48 | ) |
| | | | | | | | | | | | | | | | | | | | | |
| Distributions From Earnings: | | | | | | | | | | | | | | | | | | | | |
| Net investment income | | | (0.27 | ) | | | (0.16 | ) | | | (0.39 | ) | | | (0.41 | ) | | | (0.38 | ) |
| Return of capital | | | (0.33 | ) | | | (0.44 | ) | | | (0.21 | ) | | | (0.19 | ) | | | (0.17 | ) |
| Total Distributions | | | (0.60 | ) | | | (0.60 | ) | | | (0.60 | ) | | | (0.60 | ) | | | (0.55 | ) |
| | | | | | | | | | | | | | | | | | | | | |
Redemption Fees (b) | | | 0.00 | | | | 0.00 | | | | 0.00 | | | | 0.00 | | | | 0.00 | |
| | | | | | | | | | | | | | | | | | | | | |
| Net Asset Value, End of Year | | $ | 6.25 | | | $ | 7.38 | | | $ | 7.69 | | | $ | 7.78 | | | $ | 8.97 | |
| | | | | | | | | | | | | | | | | | | | | |
| Total Investment Return | | | (7.91 | )% | | | 3.85 | % | | | 6.85 | % | | | (7.10 | )% | | | (5.23 | )% |
| | | | | | | | | | | | | | | | | | | | | |
| Net Assets, End of Year, in Thousands | | $ | 27,618 | | | $ | 43,032 | | | $ | 46,838 | | | $ | 28,292 | | | $ | 31,428 | |
| | | | | | | | | | | | | | | | | | | | | |
Ratio/Supplemental Data:(c) | | | | | | | | | | | | | | | | | | | | |
| Ratio of expenses to average net assets: | | | | | | | | | | | | | | | | | | | | |
| Before expense waiver or recovery | | | 1.73 | % | | | 1.70 | % | | | 1.77 | % | | | 1.74 | %(d) | | | 2.03 | %(d) |
| After expense waiver or recovery | | | 1.73 | % | | | 1.74 | % | | | 1.80 | % | | | 1.80 | %(d) | | | 1.80 | %(d) |
| | | | | | | | | | | | | | | | | | | | | |
| Ratio of net investment income (loss) to average net assets: | | | | | | | | | | | | | | | | | | | | |
| Before expense waiver or recovery | | | 3.26 | % | | | 2.52 | % | | | 4.06 | % | | | 4.66 | % | | | 4.13 | % |
| After expense waiver or recovery | | | 3.26 | % | | | 2.48 | % | | | 4.03 | % | | | 4.60 | % | | | 4.36 | % |
| | | | | | | | | | | | | | | | | | | | | |
Portfolio turnover rate(e) | | | 82 | % | | | 84 | % | | | 92 | % | | | 54 | % | | | 43 | % |
| (a) | Net investment income (loss) per share is based on average shares outstanding. |
| (b) | Amount represents less than $0.005 per share. |
| (c) | Ratios do not include the expenses of the investment companies in which the Fund invests. |
| (d) | Includes interest expense on line of credit of 0.00% and 0.00% for the years ended December 31, 2015 and 2014, respectively. |
| (e) | Portfolio turnover rate is calculated on the basis of the Fund as a whole without distinguishing between classes of shares issued. |
The accompanying notes are an integral part of these financial statements.
| | |
| | |
LoCorr Macro Strategies Fund, LoCorr Long/Short Commodities Strategy Fund and LoCorr Market Trend Fund-Notes to Consolidated Financial Statements LoCorr Dynamic Equity Fund and LoCorr Specturm income Fund- Notes to Financial Statement
| | 75 |
| | |
LoCorr Investment Trust
Notes
December 31, 2018
1. Organization
LoCorr Investment Trust (the “Trust”), an Ohio business trust, was formed on November 15, 2010 and is an open-end management investment company registered under the Investment Company Act of 1940, as amended (“1940 Act”). Each fund is an investment company and accordingly follows the investment company accounting and reporting guidance of the Financial Accounting Standards Board (“FASB”) Accounting Standards Codification (“ASC”) To pic 946, Financial Services - Investment Companies. The LoCorr Macro Strategies Fund, LoCorr Long/Short Commodities Strategy Fund, LoCorr Market Trend Fund, LoCorr Dynamic Equity Fund and the LoCorr Spectrum Income Fund (individually a “Fund” and collectively the “Funds”) are series within the Trust. The LoCorr Dynamic Equity Fund is a non-diversified fund. The LoCorr Macro Strategies Fund, the LoCorr Long/Short Commodities Strategy Fund, the LoCorr Market Trend Fund and the LoCorr Spectrum Income Fund are each diversified funds.
The LoCorr Macro Strategies Fund’s primary investment objective is capital appreciation in rising and falling equity markets with managing volatility as a secondary objective.
The LoCorr Long/Short Commodities Strategy Fund’s primary investment objective is capital appreciation in rising and falling commodities markets with managing volatility as a secondary objective.
The LoCorr Market Trend Fund’s primary investment objective is capital appreciation in rising and falling equity markets with managing volatility as a secondary objective.
The LoCorr Dynamic Equity Fund’s primary investment objective is long-term capital appreciation with reduced volatility compared to traditional broad-based equity market indices as a secondary objective.
The LoCorr Spectrum Income Fund’s primary investment objective is current income with capital appreciation as a secondary objective.
Wholly-owned and Controlled Subsidiaries
In order to achieve their investment objectives, the LoCorr Macro Strategies Fund, the LoCorr Long/Short Commodities Strategy Fund and the LoCorr Market Trend Fund each invest up to 25% of their total assets (measured at the time of purchase) in wholly-owned subsidiaries, LCMFS Fund Limited (“LCMFS”), LCLSCS Fund Limited (“LCLSCS”) and LCMT Fund Limited (“LCMT”), respectively; each company is incorporated under the laws of the Cayman Islands. LCMFS, LCLSCS and LCMT act as investment vehicles in order to enter into certain investments for the LoCorr Macro Strategies Fund, the LoCorr Long/Short Commodities Strategy Fund and the LoCorr Market Trend Fund, respectively, consistent with their investment objectives and policies specified in the Prospectuses and Statement of Additional Information.
At December 31, 2018, investments in LCMFS, LCLSCS and LCMT represented 1.64%, 16.26% and 3.31% of the total net assets of LoCorr Macro Strategies Fund, LoCorr Long/Short Commodities Strategy Fund and LoCorr Market Trend Fund, respectively. See Note 2.
The consolidated financial statements of the LoCorr Macro Strategies Fund, LoCorr Long/Short Commodities Strategy Fund and the LoCorr Market Trend Fund each include the investment activity and financial statements of LCMFS, LCLSCS and LCMT, respectively. All intercompany accounts and transactions have been eliminated in consolidation. Because each Fund may invest a substantial portion of its assets in its respective subsidiary, the Fund may be considered to be investing indirectly in some of those investments through its subsidiary. For that reason, references to the Fund may also encompass its subsidiary. The subsidiary will be subject to the same investment restrictions and limitations, and follow the same compliance policies and procedures, as the Fund when viewed on a consolidated basis. Each Fund and its subsidiary are a “commodity pool” under the U.S. Commodity Exchange Act and LoCorr Fund Management, LLC (the “Adviser” or “Management”) is a “commodity pool operator” registered with and regulated by the Commodity Futures Trading Commission (“CFTC”). As a result, additional CFTC-mandated disclosure, reporting and recordkeeping obligations apply with respect to each Fund and its respective subsidiary under CFTC and the U.S. Securities and Exchange Commission (the “SEC”) harmonized regulations.
At December 31, 2018, the only investment held by LCLSCS is a swap contract, for which the notional amount was $168,945,098. At December 31, 2018, LCLSCS reported unrealized appreciation on the swap contract of $4,363,946. In addition, LCLSCS holds cash and cash equivalents as collateral on the swap contract.
At December 31, 2018, investments held by LCMFS and LCMT include open futures contracts and other investments intended to serve as margin or collateral for futures positions. At December 31, 2018, LCMFS held long open futures contracts with a total notional amount of $25,826,252 and net unrealized depreciation of $2,482,785 and short open futures contracts with a total notional amount of $154,184,282 and net unrealized appreciation of $6,262,958. At December 31, 2018, LCMT held long open futures contracts with a total notional amount of $49,652,301 and net unrealized depreciation of $4,917,061 and short open futures contracts with a total notional amount of $184,373,175 and net unrealized appreciation of $5,094,798.
| | |
| | |
76 | | LoCorr Macro Strategies Fund, LoCorr Long/Short Commodities Strategy Fund and LoCorr Market Trend Fund - Notes to Consolidated Financial Statements / LoCorr Dynamic Equity Fund and LoCorr Specturm income Fund - Notes to Financial Statement (continued)
|
| | |
Share Classes
The Funds currently offer three classes of shares: Class A, Class C and Class I shares. Each share class represents an interest in the same assets of the Fund, has the same rights and is identical in all material respects except that (i) Class A shares have a maximum front end sales load of 5.75% and maximum deferred sales charge of 1.00% and Class C shares have a maximum deferred sales charge of 1.00%, (ii) Class A shares have a 12b-1 fee of 0.25% and Class C shares have a 12b-1 fee of 1.00%; (iii) certain other class-specific expenses will be borne solely by the class to which such expenses are attributable and (iv) each class will have exclusive voting rights with respect to matters relating to its own distribution arrangements.
All classes with respect to the LoCorr Spectrum Income Fund are subject to a 2.00% redemption fee on redemptions made within 60 days of the original purchase. As of May 1, 2017, none of the other Funds are subject to a redemption fee.
The following table presents the class-specific commencement of operations dates for each of the Funds:
| | | Commencement of Operation
|
| | | Class A
| | Class C
| | Class I
|
| LoCorr Macro Strategies Fund | | March 22,2011
| | March 24, 2011
| | March 24, 2011
|
| LoCorr Long/Short Commodities Strategy Fund | | January 1, 2012
| | January 1, 2012
| | January 1, 2012
|
| LoCorr Dynamic Equity Fund | | May 10, 2013
| | May 10, 2013
| | May 10, 2013
|
| LoCorr Spectrum Income Fund | | January 1, 2014
| | January 1, 2014
| | January 1, 2014
|
| LoCorr Market Trend Fund | | July 1, 2014
| | July 1, 2014
| | July 1, 2014
|
2. Significant Accounting Policies
The following is a summary of significant accounting policies consistently followed by the Funds in the preparation of the financial statements. These policies are in conformity with generally accepted accounting principles in the United States of America (“GAAP”).
Investment Valuation
The Funds follow fair valuation accounting standards in accordance with GAAP, which establish a definition of fair value and set out a hierarchy for measuring fair value. These standards require additional disclosures about the various inputs and valuation techniques used to develop the measurements of fair value and changes in valuation techniques and related inputs during the period. These inputs are summarized in three broad levels listed below:
Level 1 – Unadjusted quoted prices in active markets for identical assets or liabilities that the Funds have the ability to access.
Level 2 – Observable inputs other than quoted prices included in Level 1 that are observable for the asset or liability, either directly or indirectly. These inputs may include quoted prices for the identical instrument on an inactive market, prices for similar instruments, interest rates, prepayment speeds, credit risk, yield curves, default rates and similar data.
Level 3 – Unobservable inputs for the asset or liability, to the extent relevant observable inputs are not available; representing the Funds’ own assumptions about the assumptions a market participant would use in valuing the asset or liability, and would be based on the best information available.
Generally, the Funds’ investments are valued each day at the last quoted sales price on each investment’s primary exchange. Investments traded or dealt in one or more exchanges (whether domestic or foreign) for which market quotations are readily available and not subject to restrictions against resale shall be valued at the last quoted sales price on the primary exchange or, in the absence of a sale on the primary exchange, at the last bid on the primary exchange. Investments primarily traded in the National Association of Securities Dealers’ Automated Quotation System (“NASDAQ”) National Market System for which market quotations are readily available shall be valued using the NASDAQ Official Closing Price.
The Funds may use independent pricing services to assist in calculating the value of the Funds’ investments. In addition, market prices for foreign investments are not determined at the same time of day as the net asset value (“NAV”) for the Funds. Because the Funds may invest in portfolio investments primarily listed on foreign exchanges and these exchanges may trade on weekends or other days when the Funds do not price their shares, the value of some of the Funds’ portfolio investments may change on days when you may not be able to buy or sell the Funds’ shares. In computing the NAV, the Funds value foreign investments held by the Funds at the latest closing price on the exchange in which they are traded immediately prior to closing of the New York Stock Exchange. Prices of foreign investments quoted in foreign currencies are translated into U.S. dollars at current rates. If events materially affecting the value of an investment in the Funds’ portfolio, particularly foreign investments, occur after the close of trading on a foreign market but before the Funds price their shares, the investment will be valued at fair value.
American Depositary Receipts
The Funds may invest in sponsored and unsponsored American Depositary Receipts (“ADRs”), which are receipts issued by an American bank or trust company evidencing ownership of underlying securities issued by a foreign issuer. ADRs, in registered form, are designed for use in U.S. securities markets. Unsponsored ADRs may be created without the participation of the foreign issuer. Holders of unsponsored ADRs generally bear all the costs of the ADR facility, whereas foreign issuers typically bear certain costs in a sponsored ADR. The bank or trust company depositary of an unsponsored ADR may be under no obligation to distribute shareholder communications received from the foreign issuer or to pass through voting rights. ADRs are generally categorized in Level 1 or Level 2 of the fair value hierarchy depending on inputs used and market activity levels for specific securities.
| | |
| | |
LoCorr Macro Strategies Fund, LoCorr Long/Short Commodities Strategy Fund and LoCorr Market Trend Fund - Notes to Consolidated Financial Statements / LoCorr Dynamic Equity Fund and LoCorr Specturm income Fund - Notes to Financial Statement (continued) | | 77 |
| | |
Equity Securities
Equity securities, including common stocks, preferred stocks, securities convertible into common stocks such as convertible bonds, warrants, rights, options, master limited partnership (“MLP”) interests, real estate investment trusts (“REITs”), business development companies and royalty trusts are generally valued by using market quotations, but may be valued on the basis of prices furnished by a pricing service when the Adviser believes such prices accurately reflect the fair market value of such securities. MLP interests are limited partnerships, the interests in which (known as “units”) typically trade publicly, like stock. MLPs are also called publicly traded partnerships and public limited partnerships. Securities that are traded on any stock exchange or on the NASDAQ over-the-counter market are generally valued by the pricing service at the last quoted sale price. Lacking a last sale price, an equity security is generally valued by the pricing service at its last bid price. Equity securities are generally categorized in Level 1 or Level 2 of the fair value hierarchy depending on inputs used and market activity levels for specific securities.
Exchange Traded Funds
The Funds may invest in Exchange Traded Funds (“ETFs”). They are managed by professionals and provide the investor with diversification, cost and tax efficiency, liquidity, marginability, usability for hedging, the ability to go long and short, and (for some ETFs) the provision of periodic distributions. Additionally, some ETFs are unit investment trusts (“UITs”), which are unmanaged portfolios overseen by trustees. ETFs generally have two markets. The primary market is where institutions swap “creation units” in block-multiples of shares, typically 25,000 or 50,000, for in-kind securities and cash in the form of dividends. The secondary market is where individual investors can trade as little as a single share during trading hours on the exchange. This is different from open-ended mutual funds that are traded after hours once the NAV is calculated. ETF shares may trade at a premium or discount to NAV per share. ETFs share many similar risks with open-end and closed-end funds. ETFs are generally categorized in Level 1 of the fair value hierarchy.
The Funds may invest in ETFs and other investment companies that hold a portfolio of foreign securities. Investing in securities of foreign companies and countries involves certain considerations and risks that are not typically associated with investing in U.S. government securities and securities of domestic companies. There may be less publicly available information about a foreign issuer than a domestic one, and foreign companies are not generally subject to uniform accounting, auditing and financial standards and requirements comparable to those applicable to U.S. companies. There may also be less government supervision and regulation of foreign securities exchanges, brokers and listed companies than exists in the United States. Interest and dividends paid by foreign issuers may be subject to withholding and other foreign taxes, which may decrease the net return on such investments as compared to dividends and interest paid to the Funds by domestic companies or the U.S. government. There may be the possibility of expropriations, seizure or nationalization of foreign deposits, confiscatory taxation, political, economic or social instability, or diplomatic developments that could affect assets of the Funds held in foreign countries. Finally, the establishment of exchange controls or other foreign governmental laws or restrictions could adversely affect the payment of obligations.
Fixed Income Securities
Fixed income securities and certificates of deposit with maturities more than 60 days when acquired generally are valued using an evaluated price supplied by an independent pricing service. Inputs used by the pricing service for U.S. government and treasury securities are normally valued using a model that incorporates market observable data such as reported sales of similar securities, broker dealer quotes, yields, bids, offers and reference data. Agency issued debt securities, foreign issued bonds and municipal bonds are generally valued in a manner similar to U.S. government securities. Evaluations for corporate bonds are typically based on valuation methodologies such as market pricing and other analytical pricing models as well as market transactions and dealer quotations based on observable inputs. Fixed income securities are generally categorized in Level 1 or Level 2 of the fair value hierarchy depending on inputs used and market activity levels for specific securities.
The fair value of asset backed securities and mortgage backed securities is estimated on models that consider the estimated cash flows of each tranche of the entity, establish a benchmark yield, and develop an estimated tranche-specific spread to the benchmark yield based on the unique attributes of the tranche. Additional inputs such as creditworthiness of the underlying collateral and quotes from outside brokers for the same or similar issuance may also be considered in the development of fair value. Asset backed and mortgage backed securities are generally categorized in Level 2 of the fair value hierarchy.
Short-term investments in fixed income securities and certificates of deposit with maturities of less than 60 days when acquired, or which subsequently are within 60 days of maturity, are valued using an amortized cost method of valuation, and are generally categorized in Level 2.
Investment Companies
With respect to any portion of the Funds’ assets that are invested in one or more open-end management investment companies, including money market funds, registered under the 1940 Act, the Funds’ NAV is calculated based upon the NAVs of those open-end management investment companies, and the prospectuses for these companies explain the circumstances under which those companies will use fair value pricing and the effects of using fair value pricing.
The Funds generally will purchase shares of closed-end investment companies only in the secondary market. The shares of many closed-end investment companies, after their initial public offering, frequently trade at a price per share that is less than the NAV per share, the difference representing the “market discount” of such shares. This market discount may be due in part to the investment objective of long-term appreciation, which is sought by many closed-end investment companies, as well as to the fact that the shares of closed-end investment companies are not redeemable by the holder upon demand to the issuer at the next determined NAV but rather are subject to the principles of supply and demand in the secondary market. A relative lack of secondary market purchasers of closed-end investment company shares also may contribute to such shares trading at a discount to their NAV . Closed-end investment companies are generally categorized in Level 1 or Level 2 of the fair value hierarchy depending on inputs used and market activity levels for specific securities.
| | |
| | |
78 | | LoCorr Macro Strategies Fund, LoCorr Long/Short Commodities Strategy Fund and LoCorr Market Trend Fund - Notes to Consolidated Financial Statements / LoCorr Dynamic Equity Fund and LoCorr Specturm income Fund - Notes to Financial Statement (continued)
|
| | |
Financial Derivative Instruments
Financial derivative instruments, such as forward currency contracts, futures contracts or swap agreements, derive their value from underlying asset prices, indices, reference rates and other inputs or a combination of these factors. These contracts are normally valued on the basis of broker-dealer quotations or a pricing service at the settlement price determined by the relevant exchange. Depending on the product and the terms of the transaction, the value of the derivative contracts can be estimated by a pricing service provider using a series of techniques, including simulation pricing models. The pricing models use inputs that are observed from actively quoted markets such as issuer details, indices, spreads, interest rates, curves, dividends and exchange rates.
Forward currency contracts represent the purchase or sale of a specific quantity of a foreign currency at the current or spot price, with delivery and settlement at a specified future date. Forward currency contracts are presented at fair value using spot currency rates and are adjusted for the time value of money (forward points) and contractual prices of the underlying financial instruments. Forward currency contracts are generally categorized in Level 2.
Futures contracts are carried at fair value using the primary exchange’s closing (settlement) price, and are generally categorized in Level 1.
Total return swap contracts are stated at fair value daily based on the fair value of the underlying futures, forward currency and foreign currency contracts constituting the contract’s stated index, taking into account any fees and expenses associated with the swap agreement. Total return swap contracts are generally categorized in Level 2.
Fair Value Pricing
If market quotations are not readily available, investments will be valued at their fair value as determined in good faith by the Adviser in accordance with procedures approved by the Board of Trustees (the “Board”) and evaluated by the Board as to the reliability of the fair value method used. In these cases, a Fund’s NAV will reflect certain portfolio investments’ fair value rather than their market price. Fair value pricing involves subjective judgments and it is possible that the fair value determined for an investment is materially different than the value that could be realized upon the sale of that investment. The fair value prices can differ from market prices when they become available or when a price becomes available.
Fair value determinations are required for the following securities:
| ● | securities for which market quotations are not readily available at the valuation time on a particular business day (including without limitation securities for which there is a short and temporary lapse in the provision of a price by the regular pricing source); |
| ● | securities determined to be illiquid in accordance with the Trust’s Liquidity Procedures; and |
| ● | securities with respect to which an event that will affect the value thereof has occurred subsequent to the determination by the Adviser/relevant Sub-Adviser of the closing prices reported on the principal exchange on which the securities are traded, but prior to the relevant Fund’s calculation of its NAV . |
| ● | For any open-end mutual funds that do not provide timely NAV information, the Adviser/relevant Sub-Adviser shall evaluate those ‘similar’ funds and determine which are most appropriate based on funds having similar benchmarks or similar objectives. The Adviser/relevant Sub-Adviser shall then calculate the NAV percentage move of those ‘similar’ funds for the day to create an aggregate average percentage move, which it shall use to calculate the price movement for the day of the Fund at issue. For closed-end funds, the aforementioned practice shall be utilized, in addition to monitoring secondary market activity during the day. |
Performing Fair Value Pricing
The Adviser considers all appropriate factors relevant to the value of securities for which market quotations are not readily available. No single standard for determining fair value can be established, since fair value depends upon the circumstances of each individual case. As a general principle, the current fair value of an issue of securities being valued by the Adviser would appear to be the amount that the owner might reasonably expect to receive for them upon their current sale. Methods that are in accord with this principle may, for example, be based on:
| ● | a discount from market of a similar freely traded security (including a derivative security or a basket of securities traded on other markets, exchanges or among dealers); or |
| ● | yield to maturity with respect to debt issues, or a combination of these and other methods. |
Fair value determinations are not based on what the Adviser believes that a buyer may pay at a later time, such as when market conditions change or when the market ultimately recognizes a security’s true value as perceived by the Adviser. Similarly, bonds and other instruments may not be fair valued at par based on the expectation that the Funds will hold the investment until maturity.
Some of the general factors that the Adviser considers in determining a valuation method for an individual issue of securities include, but shall not be limited to:
| ● | the fundamental analytical data relating to the investment; |
| ● | the nature and duration of restrictions (if any) on disposition of the securities; |
| ● | evaluation of the forces that influence the market in which these securities are purchased or sold; |
| ● | changes in interest rates; |
| ● | government (domestic or foreign) actions or pronouncements; and |
| |
| | |
LoCorr Macro Strategies Fund, LoCorr Long/Short Commodities Strategy Fund and LoCorr Market Trend Fund – Notes to Consolidated Financial Statements / LoCorr Dynamic Equity Fund and LoCorr Spectrum Income Fund – Notes to Financial Statements (continued) | | 79 |
| | |
With respect to securities traded on foreign markets, the Adviser considers the value of foreign securities traded on other foreign markets, ADR trading, closed-end fund trading, foreign currency exchange activity and the trading prices of financial products that are tied to baskets of foreign securities, such as WEBS.
Among the more specific factors that the Funds’ Adviser considers (if applicable) in determining a valuation method for an individual issue of securities are:
| • | financial statements of the issuer; |
| • | cost at date of purchase; |
| • | discount from market value of unrestricted securities of the same class at time of purchase; |
| • | special reports prepared by analysts; |
| • | information as to any transactions or offers with respect to the security; |
| • | existence of merger proposals or tender offers affecting the securities; |
| • | price and extent of public trading in similar securities of the issuer or comparable companies; and |
As a general matter, the Funds’ Adviser will value the portfolio security or other asset primarily by reference to the public market if there is a public market for securities of the same class or similar securities; primarily by reference to private transactions if public market reference is not available and private transaction reports are available; and primarily by use of one or more analytical methods or models if public and private market references are not available or not reliable. The Adviser will use cost only if no better method of valuation is available.
The Adviser regularly evaluates whether its pricing methodologies continue to result in values that the Funds might reasonably expect to receive upon a current sale. In order to do this, the Adviser compares its fair value prices with values that are available from other sources (if there are any). The next actual sales price of a security might be one such source. However, the next-day opening prices or next actual sales prices for a security may differ from the fair value of that security as of the time for NAV calculation, given the subjectivity inherent in fair valuation and the fact that events could occur after NAV calculation. Thus, discrepancies between fair values and next-day opening prices or next actual sales prices may occur on a regular and recurring basis. These discrepancies do not necessarily indicate that the Adviser’s fair value methodology is inappropriate. Nonetheless, systematic comparisons of fair values to the next-day opening prices or next actual sales prices are useful to assist the Adviser with ongoing monitoring and evaluation of the appropriateness of its fair value methodologies.
The above guidance does not purport to delineate all factors that may be considered. The Adviser takes into consideration all indications of value available to it in determining the fair value assigned to a particular security.
The following table summarizes LoCorr Macro Strategies Fund’s consolidated investments and other financial instruments as of December 31, 2018:
| Security Classification | | Level 1 | | | Level 2 | | | Level 3 | | | Total | |
| Investments | | | | | | | | | | | | |
| Asset Backed Securities | | $ | — | | | $ | 97,293,647 | | | $ | — | | | $ | 97,293,647 | |
| Corporate Bonds | | | —
| | | | 175,215,577 | | | | — | | | | 175,215,577 | |
| Mortgage Backed Securities | | | —
| | | | 88,679,669 | | | | — | | | | 88,679,669 | |
| Municipal Bond | | | —
| | | | 55,515 | | | | — | | | | 55,515 | |
| U.S. Government Agency Issues | | | —
| | | | 90,489,026 | | | | — | | | | 90,489,026 | |
| U.S. Government Notes | | | —
| | | | 34,744,945 | | | | — | | | | 34,744,945 | |
| Short Term Investments | |
| 21,240,233 | | | | 2,226,094 | | | | — | | | | 23,466,327 | |
| Total Investments | | $ | 21,240,233 | | | $ | 488,704,473 | | | $ | — | | | $ | 509,944,706 | |
| | | | | | | | | | | | | | | | | |
| Other Financial Instruments* | | | | | | | | | | | | | | | | |
| Forward Currency Contracts | | | | | | | | | | | | | | | | |
| Purchase | | $ | — | | | $ | 1,567,929 | | | $ | — | | | $ | 1,567,929 | |
| Sale | | | — | | | | (2,495,211 | ) | | | — | | | | (2,495,211 | ) |
| Total Forward Currency Contracts | | | — | | | | (927,282 | ) | | | — | | | | (927,282 | ) |
| Futures Contracts | | | | | | | | | | | | | | | | |
| Long | | | (1,537,496 | ) | | | — | | | | — | | | | (1,537,496 | ) |
| Short | | | 2,829,993 | | | | — | | | | — | | | | 2,829,993 | |
| Total Futures Contracts | | | 1,292,497 | | | | — | | | | — | | | | 1,292,497 | |
| Total Other Financial Instruments | | $ | 1,292,497 | | | $ | (927,282 | ) | | $ | — | | | $ | 365,215 | |
See the Fund’s cnsolidated schedule of investments for the investments detailed by industry classification.
*The fair value of the Fund’s other financial instruments represent the net unrealized appreciation (depreciation) at December 31, 2018.
The LoCorr Macro Strategies Fund did not hold any Level 3 assets during the year.
| | |
| | |
80 | | LoCorr Macro Strategies Fund, LoCorr Long/Short Commodities Strategy Fund and LoCorr Market Trend Fund – Notes to Consolidated Financial Statements / LoCorr Dynamic Equity Fund and LoCorr Spectrum Income Fund – Notes to Financial Statements (continued |
| | |
0 oFinancial Statements (continued)
The following table summarizes LoCorr Long/Short Commodities Strategy Fund’s consolidated investments and swap contracts as of December 31, 2018:
Security Classification | | Level 1 | | | Level 2 | | | Level 3 | | | Total | |
Investments | | | | | | | | | | | | |
Asset Backed Securities | | $ | — | | | $ | 40,140,533 | | | $ | — | | | $ | 40,140,533 | |
Corporate Bonds | | | — | | | | 65,594,515 | | | | — | | | | 65,594,515 | |
Foreign Government Bond | | | — | | | | 9,827 | | | | — | | | | 9,827 | |
Mortgage Backed Securities | | | — | | | | 27,097,419 | | | | — | | | | 27,097,419 | |
Municipal Bonds | | | — | | | | 103,115 | | | | — | | | | 103,115 | |
U.S. Government Agency Issues | | | — | | | | 28,465,314 | | | | — | | | | 28,465,314 | |
U.S. Government Notes | | | — | | | | 21,195,449 | | | | — | | | | 21,195,449 | |
Short Term Investments | | | 11,227,652 | | | | 13,702,844 | | | | — | | | | 24,930,496 | |
Total Investments | | $ | 11,227,652 | | | $ | 196,309,016 | | | $ | — | | | $ | 207,536,668 | |
| | | | | | | | | | | | | | | | |
Swap Contracts* | | | | | | | | | | | | | | | | |
Long Total Return Swap Contracts | | $ | — | | | $ | 4,363,946 | | | $ | — | | | $ | 4,363,946 | |
Total Swap Contracts | | $ | — | | | $ | 4,363,946 | | | $ | — | | | $ | 4,363,946 | |
See the Fund’s consolidated schedule of investments for the investments detailed by industry classification.
*The fair value of the Fund’s investment in swap contracts represents the net unrealized appreciation at December 31, 2018.
The LoCorr Long/Short Commodities Strategy Fund did not hold any Level 3 assets during the year.
The following table summarizes LoCorr Market Trend Fund’s consolidated investments and other financial instruments as of December 31, 2018:
Security Classification | | Level 1 | | | Level 2 | | | Level 3 | | | Total | |
Investments | | | | | | | | | | | | |
Asset Backed Securities | | $ | — | | | $ | 84,873,462 | | | $ | — | | | $ | 84,873,462 | |
Mortgage Backed Securities | | | — | | | | 36,271,867 | | | | — | | | | 36,271,867 | |
Municipal Bond | | | — | | | | 1,106,229 | | | | — | | | | 1,106,229 | |
U.S. Government Agency Issues | | | — | | | | 136,933,154 | | | | — | | | | 136,933,154 | |
U.S. Government Notes | | | — | | | | 28,397,438 | | | | — | | | | 28,397,438 | |
Short Term Investment | | | 15,074,667 | | | | — | | | | — | | | | 15,074,667 | |
Total Investments | | $ | 15,074,667 | | | $ | 287,582,150 | | | $ | — | | | $ | 302,656,817 | |
| | | | | | | | | | | | | | | | |
Other Financial Instruments* | | | | | | | | | | | | | | | | |
Forward Currency Contracts | | | | | | | | | | | | | | | | |
Purchase | | $ | — | | | $ | 865,030 | | | $ | — | | | $ | 865,030 | |
Sale | | | — | | | | (3,371,254 | ) | | | — | | | | (3,371,254 | ) |
Total Forward Currency Contracts | | | — | | | | (2,506,224 | ) | | | — | | | | (2,506,224 | ) |
Futures Contracts | | | | | | | | | | | | | | | | |
Long | | | (5,756,551 | ) | | | — | | | | — | | | | (5,756,551 | ) |
Short | | | 1,867,397 | | | | — | | | | — | | | | 1,867,397 | |
Total Futures Contracts | | | (3,889,154 | ) | | | — | | | | — | | | | (3,889,154 | ) |
Total Other Financial Instruments | | $ | (3,889,154 | ) | | $ | (2,506,224 | ) | | $ | — | | | $ | (6,395,378 | ) |
See the Fund’s consolidated schedule of investments for the investments detailed by industry classification.
*The fair value of the Fund’s other financial instruments represent the net unrealized appreciation (depreciation) at December 31, 2018.
The LoCorr Market Trend Fund did not hold any Level 3 assets during the year.
| | |
| | |
LoCorr Macro Strategies Fund, LoCorr Long/Short Commodities Strategy Fund and LoCorr Market Trend Fund – Notes to Consolidated Financial Statements / LoCorr Dynamic Equity Fund and LoCorr Spectrum Income Fund – Notes to Financial Statements (continued) | | 81 |
| | |
nts (continued
The following table summarizes LoCorr Dynamic Equity Fund’s investments and securities sold short as of December 31, 2018:
| 81
| Security Classification | | Level 1 | | | Level 2 | | | Level 3 | | | Total | |
| Investments | | | | | | | | | | | | |
| Common Stocks | | $ | 22,142,679 | | | $ | — | | | $ | — | | | $ | 22,142,679 | |
| Real Estate Investment Trusts | | | 951,035 | | | | — | | | | — | | | | 951,035 | |
| Short Term Investmen | | | 3,425,866 | | | | — | | | | — | | | | 3,425,866 | |
| Total Investments | | $ | 26,519,580 | | | $ | — | | | $ | — | | | $ | 26,519,580 | |
| | | | | | | | | | | | | | | | | |
| Securities Sold Short | | | | | | | | | | | | | | | | |
| Common Stocks | | $ | (3,560,433 | ) | | $ | — | | | $ | — | | | $ | (3,560,433 | ) |
| Exchange Traded Funds | | | (1,125,922 | ) | | | — | | | | — | | | | (1,125,922 | ) |
| Total Securities Sold Short | | $ | (4,686,355 | ) | | $ | — | | | $ | — | | | $ | (4,686,355 | ) |
See the Fund’s schedule of investments and schedule of securities sold short for detail by industry classification.
The LoCorr Dynamic Equity Fund did not hold any Level 3 assets or liabilities during the year.
The following table summarizes LoCorr Spectrum Income Fund’s investments as of December 31, 2018:
| Security Classification | | Level 1 | | | Level 2 | | | Level 3 | | | Total | |
| Investments | | | | | | | | | | | | |
| Business Development Companiesjm | | $ | 6,324,542 | | | $ | — | | | $ | — | | | $ | 6,324,542 | |
| Closed—End Investment Companies | | | 9,814,702 | | | | — | | | | — | | | | 9,814,702 | |
| Common Stocks | | | 13,081,541 | | | | — | | | | — | | | | 13,081,541 | |
| Master Limited Partnerships | | | 15,441,714 | | | | — | | | | — | | | | 15,441,714 | |
| Preferred Stocks | | | 1,391,488 | | | | 872,200 | | | | — | | | | 2,263,688 | |
| Publicly Traded Partnerships | | | 5,363,678 | | | | — | | | | — | | | | 5,363,678 | |
| Real Estate Investment Trusts | | | 14,394,973 | | | | — | | | | — | | | | 14,394,973 | |
| Short Term Investment | | | 1,829,205 | | | | — | | | | — | | | | 1,829,205 | |
| Total Investments | | $ | 67,641,843 | | | $ | 872,200 | | | $ | — | | | $ | 68,514,043 | |
See the Fund’s schedule of investments for detail by industry classification.
The LoCorr Spectrum Income Fund did not hold any Level 3 assets during the year.
Allocation of Income and Expenses
Net investment income, other than class specific expenses, and realized and unrealized gains and losses are allocated daily to each class of shares based upon the relative NAV of outstanding shares of each class of shares at the beginning of the day (after adjusting for the current capital shares activity of the respective class). Expenses associated with a specific Fund in the Trust are charged to that Fund. Common expenses are typically allocated based upon the relative net assets of each Fund, or by other equitable means.
Deposits with Broker
Forward Currency and Futures Contracts
When trading derivative instruments, such as forward or futures contracts, a Fund is only required to post initial or variation margin with the exchange or clearing broker. The use of margin in trading these instruments has the effect of creating leverage, which can expose the Fund to substantial gains or losses occurring from relatively small price changes in the value of the underlying instrument and can increase the volatility of the Fund’s returns. Volatility is a statistical measure of the dispersion of returns of an investment, where higher volatility generally indicates greater risk. At December 31, 2018, the LoCorr Macro Strategies Fund and the LoCorr Market Trend Fund pledged cash and cash equivalents, defined as short-term, highly liquid investments that are readily convertible to known amounts of cash, at U.S. Bank, N.A. (“U.S. Bank”) of $14,580,000 and $19,110,000, respectively, to Bank of America Merrill Lynch for each Fund’s investment in forward currency contracts.
Upon entering into a futures contract, and to maintain the Fund’s open positions in futures contracts, the Fund is required to deposit with its custodian or futures broker in a segregated account in the name of the futures broker an amount of cash, U.S. government securities, suitable money market instruments, or other liquid securities, known as “initial margin.” The margin required for a particular futures contract is set by the exchange on which the contract is traded, and may be significantly modified from time to time by the exchange during the term of the contract. Futures contracts are customarily purchased and sold on margins that may range upward from less than 5% of the value of the contract being traded.
| | |
| | |
82 | | LoCorr Macro Strategies Fund, LoCorr Long/Short Commodities Strategy Fund and LoCorr Market Trend Fund – Notes to Consolidated Financial Statements / LoCorr Dynamic Equity Fund and LoCorr Spectrum Income Fund – Notes to Financial Statements (continued) |
| | |
At December 31, 2018, the LoCorr Macro Strategies Fund and LCMFS, collectively, had $25,019,912 in cash and cash equivalents on deposit with the broker for derivative instruments which is presented on the Fund’s consolidated statement of assets and liabilities. In addition, LCMFS pledged securities with a fair value of $11,911 as collateral for derivative instruments.
At December 31, 2018, the LoCorr Market Trend Fund and LCMT, collectively, had $25,518,097 in cash and cash equivalents on deposit with the broker for derivative instruments which is presented on the Fund’s consolidated statements of assets and liabilities. In addition, LCMT pledged securities with a fair value of $360,027 as collateral for derivative instruments.
If the price of an open futures contract changes (by increase in underlying instrument or index in the case of a sale or by decrease in the case of a purchase) so that the loss on the futures contract reaches a point at which the margin on deposit does not satisfy margin requirements, the broker will require an increase in the margin. However, if the value of a position increases because of favorable price changes in the futures contract so that the margin deposit exceeds the required margin, the broker will pay the excess to the Fund.
These subsequent payments, called “variation margin,” to and from the futures broker (with the exception of futures contracts traded on the London Metal Exchange (“LME”)), are made on a daily basis as the price of the underlying assets fluctuate making the long and short positions in the futures contract more or less valuable, a process known as “marking to the market.” The variation margin on LME futures contracts do not settle daily, but rather settle at their respective maturity dates. At period end, the unrealized appreciation and depreciation on LME futures contracts is shown as receivable for unsettled open futures contracts and payable for unsettled open futures contracts, respectively, on the Funds’ consolidated statements of assets and liabilities. The Funds expect to earn interest income on any margin deposits.
Securities Sold Short
At December 31, 2018, the LoCorr Dynamic Equity Fund had cash on deposit with Morgan Stanley and J.P. Morgan in the amount of $4,007,728. In addition, at December 31, 2018, the LoCorr Dynamic Equity Fund pledged cash of $3,500,000 as collateral for securities sold short.
Swap Contracts
LCLSCS has a substantial portion of its assets on deposit with Deutsche Bank in connection with its trading of its swap contract. Assets deposited with Deutsche Bank in connection with the trading of the swap contract for LCLSCS are partially restricted due to deposit requirements. At December 31, 2018, the LoCorr Long/Short Commodities Strategy Fund had cash and cash equivalents on deposit with Deutsche Bank in the amount of $26,547,996, which is presented on the consolidated statements of assets and liabilities. In addition, at December 31, 2018, LCLSCS pledged securities with a fair value of $467,473 as collateral for the swap contract. Risks arise from the possible inability of the counterparty to meet the terms of its contract and may increase if the counterparty’s financial condition worsens.
Distributable Earnings and Investment Transactions
Net investment income and net realized gains (losses) may differ for financial reporting and tax purposes because of temporary or permanent book/tax differences. To the extent these differences are permanent; reclassifications are made to the appropriate equity accounts in the period that the difference arises.
Additionally, GAAP requires that certain components of net assets relating to permanent differences be reclassified between financial and tax reporting. These reclassifications have no effect on net assets or NAV per share. See Note 7.
Distributions from Earnings
Shareholder transactions are recorded on trade date. Dividends from net investment income are declared and paid at least annually by the Funds. Distribution of net realized capital gains, if any, are declared and paid at least annually. Distributions to shareholders are recorded on the ex-dividend date. The character of distributions made during the periods from net investment income or net realized gains may differ from the characterization for federal income tax purposes due to the difference in the recognition of income, expense and gain items for financial statement and tax purposes.
In 2018, dividends for the LoCorr Spectrum Income Fund were distributed monthly. The estimated characterization of the distributions paid will be an ordinary dividend, qualified dividend or return of capital. This estimate is based on each Fund’s operating results during the period. It is anticipated that a significant portion of the distributions of the Funds’ investments in MLP and certain investments in REITs and royalty trusts will be comprised of return of capital as a result of the tax character of cash distributions made by each Fund’s investments. The actual characterization of the distributions made during the period is not determined until after the end of the fiscal year.
| | |
| | |
LoCorr Macro Strategies Fund, LoCorr Long/Short Commodities Strategy Fund and LoCorr Market Trend Fund – Notes to Consolidated Financial Statements / LoCorr Dynamic Equity Fund and LoCorr Spectrum Income Fund – Notes to Financial Statements (continued) | | 83 |
| | |
The tax character of distributions paid during the periods was as follows:
| | | Year Ended December 31, 2018 | |
Fund
| | Ordinary Income | | | Long-Term
Capital Gains | | | Return of
Capital | |
| LoCorr Macro Strategies Fund | | $ | 17,125,045 | | | $ | — | | | $ | — | |
| LoCorr Long/Short Commodities Strategy Fund | | | 23,586,033 | | | | — | | | | — | |
| LoCorr Dynamic Equity Fund | | | — | | | | 1,162,325 | | | | — | |
| LoCorr Spectrum Income Fund | | | 2,900,053 | | | | — | | | | 3,468,877 | |
| | | Year Ended December 31, 2017 | |
Fund
| | Ordinary Income | | | Long-Term Capital Gains | | | Return of Capital | |
| LoCorr Macro Strategies Fund | | $ | 33,327,921 | | | $ | 12,049,157 | | | $
| — | |
| LoCorr Long/Short Commodities Strategy Fund | | | 16,544 | | | | — | | | | — | |
| LoCorr Dynamic Equity Fund | | | — | | | | 2,740,499 | | | | — | |
| LoCorr Spectrum Income Fund | | | 2,095,838 | | | | — | | | | 5,926,620 | |
Federal Income Taxes
The Funds intend to qualify as regulated investment companies pursuant to Subchapter M of the Internal Revenue Code of 1986, as amended. The Funds intend to distribute substantially all of their investment company net taxable income and net capital gains to shareholders. Therefore, no federal income tax provision is required.
As of and during the year ended December 31, 2018, the Funds did not have any tax positions that did not meet the “more-likely-than-not” threshold of being sustained by applicable tax authorities. The Funds recognize interest and penalties, if any, related to unrecognized tax benefits on uncertain tax positions as interest or other expense in the statements of operations. During the year ended December 31, 2018, the Funds did not incur any interest or penalties.
For tax purposes, LCMFS, LCLSCS and LCMT are exempted Cayman Islands investment companies. LCMFS, LCLSCS and LCMT have each received an undertaking from the Government of the Cayman Islands exempting them from all local income, profits, and capital gains taxes. No such taxes are levied in the Cayman Islands at the present time. For U.S. income tax purposes, LCMFS, LCLSCS and LCMT are controlled foreign corporations (“CFCs”) and as such are not subject to U.S. income tax. However, as a wholly-owned CFC, the net income and capital gain of each CFC, to the extent of its earnings and profits, will be included each year in the respective Funds’ investment company taxable income.
Foreign Securities and Currency
Investment securities and other assets and liabilities denominated in foreign currencies are translated into U.S. dollar amounts at the date of valuation. Purchases and sales of investment securities and income and expense items denominated in foreign currencies are translated into U.S. dollar amounts on the respective dates of such transactions.
The Funds do not isolate that portion of the results of operations resulting from changes in foreign exchange rates on investments from the fluctuations arising from changes in market prices of securities held. Such fluctuations are included with the net realized and unrealized gain or loss from investments.
Reported net realized foreign exchange gains or losses arise from sales of foreign currencies, currency gains or losses realized between the trade and settlement dates on securities transactions, and the difference between the amounts of dividends, interest, and foreign withholding taxes recorded on the Funds’ books and the U.S. dollar equivalent of the amounts actually received or paid. Net unrealized foreign exchange gains and losses arise from changes in the fair values of assets and liabilities, other than investments in securities at period end, resulting from changes in exchange rates.
Forward Currency Contracts
Gains or losses are realized when foreign currency contracts are liquidated. Any change in net unrealized gain or loss is reported in the statements of operations.
Futures Contracts
A futures contract provides for the future sale by one party and purchase by another party of a specified amount of a specific financial instrument (e.g., units of a stock index) for a specified price, date, time and place designated at the time the contract is made. Brokerage fees are incurred when a futures contract is bought or sold and margin deposits must be maintained. Entering into a contract to buy is commonly referred to as buying or purchasing a contract or holding a long position. Entering into a contract to sell is commonly referred to as selling a contract or holding a short position.
| | |
| | |
84 | | LoCorr Macro Strategies Fund, LoCorr Long/Short Commodities Strategy Fund and LoCorr Market Trend Fund – Notes to Consolidated Financial Statements / LoCorr Dynamic Equity Fund and LoCorr Spectrum Income Fund – Notes to Financial Statements (continued) |
| | |
Unlike when a Fund purchases or sells a security, no price would be paid or received by the Fund upon the purchase or sale of a futures contract.
Although certain futures contracts, by their terms, require actual future delivery of and payment for the underlying instruments, in practice most futures contracts are usually closed out before the delivery date. Gains or losses are realized when contracts are liquidated. Closing out an open futures contract purchase or sale is affected by entering into an offsetting futures contract sale or purchase, respectively, for the same aggregate amount of the identical underlying instrument or index and the same delivery date. If the offsetting purchase price is less than the original sale price, the Fund realizes a gain; if it is more, the Fund realizes a loss. Conversely, if the offsetting sale price is more than the original purchase price, the Fund realizes a gain; if it is less, the Fund realizes a loss.
The transaction costs must also be included in these calculations. There can be no assurance, however, that a Fund will be able to enter into an offsetting transaction with respect to a particular futures contract at a particular time. If a Fund is not able to enter into an offsetting transaction, the Fund will continue to be required to maintain the margin deposits on the futures contract.
Any change in net unrealized gain or loss is reported in the statements of operations.
Indemnifications
In the normal course of business, the Funds enter into contracts that contain general indemnifications to other parties. The Funds’ maximum exposure under these contracts is unknown as this would involve future claims that may be made against the Funds that have not yet occurred. However, based on experience, the Funds expect the risk of loss to be remote.
Market and Credit Risks
The Funds may engage in the speculative trading of U.S. and foreign futures, forward currency and swap contracts (collectively, “derivatives”). The Funds are exposed to both market risk, which is the risk arising from changes in the fair value of the contracts and credit risk, which is the risk of failure by another party to perform according to the terms of a contract.
Purchase and sale of futures contracts requires margin deposits with the broker. Additional deposits may be necessary for any loss on contract value. The Commodity Exchange Act requires a broker to segregate all customer ransactions and assets from such broker’s proprietary activities. A customer’s cash and other property (for example, U.S. government securities) deposited with a broker are considered commingled with all other customer funds subject to the broker’s segregation requirements. In the event of a broker’s insolvency, recovery may be limited to a pro rata share of segregated funds available. It is possible that the recovered amount could be less than total cash and other property deposited.
For derivatives, risks arise from changes in the fair value of the contracts. Theoretically, the Funds are exposed to a market risk equal to the notional contract value of swap, futures and forward currency contracts purchased and unlimited liability on such contracts sold short.
The Funds also engage in investing its assets in U.S. government securities. Risks arise from investments in U.S. government securities due to possible market illiquidity. U.S. government securities are also sensitive to changes in interest rates and economic conditions.
The Funds have established procedures to actively monitor market risk and minimize credit risk, although there can be no assurance that they will, in fact, succeed in doing so.
New Accounting Pronouncements and/or SEC Regulatory Updates
In August 2018, the SEC issued Final Rule Release No. 33-10532, Disclosure Update and Simplification, which in part amends certain disclosure requirements of Regulation S-X that have become redundant, duplicative, overlapping, outdated, or superseded, in light of other Commission disclosure requirements, GAAP, or changes in the information environment. The amendments are intended to facilitate the disclosure of information to investors and simplify compliance without significantly altering the total mix of information provided to investors. The effective date for these disclosures was November 5, 2018. Management has adopted these amendments as currently required and these are reflected in the Funds’ financial statements and related disclosures. Certain prior year information has been adjusted to conform with these amendments.
In August 2018, FASB issued Accounting Standards Update No. 2018-13, Fair Value Measurement (Topic 820): Disclosure Framework—Changes to the Disclosure Requirements for Fair Value Measurement (“ASU 2018-13”). The primary focus of ASU No. 2018-13 is to improve the effectiveness of the disclosure requirements for fair value measurements. The changes affect all companies that are required to include fair value measurement disclosures. In general, the amendments in ASU 2018-13 are effective for all entities for fiscal years and interim periods within those fiscal years, beginning after December 15, 2019. An entity is permitted to early adopt the removed or modified disclosures upon the issuance of ASU No. 2018-13 and may delay adoption of the additional disclosures, which are required for public companies only, until their effective date. Management has chosen to early adopt the eliminated or modified disclosures for the year ended December 31, 2018.
In March 2017, FASB issued Accounting Standards Update (“ASU 2017-08”) No. 2017-08, Receivables—Nonrefundable Fees and Other Costs (Subtopic 310-20): Premium Amortization of Purchased Callable Debt Securities. The amendments in the ASU 2017-08 shorten the amortization period for certain callable debt securities, held at a premium, to be amortized to the earliest call date. The ASU 2017-08 does not require an accounting change for securities held at a discount; which continues to be amortized to maturity. The ASU 2017-08 is effective for fiscal years and interim periods within those fiscal years beginning after December 15, 2018. Management is currently evaluating the impact, if any, of applying this provision.
Options on Securities
The Funds may purchase and write (i.e., sell) put and call options. Such options may relate to particular securities or stock indices, and may or may not be listed on a domestic or foreign securities exchange and may or may not be issued by the Options Clearing Corporation. Option trading is a highly specialized activity that entails greater than ordinary investment risk. Options may be more volatile than the underlying instruments, and therefore, on a percentage basis, an investment in options may be subject to greater fluctuation than an investment in the underlying instruments themselves.
| | |
| | |
LoCorr Macro Strategies Fund, LoCorr Long/Short Commodities Strategy Fund and LoCorr Market Trend Fund – Notes to Consolidated Financial Statements / LoCorr Dynamic Equity Fund and LoCorr Spectrum Income Fund – Notes to Financial Statements (continued) | | 85 |
| | |
A call option for a particular security gives the purchaser of the option the right to buy, and the writer (seller) the obligation to sell, the underlying security at the stated exercise price at any time prior to the expiration of the option, regardless of the market price of the security. The premium paid to the writer is in consideration for undertaking the obligation under the option contract. A put option for a particular security gives the purchaser the right to sell the security at the stated exercise price at any time prior to the expiration date of the option, regardless of the market price of the security.
A Fund’s obligation to sell an instrument subject to a call option written by it, or to purchase an instrument subject to a put option written by it, may be terminated prior to the expiration date of the option by the Fund’s execution of a closing purchase transaction, which is effected bypurchasing on an exchange an option of the same series (i.e., same underlying instrument, exercise price and expiration date) as the option previously written. A closing purchase transaction will ordinarily be effected to realize a profit on an outstanding option, to prevent an underlying instrument from being called, to permit the sale of the underlying instrument or to permit the writing of a new option containing different terms on such underlying instrument. The cost of such a liquidation purchase plus transactions costs may be greater than the premium received upon the original option, in which event the Fund will have incurred a loss in the transaction. There is no assurance that a liquid secondary market will exist for any particular option. An option writer unable to effect a closing purchase transaction will not be able to sell the underlying instrument or liquidate the assets held in a segregated account, as described below, until the option expires or the optioned instrument is delivered upon exercise. In such circumstances, the writer will be subject to the risk of market decline or appreciation in the instrument during such period.
If an option purchased by a Fund expires unexercised, the Fund realizes a loss equal to the premium paid. If a Fund enters into a closing sale transaction on an option purchased by it, the Fund will realize a gain if the premium received by the Fund on the closing transaction is more than the premium paid to purchase the option or a loss if it is less. If an option written by a Fund expires on the stipulated expiration date or if the Fund enters into a closing purchase transaction, it will realize a gain (or loss if the cost of a closing purchase transaction exceeds the net premium received when the option is sold). If an option written by the Fund is exercised, the proceeds of the sale will be increased by the net premium originally received and the Fund will realize a gain or loss.
Security Transactions and Investment Income
Security transactions are recorded on trade date. Generally, realized gains and losses on sales of investments are calculated on the specifically identified cost basis of the securities.
In accordance with the investment restrictions outlined within the Funds’ respective prospectuses, each Fund may invest up to 15% of its net assets in illiquid securities. Illiquid securities may include securities subject to contractual or legal restrictions on resale (e.g., because they have not been registered under the Securities Act) and securities that are otherwise not readily marketable (e.g., because trading in the security is suspended or because market makers do not exist or will not entertain bids or offers). Securities that have not been registered under the Securities Act are referred to as private investments or restricted securities and are purchased directly from the issuer or in the secondary market. Foreign securities that are freely tradable in their principal markets are not considered to be illiquid. Under guidelines adopted by the Trust’s Board, the Adviser of the Funds may determine that particular Rule 144A securities, and commercial paper issued in reliance on the private placement exemption from registration afforded by Section 4(a)(2) of the Securities Act, are liquid even though they are not registered. At December 31, 2018, the Adviser deemed all of the 144A securities held in the LoCorr Macro Strategies Fund, the LoCorr Long/Short Commodities Strategy Fund and the LoCorr Market Trend Fund to be liquid. At December 31, 2018, there were no illiquid or restricted securities held in the LoCorr Dynamic Equity Fund or the LoCorr Spectrum Income Fund.
Dividend income, less foreign taxes withheld, if any, are recorded on the ex-dividend date.
Distributions received from the investments in MLP interests, REITs, private investments, closed end funds, business development companies and royalty trusts generally are comprised of ordinary income, capital gains and return of capital. For financial statement purposes, the Funds use estimates to characterize these distributions received as return of capital, capital gains or ordinary income. Such estimates are based on historical information available from each MLP, REIT, private investment, closed end fund, business development company or royalty trust and other industry sources. These estimates may subsequently be revised based on information received from the MLP, REIT, private investment, closed end fund, business development company or royalty trust after their tax reporting periods are concluded, as the actual character of these distributions is not known until after the fiscal year end of the Funds. The distributions received from the MLP, REIT, private investment, closed end fund, business development company and royalty trust securities that have been classified as income and capital gains are included in investment income and net realized gain (loss) on investments, respectively, on the statements of operations. The distributions received that are classified as return of capital reduce the cost of investments on the statements of assets and liabilities.
Interest income and expense are recognized on the accrual basis. Market discounts, premiums and original issue discounts on fixed-income securities are amortized daily over the expected life of the security using the effective yield method.
Short Sales
The Funds may sell securities short. A short sale is a transaction in which a Fund sells a security it does not own or have the right to acquire (or that it owns but does not wish to deliver) in anticipation that the market price of that security will decline.
When a Fund makes a short sale, the broker-dealer through which the short sale is made must borrow the security sold short and deliver it to the party purchasing the security. The Funds are required to make a margin deposit in connection with such short sales; the Funds may have to pay a fee to borrow particular securities and will often be obligated to pay over any dividends and accrued interest on borrowed securities.
If the price of the security sold short increases between the time of the short sale and the time a Fund covers its short position, the Fund will incur a loss; conversely, if the price declines, the Fund will realize a gain. A gain, limited to the price at which the Fund sold the security short, or a loss, unlimited in size, will be recognized upon the close of a short sale. Any gain will be decreased, and any loss increased, by the transaction costs described above. The successful use of short selling may be adversely affected by imperfect correlation between movements in the price of the security sold short and the securities being hedged. Gains or losses from closed positions of securities sold short are presented as net realized gain or loss on securities sold short on the statements of operations.
| | |
| | |
86 | | LoCorr Macro Strategies Fund, LoCorr Long/Short Commodities Strategy Fund and LoCorr Market Trend Fund – Notes to Consolidated Financial
Statements / LoCorr Dynamic Equity Fund and LoCorr Spectrum Income Fund – Notes to Financial Statements (continued) |
| | |
In addition, the Funds are required to pay the lender any dividends declared on short positions. Dividends declared on open short positions are recorded on ex-date and shown as an expense for financial reporting purposes. To borrow the security, the Funds also may be required to pay fees, which are shown as an expense for financial reporting purposes.
To the extent the Funds sell securities short, it will provide collateral to the broker-dealer and (except in the case of short sales “against the box”) will maintain additional asset coverage in the form of cash, U.S. government securities or other liquid securities with its custodian in a segregated account in an amount at least equal to the difference between the current fair value of the securities sold short and any amounts required to be deposited as collateral with the selling broker (not including the proceeds of the short sale). A short sale is “against the box” to the extent the Funds contemporaneously own, or have the right to obtain at no added cost, securities identical to those sold short. Short sales are collateralized by cash deposits with the counterparty broker and pledged securities held at the custodian, U.S. Bank. The collateral required is determined daily by reference to the fair value of the short positions.
Total Return Swap Contracts
The Funds may enter into total return swap agreements. A total return swap entered into by the Funds is a derivative contract that transfers the market risk of underlying portfolios of futures contracts, forward currency contracts and foreign currencies (considered the “index” within each total return swap contract) between counterparties. The “notional amount” of each total return swap agreement is the agreed upon amount or value of the index used for calculating the returns that the parties to a swap agreement have agreed to exchange. The total return swaps are marked to market daily and any change is recorded in unrealized gain/loss on the consolidated statements of operations based on the value of the index on which the total return swap is referenced, as defined within the total return swap agreement between the counterparties. The composition of the index may vary based on how the underlying portfolio of futures contracts, forward currency contracts and foreign currencies is traded. A Fund’s obligation under a total return swap agreement, including any related fees, offset against amounts owed to the Fund in the case of positive performance, will be covered by designating liquid assets on the Fund’s books and records (see the consolidated statement of assets and liabilities for deposits with broker for derivative instruments). Gains or losses will be realized when the total return swap contracts are liquidated and will be presented as net realized gain or loss on swap contracts on the consolidated statements of operations. Changes in notional value and any cash holding adjustments, which represent Voluntary realizations by a Fund of swap value at any point in time, are also presented as net realized gain or loss on swap contracts on the consolidated statements of operations. Further, any cash holding adjustments realized by a Fund are subject to interest charges, which are recorded as part of unrealized gain/loss on the consolidated statements of operations. A corresponding asset or liability for “advance receipt on swap contracts” or “advance payment on swap contracts,” respectively, is recorded on the consolidated statements of assets and liabilities for the gain or loss realized on changes in notional value. Total return swaps outstanding at period end, if any, are listed after the Funds’ consolidated schedules of investments.
Use of Estimates
The preparation of financial statements in conformity with GAAP requires management to make estimates and assumptions that affect the reported amounts of assets and liabilities, disclosure of contingent assets and liabilities at the date of the financial statements and the reported revenues and expenses during the reporting period. Actual results could differ from those estimates.
Warrants
The Funds may invest in warrants. Warrants are options to purchase common stock at a specific price (usually at a premium above the market value of the optioned common stock at issuance) valid for a specific period of time. Warrants may have a life ranging from less than one year to twenty years, or they may be perpetual. However, most warrants have expiration dates after which they are worthless. In addition, a warrant is worthless if the market price of the common stock does not exceed the warrant’s exercise price during the life of the warrant. Warrants have no voting rights, pay no dividends and have no rights with respect to the assets of the corporation issuing them. The percentage increase or decrease in the market price of the warrant may tend to be greater than the percentage increase or decrease in the market price of the optioned common stock.
3. Derivative and Other Financial Instruments
The Funds may invest in derivatives such as futures, forward currency and swap contracts, in order to hedge against market movements while liquidating certain positions and buying other securities or as substitutes for securities, as well as for speculative purposes to gain exposure to such market movements.
The Funds’ market risk related to their derivatives trading is influenced by a wide variety of factors, including the level and volatility of interest rates, exchange rates, weather, supply and demand of commodities, the market value of futures and forward currency contracts, the diversification effects among the Funds’ open positions and the liquidity of the markets in which they trade.
The following are the primary trading risk exposures by market sector of the Funds as encompassed in the total return swap contracts:
Agricultural. ( grains, livestock and softs). The Funds’ primary exposure is to agricultural price movements which are often directly affected by severe or unexpected weather conditions.
Currencies. Exchange rate risk is a principal market exposure of the Funds. The Funds’ currency exposure is to exchange rate fluctuations, primarily fluctuations which disrupt the historical pricing relationships between different currencies and currency pairs. The fluctuations are influenced by interest rate changes as well as political and general economic conditions. The Funds trade in a large number of currencies including cross-rates - e.g., positions between two currencies other than the U.S. dollar.
| | |
| | |
LoCorr Macro Strategies Fund, LoCorr Long/Short Commodities Strategy Fund and LoCorr Market Trend Fund – Notes to Consolidated FinancialStatements / LoCorr Dynamic Equity Fund and LoCorr Spectrum Income Fund – Notes to Financial Statements (continued) | | 87 |
| | |
Energy. The Funds’ primary energy market exposure is to gas and oil price movements, often resulting from political developments in the Middle East and economic conditions worldwide. Energy prices are volatile and substantial profits and losses have been and are expected to continue to be experienced in this market.
Interest rates. Interest rate movements directly affect the price of the sovereign bond futures positions held by the Funds and indirectly the value of its stock index currency positions. Interest rate movements in one country as well as relative interest rate movements between countries may materially impact the Funds’ profitability. The Funds’ primary interest rate exposure is to interest rate fluctuations in countries or regions including Australia, Canada, Japan, Switzerland, the United Kingdom, the United States and the Eurozone. However, the Funds also may take positions in futures contracts on the government debt of other nations. The Funds anticipate that interest rates in these industrialized countries or areas, both long-term and short-term, will remain a primary market exposure of the Funds for the foreseeable future.
Metals. The Funds’ metals market exposure is to fluctuations in the price of aluminum, copper, gold, lead, nickel, palladium, tin, silver and zinc.
Stock index. The Funds’ equity exposure, through stock index futures, is to equity price risk in the major industrialized countries as well as other countries.
At December 31, 2018, the LoCorr Macro Strategies Fund, the LoCorr Long/Short Commodities Strategy Fund and the LoCorr Market Trend Fund held derivative and other financial instruments which are not subject to a master netting arrangement. As the tables below illustrate, no positions are netted in these consolidated financial statements.
| LoCorr Macro Strategies Fund - December 31, 2018 | | | | | | | | | | |
| Assets: | | | | | | | | | | | Gross Amounts not offset in the
Consolidated Statement of Assets & Liabilities | | | | |
| Description | | Gross Amounts of
Recognized Assets | | | Gross Amounts
Offset in the
Consolidated
Statement of
Assets & Liabilities | | | Net Amounts
Presented in the
Consolidated
Statement of
Assets & Liabilities | | | Financial
Instruments | | | Collateral Pledged
(Received) | | | Net Amount | |
| Forward currency contracts | | $ | 6,883,983 | | | $ | — | | | $ | 6,883,983 | | | $ | — | | | $ | — | | | $ | 6,883,983 | |
| Futures contracts | | | 1,485,551 | | | | — | | | | 1,485,551 | | | | — | | | | — | | | | 1,485,551 | |
| Total | | $ | 8,369,534 | | | $ | — | | | $ | 8,369,534 | | | $ | — | | | $ | — | | | $ | 8,369,534 | |
Liabilities:
| | | | | | | | | | | Gross Amounts not offset in the
Consolidated Statement of Assets & Liabilities | | | | |
| Description | | Gross Amounts
of Recognized
Liabilities | | | Gross Amounts
Offset in the
Consolidated
Statement of
Assets & Liabilities | | | Net Amounts
Presented in the
Consolidated
Statement of
Assets & Liabilities | | | Financial
Instruments | | | Collateral Received
(Pledged) | | | Net Amount | |
| Forward currency contracts | | $ | 7,811,265 | | | $ | — | | | $ | 7,811,265 | | | $ | — | | | $ | (7,811,265 | ) | | $ | — | |
| Futures contracts | | | 1,944,228 | | | | — | | | | 1,944,228 | | | | — | | | | (1,944,228 | ) | | | — | |
| Total | | $ | 9,755,493 | | | $ | — | | | $ | 9,755,493 | | | $ | — | | | $ | (9,755,493 | ) | | $ | — | |
| LoCorr Long/Short Commodities Strategy Fund - December 31, 2018 |
| Assets: | | | | | | | | | | | Gross Amounts not offset in the
Consolidated Statement of Assets & Liabilities | | | | |
| Description | | Gross Amounts of Recognized Assets | | | Gross Amounts
Offset in the
Consolidated
Statement of
Assets & Liabilities | | | Net Amounts
Presented in the
Consolidated
Statement of
Assets & Liabilities | | | Financial
Instruments | | | Collateral Pledged
(Received) | | | Net Amount | |
| Swap Contracts* | | $ | 14,782,678 | | | $ | — | | | $ | 14,782,678 | | | $ | — | | | $ | — | | | $ | 14,782,678 | |
| Total | | $ | 14,782,678 | | | $ | — | | | $ | 14,782,678 | | | $ | — | | | $ | — | | | $ | 14,782,678 | |
*Includes advance receipt on swap contracts.
| | |
| | |
88 | | LoCorr Macro Strategies Fund, LoCorr Long/Short Commodities Strategy Fund and LoCorr Market Trend Fund – Notes to Consolidated Financial Statements / LoCorr Dynamic Equity Fund and LoCorr Spectrum Income Fund – Notes to Financial Statements (continued) |
| | |
| LoCorr Market Trend Fund - December 31, 2018 | | | | | | | | | | | | | | | | |
| Assets: | | | | | | | | | | | Gross Amounts not offset in the Consolidated Statement of Assets & Liabilities | | | | |
| Description | | Gross Amounts of Recognized Assets | | | Gross Amounts Offset in the Consolidated Statement of Assets & Liabilities | | | Net Amounts Presented in the Consolidated Statement of Assets & Liabilities | | | Financial Instruments | | | Collateral Pledged (Received) | | | Net Amount | |
| Forward currency contracts | | $ | 4,999,703 | | | $ | — | | | $ | 4,999,703 | | | $ | — | | | $ | — | | | $ | 4,999,703 | |
| Futures contracts | | | 3,047,698 | | | | — | | | | 3,047,698 | | | | — | | | | — | | | | 3,047,698 | |
| Total | | $ | 8,047,401 | | | $ | — | | | $ | 8,047,401 | | | $ | — | | | $ | — | | | $ | 8,047,401 | |
Liabilities:
| | | | | | | | | | | Gross Amounts not offset in the Consolidated Statement of Assets & Liabilities | | | | |
| Description | | Gross Amounts of Recognized Liabilities | | | Gross Amounts Offset in the Consolidated Statement of Assets & Liabilities | | | Net Amounts Presented in the Consolidated Statement of Assets & Liabilities | | | Financial Instruments | | | Collateral Received (Pledged) | | | Net Amount | |
| Forward currency contracts | | $ | 7,505,927 | | | $ | — | | | $ | 7,505,927 | | | $ | — | | | $ | (7,505,927 | ) | | $ | — | |
| Futures contracts | | | 2,944,667 | | | | — | | | | 2,944,667 | | | | — | | | | (2,944,667 | ) | | | — | |
| Total | | $ | 10,450,594 | | | $ | — | | | $ | 10,450,594 | | | $ | — | | | $ | (10,450,594 | ) | | $ | — | |
The Funds have adopted authoritative standards regarding disclosure about derivatives and hedging activities and how they affect the Funds’ consolidated statements of assets and liabilities and consolidated statements of operations. Fair value of swap contracts are recorded in the consolidated statements of assets and liabilities as net unrealized gain on swap contracts or net unrealized loss on swap contracts and net unrealized appreciation of swap contracts or net unrealized depreciation of swap contracts.
Since the derivatives held long or short are for speculative trading purposes, the derivative instruments are not designated as hedging instruments. Accordingly, all realized gains and losses, as well as any change in net unrealized gains or losses on open contracts from the preceding period, are recognized as part of realized and unrealized gain (loss) in the consolidated statements of operations.
The following table presents the fair value of consolidated derivative instruments for the LoCorr Macro Strategies Fund, the LoCorr Long/Short Commodities Strategy Fund and the LoCorr Market Trend Fund as of December 31, 2018 as presented on each Fund’s consolidated statement of assets and liabilities:
| | |
Fair Value | | | Net Unrealized Gain (Loss) on Open Positions | |
| Derivatives Not Accounted for as Hedqinq Instruments | | Assets | | | Liabilities | | | |
| LoCorr Macro Strategies Fund | | | | | | | | | |
Forward Currency Contracts (a) | | | | | | | | | |
| Long | | $ | 2,769,277 | | | $ | 1,201,348 | | | $ | 1,567,929 | |
| Short | | | 4,114, 706 | | | | 6,609,917 | | | | (2,495,211 | ) |
| Total Forward Currency Contracts | | | 6,883,983 | | | | 7,811,265 | | | | (927,282 | ) |
| | | | | | | | | | | | | |
Futures Contracts (b) | | | | | | | | | | | | |
| Long Contracts | | | | | | | | | | | | |
| Commodity | | | 9,596 | | | | 2,492,381 | | | | (2,482,785 | ) |
| Equity | | | 33,178 | | | | 1,281,094 | | | | (1,247,916 | ) |
| Foreign exchange | | | — | | | | 112, 887 | | | | (112, 887 | ) |
| Interest rate | | | 2,429,876 | | | | 123,784 | | | | 2,306,092 | |
| Total Long Contracts | | | 2,472,650 | | | | 4,010,146 | | | | (1,537,496 | ) |
| | | | | | | | | | | | | |
| Short Contracts | | | | | | | | | | | | |
| Commodity | | | 7,284,309 | | | | 1,021,351 | | | | 6,262,958 | |
| Equity | | | 988,460 | | | | 404,183 | | | | 584,277 | |
| Interest rate | | | 14 | | | | 4,017,256 | | | | (4,017,242 | ) |
| Total Short Contracts | | | 8,272,783 | | | | 5,442,790 | | | | 2,829,993 | |
| Total Futures Contracts | | | 10,745,433 | | | | 9,452,936 | | | | 1,292,497 | |
| Total Forward Currency Contracts and Futures Contracts | | $ | 17,629,416 | | | $ | 17,264,201 | | | $ | 365,215 | |
| | |
| | |
LoCorr Macro Strategies Fund, LoCorr Long/Short Commodities Strategy Fund and LoCorr Market Trend Fund – Notes to Consolidated Financial
Statements / LoCorr Dynamic Equity Fund and LoCorr Spectrum Income Fund – Notes to Financial Statements (continued) | | 89 |
| | |
| | | | | | Net Unrealized Gain (Loss) on Open Positions | |
| | | | | | |
| | Fair Value | | | |
| Derivatives Not Accounted for as Hedging Instruments | | Assets | | | Liabilities | | | |
| LoCorr Long/Short Commodities Strategy Fund | | | | | | | | | |
| Long Total Return Swap Contracts | | | | | | | | | |
| LoCorr Commodities Index | | $ | 4,363,946 | | | $ | — | | | $ | 4,363,946 | |
| | | | | | | | | | | | | |
| LoCorr Market Trend Fund | | | | | | | | | | | | |
Forward Currency Contracts (a) | | | | | | | | | | | | |
| Long | | $ | 1,276,189 | | | $ | 411,159 | | | $ | 865,030 | |
| Short | | | 3,723,514 | | | | 7,094,768 | | | | (3,371,254 | ) |
| Total Forward Currency Contracts | | | 4,999,703 | | | | 7,505,927 | | | | (2,506,224 | ) |
| | | | | | | | | | | | | |
Futures Contracts (b) | | | | | | | | | | | | |
| Long Contracts | | | | | | | | | | | | |
| Commodity | | | — | | | | 4,917,061 | | | | (4,917,061 | ) |
| Equity | | | — | | | | 2,685,738 | | | | (2,685,738 | ) |
| Foreign exchange | | | — | | | | 214,775 | | | | (214,775 | ) |
| Interest rate | | | 2,085,409 | | | | 24,386 | | | | 2,061,023 | |
| Total Long Contracts | | | 2,085,409 | | | | 7,841,960 | | | | (5,756,551 | ) |
| | | | | | | | | | | | | |
| Short Contracts | | | | | | | | | | | | |
| Commodity | | | 6,942,921 | | | | 1,848,123 | | | | 5,094,798 | |
| Equity | | | 2,255,279 | | | | 397,538 | | | | 1,857,741 | |
| Interest rate | | | — | | | | 5,085,142 | | | | (5,085,142 | ) |
| Total Short Contracts | | | 9,198,200 | | | | 7,330,803 | | | | 1,867,397 | |
| Total Futures Contracts | | | 11,283,609 | | | | 15,172,763 | | | | (3,889,154 | ) |
| Total Forward Currency Contracts and Futures Contracts | | $ | 16,283,312 | | | $ | 22,678,690 | | | $ | (6,395,378 | ) |
(a) Unrealized appreciation on forward currency contracts is a receivable and unrealized depreciation on forward currency contracts is a payable on the Fund’s consolidated statement of assets and liabilities.
(b) Reflects the cumulative unrealized appreciation (depreciation) of futures contracts as reported in the Fund’s consolidated schedule of open futures contracts. Only the current day variation margin for futures contracts is separately reported within the Fund’s consolidated statement of assets and liabilities.
The following table presents the results of the derivative trading and information related to volume for the year ended December 31, 2018 for the LoCorr Macro Strategies Fund, the LoCorr Long/Short Commodities Strategy Fund and the LoCorr Market Trend Fund. The below captions of “Net Realized” and “Net Change in Unrealized” correspond to the captions in each Fund’s consolidated statements of operations.
| | | Gain (Loss) from Trading | |
| Fund and Type of Derivative Instrument | | Net Realized | | | Net Change in Unrealized | |
| LoCorr Macro Strategies Fund | | | | | | |
| Forward Currency Contracts | | $ | (10,601,438 | ) | | $ | 3,810,248 | |
| Futures Contracts | | | | | | | | |
| Commodity | | | 14,061,181 | | | | (8,538,645 | ) |
| Equity | | | (26,296,735 | ) | | | (1,230,927 | ) |
| Foreign exchange | | | (3,115,787 | ) | | | (252,488 | ) |
| Interest rate | | | (4,410,702 | ) | | | (1,279,769 | ) |
| Total Futures Contracts | | | (19,762,043 | ) | | | (11,301,829 | ) |
| Total Forward Currency Contracts and Futures Contracts | | $ | (30,363,481 | ) | | $ | (7,491,581 | ) |
| | | | | | | | | |
| LoCorr Long/Short Commodities Strategy Fund | | | | | | | | |
| Swap Contracts | | $ | 5,095,408 | | | $ | 15,883,665 | |
| | |
| | |
| 90 | | LoCorr Macro Strategies Fund, LoCorr Long/Short Commodities Strategy Fund and LoCorr Market Trend Fund – Notes to Consolidated Financial
Statements / LoCorr Dynamic Equity Fund and LoCorr Spectrum Income Fund – Notes to Financial Statements (continued) |
| | |
| | | Gain (Loss) from Trading | |
| Fund and Type of Derivative Instrument | | Net Realized | | | Net Change
in Unrealized | |
| LoCorr Market Trend Fund | | | | | | |
| Forward Currency Contracts | | $ | (19,219,843 | ) | | $ | (1,520,169 | ) |
| Futures Contracts | | | | | | | | |
| Commodity | | | 4,822,327 | | | | (24,330,524 | ) |
| Equity | | | (15,963,410 | ) | | | (1,435,184 | ) |
| Foreign exchange | | | 640,722 | | | | (571,144 | ) |
| Interest rate | | | (17,602,180 | ) | | | (6,865,027 | ) |
| Total Futures Contracts | | | (28,102,541 | ) | | | (33,201,879 | ) |
| Total Forward Currency Contracts and Futures Contracts | | $ | (47,322,384 | ) | | $ | (34,722,048 | ) |
The average monthly notional amount is shown as an indicator of volume. The average monthly notional amounts during the year ended December 31, 2018 were:
| | | Average Notional Amount | |
| | | Long Contracts | | | Short Contracts | |
| LoCorr Macro Strategies Fund | | | | | | |
| Forward Currency Contracts | | $ | 603,719,807 | | | $ | 829,720,173 | |
| Futures Contracts | | | 1,655,206,053 | | | | 1,576,508,011 | |
| | | | | | | | | |
| LoCorr Long/Short Commodities Strategy Fund | | | | | | | | |
| Swap Contracts | | $ | 114,874,661 | | | $ | — | |
| | | | | | | | | |
| LoCorr Market Trend Fund | | | | | | | | |
| Forward Currency Contracts | | $ | 761,958,982 | | | $ | 1,002,047,911 | |
| Futures Contracts | | | 1,993,147,801 | | | | 2,694,801,681 | |
The swap contracts and the commodity-related futures contracts reported in the tables in Note 3 represent balances and activity of each Fund’s respective wholly-owned and controlled subsidiary. See Note 2.
Please refer to the Funds’ prospectuses for a full listing of risks associated with these investments.
4. Investment Transactions
The cost of security purchases and proceeds from security sales, excluding short-term investments, derivative instruments, short sales and purchases to cover short sales for the year ended December 31, 2018 were as follows:
| | | U.S. Government Obligations | | | All Other | |
| | | Purchases | | | Sales | | | Purchases | | | Sales | |
| LoCorr Macro Strategies Fund | | $ | 234,474,491 | | | $ | 241,365,233 | | | $ | 374,496,721
| | | $ | 545,743,798 | |
| LoCorr Long/Short Commodities Strategy Fund | | | 64,650,996 | | | | 47,382,960 | | | | 153,764,603 | | | | 47,824,587 | |
| LoCorr Market Trend Fund | | | 146,257,483 | | | | 135,221,672 | | | | 282,114,872 | | | | 520,924,443 | |
| LoCorr Dynamic Equity Fund | | | — | | | | — | | | | 163,837,508 | | | | 182,009,996 | |
| LoCorr Spectrum Income Fund | | | — | | | | — | | | | 63,277,188 | | | | 74,167,663 | |
5. Management Fees and Other Transactions with Affiliates
Management Agreement
The Trust has a Management Agreement with the Adviser, with whom certain officers and Trustees of the Funds are affiliated, to furnish investment advisory services to the Funds. Pursuant to the amended Management Agreement, the Adviser is entitled to receive a fee as follows:
| Fund | Annual Advisory Fee as a Percentage
of the Average Daily Net Assets of the Fund |
| LoCorr Macro Strategies Fund | 1.65%* |
| LoCorr Market Trend Fund | 1.50% |
| LoCorr Dynamic Equity Fund | 1.50%** |
| LoCorr Spectrum Income Fund | 1.30% |
*Effective October 18, 2018, the Trustees of the LoCorr Macro Strategies Fund approved an amended Management Agreement pursuant to which the Adviser receives a rate of 1.65% of the Fund’s average daily net assets. Prior to October 18, 2018, the Adviser had received a rate of 1.75% of the Fund’s average daily net assets.
**Effective October 18, 2018, the Trustees of the LoCorr Dynamic Equity Fund approved an amended Management Agreement pursuant to which the Adviser receives a rate of 1.50% of the Fund’s average daily net assets. Prior to October 18, 2018, the Adviser had received a rate of 2.45% of the Fund’s average daily net assets.
| | |
| | |
LoCorr Macro Strategies Fund, LoCorr Long/Short Commodities Strategy Fund and LoCorr Market Trend Fund – Notes to Consolidated Financial Statements / LoCorr Dynamic Equity Fund and LoCorr Spectrum Income Fund – Notes to Financial Statements (continued) | | 91 |
| | |
Pursuant to the amended Management Agreement, the Adviser is entitled to receive a fee, in accordance with the Incremental Advisory Fee schedule below based on the LoCorr Long/Short Commodities Strategy Fund’s average daily net assets.
Net Assets for the LoCorr Long/Short Commodities Strategy Fund | Incremental Advisory Fee*** |
| $0.0 - $0.5 billion | 1.50% |
| $0.5 - $1.0 billion | 1.40% |
| $1.0 - $1.5 billion | 1.30% |
| $1.5 - $2.0 billion | 1.20% |
| $2.0 - $2.5 billion | 1.10% |
| Over $2.5 billion | 1.00% |
***Incremental advisory fee represents the fees paid on net assets at the related net asset level. For example, with $3 billion in net assets in the Fund, the Adviser would earn 1.50% on the first $500 million, plus 1.40% on the next $500 million, plus 1.30% on the next $500 million, plus 1.20% on the next $500 million, plus 1.10% on the next $500 million, plus 1.00% on the final $500 million.
As of and for the year ended December 31, 2018, the Funds reported the following in regards to management fees:
| Fund | | Management Fees For the Year Ended December 31, 2018 | | | Accrued Net Management Fees as of December 31, 2018 | |
| LoCorr Macro Strategies Fund | | $ | 11,858,033 | | | $ | 845,075 | |
| LoCorr Long/Short Commodities Strategy Fund | | | 2,056,058 | | | | 264,910 | |
| LoCorr Market Trend Fund | | | 9,003,592 | | | | 540,441 | |
| LoCorr Dynamic Equity Fund | | | 1,163,284 | | | | 23,398 | |
| LoCorr Spectrum Income Fund | | | 1,071,778 | | | | 82,223 | |
Sub-Advisory Agreements
Sub-advisory services are provided to the Funds, pursuant to agreements between the Adviser and the below listed sub-advisers. Under the terms of these sub-advisory agreements, the Adviser compensates the sub-advisers based on the portion of each Fund’s average daily net assets which they have been allocated to manage.
LoCorr Macro Strategies Fund:
Graham Capital Management, L.P.
Millburn Ridgefield Corporation
Nuveen Asset Management, LLC
Revolution Capital Management LLC
LoCorr Long/Short Commodities Strategy Fund:
Nuveen Asset Management, LLC
LoCorr Market Trend Fund:
Graham Capital Management, L.P.
Nuveen Asset Management, LLC
LoCorr Dynamic Equity Fund:
Billings Capital Management LLC
First Quadrant, L.P.
Kettle Hill Capital Management, LLC
LoCorr Spectrum Income Fund:
Trust & Fiduciary Income Partners, LLC
The Adviser is solely responsible for the payment of the sub-adviser’s fees, and the sub-adviser agrees not to seek payment of its fees from the Trust or the Funds.
Expense Limitation Agreement
The Funds’ Adviser has contractually agreed to waive management fees and/or reimburse the Funds for expenses they incur, but only to the extent necessary to maintain the Funds’ total annual operating expenses after fee waiver and/or reimbursement (excluding any Rule 12b-1 distribution and/or servicing fees, taxes, interest, brokerage commissions, expenses incurred in connection with any merger or reorganization, dividend expenses on short sales, swap fees, indirect expenses, expenses of other investment companies in which the Funds may invest, or extraordinary expenses such as litigation expenses and inclusive of offering and organizational costs incurred prior to the commencement of operations) at the percentages listed below:
| Fund | Expense Limit as a Percentage of the
Average Daily Net Assets of the Fund | Effective Period Through |
| LoCorr Macro Strategies Fund | 1.99% | April 30, 2020 |
| LoCorr Long/Short Commodities Strategy Fund | 1.95% | April 30, 2020 |
| LoCorr Market Trend Fund | 1.95% | April 30, 2020 |
| LoCorr Dynamic Equity Fund | 1.99%* | April 30, 2020 |
| LoCorr Spectrum Income Fund | 1.80% | April 30, 2020 |
*In conjunction with the amended Management Agreement approved on October 18, 2018, the expense limitation has been decreased to 1.99% of the average daily net assets of the Fund. Prior to October 18, 2018, the expense limitation was 2.90% of the average daily net assets of the Fund.
| | |
| | |
92 | | LoCorr Macro Strategies Fund, LoCorr Long/Short Commodities Strategy Fund and LoCorr Market Trend Fund – Notes to Consolidated Financial
Statements / LoCorr Dynamic Equity Fund and LoCorr Spectrum Income Fund – Notes to Financial Statements (continued) |
| | |
Any waiver or reimbursement is subject to repayment by the respective Fund within the three fiscal years following the fiscal year in which the expenses occurred, if the Fund is able to make the repayment without exceeding its current expense limitations and the repayment is approved by the Board. The organizational and offering costs are subject to repayment by the Funds.
The total amounts of management fees waived and/or expenses reimbursed which are subject to recovery, and their related expiration date are as follows:
| LoCorr Macro Strategies Fund | | | | | | | |
| | | | | | | | | | | | | |
| | | Management Fees (Waived) by Adviser Subject to Recovery | | | Recovery to Adviser | | | Remaining Available Subject to Recovery | | | Subject to Recovery on or Before Fiscal Year Ending December 31, | |
| Period | | | | Year Ended December 31, 2018 | | | | | |
| Year Ended December 31, 2018 | | $ | (67,297 | ) | | $ | — | | | $ | (67,297 | ) | | | 2021 | |
| Year Ended December 31, 2017 | | | (485,398 | ) | | | — | | | | (485,398 | ) | | | 2020 | |
| Total | | $ | (552,695 | ) | | $ | — | | | $ | (552,695 | ) | | | | |
LoCorr Long/Short Commodities Strategy Fund | | | | | | | |
| | | | | | | | | | | | | |
| | | Management Fees (Waived) by Adviser Subject to Recovery | | | Recovery to Adviser | | | Remaining Available Subject to Recovery | | | Subject to Recovery on or Before Fiscal Year Ending December 31, | |
| Period | | | | Year Ended December 31, 2018 | | | | | |
| Year Ended December 31, 2018 | | $ | — | | | $ | — | | | $ | — | | | | 2021 | |
| Year Ended December 31, 2017 | | | (81,840 | ) | | | — | | | | (81,840 | ) | | | 2020 | |
| Year Ended December 31, 2016 | | | (21,779 | ) | | | — | | | | (21,779 | ) | | | 2019 | |
| Total | | $ | (103,619 | ) | | $ | — | | | $ | (103,619 | ) | | | | |
LoCorr Dynamic Equity Fund | | | | | | | | | | | | |
| | | | | | | | | | | | | |
| | | Management Fees (Waived) by Adviser Subject to Recovery | | | Recovery to Adviser | | | Remaining Available Subject to Recovery | | | Subject to Recovery on or Before Fiscal Year Ending December 31, | |
| Period | | | | Year Ended December 31, 2018 | | | | | |
| Year Ended December 31, 2018 | | $ | (95,089 | ) | | $ | — | | | $ | (95,089 | ) | | | 2021 | |
| Year Ended December 31, 2017 | | | (58,609 | ) | | | — | | | | (58,609 | ) | | | 2020 | |
| Year Ended December 31, 2016 | | | (102,813 | ) | | | — | | | | (102,813 | ) | | | 2019 | |
| Total | | $ | (256,511 | ) | | $ | — | | | $ | (256,511 | ) | | | | |
For the year ended December 31, 2015, fees waived by the Adviser for the LoCorr Long/Short Commodities Strategy Fund totaled $154,527, of which $50,253 was recovered during the year, while the remaining $104,274 expired on December 31, 2018 and are no longer eligible for recovery by the Adviser.
For the year ended December 31, 2015, fees waived by the Adviser for the LoCorr Dynamic Equity Fund totaling $132,040, expired on December 31, 2018 and are no longer eligible for recovery by the Adviser.
At December 31, 2018, there were no fees subject to recovery for the LoCorr Market Trend Fund or the LoCorr Spectrum Income Fund.
Rule 12b-1 Distribution Agreement
The Funds have entered into a Rule 12b-1 distribution agreement with Quasar Distributors, LLC (“Quasar”). Class A shareholders pay distribution expenses to Quasar at the annual rate of 0.25% of the Fund’s average daily net assets. Class C shareholders pay to Quasar an annual rate of 1.00%, which is comprised of 0.75% in distribution expenses and 0.25% in service fees, of the Fund’s average daily net assets. Class shareholders pay no 12b-1 fees.
| | |
| | |
LoCorr Macro Strategies Fund, LoCorr Long/Short Commodities Strategy Fund and LoCorr Market Trend Fund – Notes to Consolidated Financial
Statements / LoCorr Dynamic Equity Fund and LoCorr Spectrum Income Fund – Notes to Financial Statements (continued) | | 93 |
| | |
6. Fund Shares
At December 31, 2018, there were an unlimited number of shares of beneficial interest authorized. The following table summarizes the activity in shares and dollar amounts applicable to each class of the Funds:
| LoCorr Macro Strategies Fund – Class A | |
| | | For the Year Ended December 31, 2018 | | | For the Year Ended December 31, 2017 | |
| | | Shares | | | Amount | | | Shares | | | Amount | |
| Shares Sold | | | 2,896,743 | | | $ | 24,405,481 | | | | 5,661,607 | | | $ | 50,641,256 | |
| Reinvestment of Distributions | | | 199,801 | | | | 1,570,436 | | | | 593,753 | | | | 5,130,033 | |
| Shares Redeemed | | | (6,956,481 | ) | | | (57,264,468 | ) | | | (28,880,996 | ) | | | (261,068,594 | ) |
| Redemption Fees | | | — | | | | — | | | | — | | | | 382 | |
| | | | (3,859,937 | ) | | $ | (31,288,551 | ) | | | (22,625,636 | ) | | $ | (205,296,923 | ) |
| Beginning Shares | | | 10,786,582 | | | | | | | | 33,412,218 | | | | | |
| Ending Shares | | | 6,926,645 | | | | | | | | 10,786,582 | | | | | |
| LoCorr Macro Strategies Fund – Class C | |
| | | For the Year Ended December 31, 2018 | | | For the Year Ended December 31, 2017 | |
| | | Shares | | | Amount | | | Shares | | | Amount | |
| Shares Sold | | | 780,250 | | | $ | 6,256,139 | | | | 2,350,906 | | | $ | 20,222,139 | |
| Reinvestment of Distributions | | | 143,755 | | | | 1,082,469 | | | | 639,470 | | | | 5,294,811 | |
| Shares Redeemed | | | (4,904,955 | ) | | | (38,557,306 | ) | | | (5,243,828 | ) | | | (44,937,545 | ) |
| Redemption Fees | | | — | | | | — | | | | — | | | | 680 | |
| | | | (3,980,950 | ) | | $ | (31,218,698 | ) | | | (2,253,452 | ) | | $ | (19,419,915 | ) |
| Beginning Shares | | | 10,957,482 | | | | | | | | 13,210,934 | | | | | |
| Ending Shares | | | 6,976,532 | | | | | | | | | | | | | |
| LoCorr Macro Strategies Fund – Class I | |
| | | For the Year Ended December 31, 2018 | | | For the Year Ended December 31, 2017 | |
| | | Shares | | | Amount | | | Shares | | | Amount | |
| Shares Sold | | | 35,161,086 | | | $ | 296,008,093 | | | | 79,170,065 | | | $ | 718,715,172 | |
| Reinvestment of Distributions | | | 1,631,374 | | | | 13,002,054 | | | | 3,449,418 | | | | 30,251,389 | |
| Shares Redeemed | | | (50,629,729 | ) | | | (423,014,386 | ) | | | (65,784,898 | ) | | | (591,399,536 | ) |
| Redemption Fees | | | — | | | | — | | | | — | | | | 10,665 | |
| | | | (13,837,269 | ) | | $ | (114,004,239 | ) | | | 16,834,585 | | | $ | 157,577,690 | |
| Beginning Shares | | | 69,090,006 | | | | | | | | 52,255,421 | | | | | |
| Ending Shares | | | 55,252,737 | | | | | | | | 69,090,006 | | | | | |
| LoCorr Macro Strategies Fund | |
| Total Net Decrease | | | | | | $ | (176,511,488 | ) | | | | | | $ | (67,139,148 | ) |
| LoCorr Long/Short Commodities Strategy Class A | |
| | | For the Year Ended December 31, 2018 | | | For the Year Ended December 31, 2017 | |
| | | Shares | | | Amount | | | Shares | | | Amount | |
| Shares Sold | | | 4,847,619 | | | $ | 49,396,793 | | | | 800,753 | | | $ | 7,404,023 | |
| Reinvestment of Distributions | | | 513,483 | | | | 4,883,224 | | | | 473 | | | | 4,544 | |
| Shares Redeemed | | | (1,055,893 | ) | | | (10,813,133 | ) | | | (1,967,602 | ) | | | (18,198,293 | ) |
| Redemption Fees | | | — | | | | — | | | | — | | | | 74 | |
| | | | 4,305,209 | | | $ | 43,466,884 | | | | (1,166,376 | ) | | $ | (10,789,652 | ) |
| Beginning Shares | | | 2,634,368 | | | | | | | | 3,800,744 | | | | | |
| Ending Shares | | | 6,939,577 | | | | | | | | 2,634,368 | | | | | |
| LoCorr Long/Short Commodities Strategy Fund – Class C | |
| | | For the Year Ended December 31, 2018 | | | For the Year Ended December 31, 2017 | |
| | | Shares | | | Amount | | | Shares | | | Amount | |
| Shares Sold | | | 257,769 | | | $ | 2,549,916 | | | | 193,488 | | | $ | 1,708,397 | |
| Reinvestment of Distributions | | | 69,279 | | | | 635,984 | | | | 127 | | | | 1,180 | |
| Shares Redeemed | | | (149,818 | ) | | | (1,446,429 | ) | | | (514,536 | ) | | | (4,603,847 | ) |
| Redemption Fees | | | — | | | | — | | | | — | | | | 34 | |
| | | | 177,230 | | | $ | 1,739,471 | | | | (320,921 | ) | | $ | (2,894,236 | ) |
| Beginning Shares | | | 503,532 | | | | | | | | 824,453 | | | | | |
| Ending Shares | | | 680,762 | | | | | | | | 503,532 | | | | | |
| LoCorr Long/Short Commodities Strategy Fund – Class I | |
| | | For the Year Ended December 31, 2018 | | | For the Year Ended December 31, 2017 | |
| | | Shares | | | Amount | | | Shares | | | Amount | |
| Shares Sold | | | 13,864,200 | | | $ | 143,363,367 | | | | 3,126,277 | | | $ | 29,116,879 | |
| Reinvestment of Distributions | | | 1,365,873 | | | | 13,153,352 | | | | 720 | | | | 6,996 | |
| Shares Redeemed | | | (2,498,836 | ) | | | (25,755,584 | ) | | | (6,520,100 | ) | | | (60,610,601 | ) |
| Redemption Fees | | | — | | | | — | | | | — | | | | (232 | ) |
| | | | 12,731,237 | | | $ | 130,761,135 | | | | (3,393,103 | ) | | $ | (31,486,958 | ) |
| Beginning Shares | | | 5,396,471 | | | | | | | | 8,789,574 | | | | | |
| Ending Shares | | | 18,127,708 | | | | | | | | 5,396,471 | | | | | |
| LoCorr Long/Short Commodities Strategy Fund | |
| Total Net Increase (Decrease) | | | | | | $ | 175,967,490 | | | | | | | $ | (45,170,846 | ) |
| | |
| | |
94 | | LoCorr Macro Strategies Fund, LoCorr Long/Short Commodities Strategy Fundand LoCorr Market Trend Fund – Notes to Consolidated Financial
Statements / LoCorr Dynamic Equity Fund and LoCorr Spectrum Income Fund – Notes to Financial Statements (continued) |
| | |
| LoCorr Market Trend Fund – Class A | |
| | | For the Year Ended December 31, 2018 | | | For the Year Ended December 31,2017 | |
| | | Shares | | | Amount | | | Shares | | | Amount | |
| Shares Sold | | | 2,041,593 | | | $ | 21,534,780 | | | | 2,737,484 | | | $ | 28,708,153 | |
| Shares Redeemed | | | (4,253,791 | ) | | | (44,013,360 | ) | | | (9,662,150 | ) | | | (101,779,824 | ) |
| Redemption Fees | | | — | | | | — | | | | — | | | | 784 | |
| | | | (2,212,198 | ) | | $ | (22,478,580 | ) | | | (6,924,666 | ) | | $ | (73,070,887 | ) |
| Beginning Shares | | | 5,580,446 | | | | | | | | 12,505,112 | | | | | |
| Ending Shares | | | 3,368,248 | | | | | | | | 5,580,446 | | | | | |
| | | | | | | | | | | | | | | | | |
| LoCorr Market Trend Fund – Class C | |
| | | For the Year Ended December 31, 2018 | | | For the Year Ended December 31, 2017 | |
| | | Shares | | | Amount | | | Shares | | | Amount | |
| Shares Sold | | | 354,298 | | | $ | 3,626,237 | | | | 484,308 | | | $ | 5,025,256 | |
| Shares Redeemed | | | (1,872,667 | ) | | | (18,856,227 | ) | | | (4,936,089 | ) | | | (51,374,646 | ) |
| Redemption Fees | | | — | | | | — | | | | — | | | | 6 | |
| | | | (1,518,369 | ) | | $ | (15,229,990 | ) | | | (4,451,781 | ) | | $ | (46,349,384 | ) |
| Beginning Shares | | | 4,041,664 | | | | | | | | 8,493,445 | | | | | |
| Ending Shares | | | 2,523,295 | | | | | | | | 4,041,664 | | | | | |
| | | | | | | | | | | | | | | | | |
| LoCorr Market Trend Fund – Class I | |
| | | For the Year Ended December 31, 2018 | | | For the Year Ended December 31, 2017 | |
| | | Shares | | | Amount | | | Shares | | | Amount | |
| Shares Sold | | | 24,293,597 | | | $ | 258,798,561 | | | | 27,701,096 | | | $ | 294,187,402 | |
| Shares Redeemed | | | (44,938,075 | ) | | | (460,309,189 | ) | | | (51,803,362 | ) | | | (548,574,396 | ) |
| Redemption Fees | | | — | | | | — | | | | — | | | | 5,091 | |
| | | | (20,644,478 | ) | | $ | (201,510,628 | ) | | | (24,102,266 | ) | | $ | (254,381,903 | ) |
| Beginning Shares | | | 50,614,887 | | | | | | | | 74,717,153 | | | | | |
| Ending Shares | | | 29,970,409 | | | | | | | | 50,614,887 | | | | | |
| LoCorr Market Trend Fund | |
| Total Net Decrease | | | | | | $ | (239,219,198 | ) | | | | | | $ | (373,802,174 | ) |
| LoCorr Dynamic Equity Fund – Class A | |
| | | For the Year Ended December 31, 2018 | | | For the Year Ended December 31, 2017 | |
| | | Shares | | | Amount | | | Shares | | | Amount | |
| Shares Sold | | | 204,446 | | | $ | 2,334,198 | | | | 1,410,774 | | | $ | 16,809,092 | |
| Reinvestment of Distributions | | | 30,595 | | | | 303,192 | | | | 65,357 | | | | 772,526 | |
| Shares Redeemed | | | (1,070,038 | ) | | | (11,843,915 | ) | | | (2,128,740 | ) | | | (25,425,721 | ) |
| Redemption Fees | | | — | | | | — | | | | — | | | | 1,548 | |
| | | | (834,997 | ) | | $ | (9,206,525 | ) | | | (652,609 | ) | | $ | (7,842,555 | ) |
| Beginning Shares | | | 1,689,399 | | | | | | | | 2,342,008 | | | | | |
| Ending Shares | | | 854,402 | | | | | | | | 1,689,399 | | | | | |
| | | | | | | | | | | | | | | | | |
| LoCorr Dynamic Equity Fund – Class C | |
| | | For the Year Ended December 31, 2018 | | | For the Year Ended December 31, 2017 | |
| | | Shares | | | Amount | | | Shares | | | Amount | |
| Shares Sold | | | 12,061 | | | $ | 129,613 | | | | 377,313 | | | $ | 4,365,067 | |
| Reinvestment of Distributions | | | 20,409 | | | | 193,276 | | | | 38,402 | | | | 437,395 | |
| Shares Redeemed | | | (451,054 | ) | | | (4,895,777 | ) | | | (398,936 | ) | | | (4,611,126 | ) |
| Redemption Fees | | | — | | | | — | | | | — | | | | 121 | |
| | | | (418,584 | ) | | $ | (4,572,888 | ) | | | 16,779 | | | $ | 191,457 | |
| Beginning Shares | | | 973,448 | | | | | | | | 956,669 | | | | | |
| Ending Shares | | | 554,864 | | | | | | | | 973,448 | | | | | |
| | | | | | | | | | | | | | | | | |
| LoCorr Dynamic Equity Fund – Class I | |
| | | For the Year Ended December 31, 2018 | | | For the Year Ended December 31, 2017 | |
| | | Shares | | | Amount | | | Shares | | | Amount | |
| Shares Sold | | | 808,578 | | | $ | 9,268,461 | | | | 2,700,182 | | | $ | 32,582,085 | |
| Reinvestment of Distributions | | | 59,248 | | | | 596,627 | | | | 102,449 | | | | 1,225,292 | |
| Shares Redeemed | | | (1,965,613 | ) | | | (22,405,609 | ) | | | (3,744,615 | ) | | | (45,234,584 | ) |
| Redemption Fees | | | — | | | | — | | | | — | | | | 614 | |
| | | | (1,097,787 | ) | | $ | (12,540,521 | ) | | | (941,984 | ) | | $ | (11,426,593 | ) |
| Beginning Shares | | | 2,740,163 | | | | | | | | 3,682,147 | | | | | |
| Ending Shares | | | 1,642,376 | | | | | | | | 2,740,163 | | | | | |
| LoCorr Dynamic Equity Fund | |
| Total Net Decrease | | | | | | $ | (26,319,934 | ) | | | | | | $ | (19,077,691 | ) |
| | |
| | |
LoCorr Macro Strategies Fund, LoCorr Long/Short Commodities Strategy Fund and LoCorr Market Trend Fund – Notes to Consolidated Financial
Statements / LoCorr Dynamic Equity Fund and LoCorr Spectrum Income Fund – Notes to Financial Statements (continued) | | 95 |
| | |
| LoCorr Spectrum Income Fund – Class A | |
| | | For the Year Ended December 31, 2018 | | | For the Year Ended December 31, 2017 | |
| | | Shares | | | Amount | | | Shares | | | Amount | |
| Shares Sold | | | 1,001,209 | | | $ | 7,351,429 | | | | 1,852,628 | | | $ | 14,027,817 | |
| Reinvestment of Distributions | | | 202,320 | | | | 1,445,202 | | | | 212,605 | | | | 1,613,841 | |
| Shares Redeemed | | | (1,648,412 | ) | | | (11,964,611 | ) | | | (2,298,854 | ) | | | (17,279,850 | ) |
| Redemption Fees | | | — | | | | 523 | | | | — | | | | 2,071 | |
| | | | (444,883 | ) | | $ | (3,167,457 | ) | | | (233,621 | ) | | $ | (1,636,121 | ) |
| Beginning Shares | | | 4,057,798 | | | | | | | | 4,291,419 | | | | | |
| Ending Shares | | | 3,612,915 | | | | | | | | 4,057,798 | | | | | |
| | | | | | | | | | | | | | | | | |
| LoCorr Spectrum Income Fund – Class C | |
| | | For the Year Ended December 31, 2018 | | | For the Year Ended December 31, 2017 | |
| | | Shares | | | Amount | | | Shares | | | Amount | |
| Shares Sold | | | 560,060 | | | $ | 4,179,406 | | | | 863,495 | | | $ | 6,604,509 | |
| Reinvestment of Distributions | | | 156,310 | | | | 1,123,445 | | | | 176,185 | | | | 1,343,087 | |
| Shares Redeemed | | | (1,017,079 | ) | | | (7,360,766 | ) | | | (1,228,452 | ) | | | (9,312,807 | ) |
| Redemption Fees | | | — | | | | 408 | | | | — | | | | 263 | |
| | | | (300,709 | ) | | $ | (2,057,507 | ) | | | (188,772 | ) | | $ | (1,364,948 | ) |
| Beginning Shares | | | 3,167,860 | | | | | | | | 3,356,632 | | | | | |
| Ending Shares | | | 2,867,151 | | | | | | | | 3,167,860 | | | | | |
| | | | | | | | | | | | | | | | | |
| LoCorr Spectrum Income Fund – Class I | |
| | | For the Year Ended December 31, 2018 | | | For the Year Ended December 31, 2017 | |
| | | Shares | | | Amount | | | Shares | | | Amount | |
| Shares Sold | | | 1,790,254 | | | $ | 12,983,667 | | | | 2,937,706 | | | $ | 22,440,235 | |
| Reinvestment of Distributions | | | 300,481 | | | | 2,145,130 | | | | 316,484 | | | | 2,399,389 | |
| Shares Redeemed | | | (3,504,043 | ) | | | (25,054,619 | ) | | | (3,509,290 | ) | | | (26,399,490 | ) |
| Redemption Fees | | | — | | | | 24,184 | | | | — | | | | 15,506 | |
| | | | (1,413,308 | ) | | $ | (9,901,638 | ) | | | (255,100 | ) | | $ | (1,544,360 | ) |
| Beginning Shares | | | 5,833,407 | | | | | | | | 6,088,507 | | | | | |
| Ending Shares | | | 4,420,099 | | | | | | | | 5,833,407 | | | | | |
| LoCorr Spectrum Income Fund | |
| Total Net Decrease | | | | | | $ | (15,126,602 | ) | | | | | | $ | (4,545,429 | ) |
7. Federal Tax Information
At December 31, 2018, the components of accumulated earnings (losses) on a tax basis were as follows:(1)
| | | LoCorr Macro Strategies Fund(2) | | | LoCorr Long/Short Commodities Strategy Fund(2) | | | LoCorr Market Trend Fund(2) | |
| Tax cost of portfolio | | $ | 564,003,036 | | | $ | 242,747,901 | | | $ | 312,199,163 | |
| | | | | | | | | | | | | |
| Gross unrealized appreciation | | $ | 7,855,108 | | | $ | 11,187,250 | | | $ | 5,325,322 | |
| Gross unrealized depreciation | | | (5,908,737 | ) | | | (6,896,884 | ) | | | (4,953,334 | ) |
| Net unrealized appreciation (depreciation) | | | 1,946,371 | | | | 4,290,366 | | | | 371,988 | |
| Undistributed ordinary income | | | 9,770,918 | | | | 15,958 | | | | 3,078,171 | |
| Undistributed long-term capital gains | | | — | | | | — | | | | — | |
| Total Distributable earnings | | | 9,770,918 | | | | 15,958 | | | | 3,078,171 | |
| Other accumulated losses | | | (49,579,773 | ) | | | (2,201,229 | ) | | | (66,328,955 | ) |
| Total accumulated earnings (losses) | | $ | (37,862,484 | ) | | $ | 2,105,095 | | | $ | (62,878,796 | ) |
| | | LoCorr Dynamic Equity Fund | | | LoCorr Spectrum Income Fund | |
| Tax cost of portfolio | | $ | 29,383,989 | | | $ | 73,493,864 | |
| Gross unrealized appreciation | | $ | 1,167,022 | | | $ | 5,251,648 | |
| Gross unrealized depreciation | | | (4,080,140 | ) | | | (10,231,469 | ) |
| Net unrealized appreciation (depreciation) | | | (2,913,118 | ) | | | (4,979,821 | ) |
| Undistributed ordinary income | | | — | | | | — | |
| Undistributed long-term capital gains | | | 93,534 | | | | — | |
| Total Distributable earnings | | | 93,534 | | | | — | |
| Other accumulated earnings (losses) | | | (215,487 | ) | | | (28,155,691 | ) |
| Total accumulated earnings (losses) | | $ | (3,035,071 | ) | | $ | (33,135,512 | ) |
| (1) | Total Portfolio represents aggregate amounts of Fund’s investments, securities sold short, forward currency contracts and futures contracts, where applicable. |
| (2) | Tax Cost is presented on a non-consolidated basis and includes each of the Fund’s investment in the respective CFC’s and the unrealized appreciation and depreciation associated with those investments. |
| | |
| | |
96 | | LoCorr Macro Strategies Fund, LoCorr Long/Short Commodities Strategy Fund and LoCorr Market Trend Fund - Notes to Consolidated Financial Statements / LoCorr Dynamic Equity Fund and LoCorr Spectrum Income Fund - Notes to Financial Statements (continued)
|
| | |
Undistributed income or net realized gains for financial statement purposes may differ from amounts recognized for federal income tax purposes due to differences in the recognition and characterization of income, expense and capital gain items. The difference between book-basis and tax-basis unrealized appreciation (depreciation) is attributed primarily to the tax deferral of losses on wash sales, mark to market, investments in partnerships and other temporary differences.
The following reclassifications were made within the components of net assets as of December 31, 2018:
| | | Accumulated Net Investment Income (Loss) |
|
| Accumulated Net Realized Gain (Loss) | | | Paid-in Capital | | |
| LoCorr Macro Strategies Fund | | $ | 16,664,597 |
|
| $ | (14,375,964 | ) | | $ | (2,288,633 | ) | |
| LoCorr Long/Short Commodities Strategy Fund | | | 23,140,326 | | | | (5,170,392 | ) | | | (17,969,934 | ) | |
| LoCorr Market Trend Fund | | | 3,851,689 | | | | (4,805,039 | ) | | | 953,350 | | |
| LoCorr Dynamic Equity Fund | | | 1,099,541 | | | | (2,244,776 | ) | | | 1,145,235 | | |
| LoCorr Spectrum Income Fund | | | 559,411 | | | | (2,981,657 | ) | | | 2,422,246 | | |
The LoCorr Macro Strategies Fund’s reclassifications are primarily attributable to certain reclassifications related to the Fund’s wholly-owned subsidiary, foreign currency, paydown and net operating losses/reclasses.
The LoCorr Long/Short Commodities Strategy Fund’s reclassifications are primarily attributable to certain reclassifications related to the Fund’s wholly-owned subsidiary, paydown and net operating losses/reclasses.
The LoCorr Market Trend Fund’s reclassifications are primarily attributable to certain reclassifications related to the Fund’s wholly-owned subsidiary, foreign currency, paydown and net operating losses/reclasses.
The LoCorr Dynamic Equity Fund’s reclassifications are primarily the result of the Fund’s net operating losses/reclasses, foreign currency and equalization.
The LoCorr Spectrum Income Fund’s reclassifications are primarily attributable to certain reclassifications related to return of capital/partnership basis adjustments.
Under the current tax law, capital losses realized after October 31 may be deferred and treated as occurring on the first day of the following fiscal year. As presented in the table below, the following Funds elected to defer capital losses for the fiscal year ended December 31, 2018:
| | | Post October Loss Deferral | | | Late Year Ordinary Loss Deferral | |
| LoCorr Dynamic Equity Fund | | $ | 167,174 | | | $ | — | |
At December 31, 2018, accumulated net realized capital loss carryovers, if any, and the year(s) in which the capital loss carryovers expire were:
| | | Capital Loss Carryover | | Year of Expiration |
| | | Short-Term | | | Long-Term | |
| LoCorr Macro Strategies Fund | | $ | 25,624,736 | | | $ | 24,193,872 | | Indefinitely |
| LoCorr Long/Short Commodities Strategy Fund | | | 1,125,032 | | | | 1,076,197 | | Indefinitely |
| LoCorr Market Trend Fund | | | 32,588,883 | | | | 33,724,138 | | Indefinitely |
| LoCorr Spectrum Income Fund | | | 11,098,789 | | | | 15,638,249 | | Indefinitely |
None of the Funds utilized any capital loss carryovers during the year ended December 31, 2018.
8. Line of Credit
The Trust entered into an unsecured, uncommitted Loan Agreement (“Line of Credit” or “LOC”) with U.S. Bank not individually but as an umbrella facility on behalf of the Funds in the Trust. The LOC expires on March 11, 2019. The LOC was established to provide the Funds a temporary short-term liquidity source, subject to certain restrictions, covenants and the right of setoff on the Funds’ assets, to meet unanticipated redemptions. Under terms of the LOC, borrowings for each Fund are limited to the lesser of one-third of the net unencumbered assets (including the amount borrowed) of the respective Fund, 5% of the gross assets of the respective Fund or $50 million in the aggregate for all of the Funds under this agreement. U.S. Bank charges an interest rate per annum equal to the Prime Rate (5.50% as of December 31, 2018).
The Funds did not utilize the Line of Credit during the year ended December 31, 2018.
| | |
| | |
| LoCorr Macro Strategies Fund, LoCorr Long/Short Commodities Strategy Fund and LoCorr Market Trend Fund - Notes to Consolidated Financial Statements / LoCorr Dynamic Equity Fund and LoCorr Spectrum Income Fund - Notes to Financial Statements (continued) | | 97 |
| | |
9. Subsequent Events
In preparing the financial statements, the Adviser has evaluated events after December 31, 2018.
Declaration of Dividends
The LoCorr Spectrum Income Fund declared the following ordinary income distributions:
Dividend Declaration Date(a) | |
Shareholder of Record Date | | Distribution Amount per Share Class |
| | | Class A | Class C | Class I |
| January 31, 2019 | | January 30, 2019 | | $ 0.04790 | $ 0.04170 | $ 0.05000 |
(a) Ex-date, reinvest date and payable date.
The estimated characterization of the distributions paid will be an ordinary dividend, qualified dividend or return of capital. See Note 2 for additional information.
There were no additional subsequent events since December 31, 2018 through the date the financial statements were issued that would require adjustments to or additional disclosure in these financial statements.
| | |
| | |
98 | | Report of Independent Registered Public Accounting Firm |
| | |
Report of Independent Registered Public Accounting Firm
To the Shareholders and Board of Trustees of
LoCorr Investment Trust
Opinion on the Financial Statements
We have audited the accompanying consolidated statements of assets and liabilities, including the consolidated schedules of investments, open forward currency contracts, swap contracts, and open futures contracts of LoCorr Macro Strategies Fund, LoCorr Long/Short Commodities Strategy Fund, and LoCorr Market Trend Fund, and the accompanying statements of assets and liabilities, including the schedules of investments and securities sold short, of LoCorr Dynamic Equity Fund and LoCorr Spectrum Income Fund (the “Funds”), each a series of LoCorr Investment Trust, as of December 31, 2018, and the related consolidated statements of operations for the year then ended, the consolidated statements of changes in net assets for each of the two years in the period then ended, including the related notes, and the consolidated financial highlights for each of the five periods presented in the period then ended of LoCorr Macro Strategies Fund, LoCorr Long/Short Commodities Strategy Fund, and LoCorr Market Trend Fund, and the related statements of operations for the year then ended, the statements of changes in net assets for each of the two years in the period then ended, including the related notes, and the financial highlights for each of the five years in the period then ended of LoCorr Dynamic Equity Fund and LoCorr Spectrum Income Fund (collectively referred to as the “financial statements”). In our opinion, the financial statements present fairly, in all material respects, the financial position of each of the Funds as of December 31, 2018, the results of their operations for the year then ended, the changes in their net assets for each of the two years in the period then ended, and the financial highlights for each of the five periods presented in the period then ended, in conformity with accounting principles generally accepted in the United States of America.
Basis for Opinion
These financial statements are the responsibility of the Funds’ management. Our responsibility is to express an opinion on the Funds’ financial statements based on our audits. We are a public accounting firm registered with the Public Company Accounting Oversight Board (United States) (“PCAOB”) and are required to be independent with respect to the Funds in accordance with the U.S. federal securities laws and the applicable rules and regulations of the Securities and Exchange Commission and the PCAOB.
We conducted our audits in accordance with the standards of the PCAOB. Those standards require that we plan and perform the audit to obtain reasonable assurance about whether the financial statements are free of material misstatement, whether due to error or fraud.
Our audits included performing procedures to assess the risks of material misstatement of the financial statements, whether due to error or fraud, and performing procedures that respond to those risks. Such procedures included examining, on a test basis, evidence regarding the amounts and disclosures in the financial statements. Our procedures included confirmation of securities owned as of December 31, 2018, by correspondence with the custodian and brokers. Our audits also included evaluating the accounting principles used and significant estimates made by management, as well as evaluating the overall presentation of the financial statements. We believe that our audits provide a reasonable basis for our opinion.
We have served as the Funds’ auditor since 2011.
COHEN & COMPANY, LTD.
Milwaukee, Wisconsin
February 27, 2019
| | |
| | |
LoCorr Investment Trust - Expense Example (Unaudited)
| | 99
|
| | |
oCorr Investment Trust - Expense Example (Unaudited)
Expense Example
December 31, 2018 (Unaudited)
As a shareholder of a mutual fund, you incur two types of costs: (1) transaction costs, including sales charges (loads) on purchase payments; redemption fees; and (2) ongoing costs, including management fees; distribution and/or service (12b-1) fees and other Fund expenses.
This Example is intended to help you understand your ongoing costs (in dollars) of investing in each of the Funds and to compare these costs with the ongoing costs of investing in other mutual funds. The Example is based on an investment of $1,000 invested at the beginning of the period and held for the entire period (July 1, 2018 through December 31, 2018).
Actual Expenses
The actual return columns in the following table provide information about account values based on actual returns and actual expenses. You may use the information in these columns, together with the amount you invested, to estimate the expenses that you paid over the period. Simply divide your account value by $1,000 (for example, an $8,600 account value divided by $1,000 = 8.6), then multiply the result by the number in the first line under the heading entitled “Expenses Paid During Period” to estimate the expenses you paid on your account during this period. The only transaction fees you may be required to pay are for outgoing wire transfers, returned checks and stop payment orders at prevailing rates charged by U.S. Bancorp Fund Services, LLC, doing business as U.S. Bank Global Fund Services, the Funds’ transfer agent. These fees are assessed on all accounts, as applicable. If you request that a redemption be made by wire transfer, currently the Funds’ transfer agent charges a $15.00 fee. The Funds’ transfer agent charges a transaction fee of $25.00 on returned checks and stop payment orders. If you paid a transaction fee, you would add the fee amount to the expenses paid on your account this period to obtain your total expenses paid.
Hypothetical Example for Comparison Purposes
The hypothetical return columns in the following table provide information about hypothetical account values and hypothetical expenses based on the Funds’ actual expense ratio and an assumed rate of return of 5% per year before expenses, which is not the Funds’ actual return. The hypothetical account values and expenses may not be used to estimate the actual ending account balance or expenses you paid for the period. You may use this information to compare the ongoing costs of investing in the Funds and other funds. To do so, compare this 5% hypothetical example with the 5% hypothetical examples that appear in the shareholder reports of the other funds. A transaction fee of $15.00 may be assessed on outgoing wire transfers and a transaction fee of $25.00 may be assessed on returned checks and stop payment orders. To include this fee in the calculation, you would add the estimated transaction fee to the hypothetical expenses shown in the table. Please note that the expenses shown in the table are meant to highlight your ongoing costs only and do not reflect the transaction fees discussed above. Therefore, those columns are useful in comparing ongoing costs only, and will not help you determine the relative total costs of owning different funds. In addition, if these transactional costs were included, your costs would have been higher.
| | |
| | |
100 | | LoCorr Investment Trust - Expense Example (Unaudited) (continued)
|
| | |
Actual vs Hypothetical ReturnsActual vs. Hypothetical returns for the Six Months Ended December 31, 2018 (Unaudited)
| | | | | | | | | |
| | | | | Actual | | Hypothetical (
5% gross annual return) |
| | Class | Fund’s
Annualized
Expense Ratio
1, 2 | Beginning
Account Value
July 1, 2018 | Ending
Account Value
December 31,
2018 | Expenses Paid
During Period
1, 2, 3 | | Ending
Account Value
December 31,
2018 | Expenses Paid
During Period
1, 2, 3 |
| | | | | | | | | |
| LoCorr Macro Strategies Fund |
| A | 2.24% | $1,000.00 | $998.50 | $11.28 | | $1,013.91 | $11.37 |
| C | 2.99% | $1,000.00 | $994.30 | $15.03 | | $1,010.13 | $15.15 |
| I | 1.99% | $1,000.00 | $999.40 | $10.03 | | $1,015.17 | $10.11 |
| | | | | | | | |
| LoCorr Long/Short Commodities Strategy Fund |
| | A | 2.20% | $1,000.00 | $1,082.50 | $11.55 | | $1,014.12 | $11.17 |
| | C | 2.95% | $1,000.00 | $1,078.90 | $15.46 | | $1,010.33 | $14.95 |
| | I | 1.95% | $1,000.00 | $1,084.40 | $10.24 | | $1,015.38 | $9.91 |
| | A | 1.98% | $1,000.00 | $939.80 | $9.68 | | $1,015.22 | $10.06 |
| | C | 2.73% | $1,000.00 | $936.40 | $13.32 | | $1,011.44 | $13.84 |
| | I | 1.73% | $1,000.00 | $941.20 | $8.46 | | $1,016.48 | $8.79 |
| | | | | | | | | |
| LoCorr Dynamic Equity Fund |
| | A | 3.09% | $1,000.00 | $911.40 | $14.89 | | $1,009.63 | $15.65 |
| | C | 3.84% | $1,000.00 | $908.60 | $18.47 | | $1,005.85 | $19.41 |
| | I | 2.84% | $1,000.00 | $912.60 | $13.69 | | $1,010.89 | $14.39 |
| | | | | | | | | |
| LoCorr Spectrum Income Fund |
| | A | 1.95% | $1,000.00 | $889.00 | $9.28 | | $1,015.38 | $9.91 |
| | C | 2.70% | $1,000.00 | $886.40 | $12.84 | | $1,011.59 | $13.69 |
| | I | 1.70% | $1,000.00 | $890.40 | $8.10 | | $1,016.64 | $8.64 |
| 1 | Includes dividend and/or interest expense of 0.00%, 0.00%, 0.00%, 0.26% and 0.00% for the LoCorr Macro Strategies Fund, the LoCorr Long/Short Commodities Strategy Fund, the LoCorr Market Trend Fund, the LoCorr Dynamic Equity Fund and the LoCorr Spectrum Income Fund, respectively. |
| 2 | Includes expenses of wholly-owned and controlled Cayman Islands subsidiaries for the LoCorr Macro Strategies Fund, the LoCorr Long/Short Commodities Strategy Fund and the LoCorr Market Trend Fund. |
| 3 | Expenses Paid During Period are equal to the net annualized expense ratio for the class, multiplied by the average account value over the period, multiplied by 184/365 (to reflect the one-half year period). |
| | |
| | |
| Approval of Advisory Agreements (Unaudited) | | 101
|
| | |
LoCorr Investment Trust
December 31, 2018 (Unaudited)
Review of Sub-Advisory Agreement
Counsel directed the Board’s attention to the Board materials for the renewal of the investment Sub-Advisory agreement for the LoCorr Dynamic Equity Fund (the “LDE Fund”).
The Board reviewed the memorandum provided by Fund Counsel which had been provided to them prior to the meeting entitled, “Duties of Trustees with Respect to Approval and Renewal of Investment Advisory and Sub-Advisory Contracts”. The Board, including a majority of the Trustees who are not “interested persons” of the Trust within the meaning of the 1940 Act (the “Independent Trustees”), reviewed the various factors relevant to its consideration of the Sub-Advisory agreement and the legal responsibilities of the Board related to such consideration. These factors included the following:
• The nature, extent and quality of the services provided by the investment sub-adviser to the fund;
• The investment performance of the fund and the investment sub-adviser;
• The costs of the services to be provided and the profits to be realized by the sub-adviser and its affiliates from the relationship with the fund;
• The extent to which economies of scale will be realized as the fund grows; and
• Whether the fee levels reflect these economies of scale to the benefit of the shareholders.
The Board reviewed the responses to the 15(c) questionnaire and the Sub-Advisory agreement prior to the meeting.
Nature, Extent and Quality of Services Provided by the Sub-Adviser
The Board reviewed the services provided by Kettle Hill Capital Management, LLC (“Kettle Hill”) for the LDE Fund. Fund Counsel and the Board reviewed the responsibilities and backgrounds of Kettle Hill’s key individuals. The Board noted that there were no changes in the key personnel of Kettle Hill since the Board’s last approval. The Trustees further noted that Kettle Hill provides equity research, financial modeling, security selection and trade execution for the LDE Fund and compliance services to assure assets are managed within the Fund’s investment guidelines and restrictions. The Board reviewed and considered Kettle Hill’s investment risk exposure policies with respect to individual security positions.
The Board reviewed Kettle Hill’s responses in the 15c questionnaire, nothing that Kettle Hill reported no material compliance issues, regulatory issues or material litigations in the past 36 months. Fund Counsel noted for the Board’s benefit that Kettle Hill maintains an Errors & Omissions insurance policy in an appropriate amount.
After a discussion, the Board concluded that Kettle Hill has the appropriate investment management experience and sufficient resources to continue to provide satisfactory services for the LDE Fund.
Investment Performance of the Sub-Adviser
Fund Counsel directed the Trustees to the performance of Kettle Hill with respect to its allocation of the LDE Fund. Fund Counsel noted for the Trustees the Sub-Adviser’s performance compared to the Fund’s benchmark and the overall LDE Fund. The Board noted that, although Kettle Hill’s performance lagged the benchmark, its performance was positive while Fund’s overall performance was negative for the 1-year period. A representative of the Adviser stated that the Fund’s adviser continued to be satisfied with Kettle Hill’s performance and the execution of its strategy.
After a discussion, the Board concluded that Kettle Hill’s performance was not unreasonable.
Costs of Services Provided and Profitability to be Realized
Fund Counsel then directed the Board’s attention to the costs of services provided by Kettle Hill to the LDE Fund. Fund Counsel reviewed for the Trustees the fees charged by Kettle Hill to other accounts including other registered investment companies.
The Board next considered Kettle Hill’s net profits related to its services to the LDE Fund. The Board discussed the level of Kettle Hill’s profitability and found it to be not excessive. After further discussion, the Board concluded that Kettle Hill’s Sub-Advisory fee and profitability were reasonable.
Other Benefits
The Trustees noted that Kettle Hill continues to receive soft-dollar benefits from its relationship with the LDE Fund that Kettle Hill uses for brokerage and research purposes. After a discussion, the Trustees concluded that the other benefits that may be derived by Kettle Hill from its relationship with the Fund were reasonable.
Conclusion.
Having requested and received such information from the Adviser as the Trustees believed to be reasonably necessary to evaluate the terms of the Sub-Advisory agreement with Kettle Hill, and as assisted by the advice of Fund Counsel, the Trustees concluded that the Sub-Advisory fee was not unreasonable and that renewal of the Sub-Advisory agreement with Kettle Hill was in the best interests of the shareholders of the LDE Fund.
02 | Approval of Advisory Agreements (Unaudited) (co| | |
| | |
102 | | Approval of Advisory Agreements (Unaudited) (continued)
|
| | |
Review of Investment Advisory, Sub-Advisory and Expense Limitation Agreements
Fund Counsel reviewed the Board’s responsibilities in considering and approving advisory and Sub-Advisory agreements for the Funds. FundCounsel turned the Board’s attention to the memos provided by the Adviser in the materials for the Meeting. The Board reviewed the memos, noting that the Adviser was requesting a decrease in the Adviser’s management fee for the LDE Fund. Fund Counsel discussed that the Adviser was also proposing a reduction in the Sub-Advisory fee to be paid to Billings Capital Management, LLC. Fund Counsel highlighted that the Adviser’s memos indicated that the Adviser would continue to provide the same level of service and resources to the LDE Fund.
A representative of the Adviser stated that the Adviser wished to also reduce its management fee for the LoCorr Macro Strategies Fund (the “Macro Fund”). After a question, the representative of the Adviser confirmed that the Adviser intended to provide the same level of service and resources to the Macro Fund under the new fee structure. The representative of the Adviser also confirmed that the Adviser had more than sufficient financial resources to continue to manage the Funds.
After a brief discussion, the Board concluded its consideration of the proposed fee changes.
Review of Proposed Sub-Adviser, First Quadrant, L.P.
Nature, Extent and Quality of Services Provided by First Quadrant L.P. (“First Quadrant”) to the Fund: The Trustees noted that, as a Sub-Adviser to the Fund, First Quadrant will provide quantitative research, security selection and trade execution for the Fund’s portfolio as well as compliance services to assure assets are managed within the Fund’s investment restrictions. The Trustees also noted that First Quadrant managed approximately $23.9 billion in assets as of September 30, 2018. The Trustees reviewed the responsibilities of First Quadrant’s key individuals, noting the experience and backgrounds of these individuals. The Trustees noted that First Quadrant has certified that it adopted a code of ethics under Rule 17j-1 of the 1940 Act, and also noted the Adviser’s familiarity with First Quadrant. In response to a question, a representative of the Adviser explained that the Adviser had identified First Quadrant as a potential Sub-Adviser after conducting significant due diligence on First Quadrant’s investment, operational and compliance capabilities.
The Trustees further noted First Quadrant’s overall strategy and risk controls. The Trustees considered First Quadrant’s compliance controls including its monitoring of Investment Company Act restrictions as well as its technology and infrastructure. As of the Trustees’ review, First Quadrant did not report any material compliance issues in the past 36 months, nor did First Quadrant have any recent regulatory examinations, material compliance issues or material litigations in the past 36 months. The Trustees concluded that First Quadrant was well-suited to perform the services as sub-adviser to the Fund.
The Trustees noted that First Quadrant carries an appropriate Errors and Omissions/Directors’ and Officers’ (“E&O/D&O”) policy. The Trustees concluded that, based on the revenue from its assets under management, First Quadrant has adequate resources available and sufficient insurance coverage. The Trustees concluded that First Quadrant is well-staffed and has a depth of experienced personnel and the quantitative expertise to provide high quality services to the Fund.
Investment Performance of First Quadrant: The Trustees considered the investment performance of First Quadrant’s Global Equity Long/Short Strategy represented by the combination of all discretionary portfolios of First Quadrant and its joint venture partners wherein First Quadrant has full investment discretion over those portfolios. First Quadrant’s composite 1-year and since inception returns outperformed the MSCI World Index and Credit Suisse Long/Short Equity Hedge Fund Index. After a discussion, the Trustees concluded that it was reasonable that First Quadrant would provide satisfactory performance.
Costs of Services Provided and Profitability to be Realized and Extent of Economies of Scale to be Realized: The Trustees considered the proposed sub-advisory fee was slightly lower than the average fee charged by First Quadrant to its separately managed account clients. After further discussion, the Trustees concluded that the proposed sub-advisory fee was reasonable. The Trustees considered whether there will be economies of scale with respect to the management of the Fund. The Trustees agreed that this was primarily an adviser-level issue and should be considered with respect to the overall advisory contract, taking into consideration the impact of the sub-advisory expense. After discussion, it was the consensus of the Trustees that a lack of breakpoints was acceptable. The Trustees considered the anticipated profits to be realized by First Quadrant in connection with its relationship with the Fund and whether the amount of profit is reasonable with respect to the sub-advisory services to be provided to the Fund. The Trustees noted that First Quadrant estimates realizing profits during the initial fiscal year, both in terms of percentage of revenue as well as actual dollars, based on the amount of assets that First Quadrant is expected to manage initially. The Trustees also noted First Quadrant’s intention to continue to devote considerable resources in developing and maintaining its trading programs. After a discussion, the Trustees concluded that the anticipated level of profit was not excessive.
Conclusions: Having requested and received such information from First Quadrant as the Trustees believed to be reasonably necessary to evaluate the terms of the Sub-Advisory Agreement, and as assisted by the advice of counsel, the Trustees concluded that the fee structure is reasonable and that approval of the Sub-Advisory Agreement is in the best interests of the shareholders of the Fund.
| | |
| | |
| Notice of Privacy Policy & Practices/Quarterly Portfolio Holdings/Proxy (Unaudited) | | 103 |
| | |
Notice of Privacy Policy & Practices
(Unaudited)
Your privacy is important to us. The Funds are committed to maintaining the confidentiality, integrity, and security of your personal information. When you provide personal information, the Funds believe that you should be aware of policies to protect the confidentiality of that information.
The Funds collect the following nonpublic personal information about you:
| ● | Information we receive from you on or in applications or other forms, correspondence, or conversations, including, but not limited to, your name, address, phone number, social security number, assets, income and date of birth; and
|
| ● | Information about your transactions with us, our affiliates, or others, including, but not limited to, your account number and balance, payments history, parties to transactions, cost basis information and other financial information. |
The Funds do not disclose any nonpublic personal information about our current or former shareholders to affiliated or nonaffiliated third parties, except as permitted by law. For example, the Funds are permitted by law to disclose all of the information we collect, as described above, to our transfer agent to process your transactions. Furthermore, the Funds restrict access to your nonpublic personal information to those persons who require such information to provide products or services to you. The Funds maintain physical, electronic and procedural safeguards that comply with applicable federal and state standards to guard your nonpublic personal information.
In the event that you hold shares of the Funds through a financial intermediary, including, but not limited to, a broker-dealer, bank, or trust company, the privacy policy of your financial intermediary would govern how your nonpublic personal information would be shared with affiliated or non-affiliated third parties.
Portfolio Holdings Disclosure
(Unaudited)
The Funds file a complete schedule of portfolio holdings with the U.S. Securities and Exchange Commission (the “SEC”) for the first and third quarters of each fiscal year on Form N-Q or Part F of Form N-PORT (beginning with filings after March 31, 2019). The Funds’ Forms N-Q or Part F of Form N-PORT are available on the SEC’s website at www.sec.gov and may be reviewed and copied at the SEC’s Public Reference Room in Washington, D.C. Information on the operation of the Public Reference Room may be obtained by calling 1-800-SEC-0330. The Funds’ Forms N-Q or Part F of Form N-PORT may also be obtained by calling toll-free 1-855-523-8637.
Proxy voting policies, procedures and record
(Unaudited)
You may obtain a description of the Funds’ (1) proxy voting policies, (2) proxy voting procedures and (3) information regarding how the Funds voted any proxies related to portfolio securities during the most recent 12-month period ended June 30 for which an SEC filing has been made, without charge, upon request by contacting the Funds directly at 1-855-523-8637, or on the EDGAR Database on the SEC’s website (http://www.sec.gov).
| | |
| | |
104 | | Qualified Dividend Income (“QDI”) / Dividends Received Deduction (“DRD”) (Unaudited)
|
| | |
Qualified Dividend Income (“QDI”)/ Dividends Received Deduction (“DRD”)(Unaudited)
For the fiscal year ended December 31, 2018, certain dividends paid by the Funds may be subject to a maximum tax rate of 15%, as provided for by the Jobs and Growth Tax Relief Reconciliation Act of 2003. The percentage of dividends declared from ordinary income designated as qualified income was as follows:
| Fund | | QDI% |
| LoCorr Macro Strategies Fund | | 0.00% |
| LoCorr Long/Short Commodities Strategy Fund | | 0.00% |
| LoCorr Market Trend Fund | | 0.00% |
| LoCorr Dynamic Equity Fund | | 0.00% |
| LoCorr Spectrum Income Fund | | 50.08% |
For corporate shareholders, the percent of ordinary income distributions qualifying for the corporate dividends received deduction for the fiscal year ended December 31, 2018 was as follows:
| Fund | | DRD% |
| LoCorr Macro Strategies Fund | | 0.00% |
| LoCorr Long/Short Commodities Strategy Fund | | 0.00% |
| LoCorr Market Trend Fund | | 0.00% |
| LoCorr Dynamic Equity Fund | | 0.00% |
| LoCorr Spectrum Income Fund | | 45.57% |
| | |
| | |
Independent Trustees/Interested Trustees and Officers
| | 105 |
| | |
The Statement of Additional Information includes additional information about the Independent Trustees/Interested Trustees and Officers and is available, without charge, by calling 1-855-523-8637.
| Independent Trustees |
| Position/Term
of Office1 | Principal Occupation
During the Past 5 Years | Number of Portfolios
in Fund Complex2
Overseen by Trustee | Other Directorships Held by Trustee During the Past 5 Years |
Year of Birth: 1954 | | Chief Executive Officer, Black River Asset Management LLC, investment subsidiary of Cargill, Inc., 2002 to 2015. | | |
Mark Thompson Year of Birth: 1959 | | Chairman and Chief Manager, Riverbridge Partners, LLC (investment management), 1987 to present. | | |
Year of Birth: 1941 | | Mr. Tschetter is presently retired from his principal occupations; Director of the U.S. Peace Corps, 2006 to 2009. | | |
| Interested Trustees and Officers |
Name and
Year of Birth | | Principal Occupation During the Past 5 Years | Number of Portfolios in Fund Complex2 Overseen by Trustee | Other Directorships Held by Trustee During the Past 5 Years |
Jon C. Essen3 Year of Birth: 1963 | Treasurer, Secretary, Chief Financial Officer/ 2011 to present; Trustee/2010 to present | LoCorr Fund Management, LLC: Chief Operating Officer (2010-2016), Chief Compliance Officer, (2010-2017); LoCorr Distributors, LLC: Principal, Chief Financial Officer, and Registered Representative (2008 to present) Chief Compliance Officer (2008-2017). | | |
Kevin M. Kinzie4 Year of Birth: 1956 | President, Trustee/ 2011 to present | Chief Executive Officer of LoCorr Fund Management, LLC, 2010 to present; President and Chief Executive Officer of LoCorr Distributors, LLC (broker/ dealer), 2002 to present. | | |
Jason Roeske5 Year of Birth: 1969 | Chief Compliance Officer/ 2017 to present | Consultant at Encore Consulting Group (2013); Chief Compliance Officer of Welsh Securities, LLC (2014-2016); Chief Compliance Officer of LoCorr Fund Management, LLC, (2017-present). | | Chief Compliance Officer of Welsh Securities, LLC (2014-2016) |
1 The term of office for each Trustee listed above will continue indefinitely.
2 The term “Fund Complex” refers to the LoCorr Investment Trust.
3 Mr. Essen is an interested Trustee because he is an officer of the Funds’ Adviser.
4 Mr. Kinzie is an interested Trustee because he is an officer and indirect controlling interest holder of the Funds’ Adviser.
5 Mr. Roeske is an interested person because he is an officer of the Funds’ Adviser.
10
This page left intentionally blank.
| 107
This page left intentionally blank.
This page left intentionally blank.
| 109
This page left intentionally blank.
This page left intentionally blank.
Item 2. Code of Ethics.
The registrant has adopted a code of ethics that applies to the registrant’s principal executive officer and principal financial officer. The registrant has not made any amendments to its code of ethics during the period covered by this report. The registrant has not granted any waivers from any provisions of the code of ethics during the period covered by this report.
A copy of the registrant’s Code of Ethics is incorporated by reference. See Item 13(a)(1).
Item 3. Audit Committee Financial Expert.
The registrant’s board of directors has determined that there is at least one audit committee financial expert serving on its audit committee. Gary Jarrett is the “audit committee financial expert” and is considered to be “independent” as each term is defined in Item 3 of Form N‑CSR.
Item 4. Principal Accountant Fees and Services.
The registrant has engaged its principal accountant to perform audit services, audit-related services, tax services and other services during the past two fiscal years. “Audit services” refer to performing an audit of the registrant's annual financial statements or services that are normally provided by the accountant in connection with statutory and regulatory filings or engagements for those fiscal years. “Audit-related services” refer to the assurance and related services by the principal accountant that are reasonably related to the performance of the audit. “Tax services” refer to professional services rendered by the principal accountant for tax compliance, tax advice, and tax planning. “Other services” provided by the principal accountant of $5,000 and $5,000 represent a cursory review of the semi-annual report for LoCorr Investment Trust for the periods ended June 30, 2018 and June 30, 2017, respectively. The following table details the aggregate fees billed or expected to be billed for each of the last two fiscal years for audit fees, audit-related fees, tax fees and other fees by the principal accountant.
| | FYE 12/31/2018 | FYE 12/31/2017 |
| Audit Fees | $119,000 | $139,000 |
| Audit-Related Fees | $0 | $0 |
| Tax Fees | $30,000 | $36,500 |
| All Other Fees | $5,000 | $5,000 |
The Audit Committee has adopted pre-approval policies and procedures that require the Audit Committee to pre‑approve all audit and non‑audit services of the registrant, including services provided to any entity affiliated with the registrant.
The percentage of fees billed by Cohen & Company, Ltd. applicable to non-audit services pursuant to waiver of pre-approval requirement were as follows:
| | FYE 12/31/2018 | FYE 12/31/2017 |
| Audit-Related Fees | 0% | 0% |
| Tax Fees | 0% | 0% |
| All Other Fees | 0% | 0% |
All of the principal accountant’s hours spent on auditing the registrant’s financial statements were attributed to work performed by full‑time permanent employees of the principal accountant.
During the last two fiscal years, there were no non-audit services, other those disclosed above under "Tax Fees" and "All Other Services", rendered by the principal accountant to the registrant. In addition, there were no non-audit services rendered by the principal accountant to the registrant’s investment adviser or any entity controlling, controlled by or under common control with the investment adviser that provides ongoing services to the registrant.
Item 5. Audit Committee of Listed Registrants.
Not applicable to registrants who are not listed issuers (as defined in Rule 10A-3 under the Securities Exchange Act of 1934).
Item 6. Investments.
| (a) | Schedule of Investments is included as part of the report to shareholders filed under Item 1 of this Form. |
Item 7. Disclosure of Proxy Voting Policies and Procedures for Closed-End Management Investment Companies.
Not applicable to open-end investment companies.
Item 8. Portfolio Managers of Closed-End Management Investment Companies.
Not applicable to open-end investment companies.
Item 9. Purchases of Equity Securities by Closed‑End Management Investment Company and Affiliated Purchasers.
Not applicable to open-end investment companies.
Item 10. Submission of Matters to a Vote of Security Holders.
There have been no material changes to the procedures by which shareholders may recommend nominees to the registrant’s Board of Trustees.
Item 11. Controls and Procedures.
| (a) | The registrant’s President and Treasurer have reviewed the registrant's disclosure controls and procedures (as defined in Rule 30a-3(c) under the Investment Company Act of 1940 (the “Act”)) as of a date within 90 days of the filing of this report, as required by Rule 30a-3(b) under the Act and Rules 13a-15(b) or 15d‑15(b) under the Securities Exchange Act of 1934. Based on their review, such officers have concluded that the disclosure controls and procedures are effective in ensuring that information required to be disclosed in this report is appropriately recorded, processed, summarized and reported and made known to them by others within the registrant and by the registrant’s service provider. |
| (b) | There were no changes in the registrant's internal control over financial reporting (as defined in Rule 30a-3(d) under the Act) that occurred during the second fiscal quarter of the period covered by this report that has materially affected, or is reasonably likely to materially affect, the registrant's internal control over financial reporting. |
Item 12. Disclosure of Securities Lending Activities for Closed-End Management Investment Companies
Not applicable to open-end investment companies.
Item 13. Exhibits.
| (a) | (1) Any code of ethics or amendment thereto, that is the subject of the disclosure required by Item 2, to the extent that the registrant intends to satisfy Item 2 requirements through filing an exhibit. |
Incorporated by reference to the registrant’s Form N-CSR filed March 7, 2014.
(2) A separate certification for each principal executive and principal financial officer pursuant to Section 302 of the Sarbanes-Oxley Act of 2002.
Filed herewith.
(3) Any written solicitation to purchase securities under Rule 23c‑1 under the Act sent or given during the period covered by the report by or on behalf of the registrant to 10 or more persons.
Not applicable to open-end investment companies.
(4) Changes in the registrant’s independent public accountant.
There was no change in the registrant’s independent public accountant for the period covered by the report.
| (b) | Certifications pursuant to Section 906 of the Sarbanes‑Oxley Act of 2002. |
Furnished herewith.
SIGNATURES
Pursuant to the requirements of the Securities Exchange Act of 1934 and the Investment Company Act of 1940, the registrant has duly caused this report to be signed on its behalf by the undersigned, thereunto duly authorized.
(Registrant) LoCorr Investment Trust
By (Signature and Title) /s/ Kevin Kinzie
Kevin Kinzie, President
Date February 27, 2019
Pursuant to the requirements of the Securities Exchange Act of 1934 and the Investment Company Act of 1940, this report has been signed below by the following persons on behalf of the registrant and in the capacities and on the dates indicated.
By (Signature and Title) /s/ Kevin Kinzie
Kevin Kinzie, President
Date February 27, 2019
By (Signature and Title) /s/ Jon Essen
Jon Essen, Treasurer
Date February 27, 2019