

Letter to Shareholders
LoCorr Funds seeks to provide investments that, over time, will have low correlation to traditional asset classes such as stocks and bonds. We believe that adding low correlating investments to portfolios can significantly reduce overall portfolio risk while enhancing returns. Correlation measures the degree to which the returns of two investments move together over time. LoCorr offers products that provide the potential for positive returns in rising or falling markets and are designed to generate returns independent of traditional stock, bond and commodity investments. In this report, LoCorr Funds is reporting on five mutual funds: LoCorr Macro Strategies Fund, LoCorr Long/Short Commodities Strategy Fund, LoCorr Market Trend Fund, LoCorr Dynamic Equity Fund and LoCorr Spectrum Income Fund (collectively, the “Funds”).
LoCorr Macro Strategies Fund
The LoCorr Macro Strategies Fund (the “Fund”) seeks capital appreciation as its primary investment objective with managing volatility as a secondary objective. The Fund attempts to achieve its objective by investing in two main strategies – a Managed Futures Strategy and a Fixed Income Strategy.
The Fund employs three sub-advisers to manage the managed futures portion of the Fund:
| ● | Millburn Ridgefield (“Millburn”) manages a portfolio for the Fund that is similar to its Millburn Diversified Program which commenced operations in 1977. Millburn invests in a diversified portfolio of global futures contracts by employing a systematic, statistical learning-based, multi-factor approach. |
| ● | Graham Capital Management(“Graham”) manages a portfolio for the Fund that is similar to its Tactical Trend strategy, a systematic medium- to long-term trend following program that commenced trading in 2006. |
| ● | Revolution Capital Management (“Revolution”) manages a strategy for the Fund that is similar to its Alpha Program that has been available in a managed account program since 2007. Revolution employs a short-term pattern recognition strategy. |
Market Commentary
2020 is likely a year that few will forget as approximately two million lives were lost to COVID-19 and virtually everyone around the globe saw their lives impacted by the virus in one way or another. As the world came to the realization that COVID-19 had spread beyond Wuhan, China and was rapidly becoming a global pandemic, our daily lives would be disrupted in a way that few had previously experienced. News regarding the spread of the virus and global efforts to contain it would be the dominating factor that drove global markets throughout the year.
As the virus exploded, attempts to slow its spread via shelter-in-place, social distancing, and the closure of non-essential businesses had an unprecedented effect on business activity and the global economy. In the U.S. for example, Q2 gross domestic product declined an unprecedented -31.4% and the unemployment rate soared to 14.7%, its highest level since the Great Depression. Certain segments of the economy like travel experienced a virtual stoppage. At its low point on April 14th, U.S. airline travel demand declined -96% year-over-year according to the Transportation Security Administration. Cruise lines stopped sailing as the Centers for Disease Control (“CDC”) issued a ‘No Sail Order’. Meanwhile other service sectors including restaurants and movie theaters were shuttered. Against this backdrop, risk assets collapsed in February/March in what became the fastest bear market in history.
In response to the growing crisis, the Federal Reserve (“Fed”) and other central banks around the globe, perhaps having learned lessons from the Global Financial Crisis in 2008, responded decisively with unprecedented stimulus efforts to stabilize the financial system. Fiscal stimulus measures were also adopted to varying degrees in the U.S. and elsewhere as legislators also responded to the crisis. According to a June 2020 McKinsey & Company study, approximately $10 trillion in fiscal and monetary policy stimulus was announced, more than triple the amount of stimulus versus the 2008/2009 financial crisis. The staggering stimulus effort quickly shifted investor attitude as this overwhelming response by central banks and policy makers, along with progress on treatment and vaccine development, contributed to a mammoth reversal in risk assets beginning in late March. This recovery strengthened as the year progressed, buoyed by increasingly positive vaccine development and efficacy news, culminating in the approval of the Pfizer and Moderna vaccines in December. Investors seemed to increasingly embrace a return-to-normal narrative which continued to fuel markets higher. Finally, whether it was the actual outcome of the U.S. Presidential election or the fact that uncertainty was resolved, the recovery in risk assets intensified in November.
Equities
2020 began with stocks continuing their upward trend, grinding higher until it became clear that market participants would need to come to grips with the emerging pandemic. This led to a massive fear-induced sell-off that staggered investors. At the deepest point of its drawdown (February 20th – March 23rd), the S&P 500 declined -33.79%. Further, the Index fell into a bear market in a mere 16 days, its fastest 20% decline in history as the VIX reached an all-time closing high of 82.69 on March 16th. The sell-off did not persist, however, as investor views shifted quickly, becoming increasingly optimistic that the actions taken by central bankers and legislators would support/stabilize financial markets and the economy. Meanwhile, massive amounts of resources were being deployed toward COVID-19 treatments/vaccines which investors increasingly gained confidence in and paved the way for a return-to-normal surge. Stocks would erase their earlier losses, rallying +70.18% from their March 23rd low, as measured by the S&P 500, and finishing 2020 up an astounding +18.40%. The calendar year gains were not as extensive in international markets, as evidenced by the +5.43% return for the MSCI EAFE PR USD Index, though the Index rallied +15.75% in the fourth quarter.
Fixed Income
With massive quantitative easing, economic growth collapsing, and investors seeking safe-haven assets, interest rates moved sharply lower. In March, the U.S. briefly joined much of the rest of the world when 1- and 3-month Treasury yields went negative for the first time in history. After approaching 2% at the beginning of the year, the 10-year U.S. Treasury bottomed near 0.5% in August. Increasing optimism regarding the economic recovery and additional stimulus measures, along with the ongoing return-to-normal narrative, helped boost interest rates from there with the U.S. 10-year yield closing the year near 1% though shorter-term rates remained firmly anchored by the Fed. Interest rates around the globe followed a similar pattern early in the year as global yields fell. The U.K. for example sold negative yielding government bonds for the first time in its history. There was generally less of a recovery in interest rates in international markets during the second half of the year. For example, the year-end yields for the German 10-Year Bund and the Japanese 10-Year were relatively unchanged versus the summer.
Commodities
With economic activity grinding to a halt, the demand for many commodities collapsed and prices fell sharply during the first months of the period. The commodity complex would rally sharply from here, however, as weakness in the U.S. Dollar and the breakthroughs on the vaccine front triggered increasing optimism that the world was moving toward a post-pandemic economic recovery.
In energy markets, oil, as measured by West Texas Intermediate crude (“WTI”), fell a staggering -70% from January to March. The Organization of the Petroleum Exporting Countries (“OPEC”) failed to reach a production cut agreement with Russia during this period, resulting in Saudi Arabia initiating an oil price war just as demand collapsed due to COVID-19. WTI for the May 2020 delivery closed at an astonishing -$37.63 one day prior to expiration. Oil prices would remain in a relatively tight trading range until late in the year before rallying higher. In metals, gold prices reached an all-time high in August, crossing $2,000/ounce. Copper prices which had fallen earlier in the year, surged to their highest level since early 2013, also benefitting from its use in electric vehicles and other green applications. In agricultural markets, grains generally finished 2020 sharply higher as dry conditions late in the year in South America, a key growing region, and strong Chinese demand boosted prices, notably soybean prices which surged nearly +40% during the year.
Foreign Currency
After strengthening early in the year as investors sought safe-haven assets, the U.S. Dollar (“USD”) peaked in late March, as measured by the U.S. Dollar Index. As optimism for an economic recovery improved and risk seeking returned to markets, the greenback weakened versus other major currencies through the end of the year. Further, concerns regarding the U.S. twin deficits (budget and trade deficits) also contributed to the dollar decline. Against the Euro, the USD reached its lowest level since the beginning of 2018. The British Pound also reached its highest level against the greenback in 2 ½ years as the UK and the European Union reached a Brexit trade deal, helping to remove major downside risk to the UK economy. Meanwhile, the Swiss Franc reached a 5-year high vs the USD, though the U.S. Treasury Department designated Switzerland as a currency manipulator. Overall, the USD fell nearly -7% in 2020.
Fund Performance Summary
For the annual period ended December 31st, 2020, the Fund’s I Shares gained +5.70% versus +2.62% for the Morningstar Managed Futures category. The Fund outperformed the S&P 500 Index by +25.71% from the S&P’s peak on February 20th to the deepest point of its drawdown (-33.79%) on March 23rd, demonstrating its potential to help diversify investor portfolios during periods of equity market stress.
During 2020, the Fund’s allocation to Revolution provided the largest positive contributions, as it quickly adapted to the shifting market regime as stocks collapsed. Graham’s trend-following strategy also generated slightly positive returns during the year while Millburn’s statistical learning-based, multi-factor strategy had negative returns. Given the incredible shifts in market dynamics over the course of the year, we are pleased with how the Fund and its sub-advisers performed in 2020. We are particularly pleased that the Fund’s sub-advisers tended to perform differently at different points in time during the year helping to smooth returns and provide a more robust return profile versus most peers.
Trading in commodities produced the largest gains for the Fund during 2020 followed closely by positive contributions from trading in fixed income and, to a lesser extent, gains from trading in foreign currency markets. Partially offsetting these gains, were losses from trading in equities. The target allocation to each sub-adviser was unchanged during the period:
| ● | Millburn Ridgefield: 40% |
| ● | Graham Capital Management: 40% |
| ● | Revolution Capital Management: 20% |
Managed Futures Strategy
Commodities
In commodities, trading was profitable across energy, metals, and agricultural commodities. In energy markets, the bulk of the gains occurred early in the year as short exposure benefitted from the collapse in oil during the first quarter. Overall, the largest gains in energy
were from trading in WTI. In metal markets, the Fund had positive contributions from both base and precious metal markets. In precious metals, long silver exposure was profitable as prices broke out to the upside after plunging earlier in the year. Long positions in gold were also profitable, benefitting from the upward push in prices which reached an all-time high in August. In base metals, trading in copper was profitable as exposure transitioned from short to long over the course of the year. Finally, agricultural markets provided smaller gains. The Fund benefitted later in the year from surging prices in grain markets, particularly long soybean positions. The Fund ended 2020 with long exposure in energy, grain, metals, and soft commodities.
Fixed Income
Trading in fixed income also produced sizable gains during 2020, particularly in the first half of the year. Long positions in fixed income were profitable in the first quarter and, to a lesser degree, in the second quarter as yields collapsed. The largest gains were from long positions in U.S. instruments with smaller gains from long exposure to Canadian government bonds. In the U.S., the largest gains were from 5-Year Treasury Notes along with the U.S. Treasury Bond. Asian and European markets produced losses during the period, led by unprofitable trading in the Euro BOBL and Euro Bund. The Fund finished 2020 with long fixed income positions, particularly in the U.S. and Europe while Asian exposure was slightly short.
Equity Indices
Trading in equity indices was the largest detractor during the period. Heading into the market peak on February 20th, the Fund remained positioned long which had been quite profitable in the prior calendar year. While those long positions were flattened as the sub-adviser models responded to the collapse in equities, the unprecedented speed of the market breakdown caused the Fund to experience significant losses from trading in the sector. Notably, outside of the February 20th through March 23rd period, the Fund generated significant gains from equities trading for the remainder of the year as long exposure benefitted from the recovery in stocks. From a regional perspective, trading in the U.S. was slightly profitable in 2020 but more than offset by losses in Europe and, to a lesser extent, in Asia. The most notable losers during the period were from trading in the TOPIX, FTSE 100, and Dow Jones Euro STOXX 50. The Fund ended the year with long exposure in the U.S. and Asia while European positions were slightly long as well.
Foreign Currencies
Trading in currencies was profitable in 2020 as the Fund was able to benefit from USD weakness in the second half of the year as positioning shifted to long Foreign Currency (“FX”). The largest gains were from long European currencies, particularly the Euro and the Swiss Franc which reached a multi-year high versus the greenback. In Emerging Market currencies, short exposure in the Brazilian Real was profitable early in the year as the currency weakened in sympathy with other risk assets. Partially offsetting these gains were losses from trading in Asian currencies and the Canadian dollar. At the end of 2020, the Fund was long FX versus the USD with the largest long exposure in the Euro, Swiss Franc, and Japanese Yen.
Outlook
As we turn the page on calendar 2020, investors need to grapple with several issues over the coming months and quarters. With the first COVID-19 vaccines approved in December, risk assets continued to surge as investors embraced the “return-to-normal” trade. Given these moves, allocators are likely to closely monitor both the pace of vaccinations in 2021 along with the number of cases which surged during the fourth quarter. Challenges to the return-to-normal narrative may lead to volatility and market disruption.
The bull market has been remarkably resilient during the final weeks of the Trump administration, shrugging off the President’s challenge of the election results and the uncertainty of the Georgia Senate runoff elections. If the political and socioeconomic divide creates increasing unrest, it will likely foster heightened market volatility, particularly to the extent that it impacts corporate America. As the Democrat party takes control of the Senate, investors will need to consider implications for further stimulus, tax policy, etc.
Finally, the outlook for interest rates will likely be another key issue to consider. Although rates are near historical lows, longer-term yields have been climbing gradually since August. It seems likely that with yields so low, but with the potential to move higher, investors will need to consider whether bonds can deliver the kind of returns that they have in the past.
Against this backdrop, the sell-off in risk assets in 2020 and Q4 2018 is perhaps another reminder of the inherent volatility in markets and the importance of diversifying strategies. As already discussed, looking forward can bonds still provide the diversification and returns that investors have enjoyed in the past? We believe the answer is no and that instead, investors may want to recommit and strengthen their allocation to other diversifying strategies like managed futures.
Fixed Income Strategy
The Fund invests most of its remaining assets in a Fixed Income Strategy comprised of high quality, short to intermediate term investment grade corporate (“IG”) and government agency securities managed by Nuveen Asset Management (“Nuveen”).
The fixed income component of the Fund is managed against the Barclay’s 1–5 Government Credit Index. Returns for the fixed income portion of the portfolio were +4.96% compared to +4.71% for the benchmark during 2020. The duration of the portfolio was managed between 2.5 and 2.7 years. Nuveen maintained a mostly neutral duration position as the Fed lowered the federal funds rate to zero. As such, duration positioning did not have a material impact on relative performance versus the benchmarks as interest rates fell. The portfolio managers remained overweight in non-government sectors, which provided a positive contribution. These sectors were negatively impacted by spread widening during the first quarter, however, they rebounded sharply thereafter. Overall, the positioning caused the funds to modestly outperform their respective benchmarks.
The Nuveen portfolio management team expects U.S. growth to continue at an above-trend pace during 2021. The recently enacted batch of fiscal stimulus, which includes another round of stimulus checks, small business support and expanded unemployment benefits, will support personal disposable income and ultimately consumption over the next several quarters. As populations receive COVID-19 vaccinations, starting with the highest-risk groups, virus-driven disruptions should be smaller in 2021. Consumer and corporate balance sheets are healthy, providing a solid backdrop for growth. The Fed remains on hold and expects the fed fund rates to be unchanged for an extended period as it continues to monitor incoming data. Given this Fed and economic outlook, Nuveen expects to manage the funds’ duration modestly underweight versus the benchmark.
For 2021, the portfolio managers expect a modest tightening in IG credit spreads, driven by a rebound in economic growth, lower primary issuance and improving credit fundamentals. With credit spreads near historical tights on the front-end of the curve, we expect individual credit selection will be a key driver of generating excess returns. Nuveen favors banking and communications, and is cautious on basic industries and consumer cyclicals. In light of favorable volatility adjusted return potential, we will continue to position the funds broadly across the securitized sectors. While the full impact of COVID-19 on residential housing borrowers is still unknown, data indicates that the worse-case scenarios for mortgage default and loss are unlikely. As time passes, COVID-19 forbearance events continue to cure, suggesting much better-than-expected credit performance from borrowers.
LoCorr Long/Short Commodities Strategy Fund
The LoCorr Long/Short Commodities Strategy Fund (the “Long/Short Commodities Fund” or the “Fund”) provides investors with access to a commodities futures strategy in a mutual fund structure. Historically, investors have primarily accessed exposure to long-only commodities that rely on rising commodity prices to generate positive returns. Of course, commodity prices do not always appreciate and occasionally experience sharp declines, as was seen in 2020, 2018, 2014/2015 and 2008. The Long/Short Commodities Fund has the potential to profit while commodity prices increase or decrease which differentiates it from most commodity-oriented mutual funds. The Fund’s primary investment objective is capital appreciation in rising and falling commodities markets. The Fund attempts to achieve its investment objective by investing in two primary strategies – a Commodities Strategy and a Fixed Income Strategy.
The Fund accesses, via a total return swap agreement or a fund-linked option, the returns of:
| ● | ARCOM Capital (“ARCOM”), which began trading in 2015. ARCOM is led by Alastair Riach, who has over 30 years of experience trading commodities, and manages a discretionary natural gas specialist strategy that trades primarily relative value. |
| ● | East X was founded in 2017 and manages a strategy that traces its roots back to 2014. East X manages a systematic approach that combines fundamental insights gleaned from discretionary traders with pattern recognition technique in a rigorous systematic framework. The portfolio will hold long/short directional, relative value (inter-market), and structural (calendar spread) positions. |
| ● | First Quadrant’s Commodities Long/Short strategy (“First Quadrant”), which began trading in 2010. FQ employs a systematic long/short directional strategy that attempts to capture commercial market participant behavior across 20+ commodity markets. |
| ● | J E Moody & Company Commodity Relative Value Program (“JEM CRV”), which began trading in 2006. JEM CRV employs a market neutral, systematic trading strategy that invests in relative value calendar spread positions across 20+ commodity markets. |
| ● | Millburn’s Commodity Program, which began trading in 2005. Millburn employs a systematic trading strategy that takes outright long/ short positions and relative value spread positions across 40+ commodity futures markets. |
2020 is likely a year that few will forget as approximately two million lives were lost to COVID-19 and virtually everyone around the globe saw their lives impacted by the virus in one way or another. As the world came to the realization that COVID-19 had spready beyond Wuhan, China and was rapidly becoming a global pandemic, our daily lives would be disrupted in a way that few had previously experienced. News regarding the spread of the virus and global efforts to contain it would be the dominating factor that drove global markets throughout the year.
As the virus exploded, attempts to slow its spread via shelter-in-place, social distancing, and closure of non-essential businesses had an unprecedented effect on business activity and the global economy. In the U.S. for example, Q2 gross domestic product declined an unprecedented -31.4% and the unemployment rate soared to 14.7%, its highest level since the Great Depression, though many feared it would top 20%. Certain segments of the economy like travel experienced a virtual stoppage. At its low point on April 14th, U.S. airline travel demand declined -96% year-over-year according to the Transportation Security Administration. Cruise lines stopped sailing as the CDC issued a ‘No Sail Order’. Meanwhile other service sectors including restaurants and movie theaters were shuttered. Against this backdrop, risk assets collapsed in February/March in what became the fastest bear market in history.
In response to the growing crisis, the Federal Reserve and other central banks around the globe, perhaps having learned lessons from the Global Financial Crisis in 2008, responded decisively with unprecedented stimulus efforts to stabilize the financial system. Fiscal stimulus measures were also adopted to varying degrees in the U.S. and elsewhere as legislators also responded to the crisis. According to a June McKinsey & Company study, approximately $10 trillion in fiscal and monetary policy stimulus was announced, more than triple the amount of stimulus versus the 2008/2009 financial crisis. The staggering stimulus effort quickly shifted investor attitude as this overwhelming response by central banks and policy makers, along with progress on treatment and vaccine development, contributed to a mammoth reversal in risk assets beginning in late March. This recovery strengthened as the year progressed, buoyed by increasingly positive vaccine development and efficacy news, culminating in the approval of the Pfizer and Moderna vaccines in December. Investors seemed to increasingly embrace a return-to-normal narrative which continued to fuel markets higher. Finally, whether it was the actual outcome of the November U.S. Presidential election or the fact that uncertainty was resolved, the recovery in risk assets intensified in November as markets seemed to anticipate a moderate U.S. government pursuing a moderate agenda.
Similar to other risk assets, commodities were also significantly impacted by the pandemic. With the global economy reaching a virtual standstill, the Bloomberg Commodity Index fell -26.95% from January 7th to March 18th. Overall, for 2020 the Index declined only -3.12% as it recovered from its March low with other cyclical and risk assets and was provided a boost by the weak U.S. Dollar. Of course, commodity performance varied considerably by sector and market.
In energy markets, oil as measured by West Texas Intermediate crude, fell a staggering -70% from January to March. OPEC failed to reach a production cut agreement with Russia during this period, resulting in Saudi Arabia initiating an oil price war just as demand collapsed due to COVID-19. This weakness eventually caused the WTI contract for May 2020 delivery to close at an astonishing -$37.63 one day prior to expiration. Prices moved higher during the fourth quarter as OPEC+ announced additional production cuts beginning in January 2021 and the market began anticipating increased regulation under the Biden administration. Before recovering in the second half of the year, natural gas prices reached $1.44 in June, its lowest levels since 1995 as low prices globally reduced U.S. LNG (liquified natural gas) exports.
In metals, base metal prices followed a similar pattern, generally falling sharply in February/March to multi-year lows before recovering sharply from there. Copper prices finished 2020 up ~25%, soaring higher from its March low and eventually reaching its highest level since early 2013 as demand improved. Further, the emergence of electric vehicles is perhaps helping to fuel the upward move as these vehicles require significantly more content of key base metals including copper. In precious metals, with real interest rates below zero gold prices soared, reaching a historical high above $2,000 per ounce in August.
Despite the weakness in the U.S. dollar, agricultural commodity prices were mixed in 2020. Grain prices generally finished higher during the year, holding up better than more industrial commodities early in the year on increased demand for food staples. While prices weakened in the Spring as trade tension with China ratcheted up, grain prices finished the year strong, particularly soybean which finished up nearly +40% in 2020, benefitting from strong Chinese demand and dry weather in South America. Livestock prices fell in 2020 as they could not fully recover from dislocations caused by processing plant shutdowns and lower demand. Despite a strong rally in the fourth quarter, soft commodities were mixed in 2020. Sugar prices moved higher during the year as the risk-off trade and weakness in the Brazilian real gave way to a strengthening currency in the fourth quarter and strong ethanol prices.
Fund Performance Summary
The Fund’s Class I Shares gained +9.91% during the annual perioded ended December 31st, 2020 versus the -3.12% return for the Bloomberg Commodity Total Return Index and the +0.67% gain for the ICE BofAML T-Bill Index. During the February/March stock market collapse, the Fund gained +5.99% versus the -33.79% decline for the S&P 500 at the deepest point of the Index’s drawdown, demonstrating its potential to help diversify investor portfolios. During the period, the Fund benefitted from positive contributions from JEM CRV, Millburn, and East X while First Quadrant and ARCOM experienced losses. Trading in Energy was the largest driver of the Fund’s positive returns while livestock and grain positions also contributed positively. The Fund had losses from trading in softs while trading in metals was not a significant performance driver in the period.
Energy
Trading in energy produced the largest gains for the Fund in 2020. With oil market fundamentals weakening, the Fund’s exposure shifted short early in the year and reaped sizable gains as prices collapsed. Of course, oil markets bottomed during the second quarter when the May WTI contract had a negative price before rallying and trading in a tight range until very late in the year. These conditions proved to be more challenging for the Fund which suffered losses from energy trading in the second half of the year following the large gains in the first half. Overall, the largest contributors in 2020 were from trading in Brent and WTI crude, with smaller gains from positions in natural gas. The largest losses were from positions in heating oil while a geographic spread position was also hurt by rising natural gas prices in Europe due to cold weather and falling prices in the U.S. where prices were hurt by mild temperatures. The Fund finished 2020 with long energy exposure.
Agricultural
Trading in agricultural commodities was profitable as gains from positions in grain and livestock markets were partially offset by losses in softs. In livestock markets, the Fund enjoyed gains from both hog and cattle markets. The Fund was able to take advantage of strong fundamentals in grain markets as strong China demand and dry weather in S. America drove grain prices higher in the second half of the year. The largest gains from the grain markets were positions in soybeans. Finally, trading in soft markets was more challenging for the Fund with positions in sugar and coffee producing the largest losses. At the end of 2020, positions in grain and soft markets were long while livestock exposure was also marginally long.
Metals
Trading in Metals was not a significant driver for the Fund during the period as gains from positions in precious metals were offset by losses from trading in base metal markets. In base metals, short positions during the first quarter were profitable as the global shutdown caused prices to fall sharply; however, as prices began to rally due to optimism for the economic recovery, that short exposure proved to be unprofitable, ultimately creating small losses for the year in its entirety. In precious metals, gains were driven by long exposure in gold and palladium which both saw prices reach historical highs. The Fund finished the period with long exposure in both base and precious metals.
Outlook
As we turn the page on calendar 2020, investors need to grapple with several issues over the coming months and quarters that will likely influence commodity markets. With the first COVID-19 vaccines approved in December, risk assets continued to surge as investors embraced the “return-to-normal” trade. Given these moves, allocators are likely to closely monitor both the pace of vaccinations in 2021 along with the number of cases which surged during the fourth quarter. Challenges to the return-to-normal narrative may lead to volatility and market disruption that may impact commodity fundamentals.
China accounts for more than 50% of global demand for many commodities. Given China’s voracious appetite for commodities, relations between the U.S. and China may continue to impact commodity prices and volatility. Though many expect improved relations between the two superpowers with the change in U.S. administration, relations as they stand today are strained. Any deterioration or improvement will likely have significant effects on commodity prices.
Finally, there is increasing discussion about the potential for a commodity super cycle. In the metal markets for example, with weaker prices there has been a lack of new investment over the past decade which is potentially bullish as demand improves. Further, many are pointing to the growth in the electric vehicle market and overall green movement given how metal-intensive these developments are, further fueling the bullish sentiment. Finally, prices for most cyclical commodity prices have rallied sharply from their lows and, in some cases like copper, have moved to multi-year highs adding support to this outlook.
Overall, we are pleased with the Fund’s performance in 2020, providing welcome diversification to investors during the February/March stock market collapse. We believe the Fund may be highly attractive to investors seeking solutions that are uncorrelated to most investment strategies and asset classes, or for investors that are seeking alternatives in the commodity market. Commodity markets are characterized by high volatility and subject to sizable drawdowns as we have seen in 2020. This volatility also creates tremendous opportunities which we believe the Fund can take advantage of. The underlying managers in the Fund can take both long and short directional positions (benefit from commodities moving up or down), as well as relative value positions (calendar, geographic, and inter-market spreads) to capture this diverse and robust set of opportunities over time making it a potentially ideal solution regardless of the market environment for commodities. Finally, the Fund’s multi-manager approach has the potential to smooth the ride for investors as the underlying managers tend to zig and zag at different times which may help reduce volatility and limit drawdowns. We remain confident in the outlook for the Fund and the underlying managers and strategies.
Fixed Income Strategy
The Fund invests most of its remaining assets in a Fixed Income Strategy comprised of high quality, short to intermediate term investment grade corporate and government agency securities managed by Nuveen.
The fixed income component of the Fund is managed against the Barclay’s 1–5 Government Credit Index. Returns for the fixed income portion of the portfolio were +4.90% compared to +4.71% for the benchmark during 2020. The duration of the portfolio was managed between 2.5 and 2.7 years. Nuveen maintained a mostly neutral duration position as the Fed lowered the federal funds rate to zero. As such, duration positioning did not have a material impact on relative performance versus the benchmarks as interest rates fell. The portfolio managers remained overweight in non-government sectors, which provided a positive contribution. These sectors were negatively impacted by spread widening during the first quarter, however, they rebounded sharply thereafter. Overall, the positioning caused the funds to modestly outperform their respective benchmarks.
LoCorr Market Trend Fund
The LoCorr Market Trend Fund (the “Market Trend Fund” or the “Fund”) was created to provide investors with access to a trend following futures strategy managed by one of the leading managers in this space—Graham Capital Management. Graham was founded in 1994 and manages approximately $16 billion in assets. The Market Trend Strategy is managed similarly to Graham’s Tactical Trend program, a systematic medium- to long-term trend following strategy that commenced trading in 2006. The Fund seeks capital appreciation as its primary investment objective with managing volatility as a secondary objective. The Fund attempts to achieve its objective by investing in two main strategies – a Managed Futures Strategy and a Fixed Income Strategy.
Market Commentary
See Macro Strategies Fund above.
Fund Performance Commentary
The Fund’s Class I Shares gained +4.81% during the annual period ended December 31st, 2020 versus +2.62% for the Morningstar Managed Futures category. The Fund was able to deliver a positive total return in 2020, benefitting from a strong second half (+12.41%) where trending activity was prevalent across a number of sectors. The Fund outperformed the S&P 500 Index by +19.46% from the S&P 500 peak on February 20th to the deepest point of its drawdown (-33.79%) on March 23rd, demonstrating its potential to help diversify investor portfolios.
Trading in Fixed Income generated sizable gains for the Fund during the period, with positive contributions also coming from positions in commodities, particularly in metal markets. Losses from trading in equity markets was the largest detractor during the year.
Market Trend Strategy
Fixed Income
Trading in fixed income produced the largest gains during 2020, particularly in the first quarter as risk assets sold off and investors sought safe-haven assets during the COVID-19 sell-off in February and March. The Fund enjoyed positive contribution from both the long- and short-end of the curve. The bulk of the gains were from long positions in U.S. instruments, particularly the 5-Year U.S. Treasury Note. Long positions in Europe and Canada were also profitable as yields declined. The Fund finished 2020 with long fixed income positions, particularly in Europe and North America while Asian exposure was short.
Commodities
In commodities, trading was profitable in base and precious metals while positions in energy and agricultural markets produced small losses. In base metals, short exposure in the first quarter benefitted from plunging prices as the global economy came to a virtual halt due to the pandemic. As prices recovered and started trending higher, positioning transitioned long, ultimately contributing positively to the Fund’s returns in the second half of the year as well. Long positions in precious metals were also profitable, as gold prices climbed to an all-time high. In energy markets, while short exposure benefitted from the collapse in oil prices during the first four months of 2020, as oil prices turned higher those short positions detracted. Strong contributions from long agricultural commodities late in the year were not enough to offset earlier losses. The Fund ended 2020 with long exposure in agricultural commodities and metal markets while positioning in energy was slightly short.
Equity Indices
The largest losses for the Fund were from trading in equities. The Fund entered 2020 with long positions in equities as stock prices had exhibited strong upward trending activity in the prior year. As stock peaked on February 19th, the Fund’s long stock exposure, which had been profitable up until that point in 2020, experienced significant losses. While positioning shifted to essentially a neutral posture as the stock market sell-off intensified, the Fund was hurt during the period where exposure transitioned. As the recovery in stocks took hold and the upward trend resumed, the Fund’s exposure shifted back to long which produced significant gains through the final three quarters of the year. Overall, the largest losses in 2020 were from trading in Europe and Asia while U.S. positions were profitable. The Fund ended the annual period with long positions across the U.S., Europe, and Asia.
Foreign Currencies
Trading in currencies was slightly unprofitable in 2020. The Fund suffered losses during the first half of the year as long USD/short FX positions were hurt when the greenback began to slide beginning in March. As this trend persisted, the Fund’s positioning shifted to short USD/long FX which contributed positively in the second half of the year and offset the aforementioned losses. Overall, in 2020 trading in European currencies produced the largest gains while positions in Asian currencies and the Canadian dollar produced losses. The Fund finished 2020 with sizable long positions in FX, particularly in European currencies and the Yen.
Outlook
As we turn the page on calendar 2020, investors need to grapple with several issues over the coming months and quarters. With the first COVID-19 vaccines approved in December, risk assets continued to surge as investors embraced the “return-to-normal” trade. Given these moves, allocators are likely to closely monitor both the pace of vaccinations in 2021 along with the number of cases which surged during the fourth quarter. Challenges to the return-to-normal narrative may lead to volatility and market disruption.
The bull market has been remarkably resilient during the final weeks of the Trump administration, shrugging off the President’s challenge of the election results and the uncertainty of the Georgia Senate runoff elections. If the political and socioeconomic divide creates increasing unrest, it will likely foster heightened market volatility, particularly to the extent that it impacts corporate America. As the Democrat party takes control of the Senate, investors will need to consider implications for further stimulus, tax policy, etc.
Finally, the outlook for interest rates will likely be another key issue to consider. Although rates are near historical lows, longer-term yields have been climbing gradually since August. It seems likely that with yields so low, but with the potential to move higher, investors will need to consider whether bonds can deliver the kind of returns that they have in the past.
Against this backdrop, the sell-off in risk assets in 2020 and Q4 2018 is perhaps another reminder of the inherent volatility in markets and the importance of diversifying strategies. As already discussed, looking forward can bonds still provide the diversification and returns that investors have enjoyed in the past? We believe the answer is no and that instead, investors may want to recommit and strengthen their allocation to other diversifying strategies like managed futures.
Fixed Income Strategy
The Fund invests most of its remaining assets in a Fixed Income Strategy comprised of high quality, short to intermediate term investment grade corporate and government agency securities managed by Nuveen.
The fixed income component of the Fund is managed against the Barclay’s 1–5 Government Credit Index. Returns for the fixed income portion of the portfolio were +5.13% compared to +4.71% for the benchmark during 2020. The duration of the portfolio was managed between 2.5 and 2.7 years. Nuveen maintained a mostly neutral duration position as the Fed lowered the federal funds rate to zero. As such, duration positioning did not have a material impact on relative performance versus the benchmarks as interest rates fell. The portfolio managers remained overweight in non-government sectors, which provided a positive contribution. These sectors were negatively impacted by spread widening during the first quarter, however, they rebounded sharply thereafter. Overall, the positioning caused the funds to modestly outperform their respective benchmarks.
LoCorr Dynamic Equity Fund
The LoCorr Dynamic Equity Fund (the “Fund”) seeks long-term capital appreciation with reduced volatility compared to traditional broad-based equity market indices as a secondary objective. Consistent with the “low correlation” our LoCorr Fund family seeks, long/short equity funds have the ability to provide positive returns when equity markets are rising, yet they offer the potential for downside protection when equity prices are falling.
The Fund employs three sub-advisers to manage the long/short equity strategy of the Fund:
| ● | Billings Capital Management (“Billings”) manages a strategy which is based on a value-oriented, concentrated, fundamental, bottom-up long/short equity approach. This manager seeks to outperform the S&P 500 over the long term. The sub-portfolio managed by Billings is similar to a strategy that this manager has executed since 2008 with their current firm and for many years prior to that at a different entity. |
| ● | Kettle Hill Capital Management (“Kettle Hill”) seeks to generate alpha by combining a bottom-up, fundamental analysis with a top-down opportunistic overlay. Investing primarily in small cap securities, Kettle Hill targets a conservative net exposure to the market. The sub-portfolio managed by Kettle Hill is similar to a strategy that this manager has executed since its inception in 2003. |
| ● | First Quadrant manages a strategy which is similar to a global long/short strategy the manager has executed since 2016. First Quadrant utilizes a systematic multi-factor approach coupled with an active beta management approach to maximize upside opportunities while reducing downside performance. First Quadrant invests in developed international and U.S. markets and was added to the portfolio January 2019. |
Market Commentary
Entering 2020 there was reason for optimism: prior year’s strong equity market returns, continued accommodative policy from most central banks, the expectation for positive trade negotiations between the US and China, record low unemployment, and near all-time low interest rates. An abundance of factors pointed to a healthy economy, but given how 2020 actually unfolded, this serves as further proof the future is always uncertain.
There is no question 2020 was one of the most trying years in recent history for the country and the entire world as approximately two million lives were lost to COVID-19. The world quickly realized the COVID-19 virus was not contained to Wuhan, China and this relatively unknown virus quickly escalated to a global pandemic in the first quarter. As global economies closed and stay-at-home orders throughout the world began virtually everyone across the globe saw their lives impacted by the virus. News regarding the spread of the virus and global efforts to control the transmission would be the dominating factor that drove global markets throughout the year.
As cases across the globe grew at an exponential speed, countries implemented sheltering-in-place and closures of non-essential businesses to reduce the spread of this contagious virus. These safety measures had unprecedented impacts on business activity and the global economy. In the U.S. for example, Q2 gross domestic product declined an unprecedented -31.4% and the unemployment rate soared to 14.7%, its highest level since the Great Depression. One of the hardest hit sectors were travel related industries, experiencing a virtual stoppage. At its low point on April 14th, U.S. airline travel demand declined -96% year-over-year according to the Transportation Security Administration. In addition, service sectors including restaurants were hit hard, with year over year sales down -18.7% in November of 2020. All these factors contributed to the fastest bear market in history during February and March as risky assets sold off.
To combat the rapidly falling asset markets, central banks around the world stepped in with unprecedented amounts of stimulus. According to a June McKinsey & Company study, approximately $10 trillion in fiscal and monetary policy stimulus was announced, more than triple the amount of stimulus versus the 2008 and 2009 financial crisis. This impressive level of response relatively calmed market participants fears as the S&P 500 found a bottom on March 23rd, 2020. In addition to central banks, policy makers targeted the consumers wallet, issuing federal aid in the US and around the globe. These measures combined with positive vaccine developments in the 4th quarter rocketed markets back to pre-pandemic levels and beyond. In the final pages of the 2020 story, the uncertain U.S. Presidential election was resolved indicating a moderate U.S. government and continued fiscal support.
During the most unclear days of the pandemic, massive-fear induced selling occurred, pushing the S&P 500 into a drawdown of -33.79% during a 16-day period (February 20th – March 23rd). This steep equity market decline was matched with unparalleled levels of volatility as the VIX reached an all-time high of 82.69 on March 16th. As fast as the market sold-off, it recovered just as quickly as market participants became increasingly optimistic that the actions taken by central bankers and legislators would support/stabilize financial markets and the economy. Stocks would erase their earlier losses, rallying +70.18% from their March 23rd low, as measured by the S&P 500, and finishing 2020 up an astounding +18.40%. The calendar year gains were not as widespread in international markets, as seen by the +5.43% return for the MSCI EAFE PR USD Index, though the Index rallied +15.75% in the fourth quarter.
Out of the eleven sectors comprising the S&P 500, eight made gains in 2020. The gains over the year were led by Information Technology, up +43.89%, and Consumer Discretionary, up +33.30%. Energy, down -33.68%, Real Estate, down -2.17%, and Financials, down -1.69% accounted for the negative sectors during 2020. Valuation for the S&P 500 continued to climb into the end of 2020 as the Forward S&P 500 P/E (price-earnings ratio) closed the year at 22.46, well above 2019 closing levels of 18.18. The past two quarters of 2020, the 12-month forward P/E has been at its highest level since 2002.
Portfolio Update
The Fund’s Class I Shares finished the year in positive territory, up +4.03%, slightly underperforming the Morningstar Long/Short Fund category which closed up +5.28%. The Fund continues to outperform the Index on a 5-year trailing basis by a margin of +1.46%. The Fund struggled alongside broader equity markets during Q1 but recovered in Q2, closing the 2nd quarter up +13.96% easily outpacing the +7.93% return for the Morningstar Long/Short Equity category. The Fund finished 2020 on a strong note, ending the 4th quarter up +16.49%, outpacing both the Morningstar Long/Short Equity Fund category of +7.77% and the S&P 500 +12.15%. In 2020, there was a significant dispersion between growth and value related companies. The Russell 1000 Growth Total Return Index finished the year up +38.49% vs the Russell 1000 Value Index up +2.80%. This diffusion proved to be a headwind as the Fund has a value-oriented bias.
Kettle Hill led the way for the Fund, posting stellar 2020 returns and finishing well in the black, while First Quadrant fought its way back to flat and Billings Capital finished in the red. LoCorr believes that Kettle Hill’s ability to tactically manage net exposure along with identifying the best risk/reward opportunities in an everchanging market environment was a significant factor to the sub-adviser’s impressive positive performance in 2020. The Fund’s overall net exposure oscillated throughout 2020, ending the year slightly above its typical 40-60% range, at 64.30% net exposure.
The Fund’s long book was a detractor for the first six months of 2020; however, these names saw a significant rebound in the second half of 2020. During the year, the Fund saw strongest returns from the Consumer Cyclical, Technology, Communication services, and Real Estate sectors. Within the Consumer Cyclical sector, RH (-0.32% of the fund as of 12/31/2020), formerly known as Restoration Hardware was a top performer. The company outperformed early in the stock market recovery, due to the retailer having a large online business presence and the company’s customer base not being as greatly impacted by the COVID-19 crisis. The long position in RH generated sizable gains and was subsequently flipped to short at the end of the year due to concerns on overextended price action. Another contributor within the Consumer Cyclical sector, CarMax (-0.32% of the fund as of 12/31/2020), traded higher on shifts in underlying consumer buying preferences and increased used car demand. Similar to RH, CarMax flipped to short at the end of the year due to overvaluation concerns. In the Technology sector, Take-Two Interactive Software (0.92% of the fund as of 12/31/2020), benefitted the Fund by capitalizing on stay-at-home trends and increased market share from premium video game offerings. A top performer within the Communication services sector was Pinterest Inc. (0.95% of the fund as of 12/31/2020), the operator of a pinboard-style photo-sharing website which allows users to create and manage theme-based image collections. Pinterest trended higher during the 3rd quarter with better-than-expected earnings and increasing global monthly users. Offsetting these gains were losses in the Industrials and Financial Services sectors. In the Industrial sector, a position in Air Canada (0.00% of the Fund as of 12/31/2020), a passenger airliner, was a large detractor to the fund early in 2020 as travel related names were hit hard and did not participate in the market recovery to the same extent as other cyclical industries. Within the Financial Services, a position in CIT Group (0.00% of the Fund as of 12/31/2020), a financial holding company, was negatively impacted by the emergency Federal Reserve Rate cuts. These unforeseen happenings negatively impacted the firm’s net interest margin along with general concerns regarding credit risk.
The Fund’s short book experienced gains in the first half of the year but faced losses in the second half of the year. Overall, these losses during the year were led by Technology and Healthcare sectors as broader equity markets rebounded sharply. These short positions predominantly revolved around over extended valuations in companies like The Trade Desk (0.00% of the Fund as of 12/31/2020), Align Technologies (0.00% of the Fund as of 12/31/2020), and iRhythm Technologies (0.00% of the Fund as of 12/31/2020). The short book had gains within the Industrial sector early in the year from The Boeing Company (-0.31% of the Fund as of 12/31/2020). This short position benefitted the Fund given the dramatic decrease in air travel during the pandemic. In addition, many airline operators canceled, and deferred orders given the unknown impacts of this decreased demand. A short position in Pioneer Natural Resources (-0.33% of the Fund as of 12/31/2020) benefited the Fund throughout the year as one of the Fund’s managers was able to strategically trade around weakness in the Energy sector.
Outlook
As we enter 2021, many questions remain unanswered. Investors will need to assess the long-term implications of the COVID-19 virus on economies around the globe and what a “return-to-normal” environment may look like. All these questions must be considered against the backdrop of new political party agendas in the White House. The equity bull market continues to prove its robustness, pushing higher during the final weeks of the Trump administration and amid political uncertainty. If political and social unrest manifest, it could foster heightened market volatility and possibly negatively impact the great strides having been made by corporate America since the darkest days of the pandemic.
Amid continued uncertainty, a long/short equity strategy may allow for continued participation in rising equity markets while the strategy’s ability to benefit from falling stock prices could mitigate losses if equities were to sell off. As we would anticipate, the Fund participated nicely within this more favorable market environment during the second half of 2020, outperforming the Morningstar Long-Short Equity Fund Category and a majority of peers in the category. We remain highly confident in the ability of the Fund to provide positive absolute returns and compelling diversification for investor’s balanced portfolios.
LoCorr Spectrum Income Fund
The LoCorr Spectrum Income Fund (the “Spectrum Income Fund” or the “Fund”) has an objective of current income with capital appreciation as a secondary objective. The Fund is designed to fit within the “low correlation” of the LoCorr Fund family by seeking to provide relatively high levels of income with low correlation to the bond market. The Fund is sub-advised by Bramshill Investments (“Bramshill”) (formerly known as Trust and Fiduciary Income Partners). Bramshill invests in a portfolio of primarily pass-through securities with an integrated covered call and hedging strategy. Bramshill seeks to generate high current income, much of which the Fund distributes monthly to investors.
Market Commentary
Entering 2020 there was reason for optimism: prior year’s strong equity market returns, continued accommodative policy from most central banks, the expectation for positive trade negotiations between the US and China, record low unemployment, and near all-time low interest rates. An abundance of factors pointed to a healthy economy, but given how 2020 actually unfolded, this serves as further proof the future is always uncertain.
There is no question 2020 was one of the most trying years in recent history for the country and the entire world as approximately two million lives were lost to COVID-19. The world quickly realized the COVID-19 virus was not contained to Wuhan, China and this relatively unknown virus quickly escalated to a global pandemic in the first quarter. As global economies closed and stay-at-home orders throughout the world began virtually everyone across the globe saw their lives impacted by the virus. News regarding the spread of the virus and global efforts to control the transmission would be the dominating factor that drove global markets throughout the year.
As cases across the globe grew at an exponential speed, countries implemented sheltering-in-place and closures of non-essential businesses to reduce the spread of this contagious virus. These safety measures had unprecedented impacts on business activity and the global economy. In the U.S. for example, Q2 gross domestic product declined an unprecedented -31.4% and the unemployment rate soared to 14.7%, its highest level since the Great Depression. One of the hardest hit sectors were travel related industries, experiencing a virtual stoppage. At its low point on April 14th, U.S. airline travel demand declined -96% year-over-year according to the Transportation Security Administration. In addition, service sectors including restaurants were hit hard, with year over year sales down -18.7% in November of 2020. All these factors contributed to the fastest bear market in history during February and March as risky assets sold off.
During the most unclear days of the pandemic, a unique dislocation occurred in the oil futures market when Saudi Arabia and Russia (formerly OPEC+ allies) engaged in a crude oil price war by ramping production amid a drastic decline in demand, causing expiring crude futures to crater to negative -$37 per barrel, as measured by West Texas Intermediate crude. Oil prices would remain in a relatively tight trading range until late in the year before rallying higher.
To combat the rapidly falling asset markets, central banks around the world stepped in with unprecedented amounts of stimulus. According to a June McKinsey & Company study, approximately $10 trillion in fiscal and monetary policy stimulus was announced, more than triple the amount of stimulus versus the 2008 and 2009 financial crisis. This impressive level of response relatively calmed market participants fears as the S&P 500 found a bottom on March 23rd, 2020. In addition to central banks, policy makers targeted the consumers wallet, issuing federal aid in the US and around the globe. These measures combined with positive vaccine developments in the 4th quarter rocketed markets back to pre-pandemic levels and beyond. During 2020, there was a significant dispersion between large cap growth and real economy oriented cyclical value. The Russell 1000 Growth TR Index finished the year up +38.49% vs the Russell 1000 Value Index up +2.80%. Although still wide, the spread between growth and value has started to narrow towards the end of the year and is largely due to emerging inflation pressure across the globe. In the final pages of the 2020 story, the uncertain U.S. Presidential election was resolved indicating a moderate U.S. government and continued fiscal support.
Portfolio Update
The Fund’s Class I Shares were down -2.60% during 2020 compared to the +7.51% gain for the Barclay’s U.S. Aggregate Bond Index. While the Fund experienced challenging performance in the first half of the year, it rocketed back in the second half (up +28.64%), outpacing the Barclay’s U.S. Aggregate Bond Index (up +1.29%), and the S&P 500 TR (+22.16%) over this same period. The Fund benefited from positive contributions by Preferred securities, Publicly Traded Partnerships (“PTPs”), Business Development Companies (“BDCs”), and the Fund’s hedging strategy. The manager’s hedging strategy proved beneficial during the first quarter as the market collapsed, contributing approximately +6.00% to the Fund. These gains were offset by losses from Master Limited Partnerships (“MLPs”), Mortgage Real Estate Investment Trust (“mREITs”), and Closed End Funds (“CEFs”), and C-Corporation holdings.
The Preferred securities sector was the top contributor to the Fund’s 2020 Performance. The leading individual position within the sector was Fortress Transportation & Infrastructure (1.94% of the Fund as of 12/31/20), which owns and acquires high quality infrastructure and equipment. The manager bought Fortress during pandemic lows at a sizable discount to believed intrinsic value. In addition, Nustar Energy preferreds (1.52% of the Fund as of 12/31/20), one of the largest independent liquid’s terminal and pipeline operators in the US, also contributed to performance from tactical purchases during the crisis lows. The manager took advantage of the market dislocations to move up the capital structure, thus attempting to increase the security of the distribution.
Within PTPs, Brookfield Renewable Partners, (3.29% of the Fund as of 12/31/20), a renewable energy holding, was a top performer, benefitting as the shift away from conventional forms of “dirty” power production into “clean” energy accelerated. Also, within the PTPs sector, Moelis & Co. (2.36% of the Fund as of 12/31/20), a boutique M&A firm, rallied into the end of the year on news of Aramco hiring the firm to devise a strategy to raise capital through asset sales. Also boosting the company was a pickup in overall M&A and advisory opportunities.
The final sector moderately additive to performance during the year was BDCs. Although the sector performance, as measured by the Vaneck BDC Income ETF lost -6.84% during 2020, this group was positive for the Fund due to the portfolio management team maintaining positions through the downturn and tactically adding later in the year to benefit from the recovery during the 4th quarter. Bramshill’s conviction in the BDC sector stemmed from their confidence that policymakers’ support of small businesses would help support business activity and therefore cash flows of BDCs. Additionally, data began to show acceleration in growth and inflation, which serves to reduce the credit risk represented by their borrowers.
Detracting from 2020 performance was the MLP sector. The broad sector was down -28.84% for the year, as measured by the Alerian Index. The shutdown in the global economy devastated energy demand, but the Fund’s holdings were able to maintain distributions through aggressive reduction of capital expenditures. The manger reduced exposure to the sector by over 50% during the 1st quarter and focused on companies which would benefit from having storage capabilities in a supply glut environment. Starting in the 3rd quarter, Bramshill began adding to the sector as reflation trade beneficiaries, with a focus on natural gas transmissions and distribution. Crestwood Equity Partners (3.05% of the Fund as of 12/31/20), an owner and operator of midstream assets, was caught in an energy and MLP selling frenzy. The company traded down to levels suggesting imminent bankruptcy, which the manager considered highly unlikely. The MLP sector experienced a substantial recovery from pandemic lows but still finished down on the year.
Mortgage REITs also detracted from 2020 performance. The broad sector was down -20.66% during the year, as measured by the iShares Mortgage Real Estate ETF. As the effects of the pandemic shutdown became apparent, the manager mitigated losses by reducing exposure to firms holding mortgages with higher credit risk, instead focusing on companies with large holdings of federal agency guaranteed mortgages. As the year progressed, Bramshill added moderately to positions with high levels of liquidity and the potential to benefit from a reopening of the economy. Significant detractors within the sector were Two Harbors Investment Corp (0.00% of the Fund as of 12/31/20), Invesco Mortgage Capital (0.00% of the Fund as of 12/31/20), Apollo Commercial Real Estate Finance (0.98% of the Fund as of 12/31/20), and New York Mortgage Trust (0.00% of the Fund as of 12/31/20). Each position suffered when their lenders elected to require additional margin on their collateral of non-agency mortgages, forcing a fire-sale of assets in a market lacking prospective buyers.
Although the Closed End Funds were a detractor during the year, the Fund took advantage of buying opportunities by significantly increasing exposure to Closed End Funds at significant discount to NAVs within the municipal and high-quality sub-sectors. Overall, the manager shifted up the capitalization structure in this sector and increased the Fund’s allocation to fixed income CEFs. During the 3rd quarter, Bramshill used many of these positions as sources of capital as more appealing opportunities arose with the pandemic lows potentially in the rearview mirror.
Finally, within the C-Corps sector the manager rotated out of integrated and upstream energy names and into regulated utilities and renewable energy producers during the 1st quarter. Bramshill also added to select consumer staples such as food distributors which benefited from stay-at-home trends. In the latter half of the year, the fund sold out of most of these utility and consumer staple positions and rotated into cyclical names which could benefit from a reflationary environment. A lagger within this sector was Macquarie Infrastructure Corp (0.00% of the Fund as of 12/31/20), which withdrew both their dividend and forward guidance.
Outlook
As Bramshill looks towards 2021, the most significant trend in the current landscape is the emergence of ESG (Environmental, Social, Governance) investing. While the manager’s focus is primarily on cash flows, it has become hard to ignore the groundswell of attention being generated by ESG. The Fund has long been holders of renewable energy producers due to improving efficiency and declining costs which have allowed these companies to grow more rapidly than traditional energy producers.
Additionally, the manager believes reflationary pressures will continue to grow and support a “risk on” investing environment which should be conducive to value sectors, particularly energy MLPs and credit sensitive BDCs within the Fund’s opportunity set. Assuming a successful rollout of the vaccine and no unforeseen geopolitical disasters, the manger believes there is a clear runway for reflation beneficiaries in the market for at least the first half of the year. Further policy support is readily apparent, as the Fed has repeatedly stated its unwavering fiscal support and its willingness to let inflation run hot for a while. In addition, the incoming Biden administration has outlined major plans to stimulate the economy through fiscal policy. At some point, markets will need to deal with risks of inflation and the withdrawal of monetary support, but that may be well into the future.
Thank you for investing in the LoCorr Funds
The S&P 500 Index is a broad-based unmanaged index of 500 stocks, which is widely recognized as representative of the equity market in general. Barclays 1-5 Year Government/Credit Index – The Barclays U.S. Government/Credit 1–5 Year Index is an index of all investment grade bonds with maturities of more than one year and less than 5 years. MSCI EAFE Index was designed to measure the equity market performance of developed markets outside of the U.S. & Canada. VIX – Chicago Board Options Exchange (CBOE), the Volatility Index, or VIX, is a real-time market index that represents the market’s expectation of 30-day forward-looking volatility. Derived from the price inputs of the S&P 500 index options, it provides a measure of market risk and investors’ sentiments. It is also known by other names like “Fear Gauge” or “Fear Index.” Investors, research analysts and portfolio managers look to VIX values as a way to measure market risk, fear and stress before they take investment decisions. ICE BofAML 3-M T-Bill Index tracks the performance of the U.S. dollar denominated U.S. Treasury Bills publicly issued in the U.S. domestic market with a remaining term to final maturity of less than 3 months. Morningstar Managed Futures Category is an average monthly return of all funds in the Morningstar Managed Futures Category. These funds typically take long and short positions in futures options, swaps, and foreign exchange contracts, both listed and over the counter, based on market trends or momentum. (A long position is a bet an investment will gain in value, while a short position is a bet that an investment will decline in value.) A majority of these funds follow trend-following, price-momentum strategies. Other strategies included in this category are systematic mean-reversion, discretionary global macro strategies, commodity index tracking, and other futures strategies. More than 60% of these funds’ exposure is invested through derivative securities. TOPIX Index (Tokyo Stock Price Index) is an important stock market index for the Tokyo Stock Exchange (TSE) in Japan, tracking all domestic companies of the exchange’s First Section. Dow Jones EURO STOXX 50 Index is a market capitalization-weighted stock index of 50 large, blue-chip European companies operating within eurozone nations. Bloomberg Commodity Index is a broadly diversified commodity price index distributed by Bloomberg Indexes. The index was originally launched in 1998 as the Dow Jones-AIG Commodity Index and renamed to Dow Jones-UBS Commodity Index in 2009, when UBS acquired the index from AIG. SG Trend Index is a subset of the SG CTA Index, and follows traders of trend following methodologies. The SG CTA Index is equal weighted, calculates the daily rate of return for a pool of CTAs selected from the larger managers that are open to new investment. Morningstar Long/Short Equity Category is an average monthly return of all funds in the Morningstar Long-Short Equity Category. The category contains a universe of funds with similar investment objectives and investment style, as defined by Morningstar. Performance of the indices and Morningstar Category Average is generated on the first business day of the month. Bloomberg Barclays U.S. Aggregate Bond Index is a broad-based bond index comprised of government, corporate, mortgage and asset-back issues rated investment grade or higher. West Texas Intermediate is a crude oil that serves as one of the main global oil benchmarks. It is sourced primarily from Texas and is one of the highest quality oils in the world, which is easy to refine. WTI is the underlying commodity for the NYMEX’s oil futures contract. One cannot invest directly in an index.
Please refer to the Schedule of Investments in this report for full holdings information. Fund holdings and sector allocations are subject to change and should not be considered recommendations to buy or sell any security.
Alpha is an annualized return measure of how much better or worse a fund’s performance is relative to an index of funds in the same category, after allowing for differences in risk. Basis Points (bps) – A unit that is equal to 1/100th of 1% and is used to denote the change in a financial instrument. The basis point is commonly used for calculating changes in interest rates, equity indexes and the yield of a fixed-income security. Beta measures the sensitivity of a stock’s return relative to the return of a selected market index. When beta is greater than one, it means a stock will rise or fall more than the market. Cash Flows refers to a company’s free cash flow which is a measure of how much cash a business generates after capital expenditures. Duration is a commonly used measure of the potential volatility of the price of a debt security, or the aggregate market value of a portfolio of debt securities, prior to maturity. Securities with a longer duration generally have more volatile prices than securities of comparable quality with a shorter duration. Investment Grade refers to bonds that are rated BBB or higher. Bond ratings are grades given to bonds that indicate their credit quality as determined by private independent rating services such as Standard & Poor’s, Moody’s and Fitch. These firms evaluate a bond issuer’s financial strength, or its ability to pay a bond’s principal and interest in a timely fashion. Ratings are expressed as letters ranging from ‘AAA’, which is the highest grade, to ‘D’, which is the lowest grade. Spread is the percentage point difference between yields of various classes of bonds compared to treasury bonds. Calendar spread is an options or futures spread established by simultaneously entering a long and short position on the same underlying asset at the same strike price but with different delivery months. It is sometimes referred to as an inter-delivery, intra-market, time, or horizontal spread. Yield Curve is a line that plots the interest rates, at a set point in time, of bonds having equal credit quality, but differing maturity dates. The most frequently reported yield curve compares the three-month, two-year, five-year and 30-year U.S. Treasury debt. The curve is used to predict changes in economic output and growth.
Must be preceded or accompanied by a prospectus.
Opinions expressed are those of the Investment Manager and are subject to change, are not guaranteed and should not be considered investment advice.
Earnings growth is not representative of the Funds’ future performance.
Past performance is not a guarantee of future results.
Diversification does not assure a profit nor protect against loss in a declining market.
Mutual fund investing involves risk. Principal loss is possible. LoCorr Macro Strategies Fund, LoCorr Long/Short Commodities Strategy Fund, LoCorr Market Trend Fund and LoCorr Spectrum Income Fund are diversified funds. LoCorr Dynamic Equity Fund is a non-diversified fund, meaning it may invest its assets in fewer individual holdings than a diversified fund. Therefore, those Funds are more exposed to individual stock volatility than a diversified fund. The Funds invest in foreign investments and foreign currencies which involve greater volatility and political, economic and currency risks and differences in accounting methods. The Funds may make short sales of securities, which involves the risk that losses may exceed the original amount invested. Investing in commodities may subject the Funds to greater risks and volatility as commodity prices may be influenced by a variety of factors including unfavorable weather, environmental factors, and changes in government regulations. The Funds may invest in derivative securities, which derive their performance from the performance of an underlying asset, index, interest rate or currency exchange rate. Derivatives can be volatile and involve various types and degrees of risks, and, depending upon the characteristics of a particular derivative, suddenly can become illiquid. Investments in debt securities typically decrease in value when interest rates rise. This risk is usually greater for longer-term debt securities. Investments in Asset Backed, Mortgage Backed, and Collateralized Mortgage Backed Securities include additional risks that investors should be aware of such as credit risk, prepayment risk, possible illiquidity and default, as well as increased susceptibility to adverse economic developments. Investments in Real Estate Investment Trusts (REITs) involve additional risks such as declines in the value of real estate and increased susceptibility to adverse economic or regulatory developments.
Derivative contracts ordinarily have leverage inherent in their terms which can magnify a Fund’s potential for gains or losses through increased long and short position exposure. A Fund may access derivatives via a swap agreement. A risk of a swap agreement is the risk that the counterparty to the agreement will default on its obligation to pay the Fund.
A Fund will incur a loss as a result of a short position if the price of the short position instrument increases in value between the date of the short position sale and the date on which an offsetting position is purchased.
Investments in small- and medium-capitalization companies involve additional risks such as limited liquidity and greater volatility. Investments in lower rated and non-rated securities presents a greater risk of loss to principal and interest than higher-rated securities. ETF investments are subject to investment advisory and other expenses, which will be indirectly paid by the Fund. As a result, the cost of investing in the Fund will be higher than the cost of investing directly in ETFs and may be higher than other mutual funds that invest directly in stocks and bonds. ETFs are subject to specific risks, depending on the nature of the ETF.
A Fund’s portfolio will be significantly impacted by the performance of the real estate market generally, and a Fund may be exposed to greater risk and experience higher volatility than would a more economically diversified portfolio. Property values may fall due to increasing vacancies or declining rents resulting from economic, legal, cultural, or technological developments. Investments in Limited Partnerships (including master limited partnerships) involve risks different from those of investing in common stock including risks related to limited control and limited rights to vote on matters affecting the Limited Partnership, risks related to potential conflicts of interest between the Limited Partnership and the Limited Partnership’s general partner, cash flow risks, dilution risks and risks related to the general partner’s limited call right. Underlying Funds are subject to management and other expenses, which will be indirectly paid by a Fund.
The LoCorr Funds are distributed by Quasar Distributors, LLC.
LoCorr Macro Strategies Fund
Rate of Return — For the period ended December 31, 2020 (Unaudited)
| | Inception | | Average Annual |
| | Date | 6 Month | 1 Year | 5 Year | Since Inception |
| LoCorr Macro Strategies Fund – Class A (without maximum load) | 3/22/11 | 5.41% | 5.41% | 4.18% | 1.99% |
| LoCorr Macro Strategies Fund – Class A (with maximum load) | 3/22/11 | -0.63% | -0.63% | 2.96% | 1.37% |
| LoCorr Macro Strategies Fund – Class C | 3/24/11 | 4.08% | 3.70% | 3.42% | 1.24% |
| LoCorr Macro Strategies Fund – Class I | 3/24/11 | 5.58% | 5.70% | 4.43% | 2.25% |
| Bank of America Merrill Lynch 3-Month Treasury Bill Index | | 0.07% | 0.67% | 1.20% | 0.64%1 |
| Barclay CTA Index | | 3.75% | 3.60% | 1.03% | 0.43%1 |
$100,000 investment in the
LoCorr Macro Strategies Fund – Class I
For the period ended December 31, 2020 (Unaudited)
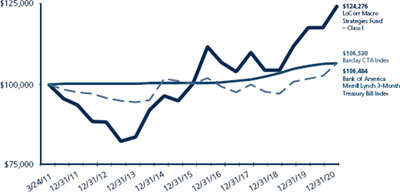
This chart illustrates the performance of a hypothetical $100,000 investment made in the Fund since inception. Assumes reinvestment of distributions, but does not reflect the effect of any applicable sales charge or redemption fees. This chart does not imply any future performance. Performance will vary from class to class based on differences in class-specific expenses and sales charges. The returns do not reflect the deduction of taxes that a shareholder would pay on Fund distributions or the redemption of Fund shares.
Performance data represents past performance; past performance does not guarantee future results. The investment return and principal value of an investment will fluctuate so that an investor’s shares, when redeemed, may be worth more or less than their original cost. Current performance of the Fund may be lower or higher than the performance quoted. Performance data current to the most recent month end may be obtained by calling 1.855.LCFUNDS, or visiting www.LoCorrFunds.com.
Performance data shown reflects the Class A maximum sales charge of 5.75% and reflects the Class C Contingent Deferred Sales Charge (CDSC) of 1.00%. Performance of the Class A without load does not reflect the deduction of the sales load or fee. If reflected, the load or fee would reduce the performance quoted.
The returns reflect the actual performance for each period and do not include the impact on trades executed on the last business day of the period that were recorded on the first business day of the next period.
Per the fee table in the Fund’s April 30, 2020 prospectus, the Fund’s annual operating expense ratio is, before fee waivers 2.17%, 2.92% and 1.92% for Class A, Class C and Class I shares, respectively.
The Bank of America Merrill Lynch U.S. 3-Month Treasury Bill Index is an unmanaged index that seeks to measure the performance of U.S. Treasury bills available in the marketplace.
The Barclay CTA Index is a leading industry benchmark of representative performance of commodity trading advisors.
One cannot invest directly in an index.
| 1 | Since inception return as of March 24, 2011. |
LoCorr Long/Short Commodities Strategy Fund
Rate of Return — For the period ended December 31, 2020 (Unaudited)
| | Inception | | Average Annual |
| | Date | 6 Month | 1 Year | 5 Year | Since Inception |
| LoCorr Long/Short Commodities Strategy Fund – Class A (without maximum load) | 12/31/11 | -1.41% | 9.66% | 3.98% | 3.74% |
| LoCorr Long/Short Commodities Strategy Fund – Class A (with maximum load) | 12/31/11 | -7.09% | 3.41% | 2.76% | 3.06% |
| LoCorr Long/Short Commodities Strategy Fund – Class C | 12/31/11 | -2.74% | 7.83% | 3.22% | 2.94% |
| LoCorr Long/Short Commodities Strategy Fund – Class I | 12/31/11 | -1.25% | 9.91% | 4.27% | 4.00% |
| Bank of America Merrill Lynch 3-Month Treasury Bill Index | | 0.07% | 0.67% | 1.20% | 0.69% |
| Morningstar Long/Short Commodity Index | | 0.84% | -4.29% | -3.35% | -2.98% |
$100,000 investment in the
LoCorr Long/Short Commodities Strategy Fund – Class I
For the period ended December 31, 2020 (Unaudited)
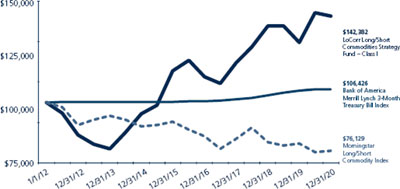
This chart illustrates the performance of a hypothetical $100,000 investment made in the Fund since inception. Assumes reinvestment of distributions, but does not reflect the effect of any applicable sales charge or redemption fees. This chart does not imply any future performance. Performance will vary from class to class based on differences in class-specific expenses and sales charges. The returns do not reflect the deduction of taxes that a shareholder would pay on Fund distributions or the redemption of Fund shares.
Performance data represents past performance; past performance does not guarantee future results. The investment return and principal value of an investment will fluctuate so that an investor’s shares, when redeemed, may be worth more or less than their original cost. Current performance of the Fund may be lower or higher than the performance quoted. Performance data current to the most recent month end may be obtained by calling 1.855.LCFUNDS, or visiting www.LoCorrFunds.com.
Performance data shown reflects the Class A maximum sales charge of 5.75% and reflects the Class C Contingent Deferred Sales Charge (CDSC) of 1.00%. Performance of the Class A without load does not reflect the deduction of the sales load or fee. If reflected, the load or fee would reduce the performance quoted.
The returns reflect the actual performance for each period and do not include the impact on trades executed on the last business day of the period that were recorded on the first business day of the next period.
Per the fee table in the Fund’s April 30, 2020 prospectus, the Fund’s annual operating expense ratio is, before fee waivers 2.61%, 3.36% and 2.36% for Class A, Class C and Class I shares, respectively.
The Bank of America Merrill Lynch U.S. 3-Month Treasury Bill Index is an unmanaged index that seeks to measure the performance of U.S. Treasury bills available in the marketplace.
The Morningstar Long/Short Commodity Index is a fully collateralized commodity futures index that uses the momentum rule to determine if each commodity is held long, short, or flat.
One cannot invest directly in an index.
LoCorr Market Trend Fund
Rate of Return — For the period ended December 31, 2020 (Unaudited)
| | Inception | | Average Annual |
| | Date | 6 Month | 1 Year | 5 Year | Since Inception |
| LoCorr Market Trend Fund – Class A (without maximum load) | 6/30/14 | 12.19% | 4.47% | -0.05% | 3.51% |
| LoCorr Market Trend Fund – Class A (with maximum load) | 6/30/14 | 5.70% | -1.52% | -1.22% | 2.58% |
| LoCorr Market Trend Fund – Class C | 6/30/14 | 10.77% | 2.76% | -0.79% | 2.74% |
| LoCorr Market Trend Fund – Class I | 6/30/14 | 12.41% | 4.81% | 0.21% | 3.78% |
| Bank of America Merrill Lynch 3-Month Treasury Bill Index | | 0.07% | 0.67% | 1.20% | 0.93% |
| Barclay CTA Index | | 3.75% | 3.60% | 1.03% | 1.60% |
$100,000 investment in the
LoCorr Market Trend Fund – Class I
For the period ended December 31, 2020 (Unaudited)
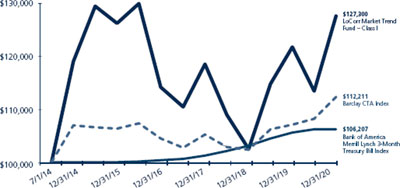
This chart illustrates the performance of a hypothetical $100,000 investment made in the Fund since inception. Assumes reinvestment of distributions, but does not reflect the effect of any applicable sales charge or redemption fees. This chart does not imply any future performance. Performance will vary from class to class based on differences in class-specific expenses and sales charges. The returns do not reflect the deduction of taxes that a shareholder would pay on Fund distributions or the redemption of Fund shares.
Performance data represents past performance; past performance does not guarantee future results. The investment return and principal value of an investment will fluctuate so that an investor’s shares, when redeemed, may be worth more or less than their original cost. Current performance of the Fund may be lower or higher than the performance quoted. Performance data current to the most recent month end may be obtained by calling 1.855.LCFUNDS, or visiting www.LoCorrFunds.com.
Performance data shown reflects the Class A maximum sales charge of 5.75% and reflects the Class C Contingent Deferred Sales Charge (CDSC) of 1.00%. Performance of the Class A without load does not reflect the deduction of the sales load or fee. If reflected, the load or fee would reduce the performance quoted.
The returns reflect the actual performance for each period and do not include the impact on trades executed on the last business day of the period that were recorded on the first business day of the next period.
Per the fee table in the Fund’s April 30, 2020 prospectus, the Fund’s annual operating expense ratio is, before fee waivers 2.03%, 2.78% and 1.78% for Class A, Class C and Class I shares, respectively.
The Bank of America Merrill Lynch U.S. 3-Month Treasury Bill Index is an unmanaged index that seeks to measure the performance of U.S. Treasury bills available in the marketplace.
The Barclay CTA Index is a leading industry benchmark of representative performance of commodity trading advisors.
One cannot invest directly in an index.
LoCorr Dynamic Equity Fund
Rate of Return — For the period ended December 31, 2020 (Unaudited)
| | Inception | | Average Annual |
| | Date | 6 Month | 1 Year | 5 Year | Since Inception |
| LoCorr Dynamic Equity Fund – Class A (without maximum load) | 5/10/13 | 20.04% | 3.75% | 5.60% | 3.18% |
| LoCorr Dynamic Equity Fund – Class A (with maximum load) | 5/10/13 | 13.15% | -2.19% | 4.35% | 2.39% |
| LoCorr Dynamic Equity Fund – Class C | 5/10/13 | 18.58% | 1.92% | 4.80% | 2.41% |
| LoCorr Dynamic Equity Fund – Class I | 5/10/13 | 20.14% | 4.03% | 5.87% | 3.46% |
| S&P 500 Total Return Index | | 22.16% | 18.40% | 15.22% | 13.79% |
| Morningstar Long/Short Equity Fund Index | | 12.00% | 5.28% | 4.41% | 3.92% |
$100,000 investment in the
LoCorr Dynamic Equity Fund – Class I
For the period ended December 31, 2020 (Unaudited)
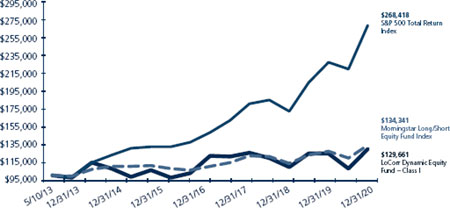
This chart illustrates the performance of a hypothetical $100,000 investment made in the Fund since inception. Assumes reinvestment of distributions, but does not reflect the effect of any applicable sales charge or redemption fees. This chart does not imply any future performance. Performance will vary from class to class based on differences in class-specific expenses and sales charges. The returns do not reflect the deduction of taxes that a shareholder would pay on Fund distributions or the redemption of Fund shares.
Performance data represents past performance; past performance does not guarantee future results. The investment return and principal value of an investment will fluctuate so that an investor’s shares, when redeemed, may be worth more or less than their original cost. Current performance of the Fund may be lower or higher than the performance quoted. Performance data current to the most recent month end may be obtained by calling 1.855.LCFUNDS, or visiting www.LoCorrFunds.com.
Performance data shown reflects the Class A maximum sales charge of 5.75% and reflects the Class C Contingent Deferred Sales Charge (CDSC) of 1.00%. Performance of the Class A without load does not reflect the deduction of the sales load or fee. If reflected, the load or fee would reduce the performance quoted.
The returns reflect the actual performance for each period and do not include the impact on trades executed on the last business day of the period that were recorded on the first business day of the next period.
Per the fee table in the Fund’s April 30, 2020 prospectus, the Fund’s annual operating expense ratio is, before fee waivers 3.75%, 4.50% and 3.50% for Class A, Class C and Class I shares, respectively.
The S&P 500 Total Return Index is an unmanaged capitalization-weighted index of 500 stocks designed to measure performance of the broad domestic economy through changes in the aggregate market value of the 500 stocks which represent all major industries.
The Morningstar Long/Short Equity Index category holds sizeable stakes in both long and short positions in equities and related derivative. At least 75% of the assets are in equity securities or derivatives.
One cannot invest directly in an index.
LoCorr Spectrum Income Fund
Rate of Return — For the period ended December 31, 2020 (Unaudited)
| | Inception | | Average Annual |
| | Date | 6 Month | 1 Year | 5 Year | Since Inception |
| LoCorr Spectrum Income Fund – Class A (without maximum load) | 12/31/13 | 28.59% | -2.75% | 3.12% | 0.30% |
| LoCorr Spectrum Income Fund – Class A (with maximum load) | 12/31/13 | 21.30% | -8.34% | 1.92% | -0.54% |
| LoCorr Spectrum Income Fund – Class C | 12/31/13 | 26.70% | -4.59% | 2.32% | -0.47% |
| LoCorr Spectrum Income Fund – Class I | 12/31/13 | 28.64% | -2.60% | 3.40% | 0.57% |
| Bloomberg Barclay U.S. Aggregate Bond Index | | 1.29% | 7.51% | 4.44% | 4.09% |
| Morningstar Allocation - 70% to 85% Equity | | 19.04% | 10.84% | 9.13% | 6.86% |
$100,000 investment in the
LoCorr Spectrum Income Fund – Class I
For the period ended December 31, 2020 (Unaudited)
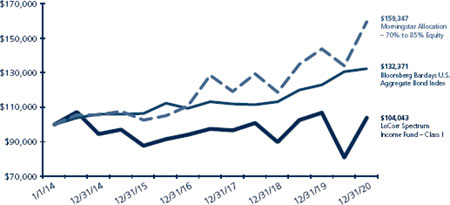
This chart illustrates the performance of a hypothetical $100,000 investment made in the Fund since inception. Assumes reinvestment of distributions, but does not reflect the effect of any applicable sales charge or redemption fees. This chart does not imply any future performance. Performance will vary from class to class based on differences in class-specific expenses and sales charges. The returns do not reflect the deduction of taxes that a shareholder would pay on Fund distributions or the redemption of Fund shares.
Performance data represents past performance; past performance does not guarantee future results. The investment return and principal value of an investment will fluctuate so that an investor’s shares, when redeemed, may be worth more or less than their original cost. Current performance of the Fund may be lower or higher than the performance quoted. Performance data current to the most recent month end may be obtained by calling 1.855.LCFUNDS, or visiting www.LoCorrFunds.com.
Performance data shown reflects the Class A maximum sales charge of 5.75% and reflects the Class C Contingent Deferred Sales Charge (CDSC) of 1.00%. Performance of the Class A without load does not reflect the deduction of the sales load or fee. If reflected, the load or fee would reduce the performance quoted.
The returns reflect the actual performance for each period and do not include the impact on trades executed on the last business day of the period that were recorded on the first business day of the next period.
Per the fee table in the Fund’s April 30, 2020 prospectus, the Fund’s annual operating expense ratio is, before fee waivers 3.32%, 4.07% and 3.07% for Class A, Class C and Class I shares, respectively.
The Bloomberg Barclay U.S. Aggregate Bond Index is a long term, market capitalization-weighted index used to represent investment grade bonds being traded in the United States.
The Morningstar Allocation – 70% to 85% Equity portfolios seek to provide both income and capital appreciation by investing in multiple asset classes, including stocks, bonds and cash. These portfolios are dominated by domestic holdings and have equity expenses between 70% and 85%.
One cannot invest directly in an index.
| | |
| | |
| LoCorr Macro Strategies Fund – Consolidated Schedule of Investments | | 19 |
| | |
LoCorr Macro Strategies Fund
Composition of Consolidated Investment Portfolio1
December 31, 2020 (Unaudited)
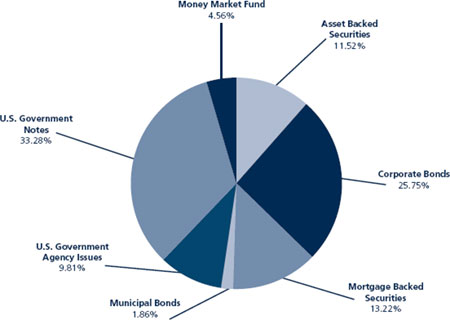
| 1 | As a percentage of total investments. |
Consolidated Schedule of Investments
December 31, 2020
| | | Maturity Date | | Coupon Rate | | | Principal Amount | | | Value | |
| ASSET BACKED SECURITIES: 10.45% | | | | | | | | | | | | | | |
| 321 Henderson Receivables I LLC | | | | | | | | | | | | | | |
| Series 2006-1A A1 (1 Month LIBOR USD + 0.200%) (a)(c) | | 03/15/2041 | | | 0.36 | % | | $ | 384,979 | | | $ | 379,958 | |
| Series 2006-4A A1 (1 Month LIBOR USD + 0.200%) (a)(c) | | 12/15/2041 | | | 0.36 | % | | | 429,130 | | | | 425,455 | |
| Series 2004-A A1 (1 Month LIBOR USD + 0.350%) (a)(c) | | 09/15/2045 | | | 0.51 | % | | | 88,328 | | | | 86,692 | |
| American Express Credit Account Master Trust, 2019-1 A | | 10/15/2024 | | | 2.87 | % | | | 2,390,000 | | | | 2,466,003 | |
| American Homes 4 Rent Trust, 2014-SFR2 A (a) | | 10/17/2036 | | | 3.79 | % | | | 746,713 | | | | 805,058 | |
| AmeriCredit Automobile Receivables Trust, 2020-3 A-3 | | 06/18/2025 | | | 0.53 | % | | | 5,420,000 | | | | 5,432,433 | |
| AMSR Trust, 2020-SFR1 A (a) | | 04/17/2037 | | | 1.82 | % | | | 499,521 | | | | 508,851 | |
| California Republic Auto Receivables Trust, 2018-1 A3 | | 08/15/2022 | | | 3.14 | % | | | 83,991 | | | | 84,110 | |
| Carmax Auto Owner Trust | | | | | | | | | | | | | | |
| Series 2019-1 A3 | | 03/15/2024 | | | 3.05 | % | | | 2,309,786 | | | | 2,359,908 | |
| Series 2020-1 A3 | | 12/16/2024 | | | 1.89 | % | | | 4,150,000 | | | | 4,257,334 | |
| Chase Issuance Trust, 2020-A1 A1 | | 01/15/2025 | | | 1.53 | % | | | 3,850,000 | | | | 3,951,966 | |
| Citibank Credit Card Issuance Trust, 2018-A3 A3 | | 05/23/2025 | | | 3.29 | % | | | 3,500,000 | | | | 3,752,771 | |
| Corevest American Finance Trust, 2020-1 A1 (a) | | 03/17/2050 | | | 1.83 | % | | | 491,798 | | | | 498,899 | |
| DB Master Finance LLC, 2019-1A A2I (a) | | 05/20/2049 | | | 3.79 | % | | | 1,989,813 | | | | 2,039,040 | |
| Diamond Resorts Owner Trust, 2018-1 A (a) | | 01/21/2031 | | | 3.70 | % | | | 1,293,052 | | | | 1,350,404 | |
| Discover Card Execution Note Trust, 2018-A2 A2 (1 Month LIBOR USD + 0.330%) (c) | | 08/15/2025 | | | 0.49 | % | | | 2,775,000 | | | | 2,785,600 | |
| Domino’s Pizza Master Issuer LLC, 2017-1A A2I (3 Month LIBOR USD + 1.250%) (a)(c) | | 07/25/2047 | | | 1.46 | % | | | 1,062,150 | | | | 1,063,191 | |
| Entergy New Orleans Storm Recovery Funding LLC, 2015-1 A | | 06/01/2027 | | | 2.67 | % | | | 787,738 | | | | 803,019 | |
| Ford Credit Auto Lease Trust, 2019-B A3 | | 10/15/2022 | | | 2.22 | % | | | 2,244,000 | | | | 2,264,764 | |
| Ford Credit Auto Owner Trust | | | | | | | | | | | | | | |
| Series 2016-1 A (a) | | 08/15/2027 | | | 2.31 | % | | | 2,350,000 | | | | 2,355,482 | |
| Series 2018-2 A (a) | | 01/15/2030 | | | 3.47 | % | | | 1,400,000 | | | | 1,501,214 | |
| GM Financial Consumer Automobile Receivables Trust | | | | | | | | | | | | | | |
| Series 2020-2 A2B (1 Month LIBOR USD + 1.050%) (c) | | 03/16/2023 | | | 1.20 | % | | | 970,559 | | | | 973,814 | |
| Series 2020-1 A3 | | 09/16/2024 | | | 1.84 | % | | | 1,680,000 | | | | 1,716,390 | |
| Hilton Grand Vacations Trust, 2019-AA A (a) | | 07/25/2033 | | | 2.34 | % | | | 2,514,874 | | | | 2,603,628 | |
| Honda Auto Receivables Owner Trust | | | | | | | | | | | | | | |
| Series 2019-1 A3 | | 03/20/2023 | | | 2.83 | % | | | 4,538,820 | | | | 4,616,007 | |
| Series 2020-3 A3 | | 10/18/2024 | | | 0.37 | % | | | 6,550,000 | | | | 6,561,076 | |
| Hyundai Auto Receivables Trust, 2020-C | | 05/15/2025 | | | 0.38 | % | | | 5,520,000 | | | | 5,529,600 | |
The accompanying notes are an integral part of these consolidated financial statements.
| | |
| | |
| 20 | | LoCorr Macro Strategies Fund – Consolidated Schedule of Investments (continued) |
| | |
| | | Maturity Date | | Coupon Rate | | | Principal Amount | | | Value | |
| ASSET BACKED SECURITIES (continued) | | | | | | | | | | | | | | |
| Invitation Homes Trust | | | | | | | | | | | | | | |
| Series 2017-SFR2 A (1 Month LIBOR USD + 0.850%) (a)(c) | | 12/19/2036 | | | 1.00 | % | | $ | 1,448,294 | | | $ | 1,444,761 | |
| Series 2018-SFR2 A (1 Month LIBOR USD + 0.900%) (a)(c) | | 06/18/2037 | | | 1.06 | % | | | 2,406,174 | | | | 2,411,475 | |
| Series 2018-SFR3 A (1 Month LIBOR USD + 1.000%) (a)(c) | | 07/17/2037 | | | 1.15 | % | | | 2,780,103 | | | | 2,780,103 | |
| Series 2018-SFR4 A (1 Month LIBOR USD + 1.100%) (a)(c) | | 01/19/2038 | | | 1.25 | % | | | 922,786 | | | | 929,658 | |
| Series 2018-SFR4 D (1 Month LIBOR USD + 1.650%) (a)(c) | | 01/19/2038 | | | 1.80 | % | | | 2,275,000 | | | | 2,269,473 | |
| Morgan Stanley Capital I Trust, 2004-HE6 M1 (1 Month LIBOR USD + 0.825%) (c) | | 08/25/2034 | | | 0.97 | % | | | 698,137 | | | | 689,092 | |
| MVW Owner Trust | | | | | | | | | | | | | | |
| Series 2019-1A A (a) | | 11/20/2036 | | | 2.89 | % | | | 1,243,683 | | | | 1,290,544 | |
| Series 2019-2A A (a) | | 10/20/2038 | | | 2.22 | % | | | 1,789,438 | | | | 1,840,647 | |
| PFS Financing Corp. | | | | | | | | | | | | | | |
| Series 2020-F A (a) | | 08/15/2024 | | | 0.93 | % | | | 3,150,000 | | | | 3,168,909 | |
| Series 2020-G (a) | | 02/17/2026 | | | 0.97 | % | | | 2,288,000 | | | | 2,300,016 | |
| Progress Residential Trust | | | | | | | | | | | | | | |
| Series 2017-SFR1 A (a) | | 08/17/2034 | | | 2.77 | % | | | 3,268,809 | | | | 3,308,303 | |
| Series 2019-SFR4 B (a) | | 11/17/2036 | | | 2.94 | % | | | 1,300,000 | | | | 1,345,189 | |
| Santander Drive Auto Receivables Trust, 2020-4 A-3 | | 07/15/2024 | | | 0.48 | % | | | 4,640,000 | | | | 4,653,941 | |
| Sierra Receivables Funding LLC, 2018-3A A (a) | | 09/20/2035 | | | 3.69 | % | | | 1,304,760 | | | | 1,362,444 | |
| SoFi Professional Loan Program LLC | | | | | | | | | | | | | | |
| Series 2016-C A2B (a) | | 12/27/2032 | | | 2.36 | % | | | 779,153 | | | | 789,137 | |
| Series 2016-D A2B (a) | | 04/25/2033 | | | 2.34 | % | | | 769,392 | | | | 784,128 | |
| Series 2015-C A2 (a) | | 08/25/2033 | | | 2.51 | % | | | 502,357 | | | | 504,450 | |
| Series 2016-A A2 (a) | | 12/26/2036 | | | 2.76 | % | | | 1,437,756 | | | | 1,460,502 | |
| Synchrony Card Issuance Trust, 2018-A1 A | | 09/15/2024 | | | 3.38 | % | | | 2,935,000 | | | | 2,999,262 | |
| Tesla Auto Lease Trust, 2020-A (a) | | 05/20/2023 | | | 0.55 | % | | | 2,902,229 | | | | 2,907,458 | |
| Toyota Auto Receivables Owner Trust, 2020-B A2 | | 12/15/2022 | | | 1.38 | % | | | 4,707,635 | | | | 4,731,286 | |
| Tricon American Homes Trust, 2017-SFR1 A (a) | | 09/19/2034 | | | 2.72 | % | | | 2,796,487 | | | | 2,832,121 | |
| Verizon Owner Trust | | | | | | | | | | | | | | |
| Series 2018-1A A1B (1 Month LIBOR USD + 0.260%) (a)(c) | | 09/20/2022 | | | 0.41 | % | | | 1,063,348 | | | | 1,063,811 | |
| Series 2018-A A1A | | 04/20/2023 | | | 3.23 | % | | | 4,372,551 | | | | 4,430,595 | |
| Series 2019-B A1A | | 12/20/2023 | | | 2.33 | % | | | 2,597,000 | | | | 2,648,404 | |
| Series 2019-C A1A | | 04/20/2024 | | | 1.94 | % | | | 705,000 | | | | 720,126 | |
| Series 2020-A A1A | | 07/20/2024 | | | 1.85 | % | | | 6,765,000 | | | | 6,927,407 | |
| TOTAL ASSET BACKED SECURITIES (Cost $121,879,465) | | | | | | | | | | | | | 123,765,909 | |
| | | | | | | | | | | | | | | |
| CORPORATE BONDS: 23.12% | | | | | | | | | | | | | | |
| Agriculture: 0.41% | | | | | | | | | | | | | | |
| BAT Capital Corp. | | 08/15/2024 | | | 3.22 | % | | | 625,000 | | | | 676,639 | |
| BAT International Finance PLC (b) | | 03/25/2026 | | | 1.67 | % | | | 4,085,000 | | | | 4,181,483 | |
| | | | | | | | | | | | | | 4,858,122 | |
| Auto Manufacturers: 0.74% | | | | | | | | | | | | | | |
| Cummins, Inc. | | 09/01/2025 | | | 0.75 | % | | | 2,800,000 | | | | 2,820,261 | |
| General Motors Financial Co., Inc. | | 06/20/2025 | | | 2.75 | % | | | 3,845,000 | | | | 4,111,473 | |
| Volkswagen Group of America Finance LLC (a) | | 11/24/2025 | | | 1.25 | % | | | 1,800,000 | | | | 1,817,844 | |
| | | | | | | | | | | | | | 8,749,578 | |
| Banks: 11.51% | | | | | | | | | | | | | | |
| Banco Santander SA (b) | | 02/23/2023 | | | 3.13 | % | | | 2,800,000 | | | | 2,948,105 | |
| Banco Santander SA (b) | | 05/28/2025 | | | 2.75 | % | | | 1,015,000 | | | | 1,083,538 | |
| Bank of America Corp. | | 10/21/2022 | | | 2.50 | % | | | 3,680,000 | | | | 3,745,888 | |
| Bank of America Corp. | | 01/11/2023 | | | 3.30 | % | | | 4,240,000 | | | | 4,495,290 | |
| Bank of America Corp. (3 Month LIBOR USD + 0.930%) (c) | | 07/21/2023 | | | 2.82 | % | | | 2,150,000 | | | | 2,232,627 | |
| Bank of America Corp. (SOFR + 0.740%) (c) | | 10/24/2024 | | | 0.81 | % | | | 5,500,000 | | | | 5,551,393 | |
| Bank of America Corp. (SOFR + 1.150%) (c) | | 06/19/2026 | | | 1.32 | % | | | 6,095,000 | | | | 6,225,012 | |
| Bank of America Corp. (SOFR + 1.010%) (c) | | 10/24/2026 | | | 1.20 | % | | | 1,000,000 | | | | 1,013,315 | |
| Bank of Montreal (b) | | 03/26/2022 | | | 2.90 | % | | | 1,770,000 | | | | 1,827,528 | |
| Bank of New York Mellon Corp. | | 02/07/2022 | | | 2.60 | % | | | 1,000,000 | | | | 1,023,703 | |
| Bank of New York Mellon Corp. | | 10/24/2024 | | | 2.10 | % | | | 1,200,000 | | | | 1,274,453 | |
| Barclays PLC (1 Year CMT Rate + 0.800%) (b)(c) | | 12/10/2024 | | | 1.01 | % | | | 3,025,000 | | | | 3,046,447 | |
| BNP Paribas SA (3 Month LIBOR USD + 1.111%) (a)(b)(c) | | 11/19/2025 | | | 2.82 | % | | | 3,640,000 | | | | 3,879,960 | |
| Citigroup, Inc. | | 01/14/2022 | | | 4.50 | % | | | 2,515,000 | | | | 2,622,336 | |
The accompanying notes are an integral part of these consolidated financial statements.
| | |
| | |
| LoCorr Macro Strategies Fund – Consolidated Schedule of Investments (continued) | | 21 |
| | |
| | | Maturity Date | | Coupon Rate | | | Principal Amount | | | Value | |
| CORPORATE BONDS (continued) | | | | | | | | | | | | | | |
| Citigroup, Inc. (3 Month LIBOR USD + 0.722%) (c) | | 01/24/2023 | | | 3.14 | % | | $ | 5,735,000 | | | $ | 5,897,231 | |
| Citigroup, Inc. (3 Month LIBOR USD + 1.023%) (c) | | 06/01/2024 | | | 4.04 | % | | | 4,140,000 | | | | 4,502,435 | |
| Citigroup, Inc. (SOFR + 0.686%) (c) | | 10/30/2024 | | | 0.78 | % | | | 1,915,000 | | | | 1,927,423 | |
| Cooperatieve Rabobank UA (b) | | 11/09/2022 | | | 3.95 | % | | | 2,130,000 | | | | 2,261,295 | |
| Credit Suisse AG (b) | | 05/05/2023 | | | 1.00 | % | | | 2,610,000 | | | | 2,649,481 | |
| Danske Bank A/S (1 Year CMT Rate + 1.730%) (a)(b)(c) | | 01/12/2023 | | | 5.00 | % | | | 2,895,000 | | | | 3,013,296 | |
| Fifth Third Bancorp | | 05/05/2023 | | | 1.63 | % | | | 2,505,000 | | | | 2,583,712 | |
| Goldman Sachs Group, Inc. | | 01/22/2023 | | | 3.63 | % | | | 3,685,000 | | | | 3,932,383 | |
| Goldman Sachs Group, Inc. | | 02/23/2023 | | | 3.20 | % | | | 4,935,000 | | | | 5,214,413 | |
| Goldman Sachs Group, Inc. | | 04/01/2025 | | | 3.50 | % | | | 1,925,000 | | | | 2,138,655 | |
| HSBC Bank Canada (a)(b) | | 09/10/2023 | | | 1.65 | % | | | 2,000,000 | | | | 2,043,904 | |
| HSBC Holdings PLC (SOFR + 1.929%) (b)(c) | | 06/04/2026 | | | 2.10 | % | | | 2,600,000 | | | | 2,701,771 | |
| Huntington National Bank | | 04/01/2022 | | | 3.13 | % | | | 1,735,000 | | | | 1,791,105 | |
| ING Groep NV (b) | | 04/09/2024 | | | 3.55 | % | | | 3,095,000 | | | | 3,381,502 | |
| JP Morgan Chase & Co. | | 09/23/2022 | | | 3.25 | % | | | 1,565,000 | | | | 1,645,926 | |
| JP Morgan Chase & Co. | | 01/25/2023 | | | 3.20 | % | | | 8,345,000 | | | | 8,834,123 | |
| JP Morgan Chase & Co. (SOFR + 0.800%) (c) | | 11/19/2026 | | | 1.05 | % | | | 2,000,000 | | | | 2,022,600 | |
| Mitsubishi UFJ Financial Group, Inc. (1 Year CMT Rate + 0.680%) (b)(c) | | 09/15/2024 | | | 0.85 | % | | | 3,025,000 | | | | 3,043,037 | |
| Morgan Stanley | | 11/01/2022 | | | 4.88 | % | | | 1,900,000 | | | | 2,047,240 | |
| Morgan Stanley | | 01/23/2023 | | | 3.13 | % | | | 7,925,000 | | | | 8,363,807 | |
| National Bank of Canada (a)(b) | | 10/07/2022 | | | 2.15 | % | | | 1,600,000 | | | | 1,648,964 | |
| NatWest Markets PLC (a)(b) | | 05/21/2023 | | | 2.38 | % | | | 3,345,000 | | | | 3,479,712 | |
| Royal Bank of Canada (b) | | 11/01/2024 | | | 2.25 | % | | | 1,855,000 | | | | 1,973,363 | |
| Santander UK PLC (b) | | 01/13/2023 | | | 2.10 | % | | | 2,255,000 | | | | 2,330,055 | |
| State Street Corp. (SOFR + 2.690%) (c) | | 03/30/2023 | | | 2.83 | % | | | 2,010,000 | | | | 2,074,450 | |
| Svenska Handelsbanken AB (a)(b) | | 06/30/2023 | | | 0.63 | % | | | 1,860,000 | | | | 1,872,659 | |
| Truist Financial Corp. | | 08/05/2025 | | | 1.20 | % | | | 2,565,000 | | | | 2,632,813 | |
| UBS AG/London (a)(b) | | 04/21/2022 | | | 1.75 | % | | | 1,750,000 | | | | 1,781,137 | |
| UBS Group AG (1 Year CMT Rate + 0.830%) (a)(b)(c) | | 07/30/2024 | | | 1.01 | % | | | 600,000 | | | | 605,801 | |
| Wells Fargo & Co. | | 02/13/2023 | | | 3.45 | % | | | 4,195,000 | | | | 4,445,639 | |
| Wells Fargo & Co. (SOFR + 1.600%) (c) | | 06/02/2024 | | | 1.65 | % | | | 2,375,000 | | | | 2,441,223 | |
| | | | | | | | | | | | | | 136,250,750 | |
| Biotechnology: 0.39% | | | | | | | | | | | | | | |
| Gilead Sciences, Inc. | | 09/29/2023 | | | 0.75 | % | | | 1,650,000 | | | | 1,655,014 | |
| Royalty Pharma PLC (a)(b) | | 09/02/2023 | | | 0.75 | % | | | 2,975,000 | | | | 2,989,220 | |
| | | | | | | | | | | | | | 4,644,234 | |
| Building Materials: 0.24% | | | | | | | | | | | | | | |
| Carrier Global Corp. | | 02/15/2025 | | | 2.24 | % | | | 2,685,000 | | | | 2,841,167 | |
| | | | | | | | | | | | | | | |
| Chemicals: 0.16% | | | | | | | | | | | | | | |
| DuPont de Nemours, Inc. | | 11/15/2023 | | | 4.21 | % | | | 1,765,000 | | | | 1,947,219 | |
| | | | | | | | | | | | | | | |
| Computers: 0.10% | | | | | | | | | | | | | | |
| Apple, Inc. | | 05/03/2023 | | | 2.40 | % | | | 1,175,000 | | | | 1,232,533 | |
| | | | | | | | | | | | | | | |
| Diversified Financial Services: 1.51% | | | | | | | | | | | | | | |
| Air Lease Corp. | | 07/03/2023 | | | 3.88 | % | | | 2,850,000 | | | | 3,043,229 | |
| Air Lease Corp. | | 02/01/2024 | | | 4.25 | % | | | 925,000 | | | | 1,003,867 | |
| American Express Co. | | 05/20/2022 | | | 2.75 | % | | | 505,000 | | | | 520,985 | |
| American Express Co. | | 07/30/2024 | | | 2.50 | % | | | 2,000,000 | | | | 2,133,609 | |
| Capital One Bank | | 02/15/2023 | | | 3.38 | % | | | 1,700,000 | | | | 1,796,479 | |
| CDP Financial, Inc. (a)(b) | | 03/07/2022 | | | 2.75 | % | | | 2,190,000 | | | | 2,253,667 | |
| GE Capital International Funding Co Unlimited Co. (b) | | 11/15/2025 | | | 3.37 | % | | | 4,605,000 | | | | 5,110,948 | |
| OMERS Finance Trust (a)(b) | | 05/02/2024 | | | 2.50 | % | | | 1,930,000 | | | | 2,061,151 | |
| | | | | | | | | | | | | | 17,923,935 | |
| Electric: 0.43% | | | | | | | | | | | | | | |
| Eversource Energy | | 08/15/2025 | | | 0.80 | % | | | 350,000 | | | | 349,321 | |
| Exelon Generation Co. LLC | | 03/15/2022 | | | 3.40 | % | | | 620,000 | | | | 640,106 | |
| Exelon Generation Co. LLC | | 06/01/2025 | | | 3.25 | % | | | 810,000 | | | | 883,234 | |
| Nextera Energy Capital Holdings, Inc. | | 04/01/2022 | | | 2.90 | % | | | 3,100,000 | | | | 3,198,861 | |
| | | | | | | | | | | | | | 5,071,522 | |
| The accompanying notes are an integral part of these consolidated financial statements. |
| | |
| | |
| 22 | | LoCorr Macro Strategies Fund – Consolidated Schedule of Investments (continued) |
| | |
| | | Maturity Date | | Coupon Rate | | | Principal Amount | | | Value | |
| CORPORATE BONDS (continued) | | | | | | | | | | | | | | |
| Food: 0.14% | | | | | | | | | | | | | | |
| Mondelez International, Inc. | | 04/13/2023 | | | 2.13% | | | $ | 1,620,000 | | | $ | 1,682,609 | |
| | | | | | | | | | | | | | | |
| Healthcare - Services: 0.28% | | | | | | | | | | | | | | |
| Anthem, Inc. | | 01/15/2025 | | | 2.38% | | | | 2,165,000 | | | | 2,315,576 | |
| UnitedHealth Group, Inc. | | 01/15/2026 | | | 1.25% | | | | 995,000 | | | | 1,025,726 | |
| | | | | | | | | | | | | | 3,341,302 | |
| Insurance: 0.99% | | | | | | | | | | | | | | |
| American International Group, Inc. | | 06/30/2025 | | | 2.50% | | | | 2,215,000 | | | | 2,381,118 | |
| Aon Corp. | | 11/15/2022 | | | 2.20% | | | | 1,660,000 | | | | 1,715,730 | |
| Equitable Financial Life Global (a) | | 07/07/2025 | | | 1.40% | | | | 2,435,000 | | | | 2,500,964 | |
| Metropolitan Life Global Funding I (a) | | 07/02/2025 | | | 0.95% | | | | 3,155,000 | | | | 3,196,832 | |
| Voya Financial, Inc. | | 07/15/2024 | | | 3.13% | | | | 1,765,000 | | | | 1,907,471 | |
| | | | | | | | | | | | | | 11,702,115 | |
| Media: 0.71% | | | | | | | | | | | | | | |
| Comcast Corp. | | 4/15/2024 | | | 3.70% | | | | 7,625,000 | | | | 8,389,090 | |
| | | | | | | | | | | | | | | |
| Miscellaneous Manufacturing: 0.14% | | | | | | | | | | | | | | |
| Parker-Hannifin Corp. | | 06/14/2024 | | | 2.70% | | | | 1,540,000 | | | | 1,651,641 | |
| | | | | | | | | | | | | | | |
| Oil & Gas: 0.92% | | | | | | | | | | | | | | |
| BP Capital Markets PLC (b) | | 03/11/2021 | | | 4.74% | | | | 1,000,000 | | | | 1,008,090 | |
| Chevron Corp. | | 05/11/2023 | | | 1.14% | | | | 2,485,000 | | | | 2,537,323 | |
| Diamondback Energy, Inc. | | 12/01/2024 | | | 2.88% | | | | 1,865,000 | | | | 1,960,395 | |
| Equinor ASA (b) | | 01/22/2026 | | | 1.75% | | | | 810,000 | | | | 850,889 | |
| Phillips 66 | | 02/15/2024 | | | 0.90% | | | | 2,280,000 | | | | 2,285,522 | |
| Saudi Arabian Oil Co. (a)(b) | | 04/16/2022 | | | 2.75% | | | | 2,150,000 | | | | 2,208,827 | |
| | | | | | | | | | | | | | 10,851,046 | |
| Pharmaceuticals: 0.84% | | | | | | | | | | | | | | |
| AbbVie, Inc. | | 11/06/2022 | | | 2.90% | | | | 1,015,000 | | | | 1,061,771 | |
| AbbVie, Inc. | | 11/21/2022 | | | 2.30% | | | | 1,805,000 | | | | 1,870,702 | |
| Bristol-Myers Squibb Co. | | 02/20/2023 | | | 3.25% | | | | 915,000 | | | | 962,571 | |
| Bristol-Myers Squibb Co. | | 11/13/2023 | | | 0.54% | | | | 1,855,000 | | | | 1,858,359 | |
| CVS Health Corp. | | 08/12/2024 | | | 3.38% | | | | 3,880,000 | | | | 4,231,618 | |
| | | | | | | | | | | | | | 9,985,021 | |
| Pipelines: 0.53% | | | | | | | | | | | | | | |
| Energy Transfer Operating LP | | 05/15/2025 | | | 2.90% | | | | 790,000 | | | | 835,791 | |
| MPLX LP | | 03/01/2026 | | | 1.75% | | | | 2,935,000 | | | | 3,037,447 | |
| ONEOK, Inc. | | 09/01/2024 | | | 2.75% | | | | 775,000 | | | | 817,732 | |
| TransCanada PipeLines Ltd. (b) | | 08/01/2022 | | | 2.50% | | | | 1,500,000 | | | | 1,550,067 | |
| | | | | | | | | | | | | | 6,241,037 | |
| Real Estate Investment Trusts: 1.09% | | | | | | | | | | | | | | |
| Alexandria Real Estate Equities, Inc. | | 01/15/2024 | | | 4.00% | | | | 2,515,000 | | | | 2,767,883 | |
| American Tower Corp. | | 09/15/2025 | | | 1.30% | | | | 4,860,000 | | | | 4,962,446 | |
| Camden Property Trust | | 12/15/2022 | | | 2.95% | | | | 1,457,000 | | | | 1,518,396 | |
| Crown Castle International Corp. | | 07/15/2025 | | | 1.35% | | | | 1,760,000 | | | | 1,796,572 | |
| Highwoods Realty LP | | 06/15/2021 | | | 3.20% | | | | 474,000 | | | | 477,301 | |
| Kilroy Realty LP | | 01/15/2023 | | | 3.80% | | | | 1,300,000 | | | | 1,361,289 | |
| | | | | | | | | | | | | | 12,883,887 | |
| Telecommunications: 1.84% | | | | | | | | | | | | | | |
| AT&T, Inc. | | 05/15/2025 | | | 3.40% | | | | 8,510,000 | | | | 9,458,450 | |
| T-Mobile USA, Inc. (a) | | 04/15/2025 | | | 3.50% | | | | 4,240,000 | | | | 4,685,115 | |
| Verizon Communications, Inc. | | 09/15/2023 | | | 5.15% | | | | 2,895,000 | | | | 3,262,206 | |
| Verizon Communications, Inc. | | 11/01/2024 | | | 3.50% | | | | 2,100,000 | | | | 2,319,493 | |
| Vodafone Group PLC (b) | | 01/16/2024 | | | 3.75% | | | | 1,915,000 | | | | 2,092,630 | |
| | | | | | | | | | | | | | 21,817,894 | |
| Transportation: 0.15% | | | | | | | | | | | | | | |
| Burlington Northern Santa Fe LLC | | 09/01/2024 | | | 3.40% | | | | 1,580,000 | | | | 1,733,628 | |
| TOTAL CORPORATE BONDS (Cost $265,486,391) | | | | | | | | | | | | | 273,798,330 | |
The accompanying notes are an integral part of these consolidated financial statements.
| | |
| | |
| LoCorr Macro Strategies Fund – Consolidated Schedule of Investments (continued) | | 23 |
| | |
| | | Maturity Date | | Coupon Rate | | | Principal Amount | | | Value | |
| MORTGAGE BACKED SECURITIES: 11.99% | | | | | | | | | | | | | | |
| Angel Oak Mortgage Trust, 2020-1 M1 (a)(d) | | 12/25/2059 | | | 3.16% |
| | $ | 1,415,000 | | | $ | 1,408,395 | |
| Barclays Commercial Mortgage Securities LLC, 2015-VFM A1 (a) | | 03/12/2036 | | | 2.47% |
| | | 1,273,528 | | | | 1,254,938 | |
| BHP Trust, 2019-BXHP (1 Month LIBOR USD + 0.975%) (a)(c) | | 08/15/2036 | | | 1.13% |
| | | 2,366,383 | | | | 2,337,222 | |
| BX Commercial Mortgage Trust | | | | | | | | | | | | | | |
| Series 2020-FOX (1 Month LIBOR USD + 1.000%) (a)(c) | | 11/15/2032 | | | 1.16% |
| | | 5,000,000 | | | | 5,008,017 | |
| Series 2019-XL A (1 Month LIBOR USD + 0.920%) (a)(c) | | 10/15/2036 | | | 1.08% |
| | | 2,847,893 | | | | 2,853,203 | |
| Citigroup Commercial Mortgage Trust, 2019-PRM B (a) | | 05/10/2035 | | | 3.64% |
| | | 2,100,000 | | | | 2,223,119 | |
| Comm Mortgage Trust | | | | | | | | | | | | | | |
| Series 2013-CR6 A4 | | 03/10/2046 | | | 3.10% |
| | | 615,000 | | | | 637,625 | |
| Series 2013-CR10 A4 (d) | | 08/10/2046 | | | 4.21% |
| | | 615,000 | | | | 667,390 | |
| Series 2014-UBS2 AM | | 03/12/2047 | | | 4.20% |
| | | 2,450,000 | | | | 2,667,764 | |
| Series 2014-CCRE19 | | 08/12/2047 | | | 3.80% |
| | | 1,380,133 | | | | 1,523,094 | |
| Series 2014-LC17 A5 | | 10/11/2047 | | | 3.92% |
| | | 724,000 | | | | 798,771 | |
| Series 2014-CR21 A3 | | 12/10/2047 | | | 3.53% |
| | | 1,668,352 | | | | 1,803,856 | |
| Series 2015-CR27 AM | | 10/13/2048 | | | 3.98% |
| | | 2,000,000 | | | | 2,211,287 | |
| Connecticut Avenue Securities Trust | | | | | | | | | | | | | | |
| Series 2020-R02 2M1 (1 Month LIBOR USD + 0.750%) (a)(c) | | 01/25/2040 | | | 0.90% |
| | | 1,552,746 | | | | 1,552,746 | |
| Series 2020-R01 1M1 (1 Month LIBOR USD + 0.800%) (a)(c) | | 01/25/2040 | | | 0.95% |
| | | 832,969 | | | | 833,630 | |
| Credit Suisse Mortgage Capital Certificates, 2019-ICE4 A (1 Month LIBOR USD + 0.980%) (a)(c) | | 05/15/2036 | | | 1.14% |
| | | 3,500,000 | | | | 3,504,688 | |
| Fannie Mae Aces | | | | | | | | | | | | | | |
| Series 2017-M7 A1 | | 02/25/2027 | | | 2.60% |
| | | 3,540,025 | | | | 3,740,513 | |
| Series 2017-M12 A1 | | 06/25/2027 | | | 2.75% |
| | | 5,223,527 | | | | 5,497,845 | |
| Series 2019-M6 A1 | | 08/25/2028 | | | 3.30% |
| | | 5,546,219 | | | | 6,116,770 | |
| Fannie Mae Connecticut Avenue Securities | | | | | | | | | | | | | | |
| Series 2014-C02 1M2 (1 Month LIBOR USD + 2.600%) (c) | | 05/28/2024 | | | 2.75% |
| | | 1,411,376 | | | | 1,374,699 | |
| Series 2014-C03 1M2 (1 Month LIBOR USD + 3.000%) (c) | | 07/25/2024 | | | 3.15% |
| | | 1,500,947 | | | | 1,456,731 | |
| Series 2017-C02 2ED4 (1 Month LIBOR USD + 0.850%) (c) | | 09/25/2029 | | | 1.00% |
| | | 902,106 | | | | 880,633 | |
| Series 2018-C01 1EB1 (1 Month LIBOR USD + 0.450%) (c) | | 07/25/2030 | | | 0.60% |
| | | 1,738,000 | | | | 1,694,762 | |
| FHLMC Multifamily Structured Pass Through Certificates | | | | | | | | | | | | | | |
| Series K059 A1 | | 09/25/2025 | | | 2.76% |
| | | 1,802,003 | | | | 1,917,037 | |
| Series KC06 A1 | | 02/25/2026 | | | 2.17% |
| | | 4,085,000 | | | | 4,263,921 | |
| Flagstar Mortgage Trust, 2017-2 A5 (a)(d) | | 10/25/2047 | | | 3.50% |
| | | 214,432 | | | | 214,178 | |
| Freddie Mac Structured Agency Credit Risk Debt Notes | | | | | | | | | | | | | | |
| Series 2017-DNA2 M1 (1 Month LIBOR USD + 1.200%) (c) | | 10/25/2029 | | | 1.35% |
| | | 628,863 | | | | 628,863 | |
| Series 2018-HRP2 M3 (1 Month LIBOR USD + 2.400%) (a)(c) | | 02/25/2047 | | | 2.55% |
| | | 2,000,000 | | | | 2,002,542 | |
| Series 2020-DNA1 M1 (1 Month LIBOR USD + 0.700%) (a)(c) | | 01/25/2050 | | | 0.85% |
| | | 583,645 | | | | 583,990 | |
| Series 2020-HQA2 M1 (1 Month LIBOR USD + 1.100%) (a)(c) | | 03/25/2050 | | | 1.25% |
| | | 302,575 | | | | 302,766 | |
| FRESB Multifamily Mortgage Pass Through Certificates | | | | | | | | | | | | | | |
| Series 2016-SB17 A7F (d) | | 05/25/2023 | | | 2.15% |
| | | 1,317,360 | | | | 1,336,646 | |
| Series 2016-SB22 A7F (d) | | 09/25/2023 | | | 1.98% |
| | | 3,389,531 | | | | 3,476,871 | |
| Series 2017-SB32 A7F (d) | | 04/25/2024 | | | 2.44% |
| | | 2,517,321 | | | | 2,591,752 | |
| Series 2019-SB67 A5F (d) | | 07/25/2024 | | | 2.09% |
| | | 3,479,240 | | | | 3,581,133 | |
| Series 2019-SB69 A5F (d) | | 10/25/2024 | | | 2.25% |
| | | 5,149,433 | | | | 5,360,458 | |
| Series 2016-SB23 A10F (d) | | 09/25/2026 | | | 2.31% |
| | | 1,770,182 | | | | 1,855,484 | |
| GS Mortgage Securities Trust | | | | | | | | | | | | | | |
| Series 2017-SLP A (a) | | 10/12/2032 | | | 3.42% |
| | | 3,000,000 | | | | 3,065,482 | |
| Series 2019-600C A (a) | | 09/12/2034 | | | 2.94% |
| | | 2,065,000 | | | | 2,114,402 | |
| Series 2013-GC16 B (d) | | 11/10/2046 | | | 5.16% |
| | | 206,000 | | | | 218,127 | |
| Series 2015-GC28 A5 | | 02/10/2048 | | | 3.40% |
| | | 1,000,000 | | | | 1,093,023 | |
| Series 2015-GC28 AS | | 02/12/2048 | | | 3.76% |
| | | 1,985,000 | | | | 2,165,227 | |
| JP Morgan Chase Commercial Mortgage Securities Trust | | | | | | | | | | | | | | |
| Series 2018-BCON A (a) | | 01/07/2031 | | | 3.73% |
| | | 3,630,000 | | | | 3,775,656 | |
| Series 2010-C2 A3 (a) | | 11/15/2043 | | | 4.07% |
| | | 1,923,558 | | | | 1,921,679 | |
| Series 2013-C15 A-S | | 11/17/2045 | | | 4.42% |
| | | 3,325,000 | | | | 3,626,665 | |
| Series 2013-C13 A4 (d) | | 01/18/2046 | | | 3.99% |
| | | 513,180 | | | | 550,036 | |
| Series 2014-C23 ASB | | 09/17/2047 | | | 3.66% |
| | | 2,210,982 | | | | 2,328,608 | |
| Series 2014-C22 AS | | 09/17/2047 | | | 4.11% |
| | | 3,650,000 | | | | 3,968,806 | |
| Series 2013-C10 AS | | 12/17/2047 | | | 3.37% |
| | | 200,000 | | | | 208,834 | |
| Series 2016-JP3 A-5 | | 08/15/2049 | | | 2.87% |
| | | 1,000,000 | | | | 1,090,874 | |
The accompanying notes are an integral part of these consolidated financial statements.
| | |
| | |
| 24 | | LoCorr Macro Strategies Fund – Consolidated Schedule of Investments (continued) |
| | |
| | | Maturity Date | | Coupon Rate | | | Principal Amount | | | Value | |
| MORTGAGE BACKED SECURITIES (continued) | | | | | | | | | | | | | | |
| JP Morgan Mortgage Trust | | | | | | | | | | | | | | |
| Series 2016-1 A5 (a)(d) | | 05/25/2046 | | | 3.50% | | | $ | 61,218 | | | $ | 61,237 | |
| Series 2017-2 A5 (a)(d) | | 05/25/2047 | | | 3.50% | | | | 407,732 | | | | 409,218 | |
| Series 2018-1 A5 (a)(d) | | 06/25/2048 | | | 3.50% | | | | 426,890 | | | | 428,101 | |
| Series 2018-5 A5 (a)(d) | | 10/25/2048 | | | 3.50% | | | | 540,141 | | | | 541,947 | |
| Series 2018-8 A5 (a)(d) | | 01/25/2049 | | | 4.00% | | | | 35,267 | | | | 35,236 | |
| KKR Industrial Portfolio Trust, 2020-AIP D (1 Month LIBOR USD + 2.030%) (a)(c) | | 03/16/2037 | | | 2.19% | | | | 1,398,098 | | | | 1,387,586 | |
| Ladder Capital Commercial Mortgage Trust, 2013-GCP A1 (a) | | 02/15/2036 | | | 3.57% | | | | 2,420,628 | | | | 2,604,877 | |
| Merit, 2020-HILL A (1 Month LIBOR USD + 1.150%) (a)(c) | | 08/17/2037 | | | 1.31% | | | | 6,300,000 | | | | 6,311,993 | |
| Morgan Stanley Capital I Trust, 2017-CLS A (1 Month LIBOR USD + 0.700%) (a)(c) | | 11/15/2034 | | | 0.86% | | | | 2,785,000 | | | | 2,783,322 | |
| Natixis Commercial Mortgage Securities Trust, 2018-285M A (a)(d) | | 11/15/2032 | | | 3.79% | | | | 1,000,000 | | | | 1,029,867 | |
| New Residential Mortgage Loan Trust | | | | | | | | | | | | | | |
| Series 2015-1A A3 (a)(d) | | 05/28/2052 | | | 3.75% | | | | 652,211 | | | | 693,466 | |
| Series 2014-2A A3 (a)(d) | | 05/25/2054 | | | 3.75% | | | | 618,302 | | | | 659,038 | |
| Series 2016-1A A1 (a)(d) | | 03/25/2056 | | | 3.75% | | | | 1,277,986 | | | | 1,354,455 | |
| Series 2017-1A A1 (a)(d) | | 02/25/2057 | | | 4.00% | | | | 1,734,908 | | | | 1,874,997 | |
| Series 2017-2A A3 (a)(d) | | 03/25/2057 | | | 4.00% | | | | 1,899,175 | | | | 2,053,666 | |
| OBX Trust, 2018-1 A2 (1 Month LIBOR USD + 0.650%) (a)(c) | | 06/25/2057 | | | 0.80% | | | | 1,235,408 | | | | 1,232,244 | |
| Sequoia Mortgage Trust | | | | | | | | | | | | | | |
| Series 2017-1 A4 (a)(d) | | 02/25/2047 | | | 3.50% | | | | 935,410 | | | | 941,817 | |
| Series 2018-CH4 A10 (a)(d) | | 10/25/2048 | | | 4.50% | | | | 130,108 | | | | 130,132 | |
| Series 2019-5 A4 (a)(d) | | 12/25/2049 | | | 3.50% | | | | 583,012 | | | | 592,171 | |
| Series 2020-1 A4 (a)(d) | | 02/25/2050 | | | 3.50% | | | | 1,029,606 | | | | 1,039,118 | |
| Series 2020-2 A4 (a)(d) | | 03/25/2050 | | | 3.50% | | | | 1,401,007 | | | | 1,425,151 | |
| Shellpoint Co-Originator Trust, 2017-2 A4 (a)(d) | | 10/25/2047 | | | 3.50% | | | | 135,452 | | | | 135,423 | |
| UBS Commercial Mortgage Trust, 2012-C1 A3 | | 05/12/2045 | | | 3.40% | | | | 1,009,921 | | | | 1,029,386 | |
| UBS-Barclays Commercial Mortgage Trust | | | | | | | | | | | | | | |
| Series 2013-C5 B (a)(d) | | 03/12/2046 | | | 3.65% | | | | 265,000 | | | | 265,664 | |
| Series 2013-C6 B (a)(d) | | 04/12/2046 | | | 3.88% | | | | 700,000 | | | | 696,190 | |
| Verus Securitization Trust, 2018-3 A1 (a)(d) | | 10/25/2058 | | | 4.11% | | | | 574,116 | | | | 588,747 | |
| Wells Fargo Commercial Mortgage Trust, 2012-LC5 AS | | 10/17/2045 | | | 3.54% | | | | 650,000 | | | | 674,869 | |
| WFRBS Commercial Mortgage Trust | | | | | | | | | | | | | | |
| Series 2011-C3 A4 (a) | | 03/17/2044 | | | 4.38% | | | | 1,786,907 | | | | 1,789,382 | |
| Series 2013-C13 AS | | 05/17/2045 | | | 3.35% | | | | 650,000 | | | | 682,458 | |
| Series 2013-C14 A5 | | 06/15/2046 | | | 3.34% | | | | 727,218 | | | | 768,520 | |
| Series 2014-C24 A5 | | 11/18/2047 | | | 3.61% | | | | 1,000,000 | | | | 1,093,515 | |
| Series 2014-C22 AS (d) | | 09/17/2057 | | | 4.07% | | | | 350,000 | | | | 386,660 | |
| TOTAL MORTGAGE BACKED SECURITIES (Cost $139,303,510) | | | | | | | | | | | | | 141,991,211 | |
| | | | | | | | | | | | | | | |
| MUNICIPAL BONDS: 1.69% | | | | | | | | | | | | | | |
| City of New York NY | | 08/01/2025 | | | 2.28% | | | | 4,180,000 | | | | 4,436,234 | |
| Massachusetts Water Resources Authority | | 08/01/2025 | | | 2.08% | | | | 4,630,000 | | | | 4,954,794 | |
| Miami Dade County Florida Aviation Refunding Taxable Series B | | 10/01/2023 | | | 2.37% | | | | 1,350,000 | | | | 1,407,821 | |
| Nebraska Public Power District | | 01/01/2024 | | | 2.22% | | | | 1,700,000 | | | | 1,770,057 | |
| Pennsylvania State University | | 09/01/2023 | | | 1.35% | | | | 2,945,000 | | | | 3,004,872 | |
| San Diego County Water Authority | | 05/01/2025 | | | 0.74% | | | | 920,000 | | | | 929,172 | |
| State of Wisconsin | | 05/01/2026 | | | 2.10% | | | | 2,590,000 | | | | 2,762,287 | |
| Water Works Board of the City of Birmingham | | 01/01/2024 | | | 2.20% | | | | 695,000 | | | | 729,444 | |
| TOTAL MUNICIPAL BONDS (Cost $19,009,048) | | | | | | | | | | | | | 19,994,681 | |
| | | | | | | | | | | | | | | |
| U.S. GOVERNMENT AGENCY ISSUES: 8.90% | | | | | | | | | | | | | | |
| Federal Farm Credit Banks | | 06/26/2023 | | | 1.77% | | | | 5,135,000 | | | | 5,332,527 | |
| Federal Farm Credit Banks | | 07/17/2023 | | | 2.88% | | | | 10,985,000 | | | | 11,722,983 | |
| Federal Home Loan Banks | | 06/10/2022 | | | 2.13% | | | | 14,115,000 | | | | 14,522,390 | |
| Federal Home Loan Banks | | 06/10/2022 | | | 2.75% | | | | 6,015,000 | | | | 6,242,492 | |
| Federal Home Loan Banks | | 06/09/2023 | | | 3.25% | | | | 15,200,000 | | | | 16,325,345 | |
| Federal Home Loan Banks | | 09/08/2023 | | | 3.38% | | | | 9,000,000 | | | | 9,769,758 | |
| Federal Home Loan Mortgage Corp. | | 07/08/2022 | | | 0.32% | | | | 6,730,000 | | | | 6,730,046 | |
| Federal Home Loan Mortgage Corp. | | 07/20/2023 | | | 0.41% | | | | 6,725,000 | | | | 6,734,764 | |
| Federal Home Loan Mortgage Corp. | | 09/08/2023 | | | 0.25% | | | | 2,000,000 | | | | 2,003,886 | |
The accompanying notes are an integral part of these consolidated financial statements.
| | |
| | |
| LoCorr Macro Strategies Fund – Consolidated Schedule of Investments (continued) | | 25 |
| | |
| | | Maturity Date | | Coupon Rate | | | Principal Amount | | | Value | |
| | | | | | | | | | | | |
| U.S. GOVERNMENT AGENCY ISSUES (continued) | | | | | | | | | | | | | | |
| Federal National Mortgage Association | | 04/12/2022 | | | 2.25% | | | $ | 3,500,000 | | | $ | 3,597,754 | |
| Federal National Mortgage Association | | 09/06/2022 | | | 1.38% | | | | 5,855,000 | | | | 5,979,589 | |
| Federal National Mortgage Association | | 07/10/2023 | | | 0.25% | | | | 9,000,000 | | | | 9,021,492 | |
| Federal National Mortgage Association | | 08/25/2025 | | | 0.38% | | | | 7,465,000 | | | | 7,463,364 | |
| TOTAL U.S. GOVERNMENT AGENCY ISSUES (Cost $101,913,261) | | | | | | | | | | | | | 105,446,390 | |
| | | | | | | | | | | | | | | |
| U.S. GOVERNMENT NOTES: 30.20% | | | | | | | | | | | | | | |
| United States Treasury Note | | 03/31/2022 | | | 1.88% | | | | 8,130,000 | | | | 8,307,844 | |
| United States Treasury Note | | 07/15/2022 | | | 1.75% | | | | 14,000,000 | | | | 14,350,000 | |
| United States Treasury Note | | 08/15/2022 | | | 1.50% | | | | 15,135,000 | | | | 15,471,990 | |
| United States Treasury Note | | 09/15/2022 | | | 1.50% | | | | 6,785,000 | | | | 6,943,493 | |
| United States Treasury Note | | 10/15/2022 | | | 1.38% | | | | 18,295,000 | | | | 18,702,350 | |
| United States Treasury Note | | 10/31/2022 | | | 2.00% | | | | 5,210,000 | | | | 5,388,076 | |
| United States Treasury Note | | 11/30/2022 | | | 0.13% | | | | 41,735,000 | | | | 41,739,891 | |
| United States Treasury Note | | 03/31/2023 | | | 1.50% | | | | 3,040,000 | | | | 3,132,625 | |
| United States Treasury Note | | 09/30/2023 | | | 2.88% | | | | 36,730,000 | | | | 39,457,489 | |
| United States Treasury Note | | 12/31/2023 | | | 2.63% | | | | 13,890,000 | | | | 14,908,419 | |
| United States Treasury Note | | 01/31/2024 | | | 2.25% | | | | 20,140,000 | | | | 21,427,072 | |
| United States Treasury Note | | 02/15/2024 | | | 2.75% | | | | 5,000,000 | | | | 5,400,977 | |
| United States Treasury Note | | 02/29/2024 | | | 2.38% | | | | 2,265,000 | | | | 2,421,161 | |
| United States Treasury Note | | 03/31/2024 | | | 2.13% | | | | 6,295,000 | | | | 6,688,192 | |
| United States Treasury Note | | 04/30/2024 | | | 2.00% | | | | 11,530,000 | | | | 12,220,899 | |
| United States Treasury Note | | 05/15/2024 | | | 2.50% | | | | 19,750,000 | | | | 21,282,168 | |
| United States Treasury Note | | 06/30/2024 | | | 1.75% | | | | 1,885,000 | | | | 1,986,613 | |
| United States Treasury Note | | 09/30/2024 | | | 1.50% | | | | 16,795,000 | | | | 17,586,858 | |
| United States Treasury Note | | 11/15/2024 | | | 2.25% | | | | 12,000,000 | | | | 12,927,188 | |
| United States Treasury Note | | 01/31/2025 | | | 1.38% | | | | 3,260,000 | | | | 3,406,700 | |
| United States Treasury Note | | 02/15/2025 | | | 7.63% | | | | 1,500,000 | | | | 1,952,402 | |
| United States Treasury Note | | 05/15/2025 | | | 2.13% | | | | 17,555,000 | | | | 18,947,057 | |
| United States Treasury Note | | 05/31/2025 | | | 0.25% | | | | 12,575,000 | | | | 12,550,931 | |
| United States Treasury Note | | 07/31/2025 | | | 0.25% | | | | 33,770,000 | | | | 33,671,064 | |
| United States Treasury Note | | 10/31/2025 | | | 0.25% | | | | 16,800,000 | | | | 16,727,812 | |
| TOTAL U.S. GOVERNMENT NOTES (Cost $351,443,717) | | | | | | | | | | | | | 357,599,271 | |
| | | | | | | | | | | | | | | |
| SHORT TERM INVESTMENTS: 4.38% | | | | | | | | | | | | | | |
| CORPORATE BOND: 0.24% | | | | | | | | | | | | | | |
| Insurance: 0.24% | | | | | | | | | | | | | | |
| Berkshire Hathaway, Inc. | | 03/15/2021 | | | 2.20% | | | | 2,835,000 | | | | 2,841,141 | |
| TOTAL CORPORATE BOND (Cost $2,832,947) | | | | | | | | | | | | | 2,841,141 | |
| | | | | | | | | | | | | | | |
| MONEY MARKET FUND: 4.14% | | | | | | | | | Shares | | | | | |
| STIT-Government & Agency Portfolio, Institutional Class, 0.03% (e)(f) | | | | | | | | | 48,986,780 | | | | 48,986,780 | |
| TOTAL MONEY MARKET FUND (Cost $48,986,780) | | | | | | | | | | | | | 48,986,780 | |
| TOTAL SHORT TERM INVESTMENTS (Cost $51,819,728) | | | | | | | | | | | | | 51,827,921 | |
| | | | | | | | | | | | | | | |
| TOTAL INVESTMENTS (Cost $1,050,855,120): 90.73% | | | | | | | | | | | | | 1,074,423,713 | |
| Other Assets in Excess of Liabilities: 9.27% (g) | | | | | | | | | | | | | 109,742,535 | |
| TOTAL NET ASSETS: 100.00% | | | | | | | | | | | | $ | 1,184,166,248 | |
| (a) | Security as defined in Rule 144A under the Securities Act of 1933 and determined to be liquid. Purchased in a private placement transaction; resale to the public may require registration or may extend only to qualified institutional buyers. At December 31, 2020, the value of these securities total $154,471,752 which represents 13.04% of total net assets. |
| (b) | Foreign issued security. |
| (c) | Variable rate security based on a reference index and spread. The rate reported is the rate in effect as of December 31, 2020. |
| (d) | Variable rate security. The coupon is based on an underlying pool of loans. The rate reported is the rate in effect as of December 31, 2020. |
| (e) | The rate quoted is the annualized seven-day effective yield as of December 31, 2020. |
| (f) | All or a portion of this security is held by LCMFS Fund Limited and pledged as collateral for derivative contracts. At December 31, 2020, the value of this security totals $12,124. |
| (g) | Includes assets pledged as collateral and deposits with broker for derivative contracts. At December 31, 2020, the value of these assets totals $56,968,047. |
| CMT | Constant Maturity Treasury |
|
|
| LIBOR | London Interbank Offered Rate |
|
|
| PLC | Public Limited Company | | |
| SOFR | Secured Overnight Financing Rate | | |
The accompanying notes are an integral part of these consolidated financial statements.
| | |
| | |
| 26 | | LoCorr Macro Strategies Fund – Consolidated Schedule of Open Forward Currency Contracts |
| | |
LoCorr Macro Strategies Fund
Consolidated Schedule of Open Forward Currency Contracts
December 31, 2020
| | | | | | | | | Currency to be Received | | | Currency to be Delivered | | | | | | | |
| Notional Amount | | | Counterparty | | Forward Settlement Date | | | Curr Abbr | | | U.S. $ Notional Amount at December 31, 2020 | | | Curr Abbr. | | | U.S. $ Notional Amount on Origination Date | | | Unrealized Appreciation | | | Unrealized (Depreciation) | |
| | | | See key for
abbreviation | |
| | |
| | | | | | | | | | | | | | | | |
| Purchase Contracts: | | | | | | | | | | | | | | | | | | | | | | | | |
| $ | 22,334,769 | | | DB | | | 01/20/2021 | | | AUD | | | $ | 23,010,669 | | | | USD | | | $ | 22,334,769 | | | $ | 675,900 | | | $ | – | |
| | | 52,395,987 | | | BAML | | | 03/19/2021 | | | AUD | | | | 54,005,036 | | | | USD | | | | 52,395,987 | | | | 1,609,049 | | | | – | |
| | | 36,667,825 | | | DB | | | 01/20/2021 | | | BRL | | | | 36,502,636 | | | | USD | | | | 36,667,825 | | | | – | | | | (165,189 | ) |
| | | 29,117,711 | | | DB | | | 01/20/2021 | | | CAD | | | | 29,266,565 | | | | USD | | | | 29,117,711 | | | | 148,854 | | | | – | |
| | | 26,279,505 | | | BAML | | | 03/19/2021 | | | CAD | | | | 26,384,752 | | | | USD | | | | 26,279,505 | | | | 105,247 | | | | – | |
| | | 10,696,275 | | | DB | | | 01/20/2021 | | | CHF | | | | 10,737,934 | | | | USD | | | | 10,696,275 | | | | 41,659 | | | | – | |
| | | 9,631,126 | | | DB | | | 02/17/2021 | | | CHF | | | | 9,615,265 | | | | USD | | | | 9,631,126 | | | | – | | | | (15,861 | ) |
| | | 68,980,639 | | | BAML | | | 03/19/2021 | | | CHF | | | | 69,203,710 | | | | USD | | | | 68,980,639 | | | | 223,071 | | | | – | |
| | | 3,441,651 | | | DB | | | 01/20/2021 | | | CLP | | | | 3,619,477 | | | | USD | | | | 3,441,651 | | | | 177,826 | | | | – | |
| | | 58,819 | | | DB | | | 01/20/2021 | | | COP | | | | 61,195 | | | | USD | | | | 58,819 | | | | 2,376 | | | | – | |
| | | 24,427,228 | | | DB | | | 01/20/2021 | | | EUR | | | | 24,604,251 | | | | NOK | | | | 24,427,228 | | | | 177,023 | | | | – | |
| | | 8,747,409 | | | DB | | | 01/20/2021 | | | EUR | | | | 8,800,328 | | | | PLN | | | | 8,747,409 | | | | 52,919 | | | | – | |
| | | 1,350,926 | | | DB | | | 02/17/2021 | | | EUR | | | | 1,345,313 | | | | PLN | | | | 1,350,926 | | | | – | | | | (5,613 | ) |
| | | 46,277,223 | | | DB | | | 01/20/2021 | | | EUR | | | | 46,971,752 | | | | SEK | | | | 46,277,223 | | | | 694,529 | | | | – | |
| | | 67,545,472 | | | DB | | | 01/20/2021 | | | EUR | | | | 67,945,867 | | | | USD | | | | 67,545,472 | | | | 400,395 | | | | – | |
| | | 92,113,089 | | | BAML | | | 03/19/2021 | | | EUR | | | | 92,910,065 | | | | USD | | | | 92,113,089 | | | | 796,976 | | | | – | |
| | | 68,751,130 | | | DB | | | 01/20/2021 | | | GBP | | | | 70,219,381 | | | | USD | | | | 68,751,130 | | | | 1,468,251 | | | | – | |
| | | 80,930,027 | | | BAML | | | 03/19/2021 | | | GBP | | | | 82,363,757 | | | | USD | | | | 80,930,027 | | | | 1,433,730 | | | | – | |
| | | 3,100,015 | | | DB | | | 01/20/2021 | | | ILS | | | | 3,162,869 | | | | USD | | | | 3,100,015 | | | | 62,854 | | | | – | |
| | | 5,794,490 | | | DB | | | 01/20/2021 | | | INR | | | | 5,871,367 | | | | USD | | | | 5,794,490 | | | | 76,877 | | | | – | |
| | | 6,210,777 | | | DB | | | 01/04/2021 | | | JPY | | | | 6,227,646 | | | | USD | | | | 6,210,777 | | | | 16,869 | | | | – | |
| | | 8,368,858 | | | DB | | | 01/05/2021 | | | JPY | | | | 8,368,212 | | | | USD | | | | 8,368,858 | | | | – | | | | (646 | ) |
| | | 34,227,746 | | | DB | | | 01/20/2021 | | | JPY | | | | 34,457,520 | | | | USD | | | | 34,227,746 | | | | 229,774 | | | | – | |
| | | 173,792,672 | | | BAML | | | 03/19/2021 | | | JPY | | | | 175,239,951 | | | | USD | | | | 173,792,672 | | | | 1,447,279 | | | | – | |
| | | 3,523,980 | | | DB | | | 01/20/2021 | | | KRW | | | | 3,533,007 | | | | USD | | | | 3,523,980 | | | | 9,027 | | | | – | |
| | | 30,546,592 | | | DB | | | 01/20/2021 | | | MXN | | | | 30,733,493 | | | | USD | | | | 30,546,592 | | | | 186,901 | | | | – | |
| | | 22,787,327 | | | BAML | | | 03/19/2021 | | | MXN | | | | 22,646,004 | | | | USD | | | | 22,787,327 | | | | – | | | | (141,323 | ) |
| | | 31,016,808 | | | DB | | | 01/20/2021 | | | NOK | | | | 31,568,999 | | | | EUR | | | | 31,016,808 | | | | 552,191 | | | | – | |
| | | 19,505,473 | | | DB | | | 01/20/2021 | | | NOK | | | | 19,812,650 | | | | USD | | | | 19,505,473 | | | | 307,177 | | | | – | |
| | | 1,009,809 | | | DB | | | 02/17/2021 | | | NOK | | | | 1,009,876 | | | | USD | | | | 1,009,809 | | | | 67 | | | | – | |
| | | 6,382,910 | | | DB | | | 01/05/2021 | | | NZD | | | | 6,375,034 | | | | USD | | | | 6,382,910 | | | | – | | | | (7,876 | ) |
| | | 2,195,384 | | | DB | | | 01/06/2021 | | | NZD | | | | 2,187,388 | | | | USD | | | | 2,195,384 | | | | – | | | | (7,996 | ) |
| | | 18,085,474 | | | DB | | | 01/20/2021 | | | NZD | | | | 18,356,982 | | | | USD | | | | 18,085,474 | | | | 271,508 | | | | – | |
| | | 34,516,458 | | | BAML | | | 03/19/2021 | | | NZD | | | | 35,160,450 | | | | USD | | | | 34,516,458 | | | | 643,992 | | | | – | |
| | | 8,694,162 | | | DB | | | 01/20/2021 | | | PLN | | | | 8,624,226 | | | | EUR | | | | 8,694,162 | | | | – | | | | (69,936 | ) |
| | | 9,802,134 | | | DB | | | 01/20/2021 | | | PLN | | | | 9,678,279 | | | | USD | | | | 9,802,134 | | | | – | | | | (123,855 | ) |
| | | 44,335,550 | | | DB | | | 01/20/2021 | | | RUB | | | | 45,035,269 | | | | USD | | | | 44,335,550 | | | | 699,719 | | | | – | |
| | | 11,772,666 | | | DB | | | 02/17/2021 | | | RUB | | | | 11,856,942 | | | | USD | | | | 11,772,666 | | | | 84,276 | | | | – | |
| | | 46,802,302 | | | DB | | | 01/20/2021 | | | SEK | | | | 47,531,215 | | | | EUR | | | | 46,802,302 | | | | 728,913 | | | | – | |
| | | 2,279,576 | | | DB | | | 02/17/2021 | | | SEK | | | | 2,277,157 | | | | EUR | | | | 2,279,576 | | | | – | | | | (2,419 | ) |
| | | 255,058 | | | DB | | | 01/04/2021 | | | SEK | | | | 254,041 | | | | USD | | | | 255,058 | | | | – | | | | (1,017 | ) |
| | | 2,227,076 | | | DB | | | 01/05/2021 | | | SEK | | | | 2,218,337 | | | | USD | | | | 2,227,076 | | | | – | | | | (8,739 | ) |
| | | 18,393,829 | | | DB | | | 01/20/2021 | | | SEK | | | | 18,563,206 | | | | USD | | | | 18,393,829 | | | | 169,377 | | | | – | |
| | | 16,508,390 | | | DB | | | 01/20/2021 | | | SGD | | | | 16,677,068 | | | | USD | | | | 16,508,390 | | | | 168,678 | | | | – | |
| | | 12,898,318 | | | DB | | | 01/20/2021 | | | ZAR | | | | 13,226,883 | | | | USD | | | | 12,898,318 | | | | 328,565 | | | | – | |
| Total Purchase Contracts | | | | | | | | | | | | | 1,238,222,024 | | | | | | | | 1,224,780,645 | | | | 13,991,849 | | | | (550,470 | ) |
| | | | | | | | | | | | | | | | | | | | | | | | | | | | | | | | | |
| Sale Contracts: | | | | | | | | | | | | | | | | | | | | | | | | | | | | | | |
| | $ | 37,847,745 | | | DB | | | 01/20/2021 | | | USD | | | $ | 38,980,875 | | | | AUD | | | $ | 37,847,745 | | | $ | – | | | $ | (1,133,130 | ) |
| | | 12,157,330 | | | BAML | | | 03/19/2021 | | | USD | | | | 12,388,642 | | | | AUD | | | | 12,157,330 | | | | – | | | | (231,312 | ) |
| | | 19,035,255 | | | DB | | | 01/20/2021 | | | USD | | | | 18,691,166 | | | | BRL | | | | 19,035,255 | | | | 344,089 | | | | – | |
| | | 31,366,870 | | | DB | | | 01/20/2021 | | | USD | | | | 31,694,315 | | | | CAD | | | | 31,366,870 | | | | – | | | | (327,445 | ) |
| | | 1,865,880 | | | BAML | | | 03/19/2021 | | | USD | | | | 1,875,645 | | | | CAD | | | | 1,865,880 | | | | – | | | | (9,765 | ) |
| | | 10,697,063 | | | DB | | | 01/20/2021 | | | USD | | | | 10,737,934 | | | | CHF | | | | 10,697,063 | | | | – | | | | (40,871 | ) |
The accompanying notes are an integral part of these consolidated financial statements.
| | |
| | |
| LoCorr Macro Strategies Fund – Consolidated Schedule of Open Forward Currency Contracts (continued) | | 27 |
| | |
| | | | | | | | | | | | Currency to be Received | | | | Currency to be Delivered | | | | | | | | | |
| | | Notional Amount | | | Counterparty | | | Forward Settlemet Date | | | Curr Abbr. | | | | U.S. $ Notional Amount at December 31, 2020 | | | | Curr Abbr. | | | | U.S. $ Notional Amount on Origination Date | | | | Unrealized Appreciation | | | | Unrealized (Depreciation) | |
| | | | | | See key for abbreviation | | | | | | | | | | | | | | | | | | | | | | | | | | | |
| Sale Contracts: (continued) | | | | | | | | | | | | | | | | | | | | | | | | | | | | | | |
| $ | 1,491,857 | | | BAML | | | 03/19/2021 | | | USD | | | $ | 1,486,584 | | | | CHF | | | $ | 1,491,857 | | | $ | 5,273 | | | $ | – | |
| | | 2,749,162 | | | DB | | | 01/20/2021 | | | USD | | | | 2,815,930 | | | | CLP | | | | 2,749,162 | | | | – | | | | (66,768 | ) |
| | | 82,560 | | | DB | | | 01/20/2021 | | | USD | | | | 84,032 | | | | COP | | | | 82,560 | | | | – | | | | (1,472 | ) |
| | | 31,016,808 | | | DB | | | 01/20/2021 | | | NOK | | | | 31,131,161 | | | | EUR | | | | 31,016,808 | | | | – | | | | (114,353 | ) |
| | | 8,694,162 | | | DB | | | 01/20/2021 | | | PLN | | | | 8,800,328 | | | | EUR | | | | 8,694,162 | | | | – | | | | (106,166 | ) |
| | | 46,802,302 | | | DB | | | 01/20/2021 | | | SEK | | | | 46,971,752 | | | | EUR | | | | 46,802,302 | | | | – | | | | (169,450 | ) |
| | | 2,279,577 | | | DB | | | 02/17/2021 | | | SEK | | | | 2,274,801 | | | | EUR | | | | 2,279,577 | | | | 4,776 | | | | – | |
| | | 46,565,670 | | | DB | | | 01/20/2021 | | | USD | | | | 46,678,408 | | | | EUR | | | | 46,565,670 | | | | – | | | | (112,738 | ) |
| | | 27,116,759 | | | BAML | | | 03/19/2021 | | | USD | | | | 27,054,150 | | | | EUR | | | | 27,116,759 | | | | 62,609 | | | | – | |
| | | 82,046,495 | | | DB | | | 01/20/2021 | | | USD | | | | 83,773,609 | | | | GBP | | | | 82,046,495 | | | | – | | | | (1,727,114 | ) |
| | | 39,632,479 | | | BAML | | | 03/19/2021 | | | USD | | | | 40,451,277 | | | | GBP | | | | 39,632,479 | | | | – | | | | (818,798 | ) |
| | | 6,962,884 | | | DB | | | 01/20/2021 | | | USD | | | | 7,079,097 | | | | ILS | | | | 6,962,884 | | | | – | | | | (116,213 | ) |
| | | 584,029 | | | DB | | | 01/20/2021 | | | USD | | | | 589,990 | | | | INR | | | | 584,029 | | | | – | | | | (5,961 | ) |
| | | 6,202,650 | | | DB | | | 01/04/2021 | | | USD | | | | 6,227,646 | | | | JPY | | | | 6,202,650 | | | | – | | | | (24,996 | ) |
| | | 8,368,885 | | | DB | | | 01/05/2021 | | | USD | | | | 8,368,212 | | | | JPY | | | | 8,368,885 | | | | 673 | | | | – | |
| | | 15,853,908 | | | DB | | | 01/20/2021 | | | USD | | | | 15,945,201 | | | | JPY | | | | 15,853,908 | | | | – | | | | (91,293 | ) |
| | | 112,296,532 | | | BAML | | | 03/19/2021 | | | USD | | | | 112,440,013 | | | | JPY | | | | 112,296,532 | | | | – | | | | (143,481 | ) |
| | | 4,724,145 | | | DB | | | 01/20/2021 | | | USD | | | | 4,741,062 | | | | KRW | | | | 4,724,145 | | | | – | | | | (16,917 | ) |
| | | 14,907,839 | | | DB | | | 01/20/2021 | | | USD | | | | 14,980,209 | | | | MXN | | | | 14,907,839 | | | | – | | | | (72,370 | ) |
| | | 49,435 | | | BAML | | | 03/19/2021 | | | USD | | | | 49,758 | | | | MXN | | | | 49,435 | | | | – | | | | (323 | ) |
| | | 24,427,228 | | | DB | | | 01/20/2021 | | | EUR | | | | 24,927,296 | | | | NOK | | | | 24,427,228 | | | | – | | | | (500,068 | ) |
| | | 19,364,827 | | | DB | | | 01/20/2021 | | | USD | | | | 19,812,650 | | | | NOK | | | | 19,364,827 | | | | – | | | | (447,823 | ) |
| | | 1,091,113 | | | DB | | | 02/17/2021 | | | USD | | | | 1,089,174 | | | | NOK | | | | 1,091,113 | | | | 1,939 | | | | – | |
| | | 6,369,320 | | | DB | | | 01/05/2021 | | | USD | | | | 6,375,034 | | | | NZD | | | | 6,369,320 | | | | – | | | | (5,714 | ) |
| | | 2,189,769 | | | DB | | | 01/06/2021 | | | USD | | | | 2,187,388 | | | | NZD | | | | 2,189,769 | | | | 2,381 | | | | – | |
| | | 36,883,846 | | | DB | | | 01/20/2021 | | | USD | | | | 37,512,720 | | | | NZD | | | | 36,883,846 | | | | – | | | | (628,874 | ) |
| | | 67,521 | | | BAML | | | 03/19/2021 | | | USD | | | | 68,375 | | | | NZD | | | | 67,521 | | | | – | | | | (854 | ) |
| | | 8,747,410 | | | DB | | | 01/20/2021 | | | EUR | | | | 8,623,263 | | | | PLN | | | | 8,747,410 | | | | 124,147 | | | | – | |
| | | 1,350,926 | | | DB | | | 02/17/2021 | | | EUR | | | | 1,340,500 | | | | PLN | | | | 1,350,926 | | | | 10,426 | | | | – | |
| | | 8,323,616 | | | DB | | | 01/20/2021 | | | USD | | | | 8,197,757 | | | | PLN | | | | 8,323,616 | | | | 125,859 | | | | – | |
| | | 44,919,350 | | | DB | | | 01/20/2021 | | | USD | | | | 45,035,269 | | | | RUB | | | | 44,919,350 | | | | – | | | | (115,919 | ) |
| | | 1,260,959 | | | DB | | | 02/17/2021 | | | USD | | | | 1,275,634 | | | | RUB | | | | 1,260,959 | | | | – | | | | (14,675 | ) |
| | | 46,277,223 | | | DB | | | 01/20/2021 | | | EUR | | | | 47,676,267 | | | | SEK | | | | 46,277,223 | | | | – | | | | (1,399,044 | ) |
| | | 254,005 | | | DB | | | 01/04/2021 | | | USD | | | | 254,041 | | | | SEK | | | | 254,005 | | | | – | | | | (36 | ) |
| | | 2,230,358 | | | DB | | | 01/05/2021 | | | USD | | | | 2,218,338 | | | | SEK | | | | 2,230,358 | | | | 12,020 | | | | – | |
| | | 15,143,210 | | | DB | | | 01/20/2021 | | | USD | | | | 15,439,958 | | | | SEK | | | | 15,143,210 | | | | – | | | | (296,748 | ) |
| | | 8,981,666 | | | DB | | | 01/20/2021 | | | USD | | | | 9,027,106 | | | | SGD | | | | 8,981,666 | | | | – | | | | (45,440 | ) |
| | | 13,756,377 | | | DB | | | 01/20/2021 | | | USD | | | | 14,039,018 | | | | ZAR | | | | 13,756,377 | | | | – | | | | (282,641 | ) |
| Total Sale Contracts | | | | | | | | | | | | | 821,411,585 | | | | | | | | 813,037,005 | | | | 694,192 | | | | (9,068,772 | ) |
| Forward Currency Contracts | | | | | | | | | | | | $ | 416,810,439 | | | | | | | $ | 411,743,640 | | | $ | 14,686,041 | | | $ | (9,619,242 | ) |
| Net Unrealized Appreciation | | | | | | | | | | | | | | | | | | | | | | | | $ | 5,066,799 | | | | | |
| Counterparty: | | | | | | |
| BAML | Bank of America Merrill Lynch | | | | | | |
| DB | Deutsche Bank | | | | | | |
| Currency Abbreviations: | | | | | | |
| AUD | AUSTRALIAN DOLLAR |
|
|
|
|
|
|
| BRL | BRAZILIAN REAL |
|
|
|
|
|
|
| CAD | CANADIAN DOLLAR |
|
|
|
|
|
|
| CHF | SWISS FRANC |
|
|
|
|
|
|
| CLP | CHILEAN PESO |
|
|
|
| | |
| COP | COLOMBIAN PESO |
|
|
|
| | |
| EUR | EURO | | | | | | |
| GBP | BRITISH POUND | | | | | | |
| ILS | ISRAELI NEW SHEQEL | | | | | | |
| INR | INDIAN RUPEE | | | | | | |
| JPY | JAPANESE YEN | | | | | | |
| KRW | SOUTH KOREAN WON | | | | | | |
| MXN | MEXICAN PESO | | | | | | |
| NOK | NORWEGIAN KRONE | | | | | | |
| NZD | NEW ZEALAND DOLLAR | | | | | | |
| PLN | POLISH ZLOTY | | | | | | |
| RUB | RUSSIAN RUBLE | | | | | | |
| SEK | SWEDISH KRONA | | | | | | |
| SGD | SINGAPORE DOLLAR | | | | | | |
| TRY | TURKISH LIRA | | | | | | |
| USD | U.S. DOLLAR | | | | | | |
| ZAR | SOUTH AFRICAN RAND | | | | | | |
| | | | | | | | |
The accompanying notes are an integral part of these consolidated financial statements.
| | |
| | |
| 28 | | LoCorr Macro Strategies Fund – Consolidated Schedule of Open Futures Contracts |
| | |
LoCorr Macro Strategies Fund
Consolidated Schedule of Open Futures Contracts
December 31, 2020
| | | | | | | | | | | | | | Value | |
| Description | | Number of Contracts Purchased (Sold) | | | Settlement Month-Year | | Current Notional Amount | | | Notional Amount at Trade Date | | | Unrealized Appreciation | | | Unrealized (Depreciation) | |
| Purchase Contracts: | | | | | | | | | | | | | | | | | | | | | | |
| 3 Mo Euro Euribor | | | 1,341 | | | Jun-22 | | $ | 411,787,767 | | | $ | 411,849,697 | | | $ | – | | | $ | (61,930 | ) |
| 90 Day Euro | | | 130 | | | Sep-21 | | | 32,444,750 | | | | 32,443,949 | | | | 801 | | | | – | |
| 90 Day Euro | | | 379 | | | Mar-22 | | | 94,579,450 | | | | 94,555,717 | | | | 23,733 | | | | – | |
| 90 Day Euro | | | 2,989 | | | Jun-22 | | | 745,830,225 | | | | 745,650,442 | | | | 179,783 | | | | – | |
| 90 Day Euro | | | 436 | | | Sep-22 | | | 108,776,550 | | | | 108,725,211 | | | | 51,339 | | | | – | |
| 90 Day Euro | | | 175 | | | Dec-22 | | | 43,638,438 | | | | 43,630,528 | | | | 7,910 | | | | – | |
| 90 Day Euro | | | 396 | | | Mar-23 | | | 98,747,550 | | | | 98,693,602 | | | | 53,948 | | | | – | |
| 90 Day Sterling | | | 1,942 | | | Dec-21 | | | 332,177,047 | | | | 331,860,804 | | | | 316,243 | | | | – | |
| Aluminum – 90 Day Settlement (a)(b) | | | 1 | | | Jan-21 | | | 49,377 | | | | 44,911 | | | | 4,466 | | | | – | |
| Aluminum – 90 Day Settlement (a)(b) | | | 1 | | | Mar-21 | | | 49,400 | | | | 50,870 | | | | – | | | | (1,470 | ) |
| Aluminum – 90 Day Settlement (a)(b) | | | 1 | | | Mar-21 | | | 49,438 | | | | 51,479 | | | | – | | | | (2,041 | ) |
| Aluminum – 90 Day Settlement (a)(b) | | | 1 | | | Mar-21 | | | 49,450 | | | | 50,480 | | | | – | | | | (1,030 | ) |
| Aluminum – 90 Day Settlement (a)(b) | | | 1 | | | Mar-21 | | | 49,477 | | | | 50,002 | | | | – | | | | (525 | ) |
| Aluminum (a)(b) | | | 330 | | | Mar-21 | | | 16,314,375 | | | | 15,631,091 | | | | 683,284 | | | | – | |
| Amsterdam Exchange Index | | | 11 | | | Jan-21 | | | 1,678,496 | | | | 1,680,888 | | | | – | | | | (2,392 | ) |
| Australian 10 Yr Bond | | | 491 | | | Mar-21 | | | 55,731,999 | | | | 55,542,766 | | | | 189,233 | | | | – | |
| Australian 3 Yr Bond | | | 244 | | | Mar-21 | | | 22,091,513 | | | | 22,076,282 | | | | 15,231 | | | | – | |
| Bovespa Index | | | 160 | | | Feb-21 | | | 3,672,712 | | | | 3,682,151 | | | | – | | | | (9,439 | ) |
| Brent Crude (a) | | | 87 | | | Mar-21 | | | 4,506,600 | | | | 4,407,372 | | | | 99,228 | | | | – | |
| Brent Crude (a) | | | 79 | | | Apr-21 | | | 4,093,780 | | | | 4,009,322 | | | | 84,458 | | | | – | |
| Brent Crude (a) | | | 34 | | | May-21 | | | 1,760,520 | | | | 1,729,872 | | | | 30,648 | | | | – | |
| Brent Crude (a) | | | 18 | | | Jun-21 | | | 929,880 | | | | 915,952 | | | | 13,928 | | | | – | |
| Brent Crude (a) | | | 10 | | | Jul-21 | | | 514,900 | | | | 503,532 | | | | 11,368 | | | | – | |
| Brent Crude (a) | | | 6 | | | Aug-21 | | | 308,100 | | | | 304,088 | | | | 4,012 | | | | – | |
| CAC 40 10 Euro Index | | | 187 | | | Jan-21 | | | 12,660,542 | | | | 12,717,728 | | | | – | | | | (57,186 | ) |
| Canadian 10 Yr Bond | | | 1,054 | | | Mar-21 | | | 123,459,345 | | | | 123,096,585 | | | | 362,760 | | | | – | |
| Cocoa (ICE) (a) | | | 70 | | | Mar-21 | | | 1,662,746 | | | | 1,582,657 | | | | 80,089 | | | | – | |
| Coffee (a) | | | 136 | | | Mar-21 | | | 6,540,750 | | | | 6,417,644 | | | | 123,106 | | | | – | |
| Copper – 90 Day Settlement (a)(b) | | | 1 | | | Jan-21 | | | 193,780 | | | | 166,963 | | | | 26,817 | | | | – | |
| Copper – 90 Day Settlement (a)(b) | | | 1 | | | Jan-21 | | | 193,852 | | | | 169,126 | | | | 24,726 | | | | – | |
| Copper – 90 Day Settlement (a)(b) | | | 1 | | | Jan-21 | | | 193,906 | | | | 167,716 | | | | 26,190 | | | | – | |
| Copper – 90 Day Settlement (a)(b) | | | 1 | | | Jan-21 | | | 193,804 | | | | 170,205 | | | | 23,599 | | | | – | |
| Copper – 90 Day Settlement (a)(b) | | | 1 | | | Feb-21 | | | 193,981 | | | | 173,521 | | | | 20,460 | | | | – | |
| Copper – 90 Day Settlement (a)(b) | | | 1 | | | Feb-21 | | | 193,919 | | | | 181,855 | | | | 12,064 | | | | – | |
| Copper – 90 Day Settlement (a)(b) | | | 1 | | | Feb-21 | | | 193,933 | | | | 181,275 | | | | 12,658 | | | | – | |
| Copper – 90 Day Settlement (a)(b) | | | 1 | | | Feb-21 | | | 193,944 | | | | 185,077 | | | | 8,867 | | | | – | |
| Copper – 90 Day Settlement (a)(b) | | | 1 | | | Mar-21 | | | 194,081 | | | | 192,548 | | | | 1,533 | | | | – | |
| Copper – 90 Day Settlement (a)(b) | | | 1 | | | Mar-21 | | | 194,094 | | | | 193,665 | | | | 429 | | | | – | |
| Copper – 90 Day Settlement (a)(b) | | | 1 | | | Mar-21 | | | 194,106 | | | | 193,402 | | | | 704 | | | | – | |
| Copper – 90 Day Settlement (a)(b) | | | 1 | | | Mar-21 | | | 194,163 | | | | 195,975 | | | | – | | | | (1,812 | ) |
| Copper (a) | | | 142 | | | Mar-21 | | | 12,492,450 | | | | 12,447,547 | | | | 44,903 | | | | – | |
| Copper (a)(b) | | | 220 | | | Mar-21 | | | 42,717,125 | | | | 38,138,999 | | | | 4,578,126 | | | | – | |
| Corn (a) | | | 804 | | | Mar-21 | | | 19,456,800 | | | | 16,922,493 | | | | 2,534,307 | | | | – | |
| Cotton No.2 (a) | | | 160 | | | Mar-21 | | | 6,249,600 | | | | 5,777,241 | | | | 472,359 | | | | – | |
| DAX Index | | | 56 | | | Mar-21 | | | 23,509,779 | | | | 23,497,886 | | | | 11,893 | | | | – | |
| Dow Jones Industrial Average Mini E–Cbot Index | | | 275 | | | Mar-21 | | | 41,933,375 | | | | 41,393,928 | | | | 539,447 | | | | – | |
| Euro–Bobl | | | 1,209 | | | Mar-21 | | | 199,656,254 | | | | 199,591,722 | | | | 64,532 | | | | – | |
| Euro–BTP | | | 372 | | | Mar-21 | | | 69,081,103 | | | | 69,076,964 | | | | 4,139 | | | | – | |
| Euro–Bund | | | 638 | | | Mar-21 | | | 138,454,037 | | | | 138,210,983 | | | | 243,054 | | | | – | |
| Euro–Buxl 30 Yr Bond | | | 37 | | | Mar-21 | | | 10,181,023 | | | | 10,177,751 | | | | 3,272 | | | | – | |
| Euro–OAT | | | 256 | | | Mar-21 | | | 52,496,622 | | | | 52,480,154 | | | | 16,468 | | | | – | |
| Euro–Schatz | | | 955 | | | Mar-21 | | | 130,987,729 | | | | 131,048,758 | | | | – | | | | (61,029 | ) |
| Euro–Stoxx 50 Index | | | 338 | | | Mar-21 | | | 14,658,489 | | | | 14,678,314 | | | | – | | | | (19,825 | ) |
| FTSE 100 Index | | | 209 | | | Mar-21 | | | 18,348,877 | | | | 18,483,810 | | | | – | | | | (134,933 | ) |
| FTSE China A50 Index | | | 491 | | | Jan-21 | | | 8,696,592 | | | | 8,491,279 | | | | 205,313 | | | | – | |
| FTSE MIB Index | | | 20 | | | Mar-21 | | | 2,703,373 | | | | 2,609,213 | | | | 94,160 | | | | – | |
| Gasoline RBOB (a) | | | 230 | | | Feb-21 | | | 13,621,566 | | | | 13,218,199 | | | | 403,367 | | | | – | |
| Gasoline RBOB (a) | | | 48 | | | Mar-21 | | | 2,853,446 | | | | 2,785,719 | | | | 67,727 | | | | – | |
| | | | | | | | | | | | | | | | | | | | | | | |
The accompanying notes are an integral part of these consolidated financial statements.
| | |
| | |
| LoCorr Macro Strategies Fund – Consolidated Schedule of Open Futures Contracts (continued) | 29 |
| | |
| | | | | | | | | | | | | | Value | |
| Description | | Number of Contracts Purchased (Sold) | | | Settlement Month-Year | | Current Notional Amount | | | Notional Amount at Trade Date | | | Unrealized Appreciation | | | Unrealized (Depreciation) | |
| Purchase Contracts: (continued) | | | | | | | | | | | | | | | | | | | | | | |
| Gasoline RBOB (a) | | | 18 | | | Apr-21 | | | 1,155,395 | | | | 1,132,145 | | | | 23,250 | | | | – | |
| Gasoline RBOB (a) | | | 10 | | | May-21 | | $ | 644,952 | | | $ | 630,221 | | | $ | 14,731 | | | $ | – | |
| Gold (a) | | | 218 | | | Feb-21 | | | 41,313,180 | | | | 40,467,362 | | | | 845,818 | | | | – | |
| Hang Seng Index | | | 268 | | | Jan-21 | | | 47,047,655 | | | | 45,897,990 | | | | 1,149,665 | | | | – | |
| Hard Red Wheat (a) | | | 266 | | | Mar-21 | | | 8,026,550 | | | | 7,555,164 | | | | 471,386 | | | | – | |
| Heating Oil (a) | | | 94 | | | Feb-21 | | | 5,858,832 | | | | 5,874,223 | | | | – | | | | (15,391 | ) |
| Heating Oil (a) | | | 45 | | | Mar-21 | | | 2,807,406 | | | | 2,808,347 | | | | – | | | | (941 | ) |
| Heating Oil (a) | | | 12 | | | Apr-21 | | | 748,490 | | | | 746,254 | | | | 2,236 | | | | – | |
| Heating Oil (a) | | | 5 | | | May-21 | | | 312,060 | | | | 312,221 | | | | – | | | | (161 | ) |
| H–Shares Index | | | 252 | | | Jan-21 | | | 17,392,256 | | | | 16,957,836 | | | | 434,420 | | | | – | |
| Japanese 10 Yr Bond | | | 10 | | | Mar-21 | | | 14,713,089 | | | | 14,716,325 | | | | – | | | | (3,236 | ) |
| Lead (a)(b) | | | 15 | | | Mar-21 | | | 748,031 | | | | 753,289 | | | | – | | | | (5,258 | ) |
| Long Gilt | | | 975 | | | Mar-21 | | | 180,717,528 | | | | 179,750,540 | | | | 966,988 | | | | – | |
| Low Sulphur Gasoil (a) | | | 34 | | | Feb-21 | | | 1,438,200 | | | | 1,453,568 | | | | – | | | | (15,368 | ) |
| Low Sulphur Gasoil (a) | | | 71 | | | Mar-21 | | | 3,017,500 | | | | 3,051,314 | | | | – | | | | (33,814 | ) |
| Low Sulphur Gasoil (a) | | | 23 | | | Apr-21 | | | 980,375 | | | | 990,805 | | | | – | | | | (10,430 | ) |
| MSCI EAFE Index | | | 38 | | | Mar-21 | | | 4,048,520 | | | | 4,061,459 | | | | – | | | | (12,939 | ) |
| MSCI Emerging Markets Index | | | 378 | | | Mar-21 | | | 24,346,980 | | | | 23,958,091 | | | | 388,889 | | | | – | |
| Nasdaq 100 E–Mini Index | | | 141 | | | Mar-21 | | | 36,337,110 | | | | 36,194,252 | | | | 142,858 | | | | – | |
| Nickel – 90 Day Settlement (a)(b) | | | 2 | | | Jan-21 | | | 200,634 | | | | 174,767 | | | | 25,867 | | | | – | |
| Nickel – 90 Day Settlement (a)(b) | | | 1 | | | Jan-21 | | | 99,381 | | | | 92,463 | | | | 6,918 | | | | – | |
| Nickel – 90 Day Settlement (a)(b) | | | 1 | | | Feb-21 | | | 99,486 | | | | 94,415 | | | | 5,071 | | | | – | |
| Nickel – 90 Day Settlement (a)(b) | | | 1 | | | Feb-21 | | | 99,542 | | | | 97,201 | | | | 2,341 | | | | – | |
| Nickel – 90 Day Settlement (a)(b) | | | 1 | | | Feb-21 | | | 99,555 | | | | 97,317 | | | | 2,238 | | | | – | |
| Nickel – 90 Day Settlement (a)(b) | | | 1 | | | Mar-21 | | | 99,610 | | | | 100,450 | | | | – | | | | (840 | ) |
| Nickel – 90 Day Settlement (a)(b) | | | 1 | | | Mar-21 | | | 99,654 | | | | 102,367 | | | | – | | | | (2,713 | ) |
| Nickel (a)(b) | | | 37 | | | Mar-21 | | | 3,686,976 | | | | 3,640,658 | | | | 46,318 | | | | – | |
| Nikkei 225 Index (OSE) | | | 175 | | | Mar-21 | | | 46,506,222 | | | | 45,270,904 | | | | 1,235,318 | | | | – | |
| Nikkei 225 Index (SGX) | | | 23 | | | Mar-21 | | | 3,061,692 | | | | 3,054,195 | | | | 7,497 | | | | – | |
| OMX Stockholm 30 Index | | | 183 | | | Jan-21 | | | 4,177,643 | | | | 4,167,469 | | | | 10,174 | | | | – | |
| Platinum (a) | | | 2 | | | Apr-21 | | | 107,920 | | | | 106,564 | | | | 1,356 | | | | – | |
| Russell 2000 Mini Index | | | 315 | | | Mar-21 | | | 31,103,100 | | | | 31,102,178 | | | | 922 | | | | – | |
| S&P 500 E–Mini Index | | | 268 | | | Mar-21 | | | 50,233,920 | | | | 49,682,359 | | | | 551,561 | | | | – | |
| S&P MidCap 400 E–Mini Index | | | 17 | | | Mar-21 | | | 3,915,950 | | | | 3,917,469 | | | | – | | | | (1,519 | ) |
| S&P/TSX 60 Index | | | 73 | | | Mar-21 | | | 11,801,352 | | | | 11,874,874 | | | | – | | | | (73,522 | ) |
| SET 50 Index | | | 24 | | | Mar-21 | | | 145,074 | | | | 147,717 | | | | – | | | | (2,643 | ) |
| Silver (a) | | | 139 | | | Mar-21 | | | 18,356,340 | | | | 17,367,623 | | | | 988,717 | | | | – | |
| Soybean (a) | | | 430 | | | Mar-21 | | | 28,186,500 | | | | 23,726,101 | | | | 4,460,399 | | | | – | |
| Soybean Meal (a) | | | 250 | | | Mar-21 | | | 10,735,000 | | | | 10,017,296 | | | | 717,704 | | | | – | |
| Soybean Oil (a) | | | 193 | | | Mar-21 | | | 4,909,919 | | | | 4,463,529 | | | | 446,390 | | | | – | |
| Sugar (a) | | | 381 | | | Mar-21 | | | 6,609,892 | | | | 5,885,033 | | | | 724,859 | | | | – | |
| Tokyo Price Index | | | 282 | | | Mar-21 | | | 49,282,747 | | | | 48,463,315 | | | | 819,432 | | | | – | |
| TWSE Capitalization Weighted Stock Index | | | 36 | | | Jan-21 | | | 3,761,178 | | | | 3,748,502 | | | | 12,676 | | | | – | |
| U.S.10 Yr Note | | | 1,425 | | | Mar-21 | | | 196,761,33 | | | | 196,566,434 | | | | 194,900 | | | | – | |
| U.S. 2 Yr Note | | | 1,726 | | | Mar-21 | | | 381,405,545 | | | | 381,093,805 | | | | 311,740 | | | | – | |
| U.S. 5 Yr Note | | | 4,160 | | | Mar-21 | | | 524,842,496 | | | | 523,974,704 | | | | 867,792 | | | | – | |
| U.S. Long Bond | | | 391 | | | Mar-21 | | | 67,716,312 | | | | 67,592,744 | | | | 123,568 | | | | – | |
| U.S. Ultra Bond | | | 162 | | | Mar-21 | | | 34,597,124 | | | | 34,416,634 | | | | 180,490 | | | | – | |
| Wheat (a) | | | 273 | | | Mar-21 | | | 8,742,824 | | | | 8,208,860 | | | | 533,964 | | | | – | |
| WTI Crude (a) | | | 15 | | | Feb-21 | | | 727,800 | | | | 720,509 | | | | 7,291 | | | | – | |
| WTI Crude (a) | | | 19 | | | Mar-21 | | | 923,970 | | | | 913,417 | | | | 10,553 | | | | – | |
| WTI Crude (a) | | | 14 | | | Apr-21 | | | 681,659 | | | | 674,926 | | | | 6,733 | | | | – | |
| WTI Crude (a) | | | 12 | | | May-21 | | | 584,279 | | | | 577,453 | | | | 6,826 | | | | – | |
| WTI Crude (a) | | | 8 | | | Jun-21 | | | 389,039 | | | | 384,615 | | | | 4,424 | | | | – | |
| WTI Crude (a) | | | 5 | | | Jul-21 | | | 242,599 | | | | 238,079 | | | | 4,520 | | | | – | |
| Zinc – 90 Day Settlement (a)(b) | | | 1 | | | Jan-21 | | | 68,265 | | | | 60,831 | | | | 7,434 | | | | – | |
| Zinc – 90 Day Settlement (a)(b) | | | 1 | | | Jan-21 | | | 68,290 | | | | 61,318 | | | | 6,972 | | | | – | |
| Zinc – 90 Day Settlement (a)(b) | | | 1 | | | Jan-21 | | | 68,302 | | | | 60,914 | | | | 7,388 | | | | – | |
| Zinc – 90 Day Settlement (a)(b) | | | 1 | | | Feb-21 | | | 68,596 | | | | 69,425 | | | | – | | | | (829 | ) |
| Zinc – 90 Day Settlement (a)(b) | | | 1 | | | Mar-21 | | | 68,624 | | | | 69,600 | | | | – | | | | (976 | ) |
| Zinc – 90 Day Settlement (a)(b) | | | 1 | | | Mar-21 | | | 68,715 | | | | 71,639 | | | | – | | | | (2,924 | ) |
| Zinc – 90 Day Settlement (a)(b) | | | 1 | | | Mar-21 | | | 68,727 | | | | 70,272 | | | | – | | | | (1,545 | ) |
| Zinc (a)(b) | | | 151 | | | Mar-21 | | | 10,378,721 | | | | 9,886,468 | | | | 492,253 | | | | – | |
| Total Purchase Contracts | | | | | | | | | | | | | | | | | 29,049,529 | | | | (538,661 | ) |
| | | | | | | | | | | | | | | | | | | | | | | |
The accompanying notes are an integral part of these consolidated financial statements.
| | |
| | |
| 30 | | LoCorr Macro Strategies Fund – Consolidated Schedule of Open Futures Contracts (continued) |
| | |
| | | | | | | | | | | | | | Value | |
| Description | | Number of Contracts Purchased (Sold) | | | Settlement Month-Year | | Current
National
Amount | | | National Amount at Trade Date | | | Unrealized Appreciation | | | Unrealized (Depreciation) | |
| | | | | | | | | | | | | | | | | | |
| Sale Contracts: | | | | | | | | | | | | | | | | | | | | | | |
| 10 Yr Mini JGB | | | (14 | ) | | Mar-21 | | $ | 2,058,748 | | | $ | 2,061,693 | | | $ | 2,945 | | | $ | – | |
| Aluminum – 90 Day Settlement (a)(b) | | | (1 | ) | | Jan-21 | | | 49,377 | | | | 45,085 | | | | – | | | | (4,292 | ) |
| Aluminum – 90 Day Settlement (a)(b) | | | (1 | ) | | Mar-21 | | | 49,400 | | | | 50,904 | | | | 1,504 | | | | – | |
| Aluminum – 90 Day Settlement (a)(b) | | | (1 | ) | | Mar-21 | | | 49,437 | | | | 51,372 | | | | 1,935 | | | | – | |
| Aluminum – 90 Day Settlement (a)(b) | | | (1 | ) | | Mar-21 | | | 49,450 | | | | 50,570 | | | | 1,120 | | | | – | |
| Aluminum – 90 Day Settlement (a)(b) | | | (1 | ) | | Mar-21 | | | 49,477 | | | | 49,732 | | | | 255 | | | | – | |
| Aluminum (a)(b) | | | (83 | ) | | Mar-21 | | | 4,103,313 | | | | 4,087,469 | | | | – | | | | (15,844 | ) |
| Brent Crude (a) | | | (4 | ) | | Mar-21 | | | 207,200 | | | | 204,075 | | | | – | | | | (3,125 | ) |
| CAC 40 10 Euro Index | | | (40 | ) | | Jan-21 | | | 2,708,137 | | | | 2,737,087 | | | | 28,950 | | | | – | |
| CBOE Volatility Index (a) | | | (146 | ) | | Jan-21 | | | 3,456,549 | | | | 3,620,343 | | | | 163,794 | | | | – | |
| CBOE Volatility Index (a) | | | (55 | ) | | Feb-21 | | | 1,406,625 | | | | 1,448,093 | | | | 41,468 | | | | – | |
| CBOE Volatility Index (a) | | | (10 | ) | | Mar-21 | | | 257,750 | | | | 263,606 | | | | 5,856 | | | | – | |
| Cocoa (NYBOT) (a) | | | (16 | ) | | Mar-21 | | | 416,480 | | | | 408,099 | | | | – | | | | (8,381 | ) |
| Coffee (a) | | | (12 | ) | | Mar-21 | | | 577,125 | | | | 561,119 | | | | – | | | | (16,006 | ) |
| Copper – 90 Day Settlement (a)(b) | | | (1 | ) | | Jan-21 | | | 193,779 | | | | 166,222 | | | | – | | | | (27,557 | ) |
| Copper – 90 Day Settlement (a)(b) | | | (1 | ) | | Jan-21 | | | 193,852 | | | | 169,094 | | | | – | | | | (24,758 | ) |
| Copper – 90 Day Settlement (a)(b) | | | (1 | ) | | Jan-21 | | | 193,906 | | | | 168,465 | | | | – | | | | (25,441 | ) |
| Copper – 90 Day Settlement (a)(b) | | | (1 | ) | | Jan-21 | | | 193,804 | | | | 170,496 | | | | – | | | | (23,308 | ) |
| Copper – 90 Day Settlement (a)(b) | | | (1 | ) | | Feb-21 | | | 193,981 | | | | 173,052 | | | | – | | | | (20,929 | ) |
| Copper – 90 Day Settlement (a)(b) | | | (1 | ) | | Feb-21 | | | 193,919 | | | | 179,513 | | | | – | | | | (14,406 | ) |
| Copper – 90 Day Settlement (a)(b) | | | (1 | ) | | Feb-21 | | | 193,933 | | | | 180,326 | | | | – | | | | (13,607 | ) |
| Copper – 90 Day Settlement (a)(b) | | | (1 | ) | | Feb-21 | | | 193,944 | | | | 184,355 | | | | – | | | | (9,589 | ) |
| Copper – 90 Day Settlement (a)(b) | | | (1 | ) | | Mar-21 | | | 194,080 | | | | 192,208 | | | | – | | | | (1,872 | ) |
| Copper – 90 Day Settlement (a)(b) | | | (1 | ) | | Mar-21 | | | 194,094 | | | | 193,423 | | | | – | | | | (671 | ) |
| Copper – 90 Day Settlement (a)(b) | | | (1 | ) | | Mar-21 | | | 194,106 | | | | 193,469 | | | | – | | | | (637 | ) |
| Copper – 90 Day Settlement (a)(b) | | | (1 | ) | | Mar-21 | | | 194,162 | | | | 196,077 | | | | 1,915 | | | | – | |
| Copper (a)(b) | | | (111 | ) | | Mar-21 | | | 21,552,731 | | | | 21,303,776 | | | | – | | | | (248,955 | ) |
| Dollar | | | (117 | ) | | Mar-21 | | | 10,517,598 | | | | 10,575,880 | | | | 58,282 | | | | – | |
| Euro–Schatz | | | (216 | ) | | Mar-21 | | | 29,626,545 | | | | 29,620,454 | | | | – | | | | (6,091 | ) |
| FTSE/JSE Top 40 Index | | | (5 | ) | | Mar-21 | | | 185,856 | | | | 184,745 | | | | – | | | | (1,111 | ) |
| Heating Oil (a) | | | (4 | ) | | Feb-21 | | | 249,312 | | | | 253,538 | | | | 4,226 | | | | – | |
| IBEX 35 Index | | | (7 | ) | | Jan-21 | | | 690,165 | | | | 697,101 | | | | 6,936 | | | | – | |
| Japanese 10 Yr Bond | | | (93 | ) | | Mar-21 | | | 136,831,727 | | | | 136,930,161 | | | | 98,434 | | | | – | |
| Lead (a)(b) | | | (13 | ) | | Mar-21 | | | 648,294 | | | | 638,043 | | | | – | | | | (10,251 | ) |
| Lean Hogs (a) | | | (3 | ) | | Feb-21 | | | 84,330 | | | | 79,483 | | | | – | | | | (4,847 | ) |
| Live Cattle (a) | | | (6 | ) | | Feb-21 | | | 276,060 | | | | 275,605 | | | | – | | | | (455 | ) |
| Low Sulphur Gasoil (a) | | | (23 | ) | | Feb-21 | | | 972,900 | | | | 992,348 | | | | 19,448 | | | | – | |
| Natural Gas (a) | | | (550 | ) | | Feb-21 | | | 13,964,500 | | | | 14,509,463 | | | | 544,963 | | | | – | |
| Natural Gas (a) | | | (74 | ) | | Mar-21 | | | 1,869,240 | | | | 1,890,609 | | | | 21,369 | | | | – | |
| Natural Gas (a) | | | (47 | ) | | Apr-21 | | | 1,192,860 | | | | 1,198,489 | | | | 5,629 | | | | – | |
| Natural Gas (a) | | | (32 | ) | | May-21 | | | 817,600 | | | | 839,159 | | | | 21,559 | | | | – | |
| Natural Gas (a) | | | (8 | ) | | Jun-21 | | | 208,880 | | | | 204,424 | | | | – | | | | (4,456 | ) |
| Nickel – 90 Day Settlement (a)(b) | | | (2 | ) | | Jan-21 | | | 200,634 | | | | 171,476 | | | | – | | | | (29,158 | ) |
| Nickel – 90 Day Settlement (a)(b) | | | (1 | ) | | Jan-21 | | | 99,381 | | | | 92,481 | | | | – | | | | (6,900 | ) |
| Nickel – 90 Day Settlement (a)(b) | | | (1 | ) | | Feb-21 | | | 99,486 | | | | 95,084 | | | | – | | | | (4,402 | ) |
| Nickel – 90 Day Settlement (a)(b) | | | (1 | ) | | Feb-21 | | | 99,542 | | | | 96,162 | | | | – | | | | (3,380 | ) |
| Nickel – 90 Day Settlement (a)(b) | | | (1 | ) | | Feb-21 | | | 99,555 | | | | 96,714 | | | | – | | | | (2,841 | ) |
| Nickel – 90 Day Settlement (a)(b) | | | (1 | ) | | Mar-21 | | | 99,610 | | | | 99,307 | | | | – | | | | (303 | ) |
| Nickel – 90 Day Settlement (a)(b) | | | (1 | ) | | Mar-21 | | | 99,654 | | | | 101,391 | | | | 1,737 | | | | – | |
| Nickel (a)(b) | | | (35 | ) | | Mar-21 | | | 3,487,680 | | | | 3,475,359 | | | | – | | | | (12,321 | ) |
| SGX Nifty 50 Index | | | (57 | ) | | Jan-21 | | | 1,597,824 | | | | 1,596,763 | | | | – | | | | (1,061 | ) |
| SPI 200 Index | | | (6 | ) | | Mar-21 | | | 755,954 | | | | 762,828 | | | | 6,874 | | | | – | |
| U.S. Long Bond | | | (160 | ) | | Mar-21 | | | 27,710,000 | | | | 27,657,803 | | | | – | | | | (52,197 | ) |
| Wheat (a) | | | (23 | ) | | Mar-21 | | | 736,575 | | | | 703,432 | | | | – | | | | (33,143 | ) |
| WTI Crude (a) | | | (86 | ) | | Feb-21 | | | 4,172,719 | | | | 4,051,175 | | | | – | | | | (121,544 | ) |
| Zinc – 90 Day Settlement (a)(b) | | | (1 | ) | | Jan-21 | | | 68,265 | | | | 60,816 | | | | – | | | | (7,449 | ) |
| Zinc – 90 Day Settlement (a)(b) | | | (1 | ) | | Jan-21 | | | 68,290 | | | | 61,249 | | | | – | | | | (7,041 | ) |
| Zinc – 90 Day Settlement (a)(b) | | | (1 | ) | | Jan-21 | | | 68,302 | | | | 60,877 | | | | – | | | | (7,425 | ) |
The accompanying notes are an integral part of these consolidated financial statements.
| | |
| | |
| LoCorr Macro Strategies Fund – Consolidated Schedule of Open Futures Contracts (continued) | | 31 |
| | |
| | | | | | | | | | | | | | Value | |
| Description | | Number of
Contracts
Purchased (Sold) | | | Settlement
Month-Year | | Current
Notional
Amount | | | Notional
Amount at
Trade Date | | | Unrealized
Appreciation | | | Unrealized (Depreciation) | |
| Sale Contracts: (continued) | | | | | | | | | | | | | | | | | | | | | | |
| Zinc – 90 Day Settlement (a)(b) | | | (1 | ) | | Feb-21 | | $ | 68,596 | | | $ | 69,113 | | | $ | 517 | | | $
| – | |
| Zinc – 90 Day Settlement (a)(b) | | | (1 | ) | | Mar-21 | | | 68,624 | | | | 70,067 | | | | 1,443 | | | | – | |
| Zinc – 90 Day Settlement (a)(b) | | | (1 | ) | | Mar-21 | | | 68,715 | | | | 71,626 | | | | 2,911 | | | | – | |
| Zinc – 90 Day Settlement (a)(b) | | | (1 | ) | | Mar-21 | | | 68,727 | | | | 70,547 | | | | 1,820 | | | | – | |
| Zinc (a)(b) | | | (17 | ) | | Mar-21 | | | 1,168,465 | | | | 1,161,035 | | | | – | | | | (7,430 | ) |
| Total Sale Contracts | | | | | | | | | | | | | | | | | 1,045,890 | | | | (783,184 | ) |
| Total Futures Contracts | | | | | | | | | | | | | | | | $ | 30,095,419 | | | $ | (1,321,845 | ) |
| Net Unrealized Appreciation | | | | | | | | | | | | | | | | $ | 28,773,574 | | | | | |
| (a) | Contract held by LCMFS Fund Limited. |
| (b) | London Metal Exchange (‘’LME’’) futures contracts settle on their respective maturity date. The unrealized appreciation on these contracts is a receivable for unsettled open futures contracts and the unrealized depreciation is a payable for unsettled open futures contracts on the Fund’s consolidated statement of assets and liabilities. |
| ICE | Intercontinental Exchange |
| NYBOT | New York Board of Trade |
| OSE | Osaka Securities Exchange |
| SGX | Singapore Exchange Limited |
| | |
The accompanying notes are an integral part of these consolidated financial statements.
| | |
| | |
| 32 | | LoCorr Long/Short Commodities Strategy Fund - Consolidated Schedule of Investments |
| | |
LoCorr Long/Short Commodities Strategy Fund
Composition of Consolidated Investment Portfolio1
December 31, 2020 (Unaudited)
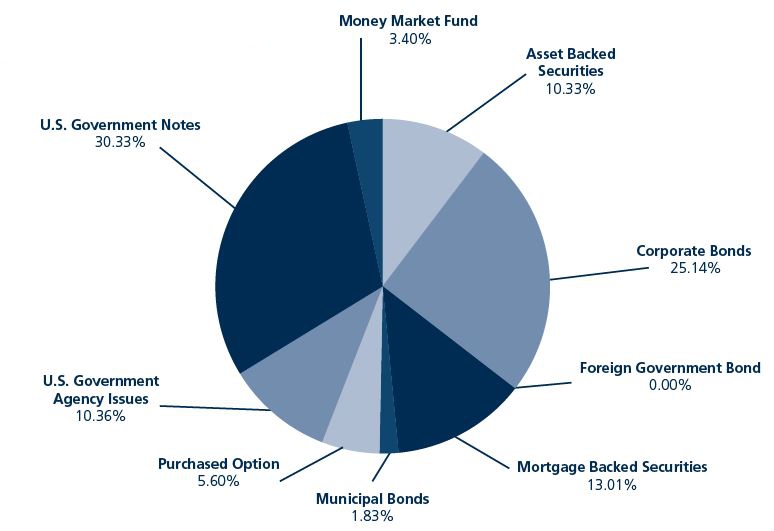
| 1 | As a percentage of total investments. |
Consolidated Schedule of Investments
December 31, 2020
| | | Maturity Date | | Coupon Rate | | | Principal Amount | | | Value | |
| ASSET BACKED SECURITIES: 8.99% | | | | | | | | | | | | | | |
| 321 Henderson Receivables I LLC | | | | | | | | | | | | | | |
| Series 2006-4A A1 (1 Month LIBOR USD + 0.200%) (a)(c) | | 12/15/2041 | | | 0.36 | % | | $ | 86,138 | | | $ | 85,401 | |
| Series 2004-A A1 (1 Month LIBOR USD + 0.350%) (a)(c) | | 09/15/2045 | | | 0.51 | % | | | 43,842 | | | | 43,030 | |
| AmeriCredit Automobile Receivables Trust, 2020-3 A-3 | | 06/18/2025 | | | 0.53 | % | | | 2,150,000 | | | | 2,154,932 | |
Asset Backed Securities Corp Home Equity Loan Trust, 2002-HE1 M1 (1 Month LIBOR USD + 1.650%) (c) | | 03/15/2032 | | | 1.81 | % | | | 409,371 | | | | 409,741 | |
| Capital One Multi-Asset Execution Trust, 2015-A4 A4 | | 05/15/2025 | | | 2.75 | % | | | 1,210,000 | | | | 1,256,512 | |
| CarMax Auto Owner Trust, 2018-4 A3 | | 09/15/2023 | | | 3.36 | % | | | 770,268 | | | | 786,499 | |
| Chase Issuance Trust, 2020-A1 A1 | | 01/15/2025 | | | 1.53 | % | | | 1,050,000 | | | | 1,077,809 | |
| Citibank Credit Card Issuance Trust | | | | | | | | | | | | | | |
| Series 2018-A6 A6 | | 12/09/2024 | | | 3.21 | % | | | 1,500,000 | | | | 1,586,028 | |
| Series 2018-A3 A3 | | 05/23/2025 | | | 3.29 | % | | | 1,085,000 | | | | 1,163,359 | |
| DB Master Finance LLC, 2019-1A A2I | | 05/20/2049 | | | 3.79 | % | | | 948,000 | | | | 971,454 | |
| Diamond Resorts Owner Trust, 2018-1 A (a) | | 01/21/2031 | | | 3.70 | % | | | 591,110 | | | | 617,328 | |
Discover Card Execution Note Trust, 2018-A2 A2 (1 Month LIBOR USD + 0.330%) (c) | | 08/15/2025 | | | 0.49 | % | | | 1,225,000 | | | | 1,229,679 | |
Domino’s Pizza Master Issuer LLC, 2017-1A A2I (3 Month LIBOR USD + 1.250%) (a)(c) | | 07/25/2047 | | | 1.46 | % | | | 485,000 | | | | 485,475 | |
| Ford Credit Auto Lease Trust, 2019-B A3 | | 10/15/2022 | | | 2.22 | % | | | 491,000 | | | | 495,543 | |
| Ford Credit Auto Owner Trust, 2016-1 A (a) | | 08/15/2027 | | | 2.31 | % | | | 795,000 | | | | 796,855 | |
GM Financial Consumer Automobile Receivables Trust, 2020-2 A2B (1 Month LIBOR USD + 1.050%) (c) | | 03/16/2023 | | | 1.20 | % | | | 278,296 | | | | 279,230 | |
| Honda Auto Receivables Owner Trust | | | | | | | | | | | | | | |
| Series 2019-1 A3 | | 03/20/2023 | | | 2.83 | % | | | 755,368 | | | | 768,214 | |
| Series 2017-4 A4 | | 03/21/2024 | | | 2.21 | % | | | 695,000 | | | | 698,712 | |
| Series 2020-3 A3 | | 10/18/2024 | | | 0.37 | % | | | 2,350,000 | | | | 2,353,974 | |
| Hyundai Auto Receivables Trust, 2020-C | | 05/15/2025 | | | 0.38 | % | | | 2,150,000 | | | | 2,153,739 | |
| Invitation Homes Trust | | | | | | | | | | | | | | |
| Series 2017-SFR2 A (1 Month LIBOR USD + 0.850%) (a)(c) | | 12/19/2036 | | | 1.00 | % | | | 436,287 | | | | 435,223 | |
| Series 2018-SFR1 A (1 Month LIBOR USD + 0.700%) (a)(c) | | 03/19/2037 | | | 0.85 | % | | | 391,723 | | | | 388,464 | |
The accompanying notes are an integral part of these consolidated financial statements.
| | |
| | |
| LoCorr Long/Short Commodities Strategy Fund – Consolidated Schedule of Investments (continued) | | 33 |
| | |
| | | Maturity Date | | Coupon Rate | | | Principal Amount | | | Value | |
| Asset Backed Securities: (continued) | | | | | | | | | | | | | | |
| Series 2018-SFR2 A (1 Month LIBOR USD + 0.900%) (a)(c) | | 06/18/2037 | | | 1.06 | % | | $ | 542,358 | | | $ | 543,552 | |
| Series 2018-SFR3 A (1 Month LIBOR USD + 1.000%) (a)(c) | | 07/17/2037 | | | 1.15 | % | | | 448,109 | | | | 448,109 | |
| Series 2018-SFR4 D (1 Month LIBOR USD + 1.650%) (a)(c) | | 01/19/2038 | | | 1.80 | % | | | 915,000 | | | | 912,777 | |
| Morgan Stanley Capital I Trust, 2004-HE6 M1 (1 Month LIBOR USD + 0.825%) (c) | | 08/25/2034 | | | 0.97 | % | | | 232,712 | | | | 229,697 | |
| MVW Owner Trust | | | | | | | | | | | | | | |
| Series 2018-1A A (a) | | 01/21/2036 | | | 3.45 | % | | | 1,219,716 | | | | 1,267,614 | |
| Series 2019-1A A (a) | | 11/20/2036 | | | 2.89 | % | | | 582,408 | | | | 604,352 | |
| Series 2019-2A A (a) | | 10/20/2038 | | | 2.22 | % | | | 745,599 | | | | 766,936 | |
| OneMain Financial Issuance Trust | | | | | | | | | | | | | | |
| Series 2016-3A A (a) | | 06/18/2031 | | | 3.83 | % | | | 752,000 | | | | 767,364 | |
| Series 2018-2A A (a) | | 03/14/2033 | | | 3.57 | % | | | 500,000 | | | | 528,297 | |
| PFS Financing Corp. | | | | | | | | | | | | | | |
| Series 2020-F A (a) | | 08/15/2024 | | | 0.93 | % | | | 1,150,000 | | | | 1,156,903 | |
| Series 2020-G (a) | | 02/17/2026 | | | 0.97 | % | | | 900,000 | | | | 904,727 | |
| Progress Residential Trust | | | | | | | | | | | | | | |
| Series 2017-SFR1 A (a) | | 08/17/2034 | | | 2.77 | % | | | 322,907 | | | | 326,808 | |
| Series 2019-SFR4 B (a) | | 11/17/2036 | | | 2.94 | % | | | 600,000 | | | | 620,857 | |
| Santander Drive Auto Receivables Trust, 2020-4 A-3 | | 07/15/2024 | | | 0.48 | % | | | 1,800,000 | | | | 1,805,408 | |
| SoFi Professional Loan Program LLC | | | | | | | | | | | | | | |
| Series 2016-D A2B (a) | | 04/25/2033 | | | 2.34 | % | | | 509,290 | | | | 519,045 | |
| Series 2015-C A2 (a) | | 08/25/2033 | | | 2.51 | % | | | 144,212 | | | | 144,813 | |
| Series 2015-D A2 (a) | | 10/27/2036 | | | 2.72 | % | | | 55,968 | | | | 56,765 | |
| Series 2016-A A2 (a) | | 12/26/2036 | | | 2.76 | % | | | 317,177 | | | | 322,195 | |
| Series 2017-B A2FX (a) | | 05/25/2040 | | | 2.74 | % | | | 406,753 | | | | 414,174 | |
| Synchrony Card Issuance Trust, 2018-A1 A | | 09/15/2024 | | | 3.38 | % | | | 1,035,000 | | | | 1,057,661 | |
| Tesla Auto Lease Trust, 2020-A (a) | | 05/20/2023 | | | 0.55 | % | | | 1,934,819 | | | | 1,938,306 | |
| Toyota Auto Receivables Owner Trust | | | | | | | | | | | | | | |
| Series 2020-B A2 | | 12/15/2022 | | | 1.38 | % | | | 1,273,444 | | | | 1,279,842 | |
| Series 2019-A A3 | | 07/17/2023 | | | 2.91 | % | | | 557,628 | | | | 567,351 | |
| Tricon American Homes Trust, 2017-SFR1 A (a) | | 09/19/2034 | | | 2.72 | % | | | 1,211,155 | | | | 1,226,587 | |
| Verizon Owner Trust | | | | | | | | | | | | | | |
| Series 2018-A A1A | | 04/20/2023 | | | 3.23 | % | | | 1,097,042 | | | | 1,111,605 | |
| Series 2019-B A1A | | 12/20/2023 | | | 2.33 | % | | | 1,215,000 | | | | 1,239,049 | |
| Series 2019-C A1A | | 04/20/2024 | | | 1.94 | % | | | 200,000 | | | | 204,291 | |
| Series 2020-A A1A | | 07/20/2024 | | | 1.85 | % | | | 1,715,000 | | | | 1,756,172 | |
| TOTAL ASSET BACKED SECURITIES (Cost $42,261,206) | | | | | | | | | | | | | 42,958,458 | |
| | | | | | | | | | | | | | | |
| CORPORATE BONDS: 21.73% | | | | | | | | | | | | | | |
| Aerospace & Defense: 0.06% | | | | | | | | | | | | | | |
| Raytheon Technologies Corp. | | 12/15/2022 | | | 2.50 | % | | | 300,000 | | | | 310,913 | |
| | | | | | | | | | | | | | | |
| Agriculture: 0.30% | | | | | | | | | | | | | | |
| BAT Capital Corp. | | 08/15/2024 | | | 3.22 | % | | | 240,000 | | | | 259,829 | |
| BAT International Finance PLC (b) | | 03/25/2026 | | | 1.67 | % | | | 1,165,000 | | | | 1,192,516 | |
| | | | | | | | | | | | | | 1,452,345 | |
| Auto Manufacturers: 0.64% | | | | | | | | | | | | | | |
| Cummins, Inc. | | 09/01/2025 | | | 0.75 | % | | | 1,030,000 | | | | 1,037,453 | |
| General Motors Financial Co., Inc. | | 06/20/2025 | | | 2.75 | % | | | 1,375,000 | | | | 1,470,293 | |
| Toyota Motor Credit Corp. | | 03/30/2023 | | | 2.90 | % | | | 510,000 | | | | 539,527 | |
| | | | | | | | | | | | | | 3,047,273 | |
| Banks: 10.06% | | | | | | | | | | | | | | |
| Banco Santander SA (b) | | 05/28/2025 | | | 2.75 | % | | | 1,310,000 | | | | 1,398,457 | |
| Bank of America Corp. | | 01/11/2023 | | | 3.30 | % | | | 2,525,000 | | | | 2,677,030 | |
| Bank of America Corp. (3 Month LIBOR USD + 0.930%) (c) | | 07/21/2023 | | | 2.82 | % | | | 625,000 | | | | 649,019 | |
| Bank of America Corp. (SOFR + 1.150%) (c) | | 06/19/2026 | | | 1.32 | % | | | 3,495,000 | | | | 3,569,552 | |
| Bank of Montreal (b) | | 03/26/2022 | | | 2.90 | % | | | 845,000 | | | | 872,464 | |
| Bank of New York Mellon Corp. | | 10/24/2024 | | | 2.10 | % | | | 650,000 | | | | 690,329 | |
| Barclays PLC (1 Year CMT Rate + 0.800%) (b)(c) | | 12/10/2024 | | | 1.01 | % | | | 1,150,000 | | | | 1,158,153 | |
| BNP Paribas SA (3 Month LIBOR USD + 1.111%) (a)(b)(c) | | 11/19/2025 | | | 2.82 | % | | | 1,150,000 | | | | 1,225,811 | |
The accompanying notes are an integral part of these consolidated financial statements.
| | |
| | |
| 34 | | LoCorr Long/Short Commodities Strategy Fund – Consolidated Schedule of Investments (continued) |
| | |
| | | Maturity Date | | Coupon Rate | | | Principal Amount | | | Value | |
| Corporate Bonds: (continued) | | | | | | | | | | | | | | |
| Citigroup, Inc. | | 01/14/2022 | | | 4.50 | % | | $ | 1,270,000 | | | $ | 1,324,201 | |
| Citigroup, Inc. (3 Month LIBOR USD + 0.722%) (c) | | 01/24/2023 | | | 3.14 | % | | | 1,205,000 | | | | 1,239,087 | |
| Citigroup, Inc. (3 Month LIBOR USD + 1.023%) (c) | | 06/01/2024 | | | 4.04 | % | | | 1,425,000 | | | | 1,549,751 | |
| Citigroup, Inc. (SOFR + 0.686%) (c) | | 10/30/2024 | | | 0.78 | % | | | 1,000,000 | | | | 1,006,487 | |
| Cooperatieve Rabobank UA (b) | | 11/09/2022 | | | 3.95 | % | | | 895,000 | | | | 950,169 | |
| Credit Suisse AG (b) | | 05/05/2023 | | | 1.00 | % | | | 900,000 | | | | 913,614 | |
| Danske Bank A/S (1 Year CMT Rate + 1.730%) (a)(b)(c) | | 01/12/2023 | | | 5.00 | % | | | 815,000 | | | | 848,303 | |
| Fifth Third Bancorp | | 05/05/2023 | | | 1.63 | % | | | 680,000 | | | | 701,367 | |
| Goldman Sachs Group, Inc. | | 01/22/2023 | | | 3.63 | % | | | 1,195,000 | | | | 1,275,223 | |
| Goldman Sachs Group, Inc. | | 02/23/2023 | | | 3.20 | % | | | 3,385,000 | | | | 3,576,654 | |
| HSBC Bank Canada (a)(b) | | 09/10/2023 | | | 1.65 | % | | | 870,000 | | | | 889,098 | |
| HSBC Holdings PLC (SOFR + 1.929%) (b)(c) | | 06/04/2026 | | | 2.10 | % | | | 1,045,000 | | | | 1,085,904 | |
| Huntington National Bank | | 04/01/2022 | | | 3.13 | % | | | 780,000 | | | | 805,223 | |
| ING Groep NV (b) | | 04/09/2024 | | | 3.55 | % | | | 965,000 | | | | 1,054,330 | |
| JP Morgan Chase & Co. | | 09/23/2022 | | | 3.25 | % | | | 910,000 | | | | 957,056 | |
| JP Morgan Chase & Co. | | 01/25/2023 | | | 3.20 | % | | | 2,650,000 | | | | 2,805,324 | |
| Mitsubishi UFJ Financial Group, Inc. (1 Year CMT Rate + 0.680%) (b)(c) | | 09/15/2024 | | | 0.85 | % | | | 1,295,000 | | | | 1,302,722 | |
| Morgan Stanley | | 11/01/2022 | | | 4.88 | % | | | 515,000 | | | | 554,910 | |
| Morgan Stanley | | 01/23/2023 | | | 3.13 | % | | | 2,440,000 | | | | 2,575,103 | |
| Morgan Stanley | | 04/29/2024 | | | 3.88 | % | | | 640,000 | | | | 709,003 | |
| Morgan Stanley (SOFR + 1.152%) (c) | | 07/22/2025 | | | 2.72 | % | | | 1,000,000 | | | | 1,069,577 | |
| National Bank of Canada (a)(b) | | 10/07/2022 | | | 2.15 | % | | | 505,000 | | | | 520,454 | |
| NatWest Markets PLC (a)(b) | | 05/21/2023 | | | 2.38 | % | | | 955,000 | | | | 993,460 | |
| Royal Bank of Canada (b) | | 04/29/2022 | | | 2.80 | % | | | 280,000 | | | | 289,469 | |
| Royal Bank of Canada (b) | | 11/01/2024 | | | 2.25 | % | | | 645,000 | | | | 686,156 | |
| Santander UK PLC (b) | | 01/13/2023 | | | 2.10 | % | | | 610,000 | | | | 630,303 | |
| State Street Corp. (SOFR + 2.690%) (c) | | 03/30/2023 | | | 2.83 | % | | | 550,000 | | | | 567,636 | |
| Svenska Handelsbanken AB (a)(b) | | 06/30/2023 | | | 0.63 | % | | | 610,000 | | | | 614,152 | |
| Truist Financial Corp. | | 08/05/2025 | | | 1.20 | % | | | 1,700,000 | | | | 1,744,944 | |
| UBS AG/London (a)(b) | | 04/21/2022 | | | 1.75 | % | | | 475,000 | | | | 483,452 | |
| UBS Group AG (1 Year CMT Rate + 0.830%) (a)(b)(c) | | 07/30/2024 | | | 1.01 | % | | | 200,000 | | | | 201,934 | |
| Wells Fargo & Co. | | 02/13/2023 | | | 3.45 | % | | | 1,075,000 | | | | 1,139,228 | |
| Wells Fargo & Co. (SOFR + 1.600%) (c) | | 06/02/2024 | | | 1.65 | % | | | 740,000 | | | | 760,634 | |
| | | | | | | | | | | | | | 48,065,743 | |
| Beverage: 0.17% | | | | | | | | | | | | | | |
| Diageo Capital PLC (b) | | 09/29/2025 | | | 1.38 | % | | | 800,000 | | | | 822,012 | |
| | | | | | | | | | | | | | | |
| Biotechnology: 0.38% | | | | | | | | | | | | | | |
| Gilead Sciences, Inc. | | 09/29/2023 | | | 0.75 | % | | | 660,000 | | | | 662,006 | |
| Royalty Pharma PLC (a)(b) | | 09/02/2023 | | | 0.75 | % | | | 1,150,000 | | | | 1,155,497 | |
| | | | | | | | | | | | | | 1,817,503 | |
| Building Materials: 0.23% | | | | | | | | | | | | | | |
| Carrier Global Corp. | | 02/15/2025 | | | 2.24 | % | | | 1,020,000 | | | | 1,079,326 | |
| | | | | | | | | | | | | | | |
| Chemicals: 0.24% | | | | | | | | | | | | | | |
| Air Products and Chemicals, Inc. | | 10/15/2025 | | | 1.50 | % | | | 260,000 | | | | 271,005 | |
| DuPont de Nemours, Inc. | | 11/15/2023 | | | 4.21 | % | | | 780,000 | | | | 860,528 | |
| | | | | | | | | | | | | | 1,131,533 | |
| Computers: 0.07% | | | | | | | | | | | | | | |
| Apple, Inc. | | 05/03/2023 | | | 2.40 | % | | | 320,000 | | | | 335,668 | |
| | | | | | | | | | | | | | | |
| Diversified Financial Services: 1.66% | | | | | | | | | | | | | | |
| Air Lease Corp. | | 07/03/2023 | | | 3.88 | % | | | 1,065,000 | | | | 1,137,207 | |
| Air Lease Corp. | | 02/01/2024 | | | 4.25 | % | | | 350,000 | | | | 379,841 | |
| American Express Co. | | 07/30/2024 | | | 2.50 | % | | | 905,000 | | | | 965,458 | |
| Capital One Bank | | 02/15/2023 | | | 3.38 | % | | | 799,000 | | | | 844,345 | |
| CDP Financial, Inc. (a)(b) | | 03/07/2022 | | | 2.75 | % | | | 990,000 | | | | 1,018,781 | |
| Charles Schwab Corp. | | 01/25/2023 | | | 2.65 | % | | | 645,000 | | | | 675,676 | |
| Dragon 2012 LLC | | 03/12/2024 | | | 1.97 | % | | | 7,526 | | | | 7,707 | |
The accompanying notes are an integral part of these consolidated financial statements.
| | |
| | |
| LoCorr Long/Short Commodities Strategy Fund - Consolidated Schedule of Investments (continued) | | 35 |
| | |
| | | Maturity Date | | Coupon Rate | | | Principal Amount | | | Value | |
| Corporate Bonds: (continued) | | | | | | | | | | | | | | |
| GE Capital International Funding Co Unlimited Co. (b) | | 11/15/2025 | | | 3.37 | % | | $ | 1,665,000 | | | $ | 1,847,932 | |
| Helios Leasing I LLC | | 05/29/2024 | | | 2.02 | % | | | 7,920 | | | | 8,093 | |
| Helios Leasing I LLC | | 07/24/2024 | | | 1.73 | % | | | 8,431 | | | | 8,615 | |
| Helios Leasing I LLC | | 09/28/2024 | | | 1.56 | % | | | 8,349 | | | | 8,546 | |
| MSN 41079 and 41084 Ltd. (b) | | 07/13/2024 | | | 1.72 | % | | | 8,415 | | | | 8,598 | |
| OMERS Finance Trust (a)(b) | | 05/02/2024 | | | 2.50 | % | | | 920,000 | | | | 982,517 | |
| Phoenix 2012 LLC | | 07/03/2024 | | | 1.61 | % | | | 8,402 | | | | 8,585 | |
| Safina Ltd. (b) | | 01/15/2022 | | | 1.55 | % | | | 3,197 | | | | 3,215 | |
| Tagua Leasing LLC | | 11/16/2024 | | | 1.58 | % | | | 8,905 | | | | 9,087 | |
| | | | | | | | | | | | | | 7,914,203 | |
| Electric: 0.36% | | | | | | | | | | | | | | |
| Eversource Energy | | 08/15/2025 | | | 0.80 | % | | | 125,000 | | | | 124,757 | |
| Exelon Generation Co. LLC | | 03/15/2022 | | | 3.40 | % | | | 265,000 | | | | 273,594 | |
| Exelon Generation Co. LLC | | 06/01/2025 | | | 3.25 | % | | | 220,000 | | | | 239,891 | |
| Nextera Energy Capital Holdings, Inc. | | 04/01/2022 | | | 2.90 | % | | | 1,065,000 | | | | 1,098,964 | |
| | | | | | | | | | | | | | 1,737,206 | |
| Food: 0.10% | | | | | | | | | | | | | | |
| Mondelez International, Inc. | | 04/13/2023 | | | 2.13 | % | | | 440,000 | | | | 457,005 | |
| | | | | | | | | | | | | | | |
| Healthcare - Services: 0.25% | | | | | | | | | | | | | | |
| Anthem, Inc. | | 01/15/2025 | | | 2.38 | % | | | 850,000 | | | | 909,118 | |
| UnitedHealth Group, Inc. | | 01/15/2026 | | | 1.25 | % | | | 285,000 | | | | 293,801 | |
| | | | | | | | | | | | | | 1,202,919 | |
| Insurance: 1.11% | | | | | | | | | | | | | | |
| American International Group, Inc. | | 06/30/2025 | | | 2.50 | % | | | 800,000 | | | | 859,997 | |
| Aon Corp. | | 11/15/2022 | | | 2.20 | % | | | 775,000 | | | | 801,019 | |
| Equitable Financial Life Global (a) | | 07/07/2025 | | | 1.40 | % | | | 925,000 | | | | 950,058 | |
| Metropolitan Life Global Funding I (a) | | 07/02/2025 | | | 0.95 | % | | | 1,145,000 | | | | 1,160,182 | |
| New York Life Global Funding (a) | | 10/21/2023 | | | 0.40 | % | | | 500,000 | | | | 500,923 | |
| Voya Financial, Inc. | | 07/15/2024 | | | 3.13 | % | | | 970,000 | | | | 1,048,298 | |
| | | | | | | | | | | | | | 5,320,477 | |
| Media: 0.44% | | | | | | | | | | | | | | |
| Comcast Corp. | | 04/15/2024 | | | 3.70 | % | | | 1,920,000 | | | | 2,112,400 | |
| | | | | | | | | | | | | | | |
| Miscellaneous Manufacturing: 0.14% | | | | | | | | | | | | | | |
| Parker-Hannifin Corp. | | 06/14/2024 | | | 2.70 | % | | | 610,000 | | | | 654,221 | |
| | | | | | | | | | | | | | | |
| Oil & Gas: 0.78% | | | | | | | | | | | | | | |
| BP Capital Markets PLC (b) | | 03/11/2021 | | | 4.74 | % | | | 535,000 | | | | 539,328 | |
| Chevron Corp. | | 05/11/2023 | | | 1.14 | % | | | 675,000 | | | | 689,212 | |
| Diamondback Energy, Inc. | | 12/01/2024 | | | 2.88 | % | | | 335,000 | | | | 352,135 | |
| Equinor ASA (b) | | 01/22/2026 | | | 1.75 | % | | | 220,000 | | | | 231,106 | |
| Phillips 66 | | 02/15/2024 | | | 0.90 | % | | | 890,000 | | | | 892,156 | |
| Saudi Arabian Oil Co. (a)(b) | | 04/16/2022 | | | 2.75 | % | | | 1,000,000 | | | | 1,027,361 | |
| | | | | | | | | | | | | | 3,731,298 | |
| Pharmaceuticals: 1.05% | | | | | | | | | | | | | | |
| AbbVie, Inc. | | 11/21/2022 | | | 2.30 | % | | | 1,600,000 | | | | 1,658,240 | |
| Bristol-Myers Squibb Co. | | 02/20/2023 | | | 3.25 | % | | | 735,000 | | | | 773,213 | |
| Bristol-Myers Squibb Co. | | 11/13/2023 | | | 0.54 | % | | | 745,000 | | | | 746,349 | |
| CVS Health Corp. | | 08/12/2024 | | | 3.38 | % | | | 1,690,000 | | | | 1,843,153 | |
| | | | | | | | | | | | | | 5,020,955 | |
| Pipelines: 0.50% | | | | | | | | | | | | | | |
| Energy Transfer Operating LP | | 05/15/2025 | | | 2.90 | % | | | 220,000 | | | | 232,752 | |
| MPLX LP | | 03/01/2026 | | | 1.75 | % | | | 1,185,000 | | | | 1,226,363 | |
| ONEOK, Inc. | | 09/01/2024 | | | 2.75 | % | | | 335,000 | | | | 353,471 | |
| TransCanada PipeLines Ltd. (b) | | 08/01/2022 | | | 2.50 | % | | | 545,000 | | | | 563,191 | �� |
| | | | | | | | | | | | | | 2,375,777 | |
| Real Estate Investment Trusts: 0.98% | | | | | | | | | | | | | | |
| Alexandria Real Estate Equities, Inc. | | 01/15/2024 | | | 4.00 | % | | | 1,145,000 | | | | 1,260,129 | |
The accompanying notes are an integral part of these consolidated financial statements.
| | |
| | |
| 36 | | LoCorr Long/Short Commodities Strategy Fund – Consolidated Schedule of Investments (continued) |
| | |
| | | Maturity Date | | Coupon Rate | | | Principal Amount | | | Value | |
| Corporate Bonds: (continued) | | | | | | | | | | | | | | |
| American Tower Corp. | | 09/15/2025 | | | 1.30 | % | | $ | 1,860,000 | | | $ | 1,899,208 | |
| Camden Property Trust | | 12/15/2022 | | | 2.95 | % | | | 375,000 | | | | 390,802 | |
| Crown Castle International Corp. | | 07/15/2025 | | | 1.35 | % | | | 505,000 | | | | 515,494 | |
| Highwoods Realty LP | | 06/15/2021 | | | 3.20 | % | | | 110,000 | | | | 110,766 | |
| Kilroy Realty LP | | 01/15/2023 | | | 3.80 | % | | | 470,000 | | | | 492,158 | |
| | | | | | | | | | | | | | 4,668,557 | |
| Software: 0.48% | | | | | | | | | | | | | | |
| Adobe, Inc. | | 02/01/2023 | | | 1.70 | % | | | 655,000 | | | | 674,156 | |
| Fiserv, Inc. | | 07/01/2024 | | | 2.75 | % | | | 105,000 | | | | 112,748 | |
| Microsoft Corp. | | 11/03/2025 | | | 3.13 | % | | | 1,350,000 | | | | 1,509,212 | |
| | | | | | | | | | | | | | 2,296,116 | |
| Telecommunications: 1.57% | | | | | | | | | | | | | | |
| AT&T, Inc. | | 05/15/2025 | | | 3.40 | % | | | 2,660,000 | | | | 2,956,460 | |
| T-Mobile USA, Inc. (a) | | 04/15/2025 | | | 3.50 | % | | | 1,880,000 | | | | 2,077,362 | |
| Verizon Communications, Inc. | | 09/15/2023 | | | 5.15 | % | | | 855,000 | | | | 963,449 | |
| Verizon Communications, Inc. | | 11/01/2024 | | | 3.50 | % | | | 455,000 | | | | 502,557 | |
| Vodafone Group PLC (b) | | 01/16/2024 | | | 3.75 | % | | | 920,000 | | | | 1,005,337 | |
| | | | | | | | | | | | | | 7,505,165 | |
| Transportation: 0.16% | | | | | | | | | | | | | | |
| Burlington Northern Santa Fe LLC | | 09/01/2024 | | | 3.40 | % | | | 715,000 | | | | 784,522 | |
| TOTAL CORPORATE BONDS (Cost $100,828,020) | | | | | | | | | | | | | 103,843,137 | |
| | | | | | | | | | | | | | | |
| FOREIGN GOVERNMENT BOND: 0.00%* | | | | | | | | | | | | | | |
| Petroleos Mexicanos (b) | | 12/20/2022 | | | 2.00 | % | | | 5,000 | | | | 5,095 | |
| TOTAL FOREIGN GOVERNMENT BOND (Cost $5,000) | | | | | | | | | | | | | 5,095 | |
| | | | | | | | | | | | | | | |
| MORTGAGE BACKED SECURITIES: 11.33% | | | | | | | | | | | | | | |
| Angel Oak Mortgage Trust, 2020-1 M1 (a)(d) | | 12/25/2059 | | | 3.16 | % | | | 377,000 | | | | 375,240 | |
| BHP Trust, 2019-BXHP (1 Month LIBOR USD + 0.975%) (a)(c) | | 08/15/2036 | | | 1.13 | % | | | 1,920,766 | | | | 1,897,096 | |
| BX Commercial Mortgage Trust, 2020-FOX (1 Month LIBOR USD + 1.000%) (a)(c) | | 11/15/2032 | | | 1.16 | % | | | 2,000,000 | | | | 2,003,207 | |
| Comm Mortgage Trust | | | | | | | | | | | | | | |
| Series 2013-CR9 A4 (d) | | 07/12/2045 | | | 4.22 | % | | | 946,086 | | | | 1,021,919 | |
| Series 2013-CR6 A4 | | 03/10/2046 | | | 3.10 | % | | | 440,000 | | | | 456,187 | |
| Series 2013-CR10 A4 (d) | | 08/10/2046 | | | 4.21 | % | | | 200,000 | | | | 217,037 | |
| Series 2014-UBS2 A5 | | 03/10/2047 | | | 3.96 | % | | | 1,150,000 | | | | 1,256,615 | |
| Series 2014-UBS2 AM | | 03/12/2047 | | | 4.20 | % | | | 1,150,000 | | | | 1,252,215 | |
| Series 2015-CR27 AM | | 10/13/2048 | | | 3.98 | % | | | 1,000,000 | | | | 1,105,644 | |
| Connecticut Avenue Securities Trust | | | | | | | | | | | | | | |
| Series 2020-R02 2M1 (1 Month LIBOR USD + 0.750%) (a)(c) | | 01/25/2040 | | | 0.90 | % | | | 1,009,285 | | | | 1,009,285 | |
| Series 2020-R01 1M1 (1 Month LIBOR USD + 0.800%) (a)(c) | | 01/25/2040 | | | 0.95 | % | | | 714,659 | | | | 715,225 | |
| Fannie Mae Aces, 2017-M7 A1 | | 02/25/2027 | | | 2.60 | % | | | 2,865,734 | | | | 3,028,034 | |
| Fannie Mae Connecticut Avenue Securities | | | | | | | | | | | | | | |
| Series 2014-C02 1M2 (1 Month LIBOR USD + 2.600%) (c) | | 05/28/2024 | | | 2.75 | % | | | 1,113,880 | | | | 1,084,934 | |
| Series 2014-C03 1M2 (1 Month LIBOR USD + 3.000%) (c) | | 07/25/2024 | | | 3.15 | % | | | 488,810 | | | | 474,410 | |
| Series 2017-C02 2ED4 (1 Month LIBOR USD + 0.850%) (c) | | 09/25/2029 | | | 1.00 | % | | | 173,482 | | | | 169,352 | |
| Series 2018-C01 1EB1 (1 Month LIBOR USD + 0.450%) (c) | | 07/25/2030 | | | 0.60 | % | | | 385,000 | | | | 375,422 | |
| FHLMC Multifamily Structured Pass Through Certificates | | | | | | | | | | | | | | |
| Series KF08 A (1 Month LIBOR USD + 0.300%) (c) | | 01/25/2022 | | | 0.45 | % | | | 146,914 | | | | 146,548 | |
| Series K052 A1 | | 01/25/2025 | | | 2.60 | % | | | 371,025 | | | | 386,204 | |
| Series K-050 A1 | | 01/25/2025 | | | 2.80 | % | | | 2,624,150 | | | | 2,751,785 | |
| Series K059 A1 | | 09/25/2025 | | | 2.76 | % | | | 806,611 | | | | 858,103 | |
| Series KC06 A1 | | 02/25/2026 | | | 2.17 | % | | | 1,510,000 | | | | 1,576,137 | |
| Flagstar Mortgage Trust, 2017-2 A5 (a)(d) | | 10/25/2047 | | | 3.50 | % | | | 59,127 | | | | 59,057 | |
| Freddie Mac Structured Agency Credit Risk Debt Notes | | | | | | | | | | | | | | |
| Series 2014-DN1 M2 (1 Month LIBOR USD + 2.200%) (c) | | 02/26/2024 | | | 2.35 | % | | | 48,464 | | | | 48,471 | |
| Series 2017-DNA2 M1 (1 Month LIBOR USD + 1.200%) (c) | | 10/25/2029 | | | 1.35 | % | | | 422,752 | | | | 422,752 | |
| Series 2020-DNA1 M1 (1 Month LIBOR USD + 0.700%) (a)(c) | | 01/25/2050 | | | 0.85 | % | | | 48,551 | | | | 48,580 | |
| Series 2020-HQA1 M1 (1 Month LIBOR USD + 0.750%) (a)(c) | | 01/25/2050 | | | 0.90 | % | | | 1,099,650 | | | | 1,099,301 | |
| Series 2020-HQA2 M1 (1 Month LIBOR USD + 1.100%) (a)(c) | | 03/25/2050 | | | 1.25 | % | | | 1,010,955 | | | | 1,011,594 | |
The accompanying notes are an integral part of these consolidated financial statements.
| | |
| | |
| LoCorr Long/Short Commodities Strategy Fund – Consolidated Schedule of Investments (continued) | | 37 |
| | |
| | | Maturity Date | | Coupon Rate | | | Principal Amount | | | Value | |
| Mortgage Backed Securities: (continued) | | | | | | | | | | | | | | |
| FRESB Multifamily Mortgage Pass Through Certificates | | | | | | | | | | | | | | |
| Series 2016-SB17 A7F (d) | | 05/25/2023 | | | 2.15 | % | | $ | 592,156 | | | $ | 600,825 | |
| Series 2017-SB32 A7F (d) | | 04/25/2024 | | | 2.44 | % | | | 1,006,290 | | | | 1,036,043 | |
| Series 2019-SB67 A5F (d) | | 07/25/2024 | | | 2.09 | % | | | 1,379,619 | | | | 1,420,022 | |
| Mortgage Backed Securities: (continued) | | | | | | | | | | | | | | |
| Series 2019-SB69 A5F (d) | | 10/25/2024 | | | 2.25 | % | | | 1,627,048 | | | | 1,693,725 | |
| Series 2016-SB23 A10F (d) | | 09/25/2026 | | | 2.31 | % | | | 862,057 | | | | 903,599 | |
| GS Mortgage Securities Trust | | | | | | | | | | | | | | |
| Series 2013-GC10 AS | | 02/12/2046 | | | 2.94 | % | | | 1,720,000 | | | | 1,784,822 | |
| Series 2015-GC28 AS | | 02/12/2048 | | | 3.76 | % | | | 885,000 | | | | 965,353 | |
| JP Morgan Chase Commercial Mortgage Securities Trust | | | | | | | | | | | | | | |
| Series 2010-C2 A3 (a) | | 11/15/2043 | | | 4.07 | % | | | 141,468 | | | | 141,330 | |
| Series 2012-C8 ASB | | 10/17/2045 | | | 2.38 | % | | | 173,066 | | | | 175,751 | |
| Series 2013-C15 A-S | | 11/17/2045 | | | 4.42 | % | | | 1,250,000 | | | | 1,363,408 | |
| Series 2014-C23 ASB | | 09/17/2047 | | | 3.66 | % | | | 996,816 | | | | 1,049,847 | |
| Series 2014-C22 AS | | 09/17/2047 | | | 4.11 | % | | | 1,350,000 | | | | 1,467,914 | |
| Series 2013-C10 AS | | 12/17/2047 | | | 3.37 | % | | | 762,000 | | | | 795,656 | |
| Series 2016-JP3 A-5 | | 08/15/2049 | | | 2.87 | % | | | 1,500,000 | | | | 1,636,311 | |
| JP Morgan Mortgage Trust | | | | | | | | | | | | | | |
| Series 2016-1 A5 (a)(d) | | 05/25/2046 | | | 3.50 | % | | | 12,244 | | | | 12,248 | |
| Series 2016-4 A5 (a)(d) | | 10/25/2046 | | | 3.50 | % | | | 56,953 | | | | 57,204 | |
| Series 2018-1 A5 (a)(d) | | 06/25/2048 | | | 3.50 | % | | | 170,626 | | | | 171,110 | |
| KKR Industrial Portfolio Trust, 2020-AIP D (1 Month LIBOR USD + 2.030%) (a)(c) | | 03/16/2037 | | | 2.19 | % | | | 482,103 | | | | 478,478 | |
| Merit, 2020-HILL A (1 Month LIBOR USD + 1.150%) (a)(c) | | 08/17/2037 | | | 1.31 | % | | | 2,350,000 | | | | 2,354,474 | |
| New Residential Mortgage Loan Trust | | | | | | | | | | | | | | |
| Series 2015-1A A3 (a)(d) | | 05/28/2052 | | | 3.75 | % | | | 523,211 | | | | 556,307 | |
| Series 2014-2A A3 (a)(d) | | 05/25/2054 | | | 3.75 | % | | | 89,301 | | | | 95,184 | |
| Series 2016-1A A1 (a)(d) | | 03/25/2056 | | | 3.75 | % | | | 204,537 | | | | 216,776 | |
| Series 2017-1A A1 (a)(d) | | 02/25/2057 | | | 4.00 | % | | | 393,655 | | | | 425,442 | |
| Series 2017-6A A1 (a)(d) | | 08/25/2057 | | | 4.00 | % | | | 187,392 | | | | 202,409 | |
| Series 2018-5A A1 (a)(d) | | 12/25/2057 | | | 4.75 | % | | | 830,598 | | | | 887,532 | |
| OBX Trust, 2018-1 A2 (1 Month LIBOR USD + 0.650%) (a)(c) | | 06/25/2057 | | | 0.80 | % | | | 463,278 | | | | 462,092 | |
| Sequoia Mortgage Trust | | | | | | | | | | | | | | |
| Series 2017-1 A4 (a)(d) | | 02/25/2047 | | | 3.50 | % | | | 282,400 | | | | 284,334 | |
| Series 2017-CH1 A11 (a)(d) | | 08/25/2047 | | | 3.50 | % | | | 81,427 | | | | 81,691 | |
| Series 2018-CH4 A10 (a)(d) | | 10/25/2048 | | | 4.50 | % | | | 29,191 | | | | 29,196 | |
| Series 2019-5 A4 (a)(d) | | 12/25/2049 | | | 3.50 | % | | | 291,506 | | | | 296,086 | |
| Series 2020-1 A4 (a)(d) | | 02/25/2050 | | | 3.50 | % | | | 346,704 | | | | 349,907 | |
| Shellpoint Co-Originator Trust, 2017-2 A4 (a)(d) | | 10/25/2047 | | | 3.50 | % | | | 63,333 | | | | 63,319 | |
| STACR Trust, 2018-DNA2 M1 (1 Month LIBOR USD + 0.800%) (a)(c) | | 12/26/2030 | | | 0.95 | % | | | 197,741 | | | | 197,741 | |
| UBS Commercial Mortgage Trust, 2017-C6 ASB | | 12/16/2050 | | | 3.50 | % | | | 1,000,000 | | | | 1,107,481 | |
| UBS-Barclays Commercial Mortgage Trust, 2012-C4 A5 | | 12/12/2045 | | | 2.85 | % | | | 870,000 | | | | 901,808 | |
| Verus Securitization Trust | | | | | | | | | | | | | | |
| Series 2018-2 A1 (a)(d) | | 07/25/2058 | | | 3.68 | % | | | 193,862 | | | | 194,097 | |
| Series 2018-3 A1 (a)(d) | | 10/25/2058 | | | 4.11 | % | | | 147,385 | | | | 151,141 | |
| VNDO Mortgage Trust, 2012-6AVE A (a) | | 11/15/2030 | | | 3.00 | % | | | 1,000,000 | | | | 1,034,083 | |
| Wells Fargo Commercial Mortgage Trust, 2012-LC5 AS | | 10/17/2045 | | | 3.54 | % | | | 185,000 | | | | 192,078 | |
| WFRBS Commercial Mortgage Trust | | | | | | | | | | | | | | |
| Series 2011-C3 A4 (a) | | 03/17/2044 | | | 4.38 | % | | | 981,729 | | | | 983,089 | |
| Series 2013-C13 AS | | 05/17/2045 | | | 3.35 | % | | | 185,000 | | | | 194,238 | |
| Series 2012-C10 A3 | | 12/15/2045 | | | 2.88 | % | | | 975,000 | | | | 1,010,021 | |
| Series 2013-UBS1 A4 (d) | | 03/16/2046 | | | 4.08 | % | | | 772,216 | | | | 837,430 | |
| Series 2013-C14 A5 | | 06/15/2046 | | | 3.34 | % | | | 200,000 | | | | 211,359 | |
| Series 2013-C17 ASB | | 12/17/2046 | | | 3.56 | % | | | 180,897 | | | | 188,643 | |
| TOTAL MORTGAGE BACKED SECURITIES (Cost $53,046,970) | | | | | | | | | | | | | 54,111,958 | |
The accompanying notes are an integral part of these consolidated financial statements.
| | |
| | |
| 38 | | LoCorr Long/Short Commodities Strategy Fund – Consolidated Schedule of Investments (continued) |
| | |
| | | Maturity Date | | Coupon Rate | | | Principal Amount | | | Value | |
| MUNICIPAL BONDS: 1.59% | | | | | | | | | | | | | | |
| City of Arlington TX | | 08/15/2025 | | | 0.71 | % | | $ | 560,000 | | | $ | 563,433 | |
| City of El Paso TX Water & Sewer Revenue | | 03/01/2025 | | | 0.77 | % | | | 550,000 | | | | 553,113 | |
| City of New York NY | | 08/01/2025 | | | 2.28 | % | | | 1,660,000 | | | | 1,761,758 | |
| Massachusetts Water Resources Authority | | 08/01/2025 | | | 2.08 | % | | | 1,840,000 | | | | 1,969,076 | |
| Miami Dade County Florida Aviation Refunding Taxable Series B | | 10/01/2023 | | | 2.37 | % | | | 650,000 | | | | 677,839 | |
| Nebraska Public Power District | | 01/01/2024 | | | 2.22 | % | | | 675,000 | | | | 702,817 | |
| San Diego County Water Authority | | 05/01/2025 | | | 0.74 | % | | | 335,000 | | | | 338,340 | |
| State of Wisconsin | | 05/01/2026 | | | 2.10 | % | | | 710,000 | | | | 757,229 | |
| Water Works Board of the City of Birmingham | | 01/01/2024 | | | 2.20 | % | | | 270,000 | | | | 283,381 | |
| TOTAL MUNICIPAL BONDS (Cost $7,249,947) | | | | | | | | | | | | | 7,606,986 | |
| | | | | | Counterparty | | | | Number of
of Contracts | | | | | |
| PURCHASED CALL OPTION: 4.87% | | | | | | | | | | | | | | |
| Call Option: 4.87% | | | | | | | | | | | | | | |
| Nomura Galaxy Option Expiration: August 2022, Current Price: | | | | | | | | | | | | | | |
| $1,179.44, Exercise Price: $0.0001 (h) | | | | | Nomura Securities | | | | 19,743 | | | | 23,285,175 | |
| TOTAL PURCHASED CALL OPTION (Cost $18,923,281) | | | | | (Bermuda) | | | | | | | | 23,285,175 | |
| | | | | | | | | | | | | | | |
| |
| Maturity Date | | | Coupon Rate | | | | Principal Amount | | | | | |
| U.S. GOVERNMENT AGENCY ISSUES: 9.02% |
| | | | | | | | | | | | | |
| Federal Farm Credit Banks | | 06/26/2023 | | | 1.77 | % | | | 2,450,000 | | | | 2,544,244 | |
| Federal Farm Credit Banks | | 07/17/2023 | | | 2.88 | % | | | 1,600,000 | | | | 1,707,489 | |
| Federal Home Loan Banks | | 07/07/2021 | | | 1.88 | % | | | 2,420,000 | | | | 2,441,896 | |
| Federal Home Loan Banks | | 06/10/2022 | | | 2.13 | % | | | 5,575,000 | | | | 5,735,907 | |
| Federal Home Loan Banks | | 06/10/2022 | | | 2.75 | % | | | 1,000,000 | | | | 1,037,821 | |
| Federal Home Loan Banks | | 06/09/2023 | | | 3.25 | % | | | 2,345,000 | | | | 2,518,614 | |
| Federal Home Loan Banks | | 09/08/2023 | | | 3.38 | % | | | 2,235,000 | | | | 2,426,157 | |
| Federal Home Loan Banks | | 12/08/2023 | | | 3.38 | % | | | 2,325,000 | | | | 2,540,118 | |
| Federal Home Loan Mortgage Corp. | | 07/08/2022 | | | 0.32 | % | | | 2,460,000 | | | | 2,460,017 | |
| Federal Home Loan Mortgage Corp. | | 06/26/2023 | | | 0.25 | % | | | 3,000,000 | | | | 3,006,522 | |
| Federal Home Loan Mortgage Corp. | | 07/20/2023 | | | 0.41 | % | | | 2,465,000 | | | | 2,468,579 | |
| Federal Home Loan Mortgage Corp. | | 09/08/2023 | | | 0.25 | % | | | 885,000 | | | | 886,719 | |
| Federal Home Loan Mortgage Corp. | | 11/06/2023 | | | 0.25 | % | | | 4,000,000 | | | | 4,003,384 | |
| Federal National Mortgage Association | | 01/19/2023 | | | 2.38 | % | | | 220,000 | | | | 230,076 | |
| Federal National Mortgage Association | | 07/10/2023 | | | 0.25 | % | | | 3,350,000 | | | | 3,358,000 | |
| Federal National Mortgage Association | | 06/17/2025 | | | 0.50 | % | | | 3,000,000 | | | | 3,015,914 | |
| Federal National Mortgage Association | | 08/25/2025 | | | 0.38 | % | | | 2,720,000 | | | | 2,719,404 | |
| Small Business Administration Participation Certificates | | 11/01/2032 | | | 2.09 | % | | | 8,996 | | | | 9,272 | |
| TOTAL U.S. GOVERNMENT AGENCY ISSUES (Cost $42,127,080) | | | | | | | | | | | | | 43,110,133 | |
| | | | | | | | | | | | | | | |
| U.S. GOVERNMENT NOTES: 26.41% | | | | | | | | | | | | | | |
| United States Treasury Note | | 05/15/2022 | | | 1.75 | % | | | 21,395,000 | | | | 21,871,373 | |
| United States Treasury Note | | 08/15/2022 | | | 1.50 | % | | | 3,495,000 | | | | 3,572,818 | |
| United States Treasury Note | | 02/15/2023 | | | 2.00 | % | | | 11,500,000 | | | | 11,952,812 | |
| United States Treasury Note | | 03/31/2023 | | | 1.50 | % | | | 10,500,000 | | | | 10,819,922 | |
| United States Treasury Note | | 12/31/2023 | | | 2.63 | % | | | 15,710,000 | | | | 16,861,862 | |
| United States Treasury Note | | 02/29/2024 | | | 2.38 | % | | | 2,025,000 | | | | 2,164,614 | |
| United States Treasury Note | | 03/31/2024 | | | 2.13 | % | | | 3,080,000 | | | | 3,272,380 | |
| United States Treasury Note | | 04/30/2024 | | | 2.00 | % | | | 4,195,000 | | | | 4,446,372 | |
| United States Treasury Note | | 04/30/2024 | | | 2.25 | % | | | 1,585,000 | | | | 1,692,978 | |
| United States Treasury Note | | 05/15/2024 | | | 2.50 | % | | | 14,180,000 | | | | 15,280,058 | |
| United States Treasury Note | | 09/30/2024 | | | 1.50 | % | | | 500,000 | | | | 523,574 | |
| United States Treasury Note | | 12/31/2024 | | | 2.25 | % | | | 440,000 | | | | 474,856 | |
| United States Treasury Note | | 01/31/2025 | | | 1.38 | % | | | 5,655,000 | | | | 5,909,475 | |
| United States Treasury Note | | 05/15/2025 | | | 2.13 | % | | | 2,320,000 | | | | 2,503,969 | |
| United States Treasury Note | | 05/31/2025 | | | 0.25 | % | | | 3,265,000 | | | | 3,258,751 | |
The accompanying notes are an integral part of these consolidated financial statements.
| | |
| | |
| LoCorr Long/Short Commodities Strategy Fund – Consolidated Schedule of Investments (continued) | | 39 |
| | |
| | | Maturity Date | | Coupon Rate | | | Principal Amount | | | Value | |
| U.S. GOVERNMENT NOTES: (continued) | | | | | | | | | | | | | | |
| United States Treasury Note | | 07/31/2025 | | | 0.25 | % | | $ | 14,005,000 | | | $ | 13,963,969 | |
| United States Treasury Note | | 10/31/2025 | | | 0.25 | % | | | 7,650,000 | | | | 7,617,129 | |
| TOTAL U.S. GOVERNMENT NOTES (Cost $124,694,878) | | | | | | | | | | | | | 126,186,912 | |
| | | | | | | | | | | | | | | |
| SHORT TERM INVESTMENTS: 3.12% | | | | | | | | | | | | | | |
| CORPORATE BOND: 0.16% | | | | | | | | | | | | | | |
| Insurance: 0.16% | | | | | | | | | | | | | | |
| Berkshire Hathaway, Inc. | | 03/15/2021 | | | 2.20 | % | | | 765,000 | | | | 766,660 | |
| TOTAL CORPORATE BOND (Cost $764,446) | | | | | | | | | | | | | 766,660 | |
| | | | | | | | | | | | | | | |
| MONEY MARKET FUND: 2.96% | | | | | | | | | Shares | | | | | |
| STIT-Government & Agency Portfolio, Institutional Class, 0.03% (e)(f) | | | | | | | | | 14,137,272 | | | | 14,137,272 | |
| TOTAL MONEY MARKET FUND (Cost $14,137,272) | | | | | | | | | | | | | 14,137,272 | |
| TOTAL SHORT TERM INVESTMENTS (Cost $14,901,718) | | | | | | | | | | | | | 14,903,932 | |
| | | | | | | | | | | | | | | |
| TOTAL INVESTMENTS (Cost $404,038,100): 87.06% | | | | | | | | | | | | | 416,011,786 | |
| Other Assets in Excess of Liabilities: 12.94% (g) | | | | | | | | | | | | | 61,822,900 | |
| TOTAL NET ASSETS: 100.00% | | | | | | | | | | | | $ | 477,834,686 | |
| (a) | Security as defined in Rule 144A under the Securities Act of 1933 and determined to be liquid. Purchased in a private placement transaction; resale to the public may require registration or may extend only to qualified institutional buyers. At December 31, 2020, the value of these securities total $49,886,611 which represents 10.44% of total net assets. |
| (b) | Foreign issued security. |
| (c) | Variable rate security based on a reference index and spread. The rate reported is the rate in effect as of December 31, 2020. |
| (d) | Variable rate security. The coupon is based on an underlying pool of loans. The rate reported is the rate in effect as of December 31, 2020. |
| (e) | The rate quoted is the annualized seven-day effective yield as of December 31, 2020. |
| (f) | A portion of this security is held by LCLSCS Fund Limited and pledged as collateral for swap contracts. At December 31, 2020, the value of this security totals $435,788. |
| (g) | Includes deposits at broker for swap contracts. At December 31, 2020, the value of these assets total $59,200,974. |
| (h) | The Nomura Call option is issued by Nomura Securities Ltd. provides LoCorr Long/Short Commodities Strategy Fund access to the performance of the Galaxy Plus Fund – East Alpha Feeder Fund (548) LLC which effectuates its trading strategy through the Galaxy Plus Fund – East Alpha Master Fund (548) LLC. The underlying strategy is a quantitative trading program specializing in commodity futures contracts. |
| * | Amount rounds to less than 0.005% of net assets. |
| CMT | Constant Maturity Treasury |
| LIBOR | London Interbank Offered Rate |
| PLC | Public Limited Company |
| SOFR | Secured Overnight Financing Rate |
The accompanying notes are an integral part of these consolidated financial statements.
| | |
| | |
| 40 | | LoCorr Long/Short Commodities Strategy Fund – Consolidated Schedule of Swap Contracts |
| | |
LoCorr Long/Short Commodities Strategy Fund
Consolidated Schedule of Swap Contracts
December 31, 2020
LONG TOTAL RETURN SWAP CONTRACTS
This investment is a holding of LCLSCS Fund Limited. See Note 1.
| Termination Date | | Reference Index | | Financing Rate | | | Payment
Frequency | | Notional Amount | | | Unrealized
(Depreciation)* | | | Counterparty |
| 12/16/2022 | | LoCorr
Commodities
Index # | | | 0.50% |
| | Quarterly | | $ | 361,945,098 | | | $ | (13,099,219 | ) | | Deutsche Bank AG |
| ^ | Comprised of a proprietary basket of Commodity Trading Advisor’s (“CTA’’) Programs investing in various futures contracts, forward currency contracts, foreign currency. See Notes 2 & 3. |
| * | Unrealized depreciation is a liability on the Fund’s consolidated statement of assets and liabilities |
The underlying components of the basket as of December 31, 2020 are shown below: #
| Description | | Expiration Date | | | Number of Contracts
Purchased (Sold) | | | Notional Amount | | | Concentration %
of Exposure | |
| Futures Contracts: | | | | | | | | | | | | | | | | |
| Purchase Contracts:(1) | | | | | | | | | | | | | | | | |
| Brent Crude | | | Feb-21 | | | | 1,586 | | | $ | 81,604,174 | | | | 6.32 | % |
| Live Cattle | | | Jun-21 | | | | 1,260 | | | | 57,771,164 | | | | 4.48 | % |
| Sugar No.11 | | | Apr-21 | | | | 3,260 | | | | 53,623,311 | | | | 4.15 | % |
| WTI Crude | | | May-21 | | | | 854 | | | | 41,263,059 | | | | 3.20 | % |
| Gold | | | Feb-21 | | | | 156 | | | | 29,644,716 | | | | 2.30 | % |
| WTI Crude | | | Feb-21 | | | | 513 | | | | 24,781,173 | | | | 1.92 | % |
| Copper (COMEX) | | | Jul-21 | | | | 236 | | | | 20,805,993 | | | | 1.61 | % |
| Natural Gas | | | Apr-21 | | | | 715 | | | | 17,977,225 | | | | 1.39 | % |
| Corn | | | May-21 | | | | 745 | | | | 17,843,957 | | | | 1.38 | % |
| Coffee | | | Dec-21 | | | | 299 | | | | 15,101,088 | | | | 1.17 | % |
| Copper | | | May-21 | | | | 155 | | | | 13,645,578 | | | | 1.06 | % |
| Soybean | | | Mar-21 | | | | 205 | | | | 13,466,625 | | | | 1.04 | % |
| Silver | | | Mar-21 | | | | 101 | | | | 13,356,057 | | | | 1.03 | % |
| Soybean Meal | | | Mar-21 | | | | 277 | | | | 11,874,687 | | | | 0.92 | % |
| Brent Crude | | | Mar-21 | | | | 198 | | | | 10,196,556 | | | | 0.79 | % |
| Coffee | | | May-21 | | | | 191 | | | | 9,337,951 | | | | 0.72 | % |
| Aluminum | | | Mar-21 | | | | 187 | | | | 9,273,950 | | | | 0.72 | % |
| Palladium | | | Mar-21 | | | | 32 | | | | 7,677,048 | | | | 0.59 | % |
| Cotton No.2 | | | May-21 | | | | 194 | | | | 7,614,271 | | | | 0.59 | % |
| Brent Crude | | | Apr-21 | | | | 147 | | | | 7,542,471 | | | | 0.58 | % |
| Gasoline RBOB | | | Jan-21 | | | | 127 | | | | 7,452,819 | | | | 0.58 | % |
| Low Sulphur Gasoil | | | Feb-21 | | | | 172 | | | | 7,297,788 | | | | 0.57 | % |
| Wheat | | | May-21 | | | | 227 | | | | 7,224,240 | | | | 0.56 | % |
| Soybean | | | May-21 | | | | 107 | | | | 6,964,971 | | | | 0.54 | % |
| Copper (LME) | | | Mar-21 | | | | 35 | | | | 6,775,341 | | | | 0.53 | % |
| Natural Gas | | | Jan-22 | | | | 231 | | | | 6,719,790 | | | | 0.52 | % |
| Gasoline RBOB | | | Feb-21 | | | | 108 | | | | 6,348,814 | | | | 0.49 | % |
| Zinc | | | Mar-21 | | | | 90 | | | | 6,183,415 | | | | 0.48 | % |
| Lean Hogs | | | Aug-21 | | | | 184 | | | | 6,090,400 | | | | 0.47 | % |
| Feeder Cattle | | | Aug-21 | | | | 79 | | | | 5,890,438 | | | | 0.46 | % |
| Heating Oil | | | Feb-21 | | | | 90 | | | | 5,572,076 | | | | 0.43 | % |
| Low Sulphur Gasoil | | | Mar-21 | | | | 128 | | | | 5,481,228 | | | | 0.43 | % |
| Lean Hogs | | | Jun-21 | | | | 141 | | | | 4,674,557 | | | | 0.36Tot | % |
Total Purchase Contracts
| | | | | | | | | | | 547,076,931
| | | | 42.38
| %
|
The accompanying notes are an integral part of these consolidated financial statements.
| | |
| | |
| LoCorr Long/Short Commodities Strategy Fund – Consolidated Schedule of Swap Contracts (continued) | | 41 |
| | |
| Description | | Expiration Date | | Number of Contracts
Purchased (Sold) | | | Notional Amout | | | Concentration %
of Exposure | |
| Sale Contracts:(1) | | | | | | | | | | | | | | |
| Brent Crude | | Jan-21 | | | (1,772 | ) | | $ | 91,082,945 | | | | 7.06 | % |
| WTI Crude | | Jan-21 | | | (1,419 | ) | | | 68,402,033 | | | | 5.29 | % |
| Live Cattle | | Feb-21 | | | (1,251 | ) | | | 57,486,697 | | | | 4.45 | % |
| Sugar No.11 | | Feb-21 | | | (2,552 | ) | | | 44,065,148 | | | | 3.42 | % |
| Copper (COMEX) | | Mar-21 | | | (330 | ) | | | 29,103,707 | | | | 2.26 | % |
| Coffee | | Mar-21 | | | (508 | ) | | | 24,385,774 | | | | 1.89 | % |
| EUR/USD | | Mar-21 | | | (155 | ) | | | 23,738,250 | | | | 1.84 | % |
| Natural Gas | | Feb-21 | | | (675 | ) | | | 16,646,507 | | | | 1.29 | % |
| Lean Hogs | | Feb-21 | | | (579 | ) | | | 16,231,123 | | | | 1.26 | % |
| Natural Gas | | Mar-21 | | | (562 | ) | | | 14,004,382 | | | | 1.09 | % |
| Wheat | | Mar-21 | | | (398 | ) | | | 12,688,105 | | | | 0.98 | % |
| Low Sulphur Gasoil | | Jan-21 | | | (224 | ) | | | 9,470,289 | | | | 0.73 | % |
| Natural Gas | | Dec-21 | | | (217 | ) | | | 6,444,900 | | | | 0.50 | % |
| Zinc | | Jan-21 | | | (90 | ) | | | 6,112,575 | | | | 0.47 | % |
| Feeder Cattle | | Mar-21 | | | (83 | ) | | | 5,827,638 | | | | 0.45 | % |
| Total Sale Contracts | | | | | | | | | 425,690,073 | | | | 32.98 | % |
| Other Futures Contracts | | | | | | | | | 145,286,630 | | | | 11.26 | % |
| Total Futures Contracts | | | | | | | | | 1,118,053,634 | | | | 86.62 | % |
| | | | | | | | | | | | | | | |
| Cash and Foreign Currency: | | | | | Quantity | | | | | | | | | |
| Cash and Foreign Currency Purchased:(1) | | | | | | | | | | | | | | |
| U.S. Dollar | | | | | 63,938,105 | | | $ | 63,938,105 | | | | 4.95 | % |
| Total Cash and Foreign Currency Purchased | | | | | | | | | 63,938,105 | | | | 4.95 | % |
| | | | | | | | | | | | | | | |
| Cash and Foreign Currency Sold:(1) | | | | | | | | | | | | | | |
| Euro | | | | | 84,262,835 | | | $ | 102,939,071 | | | | 7.98 | % |
| Total Cash and Foreign Currency Sold | | | | | | | | | 102,939,071 | | | | 7.98 | % |
| | | | | | | | | | | | | | | |
| Other Cash and Foreign Currency | | | | | | | | | 4,024,053 | | | | 0.31 | % |
Total Cash and Foreign Currency
| | | | | | | | | 170,901,229
| | | | 13.24
| %
|
| Forward Currency Contracts | | | | | | | | | 1,806,691 | | | | 0.14 | % |
| Total Underlying Positions | | | | | | | | $ | 1,290,761,554 | | | | 100.00 | % |
| ^ | The investments are not direct holdings of LoCorr Long/Short Commodities Strategy Fund. The top 50 holdings and other futures contracts, other forward currency contracts, and other cash and foreign currency were determined based on the absolute notional amount of the positions within the underlying swap basket. |
| (1) | Represents the 50 largest components of the basket. |
| COMEX | Commodity Exchange, Inc. |
The accompanying notes are an integral part of these consolidated financial statements.
| | |
| | |
| 42 | | LoCorr Market Trend Fund – Consolidated Schedule of Investments |
| | |
LoCorr Market Trend Fund
Composition of Consolidated Investment Portfolio1
December 31, 2020 (Unaudited)

| 1 | As a percentage of total investments. |
Consolidated Schedule of Investments
December 31, 2020
| | | Maturity Date | | Coupon Rate | | | Principal Amount | | | Value | |
| ASSET BACKED SECURITIES: 10.11% | | | | | | | | | | | | | | |
| American Homes 4 Rent Trust, 2014-SFR2 A (a) | | 10/17/2036 | | | 3.79 | % | | $ | 393,477 | | | $ | 424,222 | |
| AMSR Trust, 2020-SFR1 A (a) | | 04/17/2037 | | | 1.82 | % | | | 324,688 | | | | 330,753 | |
| CarMax Auto Owner Trust, 2018-4 A3 | | 09/15/2023 | | | 3.36 | % | | | 2,353,595 | | | | 2,403,191 | |
| CenterPoint Energy Residential Bond, 2009-1 A3 | | 08/15/2023 | | | 4.24 | % | | | 1,077,227 | | | | 1,113,319 | |
| Chase Issuance Trust, 2018-A1 A1 (1 Month LIBOR USD + 0.200%) (c) | | 04/17/2023 | | | 0.36 | % | | | 2,050,000 | | | | 2,050,907 | |
| Corevest American Finance Trust, 2020-1 A1(a) | | 03/17/2050 | | | 1.83 | % | | | 418,028 | | | | 424,064 | |
| DB Master Finance LLC, 2019-1A A2I (a) | | 05/20/2049 | | | 3.79 | % | | | 1,637,275 | | | | 1,677,781 | |
| Domino’s Pizza Master Issuer LLC, 2017-1A A2I (3 Month LIBOR USD + 1.250%) (a)(c) | | 07/25/2047 | | | 1.46 | % | | | 1,067,000 | | | | 1,068,046 | |
| Ford Credit Auto Lease Trust, 2019-B A3 | | 10/15/2022 | | | 2.22 | % | | | 880,000 | | | | 888,143 | |
| GM Financial Consumer Automobile Receivables Trust, 2018-4 A3 | | 10/16/2023 | | | 3.21 | % | | | 1,685,069 | | | | 1,716,805 | |
| Hilton Grand Vacations Trust, 2019-AA A (a) | | 07/25/2033 | | | 2.34 | % | | | 718,536 | | | | 743,894 | |
| Honda Auto Receivables Owner Trust | | | | | | | | | | | | | | |
| Series 2019-1 A3 | | 03/20/2023 | | | 2.83 | % | | | 708,158 | | | | 720,201 | |
| Series 2020-3 A3 | | 10/18/2024 | | | 0.37 | % | | | 1,400,000 | | | | 1,402,367 | |
| Hyundai Auto Receivables Trust, 2020-C | | 05/15/2025 | | | 0.38 | % | | | 1,150,000 | | | | 1,152,000 | |
| Invitation Homes Trust | | | | | | | | | | | | | | |
| Series 2017-SFR2 A (1 Month LIBOR USD + 0.850%) (a)(c) | | 12/19/2036 | | | 1.00 | % | | | 449,781 | | | | 448,683 | |
| Series 2018-SFR1 A (1 Month LIBOR USD + 0.700%) (a)(c) | | 03/19/2037 | | | 0.85 | % | | | 296,760 | | | | 294,291 | |
| Series 2018-SFR2 A (1 Month LIBOR USD + 0.900%) (a)(c) | | 06/18/2037 | | | 1.06 | % | | | 430,443 | | | | 431,391 | |
| Series 2018-SFR3 A (1 Month LIBOR USD + 1.000%) (a)(c) | | 07/17/2037 | | | 1.15 | % | | | 457,254 | | | | 457,254 | |
| Series 2018-SFR4 A (1 Month LIBOR USD + 1.100%) (a)(c) | | 01/19/2038 | | | 1.25 | % | | | 692,089 | | | | 697,244 | |
| Series 2018-SFR4 D (1 Month LIBOR USD + 1.650%) (a)(c) | | 01/19/2038 | | | 1.80 | % | | | 490,000 | | | | 488,809 | |
| Morgan Stanley Capital I Trust, 2004-HE6 M1 (1 Month LIBOR USD + 0.825%) (c) | | 08/25/2034 | | | 0.97 | % | | | 232,712 | | | | 229,697 | |
| MVW Owner Trust, 2019-1A A (a) | | 11/20/2036 | | | 2.89 | % | | | 728,010 | | | | 755,441 | |
| PFS Financing Corp. | | | | | | | | | | | | | | |
| Series 2020-F A (a) | | 08/15/2024 | | | 0.93 | % | | | 700,000 | | | | 704,202 | |
| Series 2020-G (a) | | 02/17/2026 | | | 0.97 | % | | | 500,000 | | | | 502,626 | |
| SoFi Professional Loan Program LLC, 2015-C A2(a) | | 08/25/2033 | | | 2.51 | % | | | 786,013 | | | | 789,288 | |
The accompanying notes are an integral part of these consolidated financial statements.
| | |
| | |
| LoCorr Market Trend Fund – Consolidated Schedule of Investments (continued) | | 43 |
| | |
| | | Maturity Date | | Coupon Rate | | | Principal Amount | | | Value | |
| ASSET BACKED SECURITIES: (continued) | | | | | | | | | | | | | | |
| Tricon American Homes Trust, 2017-SFR2 B (a) | | 01/18/2036 | | | 3.28 | % | | $ | 400,000 | | | $ | 411,636 | |
| Verizon Owner Trust | | | | | | | | | | | | | | |
| Series 2018-A A1A | | 04/20/2023 | | | 3.23 | % | | | 523,144 | | | | 530,089 | |
| Series 2019-B A1A | | 12/20/2023 | | | 2.33 | % | | | 1,080,000 | | | | 1,101,377 | |
| Series 2020-A A1A | | 07/20/2024 | | | 1.85 | % | | | 1,180,000 | | | | 1,208,328 | |
| VSE VOI Mortgage LLC, 2018-A A (a) | | 02/20/2036 | | | 3.56 | % | | | 486,461 | | | | 510,704 | |
| Wendy’s Funding LLC, 2018-1A A2I (a) | | 03/15/2048 | | | 3.57 | % | | | 213,400 | | | | 219,981 | |
| TOTAL ASSET BACKED SECURITIES (Cost $25,606,282) | | | | | | | | | | | | | 25,896,734 | |
| | | | | | | | | | | | | | | |
| CORPORATE BONDS: 21.97% | | | | | | | | | | | | | | |
| Agriculture: 0.39% | | | | | | | | | | | | | | |
| BAT Capital Corp. | | 08/15/2024 | | | 3.22 | % | | | 135,000 | | | | 146,154 | |
| BAT International Finance PLC (b) | | 03/25/2026 | | | 1.67 | % | | | 835,000 | | | | 854,722 | |
| | | | | | | | | | | | | | 1,000,876 | |
| Auto Manufacturers: 0.61% | | | | | | | | | | | | | | |
| Cummins, Inc. | | 09/01/2025 | | | 0.75 | % | | | 605,000 | | | | 609,378 | |
| General Motors Financial Co., Inc. | | 06/20/2025 | | | 2.75 | % | | | 895,000 | | | | 957,027 | |
| | | | | | | | | | | | | | 1,566,405 | |
| Banks: 10.76% | | | | | | | | | | | | | | |
| Banco Santander SA (b) | | 02/23/2023 | | | 3.13 | % | | | 540,000 | | | | 568,563 | |
| Banco Santander SA (b) | | 05/28/2025 | | | 2.75 | % | | | 230,000 | | | | 245,531 | |
| Bank of America Corp. | | 01/11/2023 | | | 3.30 | % | | | 1,740,000 | | | | 1,844,765 | |
| Bank of America Corp. (SOFR + 0.740%) (c) | | 10/24/2024 | | | 0.81 | % | | | 500,000 | | | | 504,672 | |
| Bank of America Corp. (SOFR + 1.150%) (c) | | 06/19/2026 | | | 1.32 | % | | | 1,070,000 | | | | 1,092,824 | |
| Bank of America Corp. (SOFR + 1.010%) (c) | | 10/24/2026 | | | 1.20 | % | | | 525,000 | | | | 531,990 | |
| Barclays PLC (1 Year CMT Rate + 0.800%) (b)(c) | | 12/10/2024 | | | 1.01 | % | | | 625,000 | | | | 629,431 | |
| BB&T Corp. | | 12/06/2023 | | | 3.75 | % | | | 190,000 | | | | 208,726 | |
| BNP Paribas SA (3 Month LIBOR USD + 1.111%) (a)(b)(c) | | 11/19/2025 | | | 2.82 | % | | | 750,000 | | | | 799,442 | |
| Citigroup, Inc. (3 Month LIBOR USD + 0.722%) (c) | | 01/24/2023 | | | 3.14 | % | | | 495,000 | | | | 509,003 | |
| Citigroup, Inc. (3 Month LIBOR USD + 1.023%) (c) | | 06/01/2024 | | | 4.04 | % | | | 435,000 | | | | 473,082 | |
| Citigroup, Inc. (SOFR + 0.686%) (c) | | 10/30/2024 | | | 0.78 | % | | | 1,675,000 | | | | 1,685,866 | |
| Cooperatieve Rabobank UA (b) | | 11/09/2022 | | | 3.95 | % | | | 635,000 | | | | 674,142 | |
| Credit Suisse AG (b) | | 05/05/2023 | | | 1.00 | % | | | 565,000 | | | | 573,547 | |
| Danske Bank A/S (1 Year CMT Rate + 1.730%) (a)(b)(c) | | 01/12/2023 | | | 5.00 | % | | | 630,000 | | | | 655,743 | |
| Federation des Caisses Desjardins du Quebec (a)(b) | | 09/26/2022 | | | 1.95 | % | | | 700,000 | | | | 719,870 | |
| Fifth Third Bancorp | | 05/05/2023 | | | 1.63 | % | | | 615,000 | | | | 634,324 | |
| Goldman Sachs Group, Inc. | | 02/23/2023 | | | 3.20 | % | | | 2,180,000 | | | | 2,303,429 | |
| Goldman Sachs Group, Inc. | | 04/01/2025 | | | 3.50 | % | | | 225,000 | | | | 249,973 | |
| HSBC Bank Canada (a)(b) | | 09/10/2023 | | | 1.65 | % | | | 1,130,000 | | | | 1,154,806 | |
| HSBC Holdings PLC (SOFR + 1.929%) (b)(c) | | 06/04/2026 | | | 2.10 | % | | | 515,000 | | | | 535,158 | |
| Huntington National Bank | | 04/01/2022 | | | 3.13 | % | | | 365,000 | | | | 376,803 | |
| ING Groep NV (b) | | 04/09/2024 | | | 3.55 | % | | | 540,000 | | | | 589,988 | |
| JP Morgan Chase & Co. | | 01/25/2023 | | | 3.20 | % | | | 2,140,000 | | | | 2,265,431 | |
| JP Morgan Chase & Co. (SOFR + 0.800%) (c) | | 11/19/2026 | | | 1.05 | % | | | 375,000 | | | | 379,238 | |
| Mitsubishi UFJ Financial Group, Inc. (1 Year CMT Rate + 0.680%) (b)(c) | | 09/15/2024 | | | 0.85 | % | | | 660,000 | | | | 663,935 | |
| Morgan Stanley | | 11/01/2022 | | | 4.88 | % | | | 485,000 | | | | 522,585 | |
| Morgan Stanley | | 01/23/2023 | | | 3.13 | % | | | 1,830,000 | | | | 1,931,327 | |
| National Bank of Canada (a)(b) | | 10/07/2022 | | | 2.15 | % | | | 365,000 | | | | 376,170 | |
| NatWest Markets PLC (a)(b) | | 05/21/2023 | | | 2.38 | % | | | 820,000 | | | | 853,023 | |
| Santander UK PLC (b) | | 01/13/2023 | | | 2.10 | % | | | 675,000 | | | | 697,467 | |
| Svenska Handelsbanken AB (a)(b) | | 06/30/2023 | | | 0.63 | % | | | 405,000 | | | | 407,756 | |
| UBS AG/London (a)(b) | | 04/21/2022 | | | 1.75 | % | | | 440,000 | | | | 447,829 | |
| UBS Group AG (1 Year CMT Rate + 0.830%) (a)(b)(c) | | 07/30/2024 | | | 1.01 | % | | | 200,000 | | | | 201,934 | |
| Wells Fargo & Co. | | 02/13/2023 | | | 3.45 | % | | | 625,000 | | | | 662,342 | |
| Wells Fargo & Co. (SOFR + 1.600%) (c) | | 06/02/2024 | | | 1.65 | % | | | 575,000 | | | | 591,033 | |
| | | | | | | | | | | | | | 27,561,748 | |
| Biotechnology: 0.39% | | | | | | | | | | | | | | |
| Gilead Sciences, Inc. | | 09/29/2023 | | | 0.75 | % | | | 360,000 | | | | 361,094 | |
| Royalty Pharma PLC (a)(b) | | 09/02/2023 | | | 0.75 | % | | | 625,000 | | | | 627,987 | |
| | | | | | | | | | | | | | 989,081 | |
The accompanying notes are an integral part of these consolidated financial statements.
| | |
| | |
| 44 | | LoCorr Market Trend Fund – Consolidated Schedule of Investments (continued) |
| | |
| | | Maturity Date | | Coupon Rate | | | Principal Amount | | | Value | |
| CORPORATE BONDS (continued) | | | | | | | | | | | | | | |
| Building Materials: 0.28% | | | | | | | | | | | | | | |
| Carrier Global Corp. | | 02/15/2025 | | | 2.24 | % | | $ | 680,000 | | | $ | 719,551 | |
| | | | | | | | | | | | | | | |
| Chemicals: 0.15% | | | | | | | | | | | | | | |
| DuPont de Nemours, Inc. | | 11/15/2023 | | | 4.21 | % | | | 345,000 | | | | 380,618 | |
| | | | | | | | | | | | | | | |
| Diversified Financial Services: 1.03% | | | | | | | | | | | | | | |
| Air Lease Corp. | | 07/03/2023 | | | 3.88 | % | | | 630,000 | | | | 672,714 | |
| Air Lease Corp. | | 02/01/2024 | | | 4.25 | % | | | 150,000 | | | | 162,789 | |
| Capital One Bank | | 02/15/2023 | | | 3.38 | % | | | 640,000 | | | | 676,321 | |
| GE Capital International Funding Co Unlimited Co. (b) | | 11/15/2025 | | | 3.37 | % | | | 1,005,000 | | | | 1,115,419 | |
| | | | | | | | | | | | | | 2,627,243 | |
| Electric: 0.50% | | | | | | | | | | | | | | |
| Eversource Energy | | 08/15/2025 | | | 0.80 | % | | | 75,000 | | | | 74,855 | |
| Exelon Generation Co. LLC | | 03/15/2022 | | | 3.40 | % | | | 270,000 | | | | 278,756 | |
| Exelon Generation Co. LLC | | 06/01/2025 | | | 3.25 | % | | | 195,000 | | | | 212,630 | |
| Nextera Energy Capital Holdings, Inc. | | 04/01/2022 | | | 2.90 | % | | | 695,000 | | | | 717,164 | |
| | | | | | | | | | | | | | 1,283,405 | |
| Food: 0.04% | | | | | | | | | | | | | | |
| Mondelez International, Inc. | | 04/13/2023 | | | 2.13 | % | | | 100,000 | | | | 103,865 | |
| | | | | | | | | | | | | | | |
| Healthcare - Services: 0.29% | | | | | | | | | | | | | | |
| Anthem, Inc. | | 01/15/2025 | | | 2.38 | % | | | 465,000 | | | | 497,341 | |
| UnitedHealth Group, Inc. | | 01/15/2026 | | | 1.25 | % | | | 245,000 | | | | 252,566 | |
| | | | | | | | | | | | | | 749,907 | |
| Insurance: 0.98% | | | | | | | | | | | | | | |
| American International Group, Inc. | | 06/30/2025 | | | 2.50 | % | | | 475,000 | | | | 510,623 | |
| Aon Corp. | | 11/15/2022 | | | 2.20 | % | | | 550,000 | | | | 568,465 | |
| Equitable Financial Life Global (a) | | 07/07/2025 | | | 1.40 | % | | | 530,000 | | | | 544,358 | |
| Metropolitan Life Global Funding I (a) | | 07/02/2025 | | | 0.95 | % | | | 325,000 | | | | 329,309 | |
| Voya Financial, Inc. | | 07/15/2024 | | | 3.13 | % | | | 520,000 | | | | 561,974 | |
| | | | | | | | | | | | | | 2,514,729 | |
| Media: 0.62% | | | | | | | | | | | | | | |
| Comcast Corp. | | 04/15/2024 | | | 3.70 | % | | | 1,450,000 | | | | 1,595,302 | |
| | | | | | | | | | | | | | | |
| Miscellaneous Manufacturing: 0.15% | | | | | | | | | | | | | | |
| Parker-Hannifin Corp. | | 06/14/2024 | | | 2.70 | % | | | 355,000 | | | | 380,735 | |
| | | | | | | | | | | | | | | |
| Oil & Gas: 0.84% | | | | | | | | | | | | | | |
| BP Capital Markets PLC (b) | | 03/11/2021 | | | 4.74 | % | | | 530,000 | | | | 534,287 | |
| Chevron Corp. | | 05/11/2023 | | | 1.14 | % | | | 610,000 | | | | 622,844 | |
| Diamondback Energy, Inc. | | 12/01/2024 | | | 2.88 | % | | | 300,000 | | | | 315,345 | |
| Equinor ASA (b) | | 01/22/2026 | | | 1.75 | % | | | 195,000 | | | | 204,844 | |
| Phillips 66 | | 02/15/2024 | | | 0.90 | % | | | 470,000 | | | | 471,138 | |
| | | | | | | | | | | | | | 2,148,458 | |
| Pharmaceuticals: 0.77% | | | | | | | | | | | | | | |
| AbbVie, Inc. | | 11/21/2022 | | | 2.30 | % | | | 625,000 | | | | 647,750 | |
| Bristol-Myers Squibb Co. | | 02/20/2023 | | | 3.25 | % | | | 195,000 | | | | 205,138 | |
| Bristol-Myers Squibb Co. | | 11/13/2023 | | | 0.54 | % | | | 395,000 | | | | 395,715 | |
| CVS Health Corp. | | 08/12/2024 | | | 3.38 | % | | | 665,000 | | | | 725,265 | |
| | | | | | | | | | | | | | 1,973,868 | |
| Pipelines: 0.67% | | | | | | | | | | | | | | |
| Energy Transfer Operating LP | | 05/15/2025 | | | 2.90 | % | | | 240,000 | | | | 253,911 | |
| MPLX LP | | 03/01/2026 | | | 1.75 | % | | | 640,000 | | | | 662,339 | |
| ONEOK, Inc. | | 09/01/2024 | | | 2.75 | % | | | 210,000 | | | | 221,579 | |
| TransCanada PipeLines Ltd. (b) | | 08/01/2022 | | | 2.50 | % | | | 545,000 | | | | 563,191 | |
| | | | | | | | | | | | | | 1,701,020 | |
| Real Estate Investment Trusts: 1.39% | | | | | | | | | | | | | | |
| Alexandria Real Estate Equities, Inc. | | 01/15/2024 | | | 4.00 | % | | | 565,000 | | | | 621,810 | |
The accompanying notes are an integral part of these consolidated financial statements.
| | |
| | |
| LoCorr Market Trend Fund – Consolidated Schedule of Investments (continued) | | 45 |
| | |
| | | Maturity Date | | Coupon Rate | | | Principal Amount | | | Value | |
| CORPORATE BONDS: (continued) | | | | | | | | | | | | | | |
| American Tower Corp. | | 09/15/2025 | | | 1.30 | % | | $ | 1,055,000 | | | $ | 1,077,239 | |
| Camden Property Trust | | 12/15/2022 | | | 2.95 | % | | | 395,000 | | | | 411,645 | |
| Crown Castle International Corp. | | 07/15/2025 | | | 1.35 | % | | | 430,000 | | | | 438,935 | |
| Duke Realty LP | | 04/15/2023 | | | 3.63 | % | | | 535,000 | | | | 567,180 | |
| Highwoods Realty LP | | 06/15/2021 | | | 3.20 | % | | | 100,000 | | | | 100,696 | |
| Kilroy Realty LP | | 01/15/2023 | | | 3.80 | % | | | 335,000 | | | | 350,794 | |
| | | | | | | | | | | | | | 3,568,299 | |
| Software: 0.06% | | | | | | | | | | | | | | |
| Fiserv, Inc. | | 07/01/2024 | | | 2.75 | % | | | 150,000 | | | | 161,069 | |
| | | | | | | | | | | | | | | |
| Telecommunications: 1.87% | | | | | | | | | | | | | | |
| AT&T, Inc. | | 12/01/2022 | | | 2.63 | % | | | 1,090,000 | | | | 1,130,679 | |
| AT&T, Inc. | | 05/15/2025 | | | 3.40 | % | | | 455,000 | | | | 505,710 | |
| T-Mobile USA, Inc. (a) | | 04/15/2025 | | | 3.50 | % | | | 925,000 | | | | 1,022,107 | |
| Verizon Communications, Inc. | | 09/15/2023 | | | 5.15 | % | | | 830,000 | | | | 935,279 | |
| Verizon Communications, Inc. | | 11/01/2024 | | | 3.50 | % | | | 275,000 | | | | 303,743 | |
| Verizon Communications, Inc. | | 11/20/2025 | | | 0.85 | % | | | 375,000 | | | | 377,945 | |
| Vodafone Group PLC (b) | | 01/16/2024 | | | 3.75 | % | | | 470,000 | | | | 513,596 | |
| | | | | | | | | | | | | | 4,789,059 | |
| Transportation: 0.18% | | | | | | | | | | | | | | |
| Burlington Northern Santa Fe LLC | | 09/01/2024 | | | 3.40 | % | | | 420,000 | | | | 460,838 | |
| TOTAL CORPORATE BONDS (Cost $54,710,365) | | | | | | | | | | | | | 56,276,076 | |
| | | | | | | | | | | | | | | |
| MORTGAGE BACKED SECURITIES: 10.05% | | | | | | | | | | | | | | |
| Angel Oak Mortgage Trust, 2020-1 M1 (a)(d) | | 12/25/2059 | | | 3.16 | % | | | 418,000 | | | | 416,049 | |
| BX Commercial Mortgage Trust, 2019-XL A (1 Month LIBOR USD + 0.920%) (a)(c) | | 10/15/2036 | | | 1.08 | % | | | 488,888 | | | | 489,800 | |
| Comm Mortgage Trust | | | | | | | | | | | | | | |
| Series 2013-GAM A1 (a) | | 02/11/2028 | | | 1.71 | % | | | 58,917 | | | | 58,837 | |
| Series 2016-GCT B (a) | | 08/10/2029 | | | 3.09 | % | | | 600,000 | | | | 602,324 | |
| Series 2013-CR6 A4 | | 03/10/2046 | | | 3.10 | % | | | 185,000 | | | | 191,806 | |
| Series 2013-CR6 AM (a) | | 03/12/2046 | | | 3.15 | % | | | 1,000,000 | | | | 1,039,316 | |
| Series 2013-CR10 A4 (d) | | 08/10/2046 | | | 4.21 | % | | | 185,000 | | | | 200,760 | |
| Series 2013-CR11 B (d) | | 08/12/2050 | | | 5.11 | % | | | 575,000 | | | | 624,800 | |
| Connecticut Avenue Securities Trust | | | | | | | | | | | | | | |
| Series 2020-R02 2M1 (1 Month LIBOR USD + 0.750%) (a)(c) | | 01/25/2040 | | | 0.90 | % | | | 543,461 | | | | 543,461 | |
| Series 2020-R01 1M1 (1 Month LIBOR USD + 0.800%) (a)(c) | | 01/25/2040 | | | 0.95 | % | | | 308,654 | | | | 308,899 | |
| Credit Suisse Mortgage Capital Certificates, 2019-ICE4 A | | | | | | | | | | | | | | |
| (1 Month LIBOR USD + 0.980%) (a)(c) | | 05/15/2036 | | | 1.14 | % | | | 1,000,000 | | | | 1,001,339 | |
| Fannie Mae Aces | | | | | | | | | | | | | | |
| Series 2015-M17 FA (1 Month LIBOR USD + 0.930%) (c) | | 11/25/2022 | | | 1.08 | % | | | 907,866 | | | | 910,140 | |
| Series 2014-M11 1A (d) | | 08/25/2024 | | | 3.12 | % | | | 655,116 | | | | 703,667 | |
| Fannie Mae Connecticut Avenue Securities | | | | | | | | | | | | | | |
| Series 2014-C03 1M2 (1 Month LIBOR USD + 3.000%) (c) | | 07/25/2024 | | | 3.15 | % | | | 69,591 | | | | 67,541 | |
| Series 2018-C01 1EB1 (1 Month LIBOR USD + 0.450%) (c) | | 07/25/2030 | | | 0.60 | % | | | 400,000 | | | | 390,049 | |
| FHLMC Multifamily Structured Pass Through Certificates, KF08 A | | | | | | | | | | | | | | |
| (1 Month LIBOR USD + 0.300%) (c) | | 01/25/2022 | | | 0.45 | % | | | 678,065 | | | | 676,377 | |
| Freddie Mac Structured Agency Credit Risk Debt Notes | | | | | | | | | | | | | | |
| Series 2017-DNA2 M1 (1 Month LIBOR USD + 1.200%) (c) | | 10/25/2029 | | | 1.35 | % | | | 157,216 | | | | 157,216 | |
| Series 2018-HRP2 M3 (1 Month LIBOR USD + 2.400%) (a)(c) | | 02/25/2047 | | | 2.55 | % | | | 400,000 | | | | 400,508 | |
| Series 2019-HRP1 M2 (1 Month LIBOR USD + 1.400%) (a)(c) | | 02/25/2049 | | | 1.55 | % | | | 658,330 | | | | 655,900 | |
| Series 2020-DNA1 M1 (1 Month LIBOR USD + 0.700%) (a)(c) | | 01/25/2050 | | | 0.85 | % | | | 171,057 | | | | 171,158 | |
| Series 2020-HQA1 M1 (1 Month LIBOR USD + 0.750%) (a)(c) | | 01/25/2050 | | | 0.90 | % | | | 306,620 | | | | 306,522 | |
| FRESB Multifamily Mortgage Pass Through Certificates | | | | | | | | | | | | | | |
| Series 2016-SB17 A7F (d) | | 05/25/2023 | | | 2.15 | % | | | 526,569 | | | | 534,278 | |
| Series 2017-SB31 A7F (d) | | 01/25/2024 | | | 2.46 | % | | | 632,858 | | | | 647,665 | |
| Series 2017-SB32 A7F (d) | | 04/25/2024 | | | 2.44 | % | | | 843,367 | | | | 868,303 | |
| Series 2019-SB67 A5F (d) | | 07/25/2024 | | | 2.09 | % | | | 1,240,263 | | | | 1,276,586 | |
| GS Mortgage Securities Trust | | | | | | | | | | | | | | |
| Series 2015-GC28 A5 | | 02/10/2048 | | | 3.40 | % | | | 1,000,000 | | | | 1,093,022 | |
| Series 2015-GC32 AS (d) | | 07/10/2048 | | | 4.02 | % | | | 1,000,000 | | | | 1,111,613 | |
The accompanying notes are an integral part of these consolidated financial statements.
| | |
| | |
| 46 | | LoCorr Market Trend Fund – Consolidated Schedule of Investments (continued) |
| | |
| | | Maturity Date | | Coupon Rate | | | Principal Amount | | | Value | |
| MORTGAGE BACKED SECURITIES: (continued) | | | | | | | | | | | | | | |
| JP Morgan Chase Commercial Mortgage Securities Trust | | | | | | | | | | | | | | |
| Series 2013-C13 A4 (d) | | 01/18/2046 | | | 3.99 | % | | $ | 513,180 | | | $ | 550,036 | |
| Series 2014-C22 AS | | 09/17/2047 | | | 4.11 | % | | | 685,000 | | | | 744,831 | |
| Series 2013-C10 AS | | 12/17/2047 | | | 3.37 | % | | | 200,000 | | | | 208,833 | |
| JP Morgan Mortgage Trust | | | | | | | | | | | | | | |
| Series 2016-1 A5 (a)(d) | | 05/25/2046 | | | 3.50 | % | | | 8,387 | | | | 8,389 | |
| Series 2017-1 A5 (a)(d) | | 01/25/2047 | | | 3.50 | % | | | 40,650 | | | | 40,662 | |
| Series 2017-2 A5 (a)(d) | | 05/25/2047 | | | 3.50 | % | | | 101,933 | | | | 102,304 | |
| Series 2017-3 1A5 (a)(d) | | 08/25/2047 | | | 3.50 | % | | | 41,390 | | | | 41,418 | |
| Series 2018-1 A5 (a)(d) | | 06/25/2048 | | | 3.50 | % | | | 81,251 | | | | 81,481 | |
| KKR Industrial Portfolio Trust, 2020-AIP D (1 Month LIBOR USD + 2.030%) (a)(c) | | 03/16/2037 | | | 2.19 | % | | | 289,262 | | | | 287,087 | |
| Merit, 2020-HILL A (1 Month LIBOR USD + 1.150%) (a)(c) | | 08/17/2037 | | | 1.31 | % | | | 1,350,000 | | | | 1,352,570 | |
| Natixis Commercial Mortgage Securities Trust, 2018-285M A (a)(d) | | 11/15/2032 | | | 3.79 | % | | | 1,000,000 | | | | 1,029,866 | |
| Sequoia Mortgage Trust | | | | | | | | | | | | | | |
| Series 2018-3 A4 (a)(d) | | 03/25/2048 | | | 3.50 | % | | | 277,101 | | | | 277,292 | |
| Series 2020-1 A4 (a)(d) | | 02/25/2050 | | | 3.50 | % | | | 346,704 | | | | 349,907 | |
| Series 2020-2 A4 (a)(d) | | 03/25/2050 | | | 3.50 | % | | | 636,822 | | | | 647,796 | |
| UBS Commercial Mortgage Trust, 2012-C1 A3 | | 05/12/2045 | | | 3.40 | % | | | 1,009,921 | | | | 1,029,386 | |
| Wells Fargo Commercial Mortgage Trust | | | | | | | | | | | | | | |
| Series 2012-LC5 AS | | 10/17/2045 | | | 3.54 | % | | | 165,000 | | | | 171,313 | |
| Series 2015-NXS2 A-4 | | 07/17/2058 | | | 3.50 | % | | | 1,000,000 | | | | 1,087,664 | |
| WFRBS Commercial Mortgage Trust | | | | | | | | | | | | | | |
| Series 2013-C13 AS | | 05/17/2045 | | | 3.35 | % | | | 165,000 | | | | 173,239 | |
| Series 2013-C14 A5 | | 06/15/2046 | | | 3.34 | % | | | 185,000 | | | | 195,507 | |
| Series 2014-C24 A5 | | 11/18/2047 | | | 3.61 | % | | | 1,000,000 | | | | 1,093,515 | |
| Series 2013-C12 AS | | 03/17/2048 | | | 3.56 | % | | | 780,000 | | | | 816,465 | |
| TOTAL MORTGAGE BACKED SECURITIES (Cost $25,315,780) | | | | | | | | | | | | | 25,737,497 | |
| | | | | | | | | | | | | | | |
| MUNICIPAL BONDS: 1.51% | | | | | | | | | | | | | | |
| City of Arlington TX | | 08/15/2025 | | | 0.71 | % | | | 620,000 | | | | 623,800 | |
| City of El Paso TX Water & Sewer Revenue | | 03/01/2025 | | | 0.77 | % | | | 680,000 | | | | 683,849 | |
| City of Sacramento CA Water Revenue | | 09/01/2023 | | | 1.61 | % | | | 555,000 | | | | 568,864 | |
| Pennsylvania State University | | 09/01/2023 | | | 1.35 | % | | | 940,000 | | | | 959,110 | |
| San Diego County Water Authority | | 05/01/2025 | | | 0.74 | % | | | 205,000 | | | | 207,044 | |
| State of Wisconsin | | 05/01/2026 | | | 2.10 | % | | | 780,000 | | | | 831,886 | |
| TOTAL MUNICIPAL BONDS (Cost $3,780,000) | | | | | | | | | | | | | 3,874,553 | |
| | | | | | | | | | | | | | | |
| U.S. GOVERNMENT AGENCY ISSUES: 9.48% | | | | | | | | | | | | | | |
| Federal Farm Credit Banks | | 08/14/2023 | | | 1.60 | % | | | 2,270,000 | | | | 2,351,140 | |
| Federal Home Loan Banks | | 06/10/2022 | | | 2.13 | % | | | 2,620,000 | | | | 2,695,619 | |
| Federal Home Loan Banks | | 06/10/2022 | | | 2.75 | % | | | 3,180,000 | | | | 3,300,270 | |
| Federal Home Loan Banks | | 12/09/2022 | | | 3.00 | % | | | 4,500,000 | | | | 4,751,810 | |
| Federal Home Loan Mortgage Corp. | | 07/08/2022 | | | 0.32 | % | | | 1,470,000 | | | | 1,470,010 | |
| Federal Home Loan Mortgage Corp. | | 07/20/2023 | | | 0.41 | % | | | 1,470,000 | | | | 1,472,134 | |
| Federal Home Loan Mortgage Corp. | | 08/24/2023 | | | 0.25 | % | | | 1,700,000 | | | | 1,703,351 | |
| Federal Home Loan Mortgage Corp. | | 09/08/2023 | | | 0.25 | % | | | 535,000 | | | | 536,039 | |
| Federal National Mortgage Association | | 09/06/2022 | | | 1.38 | % | | | 2,310,000 | | | | 2,359,155 | |
| Federal National Mortgage Association | | 07/10/2023 | | | 0.25 | % | | | 2,000,000 | | | | 2,004,776 | |
| Federal National Mortgage Association | | 08/25/2025 | | | 0.38 | % | | | 1,630,000 | | | | 1,629,643 | |
| TOTAL U.S. GOVERNMENT AGENCY ISSUES (Cost $23,704,150) | | | | | | | | | | | | | 24,273,947 | |
| | | | | | | | | | | | | | | |
| U.S. GOVERNMENT NOTES: 25.34% | | | | | | | | | | | | | | |
| United States Treasury Note | | 03/31/2022 | | | 1.88 | % | | | 3,160,000 | | | | 3,229,125 | |
| United States Treasury Note | | 11/30/2022 | | | 0.13 | % | | | 770,000 | | | | 770,090 | |
| United States Treasury Note | | 01/31/2023 | | | 2.38 | % | | | 5,360,000 | | | | 5,609,575 | |
| United States Treasury Note | | 03/31/2023 | | | 1.50 | % | | | 180,000 | | | | 185,484 | |
The accompanying notes are an integral part of these consolidated financial statements.
| | |
| | |
| LoCorr Market Trend Fund – Consolidated Schedule of Investments (continued) | | 47 |
| | |
| | | Maturity Date | | Coupon Rate | | | Principal Amount | | | Value | |
| U.S. GOVERNMENT NOTES: (continued) | | | | | | | | | | | | | | |
| United States Treasury Note | | 05/15/2023 | | | 1.75 | % | | $ | 2,260,000 | | | $ | 2,345,986 | |
| United States Treasury Note | | 06/30/2023 | | | 2.63 | % | | | 3,250,000 | | | | 3,450,078 | |
| United States Treasury Note | | 09/30/2023 | | | 2.88 | % | | | 1,230,000 | | | | 1,321,337 | |
| United States Treasury Note | | 02/15/2024 | | | 2.75 | % | | | 3,155,000 | | | | 3,408,016 | |
| United States Treasury Note | | 03/31/2024 | | | 2.13 | % | | | 1,815,000 | | | | 1,928,367 | |
| United States Treasury Note | | 05/15/2024 | | | 2.50 | % | | | 1,885,000 | | | | 2,031,235 | |
| United States Treasury Note | | 06/30/2024 | | | 2.00 | % | | | 10,025,000 | | | | 10,651,954 | |
| United States Treasury Note | | 09/30/2024 | | | 1.50 | % | | | 9,730,000 | | | | 10,188,754 | |
| United States Treasury Note | | 01/31/2025 | | | 1.38 | % | | | 1,090,000 | | | | 1,139,050 | |
| United States Treasury Note | | 02/15/2025 | | | 7.63 | % | | | 900,000 | | | | 1,171,442 | |
| United States Treasury Note | | 03/31/2025 | | | 2.63 | % | | | 1,400,000 | | | | 1,538,141 | |
| United States Treasury Note | | 05/15/2025 | | | 2.13 | % | | | 4,335,000 | | | | 4,678,752 | |
| United States Treasury Note | | 05/31/2025 | | | 0.25 | % | | | 1,990,000 | | | | 1,986,191 | |
| United States Treasury Note | | 07/31/2025 | | | 0.25 | % | | | 5,445,000 | | | | 5,429,048 | |
| United States Treasury Note | | 10/31/2025 | | | 0.25 | % | | | 3,860,000 | | | | 3,843,414 | |
| TOTAL U.S. GOVERNMENT NOTES (Cost $63,520,993) | | | | | | | | | | | | | 64,906,039 | |
| | | | | | | | | | | | | | | |
| SHORT TERM INVESTMENTS: 6.89% | | | | | | | | | | | | | | |
| CORPORATE BOND: 0.28% | | | | | | | | | | | | | | |
| Insurance: 0.28% | | | | | | | | | | | | | | |
| Berkshire Hathaway, Inc. | | 03/15/2021 | | | 2.20 | % | | | 710,000 | | | | 711,538 | |
| TOTAL CORPORATE BOND (Cost $709,486) | | | | | | | | | | | | | 711,538 | |
| | | | | | | | | | | | | | | |
| MONEY MARKET FUND: 6.61% | | | | | | | | | Shares | | | | | |
| STIT-Government & Agency Portfolio, Institutional Class, 0.03% (e) | | | | | | | | | 16,924,215 | | | | 16,924,215 | |
| TOTAL MONEY MARKET FUND (Cost $16,924,215) | | | | | | | | | | | | | 16,924,215 | |
| TOTAL SHORT TERM INVESTMENTS (Cost $17,633,701) | | | | | | | | | | | | | 17,635,753 | |
| | | | | | | | | | | | | | | |
| TOTAL INVESTMENTS (Cost $214,271,271): 85.35% | | | | | | | | | | | | | 218,600,599 | |
| Other Assets in Excess of Liabilities: 14.65% (f) | | | | | | | | | | | | | 37,516,434 | |
| TOTAL NET ASSETS: 100.00% | | | | | | | | | | | | $ | 256,117,033 | |
| (a) | Security as defined in Rule 144A under the Securities Act of 1933 and determined to be liquid. Purchased in a private placement transaction; resale to the public may require registration or may extend only to qualified institutional buyers. At December 31, 2020, the value of these securities total $29,733,529 which represents 11.61% of total net assets. |
| (b) | Foreign issued security. |
| (c) | Variable rate security based on a reference index and spread. The rate reported is the rate in effect as of December 31, 2020. |
| (d) | Variable rate security. The coupon is based on an underlying pool of loans. The rate reported is the rate in effect as of December 31, 2020. |
| (e) | The rate quoted is the annualized seven-day effective yield as of December 31, 2020. |
| (f) | Includes assets pledged as collateral and deposits with broker for derivative contracts. See Note 2. At December 31, 2020, the value of these assets totals $29,119,302. |
| CMT | Constant Maturity Treasury |
| LIBOR | London Interbank Offered Rate |
| PLC | Public Limited Company |
| SOFR | Secured Overnight Financing Rate |
The accompanying notes are an integral part of these consolidated financial statements.
| | |
| | |
| 48 | | LoCorr Market Trend Fund - Consolidated Schedule of Open Forward Currency Contracts |
| | |
LoCorr Market Trend Fund
Consolidated Schedule of Open Forward Currency Contracts(a)
December 31, 2020
| | | | | | | | Currency to be Received | | | Currency to be Delivered | | | | | | | |
| | | Notional
Amount | | | Forward
Settlement Date | | Curr
Abbr. | | U.S. $ Notional
Amount at
December 31, 2020 | | | Curr
Abbr. | | U.S. $ Notional
Amount on
Origination Date | | | Unrealized
Appreciation | | | Unrealized
(Depreciation) | |
| Purchase Contracts: | | | | | | | | | | | | | | | | | | | | | | | | | | |
| | $ | 35,104,572 | | | 03/19/2021 | | AUD | | $ | 36,176,933 | | | USD | | $ | 35,104,572 | | | $ | 1,072,361 | | | $ | – | |
| | | | 17,191,654 | | | 03/19/2021 | | CAD | | | 17,260,333 | | | USD | | | 17,191,654 | | | | 68,679 | | | | – | |
| | | | 46,224,463 | | | 03/19/2021 | | CHF | | | 46,371,682 | | | USD | | | 46,224,463 | | | | 147,219 | | | | – | |
| | | | 62,288,196 | | | 03/19/2021 | | EUR | | | 62,814,679 | | | USD | | | 62,288,196 | | | | 526,483 | | | | – | |
| | | | 54,806,092 | | | 03/19/2021 | | GBP | | | 55,773,398 | | | USD | | | 54,806,092 | | | | 967,306 | | | | – | |
| | | | 114,836,061 | | | 03/19/2021 | | JPY | | | 115,809,292 | | | USD | | | 114,836,061 | | | | 973,231 | | | | – | |
| | | | 15,272,954 | | | 03/19/2021 | | MXN | | | 15,174,372 | | | USD | | | 15,272,954 | | | | – | | | | (98,582 | ) |
| | | | 23,091,516 | | | 03/19/2021 | | NZD | | | 23,519,471 | | | USD | | | 23,091,516 | | | | 427,955 | | | | – | |
| Total Purchase Contracts | | | | | | | | | | | 372,900,160 | | | | | | 368,815,508 | | | | 4,183,234 | | | | (98,582 | ) |
| Sale Contracts: | | | | | | | | | | | | | | | | | | | | |
| |
| $ | 8,945,270 | | | 03/19/2021 | | USD | | $ | 9,106,913 | | | AUD | | $ | 8,945,270 | | | $ | – | | | $ | (161,643 | ) |
| | | | 1,310,535 | | | 03/19/2021 | | USD | | | 1,317,745 | | | CAD | | | 1,310,535 | | | | – | | | | (7,210 | ) |
| | | | 2,328,129 | | | 03/19/2021 | | USD | | | 2,324,415 | | | CHF | | | 2,328,129 | | | | 3,714 | | | | – | |
| | | | 20,024,189 | | | 03/19/2021 | | USD | | | 19,977,922 | | | EUR | | | 20,024,189 | | | | 46,267 | | | | – | |
| | | | 27,935,331 | | | 03/19/2021 | | USD | | | 28,511,269 | | | GBP | | | 27,935,331 | | | | – | | | | (575,938 | ) |
| | | | 74,864,104 | | | 03/19/2021 | | USD | | | 74,960,232 | | | JPY | | | 74,864,104 | | | | – | | | | (96,128 | ) |
| | | | 475,569 | | | 03/19/2021 | | USD | | | 476,313 | | | MXN | | | 475,569 | | | | – | | | | (744 | ) |
| | | | 689,879 | | | 03/19/2021 | | USD | | | 693,104 | | | NZD | | | 689,879 | | | | – | | | | (3,225 | ) |
| Total Sale Contracts | |
| | | 137,367,913 | | | | | | 136,573,006 | | | | 49,981 | | | | (844,888 | ) |
| Net Forward Currency Contracts |
| | $ | 235,532,247 | | | | | $ | 232,242,502 | | | $ | 4,233,215 | | | $ | (943,470 | ) |
| Net Unrealized Appreciation | |
| | |
| | |
| | |
| | | $ | 3,289,745 | | | |
| |
Currency Abbreviations:
| (a) | Bank of America Merrill Lynch is the counterparty for all open forward currency exchange contracts held by the Fund as of December 31, 2020. |
The accompanying notes are an integral part of these consolidated financial statements.
| | |
| | |
| LoCorr Market Trend Fund - Consolidated Schedule of Open Futures Contracts | | 49 |
| | |
LoCorr Market Trend Fund
Consolidated Schedule of Open Futures Contracts
December 31, 2020
| | | | | | | | | | | | | | Value | |
| Description | | | Number of Contracts Purchased (Sold) | | | Settlement
Month-Year | | | Current Notional Amount | | | | Notional Amount at Trade Date | | | | Unrealized Appreciation | | | | Unrealized (Depreciation) | |
| Purchase Contracts: | | | | | | | | | | | | | | | | | | | | | | |
| 3 Mo Euro Euribor | | | 873 | | | Jun-22 | | $ | 268,076,600 | | | $ | 268,116,506 | | | $ | – | | | $ | (39,906 | ) |
| 90 Day Euro | | | 1,697 | | | Jun-22 | | | 423,443,925 | | | | 423,351,284 | | | | 92,641 | | | | – | |
| 90 Day Sterling | | | 1,263 | | | Dec-21 | | | 216,034,815 | | | | 215,831,956 | | | | 202,859 | | | | – | |
| Aluminum (a)(b) | | | 145 | | | Mar-21 | | | 7,168,438 | | | | 6,666,601 | | | | 501,837 | | | | – | |
| Australian 10 Yr Bond | | | 236 | | | Mar-21 | | | 26,787,682 | | | | 26,660,780 | | | | 126,902 | | | | – | |
| CAC 40 10 Euro Index | | | 122 | | | Jan-21 | | | 8,259,819 | | | | 8,295,725 | | | | – | | | | (35,906 | ) |
| Canadian 10 Yr Bond | | | 555 | | | Mar-21 | | | 65,009,427 | | | | 64,815,989 | | | | 193,438 | | | | – | |
| Cocoa (a) | | | 46 | | | Mar-21 | | | 1,092,662 | | | | 1,036,729 | | | | 55,933 | | | | – | |
| Coffee (a) | | | 89 | | | Mar-21 | | | 4,280,344 | | | | 4,198,044 | | | | 82,300 | | | | – | |
| Copper (a)(b) | | | 117 | | | Mar-21 | | | 22,717,744 | | | | 19,965,518 | | | | 2,752,226 | | | | – | |
| Corn (a) | | | 413 | | | Mar-21 | | | 9,994,600 | | | | 8,510,458 | | | | 1,484,142 | | | | – | |
| Cotton No.2 (a) | | | 76 | | | Mar-21 | | | 2,968,560 | | | | 2,688,978 | | | | 279,582 | | | | – | |
| DAX Index | | | 20 | | | Mar-21 | | | 8,396,350 | | | | 8,431,326 | | | | – | | | | (34,976 | ) |
| Dow Jones Industrial Average Mini E-Cbot Index | | | 119 | | | Mar-21 | | | 18,145,715 | | | | 17,830,341 | | | | 315,374 | | | | – | |
| Euro-Bobl | | | 621 | | | Mar-21 | | | 102,552,964 | | | | 102,510,687 | | | | 42,277 | | | | – | |
| Euro-Bund | | | 221 | | | Mar-21 | | | 47,959,784 | | | | 47,794,065 | | | | 165,719 | | | | – | |
| Euro-Schatz | | | 621 | | | Mar-21 | | | 85,176,314 | | | | 85,216,051 | | | | – | | | | (39,737 | ) |
| Euro-Stoxx 50 Index | | | 152 | | | Mar-21 | | | 6,591,984 | | | | 6,635,509 | | | | – | | | | (43,525 | ) |
| FTSE 100 Index | | | 51 | | | Mar-21 | | | 4,477,477 | | | | 4,589,727 | | | | – | | | | (112,250 | ) |
| Gasoline RBOB (a) | | | 89 | | | Feb-21 | | | 5,270,954 | | | | 5,081,385 | | | | 189,569 | | | | – | |
| Gold (a) | | | 56 | | | Feb-21 | | | 10,612,560 | | | | 10,567,620 | | | | 44,940 | | | | – | |
| Hang Seng Index | | | 43 | | | Jan-21 | | | 7,548,691 | | | | 7,373,338 | | | | 175,353 | | | | – | |
| Hard Red Wheat (a) | | | 162 | | | Mar-21 | | | 4,888,350 | | | | 4,585,421 | | | | 302,929 | | | | – | |
| Long Gilt | | | 342 | | | Mar-21 | | | 63,390,148 | | | | 62,908,633 | | | | 481,515 | | | | – | |
| Nasdaq 100 E-Mini Index | | | 28 | | | Mar-21 | | | 7,215,880 | | | | 7,155,391 | | | | 60,489 | | | | – | |
| Nikkei 225 Index | | | 94 | | | Mar-21 | | | 24,980,485 | | | | 24,146,881 | | | | 833,604 | | | | – | |
| Russell 2000 Mini Index | | | 142 | | | Mar-21 | | | 14,021,080 | | | | 13,999,642 | | | | 21,438 | | | | – | |
| S&P 500 E-Mini Index | | | 79 | | | Mar-21 | | | 14,807,760 | | | | 14,573,662 | | | | 234,098 | | | | – | |
| Silver (a) | | | 66 | | | Mar-21 | | | 8,715,960 | | | | 8,324,709 | | | | 391,251 | | | | – | |
| Soybean (a) | | | 211 | | | Mar-21 | | | 13,831,047 | | | | 11,103,512 | | | | 2,727,535 | | | | – | |
| Soybean Meal (a) | | | 101 | | | Mar-21 | | | 4,336,940 | | | | 3,962,790 | | | | 374,150 | | | | – | |
| Soybean Oil (a) | | | 89 | | | Mar-21 | | | 2,264,160 | | | | 2,013,177 | | | | 250,983 | | | | – | |
| Sugar (a) | | | 211 | | | Mar-21 | | | 3,660,597 | | | | 3,202,510 | | | | 458,087 | | | | – | |
| Tokyo Price Index | | | 134 | | | Mar-21 | | | 23,418,043 | | | | 22,881,087 | | | | 536,956 | | | | – | |
| U.S. 10 Yr Note | | | 58 | | | Mar-21 | | | 8,008,531 | | | | 7,995,839 | | | | 12,692 | | | | – | |
| U.S. 2 Yr Note | | | 982 | | | Mar-21 | | | 216,998,984 | | | | 216,801,346 | | | | 197,638 | | | | – | |
| U.S. 5 Yr Note | | | 1,598 | | | Mar-21 | | | 201,610,173 | | | | 201,152,139 | | | | 458,034 | | | | – | |
| Wheat (a) | | | 178 | | | Mar-21 | | | 5,700,450 | | | | 5,353,827 | | | | 346,623 | | | | – | |
| Zinc (a)(b) | | | 81 | | | Mar-21 | | | 5,567,393 | | | | 5,301,585 | | | | 265,808 | | | | – | |
| Total Purchase Contracts | | | | | | | | | | | | | | | | | 14,658,922 | | | | (306,300 | ) |
| Sale Contracts: | | | | | | | | | | | | | | | | | | | | | | |
| 10 Yr Mini JGB | | | (14 | ) | | Mar-21 | | $ | 2,058,748 | | | $ | 2,061,364 | | | $ | 2,616 | | | $ | – | |
| Aluminum (a)(b) | | | (13 | ) | | Mar-21 | | | 642,688 | | | | 623,741 | | | | – | | | | (18,947 | ) |
| Brent Crude (a) | | | (3 | ) | | Mar-21 | | | 155,400 | | | | 153,196 | | | | – | | | | (2,204 | ) |
| Copper (a)(b) | | | (54 | ) | | Mar-21 | | | 10,485,113 | | | | 10,466,393 | | | | – | | | | (18,720 | ) |
| Dollar | | | (76 | ) | | Mar-21 | | | 6,831,944 | | | | 6,868,247 | | | | 36,303 | | | | – | |
| Heating Oil (a) | | | (3 | ) | | Feb-21 | | | 186,984 | | | | 190,166 | | | | 3,182 | | | | – | |
| Japanese 10 Yr Bond | | | (60 | ) | | Mar-21 | | | 88,278,534 | | | | 88,341,418 | | | | 62,884 | | | | – | |
| Low Sulphur Gasoil (a) | | | (15 | ) | | Feb-21 | | | 634,500 | | | | 648,307 | | | | 13,807 | | | | – | |
| Natural Gas (a) | | | (243 | ) | | Feb-21 | | | 6,169,770 | | | | 6,470,441 | | | | 300,671 | | | | – | |
| U.S. Long Bond | | | (104 | ) | | Mar-21 | | | 18,011,500 | | | | 17,980,247 | �� | | | – | | | | (31,253 | ) |
| WTI Crude (a) | | | (56 | ) | | Feb-21 | | | 2,717,120 | | | | 2,636,972 | | | | – | | | | (80,148 | ) |
| Zinc (a)(b) | | | (5 | ) | | Mar-21 | | | 343,666 | | | | 336,824 | | | | – | | | | (6,842 | ) |
| Total Sale Contracts | | | | | | | | | | | | | | | | $ | 419,463 | | | $ | (158,114 | ) |
| Total Futures Contracts | | | | | | | | | | | | | | | | $ | 15,078,385 | | | $ | (464,414 | ) |
| Net Unrealized Appreciation | | | | | | | | | | | | | | | | $ | 14,613,971 | | | | | |
| (a) | Contract held by LCMT Fund Limited. |
| (b) | London Metal Exchange (‘’LME’’) futures contracts settle on their respective maturity date. The unrealized appreciation on these contracts is a receivable for unsettled open futures contracts and the unrealized depreciation is a payable for unsettled open futures contracts on the Fund’s consolidated statement of assets and liabilities. |
The accompanying notes are an integral part of these consolidated financial statements.
| |
| |
| 50 | | LoCorr Dynamic Equity Fund - Schedule of Investments |
| |
LoCorr Dynamic Equity Fund
Composition of Investment Portfolio1
December 31, 2020 (Unaudited)
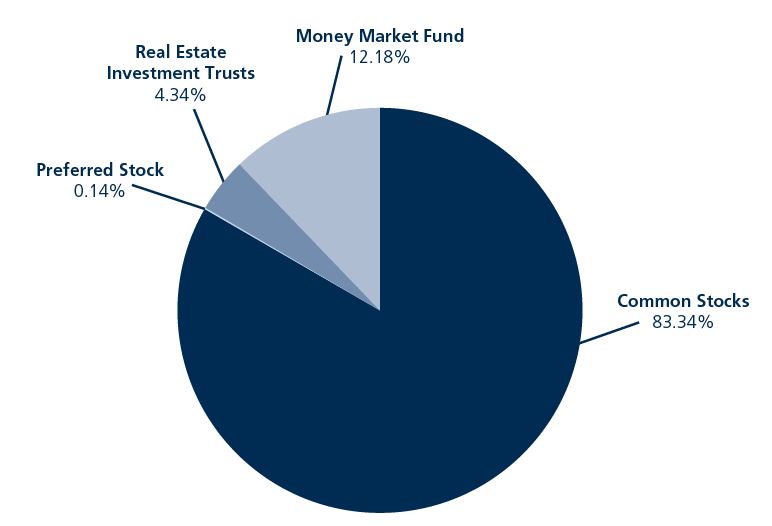
| 1 | As a percentage of total investments. |
Schedule of Investments
December 31, 2020
| | | Shares | | | Value | |
| COMMON STOCKS: 74.93% | | | | | | | | |
| Advertising: 0.22% | | | | | | | | |
| Fluent, Inc. (a) | | | 5,872 | | | $ | 31,180 | |
| Marchex, Inc. (a) | | | 4,862 | | | | 9,530 | |
| | | | | | | | 40,710 | |
| Aerospace & Defense: 0.14% | | | | | | | | |
| Dassault Aviation SA (a)(b) | | | 4 | | | | 4,383 | |
| Howmet Aerospace, Inc. | | | 767 | | | | 21,890 | |
| | | | | | | | 26,273 | |
| Agriculture: 1.82% | | | | | | | | |
| Philip Morris International, Inc. | | | 271 | | | | 22,436 | |
| Turning Point Brands, Inc. | | | 6,893 | | | | 307,152 | |
| | | | | | | | 329,588 | |
| Airlines: 3.97% | | | | | | | | |
| Allegiant Travel Co. | | | 3,510 | | | | 664,232 | |
| SkyWest, Inc. | | | 1,308 | | | | 52,726 | |
| | | | | | | | 716,958 | |
| Apparel: 0.42% | | | | | | | | |
| ASICS Corp. (b) | | | 900 | | | | 17,258 | |
| Hanesbrands, Inc. | | | 3,978 | | | | 58,000 | |
| | | | | | | | 75,258 | |
| Auto Manufacturers: 0.47% | | | | | | | | |
| Honda Motor Co. Ltd. (b) | | | 600 | | | | 16,721 | |
| Mazda Motor Corp. (b) | | | 3,000 | | | | 20,105 | |
| Renault SA (a)(b) | | | 529 | | | | 23,110 | |
| Tesla Motors, Inc. (a) | | | 36 | | | | 25,404 | |
| | | | | | | | 85,340 | |
| Auto Parts & Equipment: 0.55% | | | | | | | | |
| Cooper-Standard Holdings, Inc. (a) | | | 569 | | | | 19,727 | |
| Goodyear Tire & Rubber Co./The | | | 1,330 | | | | 14,510 | |
| NGK Spark Plug Co. Ltd. (b) | | | 1,100 | | | | 18,782 | |
| Nifco, Inc. (b) | | | 300 | | | | 11,752 | |
| Superior Industries International, Inc. (a) | | | 3,884 | | | | 15,886 | |
| Titan Machinery, Inc. | | | 3,982 | | | | 19,353 | |
| | | | | | | | 100,010 | |
The accompanying notes are an integral part of these financial statements.
| | |
| | |
| LoCorr Dynamic Equity Fund – Schedule of Investments (continued) | | 51 |
| | |
| | | Shares | | | Value | |
| COMMON STOCKS: (continued) | | | | | | | | |
| Banks: 4.87% | | | | | | | | |
| Chiba Bank Ltd./The (b) | | | 3,400 | | | $ | 18,703 | |
| Citizens Financial Group, Inc. | | | 620 | | | | 22,171 | |
| Deutsche Bank AG (a)(b) | | | 1,215 | | | | 13,283 | |
| Flagstar Bancorp, Inc. | | | 548 | | | | 22,337 | |
| Fukuoka Financial Group, Inc. (b) | | | 1,000 | | | | 17,752 | |
| Israel Discount Bank Ltd. (b) | | | 1,711 | | | | 6,581 | |
| Mediobanca Banca di Credito Finanziario SpA (a)(b) | | | 957 | | | | 8,815 | |
| Raiffeisen Bank International AG (a)(b) | | | 275 | | | | 5,604 | |
| Wells Fargo & Co. | | | 25,327 | | | | 764,369 | |
| | | | | | | | 879,615 | |
| Beverages: 0.23% | | | | | | | | |
| Brown-Forman Corp. | | | 52 | | | | 4,130 | |
| Fevertree Drinks PLC (b) | | | 628 | | | | 21,702 | |
| Vitasoy International Holdings Ltd. (b) | | | 4,000 | | | | 15,582 | |
| | | | | | | | 41,414 | |
| Biotechnology: 1.40% | | | | | | | | |
| Argenx SE (a)(b) | | | 74 | | | | 21,877 | |
| Avid Bioservices, Inc. (a) | | | 1,791 | | | | 20,668 | |
| Biogen, Inc. (a) | | | 80 | | | | 19,589 | |
| CytomX Therapeutics, Inc. (a) | | | 2,699 | | | | 17,678 | |
| Genmab A/S (a)(b) | | | 55 | | | | 22,235 | |
| GlycoMimetics, Inc. (a) | | | 5,507 | | | | 20,706 | |
| Incyte Corp. (a) | | | 148 | | | | 12,873 | |
| Ionis Pharmaceuticals, Inc.(a) | | | 390 | | | | 22,051 | |
| MorphoSys AG (a)(b) | | | 55 | | | | 6,304 | |
| Otonomy, Inc. (a) | | | 3,967 | | | | 25,667 | |
| Precision BioSciences, Inc.(a) | | | 99 | | | | 826 | |
| Sangamo Therapeutics, Inc.(a) | | | 146 | | | | 2,278 | |
| Strongbridge Biopharma PLC (a)(b) | | | 7,982 | | | | 19,396 | |
| Sutro Biopharma, Inc.(a) | | | 989 | | | | 21,471 | |
| Synlogic, Inc.(a) | | | 8,644 | | | | 18,671 | |
| | | | | | | | 252,290 | |
| Building Materials: 0.79% | | | | | | | | |
| AGC, Inc. (b) | | | 500 | | | | 17,433 | |
| Boise Cascade Co. | | | 448 | | | | 21,414 | |
| Carrier Global Corp. | | | 583 | | | | 21,991 | |
| LIXIL Group Corp. (b) | | | 900 | | | | 19,472 | |
| Louisiana-Pacific Corp. | | | 611 | | | | 22,711 | |
| Taiheiyo Cement Corp. (b) | | | 700 | | | | 17,484 | |
| Xinyi Glass Holdings Ltd. (b) | | | 8,000 | | | | 22,341 | |
| | | | | | | | 142,846 | |
| Chemicals: 0.90% | | | | | | | | |
| Akzo Nobel NV (b) | | | 214 | | | | 22,969 | |
| Denka Co. Ltd. (b) | | | 600 | | | | 23,418 | |
| Evonik Industries AG (b) | | | 147 | | | | 4,791 | |
| K+S AG (b) | | | 428 | | | | 4,072 | |
| LANXESS AG (b) | | | 305 | | | | 23,384 | |
| Mitsubishi Gas Chemical Co., Inc. (b) | | | 1,000 | | | | 22,943 | |
| Mitsui Chemicals, Inc. (b) | | | 700 | | | | 20,508 | |
| RPM International, Inc. | | | 220 | | | | 19,972 | |
| Sumitomo Chemical Co. Ltd. (b) | | | 5,000 | | | | 20,096 | |
| | | | | | | | 162,153 | |
| Commercial Services: 5.24% | | | | | | | | |
| AMERCO | | | 20 | | | | 9,079 | |
| AMN Healthcare Services, Inc. (a) | | | 862 | | | | 58,832 | |
| Ashtead Group PLC (b) | | | 456 | | | | 21,439 | |
| Gartner, Inc. (a) | | | 127 | | | | 20,344 | |
| Hill International, Inc. (a) | | | 10,352 | | | | 19,876 | |
| Insperity, Inc. | | | 7,323 | | | | 596,239 | |
| MoneyGram International, Inc. (a) | | | 1,958 | | | | 10,700 | |
| Nielsen Holdings PLC (b) | | | 4,036 | | | | 84,231 | |
| Persol Holdings Co. Ltd. (b) | | | 1,200 | | | | 21,628 | |
| Rollins, Inc. | | | 491 | | | | 19,183 | |
| Sabre Corp. | | | 5,811 | | | | 69,848 | |
| TechnoPro Holdings, Inc. (b) | | | 200 | | | | 16,561 | |
| | | | | | | | 947,960 | |
The accompanying notes are an integral part of these financial statements.
| | |
| | |
| 52 | | LoCorr Dynamic Equity Fund – Schedule of Investments (continued) |
| | |
| | | | | | | |
| | | Shares | | | Value | |
| COMMON STOCKS: (continued) | | | | | | | | |
| Computers: 0.47% | | | | | | | | |
| Bechtle AG (b) | | | 92 | | | $ | 20,051 | |
| HP, Inc. | | | 764 | | | | 18,787 | |
| Logitech International SA (b) | | | 212 | | | | 20,575 | |
| NTT Data Corp. (b) | | | 300 | | | | 4,099 | |
| Zscaler, Inc. (a) | | | 105 | | | | 20,969 | |
| | | | | | | | 84,481 | |
| Cosmetics & Personal Care: 1.09% | | | | | | | | |
| Coty, Inc. | | | 25,349 | | | | 177,950 | |
| Procter & Gamble Company/The | | | 139 | | | | 19,340 | |
| | | | | | | | 197,290 | |
| Distribution & Wholesale: 0.45% | | | | | | | | |
| Bunzl PLC (b) | | | 686 | | | | 22,918 | |
| Mitsubishi Corp. (b) | | | 400 | | | | 9,843 | |
| Rexel SA (a)(b) | | | 1,326 | | | | 20,889 | |
| Sumitomo Corp. (b) | | | 1,500 | | | | 19,837 | |
| Toyota Tsusho Corp. (b) | | | 200 | | | | 8,067 | |
| | | | | | | | 81,554 | |
| Diversified Financial Services: 9.45% | | | | | | | | |
| Ally Financial, Inc. | | | 3,361 | | | | 119,853 | |
| Capital One Financial Corp. | | | 4,621 | | | | 456,786 | |
| Credit Acceptance Corp. (a) | | | 2,808 | | | | 971,961 | |
| Hargreaves Lansdown PLC (b) | | | 1,080 | | | | 22,523 | |
| LendingTree, Inc. (a) | | | 426 | | | | 116,634 | |
| Silvercrest Asset Management Group, Inc. | | | 1,458 | | | | 20,252 | |
| | | | | | | | 1,708,009 | |
| Electric: 0.70% | | | | | | | | |
| Ameren Corp. | | | 249 | | | | 19,437 | |
| Contact Energy Ltd. (b) | | | 779 | | | | 4,994 | |
| DTE Energy Co. | | | 156 | | | | 18,940 | |
| Entergy Corp. | | | 196 | | | | 19,569 | |
| IDACORP, Inc. | | | 43 | | | | 4,129 | |
| OGE Energy Corp. | | | 623 | | | | 19,849 | |
| Vistra Energy Corp. | | | 1,135 | | | | 22,314 | |
| Xcel Energy, Inc. | | | 266 | | | | 17,734 | |
| | | | | | | | 126,966 | |
| Electrical Components & Equipment: 0.35% | | | | | | | | |
| Brother Industries Ltd. (b) | | | 300 | | | | 6,177 | |
| Legrand SA (b) | | | 265 | | | | 23,633 | |
| Signify NV (a)(b) | | | 512 | | | | 21,598 | |
| Ultralife Corp. (a) | | | 1,733 | | | | 11,212 | |
| | | | | | | | 62,620 | |
| Electronics: 0.49% | | | | | | | | |
| Anritsu Corp. (b) | | | 800 | | | | 17,851 | |
| Atkore International Group, Inc. (a) | | | 103 | | | | 4,234 | |
| Fortive Corp. | | | 276 | | | | 19,546 | |
| Mettler-Toledo International, Inc. (a) | | | 16 | | | | 18,235 | |
| TTM Technologies, Inc. (a) | | | 652 | | | | 8,994 | |
| Yokogawa Electric Corp. (b) | | | 1,000 | | | | 19,893 | |
| | | | | | | | 88,753 | |
| Engineering & Construction: 9.25% | | | | | | | | |
| Frontdoor, Inc. (a) | | | 14,113 | | | | 708,614 | |
| MasTec, Inc. (a) | | | 13,560 | | | | 924,521 | |
| NWS Holdings Ltd. (b) | | | 21,000 | | | | 19,476 | |
| Singapore Technologies Engineering Ltd. (b) | | | 6,700 | | | | 19,366 | |
| | | | | | | | 1,671,977 | |
| Entertainment: 0.77% | | | | | | | | |
| Cinemark Holdings, Inc. | | | 3,615 | | | | 62,937 | |
| Red Rock Resorts, Inc. | | | 3,038 | | | | 76,072 | |
| | | | | | | | 139,009 | |
| Environmental Control: 0.11% | | | | | | | | |
| Kurita Water Industries Ltd. (b) | | | 500 | | | | 19,103 | |
| | | | | | | | | |
| Food: 1.61% | | | | | | | | |
| Associated British Foods PLC (a)(b) | | | 639 | | | | 19,784 | |
| Carrefour SA (b) | | | 1,280 | | | | 21,939 | |
| Chocoladefabriken Lindt & Spruengli AG (b) | | | 2 | | | | 19,496 | |
| Colruyt (b) | | | 358 | | | | 21,198 | |
The accompanying notes are an integral part of these consoidated financial statements.
| | |
| | |
| LoCorr Dynamic Equity Fund – Schedule of Investments (continued) | | | 53 |
| | |
| | | | | | | |
| | | Shares | | | Value | |
| COMMON STOCKS: (continued) | | | | | | | | |
| HelloFresh SE (a)(b) | | | 330 | | | $ | 25,479 | |
| ICA Gruppen AB (b) | | | 288 | | | | 14,383 | |
| J Sainsbury PLC (b) | | | 7,159 | | | | 22,076 | |
| Kerry Group PLC (b) | | | 4 | | | | 579 | |
| Koninklijke Ahold Delhaize NV (b) | | | 767 | | | | 21,654 | |
| Lamb Weston Holdings, Inc. | | | 256 | | | | 20,158 | |
| Orkla ASA (b) | | | 1,987 | | | | 20,161 | |
| Salmar ASA (b) | | | 356 | | | | 20,909 | |
| Sysco Corp. | | | 310 | | | | 23,021 | |
| Tate & Lyle PLC (b) | | | 2,379 | | | | 21,940 | |
| WH Group Ltd. (b) | | | 22,000 | | | | 18,446 | |
| | | | | | | | 291,223 | |
| Gas: 0.57% | | | | | | | | |
| Centrica PLC (a)(b) | | | 33,258 | | | | 21,194 | |
| Enagas SA (b) | | | 935 | | | | 20,520 | |
| Italgas SpA (b) | | | 3,138 | | | | 19,934 | |
| NiSource, Inc. | | | 866 | | | | 19,866 | |
| UGI Corp. | | | 613 | | | | 21,431 | |
| | | | | | | | 102,945 | |
| Hand & Machine Tools: 0.08% | | | | | | | | |
| Techtronic Industries Co. Ltd. (b) | | | 1,000 | | | | 14,266 | |
| | | | | | | | | |
| Healthcare-Products: 1.26% | | | | | | | | |
| Avantor, Inc. (a) | | | 710 | | | | 19,986 | |
| Conformis, Inc. (a) | | | 30,286 | | | | 19,989 | |
| DiaSorin SpA (b) | | | 96 | | | | 19,949 | |
| Fisher & Paykel Healthcare Corp. Ltd. (b) | | | 175 | | | | 4,151 | |
| Getinge AB (b) | | | 898 | | | | 20,967 | |
| IDEXX Laboratories, Inc. (a) | | | 49 | | | | 24,494 | |
| Insulet Corp. (a) | | | 87 | | | | 22,240 | |
| Lifco AB (b) | | | 194 | | | | 18,604 | |
| Novocure Ltd. (a)(b) | | | 128 | | | | 22,149 | |
| NuVasive, Inc. (a) | | | 343 | | | | 19,321 | |
| QIAGEN NV (a)(b) | | | 412 | | | | 21,366 | |
| Sonova Holding AG (b) | | | 55 | | | | 14,289 | |
| | | | | | | | 227,505 | |
| Healthcare-Services: 0.11% | | | | | | | | |
| Fresenius Medical Care AG & Co. KGaA (b) | | | 243 | | | | 20,246 | |
| | | | | | | | | |
| Holding Companies - Divers: 0.09% | | | | | | | | |
| Swire Pacific Ltd. (b) | | | 3,000 | | | | 16,640 | |
| | | | | | | | | |
| Home Furnishings: 0.11% | | | | | | | | |
| Sonos, Inc. (a) | | | 871 | | | | 20,373 | |
| | | | | | | | | |
| Household Products/Wares: 0.04% | | | | | | | | |
| Church & Dwight Co., Inc. | | | 90 | | | | 7,851 | |
| | | | | | | | | |
| Insurance: 2.03% | | | | | | | | |
| Fidelity National Financial, Inc. | | | 2,972 | | | | 116,176 | |
| First American Financial Corp. | | | 398 | | | | 20,549 | |
| M&G PLC (b) | | | 8,279 | | | | 22,411 | |
| Old Republic International Corp. | | | 5,477 | | | | 107,952 | |
| Sompo Holdings, Inc. (b) | | | 500 | | | | 20,207 | |
| Stewart Information Services Corp. | | | 462 | | | | 22,342 | |
| T&D Holdings, Inc. (b) | | | 1,900 | | | | 22,394 | |
| Tryg A/S (b) | | | 464 | | | | 14,630 | |
| W R Berkley Corp. | | | 296 | | | | 19,660 | |
| | | | | | | | 366,321 | |
| Internet: 2.36% | | | | | | | | |
| Adevinta ASA (a)(b) | | | 1,306 | | | | 21,934 | |
| Amazon.com, Inc. (a) | | | 18 | | | | 58,625 | |
| ASOS PLC (a)(b) | | | 333 | | | | 21,781 | |
| Auto Trader Group PLC (b) | | | 2,780 | | | | 22,658 | |
| GoDaddy, Inc. (a) | | | 134 | | | | 11,115 | |
| Leaf Group Ltd. (a) | | | 4,307 | | | | 20,028 | |
| Pinterest, Inc. (a) | | | 2,485 | | | | 163,761 | |
| Snap, Inc. (a) | | | 84 | | | | 4,206 | |
The accompanying notes are an integral part of these financial statements.
| | |
| | |
| 54 | | LoCorr Dynamic Equity Fund – Schedule of Investments (continued) |
| | |
| | | Shares | | | Value | |
| COMMON STOCKS: (continued) | | | | | | | | |
| VeriSign, Inc. (a) | | | 108 | | | $ | 23,371 | |
| Wayfair, Inc. (a) | | | 75 | | | | 16,936 | |
| Wix.com Ltd. (a)(b) | | | 77 | | | | 19,247 | |
| Yelp, Inc. (a) | | | 693 | | | | 22,640 | |
| ZOZO, Inc. (b) | | | 800 | | | | 19,749 | |
| | | | | | | | 426,051 | |
| Investment Companies: 0.13% | | | | | | | | |
| Kinnevik AB (a)(b) | | | 465 | | | | 23,483 | |
| | | | | | | | | |
| Iron & Steel: 0.13% | | | | | | | | |
| Evraz PLC (b) | | | 3,713 | | | | 23,946 | |
| | | | | | | | | |
| Leisure Time: 0.10% | | | | | | | | |
| Yamaha Motor Co. Ltd. (b) | | | 900 | | | | 18,339 | |
| | | | | | | | | |
| Lodging: 0.71% | | | | | | | | |
| Wynn Resorts Ltd. | | | 1,132 | | | | 127,724 | |
| | | | | | | | | |
| Machinery-Construction & Mining: 0.13% | | | | | | | | |
| Epiroc AB (b) | | | 1,359 | | | | 22,959 | |
| | | | | | | | | |
| Machinery-Diversified: 1.17% | | | | | | | | |
| Amada Holdings Co. Ltd. (b) | | | 2,100 | | | | 23,043 | |
| Bucher Industries AG (b) | | | 45 | | | | 20,617 | |
| CNH Industrial NV (a)(b) | | | 1,766 | | | | 22,275 | |
| Ebara Corp. (b) | | | 600 | | | | 19,583 | |
| GEA Group AG (b) | | | 528 | | | | 18,886 | |
| KION Group AG (b) | | | 250 | | | | 21,733 | |
| Valmet Oyj (b) | | | 751 | | | | 21,432 | |
| Welbilt, Inc. (a) | | | 4,832 | | | | 63,782 | |
| | | | | | | | 211,351 | |
| Media: 5.37% | | | | | | | | |
| Altice USA, Inc. (a) | | | 571 | | | | 21,624 | |
| DISH Network Corp. (a) | | | 4,324 | | | | 139,838 | |
| News Corporation | | | 1,272 | | | | 22,858 | |
| Nexstar Broadcasting Group, Inc. | | | 6,794 | | | | 741,837 | |
| Pearson PLC (b) | | | 2,419 | | | | 22,507 | |
| ProSiebenSat.1 Media SE (a)(b) | | | 1,314 | | | | 22,080 | |
| | | | | | | | 970,744 | |
| Metal Fabricate/Hardware: 0.11% | | | | | | | | |
| NSK Ltd. (b) | | | 2,200 | | | | 19,091 | |
| | | | | | | | | |
| Mining: 0.45% | | | | | | | | |
| Barrick Gold Corp. (b) | | | 2,493 | | | | 56,790 | |
| Boliden AB (b) | | | 673 | | | | 23,836 | |
| | | | | | | | 80,626 | |
| Miscellaneous Manufacturing: 0.24% | | | | | | | | |
| Hexpol AB (b) | | | 1,897 | | | | 20,290 | |
| Knorr-Bremse (b) | | | 170 | | | | 23,193 | |
| | | | | | | | 43,483 | |
| Oil & Gas: 0.32% | | | | | | | | |
| Apache Corp. | | | 4,087 | | | | 57,995 | |
| | | | | | | | | |
| Packaging & Containers: 0.11% | | | | | | | | |
| Sealed Air Corp. | | | 441 | | | | 20,193 | |
| | | | | | | | | |
| Pharmaceuticals: 3.10% | | | | | | | | |
| Aclaris Therapeutics, Inc. (a) | | | 3,773 | | | | 24,411 | |
| Alfresa Holdings Corp. (b) | | | 900 | | | | 16,465 | |
| Alkermes PLC (a)(b) | | | 1,080 | | | | 21,546 | |
| Chimerix, Inc. (a) | | | 4,377 | | | | 21,141 | |
| Elanco Animal Health, Inc. (a) | | | 3,798 | | | | 116,485 | |
| Great Elm Group, Inc. (a) | | | 7,432 | | | | 20,364 | |
| Hikma Pharmaceuticals PLC (b) | | | 636 | | | | 21,900 | |
| Ipsen SA (b) | | | 238 | | | | 19,742 | |
| Ironwood Pharmaceuticals, Inc. (a) | | | 1,668 | | | | 18,998 | |
| Jazz Pharmaceuticals PLC (a)(b) | | | 141 | | | | 23,272 | |
| Nature’s Sunshine Products, Inc. (a) | | | 1,409 | | | | 21,065 | |
The accompanying notes are an integral part of these financial statements.
| | |
| | |
| LoCorr Dynamic Equity Fund – Schedule of Investments (continued) | | 55 |
| | |
| | | Shares | | | Value | |
| COMMON STOCKS: (continued) | | | | | | | | |
| Ono Pharmaceutical Co. Ltd. (b) | | | 700 | | | $ | 21,070 | |
| Protagonist Therapeutics, Inc. (a) | | | 410 | | | | 8,266 | |
| SIGA Technologies, Inc. (a) | | | 2,819 | | | | 20,494 | |
| Viatris, Inc. (a) | | | 9,853 | | | | 184,645 | |
| | | | | | | | 559,864 | |
| Private Equity: 0.22% | | | | | | | | |
| Intermediate Capital Group PLC (b) | | | 860 | | | | 20,299 | |
| KKR & Co., Inc. | | | 482 | | | | 19,516 | |
| | | | | | | | 39,815 | |
| Real Estate: 0.11% | | | | | | | | |
| Grainger PLC (b) | | | 5,141 | | | | 19,938 | |
| | | | | | | | | |
| Retail: 3.14% | | | | | | | | |
| At Home Group, Inc. (a) | | | 1,200 | | | | 18,552 | |
| AutoZone, Inc. (a) | | | 17 | | | | 20,152 | |
| Bassett Furniture Industries, Inc. | | | 1,213 | | | | 24,357 | |
| Costco Wholesale Corp. | | | 2 | | | | 754 | |
| Grafton Group PLC (a)(b) | | | 1,778 | | | | 22,430 | |
| Jack in the Box, Inc. | | | 637 | | | | 59,114 | |
| JD Sports Fashion PLC (a)(b) | | | 1,950 | | | | 22,933 | |
| Kingfisher PLC (a)(b) | | | 5,543 | | | | 20,496 | |
| K’s Holdings Corp. (b) | | | 1,600 | | | | 22,252 | |
| Lowe’s Cos, Inc. | | | 131 | | | | 21,027 | |
| O’Reilly Automotive, Inc. (a) | | | 43 | | | | 19,461 | |
| Signet Jewelers Ltd. (b) | | | 2,135 | | | | 58,221 | |
| Sundrug Co. Ltd. (b) | | | 400 | | | | 15,960 | |
| Ulta Beauty, Inc. (a) | | | 670 | | | | 192,397 | |
| Waitr Holdings, Inc. (a) | | | 3,071 | | | | 8,537 | |
| Welcia Holdings Co. Ltd. (b) | | | 500 | | | | 18,861 | |
| Yamada Holdings Co. Ltd. (b) | | | 4,100 | | | | 21,760 | |
| | | | | | | | 567,264 | |
| Semiconductors: 0.17% | | | | | | | | |
| EMCORE Corp. (a) | | | 4,882 | | | | 26,607 | |
| Renesas Electronics Corp. (a)(b) | | | 400 | | | | 4,180 | |
| | | | | | | | 30,787 | |
| Software: 3.05% | | | | | | | | |
| Autodesk, Inc. (a) | | | 79 | | | | 24,122 | |
| Castlight Health, Inc. (a) | | | 16,166 | | | | 21,016 | |
| Dropbox, Inc. (a) | | | 993 | | | | 22,035 | |
| Micro Focus International PLC (a)(b) | | | 3,333 | | | | 19,330 | |
| Microsoft Corp. | | | 264 | | | | 58,719 | |
| NextGen Healthcare, Inc. (a) | | | 1,043 | | | | 19,024 | |
| Sailpoint Technologies Holdings, Inc. (a) | | | 1,195 | | | | 63,622 | |
| salesforce.com, Inc. (a) | | | 630 | | | | 140,194 | |
| Take-Two Interactive Software, Inc. (a) | | | 817 | | | | 169,764 | |
| Ubisoft Entertainment SA (a)(b) | | | 141 | | | | 13,580 | |
| | | | | | | | 551,406 | |
| Telecommunications: 2.11% | | | | | | | | |
| AT&T, Inc. | | | 4,982 | | | | 143,282 | |
| Calix, Inc. (a) | | | 783 | | | | 23,302 | |
| Corning, Inc. | | | 540 | | | | 19,440 | |
| NETGEAR, Inc. (a) | | | 518 | | | | 21,046 | |
| NetLink NBN Trust (b) | | | 27,400 | | | | 20,007 | |
| Nippon Telegraph & Telephone Corp. (b) | | | 900 | | | | 23,059 | |
| SES SA (b) | | | 2,125 | | | | 20,031 | |
| Spok Holdings, Inc. | | | 1,977 | | | | 22,004 | |
| Tele2 AB (b) | | | 1,534 | | | | 20,248 | |
| Vonage Holdings Corp. (a) | | | 5,413 | | | | 69,693 | |
| | | | | | | | 382,112 | |
| Textiles: 0.69% | | | | | | | | |
| Mohawk Industries, Inc. (a) | | | 746 | | | | 105,149 | |
| Teijin Ltd. (b) | | | 1,000 | | | | 18,788 | |
| | | | | | | | 123,937 | |
| Transportation: 0.96% | | | | | | | | |
| Canadian National Railway Co. (b) | | | 160 | | | | 17,590 | |
| Daseke, Inc. (a) | | | 3,173 | | | | 18,435 | |
| Mitsui OSK Lines Ltd. (b) | | | 700 | | | | 21,355 | |
| Nippon Express Co. Ltd. (b) | | | 300 | | | | 20,135 | |
The accompanying notes are an integral part of these financial statements.
| | |
| | |
| 56 | | LoCorr Dynamic Equity Fund – Schedule of Investments (continued) |
| | |
| | | Shares | | | Value | |
| COMMON STOCKS: (continued) | | | | | | | | |
| Poste Italiane SpA (b) | | | 2,108 | | | $ | 21,426 | |
| Radiant Logistics, Inc. (a) | | | 3,380 | | | | 19,604 | |
| Royal Mail PLC (a)(b) | | | 5,059 | | | | 23,363 | |
| Yamato Holdings Co. Ltd. (b) | | | 700 | | | | 17,836 | |
| YRC Worldwide, Inc. (a) | | | 3,225 | | | | 14,287 | |
| | | | | | | | 174,031 | |
| TOTAL COMMON STOCKS (Cost $10,905,911) | | | | | | | 13,542,686 | |
| | | | | | | | | |
| PREFERRED STOCK: 0.13% | | | | | | | | |
| Auto Manufacturers: 0.13% | | | | | | | | |
| Porsche Automobil Holding SE (b) | | | 333 | | | | 22,944 | |
| TOTAL PREFERRED STOCK (Cost $18,382) | | | | | | | 22,944 | |
| | | | | | | | | |
| REAL ESTATE INVESTMENT TRUSTS: 3.90% | | | | | | | | |
| American Tower Corp. | | | 855 | | | | 191,913 | |
| CareTrust, Inc. | | | 944 | | | | 20,938 | |
| Equity LifeStyle Properties, Inc. | | | 344 | | | | 21,796 | |
| Japan Logistics Fund, Inc. (b) | | | 7 | | | | 20,643 | |
| Kimco Realty Corp. | | | 4,915 | | | | 73,774 | |
| Park Hotels & Resorts, Inc. | | | 6,115 | | | | 104,872 | |
| Regency Centers Corp. | | | 1,286 | | | | 58,629 | |
| SBA Communications Corp. | | | 678 | | | | 191,284 | |
| VEREIT, Inc. | | | 547 | | | | 20,656 | |
| TOTAL REAL ESTATE INVESTMENT TRUSTS (Cost $689,727) | | | | | | | 704,505 | |
| | | | | | | | | |
| SHORT TERM INVESTMENT: 10.95% | | | | | | | | |
| MONEY MARKET FUND: 10.95% | | | | | | | | |
| STIT-Government & Agency Portfolio, Institutional Class, 0.03% (c) | | | 1,978,951 | | | | 1,978,951 | |
| TOTAL MONEY MARKET FUND (Cost $1,978,951) | | | | | | | 1,978,951 | |
| TOTAL SHORT TERM INVESTMENT (Cost $1,978,951) | | | | | | | 1,978,951 | |
| | | | | | | | | |
| TOTAL INVESTMENTS (Cost $13,592,971): 89.91% | | | | | | | 16,249,086 | |
| Other Assets in Excess of Liabilities: 10.09% (d) | | | | | | | 1,823,449 | |
| TOTAL NET ASSETS: 100.00% | | | | | | $ | 18,072,535 | |
| | | | | | | | | |
| (a) | Non-dividend income producing security. |
| (b) | Foreign issued security. |
| (c) | The rate quoted is the annualized seven-day effective yield as of December 31, 2020. |
| (d) | Includes assets pledged as collateral and deposits with broker for securities sold short and derivative instruments. At December 31, 2020, the value of these assets total $7,238,949. See Note 2. |
| PLC | Public Limited Company |
The accompanying notes are an integral part of these financial statements
| | |
| | |
| LoCorr Dynamic Equity Fund – Schedule of Securities Sold Short | | 57 |
| | |
LoCorr Dynamic Equity Fund
Schedule of Securities Sold Short
December 31, 2020
| | | Shares | | | Value | |
COMMON STOCKS: (30.89)%
Advertising: (0.12)%
National CineMedia, Inc. | | | (5,751 | ) | | $ | (21,394 | ) |
| | | | | | | | | |
| Aerospace & Defense: (0.57)% | | | | | | | | |
| Boeing Co. | | | (272 | ) | | | (58,224 | ) |
| General Dynamics Corp. | | | (129 | ) | | | (19,198 | ) |
| Hexcel Corp. | | | (84 | ) | | | (4,073 | ) |
| Safran SA (a)(b) | | | (158 | ) | | | (22,381 | ) |
| | | | | | | | (103,876 | ) |
| Airlines: (0.86)% | | | | | | | | |
| American Airlines Group, Inc. | | | (2,414 | ) | | | (38,069 | ) |
| Spirit Airlines, Inc. (a) | | | (2,417 | ) | | | (59,096 | ) |
| United Continental Holdings, Inc. (a) | | | (1,333 | ) | | | (57,652 | ) |
| | | | | | | | (154,817 | ) |
| Apparel: (0.84)% | | | | | | | | |
| Adidas AG (a)(b) | | | (65 | ) | | | (23,655 | ) |
| Gildan Activewear, Inc. (a)(b) | | | (800 | ) | | | (22,368 | ) |
| Hermes International (b) | | | (18 | ) | | | (19,342 | ) |
| LVMH Moet Hennessy Louis Vuitton SE (b) | | | (17 | ) | | | (10,610 | ) |
| NIKE, Inc. | | | (167 | ) | | | (23,625 | ) |
| Oxford Industries, Inc. | | | (347 | ) | | | (22,732 | ) |
| PVH Corp. | | | (319 | ) | | | (29,951 | ) |
| | | | | | | | (152,283 | ) |
| Auto Manufacturers: (0.37)% | | | | | | | | |
| Blue Bird Corp. (a) | | | (1,233 | ) | | | (22,515 | ) |
| Ferrari NV (b) | | | (91 | ) | | | (20,972 | ) |
| Volvo AB (a)(b) | | | (989 | ) | | | (23,296 | ) |
| | | | | | | | (66,783 | ) |
| Auto Parts & Equipment: (0.40)% | | | | | | | | |
| American Axle & Manufacturing Holdings, Inc. (a) | | | (1,523 | ) | | | (12,702 | ) |
| Aptiv PLC (b) | | | (189 | ) | | | (24,625 | ) |
| Bridgestone Corp. (b) | | | (400 | ) | | | (13,109 | ) |
| Continental AG (b) | | | (150 | ) | | | (22,219 | ) |
| | | | | | | | (72,655 | ) |
| Banks: (0.99)% | | | | | | | | |
| CB Financial Services, Inc. | | | (681 | ) | | | (13,627 | ) |
| Comerica, Inc. | | | (226 | ) | | | (12,624 | ) |
| Goldman Sachs Group, Inc. | | | (79 | ) | | | (20,833 | ) |
| Hang Seng Bank Ltd. (b) | | | (1,200 | ) | | | (20,695 | ) |
| HSBC Holdings PLC (a)(b) | | | (4,295 | ) | | | (22,251 | ) |
| Lloyds Banking Group PLC (a)(b) | | | (47,093 | ) | | | (23,467 | ) |
| Oversea-Chinese Banking Corp. Ltd. (b) | | | (700 | ) | | | (5,328 | ) |
| Riverview Financial Corp. | | | (796 | ) | | | (7,283 | ) |
| Sumitomo Mitsui Financial Group, Inc. (b) | | | (600 | ) | | | (18,525 | ) |
| UniCredit SpA (a)(b) | | | (2,248 | ) | | | (21,003 | ) |
| Zions Bancorporation | | | (287 | ) | | | (12,467 | ) |
| | | | | | | | (178,103 | ) |
| Beverages: (0.71)% | | | | | | | | |
| Anheuser-Busch InBev SA/NV (b) | | | (311 | ) | | | (21,660 | ) |
| Britvic PLC (b) | | | (404 | ) | | | (4,486 | ) |
| Coca-Cola Co./The | | | (74 | ) | | | (4,058 | ) |
| Diageo PLC (b) | | | (576 | ) | | | (22,669 | ) |
| Heineken Holding NV (b) | | | (108 | ) | | | (10,166 | ) |
| Heineken NV (b) | | | (209 | ) | | | (23,291 | ) |
| Molson Coors Beverage Co. | | | (429 | ) | | | (19,387 | ) |
| Pernod Ricard SA (b) | | | (118 | ) | | | (22,603 | ) |
| | | | | | | | (128,320 | ) |
The accompanying notes are an integral part of these financial statements.
| | |
| | |
| 58 | | LoCorr Dynamic Equity Fund – Schedule of Securities Sold Short (continued) |
| | |
| | | Shares | | | Value | |
| COMMON STOCKS: (continued) | | | | | | | | |
| Biotechnology: (1.33)% | | | | | | | | |
| ADMA Biologics, Inc. (a) | | | (10,572 | ) | | $ | (20,615 | ) |
| Arrowhead Pharmaceuticals, Inc. (a) | | | (50 | ) | | | (3,837 | ) |
| Axsome Therapeutics, Inc. (a) | | | (267 | ) | | | (21,752 | ) |
| ChemoCentryx, Inc. (a) | | | (342 | ) | | | (21,177 | ) |
| Cortexyme, Inc. (a) | | | (535 | ) | | | (14,862 | ) |
| Dynavax Technologies Corp. (a) | | | (4,009 | ) | | | (17,840 | ) |
| Fate Therapeutics, Inc. (a) | | | (256 | ) | | | (23,278 | ) |
| IGM Biosciences, Inc. (a) | | | (276 | ) | | | (24,368 | ) |
| Insmed, Inc. (a) | | | (249 | ) | | | (8,289 | ) |
| Iovance Biotherapeutics, Inc. (a) | | | (421 | ) | | | (19,534 | ) |
| Karuna Therapeutics, Inc. (a) | | | (198 | ) | | | (20,115 | ) |
| TG Therapeutics, Inc. (a) | | | (458 | ) | | | (23,825 | ) |
| VolitionRX Ltd. (a) | | | (5,216 | ) | | | (20,290 | ) |
| | | | | | | | (239,782 | ) |
| Building Materials: (0.88)% | | | | | | | | |
| Lennox International, Inc. | | | (184 | ) | | | (50,410 | ) |
| Masco Corp. | | | (971 | ) | | | (53,337 | ) |
| Simpson Manufacturing Co., Inc. | | | (587 | ) | | | (54,855 | ) |
| | | | | | | | (158,602 | ) |
| Chemicals: (1.21)% | | | | | | | | |
| Air Liquide SA (b) | | | (118 | ) | | | (19,353 | ) |
| Albemarle Corp. | | | (141 | ) | | | (20,800 | ) |
| BASF SE (b) | | | (297 | ) | | | (23,482 | ) |
| Croda International PLC (b) | | | (272 | ) | | | (24,535 | ) |
| DuPont de Nemours, Inc. | | | (319 | ) | | | (22,684 | ) |
| Givaudan SA (b) | | | (3 | ) | | | (12,640 | ) |
| IMCD NV (b) | | | (158 | ) | | | (20,122 | ) |
| NOF Corp. (b) | | | (200 | ) | | | (10,130 | ) |
| OC Oerlikon Corp AG (b) | | | (434 | ) | | | (4,486 | ) |
| PPG Industries, Inc. | | | (158 | ) | | | (22,787 | ) |
| Quaker Chemical Corp. | | | (80 | ) | | | (20,271 | ) |
| Shin-Etsu Chemical Co. Ltd. (b) | | | (100 | ) | | | (17,471 | ) |
| | | | | | | | (218,761 | ) |
| Commercial Services: (0.63)% | | | | | | | | |
| Adecco Group AG (b) | | | (353 | ) | | | (23,589 | ) |
| Laureate Education, Inc. (a) | | | (1,356 | ) | | | (19,743 | ) |
| Loomis AB (b) | | | (713 | ) | | | (19,602 | ) |
| Monro, Inc. | | | (443 | ) | | | (23,612 | ) |
| RELX PLC (b) | | | (716 | ) | | | (17,551 | ) |
| Secom Co. Ltd. (b) | | | (100 | ) | | | (9,217 | ) |
| | | | | | | | (113,314 | ) |
| Computers: (0.08)% | | | | | | | | |
| CGI, Inc. (a)(b) | | | (193 | ) | | | (15,312 | ) |
| | | | | | | | | |
| Cosmetics & Personal Care: (0.35)% | | | | | | | | |
| Essity AB (b) | | | (605 | ) | | | (19,449 | ) |
| Estee Lauder Cos., Inc./The | | | (14 | ) | | | (3,727 | ) |
| Kao Corp. (b) | | | (200 | ) | | | (15,438 | ) |
| Shiseido Co. Ltd. (b) | | | (300 | ) | | | (20,733 | ) |
| Unicharm Corp. (b) | | | (100 | ) | | | (4,738 | ) |
| | | | | | | | (64,085 | ) |
| Distribution & Wholesale: (0.24)% | | | | | | | | |
| Copart, Inc. (a) | | | (186 | ) | | | (23,669 | ) |
| Watsco, Inc. | | | (84 | ) | | | (19,030 | ) |
| | | | | | | | (42,699 | ) |
| Diversified Financial Services: (1.34)% | | | | | | | | |
| Associated Capital Group, Inc. | | | (574 | ) | | | (20,159 | ) |
| Athersys, Inc. (a) | | | (11,275 | ) | | | (19,731 | ) |
| Deutsche Boerse AG (b) | | | (117 | ) | | | (19,903 | ) |
| Discover Financial Services | | | (661 | ) | | | (59,840 | ) |
| Quilter PLC (b) | | | (10,406 | ) | | | (21,858 | ) |
| Raymond James Financial, Inc. | | | (207 | ) | | | (19,804 | ) |
| T Rowe Price Group, Inc. | | | (395 | ) | | | (59,799 | ) |
The accompanying notes are an integral part of these financial statements.
| |
| |
| LoCorr Dynamic Equity Fund – Schedule of Securities Sold Short (continued) | | 59 |
| |
| | | Shares | | | Value | |
| COMMON STOCKS: (continued) | | | | | | | | |
| TP ICAP PLC (b) | | | (6,519 | ) | | $ | (21,235 | ) |
| | | | | | | | (242,329 | ) |
| Electric: (0.89)% | | | | | | | | |
| American Electric Power Co., Inc. | | | (207 | ) | | | (17,237 | ) |
| Chugoku Electric Power Co., Inc./The (b) | | | (1,600 | ) | | | (18,734 | ) |
| Edison International | | | (344 | ) | | | (21,610 | ) |
| Iberdrola SA (b) | | | (1,437 | ) | | | (20,539 | ) |
| NextEra Energy, Inc. | | | (266 | ) | | | (20,522 | ) |
| PG&E Corp. (a) | | | (1,824 | ) | | | (22,727 | ) |
| Power Assets Holdings Ltd. (b) | | | (3,500 | ) | | | (18,962 | ) |
| Uniper SE (b) | | | (582 | ) | | | (20,079 | ) |
| | | | | | | | (160,410 | ) |
| Electronics: (0.65)% | | | | | | | | |
| ABB Ltd. (b) | | | (731 | ) | | | (20,403 | ) |
| Alps Alpine Co. Ltd. (b) | | | (1,500 | ) | | | (19,728 | ) |
| Amphenol Corp. | | | (176 | ) | | | (23,016 | ) |
| Applied Optoelectronics, Inc. (a) | | | (2,551 | ) | | | (21,709 | ) |
| Hoya Corp. (b) | | | (100 | ) | | | (13,820 | ) |
| Kyocera Corp. (b) | | | (300 | ) | | | (18,380 | ) |
| | | | | | | | (117,056 | ) |
| Energy-Alternate Sources: (0.57)% | | | | | | | | |
| Enphase Energy, Inc. (a) | | | (106 | ) | | | (18,600 | ) |
| John Laing Group PLC (b) | | | (4,633 | ) | | | (21,034 | ) |
| Plug Power, Inc. (a) | | | (1,109 | ) | | | (37,606 | ) |
| Vestas Wind Systems A/S (b) | | | (110 | ) | | | (25,991 | ) |
| | | | | | | | (103,231 | ) |
| Engineering & Construction: (0.14)% | | | | | | | | |
| HomeServe PLC (b) | | | (1,320 | ) | | | (18,502 | ) |
| WillScot Mobile Mini Holdings Corp. (a) | | | (282 | ) | | | (6,534 | ) |
| | | | | | | | (25,036 | ) |
| Entertainment: (0.24)% | | | | | | | | |
| Live Nation Entertainment, Inc. (a) | | | (321 | ) | | | (23,587 | ) |
| Vail Resorts, Inc. | | | (70 | ) | | | (19,527 | ) |
| | | | | | | | (43,114 | ) |
| Environmental Control: (0.11)% | | | | | | | | |
| US Ecology, Inc. | | | (571 | ) | | | (20,744 | ) |
| | | | | | | | | |
| Food: (0.60)% | | | | | | | | |
| Beyond Meat, Inc. (a) | | | (147 | ) | | | (18,375 | ) |
| HF Foods Group, Inc. (a) | | | (2,452 | ) | | | (18,439 | ) |
| Hormel Foods Corp. | | | (82 | ) | | | (3,822 | ) |
| Kraft Heinz Co. | | | (605 | ) | | | (20,969 | ) |
| MEIJI Holdings Co. Ltd. (b) | | | (200 | ) | | | (14,062 | ) |
| Metro, Inc. CN (a)(b) | | | (395 | ) | | | (17,626 | ) |
| Tesco PLC (b) | | | (4,856 | ) | | | (15,366 | ) |
| | | | | | | | (108,659 | ) |
| Forest Products & Paper: (0.26)% | | | | | | | | |
| Svenska Cellulosa AB SCA (a)(b) | | | (1,310 | ) | | | (22,816 | ) |
| UPM-Kymmene Oyj (b) | | | (641 | ) | | | (23,860 | ) |
| | | | | | | | (46,676 | ) |
| Hand & Machine Tools: (0.23)% | | | | | | | | |
| Kennametal, Inc. | | | (603 | ) | | | (21,853 | ) |
| MSA Safety, Inc. | | | (133 | ) | | | (19,869 | ) |
| | | | | | | | (41,722 | ) |
| Healthcare-Products: (1.31)% | | | | | | | | |
| Abbott Laboratories | | | (202 | ) | | | (22,117 | ) |
| Asahi Intecc Co. Ltd.(b) | | | (600 | ) | | | (21,878 | ) |
| Axonics Modulation Technologies, Inc. (a) | | | (448 | ) | | | (22,364 | ) |
| Cooper Cos, Inc. | | | (20 | ) | | | (7,266 | ) |
| EssilorLuxottica SA (b) | | | (137 | ) | | | (21,347 | ) |
| Patterson Cos., Inc. | | | (709 | ) | | | (21,008 | ) |
| Pulse Biosciences, Inc. (a) | | | (12 | ) | | | (286 | ) |
| Thermo Fisher Scientific, Inc. | | | (44 | ) | | | (20,494 | ) |
The accompanying notes are an integral part of these financial statements.
| | |
| | |
| 60 | | LoCorr Dynamic Equity Fund – Schedule of Securities Sold Short (continued) |
| | |
| | | Shares | | | Value | |
| COMMON STOCKS: (continued) | | | | | | | | |
| Siemens Healthineers AG (b) | | | (456 | ) | | $ | (23,386 | ) |
| Smith & Nephew PLC (b) | | | (1,138 | ) | | | (23,499 | ) |
| STERIS PLC (b) | | | (103 | ) | | | (19,523 | ) |
| Sysmex Corp. (b) | | | (100 | ) | | | (12,009 | ) |
| Terumo Corp. (b) | | | (500 | ) | | | (20,880 | ) |
| | | | | | | | (236,057 | ) |
| Healthcare-Services: (0.36)% | | | | | | | | |
| Catalent, Inc. (a) | | | (190 | ) | | | (19,773 | ) |
| Lonza Group AG (b) | | | (33 | ) | | | (21,202 | ) |
| Orpea (a)(b) | | | (178 | ) | | | (23,387 | ) |
| | | | | | | | (64,362 | ) |
| Home Builders: (0.28)% | | | | | | | | |
| Bellway PLC (b) | | | (499 | ) | | | (20,164 | ) |
| Berkeley Group Holdings PLC (b) | | | (339 | ) | | | (21,983 | ) |
| Haseko Corp. (b) | | | (700 | ) | | | (8,020 | ) |
| | | | | | | | (50,167 | ) |
| Home Furnishings: (0.16)% | | | | | | | | |
| Sharp Corp. (b) | | | (300 | ) | | | (4,544 | ) |
| Whirlpool Corporation | | | (135 | ) | | | (24,366 | ) |
| | | | | | | | (28,910 | ) |
| Household Products/Wares: (0.16)% | | | | | | | | |
| Newell Brands, Inc. | | | (1,075 | ) | | | (22,822 | ) |
| Reckitt Benckiser Group Plc (b) | | | (70 | ) | | | (6,262 | ) |
| | | | | | | | (29,084 | ) |
| Insurance: (1.22)% | | | | | | | | |
| American International Group, Inc. | | | (528 | ) | | | (19,990 | ) |
| Equitable Holdings, Inc. | | | (208 | ) | | | (5,323 | ) |
| HCI Group, Inc. | | | (370 | ) | | | (19,351 | ) |
| Hiscox Ltd. (a)(b) | | | (1,430 | ) | | | (19,438 | ) |
| Japan Post Holdings Co. Ltd. (b) | | | (2,900 | ) | | | (22,547 | ) |
| MBIA, Inc. (a) | | | (3,138 | ) | | | (20,648 | ) |
| Palomar Holdings, Inc. (a) | | | (225 | ) | | | (19,989 | ) |
| Progressive Corp. | | | (231 | ) | | | (22,841 | ) |
| Prudential PLC (b) | | | (1,312 | ) | | | (24,167 | ) |
| Swiss Re AG (b) | | | (248 | ) | | | (23,346 | ) |
| Zurich Insurance Group AG (b) | | | (55 | ) | | | (23,204 | ) |
| | | | | | | | (220,844 | ) |
| Internet: (1.31)% | | | | | | | | |
| Delivery Hero SE (a)(b) | | | (162 | ) | | | (25,134 | ) |
| Expedia, Inc. | | | (288 | ) | | | (38,131 | ) |
| Moneysupermarket.com Group PLC (b) | | | (1,130 | ) | | | (4,027 | ) |
| Prosus NV (b) | | | (119 | ) | | | (12,845 | ) |
| Rakuten, Inc. (b) | | | (1,900 | ) | | | (18,291 | ) |
| Snap, Inc. (a) | | | (1,184 | ) | | | (59,283 | ) |
| Uber Technologies, Inc. (a) | | | (1,120 | ) | | | (57,120 | ) |
| Zillow Group, Inc. Class C (a) | | | (171 | ) | | | (22,196 | ) |
| | | | | | | | (237,027 | ) |
| Investment Companies: (0.14)% | | | | | | | | |
| Melrose Industries PLC (a)(b) | | | (10,140 | ) | | | (24,689 | ) |
| | | | | | | | | |
| Iron & Steel: (0.31)% | | | | | | | | |
| Commercial Metals Co. | | | (799 | ) | | | (16,411 | ) |
| Hitachi Metals Ltd. (b) | | | (1,300 | ) | | | (19,716 | ) |
| Nippon Steel Corp. (a)(b) | | | (1,600 | ) | | | (20,578 | ) |
| | | | | | | | (56,705 | ) |
| Leisure Time: (0.77)% | | | | | | | | |
| Nautilus, Inc. (a) | | | (1,099 | ) | | | (19,936 | ) |
| Norwegian Cruise Line Holdings Ltd. (a)(b) | | | (2,333 | ) | | | (59,328 | ) |
| Royal Caribbean Cruises Ltd. - ADR (b) | | | (810 | ) | | | (60,499 | ) |
| | | | | | | | (139,763 | ) |
| Lodging: (0.98)% | | | | | | | | |
| Hilton Worldwide Holdings, Inc. | | | (528 | ) | | | (58,745 | ) |
| Hyatt Hotels Corp. | | | (794 | ) | | | (58,955 | ) |
| Las Vegas Sands Corp. | | | (1,005 | ) | | | (59,898 | ) |
| | | | | | | | (177,598 | ) |
| The accompanying notes are an integral part of these financial statements. | | | | | | | | |
| | |
| | |
| LoCorr Dynamic Equity Fund – Schedule of Securities Sold Short (continued) | | 61 |
| | |
| | | Shares | | | Value | |
| COMMON STOCKS: (continued) | | | | | | | | |
| Machinery-Construction & Mining: (0.46)% | | | | | | | | |
| Caterpillar, Inc. | | | (322 | ) | | $ | (58,610 | ) |
| Metso Outotec Oyj (b) | | | (2,394 | ) | | | (23,909 | ) |
| | | | | | | | (82,519 | ) |
| Machinery-Diversified: (0.20)% | | | | | | | | |
| Chart Industries, Inc. (a) | | | (209 | ) | | | (24,618 | ) |
| Daifuku Co. Ltd. (b) | | | (100 | ) | | | (12,358 | ) |
| | | | | | | | (36,976 | ) |
| Media: (0.38)% | | | | | | | | |
| Comcast Corp. | | | (383 | ) | | | (20,069 | ) |
| Discovery, Inc. (a) | | | (816 | ) | | | (24,553 | ) |
| ViacomCBS, Inc. | | | (639 | ) | | | (23,809 | ) |
| | | | | | | | (68,431 | ) |
| Mining: (0.29)% | | | | | | | | |
| Glencore PLC (a)(b) | | | (7,212 | ) | | | (22,979 | ) |
| Livent Corp. (a) | | | (491 | ) | | | (9,250 | ) |
| McEwen Mining, Inc. (a) | | | (19,777 | ) | | | (19,480 | ) |
| | | | | | | | (51,709 | ) |
| Miscellaneous Manufacturing: (0.50)% | | | | | | | | |
| A.O. Smith Corp. | | | (531 | ) | | | (29,109 | ) |
| Aalberts NV (b) | | | (463 | ) | | | (20,623 | ) |
| JSR Corp. (b) | | | (200 | ) | | | (5,567 | ) |
| LiqTech International, Inc. (a) | | | (2,336 | ) | | | (18,688 | ) |
| Toshiba Corp. (b) | | | (600 | ) | | | (16,764 | ) |
| | | | | | | | (90,751 | ) |
| Oil & Gas: (0.65)% | | | | | | | | |
| Exxon Mobil Corp. | | | (1,410 | ) | | | (58,120 | ) |
| Pioneer Natural Resources Co. | | | (520 | ) | | | (59,223 | ) |
| | | | | | | | (117,343 | ) |
| Packaging & Containers: (0.10)% | | | | | | | | |
| Ball Corp. | | | (204 | ) | | | (19,009 | ) |
| | | | | | | | | |
| Pharmaceuticals: (0.64)% | | | | | | | | |
| Bausch Health Cos, Inc. (a)(b) | | | (861 | ) | | | (17,864 | ) |
| Bayer AG (b) | | | (340 | ) | | | (20,002 | ) |
| CVS Health Corp. | | | (169 | ) | | | (11,543 | ) |
| Galapagos NV (a)(b) | | | (206 | ) | | | (20,253 | ) |
| GlaxoSmithKline PLC (b) | | | (899 | ) | | | (16,498 | ) |
| Verrica Pharmaceuticals, Inc. (a) | | | (383 | ) | | | (4,408 | ) |
| Viatris, Inc. (a) | | | (1,356 | ) | | | (25,411 | ) |
| | | | | | | | (115,979 | ) |
| Pipelines: (0.07)% | | | | | | | | |
| New Fortress Energy, Inc. | | | (223 | ) | | | (11,951 | ) |
| | | | | | | | | |
| Real Estate: (0.24)% | | | | | | | | |
| Mitsui Fudosan Co. Ltd. (b) | | | (900 | ) | | | (18,814 | ) |
| Vonovia SE (b) | | | (63 | ) | | | (4,599 | ) |
| Wharf Real Estate Investment Co. Ltd. (b) | | | (4,000 | ) | | | (20,819 | ) |
| | | | | | | | (44,232 | ) |
| Retail: (2.56)% | | | | | | | | |
| Abercrombie & Fitch Co. | | | (1,865 | ) | | | (37,971 | ) |
| Aeon Co. Ltd. (b) | | | (200 | ) | | | (6,557 | ) |
| Asbury Automotive Group, Inc. (a) | | | (133 | ) | | | (19,383 | ) |
| AutoNation, Inc. (a) | | | (873 | ) | | | (60,927 | ) |
| CarMax, Inc. (a) | | | (632 | ) | | | (59,699 | ) |
| Carvana Co. (a) | | | (80 | ) | | | (19,163 | ) |
| Cheesecake Factory, Inc. | | | (193 | ) | | | (7,153 | ) |
| Domino’s Pizza Inc | | | (141 | ) | | | (54,068 | ) |
| Macy’s, Inc. | | | (3,366 | ) | | | (37,868 | ) |
| Nordstrom, Inc. | | | (765 | ) | | | (23,876 | ) |
| Papa John’s International, Inc. | | | (323 | ) | | | (27,407 | ) |
| PetMed Express, Inc. | | | (583 | ) | | | (18,691 | ) |
| Regis Corp. (a) | | | (2,446 | ) | | | (22,479 | ) |
The accompanying notes are an integral part of these financial statements.
| | |
| | |
| 62 | | LoCorr Dynamic Equity Fund – Schedule of Securities Sold Short (continued) |
| | |
| | | Shares | | | Value | |
| COMMON STOCKS: (continued) | | | | | | | | |
| RH (a) | | | (131 | ) | | $ | (58,625 | ) |
| Target Corp. | | | (24 | ) | | | (4,237 | ) |
| WH Smith PLC (b) | | | (189 | ) | | | (3,903 | ) |
| | | | | | | | (462,007 | ) |
| Semiconductors: (0.55)% | | | | | | | | |
| Hamamatsu Photonics KK (b) | | | (300 | ) | | | (17,142 | ) |
| Infineon Technologies AG (b) | | | (626 | ) | | | (24,005 | ) |
| Lam Research Corp | | | (46 | ) | | | (21,724 | ) |
| SUMCO Corp. (b) | | | (800 | ) | | | (17,533 | ) |
| Texas Instruments, Inc. | | | (118 | ) | | | (19,367 | ) |
| | | | | | | | (99,771 | ) |
| Software: (0.61)% | | | | | | | | |
| Bandwidth, Inc. (a) | | | (121 | ) | | | (18,594 | ) |
| BlackBerry Ltd. (a)(b) | | | (2,854 | ) | | | (18,924 | ) |
| Cerence, Inc. (a) | | | (112 | ) | | | (11,254 | ) |
| Nexon Co. Ltd. (b) | | | (700 | ) | | | (21,558 | ) |
| Oracle Corp Japan (b) | | | (100 | ) | | | (13,026 | ) |
| Temenos AG (b) | | | (28 | ) | | | (3,911 | ) |
| Tyler Technologies, Inc. (a) | | | (52 | ) | | | (22,699 | ) |
| | | | | | | | (109,966 | ) |
| Telecommunications: (0.48)% | | | | | | | | |
| Anterix, Inc. (a) | | | (676 | ) | | | (25,418 | ) |
| CenturyLink, Inc. | | | (2,199 | ) | | | (21,440 | ) |
| Consolidated Communications Holdings, Inc. (a) | | | (3,461 | ) | | | (16,924 | ) |
| Deutsche Telekom AG (b) | | | (235 | ) | | | (4,293 | ) |
| Telenor ASA (b) | | | (1,160 | ) | | | (19,739 | ) |
| | | | | | | | (87,814 | ) |
| Transportation: (1.44)% | | | | | | | | |
| C.H. Robinson Worldwide, Inc. | | | (213 | ) | | | (19,994 | ) |
| Central Japan Railway Co. (b) | | | (100 | ) | | | (14,130 | ) |
| East Japan Railway Co. (b) | | | (300 | ) | | | (20,004 | ) |
| Keihan Holdings Co. Ltd. (b) | | | (400 | ) | | | (19,156 | ) |
| Keikyu Corp. (b) | | | (1,100 | ) | | | (18,846 | ) |
| Keio Corp. (b) | | | (200 | ) | | | (15,496 | ) |
| Keisei Electric Railway Co. Ltd. (b) | | | (600 | ) | | | (20,280 | ) |
| Kintetsu Group Holdings Co. Ltd. (b) | | | (400 | ) | | | (17,510 | ) |
| Kirby Corp. (a) | | | (392 | ) | | | (20,317 | ) |
| MTR Corp Ltd. (b) | | | (3,500 | ) | | | (19,571 | ) |
| Nagoya Railroad Co. Ltd. (b) | | | (700 | ) | | | (18,453 | ) |
| Nankai Electric Railway Co. Ltd. (b) | | | (700 | ) | | | (17,748 | ) |
| Odakyu Electric Railway Co. Ltd. (b) | | | (700 | ) | | | (21,965 | ) |
| Sotetsu Holdings, Inc. (b) | | | (700 | ) | | | (16,772 | ) |
| | | | | | | | (260,242 | ) |
| Trucking & Leasing: (0.10)% | | | | | | | | |
| GATX Corp. | | | (226 | ) | | | (18,799 | ) |
| TOTAL COMMON STOCKS (Proceeds $5,177,269) | | | | | | | (5,582,468 | ) |
| | | | | | | | | |
| EXCHANGE TRADED FUNDS: (3.22)% | | | | | | | | |
| iShares Russell 2000 | | | (1,480 | ) | | | (290,169 | ) |
| SPDR S&P500 Trust | | | (781 | ) | | | (292,000 | ) |
| TOTAL EXCHANGE TRADED FUNDS (Proceeds $578,966) | | | | | | | (582,169 | ) |
| | | | | | | | | |
| REAL ESTATE INVESTMENT TRUSTS: (0.84)% | | | | | | | | |
| Cofinimmo SA (b) | | | (51 | ) | | | (7,589 | ) |
| CyrusOne, Inc. | | | (284 | ) | | | (20,775 | ) |
| Digital Realty Trust, Inc. | | | (143 | ) | | | (19,950 | ) |
| Equinix, Inc. | | | (26 | ) | | | (18,580 | ) |
| Macerich Co. | | | (417 | ) | | | (4,449 | ) |
| Nippon Prologis, Inc.(b) | | | (5 | ) | | | (15,592 | ) |
| Public Storage | | | (86 | ) | | | (19,860 | ) |
| STORE Capital Corp. | | | (703 | ) | | | (23,888 | ) |
| Uniti Group, Inc. | | | (1,864 | ) | | | (21,865 | ) |
| TOTAL REAL ESTATE INVESTMENT TRUSTS (Proceeds $145,403) | | | | | | | (152,548 | ) |
| TOTAL SECURITIES SOLD SHORT (Proceeds $5,901,638): (34.95)% | | | | | | $ | (6,317,185 | ) |
| (a) | | Non-dividend expense producing security. |
| (b) | | Foreign issued security. |
| ADR | | American Depositary Reciept |
| PLC | | Public Limited Company |
The accompanying notes are an integral part of these financial statements.
| | |
| | |
| LoCorr Dynamic Equity Fund – Schedule of Open Futures Contracts | | 63 |
| | |
LoCorr Dynamic Equity Fund
Schedule of Open Futures Contracts
December 31, 2020
| | | | | | | | | | | | | | Value | |
| Description | | Number of
Contracts
Purchased (Sold) | | | Settlement
Month-Year | | Current
Notional
Amount | | | Notional
Amount at
Trade Date | | | Unrealized
Appreciation | | | Unrealized
(Depreciation) | |
| | | | | | | | | | | | | | | | | | | | | | | |
| Purchase Contracts: | | | | | | | | | | | | | | | | | | | | | | |
| Euro Stoxx 50 | | | 16 | | | Mar-21 | | $ | 693,893 | | | $ | 684,339 | | | $ | 9,554 | | | $ | – | |
| Micro E-Mini Index | | | 73 | | | Mar-21 | | | 720,802 | | | | 707,572 | | | | 13,230 | | | | – | |
| Mini TPX Index | | | 41 | | | Mar-21 | | | 716,522 | | | | 712,090 | | | | 4,432 | | | | – | |
| S&P 500 E-Mini Index | | | 38 | | | Mar-21 | | | 712,272 | | | | 700,336 | | | | 11,936 | | | | – | |
| Total Purchase Contracts | | | | | | | | | | | | | | | | | 39,152 | | | | – | |
| Total Futures Contracts | | | | | | | | | | | | | | | | $ | 39,152 | | | $ | – | |
| Net Unrealized Appreciation | | | | | | | | | | | | | | | | $ | 39,152 | | | | | |
The accompanying notes are an integral part of these financial statements.
| | |
| | |
| 64 | | LoCorr Spectrum Income Fund – Schedule of Investments |
| | |
LoCorr Spectrum Income Fund
Composition of Investment Portfolio1
December 31, 2020 (Unaudited)

| 1 | As a percentage of total investments. |
Schedule of Investments
December 31, 2020
| | | Shares | | | Value | |
| BUSINESS DEVELOPMENT COMPANIES: 13.70% | | | | | | | | |
| Ares Capital Corp. | | | 67,308 | | | $ | 1,136,832 | |
| BlackRock TCP Capital Corp. | | | 45,979 | | | | 516,804 | |
| Hercules Capital, Inc.(d) | | | 98,779 | | | | 1,424,393 | |
| New Mountain Finance Corp. | | | 78,541 | | | | 892,226 | |
| Newtek Business Services Corp. | | | 63,170 | | | | 1,243,817 | |
| Oaktree Specialty Lending Corp. | | | 85,135 | | | | 474,202 | |
| Sixth Street Specialty Lending, Inc. | | | 22,239 | | | | 461,459 | |
| TriplePoint Venture Growth Corp. | | | 34,336 | | | | 447,742 | |
| TOTAL BUSINESS DEVELOPMENT COMPANIES (Cost $6,638,813) | | | | | | | 6,597,475 | |
| | | | | | | | | |
| CLOSED-END INVESTMENT COMPANIES: 4.27% | | | | | | | | |
| AllianzGI Convertible & Income Fund | | | 86,591 | | | | 497,032 | |
| AllianzGI Convertible & Income Fund II | | | 97,414 | | | | 495,837 | |
| Nuveen Credit Strategies Income Fund | | | 167,905 | | | | 1,062,839 | |
| TOTAL CLOSED-END INVESTMENT COMPANIES (Cost $2,107,693) | | | | | | | 2,055,708 | |
| | | | | | | | | |
| COMMON STOCKS: 29.28% | | | | | | | | |
| Auto Manufacturers: 0.82% | | | | | | | | |
| PACCAR, Inc. | | | 4,594 | | | | 396,370 | |
| | | | | | | | | |
| Diversified Financial Services: 4.88% | | | | | | | | |
| Lazard Ltd.(a) | | | 15,509 | | | | 656,030 | |
| Moelis & Co. | | | 24,726 | | | | 1,156,188 | |
| OneMain Holdings, Inc. | | | 11,143 | | | | 536,647 | |
| | | | | | | | 2,348,865 | |
| Electric: 3.57% | | | | | | | | |
| Avangrid, Inc. | | | 8,459 | | | | 384,462 | |
| Brookfield Renewable Corp. (a) | | | 8,779 | | | | 511,523 | |
| Clearway Energy, Inc. | | | 25,741 | | | | 821,910 | |
| | | | | | | | 1,717,895 | |
| Energy - Alternate Sources: 4.94% | | | | | | | | |
| Atlantica Yield PLC (a) | | | 36,656 | | | | 1,392,195 | |
| NextEra Energy Partners LP (d) | | | 14,735 | | | | 987,982 | |
| | | | | | | | 2,380,177 | |
The accompanying notes are an integral part of these financial statements.
| | |
| | |
| LoCorr Spectrum Income Fund – Schedule of Investments (continued) | | 65 |
| | |
| | | Shares | | | Value | |
| COMMON STOCKS: (continued) | | | | | | | | |
| Food: 0.98% | | | | | | | | |
| B&G Foods, Inc. | | | 17,009 | | | $ | 471,660 | |
| | | | | | | | | |
| Forest Products & Paper: 1.00% | | | | | | | | |
| International Paper Co. | | | 9,642 | | | | 479,400 | |
| | | | | | | | | |
| Insurance: 1.00% | | | | | | | | |
| AMERISAFE, Inc. | | | 8,368 | | | | 480,574 | |
| | | | | | | | | |
| Pipelines: 4.89% | | | | | | | | |
| Antero Midstream Corp. | | | 119,726 | | | | 923,087 | |
| Hess Midstream LP | | | 28,379 | | | | 555,377 | |
| Williams Cos. Inc. | | | 43,750 | | | | 877,188 | |
| | | | | | | | 2,355,652 | |
| Semiconductors: 2.28% | | | | | | | | |
| Broadcom, Inc. | | | 2,502 | | | | 1,095,501 | |
| | | | | | | | | |
| Transportation: 4.92% | | | | | | | | |
| DHT Holdings, Inc. (a) | | | 94,504 | | | | 494,256 | |
| Euronav NV (a) | | | 59,395 | | | | 475,160 | |
| Hoegh LNG Partners LP (a) | | | 97,960 | | | | 1,400,828 | |
| | | | | | | | 2,370,244 | |
| TOTAL COMMON STOCKS (Cost $11,982,218) | | | | | | | 14,096,338 | |
| | | | | | | | | |
| | | | Units | | | | Value | |
| MASTER LIMITED PARTNERSHIPS: 17.52% | | | | | | | | |
| Diversified Financial Services: 1.07% | | | | | | | | |
| AllianceBernstein Holding LP | | | 15,190 | | | | 512,966 | |
| | | | | | | | | |
| Energy - Alternate Sources: 1.54% | | | | | | | | |
| Enviva Partners LP | | | 16,282 | | | | 739,528 | |
| | | | | | | | | |
| Gas: 2.61% | | | | | | | | |
| Global Partners LP | | | 75,630 | | | | 1,256,971 | |
| | | | | | | | | |
| Oil & Gas: 1.36% | | | | | | | | |
| Sunoco LP | | | 22,830 | | | | 657,047 | |
| | | | | | | | | |
| Oil & Gas Services: 3.33% | | | | | | | | |
| CrossAmerica Partners LP | | | 39,794 | | | | 683,263 | |
| USA Compression Partners LP | | | 67,808 | | | | 922,189 | |
| | | | | | | | 1,605,452 | |
| Pipelines: 4.07% | | | | | | | | |
| Crestwood Equity Partners LP | | | 80,178 | | | | 1,521,778 | |
| Delek Logistics Partners LP | | | 13,689 | | | | 438,048 | |
| | | | | | | | 1,959,826 | |
| Private Equity: 1.49% | | | | | | | | |
| Icahn Enterprises LP | | | 14,144 | | | | 716,677 | |
| | | | | | | | | |
| Real Estate: 2.05% | | | | | | | | |
| Brookfield Property Partners LP (a) | | | 68,036 | | | | 984,481 | |
| TOTAL MASTER LIMITED PARTNERSHIPS (Cost $6,858,941) | | | | | | | 8,432,948 | |
| | | | | | | | | |
| | | | Shares | | | | Value | |
| PREFERRED STOCKS: 7.28% | | | | | | | | |
| Pharmaceuticals: 1.05% | | | | | | | | |
| Fortress Biotech, Inc., Series A, 9.375% | | | 26,149 | | | | 506,506 | |
| | | | | | | | | |
| Pipelines: 3.30% | | | | | | | | |
| Crestwood Equity Partners LP, 9.250% | | | 113,417 | | | | 847,225 | |
| NuStar Energy LP, Series B, 7.625% | | | 41,295 | | | | 742,484 | |
| | | | | | | | 1,589,709 | |
| Transportation: 1.01% | | | | | | | | |
| GasLog Partners LP, Series A, 8.625% (a) | | | 30,516 | | | | 488,256 | |
| | | | | | | | | |
| Trucking & Leasing: 1.92% | | | | | | | | |
| Fortress Transportation & Infrastructure Investors LLC 8.000% | | | 40,567 | | | | 922,088 | |
| TOTAL PREFERRED STOCKS (Cost $2,644,256) | | | | | | $ | 3,506,559 | |
| | | | | | | | | |
The accompanying notes are an integral part of these financial statements.
| | |
| | |
| 66 | | LoCorr Spectrum Income Fund – Schedule of Investments (continued) |
| | |
| | | | | | | |
| | | Units | | | Value | |
| PUBLICLY TRADED PARTNERSHIPS: 4.40% | | | | | | | | |
| Brookfield Renewable Partners LP (a) | | | 35,654 | | | | 1,538,470 | |
| Compass Diversified Holdings | | | 29,789 | | | | 579,396 | |
| TOTAL PUBLICLY TRADED PARTNERSHIPS (Cost $1,455,612) | | | | | | | 2,117,866 | |
| | | | | | | | | |
| | | | Shares | | | | Value | |
| REAL ESTATE INVESTMENT TRUSTS: 17.99% | | | | | | | | |
| AGNC Investment Corp.(d) | | | 86,818 | | | | 1,354,361 | |
| Annaly Capital Management, Inc. | | | 165,086 | | | | 1,394,977 | |
| Apollo Commercial Real Estate Finance, Inc. | | | 43,387 | | | | 484,633 | |
| Global Net Lease, Inc. | | | 64,443 | | | | 1,104,553 | |
| Hannon Armstrong Sustainable Infrastructure Capital, Inc. | | | 16,782 | | | | 1,064,482 | |
| Iron Mountain, Inc. | | | 28,561 | | | | 841,978 | |
| PotlatchDeltic Corp. | | | 19,192 | | | | 959,985 | |
| Sabra Health Care, Inc. | | | 28,652 | | | | 497,685 | |
| Starwood Property Trust, Inc. | | | 49,753 | | | | 960,233 | |
| TOTAL REAL ESTATE INVESTMENT TRUSTS (Cost $8,013,319) | | | | | | | 8,662,887 | |
| | | | | | | | | |
| ROYALTY TRUST: 1.06% | | | | | | | | |
| Mesabi Trust | | | 18,145 | | | | 508,967 | |
| TOTAL ROYALTY TRUST (Cost $497,294) | | | | | | | 508,967 | |
| | | | | | | | | |
| SHORT TERM INVESTMENT: 3.67% | | | | | | | | |
| MONEY MARKET FUND: 3.67% | | | | | | | | |
| STIT-Government & Agency Portfolio, Institutional Class, 0.03% (b) | | | 1,766,574 | | | | 1,766,574 | |
| TOTAL MONEY MARKET FUND (Cost $1,766,574) | | | | | | | 1,766,574 | |
| TOTAL SHORT TERM INVESTMENT (Cost $1,766,574) | | | | | | | 1,766,574 | |
| | | | | | | | | |
| TOTAL INVESTMENTS (Cost $41,964,720): 99.17% | | | | | | | 47,745,322 | |
| Other Assets in Excess of Liabilities: 0.83% (c) | | | | | | | 400,033 | |
| TOTAL NET ASSETS: 100.00% | | | | | | $ | 48,145,355 | |
| (a) | Foreign issued security. |
| (b) | The rate quoted is the annualized seven-day effective yield as of December 31, 2020. |
| (c) | Includes deposits at broker for derivative instruments. At December 31, 2020, the value of these assets total $552,147. |
| (d) | All of a portion of this security is held as collateral for options written. See Note 2. At December 31, 2020, the value of these securities is $2,766,144. |
PLC Public Limited Company
The accompanying notes are an integral part of these financial statements.
| | | |
| | | |
LoCorr Macro Strategies Fund, LoCorr Long/Short Commodities Strategy Fund and LoCorr Market Trend Fund –
Consolidated Statements of Assets & Liabilities | | | 67 |
| | | |
Consolidated Statements of Assets & Liabilities
December 31, 2020
| | | | LoCorr Macro
Strategies Fund | | | | LoCorr Long/Short
Commodities
Strategy Fund | | | | LoCorr Market
Trend Fund | |
| | | | | | | | | | | | | |
| Assets | | | | | | | | | | | | |
| Investments, at value (Cost $1,050,855,120, $404,038,100 and $214,271,271, respectively) | | $ | 1,074,423,713 | | | $ | 416,011,786 | | | $ | 218,600,599 | |
| Cash | | | 1,702,548 | | | | — | | | | 369,676 | |
| Cash held as collateral for forward currency contracts (Note 2) | | | 10,440,000 | | | | — | | | | 6,740,000 | |
| Foreign currency, at value (Cost $33,934,936, $0 and $196,715) | | | 34,209,579 | | | | — | | | | 196,715 | |
| Receivable for variation margin on futures contracts | | | 1,723,045 | | | | — | | | | 762,289 | |
| Receivable for Fund shares sold | | | 4,936,608 | | | | 2,253,939 | | | | 1,271,035 | |
| Receivable for securities sold | | | — | | | | 184,424 | | | | 139,683 | |
| Interest receivable | | | 4,150,473 | | | | 1,411,876 | | | | 787,853 | |
| Receivable for unsettled open futures contracts | | | 6,041,880 | | | | — | | | | 3,519,871 | |
| Deposits with broker for derivative instruments (Note 2) | | | 46,528,047 | | | | 59,200,974 | | | | 22,009,626 | |
| Unrealized appreciation on forward currency contracts (Note 2) | | | 14,686,041 | | | | — | | | | 4,233,215 | |
| Advance receipt on swap contracts | | | — | | | | 14,113,147 | | | | — | |
| Prepaid expenses and other assets | | | 50,059 | | | | 90,211 | | | | 28,305 | |
| Total Assets | | | 1,198,891,993 | | | | 493,266,357 | | | | 258,658,867 | |
| | | | | | | | | | | | | |
| Liabilities | | | | | | | | | | | | |
| Payable for Fund shares redeemed | | $ | 2,361,021 | | | $ | 1,383,161 | | | $ | 944,726 | |
| Payable for unsettled open futures contracts | | | 552,730 | | | | — | | | | 44,509 | |
| Accrued management fees (Note 5) | | | 1,604,425 | | | | 602,982 | | | | 325,435 | |
| Accrued Trustees' fees | | | 26,373 | | | | 11,145 | | | | 5,929 | |
| Accrued Rule 12b-1 fees | | | 71,119 | | | | 124,938 | | | | 134,248 | |
| Unrealized depreciation on swap contracts (Note 1) | | | — | | | | 13,099,219 | | | | — | |
| Unrealized depreciation on forward currency contracts (Note 2) | | | 9,619,242 | | | | — | | | | 943,470 | |
| Accrued expenses and other liabilities | | | 490,835 | | | | 210,226 | | | | 143,517 | |
| Total Liabilities | | | 14,725,745 | | | | 15,431,671 | | | | 2,541,834 | |
| | | | | | | | | | | | | |
| Net Assets | | $ | 1,184,166,248 | | | $ | 477,834,686 | | | $ | 256,117,033 | |
| | | | | | | | | | | | | |
| Net Assets Consist of: | | | | | | | | | | | | |
| Paid-in capital | | $ | 1,139,538,065 | | | $ | 478,916,571 | | | $ | 248,545,342 | |
| Total distributable earnings/(accumulated loss) | | | 44,628,183 | | | | (1,081,885 | ) | | | 7,571,691 | |
| NET ASSETS | | $ | 1,184,166,248 | | | $ | 477,834,686 | | | $ | 256,117,033 | |
| | | | | | | | | | | | | |
| Class A Shares | | | | | | | | | | | | |
| Net assets | | $ | 77,034,842 | | | $ | 26,545,817 | | | $ | 16,951,991 | |
| Shares issued and outstanding (unlimited shares authorized, no par value) | | | 9,030,476 | | | | 2,684,560 | | | | 1,449,470 | |
| Net asset value, redemption, and minimum offering price per share (a) | | $ | 8.53 | | | $ | 9.89 | | | $ | 11.70 | |
| Maximum offering price per share ($8.53/0.9425) ($9.89/0.9425) ($11.70/0.9425), respectively (b) | | $ | 9.05 | | | $ | 10.49 | | | $ | 12.41 | |
| | | | | | | | | | | | | |
| Class C Shares | | | | | | | | | | | | |
| Net assets | | $ | 43,684,310 | | | $ | 7,937,486 | | | $ | 13,169,996 | |
| Shares issued and outstanding (unlimited shares authorized, no par value) | | | 5,386,635 | | | | 838,489 | | | | 1,165,456 | |
| Net asset value, redemption, and offering price per share (a) | | $ | 8.11 | | | $ | 9.47 | | | $ | 11.30 | |
| | | | | | | | | | | | | |
| Class I Shares | | | | | | | | | | | | |
| Net assets | | $ | 1,063,447,096 | | | $ | 443,351,383 | | | $ | 225,995,046 | |
| Shares issued and outstanding (unlimited shares authorized, no par value) | | | 122,625,543 | | | | 44,315,085 | | | | 19,252,314 | |
| Net asset value, redemption, and offering price per share | | $ | 8.67 | | | $ | 10.00 | | | $ | 11.74 | |
| (a) | A 1.00% contingent deferred sales charge may apply to redemptions made within twelve months of purchase. The contingent deferred sales charge only applies to Class A share purchases of $1 million or more. |
| (b) | On investments of $25,000 or more, the offering price is reduced. |
The accompanying notes are an integral part of these consolidated financial statements.
| | |
| | |
| 68 | | LoCorr Dynamic Equity Fund and LoCorr Spectrum Income Fund - Statements of Assets & Liabilities |
| | |
Statements of Assets & Liabilities
December 31, 2020
| | | | LoCorr
Dynamic Equity
Fund | | | | LoCorr
Spectrum
Income Fund | |
| | | | | | | | | |
| Assets | | | | | | | | |
| Investments, at value (Cost $13,592,971 and $41,964,720, respectively) | | $ | 16,249,086 | | | $ | 47,745,322 | |
| Cash | | | — | | | | 33,950 | |
| Cash held as collateral for securities sold short (Note 2) | | | 1,312,604 | | | | — | |
| Foreign currency, at value (Cost $572,387 and $0, respectively) ^ | | | 578,487 | | | | — | |
| Receivable for variation margin on futures contracts | | | 4,054 | | | | — | |
| Receivable for Fund shares sold | | | 120 | | | | 8,000 | |
| Receivable for securities sold | | | 1,546,279 | | | | — | |
| Dividends, interest and other receivables | | | 8,614 | | | | 145,900 | |
| Receivable from Adviser | | | 2,284 | | | | — | |
| Deposits with broker for derivative instruments | | | 339,715 | | | | 552,147 | |
| Deposits with broker for securities sold short (Note 2) | | | 5,383,030 | | | | — | |
| Prepaid expenses and other assets | | | 12,979 | | | | 27,074 | |
| Total Assets | | $ | 25,437,252 | | | $ | 48,512,393 | |
| | | | | | | | | |
| Liabilities | | | | | | | | |
| Securities sold short, at value (Proceeds $5,901,638 and $0, respectively) | | $ | 6,317,185 | | | $ | — | |
| Payable for Fund shares redeemed | | | 103,762 | | | | 115,088 | |
| Payable for securities purchased | | | 846,930 | | | | — | |
| Payable for distributions | | | — | | | | 86,968 | |
| Dividends payable | | | 4,213 | | | | — | |
| Due to broker for options (Note 2) | | | — | | | | — | |
| Accrued management fees (Note 5) | | | — | | | | 45,148 | |
| Accrued Trustees' fees | | | 426 | | | | 1,127 | |
| Accrued Rule 12b-1 fees | | | 12,472 | | | | 53,608 | |
| Accrued expenses and other liabilities | | | 79,729 | | | | 65,099 | |
| Total Liabilities | | | 7,364,717 | | | | 367,038 | |
| | | | | | | | | |
| Net Assets | | $ | 18,072,535 | | | $ | 48,145,355 | |
| | | | | | | | | |
| Net Assets Consist of: | | | | | | | | |
| Paid-in capital | | $ | 17,993,835 | | | $ | 77,693,512 | |
| Total distributable earnings/(accumulated loss) | | | 78,700 | | | | (29,548,157 | ) |
| NET ASSETS | | $ | 18,072,535 | | | $ | 48,145,355 | |
| | | | | | | | | |
| Class A Shares | | | | | | | | |
| Net assets | | $ | 3,827,592 | | | $ | 13,635,104 | |
| Shares issued and outstanding (unlimited shares authorized, no par value) | | | 329,445 | | | | 2,218,581 | |
| Net asset value, redemption, and minimum offering price per share (a) | | $ | 11.62 | | | $ | 6.15 | (b) |
| Maximum offering price per share ($11.62/0.9425), ($6.15/0.9425), respectively(c) | | $ | 12.33 | | | $ | 6.52 | |
| | | | | | | | | |
| Class C Shares | | | | | | | | |
| Net assets | | $ | 2,435,654 | | | $ | 13,295,525 | |
| Shares issued and outstanding (unlimited shares authorized, no par value) | | | 222,903 | | | | 2,139,683 | |
| Net asset value, redemption, and offering price per share (a) | | $ | 10.93 | | | $ | 6.21 | (b) |
| | | | | | | | | |
| Class I Shares | | | | | | | | |
| Net assets | | $ | 11,809,289 | | | $ | 21,214,726 | |
| Shares issued and outstanding (unlimited shares authorized, no par value) | | | 995,506 | | | | 3,463,315 | |
| Net asset value, redemption, and offering price per share | | $ | 11.86 | | | $ | 6.13 | (b) |
| ^ | Includes $203,600 of foreign currency as collateral for securities sold short. |
| | |
| (a) | A 1.00% contingent deferred sales charge may apply to redemptions made within twelve months of purchase. The contingent deferred sales charge only applies to Class A share purchases of $1 million or more. |
| (b) | Redemptions made within 60 days of purchase may be assessed a redemption fee of 2.00%. |
| (c) | On investments of $25,000 or more, the offering price is reduced. |
The accompanying notes are an integral part of these financial statements.
| | | |
| | | |
LoCorr Macro Strategies Fund, LoCorr Long/Short Commodities Strategy Fund and LoCorr Market Trend Fund –
Consolidated Statements of Operations | | | 69 |
| | | |
Consolidated Statements of Operations
Year Ended December 31, 2020
| | | LoCorr Macro
Strategies Fund | | | LoCorr Long/Short
Commodities
Strategy Fund | | | LoCorr Market
Trend Fund | |
| | | | | | | | | | |
| Investment Income | | | | | | | | | |
| Interest income | | $ | 17,133,784 | | | $ | 5,691,040 | | | $ | 3,928,385 | |
| Total Investment Income | | | 17,133,784 | | | | 5,691,040 | | | | 3,928,385 | |
| | | | | | | | | | | | | |
| Expenses | | | | | | | | | | | | |
| Management fees (Note 5) | | | 16,831,107 | | | | 5,952,439 | | | | 3,880,402 | |
| Fund administration fees | | | 350,771 | | | | 169,529 | | | | 130,430 | |
| Fund accounting fees | | | 370,325 | | | | 190,899 | | | | 143,459 | |
| Trustees' fees | | | 107,357 | | | | 41,556 | | | | 27,592 | |
| Transfer agent fees and expenses | | | 1,544,879 | | | | 607,325 | | | | 273,905 | |
| Custodian fees | | | 63,000 | | | | 22,053 | | | | 18,176 | |
| Registration expenses | | | 98,572 | | | | 87,423 | | | | 58,892 | |
| Rule 12b-1 fee – Class A (Note 5) | | | 139,423 | | | | 89,304 | | | | 46,114 | |
| Rule 12b-1 fee – Class C (Note 5) | | | 456,784 | | | | 76,084 | | | | 138,024 | |
| Legal and audit fees | | | 86,055 | | | | 63,577 | | | | 47,296 | |
| Printing and mailing expenses | | | 137,140 | | | | 47,871 | | | | 35,251 | |
| Other expenses | | | 27,572 | | | | 77,953 | | | | 12,865 | |
| Total expenses before fee recovery to Adviser | | | 20,212,985 | | | | 7,426,013 | | | | 4,812,406 | |
| Fee recovery to Adviser (Note 5) | | | 29,733 | | | | — | | | | — | |
| Net Expenses | | | 20,242,718 | | | | 7,426,013 | | | | 4,812,406 | |
| Net Investment Income | | | (3,108,934 | ) | | | (1,734,973 | ) | | | (884,021 | ) |
| | | | | | | | | | | | | |
| Realized and Unrealized Gain (Loss) on Investments, Swap Contracts, Forward Currency Contracts, Futures Contracts and Foreign Currency: | | | | | | | | | | | | |
| Net realized gain (loss) on: | | | | | | | | | | | | |
| Investments | | | 7,237,606 | | | | 2,667,108 | | | | 3,256,603 | |
| Swap contracts | | | — | | | | 204,845 | | | | — | |
| Forward currency contracts | | | (562,610 | ) | | | — | | | | (6,295,791 | ) |
| Futures contracts | | | (4,614,548 | ) | | | — | | | | (10,212,809 | ) |
| Foreign currency transactions | | | 4,847,138 | | | | — | | | | 4,898 | |
| Net change in unrealized appreciation/depreciation on: | | | | | | | | | | | | |
| Investments | | | 16,473,887 | | | | 8,697,727 | | | | 3,119,144 | |
| Swap contracts | | | — | | | | 13,062,942 | | | | — | |
| Forward currency contracts | | | 8,808,073 | | | | — | | | | 5,124,121 | |
| Futures contracts | | | 28,943,513 | | | | — | | | | 15,397,189 | |
| Foreign currency transactions | | | 85,129 | | | | — | | | | — | |
| Net realized and unrealized gain (loss) | | | 61,218,188 | | | | 24,632,622 | | | | 10,393,355 | |
| Net Increase (Decrease) in Net Assets Resulting From Operations | | $ | 58,109,254 | | | $ | 22,897,649 | | | $ | 9,509,334 | |
The accompanying notes are an integral part of these consolidated financial statements.
| | |
| | |
| 70 | | LoCorr Dynamic Equity Fund and LoCorr Spectrum Income Fund – Statements of Operations |
| | |
Statements of Operations
Year Ended December 31, 2020
| | | | LoCorr Dynamic
Equity Fund | | | | LoCorr
Spectrum
Income Fund | |
| | | | | | | | | |
| Investment Income | | | | | | | | |
| Dividend and interest income (a) | | $ | 245,041 | | | $ | 2,155,162 | |
| Total Investment Income | | | 245,041 | | | | 2,155,162 | |
| | | | | | | | | |
| Expenses | | | | | | | | |
| Management fees (Note 5) | | | 305,888 | | | | 679,761 | |
| Fund administration fees | | | 69,308 | | | | 60,265 | |
| Fund accounting fees | | | 60,451 | | | | 42,015 | |
| Trustees' fees | | | 2,216 | | | | 5,721 | |
| Transfer agent fees and expenses | | | 70,780 | | | | 95,412 | |
| Custodian fees | | | 99,725 | | | | 8,139 | |
| Registration expenses | | | 46,731 | | | | 51,489 | |
| Rule 12b-1 fee – Class A (Note 5) | | | 11,328 | | | | 40,791 | |
| Rule 12b-1 fee – Class C (Note 5) | | | 27,578 | | | | 135,974 | |
| Legal and audit fees | | | 21,014 | | | | 33,168 | |
| Printing and mailing expenses | | | 4,650 | | | | 27,968 | |
| Other expenses | | | 3,151 | | | | 4,441 | |
| Total expenses before dividend and interest expense | | | 722,820 | | | | 1,185,144 | |
| Dividend expense on securities sold short (Note 2) | | | 117,209 | | | | — | |
| Interest expense | | | 68,026 | | | | 6,201 | |
| Total expenses before fee waiver from Advisor | | | 908,055 | | | | 1,191,345 | |
| Fee waiver from Adviser (Note 5) | | | (278,103 | ) | | | (70,144 | ) |
| Net Expenses | | | 629,952 | | | | 1,121,201 | |
| Net Investment Income (Loss) | | | (384,911 | ) | | | 1,033,961 | |
| | | | | | | | | |
| Realized and Unrealized Gain (Loss) on Investments, Securities Sold Short, Futures Contracts, Foreign Currency and Written Options: | | | | | | | | |
| Net realized gain (loss) on: | | | | | | | | |
| Investments | | | (4,526 | ) | | | (8,123,465 | ) |
| Securities sold short | | | (435,912 | ) | | | | |
| Futures contracts | | | 367,013 | | | | — | |
| Foreign currency transactions | | | 53,500 | | | | — | |
| Written options | | | — | | | | (492,743 | ) |
| Net change in unrealized appreciation/depreciation on: | | | | | | | | |
| Investments | | | (826,796 | ) | | | 521,555 | |
| Securities sold short | | | 146,351 | | | | — | |
| Futures contracts | | | 28,661 | | | | — | |
| Foreign currency transactions | | | (51,014 | ) | | | — | |
| Written options | | | — | | | | 49,495 | |
| Net realized and unrealized gain | | | (722,723 | ) | | | (8,045,158 | ) |
| Net Increase in Net Assets Resulting From Operations | | $ | (1,107,634 | ) | | $ | (7,011,197 | ) |
| (a) | Net foreign tax withheld of $13,081 and $21,017, respectively. |
The accompanying notes are an integral part of these financial statements.
| | |
| | |
| LoCorr Macro Strategies Fund – Consolidated Statements of Changes in Net Assets | | 71 |
| | |
LoCorr Macro Strategies Fund
Consolidated Statements of Changes in Net Assets
| | | Year Ended December 31, | |
| | | 2020 | | | 2019 | |
| | | | | | | |
| Operations | | | | | | |
| Net investment income (loss) | | $ | (3,108,934 | ) | | $ | 2,509,357 | |
| Net realized gain on investments, forward currency contracts, futures contracts and foreign currency translation | | | 6,907,586 | | | | 65,989,452 | |
| Net change in unrealized appreciation of investments, forward currency contracts,futures contracts and foreign currency translation | | | 54,310,602 | | | | 5,421,720 | |
| Increase in Net Assets Resulting From Operations | | | 58,109,254 | | | | 73,920,529 | |
| | | | | | | | | |
| Distributions From Earnings | | | | | | | | |
| Class A | | | (3,044,869 | ) | | | (2,273,098 | ) |
| Class C | | | (2,143,479 | ) | | | (1,949,391 | ) |
| Class I | | | (58,170,598 | ) | | | (27,731,042 | ) |
| Total Distributions From Earnings | | | (63,358,946 | ) | | | (31,953,531 | ) |
| | | | | | | | | |
| Capital Transactions (Note 6) | | | | | | | | |
| Proceeds from shares sold | | | 686,900,731 | | | | 457,926,442 | |
| Proceeds from shares issued in connection with reorganization(a) | | | 57,875,149 | | | | — | |
| Reinvestment of distributions | | | 56,490,383 | | | | 29,628,161 | |
| Cost of shares redeemed | | | (438,436,073 | ) | | | (257,017,118 | ) |
| Increase in Net Assets From Capital Transactions | | | 362,830,190 | | | | 230,537,485 | |
| | | | | | | | | |
| Total Increase in Net Assets | | | 357,580,498 | | | | 272,504,483 | |
| | | | | | | | | |
| Net Assets | | | | | | | | |
| Beginning of year | | | 826,585,750 | | | | 554,081,267 | |
| End of year | | $ | 1,184,166,248 | | | $ | 826,585,750 | |
| (a) | Shares of the Steben Managed Futures Strategy Fund converted into shares of the LoCorr Macro Strategies Fund on January 24, 2020. See Note 1. |
The accompanying notes are an integral part of these consolidated financial statements.
| | |
| | |
| 72 | | LoCorr Long/Short Commodities Strategy Fund – Consolidated Statements of Changes in Net Assets |
| | |
LoCorr Long/Short Commodities Strategy Fund
Consolidated Statements of Changes in Net Assets
| | | Year Ended December 31, | |
| | | 2020 | | | 2019 | |
| | | | | | | |
| Operations | | | | | | |
| Net investment income (loss) | | $ | (1,734,973 | ) | | $ | 2,078,123 | |
| Net realized gain on investments and swap contracts | | | 2,871,953 | | | | 5,879,198 | |
| Net change in unrealized appreciation/depreciation of investments and swap contracts | | | 21,760,669 | | | | (27,177,510 | ) |
| Increase (Decrease) in Net Assets Resulting From Operations | | | 22,897,649 | | | | (19,220,189 | ) |
| | | | | | | | | |
| Distributions From Earnings | | | | | | | | |
| Class A | | | (687,537 | ) | | | (113,252 | ) |
| Class C | | | (165,370 | ) | | | (451 | ) |
| Class I | | | (12,840,661 | ) | | | (1,133,635 | ) |
| Total Distributions From Earnings | | | (13,693,568 | ) | | | (1,247,338 | ) |
| | | | | | | | | |
| Capital Transactions (Note 6) | | | | | | | | |
| Proceeds from shares sold | | | 425,232,265 | | | | 184,040,413 | |
| Reinvestment of distributions | | | 10,893,359 | | | | 1,025,506 | |
| Cost of shares redeemed | | | (223,539,698 | ) | | | (165,579,736 | ) |
| Increase in Net Assets From Capital Transactions | | | 212,585,926 | | | | 19,486,183 | |
| | | | | | | | | |
| Total Increase (Decrease) in Net Assets | | | 221,790,007 | | | | (981,344 | ) |
| | | | | | | | | |
| Net Assets | | | | | | | | |
| Beginning of year | | | 256,044,679 | | | | 257,026,023 | |
| End of year | | $ | 477,834,686 | | | $ | 256,044,679 | |
The accompanying notes are an integral part of these consolidated financial statements.
| | |
| | |
| LoCorr Market Trend Fund – Consolidated Statements of Changes in Net Assets | | 73 |
| | |
LoCorr Market Trend Fund
Consolidated Statements of Changes in Net Assets
| | | Year Ended December 31, | |
| | | 2020 | | | 2019 | |
| | | | | | | |
| Operations | | | | | | |
| Net investment income (loss) | | $ | (884,021 | ) | | $ | 834,447 | |
| Net realized gain (loss) on investments, forward currency contracts, futures contracts and foreign currency translation | | | (13,247,099 | ) | | | 36,441,304 | |
| Net change in unrealized appreciation of investments, forward currency contracts, futures contracts and foreign currency translation | | | 23,640,454 | | | | 5,575,073 | |
| Increase in Net Assets Resulting From Operations | | | 9,509,334 | | | | 42,850,824 | |
| | | | | | | | | |
| Distributions From Earnings | | | | | | | | |
| Class A | | | — | | | | (129,659 | ) |
| Class I | | | (570,347 | ) | | | (2,948,512 | ) |
| Total Distributions to Shareholders | | | (570,347 | ) | | | (3,078,171 | ) |
| | | | | | | | | |
| Capital Transactions (Note 6) | | | | | | | | |
| Proceeds from shares sold | | | 100,733,510 | | | | 98,897,248 | |
| Reinvestment of distributions | | | 551,952 | | | | 2,954,424 | |
| Cost of shares redeemed | | | (127,312,911 | ) | | | (211,619,382 | ) |
| Decrease in Net Assets From Capital Transactions | | | (26,027,449 | ) | | | (109,767,710 | ) |
| | | | | | | | | |
| Total Decrease in Net Assets | | | (17,088,462 | ) | | | (69,995,057 | ) |
| | | | | | | | | |
| Net Assets | | | | | | | | |
| Beginning of year | | | 273,205,495 | | | | 343,200,552 | |
| End of year | | $ | 256,117,033 | | | $ | 273,205,495 | |
The accompanying notes are an integral part of these consolidated financial statements.
| | |
| | |
| 74 | | LoCorr Dynamic Equity Fund – Statements of Changes in Net Assets |
| | |
LoCorr Dynamic Equity Fund
Statements of Changes in Net Assets
| | | Year Ended December 31, | |
| | | 2020 | | | 2019 | |
| | | | | | | |
| Operations | | | | | | |
| Net investment loss | | $ | (384,911 | ) | | $ | (466,835 | ) |
| Net realized loss on investments, securities sold short, futures contracts and foreign currency translation | | | (19,925 | ) | | | (623,021 | ) |
| Net change in unrealized appreciation/depreciation of investments, securities sold short,futures contracts and foreign currency translation | | | (702,798 | ) | | | 4,704,040 | |
| Increase (Decrease) in Net Assets Resulting From Operations | | | (1,107,634 | ) | | | 3,614,184 | |
| | | | | | | | | |
| Distributions From Earnings | | | | | | | | |
| Class A | | | — | | | | (23,048 | ) |
| Class C | | | — | | | | (14,375 | ) |
| Class I | | | — | | | | (56,118 | ) |
| Total Distributions From Earnings | | | — | | | | (93,541 | ) |
| | | | | | | | | |
| Capital Transactions (Note 6) | | | | | | | | |
| Proceeds from shares sold | | | 6,264,879 | | | | 10,150,264 | |
| Reinvestment of distributions | | | — | | | | 87,631 | |
| Cost of shares redeemed | | | (14,782,464 | ) | | | (16,333,680 | ) |
| Decrease in Net Assets From Capital Transactions | | | (8,517,585 | ) | | | (6,095,785 | ) |
| | | | | | | | | |
| Total Decrease in Net Assets | | | (9,625,219 | ) | | | (2,575,142 | ) |
| Net Assets | | | | | | | | |
| Beginning of year | | | 27,697,754 | | | | 30,272,896 | |
| End of year | | $ | 18,072,535 | | | $ | 27,697,754 | |
The accompanying notes are an integral part of these financial statements.
| | |
| | |
| LoCorr Spectrum Income Fund – Statements of Changes in Net Assets | | 75 |
| | |
LoCorr Spectrum Income Fund
Statements of Changes in Net Assets
| | | Year Ended December 31, | |
| | | 2020 | | | 2019 | |
| | | | | | | |
| Operations | | | | | | |
| Net investment income | | $ | 1,033,961 | | | $ | 1,368,585 | |
| Net realized loss on investments and written options | | | (8,616,208 | ) | | | (356,359 | ) |
| Net change in unrealized appreciation of investments and written options | | | 571,050 | | | | 11,181,834 | |
| Increase (Decrease) in Net Assets Resulting From Operations | | | (7,011,197 | ) | | | 12,194,060 | |
| | | | | | | | | |
| Distributions From: | | | | | | | | |
| Net investment income: | | | | | | | | |
| Class A | | | (524,026 | ) | | | (431,377 | ) |
| Class C | | | (394,734 | ) | | | (293,781 | ) |
| Class I | | | (757,177 | ) | | | (540,423 | ) |
| Return of capital: | | | | | | | | |
| Class A | | | (801,917 | ) | | | (1,380,030 | ) |
| Class C | | | (604,063 | ) | | | (939,845 | ) |
| Class I | | | (1,158,708 | ) | | | (1,728,885 | ) |
| Total Distributions From Earnings | | | (4,240,625 | ) | | | (5,314,341 | ) |
| | | | | | | | | |
| Capital Transactions (Note 6) | | | | | | | | |
| Proceeds from shares sold | | | 10,635,063 | | | | 24,156,953 | |
| Reinvestment of distributions | | | 3,001,128 | | | | 3,980,781 | |
| Cost of shares redeemed | | | (28,130,066 | ) | | | (29,452,865 | ) |
| Redemption fees | | | 4,942 | | | | 1,562 | |
| Decrease in Net Assets From Capital Transactions | | | (14,488,933 | ) | | | (1,313,569 | ) |
| | | | | | | | | |
| Total Increase (Decrease) in Net Assets | | | (25,740,755 | ) | | | 5,566,150 | |
| | | | | | | | | |
| Net Assets | | | | | | | | |
| Beginning of year | | | 73,886,110 | | | | 68,319,960 | |
| End of year | | $ | 48,145,355 | | | $ | 73,886,110 | |
The accompanying notes are an integral part of these financial statements.
| | |
| | |
| 76 | | LoCorr Macro Strategies Fund – Consolidated Financial Highlights – Class A |
| | |
LoCorr Macro Strategies Fund – Class A
Consolidated Financial Highlights
Selected Data and Ratios (for a share outstanding throughout the year)
| | Year Ended December 31, | |
| | | | 2020 | | | | 2019 | | | | 2018 | | | | 2017 | | | | 2016 | |
| Per Share | | | | | | | | | | | | | | | | | | | | |
| Net asset value, beginning of year | | $ | 8.56 | | | $ | 7.95 | | | $ | 8.64 | | | $ | 8.91 | | | $ | 8.54 | |
| | | | | | | | | | | | | | | | | | | | | |
| Income (loss) from investment operations: | | | | | | | | | | | | | | | | | | | | |
| Net investment income (loss)(a) | | | (0.04 | ) | | | 0.02 | | | | 0.00 | (b) | | | (0.06 | ) | | | (0.09 | ) |
| Net realized and unrealized gain (loss) | | | 0.49 | | | | 0.98 | | | | (0.46 | ) | | | 0.31 | | | | 0.64 | |
| Total from Investment Operations | | | 0.45 | | | | 1.00 | | | | (0.46 | ) | | | 0.25 | | | | 0.55 | |
| | | | | | | | | | | | | | | | | | | | | |
| Distributions From Earnings: | | | | | | | | | | | | | | | | | | | | |
| Net investment income | | | (0.39 | ) | | | (0.16 | ) | | | (0.10 | ) | | | – | | | | – | |
| Net realized gains | | | (0.09 | ) | | | (0.23 | ) | | | (0.13 | ) | | | (0.52 | ) | | | (0.18 | ) |
| Total Distributions | | | (0.48 | ) | | | (0.39 | ) | | | (0.23 | ) | | | (0.52 | ) | | | (0.18 | ) |
| | | | | | | | | | | | | | | | | | | | | |
| Redemption Fees | | | – | | | | – | | | | – | | | | 0.00 | (b) | | | 0.00 | (b) |
| | | | | | | | | | | | | | | | | | | | | |
| Net Asset Value, End of Year | | $ | 8.53 | | | $ | 8.56 | | | $ | 7.95 | | | $ | 8.64 | | | $ | 8.91 | |
| | | | | | | | | | | | | | | | | | | | | |
| Total Investment Return(c) | | | 5.41 | % | | | 12.52 | % | | | (5.36 | )% | | | 2.77 | % | | | 6.39 | % |
| | | | | | | | | | | | | | | | | | | | | |
| Net Assets, End of Year, in Thousands | | $ | 77,035 | | | $ | 53,320 | | | $ | 55,075 | | | $ | 93,182 | | | $ | 297,844 | |
| | | | | | | | | | | | | | | | | | | | | |
| Ratios/Supplemental Data: | | | | | | | | | | | | | | | | | | | | |
| Ratio of expenses to average net assets: | | | | | | | | | | | | | | | | | | | | |
| Before expense waiver or recovery | | | 2.17 | % | | | 2.16 | % | | | 2.25 | % | | | 2.33 | % | | | 2.34 | %(d),(e) |
| After expense waiver or recovery | | | 2.18 | % | | | 2.24 | % | | | 2.24 | % | | | 2.28 | % | | | 2.34 | %(d),(e) |
| | | | | | | | | | | | | | | | | | | | | |
| Ratio of net investment income (loss) to average net assets: | | | | | | | | |
| Before expense waiver or recovery | | | (0.49 | )% | | | 0.32 | % | | | 0.03 | % | | | (0.76 | )% | | | (0.96 | )%(d) |
| After expense waiver or recovery | | | (0.50 | )% | | | 0.24 | % | | | 0.04 | % | | | (0.71 | )% | | | (0.96 | )%(d) |
| | | | | | | | | | | | | | | | | | | | | |
| Portfolio turnover rate(f) | | | 56 | % | | | 84 | % | | | 105 | % | | | 97 | % | | | 62 | % |
| (a) | Net investment income (loss) per share is based on average shares outstanding. |
| (b) | Amount represents less than $0.005 per share. |
| (c) | Total investment return excludes the effect of applicable sales charges. |
| (d) | Ratios do not include the income and expenses of the CTAs included in the swap. |
| (e) | Includes interest expense of 0.01% for the year ended December 31, 2016. |
| (f) | Portfolio turnover rate is calculated on the basis of the Fund as a whole without distinguishing between classes of shares issued. Consists of long-term investments only; excludes derivative instruments. |
The accompanying notes are an integral part of these consolidated financial statements.
| | |
| | |
| LoCorr Macro Strategies Fund – Consolidated Financial Highlights – Class C | | 77 |
| | |
LoCorr Macro Strategies Fund – Class C
Consolidated Financial Highlights
Selected Data and Ratios (for a share outstanding throughout the year)
| | Year Ended December 31, | |
| | | | 2020 | | | | 2019 | | | | 2018 | | | | 2017 | | | | 2016 | |
| Per Share | | | | | | | | | | | | | | | | | | | | |
| Net asset value, beginning of year | | $ | 8.15 | | | $ | 7.62 | | | $ | 8.27 | | | $ | 8.62 | | | $ | 8.32 | |
| | | | | | | | | | | | | | | | | | | | | |
| Income (loss) from investment operations: | | | | | | | | | | | | | | | | | | | | |
| Net investment income (loss)(a) | | | (0.10 | ) | | | (0.04 | ) | | | (0.06 | ) | | | (0.13 | ) | | | (0.15 | ) |
| Net realized and unrealized gain (loss) | | | 0.47 | | | | 0.92 | | | | (0.43 | ) | | | 0.30 | | | | 0.63 | |
| Total from Investment Operations | | | 0.37 | | | | 0.88 | | | | (0.49 | ) | | | 0.17 | | | | 0.48 | |
| | | | | | | | | | | | | | | | | | | | | |
| Distributions From Earnings: | | | | | | | | | | | | | | | | | | | | |
| Net investment income | | | (0.32 | ) | | | (0.12 | ) | | | (0.03 | ) | | | – | | | | – | |
| Net realized gains | | | (0.09 | ) | | | (0.23 | ) | | | (0.13 | ) | | | (0.52 | ) | | | (0.18 | ) |
| Total Distributions | | | (0.41 | ) | | | (0.35 | ) | | | (0.16 | ) | | | (0.52 | ) | | | (0.18 | ) |
| | | | | | | | | | | | | | | | | | | | | |
| Redemption Fees | | | – | | | | – | | | | – | | | | 0.00 | (b) | | | 0.00 | (b) |
| | | | | | | | | | | | | | | | | | | | | |
| Net Asset Value, End of Year | | $ | 8.11 | | | $ | 8.15 | | | $ | 7.62 | | | $ | 8.27 | | | $ | 8.62 | |
| | | | | | | | | | | | | | | | | | | | | |
| Total Investment Return(c) | | | 4.69 | % | | | 11.57 | % | | | (5.98 | )% | | | 1.93 | % | | | 5.72 | % |
| | | | | | | | | | | | | | | | | | | | | |
| Net Assets, End of Year, in Thousands | | $ | 43,684 | | | $ | 47,205 | | | $ | 53,148 | | | $ | 90,653 | | | $ | 113,814 | |
| | | | | | | | | | | | | | | | | | | | | |
| Ratios/Supplemental Data: | | | | | | | | | | | | | | | | | | | | |
| Ratio of expenses to average net assets: | | | | | | | | | | | | | | | | | | | | |
| Before expense waiver or recovery | | | 2.92 | % | | | 2.91 | % | | | 3.00 | % | | | 3.08 | % | | | 3.09 | %(d),(e) |
| After expense waiver or recovery | | | 2.93 | % | | | 2.99 | % | | | 2.99 | % | | | 3.03 | % | | | 3.09 | %(d),(e) |
| | | | | | | | | | | | | | | | | | | | | |
| Ratio of net investment income (loss) to average net assets: | | | | | | | | | | | | | | | | | | | | |
| Before expense waiver or recovery | | | (1.24 | )% | | | (0.43 | )% | | | (0.72 | )% | | | (1.51 | )% | | | (1.71 | )%(d) |
| After expense waiver or recovery | | | (1.25 | )% | | | (0.51 | )% | | | (0.71 | )% | | | (1.46 | )% | | | (1.71 | )%(d) |
| | | | | | | | | | | | | | | | | | | | | |
| Portfolio turnover rate(f) | | | 56 | % | | | 84 | % | | | 105 | % | | | 97 | % | | | 62 | % |
| (a) | Net investment income (loss) per share is based on average shares outstanding. |
| (b) | Amount represents less than $0.005 per share. |
| (c) | Total investment return excludes the effect of applicable sales charges. |
| (d) | Ratios do not include the income and expenses of the CTAs included in the swap. |
| (e) | Includes interest expense of 0.01% for the year ended December 31, 2016. |
| (f) | Portfolio turnover rate is calculated on the basis of the Fund as a whole without distinguishing between classes of shares issued. Consists of long-term investments only; excludes derivative instruments. |
The accompanying notes are an integral part of these consolidated financial statements.
| | |
| | |
| 78 | | LoCorr Macro Strategies Fund – Consolidated Financial Highlights – Class I |
| | |
LoCorr Macro Strategies Fund – Class I
Consolidated Financial Highlights
Selected Data and Ratios (for a share outstanding throughout the year)
| | Year Ended December 31, | |
| | 2020 | | | 2019 | | | 2018 | | | 2017 | | | 2016 | |
| Per Share | | | | | | | | | | | | | | | |
| Net asset value, beginning of year | | $ | 8.69 | | | $ | 8.07 | | | $ | 8.77 | | | $ | 9.01 | | | $ | 8.62 | |
| | | | | | | | | | | | | | | | | | | | | |
| Income (loss) from investment operations: | | | | | | | | | | | | | | | | | | | | |
| Net investment income (loss)(a) | | | (0.02 | ) | | | 0.04 | | | | 0.02 | | | | (0.04 | ) | | | (0.07 | ) |
| Net realized and unrealized gain (loss) | | | 0.50 | | | | 0.50 | | | | (0.47 | ) | | | 0.32 | | | | 0.64 | |
| Total from Investment Operations | | | 0.48 | | | | 0.48 | | | | (0.45 | ) | | | 0.28 | | | | 0.57 | |
| | | | | | | | | | | | | | | | | | | | | |
| Distributions From Earnings: | | | | | | | | | | | | | | | | | | | | |
| Net investment income | | | (0.41 | ) | | | (0.18 | ) | | | (0.12 | ) | | | – | | | | (0.00 | ) |
| Net realized gains | | | (0.09 | ) | | | (0.23 | ) | | | (0.13 | ) | | | (0.52 | ) | | | (0.18 | ) |
| Total Distributions | | | (0.50 | ) | | | (0.41 | ) | | | (0.25 | ) | | | (0.52 | ) | | | (0.18 | ) |
| | | | | | | | | | | | | | | | | | | | | |
| Redemption Fees | | | – | | | | – | | | | – | | | | 0.00 | (b) | | | 0.00 | (b) |
| | | | | | | | | | | | | | | | | | | | | |
| Net Asset Value, End of Year | | $ | 8.67 | | | $ | 8.69 | | | $ | 8.07 | | | $ | 8.77 | | | $ | 9.01 | |
| | | | | | | | | | | | | | | | | | | | | |
| Total Investment Return | | | 5.70 | % | | | 12.72 | % | | | (5.08 | )% | | | 3.07 | % | | | 6.57 | % |
| | | | | | | | | | | | | | | | | | | | | |
| Net Assets, End of Year, in Thousands | | $ | 1,063,447 | | | $ | 726,061 | | | $ | 445,858 | | | $ | 605,983 | | | $ | 471,002 | |
| | | | | | | | | | | | | | | | | | | | | |
| Ratios/Supplemental Data: | | | | | | | | | | | | | | | | | | | | |
| Ratio of expenses to average net assets: | | | | | | | | | | | | | | | | | | | | |
| Before expense waiver or recovery | | | 1.92 | % | | | 1.91 | % | | | 2.00 | % | | | 2.08 | % | | | 2.09 | %(c),(d) |
| After expense waiver or recovery | | | 1.93 | % | | | 1.99 | % | | | 1.99 | % | | | 2.03 | % | | | 2.09 | %(c),(d) |
| | | | | | | | | | | | | | | | | | | | | |
| Ratio of net investment income (loss) to average net assets: | | | | | | | | | | | | | | | | | | | | |
| Before expense waiver or recovery | | | (0.24 | )% | | | 0.57 | % | | | 0.28 | % | | | (0.51 | )% | | | (0.71 | )%(c) |
| After expense waiver or recovery | | | (0.25 | )% | | | 0.49 | % | | | 0.29 | % | | | (0.46 | )% | | | (0.71 | )%(c) |
| | | | | | | | | | | | | | | | | | | | | |
| Portfolio turnover rate(e) | | | 56 | % | | | 84 | % | | | 105 | % | | | 97 | % | | | 62 | % |
| (a) | Net investment income (loss) per share is based on average shares outstanding. |
| (b) | Amount represents less than $0.005 per share. |
| (c) | Ratios do not include the income and expenses of the CTAs included in the swap. |
| (d) | Includes interest expense of 0.01% for the year ended December 31, 2016. |
| (e) | Portfolio turnover rate is calculated on the basis of the Fund as a whole without distinguishing between classes of shares issued. Consists of long-term investments only; excludes derivative instruments. |
The accompanying notes are an integral part of these consolidated financial statements.
| | |
| | |
| LoCorr Long/Short Commodities Strategy Fund – Consolidated Financial Highlights – Class A | | 79 |
| | |
LoCorr Long/Short Commodities Strategy Fund – Class A
Consolidated Financial Highlights
Selected Data and Ratios (for a share outstanding throughout the year)
| | Year Ended December 31, | |
| | 2020 | | | 2019 | | | 2018 | | | 2017 | | | 2016 | |
| Per Share | | | | | | | | | | | | | | | |
| Net asset value, beginning of year | | $ | 9.26 | | | $ | 9.90 | | | $ | 9.71 | | | $ | 9.17 | | | $ | 9.72 | |
| | | | | | | | | | | | | | | | | | | | | |
| Income (loss) from investment operations: | | | | | | | | | | | | | | | | | | | | |
| Net investment income (loss)(a) | | | (0.07 | ) | | | 0.05 | | | | 0.02 | | | | (0.04 | ) | | | (0.10 | ) |
| Net realized and unrealized gain (loss) | | | 0.96 | | | | (0.67 | ) | | | 1.39 | | | | 0.58 | | | | (0.18 | ) |
| Total from Investment Operations | | | 0.89 | | | | (0.62 | ) | | | 1.41 | | | | 0.54 | | | | (0.28 | ) |
| | | | | | | | | | | | | �� | | | | | | | | |
| Distributions From Earnings: | | | | | | | | | | | | | | | | | | | | |
| Net investment income | | | (0.26 | ) | | | (0.02 | ) | | | (1.22 | ) | | | 0.00 | (b) | | | (0.27 | ) |
| Net realized gains | | | (0.00 | )(b) | | | – | | | | – | | | | – | | | | – | |
| Total Distributions | | | (0.26 | ) | | | (0.02 | ) | | | (1.22 | ) | | | 0.00 | | | | (0.27 | ) |
| | | | | | | | | | | | | | | | | | | | | |
| Redemption Fees | | | – | | | | – | | | | – | | | | 0.00 | (b) | | | 0.00 | (b) |
| | | | | | | | | | | | | | | | | | | | | |
| Net Asset Value, End of Year | | $ | 9.89 | | | $ | 9.26 | | | $ | 9.90 | | | $ | 9.71 | | | $ | 9.17 | |
| | | | | | | | | | | | | | | | | | | | | |
| Total Investment Return(c) | | | 9.66 | % | | | (6.24 | )% | | | 15.05 | % | | | 5.91 | % | | | (2.98 | )% |
| | | | | | | | | | | | | | | | | | | | | |
| Net Assets, End of Year, in Thousands | | $ | 26,546 | | | $ | 45,513 | | | $ | 68,719 | | | $ | 25,575 | | | $ | 34,860 | |
| | | | | | | | | | | | | | | | | | | | | |
| Ratio/Supplemental Data:(d) | | | | | | | | | | | | | | | | | | | | |
| Ratio of expenses to average net assets: | | | | | | | | | | | | | | | | | | | | |
| Before expense waiver or recovery | | | 2.08 | % | | | 2.11 | % | | | 2.16 | % | | | 2.28 | % | | | 2.22 | %(e) |
| After expense waiver or recovery | | | 2.08 | % | | | 2.14 | % | | | 2.20 | % | | | 2.20 | % | | | 2.20 | %(e) |
| | | | | | | | | | | | | | | | | | | | | |
| Ratio of net investment income (loss) to average net assets: | | | | | | | | | | | | | | | | | | | | |
| Before expense waiver or recovery | | | (0.65 | )% | | | 0.57 | % | | | 0.22 | % | | | (0.52 | )% | | | (0.99 | )% |
| After expense waiver or recovery | | | (0.65 | )% | | | 0.54 | % | | | 0.18 | % | | | (0.44 | )% | | | (0.97 | )% |
| | | | | | | | | | | | | | | | | | | | | |
| Portfolio turnover rate(f) | | | 60 | % | | | 103 | % | | | 92 | % | | | 74 | % | | | 105 | % |
| (a) | Net investment income (loss) per share is based on average shares outstanding. |
| (b) | Amount represents less than $0.005 per share. |
| (c) | Total investment return excludes the effect of applicable sales charges. |
| (d) | Ratios do not include the income and expenses of the CTAs included in the swap. |
| (e) | Includes interest expense of 0.00% for the year ended December 31, 2016. |
| (f) | Portfolio turnover rate is calculated on the basis of the Fund as a whole without distinguishing between classes of shares issued. Consists of long-term investments only; excludes derivative instruments. |
The accompanying notes are an integral part of these consolidated financial statements.
| | |
| | |
| 80 | | LoCorr Long/Short Commodities Strategy Fund – Consolidated Financial Highlights – Class C |
| | |
LoCorr Long/Short Commodities Strategy Fund – Class C
Consolidated Financial Highlights
Selected Data and Ratios (for a share outstanding throughout the year)
| | Year Ended December 31, | |
| | 2020 | | | 2019 | | | 2018 | | | 2017 | | | 2016 | |
| Per Share | | | | | | | | | | | | | | | | | | | | |
| Net asset value, beginning of year | | $ | 8.89 | | | $ | 9.55 | | | $ | 9.41 | | | $ | 8.95 | | | $ | 9.51 | |
| | | | | | | | | | | | | | | | | | | | | |
| Income (loss) from investment operations: | | | | | | | | | | | | | | | | | | | | |
| Net investment income (loss)(a) | | | (0.13 | ) | | | (0.02 | ) | | | (0.06 | ) | | | (0.11 | ) | | | (0.17 | ) |
| Net realized and unrealized gain (loss) | | | 0.91 | | | | (0.64 | ) | | | 1.35 | | | | 0.57 | | | | (0.18 | ) |
| Total from Investment Operations | | | 0.78 | | | | (0.66 | ) | | | 1.29 | | | | 0.46 | | | | (0.35 | ) |
| | | | | | | | | | | | | | | | | | | | | |
| Distributions From Earnings: | | | | | | | | | | | | | | | | | | | | |
| Net investment income | | | (0.20 | ) | | | (0.00 | )(b) | | | (1.15 | ) | | | 0.00 | (b) | | | (0.21 | ) |
| Net realized gains | | | (0.00 | )(b) | | | – | | | | – | | | | – | | | | – | |
| Total Distributions | | | (0.20 | ) | | | (0.00 | ) | | | (1.15 | ) | | | 0.00 | | | | (0.21 | ) |
| | | | | | | | | | | | | | | | | | | | | |
| Redemption Fees | | | – | | | | – | | | | – | | | | 0.00 | (b) | | | 0.00 | (b) |
| | | | | | | | | | | | | | | | | | | | | |
| Net Asset Value, End of Year | | $ | 9.47 | | | $ | 8.89 | | | $ | 9.55 | | | $ | 9.41 | | | $ | 8.95 | |
| | | | | | | | | | | | | | | | | | | | | |
| Total Investment Return(c) | | | 8.83 | % | | | (6.90 | )% | | | 14.20 | % | | | 5.17 | % | | | (3.72 | )% |
| | | | | | | | | | | | | | | | | | | | | |
| Net Assets, End of Year, in Thousands | | $ | 7,938 | | | $ | 6,645 | | | $ | 6,503 | | | $ | 4,737 | | | $ | 7,383 | |
| | | | | | | | | | | | | | | | | | | | | |
| Ratio/Supplemental Data:(d) | | | | | | | | | | | | | | | | | | | | |
| Ratio of expenses to average net assets: | | | | | | | | | | | | | | | | | | | | |
| Before expense waiver or recovery | | | 2.83 | % | | | 2.86 | % | | | 2.91 | % | | | 3.03 | % | | | 2.97 | %(e) |
| After expense waiver or recovery | | | 2.83 | % | | | 2.89 | % | | | 2.95 | % | | | 2.95 | % | | | 2.95 | %(e) |
| | | | | | | | | | | | | | | | | | | | | |
| Ratio of net investment income (loss) to average net assets: | | | | | | | | | | | | | | | | | | | | |
| Before expense waiver or recovery | | | (1.40 | )% | | | (0.18 | )% | | | (0.53 | )% | | | (1.27 | )% | | | (1.74 | )% |
| After expense waiver or recovery | | | (1.40 | )% | | | (0.21 | )% | | | (0.57 | )% | | | (1.19 | )% | | | (1.72 | )% |
| | | | | | | | | | | | | | | | | | | | | |
| Portfolio turnover rate(f) | | | 60 | % | | | 103 | % | | | 92 | % | | | 74 | % | | | 105 | % |
| (a) | Net investment income (loss) per share is based on average shares outstanding. |
| (b) | Amount represents less than $0.005 per share. |
| (c) | Total investment return excludes the effect of applicable sales charges. |
| (d) | Ratios do not include the income and expenses of the CTAs included in the swap. |
| (e) | Includes interest expense of 0.00% for the year ended December 31, 2016. |
| (f) | Portfolio turnover rate is calculated on the basis of the Fund as a whole without distinguishing between classes of shares issued. Consists of long-term investments only; excludes derivative instruments. |
The accompanying notes are an integral part of these consolidated financial statements.
| | |
| | |
| LoCorr Long/Short Commodities Strategy Fund – Consolidated Financial Highlights | | 81 |
| | |
LoCorr Long/Short Commodities Strategy Fund – Class I
Consolidated Financial Highlights
Selected Data and Ratios (for a share outstanding throughout the year)
| | | Year Ended December 31, | |
| | | 2020 | | | 2019 | | | 2018 | | | 2017 | | | 2016 | |
| | | | | | | | | | | | | | | | |
| Per Share | | | | | | | | | | | | | | | |
| Net asset value, beginning of year | | $ | 9.38 | | | $ | 10.03 | | | $ | 9.81 | | | $ | 9.24 | | | $ | 9.79 | |
| | | | | | | | | | | | | | | | | | | | | |
| Income (loss) from investment operations: | | | | | | | | | | | | | | | | | | | | |
| Net investment income (loss)(a) | | | (0.04 | ) | | | 0.08 | | | | 0.05 | | | | (0.02 | ) | | | (0.07 | ) |
| Net realized and unrealized gain (loss) | | | 0.95 | | | | (0.68 | ) | | | 1.41 | | | | 0.59 | | | | (0.18 | ) |
| Total from Investment Operations | | | 0.91 | | | | (0.60 | ) | | | 1.46 | | | | 0.57 | | | | (0.25 | ) |
| | | | | | | | | | | | | | | | | | | | | |
| Distributions From Earnings: | | | | | | | | | | | | | | | | | | | | |
| Net investment income | | | (0.29 | ) | | | (0.05 | ) | | | (1.24 | ) | | | 0.00 | (b) | | | (0.30 | ) |
| Net realized gains | | | (0.00 | )(b) | | | – | | | | – | | | | – | | | | – | |
| Total Distributions | | | (0.29 | ) | | | (0.05 | ) | | | (1.24 | ) | | | 0.00 | | | | (0.30 | ) |
| | | | | | | | | | | | | | | | | | | | | |
| Redemption Fees | | | – | | | | – | | | | – | | | | 0.00 | (b) | | | 0.00 | (b) |
| | | | | | | | | | | | | | | | | | | | | |
| Net Asset Value, End of Year | | $ | 10.00 | | | | 9.38 | | | | 10.03 | | | | 9.81 | | | $ | 9.24 | |
| | | | | | | | | | | | | | | | | | | | | |
| Total Investment Return | | | 9.91 | % | | | (5.97 | )% | | | 15.40 | % | | | 6.19 | % | | | (2.67 | )% |
| | | | | | | | | | | | | | | | | | | | | |
| Net Assets, End of Year, in Thousands | | $ | 443,351 | | | $ | 203,887 | | | $ | 181,804 | | | $ | 52,935 | | | $ | 81,204 | |
| Ratio/Supplemental Data:(c) | | | | | | | | | | | | | | | | | | | | |
| Ratio of expenses to average net assets: | | | | | | | | | | | | | | | | | | | | |
| Before expense waiver or recovery | | | 1.83 | % | | | 1.86 | % | | | 1.91 | % | | | 2.03 | % | | | 1.97 | %(d) |
| After expense waiver or recovery | | | 1.83 | % | | | 1.89 | % | | | 1.95 | % | | | 1.95 | % | | | 1.95 | %(d) |
| | | | | | | | | | | | | | | | | | | | | |
| Ratio of net investment income (loss) to average net assets: | | | | | | | | | | | | | | | | | | | | |
| Before expense waiver or recovery | | | (0.40 | )% | | | 0.82 | % | | | 0.47 | % | | | (0.27 | )% | | | (0.74 | )% |
| After expense waiver or recovery | | | (0.40 | )% | | | 0.79 | % | | | 0.43 | % | | | (0.19 | )% | | | (0.72 | )% |
| | | | | | | | | | | | | | | | | | | | | |
| Portfolio turnover rate(e) | | | 60 | % | | | 103 | % | | | 92 | % | | | 74 | % | | | 105 | % |
| (a) | Net investment income (loss) per share is based on average shares outstanding. |
| (b) | Amount represents less than $0.005 per share. |
| (c) | Ratios do not include the income and expenses of the CTAs included in the swap. |
| (d) | Includes interest expense of 0.00% for the year ended December 31, 2016. |
| (e) | Portfolio turnover rate is calculated on the basis of the Fund as a whole without distinguishing between classes of shares issued. Consists of long-term investments only; excludes derivative instruments. |
The accompanying notes are an integral part of these consolidated financial statements.
| | |
| | |
| 82 | | LoCorr Market Trend Fund - Consolidated Financial Highlights – Class A |
| | |
LoCorr Market Trend Fund – Class A
Consolidated Financial Highlights
Selected Data and Ratios (for a share outstanding throughout the period)
| | | Year Ended December 31, | |
| | | | 2020 | | | | 2019 | | | | 2018 | | | | 2017 | | | | 2016 | |
| | | | | | | | | | | | | | | | | | | | | |
| Per Share | | | | | | | | | | | | | | | | | | | | |
| Net asset value, beginning of year | | $ | 11.19 | | | $ | 9.52 | | | $ | 11.03 | | | $ | 10.65 | | | $ | 12.00 | |
| | | | | | | | | | | | | | | | | | | | | |
| Income (loss) from investment operations: | | | | | | | | | | | | | | | | | | | | |
| Net investment income (loss)(a) | | | (0.06 | ) | | | 0.01 | | | | (0.03 | ) | | | (0.10 | ) | | | (0.15 | ) |
| Net realized and unrealized gain (loss) | | | 0.57 | | | | 1.74 | | | | (1.48 | ) | | | 0.48 | | | | (1.01 | ) |
| Total from Investment Operations | | | 0.51 | | | | 1.75 | | | | (1.51 | ) | | | 0.38 | | | | (1.16 | ) |
| | | | | | | | | | | | | | | | | | | | | |
| Distributions From Earnings: | | | | | | | | | | | | | | | | | | | | |
| Net investment income | | | – | | | | (0.08 | ) | | | – | | | | – | | | | (0.19 | ) |
| Net realized gains | | | – | | | | – | | | | – | | | | – | | | | – | |
| Total Distributions | | | – | | | | (0.08 | ) | | | – | | | | – | | | | (0.19 | ) |
| | | | | | | | | | | | | | | | | | | | | |
| Redemption Fees | | | – | | | | – | | | | – | | | | 0.00 | (b) | | | 0.00 | (b) |
| | | | | | | | | | | | | | | | | | | | | |
| Net Asset Value, End of Year | | $ | 11.70 | | | $ | 11.19 | | | $ | 9.52 | | | $ | 11.03 | | | $ | 10.65 | |
| | | | | | | | | | | | | | | | | | | | | |
| Total Investment Return(c) | | | 4.47 | % | | | 18.33 | % | | | (13.69 | )% | | | 3.57 | % | | | (9.71 | )% |
| | | | | | | | | | | | | | | | | | | | | |
| Net Assets, End of Year, in Thousands | | $ | 16,952 | | | $ | 21,966 | | | $ | 32,082 | | | $ | 61,557 | | | $ | 133,146 | |
| | | | | | | | | | | | | | | | | | | | | |
| Ratio/Supplemental Data: | | | | | | | | | | | | | | | | | | | | |
| Ratio of expenses to average net assets: | | | | | | | | | | | | | | | | | | | | |
| Before expense waiver or recovery | | | 2.04 | % | | | 2.02 | % | | | 1.99 | % | | | 2.00 | % | | | 2.02 | %(d) |
| After expense waiver or recovery | | | 2.04 | % | | | 2.02 | % | | | 1.99 | % | | | 2.00 | % | | | 2.02 | %(d) |
| | | | | | | | | | | | | | | | | | | | | |
| Ratio of net investment income (loss) to average net assets: | | | | | | | | | | | | | | | | | | | | |
| Before expense waiver or recovery | | | (0.52 | )% | | | 0.14 | % | | | (0.24 | )% | | | (0.97 | )% | | | (1.24 | )% |
| After expense waiver or recovery | | | (0.52 | )% | | | 0.14 | % | | | (0.24 | )% | | | (0.97 | )% | | | (1.24 | )% |
| | | | | | | | | | | | | | | | | | | | | |
| Portfolio turnover rate(e) | | | 125 | % | | | 119 | % | | | 91 | % | | | 85 | % | | | 83 | % |
| (a) | Net investment income (loss) per share is based on average shares outstanding. |
| (b) | Amount represents less than $0.005 per share. |
| (c) | Total investment return excludes the effect of applicable sales charges. |
| (d) | Includes 0.00% of interest expense for the year ended December 31, 2016. |
| (e) | Portfolio turnover rate is calculated on the basis of the Fund as a whole without distinguishing between classes of shares issued. Consists of long-term investments only; excludes derivative instruments. |
The accompanying notes are an integral part of these consolidated financial statements.
| | |
| | |
| LoCorr Market Trend Fund - Consolidated Financial Highlights – Class C | | 83 |
| | |
LoCorr Market Trend Fund – Class C
Consolidated Financial Highlights
Selected Data and Ratios (for a share outstanding throughout the period)
| | | Year Ended December 31, | |
| | | | 2020 | | | | 2019 | | | | 2018 | | | | 2017 | | | | 2016 | |
| | | | | | | | | | | | | | | | | | | | | |
| Per Share | | | | | | | | | | | | | | | | | | | | |
| Net asset value, beginning of year | | $ | 10.89 | | | $ | 9.28 | | | $ | 10.83 | | | $ | 10.53 | | | $ | 11.92 | |
| | | | | | | | | | | | | | | | | | | | | |
| Income (loss) from investment operations: | | | | | | | | | | | | | | | | | | | | |
| Net investment income (loss)(a) | | | (0.13 | ) | | | (0.06 | ) | | | (0.10 | ) | | | (0.18 | ) | | | (0.23 | ) |
| Net realized and unrealized gain (loss) | | | 0.54 | | | | 1.67 | | | | (1.45 | ) | | | 0.48 | | | | (1.01 | ) |
| | | | | | | | | | | | | | | | | | | | | |
| Total from Investment Operations | | | 0.41 | | | | 1.61 | | | | (1.55 | ) | | | 0.30 | | | | (1.24 | ) |
| | | | | | | | | | | | | | | | | | | | | |
| Distributions From Earnings: | | | | | | | | | | | | | | | | | | | | |
| Net investment income | | | – | | | | – | | | | – | | | | – | | | | (0.15 | ) |
| Net realized gains | | | – | | | | – | | | | – | | | | – | | | | – | |
| Total Distributions | | | – | | | | – | | | | – | | | | – | | | | (0.15 | ) |
| | | | | | | | | | | | | | | | | | | | | |
| Redemption Fees | | | – | | | | – | | | | – | | | | 0.00 | (b) | | | 0.00 | (b) |
| | | | | | | | | | | | | | | | | | | | | |
| Net Asset Value, End of Year | | $ | 11.30 | | | $ | 10.89 | | | $ | 9.28 | | | $ | 10.83 | | | $ | 10.53 | |
| | | | | | | | | | | | | | | | | | | | | |
| Total Investment Return(c) | | | 3.76 | % | | | 17.35 | % | | | (14.31 | )% | | | 2.85 | % | | | (10.45 | )% |
| | | | | | | | | | | | | | | | | | | | | |
| Net Assets, End of Year, in Thousands | | $ | 13,170 | | | $ | 16,320 | | | $ | 23,417 | | | $ | 43,772 | | | $ | 89,454 | |
| | | | | | | | | | | | | | | | | | | | | |
| Ratio/Supplemental Data: | | | | | | | | | | | | | | | | | | | | |
| Ratio of expenses to average net assets: | | | | | | | | | | | | | | | | | | | | |
| Before expense waiver or recovery | | | 2.79 | % | | | 2.77 | % | | | 2.74 | % | | | 2.75 | % | | | 2.77 | %(d) |
| After expense waiver or recovery | | | 2.79 | % | | | 2.77 | % | | | 2.74 | % | | | 2.75 | % | | | 2.77 | %(d) |
| | | | | | | | | | | | | | | | | | | | | |
| Ratio of net investment income (loss) to average net assets: | | | | | | | | | | | | | | | | | | | | |
| Before expense waiver or recovery | | | (1.27 | )% | | | (0.61 | )% | | | (0.99 | )% | | | (1.72 | )% | | | (1.99 | )% |
| After expense waiver or recovery | | | (1.27 | )% | | | (0.61 | )% | | | (0.99 | )% | | | (1.72 | )% | | | (1.99 | )% |
| | | | | | | | | | | | | | | | | | | | | |
| Portfolio turnover rate(e) | | | 125 | % | | | 119 | % | | | 91 | % | | | 85 | % | | | 83 | % |
| (a) | Net investment income (loss) per share is based on average shares outstanding. |
| (b) | Amount represents less than $0.005 per share. |
| (c) | Total investment return excludes the effect of applicable sales charges. |
| (d) | Includes 0.00% of interest expense for the year ended December 31, 2016. |
| (e) | Portfolio turnover rate is calculated on the basis of the Fund as a whole without distinguishing between classes of shares issued. Consists of long-term investments only; excludes derivative instruments. |
The accompanying notes are an integral part of these consolidated financial statements.
| | |
| | |
| 84 | | LoCorr Market Trend Fund - Consolidated Financial Highlights – Class I |
| | |
LoCorr Market Trend Fund – Class I
Consolidated Financial Highlights
Selected Data and Ratios (for a share outstanding throughout the period)
| | | Year Ended December 31, | |
| | | 2020 | | | 2019 | | | 2018 | | | 2017 | | | 2016 | |
| | | | | | | | | | | | | | | | |
| Per Share | | | | | | | | | | | | | | | |
| Net asset value, beginning of year | | $ | 11.23 | | | $ | 9.60 | | | $ | 11.09 | | | $ | 10.68 | | | $ | 12.02 | |
| | | | | | | | | | | | | | | | | | | | | |
| Income (loss) from investment operations: | | | | | | | | | | | | | | | | | | | | |
| Net investment income (loss)(a) | | | (0.03 | ) | | | 0.04 | | | | 0.00 | (b) | | | (0.08 | ) | | | (0.12 | ) |
| Net realized and unrealized gain (loss) | | | 0.57 | | | | 1.74 | | | | (1.49 | ) | | | 0.49 | | | | (1.02 | ) |
| Total from Investment Operations | | | 0.54 | | | | 1.78 | | | | (1.49 | ) | | | 0.41 | | | | (1.14 | ) |
| | | | | | | | | | | | | | | | | | | | | |
| Distributions From Earnings: | | | | | | | | | | | | | | | | | | | | |
| Net investment income | | | (0.03 | ) | | | (0.15 | ) | | | – | | | | – | | | | (0.20 | ) |
| Net realized gains | | | – | | | | – | | | | – | | | | – | | | | – | |
| Total Distributions | | | (0.03 | ) | | | (0.15 | ) | | | – | | | | – | | | | (0.20 | ) |
| | | | | | | | | | | | | | | | | | | | | |
| Redemption Fees | | | – | | | | – | | | | – | | | | 0.00 | (b) | | | 0.00 | (b) |
| | | | | | | | | | | | | | | | | | | | | |
| Net Asset Value, End of Year | | $ | 11.74 | | | $ | 11.23 | | | $ | 9.60 | | | $ | 11.09 | | | $ | 10.68 | |
| | | | | | | | | | | | | | | | | | | | | |
| Total Investment Return | | | 4.81 | % | | | 18.53 | % | | | (13.44 | )% | | | 3.84 | % | | | (9.49 | )% |
| | | | | | | | | | | | | | | | | | | | | |
| Net Assets, End of Year, in Thousands | | $ | 225,995 | | | $ | 234,919 | | | $ | 287,702 | | | $ | 561,372 | | | $ | 797,845 | |
| | | | | | | | | | | | | | | | | | | | | |
| Ratio/Supplemental Data: | | | | | | | | | | | | | | | | | | | | |
| Ratio of expenses to average net assets: | | | | | | | | | | | | | | | | | | | | |
| Before expense waiver or recovery | | | 1.79 | % | | | 1.77 | % | | | 1.74 | % | | | 1.75 | % | | | 1.77 | %(c) |
| After expense waiver or recovery | | | 1.79 | % | | | 1.77 | % | | | 1.74 | % | | | 1.75 | % | | | 1.77 | %(c) |
| | | | | | | | | | | | | | | | | | | | | |
| Ratio of net investment income (loss) to average net assets: | | | | | | | | | | | | | | | | | | | | |
| Before expense waiver or recovery | | | (0.27 | )% | | | 0.39 | % | | | 0.01 | % | | | (0.72 | )% | | | (0.99 | )% |
| After expense waiver or recovery | | | (0.27 | )% | | | 0.39 | % | | | 0.01 | % | | | (0.72 | )% | | | (0.99 | )% |
| | | | | | | | | | | | | | | | | | | | | |
| Portfolio turnover rate(d) | | | 125 | % | | | 119 | % | | | 91 | % | | | 85 | % | | | 83 | % |
| (a) | Net investment income (loss) per share is based on average shares outstanding. |
| (b) | Amount represents less than $0.005 per share. |
| (c) | Includes 0.00% of interest expense for the year ended December 31, 2016. |
| (d) | Portfolio turnover rate is calculated on the basis of the Fund as a whole without distinguishing between classes of shares issued. Consists of long-term investments only; excludes derivative instruments. |
The accompanying notes are an integral part of these consolidated financial statements.
| | |
| | |
| LoCorr Dynamic Equity Fund - Financial Highlights – Class A | | 85 |
| | |
LoCorr Dynamic Equity Fund – Class A
Financial Highlights
Selected Data and Ratios (for a share outstanding throughout the year)
| | | Year Ended December 31, | |
| | | | 2020 | | | | 2019 | | | | 2018 | | | | 2017 | | | | 2016 | |
| | | | | | | | | | | | | | | | | | | | | |
| Per Share | | | | | | | | | | | | | | | | | | | | |
| Net asset value, beginning of year | | $ | 11.20 | | | $ | 9.92 | | | $ | 11.82 | | | $ | 12.06 | | | $ | 9.64 | |
| | | | | | | | | | | | | | | | | | | | | |
| Income (loss) from investment operations: | | | | | | | | | | | | | | | | | | | | |
| Net investment income (loss)(a) | | | (0.20 | ) | | | (0.19 | ) | | | (0.25 | ) | | | (0.30 | ) | | | (0.32 | ) |
| Net realized and unrealized gain (loss) | | | 0.62 | (b) | | | 1.51 | | | | (1.26 | ) | | | 0.59 | | | | 2.74 | |
| Total from Investment Operations | | | 0.42 | | | | 1.32 | | | | (1.51 | ) | | | 0.29 | | | | 2.42 | |
| | | | | | | | | | | | | | | | | | | | | |
| Distributions From Earnings: | | | | | | | | | | | | | | | | | | | | |
| Net realized gains | | | – | | | | (0.04 | ) | | | (0.39 | ) | | | (0.53 | ) | | | – | |
| Total Distributions | | | – | | | | (0.04 | ) | | | (0.39 | ) | | | (0.53 | ) | | | – | |
| | | | | | | | | | | | | | | | | | | | | |
| Redemption Fees | | | – | | | | – | | | | – | | | | 0.00 | (c) | | | 0.00 | (c) |
| | | | | | | | | | | | | | | | | | | | | |
| Net Asset Value, End of Year | | $ | 11.62 | | | $ | 11.20 | | | $ | 9.92 | | | $ | 11.82 | | | $ | 12.06 | |
| | | | | | | | | | | | | | | | | | | | | |
| Total Investment Return(d) | | | 3.75 | % | | | 13.40 | % | | | (12.87 | )% | | | 2.38 | % | | | 25.10 | % |
| | | | | | | | | | | | | | | | | | | | | |
| Net Assets, End of Year, in Thousands | | $ | 3,828 | | | $ | 6,744 | | | $ | 8,473 | | | $ | 19,962 | | | $ | 28,243 | |
| | | | | | | | | | | | | | | | | | | | | |
| Ratio/Supplemental Data: | | | | | | | | | | | | | | | | | | | | |
| Ratio of expenses to average net assets: | | | | | | | | | | | | | | | | | | | | |
| Before expense waiver or recovery | | | 4.51 | % | | | 3.73 | % | | | 3.40 | % | | | 3.42 | % | | | 3.74 | % |
| After expense waiver or recovery | | | 3.15 | % | | | 3.02 | % | | | 3.21 | % | | | 3.35 | % | | | 3.49 | % |
| | | | | | | | | | | | | | | | | | | | | |
| Ratio of expenses to average net assets (excluding dividend and interest expense): | | | | | | | |
| Before expense waiver or recovery | | | 3.60 | % | | | 2.95 | % | | | 3.20 | % | | | 3.22 | % | | | 3.40 | % |
| After expense waiver or recovery | | | 2.24 | % | | | 2.24 | % | | | 3.01 | % | | | 3.15 | % | | | 3.15 | % |
| | | | | | | | | | | | | | | | | | | | | |
| Ratio of net investment income (loss) to average net assets: | | | | | | | | | | | | | | | | | | | | |
| Before expense waiver or recovery | | | (3.31 | )% | | | (2.44 | )% | | | (2.39 | )% | | | (2.61 | )% | | | (3.23 | )% |
| After expense waiver or recovery | | | (1.95 | )% | | | (1.73 | )% | | | (2.20 | )% | | | (2.54 | )% | | | (2.98 | )% |
| | | | | | | | | | | | | | | | | | | | | |
| Portfolio turnover rate(e) | | | 953 | % | | | 300 | % | | | 449 | % | | | 363 | % | | | 343 | % |
| (a) | Net investment income (loss) per share is based on average shares outstanding. |
| (b) | Realized and unrealized gains and losses per share in this caption are balancing amounts necessary to reconcile the change in net asset value per share for the period, and may not reconcile with the Fund’s consolidated statement of operations due to share transactions for the period. |
| (c) | Amount represents less than $0.005 per share. |
| (d) | Total investment return excludes the effect of applicable sales charges. |
| (e) | Portfolio turnover rate is calculated on the basis of the Fund as a whole without distinguishing between classes of shares issued. Consists of long-term investments only; excludes securities sold short. |
The accompanying notes are an integral part of these financial statements.
| | |
| | |
| 86 | | LoCorr Dynamic Equity Fund - Financial Highlights – Class C |
| | |
LoCorr Dynamic Equity Fund – Class C
Financial Highlights
Selected Data and Ratios (for a share outstanding throughout the year)
| | | Year Ended December 31, | |
| | | 2020 | | | 2019 | | | 2018 | | | 2017 | | | 2016 | |
| | | | | | | | | | | | | | | | |
| Per Share | | | | | | | | | | | | | | | | | | | | |
| Net asset value, beginning of year | | $ | 10.62 | | | $ | 9.47 | | | $ | 11.39 | | | $ | 11.73 | | | $ | 9.45 | |
| | | | | | | | | | | | | | | | | | | | | |
| Income (loss) from investment operations: | | | | | | | | | | | | | | | | | | | | |
| Net investment income (loss)(a) | | | (0.26 | ) | | | (0.26 | ) | | | (0.32 | ) | | | (0.38 | ) | | | (0.38 | ) |
| Net realized and unrealized gain (loss) | | | 0.57 | (b) | | | 1.45 | | | | (1.21 | ) | | | 0.57 | | | | 2.66 | |
| Total from Investment Operations | | | 0.31 | | | | 1.19 | | | | (1.53 | ) | | | 0.19 | | | | 2.28 | |
| | | | | | | | | | | | | | | | | | | | | |
| Distributions From Earnings: | | | | | | | | | | | | | | | | | | | | |
| Net realized gains | | | – | | | | (0.04 | ) | | | (0.39 | ) | | | (0.53 | ) | | | – | |
| Total Distributions | | | – | | | | (0.04 | ) | | | (0.39 | ) | | | (0.53 | ) | | | – | |
| | | | | | | | | | | | | | | | | | | | | |
| Redemption Fees | | | – | | | | – | | | | – | | | | 0.00 | (c) | | | 0.00 | (c) |
| | | | | | | | | | | | | | | | | | | | | |
| Net Asset Value, End of Year | | $ | 10.93 | | | $ | 10.62 | | | $ | 9.47 | | | $ | 11.39 | | | $ | 11.73 | |
| | | | | | | | | | | | | | | | | | | | | |
| Total Investment Return(d) | | | 2.92 | % | | | 12.54 | % | | | (13.45 | )% | | | 1.59 | % | | | 24.13 | % |
| | | | | | | | | | | | | | | | | | | | | |
| Net Assets, End of Year, in Thousands | | $ | 2,436 | | | $ | 4,031 | | | $ | 5,255 | | | $ | 11,084 | | | $ | 11,218 | |
| | | | | | | | | | | | | | | | | | | | | |
| Ratio/Supplemental Data: | | | | | | | | | | | | | | | | | | | | |
| Ratio of expenses to average net assets: | | | | | | | | | | | | | | | | | | | | |
| Before expense waiver or recovery | | | 5.26 | % | | | 4.48 | % | | | 4.15 | % | | | 4.17 | % | | | 4.49 | % |
| After expense waiver or recovery | | | 3.90 | % | | | 3.77 | % | | | 3.96 | % | | | 4.10 | % | | | 4.24 | % |
| | | | | | | | | | | | | | | | | | | | | |
| Ratio of expenses to average net assets (excluding dividend and interest expense): | | | | | | | | | |
| Before expense waiver or recovery | | | 4.35 | % | | | 3.70 | % | | | 3.95 | % | | | 3.97 | % | | | 4.15 | % |
| After expense waiver or recovery | | | 2.99 | % | | | 2.99 | % | | | 3.76 | % | | | 3.90 | % | | | 3.90 | % |
| | | | | | | | | | | | | | | | | | | | | |
| Ratio of net investment income (loss) to average net assets: | | | | | | | | | | | | | | | | | | | | |
| Before expense waiver or recovery | | | (4.06 | )% | | | (3.19 | )% | | | (3.14 | )% | | | (3.36 | )% | | | (3.98 | )% |
| After expense waiver or recovery | | | (2.70 | )% | | | (2.48 | )% | | | (2.95 | )% | | | (3.29 | )% | | | (3.73 | )% |
| | | | | | | | | | | | | | | | | | | | | |
| Portfolio turnover rate(e) | | | 953 | % | | | 300 | % | | | 449 | % | | | 363 | % | | | 343 | % |
| (a) | Net investment income (loss) per share is based on average shares outstanding. |
| (b) | Realized and unrealized gains and losses per share in this caption are balancing amounts necessary to reconcile the change in net asset value per share for the period, and may not reconcile with the Fund’s consolidated statement of operations due to share transactions for the period. |
| (c) | Amount represents less than $0.005 per share. |
| (d) | Total investment return excludes the effect of applicable sales charges. |
| (e) | Portfolio turnover rate is calculated on the basis of the Fund as a whole without distinguishing between classes of shares issued. Consists of long-term investments only; excludes securities sold short. |
The accompanying notes are an integral part of these financial statements.
| | |
| | |
| LoCorr Dynamic Equity Fund - Financial Highlights – Class I | | 87 |
| | |
LoCorr Dynamic Equity Fund – Class I
Financial Highlights
Selected Data and Ratios (for a share outstanding throughout the year)
| | | Year Ended December 31, | |
| | | 2020 | | | 2019 | | | 2018 | | | 2017 | | | 2016 | |
| | | | | | | | | | | | | | | | |
| Per Share | | | | | | | | | | | | | | | |
| Net asset value, beginning of year | | $ | 11.41 | | | $ | 10.07 | | | $ | 11.96 | | | $ | 12.17 | | | $ | 9.71 | |
| | | | | | | | | | | | | | | | | | | | | |
| Income (loss) from investment operations: | | | | | | | | | | | | | | | | | | | | |
| Net investment income (loss)(a) | | | (0.17 | ) | | | (0.17 | ) | | | (0.23 | ) | | | (0.28 | ) | | | (0.30 | ) |
| Net realized and unrealized gain (loss) | | | 0.62 | (b) | | | 1.55 | | | | (1.27 | ) | | | 0.60 | | | | 2.76 | |
| Total from Investment Operations | | | 0.45 | | | | 1.38 | | | | (1.50 | ) | | | 0.32 | | | | 2.46 | |
| | | | | | | | | | | | | | | | | | | | | |
| Distributions From Earnings: | | | | | | | | | | | | | | | | | | | | |
| Net realized gains | | | – | | | | (0.04 | ) | | | (0.39 | ) | | | (0.53 | ) | | | – | |
| Total Distributions | | | – | | | | (0.04 | ) | | | (0.39 | ) | | | (0.53 | ) | | | – | |
| | | | | | | | | | | | | | | | | | | | | |
| Redemption Fees | | | – | | | | – | | | | – | | | | 0.00 | (c) | | | 0.00 | (c) |
| | | | | | | | | | | | | | | | | | | | | |
| Net Asset Value, End of Year | | $ | 11.86 | | | $ | 11.41 | | | $ | 10.07 | | | $ | 11.96 | | | $ | 12.17 | |
| | | | | | | | | | | | | | | | | | | | | |
| Total Investment Return | | | 4.03 | % | | | 13.68 | % | | | (12.55 | )% | | | 2.60 | % | | | 25.33 | % |
| | | | | | | | | | | | | | | | | | | | | |
| Net Assets, End of Year, in Thousands | | $ | 11,809 | | | $ | 16,923 | | | $ | 16,545 | | | $ | 32,781 | | | $ | 44,816 | |
| | | | | | | | | | | | | | | | | | | | | |
| Ratio/Supplemental Data: | | | | | | | | | | | | | | | | | | | | |
| Ratio of expenses to average net assets: | | | | | | | | | | | | | | | | | | | | |
| Before expense waiver or recovery | | | 4.26 | % | | | 3.48 | % | | | 3.15 | % | | | 3.17 | % | | | 3.49 | % |
| After expense waiver or recovery | | | 2.90 | % | | | 2.77 | % | | | 2.96 | % | | | 3.10 | % | | | 3.24 | % |
| | | | | | | | | | | | | | | | | | | | | |
| Ratio of expenses to average net assets (excluding dividend and interest expense): | | | | | | | |
| Before expense waiver or recovery | | | 3.35 | % | | | 2.70 | % | | | 2.95 | % | | | 2.97 | % | | | 3.15 | % |
| After expense waiver or recovery | | | 1.99 | % | | | 1.99 | % | | | 2.76 | % | | | 2.90 | % | | | 2.90 | % |
| | | | | | | | | | | | | | | | | | | | | |
| Ratio of net investment income (loss) to average net assets: | | | | | | | | | | | | | | | | | | | | |
| Before expense waiver or recovery | | | (3.06 | )% | | | (2.19 | )% | | | (2.14 | )% | | | (2.36 | )% | | | (2.98 | )% |
| After expense waiver or recovery | | | (1.70 | )% | | | (1.48 | )% | | | (1.95 | )% | | | (2.29 | )% | | | (2.73 | )% |
| | | | | | | | | | | | | | | | | | | | | |
| Portfolio turnover rate(d) | | | 953 | % | | | 300 | % | | | 449 | % | | | 363 | % | | | 343 | % |
| (a) | Net investment income (loss) per share is based on average shares outstanding. |
| (b) | Realized and unrealized gains and losses per share in this caption are balancing amounts necessary to reconcile the change in net asset value per share for the period, and may not reconcile with the Fund’s consolidated statement of operations due to share transactions for the period. |
| (c) | Amount represents less than $0.005 per share. |
| (d) | Portfolio turnover rate is calculated on the basis of the Fund as a whole without distinguishing between classes of shares issued. Consists of long-term investments only; excludes securities sold short. |
The accompanying notes are an integral part of these financial statements.
| | |
| | |
| 88 | | LoCorr Spectrum Income Fund – Financial Highlights – Class A |
| | |
LoCorr Spectrum Income Fund – Class A
Financial Highlights
Selected Data and Ratios (for a share outstanding throughout the year)
| | | Year Ended December 31, | |
| | | 2020 | | | 2019 | | | 2018 | | | 2017 | | | 2016 | |
| | | | | | | | | | | | | | | | |
| Per Share | | | | | | | | | | | | | | | |
| Net asset value, beginning of year | | $ | 6.89 | | | $ | 6.26 | | | $ | 7.39 | | | $ | 7.70 | | | $ | 7.78 | |
| | | | | | | | | | | | | | | | | | | | | |
| Income (loss) from investment operations: | | | | | | | | | | | | | | | | | | | | |
| Net investment income (loss)(a) | | | 0.12 | | | | 0.13 | | | | 0.22 | | | | 0.17 | | | | 0.29 | |
| Net realized and unrealized gain (loss) | | | (0.40 | ) | | | 1.00 | | | | (0.78 | ) | | | 0.09 | | | | 0.20 | |
| Total from Investment Operations | | | (0.28 | ) | | | 1.13 | | | | (0.56 | ) | | | 0.26 | | | | 0.49 | |
| | | | | | | | | | | | | | | | | | | | | |
| Distributions From Earnings: | | | | | | | | | | | | | | | | | | | | |
| Net investment income | | | (0.18 | ) | | | (0.12 | ) | | | (0.26 | ) | | | (0.15 | ) | | | (0.37 | ) |
| Return of capital | | | (0.28 | ) | | | (0.38 | ) | | | (0.31 | ) | | | (0.42 | ) | | | (0.20 | ) |
| Total Distributions | | | (0.46 | ) | | | (0.50 | ) | | | (0.57 | ) | | | (0.57 | ) | | | (0.57 | ) |
| | | | | | | | | | | | | | | | | | | | | |
| Redemption Fees(b) | | | 0.00 | | | | 0.00 | | | | 0.00 | | | | 0.00 | | | | 0.00 | |
| | | | | | | | | | | | | | | | | | | | | |
| Net Asset Value, End of Year | | $ | 6.15 | | | $ | 6.89 | | | $ | 6.26 | | | $ | 7.39 | | | $ | 7.70 | |
| | | | | | | | | | | | | | | | | | | | | |
| Total Investment Return(c) | | | (2.75 | )% | | | 18.37 | % | | | (8.22 | )% | | | 3.50 | % | | | 6.64 | % |
| | | | | | | | | | | | | | | | | | | | | |
| Net Assets, End of Year, in Thousands | | $ | 13,635 | | | $ | 25,192 | | | $ | 22,610 | | | $ | 29,970 | | | $ | 33,032 | |
| | | | | | | | | | | | | | | | | | | | | |
| Ratio/Supplemental Data:(d) | | | | | | | | | | | | | | | | | | | | |
| Ratio of expenses to average net assets: | | | | | | | | | | | | | | | | | | | | |
| Before expense waiver or recovery | | | 2.19 | % | | | 2.02 | % | | | 1.98 | % | | | 1.95 | % | | | 2.02 | % |
| After expense waiver or recovery | | | 2.06 | % | | | 2.02 | % | | | 1.98 | % | | | 1.99 | % | | | 2.05 | % |
| | | | | | | | | | | | | | | | | | | | | |
| Ratio of expenses to average net assets (excluding dividend and interest expense): | | | | | | | | |
| Before expense waiver or recovery | | | 2.18 | % | | | 2.02 | % | | | 1.98 | % | | | 1.95 | % | | | 2.02 | % |
| After expense waiver or recovery | | | 2.04 | % | | | 2.02 | % | | | 1.98 | % | | | 1.99 | % | | | 2.05 | % |
| | | | | | | | | | | | | | | | | | | | | |
| Ratio of net investment income (loss) to average net assets: | | | | | | | | | | | | | | | | | | | | |
| Before expense waiver or recovery | | | 1.93 | % | | | 1.94 | % | | | 3.01 | % | | | 2.27 | % | | | 3.81 | % |
| After expense waiver or recovery | | | 2.07 | % | | | 1.94 | % | | | 3.01 | % | | | 2.23 | % | | | 3.78 | % |
| | | | | | | | | | | | | | | | | | | | | |
| Portfolio turnover rate(e) | | | 88 | % | | | 75 | % | | | 82 | % | | | 84 | % | | | 92 | % |
| (a) | Net investment income (loss) per share is based on average shares outstanding. |
| (b) | Amount represents less than $0.005 per share. |
| (c) | Total investment return excludes the effect of applicable sales charges. |
| (d) | Ratios do not include the expenses of the investment companies in which the Fund invests. |
| (e) | Portfolio turnover rate is calculated on the basis of the Fund as a whole without distinguishing between classes of shares issued. |
The accompanying notes are an integral part of these financial statements.
| | |
| | |
| LoCorr Spectrum Income Fund – Financial Highlights – Class C | | 89 |
| | |
LoCorr Spectrum Income Fund – Class C
Financial Highlights
Selected Data and Ratios (for a share outstanding throughout the year)
| | | Year Ended December 31, | |
| | | 2020 | | | 2019 | | | 2018 | | | 2017 | | | 2016 | |
| | | | | | | | | | | | | | | | |
| Per Share | | | | | | | | | | | | | | | |
| Net asset value, beginning of year | | $ | 6.96 | | | $ | 6.31 | | | $ | 7.42 | | | $ | 7.72 | | | $ | 7.78 | |
| | | | | | | | | | | | | | | | | | | | | |
| Income (loss) from investment operations: | | | | | | | | | | | | | | | | | | | | |
| Net investment income (loss)(a) | | | 0.07 | | | | 0.08 | | | | 0.16 | | | | 0.11 | | | | 0.23 | |
| Net realized and unrealized gain (loss) | | | (0.40 | ) | | | 1.01 | | | | (0.77 | ) | | | 0.09 | | | | 0.21 | |
| Total from Investment Operations | | | (0.33 | ) | | | 1.09 | | | | (0.61 | ) | | | 0.20 | | | | 0.44 | |
| | | | | | | | | | | | | | | | | | | | | |
| Distributions From Earnings: | | | | | | | | | | | | | | | | | | | | |
| Net investment income | | | (0.17 | ) | | | (0.10 | ) | | | (0.23 | ) | | | (0.13 | ) | | | (0.33 | ) |
| Return of capital | | | (0.25 | ) | | | (0.34 | ) | | | (0.27 | ) | | | (0.37 | ) | | | (0.17 | ) |
| Total Distributions | | | (0.42 | ) | | | (0.44 | ) | | | (0.50 | ) | | | (0.50 | ) | | | (0.50 | ) |
| | | | | | | | | | | | | | | | | | | | | |
| Redemption Fees(b) | | | 0.00 | | | | 0.00 | | | | 0.00 | | | | 0.00 | | | | 0.00 | |
| | | | | | | | | | | | | | | | | | | | | |
| Net Asset Value, End of Year | | $ | 6.21 | | | $ | 6.96 | | | $ | 6.31 | | | $ | 7.42 | | | $ | 7.72 | |
| | | | | | | | | | | | | | | | | | | | | |
| Total Investment Return(c) | | | (3.70 | )% | | | 17.59 | % | | | (8.85 | )% | | | 2.62 | % | | | 5.88 | % |
| | | | | | | | | | | | | | | | | | | | | |
| Net Assets, End of Year, in Thousands | | $ | 13,295 | | | $ | 18,645 | | | $ | 18,092 | | | $ | 23,511 | | | $ | 25,898 | |
| | | | | | | | | | | | | | | | | | | | | |
| Ratio/Supplemental Data:(d) | | | | | | | | | | | | | | | | | | | | |
| Ratio of expenses to average net assets: | | | | | | | | | | | | | | | | | | | | |
| Before expense waiver or recovery | | | 2.94 | % | | | 2.77 | % | | | 2.73 | % | | | 2.70 | % | | | 2.77 | % |
| After expense waiver or recovery | | | 2.81 | % | | | 2.77 | % | | | 2.73 | % | | | 2.74 | % | | | 2.80 | % |
| | | | | | | | | | | | | | | | | | | | | |
| Ratio of expenses to average net assets (excluding dividend and interest expense): | | | | | | | | |
| Before expense waiver or recovery | | | 2.93 | % | | | 2.77 | % | | | 2.73 | % | | | 2.70 | % | | | 2.77 | % |
| After expense waiver or recovery | | | 2.79 | % | | | 2.77 | % | | | 2.73 | % | | | 2.74 | % | | | 2.80 | % |
| | | | | | | | | | | | | | | | | | | | | |
| Ratio of net investment income (loss) to average net assets: | | | | | | | | | | | | | | | | | | | | |
| Before expense waiver or recovery | | | 1.18 | % | | | 1.19 | % | | | 2.26 | % | | | 1.52 | % | | | 3.06 | % |
| After expense waiver or recovery | | | 1.32 | % | | | 1.19 | % | | | 2.26 | % | | | 1.48 | % | | | 3.03 | % |
| | | | | | | | | | | | | | | | | | | | | |
| Portfolio turnover rate(e) | | | 88 | % | | | 75 | % | | | 82 | % | | | 84 | % | | | 92 | % |
| (a) | Net investment income (loss) per share is based on average shares outstanding. |
| (b) | Amount represents less than $0.005 per share. |
| (c) | Total investment return excludes the effect of applicable sales charges. |
| (d) | Ratios do not include the expenses of the investment companies in which the Fund invests. |
| (e) | Portfolio turnover rate is calculated on the basis of the Fund as a whole without distinguishing between classes of shares issued. |
| | |
The accompanying notes are an integral part of these financial statements.
| | |
| | |
| 90 | | LoCorr Spectrum Income Fund - Financial Highlights – Class I |
| | |
LoCorr Spectrum Income Fund – Class I
Financial Highlights
Selected Data and Ratios (for a share outstanding throughout the year)
| | | Year Ended December 31, | |
| | | 2020 | | | 2019 | | | 2018 | | | 2017 | | | 2016 | |
| | | | | | | | | | | | | | | | |
| Per Share | | | | | | | | | | | | | | | |
| Net asset value, beginning of year | | $ | 6.88 | | | $ | 6.25 | | | $ | 7.38 | | | $ | 7.69 | | | $ | 7.78 | |
| | | | | | | | | | | | | | | | | | | | | |
| Income (loss) from investment operations: | | | | | | | | | | | | | | | | | | | | |
| Net investment income (loss)(a) | | | 0.13 | | | | 0.15 | | | | 0.24 | | | | 0.19 | | | | 0.31 | |
| Net realized and unrealized gain (loss) | | | (0.40 | ) | | | 1.00 | | | | (0.77 | ) | | | 0.10 | | | | 0.20 | |
| Total from Investment Operations | | | (0.27 | ) | | | 1.15 | | | | (0.53 | ) | | | 0.29 | | | | 0.51 | |
| | | | | | | | | | | | | | | | | | | | | |
| Distributions From Earnings: | | | | | | | | | | | | | | | | | | | | |
| Net investment income | | | (0.19 | ) | | | (0.12 | ) | | | (0.27 | ) | | | (0.16 | ) | | | (0.39 | ) |
| Return of capital | | | (0.29 | ) | | | (0.40 | ) | | | (0.33 | ) | | | (0.44 | ) | | | (0.21 | ) |
| Total Distributions | | | (0.48 | ) | | | (0.52 | ) | | | (0.60 | ) | | | (0.60 | ) | | | (0.60 | ) |
| | | | | | | | | | | | | | | | | | | | | |
| Redemption Fees(b) | | | 0.00 | | | | 0.00 | | | | 0.00 | | | | 0.00 | | | | 0.00 | |
| | | | | | | | | | | | | | | | | | | | | |
| Net Asset Value, End of Year | | $ | 6.13 | | | $ | 6.88 | | | $ | 6.25 | | | $ | 7.38 | | | $ | 7.69 | |
| | | | | | | | | | | | | | | | | | | | | |
| Total Investment Return | | | (2.60 | )% | | | 18.74 | % | | | (7.91 | )% | | | 3.85 | % | | | 6.85 | % |
| | | | | | | | | | | | | | | | | | | | | |
| | | | | | | | | | | | | | | | | | | | | |
| Net Assets, End of Year, in Thousands | | $ | 21,215 | | | $ | 30,049 | | | $ | 27,618 | | | $ | 43,032 | | | $ | 46,838 | |
| | | | | | | | | | | | | | | | | | | | | |
| Ratio/Supplemental Data:(c) | | | | | | | | | | | | | | | | | | | | |
| Ratio of expenses to average net assets: | | | | | | | | | | | | | | | | | | | | |
| Before expense waiver or recovery | | | 1.94 | % | | | 1.77 | % | | | 1.73 | % | | | 1.70 | % | | | 1.77 | % |
| After expense waiver or recovery | | | 1.81 | % | | | 1.77 | % | | | 1.73 | % | | | 1.74 | % | | | 1.80 | % |
| | | | | | | | | | | | | | | | | | | | | |
| Ratio of expenses to average net assets (excluding dividend and interest expense): | | | | | | | | | | | | | | | | | | | | |
| Before expense waiver or recovery | | | 1.93 | % | | | 1.77 | % | | | 1.73 | % | | | 1.70 | % | | | 1.77 | % |
| After expense waiver or recovery | | | 1.79 | % | | | 1.77 | % | | | 1.73 | % | | | 1.74 | % | | | 1.80 | % |
| | | | | | | | | | | | | | | | | | | | | |
| Ratio of net investment income (loss) to average net assets: | | | | | | | | | | | | | | | | | | | | |
| Before expense waiver or recovery | | | 2.18 | % | | | 2.19 | % | | | 3.26 | % | | | 2.52 | % | | | 4.06 | % |
| After expense waiver or recovery | | | 2.32 | % | | | 2.19 | % | | | 3.26 | % | | | 2.48 | % | | | 4.03 | % |
| | | | | | | | | | | | | | | | | | | | | |
| Portfolio turnover rate(d) | | | 88 | % | | | 75 | % | | | 82 | % | | | 84 | % | | | 92 | % |
| (a) | Net investment income (loss) per share is based on average shares outstanding. |
| (b) | Amount represents less than $0.005 per share. |
| (c) | Ratios do not include the expenses of the investment companies in which the Fund invests. |
| (d) | Portfolio turnover rate is calculated on the basis of the Fund as a whole without distinguishing between classes of shares issued. |
The accompanying notes are an integral part of these financial statements.
| | |
| | |
LoCorr Macro Strategies Fund, LoCorr Long/Short Commodities Strategy Fund and LoCorr Market Trend Fund – Notes to Consolidated Financial Statements / LoCorr Dynamic Equity Fund and LoCorr Spectrum Income Fund – Notes to Financial Statements | 91 |
| | |
LoCorr Investment Trust
Notes
December 31, 2020
1. Organization
LoCorr Investment Trust (the “Trust”), an Ohio business trust, was formed on November 15, 2010 and is an open-end management investment company registered under the Investment Company Act of 1940, as amended (“1940 Act”). Each fund is an investment company and accordingly follows the investment company accounting and reporting guidance of the Financial Accounting Standards Board (“FASB”) Accounting Standards Codification (“ASC”) Topic 946, Financial Services- Investment Companies. The LoCorr Macro Strategies Fund, LoCorr Long/Short Commodities Strategy Fund, LoCorr Market Trend Fund, LoCorr Dynamic Equity Fund and the LoCorr Spectrum Income Fund (individually a “Fund” and collectively the “Funds”) are series within the Trust. The Funds are each diversified funds.
The LoCorr Macro Strategies Fund’s primary investment objective is capital appreciation in rising and falling equity markets with managing volatility as a secondary objective.
The LoCorr Long/Short Commodities Strategy Fund’s primary investment objective is capital appreciation in rising and falling commodities markets with managing volatility as a secondary objective.
The LoCorr Market Trend Fund’s primary investment objective is capital appreciation in rising and falling equity markets with managing volatility as a secondary objective.
The LoCorr Dynamic Equity Fund’s primary investment objective is long-term capital appreciation with reduced volatility compared to traditional broad-based equity market indices as a secondary objective.
The LoCorr Spectrum Income Fund’s primary investment objective is current income with capital appreciation as a secondary objective.
On September 16, 2019, Octavus Group, LLC (the “buyer”), the parent company of LoCorr Fund Management, LLC (the “Adviser” or “Management”), which serves as the investment adviser to the LoCorr Investment Trust, entered into a purchase and sale agreement pursuant to which the buyer would acquire Steben & Company, Inc., the investment adviser to the Steben Managed Futures Strategy Fund. As part of the transaction, it was expected that the Steben Managed Futures Strategy Fund would reorganize into the LoCorr Macro Strategies Fund. The reorganization was largely based on the similar investment objectives of the Funds and the benefit to shareholders including the opportunity to benefit from long-term economies of scale. In addition, the shareholders of the Steben Managed Futures Strategy Fund will benefit from the expertise and experience of the Adviser. At a special meeting of the Board of Trustees, the Board approved an Agreement and Plan of Reorganization (the “Plan”). The sale closed on October 31, 2019. The Plan was voted on and approved at a meeting of shareholders held on January 17, 2020.
The Steben Managed Futures Strategy Fund reorganized into the LoCorr Macro Strategies Fund as of the close of business on January 24, 2020. Under the terms of the Plan, the Adviser will pay all expenses associated with the reorganization. In addition, under the terms of the Plan, shareholders of the Steben Managed Futures Strategy Fund received shares of the LoCorr Macro Strategies Fund equal in U.S. dollar value to the interests of such shareholders in the Steben Managed Futures Strategy Fund with each LoCorr Macro Strategies Fund’s shares ordinarily valued as of the close of regular trading on the NYSE on the business day immediately prior to the closing date. This was accomplished as a tax free exchange. For financial reporting purposes, assets received, and shares issued by the LoCorr Macro Strategies Fund were recorded at fair value; however, the cost basis of the investments received from the Steben Managed Futures Strategy Fund was carried forward to align ongoing reporting of the LoCorr Macro Strategies Fund’s realized and unrealized gains and losses with amounts distributable to shareholders for tax purposes. The following table illustrates the specifics of the reorganization:
| | | | | | Pre- | | | Pre- | | | | | | Post- | | | | |
| | | Pre- | | | Reorganization | | | Reorganization | | | Post- | | | Reorganization | | | | |
| | | Reorganization | | | Shares | | | Net Asset | | | Reorganization | | | Shares | | | Exchange | |
| | | Net Assets | | | Outstanding | | | Value | | | Net Assets | | | Outstanding | | | Ratio* | |
| LoCorr Macro Strategies Fund – Class A | | $ | 52,981,719 | | | | 6,079,973 | | | $ | 8.71 | | | $ | 60,136,115 | | | | 6,901,237 | | | | 1.00229621 | |
| LoCorr Macro Strategies Fund – Class C | | | 48,056,434 | | | | 5,791,792 | | | | 8.30 | | | | 49,026,785 | | | | 5,908,701 | | | | 1.01445783 | |
| LoCorr Macro Strategies Fund – Class I | | | 770,518,733 | | | | 87,046,500 | | | | 8.85 | | | | 820,269,134 | | | | 92,668,364 | | | | 0.99548023 | |
| Steben Managed Futures Strategy Fund | | | 1,731,441 | | | | 198,241 | | | | 8.73 | | | | – | | | | – | | | | – | |
| – Class A | | | | | | | | | | | | | | | | | | | | | | | | |
| Steben Managed Futures Strategy Fund | | | 970,352 | | | | 115,243 | | | | 8.42 | | | | – | | | | – | | | | – | |
| – Class C | | | | | | | | | | | | | | | | | | | | | | | | |
| Steben Managed Futures Strategy Fund | | | 49,750,401 | | | | 5,647,389 | | | | 8.81 | | | | – | | | | – | | | | – | |
| – Class I | | | | | | | | | | | | | | | | | | | | | | | | |
| Steben Managed Futures Strategy Fund | | | 5,422,955 | | | | 620,431 | | | | 8.74 | | | | – | | | | – | | | | – | |
– Class N
| * | Class N of the Steben Managed Futures Strategy Fund merged into Class A of the LoCorr Macro Strategies Fund with an exchange ratio of 1.00344432 as of the close of business on January 24, 2020 resulting in the addition of 622,567 shares outstanding in the LoCorr Macro Strategies Fund. |
| | |
| | |
| 92 | LoCorr Macro Strategies Fund, LoCorr Long/Short Commodities Strategy Fund and LoCorr Market Trend Fund – Notes to Consolidated Financial
Statements / LoCorr Dynamic Equity Fund and LoCorr Spectrum Income Fund – Notes to Financial Statements (continued) |
| | |
The net assets of the Steben Managed Futures Strategy Fund immediately before the acquisition were $57,875,149, which included $112,713 of net unrealized appreciation. The cost and market value of the securities acquired were $38,464,185 and $38,576,898, respectively. In addition, cash in the amount of $19,298,251, was acquired.
Because the combined investment portfolios have been managed as a single integrated portfolio since the acquisition was completed, it is not practicable to separate the amounts of revenue and earnings of the Steben Managed Futures Strategy Fund that would have been included in the LoCorr Macro Strategy Fund’s Statement of Operations since January 24, 2020. Assuming the acquisition had been completed on January 1, 2020, the beginning of the annual reporting period of the LoCorr Macro Strategies Fund, the LoCorr Macro Strategies Fund’s pro forma results of operations for the current fiscal period include net investment income (loss) of $(3,030,750), net gain on investments of $66,573,419, and net increase in assets resulting from operations of $63,542,669.
Wholly-Owned and Controlled Subsidiaries
In order to achieve their investment objectives, the LoCorr Macro Strategies Fund, the LoCorr Long/Short Commodities Strategy Fund and the LoCorr Market Trend Fund each invest up to 25% of their total assets (measured at the time of purchase) in wholly-owned subsidiaries, LCMFS Fund Limited (“LCMFS”), LCLSCS Fund Limited (“LCLSCS”) and LCMT Fund Limited (“LCMT”), respectively; each company is incorporated under the laws of the Cayman Islands. LCMFS, LCLSCS and LCMT act as investment vehicles in order to enter into certain investments for the LoCorr Macro Strategies Fund, the LoCorr Long/Short Commodities Strategy Fund and the LoCorr Market Trend Fund, respectively, consistent with their investment objectives and policies specified in the Prospectus and Statement of Additional Information.
At December 31, 2020 investments in LCMFS, LCLSCS and LCMT represented 1.99%, 17.57% and 3.79% of the total net assets of LoCorr Macro Strategies Fund, LoCorr Long/Short Commodities Strategy Fund and LoCorr Market Trend Fund, respectively. See Note 2.
The consolidated financial statements of the LoCorr Macro Strategies Fund, LoCorr Long/Short Commodities Strategy Fund and the LoCorr Market Trend Fund each include the investment activity and financial statements of LCMFS, LCLSCS and LCMT, respectively. All intercompany accounts and transactions have been eliminated in consolidation. Because each Fund may invest a substantial portion of its assets in its respective subsidiary, the Fund may be considered to be investing indirectly in some of those investments through its subsidiary. For that reason, references to the Fund may also encompass its subsidiary. The subsidiary will be subject to the same investment restrictions and limitations, and follow the same compliance policies and procedures, as the Fund when viewed on a consolidated basis. Each Fund and its subsidiary area “commodity pool” under the U.S. Commodity Exchange Act and LoCorr Fund Management, LLC (the “Adviser” or “Management”) is a “commodity pool operator” registered with and regulated by the Commodity Futures Trading Commission (“CFTC”). As a result, additional CFTC-mandated disclosure, reporting and recordkeeping obligations apply with respect to each Fund and its respective subsidiary under CFTC and the U.S. Securities and Exchange Commission (the “SEC”) harmonized regulations.
At December 31,2020 the LCLSCS invested in swap contract, for which the notional amount was $361,945,098. At December 31, 2020, LCLSCS reported unrealized depreciation on the swap contract of $13,099,219. In addition, LCLSCS holds cash and cash equivalents as collateral on the swap contract. At December 31, 2020, LCLSCS Fund Limited invested in a purchased option, for which the value, as reported on the consolidated schedule of investments is an accurate representation of the volume of activity for the year ended December 31, 2020. At December 31, 2020, LCLSCS reported unrealized appreciation on the purchased call option of $4,361,894.
At December 31,2020 investments held by LCMFS and LCMT include open futures contracts and other investments intended to serve as margin or collateral for futures positions. At December 31,2020, LCMFS held long open futures contracts with a total notional amount of $300,189,133 and net unrealized appreciation of $19,169,312 and short open futures contracts with a total notional amount of $65,679,270 and net unrealized appreciation of $120,745. At December 31,2020, LCMT held long open futures contracts with a total notional amount of $113,070,759 and net unrealized appreciation of $10,507,895 and short open futures contracts with a total notional amount of $21,335,241 and net unrealized depreciation of $190,799.
Share Classes
The Funds currently offer three classes of shares: Class A, Class C and Class I shares. Each share class represents an interest in the same assets of the Fund, has the same rights and is identical in all material respects except that (i) Class A shares have a maximum front end sales load of 5.75% and maximum deferred sales charge of 1.00% and Class C shares have a maximum deferred sales charge of 1.00%, (ii) Class A shares have a 12b-1 fee of 0.25% and Class C shares have a 12b-1 fee of 1.00%; (iii) certain other class-specific expenses will be borne solely by the class to which such expenses are attributable and (iv) each class will have exclusive voting rights with respect to matters relating to its own distribution arrangements.
All classes with respect to the LoCorr Spectrum Income Fund are subject to a 2.00% redemption fee on redemptions made within 60 days of the original purchase. As of May 1, 2017, none of the other Funds are subject to a redemption fee.
The following table presents the class-specific commencement of operations dates for each of the Funds:
| | | Commencement of Operations |
| | | Class A | | Class C | | Class I |
| LoCorr Macro Strategies Fund | | March 22, 2011 | | March 24, 2011 | | March 24, 2011 |
| LoCorr Long/Short Commodities Strategy Fund | | January 1, 2012 | | January 1, 2012 | | January 1, 2012 |
| LoCorr Dynamic Equity Fund | | May 10, 2013 | | May 10, 2013 | | May 10, 2013 |
| LoCorr Spectrum Income Fund | | January 1, 2014 | | January 1, 2014 | | January 1, 2014 |
| LoCorr Market Trend Fund | | July 1, 2014 | | July 1, 2014 | | July 1, 2014 |
| | | | | | | |
| | |
| | |
LoCorr Macro Strategies Fund, LoCorr Long/Short Commodities Strategy Fund and LoCorr Market Trend Fund – Notes to Consolidated Financial Statements / LoCorr Dynamic Equity Fund and LoCorr Spectrum Income Fund – Notes to Financial Statements (continued) | 93 |
| | |
The Funds may issue an unlimited number of shares of beneficial interest, with no par value. All shares of the Funds have equal rights and privileges, except as to class-specific rights and privileges described above.
2. Significant Accounting Policies
The following is a summary of significant accounting policies consistently followed by the Funds in the preparation of the financial statements. These policies are in conformity with generally accepted accounting principles in the United States of America (“GAAP”).
Investment Valuation
The Funds follow fair valuation accounting standards in accordance with GAAP, which establish a definition of fair value and set out a hierarchy for measuring fair value. These standards require additional disclosures about the various inputs and valuation techniques used to develop the measurements of fair value and changes in valuation techniques and related inputs during the period. These inputs are summarized in three broad levels listed below:
Level 1 – Unadjusted quoted prices in active markets for identical assets or liabilities that the Funds have the ability to access.
Level 2 – Observable inputs other than quoted prices included in Level 1 that are observable for the asset or liability, either directly or indirectly. These inputs may include quoted prices for the identical instrument on an inactive market, prices for similar instruments, interest rates, prepayment speeds, credit risk, yield curves, default rates and similar data.
Level 3 – Unobservable inputs for the asset or liability, to the extent relevant observable inputs are not available; representing the Funds’ own assumptions about the assumptions a market participant would use in valuing the asset or liability and would be based on the best information available.
Generally, the Funds’ investments are valued each day at the last quoted sales price on each investment’s primary exchange. Investments traded or dealt in one or more exchanges (whether domestic or foreign) for which market quotations are readily available and not subject to restrictions against resale shall be valued at the last quoted sales price on the primary exchange or, in the absence of a sale on the primary exchange, at the last bid on the primary exchange. Investments primarily traded in the National Association of Securities Dealers’ Automated Quotation System (“NASDAQ”) National Market System for which market quotations are readily available shall be valued using the NASDAQ Official Closing Price.
The Funds may use independent pricing services to assist in calculating the value of the Funds’ investments. In addition, market prices for foreign investments are not determined at the same time of day as the net asset value (“NAV”) for the Funds. Because the Funds may invest in portfolio investments primarily listed on foreign exchanges and these exchanges may trade on weekends or other days when the Funds do not price their shares, the value of some of the Funds’ portfolio investments may change on days when you may not be able to buy or sell the Funds’ shares. In computing the NAV, the Funds value foreign investments held by the Funds at the latest closing price on the exchange in which they are traded immediately prior to closing of the New York Stock Exchange. Prices of foreign investments quoted in foreign currencies are translated into U.S. dollars at current rates. If events materially affecting the value of an investment in the Funds’ portfolio, particularly foreign investments, occur after the close of trading on a foreign market but before the Funds price their shares, the investment will be valued at fair value.
American Depositary Receipts
The Funds may invest in sponsored and unsponsored American Depositary Receipts (“ADRs”), which are receipts issued by an American bank or trust company evidencing ownership of underlying securities issued by a foreign issuer. ADRs, in registered form, are designed for use in U.S. securities markets. Unsponsored ADRs may be created without the participation of the foreign issuer. Holders of unsponsored ADRs generally bear all the costs of the ADR facility, whereas foreign issuers typically bear certain costs in a sponsored ADR. The bank or trust company depositary of an unsponsored ADR may be under no obligation to distribute shareholder communications received from the foreign issuer or to pass through voting rights. ADRs are generally categorized in Level 1 or Level 2 of the fair value hierarchy depending on inputs used and market activity levels for specific securities.
Equity Securities
Equity securities, including common stocks, preferred stocks, securities convertible into common stocks such as convertible bonds, warrants, rights, options, master limited partnership (“MLP”) interests, real estate investment trusts (“REITs”), business development companies (“BDCs”) and royalty trusts are generally valued by using market quotations, but may be valued on the basis of prices furnished by a pricing service when the Adviser believes such prices accurately reflect the fair market value of such securities. MLP interests are limited partnerships, the interests in which (known as “units”) typically trade publicly, like stock. MLPs are also called publicly traded partnerships and public limited partnerships. Securities that are traded on any stock exchange or on the NASDAQ over-the-counter market are generally valued by the pricing service at the last quoted sale price. Lacking a last sale price, an equity security is generally valued by the pricing service at its last bid price. Equity securities are generally categorized in Level 1 or Level 2 of the fair value hierarchy depending on inputs used and market activity levels for specific securities.
Exchange Traded Funds
The Funds may invest in Exchange Traded Funds (“ETFs”). They are managed by professionals and provide the investor with diversification, cost and tax efficiency, liquidity, marginability, usability for hedging, the ability to go long and short, and (for some ETFs) the provision of periodic distributions. Additionally, some ETFs are unit investment trusts (“UITs”), which are unmanaged portfolios overseen by trustees. ETFs generally have two markets. The primary market is where institutions swap “creation units” in block-multiples of shares, typically 25,000 or 50,000, for in-kind securities and cash in the form of dividends. The secondary market is where individual investors can trade as little as a single share during trading hours on the exchange. This is different from open-ended mutual funds that are traded after hours once the NAV is calculated.
| | |
| | |
| 94 | LoCorr Macro Strategies Fund, LoCorr Long/Short Commodities Strategy Fund and LoCorr Market Trend Fund – Notes to Consolidated Financial
Statements / LoCorr Dynamic Equity Fund and LoCorr Spectrum Income Fund – Notes to Financial Statements (continued) |
| | |
ETF shares may trade at a premium or discount to NAV per share. ETFs share many similar risks with open-end and closed-end funds. ETFs are generally categorized in Level 1 of the fair value hierarchy.
The Funds may invest in ETFs and other investment companies that hold a portfolio of foreign securities. Investing in securities of foreign companies and countries involves certain considerations and risks that are not typically associated with investing in U.S. government securities and securities of domestic companies. There may be less publicly available information about a foreign issuer than a domestic one, and foreign companies are not generally subject to uniform accounting, auditing and financial standards and requirements comparable to those applicable to U.S. companies. There may also be less government supervision and regulation of foreign securities exchanges, brokers and listed companies than exists in the United States. Interest and dividends paid by foreign issuers may be subject to withholding and other foreign taxes, which may decrease the net return on such investments as compared to dividends and interest paid to the Funds by domestic companies or the U.S. government. There may be the possibility of expropriations, seizure or nationalization of foreign deposits, confiscatory taxation, political, economic or social instability, or diplomatic developments that could affect assets of the Funds held in foreign countries. Finally, the establishment of exchange controls or other foreign governmental laws or restrictions could adversely affect the payment of obligations.
Financial Derivative Instruments
Financial derivative instruments, such as forward currency contracts, futures contracts or swap agreements, derive their value from underlying asset prices, indices, reference rates and other inputs or a combination of these factors. These contracts are normally valued on the basis of broker-dealer quotations or a pricing service at the settlement price determined by the relevant exchange. Depending on the product and the terms of the transaction, the value of the derivative contracts can be estimated by a pricing service provider using a series of techniques, including simulation pricing models. The pricing models use inputs that are observed from actively quoted markets such as issuer details, indices, spreads, interest rates, curves, dividends and exchange rates.
Forward currency contracts represent the purchase or sale of a specific quantity of a foreign currency at the current or spot price, with delivery and settlement at a specified future date. Forward currency contracts are presented at fair value using spot currency rates and are adjusted for the time value of money (forward points) and contractual prices of the underlying financial instruments. Forward currency contracts are generally categorized in Level 2.
Futures contracts are carried at fair value using the primary exchange’s closing (settlement) price and are generally categorized in Level 1.
Total return swap contracts are stated at fair value daily based on the fair value of the underlying futures, forward currency and foreign currency contracts constituting the contract’s stated index, taking into account any fees and expenses associated with the swap agreement. Total return swap contracts are generally categorized in Level 2.
Fund-linked options are stated at fair value based on the fair value of Galaxy Plus Fund – East Alpha Feeder Fund (548) LLC, taking into account any fees and expenses associated with the fund-linked option. Fund-linked options are generally categorized in Level 2.
Fair Value Pricing
If market quotations are not readily available, investments will be valued at their fair value as determined in good faith by the Adviser in accordance with procedures approved by the Board of Trustees (the “Board”) and evaluated by the Board as to the reliability of the fair value method used.
In these cases, a Fund’s NAV will reflect certain portfolio investments’ fair value rather than their market price. Fair value pricing involves subjective judgments and it is possible that the fair value determined for an investment is materially different than the value that could be realized upon the sale of that investment. The fair value prices can differ from market prices when they become available or when a price becomes available.
Fair value determinations are required for the following securities:
| ● | securities for which market quotations are not readily available at the valuation time on a particular business day (including without limitation securities for which there is a short and temporary lapse in the provision of a price by the regular pricing source); |
| ● | securities determined to be illiquid in accordance with the Trust’s Liquidity Procedures; and |
| ● | securities with respect to which an event that will affect the value thereof has occurred subsequent to the determination by the Adviser/ relevant Sub-Adviser of the closing prices reported on the principal exchange on which the securities are traded, but prior to the relevant Fund’s calculation of its NAV. |
| ● | For any open-end mutual funds that do not provide timely NAV information, the Adviser/relevant Sub-Adviser shall evaluate those ‘similar’ funds and determine which are most appropriate based on funds having similar benchmarks or similar objectives. The Adviser/relevant Sub-Adviser |
shall then calculate the NAV percentage move of those ‘similar’ funds for the day to create an aggregate average percentage move, which it shall use to calculate the price movement for the day of the Fund at issue. For closed-end funds, the aforementioned practice shall be utilized, in addition to monitoring secondary market activity during the day.
| | |
| | |
LoCorr Macro Strategies Fund, LoCorr Long/Short Commodities Strategy Fund and LoCorr Market Trend Fund – Notes to Consolidated Financial Statements / LoCorr Dynamic Equity Fund and LoCorr Spectrum Income Fund – Notes to Financial Statements (continued) | 95 |
| | |
Performing Fair Value Pricing
The Adviser considers all appropriate factors relevant to the value of securities for which market quotations are not readily available. No single standard for determining fair value can be established, since fair value depends upon the circumstances of each individual case. As a general principle, the current fair value of an issue of securities being valued by the Adviser would appear to be the amount that the owner might reasonably expect to receive for them upon their current sale. Methods that are in accord with this principle may, for example, be based on:
| ● | a discount from market of a similar freely traded security (including a derivative security or a basket of securities traded on other markets, exchanges or among dealers); or |
| ● | yield to maturity with respect to debt issues, or a combination of these and other methods. |
Fair value determinations are not based on what the Adviser believes that a buyer may pay at a later time, such as when market conditions change or when the market ultimately recognizes a security’s true value as perceived by the Adviser. Similarly, bonds and other instruments may not be fair valued at par based on the expectation that the Funds will hold the investment until maturity.
Some of the general factors that the Adviser considers in determining a valuation method for an individual issue of securities include, but shall not be limited to:
| ● | the fundamental analytical data relating to the investment; |
| ● | the nature and duration of restrictions (if any) on disposition of the securities; |
| ● | evaluation of the forces that influence the market in which these securities are purchased or sold; |
| ● | changes in interest rates; |
| ● | government (domestic or foreign) actions or pronouncements; and |
With respect to securities traded on foreign markets, the Adviser considers the value of foreign securities traded on other foreign markets, ADR trading, closed-end fund trading, foreign currency exchange activity and the trading prices of financial products that are tied to baskets of foreign securities, such as WEBS.
Among the more specific factors that the Funds’ Adviser considers (if applicable) in determining a valuation method for an individual issue of securities are:
| ● | financial statements of the issuer; |
| ● | cost at date of purchase; |
| ● | discount from market value of unrestricted securities of the same class at time of purchase; |
| ● | special reports prepared by analysts; |
| ● | information as to any transactions or offers with respect to the security; |
| ● | existence of merger proposals or tender offers affecting the securities; |
| ● | price and extent of public trading in similar securities of the issuer or comparable companies; and |
As a general matter, the Funds’ Adviser will value the portfolio security or other asset primarily by reference to the public market if there is a public market for securities of the same class or similar securities; primarily by reference to private transactions if public market reference is not available and private transaction reports are available; and primarily by use of one or more analytical methods or models if public and private market references are not available or not reliable. The Adviser will use cost only if no better method of valuation is available.
The Adviser regularly evaluates whether its pricing methodologies continue to result in values that the Funds might reasonably expect to receive upon a current sale. In order to do this, the Adviser compares its fair value prices with values that are available from other sources (if there are any). The next actual sales price of a security might be one such source. However, the next-day opening prices or next actual sales prices for a security may differ from the fair value of that security as of the time for NAV calculation, given the subjectivity inherent in fair valuation and the fact that events could occur after NAV calculation. Thus, discrepancies between fair values and next-day opening prices or next actual sales prices may occur on a regular and recurring basis. These discrepancies do not necessarily indicate that the Adviser’s fair value methodology is inappropriate. Nonetheless, systematic comparisons of fair values to the next-day opening prices or next actual sales prices are useful to assist the Adviser with ongoing monitoring and evaluation of the appropriateness of its fair value methodologies.
| | |
| | |
| 96 | LoCorr Macro Strategies Fund, LoCorr Long/Short Commodities Strategy Fund and LoCorr Market Trend Fund – Notes to Consolidated Financial
Statements / LoCorr Dynamic Equity Fund and LoCorr Spectrum Income Fund – Notes to Financial Statements (continued) |
| | |
The following table summarizes LoCorr Macro Strategies Fund’s consolidated investments and other financial instruments as of December 31, 2020:
| Security Classification | | Level 1 | | | Level 2 | | | Level 3 | | | Total | |
| Investments | | | | | | | | | | | | | | | | |
| Asset Backed Securities | | $ | – | | | $ | 123,765,909 | | | $ | – | | | $ | 123,765,909 | |
| Corporate Bonds | | | – | | | | 273,798,330 | | | | – | | | | 273,798,330 | |
| Mortgage Backed Securities | | | – | | | | 141,991,211 | | | | – | | | | 141,991,211 | |
| Municipal Bonds | | | – | | | | 19,994,681 | | | | – | | | | 19,994,681 | |
| U.S. Government Agency Issues | | | – | | | | 105,446,390 | | | | – | | | | 105,446,390 | |
| U.S. Government Notes | | | – | | | | 357,599,271 | | | | – | | | | 357,599,271 | |
| Short Term Investments | | | 48,986,780 | | | | 2,841,141 | | | | – | | | | 51,827,921 | |
| Total Investments | | $ | 48,986,780 | | | $ | 1,025,436,933 | | | $ | – | | | $ | 1,074,423,713 | |
| | | | | | | | | | | | | | | | | |
| Other Financial Instruments* | | | | | | | | | | | | | | | | |
| Forward Currency Contracts | | | | | | | | | | | | | | | | |
| Purchase | | $ | – | | | $ | 13,441,379 | | | $ | – | | | $ | 13,441,379 | |
| Sale | | | – | | | | (8,374,580 | ) | | | – | | | | (8,374,580 | ) |
| Total Forward Currency Contracts | | | – | | | | 5,066,799 | | | | – | | | | 5,066,799 | |
| Futures Contracts | | | | | | | | | | | | | | | | |
| Long | | $ | 28,471,985 | | | $ | 38,883 | | | $ | – | | | $ | 28,510,868 | |
| Short | | | 307,953 | | | | (45,247 | ) | | | – | | | | 262,706 | |
| Total Futures Contracts | | | 28,779,938 | | | | (6,364 | ) | | | – | | | | 28,773,574 | |
| Total Other Financial Instruments | | $ | 28,779,938 | | | $ | 5,060,435 | | | $ | – | | | $ | 33,840,373 | |
| | | | | | | | | | | | | | | | | |
See the Fund’s consolidated schedule of investments for the investments detailed by industry classification.
| * | The fair value of the Fund’s other financial instruments represent the net unrealized appreciation (depreciation) at December 31, 2020. |
The LoCorr Macro Strategies Fund did not hold any Level 3 assets during the year.
The following table summarizes LoCorr Long/Short Commodities Strategy Fund’s consolidated investments and swap contracts as of December 31, 2020:
| Security Classification | | Level 1 | | | Level 2 | | | Level 3 | | | Total | |
| Investments | | | | | | | | | | | | | | | | |
| Asset Backed Securities | | $ | – | | | $ | 42,958,458 | | | $ | – | | | $ | 42,958,458 | |
| Corporate Bonds | | | – | | | | 103,843,137 | | | | – | | | | 103,843,137 | |
| Foreign Government Bond | | | – | | | | 5,095 | | | | – | | | | 5,095 | |
| Mortgage Backed Securities | | | – | | | | 54,111,958 | | | | – | | | | 54,111,958 | |
| Municipal Bonds | | | – | | | | 7,606,986 | | | | – | | | | 7,606,986 | |
| Purchased Call Option | | | – | | | | 23,285,175 | | | | – | | | | 23,285,175 | |
| U.S. Government Agency Issues | | | – | | | | 43,110,133 | | | | – | | | | 43,110,133 | |
| U.S. Government Notes | | | – | | | | 126,186,912 | | | | – | | | | 126,186,912 | |
| Short Term Investments | | | 14,137,272 | | | | 766,660 | | | | – | | | | 14,903,932 | |
| Total Investments | | $ | 14,137,272 | | | $ | 401,874,514 | | | $ | – | | | $ | 416,011,786 | |
| | | | | | | | | | | | | | | | | |
| Swap Contracts* | | | | | | | | | | | | | | | | |
| Long Total Return Swap Contracts | | $ | – | | | $ | (13,099,219 | ) | | $ | – | | | $ | (13,099,219 | ) |
| Total Swap Contracts | | $ | – | | | $ | (13,099,219 | ) | | $ | – | | | $ | (13,099,219 | ) |
See the Fund’s consolidated schedule of investments for the investments detailed by industry classification.
| * | The fair value of the Fund’s investment in swap contracts represents the net unrealized depreciation at December 31, 2020. |
The LoCorr Long/Short Commodities Strategy Fund did not hold any Level 3 assets during the year.
| | |
| | |
LoCorr Macro Strategies Fund, LoCorr Long/Short Commodities Strategy Fund and LoCorr Market Trend Fund – Notes to Consolidated Financial Statements / LoCorr Dynamic Equity Fund and LoCorr Spectrum Income Fund – Notes to Financial Statements (continued) | 97 |
| | |
The following table summarizes LoCorr Market Trend Fund’s consolidated investments and other financial instruments as of December 31, 2020:
| Security Classification | | Level 1 | | | Level 2 | | | Level 3 | | | Total | |
| Investments | | | | | | | | | | | | | | | | |
| Asset Backed Securities | | $ | – | | | $ | 25,896,734 | | | $ | – | | | $ | 25,896,734 | |
| Corporate Bonds | | | – | | | | 56,276,076 | | | | – | | | | 56,276,076 | |
| Mortgage Backed Securities | | | – | | | | 25,737,497 | | | | – | | | | 25,737,497 | |
| Municipal Bonds | | | – | | | | 3,874,553 | | | | – | | | | 3,874,553 | |
| U.S. Government Agency Issues | | | – | | | | 24,273,947 | | | | – | | | | 24,273,947 | |
| U.S. Government Notes | | | – | | | | 64,906,039 | | | | – | | | | 64,906,039 | |
| Short Term Investments | | | 16,924,215 | | | | 711,538 | | | | – | | | | 17,635,753 | |
| Total Investments | | $ | 16,924,215 | | | $ | 201,676,384 | | | $ | – | | | $ | 218,600,599 | |
| | | | | | | | | | | | | | | | | |
| Other Financial Instruments* | | | | | | | | | | | | | | | | |
| Forward Currency Contracts | | | | | | | | | | | | | | | | |
| Purchase | | $ | – | | | $ | 4,084,652 | | | $ | – | | | $ | 4,084,652 | |
| Sale | | | – | | | | (794,907 | ) | | | – | | | | (794,907 | ) |
| Total Forward Currency Contracts | | | – | | | | 3,289,745 | | | | – | | | | 3,289,745 | |
| Futures Contracts | | | | | | | | | | | | | | | | |
| Long | | $ | 14,352,622 | | | $ | – | | | $ | – | | | $ | 14,352,622 | |
| Short | | | 261,349 | | | | – | | | | – | | | | 261,349 | |
| Total Futures Contracts | | | 14,613,971 | | | | – | | | | – | | | | 14,613,971 | |
| Total Other Financial Instruments | | $ | 14,613,971 | | | $ | 3,289,745 | | | $ | – | | | $ | 17,903,716 | |
See the Fund’s consolidated schedule of investments for the investments detailed by industry classification.
| * | The fair value of the Fund’s other financial instruments represent the net unrealized appreciation (depreciation) at December 31, 2020. |
The LoCorr Market Trend Fund did not hold any Level 3 assets during the year.
The following table summarizes LoCorr Dynamic Equity Fund’s investments, securities sold short and futures contracts as of December 31, 2020:
| Security Classification | | | Level 1 | | | | Level 2 | | | | Level 3 | | | | Total | |
| Investments | | | | | | | | | | | | | | | | |
| Common Stocks | | $ | 13,542,686 | | | $ | – | | | $ | – | | | $ | 13,542,686 | |
| Preferred Stock | | | 22,944 | | | | – | | | | – | | | | 22,944 | |
| Real Estate Investment Trusts | | | 704,505 | | | | – | | | | – | | | | 704,505 | |
| Short Term Investment | | | 1,978,951 | | | | – | | | | – | | | | 1,978,951 | |
| Total Investments | | $ | 16,249,086 | | | | – | | | | – | | | $ | 16,249,086 | |
| Securities Sold Short | | | | | | | | | | | | | | | | |
| Common Stocks | | $ | (5,582,468 | ) | | $ | – | | | $ | – | | | $ | (5,582,468 | ) |
| Exchange Traded Funds | | | (582,169 | ) | | | – | | | | – | | | | (582,169 | ) |
| Real Estate Investment Trusts | | | (152,548 | ) | | | – | | | | – | | | | (152,548 | ) |
| Total Securities Sold Short | | $ | (6,317,185 | ) | | $ | – | | | $ | – | | | $ | (6,317,185 | ) |
| Futures Contracts* | | | | | | | | | | | | | | | | |
| Long | | $ | 39,152 | | | $ | – | | | $ | – | | | $ | 39,152 | |
| Short | | | – | | | | – | | | | – | | | | – | |
| Total Futures Contracts | | $ | 39,152 | | | $ | – | | | $ | – | | | $ | 39,152 | |
See the Fund’s schedule of investments and schedule of securities sold short for detail by industry classification.
| * | The fair value of the Fund’s investment in futures contracts represent the net unrealized appreciation at December 31, 2020. |
The LoCorr Dynamic Equity Fund did not hold any Level 3 assets or liabilities during the year.
| | |
| | |
| 98 | LoCorr Macro Strategies Fund, LoCorr Long/Short Commodities Strategy Fund and LoCorr Market Trend Fund – Notes to Consolidated Financial
Statements / LoCorr Dynamic Equity Fund and LoCorr Spectrum Income Fund – Notes to Financial Statements (continued) |
| | |
The following table summarizes LoCorr Spectrum Income Fund’s consolidated investments and other financial instruments as of December 31, 2020:
| Security Classification | | Level 1 | | | Level 2 | | | Level 3 | | | Total | |
| Investments | | | | | | | | | | | | | | | | |
| Business Development Companies | | $ | 6,597,475 | | | $ | – | | | $ | – | | | $ | 6,597,475 | |
| Closed-End Investment Companies | | | 2,055,708 | | | | – | | | | – | | | | 2,055,708 | |
| Common Stocks | | | 14,096,338 | | | | – | | | | – | | | | 14,096,338 | |
| Master Limited Partnerships | | | 8,432,948 | | | | – | | | | – | | | | 8,432,948 | |
| Preferred Stocks | | | 3,506,559 | | | | – | | | | – | | | | 3,506,559 | |
| Publicly Traded Partnerships | | | 2,117,866 | | | | – | | | | – | | | | 2,117,866 | |
| Real Estate Investment Trusts | | | 8,662,887 | | | | – | | | | – | | | | 8,662,887 | |
| Royalty Trust | | | 508,967 | | | | – | | | | – | | | | 508,967 | |
| Short Term Investment | | | 1,766,574 | | | | – | | | | – | | | | 1,766,574 | |
| Total Investments | | $ | 47,745,322 | | | $ | – | | | $ | – | | | $ | 47,745,322 | |
See the Fund’s schedule of investments for detail by industry classification.
The LoCorr Spectrum Income Fund did not hold any Level 3 assets during the year.
The above guidance does not purport to delineate all factors that may be considered. The Adviser takes into consideration all indications of value available to it in determining the fair value assigned to a particular security.
Allocation of Income and Expenses
Net investment income, other than class specific expenses, and realized and unrealized gains and losses are allocated daily to each class of shares based upon the relative NAV of outstanding shares of each class of shares at the beginning of the day (after adjusting for the current capital shares activity of the respective class). Expenses associated with a specific Fund in the Trust are charged to that Fund. Common expenses are typically allocated based upon the relative net assets of each Fund, or by other equitable means.
Deposits with Broker
Forward Currency and Futures Contracts
When trading derivative instruments, such as forward or futures contracts, a Fund is only required to post initial or variation margin with the exchange or clearing broker. The use of margin in trading these instruments has the effect of creating leverage, which can expose the Fund to substantial gains or losses occurring from relatively small price changes in the value of the underlying instrument and can increase the volatility of the Fund’s returns. Volatility is a statistical measure of the dispersion of returns of an investment, where higher volatility generally indicates greater risk. At December 31, 2020, the LoCorr Macro Strategies Fund and the LoCorr Market Trend Fund pledged cash and cash equivalents, defined as short-term, highly liquid investments that are readily convertible to known amounts of cash, at U.S. Bank, N.A. (“U.S. Bank”) of $10,440,000 and $6,740,000, respectively, to Bank of America Merrill Lynch for each Fund’s investment in forward currency contracts.
Upon entering into a futures contract, and to maintain the Fund’s open positions in futures contracts, the Fund is required to deposit with its custodian or futures broker in a segregated account in the name of the futures broker an amount of cash, U.S. government securities, suitable money market instruments, or other liquid securities, known as “initial margin.” The margin required for a particular futures contract is set by the exchange on which the contract is traded and may be significantly modified from time to time by the exchange during the term of the contract. Futures contracts are customarily purchased and sold on margins that may range upward from less than 5% of the value of the contract being traded.
At December 31, 2020 the LoCorr Macro Strategies Fund and LCMFS, collectively, had $46,528,047 in net cash and cash equivalents including foreign currency on deposit with the broker for derivative instruments which is presented on the Fund’s consolidated statement of assets and liabilities. In addition, LCMFS pledged securities and cash with a fair value of $12,229 as collateral for derivative instruments.
At December 31, 2020 the LoCorr Market Trend Fund and LCMT, collectively, had $22,009,626 in net cash and cash equivalents including foreign currency on deposit with the broker for derivative instruments which is presented on the Fund’s consolidated statements of assets and liabilities. In addition, LCMT pledged cash at U.S. Bank with a value of $369,676 as collateral for derivative instruments.
At December 31, 2020 the LoCorr Dynamic Equity Fund had $339,715 in cash and cash equivalents on deposit with the broker for futures contracts which is presented on the Fund’s statements of assets and liabilities.
If the price of an open futures contract changes (by increase in underlying instrument or index in the case of a sale or by decrease in the case of a purchase) so that the loss on the futures contract reaches a point at which the margin on deposit does not satisfy margin requirements, the broker will require an increase in the margin. However, if the value of a position increases because of favorable price changes in the futures contract so that the margin deposit exceeds the required margin, the broker will pay the excess to the Fund.
These subsequent payments, called “variation margin,” to and from the futures broker (with the exception of futures contracts traded on the London Metal Exchange (“LME”)), are made on a daily basis as the price of the underlying assets fluctuate making the long and short positions in the futures contract more or less valuable, a process known as “marking to the market.” The variation margin on LME futures contracts do not settle daily, but rather settle at their respective maturity dates. At period end, the unrealized appreciation and depreciation on LME futures contracts is shown as receivable for unsettled open futures contracts and payable for unsettled open futures contracts, respectively, on the Funds’ consolidated statements of assets and liabilities. The Funds expect to earn interest income on any margin deposits.
| | |
| | |
LoCorr Macro Strategies Fund, LoCorr Long/Short Commodities Strategy Fund and LoCorr Market Trend Fund – Notes to Consolidated Financial Statements / LoCorr Dynamic Equity Fund and LoCorr Spectrum Income Fund – Notes to Financial Statements (continued) | 99 |
| | |
Securities Sold Short
At December 31, 2020, the LoCorr Dynamic Equity Fund had cash on deposit with Morgan Stanley and J.P. Morgan in the amount of $5,383,030. In addition, at December 31, 2020, the LoCorr Dynamic Equity Fund pledged cash with U.S. Bank of $1,312,604 and foreign currency woth Morgan Stanley of $203,600 as collateral for securities sold short.
Swap Contracts
LCLSCS has a substantial portion of its assets on deposit with Deutsche Bank in connection with its trading of its swap contract. Assets deposited with Deutsche Bank in connection with the trading of the swap contract for LCLSCS are partially restricted due to deposit requirements. At December 31, 2020, the LoCorr Long/Short Commodities Strategy Fund had cash and cash equivalents on deposit with Deutsche Bank in the amount of $59,200,974, which is presented on the consolidated statements of assets and liabilities. In addition, at December 31, 2020, LCLSCS pledged securities with a fair value of $435,788 as collateral for the swap contract. Risks arise from the possible inability of the counterparty to meet the terms of its contract and may increase if the counterparty’s financial condition worsens.
Options
At December 31, 2020, the LoCorr Spectrum Income Fund had $552,147 in cash and cash equivalents on deposit with Pershing, LLC for options contracts which is presented on the Fund’s statement of assets and liabilities. In addition, the LoCorr Spectrum Income Fund pledged securities with a fair value of $2,766,144 as collateral for options.
Distributable Earnings and Investment Transactions
Net investment income and net realized gains (losses) may differ for financial reporting and tax purposes because of temporary or permanent book/tax differences. To the extent these differences are permanent; reclassifications are made to the appropriate equity accounts in the period that the difference arises.
Additionally, GAAP requires that certain components of net assets relating to permanent differences be reclassified between financial and tax reporting. These reclassifications have no effect on net assets or NAV per share. See Note 7.
Distributions from Earnings
Shareholder transactions are recorded on trade date. Dividends from net investment income are declared and paid at least annually by the Funds. Distribution of net realized capital gains, if any, are declared and paid at least annually. Distributions to shareholders are recorded on the ex-dividend date. The character of distributions made during the periods from net investment income or net realized gains may differ from the characterization for federal income tax purposes due to the difference in the recognition of income, expense and gain items for financial statement and tax purposes.
During the year ended December 31, 2020, dividends for the LoCorr Spectrum Income Fund were distributed monthly. The estimated characterization of the distributions paid will be an ordinary dividend, qualified dividend or return of capital. This estimate is based on the Fund’s operating results during the period. It is anticipated that a significant portion of the distributions of the Fund’s investments in MLP and certain investments in REITs and royalty trusts will be comprised of return of capital as a result of the tax character of cash distributions made by each Fund’s investments. The actual characterization of the distributions made during the period is not determined until after the end of the fiscal year.
The tax character of distributions paid during the periods was as follows:
| | Year Ended December 31, 2020 | |
| | | | Ordinary | | | | Long-Term | | | | Return of | |
| Fund | | | Income | | | | Capital Gains | | | | Capital | |
| LoCorr Macro Strategies Fund | | $ | 59,908,737 | | | $ | 3,450,209 | | | $ | – | |
| LoCorr Long/Short Commodities Strategy Fund | | | 13,693,568 | | | | – | | | | – | |
| LoCorr Market Trend Fund | | | 570,347 | | | | – | | | | – | |
| LoCorr Spectrum Income Fund | | | 1,675,937 | | | | – | | | | 2,564,688 | |
| | Year Ended December 31, 2019 | |
| | | | Ordinary | | | | Long-Term | | | | Return of | |
| Fund | | | Income | | | | Capital Gains | | | | Capital | |
| LoCorr Macro Strategies Fund | | $ | 22,150,428 | | | $ | 9,803,103 | | | $ | – | |
| LoCorr Long/Short Commodities Strategy Fund | | | 1,247,338 | | | | – | | | | – | |
| LoCorr Market Trend Fund | | | 3,078,171 | | | | – | | | | – | |
| LoCorr Dynamic Equity Fund | | | – | | | | 93,541 | | | | – | |
| LoCorr Spectrum Income Fund | | | 1,265,581 | | | | – | | | | 4,048,760 | |
| | |
| | |
| 100 | LoCorr Macro Strategies Fund, LoCorr Long/Short Commodities Strategy Fund and LoCorr Market Trend Fund – Notes to Consolidated Financial
Statements / LoCorr Dynamic Equity Fund and LoCorr Spectrum Income Fund – Notes to Financial Statements (continued) |
| | |
Federal Income Taxes
The Funds intend to qualify as regulated investment companies pursuant to Subchapter M of the Internal Revenue Code of 1986, as amended. The Funds intend to distribute substantially all of their investment company net taxable income and net capital gains to shareholders. Therefore, no federal income tax provision is required.
As of and during the year ended December 31, 2020, the Funds did not have any tax positions that did not meet the “more-likely-than-not” threshold of being sustained by applicable tax authorities. The Funds recognize interest and penalties, if any, related to unrecognized tax benefits on uncertain tax positions as interest or other expense in the statements of operations. During the year ended December 31, 2020, the Funds did not incur any interest or penalties.
For tax purposes, LCMFS, LCLSCS and LCMT are exempted Cayman Islands investment companies. LCMFS, LCLSCS and LCMT have each received an undertaking from the Government of the Cayman Islands exempting them from all local income, profits, and capital gains taxes. No such taxes are levied in the Cayman Islands at the present time. For U.S. income tax purposes, LCMFS, LCLSCS and LCMT are controlled foreign corporations (“CFCs”) and as such are not subject to U.S. income tax. However, as a wholly-owned CFC, the net income and capital gain of each CFC, to the extent of its earnings and profits, will be included each year in the respective Funds’ investment company taxable income.
Foreign Securities and Currency
Investment securities and other assets and liabilities denominated in foreign currencies are translated into U.S. dollar amounts at the date of valuation. Purchases and sales of investment securities and income and expense items denominated in foreign currencies are translated into U.S. dollar amounts on the respective dates of such transactions.
The Funds do not isolate that portion of the results of operations resulting from changes in foreign exchange rates on investments from the fluctuations arising from changes in market prices of securities held. Such fluctuations are included with the net realized and unrealized gain or loss from investments.
Reported net realized foreign exchange gains or losses arise from sales of foreign currencies, currency gains or losses realized between the trade and settlement dates on securities transactions, and the difference between the amounts of dividends, interest, and foreign withholding taxes recorded on the Funds’ books and the U.S. dollar equivalent of the amounts actually received or paid. Net unrealized foreign exchange gains and losses arise from changes in the fair values of assets and liabilities, other than investments in securities at period end, resulting from changes in exchange rates.
Forward Currency Contracts
Gains or losses are realized when foreign currency contracts are liquidated. Any change in net unrealized gain or loss is reported in the statements of operations.
Futures Contracts
A futures contract provides for the future sale by one party and purchase by another party of a specified amount of a specific financial instrument (e.g., units of a stock index) for a specified price, date, time and place designated at the time the contract is made. Brokerage fees are incurred when a futures contract is bought or sold and margin deposits must be maintained. Entering into a contract to buy is commonly referred to as buying or purchasing a contract or holding a long position. Entering into a contract to sell is commonly referred to as selling a contract or holding a short position.
Unlike when a Fund purchases or sells a security, no price would be paid or received by the Fund upon the purchase or sale of a futures contract.
Although certain futures contracts, by their terms, require actual future delivery of and payment for the underlying instruments, in practice most futures contracts are usually closed out before the delivery date. Gains or losses are realized when contracts are liquidated. Closing out an open futures contract purchase or sale is affected by entering into an offsetting futures contract sale or purchase, respectively, for the same aggregate amount of the identical underlying instrument or index and the same delivery date. If the offsetting purchase price is less than the original sale price, the Fund realizes a gain; if it is more, the Fund realizes a loss. Conversely, if the offsetting sale price is more than the original purchase price, the Fund realizes a gain; if it is less, the Fund realizes a loss.
The transaction costs must also be included in these calculations. There can be no assurance, however, that a Fund will be able to enter into an offsetting transaction with respect to a particular futures contract at a particular time. If a Fund is not able to enter into an offsetting transaction, the Fund will continue to be required to maintain the margin deposits on the futures contract.
Any change in net unrealized gain or loss is reported in the statements of operations.
Indemnifications
In the normal course of business, the Funds enter into contracts that contain general indemnifications to other parties. The Funds’ maximum exposure under these contracts is unknown as this would involve future claims that may be made against the Funds that have not yet occurred. However, based on experience, the Funds expect the risk of loss to be remote.
Market and Credit Risks
The Funds may engage in the speculative trading of U.S. and foreign futures, forward currency and swap contracts (collectively, “derivatives”). The Funds are exposed to both market risk, which is the risk arising from changes in the fair value of the contracts and credit risk, which is the risk of failure by another party to perform according to the terms of a contract.
| | |
| | |
LoCorr Macro Strategies Fund, LoCorr Long/Short Commodities Strategy Fund and LoCorr Market Trend Fund – Notes to Consolidated Financial Statements / LoCorr Dynamic Equity Fund and LoCorr Spectrum Income Fund – Notes to Financial Statements (continued) | 101 |
| | |
Purchase and sale of futures contracts requires margin deposits with the broker. Additional deposits may be necessary for any loss on contract value. The Commodity Exchange Act requires a broker to segregate all customer transactions and assets from such broker’s proprietary activities. A customer’s cash and other property (for example, U.S. government securities) deposited with a broker are considered commingled with all other customer funds subject to the broker’s segregation requirements. In the event of a broker’s insolvency, recovery may be limited to a pro rata share of segregated funds available. It is possible that the recovered amount could be less than total cash and other property deposited.
For derivatives, risks arise from changes in the fair value of the contracts. Theoretically, the Funds are exposed to a market risk equal to the notional contract value of swap, futures and forward currency contracts purchased and unlimited liability on such contracts sold short.
The Funds also engage in investing its assets in U.S. government securities. Risks arise from investments in U.S. government securities due to possible market illiquidity. U.S. government securities are also sensitive to changes in interest rates and economic conditions.
The Funds have established procedures to actively monitor market risk and minimize credit risk, although there can be no assurance that they will, in fact, succeed in doing so.
The global outbreak of COVID-19 (commonly referred to as “coronavirus”) has disrupted economic markets and the prolonged economic impact is uncertain. The ultimate economic fallout from the pandemic, and the long-term impact on economies, markets, industries and individual issuers, are not known. The operational and financial performance of the issuers of securities in which the Funds invest depends on future developments, including the duration and spread of the outbreak, and such uncertainty may in turn adversely affect the value and liquidity of the Funds’ investments, impair the Funds’ ability to satisfy redemption requests, and negatively impact the Funds’ performance.
Options on Securities
The Funds may purchase and write (i.e., sell) put and call options. Such options may relate to particular securities or stock indices and may or may not be listed on a domestic or foreign securities exchange and may or may not be issued by the Options Clearing Corporation. Option trading is a highly specialized activity that entails greater than ordinary investment risk. Options may be more volatile than the underlying instruments, and therefore, on a percentage basis, an investment in options may be subject to greater fluctuation than an investment in the underlying instruments themselves.
A call option for a particular security gives the purchaser of the option the right to buy, and the writer (seller) the obligation to sell, the underlying security at the stated exercise price at any time prior to the expiration of the option, regardless of the market price of the security. The premium paid to the writer is in consideration for undertaking the obligation under the option contract. A put option for a particular security gives the purchaser the right to sell the security at the stated exercise price at any time prior to the expiration date of the option, regardless of the market price of the security.
A Fund’s obligation to sell an instrument subject to a call option written by it, or to purchase an instrument subject to a put option written by it, may be terminated prior to the expiration date of the option by the Fund’s execution of a closing purchase transaction, which is effected by purchasing on an exchange an option of the same series (i.e., same underlying instrument, exercise price and expiration date) as the option previously written. A closing purchase transaction will ordinarily be effected to realize a profit on an outstanding option, to prevent an underlying instrument from being called, to permit the sale of the underlying instrument or to permit the writing of a new option containing different terms on such underlying instrument. The cost of such a liquidation purchase plus transactions costs may be greater than the premium received upon the original option, in which event the Fund will have incurred a loss in the transaction. There is no assurance that a liquid secondary market will exist for any particular option. An option writer unable to effect a closing purchase transaction will not be able to sell the underlying instrument or liquidate the assets held in a segregated account, as described below, until the option expires or the optioned instrument is delivered upon exercise. In such circumstances, the writer will be subject to the risk of market decline or appreciation in the instrument during such period.
If an option purchased by a Fund expires unexercised, the Fund realizes a loss equal to the premium paid. If a Fund enters into a closing sale transaction on an option purchased by it, the Fund will realize a gain if the premium received by the Fund on the closing transaction is more than the premium paid to purchase the option or a loss if it is less. If an option written by a Fund expires on the stipulated expiration date or if the Fund enters into a closing purchase transaction, it will realize a gain (or loss if the cost of a closing purchase transaction exceeds the net premium received when the option is sold). If an option written by the Fund is exercised, the proceeds of the sale will be increased by the net premium originally received and the Fund will realize a gain or loss.
Security Transactions and Investment Income
Security transactions are recorded on trade date. Generally, realized gains and losses on sales of investments are calculated on the specifically identified cost basis of the securities.
In accordance with the investment restrictions outlined within the Funds’ respective prospectus, each Fund may invest up to 15% of its net assets in illiquid securities. Illiquid securities may include securities subject to contractual or legal restrictions on resale (e.g., because they have not been registered under the Securities Act) and securities that are otherwise not readily marketable (e.g., because trading in the security is suspended or because market makers do not exist or will not entertain bids or offers). Securities that have not been registered under the Securities Act are referred to as private investments or restricted securities and are purchased directly from the issuer or in the secondary market. Foreign securities that are freely tradable in their principal markets are not considered to be illiquid. Under guidelines adopted by the Trust’s Board, the Adviser of the Funds may determine that particular Rule 144A securities, and commercial paper issued in reliance on the private placement exemption from registration afforded by Section 4(a)(2) of the Securities Act, are liquid even though they are not registered. At December 31, 2020, the Adviser deemed all of the 144A securities held in the LoCorr Macro Strategies Fund, the LoCorr Long/Short Commodities Strategy Fund and the LoCorr Market Trend Fund to be liquid. At December 31, 2020, there were no illiquid or restricted securities held in the LoCorr Dynamic Equity Fund or the LoCorr Spectrum Income Fund.
| | |
| | |
| 102 | LoCorr Macro Strategies Fund, LoCorr Long/Short Commodities Strategy Fund and LoCorr Market Trend Fund – Notes to Consolidated Financial
Statements / LoCorr Dynamic Equity Fund and LoCorr Spectrum Income Fund – Notes to Financial Statements (continued) |
| | |
Dividend income, less foreign taxes withheld, if any, are recorded on the ex-dividend date.
Distributions received from the investments in MLP interests, REITs, private investments, closed end funds, business development companies and royalty trusts generally are comprised of ordinary income, capital gains and return of capital. For financial statement purposes, the Funds use estimates to characterize these distributions received as return of capital, capital gains or ordinary income. Such estimates are based on historical information available from each MLP, REIT, private investment, closed end fund, business development company or royalty trust and other industry sources. These estimates may subsequently be revised based on information received from the MLP, REIT, private investment, closed end fund, business development company or royalty trust after their tax reporting periods are concluded, as the actual character of these distributions is not known until after the fiscal year end of the Funds. The distributions received from the MLP, REIT, private investment, closed end fund, business development company and royalty trust securities that have been classified as income and capital gains are included in investment income and net realized gain (loss) on investments, respectively, on the statements of operations. The distributions received that are classified as return of capital reduce the cost of investments on the statements of assets and liabilities.
Interest income and expense are recognized on the accrual basis. Market discounts, premiums and original issue discounts on fixed-income securities are amortized daily over the expected life of the security using the effective yield method.
Short Sales
The Funds may sell securities short. A short sale is a transaction in which a Fund sells a security it does not own or have the right to acquire (or that it owns but does not wish to deliver) in anticipation that the market price of that security will decline.
When a Fund makes a short sale, the broker-dealer through which the short sale is made must borrow the security sold short and deliver it to the party purchasing the security. The Funds are required to make a margin deposit in connection with such short sales; the Funds may have to pay a fee to borrow particular securities and will often be obligated to pay over any dividends and accrued interest on borrowed securities.
If the price of the security sold short increases between the time of the short sale and the time a Fund covers its short position, the Fund will incur a loss; conversely, if the price declines, the Fund will realize a gain. A gain, limited to the price at which the Fund sold the security short, or a loss, unlimited in size, will be recognized upon the close of a short sale. Any gain will be decreased, and any loss increased, by the transaction costs described above. The successful use of short selling may be adversely affected by imperfect correlation between movements in the price of the security sold short and the securities being hedged. Gains or losses from closed positions of securities sold short are presented as net realized gain or loss on securities sold short on the statements of operations.
In addition, the Funds are required to pay the lender any dividends declared on short positions. Dividends declared on open short positions are recorded on ex-date and shown as an expense for financial reporting purposes. To borrow the security, the Funds also may be required to pay fees, which are shown as an expense for financial reporting purposes.
To the extent the Funds sell securities short, it will provide collateral to the broker-dealer and (except in the case of short sales “against the box”) will maintain additional asset coverage in the form of cash, U.S. government securities or other liquid securities with its custodian in a segregated account in an amount at least equal to the difference between the current fair value of the securities sold short and any amounts required to be deposited as collateral with the selling broker (not including the proceeds of the short sale). A short sale is “against the box” to the extent the Funds contemporaneously own, or have the right to obtain at no added cost, securities identical to those sold short. Short sales are collateralized by cash deposits with the counterparty broker and pledged securities held at the custodian, U.S. Bank. The collateral required is determined daily by reference to the fair value of the short positions.
Total Return Swap Contracts
The Funds may enter into total return swap agreements. A total return swap entered into by the Funds is a derivative contract that transfers the market risk of underlying portfolios of futures contracts, forward currency contracts and foreign currencies (considered the “index” within each total return swap contract) between counterparties. The “notional amount” of each total return swap agreement is the agreed upon amount or value of the index used for calculating the returns that the parties to a swap agreement have agreed to exchange. The total return swaps are marked to market daily and any change is recorded in unrealized gain/loss on the consolidated statements of operations based on the value of the index on which the total return swap is referenced, as defined within the total return swap agreement between the counterparties. The composition of the index may vary based on how the underlying portfolio of futures contracts, forward currency contracts and foreign currencies is traded. A Fund’s obligation under total return swap agreement, including any related fees, offset against amounts owed to the Fund in the case of positive performance, will be covered by designating liquid assets on the Fund’s books and records (see the consolidated statement of assets and liabilities for deposits with broker for derivative instruments). Gains or losses will be realized when the total return swap contracts are liquidated and will be presented as net realized gain or loss on swap contracts on the consolidated statements of operations. Changes in notional value and any cash holding adjustments, which represent voluntary realizations by a Fund of swap value at any point in time, are also presented as net realized gain or loss on swap contracts on the consolidated statements of operations. Further, any cash holding adjustments realized by a Fund are subject to interest charges, which are recorded as part of unrealized gain/loss on the consolidated statements of operations. A corresponding asset or liability for “advance receipt on swap contracts” or “advance payment on swap contracts,” respectively, is recorded on the consolidated statements of assets and liabilities for the gain or loss realized on changes in notional value. Total return swaps outstanding at period end, if any, are listed after the Funds’ consolidated schedules of investments.
Use of Estimates
The preparation of financial statements in conformity with GAAP requires management to make estimates and assumptions that affect the reported amounts of assets and liabilities, disclosure of contingent assets and liabilities at the date of the financial statements and the reported revenues and expenses during the reporting period. Actual results could differ from those estimates.
| | |
| | |
LoCorr Macro Strategies Fund, LoCorr Long/Short Commodities Strategy Fund and LoCorr Market Trend Fund – Notes to Consolidated Financial Statements / LoCorr Dynamic Equity Fund and LoCorr Spectrum Income Fund – Notes to Financial Statements (continued) | 103 |
| | |
Warrants
The Funds may invest in warrants. Warrants are options to purchase common stock at a specific price (usually at a premium above the market value of the optioned common stock at issuance) valid for a specific period of time. Warrants may have a life ranging from less than one year to twenty years, or they may be perpetual. However, most warrants have expiration dates after which they are worthless. In addition, a warrant is worthless if the market price of the common stock does not exceed the warrant’s exercise price during the life of the warrant. Warrants have no voting rights, pay no dividends and have no rights with respect to the assets of the corporation issuing them. The percentage increase or decrease in the market price of the warrant may tend to be greater than the percentage increase or decrease in the market price of the optioned common stock.
3. Derivative and Other Financial Instruments
The Funds may invest in derivatives such as futures, forward currency and swap contracts, in order to hedge against market movements while liquidating certain positions and buying other securities or as substitutes for securities, as well as for speculative purposes to gain exposure to such market movements.
The Funds’ market risk related to their derivatives trading is influenced by a wide variety of factors, including the level and volatility of interest rates, exchange rates, weather, supply and demand of commodities, the market value of futures and forward currency contracts, the diversification effects among the Funds’ open positions and the liquidity of the markets in which they trade.
The following are the primary trading risk exposures by market sector of the Funds as encompassed in the total return swap contracts:
Agricultural. (grains, livestock and softs). The Funds’ primary exposure is to agricultural price movements which are often directly affected by severe or unexpected weather conditions.
Currencies. Exchange rate risk is a principal market exposure of the Funds. The Funds’ currency exposure is to exchange rate fluctuations, primarily fluctuations which disrupt the historical pricing relationships between different currencies and currency pairs. The fluctuations are influenced by interest rate changes as well as political and general economic conditions. The Funds trade in a large number of currencies including cross-rates– e.g., positions between two currencies other than the U.S. dollar.
Energy. The Funds’ primary energy market exposure is to gas and oil price movements, often resulting from political developments in the Middle East and economic conditions worldwide. Energy prices are volatile and substantial profits and losses have been and are expected to continue to be experienced in this market.
Interest Rates. Interest rate movements directly affect the price of the sovereign bond futures positions held by the Funds and indirectly the value of its stock index currency positions. Interest rate movements in one country as well as relative interest rate movements between countries may materially impact the Funds’ profitability. The Funds’ primary interest rate exposure is to interest rate fluctuations in countries or regions including Australia, Canada, Japan, Switzerland, the United Kingdom, the United States and the Eurozone. However, the Funds also may take positions in futures contracts on the government debt of other nations. The Funds anticipate that interest rates in these industrialized countries or areas, both long-term and short-term, will remain a primary market exposure of the Funds for the foreseeable future.
Metals. The Funds’ metals market exposure is to fluctuations in the price of aluminum, copper, gold, lead, nickel, palladium, tin, silver and zinc.
Stock index. The Funds’ equity exposure, through stock index futures, is to equity price risk in the major industrialized countries as well as other countries.
The Fund invests in options which are not traded on an exchange. In doing so, it is assuming a credit risk with regard to the party with which it trades and also bears the risk of settlement default. These risks may differ materially from risks associated with transactions effected on an exchange, which generally are backed by clearing organization guarantees, daily mark-to market and settlement, segregation and minimum capital requirements applicable to intermediaries. Relying on a counterparty exposes the Fund to the risk that a counterparty will not settle a transaction in accordance with its terms and conditions because of a dispute over the terms of the contract (whether or not bona fide) or because of a credit or liquidity problem, thus causing the Fund to suffer a loss. If a counterparty defaults on its payment obligations to the Fund, this default will cause the value of an investment in the Fund to decrease. During the year ended December 31, 2020, the Fund extended the maturity of the option to August 25, 2022.
At December 31, 2020, the LoCorr Macro Strategies Fund, the LoCorr Long/Short Commodities Strategy Fund, the LoCorr Market Trend Fund and the LoCorr Dynamic Equity Fund held derivative and other financial instruments which are not subject to a master netting arrangement. As the tables below illustrate, no positions are netted in these consolidated and non-consolidated financial statements.
| | |
| | |
| 104 | LoCorr Macro Strategies Fund, LoCorr Long/Short Commodities Strategy Fund and LoCorr Market Trend Fund – Notes to Consolidated Financial
Statements / LoCorr Dynamic Equity Fund and LoCorr Spectrum Income Fund – Notes to Financial Statements (continued) |
| | |
| LoCorr Macro Strategies Fund – December 31, 2020 |
| Assets: | | | | | | | | | | | Gross Amounts not offset in the
Consolidated Statement of Assets & Liabilities | | | | |
| Description | | Gross Amounts of
Recognized Assets | | | Gross Amounts
Offset in the
Consolidated
Statement of Assets
& Liabilities | | | Net Amounts
Presented in the
Consolidated
Statement of
Assets & Liabilities | | | Financial
Instruments | | | Collateral Pledged
(Received) | | | Net Amount | |
| Forward currency contracts | | $ | 14,686,041 | | | $ | – | | | $ | 14,686,041 | | | $ | – | | | $ | – | | | $ | 14,686,041 | |
| Futures contracts (a) | | | 7,764,925 | | | | – | | | | 7,764,925 | | | | – | | | | – | | | | 7,764,925 | |
| Total | | $ | 22,450,966 | | | $ | – | | | $ | 22,450,966 | | | $ | – | | | $ | – | | | $ | 22,450,966 | |
| Liabilities: | | | | | | | | | | | Gross Amounts not offset in the
Consolidated Statement of Assets & Liabilities | | | | |
| Description | | Gross Amounts
of Recognized
Liabilities | | | Gross Amounts
Offset in the
Consolidated
Statement of
Assets & Liabilities | | | Net Amounts
Presented in the
Consolidated
Statement of
Assets & Liabilities | | | Financial
Instruments | | | Collateral Received
(Pledged) | | | Net Amount | |
| Forward currency contracts | | $ | 9,619,242 | | | $ | – | | | $ | 9,619,242 | | | $ | – | | | $ | (9,619,242 | ) | | $ | – | |
| Futures contracts (a) | | | 552,730 | | | | – | | | | 552,730 | | | | – | | | | (552,730 | ) | | | – | |
| Total | | $ | 10,171,972 | | | $ | – | | | $ | 10,171,972 | | | $ | – | | | $ | (10,171,972 | ) | | $ | – | |
| LoCorr Long/Short Commodities Strategy Fund – December 31, 2020 |
| Assets: | | | | | | | | | | | Gross Amounts not offset in the
Consolidated Statement of Assets & Liabilities | | | | |
| Description | | Gross Amounts of
Recognized Assets | | | Gross Amounts
Offset in the
Consolidated
Statement of
Assets & Liabilities | | | Net Amounts
Presented in the
Consolidated
Statement of
Assets & Liabilities | | | Financial
Instruments | | | Collateral Pledged
(Received) | | | Net Amount | |
| Swap Contracts* | | $ | 14,113,147 | | | $ | – | | | $ | 14,113,147 | | | $ | – | | | $ | – | | | $ | 14,113,147 | |
| Total | | $ | 14,113,147 | | | $ | – | | | $ | 14,113,147 | | | $ | – | | | $ | – | | | $ | 14,113,147 | |
| | | | | | | | | | | | | | | | | | | | | | | | | |
| Liabilities: | | | | | | | | | | | | | | | Gross Amounts not offset in the
Consolidated Statement of Assets & Liabilities | | | | | |
| Description | | | Gross Amounts
of Recognized
Liabilities | | | | Gross Amounts
Offset in the
Consolidated
Statement of
Assets & Liabilities | | | | Net Amounts
Presented in the
Consolidated
Statement of
Assets & Liabilities | | | | Financial
Instruments | | | | Collateral Received
(Pledged) | | | | Net Amount | |
| Swap Contracts | | $ | 13,099,219 | | | $ | – | | | $ | 13,099,219 | | | $ | – | | | $ | (13,099,219 | ) | | $ | – | |
| Total | | $ | 13,099,219 | | | $ | – | | | $ | 13,099,219 | | | $ | – | | | $ | (13,099,219 | ) | | $ | – | |
*Represents advance receipt on swap contracts.
| LoCorr Market Trend Fund – December 31, 2020 |
| Assets: | | | | | | | | | | | Gross Amounts not offset in the
Consolidated Statement of Assets & Liabilities | | | | |
| Description | | Gross Amounts of
Recognized Assets | | | Gross Amounts
Offset in the
Consolidated
Statement of
Assets & Liabilities | | | Net Amounts
Presented in the
Consolidated
Statement of
Assets & Liabilities | | | Financial
Instruments | | | Collateral Pledged
(Received) | | | Net Amount | |
| Forward currency contracts | | $ | 4,233,215 | | | $ | – | | | $ | 4,233,215 | | | $ | – | | | $ | – | | | $ | 4,233,215 | |
| Futures contracts (a) | | | 4,282,160 | | | | – | | | | 4,282,160 | | | | – | | | | – | | | | 4,282,160 | |
| Total | | $ | 8,515,375 | | | $ | – | | | $ | 8,515,375 | | | $ | – | | | $ | – | | | $ | 8,515,375 | |
| | | | | | | | | | | | | | | | | | | | | | | | | |
| Liabilities: | | | | | | | | | | | Gross Amounts not offset in the
Consolidated Statement of Assets & Liabilities | | | | |
| Description | | Gross Amounts
of Recognized
Liabilities | | | Gross Amounts
Offset in the
Consolidated
Statement of
Assets & Liabilities | | | Net Amounts
Presented in the
Consolidated
Statement of
Assets & Liabilities | | | Financial
Instruments | | | Collateral Received
(Pledged) | | | Net Amount | |
| Forward currency contracts | | $ | 943,470 | | | $ | – | | | $ | 943,470 | | | $ | – | | | $ | (943,470 | ) | | $ | – | |
| Futures contracts (a) | | | 44,509 | | | | – | | | | 44,509 | | | | – | | | | (44,509 | ) | | | – | |
| Total | | $ | 987,979 | | | $ | – | | | $ | 987,979 | | | $ | – | | | $ | (987,979 | ) | | $ | – | |
| | |
| | |
LoCorr Macro Strategies Fund, LoCorr Long/Short Commodities Strategy Fund and LoCorr Market Trend Fund – Notes to Consolidated Financial Statements / LoCorr Dynamic Equity Fund and LoCorr Spectrum Income Fund – Notes to Financial Statements (continued) | 105 |
| | |
| LoCorr Dynamic Equity Fund – December 31, 2020 |
| Assets: | | | | | | | | | | | Gross Amounts not offset in the
Statement of Assets & Liabilities | | | | |
| Description | | Gross Amounts
of Recognized Assets | | | Gross Amounts
Offset in the
Statement of
Assets & Liabilities | | | Net Amounts
Presented in the
Statement of
Assets & Liabilities | | | Financial
Instruments | | | Collateral Pledged
(Pledged) | | | Net Amount | |
| Futures contracts (a) | | $ | 4,054 | | | $ | – | | | $ | 4,054 | | | $ | – | | | $ | – | | | $ | 4,054 | |
| Total | | $ | 4,054 | | | $ | – | | | $ | 4,054 | | | $ | – | | | $ | – | | | $ | 4,054 | |
(a) Reflects the current day variation margin and unsettled open futures contracts are separately reported within the Fund’s consolidated and non-consolidated statement of assets and liabilities.
The Funds have adopted authoritative standards regarding disclosure about derivatives and hedging activities and how they affect the Funds’ consolidated statements of assets and liabilities and consolidated statements of operations.
Since the derivatives held long or short are for speculative trading purposes, the derivative instruments are not designated as hedging instruments. Accordingly, all realized gains and losses, as well as any change in net unrealized gains or losses on open contracts from the preceding period, are recognized as part of realized and unrealized gain (loss) in the consolidated statements of operations.
The following table presents the fair value of consolidated derivative instruments for the LoCorr Macro Strategies Fund, the LoCorr Long/Short Commodities Strategy Fund, the LoCorr Market Trend Fund and the non-consolidated derivative instruments for the LoCorr Dynamic Equity Fund and the LoCorr Spectrum Income Fund as of December 31, 2020 as presented on each Fund’s consolidated and non-consolidated statements of assets and liabilities:
| | |
| | | Net Unrealized | |
| | | Fair Value | | | Gain (Loss) on | |
| Derivatives Not Accounted for as Hedging Instruments | | Assets | | | Liabilities | | | Open Positions | |
| LoCorr Macro Strategies Fund | | | | | | | | | | | | |
| Forward Currency Contracts(a) | | | | | | | | | | | | |
| Long | | $ | 13,991,849 | | | $ | 550,470 | | | $ | 13,441,379 | |
| Short | | | 694,192 | | | | 9,068,772 | | | | (8,374,580 | ) |
| Total Forward Currency Contracts | | | 14,686,041 | | | | 9,619,242 | | | | 5,066,799 | |
| Futures Contracts(b) | | | | | | | | | | | | |
| Long Contracts | | | | | | | | | | | | |
| Commodity | | | 19,267,380 | | | | 98,068 | | | | 19,169,312 | |
| Equity | | | 5,604,225 | | | | 314,398 | | | | 5,289,827 | |
| Interest rate | | | 4,177,924 | | | | 126,195 | | | | 4,051,729 | |
| Total Long Contracts | | | 29,049,529 | | | | 538,661 | | | | 28,510,868 | |
| Short Contracts | | | | | | | | | | | | |
| Commodity | | | 632,351 | | | | 722,724 | | | | (90,373 | ) |
| Equity | | | 253,878 | | | | 2,172 | | | | 251,706 | |
| Foreign exchange | | | 58,282 | | | | – | | | | 58,282 | |
| Interest rate | | | 101,379 | | | | 58,288 | | | | 43,091 | |
| Total Short Contracts | | | 1,045,890 | | | | 783,184 | | | | 262,706 | |
| Total Futures Contracts | | | 30,095,419 | | | | 1,321,845 | | | | 28,773,574 | |
| Total Forward Currency Contracts and Futures Contracts | | $ | 44,781,460 | | | $ | 10,941,087 | | | $ | 33,840,373 | |
| LoCorr Long/Short Commodities Strategy Fund | | | | | | | | | | | | |
| Long Total Return Swap Contracts | | | | | | | | | | | | |
| LoCorr Commodities Index | | $ | – | | | $ | 13,099,219 | | | $ | (13,099,219 | ) |
| Purchased Call Option | | $ | 23,285,175 | | | $ | – | | | $ | 4,361,894 | |
| | |
| | |
| 106 | LoCorr Macro Strategies Fund, LoCorr Long/Short Commodities Strategy Fund and LoCorr Market Trend Fund – Notes to Consolidated Financial
Statements / LoCorr Dynamic Equity Fund and LoCorr Spectrum Income Fund – Notes to Financial Statements (continued) |
| | |
| | |
| | | Net Unrealized | |
| | | Fair Value | | | Gain (Loss) on | |
| Derivatives Not Accounted for as Hedging Instruments | | Assets | | | Liabilities | | | Open Positions | |
| LoCorr Market Trend Fund | | | | | | | | | | | | |
| Forward Currency Contracts(a) | | | | | | | | | | | | |
| Long | | $ | 4,183,234 | | | $ | 98,582 | | | $ | 4,084,652 | |
| Short | | | 49,981 | | | | 844,888 | | | | (794,907 | ) |
| Total Forward Currency Contracts | | | 4,233,215 | | | | 943,470 | | | | 3,289,745 | |
| | | | | | | | | | | | | |
| Futures Contracts(b) | | | | | | | | | | | | |
| Long Contracts | | | | | | | | | | | | |
| Commodity | | | 10,507,895 | | | | – | | | | 10,507,895 | |
| Equity | | | 2,177,312 | | | | 226,657 | | | | 1,950,655 | |
| Interest rate | | | 1,973,715 | | | | 79,643 | | | | 1,894,072 | |
| Total Long Contracts | | | 14,658,922 | | | | 306,300 | | | | 14,352,622 | |
| Short Contracts | | | | | | | | | | | | |
| Commodity | | | 317,660 | | | | 126,861 | | | | 190,799 | |
| Equity | | | – | | | | – | | | | – | |
| Foreign exchange | | | 36,303 | | | | – | | | | 36,303 | |
| Interest rate | | | 65,500 | | | | 31,253 | | | | 34,247 | |
| Total Short Contracts | | | 419,463 | | | | 158,114 | | | | 261,349 | |
| Total Futures Contracts | | | 15,078,385 | | | | 464,414 | | | | 14,613,971 | |
| Total Forward Currency Contracts and Futures Contracts | | $ | 19,311,600 | | | $ | 1,407,884 | | | $ | 17,903,716 | |
| LoCorr Dynamic Equity Fund | | | | | | | | | | | | |
| Futures Contracts(b) | | | | | | | | | | | | |
| Long Contracts | | | | | | | | | | | | |
| Equity | | $ | 39,152 | | | $ | – | | | $ | 39,152 | |
| Total Long Contracts | | | 39,152 | | | | – | | | | 39,152 | |
| Total Futures Contracts | | $ | 39,152 | | | $ | – | | | $ | 39,152 | |
| (a) | Unrealized appreciation on forward currency contracts is a receivable and unrealized depreciation on forward currency contracts is a payable on the Fund’s consolidated statement of assets and liabilities. |
| (b) | Reflects the cumulative unrealized appreciation (depreciation) of futures contracts as reported in the Fund’s consolidated and non-consolidated schedule of open futures contracts. Only the current day variation margin and unsettled open futures contracts is separately reported within the Fund’s consolidated and non-consolidated statement of assets and liabilities. |
| | |
| | |
LoCorr Macro Strategies Fund, LoCorr Long/Short Commodities Strategy Fund and LoCorr Market Trend Fund – Notes to Consolidated Financial Statements / LoCorr Dynamic Equity Fund and LoCorr Spectrum Income Fund – Notes to Financial Statements (continued) | 107 |
| | |
The following table presents the results of the derivative trading and information related to volume for the year ended December 31, 2020 for the LoCorr Macro Strategies Fund, the LoCorr Long/Short Commodities Strategy Fund, the LoCorr Market Trend Fund, the LoCorr Dynamic Equity Fund and the LoCorr Spectrum Income Fund. The below captions of “Net Realized” and “Net Change in Unrealized” correspond to the captions in each Fund’s consolidated and non-consolidated statement of operations.
| | | | Gain (Loss) from Trading | |
| Fund and Type of Derivative Instrument | | | Net Realized | | | | Net Change
in Unrealized | |
| LoCorr Macro Strategies Fund | | | | | | | | |
| Forward Currency Contracts | | $ | (562,610 | ) | | $ | 8,808,073 | |
| Futures Contracts | | | | | | | | |
| Commodity | | | 32,323,094 | | | | 18,588,667 | |
| Equity | | | (74,138,528 | ) | | | 4,119,978 | |
| Foreign exchange | | | 3,355,894 | | | | 91,304 | |
| Interest rate | | | 33,844,992 | | | | 6,143,564 | |
| Total Futures Contracts | | | (4,614,548 | ) | | | 28,943,513 | |
| Total Forward Currency Contracts and Futures Contracts | | $ | (5,177,158 | ) | | $ | 37,751,586 | |
| | | | | | | | | |
| LoCorr Long/Short Commodities Strategy Fund | | | | | | | | |
| Swap Contracts | | $ | 204,845 | | | $ | 13,062,942 | |
| Purchased Call Option | | $ | – | | | $ | 4,361,894 | |
| | | | | | | | | |
| LoCorr Market Trend Fund | | | | | | | | |
| Forward Currency Contracts | | $ | (6,295,791 | ) | | $ | 5,124,121 | |
| Futures Contracts | | | | | | | | |
| Commodity | | | (2,685,459 | ) | | | 10,306,156 | |
| Equity | | | (21,144,982 | ) | | | 628,502 | |
| Foreign exchange | | | 342,599 | | | | 69,315 | |
| Interest rate | | | 13,275,034 | | | | 4,393,216 | |
| Total Futures Contracts | | | (10,212,808 | ) | | | 15,397,189 | |
| Total Forward Currency Contracts and Futures Contracts | | $ | (16,508,599 | ) | | $ | 20,521,310 | |
| | | | | | | | | |
| LoCorr Dynamic Equity Fund | | | | | | | | |
| Futures Contract | | | | | | | | |
| Equity | | $ | 367,013 | | | $ | 28,661 | |
| Total Futures Contract | | $ | 367,013 | | | $ | 28,661 | |
| | | | | | | | | |
| LoCorr Spectrum Income Fund | | | | | | | | |
| Options | | | | | | | | |
| Purchased Options(d) | | | 3,499,825 | | | | 52,002 | |
| Written Options | | | (492,743 | ) | | | 49,495 | |
| Total Options | | $ | 3,007,082 | | | $ | 101,500 | |
| (d) | Purchased options are included within net realized gain (loss) on investments and net change in unrealized appreciation/depreciation on investments. |
| | |
| | |
| 108 | LoCorr Macro Strategies Fund, LoCorr Long/Short Commodities Strategy Fund and LoCorr Market Trend Fund – Notes to Consolidated Financial
Statements / LoCorr Dynamic Equity Fund and LoCorr Spectrum Income Fund – Notes to Financial Statements (continued) |
| | |
The average monthly notional amount is shown as an indicator of volume. The average monthly notional amounts during the year ended December 31, 2020 were:
| | Average Notional Amount | |
| | Long Contracts | | | Short Contracts | |
| LoCorr Macro Strategies Fund | | | | | | | | |
| Forward Currency Contracts | | $ | 1,098,699,240 | | | $ | 1,023,768,979 | |
| Futures Contracts | | | 3,475,057,518 | | | | 548,616,115 | |
| | | | | | | | | |
| LoCorr Long/Short Commodities Strategy Fund | | | | | | | | |
| Swap Contracts | | $ | 321,868,175 | | | $ | – | |
| | | | | | | | | |
| LoCorr Market Trend Fund | | | | | | | | |
| Forward Currency Contracts | | $ | 381,855,669 | | | $ | 340,923,377 | |
| Futures Contracts | | | 1,754,381,430 | | | | 258,714,200 | |
| | | | | | | | | |
| LoCorr Dynamic Equity Fund | | | | | | | | |
| Futures Contracts | | $ | 3,882,878 | | | $ | 223,528 | |
| | | | | | | | | |
| LoCorr Spectrum Income Fund | | | | | | | | |
| Options | | $ | 15,805,175 | | | $ | 12,426,270 | |
The swap contracts and the commodity-related futures contracts reported in the tables in Note 3 represent balances and activity of each Fund’s respective wholly-owned and controlled subsidiary. See Note 2.
The Fund considers the purchased put option held in LCLSCS at December 31, 2020, as noted on the consolidated schedule of investments, to be an accurate representation of the volume of activity for the year ended December 31, 2020.
Please refer to the Funds’ prospectus for a full listing of risks associated with these investments.
4. Investment Transactions
The cost of security purchases and proceeds from security sales, excluding short-term investments, derivative instruments, short sales and purchases to cover short sales for the year ended December 31, 2020 were as follows:
| | | | U.S. Government Obligations | | | | All Other | |
| | | | Purchases | | | | Sales | | | | Purchases | | | | Sales | |
| LoCorr Macro Strategies Fund | | $ | 370,808,266 | | | $ | 250,382,499 | | | $ | 386,730,730 | | | $ | 237,253,722 | |
| LoCorr Long/Short Commodities Strategy Fund | | | 180,164,568 | | | | 106,586,201 | | | | 181,189,834 | | | | 69,433,594 | |
| LoCorr Market Trend Fund | | | 133,027,404 | | | | 169,698,845 | | | | 124,374,809 | | | | 112,907,369 | |
| LoCorr Dynamic Equity Fund | | | – | | | | – | | | | 146,439,124 | | | | 153,149,405 | |
| LoCorr Spectrum Income Fund | | | – | | | | – | | | | 43,983,529 | | | | 54,548,338 | |
5. Management Fees and Other Transactions with Affiliates
Management Agreement
The Trust has a Management Agreement with the Adviser, with whom certain officers and Trustees of the Funds are affiliated, to furnish investment advisory services to the Funds. Pursuant to the amended Management Agreement, the Adviser is entitled to receive a fee as follows:
| | Annual Advisory Fee as a Percentage |
| Fund | of the Average Daily Net Assets of the Fund |
| LoCorr Macro Strategies Fund | 1.65% |
| LoCorr Market Trend Fund | 1.50% |
| LoCorr Dynamic Equity Fund | 1.50% |
| LoCorr Spectrum Income Fund | 1.30% |
Pursuant to the amended Management Agreement, the Adviser is entitled to receive a fee, in accordance with the Incremental Advisory Fee schedule below based on the LoCorr Long/Short Commodities Strategy Fund’s average daily net assets.
| | |
| | |
LoCorr Macro Strategies Fund, LoCorr Long/Short Commodities Strategy Fund and LoCorr Market Trend Fund – Notes to Consolidated Financial Statements / LoCorr Dynamic Equity Fund and LoCorr Spectrum Income Fund – Notes to Financial Statements (continued) | 109 |
| | |
| | |
| Net Assets for the LoCorr Long/Short | Incremental |
| Commodities Strategy Fund | Advisory Fee* |
| $0.0 – $0.5 billion | 1.50% |
| $0.5 – $1.0 billion | 1.40% |
| $1.0 – $1.5 billion | 1.30% |
| $1.5 – $2.0 billion | 1.20% |
| $2.0 – $2.5 billion | 1.10% |
| Over $2.5 billion | 1.00% |
| * | Incremental advisory fee represents the fees paid on net assets at the related net asset level. For example, with $3 billion in net assets in the Fund, the Adviser would earn 1.50% on the first $500 million, plus 1.30% on the next $500 million, plus 1.20% on the next $500 million, plus 1.10% on the next $500 million, plus 1.00% on the final $500 million. |
| Fund | | Management Fees For the Year Ended December 31, 2020 | | | Accrued Net Management Fees as of December 31, 2020 | |
| LoCorr Macro Strategies Fund | | $ | 16,831,107 | | | $ | 1,604,425 | |
| LoCorr Long/Short Commodities Strategy Fund | | | 5,952,439 | | | | 602,982 | |
| LoCorr Market Trend Fund | | | 3,880,402 | | | | 325,435 | |
| LoCorr Dynamic Equity Fund | | | 305,888 | | | | – | |
| LoCorr Spectrum Income Fund | | | 679,761 | | | | 45,148 | |
Sub-Advisory Agreements
Sub-advisory services are provided to the Funds, pursuant to agreements between the Adviser and the below listed sub-advisers. Under the terms of these sub-advisory agreements, the Adviser compensates the sub-advisers based on the portion of each Fund’s average daily net assets which they have been allocated to manage.
| LoCorr Macro Strategies Fund: | |
| Graham Capital Management, L.P. | LoCorr Dynamic Equity Fund: |
| Millburn Ridgefield Corporation | Billings Capital Management LLC |
| Nuveen Asset Management, LLC | First Quadrant, L.P. |
| Revolution Capital Management LLC | Kettle Hill Capital Management, LLC |
| | |
| LoCorr Long/Short Commodities Strategy Fund: | LoCorr Spectrum Income Fund: |
| Nuveen Asset Management, LLC | Bramshill Investments, LLC |
LoCorr Market Trend Fund:
Graham Capital Management, L.P.
Nuveen Asset Management, LLC
The Adviser is solely responsible for the payment of the sub-adviser’s fees, and the sub-adviser agrees not to seek payment of its fees from the Trust or the Funds.
Expense Limitation Agreement
The Funds’ Adviser has contractually agreed to waive management fees and/or reimburse the Funds for expenses they incur, but only to the extent necessary to maintain the Funds’ total annual operating expenses after fee waiver and/or reimbursement (excluding any Rule 12b-1 distribution and/or servicing fees, taxes, interest, brokerage commissions, expenses incurred in connection with any merger or reorganization, dividend expenses on short sales, swap fees, indirect expenses, expenses of other investment companies in which the Funds may invest, or extraordinary expenses such as litigation expenses and inclusive of offering and organizational costs incurred prior to the commencement of operations) at the percentages listed below:
| | Expense Limit as a Percentage of the | |
| Fund | Average Daily Net Assets of the Fund | Effective Period Through |
| LoCorr Macro Strategies Fund | 1.99% | April 30, 2021 |
| LoCorr Long/Short Commodities Strategy Fund | 1.95% | April 30, 2021 |
| LoCorr Market Trend Fund | 1.95% | April 30, 2021 |
| LoCorr Dynamic Equity Fund | 1.99% | April 30, 2021 |
| LoCorr Spectrum Income Fund | 1.80% | April 30, 2021 |
Any waiver or reimbursement is subject to repayment by the respective Fund within the three fiscal years following the fiscal year in which the expenses occurred, if the Fund is able to make the repayment without exceeding its current expense limitations and the repayment is approved by the Board.
| | |
| | |
| 110 | LoCorr Macro Strategies Fund, LoCorr Long/Short Commodities Strategy Fund and LoCorr Market Trend Fund – Notes to Consolidated Financial
Statements / LoCorr Dynamic Equity Fund and LoCorr Spectrum Income Fund – Notes to Financial Statements (continued) |
| | |
The total amounts of management fees waived and/or expenses reimbursed which are subject to recovery, and their related expiration date are as follows:
| LoCorr Macro Strategies Fund |
| | | | | | | | | | | | | | | | | |
| | | | Management Fees | | | | Recovery to Adviser | | | | | | | | Subject to Recovery on or | |
| | | | (Waived) by Adviser | | | | Year Ended | | | | Remaining Available | | | | Before Fiscal Year Ending | |
| Period | | | Subject to Recovery | | | | December 31, 2020 | | | | Subject to Recovery | | | | December 31, | |
| Year Ended December 31, 2020 | | $ | – | | | $ | – | | | $ | – | | | | 2023 | |
| Year Ended December 31, 2019 | | | – | | | | – | | | | – | | | | 2022 | |
| Year Ended December 31, 2018 | | | (29,733 | ) | | | 29,733 | | | | – | | | | 2021 | |
| Total | | $ | (29,733 | ) | | $ | 29,733 | | | $ | – | | | | | |
| LoCorr Dynamic Equity Fund |
| | | | | | | | | | | | | | | | | |
| | | | Management Fees | | | | Recovery to Adviser | | | | | | | | Subject to Recovery on or | |
| | | | (Waived) by Adviser | | | | Year Ended | | | | Remaining Available | | | | Before Fiscal Year Ending | |
| Period | | | Subject to Recovery | | | | December 31, 2020 | | | | Subject to Recovery | | | | December 31, | |
| Year Ended December 31, 2020 | | $ | (278,103 | ) | | $ | - | | | $ | (278,103 | ) | | | 2023 | |
| Year Ended December 31, 2019 | | | (192,060 | ) | | | - | | | | (192,060 | ) | | | 2022 | |
| Year Ended December 31, 2018 | | | (95,089 | ) | | | - | | | | (95,089 | ) | | | 2021 | |
| Total | | $ | (565,252 | ) | | $ | - | | | $ | (565,252 | ) | | | | |
| LoCorr Spectrum Income Fund |
| | | | | | | | | | | | | | | | | |
| | | | Management Fees | | | | Recovery to Adviser - Net | | | | | | | | Subject to Recovery on or | |
| | | | (Waived) by Adviser | | | | Year Ended | | | | Remaining Available | | | | Before Fiscal Year Ending | |
| Period | | | Subject to Recovery | | | | December 31, 2020 | | | | Subject to Recovery | | | | December 31, | |
| Year Ended December 31, 2020 | | $ | (70,114 | ) | | $ | – | | | $ | (70,114 | ) | | | 2023 | |
| Year Ended December 31, 2019 | | | – | | | | – | | | | – | | | | 2022 | |
| Year Ended December 31, 2018 | | | – | | | | – | | | | – | | | | 2021 | |
| Total | | $ | (70,114 | ) | | $ | – | | | $ | (70,114 | ) | | | | |
For the year ended December 31, 2017, fees waived by the Adviser for the LoCorr Dynamic Equity Fund totaling $58,609, expired on December 31, 2020 and are no longer eligible for recovery by the Adviser.
At December 31, 2020, there were no fees subject to recovery for the LoCorr Macro Strategies Fund, the LoCorr Long/Short Commodities Strategy Fund or the LoCorr Market Trend Fund.
Rule 12b-1 Distribution Agreement
The Funds have entered into a Rule 12b-1 distribution agreement with Quasar Distributors, LLC (“Quasar”). Class A shareholders pay distribution expenses to Quasar at the annual rate of 0.25% of the Fund’s average daily net assets. Class C shareholders pay to Quasar an annual rate of 1.00%, which is comprised of 0.75% in distribution expenses and 0.25% in service fees, of the Fund’s average daily net assets. Class I shareholders pay no 12b-1 fees.
| | |
| | |
LoCorr Macro Strategies Fund, LoCorr Long/Short Commodities Strategy Fund and LoCorr Market Trend Fund – Notes to Consolidated Financial Statements / LoCorr Dynamic Equity Fund and LoCorr Spectrum Income Fund – Notes to Financial Statements (continued) | 111 |
| | |
6. Fund Shares
At December 31, 2020, there were an unlimited number of shares of beneficial interest authorized. The following table summarizes the activity in shares and dollar amounts applicable to each class of the Funds:
| LoCorr Macro Strategies Fund – Class A |
| | | For the Year Ended December 31, 2020 | | | For the Year Ended December 31, 2019 | |
| | | Shares | | | Amount | | | Shares | | | Amount | |
| Shares Sold | | | 4,716,157 | | | | 40,079,233 | | | | 2,144,444 | | | $ | 18,148,825 | |
| Shares Issued in Connection with Reorganization | | | 818,672 | | | | 7,154,396 | | | | – | | | | – | |
| Reinvestment of Distributions | | | 351,493 | | | | 2,927,933 | | | | 254,760 | | | | 2,173,104 | |
| Shares Redeemed | | | (3,086,234 | ) | | | (26,552,310 | ) | | | (3,095,461 | ) | | | (25,657,370 | ) |
| | | | 2,800,088 | | | $ | 23,609,252 | | | | (696,257 | ) | | $ | (5,335,441 | ) |
| Beginning Shares | | | 6,230,388 | | | | | | | | 6,926,645 | | | | | |
| Ending Shares | | | 9,030,476 | | | | | | | | 6,230,388 | | | | | |
| LoCorr Macro Strategies Fund – Class C | | | | | | | | | |
| | | For the Year Ended December 31, 2020 | | | For the Year Ended December 31, 2019 | |
| | | Shares | | | Amount | | | Shares | | | Amount | |
| Shares Sold | | | 735,024 | | | $ | 6,010,955 | | | | 957,663 | | | $ | 7,841,829 | |
| Shares Issued in Connection with Reorganization | | | 115,243 | | | | 970,352 | | | | – | | | | – | |
| Reinvestment of Distributions | | | 259,232 | | | | 2,053,116 | | | | 232,778 | | | | 1,892,487 | |
| Shares Redeemed | | | (1,512,807 | ) | | | (12,342,406 | ) | | | (2,377,030 | ) | | | (18,811,574 | ) |
| | | | (403,308 | ) | | $ | (3,307,983 | ) | | | (1,186,589 | ) | | $ | (9,077,258 | ) |
| Beginning Shares | | | 5,789,943 | | | | | | | | 6,976,532 | | | | | |
| Ending Shares | | | 5,386,635 | | | | | | | | 5,789,943 | | | | | |
| LoCorr Macro Strategies Fund – Class I | | | | | | | | | |
| | | For the Year Ended December 31, 2020 | | | For the Year Ended December 31, 2019 | |
| | | Shares | | | Amount | | | Shares | | | Amount | |
| Shares Sold | | | 73,017,857 | | | $ | 640,810,543 | | | | 50,459,501 | | | $ | 431,935,788 | |
| Shares Issued in Connection with Reorganization | | | 5,647,389 | | | | 49,750,401 | | | | – | | | | – | |
| Reinvestment of Distributions | | | 6,081,373 | | | | 51,509,334 | | | | 2,951,798 | | | | 25,562,570 | |
| Shares Redeemed | | | (45,653,059 | ) | | | (399,541,357 | ) | | | (25,132,053 | ) | | | (212,548,174 | ) |
| | | | 39,093,560 | | | $ | 342,528,921 | | | | 28,279,246 | | | $ | 244,950,184 | |
| Beginning Shares | | | 83,531,983 | | | | | | | | 55,252,737 | | | | | |
| Ending Shares | | | 122,625,543 | | | | | | | | 83,531,983 | | | | | |
| LoCorr Macro Strategies Fund | | | | | | | | | | | | | | | | |
| Total Net Increase | | | | | | $ | 362,830,190 | | | | | | | $ | 230,537,485 | |
| LoCorr Long/Short Commodities Strategy Fund – Class A |
| | | For the Year Ended December 31, 2020 | | | For the Year Ended December 31, 2019 | |
| | | Shares | | | Amount | | | Shares | | | Amount | |
| Shares Sold | | | 2,181,652 | | | $ | 21,959,749 | | | | 2,208,398 | | | $ | 21,399,126 | |
| Reinvestment of Distributions | | | 63,271 | | | | 616,890 | | | | 11,010 | | | | 101,404 | |
| Shares Redeemed | | | (4,473,884 | ) | | | (45,549,248 | ) | | | (4,245,464 | ) | | | (40,458,908 | ) |
| | | | (2,228,961 | ) | | $ | (22,972,609 | ) | | | (2,026,056 | ) | | $ | (18,958,378 | ) |
| Beginning Shares | | | 4,913,521 | | | | | | | | 6,939,577 | | | | | |
| Ending Shares | | | 2,684,560 | | | | | | | | 4,913,521 | | | | | |
| LoCorr Long/Short Commodities Strategy Fund – Class C | | | | | | | | | |
| | | For the Year Ended December 31, 2020 | | | For the Year Ended December 31, 2019 | |
| | | Shares | | | Amount | | | Shares | | | Amount | |
| Shares Sold | | | 251,310 | | | $ | 2,442,849 | | | | 306,455 | | | $ | 2,836,546 | |
| Reinvestment of Distributions | | | 17,021 | | | | 158,973 | | | | 49 | | | | 436 | |
| Shares Redeemed | | | (177,356 | ) | | | (1,707,358 | ) | | | (239,752 | ) | | | (2,202,571 | ) |
| | | | 90,975 |
| | $ | 894,464 | | | | 66,752 | | | $ | 634,411 | |
| Beginning Shares | | | 747,514 | | | | | | | | 680,762 | | | | | |
| Ending Shares | | | 838,489 | | | | | | | | 747,514 | | | | | |
| LoCorr Long/Short Commodities Strategy Fund – Class I |
| | | For the Year Ended December 31, 2020 | | | For the Year Ended December 31, 2019 | |
| | | Shares | | | Amount | | | Shares | | | Amount | |
| Shares Sold | | | 38,743,237 | | | $ | 400,829,667 | | | | 16,269,252 | | | $ | 159,804,741 | |
| Reinvestment of Distributions | | | 1,026,115 | | | | 10,117,496 | | | | 99,106 | | | | 923,666 | |
| Shares Redeemed | | | (17,200,077 | ) | | | (176,283,092 | ) | | | (12,750,256 | ) | | | (122,918,257 | ) |
| | | | 22,569,275 | | | $ | 234,664,071 | | | | 3,618,102 | | | $ | 37,810,150 | |
| Beginning Shares | | | 21,745,810 | | | | | | | | 18,127,708 | | | | | |
| Ending Shares | | | 44,315,085 | | | | | | | | 21,745,810 | | | | | |
| LoCorr Long/Short Commodities Strategy Fund | | | | | | | | | |
| Total Net Increase | | | | | | $ | 212,585,926 | | | | | | | $ | 19,486,183 | |
| | |
| | |
| 112 | LoCorr Macro Strategies Fund, LoCorr Long/Short Commodities Strategy Fund and LoCorr Market Trend Fund – Notes to Consolidated Financial
Statements / LoCorr Dynamic Equity Fund and LoCorr Spectrum Income Fund – Notes to Financial Statements (continued) |
| | |
| LoCorr Market Trend Fund – Class A | | | | | | | | | | | | |
| | | For the Year Ended December 31, 2020 | | | For the Year Ended December 31, 2019 | |
| | | Shares | | | Amount | | | Shares | | | Amount | |
| Shares Sold | | | 298,426 | | | $ | 3,250,712 | | | | 627,962 | | | $ | 6,723,844 | |
| Reinvestment of Distributions | | | – | | | | – | | | | 10,896 | | | | 122,254 | |
| Shares Redeemed | | | (812,653 | ) | | | (8,875,621 | ) | | | (2,043,409 | ) | | | (20,267,323 | ) |
| | | | (514,227 | ) | | $ | (5,624,909 | ) | | | (1,404,551 | ) | | $ | (13,421,225 | ) |
| Beginning Shares | | | 1,963,697 | | | | | | | | 3,368,248 | | | | | |
| Ending Shares | | | 1,449,470 | | | | | | | | 1,963,697 | | | | | |
| | | | | | | | | | | | | | | | | |
| LoCorr Market Trend Fund – Class C | | | | | | | | | | | | | | | | |
| | | | For the Year Ended December 31, 2020 | | | | For the Year Ended December 31, 2019 | |
| | | | Shares | | | | Amount | | | | Shares | | | | Amount | |
| Shares Sold | | | 59,186 | | | $ | 633,263 | | | | 77,522 | | | $ | 846,098 | |
| Shares Redeemed | | | (392,452 | ) | | | (4,127,730 | ) | | | (1,102,095 | ) | | | (10,783,418 | ) |
| | | | (333,266 | ) | | $ | (3,494,467 | ) | | | (1,024,573 | ) | | $ | (9,937,320 | ) |
| Beginning Shares | | | 1,498,722 | | | | | | | | 2,523,295 | | | | | |
| Ending Shares | | | 1,165,456 | | | | | | | | 1,498,722 | | | | | |
| | | | | | | | | | | | | | | | | |
| LoCorr Market Trend Fund – Class I | | | | | | | | | | | | | | | | |
| | | | For the Year Ended December 31, 2020 | | | | For the Year Ended December 31, 2019 | |
| | | | Shares | | | | Amount | | | | Shares | | | | Amount | |
| Shares Sold | | | 8,851,198 | | | $ | 96,849,535 | | | | 8,839,130 | | | $ | 91,327,306 | |
| Reinvestment of Distributions | | | 49,414 | | | | 551,952 | | | | 251,525 | | | | 2,832,170 | |
| Shares Redeemed | | | (10,571,183 | ) | | | (114,309,560 | ) | | | (18,138,179 | ) | | | (180,568,641 | ) |
| | | | (1,670,571 | ) | | $ | (16,908,073 | ) | | | (9,047,524 | ) | | $ | (86,409,165 | ) |
| Beginning Shares | | | 20,922,885 | | | | | | | | 29,970,409 | | | | | |
| Ending Shares | | | 19,252,314 | | | | | | | | 20,922,885 | | | | | |
| | | | | | | | | | | | | | | | | |
| LoCorr Market Trend Fund | | | | | | | | | | | | | | | | |
| Total Net Decrease | | | | | | $ | (26,027,449 | ) | | | | | | $ | (109,767,710 | ) |
| LoCorr Dynamic Equity Fund – Class A | | | | | | | | | | | | | | | | |
| | | | For the Year Ended December 31, 2020 | | | | For the Year Ended December 31, 2019 | |
| | | | Shares | | | | Amount | | | | Shares | | | | Amount | |
| Shares Sold | | | 50,164 | | | $ | 499,777 | | | | 189,196 | | | $ | 2,062,456 | |
| Reinvestment of Distributions | | | – | | | | – | | | | 1,895 | | | | 21,229 | |
| Shares Redeemed | | | (322,671 | ) | | | (3,199,298 | ) | | | (443,541 | ) | | | (4,841,813 | ) |
| | | | (272,507 | ) | | $ | (2,699,521 | ) | | | (252,450 | ) | | $ | (2,758,128 | ) |
| Beginning Shares | | | 601,952 | | | | | | | | 854,402 | | | | | |
| Ending Shares | | | 329,445 | | | | | | | | 601,952 | | | | | |
| | | | | | | | | | | | | | | | | |
| LoCorr Dynamic Equity Fund – Class C | | | | | | | | | | | | | | | | |
| | | | For the Year Ended December 31, 2020 | | | | For the Year Ended December 31, 2019 | |
| | | | Shares | | | | Amount | | | | Shares | | | | Amount | |
| Shares Sold | | | 4,223 | | | $ | 36,979 | | | | 22,329 | | | $ | 233,664 | |
| Reinvestment of Distributions | | | – | | | | – | | | | 1,253 | | | | 13,311 | |
| Shares Redeemed | | | (161,078 | ) | | | (1,472,858 | ) | | | (198,688 | ) | | | (2,074,232 | ) |
| | | | (156,855 | ) | | $ | (1,435,879 | ) | | | (175,106 | ) | | $ | (1,827,257 | ) |
| Beginning Shares | | | 379,758 | | | | | | | | 554,864 | | | | | |
| Ending Shares | | | 222,903 | | | | | | | | 379,758 | | | | | |
| | | | | | | | | | | | | | | | | |
| LoCorr Dynamic Equity Fund – Class I | | | | | | | | | | | | | | | | |
| | | | For the Year Ended December 31, 2020 | | | | For the Year Ended December 31, 2019 | |
| | | | Shares | | | | Amount | | | | Shares | | | | Amount | |
| Shares Sold | | | 544,142 | | | $ | 5,728,123 | | | | 697,873 | | | $ | 7,854,144 | |
| Reinvestment of Distributions | | | – | | | | – | | | | 4,653 | | | | 53,091 | |
| Shares Redeemed | | | (1,031,948 | ) | | | (10,110,308 | ) | | | (861,590 | ) | | | (9,417,635 | ) |
| | | | (487,806 | ) | | $ | (4,382,185 | ) | | | (159,064 | ) | | $ | (1,510,400 | ) |
| Beginning Shares | | | 1,483,312 | | | | | | | | 1,642,376 | | | | | |
| Ending Shares | | | 995,506 | | | | | | | | 1,483,312 | | | | | |
| LoCorr Dynamic Equity Fund | | | | | | | | | |
| Total Net Decrease | | | | | | $ | (8,517,585 | ) | | | | | | $ | (6,095,785 | ) |
| | |
| | |
LoCorr Macro Strategies Fund, LoCorr Long/Short Commodities Strategy Fund and LoCorr Market Trend Fund – Notes to Consolidated Financial Statements / LoCorr Dynamic Equity Fund and LoCorr Spectrum Income Fund – Notes to Financial Statements (continued) | 113 |
| | |
| LoCorr Spectrum Income Fund – Class A | | | | | | | | | |
| | | For the Year Ended December 31, 2020 | | | For the Year Ended December 31, 2019 | |
| | | Shares | | | Amount | | | Shares | | | Amount | |
| Shares Sold | | | 284,686 | | | $ | 1,707,329 | | | | 1,099,641 | | | $ | 7,558,681 | |
| Reinvestment of Distributions | | | 171,555 | | | | 926,014 | | | | 189,433 | | | | 1,298,660 | |
| Shares Redeemed | | | (1,893,903 | ) | | | (10,310,359 | ) | | | (1,245,746 | ) | | | (8,548,540 | ) |
| Redemption Fees | | | – | | | | 4,449 | | | | – | | | | 483 | |
| | | | (1,437,662 | ) | | $ | (7,672,567 | ) | | | 43,328 | | | $ | 309,284 | |
| Beginning Shares | | | 3,656,243 | | | | | | | | 3,612,915 | | | | | |
| Ending Shares | | | 2,218,581 | | | | | | | | 3,656,243 | | | | | |
| | | | | | | | | | | | | | | | | |
| LoCorr Spectrum Income Fund – Class C | | | | | | | | | | | | | | | | |
| | | | For the Year Ended December 31, 2020 | | | | For the Year Ended December 31, 2019 | |
| | | | Shares | | | | Amount | | | | Shares | | | | Amount | |
| Shares Sold | | | 96,324 | | | $ | 617,906 | | | | 428,428 | | | $ | 2,971,366 | |
| Reinvestment of Distributions | | | 144,053 | | | | 784,112 | | | | 141,182 | | | | 977,534 | |
| Shares Redeemed | | | (781,385 | ) | | | (4,311,479 | ) | | | (756,070 | ) | | | (5,246,921 | ) |
| Redemption Fees | | | – | | | | 218 | | | | – | | | | 63 | |
| | | | (541,008 | ) | | $ | (2,909,243 | ) | | | (186,460 | ) | | $ | (1,297,958 | ) |
| Beginning Shares | | | 2,680,691 | | | | | | | | 2,867,151 | | | | | |
| Ending Shares | | | 2,139,683 | | | | | | | | 2,680,691 | | | | | |
| | | | | | | | | | | | | | | | | |
| LoCorr Spectrum Income Fund – Class I | | | | | | | | | | | | | | | | |
| | | | For the Year Ended December 31, 2020 | | | | For the Year Ended December 31, 2019 | |
| | | | Shares | | | | Amount | | | | Shares | | | | Amount | |
| Shares Sold | | | 1,412,246 | | | $ | 8,309,828 | | | | 1,980,491 | | | $ | 13,626,906 | |
| Reinvestment of Distributions | | | 239,666 | | | | 1,291,002 | | | | 248,951 | | | | 1,704,587 | |
| Shares Redeemed | | | (2,558,879 | ) | | | (13,508,228 | ) | | | (2,279,259 | ) | | | (15,657,404 | ) |
| Redemption Fees | | | – | | | | 275 | | | | – | | | | 1,016 | |
| | | | (906,967 | ) | | $ | (3,907,123 | ) | | | (49,817 | ) | | $ | (324,895 | ) |
| Beginning Shares | | | 4,370,282 | | | | | | | | 4,420,099 | | | | | |
| Ending Shares | | | 3,463,315 | | | | | | | | 4,370,282 | | | | | |
| LoCorr Spectrum Income Fund | | | | | | | | | | | | | | | | |
| Total Net Decrease | | | | | | $ | (14,488,933 | ) | | | | | | $ | (1,313,569 | ) |
7. Federal Tax Information
At December 31, 2020, the components of accumulated earnings (losses) on a tax basis were as follows(1):
| | | LoCorr Macro Strategies Fund (2) | | | LoCorr Long/Short
Commodities Strategy Fund (2) | | | LoCorr Market
Trend Fund (2) | |
| Tax cost of portfolio | | $ | 1,121,065,283 | | | $ | 495,007,071 | | | $ | 220,165,613 | |
| | | | | | | | | | | | | |
| Gross unrealized appreciation | | $ | 49,541,026 | | | $ | 12,116,511 | | | $ | 17,114,743 | |
| Gross unrealized depreciation | | | (2,029,719 | ) | | | (13,242,321 | ) | | | (197,108 | ) |
| Net unrealized appreciation (depreciation) | | | 47,511,307 | | | | (1,125,810 | ) | | | 16,917,635 | |
| Undistributed ordinary income | | | 12,994,597 | | | | 43,925 | | | | – | |
| Undistributed long-term capital gains | | | – | | | | – | | | | – | |
| Total earnings accumulated | | | 12,993,050 | | | | 43,925 | | | | – | |
| Other accumulated losses | | | (15,877,721 | ) | | | – | | | | (9,345,944 | ) |
| Total distributable earnings (accumulated losses) | | $ | 44,628,183 | | | $ | (1,081,885 | ) | | $ | 7,571,691 | |
| | | | | | | | | | | | | |
| | | LoCorr Dynamic Equity Fund | | | LoCorr Spectrum Income Fund | | | | | |
| Tax cost of portfolio | | $ | 14,526,547 | | | $ | 41,179,403 | | | | | |
| Gross unrealized appreciation | | $ | 2,777,030 | | | $ | 9,130,806 | | | | | |
| Gross unrealized depreciation | | | (1,732,383 | ) | | | (2,564,887 | ) | | | | |
| Net unrealized appreciation | | | 1,044,647 | | | | 6,565,919 | | | | | |
| | | | | | | | | | | | | |
| Undistributed ordinary income | | | – | | | | – | | | | | |
| Undistributed long-term capital gains | | | – | | | | – | | | | | |
| Total earnings accumulated | | | – | | | | – | | | | | |
| Other accumulated losses | | | (965,947 | ) | | | (36,114,076 | ) | | | | |
| Total distributable earnings (accumulated losses) | | $ | 78,700 | | | $ | (29,548,157 | ) | | | | |
| (1) | Total Portfolio represents aggregate amounts of Fund’s investments, securities sold short, forward currency contracts and futures contracts, where applicable. |
| (2) | Tax Cost is presented on a non-consolidated basis and includes each of the Fund’s investment in the respective CFC’s and the unrealized appreciation and depreciation associated with those investments. |
| | |
| | |
| 114 | LoCorr Macro Strategies Fund, LoCorr Long/Short Commodities Strategy Fund and LoCorr Market Trend Fund – Notes to Consolidated Financial
Statements / LoCorr Dynamic Equity Fund and LoCorr Spectrum Income Fund – Notes to Financial Statements (continued) |
| | |
Undistributed income or net realized gains for financial statement purposes may differ from amounts recognized for federal income tax purposes due to differences in the recognition and characterization of income, expense and capital gain items. The difference between book-basis and tax-basis unrealized appreciation (depreciation) is attributed primarily to the tax deferral of losses on wash sales, mark to market on forward currency contracts and futures contracts, organizational expenses, investments in partnerships and other temporary differences.
The following reclassifications were made within the components of net assets as of December 31, 2020:
| | | Total Distributable
Earnings/(Accumulated Loss) | | | Paid-in Capital | |
| LoCorr Macro Strategies Fund | | $ | 30,647,208 | | | $ | (30,647,208 | ) |
| LoCorr Long/Short Commodities Strategy Fund | | | 12,533,396 | | | | (12,533,396 | ) |
| LoCorr Market Trend Fund | | | 3,427,561 | | | | (3,427,561 | ) |
| LoCorr Dynamic Equity Fund | | | 225,359 | | | | (225,359 | ) |
| LoCorr Spectrum Income Fund | | | 532,580 | | | | (532,580 | ) |
The LoCorr Macro Strategies Fund’s reclassifications are primarily attributable to certain reclassifications related to the Fund’s wholly-owned subsidiary and equalization.
The LoCorr Long/Short Commodities Strategy Fund’s reclassifications are primarily attributable to certain reclassifications related to the Fund’s wholly-owned subsidiary and equalization.
The LoCorr Market Trend Fund’s reclassifications are primarily attributable to certain reclassifications related to the Fund’s wholly-owned subsidiary and the result of the Fund’s net operating losses.
The LoCorr Dynamic Equity Fund’s reclassifications are primarily the result of the Fund’s net operating losses/reclasses and prior year true-ups.
The LoCorr Spectrum Income Fund’s reclassifications are primarily attributable to certain reclassifications related to partnership basis adjustments and prior year true-ups.
Under the current tax law, capital losses realized after October 31 may be deferred and treated as occurring on the first day of the following fiscal year. The Funds elected to defer no capital losses for the fiscal year ended December 31, 2020:
| | | Post October | | | Late Year | |
| | | Loss Deferral | | | Loss Deferral | |
| LoCorr Market Trend Fund | | $ | – | | | $ | 69,121 | |
| LoCorr Spectrum Income Fund | | | – | | | | 114,080 | |
At December 31, 2020, accumulated net realized capital loss carryovers, if any, and the year(s) in which the capital loss carryovers expire were:
| | | Capital Loss Carryover | | | Year of | |
| | | Short-Term | | | Long-Term | | | Expiration | |
| LoCorr Macro Strategies Fund | | $ | 16,149,213 | | | $ | – | | | | Indefinitely | |
| LoCorr Market Trend Fund | | | 9,263,923 | | | | – | | | | Indefinitely | |
| LoCorr Dynamic Equity Fund | | | 498,096 | | | | 392,513 | | | | Indefinitely | |
| LoCorr Spectrum Income Fund | | | 13,860,781 | | | | 22,070,168 | | | | Indefinitely | |
During the year ended December 31, 2020, the LoCorr Dynamic Equity Fund utilized capital loss carryover of $385,378. The LoCorr Macro Strategies Fund, the LoCorr Long/Short Commodities Strategy Fund, the LoCorr Market Trend Fund and the LoCorr Spectrum Income Fund did not utilize any capital loss carryovers during the year ended December 31, 2020.
8. Line of Credit
The Trust entered into an unsecured, uncommitted Loan Agreement (“Line of Credit” or “LOC”) with U.S. Bank not individually but as an umbrella facility on behalf of the Funds in the Trust. The LOC expires on March 9, 2021. The LOC was established to provide the Funds a temporary short-term liquidity source, subject to certain restrictions, covenants and the right of setoff on the Funds’ assets, to meet unanticipated redemptions. Under terms of the LOC, borrowings for each Fund are limited to the lesser of one-third of the net unencumbered assets (including the amount borrowed) of the respective Fund, 5% of the gross assets of the respective Fund or $50 million in the aggregate for all of the Funds under this agreement. U.S. Bank, N.A. charges an interest rate per annum equal to the Prime Rate (3.25% as of December 31, 2020).
The Funds did not utilize the Line of Credit during the year ended December 31, 2020.
| | |
| | |
LoCorr Macro Strategies Fund, LoCorr Long/Short Commodities Strategy Fund and LoCorr Market Trend Fund – Notes to Consolidated Financial Statements / LoCorr Dynamic Equity Fund and LoCorr Spectrum Income Fund – Notes to Financial Statements (continued) | 115 |
| | |
9. Subsequent Events
Declaration of Dividends
The LoCorr Spectrum Income Fund declared the following ordinary income distributions:
| Dividend Declaration | | Shareholder of | | Distribution Amount per Share Class |
| Date (a) | | Record Date | | Class A | Class C | Class I |
| January 29, 2021 | | January 28, 2021 | | $0.0386 | $0.03470 | $0.04000 |
| February 26, 2021 | | February 25, 2021 | | $0.0386 | $0.03470 | $0.04000 |
(a) Ex-date, reinvest date and payable date.
The estimated characterization of the distributions paid will be an ordinary dividend, qualified dividend or return of capital. See Note 2 for additional information.
There were no additional subsequent events since December 31, 2020 through the date the financial statements were issued that would require adjustments to or additional disclosure in these financial statements.
| | |
| | |
| 116 | | Report of Independent Registered Public Accounting Firm |
| | |
116 | Report of Independent Registered Public Accounting Firm
Report of Independent Registered Public Accounting Firm
To the Shareholders and Board of Trustees of
LoCorr Investment Trust
Opinion on the Financial Statements
We have audited the accompanying consolidated statements of assets and liabilities, including the consolidated schedules of investments, open forward currency contracts, open futures contracts and swap contracts (as applicable), of LoCorr Macro Strategies Fund, LoCorr Long/Short Commodities Strategy Fund, and LoCorr Market Trend Fund, and the accompanying statements of assets and liabilities, including the schedules of investments, securities sold short (as applicable), and open futures contracts of LoCorr Dynamic Equity Fund and LoCorr Spectrum Income Fund (the “Funds”), each a series of LoCorr Investment Trust, as of December 31, 2020, the related consolidated statements of operations for the year then ended, the consolidated statements of changes in net assets for each of the two years in the period then ended, the related notes, and the consolidated financial highlights for each of the five years in the period then ended for LoCorr Macro Strategies Fund, LoCorr Long/Short Commodities Strategy Fund, and LoCorr Market Trend Fund, and the related statements of operations for the year then ended, the statements of changes in net assets for each of the two years in the period then ended, the related notes, and the financial highlights for each of the five years in the period then ended for LoCorr Dynamic Equity Fund and LoCorr Spectrum Income Fund (collectively referred to as the “financial statements”). In our opinion, the financial statements present fairly, in all material respects, the financial position of each of the Funds as of December 31, 2020, the results of their operations for the year then ended, the changes in net assets for each of the two years in the period then ended, and the financial highlights for each of the five years in the period then ended, in conformity with accounting principles generally accepted in the United States of America.
Basis for Opinion
These financial statements are the responsibility of the Funds’ management. Our responsibility is to express an opinion on the Funds’ financial statements based on our audits. We are a public accounting firm registered with the Public Company Accounting Oversight Board (United States) (“PCAOB”) and are required to be independent with respect to the Funds in accordance with the U.S. federal securities laws and the applicable rules and regulations of the Securities and Exchange Commission and the PCAOB.
We conducted our audits in accordance with the standards of the PCAOB. Those standards require that we plan and perform the audit to obtain reasonable assurance about whether the financial statements are free of material misstatement whether due to error or fraud.
Our audits included performing procedures to assess the risks of material misstatement of the financial statements, whether due to error or fraud, and performing procedures that respond to those risks. Such procedures included examining, on a test basis, evidence regarding the amounts and disclosures in the financial statements. Our procedures included confirmation of securities owned as of December 31, 2020, by correspondence with the custodian, counterparties, and brokers or by other appropriate auditing procedures where replies from brokers or counterparties were not received. Our audits also included evaluating the accounting principles used and significant estimates made by management, as well as evaluating the overall presentation of the financial statements. We believe that our audits provide a reasonable basis for our opinion.
We have served as the Funds’ auditor since 2011.

COHEN & COMPANY, LTD.
Milwaukee, Wisconsin
March 1, 2021
| | |
| | |
| LoCorr Investment Trust - Expense Example (Unaudited) | | 117 |
| | |
Expense Example
December 31, 2020 (Unaudited)
As a shareholder of a mutual fund, you incur two types of costs: (1) transaction costs, including sales charges (loads) on purchase payments; redemption fees; and (2) ongoing costs, including management fees; distribution and/or service (12b-1) fees and other Fund expenses.
This Example is intended to help you understand your ongoing costs (in dollars) of investing in each of the Funds and to compare these costs with the ongoing costs of investing in other mutual funds. The Example is based on an investment of $1,000 invested at the beginning of the period and held for the entire period (July 1, 2020 through December 31, 2020).
Actual Expenses
The actual return columns in the following table provide information about account values based on actual returns and actual expenses. You may use the information in these columns, together with the amount you invested, to estimate the expenses that you paid over the period. Simply divide your account value by $1,000 (for example, an $8,600 account value divided by $1,000 = 8.6), then multiply the result by the number in the first line under the heading entitled “Expenses Paid During Period” to estimate the expenses you paid on your account during this period. The only transaction fees you may be required to pay are for outgoing wire transfers, returned checks and stop payment orders at prevailing rates charged by U.S. Bancorp Fund Services, LLC, doing business as U.S. Bank Global Fund Services, the Funds’ transfer agent. These fees are assessed on all accounts, as applicable. If you request that a redemption be made by wire transfer, currently the Funds’ transfer agent charges a $15.00 fee. The Funds’ transfer agent charges a transaction fee of $25.00 on returned checks and stop payment orders. If you paid a transaction fee, you would add the fee amount to the expenses paid on your account this period to obtain your total expenses paid.
Hypothetical Example for Comparison Purposes
The hypothetical return columns in the following table provide information about hypothetical account values and hypothetical expenses based on the Funds’ actual expense ratio and an assumed rate of return of 5% per year before expenses, which is not the Funds’ actual return. The hypothetical account values and expenses may not be used to estimate the actual ending account balance or expenses you paid for the period. You may use this information to compare the ongoing costs of investing in the Funds and other funds. To do so, compare this 5% hypothetical example with the 5% hypothetical examples that appear in the shareholder reports of the other funds. A transaction fee of $15.00 may be assessed on outgoing wire transfers and a transaction fee of $25.00 may be assessed on returned checks and stop payment orders. To include this fee in the calculation, you would add the estimated transaction fee to the hypothetical expenses shown in the table. Please note that the expenses shown in the table are meant to highlight your ongoing costs only and do not reflect the transaction fees discussed above. Therefore, those columns are useful in comparing ongoing costs only, and will not help you determine the relative total costs of owning different funds. In addition, if these transactional costs were included, your costs would have been higher.
| | |
| | |
| 118 | | LoCorr Investment Trust - Expense Example (Unaudited) (continued) |
| | |
Actual vs Hypothetical Returns
Actual vs. Hypothetical returns for the Six Months Ended December 31, 2020 (Unaudited)
| | | | | | | Hypothetical |
| | | | Actual | | (5% gross annual return) |
| | Fund’s | | Ending | | | Ending | |
| | Annualized | Beginning | Account Value | Expenses Paid | | Account Value | Expenses Paid |
| | Expense Ratio | Account Value | December 31, | During Period | | December 31, | During Period |
| | Class | 1, 2 | July 1, 2020 | 2020 | 1, 2, 3 | | 2020 | 1, 2, 3 |
| | | | | | | | |
| LoCorr Macro Strategies Fund |
| | A | 2.18% | $1,000.00 | $1,054.10 | $11.26 | | $1,014.18 | $11.04 |
| | C | 2.93% | $1,000.00 | $1,050.80 | $15.10 | | $1,010.41 | $14.81 |
| | I | 1.93% | $1,000.00 | $1,055.80 | $9.97 | | $1,015.43 | $9.78 |
| | | | | | | |
| LoCorr Long/Short Commodities Strategy Fund |
| | A | 2.06% | $1,000.00 | $985.90 | $10.28 | | $1,014.78 | $10.43 |
| | C | 2.81% | $1,000.00 | $982.20 | $14.00 | | $1,011.01 | $14.20 |
| | I | 1.81% | $1,000.00 | $987.50 | $9.04 | | $1,016.04 | $9.17 |
| | | | | | | | |
| LoCorr Market Trend Fund |
| | A | 2.03% | $1,000.00 | $1,121.90 | $10.83 | | $1,014.93 | $10.28 |
| | C | 2.78% | $1,000.00 | $1,117.70 | $14.80 | | $1,011.16 | $14.05 |
| | I | 1.78% | $1,000.00 | $1,124.10 | $9.50 | | $1,016.19 | $9.02 |
| | | | | | | | |
| LoCorr Dynamic Equity Fund | |
| | A | 2.94% | $1,000.00 | $1,200.40 | $16.26 | | $1,010.36 | $14.86 |
| | C | 3.69% | $1,000.00 | $1,195.80 | $20.37 | | $1,006.59 | $18.61 |
| | I | 2.69% | $1,000.00 | $1,201.40 | $14.89 | | $1,011.61 | $13.60 |
| | | | | | | | |
| LoCorr Spectrum Income Fund | |
| | A | 2.07% | $1,000.00 | $1,285.90 | $11.89 | | $1,014.73 | $10.48 |
| | C | 2.82% | $1,000.00 | $1,277.00 | $16.14 | | $1,010.96 | $14.25 |
| | I | 1.82% | $1,000.00 | $1,286.40 | $10.46 | | $1,015.99 | $9.22 |
| 1 | Includes dividend and/or interest expense of 0.00%, 0.00%, 0.00%, 0.70% and 0.02% for the LoCorr Macro Strategies Fund, the LoCorr Long/Short Commodities Strategy Fund, the LoCorr Market Trend Fund, the LoCorr Dynamic Equity Fund and the LoCorr Spectrum Income Fund, respectively. |
| 2 | Includes expenses of wholly-owned and controlled Cayman Islands subsidiaries for the LoCorr Macro Strategies Fund, the LoCorr Long/Short Commodities Strategy Fund and the LoCorr Market Trend Fund. |
| 3 | Expenses Paid During Period are equal to the net annualized expense ratio for the class, multiplied by the average account value over the period, multiplied by 184/366 (to reflect the one-half year period). |
| | |
| | |
| Approval of Advisory Agreements (Unaudited) | | 119 |
| | |
LoCorr Investment Trust
December 31, 2020 (Unaudited)
Review of Management and Sub-Advisory Agreements
Counsel directed the Board’s attention to Section 5 of the Board materials for the renewal of the investment sub-advisory agreements for the LoCorr Dynamic Equity Fund (“LDE Fund”) and LoCorr Spectrum Income Fund (“LSI Fund”).
The Board reviewed the memorandum provided by Counsel which had been provided to them prior to the meeting entitled, “Duties of Trustees with Respect to Approval and Renewal of Investment Advisory and Sub-Advisory Contracts”. The Board, including a majority of the Trustees who are not “interested persons” of the Trust within the meaning of the 1940 Act (the “Independent Trustees”), reviewed the various factors relevant to its consideration of the subadvisory agreement and the legal responsibilities of the Board related to such consideration. These factors included the following:
| ● | The nature, extent and quality of the services provided by the investment sub-adviser to the fund; |
| ● | The investment performance of the fund and the investment sub-adviser; |
| ● | The costs of the services to be provided and the profits to be realized by the sub-adviser and its affiliates from the relationship with the fund; |
| ● | The extent to which economies of scale will be realized as the fund grows; and |
| ● | Whether the fee levels reflect these economies of scale to the benefit of the shareholders. |
The Board reviewed the responses to the 15(c) questionnaire and the sub-advisory agreement prior to the meeting.
Kettle Hill Capital Management, LLC (“Kettle Hill”), Sub-Adviser (LDE Fund)
Counsel reviewed the sub-advisory services provided by Kettle Hill for the LDE Fund with the Trustees. Counsel and Management noted the responsibilities and backgrounds of Kettle Hill’s key individuals. Counsel further noted that there were no changes in the key personnel of Kettle Hill since the Board’s last approval. The Trustees further discussed the services provided by Kettle Hill including equity research, financial modeling, investment risk oversight, security selection, trade execution and compliance testing for the LDE Fund.
Counsel noted that Kettle Hill reported no material compliance issues, regulatory issues or material litigations in the past 36 months. Counsel noted for the Board’s benefit that Kettle Hill maintains an Errors & Omissions insurance policy in an appropriate amount.
After a discussion, the Board concluded that Kettle Hill has robust investment management experience and resources to continue to provide satisfactory services for the LDE Fund.
The Trustees next reviewed the performance of Kettle Hill with respect to its allocation of the LDE Fund. Fund Counsel noted for the Trustees the sub-adviser’s performance compared to the Fund’s benchmark and the overall LDE Fund. The Board noted that Kettle Hill’s 1-year performance had far exceeded the overall performance of the Fund and was roughly in line with the benchmark’s return. A representative of the Adviser noted Kettle Hill’s recent strong performance and stated that the Fund’s adviser continued to be satisfied with Kettle Hill’s performance and the execution of its strategy. After a discussion, the Board concluded that Kettle Hill’s performance was satisfactory.
Counsel then directed the Board’s attention to the costs of services provided by Kettle Hill to the LDE Fund. Counsel reviewed for the Trustees the fees charged by Kettle Hill to other accounts including other registered investment companies.
The Board next reviewed Kettle Hill’s net profits related to its services to the LDE Fund. The Board discussed the level of Kettle Hill’s profitability and found it to be not excessive After further discussion, the Board concluded that Kettle Hill’s sub-advisory fee and profitability were reasonable.
The Trustees reviewed and discussed that Kettle Hill continues to receive soft-dollar benefits from its relationship with the LDE Fund that Kettle Hill uses for brokerage and research purposes. After a discussion, the Trustees concluded that the other benefits that may be derived by Kettle Hill from its relationship with the Fund were reasonable.
Having requested and received such information from the Adviser as the Trustees believed to be reasonably necessary to evaluate the terms of the sub-advisory agreement with Kettle Hill, and as assisted by the advice of Counsel, the Trustees concluded that the subadvisory fee was not unreasonable and that renewal of the sub-advisory agreement with Kettle Hill was in the best interests of the shareholders of the LDE Fund.
Bramshill Investments, LLC (“Bramshill”), Sub-Adviser (LSI Fund)
The Trustees then considered the approval of the sub-advisory agreement with Bramshill with respect to the LSI Fund. Counsel and a representative of the Adviser noted that Bramshill would be taking the place of Trust & Fiduciary Income Partners, LLC (“TFIP”) as the Fund’s sub-adviser. A representative of the Adviser reminded the Trustees that TFIP had been operating as a subsidiary of Bramshill for several years and that there was no expected change in the nature or quality of services as a result of Bramshill replacing TFIP as the named sub-adviser. It was noted that Bramshill would utilize the same personnel and investment strategies as was used by TFIP. Counsel noted that the Board has recently considered a renewal of the sub-advisory agreement with TFIP in February 2020.
| | |
| | |
| 118 | | Approval of Advisory Agreements (Unaudited) Continued |
| | |
The Trustees considered the nature, extent and quality of services provided or to be provided by Bramshill for the income strategies for the LSI Fund, noting that there would be no changes. Counsel and a representative of the Adviser reviewed the responsibilities of TFIP’s investment personnel. The Board noted that TFIP provides quantitative research, security selection and trade execution for the income portion of the LSI Fund’s as well as compliance services and procedures. Counsel further noted that TFIP had already been operating under the Bramshill compliance policies and procedures and thus there would be no changes in the compliance services provided by Bramshill to the Fund.
The Trustees noted that Bramshill has not reported any material compliance issues in the past 36 months. Counsel also indicated that Bramshill did not have any recent regulatory examinations or material litigation issues in the past 36 months. The Trustees concluded that, based on Bramshill’s experienced personnel and fixed income expertise, Bramshill has adequate investment resources available to provide subadvisory services to the Fund. The Trustees concluded that Bramshill was well-suited to provide the services as sub-adviser to the LSI Fund.
Counsel then directed the Trustees attention to the investment performance information for Bramshill with respect to the LSI Fund. The Trustees noted that performance was negative, lagging the Fund’s benchmark and the sub-adviser’s selected benchmark for the one-year period and was slightly better than the overall Fund. A representative of the Adviser reviewed the sub-adviser’s performance and stated that the Adviser was overall satisfied with the performance of the sub-adviser but would continue to monitor and evaluate its performance. After a discussion, the Trustees agreed that performance was not unreasonable.
The Trustees discussed the costs of services provided and to be provided by Bramshill to the LSI Fund. The Trustees noted that Bramshill was expected to be profitable with respect to the LSI Fund. Counsel directed the Trustees’ attention to the materials for Bramshill which indicated that Bramshill’s sub-advisory fee was favorable in comparison to fees it charges to other clients. The Trustees concluded that the sub-advisory fees to be paid to Bramshill by the Adviser were reasonable in light of the services to be provided under the sub-advisory agreements.
Having requested and received such information from Bramshill as the Trustees believed to be reasonably necessary to evaluate the terms of the Sub-Advisory Agreement, and as assisted by the advice of Counsel, the Trustees concluded that the fee structure is reasonable and that approval of the Sub-Advisory Agreement is in the best interests of the shareholders of the LSI Fund.
First Quadrant, L.P. (“First Quadrant”), Sub-Adviser (LDE Fund)
Counsel directed the Trustee’s attention to the Board materials for the approval and renewal of the sub-advisory agreement with First Quadrant.
The Trustees reviewed the memorandum provided by Fund Counsel which had been provided to them prior to the meeting entitled, “Duties of Trustees with Respect to Approval and Renewal of Investment Advisory and Sub-Advisory Contracts”. The Trustees, including a majority of the Trustees who are not “interested persons” of the Trust within the meaning of the 1940 Act (the “Independent Trustees”), reviewed the various factors relevant to its consideration of the management agreement and the various subadvisory agreements and the legal responsibilities of the Trustees related to such consideration. These factors included the following:
| ● | The nature, extent and quality of the services provided by the investment adviser to the fund; |
| ● | The investment performance of the fund and the investment adviser; |
| ● | The costs of the services to be provided and the profits to be realized by the adviser and its affiliates from the relationship with the fund; |
| ● | The extent to which economies of scale will be realized as the fund grows; and |
| ● | Whether the fee levels reflect these economies of scale to the benefit of the shareholders. |
The Trustees reviewed the responses to the 15(c) questionnaire provided by First Quadrant and the sub-advisory agreement prior to the meeting.
The Trustees noted that First Quadrant has provided quantitative research, security selection and trade execution for the Fund’s portfolio as well as compliance services to assure assets are managed within the Fund’s investment restrictions. The Trustees discussed the qualifications of First Quadrant’s key individuals, noting their experience and backgrounds. In response to a question, a representative of the Adviser indicated that the Adviser was satisfied with the services provided by First Quadrant for the LDE Fund since First Quadrant became a sub-adviser to the Fund in early 2019.
Counsel reviewed First Quadrant’s overall strategy, risk controls and compliance resources with the Trustees. The Trustees considered First Quadrant’s compliance controls including its monitoring of Investment Company Act restrictions as well as its technology and infrastructure. Counsel noted for the Trustees that First Quadrant did not report any material compliance issues in the past 36 months, nor did First Quadrant have any material compliance issues or material litigations in the past 36 months. A representative of the Adviser noted that First Quadrant had recently been examined by the National Futures association (“NFA’) and further indicated that there were findings from that examination. After a discussion, the Trustees concluded that First Quadrant was well-suited to perform the services as sub-adviser to the Fund.
The Trustees noted that First Quadrant carries an appropriate Errors and Omissions/Directors’ and Officers’ (“E&O/D&O”) policy. The Trustees noted that First Quadrant is well-resourced and that the Trustees concluded that First Quadrant was expected to continue providing a high level of quality services to the Fund and its shareholders.
| | |
| | |
| Approval of Advisory Agreements (Unaudited) Continued | | 121 |
| | |
The Trustees considered the investment performance of First Quadrant’s allocation of the Fund’s assets. The Trustees noted that First Quadrant has performed better than the overall Fund for the prior 12 months but that it had underperformed its benchmarks. After a discussion, the Trustees concluded that First Quadrant’s performance was reasonable.
The Trustees considered the sub-advisory fee was the same as when the Board had initially approved the subadvisory agreement with First Quadrant. The Board noted that First Quadrant did not indicate that it managed other accounts with strategies comparable to the LDE Fund. After further discussion, the Trustees concluded that the sub-advisory fee continued to be reasonable. The Trustees considered whether there will be economies of scale with respect to the management of the Fund. The Trustees agreed that this was primarily an adviser-level issue and should be considered with respect to the overall advisory contract, taking into consideration the impact of the sub-advisory expense. After discussion, it was the consensus of the Trustees that a lack of breakpoints was acceptable. The Trustees considered the level of profit realized by First Quadrant in connection with its relationship with the Fund. After a discussion, the Trustees concluded that the First Quadrant’s level of profit was not excessive.
Having requested and received such information from First Quadrant as the Trustees believed to be reasonably necessary to evaluate the terms of the Sub-Advisory Agreement, and as assisted by the advice of counsel, the Trustees concluded that the fee structure is reasonable and that renewal of the Sub-Advisory Agreement is in the best interests of the shareholders of the LDE Fund.
| | |
| | |
| 122 | | Notice of Privacy Policy & Practices/Quarterly Portfolio Holdings/Proxy (Unaudited) |
| | |
Notice of Privacy Policy & Practices
(Unaudited)
Your privacy is important to us. The Funds are committed to maintaining the confidentiality, integrity, and security of your personal information. When you provide personal information, the Funds believe that you should be aware of policies to protect the confidentiality of that information.
The Funds collect the following nonpublic personal information about you:
| ● | Information we receive from you on or in applications or other forms, correspondence, or conversations, including, but not limited to, your name, address, phone number, social security number, assets, income and date of birth; and |
| ● | Information about your transactions with us, our affiliates, or others, including, but not limited to, your account number and balance, payments history, parties to transactions, cost basis information and other financial information. |
The Funds do not disclose any nonpublic personal information about our current or former shareholders to affiliated or nonaffiliated third parties, except as permitted by law. For example, the Funds are permitted by law to disclose all of the information we collect, as described above, to our transfer agent to process your transactions. Furthermore, the Funds restrict access to your nonpublic personal information to those persons who require such information to provide products or services to you. The Funds maintain physical, electronic and procedural safeguards that comply with applicable federal and state standards to guard your nonpublic personal information.
In the event that you hold shares of the Funds through a financial intermediary, including, but not limited to, a broker-dealer, bank, or trust company, the privacy policy of your financial intermediary would govern how your nonpublic personal information would be shared with affiliated or non-affiliated third parties.
Portfolio Holdings Disclosure
(Unaudited)
The Funds file a complete schedule of portfolio holdings with the U.S. Securities and Exchange Commission (the “SEC”) for the first and third quarters of each fiscal year on Part F of Form N-PORT. The Funds’ Part F of Form N-PORT are available on the SEC’s website at www.sec.gov and may be reviewed and copied at the SEC’s Public Reference Room in Washington, D.C. Information on the operation of the Public Reference Room may be obtained by calling 1-800-SEC-0330. The Funds’ Part F of Form N-PORT may also be obtained by calling toll-free 1-855-523-8637.
Proxy voting policies, procedures and record
(Unaudited)
You may obtain a description of the Funds’ (1) proxy voting policies, (2) proxy voting procedures and (3) information regarding how the Funds voted any proxies related to portfolio securities during the most recent 12-month period ended June 30 for which an SEC filing has been made, without charge, upon request by contacting the Funds directly at 1-855-523-8637, or on the EDGAR Database on the SEC’s website (http:// www.sec.gov).
| | |
| | |
| Qualified Dividend Income (“QDI”) / Dividends Received Deduction (“DRD”) (Unaudited) | | 123 |
| | |
Qualified Dividend Income (“QDI”) / Dividends Received Deduction (“DRD”)
(Unaudited)
For the fiscal year ended December 31, 2020, certain dividends paid by the Funds may be subject to a maximum tax rate of 15%, as provided for by the Jobs and Growth Tax Relief Reconciliation Act of 2003. The percentage of dividends declared from ordinary income designated as qualified income was as follows:
| Fund | | QDI% |
| LoCorr Macro Strategies Fund | | 0.00% |
| LoCorr Long/Short Commodities Strategy Fund | | 0.00% |
| LoCorr Market Trend Fund | | 0.00% |
| LoCorr Dynamic Equity Fund | | 0.00% |
| LoCorr Spectrum Income Fund | | 59.45% |
For corporate shareholders, the percent of ordinary income distributions qualifying for the corporate dividends received deduction for the fiscal year ended December 31, 2020 was as follows:
| Fund | | DRD% |
| LoCorr Macro Strategies Fund | | 0.00% |
| LoCorr Long/Short Commodities Strategy Fund | | 0.00% |
| LoCorr Market Trend Fund | | 0.00% |
| LoCorr Dynamic Equity Fund | | 0.00% |
| LoCorr Spectrum Income Fund | | 48.47% |
| | |
| | |
| 124 | | Independent Trustees/Interested Trustees and Officers |
| | |
The Statement of Additional Information includes additional information about the Independent Trustees/Interested Trustees and Officers and is available, without charge, by calling 1-855-523-8637.
| Independent Trustees | | |
Name and
Year of Birth | Position/Term
of Office1 | Principal Occupation
During the Past 5 Years | Number of
Portfolios in
Fund Complex2
Overseen by
Trustee | Other
Directorships
Held by Trustee
During the Past
5 Years |
Gary Jarrett
Year of Birth: 1954 | Trustee/
2016–present | Chief Executive Officer, Black River Asset Management LLC, investment subsidiary of Cargill, Inc., 2002–2015. | 5 | None |
Mark Thompson
Year of Birth: 1959 | Trustee/
2011–present | Chairman and Chief Manager, Riverbridge Partners, LLC (investment management), 1987–present. | 5 | None |
Ronald A. Tschetter
Year of Birth: 1941 | Trustee/
2011–present | Mr. Tschetter is presently retired from his principal occupations; Director of the U.S. Peace Corps, 2006–2009. | 5 | None |
| | | | | |
| Interested Trustees and Officers | |
Name and
Year of Birth | Position/Term
of Office1 | Principal Occupation
During the Past 5 Years | Number of
Portfolios in
Fund Complex2
Overseen by
Trustee | Other
Directorships
Held by Trustee
During the Past
5 Years |
Jon C. Essen3
Year of Birth: 1963 | Treasurer,
Secretary, Chief
Financial Officer/
2011–present;
Trustee/
2010–present | LoCorr Fund Management, LLC: Chief Operating Officer (2010–2016), Chief Compliance Officer, (2010–2017); LoCorr Distributors, LLC: Principal, Chief Financial Officer, and Registered Representative (2008–present) Chief Compliance Officer (2008–2017); Steben & Company (broker/dealer and registered investment adviser): Principal and Chief Financial Officer (2020–present) | 5 | None |
Kevin M. Kinzie4
Year of Birth: 1956 | President,
Trustee/
2011–present | Chief Executive Officer of LoCorr Fund Management, LLC, 2010 to present; President and Chief Executive Officer of LoCorr Distributors, LLC (broker/dealer), 2002– present. President and Chief Executive Officer of Steben & Company (broker/dealer and registered investment adviser), (2019–present). | 5 | None |
Brian Hull5
Year of Birth: 1968 | Chief Compliance
Officer/
2019–present | Steben & Company (broker/dealer and registered investment adviser): Chief Compliance Officer 2002–2007 and 2012–Present; Financial & Operations Principal (FINOP) 2002–Present; Registered Representative 2002–Present. | 5 | None |
Independent Trustees
| 1 | The term of office for each Trustee listed above will continue indefinitely. |
| 2 | The term “Fund Complex” refers to the LoCorr Investment Trust. |
| 3 | Mr. Essen is an interested Trustee because he is an officer of the Funds’ Adviser. |
| 4 | Mr. Kinzie is an interested Trustee because he is an officer and indirect controlling interest holder of the Funds’ Adviser. |
| 5 | Mr. Hull is an interested person because he is an officer of the Funds’ Adviser. |
This page left intentionally blank.
This page left intentionally blank.
| |
| | |
LoCorr Macro Strategies Fund LoCorr Long/Short Commodities Strategy Fund LoCorr Market Trend Fund LoCorr Dynamic Equity Fund LoCorr Spectrum Income Fund | |
| | 1.855.523.8637 | www.LoCorrFunds.com |
| | |
| | |
Investment Adviser LoCorr Fund Management, LLC 687 Excelsior Boulevard Excelsior, MN 55331 Administrator, Fund Accountant and Transfer Agent U.S. Bank Global Fund Services, LLC 615 East Michigan Street Milwaukee, WI 53202 Custodian U.S. Bank, N.A. Custody Operations 1555 North RiverCenter Drive, Suite 302 Milwaukee, WI 53212 Independent Registered Public Accounting Firm Cohen & Company, Ltd. 342 North Water Street, Suite 830 Milwaukee, WI 53202 Fund Counsel Thompson Hine LLP 41 South High Street, Suite 1700 Columbus, OH 43215 Distributor Quasar Distributors, LLC 111 East Kilbourn Avenue, Suite 2200 Milwaukee, WI 53202 
| |
| | |
LoCorr Fund Management, LLC 687 Excelsior Boulevard Excelsior, MN 55331 PHONE: 952.513.8195 FAX: 952.767.2926 | |

(b) Not applicable.