UNITED STATES
SECURITIES AND EXCHANGE COMMISSION
Washington, D.C. 20549
FORM N-CSR
CERTIFIED SHAREHOLDER REPORT OF REGISTERED
MANAGEMENT INVESTMENT COMPANIES
Investment Company Act file number 811-22509
LoCorr Investment Trust
(Exact name of registrant as specified in charter)
687 Excelsior Blvd
Excelsior, MN 55331
(Address of principal executive offices) (Zip code)
CT Corporation System
1300 East Ninth Street
Cleveland, OH 44114
(Name and address of agent for service)
952.767.2920
Registrant's telephone number, including area code
Date of fiscal year end: December 31
Date of reporting period: December 31, 2023
Item 1. Reports to Stockholders.
(a) Include a copy of the report transmitted to stockholders pursuant to Rule 30e-1 under the Act (17 CFR 270.30e-1).

Letter to Shareholders
LoCorr Funds seeks to provide investments that, over time, will have low correlation to traditional asset classes such as stocks and bonds. We believe that adding low-correlating investments to a portfolio has the potential to significantly reduce overall portfolio risk while enhancing returns. Correlation measures the degree to which the returns of two investments move together over time. LoCorr offers products that provide the potential for positive returns in rising or falling markets and are designed to generate returns independent of traditional stock, bond and commodity investments. In this report, LoCorr Funds is reporting on five mutual funds: LoCorr Macro Strategies Fund, LoCorr Long/Short Commodities Strategy Fund, LoCorr Market Trend Fund, LoCorr Dynamic Opportunity Fund and LoCorr Spectrum Income Fund (collectively, the “Funds”).
Market Commentary
Investors looked to start 2023 off on the right foot with the hopes for a dovish Federal Reserve (“Fed”) and the possibility of a soft landing. This optimism was challenged at various points during the year as the Fed continued its hawkish posture and relentlessly pushed forward in response to elevated prices and strong underlying economic growth. However, in the latter part of the fourth quarter, investor unease was quickly put in the rear-view mirror as inflation eased, the Fed shifted towards a more dovish stance, and the soft-landing narrative resurfaced in full force.
Many different factors impacted the market’s view on Fed policy during the year, such as the mini-banking crisis, looming U.S. debt ceiling deadline, geopolitical tension, falling inflation, and mixed economic data. Arguably, the most newsworthy of these was March’s epic collapse of Silicon Valley Bank gripping markets and taking the expectation for future rate hikes off the table while sending U.S. Treasury yields lower at an unprecedented pace. However, in the ensuing months as inflation remained sticky and economic growth held up, expectations for rate cuts returned, as interest rates rose to their highest levels in more than 15 years. As inflation data trended downward, the Fed shifted its hawkish posture, signaling its intent for three rate cuts in 2024 which boosted markets, sending both bonds and equities higher. Overall, the Federal Reserve raised the federal funds rate by 25 basis points on four separate occasions during the period, bringing the target rate to 5.25% - 5.50%. These policy rate increases were frontloaded in the year, with the last hike occurring at the July meeting and the FOMC leaving rates unchanged throughout the remainder of 2023 before shifting their posture late in the year.
After a strong start to the year, adding as many as 504,000 jobs in January and registering the lowest unemployment rate since 1968, the U.S. labor market remained resilient throughout 2023, adding jobs in the 100-thousands for a majority of the months. Employment growth was above expectations for much of 2023, pressuring wages and contributing to inflation. While employment has remained resilient, the slowdown in job growth has been welcomed by the Central Bank and contributed to its shift to a more dovish posture in the fourth quarter. The other half of the Fed’s mandate, price stability, which can be proxied by the Core Personal Consumption Index (PCE) continued to fall as the year progressed, but was still up +3.2% year-over-year in November, above the Fed’s target of 2%. While inflation remained modestly elevated relative to the Fed’s target and consumers may be feeling its impact, the speed at which inflation has fallen further supported the aforementioned interest rate pauses and the shift in outlook for 2024.
Equities
Global equity prices rose in 2023. The S&P 500 Index was up +26.29%, though it experienced spells of volatility and weakness. The CBOE Volatility Index, commonly referred to as the market’s fear gauge, notched a high for the year on March 13th of 26.52 as the bank failures and concerns of contagion rippled through financial markets. Since then, the general trend for the Index has been a steady decline, closing the year at 12.45, just above the yearly low of 12.07. Garnering a significant amount of focus in 2023 was the divergence between mega cap technology stocks and the rest of the equity market. The recent artificial intelligence rally fueled a meteoric rise in the NASDAQ Composite, up +44.64% in 2023, yet the Dow Jones Industrial Average was up only +16.18%, over the same period. Global stocks moved in line with U.S. equities as the MSCI World Index rose +23.79%.
Fixed Income
Global bond yields proved volatile in 2023 as investor views shifted during the year with respect to the outlook for inflation, economic growth, and central bank policy. The U.S. 10-year Treasury yield began the year at 3.79% and finished at 3.88%, however, these two data points mask massive volatility. In early March, the 10-Year U.S. Treasury yield bottomed out at 3.30% as the banking crisis caused a collapse before eventually crossing 5% toward the end of October. The aforementioned yearly high and low in yields coincided with the elevated and depressed levels of pessimism surrounding a soft landing. This 2023 low in yields came with eye popping volatility as the backdrop of Fed expectations shifted following the banking failures in mid-March, when the U.S. 2-year Treasury yield posted its largest 3-day decline since 1987. The Bloomberg U.S. Aggregate Bond Index finished the year up +5.53%, with a majority of those gains coming in November and December, up +4.53% and +3.83%, respectively.
Commodities
The Bloomberg Commodity Index fell -7.91% in 2023 with a majority of the losses coming in the first half of the year, down -7.79%, and trending sideways for the remainder of the period, down only -0.14%. The relatively muted performance does not depict the substantial impact of geopolitical events on the Index’s largest sector weighting, oil and oil related products. Instability in the Middle East, U.S. Debt Ceiling concerns, OPEC+ production cuts, and Russian supply uncertainty all contributed to price and volatility swings bringing the price of oil to over $90 per barrel in the fall and as low as $70 just two months later. Periodic strength in the U.S. Dollar, typically a headwind for commodities, hurt the Bloomberg Commodity Index, as seen in May when a +2.5% run up in the Dollar sent the Index lower by -5.64%. Similar to oil markets was natural gas, with prices in the U.S. and Europe falling massively on the back of warmer weather, and more importantly, higher than expected gas storage levels across the globe. To give a sense of the volatility, Dutch TTF Gas Futures, which hit all-time highs in the summer of 2022, at around $277, fell to around $32 by 2023-year end. Agricultural commodities were mixed, as cocoa, coffee, and sugar markets surged as El Nino weather conditions in producing areas pushed prices higher. Wheat and corn prices fell on better-than-expected weather, and a subsequent stronger-than-expected harvest. Metals markets, such as zinc, nickel, and palladium, were quite volatile, falling sharply in the period as speculators and consumers worked to understand the economic growth outlook, particularly Chinese growth, and the subsequent demand for metals. Precious metals fared better than base metals, specifically gold, reaching over $2,000 an ounce following the banking sector issues in March, the dovish Fed policy, falling real rates, and perceived fiscal irresponsibility by the U.S. government.
Foreign Currency
In currency markets, the U.S. Dollar (“USD”) depreciated against a basket of major currencies, falling over -2% in 2023, with a majority of the losses coming in the fourth quarter of the year. We attribute the weakness in the USD, to be related to a dovish Fed and falling real rates. The real interest rate impact was most notable in November and December as the USD fell almost -3% and -2%, respectively. 10-Year real interest rates fell from a high of 2.09% to 1.68%. Adding to the greenbacks weakness was the general shift to risk on as safe-haven securities became undesirable.
LOCORR MACRO STRATEGIES FUND
The LoCorr Macro Strategies Fund (the “Fund”) seeks capital appreciation as its primary investment objective with managing volatility as a secondary objective. The Fund attempts to achieve its objective by investing in two main strategies – a Managed Futures Strategy and a Fixed Income Strategy.
The Fund employs four sub-advisers to oversee the managed futures portion of the Fund:
● | Millburn Ridgefield (“Millburn”) manages a portfolio for the Fund that is similar to its Millburn Diversified Program which commenced operations in 1977. Millburn invests in a diversified portfolio of global futures contracts by employing a systematic, statistical learning-based, multi-factor approach. |
● | Graham Capital Management (“Graham”) manages a portfolio for the Fund that is similar to its Tactical Trend strategy, a systematic medium- to long-term trend following program that commenced trading in 2006. |
● | Revolution Capital Management (“Revolution”) manages a strategy for the Fund that is similar to its Alpha Program that has been available in a managed account program since 2007. Revolution employs a short-term pattern recognition strategy. |
● | R. G. Niederhoffer Capital Management (“RGN”) manages a strategy for the Fund that is similar to its Smart Alpha Program which began trading in 1993 as part of a broader strategy and since 2018 as a stand-alone strategy. RGN employs a short-term oriented systematic behavioral bias capture approach. |
Fund Performance Summary
For the annual period ending December 31, 2023, the Fund was down -6.58% as many of the major market themes experienced violent reversals. The Fund underperformed the -3.86% decline for the Morningstar Systematic Trend Futures category. Trading in fixed income, currencies, energies, and metals were the largest detractors to the Fund’s returns while equity trading was a contributor. Agricultural commodities were not a significant driver of returns. The Mexican Peso, Natural Gas, and TOPIX were the top contributing markets in 2023, while the Euro, Euro Bund, and WTI crude oil were the largest detractors.
The four managed futures sub-advisers had negative returns, to varying degrees, in 2023. The weakest manager was Graham, whose systematic medium- to long-term trend following strategy struggled as significant and persistent trends reversed course sharply at times. While Millburn’s statistical learning-based, multi-factor strategy detracted, it diversified losses from other managers at times, helping to smooth the Fund’s returns. The Fund’s short-term manager allocation was mixed as Revolution underperformed, relative to RGN. This disparity in performance within the same style bucket highlights our focus on diversification and utilizing complementary managers.
Overall, the Fund’s combination of differentiated trading styles and strategies (which tend to zig and zag at different times) has contributed to its strong returns and less volatile return profile than most peers over time.
The target allocation to each sub-adviser at the end of the period was as follows:
● | Millburn Ridgefield: 37.5% |
● | Graham Capital Management: 37.5% |
● | Revolution Capital Management: 15% |
● | R.G. Niederhoffer Capital Management: 10% |
Managed Futures Strategy
Fixed Income
Trading in fixed income produced the largest losses for the Fund, concentrated in longer-term instruments. While the Fund enjoyed profitable trading for a good portion of the year, it was the massive reversal in interest rates occurring in March, the regional banking scare, and the Fed pivot in the fourth quarter, that led to the losses. The Fund’s sub-advisers found these significant and sharp reversals difficult to trade. The Fund held a consistent short posture throughout the year, albeit at varying degrees. The largest losses from individual markets were from short positions in European fixed income instruments including the Euro Bund and Euro Bobl and short exposure in the U.S. sovereign debt market, specifically the 5-Year Treasury bond. Overall, fixed income exposure remained short into the end of the period.
Foreign Currencies
Currency trading was the second largest detractor to Fund performance in the period led by positions in Europe. The largest losses were from short positions in the Euro, British Pound, and Swiss Franc which strengthened significantly versus the USD. Positioning shifted between long and short early in the year before establishing a relatively sizable short FX vs. long USD position in early fall. This short position was neutralized into year end.
Commodities
Commodity markets also provided a difficult trading environment for the Fund’s sub-advisers as choppy price action, specifically in oil markets, negatively impacted performance. The largest losses stemmed from WTI and Brent Crude, as difficult to trade range-bound prices were followed by massive reversals related to aforementioned geopolitical tensions. Despite most energy markets detracting, U.S. Natural Gas contributed, highlighting the benefits of market breadth in the Fund. In agricultural markets, gains from wheat trading were more than offset by losses in soybeans and corn, leading to an overall negative attribution from the sector. Trading in metals was difficult, especially precious metals as gold and silver detracted the most. Base metals trading was not a significant driver of returns during 2023. Similarly, softs did not have a significant impact on yearly performance as gains from sugar and cocoa trading were offset by losses in coffee and cotton. The Fund ended the period with short positions in grains, livestock, and base metals, while energy, precious metals, and softs were positioned long.
Equity Indices
Trading in equity indices contributed to performance as gains from the Fund’s short-term trading and trend strategies offset modest losses in the systematic macro trading strategy. Generally, net equity exposure was long in varying sizes throughout the first half of the year before flipping to a short posture in the fall. This short position was brief as positioning finished the year long, with a focus in Europe and U.S. While most major geographies contributed, performance in Europe, specifically the DAX and Asian markets and most notably the TOPIX, contributed the most.
Outlook
Despite the setback this year, we believe the Fund is positioned well to continue providing beneficial diversification to investors. While diversification is always paramount to a properly constructed asset allocation, the high correlation between stocks and bonds in recent years (0.69 correlation between the S&P 500 Index and Bloomberg U.S. Aggregate Bond Index over the past 3 years) has highlighted the importance of employing additional diversifying strategies. In 2023 for example, the correlation between the S&P 500 and the Bloomberg U.S. Aggregate Bond was an astonishing 0.84 where both indices had the same directional total return move in 9 out of 12 months during the year. While “60/40 asset allocation” purists enjoyed the positive returns from both stocks and bonds this year, when two asset classes are this highly correlated, they also have the potential to be out-of-favor concurrently. That was the case in 2022 when both stocks and bonds both fell significantly, providing a painful reminder that a lack of diversification can be very detrimental for clients.
As we look forward, we remain optimistic regarding the outlook for the Fund. While the Fed has communicated its intent to reduce interest rates in 2024, we do not believe there will be a return to a zero-interest rate policy which persisted for much of the post-Global Financial Crisis period. If the Fed does reduce rates, the Fund may benefit as rate cuts have the potential to create powerful and persistent trends – not just in fixed income markets, but also in other asset classes. One of the challenges in 2023 was market participant expectations whipsawing rapidly with respect to the outlook for interest rates and economic growth. As the Fed has now communicated its expectations/outlook and market participants have had more time to digest the state of the economy, we believe there may be fewer rapid shifts in macro views like we saw in 2023. We believe this stability will be beneficial to macro-oriented strategies like the Macro Strategies Fund.
Fixed Income Strategy
The Fund invests a portion of its assets in a Fixed Income Strategy comprised of high quality, short- to intermediate-term investment grade corporate (“IG”) and government agency securities managed by Nuveen Asset Management (“Nuveen”) and a short duration laddered treasury portfolio.
The fixed income component of the Fund is managed against the Bloomberg 1-5 Government Credit Index. Returns for the fixed income portion of the portfolio were up +5.61% compared to up +4.89% for the benchmark in 2023. The duration of the fixed income component of the Fund was managed between 1.6 and 1.9 years during the period compared to about 2.6 years for the benchmark. The short duration and yield curve positioning had a positive impact on performance. The Nuveen fixed income allocation was between 20-22% in investment grade corporate bonds and 25-30% in high quality, short duration securitized sectors. The portfolio maintained broad corporate bond diversification with an overweight to financials. Given that spreads for non-government securities tightened, the Fund’s sector strategy was a positive contributor during the period.
Nuveen maintained an underweight in duration during the period as the Fed remained focused on getting inflation down to its target. As such, duration positioning had a positive impact on relative performance versus the respective benchmark as interest rates rose. Nuveen remained overweight to non-government sectors, which was a positive contributor to performance. These sectors were positively impacted by tightening spreads during the period. Overall, the positioning resulted in the fixed income allocation to outperform its respective benchmark.
Nuveen continues to expect growth to moderate, to a below trend pace. Although the risks of a recession in the U.S. and Europe later this year remain, the magnitude of any downturn should be mild by historical standards. Job growth, which has begun to decelerate, will likely continue to do so in coming quarters. Inflation appears to have peaked but will remain high relative to central bank targets during 2024. Nuveen believes the Fed is done hiking and now anticipates rate cuts of 150 bps by end of 2024. Given the Fed outlook and expectations for incoming economic data, the manager expects to move the portfolio’s duration towards a neutral setting versus the benchmark.
LOCORR LONG/SHORT COMMODITIES STRATEGY FUND
The LoCorr Long/Short Commodities Strategy Fund (the “Long/Short Commodities Fund” or the “Fund”) provides investors with access to a commodities futures strategy in a mutual fund structure. Historically, investors have primarily accessed exposure to long-only commodities which rely on rising commodity prices to generate positive returns. Of course, commodity prices do not always appreciate and occasionally experience sharp declines, as was seen in 2020, 2018, 2014/2015 and 2008. The Long/Short Commodities Fund has the potential to profit whether commodity prices increase or decrease, which differentiates it from most commodity-oriented mutual funds. The Fund’s primary investment objective is capital appreciation in rising and falling commodities markets. The Fund attempts to achieve its investment objective by investing in two primary strategies – a Commodities Strategy and a Fixed Income Strategy. The Fund accesses, via a total return swap agreement and a commodity pool, the returns of:
● | ARCOM Capital (“ARCOM”), which began trading in 2015. ARCOM is led by Alastair Riach, who has over 30 years of experience trading commodities, and manages a discretionary natural gas specialist strategy that trades primarily relative value. |
● | East X, which was founded in 2017 and manages a strategy that traces its roots back to 2014. East Alpha manages a systematic approach that combines fundamental insights gleaned from discretionary traders with pattern recognition technique in a rigorous systematic framework. The portfolio will hold long/short directional, relative value (inter-market), and structural (calendar spread) positions. |
● | Systematica’s Commodities Long/Short strategy (“Systematica”), which began trading in 2010. Systematica employs a systematic long/short directional strategy that attempts to capture commercial market participant behavior across 20+ commodity markets. |
● | J E Moody & Company’s Commodity Relative Value Program (“JEM CRV”), which began trading in 2006. JEM CRV employs a market neutral, systematic trading strategy that invests in relative value calendar spread and inter-market positions across 20+ commodity markets. |
● | Millburn Ridgefield, which is the successor firm to an organization that was established in 1971. The firm began trading dedicated long/short commodity programs beginning in 2005. Millburn employs a systematic trading strategy that takes primarily outright long/short and relative value spread positions across 40+ commodity markets. |
● | CoreCommodity, which began trading their current strategy in 2017 but traces its roots back to the firm’s inception in 2003. CoreCommodity manages a discretionary approach based on a microeconomic analysis centered on four dimensions; quantitative, fundamental, market dynamics, and manager discretion. The portfolio will hold long/short directional, relative value (inter-market), and structural (calendar spread) positions. |
Overall, the Bloomberg Commodity Index decreased -7.91% in 2023, with a majority of the losses coming in the first half of the year, down -7.79%, and trending sideways for the remainder of the period, down only -0.14%. Periodic strength in the U.S. Dollar, typically a headwind for commodities, hurt the Bloomberg Commodity Index, as seen in May when a +2.62% run up in the Dollar sent the Index lower by -5.64%.
In energy markets, oil prices, as measured by West Texas Intermediate crude (“WTI”), fell -1.97%. The relatively muted performance does not depict the substantial price and volatility swings in the second half of the year resulting from instability in the Middle East, U.S. Debt Ceiling concerns, OPEC+ production cuts, and Russian supply uncertainty, which brought the price of oil to over $90 per barrel in the fall and as low as $70 just two months later. Similar to oil markets was natural gas, with prices in the U.S. and Europe falling massively on the back of warmer weather, and more importantly, higher-than-expected gas storage levels across the globe. To give a sense of the volatility, Dutch TTF Gas Futures, which hit all-time highs in the summer of 2022, at around $277, fell to around $32 by 2023-year end. U.S. natural gas prices also fell -65.31% over the course of the year.
Within metals markets, industrial metals prices were especially volatile in the first half of the year, falling sharply as speculators and consumers worked to understand the economic growth outlook, particularly Chinese growth and the subsequent demand for metals. While the industrial metals sector fell -9.15% in 2023, metals such as nickel fell much further, dropping -44.40% over the same period. Precious metals fared better than industrial metals, rising +9.64% over the year. Gold was a large reason for this, closing the year up +12.82%, with prices reaching over $2,000 an ounce following the banking sector issues in March, the dovish Fed policy, falling real rates, and perceived fiscal irresponsibility by the U.S. government.
Agricultural commodities were mixed in 2023. The softs sector rose +18.53% with commodities such as cocoa, cotton, and sugar surging +69.30%, +25.11%, and +19.40%, respectively, as El Nino weather conditions in producing areas pushed prices higher. The markets within the livestock sector diverged, as prices for lean hogs fell -21.94%, while live cattle prices rose +10.50% over the period. The grains sector fell -13.01%, as better-than-expected weather and a subsequent stronger-than-expected harvest, caused wheat and corn prices to drop -26.45% and -17.60%, respectively.
Fund Performance Summary
The Fund’s Class I share fell -3.07% during the year ended December 31, 2023, versus the -7.91% return for the Bloomberg Commodity Total Return Index and the +5.03% gain for the ICE BofAML 3M T-Bill Index. The Fund also outperformed the Morningstar Systematic Trend category by +1.24% in 2023. Although the Fund produced a negative absolute return for the year, we are pleased that it continued to provide low-correlating returns to traditional markets and outperformed the negative returns by the long-only commodity index. ARCOM stood out this year as the Fund’s top performing manager, followed by
Systematica and JE Moody. CoreCommodity, Millburn, and EastX each had a more difficult year, particularly in the energy sector. Trading in metals was the largest driver of the Fund’s negative return, followed by energy and grains. The Fund had modest losses from trading in livestock and commodity equities, while softs was not a significant performance driver.
Metals
Trading in metals was the largest detractor to Fund performance in 2023, with losses coming mainly from industrial metals. As mentioned previously, the first half of the year was especially difficult for industrial metals, so despite having relatively small positions in these markets, large price swings ended up causing disproportionate losses. The most significant of these losses came from nickel, copper, and aluminum. Within precious metals, the Fund finished the year essentially flat, as gains in silver and palladium positions were almost entirely offset by losses in gold and platinum. At the end of 2023, the Fund had long exposure to both industrial metals and precious metals.
Agricultural
Trading in agricultural commodities was also a drag on Fund performance in 2023. Within the grains sector, corn and soybean were the largest detractors over the annual period. Short exposure to both soybean and its further refined product, soybean oil, drove losses primarily in June, when these markets spiked +18.60% and +33.38%, respectively. Modest short exposure to cocoa also hurt the Fund, as the market surged +69.30%. Trading in sugar was quite profitable for the Fund throughout 2023, particularly from long positions in March and April when sugar prices rallied +35.93%, and then pivoting to be short in December when prices reversed -20.63%. The Fund finished 2023 with short exposure in grains, softs, and livestock.
Energy
Trading in energy also detracted from Fund performance during the period. Brent crude oil turned out to be the most difficult market to trade, due to the aforementioned geopolitical events causing large and sudden price and volatility swings. The Fund also had losses from long positions in European power markets, as prices fell due to milder-than-expected weather and high natural gas storage levels. Natural gas itself, however, provided significant gains to the Fund, helping offset much of the losses from the energy sector. The Fund finished 2023 with long exposure in oil & oil products, while natural gas and power markets were positioned short.
Outlook
While diversification is always paramount to a properly constructed asset allocation, the high correlation between stocks and bonds in recent years (0.69 correlation between the S&P 500 and Bloomberg U.S. Aggregate Bond over the past 3 years) has highlighted the importance of employing additional diversifying strategies. In 2023 for example, the correlation between the S&P 500 and the Bloomberg U.S. Aggregate Bond was an astonishing 0.84 where both indices had the same directional total return move in 9 out of 12 months during the year. While “60/40 asset allocation” purists enjoyed the positive returns from both stocks and bonds this year, when two asset classes are this highly correlated, they also have the potential to be out-of-favor concurrently. That was the case in 2022 when both stocks and bonds both fell significantly, providing a painful reminder that a lack of diversification can be very detrimental for clients.
As we look forward, we remain optimistic regarding the outlook for the Fund. We expect robust market opportunities in the commodity markets that the Fund may take advantage of. We believe the Fund may be highly attractive to investors seeking uncorrelated solutions to most investment strategies and asset classes, or for investors seeking alternatives in the commodity market. Commodity markets are generally characterized by high volatility and sizable drawdowns. This volatility may create tremendous opportunities which we believe the Fund can take advantage of. The underlying managers in the Fund can take both long and short directional positions (benefit from prices moving up or down), as well as relative value positions (calendar, geographic, and inter-market spreads) to capture this diverse and robust set of opportunities over time, making it a potentially ideal solution regardless of the market environment for commodities. Finally, the Fund’s multi-manager approach has the potential to smooth the ride as the underlying managers tend to zig and zag at different times which may help reduce volatility and limit drawdowns. We remain confident in the outlook for the Fund and the underlying managers and strategies.
Fixed Income Strategy
The Fund invests a portion of its remaining assets in a Fixed Income Strategy comprised of high quality, short- to intermediate- term investment grade corporate (“IG”) and government agency securities managed by Nuveen and a short duration laddered Treasury portfolio.
The fixed income component of the Fund is managed against the Bloomberg 1-5 Government Credit Index. Returns for the fixed income portion of the portfolio were +5.70% compared to +4.89% for the benchmark in 2023. The duration of the fixed income component of the Fund was managed between 1.6 and 1.9 years during the period compared to about 2.6 years
for the benchmark. The short duration and yield curve positioning had a positive impact on performance. The Nuveen fixed income allocation was between 20-22% in investment grade corporate bonds and 25-30% in high quality, short duration securitized sectors. The portfolio maintained broad corporate bond diversification with an overweight to financials. Given that spreads for non-government securities tightened, the Fund’s sector strategy was a positive contributor during the reporting period.
Nuveen maintained an underweight in duration during the period as the Fed remained focused on getting inflation down to its target. As such, duration positioning had a positive impact on relative performance versus the respective benchmark as interest rates rose. Nuveen remained overweight to non-government sectors, which was a positive contributor to performance. These sectors were positively impacted by tightening spreads during the period. Overall, the positioning resulted in the fixed income allocation to outperform its respective benchmark.
Nuveen continues to expect growth to moderate, to a below trend pace. Although the risks of a recession in the U.S. and Europe later this year remain, the magnitude of any downturn should be mild by historical standards. Job growth, which has begun to decelerate, will likely continue to do so in coming quarters. Inflation appears to have peaked but will remain high relative to central bank targets during 2024. Nuveen believes the Fed is done hiking and now anticipates rate cuts of 150 bps by end of 2024. Given the Fed outlook and expectations for incoming economic data, the manager expects to move the portfolio’s duration towards a neutral setting versus the benchmark.
LOCORR MARKET TREND FUND
The LoCorr Market Trend Fund (the “Market Trend Fund” or the “Fund”) was created to provide investors with access to a trend-following futures strategy managed by one of the leading managers in this space—Graham Capital Management. Graham was founded in 1994 and manages approximately $17.5 billion in assets. The Market Trend Strategy is managed similarly to Graham’s Tactical Trend program, a systematic medium- to long-term trend following strategy that commenced trading in 2006. The Fund seeks capital appreciation as its primary investment objective with managing volatility as a secondary objective. The Fund attempts to achieve its objective by investing in two main strategies – a Managed Futures Strategy and a Fixed Income Strategy.
Fund Performance Commentary
For the year ended December 31, 2023, the Fund was down -14.38% as many of the major market themes experienced violent reversals in the fourth quarter. The Fund underperformed the -3.86% decline for the Morningstar Systematic Trend Futures category. Trading in fixed income currencies, metals, energy, and agricultural commodities was the largest detractor to the Fund’s returns while equity trading was a contributor. The Mexican Peso, TOPIX, and Nikkei were the top contributing markets in 2023, while silver, Swiss Franc, and the Australian 10-Year Bond were the largest detractors.
Market Trend Strategy
Fixed Income
Trading in fixed income produced the largest losses for the Fund, concentrated in longer-term instruments. While the Fund enjoyed profitable trading for a good portion of the year, it was the massive reversal in interest rates occurring in March, the regional banking scare, and the Fed pivot in the fourth quarter, that led to the losses. The Fund’s sub-adviser found these significant and sharp reversals difficult to trade. The Fund held a consistent short posture throughout the year, albeit at varying degrees. The largest losses from individual markets were from short positions in European fixed income instruments including the Euro Bund and Euro Bobl and short exposure in the Australian sovereign debt market, specifically the 10-Year Treasury bond. Overall, fixed income exposure remained short into the end of the period.
Foreign Currencies
Currency trading was the second largest detractor to Fund performance in the period led by positions in Europe. The largest losses were from short positions in the Swiss Franc and Euro which strengthened significantly versus the U.S. Dollar (“USD”). Positioning shifted between long and short early in the year before establishing a relatively sizable short FX vs long USD position in early fall. This short position was neutralized into year end.
Commodities
Commodity markets also provided a difficult trading environment as choppy price action, specifically in oil markets, negatively impacted returns. The largest losses within the energy complex stemmed from WTI and Brent Crude, as difficult to trade, range-bound prices were followed by massive price swings related to aforementioned geopolitical tensions. Despite most energy markets detracting, U.S. Natural Gas contributed, highlighting the benefits of market breadth in the Fund. In
agricultural markets, gains from wheat trading were more than offset by losses in soybeans and corn, leading to an overall negative attribution from the sector. Trading in metals was difficult, especially precious metals as gold and silver detracted the most. Base metals trading detracted with losses spread evenly across copper, aluminum, and zinc. Similarly, softs did not have a significant impact on yearly performance as gains from sugar and cocoa trading were offset by losses in coffee and cotton. The Fund ended the period with short positions in grains, energy, and base metals, while precious metals, and softs were positioned long.
Equity Indices
Trading in equity indices contributed positively. Generally, net equity exposure was long in varying sizes throughout the first half of the year before flipping to a modest short posture in the fall. This short position was brief as positioning soon reversed and finished the year long, with a focus in Europe and U.S. While Asian and European indices were positive contributors, specifically the TOPIX and Nikkei, performance in the U.S. was muted as losses in the Russell 2000 offset gains in the S&P 500.
Outlook
Despite the setback this year, we believe the Fund is positioned well to continue providing beneficial diversification to investors. While diversification is always paramount to a properly constructed asset allocation, the high correlation between stocks and bonds in recent years (0.69 correlation between the S&P 500 and Bloomberg U.S. Aggregate Bond Index over the past 3 years) has highlighted the importance of employing additional diversifying strategies. In 2023 for example, the correlation between the S&P 500 and the Bloomberg U.S. Aggregate Bond Index was an astonishing 0.84 where both indices had the same directional total return move in nine out of twelve months during the year. While “60/40 asset allocation” purists enjoyed the positive returns from both stocks and bonds this year, when two asset classes are this highly correlated, they also have the potential to be out-of-favor concurrently. That was the case in 2022 when both stocks and bonds both fell significantly, providing a painful reminder that a lack of diversification can be very detrimental for clients.
As we look forward, we remain optimistic regarding the outlook for the Fund. While the Fed has communicated its intent to reduce interest rates in 2024, we do not believe there will be a return to a zero-interest rate policy which persisted for much of the post-Global Financial Crisis period. If the Fed does in fact reduce rates, the Fund may benefit as rate cuts have the potential to create powerful and persistent trends - not just in fixed income markets, but also in other asset classes. One of the challenges in 2023 was market participant expectations whipsawing rapidly with respect to the outlook for interest rates and economic growth. As the Fed has now communicated its expectations/outlook and market participants have had more time to digest the state of the economy, we believe there may be fewer rapid shifts in macro views like we saw in 2023. We believe this stability will be beneficial to macro-oriented strategies like the Market Trend Fund.
Fixed Income Strategy
The Fund invests a portion of its assets in a Fixed Income Strategy comprised of high quality, short to intermediate term investment grade corporate (“IG”) and government agency securities managed by Nuveen and a short duration laddered treasury portfolio.
The fixed income component of the Fund is managed against the Bloomberg 1-5 Government Credit Index. Returns for the fixed income portion of the portfolio were up +5.55% compared to up +4.89% for the benchmark in 2023. The duration of the fixed income component of the Fund was managed between 1.6 and 1.9 years during the period compared to about 2.6 years for the benchmark. The short duration and yield curve positioning had a positive impact on performance. The Nuveen fixed income allocation was between 20-22% in investment grade corporate bonds and 25-30% in high quality, short duration securitized sectors. The portfolio maintained broad corporate bond diversification with an overweight to financials. Given that spreads for non-government securities tightened, the Fund’s sector strategy was a positive contributor during the period.
Nuveen maintained an underweight in duration during the period as the Fed remained focused on getting inflation down to its target. As such, duration positioning had a positive impact on relative performance versus the respective benchmark as interest rates rose. Nuveen remained overweight to non-government sectors, which was a positive contributor to performance. These sectors were positively impacted by tightening spreads during the year. Overall, the positioning resulted in the fixed income allocation outperforming its respective benchmark.
Nuveen expects growth to continue to moderate, to a below trend pace. Although the risks of a recession in the U.S. and Europe later this year remain, the magnitude of any downturn should be mild by historical standards. Job growth, which has begun to decelerate, will likely continue to do so in coming quarters. Inflation appears to have peaked but will remain high relative to central bank targets during 2024. Nuveen believes the Fed is done hiking and now anticipates rate cuts of 150 bps by end of 2024. Given the Fed outlook and expectations for incoming economic data, Nuveen expects to move the portfolio’s duration towards a more neutral setting versus the benchmark.
LOCORR DYNAMIC OPPORTUNITY FUND
The LoCorr Dynamic Opportunity Fund (the “Fund”) seeks long-term capital appreciation with reduced volatility compared to traditional broad-based equity market indices as a secondary objective. Consistent with the “low correlation” our LoCorr Fund family seeks, long/short equity funds have the ability to provide positive returns when equity markets are rising, yet they offer the potential for profits when equity prices are falling.
The Fund employs two sub-advisers to manage the long/short equity strategy:
● | Kettle Hill Capital Management (“Kettle Hill”) seeks to generate alpha by combining a bottom-up, fundamental analysis with a top-down opportunistic overlay. Investing primarily in small cap securities, Kettle Hill targets a conservative net exposure to the market. The portfolio managed by Kettle Hill is similar to a strategy that this manager has executed since its inception in 2003. |
● | Millrace Asset Group (“Millrace”) employs a bottom-up fundamental investment philosophy. The team focuses on identifying high growth businesses in the relatively inefficient micro- to small-cap segment of the market. The portfolio managed by Millrace is similar to a long/short strategy that this manager has executed since 2002. |
Eight of the eleven S&P 500 sectors made gains in 2023 led by Technology, which was up +56.13%, and Communication Services, up +53.04%. The Utilities sector was the only sector that was down more than -1%, declining -7.08%. In June, the dispersion between valuations of the S&P 500 Index and Russell 2000 Index reached the highest level in over 20 years as measured by P/E (price-earnings ratio) as the S&P 500 was trading at 22.84x earnings while the Russell 2000 traded below 11.50x earnings. Fears of rising inflation and interest rates weighed on the stock prices of smaller market cap companies while mega cap stocks experienced a sharp rally. This trend persisted until Q4 when the inflation picture began to look less murky, and the Fed began talks about pausing their hiking cycle and easing in 2024.
Portfolio Update
The Fund (I share class) finished the year in positive territory, up +3.44%, underperforming the Morningstar Long/Short Fund category which closed up +9.94%. The Fund’s small cap bias was a headwind during the period as the Russell 2000 finished 2023 up +16.93% versus the +26.29% gain for the S&P 500. The dispersion between large and small market cap stocks was also present further down the spectrum as the Russell Micro Cap Index trailed the Russell 2000 and S&P 500 by -7.60% and -16.96%, respectively.
The Fund’s two sub-advisers performed very differently throughout 2023, mainly due to the market cap skews of each manager. Kettle Hill performed in line with the Russell 2000 with an average net exposure of around 30%. While having a small cap bias, this manager’s ability to opportunistically navigate up and down the market cap spectrum proved to be a significant advantage this year. Millrace, on the other hand, has historically skewed toward small- and micro-cap stocks and finished the year with a modest loss largely due to the wide performance dispersion between large and small cap stocks. However, this manager finished the last two months of the year with performance on par with the Russell 2000, with an average net exposure below 50%, providing us with tremendous optimism heading into 2024.
The Fund’s long book was a positive contributor in 2023 as both the Russell 2000 and S&P 500 posted gains in three of the four quarters in the year. The strongest performers were from the Healthcare, Communication Services, and Financial Services sectors. Within Healthcare, Augmedix (0.43% of the Fund as of 12/31/2023), an automated medical documentation and data services provider, soared more than +175% after securing financing that the company believes will enable it to achieve positive cash flow. Within the Communication Services sector, Pinterest (1.42% of the Fund as of 12/31/2023), an image sharing and social media service, gained +19% in a single day after reporting a revenue and earnings beat. The stock was also upgraded by BofA Securities following the report. Within the Financial Services sector, Robinhood Markets (0.47% of the Fund as of 12/31/2023), an app-based commission-free brokerage software, traded higher after posting strong earnings and launching 24-hour stock trading services. In the Technology sector, SentinelOne (0.46% of the Fund as of 12/31/2023), a cybersecurity company, traded higher after posting better-than-expected Q3 earnings results. Offsetting these gains were losses in the Healthcare and Consumer Defensive sectors. In the Healthcare Services sector, a position in Neuronetics (0.73% of the Fund as of 12/31/2023), a healthcare company that develops non-invasive treatments for psychiatric disorders, detracted after reporting an earnings loss for 4Q22 in the first quarter. In the Consumer Defensive sector, a position that has since been exited in The Real Good Food Company (0.00% of the Fund as of 12/31/2023), a frozen food company, traded lower after the founder sold shares.
The Fund’s short book saw negative contributions from the general upward movement in risk assets in 2023. The largest winner was a short position in Dollar General (-0.27% of the Fund as of 12/31/2023), a discount variety store chain, as the stock price declined following a disappointing earnings report. In the Consumer Cyclical sector, a short position in Crocs (-0.29% of the Fund as of 12/31/2023), a footwear company, was a positive contributor after the stock sold off after issuing weak
guidance and reporting slower-than-expected sales growth. The Fund saw several detractors from its short book. The largest of which was an opportunistic short position that has since been exited in Meta Platforms (0.00% of the Fund as of 12/31/2023), a multinational technology conglomerate, detracted as the stock rallied with the general move upward in technology and communication services stocks in Q1.
Outlook
As we look forward, we remain optimistic regarding the outlook for the Fund. While the Fed has communicated its intent to reduce interest rates in 2024, we do not believe there will be a return to a zero-interest rate policy which has persisted for much of the post-Global Financial Crisis period. If the Fed does in fact cut rates, however, we believe it could create a strong tailwind for the small- and micro-cap companies that have been neglected during the hiking cycle. We also believe the Fund is better positioned to take advantage of this tailwind than most other funds in the category due to its inherent bias to these small- and micro- cap companies.
Although the inflation picture looks less bleak and the Federal Reserve has paused its hiking program and communicated its intention to cut rates in 2024, the conflict in the Middle East, an upcoming U.S. election, and other global uncertainties could cause turbulence in the equity markets in 2024. Amid this uncertainty, a long/short equity strategy may allow for continued participation in rising equity markets while the strategy’s hedged approach and ability to benefit from falling stock prices could mitigate losses if equities were to sell off. We remain highly confident in the ability of the Fund to provide positive absolute returns and compelling diversification for investors.
LOCORR SPECTRUM INCOME FUND
The LoCorr Spectrum Income Fund (the “Spectrum Income Fund” or the “Fund”) has an objective of current income with capital appreciation as a secondary objective. The Fund is designed to fit within the “low correlation” of the LoCorr Fund family by seeking to provide relatively high levels of income with low correlation to the bond market. The Fund is sub-advised by Bramshill Investments (“Bramshill”). Bramshill invests in a portfolio of primarily pass-through securities with an integrated covered call and hedging strategy. Bramshill seeks to generate high current income, much of which the Fund distributes monthly to investors.
Portfolio Update
The Fund’s Class I shares were up +2.02% in 2023, underperforming the +5.53% return for the Bloomberg U.S. Aggregate Bond Index. The sectors with the largest contributions to Fund performance were Master Limited Partnerships (“MLPs”), preferred equity securities, Business Development Companies (“BDCs”), and Mortgage Real Estate Investment Trusts (“mREITs”). Also contributing, was a modest allocation to Closed End Funds (“CEFs”). The C-Corps sector was the largest detractor in 2023, followed by very modest losses from Royalty Trusts, Equity Real Estate Investment Trusts (“REITs”), and Publicly Traded Partnerships (“PTPs”). While the Fund’s call writing strategy provided income, losses from the opportunistic hedging strategy outweighed those gains. Early in 2023, Bramshill maintained a defensive posture but eventually pivoted when the fears of an imminent recession faded.
The Master Limited Partnerships sector continued to build upon strong performance over the past couple of years, rising +26.56% in 2023, and annualizing at +32.43% over the past three years, as measured by the Alerian MLP Index. Despite the strong run in MLPs, Bramshill notes that midstream companies have a long way to go before getting back to levels seen before the disastrous 2015-2020 period. Bramshill would also highlight the fact that most companies are in a better financial position now, having paid down debt, bought back shares, and exhibit disciplined spending. The largest contributor to the Fund within this sector was Energy Transfer (their MLP security was 2.98% of the Fund and various Preferred yield securities were 3.33% of the Fund as of 12/31/23), a midstream MLP, which benefited from the acquisition of Crestwood Equity Partners. Also contributing was Magellan Midstream (0.00% of the Fund as of 12/31/23), a midstream MLP, which received a takeover offer from ONEOK and which Bramshill sold into strength. Also contributing was USA Compression Partners (0.89% of the Fund as of 12/31/23), a midstream MLP, which rallied after inclusion in the Alerian MLP Infrastructure Index, and increased demand for natural gas compression.
Business Development Companies, which rose +26.88% in 2023, as measured by the MVIS U.S. Business Development Companies Index, was a significant contributor to the Fund. Over the course of the year, Bramshill increased exposure to BDCs as the widely feared recession never materialized.
Equity Real Estate Investment Trusts rose +11.96% in 2023, as measured by the MSCI U.S. IMI Real Estate 25/50 Index. REITs faced headwinds in a rapidly rising rate environment, so when the Fed signaled that rates may not be rising further, the sector rallied. This rally near the end of the year boosted Fund performance in the sector, ultimately closing the year very modestly negative. The largest detractor from the Fund from the REITs sector was W.P. Carey (0.00% of the Fund as of 12/31/23),
which sold off on plans to spin off its office portfolio into a separately traded REIT that was not well-received by the market. Mortgage REITs (“mREITs”), as measured by the FTSE Nareit Mortgage REITs Index, rose +15.35%. Bramshill increased exposure to mREIT equities and preferred equity securities when the Fed signaled its pause.
In C-Corps, Bramshill initially focused on stocks with defensive characteristics, such as utilities and staples, due to recession fears brought on by deteriorating economic fundamentals. However, Bramshill did not anticipate the level of government stimulus still propping up the system, which benefited consumer demand and gave rise to the goldilocks “no landing” narrative. They also maintained holdings with macro tailwinds like renewables and precious metal producers. The largest detractor to the Fund in 2023 was Icahn Enterprises (0.00% of the Fund as of 12/31/23), which sold off on the release of Hindenburg’s bear report, the merits of which Bramshill finds debatable, but nonetheless led the team to sell their position due to headline risk. Also detracting from the Fund was NextEra Energy Partners (1.07% of the Fund as of 12/31/23), a renewable energy C-Corp, which sold off sharply after reducing its distribution growth forecast due to higher rates.
Outlook
Given the surprising ability of fiscal and monetary policy to maintain overall stability in the economy, combined with the striking volatility of securities market reactions, it appears humility is in order when discussing the future. That said, Bramshill’s evaluation of the most recent data and credible predictions suggests that we will see a slowing real economy and inflation combined with lower policy rates in 2024, though the magnitude and timing of these developments are difficult to predict. Systemic financial risks are always present, though the Fed has been up to the task of preventing worst case outcomes, at least recently. If this environment (probably with a weakening dollar) emerges, the greatest risk seems likely to be to company earnings, rather than securities’ valuation. In that context, Bramshill has high confidence in the sustainability of high cash flows and distributions in the portfolio, as well as its ability to weather most types of financial risk, particularly any overseas developments. When a new liquidity cycle emerges, we believe our current portfolio is ready to participate fully and Bramshill stands ready to increase exposure to any emerging trends which appear sustainable.
Thank you for investing in the LoCorr Funds.
The S&P 500 Index is a broad-based unmanaged index of 500 stocks, which is widely recognized as representative of the equity market in general. Consumer Price Index measures the variation in prices paid by typical consumers for retail goods and other items. The Barclays U.S. Government/Credit 1-5 Year Index is an index of all investment grade bonds with maturities of more than one year and less than 5 years. MSCI EAFE Index was designed to measure the equity market performance of developed markets outside of the U.S. & Canada. BOBL futures contract is a standardized futures contract based on a basket of medium-term debt issued by the German Federal Government. BOBL is an acronym for a German term, Bundes obligation, which translated to English is federal government bond. Bund is a debt instrument issued by Germany’s federal government to finance outgoing expenditures. Bunds, German for “bonds”, are widely viewed as the German equivalent of U.S. Treasury bonds (T-bonds). VIX - Chicago Board Options Exchange (CBOE), the Volatility Index, or VIX, is a real-time market index that represents the market’s expectation of 30-day forward-looking volatility. Derived from the price inputs of the S&P 500 index options, it provides a measure of market risk and investors’ sentiments. It is also known by other names like “Fear Gauge” or “Fear Index.” Investors, research analysts and portfolio managers look to VIX values as a way to measure market risk, fear and stress before they take investment decisions. ICE BofAML 3-M T-Bill Index tracks the performance of the U.S. dollar denominated U.S. Treasury Bills publicly issued in the U.S. domestic market with a remaining term to final maturity of less than 3 months. Morningstar Managed Futures Category is an average monthly return of all funds in the Morningstar Managed Futures Category. These funds typically take long and short positions in futures options, swaps, and foreign exchange contracts, both listed and over the counter, based on market trends or momentum. (A long position is a bet an investment will gain in value, while a short position is a bet that an investment will decline in value.) A majority of these funds follow trend-following, price-momentum strategies. Other strategies included in this category are systematic mean-reversion, discretionary global macro strategies, commodity index tracking, and other futures strategies. More than 60% of these funds’ exposure is invested through derivative securities. TOPIX Index (Tokyo Stock Price Index) is an important stock market index for the Tokyo Stock Exchange (TSE) in Japan, tracking all domestic companies of the exchange’s First Section. Dow Jones EURO STOXX 50 Index is a market capitalization-weighted stock index of 50 large, blue-chip European companies operating within eurozone nations. Bloomberg Commodity Index is a broadly diversified commodity price index distributed by Bloomberg Indexes. The index was originally launched in 1998 as the Dow Jones-AIG Commodity Index and renamed to Dow Jones-UBS Commodity Index in 2009, when UBS acquired the index from AIG. SG Trend Index is a subset of the SG CTA Index and follows traders of trend following methodologies. The SG CTA Index is equal weighted, calculates the daily rate of return for a pool of CTAs selected from the larger managers that are open to new investment. Morningstar Long/Short Equity Category is an average monthly return of all funds in the Morningstar Long-Short Equity Category. The category contains a universe of funds with similar investment objectives and investment style, as defined by Morningstar. Performance of the indices and Morningstar Category Average is generated on the first business day of the month. Bloomberg Barclays U.S. Aggregate Bond Index is a broad-based bond index comprised of government, corporate, mortgage and asset-back issues rated investment grade or higher. West Texas Intermediate is a crude oil that serves as one of the main global oil benchmarks. It is sourced primarily from Texas and is one of the highest quality oils in the world, which is easy to refine. WTI is the underlying commodity for the NYMEX’s oil futures contract. One cannot invest directly in an index. Reformulated Gasoline Blendstock for Oxygen Blending (RBOB) is the term given to unleaded gas futures.
Please refer to the Schedule of Investments in this report for full holdings information. Fund holdings and sector allocations are subject to change and should not be considered recommendations to buy or sell any security.
Alpha is an annualized return measure of how much better or worse a fund’s performance is relative to an index of funds in the same category, after allowing for differences in risk. Basis Points (bps) - A unit that is equal to 1/100th of 1% and is used to denote the change in a financial
instrument. The basis point is commonly used for calculating changes in interest rates, equity indexes and the yield of a fixed-income security. Beta measures the sensitivity of a stock’s return relative to the return of a selected market index. When beta is greater than one, it means a stock will rise or fall more than the market. Cash Flows refers to a company’s free cash flow which is a measure of how much cash a business generates after capital expenditures Duration is a commonly used measure of the potential volatility of the price of a debt security, or the aggregate market value of a portfolio of debt securities, prior to maturity. Securities with a longer duration generally have more volatile prices than securities of comparable quality with a shorter duration. Investment Grade refers to bonds that are rated BBB or higher. Bond ratings are grades given to bonds that indicate their credit quality as determined by private independent rating services such as Standard & Poor’s, Moody’s and Fitch. These firms evaluate a bond issuer’s financial strength, or its ability to pay a bond’s principal and interest in a timely fashion. Ratings are expressed as letters ranging from ‘AAA’, which is the highest grade, to ‘D’, which is the lowest grade. Spread is the percentage point difference between yields of various classes of bonds compared to treasury bonds. Calendar spread is an options or futures spread established by simultaneously entering a long and short position on the same underlying asset at the same strike price but with different delivery months. It is sometimes referred to as an inter-delivery, intra-market, time, or horizontal spread. Yield Curve is a line that plots the interest rates, at a set point in time, of bonds having equal credit quality, but differing maturity dates. The most frequently reported yield curve compares the three-month, two-year, five-year and 30-year U.S. Treasury debt. The curve is used to predict changes in economic output and growth.
Must be preceded or accompanied by a prospectus.
Opinions expressed are those of the Investment Manager and are subject to change, are not guaranteed and should not be considered investment advice.
Earnings growth is not representative of the Funds’ future performance.
Past performance is not a guarantee of future results.
Diversification does not assure a profit nor protect against loss in a declining market.
Mutual fund investing involves risk. Principal loss is possible. LoCorr Macro Strategies Fund, LoCorr Long/Short Commodities Strategy Fund, LoCorr Market Trend Fund, LoCorr Dynamic Equity Fund and LoCorr Spectrum Income Fund are diversified funds. The Funds invest in foreign investments and foreign currencies which involve greater volatility and political, economic and currency risks and differences in accounting methods. The Funds may make short sales of securities, which involves the risk that losses may exceed the original amount invested. Investing in commodities may subject the Funds to greater risks and volatility as commodity prices may be influenced by a variety of factors including unfavorable weather, environmental factors, and changes in government regulations. The Funds may invest in derivative securities, which derive their performance from the performance of an underlying asset, index, interest rate or currency exchange rate. Derivatives can be volatile and involve various types and degrees of risks, and, depending upon the characteristics of a particular derivative, suddenly can become illiquid. Investments in debt securities typically decrease in value when interest rates rise. This risk is usually greater for longer-term debt securities. Investments in Asset-Backed, Mortgage-Backed, and Collateralized Mortgage-Backed Securities include additional risks that investors should be aware of such as credit risk, prepayment risk, possible illiquidity and default, as well as increased susceptibility to adverse economic developments. Investments in Real Estate Investment Trusts (REITs) involve additional risks such as declines in the value of real estate and increased susceptibility to adverse economic or regulatory developments.
Derivative contracts ordinarily have leverage inherent in their terms which can magnify a Fund’s potential for gains or losses through increased long and short position exposure. A Fund may access derivatives via a swap agreement. A risk of a swap agreement is the risk that the counterparty to the agreement will default on its obligation to pay the Fund.
A Fund will incur a loss as a result of a short position if the price of the short position instrument increases in value between the date of the short position sale and the date on which an offsetting position is purchased.
Investments in small- and medium-capitalization companies involve additional risks such as limited liquidity and greater volatility. Investments in lower rated and non-rated securities presents a greater risk of loss to principal and interest than higher-rated securities. ETF investments are subject to investment advisory and other expenses, which will be indirectly paid by the Fund. As a result, the cost of investing in the Fund will be higher than the cost of investing directly in ETFs and may be higher than other mutual funds that invest directly in stocks and bonds. ETFs are subject to specific risks, depending on the nature of the ETF.
A Fund’s portfolio will be significantly impacted by the performance of the real estate market generally, and a Fund may be exposed to greater risk and experience higher volatility than would a more economically diversified portfolio. Property values may fall due to increasing vacancies or declining rents resulting from economic, legal, cultural, or technological developments. Investments in Limited Partnerships (including master limited partnerships) involve risks different from those of investing in common stock including risks related to limited control and limited rights to vote on matters affecting the Limited Partnership, risks related to potential conflicts of interest between the Limited Partnership and the Limited Partnership’s general partner, cash flow risks, dilution risks and risks related to the general partner’s limited call right. Underlying Funds are subject to management and other expenses, which will be indirectly paid by a Fund.
The LoCorr Funds are distributed by Quasar Distributors, LLC.
LoCorr Macro Strategies Fund
Rate of Return — For the period ended December 31, 2023 (Unaudited)
| | Inception | | Average Annual |
| | Date | 6 Month | 1 Year | 5 Year | 10 Year | Since Inception |
LoCorr Macro Strategies Fund - Class A (without maximum load) | 3/22/11 | -3.88% | -6.71% | 4.90% | 4.59% | 2.07% |
LoCorr Macro Strategies Fund - Class A (with maximum load) | 3/22/11 | -9.38% | -12.11% | 3.66% | 3.97% | 1.59% |
LoCorr Macro Strategies Fund - Class C | 3/24/11 | -5.30% | -7.48% | 4.10% | 3.80% | 1.31% |
LoCorr Macro Strategies Fund - Class I | 3/24/11 | -3.81% | -6.58% | 5.15% | 4.85% | 2.32% |
Bank of America Merrill Lynch 3-Month Treasury Bill Index | | 2.71% | 5.05% | 1.89% | 1.26% | 1.00% |
Barclay CTA Index | | -0.89% | -0.40% | 4.44% | 2.44% | 1.36% |
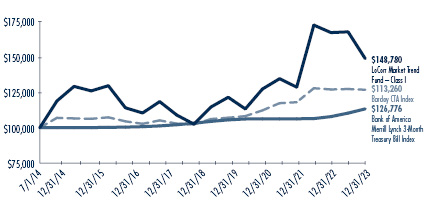
$100,000 investment in the
LoCorr Macro Strategies Fund – Class I
For the period ended December 31, 2023 (Unaudited)

This chart illustrates the performance of a hypothetical $100,000 investment made in the Fund since inception. Assumes reinvestment of distributions, but does not reflect the effect of any applicable sales charge or redemption fees. This chart does not imply any future performance. Performance will vary from class to class based on differences in class-specific expenses and sales charges. The returns do not reflect the deduction of taxes that a shareholder would pay on Fund distributions or the redemption of Fund shares.
Performance data represents past performance; past performance does not guarantee future results. The investment return and principal value of an investment will fluctuate so that an investor’s shares, when redeemed, may be worth more or less than their original cost. Current performance of the Fund may be lower or higher than the performance quoted. Performance data current to the most recent month end may be obtained by calling 1.855.LCFUNDS, or visiting www.LoCorrFunds.com.
Performance data shown reflects the Class A maximum sales charge of 5.75% and reflects the Class C Contingent Deferred Sales Charge (CDSC) of 1.00%. Performance of the Class A without load does not reflect the deduction of the sales load or fee. If reflected, the load or fee would reduce the performance quoted.
The returns reflect the actual performance for each period and do not include the impact on trades executed on the last business day of the period that were recorded on the first business day of the next period.
Per the fee table in the Fund’s May 1, 2023 prospectus, the Fund’s annual operating expense ratio is, before fee waivers 2.16%, 2.91% and 1.91% for Class A, Class C and Class I shares, respectively.
The Bank of America Merrill Lynch U.S. 3-Month Treasury Bill Index is an unmanaged index that seeks to measure the performance of U.S. Treasury bills available in the marketplace.
The Barclay CTA Index is a leading industry benchmark of representative performance of commodity trading advisors.
One cannot invest directly in an index.
LoCorr Long/Short Commodities Strategy Fund
Rate of Return — For the period ended December 31, 2023 (Unaudited)
| | Inception | | Average Annual |
| | Date | 6 Month | 1 Year | 5 Year | 10 Year | Since Inception |
LoCorr Long/Short Commodities Strategy Fund - Class A (without maximum load) | 12/31/11 | 1.04% | -3.26% | 3.81% | 7.85% | 4.17% |
LoCorr Long/Short Commodities Strategy Fund - Class A (with maximum load) | 12/31/11 | -4.77% | -8.86% | 2.60% | 7.21% | 3.66% |
LoCorr Long/Short Commodities Strategy Fund - Class C | 12/31/11 | -0.41% | -4.03% | 3.02% | 7.02% | 3.36% |
LoCorr Long/Short Commodities Strategy Fund - Class I | 12/31/11 | 1.07% | -3.07% | 4.05% | 8.12% | 4.42% |
Bank of America Merrill Lynch 3-Month Treasury Bill Index | | 2.71% | 5.05% | 1.89% | 1.26% | 1.06% |
HFRI Macro Commodity Index | | 1.40% | -2.70% | 8.99% | 4.85% | 3.28% |
$100,000 investment in the
LoCorr Long/Short Commodities Strategy Fund – Class I
For the period ended December 31, 2023 (Unaudited)

This chart illustrates the performance of a hypothetical $100,000 investment made in the Fund since inception. Assumes reinvestment of distributions, but does not reflect the effect of any applicable sales charge or redemption fees. This chart does not imply any future performance. Performance will vary from class to class based on differences in class-specific expenses and sales charges. The returns do not reflect the deduction of taxes that a shareholder would pay on Fund distributions or the redemption of Fund shares.
Performance data represents past performance; past performance does not guarantee future results. The investment return and principal value of an investment will fluctuate so that an investor’s shares, when redeemed, may be worth more or less than their original cost. Current performance of the Fund may be lower or higher than the performance quoted. Performance data current to the most recent month end may be obtained by calling 1.855.LCFUNDS, or visiting www.LoCorrFunds.com.
Performance data shown reflects the Class A maximum sales charge of 5.75% and reflects the Class C Contingent Deferred Sales Charge (CDSC) of 1.00%. Performance of the Class A without load does not reflect the deduction of the sales load or fee. If reflected, the load or fee would reduce the performance quoted.
The returns reflect the actual performance for each period and do not include the impact on trades executed on the last business day of the period that were recorded on the first business day of the next period.
Per the fee table in the Fund’s May 1, 2023 prospectus, the Fund’s annual operating expense ratio is, before fee waivers 2.43%, 3.18% and 2.18% for Class A, Class C and Class I shares, respectively.
The Bank of America Merrill Lynch U.S. 3-Month Treasury Bill Index is an unmanaged index that seeks to measure the performance of U.S. Treasury bills available in the marketplace.
The HFRI Macro Commodity Index employs an investment process designed to identify opportunities in markets exhibiting trending or momentum characteristics across commodity assets classes, frequently with related ancillary exposure in commodity sensitive equities or other derivative instruments.
One cannot invest directly in an index.
LoCorr Market Trend Fund
Rate of Return — For the period ended December 31, 2023 (Unaudited)
| | Inception | | Average Annual |
| | Date | 6 Month | 1 Year | 5 Year | Since Inception |
LoCorr Market Trend Fund - Class A (without maximum load) | 6/30/14 | -11.39% | -11.18% | 7.49% | 4.01% |
LoCorr Market Trend Fund - Class A (with maximum load) | 6/30/14 | -16.50% | -16.31% | 6.23% | 3.37% |
LoCorr Market Trend Fund - Class C | 6/30/14 | -12.63% | -11.90% | 6.67% | 3.23% |
LoCorr Market Trend Fund - Class I | 6/30/14 | -11.26% | -10.98% | 7.74% | 4.27% |
Bank of America Merrill Lynch 3-Month Treasury Bill Index | | 2.71% | 5.05% | 1.89% | 1.32% |
Barclay CTA Index | | -0.89% | -0.40% | 4.44% | 2.50% |
$100,000 investment in the
LoCorr Market Trend Fund - Class I
For the period ended December 31, 2023 (Unaudited)
This chart illustrates the performance of a hypothetical $100,000 investment made in the Fund since inception. Assumes reinvestment of distributions, but does not reflect the effect of any applicable sales charge or redemption fees. This chart does not imply any future performance. Performance will vary from class to class based on differences in class-specific expenses and sales charges. The returns do not reflect the deduction of taxes that a shareholder would pay on Fund distributions or the redemption of Fund shares.
Performance data represents past performance; past performance does not guarantee future results. The investment return and principal value of an investment will fluctuate so that an investor’s shares, when redeemed, may be worth more or less than their original cost. Current performance of the Fund may be lower or higher than the performance quoted. Performance data current to the most recent month end may be obtained by calling 1.855.LCFUNDS, or visiting www.LoCorrFunds.com.
Performance data shown reflects the Class A maximum sales charge of 5.75% and reflects the Class C Contingent Deferred Sales Charge (CDSC) of 1.00%. Performance of the Class A without load does not reflect the deduction of the sales load or fee. If reflected, the load or fee would reduce the performance quoted.
The returns reflect the actual performance for each period and do not include the impact on trades executed on the last business day of the period that were recorded on the first business day of the next period.
Per the fee table in the Fund’s May 1, 2023 prospectus, the Fund’s annual operating expense ratio is, before fee waivers 2.03%, 2.78% and 1.78% for Class A, Class C and Class I shares, respectively.
The Bank of America Merrill Lynch U.S. 3-Month Treasury Bill Index is an unmanaged index that seeks to measure the performance of U.S. Treasury bills available in the marketplace.
The Barclay CTA Index is a leading industry benchmark of representative performance of commodity trading advisors.
One cannot invest directly in an index.
LoCorr Dynamic Opportunity Fund
Rate of Return — For the period ended December 31, 2023 (Unaudited)
| | Inception | | Average Annual |
| | Date | 6 Month | 1 Year | 5 Year | 10 Year | Since Inception |
LoCorr Dynamic Opportunity Fund - Class A (without maximum load) | 5/10/13 | 2.37% | 3.19% | 4.75% | 1.73% | 2.95% |
LoCorr Dynamic Opportunity Fund - Class A (with maximum load) | 5/10/13 | -3.52% | -2.71% | 3.53% | 1.13% | 2.38% |
LoCorr Dynamic Opportunity Fund - Class C | 5/10/13 | 1.03% | 2.43% | 3.96% | 0.97% | 2.18% |
LoCorr Dynamic Opportunity Fund - Class I | 5/10/13 | 2.55% | 3.44% | 5.03% | 2.00% | 3.22% |
S&P 500 Total Return Index | | 8.04% | 26.29% | 15.69% | 12.03% | 12.71% |
Morningstar Long/Short Equity Fund Index | | 4.80% | 9.94% | 6.02% | 3.57% | 4.05% |
$100,000 investment in the
LoCorr Dynamic Opportunity Fund - Class I
For the period ended December 31, 2023 (Unaudited)

This chart illustrates the performance of a hypothetical $100,000 investment made in the Fund since inception. Assumes reinvestment of distributions, but does not reflect the effect of any applicable sales charge or redemption fees. This chart does not imply any future performance. Performance will vary from class to class based on differences in class-specific expenses and sales charges. The returns do not reflect the deduction of taxes that a shareholder would pay on Fund distributions or the redemption of Fund shares.
Performance data represents past performance; past performance does not guarantee future results. The investment return and principal value of an investment will fluctuate so that an investor’s shares, when redeemed, may be worth more or less than their original cost. Current performance of the Fund may be lower or higher than the performance quoted. Performance data current to the most recent month end may be obtained by calling 1.855.LCFUNDS, or visiting www.LoCorrFunds.com.
Performance data shown reflects the Class A maximum sales charge of 5.75% and reflects the Class C Contingent Deferred Sales Charge (CDSC) of 1.00%. Performance of the Class A without load does not reflect the deduction of the sales load or fee. If reflected, the load or fee would reduce the performance quoted.
The returns reflect the actual performance for each period and do not include the impact on trades executed on the last business day of the period that were recorded on the first business day of the next period.
Per the fee table in the Fund’s May 1, 2023 prospectus, the Fund’s annual operating expense ratio is, before fee waivers 2.70%, 3.45% and 2.45% for Class A, Class C and Class I shares, respectively.
The S&P 500 Total Return Index is an unmanaged capitalization-weighted index of 500 stocks designed to measure performance of the broad domestic economy through changes in the aggregate market value of the 500 stocks which represent all major industries.
The Morningstar Long/Short Equity Index category holds sizeable stakes in both long and short positions in equities and related derivative. At least 75% of the assets are in equity securities or derivatives.
One cannot invest directly in an index.
LoCorr Spectrum Income Fund
Rate of Return — For the period ended December 31, 2023 (Unaudited)
| | Inception | | Average Annual |
| | Date | 6 Month | 1 Year | 5 Year | 10 Year | Since Inception |
LoCorr Spectrum Income Fund - Class A (without maximum load) | 12/31/13 | 5.22% | 1.70% | 4.73% | 1.12% | 1.12% |
LoCorr Spectrum Income Fund - Class A (with maximum load) | 12/31/13 | -0.90% | -4.13% | 3.50% | 0.52% | 0.52% |
LoCorr Spectrum Income Fund - Class C | 12/31/13 | 3.70% | 0.82% | 3.93% | 0.36% | 0.36% |
LoCorr Spectrum Income Fund - Class I | 12/31/13 | 5.41% | 2.02% | 5.00% | 1.39% | 1.39% |
Bloomberg Barclay U.S. Aggregate Bond Index | | 3.37% | 5.53% | 1.10% | 1.81% | 1.81% |
Morningstar Allocation - Aggressive Allocation | | 6.90% | 17.30% | 9.59% | 6.74% | 6.74% |
$100,000 investment in the
LoCorr Spectrum Income Fund - Class I
For the period ended December 31, 2023 (Unaudited)
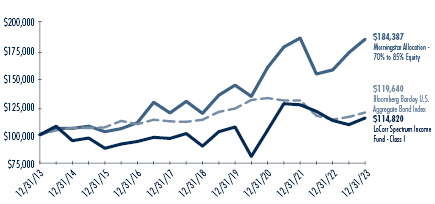
This chart illustrates the performance of a hypothetical $100,000 investment made in the Fund since inception. Assumes reinvestment of distributions, but does not reflect the effect of any applicable sales charge or redemption fees. This chart does not imply any future performance. Performance will vary from class to class based on differences in class-specific expenses and sales charges. The returns do not reflect the deduction of taxes that a shareholder would pay on Fund distributions or the redemption of Fund shares.
Performance data represents past performance; past performance does not guarantee future results. The investment return and principal value of an investment will fluctuate so that an investor’s shares, when redeemed, may be worth more or less than their original cost. Current performance of the Fund may be lower or higher than the performance quoted. Performance data current to the most recent month end may be obtained by calling 1.855.LCFUNDS, or visiting www.LoCorrFunds.com.
Performance data shown reflects the Class A maximum sales charge of 5.75% and reflects the Class C Contingent Deferred Sales Charge (CDSC) of 1.00%. Performance of the Class A without load does not reflect the deduction of the sales load or fee. If reflected, the load or fee would reduce the performance quoted.
The returns reflect the actual performance for each period and do not include the impact on trades executed on the last business day of the period that were recorded on the first business day of the next period.
Per the fee table in the Fund’s May 1, 2023 prospectus, the Fund’s annual operating expense ratio is, before fee waivers 2.88%, 3.63% and 2.63% for Class A, Class C and Class I shares, respectively.
The Bloomberg Barclay U.S. Aggregate Bond Index is a long term, market capitalization-weighted index used to represent investment grade bonds being traded in the United States.
The Morningstar Aggressive Allocation portfolios seek to provide both income and capital appreciation by investing in multiple asset classes, including stocks, bonds, and cash. These portfolios are dominated by domestic holdings and have equity exposures of over 85%. These funds typically allocate at least 10% to equities of foreign companies and do not exclusively allocate between cash and equities.
One cannot invest directly in an index.
LoCorr Macro Strategies Fund – Consolidated Schedule of Investments |
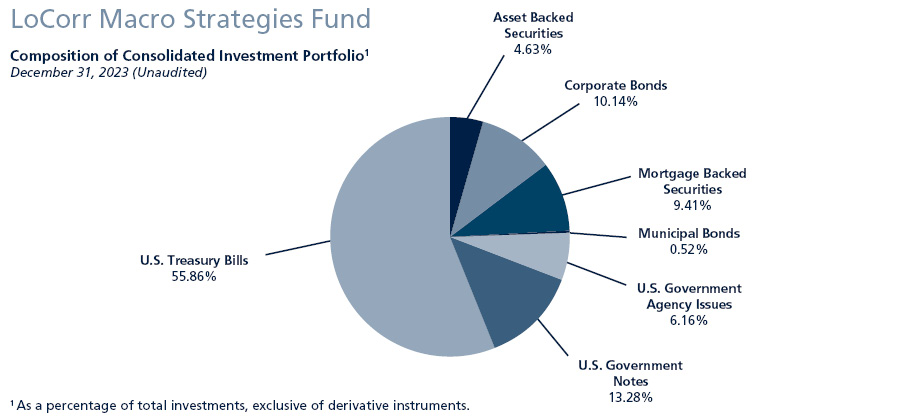
Consolidated Schedule of Investments
December 31, 2023
| | Maturity Date | | | Coupon Rate | | | Principal
Amount | | | Value | |
ASSET BACKED SECURITIES: 4.23% |
321 Henderson Receivables I LLC, 2004-A A1 (1 Month LIBOR USD + 0.464%) (a)(c) | | | 09/15/2045 | | | | 5.83% | | | $ | 16,262 | | | $ | 16,137 | |
American Homes 4 Rent Trust, 2014-SFR2 A (a) | | | 10/17/2036 | | | | 3.79% | | | | 697,388 | | | | 686,092 | |
AmeriCredit Automobile Receivables Trust, 2021-2 A3 | | | 12/18/2026 | | | | 0.34% | | | | 1,221,240 | | | | 1,208,527 | |
Bank of America Credit Card Trust, 2021-A1 A1 | | | 09/15/2026 | | | | 0.44% | | | | 2,120,000 | | | | 2,089,082 | |
Carmax Auto Owner Trust, 2021-4 A3 | | | 09/15/2026 | | | | 0.56% | | | | 2,576,718 | | | | 2,482,401 | |
Carvana Auto Receivables Trust |
Series 2021-P2 A3 | | | 03/10/2026 | | | | 0.49% | | | | 1,822,548 | | | | 1,793,763 | |
Series 2021-P4 A-3 | | | 01/11/2027 | | | | 1.31% | | | | 5,561,079 | | | | 5,389,932 | |
Series 2022-P3 | | | 11/10/2027 | | | | 4.61% | | | | 4,800,000 | | | | 4,749,683 | |
DB Master Finance LLC, 2021-1A A2I (a) | | | 11/20/2051 | | | | 2.05% | | | | 4,018,000 | | | | 3,652,611 | |
Diamond Resorts Owner Trust, 2021-1A A (a) | | | 11/21/2033 | | | | 1.51% | | | | 787,227 | | | | 733,565 | |
Elara HGV Timeshare Issuer, 2021-A A (a) | | | 08/27/2035 | | | | 1.36% | | | | 1,364,945 | | | | 1,253,269 | |
Entergy New Orleans Storm Recovery Funding LLC, 2015-1 A | | | 06/01/2027 | | | | 2.67% | | | | 114,813 | | | | 113,257 | |
GM Financial Consumer Automobile Receivables Trust |
Series 2021-1 A3 | | | 10/16/2025 | | | | 0.35% | | | | 749,231 | | | | 739,228 | |
Series 2021-3 A3 | | | 06/16/2026 | | | | 0.48% | | | | 2,951,513 | | | | 2,867,053 | |
Hilton Grand Vacations Trust, 2019-AA A (a) | | | 07/25/2033 | | | | 2.34% | | | | 815,198 | | | | 775,834 | |
Hyundai Auto Receivables Trust, 2020-C A3 | | | 05/15/2025 | | | | 0.38% | | | | 573,526 | | | | 569,894 | |
Invitation Homes Trust, 2018-SFR4 A (1 Month LIBOR USD + 1.214%) (a)(c) | | | 01/17/2038 | | | | 6.58% | | | | 851,328 | | | | 850,702 | |
John Deere Owner Trust, 2022-C | | | 08/15/2025 | | | | 4.98% | | | | 3,422,767 | | | | 3,418,042 | |
MVW Owner Trust |
Series 2019-1A A (a) | | | 11/20/2036 | | | | 2.89% | | | | 361,597 | | | | 348,411 | |
Series 2019-2A A (a) | | | 10/20/2038 | | | | 2.22% | | | | 533,809 | | | | 506,901 | |
Series 2021-1WA A (a) | | | 01/22/2041 | | | | 1.14% | | | | 1,332,571 | | | | 1,224,241 | |
Navient Student Loan Trust, 2021-A A (a) | | | 05/15/2069 | | | | 0.84% | | | | 1,652,763 | | | | 1,456,609 | |
PFS Financing Corp. |
Series 2020-G A (a) | | | 02/15/2026 | | | | 0.97% | | | | 2,288,000 | | | | 2,274,584 | |
Series 2021-B A (a) | | | 08/15/2026 | | | | 0.77% | | | | 3,550,000 | | | | 3,439,187 | |
18 | The accompanying notes are an integral part of these consolidated financial statements. |
LoCorr Macro Strategies Fund – Consolidated Schedule of Investments (continued) |
| | Maturity Date | | | Coupon Rate | | | Principal
Amount | | | Value | |
ASSET BACKED SECURITIES (continued) |
Planet Fitness Master Issuer LLC, 3.25100 (a) | | | 12/05/2051 | | | | 3.25% | | | $ | 2,515,200 | | | $ | 2,333,525 | |
Santander Drive Auto Receivables Trust, 2022-6 A3 | | | 11/16/2026 | | | | 4.49% | | | | 3,376,663 | | | | 3,358,079 | |
SoFi Professional Loan Program Trust, 2021-B AFX (a) | | | 02/15/2047 | | | | 1.14% | | | | 1,461,619 | | | | 1,230,291 | |
Taco Bell Funding LLC, 2021-1A A21 (a) | | | 08/25/2051 | | | | 1.95% | | | | 5,767,275 | | | | 5,170,766 | |
Toyota Auto Loan Extended Note Trust, 2020-1 A (a) | | | 05/25/2033 | | | | 1.35% | | | | 1,950,000 | | | | 1,850,980 | |
Toyota Auto Receivables Owner Trust, 2022-C A3 | | | 04/15/2027 | | | | 3.76% | | | | 3,000,000 | | | | 2,949,870 | |
Volkswagen Auto Loan Enhanced Trust, 2021-1 A3 | | | 06/22/2026 | | | | 1.02% | | | | 3,699,311 | | | | 3,600,977 | |
TOTAL ASSET BACKED SECURITIES (Cost $65,742,708) | | | | | | | | | | | | | | | 63,133,493 | |
| | | | | | | | | | | | | | | | | |
CORPORATE BONDS: 9.27% |
Aerospace & Defense: 0.28% |
Boeing Co. | | | 02/01/2028 | | | | 3.25% | | | | 1,865,000 | | | | 1,770,553 | |
L3Harris Technologies, Inc. | | | 01/15/2027 | | | | 5.40% | | | | 1,425,000 | | | | 1,455,328 | |
Raytheon Technologies Corp. | | | 11/16/2028 | | | | 4.13% | | | | 980,000 | | | | 957,942 | |
| | | | | | | | | | | | | | | | 4,183,823 | |
Agriculture: 0.08% |
Philip Morris International, Inc. | | | 02/15/2028 | | | | 4.88% | | | | 1,185,000 | | | | 1,198,764 | |
| | | | | | | | | | | | | | | | | |
Auto Manufacturers: 0.27% |
General Motors Financial Co., Inc. | | | 06/23/2028 | | | | 5.80% | | | | 1,700,000 | | | | 1,748,348 | |
Toyota Motor Credit Corp. | | | 09/11/2025 | | | | 5.60% | | | | 1,175,000 | | | | 1,194,246 | |
Volkswagen Group of America Finance LLC (a) | | | 11/24/2025 | | | | 1.25% | | | | 1,170,000 | | | | 1,086,489 | |
| | | | | | | | | | | | | | | | 4,029,083 | |
Banks: 3.87% |
Banco Santander SA (b) | | | 03/24/2025 | | | | 3.50% | | | | 975,000 | | | | 954,429 | |
Banco Santander SA (b) | | | 05/28/2025 | | | | 2.75% | | | | 690,000 | | | | 665,822 | |
Bank of America Corp. (SOFR + 1.150%) (c) | | | 06/19/2026 | | | | 1.32% | | | | 4,895,000 | | | | 4,607,992 | |
Bank of America Corp. (SOFR + 1.580%) (c) | | | 04/27/2028 | | | | 4.38% | | | | 2,465,000 | | | | 2,410,296 | |
Bank of America NA | | | 08/18/2026 | | | | 5.53% | | | | 4,250,000 | | | | 4,330,276 | |
Barclays PLC (SOFR + 2.220%) (b)(c) | | | 09/13/2029 | | | | 6.49% | | | | 1,510,000 | | | | 1,573,382 | |
Canadian Imperial Bank (b) | | | 04/07/2027 | | | | 3.45% | | | | 1,390,000 | | | | 1,335,529 | |
Citibank NA | | | 09/29/2028 | | | | 5.80% | | | | 2,360,000 | | | | 2,467,164 | |
Citigroup, Inc. (SOFR + 1.372%) (c) | | | 05/24/2025 | | | | 4.14% | | | | 2,945,000 | | | | 2,927,315 | |
Credit Suisse AG (b) | | | 07/09/2027 | | | | 5.00% | | | | 1,090,000 | | | | 1,090,891 | |
Deutsche Bank NY (b) | | | 05/28/2024 | | | | 0.90% | | | | 910,000 | | | | 893,733 | |
Federation des Caisses Desjardins du Quebec (a)(b) | | | 03/14/2028 | | | | 5.70% | | | | 1,100,000 | | | | 1,131,169 | |
Goldman Sachs Group, Inc. (3 Month LIBOR USD + 1.463%) (c) | | | 09/29/2025 | | | | 3.27% | | | | 4,840,000 | | | | 4,758,627 | |
Goldman Sachs Group, Inc. (SOFR + 1.075%) (c) | | | 08/10/2026 | | | | 5.80% | | | | 4,225,000 | | | | 4,266,629 | |
HSBC Holdings PLC (SOFR + 1.929%) (b)(c) | | | 06/04/2026 | | | | 2.10% | | | | 1,700,000 | | | | 1,618,646 | |
ING Groep NV (b) | | | 04/09/2024 | | | | 3.55% | | | | 1,730,000 | | | | 1,720,292 | |
ING Groep NV (SOFR + 1.640%) (b)(c) | | | 03/28/2026 | | | | 3.87% | | | | 1,335,000 | | | | 1,308,563 | |
JPMorgan Chase Bank NA | | | 12/08/2026 | | | | 5.11% | | | | 1,255,000 | | | | 1,266,881 | |
JPMorgan Chase & Co. (SOFR + 1.450%) (c) | | | 07/24/2029 | | | | 5.30% | | | | 3,880,000 | | | | 3,940,698 | |
Morgan Stanley (SOFR + 0.525%) (c) | | | 05/30/2025 | | | | 0.79% | | | | 600,000 | | | | 586,587 | |
Morgan Stanley (SOFR + 1.630%) (c) | | | 07/20/2029 | | | | 5.45% | | | | 920,000 | | | | 938,252 | |
Morgan Stanley Bank NA | | | 10/30/2026 | | | | 5.88% | | | | 3,510,000 | | | | 3,609,721 | |
NatWest Markets PLC (a)(b) | | | 08/12/2024 | | | | 0.80% | | | | 1,180,000 | | | | 1,145,190 | |
Toronto-Dominion Bank (b) | | | 06/06/2025 | | | | 3.77% | | | | 1,430,000 | | | | 1,407,126 | |
Toronto-Dominion Bank (b) | | | 09/10/2026 | | | | 1.25% | | | | 1,750,000 | | | | 1,599,506 | |
UBS Group AG (1 Year CMT Rate + 1.550%) (a)(b)(c) | | | 05/12/2026 | | | | 4.49% | | | | 900,000 | | | | 886,454 | |
UBS Group AG (1 Year CMT Rate + 1.600%) (a)(b)(c) | | | 12/22/2027 | | | | 6.33% | | | | 770,000 | | | | 794,010 | |
Wells Fargo & Co. (SOFR + 1.740%) (c) | | | 07/25/2029 | | | | 5.57% | | | | 1,960,000 | | | | 2,003,307 | |
Wells Fargo Bank NA | | | 08/07/2026 | | | | 5.45% | | | | 1,410,000 | | | | 1,434,314 | |
| | | | | | | | | | | | | | | | 57,672,801 | |
The accompanying notes are an integral part of these consolidated financial statements. | 19 |
LoCorr Macro Strategies Fund – Consolidated Schedule of Investments (continued) |
| | Maturity Date | | | Coupon Rate | | | Principal
Amount | | | Value | |
CORPORATE BONDS (continued) |
Beverages: 0.13% |
PepsiCo, Inc. | | | 11/10/2026 | | | | 5.13% | | | $ | 1,870,000 | | | $ | 1,910,270 | |
| | | | | | | | | | | | | | | | | |
Biotechnology: 0.18% |
Amgen, Inc. | | | 03/02/2028 | | | | 5.15% | | | | 2,590,000 | | | | 2,649,737 | |
| | | | | | | | | | | | | | | | | |
Building Materials: 0.11% |
Carrier Global Corp. (a) | | | 11/30/2025 | | | | 5.80% | | | | 880,000 | | | | 891,749 | |
Trane Technologies Luxembourg Finance SA (b) | | | 03/21/2026 | | | | 3.50% | | | | 780,000 | | | | 758,372 | |
| | | | | | | | | | | | | | | | 1,650,121 | |
Chemicals: 0.05% |
Nutrien Ltd. (b) | | | 03/27/2028 | | | | 4.90% | | | | 690,000 | | | | 696,672 | |
| | | | | | | | | | | | | | | | | |
Cosmetics & Personal Care: 0.15% |
Haleon U.S. Capital LLC | | | 03/24/2027 | | | | 3.38% | | | | 2,310,000 | | | | 2,223,990 | |
| | | | | | | | | | | | | | | | | |
Diversified Financial Services: 0.55% |
AerCap Ireland Capital/Global Aviation Trust (b) | | | 01/15/2027 | | | | 6.10% | | | | 2,405,000 | | | | 2,457,501 | |
Air Lease Corp. | | | 12/15/2027 | | | | 5.85% | | | | 1,560,000 | | | | 1,601,593 | |
Capital One Financial Corp. (SOFR + 1.370%) (c) | | | 05/09/2025 | | | | 4.17% | | | | 1,475,000 | | | | 1,463,945 | |
OMERS Finance Trust (a)(b) | | | 05/02/2024 | | | | 2.50% | | | | 1,355,000 | | | | 1,341,340 | |
Private Export Funding Corp. | | | 06/15/2025 | | | | 3.25% | | | | 1,255,000 | | | | 1,230,734 | |
| | | | | | | | | | | | | | | | 8,095,113 | |
Electric: 0.39% |
Florida Power & Light Co. | | | 04/01/2028 | | | | 5.05% | | | | 1,480,000 | | | | 1,514,057 | |
Florida Power & Light Co. | | | 05/15/2028 | | | | 4.40% | | | | 1,210,000 | | | | 1,212,948 | |
Georgia Power Co. | | | 05/16/2028 | | | | 4.65% | | | | 825,000 | | | | 831,073 | |
NSTAR Electric Co. | | | 05/15/2027 | | | | 3.20% | | | | 1,995,000 | | | | 1,922,545 | |
Southern California Edison Co. | | | 02/01/2026 | | | | 1.20% | | | | 410,000 | | | | 381,880 | |
| | | | | | | | | | | | | | | | 5,862,503 | |
Entertainment: 0.26% |
Warnermedia Holdings, Inc. | | | 03/15/2027 | | | | 3.76% | | | | 4,030,000 | | | | 3,864,562 | |
| | | | | | | | | | | | | | | | | |
Food: 0.08% |
SYSCO Corp. | | | 07/15/2027 | | | | 3.25% | | | | 1,190,000 | | | | 1,138,539 | |
| | | | | | | | | | | | | | | | | |
Healthcare - Products: 0.47% |
Baxter International, Inc. | | | 11/29/2024 | | | | 1.32% | | | | 3,650,000 | | | | 3,514,911 | |
PerkinElmer, Inc. | | | 09/15/2024 | | | | 0.85% | | | | 3,565,000 | | | | 3,441,333 | |
| | | | | | | | | | | | | | | | 6,956,244 | |
Healthcare - Services: 0.09% |
HCA, Inc. | | | 03/15/2027 | | | | 3.13% | | | | 1,405,000 | | | | 1,332,588 | |
| | | | | | | | | | | | | | | | | |
Household Products & Wares: 0.07% |
Clorox Co. | | | 10/01/2027 | | | | 3.10% | | | | 1,145,000 | | | | 1,084,627 | |
| | | | | | | | | | | | | | | | | |
Insurance: 0.38% |
Equitable Financial Life Global (a) | | | 07/07/2025 | | | | 1.40% | | | | 1,485,000 | | | | 1,405,116 | |
Metropolitan Life Global Funding I (a) | | | 01/06/2028 | | | | 5.05% | | | | 615,000 | | | | 621,605 | |
Principal Life Global Funding II (a) | | | 01/12/2026 | | | | 0.88% | | | | 1,525,000 | | | | 1,400,518 | |
Protective Life Global Funding (a) | | | 07/05/2024 | | | | 0.78% | | | | 2,350,000 | | | | 2,293,645 | |
| | | | | | | | | | | | | | | | 5,720,884 | |
20 | The accompanying notes are an integral part of these consolidated financial statements. |
LoCorr Macro Strategies Fund – Consolidated Schedule of Investments (continued) |
| | Maturity Date | | | Coupon Rate | | | Principal
Amount | | | Value | |
CORPORATE BONDS (continued) |
Machinery - Diversified: 0.05% |
John Deere Capital Corp. | | | 07/14/2028 | | | | 4.95% | | | $ | 730,000 | | | $ | 749,086 | |
| | | | | | | | | | | | | | | | | |
Media: 0.14% |
Charter Communications Operating LLC | | | 07/23/2025 | | | | 4.91% | | | | 2,155,000 | | | | 2,134,890 | |
| | | | | | | | | | | | | | | | | |
Oil & Gas: 0.05% |
Pioneer Natural Resources Co. | | | 03/29/2026 | | | | 5.10% | | | | 785,000 | | | | 790,987 | |
| | | | | | | | | | | | | | | | | |
Pharmaceuticals: 0.30% |
CVS Health Corp. | | | 06/01/2026 | | | | 2.88% | | | | 2,005,000 | | | | 1,915,521 | |
Pfizer Investment Enterprises Pte Ltd. (b) | | | 05/19/2028 | | | | 4.45% | | | | 2,550,000 | | | | 2,551,276 | |
| | | | | | | | | | | | | | | | 4,466,797 | |
Pipelines: 0.37% |
Enbridge, Inc. (b) | | | 02/14/2025 | | | | 2.50% | | | | 915,000 | | | | 887,249 | |
Enbridge, Inc. (b) | | | 11/15/2028 | | | | 6.00% | | | | 725,000 | | | | 761,846 | |
Energy Transfer LP | | | 12/01/2026 | | | | 6.05% | | | | 1,990,000 | | | | 2,045,191 | |
Williams Cos, Inc. | | | 03/02/2026 | | | | 5.40% | | | | 1,870,000 | | | | 1,889,584 | |
| | | | | | | | | | | | | | | | 5,583,870 | |
Real Estate Investment Trusts: 0.33% |
Brixmor Operating Partnership LP | | | 06/15/2026 | | | | 4.13% | | | | 1,185,000 | | | | 1,147,971 | |
SITE Centers Corp. | | | 02/01/2025 | | | | 3.63% | | | | 1,115,000 | | | | 1,083,469 | |
SITE Centers Corp. | | | 06/01/2027 | | | | 4.70% | | | | 2,775,000 | | | | 2,732,403 | |
| | | | | | | | | | | | | | | | 4,963,843 | |
Retail: 0.05% |
O’Reilly Automotive, Inc. | | | 11/20/2026 | | | | 5.75% | | | | 715,000 | | | | 732,447 | |
| | | | | | | | | | | | | | | | | |
Software: 0.07% |
Oracle Corp. | | | 03/25/2028 | | | | 2.30% | | | | 1,120,000 | | | | 1,021,072 | |
| | | | | | | | | | | | | | | | | |
Telecommunications: 0.50% |
AT&T, Inc. | | | 06/01/2027 | | | | 2.30% | | | | 1,655,000 | | | | 1,537,558 | |
T-Mobile USA, Inc. | | | 02/15/2026 | | | | 2.25% | | | | 3,015,000 | | | | 2,856,819 | |
T-Mobile USA, Inc. | | | 07/15/2028 | | | | 4.80% | | | | 1,490,000 | | | | 1,503,524 | |
Verizon Communications, Inc. | | | 03/22/2028 | | | | 2.10% | | | | 1,760,000 | | | | 1,593,534 | |
| | | | | | | | | | | | | | | | 7,491,435 | |
TOTAL CORPORATE BONDS (Cost $138,082,074) | | | | | | | | | | | | | | | 138,204,748 | |
| | | | | | | | | | | | | | | | | |
MORTGAGE BACKED SECURITIES: 8.60% |
ACRE Commercial Mortgage Trust, 2021-FL4 A (1 Month LIBOR USD + 0.944%) (a)(b)(c) | | | 12/18/2037 | | | | 6.30% | | | | 691,872 | | | | 692,415 | |
Alen Mortgage Trust, 2021-ACEN A (1 Month LIBOR USD + 1.264%) (a)(c) | | | 04/15/2034 | | | | 6.63% | | | | 3,150,000 | | | | 2,829,474 | |
Angel Oak Mortgage Trust |
Series 2020-1 M1 (a)(d) | | | 12/25/2059 | | | | 3.16% | | | | 1,915,000 | | | | 1,684,007 | |
Series 2020-5 A3 (a)(d) | | | 05/25/2065 | | | | 2.04% | | | | 102,070 | | | | 92,324 | |
Barclays Commercial Mortgage Securities LLC, 2015-VFM A1 (a) | | | 03/10/2036 | | | | 2.47% | | | | 571,498 | | | | 543,873 | |
BHP Trust, 2019-BXHP A (1 Month LIBOR USD + 1.022%) (a)(c) | | | 08/15/2036 | | | | 6.38% | | | | 422,278 | | | | 420,121 | |
BSREP Commercial Mortgage Trust, 2021-DC A (1 Month LIBOR USD + 1.064%) (a)(c) | | | 08/15/2038 | | | | 6.43% | | | | 4,103,567 | | | | 3,856,232 | |
BX Commercial Mortgage Trust |
Series 2019-XL A (1 Month LIBOR USD + 1.034%) (a)(c) | | | 10/15/2036 | | | | 6.40% | | | | 1,007,967 | | | | 1,005,404 | |
Series 2021-XL2 B (1 Month LIBOR USD + 1.112%) (a)(c) | | | 10/15/2038 | | | | 6.47% | | | | 4,300,616 | | | | 4,208,830 | |
Series 2021-CIP A (1 Month LIBOR USD + 1.035%) (a)(c) | | | 12/15/2038 | | | | 6.40% | | | | 6,050,000 | | | | 5,922,812 | |
The accompanying notes are an integral part of these consolidated financial statements. | 21 |
LoCorr Macro Strategies Fund – Consolidated Schedule of Investments (continued) |
| | Maturity Date | | | Coupon Rate | | | Principal
Amount | | | Value | |
MORTGAGE BACKED SECURITIES (continued) |
BX Trust, 2022-PSB (TSFR1M + 2.949%) (a)(c) | | | 08/15/2039 | | | | 8.31% | | | $ | 974,345 | | | $ | 973,985 | |
Citigroup Commercial Mortgage Trust, 2021-PRM2 A (1 Month LIBOR USD + 1.064%) (a)(c) | | | 10/15/2038 | | | | 6.43% | | | | 5,250,000 | | | | 5,157,749 | |
Comm Mortgage Trust |
Series 2014-UBS2 AM | | | 03/10/2047 | | | | 4.20% | | | | 2,450,000 | | | | 2,431,772 | |
Series 2014-LC17 A5 | | | 10/10/2047 | | | | 3.92% | | | | 724,000 | | | | 711,801 | |
Series 2014-CR21 A3 | | | 12/10/2047 | | | | 3.53% | | | | 1,503,841 | | | | 1,468,537 | |
Connecticut Avenue Securities Trust |
Series 2021-R03 1M1 (SOFR30A + 0.850%) (a)(c) | | | 12/25/2041 | | | | 6.19% | | | | 2,761,182 | | | | 2,752,076 | |
Series 2022-R04 (SOFR30A + 2.000%) (a)(c) | | | 03/25/2042 | | | | 7.34% | | | | 1,412,347 | | | | 1,422,983 | |
Series 2022-R03 1M1 (SOFR30A + 2.100%) (a)(c) | | | 03/25/2042 | | | | 7.44% | | | | 3,411,345 | | | | 3,451,265 | |
Series 2022-R04 FLT (SOFR30A + 3.100%) (a)(c) | | | 03/25/2042 | | | | 8.44% | | | | 185,000 | | | | 190,869 | |
Series 2022-R06 (SOFR30A + 3.850%) (a)(c) | | | 05/25/2042 | | | | 9.19% | | | | 80,000 | | | | 84,076 | |
Series 2022-R07 (SOFR30A + 4.650%) (a)(c) | | | 06/25/2042 | | | | 9.99% | | | | 700,000 | | | | 757,960 | |
Series 2023-R01 (SOFR30A + 2.400%) (a)(c) | | | 12/25/2042 | | | | 7.74% | | | | 2,093,181 | | | | 2,133,370 | |
Series 2023-R01 (SOFR30A + 3.750%) (a)(c) | | | 12/25/2042 | | | | 9.09% | | | | 3,350,000 | | | | 3,537,372 | |
Series 2023-R02 (SOFR30A + 3.350%) (a)(c) | | | 01/25/2043 | | | | 8.69% | | | | 4,700,000 | | | | 4,924,166 | |
Credit Suisse Mortgage Capital Certificates, 2019-ICE4 A (1 Month LIBOR USD + 1.027%) (a)(c) | | | 05/15/2036 | | | | 6.39% | | | | 3,491,314 | | | | 3,491,380 | |
ELP Commercial Mortgage Trust, 2021-ELP B (1 Month LIBOR USD + 1.235%) (a)(c) | | | 11/15/2038 | | | | 6.60% | | | | 5,393,722 | | | | 5,285,394 | |
Fannie Mae Connecticut Avenue Securities |
Series 2018-C01 1EB1 (1 Month LIBOR USD + 0.564%) (c) | | | 07/25/2030 | | | | 5.90% | | | | 168,037 | | | | 168,156 | |
Series 2018-C05 (SOFR30A + 2.464%) (c) | | | 01/25/2031 | | | | 7.80% | | | | 988,415 | | | | 1,011,718 | |
Fannie Mae Pool | | | 09/01/2038 | | | | 5.50% | | | | 2,467,730 | | | | 2,503,075 | |
FHLMC Multifamily Structured Pass Through Certificates, K059 A1 | | | 09/25/2025 | | | | 2.76% | | | | 1,189,114 | | | | 1,155,393 | |
Freddie Mac Pool | | | 10/01/2038 | | | | 5.50% | | | | 10,900,991 | | | | 11,057,123 | |
Freddie Mac STACR REMIC Trust |
Series 2021-DNA5 M2 (SOFR30A + 1.650%) (a)(c) | | | 01/25/2034 | | | | 6.99% | | | | 292,171 | | | | 293,394 | |
Series 2021-DNA6 (SOFR30A + 1.500%) (a)(c) | | | 10/25/2041 | | | | 6.84% | | | | 4,245,927 | | | | 4,208,777 | |
Series 2022-DNA3 (SOFR30A + 2.000%) (a)(c) | | | 04/25/2042 | | | | 7.34% | | | | 495,550 | | | | 500,292 | |
Series 2022-DNA5, FLT (SOFR30A + 4.500%) (a)(c) | | | 06/25/2042 | | | | 9.84% | | | | 2,515,000 | | | | 2,707,976 | |
Series 2022-DNA6, FLT (SOFR30A + 3.700%) (a)(c) | | | 09/25/2042 | | | | 9.04% | | | | 2,670,000 | | | | 2,808,634 | |
Freddie Mac Structured Agency Credit Risk Debt Notes |
Series 2021-DNA2 (SOFR30A + 2.300%) (a)(c) | | | 08/25/2033 | | | | 7.64% | | | | 2,166,885 | | | | 2,187,240 | |
Series 2022-DNA2 M1A (SOFR30A + 1.300%) (a)(c) | | | 02/25/2042 | | | | 6.64% | | | | 1,140,604 | | | | 1,140,608 | |
FRESB Multifamily Mortgage Pass Through Certificates |
Series 2017-SB32 A7F (d) | | | 04/25/2024 | | | | 2.44% | | | | 694,670 | | | | 689,328 | |
Series 2019-SB67 A5F (d) | | | 07/25/2024 | | | | 2.09% | | | | 1,285,669 | | | | 1,257,811 | |
Series 2019-SB69 A5F (d) | | | 10/25/2024 | | | | 2.25% | | | | 4,033,513 | | | | 3,928,708 | |
Series 2016-SB23 A10F (d) | | | 09/25/2026 | | | | 2.31% | | | | 1,038,894 | | | | 989,594 | |
GCT Commercial Mortgage Trust, 2021-GCT A (1 Month LIBOR USD + 0.914%) (a)(c) | | | 02/15/2038 | | | | 6.28% | | | | 3,850,000 | | | | 2,874,475 | |
GS Mortgage Securities Corp II, 2021-ARDN A (1 Month LIBOR USD + 1.364%) (a)(c) | | | 11/15/2036 | | | | 6.73% | | | | 5,400,000 | | | | 5,243,033 | |
GS Mortgage Securities Trust |
Series 2019-600C A (a) | | | 09/06/2034 | | | | 2.94% | | | | 2,065,000 | | | | 1,450,042 | |
Series 2015-GC28 A5 | | | 02/10/2048 | | | | 3.40% | | | | 1,000,000 | | | | 977,113 | |
Series 2021-NQM1 A3 (a)(d) | | | 07/25/2061 | | | | 1.53% | | | | 1,231,604 | | | | 1,050,787 | |
J.P. Morgan Chase Commercial Mortgage Securities Trust |
Series 2021-MHC A (1 Month LIBOR USD + 0.914%) (a)(c) | | | 04/15/2038 | | | | 6.28% | | | | 1,795,304 | | | | 1,778,941 | |
Series 2014-C23 ASB | | | 09/15/2047 | | | | 3.66% | | | | 402,041 | | | | 398,151 | |
Series 2016-JP3 A-5 | | | 08/15/2049 | | | | 2.87% | | | | 1,000,000 | | | | 928,141 | |
Ladder Capital Commercial Mortgage Trust, 2013-GCP A1 (a) | | | 02/15/2036 | | | | 3.57% | | | | 1,510,015 | | | | 1,402,884 | |
Natixis Commercial Mortgage Securities Trust, 2018-285M A (a)(d) | | | 11/15/2032 | | | | 3.79% | | | | 1,000,000 | | | | 840,990 | |
22 | The accompanying notes are an integral part of these consolidated financial statements. |
LoCorr Macro Strategies Fund – Consolidated Schedule of Investments (continued) |
| | Maturity Date | | | Coupon Rate | | | Principal
Amount | | | Value | |
MORTGAGE BACKED SECURITIES (continued) |
New Residential Mortgage Loan Trust |
Series 2016-1A A1 (a)(d) | | | 03/25/2056 | | | | 3.75% | | | $ | 597,428 | | | $ | 560,238 | |
Series 2017-2A A3 (a)(d) | | | 03/25/2057 | | | | 4.00% | | | | 906,912 | | | | 858,513 | |
OBX Trust, 2018-1 A2 (1 Month LIBOR USD + 0.764%) (a)(c) | | | 06/25/2057 | | | | 6.12% | | | | 509,423 | | | | 484,866 | |
PKHL Commercial Mortgage Trust, 2021-MF A (1 Month LIBOR USD + 0.994%) (a)(c) | | | 07/15/2038 | | | | 6.36% | | | | 5,750,000 | | | | 5,305,353 | |
SREIT Trust, 2021-MFP2 A (1 Month LIBOR USD + 0.936%) (a)(c) | | | 11/15/2036 | | | | 6.30% | | | | 5,000,000 | | | | 4,929,462 | |
UBS-Barclays Commercial Mortgage Trust, 2013-C5 B (a)(d) | | | 03/10/2046 | | | | 3.65% | | | | 113,420 | | | | 100,966 | |
Verus Securitization Trust |
Series 2020-1 A1 (a)(c) | | | 01/25/2060 | | | | 2.42% | | | | 349,188 | | | | 333,417 | |
Series 2020-1 A3 (a)(c) | | | 01/25/2060 | | | | 2.72% | | | | 893,570 | | | | 850,257 | |
WFRBS Commercial Mortgage Trust |
Series 2014-C24 A5 | | | 11/15/2047 | | | | 3.61% | | | | 1,000,000 | | | | 976,592 | |
Series 2014-C22 AS (d) | | | 09/15/2057 | | | | 4.07% | | | | 350,000 | | | | 318,037 | |
TOTAL MORTGAGE BACKED SECURITIES (Cost $132,691,104) | | | | | | | | | | | | | | | 128,300,332 | |
| | | | | | | | | | | | | | | | | |
MUNICIPAL BONDS: 0.47% |
Forsyth County School District | | | 02/01/2024 | | | | 0.92% | | | | 1,330,000 | | | | 1,325,688 | |
Nebraska Public Power District | | | 01/01/2024 | | | | 2.22% | | | | 1,700,000 | | | | 1,700,000 | |
State of Hawaii | | | 08/01/2025 | | | | 1.03% | | | | 4,220,000 | | | | 3,989,263 | |
TOTAL MUNICIPAL BONDS (Cost $7,250,000) | | | | | | | | | | | | | | | 7,014,951 | |
| | | | | | | | | | | | | | | | | |
U.S. GOVERNMENT AGENCY ISSUES: 5.01% |
Federal Farm Credit Banks Funding Corp. | | | 03/06/2024 | | | | 3.63% | | | | 10,000,000 | | | | 9,963,383 | |
Federal Farm Credit Banks Funding Corp. | | | 03/10/2025 | | | | 5.00% | | | | 14,165,000 | | | | 14,241,062 | |
Federal Farm Credit Banks Funding Corp. | | | 08/14/2026 | | | | 4.50% | | | | 11,900,000 | | | | 12,003,177 | |
Federal Home Loan Banks | | | 04/14/2025 | | | | 0.50% | | | | 9,350,000 | | | | 8,882,144 | |
Federal Home Loan Banks | | | 02/25/2028 | | | | 1.10% | | | | 11,160,000 | | | | 9,878,865 | |
Federal National Mortgage Association | | | 07/02/2024 | | | | 1.75% | | | | 5,000,000 | | | | 4,916,603 | |
Federal National Mortgage Association | | | 04/22/2025 | | | | 0.63% | | | | 6,045,000 | | | | 5,748,370 | |
Federal National Mortgage Association | | | 12/18/2026 | | | | 0.88% | | | | 10,105,000 | | | | 9,140,297 | |
TOTAL U.S. GOVERNMENT AGENCY ISSUES (Cost $75,050,021) | | | | | | | | | | | | | | | 74,773,901 | |
| | | | | | | | | | | | | | | | | |
U.S. GOVERNMENT NOTES: 12.13% |
United States Treasury Note | | | 02/15/2025 | | | | 7.63% | | | | 1,500,000 | | | | 1,552,618 | |
United States Treasury Note | | | 06/15/2025 | | | | 2.88% | | | | 1,385,000 | | | | 1,353,837 | |
United States Treasury Note | | | 07/15/2025 | | | | 3.00% | | | | 4,725,000 | | | | 4,622,563 | |
United States Treasury Note | | | 08/31/2025 | | | | 0.25% | | | | 6,750,000 | | | | 6,303,076 | |
United States Treasury Note | | | 04/15/2026 | | | | 3.75% | | | | 35,200,000 | | | | 34,883,750 | |
United States Treasury Note | | | 05/31/2026 | | | | 0.75% | | | | 43,190,000 | | | | 39,883,266 | |
United States Treasury Note | | | 07/15/2026 | | | | 4.50% | | | | 15,565,000 | | | | 15,715,178 | |
United States Treasury Note | | | 02/28/2027 | | | | 1.88% | | | | 12,515,000 | | | | 11,738,679 | |
United States Treasury Note | | | 11/30/2027 | | | | 3.88% | | | | 36,210,000 | | | | 36,160,494 | |
United States Treasury Note | | | 01/31/2028 | | | | 3.50% | | | | 5,520,000 | | | | 5,437,200 | |
United States Treasury Note | | | 03/31/2028 | | | | 3.63% | | | | 23,585,000 | | | | 23,347,308 | |
TOTAL U.S. GOVERNMENT NOTES (Cost $180,883,822) | | | | | | | | | | | | | | | 180,997,969 | |
| | | | | | | | | | | | | | | | | |
SHORT TERM INVESTMENTS: 51.64% |
U.S. GOVERNMENT AGENCY ISSUE: 0.62% |
Federal Home Loan Banks | | | 02/27/2024 | | | | 4.92% | | | | 9,250,000 | | | | 9,176,624 | |
TOTAL U.S. GOVERNMENT AGENCY ISSUE (Cost $9,176,624) | | | | | | | | | | | | | | | 9,176,624 | |
| | | | | | | | | | | | | | | | | |
The accompanying notes are an integral part of these consolidated financial statements. | 23 |
LoCorr Macro Strategies Fund – Consolidated Schedule of Investments (continued) |
| | Maturity Date | | | Coupon Rate | | | Principal
Amount | | | Value | |
SHORT TERM INVESTMENTS (continued) |
U.S. TREASURY BILLS: 51.03% |
United States Treasury Bill | | | 01/18/2024 | | | | 4.91% | | | $ | 61,619,000 | | | $ | 61,467,691 | |
United States Treasury Bill | | | 02/15/2024 | | | | 5.12% | | | | 182,607,000 | | | | 181,413,207 | |
United States Treasury Bill | | | 03/14/2024 | | | | 5.05% | | | | 205,463,000 | | | | 203,330,910 | |
United States Treasury Bill | | | 04/18/2024 | | | | 5.10% | | | | 184,228,000 | | | | 181,384,898 | |
United States Treasury Bill | | | 05/09/2024 | | | | 5.06% | | | | 51,341,000 | | | | 50,403,049 | |
United States Treasury Bill | | | 06/06/2024 | | | | 4.99% | | | | 85,187,000 | | | | 83,322,825 | |
TOTAL U.S. TREASURY BILLS (Cost $761,162,883) | | | | | | | | | | | | | | | 761,322,580 | |
TOTAL SHORT TERM INVESTMENTS (Cost $770,339,507) | | | | | | | | | | | | | | | 770,499,204 | |
| | | | | | | | | | | | | | | | | |
TOTAL INVESTMENTS (Cost $1,370,039,236): 91.35% | | | | | | | | | | | | | | | 1,362,924,598 | |
Cash - Interest Bearing Deposit Account: 2.22% (e)(f) | | | | | | | | | | | | | | | 33,140,752 | |
Other Assets in Excess of Liabilities: 6.43% (g) | | | | | | | | | | | | | | | 95,879,683 | |
TOTAL NET ASSETS: 100.00% | | | | | | | | | | | | | | $ | 1,491,945,033 | |
(a) | Security as defined in Rule 144A under the Securities Act of 1933. Purchased in a private placement transaction; resale to the public may require registration or may extend only to qualified institutional buyers. As of the reporting date, the value of these securities total $138,130,272 which represents 9.26% of total net assets. |
(b) | Foreign issued security. |
(c) | Variable or floating rate security based on a reference index and spread. Certain securities are fixed to variable and currently in the fixed phase. The rate reported is the rate in effect as of the reporting date. |
(d) | Variable rate security. The coupon is based on an underlying pool of loans. The rate reported is the rate in effect as of the reporting date. |
(e) | A portion of this deposit account is pledged as collateral for derivative contracts. As of the reporting date, the value of this collateral totals $12,676. |
(f) | The Money Market Deposit Account (“MMDA”) is a short-term investment vehicle in which the Fund holds cash balances. The MMDA will bear interest at a variable rate that is determined based on market conditions and may change daily and by any amount. |
(g) | Includes assets and liabilities pledged as collateral and due to broker for derivative contracts. As of the reporting date, the net value of these assets and liabilities totals $113,184,463. |
CMT | Constant Maturity Treasury | SOFR | Secured Overnight Financing Rate |
LIBOR | London Interbank Offered Rate | SOFR30A | 30 Day Average Secured Overnight Financing Rate |
PLC | Public Limited Company | TSFR1M | 1 Month Term Secured Overnight Financing Rate |
24 | The accompanying notes are an integral part of these consolidated financial statements. |
LoCorr Macro Strategies Fund – Consolidated Schedule of Open Forward Currency Contracts |
LoCorr Macro Strategies Fund
Consolidated Schedule of Open Forward Currency Contracts
December 31, 2023
| | | | | | | | | | | | | | | Currency to be Received | | | Currency to be Delivered | | | | | | | | | |
| | | Notional
Amount | | | Counterparty
Abbreviation | | | Forward
Settlement
Date | | | Currency
Abbreviation | | | U.S. $
Notional
Amount at
December 31,
2023 | | | Currency
Abbreviation | | | U.S. $
Notional
Amount on
Origination
Date | | | Unrealized
Appreciation | | | Unrealized
(Depreciation) | |
| | | | | | | | See key for abbreviation | | | | | | | | | | | | | | | | | | | | | | | | | | | | | |
Purchase Contracts: | | | | | | | | | | | | | | | | | | | | | | | | | | | | |
| | | $ | 30,438,447 | | | | DB | | | | 01/17/2024 | | | | AUD | | | $ | 30,821,926 | | | | USD | | | $ | 30,438,447 | | | $ | 383,479 | | | $ | — | |
| | | | 62,099,575 | | | | BAML | | | | 03/22/2024 | | | | AUD | | | | 62,320,624 | | | | USD | | | | 62,099,575 | | | | 221,049 | | | | — | |
| | | | 42,119,695 | | | | DB | | | | 01/17/2024 | | | | BRL | | | | 42,502,356 | | | | USD | | | | 42,119,695 | | | | 382,661 | | | | — | |
| | | | 61,682,949 | | | | BAML | | | | 01/17/2024 | | | | CAD | | | | 62,120,867 | | | | USD | | | | 61,682,949 | | | | 437,918 | | | | — | |
| | | | 32,283,955 | | | | BAML | | | | 03/22/2024 | | | | CAD | | | | 32,375,590 | | | | USD | | | | 32,283,955 | | | | 91,635 | | | | — | |
| | | | 5,739,421 | | | | DB | | | | 01/03/2024 | | | | CHF | | | | 5,722,035 | | | | USD | | | | 5,739,421 | | | | — | | | | (17,386 | ) |
| | | | 2,657,400 | | | | DB | | | | 01/04/2024 | | | | CHF | | | | 2,653,113 | | | | USD | | | | 2,657,400 | | | | — | | | | (4,287 | ) |
| | | | 45,631,293 | | | | DB | | | | 01/17/2024 | | | | CHF | | | | 47,039,302 | | | | USD | | | | 45,631,293 | | | | 1,408,009 | | | | — | |
| | | | 47,194,716 | | | | BAML | | | | 03/22/2024 | | | | CHF | | | | 47,783,929 | | | | USD | | | | 47,194,716 | | | | 589,213 | | | | — | |
| | | | 583,104 | | | | DB | | | | 01/17/2024 | | | | CLP | | | | 578,190 | | | | USD | | | | 583,104 | | | | — | | | | (4,914 | ) |
| | | | 95,490,350 | | | | BAML | | | | 01/17/2024 | | | | EUR | | | | 96,496,582 | | | | USD | | | | 95,490,350 | | | | 1,006,232 | | | | — | |
| | | | 68,419,392 | | | | BAML | | | | 03/22/2024 | | | | EUR | | | | 68,670,522 | | | | USD | | | | 68,419,392 | | | | 251,130 | | | | — | |
| | | | 77,117,883 | | | | BAML | | | | 01/17/2024 | | | | GBP | | | | 77,672,986 | | | | USD | | | | 77,117,883 | | | | 555,103 | | | | — | |
| | | | 39,063,673 | | | | BAML | | | | 03/22/2024 | | | | GBP | | | | 39,150,327 | | | | USD | | | | 39,063,673 | | | | 86,654 | | | | — | |
| | | | 5,304,415 | | | | DB | | | | 01/17/2024 | | | | ILS | | | | 5,437,613 | | | | USD | | | | 5,304,415 | | | | 133,198 | | | | — | |
| | | | 10,789,710 | | | | DB | | | | 01/17/2024 | | | | INR | | | | 10,792,665 | | | | USD | | | | 10,789,710 | | | | 2,955 | | | | — | |
| | | | 2,714,852 | | | | BAML | | | | 01/04/2024 | | | | JPY | | | | 2,725,981 | | | | USD | | | | 2,714,852 | | | | 11,129 | | | | — | |
| | | | 7,768,005 | | | | BAML | | | | 01/05/2024 | | | | JPY | | | | 7,767,431 | | | | USD | | | | 7,768,005 | | | | — | | | | (574 | ) |
| | | | 76,393,736 | | | | BAML | | | | 01/17/2024 | | | | JPY | | | | 78,502,564 | | | | USD | | | | 76,393,736 | | | | 2,108,828 | | | | — | |
| | | | 10,705,990 | | | | BAML | | | | 03/22/2024 | | | | JPY | | | | 10,800,887 | | | | USD | | | | 10,705,990 | | | | 94,897 | | | | — | |
| | | | 6,332,995 | | | | DB | | | | 01/17/2024 | | | | KRW | | | | 6,415,643 | | | | USD | | | | 6,332,995 | | | | 82,648 | | | | — | |
| | | | 37,203,089 | | | | BAML | | | | 01/17/2024 | | | | MXN | | | | 37,980,600 | | | | USD | | | | 37,203,089 | | | | 777,511 | | | | — | |
| | | | 37,032,064 | | | | BAML | | | | 03/22/2024 | | | | MXN | | | | 38,078,151 | | | | USD | | | | 37,032,064 | | | | 1,046,087 | | | | — | |
| | | | 41,328,218 | | | | DB | | | | 01/17/2024 | | | | NOK | | | | 42,810,653 | | | | USD | | | | 41,328,218 | | | | 1,482,435 | | | | — | |
| | | | 6,408,035 | | | | DB | | | | 01/03/2024 | | | | NZD | | | | 6,384,742 | | | | USD | | | | 6,408,035 | | | | — | | | | (23,293 | ) |
| | | | 1,179,403 | | | | DB | | | | 01/04/2024 | | | | NZD | | | | 1,175,804 | | | | USD | | | | 1,179,403 | | | | — | | | | (3,599 | ) |
| | | | 23,007,954 | | | | DB | | | | 01/17/2024 | | | | NZD | | | | 23,606,158 | | | | USD | | | | 23,007,954 | | | | 598,204 | | | | — | |
| | | | 52,765,423 | | | | BAML | | | | 03/22/2024 | | | | NZD | | | | 53,016,800 | | | | USD | | | | 52,765,423 | | | | 251,377 | | | | — | |
| | | | 14,792,380 | | | | DB | | | | 01/17/2024 | | | | PLN | | | | 15,077,218 | | | | USD | | | | 14,792,380 | | | | 284,838 | | | | — | |
| | | | 18,375,088 | | | | DB | | | | 01/17/2024 | | | | SEK | | | | 18,798,677 | | | | USD | | | | 18,375,088 | | | | 423,589 | | | | — | |
| | | | 15,349,935 | | | | DB | | | | 01/17/2024 | | | | SGD | | | | 15,510,140 | | | | USD | | | | 15,349,935 | | | | 160,205 | | | | — | |
| | | | 14,100,005 | | | | DB | | | | 01/17/2024 | | | | ZAR | | | | 14,370,327 | | | | USD | | | | 14,100,005 | | | | 270,322 | | | | — | |
Total Purchase Contracts | | | | | | | | | | | 1,005,160,403 | | | | | | | | 992,073,150 | | | | 13,141,306 | | | | (54,053 | ) |
The accompanying notes are an integral part of these consolidated financial statements. | 25 |
LoCorr Macro Strategies Fund – Consolidated Schedule of Open Forward Currency Contracts (continued) |
| | | | | | | | | | | | | | | Currency to be Received | | | Currency to be Delivered | | | | | | | | | |
| | | Notional
Amount | | | Counterparty
Abbreviation | | | Forward
Settlement
Date | | | Currency
Abbreviation | | | U.S. $
Notional
Amount at
December 31,
2023 | | | Currency
Abbreviation | | | U.S. $
Notional
Amount on
Origination
Date | | | Unrealized
Appreciation | | | Unrealized
(Depreciation) | |
| | | | | | | | See key for abbreviation | | | | | | | | | | | | | | | | | | | | | | | | | | | | | |
Sale Contracts: |
| | | $ | 58,097,882 | | | | DB | | | | 01/17/2024 | | | | USD | | | $ | 59,632,245 | | | | AUD | | | $ | 58,097,882 | | | $ | — | | | $ | (1,534,363 | ) |
| | | | 26,683,813 | | | | BAML | | | | 03/22/2024 | | | | USD | | | | 27,659,721 | | | | AUD | | | | 26,683,813 | | | | — | | | | (975,908 | ) |
| | | | 23,279,030 | | | | DB | | | | 01/17/2024 | | | | USD | | | | 23,644,402 | | | | BRL | | | | 23,279,030 | | | | — | | | | (365,372 | ) |
| | | | 63,212,379 | | | | BAML | | | | 01/17/2024 | | | | USD | | | | 64,604,494 | | | | CAD | | | | 63,212,379 | | | | — | | | | (1,392,115 | ) |
| | | | 100,441,919 | | | | BAML | | | | 03/22/2024 | | | | USD | | | | 102,930,954 | | | | CAD | | | | 100,441,919 | | | | — | | | | (2,489,035 | ) |
| | | | 5,715,195 | | | | DB | | | | 01/03/2024 | | | | USD | | | | 5,722,035 | | | | CHF | | | | 5,715,195 | | | | — | | | | (6,840 | ) |
| | | | 2,660,543 | | | | DB | | | | 01/04/2024 | | | | USD | | | | 2,653,113 | | | | CHF | | | | 2,660,543 | | | | 7,430 | | | | — | |
| | | | 61,363,340 | | | | DB | | | | 01/17/2024 | | | | USD | | | | 63,457,781 | | | | CHF | | | | 61,363,340 | | | | — | | | | (2,094,441 | ) |
| | | | 53,395,204 | | | | BAML | | | | 03/22/2024 | | | | USD | | | | 55,562,206 | | | | CHF | | | | 53,395,204 | | | | — | | | | (2,167,002 | ) |
| | | | 291,680 | | | | DB | | | | 01/17/2024 | | | | USD | | | | 291,362 | | | | CLP | | | | 291,680 | | | | 318 | | | | — | |
| | | | 55,208,018 | | | | BAML | | | | 01/17/2024 | | | | USD | | | | 55,993,208 | | | | EUR | | | | 55,208,018 | | | | — | | | | (785,190 | ) |
| | | | 73,059,843 | | | | BAML | | | | 03/22/2024 | | | | USD | | | | 74,676,547 | | | | EUR | | | | 73,059,843 | | | | — | | | | (1,616,704 | ) |
| | | | 77,259,981 | | | | BAML | | | | 01/17/2024 | | | | USD | | | | 77,672,986 | | | | GBP | | | | 77,259,981 | | | | — | | | | (413,005 | ) |
| | | | 10,798,194 | | | | BAML | | | | 02/21/2024 | | | | USD | | | | 10,786,661 | | | | GBP | | | | 10,798,194 | | | | 11,533 | | | | — | |
| | | | 33,433,037 | | | | BAML | | | | 03/22/2024 | | | | USD | | | | 34,021,586 | | | | GBP | | | | 33,433,037 | | | | — | | | | (588,549 | ) |
| | | | 3,967,189 | | | | DB | | | | 01/17/2024 | | | | USD | | | | 4,006,371 | | | | ILS | | | | 3,967,189 | | | | — | | | | (39,182 | ) |
| | | | 6,902,419 | | | | DB | | | | 01/17/2024 | | | | USD | | | | 6,917,331 | | | | INR | | | | 6,902,419 | | | | — | | | | (14,912 | ) |
| | | | 2,723,755 | | | | BAML | | | | 01/04/2024 | | | | USD | | | | 2,725,981 | | | | JPY | | | | 2,723,755 | | | | — | | | | (2,226 | ) |
| | | | 7,738,485 | | | | BAML | | | | 01/05/2024 | | | | USD | | | | 7,767,431 | | | | JPY | | | | 7,738,485 | | | | — | | | | (28,946 | ) |
| | | | 103,114,615 | | | | BAML | | | | 01/17/2024 | | | | USD | | | | 106,417,749 | | | | JPY | | | | 103,114,615 | | | | — | | | | (3,303,134 | ) |
| | | | 88,652,674 | | | | BAML | | | | 03/22/2024 | | | | USD | | | | 91,051,132 | | | | JPY | | | | 88,652,674 | | | | — | | | | (2,398,458 | ) |
| | | | 4,644,721 | | | | DB | | | | 01/17/2024 | | | | USD | | | | 4,699,986 | | | | KRW | | | | 4,644,721 | | | | — | | | | (55,265 | ) |
| | | | 10,636,063 | | | | BAML | | | | 01/17/2024 | | | | USD | | | | 10,808,252 | | | | MXN | | | | 10,636,063 | | | | — | | | | (172,189 | ) |
| | | | 3,331,874 | | | | BAML | | | | 03/22/2024 | | | | USD | | | | 3,364,457 | | | | MXN | | | | 3,331,874 | | | | — | | | | (32,583 | ) |
| | | | 40,943,765 | | | | DB | | | | 01/17/2024 | | | | USD | | | | 42,846,104 | | | | NOK | | | | 40,943,765 | | | | — | | | | (1,902,339 | ) |
| | | | 6,408,954 | | | | DB | | | | 01/03/2024 | | | | USD | | | | 6,384,742 | | | | NZD | | | | 6,408,954 | | | | 24,212 | | | | — | |
| | | | 1,175,202 | | | | DB | | | | 01/04/2024 | | | | USD | | | | 1,175,805 | | | | NZD | | | | 1,175,202 | | | | — | | | | (603 | ) |
| | | | 50,276,885 | | | | DB | | | | 01/17/2024 | | | | USD | | | | 51,112,958 | | | | NZD | | | | 50,276,885 | | | | — | | | | (836,073 | ) |
| | | | 20,208,034 | | | | BAML | | | | 03/22/2024 | | | | USD | | | | 20,873,891 | | | | NZD | | | | 20,208,034 | | | | — | | | | (665,857 | ) |
| | | | 10,110,203 | | | | DB | | | | 01/17/2024 | | | | USD | | | | 10,140,408 | | | | PLN | | | | 10,110,203 | | | | — | | | | (30,205 | ) |
| | | | 15,563,849 | | | | DB | | | | 01/17/2024 | | | | USD | | | | 15,777,195 | | | | SEK | | | | 15,563,849 | | | | — | | | | (213,346 | ) |
| | | | 9,010,492 | | | | DB | | | | 01/17/2024 | | | | USD | | | | 9,086,136 | | | | SGD | | | | 9,010,492 | | | | — | | | | (75,644 | ) |
| | | | 14,012,494 | | | | DB | | | | 01/17/2024 | | | | USD | | | | 14,370,326 | | | | ZAR | | | | 14,012,494 | | | | — | | | | (357,832 | ) |
| | | | 1,685,033 | | | | DB | | | | 02/21/2024 | | | | USD | | | | 1,697,013 | | | | ZAR | | | | 1,685,033 | | | | — | | | | (11,980 | ) |
Total Sale Contracts | | | | | | | | | | | 1,070,532,569 | | | | | | | | 1,046,006,764 | | | | 43,493 | | | | (24,569,298 | ) |
Net Forward Currency Contracts | | | | | | | | | | $ | (65,372,166 | ) | | | | | | $ | (53,933,614 | ) | | $ | 13,184,799 | | | $ | (24,623,351 | ) |
Net Unrealized Depreciation | | | | | | | | | | | | | | | | | | | | | | | | | | $ | (11,438,552 | ) |
Counterparty Abbreviations:
BAML | Bank of America Merrill Lynch |
Currency Abbreviations:
AUD | AUSTRALIAN DOLLAR | INR | INDIAN RUPEE | SGD | SINGAPORE DOLLAR | | |
BRL | BRAZILIAN REAL | JPY | JAPANESE YEN | USD | U.S. DOLLAR | | |
CAD | CANADIAN DOLLAR | KRW | SOUTH KOREAN WON | ZAR | SOUTH AFRICAN RAND | | |
CHF | SWISS FRANC | MXN | MEXICAN PESO | | | | |
CLP | CHILEAN PESO | NOK | NORWEGIAN KRONE | | | | |
EUR | EURO | NZD | NEW ZEALAND DOLLAR | | | | |
GBP | BRITISH POUND | PLN | POLISH ZLOTY | | | | |
ILS | ISRAELI NEW SHEQEL | SEK | SWEDISH KRONA | | | | |
26 | The accompanying notes are an integral part of these consolidated financial statements. |
LoCorr Macro Strategies Fund – Consolidated Schedule of Open Futures Contracts |
LoCorr Macro Strategies Fund
Consolidated Schedule of Open Futures Contracts
December 31, 2023
| | | Number of
Contracts | | | | | | | Current | | | Notional | | | Value | |
Description | | Purchased
(Sold) | | | Settlement
Month-Year | | | Notional
Amount | | | Amount At
Trade Date | | | Unrealized
Appreciation | | | Unrealized
(Depreciation) | |
Purchase Contracts: |
3 Mo Euro Euribor | | | 174 | | | | Sep-24 | | | $ | 46,756,353 | | | $ | 46,716,686 | | | $ | 39,667 | | | $ | — | |
3 Mo Euro Euribor | | | 245 | | | | Dec-24 | | | | 66,061,611 | | | | 65,921,212 | | | | 140,399 | | | | — | |
3 Mo Euro Euribor | | | 238 | | | | Mar-25 | | | | 64,325,212 | | | | 64,128,978 | | | | 196,234 | | | | — | |
3 Mo Euro Euribor | | | 1,418 | | | | Jun-25 | | | | 383,757,286 | | | | 383,645,462 | | | | 111,824 | | | | — | |
3 Mo Euro Euribor | | | 151 | | | | Sep-25 | | | | 40,882,220 | | | | 40,735,129 | | | | 147,091 | | | | — | |
3 Mo Euro Euribor | | | 111 | | | | Dec-25 | | | | 30,049,429 | | | | 29,890,288 | | | | 159,141 | | | | — | |
3 Mo Euro Euribor | | | 88 | | | | Mar-26 | | | | 23,813,256 | | | | 23,671,519 | | | | 141,737 | | | | — | |
Aluminum - 90 Day Settlement (a) | | | 1 | | | | Jan-24 | | | | 58,838 | | | | 55,782 | | | | 3,056 | | | | — | |
Aluminum - 90 Day Settlement (a) | | | 1 | | | | Jan-24 | | | | 58,969 | | | | 56,548 | | | | 2,421 | | | | — | |
Aluminum - 90 Day Settlement (a) | | | 1 | | | | Feb-24 | | | | 59,000 | | | | 56,122 | | | | 2,878 | | | | — | |
Aluminum - 90 Day Settlement (a) | | | 2 | | | | Feb-24 | | | | 118,219 | | | | 111,347 | | | | 6,872 | | | | — | |
Aluminum - 90 Day Settlement (a) | | | 3 | | | | Feb-24 | | | | 177,600 | | | | 167,410 | | | | 10,190 | | | | — | |
Aluminum - 90 Day Settlement (a) | | | 2 | | | | Mar-24 | | | | 118,775 | | | | 109,505 | | | | 9,270 | | | | — | |
Aluminum - 90 Day Settlement (a) | | | 1 | | | | Mar-24 | | | | 59,442 | | | | 53,389 | | | | 6,053 | | | | — | |
Aluminum - 90 Day Settlement (a) | | | 3 | | | | Mar-24 | | | | 178,607 | | | | 168,308 | | | | 10,299 | | | | — | |
Aluminum - 90 Day Settlement (a) | | | 3 | | | | Mar-24 | | | | 178,613 | | | | 170,307 | | | | 8,306 | | | | — | |
Aluminum - 90 Day Settlement (a) | | | 1 | | | | Mar-24 | | | | 59,600 | | | | 59,522 | | | | 78 | | | | — | |
Aluminum (a) | | | 123 | | | | Mar-24 | | | | 7,321,575 | | | | 6,907,181 | | | | 414,394 | | | | — | |
Australian Dollar | | | 345 | | | | Mar-24 | | | | 23,565,225 | | | | 23,618,803 | | | | — | | | | (53,578 | ) |
Bovespa Index | | | 160 | | | | Feb-24 | | | | 4,472,661 | | | | 4,466,213 | | | | 6,448 | | | | — | |
Brent Crude | | | 346 | | | | Jan-24 | | | | 26,655,840 | | | | 27,318,820 | | | | — | | | | (662,980 | ) |
Brent Crude | | | 60 | | | | Feb-24 | | | | 4,614,600 | | | | 4,754,239 | | | | — | | | | (139,639 | ) |
Brent Crude | | | 16 | | | | Mar-24 | | | | 1,228,640 | | | | 1,263,601 | | | | — | | | | (34,961 | ) |
Brent Crude | | | 12 | | | | Apr-24 | | | | 919,680 | | | | 939,876 | | | | — | | | | (20,196 | ) |
Brent Crude | | | 8 | | | | May-24 | | | | 611,440 | | | | 630,111 | | | | — | | | | (18,671 | ) |
Brent Crude | | | 5 | | | | Jun-24 | | | | 380,850 | | | | 391,447 | | | | — | | | | (10,597 | ) |
British Pound | | | 308 | | | | Mar-24 | | | | 24,545,675 | | | | 24,599,340 | | | | — | | | | (53,665 | ) |
CAC 40 10 Euro Index | | | 301 | | | | Jan-24 | | | | 25,104,378 | | | | 25,231,603 | | | | — | | | | (127,225 | ) |
Canadian Dollar | | | 420 | | | | Mar-24 | | | | 31,762,500 | | | | 31,807,861 | | | | — | | | | (45,361 | ) |
CBOE Volatility Index | | | 76 | | | | Mar-24 | | | | 8,969,188 | | | | 8,951,436 | | | | 17,752 | | | | — | |
Cocoa | | | 134 | | | | Mar-24 | | | | 5,988,350 | | | | 5,690,198 | | | | 298,152 | | | | — | |
Coffee | | | 174 | | | | Mar-24 | | | | 12,286,575 | | | | 12,126,759 | | | | 159,816 | | | | — | |
Copper - 90 Day Settlement (a) | | | 1 | | | | Jan-24 | | | | 211,917 | | | | 200,345 | | | | 11,572 | | | | — | |
Copper - 90 Day Settlement (a) | | | 1 | | | | Jan-24 | | | | 211,994 | | | | 201,391 | | | | 10,603 | | | | — | |
Copper - 90 Day Settlement (a) | | | 1 | | | | Jan-24 | | | | 212,213 | | | | 197,938 | | | | 14,275 | | | | — | |
Copper - 90 Day Settlement (a) | | | 1 | | | | Jan-24 | | | | 212,721 | | | | 202,833 | | | | 9,888 | | | | — | |
Copper - 90 Day Settlement (a) | | | 1 | | | | Feb-24 | | | | 212,800 | | | | 203,378 | | | | 9,422 | | | | — | |
Copper - 90 Day Settlement (a) | | | 1 | | | | Feb-24 | | | | 213,006 | | | | 201,714 | | | | 11,292 | | | | — | |
Copper - 90 Day Settlement (a) | | | 1 | | | | Feb-24 | | | | 213,081 | | | | 204,123 | | | | 8,958 | | | | — | |
Copper - 90 Day Settlement (a) | | | 2 | | | | Feb-24 | | | | 426,300 | | | | 411,327 | | | | 14,973 | | | | — | |
Copper - 90 Day Settlement (a) | | | 2 | | | | Feb-24 | | | | 426,477 | | | | 419,713 | | | | 6,764 | | | | — | |
Copper - 90 Day Settlement (a) | | | 3 | | | | Mar-24 | | | | 640,331 | | | | 645,395 | | | | — | | | | (5,064 | ) |
The accompanying notes are an integral part of these consolidated financial statements. | 27 |
LoCorr Macro Strategies Fund – Consolidated Schedule of Open Futures Contracts (continued) |
| | | Number of
Contracts | | | | | | | Current | | | Notional | | | Value | |
Description | | Purchased
(Sold) | | | Settlement
Month-Year | | | Notional
Amount | | | Amount At
Trade Date | | | Unrealized
Appreciation | | | Unrealized
(Depreciation) | |
Purchase Contracts: (continued) |
Copper - 90 Day Settlement (a) | | | 1 | | | | Mar-24 | | | $ | 213,619 | | | $ | 208,495 | | | $ | 5,124 | | | $ | — | |
Copper - 90 Day Settlement (a) | | | 1 | | | | Mar-24 | | | | 213,888 | | | | 214,992 | | | | — | | | | (1,104 | ) |
Copper - 90 Day Settlement (a) | | | 1 | | | | Mar-24 | | | | 213,963 | | | | 217,224 | | | | — | | | | (3,261 | ) |
Copper (a) | | | 166 | | | | Mar-24 | | | | 35,505,325 | | | | 35,130,050 | | | | 375,275 | | | | — | |
Copper (COMEX) | | | 18 | | | | Mar-24 | | | | 1,750,725 | | | | 1,765,124 | | | | — | | | | (14,399 | ) |
DAX Index | | | 131 | | | | Mar-24 | | | | 61,147,747 | | | | 61,386,953 | | | | — | | | | (239,206 | ) |
Dollar | | | 115 | | | | Mar-24 | | | | 11,618,335 | | | | 11,806,448 | | | | — | | | | (188,113 | ) |
Dow Jones Industrial Average Mini E-Cbot Index | | | 252 | | | | Mar-24 | | | | 47,895,120 | | | | 47,535,606 | | | | 359,514 | | | | — | |
Euro | | | 756 | | | | Mar-24 | | | | 104,658,750 | | | | 104,930,857 | | | | — | | | | (272,107 | ) |
Euro-Bobl | | | 246 | | | | Mar-24 | | | | 32,393,005 | | | | 32,448,719 | | | | — | | | | (55,714 | ) |
Euro-BTP | | | 83 | | | | Mar-24 | | | | 10,917,436 | | | | 10,964,696 | | | | — | | | | (47,260 | ) |
Euro-Bund | | | 153 | | | | Mar-24 | | | | 23,177,007 | | | | 23,301,288 | | | | — | | | | (124,281 | ) |
Euro-Buxl 30 Yr Bond | | | 1 | | | | Mar-24 | | | | 156,451 | | | | 156,274 | | | | 177 | | | | — | |
Euro-Schatz | | | 131 | | | | Mar-24 | | | | 15,408,234 | | | | 15,406,918 | | | | 1,316 | | | | — | |
Euro-Stoxx 50 Index | | | 1,739 | | | | Mar-24 | | | | 87,214,925 | | | | 87,818,163 | | | | — | | | | (603,238 | ) |
FTSE 100 Index | | | 147 | | | | Mar-24 | | | | 14,533,612 | | | | 14,504,409 | | | | 29,203 | | | | — | |
FTSE MIB Index | | | 23 | | | | Mar-24 | | | | 3,874,763 | | | | 3,873,562 | | | | 1,201 | | | | — | |
FTSE/JSE Top 40 Index | | | 12 | | | | Mar-24 | | | | 468,323 | | | | 468,536 | | | | — | | | | (213 | ) |
Gasoline RBOB | | | 27 | | | | Jan-24 | | | | 2,388,544 | | | | 2,473,677 | | | | — | | | | (85,133 | ) |
Gasoline RBOB | | | 19 | | | | Feb-24 | | | | 1,696,388 | | | | 1,760,018 | | | | — | | | | (63,630 | ) |
Gasoline RBOB | | | 7 | | | | Mar-24 | | | | 680,140 | | | | 704,236 | | | | — | | | | (24,096 | ) |
Gasoline RBOB | | | 3 | | | | Apr-24 | | | | 291,803 | | | | 301,814 | | | | — | | | | (10,011 | ) |
Gold | | | 133 | | | | Feb-24 | | | | 27,554,940 | | | | 27,487,777 | | | | 67,163 | | | | — | |
Heating Oil | | | 141 | | | | Jan-24 | | | | 14,976,146 | | | | 15,304,689 | | | | — | | | | (328,543 | ) |
Heating Oil | | | 11 | | | | Feb-24 | | | | 1,152,782 | | | | 1,217,459 | | | | — | | | | (64,677 | ) |
IBEX 35 Index | | | 2 | | | | Jan-24 | | | | 222,693 | | | | 222,928 | | | | — | | | | (235 | ) |
IFSC Nifty 50 Fut | | | 46 | | | | Jan-24 | | | | 2,010,062 | | | | 2,006,896 | | | | 3,166 | | | | — | |
Japanese Yen | | | 274 | | | | Mar-24 | | | | 24,577,800 | | | | 24,501,399 | | | | 76,401 | | | | — | |
KOSPI 200 Index | | | 274 | | | | Mar-24 | | | | 19,291,055 | | | | 18,955,867 | | | | 335,188 | | | | — | |
Lead - 90 Day Settlement (a) | | | 1 | | | | Mar-24 | | | | 51,808 | | | | 50,480 | | | | 1,328 | | | | — | |
Lead (a) | | | 19 | | | | Mar-24 | | | | 984,438 | | | | 1,009,969 | | | | — | | | | (25,531 | ) |
Lean Hogs | | | 6 | | | | Feb-24 | | | | 163,140 | | | | 169,115 | | | | — | | | | (5,975 | ) |
Long Gilt | | | 168 | | | | Mar-24 | | | | 21,981,569 | | | | 22,103,038 | | | | — | | | | (121,469 | ) |
Low Sulphur Gasoil | | | 165 | | | | Feb-24 | | | | 12,247,125 | | | | 12,284,776 | | | | — | | | | (37,651 | ) |
Low Sulphur Gasoil | | | 15 | | | | Mar-24 | | | | 1,102,125 | | | | 1,117,945 | | | | — | | | | (15,820 | ) |
Mexican Peso | | | 41 | | | | Mar-24 | | | | 1,193,920 | | | | 1,188,654 | | | | 5,266 | | | | — | |
MSCI Emerging Markets Index | | | 102 | | | | Mar-24 | | | | 5,271,870 | | | | 5,217,597 | | | | 54,273 | | | | — | |
MSCI Taiwan Index | | | 83 | | | | Jan-24 | | | | 5,147,660 | | | | 5,145,214 | | | | 2,446 | | | | — | |
Nasdaq 100 E-Mini Index | | | 201 | | | | Mar-24 | | | | 68,434,470 | | | | 66,312,882 | | | | 2,121,588 | | | | — | |
Nickel (a) | | | 10 | | | | Mar-24 | | | | 995,580 | | | | 1,005,427 | | | | — | | | | (9,847 | ) |
Nikkei 225 Index (OSE) | | | 177 | | | | Mar-24 | | | | 41,990,425 | | | | 41,168,431 | | | | 821,994 | | | | — | |
Platinum | | | 5 | | | | Apr-24 | | | | 252,300 | | | | 250,740 | | | | 1,560 | | | | — | |
Russell 2000 Mini Index | | | 68 | | | | Mar-24 | | | | 6,962,180 | | | | 7,006,099 | | | | — | | | | (43,919 | ) |
S&P 500 E-Mini Index | | | 351 | | | | Mar-24 | | | | 84,591,000 | | | | 82,864,277 | | | | 1,726,723 | | | | — | |
Sour Crude Oil | | | 1 | | | | Jan-24 | | | | 66,000 | | | | 61,819 | | | | 4,181 | | | | — | |
Soybean Meal | | | 191 | | | | Mar-24 | | | | 7,372,600 | | | | 8,208,152 | | | | — | | | | (835,552 | ) |
28 | The accompanying notes are an integral part of these consolidated financial statements. |
LoCorr Macro Strategies Fund – Consolidated Schedule of Open Futures Contracts (continued) |
| | | Number of
Contracts | | | | | | | Current | | | Notional | | | Value | |
Description | | Purchased
(Sold) | | | Settlement
Month-Year | | | Notional
Amount | | | Amount At
Trade Date | | | Unrealized
Appreciation | | | Unrealized
(Depreciation) | |
Purchase Contracts: (continued) |
SPI 200 Index | | | 58 | | | | Mar-24 | | | $ | 7,494,753 | | | $ | 7,375,720 | | | $ | 119,033 | | | $ | — | |
Sugar | | | 124 | | | | Feb-24 | | | | 2,858,150 | | | | 3,731,016 | | | | — | | | | (872,866 | ) |
Swiss Franc | | | 276 | | | | Mar-24 | | | | 41,331,000 | | | | 41,305,113 | | | | 25,887 | | | | — | |
Swiss Franc | | | 31 | | | | Dec-24 | | | | 9,484,373 | | | | 9,482,444 | | | | 1,929 | | | | — | |
Swiss Franc | | | 16 | | | | Dec-24 | | | | 3,836,200 | | | | 3,835,891 | | | | 309 | | | | — | |
Swiss Franc | | | 72 | | | | Mar-25 | | | | 22,114,259 | | | | 22,107,847 | | | | 6,412 | | | | — | |
Swiss Franc | | | 51 | | | | Mar-25 | | | | 12,274,425 | | | | 12,273,614 | | | | 811 | | | | — | |
Swiss Franc | | | 68 | | | | Jun-25 | | | | 20,943,113 | | | | 20,934,306 | | | | 8,807 | | | | — | |
Swiss Franc | | | 56 | | | | Jun-25 | | | | 13,521,200 | | | | 13,516,873 | | | | 4,327 | | | | — | |
Swiss Franc | | | 295 | | | | Sep-25 | | | | 91,030,059 | | | | 90,951,866 | | | | 78,193 | | | | — | |
Swiss Franc | | | 78 | | | | Sep-25 | | | | 18,874,050 | | | | 18,862,899 | | | | 11,151 | | | | — | |
Swiss Franc | | | 43 | | | | Dec-25 | | | | 13,283,176 | | | | 13,259,654 | | | | 23,522 | | | | — | |
Swiss Franc | | | 38 | | | | Dec-25 | | | | 9,205,500 | | | | 9,198,729 | | | | 6,771 | | | | — | |
Swiss Franc | | | 51 | | | | Mar-26 | | | | 12,359,213 | | | | 12,338,939 | | | | 20,274 | | | | — | |
Swiss Franc | | | 37 | | | | Mar-26 | | | | 11,435,605 | | | | 11,420,808 | | | | 14,797 | | | | — | |
Swiss Franc | | | 26 | | | | Jun-26 | | | | 8,037,073 | | | | 8,021,485 | | | | 15,588 | | | | — | |
Swiss Franc | | | 54 | | | | Jun-26 | | | | 13,085,550 | | | | 13,059,207 | | | | 26,343 | | | | — | |
Swiss Franc | | | 163 | | | | Sep-26 | | | | 39,490,825 | | | | 39,453,755 | | | | 37,070 | | | | — | |
Tokyo Price Index | | | 342 | | | | Mar-24 | | | | 57,388,085 | | | | 56,962,917 | | | | 425,168 | | | | — | |
U.S. 10 Yr Note | | | 265 | | | | Mar-24 | | | | 29,916,016 | | | | 29,863,546 | | | | 52,470 | | | | — | |
U.S. 5 Yr Note | | | 159 | | | | Mar-24 | | | | 17,294,977 | | | | 17,269,756 | | | | 25,221 | | | | — | |
U.S. Long Bond | | | 54 | | | | Mar-24 | | | | 6,746,625 | | | | 6,724,282 | | | | 22,343 | | | | — | |
U.S. Ultra Bond | | | 31 | | | | Mar-24 | | | | 4,141,406 | | | | 4,140,496 | | | | 910 | | | | — | |
WTI Crude | | | 253 | | | | Jan-24 | | | | 18,127,450 | | | | 18,376,803 | | | | — | | | | (249,353 | ) |
WTI Crude | | | 5 | | | | Feb-24 | | | | 359,200 | | | | 366,410 | | | | — | | | | (7,210 | ) |
WTI Crude | | | 1 | | | | Mar-24 | | | | 72,010 | | | | 73,532 | | | | — | | | | (1,522 | ) |
WTI Crude | | | 2 | | | | Apr-24 | | | | 144,260 | | | | 147,154 | | | | — | | | | (2,894 | ) |
WTI Crude | | | 4 | | | | May-24 | | | | 288,480 | | | | 298,378 | | | | — | | | | (9,898 | ) |
WTI Crude | | | 4 | | | | Jun-24 | | | | 287,880 | | | | 298,228 | | | | — | | | | (10,348 | ) |
Zinc - 90 Day Settlement (a) | | | 2 | | | | Jan-24 | | | | 132,313 | | | | 123,237 | | | | 9,076 | | | | — | |
Zinc - 90 Day Settlement (a) | | | 1 | | | | Feb-24 | | | | 66,264 | | | | 63,318 | | | | 2,946 | | | | — | |
Zinc - 90 Day Settlement (a) | | | 1 | | | | Mar-24 | | | | 66,476 | | | | 62,903 | | | | 3,573 | | | | — | |
Zinc - 90 Day Settlement (a) | | | 1 | | | | Mar-24 | | | | 66,506 | | | | 60,559 | | | | 5,947 | | | | — | |
Zinc - 90 Day Settlement (a) | | | 1 | | | | Mar-24 | | | | 66,494 | | | | 65,051 | | | | 1,443 | | | | — | |
Zinc (a) | | | 109 | | | | Mar-24 | | | | 7,258,038 | | | | 6,940,598 | | | | 317,440 | | | | — | |
Total Purchase Contracts | | | | | | | | | | | | | | | | | | | 9,250,673 | | | | (5,547,013 | ) |
| |
Sale Contracts: |
10 Yr Mini JGB | | | (11) | | | | Mar-24 | | | $ | 1,143,142 | | | $ | 1,144,200 | | | $ | 1,058 | | | $ | — | |
Aluminum - 90 Day Settlement (a) | | | (1) | | | | Jan-24 | | | | 58,838 | | | | 55,337 | | | | — | | | | (3,501 | ) |
Aluminum - 90 Day Settlement (a) | | | (1) | | | | Jan-24 | | | | 58,969 | | | | 56,304 | | | | — | | | | (2,665 | ) |
Aluminum - 90 Day Settlement (a) | | | (1) | | | | Feb-24 | | | | 59,000 | | | | 55,764 | | | | — | | | | (3,236 | ) |
Aluminum - 90 Day Settlement (a) | | | (2) | | | | Feb-24 | | | | 118,219 | | | | 110,742 | | | | — | | | | (7,477 | ) |
Aluminum - 90 Day Settlement (a) | | | (3) | | | | Feb-24 | | | | 177,600 | | | | 167,268 | | | | — | | | | (10,332 | ) |
Aluminum - 90 Day Settlement (a) | | | (2) | | | | Mar-24 | | | | 118,775 | | | | 109,137 | | | | — | | | | (9,638 | ) |
The accompanying notes are an integral part of these consolidated financial statements. | 29 |
LoCorr Macro Strategies Fund – Consolidated Schedule of Open Futures Contracts (continued) |
| | | Number of
Contracts | | | | | | | Current | | | Notional | | | Value | |
Description | | Purchased
(Sold) | | | Settlement
Month-Year | | | Notional
Amount | | | Amount At
Trade Date | | | Unrealized
Appreciation | | | Unrealized
(Depreciation) | |
Sale Contracts: (continued) |
Aluminum - 90 Day Settlement (a) | | | (1) | | | | Mar-24 | | | $ | 59,442 | | | $ | 53,704 | | | $ | — | | | $ | (5,738 | ) |
Aluminum - 90 Day Settlement (a) | | | (3) | | | | Mar-24 | | | | 178,607 | | | | 168,978 | | | | — | | | | (9,629 | ) |
Aluminum - 90 Day Settlement (a) | | | (3) | | | | Mar-24 | | | | 178,613 | | | | 169,640 | | | | — | | | | (8,973 | ) |
Aluminum - 90 Day Settlement (a) | | | (1) | | | | Mar-24 | | | | 59,600 | | | | 59,102 | | | | — | | | | (498 | ) |
Aluminum (a) | | | (276) | | | | Mar-24 | | | | 16,428,900 | | | | 15,551,228 | | | | — | | | | (877,672 | ) |
Australian 10 Yr Bond | | | (1,006) | | | | Mar-24 | | | | 79,978,813 | | | | 77,990,509 | | | | — | | | | (1,988,304 | ) |
Australian 3 Yr Bond | | | (180) | | | | Mar-24 | | | | 13,106,981 | | | | 12,995,722 | | | | — | | | | (111,259 | ) |
Australian Dollar | | | (79) | | | | Mar-24 | | | | 5,396,095 | | | | 5,277,329 | | | | — | | | | (118,766 | ) |
British Pound | | | (27) | | | | Mar-24 | | | | 2,151,731 | | | | 2,155,926 | | | | 4,195 | | | | — | |
CAC 40 10 Euro Index | | | (76) | | | | Jan-24 | | | | 6,338,647 | | | | 6,388,835 | | | | 50,188 | | | | — | |
Canadian 10 Yr Bond | | | (307) | | | | Mar-24 | | | | 28,771,186 | | | | 27,924,879 | | | | — | | | | (846,307 | ) |
Carbon Emission | | | (54) | | | | Dec-24 | | | | 4,791,111 | | | | 4,295,282 | | | | — | | | | (495,829 | ) |
CBOE Volatility Index | | | (84) | | | | Jan-24 | | | | 1,180,301 | | | | 1,285,958 | | | | 105,657 | | | | — | |
CBOE Volatility Index | | | (75) | | | | Feb-24 | | | | 1,147,155 | | | | 1,218,114 | | | | 70,959 | | | | — | |
CBOE Volatility Index | | | (25) | | | | Mar-24 | | | | 406,673 | | | | 421,753 | | | | 15,080 | | | | — | |
Cocoa (NYBOT) | | | (6) | | | | Mar-24 | | | | 251,760 | | | | 252,315 | | | | 555 | | | | — | |
Copper - 90 Day Settlement (a) | | | (1) | | | | Jan-24 | | | | 211,917 | | | | 200,576 | | | | — | | | | (11,341 | ) |
Copper - 90 Day Settlement (a) | | | (1) | | | | Jan-24 | | | | 211,994 | | | | 199,640 | | | | — | | | | (12,354 | ) |
Copper - 90 Day Settlement (a) | | | (1) | | | | Jan-24 | | | | 212,213 | | | | 198,750 | | | | — | | | | (13,463 | ) |
Copper - 90 Day Settlement (a) | | | (1) | | | | Jan-24 | | | | 212,721 | | | | 202,762 | | | | — | | | | (9,959 | ) |
Copper - 90 Day Settlement (a) | | | (1) | | | | Feb-24 | | | | 212,800 | | | | 204,354 | | | | — | | | | (8,446 | ) |
Copper - 90 Day Settlement (a) | | | (1) | | | | Feb-24 | | | | 213,006 | | | | 200,915 | | | | — | | | | (12,091 | ) |
Copper - 90 Day Settlement (a) | | | (1) | | | | Feb-24 | | | | 213,081 | | | | 202,736 | | | | — | | | | (10,345 | ) |
Copper - 90 Day Settlement (a) | | | (2) | | | | Feb-24 | | | | 426,300 | | | | 413,531 | | | | — | | | | (12,769 | ) |
Copper - 90 Day Settlement (a) | | | (2) | | | | Feb-24 | | | | 426,477 | | | | 417,475 | | | | — | | | | (9,002 | ) |
Copper - 90 Day Settlement (a) | | | (3) | | | | Mar-24 | | | | 640,331 | | | | 638,715 | | | | — | | | | (1,616 | ) |
Copper - 90 Day Settlement (a) | | | (1) | | | | Mar-24 | | | | 213,619 | | | | 209,091 | | | | — | | | | (4,528 | ) |
Copper - 90 Day Settlement (a) | | | (1) | | | | Mar-24 | | | | 213,888 | | | | 213,365 | | | | — | | | | (523 | ) |
Copper - 90 Day Settlement (a) | | | (1) | | | | Mar-24 | | | | 213,963 | | | | 215,788 | | | | 1,825 | | | | — | |
Copper (a) | | | (188) | | | | Mar-24 | | | | 40,210,850 | | | | 38,796,752 | | | | — | | | | (1,414,098 | ) |
Corn | | | (858) | | | | Mar-24 | | | | 20,216,625 | | | | 20,821,144 | | | | 604,519 | | | | — | |
Cotton No.2 | | | (136) | | | | Mar-24 | | | | 5,508,000 | | | | 5,473,290 | | | | — | | | | (34,710 | ) |
Euro-Bobl | | | (296) | | | | Mar-24 | | | | 38,976,948 | | | | 38,834,417 | | | | — | | | | (142,531 | ) |
Euro-Bund | | | (448) | | | | Mar-24 | | | | 67,864,701 | | | | 67,803,005 | | | | — | | | | (61,696 | ) |
Euro-Buxl 30 Yr Bond | | | (157) | | | | Mar-24 | | | | 24,562,881 | | | | 23,533,277 | | | | — | | | | (1,029,604 | ) |
Euro-OAT | | | (60) | | | | Mar-24 | | | | 8,710,810 | | | | 8,769,887 | | | | 59,077 | | | | — | |
Euro-Schatz | | | (2,115) | | | | Mar-24 | | | | 248,766,532 | | | | 247,624,080 | | | | — | | | | (1,142,452 | ) |
FTSE China A50 Index | | | (74) | | | | Jan-24 | | | | 850,630 | | | | 851,138 | | | | 508 | | | | — | |
Gasoline RBOB | | | (38) | | | | Jan-24 | | | | 3,361,655 | | | | 3,402,534 | | | | 40,879 | | | | — | |
Hang Seng Index | | | (216) | | | | Jan-24 | | | | 23,695,409 | | | | 22,899,336 | | | | — | | | | (796,073 | ) |
Hard Red Wheat | | | (259) | | | | Mar-24 | | | | 8,313,900 | | | | 8,324,932 | | | | 11,032 | | | | — | |
Heating Oil | | | (1) | | | | Mar-24 | | | | 102,942 | | | | 103,154 | | | | 212 | | | | — | |
H-Shares Index | | | (65) | | | | Jan-24 | | | | 2,412,371 | | | | 2,406,129 | | | | — | | | | (6,242 | ) |
Japanese 10 Yr Bond | | | (106) | | | | Mar-24 | | | | 110,292,624 | | | | 109,417,067 | | | | — | | | | (875,557 | ) |
Japanese Yen | | | (19) | | | | Mar-24 | | | | 1,704,300 | | | | 1,699,561 | | | | — | | | | (4,739 | ) |
30 | The accompanying notes are an integral part of these consolidated financial statements. |
LoCorr Macro Strategies Fund – Consolidated Schedule of Open Futures Contracts (continued) |
| | | Number of
Contracts | | | | | | | Current | | | Notional | | | Value | |
Description | | Purchased
(Sold) | | | Settlement
Month-Year | | | Notional
Amount | | | Amount At
Trade Date | | | Unrealized
Appreciation | | | Unrealized
(Depreciation) | |
Sale Contracts: (continued) |
Lead - 90 Day Settlement (a) | | | (1) | | | | Mar-24 | | | $ | 51,808 | | | $ | 50,560 | | | $ | — | | | $ | (1,248 | ) |
Lead (a) | | | (19) | | | | Mar-24 | | | | 984,438 | | | | 1,018,868 | | | | 34,430 | | | | — | |
Live Cattle | | | (12) | | | | Feb-24 | | | | 808,800 | | | | 811,819 | | | | 3,019 | | | | — | |
Long Gilt | | | (90) | | | | Mar-24 | | | | 11,775,840 | | | | 11,734,213 | | | | — | | | | (41,627 | ) |
MSCI EAFE Index | | | (3) | | | | Mar-24 | | | | 337,860 | | | | 337,620 | | | | — | | | | (240 | ) |
Natural Gas | | | (30) | | | | Jan-24 | | | | 745,681 | | | | 787,352 | | | | 41,671 | | | | — | |
Natural Gas | | | (564) | | | | Jan-24 | | | | 14,178,960 | | | | 13,174,444 | | | | — | | | | (1,004,516 | ) |
Natural Gas | | | (78) | | | | Feb-24 | | | | 1,815,060 | | | | 1,731,497 | | | | — | | | | (83,563 | ) |
Natural Gas | | | (30) | | | | Mar-24 | | | | 691,200 | | | | 659,111 | | | | — | | | | (32,089 | ) |
Natural Gas | | | (20) | | | | Apr-24 | | | | 473,600 | | | | 468,071 | | | | — | | | | (5,529 | ) |
Natural Gas | | | (11) | | | | May-24 | | | | 277,090 | | | | 274,768 | | | | — | | | | (2,322 | ) |
New Zealand Dollar | | | (39) | | | | Mar-24 | | | | 2,465,775 | | | | 2,452,270 | | | | — | | | | (13,505 | ) |
Nickel (a) | | | (12) | | | | Mar-24 | | | | 1,194,696 | | | | 1,237,021 | | | | 42,325 | | | | — | |
Nikkei 225 Index (OSE) | | | (26) | | | | Mar-24 | | | | 6,168,085 | | | | 6,129,565 | | | | — | | | | (38,520 | ) |
Nikkei 225 Index (SGX) | | | (4) | | | | Mar-24 | | | | 473,972 | | | | 474,287 | | | | 315 | | | | — | |
S&P MidCap 400 E-Mini Index | | | (6) | | | | Mar-24 | | | | 1,685,700 | | | | 1,695,459 | | | | 9,759 | | | | — | |
S&P/TSX 60 Index | | | (8) | | | | Mar-24 | | | | 1,534,010 | | | | 1,529,486 | | | | — | | | | (4,524 | ) |
SET 50 Index | | | (261) | | | | Mar-24 | | | | 1,335,414 | | | | 1,322,290 | | | | — | | | | (13,124 | ) |
Silver | | | (41) | | | | Mar-24 | | | | 4,937,630 | | | | 4,919,346 | | | | — | | | | (18,284 | ) |
Soybean | | | (290) | | | | Mar-24 | | | | 18,821,000 | | | | 19,187,798 | | | | 366,798 | | | | — | |
Soybean Meal | | | (43) | | | | Mar-24 | | | | 1,659,800 | | | | 1,684,930 | | | | 25,130 | | | | — | |
Soybean Oil | | | (200) | | | | Mar-24 | | | | 5,781,600 | | | | 6,107,193 | | | | 325,593 | | | | — | |
Sugar | | | (84) | | | | Feb-24 | | | | 1,936,166 | | | | 2,161,654 | | | | 225,488 | | | | — | |
Swiss Franc | | | (6) | | | | Mar-24 | | | | 898,500 | | | | 897,725 | | | | — | | | | (775 | ) |
Swiss Franc | | | (2,008) | | | | Sep-25 | | | | 485,885,800 | | | | 484,584,747 | | | | — | | | | (1,301,053 | ) |
U.S. 10 Yr Note | | | (818) | | | | Mar-24 | | | | 92,344,533 | | | | 91,058,755 | | | | — | | | | (1,285,778 | ) |
U.S. 2 Yr Note | | | (2,324) | | | | Mar-24 | | | | 478,544,279 | | | | 476,896,721 | | | | — | | | | (1,647,558 | ) |
U.S. 5 Yr Note | | | (1,212) | | | | Mar-24 | | | | 131,833,407 | | | | 129,995,144 | | | | — | | | | (1,838,263 | ) |
U.S. Long Bond | | | (433) | | | | Mar-24 | | | | 54,097,938 | | | | 52,867,187 | | | | — | | | | (1,230,751 | ) |
U.S. Ultra Bond | | | (281) | | | | Mar-24 | | | | 37,539,844 | | | | 36,965,575 | | | | — | | | | (574,269 | ) |
Wheat | | | (433) | | | | Mar-24 | | | | 13,596,200 | | | | 12,897,027 | | | | — | | | | (699,173 | ) |
Zinc - 90 Day Settlement (a) | | | (1) | | | | Jan-24 | | | | 66,000 | | | | 61,082 | | | | — | | | | (4,918 | ) |
Zinc - 90 Day Settlement (a) | | | (2) | | | | Jan-24 | | | | 132,313 | | | | 122,118 | | | | — | | | | (10,195 | ) |
Zinc - 90 Day Settlement (a) | | | (1) | | | | Feb-24 | | | | 66,264 | | | | 62,178 | | | | — | | | | (4,086 | ) |
Zinc - 90 Day Settlement (a) | | | (1) | | | | Mar-24 | | | | 66,476 | | | | 62,057 | | | | — | | | | (4,419 | ) |
Zinc - 90 Day Settlement (a) | | | (1) | | | | Mar-24 | | | | 66,506 | | | | 60,665 | | | | — | | | | (5,841 | ) |
Zinc - 90 Day Settlement (a) | | | (1) | | | | Mar-24 | | | | 66,494 | | | | 64,650 | | | | — | | | | (1,844 | ) |
Zinc (a) | | | (151) | | | | Mar-24 | | | | 10,054,713 | | | | 9,614,248 | | | | — | | | | (440,465 | ) |
Total Sale Contracts | | | | | | | | | | | | | | | | | | | 2,040,272 | | | | (20,422,442 | ) |
Total Futures Contracts | | | | | | | | | | | | | | | | | | $ | 11,290,945 | | | $ | (25,969,455 | ) |
Net Unrealized Depreciation | | | | | | | | | | | | | | $ | (14,678,510 | ) |
(a) | London Metal Exchange (‘’LME’’) futures contracts settle on their respective maturity date.The unrealized appreciation on these contracts is a receivable for unsettled open futures contracts and the unrealized depreciation is a payable for unsettled open futures contracts on the Fund’s consolidated statement of assets and liabilities. |
COMEX | Commodity Exchange, Inc. | NYBOT | New York Board of Trade | OSE | Osaka Securities Exchange |
SGX | Singapore Exchange Limited | | | | |
The accompanying notes are an integral part of these consolidated financial statements. | 31 |
LoCorr Long/Short Commodities Strategy Fund - Consolidated Schedule of Investments |
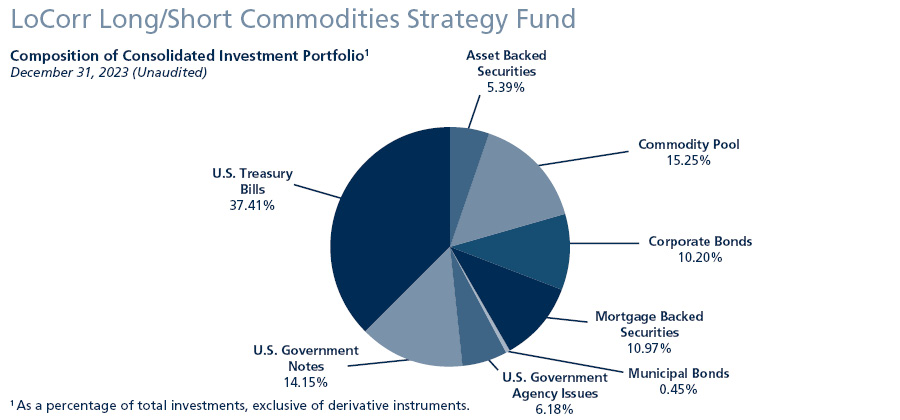
Consolidated Schedule of Investments
December 31, 2023
| | Maturity Date | | | Coupon Rate | | | Principal
Amount | | | Value | |
ASSET BACKED SECURITIES: 4.56% |
321 Henderson Receivables I LLC, 2004-A A1 (1 Month LIBOR USD + 0.464%) (a)(c) | | | 09/15/2045 | | | | 5.83% | | | $ | 8,072 | | | $ | 8,010 | |
American Homes 4 Rent Trust, 2014-SFR2 A (a) | | | 10/17/2036 | | | | 3.79% | | | | 268,098 | | | | 263,755 | |
AmeriCredit Automobile Receivables Trust, 2021-2 A3 | | | 12/18/2026 | | | | 0.34% | | | | 489,959 | | | | 484,858 | |
Asset Backed Securities Corp Home Equity Loan Trust, 2002-HE1 M1 (1 Month LIBOR USD + 1.764%) (c) | | | 03/15/2032 | | | | 7.13% | | | | 149,690 | | | | 150,524 | |
Bank of America Credit Card Trust, 2021-A1 A1 | | | 09/15/2026 | | | | 0.44% | | | | 1,050,000 | | | | 1,034,687 | |
Barclays Dryrock Issuance Trust, A | | | 02/15/2029 | | | | 4.72% | | | | 4,900,000 | | | | 4,899,777 | |
Carmax Auto Owner Trust, 2021-4 A3 | | | 09/15/2026 | | | | 0.56% | | | | 1,774,244 | | | | 1,709,301 | |
Carvana Auto Receivables Trust |
Series 2021-P2 A3 | | | 03/10/2026 | | | | 0.49% | | | | 783,219 | | | | 770,849 | |
Series 2021-P4 A-3 | | | 01/11/2027 | | | | 1.31% | | | | 2,769,066 | | | | 2,683,846 | |
Series 2022-P3 | | | 11/10/2027 | | | | 4.61% | | | | 3,825,000 | | | | 3,784,903 | |
DB Master Finance LLC, 2021-1A A2I (a) | | | 11/20/2051 | | | | 2.05% | | | | 2,009,000 | | | | 1,826,306 | |
Dell Equipment Finance Trust, 2023-2 (a) | | | 01/22/2029 | | | | 5.84% | | | | 1,010,000 | | | | 1,012,281 | |
Diamond Resorts Owner Trust, 2021-1A A (a) | | | 11/21/2033 | | | | 1.51% | | | | 317,653 | | | | 296,000 | |
Elara HGV Timeshare Issuer, 2021-A A (a) | | | 08/27/2035 | | | | 1.36% | | | | 1,364,945 | | | | 1,253,269 | |
GM Financial Consumer Automobile Receivables Trust |
Series 2021-1 A3 | | | 10/16/2025 | | | | 0.35% | | | | 288,166 | | | | 284,318 | |
Series 2021-3 A3 | | | 06/16/2026 | | | | 0.48% | | | | 1,269,645 | | | | 1,233,314 | |
Series 2021-4 A3 | | | 09/16/2026 | | | | 0.68% | | | | 1,250,675 | | | | 1,208,750 | |
Series 2023-4, A-3 | | | 08/16/2028 | | | | 5.78% | | | | 1,560,000 | | | | 1,594,939 | |
Hilton Grand Vacations Trust, 2019-AA A (a) | | | 07/25/2033 | | | | 2.34% | | | | 780,261 | | | | 742,584 | |
Honda Auto Receivables Owner Trust |
Series 2020-3 A3 | | | 10/18/2024 | | | | 0.37% | | | | 47,555 | | | | 47,425 | |
Series 2023-2 A2 | | | 04/15/2026 | | | | 5.41% | | | | 3,740,000 | | | | 3,739,911 | |
Hyundai Auto Receivables Trust, 2020-C A3 | | | 05/15/2025 | | | | 0.38% | | | | 223,384 | | | | 221,969 | |
MVW Owner Trust |
Series 2018-1A A (a) | | | 01/21/2036 | | | | 3.45% | | | | 349,410 | | | | 343,874 | |
32 | The accompanying notes are an integral part of these consolidated financial statements. |
LoCorr Long/Short Commodities Strategy Fund - Consolidated Schedule of Investments (continued) |
| | Maturity Date | | | Coupon Rate | | | Principal
Amount | | | Value | |
ASSET BACKED SECURITIES (continued) |
Series 2019-1A A (a) | | | 11/20/2036 | | | | 2.89% | | | $ | 169,333 | | | $ | 163,158 | |
Series 2019-2A A (a) | | | 10/20/2038 | | | | 2.22% | | | | 222,420 | | | | 211,209 | |
Series 2021-1WA A (a) | | | 01/22/2041 | | | | 1.14% | | | | 544,290 | | | | 500,042 | |
Navient Student Loan Trust, 2021-A A (a) | | | 05/15/2069 | | | | 0.84% | | | | 601,005 | | | | 529,676 | |
OneMain Financial Issuance Trust, 2018-2A A (a) | | | 03/14/2033 | | | | 3.57% | | | | 195,950 | | | | 194,212 | |
PFS Financing Corp. |
Series 2020-G A (a) | | | 02/15/2026 | | | | 0.97% | | | | 900,000 | | | | 894,723 | |
Series 2021-B A (a) | | | 08/15/2026 | | | | 0.77% | | | | 1,450,000 | | | | 1,404,738 | |
Planet Fitness Master Issuer LLC, 3.25100 (a) | | | 12/05/2051 | | | | 3.25% | | | | 2,358,000 | | | | 2,187,680 | |
SoFi Professional Loan Program Trust, 2021-B AFX (a) | | | 02/15/2047 | | | | 1.14% | | | | 1,461,619 | | | | 1,230,291 | |
Taco Bell Funding LLC, 2021-1A A21 (a) | | | 08/25/2051 | | | | 1.95% | | | | 2,480,813 | | | | 2,224,222 | |
Toyota Auto Loan Extended Note Trust, 2020-1 A (a) | | | 05/25/2033 | | | | 1.35% | | | | 1,050,000 | | | | 996,681 | |
Volkswagen Auto Loan Enhanced Trust, 2021-1 A3 | | | 06/22/2026 | | | | 1.02% | | | | 1,852,976 | | | | 1,803,721 | |
TOTAL ASSET BACKED SECURITIES (Cost $43,386,205) | | | | | | | | | | | | | | | 41,935,803 | |
| | | | | | | | | | | | | | | | | |
COMMODITY POOL: 12.90% | | | | | | | | | | Shares | | | | | |
Galaxy Commodity - Polaris Fund LLC (h) | | | | | | | | | | | N/A | | | | 118,554,191 | |
TOTAL COMMODITY POOL (Cost $166,114,207) | | | | | | | | | | | | | | | 118,554,191 | |
| | | | | | | | | | | | | | | | | |
| | | | | | | | | | | Principal
Amount | | | | | |
CORPORATE BONDS: 8.63% | | | | | | | | | | | | | | | | |
Aerospace & Defense: 0.26% |
Boeing Co. | | | 02/01/2028 | | | | 3.25% | | | | 1,075,000 | | | | 1,020,560 | |
L3Harris Technologies, Inc. | | | 01/15/2027 | | | | 5.40% | | | | 810,000 | | | | 827,239 | |
Raytheon Technologies Corp. | | | 11/16/2028 | | | | 4.13% | | | | 565,000 | | | | 552,283 | |
| | | | | | | | | | | | | | | | 2,400,082 | |
Agriculture: 0.08% |
Philip Morris International, Inc. | | | 02/15/2028 | | | | 4.88% | | | | 680,000 | | | | 687,898 | |
| | | | | | | | | | | | | | | | | |
Auto Manufacturers: 0.25% |
General Motors Financial Co., Inc. | | | 06/23/2028 | | | | 5.80% | | | | 980,000 | | | | 1,007,871 | |
Toyota Motor Credit Corp. | | | 09/11/2025 | | | | 5.60% | | | | 675,000 | | | | 686,056 | |
Volkswagen Group of America Finance LLC (a) | | | 11/24/2025 | | | | 1.25% | | | | 665,000 | | | | 617,534 | |
| | | | | | | | | | | | | | | | 2,311,461 | |
Banks: 3.60% |
Banco Santander SA (b) | | | 03/24/2025 | | | | 3.50% | | | | 550,000 | | | | 538,396 | |
Banco Santander SA (b) | | | 05/28/2025 | | | | 2.75% | | | | 265,000 | | | | 255,714 | |
Bank of America Corp. (SOFR + 1.150%) (c) | | | 06/19/2026 | | | | 1.32% | | | | 2,815,000 | | | | 2,649,948 | |
Bank of America Corp. (SOFR + 1.580%) (c) | | | 04/27/2028 | | | | 4.38% | | | | 1,430,000 | | | | 1,398,265 | |
Bank of America NA | | | 08/18/2026 | | | | 5.53% | | | | 2,460,000 | | | | 2,506,466 | |
Barclays PLC (SOFR + 2.220%) (b)(c) | | | 09/13/2029 | | | | 6.49% | | | | 870,000 | | | | 906,518 | |
Canadian Imperial Bank (b) | | | 04/07/2027 | | | | 3.45% | | | | 800,000 | | | | 768,650 | |
Citibank NA | | | 09/29/2028 | | | | 5.80% | | | | 1,350,000 | | | | 1,411,302 | |
Citigroup, Inc. (SOFR + 1.372%) (c) | | | 05/24/2025 | | | | 4.14% | | | | 1,700,000 | | | | 1,689,791 | |
Credit Suisse AG (b) | | | 07/09/2027 | | | | 5.00% | | | | 600,000 | | | | 600,490 | |
Deutsche Bank NY (b) | | | 05/28/2024 | | | | 0.90% | | | | 525,000 | | | | 515,615 | |
Federation des Caisses Desjardins du Quebec (a)(b) | | | 03/14/2028 | | | | 5.70% | | | | 635,000 | | | | 652,993 | |
Goldman Sachs Group, Inc. (3 Month LIBOR USD + 1.463%) (c) | | | 09/29/2025 | | | | 3.27% | | | | 2,780,000 | | | | 2,733,261 | |
Goldman Sachs Group, Inc. (SOFR + 1.075%) (c) | | | 08/10/2026 | | | | 5.80% | | | | 2,425,000 | | | | 2,448,893 | |
HSBC Holdings PLC (SOFR + 1.929%) (b)(c) | | | 06/04/2026 | | | | 2.10% | | | | 1,005,000 | | | | 956,906 | |
ING Groep NV (b) | | | 04/09/2024 | | | | 3.55% | | | | 975,000 | | | | 969,529 | |
ING Groep NV (SOFR + 1.640%) (b)(c) | | | 03/28/2026 | | | | 3.87% | | | | 730,000 | | | | 715,544 | |
The accompanying notes are an integral part of these consolidated financial statements. | 33 |
LoCorr Long/Short Commodities Strategy Fund - Consolidated Schedule of Investments (continued) |
| | Maturity Date | | | Coupon Rate | | | Principal
Amount | | | Value | |
CORPORATE BONDS (continued) |
JPMorgan Chase & Co. (SOFR + 1.450%) (c) | | | 07/24/2029 | | | | 5.30% | | | $ | 2,235,000 | | | $ | 2,269,964 | |
JPMorgan Chase Bank NA | | | 12/08/2026 | | | | 5.11% | | | | 725,000 | | | | 731,864 | |
Morgan Stanley (SOFR + 0.525%) (c) | | | 05/30/2025 | | | | 0.79% | | | | 355,000 | | | | 347,064 | |
Morgan Stanley (SOFR + 1.630%) (c) | | | 07/20/2029 | | | | 5.45% | | | | 530,000 | | | | 540,515 | |
Morgan Stanley Bank NA | | | 10/30/2026 | | | | 5.88% | | | | 2,025,000 | | | | 2,082,531 | |
NatWest Markets PLC (a)(b) | | | 08/12/2024 | | | | 0.80% | | | | 720,000 | | | | 698,760 | |
Toronto-Dominion Bank (b) | | | 06/06/2025 | | | | 3.77% | | | | 820,000 | | | | 806,883 | |
Toronto-Dominion Bank (b) | | | 09/10/2026 | | | | 1.25% | | | | 1,005,000 | | | | 918,574 | |
UBS Group AG (1 Year CMT Rate + 1.550%) (a)(b)(c) | | | 05/12/2026 | | | | 4.49% | | | | 450,000 | | | | 443,227 | |
UBS Group AG (1 Year CMT Rate + 1.600%) (a)(b)(c) | | | 12/22/2027 | | | | 6.33% | | | | 480,000 | | | | 494,967 | |
Wells Fargo & Co. (SOFR + 1.740%) (c) | | | 07/25/2029 | | | | 5.57% | | | | 1,130,000 | | | | 1,154,968 | |
Wells Fargo Bank NA | | | 08/07/2026 | | | | 5.45% | | | | 810,000 | | | | 823,967 | |
| | | | | | | | | | | | | | | | 33,031,565 | |
Beverages: 0.12% |
PepsiCo, Inc. | | | 11/10/2026 | | | | 5.13% | | | | 1,075,000 | | | | 1,098,150 | |
| | | | | | | | | | | | | | | | | |
Biotechnology: 0.17% |
Amgen, Inc. | | | 03/02/2028 | | | | 5.15% | | | | 1,500,000 | | | | 1,534,597 | |
| | | | | | | | | | | | | | | | | |
Building Materials: 0.10% |
Carrier Global Corp. (a) | | | 11/30/2025 | | | | 5.80% | | | | 505,000 | | | | 511,742 | |
Trane Technologies Luxembourg Finance SA (b) | | | 03/21/2026 | | | | 3.50% | | | | 450,000 | | | | 437,522 | |
| | | | | | | | | | | | | | | | 949,264 | |
Chemicals: 0.04% |
Nutrien Ltd. (b) | | | 03/27/2028 | | | | 4.90% | | | | 395,000 | | | | 398,820 | |
| | | | | | | | | | | | | | | | | |
Cosmetics & Personal Care: 0.14% |
Haleon U.S. Capital LLC | | | 03/24/2027 | | | | 3.38% | | | | 1,335,000 | | | | 1,285,293 | |
| | | | | | | | | | | | | | | | | |
Diversified Financial Services: 0.48% |
AerCap Ireland Capital/Global Aviation Trust (b) | | | 01/15/2027 | | | | 6.10% | | | | 1,390,000 | | | | 1,420,344 | |
Air Lease Corp. | | | 12/15/2027 | | | | 5.85% | | | | 900,000 | | | | 923,996 | |
Capital One Financial Corp. (SOFR + 1.370%) (c) | | | 05/09/2025 | | | | 4.17% | | | | 845,000 | | | | 838,666 | |
Dragon 2012 LLC | | | 03/12/2024 | | | | 1.97% | | | | 597 | | | | 593 | |
MSN 41079 and 41084 Ltd. (b) | | | 07/13/2024 | | | | 1.72% | | | | 1,730 | | | | 1,708 | |
OMERS Finance Trust (a)(b) | | | 05/02/2024 | | | | 2.50% | | | | 670,000 | | | | 663,246 | |
Phoenix 2012 LLC | | | 07/03/2024 | | | | 1.61% | | | | 1,714 | | | | 1,690 | |
Private Export Funding Corp. | | | 06/15/2025 | | | | 3.25% | | | | 510,000 | | | | 500,139 | |
Tagua Leasing LLC (c) | | | 11/16/2024 | | | | 1.58% | | | | 2,283 | | | | 2,241 | |
| | | | | | | | | | | | | | | | 4,352,623 | |
Electric: 0.37% |
Florida Power & Light Co. | | | 04/01/2028 | | | | 5.05% | | | | 855,000 | | | | 874,675 | |
Florida Power & Light Co. | | | 05/15/2028 | | | | 4.40% | | | | 700,000 | | | | 701,705 | |
Georgia Power Co. | | | 05/16/2028 | | | | 4.65% | | | | 475,000 | | | | 478,496 | |
NSTAR Electric Co. | | | 05/15/2027 | | | | 3.20% | | | | 1,145,000 | | | | 1,103,416 | |
Southern California Edison Co. | | | 02/01/2026 | | | | 1.20% | | | | 250,000 | | | | 232,854 | |
| | | | | | | | | | | | | | | | 3,391,146 | |
Entertainment: 0.24% |
Warnermedia Holdings, Inc. | | | 03/15/2027 | | | | 3.76% | | | | 2,335,000 | | | | 2,239,144 | |
| | | | | | | | | | | | | | | | | |
Food: 0.07% |
SYSCO Corp. | | | 07/15/2027 | | | | 3.25% | | | | 685,000 | | | | 655,378 | |
| | | | | | | | | | | | | | | | | |
34 | The accompanying notes are an integral part of these consolidated financial statements. |
LoCorr Long/Short Commodities Strategy Fund - Consolidated Schedule of Investments (continued) |
| | Maturity Date | | | Coupon Rate | | | Principal
Amount | | | Value | |
CORPORATE BONDS (continued) |
Healthcare - Products: 0.45% |
Baxter International, Inc. | | | 11/29/2024 | | | | 1.32% | | | $ | 2,215,000 | | | $ | 2,133,021 | |
PerkinElmer, Inc. | | | 09/15/2024 | | | | 0.85% | | | | 2,065,000 | | | | 1,993,367 | |
| | | | | | | | | | | | | | | | 4,126,388 | |
Healthcare - Services: 0.08% |
HCA, Inc. | | | 03/15/2027 | | | | 3.13% | | | | 810,000 | | | | 768,254 | |
| | | | | | | | | | | | | | | | | |
Household Products & Wares: 0.07% |
Clorox Co. | | | 10/01/2027 | | | | 3.10% | | | | 660,000 | | | | 625,200 | |
| | | | | | | | | | | | | | | | | |
Insurance: 0.36% |
Equitable Financial Life Global (a) | | | 07/07/2025 | | | | 1.40% | | | | 855,000 | | | | 809,006 | |
Metropolitan Life Global Funding I (a) | | | 01/06/2028 | | | | 5.05% | | | | 375,000 | | | | 379,028 | |
Principal Life Global Funding II (a) | | | 01/12/2026 | | | | 0.88% | | | | 880,000 | | | | 808,168 | |
Protective Life Global Funding (a) | | | 07/05/2024 | | | | 0.78% | | | | 1,355,000 | | | | 1,322,506 | |
| | | | | | | | | | | | | | | | 3,318,708 | |
Machinery - Diversified: 0.05% |
John Deere Capital Corp. | | | 07/14/2028 | | | | 4.95% | | | | 420,000 | | | | 430,981 | |
| | | | | | | | | | | | | | | | | |
Media: 0.13% |
Charter Communications Operating LLC | | | 07/23/2025 | | | | 4.91% | | | | 1,250,000 | | | | 1,238,335 | |
| | | | | | | | | | | | | | | | | |
Oil & Gas: 0.05% |
Pioneer Natural Resources Co. | | | 03/29/2026 | | | | 5.10% | | | | 435,000 | | | | 438,317 | |
| | | | | | | | | | | | | | | | | |
Pharmaceuticals: 0.28% |
CVS Health Corp. | | | 06/01/2026 | | | | 2.88% | | | | 1,155,000 | | | | 1,103,455 | |
Pfizer Investment Enterprises Pte Ltd. (b) | | | 05/19/2028 | | | | 4.45% | | | | 1,475,000 | | | | 1,475,738 | |
| | | | | | | | | | | | | | | | 2,579,193 | |
Pipelines: 0.35% |
Enbridge, Inc. (b) | | | 02/14/2025 | | | | 2.50% | | | | 525,000 | | | | 509,077 | |
Enbridge, Inc. (b) | | | 11/15/2028 | | | | 6.00% | | | | 420,000 | | | | 441,346 | |
Energy Transfer LP | | | 12/01/2026 | | | | 6.05% | | | | 1,145,000 | | | | 1,176,755 | |
Williams Cos., Inc. | | | 03/02/2026 | | | | 5.40% | | | | 1,075,000 | | | | 1,086,258 | |
| | | | | | | | | | | | | | | | 3,213,436 | |
Real Estate Investment Trusts: 0.32% |
Brixmor Operating Partnership LP | | | 06/15/2026 | | | | 4.13% | | | | 685,000 | | | | 663,595 | |
SITE Centers Corp. | | | 02/01/2025 | | | | 3.63% | | | | 525,000 | | | | 510,153 | |
SITE Centers Corp. | | | 06/01/2027 | | | | 4.70% | | | | 1,755,000 | | | | 1,728,061 | |
| | | | | | | | | | | | | | | | 2,901,809 | |
Retail: 0.04% |
O’Reilly Automotive, Inc. | | | 11/20/2026 | | | | 5.75% | | | | 395,000 | | | | 404,639 | |
| | | | | | | | | | | | | | | | | |
Software: 0.06% |
Oracle Corp. | | | 03/25/2028 | | | | 2.30% | | | | 645,000 | | | | 588,028 | |
| | | | | | | | | | | | | | | | | |
Telecommunications: 0.47% |
AT&T, Inc. | | | 06/01/2027 | | | | 2.30% | | | | 955,000 | | | | 887,231 | |
T-Mobile USA, Inc. | | | 02/15/2026 | | | | 2.25% | | | | 1,740,000 | | | | 1,648,712 | |
T-Mobile USA, Inc. | | | 07/15/2028 | | | | 4.80% | | | | 860,000 | | | | 867,805 | |
Verizon Communications, Inc. | | | 03/22/2028 | | | | 2.10% | | | | 1,015,000 | | | | 918,999 | |
| | | | | | | | | | | | | | | | 4,322,747 | |
TOTAL CORPORATE BONDS (Cost $79,420,242) | | | | | | | | | | | | | | | 79,291,456 | |
| | | | | | | | | | | | | | | | | |
The accompanying notes are an integral part of these consolidated financial statements. | 35 |
LoCorr Long/Short Commodities Strategy Fund - Consolidated Schedule of Investments (continued) |
| | Maturity Date | | | Coupon Rate | | | Principal
Amount | | | Value | |
MORTGAGE BACKED SECURITIES: 9.29% |
ACRE Commercial Mortgage Trust, 2021-FL4 A (1 Month LIBOR USD + 0.944%) (a)(b)(c) | | | 12/18/2037 | | | | 6.30% | | | $ | 240,037 | | | $ | 240,226 | |
Alen Mortgage Trust, 2021-ACEN A (1 Month LIBOR USD + 1.264%) (a)(c) | | | 04/15/2034 | | | | 6.63% | | | | 1,250,000 | | | | 1,122,807 | |
Angel Oak Mortgage Trust |
Series 2020-1 M1 (a)(d) | | | 12/25/2059 | | | | 3.16% | | | | 877,000 | | | | 771,214 | |
Series 2020-5 A3 (a)(d) | | | 05/25/2065 | | | | 2.04% | | | | 42,529 | | | | 38,468 | |
BAMLL Commercial Mortgage Securities Trust, 2022-DKLX A (TSFR1M + 1.150%) (a)(c) | | | 01/15/2039 | | | | 6.51% | | | | 3,750,000 | | | | 3,665,517 | |
BHP Trust, 2019-BXHP A (1 Month LIBOR USD + 1.022%) (a)(c) | | | 08/15/2036 | | | | 6.38% | | | | 269,769 | | | | 268,391 | |
BSREP Commercial Mortgage Trust, 2021-DC A (1 Month LIBOR USD + 1.064%) (a)(c) | | | 08/15/2038 | | | | 6.43% | | | | 1,895,412 | | | | 1,781,169 | |
BX Commercial Mortgage Trust |
Series 2021-XL2 B (1 Month LIBOR USD + 1.112%) (a)(c) | | | 10/15/2038 | | | | 6.47% | | | | 2,736,756 | | | | 2,678,346 | |
Series 2021-CIP A (1 Month LIBOR USD + 1.035%) (a)(c) | | | 12/15/2038 | | | | 6.40% | | | | 2,950,000 | | | | 2,887,983 | |
Citigroup Commercial Mortgage Trust, 2021-PRM2 A (1 Month LIBOR USD + 1.064%) (a)(c) | | | 10/15/2038 | | | | 6.43% | | | | 3,750,000 | | | | 3,684,106 | |
Comm Mortgage Trust |
Series 2015-3BP A (a) | | | 02/10/2035 | | | | 3.18% | | | | 1,030,000 | | | | 978,329 | |
Series 2014-UBS2 A5 | | | 03/10/2047 | | | | 3.96% | | | | 474,093 | | | | 473,263 | |
Series 2014-UBS2 AM | | | 03/10/2047 | | | | 4.20% | | | | 1,150,000 | | | | 1,141,444 | |
Series 2015-CR27 AM | | | 10/10/2048 | | | | 3.98% | | | | 1,000,000 | | | | 956,927 | |
Connecticut Avenue Securities Trust |
Series 2021-R03 1M1 (SOFR30A + 0.850%) (a)(c) | | | 12/25/2041 | | | | 6.19% | | | | 1,354,929 | | | | 1,350,461 | |
Series 2022-R04 (SOFR30A + 2.000%) (a)(c) | | | 03/25/2042 | | | | 7.34% | | | | 1,729,728 | | | | 1,742,755 | |
Series 2022-R03 1M1 (SOFR30A + 2.100%) (a)(c) | | | 03/25/2042 | | | | 7.44% | | | | 1,886,849 | | | | 1,908,929 | |
Series 2022-R04 FLT (SOFR30A + 3.100%) (a)(c) | | | 03/25/2042 | | | | 8.44% | | | | 155,000 | | | | 159,917 | |
Series 2022-R06 (SOFR30A + 3.850%) (a)(c) | | | 05/25/2042 | | | | 9.19% | | | | 65,000 | | | | 68,312 | |
Series 2022-R07 (SOFR30A + 4.650%) (a)(c) | | | 06/25/2042 | | | | 9.99% | | | | 300,000 | | | | 324,840 | |
Series 2023-R01 (SOFR30A + 2.400%) (a)(c) | | | 12/25/2042 | | | | 7.74% | | | | 1,239,609 | | | | 1,263,409 | |
Series 2023-R01 (SOFR30A + 3.750%) (a)(c) | | | 12/25/2042 | | | | 9.09% | | | | 2,830,000 | | | | 2,988,288 | |
Series 2023-R02 (SOFR30A + 3.350%) (a)(c) | | | 01/25/2043 | | | | 8.69% | | | | 1,965,000 | | | | 2,058,721 | |
CSMC Trust, 2017-CALI A (a) | | | 11/10/2032 | | | | 3.43% | | | | 1,750,000 | | | | 1,439,217 | |
ELP Commercial Mortgage Trust, 2021-ELP B (1 Month LIBOR USD + 1.235%) (a)(c) | | | 11/15/2038 | | | | 6.60% | | | | 2,646,919 | | | | 2,593,758 | |
Fannie Mae Connecticut Avenue Securities |
Series 2018-C01 1EB1 (1 Month LIBOR USD + 0.564%) (c) | | | 07/25/2030 | | | | 5.90% | | | | 37,223 | | | | 37,250 | |
Series 2018-C05 (SOFR30A + 2.464%) (c) | | | 01/25/2031 | | | | 7.80% | | | | 1,179,876 | | | | 1,207,693 | |
Fannie Mae Pool | | | 09/01/2038 | | | | 5.50% | | | | 1,567,099 | | | | 1,589,544 | |
FHLMC Multifamily Structured Pass Through Certificates |
Series K052 A1 | | | 01/25/2025 | | | | 2.60% | | | | 98,106 | | | | 96,471 | |
Series K050 A1 | | | 01/25/2025 | | | | 2.80% | | | | 828,622 | | | | 816,575 | |
Series K059 A1 | | | 09/25/2025 | | | | 2.76% | | | | 532,270 | | | | 517,176 | |
Freddie Mac Pool | | | 10/01/2038 | | | | 5.50% | | | | 6,929,026 | | | | 7,028,268 | |
Freddie Mac STACR REMIC Trust |
Series 2021-DNA5 M2 (SOFR30A + 1.650%) (a)(c) | | | 01/25/2034 | | | | 6.99% | | | | 84,243 | | | | 84,596 | |
Series 2021-DNA6 M1 (SOFR30A + 0.800%) (a)(c) | | | 10/25/2041 | | | | 6.14% | | | | 1,696,018 | | | | 1,689,707 | |
Series 2021-DNA6 (SOFR30A + 1.500%) (a)(c) | | | 10/25/2041 | | | | 6.84% | | | | 2,190,000 | | | | 2,170,839 | |
Series 2022-DNA3 (SOFR30A + 2.000%) (a)(c) | | | 04/25/2042 | | | | 7.34% | | | | 586,835 | | | | 592,450 | |
Series 2022-DNA5, FLT (SOFR30A + 4.500%) (a)(c) | | | 06/25/2042 | | | | 9.84% | | | | 1,375,000 | | | | 1,480,504 | |
Series 2022-DNA6, FLT (SOFR30A + 3.700%) (a)(c) | | | 09/25/2042 | | | | 9.04% | | | | 1,830,000 | | | | 1,925,019 | |
Freddie Mac Structured Agency Credit Risk Debt Notes |
Series 2021-DNA2 (SOFR30A + 2.300%) (a)(c) | | | 08/25/2033 | | | | 7.64% | | | | 1,964,290 | | | | 1,982,742 | |
Series 2021-DNA7 M1 (SOFR30A + 0.850%) (a)(c) | | | 11/25/2041 | | | | 6.19% | | | | 2,465,345 | | | | 2,451,537 | |
Series 2022-DNA2 M1A (SOFR30A + 1.300%) (a)(c) | | | 02/25/2042 | | | | 6.64% | | | | 706,350 | | | | 706,353 | |
36 | The accompanying notes are an integral part of these consolidated financial statements. |
LoCorr Long/Short Commodities Strategy Fund - Consolidated Schedule of Investments (continued) |
| | Maturity Date | | | Coupon Rate | | | Principal
Amount | | | Value | |
MORTGAGE BACKED SECURITIES (continued) |
FRESB Multifamily Mortgage Pass Through Certificates |
Series 2017-SB32 A7F (d) | | | 04/25/2024 | | | | 2.44% | | | $ | 277,692 | | | $ | 275,556 | |
Series 2019-SB67 A5F (d) | | | 07/25/2024 | | | | 2.09% | | | | 509,805 | | | | 498,758 | |
Series 2019-SB69 A5F (d) | | | 10/25/2024 | | | | 2.25% | | | | 1,274,455 | | | | 1,241,340 | |
Series 2016-SB23 A10F (d) | | | 09/25/2026 | | | | 2.31% | | | | 505,929 | | | | 481,921 | |
GCT Commercial Mortgage Trust, 2021-GCT A (1 Month LIBOR USD + 0.914%) (a)(c) | | | 02/15/2038 | | | | 6.28% | | | | 1,400,000 | | | | 1,045,264 | |
GS Mortgage Securities Corp II, 2021-ARDN A (1 Month LIBOR USD + 1.364%) (a)(c) | | | 11/15/2036 | | | | 6.73% | | | | 3,685,000 | | | | 3,577,885 | |
GS Mortgage Securities Trust, 2021-NQM1 A3 (a)(d) | | | 07/25/2061 | | | | 1.53% | | | | 852,649 | | | | 727,467 | |
J.P. Morgan Chase Commercial Mortgage Securities Trust |
Series 2021-MHC A (1 Month LIBOR USD + 0.914%) (a)(c) | | | 04/15/2038 | | | | 6.28% | | | | 1,653,569 | | | | 1,638,498 | |
Series 2014-C23 ASB | | | 09/15/2047 | | | | 3.66% | | | | 181,259 | | | | 179,506 | |
Series 2014-C22 AS | | | 09/15/2047 | | | | 4.11% | | | | 1,350,000 | | | | 1,265,541 | |
Series 2016-JP3 A-5 | | | 08/15/2049 | | | | 2.87% | | | | 1,500,000 | | | | 1,392,211 | |
MHC Commercial Mortgage Trust, 2021-MHC A (1 Month LIBOR USD + 0.915%) (a)(c) | | | 04/15/2038 | | | | 6.28% | | | | 1,844,982 | | | | 1,825,307 | |
New Residential Mortgage Loan Trust, 2016-1A A1 (a)(d) | | | 03/25/2056 | | | | 3.75% | | | | 95,616 | | | | 89,664 | |
OBX Trust, 2018-1 A2 (1 Month LIBOR USD + 0.764%) (a)(c) | | | 06/25/2057 | | | | 6.12% | | | | 191,034 | | | | 181,825 | |
PKHL Commercial Mortgage Trust, 2021-MF A (1 Month LIBOR USD + 0.994%) (a)(c) | | | 07/15/2038 | | | | 6.36% | | | | 3,250,000 | | | | 2,998,678 | |
SMR Mortgage Trust, 2022-IND A (TSFR1M + 1.650%) (a)(c) | | | 02/15/2039 | | | | 7.01% | | | | 3,478,968 | | | | 3,291,917 | |
SREIT Trust, 2021-MFP2 A (1 Month LIBOR USD + 0.936%) (a)(c) | | | 11/15/2036 | | | | 6.30% | | | | 2,500,000 | | | | 2,464,732 | |
UBS Commercial Mortgage Trust, 2017-C6 ASB | | | 12/15/2050 | | | | 3.50% | | | | 765,059 | | | | 740,540 | |
Verus Securitization Trust |
Series 2020-1 A1 (a)(c) | | | 01/25/2060 | | | | 2.42% | | | | 139,675 | | | | 133,367 | |
Series 2020-1 A3 (a)(c) | | | 01/25/2060 | | | | 2.72% | | | | 329,210 | | | | 313,252 | |
TOTAL MORTGAGE BACKED SECURITIES (Cost $87,892,352) | | | | | | | | | | | | | | | 85,326,750 | |
| | | | | | | | | | | | | | | | | |
MUNICIPAL BONDS: 0.38% |
County of King WA Sewer Revenue | | | 07/01/2025 | | | | 0.80% | | | | 320,000 | | | | 302,165 | |
Forsyth County School District | | | 02/01/2024 | | | | 0.92% | | | | 660,000 | | | | 657,860 | |
Nebraska Public Power District | | | 01/01/2024 | | | | 2.22% | | | | 675,000 | | | | 675,000 | |
State of Hawaii | | | 08/01/2025 | | | | 1.03% | | | | 1,955,000 | | | | 1,848,107 | |
TOTAL MUNICIPAL BONDS (Cost $3,610,000) | | | | | | | | | | | | | | | 3,483,132 | |
| | | | | | | | | | | | | | | | | |
U.S. GOVERNMENT AGENCY ISSUES: 4.07% |
Federal Home Loan Banks | | | 12/20/2024 | | | | 1.00% | | | | 5,835,000 | | | | 5,624,906 | |
Federal Home Loan Banks | | | 04/14/2025 | | | | 0.50% | | | | 3,950,000 | | | | 3,752,349 | |
Federal Home Loan Banks | | | 08/28/2025 | | | | 2.07% | | | | 11,855,000 | | | | 11,412,436 | |
Federal Home Loan Banks | | | 02/25/2028 | | | | 1.10% | | | | 6,475,000 | | | | 5,731,689 | |
Federal National Mortgage Association | | | 07/02/2024 | | | | 1.75% | | | | 6,000,000 | | | | 5,899,924 | |
Federal National Mortgage Association | | | 12/18/2026 | | | | 0.88% | | | | 5,505,000 | | | | 4,979,449 | |
Small Business Administration Participation Certificates | | | 11/01/2032 | | | | 2.09% | | | | 4,344 | | | | 3,968 | |
TOTAL U.S. GOVERNMENT AGENCY ISSUES (Cost $37,845,685) | | | | | | | | | | | | | | | 37,404,721 | |
| | | | | | | | | | | | | | | | | |
U.S. GOVERNMENT NOTES: 11.98% |
United States Treasury Note | | | 05/31/2025 | | | | 0.25% | | | | 2,860,000 | | | | 2,693,874 | |
United States Treasury Note | | | 10/31/2025 | | | | 0.25% | | | | 4,400,000 | | | | 4,088,047 | |
United States Treasury Note | | | 04/15/2026 | | | | 3.75% | | | | 14,905,000 | | | | 14,771,088 | |
United States Treasury Note | | | 05/31/2026 | | | | 0.75% | | | | 23,655,000 | | | | 21,843,914 | |
United States Treasury Note | | | 07/15/2026 | | | | 4.50% | | | | 5,145,000 | | | | 5,194,641 | |
United States Treasury Note | | | 08/15/2026 | | | | 1.50% | | | | 11,880,000 | | | | 11,123,578 | |
United States Treasury Note | | | 11/30/2027 | | | | 3.88% | | | | 21,540,000 | | | | 21,510,551 | |
United States Treasury Note | | | 01/31/2028 | | | | 3.50% | | | | 15,035,000 | | | | 14,809,475 | |
United States Treasury Note | | | 03/31/2028 | | | | 3.63% | | | | 14,185,000 | | | | 14,042,042 | |
TOTAL U.S. GOVERNMENT NOTES (Cost $110,071,722) | | | | | | | | | | | | | | | 110,077,210 | |
| | | | | | | | | | | | | | | | | |
The accompanying notes are an integral part of these consolidated financial statements. | 37 |
LoCorr Long/Short Commodities Strategy Fund - Consolidated Schedule of Investments (continued) |
| | Maturity Date | | | Coupon Rate | | | Principal
Amount | | | Value | |
SHORT TERM INVESTMENTS: 32.82% |
U.S. GOVERNMENT AGENCY ISSUE: 1.16% |
Federal Home Loan Banks | | | 02/27/2024 | | | | 4.92% | | | $ | 10,750,000 | | | $ | 10,664,726 | |
TOTAL U.S. GOVERNMENT AGENCY ISSUE (Cost $10,664,726) | | | | | | | | | | | | | | | 10,664,726 | |
| | | | | | | | | | | | | | | | | |
U.S. TREASURY BILLS: 31.66% |
United States Treasury Bill | | | 01/18/2024 | | | | 4.91% | | | | 61,619,000 | | | | 61,467,691 | |
United States Treasury Bill | | | 02/15/2024 | | | | 5.12% | | | | 24,347,000 | | | | 24,187,831 | |
United States Treasury Bill | | | 03/14/2024 | | | | 5.05% | | | | 61,639,000 | | | | 60,999,372 | |
United States Treasury Bill | | | 04/18/2024 | | | | 5.10% | | | | 85,095,000 | | | | 83,781,770 | |
United States Treasury Bill | | | 05/09/2024 | | | | 5.06% | | | | 61,610,000 | | | | 60,484,445 | |
TOTAL U.S. TREASURY BILLS (Cost $290,857,899) | | | | | | | | | | | | | | | 290,921,109 | |
TOTAL SHORT TERM INVESTMENTS (Cost $301,522,625) | | | | | | | | | | | | | | | 301,585,835 | |
| | | | | | | | | | | | | | | | | |
TOTAL INVESTMENTS (Cost $829,863,038): 84.63% | | | | | | | | | | | | | | | 777,659,098 | |
Cash - Interest Bearing Deposit Account: 4.94% (e)(f) | | | | | | | | | | | | | | | 45,421,282 | |
Other Assets in Excess of Liabilities: 10.43% (g) | | | | | | | | | | | | | | | 95,842,206 | |
TOTAL NET ASSETS: 100.00% | | | | | | | | | | | | | | $ | 918,922,586 | |
(a) | Security as defined in Rule 144A under the Securities Act of 1933. Purchased in a private placement transaction; resale to the public may require registration or may extend only to qualified institutional buyers. As of the reporting date, the value of these securities total $89,070,654 which represents 9.69% of total net assets. |
(b) | Foreign issued security. |
(c) | Variable or floating rate security based on a reference index and spread. Certain securities are fixed to variable and currently in the fixed phase. The rate reported is the rate in effect as of the reporting date. |
(d) | Variable rate security. The coupon is based on an underlying pool of loans. The rate reported is the rate in effect as of the reporting date. |
(e) | A portion of this deposit account is held by LCLSCS Fund Limited and pledged as collateral for derivative contracts. As of the reporting date, the value of this collateral totals $38,386. |
(f) | The Money Market Deposit Account (“MMDA”) is a short-term investment vehicle in which the Fund holds cash balances. The MMDA will bear interest at a variable rate that is determined based on market conditions and may change daily and by any amount. |
(g) | Includes assets pledged as collateral for derivative contracts. As of the reporting date, the value of these assets totals $408,002. |
(h) | Investment valued using net asset value per share as practical expedient. See Note 2. Galaxy Commodity - Polaris Fund, LLC’s (“Galaxy”) investment objective is to generate diversified investment returns that are uncorrelated with the equity and debt markets by committing its assets to the investment discretion of a select group of experienced sub-managers that pursue various alternative investment strategies. Specifically, Galaxy accesses the sub-managers through an affiliated platform called Galaxy Plus Fund, LLC (the “Platform”). The Platform identifies sub-managers that, in its judgment, are capable of generating attractive investment returns whose correlation to the U.S. equity and fixed-income markets is minimal. In implementing their strategies, the sub-managers selected by the Platform will have the discretion to invest and trade in a broad variety of securities and other financial instruments (including derivatives). Galaxy has no unfunded commitments or redemption lock-up period, as the investment offers daily redemptions. However, the managers of Galaxy may temporarily suspend redemptions in certain limited circumstances. |
CMT | Constant Maturity Treasury | PLC | Public Limited Company | TSFR1M | 1 Month Average Secured Overnight Financing Rate |
LIBOR | London Interbank Offered Rate | SOFR | Secured Overnight Financing Rate | | |
38 | The accompanying notes are an integral part of these consolidated financial statements. |
LoCorr Long/Short Commodities Strategy Fund – Consolidated Schedule of Swap Contracts |
LoCorr Long/Short Commodities Strategy Fund
Consolidated Schedule of Swap Contracts
December 31, 2023
LONG TOTAL RETURN SWAP CONTRACTS
Termination
Date | Reference
Index | Financing
Rate | Payment
Frequency | Notional
Amount | Value | Advance Receipt on
Swap Contracts
(Received)/Paid | Unrealized
Appreciation | Counterparty |
12/17/2027 | LoCorr Commodities Index# | 0.50% | Quarterly | $338,445,098 | $95,927,977 | $(30,708,420) | $65,219,557 | Deutsche Bank AG |
# | Comprised of a proprietary basket of Commodity Trading Advisor’s ‘’CTA’’) Programs investing in various futures contracts, forward currency contracts, foreign currency and other similar investments. See Notes 2 & 3. |
The underlying components of the basket as of December 31, 2023 are shown below:#
Description | | Expiration Date | | | Number of Contracts
Purchased (Sold) | | | Notional
Amount | | | Concentration
% of Exposure | |
Futures Contracts: |
Purchase Contracts:(1) |
Brent Crude (ICE) | | | Jan-24 | | | | 3,404 | | | $ | 263,866,247 | | | | 15.98 | % |
WTI Crude (NYMEX) | | | Jan-24 | | | | 2,341 | | | | 168,735,367 | | | | 10.22 | % |
Gasoline RBOB Future | | | Jan-24 | | | | 436 | | | | 39,157,862 | | | | 2.37 | % |
Sugar No.11 | | | Apr-24 | | | | 1,350 | | | | 31,210,036 | | | | 1.89 | % |
Live Cattle | | | Jun-24 | | | | 439 | | | | 29,900,797 | | | | 1.81 | % |
Corn | | | May-24 | | | | 1,201 | | | | 29,210,375 | | | | 1.77 | % |
Coffee | | | May-24 | | | | 315 | | | | 21,766,775 | | | | 1.32 | % |
Natural Gas | | | Jan-24 | | | | 826 | | | | 20,920,702 | | | | 1.27 | % |
WTI Crude (NYMEX) | | | May-24 | | | | 227 | | | | 16,443,868 | | | | 1.00 | % |
Soybean Oil | | | May-24 | | | | 519 | | | | 14,978,272 | | | | 0.91 | % |
Copper (COMEX) | | | May-24 | | | | 146 | | | | 14,224,834 | | | | 0.86 | % |
Endex Dutch TTF Gas Future | | | Dec-24 | | | | 329 | | | | 10,403,602 | | | | 0.63 | % |
Soybean Oil | | | Jul-24 | | | | 356 | | | | 10,316,879 | | | | 0.62 | % |
Low Sulphur Gasoil | | | Jan-24 | | | | 129 | | | | 9,793,765 | | | | 0.59 | % |
Brent Crude (ICE) | | | Apr-24 | | | | 118 | | | | 9,083,943 | | | | 0.55 | % |
Gold | | | Feb-24 | | | | 40 | | | | 8,396,863 | | | | 0.51 | % |
Platinum | | | Apr-24 | | | | 129 | | | | 6,557,087 | | | | 0.40 | % |
Endex Dutch TTF Gas Future | | | Feb-25 | | | | 209 | | | | 6,339,469 | | | | 0.38 | % |
Endex Dutch TTF Gas Future | | | Jan-25 | | | | 209 | | | | 5,895,749 | | | | 0.36 | % |
Endex Dutch TTF Gas Future | | | Aug-24 | | | | 228 | | | | 5,889,872 | | | | 0.36 | % |
Gold | | | Apr-24 | | | | 25 | | | | 5,222,636 | | | | 0.32 | % |
Total Purchase Contracts | | | | | | | | | | | 728,315,000 | | | | 44.12 | % |
| |
Sale Contracts:(1) |
Brent Crude (ICE) | | | Feb-24 | | | | (2,596) | | | $ | 200,847,607 | | | | 12.16 | % |
WTI Crude (NYMEX) | | | Feb-24 | | | | (2,301) | | | | 166,326,989 | | | | 10.07 | % |
Corn | | | Mar-24 | | | | (1,705) | | | | 40,412,290 | | | | 2.45 | % |
Sugar No.11 | | | Feb-24 | | | | (1,649) | | | | 38,610,213 | | | | 2.34 | % |
Live Cattle | | | Apr-24 | | | | (449) | | | | 30,995,909 | | | | 1.88 | % |
Gasoline RBOB | | | Feb-24 | | | | (335) | | | | 30,266,639 | | | | 1.83 | % |
Brent Crude (ICE) | | | Mar-24 | | | | (349) | | | | 26,935,148 | | | | 1.63 | % |
Soybean Oil | | | Mar-24 | | | | (862) | | | | 24,635,679 | | | | 1.49 | % |
WTI Crude (NYMEX) | | | Mar-24 | | | | (308) | | | | 22,310,046 | | | | 1.35 | % |
Copper (COMEX) | | | Mar-24 | | | | (189) | | | | 18,362,305 | | | | 1.11 | % |
Aluminum | | | Mar-24 | | | | (287) | | | | 17,081,346 | | | | 1.03 | % |
The accompanying notes are an integral part of these consolidated financial statements. | 39 |
LoCorr Long/Short Commodities Strategy Fund – Consolidated Schedule of Swap Contracts (continued) |
Description | | Expiration Date | | | Number of Contracts
Purchased (Sold) | | | Notional
Amount | | | Concentration
% of Exposure | |
Sale Contracts:(1) (continued) |
Natural Gas | | | Feb-24 | | | | (721) | | | $ | 17,034,829 | | | | 1.03 | % |
Coffee | | | Mar-24 | | | | (243) | | | | 16,983,501 | | | | 1.03 | % |
Wheat | | | Mar-24 | | | | (508) | | | | 15,921,469 | | | | 0.97 | % |
WTI Crude (ICE) | | | Feb-24 | | | | (219) | | | | 15,841,585 | | | | 0.96 | % |
Red Spring Wheat | | | Mar-24 | | | | (406) | | | | 14,687,510 | | | | 0.89 | % |
Endex Dutch TTF Gas Future | | | Mar-24 | | | | (490) | | | | 12,429,049 | | | | 0.75 | % |
Soybean | | | Mar-24 | | | | (181) | | | | 11,763,031 | | | | 0.71 | % |
Natural Gas (NYMEX) | | | Jan-24 | | | | (1,564) | | | | 9,898,165 | | | | 0.60 | % |
Milling Wheat | | | Mar-24 | | | | (792) | | | | 9,771,937 | | | | 0.59 | % |
Cotton No.2 | | | Mar-24 | | | | (218) | | | | 8,854,920 | | | | 0.54 | % |
WTI Crude (NYMEX) | | | Apr-24 | | | | (121) | | | | 8,808,055 | | | | 0.53 | % |
Endex Dutch TTF Gas Future | | | Apr-24 | | | | (318) | | | | 8,322,013 | | | | 0.50 | % |
Low Sulphur Gasoil | | | Feb-24 | | | | (100) | | | | 7,470,339 | | | | 0.45 | % |
Endex Dutch TTF Gas Future | | | Nov-24 | | | | (201) | | | | 6,310,435 | | | | 0.38 | % |
European Carbon Emissions Allowance | | | Dec-24 | | | | (67) | | | | 5,974,033 | | | | 0.36 | % |
Nickel | | | Mar-24 | | | | (56) | | | | 5,547,766 | | | | 0.34 | % |
European Rapeseed | | | Mar-24 | | | | (39) | | | | 5,404,913 | | | | 0.33 | % |
Total Sale Contracts | | | | | | | | | | | 797,807,721 | | | | 48.30 | % |
Other Futures Contracts | | | | | | | | | | | 99,696,509 | | | | 6.04 | % |
Total Futures Contracts | | | | | | | | | | | 1,625,819,230 | | | | 98.46 | % |
| | | | | | | | | | | | | | | | | |
Cash and Foreign Currency: | | | | | | | | | | | | | | | | |
Cash and Foreign Currency Purchased:(1) |
U.S. Dollar | | | | | | | | | | $ | 14,072,508 | | | | 0.85 | % |
Foreign Currency | | | | | | | | | | | 7,862,669 | | | | 0.48 | % |
Total Cash and Foreign Currency | | | | | | | | | | | 21,935,177 | | | | 1.33 | % |
Forward Currency Contracts | | | | | | | | | | | 3,486,648 | | | | 0.21 | % |
Total Underlying Positions | | | | | | | | | | $ | 1,651,241,055 | | | | 100.00 | % |
# | The investment is not a direct holding of LoCorr Long/Short Commodities Strategy Fund. The top 50 holdings and other futures contracts, other forward currency contracts, and other cash and foreign currency were determined based on the absolute notional amount of the positions within the underlying swap basket. |
(1) | Represents the 50 largest components of the basket. |
40 | The accompanying notes are an integral part of these consolidated financial statements. |
LoCorr Market Trend Fund – Consolidated Schedule of Investments |
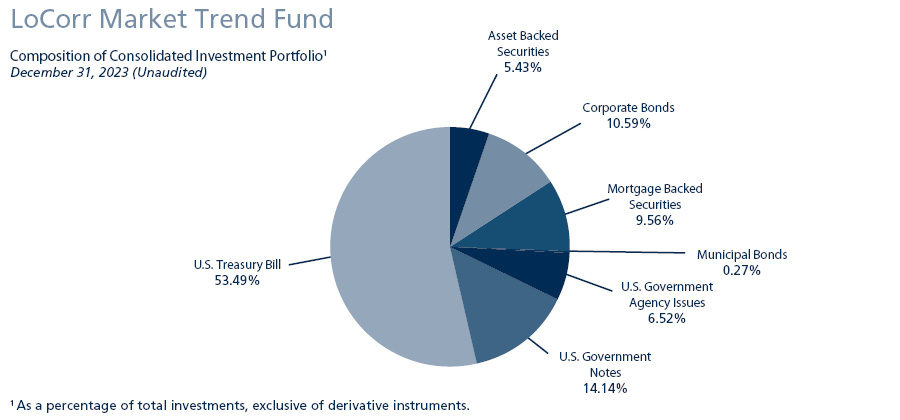
Consolidated Schedule of Investments
December 31, 2023
| | Maturity Date | | | Coupon Rate | | | Principal
Amount | | | Value | |
ASSET BACKED SECURITIES: 4.51% |
American Homes 4 Rent Trust, 2014-SFR2 A (a) | | | 10/17/2036 | | | | 3.79% | | | $ | 367,486 | | | $ | 361,534 | |
AmeriCredit Automobile Receivables Trust |
Series 2021-3 A-3 | | | 08/18/2026 | | | | 0.76% | | | | 578,420 | | | | 564,980 | |
Series 2021-2 A3 | | | 12/18/2026 | | | | 0.34% | | | | 226,697 | | | | 224,337 | |
Avis Budget Rental Car Funding AESOP LLC |
Series A (a) | | | 03/20/2026 | | | | 2.36% | | | | 264,000 | | | | 255,836 | |
Series 2023-2 (a) | | | 10/20/2027 | | | | 5.20% | | | | 200,000 | | | | 200,296 | |
CarMax Auto Owner Trust |
Series 2021-3 | | | 06/15/2026 | | | | 0.55% | | | | 1,542,828 | | | | 1,494,770 | |
Series 2021-4 A3 | | | 09/15/2026 | | | | 0.56% | | | | 402,930 | | | | 388,181 | |
Carvana Auto Receivables Trust |
Series 2021-P2 A3 | | | 03/10/2026 | | | | 0.49% | | | | 268,022 | | | | 263,789 | |
Series 2021-P4 A-3 | | | 01/11/2027 | | | | 1.31% | | | | 940,870 | | | | 911,914 | |
Series 2022-P3 | | | 11/10/2027 | | | | 4.61% | | | | 1,925,000 | | | | 1,904,821 | |
DB Master Finance LLC, 2021-1A A2I (a) | | | 11/20/2051 | | | | 2.05% | | | | 637,000 | | | | 579,072 | |
GM Financial Consumer Automobile Receivables Trust |
Series 2021-1 A3 | | | 10/16/2025 | | | | 0.35% | | | | 154,375 | | | | 152,313 | |
Series 2020-4 A4 | | | 02/17/2026 | | | | 0.50% | | | | 1,150,000 | | | | 1,117,015 | |
Series 2021-3 A3 | | | 06/16/2026 | | | | 0.48% | | | | 549,630 | | | | 533,902 | |
Series 2023-4, A-3 | | | 08/16/2028 | | | | 5.78% | | | | 1,380,000 | | | | 1,410,908 | |
Hilton Grand Vacations Trust |
Series 2019-AA A (a) | | | 07/25/2033 | | | | 2.34% | | | | 232,914 | | | | 221,667 | |
Series 2023-1 (a) | | | 01/25/2038 | | | | 5.72% | | | | 131,423 | | | | 133,592 | |
Honda Auto Receivables Owner Trust, 2020-3 A3 | | | 10/18/2024 | | | | 0.37% | | | | 28,330 | | | | 28,253 | |
Hyundai Auto Receivables Trust, 2020-C A3 | | | 05/15/2025 | | | | 0.38% | | | | 119,485 | | | | 118,728 | |
Invitation Homes Trust, 2018-SFR4 A (1 Month LIBOR USD + 1.214%) (a)(c) | | | 01/17/2038 | | | | 6.58% | | | | 638,496 | | | | 638,027 | |
MVW Owner Trust, 2019-1A A (a) | | | 11/20/2036 | | | | 2.89% | | | | 514,174 | | | | 495,423 | |
The accompanying notes are an integral part of these consolidated financial statements. | 41 |
LoCorr Market Trend Fund – Consolidated Schedule of Investments (continued) |
| | Maturity Date | | | Coupon Rate | | | Principal
Amount | | | Value | |
ASSET BACKED SECURITIES (continued) |
PFS Financing Corp. |
Series 2020-G A (a) | | | 02/15/2026 | | | | 0.97% | | | $ | 500,000 | | | $ | 497,068 | |
Series 2022-D (a) | | | 08/15/2027 | | | | 4.27% | | | | 1,200,000 | | | | 1,178,646 | |
Planet Fitness Master Issuer LLC, 3.25100 (a) | | | 12/05/2051 | | | | 3.25% | | | | 786,000 | | | | 729,226 | |
Santander Drive Auto Receivables Trust |
Series 2022-5 A3 | | | 08/17/2026 | | | | 4.11% | | | | 763,742 | | | | 760,142 | |
Series 2022-6 A3 | | | 11/16/2026 | | | | 4.49% | | | | 862,925 | | | | 858,176 | |
Taco Bell Funding LLC, 2021-1A A21 (a) | | | 08/25/2051 | | | | 1.95% | | | | 1,007,063 | | | | 902,902 | |
Toyota Auto Loan Extended Note Trust, 2020-1 A (a) | | | 05/25/2033 | | | | 1.35% | | | | 500,000 | | | | 474,610 | |
Volkswagen Auto Loan Enhanced Trust, 2021-1 A3 | | | 06/22/2026 | | | | 1.02% | | | | 630,942 | | | | 614,170 | |
VSE VOI Mortgage LLC, 2018-A A (a) | | | 02/20/2036 | | | | 3.56% | | | | 139,240 | | | | 136,503 | |
TOTAL ASSET BACKED SECURITIES (Cost $18,524,021) | | | | | | | | | | | | | | | 18,150,801 | |
| | | | | | | | | | | | | | | | | |
CORPORATE BONDS: 8.43% |
Aerospace & Defense: 0.27% |
Boeing Co. | | | 02/01/2028 | | | | 3.25% | | | | 485,000 | | | | 460,439 | |
L3Harris Technologies, Inc. | | | 01/15/2027 | | | | 5.40% | | | | 365,000 | | | | 372,768 | |
Raytheon Technologies Corp. | | | 11/16/2028 | | | | 4.13% | | | | 265,000 | | | | 259,035 | |
| | | | | | | | | | | | | | | | 1,092,242 | |
Agriculture: 0.08% |
Philip Morris International, Inc. | | | 02/15/2028 | | | | 4.88% | | | | 305,000 | | | | 308,543 | |
| | | | | | | | | | | | | | | | | |
Auto Manufacturers: 0.26% |
General Motors Financial Co., Inc. | | | 06/23/2028 | | | | 5.80% | | | | 440,000 | | | | 452,513 | |
Toyota Motor Credit Corp. | | | 09/11/2025 | | | | 5.60% | | | | 305,000 | | | | 309,996 | |
Volkswagen Group of America Finance LLC (a) | | | 11/24/2025 | | | | 1.25% | | | | 300,000 | | | | 278,587 | |
| | | | | | | | | | | | | | | | 1,041,096 | |
Banks: 3.72% |
Banco Santander SA (b) | | | 03/24/2025 | | | | 3.50% | | | | 250,000 | | | | 244,725 | |
Banco Santander SA (b) | | | 05/28/2025 | | | | 2.75% | | | | 180,000 | | | | 173,693 | |
Bank of America Corp. (SOFR + 1.150%) (c) | | | 06/19/2026 | | | | 1.32% | | | | 1,270,000 | | | | 1,195,536 | |
Bank of America Corp. (SOFR + 1.580%) (c) | | | 04/27/2028 | | | | 4.38% | | | | 640,000 | | | | 625,797 | |
Bank of America NA | | | 08/18/2026 | | | | 5.53% | | | | 1,105,000 | | | | 1,125,872 | |
Barclays PLC (SOFR + 2.220%) (b)(c) | | | 09/13/2029 | | | | 6.49% | | | | 390,000 | | | | 406,370 | |
Canadian Imperial Bank (b) | | | 04/07/2027 | | | | 3.45% | | | | 360,000 | | | | 345,892 | |
Citibank NA | | | 09/29/2028 | | | | 5.80% | | | | 610,000 | | | | 637,699 | |
Citigroup, Inc. (SOFR + 1.372%) (c) | | | 05/24/2025 | | | | 4.14% | | | | 755,000 | | | | 750,466 | |
Credit Suisse AG (b) | | | 07/09/2027 | | | | 5.00% | | | | 275,000 | | | | 275,225 | |
Deutsche Bank NY (b) | | | 05/28/2024 | | | | 0.90% | | | | 235,000 | | | | 230,799 | |
Federation des Caisses Desjardins du Quebec (a)(b) | | | 03/14/2028 | | | | 5.70% | | | | 285,000 | | | | 293,076 | |
Goldman Sachs Group, Inc. (3 Month LIBOR USD + 1.463%) (c) | | | 09/29/2025 | | | | 3.27% | | | | 1,255,000 | | | | 1,233,900 | |
Goldman Sachs Group, Inc. (SOFR + 1.075%) (c) | | | 08/10/2026 | | | | 5.80% | | | | 1,095,000 | | | | 1,105,789 | |
HSBC Holdings PLC (SOFR + 1.929%) (b)(c) | | | 06/04/2026 | | | | 2.10% | | | | 445,000 | | | | 423,704 | |
ING Groep NV (b) | | | 04/09/2024 | | | | 3.55% | | | | 445,000 | | | | 442,503 | |
ING Groep NV (SOFR + 1.640%) (b)(c) | | | 03/28/2026 | | | | 3.87% | | | | 355,000 | | | | 347,970 | |
JPMorgan Chase Bank NA | | | 12/08/2026 | | | | 5.11% | | | | 325,000 | | | | 328,077 | |
JPMorgan Chase & Co. (SOFR + 1.450%) (c) | | | 07/24/2029 | | | | 5.30% | | | | 1,005,000 | | | | 1,020,722 | |
Morgan Stanley (SOFR + 0.525%) (c) | | | 05/30/2025 | | | | 0.79% | | | | 150,000 | | | | 146,647 | |
Morgan Stanley Bank NA | | | 10/30/2026 | | | | 5.88% | | | | 910,000 | | | | 935,854 | |
Morgan Stanley (SOFR + 1.630%) (c) | | | 07/20/2029 | | | | 5.45% | | | | 235,000 | | | | 239,662 | |
NatWest Markets PLC (a)(b) | | | 08/12/2024 | | | | 0.80% | | | | 305,000 | | | | 296,003 | |
Toronto-Dominion Bank (b) | | | 06/06/2025 | | | | 3.77% | | | | 360,000 | | | | 354,241 | |
Toronto-Dominion Bank (b) | | | 09/10/2026 | | | | 1.25% | | | | 470,000 | | | | 429,582 | |
UBS Group AG (1 Year CMT Rate + 1.550%) (a)(b)(c) | | | 05/12/2026 | | | | 4.49% | | | | 250,000 | | | | 246,237 | |
42 | The accompanying notes are an integral part of these consolidated financial statements. |
LoCorr Market Trend Fund – Consolidated Schedule of Investments (continued) |
| | Maturity Date | | | Coupon Rate | | | Principal
Amount | | | Value | |
CORPORATE BONDS (continued) |
UBS Group AG (1 Year CMT Rate + 1.600%) (a)(b)(c) | | | 12/22/2027 | | | | 6.33% | | | $ | 200,000 | | | $ | 206,236 | |
Wells Fargo Bank NA | | | 08/07/2026 | | | | 5.45% | | | | 365,000 | | | | 371,294 | |
Wells Fargo & Co. (SOFR + 1.740%) (c) | | | 07/25/2029 | | | | 5.57% | | | | 510,000 | | | | 521,269 | |
| | | | | | | | | | | | | | | | 14,954,840 | |
Beverages: 0.12% |
PepsiCo, Inc. | | | 11/10/2026 | | | | 5.13% | | | | 485,000 | | | | 495,445 | |
| | | | | | | | | | | | | | | | | |
Biotechnology: 0.17% |
Amgen, Inc. | | | 03/02/2028 | | | | 5.15% | | | | 670,000 | | | | 685,453 | |
| | | | | | | | | | | | | | | | | |
Building Materials: 0.11% |
Carrier Global Corp. (a) | | | 11/30/2025 | | | | 5.80% | | | | 225,000 | | | | 228,004 | |
Trane Technologies Luxembourg Finance SA (b) | | | 03/21/2026 | | | | 3.50% | | | | 200,000 | | | | 194,454 | |
| | | | | | | | | | | | | | | | 422,458 | |
Chemicals: 0.05% |
Nutrien Ltd. (b) | | | 03/27/2028 | | | | 4.90% | | | | 180,000 | | | | 181,741 | |
| | | | | | | | | | | | | | | | | |
Cosmetics & Personal Care: 0.14% |
Haleon U.S. Capital LLC | | | 03/24/2027 | | | | 3.38% | | | | 600,000 | | | | 577,660 | |
| | | | | | | | | | | | | | | | | |
Diversified Financial Services: 0.40% |
AerCap Ireland Capital DAC/Global Aviation Trust (b) | | | 01/15/2027 | | | | 6.10% | | | | 625,000 | | | | 638,644 | |
Air Lease Corp. | | | 12/15/2027 | | | | 5.85% | | | | 405,000 | | | | 415,798 | |
Capital One Financial Corp. (SOFR + 1.370%) (c) | | | 05/09/2025 | | | | 4.17% | | | | 380,000 | | | | 377,152 | |
Private Export Funding Corp. | | | 06/15/2025 | | | | 3.25% | | | | 200,000 | | | | 196,133 | |
| | | | | | | | | | | | | | | | 1,627,727 | |
Electric: 0.38% |
Florida Power & Light Co. | | | 04/01/2028 | | | | 5.05% | | | | 385,000 | | | | 393,859 | |
Florida Power & Light Co. | | | 05/15/2028 | | | | 4.40% | | | | 315,000 | | | | 315,767 | |
Georgia Power Co. | | | 05/16/2028 | | | | 4.65% | | | | 215,000 | | | | 216,583 | |
NSTAR Electric Co. | | | 05/15/2027 | | | | 3.20% | | | | 515,000 | | | | 496,296 | |
Southern California Edison Co. | | | 02/01/2026 | | | | 1.20% | | | | 115,000 | | | | 107,113 | |
| | | | | | | | | | | | | | | | 1,529,618 | |
Entertainment: 0.25% |
Warnermedia Holdings, Inc. | | | 03/15/2027 | | | | 3.76% | | | | 1,045,000 | | | | 1,002,101 | |
| | | | | | | | | | | | | | | | | |
Food: 0.07% |
SYSCO Corp. | | | 07/15/2027 | | | | 3.25% | | | | 305,000 | | | | 291,810 | |
| | | | | | | | | | | | | | | | | |
Healthcare - Products: 0.23% |
Baxter International, Inc. | | | 11/29/2024 | | | | 1.32% | | | | 945,000 | | | | 910,025 | |
| | | | | | | | | | | | | | | | | |
Healthcare - Services: 0.08% |
HCA, Inc. | | | 03/15/2027 | | | | 3.13% | | | | 365,000 | | | | 346,188 | |
| | | | | | | | | | | | | | | | | |
Household Products & Wares: 0.07% |
Clorox Co. | | | 10/01/2027 | | | | 3.10% | | | | 305,000 | | | | 288,918 | |
| | | | | | | | | | | | | | | | | |
Insurance: 0.22% |
Equitable Financial Life Global (a) | | | 07/07/2025 | | | | 1.40% | | | | 385,000 | | | | 364,289 | |
Metropolitan Life Global Funding I (a) | | | 01/06/2028 | | | | 5.05% | | | | 160,000 | | | | 161,719 | |
Principal Life Global Funding II (a) | | | 01/12/2026 | | | | 0.88% | | | | 395,000 | | | | 362,757 | |
| | | | | | | | | | | | | | | | 888,765 | |
The accompanying notes are an integral part of these consolidated financial statements. | 43 |
LoCorr Market Trend Fund – Consolidated Schedule of Investments (continued) |
| | Maturity Date | | | Coupon Rate | | | Principal
Amount | | | Value | |
CORPORATE BONDS (continued) |
Machinery - Diversified: 0.05% |
John Deere Capital Corp. | | | 07/14/2028 | | | | 4.95% | | | $ | 190,000 | | | $ | 194,967 | |
| | | | | | | | | | | | | | | | | |
Media: 0.14% |
Charter Communications Operating LLC | | | 07/23/2025 | | | | 4.91% | | | | 560,000 | | | | 554,774 | |
| | | | | | | | | | | | | | | | | |
Oil & Gas: 0.05% |
Pioneer Natural Resources Co. | | | 03/29/2026 | | | | 5.10% | | | | 195,000 | | | | 196,487 | |
| | | | | | | | | | | | | | | | | |
Pharmaceuticals: 0.29% |
CVS Health Corp. | | | 06/01/2026 | | | | 2.88% | | | | 520,000 | | | | 496,794 | |
Pfizer Investment Enterprises Pte Ltd. (b) | | | 05/19/2028 | | | | 4.45% | | | | 660,000 | | | | 660,330 | |
| | | | | | | | | | | | | | | | 1,157,124 | |
Pipelines: 0.35% |
Enbridge, Inc. (b) | | | 02/14/2025 | | | �� | 2.50% | | | | 235,000 | | | | 227,873 | |
Enbridge, Inc. (b) | | | 11/15/2028 | | | | 6.00% | | | | 185,000 | | | | 194,402 | |
Energy Transfer LP | | | 12/01/2026 | | | | 6.05% | | | | 515,000 | | | | 529,283 | |
Williams Cos, Inc. | | | 03/02/2026 | | | | 5.40% | | | | 485,000 | | | | 490,080 | |
| | | | | | | | | | | | | | | | 1,441,638 | |
Real Estate Investment Trusts: 0.33% |
Brixmor Operating Partnership LP | | | 06/15/2026 | | | | 4.13% | | | | 295,000 | | | | 285,782 | |
SITE Centers Corp. | | | 02/01/2025 | | | | 3.63% | | | | 290,000 | | | | 281,799 | |
SITE Centers Corp. | | | 06/01/2027 | | | | 4.70% | | | | 755,000 | | | | 743,410 | |
| | | | | | | | | | | | | | | | 1,310,991 | |
Retail: 0.05% |
O’Reilly Automotive, Inc. | | | 11/20/2026 | | | | 5.75% | | | | 190,000 | | | | 194,636 | |
| | | | | | | | | | | | | | | | | |
Software: 0.07% |
Oracle Corp. | | | 03/25/2028 | | | | 2.30% | | | | 290,000 | | | | 264,385 | |
| | | | | | | | | | | | | | | | | |
Telecommunications: 0.48% |
AT&T, Inc. | | | 06/01/2027 | | | | 2.30% | | | | 430,000 | | | | 399,486 | |
T-Mobile USA, Inc. | | | 02/15/2026 | | | | 2.25% | | | | 780,000 | | | | 739,078 | |
T-Mobile USA, Inc. | | | 07/15/2028 | | | | 4.80% | | | | 385,000 | | | | 388,494 | |
Verizon Communications, Inc. | | | 03/22/2028 | | | | 2.10% | | | | 455,000 | | | | 411,965 | |
| | | | | | | | | | | | | | | | 1,939,023 | |
TOTAL CORPORATE BONDS (Cost $33,770,559) | | | | | | | | | | | | | | | 33,898,655 | |
| | | | | | | | | | | | | | | | | |
MORTGAGE BACKED SECURITIES: 7.95% |
ACRE Commercial Mortgage Trust, 2021-FL4 A (1 Month LIBOR USD + 0.944%) (a)(b)(c) | | | 12/18/2037 | | | | 6.30% | | | | 141,198 | | | | 141,309 | |
Alen Mortgage Trust, 2021-ACEN A (1 Month LIBOR USD + 1.264%) (a)(c) | | | 04/15/2034 | | | | 6.63% | | | | 600,000 | | | | 538,947 | |
Angel Oak Mortgage Trust |
Series 2020-1 M1 (a)(d) | | | 12/25/2059 | | | | 3.16% | | | | 418,000 | | | | 367,580 | |
Series 2020-5 A3 (a)(d) | | | 05/25/2065 | | | | 2.04% | | | | 17,012 | | | | 15,387 | |
BAMLL Commercial Mortgage Securities Trust, 2022-DKLX A (TSFR1M + 1.150%) (a)(c) | | | 01/15/2039 | | | | 6.51% | | | | 1,250,000 | | | | 1,221,839 | |
BSREP Commercial Mortgage Trust, 2021-DC A (1 Month LIBOR USD + 1.064%) (a)(c) | | | 08/15/2038 | | | | 6.43% | | | | 317,482 | | | | 298,346 | |
BX Commercial Mortgage Trust |
Series 2019-XL A (1 Month LIBOR USD + 1.034%) (a)(c) | | | 10/15/2036 | | | | 6.40% | | | | 173,034 | | | | 172,595 | |
Series 2021-CIP A (1 Month LIBOR USD + 1.035%) (a)(c) | | | 12/15/2038 | | | | 6.40% | | | | 1,000,000 | | | | 978,977 | |
BX Trust, 2022-PSB (TSFR1M + 2.451%) (a)(c) | | | 08/15/2039 | | | | 7.81% | | | | 885,768 | | | | 888,110 | |
Connecticut Avenue Securities Trust |
Series 2021-R03 1M1 (SOFR30A + 0.850%) (a)(c) | | | 12/25/2041 | | | | 6.19% | | | | 482,437 | | | | 480,846 | |
Series 2022-R04 (SOFR30A + 2.000%) (a)(c) | | | 03/25/2042 | | | | 7.34% | | | | 825,191 | | | | 831,406 | |
Series 2022-R03 1M1 (SOFR30A + 2.100%) (a)(c) | | | 03/25/2042 | | | | 7.44% | | | | 904,251 | | | | 914,833 | |
44 | The accompanying notes are an integral part of these consolidated financial statements. |
LoCorr Market Trend Fund – Consolidated Schedule of Investments (continued) |
| | Maturity Date | | | Coupon Rate | | | Principal
Amount | | | Value | |
MORTGAGE BACKED SECURITIES (continued) |
Series 2023-R01 (SOFR30A + 2.400%) (a)(c) | | | 12/25/2042 | | | | 7.74% | | | $ | 270,226 | | | $ | 275,414 | |
Series 2023-R01 (SOFR30A + 3.750%) (a)(c) | | | 12/25/2042 | | | | 9.09% | | | | 415,000 | | | | 438,212 | |
Series 2023-R02 (SOFR30A + 3.350%) (a)(c) | | | 01/25/2043 | | | | 8.69% | | | | 1,140,000 | | | | 1,194,372 | |
ELP Commercial Mortgage Trust |
Series 2021-ELP A (1 Month LIBOR USD + 0.815%) (a)(c) | | | 11/15/2038 | | | | 6.18% | | | | 1,242,554 | | | | 1,219,157 | |
Series 2021-ELP B (1 Month LIBOR USD + 1.235%) (a)(c) | | | 11/15/2038 | | | | 6.60% | | | | 948,896 | | | | 929,838 | |
Fannie Mae Aces, 2014-M11 1A (d) | | | 08/25/2024 | | | | 3.08% | | | | 285,493 | | | | 280,457 | |
Fannie Mae Connecticut Avenue Securities |
Series 2018-C01 1EB1 (1 Month LIBOR USD + 0.564%) (c) | | | 07/25/2030 | | | | 5.90% | | | | 38,674 | | | | 38,701 | |
Series 2018-C05 (SOFR30A + 2.464%) (c) | | | 01/25/2031 | | | | 7.80% | | | | 512,157 | | | | 524,232 | |
Fannie Mae Pool | | | 09/01/2038 | | | | 5.50% | | | | 679,977 | | | | 689,716 | |
Freddie Mac Pool | | | 10/01/2038 | | | | 5.50% | | | | 2,993,967 | | | | 3,036,848 | |
Freddie Mac STACR REMIC Trust |
Series 2021-DNA5 M2 (SOFR30A + 1.650%) (a)(c) | | | 01/25/2034 | | | | 6.99% | | | | 31,201 | | | | 31,332 | |
Series 2021-DNA6 (SOFR30A + 1.500%) (a)(c) | | | 10/25/2041 | | | | 6.84% | | | | 820,000 | | | | 812,825 | |
Series 2022-DNA3 (SOFR30A + 2.000%) (a)(c) | | | 04/25/2042 | | | | 7.34% | | | | 254,295 | | | | 256,729 | |
Series 2022-DNA5, FLT (SOFR30A + 4.500%) (a)(c) | | | 06/25/2042 | | | | 9.84% | | | | 680,000 | | | | 732,176 | |
Series 2022-DNA6, FLT (SOFR30A + 3.700%) (a)(c) | | | 09/25/2042 | | | | 9.04% | | | | 720,000 | | | | 757,384 | |
Freddie Mac Structured Agency Credit Risk Debt Notes |
Series 2021-DNA2 (SOFR30A + 2.300%) (a)(c) | | | 08/25/2033 | | | | 7.64% | | | | 598,976 | | | | 604,604 | |
Series 2021-DNA7 M1 (SOFR30A + 0.850%) (a)(c) | | | 11/25/2041 | | | | 6.19% | | | | 723,168 | | | | 719,118 | |
Series 2022-DNA2 M1A (SOFR30A + 1.300%) (a)(c) | | | 02/25/2042 | | | | 6.64% | | | | 263,851 | | | | 263,851 | |
FRESB Multifamily Mortgage Pass Through Certificates |
Series 2017-SB32 A7F (d) | | | 04/25/2024 | | | | 2.44% | | | | 232,732 | | | | 230,942 | |
Series 2019-SB67 A5F (d) | | | 07/25/2024 | | | | 2.09% | | | | 458,309 | | | | 448,379 | |
GCT Commercial Mortgage Trust, 2021-GCT A (1 Month LIBOR USD + 0.914%) (a)(c) | | | 02/15/2038 | | | | 6.28% | | | | 750,000 | | | | 559,963 | |
GS Mortgage Securities Corp II, 2021-ARDN A (1 Month LIBOR USD + 1.364%) (a)(c) | | | 11/15/2036 | | | | 6.73% | | | | 950,000 | | | | 922,386 | |
GS Mortgage Securities Trust, 2015-GC28 A5 | | | 02/10/2048 | | | | 3.40% | | | | 1,000,000 | | | | 977,113 | |
J.P. Morgan Chase Commercial Mortgage Securities Trust |
Series 2021-MHC A (1 Month LIBOR USD + 0.914%) (a)(c) | | | 04/15/2038 | | | | 6.28% | | | | 803,162 | | | | 795,842 | |
Series 2014-C22 AS | | | 09/15/2047 | | | | 4.11% | | | | 685,000 | | | | 642,145 | |
MTN Commercial Mortgage Trust, 2022-LPFL A (TSFR1M + 1.397%) (a)(c) | | | 03/15/2039 | | | | 6.77% | | | | 1,500,000 | | | | 1,462,275 | |
Natixis Commercial Mortgage Securities Trust, 2018-285M A (a)(d) | | | 11/15/2032 | | | | 3.79% | | | | 1,000,000 | | | | 840,990 | |
PKHL Commercial Mortgage Trust, 2021-MF A (1 Month LIBOR USD + 0.994%) (a)(c) | | | 07/15/2038 | | | | 6.36% | | | | 1,000,000 | | | | 922,670 | |
SMR Mortgage Trust, 2022-IND A (TSFR1M + 1.650%) (a)(c) | | | 02/15/2039 | | | | 7.01% | | | | 1,159,656 | | | | 1,097,306 | |
SREIT Trust, 2021-MFP2 A (1 Month LIBOR USD + 0.936%) (a)(c) | | | 11/15/2036 | | | | 6.30% | | | | 1,250,000 | | | | 1,232,366 | |
Verus Securitization Trust |
Series 2020-1 A1 (a)(c) | | | 01/25/2060 | | | | 2.42% | | | | 65,730 | | | | 62,761 | |
Series 2020-1 A3 (a)(c) | | | 01/25/2060 | | | | 2.72% | | | | 188,120 | | | | 179,001 | |
Wells Fargo Commercial Mortgage Trust, 2015-NXS2 A-4 | | | 07/15/2058 | | | | 3.50% | | | | 1,000,000 | | | | 973,667 | |
WFRBS Commercial Mortgage Trust, 2014-C24 A5 | | | 11/15/2047 | | | | 3.61% | | | | 1,000,000 | | | | 976,592 | |
TOTAL MORTGAGE BACKED SECURITIES (Cost $32,884,796) | | | | | | | | | | | | | | | 31,979,539 | |
| | | | | | | | | | | | | | | | | |
MUNICIPAL BONDS: 0.23% |
Forsyth County School District | | | 02/01/2024 | | | | 0.92% | | | | 230,000 | | | | 229,254 | |
State of Hawaii | | | 08/01/2025 | | | | 1.03% | | | | 720,000 | | | | 680,633 | |
TOTAL MUNICIPAL BONDS (Cost $950,000) | | | | | | | | | | | | | | | 909,887 | |
| | | | | | | | | | | | | | | | | |
U.S. GOVERNMENT AGENCY ISSUES: 5.42% |
Federal Farm Credit Banks Funding Corp. | | | 03/10/2025 | | | | 5.00% | | | | 2,015,000 | | | | 2,025,820 | |
Federal Home Loan Banks | | | 12/20/2024 | | | | 1.00% | | | | 1,980,000 | | | | 1,908,709 | |
Federal Home Loan Banks | | | 04/14/2025 | | | | 0.50% | | | | 1,700,000 | | | | 1,614,935 | |
Federal Home Loan Banks | | | 08/28/2025 | | | | 2.07% | | | | 2,145,000 | | | | 2,064,924 | |
Federal Home Loan Banks | | | 03/23/2026 | | | | 1.00% | | | | 1,950,000 | | | | 1,811,750 | |
The accompanying notes are an integral part of these consolidated financial statements. | 45 |
LoCorr Market Trend Fund – Consolidated Schedule of Investments (continued) |
| | Maturity Date | | | Coupon Rate | | | Principal
Amount | | | Value | |
U.S. GOVERNMENT AGENCY ISSUES (continued) |
Federal Home Loan Banks | | | 09/11/2026 | | | | 4.63% | | | $ | 7,070,000 | | | $ | 7,163,472 | |
Federal Home Loan Banks | | | 02/25/2028 | | | | 1.10% | | | | 2,365,000 | | | | 2,093,505 | |
Federal National Mortgage Association | | | 07/02/2024 | | | | 1.75% | | | | 1,000,000 | | | | 983,321 | |
Federal National Mortgage Association | | | 12/18/2026 | | | | 0.88% | | | | 2,340,000 | | | | 2,116,605 | |
TOTAL U.S. GOVERNMENT AGENCY ISSUES (Cost $21,815,968) | | | | | | | | | | | | | | | 21,783,041 | |
| | | | | | | | | | | | | | | | | |
U.S. GOVERNMENT NOTES: 11.66% |
United States Treasury Note | | | 05/31/2025 | | | | 0.25% | | | | 14,045,000 | | | | 13,229,183 | |
United States Treasury Note | | | 10/31/2025 | | | | 0.25% | | | | 2,000,000 | | | | 1,858,203 | |
United States Treasury Note | | | 04/15/2026 | | | | 3.75% | | | | 6,755,000 | | | | 6,694,311 | |
United States Treasury Note | | | 05/31/2026 | | | | 0.75% | | | | 8,780,000 | | | | 8,107,781 | |
United States Treasury Note | | | 02/28/2027 | | | | 1.88% | | | | 1,080,000 | | | | 1,013,006 | |
United States Treasury Note | | | 11/30/2027 | | | | 3.88% | | | | 7,235,000 | | | | 7,225,108 | |
United States Treasury Note | | | 01/31/2028 | | | | 3.50% | | | | 2,570,000 | | | | 2,531,450 | |
United States Treasury Note | | | 03/31/2028 | | | | 3.63% | | | | 6,280,000 | | | | 6,216,710 | |
TOTAL U.S. GOVERNMENT NOTES (Cost $46,868,135) | | | | | | | | | | | | | | | 46,875,752 | |
| | | | | | | | | | | | | | | | | |
SHORT TERM INVESTMENTS: 44.94% |
CORPORATE BONDS: 0.37% |
Healthcare - Products: 0.22% |
Revvity, Inc. | | | 09/15/2024 | | | | 0.85% | | | | 925,000 | | | | 892,913 | |
| | | | | | | | | | | | | | | | | |
Insurance: 0.15% |
Protective Life Global Funding (a) | | | 07/05/2024 | | | | 0.78% | | | | 620,000 | | | | 605,132 | |
TOTAL CORPORATE BONDS (Cost $1,520,742) | | | | | | | | | | | | | | | 1,498,045 | |
| | | | | | | | | | | | | | | | | |
U.S. GOVERNMENT NOTE: 0.10% |
United States Treasury Note | | | 05/15/2024 | | | | 0.25% | | | | 395,000 | | | | 387,902 | |
| | | | | | | | | | | | | | | | | |
TOTAL U.S. GOVERNMENT NOTE (Cost $387,553) |
U.S. TREASURY BILLS: 44.47% |
United States Treasury Bill | | | 01/18/2024 | | | | 4.91% | | | | 37,257,000 | | | | 37,165,513 | |
United States Treasury Bill | | | 02/15/2024 | | | | 5.12% | | | | 37,390,000 | | | | 37,145,563 | |
United States Treasury Bill | | | 03/14/2024 | | | | 5.05% | | | | 37,525,000 | | | | 37,135,603 | |
United States Treasury Bill | | | 04/18/2024 | | | | 5.10% | | | | 37,722,000 | | | | 37,139,855 | |
United States Treasury Bill | | | 05/09/2024 | | | | 5.06% | | | | 30,805,000 | | | | 30,242,222 | |
TOTAL U.S. TREASURY BILLS (Cost $178,796,889) | | | | | | | | | | | | | | | 178,828,756 | |
SHORT TERM INVESTMENTS (Cost $180,705,184) | | | | | | | | | | | | | | | 180,714,703 | |
| | | | | | | | | | | | | | | | | |
TOTAL INVESTMENTS (Cost $335,518,663): 83.14% | | | | | | | | | | | | | | | 334,312,378 | |
Cash - Interest Bearing Deposit Account: 3.57% (e)(f) | | | | | | | | | | | | | | | 14,336,702 | |
Other Assets in Excess of Liabilities: 13.29% (g) | | | | | | | | | | | | | | | 53,443,207 | |
TOTAL NET ASSETS: 100.00% | | | | | | | | | | | | | | $ | 402,092,287 | |
(a) | Security as defined in Rule 144A under the Securities Act of 1933. Purchased in a private placement transaction; resale to the public may require registration or may extend only to qualified institutional buyers. As of the reporting date, the value of these securities total $33,007,189 which represents 8.21% of total net assets. |
(b) | Foreign issued security. |
(c) | Variable or floating rate security based on a reference index and spread. Certain securities are fixed to variable and currently in the fixed phase. The rate reported is the rate in effect as of the reporting date. |
(d) | Variable rate security. The coupon is based on an underlying pool of loans. The rate reported is the rate in effect as of the reporting date. |
(e) | A portion of this deposit account is pledged as collateral for derivative contracts. As of the reporting date, the value of this collateral totals $393,028. |
(f) | The Money Market Deposit Account (“MMDA”) is a short-term investment vehicle in which the Fund holds cash balances. The MMDA will bear interest at a variable rate that is determined based on market conditions and may change daily and by any amount. |
(g) | Includes assets pledged as collateral for derivative contracts. As of the reporting date, the value of these assets totals $59,295,449. |
CMT | Constant Maturity Treasury | SOFR30 | 30 Day Average Secured Overnight Financing Rate |
LIBOR | London Interbank Offered Rate | TSFR1 | 1 Month Average Secured Overnight Financing Rate |
PLC | Public Limited Company | | |
46 | The accompanying notes are an integral part of these consolidated financial statements. |
LoCorr Market Trend Fund - Consolidated Schedule of Open Forward Currency Contracts |
LoCorr Market Trend Fund
Consolidated Schedule of Open Forward Currency Contracts(a)
December 31, 2023
| | | | | | | | | | | | | | | Currency to be Received | | | Currency to be Delivered | | | | | |
| | | Notional
Amount | | | Forward
Settlement
Date | | | Currency
Abbreviation | | | U.S. $
Notional
Amount at
December 31,
2023 | | | Currency
Abbreviation | | | U.S. $
Notional
Amount on
Origination
Date | | | Unrealized
Appreciation | | | Unrealized
(Depreciation) | |
Purchase Contracts: |
| | | $ | 52,612,169 | | | | 03/22/2024 | | | | AUD | | | $ | 52,800,575 | | | | USD | | | $ | 52,612,169 | | | $ | 188,406 | | | $ | — | |
| | | | 27,370,863 | | | | 03/22/2024 | | | | CAD | | | | 27,450,118 | | | | USD | | | | 27,370,863 | | | | 79,255 | | | | — | |
| | | | 39,990,114 | | | | 03/22/2024 | | | | CHF | | | | 40,492,619 | | | | USD | | | | 39,990,114 | | | | 502,505 | | | | — | |
| | | | 57,974,803 | | | | 03/22/2024 | | | | EUR | | | | 58,190,438 | | | | USD | | | | 57,974,803 | | | | 215,635 | | | | — | |
| | | | 33,101,039 | | | | 03/22/2024 | | | | GBP | | | | 33,173,597 | | | | USD | | | | 33,101,039 | | | | 72,558 | | | | — | |
| | | | 8,527,936 | | | | 03/22/2024 | | | | JPY | | | | 8,587,656 | | | | USD | | | | 8,527,936 | | | | 59,720 | | | | — | |
| | | | 31,379,435 | | | | 03/22/2024 | | | | MXN | | | | 32,265,846 | | | | USD | | | | 31,379,435 | | | | 886,411 | | | | — | |
| | | | 44,703,024 | | | | 03/22/2024 | | | | NZD | | | | 44,916,739 | | | | USD | | | | 44,703,024 | | | | 213,715 | | | | — | |
Total Purchase Contracts | | | | | | | 297,877,588 | | | | | | | | 295,659,383 | | | | 2,218,205 | | | | — | |
| |
Sale Contracts: |
| | | $ | 22,610,753 | | | | 03/22/2024 | | | | USD | | | $ | 23,437,697 | | | | AUD | | | $ | 22,610,753 | | | $ | — | | | $ | (826,944 | ) |
| | | | 85,110,805 | | | | 03/22/2024 | | | | USD | | | | 87,219,915 | | | | CAD | | | | 85,110,805 | | | | — | | | | (2,109,110 | ) |
| | | | 45,244,838 | | | | 03/22/2024 | | | | USD | | | | 47,081,065 | | | | CHF | | | | 45,244,838 | | | | — | | | | (1,836,227 | ) |
| | | | 61,908,025 | | | | 03/22/2024 | | | | USD | | | | 63,278,169 | | | | EUR | | | | 61,908,025 | | | | — | | | | (1,370,144 | ) |
| | | | 28,330,364 | | | | 03/22/2024 | | | | USD | | | | 28,829,086 | | | | GBP | | | | 28,330,364 | | | | — | | | | (498,722 | ) |
| | | | 74,539,020 | | | | 03/22/2024 | | | | USD | | | | 76,570,758 | | | | JPY | | | | 74,539,020 | | | | — | | | | (2,031,738 | ) |
| | | | 2,825,169 | | | | 03/22/2024 | | | | USD | | | | 2,858,554 | | | | MXN | | | | 2,825,169 | | | | — | | | | (33,385 | ) |
| | | | 17,123,025 | | | | 03/22/2024 | | | | USD | | | | 17,687,231 | | | | NZD | | | | 17,123,025 | | | | — | | | | (564,206 | ) |
Total Sale Contracts | | | | | | | 346,962,475 | | | | | | | | 337,691,999 | | | | — | | | | (9,270,476 | ) |
Net Forward Currency Contracts | | | | | | $ | (49,084,887 | ) | | | | | | $ | (42,032,616 | ) | | $ | 2,218,205 | | | $ | (9,270,476 | ) |
Net Unrealized Depreciation | | | | | | | | | | | | | | | | | | | | | | $ | (7,052,271 | ) |
Currency Abbreviations:
(a) Bank of America Merrill Lynch is the counterparty for all open forward currency exchange contracts held by the Fund as of December 31, 2023.
The accompanying notes are an integral part of these consolidated financial statements. | 47 |
LoCorr Market Trend Fund – Consolidated Schedule of Open Futures Contracts |
LoCorr Market Trend Fund
Consolidated Schedule of Open Futures Contracts
December 31, 2023
| | | Number of
Contracts | | | | | | | Current | | | Notional | | | Value | |
Description | | Purchased
(Sold) | | | Settlement
Month-Year | | | Notional
Amount | | | Amount At
Trade Date | | | Unrealized
Appreciation | | | Unrealized
(Depreciation) | |
Purchase Contracts: |
3 Mo Euro Euribor | | | 1,045 | | | | Jun-25 | | | $ | 282,811,258 | | | $ | 282,843,424 | | | $ | — | | | $ | (32,166 | ) |
Aluminum (a) | | | 43 | | | | Mar-24 | | | | 2,559,575 | | | | 2,423,177 | | | | 136,398 | | | | — | |
Brent Crude | | | 65 | | | | Jan-24 | | | | 5,007,600 | | | | 5,016,593 | | | | — | | | | (8,993 | ) |
CAC 40 10 Euro Index | | | 255 | | | | Jan-24 | | | | 21,267,829 | | | | 21,374,652 | | | | — | | | | (106,823 | ) |
Cocoa | | | 113 | | | | Mar-24 | | | | 5,049,877 | | | | 4,806,558 | | | | 243,319 | | | | — | |
Coffee | | | 142 | | | | Mar-24 | | | | 10,026,975 | | | | 9,878,247 | | | | 148,728 | | | | — | |
Copper (a) | | | 91 | | | | Mar-24 | | | | 19,463,763 | | | | 19,378,429 | | | | 85,334 | | | | — | |
DAX Index | | | 109 | | | | Mar-24 | | | | 50,878,659 | | | | 51,068,092 | | | | — | | | | (189,433 | ) |
Dollar | | | 97 | | | | Mar-24 | | | | 9,799,813 | | | | 9,966,457 | | | | — | | | | (166,644 | ) |
Dow Jones Industrial Average Mini E-Cbot Index | | | 203 | | | | Mar-24 | | | | 38,582,180 | | | | 38,276,676 | | | | 305,504 | | | | — | |
Euro-Bobl | | | 109 | | | | Mar-24 | | | | 14,352,998 | | | | 14,368,639 | | | | — | | | | (15,641 | ) |
Euro-Bund | | | 130 | | | | Mar-24 | | | | 19,692,882 | | | | 19,798,658 | | | | — | | | | (105,776 | ) |
Euro-Stoxx 50 Index | | | 1,098 | | | | Mar-24 | | | | 55,067,274 | | | | 55,506,555 | | | | — | | | | (439,281 | ) |
FTSE 100 Index | | | 28 | | | | Mar-24 | | | | 2,768,307 | | | | 2,767,922 | | | | 385 | | | | — | |
Gold | | | 81 | | | | Feb-24 | | | | 16,781,580 | | | | 16,669,318 | | | | 112,262 | | | | — | |
Heating Oil | | | 81 | | | | Jan-24 | | | | 8,603,318 | | | | 8,680,781 | | | | — | | | | (77,463 | ) |
Long Gilt | | | 65 | | | | Mar-24 | | | | 8,504,774 | | | | 8,528,790 | | | | — | | | | (24,016 | ) |
Low Sulphur Gasoil | | | 130 | | | | Feb-24 | | | | 9,649,250 | | | | 9,645,035 | | | | 4,215 | | | | — | |
Nasdaq 100 E-Mini Index | | | 142 | | | | Mar-24 | | | | 48,346,740 | | | | 46,529,215 | | | | 1,817,525 | | | | — | |
Nikkei 225 Index (OSE) | | | 150 | | | | Mar-24 | | | | 35,585,106 | | | | 34,891,046 | | | | 694,060 | | | | — | |
Russell 2000 Mini Index | | | 36 | | | | Mar-24 | | | | 3,685,860 | | | | 3,714,016 | | | | — | | | | (28,156 | ) |
S&P 500 E-Mini Index | | | 239 | | | | Mar-24 | | | | 57,599,000 | | | | 56,119,496 | | | | 1,479,504 | | | | — | |
Soybean Meal | | | 162 | | | | Mar-24 | | | | 6,253,200 | | | | 6,940,840 | | | | — | | | | (687,640 | ) |
Sugar | | | 105 | | | | Feb-24 | | | | 2,420,208 | | | | 3,159,667 | | | | — | | | | (739,459 | ) |
Swiss Franc | | | 203 | | | | Sep-25 | | | | 62,641,024 | | | | 62,584,867 | | | | 56,157 | | | | — | |
Tokyo Price Index | | | 231 | | | | Mar-24 | | | | 38,762,128 | | | | 38,426,846 | | | | 335,282 | | | | — | |
WTI Crude | | | 69 | | | | Jan-24 | | | | 4,943,850 | | | | 4,816,023 | | | | 127,827 | | | | — | |
Zinc (a) | | | 57 | | | | Mar-24 | | | | 3,795,488 | | | | 3,653,121 | | | | 142,367 | | | | — | |
Total Purchase Contracts | | | | | | | | | | | | | | | | | | | 5,688,867 | | | | (2,621,491 | ) |
| |
Sale Contracts: |
10 Yr Mini JGB | | | (12) | | | | Mar-24 | | | $ | 1,247,064 | | | $ | 1,247,874 | | | $ | 810 | | | $ | — | |
Aluminum (a) | | | (144) | | | | Mar-24 | | | | 8,571,600 | | | | 8,115,721 | | | | — | | | | (455,879 | ) |
Australian 10 Yr Bond | | | (676) | | | | Mar-24 | | | | 53,743,219 | | | | 52,202,949 | | | | — | | | | (1,540,270 | ) |
Canadian 10 Yr Bond | | | (178) | | | | Mar-24 | | | | 16,681,665 | | | | 15,940,336 | | | | — | | | | (741,329 | ) |
Copper (a) | | | (111) | | | | Mar-24 | | | | 23,741,513 | | | | 22,740,455 | | | | — | | | | (1,001,058 | ) |
Corn | | | (660) | | | | Mar-24 | | | | 15,551,250 | | | | 16,031,135 | | | | 479,885 | | | | — | |
Cotton No.2 | | | (101) | | | | Mar-24 | | | | 4,090,500 | | | | 4,060,355 | | | | — | | | | (30,145 | ) |
Euro-Schatz | | | (1,450) | | | | Mar-24 | | | | 170,549,159 | | | | 169,645,027 | | | | — | | | | (904,132 | ) |
Gasoline RBOB | | | (32) | | | | Jan-24 | | | | 2,830,867 | | | | 2,868,855 | | | | 37,988 | | | | — | |
Hang Seng Index | | | (182) | | | | Jan-24 | | | | 19,965,576 | | | | 19,294,570 | | | | — | | | | (671,006 | ) |
Hard Red Wheat | | | (203) | | | | Mar-24 | | | | 6,516,300 | | | | 6,531,287 | | | | 14,987 | | | | — | |
48 | The accompanying notes are an integral part of these consolidated financial statements. |
LoCorr Market Trend Fund – Consolidated Schedule of Open Futures Contracts |
| | | Number of
Contracts | | | | | | | Current | | | Notional | | | Value | |
Description | | Purchased
(Sold) | | | Settlement
Month-Year | | | Notional
Amount | | | Amount At
Trade Date | | | Unrealized
Appreciation | | | Unrealized
(Depreciation) | |
Sale Contracts: (continued) |
Japanese 10 Yr Bond | | | (81) | | | | Mar-24 | | | $ | 84,280,213 | | | $ | 83,543,348 | | | $ | — | | | $ | (736,865 | ) |
Natural Gas | | | (296) | | | | Jan-24 | | | | 7,441,440 | | | | 6,882,163 | | | | — | | | | (559,277 | ) |
Silver | | | (28) | | | | Mar-24 | | | | 3,372,040 | | | | 3,350,817 | | | | — | | | | (21,223 | ) |
Soybean | | | (130) | | | | Mar-24 | | | | 8,437,000 | | | | 8,590,039 | | | | 153,039 | | | | — | |
Soybean Oil | | | (142) | | | | Mar-24 | | | | 4,104,936 | | | | 4,370,611 | | | | 265,675 | | | | — | |
Swiss Franc | | | (1,701) | | | | Sep-25 | | | | 411,599,475 | | | | 410,490,265 | | | | — | | | | (1,109,210 | ) |
U.S. 10 Yr Note | | | (518) | | | | Mar-24 | | | | 58,477,344 | | | | 57,432,399 | | | | — | | | | (1,044,945 | ) |
U.S. 2 Yr Note | | | (1,369) | | | | Mar-24 | | | | 281,896,351 | | | | 280,690,300 | | | | — | | | | (1,206,051 | ) |
U.S. 5 Yr Note | | | (883) | | | | Mar-24 | | | | 96,046,946 | | | | 94,501,196 | | | | — | | | | (1,545,750 | ) |
U.S. Long Bond | | | (182) | | | | Mar-24 | | | | 22,738,625 | | | | 21,760,149 | | | | — | | | | (978,476 | ) |
Wheat | | | (284) | | | | Mar-24 | | | | 8,917,600 | | | | 8,373,794 | | | | — | | | | (543,806 | ) |
Zinc (a) | | | (102) | | | | Mar-24 | | | | 6,791,925 | | | | 6,522,324 | | | | — | | | | (269,601 | ) |
Total Sale Contracts | | | | | | | | | | | | | | | | | | | 952,384 | | | | (13,359,023 | ) |
Total Futures Contracts | | | | | | | | | | | | | | | | | | $ | 6,641,251 | | | $ | (15,980,514 | ) |
Net Unrealized Depreciation | | | | | | | | | | | | | | $ | (9,339,263 | ) |
(a) | London Metal Exchange (‘’LME’’) futures contracts settle on their respective maturity date.The unrealized appreciation on these contracts is a receivable for unsettled open futures contracts and the unrealized depreciation is a payable for unsettled open futures contracts on the Fund’s consolidated statement of assets and liabilities. |
The accompanying notes are an integral part of these consolidated financial statements. | 49 |
LoCorr Dynamic Opportunity Fund - Schedule of Investments |
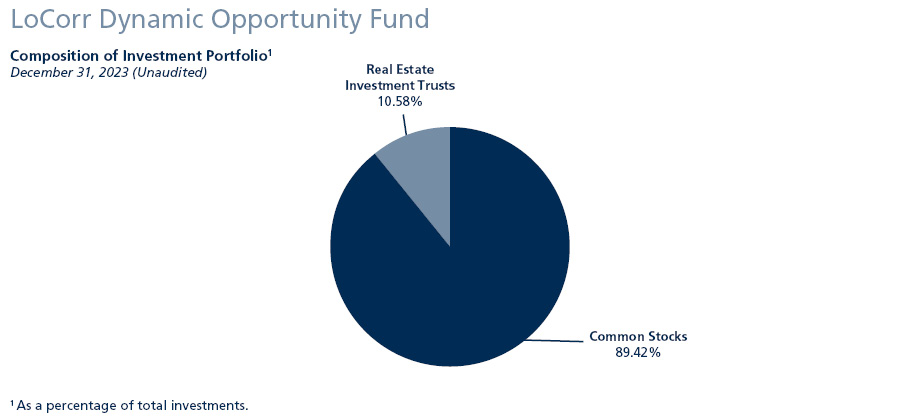
Schedule of Investments
December 31, 2023
| | Shares | | | Value | |
COMMON STOCKS: 55.55% |
Apparel: 0.87% |
Crocs, Inc. (a) | | | 4,347 | | | $ | 406,053 | |
Under Armour, Inc. (a) | | | 15,372 | | | | 135,120 | |
| | | | | | | | 541,173 | |
Auto Manufacturers: 0.53% |
Wabash National Corp. | | | 12,819 | | | | 328,423 | |
| | | | | | | | | |
Auto Parts & Equipment: 2.05% |
Cooper-Standard Holdings, Inc. (a) | | | 21,553 | | | | 421,146 | |
Gentherm, Inc. (a) | | | 7,384 | | | | 386,626 | |
indie Semiconductor, Inc. (a) | | | 58,093 | | | | 471,134 | |
| | | | | | | | 1,278,906 | |
Biotechnology: 0.14% |
NeoGenomics, Inc. (a) | | | 5,547 | | | | 89,751 | |
| | | | | | | | | |
Commercial Services: 5.73% |
Alta Equipment Group, Inc. | | | 13,203 | | | | 163,321 | |
LiveRamp Holdings, Inc. (a) | | | 14,204 | | | | 538,048 | |
Marqeta, Inc. (a) | | | 52,008 | | | | 363,016 | |
Matthews International Corp. | | | 10,510 | | | | 385,191 | |
Progyny, Inc. (a) | | | 14,709 | | | | 546,881 | |
Repay Holdings Corp. (a) | | | 80,240 | | | | 685,250 | |
Square, Inc. (a) | | | 11,630 | | | | 899,581 | |
| | | | | | | | 3,581,288 | |
Computers: 1.77% |
Rapid7, Inc. (a) | | | 6,473 | | | | 369,608 | |
Stratasys Ltd. - ADR (a)(b) | | | 28,877 | | | | 412,364 | |
Varonis Systems, Inc. (a) | | | 7,113 | | | | 322,077 | |
| | | | | | | | 1,104,049 | |
50 | The accompanying notes are an integral part of these financial statements. |
LoCorr Dynamic Opportunity Fund – Schedule of Investments (continued) |
| | Shares | | | Value | |
COMMON STOCKS (continued) |
Distribution & Wholesale: 1.30% |
H&E Equipment Services, Inc. | | | 8,712 | | | $ | 455,812 | |
VSE Corp. | | | 5,471 | | | | 353,481 | |
| | | | | | | | 809,293 | |
Diversified Financial Services: 1.46% |
Encore Capital Group, Inc. (a) | | | 5,259 | | | | 266,894 | |
International Money Express, Inc. (a) | | | 23,965 | | | | 529,387 | |
LendingTree, Inc. (a) | | | 3,911 | | | | 118,582 | |
| | | | | | | | 914,863 | |
Electronics: 3.12% |
Benchmark Electronics, Inc. | | | 12,624 | | | | 348,927 | |
Coherent Corp. (a) | | | 6,776 | | | | 294,959 | |
Enovix Corp. (a) | | | 30,592 | | | | 383,012 | |
Evolv Technologies Holdings, Inc. (a) | | | 93,606 | | | | 441,820 | |
FARO Technologies, Inc. (a) | | | 21,296 | | | | 479,799 | |
| | | | | | | | 1,948,517 | |
Engineering & Construction: 1.84% |
Bowman Consulting Group Ltd. (a) | | | 11,870 | | | | 421,622 | |
Dycom Industries, Inc. (a) | | | 2,654 | | | | 305,449 | |
Fluor Corp. (a) | | | 10,779 | | | | 422,214 | |
| | | | | | | | 1,149,285 | |
Entertainment: 2.71% |
Genius Sports Ltd. - ADR (a)(b) | | | 82,823 | | | | 511,846 | |
Madison Square Garden Entertainment Corp. (a) | | | 26 | | | | 827 | |
TKO Group Holdings, Inc. | | | 10,957 | | | | 893,872 | |
Vail Resorts, Inc. | | | 1,332 | | | | 284,342 | |
| | | | | | | | 1,690,887 | |
Environmental Control: 0.82% |
CECO Environmental Corp. (a) | | | 25,216 | | | | 511,380 | |
| | | | | | | | | |
Food: 0.41% |
Kroger Co. | | | 5,607 | | | | 256,296 | |
| | | | | | | | | |
Healthcare - Products: 5.40% |
Alphatec Holdings, Inc. (a) | | | 24,909 | | | | 376,375 | |
Azenta, Inc. (a) | | | 3,944 | | | | 256,912 | |
BioLife Solutions, Inc. (a) | | | 23,890 | | | | 388,212 | |
Castle Biosciences, Inc. (a) | | | 17,839 | | | | 384,966 | |
Globus Medical, Inc. (a) | | | 8,910 | | | | 474,814 | |
Haemonetics Corp. (a) | | | 3,043 | | | | 260,207 | |
Inspire Medical Systems, Inc. (a) | | | 549 | | | | 111,683 | |
MiMedx Group, Inc. (a) | | | 31,331 | | | | 274,773 | |
Natera, Inc. (a) | | | 4,729 | | | | 296,224 | |
OrthoPediatrics Corp. (a) | | | 8,980 | | | | 291,940 | |
Tactile Systems Technology, Inc. (a) | | | 7,997 | | | | 114,357 | |
TransMedics Group, Inc. (a) | | | 1,845 | | | | 145,626 | |
| | | | | | | | 3,376,089 | |
Healthcare - Services: 1.36% |
Neuronetics, Inc. (a) | | | 164,054 | | | | 475,757 | |
Oscar Health, Inc. (a) | | | 4,598 | | | | 42,071 | |
Viemed Healthcare, Inc. - ADR (a)(b) | | | 42,019 | | | | 329,849 | |
| | | | | | | | 847,677 | |
Home Furnishings: 1.01% |
Arhaus, Inc. (a) | | | 24,914 | | | | 295,231 | |
The accompanying notes are an integral part of these financial statements. | 51 |
LoCorr Dynamic Opportunity Fund – Schedule of Investments (continued) |
| | Shares | | | Value | |
COMMON STOCKS (continued) |
Lovesac Co. (a) | | | 13,123 | | | $ | 335,293 | |
| | | | | | | | 630,524 | |
Housewares: 0.51% |
Scotts Miracle-Gro Co. | | | 4,995 | | | | 318,432 | |
| | | | | | | | | |
Insurance: 0.48% |
Unum Group | | | 6,627 | | | | 299,673 | |
| | | | | | | | | |
Internet: 5.97% |
OptimizeRx Corp. (a) | | | 30,217 | | | | 432,405 | |
Pinterest, Inc. (a) | | | 24,314 | | | | 900,591 | |
Robinhood Markets, Inc. (a) | | | 23,619 | | | | 300,906 | |
Solo Brands, Inc. (a) | | | 23,515 | | | | 144,852 | |
Sprinklr, Inc. (a) | | | 53,745 | | | | 647,090 | |
TripAdvisor, Inc. (a) | | | 28,338 | | | | 610,117 | |
Vivid Seats, Inc. (a) | | | 60,340 | | | | 381,349 | |
Yatra Online, Inc. - ADR (a)(b) | | | 191,660 | | | | 312,406 | |
| | | | | | | | 3,729,716 | |
Machinery - Diversified : 0.35% |
Tennant Co. | | | 2,368 | | | | 219,490 | |
| | | | | | | | | |
Oil & Gas: 0.54% |
DMC Global, Inc. (a) | | | 18,136 | | | | 341,319 | |
| | | | | | | | | |
Retail: 3.25% |
BJ’s Restaurants, Inc. (a) | | | 4,726 | | | | 170,183 | |
Kura Sushi USA, Inc. (a) | | | 4,431 | | | | 336,756 | |
Potbelly Corp. (a) | | | 30,184 | | | | 314,517 | |
RH (a) | | | 3,019 | | | | 879,978 | |
Shake Shack, Inc. (a) | | | 4,424 | | | | 327,907 | |
| | | | | | | | 2,029,341 | |
Semiconductors: 1.39% |
MaxLinear, Inc. (a) | | | 3,332 | | | | 79,202 | |
Semtech Corp. (a) | | | 12,929 | | | | 283,274 | |
SiTime Corp. (a) | | | 946 | | | | 115,488 | |
Synaptics, Inc. (a) | | | 3,444 | | | | 392,891 | |
| | | | | | | | 870,855 | |
Software: 11.10% |
Alteryx, Inc. (a) | | | 12,725 | | | | 600,111 | |
Augmedix, Inc. (a) | | | 45,995 | | | | 269,071 | |
Confluent, Inc. (a) | | | 5,041 | | | | 117,959 | |
Digital Turbine, Inc. (a) | | | 45,932 | | | | 315,094 | |
Elastic NV - ADR (a)(b) | | | 2,702 | | | | 304,515 | |
Everbridge, Inc. (a) | | | 25,703 | | | | 624,840 | |
Five9, Inc. (a) | | | 5,839 | | | | 459,471 | |
Lightspeed Commerce, Inc. - ADR (a)(b) | | | 11,851 | | | | 248,752 | |
MongoDB, Inc. (a) | | | 730 | | | | 298,460 | |
PROS Holdings, Inc. (a) | | | 11,400 | | | | 442,206 | |
Schrodinger, Inc. (a) | | | 10,246 | | | | 366,807 | |
SentinelOne, Inc. (a) | | | 10,889 | | | | 298,794 | |
Unity Software, Inc. (a) | | | 14,618 | | | | 597,730 | |
Zeta Global Holdings Corp. (a) | | | 96,569 | | | | 851,739 | |
Zoom Video Communications, Inc. (a) | | | 12,445 | | | | 894,920 | |
52 | The accompanying notes are an integral part of these financial statements. |
LoCorr Dynamic Opportunity Fund – Schedule of Investments (continued) |
| | Shares | | | Value | |
COMMON STOCKS (continued) |
Zuora, Inc. (a) | | | 26,274 | | | $ | 246,976 | |
| | | | | | | | 6,937,445 | |
Telecommunications: 1.44% |
Applied Digital Corp. (a) | | | 8,212 | | | | 55,349 | |
Aviat Networks, Inc. (a) | | | 11,296 | | | | 368,927 | |
Corning, Inc. | | | 10,020 | | | | 305,109 | |
Powerfleet, Inc. NJ (a) | | | 49,910 | | | | 170,692 | |
| | | | | | | | 900,077 | |
TOTAL COMMON STOCKS (Cost $30,599,636) | | | | | | | 34,704,749 | |
| | | | | | | | | |
REAL ESTATE INVESTMENT TRUSTS: 6.58% |
Alexandria Real Estate Equities, Inc. | | | 4,690 | | | | 594,551 | |
Camden Property Trust | | | 3,350 | | | | 332,622 | |
Essex Property Trust, Inc. | | | 2,409 | | | | 597,287 | |
Healthcare Realty Trust, Inc. | | | 18,850 | | | | 324,786 | |
Kimco Realty Corp. | | | 41,703 | | | | 888,690 | |
Park Hotels & Resorts, Inc. | | | 50,799 | | | | 777,225 | |
SL Green Realty Corp. | | | 13,119 | | | | 592,585 | |
TOTAL REAL ESTATE INVESTMENT TRUSTS (Cost $4,067,160) | | | | | | | 4,107,746 | |
| | | | | | | | | |
TOTAL INVESTMENTS (Cost $34,666,796): 62.13% | | | | | | | 38,812,495 | |
Cash - Interest Bearing Deposit Account: 30.94% (c) | | | | | | | 19,323,996 | |
Other Assets in Excess of Liabilities: 6.93% (d) | | | | | | | 4,325,592 | |
TOTAL NET ASSETS: 100.00% | | | | | | $ | 62,462,083 | |
(a) | Non-dividend income producing security. |
(b) | Foreign issued security. |
(c) | The Money Market Deposit Account (“MMDA”) is a short-term investment vehicle in which the Fund holds cash balances. The MMDA will bear interest at a variable rate that is determined based on market conditions and may change daily and by any amount. |
(d) | Includes assets pledged as collateral for securities sold short and due to broker for derivatives. As of the reporting date, the net value of these assets and liabilities totals $24,660,957. |
ADR American Depositary Reciept
The accompanying notes are an integral part of these financial statements. | 53 |
LoCorr Dynamic Opportunity Fund – Schedule of Securities Sold Short |
LoCorr Dynamic Opportunity Fund
Schedule of Securities Sold Short
December 31, 2023
| | Shares | | | Value | |
COMMON STOCKS: (21.87)% |
Apparel: (0.29)% |
Crocs, Inc. (a) | | | (1,946 | ) | | $ | (181,776 | ) |
| | | | | | | | | |
Banks: (0.88)% |
Goldman Sachs Group, Inc. | | | (1,025 | ) | | | (395,414 | ) |
Pinnacle Financial Partners, Inc. | | | (1,774 | ) | | | (154,728 | ) |
| | | | | | | | (550,142 | ) |
Building Materials: (0.61)% |
Armstrong World Industries, Inc. | | | (1,528 | ) | | | (150,233 | ) |
Modine Manufacturing Co. (a) | | | (3,865 | ) | | | (230,741 | ) |
| | | | | | | | (380,974 | ) |
Commercial Services: (0.35)% |
Cross Country Healthcare, Inc. (a) | | | (6,441 | ) | | | (145,824 | ) |
Marathon Digital Holdings, Inc. (a) | | | (2,997 | ) | | | (70,400 | ) |
| | | | | | | | (216,224 | ) |
Computers: (1.17)% |
Accenture PLC - ADR (b) | | | (675 | ) | | | (236,864 | ) |
Check Point Software Technologies Ltd. - ADR (a)(b) | | | (1,032 | ) | | | (157,679 | ) |
DXC Technology Co. (a) | | | (10,537 | ) | | | (240,981 | ) |
ExlService Holdings, Inc. (a) | | | (3,108 | ) | | | (95,882 | ) |
| | | | | | | | (731,406 | ) |
Cosmetics & Personal Care: (0.26)% |
Estee Lauder Cos., Inc. | | | (1,091 | ) | | | (159,559 | ) |
| | | | | | | | | |
Diversified Financial Services: (0.24)% |
Navient Corp. | | | (8,156 | ) | | | (151,865 | ) |
| | | | | | | | | |
Electronics: (0.46)% |
Advanced Energy Industries, Inc. | | | (1,318 | ) | | | (143,557 | ) |
Knowles Corp. (a) | | | (7,885 | ) | | | (141,220 | ) |
| | | | | | | | (284,777 | ) |
Entertainment: (0.09)% |
Red Rock Resorts, Inc. | | | (1,003 | ) | | | (53,490 | ) |
| | | | | | | | | |
Healthcare - Products: (0.73)% |
Avanos Medical, Inc. (a) | | | (6,568 | ) | | | (147,320 | ) |
Establishment Labs Holdings, Inc. - ADR (a)(b) | | | (3,678 | ) | | | (95,223 | ) |
Shockwave Medical, Inc. (a) | | | (709 | ) | | | (135,107 | ) |
Tandem Diabetes Care, Inc. (a) | | | (2,627 | ) | | | (77,707 | ) |
| | | | | | | | (455,357 | ) |
Home Furnishings: (0.05)% |
Traeger, Inc. (a) | | | (10,337 | ) | | | (28,220 | ) |
| | | | | | | | | |
Internet: (0.80)% |
Criteo SA - ADR (a)(b) | | | (6,306 | ) | | | (159,668 | ) |
fuboTV, Inc. (a) | | | (25,716 | ) | | | (81,777 | ) |
RealReal, Inc. (a) | | | (52,529 | ) | | | (105,583 | ) |
Shutterstock, Inc. | | | (3,216 | ) | | | (155,268 | ) |
| | | | | | | | (502,296 | ) |
54 | The accompanying notes are an integral part of these financial statements. |
LoCorr Dynamic Opportunity Fund – Schedule of Securities Sold Short (continued) |
| | Shares | | | Value | |
COMMON STOCKS (continued) |
Iron & Steel: (0.47)% |
Nucor Corp. | | | (847 | ) | | $ | (147,412 | ) |
Steel Dynamics, Inc. | | | (1,243 | ) | | | (146,798 | ) |
| | | | | | | | (294,210 | ) |
Leisure Time: (1.23)% |
YETI Holdings, Inc. (a) | | | (14,803 | ) | | | (766,499 | ) |
| | | | | | | | | |
Machinery - Diversified: (0.61)% |
Otis Worldwide Corp. | | | (4,262 | ) | | | (381,321 | ) |
| | | | | | | | | |
Mining: (0.24)% |
Freeport-McMoRan, Inc. | | | (3,484 | ) | | | (148,314 | ) |
| | | | | | | | | |
Oil & Gas: (0.11)% |
Weatherford International PLC - ADR (a)(b) | | | (738 | ) | | | (72,199 | ) |
| | | | | | | | | |
Pharmaceuticals: (1.01)% |
Johnson & Johnson | | | (2,478 | ) | | | (388,402 | ) |
Prestige Brands Holdings, Inc. (a) | | | (3,946 | ) | | | (241,574 | ) |
| | | | | | | | (629,976 | ) |
Retail: (2.92)% |
Asbury Automotive Group, Inc. (a) | | | (691 | ) | | | (155,454 | ) |
Carvana Co. (a) | | | (1,577 | ) | | | (83,486 | ) |
Dick’s Sporting Goods, Inc. | | | (1,602 | ) | | | (235,414 | ) |
Dollar General Corp. | | | (1,184 | ) | | | (160,965 | ) |
Dutch Bros, Inc. (a) | | | (6,045 | ) | | | (191,445 | ) |
Group 1 Automotive, Inc. | | | (510 | ) | | | (155,417 | ) |
Texas Roadhouse, Inc. | | | (1,939 | ) | | | (237,004 | ) |
Ulta Beauty, Inc. (a) | | | (919 | ) | | | (450,301 | ) |
Wingstop, Inc. | | | (604 | ) | | | (154,974 | ) |
| | | | | | | | (1,824,460 | ) |
Semiconductors: (3.98)% |
Alpha & Omega Semiconductor Ltd. - ADR (a)(b) | | | (5,254 | ) | | | (136,919 | ) |
Axcelis Technologies, Inc. (a) | | | (1,050 | ) | | | (136,175 | ) |
Microchip Technology, Inc. | | | (3,370 | ) | | | (303,907 | ) |
NVIDIA Corp. | | | (768 | ) | | | (380,329 | ) |
ON Semiconductor Corp. (a) | | | (5,380 | ) | | | (449,391 | ) |
Onto Innovation, Inc. (a) | | | (1,047 | ) | | | (160,086 | ) |
Power Integrations, Inc. | | | (1,569 | ) | | | (128,831 | ) |
QUALCOMM, Inc. | | | (2,719 | ) | | | (393,249 | ) |
Silicon Laboratories, Inc. (a) | | | (1,710 | ) | | | (226,182 | ) |
Wolfspeed, Inc. (a) | | | (3,941 | ) | | | (171,473 | ) |
| | | | | | | | (2,486,542 | ) |
Software: (3.41)% |
Box, Inc. (a) | | | (6,568 | ) | | | (168,206 | ) |
Envestnet, Inc. (a) | | | (2,653 | ) | | | (131,377 | ) |
Fastly, Inc. (a) | | | (3,162 | ) | | | (56,284 | ) |
MicroStrategy, Inc. (a) | | | (259 | ) | | | (163,590 | ) |
Monday.com Ltd. - ADR (a)(b) | | | (1,223 | ) | | | (229,692 | ) |
Oracle Corp. | | | (3,670 | ) | | | (386,928 | ) |
Roblox Corp. (a) | | | (2,351 | ) | | | (107,488 | ) |
Smartsheet, Inc. (a) | | | (4,376 | ) | | | (209,260 | ) |
Snowflake, Inc. (a) | | | (2,262 | ) | | | (450,138 | ) |
SPS Commerce, Inc. (a) | | | (1,183 | ) | | | (229,313 | ) |
| | | | | | | | (2,132,276 | ) |
The accompanying notes are an integral part of these financial statements. | 55 |
LoCorr Dynamic Opportunity Fund – Schedule of Securities Sold Short (continued) |
| | Shares | | | Value | |
COMMON STOCKS (continued) |
Telecommunications: (1.64)% |
Calix, Inc. (a) | | | (5,948 | ) | | $ | (259,868 | ) |
Cisco Systems, Inc. | | | (6,197 | ) | | | (313,071 | ) |
Juniper Networks, Inc. | | | (15,356 | ) | | | (452,695 | ) |
| | | | | | | | (1,025,634 | ) |
Toys, Games, & Hobbies: (0.32)% |
Funko, Inc. (a) | | | (26,155 | ) | | | (202,178 | ) |
TOTAL COMMON STOCKS (Proceeds $13,059,209) | | | | | | | (13,659,695 | ) |
| | | | | | | | | |
EXCHANGE TRADED FUNDS: (3.06)% |
iShares Russell 2000 | | | (1,567 | ) | | | (314,513 | ) |
iShares Russell 2000 Growth ETF | | | (3,232 | ) | | | (815,175 | ) |
iShares U.S. Technology ETF | | | (5,519 | ) | | | (677,457 | ) |
ProShares Ultra Financials | | | (1,929 | ) | | | (106,481 | ) |
TOTAL EXCHANGE TRADED FUNDS (Proceeds $1,763,458) | | | | | | | (1,913,626 | ) |
| | | | | | | | | |
REAL ESTATE INVESTMENT TRUSTS: (1.98)% |
Federal Realty Investment Trust | | | (2,214 | ) | | | (228,153 | ) |
Gaming and Leisure Properties, Inc. | | | (4,824 | ) | | | (238,064 | ) |
Regency Centers Corp. | | | (3,468 | ) | | | (232,356 | ) |
Simon Property Group, Inc. | | | (641 | ) | | | (91,432 | ) |
Vornado Realty Trust | | | (15,754 | ) | | | (445,051 | ) |
TOTAL REAL ESTATE INVESTMENT TRUSTS (Proceeds $1,244,485) | | | | | | | (1,235,056 | ) |
TOTAL SECURITIES SOLD SHORT (Proceeds $16,067,152) (26.91)% | | | | | | $ | (16,808,377 | ) |
| | | | | | | | | |
Percentages are stated as a percent of net assets. |
(a) | Non-dividend expense producing security. |
ADR American Depositary Reciept
PLC Public Limited Company
56 | The accompanying notes are an integral part of these financial statements. |
LoCorr Spectrum Income Fund – Schedule of Investments |
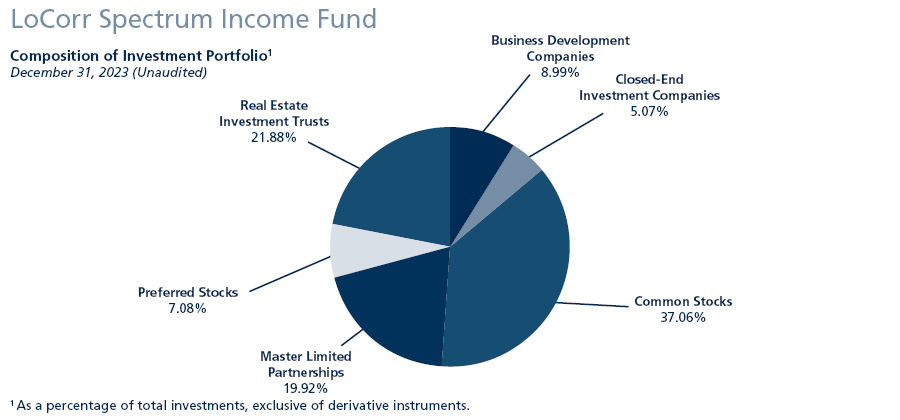
Schedule of Investments
December 31, 2023
| | Shares | | | Value | |
BUSINESS DEVELOPMENT COMPANIES: 8.57% |
Ares Capital Corp. | | | 106,975 | | | $ | 2,142,709 | |
FS KKR Capital Corp. | | | 102,821 | | | | 2,053,335 | |
New Mountain Finance Corp. | | | 74,302 | | | | 945,122 | |
Oaktree Specialty Lending Corp. | | | 108,368 | | | | 2,212,875 | |
TOTAL BUSINESS DEVELOPMENT COMPANIES (Cost $6,877,086) | | | | | | | 7,354,041 | |
| | | | | | | | | |
CLOSED-END INVESTMENT COMPANIES: 4.83% |
Nuveen Credit Strategies Income Fund | | | 228,724 | | | | 1,193,939 | |
Guggenheim Taxable Municipal Bond & Investment Grade Debt Trust | | | 68,107 | | | | 1,102,652 | |
PIMCO Dynamic Income Opportunities Fund | | | 45,657 | | | | 558,842 | |
Sixth Street Specialty Lending, Inc. | | | 59,724 | | | | 1,290,039 | |
TOTAL CLOSED-END INVESTMENT COMPANIES (Cost $4,241,289) | | | | | | | 4,145,472 | |
| | | | | | | | | |
COMMON STOCKS: 35.30% |
Agriculture: 0.95% |
Altria Group, Inc. | | | 20,168 | | | | 813,577 | |
| | | | | | | | | |
Chemicals: 3.33% |
CVR Partners LP | | | 23,704 | | | | 1,552,612 | |
LyondellBasell Industries NV - ADR (a) | | | 13,704 | | | | 1,302,976 | |
| | | | | | | | 2,855,588 | |
Coal: 1.64% |
Arch Resources, Inc. | | | 8,464 | | | | 1,404,516 | |
| | | | | | | | | |
Electric: 2.66% |
Atlantica Yield PLC - ADR (a)(c) | | | 58,209 | | | | 1,251,493 | |
Clearway Energy, Inc. (c) | | | 37,726 | | | | 1,034,824 | |
| | | | | | | | 2,286,317 | |
The accompanying notes are an integral part of these financial statements. | 57 |
LoCorr Spectrum Income Fund – Schedule of Investments (continued) |
| | Shares | | | Value | |
COMMON STOCKS (continued) |
Energy - Alternate Sources: 1.07% |
NextEra Energy Partners LP (c) | | | 30,221 | | | $ | 919,021 | |
| | | | | | | | | |
Insurance: 0.86% |
AMERISAFE, Inc. | | | 15,775 | | | | 737,954 | |
| | | | | | | | | |
Investment Companies: 2.95% |
Blackstone Secured Lending Fund | | | 91,529 | | | | 2,529,862 | |
| | | | | | | | | |
Machinery - Diversified: 2.50% |
AGCO Corp. | | | 17,688 | | | | 2,147,500 | |
| | | | | | | | | |
Mining: 8.55% |
Agnico Eagle Mines Ltd. - ADR (a) | | | 39,689 | | | | 2,176,942 | |
Barrick Gold Corp. - ADR (a)(c) | | | 111,839 | | | | 2,023,168 | |
Newmont Corp. | | | 46,088 | | | | 1,907,582 | |
Rio Tinto PLC - ADR (a) | | | 16,590 | | | | 1,235,291 | |
| | | | | | | | 7,342,983 | |
Oil & Gas: 4.35% |
Chesapeake Energy Corp. (c) | | | 14,695 | | | | 1,130,633 | |
CVR Energy, Inc. | | | 25,028 | | | | 758,348 | |
Sabine Royalty Trust | | | 14,067 | | | | 954,587 | |
Viper Energy, Inc. | | | 28,586 | | | | 897,029 | |
| | | | | | | | 3,740,597 | |
Pipelines: 4.35% |
Antero Midstream Corp. | | | 127,693 | | | | 1,599,993 | |
Hess Midstream LP | | | 37,666 | | | | 1,191,376 | |
Western Midstream Partners LP | | | 32,282 | | | | 944,571 | |
| | | | | | | | 3,735,940 | |
Transportation: 2.09% |
FLEX LNG Ltd. - ADR (a) | | | 33,726 | | | | 980,078 | |
Frontline PLC - ADR (a) | | | 40,550 | | | | 813,028 | |
| | | | | | | | 1,793,106 | |
TOTAL COMMON STOCKS (Cost $30,809,030) | | | | | | | 30,306,961 | |
| | | | | | | | | |
MASTER LIMITED PARTNERSHIPS: 18.98% | | Units | | | | | |
Coal: 0.95% |
Alliance Resource Partners LP | | | 38,332 | | | | 811,872 | |
| | | | | | | | | |
Gas: 1.55% |
Global Partners LP | | | 31,539 | | | | 1,334,415 | |
| | | | | | | | | |
Oil & Gas: 3.65% |
Black Stone Minerals LP | | | 65,674 | | | | 1,048,157 | |
Kimbell Royalty Partners LP | | | 71,163 | | | | 1,071,003 | |
Sunoco LP | | | 16,894 | | | | 1,012,458 | |
| | | | | | | | 3,131,618 | |
Oil & Gas Services: 2.25% |
CrossAmerica Partners LP | | | 51,338 | | | | 1,170,506 | |
USA Compression Partners LP | | | 33,302 | | | | 760,285 | |
| | | | | | | | 1,930,791 | |
58 | The accompanying notes are an integral part of these financial statements. |
LoCorr Spectrum Income Fund – Schedule of Investments (continued) |
| | Units | | | Value | |
MASTER LIMITED PARTNERSHIPS (continued) |
Pipelines: 10.58% |
Cheniere Energy Partners LP | | | 18,619 | | | $ | 927,040 | |
Delek Logistics Partners LP | | | 23,122 | | | | 998,177 | |
Energy Transfer LP (c) | | | 185,343 | | | | 2,557,733 | |
Enterprise Products Partners LP | | | 73,124 | | | | 1,926,817 | |
MPLX LP | | | 43,461 | | | | 1,595,888 | |
NuStar Energy LP | | | 57,756 | | | | 1,078,882 | |
| | | | | | | | 9,084,537 | |
TOTAL MASTER LIMITED PARTNERSHIPS (Cost $13,016,604) | | | | | | | 16,293,233 | |
| | | | | | | | | |
PREFERRED STOCKS: 11.93% | | Shares | | | | | |
Diversified Financial Services: 1.47% |
FTAI Aviation Ltd., 9.000% (a) | | | 50,000 | | | | 1,264,000 | |
| | | | | | | | | |
Insurance: 0.34% |
Lincoln National Corp., 9.000% | | | 10,684 | | | | 291,567 | |
| | | | | | | | | |
Pipelines: 4.93% |
Energy Transfer LP, 9.250% | | | 171,508 | | | | 1,697,929 | |
Energy Transfer LP, 7.375% | | | 45,210 | | | | 1,141,100 | |
NuStar Energy LP, 7.625% | | | 55,789 | | | | 1,395,283 | |
| | | | | | | | 4,234,312 | |
Real Estate Investment Trusts: 5.19% | | | | | | | | |
AGNC Investment Corp., 6.125% | | | 52,443 | | | | 1,141,160 | |
Annaly Capital Management, Inc., 6.500% | | | 47,221 | | | | 1,166,359 | |
Annaly Capital Management, Inc., 6.950% | | | 33,421 | | | | 840,204 | |
Rithm Capital Corp., 7.000% | | | 60,086 | | | | 1,311,076 | |
| | | | | | | | 4,458,799 | |
TOTAL PREFERRED STOCKS (Cost $8,346,848) | | | | | | | 10,248,678 | |
| | | | | | | | | |
REAL ESTATE INVESTMENT TRUSTS: 15.66% |
AGNC Investment Corp. (c) | | | 186,925 | | | | 1,833,734 | |
Annaly Capital Management, Inc. | | | 115,642 | | | | 2,239,986 | |
Apollo Commercial Real Estate Finance, Inc. | | | 67,805 | | | | 796,031 | |
Brandywine Realty Trust | | | 205,581 | | | | 1,110,137 | |
Chimera Investment Corp. | | | 52,329 | | | | 1,226,068 | |
Gaming and Leisure Properties, Inc. | | | 21,669 | | | | 1,069,365 | |
Global Net Lease, Inc. (c) | | | 186,682 | | | | 1,857,486 | |
Hannon Armstrong Sustainable Infrastructure Capital, Inc. | | | 7 | | | | 193 | |
Rithm Capital Corp. | | | 83,092 | | | | 887,423 | |
Sabra Health Care, Inc. | | | 91,322 | | | | 1,303,165 | |
Starwood Property Trust, Inc. | | | 53,076 | | | | 1,115,657 | |
TOTAL REAL ESTATE INVESTMENT TRUSTS (Cost $13,254,496) | | | | | | | 13,439,245 | |
| | | | | | | | | |
TOTAL INVESTMENTS (Cost $76,545,353): 95.27% | | | | | | | 81,787,630 | |
Cash - Interest Bearing Deposit Account: 4.33% (b) | | | | | | | 3,716,162 | |
Other Assets in Excess of Liabilities: 0.40% (d) | | | | | | | 346,609 | |
TOTAL NET ASSETS: 100.00% | | | | | | $ | 85,850,401 | |
(a) | Foreign issued security. |
(b) | The Money Market Deposit Account (“MMDA”) is a short-term investment vehicle in which the Fund holds cash balances. The MMDA will bear interest at a variable rate that is determined based on market conditions and may change daily and by any amount. |
(c) | All or a portion of this security is held as collateral for options written. As of the reporting date, the value of this collateral is $8,302,585. |
(d) | Includes deposits with broker for derivatives. As of the reporting date, the value of these assets total $523,039. |
ADR | American Depositary Receipts |
PLC | Public Limited Company |
The accompanying notes are an integral part of these financial statements. | 59 |
LoCorr Spectrum Income Fund – Schedule of Written Options |
LoCorr Spectrum Income Fund
Schedule of Written Options
December 31, 2023
| | | Notional
Amount | | | Number of
Contracts (a) | | | Value | |
WRITTEN OPTION: (0.06)% | | | | | | | | | | | | |
Call Option: (0.06)% | | | | | | | | | | | | |
Agnico Eagle Mines Ltd. Expiration: January 2024, Exercise Price: $55.00 | | $ | (2,172,060 | ) | | | 396 | | | $ | (55,440 | ) |
TOTAL WRITTEN OPTION (Premiums received $41,176)(0.06)% | | | | | | | | | | $ | (55,440 | ) |
Percentages are stated as a percent of net assets.
(a) | Each contract is equivalent to 100 shares of common stock. |
60 | The accompanying notes are an integral part of these financial statements. |
LoCorr Macro Strategies Fund, LoCorr Long/Short Commodities Strategy Fund and LoCorr Market Trend Fund
Consolidated Statements of Assets & Liabilities |
Consolidated Statements of Assets & Liabilities
December 31, 2023
| | | LoCorr Macro
Strategies Fund | | | LoCorr Long/Short
Commodities
Strategy Fund | | | LoCorr Market
Trend Fund | |
Assets | | | | | | | | | | | | |
Investments, at value (Cost $1,370,039,236, $829,863,038 and $335,518,663, respectively) | | $ | 1,362,924,598 | | | $ | 777,659,098 | | | $ | 334,312,378 | |
Cash held in interest bearing deposit account (Note 2) | | | 33,140,752 | | | | 45,421,282 | | | | 14,336,702 | |
Cash held as collateral for forward currency contracts (Note 2) | | | 32,843,064 | | | | — | | | | 16,060,000 | |
Foreign currency, at value (Cost $0, $0, and $519,642, respectively) | | | — | | | | — | | | | 519,642 | |
Receivable for Fund shares sold | | | 6,501,169 | | | | 2,574,259 | | | | 5,920,024 | |
Interest receivable | | | 3,986,997 | | | | 2,193,792 | | | | 947,000 | |
Receivable for unsettled open futures contracts | | | 1,376,477 | | | | — | | | | 364,098 | |
Deposits with broker for derivative instruments | | | 103,704,044 | | | | — | | | | 43,235,449 | |
Deposits with broker for swap contracts | | | — | | | | 408,002 | | | | — | |
Unrealized appreciation on swap contracts (Note 2) | | | — | | | | 65,219,557 | | | | — | |
Unrealized appreciation on forward currency contracts (Note 2) | | | 13,184,799 | | | | — | | | | 2,218,205 | |
Advance receipt on swap contracts | | | — | | | | 30,708,420 | | | | — | |
Prepaid expenses and other assets | | | 329,298 | | | | 58,391 | | | | 139,748 | |
Total Assets | | | 1,557,991,198 | | | | 924,242,801 | | | | 418,053,246 | |
| | | | | | | | | | | | | |
Liabilities | | | | | | | | | | | | |
Payable for Fund shares redeemed | | $ | 11,681,725 | | | $ | 3,364,689 | | | $ | 3,157,078 | |
Payable for securities purchased | | | 27,250 | | | | — | | | | 6,875 | |
Foreign currency due to broker, at value (Cost $22,683,011, $0, and $0, respectively) | | | 23,362,645 | | | | — | | | | — | |
Unrealized depreciation on forward currency contracts (Note 2) | | | 24,623,351 | | | | — | | | | 9,270,476 | |
Payable for unsettled open futures contracts | | | 2,977,719 | | | | — | | | | 1,726,538 | |
Payable for variation margin on futures contracts | | | 161,982 | | | | — | | | | 903,190 | |
Accrued management fees (Note 5) | | | 2,246,940 | | | | 1,245,605 | | | | 541,024 | |
Accrued Trustees’ fees | | | 49,582 | | | | 32,722 | | | | 13,204 | |
Accrued Rule 12b-1 fees | | | 389,341 | | | | 305,667 | | | | 167,433 | |
Accrued expenses and other liabilities | | | 525,630 | | | | 371,532 | | | | 175,141 | |
Total Liabilities | | | 66,046,165 | | | | 5,320,215 | | | | 15,960,959 | |
| | | | | | | | | | | | | |
Net Assets | | $ | 1,491,945,033 | | | $ | 918,922,586 | | | $ | 402,092,287 | |
| | | | | | | | | | | | | |
Net Assets Consist of: | | | | | | | | | | | | |
Paid-in capital | | $ | 1,747,049,653 | | | $ | 928,932,679 | | | $ | 459,056,860 | |
Total distributable earnings/(accumulated loss) | | | (255,104,620 | ) | | | (10,010,093 | ) | | | (56,964,573 | ) |
NET ASSETS | | $ | 1,491,945,033 | | | $ | 918,922,586 | | | $ | 402,092,287 | |
| | | | | | | | | | | | | |
Class A Shares | | | | | | | | | | | | |
Net assets | | $ | 70,795,400 | | | $ | 103,238,908 | | | $ | 25,345,247 | |
Shares issued and outstanding (unlimited shares authorized, no par value) | | | 9,587,102 | | | | 10,747,372 | | | | 2,328,280 | |
Net asset value, redemption, and minimum offering price per share (a) | | $ | 7.38 | | | $ | 9.61 | | | $ | 10.89 | |
Maximum offering price per share ($7.38/0.9425) ($9.61/0.9425) ($10.89/0.9425) (b) | | $ | 7.83 | | | $ | 10.19 | | | $ | 11.55 | |
| | | | | | | | | | | | | |
Class C Shares | | | | | | | | | | | | |
Net assets | | $ | 33,145,699 | | | $ | 9,368,594 | | | $ | 18,078,668 | |
Shares issued and outstanding (unlimited shares authorized, no par value) | | | 4,768,671 | | | | 1,027,145 | | | | 1,744,359 | |
Net asset value, redemption, and offering price per share (a) | | $ | 6.95 | | | $ | 9.12 | | | $ | 10.36 | |
| | | | | | | | | | | | | |
Class I Shares | | | | | | | | | | | | |
Net assets | | $ | 1,388,003,934 | | | $ | 806,315,084 | | | $ | 358,668,372 | |
Shares issued and outstanding (unlimited shares authorized, no par value) | | | 184,161,780 | | | | 82,626,465 | | | | 32,789,006 | |
Net asset value, redemption, and offering price per share | | $ | 7.54 | | | $ | 9.76 | | | $ | 10.94 | |
(a) | A 1.00% contingent deferred sales charge may apply to redemptions made within twelve months of purchase. The contingent deferred sales charge only applies to Class A share purchases of $1 million or more. |
(b) | On investments of $25,000 or more, the offering price is reduced. |
The accompanying notes are an integral part of these consolidated financial statements. | 61 |
LoCorr Dynamic Opportunity Fund and LoCorr Spectrum Income Fund - Statements of Assets & Liabilities |
Statements of Assets & Liabilities
December 31, 2023
| | | LoCorr Dynamic
Opportunity Fund | | | LoCorr Spectrum
Income Fund | |
Assets | | | | | | | | |
Investments, at value (Cost $34,666,796 and $76,545,353, respectively) | | $ | 38,812,495 | | | $ | 81,787,630 | |
Cash held in interest bearing deposit account (Note 2) | | | 19,323,996 | | | | 3,716,162 | |
Cash held as collateral for securities sold short (Note 2) | | | 3,928,000 | | | | — | |
Deposits with broker for securities sold short (Note 2) | | | 20,763,749 | | | | — | |
Receivable for Fund shares sold | | | 213,214 | | | | 21,620 | |
Receivable for securities sold | | | 5,158,247 | | | | 178,949 | |
Dividends, interest, and other receivables | | | 150,648 | | | | 454,008 | |
Deposits with broker for derivative instruments (Note 2) | | | — | | | | 523,039 | |
Prepaid expenses and other assets | | | 18,533 | | | | 37,977 | |
Total Assets | | | 88,368,882 | | | | 86,719,385 | |
| | | | | | | | | |
Liabilities | | | | | | | | |
Securities sold short, at value (Proceeds $16,067,152 and $0, respectively) | | $ | 16,808,377 | | | $ | — | |
Written options, at value (Premiums received $0 and $41,176, respectively) | | | — | | | | 55,440 | |
Payable for securities purchased | | | 8,315,012 | | | | — | |
Payable for Fund shares redeemed | | | 410,844 | | | | 504,432 | |
Payable for distributions | | | 193,727 | | | | 106,747 | |
Dividends payable | | | 3,711 | | | | 94 | |
Due to broker for options | | | 30,792 | | | | — | |
Accrued management fees (Note 5) | | | 69,765 | | | | 95,538 | |
Accrued Trustees’ fees | | | 1,875 | | | | 2,616 | |
Accrued Rule 12b-1 fees | | | 21,988 | | | | 54,890 | |
Accrued expenses and other liabilities | | | 50,708 | | | | 49,227 | |
Total Liabilities | | | 25,906,799 | | | | 868,984 | |
| | | | | | | | | |
Net Assets | | $ | 62,462,083 | | | $ | 85,850,401 | |
| | | | | | | | | |
Net Assets Consist of: | | | | | | | | |
Paid-in capital | | $ | 64,287,973 | | | $ | 126,865,109 | |
Total distributable earnings/(accumulated loss) | | | (1,825,890 | ) | | | (41,014,708 | ) |
NET ASSETS | | $ | 62,462,083 | | | $ | 85,850,401 | |
| | | | | | | | | |
Class A Shares | | | | | | | | |
Net assets | | $ | 3,556,854 | | | $ | 15,350,439 | |
Shares issued and outstanding (unlimited shares authorized, no par value) | | | 311,202 | | | | 2,852,612 | |
Net asset value, redemption, and minimum offering price per share (a) | | $ | 11.43 | | | $ | 5.38 | |
Maximum offering price per share ($11.43/0.9425) ($5.38/0.9425)(c) | | $ | 12.13 | | | $ | 5.71 | |
| | | | | | | | | |
Class C Shares | | | | | | | | |
Net assets | | $ | 1,914,229 | | | $ | 10,217,760 | |
Shares issued and outstanding (unlimited shares authorized, no par value) | | | 181,513 | | | | 1,873,410 | |
Net asset value, redemption, and offering price per share (a) | | $ | 10.55 | | | $ | 5.45 | (b) |
| | | | | | | | | |
Class I Shares | | | | | | | | |
Net assets | | $ | 56,991,000 | | | $ | 60,282,202 | |
Shares issued and outstanding (unlimited shares authorized, no par value) | | | 4,843,361 | | | | 11,250,168 | |
Net asset value, redemption, and offering price per share | | $ | 11.77 | | | $ | 5.36 | (b) |
(a) | A 1.00% contingent deferred sales charge may apply to redemptions made within twelve months of purchase. The contingent deferred sales charge only applies to Class A share purchases of $1 million or more. |
(b) | Redemptions made within 60 days of purchase may be assessed a redemption fee of 2.00%. |
(c) | On investments of $25,000 or more, the offering price is reduced. |
62 | The accompanying notes are an integral part of these financial statements. |
LoCorr Macro Strategies Fund, LoCorr Long/Short Commodities Strategy Fund and LoCorr Market Trend Fund –
Consolidated Statements of Operations |
Consolidated Statements of Operations
Year Ended December 31, 2023
| | LoCorr Macro
Strategies Fund | | | LoCorr Long/Short
Commodities
Strategy Fund | | | LoCorr Market
Trend Fund | |
Investment Income | | | | | | | | | | | | |
Interest income | | $ | 81,535,740 | | | $ | 41,505,484 | | | $ | 19,427,434 | |
Broker interest income | | | 4,832,260 | | | | 498,722 | | | | 1,236,174 | |
Total Investment Income | | | 86,368,000 | | | | 42,004,206 | | | | 20,663,608 | |
| | | | | | | | | | | | | |
Expenses | | | | | | | | | | | | |
Management fees (Note 5) | | | 33,128,831 | | | | 18,013,657 | | | | 7,493,948 | |
Fund administration fees | | | 574,431 | | | | 407,219 | | | | 216,887 | |
Fund accounting fees | | | 572,669 | | | | 411,004 | | | | 221,498 | |
Trustees’ fees | | | 230,514 | | | | 145,420 | | | | 56,822 | |
Transfer agent fees and expenses | | | 2,601,252 | | | | 1,981,436 | | | | 511,321 | |
Custodian fees | | | 131,806 | | | | 63,076 | | | | 30,276 | |
Registration expenses | | | 155,474 | | | | 138,579 | | | | 84,336 | |
Rule 12b-1 fee - Class A (Note 5) | | | 198,128 | | | | 501,076 | | | | 73,198 | |
Rule 12b-1 fee - Class C (Note 5) | | | 429,432 | | | | 115,182 | | | | 221,133 | |
Legal and audit fees | | | 103,260 | | | | 89,454 | | | | 65,991 | |
Printing and mailing expenses | | | 348,332 | | | | 184,916 | | | | 78,699 | |
Other expenses | | | 8,390 | | | | 8,342 | | | | 4,558 | |
Total Expenses | | | 38,482,519 | | | | 22,059,361 | | | | 9,058,667 | |
Net Investment Income (Loss) | | | 47,885,481 | | | | 19,944,845 | | | | 11,604,941 | |
| | | | | | | | | | | | | |
Realized and Unrealized Gain (Loss) on Investments, Swap Contracts, Forward Currency Contracts, Futures Contracts, Foreign Currency, and Securities Litigation: | | | | | | | | | | | | |
Net realized gain (loss) on: | | | | | | | | | | | | |
Investments | | | (16,465,614 | ) | | | (66,121,235 | ) | | | (3,365,002 | ) |
Swap contracts | | | — | | | | 38,595,277 | | | | — | |
Forward currency contracts | | | (13,001,132 | ) | | | — | | | | (6,637,990 | ) |
Futures contracts | | | (110,917,383 | ) | | | — | | | | (34,013,549 | ) |
Foreign currency transactions | | | 1,725,080 | | | | — | | | | (626,608 | ) |
Securities litigation | | | 10,713 | | | | 2,565 | | | | 18,645 | |
Net change in unrealized appreciation (depreciation) on: | | | | | | | | | | | | |
Investments | | | 27,747,020 | | | | (4,031,158 | ) | | | 6,157,233 | |
Swap contracts | | | — | | | | (32,670,084 | ) | | | — | |
Forward currency contracts | | | (15,500,920 | ) | | | — | | | | (8,027,131 | ) |
Futures contracts | | | (53,967,473 | ) | | | — | | | | (18,723,419 | ) |
Foreign currency translation | | | 952,080 | | | | — | | | | (4 | ) |
Net realized and unrealized gain (loss) | | | (179,417,629 | ) | | | (64,224,635 | ) | | | (65,217,825 | ) |
Net Increase (Decrease) in Net Assets From Operations | | $ | (131,532,148 | ) | | $ | (44,279,790 | ) | | $ | (53,612,884 | ) |
The accompanying notes are an integral part of these consolidated financial statements. | 63 |
LoCorr Dynamic Opportunity Fund and LoCorr Spectrum Income Fund – Statements of Operations |
Statements of Operations
Year Ended December 31, 2023
| | LoCorr Dynamic
Opportunity Fund | | | LoCorr Spectrum
Income Fund | |
Investment Income | | | | | | | | |
Dividend income (a) | | $ | 334,169 | | | $ | 4,926,630 | |
Interest income | | | 1,305,993 | | | | 233,267 | |
Broker interest income | | | 948,495 | | | | 29,143 | |
Total Investment Income | | | 2,588,657 | | | | 5,189,040 | |
| | | | | | | | | |
Expenses | | | | | | | | |
Management fees (Note 5) | | | 1,189,771 | | | | 1,325,058 | |
Fund administration fees | | | 74,877 | | | | 78,771 | |
Fund accounting fees | | | 50,073 | | | | 55,825 | |
Trustees’ fees | | | 9,028 | | | | 11,821 | |
Transfer agent fees and expenses | | | 162,010 | | | | 178,575 | |
Custodian fees | | | 40,325 | | | | 7,798 | |
Registration expenses | | | 45,966 | | | | 56,366 | |
Rule 12b-1 fee - Class A (Note 5) | | | 8,889 | | | | 39,798 | |
Rule 12b-1 fee - Class C (Note 5) | | | 27,189 | | | | 123,664 | |
Legal and audit fees | | | 31,831 | | | | 31,689 | |
Printing and mailing expenses | | | 17,988 | | | | 53,756 | |
Other expenses | | | 3,256 | | | | 3,694 | |
Total expenses before dividend and tax expense | | | 1,661,203 | | | | 1,966,815 | |
Dividend expense on securities sold short (Note 2) | | | 183,028 | | | | — | |
Tax expense | | | 1,504 | | | | — | |
Total expenses before fee (waiver from)/recovery to Adviser | | | 1,845,735 | | | | 1,966,815 | |
Fee waiver from Adviser (Note 5) | | | (50,998 | ) | | | — | |
Fee recovery to Adviser (Note 5) | | | 4,302 | | | | 11,768 | |
Net Expenses | | | 1,799,039 | | | | 1,978,583 | |
Net Investment Income (Loss) | | | 789,618 | | | | 3,210,457 | |
| | | | | | | | | |
Realized and Unrealized Gain (Loss) on Investments, Securities Sold Short, Foreign Currency, Securities Litigation, and Written Options: | | | | | | | | |
Net realized gain (loss) on: | | | | | | | | |
Investments | | | 1,924,164 | | | | (8,994,215 | ) |
Securities sold short | | | (2,916,797 | ) | | | — | |
Foreign currency transactions | | | (20 | ) | | | — | |
Securities litigation | | | 15 | | | | 37,492 | |
Written options | | | — | | | | 1,036,555 | |
Net change in unrealized appreciation (depreciation) on: | | | | | | | | |
Investments | | | 2,080,798 | | | | 5,339,666 | |
Securities sold short | | | (1,210,631 | ) | | | — | |
Written options | | | — | | | | (14,264 | ) |
Net realized and unrealized gain (loss) | | | (122,471 | ) | | | (2,594,766 | ) |
Net Increase (Decrease) in Net Assets From Operations | | $ | 667,147 | | | $ | 615,691 | |
(a) | Net of issuance fees and/or foreign tax withheld of $999 and $41,775, respectively. |
64 | The accompanying notes are an integral part of these financial statements. |
LoCorr Macro Strategies Fund – Consolidated Statements of Changes in Net Assets |
LoCorr Macro Strategies Fund
Consolidated Statements of Changes in Net Assets
| | Year Ended
December 31,
2023 | | | Year Ended
December 31,
2022 | |
Operations | | | | | | | | |
Net investment income (loss) | | $ | 47,885,481 | | | $ | 2,227,233 | |
Net realized gain (loss) on investments, forward currency contracts, futures contracts, foreign currency transactions, and securities litigation | | | (138,648,336 | ) | | | 217,759,436 | |
Net change in unrealized appreciation/depreciation of investments, forward currency contracts, futures contracts and foreign currency translation | | | (40,769,293 | ) | | | 3,548,208 | |
Increase (Decrease) in Net Assets From Operations | | | (131,532,148 | ) | | | 223,534,877 | |
| | | | | | | | | |
Distributions | | | | | | | | |
Class A | | | (2,141,193 | ) | | | (10,262,910 | ) |
Class C | | | (733,380 | ) | | | (6,747,377 | ) |
Class I | | | (46,560,499 | ) | | | (280,869,228 | ) |
Total Distributions | | | (49,435,072 | ) | | | (297,879,515 | ) |
| | | | | | | | | |
Capital Transactions (Note 6) | | | | | | | | |
Proceeds from shares sold | | | 711,007,731 | | | | 1,751,928,516 | |
Reinvestment of distributions | | | 44,704,286 | | | | 280,322,098 | |
Cost of shares redeemed | | | (1,448,508,119 | ) | | | (1,018,222,686 | ) |
Increase (Decrease) in Net Assets From Capital Transactions | | | (692,796,102 | ) | | | 1,014,027,928 | |
| | | | | | | | | |
Total Increase (Decrease) in Net Assets | | | (873,763,322 | ) | | | 939,683,290 | |
| | | | | | | | | |
Net Assets | | | | | | | | |
Beginning of year | | | 2,365,708,355 | | | | 1,426,025,065 | |
End of year | | $ | 1,491,945,033 | | | $ | 2,365,708,355 | |
The accompanying notes are an integral part of these consolidated financial statements. | 65 |
LoCorr Long/Short Commodities Strategy Fund – Consolidated Statements of Changes in Net Assets |
LoCorr Long/Short Commodities Strategy Fund
Consolidated Statements of Changes in Net Assets
| | | Year Ended
December 31,
2023 | | | Year Ended
December 31,
2022 | |
Operations | | | | | | | | |
Net investment income (loss) | | $ | 19,944,845 | | | $ | (2,800,645 | ) |
Net realized gain (loss) on investments, swap contracts and securities litigation | | | (27,523,393 | ) | | | 89,199,277 | |
Net change in unrealized appreciation/depreciation of investments and swap contracts | | | (36,701,242 | ) | | | (26,394,845 | ) |
Increase (Decrease) in Net Assets From Operations | | | (44,279,790 | ) | | | 60,003,787 | |
| | | | | | | | | |
Distributions From: | | | | | | | | |
Earnings: | | | | | | | | |
Class A | | | (3,326,991 | ) | | | (18,366,655 | ) |
Class C | | | (76,672 | ) | | | (1,315,248 | ) |
Class I | | | (16,291,274 | ) | | | (117,287,898 | ) |
Return of capital: | | | | | | | | |
Class A | | | (2,689 | ) | | | — | |
Class C | | | (62 | ) | | | — | |
Class I | | | (13,170 | ) | | | — | |
Total Distributions | | | (19,710,858 | ) | | | (136,969,801 | ) |
| | | | | | | | | |
Capital Transactions (Note 6) | | | | | | | | |
Proceeds from shares sold | | | 429,006,881 | | | | 935,245,962 | |
Reinvestment of distributions | | | 16,343,432 | | | | 109,970,580 | |
Cost of shares redeemed | | | (828,838,252 | ) | | | (500,208,232 | ) |
Increase (Decrease) in Net Assets From Capital Transactions | | | (383,487,939 | ) | | | 545,008,310 | |
| | | | | | | | | |
Total Increase (Decrease) in Net Assets | | | (447,478,587 | ) | | | 468,042,296 | |
| | | | | | | | | |
Net Assets | | | | | | | | |
Beginning of year | | | 1,366,401,173 | | | | 898,358,877 | |
End of year | | $ | 918,922,586 | | | $ | 1,366,401,173 | |
66 | The accompanying notes are an integral part of these consolidated financial statements. |
LoCorr Market Trend Fund – Consolidated Statements of Changes in Net Assets |
LoCorr Market Trend Fund
Consolidated Statements of Changes in Net Assets
| | | Year Ended
December 31,
2023 | | | Year Ended
December 31,
2022 | |
Operations | | | | | | | | |
Net investment income (loss) | | $ | 11,604,941 | | | $ | 533,142 | |
Net realized gain (loss) on investments, forward currency contracts, futures contracts and foreign currency transactions | | | (44,624,504 | ) | | | 80,488,966 | |
Net change in unrealized appreciation/depreciation on investments, forward currency contracts, futures contracts and foreign currency translation | | | (20,593,321 | ) | | | 980,928 | |
Increase (Decrease) in Net Assets From Operations | | | (53,612,884 | ) | | | 82,003,036 | |
| | | | | | | | | |
Distributions | | | | | | | | |
Class A | | | (672,331 | ) | | | (4,313,334 | ) |
Class C | | | (315,089 | ) | | | (2,917,130 | ) |
Class I | | | (9,999,263 | ) | | | (75,091,417 | ) |
Total Distributions | | | (10,986,683 | ) | | | (82,321,881 | ) |
| | | | | | | | | |
Capital Transactions (Note 6) | | | | | | | | |
Proceeds from shares sold | | | 228,914,608 | | | | 557,137,124 | |
Reinvestment of distributions | | | 10,535,522 | | | | 79,164,885 | |
Cost of shares redeemed | | | (277,489,887 | ) | | | (397,692,597 | ) |
Increase (Decrease) in Net Assets From Capital Transactions | | | (38,039,757 | ) | | | 238,609,412 | |
| | | | | | | | | |
Total Increase (Decrease) in Net Assets | | | (102,639,324 | ) | | | 238,290,567 | |
| | | | | | | | | |
Net Assets | | | | | | | | |
Beginning of year | | | 504,731,611 | | | | 266,441,044 | |
End of year | | $ | 402,092,287 | | | $ | 504,731,611 | |
The accompanying notes are an integral part of these consolidated financial statements. | 67 |
LoCorr Dynamic Opportunity Fund – Statements of Changes in Net Assets |
LoCorr Dynamic Opportunity Fund
Statements of Changes in Net Assets
| | | Year Ended
December 31,
2023 | | | Year Ended
December 31,
2022 | |
Operations | | | | | | | | |
Net investment income (loss) | | $ | 789,618 | | | $ | (278,064 | ) |
Net realized gain (loss) on investments, securities sold short, foreign currency transactions and securities litigation | | | (992,638 | ) | | | (2,049,922 | ) |
Net change in unrealized appreciation/depreciation of investments, securities sold short and foreign currency translation | | | 870,167 | | | | 899,331 | |
Increase (Decrease) in Net Assets From Operations | | | 667,147 | | | | (1,428,655 | ) |
| | | | | | | | | |
Distributions | | | | | | | | |
Class A | | | (45,555 | ) | | | (47,218 | ) |
Class C | | | (7,402 | ) | | | (44,543 | ) |
Class I | | | (848,889 | ) | | | (961,093 | ) |
Total Distributions | | | (901,846 | ) | | | (1,052,854 | ) |
| | | | | | | | | |
Capital Transactions (Note 6) | | | | | | | | |
Proceeds from shares sold | | | 59,750,030 | | | | 67,981,118 | |
Reinvestment of distributions | | | 708,119 | | | | 896,687 | |
Cost of shares redeemed | | | (79,795,915 | ) | | | (8,870,439 | ) |
Increase (Decrease) in Net Assets From Capital Transactions | | | (19,337,766 | ) | | | 60,007,366 | |
| | | | | | | | | |
Total Increase (Decrease) in Net Assets | | | (19,572,465 | ) | | | 57,525,857 | |
| | | | | | | | | |
Net Assets | | | | | | | | |
Beginning of year | | | 82,034,548 | | | | 24,508,691 | |
End of year | | $ | 62,462,083 | | | $ | 82,034,548 | |
68 | The accompanying notes are an integral part of these financial statements. |
LoCorr Spectrum Income Fund – Statements of Changes in Net Assets |
LoCorr Spectrum Income Fund | |
Statements of Changes in Net Assets
| | | Year Ended
December 31,
2023 | | | Year Ended
December 31,
2022 | |
Operations | | | | | | | | |
Net investment income (loss) | | $ | 3,210,457 | | | $ | 2,574,857 | |
Net realized gain (loss) on investments, securities litigation and written options | | | (7,920,168 | ) | | | (5,792,599 | ) |
Net change in unrealized appreciation/depreciation of investments and written options | | | 5,325,402 | | | | (9,264,535 | ) |
Increase (Decrease) in Net Assets From Operations | | | 615,691 | | | | (12,482,277 | ) |
| | | | | | | | | |
Distributions From: | | | | | | | | |
Earnings: | | | | | | | | |
Class A | | | (689,340 | ) | | | (393,790 | ) |
Class C | | | (470,397 | ) | | | (395,976 | ) |
Class I | | | (3,275,284 | ) | | | (1,890,981 | ) |
Return of capital: | | | | | | | | |
Class A | | | (657,403 | ) | | | (685,406 | ) |
Class C | | | (448,604 | ) | | | (689,211 | ) |
Class I | | | (3,123,544 | ) | | | (3,291,317 | ) |
Total Distributions | | | (8,664,572 | ) | | | (7,346,681 | ) |
| | | | | | | | | |
Capital Transactions (Note 6) | | | | | | | | |
Proceeds from shares sold | | | 28,206,402 | | | | 88,064,098 | |
Reinvestment of distributions | | | 6,973,051 | | | | 5,849,032 | |
Cost of shares redeemed | | | (57,769,695 | ) | | | (33,428,482 | ) |
Redemption fees | | | 6,188 | | | | 20,548 | |
Increase (Decrease) in Net Assets From Capital Transactions | | | (22,584,054 | ) | | | 60,505,196 | |
| | | | | | | | | |
Total Increase (Decrease) in Net Assets | | | (30,632,935 | ) | | | 40,676,238 | |
| | | | | | | | | |
Net Assets | | | | | | | | |
Beginning of year | | | 116,483,336 | | | | 75,807,098 | |
End of year | | $ | 85,850,401 | | | $ | 116,483,336 | |
The accompanying notes are an integral part of these financial statements. | 69 |
LoCorr Macro Strategies Fund – Consolidated Financial Highlights – Class A |
LoCorr Macro Strategies Fund - Class A
Consolidated Financial Highlights
Selected Data and Ratios (for a share outstanding throughout the year)
| | | Year Ended December 31, | |
| | | 2023 | | | 2022 | | | 2021 | | | 2020 | | | 2019 | |
Per Share | | | | | | | | | | | | | | | | | | | | |
Net asset value, beginning of year | | $ | 8.15 | | | $ | 8.13 | | | $ | 8.53 | | | $ | 8.56 | | | $ | 7.95 | |
| | | | | | | | | | | | | | | | | | | | | |
Income (loss) from investment operations: | | | | | | | | | | | | | | | | | | | | |
Net investment income (loss)(a) | | | 0.17 | | | | (0.01 | ) | | | (0.10 | ) | | | (0.04 | ) | | | 0.02 | |
Net realized and unrealized gain (loss)(b) | | | (0.72 | ) | | | 1.21 | | | | 0.09 | | | | 0.49 | | | | 0.98 | |
Total from Investment Operations | | | (0.55 | ) | | | 1.20 | | | | (0.01 | ) | | | 0.45 | | | | 1.00 | |
| | | | | | | | | | | | | | | | | | | | | |
Distributions From Earnings: | | | | | | | | | | | | | | | | | | | | |
Net investment income | | | (0.22 | ) | | | (0.24 | ) | | | (0.39 | ) | | | (0.39 | ) | | | (0.16 | ) |
Net realized gains | | | — | | | | (0.94 | ) | | | — | | | | (0.09 | ) | | | (0.23 | ) |
Total Distributions | | | (0.22 | ) | | | (1.18 | ) | | | (0.39 | ) | | | (0.48 | ) | | | (0.39 | ) |
| | | | | | | | | | | | | | | | | | | | | |
Net Asset Value, End of Year | | $ | 7.38 | | | $ | 8.15 | | | $ | 8.13 | | | $ | 8.53 | | | $ | 8.56 | |
| | | | | | | | | | | | | | | | | | | | | |
Total Investment Return(c) | | | (6.71 | )% | | | 15.01 | % | | | (0.15 | )% | | | 5.41 | % | | | 12.52 | % |
| | | | | | | | | | | | | | | | | | | | | |
Net Assets, End of Year, in Thousands | | $ | 70,795 | | | $ | 79,936 | | | $ | 84,981 | | | $ | 77,035 | | | $ | 53,320 | |
| | | | | | | | | | | | | | | | | | | | | |
Ratios/Supplemental Data: | | | | | | | | | | | | | | | | | | | | |
Ratio of expenses to average net assets: | | | | | | | | | | | | | | | | | | | | |
Before expense waiver or recovery | | | 2.14 | % | | | 2.13 | % | | | 2.15 | % | | | 2.17 | % | | | 2.16 | % |
After expense waiver or recovery | | | 2.14 | % | | | 2.13 | % | | | 2.15 | % | | | 2.18 | % | | | 2.24 | % |
| | | | | | | | | | | | | | | | | | | | | |
Ratio of net investment income (loss) to average net assets: | | | | | | | | | | | | | | | | | | | | |
Before expense waiver or recovery | | | 2.17 | % | | | (0.11 | )% | | | (1.10 | )% | | | (0.49 | )% | | | 0.32 | % |
After expense waiver or recovery | | | 2.17 | % | | | (0.11 | )% | | | (1.10 | )% | | | (0.50 | )% | | | 0.24 | % |
| | | | | | | | | | | | | | | | | | | | | |
Portfolio turnover rate(d) | | | 74 | % | | | 76 | % | | | 75 | % | | | 56 | % | | | 84 | % |
(a) | Net investment income (loss) per share is based on average shares outstanding. |
(b) | Realized and unrealized gains and losses per share in this caption may be balancing amounts necessary to reconcile the change in net asset value per share for the period, and may not reconcile with the Fund’s statement of operations due to share transactions for the period. |
(c) | Total investment return excludes the effect of applicable sales charges. |
(d) | Portfolio turnover rate is calculated on the basis of the Fund as a whole without distinguishing between classes of shares issued. Consists of long-term investments only; excludes derivative instruments. |
70 | The accompanying notes are an integral part of these consolidated financial statements. |
LoCorr Macro Strategies Fund – Consolidated Financial Highlights – Class C |
LoCorr Macro Strategies Fund - Class C
Consolidated Financial Highlights
Selected Data and Ratios (for a share outstanding throughout the year)
| | | Year Ended December 31, | |
| | | 2023 | | | 2022 | | | 2021 | | | 2020 | | | 2019 | |
Per Share | | | | | | | | | | | | | | | | | | | | |
Net asset value, beginning of year | | $ | 7.67 | | | $ | 7.72 | | | $ | 8.11 | | | $ | 8.15 | | | $ | 7.62 | |
| | | | | | | | | | | | | | | | | | | | | |
Income (loss) from investment operations: | | | | | | | | | | | | | | | | | | | | |
Net investment income (loss)(a) | | | 0.11 | | | | (0.07 | ) | | | (0.15 | ) | | | (0.10 | ) | | | (0.04 | ) |
Net realized and unrealized gain (loss)(b) | | | (0.68 | ) | | | 1.14 | | | | 0.08 | | | | 0.47 | | | | 0.92 | |
Total from Investment Operations | | | (0.57 | ) | | | 1.07 | | | | (0.07 | ) | | | 0.37 | | | | 0.88 | |
| | | | | | | | | | | | | | | | | | | | | |
Distributions From Earnings: | | | | | | | | | | | | | | | | | | | | |
Net investment income | | | (0.15 | ) | | | (0.18 | ) | | | (0.32 | ) | | | (0.32 | ) | | | (0.12 | ) |
Net realized gains | | | — | | | | (0.94 | ) | | | — | | | | (0.09 | ) | | | (0.23 | ) |
Total Distributions | | | (0.15 | ) | | | (1.12 | ) | | | (0.32 | ) | | | (0.41 | ) | | | (0.35 | ) |
| | | | | | | | | | | | | | | | | | | | | |
Net Asset Value, End of Year | | $ | 6.95 | | | $ | 7.67 | | | $ | 7.72 | | | $ | 8.11 | | | $ | 8.15 | |
| | | | | | | | | | | | | | | | | | | | | |
Total Investment Return(c) | | | (7.48 | )% | | | 14.17 | % | | | (0.91 | )% | | | 4.69 | % | | | 11.57 | % |
| | | | | | | | | | | | | | | | | | | | | |
Net Assets, End of Year, in Thousands | | $ | 33,146 | | | $ | 51,327 | | | $ | 34,789 | | | $ | 43,684 | | | $ | 47,205 | |
| | | | | | | | | | | | | | | | | | | | | |
Ratios/Supplemental Data: | | | | | | | | | | | | | | | | | | | | |
Ratio of expenses to average net assets: | | | | | | | | | | | | | | | | | | | | |
Before expense waiver or recovery | | | 2.89 | % | | | 2.88 | % | | | 2.90 | % | | | 2.92 | % | | | 2.91 | % |
After expense waiver or recovery | | | 2.89 | % | | | 2.88 | % | | | 2.90 | % | | | 2.93 | % | | | 2.99 | % |
| | | | | | | | | | | | | | | | | | | | | |
Ratio of net investment income (loss) to average net assets: | | | | | | | | | | | | | | | | | | | | |
Before expense waiver or recovery | | | 1.42 | % | | | (0.86 | )% | | | (1.85 | )% | | | (1.24 | )% | | | (0.43 | )% |
After expense waiver or recovery | | | 1.42 | % | | | (0.86 | )% | | | (1.85 | )% | | | (1.25 | )% | | | (0.51 | )% |
| | | | | | | | | | | | | | | | | | | | | |
Portfolio turnover rate(d) | | | 74 | % | | | 76 | % | | | 75 | % | | | 56 | % | | | 84 | % |
(a) | Net investment income (loss) per share is based on average shares outstanding. |
(b) | Realized and unrealized gains and losses per share in this caption may be balancing amounts necessary to reconcile the change in net asset value per share for the period, and may not reconcile with the Fund’s statement of operations due to share transactions for the period. |
(c) | Total investment return excludes the effect of applicable sales charges. |
(d) | Portfolio turnover rate is calculated on the basis of the Fund as a whole without distinguishing between classes of shares issued. Consists of long-term investments only; excludes derivative instruments. |
The accompanying notes are an integral part of these consolidated financial statements. | 71 |
LoCorr Macro Strategies Fund – Consolidated Financial Highlights – Class I |
LoCorr Macro Strategies Fund - Class I
Consolidated Financial Highlights
Selected Data and Ratios (for a share outstanding throughout the year)
| | | Year Ended December 31, | |
| | | 2023 | | | 2022 | | | 2021 | | | 2020 | | | 2019 | |
Per Share | | | | | | | | | | | | | | | | | | | | |
Net asset value, beginning of year | | $ | 8.31 | | | $ | 8.27 | | | $ | 8.67 | | | $ | 8.69 | | | $ | 8.07 | |
| | | | | | | | | | | | | | | | | | | | | |
Income (loss) from investment operations: | | | | | | | | | | | | | | | | | | | | |
Net investment income (loss)(a) | | | 0.20 | | | | 0.01 | | | | (0.08 | ) | | | (0.02 | ) | | | 0.04 | |
Net realized and unrealized gain (loss)(b) | | | (0.73 | ) | | | 1.23 | | | | 0.09 | | | | 0.50 | | | | 0.99 | |
Total from Investment Operations | | | (0.53 | ) | | | 1.24 | | | | 0.01 | | | | 0.48 | | | | 1.03 | |
| | | | | | | | | | | | | | | | | | | | | |
Distributions From Earnings: | | | | | | | | | | | | | | | | | | | | |
Net investment income | | | (0.24 | ) | | | (0.26 | ) | | | (0.41 | ) | | | (0.41 | ) | | | (0.18 | ) |
Net realized gains | | | — | | | | (0.94 | ) | | | — | | | | (0.09 | ) | | | (0.23 | ) |
Total Distributions | | | (0.24 | ) | | | (1.20 | ) | | | (0.41 | ) | | | (0.50 | ) | | | (0.41 | ) |
| | | | | | | | | | | | | | | | | | | | | |
Net Asset Value, End of Year | | $ | 7.54 | | | $ | 8.31 | | | $ | 8.27 | | | $ | 8.67 | | | $ | 8.69 | |
| | | | | | | | | | | | | | | | | | | | | |
Total Investment Return | | | (6.58 | )% | | | 15.40 | % | | | 0.08 | % | | | 5.70 | % | | | 12.72 | % |
| | | | | | | | | | | | | | | | | | | | | |
Net Assets, End of Year, in Thousands | | $ | 1,388,004 | | | $ | 2,234,445 | | | $ | 1,306,255 | | | $ | 1,063,447 | | | $ | 726,061 | |
| | | | | | | | | | | | | | | | | | | | | |
Ratios/Supplemental Data: | | | | | | | | | | | | | | | | | | | | |
Ratio of expenses to average net assets: | | | | | | | | | | | | | | | | | | | | |
Before expense waiver or recovery | | | 1.89 | % | | | 1.88 | % | | | 1.90 | % | | | 1.92 | % | | | 1.91 | % |
After expense waiver or recovery | | | 1.89 | % | | | 1.88 | % | | | 1.90 | % | | | 1.93 | % | | | 1.99 | % |
| | | | | | | | | | | | | | | | | | | | | |
Ratio of net investment income (loss) to average net assets: | | | | | | | | | | | | | | | | | | | | |
Before expense waiver or recovery | | | 2.42 | % | | | 0.14 | % | | | (0.85 | )% | | | (0.24 | )% | | | 0.57 | % |
After expense waiver or recovery | | | 2.42 | % | | | 0.14 | % | | | (0.85 | )% | | | (0.25 | )% | | | 0.49 | % |
| | | | | | | | | | | | | | | | | | | | | |
Portfolio turnover rate(c) | | | 74 | % | | | 76 | % | | | 75 | % | | | 56 | % | | | 84 | % |
(a) | Net investment income (loss) per share is based on average shares outstanding. |
(b) | Realized and unrealized gains and losses per share in this caption may be balancing amounts necessary to reconcile the change in net asset value per share for the period, and may not reconcile with the Fund’s statement of operations due to share transactions for the period. |
(c) | Portfolio turnover rate is calculated on the basis of the Fund as a whole without distinguishing between classes of shares issued. Consists of long-term investments only; excludes derivative instruments. |
72 | The accompanying notes are an integral part of these consolidated financial statements. |
LoCorr Long/Short Commodities Strategy Fund – Consolidated Financial Highlights – Class A |
LoCorr Long/Short Commodities Strategy Fund - Class A
Consolidated Financial Highlights
Selected Data and Ratios (for a share outstanding throughout the year)
| | | Year Ended December 31, | |
| | | 2023 | | | 2022 | | | 2021 | | | 2020 | | | 2019 | |
Per Share | | | | | | | | | | | | | | | | | | | | |
Net asset value, beginning of year | | $ | 10.10 | | | $ | 10.58 | | | $ | 9.89 | | | $ | 9.26 | | | $ | 9.90 | |
| | | | | | | | | | | | | | | | | | | | | |
Income (loss) from investment operations: | | | | | | | | | | | | | | | | | | | | |
Net investment income (loss)(a) | | | 0.13 | | | | (0.05 | ) | | | (0.14 | ) | | | (0.07 | ) | | | 0.05 | |
Net realized and unrealized gain (loss)(b) | | | (0.46 | ) | | | 0.66 | | | | 1.57 | | | | 0.96 | | | | (0.67 | ) |
Total from Investment Operations | | | (0.33 | ) | | | 0.61 | | | | 1.43 | | | | 0.89 | | | | (0.62 | ) |
| | | | | | | | | | | | | | | | | | | | | |
Distributions From: | | | | | | | | | | | | | | | | | | | | |
Net investment income | | | (0.16 | ) | | | (1.09 | ) | | | (0.74 | ) | | | (0.26 | ) | | | (0.02 | ) |
Net realized gains | | | — | | | | — | | | | — | | | | (0.00 | )(c) | | | — | |
Return of capital | | | (0.00 | )(c) | | | — | | | | — | | | | — | | | | — | |
Total Distributions | | | (0.16 | ) | | | (1.09 | ) | | | (0.74 | ) | | | (0.26 | ) | | | (0.02 | ) |
| | | | | | | | | | | | | | | | | | | | | |
Net Asset Value, End of Year | | $ | 9.61 | | | $ | 10.10 | | | $ | 10.58 | | | $ | 9.89 | | | $ | 9.26 | |
| | | | | | | | | | | | | | | | | | | | | |
Total Investment Return(d) | | | (3.26 | )% | | | 5.84 | % | | | 14.55 | % | | | 9.66 | % | | | (6.24 | )% |
| | | | | | | | | | | | | | | | | | | | | |
Net Assets, End of Year, in Thousands | | $ | 103,239 | | | $ | 187,553 | | | $ | 35,149 | | | $ | 26,546 | | | $ | 45,513 | |
| | | | | | | | | | | | | | | | | | | | | |
Ratios/Supplemental Data:(e) | | | | | | | | | | | | | | | | | | | | |
Ratio of expenses to average net assets: | | | | | | | | | | | | | | | | | | | | |
Before expense waiver or recovery | | | 1.94 | % | | | 2.00 | %(f) | | | 2.08 | %(f) | | | 2.08 | %(f) | | | 2.11 | % |
After expense waiver or recovery | | | 1.94 | % | | | 2.00 | %(f) | | | 2.08 | %(f) | | | 2.08 | %(f) | | | 2.14 | % |
| | | | | | | | | | | | | | | | | | | | | |
Ratio of net investment income (loss) to average net assets: | | | | | | | | | | | | | | | | | | | | |
Before expense waiver or recovery | | | 1.37 | % | | | (0.46 | )%(f) | | | (1.31 | )%(f) | | | (0.65 | )%(f) | | | 0.57 | % |
After expense waiver or recovery | | | 1.37 | % | | | (0.46 | )%(f) | | | (1.31 | )%(f) | | | (0.65 | )%(f) | | | 0.54 | % |
| | | | | | | | | | | | | | | | | | | | | |
Portfolio turnover rate(g) | | | 64 | % | | | 90 | % | | | 66 | % | | | 60 | % | | | 103 | % |
(a) | Net investment income (loss) per share is based on average shares outstanding. |
(b) | Realized and unrealized gains and losses per share in this caption may be balancing amounts necessary to reconcile the change in net asset value per share for the period, and may not reconcile with the Fund’s statement of operations due to share transactions for the period. |
(c) | Amount represents less than $0.005 per share. |
(d) | Total investment return excludes the effect of applicable sales charges. |
(e) | Ratios do not include the income and expenses of the CTAs included in the swap nor the commodity pool in which the Fund invests. |
(f) | Includes 0.07%, 0.08% and 0.02% service fees paid for options for the years ended December 31, 2022, December 31, 2021 and December 31, 2020, respectively. |
(g) | Portfolio turnover rate is calculated on the basis of the Fund as a whole without distinguishing between classes of shares issued. Consists of long-term investments only; excludes derivative instruments. |
The accompanying notes are an integral part of these consolidated financial statements. | 73 |
LoCorr Long/Short Commodities Strategy Fund – Consolidated Financial Highlights – Class C |
LoCorr Long/Short Commodities Strategy Fund - Class C
Consolidated Financial Highlights
Selected Data and Ratios (for a share outstanding throughout the year)
| | | Year Ended December 31, | |
| | | 2023 | | | 2022 | | | 2021 | | | 2020 | | | 2019 | |
Per Share | | | | | | | | | | | | | | | | | | | | |
Net asset value, beginning of year | | $ | 9.58 | | | $ | 10.08 | | | $ | 9.47 | | | $ | 8.89 | | | $ | 9.55 | |
| | | | | | | | | | | | | | | | | | | | | |
Income (loss) from investment operations: | | | | | | | | | | | | | | | | | | | | |
Net investment income (loss)(a) | | | 0.06 | | | | (0.13 | ) | | | (0.21 | ) | | | (0.13 | ) | | | (0.02 | ) |
Net realized and unrealized gain (loss)(b) | | | (0.45 | ) | | | 0.63 | | | | 1.50 | | | | 0.91 | | | | (0.64 | ) |
Total from Investment Operations | | | (0.39 | ) | | | 0.50 | | | | 1.29 | | | | 0.78 | | | | (0.66 | ) |
| | | | | | | | | | | | | | | | | | | | | |
Distributions From: | | | | | | | | | | | | | | | | | | | | |
Net investment income | | | (0.07 | ) | | | (1.00 | ) | | | (0.68 | ) | | | (0.20 | ) | | | (0.00 | )(c) |
Net realized gains | | | — | | | | — | | | | — | | | | (0.00 | )(c) | | | — | |
Return of capital | | | (0.00 | )(c) | | | — | | | | — | | | | — | | | | — | |
Total Distributions | | | (0.07 | ) | | | (1.00 | ) | | | (0.68 | ) | | | (0.20 | ) | | | (0.00 | ) |
| | | | | | | | | | | | | | | | | | | | | |
Net Asset Value, End of Year | | $ | 9.12 | | | $ | 9.58 | | | $ | 10.08 | | | $ | 9.47 | | | $ | 8.89 | |
| | | | | | | | | | | | | | | | | | | | | |
Total Investment Return(d) | | | (4.03 | )% | | | 5.03 | % | | | 13.66 | % | | | 8.83 | % | | | (6.90 | )% |
| | | | | | | | | | | | | | | | | | | | | |
Net Assets, End of Year, in Thousands | | $ | 9,369 | | | $ | 13,384 | | | $ | 11,058 | | | $ | 7,938 | | | $ | 6,645 | |
| | | | | | | | | | | | | | | | | | | | | |
Ratios/Supplemental Data:(e) | | | | | | | | | | | | | | | | | | | | |
Ratio of expenses to average net assets: | | | | | | | | | | | | | | | | | | | | |
Before expense waiver or recovery | | | 2.69 | % | | | 2.75 | %(f) | | | 2.83 | %(f) | | | 2.83 | %(f) | | | 2.86 | % |
After expense waiver or recovery | | | 2.69 | % | | | 2.75 | %(f) | | | 2.83 | %(f) | | | 2.83 | %(f) | | | 2.89 | % |
| | | | | | | | | | | | | | | | | | | | | |
Ratio of net investment income (loss) to average net assets: | | | | | | | | | | | | | | | | | | | | |
Before expense waiver or recovery | | | 0.62 | % | | | (1.21 | )%(f) | | | (2.06 | )%(f) | | | (1.40 | )%(f) | | | (0.18 | )% |
After expense waiver or recovery | | | 0.62 | % | | | (1.21 | )%(f) | | | (2.06 | )%(f) | | | (1.40 | )%(f) | | | (0.21 | )% |
| | | | | | | | | | | | | | | | | | | | | |
Portfolio turnover rate(g) | | | 64 | % | | | 90 | % | | | 66 | % | | | 60 | % | | | 103 | % |
(a) | Net investment income (loss) per share is based on average shares outstanding. |
(b) | Realized and unrealized gains and losses per share in this caption may be balancing amounts necessary to reconcile the change in net asset value per share for the period, and may not reconcile with the Fund’s statement of operations due to share transactions for the period. |
(c) | Amount represents less than $0.005 per share. |
(d) | Total investment return excludes the effect of applicable sales charges. |
(e) | Ratios do not include the income and expenses of the CTAs included in the swap nor the commodity pool in which the Fund invests. |
(f) | Includes 0.07%, 0.08% and 0.02% service fees paid for options for the years ended December 31, 2022, December 31, 2021 and December 31, 2020, respectively. |
(g) | Portfolio turnover rate is calculated on the basis of the Fund as a whole without distinguishing between classes of shares issued. Consists of long-term investments only; excludes derivative instruments. |
74 | The accompanying notes are an integral part of these consolidated financial statements. |
LoCorr Long/Short Commodities Strategy Fund – Consolidated Financial Highlights – Class I |
LoCorr Long/Short Commodities Strategy Fund - Class I
Consolidated Financial Highlights
Selected Data and Ratios (for a share outstanding throughout the year)
| | | Year Ended December 31, | |
| | | 2023 | | | 2022 | | | 2021 | | | 2020 | | | 2019 | |
Per Share | | | | | | | | | | | | | | | | | | | | |
Net asset value, beginning of year | | $ | 10.26 | | | $ | 10.72 | | | $ | 10.00 | | | $ | 9.38 | | | $ | 10.03 | |
| | | | | | | | | | | | | | | | | | | | | |
Income (loss) from investment operations: | | | | | | | | | | | | | | | | | | | | |
Net investment income (loss)(a) | | | 0.16 | | | | (0.02 | ) | | | (0.11 | ) | | | (0.04 | ) | | | 0.08 | |
Net realized and unrealized gain (loss)(b) | | | (0.48 | ) | | | 0.66 | | | | 1.59 | | | | 0.95 | | | | (0.68 | ) |
Total from Investment Operations | | | (0.32 | ) | | | 0.64 | | | | 1.48 | | | | 0.91 | | | | (0.60 | ) |
| | | | | | | | | | | | | | | | | | | | | |
Distributions From: | | | | | | | | | | | | | | | | | | | | |
Net investment income | | | (0.18 | ) | | | (1.10 | ) | | | (0.76 | ) | | | (0.29 | ) | | | (0.05 | ) |
Net realized gains | | | — | | | | — | | | | — | | | | (0.00 | )(c) | | | — | |
Return of capital | | | (0.00 | )(c) | | | — | | | | — | | | | — | | | | — | |
Total Distributions | | | (0.18 | ) | | | (1.10 | ) | | | (0.76 | ) | | | (0.29 | ) | | | (0.05 | ) |
| | | | | | | | | | | | | | | | | | | | | |
Net Asset Value, End of Year | | $ | 9.76 | | | $ | 10.26 | | | $ | 10.72 | | | $ | 10.00 | | | $ | 9.38 | |
| | | | | | | | | | | | | | | | | | | | | |
Total Investment Return | | | (3.07 | )% | | | 6.06 | % | | | 14.82 | % | | | 9.91 | % | | | (5.97 | )% |
| | | | | | | | | | | | | | | | | | | | | |
Net Assets, End of Year, in Thousands | | $ | 806,315 | | | $ | 1,165,464 | | | $ | 852,152 | | | $ | 443,351 | | | $ | 203,887 | |
| | | | | | | | | | | | | | | | | | | | | |
Ratios/Supplemental Data:(d) | | | | | | | | | | | | | | | | | | | | |
Ratio of expenses to average net assets: | | | | | | | | | | | | | | | | | | | | |
Before expense waiver or recovery | | | 1.69 | % | | | 1.75 | %(e) | | | 1.83 | %(e) | | | 1.83 | %(e) | | | 1.86 | % |
After expense waiver or recovery | | | 1.69 | % | | | 1.75 | %(e) | | | 1.83 | %(e) | | | 1.83 | %(e) | | | 1.89 | % |
| | | | | | | | | | | | | | | | | | | | | |
Ratio of net investment income (loss) to average net assets: | | | | | | | | | | | | | | | | | | | | |
Before expense waiver or recovery | | | 1.62 | % | | | (0.21 | )%(e) | | | (1.06 | )%(e) | | | (0.40 | )%(e) | | | 0.82 | % |
After expense waiver or recovery | | | 1.62 | % | | | (0.21 | )%(e) | | | (1.06 | )%(e) | | | (0.40 | )%(e) | | | 0.79 | % |
| | | | | | | | | | | | | | | | | | | | | |
Portfolio turnover rate(f) | | | 64 | % | | | 90 | % | | | 66 | % | | | 60 | % | | | 103 | % |
(a) | Net investment income (loss) per share is based on average shares outstanding. |
(b) | Realized and unrealized gains and losses per share in this caption may be balancing amounts necessary to reconcile the change in net asset value per share for the period, and may not reconcile with the Fund’s statement of operations due to share transactions for the period. |
(c) | Amount represents less than $0.005 per share. |
(d) | Ratios do not include the income and expenses of the CTAs included in the swap nor the commodity pool in which the Fund invests. |
(e) | Includes 0.07%, 0.08% and 0.02% service fees paid for options for the years ended December 31, 2022, December 31, 2021 and December 31, 2020, respectively. |
(f) | Portfolio turnover rate is calculated on the basis of the Fund as a whole without distinguishing between classes of shares issued. Consists of long-term investments only; excludes derivative instruments. |
The accompanying notes are an integral part of these consolidated financial statements. | 75 |
LoCorr Market Trend Fund – Consolidated Financial Highlights – Class A |
LoCorr Market Trend Fund - Class A
Consolidated Financial Highlights
Selected Data and Ratios (for a share outstanding throughout the year)
| | | Year Ended December 31, | |
| | | 2023 | | | 2022 | | | 2021 | | | 2020 | | | 2019 | |
Per Share | | | | | | | | | | | | | | | | | | | | |
Net asset value, beginning of year | | $ | 12.55 | | | $ | 11.41 | | | $ | 11.70 | | | $ | 11.19 | | | $ | 9.52 | |
| | | | | | | | | | | | | | | | | | | | | |
Income (loss) from investment operations: | | | | | | | | | | | | | | | | | | | | |
Net investment income (loss)(a) | | | 0.26 | | | | (0.01 | ) | | | (0.13 | ) | | | (0.06 | ) | | | 0.01 | |
Net realized and unrealized gain (loss)(b) | | | (1.65 | ) | | | 3.34 | | | | 0.22 | | | | 0.57 | | | | 1.74 | |
Total from Investment Operations | | | (1.39 | ) | | | 3.33 | | | | 0.09 | | | | 0.51 | | | | 1.75 | |
| | | | | | | | | | | | | | | | | | | | | |
Distributions From Earnings: | | | | | | | | | | | | | | | | | | | | |
Net investment income | | | (0.27 | ) | | | (0.53 | ) | | | (0.38 | ) | | | — | | | | (0.08 | ) |
Net realized gains | | | — | | | | (1.66 | ) | | | — | | | | — | | | | — | |
Total Distributions | | | (0.27 | ) | | | (2.19 | ) | | | (0.38 | ) | | | — | | | | (0.08 | ) |
| | | | | | | | | | | | | | | | | | | | | |
Net Asset Value, End of Year | | $ | 10.89 | | | $ | 12.55 | | | $ | 11.41 | | | $ | 11.70 | | | $ | 11.19 | |
| | | | | | | | | | | | | | | | | | | | | |
Total Investment Return(c) | | | (11.18 | )% | | | 29.59 | % | | | 0.87 | % | | | 4.47 | % | | | 18.33 | % |
| | | | | | | | | | | | | | | | | | | | | |
Net Assets, End of Year, in Thousands | | $ | 25,345 | | | $ | 27,903 | | | $ | 15,109 | | | $ | 16,952 | | | $ | 21,966 | |
| | | | | | | | | | | | | | | | | | | | | |
Ratios/Supplemental Data: | | | | | | | | | | | | | | | | | | | | |
Ratio of expenses to average net assets: | | | 2.00 | % | | | 2.00 | % | | | 2.02 | % | | | 2.04 | % | | | 2.02 | % |
| | | | | | | | | | | | | | | | | | | | | |
Ratio of net investment income (loss) to average net assets: | | | 2.13 | % | | | (0.10 | )% | | | (1.10 | )% | | | (0.52 | )% | | | 0.14 | % |
| | | | | | | | | | | | | | | | | | | | | |
Portfolio turnover rate(d) | | | 77 | % | | | 100 | % | | | 110 | % | | | 125 | % | | | 119 | % |
(a) | Net investment income (loss) per share is based on average shares outstanding. |
(b) | Realized and unrealized gains and losses per share in this caption may be balancing amounts necessary to reconcile the change in net asset value per share for the period, and may not reconcile with the Fund’s statement of operations due to share transactions for the period. |
(c) | Total investment return excludes the effect of applicable sales charges. |
(d) | Portfolio turnover rate is calculated on the basis of the Fund as a whole without distinguishing between classes of shares issued. Consists of long-term investments only; excludes derivative instruments. |
76 | The accompanying notes are an integral part of these consolidated financial statements. |
LoCorr Market Trend Fund - Consolidated Financial Highlights – Class C |
LoCorr Market Trend Fund - Class C
Consolidated Financial Highlights
Selected Data and Ratios (for a share outstanding throughout the year)
| | | Year Ended December 31, | |
| | | 2023 | | | 2022 | | | 2021 | | | 2020 | | | 2019 | |
Per Share | | | | | | | | | | | | | | | | | | | | |
Net asset value, beginning of year | | $ | 11.95 | | | $ | 11.02 | | | $ | 11.30 | | | $ | 10.89 | | | $ | 9.28 | |
| | | | | | | | | | | | | | | | | | | | | |
Income (loss) from investment operations: | | | | | | | | | | | | | | | | | | | | |
Net investment income (loss)(a) | | | 0.16 | | | | (0.12 | ) | | | (0.22 | ) | | | (0.13 | ) | | | (0.06 | ) |
Net realized and unrealized gain (loss)(b) | | | (1.57 | ) | | | 3.23 | | | | 0.23 | | | | 0.54 | | | | 1.67 | |
Total from Investment Operations | | | (1.41 | ) | | | 3.11 | | | | 0.01 | | | | 0.41 | | | | 1.61 | |
| | | | | | | | | | | | | | | | | | | | | |
Distributions From Earnings: | | | | | | | | | | | | | | | | | | | | |
Net investment income | | | (0.18 | ) | | | (0.52 | ) | | | (0.29 | ) | | | — | | | | — | |
Net realized gains | | | — | | | | (1.66 | ) | | | — | | | | — | | | | — | |
Total Distributions | | | (0.18 | ) | | | (2.18 | ) | | | (0.29 | ) | | | — | | | | — | |
| | | | | | | | | | | | | | | | | | | | | |
Net Asset Value, End of Year | | $ | 10.36 | | | $ | 11.95 | | | $ | 11.02 | | | $ | 11.30 | | | $ | 10.89 | |
| | | | | | | | | | | | | | | | | | | | | |
Total Investment Return(c) | | | (11.90 | )% | | | 28.67 | % | | | 0.05 | % | | | 3.76 | % | | | 17.35 | % |
| | | | | | | | | | | | | | | | | | | | | |
Net Assets, End of Year, in Thousands | | $ | 18,079 | | | $ | 19,569 | | | $ | 10,825 | | | $ | 13,170 | | | $ | 16,320 | |
| | | | | | | | | | | | | | | | | | | | | |
Ratios/Supplemental Data: | | | | | | | | | | | | | | | | | | | | |
Ratio of expenses to average net assets: | | | 2.75 | % | | | 2.75 | % | | | 2.77 | % | | | 2.79 | % | | | 2.77 | % |
| | | | | | | | | | | | | | | | | | | | | |
Ratio of net investment income (loss) to average net assets: | | | 1.38 | % | | | (0.85 | )% | | | (1.85 | )% | | | (1.27 | )% | | | (0.61 | )% |
| | | | | | | | | | | | | | | | | | | | | |
Portfolio turnover rate(d) | | | 77 | % | | | 100 | % | | | 110 | % | | | 125 | % | | | 119 | % |
(a) | Net investment income (loss) per share is based on average shares outstanding. |
(b) | Realized and unrealized gains and losses per share in this caption may be balancing amounts necessary to reconcile the change in net asset value per share for the period, and may not reconcile with the Fund’s statement of operations due to share transactions for the period. |
(c) | Total investment return excludes the effect of applicable sales charges. |
(d) | Portfolio turnover rate is calculated on the basis of the Fund as a whole without distinguishing between classes of shares issued. Consists of long-term investments only; excludes derivative instruments. |
The accompanying notes are an integral part of these consolidated financial statements. | 77 |
LoCorr Market Trend Fund - Consolidated Financial Highlights – Class I |
LoCorr Market Trend Fund - Class I
Consolidated Financial Highlights
Selected Data and Ratios (for a share outstanding throughout the year)
| | | Year Ended December 31, | |
| | | 2023 | | | 2022 | | | 2021 | | | 2020 | | | 2019 | |
Per Share | | | | | | | | | | | | | | | | | | | | |
Net asset value, beginning of year | | $ | 12.61 | | | $ | 11.45 | | | $ | 11.74 | | | $ | 11.23 | | | $ | 9.60 | |
| | | | | | | | | | | | | | | | | | | | | |
Income (loss) from investment operations: | | | | | | | | | | | | | | | | | | | | |
Net investment income (loss)(a) | | | 0.30 | | | | 0.02 | | | | (0.10 | ) | | | (0.03 | ) | | | 0.04 | |
Net realized and unrealized gain (loss)(b) | | | (1.67 | ) | | | 3.36 | | | | 0.22 | | | | 0.57 | | | | 1.74 | |
Total from Investment Operations | | | (1.37 | ) | | | 3.38 | | | | 0.12 | | | | 0.54 | | | | 1.78 | |
| | | | | | | | | | | | | | | | | | | | | |
Distributions From Earnings: | | | | | | | | | | | | | | | | | | | | |
Net investment income | | | (0.30 | ) | | | (0.56 | ) | | | (0.41 | ) | | | (0.03 | ) | | | (0.15 | ) |
Net realized gains | | | — | | | | (1.66 | ) | | | — | | | | — | | | | — | |
Total Distributions | | | (0.30 | ) | | | (2.22 | ) | | | (0.41 | ) | | | (0.03 | ) | | | (0.15 | ) |
| | | | | | | | | | | | | | | | | | | | | |
Net Asset Value, End of Year | | $ | 10.94 | | | $ | 12.61 | | | $ | 11.45 | | | $ | 11.74 | | | $ | 11.23 | |
| | | | | | | | | | | | | | | | | | | | | |
Total Investment Return | | | (10.98 | )% | | | 29.94 | % | | | 1.04 | % | | | 4.81 | % | | | 18.53 | % |
| | | | | | | | | | | | | | | | | | | | | |
Net Assets, End of Year, in Thousands | | $ | 358,668 | | | $ | 457,260 | | | $ | 240,507 | | | $ | 225,995 | | | $ | 234,919 | |
| | | | | | | | | | | | | | | | | | | | | |
Ratios/Supplemental Data: | | | | | | | | | | | | | | | | | | | | |
Ratio of expenses to average net assets: | | | 1.75 | % | | | 1.75 | % | | | 1.77 | % | | | 1.79 | % | | | 1.77 | % |
| | | | | | | | | | | | | | | | | | | | | |
Ratio of net investment income (loss) to average net assets: | | | 2.38 | % | | | 0.15 | % | | | (0.85 | )% | | | (0.27 | )% | | | 0.39 | % |
| | | | | | | | | | | | | | | | | | | | | |
Portfolio turnover rate(c) | | | 77 | % | | | 100 | % | | | 110 | % | | | 125 | % | | | 119 | % |
(a) | Net investment income (loss) per share is based on average shares outstanding. |
(b) | Realized and unrealized gains and losses per share in this caption may be balancing amounts necessary to reconcile the change in net asset value per share for the period, and may not reconcile with the Fund’s statement of operations due to share transactions for the period. |
(c) | Portfolio turnover rate is calculated on the basis of the Fund as a whole without distinguishing between classes of shares issued. Consists of long-term investments only; excludes derivative instruments. |
78 | The accompanying notes are an integral part of these consolidated financial statements. |
LoCorr Dynamic Opportunity Fund - Financial Highlights – Class A |
LoCorr Dynamic Opportunity Fund - Class A
Financial Highlights
Selected Data and Ratios (for a share outstanding throughout the year)
| | | Year Ended December 31, | |
| | | 2023 | | | 2022 | | | 2021 | | | 2020 | | | 2019 | |
Per Share | | | | | | | | | | | | | | | | | | | | |
Net asset value, beginning of year | | $ | 11.22 | | | $ | 12.46 | | | $ | 11.62 | | | $ | 11.20 | | | $ | 9.92 | |
| | | | | | | | | | | | | | | | | | | | | |
Income (loss) from investment operations: | | | | | | | | | | | | | | | | | | | | |
Net investment income (loss)(a) | | | 0.09 | | | | (0.09 | ) | | | (0.23 | ) | | | (0.20 | ) | | | (0.19 | ) |
Net realized and unrealized gain (loss)(b) | | | 0.27 | | | | (1.00 | ) | | | 1.85 | | | | 0.62 | | | | 1.51 | |
Total from Investment Operations | | | 0.36 | | | | (1.09 | ) | | | 1.62 | | | | 0.42 | | | | 1.32 | |
| | | | | | | | | | | | | | | | | | | | | |
Distributions From Earnings: | | | | | | | | | | | | | | | | | | | | |
Net investment income | | | (0.11 | ) | | | — | | | | — | | | | — | | | | — | |
Net realized gains | | | (0.04 | ) | | | (0.15 | ) | | | (0.78 | ) | | | — | | | | (0.04 | ) |
Total Distributions | | | (0.15 | ) | | | (0.15 | ) | | | (0.78 | ) | | | — | | | | (0.04 | ) |
| | | | | | | | | | | | | | | | | | | | | |
Net Asset Value, End of Year | | $ | 11.43 | | | $ | 11.22 | | | $ | 12.46 | | | $ | 11.62 | | | $ | 11.20 | |
| | | | | | | | | | | | | | | | | | | | | |
Total Investment Return(c) | | | 3.19 | % | | | (9.18 | )% | | | 14.38 | % | | | 3.75 | % | | | 13.40 | % |
| | | | | | | | | | | | | | | | | | | | | |
Net Assets, End of Year, in Thousands | | $ | 3,557 | | | $ | 3,534 | | | $ | 4,010 | | | $ | 3,828 | | | $ | 6,744 | |
| | | | | | | | | | | | | | | | | | | | | |
Ratios/Supplemental Data: | | | | | | | | | | | | | | | | | | | | |
Ratio of expenses to average net assets: | | | | | | | | | | | | | | | | | | | | |
Before expense waiver or recovery | | | 2.53 | % | | | 2.82 | % | | | 3.90 | % | | | 4.51 | % | | | 3.73 | % |
After expense waiver or recovery | | | 2.47 | % | | | 2.51 | % | | | 2.67 | % | | | 3.15 | % | | | 3.02 | % |
| | | | | | | | | | | | | | | | | | | | | |
Ratio of expenses to average net assets (excluding dividend, interest, and tax expense): | | | | | | | | | | | | | | | | | | | | |
Before expense waiver or recovery | | | 2.30 | % | | | 2.55 | % | | | 3.47 | % | | | 3.60 | % | | | 2.95 | % |
After expense waiver or recovery | | | 2.24 | % | | | 2.24 | % | | | 2.24 | % | | | 2.24 | % | | | 2.24 | % |
| | | | | | | | | | | | | | | | | | | | | |
Ratio of net investment income (loss) to average net assets: | | | | | | | | | | | | | | | | | | | | |
Before expense waiver or recovery | | | 0.73 | % | | | (1.08 | )% | | | (3.02 | )% | | | (3.31 | )% | | | (2.44 | )% |
After expense waiver or recovery | | | 0.79 | % | | | (0.77 | )% | | | (1.79 | )% | | | (1.95 | )% | | | (1.73 | )% |
| | | | | | | | | | | | | | | | | | | | | |
Portfolio turnover rate(d) | | | 932 | % | | | 686 | % | | | 506 | % | | | 953 | % | | | 300 | % |
(a) | Net investment income (loss) per share is based on average shares outstanding. |
(b) | Realized and unrealized gains and losses per share in this caption may be balancing amounts necessary to reconcile the change in net asset value per share for the period, and may not reconcile with the Fund’s statement of operations due to share transactions for the period. |
(c) | Total investment return excludes the effect of applicable sales charges. |
(d) | Portfolio turnover rate is calculated on the basis of the Fund as a whole without distinguishing between classes of shares issued. Consists of long-term investments only; excludes securities sold short. |
The accompanying notes are an integral part of these financial statements. | 79 |
LoCorr Dynamic Opportunity Fund - Financial Highlights – Class C |
LoCorr Dynamic Opportunity Fund - Class C
Financial Highlights
Selected Data and Ratios (for a share outstanding throughout the year)
| | | Year Ended December 31, | |
| | | 2023 | | | 2022 | | | 2021 | | | 2020 | | | 2019 | |
Per Share | | | | | | | | | | | | | | | | | | | | |
Net asset value, beginning of year | | $ | 10.33 | | | $ | 11.58 | | | $ | 10.93 | | | $ | 10.62 | | | $ | 9.47 | |
| | | | | | | | | | | | | | | | | | | | | |
Income (loss) from investment operations: | | | | | | | | | | | | | | | | | | | | |
Net investment income (loss)(a) | | | 0.00 | (c) | | | (0.16 | ) | | | (0.31 | ) | | | (0.26 | ) | | | (0.26 | ) |
Net realized and unrealized gain (loss)(b) | | | 0.26 | | | | (0.94 | ) | | | 1.74 | | | | 0.57 | | | | 1.45 | |
Total from Investment Operations | | | 0.26 | | | | (1.10 | ) | | | 1.43 | | | | 0.31 | | | | 1.19 | |
| | | | | | | | | | | | | | | | | | | | | |
Distributions From Earnings: | | | | | | | | | | | | | | | | | | | | |
Net investment income | | | — | | | | — | | | | — | | | | — | | | | — | |
Net realized gains | | | (0.04 | ) | | | (0.15 | ) | | | (0.78 | ) | | | — | | | | (0.04 | ) |
Total Distributions | | | (0.04 | ) | | | (0.15 | ) | | | (0.78 | ) | | | — | | | | (0.04 | ) |
| | | | | | | | | | | | | | | | | | | | | |
Net Asset Value, End of Year | | $ | 10.55 | | | $ | 10.33 | | | $ | 11.58 | | | $ | 10.93 | | | $ | 10.62 | |
| | | | | | | | | | | | | | | | | | | | | |
Total Investment Return(d) | | | 2.43 | % | | | (9.80 | )% | | | 13.46 | % | | | 2.92 | % | | | 12.54 | % |
| | | | | | | | | | | | | | | | | | | | | |
Net Assets, End of Year, in Thousands | | $ | 1,914 | | | $ | 3,086 | | | $ | 2,786 | | | $ | 2,436 | | | $ | 4,031 | |
| | | | | | | | | | | | | | | | | | | | | |
Ratios/Supplemental Data: | | | | | | | | | | | | | | | | | | | | |
Ratio of expenses to average net assets: | | | | | | | | | | | | | | | | | | | | |
Before expense waiver or recovery | | | 3.28 | % | | | 3.57 | % | | | 4.65 | % | | | 5.26 | % | | | 4.48 | % |
After expense waiver or recovery | | | 3.22 | % | | | 3.26 | % | | | 3.42 | % | | | 3.90 | % | | | 3.77 | % |
| | | | | | | | | | | | | | | | | | | | | |
Ratio of expenses to average net assets (excluding dividend, interest, and tax expense): | | | | | | | | | | | | | | | | | | | | |
Before expense waiver or recovery | | | 3.05 | % | | | 2.30 | % | | | 4.22 | % | | | 4.35 | % | | | 3.70 | % |
After expense waiver or recovery | | | 2.99 | % | | | 2.99 | % | | | 2.99 | % | | | 2.99 | % | | | 2.99 | % |
| | | | | | | | | | | | | | | | | | | | | |
Ratio of net investment income (loss) to average net assets: | | | | | | | | | | | | | | | | | | | | |
Before expense waiver or recovery | | | (0.02 | )% | | | (1.83 | )% | | | (3.77 | )% | | | (4.06 | )% | | | (3.19 | )% |
After expense waiver or recovery | | | 0.04 | % | | | (1.52 | )% | | | (2.54 | )% | | | (2.70 | )% | | | (2.48 | )% |
| | | | | | | | | | | | | | | | | | | | | |
Portfolio turnover rate(e) | | | 932 | % | | | 686 | % | | | 506 | % | | | 953 | % | | | 300 | % |
(a) | Net investment income (loss) per share is based on average shares outstanding. |
(b) | Realized and unrealized gains and losses per share in this caption may be balancing amounts necessary to reconcile the change in net asset value per share for the period, and may not reconcile with the Fund’s statement of operations due to share transactions for the period. |
(c) | Amount represents less than $0.005 per share. |
(d) | Total investment return excludes the effect of applicable sales charges. |
(e) | Portfolio turnover rate is calculated on the basis of the Fund as a whole without distinguishing between classes of shares issued. Consists of long-term investments only; excludes securities sold short. |
80 | The accompanying notes are an integral part of these financial statements. |
LoCorr Dynamic Opportunity Fund - Financial Highlights – Class I |
LoCorr Dynamic Opportunity Fund - Class I
Financial Highlights
Selected Data and Ratios (for a share outstanding throughout the year)
| | | Year Ended December 31, | |
| | | 2023 | | | 2022 | | | 2021 | | | 2020 | | | 2019 | |
Per Share | | | | | | | | | | | | | | | | | | | | |
Net asset value, beginning of year | | $ | 11.54 | | | $ | 12.77 | | | $ | 11.86 | | | $ | 11.41 | | | $ | 10.07 | |
| | | | | | | | | | | | | | | | | | | | | |
Income (loss) from investment operations: | | | | | | | | | | | | | | | | | | | | |
Net investment income (loss)(a) | | | 0.12 | | | | (0.06 | ) | | | (0.20 | ) | | | (0.17 | ) | | | (0.17 | ) |
Net realized and unrealized gain (loss)(b) | | | 0.29 | | | | (1.02 | ) | | | 1.89 | | | | 0.62 | | | | 1.55 | |
Total from Investment Operations | | | 0.41 | | | | (1.08 | ) | | | 1.69 | | | | 0.45 | | | | 1.38 | |
| | | | | | | | | | | | | | | | | | | | | |
Distributions From Earnings: | | | | | | | | | | | | | | | | | | | | |
Net investment income | | | (0.14 | ) | | | — | | | | — | | | | — | | | | — | |
Net realized gains | | | (0.04 | ) | | | (0.15 | ) | | | (0.78 | ) | | | — | | | | (0.04 | ) |
Total Distributions | | | (0.18 | ) | | | (0.15 | ) | | | (0.78 | ) | | | — | | | | (0.04 | ) |
| | | | | | | | | | | | | | | | | | | | | |
Net Asset Value, End of Year | | $ | 11.77 | | | $ | 11.54 | | | $ | 12.77 | | | $ | 11.86 | | | $ | 11.41 | |
| | | | | | | | | | | | | | | | | | | | | |
Total Investment Return | | | 3.44 | % | | | (8.80 | )% | | | 14.58 | % | | | 4.03 | % | | | 13.68 | % |
| | | | | | | | | | | | | | | | | | | | | |
Net Assets, End of Year, in Thousands | | $ | 56,991 | | | $ | 75,415 | | | $ | 17,713 | | | $ | 11,809 | | | $ | 16,923 | |
| | | | | | | | | | | | | | | | | | | | | |
Ratios/Supplemental Data: | | | | | | | | | | | | | | | | | | | | |
Ratio of expenses to average net assets: | | | | | | | | | | | | | | | | | | | | |
Before expense waiver or recovery | | | 2.28 | % | | | 2.57 | % | | | 3.65 | % | | | 4.26 | % | | | 3.48 | % |
After expense waiver or recovery | | | 2.22 | % | | | 2.26 | % | | | 2.42 | % | | | 2.90 | % | | | 2.77 | % |
| | | | | | | | | | | | | | | | | | | | | |
Ratio of expenses to average net assets (excluding dividend, interest, and tax expense): | | | | | | | | | | | | | | | | | | | | |
Before expense waiver or recovery | | | 2.05 | % | | | 2.30 | % | | | 3.22 | % | | | 3.35 | % | | | 2.70 | % |
After expense waiver or recovery | | | 1.99 | % | | | 1.99 | % | | | 1.99 | % | | | 1.99 | % | | | 1.99 | % |
| | | | | | | | | | | | | | | | | | | | | |
Ratio of net investment income (loss) to average net assets: | | | | | | | | | | | | | | | | | | | | |
Before expense waiver or recovery | | | 0.98 | % | | | (0.83 | )% | | | (2.77 | )% | | | (3.06 | )% | | | (2.19 | )% |
After expense waiver or recovery | | | 1.04 | % | | | (0.52 | )% | | | (1.54 | )% | | | (1.70 | )% | | | (1.48 | )% |
| | | | | | | | | | | | | | | | | | | | | |
Portfolio turnover rate(c) | | | 932 | % | | | 686 | % | | | 506 | % | | | 953 | % | | | 300 | % |
(a) | Net investment income (loss) per share is based on average shares outstanding. |
(b) | Realized and unrealized gains and losses per share in this caption may be balancing amounts necessary to reconcile the change in net asset value per share for the period, and may not reconcile with the Fund’s statement of operations due to share transactions for the period. |
(c) | Portfolio turnover rate is calculated on the basis of the Fund as a whole without distinguishing between classes of shares issued. Consists of long-term investments only; excludes securities sold short. |
The accompanying notes are an integral part of these financial statements. | 81 |
LoCorr Spectrum Income Fund – Financial Highlights – Class A |
LoCorr Spectrum Income Fund - Class A
Financial Highlights
Selected Data and Ratios (for a share outstanding throughout the year)
| | | Year Ended December 31, | |
| | | 2023 | | | 2022 | | | 2021 | | | 2020 | | | 2019 | |
Per Share | | | | | | | | | | | | | | | | | | | | |
Net asset value, beginning of year | | $ | 5.76 | | | $ | 6.98 | | | $ | 6.15 | | | $ | 6.89 | | | $ | 6.26 | |
| | | | | | | | | | | | | | | | | | | | | |
Income (loss) from investment operations: | | | | | | | | | | | | | | | | | | | | |
Net investment income (loss)(a) | | | 0.17 | | | | 0.17 | | | | 0.08 | | | | 0.12 | | | | 0.13 | |
Net realized and unrealized gain (loss)(b) | | | (0.09 | ) | | | (0.93 | ) | | | 1.21 | | | | (0.40 | ) | | | 1.00 | |
Total from Investment Operations | | | 0.08 | | | | (0.76 | ) | | | 1.29 | | | | (0.28 | ) | | | 1.13 | |
| | | | | | | | | | | | | | | | | | | | | |
Distributions From: | | | | | | | | | | | | | | | | | | | | |
Net investment income | | | (0.24 | ) | | | (0.17 | ) | | | (0.28 | ) | | | (0.18 | ) | | | (0.12 | ) |
Return of capital | | | (0.22 | ) | | | (0.29 | ) | | | (0.18 | ) | | | (0.28 | ) | | | (0.38 | ) |
Total Distributions | | | (0.46 | ) | | | (0.46 | ) | | | (0.46 | ) | | | (0.46 | ) | | | (0.50 | ) |
| | | | | | | | | | | | | | | | | | | | | |
Redemption Fees (c) | | | 0.00 | | | | 0.00 | | | | 0.00 | | | | 0.00 | | | | 0.00 | |
| | | | | | | | | | | | | | | | | | | | | |
Net Asset Value, End of Year | | $ | 5.38 | | | $ | 5.76 | | | $ | 6.98 | | | $ | 6.15 | | | $ | 6.89 | |
| | | | | | | | | | | | | | | | | | | | | |
Total Investment Return(d) | | | 1.70 | % | | | (11.31 | )% | | | 21.33 | % | | | (2.75 | )% | | | 18.37 | % |
| | | | | | | | | | | | | | | | | | | | | |
Net Assets, End of Year, in Thousands | | $ | 15,350 | | | $ | 15,696 | | | $ | 13,838 | | | $ | 13,635 | | | $ | 25,192 | |
| | | | | | | | | | | | | | | | | | | | | |
Ratios/Supplemental Data:(e) | | | | | | | | | | | | | | | | | | | | |
Ratio of expenses to average net assets: | | | | | | | | | | | | | | | | | | | | |
Before expense waiver or recovery | | | 2.02 | % | | | 2.02 | % | | | 2.06 | % | | | 2.19 | % | | | 2.02 | % |
After expense waiver or recovery | | | 2.03 | % | | | 2.09 | % | | | 2.05 | % | | | 2.06 | % | | | 2.02 | % |
| | | | | | | | | | | | | | | | | | | | | |
Ratio of expenses to average net assets (excluding dividend and interest expense): | | | | | | | | | | | | | | | | | | | | |
Before expense waiver or recovery | | | 2.02 | % | | | 1.98 | % | | | 2.06 | % | | | 2.18 | % | | | 2.02 | % |
After expense waiver or recovery | | | 2.03 | % | | | 2.05 | % | | | 2.05 | % | | | 2.04 | % | | | 2.02 | % |
| | | | | | | | | | | | | | | | | | | | | |
Ratio of net investment income (loss) to average net assets: | | | | | | | | | | | | | | | | | | | | |
Before expense waiver or recovery | | | 3.07 | % | | | 2.63 | % | | | 1.21 | % | | | 1.93 | % | | | 1.94 | % |
After expense waiver or recovery | | | 3.06 | % | | | 2.56 | % | | | 1.22 | % | | | 2.07 | % | | | 1.94 | % |
| | | | | | | | | | | | | | | | | | | | | |
Portfolio turnover rate(f) | | | 38 | % | | | 50 | % | | | 53 | % | | | 88 | % | | | 75 | % |
(a) | Net investment income (loss) per share is based on average shares outstanding. |
(b) | Realized and unrealized gains and losses per share in this caption may be balancing amounts necessary to reconcile the change in net asset value per share for the period, and may not reconcile with the Fund’s statement of operations due to share transactions for the period. |
(c) | Amount represents less than $0.005 per share. |
(d) | Total investment return excludes the effect of applicable sales charges. |
(e) | Ratios do not include the income and expenses of the investment companies in which the Fund invests. |
(f) | Portfolio turnover rate is calculated on the basis of the Fund as a whole without distinguishing between classes of shares issued. |
82 | The accompanying notes are an integral part of these financial statements. |
LoCorr Spectrum Income Fund – Financial Highlights – Class C |
LoCorr Spectrum Income Fund - Class C
Financial Highlights
Selected Data and Ratios (for a share outstanding throughout the year)
| | | Year Ended December 31, | |
| | | 2023 | | | 2022 | | | 2021 | | | 2020 | | | 2019 | |
Per Share | | | | | | | | | | | | | | | | | | | | |
Net asset value, beginning of year | | $ | 5.83 | | | $ | 7.05 | | | $ | 6.21 | | | $ | 6.96 | | | $ | 6.31 | |
| | | | | | | | | | | | | | | | | | | | | |
Income (loss) from investment operations: | | | | | | | | | | | | | | | | | | | | |
Net investment income (loss)(a) | | | 0.13 | | | | 0.12 | | | | 0.03 | | | | 0.07 | | | | 0.08 | |
Net realized and unrealized gain (loss)(b) | | | (0.09 | ) | | | (0.92 | ) | | | 1.23 | | | | (0.40 | ) | | | 1.01 | |
Total from Investment Operations | | | 0.04 | | | | (0.80 | ) | | | 1.26 | | | | (0.33 | ) | | | 1.09 | |
| | | | | | | | | | | | | | | | | | | | | |
Distributions From: | | | | | | | | | | | | | | | | | | | | |
Net investment income | | | (0.21 | ) | | | (0.15 | ) | | | (0.26 | ) | | | (0.17 | ) | | | (0.10 | ) |
Return of capital | | | (0.21 | ) | | | (0.27 | ) | | | (0.16 | ) | | | (0.25 | ) | | | (0.34 | ) |
Total Distributions | | | (0.42 | ) | | | (0.42 | ) | | | (0.42 | ) | | | (0.42 | ) | | | (0.44 | ) |
| | | | | | | | | | | | | | | | | | | | | |
Redemption Fees (c) | | | 0.00 | | | | 0.00 | | | | 0.00 | | | | 0.00 | | | | 0.00 | |
| | | | | | | | | | | | | | | | | | | | | |
Net Asset Value, End of Year | | $ | 5.45 | | | $ | 5.83 | | | $ | 7.05 | | | $ | 6.21 | | | $ | 6.96 | |
| | | | | | | | | | | | | | | | | | | | | |
Total Investment Return(d) | | | 0.82 | % | | | (11.83 | )% | | | 20.47 | % | | | (3.70 | )% | | | 17.59 | % |
| | | | | | | | | | | | | | | | | | | | | |
Net Assets, End of Year, in Thousands | | $ | 10,218 | | | $ | 14,617 | | | $ | 17,777 | | | $ | 13,295 | | | $ | 18,645 | |
| | | | | | | | | | | | | | | | | | | | | |
Ratios/Supplemental Data:(e) | | | | | | | | | | | | | | | | | | | | |
Ratio of expenses to average net assets: | | | | | | | | | | | | | | | | | | | | |
Before expense waiver or recovery | | | 2.77 | % | | | 2.77 | % | | | 2.81 | % | | | 2.94 | % | | | 2.77 | % |
After expense waiver or recovery | | | 2.78 | % | | | 2.84 | % | | | 2.80 | % | | | 2.81 | % | | | 2.77 | % |
| | | | | | | | | | | | | | | | | | | | | |
Ratio of expenses to average net assets (excluding dividend and interest expense): | | | | | | | | | | | | | | | | | | | | |
Before expense waiver or recovery | | | 2.77 | % | | | 2.73 | % | | | 2.81 | % | | | 2.93 | % | | | 2.77 | % |
After expense waiver or recovery | | | 2.78 | % | | | 2.80 | % | | | 2.80 | % | | | 2.79 | % | | | 2.77 | % |
| | | | | | | | | | | | | | | | | | | | | |
Ratio of net investment income (loss) to average net assets: | | | | | | | | | | | | | | | | | | | | |
Before expense waiver or recovery | | | 2.32 | % | | | 1.88 | % | | | 0.46 | % | | | 1.18 | % | | | 1.19 | % |
After expense waiver or recovery | | | 2.31 | % | | | 1.81 | % | | | 0.47 | % | | | 1.32 | % | | | 1.19 | % |
| | | | | | | | | | | | | | | | | | | | | |
Portfolio turnover rate(f) | | | 38 | % | | | 50 | % | | | 53 | % | | | 88 | % | | | 75 | % |
(a) | Net investment income (loss) per share is based on average shares outstanding. |
(b) | Realized and unrealized gains and losses per share in this caption may be balancing amounts necessary to reconcile the change in net asset value per share for the period, and may not reconcile with the Fund’s statement of operations due to share transactions for the period. |
(c) | Amount represents less than $0.005 per share. |
(d) | Total investment return excludes the effect of applicable sales charges. |
(e) | Ratios do not include the income and expenses of the investment companies in which the Fund invests. |
(f) | Portfolio turnover rate is calculated on the basis of the Fund as a whole without distinguishing between classes of shares issued. |
The accompanying notes are an integral part of these financial statements. | 83 |
LoCorr Spectrum Income Fund - Financial Highlights – Class I |
LoCorr Spectrum Income Fund - Class I
Financial Highlights
Selected Data and Ratios (for a share outstanding throughout the year)
| | | Year Ended December 31, | |
| | | 2023 | | | 2022 | | | 2021 | | | 2020 | | | 2019 | |
Per Share | | | | | | | | | | | | | | | | | | | | |
Net asset value, beginning of year | | $ | 5.74 | | | $ | 6.95 | | | $ | 6.13 | | | $ | 6.88 | | | $ | 6.25 | |
| | | | | | | | | | | | | | | | | | | | | |
Income (loss) from investment operations: | | | | | | | | | | | | | | | | | | | | |
Net investment income (loss)(a) | | | 0.18 | | | | 0.18 | | | | 0.10 | | | | 0.13 | | | | 0.15 | |
Net realized and unrealized gain (loss)(b) | | | (0.08 | ) | | | (0.91 | ) | | | 1.20 | | | | (0.40 | ) | | | 1.00 | |
Total from Investment Operations | | | 0.10 | | | | (0.73 | ) | | | 1.30 | | | | (0.27 | ) | | | 1.15 | |
| | | | | | | | | | | | | | | | | | | | | |
Distributions From: | | | | | | | | | | | | | | | | | | | | |
Net investment income | | | (0.25 | ) | | | (0.18 | ) | | | (0.29 | ) | | | (0.19 | ) | | | (0.12 | ) |
Return of capital | | | (0.23 | ) | | | (0.30 | ) | | | (0.19 | ) | | | (0.29 | ) | | | (0.40 | ) |
Total Distributions | | | (0.48 | ) | | | (0.48 | ) | | | (0.48 | ) | | | (0.48 | ) | | | (0.52 | ) |
| | | | | | | | | | | | | | | | | | | | | |
Redemption Fees (c) | | | 0.00 | | | | 0.00 | | | | 0.00 | | | | 0.00 | | | | 0.00 | |
| | | | | | | | | | | | | | | | | | | | | |
Net Asset Value, End of Year | | $ | 5.36 | | | $ | 5.74 | | | $ | 6.95 | | | $ | 6.13 | | | $ | 6.88 | |
| | | | | | | | | | | | | | | | | | | | | |
Total Investment Return | | | 2.02 | % | | | (10.99 | )% | | | 21.53 | % | | | (2.60 | )% | | | 18.74 | % |
| | | | | | | | | | | | | | | | | | | | | |
Net Assets, End of Year, in Thousands | | $ | 60,282 | | | $ | 86,170 | | | $ | 44,192 | | | $ | 21,215 | | | $ | 30,049 | |
| | | | | | | | | | | | | | | | | | | | | |
Ratios/Supplemental Data:(d) | | | | | | | | | | | | | | | | | | | | |
Ratio of expenses to average net assets: | | | | | | | | | | | | | | | | | | | | |
Before expense waiver or recovery | | | 1.77 | % | | | 1.77 | % | | | 1.81 | % | | | 1.94 | % | | | 1.77 | % |
After expense waiver or recovery | | | 1.78 | % | | | 1.84 | % | | | 1.80 | % | | | 1.81 | % | | | 1.77 | % |
| | | | | | | | | | | | | | | | | | | | | |
Ratio of expenses to average net assets (excluding dividend and interest expense): | | | | | | | | | | | | | | | | | | | | |
Before expense waiver or recovery | | | 1.77 | % | | | 1.73 | % | | | 1.81 | % | | | 1.93 | % | | | 1.77 | % |
After expense waiver or recovery | | | 1.78 | % | | | 1.80 | % | | | 1.80 | % | | | 1.79 | % | | | 1.77 | % |
| | | | | | | | | | | | | | | | | | | | | |
Ratio of net investment income (loss) to average net assets: | | | | | | | | | | | | | | | | | | | | |
Before expense waiver or recovery | | | 3.32 | % | | | 2.88 | % | | | 1.46 | % | | | 2.18 | % | | | 2.19 | % |
After expense waiver or recovery | | | 3.31 | % | | | 2.81 | % | | | 1.47 | % | | | 2.32 | % | | | 2.19 | % |
| | | | | | | | | | | | | | | | | | | | | |
Portfolio turnover rate(e) | | | 38 | % | | | 50 | % | | | 53 | % | | | 88 | % | | | 75 | % |
(a) | Net investment income (loss) per share is based on average shares outstanding. |
(b) | Realized and unrealized gains and losses per share in this caption may be balancing amounts necessary to reconcile the change in net asset value per share for the period, and may not reconcile with the Fund’s statement of operations due to share transactions for the period. |
(c) | Amount represents less than $0.005 per share. |
(d) | Ratios do not include the income and expenses of the investment companies in which the Fund invests. |
(e) | Portfolio turnover rate is calculated on the basis of the Fund as a whole without distinguishing between classes of shares issued. |
84 | The accompanying notes are an integral part of these financial statements. |
LoCorr Macro Strategies Fund, LoCorr Long/Short Commodities Strategy Fund and LoCorr Market Trend Fund – Notes to Consolidated Financial
Statements / LoCorr Dynamic Opportunity Fund and LoCorr Spectrum Income Fund – Notes to Financial Statements |
LoCorr Investment Trust
Notes
December 31, 2023
LoCorr Investment Trust (the “Trust”), an Ohio business trust, was formed on November 15, 2010 and is an open-end management investment company registered under the Investment Company Act of 1940, as amended (“1940 Act”). Each fund is an investment company and accordingly follows the investment company accounting and reporting guidance of the Financial Accounting Standards Board (“FASB”) Accounting Standards Codification (“ASC”) Topic 946, Financial Services- Investment Companies. The LoCorr Macro Strategies Fund, LoCorr Long/Short Commodities Strategy Fund, LoCorr Market Trend Fund, LoCorr Dynamic Opportunity Fund and the LoCorr Spectrum Income Fund (individually a “Fund” and collectively the “Funds”) are series within the Trust. The Funds are each diversified funds.
The LoCorr Macro Strategies Fund’s primary investment objective is capital appreciation in rising and falling equity markets with managing volatility as a secondary objective.
The LoCorr Long/Short Commodities Strategy Fund’s primary investment objective is capital appreciation in rising and falling commodities markets with managing volatility as a secondary objective.
The LoCorr Market Trend Fund’s primary investment objective is capital appreciation in rising and falling equity markets with managing volatility as a secondary objective.
The LoCorr Dynamic Opportunity Fund’s primary investment objective is long-term capital appreciation with reduced volatility compared to traditional broad-based equity market indices as a secondary objective.
The LoCorr Spectrum Income Fund’s primary investment objective is current income with capital appreciation as a secondary objective.
Wholly-owned and Controlled Subsidiaries
In order to achieve their investment objectives, the LoCorr Macro Strategies Fund, the LoCorr Long/Short Commodities Strategy Fund and the LoCorr Market Trend Fund each invest up to 25% of their total assets (measured at the time of purchase) in wholly-owned subsidiaries, LCMFS Fund Limited (“LCMFS”), LCLSCS Fund Limited (“LCLSCS”) and LCMT Fund Limited (“LCMT”), respectively; each company is incorporated under the laws of the Cayman Islands. LCMFS, LCLSCS and LCMT act as investment vehicles in order to enter into certain investments for the LoCorr Macro Strategies Fund, the LoCorr Long/Short Commodities Strategy Fund and the LoCorr Market Trend Fund, respectively, consistent with their investment objectives and policies specified in the Prospectuses and Statement of Additional Information.
At December 31, 2023, investments in LCMFS, LCLSCS and LCMT represented 1.38%, 23.39% and 2.32% of the total net assets of LoCorr Macro Strategies Fund, LoCorr Long/Short Commodities Strategy Fund and LoCorr Market Trend Fund, respectively.
The consolidated financial statements of the LoCorr Macro Strategies Fund, LoCorr Long/Short Commodities Strategy Fund and the LoCorr Market Trend Fund each include the investment activity and financial statements of LCMFS, LCLSCS and LCMT, respectively. All intercompany accounts and transactions have been eliminated in consolidation. Because each Fund may invest a substantial portion of its assets in its respective subsidiary, the Fund may be considered to be investing indirectly in some of those investments through its subsidiary. For that reason, references to the Fund may also encompass its subsidiary. The subsidiary will be subject to the same investment restrictions and limitations, and follow the same compliance policies and procedures, as the Fund when viewed on a consolidated basis. Each Fund and its subsidiary area “commodity pool” under the U.S. Commodity Exchange Act and LoCorr Fund Management, LLC (the “Adviser” or “Management”) is a “commodity pool operator” registered with and regulated by the Commodity Futures Trading Commission (“CFTC”). As a result, additional CFTC- mandated disclosure, reporting and recordkeeping obligations apply with respect to each Fund and its respective subsidiary under CFTC and the U.S. Securities and Exchange Commission (the “SEC”) harmonized regulations.
Share Classes
The Funds currently offer three classes of shares: Class A, Class C and Class I shares. Each share class represents an interest in the same assets of the Fund, has the same rights and is identical in all material respects except that (i) Class A shares have a maximum front end sales load of 5.75% and maximum deferred sales charge of 1.00% and Class C shares have a maximum
LoCorr Macro Strategies Fund, LoCorr Long/Short Commodities Strategy Fund and LoCorr Market Trend Fund – Notes to Consolidated Financial
Statements / LoCorr Dynamic Opportunity Fund and LoCorr Spectrum Income Fund – Notes to Financial Statements (continued) |
deferred sales charge of 1.00%, (ii) Class A shares have a 12b-1 fee of 0.25% and Class C shares have a 12b-1 fee of 1.00%; (iii) certain other class-specific expenses will be borne solely by the class to which such expenses are attributable and (iv) each class will have exclusive voting rights with respect to matters relating to its own distribution arrangements.
All classes with respect to the LoCorr Spectrum Income Fund are subject to a 2.00% redemption fee on redemptions made within 60 days of the original purchase. As of May 1, 2017, none of the other Funds are subject to a redemption fee.
The following table presents the class-specific commencement of operations dates for each of the Funds:
| | Commencement of Operations |
| | Class A | Class C | Class I |
LoCorr Macro Strategies Fund | March 22, 2011 | March 24, 2011 | March 24, 2011 |
LoCorr Long/Short Commodities Strategy Fund | January 1, 2012 | January 1, 2012 | January 1, 2012 |
LoCorr Dynamic Opportunity Fund | May 10, 2013 | May 10, 2013 | May 10, 2013 |
LoCorr Spectrum Income Fund | January 1, 2014 | January 1, 2014 | January 1, 2014 |
LoCorr Market Trend Fund | July 1, 2014 | July 1, 2014 | July 1, 2014 |
The Funds may issue an unlimited number of shares of beneficial interest, with no par value. All shares of the Funds have equal rights and privileges, except as to class-specific rights and privileges described above.
2. | Significant Accounting Policies |
The following is a summary of significant accounting policies consistently followed by the Funds in the preparation of the financial statements. These policies are in conformity with generally accepted accounting principles in the United States of America (“GAAP”).
Investment Valuation
The Funds follow fair valuation accounting standards in accordance with GAAP, which establish a definition of fair value and set out a hierarchy for measuring fair value. These standards require additional disclosures about the various inputs and valuation techniques used to develop the measurements of fair value and changes in valuation techniques and related inputs during the period. These inputs are summarized in three broad levels listed below:
Level 1 – Unadjusted quoted prices in active markets for identical assets or liabilities that the Funds have the ability to access.
Level 2 – Observable inputs other than quoted prices included in Level 1 that are observable for the asset or liability, either directly or indirectly. These inputs may include quoted prices for the identical instrument on an inactive market, prices for similar instruments, interest rates, prepayment speeds, credit risk, yield curves, default rates and similar data.
Level 3 – Unobservable inputs for the asset or liability, to the extent relevant observable inputs are not available; representing the Funds’ own assumptions about the assumptions a market participant would use in valuing the asset or liability and would be based on the best information available.
Generally, the Funds’ investments are valued each day at the last quoted sales price on each investment’s primary exchange. Investments traded or dealt in one or more exchanges (whether domestic or foreign) for which market quotations are readily available and not subject to restrictions against resale shall be valued at the last quoted sales price on the primary exchange or, in the absence of a sale on the primary exchange, at the last bid on the primary exchange. Investments primarily traded in the National Association of Securities Dealers’ Automated Quotation System (“NASDAQ”) National Market System for which market quotations are readily available shall be valued using the NASDAQ Official Closing Price.
The Funds may use independent pricing services to assist in calculating the value of the Funds’ investments. In addition, market prices for foreign investments are not determined at the same time of day as the net asset value (“NAV”) for the Funds.Because the Funds may invest in portfolio investments primarily listed on foreign exchanges and these exchanges may trade on weekends or other days when the Funds do not price their shares, the value of some of the Funds’ portfolio investments may change on days when you may not be able to buy or sell the Funds’ shares. In computing the NAV, the Funds value foreign investments held by the Funds at the latest closing price on the exchange in which they are traded immediately prior to closing of the New York Stock Exchange. Prices of foreign investments quoted in foreign currencies are translated into U.S. dollars at current rates. If events materially affecting the value of an investment in the Funds’ portfolio, particularly foreign investments, occur after the close of trading on a foreign market but before the Funds price their shares, the investment will be valued at fair value.
LoCorr Macro Strategies Fund, LoCorr Long/Short Commodities Strategy Fund and LoCorr Market Trend Fund – Notes to Consolidated Financial
Statements / LoCorr Dynamic Opportunity Fund and LoCorr Spectrum Income Fund – Notes to Financial Statements (continued) |
Certain investments such as commodity pools are measured based upon NAV as a practical expedient to determine fair value and are not required to be categorized in the fair value hierarchy.
American Depositary Receipts
The Funds may invest in sponsored and unsponsored American Depositary Receipts (“ADRs”), which are receipts issued by an American bank or trust company evidencing ownership of underlying securities issued by a foreign issuer. ADRs, in registered form, are designed for use in U.S. securities markets. Unsponsored ADRs may be created without the participation of the foreign issuer. Holders of unsponsored ADRs generally bear all the costs of the ADR facility, whereas foreign issuers typically bear certain costs in a sponsored ADR. The bank or trust company depositary of an unsponsored ADR may be under no obligation to distribute shareholder communications received from the foreign issuer or to pass through voting rights. ADRs are generally categorized in Level 1 or Level 2 of the fair value hierarchy depending on inputs used and market activity levels for specific securities.
Cash and Cash Equivalents
Idle cash may be swept into various overnight demand deposits and is classified as Cash held in interest bearing deposit account on the Statements of Assets and Liabilities. The Funds maintain cash in bank deposit accounts which, at times, may exceed United States federally insured limits. Amounts swept overnight are available on the next business day.
Equity Securities
Equity securities, including common stocks, preferred stocks, securities convertible into common stocks such as convertible bonds, warrants, rights, options, master limited partnership (“MLP”) interests, real estate investment trusts (“REITs”), business development companies (“BDCs”) and royalty trusts are generally valued by using market quotations, but may be valued on the basis of prices furnished by a pricing service when the Adviser believes such prices accurately reflect the fair market value of such securities. MLP interests are limited partnerships, the interests in which (known as “units”) typically trade publicly, like stock. MLPs are also called publicly traded partnerships and public limited partnerships. Securities that are traded on any stock exchange or on the NASDAQ over-the-counter market are generally valued by the pricing service at the last quoted sale price. Lacking a last sale price, an equity security is generally valued by the pricing service at its last bid price. Equity securities are generally categorized in Level 1 or Level 2 of the fair value hierarchy depending on inputs used and market activity levels for specific securities.
Exchange Traded Funds
The Funds may invest in Exchange Traded Funds (“ETFs”). They are managed by professionals and provide the investor with diversification, cost and tax efficiency, liquidity, marginability, usability for hedging, the ability to go long and short, and (for some ETFs) the provision of periodic distributions. Additionally, some ETFs are unit investment trusts (“UITs”), which are unmanaged portfolios overseen by trustees. ETFs generally have two markets. The primary market is where institutions swap “creation units” in block-multiples of shares, typically 25,000 or 50,000, for in-kind securities and cash in the form of dividends. The secondary market is where individual investors can trade as little as a single share during trading hours on the exchange. This is different from open-ended mutual funds that are traded after hours once the NAV is calculated. ETF shares may trade at a premium or discount to NAV per share. ETFs share many similar risks with open-end and closed-end funds. ETFs are generally categorized in Level 1 of the fair value hierarchy.
The Funds may invest in ETFs and other investment companies that hold a portfolio of foreign securities. Investing in securities of foreign companies and countries involves certain considerations and risks that are not typically associated with investing in U.S. government securities and securities of domestic companies. There may be less publicly available information about a foreign issuer than a domestic one, and foreign companies are not generally subject to uniform accounting, auditing and financial standards and requirements comparable to those applicable to U.S. companies. There may also be less government supervision and regulation of foreign securities exchanges, brokers and listed companies than exists in the United States. Interest and dividends paid by foreign issuers may be subject to withholding and other foreign taxes, which may decrease the net return on such investments as compared to dividends and interest paid to the Funds by domestic companies or the U.S. government. There may be the possibility of expropriations, seizure or nationalization of foreign deposits, confiscatory taxation, political, economic or social instability, or diplomatic developments that could affect assets of the Funds held in foreign countries. Finally, the establishment of exchange controls or other foreign governmental laws or restrictions could adversely affect the payment of obligations.
LoCorr Macro Strategies Fund, LoCorr Long/Short Commodities Strategy Fund and LoCorr Market Trend Fund – Notes to Consolidated Financial
Statements / LoCorr Dynamic Opportunity Fund and LoCorr Spectrum Income Fund – Notes to Financial Statements (continued) |
Fixed Income Securities
Fixed income securities and certificates of deposit with maturities more than 60 days when acquired generally are valued using an evaluated price supplied by an independent pricing service. Inputs used by the pricing service for U.S. government and treasury securities are normally valued using a model that incorporates market observable data such as reported sales of similar securities, broker dealer quotes, yields, bids, offers and reference data. Agency issued debt securities, foreign issued bonds and municipal bonds are generally valued in a manner similar to U.S. government securities. Evaluations for corporate bonds are typically based on valuation methodologies such as market pricing and other analytical pricing models as well as market transactions and dealer quotations based on observable inputs. Fixed income securities are generally categorized in Level 2 of the fair value hierarchy depending on inputs used and market activity levels for specific securities.
The fair value of asset backed securities and mortgage backed securities is estimated on models that consider the estimated cash flows of each tranche of the entity, establish a benchmark yield, and develop an estimated tranche-specific spread to the benchmark yield based on the unique attributes of the tranche. Additional inputs such as creditworthiness of the underlying collateral and quotes from outside brokers for the same or similar issuance may also be considered in the development of fair value. Asset backed and mortgage backed securities are generally categorized in Level 2 of the fair value hierarchy.
Short-term investments in fixed income securities and certificates of deposit with maturities of less than 60 days when acquired, or which subsequently are within 60 days of maturity, are valued using an amortized cost method of valuation, and are generally categorized in Level 2.
Investment Companies
With respect to any portion of the Funds’ assets that are invested in one or more open-end management investment companies, including money market funds, registered under the 1940 Act, the Funds’ NAV is calculated based upon the NAVs of those open-end management investment companies, and the prospectuses for these companies explain the circumstances under which those companies will use fair value pricing and the effects of using fair value pricing.
The Funds generally will purchase shares of closed-end investment companies only in the secondary market. The shares of many closed end investment companies, after their initial public offering, frequently trade at a price per share that is less than the NAV per share, the difference representing the “market discount” of such shares. This market discount may be due in part to the investment objective of long-term appreciation, which is sought by many closed-end investment companies, as well as to the fact that the shares of closed-end investment companies are not redeemable by the holder upon demand to the issuer at the next determined NAV but rather are subject to the principles of supply and demand in the secondary market. A relative lack of secondary market purchasers of closed-end investment company shares also may contribute to such shares trading at a discount to their NAV. Closed-end investment companies are generally categorized in Level 1 or Level 2 of the fair value hierarchy depending on inputs used and market activity levels for specific securities.
Financial Derivative Instruments
Financial derivative instruments, such as forward currency contracts, futures contracts, options, or swap agreements, derive their value from underlying asset prices, indices, reference rates and other inputs or a combination of these factors. These contracts are normally valued on the basis of broker- dealer quotations or a pricing service at the settlement price determined by the relevant exchange. Depending on the product and the terms of the transaction, the value of the derivative contracts can be estimated by a pricing service provider using a series of techniques, including simulation pricing models. The pricing models use inputs that are observed from actively quoted markets such as issuer details, indices, spreads, interest rates, curves, dividends and exchange rates.
Forward currency contracts represent the purchase or sale of a specific quantity of a foreign currency at the current or spot price, with delivery and settlement at a specified future date. Forward currency contracts are presented at fair value using spot currency rates and are adjusted for the time value of money (forward points) and contractual prices of the underlying financial instruments. Forward currency contracts are generally categorized in Level 2.
Futures contracts are carried at fair value using the primary exchange’s closing (settlement) price and are generally categorized in Level 1.
The Funds may purchase and write (i.e., sell) put and call options. Such options may relate to particular securities or stock indices, and may or may not be listed on a domestic or foreign securities exchange and may or may not be issued by the Options Clearing Corporation. Options trading is a highly specialized activity that entails greater than ordinary investment risk. Options may be more volatile than the underlying instruments, and therefore, on a percentage basis, an investment in options may be subject to greater fluctuation than an investment in the underlying instruments themselves. Purchased or written options are generally categorized in Level 1 of the fair value hierarchy.
LoCorr Macro Strategies Fund, LoCorr Long/Short Commodities Strategy Fund and LoCorr Market Trend Fund – Notes to Consolidated Financial
Statements / LoCorr Dynamic Opportunity Fund and LoCorr Spectrum Income Fund – Notes to Financial Statements (continued) |
Total return swap contracts are stated at fair value daily based on the fair value of the underlying futures, forward currency and foreign currency contracts constituting the contract’s stated index, taking into account any fees and expenses associated with the swap agreement. Total return swap contracts are generally categorized in Level 2.
Fair Value Pricing
If market quotations are not readily available, investments will be valued at their fair value as determined in good faith by the Adviser in accordance with procedures approved by the Board of Trustees (the “Board”) and evaluated by the Board as to the reliability of the fair value method used.In these cases, a Fund’s NAV will reflect certain portfolio investments’ fair value rather than their market price. Fair value pricing involves subjective judgments and it is possible that the fair value determined for an investment is materially different than the value that could be realized upon the sale of that investment. The fair value prices can differ from market prices when they become available or when a price becomes available.
Fair value determinations are required for the following securities:
● | securities for which market quotations are not readily available at the valuation time on a particular business day (including without limitation securities for which there is a short and temporary lapse in the provision of a price by the regular pricing source); |
● | securities determined to be illiquid in accordance with the Trust’s Liquidity Procedures; and |
● | securities with respect to which an event that will affect the value thereof has occurred subsequent to the determination by the Adviser/relevant Sub-Adviser of the closing prices reported on the principal exchange on which the securities are traded, but prior to the relevant Fund’s calculation of its NAV. |
● | For any open-end mutual funds that do not provide timely NAV information, the Adviser/relevant Sub-Adviser shall evaluate those ‘similar’ funds and determine which are most appropriate based on funds having similar benchmarks or similar objectives. The Adviser/relevant Sub-Adviser shall then calculate the NAV percentage move of those ‘similar’ funds for the day to create an aggregate average percentage move, which it shall use to calculate the price movement for the day of the Fund at issue. For closed-end funds, the aforementioned practice shall be utilized, in addition to monitoring secondary market activity during the day. |
Performing Fair Value Pricing
The Adviser considers all appropriate factors relevant to the value of securities for which market quotations are not readily available. No single standard for determining fair value can be established, since fair value depends upon the circumstances of each individual case. As a general principle, the current fair value of an issue of securities being valued by the Adviser would appear to be the amount that the owner might reasonably expect to receive for them upon their current sale.
As a general matter, the Funds’ Adviser will value the portfolio security or other asset primarily by reference to the public market if there is a public market for securities of the same class or similar securities; primarily by reference to private transactions if public market reference is not available and private transaction reports are available; and primarily by use of one or more analytical methods or models if public and private market references are not available or not reliable. The Adviser will use cost only if no better method of valuation is available.
The Adviser regularly evaluates whether its pricing methodologies continue to result in values that the Funds might reasonably expect to receive upon a current sale. In order to do this, the Adviser compares its fair value prices with values that are available from other sources (if there are any). The next actual sales price of a security might be one such source. However, the next-day opening prices or next actual sales prices for a security may differ from the fair value of that security as of the time for NAV calculation, given the subjectivity inherent in fair valuation and the fact that events could occur after NAV calculation. Thus, discrepancies between fair values and next-day opening prices or next actual sales prices may occur on a regular and recurring basis. These discrepancies do not necessarily indicate that the Adviser’s fair value methodology is inappropriate. Nonetheless, systematic comparisons of fair values to the next-day opening prices or next actual sales prices are useful to assist the Adviser with ongoing monitoring and evaluation of the appropriateness of its fair value methodologies. The above guidance does not purport to delineate all factors that may be considered. The Adviser takes into consideration all indications of value available to it in determining the fair value assigned to a particular security.
LoCorr Macro Strategies Fund, LoCorr Long/Short Commodities Strategy Fund and LoCorr Market Trend Fund – Notes to Consolidated Financial
Statements / LoCorr Dynamic Opportunity Fund and LoCorr Spectrum Income Fund – Notes to Financial Statements (continued) |
The following table summarizes LoCorr Macro Strategies Fund’s consolidated investments and other financial instruments as of December 31, 2023:
Security Classification | | Level 1 | | | Level 2 | | | Level 3 | | | Total | |
Investments | | | | | | | | | | | | | | | | |
Asset Backed Securities | | $ | — | | | $ | 63,133,493 | | | $ | — | | | $ | 63,133,493 | |
Corporate Bonds | | | — | | | | 138,204,748 | | | | — | | | | 138,204,748 | |
Mortgage Backed Securities | | | — | | | | 128,300,332 | | | | — | | | | 128,300,332 | |
Municipal Bonds | | | — | | | | 7,014,951 | | | | — | | | | 7,014,951 | |
U.S. Government Agency Issues | | | — | | | | 74,773,901 | | | | — | | | | 74,773,901 | |
U.S. Government Notes | | | — | | | | 180,997,969 | | | | — | | | | 180,997,969 | |
Short Term Investments | | | — | | | | 770,499,204 | | | | — | | | | 770,499,204 | |
Total Investments | | $ | — | | | $ | 1,362,924,598 | | | $ | — | | | $ | 1,362,924,598 | |
Other Financial Instruments* | | | | | | | | | | | | | | | | |
Forward Currency Contracts | | | | | | | | | | | | | | | | |
Purchase | | $ | — | | | $ | 13,087,253 | | | $ | — | | | $ | 13,087,253 | |
Sale | | | — | | | | (24,525,805 | ) | | | — | | | | (24,525,805 | ) |
Total Forward Currency Contracts | | | — | | | | (11,438,552 | ) | | | — | | | | (11,438,552 | ) |
Futures Contracts | | | | | | | | | | | | | | | | |
Long | | $ | 3,703,660 | | | $ | — | | | $ | — | | | $ | 3,703,660 | |
Short | | | (18,382,170 | ) | | | — | | | | — | | | | (18,382,170 | ) |
Total Futures Contracts | | | (14,678,510 | ) | | | — | | | | — | | | | (14,678,510 | ) |
Total Other Financial Instruments | | $ | (14,678,510 | ) | | $ | (11,438,552 | ) | | $ | — | | | $ | (26,117,062 | ) |
See the Fund’s consolidated schedule of investments for the investments detailed by industry classification.
* | The fair value of the Fund’s other financial instruments represent the net unrealized appreciation (depreciation) at December 31, 2023. |
The LoCorr Macro Strategies Fund did not hold any Level 3 assets during the year.
The following table summarizes LoCorr Long/Short Commodities Strategy Fund’s consolidated investments and swap contracts as of December 31, 2023:
Security Classification | | Level 1 | | | Level 2 | | | Level 3 | | | NAV as Practical
Expedient | | | Total | |
Investments | | | | | | | | | | | | | | | | | | | | |
Asset Backed Securities | | $ | — | | | $ | 41,935,803 | | | $ | — | | | $ | — | | | $ | 41,935,803 | |
Commodity Pool | | | — | | | | — | | | | — | | | | 118,554,191 | | | | 118,554,191 | |
Corporate Bonds | | | — | | | | 79,291,456 | | | | — | | | | — | | | | 79,291,456 | |
Mortgage Backed Securities | | | — | | | | 85,326,750 | | | | — | | | | — | | | | 85,326,750 | |
Municipal Bonds | | | — | | | | 3,483,132 | | | | — | | | | — | | | | 3,483,132 | |
U.S. Government Agency Issues | | | — | | | | 37,404,721 | | | | — | | | | — | | | | 37,404,721 | |
U.S. Government Notes | | | — | | | | 110,077,210 | | | | — | | | | — | | | | 110,077,210 | |
Short Term Investments | | | — | | | | 301,585,835 | | | | — | | | | — | | | | 301,585,835 | |
Total Investments | | $ | — | | | $ | 659,104,907 | | | $ | — | | | $ | 118,554,191 | | | $ | 777,659,098 | |
| | | | | | | | | | | | | | | | | | | | | |
Swap Contracts* | | | | | | | | | | | | | | | | | | | | |
Long Total Return Swap Contracts | | $ | — | | | $ | 65,219,557 | | | $ | — | | | $ | — | | | $ | 65,219,557 | |
Total Swap Contracts | | $ | — | | | $ | 65,219,557 | | | $ | — | | | $ | — | | | $ | 65,219,557 | |
See the Fund’s consolidated schedule of investments for the investments detailed by industry classification.
* | The fair value of the Fund’s investment in swap contracts represents the net unrealized appreciation at December 31, 2023. |
LoCorr Macro Strategies Fund, LoCorr Long/Short Commodities Strategy Fund and LoCorr Market Trend Fund – Notes to Consolidated Financial
Statements / LoCorr Dynamic Opportunity Fund and LoCorr Spectrum Income Fund – Notes to Financial Statements (continued) |
The LoCorr Long/Short Commodities Strategy Fund did not hold any Level 3 assets during the year.
The following table summarizes LoCorr Market Trend Fund’s consolidated investments and other financial instruments as of December 31, 2023:
Security Classification | | Level 1 | | | Level 2 | | | Level 3 | | | Total | |
Investments | | | | | | | | | | | | | | | | |
Asset Backed Securities | | $ | — | | | $ | 18,150,801 | | | $ | — | | | $ | 18,150,801 | |
Corporate Bonds | | | — | | | | 33,898,655 | | | | — | | | | 33,898,655 | |
Mortgage Backed Securities | | | — | | | | 31,979,539 | | | | — | | | | 31,979,539 | |
Municipal Bonds | | | — | | | | 909,887 | | | | — | | | | 909,887 | |
U.S. Government Agency Issues | | | — | | | | 21,783,041 | | | | — | | | | 21,783,041 | |
U.S. Government Notes | | | — | | | | 46,875,752 | | | | — | | | | 46,875,752 | |
Short Term Investments | | $ | — | | | $ | 180,714,703 | | | $ | — | | | $ | 180,714,703 | |
Total Investments | | $ | — | | | $ | 334,312,378 | | | $ | — | | | $ | 334,312,378 | |
Other Financial Instruments* | | | | | | | | | | | | | | | | |
Forward Currency Contracts | | | | | | | | | | | | | | | | |
Purchase | | $ | — | | | $ | 2,218,205 | | | $ | — | | | $ | 2,218,205 | |
Sale | | | — | | | | (9,270,476 | ) | | | — | | | | (9,270,476 | ) |
Total Forward Currency Contracts | | | — | | | | (7,052,271 | ) | | | — | | | | (7,052,271 | ) |
Futures Contracts | | | | | | | | | | | | | | | | |
Long | | $ | 3,067,376 | | | $ | — | | | $ | — | | | $ | 3,067,376 | |
Short | | | (12,406,639 | ) | | | — | | | | — | | | | (12,406,639 | ) |
Total Futures Contracts | | | (9,339,263 | ) | | | — | | | | — | | | | (9,339,263 | ) |
Total Other Financial Instruments | | $ | (9,339,263 | ) | | $ | (7,052,271 | ) | | $ | — | | | $ | (16,391,534 | ) |
See the Fund’s consolidated schedule of investments for the investments detailed by industry classification.
* | The fair value of the Fund’s other financial instruments represent the net unrealized appreciation (depreciation) at December 31, 2023. |
The LoCorr Market Trend Fund did not hold any Level 3 assets during the year.
The following table summarizes LoCorr Dynamic Opportunity Fund’s investments and securities sold short as of December 31, 2023:
Security Classification | | Level 1 | | | Level 2 | | | Level 3 | | | Total | |
Investments | | | | | | | | | | | | | | | | |
Common Stocks | | $ | 34,704,749 | | | $ | — | | | $ | — | | | $ | 34,704,749 | |
Real Estate Investment Trusts | | | 4,107,746 | | | | — | | | | — | | | | 4,107,746 | |
Total Investments | | $ | 38,812,495 | | | $ | — | | | $ | — | | | $ | 38,812,495 | |
| | | | | | | | | | | | | | | | | |
Securities Sold Short | | | | | | | | | | | | | | | | |
Common Stocks | | $ | (13,659,695 | ) | | $ | — | | | $ | — | | | $ | (13,659,695 | ) |
Exchange Traded Funds | | | (1,913,626 | ) | | | — | | | | — | | | | (1,913,626 | ) |
Real Estate Investment Trusts | | | (1,235,056 | ) | | | — | | | | — | | | | (1,235,056 | ) |
Total Securities Sold Short | | $ | (16,808,377 | ) | | $ | — | | | $ | — | | | $ | (16,808,377 | ) |
See the Fund’s schedule of investments and schedule of securities sold short for detail by industry classification.
The LoCorr Dynamic Opportunity Fund did not hold any Level 3 assets during the year.
LoCorr Macro Strategies Fund, LoCorr Long/Short Commodities Strategy Fund and LoCorr Market Trend Fund – Notes to Consolidated Financial
Statements / LoCorr Dynamic Opportunity Fund and LoCorr Spectrum Income Fund – Notes to Financial Statements (continued) |
The following table summarizes LoCorr Spectrum Income Fund’s investments and written options as of December 31, 2023:
Security Classification | | Level 1 | | | Level 2 | | | Level 3 | | | Total | |
Investments | | | | | | | | | | | | | | | | |
Business Development Companies | | $ | 7,354,041 | | | $ | — | | | $ | — | | | $ | 7,354,041 | |
Closed-End Investment Companies | | | 4,145,472 | | | | — | | | | — | | | | 4,145,472 | |
Common Stocks | | | 30,306,961 | | | | — | | | | — | | | | 30,306,961 | |
Master Limited Partnerships | | | 16,293,233 | | | | — | | | | — | | | | 16,293,233 | |
Preferred Stocks | | | 10,248,678 | | | | — | | | | — | | | | 10,248,678 | |
Real Estate Investment Trusts | | | 13,439,245 | | | | — | | | | — | | | | 13,439,245 | |
Total Investments | | $ | 81,787,630 | | | $ | — | | | $ | — | | | $ | 81,787,630 | |
Written Options | | | | | | | | | | | | | | | | |
Written Call Options | | $ | (55,440 | ) | | $ | — | | | $ | — | | | $ | (55,440 | ) |
Total Written Options | | $ | (55,440 | ) | | $ | — | | | $ | — | | | $ | (55,440 | ) |
See the Fund’s schedule of investments for detail by industry classification.
The LoCorr Spectrum Income Fund did not hold any Level 3 assets during the year.
Allocation of Income and Expenses
Net investment income, other than class specific expenses, and realized and unrealized gains and losses are allocated daily to each class of shares based upon the relative NAV of outstanding shares of each class of shares at the beginning of the day (after adjusting for the current capital shares activity of the respective class). Expenses associated with a specific Fund in the Trust are charged to that Fund. Common expenses are typically allocated based upon the relative net assets of each Fund, or by other equitable means.
Deposits with Broker
Forward Currency and Futures Contracts
When trading derivative instruments, such as futures contracts, a Fund is only required to post initial or variation margin with the exchange or clearing broker. The use of margin in trading these instruments has the effect of creating leverage, which can expose the Fund to substantial gains or losses occurring from relatively small price changes in the value of the underlying instrument and can increase the volatility of the Fund’s returns. Volatility is a statistical measure of the dispersion of returns of an investment, where higher volatility generally indicates greater risk. At December 31, 2023, the LoCorr Macro Strategies Fund and the LoCorr Market Trend Fund pledged cash and cash equivalents, defined as short-term, highly liquid investments that are readily convertible to known amounts of cash at U.S. Bank, N.A. (“U.S. Bank”) to Bank of America Merrill Lynch for each Fund’s investment in forward currency contracts. See the Funds’ consolidated statements of assets and liabilities for these amounts.
Upon entering into a futures contract, and to maintain the Fund’s open positions in futures contracts, the Fund is required to deposit with its custodian or futures broker in a segregated account in the name of the futures broker an amount of cash, U.S. government securities, suitable money market instruments, or other liquid securities, known as “initial margin.” The margin required fora particular futures contract is set by the exchange on which the contract is traded and may be significantly modified from time to time by the exchange during the term of the contract. Futures contracts are customarily purchased and sold on margins that may range upward from less than 5% of the value of the contract being traded.
At December 31, 2023, the LoCorr Macro Strategies Fund and LCMFS, collectively, had cash and cash equivalents including foreign currency on deposit with the broker for derivative instruments which is presented on the Fund’s consolidated statement of assets and liabilities. In addition, LCMFS pledged a portion of its deposit account as collateral for derivative instruments. See the Fund’s consolidated schedule of investments for the fair value of the deposit account pledged as collateral.
At December 31, 2023, the LoCorr Market Trend Fund and LCMT, collectively, had cash and cash equivalents including foreign currency on deposit with the broker for derivative instruments which is presented on the Fund’s consolidated statement of assets and liabilities. In addition, LCMT pledged a portion of its deposit account as collateral for derivative instruments. See the Fund’s consolidated schedule of investments for the fair value of the deposit account pledged as collateral.
LoCorr Macro Strategies Fund, LoCorr Long/Short Commodities Strategy Fund and LoCorr Market Trend Fund – Notes to Consolidated Financial
Statements / LoCorr Dynamic Opportunity Fund and LoCorr Spectrum Income Fund – Notes to Financial Statements (continued) |
If the price of an open futures contract changes (by increase in underlying instrument or index in the case of a sale or by decrease in the case of a purchase) so that the loss on the futures contract reaches a point at which the margin on deposit does not satisfy margin requirements, the broker will require an increase in the margin. However, if the value of a position increases because of favorable price changes in the futures contract so that the margin deposit exceeds the required margin, the broker will pay the excess to the Fund.
These subsequent payments, called “variation margin,” to and from the futures broker (with the exception of futures contracts traded on the London Metal Exchange (“LME”)), are made on a daily basis as the price of the underlying assets fluctuate making the long and short positions in the futures contract more or less valuable, a process known as “marking to the market.” The variation margin on LME futures contracts do not settle daily, but rather settle at their respective maturity dates. At period end, the unrealized appreciation and depreciation on LME futures contracts is shown as receivable for unsettled open futures contracts and payable for unsettled open futures contracts, respectively, on the Funds’ consolidated statements of assets and liabilities. The Funds expect to earn interest income on any margin deposits, which is disclosed as broker interest income on the Funds’ consolidated statements of operations.
Securities Sold Short
At December 31, 2023, the LoCorr Dynamic Opportunity Fund pledged cash with U.S. Bank as collateral for securities sold short. See the Fund’s statement of assets and liabilities for amounts.
Swap Contracts
LCLSCS has a substantial portion of its assets on deposit with Deutsche Bank in connection with its trading of its swap contract. Assets deposited with Deutsche Bank in connection with the trading of the swap contract for LCLSCS are partially restricted due to deposit requirements. At December 31, 2023, the LoCorr Long/Short Commodities Strategy Fund had cash and cash equivalents on deposit with Deutsche Bank which is presented on the consolidated statements of assets and liabilities as deposits with broker for swap contracts. In addition, at December 31, 2023, LCLSCS pledged a portion of its deposit account as collateral for the swap contract. See the Fund’s consolidated schedule of investments for the fair value of the deposit account pledged as collateral. Risks arise from the possible inability of the counterparty to meet the terms of its contract and may increase if the counterparty’s financial condition worsens.
Options
At December 31, 2023, the LoCorr Spectrum Income Fund had cash on deposit with Pershing, LLC for options contracts which is presented on the Fund’s statement of assets and liabilities. In addition, the LoCorr Spectrum Income Fund pledged securities as collateral for options. See the Fund’s consolidated schedule of investments for the fair value of securities pledged as collateral.
Distributable Earnings and Investment Transactions
Net investment income and net realized gains (losses) may differ for financial reporting and tax purposes because of temporary or permanent book/tax differences. To the extent these differences are permanent; reclassifications are made to the appropriate equity accounts in the period that the difference arises.
Additionally, GAAP requires that certain components of net assets relating to permanent differences be reclassified between financial and tax reporting. These reclassifications have no effect on net assets or NAV per share. See Note 7.
Distributions from Earnings
Shareholder transactions are recorded on trade date. Dividends from net investment income are declared and paid at least annually by the Funds. Distribution of net realized capital gains, if any, are declared and paid at least annually. Distributions to shareholders are recorded on the ex-dividend date. The character of distributions made during the periods from net investment income or net realized gains may differ from the characterization for federal income tax purposes due to the difference in the recognition of income, expense and gain items for financial statement and tax purposes.
During the year ended December 31, 2023, dividends for the LoCorr Spectrum Income Fund were distributed monthly. The estimated characterization of the distributions paid will be an ordinary dividend, qualified dividend or return of capital.
This estimate is based on the Fund’s operating results during the period. It is anticipated that a significant portion of the distributions of the Fund’s investments in MLP and certain investments in REITs and royalty trusts will be comprised of return of capital as a result of the tax character of cash distributions made by each Fund’s investments. The actual characterization of the distributions made during the period is not determined until after the end of the fiscal year.
LoCorr Macro Strategies Fund, LoCorr Long/Short Commodities Strategy Fund and LoCorr Market Trend Fund – Notes to Consolidated Financial
Statements / LoCorr Dynamic Opportunity Fund and LoCorr Spectrum Income Fund – Notes to Financial Statements (continued) |
The tax character of distributions paid during the periods was as follows:
| | | Year Ended December 31, 2023 | |
Fund | | Ordinary
Income | | | Long-Term
Capital Gains | | | Return of
Capital | |
LoCorr Macro Strategies Fund | | $ | 49,435,072 | | | $ | — | | | $ | — | |
LoCorr Long/Short Commodities Strategy Fund | | | 19,694,937 | | | | — | | | | 15,921 | |
LoCorr Market Trend Fund | | | 10,986,683 | | | | — | | | | — | |
LoCorr Dynamic Opportunity Fund | | | 889,196 | | | | 12,650 | | | | — | |
LoCorr Spectrum Income Fund | | | 4,435,021 | | | | — | | | | 4,229,551 | |
| | | Year Ended December 31, 2022 | |
Fund | | Ordinary
Income | | | Long-Term
Capital Gains | | | Return of
Capital | |
LoCorr Macro Strategies Fund | | $ | 172,644,237 | | | $ | 125,235,278 | | | $ | — | |
LoCorr Long/Short Commodities Strategy Fund | | | 136,969,801 | | | | — | | | | — | |
LoCorr Market Trend Fund | | | 55,179,207 | | | | 27,142,674 | | | | — | |
LoCorr Dynamic Opportunity Fund | | | 716,754 | | | | 336,100 | | | | — | |
LoCorr Spectrum Income Fund | | | 2,680,748 | | | | — | | | | 4,665,933 | |
Federal Income Taxes
The Funds intend to qualify as regulated investment companies pursuant to Subchapter M of the Internal Revenue Code of 1986, as amended. The Funds intend to distribute substantially all of their investment company net taxable income and net capital gains to shareholders. Therefore, no federal income tax provision is required.
As of and during the year ended December 31, 2023, the Funds did not have any tax positions that did not meet the “more- likely-than-not” threshold of being sustained by applicable tax authorities. The Funds recognize interest and penalties, if any, related to unrecognized tax benefits on uncertain tax positions as interest or other expense in the statements of operations. During the year ended December 31, 2023, the Funds did not incur any interest or penalties.
For tax purposes, LCMFS, LCLSCS and LCMT are exempted Cayman Islands investment companies. LCMFS, LCLSCS and LCMT have each received an undertaking from the Government of the Cayman Islands exempting them from all local income, profits, and capital gains taxes. No such taxes are levied in the Cayman Islands at the present time. For U.S. income tax purposes, LCMFS, LCLSCS and LCMT are controlled foreign corporations (“CFCs”) and as such are not subject to U.S. income tax. However, as a wholly-owned CFC, the net income and capital gain of each CFC, to the extent of its earnings and profits, will be included each year in the respective Funds’ investment company taxable income.
Foreign Securities and Currency
Investment securities and other assets and liabilities denominated in foreign currencies are translated into U.S. dollar amounts at the date of valuation. Purchases and sales of investment securities and income and expense items denominated in foreign currencies are translated into U.S. dollar amounts on the respective dates of such transactions.
The Funds do not isolate that portion of the results of operations resulting from changes in foreign exchange rates on investments from the fluctuations arising from changes in market prices of securities held. Such fluctuations are included with the net realized and unrealized gain or loss from investments.
Reported net realized foreign exchange gains or losses arise from sales of foreign currencies, currency gains or losses realized between the trade and settlement dates on securities transactions, and the difference between the amounts of dividends, interest, and foreign withholding taxes recorded on the Funds’ books and the U.S. dollar equivalent of the amounts actually received or paid. Net unrealized foreign exchange gains and losses arise from changes in the fair values of assets and liabilities, other than investments in securities at period end, resulting from changes in exchange rates.
Forward Currency Contracts
Gains or losses are realized when foreign currency contracts are liquidated. Any change in net unrealized gain or loss is reported in the statements of operations.
LoCorr Macro Strategies Fund, LoCorr Long/Short Commodities Strategy Fund and LoCorr Market Trend Fund – Notes to Consolidated Financial
Statements / LoCorr Dynamic Opportunity Fund and LoCorr Spectrum Income Fund – Notes to Financial Statements (continued) |
Futures Contracts
A futures contract provides for the future sale by one party and purchase by another party of a specified amount of a specific financial instrument (e.g., units of a stock index) for a specified price, date, time and place designated at the time the contract is made. Brokerage fees are incurred when a futures contract is bought or sold and margin deposits must be maintained.
Entering into a contract to buy is commonly referred to as buying or purchasing a contract or holding a long position. Entering into a contract to sell is commonly referred to as selling a contract or holding a short position. Unlike when a Fund purchases or sells a security, no price would be paid or received by the Fund upon the purchase or sale of a futures contract.
Although certain futures contracts, by their terms, require actual future delivery of and payment for the underlying instruments, in practice most futures contracts are usually closed out before the delivery date. Gains or losses are realized when contracts are liquidated. Closing out an open futures contract purchase or sale is affected by entering into an offsetting futures contract sale or purchase, respectively, for the same aggregate amount of the identical underlying instrument or index and the same delivery date. If the offsetting purchase price is less than the original sale price, the Fund realizes a gain; if it is more, the Fund realizes a loss. Conversely, if the offsetting sale price is more than the original purchase price, the Fund realizes a gain; if it is less, the Fund realizes a loss.
The transaction costs must also be included in these calculations. There can be no assurance, however, that a Fund will be able to enter into an offsetting transaction with respect to a particular futures contract at a particular time. If a Fund is not able to enter into an offsetting transaction, the Fund will continue to be required to maintain the margin deposits on the futures contract. Any change in net unrealized gain or loss is reported in the statements of operations.
Indemnifications
In the normal course of business, the Funds enter into contracts that contain general indemnifications to other parties. The Funds’ maximum exposure under these contracts is unknown as this would involve future claims that may be made against the Funds that have not yet occurred. However, based on experience, the Funds expect the risk of loss to be remote.
Market and Credit Risks
The Funds may engage in the speculative trading of U.S. and foreign futures, forward currency and swap contracts (collectively, “derivatives”). The Funds are exposed to both market risk, which is the risk arising from changes in the fair value of the contracts and credit risk, which is the risk of failure by another party to perform according to the terms of a contract.
Purchase and sale of futures contracts requires margin deposits with the broker. Additional deposits may be necessary for any loss on contract value. The Commodity Exchange Act requires a broker to segregate all customer transactions and assets from such broker’s proprietary activities. A customer’s cash and other property (for example, U.S. government securities) deposited with a broker are considered commingled with all other customer funds subject to the broker’s segregation requirements. In the event of a broker’s insolvency, recovery may be limited to a pro rata share of segregated funds available. It is possible that the recovered amount could be less than total cash and other property deposited.
For derivatives, risks arise from changes in the fair value of the contracts. Theoretically, the Funds are exposed to a market risk equal to the notional contract value of swap, futures and forward currency contracts purchased and unlimited liability on such contracts sold short.
The Funds also engage in investing its assets in U.S. government securities. Risks arise from investments in U.S. government securities due to possible market illiquidity. U.S. government securities are also sensitive to changes in interest rates and economic conditions.
The Funds have established procedures to actively monitor market risk and minimize credit risk, although there can be no assurance that they will, in fact, succeed in doing so.
The global outbreak of COVID-19 (commonly referred to as “coronavirus”) has disrupted economic markets and the prolonged economic impact is uncertain. The ultimate economic fallout from the pandemic, and the long-term impact on economies, markets, industries and individual issuers, are not known. The operational and financial performance of the issuers of securities in which the Funds invest depends on future developments, including the duration and spread of the outbreak, and such uncertainty may in turn adversely affect the value and liquidity of the Funds’ investments, impair the Funds’ ability to satisfy redemption requests, and negatively impact the Funds’ performance.
LoCorr Macro Strategies Fund, LoCorr Long/Short Commodities Strategy Fund and LoCorr Market Trend Fund – Notes to Consolidated Financial
Statements / LoCorr Dynamic Opportunity Fund and LoCorr Spectrum Income Fund – Notes to Financial Statements (continued) |
New Accounting Pronouncements and/or SEC Regulatory Updates
In December 2022, the Financial Accounting Standards Board issued an Accounting Standards Update, ASU 2022-06, Reference Rate Reform (Topic 848) – Deferral of the Sunset Date of Topic 848 (“ASU 2022-06“). ASU 2022-06 is an amendment to ASU 2020-04, which provided optional guidance to ease the potential accounting burden due to the discontinuation of the LIBOR and other interbank-offered based reference rates and which was effective as of March 12, 2020 through December 31, 2022. ASU 2022-06 extends the effective period through December 31, 2024. Management is currently evaluating the impact, if any, of applying ASU 2022-06.
In October 2022, the Securities and Exchange Commission (the “SEC”) adopted a final rule relating to Tailored Shareholder Reports for Mutual Funds and Exchange-Traded Funds; Fee Information in Investment Company Advertisements. The rule and form amendments will, among other things, require the Fund to transmit concise and visually engaging shareholder reports that highlight key information. The amendments will require that funds tag information in a structured data format and that certain more in-depth information be made available online and available for delivery free of charge to investors on request. The amendments became effective January 24, 2023. There is an 18-month transition period after the effective date of the amendment.
Options on Securities
The Funds may purchase and write (i.e., sell) put and call options. Such options may relate to particular securities or stock indices and may or may not be listed on a domestic or foreign securities exchange and may or may not be issued by the Options Clearing Corporation. Option trading is a highly specialized activity that entails greater than ordinary investment risk. Options may be more volatile than the underlying instruments, and therefore, on a percentage basis, an investment in options may be subject to greater fluctuation than an investment in the underlying instruments themselves.
A call option for a particular security gives the purchaser of the option the right to buy, and the writer (seller) the obligation to sell, the underlying security at the stated exercise price at any time prior to the expiration of the option, regardless of the market price of the security. The premium paid to the writer is in consideration for undertaking the obligation under the option contract. A put option for a particular security gives the purchaser the right to sell the security at the stated exercise price at any time prior to the expiration date of the option, regardless of the market price of the security.
A Fund’s obligation to sell an instrument subject to a call option written by it, or to purchase an instrument subject to a put option written by it, may be terminated prior to the expiration date of the option by the Fund’s execution of a closing purchase transaction, which is effected by purchasing on an exchange an option of the same series (i.e., same underlying
instrument, exercise price and expiration date) as the option previously written. A closing purchase transaction will ordinarily be effected to realize a profit on an outstanding option, to prevent an underlying instrument from being called, to permit the sale of the underlying instrument or to permit the writing of a new option containing different terms on such underlying instrument. The cost of such a liquidation purchase plus transactions costs may be greater than the premium received upon the original option, in which event the Fund will have incurred a loss in the transaction. There is no assurance that a liquid secondary market will exist for any particular option. An option writer unable to effect a closing purchase transaction will not be able to sell the underlying instrument or liquidate the assets held in a segregated account, as described below, until the option expires or the optioned instrument is delivered upon exercise. In such circumstances, the writer will be subject to the risk of market decline or appreciation in the instrument during such period.
If an option purchased by a Fund expires unexercised, the Fund realizes a loss equal to the premium paid. If a Fund enters into a closing sale transaction on an option purchased by it, the Fund will realize a gain if the premium received by the Fund on the closing transaction is more than the premium paid to purchase the option or a loss if it is less. If an option written by a Fund expires on the stipulated expiration date or if the Fund enters into a closing purchase transaction, it will realize a gain (or loss if the cost of a closing purchase transaction exceeds the net premium received when the option is sold). If an option written by the Fund is exercised, the proceeds of the sale will be increased by the net premium originally received and the Fund will realize a gain or loss.
Security Transactions and Investment Income
Security transactions are recorded on trade date. Generally, realized gains and losses on sales of investments are calculated on the specifically identified cost basis of the securities.
Dividend income, less foreign taxes withheld, if any, are recorded on the ex-dividend date. Withholding taxes on foreign dividends have been provided for in accordance with the Funds’ understanding of the applicable country’s tax rules and rates.
LoCorr Macro Strategies Fund, LoCorr Long/Short Commodities Strategy Fund and LoCorr Market Trend Fund – Notes to Consolidated Financial
Statements / LoCorr Dynamic Opportunity Fund and LoCorr Spectrum Income Fund – Notes to Financial Statements (continued) |
Distributions received from the investments in MLP interests, REITs, private investments, closed end funds, business development companies and royalty trusts generally are comprised of ordinary income, capital gains and return of capital. Distributions from commodity pools are recorded on the effective date, based on the character determined by the underlying commodity pool. For financial statement purposes, the Funds use estimates to characterize these distributions received as return of capital, capital gains or ordinary income. Such estimates are based on historical information available from each MLP, REIT, private investment, closed end fund, business development company or royalty trust and other industry sources. These estimates may subsequently be revised based on information received from the MLP, REIT, private investment, closed end fund, business development company or royalty trust after their tax reporting periods are concluded, as the actual character of these distributions is not known until after the fiscal year end of the Funds. The distributions received from the MLP, REIT, private investment, closed-end fund, business development company and royalty trust securities that have been classified as income and capital gains are included in investment income and net realized gain (loss) on investments, respectively, on the statements of operations. The distributions received that are classified as return of capital reduce the cost of investments on the statements of assets and liabilities.
Interest income and expense is recognized on the accrual basis. Market discounts, premiums and original issue discounts on fixed-income securities are amortized daily over the expected life of the security using the effective yield method.
Short Sales
The Funds may sell securities short. A short sale is a transaction in which a Fund sells a security it does not own or have the right to acquire (or that it owns but does not wish to deliver) in anticipation that the market price of that security will decline. When a Fund makes a short sale, the broker-dealer through which the short sale is made must borrow the security sold short and deliver it to the party purchasing the security. The Funds are required to make a margin deposit in connection with such short sales; the Funds may have to pay a fee to borrow particular securities and will often be obligated to pay over any dividends and accrued interest on borrowed securities.
If the price of the security sold short increases between the time of the short sale and the time a Fund covers its short position, the Fund will incur a loss; conversely, if the price declines, the Fund will realize a gain. A gain, limited to the price at which the Fund sold the security short, or a loss, unlimited in size, will be recognized upon the close of a short sale. Any gain will be decreased, and any loss increased, by the transaction costs described above. The successful use of short selling may be adversely affected by imperfect correlation between movements in the price of the security sold short and the securities being hedged. Gains or losses from closed positions of securities sold short are presented as net realized gain or loss on securities sold short on the statements of operations.
In addition, the Funds are required to pay the lender any dividends declared on short positions. Dividends declared on open short positions are recorded on ex-date and shown as an expense for financial reporting purposes. To borrow the security, the Funds also may be required to pay fees, which are shown as an expense for financial reporting purposes. A Fund may receive rebate income or be charged a fee for borrowed securities. Such income or fee is calculated on a daily basis based upon the value of each borrowed security and a variable rate that is dependent upon the availability of such security. The Funds record these broker charges on a net basis as broker interest income or interest expense on the Funds’ statements of operations.
To the extent the Funds sell securities short, it will provide collateral to the broker-dealer and (except in the case of short sales “against the box”) will maintain additional asset coverage in the form of cash, U.S. government securities or other liquid securities with its custodian in a segregated account in an amount at least equal to the difference between the current fair value of the securities sold short and any amounts required to be deposited as collateral with the selling broker (not including the proceeds of the short sale). A short sale is “against the box” to the extent the Funds contemporaneously own or have the right to obtain at no added cost, securities identical to those sold short. Short sales are collateralized by cash deposits with the counterparty broker and pledged securities held at the custodian, U.S. Bank. The collateral required is determined daily by reference to the fair value of the short positions.
Total Return Swap Contracts
The Funds may enter into total return swap agreements. A total return swap entered into by the Funds is a derivative contract that transfers the market risk of underlying portfolios of futures contracts, forward currency contracts and foreign currencies (considered the “index” within each total return swap contract) between counterparties. The “notional amount” of each total return swap agreement is the agreed upon amount or value of the index used for calculating the returns that the parties to a swap agreement have agreed to exchange. The total return swaps are marked to market daily and any change is recorded in unrealized gain/loss on the consolidated statements of operations based on the value of the index on which the total return swap is referenced, as defined within the total return swap agreement between the counterparties. The composition of the index may vary based on how the underlying portfolio of futures contracts, forward currency contracts and foreign currencies is traded. A Fund’s obligation under total return swap agreement, including any related fees, offset against amounts owed to the Fund in the case of positive performance, will be covered by designating liquid assets on the Fund’s books and records
LoCorr Macro Strategies Fund, LoCorr Long/Short Commodities Strategy Fund and LoCorr Market Trend Fund – Notes to Consolidated Financial
Statements / LoCorr Dynamic Opportunity Fund and LoCorr Spectrum Income Fund – Notes to Financial Statements (continued) |
(see the consolidated statement of assets and liabilities for deposits with broker for derivative instruments). Gains or losses will be realized when the total return swap contracts are liquidated and will be presented as net realized gain or loss on swap contracts on the consolidated statements of operations. Changes in notional value and any cash holding adjustments, which represent voluntary realizations by a Fund of swap value at any point in time, are also presented as net realized gain or loss on swap contracts on the consolidated statements of operations. Further, any cash holding adjustments realized by a Fund are subject to interest charges, which are recorded as part of unrealized gain/loss on the consolidated statements of operations. A corresponding asset or liability for “advance receipt on swap contracts” or “advance payment on swap contracts,” respectively, is recorded on the consolidated statements of assets and liabilities for the gain or loss realized on changes in notional value. Total return swaps outstanding at period end, if any, are listed after the Funds’ consolidated schedules of investments.
Use of Estimates
The preparation of financial statements in conformity with GAAP requires management to make estimates and assumptions that affect the reported amounts of assets and liabilities, disclosure of contingent assets and liabilities at the date of the financial statements and the reported revenues and expenses during the reporting period. Actual results could differ from those estimates.
Warrants
The Funds may invest in warrants. Warrants are options to purchase common stock at a specific price (usually at a premium above the market value of the optioned common stock at issuance) valid for a specific period of time. Warrants may have a life ranging from less than one year to twenty years, or they may be perpetual. However, most warrants have expiration dates after which they are worthless. In addition, a warrant is worthless if the market price of the common stock does not exceed the warrant’s exercise price during the life of the warrant. Warrants have no voting rights, pay no dividends and have no rights with respect to the assets of the corporation issuing them. The percentage increase or decrease in the market price of the warrant may tend to be greater than the percentage increase or decrease in the market price of the optioned common stock.
3. | Derivative and Other Financial Instruments |
The Funds may invest in derivatives such as futures, forward currency, options, and swap contracts, in order to hedge against market movements while liquidating certain positions and buying other securities or as substitutes for securities, as well as for speculative purposes to gain exposure to such market movements.
The Funds’ market risk related to their derivatives trading is influenced by a wide variety of factors, including the level and volatility of interest rates, exchange rates, weather, supply and demand of commodities, the market value of futures and forward currency contracts, the diversification effects among the Funds’ open positions and the liquidity of the markets in which they trade.
The following are the primary trading risk exposures by market sector of the Funds as encompassed in the total return swap contracts:
Agricultural. (grains, livestock and softs). The Funds’ primary exposure is to agricultural price movements which are often directly affected by severe or unexpected weather conditions.
Currencies. Exchange rate risk is a principal market exposure of the Funds. The Funds’ currency exposure is to exchange rate fluctuations, primarily fluctuations which disrupt the historical pricing relationships between different currencies and currency pairs. The fluctuations are influenced by interest rate changes as well as political and general economic conditions. The Funds trade in a large number of currencies including cross-rates– e.g., positions between two currencies other than the U.S. dollar.
Energy. The Funds’ primary energy market exposure is to gas and oil price movements, often resulting from political developments in the Middle East and economic conditions worldwide. Energy prices are volatile and substantial profits and losses have been and are expected to continue to be experienced in this market.
Interest Rates. Interest rate movements directly affect the price of the sovereign bond futures positions held by the Funds and indirectly the value of its stock index currency positions. Interest rate movements in one country as well as relative interest rate movements between countries may materially impact the Funds’ profitability. The Funds’ primary interest rate exposure is to interest rate fluctuations in countries or regions including Australia, Canada, Japan, Switzerland, the United Kingdom, the
United States and the Eurozone. However, the Funds also may take positions in futures contracts on the government debt of other nations. The Funds anticipate that interest rates in these industrialized countries or areas, both long-term and short-term, will remain a primary market exposure of the Funds for the foreseeable future.
LoCorr Macro Strategies Fund, LoCorr Long/Short Commodities Strategy Fund and LoCorr Market Trend Fund – Notes to Consolidated Financial
Statements / LoCorr Dynamic Opportunity Fund and LoCorr Spectrum Income Fund – Notes to Financial Statements (continued) |
Metals. The Funds’ metals market exposure is to fluctuations in the price of aluminum, copper, gold, lead, nickel, palladium, tin, silver and zinc.
Stock Index. The Funds’ equity exposure, through stock index futures, is to equity price risk in the major industrialized countries as well as other countries.
The Fund invests in options which are not traded on an exchange. In doing so, it is assuming a credit risk with regard to the party with which it trades and also bears the risk of settlement default. These risks may differ materially from risks associated with transactions effected on an exchange, which generally are backed by clearing organization guarantees, daily mark-to market and settlement, segregation and minimum capital requirements applicable to intermediaries. Relying on a counterparty exposes the Fund to the risk that a counterparty will not settle a transaction in accordance with its terms and conditions because of a dispute over the terms of the contract (whether or not bona fide) or because of a credit or liquidity problem, thus causing the Fund to suffer a loss. If a counterparty defaults on its payment obligations to the Fund, this default will cause the value of an investment in the Fund to decrease.
At December 31, 2023, the LoCorr Macro Strategies Fund, the LoCorr Long/Short Commodities Strategy Fund and the LoCorr Market Trend Fund held derivative and other financial instruments which are not subject to a master netting arrangement. The following table presents derivative financial instruments that are subject to enforceable netting agreements, collateral agreements, or other similar agreements as of the reporting date.
LoCorr Macro Strategies Fund - December 31, 2023 | | | | | | | | | | | | |
Assets: | | | | | | | | | | | | | | Gross Amounts
not offset in the Consolidated
Statement of Assets & Liabilities | | | | | |
Description | | Gross Amounts of
Recognized Assets | | | Gross Amounts
Offset in the
Consolidated
Statement of
Assets & Liabilities | | | Net Amounts
Presented in the
Consolidated
Statement of
Assets & Liabilities | | | Financial
Instruments | | | Collateral Pledged
(Received) | | | Net Amount | |
Forward currency contracts | | $ | 13,184,799 | | | $ | — | | | $ | 13,184,799 | | | $ | — | | | $ | — | | | $ | 13,184,799 | |
Total | | $ | 13,184,799 | | | $ | — | | | $ | 13,184,799 | | | $ | — | | | $ | — | | | $ | 13,184,799 | |
Liabilities: | | | | | | | | | | | | | | Gross Amounts
not offset in the Consolidated
Statement of Assets & Liabilities | | | | | |
Description | | Gross Amounts
of Recognized
Liabilities | | | Gross Amounts
Offset in the
Consolidated
Statement of
Assets & Liabilities | | | Net Amounts
Presented in the
Consolidated
Statement of
Assets & Liabilities | | | Financial
Instruments | | | Collateral Received
(Pledged) | | | Net Amount | |
Forward currency contracts | | $ | 24,623,351 | | | $ | — | | | $ | 24,623,351 | | | $ | — | | | $ | (24,623,351 | ) | | $ | — | |
Total | | $ | 24,623,351 | | | $ | — | | | $ | 24,623,351 | | | $ | — | | | $ | (24,623,351 | ) | | $ | — | |
LoCorr Long/Short Commodities Strategy Fund - December 31, 2023 | | | | | | | | | | | | |
Assets: | | | | | | | | | | | | | | Gross Amounts
not offset in the Consolidated
Statement of Assets & Liabilities | | | | | |
Description | | Gross Amounts of
Recognized Assets | | | Gross Amounts
Offset in the
Consolidated
Statement of
Assets & Liabilities | | | Net Amounts
Presented in the
Consolidated
Statement of
Assets & Liabilities | | | Financial
Instruments | | | Collateral Pledged
(Received) | | | Net Amount | |
Swap Contracts* | | $ | 95,927,977 | | | $ | — | | | $ | 95,927,977 | | | $ | — | | | $ | — | | | $ | 95,927,977 | |
Total | | $ | 95,927,977 | | | $ | — | | | $ | 95,927,977 | | | $ | — | | | $ | — | | | $ | 95,927,977 | |
* | Includes $30,708,420 of advance receipt on swap contracts. |
LoCorr Macro Strategies Fund, LoCorr Long/Short Commodities Strategy Fund and LoCorr Market Trend Fund – Notes to Consolidated Financial
Statements / LoCorr Dynamic Opportunity Fund and LoCorr Spectrum Income Fund – Notes to Financial Statements (continued) |
LoCorr Market Trend Fund - December 31, 2023 | | | | | | | | | | | | |
Assets: | | | | | | | | | | | | | | Gross Amounts
not offset in the Consolidated
Statement of Assets & Liabilities | | | | | |
Description | | Gross Amounts of
Recognized Assets | | | Gross Amounts
Offset in the
Consolidated
Statement of
Assets & Liabilities | | | Net Amounts
Presented in the
Consolidated
Statement of
Assets & Liabilities | | | Financial
Instruments | | | Collateral Pledged
(Received) | | | Net Amount | |
Forward currency contracts | | $ | 2,218,205 | | | $ | — | | | $ | 2,218,205 | | | $ | — | | | $ | — | | | $ | 2,218,205 | |
Total | | $ | 2,218,205 | | | $ | — | | | $ | 2,218,205 | | | $ | — | | | $ | — | | | $ | 2,218,205 | |
Liabilities: | | | | | | | | | | | | | | Gross Amounts
not offset in the Consolidated
Statement of Assets & Liabilities | | | | | |
Description | | Gross Amounts
of Recognized
Liabilities | | | Gross Amounts
Offset in the
Consolidated
Statement of
Assets & Liabilities | | | Net Amounts
Presented in the
Consolidated
Statement of
Assets & Liabilities | | | Financial
Instruments | | | Collateral Received
(Pledged) | | | Net Amount | |
Forward currency contracts | | $ | 9,270,476 | | | $ | — | | | $ | 9,270,476 | | | $ | — | | | $ | (9,270,476 | ) | | $ | — | |
Total | | $ | 9,270,476 | | | $ | — | | | $ | 9,270,476 | | | $ | — | | | $ | (9,270,476 | ) | | $ | — | |
The Funds have adopted authoritative standards regarding disclosure about derivatives and hedging activities and how they affect the Funds’ consolidated statements of assets and liabilities and consolidated statements of operations. Fair value of swap contracts are recorded in the consolidated statements of assets and liabilities as net unrealized appreciation on swap contracts or net unrealized depreciation on swap contracts.
Since the derivatives held long or short are for speculative trading purposes, the derivative instruments are not designated as hedging instruments. Accordingly, all realized gains and losses, as well as any change in net unrealized gains or losses on open contracts from the preceding period, are recognized as part of realized and unrealized gain (loss) in the consolidated statements of operations.
The following table presents the fair value of consolidated derivative instruments for the LoCorr Macro Strategies Fund, LoCorr Long/Short Commodities Strategy Fund and LoCorr Market Trend Fund and the non-consolidated derivative instrsuments for the LoCorr Spectrum Income Fund as of December 31, 2023 as presented on each Fund’s consolidated and non-consolidated statements of assets and liabilities:
| | | Fair Value | | | Net Unrealized
Gain (Loss) on | |
Derivatives Not Accounted for as Hedging Instruments | | Assets | | | Liabilities | | | Open Positions | |
LoCorr Macro Strategies Fund | | | | | | | | | | | | |
Forward Currency Contracts(a) | | | | | | | | | | | | |
Long | | $ | 13,141,306 | | | $ | 54,053 | | | $ | 13,087,253 | |
Short | | | 43,493 | | | | 24,569,298 | | | | (24,525,805 | ) |
Total Forward Currency Contracts | | | 13,184,799 | | | | 24,623,351 | | | | (11,438,552 | ) |
| | | | | | | | | | | | | |
Futures Contracts(b) | | | | | | | | | | | | |
Long Contracts | | | | | | | | | | | | |
Commodity | | | 1,824,588 | | | | 3,571,429 | | | | (1,746,841 | ) |
Equity | | | 6,005,945 | | | | 1,014,036 | | | | 4,991,909 | |
Foreign exchange | | | 107,554 | | | | 612,824 | | | | (505,270 | ) |
Interest rate | | | 1,312,586 | | | | 348,724 | | | | 963,862 | |
Total Long Contracts | | | 9,250,673 | | | | 5,547,013 | | | | 3,703,660 | |
LoCorr Macro Strategies Fund, LoCorr Long/Short Commodities Strategy Fund and LoCorr Market Trend Fund – Notes to Consolidated Financial
Statements / LoCorr Dynamic Opportunity Fund and LoCorr Spectrum Income Fund – Notes to Financial Statements (continued) |
| | | Fair Value | | | Net Unrealized
Gain (Loss) on | |
Derivatives Not Accounted for as Hedging Instruments | | Assets | | | Liabilities | | | Open Positions | |
| | | | | | | | | | | | | |
Short Contracts | | | | | | | | | | | | |
Commodity | | $ | 1,723,476 | | | $ | 5,308,925 | | | $ | (3,585,449 | ) |
Equity | | | 252,466 | | | | 858,723 | | | | (606,257 | ) |
Foreign exchange | | | 4,195 | | | | 137,785 | | | | (133,590 | ) |
Interest rate | | | 60,135 | | | | 14,117,009 | | | | (14,056,874 | ) |
Total Short Contracts | | | 2,040,272 | | | | 20,422,442 | | | | (18,382,170 | ) |
Total Futures Contracts | | | 11,290,945 | | | | 25,969,455 | | | | (14,678,510 | ) |
Total Forward Currency Contracts and Futures Contracts | | $ | 24,475,744 | | | $ | 50,592,806 | | | $ | (26,117,062 | ) |
| | | | | | | | | | | | | |
LoCorr Long/Short Commodities Strategy Fund | | | | | | | | | | | | |
Long Total Return Swap Contracts | | | | | | | | | | | | |
LoCorr Commodities Index | | $ | 65,219,557 | | | $ | — | | | $ | 65,219,557 | |
| | | | | | | | | | | | | |
LoCorr Market Trend Fund | | | | | | | | | | | | |
Forward Currency Contracts(a) | | | | | | | | | | | | |
Long | | $ | 2,218,205 | | | $ | — | | | $ | 2,218,205 | |
Short | | | — | | | | 9,270,476 | | | | (9,270,476 | ) |
Total Forward Currency Contracts | | | 2,218,205 | | | | 9,270,476 | | | | (7,052,271 | ) |
| | | | | | | | | | | | | |
Futures Contracts(b) | | | | | | | | | | | | |
Long Contracts | | | | | | | | | | | | |
Commodity | | | 1,000,450 | | | | 1,513,555 | | | | (513,105 | ) |
Equity | | | 4,632,260 | | | | 763,693 | | | | 3,868,567 | |
Foreign exchange | | | — | | | | 166,644 | | | | (166,644 | ) |
Interest rate | | | 56,157 | | | | 177,599 | | | | (121,442 | ) |
Total Long Contracts | | | 5,688,867 | | | | 2,621,491 | | | | 3,067,376 | |
Short Contracts | | | | | | | | | | | | |
Commodity | | $ | 951,574 | | | $ | 2,880,989 | | | $ | (1,929,415 | ) |
Equity | | | — | | | | 671,006 | | | | (671,006 | ) |
Interest rate | | | 810 | | | | 9,807,028 | | | | (9,806,218 | ) |
Total Short Contracts | | | 952,384 | | | | 13,359,023 | | | | (12,406,639 | ) |
Total Futures Contracts | | | 6,641,251 | | | | 15,980,514 | | | | (9,339,263 | ) |
Total Forward Currency Contracts and Futures Contracts | | $ | 8,859,456 | | | $ | 25,250,990 | | | $ | (16,391,534 | ) |
| | | | | | | | | | | | | |
LoCorr Spectrum Income Fund | | | | | | | | | | | | |
Options | | | | | | | | | | | | |
Written Options | | $ | — | | | $ | (55,440 | ) | | $ | (14,264 | ) |
Total Options | | $ | — | | | $ | (55,440 | ) | | $ | (14,264 | ) |
(a) | Unrealized appreciation on forward currency contracts is a receivable and unrealized depreciation on forward currency contracts is a payable on the Fund’s consolidated statement of assets and liabilities. |
(b) | Reflects the cumulative unrealized appreciation (depreciation) of futures contracts as reported in the Fund’s consolidated schedule of open futures contracts. Only the current day variation margin and unsettled open futures contracts is separately reported within the Fund’s consolidated statement of assets and liabilities. |
LoCorr Macro Strategies Fund, LoCorr Long/Short Commodities Strategy Fund and LoCorr Market Trend Fund – Notes to Consolidated Financial
Statements / LoCorr Dynamic Opportunity Fund and LoCorr Spectrum Income Fund – Notes to Financial Statements (continued) |
The following table presents the results of the derivative trading and information related to volume for the year ended December 31, 2023. The below captions of “Net Realized” and “Net Change in Unrealized” correspond to the captions in each Fund’s consolidated and non-consolidated statement of operations.
| | | Gain (Loss) from Trading | |
Fund and Type of Derivative Instrument | | Net Realized | | | Net Change in
Unrealized | |
LoCorr Macro Strategies Fund | | | | | | | | |
Forward Currency Contracts | | $ | (13,001,132 | ) | | $ | (15,500,920 | ) |
Futures Contracts | | | | | | | | |
Commodity | | | (61,462,796 | ) | | | (16,493,143 | ) |
Equity | | | 4,607,675 | | | | 22,180,347 | |
Foreign exchange | | | (37,648,396 | ) | | | (1,972,389 | ) |
Interest rate | | | (16,413,866 | ) | | | (57,682,288 | ) |
Total Futures Contracts | | | (110,917,383 | ) | | | (53,967,473 | ) |
Total Forward Currency Contracts and Futures Contracts | | $ | (123,918,515 | ) | | $ | (69,468,393 | ) |
| | | | | | | | | |
LoCorr Long/Short Commodities Strategy Fund | | | | | | | | |
Swap Contracts | | $ | 38,595,277 | | | $ | (32,670,084 | ) |
| | | | | | | | | |
LoCorr Market Trend Fund | | | | | | | | |
Forward Currency Contracts | | $ | (6,637,990 | ) | | $ | (8,027,131 | ) |
Futures Contracts | | | | | | | | |
Commodity | | | (30,053,632 | ) | | | (3,935,339 | ) |
Equity | | | (6,394,765 | ) | | | 15,355,939 | |
Foreign exchange | | | 155,262 | | | | (139,716 | ) |
Interest rate | | | 2,279,586 | | | | (30,004,303 | ) |
Total Futures Contracts | | | (34,013,549 | ) | | | (18,723,419 | ) |
Total Forward Currency Contracts and Futures Contracts | | $ | (40,651,539 | ) | | $ | (26,750,550 | ) |
| | | | | | | | | |
LoCorr Spectrum Income Fund | | | | | | | | |
Options | | | | | | | | |
Written Options | | | 1,036,555 | | | | (14,264 | ) |
Total Options | | $ | 1,036,555 | | | $ | (14,264 | ) |
(d) | Purchased options are included within net realized gain (loss) on investments and net change in unrealized appreciation/depreciation on investments. |
The average monthly notional amount is shown as an indicator of volume. The average monthly notional amounts during the year ended December 31, 2023 were:
| | | Average Notional Amount | |
| | Long Contracts | | | Short Contracts | |
LoCorr Macro Strategies Fund | | | | | | | | |
Forward Currency Contracts | | $ | 1,171,111,135 | | | $ | 1,355,326,871 | |
Futures Contracts | | | 1,253,529,035 | | | | 4,162,600,017 | |
| | | | | | | | | |
LoCorr Long/Short Commodities Strategy Fund | | | | | | | | |
Swap Contracts | | $ | 443,137,406 | | | $ | — | |
| | | | | | | | | |
LoCorr Market Trend Fund | | | | | | | | |
Forward Currency Contracts | | $ | 345,615,643 | | | $ | 455,712,834 | |
Futures Contracts | | | 452,016,072 | | | | 1,850,006,534 | |
| | | | | | | | | |
LoCorr Macro Strategies Fund, LoCorr Long/Short Commodities Strategy Fund and LoCorr Market Trend Fund – Notes to Consolidated Financial
Statements / LoCorr Dynamic Opportunity Fund and LoCorr Spectrum Income Fund – Notes to Financial Statements (continued) |
| | | Average Notional Amount | |
| | Long Contracts | | | Short Contracts | |
LoCorr Spectrum Income Fund | | | | | | | | |
Options(a) | | $ | 72,876,702 | | | $ | 15,959,519 | |
(a) | Represents an average of each month the Fund held purchased or written options. |
The swap contracts and the commodity-related futures contracts reported in the tables in Note 3 represent balances and activity of each Fund’s respective wholly-owned and controlled subsidiary. See Note 2.
Please refer to the Funds’ prospectus for a full listing of risks associated with these investments.
4. | Investment Transactions |
The cost of security purchases and proceeds from security sales, excluding short-term investments, derivative instruments, short sales and purchases to cover short sales, for the year ended December 31, 2023 were as follows:
| | | U.S. Government Obligations | | | All Other | |
| | Purchases | | | Sales | | | Purchases | | | Sales | |
LoCorr Macro Strategies Fund | | $ | 364,020,095 | | | $ | 478,985,071 | | | $ | 211,723,194 | | | $ | 412,764,137 | |
LoCorr Long/Short Commodities Strategy Fund | | | 201,585,664 | | | | 277,442,244 | | | | 223,499,081 | | | | 326,228,266 | |
LoCorr Market Trend Fund | | | 84,065,031 | | | | 97,610,588 | | | | 65,449,336 | | | | 99,234,985 | |
LoCorr Dynamic Opportunity Fund | | | — | | | | — | | | | 437,622,327 | | | | 457,030,544 | |
LoCorr Spectrum Income Fund | | | — | | | | — | | | | 36,704,881 | | | | 60,970,339 | |
5. | Management Fees and Other Transactions with Affiliates |
Management Agreement
The Trust has a Management Agreement with the Adviser, with whom certain officers and Trustees of the Funds are affiliated, to furnish investment advisory services to the Funds. Pursuant to the Management Agreement, the Adviser is entitled to receive a fee, paid monthly, as follows:
Fund | Annual Advisory Fee as a
Percentage of the Average Daily
Net Assets of the Fund |
LoCorr Macro Strategies Fund | 1.65% |
LoCorr Market Trend Fund | 1.50% |
LoCorr Dynamic Opportunity Fund | 1.50% |
LoCorr Spectrum Income Fund | 1.30% |
Pursuant to the Management Agreement, the Adviser is entitled to receive a fee, paid monthly, in accordance with the Incremental Advisory Fee schedule below based on the LoCorr Long/Short Commodities Strategy Fund’s average daily net assets.
Net Assets for the LoCorr Long/Short
Commodities Strategy Fund | Incremental
Advisory Fee* |
$0.0 - $0.5 billion | 1.50% |
$0.5 - $1.0 billion | 1.40% |
$1.0 - $1.5 billion | 1.30% |
$1.5 - $2.0 billion | 1.20% |
$2.0 - $2.5 billion | 1.10% |
Over $2.5 billion | 1.00% |
* | Incremental advisory fee represents the fees paid on net assets at the related net asset level. For example, with $3 billion in net assets in the Fund, the Adviser would earn 1.50% on the first $500 million, plus 1.40% on the next $500 million, plus 1.30% on the next $500 million, plus 1.20% on the next $500 million, plus 1.10% on the next $500 million, plus 1.00% on the final $500 million. |
LoCorr Macro Strategies Fund, LoCorr Long/Short Commodities Strategy Fund and LoCorr Market Trend Fund – Notes to Consolidated Financial
Statements / LoCorr Dynamic Opportunity Fund and LoCorr Spectrum Income Fund – Notes to Financial Statements (continued) |
As of and for the year ended December 31, 2023, the Funds reported the following in regards to management fees:
Fund | | Management
Fees For the
Year Ended
December 31, 2023 | | | Accrued Net
Management
Fees as of
December 31, 2023 | |
LoCorr Macro Strategies Fund | | $ | 33,128,831 | | | $ | 2,246,940 | |
LoCorr Long/Short Commodities Strategy Fund | | | 18,013,657 | | | | 1,245,605 | |
LoCorr Market Trend Fund | | | 7,493,948 | | | | 541,024 | |
LoCorr Dynamic Opportunity Fund | | | 1,189,771 | | | | 69,765 | |
LoCorr Spectrum Income Fund | | | 1,325,058 | | | | 95,538 | |
Sub-Advisory Agreements
Sub-advisory services are provided to the Funds, pursuant to agreements between the Adviser and the below listed sub- advisers. Under the terms of these sub-advisory agreements, the Adviser compensates the sub-advisers based on the portion of each Fund’s average daily net assets which they have been allocated to manage.
LoCorr Macro Strategies Fund: | LoCorr Dynamic Opportunity Fund: |
Graham Capital Management, L.P. | Kettle Hill Capital Management, LLC |
Millburn Ridgefield Corporation | Millrace Asset Group, Inc. |
Nuveen Asset Management, LLC | |
Revolution Capital Management LLC | |
R.G. Niederhoffer Capital Management | |
| | |
LoCorr Long/Short Commodities Strategy Fund: | LoCorr Spectrum Income Fund: |
Nuveen Asset Management, LLC | Bramshill Investments, LLC |
| | |
LoCorr Market Trend Fund: | |
Graham Capital Management, L.P. | |
Nuveen Asset Management, LLC | |
The Adviser is solely responsible for the payment of the sub-adviser’s fees, and the sub-adviser agrees not to seek payment of its fees from the Trust or the Funds.
Expense Limitation Agreement
The Funds’ Adviser has contractually agreed to waive management fees and/or reimburse the Funds for expenses they incur, but only to the extent necessary to maintain the Funds’ total annual operating expenses after fee waiver and/or reimbursement (excluding any Rule 12b-1 distribution and/or servicing fees, taxes, interest, brokerage commissions, expenses incurred in connection with any merger or reorganization, dividend expenses on short sales, swap fees, indirect expenses, expenses of other investment companies in which the Funds may invest, or extraordinary expenses such as litigation expenses and inclusive of offering and organizational costs incurred prior to the commencement of operations) at the percentages listed below:
Fund | Expense Limit as a
Percentage of the Average Daily
Net Assets of the Fund | Effective Period Through |
LoCorr Macro Strategies Fund | 1.99% | April 30, 2024 |
LoCorr Long/Short Commodities Strategy Fund | 1.95% | April 30, 2024 |
LoCorr Market Trend Fund | 1.95% | April 30, 2024 |
LoCorr Dynamic Opportunity Fund | 1.99% | April 30, 2024 |
LoCorr Spectrum Income Fund | 1.80% | April 30, 2024 |
LoCorr Macro Strategies Fund, LoCorr Long/Short Commodities Strategy Fund and LoCorr Market Trend Fund – Notes to Consolidated Financial
Statements / LoCorr Dynamic Opportunity Fund and LoCorr Spectrum Income Fund – Notes to Financial Statements (continued) |
Any waiver or reimbursement is subject to repayment by the respective Fund within the three fiscal years following the fiscal year in which the expenses occurred if the Fund is able to make the repayment without exceeding its current expense limitation and the expense limitation at the time of the waiver and the repayment is approved by the Board.
The total amounts of management fees waived and/or expenses reimbursed which are subject to recovery, and their related expiration date are as follows:
LoCorr Dynamic Opportunity Fund | | | | | | | | |
| | | Management Fees | | | Recovery to Adviser | | | | | | | Subject to Recovery
on or Before | |
Period | | (Waived) by Adviser
Subject to Recovery | | | Year Ended
December 31, 2023 | | | Remaining Available
Subject to Recovery | | | Fiscal Year Ending
December 31, | |
Year Ended December 31, 2023 | | $ | (50,998 | ) | | $ | — | | | $ | (50,998 | ) | | | 2026 | |
Year Ended December 31, 2022 | | | (154,575 | ) | | | — | | | | (154,575 | ) | | | 2025 | |
Year Ended December 31, 2021 | | | (263,217 | ) | | | — | | | | (263,217 | ) | | | 2024 | |
Year Ended December 31, 2020 | | | (278,103 | ) | | | 4,302 | | | | — | | | | 2023 | |
Total | | $ | (746,893 | ) | | $ | 4,302 | | | $ | (468,790 | ) | | | | |
LoCorr Spectrum Income Fund | | | | | | | | |
| | | Management Fees | | | Recovery to Adviser | | | | | | | Subject to Recovery
on or Before | |
Period | | (Waived) by Adviser
Subject to Recovery | | | Year Ended
December 31, 2023 | | | Remaining Available
Subject to Recovery | | | Fiscal Year Ending
December 31, | |
Year Ended December 31, 2023 | | $ | — | | | $ | — | | | $ | — | | | | 2026 | |
Year Ended December 31, 2022 | | | (9,125 | ) | | | 9,125 | | | | — | | | | 2025 | |
Year Ended December 31, 2021 | | | (2,643 | ) | | | 2,643 | | | | — | | | | 2024 | |
Total | | $ | (11,768 | ) | | $ | 11,768 | | | $ | — | | | | | |
For the year ended December 31, 2020, fees waived by the Adviser for the LoCorr Dynamic Opportunity Fund totaling $273,801, expired on December 31, 2023 and are no longer eligible for recovery by the Adviser.
At December 31, 2023, there were no fees subject to recovery for the LoCorr Macro Strategies Fund, the LoCorr Long/Short Commodities Strategy Fund or the LoCorr Market Trend Fund.
Rule 12b-1 Distribution Agreement
The Funds have entered into a Rule 12b-1 distribution agreement with Quasar Distributors, LLC (“Quasar”). Class A shareholders pay distribution expenses to Quasar at the annual rate not to exceed 0.25% of the Fund’s average daily net assets. Class C shareholders pay to Quasar an annual rate not to exceed 1.00%, which is comprised of 0.75% in distribution expenses and 0.25% in service fees, of the Fund’s average daily net assets. Class I shareholders pay no 12b-1 fees.
Sales Charges
Contingent deferred sales charges (“CDSC”) do not represent expenses of the Fund. They are deducted from the proceed of sales of Fund shares from redemption proceeds prior to remittance. The CDSC retained by the Distributor on the redemption of shares is shown in the following table for the fiscal year ended December 31, 2023.
Fund | | Class A CDSC
Retained by
Distributor | | | Class C CDSC
Retained by
Distributor | |
LoCorr Macro Strategies Fund | | $ | — | | | $ | 9,876 | |
LoCorr Long/Short Commodities Strategy Fund | | | — | | | | 1,588 | |
LoCorr Market Trend Fund | | | — | | | | 16,270 | |
LoCorr Dynamic Opportunity Fund | | | — | | | | 550 | |
LoCorr Spectrum Income Fund | | | 41 | | | | 1,065 | |
LoCorr Macro Strategies Fund, LoCorr Long/Short Commodities Strategy Fund and LoCorr Market Trend Fund – Notes to Consolidated Financial
Statements / LoCorr Dynamic Opportunity Fund and LoCorr Spectrum Income Fund – Notes to Financial Statements (continued) |
At December 31, 2023 there were an unlimited number of shares of beneficial interest authorized. The following table summarizes the activity in shares and dollar amounts applicable to each class of the Funds.
LoCorr Macro Strategies Fund - Class A | | | | | | | | |
| | | For the Year Ended December 31, 2023 | | | For the Year Ended December 31, 2022 | |
| | Shares | | | Amount | | | Shares | | | Amount | |
Shares Sold | | | 3,495,601 | | | $ | 27,906,925 | | | | 3,718,727 | | | $ | 33,874,831 | |
Reinvestment of Distributions | | | 272,677 | | | | 2,069,619 | | | | 1,242,991 | | | | 9,894,206 | |
Shares Redeemed | | | (3,989,358 | ) | | | (31,449,278 | ) | | | (5,605,764 | ) | | | (47,818,163 | ) |
| | | | (221,080 | ) | | $ | (1,472,734 | ) | | | (644,046 | ) | | $ | (4,049,126 | ) |
Beginning Shares | | | 9,808,182 | | | | | | | | 10,452,228 | | | | | |
Ending Shares | | | 9,587,102 | | | | | | | | 9,808,182 | | | | | |
LoCorr Macro Strategies Fund - Class C | | | | | | | | |
| | For the Year Ended December 31, 2023 | | | For the Year Ended December 31, 2022 | |
| | Shares | | | Amount | | | Shares | | | Amount | |
Shares Sold | | | 650,312 | | | $ | 4,863,443 | | | | 2,808,722 | | | $ | 24,616,463 | |
Reinvestment of Distributions | | | 100,755 | | | | 720,399 | | | | 888,498 | | | | 6,663,735 | |
Shares Redeemed | | | (2,673,794 | ) | | | (19,923,852 | ) | | | (1,511,710 | ) | | | (12,660,740 | ) |
| | | | (1,922,727 | ) | | $ | (14,340,010 | ) | | | 2,185,510 | | | $ | 18,619,458 | |
Beginning Shares | | | 6,691,398 | | | | | | | | 4,505,888 | | | | | |
Ending Shares | | | 4,768,671 | | | | | | | | 6,691,398 | | | | | |
LoCorr Macro Strategies Fund - Class I | | | | | | | | |
| | For the Year Ended December 31, 2023 | | | For the Year Ended December 31, 2022 | |
| | Shares | | | Amount | | | Shares | | | Amount | |
Shares Sold | | | 83,659,132 | | | $ | 678,237,363 | | | | 183,173,847 | | | $ | 1,693,437,222 | |
Reinvestment of Distributions | | | 5,408,293 | | | | 41,914,268 | | | | 32,483,271 | | | | 263,764,157 | |
Shares Redeemed | | | (173,679,275 | ) | | | (1,397,134,989 | ) | | | (104,774,262 | ) | | | (957,743,783 | ) |
| | | | (84,611,850 | ) | | $ | (676,983,358 | ) | | | 110,882,856 | | | $ | 999,457,596 | |
Beginning Shares | | | 268,773,630 | | | | | | | | 157,890,774 | | | | | |
Ending Shares | | | 184,161,780 | | | | | | | | 268,773,630 | | | | | |
LoCorr Macro Strategies Fund | | | | | | | | |
Total Net Increase (Decrease) | | | | | | $ | (692,796,102 | ) | | | | | | $ | 1,014,027,928 | |
LoCorr Long/Short Commodities Strategy Fund - Class A | | | | | | | | |
| | | For the Year Ended December 31, 2023 | | | For the Year Ended December 31, 2022 | |
| | | Shares | | | Amount | | | Shares | | | Amount | |
Shares Sold | | | 4,554,740 | | | $ | 45,161,098 | | | | 14,948,929 | | | $ | 165,514,327 | |
Reinvestment of Distributions | | | 343,576 | | | | 3,277,713 | | | | 1,781,374 | | | | 17,884,998 | |
Shares Redeemed | | | (12,723,610 | ) | | | (122,762,856 | ) | | | (1,478,589 | ) | | | (16,073,870 | ) |
| | | | (7,825,294 | ) | | $ | (74,324,045 | ) | | | 15,251,714 | | | $ | 167,325,455 | |
Beginning Shares | | | 18,572,666 | | | | | | | | 3,320,952 | | | | | |
Ending Shares | | | 10,747,372 | | | | | | | | 18,572,666 | | | | | |
LoCorr Macro Strategies Fund, LoCorr Long/Short Commodities Strategy Fund and LoCorr Market Trend Fund – Notes to Consolidated Financial
Statements / LoCorr Dynamic Opportunity Fund and LoCorr Spectrum Income Fund – Notes to Financial Statements (continued) |
LoCorr Long/Short Commodities Strategy Fund - Class C | | | | | | | | |
| | For the Year Ended December 31, 2023 | | | For the Year Ended December 31, 2022 | |
| | Shares | | | Amount | | | Shares | | | Amount | |
Shares Sold | | | 65,225 | | | $ | 611,999 | | | | 455,799 | | | $ | 4,755,955 | |
Reinvestment of Distributions | | | 7,858 | | | | 71,193 | | | | 126,477 | | | | 1,205,323 | |
Shares Redeemed | | | (443,040 | ) | | | (4,118,456 | ) | | | (281,675 | ) | | | (2,893,417 | ) |
| | | | (369,957 | ) | | $ | (3,435,264 | ) | | | 300,601 | | | $ | 3,067,861 | |
Beginning Shares | | | 1,397,102 | | | | | | | | 1,096,501 | | | | | |
Ending Shares | | | 1,027,145 | | | | | | | | 1,397,102 | | | | | |
LoCorr Long/Short Commodities Strategy Fund - Class I | | | | | | | | |
| | For the Year Ended December 31, 2023 | | | For the Year Ended December 31, 2022 | |
| | Shares | | | Amount | | | Shares | | | Amount | |
Shares Sold | | | 38,008,360 | | | $ | 383,233,784 | | | | 68,854,599 | | | $ | 764,975,680 | |
Reinvestment of Distributions | | | 1,341,024 | | | | 12,994,526 | | | | 8,909,829 | | | | 90,880,259 | |
Shares Redeemed | | | (70,352,644 | ) | | | (701,956,940 | ) | | | (43,617,269 | ) | | | (481,240,945 | ) |
| | | | (31,003,260 | ) | | $ | (305,728,630 | ) | | | 34,147,159 | | | $ | 374,614,994 | |
Beginning Shares | | | 113,629,725 | | | | | | | | 79,482,566 | | | | | |
Ending Shares | | | 82,626,465 | | | | | | | | 113,629,725 | | | | | |
LoCorr Long/Short Commodities Strategy Fund | | | | | | | | |
Total Net Increase (Decrease) | | | | | | $ | (383,487,939 | ) | | | | | | $ | 545,008,310 | |
LoCorr Market Trend Fund - Class A | | | | | | | | |
| | | For the Year Ended December 31, 2023 | | | For the Year Ended December 31, 2022 | |
| | Shares | | | Amount | | | Shares | | | Amount | |
Shares Sold | | | 809,102 | | | $ | 10,146,943 | | | | 1,178,542 | | | $ | 17,579,997 | |
Reinvestment of Distributions | | | 54,786 | | | | 624,566 | | | | 342,409 | | | | 4,197,938 | |
Shares Redeemed | | | (758,379 | ) | | | (9,051,634 | ) | | | (622,589 | ) | | | (8,726,213 | ) |
| | | | 105,509 | | | $ | 1,719,875 | | | | 898,362 | | | $ | 13,051,722 | |
Beginning Shares | | | 2,222,771 | | | | | | | | 1,324,409 | | | | | |
Ending Shares | | | 2,328,280 | | | | | | | | 2,222,771 | | | | | |
LoCorr Market Trend Fund - Class C | | | | | | | | |
| | For the Year Ended December 31, 2023 | | | For the Year Ended December 31, 2022 | |
| | Shares | | | Amount | | | Shares | | | Amount | |
Shares Sold | | | 684,365 | | | $ | 8,183,338 | | | | 760,227 | | | $ | 10,799,750 | |
Dividends Reinvested | | | 28,367 | | | | 307,781 | | | | 242,029 | | | | 2,826,897 | |
Shares Redeemed | | | (605,338 | ) | | | (7,022,335 | ) | | | (347,625 | ) | | | (4,728,902 | ) |
| | | | 107,394 | | | $ | 1,468,784 | | | | 654,631 | | | $ | 8,897,745 | |
Beginning Shares | | | 1,636,965 | | | | | | | | 982,334 | | | | | |
Ending Shares | | | 1,744,359 | | | | | | | | 1,636,965 | | | | | |
LoCorr Market Trend Fund - Class I | | | | | | | | |
| | For the Year Ended December 31, 2023 | | | For the Year Ended December 31, 2022 | |
| | Shares | | | Amount | | | Shares | | | Amount | |
Shares Sold | | | 17,147,874 | | | $ | 210,584,327 | | | | 36,052,865 | | | $ | 528,757,377 | |
Reinvestment of Distributions | | | 838,705 | | | | 9,603,175 | | | | 5,855,523 | | | | 72,140,050 | |
Shares Redeemed | | | (21,447,171 | ) | | | (261,415,918 | ) | | | (26,662,847 | ) | | | (384,237,482 | ) |
| | | | (3,460,592 | ) | | $ | (41,228,416 | ) | | | 15,245,541 | | | $ | 216,659,945 | |
Beginning Shares | | | 36,249,598 | | | | | | | | 21,004,057 | | | | | |
Ending Shares | | | 32,789,006 | | | | | | | | 36,249,598 | | | | | |
LoCorr Market Trend Fund | | | | | | | | |
Total Net Increase (Decrease) | | | | | | $ | (38,039,757 | ) | | | | | | $ | 238,609,412 | |
LoCorr Macro Strategies Fund, LoCorr Long/Short Commodities Strategy Fund and LoCorr Market Trend Fund – Notes to Consolidated Financial
Statements / LoCorr Dynamic Opportunity Fund and LoCorr Spectrum Income Fund – Notes to Financial Statements (continued) |
LoCorr Dynamic Opportunity Fund - Class A | | | | | | | | |
| | | For the Year Ended December 31, 2023 | | | For the Year Ended December 31, 2022 | |
| | Shares | | | Amount | | | Shares | | | Amount | |
Shares Sold | | | 92,549 | | | $ | 1,042,714 | | | | 101,003 | | | $ | 1,131,973 | |
Reinvestment of Distributions | | | 3,209 | | | | 36,642 | | | | 3,091 | | | | 34,645 | |
Shares Redeemed | | | (99,623 | ) | | | (1,084,217 | ) | | | (110,930 | ) | | | (1,278,381 | ) |
| | | | (3,865 | ) | | $ | (4,861 | ) | | | (6,836 | ) | | $ | (111,763 | ) |
Beginning Shares | | | 315,067 | | | | | | | | 321,903 | | | | | |
Ending Shares | | | 311,202 | | | | | | | | 315,067 | | | | | |
LoCorr Dynamic Opportunity Fund - Class C | | | | | | | | |
| | For the Year Ended December 31, 2023 | | | For the Year Ended December 31, 2022 | |
| | Shares | | | Amount | | | Shares | | | Amount | |
Shares Sold | | | 4,503 | | | $ | 46,207 | | | | 112,861 | | | $ | 1,203,013 | |
Reinvestment of Distributions | | | 680 | | | | 7,167 | | | | 4,142 | | | | 42,783 | |
Shares Redeemed | | | (122,278 | ) | | | (1,237,422 | ) | | | (59,043 | ) | | | (622,346 | ) |
| | | | (117,095 | ) | | $ | (1,184,048 | ) | | | 57,960 | | | $ | 623,450 | |
Beginning Shares | | | 298,608 | | | | | | | | 240,648 | | | | | |
Ending Shares | | | 181,513 | | | | | | | | 298,608 | | | | | |
LoCorr Dynamic Opportunity Fund - Class I | | | | | | | | |
| | For the Year Ended December 31, 2023 | | | For the Year Ended December 31, 2022 | |
| | Shares | | | Amount | | | Shares | | | Amount | |
Shares Sold | | | 5,076,372 | | | $ | 58,661,109 | | | | 5,670,275 | | | $ | 65,646,132 | |
Reinvestment of Distributions | | | 56,489 | | | | 664,310 | | | | 70,993 | | | | 819,259 | |
Shares Redeemed | | | (6,822,774 | ) | | | (77,474,276 | ) | | | (595,202 | ) | | | (6,969,712 | ) |
| | | | (1,689,913 | ) | | $ | (18,148,857 | ) | | | 5,146,066 | | | $ | 59,495,679 | |
Beginning Shares | | | 6,533,274 | | | | | | | | 1,387,208 | | | | | |
Ending Shares | | | 4,843,361 | | | | | | | | 6,533,274 | | | | | |
LoCorr Dynamic Opportunity Fund | | | | | | | | |
Total Net Increase (Decrease) | | | | | | $ | (19,337,766 | ) | | | | | | $ | 60,007,366 | |
LoCorr Spectrum Income Fund - Class A | | | | | | | | |
| | | For the Year Ended December 31, 2023 | | | For the Year Ended December 31, 2022 | |
| | Shares | | | Amount | | | Shares | | | Amount | |
Shares Sold | | | 819,818 | | | $ | 4,507,897 | | | | 1,040,690 | | | $ | 6,787,508 | |
Reinvestment of Distributions | | | 184,362 | | | | 1,000,182 | | | | 116,828 | | | | 742,252 | |
Shares Redeemed | | | (875,802 | ) | | | (4,687,202 | ) | | | (417,030 | ) | | | (2,720,502 | ) |
Redemption Fees | | | — | | | | 966 | | | | — | | | | 3,102 | |
| | | | 128,378 | | | $ | 821,843 | | | | 740,488 | | | $ | 4,812,360 | |
Beginning Shares | | | 2,724,234 | | | | | | | | 1,983,746 | | | | | |
Ending Shares | | | 2,852,612 | | | | | | | | 2,724,234 | | | | | |
LoCorr Spectrum Income Fund - Class C | | | | | | | | |
| | For the Year Ended December 31, 2023 | | | For the Year Ended December 31, 2022 | |
| | Shares | | | Amount | | | Shares | | | Amount | |
Shares Sold | | | 103,710 | | | $ | 586,632 | | | | 574,298 | | | $ | 3,883,712 | |
Reinvestment of Distributions | | | 133,738 | | | | 736,654 | | | | 131,828 | | | | 854,654 | |
Shares Redeemed | | | (872,145 | ) | | | (4,777,672 | ) | | | (718,785 | ) | | | (4,667,557 | ) |
Redemption Fees | | | — | | | | 751 | | | | — | | | | 3,557 | |
| | | | (634,697 | ) | | $ | (3,453,635 | ) | | | (12,659 | ) | | $ | 74,366 | |
Beginning Shares | | | 2,508,107 | | | | | | | | 2,520,766 | | | | | |
Ending Shares | | | 1,873,410 | | | | | | | | 2,508,107 | | | | | |
LoCorr Macro Strategies Fund, LoCorr Long/Short Commodities Strategy Fund and LoCorr Market Trend Fund – Notes to Consolidated Financial
Statements / LoCorr Dynamic Opportunity Fund and LoCorr Spectrum Income Fund – Notes to Financial Statements (continued) |
LoCorr Spectrum Income Fund - Class I | | | | | | | | |
| | For the Year Ended December 31, 2023 | | | For the Year Ended December 31, 2022 | |
| | Shares | | | Amount | | | Shares | | | Amount | |
Shares Sold | | | 4,168,407 | | | $ | 23,111,873 | | | | 12,114,713 | | | $ | 77,392,878 | |
Reinvestment of Distributions | | | 965,973 | | | | 5,236,215 | | | | 675,814 | | | | 4,252,126 | |
Shares Redeemed | | | (8,890,669 | ) | | | (48,304,821 | ) | | | (4,141,178 | ) | | | (26,040,423 | ) |
Redemption Fees | | | — | | | | 4,471 | | | | — | | | | 13,889 | |
| | | | (3,756,289 | ) | | $ | (19,952,262 | ) | | | 8,649,349 | | | $ | 55,618,470 | |
Beginning Shares | | | 15,006,457 | | | | | | | | 6,357,108 | | | | | |
Ending Shares | | | 11,250,168 | | | | | | | | 15,006,457 | | | | | |
LoCorr Spectrum Income Fund | | | | | | | | |
Total Net Increase (Decrease) | | | | | | $ | (22,584,054 | ) | | | | | | $ | 60,505,196 | |
Conversion Feature
Class C shares purchased directly from the Funds or through a financial intermediary, except as otherwise disclosed in the Funds’ prospectus, automatically convert to Class A shares in the month of the 8-year anniversary date of the purchase of the Class C shares, based on the relative NAV of each such class without the imposition of any sales charge, fee or other charge.
7. | Federal Tax Information |
At December 31, 2023, the components of accumulated earnings (losses) on a tax basis were as follows(1):
| | | LoCorr Macro
Strategies Fund(2) | | | LoCorr Long/Short
Commodities
Strategy Fund(2) | | | LoCorr Market
Trend Fund(2) | |
Tax cost of portfolio | | $ | 1,436,243,801 | | | $ | 1,054,337,246 | | | $ | 347,539,308 | |
| | | | | | | | | | | | | |
Gross unrealized appreciation | | $ | 18,015,059 | | | $ | 114,569,158 | | | $ | 4,088,109 | |
Gross unrealized depreciation | | | (34,047,696 | ) | | | (101,849,135 | ) | | | (10,853,364 | ) |
Net unrealized appreciation (depreciation) | | | (16,032,637 | ) | | | 12,720,023 | | | | (6,765,255 | ) |
Undistributed ordinary income | | | 96,889 | | | | — | | | | 227,874 | |
Undistributed long-term capital gains | | | — | | | | — | | | | — | |
Total earnings accumulated | | | 96,889 | | | | — | | | | 227,874 | |
Other accumulated losses | | | (239,168,872 | ) | | | (22,730,116 | ) | | | (50,427,192 | ) |
Total distributable earnings (accumulated losses) | | $ | (255,104,620 | ) | | $ | (10,010,093 | ) | | $ | (56,964,573 | ) |
| | | LoCorr Dynamic
Opportunity Fund | | | LoCorr Spectrum
Income Fund | |
Tax cost of portfolio | | $ | 53,161,442 | | | $ | 75,786,599 | |
| | | | | | | | | |
Gross unrealized appreciation | | $ | 4,593,891 | | | $ | 11,518,637 | |
Gross unrealized depreciation | | | (3,616,911 | ) | | | (5,531,870 | ) |
Net unrealized appreciation | | | 976,980 | | | | 5,986,767 | |
Undistributed ordinary income | | | 193,268 | | | | — | |
Undistributed long-term capital gains | | | — | | | | — | |
Total earnings accumulated | | | 193,268 | | | | — | |
Other accumulated losses | | | (2,996,138 | ) | | | (47,001,475 | ) |
Total distributable earnings (accumulated losses) | | $ | (1,825,890 | ) | | $ | (41,014,708 | ) |
(1) | Total Portfolio represents aggregate amounts of Fund’s investments, securities sold short, forward currency contracts and futures contracts, where applicable. |
(2) | Tax Cost is presented on a non-consolidated basis and includes each of the Fund’s investment in the respective CFC’s and the unrealized appreciation and depreciation associated with those investments. |
LoCorr Macro Strategies Fund, LoCorr Long/Short Commodities Strategy Fund and LoCorr Market Trend Fund – Notes to Consolidated Financial
Statements / LoCorr Dynamic Opportunity Fund and LoCorr Spectrum Income Fund – Notes to Financial Statements (continued) |
Undistributed income or net realized gains for financial statement purposes may differ from amounts recognized for federal income tax purposes due to differences in the recognition and characterization of income, expense and capital gain items. The difference between book-basis and tax-basis unrealized appreciation (depreciation) is attributed primarily to the tax deferral of losses on wash sales, mark to market on certain derivative contracts, investments in partnerships and other temporary differences.
The following reclassifications were made within the components of net assets as of December 31, 2023:
| | Total Distributable
Earnings/
(Accumulated Loss) | | | Paid-in Capital | |
LoCorr Macro Strategies Fund | | $ | 55,980,350 | | | $ | (55,980,350 | ) |
LoCorr Long/Short Commodities Strategy Fund | | | 17,094,875 | | | | (17,094,875 | ) |
LoCorr Market Trend Fund | | | 29,752,636 | | | | (29,752,636 | ) |
LoCorr Dynamic Opportunity Fund | | | — | | | | — | |
LoCorr Spectrum Income Fund | | | 222,540 | | | | (222,540 | ) |
The LoCorr Macro Strategies Fund’s reclassifications are primarily attributable to certain reclassifications related to the Fund’s wholly-owned subsidiary.
The LoCorr Long/Short Commodities Strategy Fund’s reclassifications are primarily attributable to certain reclassifications related to the Fund’s wholly-owned subsidiary.
The LoCorr Market Trend Fund’s reclassifications are primarily attributable to certain reclassifications related to the Fund’s wholly-owned subsidiary.
The LoCorr Spectrum Income Fund’s reclassifications are primarily attributable to certain reclassifications related to partnership basis adjustments and prior year true-ups.
Under the current tax law, capital losses realized after October 31 may be deferred and treated as occurring on the first day of the following fiscal year. The Funds elected to defer no capital losses for the fiscal year ended December 31, 2023.
| | | Post October Loss
Deferral | | | Late Year Loss
Deferral | |
LoCorr Spectrum Income Fund | | $ | — | | | $ | 613,285 | |
At December 31, 2023, accumulated net realized capital loss carryovers, if any, and the year(s) in which the capital loss carryovers expire were:
| | | Capital Loss Carryover | | | | | |
| | | Short-Term | | | Long-Term | | | Year of
Expiration | |
LoCorr Macro Strategies Fund | | $ | 114,095,151 | | | $ | 125,073,721 | | | | Indefinitely | |
LoCorr Long/Short Commodities Strategy Fund | | | 10,271,568 | | | | 12,458,548 | | | | Indefinitely | |
LoCorr Market Trend Fund | | | 17,274,492 | | | | 33,144,351 | | | | Indefinitely | |
LoCorr Dynamic Opportunity Fund | | | 2,142,678 | | | | 827,386 | | | | Indefinitely | |
LoCorr Spectrum Income Fund | | | 19,815,765 | | | | 26,092,569 | | | | Indefinitely | |
During the year ended December 31, 2023, the Funds did not utilize any capital loss carryovers.
The Trust entered into an unsecured, uncommitted Loan Agreement (“Line of Credit” or “LOC”) with U.S. Bank not individually but as an umbrella facility on behalf of the Funds in the Trust. The LOC expires on March 8, 2024. The LOC was established to provide the Funds a temporary short-term liquidity source, subject to certain restrictions, covenants and the right of setoff on the Funds’ assets, to meet unanticipated redemptions. Under terms of the LOC, borrowings for each Fund are limited to the
LoCorr Macro Strategies Fund, LoCorr Long/Short Commodities Strategy Fund and LoCorr Market Trend Fund – Notes to Consolidated Financial
Statements / LoCorr Dynamic Opportunity Fund and LoCorr Spectrum Income Fund – Notes to Financial Statements (continued) |
lesser of one-third of the net unencumbered assets (including the amount borrowed) of the respective Fund, 5% of the gross assets of the respective Fund or $50 million in the aggregate for all of the Funds under this agreement. U.S. Bank, N.A. charges an interest rate per annum equal to the Prime Rate (8.50% as of December 31, 2023).
The Funds did not utilize the Line of Credit for the year ended December 31, 2023.
In preparing the financial statements, the Adviser has evaluated events after December 31, 2023.
Declaration of Dividends
The LoCorr Spectrum Income Fund declared the following ordinary income distributions:
| | | Distribution Amount per Share Class |
Dividend Declaration
Date (a) | Shareholder of
Record Date | Class A | Class C | Class I |
January 31, 2024 | January 30, 2024 | $0.0386 | $0.03470 | $0.04000 |
(a) | Ex-date, reinvest date and payable date. |
The estimated characterization of the distributions paid will be an ordinary dividend, qualified dividend or return of capital. See Note 2 for additional information.
At the Board Meeting held February 27, 2024, the Board approved an extension of the Loan Agreement with U.S. Bank to March 5, 2025. Other terms of the Loan Agreement remained the same.
There were no additional subsequent events since December 31, 2023 through the date the financial statements were issued that would require adjustments to or additional disclosure in these financial statements.
Report of Independent Registered Public Accounting Firm |
Report of Independent Registered Public Accounting Firm
To the Shareholders and Board of Trustees of
LoCorr Investment Trust
Opinion on the Financial Statements
We have audited the accompanying statements of assets and liabilities, including the schedules of investments, written options, open forward currency contracts, open futures contracts, swap contracts, and securities sold short (as applicable), of LoCorr Investment Trust comprising the funds listed below (the “Funds”) as of December 31, 2023, the related statements of operations, the statements of changes in net assets, the related notes, and the financial highlights for each of the periods indicated below (collectively referred to as the “financial statements”). In our opinion, the financial statements present fairly, in all material respects, the financial position of each of the Funds as of December 31, 2023, the results of their operations, the changes in net assets, and the financial highlights for each of the periods indicated below in conformity with accounting principles generally accepted in the United States of America.
Fund Name | | Statements of
Operations | | | Statements of
Changes in Net Assets | | | Financial Highlights | |
LoCorr Macro Strategies Fund, LoCorr Long/Short Commodities Strategy Fund and LoCorr Market Trend Fund* | | For the year ended December 31, 2023 | | | For the years ended December 31, 2023 and 2022 | | | For the years ended December 31, 2023, 2022, 2021, 2020, and 2019 | |
LoCorr Dynamic Opportunity Fund and LoCorr Spectrum Income Fund | | For the year ended December 31, 2023 | | | For the years ended December 31, 2023 and 2022 | | | For the years ended December 31, 2023, 2022, 2021, 2020, and 2019 | |
* | The financial statements referred to throughout are consolidated. |
Basis for Opinion
These financial statements are the responsibility of the Funds’ management. Our responsibility is to express an opinion on the Funds’ financial statements based on our audits. We are a public accounting firm registered with the Public Company Accounting Oversight Board (United States) (“PCAOB”) and are required to be independent with respect to the Funds in accordance with the U.S. federal securities laws and the applicable rules and regulations of the Securities and Exchange Commission and the PCAOB.
We conducted our audits in accordance with the standards of the PCAOB. Those standards require that we plan and perform the audit to obtain reasonable assurance about whether the financial statements are free of material misstatement whether due to error or fraud.
Our audits included performing procedures to assess the risks of material misstatement of the financial statements, whether due to error or fraud, and performing procedures that respond to those risks. Such procedures included examining, on a test basis, evidence regarding the amounts and disclosures in the financial statements. Our procedures included confirmation of securities owned as of December 31, 2023, by correspondence with the custodian, brokers, and underlying fund sponsor; when replies were not received from brokers, we performed other auditing procedures. Our audits also included evaluating the accounting principles used and significant estimates made by management, as well as evaluating the overall presentation of the financial statements. We believe that our audits provide a reasonable basis for our opinion.
We have served as the Funds’ auditor since 2011.

COHEN & COMPANY, LTD.
Milwaukee, Wisconsin
February 28, 2024
LoCorr Investment Trust - Expense Example (Unaudited) |
Expense Example
December 31, 2023 (Unaudited)
As a shareholder of a mutual fund, you incur two types of costs: (1) transaction costs, including sales charges (loads) on purchase payments; redemption fees; and (2) ongoing costs, including management fees; distribution and/or service (12b-1) fees and other Fund expenses.
This Example is intended to help you understand your ongoing costs (in dollars) of investing in each of the Funds and to compare these costs with the ongoing costs of investing in other mutual funds. The Example is based on an investment of $1,000 invested at the beginning of the period and held for the entire period (July 1, 2023 through December 31, 2023).
Actual Expenses
The actual return columns in the following table provide information about account values based on actual returns and actual expenses. You may use the information in these columns, together with the amount you invested, to estimate the expenses that you paid over the period. Simply divide your account value by $1,000 (for example, an $8,600 account value divided by $1,000 = 8.6), then multiply the result by the number in the first line under the heading entitled “Expenses Paid During Period” to estimate the expenses you paid on your account during this period. The only transaction fees you may be required to pay are for outgoing wire transfers, returned checks and stop payment orders at prevailing rates charged by U.S. Bancorp Fund Services, LLC, doing business as U.S. Bank Global Fund Services, the Funds’ transfer agent. These fees are assessed on all accounts, as applicable. If you request that a redemption be made by wire transfer, currently the Funds’ transfer agent charges a $15.00 fee. The Funds’ transfer agent charges a transaction fee of $25.00 on returned checks and stop payment orders. If you paid a transaction fee, you would add the fee amount to the expenses paid on your account this period to obtain your total expenses paid.
Hypothetical Example for Comparison Purposes
The hypothetical return columns in the following table provide information about hypothetical account values and hypothetical expenses based on the Funds’ actual expense ratio and an assumed rate of return of 5% per year before expenses, which is not the Funds’ actual return. The hypothetical account values and expenses may not be used to estimate the actual ending account balance or expenses you paid for the period. You may use this information to compare the ongoing costs of investing in the Funds and other funds. To do so, compare this 5% hypothetical example with the 5% hypothetical examples that appear in the shareholder reports of the other funds. A transaction fee of $15.00 may be assessed on outgoing wire transfers and a transaction fee of $25.00 may be assessed on returned checks and stop payment orders. To include this fee in the calculation, you would add the estimated transaction fee to the hypothetical expenses shown in the table. Please note that the expenses shown in the table are meant to highlight your ongoing costs only and do not reflect the transaction fees discussed above. Therefore, those columns are useful in comparing ongoing costs only, and will not help you determine the relative total costs of owning different funds. In addition, if these transactional costs were included, your costs would have been higher.
LoCorr Investment Trust - Expense Example (Unaudited) (continued) |
Actual vs Hypothetical Returns
Actual vs. Hypothetical returns for the Six Months Ended December 31, 2023 (Unaudited)
| | | | | | | | | | | | | | | Actual | | | Hypothetical
(5% gross annual return) | |
Fund | | Class | | | Fund’s
Annualized
Expense Ratio 1, 2 | | | Beginning
Account Value
July 1, 2023 | | | Ending
Account Value
December 31,
2023 | | | Expenses Paid
During Period 1, 2, 3 | | | Ending
Account Value
December 31,
2023 | | | Expenses Paid
During Period 1, 2, 3 | |
| | | | | | | | | | | | | | | | | | | | | | | | | | | | | |
LoCorr Macro Strategies Fund | | | | | | | | | | | | | | | | |
| | | | A | | | | 2.13 | % | | $ | 1,000.00 | | | $ | 961.20 | | | $ | 10.53 | | | $ | 1,014.47 | | | $ | 10.82 | |
| | | | C | | | | 2.88 | % | | $ | 1,000.00 | | | $ | 956.40 | | | $ | 14.20 | | | $ | 1,010.69 | | | $ | 14.60 | |
| | | | I | | | | 1.88 | % | | $ | 1,000.00 | | | $ | 961.90 | | | $ | 9.30 | | | $ | 1,015.73 | | | $ | 9.55 | |
| | | | | | | | | | | | | | | | | | | | | | | | | | | | | |
LoCorr Long/Short Commodities Strategy Fund | | | | | | | | | | | | |
| | | | A | | | | 1.96 | % | | $ | 1,000.00 | | | $ | 1,010.40 | | | $ | 9.93 | | | $ | 1,015.32 | | | $ | 9.96 | |
| | | | C | | | | 2.71 | % | | $ | 1,000.00 | | | $ | 1,005.90 | | | $ | 13.70 | | | $ | 1,011.54 | | | $ | 13.74 | |
| | | | I | | | | 1.71 | % | | $ | 1,000.00 | | | $ | 1,010.70 | | | $ | 8.67 | | | $ | 1,016.59 | | | $ | 8.69 | |
| | | | | | | | | | | | | | | | | | | | | | | | | | | | | |
LoCorr Market Trend Fund | | | | | | | | | | | | |
| | | | A | | | | 1.99 | % | | $ | 1,000.00 | | | $ | 886.10 | | | $ | 9.46 | | | $ | 1,015.17 | | | $ | 10.11 | |
| | | | C | | | | 2.74 | % | | $ | 1,000.00 | | | $ | 882.40 | | | $ | 13.00 | | | $ | 1,011.39 | | | $ | 13.89 | |
| | | | I | | | | 1.74 | % | | $ | 1,000.00 | | | $ | 887.40 | | | $ | 8.28 | | | $ | 1,016.43 | | | $ | 8.84 | |
| | | | | | | | | | | | | | | | | | | | | | | | | | | | | |
LoCorr Dynamic Opportunity Fund | | | | | | | | | | | | | | | | |
| | | | A | | | | 2.47 | % | | $ | 1,000.00 | | | $ | 1,023.70 | | | $ | 12.60 | | | $ | 1,012.75 | | | $ | 12.53 | |
| | | | C | | | | 3.22 | % | | $ | 1,000.00 | | | $ | 1,020.30 | | | $ | 16.40 | | | $ | 1,008.97 | | | $ | 16.31 | |
| | | | I | | | | 2.22 | % | | $ | 1,000.00 | | | $ | 1,025.50 | | | $ | 11.33 | | | $ | 1,014.01 | | | $ | 11.27 | |
| | | | | | | | | | | | | | | | | | | | | | | | | | | | | |
LoCorr Spectrum Income Fund | | | | | | | | | | | | |
| | | | A | | | | 2.05 | % | | $ | 1,000.00 | | | $ | 1,052.20 | | | $ | 10.60 | | | $ | 1,014.87 | | | $ | 10.41 | |
| | | | C | | | | 2.80 | % | | $ | 1,000.00 | | | $ | 1,047.00 | | | $ | 14.45 | | | $ | 1,011.09 | | | $ | 14.19 | |
| | | | I | | | | 1.80 | % | | $ | 1,000.00 | | | $ | 1,054.10 | | | $ | 9.32 | | | $ | 1,016.13 | | | $ | 9.15 | |
1 | Includes dividend, tax and/or interest expense of 0.00%, 0.00%, 0.00%, 0.23% and 0.00% for the LoCorr Macro Strategies Fund, the LoCorr Long/Short Commodities Strategy Fund, the LoCorr Market Trend Fund, the LoCorr Dynamic Opportunity Fund and the LoCorr Spectrum Income Fund, respectively. |
2 | Includes expenses of wholly-owned and controlled Cayman Islands subsidiaries for the LoCorr Macro Strategies Fund, the LoCorr Long/Short Commodities Strategy Fund and the LoCorr Market Trend Fund. |
3 | Expenses Paid During Period are equal to the net annualized expense ratio for the class, multiplied by the average account value over the period, multiplied by 184/365 (to reflect the one-half year period). |
Review of Management and Sub-Advisory Agreements (Unaudited) |
LoCorr Investment Trust
December 31, 2023 (Unaudited)
Review of Management and Sub-Advisory Agreements
Counsel directed the Board’s attention to Section 5 of the Board materials for the renewal of the investment sub-advisory agreement for the LoCorr Dynamic Opportunity Fund (“LDO Fund”).
The Board reviewed the memorandum provided by Counsel which had been provided to them prior to the meeting entitled, “Duties of Trustees with Respect to Approval and Renewal of Investment Advisory and Sub-Advisory Contracts”. The Board, including a majority of the Trustees who are not “interested persons” of the Trust within the meaning of the 1940 Act (the “Independent Trustees”), reviewed the various factors relevant to its consideration of the subadvisory agreement and the legal responsibilities of the Board related to such consideration. These factors included the following:
● | The nature, extent and quality of the services provided by the investment sub-adviser to the fund; |
● | The investment performance of the fund and the investment sub-adviser; |
● | The costs of the services to be provided and the profits to be realized by the sub-adviser and its affiliates from the relationship with the fund; |
● | The extent to which economies of scale will be realized as the fund grows; and |
● | Whether the fee levels reflect these economies of scale to the benefit of the shareholders. |
The Board reviewed the responses to the 15(c) questionnaire and the sub-advisory agreement prior to the meeting.
Kettle Hill Capital Management, LLC (“Kettle Hill”), Sub-Adviser (LDO Fund)
Counsel and a representative of the Adviser reviewed the subadvisory services provided by Kettle Hill for the LDO Fund with the Trustees including the responsibilities and experience of Kettle Hill’s key individuals and the overall resources of Kettle Hill devoted to managing its allocation of the LDO Fund. The Board noted that there were no changes in the key personnel of Kettle Hill since the Board’s last approval.
The Trustees noted that Kettle Hill reported no material compliance issues, regulatory issues or material litigations in the past year. Counsel further noted for the Board that Kettle Hill continued to maintain an Errors & Omissions insurance policy. After a discussion, the Board concluded that Kettle Hill has extensive investment management experience and appropriate resources to continue to provide satisfactory services for the LDO Fund.
The Trustees next discussed the performance of Kettle Hill with respect to its allocation of the LDO Fund. The Board noted that Kettle Hill’s 1-year and 5-year performance had outperformed the overall performance of the Fund and the subadviser’s benchmark. In response to a question, a representative of the Adviser indicated that it continued to be satisfied with Kettle Hill’s overall performance. After a discussion, the Board concluded that Kettle Hill’s performance remained satisfactory.
The Trustees considered that Kettle Hill continues to receive soft-dollar benefits from its relationship with the LDO Fund that Kettle Hill uses for brokerage and research purposes. After a discussion, the Trustees concluded that the other benefits that may be derived by Kettle Hill from its relationship with the Fund were not unreasonable.
Counsel then directed the Board’s attention to the costs of services provided by Kettle Hill to the LDO Fund. Counsel reviewed for the Trustees the fees charged by Kettle Hill to its other advisory accounts including other registered investment companies. The Board noted Kettle Hill’s net profits related to its services to the LDO Fund, noting that Kettle Hill was moderately profitable with respect to its management of the LDO Fund. The Board reviewed and discussed the level of Kettle Hill’s profitability and found it to be not excessive After further discussion, the Board concluded that Kettle Hill’s sub-advisory fee and profitability were reasonable.
Having requested and received such information from the Adviser as the Trustees believed to be reasonably necessary to evaluate the terms of the sub-advisory agreement with Kettle Hill, and as assisted by the advice of Counsel, the Trustees concluded that the subadvisory fee was not unreasonable and that renewal of the sub-advisory agreement with Kettle Hill was in the best interests of the shareholders of the LDO Fund.
Notice of Privacy Policy & Practices/Quarterly Portfolio Holdings/Proxy (Unaudited) |
Notice of Privacy Policy & Practices
(Unaudited)
Your privacy is important to us. The Funds are committed to maintaining the confidentiality, integrity, and security of your personal information. When you provide personal information, the Funds believe that you should be aware of policies to protect the confidentiality of that information.
The Funds collect the following nonpublic personal information about you:
● | Information we receive from you on or in applications or other forms, correspondence, or conversations, including, but not limited to, your name, address, phone number, social security number, assets, income and date of birth; and |
● | Information about your transactions with us, our affiliates, or others, including, but not limited to, your account number and balance, payments history, parties to transactions, cost basis information and other financial information. |
The Funds do not disclose any nonpublic personal information about our current or former shareholders to affiliated or nonaffiliated third parties, except as permitted by law. For example, the Funds are permitted by law to disclose all of the information we collect, as described above, to our transfer agent to process your transactions. Furthermore, the Funds restrict access to your nonpublic personal information to those persons who require such information to provide products or services to you. The Funds maintain physical, electronic and procedural safeguards that comply with applicable federal and state standards to guard your nonpublic personal information.
In the event that you hold shares of the Funds through a financial intermediary, including, but not limited to, a broker-dealer, bank, or trust company, the privacy policy of your financial intermediary would govern how your nonpublic personal information would be shared with affiliated or non-affiliated third parties.
Portfolio Holdings Disclosure
(Unaudited)
The Funds file a complete schedule of portfolio holdings with the U.S. Securities and Exchange Commission (the “SEC”) for the first and third quarters of each fiscal year on Part F of Form N-PORT. The Funds’ Part F of Form N-PORT are available on the SEC’s website at www.sec.gov and may be reviewed and copied at the SEC’s Public Reference Room in Washington, D.C. Information on the operation of the Public Reference Room may be obtained by calling 1-800-SEC-0330. The Funds’ Part F of Form N-PORT may also be obtained by calling toll-free 1-855-523-8637.
Proxy voting policies, procedures and record
(Unaudited)
You may obtain a description of the Funds’ (1) proxy voting policies, (2) proxy voting procedures and (3) information regarding how the Funds voted any proxies related to portfolio securities during the most recent 12-month period ended June 30 for which an SEC filing has been made, without charge, upon request by contacting the Funds directly at 1-855-523-8637, or on the EDGAR Database on the SEC’s website (http:// www.sec.gov).
Qualified Dividend Income (“QDI”) / Dividends Received Deduction (“DRD”) (Unaudited) |
Qualified Dividend Income (“QDI”) / Dividends Received Deduction (“DRD”)
(Unaudited)
For the fiscal year ended December 31, 2023, certain dividends paid by the Funds may be subject to a maximum tax rate of 15%, as provided for by the Jobs and Growth Tax Relief Reconciliation Act of 2003. The percentage of dividends declared from ordinary income designated as qualified income was as follows:
Fund | QDI% |
LoCorr Macro Strategies Fund | 0.00% |
LoCorr Long/Short Commodities Strategy Fund | 0.00% |
LoCorr Market Trend Fund | 0.00% |
LoCorr Dynamic Opportunity Fund | 15.10% |
LoCorr Spectrum Income Fund | 50.42% |
For corporate shareholders, the percent of ordinary income distributions qualifying for the corporate dividends received deduction for the fiscal year ended December 31, 2023 was as follows:
Fund | DRD% |
LoCorr Macro Strategies Fund | 0.00% |
LoCorr Long/Short Commodities Strategy Fund | 0.00% |
LoCorr Market Trend Fund | 0.00% |
LoCorr Dynamic Opportunity Fund | 14.48% |
LoCorr Spectrum Income Fund | 42.64% |
Independent Trustees/Interested Trustees and Officers |
The Statement of Additional Information includes additional information about the Independent Trustees/Interested Trustees and Officers and is available, without charge, by calling 1-855-523-8637.
Independent Trustees | | | |
Name and
Year of Birth | Position/Term
of Office1 | Principal Occupation
During the Past 5 Years | Number of
Portfolios in
Fund Complex2
Overseen by
Trustee | Other
Directorships
Held by Trustee
During the Past
5 Years |
Dan T. O’Lear
Year of Birth: 1961 | Trustee/
January 2023 to present | Mr. O’Lear is presently retired (since 2021); President, Franklin Templeton Distributors, 2018-2021; Head of Retail Distribution, Franklin Templeton Distributors, 2014-2018. | 5 | None |
Jeff E. Place
Year of Birth: 1953 | Trustee/
January 2023 to present | Mr. Place is presently retired (since 2016) from his principal occupation as a distribution fund executive. | 5 | None |
Catie B. Tobin
Year of Birth: 1958 | Trustee/
January 2023 to present | Ms. Tobin is presently retired (since 2021); Senior Vice President, Director, Field Development & Effectiveness, Wells Fargo Advisors, 2017-2021. | 5 | None |
Mark Thompson
Year of Birth: 1959 | Trustee/
2011–present | Chairman and Chief Manager, Riverbridge Partners, LLC (investment management), 1987–present. | 5 | None |
Ronald A. Tschetter
Year of Birth: 1941 | Trustee/
2011–present | Mr. Tschetter is presently retired from his principal occupations; Director of the U.S. Peace Corps, 2006–2009. | 5 | None |
Independent Trustees/Interested Trustees and Officers |
Interested Trustees and Officers | | | |
Name and
Year of Birth | Position/Term
of Office1 | Principal Occupation
During the Past 5 Years | Number of
Portfolios in
Fund Complex2
Overseen by
Trustee | Other
Directorships
Held by Trustee
During the Past
5 Years |
Jon C. Essen3
Year of Birth: 1963 | Treasurer,
Secretary, Chief Financial Officer/ 2011–present; Trustee/
2010–present | LoCorr Fund Management, LLC: Chief Operating Officer (2010–2016), Chief Compliance Officer, (2010–2017); LoCorr Distributors, LLC: Principal, Chief Financial Officer, and Registered Representative (2008–present) Chief Compliance Officer (2008–2017); Steben & Company (broker/dealer and registered investment adviser): Principal and Chief Financial Officer (2020–present) | 5 | None |
Kevin M. Kinzie4
Year of Birth: 1956 | President, Trustee/ 2011–present | Chief Executive Officer of LoCorr Fund Management, LLC, 2010 to present; President and Chief Executive Officer of LoCorr Distributors, LLC (broker/dealer), 2002– present. President and Chief Executive Officer of Steben & Company (broker/dealer and registered investment adviser), (2019–present). | 5 | None |
Brian Hull5
Year of Birth: 1968 | Chief Compliance Officer/
2019–present | Steben & Company (broker/dealer and registered investment adviser): Chief Compliance Officer 2002–2007 and 2012���Present; Financial & Operations Principal (FINOP) 2002–Present; Registered Representative 2002–Present. | 5 | None |
1 | The term of office for each Trustee listed above will continue indefinitely. |
2 | The term “Fund Complex” refers to the LoCorr Investment Trust. |
3 | Mr. Essen is an interested Trustee because he is an officer of the Funds’ Adviser. |
4 | Mr. Kinzie is an interested Trustee because he is an officer and indirect controlling interest holder of the Funds’ Adviser. |
5 | Mr. Hull is an interested person because he is an officer of the Funds’ Adviser. |
This page left intentionally blank.
This page left intentionally blank.
This page left intentionally blank.


(b) Not applicable.
Item 2. Code of Ethics.
The registrant has adopted a code of ethics that applies to the registrant’s principal executive officer and principal financial officer. The registrant has not made any amendments to its code of ethics during the period covered by this report. The registrant has not granted any waivers from any provisions of the code of ethics during the period covered by this report.
A copy of the registrant’s Code of Ethics is incorporated by reference. See Item 13(a)(1).
Item 3. Audit Committee Financial Expert.
The registrant’s board of directors has determined that it does not have an audit committee financial expert serving on its audit committee. At this time, the registrant believes that the experience provided by each member of the audit committee together offers the registrant adequate oversight for the registrant’s level of financial complexity.
Item 4. Principal Accountant Fees and Services.
The registrant has engaged its principal accountant to perform audit services, audit-related services, tax services and other services during the past two fiscal years. “Audit services” refer to performing an audit of the registrant's annual financial statements or services that are normally provided by the accountant in connection with statutory and regulatory filings or engagements for those fiscal years. “Audit-related services” refer to the assurance and related services by the principal accountant that are reasonably related to the performance of the audit. “Tax services” refer to professional services rendered by the principal accountant for tax compliance, tax advice, and tax planning. These include federal and state income tax returns, review of excise tax distribution calculations and federal excise tax returns. “Other services” provided by the principal accountant of $3,750 and $5,565 represent a cursory review of the semi-annual report for LoCorr Investment Trust for the periods ended June 30, 2023 and June 30, 2022, respectively. The following table details the aggregate fees billed or expected to be billed for each of the last two fiscal years for audit fees, audit-related fees, tax fees and other fees by the principal accountant.
| | FYE 12/31/2023 | FYE 12/31/2022 |
| (a) Audit Fees | $185,000 | $137,000 |
| (b) Audit-Related Fees | $0 | $0 |
| (c)Tax Fees | $31,500 | $31,500 |
| (d) All Other Fees | $3,750 | $5,565 |
(e)(1) The Audit Committee has adopted pre-approval policies and procedures that require the Audit Committee to pre-approve all audit and non-audit services of the registrant, including services provided to any entity affiliated with the registrant.
(e)(2) The percentage of fees billed by Cohen & Company, Ltd. applicable to non-audit services pursuant to waiver of pre-approval requirement were as follows:
| | | FYE 12/31/2023 | | | FYE 12/31/2022 | |
| Audit-Related Fees | | | 0% | | | | 0% | |
| Tax Fees | | | 0% | | | | 0% | |
| All Other Fees | | | 0% | | | | 0% | |
| | (f) | The percentage of hours expended on the principal accountant’s engagement to audit the registrant’s financial statements for the most recent fiscal year that were attributed to work performed by persons other than the principal accountant’s full-time, permanent employees was zero percent. |
| | | |
| | (g) | The aggregate non-audit fees billed by the registrant’s accountant for services rendered to the registrant, and rendered to the registrant’s investment adviser (not including any sub-adviser whose role is primarily portfolio management and is subcontracted with or overseen by another investment adviser), and any entity controlling, controlled by, or under common control with the adviser that provides ongoing services to the registrant for each of the last two fiscal years of the registrant was $0 for 2023 and $0 for 2022. |
| | | |
| | (h) | Not applicable |
| | | |
| (i) | Not applicable |
| | | |
| | (j) | Not applicable |
Item 5. Audit Committee of Listed Registrants.
Not applicable to registrants who are not listed issuers (as defined in Rule 10A-3 under the Securities Exchange Act of 1934).
Item 6. Investments.
| (a) | Schedule of Investments is included as part of the report to shareholders filed under Item 1 of this Form. |
Item 7. Disclosure of Proxy Voting Policies and Procedures for Closed-End Management Investment Companies.
Not applicable to open-end investment companies.
Item 8. Portfolio Managers of Closed-End Management Investment Companies.
Not applicable to open-end investment companies.
Item 9. Purchases of Equity Securities by Closed-End Management Investment Company and Affiliated Purchasers.
Not applicable to open-end investment companies.
Item 10. Submission of Matters to a Vote of Security Holders.
There have been no material changes to the procedures by which shareholders may recommend nominees to the registrant’s Board of Trustees.
Item 11. Controls and Procedures.
| (a) | The registrant’s President and Treasurer have reviewed the registrant's disclosure controls and procedures (as defined in Rule 30a-3(c) under the Investment Company Act of 1940 (the “Act”)) as of a date within 90 days of the filing of this report, as required by Rule 30a-3(b) under the Act and Rules 13a-15(b) or 15d-15(b) under the Securities Exchange Act of 1934. Based on their review, such officers have concluded that the disclosure controls and procedures are effective in ensuring that information required to be disclosed in this report is appropriately recorded, processed, summarized and reported and made known to them by others within the registrant and by the registrant’s service provider. |
| (b) | There were no changes in the registrant's internal control over financial reporting (as defined in Rule 30a-3(d) under the Act) that occurred during the period covered by this report that has materially affected, or is reasonably likely to materially affect, the registrant's internal control over financial reporting. |
Item 12. Disclosure of Securities Lending Activities for Closed-End Management Investment Companies
Not applicable to open-end investment companies.
Item 13. Exhibits.
| (a) | (1) Any code of ethics or amendment thereto, that is the subject of the disclosure required by Item 2, to the extent that the registrant intends to satisfy Item 2 requirements through filing an exhibit. |
Incorporated by reference to the registrant’s Form N-CSR filed March 7, 2014.
(2) A separate certification for each principal executive and principal financial officer pursuant to Section 302 of the Sarbanes-Oxley Act of 2002.
Filed herewith.
(3) Any written solicitation to purchase securities under Rule 23c-1 under the Act sent or given during the period covered by the report by or on behalf of the registrant to 10 or more persons.
Not applicable to open-end investment companies.
(4) Changes in the registrant’s independent public accountant.
There was no change in the registrant’s independent public accountant for the period covered by the report.
| (b) | Certifications pursuant to Section 906 of the Sarbanes-Oxley Act of 2002. |
Furnished herewith.
SIGNATURES
Pursuant to the requirements of the Securities Exchange Act of 1934 and the Investment Company Act of 1940, the registrant has duly caused this report to be signed on its behalf by the undersigned, thereunto duly authorized.
| (Registrant) | LoCorr Investment Trust | |
| | | |
| By (Signature and Title) | /s/ Kevin Kinzie | |
| | Kevin Kinzie, President | |
| | | |
| Date | March 8, 2024 | |
Pursuant to the requirements of the Securities Exchange Act of 1934 and the Investment Company Act of 1940, this report has been signed below by the following persons on behalf of the registrant and in the capacities and on the dates indicated.
| By (Signature and Title) | /s/ Kevin Kinzie | |
| | Kevin Kinzie, President | |
| | | |
| Date | March 8, 2024 | |
| By (Signature and Title) | /s/ Jon Essen | |
| | Jon Essen, Treasurer | |
| | | |
| Date | March 8, 2024 | |