As filed with the Securities and Exchange Commission on March 9, 2016
UNITED STATES
SECURITIES AND EXCHANGE COMMISSION
Washington, D.C. 20549
FORM N-CSR
CERTIFIED SHAREHOLDER REPORT OF REGISTERED
MANAGEMENT INVESTMENT COMPANIES
Investment Company Act file number 811-22509
LoCorr Investment Trust
(Exact name of registrant as specified in charter)
261 School Avenue, 4th Floor
Excelsior, MN 55331
(Address of principal executive offices) (Zip code)
CT Corporation System
1300 East Ninth Street
Cleveland, OH 44114
(Name and address of agent for service)
952.767.6903
Registrant's telephone number, including area code
Date of fiscal year end: December 31
Date of reporting period: December 31, 2015
Item 1. Reports to Stockholders.

Shareholder Letter | 3 |
Letter to Shareholders
LoCorr Funds seek to provide investments that, over time, will have low correlation to traditional asset classes such as stocks and bonds. We believe that adding low correlating investments to portfolios can significantly reduce the overall portfolio risk and help enhance returns. Correlation measures the degree to which the returns of two investments move together over time. LoCorr offers products that provide the potential for positive returns in rising or falling markets and are designed to resist correlation with traditional stock, bond and commodity investments. In this report, LoCorr Funds are reporting on six mutual funds: LoCorr Managed Futures Strategy Fund, LoCorr Long/Short Commodities Strategy Fund, LoCorr Multi-Strategy Fund, LoCorr Market Trend Fund, LoCorr Long/Short Equity Fund and LoCorr Spectrum Income Fund (collectively, the “Funds”).
LoCorr Managed Futures Strategy Fund
The LoCorr Managed Futures Strategy Fund (the “Managed Futures Fund” or the “Fund”) seeks capital appreciation in rising and falling equity markets as its primary investment objective with managing volatility as a secondary objective. The Managed Futures Fund attempts to achieve its objective by investing in two main strategies - a Managed Futures Strategy and a Fixed Income Strategy.
The Managed Futures Fund invests up to 25% of its total assets into a portfolio of globally diversified managed futures positions. The Fund accesses the returns of certain trading programs of Millburn Ridgefield Corporation (“Millburn”), Crabel Capital Management, LLC (“Crabel”) and Graham Capital Management, LLC (“Graham”) via its investment in a total return swap agreement. The Fund uses Millburn, Crabel and Graham to execute its Managed Futures Strategy. Millburn was founded in 1971 and manages about $1.5 billion in assets. Crabel was founded in 1992 and manages about $1.8 billion in assets. Graham was founded in 1994 and manages about $11.3 billion in assets.
The Managed Futures Fund accesses returns generated by Millburn’s Diversified Program (“MDP”), a commodity pool which commenced operations in 1977. MDP systematically invests in about 120 futures markets with long and short positions in sectors such as currencies, interest rates, stock indices and commodities (agricultural, energy and metals). The Fund also accesses returns generated by Crabel’s Multi-Product program, a short-term trend following strategy that commenced trading in March 1998. Crabel’s program was added to complement Millburn’s longer-term trend strategy in an attempt to improve the Fund’s risk-adjusted returns. Finally, the Fund accesses returns generated by Graham’s Tactical Trend program, a systematic trend strategy that commenced trading in 2006. Graham’s program was added to complement the other strategies in the Fund in an attempt to improve the Fund’s risk-adjusted returns.
Overall, the Fund’s Class I shares gained 3.72% during the twelve-month period ended December 31, 2015, largely due to gains from long interest rate futures positions, and short energy and metal future trades. Strong gains from Millburn (+5.48%) and Graham (+7.55%) during the period were more than sufficient to offset a small loss from Crabel (-2.67%).
Managed Futures Strategy
Vacillating global growth, inflation, monetary policy and political prospects led to volatile trading conditions across most markets throughout 2015. Uneven growth against the backdrop of stubborn, below-target price and wage inflation in the U.S. produced on again-off again Federal Reserve rate hike discussions that were not resolved until December but exacerbated market volatility. The European Central Bank’s “ECB” quantitative easing (“QE”) program—started in the first quarter—seemed to put a floor under European growth, although the recovery has been sluggish and targeted inflation remains a distant hope. China’s policy makers continued to struggle with the challenging transition away from export- and infrastructure-led growth to expansion driven by consumption and domestic demand; and, from controlled- to market-based equity, foreign exchange and fixed income prices. Hence, even as the People’s Bank of China (PBOC) instituted numerous easing actions—including six official interest rate cuts in the past year—growth continued to decelerate. Finally, in Japan both growth and inflation continued to straddle the zero line. These large country problems spilled into both smaller developed countries and emerging markets as shrinking global trade hurt growth and as capital outflows pressured exchange rates and commodity producers.
Commodities
Short positions in certain energy markets were highly profitable due to unrelenting production from key oil producers coupled with historically high inventory levels which drove crude prices to 11 year lows. U.S. natural gas prices fell to 17 year lows in response to ample supplies and an especially warm fall and winter season. Short positions in certain metal markets were profitable as high inventory levels, decelerating global growth, and the persistent slowdown in China’s manufacturing and real estate sectors crimped demand for industrial metals. Trading of agricultural commodities was fractionally unprofitable.
| 4 | Shareholder Letter | ||
Interest Rates
Long positions in interest rate futures were profitable overall during 2015. Rates were particularly profitable early in the year when growth disappointed and the Fed held off on raising rates and again during the late summer when Chinese stocks collapsed, causing the Fed to once again hold off on hiking rates. At other times during the year, particularly in the fourth quarter when the Fed finally raised rates, long positions proved to be unprofitable.
Equity Indices
Against an uncertain economic and political background, trading of equity futures was volatile throughout the year and was marginally unprofitable. The June through August period was particularly challenging as the Chinese equity market collapsed. Long equity futures positions in U.S. and elsewhere registered losses. Offsetting these losses were gains from long positions in European equity futures, which were profitable in the wake of the ECB’s QE program.
Currency
The U.S. dollar, which was buffeted by a multitude of economic and political concerns, strengthened during the year, although the path was uneven. Long dollar positions versus the Euro and Yen were profitable as the ECB introduced QE in the first quarter and as the Bank of Japan added to its accommodation. Later in the year, as emerging economies and commodity producing countries came under pressure, long dollar trades against certain foreign currencies generated gains. On the other hand, a long dollar/short Swiss franc trade sustained a large loss when the Swiss National Bank unexpectedly ended the Franc’s peg to the Euro causing the Franc to soar. Finally, non-dollar cross rate trading was unprofitable largely due to trading the Euro against a variety of currencies.
Looking ahead, as market participants grapple with the myriad economic, geopolitical and local political factors that will impact financial and commodity markets, we believe it is likely that capital flows from market to market and from country to country will generate price activity that can be beneficial to the quantitative, systematic approach to trading global markets.
Fixed Income Strategy
The Managed Futures Strategy Fund invested most of its remaining assets in a Fixed Income Strategy comprised of short to intermediate term investment grade corporate and government agency securities. Nuveen Asset Management (“Nuveen”) is the sub-adviser for this strategy and manages a shorter duration, high quality portfolio. Nuveen manages approximately $142 billion in assets.
The fixed income component of the LoCorr Managed Futures Fund is managed against the Barclays 1-5 Government Credit Index. In 2015, returns for this portion of the portfolio were 0.81% compared with 0.97% for the benchmark. The fixed income portfolio’s duration was managed between 1.25 and 1.75 years during the year compared with about 2.7 years for the benchmark. The decision to position the Fund’s duration defensively over the course of the year accounted for the underperformance versus the benchmark. Sector-wise, the portfolio was positioned with roughly a 40% weighting in investment grade corporate bonds along with a 45% aggregate weighting to high quality, short duration securitized instruments for much of the year. Overall, our sector strategy was a modest boost to investment returns as most of these securitized sectors marginally outperformed Treasuries. Our corporate weighting was generally in line with the benchmark.
The U.S. economy lost momentum in 2015, as headwinds from a strong dollar and softer global growth caused a slowdown in manufacturing and trade. Consumer spending remained solid, as gains in the labor market and increased disposable income provided a solid backdrop for both automobile sales and housing. Business spending was sluggish as energy-related capital expenditures continued to decline. Inflation remained quite subdued in response to the weakness in commodity prices and strong dollar. Though we expected to see early signs of wage pressures due to the reduced slack in labor markets, these pressures were largely absent. Despite low inflation and uncertainty surrounding global growth, the U.S. Federal Reserve Bank (the “Fed”) reacted to continued strength in the labor market and took their first step towards policy normalization in December, raising policy rates off historic lows.
This uncertainty resulted in elevated financial market volatility. In early 2015, interest rates rallied sharply as the ECB embarked on another round of policy easing, pushing European yields below zero in certain markets. Given downshifting domestic growth and a reduction in inflation estimates, the U.S. rates market quickly lowered expectations for the timing and magnitude of Fed rate hikes.
From a high-level perspective, portfolio themes in the Funds were focused on maintaining a defensive interest rate posture, as the Fed begins normalizing policy, and on improving portfolio quality bias as the overall credit cycle matures. We have continued to expect short and intermediate term rates to rise and had positioned the duration, or interest rate sensitivity of the portfolio, significantly short to the benchmark throughout the year.
| Shareholder Letter | 5 | ||
Looking ahead, we expect the U.S economy to continue to expand at a relatively moderate pace with consumption supported by a healthy labor market and strong household balance sheets. We believe manufacturing and business spending will likely see headwinds from soft trade and volatility in the commodity sectors. Wage pressures should gradually rise if the jobless rate continues to fall. This should prompt the Fed to continue to tighten policy very gradually. At the same time, policymakers will have a keen eye on global growth and will continue utilizing forward guidance to reinforce their intention to keep rates at historically accommodative levels to avoid unnecessary tightening of financial conditions. Overall, we look for rates to rise modestly.
LoCorr Long/Short Commodities Strategy Fund
The LoCorr Long/Short Commodities Strategy Fund (the “Long/Short Commodities Fund” or the “Fund”) provides investors with access to a commodities futures strategy in a mutual fund structure. Historically, investors have primarily accessed exposure to long-only commodities that rely on rising commodity prices to generate positive returns. Of course, commodity prices don’t always appreciate and occasionally experience sharp declines. The Long/Short Commodities Fund has the ability to profit while commodity prices increase or decrease. The Long/Short Commodities Fund’s primary investment objective is capital appreciation in rising and falling commodities markets with managing volatility as a secondary objective. The Long/Short Commodities Fund attempts to achieve its investment objective by investing in two primary strategies – a Commodities Strategy and a Fixed Income Strategy.
The Fund accesses, via a total return swap agreement, the returns of Millburn’s Commodity Program (“Milcom”), which began trading in 2005. Milcom systematically invests in about 50 futures markets with long and short positions in sectors such as energy, metals, livestock, grains and softs and lumber.
Overall, the Fund’s Class I shares gained 22.61% during the twelve-month period ended December 31, 2015, largely due to gains from short positions in energy and metals, and to broad based gains from spread trading. Outright trading of soft commodity and livestock futures was also profitable, while outright trading of grain futures was slightly unprofitable.
Commodity Strategy
Trading in the energy sector was highly profitable in 2015. Although oil prices were supported during the first half of 2015 by an apparent stabilization in the outlook for global economic growth, prices plunged again from July through December. As a result, short positions in oil futures were highly profitable. Short positions in natural gas were also profitable as excessive inventories and warm weather caused prices to fall. Spread trading in energy contracts was profitable during the year.
The portfolio’s short positions across most industrial metals were profitable in 2015 as industrial metals prices followed a similar path to crude oil prices; stabilizing or rising early in the year before falling sharply thereafter.
Trading in soft commodities was beneficial in 2015, particularly a short position in coffee where large supplies weighed on prices. Spread trading in softs was generally profitable during the year.
Outright directional trading in grains was unprofitable during the year, due entirely to losses from trading corn and wheat. During June and July, prices, which had drifted lower under the weight of large inventories and solid crop reports, spiked higher on spurious reports that China was aggressively buying grains and on a revised USDA forecast suggesting a less favorable crop outlook. Spread trading of soybeans, wheat, and corn were quite profitable over the course of the year.
Looking ahead, as market participants grapple with the myriad economic, geopolitical and local political factors that will impact financial and commodity markets, it seems probable that capital flows from market to market and from country to country will generate price activity that can be beneficial to a quantitative, systematic approach to trading global markets.
Fixed Income Strategy
The Fund invests most of its remaining assets in a Fixed Income Strategy comprised of short to intermediate term investment grade corporate and government agency securities. Nuveen Asset Management (“Nuveen”) is the sub-adviser for this strategy – a shorter duration, high quality portfolio.
The fixed income component of the Long/Short Commodities Fund is managed against the Barclays 1-5 Government Credit Index. Returns for this portion of the portfolio were 0.64% compared to 0.97% for the benchmark for 2015. The portfolio was managed with a duration of between 1.0 and 1.75 years during 2015, compared to about 2.7 years for the benchmark. Early in the reporting period, the portfolio was positioned with a higher than normal level of liquidity and maintained a large position in short Treasuries securities.
| 6 | Shareholder Letter | ||
This positioning, while benefitting the Fund on an overall basis, held back returns as rates dropped sharply during this time period. As 2015 progressed, we focused on re-building the Fund’s exposure to non-Treasury securities and expect it to be managed with a greater allocation to income-earning sectors going forward.
LoCorr Multi-Strategy Fund
The LoCorr Multi-Strategy Fund (the “Multi-Strategy Fund” or the “Fund”) commenced operations in April 2015. The Fund’s objective is capital appreciation and it invests in securities that seek to produce a competitive level of current income. The Fund was launched in part due to demand for a Fund that would include a variety of our alternative investment strategies into one investment. Currently, the Fund invests in the following strategies: Income Strategy, Long/Short Equity Strategy, Managed Futures Strategy and Commodities Strategy. For the period April 6, 2015 (inception date of Fund) to December 31, 2015, the Fund’s Class I shares cumulative total return declined 14.98%.
Income Strategy
The Fund’s Income Strategy, sub-advised by Trust and Fiduciary Management Services (“TFMS”) in a similar strategy as used in Spectrum Income Fund, suffered losses as market dynamics have been particularly challenging for its investment approach since the Fund’s April inception. For example, Master Limited Partnerships (“MLPs”) comprise a significant portion of the Fund’s investment opportunity set and the Alerian MLP Index declined -29.1% since the Fund’s launch due to challenging conditions in the energy markets. Please refer to the commentary below for the Spectrum Income Fund’s Income Strategy to learn more about current portfolio positioning and market outlook.
Long/Short Equity Strategy
The Fund’s Long/Short Equity Strategy, sub-advised by Billings in a similar strategy as used in Long/Short Equity Fund, produced negative returns since the Fund’s inception as equity market volatility increased, particularly during the third quarter and again in December. The best-performing holdings during the period were a position in a small homebuilder primarily operating in the South and Midwest and a hospitality company specializing in timeshares. Please refer to Billings’ commentary below for the Long/Short Equity Fund to learn more about current portfolio positioning and market outlook.
Commodities Strategy
The Fund’s Commodities Strategy is managed by Millburn in a similar strategy as used in Long/Short Commodities Fund. The commodities portion of the Fund was highly profitable since the April inception, largely due to gains from short positions in energy and metals, and to broad based gains from spread trading. Please refer to the commentary above in the Long/Short Commodities Strategy Fund to learn more about current portfolio positioning and market outlook.
Managed Futures Strategy
The Fund’s Managed Futures Strategy is managed by Graham in a similar strategy as used in Market Trend Fund. Since the inception of the Fund the portfolio realized modest declines. During the period, the largest gains in the portfolio were generated from trading in currencies followed by energy and short-term rates. The strategy benefited from long dollar positions as the greenback continued to strengthen, particularly against some of the commodity currencies. Short positions in energy were advantageous as oil prices declined sharply, following a brief April rally. Trading in equities was the largest detractor as long positions, particularly in the third quarter when market volatility surged, were unprofitable. Finally, long positions in long-term interest rate futures were unprofitable, primarily in the second and fourth quarters when investor anxiety with respect to the Fed was at its highest, culminating in the first rate hike since 2006. Please refer to the commentary below for the Market Trend Fund to learn more about current portfolio positioning and market outlook.
While the Fund was challenged in 2015, we believe the outlook for the Fund is favorable. Three of the four underlying managers had negative returns since the Fund’s launch, a dynamic that we believe is not likely to repeat in most market environments. While past performance is no guarantee of future results, over the long-term we are confident in the ability of the underlying managers to produce compelling returns.
| Shareholder Letter | 7 | ||
LoCorr Market Trend Fund
The LoCorr Market Trend Fund (the “Market Trend Fund” or the “Fund”) was created to provide investors with access to a trend following futures strategy with one of the world’s most prominent managers in this space—Graham Capital Management. Graham was founded in 1994 and manages about $11.3 billion in assets. The Market Trend Strategy is managed similarly to Graham’s Tactical Trend program, a systematic trend strategy that commenced trading in 2006. The Fund seeks capital appreciation in rising and falling equity markets as its primary investment objective with managing volatility as a secondary objective. The Market Trend Fund attempts to achieve its objective by investing in two main strategies – a Market Trend Strategy and a Fixed Income Strategy.
Overall, the Fund’s Class I shares gained 5.96% during the one year period ended December 31, 2015. Trading in currency, energy, and short-term interest rate contracts were the most notable contributor’s to the Fund’s strong gains during the year while positions in equities and long-term/intermediate interest rate contracts were unprofitable.
Market Trend Strategy
2015 could be characterized as a tug-of-war between optimism and anxiety, with incidents of risk-taking followed by reversals that made for a challenging trading environment. The first quarter saw established trends from the prior year remain in effect, including a strengthening U.S. dollar, surging equities, and higher prices in the fixed income market. This trading regime gave way to increased volatility in the second quarter marked by sharp reversals in currencies, rising bond yields, declining equities, and a 25% rally in crude oil in April. As the year progressed, optimism in August was followed by uncertainty regarding Fed policy and growth in major developed economies and the emerging markets. By December, the Fed’s long-anticipated rate hike came to pass as the Fed funds rate was raised for the first time since 2006. The Fed’s decision to raise rates came at a time when investors were becoming increasingly concerned about weakening global economic conditions, particularly in China, which contributed to a flight-to-safety and general avoidance of risk at year-end.
Trading in foreign currencies was highly profitable in 2015 as the portfolio’s long U.S. dollar position benefited from the strength in the greenback versus its major counterparts the euro and British pound sterling. Meanwhile, the dollar made strong gains versus the major commodity currencies, including the Australian dollar, Mexican peso and New Zealand dollar.
Strong gains from trading in commodities contributed to the Fund’s gains during the year. Excessive inventories and production drove energy prices sharply lower, leading to strong gains from short positions in oil futures. The portfolio also recorded profits from short positions in metals, particularly in copper, aluminum and gold as global growth concerns triggered significant price declines.
Trading in equity indices was unprofitable during the year, as gains in Asian benchmark indices were more than offset by losses in the U.S. In fixed income, gains on the front end of the yield curve were mitigated by losses on the long end in the U.S. and Australia.
Following several years post-2008 when long-only beta strategies excelled, it is our belief that 2016 may well be the year when active trading strategies trump passive investments. We believe these changing market dynamics may be conducive to the Market Trend Fund, which has exhibited low correlation to traditional markets and employs an active systematic, quantitatively-driven investment approach.
Fixed Income Strategy
The Fund invests most of its remaining assets in a Fixed Income Strategy comprised of primarily government securities and very highly rated corporate fixed income of shorter durations. Nuveen is the sub-adviser for this strategy – a shorter duration, high quality portfolio.
The fixed income portion of LoCorr Market Trend is conservatively managed as a very short duration portfolio of the highest credit quality and is managed against the Barclays 1-3 Year Government Bond Index. Returns for the fixed income portion of the portfolio were 0.45% compared to 0.57% for the benchmark in 2015. Our defensive interest rate strategy accounted for the underperformance relative to the index as we had positioned the duration of the portfolio short to the benchmark by between 0.50 and 0.75 years for all of 2015. While this strategy reduced the potential downside risk of the portfolio, it proved to be costly as rates did not rise as much as we anticipated.
| 8 | Shareholder Letter | ||
LoCorr Long/Short Equity Fund
The LoCorr Long/Short Equity Fund (the “Long/Short Equity Fund” or the “Fund”) seeks long-term capital appreciation with reduced volatility compared to traditional broad-based equity market indices as a secondary objective. Consistent with the “low correlation” our LoCorr Fund family seeks, long/short equity funds have the ability to provide positive returns when equity markets are rising, yet they offer the potential for downside protection when equity prices are falling.
The Fund currently uses two sub-advisers—Billings Capital Management (“Billings”) and Kettle Hill Capital Management (“Kettle Hill”). During September, Kettle Hill was added as a sub-adviser to the Fund, replacing Millennium Asset Management. Kettle Hill’s portfolio in the Fund is based on the long/short equity strategy that Kettle Hill has managed since the firm’s inception in 2003. Kettle Hill seeks to earn superior returns over an investment cycle while focusing on capital preservation and downside volatility. The manager employs an investment process that combines bottom-up, fundamental analysis with a top-down opportunistic overlay. Investing primarily in small cap securities, Kettle Hill targets a conservative net exposure to the market. Billings’ strategy is based on a value-oriented, fundamental, bottom-up long/ short equity approach. This manager seeks to maximize absolute returns, exceeding the S&P 500 index over the long term. The Fund invests with Billings based on a strategy that this manager has executed since 2008 with their current firm and for many years prior to that at a different entity.
Overall, the Fund’s Class I shares fell 1.22% during the year ended December 31, 2015.
Billings
After three consecutive years of positive double digit returns for the S&P 500 Index, the modest 1.4% advance in 2015 is likely not to be what market participants remember most. 2015 will likely be remembered for the first interest rate hike in nearly a decade and the return of volatility - levels not experienced since 2008 & 2011. It was a year that saw macro concerns, falling commodity prices and emotions drive stock prices day-to-day and month-to-month. The virtually flat index return masked major gyrations among its constituents. This created a ripe environment for fundamental, deep value stock pickers but is also a tough landscape to navigate on a short-term basis.
For the full calendar 2015, the Long/Short Equity Fund portion managed by Billings generated solid positive absolute returns. The portfolio’s long book was the largest contributor to the portfolio’s returns led by a holding in the financial services sector. Holdings in the broadcasting industry also performed well over the course of the year. On the flip side, positions in the industrial and consumer sectors detracted. Net exposure moved lower over the course of the year, finishing 2015 around 70% net long.
Despite the volatility and alarmist headlines, our view on the U.S. economy, as well as U.S. equity markets, continues to be more upbeat than seems to be the norm lately. The U.S. banking system remains on solid footing after trouble in 2008, the economy has continued to grow (albeit modestly) and valuations generally speaking appear fair. We do not allocate our intellectual capital towards predicting short-term market movements nor adjusting exposures to those forecasts. Instead, our time is spent analyzing companies on their fundamental merits and evaluating how appropriately today’s stock price fits or does not fit those merits. We accept that volatility may remain throughout 2016; however, it is in these times that we often find the biggest dislocations between the prices today and intrinsic value. We believe that 2016 will provide unique opportunities for both longs and shorts.
Kettle Hill
Overall market conditions were extremely challenging in 2015. The average stock declined, and the S&P 500’s gains were carried by only a handful of internet stocks. This can also be seen by the divergence in performance between the S&P 500 Index up 1.38% and the Russell 2000 Index down -4.41% for the period ending December 31, 2015.
Kettle Hill was positioned defensively during the September – December period for which it was a sub-adviser for the Fund, generally maintaining net exposure between 20 – 35% net long. During episodes of heightened market volatility in the period, Kettle Hill was able to limit the portfolio’s losses to a fraction of the index’s losses while taking advantage of the turmoil to select many investments at very attractive valuations.
Holdings in the consumer cyclical sector performed best during the period, led by positions in the apparel industry. Gains were also generated in the commodities sectors as Kettle Hill increased the portfolio’s exposure to beaten down basic material and energy stocks that, in many cases, were trading at 50% discounts to replacement value in the view of the manager. Partially offsetting this were losses in the technology sector. Thematically, concerns with weakening global capital expenditures and elevated valuations in many cases, led Kettle Hill to short Industrial and consumer holdings as well as technology and media companies facing technological disruption.
| Shareholder Letter | 9 | ||
We enter 2016 with a healthy respect for the power of the market and the negative signal that the aforementioned lack of breadth is sending. There are serious problems in emerging markets as well as in the debt markets, and the U.S. economy is showing signs of strain from the strong dollar and divergent monetary policy the Fed is pursuing. We think this will be a year of defense as opposed to offense. We remain committed to our focus on preserving capital and are excited about the potential of finding value during a period of extreme turmoil in the market.
LoCorr Spectrum Income Fund
The LoCorr Spectrum Income Fund (the “Spectrum Income Fund” or the “Fund”) has an objective of current income with capital appreciation as a secondary objective. The Fund is designed to fit within the “low correlation” of the LoCorr Fund family by seeking to provide relatively high levels of income with low correlation to the bond market. The Fund uses two strategies to attempt to achieve its objective – an Income Strategy and a Loan Investment Strategy. The Fund’s sub-adviser of the Income Strategy is TFMS. TFMS invests in pass-through securities to seek high current income, much of which the Fund distributes monthly to investors. Overall, the Fund’s Class I shares fell -7.10% during the year ended December 31, 2015.
Income Strategy
Two macroeconomic factors weighed on the portfolio in 2015: The economic slowdown in China, which affected the energy and high-yield markets, and the divergent policies of the ECB and the Fed. The portfolio’s positive performance in January to April was followed by a correction in May through August and stabilization from September to December. We believe that with its high dividend yield and lower volatility profile, the portfolio is well positioned to face turbulent markets in 2016.
January-April 2015: Favorable macro-environment. During this period, signs of a better performing Chinese economy led to a recovery of commodity markets. Crude oil prices troughed at approximately $44 a barrel in January and were back around $60 a barrel at the end of April. Meanwhile, central bank policies became more accommodative: The ECB launched a Quantitative Easing program in January in an effort to spur higher growth rates in Europe while the Fed refrained from raising short-term rates. In this environment, our energy, basic materials and transportation holdings, performed strongly. These positions represented approximately 30% of the portfolio, but delivered more than 50% of the returns during this period. Among our energy holdings, Master Limited Partnerships (MLPs) involved in downstream activities (refiners and processors) benefited from a positive differential between refined product and crude oil prices (crack spreads).
May-August 2015: The impact of the Chinese economic slowdown. The market’s appreciation for the new economic reality hurt the portfolio. In China, the stock market went on a free fall at the end of June and authorities took extraordinary measures to contain spillover effects. Then, in August, China unexpectedly devalued the Yuan by 2% vs. the U.S. dollar which led to renewed fears regarding the state of the Chinese economy and caused commodity markets to correct again. During this time, the expectations for higher U.S. short-term rates also weighed on the stock market, though the Federal Reserve refrained from hiking rates due to economic uncertainties. Our best performing holdings from the January through April period were the portfolio’s worst performers during this period. The largest detractors were the portfolio’s upstream MLPs, which produce oil and natural gas. A new issue emerged during this period: financial contagion. While a rise in credit spreads had so far been mostly limited to energy high yield bonds, other sectors started to show more financial strain as U.S. Industrial production felt the effects of massive cuts in oil and gas capital expenditures’ programs. At the same time, the expectations for higher rates were a blow to interest-rate sensitive Real Estate Investment Trusts (REITs) and Health Care REITs with long term leases.
September-December 2015: Stabilization with volatility. When it became apparent that the Chinese economic slowdown was significant and pervasive, the Fed kept its short-term rate hikes on hold until December. The portfolio’s performance was volatile during this period, with large declines followed by strong rebounds. We restructured the portfolio to reduce its volatility by further cutting the already small portion of our holdings that were most exposed to commodity markets (upstream MLPs and bulk carriers) and higher yield spreads (non-investment grade closed end funds (“CEFs”)). We initiated new positions in preferred stock CEFs, as preferred securities are mostly issued by banks whose net interest margins could rise in a higher short-term rate environment. Having built a sizable allocation to these defensive positions, we started to invest in beaten-down energy MLP’s in mid-December.
2016: Positioned for a volatile environment. We believe that uncertainties regarding the extent of the Chinese economic slowdown and the pace of the Fed’s short-term rate hikes will lead to more volatility. We have built a “barbell” portfolio with large defensive positions combined with prospective growth beneficiaries trading at what we believe to be extremely attractive yields (i.e. large cap midstream MLPs) which we are buying on the dips. In our opinion, most of the total return in 2016 may come from dividends and we believe our high dividend yield should be sustainable in the expected slow growth environment.
| 10 | Shareholder Letter | ||
Loan Investment Strategy
The Loan Investment Strategy is designed to invest in secured real estate loans that provide the Fund with the potential to enhance yield, reduce volatility and provide the portfolio benefits of lower correlation to stocks and bonds. The Fund’s Loan Investment Strategy is based on its investment in a pool of secured real estate loans managed and administered by Terra Capital Partners (“Terra”), which was founded in 2002. During the period, this investment has generated a steady source of high income and helped dampen the Fund’s volatility while producing positive returns.
Thank you for investing in LoCorr Funds.
| Shareholder Letter | 11 | ||
Definitions: Barclay’s 1-5 Year Government Credit Index-The Barclays U.S. Government/Credit 1-5 Year Index is an index of all investment grade bonds with maturities of more than one year and less than 5 years. The Barclays U.S. Government/Credit 1-5 Year Index is a market value weighted performance benchmark. Alerian MLP Index-The Alerian MLP Index is the leading gauge of energy Master Limited Partnerships (MLPs). The float-adjusted, capitalization-weighted index, whose 50 constituents represent approximately 75% of total market capitalization, is disseminated real-time on a price-return basis (AMZ) and on a total-return basis (AMZX). Barclay’s 1-3 Year Government Bond Index-The Barclays U.S. 1-3 Year Government/Credit Bond Index is a part of the Barclays U.S. Government/Credit Bond Index. It includes Treasury and agency securities (U.S. Government Bond Index) and publicly issued U.S. corporate and foreign debentures and secured notes (U.S. Credit Bond Index). The bonds in the index are investment-grade with a maturity between one and three years. S&P 500 Index-Consists of 500 selected common stocks, most of which are listed on the New York Stock Exchange. The S&P’s Ratings Group designates the stocks to be included in the Index on a statistical basis. A particular stock’s weighting in the Index is based on its relative total market value (i.e., its market price per share times the number of shares outstanding). Stocks may be added or deleted from the Index from time to time. Russell 2000 Index-The Russell 2000 Growth Index is an unmanaged index representing those Russell 2000 Index companies with higher price-to-book ratios and future projected earnings according to Russell Investments. Growth stocks typically are more volatile than value stocks; however, value stocks have a lower expected growth rate in earnings and sales. One cannot invest directly in an index. Investment Grade-Investment Grade refers to bonds that are rated BBB or higher. Bond ratings are grades given to bonds that indicate their credit quality as determined by private independent rating services such as Standard & Poor’s, Moody’s and Fitch. These firms evaluate a bond issuer’s financial strength, or its ability to pay a bond’s principal and interest in a timely fashion. Ratings are expressed as letters ranging from ‘AAA’, which is the highest grade, to ‘D’, which is the lowest grade. Beta-Beta measures the sensitivity of rates of return on a fund to general market movements.
Must be preceded or accompanied by a prospectus.
Opinions expressed are those of the Investment Manager and are subject to change, are not guaranteed and should not be considered investment advice.
Past performance is not a guarantee of future results.
Diversification does not assure a profit nor protect against loss in a declining market.
Mutual fund investing involves risk. Principal loss is possible. The LoCorr Managed Futures Strategy Fund is a diversified fund. The LoCorr Long/ Short Commodities Strategy Fund, the LoCorr Multi-Strategy Fund, the LoCorr Market Trend Fund, the LoCorr Long/Short Equity Fund and the LoCorr Spectrum Income Fund are each non-diversified funds, meaning they may invest their assets in fewer individual holdings than a diversified fund. Therefore, the Funds are more exposed to individual stock volatility than a diversified fund. The Funds invest in foreign investments and foreign currencies which involve greater volatility and political, economic and currency risks and differences in accounting methods. The Funds may make short sales of securities, which involves the risk that losses may exceed the original amount invested. Investing in commodities may subject the Funds to greater risks and volatility as commodity prices may be influenced by a variety of factors including unfavorable weather, environmental factors, and changes in government regulations. The Funds may invest in derivative securities, which derive their performance from the performance of an underlying asset, index, interest rate or currency exchange rate. Derivatives can be volatile and involve various types and degrees of risks, and, depending upon the characteristics of a particular derivative, suddenly can become illiquid. Investments in debt securities typically decrease in value when interest rates rise. This risk is usually greater for longer-term debt securities. Investments in Asset Backed, Mortgage Backed, and Collateralized Mortgage Backed Securities include additional risks that investors should be aware of such as credit risk, prepayment risk, possible illiquidity and default, as well as increased susceptibility to adverse economic developments.
Derivative contracts ordinarily have leverage inherent in their terms which can magnify a Fund’s potential for gains or losses through increased long and short position exposure. A Fund may access derivatives via a swap agreement. A risk of a swap agreement is the risk that the counterparty to the agreement will default on its obligation to pay the Fund.
A Fund will incur a loss as a result of a short position if the price of the short position instrument increases in value between the date of the short position sale and the date on which an offsetting position is purchased.
Investments in small- and medium-capitalization companies involve additional risks such as limited liquidity and greater volatility. Investments in lower rated and non-rated securities presents a greater risk of loss to principal and interest than higher-rated securities. ETF investments are subject to investment advisory and other expenses, which will be indirectly paid by the Fund. As a result, the cost of investing in the Fund will be higher than the cost of investing directly in ETFs and may be higher than other mutual funds that invest directly in stocks and bonds. ETFs are subject to specific risks, depending on the nature of the ETF.
A Fund’s portfolio will be significantly impacted by the performance of the real estate market generally, and a Fund may be exposed to greater risk and experience higher volatility than would a more economically diversified portfolio. Property values may fall due to increasing vacancies or declining rents resulting from economic, legal, cultural, or technological developments. Investments in Limited Partnerships (including master limited partnerships) involve risks different from those of investing in common stock including risks related to limited control and limited rights to vote on matters affecting the Limited Partnership, risks related to potential conflicts of interest between the Limited Partnership and the Limited Partnership’s general partner, cash flow risks, dilution risks and risks related to the general partner’s limited call right. Underlying Funds are subject to management and other expenses, which will be indirectly paid by a Fund.
The LoCorr Managed Futures Strategy Fund, LoCorr Long/Short Commodities Strategy Fund, LoCorr Market Trend Fund, LoCorr Long/Short Equity Fund, LoCorr Spectrum Income Fund, and the LoCorr Multi-Strategy Fund are distributed by Quasar Distributors, LLC.
| 12 | Fund Performance | ||
Rate of Return — For the period ended December 31, 2015 (Unaudited)
| Inception Date | 6 Month | 1 Year | Average Annual Since Inception | ||||
| LoCorr Managed Futures Strategy Fund - Class A (without maximum load) | 3/22/11 | 5.24 | % | 3.27 | % | -0.26 | % |
| LoCorr Managed Futures Strategy Fund - Class A (with maximum load) | 3/22/11 | -0.81 | % | -2.68 | % | -1.49 | % |
| LoCorr Managed Futures Strategy Fund - Class C | 3/24/11 | 3.78 | % | 1.51 | % | -1.00 | % |
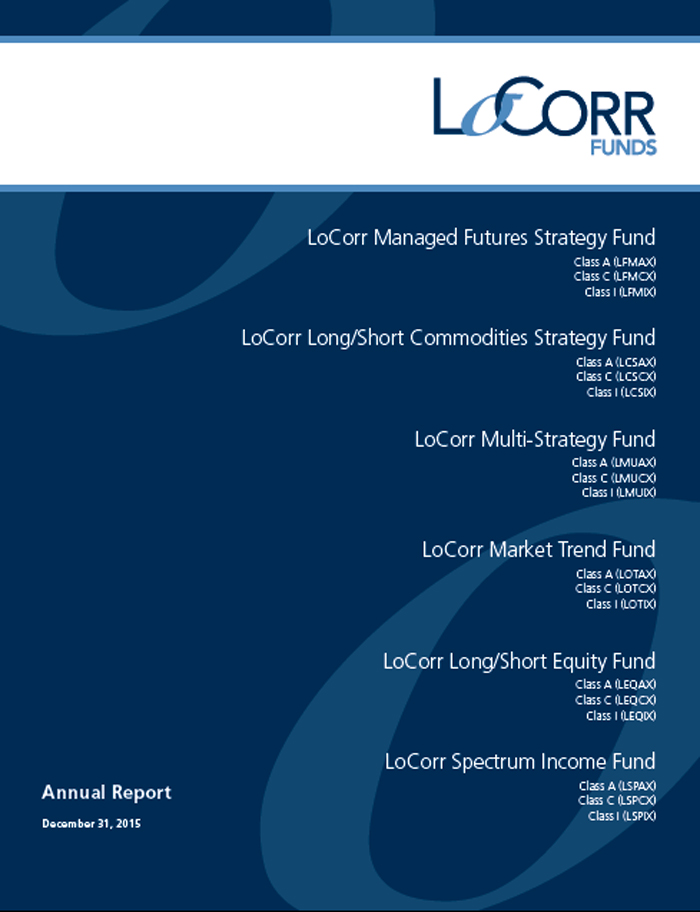
| LoCorr Managed Futures Strategy Fund - Class I | 3/24/11 | 5.44 | % | 3.72 | % | 0.01 | % |
| S&P 500 Total Return Index | 0.15 | % | 1.38 | % | 12.14 | %1 | |
| Barclays CTA Index | 0.63 | % | -0.82 | % | 0.18 | %2 | |
$100,000 investment in the
LoCorr Managed Futures Strategy Fund – Class I
For the period ended December 31, 2015 (Unaudited)
This chart illustrates the performance of a hypothetical $100,000 investment made in the Fund since inception. Assumes reinvestment of dividends and capital gains, but does not reflect the effect of any applicable sales charge or redemption fees. This chart does not imply any future performance. Performance will vary from class to class based on differences in class-specific expenses and sales charges. The returns do not reflect the deduction of taxes that a shareholder would pay on Fund distributions or the redemption of Fund shares.
Performance data represents past performance; past performance does not guarantee future results. The investment return and principal value of an investment will fluctuate so that an investor’s shares, when redeemed, may be worth more or less than their original cost. Current performance of the Fund may be lower or higher than the performance quoted. Performance data current to the most recent month end may be obtained by calling 1.855.LCFUNDS, or visiting www.LoCorrFunds.com.
Performance data shown reflects the Class A maximum sales charge of 5.75% and reflects the Class C Contingent Deferred Sales Charge (CDSC) of 1.00%. Performance of the Class A without load does not reflect the deduction of the sales load or fee. If reflected, the load or fee would reduce the performance quoted.
The Fund imposes a 1.00% redemption fee on shares held for less than 30 days. Performance data does not reflect the redemption fee. If it had, return would be reduced.
Per the fee table in the Fund’s May 1, 2015 prospectus, the Fund’s annual operating expense ratio is 2.62%, 3.37% and 2.37% for Class A, Class C and Class I shares, respectively.
The S&P 500 Total Return Index is an unmanaged capitalization-weighted index of 500 stocks designed to measure performance of the broad domestic economy through changes in the aggregate market value of the 500 stocks which represent all major industries. The Barclays CTA Index is a leading industry benchmark of representative performance of commodity trading advisors.
One cannot invest directly in an index.
1 Since inception return as of March 24, 2011.
2 Since inception return as of March 31, 2011.
LoCorr Long/Short Commodities Strategy Fund
Rate of Return — For the period ended December 31, 2015 (Unaudited)
| Average Annual | |||||||
| Inception Date | 6 Month | 1 Year | Since Inception1 | ||||
| LoCorr Long/Short Commodities Strategy Fund - Class A (without maximum load) | 1/1/12 | 17.13 | % | 22.34 | % | 3.45 | % |
| LoCorr Long/Short Commodities Strategy Fund - Class A (with maximum load) | 1/1/12 | 10.44 | % | 15.32 | % | 1.93 | % |
| LoCorr Long/Short Commodities Strategy Fund - Class C | 1/1/12 | 15.78 | % | 20.39 | % | 2.59 | % |
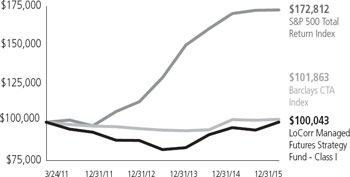
| LoCorr Long/Short Commodities Strategy Fund - Class I | 1/1/12 | 17.28 | % | 22.61 | % | 3.67 | % |
| S&P 500 Total Return Index | 0.15 | % | 1.38 | % | 15.33 | % | |
| Morningstar Long/Short Commodity Index | 1.85 | % | 2.42 | % | -2.52 | % | |
$100,000 investment in the
LoCorr Long/Short Commodities Strategy Fund – Class I
For the period ended December 31, 2015 (Unaudited)
This chart illustrates the performance of a hypothetical $100,000 investment made in the Fund since inception. Assumes reinvestment of dividends and capital gains, but does not reflect the effect of any applicable sales charge or redemption fees. This chart does not imply any future performance. Performance will vary from class to class based on differences in class-specific expenses and sales charges. The returns do not reflect the deduction of taxes that a shareholder would pay on Fund distributions or the redemption of Fund shares.
Performance data represents past performance; past performance does not guarantee future results. The investment return and principal value of an investment will fluctuate so that an investor’s shares, when redeemed, may be worth more or less than their original cost. Current performance of the Fund may be lower or higher than the performance quoted. Performance data current to the most recent month end may be obtained by calling 1.855.LCFUNDS, or visiting www.LoCorrFunds.com.
Performance data shown reflects the Class A maximum sales charge of 5.75% and reflects the Class C Contingent Deferred Sales Charge (CDSC) of 1.00%. Performance of the Class A without load does not reflect the deduction of the sales load or fee. If reflected, the load or fee would reduce the performance quoted.
The Fund imposes a 1.00% redemption fee on shares held for less than 30 days. Performance data does not reflect the redemption fee. If it had, return would be reduced.
Per the fee table in the Fund’s May 1, 2015 prospectus, the Fund’s annual operating expense ratio, before fee waivers is 3.53%, 4.28% and 3.28% for Class A, Class C and Class I shares, respectively.
The S&P 500 Total Return Index is an unmanaged capitalization-weighted index of 500 stocks designed to measure performance of the broad domestic economy through changes in the aggregate market value of the 500 stocks which represent all major industries. The Morningstar Long/Short Commodity Index is a fully collateralized commodity futures index that uses the momentum rule to determine if each commodity is held long, short, or flat.
One cannot invest directly in an index.
1 Since inception returns as of January 1, 2012.
| Fund Performance | 13 | ||
LoCorr Multi-Strategy Fund
Rate of Return — For the period ended December 31, 2015 (Unaudited)
| Since | |||||
| Inception Date | 6 Month | Inception1 | |||
| LoCorr Multi-Strategy Fund - Class A (without maximum load) | 4/6/15 | -7.81 | % | -15.14% | |
| LoCorr Multi-Strategy Fund - Class A (with maximum load) | 4/6/15 | -13.12 | % | -20.02% | |
| LoCorr Multi-Strategy Fund - Class C | 4/6/15 | -9.02 | % | -16.45% | |
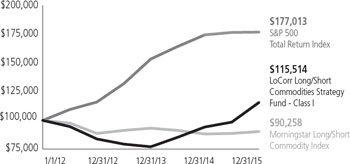
| LoCorr Multi-Strategy Fund - Class I | 4/6/15 | -7.67 | % | -14.98% | |
| S&P 500 Total Return Index | 0.15 | % | -0.20% | ||
| Morningstar Multialternative Category | -3.11 | % | -4.77% | ||
$100,000 investment in the
LoCorr Multi-Strategy Fund - Class I
For the period ended December 31, 2015 (Unaudited)
This chart illustrates the performance of a hypothetical $100,000 investment made in the Fund since inception. Assumes reinvestment of dividends and capital gains, but does not reflect the effect of any applicable sales charge or redemption fees. This chart does not imply any future performance. Performance will vary from class to class based on differences in class-specific expenses and sales charges. The returns do not reflect the deduction of taxes that a shareholder would pay on Fund distributions or the redemption of Fund shares.
Performance data represents past performance; past performance does not guarantee future results. The investment return and principal value of an investment will fluctuate so that an investor’s shares, when redeemed, may be worth more or less than their original cost. Current performance of the Fund may be lower or higher than the performance quoted. Performance data current to the most recent month end may be obtained by calling 1.855.LCFUNDS, or visiting www.LoCorrFunds.com.
Performance data shown reflects the Class A maximum sales charge of 5.75% and reflects the Class C Contingent Deferred Sales Charge (CDSC) of 1.00%. Performance of the Class A without load does not reflect the deduction of the sales load or fee. If reflected, the load or fee would reduce the performance quoted.
The Fund imposes a 1.00% redemption fee on shares held for less than 30 days. Performance data does not reflect the redemption fee. If it had, return would be reduced.
Per the fee table in the Fund’s May 1, 2015 prospectus, the Fund’s annual operating expense ratio, before fee waivers is 3.14%, 3.89% and 2.89% for Class A, Class C and Class I shares, respectively.
The S&P 500 Total Return Index is an unmanaged capitalization-weighted index of 500 stocks designed to measure performance of the broad domestic economy through changes in the aggregate market value of the 500 stocks which represent all major industries. The funds in the Morningstar Multialternative Category use a combination of alternative strategies. Funds in this category have a majority of their assets exposed to alternative strategies and include both funds with static allocations to alternative strategies and funds tactically allocating among alternative strategies and asset classes.
One cannot invest directly in an index.
1 Cumulative total return since inception as of April 6, 2015.
LoCorr Market Trend Fund
Rate of Return — For the period ended December 31, 2015 (Unaudited)
| Inception Date | 6 Month | 1 Year | Average Annual Since Inception1 | ||||
| LoCorr Market Trend Fund - Class A (without maximum load) | 7/1/14 | -2.58 | % | 5.68 | % | 16.29% | |
| LoCorr Market Trend Fund - Class A (with maximum load) | 7/1/14 | -8.20 | % | -0.41 | % | 11.80% | |
| LoCorr Market Trend Fund - Class C | 7/1/14 | -3.89 | % | 3.90 | % | 15.43% | |
| LoCorr Market Trend Fund - Class I | 7/1/14 | -2.47 | % | 5.96 | % | 16.59% | |
| S&P 500 Total Return Index | 0.15 | % | 1.38 | % | 4.98% | ||
| Barclays CTA Index | 0.63 | % | -0.82 | % | 4.02% | ||
$100,000 investment in the
LoCorr Market Trend Fund - Class I
For the period ended December 31, 2015 (Unaudited)

This chart illustrates the performance of a hypothetical $100,000 investment made in the Fund since inception. Assumes reinvestment of dividends and capital gains, but does not reflect the effect of any applicable sales charge or redemption fees. This chart does not imply any future performance. Performance will vary from class to class based on differences in class-specific expenses and sales charges. The returns do not reflect the deduction of taxes that a shareholder would pay on Fund distributions or the redemption of Fund shares.
Performance data represents past performance; past performance does not guarantee future results. The investment return and principal value of an investment will fluctuate so that an investor’s shares, when redeemed, may be worth more or less than their original cost. Current performance of the Fund may be lower or higher than the performance quoted. Performance data current to the most recent month end may be obtained by calling 1.855.LCFUNDS, or visiting www.LoCorrFunds.com.
Performance data shown reflects the Class A maximum sales charge of 5.75% and reflects the Class C Contingent Deferred Sales Charge (CDSC) of 1.00%. Performance of the Class A without load does not reflect the deduction of the sales load or fee. If reflected, the load or fee would reduce the performance quoted.
The Fund imposes a 1.00% redemption fee on shares held for less than 30 days. Performance data does not reflect the redemption fee. If it had, return would be reduced.
Per the fee table in the Fund’s May 1, 2015 prospectus, the Fund’s annual operating expense ratio, before fee waivers is 3.70%, 4.45% and 3.45% for Class A, Class C and Class I shares, respectively.
The S&P 500 Total Return Index is an unmanaged capitalization-weighted index of 500 stocks designed to measure performance of the broad domestic economy through changes in the aggregate market value of the 500 stocks which represent all major industries. The Barclays CTA Index is a leading industry benchmark of representative performance of commodity trading advisors.
One cannot invest directly in an index.
1 Since inception return as of July 1, 2014.
| 14 | Fund Performance | ||
LoCorr Long/Short Equity Fund
Rate of Return — For the period ended December 31, 2015 (Unaudited)
| Average Annual | |||||||
| Inception Date | 6 Month | 1 Year | Since Inception1 | ||||
| LoCorr Long/Short Equity Fund - Class A (without maximum load) | 5/10/13 | -8.54 | % | -1.53 | % | -1.23% | |
| LoCorr Long/Short Equity Fund - Class A (with maximum load) | 5/10/13 | -13.77 | % | -7.22 | % | -3.41% | |
| LoCorr Long/Short Equity Fund - Class C | 5/10/13 | -9.70 | % | -3.25 | % | -1.96% | |
| LoCorr Long/Short Equity Fund - Class I | 5/10/13 | -8.31 | % | -1.22 | % | -0.96% | |
| S&P 500 Total Return Index | 0.15 | % | 1.38 | % | 11.14% | ||
| Russell 2000 Total Return Index | -8.75 | % | -4.41 | % | 7.38% | ||
$100,000 investment in the
LoCorr Long/Short Equity Fund - Class I
For the period ended December 31, 2015 (Unaudited)
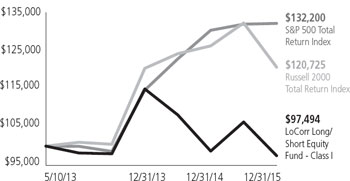
This chart illustrates the performance of a hypothetical $100,000 investment made in the Fund since inception. Assumes reinvestment of dividends and capital gains, but does not reflect the effect of any applicable sales charge or redemption fees. This chart does not imply any future performance. Performance will vary from class to class based on differences in class-specific expenses and sales charges. The returns do not reflect the deduction of taxes that a shareholder would pay on Fund distributions or the redemption of Fund shares.
Performance data represents past performance; past performance does not guarantee future results. The investment return and principal value of an investment will fluctuate so that an investor’s shares, when redeemed, may be worth more or less than their original cost. Current performance of the Fund may be lower or higher than the performance quoted. Performance data current to the most recent month end may be obtained by calling 1.855.LCFUNDS, or visiting www.LoCorrFunds.com.
Performance data shown reflects the Class A maximum sales charge of 5.75% and reflects the Class C Contingent Deferred Sales Charge (CDSC) of 1.00%. Performance of the Class A without load does not reflect the deduction of the sales load or fee. If reflected, the load or fee would reduce the performance quoted.
The Fund imposes a 1.00% redemption fee on shares held for less than 30 days. Performance data does not reflect the redemption fee. If it had, return would be reduced.
Per the fee table in the Fund’s May 1, 2015 prospectus, the Fund’s annual operating expense ratio before fee waivers is 3.61%, 4.36% and 3.36% for Class A, Class C and Class I shares, respectively.
The S&P 500 Total Return Index is an unmanaged capitalization-weighted index of 500 stocks designed to measure performance of the broad domestic economy through changes in the aggregate market value of the 500 stocks which represent all major industries. The Russell 2000 Total Return Index measures the performance of the small-cap segment of the U.S. equity universe.
One cannot invest directly in an index.
1 Since inception returns as of May 10, 2013.
LoCorr Spectrum Income Fund
Rate of Return — For the period ended December 31, 2015 (Unaudited)
| Average Annual | |||||||
| Inception Date | 6 Month | 1 Year | Since Inception1 | ||||
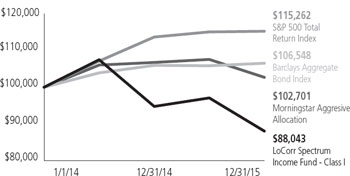
| LoCorr Spectrum Income Fund - Class A (without maximum load) | 1/1/14 | -9.46 | % | -7.36 | % | -6.41 | % |
| LoCorr Spectrum Income Fund - Class A (with maximum load) | 1/1/14 | -14.64 | % | -12.72 | % | -9.14 | % |
| LoCorr Spectrum Income Fund - Class C | 1/1/14 | -10.74 | % | -8.91 | % | -7.12 | % |
| LoCorr Spectrum Income Fund - Class I | 1/1/14 | -9.32 | % | -7.10 | % | -6.17 | % |
| S&P 500 Total Return Index | 0.15 | % | 1.38 | % | 7.36 | % | |
| Morningstar Aggressive Allocation | -4.54 | % | -2.73 | % | 1.34 | % | |
| Barclays Aggregate Bond Index | 0.65 | % | 0.55 | % | 3.22 | % | |
$100,000 investment in the
LoCorr Spectrum Income Fund - Class I
For the period ended December 31, 2015 (Unaudited)
This chart illustrates the performance of a hypothetical $100,000 investment made in the Fund since inception. Assumes reinvestment of dividends and capital gains, but does not reflect the effect of any applicable sales charge or redemption fees. This chart does not imply any future performance. Performance will vary from class to class based on differences in class-specific expenses and sales charges. The returns do not reflect the deduction of taxes that a shareholder would pay on Fund distributions or the redemption of Fund shares.
Performance data represents past performance; past performance does not guarantee future results. The investment return and principal value of an investment will fluctuate so that an investor’s shares, when redeemed, may be worth more or less than their original cost. Current performance of the Fund may be lower or higher than the performance quoted. Performance data current to the most recent month end may be obtained by calling 1.855.LCFUNDS, or visiting www.LoCorrFunds.com.
Performance data shown reflects the Class A maximum sales charge of 5.75% and reflects the Class C Contingent Deferred Sales Charge (CDSC) of 1.00%. Performance of the Class A without load does not reflect the deduction of the sales load or fee. If reflected, the load or fee would reduce the performance quoted.
The Fund imposes a 2.00% redemption fee on shares held for less than 60 days. Performance data does not reflect the redemption fee. If it had, return would be reduced.
Per the fee table in the Fund’s May 1, 2015 prospectus, the Fund’s annual operating expense ratio, before fee waivers is 3.37%, 4.12% and 3.12% for Class A, Class C and Class I shares, respectively.
The S&P 500 Total Return Index is an unmanaged capitalization-weighted index of 500 stocks designed to measure performance of the broad domestic economy through changes in the aggregate market value of the 500 stocks which represent all major industries. The Barclays Aggregate Bond Index is a long term, market capitalization-weighted index used to represent investment grade bonds being traded in the United States. The Morningstar Aggressive Allocation portfolios seek to provide both capital appreciation and income by investing in three major areas: stocks, bonds and cash.
One cannot invest directly in an index.
1 Since inception returns as of January 1, 2014.
| LoCorr Managed Futures Strategy Fund - Consolidated Schedule of Investments | 15 | ||
LoCorr Managed Futures Strategy Fund
Composition of Consolidated Investment Portfolio1
December 31, 2015 (Unaudited)
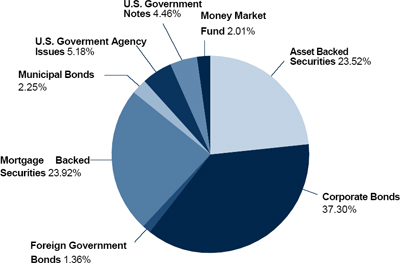
1 As a percentage of total investments.
Consolidated Schedule of Investments
December 31, 2015
| Maturity Date | Coupon Rate | Principal Amount | Value | |||||||||
| ASSET BACKED SECURITIES: 19.41% | ||||||||||||
| 321 Henderson Receivables I LLC, 2004-A A1 (Acquired 02/08/2013, Cost, $336,224) (a)(c) | 09/15/2045 | 0.68 | % | $ | 353,223 | $ | 348,562 | |||||
| 321 Henderson Receivables II LLC, 2006-1 (Acquired 03/30/2015, Cost, $2,306,903) (a)(c) | 03/15/2041 | 0.53 | % | 2,340,177 | 2,261,723 | |||||||
| Ally Auto Receivables Trust | ||||||||||||
| Series 2013-2 A3 | 01/16/2018 | 0.79 | % | 601,645 | 601,076 | |||||||
| Series 2013-1 A4 | 02/15/2018 | 0.84 | % | 1,100,000 | 1,097,600 | |||||||
| American Homes 4 Rent, 2014-SFR1 A (Acquired 05/13/2014 and 10/08/2014, Cost, $3,721,482) (a)(c) | 06/17/2031 | 1.35 | % | 3,727,441 | 3,652,697 | |||||||
| AmeriCredit Automobile Receivables Trust, 2014-2 A2A | 10/10/2017 | 0.54 | % | 256,129 | 255,973 | |||||||
| Atlantic City Electric Transition Funding LLC, 2003-1 A3 | 10/20/2020 | 5.05 | % | 797,538 | 837,388 | |||||||
| BA Credit Card Trust, 2014-A3 A (c) | 01/15/2020 | 0.62 | % | 2,040,000 | 2,037,770 | |||||||
| Bank of The West Auto Trust, 2014-1 A2 (Acquired 11/05/2014, Cost, $1,135,575) (a) | 07/17/2017 | 0.69 | % | 1,135,654 | 1,134,834 | |||||||
Cabela’s Credit Card Master Note Trust, 2012-1A A1 (Acquired 05/08/2012, 07/23/2012 and 05/06/2015, Cost, $3,608,089) (a) | 02/18/2020 | 1.63 | % | 3,590,000 | 3,597,248 | |||||||
| California Republic Auto Receivables Trust Series 2012-1 A (Acquired 12/03/2014, Cost, $42,128) (a) | 08/15/2017 | 1.18 | % | 42,106 | 42,100 | |||||||
| Series 2013-2 A2 | 03/15/2019 | 1.23 | % | 1,032,846 | 1,029,960 | |||||||
| Series 2015-1 A3 | 04/15/2019 | 1.33 | % | 2,500,000 | 2,486,792 | |||||||
| Capital Auto Receivables Asset Trust | ||||||||||||
| Series 2013-2 A3 | 10/20/2017 | 1.24 | % | 225,524 | 225,498 | |||||||
| Series 2013-1 A4 | 01/22/2018 | 0.97 | % | 1,901,000 | 1,899,405 | |||||||
| Capital One Multi-Asset Execution Trust, 2006-A11 A11 (c) | 06/15/2019 | 0.42 | % | 3,500,000 | 3,495,087 | |||||||
| CenterPoint Energy Restoration Bond Co. LLC, 2009-1 A2 | 08/15/2019 | 3.46 | % | 2,908,890 | 2,977,553 | |||||||
| CenterPoint Energy Transition Bond Co. IV LLC, 2012-1 A1 | 04/15/2018 | 0.90 | % | 1,064,945 | 1,062,033 | |||||||
| Chase Issuance Trust | ||||||||||||
| Series 2007-A2 A (c) | 04/15/2019 | 0.38 | % | 3,500,000 | 3,488,151 | |||||||
| Series 2013-A3 (c) | 04/15/2020 | 0.61 | % | 234,000 | 233,509 | |||||||
| Citibank Credit Card Issuance Trust | ||||||||||||
| Series 2013-A12 (c) | 11/07/2018 | 0.57 | % | 1,000,000 | 999,571 | |||||||
| Series 2007-A8 | 09/20/2019 | 5.65 | % | 3,500,000 | 3,738,908 | |||||||
| Colony American Homes | ||||||||||||
| Series 2014-1A A (Acquired 04/02/2014 and 12/02/2014, Cost, $3,080,020) (a)(c) | 05/17/2031 | 1.40 | % | 3,087,668 | 3,024,407 | |||||||
| Series 2015-1C C (Acquired 05/27/2015, Cost, $1,940,000) (a)(c) | 07/19/2032 | 2.30 | % | 1,940,000 | 1,865,430 | |||||||
| Consumers 2014 Securitization Funding LLC, 2014-A A1 | 11/01/2020 | 1.33 | % | 1,741,323 | 1,724,777 | |||||||
| Discover Card Execution Note Trust, 2013-A1 (c) | 08/17/2020 | 0.63 | % | 3,300,000 | 3,294,282 | |||||||
The accompanying notes are an integral part of these consolidated financial statements.
| 16 | LoCorr Managed Futures Strategy Fund - Consolidated Schedule of Investments (continued) | ||
| Maturity Date | Coupon Rate | Principal Amount | Value | |||||||||
ASSET BACKED SECURITIES (continued) | ||||||||||||
| Entergy Arkansas Restoration Funding LLC, 2010-A A1 | 08/01/2021 | 2.30 | % | $ | 1,598,254 | $ | 1,606,740 | |||||
| Entergy Gulf States Reconstruction Funding 1 LLC, 2007-A A2 | 10/01/2018 | 5.79 | % | 612,012 | 636,836 | |||||||
| Fifth Third Auto Trust | ||||||||||||
| Series 2014-3 A2B (c) | 05/15/2017 | 0.43 | % | 1,596,266 | 1,595,665 | |||||||
| Series 2013-A B | 04/15/2019 | 1.21 | % | 1,500,000 | 1,492,462 | |||||||
| Ford Credit Auto Owner Trust, 2013-B A3 | 10/15/2017 | 0.57 | % | 660,517 | 660,050 | |||||||
| Green Tree Agency Advance Funding Trust I, 2015-T1 | ||||||||||||
| (Acquired 10/16/2015, Cost, $2,900,000) (a) | 10/15/2046 | 2.30 | % | 2,900,000 | 2,894,902 | |||||||
| Honda Auto Receivables Owner Trust, 2012-4 A4 | 12/18/2018 | 0.66 | % | 2,644,055 | 2,643,660 | |||||||
| Huntington Auto Trust, 2015-1 A3 | 09/16/2019 | 1.24 | % | 4,700,000 | 4,671,911 | |||||||
| Invitation Homes Trust | ||||||||||||
| Series 2013-SFR 1 A (Acquired 11/05/2013 and 10/24/2014, Cost, $4,104,167) (a)(c) | 12/17/2030 | 1.45 | % | 4,103,869 | 4,021,986 | |||||||
| Series 2014-SFR2 A (Acquired 08/04/2014 and 05/06/2015, Cost, $3,800,000) (a)(c) | 09/18/2031 | 1.45 | % | 3,800,000 | 3,729,656 | |||||||
| John Deere Owner Trust, 2015-A A3 | 06/17/2019 | 1.32 | % | 1,500,000 | 1,492,059 | |||||||
| NRZ Advance Receivables Trust, 2015-T2 (Acquired 08/25/2015, Cost, $1,499,997) (a) | 08/17/2048 | 3.30 | % | 1,500,000 | 1,489,325 | |||||||
| Ocwen Master Advance Receivables Trust, 2015-AT3 (Acquired 11/06/2015, | ||||||||||||
| Cost, $1,549,987) (a) | 11/15/2047 | 3.21 | % | 1,550,000 | 1,545,329 | |||||||
| Ohio Phase-In-Recovery Funding LLC, 2013-1 A1 | 07/01/2018 | 0.96 | % | 1,896,827 | 1,891,546 | |||||||
| Santander Drive Auto Receivables Trust | ||||||||||||
| Series 2014-3 A3 | 07/16/2018 | 0.81 | % | 2,374,915 | 2,372,634 | |||||||
| Series 2015-3 | 09/17/2018 | 1.02 | % | 4,763,777 | 4,754,568 | |||||||
| SoFi Professional Loan Program LLC, 2015-C A2 (Acquired 07/29/2015, | ||||||||||||
| Cost, $2,772,930) (a) | 08/25/2033 | 2.51 | % | 2,788,237 | 2,732,614 | |||||||
| SWAY Residential Trust, 2014-1 A (Acquired 12/04/2014, Cost, $3,501,699) (a)(c) | 01/20/2032 | 1.62 | % | 3,519,113 | 3,451,754 | |||||||
| Synchrony Credit Card Master Note Trust, 2014-1 A | 11/15/2020 | 1.61 | % | 5,000,000 | 4,984,024 | |||||||
TCF Auto Receivables Owner Trust, 2015-1A A2 (Acquired 06/03/2015, Cost, $2,678,077) (a) | 08/15/2018 | 1.02 | % | 2,678,231 | 2,673,361 | |||||||
| United States Small Business Administration, 2008-10B 1 | 09/10/2018 | 5.73 | % | 23,415 | 24,320 | |||||||
| Volkswagen Auto Loan Enhanced Trust, 2014-1 | 10/22/2018 | 0.91 | % | 2,240,000 | 2,223,937 | |||||||
| TOTAL ASSET BACKED SECURITIES (Cost $101,685,032) | 101,001,673 | |||||||||||
| CORPORATE BONDS: 30.77% | ||||||||||||
| Administrative and Support and Waste Management and Remediation Services: 0.24% | ||||||||||||
| Synchrony Financial | 08/15/2017 | 1.88 | % | 1,250,000 | 1,244,270 | |||||||
| Finance and Insurance: 13.92% | ||||||||||||
| Aetna, Inc. | 11/15/2017 | 1.50 | % | 1,500,000 | 1,494,350 | |||||||
| Aflac, Inc. | 02/15/2017 | 2.65 | % | 1,750,000 | 1,773,042 | |||||||
| American Express Co. | 05/22/2018 | 1.55 | % | 2,500,000 | 2,480,480 | |||||||
| Anthem, Inc. | 01/15/2018 | 1.88 | % | 1,250,000 | 1,244,578 | |||||||
| Bank of America Corp. | 05/01/2018 | 5.65 | % | 4,570,000 | 4,914,158 | |||||||
| Bank of Montreal (Acquired 12/04/2014, Cost, $2,020,470) (a)(b) | 01/30/2017 | 1.95 | % | 2,000,000 | 2,015,778 | |||||||
| Berkshire Hathaway Finance Corp. | 08/15/2018 | 2.00 | % | 1,330,000 | 1,349,776 | |||||||
| BNP Paribas (b) | 08/20/2018 | 2.70 | % | 1,750,000 | 1,775,095 | |||||||
| Capital One Financial Corp. | 04/24/2019 | 2.45 | % | 1,810,000 | 1,813,307 | |||||||
| Charles Schwab Corp./The | 03/10/2018 | 1.50 | % | 2,050,000 | 2,039,982 | |||||||
| Credit Agricole SA (Acquired 10/01/2012, Cost, $1,501,816) (a)(b) | 10/01/2017 | 3.00 | % | 1,500,000 | 1,528,496 | |||||||
| Daimler Finance North America LLC (Acquired 09/15/2015, Cost, $2,040,644) (a) | 01/11/2018 | 1.88 | % | 2,040,000 | 2,031,946 | |||||||
| Deutsche Bank AG (b) | 02/13/2019 | 2.50 | % | 1,060,000 | 1,067,904 | |||||||
| Fifth Third Bancorp | 06/01/2018 | 4.50 | % | 1,000,000 | 1,052,963 | |||||||
| Ford Motor Credit Company LLC | 01/17/2017 | 1.50 | % | 1,500,000 | 1,489,485 | |||||||
| General Electric Capital Corp. | 05/01/2018 | 5.63 | % | 3,085,000 | 3,364,503 | |||||||
| Goldman Sachs Group, Inc./The | 04/01/2018 | 6.15 | % | 4,135,000 | 4,490,262 | |||||||
| Heineken NV (Acquired 10/02/2012 and 05/06/2015, Cost, $3,001,496) (a)(b) | 10/01/2017 | 1.40 | % | 3,000,000 | 2,988,207 | |||||||
| Hyundai Capital America (Acquired 10/27/2015, Cost, $1,534,816) (a) | 10/30/2018 | 2.40 | % | 1,535,000 | 1,530,238 | |||||||
| ING Bank NV (Acquired 02/29/2012 and 10/23/2012, Cost, $1,508,653) (a)(b) | 03/07/2017 | 3.75 | % | 1,500,000 | 1,536,741 | |||||||
| JPMorgan Chase & Co. | 01/15/2018 | 6.00 | % | 3,115,000 | 3,364,390 | |||||||
| Keycorp | 12/13/2018 | 2.30 | % | 1,170,000 | 1,171,740 | |||||||
| Morgan Stanley | 07/24/2020 | 5.50 | % | 2,385,000 | 2,653,587 | |||||||
| Nomura Holdings, Inc. (b) | 03/19/2019 | 2.75 | % | 1,560,000 | 1,568,416 | |||||||
| Nordea Bank AB (Acquired 02/12/2013, Cost, $1,017,510) (a)(b) | 03/20/2017 | 3.13 | % | 1,000,000 | 1,019,730 | |||||||
| PNC Bank NA | 10/18/2019 | 2.40 | % | 1,400,000 | 1,405,428 | |||||||
| Pricoa Global Funding I (Acquired 09/14/2015, Cost, $1,849,186) (a) | 09/21/2018 | 1.90 | % | 1,850,000 | 1,843,155 | |||||||
| Principal Life Global Funding II (Acquired 11/17/2015, Cost, $2,019,941) (a) | 10/15/2018 | 2.25 | % | 2,000,000 | 2,009,696 | |||||||
The accompanying notes are an integral part of these consolidated financial statements.
| LoCorr Managed Futures Strategy Fund - Consolidated Schedule of Investments (continued) | 17 | ||
| Maturity Date | Coupon Rate | Principal Amount | Value | |||||||||
CORPORATE BONDS (continued) | ||||||||||||
| Prudential Financial, Inc. | 06/15/2019 | 7.38 | % | $ | 1,400,000 | $ | 1,624,724 | |||||
| Rabobank Nederland (b) | 01/19/2017 | 3.38 | % | 1,000,000 | 1,022,234 | |||||||
| Realty Income Corp. | 01/31/2018 | 2.00 | % | 1,750,000 | 1,750,999 | |||||||
| State Street Corp. | 08/18/2020 | 2.55 | % | 1,500,000 | 1,518,671 | |||||||
| SunTrust Banks, Inc. | 11/01/2018 | 2.35 | % | 1,570,000 | 1,578,208 | |||||||
| UBS AG (b) | 12/20/2017 | 5.88 | % | 872,000 | 941,845 | |||||||
| UnitedHealth Group, Inc. | 12/15/2017 | 1.40 | % | 445,000 | 443,690 | |||||||
| Visa, Inc. | 12/14/2020 | 2.20 | % | 2,355,000 | 2,350,617 | |||||||
| Voya Financial, Inc. | 02/15/2018 | 2.90 | % | 1,475,000 | 1,490,945 | |||||||
| Wells Fargo & Co. | 01/16/2018 | 1.50 | % | 2,725,000 | 2,713,392 | |||||||
| 72,452,758 | ||||||||||||
| Health Care and Social Assistance: 0.37% | ||||||||||||
| Catholic Health Initiatives | 11/01/2017 | 1.60 | % | 1,900,000 | 1,896,306 | |||||||
| Information: 3.60% | ||||||||||||
| AT&T, Inc. | 03/11/2019 | 2.30 | % | 1,985,000 | 1,984,038 | |||||||
| CA, Inc. | 08/15/2018 | 2.88 | % | 1,500,000 | 1,505,810 | |||||||
| CBS Corp. | 07/01/2017 | 1.95 | % | 1,000,000 | 1,000,314 | |||||||
| Comcast Corp. | 02/15/2018 | 5.88 | % | 1,500,000 | 1,633,754 | |||||||
| DIRECTV Holdings LLC / DIRECTV Financing Co., Inc. | 03/15/2017 | 2.40 | % | 1,500,000 | 1,512,071 | |||||||
| Discovery Communications LLC | 08/15/2019 | 5.63 | % | 1,250,000 | 1,360,259 | |||||||
| Hewlett-Packard Co. (Acquired 09/30/2015, Cost, $1,218,438) (a) | 10/05/2018 | 2.85 | % | 1,220,000 | 1,219,319 | |||||||
| Oracle Corp. | 04/15/2018 | 5.75 | % | 1,500,000 | 1,636,697 | |||||||
| Symantec Corp. | 06/15/2017 | 2.75 | % | 1,000,000 | 998,692 | |||||||
| Total System Services, Inc. | 06/01/2018 | 2.38 | % | 1,000,000 | 989,613 | |||||||
| Verizon Communications, Inc. | 09/14/2018 | 3.65 | % | 1,400,000 | 1,463,967 | |||||||
| Vodafone Group PLC (b) | 02/19/2018 | 1.50 | % | 1,575,000 | 1,557,503 | |||||||
| Walt Disney Co./The | 09/17/2018 | 1.50 | % | 1,880,000 | 1,876,434 | |||||||
| 18,738,471 | ||||||||||||
| Manufacturing: 5.71% | ||||||||||||
| AbbVie, Inc. | 05/14/2018 | 1.80 | % | 1,450,000 | 1,443,324 | |||||||
| Anheuser-Busch InBev Finance, Inc. | 01/17/2018 | 1.25 | % | 1,500,000 | 1,485,959 | |||||||
| Becton, Dickinson and Co. | 12/15/2017 | 1.80 | % | 2,135,000 | 2,131,896 | |||||||
| Bunge Ltd. Finance Corp. | 11/24/2020 | 3.50 | % | 1,410,000 | 1,402,151 | |||||||
| Cisco Systems, Inc. | 06/15/2018 | 1.65 | % | 1,710,000 | 1,717,146 | |||||||
| Eastman Chemical Co. | 01/15/2020 | 2.70 | % | 2,000,000 | 1,980,244 | |||||||
| Ecolab, Inc. | 12/08/2017 | 1.45 | % | 1,500,000 | 1,485,788 | |||||||
| Hershey Co./The | 11/01/2016 | 1.50 | % | 1,000,000 | 1,004,689 | |||||||
| HJ Heinz Co. (Acquired 06/23/2015, Cost, $1,497,000) (a) | 07/02/2018 | 2.00 | % | 1,500,000 | 1,492,920 | |||||||
| Ingersoll-Rand Global Holding Co., Ltd. | 01/15/2019 | 2.88 | % | 1,045,000 | 1,055,475 | |||||||
| Johnson Controls, Inc. | 11/02/2017 | 1.40 | % | 1,255,000 | 1,241,957 | |||||||
| Merck & Co., Inc. | 05/18/2018 | 1.30 | % | 1,580,000 | 1,576,293 | |||||||
| PepsiCo, Inc. | 10/14/2020 | 2.15 | % | 1,400,000 | 1,393,724 | |||||||
| Qualcomm, Inc. | 05/18/2018 | 1.40 | % | 2,050,000 | 2,032,467 | |||||||
| Reynolds American, Inc. | 08/21/2017 | 2.30 | % | 1,500,000 | 1,511,675 | |||||||
| Sherwin-Williams Co./The | 12/15/2017 | 1.35 | % | 1,640,000 | 1,625,988 | |||||||
| Suncor Energy, Inc. (b) | 06/01/2018 | 6.10 | % | 1,170,000 | 1,258,403 | |||||||
| Thermo Fisher Scientific, Inc. | 02/01/2017 | 1.30 | % | 565,000 | 563,002 | |||||||
| Tyco Electronics Group SA (b) | 12/17/2018 | 2.38 | % | 1,000,000 | 998,621 | |||||||
| Wm Wrigley Jr Co. (Acquired 08/14/2015, Cost, $1,357,674) (a) | 10/21/2019 | 2.90 | % | 1,335,000 | 1,347,354 | |||||||
| Zoetis, Inc. | 02/01/2018 | 1.88 | % | 1,000,000 | 986,635 | |||||||
| 29,735,711 | ||||||||||||
| Mining, Quarrying, and Oil and Gas Extraction: 1.54% | ||||||||||||
| Anadarko Petroleum Corp. | 09/15/2017 | 6.38 | % | 2,000,000 | 2,097,244 | |||||||
| BHP Billiton Finance (USA) Ltd. (b) | 02/24/2017 | 1.63 | % | 1,015,000 | 1,012,935 | |||||||
| Occidental Petroleum Corp. | 02/15/2018 | 1.50 | % | 425,000 | 419,780 | |||||||
| Phillips 66 | 05/01/2017 | 2.95 | % | 1,500,000 | 1,520,388 | |||||||
| Rio Tinto Finance (USA) PLC (b) | 08/21/2017 | 1.63 | % | 1,505,000 | 1,483,403 | |||||||
| Sinopec Group Overseas Development (2014) Ltd. (Acquired 04/02/2014, | ||||||||||||
| Cost, $1,500,000) (a)(b)(c) | 04/10/2017 | 1.10 | % | 1,500,000 | 1,497,692 | |||||||
| 8,031,442 | ||||||||||||
The accompanying notes are an integral part of these consolidated financial statements.
| 18 | LoCorr Managed Futures Strategy Fund - Consolidated Schedule of Investments (continued) | ||
| Maturity Date | Coupon Rate | Principal Amount | Value | |||||||||
CORPORATE BONDS (continued) | ||||||||||||
| Professional, Scientific, and Technical Services: 0.47% | ||||||||||||
| Biogen, Inc. | 09/15/2020 | 2.90 | % | $ | 1,250,000 | $ | 1,246,714 | |||||
| Mastercard, Inc. | 04/01/2019 | 2.00 | % | 1,165,000 | 1,169,560 | |||||||
| 2,416,274 | ||||||||||||
| Real Estate and Rental and Leasing: 0.49% | ||||||||||||
| Health Care REIT, Inc. | 04/01/2019 | 4.13 | % | 1,500,000 | 1,564,350 | |||||||
| Ventas Realty LP / Ventas Capital Corp. | 02/15/2018 | 2.00 | % | 1,000,000 | 995,117 | |||||||
| 2,559,467 | ||||||||||||
| Retail Trade: 1.36% | ||||||||||||
| Amazon.com, Inc. | 11/29/2017 | 1.20 | % | 1,250,000 | 1,246,129 | |||||||
| BP Capital Markets (b) | 09/26/2018 | 2.24 | % | 1,000,000 | 1,003,041 | |||||||
| CVS Health Corp. | 12/05/2018 | 2.25 | % | 2,115,000 | 2,125,205 | |||||||
| Macy’s Retail Holdings, Inc. | 12/01/2016 | 5.90 | % | 1,500,000 | 1,556,421 | |||||||
| Walgreens Boots Alliance, Inc. | 11/17/2017 | 1.75 | % | 1,150,000 | 1,147,756 | |||||||
| 7,078,552 | ||||||||||||
| Transportation and Warehousing: 0.32% | ||||||||||||
| Carnival Corp. | 12/15/2017 | 1.88 | % | 775,000 | 773,899 | |||||||
| Spectra Energy Partners, LP | 09/25/2018 | 2.95 | % | 915,000 | 899,042 | |||||||
| 1,672,941 | ||||||||||||
| Utilities: 1.27% | ||||||||||||
| Exelon Generation Co., LLC | 10/01/2019 | 5.20 | % | 2,000,000 | 2,154,572 | |||||||
| Northern States Power Co./MN | 08/15/2020 | 2.20 | % | 2,000,000 | 1,986,290 | |||||||
| Sempra Energy | 04/01/2017 | 2.30 | % | 1,000,000 | 1,005,815 | |||||||
| Southern Power Co. | 06/01/2018 | 1.50 | % | 1,500,000 | 1,468,332 | |||||||
| 6,615,009 | ||||||||||||
| Wholesale Trade: 1.48% | ||||||||||||
| B.A.T. International Finance PLC (Acquired 06/06/2012, Cost, $995,160) (a)(b) | 06/07/2017 | 2.13 | % | 1,000,000 | 1,006,254 | |||||||
| Cardinal Health, Inc. | 11/15/2019 | 2.40 | % | 1,500,000 | 1,499,426 | |||||||
| McKesson Corp. | 03/10/2017 | 1.29 | % | 1,500,000 | 1,495,784 | |||||||
| Samsung Electronics America, Inc. (Acquired 04/18/2013, Cost, $2,011,903) (a) | 04/10/2017 | 1.75 | % | 2,000,000 | 1,995,461 | |||||||
| Sysco Corp. | 10/01/2020 | 2.60 | % | 1,695,000 | 1,697,681 | |||||||
| 7,694,606 | ||||||||||||
| TOTAL CORPORATE BONDS (Cost $160,668,233) | 160,135,807 | |||||||||||
| FOREIGN GOVERNMENT BONDS: 1.13% | ||||||||||||
| European Investment Bank (b) | 03/15/2018 | 1.00 | % | 3,500,000 | 3,471,423 | |||||||
| European Investment Bank (b) | 08/15/2018 | 1.13 | % | 2,400,000 | 2,378,923 | |||||||
| TOTAL FOREIGN GOVERNMENT BONDS (Cost $5,868,114) | 5,850,346 | |||||||||||
| MORTGAGE BACKED SECURITIES: 19.73% | ||||||||||||
| American Tower Trust I, 2013-1-2 (Acquired 03/06/2013, Cost, $1,830,000) (a) | 03/15/2043 | 1.55 | % | 1,830,000 | 1,787,046 | |||||||
| BXHTL Mortgage Trust, 2015-JWRZ (Acquired 06/19/2015, Cost, $1,583,488) (a)(c) | 05/15/2029 | 1.56 | % | 1,585,000 | 1,570,590 | |||||||
| CD 2007-CD5 Mortgage Trust, A4 (c) | 11/15/2044 | 5.89 | % | 2,590,491 | 2,686,363 | |||||||
| COMM 2012-CCRE2 Mortgage Trust, 2012-CR2 A1 | 08/15/2045 | 0.82 | % | 327,146 | 326,692 | |||||||
| COMM 2012-CCRE4 Mortgage Trust, 2012-CR4 A2 | 10/17/2045 | 1.80 | % | 2,500,000 | 2,479,617 | |||||||
| Commercial Mortgage Trust, 2007-GG11 A4 | 12/10/2049 | 5.74 | % | 1,005,666 | 1,037,575 | |||||||
| CSMC Trust | ||||||||||||
| Series 2014-ICE A (Acquired 10/07/2014, Cost, $3,582,771) (a)(c) | 04/15/2027 | 1.13 | % | 3,580,000 | 3,556,700 | |||||||
| Series 2013-6 1A1 (Acquired 07/24/2013, Cost, $2,165,757) (a)(c) | 07/25/2028 | 2.50 | % | 2,219,155 | 2,197,831 | |||||||
| Series 2015-2 (Acquired 04/30/2015, Cost, $2,583,177) (a) | 02/25/2045 | 3.00 | % | 2,544,779 | 2,556,698 | |||||||
| DBUBS 2011-LC3 Mortgage Trust, A2 | 08/12/2044 | 3.64 | % | 1,552,027 | 1,557,969 | |||||||
| Fannie Mae-Aces | ||||||||||||
| Series 2014-M13 ASQ2 | 11/25/2017 | 1.64 | % | 2,403,725 | 2,411,327 | |||||||
| Series 2015-M1 ASQ2 | 02/25/2018 | 1.63 | % | 715,000 | 717,171 | |||||||
| Series 2015-M7 ASQ2 | 04/25/2018 | 1.55 | % | 2,500,000 | 2,497,569 | |||||||
| Series 2013-M13 FA (c) | 05/25/2018 | 0.77 | % | 1,197,753 | 1,198,713 | |||||||
| Fannie Mae Connecticut Avenue Securities | ||||||||||||
| Series 2014-C02 1M1 (c) | 05/25/2024 | 1.37 | % | 2,684,850 | 2,655,511 | |||||||
| Series 2014-C03 1M1 (c) | 07/25/2024 | 1.62 | % | 2,689,056 | 2,679,299 | |||||||
The accompanying notes are an integral part of these consolidated financial statements.
| LoCorr Managed Futures Strategy Fund - Consolidated Schedule of Investments (continued) | 19 | ||
| Maturity Date | Coupon Rate | Principal Amount | Value | |||||||||
MORTGAGE BACKED SECURITIES (continued) | ||||||||||||
| Fannie Mae Pool | 02/01/2021 | 3.50 | % | $ | 64,118 | $ | 67,174 | |||||
| Fannie Mae Pool | 08/01/2021 | 3.00 | % | 233,101 | 240,489 | |||||||
| Fannie Mae Pool | 09/01/2021 | 3.00 | % | 282,475 | 291,446 | |||||||
| Fannie Mae Pool | 11/01/2021 | 3.00 | % | 542,665 | 559,944 | |||||||
| Fannie Mae Pool | 12/01/2025 | 3.50 | % | 423,135 | 444,013 | |||||||
| Fannie Mae Pool | 09/01/2026 | 3.50 | % | 404,043 | 423,902 | |||||||
| Fannie Mae Pool (c) | 10/01/2033 | 2.63 | % | 986,696 | 1,045,758 | |||||||
| FDIC Guaranteed Notes Trust | ||||||||||||
| Series 2010-S4 A (Acquired 02/24/2012, Cost, $616,253) (a)(c) | 12/04/2020 | 0.97 | % | 615,158 | 619,240 | |||||||
| Series 2010-S1 2A (Acquired 03/01/2012, Cost, $559,063) (a) | 04/25/2038 | 3.25 | % | 552,960 | 564,921 | |||||||
| Series 2010-S1 1A (Acquired 11/18/2011, Cost, $173,931) (a)(c) | 02/25/2048 | 0.79 | % | 174,204 | 174,240 | |||||||
| FHLMC Multifamily Structured Pass Through Certificates | ||||||||||||
| Series K501 A2 | 11/25/2016 | 1.66 | % | 669,845 | 670,998 | |||||||
| Series K703 A1 | 01/25/2018 | 1.87 | % | 49,660 | 49,692 | |||||||
| Series K709 A1 | 10/25/2018 | 1.56 | % | 1,003,730 | 1,004,835 | |||||||
| Series KP02 A2 (c) | 04/25/2021 | 2.36 | % | 3,400,000 | 3,437,102 | |||||||
| Freddie Mac REMICS | ||||||||||||
| Series 3855 HE | 02/15/2026 | 2.50 | % | 28,383 | 28,680 | |||||||
| Series 4181 PF (c) | 11/15/2042 | 0.58 | % | 2,258,179 | 2,249,710 | |||||||
| Freddie Mac Structured Agency Credit Risk Debt Notes | ||||||||||||
| Series 2013-DN2 M1 (c) | 11/25/2023 | 1.87 | % | 2,453,495 | 2,453,494 | |||||||
| Series 2014-DN2 M1 (c) | 04/25/2024 | 1.07 | % | 1,161,455 | 1,159,844 | |||||||
| Series 2014-HQ2 M1 (c) | 09/25/2024 | 1.87 | % | 2,076,479 | 2,085,749 | |||||||
| FREMF Mortgage Trust | ||||||||||||
| Series 2012-KF01 (Acquired 02/02/2015, Cost, $3,048,692) (a)(c) | 10/25/2044 | 3.02 | % | 3,000,000 | 3,015,237 | |||||||
| Series 2012-K708 (Acquired 02/03/2015, Cost, $3,388,560) (a)(c) | 02/25/2045 | 3.75 | % | 3,250,000 | 3,308,509 | |||||||
| Series 2013-K502 (Acquired 05/06/2015, Cost, $2,913,332) (a)(c) | 03/25/2045 | 2.71 | % | 2,875,000 | 2,868,281 | |||||||
| Series 2013-KF02 (Acquired 11/01/2013, Cost, $400,473) (a)(c) | 12/25/2045 | 3.42 | % | 400,473 | 411,366 | |||||||
| GAHR Commercial Mortgage Trust, 2015-NRF AFL1 (Acquired 05/07/2015, | ||||||||||||
| Cost, $2,878,113) (a)(c) | 12/15/2034 | 1.63 | % | 2,870,000 | 2,860,189 | |||||||
| GS Mortgage Securities Trust | ||||||||||||
| Series 2014-GSFL A (Acquired 08/06/2014, Cost, $1,639,894) (a)(c) | 07/15/2031 | 1.33 | % | 1,639,894 | 1,636,341 | |||||||
| Series 2010-C2 A1 (Acquired 04/11/2012, Cost, $221,026) (a) | 12/10/2043 | 3.85 | % | 210,348 | 216,780 | |||||||
| Series 2011-GC5 A2 | 08/10/2044 | 3.00 | % | 3,660,842 | 3,679,194 | |||||||
| Series 2007-GG10 A4 (c) | 08/10/2045 | 5.79 | % | 5,465,278 | 5,615,470 | |||||||
| JPMBB Commercial Mortgage Securities Trust, 2014-C25 A1 | 11/18/2047 | 1.52 | % | 4,256,940 | 4,200,125 | |||||||
| JPMorgan Chase Commercial Mortgage Securities Trust | ||||||||||||
| Series 2010-C1 A1 (Acquired 12/30/2011, Cost, $34,912) (a) | 06/15/2043 | 3.85 | % | 33,719 | 33,585 | |||||||
| Series 2011-C3 A3 (Acquired 04/17/2015, Cost, $2,688,123) (a) | 02/16/2046 | 4.39 | % | 2,500,000 | 2,605,743 | |||||||
| Series 2007-CIBC20 A4 (c) | 02/12/2051 | 5.79 | % | 1,237,101 | 1,285,959 | |||||||
| MASTR Asset Securitization Trust, 2004-1 | 02/25/2019 | 4.50 | % | 296,034 | 298,209 | |||||||
| NCUA Guaranteed Notes Trust | ||||||||||||
| Series 2011-R1 1A (c) | 01/08/2020 | 0.72 | % | 78,392 | 78,705 | |||||||
| Series 2011-R2 1A (c) | 03/06/2020 | 0.67 | % | 2,159,017 | 2,165,415 | |||||||
| Series 2011-R3 1A (c) | 04/09/2020 | 0.59 | % | 2,395,804 | 2,402,508 | |||||||
| Series 2010-R1 1A (c) | 10/07/2020 | 0.72 | % | 250,041 | 251,219 | |||||||
| Series 2010-C1 APT | 10/29/2020 | 2.65 | % | 1,942,600 | 1,946,164 | |||||||
| New Residential Mortgage Loan Trust, 2015-1 (Acquired 06/23/2015, Cost, $1,025,805) (a)(c) 05/28/2052 | 3.75 | % | 1,002,576 | 1,025,853 | ||||||||
| Opteum Mortgage Acceptance Corp. Asset Backed Pass-Through Certificates, 2005-1 (c) | 02/25/2035 | 0.99 | % | 1,400,000 | 1,342,173 | |||||||
| SBA Tower Trust, 2012-1 (Acquired 06/12/2014 and 09/03/2014, Cost, $1,605,553) (a) | 12/15/2042 | 2.93 | % | 1,562,000 | 1,580,472 | |||||||
| Sequoia Mortgage Trust, 2015-3 (Acquired 06/19/2015, Cost, $1,444,478) (a)(c) | 07/25/2045 | 3.50 | % | 1,425,943 | 1,433,539 | |||||||
| Springleaf Mortgage Loan Trust, 2013-1A A (Acquired 04/03/2013, Cost, $935,739) (a)(c) | 06/25/2058 | 1.27 | % | 935,814 | 932,024 | |||||||
| UBS-Citigroup Commercial Mortgage Trust, 2011-C1 A2 | 01/12/2045 | 2.80 | % | 4,000,000 | 4,028,963 | |||||||
| Wells Fargo Commercial Mortgage Trust, 2015-LC22 A1 | 09/17/2058 | 1.64 | % | 3,705,692 | 3,669,153 | |||||||
| WIMC Capital Trust, 2012-A A1 (Acquired 06/21/2012, Cost, $318,017) (a) | 10/16/2050 | 4.55 | % | 318,020 | 319,759 | |||||||
| TOTAL MORTGAGE BACKED SECURITIES (Cost $103,884,330) | 102,698,837 | |||||||||||
| MUNICIPAL BONDS: 1.85% | ||||||||||||
| County of Hamilton OH Sewer System Revenue | 12/01/2016 | 1.23 | % | 825,000 | 827,871 | |||||||
| Louisiana Local Government Environmental Facilities & Community Development Authority | 02/01/2018 | 1.52 | % | 108,216 | 108,258 | |||||||
| Louisiana Local Government Environmental Facilities & Community Development Authority | 02/01/2021 | 3.22 | % | 850,000 | 868,802 | |||||||
| Metropolitan Council, (Minneapolis - St. Paul Metropolitan Area), State of Minnesota | 09/01/2017 | 1.20 | % | 2,020,000 | 2,023,555 | |||||||
| Metropolitan Government of Nashville & Davidson County TN | 07/01/2017 | 1.21 | % | 1,500,000 | 1,503,465 | |||||||
The accompanying notes are an integral part of these consolidated financial statements.
| 20 | LoCorr Managed Futures Strategy Fund - Consolidated Schedule of Investments (continued) | ||
| Maturity Date | Coupon Rate | Principal Amount | Value | |||||||||
MUNICIPAL BONDS (continued) | ||||||||||||
| North Carolina Eastern Municipal Power Agency | 07/01/2018 | 2.00 | % | $ | 1,385,000 | $ | 1,390,263 | |||||
| St. Paul Housing & Redevelopment Authority | 07/01/2018 | 1.84 | % | 1,385,000 | 1,379,086 | |||||||
| State of Ohio | 08/01/2017 | 3.33 | % | 1,500,000 | 1,546,815 | |||||||
| TOTAL MUNICIPAL BONDS (Cost $9,657,774) | 9,648,115 | |||||||||||
| U.S. GOVERNMENT AGENCY ISSUES: 4.27% | ||||||||||||
| Federal Home Loan Banks | 12/09/2016 | 1.63 | % | 4,000,000 | 4,029,584 | |||||||
| Federal Home Loan Banks | 12/16/2016 | 4.75 | % | 5,000,000 | 5,185,100 | |||||||
| Federal Home Loan Banks | 03/10/2017 | 0.88 | % | 3,000,000 | 2,997,879 | |||||||
| Federal Home Loan Mortgage Corp. | 12/15/2017 | 1.00 | % | 5,000,000 | 4,986,625 | |||||||
| Federal National Mortgage Association | 11/15/2016 | 1.38 | % | 5,000,000 | 5,023,215 | |||||||
| TOTAL U.S. GOVERNMENT AGENCY ISSUES (Cost $22,249,420) | 22,222,403 | |||||||||||
| U.S. GOVERNMENT NOTES: 3.68% | ||||||||||||
| United States Treasury Note | 07/31/2020 | 1.63 | % | 8,830,000 | 8,787,916 | |||||||
| United States Treasury Note | 09/30/2020 | 1.38 | % | 10,550,000 | 10,367,844 | |||||||
| TOTAL U.S. GOVERNMENT NOTES (Cost $19,320,835) | 19,155,760 | |||||||||||
| SHORT TERM INVESTMENT: 1.66% | ||||||||||||
| MONEY MARKET FUND: 1.66% | Shares | |||||||||||
| Fidelity Institutional Money Market Portfolio - Class I , 0.28% (d)(e)(f) | 8,644,947 | 8,644,947 | ||||||||||
| TOTAL MONEY MARKET FUND | 8,644,947 | |||||||||||
| TOTAL SHORT TERM INVESTMENT (Cost $8,644,947) | 8,644,947 | |||||||||||
| TOTAL INVESTMENTS (Cost $431,978,685): 82.50% | 429,357,888 | |||||||||||
| Other Assets in Excess of Liabilities: 17.50% (f) | 91,107,023 | |||||||||||
| TOTAL NET ASSETS: 100.00% | $ | 520,464,911 | ||||||||||
| (a) | Restricted security as defined in Rule 144(a) under the Securities Act of 1933 and determined to be liquid. Purchased in a private placement transaction; resale to the public may require registration or may extend only to qualified institutional buyers. At December 31, 2015, the value of these securities total $98,803,859 which represents 18.98% of total net assets. |
| (b) | Foreign issued security. |
| (c) | Variable rate security. The rate reported is the rate in effect as of December 31, 2015. |
| (d) | The rate quoted is the annualized seven-day effective yield as of December 31, 2015. |
| (e) | All or a portion of this security is held by LCMFS Fund Limited. See Note 1. |
| (f) | Includes assets pledged as collateral for swap contracts. See Note 2. |
The accompanying notes are an integral part of these consolidated financial statements.
| LoCorr Managed Futures Strategy Fund - Consolidated Schedule of Swap Contracts | 21 | ||
Consolidated Schedule of Swap Contracts
December 31, 2015
LONG TOTAL RETURN SWAP CONTRACTS
This investment is a holding of LCMFS Fund Limited. See Note 1.
| Termination Date | Notional | Unrealized Appreciation (Depreciation)* | Counterparty | |
| 12/20/17 | LoCorr Managed Futures Index^ | $493,519,768 | $(12,934,752) | Deutsche Bank AG |
^ Comprised of a proprietary basket of Commodity Trading Advisor’s (“CTA”) Programs investing in various futures, forwards, and currency derivative contracts and other similar investments. See Notes 2 and 3.
* Unrealized depreciation is a payable on the Fund’s consolidated statement of assets and liabilities.
The accompanying notes are an integral part of these consolidated financial statements.
| 22 | LoCorr Long/Short Commodities Strategy Fund - Consolidated Schedule of Investments | ||
LoCorr Long/Short Commodities Strategy Fund
Composition of Consolidated Investment Portfolio1
December 31, 2015 (Unaudited)
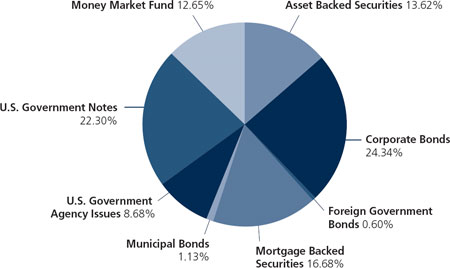
1 As a percentage of total investments.
Consolidated Schedule of Investments
December 31, 2015
| Maturity Date | Coupon Rate | Principal Amount | Value | ||||||||||
| ASSET BACKED SECURITIES: 11.27% | |||||||||||||
| American Express Credit Account Master Trust | |||||||||||||
| Series 2012-1 A (c) | 01/15/2020 | 0.60 | % | $ | 200,000 | $ | 199,686 | ||||||
| Series 2013-2 A (c) | 05/17/2021 | 0.75 | % | 200,000 | 200,013 | ||||||||
| AmeriCredit Automobile Receivables Trust, 2013-5 A3 | 09/10/2018 | 0.90 | % | 162,464 | 162,227 | ||||||||
Bank of The West Auto Trust, 2014-1 A2 (Acquired 11/05/2014 and 03/19/2015, Cost, $98,727) (a) | 07/17/2017 | 0.69 | % | 98,753 | 98,681 | ||||||||
Cabela’s Credit Card Master Note Trust, 2011-4A A1 (Acquired 08/25/2015, Cost, $251,810) (a) | 10/15/2019 | 1.90 | % | 250,000 | 250,730 | ||||||||
| California Republic Auto Receivables Trust, 2013-2 A2 | 03/15/2019 | 1.23 | % | 263,196 | 262,461 | ||||||||
| Capital Auto Receivables Asset Trust | |||||||||||||
| Series A3 | 12/20/2017 | 1.31 | % | 130,678 | 130,671 | ||||||||
| Series 2013-1 A4 | 01/22/2018 | 0.97 | % | 100,000 | 99,916 | ||||||||
| Capital One Multi-Asset Execution Trust, 2006-A11 A11 (c) | 06/17/2019 | 0.42 | % | 225,000 | 224,684 | ||||||||
| CenterPoint Energy Restoration Bond Co. LLC, 2009-1 A2 | 08/15/2019 | 3.46 | % | 231,734 | 237,204 | ||||||||
| CenterPoint Energy Transition Bond Co. II LLC, 2005-A A4 | 08/01/2019 | 5.17 | % | 243,427 | 249,604 | ||||||||
| CenterPoint Energy Transition Bond Co. IV LLC, 2012-1 A1 | 04/15/2018 | 0.90 | % | 111,059 | 110,755 | ||||||||
| Chase Issuance Trust, 2013-A3 (c) | 04/15/2020 | 0.61 | % | 300,000 | 299,371 | ||||||||
| Citibank Credit Card Issuance Trust | |||||||||||||
| Series 2013-A11 (c) | 02/07/2018 | 0.51 | % | 100,000 | 99,994 | ||||||||
| Series 2007-A8 | 09/20/2019 | 5.65 | % | 250,000 | 267,065 | ||||||||
| Series 2008-A1 | 02/07/2020 | 5.35 | % | 250,000 | 268,869 | ||||||||
| CNH Equipment Trust | |||||||||||||
| Series 2012-C A3 | 12/15/2017 | 0.57 | % | 927 | 926 | ||||||||
| Series 2012-D A3 | 04/16/2018 | 0.65 | % | 4,660 | 4,658 | ||||||||
| Colony American Homes | |||||||||||||
| Series 2014-1A A (Acquired 04/02/2014 and 12/02/2014, Cost, $478,084) (a)(c) | 05/17/2031 | 1.40 | % | 479,452 | 469,628 | ||||||||
| Series 2015-1C C (Acquired 05/27/2015, Cost, $100,000) (a)(c) | 07/19/2032 | 2.30 | % | 100,000 | 96,156 | ||||||||
| Discover Card Execution Note Trust | |||||||||||||
| Series 2013-A1 (c) | 08/17/2020 | 0.63 | % | 200,000 | 199,653 | ||||||||
| Series 2012-A6 A6 | 01/18/2022 | 1.67 | % | 200,000 | 197,271 | ||||||||
The accompanying notes are an integral part of these consolidated financial statements.
| LoCorr Long/Short Commodities Strategy Fund - Consolidated Schedule of Investments (continued) | 23 | ||
| Maturity Date | Coupon Rate | Principal Amount | Value | ||||||||||
ASSET BACKED SECURITIES (continued) | |||||||||||||
| Fifth Third Auto Trust | |||||||||||||
| Series 2014-3 A2B (c) | 05/15/2017 | 0.43 | % | $ | 31,925 | $ | 31,913 | ||||||
| Series 2013-A A3 | 09/15/2017 | 0.61 | % | 17,210 | 17,182 | ||||||||
| Green Tree Agency Advance Funding Trust I, 2015-T1 (Acquired 10/16/2015, | |||||||||||||
| Cost, $190,000) (a) | 10/15/2046 | 2.30 | % | 190,000 | 189,666 | ||||||||
| Huntington Auto Trust, 2015-1 A3 | 09/16/2019 | 1.24 | % | 250,000 | 248,506 | ||||||||
| Invitation Homes Trust, 2014-SFR2 A (Acquired 08/04/2014 and 05/06/2015, | |||||||||||||
| Cost, $200,000) (a)(c) | 09/18/2031 | 1.45 | % | 200,000 | 196,298 | ||||||||
| John Deere Owner Trust, 2013-A A3 | 03/15/2017 | 0.60 | % | 9,425 | 9,420 | ||||||||
| Nationstar Agency Advance Funding Trust, 2013-T2A (Acquired 12/18/2015, | |||||||||||||
| Cost, $195,000) (a)(c) | 02/18/2048 | 1.89 | % | 200,000 | 196,080 | ||||||||
| NRZ Advance Receivables Trust, 2015-T2 (Acquired 08/25/2015, Cost, $100,000) (a)(b) | 08/17/2048 | 3.30 | % | 100,000 | 99,289 | ||||||||
| Ocwen Master Advance Receivables Trust, 2015-AT3 (Acquired 11/06/2015, | |||||||||||||
| Cost, $99,999) (a) | 11/15/2047 | 3.21 | % | 100,000 | 99,699 | ||||||||
| Ohio Phase-In-Recovery Funding LLC, 2013-1 A1 | 07/01/2018 | 0.96 | % | 333,226 | 332,299 | ||||||||
| Small Business Administration Participation Certificates, 2012-20K 1 | 11/01/2032 | 2.09 | % | 19,833 | 19,549 | ||||||||
| SoFi Professional Loan Program LLC, 2015-C A2 (Acquired 07/29/2015, Cost, $136,374) (a) | 08/25/2033 | 2.51 | % | 137,126 | 134,392 | ||||||||
| Susquehanna Auto Receivables Trust, 2014-1 (Acquired 12/22/2015, Cost, $275,745) (a) | 02/15/2018 | 1.00 | % | 276,296 | 275,734 | ||||||||
| Synchrony Credit Card Master Note Trust, 2014-1 A | 11/15/2020 | 1.61 | % | 250,000 | 249,201 | ||||||||
| TCF Auto Receivables Owner Trust, 2015-1A A2 (Acquired 06/03/2015, Cost, $124,977) (a) | 08/15/2018 | 1.02 | % | 124,984 | 124,757 | ||||||||
| Volkswagen Auto Loan Enhanced Trust, 2014-1 | 10/22/2018 | 0.91 | % | 150,000 | 148,924 | ||||||||
| World Omni Auto Receivables Trust, 2014-A | 04/15/2019 | 0.94 | % | 248,628 | 247,975 | ||||||||
| TOTAL ASSET BACKED SECURITIES (Cost $6,784,075) | 6,751,107 | ||||||||||||
| CORPORATE BONDS: 20.13% | |||||||||||||
| Administrative and Support and Waste Management and Remediation Services: 0.33% | |||||||||||||
| Mastercard, Inc. | 04/01/2019 | 2.00 | % | 100,000 | 100,391 | ||||||||
| Synchrony Financial | 08/15/2017 | 1.88 | % | 60,000 | 59,725 | ||||||||
| Waste Management, Inc. | 09/01/2016 | 2.60 | % | 40,000 | 40,277 | ||||||||
| 200,393 | |||||||||||||
| Finance and Insurance: 8.69% | |||||||||||||
| Aetna, Inc. | 11/15/2017 | 1.50 | % | 130,000 | 129,510 | ||||||||
| Aflac, Inc. | 02/15/2017 | 2.65 | % | 125,000 | 126,646 | ||||||||
| American Express Co. | 05/22/2018 | 1.55 | % | 215,000 | 213,321 | ||||||||
| Bank of America Corp. | 05/01/2018 | 5.65 | % | 280,000 | 301,086 | ||||||||
| Bank of Montreal (Acquired 12/04/2014, Cost, $90,921) (a)(b) | 01/30/2017 | 1.95 | % | 90,000 | 90,710 | ||||||||
| BB&T Corp. | 01/12/2018 | 1.45 | % | 80,000 | 79,480 | ||||||||
| Berkshire Hathaway Finance Corp. | 08/15/2018 | 2.00 | % | 65,000 | 65,966 | ||||||||
| BNP Paribas (b) | 08/20/2018 | 2.70 | % | 75,000 | 76,076 | ||||||||
| Capital One Financial Corp. | 04/24/2019 | 2.45 | % | 120,000 | 120,219 | ||||||||
| Caterpillar Financial Services Corp. | 09/06/2018 | 2.45 | % | 125,000 | 126,861 | ||||||||
| Charles Schwab Corp./The | 03/10/2018 | 1.50 | % | 110,000 | 109,462 | ||||||||
| Deutsche Bank AG (b) | 02/13/2019 | 2.50 | % | 70,000 | 70,522 | ||||||||
| Dragon 2012 LLC | 03/12/2024 | 1.97 | % | 18,171 | 17,931 | ||||||||
| Fifth Third Bancorp | 06/01/2018 | 4.50 | % | 55,000 | 57,913 | ||||||||
| Ford Motor Credit Company LLC | 01/17/2017 | 1.50 | % | 130,000 | 129,089 | ||||||||
| General Electric Capital Corp. | 05/01/2018 | 5.63 | % | 175,000 | 190,855 | ||||||||
| Goldman Sachs Group, Inc./The | 04/01/2018 | 6.15 | % | 270,000 | 293,197 | ||||||||
| Heineken NV (Acquired 07/28/2015, Cost, $99,819) (a)(b) | 10/01/2017 | 1.40 | % | 100,000 | 99,607 | ||||||||
| Helios Leasing I LLC | 05/29/2024 | 2.02 | % | 18,316 | 18,081 | ||||||||
| Helios Leasing I LLC | 07/24/2024 | 1.73 | % | 18,780 | 18,314 | ||||||||
| Helios Leasing I LLC | 09/28/2024 | 1.56 | % | 18,709 | 18,058 | ||||||||
| Hyundai Capital America (Acquired 10/27/2015, Cost, $84,990) (a) | 10/30/2018 | 2.40 | % | 85,000 | 84,736 | ||||||||
| John Deere Capital Corp. | 04/13/2017 | 5.50 | % | 50,000 | 52,639 | ||||||||
| JPMorgan Chase & Co. | 01/15/2018 | 6.00 | % | 235,000 | 253,814 | ||||||||
| KeyBank National Association | 11/01/2017 | 5.70 | % | 27,000 | 28,684 | ||||||||
| Keycorp | 12/13/2018 | 2.30 | % | 130,000 | 130,193 | ||||||||
| Morgan Stanley | 03/22/2017 | 4.75 | % | 55,000 | 56,970 | ||||||||
| Morgan Stanley | 12/28/2017 | 5.95 | % | 90,000 | 96,779 | ||||||||
| MSN 41079 and 41084 Ltd. (b) | 07/13/2024 | 1.72 | % | 18,766 | 18,280 | ||||||||
| Nomura Holdings, Inc. (b) | 03/19/2019 | 2.75 | % | 90,000 | 90,486 | ||||||||
| Phoenix 2012 LLC | 07/03/2024 | 1.61 | % | 18,980 | 18,401 | ||||||||
| PNC Funding Corp. | 09/19/2016 | 2.70 | % | 55,000 | 55,540 | ||||||||
The accompanying notes are an integral part of these consolidated financial statements.
| 24 | LoCorr Long/Short Commodities Strategy Fund - Consolidated Schedule of Investments (continued) | ||
| Maturity Date | Coupon Rate | Principal Amount | Value | ||||||||||
CORPORATE BONDS (continued) | |||||||||||||
| Pricoa Global Funding I (Acquired 09/14/2015, Cost, $149,934) (a) | 09/21/2018 | 1.90 | % | $ | 150,000 | $ | 149,445 | ||||||
| Principal Life Global Funding II (Acquired 11/17/2015, Cost, $151,496) (a) | 10/15/2018 | 2.25 | % | 150,000 | 150,727 | ||||||||
| Prudential Financial, Inc. | 06/15/2019 | 7.38 | % | 50,000 | 58,026 | ||||||||
| Rabobank Nederland (b) | 01/19/2017 | 3.38 | % | 40,000 | 40,889 | ||||||||
| Realty Income Corp. | 01/31/2018 | 2.00 | % | 75,000 | 75,043 | ||||||||
| Royal Bank of Canada (b) | 07/27/2018 | 2.20 | % | 100,000 | 100,808 | ||||||||
| Safina Ltd. (b) | 01/15/2022 | 1.55 | % | 16,742 | 16,520 | ||||||||
| Societe Generale SA (b) | 10/12/2017 | 2.75 | % | 100,000 | 101,387 | ||||||||
| State Street Bank & Trust Co. | 10/15/2018 | 5.25 | % | 20,000 | 21,702 | ||||||||
| State Street Corp. | 08/18/2020 | 2.55 | % | 55,000 | 55,685 | ||||||||
| SunTrust Banks, Inc. | 11/01/2018 | 2.35 | % | 145,000 | 145,758 | ||||||||
| Tagua Leasing LLC | 11/16/2024 | 1.58 | % | 19,219 | 18,556 | ||||||||
| Toronto-Dominion Bank/The (Acquired 12/04/2014, Cost, $100,566) (a)(b) | 09/14/2016 | 1.63 | % | 100,000 | 100,385 | ||||||||
| Toyota Motor Credit Corp. | 01/12/2017 | 2.05 | % | 10,000 | 10,086 | ||||||||
| Toyota Motor Credit Corp. | 05/22/2017 | 1.75 | % | 70,000 | 70,451 | ||||||||
| UBS AG (b) | 12/20/2017 | 5.88 | % | 50,000 | 54,006 | ||||||||
| UnitedHealth Group, Inc. | 12/15/2017 | 1.40 | % | 100,000 | 99,706 | ||||||||
| Visa, Inc. | 12/14/2020 | 2.20 | % | 155,000 | 154,712 | ||||||||
| Voya Financial, Inc. | 02/15/2018 | 2.90 | % | 100,000 | 101,081 | ||||||||
| WellPoint, Inc. | 01/15/2018 | 1.88 | % | 65,000 | 64,718 | ||||||||
| Wells Fargo & Co. | 01/16/2018 | 1.50 | % | 220,000 | 219,063 | ||||||||
| Wells Fargo & Co. | 04/22/2019 | 2.13 | % | 70,000 | 70,085 | ||||||||
| Westpac Banking Corp. (b) | 08/14/2017 | 2.00 | % | 85,000 | 85,531 | ||||||||
| 5,203,796 | |||||||||||||
| Information: 2.64% | |||||||||||||
| America Movil SAB de CV (b) | 09/08/2016 | 2.38 | % | 65,000 | 65,238 | ||||||||
| AT&T, Inc. | 06/01/2017 | 1.70 | % | 40,000 | 40,110 | ||||||||
| AT&T, Inc. | 03/11/2019 | 2.30 | % | 55,000 | 54,973 | ||||||||
| CA, Inc. | 08/15/2018 | 2.88 | % | 75,000 | 75,290 | ||||||||
| CBS Corp. | 07/01/2017 | 1.95 | % | 40,000 | 40,013 | ||||||||
| CBS Corp. | 04/15/2020 | 5.75 | % | 45,000 | 49,948 | ||||||||
| CCO Safari II LLC (Acquired 07/09/2015, Cost, $84,794) (a) | 07/23/2020 | 3.58 | % | 85,000 | 84,491 | ||||||||
| Comcast Corp. | 02/15/2018 | 5.88 | % | 125,000 | 136,147 | ||||||||
| DIRECTV Holdings LLC / DIRECTV Financing Co., Inc. | 03/15/2017 | 2.40 | % | 75,000 | 75,604 | ||||||||
| Discovery Communications LLC | 08/15/2019 | 5.63 | % | 115,000 | 125,144 | ||||||||
| Hewlett-Packard Co. (Acquired 09/30/2015, Cost, $74,904) (a) | 10/05/2018 | 2.85 | % | 75,000 | 74,958 | ||||||||
| Microsoft Corp. | 12/06/2018 | 1.63 | % | 130,000 | 130,829 | ||||||||
| Oracle Corp. | 04/15/2018 | 5.75 | % | 130,000 | 141,847 | ||||||||
| Symantec Corp. | 06/15/2017 | 2.75 | % | 110,000 | 109,856 | ||||||||
| Total System Services, Inc. | 06/01/2018 | 2.38 | % | 45,000 | 44,533 | ||||||||
| Verizon Communications, Inc. | 09/14/2018 | 3.65 | % | 140,000 | 146,397 | ||||||||
| Vodafone Group PLC (b) | 02/19/2018 | 1.50 | % | 70,000 | 69,222 | ||||||||
| Walt Disney Co./The | 09/17/2018 | 1.50 | % | 120,000 | 119,772 | ||||||||
| 1,584,372 | |||||||||||||
| Manufacturing: 4.05% | |||||||||||||
| ABB Finance USA, Inc. | 05/08/2017 | 1.63 | % | 70,000 | 70,047 | ||||||||
| AbbVie, Inc. | 05/14/2018 | 1.80 | % | 130,000 | 129,401 | ||||||||
| Anheuser-Busch InBev Finance, Inc. | 01/17/2018 | 1.25 | % | 125,000 | 123,830 | ||||||||
| Apple, Inc. (c) | 05/05/2017 | 0.41 | % | 75,000 | 74,936 | ||||||||
| Apple, Inc. | 05/06/2019 | 2.10 | % | 60,000 | 60,702 | ||||||||
| Becton, Dickinson and Co. | 12/15/2017 | 1.80 | % | 140,000 | 139,796 | ||||||||
| Bunge Ltd. Finance Corp. | 11/24/2020 | 3.50 | % | 90,000 | 89,499 | ||||||||
| Chevron Corp. | 12/05/2017 | 1.10 | % | 95,000 | 94,347 | ||||||||
| Cisco Systems, Inc. | 06/15/2018 | 1.65 | % | 125,000 | 125,522 | ||||||||
| Eastman Chemical Co. | 01/15/2020 | 2.70 | % | 100,000 | 99,012 | ||||||||
| Ecolab, Inc. | 12/08/2016 | 3.00 | % | 30,000 | 30,431 | ||||||||
| Ecolab, Inc. | 12/08/2017 | 1.45 | % | 40,000 | 39,621 | ||||||||
| HJ Heinz Co. (Acquired 06/23/2015, Cost, $59,880) (a) | 07/02/2018 | 2.00 | % | 60,000 | 59,717 | ||||||||
| Ingersoll-Rand Global Holding Co., Ltd. | 01/15/2019 | 2.88 | % | 55,000 | 55,551 | ||||||||
| Intel Corp. | 12/15/2017 | 1.35 | % | 75,000 | 75,100 | ||||||||
| Johnson Controls, Inc. | 11/02/2017 | 1.40 | % | 115,000 | 113,805 | ||||||||
| Kraft Foods Group, Inc. | 06/05/2017 | 2.25 | % | 30,000 | 30,217 | ||||||||
| Merck & Co., Inc. | 05/18/2018 | 1.30 | % | 70,000 | 69,836 | ||||||||
The accompanying notes are an integral part of these consolidated financial statements.
LoCorr Long/Short Commodities Strategy Fund - Consolidated Schedule of Investments (continued) | | | 25 |
| Maturity Date | Coupon Rate | Principal Amount | Value | ||||||||||
CORPORATE BONDS (continued) | |||||||||||||
| Mondelez International, Inc. | 02/01/2019 | 2.25 | % | $ | 115,000 | $ | 114,958 | ||||||
| PepsiCo, Inc. | 10/14/2020 | 2.15 | % | 100,000 | 99,552 | ||||||||
| Qualcomm, Inc. | 05/18/2018 | 1.40 | % | 140,000 | 138,802 | ||||||||
| Sherwin-Williams Co./The | 12/15/2017 | 1.35 | % | 65,000 | 64,445 | ||||||||
| Suncor Energy, Inc. (b) | 06/01/2018 | 6.10 | % | 50,000 | 53,778 | ||||||||
| Thermo Fisher Scientific, Inc. | 02/01/2017 | 1.30 | % | 70,000 | 69,752 | ||||||||
| Tyco Electronics Group SA (b) | 12/17/2018 | 2.38 | % | 110,000 | 109,848 | ||||||||
| Tyson Foods, Inc. | 08/15/2019 | 2.65 | % | 110,000 | 110,061 | ||||||||
| United Technologies Corp. | 06/01/2017 | 1.80 | % | 30,000 | 30,169 | ||||||||
| Wm Wrigley Jr Co. (Acquired 08/14/2015, Cost, $66,104) (a) | 10/21/2019 | 2.90 | % | 65,000 | 65,602 | ||||||||
| Zoetis, Inc. | 02/01/2018 | 1.88 | % | 85,000 | 83,864 | ||||||||
| 2,422,201 | |||||||||||||
| Mining, Quarrying, and Oil and Gas Extraction: 0.87% | |||||||||||||
| Anadarko Petroleum Corp. | 09/15/2017 | 6.38 | % | 100,000 | 104,862 | ||||||||
| BHP Billiton Finance (USA) Ltd. (b) | 02/24/2017 | 1.63 | % | 35,000 | 34,929 | ||||||||
| Phillips 66 | 05/01/2017 | 2.95 | % | 130,000 | 131,767 | ||||||||
| Rio Tinto Finance (USA) PLC (b) | 03/22/2017 | 2.00 | % | 65,000 | 64,943 | ||||||||
| Rio Tinto Finance (USA) PLC (b) | 08/21/2017 | 1.63 | % | 15,000 | 14,785 | ||||||||
| Shell International Finance BV (b) | 03/22/2017 | 5.20 | % | 100,000 | 104,741 | ||||||||
| Total Capital International (b) | 06/28/2017 | 1.55 | % | 65,000 | 65,166 | ||||||||
| 521,193 | |||||||||||||
| Professional, Scientific, and Technical Services: 0.17% | |||||||||||||
| ABB Treasury Center USA, Inc. (Acquired 06/19/2012, Cost, $15,060) (a) | 06/15/2016 | 2.50 | % | 15,000 | 15,075 | ||||||||
| Biogen, Inc. | 09/15/2020 | 2.90 | % | 85,000 | 84,777 | ||||||||
| 99,852 | |||||||||||||
| Real Estate and Rental and Leasing: 0.30% | |||||||||||||
| ERAC USA Finance LLC (Acquired 12/14/2015, Cost, $101,158) (a) | 11/01/2018 | 2.80 | % | 100,000 | 100,648 | ||||||||
| Health Care REIT, Inc. | 04/01/2019 | 4.13 | % | 35,000 | 36,502 | ||||||||
| Ventas Realty LP / Ventas Capital Corp. | 02/15/2018 | 2.00 | % | 45,000 | 44,780 | ||||||||
| 181,930 | |||||||||||||
| Retail Trade: 1.23% | |||||||||||||
| Amazon.com, Inc. | 11/29/2017 | 1.20 | % | 70,000 | 69,783 | ||||||||
| Amazon.com, Inc. | 12/05/2019 | 2.60 | % | 50,000 | 50,784 | ||||||||
| BP Capital Markets (b) | 05/05/2017 | 1.85 | % | 20,000 | 20,096 | ||||||||
| BP Capital Markets (b) | 09/26/2018 | 2.24 | % | 90,000 | 90,274 | ||||||||
| Costco Wholesale Corp. | 12/15/2019 | 1.70 | % | 90,000 | 89,241 | ||||||||
| CVS Health Corp. | 12/05/2018 | 2.25 | % | 115,000 | 115,555 | ||||||||
| Home Depot, Inc./The | 06/15/2019 | 2.00 | % | 115,000 | 115,806 | ||||||||
| Macy’s Retail Holdings, Inc. | 12/01/2016 | 5.90 | % | 100,000 | 103,761 | ||||||||
| Walgreens Boots Alliance, Inc. | 11/17/2017 | 1.75 | % | 83,000 | 82,838 | ||||||||
| 738,138 | |||||||||||||
| Transportation and Warehousing: 0.48% | |||||||||||||
| Burlington Northern Santa Fe LLC | 03/15/2018 | 5.75 | % | 105,000 | 113,354 | ||||||||
| Carnival Corp. | 12/15/2017 | 1.88 | % | 125,000 | 124,822 | ||||||||
| Spectra Energy Partners, LP | 09/25/2018 | 2.95 | % | 50,000 | 49,128 | ||||||||
| 287,304 | |||||||||||||
| Utilities: 0.68% | |||||||||||||
| Exelon Generation Co., LLC | 10/01/2019 | 5.20 | % | 100,000 | 107,729 | ||||||||
| Northern States Power Co./MN | 08/15/2020 | 2.20 | % | 165,000 | 163,869 | ||||||||
| Sempra Energy | 04/01/2017 | 2.30 | % | 25,000 | 25,145 | ||||||||
| Southern Power Co. | 06/01/2018 | 1.50 | % | 115,000 | 112,572 | ||||||||
| 409,315 | |||||||||||||
| Wholesale Trade: 0.69% | |||||||||||||
| Cardinal Health, Inc. | 11/15/2019 | 2.40 | % | 125,000 | 124,952 | ||||||||
| McKesson Corp. | 03/10/2017 | 1.29 | % | 80,000 | 79,775 | ||||||||
| Procter & Gamble Co. | 02/15/2019 | 4.70 | % | 90,000 | 98,064 | ||||||||
| Sysco Corp. | 10/01/2020 | 2.60 | % | 110,000 | 110,174 | ||||||||
| 412,965 | |||||||||||||
| TOTAL CORPORATE BONDS (Cost $12,118,265) | 12,061,459 | ||||||||||||
The accompanying notes are an integral part of these consolidated financial statements.
| 26 | LoCorr Long/Short Commodities Strategy Fund - Consolidated Schedule of Investments (continued) | ||
| Maturity Date | Coupon Rate | Principal Amount | Value | ||||||||||
| FOREIGN GOVERNMENT BONDS: 0.49% | |||||||||||||
| European Investment Bank (b) | 03/15/2018 | 1.00 | % | $ | 180,000 | $ | 178,530 | ||||||
| European Investment Bank (b) | 08/15/2018 | 1.13 | % | 100,000 | 99,122 | ||||||||
| Petroleos Mexicanos (b) | 12/20/2022 | 2.00 | % | 17,500 | 17,397 | ||||||||
| TOTAL FOREIGN GOVERNMENT BONDS (Cost $295,922) | 295,049 | ||||||||||||
| MORTGAGE BACKED SECURITIES: 13.80% | |||||||||||||
| Banc of America Commercial Mortgage Trust, 2006-2 A4 (c) | 05/10/2045 | 5.83 | % | 7,144 | 7,154 | ||||||||
| Bear Stearns Commercial Mortgage Securities Trust | |||||||||||||
| Series 2006-PWR12 A4 (c) | 09/11/2038 | 5.71 | % | 14,564 | 14,658 | ||||||||
| Series 2006-PWR14 A4 | 12/11/2038 | 5.20 | % | 266,009 | 271,146 | ||||||||
| Series 2006-TOP24 A4 | 10/12/2041 | 5.54 | % | 21,827 | 22,115 | ||||||||
| Citigroup Commercial Mortgage Trust | |||||||||||||
| Series 2014-388G (Acquired 12/30/2015, Cost, $221,906) (a)(c) | 06/16/2033 | 1.38 | % | 225,000 | 220,614 | ||||||||
| Series 2006-C5 A4 | 10/18/2049 | 5.43 | % | 34,653 | 35,117 | ||||||||
| Commercial Mortgage Pass-Through Certificates, 2012-CRE3 A1 | 10/17/2045 | 0.67 | % | 4,066 | 4,055 | ||||||||
| Commercial Mortgage Trust, 2007-GG9 | 03/10/2039 | 5.44 | % | 194,109 | 198,434 | ||||||||
| CSMC Trust | |||||||||||||
| Series 2014-ICE A (Acquired 10/07/2014, Cost, $420,327) (a)(c) | 04/15/2027 | 1.13 | % | 420,000 | 417,266 | ||||||||
| Series 2015-2 (Acquired 04/30/2015, Cost, $118,908) (a) | 02/25/2045 | 3.00 | % | 117,141 | 117,689 | ||||||||
| Fannie Mae-Aces | |||||||||||||
| Series 2013-M3 ASQ2 | 02/25/2016 | 1.08 | % | 36,411 | 36,383 | ||||||||
| Series 2013-M1 ASQ2 | 11/25/2016 | 1.07 | % | 40,460 | 40,436 | ||||||||
| Series 2014-M13 ASQ2 | 11/25/2017 | 1.64 | % | 445,134 | 446,542 | ||||||||
| Series 2012-M9 | 12/25/2017 | 1.51 | % | 366,262 | 366,026 | ||||||||
| Series 2015-M1 ASQ2 | 02/25/2018 | 1.63 | % | 365,000 | 366,108 | ||||||||
| Series 2013-M7 ASQ2 | 03/25/2018 | 1.23 | % | 79,833 | 79,647 | ||||||||
| Series 2014-M8 FA (c) | 05/25/2018 | 0.44 | % | 229,389 | 228,324 | ||||||||
| Series 2014-M10 ASQ2 (c) | 09/25/2019 | 2.17 | % | 270,000 | 272,064 | ||||||||
| Series 2010-M3 A3 (c) | 03/25/2020 | 4.33 | % | 341,748 | 366,591 | ||||||||
| Fannie Mae Connecticut Avenue Securities | |||||||||||||
| Series 2014-C01 M1 (c) | 01/25/2024 | 2.02 | % | 164,890 | 165,143 | ||||||||
| Series 2014-C02 1M1 (c) | 05/28/2024 | 1.37 | % | 169,498 | 167,646 | ||||||||
| Fannie Mae Pool | 07/01/2017 | 1.50 | % | 35,000 | 35,124 | ||||||||
| FHLMC Multifamily Structured Pass Through Certificates | |||||||||||||
| Series K701 A2 (c) | 11/25/2017 | 3.88 | % | 50,000 | 51,915 | ||||||||
| Series K703 A2 | 05/25/2018 | 2.70 | % | 500,000 | 510,872 | ||||||||
| Series K705 A2 | 09/25/2018 | 2.30 | % | 285,000 | 289,123 | ||||||||
| Series K708 A2 | 01/25/2019 | 2.13 | % | 30,000 | 30,253 | ||||||||
| Series K709 A2 | 03/25/2019 | 2.09 | % | 25,000 | 25,162 | ||||||||
| Series KF01 A (c) | 04/25/2019 | 0.77 | % | 784 | 783 | ||||||||
| Series K710 A2 | 05/25/2019 | 1.88 | % | 50,000 | 49,981 | ||||||||
| Series KP02 A2 (c) | 04/25/2021 | 2.36 | % | 170,000 | 171,855 | ||||||||
| Freddie Mac Structured Agency Credit Risk Debt Notes, 2013-DN2 M1 (c) | 11/25/2023 | 1.87 | % | 163,566 | 163,566 | ||||||||
| FREMF Mortgage Trust | |||||||||||||
| Series 2012-KF01 (Acquired 04/06/2015, Cost, $153,429) (a)(c) | 10/25/2044 | 3.02 | % | 150,000 | 150,762 | ||||||||
| Series 2012-K708 (Acquired 04/21/2015, Cost, $157,022) (a)(c) | 02/25/2045 | 3.75 | % | 150,000 | 152,700 | ||||||||
| Series 2013-K502 (Acquired 05/06/2015, Cost, $126,667) (a)(c) | 03/25/2045 | 2.71 | % | 125,000 | 124,708 | ||||||||
| Series 2013-KF02 (Acquired 04/06/2015, Cost, $63,095) (a)(c) | 12/25/2045 | 3.42 | % | 61,406 | 63,076 | ||||||||
| GAHR Commercial Mortgage Trust, 2015-NRF AFL1 (Acquired 05/07/2015, | |||||||||||||
| Cost, $130,368) (a)(c) | 12/15/2034 | 1.63 | % | 130,000 | 129,556 | ||||||||
| GS Mortgage Securities Trust | |||||||||||||
| Series 2014-GSFL A (Acquired 08/06/2014, Cost, $81,995) (a)(c) | 07/15/2031 | 1.33 | % | 81,995 | 81,817 | ||||||||
| Series 2006-GG8 A4 | 11/10/2039 | 5.56 | % | 20,972 | 20,936 | ||||||||
| Series 2011-GC5 A2 | 08/10/2044 | 3.00 | % | 177,376 | 178,265 | ||||||||
| Series 2007-GG10 A4 (c) | 08/10/2045 | 5.79 | % | 179,189 | 184,114 | ||||||||
| JPMBB Commercial Mortgage Securities Trust, 2014-C25 A1 | 11/18/2047 | 1.52 | % | 323,527 | 319,210 | ||||||||
| JPMorgan Chase Commercial Mortgage Securities Trust | |||||||||||||
| Series 2006-LDP6 A4 (c) | 04/15/2043 | 5.48 | % | 6,885 | 6,883 | ||||||||
| Series 2006-LDP7 A4 (c) | 04/15/2045 | 5.91 | % | 17,278 | 17,334 | ||||||||
| Series 2012-C8 ASB | 10/17/2045 | 2.38 | % | 50,000 | 49,494 | ||||||||
| Series 2011-C3 A3 (Acquired 08/26/2015, Cost, $265,559) (a) | 02/16/2046 | 4.39 | % | 250,000 | 260,574 | ||||||||
| Series 2007-CIBC20 A4 (c) | 02/12/2051 | 5.79 | % | 198,820 | 206,673 | ||||||||
| LB Commercial Mortgage Trust, 2007-C3 A4B | 07/15/2044 | 5.52 | % | 34,178 | 35,461 | ||||||||
| LB-UBS Commercial Mortgage Trust, 2006-C6 A4 | 09/15/2039 | 5.37 | % | 39,559 | 40,132 | ||||||||
The accompanying notes are an integral part of these consolidated financial statements.
| LoCorr Long/Short Commodities Strategy Fund - Consolidated Schedule of Investments (continued) | 27 | ||
| Maturity Date | Coupon Rate | Principal Amount | Value | ||||||||||
| MORTGAGE BACKED SECURITIES (continued) | |||||||||||||
| MASTR Asset Securitization Trust | |||||||||||||
| Series 2003-2 | 03/25/2018 | 5.00 | % | $ | 118,151 | $ | 118,506 | ||||||
| Series 2004-1 | 02/25/2019 | 4.50 | % | 201,841 | 203,325 | ||||||||
| Morgan Stanley Bank of America Merrill Lynch Trust, 2012-C6 A1 | 11/17/2045 | 0.66 | % | 5,650 | 5,631 | ||||||||
| Morgan Stanley Capital I Trust, 2006-IQ12 A4 | 12/15/2043 | 5.33 | % | 21,806 | 22,193 | ||||||||
| Opteum Mortgage Acceptance Corp. Asset Backed Pass-Through Certificates, 2005-1 (c) | 02/25/2035 | 0.99 | % | 100,000 | 95,870 | ||||||||
| SBA Tower Trust, 2012-1 (Acquired 09/03/2014, Cost, $40,858) (a) | 12/15/2042 | 2.93 | % | 40,000 | 40,473 | ||||||||
| Sequoia Mortgage Trust, 2015-3 (Acquired 06/19/2015, Cost, $158,893) (a)(c) | 07/25/2045 | 3.50 | % | 156,854 | 157,689 | ||||||||
| UBS-Citigroup Commercial Mortgage Trust, 2011-C1 A2 | 01/12/2045 | 2.80 | % | 200,000 | 201,448 | ||||||||
| Wells Fargo Commercial Mortgage Trust, 2015-LC22 A1 | 09/17/2058 | 1.64 | % | 231,004 | 228,726 | ||||||||
| TOTAL MORTGAGE BACKED SECURITIES (Cost $8,330,812) | 8,267,348 | ||||||||||||
| MUNICIPAL BONDS: 0.94% | |||||||||||||
| City of Huntsville, AL | 09/01/2016 | 2.41 | % | 40,000 | 40,362 | ||||||||
| City of Lubbock, TX | 02/15/2018 | 4.44 | % | 25,000 | 26,628 | ||||||||
| City of Rochester, MN | 02/01/2016 | 2.25 | % | 25,000 | 25,013 | ||||||||
| County of Berks, PA | 11/15/2016 | 1.01 | % | 25,000 | 25,050 | ||||||||
| County of Forsyth, NC | 04/01/2020 | 3.55 | % | 30,000 | 31,609 | ||||||||
| Maricopa County School District No. 28 Kyrene Elementary | 07/01/2019 | 5.38 | % | 15,000 | 16,842 | ||||||||
| North Carolina Eastern Municipal Power Agency | 07/01/2018 | 2.00 | % | 60,000 | 60,227 | ||||||||
| Rosemount-Apple Valley-Eagan Independent School District No. 196 | 02/01/2019 | 5.00 | % | 25,000 | 27,333 | ||||||||
| St. Paul Housing & Redevelopment Authority | 07/01/2018 | 1.84 | % | 60,000 | 59,744 | ||||||||
| State of Hawaii | 02/01/2017 | 3.73 | % | 25,000 | 25,708 | ||||||||
| State of Mississippi | 11/01/2017 | 1.35 | % | 30,000 | 30,120 | ||||||||
| State of Ohio | 04/01/2018 | 3.66 | % | 45,000 | 47,378 | ||||||||
| State of Tennessee | 05/01/2017 | 3.82 | % | 25,000 | 25,874 | ||||||||
| State of Texas | 10/01/2017 | 2.50 | % | 25,000 | 25,539 | ||||||||
| State of Washington | 02/01/2017 | 3.04 | % | 40,000 | 40,899 | ||||||||
| University of Texas System | 08/15/2018 | 3.81 | % | 25,000 | 26,449 | ||||||||
| Virginia College Building Authority | 02/01/2016 | 2.40 | % | 25,000 | 25,041 | ||||||||
| TOTAL MUNICIPAL BONDS (Cost $557,674) | 559,816 | ||||||||||||
| U.S. GOVERNMENT AGENCY ISSUES: 4.58% | |||||||||||||
| Federal Farm Credit Banks Funding Corp. | 03/03/2017 | 0.65 | % | 500,000 | 498,596 | ||||||||
| Federal Home Loan Banks | 03/24/2017 | 0.75 | % | 500,000 | 499,174 | ||||||||
| Federal Home Loan Mortgage Corp. | 11/28/2016 | 0.60 | % | 500,000 | 499,263 | ||||||||
| Federal Home Loan Mortgage Corp. | 09/29/2017 | 1.00 | % | 1,000,000 | 997,246 | ||||||||
| Federal National Mortgage Association | 11/15/2016 | 1.38 | % | 150,000 | 150,696 | ||||||||
| Ginnie Mae II Pool | 07/20/2060 | 5.31 | % | 23,634 | 25,092 | ||||||||
| Ginnie Mae II Pool | 07/20/2062 | 4.56 | % | 23,584 | 25,035 | ||||||||
| Ginnie Mae II Pool | 08/20/2062 | 4.12 | % | 49,668 | 52,219 | ||||||||
| TOTAL U.S. GOVERNMENT AGENCY ISSUES (Cost $2,760,234) | 2,747,321 | ||||||||||||
| U.S. GOVERNMENT NOTES: 18.44% | |||||||||||||
| United States Treasury Note | 10/15/2016 | 0.63 | % | 250,000 | 249,766 | ||||||||
| United States Treasury Note | 12/31/2016 | 0.88 | % | 2,500,000 | 2,501,563 | ||||||||
| United States Treasury Note | 05/15/2017 | 0.88 | % | 2,000,000 | 1,998,750 | ||||||||
| United States Treasury Note | 11/30/2017 | 0.88 | % | 2,000,000 | 1,994,218 | ||||||||
| United States Treasury Note | 06/15/2018 | 1.13 | % | 500,000 | 498,828 | ||||||||
| United States Treasury Note | 12/15/2018 | 1.25 | % | 2,350,000 | 2,345,043 | ||||||||
| United States Treasury Note | 12/31/2018 | 1.38 | % | 540,000 | 540,401 | ||||||||
| United States Treasury Note | 07/31/2020 | 1.63 | % | 625,000 | 622,021 | ||||||||
| United States Treasury Note | 09/30/2020 | 1.38 | % | 305,000 | 299,734 | ||||||||
| TOTAL U.S. GOVERNMENT NOTES (Cost $11,062,542) | 11,050,324 | ||||||||||||
| SHORT TERM INVESTMENTS: 13.05% | |||||||||||||
| U.S. GOVERNMENT AGENCY ISSUE: 2.59% | |||||||||||||
| Federal Home Loan Mortgage Corp. | 10/18/2016 | 5.13 | % | 1,500,000 | 1,550,912 | ||||||||
| TOTAL U.S. GOVERNMENT AGENCY ISSUE | 1,550,912 | ||||||||||||
The accompanying notes are an integral part of these consolidated financial statements.
| 28 | LoCorr Long/Short Commodities Strategy Fund - Consolidated Schedule of Investments (continued) | ||
Shares | Value | |||||||
| MONEY MARKET FUND: 10.46% | ||||||||
Fidelity Institutional Money Market Portfolio - Class I, 0.28% (d)(e)(f) | 6,270,128 | $ | 6,270,128 | |||||
| TOTAL MONEY MARKET FUND | 6,270,128 | |||||||
| TOTAL SHORT TERM INVESTMENTS (Cost $7,822,037) | 7,821,040 | |||||||
| TOTAL INVESTMENTS (Cost $49,731,561): 82.70% | 49,553,464 | |||||||
Other Assets in Excess of Liabilities 17.30% (f) | 10,367,344 | |||||||
| TOTAL NET ASSETS: 100.00% | $ | 59,920,808 | ||||||
| (a) | Restricted security as defined in Rule 144(a) under the Securities Act of 1933 and determined to be liquid. Purchased in a private placement transaction; resale to the public may require registration or may extend only to qualified institutional buyers. At December 31, 2015, the value of these securities total $5,224,135 which represents 8.72% of total net assets. |
| (b) | Foreign issued security. |
| (c) | Variable rate security. The rate reported is the rate in effect as of December 31, 2015. |
| (d) | The rate quoted is the annualized seven-day effective yield as of December 31, 2015. |
| (e) | All or a portion of this security is held by LCLSCS Fund Limited. See Note 1. |
| (f) | Includes assets pledged as collateral for swap contracts. See Note 2. |
The accompanying notes are an integral part of these consolidated financial statements.
| LoCorr Long/Short Commodities Strategy Fund - Consolidated Schedule of Swap Contracts | 29 | ||
Consolidated Schedule of Swap Contracts
December 31, 2015
LONG TOTAL RETURN SWAP CONTRACTS
This investment is a holding of LCLSCS Fund Limited. See Note 1.
| Unrealized | ||||||||||
| Appreciation | ||||||||||
| Termination Date | Reference Index | Notional | (Depreciation)* | Counterparty | ||||||
| 12/20/17 | LoCorr Commodities Indexˆ | $39,100,000 | $(3,079,037) | Deutsche Bank AG | ||||||
| ^ | Comprised of a proprietary basket of Commodity Trading Advisor’s (“CTA”) Programs investing in various futures, forwards, and currency derivative contracts and other similar investments. See Notes 2 and 3. |
* | Unrealized depreciation is a payable on the Fund’s consolidated statement of assets and liabilities. |
The accompanying notes are an integral part of these consolidated financial statements.
| 30 | LoCorr Multi-Strategy Fund - Consolidated Schedule of Investments | ||
LoCorr Multi-Strategy Fund
Composition of Consolidated Investment Portfolio1
December 31, 2015 (Unaudited)
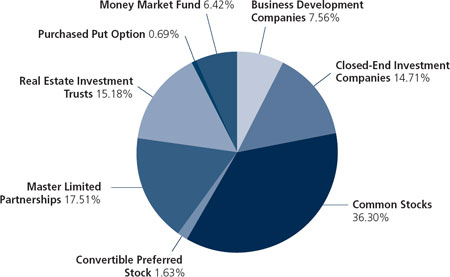
1 As a percentage of total investments.
Consolidated Schedule of Investments
December 31, 2015
| Shares | Value | |||||||
| BUSINESS DEVELOPMENT COMPANIES: 6.13% | ||||||||
| Ares Capital Corp. | 62,030 | $ | 883,928 | |||||
| Fifth Street Finance Corp. | 43,750 | 279,125 | ||||||
| FS Investment Corp. | 36,775 | 330,607 | ||||||
| Medley Capital Corp. | 26,235 | 197,287 | ||||||
| Prospect Capital Corp. | 57,700 | 402,746 | ||||||
| TOTAL BUSINESS DEVELOPMENT COMPANIES (Cost $2,347,546) | 2,093,693 | |||||||
| CLOSED-END INVESTMENT COMPANIES: 11.93% | ||||||||
| BlackRock Corporate High Yield Fund, Inc. | 32,600 | 318,828 | ||||||
| First Trust Intermediate Duration Preferred & Income Fund | 35,535 | 755,829 | ||||||
| Invesco Dynamic Credit Opportunities Fund | 38,310 | 404,171 | ||||||
| Nuveen Preferred & Income Term Fund | 32,725 | 744,821 | ||||||
| Nuveen Preferred Income Opportunities Fund | 84,850 | 777,226 | ||||||
| Nuveen Quality Preferred Income Fund 2 | 81,325 | 740,871 | ||||||
| Western Asset Global High Income Fund, Inc. | 38,050 | 331,796 | ||||||
| TOTAL CLOSED-END INVESTMENT COMPANIES (Cost $4,234,027) | 4,073,542 | |||||||
| COMMON STOCKS: 29.43% | ||||||||
| Accommodation and Food Services: 2.39% | ||||||||
| Diamond Resorts International, Inc. (a) | 31,983 | 815,886 | ||||||
| Construction: 6.03% | ||||||||
| Century Communities, Inc. (a) | 36,191 | 640,942 | ||||||
| MasTec, Inc. (a) | 81,704 | 1,420,016 | ||||||
| 2,060,958 | ||||||||
The accompanying notes are an integral part of these consolidated financial statements.
| LoCorr Multi-Strategy Fund - Consolidated Schedule of Investments (continued) | 31 | ||
| Shares | Value | |||||||
COMMON STOCK (continued) | ||||||||
| Finance and Insurance: 8.25% | ||||||||
| Apollo Global Management LLC | 22,150 | $ | 336,237 | |||||
| Credit Acceptance Corp. (a) | 7,651 | 1,637,467 | ||||||
| JPMorgan Chase & Co. | 6,427 | 424,374 | ||||||
| Wells Fargo & Co. | 7,707 | 418,953 | ||||||
| 2,817,031 | ||||||||
| Information: 5.19% | ||||||||
| Frontier Communications Corp. | 147,650 | 689,526 | ||||||
| Nexstar Broadcasting Group, Inc. | 9,443 | 554,303 | ||||||
| Sinclair Broadcast Group, Inc. | 16,223 | 527,896 | ||||||
| 1,771,725 | ||||||||
| Manufacturing: 2.01% | ||||||||
| Tenneco, Inc. (a) | 14,949 | 686,309 | ||||||
| Real Estate and Rental and Leasing: 2.04% | ||||||||
| RMR Group, Inc./The (a)(g) | 0 | 5 | ||||||
| United Rentals, Inc. (a) | 9,582 | 695,079 | ||||||
| 695,084 | ||||||||
| Transportation and Warehousing: 3.52% | ||||||||
| Ship Finance International Ltd. (b) | 64,150 | 1,062,966 | ||||||
| Student Transportation, Inc. (b) | 37,875 | 140,516 | ||||||
| 1,203,482 | ||||||||
| TOTAL COMMON STOCKS (Cost $10,549,053) | 10,050,475 | |||||||
| CONVERTIBLE PREFERRED STOCK: 1.32% | ||||||||
| Utilities: 1.32% | ||||||||
| Kinder Morgan, Inc./DE (a) | 11,200 | 451,360 | ||||||
| TOTAL CONVERTIBLE PREFERRED STOCK (Cost $450,069) | 451,360 | |||||||
| MASTER LIMITED PARTNERSHIPS: 14.19% | Units | |||||||
| Arts, Entertainment, and Recreation: 1.60% | ||||||||
| Cedar Fair LP | 9,800 | 547,232 | ||||||
| Finance and Insurance: 1.30% | ||||||||
| KKR & Co. LP | 28,600 | 445,874 | ||||||
| Manufacturing: 4.10% | ||||||||
| Calumet Specialty Products Partners LP | 16,700 | 332,497 | ||||||
| CVR Partners LP | 29,000 | 232,290 | ||||||
| CVR Refining LP | 8,650 | 163,745 | ||||||
| Terra Nitrogen Co. LP | 6,600 | 670,428 | ||||||
| 1,398,960 | ||||||||
| Mining, Quarrying, and Oil and Gas Extraction: 2.09% | ||||||||
| Enterprise Products Partners LP | 27,900 | 713,682 | ||||||
| Other Services (except Public Administration): 1.60% | ||||||||
| StoneMor Partners LP | 20,425 | 545,960 | ||||||
| Transportation and Warehousing: 2.35% | ||||||||
| Energy Transfer Partners LP | 23,800 | 802,774 | ||||||
| Wholesale Trade: 1.15% | ||||||||
| Martin Midstream Partners LP | 18,150 | 393,855 | ||||||
| TOTAL MASTER LIMITED PARTNERSHIPS (Cost $5,375,695) | 4,848,337 | |||||||
| REAL ESTATE INVESTMENT TRUSTS: 12.31% | Shares | |||||||
| Finance and Insurance: 5.61% | ||||||||
| Apollo Commercial Real Estate Finance, Inc. | 51,350 | 884,761 | ||||||
| Invesco Mortgage Capital, Inc. | 15,250 | 188,947 | ||||||
| Starwood Property Trust, Inc. | 40,975 | 842,446 | ||||||
| 1,916,154 | ||||||||
The accompanying notes are an integral part of these consolidated financial statements.
| 32 | LoCorr Multi-Strategy Fund - Consolidated Schedule of Investments (continued) | ||
| Shares | Value | |||||||
REAL ESTATE INVESTMENT TRUSTS (continued) | ||||||||
| Real Estate and Rental and Leasing: 6.70% | ||||||||
| Capstead Mortgage Corp. | 18,150 | $ | 158,631 | |||||
| EPR Properties | 10,050 | 587,422 | ||||||
| Hospitality Properties Trust | 26,950 | 704,743 | ||||||
| New Residential Investment Corp. | 36,950 | 449,312 | ||||||
| Vereit, Inc. | 49,000 | 388,080 | ||||||
| 2,288,188 | ||||||||
| TOTAL REAL ESTATE INVESTMENT TRUSTS (Cost $4,557,315) | 4,204,342 | |||||||
| PURCHASED OPTION: 0.56% | ||||||||
| Put Option: 0.56% | Number of Contracts | |||||||
| JetBlue Airways Corp., Expiration: January, 2017 Exercise Price: $35.00 | 156 | 190,320 | ||||||
| TOTAL PURCHASED OPTION (Cost $167,327 (c)) | 190,320 | |||||||
| SHORT TERM INVESTMENT: 5.20% | ||||||||
| MONEY MARKET FUND: 5.20% | Shares | |||||||
| Fidelity Institutional Money Market Portfolio - Class I , 0.28% (d)(e)(f) | 1,776,792 | 1,776,792 | ||||||
| TOTAL MONEY MARKET FUND | 1,776,792 | |||||||
| TOTAL SHORT TERM INVESTMENT (Cost $1,776,792) | 1,776,792 | |||||||
| TOTAL INVESTMENTS (Cost $29,457,824): 81.07% | 27,688,861 | |||||||
| Other Assets in Excess of Liabilities: 18.93% (f) | 6,465,369 | |||||||
| TOTAL NET ASSETS: 100.00% | $ | 34,154,230 | ||||||
| (a) | Non-dividend income producing security. |
| (b) | Foreign issued security. |
| (c) | Represents premiums paid. |
| (d) | The rate quoted is the annualized seven-day effective yield as of December 31, 2015. |
| (e) | All or a portion of this security is held by LCMSF Fund Limited. See Note 1. |
| (f) | Includes assets pledged as collateral for swap contracts. See Note 2. |
| (g) | Represents a fractional holding. |
The accompanying notes are an integral part of these consolidated financial statements.
| LoCorr Multi-Strategy Fund - Consolidated Schedule of Securities Sold Short | 33 | ||
Consolidated Schedule of Securities Sold Short
December 31, 2015
| Shares | Value | |||||||
| COMMON STOCKS: (2.14)% | ||||||||
| Other Services (except Public Administration): (2.14)% | ||||||||
| Regis Corp. (a) | (26,841 | ) | $ | (379,800 | ) | |||
| Weight Watchers International, Inc. (a) | (15,380 | ) | (350,664 | ) | ||||
| TOTAL COMMON STOCKS (Proceeds $739,813) | (730,464 | ) | ||||||
| TOTAL SECURITIES SOLD SHORT (Proceeds $739,813): (2.14)% | $ | (730,464 | ) | |||||
(a) Non-dividend expense producing security.
Percentages are stated as a percent of net assets.
The accompanying notes are an integral part of these consolidated financial statements.
| 34 | | | LoCorr Multi-Strategy Fund - Consolidated Schedule of Swap Contracts |
Consolidated Schedule of Swap Contracts
December 31, 2015
LONG TOTAL RETURN SWAP CONTRACTS
This investment is a holding of LCMSF Fund Limited. See Note 1.
| Termination Date | Reference Index | Notional | Unrealized Appreciation (Depreciation)* | Counterparty | ||||
| 04/14/2020 | LoCorr Multi-Strategy Index^ | $32,582,500 | $(195,200) | Deutsche Bank AG |
^Comprised of a proprietary basket of Commodity Trading Advisor’s (“CTA”) Programs investing in various futures, forwards, and currency derivative contracts and other similar investments. See Notes 2 and 3.
* Unrealized depreciation is a payable on the Fund’s consolidated statement of assets and liabilities.
The accompanying notes are an integral part of these consolidated financial statements.
LoCorr Market Trend Fund - Consolidated Schedule of Investments | | | 35 |
LoCorr Market Trend Fund
Composition of Consolidated Investment Portfolio1
December 31, 2015 (Unaudited)
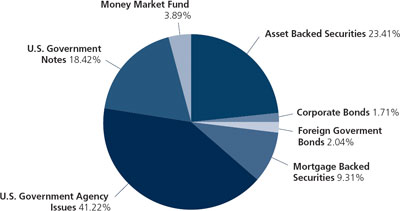
1 As a percentage of total investments.
Consolidated Schedule of Investments
December 31, 2015
| Maturity Date | Coupon Rate | Principal Amount | Value | ||||||||||
| ASSET BACKED SECURITIES: 19.61% | |||||||||||||
| AEP Texas Central Transition Funding III LLC, 2012-1 A1 | 12/01/2018 | 0.88% | $ | 2,419,598 | $ | 2,410,059 | |||||||
| AEP Texas Central Transition Funding LLC, 2002-1 A5 | 01/15/2017 | 6.25% | 547,131 | 548,259 | |||||||||
| Ally Auto Receivables Trust | |||||||||||||
| Series 2012-4 A4 | 10/16/2017 | 0.80% | 1,891,048 | 1,889,137 | |||||||||
| Series 2013-2 A3 | 01/16/2018 | 0.79% | 906,092 | 905,235 | |||||||||
| Series 2013-1 A4 | 02/15/2018 | 0.84% | 3,750,000 | 3,741,819 | |||||||||
| Series 2014-2 A3 | 04/15/2019 | 1.25% | 4,800,000 | 4,789,971 | |||||||||
| American Express Credit Account Master Trust, 2012-1 A (c) | 01/15/2020 | 0.48% | 1,590,000 | 1,587,504 | |||||||||
| AmeriCredit Automobile Receivables Trust | |||||||||||||
| Series 2014-2 A2A | 10/10/2017 | 0.54% | 222,721 | 222,585 | |||||||||
| Series 2014-4 A2A | 04/09/2018 | 0.72% | 2,300,025 | 2,295,946 | |||||||||
| Series 2013-3 A3 | 04/09/2018 | 0.92% | 603,404 | 603,021 | |||||||||
| BA Credit Card Trust | |||||||||||||
| Series 2014-A2 A (c) | 09/16/2019 | 0.48% | 3,000,000 | 2,996,605 | |||||||||
| Series 2014-A3 A (c) | 01/15/2020 | 0.47% | 5,000,000 | 4,994,535 | |||||||||
| Bank of The West Auto Trust, 2014-1 A2 (Acquired 11/05/2014, 01/14/2015, 02/26/2015 and 03/25/2015, Cost, $590,658) (a) | 07/17/2017 | 0.69% | 590,869 | 590,442 | |||||||||
| Cabela’s Credit Card Master Note Trust | |||||||||||||
| Series 2011-4A A1 (Acquired 07/09/2015 and 08/27/2015, Cost, $5,308,746) (a) | 10/15/2019 | 1.90% | 5,270,000 | 5,285,394 | |||||||||
| Series 2012-1A A2 (Acquired 02/27/2015 and 05/19/2015, Cost, $1,728,513) (a)(c) | 02/18/2020 | 0.74% | 1,725,000 | 1,726,276 | |||||||||
| Series 2012-1A A1 (Acquired 08/31/2015, Cost, $5,026,625) (a) | 02/18/2020 | 1.63% | 5,000,000 | 5,010,095 | |||||||||
| Series 2014-1 A (c) | 03/16/2020 | 0.56% | 3,220,000 | 3,213,847 | |||||||||
| California Republic Auto Receivables Trust | |||||||||||||
| Series 2012-1 A (Acquired 02/26/2015 and 06/23/2015, Cost, $120,969) (a) | 08/15/2017 | 1.18% | 120,896 | 120,878 | |||||||||
| Series 2015-1 A2 | 12/15/2017 | 0.88% | 83,408 | 83,292 | |||||||||
| Series 2013-2 A2 | 03/15/2019 | 1.23% | 4,808,119 | 4,794,684 | |||||||||
| Series 2015-1 A3 | 04/15/2019 | 1.33% | 960,000 | 954,928 | |||||||||
| Capital Auto Receivables Asset Trust | |||||||||||||
| Series 2013-2 A3 | 10/20/2017 | 1.24% | 1,782,802 | 1,782,591 | |||||||||
| Series 2013-1 A4 | 01/22/2018 | 0.97% | 2,000,000 | 1,998,322 | |||||||||
The accompanying notes are an integral part of these consolidated financial statements.
| 36 | | | LoCorr Market Trend Fund - Consolidated Schedule of Investments (continued) |
| Maturity Date | Coupon Rate | Principal Amount | Value | ||||||||||
ASSET BACKED SECURITIES (continued) | |||||||||||||
| Capital One Multi-Asset Execution Trust | |||||||||||||
| Series 2007-A2 (c) | 12/16/2019 | 0.29% | $ | 2,300,000 | $ | 2,292,492 | |||||||
| Series 2015-A6 (c) | 06/15/2020 | 0.57% | 3,500,000 | 3,495,296 | |||||||||
| Series 2007-A7 | 07/15/2020 | 5.75% | 4,895,000 | 5,231,601 | |||||||||
| CarMax Auto Owner Trust | |||||||||||||
| Series 2012-3 A3 | 07/17/2017 | 0.52% | 113,871 | 113,819 | |||||||||
| Series 2013-1 A3 | 10/16/2017 | 0.60% | 564,904 | 564,291 | |||||||||
| Series 2014-1 A3 | 10/15/2018 | 0.79% | 3,658,858 | 3,643,952 | |||||||||
| CenterPoint Energy Restoration Bond Co. LLC, 2009-1 A2 | 08/15/2019 | 3.46% | 4,004,358 | 4,098,880 | |||||||||
| CenterPoint Energy Transition Bond Co. II LLC, 2005-A A4 | 08/01/2019 | 5.17% | 749,309 | 768,323 | |||||||||
| CenterPoint Energy Transition Bond Co. IV LLC, 2012-1 A1 | 04/15/2018 | 0.90% | 4,124,380 | 4,113,101 | |||||||||
| Chase Issuance Trust | |||||||||||||
| Series 2014-A3 (c) | 05/15/2018 | 0.41% | 150,000 | 149,963 | |||||||||
| Series 2013-A8 | 10/15/2018 | 1.01% | 3,500,000 | 3,496,867 | |||||||||
| Series 2007-A3 | 04/15/2019 | 5.23% | 3,315,000 | 3,461,492 | |||||||||
| Series 2014-A7 | 11/15/2019 | 1.38% | 3,695,000 | 3,684,437 | |||||||||
| Citibank Credit Card Issuance Trust | |||||||||||||
| Series 2013-A11 (c) | 02/07/2018 | 0.44% | 375,000 | 374,978 | |||||||||
| Series 2007-A8 | 09/20/2019 | 5.65% | 6,600,000 | 7,050,511 | |||||||||
| Series 2008-A1 | 02/07/2020 | 5.35% | 4,270,000 | 4,592,287 | |||||||||
| Discover Card Execution Note Trust | |||||||||||||
| Series 2013-A5 | 04/15/2019 | 1.04% | 4,660,000 | 4,657,657 | |||||||||
| Series 2007-A1 | 03/16/2020 | 5.65% | 4,500,000 | 4,811,472 | |||||||||
| Entergy Gulf States Reconstruction Funding 1 LLC, 2007-A A2 | 10/01/2018 | 5.79% | 4,447,698 | 4,628,098 | |||||||||
| Entergy Texas Restoration Funding LLC, 2009-A A2 | 08/01/2019 | 3.65% | 507,002 | 520,151 | |||||||||
| Fifth Third Auto Trust, 2014-3 A2B (c) | 05/15/2017 | 0.44% | 207,515 | 207,436 | |||||||||
| Ford Credit Auto Owner Trust, 2013-B A3 | 10/15/2017 | 0.57% | 33,026 | 33,003 | |||||||||
| Honda Auto Receivables Owner Trust | |||||||||||||
| Series 2015-3 A2 | 11/20/2017 | 0.92% | 5,500,000 | 5,495,060 | |||||||||
| Series 2015-2 A3 | 02/21/2019 | 1.04% | 3,460,000 | 3,440,374 | |||||||||
| Huntington Auto Trust, 2015-1 A3 | 09/16/2019 | 1.24% | 3,000,000 | 2,982,070 | |||||||||
| Hyundai Auto Receivables Trust | |||||||||||||
| Series 2012-B A4 | 03/15/2018 | 0.81% | 948,937 | 948,416 | |||||||||
| Series 2014-B A3 | 12/17/2018 | 0.90% | 4,568,810 | 4,559,049 | |||||||||
| John Deere Owner Trust, 2015-A A3 | 06/17/2019 | 1.32% | 1,500,000 | 1,492,059 | |||||||||
| Ohio Phase-In-Recovery Funding LLC, 2013-1 A1 | 07/01/2018 | 0.96% | 7,889,774 | 7,867,807 | |||||||||
| Santander Drive Auto Receivables Trust | |||||||||||||
| Series 2014-2 A3 | 04/16/2018 | 0.80% | 1,503,870 | 1,502,836 | |||||||||
| Series 2014-5 A3 | 01/15/2019 | 1.15% | 5,797,000 | 5,787,796 | |||||||||
| SMART ABS Trust | |||||||||||||
| Series 2013-2US A3A (b) | 01/14/2017 | 0.83% | 552,956 | 552,845 | |||||||||
| Series 2015-1US A2A (b) | 08/14/2017 | 0.99% | 2,844,862 | 2,844,135 | |||||||||
| Susquehanna Auto Receivables Trust, 2014-1 (Acquired 12/22/2015, Cost, $5,239,158) (a) | 02/15/2018 | 1.00% | 5,249,617 | 5,238,952 | |||||||||
| Synchrony Credit Card Master Note Trust | |||||||||||||
| Series 2010-2 A | 03/15/2020 | 4.47% | 5,435,000 | 5,629,269 | |||||||||
| Series 2012-6 A | 08/15/2020 | 1.36% | 6,771,000 | 6,737,526 | |||||||||
| TCF Auto Receivables Owner Trust, 2015-1A A2 (Acquired 06/03/2015, Cost, $1,660,408) (a) | 08/15/2018 | 1.02% | 1,660,503 | 1,657,484 | |||||||||
| USAA Auto Owner Trust, 2014-1 A3 | 12/15/2017 | 0.58% | 302,913 | 302,425 | |||||||||
| Volkswagen Auto Loan Enhanced Trust, 2014-1 | 10/22/2018 | 0.91% | 4,570,000 | 4,537,228 | |||||||||
| World Omni Auto Receivables Trust, 2013-A3 | 04/16/2018 | 0.64% | 587,616 | 586,791 | |||||||||
| TOTAL ASSET BACKED SECURITIES (Cost $177,167,133) | 176,697,654 | ||||||||||||
| CORPORATE BONDS: 1.43% | |||||||||||||
| Finance and Insurance: 0.89% | |||||||||||||
| Bank of Montreal (Acquired 12/04/2014, 04/29/2015 and 06/18/2015, Cost, $3,033,552) (a)(b) | 01/30/2017 | 1.95% | 3,000,000 | 3,023,667 | |||||||||
| Bank of Nova Scotia/The (Acquired 01/13/2015 and 04/29/2015, Cost, $1,512,423) (a)(b) | 08/03/2016 | 2.15% | 1,500,000 | 1,508,104 | |||||||||
| Canadian Imperial Bank of Commerce (Acquired 01/14/2015, Cost, $500,821) (a)(b) | 01/27/2016 | 2.75% | 500,000 | 500,509 | |||||||||
| Toronto-Dominion Bank/The (Acquired 12/04/2014, 04/29/2015 and 06/18/2015, Cost, $3,018,410) (a)(b) | 09/14/2016 | 1.63% | 3,000,000 | 3,011,553 | |||||||||
| 8,043,833 | |||||||||||||
The accompanying notes are an integral part of these consolidated financial statements.
LoCorr Market Trend Fund - Consolidated Schedule of Investments (continued) | | | 37 |
| Maturity Date | Coupon Rate | Principal Amount | Value | ||||||||||
CORPORATE BONDS (continued) | |||||||||||||
| Information: 0.35% | |||||||||||||
| Microsoft Corp. | 11/15/2017 | 0.88% | $ | 110,000 | $ | 109,595 | |||||||
| Microsoft Corp. | 12/06/2018 | 1.63% | 3,000,000 | 3,019,134 | |||||||||
| 3,128,729 | |||||||||||||
| Manufacturing: 0.19% | |||||||||||||
| Johnson & Johnson | 07/15/2018 | 5.15% | 1,595,000 | 1,744,139 | |||||||||
| TOTAL CORPORATE BONDS (Cost $12,948,252) | 12,916,701 | ||||||||||||
| FOREIGN GOVERNMENT BONDS: 1.71% | |||||||||||||
| European Investment Bank (b) | 03/15/2016 | 2.25% | 500,000 | 501,633 | |||||||||
| European Investment Bank (b) | 03/15/2018 | 1.00% | 6,000,000 | 5,951,010 | |||||||||
| European Investment Bank (b) | 05/15/2018 | 1.25% | 1,000,000 | 996,273 | |||||||||
| European Investment Bank (b) | 08/15/2018 | 1.13% | 2,500,000 | 2,478,044 | |||||||||
| International Bank for Reconstruction & Development (b) | 03/15/2016 | 2.13% | 500,000 | 501,459 | |||||||||
| International Bank for Reconstruction & Development (b) | 11/15/2017 | 1.00% | 5,000,000 | 4,991,635 | |||||||||
| TOTAL FOREIGN GOVERNMENT BONDS (Cost $15,483,317) | 15,420,054 | ||||||||||||
| MORTGAGE BACKED SECURITIES: 7.80% | |||||||||||||
| Fannie Mae-Aces | |||||||||||||
| Series 2014-M5 FA (c) | 01/25/2017 | 0.56% | 1,075,605 | 1,075,584 | |||||||||
| Series 2012-M13 ASQ2 | 08/25/2017 | 1.25% | 1,762,978 | 1,762,555 | |||||||||
| Series 2014-M6 FA (c) | 12/25/2017 | 0.50% | 2,010,302 | 2,007,310 | |||||||||
| Series 2015-M1 ASQ2 | 02/25/2018 | 1.63% | 1,500,000 | 1,504,553 | |||||||||
| Series 2015-M7 ASQ2 | 04/25/2018 | 1.55% | 2,500,000 | 2,497,569 | |||||||||
| Series 2014-M8 FA (c) | 05/25/2018 | 0.46% | 2,683,856 | 2,671,393 | |||||||||
| Series 2013-M13 FA (c) | 05/25/2018 | 0.54% | 2,925,736 | 2,928,083 | |||||||||
| Series 2013-M14 FA (c) | 08/25/2018 | 0.54% | 1,617,367 | 1,618,621 | |||||||||
| Series 2009-M2 A3 | 01/25/2019 | 4.00% | 2,812,796 | 2,979,277 | |||||||||
| Series 2014-M10 ASQ2 (c) | 09/25/2019 | 2.17% | 4,880,000 | 4,917,308 | |||||||||
| Series 2010-M1 A2 | 09/25/2019 | 4.45% | 3,794,582 | 4,092,499 | |||||||||
| Series 2010-M3 A3 (c) | 03/25/2020 | 4.33% | 3,503,408 | 3,758,079 | |||||||||
| Fannie Mae Pool | 04/01/2017 | 1.92% | 2,500,000 | 2,516,538 | |||||||||
| FHLMC Multifamily Structured Pass Through Certificates | |||||||||||||
| Series K501 A2 | 11/25/2016 | 1.66% | 2,401,872 | 2,406,007 | |||||||||
| Series K701 A2 (c) | 11/25/2017 | 3.88% | 5,000,000 | 5,191,531 | |||||||||
| Series K703 A2 | 05/25/2018 | 2.70% | 9,000,000 | 9,195,700 | |||||||||
| Series K704 A2 | 08/25/2018 | 2.41% | 4,000,000 | 4,068,680 | |||||||||
| Series K705 A2 | 09/25/2018 | 2.30% | 4,000,000 | 4,057,866 | |||||||||
| Series K706 A2 | 10/25/2018 | 2.32% | 6,875,000 | 6,974,151 | |||||||||
| Series K708 A2 | 01/25/2019 | 2.13% | 1,400,000 | 1,411,798 | |||||||||
| Series K006 A1 | 07/25/2019 | 3.40% | 2,537,069 | 2,615,650 | |||||||||
| TOTAL MORTGAGE BACKED SECURITIES (Cost $70,454,855) | 70,250,752 | ||||||||||||
| U.S. GOVERNMENT AGENCY ISSUES: 34.52% | |||||||||||||
| Federal Farm Credit Banks Funding Corp. | 04/18/2016 | 0.45% | 3,000,000 | 3,000,657 | |||||||||
| Federal Farm Credit Banks Funding Corp. | 05/16/2016 | 0.40% | 355,000 | 355,158 | |||||||||
| Federal Farm Credit Banks Funding Corp. | 10/03/2016 | 0.57% | 5,000,000 | 4,994,355 | |||||||||
| Federal Farm Credit Banks Funding Corp. | 12/15/2016 | 0.72% | 2,465,000 | 2,462,333 | |||||||||
| Federal Farm Credit Banks Funding Corp. | 03/03/2017 | 0.65% | 2,500,000 | 2,492,980 | |||||||||
| Federal Farm Credit Banks Funding Corp. | 08/14/2017 | 0.75% | 5,000,000 | 4,974,465 | |||||||||
| Federal Home Loan Banks | 06/24/2016 | 0.38% | 10,500,000 | 10,486,843 | |||||||||
| Federal Home Loan Banks | 07/22/2016 | 0.80% | 500,000 | 500,590 | |||||||||
| Federal Home Loan Banks | 09/09/2016 | 2.00% | 3,500,000 | 3,529,397 | |||||||||
| Federal Home Loan Banks | 09/28/2016 | 0.50% | 6,500,000 | 6,488,593 | |||||||||
| Federal Home Loan Banks | 11/23/2016 | 0.63% | 7,470,000 | 7,455,366 | |||||||||
| Federal Home Loan Banks | 12/29/2016 | 0.70% | 500,000 | 500,338 | |||||||||
| Federal Home Loan Banks | 02/24/2017 | 0.70% | 5,000,000 | 4,992,240 | |||||||||
| Federal Home Loan Banks | 03/10/2017 | 0.88% | 16,655,000 | 16,643,224 | |||||||||
| Federal Home Loan Banks | 06/09/2017 | 1.00% | 13,000,000 | 12,997,322 | |||||||||
| Federal Home Loan Banks | 08/28/2017 | 0.75% | 15,500,000 | 15,422,283 | |||||||||
The accompanying notes are an integral part of these consolidated financial statements.
| 38 | | | LoCorr Market Trend Fund - Consolidated Schedule of Investments (continued) |
| Maturity Date | Coupon Rate | Principal Amount | Value | ||||||||||
U.S. GOVERNMENT AGENCY ISSUES (continued) | |||||||||||||
| Federal Home Loan Banks | 10/26/2017 | 0.63% | $ | 15,000,000 | $ | 14,865,794 | |||||||
| Federal Home Loan Banks | 12/08/2017 | 1.13% | 5,000,000 | 4,997,455 | |||||||||
| Federal Home Loan Banks | 12/08/2017 | 2.13% | 5,000,000 | 5,097,510 | |||||||||
| Federal Home Loan Banks | 12/19/2017 | 1.00% | 10,000,000 | 9,975,090 | |||||||||
| Federal Home Loan Mortgage Corp. | 05/13/2016 | 0.50% | 17,287,000 | 17,288,469 | |||||||||
| Federal Home Loan Mortgage Corp. | 11/01/2016 | 0.63% | 8,250,000 | 8,238,970 | |||||||||
| Federal Home Loan Mortgage Corp. | 01/27/2017 | 0.50% | 5,000,000 | 4,979,880 | |||||||||
| Federal Home Loan Mortgage Corp. | 03/08/2017 | 1.00% | 7,000,000 | 7,005,803 | |||||||||
| Federal Home Loan Mortgage Corp. | 07/14/2017 | 0.75% | 17,900,000 | 17,802,803 | |||||||||
| Federal Home Loan Mortgage Corp. | 07/25/2017 | 1.00% | 5,000,000 | 5,001,520 | |||||||||
| Federal Home Loan Mortgage Corp. | 12/15/2017 | 1.00% | 35,000,000 | 34,906,375 | |||||||||
| Federal Home Loan Mortgage Corp. | 10/02/2019 | 1.25% | 10,000,000 | 9,863,690 | |||||||||
| Federal National Mortgage Association | 03/15/2016 | 2.25% | 8,000,000 | 8,028,576 | |||||||||
| Federal National Mortgage Association | 03/30/2016 | 0.50% | 6,250,000 | 6,250,481 | |||||||||
| Federal National Mortgage Association | 08/26/2016 | 0.63% | 7,000,000 | 7,000,350 | |||||||||
| Federal National Mortgage Association | 11/15/2016 | 1.38% | 13,500,000 | 13,562,681 | |||||||||
| Federal National Mortgage Association | 06/12/2017 | 5.38% | 12,500,000 | 13,275,963 | |||||||||
| Federal National Mortgage Association | 09/27/2017 | 1.00% | 9,000,000 | 8,979,714 | |||||||||
| Federal National Mortgage Association | 10/19/2018 | 1.13% | 11,500,000 | 11,426,688 | |||||||||
| Federal National Mortgage Association | 02/19/2019 | 1.88% | 5,000,000 | 5,067,100 | |||||||||
| Tennessee Valley Authority | 12/15/2016 | 4.88% | 145,000 | 150,305 | |||||||||
| TOTAL U.S. GOVERNMENT AGENCY ISSUES (Cost $311,920,112) | 311,061,361 | ||||||||||||
| U.S. GOVERNMENT NOTES: 15.43% | |||||||||||||
| United States Treasury Note | 10/15/2016 | 0.63% | 12,695,000 | 12,683,092 | |||||||||
| United States Treasury Note | 01/31/2017 | 0.50% | 14,500,000 | 14,446,756 | |||||||||
| United States Treasury Note | 05/15/2017 | 0.88% | 10,000,000 | 9,993,750 | |||||||||
| United States Treasury Note | 08/15/2017 | 0.88% | 13,000,000 | 12,971,049 | |||||||||
| United States Treasury Note | 12/31/2017 | 2.75% | 10,000,000 | 10,321,880 | |||||||||
| United States Treasury Note | 06/15/2018 | 1.13% | 23,000,000 | 22,946,088 | |||||||||
| United States Treasury Note | 07/15/2018 | 0.88% | 8,000,000 | 7,927,816 | |||||||||
| United States Treasury Note | 08/15/2018 | 1.00% | 23,750,000 | 23,596,005 | |||||||||
| United States Treasury Note | 06/30/2019 | 1.63% | 24,000,000 | 24,107,808 | |||||||||
| TOTAL U.S. GOVERNMENT NOTES (Cost $139,708,521) | 138,994,244 | ||||||||||||
| SHORT TERM INVESTMENT: 3.26% | |||||||||||||
| MONEY MARKET FUND: 3.26% | Shares | ||||||||||||
| Fidelity Institutional Money Market Portfolio - Class I , 0.28% (d)(e)(f) | 29,338,231 | 29,338,231 | |||||||||||
| TOTAL MONEY MARKET FUND | 29,338,231 | ||||||||||||
| TOTAL SHORT TERM INVESTMENT (Cost $29,338,231) | 29,338,231 | ||||||||||||
| TOTAL INVESTMENTS (Cost $757,020,421): 83.76% | 754,678,997 | ||||||||||||
| Other Assets in Excess of Liabilities: 16.24% (f) | 146,338,769 | ||||||||||||
| TOTAL NET ASSETS: 100.00% | $ | 901,017,766 | |||||||||||
| (a) | Restricted security as defined in Rule 144(a) under the Securities Act of 1933 and determined to be liquid. Purchased in a private placement transaction; resale to the public may require registration or may extend only to qualified institutional buyers. At December 31, 2015, the value of these securities total $27,673,354 which represents 3.07% of total net assets. |
| (b) | Foreign issued security. |
| (c) | Variable rate security. The rate reported is the rate in effect as of December 31, 2015. |
| (d) | The rate quoted is the annualized seven-day effective yield as of December 31, 2015. |
| (e) | All or a portion of this security is held by LCMT Fund Limited. See Note 1. |
| (f) | Includes assets pledged as collateral for derivative contracts. See Note 2. |
The accompanying notes are an integral part of these consolidated financial statements.
LoCorr Market Trend Fund - Consolidated Schedule of Open Forward Currency Contracts | | | 39 |
LoCorr Market Trend Fund
Consolidated Schedule of Open Forward Currency Contracts(a)
December 31, 2015
| Currency to be Received | Currency to be Delivered | ||||||||||||||||||||||||
Notional Amount | Forward Settlement Date | Curr Abbr. | U.S. $ Value at December 31, 2015 | Curr Abbr. | U.S. $ Value on Origination Date | Unrealized Appreciation | Unrealized (Depreciation) | ||||||||||||||||||
| Purchase Contracts: | |||||||||||||||||||||||||
| $ | 19,047,210 | 03/18/2016 | AUD | $ | 19,095,215 | USD | $ | 19,047,210 | $ | 48,005 | $ | — | |||||||||||||
| 7,327,388 | 03/18/2016 | CAD | 7,393,325 | USD | 7,327,388 | 65,937 | — | ||||||||||||||||||
| 34,320,495 | 03/18/2016 | CHF | 33,836,669 | USD | 34,320,495 | — | (483,826 | ) | |||||||||||||||||
| 75,203,088 | 03/18/2016 | EUR | 74,593,628 | USD | 75,203,088 | — | (609,460 | ) | |||||||||||||||||
| 30,939,695 | 03/18/2016 | GBP | 30,701,341 | USD | 30,939,695 | — | (238,354 | ) | |||||||||||||||||
| 80,661,318 | 03/18/2016 | JPY | 80,839,051 | USD | 80,661,318 | 177,733 | — | ||||||||||||||||||
| 555,417 | 03/18/2016 | MXN | 551,614 | USD | 555,417 | — | (3,803 | ) | |||||||||||||||||
| 102,746,836 | 03/18/2016 | NZD | 104,044,842 | USD | 102,746,836 | 1,298,006 | — | ||||||||||||||||||
| Total Purchase Contracts | 351,055,685 | 350,801,447 | 1,589,681 | (1,335,443 | ) | ||||||||||||||||||||
| Sale Contracts: | |||||||||||||||||||||||||
| $ | 76,912,365 | 03/18/2016 | USD | $ | (76,952,111 | ) | AUD | $ | (76,912,365 | ) | $ | — | $ | (39,746 | ) | ||||||||||
| 342,110,252 | 03/18/2016 | USD | (339,305,050 | ) | CAD | (342,110,252 | ) | 2,805,202 | — | ||||||||||||||||
| 130,175,867 | 03/18/2016 | USD | (128,468,344 | ) | CHF | (130,175,867 | ) | 1,707,523 | — | ||||||||||||||||
| 110,423,286 | 03/18/2016 | USD | (109,637,388 | ) | EUR | (110,423,286 | ) | 785,898 | — | ||||||||||||||||
| 331,100,668 | 03/18/2016 | USD | (323,017,970 | ) | GBP | (331,100,668 | ) | 8,082,698 | — | ||||||||||||||||
| 36,458,446 | 03/18/2016 | USD | (36,784,312 | ) | JPY | (36,458,446 | ) | — | (325,866 | ) | |||||||||||||||
| 96,027,544 | 03/18/2016 | USD | (95,090,802 | ) | MXN | (96,027,544 | ) | 936,742 | — | ||||||||||||||||
| 6,082,304 | 03/18/2016 | USD | (6,062,669 | ) | NZD | (6,082,304 | ) | 19,635 | — | ||||||||||||||||
| Total Sale Contracts | (1,115,318,646 | ) | (1,129,290,732 | ) | 14,337,698 | (365,612 | ) | ||||||||||||||||||
| Total Forward Currency Contracts | $ | (764,262,961 | ) | $ | (778,489,285 | ) | $ | 15,927,379 | $ | (1,701,055 | ) | ||||||||||||||
| Net Unrealized Appreciation | $ | 14,226,324 | |||||||||||||||||||||||
Currency abbreviations:
| AUD | AUSTRALIAN DOLLAR |
| CAD | CANADIAN DOLLAR |
| CHF | SWISS FRANC |
| EUR | EURO |
| GBP | BRITISH POUND |
| JPY | JAPANESE YEN |
| MXN | MEXICAN PESO |
| NZD | NEW ZEALAND DOLLAR |
| USD | U.S. DOLLAR |
| (a) | Bank of America Merrill Lynch is the counterparty for all open forward currency exchange contracts held by the Fund as of December 31, 2015. |
The accompanying notes are an integral part of these consolidated financial statements.
| 40 | | | LoCorr Market Trend Fund - Consolidated Schedule of Open Futures Contracts |
LoCorr Market Trend Fund
Consolidated Schedule of Open Futures Contracts
December 31, 2015
| Description | Notional Amount | Number of Contracts Purchased (Sold) | Settlement Month-Year | Unrealized Appreciation | Unrealized (Depreciation) | |||||||||||
| Purchase Contracts: | ||||||||||||||||
| 3 Mo Euro Euribor | $ | 1,590,120,005 | 5,846 | Jun-17 | $ | — | $ | (2,151,199 | ) | |||||||
| 90 Day Sterling | 937,230,220 | 5,153 | Jun-17 | — | (2,250,098 | ) | ||||||||||
| Dax Index | 61,751,959 | 211 | Mar-16 | 1,922,596 | — | |||||||||||
| Euro Bond | 72,252,214 | 421 | Mar-16 | — | (645,219 | ) | ||||||||||
| Long Gilt | 99,671,001 | 579 | Mar-16 | — | (830,653 | ) | ||||||||||
| Nasdaq 100 E-Mini | 118,363,950 | 1,290 | Mar-16 | — | (499,627 | ) | ||||||||||
| Nikkei 225 (Ose) | 38,948,209 | 246 | Mar-16 | — | (793,585 | ) | ||||||||||
| S&P500 E-Mini | 181,354,140 | 1,782 | Mar-16 | 242,264 | — | |||||||||||
| Tokyo Price Index | 58,709,597 | 456 | Mar-16 | — | (734,191 | ) | ||||||||||
| U.S. Long Bond (Cbt) | 68,880,000 | 448 | Mar-16 | — | (356,586 | ) | ||||||||||
| Total Purchase Contracts | 2,164,860 | (8,261,158 | ) | |||||||||||||
| Sale Contracts: | ||||||||||||||||
| 90 Day Eurodollar | $ | 121,118,100 | (492) | Jun-17 | $ | 18,471 | $ | — | ||||||||
| Aust 10Y Bond | 74,712,719 | (808) | Mar-16 | — | (21,566 | ) | ||||||||||
| Brent Crude (a) | 44,176,800 | (1,185) | Feb-16 | 4,155,428 | — | |||||||||||
| Cac 40 10 Euro | 22,583,305 | (448) | Jan-16 | — | (15,181 | ) | ||||||||||
| Canadian 10 Yr Bond | 67,045,906 | (658) | Mar-16 | — | (551,181 | ) | ||||||||||
| Dow Jones Industrial Average Mini E-Cbot | 52,543,230 | (606) | Mar-16 | 83,759 | — | |||||||||||
| Euro Stoxx 50 | 27,535,173 | (772) | Mar-16 | — | (265,266 | ) | ||||||||||
| Ftse 100 Index | 144,366,901 | (1,580) | Mar-16 | — | (5,336,446 | ) | ||||||||||
| Gasoline RBOB (a) | 2,348,808 | (44) | Feb-16 | — | (65,399 | ) | ||||||||||
| Hang Seng Index | 85,660,480 | (606) | Jan-16 | 236,368 | — | |||||||||||
| Lme Copper (a) | 47,553,325 | (404) | Mar-16 | — | (726,795 | ) | ||||||||||
| Lme Zinc (a) | 27,875,925 | (693) | Mar-16 | — | (499,952 | ) | ||||||||||
| Low Su Gasoil G (a) | 9,960,650 | (298) | Feb-16 | 1,649,155 | — | |||||||||||
| Natural Gas (a) | 13,531,230 | (579) | Feb-16 | — | (1,509,361 | ) | ||||||||||
| Russell 2000 Mini | 45,712,600 | (404) | Mar-16 | — | (510,345 | ) | ||||||||||
| Silver (a) | 19,393,215 | (281) | Mar-16 | 421,472 | — | |||||||||||
| Soybean Oil (a) | 4,206,600 | (228) | Mar-16 | — | (241,044 | ) | ||||||||||
| U.S. 10 Yr Note | 248,664,844 | (1,975) | Mar-16 | 163,283 | — | |||||||||||
| U.S. 5 Yr Note | 15,618,281 | (132) | Mar-16 | 80 | — | |||||||||||
| Wheat (Cbt) (a) | 7,214,500 | (307) | Mar-16 | 562,074 | — | |||||||||||
| Total Sale Contracts | 7,290,090 | (9,742,536 | ) | |||||||||||||
| Total Futures Contracts | $ | 9,454,950 | $ | (18,003,694 | ) | |||||||||||
| Net Unrealized Depreciation | $ | (8,548,744 | ) | |||||||||||||
| (a) | Contract held by LCMT Fund Limited. See Note 1. |
The accompanying notes are an integral part of these consolidated financial statements.
LoCorr Long/Short Equity Fund - Schedule of Investments | | | 41 |
LoCorr Long/Short Equity Fund
Composition of Investment Portfolio1 December 21, 2015 (Unaudited) | Composition of Common Stock Portfolio1 December 21, 2015 (Unaudited) |
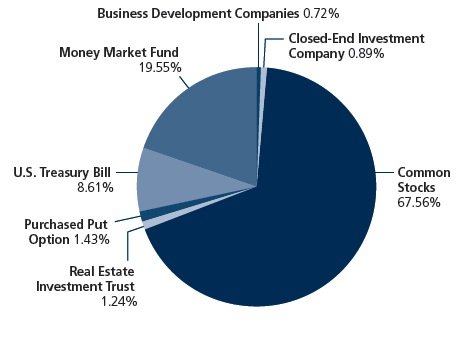 |  |
1 As a percentage of total investments. | 1 As a percentage of total common stocks. |
Schedule of Investments
December 31, 2015
| Shares | Value | |||||||
| BUSINESS DEVELOPMENT COMPANIES: 0.69% | ||||||||
| Apollo Investment Corp. | 10,026 | $ | 52,336 | |||||
| PennantPark Floating Rate Capital Ltd. | 9,281 | 104,411 | ||||||
| PennantPark Investment Corp. | 8,525 | 52,684 | ||||||
| TOTAL BUSINESS DEVELOPMENT COMPANIES (Cost $208,224) | 209,431 | |||||||
| CLOSED-END INVESTMENT COMPANY: 0.86% | ||||||||
| Reaves Utility Income Fund | 9,967 | 258,843 | ||||||
| TOTAL CLOSED-END INVESTMENT COMPANY (Cost $255,358) | 258,843 | |||||||
| COMMON STOCKS: 64.78% | ||||||||
| Accommodation and Food Services: 5.69% | ||||||||
| Diamond Resorts International, Inc. (a) | 67,540 | 1,722,945 | ||||||
| Administrative and Support and Waste Management and Remediation Services: 0.37% | ||||||||
| TripAdvisor, Inc. (a) | 1,296 | 110,484 | ||||||
| Construction: 15.20% | ||||||||
| Century Communities, Inc. (a) | 76,425 | 1,353,487 | ||||||
| LGI Homes, Inc. (a) | 8,602 | 209,287 | ||||||
| MasTec, Inc. (a) | 174,809 | 3,038,180 | ||||||
| 4,600,954 | ||||||||
| Finance and Insurance: 11.76% | ||||||||
| Credit Acceptance Corp. (a) | 7,836 | 1,677,061 | ||||||
| JPMorgan Chase & Co. | 13,574 | 896,291 | ||||||
| Vince Holding Corp. (a) | 22,245 | 101,882 | ||||||
| Wells Fargo & Co. | 16,270 | 884,437 | ||||||
| 3,559,671 | ||||||||
The accompanying notes are an integral part of these financial statements.
| 42 | | | LoCorr Long/Short Equity Fund - Schedule of Investments (continued) |
| Shares | Value | |||||||
COMMON STOCKS (continued) | ||||||||
| Information: 10.15% | ||||||||
| Cincinnati Bell, Inc. (a) | 43,639 | $ | 157,100 | |||||
| Five9, Inc. (a) | 3,605 | 31,364 | ||||||
| Nexstar Broadcasting Group, Inc. | 19,781 | 1,161,145 | ||||||
| Ooma, Inc. (a) | 16,766 | 106,464 | ||||||
| Rovi Corp. (a) | 3,300 | 54,978 | ||||||
| Sinclair Broadcast Group, Inc. | 33,758 | 1,098,485 | ||||||
| Take-Two Interactive Software, Inc. (a) | 13,315 | 463,895 | ||||||
| 3,073,431 | ||||||||
| Management of Companies and Enterprises: 0.53% | ||||||||
| Boston Private Financial Holdings, Inc. | 14,176 | 160,756 | ||||||
| Manufacturing: 9.38% | ||||||||
| Aquinox Pharmaceuticals, Inc. (a) | 2,099 | 26,196 | ||||||
| Brunswick Corp./DE | 5,164 | 260,834 | ||||||
| Chemtura Corp. (a) | 3,818 | 104,117 | ||||||
| Cirrus Logic, Inc. (a) | 1,682 | 49,669 | ||||||
| Durect Corp. (a) | 23,841 | 52,689 | ||||||
| Juniper Networks, Inc. | 13,268 | 366,196 | ||||||
| Marvell Technology Group Ltd. (b) | 5,794 | 51,103 | ||||||
| Olympic Steel, Inc. | 10,791 | 124,959 | ||||||
| Tenneco, Inc. (a) | 32,414 | 1,488,127 | ||||||
| Titan Machinery, Inc. | 6,508 | 25,642 | ||||||
| United States Steel Corp. | 6,424 | 51,264 | ||||||
| Vuzix Corp. (a) | 3,583 | 27,195 | ||||||
| Zynga, Inc. (a) | 79,041 | 211,829 | ||||||
| 2,839,820 | ||||||||
| Mining, Quarrying, and Oil and Gas Extraction: 1.33% | ||||||||
| Eclipse Resources Corp. (a) | 5,600 | 10,192 | ||||||
| Gran Tierra Energy, Inc. (a) | 95,907 | 208,118 | ||||||
| Gulfport Energy Corp. (a) | 2,221 | 54,570 | ||||||
| Rice Energy, Inc. (a) | 4,971 | 54,184 | ||||||
| Southwestern Energy Co. (a) | 7,805 | 55,494 | ||||||
| Ultra Petroleum Corp. (a)(b) | 4,226 | 10,564 | ||||||
| Willbros Group, Inc. (a) | 3,937 | 10,591 | ||||||
| 403,713 | ||||||||
| Professional, Scientific, and Technical Services: 1.84% | ||||||||
| Booz Allen Hamilton Holding Corp. | 11,905 | 367,269 | ||||||
| Intralinks Holdings, Inc. (a) | 5,763 | 52,270 | ||||||
| Mattersight Corp. (a) | 12,972 | 85,097 | ||||||
| Zogenix, Inc. (a) | 3,606 | 53,152 | ||||||
| 557,788 | ||||||||
| Real Estate and Rental and Leasing: 4.99% | ||||||||
| United Rentals, Inc. (a) | 20,826 | 1,510,718 | ||||||
| Retail Trade: 2.42% | ||||||||
| 1-800-Flowers.com, Inc. (a) | 22,112 | 160,976 | ||||||
| Abercrombie & Fitch Co. | 3,905 | 105,435 | ||||||
| Titan Machinery, Inc. (a) | 38,060 | 415,996 | ||||||
| TravelCenters of America LLC (a) | 5,427 | 51,014 | ||||||
| 733,421 | ||||||||
| Transportation and Warehousing: 0.77% | ||||||||
| Expedia, Inc. | 1,656 | 205,841 | ||||||
| Hornbeck Offshore Services, Inc. (a) | 2,654 | 26,381 | ||||||
| 232,222 | ||||||||
The accompanying notes are an integral part of these financial statements.
LoCorr Long/Short Equity Fund - Schedule of Investments (continued) | | | 43 |
| Shares | Value | |||||||||||||
COMMON STOCKS (continued) | ||||||||||||||
| Utilities: 0.35% | ||||||||||||||
| ONEOK, Inc. | 4,323 | $ | 106,605 | |||||||||||
| TOTAL COMMON STOCKS (Cost $18,843,231) | 19,612,528 | |||||||||||||
| REAL ESTATE INVESTMENT TRUST: 1.19% | ||||||||||||||
| Finance and Insurance: 1.19% | ||||||||||||||
| Equity Commonwealth (a) | 13,028 | 361,266 | ||||||||||||
| TOTAL REAL ESTATE INVESTMENT TRUST (Cost $354,625) | 361,266 | |||||||||||||
| PURCHASED OPTION: 1.37% | ||||||||||||||
| Put Option: 1.37% | Number of Contracts | |||||||||||||
| JetBlue Airways Corp., Expiration: January, 2017 | ||||||||||||||
| Exercise Price: $35.00 | 339 | 413,580 | ||||||||||||
| TOTAL PURCHASED OPTION (Cost $358,188 (c)) | 413,580 | |||||||||||||
| SHORT TERM INVESTMENTS: 27.00% | ||||||||||||||
| U.S. TREASURY BILL: 8.26% | Maturity Date | Coupon | Principal Amount | |||||||||||
| United States Treasury Bill (d) | 03/10/2016 | 0.11%(e) | $ | 2,500,000 | 2,499,458 | |||||||||
| TOTAL U.S. TREASURY BILL | 2,499,458 | |||||||||||||
| MONEY MARKET FUND: 18.74% | Shares | |||||||||||||
| Fidelity Institutional Money Market Portfolio - Class I , 0.28% (f) | 5,674,822 | 5,674,822 | ||||||||||||
| TOTAL MONEY MARKET FUND | 5,674,822 | |||||||||||||
| TOTAL SHORT TERM INVESTMENTS (Cost $8,173,672) | 8,174,280 | |||||||||||||
| TOTAL INVESTMENTS (Cost $28,193,298): 95.89% | 29,029,928 | |||||||||||||
| Other Assets in Excess of Liabilities: 4.11% | 1,243,267 | |||||||||||||
| TOTAL NET ASSETS: 100.00% | $ | 30,273,195 | ||||||||||||
| (a) | Non-dividend income producing security. |
| (b) | Foreign issued security. |
| (c) | Represents premiums paid. |
| (d) | This security or a portion of this security is pledged to cover short positions. See Note 2. |
| (e) | Effective yield. |
| (f) | The rate quoted is the annualized seven-day effective yield as of December 31, 2015. |
The accompanying notes are an integral part of these financial statements.
| 44 | | | LoCorr Long/Short Equity Fund - Schedule of Securities Sold Short |
| Schedule of Securities Sold Short | ||||||||
| December 31, 2015 | ||||||||
| Shares | Value | |||||||
| COMMON STOCKS: (13.53)% | ||||||||
| Accommodation and Food Services: (0.57)% | ||||||||
| Chipotle Mexican Grill, Inc. (a) | (360 | ) | $ | (172,746 | ) | |||
| Administrative and Support and Waste Management and Remediation Services: (0.86)% | ||||||||
| Akamai Technologies, Inc. (a) | (2,450 | ) | (128,943 | ) | ||||
| Criteo SA - ADR (a)(b) | (3,288 | ) | (130,205 | ) | ||||
| (259,148 | ) | |||||||
| Information: (3.01)% | ||||||||
| AMC Networks, Inc. (a) | (1,404 | ) | (104,851 | ) | ||||
| ANSYS, Inc. (a) | (876 | ) | (81,030 | ) | ||||
| Disney Walt Co./The | (972 | ) | (102,138 | ) | ||||
| Fortinet, Inc. (a) | (3,327 | ) | (103,703 | ) | ||||
| MSG Networks, Inc. (a) | (3,831 | ) | (79,684 | ) | ||||
| NetSuite, Inc. (a) | (1,801 | ) | (152,401 | ) | ||||
| Oracle Corp. | (3,546 | ) | (129,535 | ) | ||||
| Tableau Software, Inc. (a) | (840 | ) | (79,145 | ) | ||||
| Twenty-First Century Fox, Inc. | (2,871 | ) | (77,976 | ) | ||||
| (910,463 | ) | |||||||
| Manufacturing: (2.38)% | ||||||||
| Harley-Davidson, Inc. | (1,527 | ) | (69,311 | ) | ||||
| Hexcel Corp. | (2,205 | ) | (102,422 | ) | ||||
| Inphi Corp. (a) | (788 | ) | (21,292 | ) | ||||
| Polaris Industries, Inc. | (820 | ) | (70,479 | ) | ||||
| Steven Madden Ltd. (a) | (2,631 | ) | (79,509 | ) | ||||
| Under Armour, Inc. (a) | (1,033 | ) | (83,270 | ) | ||||
| VF Corp. | (2,572 | ) | (160,107 | ) | ||||
| Wabtec Corp. | (1,901 | ) | (135,199 | ) | ||||
| (721,589 | ) | |||||||
| Other Services (except Public Administration): (5.16)% | ||||||||
| Regis Corp. (a) | (56,600 | ) | (800,890 | ) | ||||
| Weight Watchers International, Inc. (a) | (33,423 | ) | (762,044 | ) | ||||
| (1,562,934 | ) | |||||||
| Professional, Scientific, and Technical Services: (0.25)% | ||||||||
| Nielsen Holdings PLC (b) | (1,622 | ) | (75,585 | ) | ||||
| Retail Trade: (0.25)% | ||||||||
| Blackhawk Network Holdings, Inc. (a) | (1,734 | ) | (76,660 | ) | ||||
| Transportation and Warehousing: (0.36)% | ||||||||
| United Parcel Service, Inc. | (1,129 | ) | (108,644 | ) | ||||
| Wholesale Trade: (0.69)% | ||||||||
| Dorman Products, Inc. (a) | (2,217 | ) | (105,241 | ) | ||||
| Phibro Animal Health Corp. | (3,458 | ) | (104,190 | ) | ||||
| (209,431 | ) | |||||||
| TOTAL COMMON STOCKS (Proceeds $4,248,066) | (4,097,200 | ) | ||||||
| TOTAL SECURITIES SOLD SHORT (Proceeds $4,248,066): (13.53)% | $ | (4,097,200 | ) | |||||
ADR American Depository Receipt
| (a) | Non-dividend expense producing security. |
| (b) | Foreign issued security. |
Percentages are stated as a percent of net assets.
The accompanying notes are an integral part of these financial statements.
LoCorr Spectrum Income Fund - Schedule of Investments | | | 45 |
LoCorr Spectrum Income Fund
Composition of Investment Portfolio1
December 31, 2015 (Unaudited)

| 1 | As a percentage of total investments. |
| Schedule of Investments | ||||||||
| December 31, 2015 | ||||||||
| Shares | Value | |||||||
| BUSINESS DEVELOPMENT COMPANIES: 6.77% | ||||||||
| Ares Capital Corp. | 141,050 | $ | 2,009,962 | |||||
| FS Investment Corp. | 166,025 | 1,492,565 | ||||||
| Medley Capital Corp. | 118,465 | 890,857 | ||||||
| Prospect Capital Corp. | 272,600 | 1,902,748 | ||||||
| TOTAL BUSINESS DEVELOPMENT COMPANIES (Cost $7,830,183) | 6,296,132 | |||||||
| CLOSED-END INVESTMENT COMPANIES: 16.56% | ||||||||
| First Trust Intermediate Duration Preferred & Income Fund | 160,540 | 3,414,686 | ||||||
| Invesco Dynamic Credit Opportunities Fund | 172,950 | 1,824,623 | ||||||
| Nuveen Preferred & Income Term Fund | 147,665 | 3,360,855 | ||||||
| Nuveen Preferred Income Opportunities Fund | 383,100 | 3,509,196 | ||||||
| Nuveen Quality Preferred Income Fund 2 | 362,075 | 3,298,503 | ||||||
| TOTAL CLOSED-END INVESTMENT COMPANIES (Cost $15,853,594) | 15,407,863 | |||||||
| COMMON STOCKS: 10.11% | ||||||||
| Finance and Insurance: 1.63% | ||||||||
| Apollo Global Management LLC | 99,950 | 1,517,241 | ||||||
| Information: 3.32% | ||||||||
| Frontier Communications Corp. | 661,950 | 3,091,307 | ||||||
| Real Estate and Rental and Leasing: 0.00% | ||||||||
| RMR Group, Inc./The (a)(e) | 1 | 9 | ||||||
| Transportation and Warehousing: 5.16% | ||||||||
| Ship Finance International Ltd. (b) | 289,600 | 4,798,672 | ||||||
| TOTAL COMMON STOCKS (Cost $10,613,141) | 9,407,229 | |||||||
| CONVERTIBLE PREFERRED STOCK: 3.38% | ||||||||
| Utilities: 3.38% | ||||||||
| Kinder Morgan, Inc./DE (a) | 78,130 | 3,148,639 | ||||||
| TOTAL CONVERTIBLE PREFERRED STOCK (Cost $3,126,815) | 3,148,639 | |||||||
The accompanying notes are an integral part of these financial statements.
| 46 | | | LoCorr Spectrum Income Fund - Schedule of Investments (continued) |
| Units | Value | |||||||||||
| MASTER LIMITED PARTNERSHIPS: 23.26% | ||||||||||||
| Arts, Entertainment, and Recreation: 3.46% | ||||||||||||
| Cedar Fair LP | 57,650 | $ | 3,219,176 | |||||||||
| Finance and Insurance: 1.40% | ||||||||||||
| KKR & Co. LP | 83,650 | 1,304,103 | ||||||||||
| Manufacturing: 6.72% | ||||||||||||
| Calumet Specialty Products Partners LP | 73,450 | 1,462,390 | ||||||||||
| CVR Partners LP | 130,725 | 1,047,107 | ||||||||||
| CVR Refining LP | 38,025 | 719,813 | ||||||||||
| Terra Nitrogen Co. LP | 29,800 | 3,027,084 | ||||||||||
| 6,256,394 | ||||||||||||
| Mining, Quarrying, and Oil and Gas Extraction: 3.36% | ||||||||||||
| Enterprise Products Partners LP | 122,300 | 3,128,434 | ||||||||||
| Other Services (except Public Administration): 2.65% | ||||||||||||
| StoneMor Partners LP | 92,120 | 2,462,368 | ||||||||||
| Transportation and Warehousing: 3.81% | ||||||||||||
| Energy Transfer Partners LP | 105,100 | 3,545,023 | ||||||||||
| Wholesale Trade: 1.86% | ||||||||||||
| Martin Midstream Partners LP | 79,975 | 1,735,457 | ||||||||||
| TOTAL MASTER LIMITED PARTNERSHIPS (Cost $24,197,609) | 21,650,955 | |||||||||||
| PRIVATE INVESTMENT: 12.36% | Preferred Return | |||||||||||
| Terra Secured Income Fund 5, LLC (c) | 8.50% | 246.80 | 11,498,342 | |||||||||
| TOTAL PRIVATE INVESTMENT (Cost $10,876,759) | 11,498,342 | |||||||||||
| Shares | ||||||||||||
| REAL ESTATE INVESTMENT TRUSTS: 21.95% | ||||||||||||
| Finance and Insurance: 10.06% | ||||||||||||
| Apollo Commercial Real Estate Finance, Inc. | 251,625 | 4,335,499 | ||||||||||
| Invesco Mortgage Capital, Inc. | 72,020 | 892,328 | ||||||||||
| Starwood Property Trust, Inc. | 201,100 | 4,134,616 | ||||||||||
| 9,362,443 | ||||||||||||
| Real Estate and Rental and Leasing: 11.89% | ||||||||||||
| Capstead Mortgage Corp. | 85,625 | 748,362 | ||||||||||
| EPR Properties | 48,875 | 2,856,744 | ||||||||||
| Hospitality Properties Trust | 130,700 | 3,417,805 | ||||||||||
| New Residential Investment Corp. | 177,965 | 2,164,054 | ||||||||||
| Vereit, Inc. | 237,450 | 1,880,604 | ||||||||||
| 11,067,569 | ||||||||||||
| TOTAL REAL ESTATE INVESTMENT TRUSTS (Cost $22,432,674) | 20,430,012 | |||||||||||
| SHORT TERM INVESTMENT: 7.86% | ||||||||||||
| MONEY MARKET FUND: 7.86% | ||||||||||||
| Fidelity Institutional Money Market Portfolio - Class I , 0.28% (d) | 7,319,122 | 7,319,122 | ||||||||||
| TOTAL MONEY MARKET FUND | 7,319,122 | |||||||||||
| TOTAL SHORT TERM INVESTMENT (Cost $7,319,122) | 7,319,122 | |||||||||||
| TOTAL INVESTMENTS (Cost $102,249,897): 102.25% | 95,158,294 | |||||||||||
| Liabilities in Excess of Other Assets: (2.25)% | (2,092,693) | |||||||||||
| TOTAL NET ASSETS: 100.00% | $ | 93,065,601 | ||||||||||
| (a) | Non-dividend income producing security. |
| (b) | Foreign issued security. |
| (c) | Deemed to be illiquid. At December 31, 2015, the value of these securities total $11,498,342 which represents 12.36% of total net assets. See Note 2. |
| (d) | The rate quoted is the annualized seven-day effective yield as of December 31, 2015. |
| (e) | Represents a fractional holding. |
The accompanying notes are an integral part of these financial statements.
LoCorr Managed Futures Strategy Fund, LoCorr Long/Short Commodities Strategy Fund, LoCorr Multi-Strategy Fund and LoCorr Market Trend Fund - Consolidated Statements of Assets & Liabilities | | | 47 |
Consolidated Statements of Assets & Liabilities
December 31, 2015
LoCorr Managed Futures Strategy Fund | LoCorr Long/Short Commodities Strategy Fund | LoCorr Multi-Strategy Fund | LoCorr Market Trend Fund | ||||||||||
| Assets | |||||||||||||
| Investments, at value (Cost $431,978,685, $49,731,561, $29,457,824 and $757,020,421, respectively) | $ | 429,357,888 | $ | 49,553,464 | $ | 27,688,861 | $ | 754,678,997 | |||||
| Cash | — | — | — | 26,770,000 | |||||||||
| Foreign currency, at value (Cost $1,473,354) | — | — | — | 1,473,023 | |||||||||
| Receivable for Fund shares sold | 1,138,074 | 928,213 | 318,001 | 25,386,902 | |||||||||
| Receivable for securities sold | 14,121 | — | 135,781 | — | |||||||||
| Dividend and interest receivable | 1,723,210 | 158,469 | 102,731 | 1,621,574 | |||||||||
| Deferred offering costs (Note 2) | — | — | 17,164 | — | |||||||||
| Deposits with broker for derivative instruments (Note 2) | 101,000,010 | 9,435,010 | 6,316,500 | 85,130,584 | |||||||||
| Deposits with broker for securities sold short (Note 2) | — | — | 935,779 | — | |||||||||
| Unrealized appreciation on forward currency contracts (Note 2) | — | — | — | 15,927,379 | |||||||||
| Advance receipt on swap contracts | 2,271,538 | 3,728,822 | — | — | |||||||||
| Prepaid expenses and other assets | 18,344 | 28,589 | — | 47,917 | |||||||||
| Total Assets | 535,523,185 | 63,832,567 | 35,514,817 | 911,036,376 | |||||||||
| Liabilities | |||||||||||||
| Securities sold short, at value (Proceeds $739,813) | $ | — | $ | — | $ | 730,464 | $ | — | |||||
| Payable for Fund shares redeemed | 1,139,069 | 57,653 | 3,087 | 5,111,511 | |||||||||
| Payable for securities purchased | — | 589,204 | 245,546 | — | |||||||||
| Payable for distributions | — | — | 23,621 | — | |||||||||
| Payable for variation margin on futures contracts | — | — | — | 1,570,391 | |||||||||
| Accrued management fees (Note 5) | 666,056 | 57,111 | 35,008 | 1,082,912 | |||||||||
| Accrued Trustees’ fees | 8,084 | 655 | 441 | 12,375 | |||||||||
| Accrued Rule 12b-1 fees | 13,145 | 55,356 | 15,466 | 212,120 | |||||||||
| Unrealized depreciation on swap contracts (Note 1) | 12,934,752 | 3,079,037 | 195,200 | — | |||||||||
| Unrealized depreciation on forward currency contracts (Note 2) | — | — | — | 1,701,055 | |||||||||
| Advance payment on swap contracts | — | — | 44,245 | — | |||||||||
| Accrued expenses and other liabilities | 297,168 | 72,743 | 67,509 | 328,246 | |||||||||
| Total Liabilities | 15,058,274 | 3,911,759 | 1,360,587 | 10,018,610 | |||||||||
| Net Assets | $ | 520,464,911 | $ | 59,920,808 | $ | 34,154,230 | $ | 901,017,766 | |||||
| Net Assets Consist of: | |||||||||||||
| Paid-in capital | $ | 536,537,792 | $ | 63,305,690 | $ | 37,447,416 | $ | 925,395,285 | |||||
| Accumulated net investment income (loss) | 23,817 | — | (9,659) | 5,933,169 | |||||||||
| Accumulated net realized loss | (541,149) | (127,748) | (1,328,713) | (33,646,513) | |||||||||
| Net unrealized appreciation (depreciation) of: | |||||||||||||
| Investments | (2,620,797) | (178,097) | (1,768,963) | (2,341,424) | |||||||||
| Securities sold short | — | — | 9,349 | — | |||||||||
| Swap contracts | (12,934,752) | (3,079,037) | (195,200) | — | |||||||||
| Forward currency contracts | — | — | — | 14,226,324 | |||||||||
| Futures contracts | — | — | — | (8,548,744) | |||||||||
| Foreign currency translation | — | — | — | (331) | |||||||||
| NET ASSETS | $ | 520,464,911 | $ | 59,920,808 | $ | 34,154,230 | $ | 901,017,766 | |||||
| Class A Shares | |||||||||||||
| Net assets | $ | 229,427,341 | $ | 24,425,117 | $ | 12,101,684 | $ | 110,324,098 | |||||
| Shares issued and outstanding (unlimited shares authorized, no par value) | 26,855,979 | 2,513,488 | 1,455,738 | 9,194,610 | |||||||||
| Net asset value, redemption, and minimum offering price per share (a)(b) | $ | 8.54 | $ | 9.72 | $ | 8.31 | $ | 12.00 | |||||
| Maximum offering price per share ($8.54/0.9425), ($9.72/0.9425) ($8.31/0.9425) ($12.00/0.9425) (c) | $ | 9.06 | $ | 10.31 | $ | 8.82 | $ | 12.73 | |||||
| Class C Shares | |||||||||||||
| Net assets | $ | 98,729,086 | $ | 4,329,458 | $ | 5,490,539 | $ | 94,706,430 | |||||
| Shares issued and outstanding (unlimited shares authorized, no par value) | 11,860,266 | 455,299 | 660,950 | 7,946,957 | |||||||||
| Net asset value, redemption, and offering price per share (a)(b) | $ | 8.32 | $ | 9.51 | $ | 8.31 | $ | 11.92 | |||||
| Class I Shares | |||||||||||||
| Net assets | $ | 192,308,484 | $ | 31,166,233 | $ | 16,562,007 | $ | 695,987,238 | |||||
| Shares issued and outstanding (unlimited shares authorized, no par value) | 22,322,234 | 3,183,735 | 1,993,984 | 57,903,916 | |||||||||
| Net asset value, redemption, and offering price per share (b) | $ | 8.62 | $ | 9.79 | $ | 8.31 | $ | 12.02 | |||||
| (a) | A 1.00% contingent deferred sales charge may apply to redemptions made within twelve months of purchase. The contingent deferred sales charge only applies to Class A share purchases of $1 million or more. |
| (b) | Redemptions made within 30 days of purchase may be assessed a redemption fee of 1.00%. |
| (c) | On investments of $25,000 or more, the offering price is reduced. |
The accompanying notes are an integral part of these consolidated financial statements.
| 48 | | | LoCorr Long/Short Equity Fund and LoCorr Spectrum Income Fund - Statements of Assets & Liabilities |
Statements of Assets & Liabilities
December 31, 2015
LoCorr Long/Short Equity Fund | LoCorr Spectrum Income Fund | ||||||
| Assets | |||||||
| Investments, at value (Cost $28,193,298 and $102,249,897, respectively) | $ | 29,029,928 | $ | 95,158,294 | |||
| Cash | — | 87,409 | |||||
| Receivable for Fund shares sold | 168,274 | 235,360 | |||||
| Receivable for securities sold | 2,920,289 | 1,482,968 | |||||
| Dividends, interest and other receivables | 3,877 | 456,635 | |||||
| Deposits with broker for securities sold short (Note 2) | 4,143,194 | — | |||||
| Prepaid expenses and other assets | 11,425 | 27,059 | |||||
| Total Assets | 36,276,987 | 97,447,725 | |||||
| Liabilities | |||||||
| Securities sold short, at value (Proceeds $4,248,066) | $ | 4,097,200 | $ | — | |||
| Payable for Fund shares redeemed | 49,635 | 988,012 | |||||
| Payable for securities purchased | 1,739,904 | 2,991,456 | |||||
| Payable for distributions | — | 119,482 | |||||
| Accrued management fees (Note 5) | 45,414 | 99,423 | |||||
| Accrued Trustees’ fees | 567 | 1,858 | |||||
| Accrued Rule 12b-1 fees | 15,948 | 89,304 | |||||
| Accrued interest on line of credit (Note 8) | — | 370 | |||||
| Accrued expenses and other liabilities | 55,124 | 92,219 | |||||
| Total Liabilities | 6,003,792 | 4,382,124 | |||||
| Net Assets | $ | 30,273,195 | $ | 93,065,601 | |||
| Net Assets Consist of: | |||||||
| Paid-in capital | $ | 33,064,147 | $ | 119,634,977 | |||
| Accumulated net investment loss | — | (559,687) | |||||
| Accumulated net realized loss | (3,778,448) | (18,918,086) | |||||
| Net unrealized appreciation (depreciation) of: | |||||||
| Investments | 836,630 | (7,091,603) | |||||
| Securities sold short | 150,866 | — | |||||
| NET ASSETS | $ | 30,273,195 | $ | 93,065,601 | |||
| Class A Shares | |||||||
| Net assets | $ | 12,445,608 | $ | 36,956,952 | |||
| Shares issued and outstanding (unlimited shares authorized, no par value) | 1,290,685 | 4,749,876 | |||||
| Net asset value, redemption, and minimum offering price per share (a) | $ | 9.64 | (b) | $ | 7.78 | (c) | |
| Maximum offering price per share ($9.64/0.9425) ($7.78/0.9425) (d) | $ | 10.23 | $ | 8.25 | |||
| Class C Shares | |||||||
| Net assets | $ | 7,837,040 | $ | 27,816,500 | |||
| Shares issued and outstanding (unlimited shares authorized, no par value) | 829,393 | 3,574,461 | |||||
| Net asset value, redemption, and offering price per share (a) | $ | 9.45 | (b) | $ | 7.78 | (c) | |
| Class I Shares | |||||||
| Net assets | $ | 9,990,547 | $ | 28,292,149 | |||
| Shares issued and outstanding (unlimited shares authorized, no par value) | 1,029,273 | 3,635,819 | |||||
Net asset value, redemption, and offering price per share | $ | 9.71 | (b) | $ | 7.78 | (c) | |
| (a) | A 1.00% contingent deferred sales charge may apply to redemptions made within twelve months of purchase. |
The contingent deferred sales charge only applies to Class A share purchases of $1 million or more. | |
| (b) | Redemptions made within 30 days of purchase may be assessed a redemption fee of 1.00%. |
| (c) | Redemptions made within 60 days of purchase may be assessed a redemption fee of 2.00%. |
| (d) | On investments of $25,000 or more, the offering price is reduced. |
The accompanying notes are an integral part of these financial statements.
LoCorr Managed Futures Strategy Fund, LoCorr Long/Short Commodities Strategy Fund, LoCorr Multi-Strategy Fund and LoCorr Market Trend Fund - Consolidated Statements of Operations | | | 49 |
Consolidated Statements of Operations
Year Ended December 31, 2015 | Period from April 6, 2015 (commencement of operations) through December 31, 2015 | Year Ended December 31, 2015 | |||||||||||||||
LoCorr Managed Futures Strategy Fund | LoCorr Long/Short Commodities Strategy Fund | LoCorr Multi-Strategy Fund | LoCorr Market Trend Fund | ||||||||||||||
| Investment Income | |||||||||||||||||
| Dividend and interest income (a) | $ | 6,145,160 | $ | 314,620 | $ | 585,341 | $ | 2,417,691 | |||||||||
| Distributions received from master limited partnerships (“MLP”) interests | — | — | 300,441 | — | |||||||||||||
| Less: return of capital on distributions from MLP interests (Note 2) | — | — | (300,441) | — | |||||||||||||
| Other income | 3,755 | — | — | 5,966 | |||||||||||||
| Total Investment Income | 6,148,915 | 314,620 | 585,341 | 2,423,657 | |||||||||||||
| Expenses | |||||||||||||||||
| Management fees (Note 5) | 7,928,766 | 592,149 | 301,296 | 6,778,986 | |||||||||||||
| Fund administration fees | 210,982 | 44,988 | 32,102 | 177,568 | |||||||||||||
| Fund accounting fees | 234,651 | 78,763 | 32,746 | 192,013 | |||||||||||||
| Trustees’ fees | 44,208 | 3,259 | 1,148 | 32,556 | |||||||||||||
| Transfer agent fees and expenses | 902,671 | 97,477 | 46,178 | 531,374 | |||||||||||||
| Custodian fees | 26,552 | 9,161 | 9,507 | 24,750 | |||||||||||||
| Registration expenses | 86,481 | 48,821 | 18,196 | 136,034 | |||||||||||||
| Rule 12b-1 fees - Class A (Note 5) | 567,303 | 52,076 | 8,081 | 181,420 | |||||||||||||
| Rule 12b-1 fees - Class C (Note 5) | 997,144 | 32,422 | 31,239 | 508,310 | |||||||||||||
| Legal and audit fees | 56,862 | 34,664 | 35,704 | 41,335 | |||||||||||||
| Printing and mailing expenses | 88,330 | 11,442 | 5,847 | 81,001 | |||||||||||||
| Offering costs (Note 2) | — | — | 47,601 | 36,544 | |||||||||||||
| Organizational costs (Note 2) | — | — | 15,167 | — | |||||||||||||
| Other expenses | 30,765 | 3,597 | 1,212 | 5,210 | |||||||||||||
| Total expenses before dividend and interest expense | 11,174,715 | 1,008,819 | 586,024 | 8,727,101 | |||||||||||||
| Dividend and interest expense on securities sold short (See Note 2) | — | — | 1,166 | — | |||||||||||||
| Interest expense on credit line (Note 8) | 105 | 15 | 542 | — | |||||||||||||
| Total expenses before recovery (reimbursement) | 11,174,820 | 1,008,834 | 587,732 | 8,727,101 | |||||||||||||
| Recovery to (Reimbursement from) Adviser (Note 5) | — | (154,527) | (195,479) | 143,030 | |||||||||||||
| Net Expenses | 11,174,820 | 854,307 | 392,253 | 8,870,131 | |||||||||||||
| Net Investment Income (Loss) | (5,025,905) | (539,687) | 193,088 | (6,446,474) | |||||||||||||
| Realized and Unrealized Gain (Loss) on Investments, Securities Sold Short, Swap Contracts, Forward Currency Contracts, Futures Contracts and Foreign Currency Translation: | |||||||||||||||||
| Net realized gain (loss) on: | |||||||||||||||||
| Investments | (200,209) | (32,784) | (1,410,207) | (44,214) | |||||||||||||
| Capital gain distributions from regulated investment companies | — | — | 5,969 | — | |||||||||||||
| Swap contracts | 53,464,901 | 9,770,486 | (44,245) | — | |||||||||||||
| Forward currency contracts | — | — | — | 2,652,623 | |||||||||||||
| Futures contracts | — | — | — | (15,810,366) | |||||||||||||
| Foreign currency translation | — | — | (26) | (246,321) | |||||||||||||
| Net change in unrealized appreciation (depreciation) on: | |||||||||||||||||
| Investments | (2,726,658) | (107,068) | (1,768,963) | (2,308,809) | |||||||||||||
| Securities sold short | — | — | 9,349 | — | |||||||||||||
| Swap contracts | (29,782,805) | (1,153,882) | (195,200) | — | |||||||||||||
| Forward currency contracts | — | — | — | 13,812,767 | |||||||||||||
| Futures contracts | — | — | — | (10,008,814) | |||||||||||||
| Foreign currency translation | — | — | — | (331) | |||||||||||||
| Net realized and unrealized gain (loss) | 20,755,229 | 8,476,752 | (3,403,323) | (11,953,465) | |||||||||||||
| Net Increase (Decrease) in Net Assets From Operations | $ | 15,729,324 | $ | 7,937,065 | $ | (3,210,235) | $ | (18,399,939) | |||||||||
| (a) | Net of foreign tax withheld of $229, $143, $1,267 and $411, respectively. |
The accompanying notes are an integral part of these consolidated financial statements.
| 50 | | | LoCorr Long/Short Equity and LoCorr Spectrum Income Fund - Statements of Operations |
Statements of Operations
Year Ended December 31, 2015
LoCorr Long/Short Equity Fund | LoCorr Spectrum Income Fund | ||||||
| Investment Income | |||||||
Dividend and interest income (a) | $ | 235,634 | $ | 6,985,889 | |||
| Distributions received from master limited partnership (“MLP”) interests | 25,339 | 3,166,910 | |||||
| Less: return of capital on distributions from MLP interests (Note 2) | (25,339) | (3,166,910) | |||||
| Other income | 49 | — | |||||
| Total Investment Income | 235,683 | 6,985,889 | |||||
| Expenses | |||||||
| Management fees (Note 5) | 869,057 | 1,417,735 | |||||
| Fund administration fees | 45,762 | 63,445 | |||||
| Fund accounting fees | 44,903 | 63,821 | |||||
| Trustees’ fees | 4,401 | 9,421 | |||||
| Transfer agent fees and expenses | 88,487 | 202,899 | |||||
| Custodian fees | 13,995 | 7,526 | |||||
| Registration expenses | 47,528 | 49,629 | |||||
| Rule 12b-1 fees - Class A (Note 5) | 36,362 | 104,574 | |||||
| Rule 12b-1 fees - Class C (Note 5) | 97,048 | 312,361 | |||||
| Legal and audit fees | 30,969 | 36,263 | |||||
| Printing and mailing expenses | 11,322 | 38,446 | |||||
| Other expenses | 4,295 | 6,833 | |||||
| Total expenses before dividend and interest expense | 1,294,129 | 2,312,953 | |||||
| Dividend and interest expense on securities sold short (See Note 2) | 67,413 | — | |||||
| Interest expense on credit line (Note 8) | 3,698 | 1,562 | |||||
| Total expenses before recovery (reimbursement) | 1,365,240 | 2,314,515 | |||||
| Recovery to (Reimbursement from) Adviser (Note 5) | (132,040) | 67,000 | |||||
| Net Expenses | 1,233,200 | 2,381,515 | |||||
| Net Investment Income (Loss) | (997,517) | 4,604,374 | |||||
| Realized and Unrealized Gain (Loss) on Investments, Securities Sold Short and Foreign Currency Translation: | |||||||
| Net realized gain (loss) on: | |||||||
| Investments | 1,816,701 | (16,854,353) | |||||
| Capital gain distributions from regulated investment companies | — | 26,934 | |||||
| Securities sold short | 147,130 | — | |||||
| Foreign currency translation | — | (780) | |||||
| Net change in unrealized appreciation (depreciation) on: | |||||||
| Investments | (1,528,958) | 2,371,967 | |||||
| Securities sold short | 222,417 | — | |||||
| Net realized and unrealized gain (loss) | 657,290 | (14,456,232) | |||||
| Net Decrease in Net Assets From Operations | $ | (340,227) | $ | (9,851,858) | |||
| (a) | Net of foreign tax credit of $347 and foreign tax withheld of $10,614, respectively. |
The accompanying notes are an integral part of these financial statements.
LoCorr Managed Futures Strategy Fund - Consolidated Statements of Changes in Net Assets | | | 51 |
LoCorr Managed Futures Strategy Fund
Consolidated Statements of Changes in Net Assets
| Year Ended | ||||||||||
| December 31, 2015 | December 31, 2014 | |||||||||
Operations | ||||||||||
| Net investment loss | $ | (5,025,905) | $ | (4,018,359) | ||||||
| Net realized gain on investments and swap contracts | 53,264,692 | 1,135,537 | ||||||||
| Net change in unrealized appreciation (depreciation) of investments and swap contracts | (32,509,463) | 57,786,972 | ||||||||
| Increase in Net Assets From Operations | 15,729,324 | 54,904,150 | ||||||||
| Distributions to Shareholders From | ||||||||||
| Net investment income: | ||||||||||
| Class A | (6,432,086) | (22,591,169) | ||||||||
| Class C | (2,193,991) | (9,858,197) | ||||||||
| Class I | (5,902,168) | (20,118,881) | ||||||||
| Net realized gain: | ||||||||||
| Class A | — | (177,091) | ||||||||
| Class C | — | (81,762) | ||||||||
| Class I | — | (154,423) | ||||||||
| Total Distributions to Shareholders | (14,528,245) | (52,981,523) | ||||||||
| Capital Transactions (Note 6) | ||||||||||
| Proceeds from shares sold | 188,314,941 | 246,619,230 | ||||||||
| Reinvestment of distributions | 12,372,395 | 45,334,085 | ||||||||
| Cost of shares redeemed | (172,340,625) | (174,009,967) | ||||||||
| Redemption fees | 10,605 | 24,729 | ||||||||
| Increase in Net Assets From Capital Transactions | 28,357,316 | 117,968,077 | ||||||||
| Total Increase in Net Assets | 29,558,395 | 119,890,704 | ||||||||
| Net Assets | ||||||||||
| Beginning of year | 490,906,516 | 371,015,812 | ||||||||
| End of year (including accumulated net investment income of $23,817 and $0, respectively) | $ | 520,464,911 | $ | 490,906,516 | ||||||
The accompanying notes are an integral part of these consolidated financial statements.
| 52 | | | LoCorr Long/Short Commodities Strategy Fund - Consolidated Statements of Changes in Net Assets |
LoCorr Long/Short Commodities Strategy Fund
Consolidated Statements of Changes in Net Assets
| Year Ended | ||||||||||
| December 31, 2015 | December 31, 2014 | |||||||||
Operations | ||||||||||
| Net investment loss | $ | (539,687) | $ | (434,332) | ||||||
| Net realized gain on investments and swap contracts | 9,737,702 | 5,475,762 | ||||||||
| Net change in unrealized depreciation of investments and swap contracts | (1,260,950) | (1,097,072) | ||||||||
| Increase in Net Assets From Operations | 7,937,065 | 3,944,358 | ||||||||
| Distributions to Shareholders From | ||||||||||
| Net investment income: | ||||||||||
| Class A | (1,496,185) | (4,370,892) | ||||||||
| Class C | (252,385) | (198,919) | ||||||||
| Class I | (1,602,503) | (986,117) | ||||||||
| Total Distributions to Shareholders | (3,351,073) | (5,555,928) | ||||||||
| Capital Transactions (Note 6) | ||||||||||
| Proceeds from shares sold | 44,224,957 | 61,824,488 | ||||||||
| Reinvestment of distributions | 2,944,665 | 5,432,471 | ||||||||
| Cost of shares redeemed | (50,989,816) | (17,301,505) | ||||||||
| Redemption fees | 1,609 | 1,528 | ||||||||
| Increase (Decrease) in Net Assets From Capital Transactions | (3,818,585) | 49,956,982 | ||||||||
| Total Increase in Net Assets | 767,407 | 48,345,412 | ||||||||
| Net Assets | ||||||||||
| Beginning of year | 59,153,401 | 10,807,989 | ||||||||
| End of year (including accumulated net investment income of $0 and $47,467, respectively) | $ | 59,920,808 | $ | 59,153,401 | ||||||
The accompanying notes are an integral part of these consolidated financial statements.
LoCorr Multi-Strategy Fund - Consolidated Statement of Changes in Net Assets | | | 53 |
LoCorr Multi-Strategy Fund
Consolidated Statement of Changes in Net Assets
| Period from April 6, 2015 (commencement of operations) through December 31, 2015 | ||||||
| Operations | ||||||
| Net investment income | $ | 193,088 | ||||
| Net realized loss on investments, swap contracts and foreign currency translation | (1,448,509) | |||||
| Net change in unrealized depreciation of investments, securities sold short and swap contracts | (1,954,814) | |||||
| Decrease in Net Assets From Operations | (3,210,235) | |||||
| Distributions to Shareholders From | ||||||
| Net investment income: | ||||||
| Class A | (57,171) | |||||
| Class C | (37,332) | |||||
| Class I | (172,857) | |||||
| Return of capital: | ||||||
| Class A | (59,982) | |||||
| Class C | (39,167) | |||||
| Class I | (181,352) | |||||
| Total Distributions to Shareholders | (547,861) | |||||
| Capital Transactions (Note 6) | ||||||
| Proceeds from shares sold | 40,943,678 | |||||
| Reinvestment of distributions | 397,009 | |||||
| Cost of shares redeemed | (3,428,828) | |||||
| Redemption fees | 467 | |||||
| Increase in Net Assets From Capital Transactions | 37,912,326 | |||||
| Total Increase in Net Assets | 34,154,230 | |||||
| Net Assets | ||||||
| Beginning of period | — | |||||
| End of period (including accumulated net investment loss of $9,659) | $ | 34,154,230 | ||||
The accompanying notes are an integral part of these consolidated financial statements.
| 54 | | | LoCorr Market Trend Fund - Consolidated Statements of Changes in Net Assets |
LoCorr Market Trend Fund
Consolidated Statements of Changes in Net Assets
| Year Ended December 31, 2015 | Period from July 1, 2014 (commencement of operations) through December 31, 2014 | |||||||||
| Operations | ||||||||||
| Net investment loss | $ | (6,446,474) | $ | (192,710) | ||||||
| Net realized gain (loss) on investments, forward currency contracts, futures contracts and foreign currency translation | (13,448,278) | 3,306,313 | ||||||||
| Net change in unrealized appreciation of investments, forward currency contracts, futures contracts and foreign currency translation | 1,494,813 | 1,841,012 | ||||||||
| Increase (Decrease) in Net Assets From Operations | (18,399,939) | 4,954,615 | ||||||||
| Distributions to Shareholders From | ||||||||||
| Net investment income: | ||||||||||
| Class A | (555,579) | (281,419) | ||||||||
| Class C | (187,583) | (134,709) | ||||||||
| Class I | (4,581,749) | (860,029) | ||||||||
| Net realized gain: | ||||||||||
| Class A | (199,576) | (203,792) | ||||||||
| Class C | (175,420) | (103,703) | ||||||||
| Class I | (1,224,826) | (613,333) | ||||||||
| Total Distributions to Shareholders | (6,924,733) | (2,196,985) | ||||||||
| Capital Transactions (Note 6) | ||||||||||
| Proceeds from shares sold | 1,017,177,800 | 56,201,611 | ||||||||
| Reinvestment of distributions | 6,556,398 | 1,998,424 | ||||||||
| Cost of shares redeemed | (157,925,020) | (481,368) | ||||||||
| Redemption fees | 55,555 | 1,408 | ||||||||
| Increase in Net Assets From Capital Transactions | 865,864,733 | 57,720,075 | ||||||||
| Total Increase in Net Assets | 840,540,061 | 60,477,705 | ||||||||
| Net Assets | ||||||||||
| Beginning of period | 60,477,705 | — | ||||||||
| End of period (including accumulated net investment income of $5,933,169 and $164,827, respectively) | $ | 901,017,766 | $ | 60,477,705 | ||||||
The accompanying notes are an integral part of these consolidated financial statements.
LoCorr Long/Short Equity Fund - Statements of Changes in Net Assets | | | 55 |
LoCorr Long/Short Equity Fund
Statements of Changes in Net Assets
| Year Ended | ||||||||
| December 31, 2015 | December 31, 2014 | |||||||
| Operations | ||||||||
| Net investment loss | $ | (997,517) | $ | (1,131,444) | ||||
| Net realized gain (loss) on investments and securities sold short | 1,963,831 | (5,380,860) | ||||||
| Net change in unrealized depreciation of investments and securities sold short | (1,306,541) | (1,145,545) | ||||||
| Decrease in Net Assets From Operations | (340,227) | (7,657,849) | ||||||
| Distributions to Shareholders From | ||||||||
| Net realized gain: | ||||||||
| Class A | — | (70,089) | ||||||
| Class C | — | (49,882) | ||||||
| Class I | — | (49,706) | ||||||
| Total Distributions to Shareholders | — | (169,677) | ||||||
| Capital Transactions (Note 6) | ||||||||
| Proceeds from shares sold | 11,326,336 | 41,083,555 | ||||||
| Reinvestment of distributions | — | 151,442 | ||||||
| Cost of shares redeemed | (22,349,664) | (33,834,867) | ||||||
| Redemption fees | 279 | 3,575 | ||||||
| Increase (Decrease) in Net Assets From Capital Transactions | (11,023,049) | 7,403,705 | ||||||
| Total Decrease in Net Assets | (11,363,276) | (423,821) | ||||||
| Net Assets | ||||||||
| Beginning of year | 41,636,471 | 42,060,292 | ||||||
| End of year (including accumulated net investment income of $0 and $0, respectively) | $ | 30,273,195 | $ | 41,636,471 | ||||
The accompanying notes are an integral part of these financial statements.
| 56 | | | LoCorr Spectrum Income Fund - Statements of Changes in Net Assets |
LoCorr Spectrum Income Fund
Statements of Changes in Net Assets
| Year Ended | ||||||||
| December 31, 2015 | December 31, 2014 | |||||||
| Operations | ||||||||
| Net investment income | $ | 4,604,374 | $ | 2,361,119 | ||||
| Net realized loss on investments and foreign currency translation | (16,828,199) | (2,730,887) | ||||||
| Net change in unrealized appreciation (depreciation) of investments | 2,371,967 | (9,463,570) | ||||||
| Decrease in Net Assets From Operations | (9,851,858) | (9,833,338) | ||||||
| Distributions to Shareholders From | ||||||||
| Net investment income: | ||||||||
| Class A | (1,853,135) | (963,509) | ||||||
| Class C | (1,211,916) | (507,139) | ||||||
| Class I | (1,650,068) | (912,226) | ||||||
| Return of capital: | ||||||||
| Class A | (883,774) | (443,908) | ||||||
| Class C | (577,971) | (233,650) | ||||||
| Class I | (786,930) | (420,282) | ||||||
| Total Distributions to Shareholders | (6,963,794) | (3,480,714) | ||||||
| Capital Transactions (Note 6) | ||||||||
| Proceeds from shares sold | 58,801,112 | 124,120,006 | ||||||
| Reinvestment of distributions | 5,179,324 | 2,216,013 | ||||||
| Cost of shares redeemed | (48,180,021) | (18,977,948) | ||||||
| Redemption fees | 17,905 | 18,914 | ||||||
| Increase in Net Assets From Capital Transactions | 15,818,320 | 107,376,985 | ||||||
| Total Increase (Decrease) in Net Assets | (997,332) | 94,062,933 | ||||||
| Net Assets | ||||||||
| Beginning of year | 94,062,933 | — | ||||||
| End of year (including accumulated net investment income (loss) of $(559,687) and $60,996, respectively) | $ | 93,065,601 | $ | 94,062,933 | ||||
The accompanying notes are an integral part of these financial statements.
LoCorr Spectrum Income Fund - Statement of Cash Flows | | | 57 |
LoCorr Spectrum Income Fund
Statement of Cash Flows
Year Ended December 31, 2015 | ||||
| Cash Flows from Operating Activities | ||||
| Decrease in net assets from operations | $ | (9,851,858) | ||
| Adjustments to reconcile net decrease in net assets resulting from operations to net cash used in operating activities: | ||||
| Purchases of investments | (69,120,485) | |||
| Sales of investments | 55,298,229 | |||
| Purchases of short term investments, net | (2,324,086) | |||
| Net realized loss on investments | 16,854,353 | |||
| Return of capital on distributions from investments | 3,166,910 | |||
| Real estate investment trust adjustment | 986,822 | |||
| Net change in unrealized appreciation on investments | (2,371,967) | |||
| Receivable for securities sold | (1,482,968) | |||
| Dividends, interest and other receivables | 174,106 | |||
| Prepaid expenses and other assets | (4,372) | |||
| Payable for securities purchased | 1,606,068 | |||
| Payable to custodian | (87,409) | |||
| Accrued management fees | 11,566 | |||
| Accrued Trustees’ fees | (293) | |||
| Accrued Rule 12b-1 fees | 1,986 | |||
| Accrued interest on line of credit (Note 8) | 370 | |||
| Accrued expenses and other liabilities | 17,427 | |||
| Net cash used in operating activities | (7,125,601) | |||
| Cash Flows from Financing Activities | ||||
| Proceeds from shares sold, net of receivable for Fund shares sold | 59,287,202 | |||
| Distributions paid in cash | (1,847,894) | |||
| Cost of shares redeemed, net of payable for Fund shares redeemed | (50,244,203) | |||
| Redemption fees | 17,905 | |||
| Net cash from financing activities | 7,213,010 | |||
| Net change in cash | 87,409 | |||
| Cash at beginning of year | — | |||
| Cash at end of year | $ | 87,409 | ||
Supplemental disclosure of cash flow information:
Non-cash financing activities not included herein consist of reinvestment of dividends of $5,179,324.
Cash paid during the period for interest of $1,192.
The accompanying notes are an integral part of these financial statements.
| 58 | | | LoCorr Managed Futures Strategy Fund - Consolidated Financial Highlights - Class A |
LoCorr Managed Futures Strategy Fund - Class A
Consolidated Financial Highlights
Selected Data and Ratios (for a share outstanding throughout the period)
Period from March 22, 2011 (commencement of operations) through December 31, 2011(a), (b) | ||||||||||||||||
| Year Ended | ||||||||||||||||
| December 31, 2015 | December 31, 2014 | December 31, 2013 | December 31, 2012(a) | |||||||||||||
| Per Share | ||||||||||||||||
| Net asset value, beginning of period | $ | 8.51 | $ | 8.28 | $ | 8.77 | $ | 9.33 | $ | 10.00 | ||||||
| Income (loss) from investment operations: | ||||||||||||||||
Net investment income (loss)(c) | (0.08) | (0.08) | (0.07) | (0.24) | (0.22) | |||||||||||
| Net realized and unrealized gain (loss) | 0.36 | 1.36 | (0.41) | (0.32) | (0.45) | |||||||||||
| Total from Investment Operations | 0.28 | 1.28 | (0.48) | (0.56) | (0.67) | |||||||||||
| Distributions to shareholders from: | ||||||||||||||||
| Net investment income | (0.25) | (1.04) | — | — | — | |||||||||||
| Net realized gains on investments and swap contracts | — | (0.01) | (0.01) | (0.00) | (d) | — | ||||||||||
| Total Distributions | (0.25) | (1.05) | (0.01) | (0.00) | — | |||||||||||
Redemption Fees(d) | 0.00 | 0.00 | 0.00 | 0.00 | 0.00 | |||||||||||
| Net Asset Value, End of Period | $ | 8.54 | $ | 8.51 | $ | 8.28 | $ | 8.77 | $ | 9.33 | ||||||
Total Investment Return(e) | 3.27 | % | 15.42 | % | (5.53) | % | (5.98) | % | (6.70) | % | ||||||
| Net Assets, End of Period, in Thousands | $ | 229,427 | $ | 206,931 | $ | 195,046 | $ | 182,457 | $ | 71,532 | ||||||
| Ratios/Supplemental Data: | ||||||||||||||||
| Ratio of expenses to average net assets: | ||||||||||||||||
| Before expense reimbursement or recovery | 2.06 | %(f),(g) | 2.11 | %(f) | 2.08 | %(f) | 3.95 | %(f),(h) | 4.15 | %(h) | ||||||
| After expense reimbursement or recovery | 2.06 | %(f),(g) | 2.11 | %(f) | 2.08 | %(f) | 4.00 | %(f),(h) | 3.93 | %(h) | ||||||
| Ratio of net investment income (loss) to average net assets: | ||||||||||||||||
| Before expense reimbursement or recovery | (0.90) | %(f) | (0.94) | %(f) | (0.87) | %(f) | (2.60) | %(f),(i) | (3.18) | %(i) | ||||||
| After expense reimbursement or recovery | (0.90) | %(f) | (0.94) | %(f) | (0.87) | %(f) | (2.65) | %(f),(i) | (2.96) | %(i) | ||||||
Portfolio turnover rate(j) | 53 | % | 57 | % | 46 | % | 46 | % | 18 | % | ||||||
| (a) | Selected data and ratios (for a share outstanding throughout the period) do not include non-controlling interest. |
| (b) | All ratios have been annualized except total investment return and portfolio turnover. |
| (c) | Net investment income (loss) per share is based on average shares outstanding. |
| (d) | Amount represents less than $0.005 per share. |
| (e) | Total investment return excludes the effect of applicable sales charges. |
| (f) | Ratios do not include the income and expenses of the CTAs included in the swap. |
| (g) | Includes interest expense on line of credit of 0.00% for the year ended December 31, 2015. |
| (h) | For the year ended December 31, 2012 and period from March 22, 2011 through December 31, 2011, the ratios include 1.88% and 1.73%, respectively, of expenses attributable to the Partnership. See Note 1. |
| (i) | For the year ended December 31, 2012 and period from March 22, 2011 through December 31, 2011, the ratios include (1.63)% and (1.71)%, respectively, of net investment losses attributable to the Partnership. See Note 1. |
| (j) | Portfolio turnover rate is calculated on the basis of the Fund as a whole without distinguishing between classes of shares issued. Consists of long-term investments only; excludes derivative instruments. |
The accompanying notes are an integral part of these consolidated financial statements.
LoCorr Managed Futures Strategy Fund - Consolidated Financial Highlights - Class C | | | 59 |
LoCorr Managed Futures Strategy Fund - Class C
Consolidated Financial Highlights
Selected Data and Ratios (for a share outstanding throughout the period)
Period from March 24, 2011 (commencement of operations) through December 31, 2011(a), (b) | ||||||||||||||||
| Year Ended | ||||||||||||||||
| December 31, 2015 | December 31, 2014 | December 31, 2013 | December 31, 2012(a) | |||||||||||||
| Per Share | ||||||||||||||||
| Net asset value, beginning of period | $ | 8.30 | $ | 8.12 | $ | 8.65 | $ | 9.28 | $ | 10.00 | ||||||
| Income (loss) from investment operations: | ||||||||||||||||
Net investment income (loss)(c) | (0.14) | (0.15) | (0.14) | (0.30) | (0.27) | |||||||||||
| Net realized and unrealized gain (loss) | 0.35 | 1.33 | (0.38) | (0.33) | (0.45) | |||||||||||
| Total from Investment Operations | 0.21 | 1.18 | (0.52) | (0.63) | (0.72) | |||||||||||
| Distributions to shareholders from: | ||||||||||||||||
| Net investment income | (0.19) | (0.99) | — | — | — | |||||||||||
| Net realized gains on investments and swap contracts | — | (0.01) | (0.01) | (0.00) | (d) | — | ||||||||||
| Total Distributions | (0.19) | (1.00) | (0.01) | (0.00) | — | |||||||||||
Redemption Fees(d) | 0.00 | 0.00 | 0.00 | 0.00 | 0.00 | |||||||||||
| Net Asset Value, End of Period | $ | 8.32 | $ | 8.30 | $ | 8.12 | $ | 8.65 | $ | 9.28 | ||||||
Total Investment Return(e) | 2.51 | % | 14.39 | % | (6.07) | % | (6.77) | % | (7.20) | % | ||||||
| Net Assets, End of Period, in Thousands | $ | 98,729 | $ | 93,924 | $ | 73,691 | $ | 76,979 | $ | 38,055 | ||||||
| Ratios/Supplemental Data: | ||||||||||||||||
| Ratio of expenses to average net assets: | ||||||||||||||||
| Before expense reimbursement or recovery | 2.81 | %(f),(g) | 2.86 | %(f) | 2.83 | %(f) | 4.70 | %(f),(h) | 4.89 | %(h) | ||||||
| After expense reimbursement or recovery | 2.81 | %(f),(g) | 2.86 | %(f) | 2.83 | %(f) | 4.75 | %(f),(h) | 4.68 | %(h) | ||||||
| Ratio of net investment income (loss) to average net assets: | ||||||||||||||||
| Before expense reimbursement or recovery | (1.65) | %(f) | (1.69) | %(f) | (1.62) | %(f) | (3.35) | %(f),(i) | (3.92) | %(i) | ||||||
| After expense reimbursement or recovery | (1.65) | %(f) | (1.69) | %(f) | (1.62) | %(f) | (3.40) | %(f),(i) | (3.71) | %(i) | ||||||
Portfolio turnover rate(j) | 53 | % | 57 | % | 46 | % | 46 | % | 18 | % | ||||||
| (a) | Selected data and ratios (for a share outstanding throughout the period) do not include non-controlling interest. |
| (b) | All ratios have been annualized except total investment return and portfolio turnover. |
| (c) | Net investment income (loss) per share is based on average shares outstanding. |
| (d) | Amount represents less than $0.005 per share. |
| (e) | Total investment return excludes the effect of applicable sales charges. |
| (f) | Ratios do not include the income and expenses of the CTAs included in the swap. |
| (g) | Includes interest expense on line of credit of 0.00% for the year ended December 31, 2015. |
| (h) | For the year ended December 31, 2012 and period from March 24, 2011 through December 31, 2011, the ratios include 1.88% and 1.73%, respectively, of expenses attributable to the Partnership. See Note 1. |
| (i) | For the year ended December 31, 2012 and period from March 24, 2011 through December 31, 2011, the ratios include (1.63)% and (1.71)%, respectively, of net investment losses attributable to the Partnership. See Note 1. |
| (j) | Portfolio turnover rate is calculated on the basis of the Fund as a whole without distinguishing between classes of shares issued. Consists of long-term investments only; excludes derivative instruments. |
The accompanying notes are an integral part of these consolidated financial statements.
| 60 | | | LoCorr Managed Futures Strategy Fund - Consolidated Financial Highlights - Class I |
LoCorr Managed Futures Strategy Fund - Class I
Consolidated Financial Highlights
Selected Data and Ratios (for a share outstanding throughout the period)
Period from March 24, 2011 (commencement of operations) through December 31, 2011(a), (b) | ||||||||||||||||
| Year Ended | ||||||||||||||||
| December 31, 2015 | December 31, 2014 | December 31, 2013 | December 31, 2012(a) | |||||||||||||
| Per Share | ||||||||||||||||
| Net asset value, beginning of period | $ | 8.57 | $ | 8.34 | $ | 8.81 | $ | 9.35 | $ | 10.00 | ||||||
| Income (loss) from investment operations: | ||||||||||||||||
Net investment income (loss)(c) | (0.06) | (0.06) | (0.05) | (0.22) | (0.20) | |||||||||||
| Net realized and unrealized gain (loss) | 0.38 | 1.36 | (0.41) | (0.32) | (0.45) | |||||||||||
| Total from Investment Operations | 0.32 | 1.30 | (0.46) | (0.54) | (0.65) | |||||||||||
| Distributions to shareholders from: | ||||||||||||||||
| Net investment income | (0.27) | (1.06) | — | — | — | |||||||||||
| Net realized gains on investments and swap contracts | — | (0.01) | (0.01) | (0.00) | (d) | — | ||||||||||
| Total Distributions | (0.27) | (1.07) | (0.01) | (0.00) | — | |||||||||||
Redemption Fees(d) | 0.00 | 0.00 | 0.00 | 0.00 | 0.00 | |||||||||||
| Net Asset Value, End of Period | $ | 8.62 | $ | 8.57 | $ | 8.34 | $ | 8.81 | $ | 9.35 | ||||||
| Total Investment Return | 3.72 | % | 15.56 | % | (5.28) | % | (5.75) | % | (6.50) | % | ||||||
| Net Assets, End of Period, in Thousands | $ | 192,309 | $ | 190,052 | $ | 102,279 | $ | 138,096 | $ | 91,161 | ||||||
| Ratios/Supplemental Data: | ||||||||||||||||
| Ratio of expenses to average net assets: | ||||||||||||||||
| Before expense reimbursement or recovery | 1.81 | %(e),(f) | 1.86 | %(e) | 1.83 | %(e) | 3.70 | %(e),(g) | 3.89 | %(g) | ||||||
| After expense reimbursement or recovery | 1.81 | %(e),(f) | 1.86 | %(e) | 1.83 | %(e) | 3.75 | %(e),(g) | 3.68 | %(g) | ||||||
| Ratio of net investment income (loss) to average net assets: | ||||||||||||||||
| Before expense reimbursement or recovery | (0.65) | %(e) | (0.69) | %(e) | (0.62) | %(e) | (2.35) | %(e),(h) | (2.92) | %(h) | ||||||
| After expense reimbursement or recovery | (0.65) | %(e) | (0.69) | %(e) | (0.62) | %(e) | (2.40) | %(e),(h) | (2.71) | %(h) | ||||||
Portfolio turnover rate(i) | 53 | % | 57 | % | 46 | % | 46 | % | 18 | % | ||||||
| (a) | Selected data and ratios (for a share outstanding throughout the period) do not include non-controlling interest. |
| (b) | All ratios have been annualized except total investment return and portfolio turnover. |
| (c) | Net investment income (loss) per share is based on average shares outstanding. |
| (d) | Amount represents less than $0.005 per share. |
| (e) | Ratios do not include the income and expenses of the CTAs included in the swap. |
| (f) | Includes interest expense on line of credit of 0.00% for the year ended December 31, 2015. |
| (g) | For the year ended December 31, 2012 and period from March 24, 2011 through December 31, 2011, the ratios include 1.88% and 1.73%, respectively, of expenses attributable to the Partnership. See Note 1. |
| (h) | For the year ended December 31, 2012 and period from March 24, 2011 through December 31, 2011, the ratios include (1.63)% and (1.71)%, respectively, of net investment losses attributable to the Partnership. See Note 1. |
| (i) | Portfolio turnover rate is calculated on the basis of the Fund as a whole without distinguishing between classes of shares issued. Consists of long-term investments only; excludes derivative instruments. |
The accompanying notes are an integral part of these consolidated financial statements.
LoCorr Long/Short Commodities Strategy Fund - Consolidated Financial Highlights - Class A | | | 61 |
LoCorr Long/Short Commodities Strategy Fund - Class A
Consolidated Financial Highlights
Selected Data and Ratios (for a share outstanding throughout the period)
Year Ended | ||||||||||||||||
| December 31, 2015 | December 31, 2014 | December 31, 2013 | December 31, 2012 | |||||||||||||
| Per Share | ||||||||||||||||
| Net asset value, beginning of period | $ | 8.54 | $ | 7.67 | $ | 8.37 | $ | 10.00 | ||||||||
| Income (loss) from investment operations: | ||||||||||||||||
Net investment income (loss)(a) | (0.13) | (0.14) | (0.12) | (0.17) | ||||||||||||
| Net realized and unrealized gain (loss) | 2.02 | 1.85 | (0.58) | (1.46) | ||||||||||||
| Total from Investment Operations | 1.89 | 1.71 | (0.70) | (1.63) | ||||||||||||
| Distributions to shareholders from: | ||||||||||||||||
| Net investment income | (0.71) | (0.84) | — | — | ||||||||||||
| Total Distributions | (0.71) | (0.84) | — | — | ||||||||||||
Redemption Fees(b) | 0.00 | 0.00 | 0.00 | 0.00 | ||||||||||||
| Net Asset Value, End of Period | $ | 9.72 | $ | 8.54 | $ | 7.67 | $ | 8.37 | ||||||||
Total Investment Return(c) | 22.34 | % | 22.07 | % | (8.36) | % | (16.30) | % | ||||||||
| Net Assets, End of Period, in Thousands | $ | 24,425 | $ | 43,345 | $ | 3,653 | $ | 3,213 | ||||||||
Ratios/Supplemental Data:(d) | ||||||||||||||||
| Ratio of expenses to average net assets: | ||||||||||||||||
| Before expense reimbursement or recovery | 2.59 | %(e) | 3.01 | %(e) | 4.18 | % | 6.12 | % | ||||||||
| After expense reimbursement or recovery | 2.20 | %(e) | 2.20 | %(e) | 2.20 | % | 2.20 | % | ||||||||
| Ratio of net investment income (loss) to average net assets: | ||||||||||||||||
| Before expense reimbursement or recovery | (1.79) | % | (2.39) | % | (3.46) | % | (5.82) | % | ||||||||
| After expense reimbursement or recovery | (1.40) | % | (1.58) | % | (1.48) | % | (1.90) | % | ||||||||
Portfolio turnover rate(f) | 164 | % | 55 | % | 59 | % | 60 | % | ||||||||
| (a) | Net investment income (loss) per share is based on average shares outstanding. |
| (b) | Amount represents less than $0.005 per share. |
| (c) | Total return excludes the effect of applicable sales charges. |
| (d) | Ratios do not include the income and expenses of the CTAs included in the swap. |
| (e) | Includes interest expense on line of credit of 0.00% and 0.00% for the years ended December 31, 2015 and December 31, 2014, respectively. |
| (f) | Portfolio turnover rate is calculated on the basis of the Fund as a whole without distinguishing between classes of shares issued. Consists of long-term investments only; excludes derivative instruments. |
The accompanying notes are an integral part of these consolidated financial statements.
| 62 | | | LoCorr Long/Short Commodities Strategy Fund - Consolidated Financial Highlights - Class C |
LoCorr Long/Short Commodities Strategy Fund - Class C
Consolidated Financial Highlights
Selected Data and Ratios (for a share outstanding throughout the period)
| Year Ended | ||||||||||||||||
| December 31, 2015 | December 31, 2014 | December 31, 2013 | December 31, 2012 | |||||||||||||
| Per Share | ||||||||||||||||
| Net asset value, beginning of period | $ | 8.36 | $ | 7.54 | $ | 8.29 | $ | 10.00 | ||||||||
| Income (loss) from investment operations: | ||||||||||||||||
Net investment income (loss)(a) | (0.19) | (0.20) | (0.17) | (0.24) | ||||||||||||
| Net realized and unrealized gain (loss) | 1.96 | 1.80 | (0.58) | (1.47) | ||||||||||||
| Total from Investment Operations | 1.77 | 1.60 | (0.75) | (1.71) | ||||||||||||
| Distributions to shareholders from: | ||||||||||||||||
| Net investment income | (0.62) | (0.78) | — | — | ||||||||||||
| Total Distributions | (0.62) | (0.78) | — | — | ||||||||||||
| Redemption Fees | — | — | — | 0.00 | (b) | |||||||||||
| Net Asset Value, End of Period | $ | 9.51 | $ | 8.36 | $ | 7.54 | $ | 8.29 | ||||||||
Total Investment Return(c) | 21.39 | % | 21.01 | % | (9.05) | % | (17.10) | % | ||||||||
| Net Assets, End of Period, in Thousands | $ | 4,330 | $ | 2,983 | $ | 1,653 | $ | 1,605 | ||||||||
Ratios/Supplemental Data:(d) | ||||||||||||||||
| Ratio of expenses to average net assets: | ||||||||||||||||
| Before expense reimbursement or recovery | 3.34 | %(e) | 3.76 | %(e) | 4.93 | % | 6.87 | % | ||||||||
| After expense reimbursement or recovery | 2.95 | %(e) | 2.95 | %(e) | 2.95 | % | 2.95 | % | ||||||||
| Ratio of net investment income (loss) to average net assets: | ||||||||||||||||
| Before expense reimbursement or recovery | (2.54) | % | (3.14) | % | (4.21) | % | (6.57) | % | ||||||||
| After expense reimbursement or recovery | (2.15) | % | (2.33) | % | (2.23) | % | (2.65) | % | ||||||||
Portfolio turnover rate(f) | 164 | % | 55 | % | 59 | % | 60 | % | ||||||||
| (a) | Net investment income (loss) per share is based on average shares outstanding. |
| (b) | Amount represents less than $0.005 per share. |
| (c) | Total return excludes the effect of applicable sales charges. |
| (d) | Ratios do not include the income and expenses of the CTAs included in the swap. |
| (e) | Includes interest expense on line of credit of 0.00% and 0.00% for the years ended December 31, 2015 and December 31, 2014, respectively. |
| (f) | Portfolio turnover rate is calculated on the basis of the Fund as a whole without distinguishing between classes of shares issued. Consists of long-term investments only; excludes derivative instruments. |
The accompanying notes are an integral part of these consolidated financial statements.
LoCorr Long/Short Commodities Strategy Fund - Consolidated Financial Highlights - Class I | | | 63 |
LoCorr Long/Short Commodities Strategy Fund - Class I
Consolidated Financial Highlights
Selected Data and Ratios (for a share outstanding throughout the period)
| Year Ended | ||||||||||||||||
| December 31, 2015 | December 31, 2014 | December 31, 2013 | December 31, 2012 | |||||||||||||
| Per Share | ||||||||||||||||
| Net asset value, beginning of period | $ | 8.59 | $ | 7.70 | $ | 8.38 | $ | 10.00 | ||||||||
| Income (loss) from investment operations: | ||||||||||||||||
Net investment income (loss)(a) | (0.11) | (0.12) | (0.10) | (0.15) | ||||||||||||
| Net realized and unrealized gain (loss) | 2.03 | 1.86 | (0.58) | (1.47) | ||||||||||||
| Total from Investment Operations | 1.92 | 1.74 | (0.68) | (1.62) | ||||||||||||
| Distributions to shareholders from: | ||||||||||||||||
| Net investment income | (0.72) | (0.85) | — | — | ||||||||||||
| Total Distributions | (0.72) | (0.85) | — | — | ||||||||||||
Redemption Fees(b) | 0.00 | 0.00 | 0.00 | 0.00 | ||||||||||||
| Net Asset Value, End of Period | $ | 9.79 | $ | 8.59 | $ | 7.70 | $ | 8.38 | ||||||||
| Total Investment Return | 22.61 | % | 22.36 | % | (8.11) | % | (16.20) | % | ||||||||
| Net Assets, End of Period, in Thousands | $ | 31,166 | $ | 12,825 | $ | 5,502 | $ | 6,373 | ||||||||
Ratios/Supplemental Data:(c) | ||||||||||||||||
| Ratio of expenses to average net assets: | ||||||||||||||||
| Before expense reimbursement or recovery | 2.34 | %(d) | 2.76 | %(d) | 3.93 | % | 5.87 | % | ||||||||
| After expense reimbursement or recovery | 1.95 | %(d) | 1.95 | %(d) | 1.95 | % | 1.95 | % | ||||||||
| Ratio of net investment income (loss) to average net assets: | ||||||||||||||||
| Before expense reimbursement or recovery | (1.54) | % | (2.14) | % | (3.21) | % | (5.57) | % | ||||||||
| After expense reimbursement or recovery | (1.15) | % | (1.33) | % | (1.23) | % | (1.65) | % | ||||||||
Portfolio turnover rate(e) | 164 | % | 55 | % | 59 | % | 60 | % | ||||||||
| (a) | Net investment income (loss) per share is based on average shares outstanding. |
| (b) | Amount represents less than $0.005 per share. |
| (c) | Ratios do not include the income and expenses of the CTAs included in the swap. |
| (d) | Includes interest expense on line of credit of 0.00% and 0.00% for the years ended December 31, 2015 and December 31, 2014, respectively. |
| (e) | Portfolio turnover rate is calculated on the basis of the Fund as a whole without distinguishing between classes of shares issued. Consists of long-term investments only; excludes derivative instruments. |
The accompanying notes are an integral part of these consolidated financial statements.
| 64 | | | LoCorr Multi-Strategy Fund - Consolidated Financial Highlights - Class A |
LoCorr Multi-Strategy Fund - Class A
Consolidated Financial Highlights
Selected Data and Ratios (for a share outstanding throughout the period)
| Period from April 6, 2015 | |||||
| (commencement of operations) | |||||
| through | |||||
| December 31, 2015 (a) | |||||
| Per Share | |||||
| Net asset value, beginning of period | $ | 10.00 | |||
| Income (loss) from investment operations: | |||||
Net investment income (loss)(b) | 0.07 | ||||
| Net realized and unrealized gain (loss) | (1.58) | ||||
| Total from Investment Operations | (1.51) | ||||
| Distributions to shareholders from: | |||||
| Net investment income | (0.09) | ||||
| Return of capital | (0.09) | ||||
| Total Distributions | (0.18) | ||||
Redemption Fees(c) | 0.00 | ||||
| Net Asset Value, End of Period | $ | 8.31 | |||
Total Investment Return(d) | (15.14) | % | |||
| Net Assets, End of Period, in Thousands | $ | 12,102 | |||
Ratios/Supplemental Data:(e)(f) | |||||
| Ratio of expenses to average net assets: | |||||
| Before expense reimbursement or recovery | 3.44 | % | |||
| After expense reimbursement or recovery | 2.30 | % | |||
| Ratio of expenses to average net assets (excluding dividend and interest expense on securities sold short and interest expense on line of credit): | |||||
| Before expense reimbursement or recovery | 3.43 | % | |||
| After expense reimbursement or recovery | 2.29 | % | |||
| Ratio of net investment income (loss) to average net assets: | |||||
| Before expense reimbursement or recovery | (0.04) | % | |||
| After expense reimbursement or recovery | 1.10 | % | |||
Portfolio turnover rate(g) | 38 | % | |||
| (a) | All ratios have been annualized except total investment return and portfolio turnover. |
| (b) | Net investment income (loss) per share is based on average shares outstanding. |
| (c) | Amount represents less than $0.005 per share. |
| (d) | Total return excludes the effect of applicable sales charges. |
| (e) | Ratios do not include the income and expenses of the CTAs included in the swap. |
| (f) | Ratios do not include the expenses of the investment companies in which the Fund invests. |
| (g) | Portfolio turnover rate is calculated on the basis of the Fund as a whole without distinguishing between classes of shares issued. Consists of long-term investments only; excludes securities sold short and swap transactions. |
The accompanying notes are an integral part of these consolidated financial statements.
LoCorr Multi-Strategy Fund - Consolidated Financial Highlights - Class C | | | 65 |
LoCorr Multi-Strategy Fund - Class C
Consolidated Financial Highlights
Selected Data and Ratios (for a share outstanding throughout the period)
| Period from April 6, 2015 | |||||
| (commencement of operations) | |||||
| through | |||||
| December 31, 2015 (a) | |||||
| Per Share | |||||
| Net asset value, beginning of period | $ | 10.00 | |||
| Income (loss) from investment operations: | |||||
Net investment income (loss)(b) | 0.02 | ||||
| Net realized and unrealized gain (loss) | (1.58) | ||||
| Total from Investment Operations | (1.56) | ||||
| Distributions to shareholders from: | |||||
| Net investment income | (0.06) | ||||
| Return of capital | (0.07) | ||||
| Total Distributions | (0.13) | ||||
Redemption Fees(c) | 0.00 | ||||
| Net Asset Value, End of Period | $ | 8.31 | |||
Total Investment Return(d) | (15.62) | % | |||
| Net Assets, End of Period, in Thousands | $ | 5,490 | |||
Ratios/Supplemental Data:(e)(f) | |||||
| Ratio of expenses to average net assets: | |||||
| Before expense reimbursement or recovery | 4.19 | % | |||
| After expense reimbursement or recovery | 3.05 | % | |||
| Ratio of expenses to average net assets (excluding dividend and interest expense on securities sold short and interest expense on line of credit): | |||||
| Before expense reimbursement or recovery | 4.18 | % | |||
| After expense reimbursement or recovery | 3.04 | % | |||
| Ratio of net investment income (loss) to average net assets: | |||||
| Before expense reimbursement or recovery | (0.79) | % | |||
| After expense reimbursement or recovery | 0.35 | % | |||
Portfolio turnover rate(g) | 38 | % | |||
| (a) | All ratios have been annualized except total investment return and portfolio turnover. |
| (b) | Net investment income (loss) per share is based on average shares outstanding. |
| (c) | Amount represents less than $0.005 per share. |
| (d) | Total return excludes the effect of applicable sales charges. |
| (e) | Ratios do not include the income and expenses of the CTAs included in the swap. |
| (f) | Ratios do not include the expenses of the investment companies in which the Fund invests. |
| (g) | Portfolio turnover rate is calculated on the basis of the Fund as a whole without distinguishing between classes of shares issued. Consists of long-term investments only; excludes securities sold short and swap transactions. |
The accompanying notes are an integral part of these consolidated financial statements.
| 66 | | | LoCorr Multi-Strategy Fund - Consolidated Financial Highlights - Class I |
LoCorr Multi-Strategy Fund - Class I
Consolidated Financial Highlights
Selected Data and Ratios (for a share outstanding throughout the period)
| Period from April 6, 2015 | |||||
| (commencement of operations) | |||||
| through | |||||
| December 31, 2015 (a) | |||||
| Per Share | |||||
| Net asset value, beginning of period | $ | 10.00 | |||
| Income (loss) from investment operations: | |||||
Net investment income (loss)(b) | 0.09 | ||||
| Net realized and unrealized gain (loss) | (1.58) | ||||
| Total from Investment Operations | (1.49) | ||||
| Distributions to shareholders from: | |||||
| Net investment income | (0.10) | ||||
| Return of capital | (0.10) | ||||
| Total Distributions | (0.20) | ||||
Redemption Fees(c) | 0.00 | ||||
| Net Asset Value, End of Period | $ | 8.31 | |||
| Total Investment Return | (14.98) | % | |||
| Net Assets, End of Period, in Thousands | $ | 16,562 | |||
Ratios/Supplemental Data:(d)(e) | |||||
| Ratio of expenses to average net assets: | |||||
| Before expense reimbursement or recovery | 3.19 | % | |||
| After expense reimbursement or recovery | 2.05 | % | |||
| Ratio of expenses to average net assets (excluding dividend and interest expense on securities sold short and interest expense on line of credit): | |||||
| Before expense reimbursement or recovery | 3.18 | % | |||
| After expense reimbursement or recovery | 2.04 | % | |||
| Ratio of net investment income (loss) to average net assets: | |||||
| Before expense reimbursement or recovery | 0.21 | % | |||
| After expense reimbursement or recovery | 1.35 | % | |||
Portfolio turnover rate(f) | 38 | % | |||
| (a) | All ratios have been annualized except total investment return and portfolio turnover. |
| (b) | Net investment income (loss) per share is based on average shares outstanding. |
| (c) | Amount represents less than $0.005 per share. |
| (d) | Ratios do not include the income and expenses of the CTAs included in the swap. |
| (e) | Ratios do not include the expenses of the investment companies in which the Fund invests. |
| (f) | Portfolio turnover rate is calculated on the basis of the Fund as a whole without distinguishing between classes of shares issued. Consists of long-term investments only; excludes securities sold short and swap transactions. |
The accompanying notes are an integral part of these consolidated financial statements.
LoCorr Market Trend Fund - Consolidated Financial Highlights - Class A | | | 67 |
LoCorr Market Trend Fund - Class A
Consolidated Financial Highlights
Selected Data and Ratios (for a share outstanding throughout the period)
| Period from July 1, 2014 | |||||||||
| (commencement of operations) | |||||||||
| Year Ended | through | ||||||||
| December 31, 2015 | December 31, 2014(a) | ||||||||
| Per Share | |||||||||
| Net asset value, beginning of period | $ | 11.44 | $ | 10.00 | |||||
| Income (loss) from investment operations: | |||||||||
Net investment income (loss)(b) | (0.19) | (0.12) | |||||||
| Net realized and unrealized gain (loss) | 0.84 | (c) | 1.99 | ||||||
| Total from Investment Operations | 0.65 | 1.87 | |||||||
| Distributions to shareholders from: | |||||||||
| Net investment income | (0.07) | (0.25) | |||||||
| Net realized gains on investments, forward currency contracts, futures contracts and foreign currency translation | (0.02) | (0.18) | |||||||
| Total Distributions | (0.09) | (0.43) | |||||||
Redemption Fees(d) | 0.00 | 0.00 | |||||||
| Net Asset Value, End of Period | $ | 12.00 | $ | 11.44 | |||||
Total Investment Return(e) | 5.68 | % | 18.74 | % | |||||
| Net Assets, End of Period, in Thousands | $ | 110,324 | $ | 13,337 | |||||
| Ratios/Supplemental Data: | |||||||||
| Ratio of expenses to average net assets: | |||||||||
| Before expense reimbursement or recovery | 2.03 | % | 3.64 | % | |||||
| After expense reimbursement or recovery | 2.06 | % | 2.20 | % | |||||
| Ratio of net investment income (loss) to average net assets: | |||||||||
| Before expense reimbursement or recovery | (1.49) | % | (3.48) | % | |||||
| After expense reimbursement or recovery | (1.52) | % | (2.04) | % | |||||
Portfolio turnover rate(f) | 27 | % | 6 | % | |||||
| (a) | All ratios have been annualized except total investment return and portfolio turnover. |
| (b) | Net investment income (loss) per share is based on average shares outstanding. |
| (c) | Realized and unrealized gains and losses per share in this caption are balancing amounts necessary to reconcile the change in net asset value per share for the period, and may not reconcile with the aggregate losses in the Fund’s Consolidated Statement of Operations due to share transactions for the period. |
| (d) | Amount represents less than $0.005 per share. |
| (e) | Total return excludes the effect of applicable sales charges. |
| (f) | Portfolio turnover rate is calculated on the basis of the Fund as a whole without distinguishing between classes of shares issued. Consists of long-term investments only; excludes derivative instruments. |
The accompanying notes are an integral part of these consolidated financial statements.
| 68 | | | LoCorr Market Trend Fund - Consolidated Financial Highlights - Class C |
| LoCorr Market Trend Fund - Class C |
| Consolidated Financial Highlights |
| Selected Data and Ratios (for a share outstanding throughout the period) |
| Year Ended December 31, 2015 | Period from July 1, 2014 (commencement of operations) through December 31, 2014(a) | |||||||||
| Per Share | ||||||||||
| Net asset value, beginning of period | $ | 11.41 | $ | 10.00 | ||||||
| Income (loss) from investment operations: | ||||||||||
Net investment income (loss)(b) | (0.28) | (0.16) | ||||||||
| Net realized and unrealized gain (loss) | 0.84 | (c) | 1.99 | |||||||
| Total from Investment Operations | 0.56 | 1.83 | ||||||||
| Distributions to shareholders from: | ||||||||||
| Net investment income | (0.03) | (0.24) | ||||||||
| Net realized gains on investments, forward currency contracts, futures contracts and foreign currency translation | (0.02) | (0.18) | ||||||||
| Total Distributions | (0.05) | (0.42) | ||||||||
Redemption Fees(d) | 0.00 | 0.00 | ||||||||
| Net Asset Value, End of Period | $ | 11.92 | $ | 11.41 | ||||||
Total Investment Return(e) | 4.90 | % | 18.29 | % | ||||||
| Net Assets, End of Period, in Thousands | $ | 94,707 | $ | 6,949 | ||||||
| Ratios/Supplemental Data: | ||||||||||
| Ratio of expenses to average net assets: | ||||||||||
| Before expense reimbursement or recovery | 2.78 | % | 4.39 | % | ||||||
| After expense reimbursement or recovery | 2.81 | % | 2.95 | % | ||||||
| Ratio of net investment income (loss) to average net assets: | ||||||||||
| Before expense reimbursement or recovery | (2.24) | % | (4.23) | % | ||||||
| After expense reimbursement or recovery | (2.27) | % | (2.79) | % | ||||||
Portfolio turnover rate(f) | 27 | % | 6 | % | ||||||
| (a) | All ratios have been annualized except total investment return and portfolio turnover. |
| (b) | Net investment income (loss) per share is based on average shares outstanding. |
| (c) | Realized and unrealized gains and losses per share in this caption are balancing amounts necessary to reconcile the change in net asset value per share for the period, and may not reconcile with the aggregate losses in the Fund’s Consolidated Statement of Operations due to share transactions for the period. |
| (d) | Amount represents less than $0.005 per share. |
| (e) | Total return excludes the effect of applicable sales charges. |
| (f) | Portfolio turnover rate is calculated on the basis of the Fund as a whole without distinguishing between classes of shares issued. Consists of long-term investments only; excludes derivative instruments. |
The accompanying notes are an integral part of these consolidated financial statements.
LoCorr Market Trend Fund - Consolidated Financial Highlights - Class I | | | 69 |
| LoCorr Market Trend Fund - Class I |
| Consolidated Financial Highlights |
| Selected Data and Ratios (for a share outstanding throughout the period) |
| Year Ended December 31, 2015 | Period from July 1, 2014 (commencement of operations) through December 31, 2014(a) | |||||||||
| Per Share | ||||||||||
| Net asset value, beginning of period | $ | 11.45 | $ | 10.00 | ||||||
| Income (loss) from investment operations: | ||||||||||
Net investment income (loss)(b) | (0.16) | (0.10) | ||||||||
| Net realized and unrealized gain (loss) | 0.84 | (c) | 1.99 | |||||||
| Total from Investment Operations | 0.68 | 1.89 | ||||||||
| Distributions to shareholders from: | ||||||||||
| Net investment income | (0.09) | (0.26) | ||||||||
| Net realized gains on investments, forward currency contracts, futures contracts and foreign currency translation | (0.02) | (0.18) | ||||||||
| Total Distributions | (0.11) | (0.44) | ||||||||
Redemption Fees(d) | 0.00 | 0.00 | ||||||||
| Net Asset Value, End of Period | $ | 12.02 | $ | 11.45 | ||||||
| Total Investment Return | 5.96 | % | 18.88 | % | ||||||
| Net Assets, End of Period, in Thousands | $ | 695,987 | $ | 40,192 | ||||||
| Ratios/Supplemental Data: | ||||||||||
| Ratio of expenses to average net assets: | ||||||||||
| Before expense reimbursement or recovery | 1.78 | % | 3.39 | % | ||||||
| After expense reimbursement or recovery | 1.81 | % | 1.95 | % | ||||||
| Ratio of net investment income (loss) to average net assets: | ||||||||||
| Before expense reimbursement or recovery | (1.24) | % | (3.23) | % | ||||||
| After expense reimbursement or recovery | (1.27) | % | (1.79) | % | ||||||
Portfolio turnover rate(e) | 27 | % | 6 | % | ||||||
| (a) | All ratios have been annualized except total investment return and portfolio turnover. |
| (b) | Net investment income (loss) per share is based on average shares outstanding. |
| (c) | Realized and unrealized gains and losses per share in this caption are balancing amounts necessary to reconcile the change in net asset value per share for the period, and may not reconcile with the aggregate losses in the Fund’s Consolidated Statement of Operations due to share transactions for the period. |
| (d) | Amount represents less than $0.005 per share. |
| (e) | Portfolio turnover rate is calculated on the basis of the Fund as a whole without distinguishing between classes of shares issued. Consists of long-term investments only; excludes derivative instruments. |
The accompanying notes are an integral part of these consolidated financial statements.
| 70 | | | LoCorr Long/Short Equity Fund - Financial Highlights - Class A |
| LoCorr Long/Short Equity Fund - Class A |
| Financial Highlights |
| Selected Data and Ratios (for a share outstanding throughout the period) |
| Period from May 10, 2013 | |||||||||||||
| (commencement of operations) | |||||||||||||
| Year Ended | through | ||||||||||||
| December 31, 2015 | December 31, 2014 | December 31, 2013(a) | |||||||||||
| Per Share | |||||||||||||
| Net asset value, beginning of period | $ | 9.80 | $ | 11.48 | $ | 10.00 | |||||||
| Income (loss) from investment operations: | |||||||||||||
Net investment income (loss)(b) | (0.27) | (0.22) | (0.13) | ||||||||||
| Net realized and unrealized gain (loss) | 0.11 | (1.42) | 1.61 | ||||||||||
| Total from Investment Operations | (0.16) | (1.64) | 1.48 | ||||||||||
| Distributions to shareholders from: | |||||||||||||
| Net realized gains on investments and securities sold short | — | (0.04) | — | ||||||||||
| Total Distributions | — | (0.04) | — | ||||||||||
Redemption Fees(c) | 0.00 | 0.00 | 0.00 | ||||||||||
| Net Asset Value, End of Period | $ | 9.64 | $ | 9.80 | $ | 11.48 | |||||||
Total Investment Return(d) | (1.53) | % | (14.37) | % | 14.80 | % | |||||||
| Net Assets, End of Period, in Thousands | $ | 12,446 | $ | 17,174 | $ | 21,256 | |||||||
| Ratios/Supplemental Data: | |||||||||||||
| Ratio of expenses to average net assets: | |||||||||||||
| Before expense reimbursement or recovery | 3.72 | % | 3.55 | % | 5.05 | % | |||||||
| After expense reimbursement or recovery | 3.35 | % | 3.30 | % | 3.26 | % | |||||||
| Ratio of expenses to average net assets (excluding dividend and interest expense on securities sold short and interest expense on line of credit): | |||||||||||||
| Before expense reimbursement or recovery | 3.52 | % | 3.40 | % | 4.94 | % | |||||||
| After expense reimbursement or recovery | 3.15 | % | 3.15 | % | 3.15 | % | |||||||
| Ratio of net investment income (loss) to average net assets: | |||||||||||||
| Before expense reimbursement or recovery | (3.06) | % | (2.41) | % | (3.64) | % | |||||||
| After expense reimbursement or recovery | (2.69) | % | (2.16) | % | (1.85) | % | |||||||
Portfolio turnover rate(e) | 269 | % | 256 | % | 66 | % | |||||||
| (a) | All ratios have been annualized except total investment return and portfolio turnover. |
| (b) | Net investment income (loss) per share is based on average shares outstanding. |
| (c) | Amount represents less than $0.005 per share. |
| (d) | Total return excludes the effect of applicable sales charges. |
| (e) | Portfolio turnover rate is calculated on the basis of the Fund as a whole without distinguishing between classes of shares issued. Consists of long-term investments only; excludes securities sold short. |
The accompanying notes are an integral part of these financial statements.
| LoCorr Long/Short Equity Fund - Financial Highlights - Class C | | | 71 |
LoCorr Long/Short Equity Fund - Class C
Financial Highlights
Selected Data and Ratios (for a share outstanding throughout the period)
| Period from May 10, 2013 | |||||||||||||
| (commencement of operations) | |||||||||||||
| Year Ended | through | ||||||||||||
| December 31, 2015 | December 31, 2014 | December 31, 2013(a) | |||||||||||
| Per Share | |||||||||||||
| Net asset value, beginning of period | $ | 9.67 | $ | 11.42 | $ | 10.00 | |||||||
| Income (loss) from investment operations: | |||||||||||||
Net investment income (loss)(b) | (0.33) | (0.29) | (0.18) | ||||||||||
| Net realized and unrealized gain (loss) | 0.11 | (1.42) | 1.60 | ||||||||||
| Total from Investment Operations | (0.22) | (1.71) | 1.42 | ||||||||||
| Distributions to shareholders from: | |||||||||||||
| Net realized gains on investments and securities sold short | — | (0.04) | — | ||||||||||
| Total Distributions | — | (0.04) | — | ||||||||||
| Redemption Fees | 0.00 | (c) | 0.00 | (c) | — | ||||||||
| Net Asset Value, End of Period | $ | 9.45 | $ | 9.67 | $ | 11.42 | |||||||
Total Investment Return(d) | (2.28) | % | (14.98) | % | 14.20 | % | |||||||
| Net Assets, End of Period, in Thousands | $ | 7,837 | $ | 12,158 | $ | 8,443 | |||||||
| Ratios/Supplemental Data: | |||||||||||||
| Ratio of expenses to average net assets: | |||||||||||||
| Before expense reimbursement or recovery | 4.47 | % | 4.30 | % | 5.80 | % | |||||||
| After expense reimbursement or recovery | 4.10 | % | 4.05 | % | 4.01 | % | |||||||
| Ratio of expenses to average net assets (excluding dividend and interest expense on securities sold short and interest expense on line of credit): | |||||||||||||
| Before expense reimbursement or recovery | 4.27 | % | 4.15 | % | 5.69 | % | |||||||
| After expense reimbursement or recovery | 3.90 | % | 3.90 | % | 3.90 | % | |||||||
| Ratio of net investment income (loss) to average net assets: | |||||||||||||
| Before expense reimbursement or recovery | (3.81) | % | (3.16) | % | (4.39) | % | |||||||
| After expense reimbursement or recovery | (3.44) | % | (2.91) | % | (2.60) | % | |||||||
Portfolio turnover rate(e) | 269 | % | 256 | % | 66 | % | |||||||
| (a) | All ratios have been annualized except total investment return and portfolio turnover. |
| (b) | Net investment income (loss) per share is based on average shares outstanding. |
| (c) | Amount represents less than $0.005 per share. |
| (d) | Total return excludes the effect of applicable sales charges. |
| (e) | Portfolio turnover rate is calculated on the basis of the Fund as a whole without distinguishing between classes of shares issued. Consists of long-term investments only; excludes securities sold short. |
The accompanying notes are an integral part of these financial statements.
| 72 | | | LoCorr Long/Short Equity Fund - Financial Highlights - Class I |
| LoCorr Long/Short Equity Fund - Class I |
| Financial Highlights |
| Selected Data and Ratios (for a share outstanding throughout the period) |
| Period from May 10, 2013 | |||||||||||||
| (commencement of operations) | |||||||||||||
| Year Ended | through | ||||||||||||
| December 31, 2015 | December 31, 2014 | December 31, 2013(a) | |||||||||||
| Per Share | |||||||||||||
| Net asset value, beginning of period | $ | 9.84 | $ | 11.50 | $ | 10.00 | |||||||
| Income (loss) from investment operations: | |||||||||||||
Net investment income (loss)(b) | (0.24) | (0.20) | (0.11) | ||||||||||
| Net realized and unrealized gain (loss) | 0.11 | (1.42) | 1.61 | ||||||||||
| Total from Investment Operations | (0.13) | (1.62) | 1.50 | ||||||||||
| Distributions to shareholders from: | |||||||||||||
| Net realized gains on investments and securities sold short | — | (0.04) | — | ||||||||||
| Total Distributions | — | (0.04) | — | ||||||||||
Redemption Fees(c) | 0.00 | 0.00 | 0.00 | ||||||||||
| Net Asset Value, End of Period | $ | 9.71 | $ | 9.84 | $ | 11.50 | |||||||
| Total Investment Return | (1.22) | % | (14.18) | % | 15.00 | % | |||||||
| Net Assets, End of Period, in Thousands | $ | 9,990 | $ | 12,304 | $ | 12,361 | |||||||
| Ratios/Supplemental Data: | |||||||||||||
| Ratio of expenses to average net assets: | |||||||||||||
| Before expense reimbursement or recovery | 3.47 | % | 3.30 | % | 4.80 | % | |||||||
| After expense reimbursement or recovery | 3.10 | % | 3.05 | % | 3.01 | % | |||||||
| Ratio of expenses to average net assets (excluding dividend and interest expense on securities sold short and interest expense on line of credit): | |||||||||||||
| Before expense reimbursement or recovery | 3.27 | % | 3.15 | % | 4.69 | % | |||||||
| After expense reimbursement or recovery | 2.90 | % | 2.90 | % | 2.90 | % | |||||||
| Ratio of net investment income (loss) to average net assets: | |||||||||||||
| Before expense reimbursement or recovery | (2.81) | % | (2.16) | % | (3.39) | % | |||||||
| After expense reimbursement or recovery | (2.44) | % | (1.91) | % | (1.60) | % | |||||||
Portfolio turnover rate(d) | 269 | % | 256 | % | 66 | % | |||||||
| (a) | All ratios have been annualized except total investment return and portfolio turnover. |
| (b) | Net investment income (loss) per share is based on average shares outstanding. |
| (c) | Amount represents less than $0.005 per share. |
| (d) | Portfolio turnover rate is calculated on the basis of the Fund as a whole without distinguishing between classes of shares issued. Consists of long-term investments only; excludes securities sold short. |
The accompanying notes are an integral part of these financial statements.
| LoCorr Spectrum Income Fund - Financial Highlights - Class A | | | 73 |
| LoCorr Spectrum Income Fund - Class A |
| Financial Highlights |
| Selected Data and Ratios (for a share outstanding throughout the period) |
| Year Ended | ||||||||
| December 31, 2015 | December 31, 2014 | |||||||
| Per Share | ||||||||
| Net asset value, beginning of period | $ | 8.97 | $ | 10.00 | ||||
| Income (loss) from investment operations: | ||||||||
Net investment income (loss)(a) | 0.38 | 0.41 | ||||||
| Net realized and unrealized gain (loss) | (1.00) | (0.91) | ||||||
| Total from Investment Operations | (0.62) | (0.50) | ||||||
| Distributions to shareholders from: | ||||||||
| Net investment income | (0.39) | (0.36) | ||||||
| Return of capital | (0.18) | (0.17) | ||||||
| Total Distributions | (0.57) | (0.53) | ||||||
Redemption Fees(b) | 0.00 | 0.00 | ||||||
| Net Asset Value, End of Period | $ | 7.78 | $ | 8.97 | ||||
Total Investment Return(c) | (7.36) | % | (5.45) | % | ||||
| Net Assets, End of Period, in Thousands | $ | 36,957 | $ | 37,425 | ||||
Ratios/Supplemental Data:(d) | ||||||||
| Ratio of expenses to average net assets: | ||||||||
Before expense reimbursement or recovery(e) | 1.99 | % | 2.28 | % | ||||
After expense reimbursement or recovery(e) | 2.05 | % | 2.05 | % | ||||
| Ratio of net investment income (loss) to average net assets: | ||||||||
| Before expense reimbursement or recovery | 4.41 | % | 3.88 | % | ||||
| After expense reimbursement or recovery | 4.35 | % | 4.11 | % | ||||
Portfolio turnover rate(f) | 54 | % | 43 | % | ||||
| (a) | Net investment income (loss) per share is based on average shares outstanding. |
| (b) | Amount represents less than $0.005 per share. |
| (c) | Total return excludes the effect of applicable sales charges. |
| (d) | Ratios do not include the expenses of the investment companies in which the Fund invests. |
| (e) | Includes interest expense on line of credit of 0.00% and 0.00% for the years ended December 31, 2015 and December 31, 2014, respectively. |
| (f) | Portfolio turnover rate is calculated on the basis of the Fund as a whole without distinguishing between classes of shares issued. |
The accompanying notes are an integral part of these financial statements.
| 74 | | | LoCorr Spectrum Income Fund - Financial Highlights - Class C |
| LoCorr Spectrum Income Fund - Class C |
| Financial Highlights |
| Selected Data and Ratios (for a share outstanding throughout the period) |
| Year Ended | ||||||||
| December 31, 2015 | December 31, 2014 | |||||||
| Per Share | ||||||||
| Net asset value, beginning of period | $ | 8.96 | $ | 10.00 | ||||
| Income (loss) from investment operations: | ||||||||
Net investment income (loss)(a) | 0.32 | 0.33 | ||||||
| Net realized and unrealized gain (loss) | (1.00) | (0.91) | ||||||
| Total from Investment Operations | (0.68) | (0.58) | ||||||
| Distributions to shareholders from: | ||||||||
| Net investment income | (0.34) | (0.31) | ||||||
| Return of capital | (0.16) | (0.15) | ||||||
| Total Distributions | (0.50) | (0.46) | ||||||
Redemption Fees(b) | 0.00 | 0.00 | ||||||
| Net Asset Value, End of Period | $ | 7.78 | $ | 8.96 | ||||
Total Investment Return(c) | (8.05) | % | (6.19) | % | ||||
| Net Assets, End of Period, in Thousands | $ | 27,817 | $ | 25,210 | ||||
Ratios/Supplemental Data:(d) | ||||||||
| Ratio of expenses to average net assets: | ||||||||
Before expense reimbursement or recovery(e) | 2.74 | % | 3.03 | % | ||||
After expense reimbursement or recovery(e) | 2.80 | % | 2.80 | % | ||||
| Ratio of net investment income (loss) to average net assets: | ||||||||
| Before expense reimbursement or recovery | 3.66 | % | 3.13 | % | ||||
| After expense reimbursement or recovery | 3.60 | % | 3.36 | % | ||||
Portfolio turnover rate(f) | 54 | % | 43 | % | ||||
| (a) | Net investment income (loss) per share is based on average shares outstanding. |
| (b) | Amount represents less than $0.005 per share. |
| (c) | Total return excludes the effect of applicable sales charges. |
| (d) | Ratios do not include the expenses of the investment companies in which the Fund invests. |
| (e) | Includes interest expense on line of credit of 0.00% and 0.00% for the years ended December 31, 2015 and December 31, 2014, respectively. |
| (f) | Portfolio turnover rate is calculated on the basis of the Fund as a whole without distinguishing between classes of shares issued. |
The accompanying notes are an integral part of these financial statements.
| LoCorr Spectrum Income Fund - Financial Highlights - Class I | | | 75 |
| LoCorr Spectrum Income Fund - Class I |
| Financial Highlights |
| Selected Data and Ratios (for a share outstanding throughout the period) |
| Year Ended | ||||||||
| December 31, 2015 | December 31, 2014 | |||||||
| Per Share | ||||||||
| Net asset value, beginning of period | $ | 8.97 | $ | 10.00 | ||||
| Income (loss) from investment operations: | ||||||||
Net investment income (loss)(a) | 0.41 | 0.43 | ||||||
| Net realized and unrealized gain (loss) | (1.00) | (0.91) | ||||||
| Total from Investment Operations | (0.59) | (0.48) | ||||||
| Distributions to shareholders from: | ||||||||
| Net investment income | (0.41) | (0.38) | ||||||
| Return of capital | (0.19) | (0.17) | ||||||
| Total Distributions | (0.60) | (0.55) | ||||||
Redemption Fees(b) | 0.00 | 0.00 | ||||||
| Net Asset Value, End of Period | $ | 7.78 | $ | 8.97 | ||||
| Total Investment Return | (7.10) | % | (5.23) | % | ||||
| Net Assets, End of Period, in Thousands | $ | 28,292 | $ | 31,428 | ||||
Ratios/Supplemental Data:(c) | ||||||||
| Ratio of expenses to average net assets: | ||||||||
Before expense reimbursement or recovery(d) | 1.74 | % | 2.03 | % | ||||
After expense reimbursement or recovery(d) | 1.80 | % | 1.80 | % | ||||
| Ratio of net investment income (loss) to average net assets: | ||||||||
| Before expense reimbursement or recovery | 4.66 | % | 4.13 | % | ||||
| After expense reimbursement or recovery | 4.60 | % | 4.36 | % | ||||
Portfolio turnover rate(e) | 54 | % | 43 | % | ||||
| (a) | Net investment income (loss) per share is based on average shares outstanding. |
| (b) | Amount represents less than $0.005 per share. |
| (c) | Ratios do not include the expenses of the investment companies in which the Fund invests. |
| (d) | Includes interest expense on line of credit of 0.00% and 0.00% for the years ended December 31, 2015 and December 31, 2014, respectively. |
| (e) | Portfolio turnover rate is calculated on the basis of the Fund as a whole without distinguishing between classes of shares issued. |
The accompanying notes are an integral part of these financial statements.
| 76 | | | LoCorr Managed Futures Strategy Fund, LoCorr Long/Short Commodities Strategy Fund, LoCorr Multi-Strategy Fund and LoCorr Market Trend Fund - Notes to Consolidated Financial Statements / LoCorr Long/Short Equity Fund and LoCorr Spectrum Income Fund - Notes to Financial Statements |
LoCorr Investment Trust
Notes
December 31, 2015
1. Organization
LoCorr Investment Trust (the “Trust”), an Ohio business trust, was formed on November 15, 2010 and is an open-end management investment company registered under the Investment Company Act of 1940, as amended (“1940 Act”). Each Fund is an investment company and accordingly follows the investment company accounting and reporting guidance of the Financial Accounting Standards Board (“FASB”) Accounting Standards Codification Topic 946 “Financial Services - Investment Companies.” The LoCorr Managed Futures Strategy Fund, LoCorr Long/Short Commodities Strategy Fund, LoCorr Multi-Strategy Fund, LoCorr Market Trend Fund, LoCorr Long/Short Equity Fund and the LoCorr Spectrum Income Fund (individually a “Fund” and collectively the “Funds”) are series within the Trust. The LoCorr Long/Short Commodities Strategy Fund, the LoCorr Multi-Strategy Fund, the LoCorr Market Trend Fund, the LoCorr Long/Short Equity Fund and the LoCorr Spectrum Income Fund are each non-diversified funds and the LoCorr Managed Futures Strategy Fund is a diversified fund.
The LoCorr Managed Futures Strategy Fund’s primary investment objective is capital appreciation in rising and falling equity markets with managing volatility as a secondary objective.
The LoCorr Long/Short Commodities Strategy Fund’s primary investment objective is capital appreciation in rising and falling commodities markets with managing volatility as a secondary objective.
The LoCorr Multi-Strategy Fund’s investment objective is capital appreciation.
The LoCorr Market Trend Fund’s primary investment objective is capital appreciation in rising and falling equity markets with managing volatility as a secondary objective.
The LoCorr Long/Short Equity Fund’s primary investment objective is long-term capital appreciation with reduced volatility compared to traditional broad-based equity market indices as a secondary objective.
The LoCorr Spectrum Income Fund’s primary investment objective is current income with capital appreciation as a secondary objective.
Wholly-owned and Controlled Subsidiaries
In order to achieve their investment objectives, the LoCorr Managed Futures Strategy Fund, the LoCorr Long/Short Commodities Strategy Fund, the LoCorr Multi-Strategy Fund and the LoCorr Market Trend Fund each invest up to 25% of their total assets (measured at the time of purchase) in wholly-owned subsidiaries, LCMFS Fund Limited (“LCMFS”), LCLSCS Fund Limited (“LCLSCS”), LCMSF Fund Limited (“LCMSF”) and LCMT Fund Limited (“LCMT”), respectively; each company incorporated under the laws of the Cayman Islands. LCMFS, LCLSCS, LCMSF and LCMT act as investment vehicles in order to enter into certain investments for the LoCorr Managed Futures Strategy Fund, the LoCorr Long/Short Commodities Strategy Fund, the LoCorr Multi-Strategy Fund and the LoCorr Market Trend Fund, respectively, consistent with their investment objectives and policies specified in the Prospectus and Statement of Additional Information.
At December 31, 2015, each Fund’s investment in LCMFS, LCLSCS, LCMSF and LCMT represented 17.36%, 17.36%, 17.79% and 3.99% of the total assets of LoCorr Managed Futures Strategy Fund, LoCorr Long/Short Commodities Strategy Fund, LoCorr Multi-Strategy Fund and LoCorr Market Trend Fund, respectively. See Note 2.
The consolidated financial statements of the LoCorr Managed Futures Strategy Fund, LoCorr Long/Short Commodities Strategy Fund, LoCorr Multi-Strategy Fund and the LoCorr Market Trend Fund each include the investment activity and financial statements of LCMFS, LCLSCS, LCMSF and LCMT, respectively. All intercompany accounts and transactions have been eliminated in consolidation. Because each Fund may invest a substantial portion of its assets in its respective subsidiary, the Fund may be considered to be investing indirectly in some of those investments through its subsidiary. For that reason, references to the Fund may also include its subsidiary. The subsidiary will be subject to the same investment restrictions and limitations, and follow the same compliance policies and procedures, as the Fund when viewed on a consolidated basis. Each Fund and its subsidiary are a “commodity pool” under the U.S. Commodity Exchange Act and LoCorr Fund Management, LLC (the “Adviser” or “Management”) is a “commodity pool operator” registered with and regulated by the Commodity Futures Trading Commission (“CFTC”). As a result, additional CFTC-mandated disclosure, reporting and recordkeeping obligations apply with respect to each Fund and its respective subsidiary under CFTC and the U.S. Securities and Exchange Commission (the “SEC”) harmonized regulations.
At December 31, 2015, the only investment held by LCMFS, LCLSCS and LCMSF are swap contracts, for which the notional amount was $493,519,768, $39,100,000 and $32,582,500, respectively. At December 31, 2015, LCMFS, LCLSCS and LCMSF reported unrealized depreciation on swap contracts of $12,934,752, $3,079,037 and $195,200, respectively. In addition, LCMFS, LCLSCS and LCMSF hold cash and cash equivalents as collateral on the swap contracts.
At December 31, 2015, investments held by LCMT include open futures contracts and other investments intended to serve as margin or collateral for futures positions. At December 31, 2015, the notional amount and net unrealized appreciation of short open futures contracts held by LCMT were $176,261,053 and $3,745,578, respectively.
Partnership interest
During the year ended December 31, 2012, LCMFS had a controlling ownership interest in Millburn Diversified Plus L.P. (the “Partnership”), a limited partnership organized on February 14, 2011, under the Delaware Revised Uniform Limited Partnership Act, which commenced operations on March 24, 2011. The Partnership engaged in speculative trading of futures and forward currency contracts. Similarly, LCLSCS had an investment in a partnership during the year ended December 31, 2012, however, based on the ownership percentage held during the year ended December 31, 2012, LCLSCS was not considered to have a controlling interest in that entity. The General Partner of the Partnership was Millburn Ridgefield Corporation (the “General Partner”). LCMFS and LCLSCS had fully redeemed out of their positions held in the partnerships as of December 20, 2012, and as a result, LCMFS no longer consolidated the Partnership, and its assets, liabilities, and related non-controlling interest were no longer included in the LoCorr Managed Futures Strategy Fund’s financial statements. As of December 20, 2012, there was no gain or loss on the redemption and deconsolidation because the investment in the Partnership was carried at fair value on a daily basis by LCMFS.
LoCorr Managed Futures Strategy Fund, LoCorr Long/Short Commodities Strategy Fund, LoCorr Multi-Strategy Fund and LoCorr Market Trend Fund - Notes to Consolidated Financial Statements / LoCorr Long/Short Equity Fund and LoCorr Spectrum Income Fund - Notes to Financial Statements (continued) | | | 77 |
Because LCMFS had a controlling interest (greater than 50% but less than 100%) in the Partnership for the period January 1, 2012 through December 20, 2012, the financial activity of the Partnership for that period ended December 20, 2012, was also consolidated with the financial statements of LCMFS. All intercompany balances, revenues, and expenses have been eliminated in consolidation. LoCorr Managed Futures Strategy Fund, LCMFS and the Partnership are collectively referred to as the LoCorr Managed Futures Strategy Fund throughout these consolidated financial statements.
Non-controlling interest is the portion of equity ownership in the Partnership not attributable to the LoCorr Managed Futures Strategy Fund. Non-controlling interest represents additional, non-related partners in the Partnership and was equal to 2.20% of the Partnership’s net assets prior to LCMFS having fully redeemed its holding of the Partnership.
Share Classes
The Funds currently offer three classes of shares: Class A, Class C and Class I shares. Each share class represents an interest in the same assets of the Fund, has the same rights and is identical in all material respects except that (i) Class A shares have a maximum front end sales load of 5.75% and maximum deferred sales charge of 1.00% and Class C shares have a maximum deferred sales charge of 1.00%, (ii) Class A shares have a 12b-1 fee of 0.25% and Class C shares have a 12b-1 fee of 1.00%; (iii) certain other class-specific expenses will be borne solely by the class to which such expenses are attributable and (iv) each class will have exclusive voting rights with respect to matters relating to its own distribution arrangements.
With respect to the LoCorr Managed Futures Strategy Fund, the LoCorr Long/Short Commodities Strategy Fund, the LoCorr Multi-Strategy Fund, the LoCorr Market Trend Fund and the LoCorr Long/Short Equity Fund, all classes are subject to a 1.00% redemption fee on redemptions made within 30 days of the original purchase. All classes with respect to the LoCorr Spectrum Income Fund are subject to a 2.00% redemption fee on redemptions made within 60 days of the original purchase.
The following table presents the class-specific commencement of operations dates for each of the Funds:
| Commencement of Operations | ||||||
| Class A | Class C | Class I | ||||
| LoCorr Managed Futures Strategy Fund | March 22, 2011 | March 24, 2011 | March 24, 2011 | |||
| LoCorr Long/Short Commodities Strategy Fund | January 1, 2012 | January 1, 2012 | January 1, 2012 | |||
| LoCorr Long/Short Equity Fund | May 10, 2013 | May 10, 2013 | May 10, 2013 | |||
| LoCorr Spectrum Income Fund | January 1, 2014 | January 1, 2014 | January 1, 2014 | |||
| LoCorr Market Trend Fund | July 1, 2014 | July 1, 2014 | July 1, 2014 | |||
| LoCorr Multi-Strategy Fund | April 6, 2015 | April 6, 2015 | April 6, 2015 | |||
The Funds may issue an unlimited number of shares of beneficial interest, with no par value. All shares of the Funds have equal rights and privileges, except as to class-specific rights and privileges described above.
2. Significant Accounting Policies
The following is a summary of significant accounting policies consistently followed by the Funds in the preparation of the consolidated financial statements. These policies are in conformity with generally accepted accounting principles in the United States of America (“GAAP”).
Investment Valuation
The Funds follow fair valuation accounting standards which establish a definition of fair value and set out a hierarchy for measuring fair value. These standards require additional disclosures about the various inputs and valuation techniques used to develop the measurements of fair value and changes in valuation techniques and related inputs during the period. These inputs are summarized in three broad levels listed below:
Level 1 – Unadjusted quoted prices in active markets for identical assets or liabilities that the Funds have the ability to access.
Level 2 – Observable inputs other than quoted prices included in Level 1 that are observable for the asset or liability, either directly or indirectly. These inputs may include quoted prices for the identical instrument on an inactive market, prices for similar instruments, interest rates, prepayment speeds, credit risk, yield curves, default rates and similar data.
Level 3 – Unobservable inputs for the asset or liability, to the extent relevant observable inputs are not available; representing the Funds’ own assumptions about the assumptions a market participant would use in valuing the asset or liability, and would be based on the best information available.
Generally, the Funds’ investments are valued each day at the last quoted sales price on each investment’s primary exchange. Investments traded or dealt in upon one or more exchanges (whether domestic or foreign) for which market quotations are readily available and not subject to restrictions against resale shall be valued at the last quoted sales price on the primary exchange or, in the absence of a sale on the primary exchange, at the last bid on the primary exchange. Investments primarily traded in the National Association of Securities Dealers’ Automated Quotation System (“NASDAQ”) National Market System for which market quotations are readily available shall be valued using the NASDAQ Official Closing Price.
| 78 | | | LoCorr Managed Futures Strategy Fund, LoCorr Long/Short Commodities Strategy Fund, LoCorr Multi-Strategy Fund and LoCorr Market Trend Fund - Notes to Consolidated Financial Statements / LoCorr Long/Short Equity Fund and LoCorr Spectrum Income Fund - Notes to Financial Statements (continued) |
The Funds may use independent pricing services to assist in calculating the value of the Funds’ investments. In addition, market prices for foreign investments are not determined at the same time of day as the net asset value (“NAV”) for the Funds. Because the Funds may invest in portfolio investments primarily listed on foreign exchanges, and these exchanges may trade on weekends or other days when the Funds do not price their shares, the value of some of the Funds’ portfolio investments may change on days when you may not be able to buy or sell the Funds’ shares. In computing the NAV, the Funds value foreign investments held by the Funds at the latest closing price on the exchange in which they are traded immediately prior to closing of the NYSE. Prices of foreign investments quoted in foreign currencies are translated into U.S. dollars at current rates. If events materially affecting the value of an investment in the Funds’ portfolio, particularly foreign investments, occur after the close of trading on a foreign market but before the Funds price their shares, the investment will be valued at fair value.
American Depositary Receipts
The Funds may invest in sponsored and unsponsored American Depositary Receipts (“ADRs”), which are receipts issued by an American bank or trust company evidencing ownership of underlying securities issued by a foreign issuer. ADRs, in registered form, are designed for use in U.S. securities markets. Unsponsored ADRs may be created without the participation of the foreign issuer. Holders of unsponsored ADRs generally bear all the costs of the ADR facility, whereas foreign issuers typically bear certain costs in a sponsored ADR. The bank or trust company depositary of an unsponsored ADR may be under no obligation to distribute shareholder communications received from the foreign issuer or to pass through voting rights. ADRs are generally categorized in Level 1 or Level 2 of the fair value hierarchy depending on inputs used and market activity levels for specific securities.
Equity Securities
Equity securities, including common stocks, preferred stocks, securities convertible into common stocks, such as convertible bonds, warrants, rights, options, master limited partnership (“MLP”) interests, real estate investment trusts (“REITs”), business development companies and royalty trusts, generally are valued by using market quotations, but may be valued on the basis of prices furnished by a pricing service when the Adviser believes such prices accurately reflect the fair market value of such securities. MLP interests are limited partnerships, the interests in which (known as “units”) typically trade publicly, like stock. MLPs are also called publicly traded partnerships and public limited partnerships. Securities that are traded on any stock exchange or on the NASDAQ over-the-counter market are generally valued by the pricing service at the last quoted sale price. Lacking a last sale price, an equity security is generally valued by the pricing service at its last bid price. Equity securities are generally categorized in Level 1 or Level 2 of the fair value hierarchy depending on inputs used and market activity levels for specific securities.
Exchange Traded Funds
The Funds may invest in Exchange Traded Funds (“ETFs”). ETFs are passive funds that track their related index and have the flexibility of trading like a security. They are managed by professionals and provide the investor with diversification, cost and tax efficiency, liquidity, marginability, are useful for hedging, have the ability to go long and short, and some provide quarterly dividends. Additionally, some ETFs are unit investment trusts (“UITs”), which are unmanaged portfolios overseen by trustees. ETFs generally have two markets. The primary market is where institutions swap “creation units” in block-multiples of shares, typically 25,000 or 50,000, for in-kind securities and cash in the form of dividends. The secondary market is where individual investors can trade as little as a single share during trading hours on the exchange. This is different from open-ended mutual funds that are traded after hours once the NAV is calculated. ETFs share many similar risks with open-end and closed-end funds. ETFs are generally categorized in Level 1 of the fair value hierarchy.
The Funds may invest in ETFs and other investment companies that hold a portfolio of foreign securities. Investing in securities of foreign companies and countries involves certain considerations and risks that are not typically associated with investing in U.S. government securities and securities of domestic companies. There may be less publicly available information about a foreign issuer than a domestic one, and foreign companies are not generally subject to uniform accounting, auditing and financial standards and requirements comparable to those applicable to U.S. companies. There may also be less government supervision and regulation of foreign securities exchanges, brokers and listed companies than exists in the United States. Interest and dividends paid by foreign issuers may be subject to withholding and other foreign taxes, which may decrease the net return on such investments as compared to dividends and interest paid to the Fund by domestic companies or the U.S. government. There may be the possibility of expropriations, seizure or nationalization of foreign deposits, confiscatory taxation, political, economic or social instability or diplomatic developments that could affect assets of the Fund held in foreign countries. Finally, the establishment of exchange controls or other foreign governmental laws or restrictions could adversely affect the payment of obligations.
Fixed Income Securities
Fixed income securities and certificates of deposit with maturities more than 60 days when acquired generally are valued using an evaluated price supplied by an independent pricing service. Inputs used by the pricing service for U.S. government and treasury securities are normally valued using a model that incorporates market observable data such as reported sales of similar securities, broker dealer quotes, yields, bids, offers, and reference data. Agency issued debt securities, foreign issued bonds and municipal bonds are generally valued in a manner similar to U.S. government securities. Evaluations for corporate bonds are typically based on valuation methodologies such as market pricing and other analytical pricing models as well as market transactions and dealer quotations based on observable inputs. Fixed income securities are generally categorized in Level 1 or Level 2 of the fair value hierarchy depending on inputs used and market activity levels for specific securities.
The fair value of asset backed securities and mortgage backed securities is estimated on models that consider the estimated cash flows of each tranche of the entity, establish a benchmark yield, and develop an estimated tranche-specific spread to the benchmark yield based on the unique attributes of the tranche. Additional inputs such as creditworthiness of the underlying collateral and quotes from outside brokers for the same or similar issuance may also be considered in the development of fair value. Asset backed and mortgage backed securities are generally categorized in Level 2 of the fair value hierarchy.
Short-term investments in fixed income securities and certificates of deposit with maturities of less than 60 days when acquired, or which subsequently are within 60 days of maturity, are valued using an amortized cost method of valuation, and are generally categorized in Level 2.
LoCorr Managed Futures Strategy Fund, LoCorr Long/Short Commodities Strategy Fund, LoCorr Multi-Strategy Fund and LoCorr Market Trend Fund - Notes to Consolidated Financial Statements / LoCorr Long/Short Equity Fund and LoCorr Spectrum Income Fund - Notes to Financial Statements (continued) | | | 79 |
Investment Companies
With respect to any portion of the Funds’ assets that are invested in one or more open-end management investment companies, including money market funds, registered under the 1940 Act, the Funds’ net asset value is calculated based upon the net asset values of those open-end management investment companies, and the prospectuses for these companies explain the circumstances under which those companies will use fair value pricing and the effects of using fair value pricing.
The Funds generally will purchase shares of closed-end investment companies only in the secondary market. The shares of many closed-end investment companies, after their initial public offering, frequently trade at a price per share that is less than the net asset value per share, the difference representing the “market discount” of such shares. This market discount may be due in part to the investment objective of long-term appreciation, which is sought by many closed-end investment companies, as well as to the fact that the shares of closed-end investment companies are not redeemable by the holder upon demand to the issuer at the next determined net asset value but rather are subject to the principles of supply and demand in the secondary market. A relative lack of secondary market purchasers of closed-end investment company shares also may contribute to such shares trading at a discount to their net asset value. Closed-end investment companies are generally categorized in Level 1 or Level 2 of the fair value hierarchy depending on inputs used and market activity levels for specific securities.
Over-the-counter Financial Derivative Instruments
Over-the-counter financial derivative instruments, such as forward currency contracts, futures contracts, or swap agreements, derive their value from underlying asset prices, indices, reference rates, and other inputs or a combination of these factors. These contracts are normally valued on the basis of broker-dealer quotations or a pricing service at the settlement price determined by the relevant exchange. Depending on the product and the terms of the transaction, the value of the derivative contracts can be estimated by a pricing service provider using a series of techniques, including simulation pricing models. The pricing models use inputs that are observed from actively quoted markets such as issuer details, indices, spreads, interest rates, curves, dividends and exchange rates.
Forward currency contracts represent the purchase or sale of a specific quantity of a foreign currency at the current or spot price, with delivery and settlement at a specified future date. Forward currency contracts are presented at fair value using spot currency rates and are adjusted for the time value of money (forward points) and contractual prices of the underlying financial instruments. Forward currency contracts are generally categorized in Level 2.
Futures contracts are carried at fair value using the primary exchange’s closing (settlement) price, and are generally categorized in Level 1.
Total return swap contracts are stated at fair value daily based on the fair value of the underlying futures and forward currency contracts constituting the contract’s stated index, taking into account any fees and expenses associated with the swap agreement. Total return swap contracts are generally categorized in Level 2.
Fair Value Pricing
If market quotations are not readily available, investments will be valued at their fair value as determined in good faith by the Adviser in accordance with procedures approved by the Board of Trustees (the “Board”) and evaluated by the Board as to the reliability of the fair value method used. In these cases, a Fund’s NAV will reflect certain portfolio investments’ fair value rather than their market price. Fair value pricing involves subjective judgments and it is possible that the fair value determined for an investment is materially different than the value that could be realized upon the sale of that investment. The fair value prices can differ from market prices when they become available or when a price becomes available.
Fair value determinations are required for the following securities:
| ● | securities for which market quotations are not readily available at the valuation time on a particular business day (including without limitation securities for which there is a short and temporary lapse in the provision of a price by the regular pricing source); |
| ● | securities for which, in the opinion of the Adviser/relevant Sub-Adviser, the prices or values available do not represent the fair value of the instrument, based upon factors that may include, but are not limited to, the following: the availability of only a bid price or an ask price; the spread between bid and ask prices; the frequency of sales; the thinness of the market; the size of reported trades; and actions of the securities markets or regulators, such as the suspension or limitation of trading; |
| ● | securities determined to be illiquid in accordance with the Trust’s Liquidity Procedures; and |
| ● | securities with respect to which an event that will affect the value thereof has occurred subsequent to the determination by the Adviser/relevant Sub-Adviser of the closing prices reported on the principal exchange on which the securities are traded, but prior to the relevant Fund’s calculation of its NAV. |
| ● | For any open-end mutual funds that do not provide timely NAV information, the Adviser/relevant Sub-Adviser shall evaluate those ‘similar’ funds and determine which are most appropriate based on funds having similar benchmarks or similar objectives. The Adviser/relevant Sub-Adviser shall then calculate the NAV percentage move of those ‘similar’ funds for the day to create an aggregate average percentage move, which it shall use to calculate the price movement for the day of the Fund at issue. For closed-end funds, the aforementioned practice shall be utilized, in addition to monitoring secondary market activity during the day. |
Performing Fair Value Pricing
The Adviser considers all appropriate factors relevant to the value of securities for which market quotations are not readily available. No single standard for determining fair value can be established, since fair value depends upon the circumstances of each individual case. As a general principle, the current fair value of an issue of securities being valued by the Adviser would appear to be the amount that the owner might reasonably expect to receive for them upon their current sale. Methods that are in accord with this principle may, for example, be based on:
| 80 | | | LoCorr Managed Futures Strategy Fund, LoCorr Long/Short Commodities Strategy Fund, LoCorr Multi-Strategy Fund and LoCorr Market Trend Fund - Notes to Consolidated Financial Statements / LoCorr Long/Short Equity Fund and LoCorr Spectrum Income Fund - Notes to Financial Statements (continued) |
| ● | a multiple of earnings; |
| ● | a discount from market of a similar freely traded security (including a derivative security or a basket of securities traded on other markets, exchanges or among dealers); or |
| ● | yield to maturity with respect to debt issues, or a combination of these and other methods. |
Fair value determinations are not based on what the Adviser believes that a buyer may pay at a later time, such as when market conditions change or when the market ultimately recognizes a security’s true value as perceived by the Adviser. Similarly, bonds and other instruments may not be fair valued at par based on the expectation that the Fund will hold the investment until maturity.
Some of the general factors that the Adviser considers in determining a valuation method for an individual issue of securities include, but shall not be limited to:
| ● | the fundamental analytical data relating to the investment; |
| ● | the nature and duration of restrictions (if any) on disposition of the securities; |
| ● | evaluation of the forces that influence the market in which these securities are purchased or sold; |
| ● | changes in interest rates; |
| ● | government (domestic or foreign) actions or pronouncements; and |
| ● | other news events. |
With respect to securities traded on foreign markets, the Adviser considers the value of foreign securities traded on other foreign markets, ADR trading, closed-end fund trading, foreign currency exchange activity and the trading prices of financial products that are tied to baskets of foreign securities, such as WEBS.
Among the more specific factors that the Funds’ Adviser considers (if applicable) in determining a valuation method for an individual issue of securities are:
| ● | type of security; |
| ● | financial statements of the issuer; |
| ● | cost at date of purchase; |
| ● | size of holding; |
| ● | discount from market value of unrestricted securities of the same class at time of purchase; |
| ● | special reports prepared by analysts; |
| ● | information as to any transactions or offers with respect to the security; |
| ● | existence of merger proposals or tender offers affecting the securities; |
| ● | price and extent of public trading in similar securities of the issuer or comparable companies; and |
| ● | other relevant matters. |
As a general matter, the Funds’ Adviser will value the portfolio security or other asset primarily by reference to the public market if there is a public market for securities of the same class or similar securities; primarily by reference to private transactions if public market reference is not available and private transaction reports are available; and primarily by use of one or more analytical methods or models if public and private market references are not available or not reliable. The Adviser will use cost only if no better method of valuation is available.
The Adviser regularly evaluates whether its pricing methodologies continue to result in values that the Fund might reasonably expect to receive upon a current sale. In order to do this, the Adviser compares its fair value prices with values that are available from other sources (if there are any). The next actual sales price of a security might be one such source. However, the next-day opening prices or next actual sales prices for a security may differ from the fair value of that security as of the time for NAV calculation, given the subjectivity inherent in fair valuation and the fact that events could occur after NAV calculation. Thus, discrepancies between fair values and next-day opening prices or next actual sales prices may occur on a regular and recurring basis. These discrepancies do not necessarily indicate that the Adviser’s fair value methodology is inappropriate. Nonetheless, systematic comparisons of fair values to the next-day opening prices or next actual sales prices are useful to assist the Adviser with ongoing monitoring and evaluation of the appropriateness of its fair value methodologies.
The above guidance does not purport to delineate all factors that may be considered. The Adviser takes into consideration all indications of value available to it in determining the fair value assigned to a particular security.
The fair value of the LoCorr Spectrum Income Fund’s investment in Terra Secured Income Fund 5, LLC (“Terra”) is based on the Adviser’s analysis of certain existing data to determine the significance and character of inputs used to determine value. These inputs include, but are not limited to, financial statements (audited and unaudited) of Terra and the value used by other investors in Terra. Management also engaged a third party appraisal firm to review the valuation process used by Terra and the Adviser in determining the value of the investment. Changes to the fair value of this investment would result from changes to the underlying financial performance of Terra or other market factors, such as adverse changes to the financial condition of Terra, its borrowers or the secured assets as well as the deterioration of real estate market or general economic conditions. Terra is a private investment, limited liability company formed to originate, fund and structure real estate-related loans, including mezzanine loans, first and second mortgage loans, subordinated mortgage loans, bridge loans, preferred equity investments and other loans related to high quality commercial real estate in the United States. Units invested with Terra are not registered with the SEC under the Securities Act of 1933, as amended (the “Securities Act”) or the securities agency of any state. The units were offered in reliance upon an exemption from the registration provisions of the Securities Act and state securities laws applicable only to offers and sales to investors meeting the suitability requirements set forth herein. Due to lack of market activity and observable inputs, the LoCorr Spectrum Income Fund’s investment in Terra is categorized in Level 3 of the fair value hierarchy.
LoCorr Managed Futures Strategy Fund, LoCorr Long/Short Commodities Strategy Fund, LoCorr Multi-Strategy Fund and LoCorr Market Trend Fund - Notes to Consolidated Financial Statements / LoCorr Long/Short Equity Fund and LoCorr Spectrum Income Fund - Notes to Financial Statements (continued) | | | 81 |
The following table summarizes LoCorr Managed Futures Strategy Fund’s consolidated investments and swap contracts as of December 31, 2015:
| Security Classification | Level 1 | Level 2 | Level 3 | Total | ||||||||||||
| Investments | ||||||||||||||||
| Asset Backed Securities | $ | — | $ | 101,001,673 | $ | — | $ | 101,001,673 | ||||||||
| Corporate Bonds | — | 160,135,807 | — | 160,135,807 | ||||||||||||
| Foreign Government Bonds | — | 5,850,346 | — | 5,850,346 | ||||||||||||
| Mortgage Backed Securities | — | 102,698,837 | — | 102,698,837 | ||||||||||||
| Municipal Bonds | — | 9,648,115 | — | 9,648,115 | ||||||||||||
| U.S. Government Agency Issues | — | 22,222,403 | — | 22,222,403 | ||||||||||||
| U.S. Government Notes | — | 19,155,760 | — | 19,155,760 | ||||||||||||
| Short Term Investment | 8,644,947 | — | — | 8,644,947 | ||||||||||||
| Total Investments | $ | 8,644,947 | $ | 420,712,941 | $ | — | $ | 429,357,888 | ||||||||
Swap Contracts* | ||||||||||||||||
| Long Total Return Swap Contracts | $ | — | $ | (12,934,752) | $ | — | $ | (12,934,752) | ||||||||
| Total Swap Contracts | $ | — | $ | (12,934,752) | $ | — | $ | (12,934,752) | ||||||||
See the Fund’s consolidated schedule of investments for the investments detailed by industry classification.
*Swap contracts are derivative instruments not reflected in the Fund’s consolidated schedule of investments. The fair value of the Fund’s investment in swap contracts represents the net unrealized depreciation at December 31, 2015.
The LoCorr Managed Futures Strategy Fund did not hold any Level 3 assets during the period.
The following table summarizes LoCorr Long/Short Commodities Strategy Fund’s consolidated investments and swap contracts as of December 31, 2015:
| Security Classification | Level 1 | Level 2 | Level 3 | Total | ||||||||||||
| Investments | ||||||||||||||||
| Asset Backed Securities | $ | — | $ | 6,751,107 | $ | — | $ | 6,751,107 | ||||||||
| Corporate Bonds | — | 12,061,459 | — | 12,061,459 | ||||||||||||
| Foreign Government Bonds | — | 295,049 | — | 295,049 | ||||||||||||
| Mortgage Backed Securities | — | 8,267,348 | — | 8,267,348 | ||||||||||||
| Municipal Bonds | — | 559,816 | — | 559,816 | ||||||||||||
| U.S. Government Agency Issues | — | 2,747,321 | — | 2,747,321 | ||||||||||||
| U.S. Government Notes | — | 11,050,324 | — | 11,050,324 | ||||||||||||
| Short Term Investments | 6,270,128 | 1,550,912 | — | 7,821,040 | ||||||||||||
| Total Investments | $ | 6,270,128 | $ | 43,283,336 | $ | — | $ | 49,553,464 | ||||||||
Swap Contracts* | ||||||||||||||||
| Long Total Return Swap Contracts | $ | — | $ | (3,079,037) | $ | — | $ | (3,079,037) | ||||||||
| Total Swap Contracts | $ | — | $ | (3,079,037) | $ | — | $ | (3,079,037) | ||||||||
See the Fund’s consolidated schedule of investments for the investments detailed by industry classification.
*Swap contracts are derivative instruments not reflected in the Fund’s consolidated schedule of investments. The fair value of the Fund’s investment in swap contracts represents the net unrealized depreciation at December 31, 2015.
The LoCorr Long/Short Commodities Strategy Fund did not hold any Level 3 assets during the period.
| 82 | | | LoCorr Managed Futures Strategy Fund, LoCorr Long/Short Commodities Strategy Fund, LoCorr Multi-Strategy Fund and LoCorr Market Trend Fund - Notes to Consolidated Financial Statements / LoCorr Long/Short Equity Fund and LoCorr Spectrum Income Fund - Notes to Financial Statements (continued) |
The following table summarizes LoCorr Multi-Strategy Fund’s consolidated investments, securities sold short and swap contracts as of December 31, 2015:
| Security Classification | Level 1 | Level 2 | Level 3 | Total | |||||||||
| Investments | |||||||||||||
| Business Development Companies | $ | 2,093,693 | $ | — | $ | — | $ | 2,093,693 | |||||
| Closed-End Investment Companies | 4,073,542 | — | — | 4,073,542 | |||||||||
| Common Stocks | 10,050,475 | — | — | 10,050,475 | |||||||||
| Convertible Preferred Stock | 451,360 | — | — | 451,360 | |||||||||
| Master Limited Partnerships | 4,848,337 | — | — | 4,848,337 | |||||||||
| Real Estate Investment Trusts | 4,204,342 | — | — | 4,204,342 | |||||||||
| Purchased Put Option | — | 190,320 | — | 190,320 | |||||||||
| Short Term Investment | 1,776,792 | — | — | 1,776,792 | |||||||||
| Total Investments | $ | 27,498,541 | $ | 190,320 | $ | — | $ | 27,688,861 | |||||
| Securities Sold Short | |||||||||||||
| Common Stocks | $ | (730,464) | $ | — | $ | — | $ | (730,464) | |||||
| Total Securities Sold Short | $ | (730,464) | $ | — | $ | — | $ | (730,464) | |||||
Swap Contracts* | |||||||||||||
| Long Total Return Swap Contracts | $ | — | $ | (195,200) | $ | — | $ | (195,200) | |||||
| Total Swap Contracts | $ | — | $ | (195,200) | $ | — | $ | (195,200) | |||||
See the Fund’s consolidated schedule of investments and securities sold short for the investments detailed by industry classification.
*Swap contracts are derivative instruments not reflected in the Fund’s consolidated schedule of investments. The fair value of the Fund’s investment in swap contracts represents the net unrealized depreciation at December 31, 2015.
The LoCorr Multi-Strategy Fund did not hold any Level 3 assets during the period.
The following table summarizes LoCorr Market Trend Fund’s consolidated investments and other financial instruments as of December 31, 2015:
| Security Classification | Level 1 | Level 2 | Level 3 | Total | |||||||||
| Investments | |||||||||||||
| Asset Backed Securities | $ | — | $ | 176,697,654 | $ | — | $ | 176,697,654 | |||||
| Corporate Bonds | — | 12,916,701 | — | 12,916,701 | |||||||||
| Foreign Government Bonds | — | 15,420,054 | — | 15,420,054 | |||||||||
| Mortgage Backed Securities | — | 70,250,752 | — | 70,250,752 | |||||||||
| U.S. Government Agency Issues | — | 311,061,361 | — | 311,061,361 | |||||||||
| U.S. Government Notes | — | 138,994,244 | — | 138,994,244 | |||||||||
| Short Term Investment | 29,338,231 | — | — | 29,338,231 | |||||||||
| Total Investments | $ | 29,338,231 | $ | 725,340,766 | $ | — | $ | 754,678,997 | |||||
Other Financial Instruments* | |||||||||||||
| Forward Currency Contracts | |||||||||||||
| Long Forward Currency Contracts | $ | — | $ | 254,238 | $ | — | $ | 254,238 | |||||
| Short Forward Currency Contracts | — | 13,972,086 | — | 13,972,086 | |||||||||
| Total Forward Currency Contracts | — | 14,226,324 | — | 14,226,324 | |||||||||
| Futures Contracts | |||||||||||||
| Long Futures Contracts | (6,096,298) | — | — | (6,096,298) | |||||||||
| Short Futures Contracts | (2,452,446) | — | — | (2,452,446) | |||||||||
| Total Futures Contracts | (8,548,744) | — | — | (8,548,744) | |||||||||
| Total Other Financial Instruments | $ | (8,548,744) | $ | 14,226,324 | $ | — | $ | 5,677,580 | |||||
See the Fund’s consolidated schedule of investments for the investments detailed by industry classification.
*Other financial instruments include forward currency contracts and futures contracts which are not included in the Fund’s consolidated schedule of investments. The fair value of the Fund’s other financial instruments represent the net unrealized appreciation (depreciation) at December 31, 2015.
The LoCorr Market Trend Fund did not hold any Level 3 assets during the period.
LoCorr Managed Futures Strategy Fund, LoCorr Long/Short Commodities Strategy Fund, LoCorr Multi-Strategy Fund and LoCorr Market Trend Fund - Notes to Consolidated Financial Statements / LoCorr Long/Short Equity Fund and LoCorr Spectrum Income Fund - Notes to Financial Statements (continued) | | | 83 |
The following table summarizes LoCorr Long/Short Equity Fund’s investments and securities sold short as of December 31, 2015:
| Security Classification | Level 1 | Level 2 | Level 3 | Total | |||||||||
| Investments | |||||||||||||
| Business Development Companies | $ | 209,431 | $ | — | $ | — | $ | 209,431 | |||||
| Closed-End Investment Company | 258,843 | — | — | 258,843 | |||||||||
| Common Stocks | 19,612,528 | — | — | 19,612,528 | |||||||||
| Real Estate Investment Trust | 361,266 | — | — | 361,266 | |||||||||
| Purchased Put Option | — | 413,580 | — | 413,580 | |||||||||
| Short Term Investments | 5,674,822 | 2,499,458 | — | 8,174,280 | |||||||||
| Total Investments | $ | 26,116,890 | $ | 2,913,038 | $ | — | $ | 29,029,928 | |||||
| Securities Sold Short | |||||||||||||
| Common Stocks | $ | (4,097,200) | $ | — | $ | — | $ | (4,097,200) | |||||
| Total Securities Sold Short | $ | (4,097,200) | $ | — | $ | — | $ | (4,097,200) | |||||
See the Fund’s schedule of investments and schedule of securities sold short for detail by industry classification.
The LoCorr Long/Short Equity Fund did not hold any Level 3 assets during the period.
The following table summarizes LoCorr Spectrum Income Fund’s investments as of December 31, 2015:
| Security Classification | Level 1 | Level 2 | Level 3 | Total | |||||||||
| Investments | |||||||||||||
| Business Development Companies | $ | 6,296,132 | $ | — | $ | — | $ | 6,296,132 | |||||
| Closed-End Investment Companies | 15,407,863 | — | — | 15,407,863 | |||||||||
| Common Stocks | 9,407,229 | — | — | 9,407,229 | |||||||||
| Convertible Preferred Stock | 3,148,639 | — | — | 3,148,639 | |||||||||
| Master Limited Partnerships | 21,650,955 | — | — | 21,650,955 | |||||||||
| Private Investment | — | — | 11,498,342 | 11,498,342 | |||||||||
| Real Estate Investment Trusts | 20,430,012 | — | — | 20,430,012 | |||||||||
| Short Term Investment | 7,319,122 | — | — | 7,319,122 | |||||||||
| Total Investments | $ | 83,659,952 | $ | — | $ | 11,498,342 | $ | 95,158,294 | |||||
See the Fund’s schedule of investments for detail by industry classification.
The following is a reconciliation of the beginning and ending balances for assets measured at fair value using significant unobservable inputs (Level 3) during the year ended December 31, 2015:
| Level 3 Reconciliation Disclosure | Investments in Securities, at fair value | |||
| Balance, December 31, 2014 | $ | 11,251,542 | ||
| Purchases | — | |||
| Sales | — | |||
| Realized gain (loss) | — | |||
| Change in net unrealized gain (loss) | 246,800 | |||
| Transfer into Level 3 | — | |||
| Transfer out of Level 3 | — | |||
| Balance, December 31, 2015 | $ | 11,498,342 | ||
| Net change in unrealized gains relating to Level 3 investments still held at December 31, 2015 | $ | 246,800 | ||
Quantitative Information about Level 3 Fair Value Measurements held in the LoCorr Spectrum Income Fund:
| Type of Security | Valuation Technique | Unobservable Input | Range | Fair Value at December 31, 2015 | |||||||
| Private Investment | See note below | Subscription Price $50,000 per unit | Unchanged | $ | 11,498,342 | ||||||
Note: Management’s fair valuation is based on the issuer’s financial statements and other data, as well as other trades in this security as noted above. See additional detail related to these considerations in the Investment Valuation disclosures. The purchase discount on LoCorr Spectrum Income Fund’s investment in Terra is accreted on a straight-line basis over a period of five years, and is presented as part of unrealized appreciation for financial reporting purposes.
For each of the Funds, there were no transfers between levels during the period. Transfers between levels are recognized at the end of the reporting period.
| 84 | | | LoCorr Managed Futures Strategy Fund, LoCorr Long/Short Commodities Strategy Fund, LoCorr Multi-Strategy Fund and LoCorr Market Trend Fund - Notes to Consolidated Financial Statements / LoCorr Long/Short Equity Fund and LoCorr Spectrum Income Fund - Notes to Financial Statements (continued) |
Allocation of Income and Expenses
Net investment income, other than class specific expenses, and realized and unrealized gains and losses are allocated daily to each class of shares based upon the relative net asset value of outstanding shares of each class of shares at the beginning of the day (after adjusting for the current capital shares activity of the respective class). Expenses associated with a specific Fund in the Trust are charged to that Fund. Common expenses are typically allocated based upon the relative net assets of each Fund, or by other equitable means.
Deferred Offering Costs
Offering costs are accounted for as a deferred charge until operations begin and thereafter amortized to expense over twelve months on a straight-line basis. For the LoCorr Multi-Strategy Fund and the LoCorr Market Trend Fund, these costs consisted of legal fees pertaining to preparing the Fund’s initial registration statement, printing costs, and SEC and state registration fees. For the period from April 6, 2015 (commencement of operations) through December 31, 2015, the LoCorr Multi-Strategy Fund amortized $47,601 in deferred offering costs. At December 31, 2015, the remaining cumulative balance of unamortized offering costs for the LoCorr Multi-Strategy Fund amounted to $17,164. For the year ended December 31, 2015, the LoCorr Market Trend Fund amortized $36,544 in deferred offering costs. At December 31, 2015, the LoCorr Market Trend Fund fully amortized all of its deferred offering costs.
Deposits with Broker
Forward Currency and Futures Contracts
When trading derivative instruments, such as forward or futures contracts, the Fund is only required to post initial or variation margin with the exchange or clearing broker. The use of margin in trading these instruments has the effect of creating leverage, which can expose the Fund to substantial gains or losses occurring from relatively small price changes in the value of the underlying instrument and can increase the volatility of the Fund’s returns. Volatility is a statistical measure of the dispersion of returns of an investment, where higher volatility generally indicates greater risk. At December 31, 2015, the LoCorr Market Trend Fund pledged $26,770,000 in cash and cash equivalents with Bank of America Merrill Lynch for its investment in forward currency contracts.
Upon entering into a futures contract, and to maintain the Fund’s open positions in futures contracts, the Fund is required to deposit with its custodian or futures broker in a segregated account in the name of the futures broker an amount of cash, U.S. government securities, suitable money market instruments, or other liquid securities, known as “initial margin.” The margin required for a particular futures contract is set by the exchange on which the contract is traded, and may be significantly modified from time to time by the exchange during the term of the contract. Futures contracts are customarily purchased and sold on margins that may range upward from less than 5% of the value of the contract being traded.
At December 31, 2015, the LoCorr Market Trend Fund and LCMT, collectively, had $85,130,584 in cash and cash equivalents on deposit with the broker for derivative instruments which is presented on the Fund’s consolidated statement of assets and liabilities. In addition, LCMT pledged securities with a fair value of $15,348,788 as collateral for derivative instruments.
If the price of an open futures contract changes (by increase in underlying instrument or index in the case of a sale or by decrease in the case of a purchase) so that the loss on the futures contract reaches a point at which the margin on deposit does not satisfy margin requirements, the broker will require an increase in the margin. However, if the value of a position increases because of favorable price changes in the futures contract so that the margin deposit exceeds the required margin, the broker will pay the excess to the Fund.
These subsequent payments, called “variation margin,” to and from the futures broker, are made on a daily basis as the price of the underlying assets fluctuate making the long and short positions in the futures contract more or less valuable, a process known as “marking to the market”. The Fund expects to earn interest income on any margin deposits.
Securities Sold Short
At December 31, 2015, the LoCorr Multi-Strategy Fund and the LoCorr Long/Short Equity Fund had cash on deposit with the broker-dealer in the amount of $935,779 and $4,143,194, respectively. At December 31, 2015, the LoCorr Long/Short Equity Fund pledged securities with a fair value of $2,499,458.
Swap Contracts
LCMFS, LCLSCS and LCMSF have a substantial portion of their assets on deposit with Deutsche Bank in connection with their trading of swap contracts. Assets deposited with Deutsche Bank in connection with the trading of swap contracts for LCMFS, LCLSCS and LCMSF are partially restricted due to deposit requirements. At December 31, 2015, the LoCorr Managed Futures Strategy Fund, the LoCorr Long/Short Commodities Strategy Fund and the LoCorr Multi-Strategy Fund had cash and cash equivalents on deposit with Deutsche Bank in the amount of $101,000,010, $9,435,010 and $6,316,500, respectively, which have been presented on the consolidated statements of assets and liabilities for each Fund. In addition, at December 31, 2015, the LCMFS, LCLSCS and LCMSF pledged securities with a fair value of $370,114, $461,543 and $200,094, respectively, as collateral for swap contracts. Risks arise from the possible inability of the counterparty to meet the term of its contract and may increase if the counterparty’s financial condition worsens.
Distributable Earnings and Investment Transactions
Net investment income and net realized gains (losses) may differ for financial reporting and tax purposes because of temporary or permanent book/tax differences. To the extent these differences are permanent; reclassifications are made to the appropriate equity accounts in the period that the difference arises.
Additionally, U.S. generally accepted accounting principles require that certain components of net assets relating to permanent differences be reclassified between financial and tax reporting. These reclassifications have no effect on net assets or net asset value per share. See Note 7.
LoCorr Managed Futures Strategy Fund, LoCorr Long/Short Commodities Strategy Fund, LoCorr Multi-Strategy Fund and LoCorr Market Trend Fund - Notes to Consolidated Financial Statements / LoCorr Long/Short Equity Fund and LoCorr Spectrum Income Fund - Notes to Financial Statements (continued) | | | 85 |
Distributions to Shareholders
Shareholder transactions are recorded on trade date. Dividends from net investment income are declared and paid at least annually by the Funds. Distribution of net realized capital gains, if any, are declared and paid at least annually. Distributions to shareholders are recorded on the ex-dividend date. The character of distributions made during the periods from net investment income or net realized gains may differ from the characterization for federal income tax purposes due to the difference in the recognition of income, expense and gain items for financial statement and tax purposes.
Beginning in May 2015, dividends for the LoCorr Multi-Strategy Fund were distributed monthly. In 2015, the dividends for the LoCorr Spectrum Income Fund were distributed monthly. The estimated characterization of the distributions paid will be either a qualified dividend or return of capital. This estimate is based on each Fund’s operating results during the period. It is anticipated that a significant portion of the distributions of the Funds’ investments in MLP and certain investments in REIT and royalty trusts will be comprised of return of capital as a result of the tax character of cash distributions made by each Fund’s investments. The actual characterization of the distributions made during the period is not determined until after the end of the fiscal year.
The tax character of distributions paid during the periods was as follows:
Period Ended December 31, 2015(a) | ||||||||||
| Fund | Ordinary Income | Long-Term Capital Gains | Return of Capital | |||||||
| LoCorr Managed Futures Strategy Fund | $ | 14,528,245 | $ | — | $ | — | ||||
| LoCorr Long/Short Commodities Strategy Fund | 3,351,073 | — | — | |||||||
| LoCorr Multi-Strategy Fund | 267,360 | — | 280,501 | |||||||
| LoCorr Market Trend Fund | 5,964,617 | 960,116 | — | |||||||
| LoCorr Long/Short Equity Fund | — | — | — | |||||||
| LoCorr Spectrum Income Fund | 4,715,119 | — | 2,248,675 | |||||||
(a) For the year ended December 31, 2015 for the LoCorr Managed Futures Strategy Fund, the LoCorr Long/Short Commodities Strategy Fund, the LoCorr Market Trend Fund, the LoCorr Long/Short Equity Fund and the LoCorr Spectrum Income Fund and for the period from April 6, 2015 (commencement of operations) through December 31, 2015 for the LoCorr Multi-Strategy Fund.
Period Ended December 31, 2014(a) | ||||||||||
| Fund | Ordinary Income | Long-Term Capital Gains | Return of Capital | |||||||
| LoCorr Managed Futures Strategy Fund | $ | 52,568,247 | $ | 413,276 | $ | — | ||||
| LoCorr Long/Short Commodities Strategy Fund | 5,555,928 | — | — | |||||||
| LoCorr Market Trend Fund | 1,644,488 | 552,497 | — | |||||||
| LoCorr Long/Short Equity Fund | 169,677 | — | — | |||||||
| LoCorr Spectrum Income Fund | 2,382,874 | — | 1,097,840 | |||||||
(a) For the year ended December 31, 2014 for the LoCorr Managed Futures Strategy Fund, the LoCorr Long/Short Commodities Strategy Fund, the LoCorr Long/Short Equity Fund and the LoCorr Spectrum Income Fund and for the period from July 1, 2014 (commencement of operations) through December 31, 2014 for the LoCorr Market Trend Fund.
Federal Income Taxes
The Funds intend to qualify as regulated investment companies pursuant to Subchapter M of the Internal Revenue Code of 1986, as amended. The Funds intend to distribute substantially all of their investment company net taxable income and net capital gains to shareholders. Therefore, no federal income tax provision is required.
As of and during the period ended December 31, 2015, the Funds did not have any tax positions that did not meet the “more-likely-than-not” threshold of being sustained by applicable tax authorities. The Funds recognize interest and penalties, if any, related to unrecognized tax benefits on uncertain tax positions as interest or other expense in the statements of operations. During the period ended December 31, 2015, the Funds did not incur any interest or penalties.
For tax purposes, LCMFS, LCLSCS, LCMSF and LCMT are exempted Cayman Islands investment companies. LCMFS, LCLSCS, LCMSF and LCMT have each received an undertaking from the Government of the Cayman Islands exempting them from all local income, profits, and capital gains taxes. No such taxes are levied in the Cayman Islands at the present time. For U.S. income tax purposes, LCMFS, LCLSCS, LCMSF and LCMT are controlled foreign corporations (“CFCs”) and as such are not subject to U.S. income tax. However, as a wholly-owned CFC, the net income and capital gain of each CFC, to the extent of its earnings and profits, will be included each year in the respective Funds’ investment company taxable income.
Foreign Securities and Currency
Investment securities and other assets and liabilities denominated in foreign currencies are translated into U.S. dollar amounts at the date of valuation. Purchases and sales of investment securities and income and expense items denominated in foreign currencies are translated into U.S. dollar amounts on the respective dates of such transactions.
The Funds do not isolate that portion of the results of operations resulting from changes in foreign exchange rates on investments from the fluctuations arising from changes in market prices of securities held. Such fluctuations are included with the net realized and unrealized gain or loss from investments.
| 86 | | | LoCorr Managed Futures Strategy Fund, LoCorr Long/Short Commodities Strategy Fund, LoCorr Multi-Strategy Fund and LoCorr Market Trend Fund - Notes to Consolidated Financial Statements / LoCorr Long/Short Equity Fund and LoCorr Spectrum Income Fund - Notes to Financial Statements (continued) |
Reported net realized foreign exchange gains or losses arise from sales of foreign currencies, currency gains or losses realized between the trade and settlement dates on securities transactions, and the difference between the amounts of dividends, interest, and foreign withholding taxes recorded on the Funds’ books and the U.S. dollar equivalent of the amounts actually received or paid. Net unrealized foreign exchange gains and losses arise from changes in the fair values of assets and liabilities, other than investments in securities at period end, resulting from changes in exchange rates.
Forward Currency Contracts
Gains or losses are realized when foreign currency contracts are liquidated. Any change in net unrealized gain or loss is reported in the statement of operations.
Futures Contracts
A futures contract provides for the future sale by one party and purchase by another party of a specified amount of a specific financial instrument (e.g., units of a stock index) for a specified price, date, time and place designated at the time the contract is made. Brokerage fees are incurred when a futures contract is bought or sold and margin deposits must be maintained. Entering into a contract to buy is commonly referred to as buying or purchasing a contract or holding a long position. Entering into a contract to sell is commonly referred to as selling a contract or holding a short position.
Unlike when a Fund purchases or sells a security, no price would be paid or received by the Fund upon the purchase or sale of a futures contract.
Although certain futures contracts, by their terms, require actual future delivery of and payment for the underlying instruments, in practice most futures contracts are usually closed out before the delivery date. Gains or losses are realized when contracts are liquidated. Closing out an open futures contract purchase or sale is effected by entering into an offsetting futures contract sale or purchase, respectively, for the same aggregate amount of the identical underlying instrument or index and the same delivery date. If the offsetting purchase price is less than the original sale price, the Fund realizes a gain; if it is more, the Fund realizes a loss. Conversely, if the offsetting sale price is more than the original purchase price, the Fund realizes a gain; if it is less, the Fund realizes a loss.
The transaction costs must also be included in these calculations. There can be no assurance, however, that a Fund will be able to enter into an offsetting transaction with respect to a particular futures contract at a particular time. If a Fund is not able to enter into an offsetting transaction, the Fund will continue to be required to maintain the margin deposits on the futures contract.
Any change in net unrealized gain or loss is reported in the statement of operations.
Indemnifications
In the normal course of business, the Funds enter into contracts that contain general indemnifications to other parties. The Funds’ maximum exposure under these contracts is unknown as this would involve future claims that may be made against the Funds that have not yet occurred. However, based on experience, the Funds expect the risk of loss to be remote.
Market and Credit Risks
The Funds may engage in the speculative trading of U.S. and foreign futures, forward currency and swap contracts (collectively, derivatives). The Funds are exposed to both market risk, which is the risk arising from changes in the fair value of the contracts, and credit risk, which is the risk of failure by another party to perform according to the terms of a contract.
Purchase and sale of futures contracts requires margin deposits with the broker. Additional deposits may be necessary for any loss on contract value. The Commodity Exchange Act requires a broker to segregate all customer transactions and assets from such broker’s proprietary activities. A customer’s cash and other property (for example, U.S. government securities) deposited with a broker are considered commingled with all other customer funds subject to the broker’s segregation requirements. In the event of a broker’s insolvency, recovery may be limited to a pro rata share of segregated funds available. It is possible that the recovered amount could be less than total cash and other property deposited.
For derivatives, risks arise from changes in the fair value of the contracts. Theoretically, the Funds are exposed to a market risk equal to the notional contract value of swap, futures and forward currency contracts purchased and unlimited liability on such contracts sold short.
The Funds also engage in investing its assets in U.S. government securities. Risks arise from investments in U.S. government securities due to possible market illiquidity. U.S. government securities are also sensitive to changes in interest rates and economic conditions.
The Funds have established procedures to actively monitor market risk and minimize credit risk, although there can be no assurance that they will, in fact, succeed in doing so.
New Accounting Pronouncements
In May 2015, the FASB issued Accounting Standards Update (“ASU”) No. 2015-07, “Disclosure for Investments in Certain Entities that Calculate Net Asset Value per Share (or Its Equivalent)”. The amendments in ASU No. 2015-07 remove the requirement to categorize within the fair value hierarchy investments measured using the Net Asset Value (“NAV”) practical expedient. The ASU also removes certain disclosure requirements for investments that qualify, but do not utilize, the NAV practical expedient. The amendments in the ASU are effective for fiscal years beginning after December 15, 2015, and interim periods within those fiscal years. Management is currently evaluating the impact these changes will have on the Funds’ financial statements and related disclosures.
Options on Securities
The Funds may purchase and write (i.e., sell) put and call options. Such options may relate to particular securities or stock indices, and may or may not be listed on a domestic or foreign securities exchange and may or may not be issued by the Options Clearing Corporation. Options trading is a highly specialized activity that entails greater than ordinary investment risk. Options may be more volatile than the underlying instruments, and therefore, on a percentage basis, an investment in options may be subject to greater fluctuation than an investment in the underlying instruments themselves.
LoCorr Managed Futures Strategy Fund, LoCorr Long/Short Commodities Strategy Fund, LoCorr Multi-Strategy Fund and LoCorr Market Trend Fund - Notes to Consolidated Financial Statements / LoCorr Long/Short Equity Fund and LoCorr Spectrum Income Fund - Notes to Financial Statements (continued) | | | 87 |
A call option for a particular security gives the purchaser of the option the right to buy, and the writer (seller) the obligation to sell, the underlying security at the stated exercise price at any time prior to the expiration of the option, regardless of the market price of the security. The premium paid to the writer is in consideration for undertaking the obligation under the option contract. A put option for a particular security gives the purchaser the right to sell the security at the stated exercise price at any time prior to the expiration date of the option, regardless of the market price of the security.
A Fund’s obligation to sell an instrument subject to a call option written by it, or to purchase an instrument subject to a put option written by it, may be terminated prior to the expiration date of the option by the Fund’s execution of a closing purchase transaction, which is effected by purchasing on an exchange an option of the same series (i.e., same underlying instrument, exercise price and expiration date) as the option previously written. A closing purchase transaction will ordinarily be effected to realize a profit on an outstanding option, to prevent an underlying instrument from being called, to permit the sale of the underlying instrument or to permit the writing of a new option containing different terms on such underlying instrument. The cost of such a liquidation purchase plus transactions costs may be greater than the premium received upon the original option, in which event the Fund will have incurred a loss in the transaction. There is no assurance that a liquid secondary market will exist for any particular option. An option writer unable to effect a closing purchase transaction will not be able to sell the underlying instrument or liquidate the assets held in a segregated account, as described below, until the option expires or the optioned instrument is delivered upon exercise. In such circumstances, the writer will be subject to the risk of market decline or appreciation in the instrument during such period.
If an option purchased by a Fund expires unexercised, the Fund realizes a loss equal to the premium paid. If a Fund enters into a closing sale transaction on an option purchased by it, the Fund will realize a gain if the premium received by the Fund on the closing transaction is more than the premium paid to purchase the option or a loss if it is less. If an option written by a Fund expires on the stipulated expiration date or if the Fund enters into a closing purchase transaction, it will realize a gain (or loss if the cost of a closing purchase transaction exceeds the net premium received when the option is sold). If an option written by the Fund is exercised, the proceeds of the sale will be increased by the net premium originally received and the Fund will realize a gain or loss.
Organizational Costs
Organizational costs in connection with the organization of the Funds are expensed as incurred. For the period from April 6, 2015 (commencement of operations) through December 31, 2015, the LoCorr Multi-Strategy Fund expensed $15,167 in organizational costs associated with the legal fees related to the Fund’s formation and incorporation of business.
Security Transactions and Investment Income
Security transactions are recorded on trade date. Generally, realized gains and losses on sales of investments are calculated on the specifically identified cost basis of the securities.
Each Fund may invest up to 15% of its net assets in illiquid securities. Illiquid securities may include securities subject to contractual or legal restrictions on resale (e.g., because they have not been registered under the Securities Act) and securities that are otherwise not readily marketable (e.g., because trading in the security is suspended or because market makers do not exist or will not entertain bids or offers). Securities that have not been registered under the Securities Act are referred to as private investments or restricted securities and are purchased directly from the issuer or in the secondary market. Foreign securities that are freely tradable in their principal markets are not considered to be illiquid. Under guidelines adopted by the Trust’s Board, the Adviser of the Fund may determine that particular Rule 144(a) securities, and commercial paper issued in reliance on the private placement exemption from registration afforded by Section 4(a)(2) of the Securities Act, are liquid even though they are not registered. At December 31, 2015, the Adviser deemed all of the restricted securities held in the LoCorr Managed Futures Strategy Fund, the LoCorr Long/Short Commodities Strategy Fund and the LoCorr Market Trend Fund to be liquid. There were no illiquid or restricted securities held in the LoCorr Multi-Strategy Fund or the LoCorr Long/Short Equity Fund at December 31, 2015. The LoCorr Spectrum Income Fund’s investment in Terra was deemed by the Adviser to be illiquid at December 31, 2015 and represented 12.36% of the Fund’s net assets. The private placement memorandum of Terra specifies that it will continue in existence until December 31, 2023, unless terminated sooner.
Dividend income, less foreign taxes withheld, if any, are recorded on the ex-dividend date.
Distributions received from the investments in MLP interests, REITs, private investments and royalty trusts generally are comprised of ordinary income, capital gains and return of capital. For financial statement purposes, the Funds use estimates to characterize these distributions received as return of capital, capital gains or ordinary income. Such estimates are based on historical information available from each MLP, REIT, private investment or royalty trust and other industry sources. These estimates may subsequently be revised based on information received from the MLP, REIT, private investment or royalty trust after their tax reporting periods are concluded, as the actual character of these distributions is not known until after the fiscal year end of the Funds. The distributions received from the MLP, REIT, private investment and royalty trust securities that have been classified as income and capital gains are included in investment income and net realized gain (loss) on investments, respectively, on the statement of operations. The distributions received that are classified as return of capital reduce the cost of investments on the statement of assets and liabilities. For the period ended December 31, 2015, the Funds estimated that 100% of the MLP distributions received would be treated as return of capital. For the year ended December 31, 2015, approximately 100% of the total distributions received from Terra are estimated to be interest income.
Interest income and expense are recognized on the accrual basis. Market discounts, premiums and original issue discounts on fixed-income securities are amortized daily over the expected life of the security using the effective yield method.
Short Sales
The Funds may sell securities short. A short sale is a transaction in which the Fund sells a security it does not own or have the right to acquire (or that it owns but does not wish to deliver) in anticipation that the market price of that security will decline.
| 88 | | | LoCorr Managed Futures Strategy Fund, LoCorr Long/Short Commodities Strategy Fund, LoCorr Multi-Strategy Fund and LoCorr Market Trend Fund - Notes to Consolidated Financial Statements / LoCorr Long/Short Equity Fund and LoCorr Spectrum Income Fund - Notes to Financial Statements (continued) |
When a Fund makes a short sale, the broker-dealer through which the short sale is made must borrow the security sold short and deliver it to the party purchasing the security. The Funds are required to make a margin deposit in connection with such short sales; the Funds may have to pay a fee to borrow particular securities and will often be obligated to pay over any dividends and accrued interest on borrowed securities.
If the price of the security sold short increases between the time of the short sale and the time the Fund covers its short position, the Fund will incur a loss; conversely, if the price declines, the Fund will realize a gain. A gain, limited to the price at which the Fund sold the security short, or a loss, unlimited in size, will be recognized upon the close of a short sale. Any gain will be decreased, and any loss increased, by the transaction costs described above. The successful use of short selling may be adversely affected by imperfect correlation between movements in the price of the security sold short and the securities being hedged. Gains or losses from closed positions of securities sold short are presented as net realized gain or loss on securities sold short on the statement of operations.
In addition, the Funds are required to pay the lender any dividends declared on short positions. Dividends declared on open short positions are recorded on ex-date and shown as an expense for financial reporting purposes. To borrow the security, the Funds also may be required to pay fees, which is shown as an expense for financial reporting purposes.
To the extent the Funds sell securities short, it will provide collateral to the broker-dealer and (except in the case of short sales “against the box”) will maintain additional asset coverage in the form of cash, U.S. government securities or other liquid securities with its custodian in a segregated account in an amount at least equal to the difference between the current fair value of the securities sold short and any amounts required to be deposited as collateral with the selling broker (not including the proceeds of the short sale). A short sale is “against the box” to the extent the Funds contemporaneously own, or have the right to obtain at no added cost, securities identical to those sold short. Short sales are collateralized by cash deposits with the counterparty broker and pledged securities held at the custodian, U.S. Bank, N.A. (“U.S. Bank”). The collateral required is determined daily by reference to the fair value of the short positions.
Total Return Swap Contracts
The Funds may enter into total return swap agreements. A total return swap entered into by the Funds is a derivative contract that transfers the market risk of underlying portfolios of futures and forward currency contracts (considered the “index” within each total return swap contract) between counterparties. The “notional amount” of each total return swap agreement is the agreed upon amount or value of the index used for calculating the returns that the parties to a swap agreement have agreed to exchange. The total return swaps are marked to market daily and any change is recorded in unrealized gain/loss on the consolidated statement of operations based on the value of the index on which the total return swap is referenced, as defined within the total return swap agreement between the counterparties. The composition of the index may vary based on how the underlying portfolio of futures and forward currency contracts is traded. A Fund’s obligation under a total return swap agreement, including any related fees, offset against amounts owed to the Fund in the case of positive performance, will be covered by designating liquid assets on the Fund’s books and records (see the consolidated statement of assets and liabilities for deposits with broker for derivative instruments). Gains or losses will be realized when the total return swap contracts are liquidated and will be presented as net realized gain or loss on swap contracts on the consolidated statements of operations. In addition, changes in notional value and any cash holding adjustments, which represent voluntary realizations by a Fund of swap value at any point in time, are also presented as net realized gain or loss on swap contracts on the consolidated statements of operations. A corresponding asset or liability for “advance receipt on swap contracts” or “advance payment on swap contracts”, respectively, is recorded on the consolidated statements of assets and liabilities for the gain or loss realized on changes in notional value. Total return swaps outstanding at period end, if any, are listed after the Funds’ consolidated schedules of investments.
Use of Estimates
The preparation of consolidated financial statements in conformity with GAAP requires management to make estimates and assumptions that affect the reported amounts of assets and liabilities, disclosure of contingent assets and liabilities at the date of the financial statements and the reported revenues and expenses during the reporting period. Actual results could differ from those estimates.
Warrants
The Funds may invest in warrants. Warrants are options to purchase common stock at a specific price (usually at a premium above the market value of the optioned common stock at issuance) valid for a specific period of time. Warrants may have a life ranging from less than one year to twenty years, or they may be perpetual. However, most warrants have expiration dates after which they are worthless. In addition, a warrant is worthless if the market price of the common stock does not exceed the warrant’s exercise price during the life of the warrant. Warrants have no voting rights, pay no dividends, and have no rights with respect to the assets of the corporation issuing them. The percentage increase or decrease in the market price of the warrant may tend to be greater than the percentage increase or decrease in the market price of the optioned common stock.
3. Derivative and Other Financial Instruments
The Funds may invest in derivatives such as futures, forward currency, and swap contracts, in order to hedge against market movements while liquidating certain positions and buying other securities or as substitutes for securities, as well as for speculative purposes to gain exposure to such market movements.
The Funds’ market risk related to their derivatives trading is influenced by a wide variety of factors, including the level and volatility of interest rates, exchange rates, weather, supply and demand of commodities, the market value of futures and forward currency contracts, the diversification effects among the Funds’ open positions and the liquidity of the markets in which they trade.
The following are the primary trading risk exposures by market sector of the Funds as encompassed in the total return swap contracts:
LoCorr Managed Futures Strategy Fund, LoCorr Long/Short Commodities Strategy Fund, LoCorr Multi-Strategy Fund and LoCorr Market Trend Fund - Notes to Consolidated Financial Statements / LoCorr Long/Short Equity Fund and LoCorr Spectrum Income Fund - Notes to Financial Statements (continued) | | | 89 |
Agricultural (grains, livestock and softs). The Funds’ primary exposure is to agricultural price movements which are often directly affected by severe or unexpected weather conditions.
Currencies. Exchange rate risk is a principal market exposure of the Funds. The Funds’ currency exposure is to exchange rate fluctuations, primarily fluctuations which disrupt the historical pricing relationships between different currencies and currency pairs. The fluctuations are influenced by interest rate changes as well as political and general economic conditions. The Funds trade in a large number of currencies including cross-rates – e.g., positions between two currencies other than the U.S. dollar.
Energy. The Funds’ primary energy market exposure is to gas and oil price movements, often resulting from political developments in the Middle East and economic conditions worldwide. Energy prices are volatile and substantial profits and losses have been and are expected to continue to be experienced in this market.
Interest rates. Interest rate movements directly affect the price of the sovereign bond futures positions held by the Funds and indirectly the value of its stock index currency positions. Interest rate movements in one country as well as relative interest rate movements between countries may materially impact the Funds’ profitability. The Funds’ primary interest rate exposure is to interest rate fluctuations in countries or regions including Australia, Canada, Japan, Switzerland, the United Kingdom, the United States and the Eurozone. However, the Funds also may take positions in futures contracts on the government debt of other nations. The Funds anticipate that interest rates in these industrialized countries or areas, both long-term and short-term, will remain a primary market exposure of the Funds for the foreseeable future.
Metals. The Funds’ metals market exposure is to fluctuations in the price of aluminum, copper, gold, lead, nickel, palladium, tin, silver and zinc.
Stock index. The Funds’ equity exposure, through stock index futures, is to equity price risk in the major industrialized countries as well as other countries.
At December 31, 2015, the LoCorr Managed Futures Strategy Fund, the LoCorr Long/Short Commodities Strategy Fund and the LoCorr Multi-Strategy Fund held swap contracts which are not subject to a master netting arrangement. As the tables below illustrate, no positions are netted in these consolidated financial statements.
| LoCorr Managed Futures Strategy Fund - December 31, 2015 | |||||||||||||||||||
| Liabilities: | Gross Amounts not offset in the Consolidated Statement of Assets & Liabilities | ||||||||||||||||||
| Description | Gross Amounts of Recognized Liabilities | Gross Amounts Offset in the Consolidated Statement of Assets & Liabilities | Net Amounts Presented in the Consolidated Statement of Assets & Liabilities | Financial Instruments | Collateral Received (Pledged) | Net Amount | |||||||||||||
| Swap Contracts | $ | 12,934,752 | $ | — | $ | 12,934,752 | $ | — | $ | (12,934,752) | $ | — | |||||||
| Total | $ | 12,934,752 | $ | — | $ | 12,934,752 | $ | — | $ | (12,934,752) | $ | — | |||||||
| LoCorr Long/Short Commodities Strategy Fund - December 31, 2015 | |||||||||||||||||||
| Liabilities: | Gross Amounts not offset in the Consolidated Statement of Assets & Liabilities | ||||||||||||||||||
| Description | Gross Amounts of Recognized Liabilities | Gross Amounts Offset in the Consolidated Statement of Assets & Liabilities | Net Amounts Presented in the Consolidated Statement of Assets & Liabilities | Financial Instruments | Collateral Received (Pledged) | Net Amount | |||||||||||||
| Swap Contracts | $ | 3,079,037 | $ | — | $ | 3,079,037 | $ | — | $ | (3,079,037) | $ | — | |||||||
| Total | $ | 3,079,037 | $ | — | $ | 3,079,037 | $ | — | $ | (3,079,037) | $ | — | |||||||
| LoCorr Multi-Strategy Fund - December 31, 2015 | |||||||||||||||||||
| Liabilities: | Gross Amounts not offset in the Consolidated Statement of Assets & Liabilities | ||||||||||||||||||
| Description | Gross Amounts of Recognized Liabilities | Gross Amounts Offset in the Consolidated Statement of Assets & Liabilities | Net Amounts Presented in the Consolidated Statement of Assets & Liabilities | Financial Instruments | Collateral Received (Pledged) | Net Amount | |||||||||||||
Swap Contracts* | $ | 239,445 | $ | — | $ | 239,445 | $ | — | $ | (239,445) | $ | — | |||||||
| Total | $ | 239,445 | $ | — | $ | 239,445 | $ | — | $ | (239,445) | $ | — | |||||||
*Includes advance payment on swap contracts.
| 90 | | | LoCorr Managed Futures Strategy Fund, LoCorr Long/Short Commodities Strategy Fund, LoCorr Multi-Strategy Fund and LoCorr Market Trend Fund - Notes to Consolidated Financial Statements / LoCorr Long/Short Equity Fund and LoCorr Spectrum Income Fund - Notes to Financial Statements (continued) |
At December 31, 2015, the LoCorr Market Trend Fund held derivative and other financial instruments which are not subject to a master netting arrangement.
| LoCorr Market Trend Fund - December 31, 2015 | |||||||||||||||||||
| Assets: | Gross Amounts not offset in the Consolidated Statement of Assets & Liabilities | ||||||||||||||||||
| Description | Gross Amounts of Recognized Assets | Gross Amounts Offset in the Consolidated Statement of Assets & Liabilities | Net Amounts Presented in the Consolidated Statement of Assets & Liabilities | Financial Instruments | Collateral Pledged (Received) | Net Amount | |||||||||||||
| Forward Currency Contracts | $ | 15,927,379 | $ | — | $ | 15,927,379 | $ | — | $ | — | $ | 15,927,379 | |||||||
| Total | $ | 15,927,379 | $ | — | $ | 15,927,379 | $ | — | $ | — | $ | 15,927,379 | |||||||
| Liabilities: | Gross Amounts not offset in the Consolidated Statement of Assets & Liabilities | ||||||||||||||||||
| Description | Gross Amounts of Recognized Liabilities | Gross Amounts Offset in the Consolidated Statement of Assets & Liabilities | Net Amounts Presented in the Consolidated Statement of Assets & Liabilities | Financial Instruments | Collateral Received (Pledged) | Net Amount | |||||||||||||
| Forward Currency Contracts | $ | 1,701,055 | $ | — | $ | 1,701,055 | $ | — | $ | (1,701,055) | $ | — | |||||||
| Futures Contracts | 1,570,391 | — | 1,570,391 | — | (1,570,391) | — | |||||||||||||
| Total | $ | 3,271,446 | $ | — | $ | 3,271,446 | $ | — | $ | (3,271,446) | $ | — | |||||||
The Funds have adopted authoritative standards regarding disclosure about derivatives and hedging activities and how they affect the Funds’ consolidated statements of assets and liabilities and consolidated statements of operations. Fair value of swap contracts are recorded in the consolidated statements of assets and liabilities as net unrealized gain on swap contracts or net unrealized loss on swap contracts and net unrealized appreciation of swap contracts or net unrealized depreciation of swap contracts.
Since the derivatives held long or short are for speculative trading purposes, the derivative instruments are not designated as hedging instruments. Accordingly, all realized gains and losses, as well as any change in net unrealized gains or losses on open contracts from the preceding period, are recognized as part of realized and unrealized gain (loss) in the consolidated statements of operations.
The following table presents the fair value of consolidated derivative instruments for the LoCorr Managed Futures Strategy Fund, the LoCorr Long/Short Commodities Strategy Fund, the LoCorr Long/Short Equity Fund, the LoCorr Multi-Strategy Fund and the LoCorr Market Trend Fund as of December 31, 2015 as presented on the Fund’s consolidated statement of assets and liabilities:
| Net Unrealized | ||||||||||
| Gain (Loss) on | ||||||||||
| Fair Value | Open | |||||||||
| Derivatives not accounted for as hedging instruments | Assets | Liabilities | Positions | |||||||
| LoCorr Managed Futures Strategy Fund | ||||||||||
Long Total Return Swap Contracts(a) | ||||||||||
| LoCorr Managed Futures Index | $ | — | $ | 12,934,752 | $ | (12,934,752) | ||||
| LoCorr Long/Short Commodities Strategy Fund | ||||||||||
Long Total Return Swap Contracts(a) | ||||||||||
| LoCorr Commodities Index | $ | — | $ | 3,079,037 | $ | (3,079,037) | ||||
| LoCorr Multi-Strategy Fund | ||||||||||
Long Put Option Contract(b) | ||||||||||
| Equity Put Option | $ | 190,320 | $ | — | $ | 22,993 | ||||
Long Total Return Swap Contracts(a) | ||||||||||
| LoCorr Multi-Strategy Index | $ | — | $ | 195,200 | $ | (195,200) | ||||
| LoCorr Market Trend Fund | ||||||||||
Forward Currency Contracts(a) | ||||||||||
| Long | $ | 1,589,681 | $ | 1,335,443 | $ | 254,238 | ||||
| Short | 14,337,698 | 365,612 | 13,972,086 | |||||||
| Total Forward Currency Contracts | 15,927,379 | 1,701,055 | 14,226,324 | |||||||
LoCorr Managed Futures Strategy Fund, LoCorr Long/Short Commodities Strategy Fund, LoCorr Multi-Strategy Fund and LoCorr Market Trend Fund - Notes to Consolidated Financial Statements / LoCorr Long/Short Equity Fund and LoCorr Spectrum Income Fund - Notes to Financial Statements (continued) | | | 91 |
Net Unrealized Gain (Loss) on Open Positions | ||||||||||||
| Fair Value | ||||||||||||
| Derivatives not accounted for as hedging instruments | Assets | Liabilities | ||||||||||
Futures Contracts(c) | ||||||||||||
| Long Contracts | ||||||||||||
| Commodity | $ | — | $ | — | $ | — | ||||||
| Equity | 2,164,860 | 2,027,403 | 137,457 | |||||||||
| Interest Rate | — | 6,233,755 | (6,233,755) | |||||||||
| Total Long Contracts | 2,164,860 | 8,261,158 | (6,096,298) | |||||||||
| Short Contracts | ||||||||||||
| Commodity | 6,788,129 | 3,042,551 | 3,745,578 | |||||||||
| Equity | 320,127 | 6,127,238 | (5,807,111) | |||||||||
| Interest Rate | 181,834 | 572,747 | (390,913) | |||||||||
| Total Short Contracts | 7,290,090 | 9,742,536 | (2,452,446) | |||||||||
| Total Futures Contracts | 9,454,950 | 18,003,694 | (8,548,744) | |||||||||
| Total Forward Currency Contracts and Futures Contracts | $ | 25,382,329 | $ | 19,704,749 | $ | 5,677,580 | ||||||
| LoCorr Long/Short Equity Fund | ||||||||||||
Long Put Option Contract(b) | ||||||||||||
| Equity Put Option | $ | 413,580 | $ | — | $ | 55,392 | ||||||
(a) Unrealized appreciation on total return swap contracts and forward currency contracts are a receivable and unrealized depreciation on total return swap contracts and forward currency contracts are a payable on the Fund’s consolidated statement of assets and liabilities.
(b) Included in the consolidated statement of assets and liabilities: Investments, at value.
(c) Reflects the cumulative unrealized appreciation (depreciation) of futures contracts as reported in the Fund’s consolidated schedule of open futures contracts. Only the current day variation margin for futures contracts is separately reported within the Fund’s consolidated statement of assets and liabilities.
The following table presents the trading results of the derivative trading and information related to volume for the year ended December 31, 2015 for the LoCorr Managed Futures Strategy Fund, the LoCorr Long/Short Commodities Strategy Fund and the LoCorr Market Trend Fund and for the period from April 6, 2015 (commencement of operations) through December 31, 2015 for the LoCorr Multi-Strategy Fund. The below captions of “Net Realized” and “Net Change in Unrealized” correspond to the captions in each Fund’s consolidated statement of operations.
| Gain (Loss) from Trading | ||||||||
| Fund and Type of Derivative Instrument | Net Realized | Net Change in Unrealized | ||||||
| LoCorr Managed Futures Strategy Fund | ||||||||
| Swap Contracts | $ | 53,464,901 | $ | (29,782,805) | ||||
| LoCorr Long/Short Commodities Strategy Fund | ||||||||
| Swap Contracts | $ | 9,770,486 | $ | (1,153,882) | ||||
| LoCorr Multi-Strategy Fund | ||||||||
Put Option(a) | $ | — | $ | 22,993 | ||||
| Swap Contracts | (44,245) | (195,200) | ||||||
| LoCorr Market Trend Fund | ||||||||
| Forward Currency Contracts | $ | 2,652,623 | $ | 13,812,767 | ||||
| Futures Contracts | ||||||||
| Commodity | 16,630,225 | 3,047,643 | ||||||
| Equity | (28,297,662) | (5,718,408) | ||||||
| Interest rate | (4,142,929) | (7,338,049) | ||||||
| Total Futures Contracts | (15,810,366) | (10,008,814) | ||||||
| Total Forward Currency Contracts and Futures Contracts | $ | (13,157,743) | $ | 3,803,953 | ||||
| LoCorr Long/Short Equity Fund | ||||||||
Put Option(a) | $ | — | $ | 55,392 | ||||
(a) Included in the consolidated statement of operations: Net realized gain (loss) on investments and net change in unrealized appreciation (depreciation) on investments.
| 92 | | | LoCorr Managed Futures Strategy Fund, LoCorr Long/Short Commodities Strategy Fund, LoCorr Multi-Strategy Fund and LoCorr Market Trend Fund - Notes to Consolidated Financial Statements / LoCorr Long/Short Equity Fund and LoCorr Spectrum Income Fund - Notes to Financial Statements (continued) |
The average monthly notional amount is shown as an indicator of volume. The average monthly notional amounts during the period were:
Average Notional Amount (a) | ||||||||
| Fund and Type of Derivative Instrument | Long Contracts | Short Contracts | ||||||
| LoCorr Managed Futures Strategy Fund | ||||||||
| Swap Contracts | $ | 515,519,768 | $ | — | ||||
| LoCorr Long/Short Commodities Strategy Fund | ||||||||
| Swap Contracts | $ | 34,015,384 | $ | — | ||||
| LoCorr Multi-Strategy Fund | ||||||||
| Swap Contracts | $ | 24,104,805 | $ | — | ||||
| LoCorr Market Trend Fund | ||||||||
| Forward Currency Contracts | $ | 384,190,890 | $ | 675,489,521 | ||||
| Futures Contracts | 2,980,809,742 | 342,239,816 | ||||||
(a) During the year ended December 31, 2015 for the LoCorr Managed Futures Strategy Fund, the LoCorr Long/Short Commodities Strategy Fund and the LoCorr Market Trend Fund and for the period from April 6, 2015 (commencement of operations) through December 31, 2015 for the LoCorr Multi-Strategy Fund.
The Funds consider the put options held at December 31, 2015, as noted on the respective schedules of investments, to be an accurate representation of the volume of activity in options contracts for the year ended December 31, 2015.
Please refer to the Funds’ prospectus for a full listing of risks associated with these investments.
4. Investment Transactions
The cost of security purchases and proceeds from security sales, excluding short-term investments, derivative instruments, short sales and purchases to cover short sales for the period ended December 31, 2015(a) were as follows:
| U.S. Government Obligations | All Other | |||||||||||||||
| Purchases | Sales | Purchases | Sales | |||||||||||||
| LoCorr Managed Futures Strategy Fund | $ | 69,840,391 | $ | 55,508,199 | $ | 241,072,557 | $ | 156,861,518 | ||||||||
| LoCorr Long/Short Commodities Strategy Fund | 12,037,511 | 980,109 | 32,490,318 | 38,652,932 | ||||||||||||
| LoCorr Multi-Strategy Fund | — | — | 36,507,879 | 7,044,363 | ||||||||||||
| LoCorr Market Trend Fund | 163,138,320 | 23,193,017 | 613,682,925 | 71,139,441 | ||||||||||||
| LoCorr Long/Short Equity Fund | — | — | 84,902,497 | 105,215,504 | ||||||||||||
| LoCorr Spectrum Income Fund | — | — | 69,120,485 | 55,298,229 | ||||||||||||
(a) During the year ended December 31, 2015 for the LoCorr Managed Futures Strategy Fund, the LoCorr Long/Short Commodities Strategy Fund, the LoCorr Market Trend Fund, the LoCorr Long/Short Equity Fund and the LoCorr Spectrum Income Fund and for the period from April 6, 2015 (commencement of operations) through December 31, 2015 for the LoCorr Multi-Strategy Fund.
5. Management Fees and Other Transactions with Affiliates
Management Agreement
The Trust has a Management Agreement with the Adviser, with whom certain officers and Trustees of the Funds are affiliated, to furnish investment advisory services to the Funds. Pursuant to the Amendment to the Management Agreement, the Adviser is entitled to receive a fee, in accordance with the Incremental Advisory Fee schedule below based on each of the LoCorr Managed Futures Strategy Fund and the LoCorr Long/Short Commodities Strategy Fund’s average daily net assets.
| Net Assets per Fund for each of the | |
| LoCorr Managed Futures Strategy Fund and the | Incremental* |
| LoCorr Long/Short Commodities Strategy Fund | Advisory Fee |
| $0.0 – $0.5 billion | 1.50% |
| $0.5 – $1.0 billion | 1.40% |
| $1.0 – $1.5 billion | 1.30% |
| $1.5 – $2.0 billion | 1.20% |
| $2.0 – $2.5 billion | 1.10% |
| Over $2.5 billion | 1.00% |
*Incremental advisory fee represents the fees paid on net assets at the related net asset level. For example, with $3 billion in net assets in a Fund, the Adviser would earn 1.50% on the first $500 million, plus 1.40% on the next $500 million, plus 1.30% on the next $500 million, plus 1.20% on the next $500 million, plus 1.10% on the next $500 million, plus 1.00% on the final $500 million.
LoCorr Managed Futures Strategy Fund, LoCorr Long/Short Commodities Strategy Fund, LoCorr Multi-Strategy Fund and LoCorr Market Trend Fund - Notes to Consolidated Financial Statements / LoCorr Long/Short Equity Fund and LoCorr Spectrum Income Fund - Notes to Financial Statements (continued) | | | 93 |
In addition, pursuant to the Amendment to the Management Agreement, the Adviser is entitled to receive a fee as follows:
| Annual Advisory Fee as a Percentage | |
| Fund | of the Average Daily Net Assets of the Fund |
| LoCorr Multi-Strategy Fund | 1.75% |
| LoCorr Market Trend Fund | 1.50% |
| LoCorr Long/Short Equity Fund | 2.45% |
| LoCorr Spectrum Income Fund | 1.30% |
For the period ended December 31, 2015, the Funds reported the following in regards to management fees:
| Accrued | ||||||||
| Management Fees | Management Fees | |||||||
| For the Period Ended | as of | |||||||
| Fund | December 31, 2015(a) | December 31, 2015 | ||||||
| LoCorr Managed Futures Strategy Fund | $ | 7,928,766 | $ | 666,056 | ||||
| LoCorr Long/Short Commodities Strategy Fund | 592,149 | 57,111 | ||||||
| LoCorr Multi-Strategy Fund | 301,296 | 35,008 | ||||||
| LoCorr Market Trend Fund | 6,778,986 | 1,082,912 | ||||||
| LoCorr Long/Short Equity Fund | 869,057 | 45,414 | ||||||
| LoCorr Spectrum Income Fund | 1,417,735 | 99,423 | ||||||
(a) For the year ended December 31, 2015 for the LoCorr Managed Futures Strategy Fund, the LoCorr Long/Short Commodities Strategy Fund, the LoCorr Market Trend Fund, the LoCorr Long/Short Equity Fund and the LoCorr Spectrum Income Fund and for the period from April 6, 2015 (commencement of operations) through December 31, 2015 for the LoCorr Multi-Strategy Fund.
Sub-Advisory Agreements
Sub-advisory services are provided to the Funds, pursuant to agreements between the Adviser and the below listed sub-advisers. Under the terms of these sub-advisory agreements, the Adviser compensates the sub-advisers based on the portion of each Fund’s average daily net assets which they have been allocated to manage.
| LoCorr Managed Futures Strategy Fund: | LoCorr Market Trend Fund: |
| Nuveen Asset Management, LLC | Graham Capital Management, L.P. |
| Nuveen Asset Management, LLC | |
| LoCorr Long/Short Commodities Strategy Fund: | |
| Nuveen Asset Management, LLC | LoCorr Long/Short Equity Fund: |
| Billings Capital Management LLC | |
| LoCorr Multi-Strategy Fund: | Kettle Hill Capital Management, LLC |
| Billings Capital Management LLC | Millennium Asset Management, L.L.C.(a) |
| Trust and Fiduciary Management Services, Inc. | |
| LoCorr Spectrum Income Fund: | |
| Trust and Fiduciary Management Services, Inc. |
(a) Effective October 30, 2015, Millennium Asset Management, L.L.C. no longer serves as a sub-adviser to the LoCorr Long/Short Equity Fund.
The Adviser is solely responsible for the payment of the sub-adviser’s fees, and the sub-adviser agrees not to seek payment of its fees from the Trust or the Funds.
Expense Limitation Agreement
The Funds’ Adviser has contractually agreed to waive management fees and/or reimburse the Funds for expenses it incurs but only to the extent necessary to maintain the Funds’ total annual operating expenses after fee waiver and/or reimbursement (excluding any Rule 12b-1 distribution and/or servicing fees, taxes, interest, brokerage commissions, expenses incurred in connection with any merger or reorganization, dividend expenses on short sales, swap fees, indirect expenses, expenses of other investment companies in which the Funds may invest, or extraordinary expenses such as litigation and inclusive of organizational costs incurred prior to the commencement of operations) at the percentages listed below:
| Expense Limit as a Percentage of the | ||
| Fund | Average Daily Net Assets of the Fund | Effective Period Through |
| LoCorr Managed Futures Strategy Fund | 1.95% | April 30, 2016 |
| LoCorr Long/Short Commodities Strategy Fund | 1.95% | April 30, 2016 |
| LoCorr Multi-Strategy Fund | 2.04% | April 30, 2016 |
| LoCorr Market Trend Fund | 1.95% | April 30, 2016 |
| LoCorr Long/Short Equity Fund | 2.90% | April 30, 2016 |
| LoCorr Spectrum Income Fund | 1.80% | April 30, 2016 |
Any waiver or reimbursement is subject to repayment by the respective Fund within the three fiscal years following the fiscal year in which the expenses occurred, if the Fund is able to make the repayment without exceeding its current expense limitations and the repayment is approved by the Board of Trustees. The organizational and offering costs are subject to repayment by the Funds.
| 94 | | | LoCorr Managed Futures Strategy Fund, LoCorr Long/Short Commodities Strategy Fund, LoCorr Multi-Strategy Fund and LoCorr Market Trend Fund - Notes to Consolidated Financial Statements / LoCorr Long/Short Equity Fund and LoCorr Spectrum Income Fund - Notes to Financial Statements (continued) |
The total amounts of management fees waived and/or expenses reimbursed which are subject to recovery, and their related expiration date are as follows:
| LoCorr Long/Short Commodities Strategy Fund | ||||||||||||||||||||||||
| Fees (Waived) or Expenses (Borne) by | Subject to Recovery | |||||||||||||||||||||||
| Adviser Subject to Recovery | Recovery to Adviser | on or before Fiscal | ||||||||||||||||||||||
| Management | Other | Year Ended | Remaining Available | Year Ending | ||||||||||||||||||||
| Period | Fees | Expenses | Total | December 31, 2015 | Subject to Recovery | December 31, | ||||||||||||||||||
| Year Ended December 31, 2015 | $ | (154,527 | ) | $ | — | $ | (154,527 | ) | $ | — | $ | (154,527 | ) | 2018 | ||||||||||
| Year Ended December 31, 2014 | (226,735 | ) | — | (226,735 | ) | — | (226,735 | ) | 2017 | |||||||||||||||
| Year Ended December 31, 2013 | (171,188 | ) | (54,559) | (225,747 | ) | — | (225,747 | ) | 2016 | |||||||||||||||
| Total | $ | (552,450 | ) | $ | (54,559) | $ | (607,009 | ) | $ | — | $ | (607,009 | ) | |||||||||||
| LoCorr Multi-Strategy Fund | ||||||||||||||||||||||||
| Fees (Waived) or Expenses (Borne) by | Subject to Recovery | |||||||||||||||||||||||
| Adviser Subject to Recovery | Recovery to Adviser | on or before Fiscal | ||||||||||||||||||||||
| Management | Other | Period Ended | Remaining Available | Year Ending | ||||||||||||||||||||
| Period | Fees | Expenses | Total | December 31, 2015* | Subject to Recovery | December 31, | ||||||||||||||||||
Period Ended December 31, 2015* | $ | (195,479 | ) | $ | — | $ | (195,479 | ) | $ | — | $ | (195,479 | ) | 2018 | ||||||||||
| Total | $ | (195,479 | ) | $ | — | $ | (195,479 | ) | $ | — | $ | (195,479 | ) | |||||||||||
| *Period from April 6, 2015 (commencement of operations) through December 31, 2015. | ||||||||||||||||||||||||
| LoCorr Market Trend Fund | ||||||||||||||||||||||||
| Fees (Waived) or Expenses (Borne) by | Subject to Recovery | |||||||||||||||||||||||
| Adviser Subject to Recovery | Recovery to Adviser | on or before Fiscal | ||||||||||||||||||||||
| Management | Other | Year Ended | Remaining Available | Year Ending | ||||||||||||||||||||
| Period | Fees | Expenses | Total | December 31, 2015 | Subject to Recovery | December 31, | ||||||||||||||||||
Period Ended December 31, 2014* | $ | (143,030 | ) | $ | — | $ | (143,030 | ) | $ | 143,030 | $ | — | 2017 | |||||||||||
| Total | $ | (143,030 | ) | $ | — | $ | (143,030 | ) | $ | 143,030 | $ | — | ||||||||||||
| *Period from July 1, 2014 (commencement of operations) through December 31, 2014. | ||||||||||||||||||||||||
| LoCorr Long/Short Equity Fund | ||||||||||||||||||||||||
| Fees (Waived) or Expenses (Borne) by | Subject to Recovery | |||||||||||||||||||||||
| Adviser Subject to Recovery | Recovery to Adviser | on or before Fiscal | ||||||||||||||||||||||
| Management | Other | Year Ended | Remaining Available | Year Ending | ||||||||||||||||||||
| Period | Fees | Expenses | Total | December 31, 2015 | Subject to Recovery | December 31, | ||||||||||||||||||
| Year Ended December 31, 2015 | $ | (132,040 | ) | $ | — | $ | (132,040 | ) | $ | — | $ | (132,040 | ) | 2018 | ||||||||||
| Year Ended December 31, 2014 | (122,831 | ) | — | (122,831 | ) | — | (122,831 | ) | 2017 | |||||||||||||||
Period Ended December 31, 2013* | (140,599 | ) | — | (140,599 | ) | — | (140,599 | ) | 2016 | |||||||||||||||
| Total | $ | (395,470 | ) | $ | — | $ | (395,470 | ) | $ | — | $ | (395,470 | ) | |||||||||||
| *Period from May 10, 2013 (commencement of operations) through December 31, 2013. | ||||||||||||||||||||||||
| LoCorr Spectrum Income Fund | ||||||||||||||||||||||||
| Fees (Waived) or Expenses (Borne) by | Subject to Recovery | |||||||||||||||||||||||
| Adviser Subject to Recovery | Recovery to Adviser | on or before Fiscal | ||||||||||||||||||||||
| Management | Other | Year Ended | Remaining Available | Year Ending | ||||||||||||||||||||
| Period | Fees | Expenses | Total | December 31, 2015 | Subject to Recovery | December 31, | ||||||||||||||||||
| Year Ended December 31, 2014 | $ | (132,869 | ) | $ | — | $ | (132,869 | ) | $ | 67,000 | $ | (65,869 | ) | 2017 | ||||||||||
| Total | $ | (132,869 | ) | $ | — | $ | (132,869 | ) | $ | 67,000 | $ | (65,869 | ) | |||||||||||
At December 31, 2015, there were no fees subject to recovery for the LoCorr Managed Futures Strategy Fund. As of December 31, 2015, the Adviser had recovered all previously waived fees for the LoCorr Market Trend Fund.
For the year ended December 31, 2012, fees and expenses waived and borne by the LoCorr Long/Short Commodities Strategy Fund’s Adviser consisting of $80,503 in management fees and $129,605 in other expenses, totaling $210,108, expired on December 31, 2015 and are no longer eligible for recovery.
Rule 12b-1 Distribution Agreement
The Funds have entered into a 12b-1 distribution agreement with Quasar Distributors, LLC (“Quasar”). Class A and Class C shareholders pay Rule 12b-1 fees to Quasar at the annual rate of 0.25% and 1.00%, respectively, of average daily net assets. Class I shareholders pay no 12b-1 fees.
LoCorr Managed Futures Strategy Fund, LoCorr Long/Short Commodities Strategy Fund, LoCorr Multi-Strategy Fund and LoCorr Market Trend Fund - Notes to Consolidated Financial Statements / LoCorr Long/Short Equity Fund and LoCorr Spectrum Income Fund - Notes to Financial Statements (continued) | | | 95 |
6. Fund Shares
At December 31, 2015, there were an unlimited number of shares of beneficial interest authorized. The following table summarizes the activity in shares and dollar amounts applicable to each class of the Funds:
| LoCorr Managed Futures Strategy Fund – Class A | ||||||||||||||||
| For the Year Ended December 31, 2015 | For the Year Ended December 31, 2014 | |||||||||||||||
| Shares | Amount | Shares | Amount | |||||||||||||
| Shares Sold | 8,987,226 | $ | 77,825,462 | 9,075,320 | $ | 80,698,695 | ||||||||||
| Dividends Reinvested | 622,596 | 5,254,701 | 2,278,102 | 19,454,988 | ||||||||||||
| Shares Redeemed | (7,079,433) | (61,059,914) | (10,570,526) | (92,993,732) | ||||||||||||
| Redemption Fees | — | 1,423 | — | 10,951 | ||||||||||||
| 2,530,389 | $ | 22,021,672 | 782,896 | $ | 7,170,902 | |||||||||||
| Beginning Shares | 24,325,590 | 23,542,694 | ||||||||||||||
| Ending Shares | 26,855,979 | 24,325,590 | ||||||||||||||
| LoCorr Managed Futures Strategy Fund – Class C | ||||||||||||||||
| For the Year Ended December 31, 2015 | For the Year Ended December 31, 2014 | |||||||||||||||
| Shares | Amount | Shares | Amount | |||||||||||||
| Shares Sold | 2,909,687 | $ | 24,579,972 | 3,629,307 | $ | 31,696,190 | ||||||||||
| Dividends Reinvested | 250,744 | 2,061,119 | 1,113,439 | 9,286,080 | ||||||||||||
| Shares Redeemed | (2,616,414) | (21,913,915) | (2,506,615) | (21,310,340) | ||||||||||||
| Redemption Fees | — | 284 | — | 597 | ||||||||||||
| 544,017 | $ | 4,727,460 | 2,236,131 | $ | 19,672,527 | |||||||||||
| Beginning Shares | 11,316,249 | 9,080,118 | ||||||||||||||
| Ending Shares | 11,860,266 | 11,316,249 | ||||||||||||||
| LoCorr Managed Futures Strategy Fund – Class I | ||||||||||||||||
| For the Year Ended December 31, 2015 | For the Year Ended December 31, 2014 | |||||||||||||||
| Shares | Amount | Shares | Amount | |||||||||||||
| Shares Sold | 9,843,336 | $ | 85,909,507 | 14,790,210 | $ | 134,224,345 | ||||||||||
| Dividends Reinvested | 594,192 | 5,056,575 | 1,927,180 | 16,593,017 | ||||||||||||
| Shares Redeemed | (10,279,085) | (89,366,796) | (6,813,241) | (59,705,895) | ||||||||||||
| Redemption Fees | — | 8,898 | — | 13,181 | ||||||||||||
| 158,443 | $ | 1,608,184 | 9,904,149 | $ | 91,124,648 | |||||||||||
| Beginning Shares | 22,163,791 | 12,259,642 | ||||||||||||||
| Ending Shares | 22,322,234 | 22,163,791 | ||||||||||||||
| LoCorr Managed Futures Strategy Fund | ||||||||||||||||
| Total Net Increase | $ | 28,357,316 | $ | 117,968,077 | ||||||||||||
| LoCorr Long/Short Commodities Strategy Fund – Class A | ||||||||||||||||
| For the Year Ended December 31, 2015 | For the Year Ended December 31, 2014 | |||||||||||||||
| Shares | Amount | Shares | Amount | |||||||||||||
| Shares Sold | 2,034,940 | $ | 18,817,396 | 5,384,775 | $ | 48,541,702 | ||||||||||
| Dividends Reinvested | 128,995 | 1,216,428 | 493,118 | 4,290,126 | ||||||||||||
| Shares Redeemed | (4,723,247) | (41,232,944) | (1,281,113) | (11,117,228) | ||||||||||||
| Redemption Fees | — | 1,049 | — | 1,279 | ||||||||||||
| (2,559,312) | $ | (21,198,071) | 4,596,780 | $ | 41,715,879 | |||||||||||
| Beginning Shares | 5,072,800 | 476,020 | ||||||||||||||
| Ending Shares | 2,513,488 | 5,072,800 | ||||||||||||||
| LoCorr Long/Short Commodities Strategy Fund – Class C | ||||||||||||||||
| For the Year Ended December 31, 2015 | For the Year Ended December 31, 2014 | |||||||||||||||
| Shares | Amount | Shares | Amount | |||||||||||||
| Shares Sold | 162,705 | $ | 1,482,253 | 196,491 | $ | 1,692,395 | ||||||||||
| Dividends Reinvested | 26,512 | 244,707 | 22,725 | 193,620 | ||||||||||||
| Shares Redeemed | (90,665) | (791,576) | (81,685) | (656,781) | ||||||||||||
| Redemption Fees | — | — | — | — | ||||||||||||
| 98,552 | $ | 935,384 | 137,531 | $ | 1,229,234 | |||||||||||
| Beginning Shares | 356,747 | 219,216 | ||||||||||||||
| Ending Shares | 455,299 | 356,747 | ||||||||||||||
| LoCorr Long/Short Commodities Strategy Fund – Class I | ||||||||||||||||
| For the Year Ended December 31, 2015 | For the Year Ended December 31, 2014 | |||||||||||||||
| Shares | Amount | Shares | Amount | |||||||||||||
| Shares Sold | 2,537,268 | $ | 23,925,308 | 1,311,420 | $ | 11,590,391 | ||||||||||
| Dividends Reinvested | 156,161 | 1,483,530 | 108,426 | 948,725 | ||||||||||||
| Shares Redeemed | (1,002,228) | (8,965,296) | (641,482) | (5,527,496) | ||||||||||||
| Redemption Fees | — | 560 | — | 249 | ||||||||||||
| 1,691,201 | $ | 16,444,102 | 778,364 | $ | 7,011,869 | |||||||||||
| Beginning Shares | 1,492,534 | 714,170 | ||||||||||||||
| Ending Shares | 3,183,735 | 1,492,534 | ||||||||||||||
| LoCorr Long/Short Commodities Strategy Fund Fund | ||||||||||||||||
| Total Net Increase (Decrease) | $ | (3,818,585 | ) | $ | 49,956,982 | |||||||||||
| 96 | | | LoCorr Managed Futures Strategy Fund, LoCorr Long/Short Commodities Strategy Fund, LoCorr Multi-Strategy Fund and LoCorr Market Trend Fund - Notes to Consolidated Financial Statements / LoCorr Long/Short Equity Fund and LoCorr Spectrum Income Fund - Notes to Financial Statements (continued) |
| LoCorr Multi-Strategy Fund - Class A | ||||||||
For the Period Ended December 31, 2015(a) | ||||||||
| Shares | Amount | |||||||
| Shares Sold | 1,600,796 | $ | 13,751,697 | |||||
| Dividends Reinvested | 11,062 | 94,305 | ||||||
| Shares Redeemed | (156,120) | (1,307,967) | ||||||
| Redemption Fees | — | 18 | ||||||
| 1,455,738 | $ | 12,538,053 | ||||||
| Beginning Shares | — | |||||||
| Ending Shares | 1,455,738 | |||||||
| LoCorr Multi-Strategy Fund - Class C | ||||||||
For the Period Ended December 31, 2015(a) | ||||||||
| Shares | Amount | |||||||
| Shares Sold | 729,049 | $ | 6,755,532 | |||||
| Dividends Reinvested | 8,655 | 74,857 | ||||||
| Shares Redeemed | (76,754) | (644,545) | ||||||
| Redemption Fees | — | 1 | ||||||
| 660,950 | $ | 6,185,845 | ||||||
| Beginning Shares | — | |||||||
| Ending Shares | 660,950 | |||||||
| LoCorr Multi-Strategy Fund - Class I | ||||||||
For the Period Ended December 31, 2015(a) | ||||||||
| Shares | Amount | |||||||
| Shares Sold | 2,143,805 | $ | 20,436,449 | |||||
| Dividends Reinvested | 26,332 | 227,847 | ||||||
| Shares Redeemed | (176,153) | (1,476,316) | ||||||
| Redemption Fees | — | 448 | ||||||
| 1,993,984 | $ | 19,188,428 | ||||||
| Beginning Shares | — | |||||||
| Ending Shares | 1,993,984 | |||||||
| LoCorr Multi-Strategy Fund | ||||||||
| Total Net Increase | $ | 37,912,326 | ||||||
| (a) | Class A, Class C and Class I shares of the LoCorr Multi-Strategy Fund commenced operations on April 6, 2015. |
| LoCorr Market Trend Fund - Class A | ||||||||||||||||
| For the Year Ended December 31, 2015 | For the Period Ended December 31, 2014(a) | |||||||||||||||
| Shares | Amount | Shares | Amount | |||||||||||||
| Shares Sold | 10,981,830 | $ | 136,204,957 | 1,140,203 | $ | 12,638,973 | ||||||||||
| Dividends Reinvested | 57,551 | 690,031 | 38,866 | 444,627 | ||||||||||||
| Shares Redeemed | (3,010,766) | (37,007,295) | (13,074) | (144,143) | ||||||||||||
| Redemption Fees | — | 4,282 | — | 97 | ||||||||||||
| 8,028,615 | $ | 99,891,975 | 1,165,995 | $ | 12,939,554 | |||||||||||
| Beginning Shares | 1,165,995 | — | ||||||||||||||
| Ending Shares | 9,194,610 | 1,165,995 | ||||||||||||||
| LoCorr Market Trend Fund - Class C | ||||||||||||||||
| For the Year Ended December 31, 2015 | For the Period Ended December 31, 2014(a) | |||||||||||||||
| Shares | Amount | Shares | Amount | |||||||||||||
| Shares Sold | 7,663,453 | $ | 94,694,283 | 589,942 | $ | 6,399,896 | ||||||||||
| Dividends Reinvested | 29,569 | 352,169 | 19,209 | 219,169 | ||||||||||||
| Shares Redeemed | (355,182) | (4,295,885) | (34) | (375) | ||||||||||||
| Redemption Fees | — | 1,142 | — | 4 | ||||||||||||
| 7,337,840 | $ | 90,751,709 | 609,117 | $ | 6,618,694 | |||||||||||
| Beginning Shares | 609,117 | — | ||||||||||||||
| Ending Shares | 7,946,957 | 609,117 | ||||||||||||||
| LoCorr Market Trend Fund - Class I | ||||||||||||||||
| For the Year Ended December 31, 2015 | For the Period Ended December 31, 2014(a) | |||||||||||||||
| Shares | Amount | Shares | Amount | |||||||||||||
| Shares Sold | 63,469,686 | $ | 786,278,560 | 3,422,289 | $ | 37,162,742 | ||||||||||
| Dividends Reinvested | 459,518 | 5,514,198 | 116,561 | 1,334,628 | ||||||||||||
| Shares Redeemed | (9,534,760) | (116,621,840) | (29,378) | (336,850) | ||||||||||||
| Redemption Fees | — | 50,131 | — | 1,307 | ||||||||||||
| 54,394,444 | $ | 675,221,049 | 3,509,472 | $ | 38,161,827 | |||||||||||
| Beginning Shares | 3,509,472 | — | ||||||||||||||
| Ending Shares | 57,903,916 | 3,509,472 | ||||||||||||||
| LoCorr Market Trend Fund | ||||||||||||||||
| Total Net Increase | $ | 865,864,733 | $ | 57,720,075 | ||||||||||||
| (a) | Class A, Class C and Class I shares of the LoCorr Market Trend Fund commenced operations on July 1, 2014. |
LoCorr Managed Futures Strategy Fund, LoCorr Long/Short Commodities Strategy Fund, LoCorr Multi-Strategy Fund and LoCorr Market Trend Fund - Notes to Consolidated Financial Statements / LoCorr Long/Short Equity Fund and LoCorr Spectrum Income Fund - Notes to Financial Statements (continued) | | | 97 |
| LoCorr Long/Short Equity Fund – Class A | ||||||||||||||||
| For the Year Ended December 31, 2015 | For the Year Ended December 31, 2014 | |||||||||||||||
| Shares | Amount | Shares | Amount | |||||||||||||
| Shares Sold | 486,410 | $ | 4,888,251 | 1,404,936 | $ | 14,534,404 | ||||||||||
| Dividends Reinvested | — | — | 6,351 | 62,174 | ||||||||||||
| Shares Redeemed | (948,753) | (9,453,852) | (1,509,894) | (15,298,824) | ||||||||||||
| Redemption Fees | — | 220 | — | 1,736 | ||||||||||||
| (462,343) | $ | (4,565,381) | (98,607) | $ | (700,510) | |||||||||||
| Beginning Shares | 1,753,028 | 1,851,635 | ||||||||||||||
| Ending Shares | 1,290,685 | 1,753,028 | ||||||||||||||
| LoCorr Long/Short Equity Fund – Class C | ||||||||||||||||
| For the Year Ended December 31, 2015 | For the Year Ended December 31, 2014 | |||||||||||||||
| Shares | Amount | Shares | Amount | |||||||||||||
| Shares Sold | 174,848 | $ | 1,678,326 | 948,844 | $ | 9,918,172 | ||||||||||
| Dividends Reinvested | — | — | 4,865 | 47,048 | ||||||||||||
| Shares Redeemed | (602,384) | (5,921,260) | (436,057) | (4,341,537) | ||||||||||||
| Redemption Fees | — | 4 | — | 730 | ||||||||||||
| (427,536) | $ | (4,242,930) | 517,652 | $ | 5,624,413 | |||||||||||
| Beginning Shares | 1,256,929 | 739,277 | ||||||||||||||
| Ending Shares | 829,393 | 1,256,929 | ||||||||||||||
| LoCorr Long/Short Equity Fund – Class I | ||||||||||||||||
| For the Year Ended December 31, 2015 | For the Year Ended December 31, 2014 | |||||||||||||||
| Shares | Amount | Shares | Amount | |||||||||||||
| Shares Sold | 487,509 | $ | 4,759,759 | 1,591,039 | $ | 16,630,979 | ||||||||||
| Dividends Reinvested | — | — | 4,295 | 42,220 | ||||||||||||
| Shares Redeemed | (709,053) | (6,974,552) | (1,419,669) | (14,194,506) | ||||||||||||
| Redemption Fees | — | 55 | — | 1,109 | ||||||||||||
| (221,544) | $ | (2,214,738) | 175,665 | $ | 2,479,802 | |||||||||||
| Beginning Shares | 1,250,817 | 1,075,152 | ||||||||||||||
| Ending Shares | 1,029,273 | 1,250,817 | ||||||||||||||
| LoCorr Long/Short Equity Fund | ||||||||||||||||
| Total Net Increase (Decrease) | $ | (11,023,049 | ) | $ | 7,403,705 | |||||||||||
| LoCorr Spectrum Income Fund – Class A | ||||||||||||||||
| For the Year Ended December 31, 2015 | For the Year Ended December 31, 2014 | |||||||||||||||
| Shares | Amount | Shares | Amount | |||||||||||||
| Shares Sold | 2,106,932 | $ | 18,935,848 | 4,706,973 | $ | 47,619,090 | ||||||||||
| Dividends Reinvested | 226,386 | 1,954,189 | 82,891 | 817,475 | ||||||||||||
| Shares Redeemed | (1,757,377) | (15,153,147) | (615,929) | (5,744,702) | ||||||||||||
| Redemption Fees | — | 3,036 | — | 5,368 | ||||||||||||
| 575,941 | $ | 5,739,926 | 4,173,935 | $ | 42,697,231 | |||||||||||
| Beginning Shares | 4,173,935 | — | ||||||||||||||
| Ending Shares | 4,749,876 | 4,173,935 | ||||||||||||||
| LoCorr Spectrum Income Fund – Class C | ||||||||||||||||
| For the Year Ended December 31, 2015 | For the Year Ended December 31, 2014 | |||||||||||||||
| Shares | Amount | Shares | Amount | |||||||||||||
| Shares Sold | 1,725,350 | $ | 15,797,616 | 2,916,738 | $ | 29,471,751 | ||||||||||
| Dividends Reinvested | 164,425 | 1,418,707 | 52,035 | 511,280 | ||||||||||||
| Shares Redeemed | (1,129,329) | (9,658,785) | (154,758) | (1,456,007) | ||||||||||||
| Redemption Fees | — | 2,087 | — | 3,926 | ||||||||||||
| 760,446 | $ | 7,559,625 | 2,814,015 | $ | 28,530,950 | |||||||||||
| Beginning Shares | 2,814,015 | — | ||||||||||||||
| Ending Shares | 3,574,461 | 2,814,015 | ||||||||||||||
| LoCorr Spectrum Income Fund – Class I | ||||||||||||||||
| For the Year Ended December 31, 2015 | For the Year Ended December 31, 2014 | |||||||||||||||
| Shares | Amount | Shares | Amount | |||||||||||||
| Shares Sold | 2,681,290 | $ | 24,067,648 | 4,658,456 | $ | 47,029,165 | ||||||||||
| Dividends Reinvested | 207,541 | 1,806,428 | 89,822 | 887,258 | ||||||||||||
| Shares Redeemed | (2,757,482) | (23,368,089) | (1,243,808) | (11,777,239) | ||||||||||||
| Redemption Fees | — | 12,782 | — | 9,620 | ||||||||||||
| 131,349 | $ | 2,518,769 | 3,504,470 | $ | 36,148,804 | |||||||||||
| Beginning Shares | 3,504,470 | — | ||||||||||||||
| Ending Shares | 3,635,819 | 3,504,470 | ||||||||||||||
| LoCorr Spectrum Income Fund | ||||||||||||||||
| Total Net Increase | $ | 15,818,320 | $ | 107,376,985 | ||||||||||||
| 98 | | | LoCorr Managed Futures Strategy Fund, LoCorr Long/Short Commodities Strategy Fund, LoCorr Multi-Strategy Fund and LoCorr Market Trend Fund - Notes to Consolidated Financial Statements / LoCorr Long/Short Equity Fund and LoCorr Spectrum Income Fund - Notes to Financial Statements (continued) |
7. Federal Tax Information
At December 31, 2015, the components of accumulated earnings (losses) on a tax basis were as follows:
| LoCorr Managed | LoCorr Long/Short | LoCorr | ||||||||||
| Futures Strategy | Commodities Strategy | Multi Strategy | ||||||||||
| Fund | Fund | Fund | ||||||||||
| Period from | ||||||||||||
| Year Ended | Year Ended | April 6, 2015(a) through | ||||||||||
| December 31, 2015 | December 31, 2015 | December 31, 2015 | ||||||||||
| Tax cost of investments | $ | 431,978,685 | $ | 49,732,363 | $ | 29,510,084 | ||||||
| Gross unrealized appreciation | 551,181 | 47,403 | 975,271 | |||||||||
| Gross unrealized depreciation | (3,171,978) | (226,302) | (2,796,494) | |||||||||
| Net unrealized appreciation (depreciation) | (2,620,797) | (178,899) | (1,821,223) | |||||||||
| Undistributed ordinary income | 23,817 | — | — | |||||||||
| Total distributable earnings | $ | 23,817 | $ | — | $ | — | ||||||
| Other accumulated earnings (losses) | $ | (13,475,901) | $ | (3,205,983) | $ | (1,471,963) | ||||||
| Total accumulated earnings (losses) | $ | (16,072,881) | $ | (3,384,882) | $ | (3,293,186) | ||||||
| LoCorr Market | LoCorr Long/Short | LoCorr Spectrum | ||||||||||
| Trend | Equity | Income | ||||||||||
| Fund | Fund | Fund | ||||||||||
| Year Ended | Year Ended | Year Ended | ||||||||||
| December 31, 2015 | December 31, 2015 | December 31, 2015 | ||||||||||
| Tax cost of investments | $ | 757,020,421 | $ | 28,352,352 | $ | 103,181,141 | ||||||
| Gross unrealized appreciation | 3,688,572 | 1,710,502 | 1,677,171 | |||||||||
| Gross unrealized depreciation | (6,029,996) | (1,032,926) | (9,700,018) | |||||||||
| Net unrealized appreciation (depreciation) | (2,341,424) | 677,576 | (8,022,847) | |||||||||
| Undistributed ordinary income | 20,179,978 | — | — | |||||||||
| Total distributable earnings | $ | 20,179,978 | $ | — | $ | — | ||||||
| Other accumulated earnings (losses) | $ | (42,216,073) | $ | (3,468,528) | $ | (18,546,529) | ||||||
| Total accumulated earnings (losses) | $ | (24,377,519) | $ | (2,790,952) | $ | (26,569,376) | ||||||
| (a) | Commencement of operations. |
Undistributed income or net realized gains for financial statement purposes may differ from amounts recognized for federal income tax purposes due to differences in the recognition and characterization of income, expense and capital gain items. The difference between book-basis and tax-basis unrealized appreciation is attributed primarily to the tax deferral of losses on wash sales and other temporary differences.
The following reclassifications were made within the components of net assets as of December 31, 2015:
| Accumulated Net | Acccumulated Net | |||||||||||
| Investment | Realized Gain | |||||||||||
| Fund | Income (Loss) | (Loss) | Paid-in Capital | |||||||||
| LoCorr Managed Futures Strategy Fund | $ | 19,577,967 | $ | (53,788,662) | $ | 34,210,695 | ||||||
| LoCorr Long/Short Commodities Strategy Fund | 3,843,293 | (9,794,905) | 5,951,612 | |||||||||
| LoCorr Multi-Strategy Fund | 345,114 | 119,796 | (464,910) | |||||||||
| LoCorr Market Trend Fund | 17,539,727 | (19,438,006) | 1,898,279 | |||||||||
| LoCorr Long/Short Equity Fund | 997,517 | (134,055) | (863,462) | |||||||||
| LoCorr Spectrum Income Fund | 1,738,737 | 605,699 | (2,344,436) | |||||||||
The reclassifications in the LoCorr Managed Futures Strategy Fund, the LoCorr Long/Short Commodities Strategy Fund and the LoCorr Market Trend Fund are primarily attributable to certain reclassifications related to each Funds’ wholly-owned subsidiary, paydown and/or currency adjustments. Reclassifications in the LoCorr Multi-Strategy Fund are attributable to certain reclassifications related to the Fund’s wholly-owned subsidiary, organizational costs and return of capital adjustments. The LoCorr Long/Short Equity Fund’s reclassifications are primarily the result of the Fund’s net operating loss and adjustments resulting from revisions of prior year estimates. The reclassifications in the LoCorr Spectrum Income Fund are the result of revisions of prior year estimates and return of capital and partnership basis adjustments.
LoCorr Managed Futures Strategy Fund, LoCorr Long/Short Commodities Strategy Fund, LoCorr Multi-Strategy Fund and LoCorr Market Trend Fund - Notes to Consolidated Financial Statements / LoCorr Long/Short Equity Fund and LoCorr Spectrum Income Fund - Notes to Financial Statements (continued) | | | 99 |
Under the current tax law, capital losses realized after October 31 may be deferred and treated as occurring on the first day of the following fiscal year. As presented in the table below, the following Funds elected to defer capital losses for the year ended December 31, 2015:
Post October Loss Deferral | Late Year Loss Deferral | |||||||
| LoCorr Spectrum Income Fund | $ | — | $ | 14,253 | ||||
At December 31, 2015, accumulated net realized capital loss carryovers, if any, and the year(s) in which the capital loss carryovers expire were:
| Capital Loss Carryover | Year of Expiration | ||||||||
| Short-Term | Long-Term | ||||||||
| LoCorr Managed Futures Strategy Fund | $ | 186,908 | $ | 354,241 | Indefinitely | ||||
| LoCorr Long/Short Commodities Strategy Fund | 84,571 | 42,375 | Indefinitely | ||||||
| LoCorr Multi-Strategy Fund | 1,276,453 | — | Indefinitely | ||||||
| LoCorr Market Trend Fund | 18,455,612 | 27,485,224 | Indefinitely | ||||||
| LoCorr Long/Short Equity Fund | 3,595,662 | — | Indefinitely | ||||||
| LoCorr Spectrum Income Fund | 6,821,952 | 11,709,703 | Indefinitely | ||||||
The LoCorr Long/Short Equity Fund utilized $323,176 of capital loss carryover in the fiscal year 2015. During the year ended December 31, 2015, none of the other LoCorr Funds utilized capital loss carryovers.
8. Line of Credit
The Trust entered into an unsecured, uncommitted Loan Agreement (“Line of Credit” or “LOC”) with U.S. Bank not individually but as an umbrella facility on behalf of the Funds in the Trust. The LOC expires on March 14, 2016. The LOC was established to provide the Funds a temporary short-term liquidity source, subject to certain restrictions and the right of setoff on the Funds’ assets, to meet unanticipated redemptions. Under terms of the LOC, borrowings for each Fund are limited to the lesser of one-third of the total unencumbered assets (including the amount borrowed) of the respective Fund, 5% of the gross assets of the respective Fund or $32 million in the aggregate for all of the Funds under this agreement. Prior to March 15, 2015, the maximum borrowing for the Funds in the aggregate was $20 million. U.S. Bank charges an interest rate per annum equal to the Prime Rate (3.5% as of December 31, 2015).
Line of Credit activity for the period was as follows:
For the Period Ended December 31, 2015 (a) | |||||||||||||||||
| Fund | Interest Charges Incurred | Average Daily Loan Balance | Weighted Average % | Maximum Amount Borrowed | |||||||||||||
| $ | Date | ||||||||||||||||
| LoCorr Managed Futures Strategy Fund | $ | 105 | $ | 3,225 | 3.25% | $ | 387,000 | August 28, 2015 | |||||||||
| LoCorr Long/Short Commodities Strategy Fund | 15 | 464 | 3.25% | 167,000 | February 24, 2015 | ||||||||||||
| LoCorr Multi-Strategy Fund | 542 | 16,667 | 3.25% | 1,200,000 | October 16, 2015 | ||||||||||||
| LoCorr Long/Short Equity Fund | 3,698 | 113,789 | 3.25% | 1,522,000 | February 24, 2015 | ||||||||||||
| LoCorr Spectrum Income Fund | 1,562 | 47,256 | 3.31% | 1,251,000 | January 15, 2015 | ||||||||||||
(a) For the year ended December 31, 2015 for the LoCorr Managed Futures Strategy Fund, the LoCorr Long/Short Commodities Strategy Fund, the LoCorr Long/Short Equity Fund and the LoCorr Spectrum Income Fund and for the period from April 6, 2015 (commencement of operations) through December 31, 2015 for the LoCorr Multi-Strategy Fund.
The LoCorr Market Trend Fund did not utilize the Line of Credit during the year ended December 31, 2015. At December 31, 2015, the Funds did not have any outstanding borrowings.
9. Subsequent Events
In preparing the financial statements, the Adviser has evaluated events after December 31, 2015.
Declaration of Dividends
LoCorr Multi-Strategy Fund
The LoCorr Multi-Strategy Fund declared the following ordinary income distributions:
| Dividend Declaration | Shareholder of | Distribution Amount per Share Class | |||||||||
Date (a) | Record Date | Class A | Class C | Class I | |||||||
| January 29, 2016 | January 28, 2016 | $0.02292 | $0.01667 | $0.02500 | |||||||
| February 29, 2016 | February 26, 2016 | $0.02292 | $0.01667 | $0.02500 | |||||||
(a) Ex-Date, reinvest date and payable date.
| 100 | | | LoCorr Managed Futures Strategy Fund, LoCorr Long/Short Commodities Strategy Fund, LoCorr Multi-Strategy Fund and LoCorr Market Trend Fund - Notes to Consolidated Financial Statements / LoCorr Long/Short Equity Fund and LoCorr Spectrum Income Fund - Notes to Financial Statements (continued) |
LoCorr Spectrum Income Fund
The LoCorr Spectrum Income Fund declared the following ordinary income distributions:
| Dividend Declaration | Shareholder of | Distribution Amount per Share Class | |||||||||
Date (a) | Record Date | Class A | Class C | Class I | |||||||
| January 29, 2016 | January 28, 2016 | $0.0479 | $0.0417 | $0.0500 | |||||||
| February 29, 2016 | February 26, 2016 | $0.0479 | $0.0417 | $0.0500 | |||||||
(a) Ex-Date, reinvest date and payable date.
The estimated characterization of the distributions paid will be either a qualified dividend or return of capital. See Note 2 for additional information.
Restructuring of Terra
Subsequent to December 31, 2015, the preferred return on LoCorr Spectrum Income Fund’s investment in Terra was increased to 9% as a result of the restructuring of the investment by Terra’s investment manager and with the consent of Terra’s investors.
Special Meeting of Shareholders and Proxy Statement
A special meeting of shareholders of the LoCorr Managed Futures Strategy Fund (the “Fund”) was held on February 26, 2016, to approve the Amended Management Agreement between the Trust, on behalf of the Fund, and the Adviser; and to transact such other business as may properly come before the meeting. The Adviser is seeking to increase the advisory fee paid by the Fund to 1.85% from the amounts currently in place. See Note 5. No action was taken at the meeting and the vote will be rescheduled to a future date.
There were no additional subsequent events since December 31, 2015 through the date the financial statements were issued that would require adjustment to or additional disclosure in these financial statements.
| Audit Opinion - LoCorr Investment Trust | | | 101 |
Report of Independent Registered
Public Accounting Firm
To the Shareholders and Board of Trustees of
LoCorr Investment Trust
We have audited the consolidated statements of assets and liabilities, including the consolidated schedules of investments, swap contracts, securities sold short, open forward currency contracts, and open futures contracts, of LoCorr Managed Futures Strategy Fund, LoCorr Long/ Short Commodities Strategy Fund, LoCorr Multi-Strategy Fund, and LoCorr Market Trend Fund and the statements of assets and liabilities, including the schedules of investments and securities sold short, of LoCorr Long/Short Equity Fund and LoCorr Spectrum Income Fund, each a series of LoCorr Investment Trust (the “Funds”), as of December 31, 2015, and the related consolidated statements of operations for the year then ended, the consolidated statements of changes in net assets for each of the two periods in the period then ended, and the consolidated financial highlights for each of the periods presented of LoCorr Managed Futures Strategy Fund, LoCorr Long/Short Commodities Strategy Fund, and LoCorr Market Trend Fund, and the related consolidated statements of operations and changes in net assets, and the consolidated financial highlights for the period April 6, 2015 (commencement of operations) through December 31, 2015, of LoCorr Multi-Strategy Fund, and the related statements of operations for the year then ended, the statements of changes in net assets for each of the two years in the period then ended, and the financial highlights for each of the periods presented of LoCorr Long/Short Equity Fund, and the related statements of operations and cash flows for the year then ended, the statements of changes in net assets for each of the two years in the period then ended, and the financial highlights for each of the periods presented of LoCorr Spectrum Income Fund. These financial statements and financial highlights are the responsibility of the Funds’ management. Our responsibility is to express an opinion on these financial statements and financial highlights based on our audits.
We conducted our audits in accordance with the standards of the Public Company Accounting Oversight Board (United States). Those standards require that we plan and perform the audit to obtain reasonable assurance about whether the financial statements and financial highlights are free of material misstatement. An audit includes examining, on a test basis, evidence supporting the amounts and disclosures in the financial statements. Our procedures included confirmation of securities owned as of December 31, 2015, by correspondence with the custodian and brokers or by other appropriate auditing procedures where replies from brokers were not received. An audit also includes assessing the accounting principles used and significant estimates made by management, as well as evaluating the overall financial statement presentation. We believe that our audits provide a reasonable basis for our opinion.
In our opinion, the consolidated financial statements and financial highlights of LoCorr Managed Futures Strategy Fund, LoCorr Long/Short Commodities Strategy Fund, LoCorr Market Trend, and LoCorr Multi-Strategy Fund and the financial statements and financial highlights of LoCorr Long/Short Equity Fund and LoCorr Spectrum Income Fund referred to above present fairly, in all material respects, the financial position of each of the Funds constituting LoCorr Investment Trust as of December 31, 2015, and the results of their operations, changes in their net assets, cash flows, and their financial highlights for the periods indicated above, in conformity with accounting principles generally accepted in the United States of America.

COHEN FUND AUDIT SERVICES, LTD.
Cleveland, Ohio
February 29, 2016
| 102 | | | LoCorr Investment Trust - Expense Example (Unaudited) |
Expense Example
December 31, 2015 (Unaudited)
As a shareholder of a mutual fund, you incur two types of costs: (1) transaction costs, including sales charges (loads) on purchase payments; redemption fees; and (2) ongoing costs, including management fees; distribution and/or service (12b-1) fees and other Fund expenses.
This Example is intended to help you understand your ongoing costs (in dollars) of investing in each of the Funds and to compare these costs with the ongoing costs of investing in other mutual funds. The Example is based on an investment of $1,000 invested at the beginning of the period and held for the entire period (July 1, 2015 through December 31, 2015).
Actual Expenses
The actual return rows in the following table provide information about account values based on actual returns and actual expenses. You may use the information in these rows, together with the amount you invested, to estimate the expenses that you paid over the period. Simply divide your account value by $1,000 (for example, an $8,600 account value divided by $1,000 = 8.6), then multiply the result by the number in the first line under the heading entitled “Expenses Paid During Period” to estimate the expenses you paid on your account during this period. The only transaction fees you may be required to pay are for outgoing wire transfers, returned checks and stop payment orders at prevailing rates charged by U.S. Bancorp Fund Services, LLC, the Funds’ transfer agent. These fees are assessed on all accounts, as applicable. If you request that a redemption be made by wire transfer, currently the Funds’ transfer agent charges a $15.00 fee. The Funds’ transfer agent charges a transaction fee of $25.00 on returned checks and stop payment orders. If you paid a transaction fee, you would add the fee amount to the expenses paid on your account this period to obtain your total expenses paid.
Hypothetical Example for Comparison Purposes
The hypothetical return rows in the following table provide information about hypothetical account values and hypothetical expenses based on the Funds’ actual expense ratio and an assumed rate of return of 5% per year before expenses, which is not the Funds’ actual return. The hypothetical account values and expenses may not be used to estimate the actual ending account balance or expenses you paid for the period. You may use this information to compare the ongoing costs of investing in the Funds and other funds. To do so, compare this 5% hypothetical example with the 5% hypothetical examples that appear in the shareholder reports of the other funds. A transaction fee of $15.00 may be assessed on outgoing wire transfers and a transaction fee of $25.00 may be assessed on returned checks and stop payment orders. To include this fee in the calculation, you would add the estimated transaction fee to the hypothetical expenses shown in the table. Please note that the expenses shown in the table are meant to highlight your ongoing costs only and do not reflect the transaction fees discussed above. Therefore, those columns are useful in comparing ongoing costs only, and will not help you determine the relative total costs of owning different funds. In addition, if these transactional costs were included, your costs would have been higher.
Actual vs. Hypothetical Returns
Actual vs. Hypothetical returns for the Six Months Ended December 31, 2015 (Unaudited)
Fund’s Annualized Consolidated Expense Ratio | Beginning Value July 1, 2015 | Ending Account Value December 31, 2015 | Consolidated Expenses Paid During Period1 | |||||||||
| LoCorr Managed Futures Strategy Fund – Class A | ||||||||||||
| Actual | 2.10% | $1,000.00 | $1,052.40 | $10.86 | ||||||||
Hypothetical2 | 2.10% | $1,000.00 | $1,014.62 | $10.66 | ||||||||
| LoCorr Managed Futures Strategy Fund – Class C | ||||||||||||
| Actual | 2.85% | $1,000.00 | $1,047.80 | $14.71 | ||||||||
Hypothetical2 | 2.85% | $1,000.00 | $1,010.84 | $14.44 | ||||||||
| LoCorr Managed Futures Strategy Fund – Class I | ||||||||||||
| Actual | 1.85% | $1,000.00 | $1,054.40 | $9.58 | ||||||||
Hypothetical2 | 1.85% | $1,000.00 | $1,015.88 | $9.40 | ||||||||
1 Consolidated expenses are equal to the Fund’s annualized expense ratio multiplied by the average account value over the period, multiplied by 184 days and divided by 365 to reflect the period of July 1, 2015 through December 31, 2015.
2 Hypothetical assumes a 5% return.
| LoCorr Investment Trust - Expense Example (Unaudited) (continued) | | | 103 |
Actual vs. Hypothetical returns for the Six Months Ended December 31, 2015 (Unaudited)
Fund’s Annualized Consolidated Expense Ratio | Beginning Value July 1, 2015 | Ending Account Value December 31, 2015 | Consolidated Expenses Paid During Period1 | |||||||||
| LoCorr Long/Short Commodities Strategy Fund – Class A | ||||||||||||
| Actual | 2.20% | $1,000.00 | $1,171.30 | $12.04 | ||||||||
Hypothetical2 | 2.20% | $1,000.00 | $1,014.11 | $11.17 | ||||||||
| LoCorr Long/Short Commodities Strategy Fund – Class C | ||||||||||||
| Actual | 2.95% | $1,000.00 | $1,167.80 | $16.12 | ||||||||
Hypothetical2 | 2.95% | $1,000.00 | $1,010.33 | $14.95 | ||||||||
| LoCorr Long/Short Commodities Strategy Fund – Class I | ||||||||||||
| Actual | 1.95% | $1,000.00 | $1,172.80 | $10.68 | ||||||||
Hypothetical2 | 1.95% | $1,000.00 | $1,015.37 | $9.91 | ||||||||
1 Consolidated expenses are equal to the Fund’s annualized expense ratio multiplied by the average account value over the period, multiplied by 184 days and divided by 365 to reflect the period of July 1, 2015 through December 31, 2015.
2 Hypothetical assumes a 5% return.
Actual vs. Hypothetical returns for the Six Months Ended December 31, 2015 (Unaudited)
Fund’s Annualized Consolidated Expense Ratio | Beginning Value July 1, 2015 | Ending Account Value December 31, 2015 | Consolidated Expenses Paid During Period1 | |||||||||
| LoCorr Multi-Strategy Fund – Class A | ||||||||||||
| Actual | 2.30% | $1,000.00 | $921.90 | $11.14 | ||||||||
Hypothetical2 | 2.30% | $1,000.00 | $1,013.61 | $11.67 | ||||||||
| LoCorr Multi-Strategy Fund – Class C | ||||||||||||
| Actual | 3.05% | $1,000.00 | $918.90 | $14.75 | ||||||||
Hypothetical2 | 3.05% | $1,000.00 | $1,009.83 | $15.45 | ||||||||
| LoCorr Multi-Strategy Fund – Class I | ||||||||||||
| Actual | 2.05% | $1,000.00 | $923.30 | $9.94 | ||||||||
Hypothetical2 | 2.05% | $1,000.00 | $1,014.87 | $10.41 | ||||||||
1 Consolidated expenses are equal to the Fund’s annualized expense ratio multiplied by the average account value over the period, multiplied by 184 days and divided by 365 to reflect the period of July 1, 2015 through December 31, 2015.
2 Hypothetical assumes a 5% return.
Actual vs. Hypothetical returns for the Six Months Ended December 31, 2015 (Unaudited)
Fund’s Annualized Consolidated Expense Ratio | Beginning Value July 1, 2015 | Ending Account Value December 31, 2015 | Consolidated Expenses Paid During Period1 | |||||||||
| LoCorr Market Trend Fund – Class A | ||||||||||||
| Actual | 2.02% | $1,000.00 | $974.20 | $10.05 | ||||||||
Hypothetical2 | 2.02% | $1,000.00 | $1,015.02 | $10.26 | ||||||||
| LoCorr Market Trend Fund – Class C | ||||||||||||
| Actual | 2.77% | $1,000.00 | $970.70 | $13.76 | ||||||||
Hypothetical2 | 2.77% | $1,000.00 | $1,011.24 | $14.04 | ||||||||
| LoCorr Market Trend Fund – Class I | ||||||||||||
| Actual | 1.77% | $1,000.00 | $975.30 | $8.81 | ||||||||
Hypothetical2 | 1.77% | $1,000.00 | $1,016.28 | $9.00 | ||||||||
1 Consolidated expenses are equal to the Fund’s annualized expense ratio multiplied by the average account value over the period, multiplied by 184 days and divided by 365 to reflect the period of July 1, 2015 through December 31, 2015.
2 Hypothetical assumes a 5% return.
| 104 | | | LoCorr Investment Trust - Expense Example (Unaudited) (continued) |
Actual vs. Hypothetical returns for the Six Months Ended December 31, 2015 (Unaudited)
Fund’s Annualized Expense Ratio | Beginning Value July 1, 2015 | Ending Account Value December 31, 2015 | Expenses Paid During Period1 | |||||||||
| LoCorr Long/Short Equity Fund – Class A | ||||||||||||
Actual2 | 3.30% | $1,000.00 | $914.60 | $15.93 | ||||||||
Hypothetical2, 3 | 3.30% | $1,000.00 | $1,008.57 | $16.71 | ||||||||
| LoCorr Long/Short Equity Fund – Class C | ||||||||||||
Actual2 | 4.05% | $1,000.00 | $912.20 | $19.52 | ||||||||
Hypothetical2, 3 | 4.05% | $1,000.00 | $1,004.79 | $20.47 | ||||||||
| LoCorr Long/Short Equity Fund – Class I | ||||||||||||
Actual2 | 3.05% | $1,000.00 | $916.90 | $14.74 | ||||||||
Hypothetical2, 3 | 3.05% | $1,000.00 | $1,009.83 | $15.45 | ||||||||
1 Expenses are equal to the Fund’s annualized expense ratio multiplied by the average account value over the period, multiplied by 184 days and divided by 365 to reflect the period of July 1, 2015 through December 31, 2015.
2 Includes 0.15% of dividend and interest expense on securities sold short and interest expense on credit line.
3 Hypothetical assumes a 5% return.
Actual vs. Hypothetical returns for the Six Months Ended December 31, 2015 (Unaudited)
Fund’s Annualized Expense Ratio | Beginning Value July 1, 2015 | Ending Account Value December 31, 2015 | Consolidated Paid During Period1 | |||||||||
| LoCorr Spectrum Income Fund – Class A | ||||||||||||
| Actual | 2.05% | $1,000.00 | $905.40 | $9.85 | ||||||||
Hypothetical2 | 2.05% | $1,000.00 | $1,014.87 | $10.41 | ||||||||
| LoCorr Spectrum Income Fund – Class C | ||||||||||||
| Actual | 2.80% | $1,000.00 | $901.30 | $13.42 | ||||||||
Hypothetical2 | 2.80% | $1,000.00 | $1,011.09 | $14.19 | ||||||||
| LoCorr Spectrum Income Fund – Class I | ||||||||||||
| Actual | 1.80% | $1,000.00 | $906.80 | $8.65 | ||||||||
Hypothetical2 | 1.80% | $1,000.00 | $1,016.13 | $9.15 | ||||||||
1 Expenses are equal to the Fund’s annualized expense ratio multiplied by the average account value over the period, multiplied by 184 days and divided by 365 to reflect the period of July 1, 2015 through December 31, 2015.
2 Hypothetical assumes a 5% return.
Approval of Advisory Agreements (Unaudited) | | | 105 |
LoCorr Investment Trust
December 31, 2015 (Unaudited)
LoCorr Managed Futures Strategy Fund
Approval of Advisory Agreement
The Trustees, including a majority of the Trustees who are not interested persons of the Trust (the “Independent Trustees”), considered the approval of the Advisory Agreement between LoCorr Fund Management, LLC (the “Adviser”) and the Trust, with respect to the Fund, at a meeting held on November 23, 2015. The Trustees were provided with an overview of the Fund, its strategies, and information reported in the Adviser’s responses to a 15(c) questionnaire. The Trustees considered some of the key risks of the Fund, performance information, and fee and expense information of the Fund, as identified by the Adviser in its 15(c) response.
The Board considered the nature, extent and quality of services to be provided by the Adviser to the Fund and reviewed the 15(c) responses for each, which included a review of the key personnel of the Adviser. The Trustees noted that the Adviser has furnished a continuous investment program for the Fund consistent with the Fund’s investment objective and policies and regulatory restrictions. The Adviser provides sub-adviser research and due diligence, oversight of trade execution and settlement support in determining the investments to be purchased, held and sold for the Funds. The Adviser also provides overall portfolio and risk management consistent with the Fund’s investment strategy. The Trustees noted that the Adviser provided exposure to the trading programs of certain commodity trading advisors (“CTAs”) to the Fund through swaps. The Trustees discussed the Adviser’s new proposed structure for the Fund which would eliminate such swaps and allow the Adviser to directly engage certain CTAs as sub-advisers to the Fund. The Trustees noted that the Adviser would be taking on additional oversight and evaluation responsibilities by engaging the CTAs as sub-advisers to the Fund. The Board concluded that the Adviser is well-staffed and offers the experience and expertise to continue to provide, high quality services.
The Board reviewed and discussed the Fund’s one-year and since inception returns, noting that the one-year performance was slightly lower than the Morningstar Category Average and peer group average while the since inception performance did slightly lag both averages. The Board further noted its overall satisfaction with the Fund’s one-year and since inception performance.
The Board reviewed and considered the costs of services provided and profits to be realized by the Adviser, noting the proposed increase in the management fee. The Trustees discussed the management fee increase in light of the Adviser’s additional responsibilities, the Adviser’s direct engagement of the CTAs as sub-advisers to the Fund and the fact that the proposed sub-advisers would be paid by the Adviser for their services to the Fund. The Board also noted the overall benefit that shareholders would receive as a result of the Fund no longer having to pay swap and incentive fees and expenses.
The Trustees noted that the proposed management fee for the Fund was within the range of its peer group and Morningstar Category. After a discussion, the Board agreed that the Fund’s proposed management fee was reasonable.
The Board reviewed the profit analysis of the Adviser with respect to the Fund and considered that the Adviser’s profits from the advisory agreement, net of sub-advisory fees and overhead, to be a fair profit. The Board noted that the Adviser’s expected profitability margin was expected to decline in comparison to the Adviser’s profitability discussed at the most recent renewal of the Fund’s existing advisory agreement.
The Trustees noted the absence of breakpoints at this time, but considered, given the size of the Fund, breakpoints are not realistic at this time. The Board and the Adviser agreed to consider the matter of breakpoints as the Fund realizes meaningful asset growth. The Board concluded to annually monitor the Fund’s asset levels and discuss breakpoints in the future as economies are realized.
Having requested and received such information from the Adviser as the Trustees believed to be reasonably necessary to evaluate the terms of the Amended Advisory Agreement, and as assisted by the advice of Counsel, the Trustees, including a majority of the Independent Trustees, concluded that the fee structure is reasonable and that approval of the New Advisory Agreement is in the best interests of the shareholders of the Fund.
Approval of Sub-Advisory Agreements
Graham Capital Management (“Graham”)
The Board considered the nature, extent and quality of services to be provided by Graham to the Fund. The Board reviewed the responsibilities of Graham’s key individuals, noting the experience and backgrounds of these individuals. The Trustees further noted that Graham will provide quantitative research, security selection and trade execution for the Fund’s portfolio as well as compliance services to assure assets are managed within the Fund’s investment restrictions. The Trustees noted that Graham has certified that it adopted a code of ethics under Rule 17j-1 of the 1940 Act. The Trustees further noted Graham’s overall strategy and risk controls. The Board considered Graham’s compliance controls including its monitoring of Investment Company Act restrictions as well as its technology and infrastructure. The Board concluded that Graham is well-staffed and has a depth of experienced personnel and the quantitative expertise to provide high quality services to the Fund.
The Board noted Graham’s representative fund accounts reported 1-year and since inception returns that outperformed the Barclay CTA Index and Newedge CTA Index. After a discussion, the Trustees concluded that it was reasonable that Graham would provide satisfactory performance.
| 106 | | | Approval of Advisory Agreements (continued) (Unaudited) |
The Trustees considered the proposed sub-advisory fee was slightly lower than the average fee charged by Graham to its separately managed account clients. After further discussion, the Trustees concluded that the proposed sub-advisory fee was reasonable.
The Trustees considered whether there will be economies of scale with respect to the management of the Fund. The Trustees agreed that this was primarily an adviser level issue and should be considered with respect to the overall advisory contract, taking into consideration the impact of the sub-advisory expense. After discussion, it was the consensus of the Trustees that a lack of breakpoints was acceptable.
The Trustees considered the anticipated profits to be realized by Graham in connection with its relationship with the Fund and whether the amount of profit is reasonable with respect to the sub-advisory services to be provided to the Fund. The Trustees also noted Graham’s intention to continue to devote considerable resources in developing and maintaining its trading programs. After a discussion, the Trustees concluded that the anticipated level of profit was not excessive.
Having requested and received such information from Graham as the Trustees believed to be reasonably necessary to evaluate the terms of the Sub-Advisory Agreement, and as assisted by the advice of counsel, the Trustees, including a majority of the Independent Trustees, concluded that the fee structure is reasonable and that approval of the Sub-Advisory Agreement is in the best interests of the shareholders of the Fund.
Millburn Ridgefield Corp. (“Millburn”)
The Board also considered the nature, extent and quality of services provided or to be provided by Millburn for the Fund. The Board noted that Millburn managed approximately $1.5 billion in assets as of October 1, 2015 and has a history dating back to 1982. The Board reviewed the responsibilities of Millburn’s key individuals, noted the many years of experience for the portfolio management team and a depth of investment capabilities. The Trustees considered that Millburn will provide portfolio construction, investment strategy development and trade execution for the Fund’s portfolio as well as compliance services to assure assets are managed within the Fund’s investment restrictions. The Board concluded that Millburn is well-staffed and has a depth of experienced personnel and investment expertise and is expected to provide the same to the Fund.
The Board considered the investment performance of Millburn’s representative account for its strategy as a reference performance record, noting that Millburn’s representative fund account’s 1-year, 5-year, 10-year and since inception returns outperformed the Barclay CTA Index for all periods. After a discussion, the Trustees concluded that it was reasonable that Millburn would provide satisfactory performance.
The Board also noted that the proposed fee structure included breakpoints at certain asset levels. After further discussion, the Trustees concluded that the proposed sub-advisory fee was reasonable.
The Trustees considered whether there will be economies of scale with respect to the management of the Fund. The Trustees agreed that this was primarily an adviser level issue and should be considered with respect to the overall advisory contract, taking into consideration the impact of the sub-advisory expense.
The Trustees considered the anticipated profits to be realized by Millburn in connection with its relationship with the Fund and whether the amount of profit is a fair entrepreneurial profit with respect to the sub-advisory services to be provided to the Fund. The Trustees noted that Millburn did not expect to earn a profit during the initial fiscal year based on several ranges of assets that Millburn is expected manage initially. The Trustees concluded that the anticipated level of profit was not excessive.
Having requested and received such information from Millburn as the Trustees believed to be reasonably necessary to evaluate the terms of the Sub-Advisory Agreement, and as assisted by the advice of counsel, the Trustees, including a majority of the Independent Trustees, concluded that the fee structure is reasonable and that approval of the Sub-Advisory Agreement is in the best interests of the shareholders of the Fund.
Revolution Capital Management (“Revolution”)
The Board reviewed the responsibilities of Revolution’s principals, noting the experience and backgrounds of these individuals. The Trustees further noted that Revolution will be responsible for the maintenance and improvement of the trading models used in its strategy for the Fund’s portfolio and trade execution as well as compliance services to assure assets are managed within the Fund’s investment restrictions. After a discussion, the Board concluded that Revolution is appropriately staffed and has the resources and expertise to provide high quality services to the Fund.
The Board considered the investment performance of Revolution’s representative account for its strategy as a reference performance record, noting that Revolution’s representative fund account had 1-year, 5-year, 10-year and since inception returns that outperformed the Newedge CTA Index for all periods. After a discussion, the Trustees concluded that it was reasonable that Revolution would provide satisfactory performance.
The Trustees considered that the proposed fee structure was favorable compared to the average fee charged by Revolution to its separately managed account clients in the same strategy. After further discussion, the Trustees concluded that the proposed sub-advisory fee was reasonable.
Approval of Advisory Agreements (continued) (Unaudited) | | | 107 |
The Trustees considered whether there will be economies of scale with respect to the management of the Fund. The Trustees agreed that this was primarily an adviser level issue and should be considered with respect to the overall advisory contract, taking into consideration the impact of the sub-advisory expense.
The Trustees considered the anticipated profits to be realized by Revolution in connection with its relationship with the Fund and whether the amount of profit is a fair entrepreneurial profit with respect to the sub-advisory services to be provided to the Fund. The Trustees noted that Revolution estimates realizing reasonable profits during the initial fiscal year, both in terms of percentage of revenue as well as actual dollars, based on the amount of assets that Revolution is expected manage initially. The Trustees concluded that the anticipated level of profit was not excessive.
Having requested and received such information from Revolution as the Trustees believed to be reasonably necessary to evaluate the terms of the Sub-Advisory Agreement, and as assisted by the advice of counsel, the Trustees, including a majority of the Independent Trustees, concluded that the fee structure is reasonable and that approval of the Sub-Advisory Agreement is in the best interests of the shareholders of the Fund.
LoCorr Long/Short Equity Fund
Approval of Sub-Advisory Agreement
The Trustees, including a majority of the Trustees who are not interested persons of the Trust (the “Independent Trustees”), considered the approval of the Sub-Advisory Agreement between LoCorr Fund Management, LLC (the “Adviser”) and Kettle Hill Capital Management, LLC (“Kettle Hill”), with respect to the Fund, at a meeting held on July 15, 2015.
The Board considered the nature, extent and quality of services to be provided by Kettle Hill for the Fund. The Board reviewed the responsibilities of Kettle Hill’s key individuals, noting the many years of experience of the portfolio manager. The Trustees further noted that Kettle Hill will conduct equity research, financial modeling, security selection and trade execution for the Fund as well as compliance services to assure assets are managed within the Fund’s investment restrictions. The Board concluded that Kettle Hill has the requisite financial expertise and that it has provided high quality services and is expected to provide the same to the Fund.
The Trustees considered the outperformance of the similar accounts against the benchmarks for the one, five and ten year periods as well as since inception. The Trustees also noted the favorable performance of the other similar accounts versus the benchmarks on an average annual basis. After a discussion, the Board agreed that it expected Kettle Hill to provide similar satisfactory performance with respect to the Fund.
The Trustees noted that the fee to be paid to Kettle Hill by the Adviser compared favorably to the fee charged by Kettle Hill to its other accounts. The Board considered Kettle Hill’s net profits related to its services to the Fund. After a discussion, the Board concluded that Kettle Hill’s sub-advisory fee and profitability were within the range of reasonableness.
The Trustees noted that Kettle Hill may derive certain other benefits from its relationship with the Fund including soft dollars that may be generated from Fund transactions that Kettle Hill would use for brokerage and research purposes and may generally benefit from any publicity generated by Fund through coverage of the Fund by industry ranking services, media coverage and marketing materials. After a discussion, the Trustees concluded that the other benefits that may be derived by Kettle Hill from its relationship with the Fund were reasonable.
Having requested and received such information from Kettle Hill as the Trustees believed to be reasonably necessary to evaluate the terms of the Sub-Advisory Agreement, and as assisted by the advice of counsel, the Trustees, including a majority of the Independent Trustees, concluded that the fee structure is reasonable and that approval of the Sub-Advisory Agreement is in the best interests of the shareholders of the Fund.
| 108 | | | Notice of Privacy Policy & Practices/Quarterly Portfolio Holdings/Proxy (Unaudited) |
Notice of Privacy Policy & Practices
(Unaudited)
Your privacy is important to us. The Funds are committed to maintaining the confidentiality, integrity, and security of your personal information. When you provide personal information, the Funds believe that you should be aware of policies to protect the confidentiality of that information.
The Funds collect the following nonpublic personal information about you:
| ● | Information we receive from you on or in applications or other forms, correspondence, or conversations, including, but not limited to, your name, address, phone number, social security number, assets, income, and date of birth; and |
| ● | Information about your transactions with us, our affiliates, or others, including, but not limited to, your account number and balance, payments history, parties to transactions, cost basis information, and other financial information. |
The Funds do not disclose any nonpublic personal information about our current or former shareholders to affiliated or nonaffiliated third parties, except as permitted by law. For example, the Funds are permitted by law to disclose all of the information we collect, as described above, to our transfer agent to process your transactions. Furthermore, the Funds restrict access to your nonpublic personal information to those persons who require such information to provide products or services to you. The Funds maintain physical, electronic, and procedural safeguards that comply with applicable federal and state standards to guard your nonpublic personal information.
In the event that you hold shares of the Funds through a financial intermediary, including, but not limited to, a broker-dealer, bank, or trust company, the privacy policy of your financial intermediary would govern how your nonpublic personal information would be shared with affiliated or non-affiliated third parties.
Quarterly Form N-Q portfolio schedule
(Unaudited)
The Funds file their complete schedule of portfolio holdings with the Securities and Exchange Commission (“SEC”) for the first and third quarters of each fiscal year on Form N-Q. The Funds’ Forms N-Q are available on the SEC’s website at http://www.sec.gov. The Funds’ Forms N-Q may be reviewed and copied at the SEC’s Public Reference Room in Washington, D.C. Information on the operation of the SEC’s Public Reference Room may be obtained by calling 1-800-SEC-0330. Additionally, you may obtain copies of Forms N-Q from the Funds upon request by calling 1-855-523-8637.
Proxy voting policies, procedures and record
(Unaudited)
You may obtain a description of the Funds’ (1) proxy voting policies, (2) proxy voting procedures and (3) information regarding how the Funds voted any proxies related to portfolio securities during the most recent 12-month period ended December 31 for which an SEC filing has been made, without charge, upon request by contacting the Funds directly at 1-855-523-8637, or on the EDGAR Database on the SEC’s website (http:// www.sec.gov).
Qualified Dividends | | | 109 |
Qualified Dividend Income/Dividends Received Deduction
(Unaudited)
For the period ended December 31, 2015(a), certain dividends paid by the Funds may be subject to a maximum tax rate of 15%, as provided for by the Jobs and Growth Tax Relief Reconcilliation Act of 2003. The percentage of dividends declared from ordinary income designated as qualified income was as follows:
| LoCorr Managed Futures Strategy Fund | 0.00 | % |
| LoCorr Long/Short Commodities Strategy Fund | 0.00 | % |
| LoCorr Multi-Strategy Fund | 23.78 | % |
| LoCorr Market Trend Fund | 0.00 | % |
| LoCorr Long/Short Equity Fund | 0.00 | % |
| LoCorr Spectrum Income Fund | 11.87 | % |
For corporate shareholders, the percent of ordinary income distributions qualifying for the corporate dividends received deduction for the period ended December 31, 2015(a) was as follows:
| LoCorr Managed Futures Strategy Fund | 0.00 | % |
| LoCorr Long/Short Commodities Strategy Fund | 0.00 | % |
| LoCorr Multi-Strategy Fund | 41.25 | % |
| LoCorr Market Trend Fund | 0.00 | % |
| LoCorr Long/Short Equity Fund | 0.00 | % |
| LoCorr Spectrum Income Fund | 14.24 | % |
(a) For the year ended December 31, 2015 for the LoCorr Managed Futures Strategy Fund, the LoCorr Long/Short Commodities Strategy Fund, the LoCorr Market Trend Fund, the LoCorr Long/ Short Equity Fund and the LoCorr Spectrum Income Fund and for the period from April 6, 2015 (commencement of operations) through December 31, 2015 for the LoCorr Multi-Strategy Fund.
| 110 | | | Independent Trustees/Interested Trustees and Officers |
The Statement of Additional Information includes additional information about the Independent Trustees/Interested Trustees and Officers and is available, without charge, by calling 1-855-523-8637.
| Independent Trustees | |||||||||||||
Name, Address and Year of Birth | Position/Term of Office1 | Principal Occupation During the Past 5 Years | Number of Portfolios in Fund Complex2 Overseen by Trustee | Other Directorships held by Trustee During the Past 5 Years | |||||||||
James W. Morton Year of Birth: 1939 | Trustee/January 2011 to present | Chairman of the Board, Fidelity Bank (community bank), 2008 to present, President 1978 to 2008. | 6 | None | |||||||||
Mark Thompson Year of Birth: 1959 | Trustee/December 2011 to present | Chairman and Chief Manager, Riverbridge Partners, LLC (investment management), 1987 to present. | 6 | None | |||||||||
Ronald A. Tschetter Year of Birth: 1941 | Trustee/January 2011 to present | Mr. Tschetter is presently retired from his principal occupation; Director of the U.S. Peace Corps, September 2006 to January 2009. | 6 | None | |||||||||
| Interested Trustees and Officers | |||||||||||||
Name, Address and Year of Birth | Position/Term of Office1 | Principal Occupation During the Past 5 Years | Number of Portfolios in Fund Complex2 Overseen by Trustee | Other Directorships held by Trustee During the Past 5 Years | |||||||||
Jon C. Essen3 Year of Birth: 1963 | Treasurer, Secretary, Chief Compliance Officer/January 2011 to present; Trustee/November, 2010 to present | Chief Operating Officer and Chief Compliance Officer of LoCorr Fund Management, LLC, November 2010 to present; Senior Vice President, Chief Operating Officer and Registered Representative of Octavus Group, LLC (broker/dealer), April 2008 to present. | 6 | None | |||||||||
Kevin M. Kinzie4 Year of Birth: 1956 | President, Trustee/ January 2011 to present | Chief Executive Officer of LoCorr Fund Management, LLC, November 2010 to present; President and Chief Executive Officer of Octavus Group, LLC (broker/dealer), March 2002 to present. | 6 | None | |||||||||
1 The term of office for each Trustee listed above will continue indefinitely.
2 The term “Fund Complex” refers to the LoCorr Investment Trust.
3 Mr. Essen is an interested Trustee because he is an officer of the Funds’ Adviser.
4 Mr. Kinzie is an interested Trustee because he is an officer and indirect controlling interest holder of the Funds’ Adviser.

Item 2. Code of Ethics.
The registrant has adopted a code of ethics that applies to the registrant’s principal executive officer and principal financial officer. The registrant has not made any amendments to its code of ethics during the period covered by this report. The registrant has not granted any waivers from any provisions of the code of ethics during the period covered by this report.
A copy of the registrant’s Code of Ethics is incorporated by reference. See Item 12(a)(1).
Item 3. Audit Committee Financial Expert.
The registrant’s Board of Trustees has determined that it does not have an audit committee financial expert serving on its Audit Committee. At this time, the registrant believes that the experience provided by each member of the Audit Committee together offers the registrant adequate oversight for the registrant’s level of financial complexity.
Item 4. Principal Accountant Fees and Services.
The registrant has engaged its principal accountant to perform audit services, audit-related services, tax services and other services during the past two fiscal years. “Audit services” refer to performing an audit of the registrant's annual financial statements or services that are normally provided by the accountant in connection with statutory and regulatory filings or engagements for those fiscal years. “Audit-related services” refer to the assurance and related services by the principal accountant that are reasonably related to the performance of the audit. “Tax services” refer to professional services rendered by the principal accountant for tax compliance, tax advice, and tax planning. “Other services” provided by the principal accountant of $6,000 and $5,200 represent a cursory review of the semi-annual report for LoCorr Investment Trust for the periods ended June 30, 2015 and June 30, 2014, respectively. The following table details the aggregate fees billed or expected to be billed for each of the last two fiscal years for audit fees, audit-related fees, tax fees and other fees by the principal accountant.
| FYE 12/31/2015 | FYE 12/31/2014 | |
| Audit Fees | $132,000 | $101,000 |
| Audit-Related Fees | $0 | $0 |
| Tax Fees | $35,500 | $24,000 |
| All Other Fees | $6,000 | $5,200 |
The Audit Committee has adopted pre-approval policies and procedures that require the Audit Committee to pre-approve all audit and non-audit services of the registrant, including services provided to any entity affiliated with the registrant.
The percentage of fees billed by Cohen Fund Audit Services, Ltd. applicable to non-audit services pursuant to waiver of pre-approval requirement were as follows:
| FYE 12/31/2015 | FYE 12/31/2014 | |
| Audit-Related Fees | 0% | 0% |
| Tax Fees | 0% | 0% |
| All Other Fees | 0% | 0% |
All of the principal accountant’s hours spent on auditing the registrant’s financial statements were attributed to work performed by full-time permanent employees of the principal accountant.
During the last two fiscal years, there were no non-audit services, other those disclosed above under "Tax Fees" and "All Other Services", rendered by the principal accountant to the registrant. In addition, there were no non-audit services rendered by the principal accountant to the registrant’s investment adviser or any entity controlling, controlled by or under common control with the investment adviser that provides ongoing services to the registrant.
Item 5. Audit Committee of Listed Registrants.
Not applicable to registrants who are not listed issuers (as defined in Rule 10A-3 under the Securities Exchange Act of 1934).
Item 6. Investments.
| (a) | Schedule of Investments is included as part of the report to shareholders filed under Item 1 of this Form. |
| (b) | Not Applicable. |
Item 7. Disclosure of Proxy Voting Policies and Procedures for Closed-End Management Investment Companies.
Not applicable to open-end investment companies.
Item 8. Portfolio Managers of Closed-End Management Investment Companies.
Not applicable to open-end investment companies.
Item 9. Purchases of Equity Securities by Closed-End Management Investment Company and Affiliated Purchasers.
Not applicable to open-end investment companies.
Item 10. Submission of Matters to a Vote of Security Holders.
There have been no material changes to the procedures by which shareholders may recommend nominees to the registrant’s Board of Trustees.
Item 11. Controls and Procedures.
| (a) | The registrant’s President and Treasurer have reviewed the registrant's disclosure controls and procedures (as defined in Rule 30a-3(c) under the Investment Company Act of 1940 (the “Act”)) as of a date within 90 days of the filing of this report, as required by Rule 30a-3(b) under the Act and Rules 13a-15(b) or 15d-15(b) under the Securities Exchange Act of 1934. Based on their review, such officers have concluded that the disclosure controls and procedures are effective in ensuring that information required to be disclosed in this report is appropriately recorded, processed, summarized and reported and made known to them by others within the registrant and by the registrant’s service provider. |
| (b) | There were no changes in the registrant's internal control over financial reporting (as defined in Rule 30a-3(d) under the Act) that occurred during the second fiscal quarter of the period covered by this report that has materially affected, or is reasonably likely to materially affect, the registrant's internal control over financial reporting. |
Item 12. Exhibits.
| (a) | (1) Any code of ethics or amendment thereto, that is the subject of the disclosure required by Item 2, to the extent that the registrant intends to satisfy Item 2 requirements through filing an exhibit. |
Incorporated by reference to the registrant’s Form N-CSR filed March 7, 2014.
(2) A separate certification for each principal executive and principal financial officer pursuant to Section 302 of the Sarbanes-Oxley Act of 2002.
Filed herewith.
(3) Any written solicitation to purchase securities under Rule 23c-1 under the Act sent or given during the period covered by the report by or on behalf of the registrant to 10 or more persons.
Not applicable to open-end investment companies.
| (b) | Certifications pursuant to Section 906 of the Sarbanes-Oxley Act of 2002. |
Furnished herewith.
SIGNATURES
Pursuant to the requirements of the Securities Exchange Act of 1934 and the Investment Company Act of 1940, the registrant has duly caused this report to be signed on its behalf by the undersigned, thereunto duly authorized.
(Registrant) LoCorr Investment Trust
By (Signature and Title) /s/ Kevin Kinzie
Kevin Kinzie, President
Date 3/9/16
Pursuant to the requirements of the Securities Exchange Act of 1934 and the Investment Company Act of 1940, this report has been signed below by the following persons on behalf of the registrant and in the capacities and on the dates indicated.
By (Signature and Title) /s/ Kevin Kinzie
Kevin Kinzie, President
Date 3/9/16
By (Signature and Title) /s/ Jon Essen
Jon Essen, Treasurer
Date 3/9/16