Great Lakes Bond Fund
Institutional Class Shares – GLBNX
Great Lakes Disciplined Equity Fund
Institutional Class Shares – GLDNX
Great Lakes Large Cap Value Fund
Institutional Class Shares – GLLIX
Great Lakes Small Cap Opportunity Fund
Investor Class Shares – GLSCX
Institutional Class Shares – GLSIX
Annual Report
March 31, 2021
1-855-278-2020
www.glafunds.com
Distributed by Quasar Distributors, LLC
Member FINRA
Great Lakes Bond Fund
May 3, 2021
Dear Shareholders,
I. INVESTMENT RESULTS
In the 12 months ended March 31st of 2021, your Great Lakes Bond Fund returned the following:
Share Class | 12 Months ended 3/31/21 | |
| Institutional Class | 5.80% | |
| Bloomberg Barclays U.S. Aggregate Bond Index | 0.71% | |
During the 12 months ended March 31, 2021, the global pandemic, in the form of COVID-19, was still at the center of attention for the U.S. Federal Reserve (the “Fed”) and global central banks. Unprecedented stimuli were introduced in an effort to keep the global economy from locking up. Interest rates initially plummeted as the Fed opened the flood gates of liquidity, backstopping everything from mortgages to corporate and municipal bonds, to municipalities and state governments and private businesses through an array of grants and loans. This stimulus and vaccination program are showing signs of recovery, and with it, the expected rise in interest rates, as seen in the steepness of the yield curve.
II. ATTRIBUTION
The Fund outperformed its benchmark significantly on a total return basis. The yield on the Fund and the income paid out to shareholders was very competitive with the benchmark, but owing to a much shorter average duration and maturity, the Fund was much better insulated from the downward movement in bond prices that declined in price in the volatile market environment near the end of the period. This move is something we expect to continue as the world recovers from the pandemic.
III. OUTLOOK
We expect more sporadic volatility over the next few quarters in the form of price moves up and down as the bond market continues to dissect and digest the constant flow of data and chatter from the Fed and more importantly, the global pandemic. We expect the Fed to continue to stimulate the economy with whatever means necessary. With regard to structure of the Fund, the addition of some longer maturity assets in an attempt to move all-in duration somewhat closer, but still less than that of the benchmark. Although our outlook is for a steeper yield curve as the economy continues to recover, and the possibility of wider corporate spreads, the specter of increased volatility is still very real. We believe that shorter duration and average maturity, and continuing to emphasize yield from lower rated, shorter maturity bonds will continue to insulate the Fund shares from some of this expected volatility.
Patrick Morrissey
Past performance is not a guarantee of future results.
Investing involves risk including loss of principal. In addition to the normal risks associated with investing, international investments may involve risk of capital loss from unfavorable fluctuation in currency values, from differences in generally accepted accounting principles or from economic or political instability in other nations. The Fund may invest in ETFs. The market price of the shares of an ETF will fluctuate based on changes in the net asset value as well as changes in the supply and demand of its shares in the secondary market. ETFs have management and other expenses. The Fund will bear it’s pro rata portion of these expenses and therefore the Fund’s expenses may be higher than if it invested directly in securities.
Great Lakes Bond Fund
The opinions expressed are those of the fund managers and are not intended to be a forecast of future events, a guarantee of future results, nor investment advice.
Fund holdings and sector allocations are subject to change at any time and should not be considered a recommendation to buy or sell any security. Please refer to the schedules of investments for complete holdings information.
It is not possible to invest directly in an index.
Definitions:
The Bloomberg Barclays U.S. Aggregate Bond Index is an unmanaged, intermediate term index and a market capitalization-weighted index, where securities in the index are weighted according to the market size of each bond type and composed of securities from the Bloomberg Barclays Government/Corporate Bond Index, Mortgage-Backed Securities Index and the Asset-Backed Securities Index. Total return comprises price appreciation/depreciation and income as a percentage of the original investment.
Basis point (bp) is a unit equal to 1/100th of 1% and is used to denote the change in a financial instrument.
Duration is a measure of the sensitivity of the price of a bond or other debt instrument to a change in interest rates. Duration measures how long it takes, in years, for an investor to be repaid the bond’s price by the bond’s total cash flows.
A corporate spread is the difference in yield between a U.S. Treasury bond and a debt security with the same maturity but of lesser quality. Credit spreads between U.S. Treasuries and other bond issuances are measured in basis points, with a 1% difference in yield equal to a spread of 100 basis points.
Average maturity is the average time before bonds or other fixed-income investments mature. The longer the average maturity, the greater the risk of rising interest rates.
Great Lakes Bond Fund
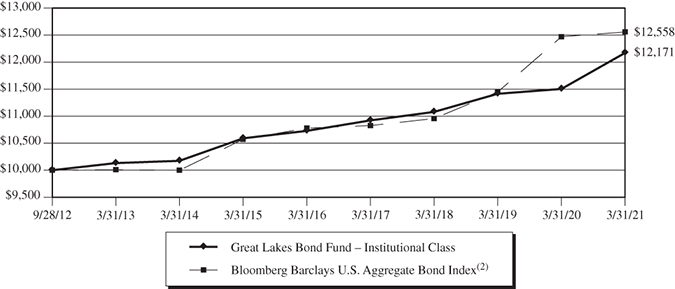
Value of $10,000 Investment (Unaudited)
The chart assumes an initial investment of $10,000. Performance reflects waivers of fee and operating expenses in effect. In the absence of such waivers, total return would be reduced. Performance data quoted represents past performance and does not guarantee future results. Investment returns and principal value will fluctuate, and when sold, may be worth more or less than their original cost. Performance current to the most recent month-end may be lower or higher than the performance quoted and can be obtained by calling 855-278-2020. Performance assumes the reinvestment of capital gains and income distributions. The performance does not reflect the deduction of taxes that a shareholder would pay on Fund distributions or the redemption of Fund shares.
Annualized Rates of Return as of March 31, 2021
| | 1-Year | 3-Year | 5-Year | Since Inception(1) |
| Institutional Class | 5.80% | 3.18% | 2.56% | 2.34% |
Bloomberg Barclays U.S. Aggregate Bond Index(2) | 0.71% | 4.65% | 3.10% | 2.71% |
| (1) | Inception date of the Fund was September 28, 2012. |
| (2) | The Bloomberg Barclays U.S. Aggregate Bond Index is an intermediate term index and a market capitalization-weighted index, where securities in the index are weighted according to the market size of each bond type. This index can not be invested in directly. |
The following is expense information for the Great Lakes Bond Fund as disclosed in the Fund’s most recent prospectus dated July 29, 2020:
Gross Expenses: 0.60%; Net Expenses: 0.60%.
The actual net expense ratio applicable to investors, as disclosed in the Financial Highlights for the year ended March 31, 2021 was 0.60%.
Great Lakes Bond Fund
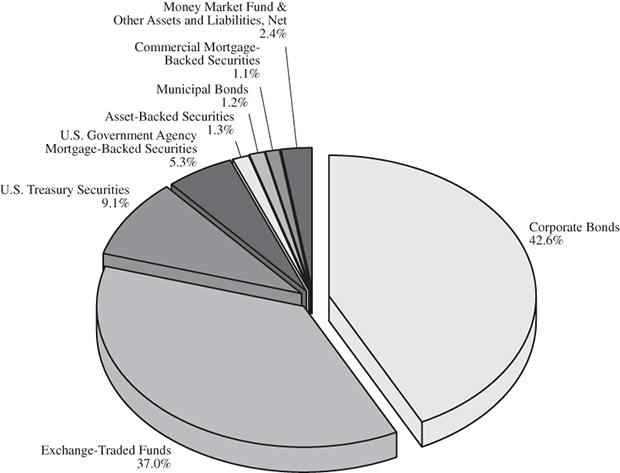
Allocation of Portfolio Net Assets (Unaudited)
March 31, 2021(1)
(% of Net Assets)
Top 10 Holdings (Unaudited)
March 31, 2021(1)
(% of Net Assets)
| | iShares iBoxx $ High Yield Corporate Bond Fund | 9.5% | |
| | iShares MBS Fund | 7.7% | |
| | iShares 1-5 Year Inv. Grade Corporate Bond Fund | 7.7% | |
| | iShares Floating Rate Bond Fund | 6.5% | |
| | iShares Core U.S. Aggregate Bond Fund | 5.7% | |
| | U.S. Treasury Bond, 2.000%, 02/15/2023 | 5.4% | |
| | Morgan Stanley, 1.413%, 05/08/2024 | 4.1% | |
| | JPMorgan Chase & Co., 2.972%, 01/15/2023 | 3.1% | |
| | Goldman Sachs Group, Inc., 1.244%, 06/05/2023 | 2.6% | |
| | Booking Holdings, Inc., 3.600%, 06/01/2026 | 2.5% | |
| (1) | Fund holdings and sector allocations are subject to change at any time and are not recommendations to buy or sell any security. |
Great Lakes Disciplined Equity Fund
May 27, 2021
Dear Shareholders,
I. INVESTMENT RESULTS
Market Review
During the one-year period ending March 31, 2021, U.S. equities saw a continuation of highly anomalous behavior. During these 12 months alone investors have had to adapt to:
| | • | An unprecedented wave of monetary and fiscal stimulus |
| | • | A shift to a work-from-home environment |
| | • | A “contested” Presidential election |
| | • | Successful vaccine trials effectively forcing an unwind of the work-from-home trade |
| | • | Runoff elections ultimately resulting in a “Blue Wave”, setting the stage for yet another massive stimulus package |
| | • | The worst quarter for Treasuries in 40 years |
| | • | The best quarter for value stocks in 20 years |
While we anticipated an increase in Treasury yields, strong corporate earnings growth, and a rotation into value stocks, we did not anticipate the speed with which this latest rotation occurred.
Against this backdrop, for the 12 months ended March 31st of 2021, your Great Lakes Disciplined Equity Fund returned the following:
Total Returns
Share Class | 12 Months ended 3/31/21 | |
| Institutional Class | 52.43% | |
| S&P 500 Index | 56.35% | |
Size/Style
| | • | Mega-caps slightly underperformed large-caps as measured by the S&P 100 and S&P 500. |
| | | |
| | • | Growth edged value, as measured by the S&P 500 Growth and S&P 500 Value Indexes. |
| | | o | Closer observation reveals the growth advantage occurred entirely prior to September 1st, and was largely the result of big tech, work-from home beneficiaries. After September 1st, value stocks outperformed – particularly after the vaccine test results were announced on November 9th, 2020. |
S&P 500 Sectors
| | • | Cyclical sectors dominated the S&P 500 during this period. |
| | | o | The Materials sector returned over 78%, Energy just over 75%, Consumer Discretionary stocks 70%. |
| | • | Most all Defensive / counter-cyclical sectors underperformed the market during the 12-month period. |
| | | o | Utilities was the worst-performing sector, yet still added 19%. Consumer Staples were the next worst, adding “only” a bit over 28%. |
Great Lakes Disciplined Equity Fund
II. ATTRIBUTION
The Disciplined Equity strategy added 52.43% during the one-year period yet trailed the benchmark S&P 500 Index’s 56.35% return. Below are the contributions from sector positioning and stock selection:
In total, sector positioning added 1.5% to active return:
| | • | Underweighting the Consumer Staples sector added about 100 basis points (“bps”) as the sector underperformed the benchmark by 28% during the one-year period.
|
| | • | Underweighting the Health Care sector also added close to 1%, as the sector trailed the S&P 500 Index by about 22%. |
Stock selection within the respective sectors detracted about 5% from active return:
| | • | Stock which benefitted relative performance included: |
| | | o | Expedia Group (EXPE) tripled during the period, surging strongly on the reopening trade.
|
| | | o | The Trade Desk (TTD), an advertising technology company, also more than tripled during the period. |
| | • | Stock which detracted from relative performance included: |
| | | o | Netflix Inc. (NFLX) went from the top contributor to portfolio performance last fiscal year to one of the larger detractors – despite a 39% advance. The stock failed to keep up with industry peers during the latter half of the fiscal year – especially as the economy began to re-open.
|
| | | o | Apple (APPL) added over 93% during the 12 months. Our underweight position in the stock helped total return yet contributed to underperforming the S&P 500 Index. |
III. OUTLOOK
Not-so-bold prediction: 2019 – 2021 will go down in history as one of the more unique periods for U.S. equities. From an incredibly swift bull market transition to start 2019, to the Fed easing and injecting liquidity at the end of a long economic expansion in late summer 2019, to COVID-19/shelter-in-place/#WFH, to unprecedented monetary response, the most surreal of Presidential races, a COVID-19 vaccine, a change in control of the Senate decided in a run-off some 2 months after the general election, another $2T in fiscal stimulus, and finally the worst quarter for U.S. treasuries since 1980. Ho hum.
We weren’t surprised to see much of what came to pass during the opening quarter of 2021, but we were once again taken aback by the speed and violence of the rotation. Then again, I suppose one would be foolish to have “expected” the most violent rotation since Ronald Reagan’s first year in office!
The economic data looks quite good at this point, as does the vaccine rollout. There’s every reason to be optimistic in the short run, but also cautious in the long run. Corporate profits have recovered nicely and remain near record levels. Equity markets remain volatile under the surface to be sure, but headline equity volatility has receded. A recession is really off the table, and in fact, GDP growth in the high single digits is the most likely scenario over the next couple of quarters.
Although commodity prices are on the rise, inflation numbers remain in check at this point – but merit careful study. Manufacturing hours worked are down a bit, and while payroll expansion is robust, we still have slack in the labor market to counter commodity inflation.
Great Lakes Disciplined Equity Fund
Housing remains incredibly strong, with prices up 10% y/y. But there may be some signs of rising mortgage rates taking a bite out of demand, with both permits and new home sales down slightly. However, at least some of this decline is also due to very long wait times for building materials.
Consumers appear to be in good shape. Household balance sheets are robust, with low debt levels and plenty of excess savings. This makes for solid consumer confidence numbers, and impressive retail sales growth.
Stock prices are certainly elevated if one uses any kind of backward-looking valuation metrics. Stocks are trading higher based on optimism for a broad, robust economic recovery – and that is what we have underway, by most all indicators.
Jon Quigley, CFA. MSc
CIO, Disciplined Equity
Definitions:
Active Return refers to that segment of the returns in an investment portfolio that is due to active management decisions made by the portfolio manager. It does not include any return that is merely a function of the market’s movement. The active return is calculated as the return of the portfolio minus its benchmark return.
Basis point (bp) is a unit equal to 1/100th of 1% and is used to denote the change in a financial instrument.
The S&P 500 Index is a broad-based index of 500 stocks, which is widely recognized as representative of the equity market in general.
The S&P 500 Growth index tracks the investment results of the S&P 500 index composed of large-capitalization U.S. equities that exhibit growth characteristics.
The S&P 500 Value Index measures the performance of the large-capitalization value sector in the US equity market. It is a subset of the S&P 500 Index and consists of those stocks in the S&P 500 Index exhibiting the strongest value characteristics.
The Russell Top 200 Growth Index measures the performance of the 200 largest companies in the Russell 1000 Index. (The Russell 1000 Index is a stock market index that represents the highest-ranking 1,000 stocks in the Russell 3000 Index, which represents about 90% of the total market capitalization of that index.)
The Russell Top 200 Value Index tracks the investment results of an index composed of large-capitalization U.S. equities that exhibit value characteristics.
The Russell Top 200® Index measures the performance of the largest cap segment of the U.S. equity universe. The Russell Top 200® Index is a subset of the Russell 3000® Index. It includes approximately 200 of the largest securities based on a combination of their market cap and current index membership and represents approximately 68% of the U.S. market.
It is not possible to invest directly in an index.
Basis point (bp) is a unit equal to 1/100th of 1% and is used to denote the change in a financial instrument.
Past performance does not guarantee future results.
Opinions expressed are subject to change at any time, are not guaranteed and should not be considered investment advice.
Great Lakes Disciplined Equity Fund
Fund holdings and sector allocations are subject to change and are not recommendations to buy or sell any security. Please refer to the schedules of investments for complete holdings information.
Mutual fund investing involves risk. Principal loss is possible. The Fund may invest in ETFs. Investing in ETFs are subject to additional risks that do not apply to conventional mutual funds, including the risks that the market price of the shares may trade at a discount to its net asset value (“NAV”), an active secondary trading market may not develop or be maintained, or trading may be halted by the exchange in which they trade, which may impact a Funds ability to sell its shares. ETFs have management and other expense. The Fund will bear its pro rata portion of these expenses and therefore the Fund’s expenses may be higher than if it invested directly in securities. The Fund invests in foreign securities which involve greater volatility and political, economic and currency risks and differences in accounting methods. These risks are greater in emerging markets. Growth stocks typically are more volatile than value stocks; however, value stocks have a lower expected growth rate in earnings and sales.
Great Lakes Disciplined Equity Fund
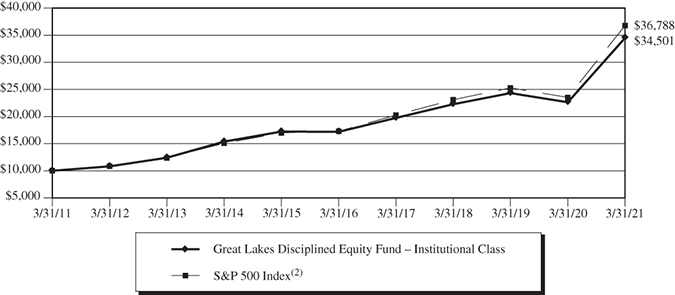
Value of $10,000 Investment (Unaudited)
The chart assumes an initial investment of $10,000. Performance reflects waivers of fee and operating expenses in effect. In the absence of such waivers, total return would be reduced. Performance data quoted represents past performance and does not guarantee future results. Investment returns and principal value will fluctuate, and when sold, may be worth more or less than their original cost. Performance current to the most recent month-end may be lower or higher than the performance quoted and can be obtained by calling 855-278-2020. Performance assumes the reinvestment of capital gains and income distributions. The performance does not reflect the deduction of taxes that a shareholder would pay on Fund distributions or the redemption of Fund shares.
Annualized Rates of Return as of March 31, 2021
| | 1-Year | 3-Year | 5-Year | 10-Year | Since Inception(1) |
| Institutional Class | 52.43% | 15.71% | 14.96% | 13.18% | 14.44% |
S&P 500 Index(2) | 56.35% | 16.78% | 16.29% | 13.91% | 15.26% |
| (1) | Inception date of the Fund was June 1, 2009. |
| (2) | The S&P 500 Index is a broad based unmanaged index of 500 stocks, which is widely recognized as representative of the equity market in general. This index can not be invested in directly. |
The following is expense information for the Great Lakes Disciplined Equity Fund as disclosed in the Fund’s most recent prospectus dated July 29, 2020:
Gross Expenses: 0.98%; Net Expenses: 0.85%. Great Lakes Advisors, LLC (the “Adviser” or “Great Lakes”) has contractually agreed to waive its management fees and pay Fund expenses in order to ensure that Total Annual Fund Operating Expenses (excluding acquired fund fees and expenses (“AFFE”), leverage/borrowing interest, interest expense, dividends paid on short sales, taxes, brokerage commissions and other transactional expenses, and extraordinary expenses) do not exceed 0.85% of the average daily net assets of the Fund. Fees waived and expenses paid by the Adviser may be recouped by the Adviser for a period of 36 months following the month during which such fee waiver and expense payment was made if such recoupment can be achieved without exceeding the expense limit in effect at the time the fee waiver and expense payment occurred and at the time of recoupment. The Operating Expense Limitation Agreement is indefinite in term and cannot be terminated through at least July 29, 2021. Thereafter, the agreement may be terminated at any time upon 60 days’ written notice by the Trust’s Board or the Adviser, with the consent of the Board.
The actual net expense ratio applicable to investors, as disclosed in the Financial Highlights for the year ended March 31, 2021 was 0.85%.
Great Lakes Disciplined Equity Fund
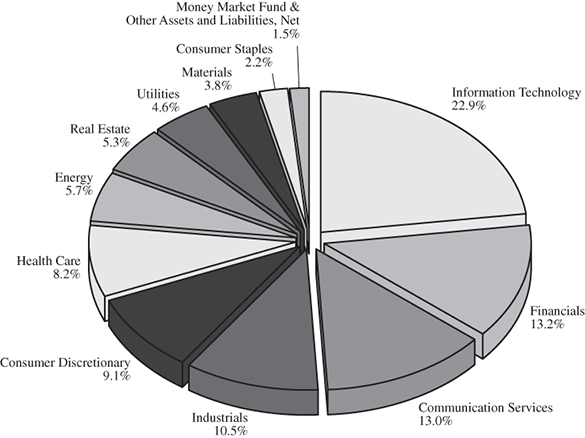
Allocation of Portfolio Net Assets (Unaudited)
March 31, 2021(1)
(% of Net Assets)
Top 10 Equity Holdings (Unaudited)
March 31, 2021(1)
(% of Net Assets)
| | Microsoft Corp. | 7.4% | |
| | Apple, Inc. | 4.0% | |
| | Bank of America Corp. | 3.7% | |
| | Alphabet, Inc. – Class C | 3.4% | |
| | Walt Disney Co. | 3.3% | |
| | Amazon.com, Inc. | 3.1% | |
| | Chevron Corp. | 3.0% | |
| | Texas Instruments, Inc. | 2.8% | |
| | Union Pacific Corp. | 2.8% | |
| | Visa, Inc. – Class A | 2.7% | |
| (1) | Fund holdings and sector allocations are subject to change at any time and are not recommendations to buy or sell any security. |
Great Lakes Large Cap Value Fund
May 2, 2021
Dear Shareholders,
I. INVESTMENT RESULTS
The fiscal year began with the equity market near a low point following the exogenous shock of the COVID-19 viral pandemic and the energy price drop following a struggle among producers. Accommodative monetary policy, as central bank actions went beyond those of the 2008-2009 period to bring about quite low interest rates, and fiscal stimulus to support consumption, quickly occurred. Virus vaccine development success (in a surprisingly short period), availability, and distribution allowed business recoveries and re-openings which underlay economic progress. As projections for corporate profits began to turn positive for 2021, and as interest rates moved only somewhat from very low levels in reflection of the beginning of an economic recovery, both the equity market (S&P 500) and value style indexes surged over 50% during the fiscal year.
Share Class | 12 Months ended 3/31/21 | |
| Institutional Class | 55.58% | |
| Russell 1000 Value Index | 56.09% | |
II. ATTRIBUTION
Through a period in which equity market and value style index returns exceeded 50%, company-specific issues, not overarching themes, were reasons why five holdings rose 13% or less. Company-specific problems include their industry price trends and prospects, their industry competition, and, in the case of defense prime Lockheed Martin, government spending.
Areas leading the strategy included those more sensitive to the economic pace, beneficiaries of a re-opening economy, and financials. Overall, fourteen positions held for the entire fiscal year rose at least 70%. Areas more sensitive to economic trends include makers of truck engines and components, auto propulsion products, chemicals and other industrial products, and energy production services. Three holdings which would benefit from the economy re-opening include two online travel agencies and Disney. Six financials in the group still have good credit quality despite the downturn, and benefit from somewhat higher interest rates on loan pricing and fixed income securities reinvestment.
III. OUTLOOK
Economic progress resumed as vaccines were approved, produced and reached arms. Further movement is dependent on global availability of approved vaccines. Success of vaccines (with possible modifications) against variants remains important to economic expansion.
Corporate profit outlook in 2021 now is constructive. Low interest rates, and even rising interest rates up to a point, are favorable for equities as they reflect economic growth. In contrast, should markedly higher inflation levels develop from possible relatively high economic growth, effect on equities would not be positive. Valuation of equities currently is not threatening, but not encouraging for large advances either. We intend to continue our value approach, which is based on rising or high earning power, attractive valuation and sufficient diversification.
Edward J. Calkins, CFA
Senior Portfolio Manager
Fund Shareholder
Great Lakes Large Cap Value Fund
Definitions:
The Russell 1000® Value Index measures the performance of those Russell 1000® Index companies with lower price-to-book ratios and lower forecasted growth rates.
One cannot invest directly in an index.
Past performance does not guarantee future results.
Diversification does not assure a profit nor protect against loss in a declining market.
Opinions expressed are subject to change at any time, are not guaranteed and should not be considered investment advice.
Fund holdings and sector allocations are subject to change and are not recommendations to buy or sell any security. For a complete list of fund holdings, please see the Schedule of Investments included in this report.
Mutual fund investing involves risk. Principal loss is possible. The Fund’s value investments are subject to the risk that their intrinsic values may not be recognized by the broad market or that their prices may decline. Investing in ETFs are subject to additional risks that do not apply to conventional mutual funds, including the risks that the market price of the shares may trade at a discount to its net asset value (“NAV”), an active secondary trading market may not develop or be maintained, or trading may be halted by the exchange in which they trade, which may impact a Funds ability to sell its shares. The Fund invests in foreign securities which involve greater volatility and political, economic and currency risks and differences in accounting methods. These risks are greater in emerging markets.
Great Lakes Large Cap Value Fund
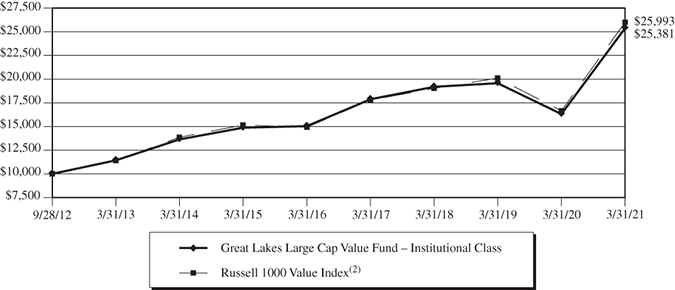
Value of $10,000 Investment (Unaudited)
The chart assumes an initial investment of $10,000. Performance reflects waivers of fee and operating expenses in effect. In the absence of such waivers, total return would be reduced. Performance data quoted represents past performance and does not guarantee future results. Investment returns and principal value will fluctuate, and when sold, may be worth more or less than their original cost. Performance current to the most recent month-end may be lower or higher than the performance quoted and can be obtained by calling 855-278-2020. Performance assumes the reinvestment of capital gains and income distributions. The performance does not reflect the deduction of taxes that a shareholder would pay on Fund distributions or the redemption of Fund shares.
Annualized Rates of Return as of March 31, 2021
| | 1-Year | 3-Year | 5-Year | Since Inception(1) |
| Institutional Class | 55.58% | 9.76% | 11.04% | 11.57% |
Russell 1000 Value Index(2) | 56.09% | 10.96% | 11.74% | 11.89% |
| (1) | Inception date of the Fund was September 28, 2012. |
| (2) | The Russell 1000 Value Index measures the performance of the large-cap value segment of the U.S. equity universe. It includes those Russell 1000 Index companies with lower price-to-book ratios and lower expected growth values. This index can not be invested in directly. |
The following is expense information for the Great Lakes Large Cap Value Fund as disclosed in the Fund’s most recent prospectus dated July 29, 2020:
Gross Expenses: 0.93%; Net Expenses: 0.85%. Great Lakes Advisors, LLC (the “Adviser” or “Great Lakes”) has contractually agreed to waive its management fees and pay Fund expenses in order to ensure that Total Annual Fund Operating Expenses (excluding acquired fund fees and expenses (“AFFE”), leverage/borrowing interest, interest expense, dividends paid on short sales, taxes, brokerage commissions and other transactional expenses, and extraordinary expenses) do not exceed 0.85% of the average daily net assets of the Fund. Fees waived and expenses paid by the Adviser may be recouped by the Adviser for a period of 36 months following the month during which such fee waiver and expense payment was made if such recoupment can be achieved without exceeding the expense limit in effect at the time the fee waiver and expense payment occurred and at the time of recoupment. The Operating Expense Limitation Agreement is indefinite in term and cannot be terminated through at least July 29, 2021. Thereafter, the agreement may be terminated at any time upon 60 days’ written notice by the Trust’s Board or the Adviser, with the consent of the Board.
The actual net expense ratio applicable to investors, as disclosed in the Financial Highlights for the year ended March 31, 2021 was 0.85%.
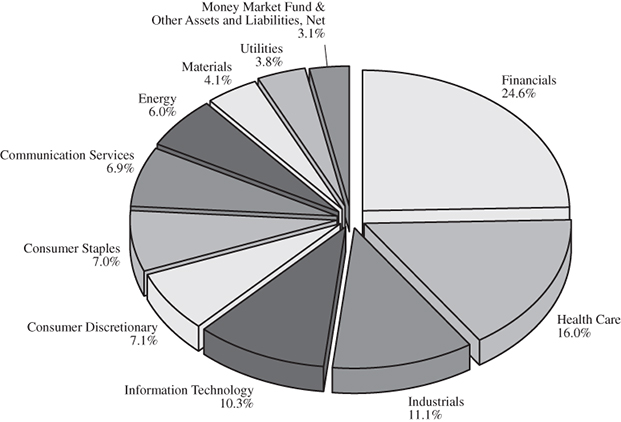
Great Lakes Large Cap Value Fund
Allocation of Portfolio Net Assets (Unaudited)
March 31, 2021(1)
(% of Net Assets)
Top 10 Equity Holdings (Unaudited)
March 31, 2021(1)
(% of Net Assets)
| | BorgWarner, Inc. | 4.0% | |
| | Comcast Corp. – Class A | 3.8% | |
| | Philip Morris International, Inc. | 3.7% | |
| | Berkshire Hathaway, Inc. – Class B | 3.4% | |
| | Chubb Ltd. | 3.2% | |
| | Merck & Co., Inc. | 3.1% | |
| | Citigroup, Inc. | 3.1% | |
| | Bank of America Corp. | 3.0% | |
| | RenaissanceRe Holdings, Ltd. | 3.0% | |
| | CVS Health Corp. | 2.9% | |
| (1) | Fund holdings and sector allocations are subject to change at any time and are not recommendations to buy or sell any security. |
Great Lakes Small Cap Opportunity Fund
May 7, 2021
Dear Shareholders,
I. INVESTMENT RESULTS
The Great Lakes Small Cap Opportunity Institutional Class (GLSIX) increased 80.39% for the twelve months ended March 31, 2021. This lagged the Russell 2000 index return, which was up 94.85%.
Share Class | 12 Months ended 3/31/21 | |
| Institutional Class | 80.39% | |
| Russell 2000 Index | 94.85% | |
This time last year, the shock of the coronavirus pandemic and shutdown crippled the global economy into a severe contraction. There was extreme uncertainty in the world. As a result, the stock market plummeted with frightening speed and depth, with the Russell 2000 index taking the brunt of it, falling nearly 45% from its peak level.
Today, as a result of the aggressive monetary and fiscal responses by the Fed and Congress and the rapid advancement of the COVID-19 vaccines, it appears that global economies are on the mend. It appears that investors are quite optimistic for what lies ahead as stocks are near all-time highs.
This has sparked a significant rotation away from high-growth, high multiple stocks into the more economically sensitive reopening stocks (i.e. value stocks). Over the past two quarters, the Russell 2000 value index has staged a massive recovery, outperforming the Russell 2000 growth index by over 25.68%. In our prior letter we stated that, eventually, the pendulum will swing back to the value investing camp, and when it does, that should provide us with a tailwind. In fact, that has occurred as the Fund has outperformed its benchmark over the past six-month period.
We believe a rotation back to value (and small caps) could be in the early innings as we head closer to a reopening of the global economy. As the economic activity continues to improve, this should fuel faster profit growth for the value/cyclical sectors which have languished during the pandemic versus the growth stocks that have benefited from the environment. Historically, coming out of the recession value stocks perform relatively better than growth stocks, we see no reason why this won’t be the case today. Additionally, with the Russell 2000 growth index trading at a huge premium to the value index, the starting point looks significantly more reasonable. We remain optimistic about the future prospects of our value-oriented portfolio.
II. ATTRIBUTION
For the twelve months ended March 31, 2021, the Fund enjoyed strong absolute performance, gaining 80.39%, but lagged the Russell 2000 index by nearly 1,446 basis points. The Fund’s underperformance relative to the index was primarily driven by holdings in Consumer Discretionary, Materials, Energy, and Technology. On a positive note, the Fund outperformed in Financials, Communication Services, and Real Estate.
The Consumer Discretionary was the best performing sector in the Russell 2000 index, advancing 184.9%. The best performing stocks in the sector were the high beta, weak balance sheet industries (travel/leisure and retailers) that were left for dead by the COVID-19 disruption. The Fund’s lack of exposure to those areas dinged our relative performance. While we underperformed the sector by 445 basis points, we are generally pleased with our overall stock selection. We had a number of solid performers that benefited from the expectation of the reopening of the economy including Urban Outfitters (+161.1%), Spectrum Brands (+140.7%), Gildan Activewear (+140.3%), and Mattel (+126.1%).
Great Lakes Small Cap Opportunity Fund
The Materials sector detracted 436 basis points on an attribution basis. Investors have flocked to the commodity producers as a way to play the reflation trade. Historically, we have not had much exposure to the commodity producers due to their undifferentiated products, sub-par returns on capital, and use of high leverage. Our investments in the Materials sector (NeuMarket and Berry Global) are focused on value-added producers that are generally insensitive to the commodity prices as they are able to pass on the higher input costs due their strong competitive positions. Put simply, our holdings did not keep pace in the sharp rebound.
The Fund’s Energy sector dinged our relative performance by 318 basis points. Similar to the Materials sector, the best performing companies were those that were directly impacted by the higher oil prices (levered exploration and production stocks). We own two high-quality offshore oil equipment companies (DrilQuip and NOV) with strong competitive positions and resilient balance sheets that lagged the sector’s 174.9% return. While the benefit of higher oil prices is not as immediate for our oil equipment suppliers, higher oil prices should eventually drive increased equipment purchases. We are encouraged by the outlook for both companies.
The Fund’s Technology sector detracted 282 basis point of relative performance. Half of the Fund’s underperformance was due to ViaSat (VSAT), which was up 33.8% but lagged the sectors’ 98.3% increase. VSAT business fundamentals have largely tracked our expectations and management has execution has been good, but the stock has lagged due to some concerns over the competitive landscape. We believe the concerns are overstated as VSAT’s technology and cost leadership remains strong.
The Financial sector was a bright spot for the Fund, outperforming by 225 basis points. Trupanion and Jefferies helped drive our strong relative outperformance. Trupanion was a great investment for us. The stocks was up 148.9% as the company delivered better than expected earnings, as its business remains very resilient in the COVID-19 period. The stock reached our price target so we exited the position. Jefferies also significantly outperformed the sector return, up 127.7%. The company continues to execute on its long-term strategy to simplify the business, increase returns, and buy back stock. We have high regard for this owner-operator management team, and the stock remains undervalued.
TripAdvisor (TRIP) was our best performing stock in the portfolio, advancing 209.3%. As a result, we outperformed in the Communication Services sector by 205 basis points. TRIP should be a strong beneficiary of a pent-up demand in leisure travel. During this downturn, the company has taken the opportunity to streamline its cost structure, so when demand recovers we should see meaningful operating leverage. With that said, we have trimmed the position size as it has approached our value.
In the Real Estate sector, Jones Lang LaSalle (JLL) advanced 77.3%, handily outpacing the sectors 49.3% return. JLL fundamentals have held up relatively well due to its fee based revenue stream. The company should be a beneficiary as the corporate workforce slowly returns to the office. While there will be a number of changes in the office space usage, we believe the overall demand will not be vastly different on the other side of COVID-19. JLL is a high-quality business that remains attractively valued at 10x normalized earnings.
Thanks for your trust and patience,
Benjamin Kim, CFA
Great Lakes Small Cap Opportunity Fund
Definitions:
The Russell 2000 Index consists of the smallest 2,000 companies in a group of 3,000 U.S. companies in the Russell 3000 Index, as ranked by market capitalization.
The Russell 2000 Growth index consists of 2,000 companies in a group of 3,000 U.S. companies in the Russell 3000 Index that exhibit a growth probability.
The Russell 2000 Value index consists of 2,000 companies in a group of 3,000 U.S. companies in the Russell 3000 Index that also exhibit a value probability.
Beta: Beta measures the volatility of the fund, as compared to that of the overall market. The Market’s beta is set at 1.00; a beta higher than 1.00 is considered to be more volatile than the market, while a beta lower than 1.00 is considered to be less volatile.
Basis point (bp) is a unit equal to 1/100th of 1% and is used to denote the change in a financial instrument.
Opinions expressed are subject to change at any time, are not guaranteed and should not be considered investment advice.
Fund holdings and sector allocations are subject to change and are not recommendations to buy or sell any security. Please refer to the schedules of investments for complete holdings information. Growth stocks typically are more volatile than value stocks; however, value stocks have a lower expected growth rate in earnings and sales.
Mutual fund investing involves risk. Principal loss is possible. Investing in ETFs are subject to additional risks that do not apply to conventional mutual funds, including the risks that the market price of the shares may trade at a discount to its net asset value (“NAV”), an active secondary trading market may not develop or be maintained, or trading may be halted by the exchange in which they trade, which may impact a Funds ability to sell its shares. Small-capitalization companies tend to have limited liquidity and greater price volatility than large-capitalization companies. The Fund invests in foreign securities which involve greater volatility and political, economic and currency risks and differences in accounting methods. These risks are greater in emerging markets. The Fund’s value investments are subject to the risk that their intrinsic values may not be recognized by the broad market or that their prices may decline.
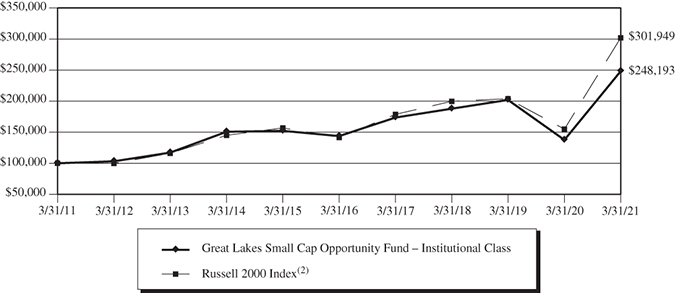
Great Lakes Small Cap Opportunity Fund
Value of $100,000 Investment (Unaudited)
The chart assumes an initial investment of $100,000. Performance reflects waivers of fee and operating expenses in effect. In the absence of such waivers, total return would be reduced. Performance data quoted represents past performance and does not guarantee future results. Investment returns and principal value will fluctuate, and when sold, may be worth more or less than their original cost. Performance current to the most recent month-end may be lower or higher than the performance quoted and can be obtained by calling 855-278-2020. Performance assumes the reinvestment of capital gains and income distributions. The performance does not reflect the deduction of taxes that a shareholder would pay on Fund distributions or the redemption of Fund shares.
Annualized Rates of Return as of March 31, 2021
| | 1-Year | 3-Year | 5-Year | 10-Year | Since Inception(1) |
| Investor Class | 79.97% | 9.46% | 11.28% | 9.25% | 13.91% |
| Institutional Class | 80.39% | 9.73% | 11.54% | 9.52% | 14.20% |
Russell 2000 Index(2) | 94.85% | 14.76% | 16.35% | 11.68% | 15.19% |
| (1) | Inception date of each class was December 5, 2008. |
| (2) | The Russell 2000 Index is a market capitalization-weighted index comprised of the 2,000 smallest companies listed on the Russell 3000 Index, which contains the 3,000 largest companies in the U.S. based on market capitalization. This index can not be invested in directly. |
The following is expense information for the Great Lakes Small Cap Opportunity Fund as disclosed in the Fund’s most recent prospectus dated July 29, 2020:
| Investor Class Gross Expense Ratio: 1.13% | Net Expense Ratio: 1.13% | |
| Institutional Class Gross Expense Ratio: 0.88% | Net Expense Ratio: 0.88% | |
Great Lakes Advisors, LLC (the “Adviser” or “Great Lakes”) has contractually agreed to waive its management fees and pay Fund expenses in order to ensure that Total Annual Fund Operating Expenses (excluding acquired fund fees and expenses (“AFFE”), leverage/borrowing interest, interest expense, dividends paid on short sales, taxes, brokerage commissions and other transactional expenses, and extraordinary expenses) do not exceed 1.24% of the average daily net assets of the Investor Class and 0.99% of the average daily net assets of the Institutional Class. Fees waived and expenses paid by the Adviser may be recouped by the Adviser for a period of 36 months
Great Lakes Small Cap Opportunity Fund
following the month during which such fee waiver and expense payment was made if such recoupment can be achieved without exceeding the expense limit in effect at the time the fee waiver and expense payment occurred and at the time of recoupment. The Operating Expense Limitation Agreement is indefinite in term and cannot be terminated through at least July 29, 2021. Thereafter, the agreement may be terminated at any time upon 60 days’ written notice by the Trust’s Board or the Adviser, with the consent of the Board.
The actual net expense ratio applicable to investors, as disclosed in the Financial Highlights for the year ended March 31, 2021, was 1.24% and 0.99% for the Investor Class and Institutional Class, respectively.
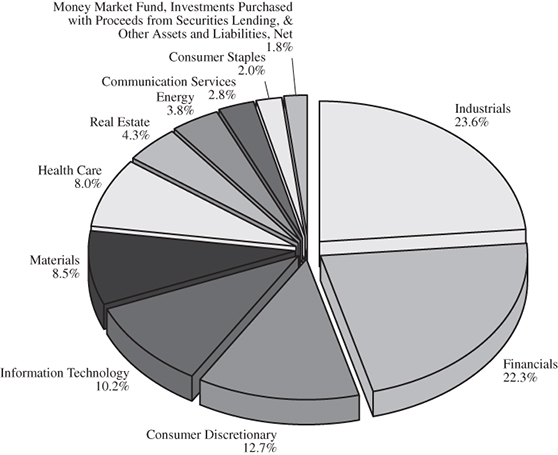
Great Lakes Small Cap Opportunity Fund
Allocation of Portfolio Net Assets (Unaudited)
March 31, 2021(1)(2)
(% of Net Assets)
Top 10 Equity Holdings (Unaudited)
March 31, 2021(1)
(% of Net Assets)
| | Investors Bancorp, Inc. | 3.4% | |
| | Jones Lang LaSalle, Inc. | 3.2% | |
| | Crane Co. | 3.2% | |
| | Axis Capital Holdings Ltd. | 3.1% | |
| | Jefferies Financial Group, Inc. | 3.1% | |
| | Berry Global Group, Inc. | 3.1% | |
| | Gildan Activewear, Inc. | 3.0% | |
| | Acuity Brands, Inc. | 2.9% | |
| | First American Financial Corp. | 2.8% | |
| | ViaSat, Inc. | 2.5% | |
| (1) | Fund holdings and sector allocations are subject to change at any time and are not recommendations to buy or sell any security. |
| (2) | Excludes securities lending collateral. |
Great Lakes Funds
Expense Examples (Unaudited)
March 31, 2021
As a shareholder of a Fund, you incur two types of costs: (1) transaction costs and (2) ongoing costs, including management fees; distribution (12b-1) fees (Investor Class only), and other Fund expenses. This Example is intended to help you understand your ongoing costs (in dollars) of investing in the Fund and to compare these costs with the ongoing costs of investing in other mutual funds. The Example is based on an investment of $1,000 invested at the beginning of the period and held for the entire period (October 1, 2020 – March 31, 2021).
ACTUAL EXPENSES
For each class, the first line of the table provides information about actual account values and actual expenses. You may use the information in this line, together with the amount you invested, to estimate the expenses that you paid over the period. Simply divide your account value by $1,000 (for example, an $8,600 account value divided by $1,000 = 8.6), then multiply the result by the number in the first line under the heading entitled “Expenses Paid During Period” to estimate the expenses you paid on your account during this period.
HYPOTHETICAL EXAMPLE FOR COMPARISON PURPOSES
For each class, the second line of the table below provides information about hypothetical account values and hypothetical expenses based on the Fund’s actual expense ratio and an assumed rate of return of 5% per year before expenses, which is not the Fund’s actual return. The hypothetical account values and expenses may not be used to estimate the actual ending account balance or expenses you paid for the period. You may use this information to compare the ongoing costs of investing in the Fund and other funds. To do so, compare this 5% hypothetical example with the 5% hypothetical examples that appear in the shareholder reports of the other funds.
Please note that the expenses shown in the table are meant to highlight your ongoing costs only. Therefore, the second line of the table is useful in comparing ongoing costs only, and will not help you determine the relative total costs of owning different funds.
Great Lakes Bond Fund
| | | | Expenses Paid |
| | Beginning Account | Ending Account | During Period(1) |
| | Value (10/1/2020) | Value (3/31/2021) | (10/1/2020 to 3/31/2021) |
Institutional Class Actual(2) | $1,000.00 | $ 999.50 | $2.99 |
| Institutional Class Hypothetical | | | |
| (5% return before expenses) | $1,000.00 | $1,021.94 | $3.02 |
| (1) | Expenses are equal to the Fund’s annualized expense ratio for the most recent six-month period of 0.60%, multiplied by the average account value over the period, multiplied by 182/365 to reflect the one-half year period. |
| (2) | Based on the actual returns for the six-month period ended March 31, 2021, of -0.05%. |
Great Lakes Disciplined Equity Fund
| | | | Expenses Paid |
| | Beginning Account | Ending Account | During Period(3) |
| | Value (10/1/2020) | Value (3/31/2021) | (10/1/2020 to 3/31/2021) |
Institutional Class Actual(4) | $1,000.00 | $1,152.40 | $4.56 |
| Institutional Class Hypothetical | | | |
| (5% return before expenses) | $1,000.00 | $1,020.69 | $4.28 |
| (3) | Expenses are equal to the Fund’s annualized expense ratio for the most recent six-month period of 0.85%, multiplied by the average account value over the period, multiplied by 182/365 to reflect the one-half year period. |
| (4) | Based on the actual returns for the six-month period ended March 31, 2021, of 15.24%. |
Great Lakes Funds
Expense Examples (Unaudited)
March 31, 2021
Great Lakes Large Cap Value Fund
| | | | Expenses Paid |
| | Beginning Account | Ending Account | During Period(1) |
| | Value (10/1/2020) | Value (3/31/2021) | (10/1/2020 to 3/31/2021) |
Institutional Class Actual(2) | $1,000.00 | $1,303.40 | $4.88 |
| Institutional Class Hypothetical | | | |
| (5% return before expenses) | $1,000.00 | $1,020.69 | $4.28 |
| (1) | Expenses are equal to the Fund’s annualized expense ratio for the most recent six-month period of 0.85%, multiplied by the average account value over the period, multiplied by 182/365 to reflect the one-half year period. |
| (2) | Based on the actual returns for the six-month period ended March 31, 2021, of 30.34%. |
Great Lakes Small Cap Opportunity Fund
| | | | Expenses Paid |
| | Beginning Account | Ending Account | During Period(3) |
| | Value (10/1/2020) | Value (3/31/2021) | (10/1/2020 to 3/31/2021) |
Investor Class Actual(4) | $1,000.00 | $1,496.00 | $7.72 |
| Investor Class Hypothetical | | | |
| (5% return before expenses) | $1,000.00 | $1,018.75 | $6.24 |
Institutional Class Actual(4) | $1,000.00 | $1,497.40 | $6.16 |
| Institutional Class Hypothetical | | | |
| (5% return before expenses) | $1,000.00 | $1,020.00 | $4.99 |
| (3) | Expenses are equal to the Fund’s annualized expense ratio for the most recent six-month period of 1.24% and 0.99% for the Investor Class and Institutional Class, respectively, multiplied by the average account value over the period, multiplied by 182/365 to reflect the one-half year period. |
| (4) | Based on the actual returns for the six-month period ended March 31, 2021, of 49.60% and 49.74% for the Investor Class and Institutional Class, respectively. |
Great Lakes Bond Fund
Schedule of Investments
March 31, 2021
Description | | Par | | | Value | |
| | | | | | | |
| CORPORATE BONDS – 42.6% | | | | | | |
| | | | | | | |
| Communication Services – 1.9% | | | | | | |
| Indiana Bell Telephone Co., Inc. | | | | | | |
| 7.300%, 08/15/2026 | | $ | 535,000 | | | $ | 654,651 | |
| Verizon Communications, Inc. | | | | | | | | |
| 0.750%, 03/22/2024 | | | 1,000,000 | | | | 1,001,312 | |
| | | | | | | | 1,655,963 | |
| Consumer Discretionary – 2.6% | | | | | | | | |
| Booking Holdings, Inc. | | | | | | | | |
| 3.600%, 06/01/2026 | | | 2,000,000 | | | | 2,187,130 | |
| | | | | | | | | |
| Energy – 1.3% | | | | | | | | |
| MPLX LP | | | | | | | | |
| 4.875%, 12/01/2024 | | | 750,000 | | | | 842,002 | |
| 4.800%, 02/15/2029 | | | 250,000 | | | | 286,471 | |
| | | | | | | | 1,128,473 | |
| Financials# – 28.8% | | | | | | | | |
| Affiliated Managers Group | | | | | | | | |
| 3.500%, 08/01/2025 | | | 445,000 | | | | 482,249 | |
| Ally Financial, Inc. | | | | | | | | |
| 5.125%, 09/30/2024 | | | 1,750,000 | | | | 1,974,126 | |
| Credit Suisse Group Funding Ltd. | | | | | | | | |
| 3.800%, 09/15/2022 | | | 1,000,000 | | | | 1,041,802 | |
| 3.800%, 06/09/2023 | | | 827,000 | | | | 877,939 | |
| Ford Motor Credit Co., LLC | | | | | | | | |
| 1.276% (3 Month LIBOR USD + 1.080%), 08/03/2022^ | | | 2,000,000 | | | | 1,981,960 | |
| 3.810%, 01/09/2024 | | | 1,190,000 | | | | 1,228,675 | |
| Goldman Sachs Group, Inc. | | | | | | | | |
| 5.250%, 07/27/2021 | | | 1,593,000 | | | | 1,617,660 | |
| 1.244% (3 Month LIBOR USD + 1.050%), 06/05/2023^ | | | 2,187,000 | | | | 2,203,310 | |
| 1.790% (3 Month LIBOR USD + 1.600%), 11/29/2023^ | | | 1,250,000 | | | | 1,286,979 | |
| JPMorgan Chase & Co. | | | | | | | | |
| 2.972%, 01/15/2023 | | | 2,575,000 | | | | 2,627,128 | |
| 0.653% (SOFR + 0.600%), 09/16/2024^ | | | 1,000,000 | | | | 1,002,261 | |
| Morgan Stanley | | | | | | | | |
| 1.152% (3 Month LIBOR USD + 0.930%), 07/22/2022^ | | | 600,000 | | | | 601,379 | |
| 1.413% (3 Month LIBOR USD + 1.220%), 05/08/2024^ | | | 3,467,000 | | | | 3,522,252 | |
| Sumitomo Mitsui Banking Corp. | | | | | | | | |
| 3.000%, 01/18/2023 | | | 605,000 | | | | 631,836 | |
| Symetra Financial Corp. | | | | | | | | |
| 4.250%, 07/15/2024 | | | 640,000 | | | | 695,672 | |
See Notes to the Financial Statements
Great Lakes Bond Fund
Schedule of Investments – Continued
March 31, 2021
Description | | Par | | | Value | |
| | | | | | | |
| CORPORATE BONDS – 42.6% (Continued) | | | | | | |
| | | | | | | |
| Financials# – 28.8% (Continued) | | | | | | |
| Wells Fargo & Co. | | | | | | |
| 4.125%, 08/15/2023 | | $ | 1,439,000 | | | $ | 1,555,892 | |
| 1.442% (3 Month LIBOR USD + 1.230%), 10/31/2023^ | | | 1,327,000 | | | | 1,348,015 | |
| | | | | | | | 24,679,135 | |
| Health Care – 2.5% | | | | | | | | |
| CVS Health Corp. | | | | | | | | |
| 2.125%, 06/01/2021 | | | 2,175,000 | | | | 2,177,916 | |
| | | | | | | | | |
| Industrials – 1.7% | | | | | | | | |
| General Electric Co. | | | | | | | | |
| 1.184% (3 Month LIBOR USD + 1.000%), 03/15/2023^ | | | 1,450,000 | | | | 1,466,075 | |
| | | | | | | | | |
| Materials – 1.5% | | | | | | | | |
| Georgia-Pacific, LLC | | | | | | | | |
| 7.250%, 06/01/2028 | | | 1,000,000 | | | | 1,295,474 | |
| | | | | | | | | |
| Utilities – 2.3% | | | | | | | | |
| Duke Energy Carolinas, LLC | | | | | | | | |
| 6.000%, 12/01/2028 | | | 445,000 | | | | 559,934 | |
| PSEG Power, LLC | | | | | | | | |
| 4.150%, 09/15/2021 | | | 1,379,000 | | | | 1,389,015 | |
| | | | | | | | 1,948,949 | |
| Total Corporate Bonds | | | | | | | | |
| (Cost $36,080,557) | | | | | | | 36,539,115 | |
| | | | | | | | | |
| | | Shares | | | | | |
| EXCHANGE TRADED FUNDS – 37.0% | | | | | | | | |
| iShares 1-5 Year Investment Grade Corporate Bond Fund | | | 120,500 | | | | 6,588,940 | |
| iShares Core U.S. Aggregate Bond Fund | | | 42,800 | | | | 4,871,924 | |
| iShares Floating Rate Bond Fund | | | 110,000 | | | | 5,585,800 | |
| iShares iBoxx $ High Yield Corporate Bond Fund | | | 93,000 | | | | 8,107,740 | |
| iShares MBS Fund | | | 61,000 | | | | 6,613,620 | |
| Total Exchange Traded Funds | | | | | | | | |
| (Cost $31,714,408) | | | | | | | 31,768,024 | |
See Notes to the Financial Statements
Great Lakes Bond Fund
Schedule of Investments – Continued
March 31, 2021
Description | | Par | | | Value | |
| | | | | | | |
| U.S. TREASURY SECURITIES – 9.1% | | | | | | |
| U.S. Treasury Notes | | | | | | |
| 0.125%, 08/31/2022 | | $ | 1,000,000 | | | $ | 1,000,117 | |
| 2.000%, 02/15/2023 | | | 4,500,000 | | | | 4,654,951 | |
| 2.000%, 08/15/2025 | | | 2,000,000 | | | | 2,107,070 | |
| Total U.S. Treasury Securities | | | | | | | | |
| (Cost $7,794,078) | | | | | | | 7,762,138 | |
| | | | | | | | | |
| U.S. GOVERNMENT AGENCY | | | | | | | | |
| MORTGAGE-BACKED SECURITIES – 5.3% | | | | | | | | |
| Federal Home Loan Mortgage Association | | | | | | | | |
| Series 4949, Class BC | | | | | | | | |
| 2.250%, 03/25/2049 | | | 805,870 | | | | 829,501 | |
| Federal National Mortgage Association | | | | | | | | |
| Series 2013-130, Class CA | | | | | | | | |
| 2.500%, 06/25/2043 | | | 240,632 | | | | 249,891 | |
| Series 2013-130, Class CD | | | | | | | | |
| 3.000%, 06/25/2043 | | | 437,513 | | | | 463,881 | |
| Federal National Mortgage Association Pool | | | | | | | | |
| 5.170%, 06/01/2028, #468516 | | | 213,129 | | | | 238,195 | |
| 2.000%, 01/01/2051, #FM5733 | | | 1,489,620 | | | | 1,487,751 | |
| Government National Mortgage Association | | | | | | | | |
| Series 2018-52, Class AE | | | | | | | | |
| 2.750%, 05/16/2051 | | | 196,904 | | | | 204,062 | |
| Series 2021-029, Class CY | | | | | | | | |
| 3.000%, 09/20/2050 | | | 1,000,000 | | | | 1,042,057 | |
| Total U.S. Government Agency Mortgage-Backed Securities | | | | | | | | |
| (Cost $4,478,644) | | | | | | | 4,515,338 | |
| | | | | | | | | |
| ASSET BACKED SECURITIES – 1.3% | | | | | | | | |
| ABS Corp. Home Equity Loan Trust | | | | | | | | |
| Series 2006-HE3, Class A5 | | | | | | | | |
| 0.379% (1 Month LIBOR USD + 0.270%), 03/25/2036^ | | | 1,000,000 | | | | 984,412 | |
| Santander Drive Auto Receivables Trust | | | | | | | | |
| Series 2018-2, Class C | | | | | | | | |
| 3.350%, 07/17/2023 | | | 102,040 | | | | 102,565 | |
| Total Asset Backed Securities | | | | | | | | |
| (Cost $1,080,563) | | | | | | | 1,086,977 | |
See Notes to the Financial Statements
Great Lakes Bond Fund
Schedule of Investments – Continued
March 31, 2021
Description | | Par | | | Value | |
| | | | | | | |
| MUNICIPAL BONDS – 1.2% | | | | | | |
| Cook County, Illinois | | | | | | |
| Series B | | | | | | |
| 4.940%, 11/15/2023 – BAM Insured | | $ | 500,000 | | | $ | 512,379 | |
| Rosemont, Illinois General Obligation Fund | | | | | | | | |
| 5.375%, 12/01/2023 – BAM Insured | | | 470,000 | | | | 526,567 | |
| Total Municipal Bonds | | | | | | | | |
| (Cost $1,010,101) | | | | | | | 1,038,946 | |
| | | | | | | | | |
| COMMERCIAL MORTGAGE-BACKED SECURITIES – 1.1% | | | | | | | | |
| Citigroup Commercial Mortgage Trust | | | | | | | | |
| Series 2014-GC19, Class A4 | | | | | | | | |
| 4.023%, 03/12/2047 | | | 500,000 | | | | 539,481 | |
| Commercial Mortgage Trust | | | | | | | | |
| Series 2012-CR1, Class AM | | | | | | | | |
| 3.912%, 05/17/2045 | | | 350,000 | | | | 357,526 | |
| CS First Boston Commercial Mortgage Trust | | | | | | | | |
| Series 2003-29, Class 2A3 | | | | | | | | |
| 5.500%, 12/25/2033 | | | 7,507 | | | | 7,521 | |
| Greenpoint Mortgage | | | | | | | | |
| Series 2003-1, Class A1 | | | | | | | | |
| 2.684%, 10/25/2033 (a) | | | 61,958 | | | | 63,169 | |
| Total Commercial Mortgage-Backed Securities | | | | | | | | |
| (Cost $939,435) | | | | | | | 967,697 | |
See Notes to the Financial Statements
Great Lakes Bond Fund
Schedule of Investments – Continued
March 31, 2021
Description | | Shares | | | Value | |
| | | | | | | |
| MONEY MARKET FUND – 2.3% | | | | | | |
| First American Government Obligations Fund – Class Z, 0.03% (b) | | | | | | |
| Total Money Market Fund | | | | | | |
| (Cost $2,000,352) | | | 2,000,352 | | | $ | 2,000,352 | |
| Total Investments – 99.9% | | | | | | | | |
| (Cost $85,098,138) | | | | | | | 85,678,587 | |
| Other Assets and Liabilities, Net – 0.1% | | | | | | | 98,463 | |
| Total Net Assets – 100.0% | | | | | | $ | 85,777,050 | |
| # | | As of March 31, 2021, the Fund had a significant portion of its assets invested in the financials sector. See Note 11 in the Notes to the Financial Statements. |
| ^ | | Variable rate security – The rate shown is the rate in effect as of March 31, 2021. |
| (a) | | Variable rate security. The coupon is based on an underlying pool of loans. |
| (b) | | The rate shown is the annualized seven-day effective yield as of March 31, 2021. |
The Global Industry Classification Standard (“GICS”®) was developed by and is the exclusive property of MSCI, Inc. (“MSCI”) and Standard & Poor’s Financial Services LLC (“S&P”). GICS is a service mark of MSCI and S&P and has been licensed for use.
BAM – Build America Mutual Assurance Company
LIBOR – London Interbank Offered Rate
SOFR – Secured Overnight Financing Rate
See Notes to the Financial Statements
Great Lakes Disciplined Equity Fund
Schedule of Investments
March 31, 2021
Description | | Shares | | | Value | |
| | | | | | | |
| COMMON STOCKS – 98.5% | | | | | | |
| | | | | | | |
| Communication Services – 13.0% | | | | | | |
| Alphabet, Inc. – Class C* | | | 592 | | | $ | 1,224,629 | |
| Netflix, Inc.* | | | 1,634 | | | | 852,392 | |
| News Corp. – Class A | | | 7,842 | | | | 199,422 | |
| Spotify Technology SA* | | | 1,187 | | | | 318,057 | |
| T-Mobile U.S., Inc.* | | | 2,044 | | | | 256,093 | |
| Twitter, Inc.* | | | 2,492 | | | | 158,566 | |
| ViacomCBS, Inc. – Class B | | | 11,035 | | | | 497,678 | |
| Walt Disney Co. | | | 6,478 | | | | 1,195,321 | |
| | | | | | | | 4,702,158 | |
| Consumer Discretionary – 9.1% | | | | | | | | |
| Amazon.com, Inc.* | | | 364 | | | | 1,126,245 | |
| Domino’s Pizza, Inc. | | | 537 | | | | 197,503 | |
| Expedia Group, Inc. | | | 5,501 | | | | 946,832 | |
| NIKE, Inc. – Class B | | | 3,832 | | | | 509,235 | |
| Starbucks Corp. | | | 2,090 | | | | 228,374 | |
| TJX Companies, Inc. | | | 1,849 | | | | 122,312 | |
| Wynn Resorts Ltd. | | | 1,152 | | | | 144,426 | |
| | | | | | | | 3,274,927 | |
| Consumer Staples – 2.2% | | | | | | | | |
| Molson Coors Beverage Co. – Class B | | | 2,728 | | | | 139,537 | |
| Sysco Corp. | | | 8,126 | | | | 639,841 | |
| | | | | | | | 779,378 | |
| Energy – 5.7% | | | | | | | | |
| Baker Hughes Co. | | | 7,245 | | | | 156,565 | |
| Chevron Corp. | | | 10,218 | | | | 1,070,744 | |
| ConocoPhillips | | | 2,720 | | | | 144,078 | |
| Exxon Mobil Corp. | | | 12,120 | | | | 676,660 | |
| | | | | | | | 2,048,047 | |
| Financials – 13.2% | | | | | | | | |
| American International Group, Inc. | | | 5,300 | | | | 244,913 | |
| Bank of America Corp. | | | 34,674 | | | | 1,341,537 | |
| Bank of New York Mellon Corp. | | | 3,647 | | | | 172,467 | |
| Capital One Financial Corp. | | | 3,736 | | | | 475,331 | |
| Everest Re Group Ltd. | | | 821 | | | | 203,452 | |
| Hartford Financial Services Group, Inc. | | | 2,914 | | | | 194,626 | |
| JPMorgan Chase & Co. | | | 3,289 | | | | 500,684 | |
| PNC Financial Services Group, Inc. | | | 1,288 | | | | 225,928 | |
See Notes to the Financial Statements
Great Lakes Disciplined Equity Fund
Schedule of Investments – Continued
March 31, 2021
Description | | Shares | | | Value | |
| | | | | | | |
| COMMON STOCKS – 98.5% (Continued) | | | | | | |
| | | | | | | |
| Financials – 13.2% (Continued) | | | | | | |
| S&P Global, Inc. | | | 1,448 | | | $ | 510,956 | |
| T. Rowe Price Group, Inc. | | | 1,312 | | | | 225,139 | |
| Travelers Companies, Inc. | | | 857 | | | | 128,893 | |
| W.R. Berkley Corp. | | | 4,785 | | | | 360,550 | |
| Wells Fargo & Co. | | | 4,414 | | | | 172,455 | |
| | | | | | | | 4,756,931 | |
| Health Care – 8.2% | | | | | | | | |
| ABIOMED, Inc.* | | | 687 | | | | 218,968 | |
| BioMarin Pharmaceutical, Inc.* | | | 4,491 | | | | 339,115 | |
| Danaher Corp. – Class A | | | 605 | | | | 136,173 | |
| DexCom, Inc.* | | | 663 | | | | 238,276 | |
| Exact Sciences Corp.* | | | 2,996 | | | | 394,813 | |
| Incyte Corp.* | | | 2,478 | | | | 201,387 | |
| Medtronic plc | | | 987 | | | | 116,594 | |
| STERIS plc | | | 586 | | | | 111,621 | |
| Stryker Corp. | | | 1,065 | | | | 259,413 | |
| Teladoc Health, Inc.* | | | 721 | | | | 131,042 | |
| Viatris, Inc.* | | | 12,075 | | | | 168,688 | |
| Zoetis, Inc. | | | 4,126 | | | | 649,762 | |
| | | | | | | | 2,965,852 | |
| Industrials – 10.5% | | | | | | | | |
| Boeing Co.* | | | 2,362 | | | | 601,649 | |
| Caterpillar, Inc. | | | 784 | | | | 181,786 | |
| Cummins, Inc. | | | 639 | | | | 165,571 | |
| FedEx Corp. | | | 605 | | | | 171,844 | |
| Jacobs Engineering Group, Inc. | | | 1,302 | | | | 168,309 | |
| Norfolk Southern Corp. | | | 2,003 | | | | 537,846 | |
| Raytheon Technologies Corp. | | | 1,669 | | | | 128,964 | |
| Republic Services, Inc. | | | 1,158 | | | | 115,047 | |
| Uber Technologies, Inc.* | | | 10,547 | | | | 574,917 | |
| Union Pacific Corp. | | | 4,545 | | | | 1,001,763 | |
| Waste Management, Inc. | | | 978 | | | | 126,182 | |
| | | | | | | | 3,773,878 | |
| Information Technology – 22.9% | | | | | | | | |
| Adobe, Inc. | | | 407 | | | | 193,476 | |
| Apple, Inc. | | | 11,877 | | | | 1,450,776 | |
| Atlassian Corp. plc – Class A* | | | 1,297 | | | | 273,356 | |
| Autodesk, Inc.* | | | 803 | | | | 222,551 | |
See Notes to the Financial Statements
Great Lakes Disciplined Equity Fund
Schedule of Investments – Continued
March 31, 2021
Description | | Shares | | | Value | |
| | | | | | | |
| COMMON STOCKS – 98.5% (Continued) | | | | | | |
| | | | | | | |
| Information Technology – 22.9% (Continued) | | | | | | |
| Automatic Data Processing, Inc. | | | 668 | | | $ | 125,898 | |
| Cognizant Technology Solutions Corp. – Class A | | | 1,476 | | | | 115,305 | |
| Datadog, Inc.* | | | 1,462 | | | | 121,843 | |
| Dell Technologies, Inc. – Class C* | | | 1,459 | | | | 128,611 | |
| Micron Technology, Inc.* | | | 10,823 | | | | 954,697 | |
| Microsoft Corp. | | | 11,277 | | | | 2,658,778 | |
| Texas Instruments, Inc. | | | 5,367 | | | | 1,014,309 | |
| Visa, Inc. – Class A | | | 4,612 | | | | 976,499 | |
| | | | | | | | 8,236,099 | |
| Materials – 3.8% | | | | | | | | |
| Air Products & Chemicals, Inc. | | | 1,414 | | | | 397,815 | |
| Southern Copper Corp. | | | 12,516 | | | | 849,461 | |
| Westrock Co. | | | 2,488 | | | | 129,500 | |
| | | | | | | | 1,376,776 | |
| Real Estate – 5.3% | | | | | | | | |
| Crown Castle International Corp. – REIT | | | 1,326 | | | | 228,244 | |
| Digital Realty Trust, Inc. – REIT | | | 2,865 | | | | 403,507 | |
| Medical Properties Trust, Inc. – REIT | | | 13,280 | | | | 282,598 | |
| Prologis, Inc. – REIT | | | 6,510 | | | | 690,060 | |
| Realty Income Corp. – REIT | | | 4,767 | | | | 302,705 | |
| | | | | | | | 1,907,114 | |
| Utilities – 4.6% | | | | | | | | |
| AES Corp. | | | 10,736 | | | | 287,832 | |
| Ameren Corp. | | | 1,917 | | | | 155,967 | |
| FirstEnergy Corp. | | | 14,597 | | | | 506,370 | |
| NRG Energy, Inc. | | | 4,165 | | | | 157,145 | |
| PPL Corp. | | | 19,190 | | | | 553,440 | |
| | | | | | | | 1,660,754 | |
| Total Common Stocks | | | | | | | | |
| (Cost $27,507,946) | | | | | | | 35,481,914 | |
See Notes to the Financial Statements
Great Lakes Disciplined Equity Fund
Schedule of Investments – Continued
March 31, 2021
Description | | Shares | | | Value | |
| | | | | | | |
| MONEY MARKET FUND – 1.6% | | | | | | |
| First American Government Obligations Fund – Class Z, 0.03%^ | | | | | | |
| Total Money Market Fund | | | | | | |
| (Cost $588,819) | | | 588,819 | | | $ | 588,819 | |
| Total Investments – 100.1% | | | | | | | | |
| (Cost $28,096,765) | | | | | | | 36,070,733 | |
| Other Assets and Liabilities, Net – (0.1)% | | | | | | | (25,886 | ) |
| Total Net Assets – 100.0% | | | | | | $ | 36,044,847 | |
| * | | Non-income producing security. |
| ^ | | The rate shown is the annualized seven-day effective yield as of March 31, 2021. |
REIT – Real Estate Investment Trust
The Global Industry Classification Standard (“GICS”®) was developed by and is the exclusive property of MSCI, Inc. (“MSCI”) and Standard & Poor’s Financial Services LLC (“S&P”). GICS is a service mark of MSCI and S&P and has been licensed for use.
See Notes to the Financial Statements
Great Lakes Large Cap Value Fund
Schedule of Investments
March 31, 2021
Description | | Shares | | | Value | |
| | | | | | | |
| COMMON STOCKS – 96.9% | | | | | | |
| | | | | | | |
| Communication Services – 6.9% | | | | | | |
| Alphabet, Inc. – Class C* | | | 250 | | | $ | 517,157 | |
| Comcast Corp. – Class A | | | 31,284 | | | | 1,692,777 | |
| Walt Disney Co. | | | 4,584 | | | | 845,840 | |
| | | | | | | | 3,055,774 | |
| Consumer Discretionary – 7.1% | | | | | | | | |
| Booking Holdings, Inc.* | | | 186 | | | | 433,350 | |
| BorgWarner, Inc. | | | 38,609 | | | | 1,789,913 | |
| Expedia Group, Inc. | | | 3,070 | | | | 528,409 | |
| Hasbro, Inc. | | | 4,342 | | | | 417,353 | |
| | | | | | | | 3,169,025 | |
| Consumer Staples – 7.0% | | | | | | | | |
| Anheuser-Busch InBev SA/NV – ADR | | | 11,874 | | | | 746,281 | |
| JM Smucker Co. | | | 5,752 | | | | 727,801 | |
| Philip Morris International, Inc. | | | 18,726 | | | | 1,661,745 | |
| | | | | | | | 3,135,827 | |
| Energy – 6.0% | | | | | | | | |
| Chevron Corp. | | | 9,199 | | | | 963,963 | |
| Royal Dutch Shell plc – Class A – ADR | | | 32,022 | | | | 1,255,583 | |
| Schlumberger Ltd. | | | 16,450 | | | | 447,275 | |
| | | | | | | | 2,666,821 | |
| Financials – 24.6% | | | | | | | | |
| American Express Co. | | | 8,061 | | | | 1,140,148 | |
| Ameriprise Financial, Inc. | | | 2,106 | | | | 489,540 | |
| Bank of America Corp. | | | 34,737 | | | | 1,343,975 | |
| Berkshire Hathaway, Inc. – Class B* | | | 5,994 | | | | 1,531,287 | |
| Chubb Ltd. | | | 9,000 | | | | 1,421,730 | |
| Citigroup, Inc. | | | 18,863 | | | | 1,372,283 | |
| Discover Financial Services | | | 5,432 | | | | 515,986 | |
| PNC Financial Services Group, Inc. | | | 5,044 | | | | 884,768 | |
| Prudential Financial, Inc. | | | 10,502 | | | | 956,732 | |
| RenaissanceRe Holdings, Ltd. | | | 8,205 | | | | 1,314,851 | |
| | | | | | | | 10,971,300 | |
| Health Care – 16.0% | | | | | | | | |
| AbbVie, Inc. | | | 10,401 | | | | 1,125,596 | |
| Biogen, Inc.* | | | 2,507 | | | | 701,333 | |
| Boston Scientific Corp.* | | | 19,258 | | | | 744,322 | |
See Notes to the Financial Statements
Great Lakes Large Cap Value Fund
Schedule of Investments – Continued
March 31, 2021
Description | | Shares | | | Value | |
| | | | | | | |
| COMMON STOCKS – 96.9% (Continued) | | | | | | |
| | | | | | | |
| Health Care – 16.0% (Continued) | | | | | | |
| CVS Health Corp. | | | 17,285 | | | $ | 1,300,351 | |
| McKesson Corp. | | | 4,878 | | | | 951,405 | |
| Merck & Co., Inc. | | | 17,892 | | | | 1,379,294 | |
| UnitedHealth Group, Inc. | | | 2,443 | | | | 908,967 | |
| | | | | | | | 7,111,268 | |
| Industrials – 11.1% | | | | | | | | |
| Canadian National Railway Co. | | | 5,058 | | | | 586,627 | |
| Cummins, Inc. | | | 4,350 | | | | 1,127,128 | |
| Emerson Electric Co. | | | 5,558 | | | | 501,443 | |
| General Electric Co. | | | 85,410 | | | | 1,121,433 | |
| Lockheed Martin Corp. | | | 2,359 | | | | 871,651 | |
| Wabtec Corp. | | | 9,435 | | | | 746,875 | |
| | | | | | | | 4,955,157 | |
| Information Technology – 10.3% | | | | | | | | |
| Cisco Systems, Inc. | | | 19,197 | | | | 992,677 | |
| Intel Corp. | | | 18,177 | | | | 1,163,328 | |
| Oracle Corp. | | | 18,082 | | | | 1,268,814 | |
| SS&C Technologies Holdings, Inc. | | | 16,374 | | | | 1,144,051 | |
| | | | | | | | 4,568,870 | |
| Materials – 4.1% | | | | | | | | |
| Avery Dennison Corp. | | | 2,652 | | | | 487,040 | |
| DuPont de Nemours, Inc. | | | 9,707 | | | | 750,157 | |
| International Flavors & Fragrances, Inc. | | | 4,253 | | | | 593,761 | |
| | | | | | | | 1,830,958 | |
| Utilities – 3.8% | | | | | | | | |
| Ameren Corp. | | | 5,895 | | | | 479,617 | |
| Public Service Enterprise Group, Inc. | | | 20,054 | | | | 1,207,452 | |
| | | | | | | | 1,687,069 | |
| Total Common Stocks | | | | | | | | |
| (Cost $33,457,410) | | | | | | | 43,152,069 | |
See Notes to the Financial Statements
Great Lakes Large Cap Value Fund
Schedule of Investments – Continued
March 31, 2021
Description | | Shares | | | Value | |
| | | | | | | |
| MONEY MARKET FUND – 3.1% | | | | | | |
| First American Government Obligations Fund – Class Z, 0.03%^ | | | | | | |
| Total Money Market Fund | | | | | | |
| (Cost $1,382,541) | | | 1,382,541 | | | $ | 1,382,541 | |
| Total Investments – 100.0% | | | | | | | | |
| (Cost $34,839,951) | | | | | | | 44,534,610 | |
| Other Assets and Liabilities, Net – 0.0% | | | | | | | (5,517 | ) |
| Total Net Assets – 100.0% | | | | | | $ | 44,529,093 | |
| * | | Non-income producing security. |
ADR – American Depositary Receipt
| ^ | | The rate shown is the annualized seven-day effective yield as of March 31, 2021. |
The Global Industry Classification Standard (“GICS”®) was developed by and is the exclusive property of MSCI, Inc. (“MSCI”) and Standard & Poor’s Financial Services LLC (“S&P”). GICS is a service mark of MSCI and S&P and has been licensed for use.
See Notes to the Financial Statements
Great Lakes Small Cap Opportunity Fund
Schedule of Investments
March 31, 2021
Description | | Shares | | | Value | |
| | | | | | | |
| COMMON STOCKS – 98.2% | | | | | | |
| | | | | | | |
| Communication Services – 2.8% | | | | | | |
Manchester United plc – Class A+ | | | 28,024 | | | $ | 441,098 | |
TripAdvisor, Inc.*+ | | | 17,212 | | | | 925,833 | |
| | | | | | | | 1,366,931 | |
| Consumer Discretionary – 12.7% | | | | | | | | |
Cheesecake Factory Inc.+ | | | 8,828 | | | | 516,526 | |
| frontdoor, Inc.* | | | 16,176 | | | | 869,460 | |
Gildan Activewear, Inc.+ | | | 48,107 | | | | 1,474,960 | |
| Green Brick Partners, Inc.* | | | 23,397 | | | | 530,644 | |
| Mattel, Inc.* | | | 36,885 | | | | 734,749 | |
| Quotient Technology, Inc.* | | | 47,250 | | | | 772,065 | |
| Terminix Global Holdings, Inc.* | | | 13,640 | | | | 650,219 | |
| Urban Outfitters, Inc.* | | | 13,756 | | | | 511,586 | |
| Zumiez, Inc.* | | | 6,012 | | | | 257,915 | |
| | | | | | | | 6,318,124 | |
| Consumer Staples – 2.0% | | | | | | | | |
| Spectrum Brands Holdings, Inc. | | | 11,751 | | | | 998,835 | |
| Energy – 3.8% | | | | | | | | |
| Dril-Quip, Inc.* | | | 28,361 | | | | 942,436 | |
| NOV, Inc. | | | 67,031 | | | | 919,666 | |
| | | | | | | | 1,862,102 | |
| Financials – 22.3% | | | | | | | | |
| Axis Capital Holdings Ltd. | | | 31,307 | | | | 1,551,888 | |
Bank OZK+ | | | 27,912 | | | | 1,140,205 | |
| First American Financial Corp. | | | 24,450 | | | | 1,385,092 | |
| Horace Mann Educators Corp. | | | 15,537 | | | | 671,354 | |
Investors Bancorp, Inc.+ | | | 113,466 | | | | 1,666,816 | |
| Jefferies Financial Group, Inc. | | | 51,010 | | | | 1,535,401 | |
PRA Group, Inc.*+ | | | 26,813 | | | | 993,958 | |
| Prosperity Bancshares, Inc. | | | 16,364 | | | | 1,225,500 | |
| Pzena Investment Management, Inc. – Class A | | | 83,189 | | | | 875,980 | |
| | | | | | | | 11,046,194 | |
| Health Care – 8.0% | | | | | | | | |
Luminex Corp.+ | | | 34,012 | | | | 1,084,983 | |
| MEDNAX, Inc.* | | | 29,097 | | | | 741,100 | |
| Medpace Holdings, Inc.* | | | 2,610 | | | | 428,170 | |
Patterson Companies, Inc.+ | | | 22,708 | | | | 725,521 | |
| Prestige Consumer Healthcare, Inc.* | | | 22,848 | | | | 1,007,140 | |
| | | | | | | | 3,986,914 | |
See Notes to the Financial Statements
Great Lakes Small Cap Opportunity Fund
Schedule of Investments – Continued
March 31, 2021
Description | | Shares | | | Value | |
| | | | | | | |
| COMMON STOCKS – 98.2% (Continued) | | | | | | |
| | | | | | | |
| Industrials – 23.6% | | | | | | |
Acuity Brands, Inc.+ | | | 8,571 | | | $ | 1,414,215 | |
| Crane Co. | | | 16,917 | | | | 1,588,676 | |
| EnerSys | | | 12,532 | | | | 1,137,906 | |
Flowserve Corp.+ | | | 30,792 | | | | 1,195,038 | |
Healthcare Services Group, Inc.+ | | | 27,271 | | | | 764,406 | |
| Herman Miller, Inc. | | | 19,802 | | | | 814,852 | |
| KAR Auction Services, Inc. | | | 80,055 | | | | 1,200,825 | |
| Middleby Corp.* | | | 4,628 | | | | 767,091 | |
| MSC Industrial Direct Co., Inc. – Class A | | | 5,697 | | | | 513,812 | |
| Resideo Technologies, Inc.* | | | 18,177 | | | | 513,500 | |
| Sensata Technologies Holding plc* | | | 15,523 | | | | 899,558 | |
| UniFirst Corp. | | | 3,958 | | | | 885,444 | |
| | | | | | | | 11,695,323 | |
| Information Technology – 10.2% | | | | | | | | |
| ACI Worldwide, Inc.* | | | 18,841 | | | | 716,900 | |
| Avnet, Inc. | | | 25,077 | | | | 1,040,946 | |
| CACI International, Inc. – Class A* | | | 4,152 | | | | 1,024,133 | |
| Coherent, Inc.* | | | 1,994 | | | | 504,263 | |
Knowles Corp.*+ | | | 24,565 | | | | 513,900 | |
ViaSat, Inc.*+ | | | 25,747 | | | | 1,237,658 | |
| | | | | | | | 5,037,800 | |
| Materials – 8.5% | | | | | | | | |
| Berry Global Group, Inc.* | | | 24,906 | | | | 1,529,229 | |
| Compass Minerals International, Inc. | | | 11,363 | | | | 712,687 | |
| NewMarket Corp. | | | 3,193 | | | | 1,213,851 | |
| Valvoline, Inc. | | | 29,101 | | | | 758,663 | |
| | | | | | | | 4,214,430 | |
| Real Estate – 4.3% | | | | | | | | |
| Jones Lang LaSalle, Inc. | | | 8,979 | | | | 1,607,600 | |
Park Hotels & Resorts, Inc.+ | | | 24,002 | | | | 517,963 | |
| | | | | | | | 2,125,563 | |
| Total Common Stocks | | | | | | | | |
| (Cost $39,449,021) | | | | | | | 48,652,216 | |
See Notes to the Financial Statements
Great Lakes Small Cap Opportunity Fund
Schedule of Investments – Continued
March 31, 2021
Description | | Shares | | | Value | |
| | | | | | | |
| MONEY MARKET FUND – 2.8% | | | | | | |
| First American Government Obligations Fund – Class Z, 0.03%^ | | | | | | |
| Total Money Market Fund | | | | | | |
| (Cost $1,372,799) | | | 1,372,799 | | | $ | 1,372,799 | |
| | | | | | | | | |
| INVESTMENTS PURCHASED WITH | | | | | | | | |
| PROCEEDS FROM SECURITIES LENDING – 22.4% | | | | | | | | |
| Mount Vernon Liquid Assets Portfolio, 0.11%^ | | | | | | | | |
| Total Investments Purchased with Proceeds from Securities Lending | | | | | | | | |
| (Cost $11,123,854) | | | 11,123,854 | | | | 11,123,854 | |
| Total Investments – 123.4% | | | | | | | | |
| (Cost $51,945,674) | | | | | | | 61,148,869 | |
| Other Assets and Liabilities, Net – (23.4)% | | | | | | | (11,593,324 | ) |
| Total Net Assets – 100.0% | | | | | | $ | 49,555,545 | |
| + | | All or a portion of this security was out on loan at March 31, 2021. Total loaned securities had a fair value of $10,912,602 at March 31, 2021. See Note 9 in the Notes to the Financial Statements. |
| * | | Non-income producing security. |
| ^ | | The rate shown is the annualized seven-day yield as of March 31, 2021. |
The Global Industry Classification Standard (“GICS”®) was developed by and is the exclusive property of MSCI, Inc. (“MSCI”) and Standard & Poor’s Financial Services LLC (“S&P”). GICS is a service mark of MSCI and S&P and has been licensed for use.
See Notes to the Financial Statements
Great Lakes Funds
Statements of Assets and Liabilities
March 31, 2021
| | | | | | | | | | | | Small Cap | |
| | | | | | Disciplined | | | Large Cap | | | Opportunity | |
| | | Bond Fund | | | Equity Fund | | | Value Fund | | | Fund | |
| ASSETS | | | | | | | | | | | | |
| Investment securities: | | | | | | | | | | | | |
| At cost | | $ | 85,098,138 | | | $ | 28,096,765 | | | $ | 34,839,951 | | | $ | 51,945,674 | |
At value(1) | | $ | 85,678,587 | | | $ | 36,070,733 | | | $ | 44,534,610 | | | $ | 61,148,869 | |
| Cash | | | — | | | | — | | | | 1,856 | | | | — | |
| Receivable for investment securities sold | | | — | | | | — | | | | — | | | | 184,441 | |
| Dividends & interest receivable | | | 233,689 | | | | 18,950 | | | | 56,458 | | | | 40,549 | |
| Receivable for capital shares sold | | | — | | | | 108 | | | | 1,160 | | | | 1,607 | |
| Interest receivable from securities lending | | | — | | | | — | | | | — | | | | 493 | |
| Prepaid expenses | | | 10,893 | | | | 12,320 | | | | 1,677 | | | | 18,014 | |
| Total Assets | | | 85,923,169 | | | | 36,102,111 | | | | 44,595,761 | | | | 61,393,973 | |
| LIABILITIES | | | | | | | | | | | | | | | | |
| Payable upon return of securities loaned (See Note 9) | | | — | | | | — | | | | — | | | | 11,123,854 | |
| Distributions payable | | | 64,381 | | | | — | | | | — | | | | — | |
| Payable for investment securities purchased | | | — | | | | — | | | | — | | | | 274,262 | |
| Payable for capital shares redeemed | | | 3,698 | | | | 3,000 | | | | 7,716 | | | | 361,366 | |
| Payable to investment adviser | | | 29,276 | | | | 11,072 | | | | 16,100 | | | | 28,175 | |
| Payable for fund administration & accounting fees | | | 12,097 | | | | 11,605 | | | | 11,417 | | | | 12,997 | |
| Payable for compliance fees | | | 1,934 | | | | 1,934 | | | | 1,934 | | | | 1,935 | |
| Payable for transfer agent fees & expenses | | | 3,167 | | | | 2,982 | | | | 2,869 | | | | 5,234 | |
| Payable for custody fees | | | 544 | | | | 1,203 | | | | 407 | | | | 427 | |
| Payable for audit and tax fees | | | 19,000 | | | | 16,997 | | | | 17,000 | | | | 17,501 | |
| Payable for trustee fees | | | 4,108 | | | | 4,112 | | | | 4,111 | | | | 4,114 | |
| Accrued other fees | | | 7,914 | | | | 4,359 | | | | 5,114 | | | | 4,850 | |
| Accrued distribution fees – Investor Class | | | — | | | | — | | | | — | | | | 3,713 | |
| Total Liabilities | | | 146,119 | | | | 57,264 | | | | 66,668 | | | | 11,838,428 | |
| NET ASSETS | | $ | 85,777,050 | | | $ | 36,044,847 | | | $ | 44,529,093 | | | $ | 49,555,545 | |
| COMPOSITION OF NET ASSETS | | | | | | | | | | | | | | | | |
| Paid-in capital | | $ | 85,328,011 | | | $ | 22,803,474 | | | $ | 35,151,448 | | | $ | 41,795,902 | |
| Total distributable earnings | | | 449,039 | | | | 13,241,373 | | | | 9,377,645 | | | | 7,759,643 | |
| Total net assets | | $ | 85,777,050 | | | $ | 36,044,847 | | | $ | 44,529,093 | | | $ | 49,555,545 | |
| (1) Includes loaned securities of: | | $ | — | | | $ | — | | | $ | — | | | $ | 10,912,602 | |
| | | | | | | | | | | | | | | | | |
| Investor Class Shares: | | | | | | | | | | | | | | | | |
| Net Assets | | $ | — | | | $ | — | | | $ | — | | | $ | 5,185,556 | |
Shares issued and outstanding(2) | | | — | | | | — | | | | — | | | | 277,632 | |
| Net asset value, offering price, and redemption price per share | | $ | — | | | $ | — | | | $ | — | | | $ | 18.68 | |
| | | | | | | | | | | | | | | | | |
| Institutional Class Shares: | | | | | | | | | | | | | | | | |
| Net Assets | | $ | 85,777,050 | | | $ | 36,044,847 | | | $ | 44,529,093 | | | $ | 44,369,989 | |
Shares issued and outstanding(2) | | | 8,637,157 | | | | 1,894,736 | | | | 2,898,585 | | | | 2,330,410 | |
| Net asset value, offering price, and redemption price per share | | $ | 9.93 | | | $ | 19.02 | | | $ | 15.36 | | | $ | 19.04 | |
| (2) | Unlimited shares authorized without par value. |
See Notes to the Financial Statements
Great Lakes Funds
Statements of Operations
For the Year Ended March 31, 2021
| | | | | | | | | | | | Small Cap | |
| | | | | | Disciplined | | | Large Cap | | | Opportunity | |
| | | Bond Fund | | | Equity Fund | | | Value Fund | | | Fund | |
| INVESTMENT INCOME: | | | | | | | | | | | | |
| Interest income | | $ | 1,594,302 | | | $ | 343 | | | $ | 1,049 | | | $ | 1,129 | |
| Dividend income | | | 563,137 | | | | 383,906 | | | | 989,383 | | | | 604,759 | |
| Less: Foreign taxes withheld | | | — | | | | — | | | | (11,064 | ) | | | — | |
| Securities lending income | | | — | | | | — | | | | — | | | | 3,405 | |
| Total investment income | | | 2,157,439 | | | | 384,249 | | | | 979,368 | | | | 609,293 | |
| | | | | | | | | | | | | | | | | |
| EXPENSES: | | | | | | | | | | | | | | | | |
| Investment advisory fees (See Note 4) | | | 382,849 | | | | 206,939 | | | | 248,944 | | | | 276,550 | |
| Fund administration & accounting fees (See Note 4) | | | 74,899 | | | | 71,258 | | | | 69,352 | | | | 77,148 | |
| Federal & state registration fees | | | 22,523 | | | | 21,527 | | | | 31,121 | | | | 32,860 | |
| Transfer agent fees & expenses (See Note 4) | | | 19,856 | | | | 16,923 | | | | 17,037 | | | | 30,626 | |
| Audit and tax fees | | | 19,006 | | | | 17,007 | | | | 17,001 | | | | 17,511 | |
| Trustee fees (See Note 4) | | | 14,527 | | | | 14,465 | | | | 14,453 | | | | 14,491 | |
| Compliance fees (See Note 4) | | | 11,600 | | | | 11,600 | | | | 11,600 | | | | 11,600 | |
| Postage & printing fees | | | 9,048 | | | | 5,273 | | | | 5,275 | | | | 5,312 | |
| Legal fees | | | 6,635 | | | | 6,651 | | | | 6,637 | | | | 6,639 | |
| Custody fees (See Note 4) | | | 6,555 | | | | 10,374 | | | | 4,658 | | | | 5,824 | |
| Other fees | | | 4,060 | | | | 3,970 | | | | 4,186 | | | | 4,880 | |
| Insurance fees | | | 2,037 | | | | 1,670 | | | | 1,690 | | | | 1,756 | |
| Distribution fees – Investor Class (See Note 5) | | | — | | | | — | | | | — | | | | 13,243 | |
| Total expenses before interest expense and waiver | | | 573,595 | | | | 387,657 | | | | 431,954 | | | | 498,458 | |
| Interest expense (See Note 10) | | | 62 | | | | 2,499 | | | | 379 | | | | 18 | |
| Total expenses before waiver | | | 573,657 | | | | 390,156 | | | | 432,333 | | | | 498,458 | |
| Fee recoupment (See Note 4) | | | — | | | | — | | | | — | | | | 2,477 | |
| Less: Fee waiver from investment adviser (See Note 4) | | | — | | | | (94,494 | ) | | | (79,283 | ) | | | (31,351 | ) |
| Total net expenses | | | 573,657 | | | | 295,662 | | | | 353,050 | | | | 469,584 | |
| NET INVESTMENT INCOME | | | 1,583,782 | | | | 88,587 | | | | 626,318 | | | | 139,709 | |
| | | | | | | | | | | | | | | | | |
| REALIZED AND UNREALIZED | | | | | | | | | | | | | | | | |
| GAIN (LOSS) ON INVESTMENTS | | | | | | | | | | | | | | | | |
| Net realized gain (loss) on: | | | | | | | | | | | | | | | | |
| Investments | | | 915,204 | | | | 6,479,624 | | | | 108,622 | | | | (36,665 | ) |
| Foreign currency translation | | | — | | | | — | | | | 5 | | | | — | |
| Net change in unrealized appreciation/depreciation of: | | | | | | | | | | | | | | | | |
| Investments | | | 3,504,173 | | | | 7,498,133 | | | | 17,035,669 | | | | 26,989,577 | |
| Foreign currency translation | | | — | | | | — | | | | 36 | | | | — | |
| Net realized and unrealized gain on investments | | | 4,419,377 | | | | 13,977,757 | | | | 17,144,332 | | | | 26,952,912 | |
| | | | | | | | | | | | | | | | | |
| NET INCREASE IN NET ASSETS FROM OPERATIONS | | $ | 6,003,159 | | | $ | 14,066,344 | | | $ | 17,770,650 | | | $ | 27,092,621 | |
See Notes to the Financial Statements
Great Lakes Bond Fund
Statements of Changes in Net Assets
| | | For the | | | For the | |
| | | Year Ended | | | Year Ended | |
| | | March 31, 2021 | | | March 31, 2020 | |
| OPERATIONS: | | | | | | |
| Net investment income | | $ | 1,583,782 | | | $ | 3,179,640 | |
| Net realized gain on investments | | | 915,204 | | | | 1,132,344 | |
| Net change in unrealized appreciation/depreciation of investments | | | 3,504,173 | | | | (3,010,060 | ) |
| Net increase resulting from operations | | | 6,003,159 | | | | 1,301,924 | |
| | | | | | | | | |
| CAPITAL SHARE TRANSACTIONS: | | | | | | | | |
| Institutional Class: | | | | | | | | |
| Proceeds from shares sold | | | 1,361,731 | | | | 11,213,038 | |
| Proceeds from reinvestment of distributions | | | 480,505 | | | | 1,013,977 | |
| Payments for shares redeemed | | | (24,355,439 | ) | | | (36,442,386 | ) |
| Net decrease in net assets from capital share transactions | | | (22,513,203 | ) | | | (24,215,371 | ) |
| | | | | | | | | |
| DISTRIBUTIONS TO SHAREHOLDERS: | | | | | | | | |
| Total distributions to shareholders | | | (1,591,930 | ) | | | (3,209,885 | ) |
| TOTAL DECREASE IN NET ASSETS | | | (18,101,974 | ) | | | (26,123,332 | ) |
| | | | | | | | | |
| NET ASSETS: | | | | | | | | |
| Beginning of Year | | | 103,879,024 | | | | 130,002,356 | |
| End of Year | | $ | 85,777,050 | | | $ | 103,879,024 | |
See Notes to the Financial Statements
Great Lakes Disciplined Equity Fund
Statements of Changes in Net Assets
| | | For the | | | For the | |
| | | Year Ended | | | Year Ended | |
| | | March 31, 2021 | | | March 31, 2020 | |
| OPERATIONS: | | | | | | |
| Net investment income | | $ | 88,587 | | | $ | 349,495 | |
| Net realized gain on investments | | | 6,479,624 | | | | 2,126,399 | |
| Net change in unrealized appreciation/depreciation of investments | | | 7,498,133 | | | | (4,994,003 | ) |
| Net increase (decrease) resulting from operations | | | 14,066,344 | | | | (2,518,109 | ) |
| | | | | | | | | |
| CAPITAL SHARE TRANSACTIONS: | | | | | | | | |
| Institutional Class: | | | | | | | | |
| Proceeds from shares sold | | | 2,892,898 | | | | 5,188,288 | |
| Proceeds from reinvestment of distributions | | | 1,085,158 | | | | 876,281 | |
| Payments for shares redeemed | | | (8,689,583 | ) | | | (15,532,066 | ) |
| Net decrease in net assets from capital share transactions | | | (4,711,527 | ) | | | (9,467,497 | ) |
| | | | | | | | | |
| DISTRIBUTIONS TO SHAREHOLDERS: | | | | | | | | |
| Total distributions to shareholders | | | (2,562,569 | ) | | | (1,596,824 | ) |
| TOTAL INCREASE (DECREASE) IN NET ASSETS | | | 6,792,248 | | | | (13,582,430 | ) |
| | | | | | | | | |
| NET ASSETS: | | | | | | | | |
| Beginning of Year | | | 29,252,599 | | | | 42,835,029 | |
| End of Year | | $ | 36,044,847 | | | $ | 29,252,599 | |
See Notes to the Financial Statements
Great Lakes Large Cap Value Fund
Statements of Changes in Net Assets
| | | For the | | | For the | |
| | | Year Ended | | | Year Ended | |
| | | March 31, 2021 | | | March 31, 2020 | |
| OPERATIONS: | | | | | | |
| Net investment income | | $ | 626,318 | | | $ | 779,753 | |
| Net realized gain on: | | | | | | | | |
| Investments | | | 108,622 | | | | 20,483 | |
| Foreign currency translation | | | 5 | | | | — | |
| Net change in unrealized appreciation/depreciation of: | | | | | | | | |
| Investments | | | 17,035,669 | | | | (7,578,043 | ) |
| Foreign currency translation | | | 36 | | | | — | |
| Net increase (decrease) resulting from operations | | | 17,770,650 | | | | (6,777,807 | ) |
| | | | | | | | | |
| CAPITAL SHARE TRANSACTIONS: | | | | | | | | |
| Institutional Class: | | | | | | | | |
| Proceeds from shares sold | | | 1,935,310 | | | | 6,810,802 | |
| Proceeds from reinvestment of distributions | | | 294,289 | | | | 1,054,217 | |
| Payments for shares redeemed | | | (11,985,518 | ) | | | (7,989,169 | ) |
| Net decrease in net assets from capital share transactions | | | (9,755,919 | ) | | | (124,150 | ) |
| | | | | | | | | |
| DISTRIBUTIONS TO SHAREHOLDERS: | | | | | | | | |
| From distributable earnings | | | (904,201 | ) | | | (2,478,516 | ) |
| From return of capital | | | (4,900 | ) | | | — | |
| Total distributions to shareholders | | | (909,101 | ) | | | (2,478,516 | ) |
| TOTAL INCREASE (DECREASE) IN NET ASSETS | | | 7,105,630 | | | | (9,380,473 | ) |
| | | | | | | | | |
| NET ASSETS: | | | | | | | | |
| Beginning of Year | | | 37,423,463 | | | | 46,803,936 | |
| End of Year | | $ | 44,529,093 | | | $ | 37,423,463 | |
See Notes to the Financial Statements
Great Lakes Small Cap Opportunity Fund
Statements of Changes in Net Assets
| | | For the | | | For the | |
| | | Year Ended | | | Year Ended | |
| | | March 31, 2021 | | | March 31, 2020 | |
| OPERATIONS: | | | | | | |
| Net investment income | | $ | 139,709 | | | $ | 928,564 | |
| Net realized loss on investments | | | (36,665 | ) | | | (199,834 | ) |
| Net change in unrealized appreciation/depreciation of investments | | | 26,989,577 | | | | (21,024,946 | ) |
| Net increase (decrease) resulting from operations | | | 27,092,621 | | | | (20,296,216 | ) |
| | | | | | | | | |
| CAPITAL SHARE TRANSACTIONS: | | | | | | | | |
| Investor Class: | | | | | | | | |
| Proceeds from shares sold | | | 152,593 | | | | 2,797,994 | |
| Proceeds from reinvestment of distributions | | | 28,798 | | | | 821,432 | |
| Payments for shares redeemed | | | (4,643,391 | ) | | | (3,717,534 | ) |
| Decrease in net assets from Investor Class transactions | | | (4,462,000 | ) | | | (98,108 | ) |
| Institutional Class: | | | | | | | | |
| Proceeds from shares sold | | | 3,309,932 | | | | 6,881,224 | |
| Proceeds from reinvestment of distributions | | | 250,539 | | | | 3,331,708 | |
| Payments for shares redeemed | | | (17,761,934 | ) | | | (21,752,292 | ) |
| Decrease in net assets from Institutional Class transactions | | | (14,201,463 | ) | | | (11,539,360 | ) |
| Net decrease in net assets from capital share transactions | | | (18,663,463 | ) | | | (11,637,468 | ) |
| | | | | | | | | |
| DISTRIBUTIONS TO SHAREHOLDERS: | | | | | | | | |
| Net Distributions to Shareholders – Investor Class | | | (28,802 | ) | | | (821,488 | ) |
| Net Distributions to Shareholders – Institutional Class | | | (387,358 | ) | | | (4,374,202 | ) |
| Total distributions to shareholders | | | (416,160 | ) | | | (5,195,690 | ) |
| TOTAL INCREASE (DECREASE) IN NET ASSETS | | | 8,012,998 | | | | (37,129,374 | ) |
| | | | | | | | | |
| NET ASSETS: | | | | | | | | |
| Beginning of Year | | | 41,542,547 | | | | 78,671,921 | |
| End of Year | | $ | 49,555,545 | | | $ | 41,542,547 | |
See Notes to the Financial Statements
Great Lakes Bond Fund
Financial Highlights
For a Fund share outstanding throughout the year
Institutional Class
| | | Year Ended | | | Year Ended | | | Year Ended | | | Year Ended | | | Year Ended | |
| | | March 31, | | | March 31, | | | March 31, | | | March 31, | | | March 31, | |
| | | 2021 | | | 2020 | | | 2019 | | | 2018 | | | 2017 | |
| Per Common Share Data | | | | | | | | | | | | | | | |
| | | | | | | | | | | | | | | | |
| Net asset value, beginning of year | | $ | 9.54 | | | $ | 9.71 | | | $ | 9.68 | | | $ | 9.76 | | | $ | 9.81 | |
| | | | | | | | | | | | | | | | | | | | | |
| Investment operations: | | | | | | | | | | | | | | | | | | | | |
| Net investment income | | | 0.16 | | | | 0.25 | | | | 0.25 | | | | 0.22 | | | | 0.21 | |
| Net realized and unrealized gain (loss) on investments | | | 0.39 | | | | (0.17 | ) | | | 0.03 | | | | (0.08 | ) | | | (0.04 | ) |
| Total from investment operations | | | 0.55 | | | | 0.08 | | | | 0.28 | | | | 0.14 | | | | 0.17 | |
| | | | | | | | | | | | | | | | | | | | | |
| Less distributions from: | | | | | | | | | | | | | | | | | | | | |
| Net investment income | | | (0.16 | ) | | | (0.25 | ) | | | (0.25 | ) | | | (0.22 | ) | | | (0.22 | ) |
| Net realized gains | | | — | | | | — | | | | — | | | | — | | | | — | |
| Total distributions | | | (0.16 | ) | | | (0.25 | ) | | | (0.25 | ) | | | (0.22 | ) | | | (0.22 | ) |
| Net asset value, end of year | | $ | 9.93 | | | $ | 9.54 | | | $ | 9.71 | | | $ | 9.68 | | | $ | 9.76 | |
| | | | | | | | | | | | | | | | | | | | | |
| Total return | | | 5.80 | % | | | 0.79 | % | | | 3.02 | % | | | 1.44 | % | | | 1.71 | % |
| | | | | | | | | | | | | | | | | | | | | |
| Supplemental Data and Ratios | | | | | | | | | | | | | | | | | | | | |
| Net assets, at end of year (000’s) | | $ | 85,777 | | | $ | 103,879 | | | $ | 130,002 | | | $ | 134,724 | | | $ | 120,752 | |
| | | | | | | | | | | | | | | | | | | | | |
Ratio of expenses to average net assets(1): | | | | | | | | | | | | | | | | | | | | |
| Before expense recoupment | | | 0.60 | % | | | 0.57 | % | | | 0.56 | % | | | 0.57 | % | | | 0.60 | % |
| After expense recoupment | | | 0.60 | % | | | 0.57 | % | | | 0.61 | % | | | 0.65 | % | | | 0.65 | % |
| | | | | | | | | | | | | | | | | | | | | |
Ratio of net investment income to average net assets(1): | | | | | | | | | | | | | | | | | | | | |
| After expense recoupment | | | 1.65 | % | | | 2.54 | % | | | 2.65 | % | | | 2.22 | % | | | 2.13 | % |
| | | | | | | | | | | | | | | | | | | | | |
| Portfolio Turnover Rate | | | 110 | % | | | 87 | % | | | 47 | % | | | 52 | % | | | 69 | % |
| (1) | Does not include income and expenses of investment companies in which the Fund invests. |
See Notes to the Financial Statements
Great Lakes Disciplined Equity Fund
Financial Highlights
For a Fund share outstanding throughout the year
Institutional Class
| | | Year Ended | | | Year Ended | | | Year Ended | | | Year Ended | | | Year Ended | |
| | | March 31, | | | March 31, | | | March 31, | | | March 31, | | | March 31, | |
| | | 2021 | | | 2020 | | | 2019 | | | 2018 | | | 2017 | |
| Per Common Share Data | | | | | | | | | | | | | | | |
| | | | | | | | | | | | | | | | |
| Net asset value, beginning of year | | $ | 13.43 | | | $ | 14.97 | | | $ | 15.16 | | | $ | 15.61 | | | $ | 14.41 | |
| | | | | | | | | | | | | | | | | | | | | |
| Investment operations: | | | | | | | | | | | | | | | | | | | | |
| Net investment income | | | 0.05 | | | | 0.13 | | | | 0.13 | | | | 0.15 | | | | 0.22 | |
| Net realized and unrealized gain (loss) on investments | | | 6.89 | | | | (1.08 | ) | | | 1.13 | | | | 1.87 | | | | 1.91 | |
| Total from investment operations | | | 6.94 | | | | (0.95 | ) | | | 1.26 | | | | 2.02 | | | | 2.13 | |
| | | | | | | | | | | | | | | | | | | | | |
| Less distributions from: | | | | | | | | | | | | | | | | | | | | |
| Net investment income | | | (0.05 | ) | | | (0.13 | ) | | | (0.14 | ) | | | (0.15 | ) | | | (0.22 | ) |
| Net realized gains | | | (1.30 | ) | | | (0.46 | ) | | | (1.31 | ) | | | (2.32 | ) | | | (0.71 | ) |
| Total distributions | | | (1.35 | ) | | | (0.59 | ) | | | (1.45 | ) | | | (2.47 | ) | | | (0.93 | ) |
| Net asset value, end of year | | $ | 19.02 | | | $ | 13.43 | | | $ | 14.97 | | | $ | 15.16 | | | $ | 15.61 | |
| | | | | | | | | | | | | | | | | | | | | |
| Total return | | | 52.43 | % | | | -6.88 | % | | | 9.22 | % | | | 12.76 | % | | | 14.95 | % |
| | | | | | | | | | | | | | | | | | | | | |
| Supplemental Data and Ratios | | | | | | | | | | | | | | | | | | | | |
| Net assets, at end of year (000’s) | | $ | 36,045 | | | $ | 29,253 | | | $ | 42,835 | | | $ | 44,160 | | | $ | 46,611 | |
| | | | | | | | | | | | | | | | | | | | | |
| Ratio of expenses to average net assets: | | | | | | | | | | | | | | | | | | | | |
| Before expense waiver | | | 1.13 | % | | | 0.98 | % | | | 0.95 | % | | | 0.95 | % | | | 0.92 | % |
| After expense waiver | | | 0.86 | % | | | 0.85 | % | | | 0.85 | % | | | 0.85 | % | | | 0.85 | % |
| | | | | | | | | | | | | | | | | | | | | |
| Ratio of expenses excluding interest | | | | | | | | | | | | | | | | | | | | |
| expense to average net assets: | | | | | | | | | | | | | | | | | | | | |
| Before expense waiver | | | 1.12 | % | | | 0.98 | % | | | 0.95 | % | | | 0.95 | % | | | 0.92 | % |
| After expense waiver | | | 0.85 | % | | | 0.85 | % | | | 0.85 | % | | | 0.85 | % | | | 0.85 | % |
| | | | | | | | | | | | | | | | | | | | | |
| Ratio of net investment income to average net assets: | | | | | | | | | | | | | | | | | | | | |
| After expense waiver | | | 0.25 | % | | | 0.85 | % | | | 0.85 | % | | | 0.91 | % | | | 1.39 | % |
| | | | | | | | | | | | | | | | | | | | | |
| Portfolio Turnover Rate | | | 99 | % | | | 97 | % | | | 107 | % | | | 104 | % | | | 114 | % |
See Notes to the Financial Statements
Great Lakes Large Cap Value Fund
Financial Highlights
For a Fund share outstanding throughout the year
Institutional Class
| | | Year Ended | | | Year Ended | | | Year Ended | | | Year Ended | | | Year Ended | |
| | | March 31, | | | March 31, | | | March 31, | | | March 31, | | | March 31, | |
| | | 2021 | | | 2020 | | | 2019 | | | 2018 | | | 2017 | |
| Per Common Share Data | | | | | | | | | | | | | | | |
| | | | | | | | | | | | | | | | |
| Net asset value, beginning of year | | $ | 10.09 | | | $ | 12.75 | | | $ | 14.29 | | | $ | 15.23 | | | $ | 13.45 | |
| | | | | | | | | | | | | | | | | | | | | |
| Investment operations: | | | | | | | | | | | | | | | | | | | | |
| Net investment income | | | 0.19 | | | | 0.22 | | | | 0.25 | | | | 0.20 | | | | 0.24 | |
| Net realized and unrealized gain (loss) on investments | | | 5.36 | | | | (2.19 | ) | | | (0.08 | ) | | | 1.01 | | | | 2.26 | |
| Total from investment operations | | | 5.55 | | | | (1.97 | ) | | | 0.17 | | | | 1.21 | | | | 2.50 | |
| | | | | | | | | | | | | | | | | | | | | |
| Less distributions from: | | | | | | | | | | | | | | | | | | | | |
| Net investment income | | | (0.19 | ) | | | (0.22 | ) | | | (0.25 | ) | | | (0.20 | ) | | | (0.24 | ) |
| Net realized gains | | | (0.09 | ) | | | (0.47 | ) | | | (1.46 | ) | | | (1.95 | ) | | | (0.48 | ) |
| Return of capital | | | (0.00 | )(1) | | | — | | | | — | | | | — | | | | — | |
| Total distributions | | | (0.28 | ) | | | (0.69 | ) | | | (1.71 | ) | | | (2.15 | ) | | | (0.72 | ) |
| Net asset value, end of year | | $ | 15.36 | | | $ | 10.09 | | | $ | 12.75 | | | $ | 14.29 | | | $ | 15.23 | |
| | | | | | | | | | | | | | | | | | | | | |
| Total return | | | 55.58 | % | | | -16.64 | % | | | 1.98 | % | | | 7.36 | % | | | 18.87 | % |
| | | | | | | | | | | | | | | | | | | | | |
| Supplemental Data and Ratios | | | | | | | | | | | | | | | | | | | | |
| Net assets, at end of year (000’s) | | $ | 44,529 | | | $ | 37,423 | | | $ | 46,804 | | | $ | 50,135 | | | $ | 50,902 | |
| | | | | | | | | | | | | | | | | | | | | |
| Ratio of expenses to average net assets: | | | | | | | | | | | | | | | | | | | | |
| Before expense waiver | | | 1.04 | % | | | 0.93 | % | | | 0.90 | % | | | 0.90 | % | | | 0.91 | % |
| After expense waiver | | | 0.85 | % | | | 0.85 | % | | | 0.85 | % | | | 0.85 | % | | | 0.85 | % |
| | | | | | | | | | | | | | | | | | | | | |
| Ratio of net investment income to average net assets: | | | | | | | | | | | | | | | | | | | | |
| After expense waiver | | | 1.51 | % | | | 1.62 | % | | | 1.76 | % | | | 1.28 | % | �� | | 1.66 | % |
| | | | | | | | | | | | | | | | | | | | | |
| Portfolio Turnover Rate | | | 35 | % | | | 27 | % | | | 42 | % | | | 61 | % | | | 48 | % |
| (1) | Amount per share is less than $0.01. |
See Notes to the Financial Statements
Great Lakes Small Cap Opportunity Fund
Financial Highlights
For a Fund share outstanding throughout the year
Investor Class
| | | Year Ended | | | Year Ended | | | Year Ended | | | Year Ended | | | Year Ended | |
| | | March 31, | | | March 31, | | | March 31, | | | March 31, | | | March 31, | |
| | | 2021 | | | 2020 | | | 2019 | | | 2018 | | | 2017 | |
| Per Common Share Data | | | | | | | | | | | | | | | |
| | | | | | | | | | | | | | | | |
| Net asset value, beginning of year | | $ | 10.44 | | | $ | 16.50 | | | $ | 17.36 | | | $ | 17.24 | | | $ | 14.36 | |
| | | | | | | | | | | | | | | | | | | | | |
| Investment operations: | | | | | | | | | | | | | | | | | | | | |
| Net investment income (loss) | | | 0.13 | | | | 0.18 | | | | (0.01 | ) | | | 0.02 | | | | 0.04 | |
| Net realized and unrealized gain (loss) on investments | | | 8.20 | | | | (5.07 | ) | | | 1.05 | | | | 1.35 | | | | 2.90 | |
| Total from investment operations | | | 8.33 | | | | (4.89 | ) | | | 1.04 | | | | 1.37 | | | | 2.94 | |
| | | | | | | | | | | | | | | | | | | | | |
| Less distributions from: | | | | | | | | | | | | | | | | | | | | |
| Net investment income | | | (0.09 | ) | | | (0.14 | ) | | | — | | | | (0.06 | ) | | | (0.06 | ) |
| Net realized gains | | | — | | | | (1.03 | ) | | | (1.90 | ) | | | (1.19 | ) | | | — | |
| Total distributions | | | (0.09 | ) | | | (1.17 | ) | | | (1.90 | ) | | | (1.25 | ) | | | (0.06 | ) |
| Net asset value, end of year | | $ | 18.68 | | | $ | 10.44 | | | $ | 16.50 | | | $ | 17.36 | | | $ | 17.24 | |
| | | | | | | | | | | | | | | | | | | | | |
| Total return | | | 79.97 | % | | | -32.07 | % | | | 7.28 | % | | | 7.98 | % | | | 20.47 | % |
| | | | | | | | | | | | | | | | | | | | | |
| Supplemental Data and Ratios | | | | | | | | | | | | | | | | | | | | |
| Net assets, at end of year (000’s) | | $ | 5,186 | | | $ | 6,531 | | | $ | 10,868 | | | $ | 7,238 | | | $ | 9,772 | |
| | | | | | | | | | | | | | | | | | | | | |
| Ratio of expenses to average net assets: | | | | | | | | | | | | | | | | | | | | |
| Before expense waiver | | | 1.30 | % | | | 1.13 | % | | | 1.10 | % | | | 1.10 | % | | | 1.10 | % |
| After expense waiver | | | 1.24 | % | | | 1.13 | % | | | 1.10 | % | | | 1.10 | % | | | 1.10 | % |
| | | | | | | | | | | | | | | | | | | | | |
| Ratio of net investment income to average net assets: | | | | | | | | | | | | | | | | | | | | |
| After expense waiver | | | 0.37 | % | | | 1.06 | % | | | 0.00 | % | | | 0.05 | % | | | 0.14 | % |
| | | | | | | | | | | | | | | | | | | | | |
| Portfolio Turnover Rate | | | 64 | % | | | 53 | % | | | 115 | % | | | 101 | % | | | 106 | % |
See Notes to the Financial Statements
Great Lakes Small Cap Opportunity Fund
Financial Highlights
For a Fund share outstanding throughout the year
Institutional Class
| | | Year Ended | | | Year Ended | | | Year Ended | | | Year Ended | | | Year Ended | |
| | | March 31, | | | March 31, | | | March 31, | | | March 31, | | | March 31, | |
| | | 2021 | | | 2020 | | | 2019 | | | 2018 | | | 2017 | |
| Per Common Share Data | | | | | | | | | | | | | | | |
| | | | | | | | | | | | | | | | |
| Net asset value, beginning of year | | $ | 10.65 | | | $ | 16.80 | | | $ | 17.64 | | | $ | 17.51 | | | $ | 14.58 | |
| | | | | | | | | | | | | | | | | | | | | |
| Investment operations: | | | | | | | | | | | | | | | | | | | | |
| Net investment income | | | 0.06 | | | | 0.23 | | | | 0.04 | | | | 0.06 | | | | 0.06 | |
| Net realized and unrealized gain (loss) on investments | | | 8.47 | | | | (5.18 | ) | | | 1.06 | | | | 1.37 | | | | 2.97 | |
| Total from investment operations | | | 8.53 | | | | (4.95 | ) | | | 1.10 | | | | 1.43 | | | | 3.03 | |
| | | | | | | | | | | | | | | | | | | | | |
| Less distributions from: | | | | | | | | | | | | | | | | | | | | |
| Net investment income | | | (0.14 | ) | | | (0.18 | ) | | | (0.04 | ) | | | (0.11 | ) | | | (0.10 | ) |
| Net realized gains | | | — | | | | (1.02 | ) | | | (1.90 | ) | | | (1.19 | ) | | | — | |
| Total distributions | | | (0.14 | ) | | | (1.20 | ) | | | (1.94 | ) | | | (1.30 | ) | | | (0.10 | ) |
| Net asset value, end of year | | $ | 19.04 | | | $ | 10.65 | | | $ | 16.80 | | | $ | 17.64 | | | $ | 17.51 | |
| | | | | | | | | | | | | | | | | | | | | |
| Total return | | | 80.39 | % | | | -31.87 | % | | | 7.51 | % | | | 8.21 | % | | | 20.78 | % |
| | | | | | | | | | | | | | | | | | | | | |
| Supplemental Data and Ratios | | | | | | | | | | | | | | | | | | | | |
| Net assets, at end of year (000’s) | | $ | 44,370 | | | $ | 35,011 | | | $ | 67,804 | | | $ | 74,626 | | | $ | 72,171 | |
| | | | | | | | | | | | | | | | | | | | | |
| Ratio of expenses to average net assets: | | | | | | | | | | | | | | | | | | | | |
| Before expense waiver | | | 1.05 | % | | | 0.88 | % | | | 0.85 | % | | | 0.85 | % | | | 0.85 | % |
| After expense waiver | | | 0.99 | % | | | 0.88 | % | | | 0.85 | % | | | 0.85 | % | | | 0.85 | % |
| | | | | | | | | | | | | | | | | | | | | |
| Ratio of net investment income to average net assets: | | | | | | | | | | | | | | | | | | | | |
| After expense waiver | | | 0.29 | % | | | 1.32 | % | | | 0.25 | % | | | 0.30 | % | | | 0.39 | % |
| | | | | | | | | | | | | | | | | | | | | |
| Portfolio Turnover Rate | | | 64 | % | | | 53 | % | | | 115 | % | | | 101 | % | | | 106 | % |
See Notes to the Financial Statements
Great Lakes Funds
Notes to the Financial Statements
March 31, 2021
1. ORGANIZATION
Managed Portfolio Series (the “Trust”) was organized as a Delaware statutory trust on January 27, 2011. The Trust is registered under the Investment Company Act of 1940 (the “1940 Act”), as amended, as an open-end management investment company. The Great Lakes Bond Fund (“Bond Fund”), Great Lakes Disciplined Equity Fund (“Disciplined Equity Fund”), Great Lakes Large Cap Value Fund (“Large Cap Value Fund”), and Great Lakes Small Cap Opportunity Fund (“Small Cap Opportunity Fund”) (each a “Fund” and collectively, the “Funds”) are each a diversified series with their own investment objectives and policies within the Trust. The investment objective of each Fund is total return. Additionally, the Bond Fund has an emphasis on current income. The Funds are investment companies and accordingly follow the investment company accounting and reporting guidance of the Financial Accounting Standards Board (“FASB”) Accounting Standards Codification Topic 946 Financial Services – Investment Companies. The Bond Fund and Large Cap Value Fund commenced operations on September 28, 2012. The Disciplined Equity Fund commenced operations on June 1, 2009 and the Small Cap Opportunity Fund commenced operations on December 5, 2008. The Small Cap Opportunity Fund currently offers two classes of shares, the Investor Class and the Institutional Class. Each class of shares has identical rights and privileges except with respect to the distribution fees and voting rights on matters affecting a single share class. The Bond Fund, Disciplined Equity Fund and Large Cap Value Fund currently offer only Institutional Class shares. The Funds may issue an unlimited number of shares of beneficial interest, with no par value.
2. SIGNIFICANT ACCOUNTING POLICIES
The following is a summary of significant accounting policies consistently followed by the Funds in preparation of its financial statements. These policies are in conformity with generally accepted accounting principles in the United States of America (“GAAP”).
Security Valuation – All investments in securities are recorded at their estimated fair value, as described in Note 3.
Federal Income Taxes – The Funds comply with the requirements of subchapter M of the Internal Revenue Code of 1986, as amended, necessary to qualify as regulated investment companies and distribute substantially all net taxable investment income and net realized gains to shareholders in a manner which results in no cost to the Funds. Therefore, no federal income or excise tax provision is required. As of and during the year ended March 31, 2021, the Funds did not have any tax positions that did not meet the “more-likely-than-not” threshold of being sustained by the applicable tax authority. The Funds recognize interest and penalties, if any, related to unrecognized tax benefits on uncertain tax positions as income tax expense in the Statements of Operations. As of and during the year ended March 31, 2021, the Funds did not incur any interest or penalties. The Funds are not subject to examination by U.S. tax authorities for the years prior to March 31, 2018.
Security Transactions, Investment Income and Distributions – The Funds follow industry practice and record security transactions on the trade date. Realized gains and losses on sales of securities are calculated on the basis of identified cost. Dividend income is recorded on the ex-dividend date and interest income is recorded on an accrual basis. Withholding taxes on foreign dividends have been provided for in accordance with the Funds’ understanding of the applicable country’s tax rules and regulations. Gains realized by the Funds on the sale of securities in certain countries may also be subject to non-U.S. taxes. Discounts and premiums on securities purchased are amortized over the expected life of the respective securities using the constant yield method.
Great Lakes Funds
Notes to the Financial Statements – Continued
March 31, 2021
The Bond Fund will declare daily and pay monthly distributions of net investment income. The Large Cap Value Fund and the Disciplined Equity Fund will make distributions, if any, of net investment income quarterly. The Small Cap Opportunity Fund will make distributions, if any, of net investment income annually. The Funds will also distribute net capital gains, if any, at least annually, typically during the month of December. The Funds may make additional distributions if deemed to be desirable any time during the year. Distributions to shareholders are recorded on the ex-dividend date. The treatment for financial reporting purposes of distributions made to shareholders during the year from net investment income or net realized capital gains may differ from their treatment for federal income tax purposes. Where such differences are permanent in nature, GAAP requires that they be reclassified in the components of the net assets based on their ultimate characterization for federal income tax purposes.
Reclassification of Capital Accounts – GAAP requires that certain components of net assets relating to permanent differences be reclassified between financial and tax reporting. These differences are caused primarily by differences in the timing of the recognition of certain components of income, expense or realized capital gain for federal income tax purposes. These reclassifications have no effect on net assets, results of operations or net asset value (“NAV”) per share. For the year ended March 31, 2021, the following reclassifications were made:
| | Total Distributable | |
| Fund | Earnings | Paid-in Capital |
| Bond Fund | $— | $— |
| Disciplined Equity Fund | — | — |
| Large Cap Value Fund | 4,900 | (4,900) |
| Small Cap Opportunity Fund | — | — |
Foreign Currency – Investment securities and other assets and liabilities denominated in foreign currencies are translated into U.S. dollar amounts at the date of valuation. Purchases and sales of investment securities and income and expense items denominated in foreign currencies are translated into U.S. dollar amounts on the respective dates of such transactions. The Funds do not isolate that portion of the results of operations resulting from changes in foreign exchange rates on investments from the fluctuations arising from changes in market prices of securities held. Such fluctuations are included with the net realized and unrealized gain or loss from investments. The Funds report net realized foreign exchange gains or losses that arise from sales of foreign currencies, currency gains or losses realized between the trade and settlement dates on securities transactions, and the difference between the amounts of dividends, interest, and foreign withholding taxes recorded on the Funds’ books and the U.S. dollar equivalent of the amounts actually received or paid. Net unrealized foreign exchange gains and losses arise from changes in the fair values of assets and liabilities, other than investments in securities at fiscal period end, resulting from changes in exchange rates.
Use of Estimates – The preparation of financial statements in conformity with GAAP requires management to make estimates and assumptions that affect the reported amounts of assets and liabilities and disclosure of contingent assets and liabilities at the date of the financial statements and the reported amounts of revenues and expenses during the reporting period. Actual results could differ from those estimates.
Allocation of Income, Expenses and Gains/Losses – Income, expenses (other than those deemed attributable to a specific share class), and gains and losses of the Funds are allocated daily to each class of shares based upon the ratio of net assets represented by each class as a percentage of the net assets of each Fund. Expenses deemed directly attributable to a class of shares are recorded by the specific class. Most Fund expenses are allocated by class based on relative net assets. 12b-1 fees are expensed at 0.25% of average daily net assets of Investor Class shares. Expenses
Great Lakes Funds
Notes to the Financial Statements – Continued
March 31, 2021
associated with a specific fund in the Trust are charged to that fund. Common Trust expenses are typically allocated evenly between the funds of the Trust, or by other equitable means.
Illiquid Securities – A security may be considered illiquid if it lacks a readily available market. Securities are generally considered liquid if they can be sold or disposed of in the ordinary course of business within seven days at approximately the price at which the security is valued by the Fund. Illiquid securities may be valued under methods approved by the Board of Trustees (the “Board”) as reflecting fair value. The Funds will not hold more than 15% of the value of their net assets in illiquid securities. At March 31, 2021, the Funds did not hold any illiquid securities.
Security Loans – When the Funds loan securities held in their portfolios, the Funds receive compensation in the form of fees, or retain a portion of the interest on the investment of any cash received as collateral. The Funds also continue to receive dividends on the securities loaned. The loans are secured by collateral at least equal to 105% of the value of the loaned securities that are foreign securities or 102% of the value of any other loaned securities marked-to-market daily. Loans shall be marked to market daily and the margin restored in the event collateralization is below 100% of the value of securities loaned. Gain or loss in the value of securities loaned that may occur during the term of the loan will be for the account of the Funds. The Funds have the right under the lending agreement to recover the securities from the borrower on demand. Currently, only the Small Cap Opportunity Fund is eligible to participate in securities lending. See Note 9.
New Accounting Pronouncements – In March 2020, FASB issued Accounting Standards Update 2020-04, Reference Rate Reform: Facilitation of the Effects of Reference Rate Reform on Financial Reporting (“ASU 2020-04”). The main objective of ASU 2020-04 is to provide relief to companies that will be impacted by the expected change in benchmark interest rates at the end of 2021, when participating banks will no longer be required to submit London Inter-bank Offered Rate (“LIBOR”) quotes by the UK Financial Conduct Authority. ASU 2020-04 allows companies to, provided the only change to existing contracts are a change to an approved benchmark interest rate, account for modifications as a continuance of the existing contract without additional analysis. In addition, derivative contracts that qualified for hedge accounting prior to modification, will be allowed to continue to receive such treatment, even if critical terms change due to a change in the benchmark interest rate. For new and existing contracts, the Funds may elect to apply the amendments as of March 12, 2020 through December 31, 2022. Management is currently assessing the impact of the adoption of ASU 2020-04 to the Funds’ financial statements and various filings.
3. SECURITIES VALUATION
The Funds have adopted authoritative fair value accounting standards which establish an authoritative definition of fair value and set out a hierarchy for measuring fair value. These standards require additional disclosures about the various inputs and valuation techniques used to develop the measurements of fair value, a discussion in changes in valuation techniques and related inputs during the period and expanded disclosure of valuation levels for major security types. These inputs are summarized in the three broad levels listed below:
| Level 1 – | Unadjusted quoted prices in active markets for identical assets or liabilities that the Funds have the ability to access.
|
| Level 2 – | Observable inputs other than quoted prices included in Level 1 that are observable for the asset or liability, either directly or indirectly. These inputs may include quoted prices for the identical instrument on an inactive market, prices for similar instruments, interest rates, prepayment speeds, credit risk, yield curves, default rates and similar data. |
Great Lakes Funds
Notes to the Financial Statements – Continued
March 31, 2021
| Level 3 – | Unobservable inputs for the asset or liability, to the extent relevant observable inputs are not available, representing the Funds’ own assumptions about the assumptions a market participant would use in valuing the asset or liability, and would be based on the best information available. |
Following is a description of the valuation techniques applied to each Fund’s major categories of assets and liabilities measured at fair value on a recurring basis. Each Fund’s investments are carried at fair value.
Equity Securities – Equity securities, including common stocks and exchange traded funds (“ETFs”) and real estate investment trusts (“REITs”), that are primarily traded on a national securities exchange shall be valued at the last sale price on the exchange on which they are primarily traded on the day of valuation or, if there has been no sale on such day, at the mean between the bid and ask prices. Securities traded primarily in the Nasdaq Global Market System for which market quotations are readily available shall be valued using the Nasdaq Official Closing Price (“NOCP”). If the NOCP is not available, such securities shall be valued at the last sale price on the day of valuation, or if there has been no sale on such day, at the mean between the bid and ask prices. To the extent these securities are actively traded, and valuation adjustments are not applied, they are categorized in Level 1 of the fair value hierarchy. If the market for a particular security is not active, and the mean between bid and ask prices is used, these securities are categorized in Level 2 of the fair value hierarchy.
Investment Companies – Investments in other mutual funds, including money market funds, are valued at their NAV per share and are categorized in Level 1 of the fair value hierarchy.
Fixed Income Securities – Asset-backed, corporate, mortgage-backed, municipal bonds, and U.S. government & agency securities are valued at fair value on the basis of valuations furnished by an independent pricing service which utilizes both dealer-supplied valuations and formula-based techniques. The pricing service may consider recently executed transactions in securities of the issuer or comparable issuers, market price quotations (where observable), bond spreads, and fundamental data relating to the issuer. Fixed income securities are categorized in Level 2 of the fair value hierarchy.
Securities for which market quotations are not readily available, or if the closing price does not represent fair value, are valued following procedures approved by the Board. These procedures consider many factors, including the type of security, size of holding, trading volume and news events. There can be no assurance that the Fund could obtain the fair value assigned to a security if they were to sell the security at approximately the time at which the Fund determines their net asset values per share. The Board has established a Valuation Committee to administer, implement, and oversee the fair valuation process, and to make fair value decisions when necessary. The Board regularly reviews reports of the Valuation Committee that describe any fair value determinations and methods.
Great Lakes Funds
Notes to the Financial Statements – Continued
March 31, 2021
The inputs or methodology used for valuing securities are not an indication of the risk associated with investing in those securities. The following is a summary of the inputs used to value each Fund’s securities as of March 31, 2021:
| Bond Fund | | Level 1 | | | Level 2 | | | Level 3 | | | Total | |
| Corporate Bonds | | $ | — | | | $ | 36,539,115 | | | $ | — | | | $ | 36,539,115 | |
| Exchange-Traded Funds | | | 31,768,024 | | | | — | | | | — | | | | 31,768,024 | |
| U.S. Treasury Securities | | | — | | | | 7,762,138 | | | | — | | | | 7,762,138 | |
| U.S. Government Agency | | | | | | | | | | | | | | | | |
| Mortgage-Backed Securities | | | — | | | | 4,515,338 | | | | — | | | | 4,515,338 | |
| Asset-Backed Securities | | | — | | | | 1,086,977 | | | | — | | | | 1,086,977 | |
| Municipal Bonds | | | — | | | | 1,038,946 | | | | — | | | | 1,038,946 | |
| Commercial Mortgage-Backed Securities | | | — | | | | 967,697 | | | | — | | | | 967,697 | |
| Money Market Fund | | | 2,000,352 | | | | — | | | | — | | | | 2,000,352 | |
| Total Investments | | $ | 33,768,376 | | | $ | 51,910,211 | | | $ | — | | | $ | 85,678,587 | |
| Disciplined Equity Fund | | Level 1 | | | Level 2 | | | Level 3 | | | Total | |
| Common Stocks | | $ | 35,481,914 | | | $ | — | | | $ | — | | | $ | 35,481,914 | |
| Money Market Fund | | | 588,819 | | | | — | | | | — | | | | 588,819 | |
| Total Investments | | $ | 36,070,733 | | | $ | — | | | $ | — | | | $ | 36,070,733 | |
| Large Cap Value Fund | | Level 1 | | | Level 2 | | | Level 3 | | | Total | |
| Common Stocks | | $ | 43,152,069 | | | $ | — | | | $ | — | | | $ | 43,152,069 | |
| Money Market Fund | | | 1,382,541 | | | | — | | | | — | | | | 1,382,541 | |
| Total Investments | | $ | 44,534,610 | | | $ | — | | | $ | — | | | $ | 44,534,610 | |
| Small Cap Opportunity Fund | | Uncategorized | | | Level 1 | | | Level 2 | | | Level 3 | | | Total | |
| Common Stocks | | $ | — | | | $ | 48,652,216 | | | $ | — | | | $ | — | | | $ | 48,652,216 | |
| Investment Purchased | | | | | | | | | | | | | | | | | | | | |
| with Proceeds from | | | | | | | | | | | | | | | | | | | | |
| Securities Lending* | | | 11,123,854 | | | | — | | | | — | | | | — | | | | 11,123,854 | |
| Money Market Fund | | | — | | | | 1,372,799 | | | | — | | | | — | | | | 1,372,799 | |
| Total Investments | | $ | 11,123,854 | | | $ | 50,025,015 | | | $ | — | | | $ | — | | | $ | 61,148,869 | |
| * | Certain investments that are measured at fair value using the NAV per share (or its equivalent) as a practical expedient have not been characterized in the fair value hierarchy. The fair value amounts presented in the table are intended to permit reconciliation of the fair value hierarchy to the amount presented in the Statements of Assets and Liabilities. See Note 9 for additional information regarding securities lending activity. |
Refer to the Schedule of Investments for further information on the classification of investments.
The global outbreak of COVID-19 (commonly referred to as “coronavirus”) has disrupted economic markets and the prolonged economic impact is uncertain. The ultimate economic fallout from the pandemic, and the long-term impact on economies, markets, industries and individual issuers, are not known. The operational and financial performance of the issuers of securities in which the Funds invest depends on future developments, including the duration and spread of the outbreak, and such uncertainty may in turn adversely affect the value and liquidity of the Funds’ investments, impair the Funds’ ability to satisfy redemption requests, and negatively impact the Funds’ performance.
Great Lakes Funds
Notes to the Financial Statements – Continued
March 31, 2021
4. INVESTMENT ADVISORY FEE AND OTHER TRANSACTIONS WITH AFFILIATES
The Trust has an agreement with Great Lakes Advisors, LLC (the “Adviser”) to furnish investment advisory services to the Funds. For its services, the Funds pay the Adviser a monthly management fee based upon the average daily net assets of the Funds at the following annual rates:
| Fund | | |
| Bond Fund | 0.40% | |
| Disciplined Equity Fund | 0.60% | |
| Large Cap Value Fund | 0.60% | |
| Small Cap Opportunity Fund | 0.60% | |
The Funds’ Adviser has contractually agreed to waive its management fees and pay Fund expenses to ensure that total annual operating expenses (excluding acquired fund fees and expenses, leverage/borrowing interest, interest expense, taxes, brokerage commissions, and extraordinary expenses) do not exceed the following rates (based upon the average daily net assets of the Funds):
| Fund | Investor Class | Institutional Class | |
| Bond Fund | N/A | 0.65% | |
| Disciplined Equity Fund | N/A | 0.85% | |
| Large Cap Value Fund | N/A | 0.85% | |
| Small Cap Opportunity Fund | 1.24% | 0.99% | |
Fees waived and expenses paid by the Adviser may be recouped by the Adviser for a period of thirty-six months following the date on which such fee waiver and expense payment was made, if such recoupment can be achieved without exceeding the expense limit in effect at the time the fee waiver and expense payment occurred and the expense limit in effect at the time of recoupment. The Operating Expenses Limitation Agreement is intended to be continual in nature and cannot be terminated within a year after the effective date of the Funds’ prospectus. After that date, the agreement may be terminated at any time upon 60 days’ written notice by the Trust’s Board or the Adviser, with consent of the Board. For the year ended March 31, 2021, the Adviser recouped expenses of $2,477 in the Small Cap Opportunity Fund relating to fees waived in prior years. Waived fees and reimbursed expenses subject to potential recovery by month of expiration are as follows:
| | April 2021 – | April 2022 – | April 2023 – | |
| Fund | March 2022 | March 2023 | March 2024 | |
| Bond Fund | $ — | $ — | $ — | |
| Disciplined Equity Fund | 44,304 | 56,140 | 94,494 | |
| Large Cap Value Fund | 23,953 | 40,009 | 79,283 | |
| Small Cap Opportunity Fund | — | 887 | 31,351 | |
U.S. Bancorp Fund Services, LLC (the “Administrator”), doing business as U.S. Bank Global Fund Services, acts as the Funds’ Administrator, Transfer Agent, and Fund Accountant. U.S. Bank, N.A. (the “Custodian”) serves as the custodian to the Funds. The Custodian is an affiliate of the Administrator. The Administrator performs various administrative and accounting services for the Funds. The Administrator prepares various federal and state regulatory filings, reports and returns for the Funds; prepares reports and materials to be supplied to the Trustees; monitors the activities of the Funds’ custodian; coordinates the payment of the Funds’ expenses and reviews the Funds’ expense accruals. The officers of the Trust, including the Chief Compliance Officer, are employees of the Administrator. As compensation for its services,
Great Lakes Funds
Notes to the Financial Statements – Continued
March 31, 2021
the Administrator is entitled to a monthly fee at an annual rate based upon the average daily net assets of the Funds, subject to annual minimums. Fees paid by the Funds for administration and accounting, transfer agency, custody and compliance services for the year ended March 31, 2021, are disclosed in the Statements of Operations.
Quasar Distributors, LLC (the “Distributor”) acts as the Funds’ principal underwriter in a continuous public offering of the Funds’ shares.
5. DISTRIBUTION AND SHAREHOLDER SERVICING FEES
The Small Cap Opportunity Fund has adopted a Distribution Plan pursuant to Rule 12b-1 (the “Plan”) in the Investor Class only. The Plan permits the Fund to pay for distribution and related expenses at an annual rate of 0.25% of the Investor Class average daily net assets. The expenses covered by the Plan may include the cost of preparing and distributing prospectuses and other sales material, advertising and public relations expenses, payments to financial intermediaries and compensation of personnel involved in selling shares of the Fund. Payments made pursuant to the Plan will represent compensation for distribution and service activities, not reimbursements for specific expenses incurred. For the year ended March 31, 2021, the Fund’s Investor Class incurred the following expenses pursuant to the Plan:
| Fund | Amount | |
| Small Cap Opportunity Fund | $13,243 | |
6. CAPITAL SHARE TRANSACTIONS
Transactions in shares of the Funds were as follows:
| | | Bond Fund | | | Disciplined Equity Fund | |
| | | Year Ended | | | Year Ended | | | Year Ended | | | Year Ended | |
| | | March 31, 2021 | | | March 31, 2020 | | | March 31, 2021 | | | March 31, 2020 | |
| Institutional Class: | | | | | | | | | | | | |
| Shares sold | | | 138,126 | | | | 1,143,958 | | | | 163,060 | | | | 344,093 | |
| Shares issued in reinvestment | | | | | | | | | | | | | | | | |
| of distributions | | | 48,188 | | | | 102,805 | | | | 60,347 | | | | 56,218 | |
| Shares redeemed | | | (2,442,705 | ) | | | (3,735,466 | ) | | | (507,145 | ) | | | (1,083,611 | ) |
| Net decrease in capital shares | | | (2,256,391 | ) | | | (2,488,703 | ) | | | (283,738 | ) | | | (683,300 | ) |
Great Lakes Funds
Notes to the Financial Statements – Continued
March 31, 2021
| | | Large Cap Value Fund | | | Small Cap Opportunity Fund | |
| | | Year Ended | | | Year Ended | | | Year Ended | | | Year Ended | |
| | | March 31, 2021 | | | March 31, 2020 | | | March 31, 2021 | | | March 31, 2020 | |
| Investor Class: | | | | | | | | | | | | |
| Shares sold | | | — | | | | — | | | | 12,984 | | | | 170,623 | |
| Shares issued in reinvestment | | | | | | | | | | | | | | | | |
| of distributions | | | — | | | | — | | | | 1,818 | | | | 51,989 | |
| Shares redeemed | | | — | | | | — | | | | (362,683 | ) | | | (255,895 | ) |
| Net decrease | | | — | | | | — | | | | (347,881 | ) | | | (33,283 | ) |
| | | | | | | | | | | | | | | | | |
| Institutional Class: | | | | | | | | | | | | | | | | |
| Shares sold | | | 160,658 | | | | 562,956 | | | | 285,112 | | | | 431,536 | |
| Shares issued in reinvestment | | | | | | | | | | | | | | | | |
| of distributions | | | 22,911 | | | | 80,424 | | | | 15,532 | | | | 206,939 | |
| Shares redeemed | | | (993,310 | ) | | | (604,704 | ) | | | (1,257,042 | ) | | | (1,386,653 | ) |
| Net increase (decrease) | | | (809,741 | ) | | | 38,676 | | | | (956,398 | ) | | | (748,178 | ) |
| Net increase (decrease) | | | | | | | | | | | | | | | | |
| in capital shares | | | (809,741 | ) | | | 38,676 | | | | (1,304,279 | ) | | | (781,461 | ) |
7. INVESTMENT TRANSACTIONS
The aggregate purchases and sales, excluding short-term investments, by the Funds for the year ended March 31, 2021, were as follows:
| | | U.S. Government Securities | | | Other | |
| Fund | | Purchases | | | Sales | | | Purchases | | | Sales | |
| Bond Fund | | $ | 48,230,179 | | | $ | 48,967,229 | | | $ | 52,978,000 | | | $ | 72,330,255 | |
| Disciplined Equity Fund | | | — | | | | — | | | | 33,788,754 | | | | 46,060,991 | |
| Large Cap Value Fund | | | — | | | | — | | | | 13,585,517 | | | | 22,118,747 | |
| Small Cap Opportunity Fund | | | — | | | | — | | | | 27,848,109 | | | | 45,179,536 | |
8. INCOME TAX INFORMATION
The aggregate gross unrealized appreciation and depreciation of securities held by the Funds and the total cost of securities for federal income tax purposes at March 31, 2021, were as follows:
| | | Aggregate Gross | | | Aggregate Gross | | | Net | | | Federal Income | |
| Fund | | Appreciation | | | Depreciation | | | Appreciation | | | Tax Cost | |
| Bond Fund | | $ | 1,122,177 | | | $ | (578,236 | ) | | $ | 543,941 | | | $ | 85,134,646 | |
| Disciplined Equity Fund | | | 8,412,309 | | | | (445,375 | ) | | | 7,966,934 | | | | 28,103,799 | |
| Large Cap Value Fund | | | 10,118,131 | | | | (485,934 | ) | | | 9,632,197 | | | | 34,902,449 | |
| Small Cap Opportunity Fund | | | 10,282,394 | | | | (1,541,983 | ) | | | 8,740,411 | | | | 52,408,458 | |
The difference between book-basis and tax-basis unrealized appreciation (depreciation) is attributable primarily to the differences in tax treatment of wash sales and distributions payable.
Great Lakes Funds
Notes to the Financial Statements – Continued
March 31, 2021
At March 31, 2021, the components of accumulated earnings (deficit) on a tax-basis were as follows:
| | | Undistributed | | | Undistributed | | | Other | | | | | | Total | |
| | | Ordinary | | | Long-Term | | | Accumulated | | | Unrealized | | | Distributable | |
| Fund | | Income | | | Capital Gains | | | Losses/Payables | | | Appreciation | | | Earnings | |
| Bond Fund | | $ | 21,857 | | | $ | — | | | $ | (116,759 | ) | | $ | 543,941 | | | $ | 449,039 | |
| Disciplined Equity Fund | | | 1,928,837 | | | | 3,345,602 | | | | — | | | | 7,966,934 | | | | 13,241,373 | |
| Large Cap Value Fund | | | — | | | | — | | | | (254,552 | ) | | | 9,632,197 | | | | 9,377,645 | |
| Small Cap Opportunity Fund | | | 4,437 | | | | — | | | | (985,205 | ) | | | 8,740,411 | | | | 7,759,643 | |
As of March 31, 2021, the Funds’ had the following in capital loss carryovers, which will be permitted to be carried over for an unlimited period. During the year ended March 31, 2021, the Bond Fund utilized $962,168 in long-term capital loss carryovers.
| Fund | | Short-Term | | | Long-Term | |
| Bond Fund | | $ | 52,378 | | | $ | — | |
| Disciplined Equity Fund | | | — | | | | — | |
| Large Cap Value Fund | | | — | | | | — | |
| Small Cap Opportunity Fund | | | — | | | | 985,205 | |
A regulated investment company may elect for any taxable year to treat any portion of any qualified late year loss as arising on the first day of the next taxable year. Qualified late year losses are certain capital and ordinary losses which occur during the portion of each Fund’s taxable year subsequent to October 31 and December 31, respectively. For the taxable year ended March 31, 2021, the Bond Fund, the Disciplined Equity Fund and the Small Cap Opportunity Fund do not plan to defer any late year losses. The Large Cap Value Fund plans to defer post-October losses of $254,552.
The tax character of distributions paid during the year ended March 31, 2021, was as follows:
| Fund | | Ordinary Income* | | | Long-Term Capital Gains** | | | Return of Capital | | | Total | |
| Bond Fund*** | | $ | 1,690,342 | | | $ | — | | | $ | — | | | $ | 1,690,342 | |
| Disciplined Equity Fund | | | 104,406 | | | | 2,458,163 | | | | — | | | | 2,562,569 | |
| Large Cap Value Fund | | | 892,361 | | | | 11,840 | | | | 4,900 | | | | 909,101 | |
| Small Cap Opportunity Fund | | | 416,160 | | | | — | | | | — | | | | 416,160 | |
The tax character of distributions paid during the year ended March 31, 2020, was as follows:
| Fund | | Ordinary Income* | | | Long-Term Capital Gains** | | | Total | |
| Bond Fund*** | | $ | 3,262,785 | | | $ | — | | | $ | 3,262,785 | |
| Disciplined Equity Fund | | | 485,757 | | | | 1,111,067 | | | | 1,596,824 | |
| Large Cap Value Fund | | | 777,020 | | | | 1,701,496 | | | | 2,478,516 | |
| Small Cap Opportunity Fund | | | 3,979,338 | | | | 1,216,352 | | | | 5,195,690 | |
| * | For Federal income tax purposes, distributions of short-term capital gains are treated as ordinary income. |
| ** | The Fund designated as long-term capital gain dividend, pursuant to Internal Revenue Code Section 852(b)(3), the amount necessary to reduce the earnings and profits of the Fund related to net capital gain to zero for the tax year ended March 31, 2021. To the extent necessary to fully distribute such capital gain, the Funds also designate earnings and profits distributed to shareholders on the redemption of shares. |
| *** | The tax character of distributions do not agree to the book character of distributions due to the timing differences of the distribution's ex-date at March 31, 2021 and when payment of the distribution to shareholders is recorded. |
Great Lakes Funds
Notes to the Financial Statements – Continued
March 31, 2021
9. SECURITIES LENDING
Following the terms of a securities lending agreement with the Funds’ Custodian, the Funds may lend securities from its portfolio to brokers, dealers and financial institutions in order to increase the return on its portfolio, primarily through the receipt of borrowing fees and earnings on invested collateral. Any such loan must be continuously secured by collateral in cash or cash equivalents maintained on a current basis in an amount at least equal to 105% of the value of the loaned securities that are foreign securities or 102% of the value of any other loaned securities marked-to-market daily. Loans shall be marked to market daily and the margin restored in the event the collateralization is below 100% of the value of the securities loaned. During the time securities are on loan, the borrower will pay the applicable Fund any accrued income on those securities, and the Fund may invest the cash collateral and earn income or receive an agreed-upon fee from a borrower that has delivered cash-equivalent collateral. In determining whether or not to lend a security to a particular broker, dealer or financial institution, the Adviser considers all relevant facts and circumstances, including the size, creditworthiness and reputation of the broker, relevant facts dealer or financial institution. Securities lending involves the risk of a default or insolvency of the borrower. In either of these cases, a Fund could experience delays in recovering securities or collateral or could lose all or part of the value of the loaned securities. A Fund also could lose money in the event of a decline in the value of the collateral provided for loaned securities. Additionally, the loaned portfolio securities may not be available to a Fund on a timely basis and that Fund may therefore lose the opportunity to sell the securities at a desirable price. Any decline in the value of a security that occurs while the security is out on loan would continue to be borne by the applicable Fund. Currently, only the Small Cap Opportunity Fund is eligible to participate in securities lending. As of March 31, 2021, the Small Cap Opportunity Fund had securities on loan with a value of $10,912,602 and collateral value of $11,123,854.
The Fund receives cash as collateral in return for securities lent as part of the securities lending program. The collateral is invested in the Mount Vernon Liquid Assets Portfolio, LLC of which the investment objective is to seek to maximize current income to the extent with the preservation of capital and liquidity and maintain a stable NAV of $1.00 per unit. The Fund held $11,123,854 as of March 31, 2021. The remaining contractual maturity of all securities lending transactions is overnight and continuous. The Fund is not subject to a master netting agreement with respect to securities lending; therefore no additional disclosures are required. The net income earned by the Fund on investments of cash collateral received from borrowers for the securities loaned to them is reflected in the Fund’s Statement of Operations. Securities lending income, as disclosed in the Fund’s Statement of Operations, represents the income earned from the investment of cash collateral, net of fee rebates paid to the borrower and net of fees paid to the Custodian as lending agent.
Great Lakes Funds
Notes to the Financial Statements – Continued
March 31, 2021
10. LINE OF CREDIT
The Funds have established an unsecured line of credit (“LOC”) in the amount of $25,000,000, 15% of a Fund’s gross market value or 33.33% of the fair value of the Fund’s investments, whichever is less. The LOC matures, unless renewed on July 23, 2021. The LOC is intended to provide short-term financing, if necessary, subject to certain restrictions and covenants, in connection with shareholder redemptions and other short-term liquidity needs of the Funds. The LOC is with the Custodian. Interest is charged at the prime rate which was 3.25% as of and during the year ended March 31, 2021. The Funds have authorized U.S. Bank N.A. to charge any of the accounts of the Funds for any missed payments. For the period ended March 31, 2021, the Funds’ LOC activity was as follows:
| | | | Amount | | | |
| | | | Outstanding | | | Date of |
| �� | | Average | as of | Interest | Maximum | Maximum |
| LOC Agent | Fund | Borrowings | March 31, 2021 | Expense | Borrowing | Borrowing |
| U.S. Bank N.A. | Bond Fund | $ 1,874 | $ — | $62 | $ 684,000 | 04/01/2020 |
| U.S. Bank N.A. | Disciplined | | | | | |
| | Equity Fund | 75,825 | — | 2,499 | 5,184,000 | 04/01/2020 |
| U.S. Bank N.A. | Large Cap | | | | | |
| | Value Fund | 11,515 | — | 379 | 4,203,000 | 09/28/2020 |
| U.S. Bank N.A. | Small Cap | | | | | |
| | Opportunity | | | | | |
| | Fund | 551 | — | 18 | 201,000 | 10/13/2020 |
11. SECTOR RISK
As of March 31, 2021, the Bond Fund had a significant portion of its assets invested in the financials sector. The financials sector may be more greatly impacted by the performance of the overall economy, interest rates, competition, and consumer confidence spending.
12. CONTROL OWNERSHIP
The beneficial ownership, either directly or indirectly, of more than 25% of the voting securities of a fund creates a presumption of control of the fund, under Section 2(a)(9) of the 1940 Act. As of March 31, 2021, each Fund’s percentage of control ownership positions greater than 25% are as follows:
| Fund | Shareholder | Percent of Shares Held |
| Bond Fund | Maril & Co. FBO | 68.18% |
| | Wells Fargo Clearing | 26.58% |
| Disciplined Equity Fund | Maril & Co. FBO | 53.99% |
| | Wells Fargo Clearing | 38.80% |
| Large Cap Value Fund | Maril & Co. FBO | 42.93% |
| | Wells Fargo Clearing | 27.34% |
| Small Cap Opportunity Fund | Wells Fargo Clearing | 44.75% |
| | Maril & Co. FBO | 26.28% |
Great Lakes Funds
Notes to the Financial Statements – Continued
March 31, 2021
13. SUBSEQUENT EVENTS
A Special Meeting of Shareholders of the Great Lakes Bond Fund (the “Acquired Fund”), a series of Managed Portfolio Series Trust, will take place on July 15, 2021 to vote on a proposed Agreement and Plan of Reorganization for the Acquired Fund, whereby the Weitz Core Plus Income Fund (the “Acquiring Fund”), a series of The Weitz Funds, would acquire all the assets and liabilities of the Acquired Fund, in exchange for shares of the Acquiring Fund which would be distributed pro rata by the Acquired Fund to its shareholders, in complete liquidation and termination of the Acquired Fund (the “Reorganization”). Subject to shareholder approval, the Reorganization is expected to take place on July 23, 2021.
Management has performed an evaluation of subsequent events through the date the financial statements were issued and has determined that no additional items require recognition or disclosure.
Great Lakes Funds
Report of Independent Registered Public Accounting Firm
To the Shareholders of Great Lakes Funds and
Board of Trustees of Managed Portfolio Series
Opinion on the Financial Statements
We have audited the accompanying statements of assets and liabilities, including the schedules of investments, of Great Lakes Bond Fund, Great Lakes Disciplined Equity Fund, Great Lakes Large Cap Value Fund, and Great Lakes Small Cap Opportunity Fund (the “Great Lakes Funds” or the “Funds”), each a series of Managed Portfolio Series, as of March 31, 2021, the related statements of operations for the year then ended, the statements of changes in net assets for each of the two years in the period then ended, the related notes, and the financial highlights for each of the five years in the period then ended (collectively referred to as the “financial statements”). In our opinion, the financial statements present fairly, in all material respects, the financial position of each of the Funds as of March 31, 2021, the results of their operations for the year then ended, the changes in net assets for each of the two years in the period then ended, and the financial highlights for each of the five years in the period then ended, in conformity with accounting principles generally accepted in the United States of America.
Basis for Opinion
These financial statements are the responsibility of the Funds’ management. Our responsibility is to express an opinion on Funds’ financial statements based on our audits. We are a public accounting firm registered with the Public Company Accounting Oversight Board (United States) (“PCAOB”) and are required to be independent with respect to the Funds in accordance with the U.S. federal securities laws and the applicable rules and regulations of the Securities and Exchange Commission and the PCAOB.
We conducted our audits in accordance with the standards of the PCAOB. Those standards require that we plan and perform the audit to obtain reasonable assurance about whether the financial statements are free of material misstatement whether due to error or fraud.
Our audits included performing procedures to assess the risks of material misstatement of the financial statements, whether due to error or fraud, and performing procedures that respond to those risks. Such procedures included examining, on a test basis, evidence regarding the amounts and disclosures in the financial statements. Our procedures included confirmation of securities owned as of March 31, 2021, by correspondence with the custodian and brokers. Our audits also included evaluating the accounting principles used and significant estimates made by management, as well as evaluating the overall presentation of the financial statements. We believe that our audits provide a reasonable basis for our opinion.
We have served as the Funds’ auditor since 2015.
COHEN & COMPANY, LTD.
Cleveland, Ohio
June 1, 2021
Great Lakes Funds
Additional Information (Unaudited)
March 31, 2021
APPROVAL OF INVESTMENT ADVISORY AGREEMENT – Great Lakes Advisors, LLC
At the regular meeting of the Board of Trustees of Managed Portfolio Series (“Trust”) on February 23-24, 2021, the Trust’s Board of Trustees (“Board”), each of whom were present virtually via video conference, including all of the Trustees who are not “interested persons” of the Trust, as that term is defined in Section 2(a)(19) of the Investment Company Act of 1940, as amended, (“Independent Trustees”) considered and approved the continuation of the Investment Advisory Agreement between the Trust and Great Lakes Advisors, LLC (“Great Lakes” or the “Adviser”) regarding the Great Lakes Bond Fund, the Great Lakes Large Cap Value Fund, the Great Lakes Disciplined Equity Fund, and the Great Lakes Small Cap Opportunity Fund (each a “Fund” or collectively, the “Funds”) (the “Investment Advisory Agreement”) for another annual term.
Prior to the meeting and at a meeting held on January 6, 2021, the Trustees received and considered information from Great Lakes and the Trust’s administrator designed to provide the Trustees with the information necessary to evaluate the continuance of the Investment Advisory Agreement (“Support Materials”). Before voting to approve the continuance of the Investment Advisory Agreement, the Trustees reviewed the Support Materials with Trust management and with counsel to the Independent Trustees, and received a memorandum from such counsel discussing the legal standards for their consideration of the renewal of the Investment Advisory Agreement. This information, together with the information provided to the Board throughout the course of the year, formed the primary (but not exclusive) basis for the Board’s determinations.
In determining whether to continue the Investment Advisory Agreement, the Trustees considered all factors they believed relevant, including the following with respect to each Fund: (1) the nature, extent, and quality of the services provided by Great Lakes with respect to the Fund; (2) the Fund’s historical performance and the performance of other investment accounts managed by Great Lakes; (3) the costs of the services provided by Great Lakes and the profits realized by Great Lakes from services rendered to the Fund; (4) comparative fee and expense data for the Fund and other investment companies with similar investment objectives; (5) the extent to which economies of scale may be realized as the Fund grows, and whether the advisory fee for the Fund reflects such economies of scale for the Fund’s benefit; and (6) other benefits to Great Lakes resulting from its relationship with the Funds. In their deliberations, the Trustees weighed to varying degrees the importance of the information provided to them, did not identify any particular information that was all-important or controlling, and considered the information and made its determinations for each Fund separately and independently of the other Funds.
Based upon the information provided to the Board throughout the course of the year, including at an in-person presentation by representatives of Great Lakes, and the Support Materials, the Board concluded that the overall arrangements between the Trust and Great Lakes set forth in the Investment Advisory Agreement, as it relates to each Fund, continue to be fair and reasonable in light of the services that Great Lakes performs, the investment advisory fees that each Fund pays, and such other matters as the Trustees considered relevant in the exercise of their reasonable business judgment. The material factors and conclusions that formed the basis of the Trustees’ determination to approve the continuation of the Investment Advisory Agreement, as it relates to each Fund, are summarized below.
Nature, Extent and Quality of Services Provided. The Trustees considered the scope of services that Great Lakes provides under the Investment Advisory Agreement with respect to each Fund, noting that such services include, but are not limited to, the following: (1) investing each Fund’s assets consistent with the Fund’s investment objective and investment policies; (2) determining the portfolio securities to be purchased, sold or otherwise disposed of, and the timing of such transactions; (3) voting all proxies with respect to the Funds’ portfolio securities; (4) maintaining the
Great Lakes Funds
Additional Information (Unaudited) – Continued
March 31, 2021
required books and records for transactions that Great Lakes effects on behalf of the Funds; (5) selecting broker-dealers to execute orders on behalf of the Funds; (6) monitoring and maintaining each Fund’s compliance with policies and procedures of the Trust and with applicable securities laws. The Trustees reviewed Great Lakes’ audited financial statements and considered Great Lakes’ strong capitalization and its assets under management. In addition, the Board considered the fact that Great Lakes is a wholly-owned subsidiary of Wintrust Financial Corporation, a financial services holding company. In that regard, the Trustees concluded that Great Lakes had sufficient resources to support the management of the Funds. The Trustees then considered the Funds’ portfolio managers and noted each portfolio manager’s extensive portfolio management and security research and analysis experience. The Trustees concluded that they were satisfied with the nature, extent and quality of services that Great Lakes provides to each of the Funds under the Investment Advisory Agreement.
Fund Historical Performance and the Overall Performance of Great Lakes. In assessing the quality of the portfolio management delivered by Great Lakes, the Trustees considered the short-term and long-term performance of each Fund on both an absolute basis and in comparison to an appropriate benchmark index, each Fund’s respective peer funds according to Morningstar classifications, and each Fund’s respective composite of separate accounts that Great Lakes manages utilizing a similar investment strategy. When comparing each Fund’s performance against its respective Morningstar peer group, the Trustees took into account that the investment objective and strategies of each Fund, as well as the Fund’s level of risk tolerance, may differ significantly from the funds in the peer group.
| | • | Great Lakes Bond Fund. The Trustees noted the Fund had underperformed its peer group median and average for the year-to-date, one-year, three-year and five-year periods ended October 31, 2020. The Trustees also noted that the Fund had underperformed its benchmark index over the year-to-date, one-year, three-year and five-year periods ended October 31, 2020. The Trustees also considered that the Fund had achieved positive total returns across all periods reviewed since inception and observed that the Fund’s performance generally tracked the performance of a composite of Great Lakes’ similarly managed accounts over all relevant time periods.
|
| | • | Great Lakes Disciplined Equity Fund. The Trustees noted that the Fund had outperformed its peer group median and average over the year-to-date, one-year, three-year, five-year and ten-year periods ended October 31, 2020. The Trustees also observed that the Fund outperformed its benchmark over the year-to-date and one-year periods, but trailed its benchmark across the three-year, five-year and ten-year periods ended October 31, 2020. The Trustees considered that the Fund had achieved positive total returns across each time period reviewed since inception and also observed that the Fund’s performance was consistent with the performance of a composite of Great Lakes’ similarly managed accounts over all relevant time periods.
|
| | • | Great Lakes Large Cap Value Fund. The Trustees noted that the Fund had underperformed its peer group median and average over the year-to-date, one-year, three-year and five-year periods ended October 31, 2020. The Trustees also observed that the Fund had also underperformed its benchmark index over all periods ended October 31, 2020. The Trustees also considered that the Fund had achieved positive total returns since inception. The Trustees also observed that the Fund’s performance was consistent with the performance of a composite of Great Lakes’ similarly managed accounts over all relevant time periods.
|
| | • | Great Lakes Small Cap Opportunity Fund. The Trustees noted that the Fund had underperformed the peer group median and average over the year-to-date, one-year, three-year, five-year and ten-year periods ended October 31, 2020. The Trustees also observed that the Fund had underperformed its benchmark index over all periods reviewed. The Trustees also considered that the Fund had achieved positive total returns across the |
Great Lakes Funds
Additional Information (Unaudited) – Continued
March 31, 2021
| | | five-year and ten-year periods ended October 31, 2020. The Trustees also observed that the Fund’s performance was consistent over the longer-term with the performance of a composite of Great Lakes’ similarly managed accounts over all relevant time periods. |
Cost of Advisory Services and Profitability. The Trustees considered the annual management fee that each Fund pays to Great Lakes under the Investment Advisory Agreement, as well as Great Lakes’ profitability from services that it rendered to each Fund during the 12-month period ended September 30, 2020. In that regard, the Trustees considered the effect of an expense limitation agreement on Great Lakes’ compensation and that Great Lakes has contractually agreed to reduce its advisory fees and, if necessary, reimburse each Fund for operating expenses, as specified in the Funds’ prospectus. The Trustees noted that Great Lakes had waived a portion of its management fees during the 12 months ended September 30, 2020 with respect to the Great Lakes Large Cap Value Fund, Great Lakes Disciplined Equity Fund and Great Lakes Small Cap Opportunity Fund. The Trustees noted that the relationship with each of the Great Lakes Funds had been profitable. The Trustees then considered that the management fees that Great Lakes charges to separately managed accounts with similar investment strategies to those of the Great Lakes Large Cap Value Fund, Great Lakes Bond Fund and Great Lakes Disciplined Equity Fund are generally lower than the management fee for the corresponding Fund. The Trustees observed that the fee charged to accounts utilizing a similar investment strategy to the Great Lakes Small Cap Opportunity Fund is higher than the fee charged to the Fund. The Trustees took into account that Great Lakes has additional responsibilities with respect to the Funds, including additional compliance obligations, greater cash management responsibilities and increased trading. The Trustees concluded that Great Lakes’ service relationship with each of the Funds yields a reasonable profit.
Comparative Fee and Expense Data. The Trustees considered a comparative analysis of contractual expenses borne by the Funds and those of funds in corresponding Morningstar peer group. The Trustees noted:
| | • | Great Lakes Bond Fund. The Fund’s management fee was equal to the peer group median and slightly above the peer group average. When limited to similarly-sized funds, the management fee was equal to the peer group median and below the average. The total expenses of the Fund (after fee waivers and expense reimbursements) were above the peer group median and average. When limited to similarly-sized funds, the Fund’s total expenses were above the peer group median but below the average.
|
| | • | Great Lakes Disciplined Equity Fund. The Fund’s management fee was equal to the peer group median and above the peer group average. The total expenses of the Fund (after fee waivers and expense reimbursements) were above the peer group median and average. When limited to similarly-sized funds both the management fee and total expenses of the Fund (after fee waivers and expense reimbursements) were below the peer group median and average.
|
| | • | Great Lakes Large Cap Value Fund. The Fund’s management fee was equal to the peer group median and slightly above the average. The total expenses of the Fund (after fee waivers and expense reimbursements) were above the peer group median and average. Additionally, when limited to similarly-sized funds, the Fund’s management fee and total expenses were below the peer group median and average.
|
| | • | Great Lakes Small Cap Opportunity Fund. The Fund’s management fee was significantly lower than the peer group median and average management fees. The total expenses of the Fund’s Institutional Class (after fee waivers and expense reimbursements) were lower than the peer group median and average. The total expenses of the Fund’s Investor Class were above the peer group median and average. |
Great Lakes Funds
Additional Information (Unaudited) – Continued
March 31, 2021
While recognizing that it is difficult to compare advisory fees because the scope of advisory services provided may vary from one investment adviser to another, the Trustees concluded that Great Lakes’ advisory fees with respect to each Fund continue to be reasonable.
Economies of Scale. The Trustees considered whether the Funds would benefit from any economies of scale, noting that the investment advisory fees for the Funds do not contain breakpoints. The Trustees took into account the fact that Great Lakes had agreed to consider breakpoints in the future in response to asset growth in each of the Funds, but had also expressed some reservation about doing so for the Great Lakes Small Cap Opportunity Fund because of concerns about potential capacity constraints associated with the Fund’s strategy of investing in small cap stocks. The Trustees noted that given current asset levels, it was not necessary to consider the implementation of fee breakpoints at the present time, but agreed to revisit the issue in the future as circumstances change and Fund asset levels increase.
Other Benefits. The Trustees considered the direct and indirect benefits that could be realized by the Adviser and its affiliates from the Adviser’s relationship with the Funds. The Trustees considered the extent to which Great Lakes utilizes soft dollar arrangements with respect to portfolio transactions of certain Funds. The Trustees noted that Great Lakes does not use affiliated brokers to execute the portfolio transactions of the Funds. While the Trustees noted the Great Lakes Small Cap Opportunity Fund utilizes Rule 12b-1 fees to pay for shareholder and distribution services performed on behalf of each Fund, the Trustees observed that distribution expenses that Great Lakes incurred significantly exceed any Rule 12b-1 payments from such Fund. The Trustees considered that Great Lakes may receive some form of reputational benefit from services rendered to the Funds, but that such benefits are immaterial and cannot otherwise be quantified. The Trustees concluded that Great Lakes does not receive any additional material benefits from its relationship with the Funds.
Great Lakes Funds
Additional Information (Unaudited) – Continued
March 31, 2021
TRUSTEES AND OFFICERS
| | | Term of | Number of | | Other |
| | | Office and | Portfolios | | Directorships |
| | Position(s) | Length of | in Trust | | Held by |
| Name, Address | Held with | Time | Overseen | Principal Occupation(s) | Trustee During |
| and Year of Birth | the Trust | Served | by Trustee | During the Past Five Years | the Past Five Years |
| Independent Trustees | | | | | |
| | | | | | |
| Leonard M. Rush, CPA | Chairman, | Indefinite | 33 | Retired, Chief Financial Officer, | Independent Trustee, |
| 615 E. Michigan St. | Trustee | Term; Since | | Robert W. Baird & Co. Incorporated | ETF Series Solutions |
| Milwaukee, WI 53202 | and Audit | April 2011 | | (2000-2011). | (47 Portfolios) |
| Year of Birth: 1946 | Committee | | | | (2012-Present). |
| | Chairman | | | | |
| | | | | | |
| David A. Massart | Trustee | Indefinite | 33 | Co-Founder and Chief Investment | Independent Trustee, |
| 615 E. Michigan St. | | Term; Since | | Strategist, Next Generation Wealth | ETF Series Solutions |
| Milwaukee, WI 53202 | | April 2011 | | Management, Inc. (2005-Present). | (47 Portfolios) |
| Year of Birth: 1967 | | | | | (2012-Present). |
| �� | | | | | |
| David M. Swanson | Trustee | Indefinite | 33 | Founder and Managing Principal, | Independent Trustee, |
| 615 E. Michigan St. | and | Term; Since | | SwanDog Strategic Marketing, LLC | ALPS Variable |
| Milwaukee, WI 53202 | Nominating | April 2011 | | (2006-Present), Executive Vice | Investment Trust |
| Year of Birth: 1957 | & Governance | | | President, Calamos Investments | (7 Portfolios) |
| | Committee | | | (2004-2006). | (2006-Present); |
| | Chairman | | | | Independent Trustee, |
| | | | | | RiverNorth Funds |
| | | | | | (3 Portfolios) |
| | | | | | (2018-Present); |
| | | | | | RiverNorth Managed |
| | | | | | Duration Municipal |
| | | | | | Income Fund Inc. |
| | | | | | (1 Portfolio) |
| | | | | | (2019-Present); |
| | | | | | RiverNorth |
| | | | | | Marketplace |
| | | | | | Lending Corporation |
| | | | | | (1 Portfolio) |
| | | | | | (2018-Present); |
| | | | | | RiverNorth/ |
| | | | | | DoubleLine Strategic |
| | | | | | Opportunity Fund, |
| | | | | | Inc. (1 Portfolio) |
| | | | | | (2018-Present); |
| | | | | | RiverNorth |
| | | | | | Opportunities Fund, |
| | | | | | Inc. (1 Portfolio) |
| | | | | | (2018-Present); |
| | | | | | RiverNorth |
| | | | | | Opportunistic |
| | | | | | Municipal Income |
| | | | | | Fund, Inc. |
| | | | | | (1 Portfolio) |
| | | | | | (2018-Present). |
Great Lakes Funds
Additional Information (Unaudited) – Continued
March 31, 2021
| | | Term of | Number of | | Other |
| | | Office and | Portfolios | | Directorships |
| | Position(s) | Length of | in Trust | | Held by |
| Name, Address | Held with | Time | Overseen | Principal Occupation(s) | Trustee During |
| and Year of Birth | the Trust | Served | by Trustee | During the Past Five Years | the Past Five Years |
| Interested Trustee | | | | | |
| | | | | | |
| Robert J. Kern* | Trustee | Indefinite | 33 | Retired (July 2018-Present); | None |
| 615 E. Michigan St. | | Term; Since | | Executive Vice President, | |
| Milwaukee, WI 53202 | | January 2011 | | U.S. Bancorp Fund Services, | |
| Year of Birth: 1958 | | | | LLC (1994-2018). | |
| | | | | | |
| Officers | | | | | |
| | | | | | |
| Brian R. Wiedmeyer | President and | Indefinite | N/A | Vice President, U.S. Bancorp | N/A |
| 615 E. Michigan St. | Principal | Term; Since | | Fund Services, LLC | |
| Milwaukee, WI 53202 | Executive | November 2018 | | (2005-Present). | |
| Year of Birth: 1973 | Officer | | | | |
| | | | | | |
| Deborah Ward | Vice President, | Indefinite | N/A | Senior Vice President, U.S. | N/A |
| 615 E. Michigan St. | Chief | Term; Since | | Bancorp Fund Services, LLC | |
| Milwaukee, WI 53202 | Compliance | April 2013 | | (2004-Present). | |
| Year of Birth: 1966 | Officer and | | | | |
| | Anti-Money | | | | |
| | Laundering | | | | |
| | Officer | | | | |
| | | | | | |
| Benjamin Eirich | Treasurer, | Indefinite | N/A | Assistant Vice President, U.S. | N/A |
| 615 E. Michigan St. | Principal | Term; Since | | Bancorp Fund Services, LLC | |
| Milwaukee, WI 53202 | Financial | August 2019 | | (2008-Present). | |
| Year of Birth: 1981 | Officer and | (Treasurer); Since | | | |
| | Vice President | November 2018 | | | |
| | | (Vice President) | | | |
| | | | | | |
| Joseph Destache | Secretary | Indefinite | N/A | U.S. Bancorp Fund Services, LLC | N/A |
| 615 E. Michigan St. | | Term; Since | | (2018-Present). | |
| Milwaukee, WI 53202 | | March 2021 | | | |
| Year of Birth: 1991 | | | | | |
| | | | | | |
| Douglas Schafer | Assistant | Indefinite | N/A | Assistant Vice President, U.S. | |
| 615 E. Michigan St. | Treasurer | Term; Since | | Bancorp Fund Services, LLC | N/A |
| Milwaukee, WI 53202 | and Vice | May 2016 | | (2002-Present). | |
| Year of Birth: 1970 | President | (Assistant | | | |
| | | Treasurer); Since | | | |
| | | November 2018 | | | |
| | | (Vice President) | | | |
| | | | | | |
| Michael J. Cyr II | Assistant | Indefinite | N/A | Assistant Vice President, U.S. | N/A |
| 615 E. Michigan St. | Treasurer | Term; Since | | Bancorp Fund Services, LLC | |
| Milwaukee, WI 53202 | and Vice | August 2019 | | (2013-Present). | |
| Year of Birth: 1992 | President | | | | |
| * | Mr. Kern became an independent Trustee on July 6, 2020. Previously he was an Interested Trustee. |
Great Lakes Funds
Additional Information (Unaudited) – Continued
March 31, 2021
AVAILABILITY OF FUND PORTFOLIO INFORMATION
Each Fund files complete schedules of portfolio holdings with the SEC for the first and third quarters of each fiscal year on Part F of Form N-PORT. The Funds’ Part F of Form N-PORT are available on the SEC’s website at www.sec.gov and may be reviewed and copied at the SEC’s Public Reference Room in Washington, D.C. For information on the Public Reference Room call 1-800-SEC-0330. In addition, each Fund’s Part F of Form N-PORT is available without charge upon request by calling 1-855-278-2020.
AVAILABILITY OF FUND PROXY VOTING INFORMATION
A description of the Funds’ Proxy Voting Policies and Procedures is available without charge, upon request, by calling 1-855-278-2020. Information regarding how the Funds voted proxies relating to portfolio securities during the most recent 12-month period ended June 30 is available (1) without charge, upon request, by calling 1-855-278-2020, or (2) on the SEC’s website at www.sec.gov.
QUALIFIED DIVIDEND INCOME/DIVIDENDS RECEIVED DEDUCTION
For the fiscal year ended March 31, 2021, certain dividends paid by the Funds may be reported as qualified dividend income and may be eligible for taxation at capital gain rates. The percentage of dividends declared from ordinary income designated as qualified dividend income was as follows:
| Fund | | |
| Bond Fund | 0.00% | |
| Disciplined Equity Fund | 15.74% | |
| Large Cap Value Fund | 100.00% | |
| Small Cap Opportunity Fund | 97.41% | |
For corporate shareholders, the percent of ordinary income distributions qualifying for the corporate dividends received deduction for the fiscal year ended March 31, 2021, was as follows:
| Fund | | |
| Bond Fund | 0.00% | |
| Disciplined Equity Fund | 15.36% | |
| Large Cap Value Fund | 98.56% | |
| Small Cap Opportunity Fund | 95.41% | |
The percentage of taxable ordinary income distributions that are designated as short-term capital gain distributions under Internal Revenue Section 871(k)(2)(C) for each Fund were as follows:
| Fund | | |
| Bond Fund | 0.00% | |
| Disciplined Equity Fund | 0.00% | |
| Large Cap Value Fund | 29.35% | |
| Small Cap Opportunity Fund | 0.00% | |
Great Lakes Funds
PRIVACY NOTICE (UNAUDITED)
The Funds collect only relevant information about you that the law allows or requires it to have in order to conduct its business and properly service you. The Funds collect financial and personal information about you (“Personal Information”) directly (e.g., information on account applications and other forms, such as your name, address, and social security number, and information provided to access account information or conduct account transactions online, such as password, account number, e-mail address, and alternate telephone number), and indirectly (e.g., information about your transactions with us, such as transaction amounts, account balance and account holdings).
The Funds do not disclose any non-public personal information about its shareholders or former shareholders other than for everyday business purposes such as to process a transaction, service an account, respond to court orders and legal investigations or as otherwise permitted by law. Third parties that may receive this information include companies that provide transfer agency, technology and administrative services to the Funds, as well as the Funds’ investment adviser who is an affiliate of the Funds. If you maintain a retirement/educational custodial account directly with the Funds, we may also disclose your Personal Information to the custodian for that account for shareholder servicing purposes. The Funds limit access to your Personal Information provided to unaffiliated third parties to information necessary to carry out their assigned responsibilities to the Funds. All shareholder records will be disposed of in accordance with applicable law. The Funds maintain physical, electronic and procedural safeguards to protect your Personal Information and requires its third-party service providers with access to such information to treat your Personal Information with the same high degree of confidentiality.
In the event that you hold shares of the Funds through a financial intermediary, including, but not limited to, a broker-dealer, credit union, bank or trust company, the privacy policy of your financial intermediary governs how your non-public personal information is shared with unaffiliated third parties.
INVESTMENT ADVISER
Great Lakes Advisors, LLC
231 South LaSalle Street, 4th Floor
Chicago, Illinois 60604
DISTRIBUTOR
Quasar Distributors, LLC
111 East Kilbourn Avenue, Suite 2200
Milwaukee, Wisconsin 53202
CUSTODIAN
U.S. Bank, N.A.
1555 North River Center Drive
Milwaukee, Wisconsin 53212
ADMINISTRATOR, FUND ACCOUNTANT
AND TRANSFER AGENT
U.S. Bancorp Fund Services, LLC
615 East Michigan Street
Milwaukee, Wisconsin 53202
INDEPENDENT REGISTERED PUBLIC ACCOUNTING FIRM
Cohen & Company, Ltd.
1350 Euclid Avenue, Suite 800
Cleveland, Ohio 44115
LEGAL COUNSEL
Stradley Ronon Stevens & Young, LLP
2005 Market Street, Suite 2600
Philadelphia, Pennsylvania 19103
This report must be accompanied or preceded by a prospectus.
The Funds’ Statement of Additional Information contains additional information about the
Funds’ trustees and is available without charge upon request by calling 1-855-278-2020.
GK-ANNUAL
(b) Not applicable
Item 2. Code of Ethics.
The registrant has adopted a code of ethics that applies to the Registrant’s principal executive officer and principal financial officer. The registrant has not made any substantive amendments to its code of ethics during the period covered by this report.
The registrant has not granted any waivers from any provisions of the code of ethics during the period covered by this report.
A copy of the registrant’s code of ethics that applies to the registrant’s principal executive officer and principal financial officer is filed herewith.
Item 3. Audit Committee Financial Expert.
The registrant’s board of Trustees has determined that there is at least one audit committee financial expert serving on its audit committee. Leonard M. Rush is the “audit committee financial expert” and is considered to be “independent” as each term is defined in Item 3 of Form N‑CSR.
Item 4. Principal Accountant Fees and Services.
The registrant has engaged its principal accountant to perform audit services, audit-related services, tax services and other services during the past two fiscal years. “Audit services” refer to performing an audit of the registrant's annual financial statements or services that are normally provided by the accountant in connection with statutory and regulatory filings or engagements for those fiscal years. “Audit-related services” refer to the assurance and related services by the principal accountant that are reasonably related to the performance of the audit. “Tax services” refer to professional services rendered by the principal accountant for tax compliance, tax advice, and tax planning; including reviewing the Funds’ tax returns and distribution calculations. There were no “other services” provided by the principal accountant. For the fiscal years ended March 31, 2020 and March 31, 2021, the Funds’ principal accountant was Cohen & Company, Ltd. The following table details the aggregate fees billed or expected to be billed for each of the last two fiscal years for audit fees, audit-related fees, tax fees and other fees by the principal accountant.
| | FYE 3/31/2021 | FYE 3/31/2020 |
Audit Fees | $56,500 | $65,000 |
Audit-Related Fees | $0 | $0 |
Tax Fees | $28,000 | $15,000 |
All Other Fees | $0 | $0 |
The audit committee has adopted pre-approval policies and procedures that require the audit committee to pre‑approve all audit and non‑audit services of the registrant, including services provided to any entity affiliated with the registrant.
The percentage of fees billed by Cohen & Company, Ltd. for the fiscal years ended March 31, 2020 and March 31, 2021, applicable to non-audit services pursuant to waiver of pre-approval requirement were as follows:
| | FYE 3/31/2021 | FYE 3/31/2020 |
Audit-Related Fees | 0% | 0% |
Tax Fees | 0% | 0% |
All Other Fees | 0% | 0% |
All of the principal accountant’s hours spent on auditing the registrant’s financial statements were attributed to work performed by full‑time permanent employees of the principal accountant.
The following table indicates the non-audit fees billed or expected to be billed by the registrant’s accountant for services to the registrant and to the registrant’s investment adviser (and any other controlling entity, etc.—not sub-adviser) for the last two years.
Non-Audit Related Fees | FYE 3/31/2021 | FYE 3/31/2020 |
Registrant | $0 | $0 |
Registrant’s Investment Adviser | $0 | $0 |
The audit committee of the board of trustees/directors has considered whether the provision of non-audit services that were rendered to the registrant's investment adviser is compatible with maintaining the principal accountant's independence and has concluded that the provision of such non-audit services by the accountant has not compromised the accountant’s independence.
(i) Not applicable.
(j) Not applicable.
Item 5. Audit Committee of Listed Registrants.
Not applicable to registrants who are not listed issuers (as defined in Rule 10A-3 under the Securities Exchange Act of 1934).
Item 6. Investments.
(a) | Schedule of Investments is included as part of the report to shareholders filed under Item 1 of this Form. |
Item 7. Disclosure of Proxy Voting Policies and Procedures for Closed-End Management Investment Companies.
Not applicable to open-end investment companies.
Item 8. Portfolio Managers of Closed-End Management Investment Companies.
Not applicable to open-end investment companies.
Item 9. Purchases of Equity Securities by Closed‑End Management Investment Company and Affiliated Purchasers.
Not applicable to open-end investment companies.
Item 10. Submission of Matters to a Vote of Security Holders.
There have been no material changes to the procedures by which shareholders may recommend nominees to the Registrant’s board of trustees.
Item 11. Controls and Procedures.
(a) | The Registrant’s [President/Chief Executive Officer] and [Treasurer/Chief Financial Officer] have reviewed the Registrant's disclosure controls and procedures (as defined in Rule 30a-3(c) under the Investment Company Act of 1940 (the “Act”)) as of a date within 90 days of the filing of this report, as required by Rule 30a-3(b) under the Act and Rules 13a-15(b) or 15d‑15(b) under the Securities Exchange Act of 1934. Based on their review, such officers have concluded that the disclosure controls and procedures are effective in ensuring that information required to be disclosed in this report is appropriately recorded, processed, summarized and reported and made known to them by others within the Registrant and by the Registrant’s service provider. |
(b) | There were no changes in the Registrant's internal control over financial reporting (as defined in Rule 30a-3(d) under the Act) that occurred during the period covered by this report that has materially affected, or is reasonably likely to materially affect, the Registrant's internal control over financial reporting. |
Item 12. Disclosure of Securities Lending Activities for Closed-End Management Investment Companies.
Not applicable to open-end investment companies.
Item 13. Exhibits.
(3) Any written solicitation to purchase securities under Rule 23c‑1 under the Act sent or given during the period covered by the report by or on behalf of the registrant to 10 or more persons. Not applicable to open-end investment companies.
(4) Change in the registrant’s independent public accountant. There was no change in the registrant’s independent public accountant for the period covered by this report.
SIGNATURES
Pursuant to the requirements of the Securities Exchange Act of 1934 and the Investment Company Act of 1940, the registrant has duly caused this report to be signed on its behalf by the undersigned, thereunto duly authorized.
(Registrant) Managed Portfolio Series
By (Signature and Title)* /s/ Brian R. Wiedmeyer
Brian R. Wiedmeyer, President
Date 6/7/21
Pursuant to the requirements of the Securities Exchange Act of 1934 and the Investment Company Act of 1940, this report has been signed below by the following persons on behalf of the registrant and in the capacities and on the dates indicated.
By (Signature and Title)* /s/ Brian R. Wiedmeyer
Brian R. Wiedmeyer, President
By (Signature and Title)* /s/ Benjamin J. Eirich
Benjamin J. Eirich, Treasurer
* Print the name and title of each signing officer under his or her signature.