Item 1. Reports to Stockholders.
| |
| |
| |
| |
| TortoiseEcofin |
2020 Annual Report |
| |
This combined financial report provides you with a comprehensive review of our funds that span the entire energy value chain.
Tortoise Capital Advisors is one of the largest managers of energy investments, including closed-end funds, open-end funds, private funds and separate accounts.
| | | | |
| Table of Contents | | | |
| | | | |
| Letter to Shareholders | | 2 | |
| | | | |
| Tortoise MLP & Pipeline Fund | | 5 | |
| | | | |
| Tortoise MLP & Energy Income Fund | | 8 | |
| | | | |
| Tortoise MLP & Energy Infrastructure Fund | | 11 | |
| | | | |
| Tortoise Energy Evolution Fund | | 14 | |
| | | | |
| Ecofin Global Renewables Infrastructure Fund | | 17 | |
| | | | |
| Expense Examples | | 21 | |
| | | | |
| Financial Statements | | 24 | |
| | | | |
| Notes to Financial Statements | | 54 | |
| | | | |
| Report of Independent Registered Public Accounting Firm | | 64 | |
| | | | |
| Investment Advisory Agreement | | 65 | |
| | | | |
| Trustees & Officers | | 67 | |
| | | | |
| Additional Information | | 69 | |
TortoiseEcofin
| |
| |
| 2020 Annual Report | November 30, 2020 |
| |
| |
| |
| |
| Open-end fund comparison |
| | Name/Ticker | | Primary focus | | Total assets
($ Millions)1 | | Portfolio mix by asset type2 | | Portfolio mix by ownership2 |
 | | Tortoise MLP & Pipeline Fund Institutional Class (TORIX)
A Class (TORTX)
Inception: 5/2011
C Class (TORCX)
Inception: 9/2012 | | North American pipeline companies | | $1,535.4 | | 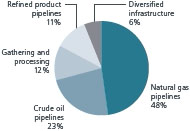 | |  |
| Tortoise MLP & Energy
Income Fund Institutional Class (INFIX)
A Class (INFRX)
Inception: 5/2011
C Class (INFFX)
Inception: 4/2012 | | Energy infrastructure equity and debt | | $342.5 | |  | |  |
| Tortoise MLP & Energy
Infrastructure Fund Institutional Class (MLPPX) | | Energy infrastructure equity and debt | | $17.0 | | 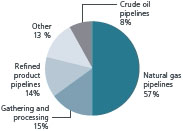 | | 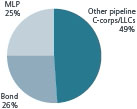 |
 | | Tortoise Energy
Evolution Fund Institutional Class (TOPIX)
Investor Class (TOPTX)
C Class (TOPCX)
Inception: 9/2013 | | Global Securities benefiting from long-term growth associated with energy transition | | $9.6(2) | |  | | Portfolio mix by geography2  |
 | | Ecofin Global Renewables
Infrastructure Fund Institutional Class (ECOIX)
A Class (ECOAX)
Inception: 8/2020 | | | | $126.8 | | | | Portfolio mix by geography2 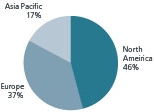 |
| (1) | As of 12/31/2020 |
(2) | As of 11/30/2020 |
| (unaudited) |
| | |
| TortoiseEcofin | 1 |
| |
| |
| |
| |
| Tortoise |
| 2020 Annual Report |
| |
Dear shareholder
The 2020 fiscal year, ending on November 30, 2020 was certainly like no other. The COVID-19 global pandemic affected every part of our lives and the essential asset in which we invest. Energy demand concerns and volatile commodity prices plagued the energy sector. The sustainable infrastructure sector, particularly renewable energy, had a strong year propelled even higher by anticipated Biden Administration energy policy. As we move into 2021, with COVID-19 vaccinations being administered throughout the world driving energy demand toward pre-COVID-19 levels and the push toward cleaner energy gaining momentum, we are optimistic that 2021 will be a strong year for investors in these essential assets sectors.
Energy and power infrastructure
The broader energy sector, as represented by the S&P Energy Select Sector® Index, finished the fourth fiscal quarter ending November 30, 2020 in positive territory, returning 4.9%, bringing fiscal year 2020 performance to -31.7%. Energy markets and prices experienced significant volatility throughout the fiscal year driven by the uncertainty around energy demand due to COVID-19, concerns over the massively oversupplied global oil market in April, and ultimately a recovery in the latter part of 2020. Looking ahead to 2021, all eyes are focused on energy demand and the subsequent rollout of COVID-19 vaccinations. Pfizer and Moderna’s November announcements of positive data regarding their vaccines for COVID-19 led to a stock market surge, with beaten down energy companies leading the charge, along with commodities such as crude oil. With the growing belief in vaccine success and visibility to significantly improved economic activity, 2021 energy demand growth could exceed anything ever seen on a year-over-year basis.
Following the price war between Saudi Arabia and Russia in early March, the Organization of Petroleum Exporting Countries (OPEC) and their Non-OPEC partners (OPEC+) announced deep production cuts with a clear goal of balancing the global crude oil market. The market dramatically shifted from an approximate 20 million barrels per day (b/d) surplus in April to an approximate 4 million b/d deficit in July, providing the path for market rebalancing. Overall adherence to the production cut agreement remained strong in the second half of 2020 leading to inventory draws. Entering 2021, the global crude oil market remains in deficit, supported by the OPEC+ crude oil production cut agreement, and expected inventory draws are expected to continue throughout 2021.
U.S. crude oil production declined in 2020 in response to the supply-demand imbalance resulting from the economic shutdowns and stay-at-home orders in March and April. This resulted in the first annual decline in U.S. production since 2016. Specifically, U.S. crude oil production fell from a record 12.9 million barrels per day (b/d) in November 2019 to 11.2 million b/d in November 20201. EIA forecasts that U.S. crude oil production will average 11.1 million b/d in 2021.
For U.S. producers, 2020 was a year of change. The COVID-19 pandemic accelerated producers’ capital discipline as investors focused on higher free cash flow generation and return of capital to shareholders. This free-cash-flow emphasis led to a host of merger and acquisition deals as exploration and production companies prioritized the importance of scale, diversity and strengthening balance sheets in a challenging oil price environment.
While oil dominated the headlines, natural gas continued to provide a cleaner burning source. As a result, we continue to see natural gas as a critical source of energy supply going forward. During the 2020 fiscal year, a reduction in natural gas demand caused by COVID-19 initially resulted in the convergence of global natural gas prices. However, in the final months of the year, LNG exports from the U.S. rapidly shot back up driven by increasing demand for natural gas in Asia and resulting in Asian gas prices trading at a premium relative to the U.S. Henry Hub prices. Domestically, the backdrop of slowing production growth and strong domestic and export demand paints a picture of improving natural gas fundamentals in the future. Rising U.S. energy exports of liquids and natural gas are expected to positively affect the U.S. trade deficit and to ultimately help reduce global CO2 emissions, along with renewables, as they take market share from coal.
Midstream energy outperformed broader energy in the fourth fiscal quarter and the fiscal year with the Tortoise North American Pipeline IndexSM returning 6.3% and the Tortoise MLP Index® returning 11.2%, bringing fiscal year performance to -15.8% and -23.6%, respectively. There were several contributors to midstream energy’s negative performance for the fiscal year including: negative energy sentiment following energy demand uncertainty, excess pipeline takeaway capacity related to the COVID-19 pandemic resulting in lower production, and political rhetoric focused on an energy transition to cleaner energy sources. Midstream companies structured as C-Corporations continued to benefit from several items versus MLPs, including: stronger corporate governance, broad market index inclusion for some companies, lack of K-1s, and a more certain corporate structure.
There were a couple of positive themes standing out for midstream businesses throughout the fiscal year. First, resiliency. Resilient cash flows confirm the essential nature of the assets that midstream businesses operate. Strong contractual obligations (take or pay contracts) and customer profiles (large, investment grade rated counterparties) helped midstream energy companies generate consistent cash flow from operations even in the low and volatile 2020 price environment. At the onset of the COVID-19 pandemic, we forecasted midstream earnings before interest, taxes, depreciation, and amortization (EBITDA) declining 5%-10% in 2020. However, heading into the final months of 2020, companies revised their forecasts higher and EBITDA is expected to only be down 4% for the year. Notably, companies with significant natural gas businesses and/or take or pay contracts reaffirmed guidance, whereas others with cash flows tied to wellhead volumes provided a wider range of outcomes.
The other clear trend in earnings was virtually every midstream energy company transitioning to a capital allocation focused on positive free-cash-flow after dividends. This is a stark change
| (unaudited) | |
| | |
| 2 | TortoiseEcofin |
| |
| |
| 2020 Annual Report | November 30, 2020 |
| |
| |
| |
made possible by declining capital expenditures for midstream projects and sale of non-core assets. We forecast growth capex to decline by approximately $16 billion YTD as midstream rationalizes project spending. This shift in spending has allowed the midstream sector to not only be free cash flow positive, but materially so, especially compared to other asset classes and the S&P 500. In 2021, we expect midstream companies to have $8 billion of free cash flow after distributions and by 2024 we expect $21 billion of free cash flow after distributions.
We believe midstream companies will more directly return cash flow to shareholders in the form of dividends, debt reduction and share buybacks. While continuing to pay out very high dividend yields, we are advocating for companies to utilize stock buybacks to create their own flows and help turn the tide on stock performance. The numbers show that this can be achieved while still reducing leverage in a meaningful way.
During the last few months of the fiscal year, the buyback announcements started coming in earnest. In early October, Targa Resources (TRGP) announced a $500 million stock buyback program. MPLX and Plains All American followed suite, announcing significant buyback programs for $1 billion and $500 million, respectively for the three largest during the quarter. In total, 10 midstream companies announced share buyback programs in 2020, including six during the fourth quarter. We believe the forthcoming free cash flow and share buyback themes can help drive sustainable outperformance for the midstream sector.
One of the key regulatory announcements of 2020 was the Army Corps of Engineers announcing it began work on an environmental impact statement for the Dakota Access Pipeline, something the district court requested for the better part of the year. Another requirement of the court was that the Corps determine a remedy for the fact that the pipeline no longer has a permit to cross Federal land. The Corps stated that it would require no immediate action and that it does not think the court has jurisdiction over the matter. We are closely monitoring Dakota Access Pipeline developments as the fate of the pipeline impacts several midstream companies. In other pipeline news, in July, the Supreme Court agreed to reinstate streamlined permitting for pipelines across the country, except for Keystone XL. This is positive for the most notable project under construction, the Mountain Valley Pipeline, Equitrans’ 300+ mile natural gas pipeline which is nearing completion after a series of several delays. Construction of the pipeline continues, and we expect for it to be in service within the next year.
While the 2020 presidential election created headline risks for the energy sector, we believe the consensus path forward for the Biden Administration will focus on getting Americans back to work with supportive policies versus policies aimed at opposing the oil and gas industry or destroying jobs. The predominant theme around Biden’s energy plan is to address climate change and create substantial job opportunities for Americans. The topic of climate change and related opportunities for the overall economy was one of the four pillars of the convention platform, integrated into an overall vision of revitalization of America. We expect market economics to dictate the trajectory of future energy supply and demand. Renewables and natural gas are more economic than coal in generating electricity and will likely continue to take share, while crude oil will likely remain the predominant fuel source in the transportation sector for the near future.
Finally, despite past comments early on during the campaign, we do not expect a ban on fracking. It is worth noting that under the Obama Administration, the ban on crude oil exports was lifted which was supportive of the energy industry. Ironically, regulatory pressures have the potential to tighten new supply, pushing oil and gas prices up, and making existing infrastructure more valuable.
2020 also ushered in continued questions about midstream energy’s role in an energy transition environment. During the fiscal year there were three oil majors, Shell, Total SE and BP, that openly discussed a path forward around renewable energy. The European Union (EU) moved further towards renewables and 7 of the 10 largest economies stated their intention to have net-zero emissions by 2050. While the energy transition will take time to play out, midstream management teams openly discussed the role their companies could play in such a transition. Pipeline infrastructure, for example, could be repurposed to transport hydrogen. As the world continues to demand more energy and less carbon, we are encouraging midstream companies to view energy transition opportunistically.
Within the downstream portion of the energy value chain, the refining sector remained among the most challenged sectors in 2020 due to the COVID-19 pandemic. Refinery utilization has recovered from the depths of the economic contraction in March and April but remains below 2019 levels. Permanent refinery closures have and should continue to help balance the market from a supply and demand perspective. From a U.S. refined product standpoint, we believe gasoline and diesel will continue to inch towards pre-COVID levels during 2021 while a slower recovery should be expected in jet fuel. As U.S. energy demand recovers in 2021, U.S. refinery utilization and throughput should exhibit strong growth and return to more normalized levels.
Natural gas liquids, unlike the refining sector, has proved resilient despite challenges faced during the COVID-19 pandemic. Strength can be seen in LPGs (liquid petroleum gases) where demand is driven by global population growth and improvements in living standards in Asia, notably in China and India.
Sustainable infrastructure
2020 started out strong for new renewables installation on the heels of a 2019 that itself was the second and third-strongest years ever for solar and wind, respectively. Like most of the economy, renewables then saw a COVID-driven decline bottom-out during the second quarter, but rebounded substantially in the following months. Utility solar in particular has been only minimally impacted by COVID-19 related construction delays. For solar, more than 19 giga watts (GW) of installations are expected for the full year of
| (unaudited) | |
| | |
| TortoiseEcofin | 3 |
2020 – making it the most capacity installed in a single year in the U.S. and an increase of new growth of around 40% over 20192. Activity remains concentrated in the southwest and southeast, with Texas ahead of Florida and California in year-to-date installations2. According to the U.S. Energy Information Administration, wind installation is also expected to see a strong finish to the year with as much as 23 GW of new capacity coming on line in 2020.
The pandemic caused little to no slowdown in new project announcements as growth is expected to continue in the coming years with a backlog of more than 150 GW over the next five years. That includes major announcements we’ve seen this year from the likes of Amazon, Google, and Microsoft, among others, as well as from several individual states. This represents market share gain for renewables as, between them, wind and solar represent more than 70% of all U.S. electricity-generating capacity additions in 20202. This is not surprising, given that on a levelized cost of energy basis (LCOE) wind and utility-scale solar tend to be a cheaper option than building out any new fossil fuel powered options. Support from the incoming Biden Administration should serve to only provide further momentum to this trend.
Concluding thoughts
We feel strongly that in the future of energy will be driven by a combination of natural gas and renewables to meet growing energy demand while simultaneously reducing global CO2 emissions. There are many tailwinds driving the move to cleaner energy with the Biden Administration and the trends toward ESG investing. We are positioning the funds to take advantage of these trends and have an optimistic outlook for 2021 and beyond.
The S&P 500® Index is an unmanaged market-value weighted index of stocks, which is widely regarded as the standard for measuring large-cap U.S. stock market performance. The S&P Energy Select Sector® Index is a capitalization-weighted index of S&P 500® Index companies in the energy sector involved in the development or production of energy products. The Tortoise North American Oil and Gas Producers IndexSM is a float-adjusted, capitalization-weighted index of North American energy companies engaged primarily in the production of crude oil, condensate, natural gas or natural gas liquids (NGLs). The Tortoise North American Pipeline IndexSM is a float adjusted, capitalization-weighted index of energy pipeline companies domiciled in the United States and Canada. The Tortoise MLP Index® is a float-adjusted, capitalization-weighted index of energy master limited partnerships.
The Tortoise indices are the exclusive property of TIS Advisors which has contracted with S&P Opco, LLC (a subsidiary of S&P Dow Jones Indices LLC) to calculate and maintain the Tortoise MLP Index®, Tortoise North American Pipeline IndexSM and Tortoise North American Oil and Gas Producers IndexSM (the “Indices”). The Indices are not sponsored by S&P Dow Jones Indices or its affiliates or its third party licensors (collectively, “S&P Dow Jones Indices LLC”). S&P Dow Jones Indices will not be liable for any errors or omission in calculating the Indices. “Calculated by S&P Dow Jones Indices” and its related stylized mark(s) are service marks of S&P Dow Jones Indices and have been licensed for use by TIS Advisors and its affiliates. S&P® is a registered trademark of Standard & Poor’s Financial Services LLC (“SPFS”), and Dow Jones® is a registered trademark of Dow Jones Trademark Holdings LLC (“Dow Jones”).
Free cash flow is the cash a company produces through its operations, less the cost of total capital expenditures (growth and maintenance).
It is not possible to invest directly in an index.
Performance data quoted represent past performance; past performance does not guarantee future results. Like any other stock, total return and market value will fluctuate so that an investment, when sold, may be worth more or less than its original cost.
| 1. | Energy Information Administration, December 2020 STEO |
| 2. | Solar Market Insight Report, 2020 Q4 |
| (unaudited) | |
| | |
| 4 | TortoiseEcofin |
| |
| |
| 2020 Annual Report | November 30, 2020 |
| |
| Tortoise |
| MLP & Pipeline Fund |
| |
Basic fund facts
Investment objective: Total return
Structure: Regulated investment company
| | Institutional | | A Class | | C Class |
| Ticker | | | TORIX | | | | TORTX | | | TORCX | |
| Gross expense ratio | | | 0.93% | | | | 1.18% | | | 1.93% | |
| Redemption fee | | | None | | | | None | | | None | |
| Maximum front-end | | | None | (1) | | | 5.50% | (2) | | None | (1) |
| sales load | | | | | |
| Maximum deferred | | | None | | | | None | (3) | | 1.00% | (4) |
| sales load | | | | | | |
| (1) | While the Institutional and C Classes have no front-end load, advisory and other expenses still apply. |
| (2) | You may qualify for sales charge discounts if you invest at least $50,000. |
| (3) | No front-end sales charge is payable on A Class investments of $1 million or more, although the fund may impose a Contingent Deferred Sales Charge (“CDSC”) of 1% on certain redemptions made within 12 months of purchase. |
| (4) | The C Class CDSC applies to redemptions made within 12 months of purchase. |
Targeted investment characteristics
The fund’s targeted investments generally will have the following characteristics:
| ● | Strategic assets that fuel the economy |
| | |
| ● | Diversified asset base |
| | |
| ● | Limited direct commodity price exposure |
| | |
| ● | History of predictable, recurring cash flows |
| | |
| ● | Total-return potential through growth and current income |
| | |
| ● | Experienced management teams |
Top ten holdings (as of November 30, 2020)
| 1. | The Williams Companies, Inc. | | 9.4% |
| 2. | Cheniere Energy, Inc. | | 7.8% |
| 3. | Enbridge Inc. | | 7.7% |
| 4. | Kinder Morgan, Inc. | | 7.6% |
| 5. | TC Energy Corporation | | 6.3% |
| 6. | Plains GP Holdings, L.P. | | 5.9% |
| 7. | Targa Resources Corp. | | 5.9% |
| 8. | ONEOK, Inc. | | 5.0% |
| 9. | MPLX LP | | 4.9% |
| 10. | Pembina Pipeline Corporation | | 4.8% |
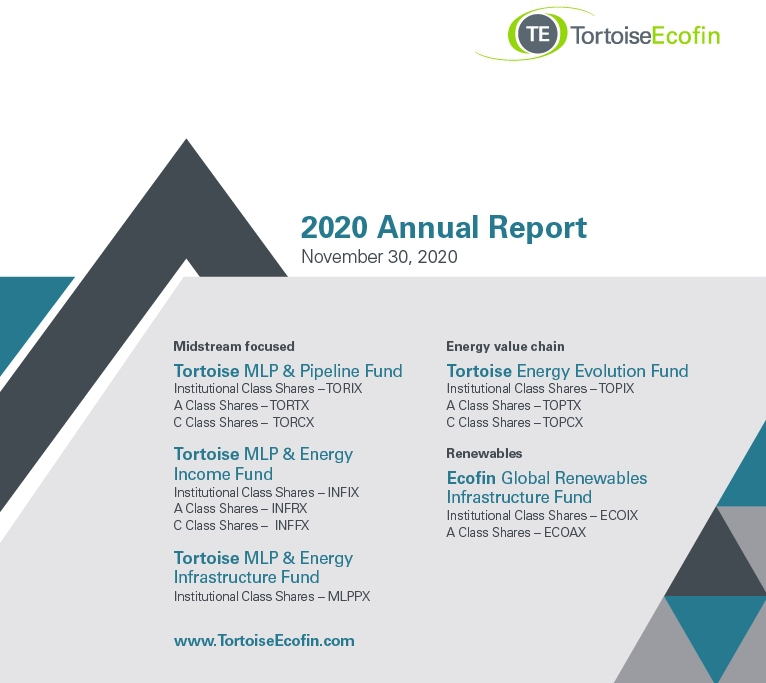
Key asset performance drivers
| ● | The fund’s large allocation to natural gas pipeline companies detracted the most from performance |
| | |
| ● | Exposure to crude oil pipeline companies and gathering & processing companies also contributed to negative performance |
| | |
| ● | The fund’s allocation to power companies and diversified infrastructure added positive performance |
| Top five contributors |
| The Williams Companies, Inc. |
| MPLX LP |
| Antero Midstream Corporation |
| NextEra Energy Inc. |
| Tallgrass Energy LP |
| |
| Bottom five contributors |
| ONEOK, Inc. |
| Targa Resources Corp. |
| Energy Transfer LP |
| Plains GP Holdings, L.P. |
| Kinder Morgan Inc. |
| (unaudited) | |
| | |
| TortoiseEcofin | 5 |
| |
| |
| |
| |
| Tortoise |
| MLP & Pipeline Fund (continued) |
| |
Value of $1,000,000 vs. S&P 500® Index
Since inception on May 31, 2011 through November 30, 2020 |
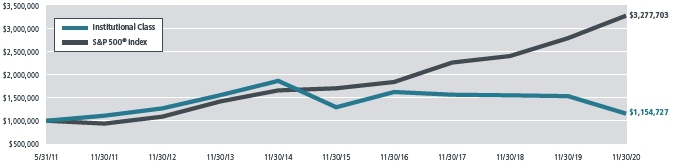 |
This chart illustrates the performance of a hypothetical $1,000,000 investment made on May 31, 2011 and is not intended to imply any future performance. The returns shown do not reflect the deduction of taxes that a shareholder would pay on fund distributions or the redemption of fund shares. The returns reflect fee waivers in effect. In the absence of such waivers, total return would be reduced. The chart assumes reinvestment of capital gains and dividends for a fund and dividends for the index.
The performance data quoted above represents past performance since inception on May 31, 2011 through November 30, 2020. Past performance is no guarantee of future results. The investment return and value of an investment will fluctuate so that an investor’s shares, when redeemed, may be worth more or less than their original cost. Current performance of the fund may be obtained through the most recent month-end by calling 855-TCA-FUND (855-822-3863). Future performance may be lower or higher than the performance stated above.
The S&P 500® Index is an unmanaged market-value weighted index of stocks, which is widely regarded as the standard for measuring large-cap U.S. stock market performance. Returns include reinvested dividends. You cannot invest directly in an index.
| (unaudited) | |
| | |
| 6 | TortoiseEcofin |
| |
| |
| 2020 Annual Report | November 30, 2020 |
| |
| |
| |
| |
Total returns (as of November 30, 2020)
| Ticker | | Class | | 1 year | | 3 years | | 5 years | | Since inception(1) | | Gross expense ratio |
| TORIX | | Institutional | | -24.70% | | -9.62% | | -2.22% | | | 1.53% | | | | 0.93% | |
| TORTX | | A Class (excluding load)(2) | | -24.94% | | -9.94% | | -2.52% | | | 1.23% | | | | 1.18% | |
| TORTX | | A Class (maximum load)(2) | | -29.07% | | -11.61% | | -3.61% | | | 0.63% | | | | 1.18% | |
| TORCX | | C Class (excluding CDSC) | | -25.41% | | -10.53% | | -3.18% | | | 0.50% | | | | 1.93% | |
| TORCX | | C Class (including CDSC) | | -26.13% | | -10.53% | | -3.18% | | | 0.50% | | | | 1.93% | |
| S&P 500® Index(3) | | | | 17.46% | | 13.17% | | 13.99% | | | 13.31% | | | | — | |
| TNAPT(4) | | | | -15.83% | | -3.54% | | 2.86% | | | 4.33% | | | | — | |
| (1) | Reflects period from fund inception on May 31, 2011 through November 30, 2020. The Institutional and A Class Shares commenced operations on May 31, 2011 and C Class Shares commenced operations on September 19, 2012. Performance shown for the C Class prior to inception of the C Class Shares is based on the performance of the Institutional Class Shares, adjusted for the higher expenses applicable to C Class Shares. |
| (2) | Prior to March 30, 2019, A Class Shares were known as Investor Class Shares |
| (3) | The S&P 500® Index is an unmanaged market-value weighted index of stocks, which is widely regarded as the standard for measuring large-cap U.S. stock market performance. Returns include reinvested dividends. You cannot invest directly in an index. |
| (4) | The Tortoise North American Pipeline IndexSM is a float-adjusted, capitalization weighted index of pipeline companies headquartered in the United States and Canada. You cannot invest directly in an index. |
Note: For periods over 1 year, performance reflected is for the average annual returns. Performance data shown for the A Class (maximum load) reflects a sales charge of 5.50%. Performance data shown “excluding load” does not reflect the deduction of the maximum sales load. Performance data shown for the C Class (including CDSC) reflects a contingent deferred sales charge (“CDSC”) of 1% for the first 12 months of investment. Performance data shown “excluding CDSC” does not reflect the deduction of the CDSC. If reflected, the load and CDSC would reduce the performance quoted. Investment performance reflects fee waivers in effect. In the absence of such waivers, total return would be reduced.
Performance data quoted represents past performance; past performance does not guarantee future results. The investment return and principal value of an investment will fluctuate so that an investor’s shares, when redeemed, may be worth more or less than their original cost. Current performance of the portfolio may be lower or higher than the performance quoted. Performance data current to the most recent month end may be obtained by calling 855-TCA-FUND (855-822-3863).
| (unaudited) | |
| |
| TortoiseEcofin | 7 |
| |
| |
| |
| |
| Tortoise |
| MLP & Energy Income Fund |
| |
Basic fund facts
Investment objective: Current income and long-term capital appreciation
Structure: Regulated investment company
| | Institutional | | A Class | | C Class |
| Ticker | | | INFIX | | | | INFRX | | | | INFFX | |
| Gross expense ratio | | | 1.17% | | | | 1.42% | | | | 2.17% | |
| Redemption fee | | | None | | | | None | | | | None | |
Maximum front-end
sales load | | | None | (1) | | | 5.50% | (2) | | | None | (1) |
Maximum deferred
sales load | | | None | | | | None | | | | 1.00% | (4) |
| (1) | While the Institutional and C Classes have no front-end load, advisory and other expenses still apply. |
| (2) | You may qualify for sales charge discounts if you invest at least $50,000. |
| (3) | No front-end sales charge is payable on A Class investments of $1 million or more, although the fund may impose a Contingent Deferred Sales Charge (“CDSC”) of 1% on certain redemptions made within 12 months of purchase. |
| (4) | The C Class CDSC applies to redemptions made within 12 months of purchase. |
Targeted investment characteristics
The fund’s targeted investments generally will have the following characteristics:
| ● | Securities from across the capital structure and energy value chain |
| | |
| ● | Strategic assets that fuel the economy |
| | |
| ● | Diversified asset base |
| | |
| ● | Limited direct commodity price exposure |
| | |
| ● | History of predictable, recurring cash flows |
| | |
| ● | Current income through distributions |
| | |
| ● | A flexible asset allocation dependent on current market opportunities |
| | |
| ● | Experienced management team |
Top ten holdings (as of November 30, 2020)
| 1. | The Williams Companies, Inc. | | 5.7% |
| 2. | MPLX LP | | 5.4% |
| 3. | Enterprise Products Partners, L.P. | | 4.8% |
| 4. | ONEOK, Inc. | | 4.7% |
| 5. | NextEra Energy Partners LP | | 4.4% |
| 6. | Magellan Midstream Partners, L.P. | | 4.2% |
| 7. | TC Energy Corporation | | 4.2% |
| 8. | Enbridge Inc. | | 4.2% |
| 9. | Cheniere Energy, Inc. | | 4.1% |
| 10. | New Fortress Energy, Inc. | | 4.0% |
Key asset performance drivers
| ● | The fund’s allocation to the refining sector detracted the most from performance |
| | |
| ● | Exposure to crude oil pipeline companies and natural gas pipeline companies also restrained performance |
| | |
| ● | Exposure to diversified infrastructure companies added positive performance |
| Top five contributors |
| New Fortress Energy Inc. |
| Tallgrass Energy LP |
| Equitrans Midstream Corporation |
| MPLX LP |
| Noble Midstream Partners LP |
| |
| Bottom five contributors |
| ONEOK, Inc. |
| Plains GP Holdings, L.P. |
| Phillips 66 Partners LP |
| Energy Transfer LP |
| Noble Midstream Partners LP |
| (unaudited) | |
| | |
| 8 | TortoiseEcofin |
| |
| |
| 2020 Annual Report | November 30, 2020 |
| |
| |
| |
| |
Value of $1,000,000 vs. the Alerian MLP Index
Since inception on December 27, 2010 through November 30, 2020 |
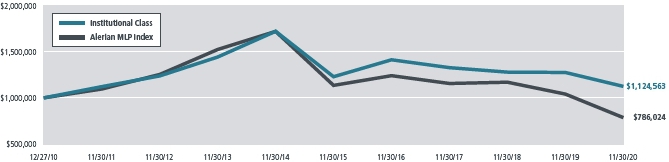 |
This chart illustrates the performance of a hypothetical $1,000,000 investment made on December 27, 2010 and is not intended to imply any future performance. The returns shown do not reflect the deduction of taxes that a shareholder would pay on fund distributions or the redemption of fund shares. The returns reflect fee waivers in effect. In the absence of such waivers, total return would be reduced. The chart assumes reinvestment of capital gains and dividends for a fund and dividends for the index.
The performance data quoted above represents past performance since inception on December 27, 2010 through November 30, 2020. Past performance is no guarantee of future results. The investment return and value of an investment will fluctuate so that an investor’s shares, when redeemed, may be worth more or less than their original cost. Current performance of the fund may be obtained through the most recent month-end by calling 855-TCA-FUND (855-822-3863). Future performance may be lower or higher than the performance stated above.
The Alerian MLP Index is the leading gauge of energy infrastructure Master Limited Partnerships (MLPs). The capped, float-adjusted, capitalization-weighted index, whose constituents earn the majority of their cash flow from midstream activities involving energy commodities, is disseminated real-time on a pricereturn basis (AMZ) and on a total-return basis (AMZX).
| (unaudited) | |
| |
| TortoiseEcofin | 9 |
| |
| |
| |
| |
| Tortoise |
| MLP & Energy Income Fund (continued) |
| |
Total returns (as of November 30, 2020)
| Ticker | | Class | | 1 year | | 3 years | | 5 years | | Since inception(1) | | Gross expense ratio |
| INFIX | | Institutional | | -11.83% | | -5.38% | | -1.77% | | | 1.19% | | | | 1.17% | |
| INFRX | | A Class (excluding load) | | -11.96% | | -5.57% | | -1.96% | | | 0.97% | | | | 1.42% | |
| INFRX | | A Class (maximum load) | | -16.81% | | -7.34% | | -3.06% | | | 0.40% | | | | 1.42% | |
| INFFX | | C Class (excluding CDSC) | | -12.72% | | -6.34% | | -2.73% | | | 0.27% | | | | 2.17% | |
| INFFX | | C Class (including CDSC) | | -13.52% | | -6.34% | | -2.73% | | | 0.27% | | | | 2.17% | |
| Alerian MLP Index(2) | | | | -24.50% | | -12.06% | | -7.09% | | | -2.40% | | | | — | |
| (1) | Reflects period from fund inception on December 27 2010 through November 30, 2020. The Institutional Class commenced operations on December 27, 2010, the A Class Shares commenced operation on May 18, 2011 and the C Class Shares commenced operations on April 2, 2012. Performance shown for the A Class and C Class prior to the inception of the A Class Shares and C Class Shares is based on the performance of the Institutional Class Shares, adjusted for the higher expenses applicable to the A Class Shares and the C Class Shares, respectively. |
| (2) | The Alerian MLP Index is the leading gauge of energy infrastructure Master Limited Partnerships (MLPs). The capped, float-adjusted, capitalization-weighted index, whose constituents earn the majority of their cash flow from midstream activities involving energy commodities, is disseminated real-time on a pricereturn basis (AMZ) and on a total-return basis (AMZX). |
Note: For periods over 1 year, performance reflected is for the average annual returns. Performance data shown for the A Class (maximum load) reflects a sales charge of 5.50%. Performance data shown “excluding load” does not reflect the deduction of the maximum sales load. Performance data shown for the C Class (including CDSC) reflects a contingent deferred sales charge (“CDSC”) of 1% for the first 18 months of investment. Performance data shown “excluding CDSC” does not reflect the deduction of the CDSC. If reflected, the load and CDSC would reduce the performance quoted. Investment performance reflects fee waivers in effect. In the absence of such waivers, total return would be reduced.
Performance data quoted represents past performance; past performance does not guarantee future results. The investment return and principal value of an investment will fluctuate so that an investor’s shares, when redeemed, may be worth more or less than their original cost. Current performance of the portfolio may be lower or higher than the performance quoted. Performance data current to the most recent month end may be obtained by calling 855-TCA-FUND (855-822-3863).
| (unaudited) | |
| |
| 10 | TortoiseEcofin |
| |
| |
| 2020 Annual Report | November 30, 2020 |
| |
| Tortoise |
| MLP & Energy Infrastructure Fund |
| |
Basic fund facts
Investment objective: Current income and long-term capital appreciation
Structure: Regulated investment company
| | Institutional |
| Ticker | | | MLPPX | |
| Gross expense ratio | | | 0.94% | |
| Redemption fee | | | None | |
| Maximum front-end sales load | | | None | (1) |
| Maximum deferred sales load | | | None | |
| (1) | While the Institutional Class has no front-end load, advisory and other expenses still apply. |
Targeted investment characteristics
The fund’s targeted investments generally will have the following characteristics:
| ● | Securities from across the capital structure and energy value chain |
| | |
| ● | Strategic assets that fuel the economy |
| | |
| ● | Diversified asset base |
| | |
| ● | Limited direct commodity price exposure |
| | |
| ● | History of predictable, recurring cash flows |
| | |
| ● | Current income through distributions |
| | |
| ● | A flexible asset allocation dependent on current market opportunities |
| | |
| ● | Experienced management team |
Top ten holdings (as of November 30, 2020)
| 1. | | The Williams Companies, Inc. | | 5.7% |
| 2. | | MPLX LP | | 5.4% |
| 3. | | Enterprise Products Partners, L.P. | | 4.7% |
| 4. | | ONEOK, Inc. | | 4.7% |
| 5. | | NextEra Energy Partners LP | | 4.4% |
| 6. | | Magellan Midstream Partners, L.P. | | 4.2% |
| 7. | | TC Energy Corporation | | 4.2% |
| 8. | | Enbridge Inc. | | 4.2% |
| 9. | | Cheniere Energy, Inc. | | 4.1% |
| 10. | | New Fortress Energy, Inc. | | 3.9% |
Key asset performance drivers
| ● | The fund’s allocation to the refining sector detracted the most from performance |
| | |
| ● | Exposure to crude oil pipeline companies and natural gas pipeline companies also restrained performance |
| | |
| ● | Exposure to diversified infrastructure companies added positive performance |
| Top five contributors |
| New Fortress Energy Inc. |
| Tallgrass Energy LP |
| Equitrans Midstream Corporation |
| MPLX LP |
| Noble Midstream Partners LP |
| Bottom five contributors |
| ONEOK, Inc. |
| Plains GP Holdings, L.P. |
| Phillips 66 Partners LP |
| Energy Transfer LP |
PBF Holding Co LLC,
7.250%, 06/15/2025 |
| (unaudited) | |
| | |
| TortoiseEcofin | 11 |
| |
| |
| |
| |
| Tortoise |
| MLP & Energy Infrastructure Fund (continued) |
| |
Value of $5,000,000 vs. the Alerian MLP Index
November 30, 2010 through November 30, 2020 |
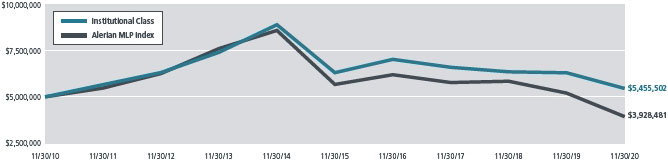 |
This chart illustrates the performance of a hypothetical $5,000,000 investment made on November 30, 2010 and is not intended to imply any future performance. The returns shown do not reflect the deduction of taxes that a shareholder would pay on fund distributions or the redemption of fund shares. The returns reflect fee waivers in effect. In the absence of such waivers, total return would be reduced. The chart assumes reinvestment of capital gains and dividends for a fund and dividends for the index.
The performance data quoted above represents past performance since November 30, 2010 through November 30, 2020. Past performance is no guarantee of future results. The investment return and value of an investment will fluctuate so that an investor’s shares, when redeemed, may be worth more or less than their original cost. Current performance of the fund may be obtained through the most recent month-end by calling 855-TCA-FUND (855-822-3863). Future performance may be lower or higher than the performance stated above.
The Alerian MLP Index is the leading gauge of energy infrastructure Master Limited Partnerships (MLPs). The capped, float-adjusted, capitalization-weighted index, whose constituents earn the majority of their cash flow from midstream activities involving energy commodities, is disseminated real-time on a price-return basis (AMZ) and on a total-return basis (AMZX).
| (unaudited) | |
| | |
| 12 | TortoiseEcofin |
| |
| |
| 2020 Annual Report | November 30, 2020 |
| |
| |
| |
| |
Total returns (as of November 30, 2020)
| Ticker | | Class | | 1 year | | 3 years | | 5 years | | 10 years | | Since inception(1) | | Gross expense ratio(3) |
| MLPXX | | Institutional | | -13.48% | | -6.16% | | -2.87% | | 0.88% | | | 1.41% | | | | 0.94% | |
| Alerian MLP Index(2) | | | | -24.50% | | -12.06% | | -7.09% | | -2.38% | | | -1.37% | | | | — | |
| (1) | Reflects period from fund inception on September 9, 2010 through November 30, 2020. |
| (2) | The Alerian MLP Index is the leading gauge of energy infrastructure Master Limited Partnerships (MLPs). The capped, float-adjusted, capitalization-weighted index, whose constituents earn the majority of their cash flow from midstream activities involving energy commodities, is disseminated real-time on a pricereturn basis (AMZ) and on a total-return basis (AMZX). |
| (3) | The gross expense ratio is in line with the MLP & Energy Infrastructure Fund’s most recent effective prospectus and may not reflect current year activity. |
Performance data quoted represents past performance; past performance does not guarantee future results. The investment return and principal value of an investment will fluctuate so that an investor’s shares, when redeemed, may be worth more or less than their original cost. Current performance of the portfolio may be lower or higher than the performance quoted. Performance data current to the most recent month end may be obtained by calling 855-TCA-FUND (855-822-3863).
| (unaudited) | |
| | |
| TortoiseEcofin | 13 |
| |
| |
| |
| |
| Tortoise |
| Energy Evolution Fund |
| |
Basic fund facts
Investment objective: Total return
Structure: Regulated investment company
| | Institutional | | A Class | | C Class |
| Ticker | | | TOPIX | | | | | TOPTX | | | | | TOPCX | |
| Net expense ratio(1) | | | 1.10% | | | | | 1.35% | | | | | 2.10% | |
| Redemption fee | | | None | | | | | None | | | | | None | |
Maximum front-end
sales load | | | None | (2) | | | | 5.50% | (3) | | | | None | (2) |
Maximum deferred
sales load | | | None | | | | | None | (4) | | | | 1.00% | (5) |
| (1) | Tortoise has contractually agreed to limit total operating expenses (excluding acquired fund fees and expenses, brokerage commissions, leverage/borrowing interest, interest expense, taxes and extraordinary expenses) through 3/31/2021. Reimbursed expenses may be recouped for a period of thirty-six months if such recoupment can be achieved without exceeding these expense limits. |
| (2) | While the Institutional and C Classes have no front-end load, advisory and other expenses still apply. |
| (3) | You may qualify for sales charge discounts if you invest at least $50,000. |
| (4) | No front-end sales charge is payable on A Class investments of $1 million or more, although the fund may impose a Contingent Deferred Sales Charge (“CDSC”) of 1% on certain redemptions made within 12 months of purchase. |
| (5) | The C Class CDSC applies to redemptions made within 12 months of purchase. |
Targeted investment characteristics
The fund’s targeted investments generally will have the following characteristics:
| ● | 15 – 40 holdings across energy value chain |
| | |
| ● | Sector ranges will vary over time based on targeted catalyst and trend exposure |
| | |
| ● | Value chain segment and company specific exposure will fluctuate based on areas of highest conviction |
Top ten holdings (as of November 30, 2020)
| 1. | | Orsted A/S | | 7.3% |
| 2. | | Enel SpA | | 7.2% |
| 3. | | Iberdrola, S.A. | | 7.1% |
| 4. | | NextEra Energy, Inc. | | 6.2% |
| 5. | | RWE AG | | 6.1% |
| 6. | | EDP - Energias de Portugal, S.A. | | 5.4% |
| 7. | | Xcel Energy, Inc. | | 5.0% |
| 8. | | Enbridge Inc. | | 4.5% |
| 9. | | The Williams Companies, Inc. | | 4.5% |
| 10. | | TC Energy Corporation | | 4.3% |
Key asset performance drivers
| ● | The fund’s large allocation to natural gas pipeline companies, as part of the U.S. exports theme, detracted the most from performance |
| | |
| ● | Exposure to integrated energy producers, as part of the CO2 emission reduction theme, also restrained performance |
| | |
| ● | The fund’s exposure to power companies, part of the electrification theme, added positive performance |
| Top five contributors |
| Orsted A/S |
| Enel SpA |
| Iberdrola, S.A. |
| RWE AG |
| NextEra Energy, Inc. |
| Bottom five contributors |
| ONEOK, Inc. |
| Royal Dutch Shell PLC |
| Phillips 66 |
| Kinder Morgan Inc. |
| Magellan Midstream Partners, L.P. |
| (unaudited) | |
| | |
| 14 | TortoiseEcofin |
| |
| |
| 2020 Annual Report | November 30, 2020 |
| |
| |
| |
| |
Value of $1,000,000 vs. S&P 500® Index
Since inception on September 30, 2013 through November 30, 2020 |
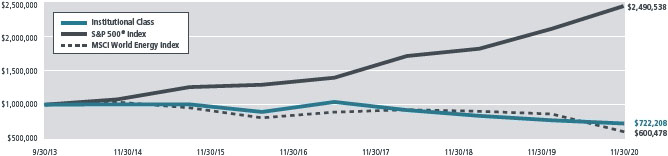 |
This chart illustrates the performance of a hypothetical $1,000,000 investment made on September 30, 2013 and is not intended to imply any future performance. The returns shown do not reflect the deduction of taxes that a shareholder would pay on fund distributions or the redemption of fund shares. The chart assumes reinvestment of capital gains and dividends for a fund and dividends for the index.
The performance data quoted above represents past performance since inception on September 30, 2013 through November 30, 2020. Past performance is no guarantee of future results. The investment return and value of an investment will fluctuate so that an investor’s shares, when redeemed, may be worth more or less than their original cost. Current performance of the fund may be obtained through the most recent month-end by calling 855-TCA-FUND (855-822-3863). Future performance may be lower or higher than the performance stated above.
The S&P 500® Index is an unmanaged market-value weighted index of stocks, which is widely regarded as the standard for measuring large-cap U.S. stock market performance. Returns include reinvested dividends. You cannot invest directly in an index.
The MSCI World Energy Index is designed to capture the large and mid cap segments across 23 Developed Markets (DM) countries. All securities in the index are classified in the Energy sector as per the Global Industry Classification Standard (GICS®). You cannot invest directly in an index.
| (unaudited) | |
| | |
| TortoiseEcofin | 15 |
| |
| |
| |
| |
| Tortoise |
| Energy Evolution Fund (continued) |
| |
Total returns (as of November 30, 2020)
| Ticker | | Class | | 1 year | | 3 years | | 5 years | | Since inception(1) | | Gross expense ratio(5) |
| TOPIX | | Institutional | | -6.19% | | -7.76% | | -4.16% | | | -4.44% | | | | 2.16% | |
| TOPTX | | A Class (excluding load)(2) | | -6.30% | | -7.97% | | -4.39% | | | -4.67% | | | | 2.41% | |
| TOPTX | | A Class (maximum load)(2) | | -11.40% | | -9.68% | | -5.46% | | | -5.41% | | | | 2.41% | |
| TOPCX | | C Class (excluding CDSC) | | -7.10% | | -8.66% | | -5.09% | | | -5.37% | | | | 3.15% | |
| TOPCX | | C Class (including CDSC) | | -8.03% | | -8.66% | | -5.09% | | | -5.37% | | | | 3.15% | |
| S&P 500® Index(3) | | | | 17.46% | | 13.17% | | 13.99% | | | 13.58% | | | | — | |
MSCI World
Energy Index(4) | | | | -30.38% | | -13.43% | | -5.73% | | | -6.87% | | | | — | |
| (1) | Reflects period from fund inception on September 30, 2013 through November 30, 2020. |
| (2) | Prior to March 30, 2019, A Class Shares were known as Investor Class Shares |
| (3) | The S&P 500® Index is an unmanaged market-value weighted index of stocks, which is widely regarded as the standard for measuring large-cap U.S. stock market performance. Returns include reinvested dividends. You cannot invest directly in an index. |
| (4) | The MSCI World Energy Index is designed to capture the large and mid cap segments across 23 Developed Markets (DM) countries. All securities in the index are classified in the Energy sector as per the Global Industry Classification Standard (GICS®). You cannot invest directly in an index. |
| (5) | The gross expense ratio is in line with the Energy Evolution Fund’s most recent effective prospectus and may not reflect current year activity. |
Note: For periods over 1 year, performance reflected is for the average annual returns. Performance data shown for the A Class (maximum load) reflects a sales charge of 5.50%. Performance data shown “excluding load” does not reflect the deduction of the maximum sales load. Performance data shown for the C Class (including CDSC) reflects a contingent deferred sales charge (“CDSC”) of 1% for the first 12 months of investment. Performance data shown “excluding CDSC” does not reflect the deduction of the CDSC. If reflected, the load and CDSC would reduce the performance quoted. Investment performance reflects fee waivers in effect. In the absence of such waivers, total return would be reduced.
Performance data quoted represents past performance; past performance does not guarantee future results. The investment return and principal value of an investment will fluctuate so that an investor’s shares, when redeemed, may be worth more or less than their original cost. Current performance of the portfolio may be lower or higher than the performance quoted. Performance data current to the most recent month end may be obtained by calling 855-TCA-FUND (855-822-3863).
| (unaudited) | |
| | |
| 16 | TortoiseEcofin |
| |
| |
| 2020 Annual Report | November 30, 2020 |
| |
| Ecofin |
| Global Renewables Infrastructure Fund |
| |
Basic fund facts
Investment objective: Total Return
Structure: Regulated Investment Company
| | Institutional | | A Class |
| Ticker | | | ECOIX | | | | ECOAX | |
| Net Expense Ratio(1) | | | 1.00% | | | | 1.25% | |
| Redemption fee | | | None | | | | None | |
| Maximum front-end sales load | | | None | (2) | | | 5.50% | (3) |
| Maximum deferred sales load | | | None | | | | None | (4) |
| (1) | Tortoise has contractually agreed to limit total operating expenses (excluding acquired fund fees and expenses, brokerage commissions, leverage/borrowing interest, interest expense, taxes and extraordinary expenses) through 8/7/2021. Reimbursed expenses may be recouped for a period of thirty-six months if such recoupment can be achieved without exceeding these expense limits. |
| (2) | While the Institutional Class has no front-end load, advisory and other expenses still apply. |
| (3) | You may qualify for sales charge discounts if you invest at least $50,000. |
| (4) | No front-end sales charge is payable on A Class investments of $1 million or more, although the fund may impose a Contingent Deferred Sales Charge (“CDSC”) of 1% on certain redemptions made within 12 months of purchase. |
Targeted investment characteristics
The fund’s targeted investments generally will have the following characteristics:
| ● | Securities from across the capital structure and energy value chain |
| | |
| ● | Strategic assets that fuel the economy |
| | |
| ● | Diversified asset base |
| | |
| ● | Limited direct commodity price exposure |
| | |
| ● | History of predictable, recurring cash flows |
| | |
| ● | Current income through distributions |
| | |
| ● | A flexible asset allocation dependent on current market opportunities |
| | |
| ● | Experienced management team |
Top ten holdings (as of November 30, 2020)
| 1. | NextEra Energy, Inc. | | 6.3% |
| 2. | Orsted A/S | | 6.0% |
| 3. | Edison International | | 6.0% |
| 4. | China Longyuan Power Group Corp. Ltd. | | 5.3% |
| 5. | Iberdrola, S.A. | | 5.1% |
| 6. | Brookfield Renewable Partners LP | | 5.0% |
| 7. | TransAlta Renewables, Inc. | | 4.7% |
| 8. | EDP - Energias de Portugal, S.A. | | 4.4% |
| 9. | Exelon Corporation | | 4.4% |
| 10. | RENOVA, Inc. | | 4.2% |
Key asset performance drivers
| ● | The fund’s large allocation to power companies focusing on renewable energy contributed the most to the fund’s positive performance |
| | |
| ● | Exposure to renewables infrastructure, including wind and solar also added to positive performance |
| | |
| ● | Specific company selection detracted from the fund’s positive performance |
| Top five contributors |
| RENOVA, Inc. |
| Sunrun, Inc. |
| Brookfield Renewable Partners LP |
| Orsted A/S |
| Scatec Solar ASA |
| |
| Bottom five contributors |
| BCPG PCL |
| China Suntien Green Energy Corp. Ltd. |
| Covanta Holding Corporation |
| SSE PLC |
| National Grid PLC |
| (unaudited) | |
| | |
| TortoiseEcofin | 17 |
| |
| |
| |
| |
| Ecofin |
| Global Renewables Infrastructure Fund (continued) |
| |
Value of $1,000,000 vs. S&P Global Infrastructure® Index
November 2, 2015 through November 30, 2020 |
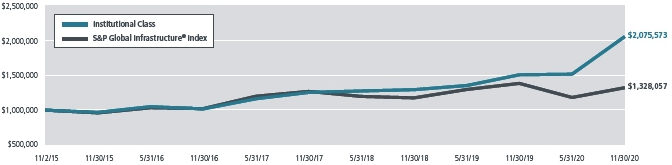 |
The Fund commenced operations on August 7, 2020. The performance data quoted for the period prior to August 7, 2020 is that of the Tortoise Global Renewables Infrastructure Fund (the “Predecessor Fund”) and has been adjusted to reflect the Fund’s shares class’ fees and expenses. The Predecessor Fund commenced operations on November 2, 2015 and was not a registered mutual fund subject to the same investment and tax restrictions as the Fund. This chart illustrates the performance of a hypothetical $1,000,000 investment made on November 2, 2015 and is not intended to imply any future performance. The returns shown do not reflect the deduction of taxes that a shareholder would pay on fund distributions or the redemption of fund shares. The returns reflect fee waivers in effect. In the absence of such waivers, total return would be reduced. The chart assumes reinvestment of capital gains and dividends for a fund and dividends for the index.
The performance data quoted above represents past performance on November 2, 2015 through November 30, 2020. Past performance is no guarantee of future results. The investment return and value of an investment will fluctuate so that an investor’s shares, when redeemed, may be worth more or less than their original cost. Current performance of the fund may be obtained through the most recent month-end by calling 855-TCA-FUND (855-822-3863). Future performance may be lower or higher than the performance stated above.
The S&P Global Infrastructure® Index is designed to track 75 companies from around the world chosen to represent the listed infrastructure industry while maintaining liquidity and tradability. You cannot invest directly in an index.
| (unaudited) | |
| | |
| 18 | TortoiseEcofin |
| |
| |
| 2020 Annual Report | November 30, 2020 |
| |
| |
| |
| |
Total returns (as of November 30, 2020)
| Ticker | | Class | | 1 Year | | 3 Years | | 5 Years | | Since inception | | Gross expense ratio(5) |
| ECOIX(1)(2) | | Institutional | | 36.80% | | 18.13% | | 16.49% | | | 15.47% | | | | 1.06% | |
| ECOAX(1)(3) | | A Class (excluding load) | | 36.67% | | 17.89% | | 16.24% | | | 15.22% | | | | 1.31% | |
| ECOAX(1)(3) | | A Class (maximum load) | | 29.15% | | 15.69% | | 14.93% | | | 13.94% | | | | 1.31% | |
| S&P Global Infrastructure Index(4) | | | | -4.53% | | 1.39% | | 6.71% | | | 5.75% | | | | — | |
| (1) | Fund commenced operations on August 7, 2020. |
| (2) | The performance data quoted for the period prior to August 7, 2020 is that of the Tortoise Global Renewables Infrastructure Fund Limited (the “Predecessor Fund”) and has been adjusted to reflect the Fund’s share class’ fees and expenses. The Predecessor Fund commenced operations during November 2, 2015, and was not a registered mutual fund subject to the same investment and tax restrictions as the Fund. If it had, the Predecessor Fund’s performance might have been lower. The Predecessor Fund’s shares were exchanged for the Fund’s Institutional Class shares on August 7, 2020. |
| (3) | Performance of the A Class prior to the inception of the class is based on the performance of the Predecessor Fund, adjusted for the higher expenses applicable to the class compared to the Institutional Class. |
| (4) | The S&P Global Infrastructure® Index is designed to track 75 companies from around the world chosen to represent the listed infrastructure industry while maintaining liquidity and tradability. You cannot invest directly in an index. |
| (5) | The gross expense ratio is in line with the Global Renewables Infrastructure Fund’s most recent effective prospectus and may not reflect current year activity. |
Note: For periods over 1 year, performance reflected is for the average annual returns. Performance data shown for the A Class (maximum load) reflects a sales charge of 5.50%. Performance data shown “excluding load” does not reflect the deduction of the maximum sales load.
Performance data quoted represents past performance; past performance does not guarantee future results. The investment return and principal value of an investment will fluctuate so that an investor’s shares, when redeemed, may be worth more or less than their original cost. Current performance of the portfolio may be lower or higher than the performance quoted. Performance data current to the most recent month end may be obtained by calling 855-TCA-FUND (855-822-3863).
| (unaudited) | |
| | |
| TortoiseEcofin | 19 |
Mutual fund investing involves risk. Principal loss is possible. The funds are non-diversified, meaning they may concentrate their assets in fewer individual holdings than a diversified fund. Therefore, the funds are more exposed to individual stock volatility than diversified funds. Investing in specific sectors such as North American energy may involve greater risk and volatility than less concentrated investments. Risks include, but are not limited to, risks associated with energy investments, including upstream energy companies, midstream companies, downstream companies, energy company beneficiaries, master limited partnerships (MLPs), MLP affiliates, commodity price volatility, supply and demand, regulatory, environmental, operating, capital markets, terrorism, natural disaster and climate change risks. The tax benefits received by an investor investing in the funds differ from that of a direct investment in an MLP by an investor. The value of the funds’ investments in an MLP will depend largely on the MLP’s treatment as a partnership for U.S. federal income tax purposes. If the MLP is deemed to be a corporation then its income would be subject to federal taxation, reducing the amount of cash available for distribution to the funds which could result in a reduction of the funds’ values. Investments in foreign companies involve risk not ordinarily associated with investments in securities and instruments of U.S. issuers, including risks related to political, social and economic developments abroad, differences between U.S. and foreign regulatory and accounting requirements, tax risk and market practices, as well as fluctuations in foreign currencies. The funds invest in large, small and mid-cap companies, which involve additional risks such as limited liquidity and greater volatility than larger companies. Investments in debt securities typically decrease in value when interest rates rise. This risk is usually greater for longer-term debt securities. Investment in lower-rated and non-rated securities presents a greater risk of loss to principal and interest than higher-rated securities. The funds may also write call options which may limit the funds’ abilities to profit from increases in the market value of a security, but cause it to retain the risk of loss should the price of the security decline. Some funds may invest in other derivatives including options, futures and swap agreements, which can be highly volatile, illiquid and difficult to value, and changes in the value of a derivative held by the funds may not correlate with the underlying instrument or the fund’s other investments and can include additional risks such as liquidity risk, leverage risk and counterparty risk that are possibly greater than risks associated with investing directly in the underlying investments. Some funds may engage in short sales and in doing so are subject to the risk that they may not always be able to borrow a security, or close out a short position at a particular time or at an acceptable price.
Nothing contained on this communication constitutes tax, legal, or investment advice. Investors must consult their tax advisor or legal counsel for advice and information concerning their particular situation.
This report reflects our views and opinions as of the date herein, which are subject to change at any time based on market and other conditions. We disclaim any responsibility to update these views. The views should not be relied on as investment advice or an indication of trading intent on behalf of the funds.
Fund holdings and allocations are subject to change at any time and should not be considered a recommendation to buy or sell any security. For a complete list of fund holdings, please refer to the fund’s Schedule of Investments in this report.
| (unaudited) | |
| | |
| 20 | TortoiseEcofin |
| |
| |
| 2020 Annual Report | November 30, 2020 |
| |
| |
| |
| |
Expense example
As a shareholder of the Fund, you incur two types of costs: (1) transaction costs, including sales charges (loads) on purchase payments, reinvested dividends, or other distributions; exchange fees; and (2) ongoing costs, including management fees; distribution (12b-1) fees; and other Fund expenses. This example is intended to help you understand your ongoing costs (in dollars) of investing in the Fund and to compare these costs with the ongoing costs of investing in other mutual funds. The example is based on an investment of $1,000 invested at the beginning of the period and held for the entire period (June 1, 2020 – November 30, 2020) The example for the Ecofin Global Renewables Infrastructure Fund is based on an investment of $1,000 invested at the commencement of operations and held for the entire period (August 7, 2020 – November 30, 2020).
Actual expenses
For each class, the first line of the table below provides information about actual account values and actual expenses. You may use the information in this line, together with the amount you invested, to estimate the expenses that you paid over the period. Simply divide your account value by $1,000 (for example, an $8,600 account value divided by $1,000 = 8.6), then multiply the result by the number in the first line under the heading entitled “Expenses Paid During Period” to estimate the expenses you paid on your account during this period.
Hypothetical example for comparison purposes
For each class, the second line of the table below provides information about hypothetical account values and hypothetical expenses based on the Fund’s actual expense ratio and an assumed rate of return of 5% per year before expenses, which is not the Fund’s actual return. The hypothetical account values and expenses may not be used to estimate the actual ending account balance or expenses you paid for the period. You may use this information to compare the ongoing costs of investing in the Fund and other funds. To do so, compare this 5% hypothetical example with the 5% hypothetical examples that appear in the shareholder reports of the other funds.
Please note that the expenses shown in the table are meant to highlight your ongoing costs only and do not reflect any transactional costs, such as redemption fees or exchange fees. Therefore, the second line of the table is useful in comparing ongoing costs only, and will not help you determine the relative total costs of owning different funds. In addition, if these transactional costs were included, your costs would have been higher.
| Tortoise MLP & Pipeline Fund |
| | Beginning
Account Value
(06/01/2020) | | Ending
Account Value
(11/30/2020) | | Expenses Paid
During Period(1)
(06/01/2020 – 11/30/2020) |
| Institutional Class Actual(2)(3) | | | $ | 1,000.00 | | | | $ | 1,013.30 | | | | $ | 4.78 | |
| Institutional Class Hypothetical (5% annual return before expenses)(4) | | | $ | 1,000.00 | | | | $ | 1,020.25 | | | | $ | 4.80 | |
| A Class Actual(2)(3) | | | $ | 1,000.00 | | | | $ | 1,012.20 | | | | $ | 6.04 | |
| A Class Hypothetical (5% annual return before expenses)(4) | | | $ | 1,000.00 | | | | $ | 1,019.00 | | | | $ | 6.06 | |
| C Class Actual(2)(3) | | | $ | 1,000.00 | | | | $ | 1,008.60 | | | | $ | 9.79 | |
| C Class Hypothetical (5% annual return before expenses)(4) | | | $ | 1,000.00 | | | | $ | 1,015.25 | | | | $ | 9.82 | |
| (1) | Expenses are equal to the Fund’s annualized expense ratio for the most recent six-month period of 0.95%, 1.20%, and 1.95% for the Institutional Class, A Class and C Class, respectively, multiplied by the average account value over the period, multiplied by 183/366 to reflect the one-half year period. |
| (2) | Based on the actual returns for the six-month period ended November 30, 2020 of 1.33%, 1.22% and 0.86% for the Institutional Class, A Class and C Class, respectively. |
| (3) | Excluding interest expense, the actual expenses would be $4.78, $6.04 and $9.79 for the Institutional Class, A Class and C Class, respectively. |
| (4) | Excluding interest expense, the hypothetical expenses would be $4.80, $6.06 and $9.82 for the Institutional Class, A Class and C Class, respectively. |
| (unaudited) | |
| | |
| TortoiseEcofin | 21 |
| Tortoise MLP & Energy Income Fund |
| | Beginning
Account Value
(06/01/2020) | | Ending
Account Value
(11/30/2020) | | Expenses Paid
During Period(1)
(06/01/2020 – 11/30/2020) |
| Institutional Class Actual(2)(3) | | | $ | 1,000.00 | | | | $ | 1,059.60 | | | | $ | 5.77 | |
| Institutional Class Hypothetical (5% annual return before expenses)(4) | | | $ | 1,000.00 | | | | $ | 1,019.40 | | | | $ | 5.65 | |
| A Class Actual(2)(3) | | | $ | 1,000.00 | | | | $ | 1,058.90 | | | | $ | 7.05 | |
| A Class Hypothetical (5% annual return before expenses)(4) | | | $ | 1,000.00 | | | | $ | 1,018.15 | | | | $ | 6.91 | |
| C Class Actual(2)(3) | | | $ | 1,000.00 | | | | $ | 1,054.20 | | | | $ | 10.89 | |
| C Class Hypothetical (5% annual return before expenses)(4) | | | $ | 1,000.00 | | | | $ | 1,014.40 | | | | $ | 10.68 | |
| (1) | Expenses are equal to the Fund’s annualized expense ratio for the most recent six-month period of 1.12%, 1.37%, and 2.12% for the Institutional Class, A Class and C Class, respectively, multiplied by the average account value over the period, multiplied by 183/366 to reflect the one-half year period. |
| (2) | Based on the actual returns for the six-month period ended November 30, 2020 of 5.96%, 5.89% and 5.42% for the Institutional Class, A Class and C Class, respectively. |
| (3) | Excluding interest expense, the actual expenses would be $5.77, $7.05 and $10.84 for the Institutional Class, A Class and C Class, respectively. |
| (4) | Excluding interest expense, the hypothetical expenses would be $5.65, $6.91 and $10.63 for the Institutional Class, A Class and C Class, respectively. |
| Tortoise MLP & Energy Infrastructure Fund |
| | Beginning
Account Value
(06/01/2020) | | Ending
Account Value
(11/30/2020) | | Expenses Paid
During Period(1)
(06/01/2020 – 11/30/2020) |
| Institutional Class Actual(2)(3) | | | $ | 1,000.00 | | | | $ | 1,022.40 | | | | $ | 5.21 | |
| Institutional Class Hypothetical (5% annual return before expenses)(4) | | | $ | 1,000.00 | | | | $ | 1,019.85 | | | | $ | 5.20 | |
| (1) | Expenses are equal to the Fund’s annualized expense ratio for the most recent six-month period of 1.03%, multiplied by the average account value over the period, multiplied by 183/366 to reflect the one-half year period. |
| (2) | Based on the actual returns for the six-month period ended November 30, 2020 of 2.24%. |
| (3) | Excluding interest expense, the actual expenses would be $5.06 for the Institutional Class. |
| (4) | Excluding interest expense, the hypothetical expenses would be $5.05 for the Institutional Class. |
| (unaudited) | |
| | |
| 22 | TortoiseEcofin |
| |
| |
| 2020 Annual Report | November 30, 2020 |
| |
| |
| |
| |
| Tortoise Energy Evolution Fund |
| | Beginning
Account Value
(06/01/2020) | | Ending
Account Value
(11/30/2020) | | Expenses Paid
During Period(1)
(06/01/2020 – 11/30/2020) |
| Institutional Class Actual(2)(3) | | | $ | 1,000.00 | | | | $ | 1,128.90 | | | | $ | 5.85 | |
| Institutional Class Hypothetical (5% annual return before expenses) | | | $ | 1,000.00 | | | | $ | 1,019.50 | | | | $ | 5.55 | |
| A Class Actual(2)(3) | | | $ | 1,000.00 | | | | $ | 1,127.90 | | | | $ | 7.18 | |
| A Class Hypothetical (5% annual return before expenses) | | | $ | 1,000.00 | | | | $ | 1,018.25 | | | | $ | 6.81 | |
| C Class Actual(2)(3) | | | $ | 1,000.00 | | | | $ | 1,123.50 | | | | $ | 11.15 | |
| C Class Hypothetical (5% annual return before expenses) | | | $ | 1,000.00 | | | | $ | 1,014.50 | | | | $ | 10.58 | |
| (1) | Expenses are equal to the Fund’s annualized expense ratio for the most recent six-month period of 1.10%, 1.35%, and 2.10% for the Institutional Class, A Class and C Class, respectively, multiplied by the average account value over the period, multiplied by 183/366 to reflect the one-half year period. |
| (2) | Based on the actual returns for the six-month period ended November 30, 2020 of 12.89%, 12.79% and 12.35% for the Institutional Class, A Class and C Class, respectively. |
| Ecofin Global Renewables Infrastructure Fund |
| | Commencement
of Operations(1)
(08/07/2020) | | Ending
Account Value
(11/30/2020) | | Expenses Paid
During Period(1)
(08/07/2020 – 11/30/2020) |
| Institutional Class Actual(2) | | | $ | 1,000.00 | | | | $ | 1,144.30 | | | | $ | 3.31 | |
| Institutional Class Hypothetical (5% annual return before expenses) | | | $ | 1,000.00 | | | | $ | 1,012.35 | | | | $ | 3.11 | |
| A Class Actual(2) | | | $ | 1,000.00 | | | | $ | 1,178.20 | | | | $ | 2.34 | |
| A Class Hypothetical (5% annual return before expenses) | | | $ | 1,000.00 | | | | $ | 1,011.58 | | | | $ | 2.16 | |
| (1) | Expenses are equal to the Fund’s annualized expense ratio for the period from commencement of operations to November 30, 2020 of 1.00% and 1.25% for the Institutional Class and A Class, respectively, multiplied by the average account value over the period, multiplied by 113/366 for the Institutional Class and 63/366 for the A Class. The Institutional Class commenced operations on August 10, 2020 and the A Class commenced operations on September 29, 2020. |
| (2) | Based on the actual returns for the period August 7, 2020 (inception date) through November 30, 2020 of 14.43% for the Institutional Class and for the period September 25, 2020 (inception date) through November 30, 2020 of 17.82% for the A Class. |
| (unaudited) | |
| | |
| TortoiseEcofin | 23 |
| |
| |
| |
| |
| Tortoise MLP & Pipeline Fund |
| Schedule of Investments |
| November 30, 2020 |
| | Shares | | Fair Value |
| Common Stock — 73.5%(1) | | | | | |
| Canadian Crude Oil Pipelines — 13.9%(1) | | | |
| Enbridge Inc. | | 4,010,165 | | $ | 125,157,249 |
| Inter Pipeline Ltd. | | 2,579,551 | | | 25,702,156 |
| Pembina Pipeline Corporation | | 3,061,612 | | | 78,078,532 |
| | | | | 228,937,937 |
| |
| Canadian Natural Gas/Natural Gas Liquids Pipelines — 8.7%(1) |
| Keyera Corp. | | 2,444,425 | | | 42,180,307 |
| TC Energy Corporation | | 2,309,487 | | | 101,455,764 |
| | | | | | 143,636,071 |
| |
| United States Crude Oil Pipelines — 5.8%(1) | | | |
| Plains GP Holdings, L.P.(2) | | 12,061,845 | | | 95,650,431 |
| |
| United States Diversified Infrastructure — 5.5%(1) | | | |
| Clearway Energy, Inc. | | 494,058 | | | 14,461,078 |
| NextEra Energy Partners LP | | 463,650 | | | 29,427,865 |
| NextEra Energy, Inc. | | 506,974 | | | 37,308,217 |
| Sempra Energy | | 64,322 | | | 8,199,769 |
| | | | | | 89,396,929 |
| |
| United States Natural Gas Gathering/Processing — 10.4%(1) |
| Antero Midstream Corporation | | 2,626,593 | | | 17,703,237 |
| Equitrans Midstream Corporation | | 6,012,784 | | | 49,064,317 |
| Hess Midstream LP | | 483,874 | | | 8,724,248 |
| Targa Resources Corp. | | 4,044,488 | | | 95,045,468 |
| | | | | | 170,537,270 |
| |
| United States Natural Gas/Natural Gas Liquids Pipelines — 29.2%(1) |
| Cheniere Energy, Inc.(3) | | 2,234,414 | | | 126,668,930 |
| Kinder Morgan, Inc. | | 8,522,808 | | | 122,557,979 |
| ONEOK, Inc. | | 2,241,717 | | | 80,410,389 |
| The Williams Companies, Inc. | | 7,210,529 | | | 151,276,898 |
| | | | | | 480,914,196 |
| Total Common Stock | | | | | |
| (Cost $1,331,293,304) | | | | | 1,209,072,834 |
| | | | |
| Master Limited Partnerships — 24.6%(1) | | | |
| | | | |
| United States Crude Oil Pipelines — 3.3%(1) | | | |
| BP Midstream Partners LP | | 1,379,969 | | | 15,648,849 |
| Nustar Energy L.P. | | 355,495 | | | 4,724,529 |
| Shell Midstream Partners, L.P. | | 3,272,685 | | | 33,577,748 |
| | | | | | 53,951,126 |
| |
| United States Natural Gas Gathering/Processing — 1.6%(1) |
| Western Midstream Partners, LP | | 2,081,920 | | | 26,856,768 |
| |
| United States Natural Gas/Natural Gas Liquids Pipelines — 9.2%(1) |
| DCP Midstream, LP | | 453,129 | | | 7,318,033 |
| Energy Transfer LP | | 10,633,013 | | | 65,712,020 |
| Enterprise Products Partners L.P. | | 4,017,262 | | | 77,934,883 |
| | | | | | 150,964,936 |
| |
| United States Other — 0.1%(1) | | | | | |
| Westlake Chemical Partners LP | | 129,936 | | | 2,758,541 |
| |
| United States Refined Product Pipelines — 10.4%(1) |
| Magellan Midstream Partners, L.P. | | 1,535,098 | | | 63,169,283 |
| MPLX LP | | 3,783,530 | | | 79,605,471 |
| Phillips 66 Partners LP | | 1,055,971 | | | 28,384,500 |
| | | | | | 171,159,254 |
| Total Master Limited Partnerships | | | | | |
| (Cost $545,749,792) | | | | | 405,690,625 |
| |
| Short-Term Investment — 0.1%(1) | | | |
| United States Investment Company — 0.1%(1) | | | |
| First American Government Obligations Fund, | | | |
| Class X, 0.05%(4) | | | | | |
| (Cost $1,641,409) | | 1,641,409 | | | 1,641,409 |
| Total Investments — 98.2%(1) | | | | | |
| (Cost $1,878,684,505) | | | | | 1,616,404,868 |
| Other Assets in Excess of | | | | | |
| Liabilities, Net — 1.8%(1) | | | | | 29,628,491 |
| Total Net Assets — 100.0%(1) | | | | $ | 1,646,033,359 |
| (1) | Calculated as a percentage of net assets. |
| (2) | Represents an affiliated company as defined by the Investment Company Act of 1940. |
| (3) | Non-income producing security. |
| (4) | Rate indicated is the current yield as of November 30, 2020. |
| See accompanying Notes to Financial Statements. | |
| | |
| 24 | TortoiseEcofin |
| |
| |
| 2020 Annual Report | November 30, 2020 |
| |
| Tortoise MLP & Energy Income Fund |
| Schedule of Investments |
| November 30, 2020 |
| | Shares | | Fair Value |
| Common Stocks — 45.2%(1) | | | | | | |
| Britain Power — 1.8%(1) | | | | | | |
| Atlantica Yield plc | | | 178,060 | | $ | 6,123,483 |
| |
| Canadian Crude Oil Pipelines — 4.2%(1) | | | |
| Enbridge Inc. | | | 465,024 | | | 14,513,399 |
| |
| Canadian Natural Gas Pipelines — 4.2%(1) | | | |
| TC Energy Corporation | | | 331,429 | | | 14,559,676 |
| |
| United States Crude Oil Pipelines — 3.4%(1) | | | |
| Plains GP Holdings L.P. | | | 1,503,705 | | | 11,924,381 |
| |
| United States Diversified Infrastructure — 6.5%(1) | | | |
| Clearway Energy, Inc. | | | 255,250 | | | 7,471,167 |
| NextEra Energy Partners LP | | | 239,816 | | | 15,221,122 |
| | | | | | | 22,692,289 |
| |
| United States Gathering and Processing — 3.9%(1) | | | |
| Equitrans Midstream Corporation | | | 1,165,251 | | | 9,508,448 |
| Targa Resources Corp. | | | 177,689 | | | 4,175,692 |
| | | | | | | 13,684,140 |
| |
| United States Natural Gas/Natural Gas Liquids Pipelines — 21.2%(1) |
| Cheniere Energy, Inc.(2) | | | 252,634 | | | 14,321,821 |
| Kinder Morgan, Inc. | | | 660,378 | | | 9,496,236 |
| New Fortress Energy, Inc. | | | 318,068 | | | 13,711,911 |
| ONEOK, Inc. | | | 452,348 | | | 16,225,723 |
| The Williams Companies, Inc. | | | 942,980 | | | 19,783,720 |
| | | | | | | 73,539,411 |
| Total Common Stocks | | | | | | |
| (Cost $187,005,295) | | | | | | 157,036,779 |
| | | | | | | |
| | Principal Amount | | | |
| Corporate Bonds — 27.2%(1) | | | | | | |
| Canadian Natural Gas Pipelines — 2.0%(1) | | | |
| Rockpoint Gas Storage Canada Ltd. | | | | | | |
| 7.000%, 03/31/2023(3) | | $ | 7,250,000 | | | 6,991,719 |
| |
| Marshall Island Marine Transportation — 2.0%(1) | | | |
| Teekay Corporation | | | | | | |
| 9.250%, 11/15/2022(3) | | | 3,875,000 | | | 3,730,187 |
| Teekay Offshore Partners LP / | | | | | | |
| Teekay Offshore Finance Corp. | | | | | | |
| 8.500%, 07/15/2023(3) | | | 3,700,000 | | | 3,073,461 |
| | | | | | | 6,803,648 |
| |
| United States Gathering and Processing — 12.2%(1) | | | |
| Antero Midstream Partners LP / | | | | | | |
| Antero Midstream Finance Corp. | | | | | | |
| 5.750%, 03/01/2027(3) | | | 2,600,000 | | | 2,374,125 |
| Blue Racer Midstream LLC / | | | | | | |
| Blue Racer Finance Corp. | | | | | | |
| 6.125%, 11/15/2022(3) | | | 11,325,000 | | | 11,349,632 |
| EnLink Midstream, LLC | | | | | | |
| 5.375%, 06/01/2029 | | | 4,255,000 | | | 4,039,590 |
| EnLink Midstream Partners, LP | | | | | | |
| 4.850%, 07/15/2026 | | | 7,200,000 | | | 6,759,000 |
| Hess Midstream Operations LP | | | | | | |
| 5.625%, 02/15/2026(3) | | | 7,750,000 | | | 8,016,406 |
| 5.125%, 06/15/2028(3) | | | 3,875,000 | | | 3,975,518 |
| Targa Resources Partners LP / Targa | | | | | | |
| Resources Partners Finance Corp. | | | | | | |
| 6.500%, 07/15/2027 | | | 5,275,000 | | | 5,723,375 |
| | | | | | | 42,237,646 |
| |
| United States Natural Gas Pipelines — 6.5%(1) | | | |
| NGPL Pipeco LLC | | | | | | |
| 7.768%, 12/15/2037(3) | | | 8,700,000 | | | 11,517,394 |
| Tallgrass Energy Partners LP / | | | | | | |
| Tallgrass Energy Finance Corp. | | | | | | |
| 6.000%, 03/01/2027(3) | | | 4,050,000 | | | 4,004,437 |
| 5.500%, 01/15/2028(3) | | | 7,575,000 | | | 7,237,193 |
| | | | | | | 22,759,024 |
| |
| United States Natural Gas/Natural Gas Liquids Pipelines — 2.6%(1) |
| New Fortress Energy, Inc. | | | | | | |
| 6.750%, 09/15/2025(3) | | | 8,400,000 | | | 8,940,750 |
| |
| United States Oil Field Services — 1.9%(1) | | | |
| Archrock Partners LP / | | | | | | |
| Archrock Partners Finance Corp. | | | | | | |
| 6.875%, 04/01/2027(3) | | | 6,275,000 | | | 6,535,099 |
| Total Corporate Bonds | | | | | | |
| (Cost $93,207,264) | | | | | | 94,267,886 |
| See accompanying Notes to Financial Statements. | |
| | |
| TortoiseEcofin | 25 |
| |
| |
| |
| |
| Tortoise MLP & Energy Income Fund |
| Schedule of Investments (continued) |
| November 30, 2020 |
| | Shares | | Fair Value |
| Master Limited Partnerships — 23.9%(1) | | | | | |
| | | | | | |
| United States Natural Gas Pipelines — 11.0%(1) | | | | | |
| DCP Midstream, LP | | 523,079 | | $ | 8,447,726 |
| Energy Transfer LP | | 2,169,051 | | | 13,404,735 |
| Enterprise Products Partners, L.P. | | 850,980 | | | 16,509,012 |
| | | | | 38,361,473 |
| | | | | |
| United States Refined Product Pipelines — 12.9%(1) | | | | | |
| Magellan Midstream Partners, L.P. | | 355,215 | | | 14,617,098 |
| MPLX LP | | 887,153 | | | 18,665,699 |
| Phillips 66 Partners LP | | 425,715 | | | 11,443,219 |
| | | | | 44,726,016 |
| Total Master Limited Partnerships | | | | | |
| (Cost $101,497,818) | | | | | 83,087,489 |
| | | | | |
| Convertible Preferred Stock — 1.1%(1) | | | | | |
| | | | | | |
| United States Power — 1.1%(1) | | | | | |
| CenterPoint Energy, Inc. | | | | | |
| 7.000%, 09/01/2021 | | | | | |
| (Cost $3,564,332) | | 90,145 | | | 3,802,316 |
| | | | | | |
| Short-Term Investment — 2.4%(1) | | | | | |
| | | | | | |
| United States Investment Company — 2.4%(1) | | | | | |
| First American Government Obligations Fund, | | | | | |
| Class X, 0.05%(4) | | | | | |
| (Cost $8,383,287) | | 8,383,287 | | | 8,383,287 |
| | | | | |
| Total Investments — 99.8%(1) | | | | | |
| (Cost $393,657,996) | | | | | 346,577,757 |
| Other Assets in Excess of | | | | | |
| Liabilities, Net — 0.2%(1) | | | | | 747,949 |
| Total Net Assets — 100.0%(1) | | | | $ | 347,325,706 |
| (1) | Calculated as a percentage of net assets. |
| (2) | Non-income producing security. |
| (3) | Security purchased within the terms of a private placement memorandum, except from registration under Rule 144A of the Securities Act 0f 1933, as amended, and may be sold only to dealers in that program or other “qualified institutional buyers.” As of November 30, 2020, the value of this investment was $77,745,921 or 22.4% of total net assets. |
| (4) | Rate indicated is the current yield as of November 30, 2020. |
| See accompanying Notes to Financial Statements. | |
| | |
| 26 | TortoiseEcofin |
| |
| |
| 2020 Annual Report | November 30, 2020 |
| |
| Tortoise MLP & Energy Infrastructure Fund |
| Schedule of Investments |
| November 30, 2020 |
| | Shares | | Fair Value |
| Common Stock — 45.0%(1) | | | | | | |
| | | | | | | |
| Britain Power — 1.8%(1) | | | | | | |
| Atlantica Yield plc | | | 8,455 | | $ | 290,767 |
| | | | | | | |
| Canadian Crude Oil Pipelines — 4.2%(1) | | | | | | |
| Enbridge Inc. | | | 22,080 | | | 689,117 |
| |
| Canadian Natural Gas Pipelines — 4.2%(1) | | | | | | |
| TC Energy Corporation | | | 15,736 | | | 691,282 |
| | | | | | | |
| United States Crude Oil Pipelines — 3.4%(1) | | | | | | |
| Plains GP Holdings L.P. | | | 71,403 | | | 566,226 |
| | | | | | | |
| United States Diversified Infrastructure — 6.5%(1) | | | | | | |
| Clearway Energy, Inc. | | | 12,120 | | | 354,752 |
| NextEra Energy Partners LP | | | 11,389 | | | 722,860 |
| | | | | | 1,077,612 |
| | | | | | | |
| United States Gathering and Processing — 3.9%(1) | | | | | | |
| Equitrans Midstream Corporation | | | 55,329 | | | 451,485 |
| Targa Resources Corp. | | | 8,440 | | | 198,340 |
| | | | | | 649,825 |
| |
| United States Natural Gas/Natural Gas Liquids Pipelines — 21.0%(1) |
| Cheniere Energy, Inc.(2) | | | 11,996 | | | 680,053 |
| Kinder Morgan, Inc. | | | 31,359 | | | 450,942 |
| New Fortress Energy, Inc. | | | 15,102 | | | 651,047 |
| ONEOK, Inc. | | | 21,481 | | | 770,524 |
| The Williams Companies, Inc. | | | 44,774 | | | 939,359 |
| | | | | | 3,491,925 |
| Total Common Stock | | | | | | |
| (Cost $4,260,500) | | | | | | 7,456,754 |
| |
| Master Limited Partnerships — 23.8%(1) | | | | | | |
| | | | | | | |
| United States Natural Gas Pipelines — 11.0%(1) | | | | | | |
| DCP Midstream, LP | | | 24,837 | | | 401,118 |
| Energy Transfer LP | | | 102,997 | | | 636,521 |
| Enterprise Products Partners, L.P. | | | 40,407 | | | 783,896 |
| | | | | | 1,821,535 |
| |
| United States Refined Product Pipelines — 12.8%(1) | | | | | | |
| Magellan Midstream Partners, L.P. | | | 16,868 | | | 694,118 |
| MPLX LP | | | 42,126 | | | 886,331 |
| Phillips 66 Partners LP | | | 20,215 | | | 543,379 |
| | | | | | 2,123,828 |
| Total Master Limited Partnerships | | | | | | |
| (Cost $2,161,431) | | | | | | 3,945,363 |
| | | | | | | |
| | | Principal Amount | | |
| Corporate Bonds — 22.8%(1) | | | | | | |
| | | | | | | |
| Canadian Natural Gas Pipelines — 1.7%(1) | | | |
| Rockpoint Gas Storage Canada Ltd. | | | | | | |
| 7.000%, 03/31/2023(3) | | $ | 300,000 | | | 289,313 |
| |
| Marshall Island Marine Transportation — 1.5%(1) | | | |
| Teekay Corporation | | | | | | |
| 9.250%, 11/15/2022(3) | | | 150,000 | | | 144,394 |
| Teekay Offshore Partners LP / | | | | | | |
| Teekay Offshore Finance Corp. | | | | | | |
| 8.500%, 07/15/2023(3) | | | 125,000 | | | 103,833 |
| | | | | | 248,227 |
| |
| United States Gathering and Processing — 10.2%(1) | | | |
| Antero Midstream Partners LP / | | | | | | |
| Antero Midstream Finance Corp. | | | | | | |
| 5.750%, 03/01/2027(3) | | | 95,000 | | | 86,747 |
| Blue Racer Midstream LLC / | | | | | | |
| Blue Racer Finance Corp. | | | | | | |
| 6.125%, 11/15/2022(3) | | | 450,000 | | | 450,979 |
| EnLink Midstream, LLC | | | | | | |
| 5.375%, 06/01/2029 | | | 175,000 | | | 166,140 |
| EnLink Midstream Partners, LP | | | | | | |
| 4.850%, 07/15/2026 | | | 275,000 | | | 258,156 |
| Hess Midstream Operations LP | | | | | | |
| 5.625%, 02/15/2026(3) | | | 325,000 | | | 336,172 |
| 5.125%, 06/15/2028(3) | | | 150,000 | | | 153,891 |
| Targa Resources Partners LP / Targa | | | | | | |
| Resources Partners Finance Corp. | | | | | | |
| 6.500%, 07/15/2027 | | | 212,000 | | | 230,020 |
| | | | | | 1,682,105 |
| |
| United States Natural Gas Pipelines — 5.6%(1) | | | | | | |
| NGPL Pipeco LLC | | | | | | |
| 7.768%, 12/15/2037(3) | | | 350,000 | | | 463,343 |
| Tallgrass Energy Partners LP / | | | | | | |
| Tallgrass Energy Finance Corp. | | | | | | |
| 6.000%, 03/01/2027(3) | | | 175,000 | | | 173,031 |
| 5.500%, 01/15/2028(3) | | | 300,000 | | | 286,622 |
| | | | | | 922,996 |
| See accompanying Notes to Financial Statements. | |
| | |
| TortoiseEcofin | 27 |
| |
| |
| |
| |
| Tortoise MLP & Energy Infrastructure Fund |
| Schedule of Investments (continued) |
| November 30, 2020 |
| | Principal | | | |
| | Amount/Shares | | Fair Value |
| United States Natural Gas/Natural Gas Liquids — 2.2%(1) | | | | | | |
| New Fortress Energy, Inc. | | | | | | |
| 6.750%, 09/15/2025(3) | | $ | 350,000 | | $ | 372,531 |
| |
| United States Oil Field Services — 1.6%(1) | | | | | | |
| Archrock Partners LP / | | | | | | |
| Archrock Partners Finance Corp. | | | | | | |
| 6.875%, 04/01/2027(3) | | | 250,000 | | | 260,363 |
| Total Corporate Bonds | | | | | | |
| (Cost $3,685,405) | | | | | | 3,775,535 |
| |
| Convertible Preferred Stock — 1.1%(1) | | | | | | |
| | | | | | | |
| United States Power — 1.1%(1) | | | | | | |
| CenterPoint Energy, Inc. | | | | | | |
| 7.000%, 09/01/2021 | | | | | | |
| (Cost $169,129) | | | 4,280 | | | 180,531 |
| | | | | | | |
| | Shares | | |
| Short-Term Investment — 7.0%(1) | | | | | | |
| | | | | | | |
| United States Investment Company — 7.0%(1) | | | | | | |
| First American Government Obligations Fund, | | | | | | |
| Class X, 0.05%(4) | | | | | | |
| (Cost $1,167,638) | | | 1,167,638 | | | 1,167,638 |
| |
| Total Investments — 99.7%(1) | | | | | | |
| (Cost $11,444,103) | | | | | | 16,525,821 |
| Other Assets in Excess of | | | | | | |
| Liabilities, Net — 0.3%(1) | | | | | | 47,885 |
| Total Net Assets — 100.0%(1) | | | | | $ | 16,573,706 |
| (1) | Calculated as a percentage of net assets. |
| (2) | Non-income producing security. |
| (3) | Security purchased within the terms of a private placement memorandum, except from registration under Rule 144A of the Securities Act 0f 1933, as amended, and may be sold only to dealers in that program or other “qualified institutional buyers.” As of November 30, 2020, the value of this investment was $3,121,219 or 18.8% of total net assets. |
| (4) | Rate indicated is the current yield as of November 30, 2020. |
| See accompanying Notes to Financial Statements. | |
| | |
| 28 | TortoiseEcofin |
| |
| |
| 2020 Annual Report | November 30, 2020 |
| |
| Tortoise Energy Evolution Fund |
| Schedule of Investments |
| November 30, 2020 |
| | Shares | | Fair Value |
| Common Stock — 109.9%(1) | | | | | | |
| | | | | | | |
| Australia Power — 2.6%(1) | | | | | | |
| Spark Infrastructure Group | | 142,684 | | $ | 214,286 | |
| | |
| Britain Power — 4.0%(1) | | | | | | |
| Atlantica Sustainable Infrastructure PLC | | 9,545 | | | 328,253 | |
| | |
| Canadian Crude Oil Pipelines — 5.1%(1) | | | | | | |
| Enbridge Inc. | | 13,501 | | | 421,366 | |
| | |
| Canadian Natural Gas/Natural Gas Liquids Pipelines — 4.9%(1) | |
| TC Energy Corporation | | 9,158 | | | 402,311 | |
| | |
| Canadian Power — 6.9%(1) | | | | | | |
| Algonquin Power & Utilities Corp. | | 10,218 | | | 160,111 | |
| Innergex Renewable Energy Inc. | | 10,423 | | | 206,261 | |
| TransAlta Renewables Inc. | | 14,728 | | | 203,450 | |
| | | | | 569,822 | |
| | |
| Canadian Renewable Infrastructure — 1.5%(1) | | | | |
| Ballard Power Systems Inc.(2) | | 6,062 | | | 124,453 | |
| | |
| Denmark Power — 8.3%(1) | | | | | | |
| Orsted A/S | | 3,822 | | | 687,680 | |
| | |
| Germany Power — 7.0%(1) | | | | | | |
| RWE AG | | 13,924 | | | 575,928 | |
| | |
| Italy Power — 12.7%(1) | | | | | | |
| Enel SpA | | 67,888 | | | 681,107 | |
| Terna — Rete Elettrica Nazionale SpA | | 48,972 | | | 367,844 | |
| | | | | 1,048,951 | |
| | |
| Portugal Power — 6.2%(1) | | | | | | |
| EDP — Energias de Portugal, S.A. | | 95,324 | | | 509,532 | |
| | |
| Spain Power — 8.1%(1) | | | | | | |
| Iberdrola, S.A. | | 48,628 | | | 667,550 | |
| | |
| United States Diversified Infrastructure — 21.0%(1) | | | | |
| Clearway Energy, Inc. | | 6,578 | | | 192,538 | |
| Dominion Energy, Inc. | | 1,084 | | | 85,083 | |
| NextEra Energy Partners LP | | 4,207 | | | 267,018 | |
| NextEra Energy, Inc. | | 7,932 | | | 583,716 | |
| Sempra Energy | | 1,101 | | | 140,356 | |
| Xcel Energy, Inc. | | 6,919 | | | 466,064 | |
| | | | | 1,734,775 | |
| | | | | | | |
| United States Natural Gas/Natural Gas Liquids Pipelines — 8.8%(1) | |
| Cheniere Energy, Inc.(2) | | 3,388 | | | 192,066 | |
| New Fortress Energy Inc. | | 2,692 | | | 116,052 | |
| The Williams Companies, Inc. | | 20,029 | | | 420,208 | |
| | | | | 728,326 | |
| |
| United States Power — 9.4%(1) | | | | | | |
| Covanta Holding Corporation | | 31,329 | | | 388,479 | |
| Edison International | | 1,694 | | | 103,944 | |
| Eversource Energy | | 2,110 | | | 184,646 | |
| Public Service Enterprise Group Incorporated | | 1,692 | | | 98,610 | |
| | | | | 775,679 | |
| |
| United States Renewable Infrastructure — 1.2%(1) | | | | |
| Generac Holdings Inc.(2) | | 442 | | | 95,295 | |
| |
| United States Solar — 2.2%(1) | | | | | | |
| Sunrun Inc.(2) | | 2,795 | | | 179,104 | |
| Total Common Stock | | | | | | |
| (Cost $7,794,301) | | | | | 9,063,311 | |
| |
| Master Limited Partnership — 3.4%(1) | | | | | | |
| | | | | | | |
| United States Natural Gas/Natural Gas Liquids Pipelines — 3.4%(1) | |
| Enterprise Products Partners L.P. | | | | | | |
| (Cost $264,956) | | 14,559 | | | 282,445 | |
| |
| Short-Term Investment — 0.9%(1) | | | | | | |
| | | | | | | |
| United States Investment Company — 0.9%(1) | | | | |
| First American Government Obligations Fund, | | | | | | |
| Class X, 0.05%(3) | | | | | | |
| (Cost $74,472) | | 74,472 | | | 74,472 | |
| |
| Total Investments — 114.2%(1) | | | | | | |
| (Cost $8,133,729) | | | | | 9,420,228 | |
| Liabilities in Excess of | | | | | | |
| Other Assets, Net — (14.2)%(1) | | | | | (1,171,478 | ) |
| Total Net Assets — 100.0%(1) | | | | $ | 8,248,750 | |
| (1) | Calculated as a percentage of net assets. |
| (2) | Non-income producing security. |
| (3) | Rate indicated is the current yield as of November 30, 2020. |
| See accompanying Notes to Financial Statements. | |
| | |
| TortoiseEcofin | 29 |
| |
| |
| |
| |
| Ecofin Global Renewables Infrastructure Fund |
| Schedule of Investments |
| November 30, 2020 |
| | Shares | | Fair Value |
| Common Stock — 87.3%(1) | | | | | |
| | | | | | |
| Australia Power — 2.0%(1) | | | | | |
| Spark Infrastructure Group | | 1,436,217 | | $ | 2,156,945 |
| |
| Belgium Power — 2.0%(1) | | | | | |
| Elia Group SA/NV | | 19,438 | | | 2,197,167 |
| |
| Canada Power — 9.3%(1) | | | | | |
| Algonquin Power & Utilities Corp. | | 182,151 | | | 2,854,218 |
| Innergex Renewable Energy Inc. | | 131,507 | | | 2,602,395 |
| TransAlta Renewables, Inc. | | 342,088 | | | 4,725,540 |
| | | | | 10,182,153 |
| |
| Denmark Power — 5.5%(1) | | | | | |
| Orsted A/S | | 33,249 | | | 5,982,386 |
| |
| Germany Power — 3.7%(1) | | | | | |
| Encavis AG | | 190,305 | | | 4,044,108 |
| |
| Hong Kong Power — 4.9%(1) | | | | | |
| China Longyuan Power Group Corp. Ltd. | | 6,304,498 | | | 5,326,304 |
| |
| Hong Kong Transportation/Storage — 3.2%(1) | | | |
| China Suntien Green Energy Corp. Ltd. | | 13,158,397 | | | 3,481,631 |
| |
| Italy Power — 7.1%(1) | | | | | |
| ERG SpA | | 167,200 | | | 4,041,231 |
| Terna — Rete Elettrica Nazionale SpA | | 500,724 | | | 3,761,096 |
| | | | | 7,802,327 |
| |
| Japan Power — 3.9%(1) | | | | | |
| RENOVA, Inc.(2) | | 171,672 | | | 4,236,972 |
| |
| Norway Power — 2.6%(1) | | | | | |
| Scatec Solar ASA | | 90,569 | | | 2,827,872 |
| |
| Portugal Power — 4.0%(1) | | | | | |
| EDP — Energias de Portugal, S.A. | | 829,285 | | | 4,432,738 |
| |
| Spain Power — 4.7%(1) | | | | | |
| Iberdrola, S.A. | | 375,436 | | | 5,153,869 |
| | | | |
| United States Diversified Infrastructure — 8.4%(1) | | | |
| NextEra Energy Partners LP | | 45,681 | | | 2,899,373 |
| NextEra Energy, Inc. | | 85,316 | | | 6,278,404 |
| | | | | 9,177,777 |
| |
| United States Power — 22.2%(1) | | | | | |
| Atlantica Yield plc | | 122,548 | | | 4,214,426 |
| Brookfield Renewable Partners LP | | 78,314 | | | 4,979,204 |
| Covanta Holding Corporation | | 73,108 | | | 906,539 |
| Edison International | | 97,479 | | | 5,981,311 |
| Exelon Corporation | | 106,910 | | | 4,390,794 |
| Public Service Enterprise | | | | | |
| Group Incorporated | | 65,553 | | | 3,820,429 |
| | | | | 24,292,703 |
| |
| United States Solar — 3.8%(1) | | | | | |
| Sunrun, Inc.(2) | | 65,451 | | | 4,194,100 |
| Total Common Stock | | | | | |
| (Cost $76,359,075) | | | | | 95,489,052 |
| |
| Short-Term Investment — 4.1%(1) | | | | | |
| | | | | | |
| United States Investment Company — 4.1%(1) | | | |
| First American Government Obligations Fund, | | | |
| Class X, 0.05%(3) | | | | | |
| (Cost $4,504,049) | | 4,504,049 | | | 4,504,049 |
| |
| Total Investments — 91.4%(1) | | | | | |
| (Cost $80,863,124) | | | | | 99,993,101 |
| Other Assets in Excess of | | | | | |
| Liabilities, Net — 8.6%(1) | | | | | 9,393,019 |
| Total Net Assets — 100.0%(1) | | | | $ | 109,386,120 |
| (1) | Calculated as a percentage of net assets. |
| (2) | Non-income producing security. |
| (3) | Rate indicated is the current yield as of November 30, 2020. |
| See accompanying Notes to Financial Statements. | |
| | |
| 30 | TortoiseEcofin |
| |
| |
2020 Annual Report | November 30, 2020 |
| |
| Ecofin Global Renewables Infrastructure Fund |
| Open Swap Contracts |
| November 30, 2020 |
| | | | | | Pay/Receive | | | | | | | | | | | | | |
| | | | | | on | | | | | | | | | | | Unrealized |
| | | | Termination | | Financing | | | | Payment | | | | Notional | | Appreciation |
| Counterparty | | Security | | Date | | Rate | | Financing Rate | | Frequency | | Shares | | Amount | | (Depreciation)* |
| Morgan Stanley | | SSE PLC | | 8/17/21 | | Pay | | 0.200% + Sterling | | Monthly | | 86,189 | | $ | 1,540,854 | | $ | (24,267 | ) |
| | | | | | | | Overnight Index Average | | | | | | | | | | | |
| |
| Morgan Stanley | | EDF | | 8/17/21 | | Pay | | 0.200% + Euro | | Monthly | | 228,515 | | | 3,465,900 | | | 188,792 | |
| | | | | | | | Overnight Index Average | | | | | | | | | | | |
| |
| Morgan Stanley | | Greencoat UK | | 8/17/21 | | Pay | | 0.200% + Sterling | | Monthly | | 1,552,218 | | | 2,698,430 | | | (3,669 | ) |
| | Wind PLC | | | | | | Overnight Index Average | | | | | | | | | | | |
| |
| Morgan Stanley | | National Grid PLC | | 8/17/21 | | Pay | | 0.200% + Sterling | | Monthly | | 169,012 | | | 1,911,609 | | | (163,575 | ) |
| | | | | | | | Overnight Index Average | | | | | | | | | | | |
| | | | | | | | | | | | | | | | | $ | (2,719 | ) |
| * | Based on the net swap value held at each counterparty. Unrealized appreciation (depreciation) is a receivable (payable). |
| |
| |
| |
| |
| Statements of Assets & Liabilities |
| November 30, 2020 |
| |
| | | | | | Tortoise MLP |
| | Tortoise MLP & | | & Energy |
| | Pipeline Fund | | Income Fund |
| Assets: | | | | | | | | |
| Investments, at fair value | | | | | | | | |
| Unaffiliated Investments (cost $1,707,167,626, $393,657,996, $11,444,103, | | | | | | | | |
| $8,133,729 and $80,863,124, respectively) | | $ | 1,520,754,437 | | | $ | 346,577,757 | |
| Affiliated Investments (cost $171,516,879, $0, $0 $0 and $0, respectively) | | | 95,650,431 | | | | — | |
| Cash | | | — | | | | 4 | |
| Foreign cash (cost $0, $0, $0, $0, $35,269, respectively) | | | — | | | | — | |
| Cash held as collateral | | | — | | | | — | |
| Dividends and interest receivable | | | 3,238,779 | | | | 2,209,654 | |
| Receivable for investment securities sold | | | 27,148,639 | | | | — | |
| Receivable for capital shares sold | | | 3,644,945 | | | | 500,198 | |
| Receivable for Adviser expense reimbursement | | | — | | | | — | |
| Prepaid expenses and other assets | | | 49,662 | | | | 51,243 | |
| Total assets | | | 1,650,486,893 | | | | 349,338,856 | |
| Liabilities: | | | | | | | | |
| Payable for swap contracts | | | — | | | | — | |
| Payable for investment securities purchased | | | — | | | | — | |
| Payable for capital shares redeemed | | | 2,938,488 | | | | 1,603,070 | |
| Payable to Adviser | | | 1,094,791 | | | | 277,547 | |
| Payable for fund administration & accounting fees | | | 104,474 | | | | 39,972 | |
| Payable for compliance fees | | | 2,157 | | | | 2,165 | |
| Payable for custody fees | | | 15,967 | | | | 2,346 | |
| Payable for audit & tax | | | 51,152 | | | | 27,232 | |
| Payable for transfer agent fees & expenses | | | 63,984 | | | | 20,623 | |
| Payable for interest expense | | | 276 | | | | — | |
| Accrued expenses | | | 88,878 | | | | 21,168 | |
| Accrued distribution fees | | | 93,367 | | | | 19,027 | |
| Total liabilities | | | 4,453,534 | | | | 2,013,150 | |
| Net Assets | | $ | 1,646,033,359 | | | $ | 347,325,706 | |
| Net Assets Consist of: | | | | | | | | |
| Capital Stock | | $ | 3,239,811,710 | | | $ | 711,573,291 | |
| Total distributable earnings (loss) | | | (1,593,778,351 | ) | | | (364,247,585 | ) |
| Net Assets | | $ | 1,646,033,359 | | | $ | 347,325,706 | |
| |
| Institutional Class | | | | | | | | |
| Net Assets | | $ | 1,493,620,893 | | | $ | 291,420,192 | |
| Shares issued and outstanding(1) | | | 179,234,249 | | | | 53,551,093 | |
| Net asset value, redemption price and minimum offering price per share | | $ | 8.33 | | | $ | 5.44 | |
| |
| A Class | | | | | | | | |
| Net Assets | | $ | 132,881,598 | | | $ | 32,255,361 | |
| Shares issued and outstanding(1) | | | 16,098,050 | | | | 5,803,962 | |
| Net asset value, redemption price and minimum offering price per share | | $ | 8.25 | | | $ | 5.56 | |
| Maximum offering price per share(2) | | $ | 8.73 | | | $ | 5.88 | |
| |
| C Class | | | | | | | | |
| Net Assets | | $ | 19,530,868 | | | $ | 23,650,153 | |
| Shares issued and outstanding(1) | | | 2,387,810 | | | | 4,242,663 | |
| Net asset value, redemption price and minimum offering price per share | | $ | 8.18 | | | $ | 5.57 | |
| (1) | Unlimited shares authorized. |
| (2) | The offering price is calculated by dividing the net asset value by 1 minus the maximum sales charge of 5.50%. |
| See accompanying Notes to Financial Statements. | |
| | |
| 32 | TortoiseEcofin |
| |
| |
| 2020 Annual Report | November 30, 2020 |
| |
| |
| |
| |
| Tortoise MLP | | | | | | Ecofin Global | |
| & Energy | | Tortoise Energy | | Renewables | |
| Infrastructure Fund | | Evolution Fund | | Infrastructure Fund | |
| | | | | | |
| | |
| | |
| $ | 16,525,821 | | | $ | 9,420,228 | | | $ | 99,993,101 | |
| — | | | | — | | | | — | |
| — | | | | — | | | | — | |
| — | | | | — | | | | 35,326 | |
| — | | | | — | | | | 8,990,948 | |
| 99,465 | | | | 21,013 | | | | 371,252 | |
| — | | | | — | | | | 176,053 | |
| — | | | | 78,640 | | | | 90,150 | |
| 10,403 | | | | 20,284 | | | | 23,965 | |
| 9,910 | | | | 22,114 | | | | 12,430 | |
| 16,645,599 | | | | 9,562,279 | | | | 109,693,225 | |
| | |
| — | | | | — | | | | 2,719 | |
| — | | | | — | | | | 176,053 | |
| — | | | | 1,226,196 | | | | — | |
| 19,208 | | | | 6,367 | | | | 63,375 | |
| 12,998 | | | | 16,844 | | | | 15,246 | |
| 2,164 | | | | 2,165 | | | | 1,619 | |
| 834 | | | | 5,070 | | | | 5,545 | |
| 27,051 | | | | 42,849 | | | | 28,646 | |
| 1,492 | | | | 4,571 | | | | 3,713 | |
| — | | | | 68 | | | | — | |
| 8,146 | | | | 7,801 | | | | 9,963 | |
| — | | | | 1,598 | | | | 226 | |
| 71,893 | | | | 1,313,529 | | | | 307,105 | |
| $ | 16,573,706 | | | $ | 8,248,750 | | | $ | 109,386,120 | |
| | |
| $ | 150,132,491 | | | $ | 40,055,830 | | | $ | 88,709,154 | |
| (133,558,785 | ) | | | (31,807,080 | ) | | | 20,676,966 | |
| $ | 16,573,706 | | | $ | 8,248,750 | | | $ | 109,386,120 | |
| | |
| | |
| $ | 16,573,706 | | | $ | 5,550,035 | | | $ | 108,047,953 | |
| 3,212,575 | | | | 801,749 | | | | 9,461,639 | |
| $ | 5.16 | | | $ | 6.92 | | | $ | 11.42 | |
| | |
| | |
| $ | — | | | $ | 1,948,027 | | | $ | 1,338,167 | |
| — | | | | 283,291 | | | | 116,983 | |
| $ | — | | | $ | 6.88 | | | $ | 11.44 | |
| $ | — | | | $ | 7.28 | | | $ | 12.11 | |
| | |
| | |
| $ | — | | | $ | 750,688 | | | $ | — | |
| — | | | | 113,031 | | | | — | |
| $ | — | | | $ | 6.64 | | | $ | — | |
| |
| |
| |
| |
| Statements of Operations |
| For the Year Ended November 30, 2020 |
| |
| | | | | | Tortoise MLP |
| | Tortoise MLP & | | & Energy |
| | Pipeline Fund | | Income Fund |
| Investment Income: | | | | | | | | |
| Dividends and distributions from unaffiliated common stock | | $ | 122,164,658 | | | $ | 12,088,080 | |
| Dividends and distributions from affiliated common stock | | | 10,413,327 | | | | — | |
| Distributions from master limited partnerships | | | 67,802,481 | | | | 13,903,675 | |
| Less: return of capital on distributions from unaffiliated investments | | | (122,466,034 | ) | | | (20,241,244 | ) |
| Less: return of capital on distributions from affiliated investments | | | (10,413,327 | ) | | | — | |
| Less: foreign taxes withheld | | | (5,380,334 | ) | | | (382,255 | ) |
| Net dividends and distributions from investments | | | 62,120,771 | | | | 5,368,256 | |
| Dividends from money market mutual funds | | | 256,532 | | | | 94,772 | |
| Interest income | | | — | | | | 9,711,486 | |
| Total investment income | | | 62,377,303 | | | | 15,174,514 | |
| Expenses: | | | | | | | | |
| Advisory fees (See Note 6) | | | 20,533,746 | | | | 4,812,477 | |
| Fund administration & accounting fees (See Note 6) | | | 926,247 | | | | 323,554 | |
| Transfer agent fees & expenses (See Note 6) | | | 483,769 | | | | 99,606 | |
| Shareholder communication fees | | | 254,325 | | | | 56,944 | |
| Registration fees | | | 199,032 | | | | 75,139 | |
| Custody fees (See Note 6) | | | 146,399 | | | | 22,697 | |
| Audit & tax fees | | | 47,508 | | | | 23,994 | |
| Insurance fees | | | 21,099 | | | | 3,593 | |
| Other | | | 15,013 | | | | 7,005 | |
| Trustee fees | | | 13,238 | | | | 10,006 | |
| Compliance fees (See Note 6) | | | 10,301 | | | | 10,844 | |
| Legal fees | | | 7,579 | | | | 6,786 | |
| Distribution fees (See Note 7): | | | | | | | | |
| A Class | | | 579,147 | | | | 89,504 | |
| C Class | | | 253,188 | | | | 323,192 | |
| Total expenses before interest expense on line of credit | | | 23,490,591 | | | | 5,865,341 | |
| Interest expense on line of credit (See Note 11) | | | 82,229 | | | | 24,111 | |
| Total expenses before reimbursement/recoupment | | | 23,572,820 | | | | 5,889,452 | |
| Fee recoupment (See Note 6) | | | — | | | | 26,884 | |
| Less: expense reimbursement by Adviser | | | — | | | | (26,884 | ) |
| Net expenses | | | 23,572,820 | | | | 5,889,452 | |
| Net Investment Income | | | 38,804,483 | | | | 9,285,062 | |
| Realized and Unrealized Gain (Loss) on Investments | | | | | | | | |
| and Translations of Foreign Currency | | | | | | | | |
| Net realized gain (loss) on: | | | | | | | | |
| Unaffiliated investments, including foreign currency gain (loss) | | | (933,053,281 | ) | | | (113,299,470 | ) |
| Affiliated investments, including foreign currency gain (loss) | | | (50,625,613 | ) | | | — | |
| Written options contracts | | | — | | | | (2,188,386 | ) |
| Swap contracts | | | — | | | | — | |
| Net change in unrealized appreciation (depreciation) of: | | | | | | | | |
| Unaffiliated investments and translations of foreign currency | | | (84,888,734 | ) | | | (15,202,128 | ) |
| Affiliated investments and translations of foreign currency | | | (39,596,967 | ) | | | — | |
| Written options contracts | | | — | | | | 1,758,724 | |
| Swap contracts | | | — | | | | — | |
| Net Realized and Unrealized Gain (Loss) on Investments | | | | | | | | |
| and Translations of Foreign Currency | | | (1,108,164,595 | ) | | | (128,931,260 | ) |
| Net Increase (Decrease) in Net Assets Resulting from Operations | | $ | (1,069,360,112 | ) | | $ | (119,646,198 | ) |
| See accompanying Notes to Financial Statements. | |
| | |
| 34 | TortoiseEcofin |
| |
| |
| 2020 Annual Report | November 30, 2020 |
| |
| |
| |
| |
| Tortoise MLP | | | | | | Ecofin Global | |
| & Energy | | Tortoise Energy | | Renewables | |
| Infrastructure Fund | | Evolution Fund | | Infrastructure Fund | |
| | | | | | |
| $ | 1,591,228 | | | $ | 503,460 | | | $ | 862,291 | | |
| — | | | | — | | | | — | | |
| 1,850,806 | | | | 52,337 | | | | — | | |
| (2,699,403 | ) | | | (120,442 | ) | | | (123,546 | ) | |
| — | | | | — | | | | — | | |
| (49,298 | ) | | | (32,354 | ) | | | (48,862 | ) | |
| 693,333 | | | | 403,001 | | | | 689,883 | | |
| 16,314 | | | | 328 | | | | 509 | | |
| 1,136,841 | | | | — | | | | — | | |
| 1,846,488 | | | | 403,329 | | | | 690,392 | | |
| | |
| 460,005 | | | | 95,260 | | | | 205,312 | | |
| 82,949 | | | | 111,337 | | | | 34,582 | | |
| 5,240 | | | | 24,640 | | | | 5,974 | | |
| 4,561 | | | | 1,899 | | | | 1,198 | | |
| 18,685 | | | | 47,455 | | | | 39,468 | | |
| 16,977 | | | | 36,767 | | | | 13,697 | | |
| 24,056 | | | | 39,203 | | | | 28,646 | | |
| 1,366 | | | | 1,330 | | | | 4 | | |
| 1,501 | | | | 8,654 | | | | 1,201 | | |
| 10,063 | | | | 12,471 | | | | 3,304 | | |
| 10,440 | | | | 10,312 | | | | 3,040 | | |
| 7,182 | | | | 7,490 | | | | 64,737 | | |
| | |
| — | | | | 4,479 | | | | 249 | | |
| — | | | | 8,238 | | | | — | | |
| 643,025 | | | | 409,535 | | | | 401,412 | | |
| 7,201 | | | | 937 | | | | — | | |
| 650,226 | | | | 410,472 | | | | 401,412 | | |
| 4,166 | | | | — | | | | — | | |
| (34,322 | ) | | | (273,530 | ) | | | (127,414 | ) | |
| 620,070 | | | | 136,942 | | | | 273,998 | | |
| 1,226,418 | | | | 266,387 | | | | 416,394 | | |
| | |
| | |
| | |
| (16,231,897 | ) | | | (3,314,275 | ) | | | 728,125 | | |
| — | | | | — | | | | — | | |
| (607,940 | ) | | | — | | | | — | | |
| — | | | | — | | | | 624,251 | | |
| | |
| 7,743,024 | | | | 1,287,104 | | | | 19,124,210 | | |
| — | | | | — | | | | — | | |
| 177,446 | | | | — | | | | — | | |
| — | | | | — | | | | (2,719 | ) | |
| | |
| (8,919,367 | ) | | | (2,027,171 | ) | | | 20,473,867 | | |
| $ | (7,692,949 | ) | | $ | (1,760,784 | ) | | $ | 20,890,261 | | |
| |
| |
| |
| |
| Statements of Changes in Net Assets |
| |
| |
| | Tortoise MLP & Pipeline Fund | | Tortoise MLP & Energy Income Fund |
| | Year Ended | | Year Ended | | Year Ended | | Year Ended |
| | November 30, 2020 | | November 30, 2019 | | November 30, 2020 | | November 30, 2019 |
| Operations | | | | | | | | | | | | | | | | |
| Net investment income | | $ | 38,804,483 | | | $ | 39,717,457 | | | $ | 9,285,062 | | | $ | 13,219,961 | |
| Net realized loss on unaffiliated investments, | | | | | | | | | | | | | | | | |
| written options contracts and foreign currency | | | (933,053,281 | ) | | | (118,356,314 | ) | | | (115,487,856 | ) | | | (45,624,308 | ) |
| Net realized loss on affiliated investments | | | | | | | | | | | | | | | | |
| and foreign currency | | | (50,625,613 | ) | | | — | | | | — | | | | — | |
| Net change in unrealized depreciation of affiliated | | | | | | | | | | | | | | | | |
| investments and translations of foreign currency | | | (39,596,967 | ) | | | — | | | | — | | | | — | |
| Net change in unrealized appreciation (depreciation) | | | | | | | | | | | | | | | | |
| of unaffiliated investments, written options | | | | | | | | | | | | | | | | |
| contracts and translations of foreign currency | | | (84,888,734 | ) | | | 38,511,279 | | | | (13,443,404 | ) | | | 26,021,877 | |
| Net decrease in net assets resulting | | | | | | | | | | | | | | | | |
| from operations | | | (1,069,360,112 | ) | | | (40,127,578 | ) | | | (119,646,198 | ) | | | (6,382,470 | ) |
| Capital Share Transactions | | | | | | | | | | | | | | | | |
| Institutional Class: | | | | | | | | | | | | | | | | |
| Proceeds from shares sold | | | 1,666,220,458 | | | | 1,735,478,141 | | | | 216,836,920 | | | | 331,280,795 | |
| Proceeds from reinvestment of distributions | | | 80,595,382 | | | | 116,680,997 | | | | 20,273,405 | | | | 41,875,525 | |
| Payments for shares redeemed | | | (2,480,220,357 | ) | | | (1,985,311,239 | ) | | | (435,561,392 | ) | | | (423,416,384 | ) |
| Proceeds from redemption fees | | | — | | | | — | | | | — | | | | 64,051 | |
| Decrease in net assets from | | | | | | | | | | | | | | | | |
| Institutional Class transactions | | | (733,404,517 | ) | | | (133,152,101 | ) | | | (198,451,067 | ) | | | (50,196,013 | ) |
| A Class(1): | | | | | | | | | | | | | | | | |
| Proceeds from shares sold | | | 66,455,457 | | | | 99,215,372 | | | | 21,090,138 | | | | 17,094,555 | |
| Proceeds from reinvestment of distributions | | | 8,121,627 | | | | 20,142,451 | | | | 1,114,922 | | | | 1,766,514 | |
| Payments for shares redeemed | | | (246,342,793 | ) | | | (95,709,057 | ) | | | (23,895,013 | ) | | | (23,666,932 | ) |
| Proceeds from redemption fees | | | — | | | | — | | | | — | | | | 18,653 | |
| Increase (Decrease) in net assets from | | | | | | | | | | | | | | | | |
| A Class transactions | | | (171,765,709 | ) | | | 23,648,766 | | | | (1,689,953 | ) | | | (4,787,210 | ) |
| C Class: | | | | | | | | | | | | | | | | |
| Proceeds from shares sold | | | 6,315,299 | | | | 8,742,459 | | | | 5,103,535 | | | | 12,441,343 | |
| Proceeds from reinvestment of distributions | | | 716,944 | | | | 1,273,399 | | | | 1,061,684 | | | | 2,060,859 | |
| Payments for shares redeemed | | | (14,426,219 | ) | | | (21,390,810 | ) | | | (19,839,051 | ) | | | (17,917,138 | ) |
| Proceeds from redemption fees | | | — | | | | — | | | | — | | | | 10,027 | |
| Decrease in net assets from C Class transactions | | | (7,393,976 | ) | | | (11,374,952 | ) | | | (13,673,832 | ) | | | (3,404,909 | ) |
| Net decrease in net assets resulting | | | | | | | | | | | | | | | | |
| from capital share transactions | | | (912,564,202 | ) | | | (120,878,287 | ) | | | (213,814,852 | ) | | | (58,388,132 | ) |
| Distributions to Shareholders | | | | | | | | | | | | | | | | |
| From distributable earnings | | | | | | | | | | | | | | | | |
| Institutional Class | | | (33,907,900 | ) | | | (54,033,930 | ) | | | (5,229,945 | ) | | | (1,078,191 | ) |
| A Class(1) | | | (3,340,533 | ) | | | (6,745,708 | ) | | | (442,607 | ) | | | (78,538 | ) |
| C Class | | | (127,088 | ) | | | (340,815 | ) | | | (346,587 | ) | | | (74,983 | ) |
| From tax return of capital | | | | | | | | | | | | | | | | |
| Institutional Class | | | (63,087,200 | ) | | | (99,340,629 | ) | | | (29,373,316 | ) | | | (63,519,356 | ) |
| A Class(1) | | | (5,107,626 | ) | | | (13,841,994 | ) | | | (2,566,298 | ) | | | (4,711,756 | ) |
| C Class | | | (692,215 | ) | | | (1,115,300 | ) | | | (2,021,216 | ) | | | (4,192,292 | ) |
| Total distributions to shareholders | | | (106,262,562 | ) | | | (175,418,376 | ) | | | (39,979,969 | ) | | | (73,655,116 | ) |
| Total Decrease in Net Assets | | | (2,088,186,876 | ) | | | (336,424,241 | ) | | | (373,441,019 | ) | | | (138,425,718 | ) |
| Net Assets | | | | | | | | | | | | | | | | |
| Beginning of year | | | 3,734,220,235 | | | | 4,070,644,476 | | | | 720,766,725 | | | | 859,192,443 | |
| End of year | | $ | 1,646,033,359 | | | $ | 3,734,220,235 | | | $ | 347,325,706 | | | $ | 720,766,725 | |
| (1) | Prior to March 30, 2019, A Class Shares for the MLP & Pipeline Fund were known as Investor Class Shares |
| | |
| See accompanying Notes to Financial Statements. | |
| | |
| 36 | TortoiseEcofin |
| |
| |
| 2020 Annual Report | November 30, 2020 |
| |
| Statements of Changes in Net Assets (continued) |
| |
| |
| | Tortoise MLP & Pipeline Fund | | Tortoise MLP & Energy Income Fund |
| | Year Ended | | Year Ended | | Year Ended | | Year Ended |
| | November 30, 2020 | | November 30, 2019 | | November 30, 2020 | | November 30, 2019 |
| Transactions in Shares: | | | | | | | | | | | | |
| Institutional Class: | | | | | | | | | | | | |
| Shares sold | | 196,548,538 | | | 140,773,462 | | | 37,743,731 | | | 45,267,457 | |
| Shares issued to holders in reinvestment | | | | | | | | | | | | |
| of dividends | | 8,890,623 | | | 9,729,012 | | | 3,616,878 | | | 5,824,325 | |
| Shares redeemed | | (304,075,115 | ) | | (160,919,033 | ) | | (81,062,908 | ) | | (58,583,809 | ) |
| Decrease in Institutional Class shares outstanding | | (98,635,954 | ) | | (10,416,559 | ) | | (39,702,299 | ) | | (7,492,027 | ) |
| A Class(1): | | | | | | | | | | | | |
| Shares sold | | 7,776,352 | | | 7,957,922 | | | 3,567,851 | | | 2,290,349 | |
| Shares issued to holders in reinvestment | | | | | | | | | | | | |
| of dividends | | 877,896 | | | 1,689,780 | | | 194,479 | | | 241,586 | |
| Shares redeemed | | (33,402,644 | ) | | (7,776,547 | ) | | (4,583,449 | ) | | (3,235,462 | ) |
| Increase (Decrease) in A Class shares outstanding | | (24,748,396 | ) | | 1,871,155 | | | (821,119 | ) | | (703,527 | ) |
| C Class: | | | | | | | | | | | | |
| Shares sold | | 647,938 | | | 734,617 | | | 897,219 | | | 1,665,205 | |
| Shares issued to holders in reinvestment | | | | | | | | | | | | |
| of dividends | | 85,701 | | | 106,172 | | | 185,660 | | | 280,410 | |
| Shares redeemed | | (1,671,446 | ) | | (1,785,450 | ) | | (3,659,576 | ) | | (2,419,130 | ) |
| Decrease in C Class shares outstanding | | (937,807 | ) | | (944,661 | ) | | (2,576,697 | ) | | (473,515 | ) |
| Net decrease in shares outstanding | | (124,322,157 | ) | | (9,490,065 | ) | | (43,100,115 | ) | | (8,669,069 | ) |
| (1) | Prior to March 30, 2019, A Class Shares for the MLP & Pipeline Fund were known as Investor Class Shares |
| See accompanying Notes to Financial Statements. | |
| | |
| TortoiseEcofin | 37 |
| |
| |
| |
| |
| Statements of Changes in Net Assets (continued) |
| |
| |
| | Tortoise MLP & Energy Infrastructure Fund | | Tortoise Energy Evolution Fund |
| | Year Ended | | Year Ended | | Year Ended | | Year Ended |
| | November 30, 2020 | | November 30, 2019 | | November 30, 2020 | | November 30, 2019 |
| Operations | | | | | | | | | | | | | | | | |
| Net investment income | | $ | 1,226,418 | | | $ | 2,840,107 | | | $ | 266,387 | | | $ | 269,085 | |
| Net realized loss on investments, | | | | | | | | | | | | | | | | |
| written options contracts and foreign currency | | | (16,839,837 | ) | | | (31,020,540 | ) | | | (3,314,275 | ) | | | (7,232,326 | ) |
| Net change in unrealized appreciation | | | | | | | | | | | | | | | | |
| of investments, written options contracts | | | | | | | | | | | | | | | | |
| and translations of foreign currency | | | 7,920,470 | | | | 36,860,325 | | | | 1,287,104 | | | | 4,113,782 | |
| Net increase (decrease) in net assets resulting | | | | | | | | | | | | | | | | |
| from operations | | | (7,692,949 | ) | | | 8,679,892 | | | | (1,760,784 | ) | | | (2,849,459 | ) |
| Capital Share Transactions | | | | | | | | | | | | | | | | |
| Institutional Class: | | | | | | | | | | | | | | | | |
| Proceeds from shares sold | | | 27,891,465 | | | | 28,824,075 | | | | 4,046,071 | | | | 10,542,931 | |
| Proceeds from reinvestment of distributions | | | 4,776,174 | | | | 14,452,643 | | | | 183,427 | | | | — | |
| Payments for shares redeemed | | | (79,534,627 | ) | | | (227,497,717 | ) | | | (18,559,538 | ) | | | (19,258,055 | ) |
| Proceeds from redemption fees | | | — | | | | 11,367 | | | | — | | | | — | |
| Decrease in net assets from | | | | | | | | | | | | | | | | |
| Institutional Class transactions | | | (46,866,988 | ) | | | (184,209,632 | ) | | | (14,330,040 | ) | | | (8,715,124 | ) |
| A Class(1): | | | | | | | | | | | | | | | | |
| Proceeds from shares sold | | | — | | | | — | | | | 891,690 | | | | 480,956 | |
| Proceeds from reinvestment of distributions | | | — | | | | — | | | | 32,469 | | | | — | |
| Payments for shares redeemed | | | — | | | | — | | | | (1,160,766 | ) | | | (1,581,843 | ) |
| Decrease in net assets from A Class transactions | | | — | | | | — | | | | (236,607 | ) | | | (1,100,887 | ) |
| C Class: | | | | | | | | | | | | | | | | |
| Proceeds from shares sold | | | — | | | | — | | | | 218,590 | | | | 1,747,294 | |
| Proceeds from reinvestment of distributions | | | — | | | | — | | | | 3,204 | | | | — | |
| Payments for shares redeemed | | | — | | | | — | | | | (715,405 | ) | | | (2,056,386 | ) |
| Decrease in net assets from C Class transactions | | | — | | | | — | | | | (493,611 | ) | | | (309,092 | ) |
| Net decrease in net assets resulting | | | | | | | | | | | | | | | | |
| from capital share transactions | | | (46,866,988 | ) | | | (184,209,632 | ) | | | (15,060,258 | ) | | | (10,125,103 | ) |
| Distributions to Shareholders | | | | | | | | | | | | | | | | |
| From distributable earnings | | | | | | | | | | | | | | | | |
| Institutional Class | | | (1,874,368 | ) | | | (8,869,767 | ) | | | (316,197 | ) | | | — | |
| A Class(1) | | | — | | | | — | | | | (39,647 | ) | | | — | |
| C Class | | | — | | | | — | | | | (3,679 | ) | | | — | |
| From tax return of capital | | | | | | | | | | | | | | | | |
| Institutional Class | | | (2,901,876 | ) | | | (5,582,876 | ) | | | — | | | | — | |
| A Class(1) | | | — | | | | — | | | | — | | | | — | |
| C Class | | | — | | | | — | | | | — | | | | — | |
| Total distributions to shareholders | | | (4,776,244 | ) | | | (14,452,643 | ) | | | (359,523 | ) | | | — | |
| Total Decrease in Net Assets | | | (59,336,181 | ) | | | (189,982,383 | ) | | | (17,180,565 | ) | | | (12,974,562 | ) |
| Net Assets | | | | | | | | | | | | | | | | |
| Beginning of year | | | 75,909,887 | | | | 265,892,270 | | | | 25,429,315 | | | | 38,403,877 | |
| End of year | | $ | 16,573,706 | | | $ | 75,909,887 | | | $ | 8,248,750 | | | $ | 25,429,315 | |
| (1) | Prior to March 30, 2019, A Class Shares for the Energy Evolution Fund were known as Investor Class Shares. |
| | |
| See accompanying Notes to Financial Statements. | |
| | |
| 38 | TortoiseEcofin |
| |
| |
| |
| |
| Statements of Changes in Net Assets (continued) |
| |
| |
| | Tortoise MLP & Energy Infrastructure Fund | | Tortoise Energy Evolution Fund |
| | Year Ended | | Year Ended | | Year Ended | | Year Ended |
| | November 30, 2020 | | November 30, 2019 | | November 30, 2020 | | November 30, 2019 |
| Transactions in Shares: | | | | | | | | | | | | |
| Institutional Class: | | | | | | | | | | | | |
| Shares sold | | 6,209,395 | | | 4,072,546 | | | 635,561 | | | 1,358,682 | |
| Shares issued to holders in reinvestment | | | | | | | | | | | | |
| of dividends | | 880,190 | | | 2,031,608 | | | 23,915 | | | — | |
| Shares redeemed | | (15,515,865 | ) | | (31,200,191 | ) | | (2,746,248 | ) | | (2,509,009 | ) |
| Decrease in Institutional Class shares outstanding | | (8,426,280 | ) | | (25,096,037 | ) | | (2,086,772 | ) | | (1,150,327 | ) |
| A Class(1): | | | | | | | | | | | | |
| Shares sold | | — | | | — | | | 144,824 | | | 64,578 | |
| Shares issued to holders in reinvestment | | | | | | | | | | | | |
| of dividends | | — | | | — | | | 4,250 | | | — | |
| Shares redeemed | | — | | | — | | | (180,165 | ) | | (210,561 | ) |
| Decrease in A Class shares outstanding | | — | | | — | | | (31,091 | ) | | (145,983 | ) |
| C Class: | | | | | | | | | | | | |
| Shares sold | | — | | | — | | | 34,127 | | | 247,613 | |
| Shares issued to holders in reinvestment | | | | | | | | | | | | |
| of dividends | | — | | | — | | | 431 | | | — | |
| Shares redeemed | | — | | | — | | | (107,244 | ) | | (275,689 | ) |
| Decrease in C Class shares outstanding | | — | | | — | | | (72,686 | ) | | (28,076 | ) |
| Net decrease in shares outstanding | | (8,426,280 | ) | | (25,096,037 | ) | | (2,190,549 | ) | | (1,324,386 | ) |
| (1) | Prior to March 30, 2019, A Class Shares for the Energy Evolution Fund were known as Investor Class Shares. |
| See accompanying Notes to Financial Statements. | |
| | |
| TortoiseEcofin | 39 |
| |
| |
| |
| |
| Statements of Changes in Net Assets (continued) |
| |
| |
| | Ecofin Global |
| | Renewables |
| | Infrastructure Fund |
| | Period from |
| | Inception(1) to |
| | November 30, 2020 |
| Operations | | | | |
| Net investment income | | $ | 416,394 | |
| Net realized gain on investments, swap contracts and foreign currency | | | 1,352,376 | |
| Net change in unrealized appreciation of investments, swap contracts and translations of foreign currency | | | 19,121,491 | |
| Net increase in net assets resulting from operations | | | 20,890,261 | |
| Capital Share Transactions | | | | |
| Institutional Class: | | | | |
| Proceeds from shares sold | | | 17,033,185 | |
| Proceeds from reinvestment of distributions | | | 208,962 | |
| Payments for shares redeemed | | | (203,273 | ) |
| Proceeds related to shares issued from reorganization (See Note 13) | | | 70,442,917 | |
| Increase in net assets from Institutional Class transactions | | | 87,481,791 | |
| A Class: | | | | |
| Proceeds from shares sold | | | 1,227,248 | |
| Proceeds from reinvestment of distributions | | | 115 | |
| Payments for shares redeemed | | | — | |
| Increase in net assets from A Class transactions | | | 1,227,363 | |
| Net increase in net assets resulting from capital share transactions | | | 88,709,154 | |
| Distributions to Shareholders | | | | |
| From distributable earnings | | | | |
| Institutional Class | | | (211,910 | ) |
| A Class | | | (1,385 | ) |
| Total distributions to shareholders | | | (213,295 | ) |
| Total Increase in Net Assets | | | 109,386,120 | |
| Net Assets | | | | |
| Beginning of period | | | — | |
| End of period | | $ | 109,386,120 | |
| (1) | Inception date of the Institutional Class was August 7, 2020 and the A Class was September 25, 2020. |
| | |
| See accompanying Notes to Financial Statements. | |
| | |
| 40 | TortoiseEcofin |
| |
| |
2020 Annual Report | November 30, 2020 |
| |
| Statements of Changes in Net Assets (continued) |
| |
| |
| | Ecofin Global |
| | Renewables |
| | Infrastructure Fund |
| | Period from |
| | Inception(1) to |
| | November 30, 2020 |
| Transactions in Shares: | | | |
| Institutional Class: | | | |
| Shares sold | | 1,636,928 | |
| Shares issued to holders in reinvestment of dividends | | 18,395 | |
| Shares redeemed | | (18,902 | ) |
| Shares issued from reorganization (See Note 13) | | 7,825,218 | |
| Increase in Institutional Class shares outstanding | | 9,461,639 | |
| A Class: | | | |
| Shares sold | | 116,973 | |
| Shares issued to holders in reinvestment of dividends | | 10 | |
| Shares redeemed | | — | |
| Increase in A Class shares outstanding | | 116,983 | |
| Net increase in shares outstanding | | 9,578,622 | |
| (1) | Inception date of the Institutional Class was August 7, 2020 and the A Class was September 25, 2020. |
| See accompanying Notes to Financial Statements. | |
| | |
| TortoiseEcofin | 41 |
| |
| |
| |
| |
| Tortoise MLP & Pipeline Fund |
| Financial Highlights |
| Institutional Class |
| | Year Ended | | Year Ended | | Year Ended | | Year Ended | | Year Ended |
| | November 30, | | November 30, | | November 30, | | November 30, | | November 30, |
| | 2020 | | 2019 | | 2018 | | 2017 | | 2016 |
| Per Common Share Data(1) | | | | | | | | | | | | | | | | | | | | | | | | | |
| Net asset value, beginning of year | | $ | 11.61 | | | | $ | 12.29 | | | | $ | 12.85 | | | | $ | 13.76 | | | | $ | 11.28 | | |
| Investment operations: | | | | | | | | | | | | | | | | | | | | | | | | | |
| Net investment income(2) | | | 0.12 | | | | | 0.14 | | | | | 0.16 | | | | | 0.15 | | | | | 0.21 | (3) |
| Net realized and unrealized gain (loss) on investments | | | | | | | | | | | | | | | | | | | | | | | | | |
| and translations of foreign currency(2) | | | (2.96 | ) | | | | (0.26 | ) | | | | (0.26 | ) | | | | (0.64 | ) | | | | 2.59 | | |
| Total from investment operations | | | (2.84 | ) | | | | (0.12 | ) | | | | (0.10 | ) | | | | (0.49 | ) | | | | 2.80 | | |
| Less distributions from: | | | | | | | | | | | | | | | | | | | | | | | | | |
| Net investment income | | | (0.14 | ) | | | | (0.20 | ) | | | | (0.17 | ) | | | | (0.22 | ) | | | | (0.27 | ) | |
| Net realized gains | | | — | | | | | — | | | | | — | | | | | — | | | | | — | | |
| Return of capital | | | (0.30 | ) | | | | (0.36 | ) | | | | (0.29 | ) | | | | (0.20 | ) | | | | (0.05 | ) | |
| Total distributions | | | (0.44 | ) | | | | (0.56 | ) | | | | (0.46 | ) | | | | (0.42 | ) | | | | (0.32 | ) | |
| Net asset value, end of year | | $ | 8.33 | | | | $ | 11.61 | | | | $ | 12.29 | | | | $ | 12.85 | | | | $ | 13.76 | | |
| Total Return | | | (24.70 | ) | % | | | (1.09 | ) | % | | | (0.88 | ) | % | | | (3.63 | ) | % | | | 25.62 | | % |
| Supplemental Data and Ratios | | | | | | | | | | | | | | | | | | | | | | | | | |
| Net assets, end of year (in 000’s) | | $ | 1,493,621 | | | | $ | 3,226,450 | | | | $ | 3,544,401 | | | | $ | 2,872,704 | | | | $ | 2,213,434 | | |
| Ratio of expenses to average net assets | | | 0.94 | | % | | | 0.93 | | % | | | 0.93 | | % | | | 0.96 | | % | | | 0.97 | | % |
| Ratio of expenses excluding interest expense | | | | | | | | | | | | | | | | | | | | | | | | | |
| to average net assets | | | 0.94 | | % | | | 0.93 | | % | | | 0.93 | | % | | | 0.96 | | % | | | 0.97 | | % |
| Ratio of net investment income to average net assets | | | 1.64 | | % | | | 1.01 | | % | | | 1.06 | | % | | | 1.17 | | % | | | 1.73 | | % |
| Portfolio turnover rate | | | 39 | | % | | | 19 | | % | | | 14 | | % | | | 15 | | % | | | 25 | | % |
| (1) | For an Institutional Class Share outstanding for the entire period. |
| (2) | The per common share data for the years ended November 30, 2019, 2018, 2017, and 2016 do not reflect the change in estimate of investment income and return of capital. See Note 2 to the financial statements for further disclosure. |
| (3) | Per share amounts calculated using average shares method. |
| See accompanying Notes to Financial Statements. | |
| | |
| 42 | TortoiseEcofin |
| |
| |
| 2020 Annual Report | November 30, 2020 |
| |
| Tortoise MLP & Pipeline Fund |
| Financial Highlights (continued) |
A Class |
| | Year Ended | | Year Ended | | Year Ended | | Year Ended | | Year Ended |
| | November 30, | | November 30, | | November 30, | | November 30, | | November 30, |
| | 2020 | | 2019 | | 2018 | | 2017 | | 2016 |
| Per Common Share Data(1) | | | | | | | | | | | | | | | | | | | | | | | | | |
| Net asset value, beginning of year | | $ | 11.50 | | | | $ | 12.18 | | | | $ | 12.77 | | | | $ | 13.67 | | | | $ | 11.23 | | |
| Investment operations: | | | | | | | | | | | | | | | | | | | | | | | | | |
| Net investment income(2) | | | 0.16 | | | | | 0.11 | | | | | 0.06 | | | | | 0.13 | | | | | 0.18 | (3) |
| Net realized and unrealized gain (loss) on investments | | | | | | | | | | | | | | | | | | | | | | | | | |
| and translations of foreign currency(2) | | | (3.01 | ) | | | | (0.26 | ) | | | | (0.22 | ) | | | | (0.64 | ) | | | | 2.56 | | |
| Total from investment operations | | | (2.85 | ) | | | | (0.15 | ) | | | | (0.16 | ) | | | | (0.51 | ) | | | | 2.74 | | |
| Less distributions from: | | | | | | | | | | | | | | | | | | | | | | | | | |
| Net investment income | | | (0.11 | ) | | | | (0.18 | ) | | | | (0.16 | ) | | | | (0.20 | ) | | | | (0.25 | ) | |
| Net realized gains | | | — | | | | | — | | | | | — | | | | | — | | | | | — | | |
| Return of capital | | | (0.29 | ) | | | | (0.35 | ) | | | | (0.27 | ) | | | | (0.19 | ) | | | | (0.05 | ) | |
| Total distributions | | | (0.40 | ) | | | | (0.53 | ) | | | | (0.43 | ) | | | | (0.39 | ) | | | | (0.30 | ) | |
| Net asset value, end of year | | $ | 8.25 | | | | $ | 11.50 | | | | $ | 12.18 | | | | $ | 12.77 | | | | $ | 13.67 | | |
| Total Return(4) | | | (24.94 | ) | % | | | (1.38 | ) | % | | | (1.31 | ) | % | | | (3.81 | ) | % | | | 25.25 | | % |
| Supplemental Data and Ratios | | | | | | | | | | | | | | | | | | | | | | | | | |
| Net assets, end of year (in 000’s) | | $ | 132,882 | | | | $ | 469,882 | | | | $ | 474,785 | | | | $ | 300,926 | | | | $ | 312,642 | | |
| Ratio of expenses to average net assets | | | 1.19 | | % | | | 1.18 | | % | | | 1.18 | | % | | | 1.21 | | % | | | 1.22 | | % |
| Ratio of expenses excluding interest expense | | | | | | | | | | | | | | | | | | | | | | | | | |
| to average net assets | | | 1.18 | | % | | | 1.18 | | % | | | 1.18 | | % | | | 1.21 | | % | | | 1.22 | | % |
| Ratio of net investment income to average net assets | | | 1.40 | | % | | | 0.76 | | % | | | 0.81 | | % | | | 0.92 | | % | | | 1.48 | | % |
| Portfolio turnover rate | | | 39 | | % | | | 19 | | % | | | 14 | | % | | | 15 | | % | | | 25 | | % |
| (1) | For an A Class Share outstanding for the entire period. Prior to March 30, 2019, A Class Shares were known as Investor Class Shares. |
| (2) | The per common share data for the years ended November 30, 2019, 2018, 2017, and 2016 do not reflect the change in estimate of investment income and return of capital. See Note 2 to the financial statements for further disclosure. |
| (3) | Per share amounts calculated using average shares method. |
| (4) | Total return does not reflect sales charges. |
| See accompanying Notes to Financial Statements. | |
| | |
| TortoiseEcofin | 43 |
| |
| |
| |
| |
| Tortoise MLP & Pipeline Fund |
| Financial Highlights (continued) |
C Class |
| | Year Ended | | Year Ended | | Year Ended | | Year Ended | | Year Ended |
| | November 30, | | November 30, | | November 30, | | November 30, | | November 30, |
| | 2020 | | 2019 | | 2018 | | 2017 | | 2016 |
| Per Common Share Data(1) | | | | | | | | | | | | | | | | | | | | | | | | | |
| Net asset value, beginning of year | | $ | 11.39 | | | | $ | 12.05 | | | | $ | 12.61 | | | | $ | 13.51 | | | | $ | 11.14 | | |
| Investment operations: | | | | | | | | | | | | | | | | | | | | | | | | | |
| Net investment income (loss)(2) | | | 0.05 | | | | | (0.01 | ) | | | | — | (3) | | | 0.02 | | | | | 0.08 | (4) |
| Net realized and unrealized gain (loss) on investments | | | | | | | | | | | | | | | | | | | | | | | | | |
| and translations of foreign currency(2) | | | (2.94 | ) | | | | (0.23 | ) | | | | (0.23 | ) | | | | (0.62 | ) | | | | 2.55 | | |
| Total from investment operations | | | (2.89 | ) | | | | (0.24 | ) | | | | (0.23 | ) | | | | (0.60 | ) | | | | 2.63 | | |
| Less distributions from: | | | | | | | | | | | | | | | | | | | | | | | | | |
| Net investment income | | | (0.11 | ) | | | | (0.15 | ) | | | | (0.12 | ) | | | | (0.16 | ) | | | | (0.22 | ) | |
| Net realized gains | | | — | | | | | — | | | | | — | | | | | — | | | | | — | | |
| Return of capital | | | (0.21 | ) | | | | (0.27 | ) | | | | (0.21 | ) | | | | (0.14 | ) | | | | (0.04 | ) | |
| Total distributions | | | (0.32 | ) | | | | (0.42 | ) | | | | (0.33 | ) | | | | (0.30 | ) | | | | (0.26 | ) | |
| Net asset value, end of year | | $ | 8.18 | | | | $ | 11.39 | | | | $ | 12.05 | | | | $ | 12.61 | | | | $ | 13.51 | | |
| Total Return(5) | | | (25.41 | ) | % | | | (2.13 | ) | % | | | (1.89 | ) | % | | | (4.51 | ) | % | | | 24.37 | | % |
| Supplemental Data and Ratios | | | | | | | | | | | | | | | | | | | | | | | | | |
| Net assets, end of year (in 000’s) | | $ | 19,530 | | | | $ | 37,888 | | | | $ | 51,458 | | | | $ | 58,147 | | | | $ | 60,170 | | |
| Ratio of expenses to average net assets | | | 1.94 | | % | | | 1.93 | | % | | | 1.93 | | % | | | 1.96 | | % | | | 1.97 | | % |
| Ratio of expenses excluding interest expense | | | | | | | | | | | | | | | | | | | | | | | | | |
| to average net assets | | | 1.94 | | % | | | 1.93 | | % | | | 1.93 | | % | | | 1.96 | | % | | | 1.97 | | % |
| Ratio of net investment income to average net assets | | | 0.64 | | % | | | 0.01 | | % | | | 0.06 | | % | | | 0.17 | | % | | | 0.73 | | % |
| Portfolio turnover rate | | | 39 | | % | | | 19 | | % | | | 14 | | % | | | 15 | | % | | | 25 | | % |
| (1) | For a C Class Share outstanding for the entire period. |
| (2) | The per common share data for the years ended November 30, 2019, 2018, 2017, and 2016 do not reflect the change in estimate of investment income and return of capital. See Note 2 to the financial statements for further disclosure. |
| (3) | Amount per share is less than $0.01. |
| (4) | Per share amounts calculated using average shares method. |
| (5) | Total return does not reflect sales charges. |
| See accompanying Notes to Financial Statements. | |
| | |
| 44 | TortoiseEcofin |
| |
| |
| 2020 Annual Report | November 30, 2020 |
| |
| Tortoise MLP & Energy Income Fund |
| Financial Highlights |
Institutional Class |
| | Year Ended | | Year Ended | | Year Ended | | Year Ended | | Year Ended |
| | November 30, | | November 30, | | November 30, | | November 30, | | November 30, |
| | 2020 | | 2019 | | 2018 | | 2017 | | 2016 |
| Per Common Share Data(1) | | | | | | | | | | | | | | | | | | | | | | | | | |
| Net asset value, beginning of year | | $ | 6.74 | | | | $ | 7.43 | | | | $ | 8.42 | | | | $ | 9.70 | | | | $ | 9.20 | | |
| Investment operations: | | | | | | | | | | | | | | | | | | | | | | | | | |
| Net investment income | | | 0.11 | (2) | | | 0.81 | | | | | 0.08 | (2) | | | 0.11 | (2) | | | 0.23 | (2) |
| Net realized and unrealized gain (loss) on | | | | | | | | | | | | | | | | | | | | | | | | | |
| investments and translations of foreign currency | | | (0.91 | ) | | | | (0.82 | ) | | | | (0.35 | ) | | | | (0.68 | ) | | | | 1.01 | | |
| Total from investment operations | | | (0.80 | ) | | | | (0.01 | ) | | | | (0.27 | ) | | | | (0.57 | ) | | | | 1.24 | | |
| Less distributions from: | | | | | | | | | | | | | | | | | | | | | | | | | |
| Net investment income | | | (0.08 | ) | | | | (0.01 | ) | | | | (0.43 | ) | | | | (0.16 | ) | | | | (0.25 | ) | |
| Net realized gains | | | — | | | | | — | | | | | — | | | | | — | | | | | — | | |
| Return of capital | | | (0.42 | ) | | | | (0.67 | ) | | | | (0.29 | ) | | | | (0.55 | ) | | | | (0.49 | ) | |
| Total distributions | | | (0.50 | ) | | | | (0.68 | ) | | | | (0.72 | ) | | | | (0.71 | ) | | | | (0.74 | ) | |
| Redemption fee proceeds | | | — | | | | | — | (3) | | | — | (2)(3) | | | — | (2)(3) | | | — | (2)(3) |
| Net asset value, end of year | | $ | 5.44 | | | | $ | 6.74 | | | | $ | 7.43 | | | | $ | 8.42 | | | | $ | 9.70 | | |
| Total Return | | | (11.83 | ) | % | | | (0.29 | ) | % | | | (3.66 | ) | % | | | (6.03 | ) | % | | | 14.93 | | % |
| Supplemental Data and Ratios | | | | | | | | | | | | | | | | | | | | | | | | | |
| Net assets, end of year (in 000’s) | | $ | 291,420 | | | | $ | 628,295 | | | | $ | 748,415 | | | | $ | 735,670 | | | | $ | 733,365 | | |
| Ratio of expenses to average net assets | | | 1.14 | | % | | | 1.17 | | % | | | 1.16 | | % | | | 1.14 | | % | | | 1.15 | | % |
| Ratio of expenses excluding interest expense | | | | | | | | | | | | | | | | | | | | | | | | | |
| to average net assets | | | 1.13 | | % | | | 1.17 | | % | | | 1.16 | | % | | | 1.14 | | % | | | 1.15 | | % |
| Ratio of net investment income to average net assets | | | 2.02 | | % | | | 1.68 | | % | | | 0.99 | | % | | | 1.23 | | % | | | 2.61 | | % |
| Portfolio turnover rate | | | 43 | | % | | | 48 | | % | | | 55 | | % | | | 30 | | % | | | 65 | | % |
| (1) | For an Institutional Class Share outstanding for the entire period. |
| (2) | Per share amounts calculated using average shares method. |
| (3) | Amount per share is less than $0.01. |
| See accompanying Notes to Financial Statements. | |
| | |
| TortoiseEcofin | 45 |
| |
| |
| |
| |
Tortoise MLP & Energy Income Fund
Financial Highlights (continued) |
| A Class |
| | Year Ended | | Year Ended | | | Year Ended | | Year Ended | | Year Ended |
| | November 30, | | November 30, | | | November 30, | | November 30, | | November 30, |
| | 2020 | | 2019 | | | 2018 | | 2017 | | 2016 |
| Per Common Share Data(1) | | | | | | | | | | | | | | | | | | | | | | | | | |
| Net asset value, beginning of year | | $ | 6.87 | | | | $ | 7.56 | | | | $ | 8.57 | | | | $ | 9.87 | | | | $ | 9.35 | | |
| Investment operations: | | | | | | | | | | | | | | | | | | | | | | | | | |
| Net investment income | | | 0.10 | (2) | | | 0.79 | | | | | 0.60 | (2) | | | 0.09 | (2) | | | 0.20 | (2) |
| Net realized and unrealized gain (loss) on | | | | | | | | | | | | | | | | | | | | | | | | | |
| investments and translations of foreign currency | | | (0.93 | ) | | | | (0.80 | ) | | | | (0.36 | ) | | | | (0.69 | ) | | | | 1.04 | | |
| Total from investment operations | | | (0.83 | ) | | | | (0.01 | ) | | | | (0.30 | ) | | | | (0.60 | ) | | | | 1.24 | | |
| Less distributions from: | | | | | | | | | | | | | | | | | | | | | | | | | |
| Net investment income | | | (0.07 | ) | | | | (0.01 | ) | | | | (0.42 | ) | | | | (0.16 | ) | | | | (0.24 | ) | |
| Net realized gains | | | — | | | | | — | | | | | — | | | | | — | | | | | — | | |
| Return of capital | | | (0.41 | ) | | | | (0.67 | ) | | | | (0.29 | ) | | | | (0.54 | ) | | | | (0.48 | ) | |
| Total distributions | | | (0.48 | ) | | | | (0.68 | ) | | | | (0.71 | ) | | | | (0.70 | ) | | | | (0.72 | ) | |
| Redemption fee proceeds | | | — | | | | | — | (3) | | | — | (2)(3) | | | — | (2)(3) | | | — | (2)(3) |
| Net asset value, end of year | | $ | 5.56 | | | | $ | 6.87 | | | | $ | 7.56 | | | | $ | 8.57 | | | | $ | 9.87 | | |
| Total Return(4) | | | (11.96 | ) | % | | | (0.41 | ) | % | | | (3.95 | ) | % | | | (6.26 | ) | % | | | 14.74 | | % |
| Supplemental Data and Ratios | | | | | | | | | | | | | | | | | | | | | | | | | |
| Net assets, end of year (in 000’s) | | $ | 32,256 | | | | $ | 45,492 | | | | $ | 55,436 | | | | $ | 62,135 | | | | $ | 54,418 | | |
| Ratio of expenses to average net assets | | | 1.39 | | % | | | 1.42 | | % | | | 1.41 | | % | | | 1.39 | | % | | | 1.40 | | % |
| Ratio of expenses excluding interest expense | | | | | | | | | | | | | | | | | | | | | | | | | |
| to average net assets | | | 1.38 | | % | | | 1.42 | | % | | | 1.41 | | % | | | 1.39 | | % | | | 1.40 | | % |
| Ratio of net investment income to average net assets | | | 1.76 | | % | | | 1.43 | | % | | | 0.74 | | % | | | 0.98 | | % | | | 2.36 | | % |
| Portfolio turnover rate | | | 43 | | % | | | 48 | | % | | | 55 | | % | | | 30 | | % | | | 65 | | % |
| (1) | For an A Class Share outstanding for the entire period. |
| (2) | Per share amounts calculated using average shares method. |
| (3) | Amount per share is less than $0.01. |
| (4) | Total return does not reflect sales charges. |
| See accompanying Notes to Financial Statements. | |
| | |
| 46 | TortoiseEcofin |
| |
| |
| 2020 Annual Report | November 30, 2020 |
| |
| Tortoise MLP & Energy Income Fund |
| Financial Highlights (continued) |
| C Class |
| | Year Ended | | Year Ended | | | Year Ended | | Year Ended | | Year Ended |
| | November 30, | | November 30, | | | November 30, | | November 30, | | November 30, |
| | 2020 | | 2019 | | 2018 | | 2017 | | 2016 |
| Per Common Share Data(1) | | | | | | | | | | | | | | | | | | | | | | | | | |
| Net asset value, beginning of year | | $ | 6.89 | | | | $ | 7.59 | | | | $ | 8.60 | | | | $ | 9.90 | | | | $ | 9.37 | | |
| Investment operations: | | | | | | | | | | | | | | | | | | | | | | | | | |
| Net investment income | | | 0.06 | (3) | | | 0.67 | | | | | — | (2)(3) | | | 0.02 | (3) | | | 0.14 | (3) |
| Net realized and unrealized gain (loss) on | | | | | | | | | | | | | | | | | | | | | | | | | |
| investments and translations of foreign currency | | | (0.94 | ) | | | | (0.75 | ) | | | | (0.37 | ) | | | | (0.69 | ) | | | | 1.04 | | |
| Total from investment operations | | | (0.88 | ) | | | | (0.08 | ) | | | | (0.37 | ) | | | | (0.67 | ) | | | | 1.18 | | |
| Less distributions from: | | | | | | | | | | | | | | | | | | | | | | | | | |
| Net investment income | | | (0.07 | ) | | | | (0.01 | ) | | | | (0.38 | ) | | | | (0.14 | ) | | | | (0.21 | ) | |
| Net realized gains | | | — | | | | | — | | | | | — | | | | | — | | | | | — | | |
| Return of capital | | | (0.37 | ) | | | | (0.61 | ) | | | | (0.26 | ) | | | | (0.49 | ) | | | | (0.44 | ) | |
| Total distributions | | | (0.44 | ) | | | | (0.62 | ) | | | | (0.64 | ) | | | | (0.63 | ) | | | | (0.65 | ) | |
| Redemption fee proceeds | | | — | | | | | — | (2) | | | — | (2)(3) | | | — | (2)(3) | | | — | (2)(3) |
| Net asset value, end of year | | $ | 5.57 | | | | $ | 6.89 | | | | $ | 7.59 | | | | $ | 8.60 | | | | $ | 9.90 | | |
| Total Return(4) | | | (12.72 | ) | % | | | (1.30 | ) | % | | | (4.64 | ) | % | | | (6.95 | ) | % | | | 13.89 | | % |
| Supplemental Data and Ratios | | | | | | | | | | | | | | | | | | | | | | | | | |
| Net assets, end of year (in 000’s) | | $ | 23,650 | | | | $ | 46,979 | | | | $ | 55,341 | | | | $ | 68,541 | | | | $ | 92,873 | | |
| Ratio of expenses to average net assets | | | 2.14 | | % | | | 2.17 | | % | | | 2.16 | | % | | | 2.14 | | % | | | 2.15 | | |
| Ratio of expenses excluding interest expense | | | | | | | | | | | | | | | | | | | | | | | | | |
| to average net assets | | | 2.13 | | % | | | 2.17 | | % | | | 2.16 | | % | | | 2.14 | | % | | | 2.15 | | % |
| Ratio of net investment income to average net assets | | | 1.02 | | % | | | 0.68 | | % | | | (0.01 | ) | % | | | 0.23 | | % | | | 1.61 | | % |
| Portfolio turnover rate | | | 43 | | % | | | 48 | | % | | | 55 | | % | | | 30 | | % | | | 65 | | % |
| (1) | For a C Class Share outstanding for the entire period. |
| (2) | Amount per share is less than $0.01. |
| (3) | Per share amounts calculated using average shares method. |
| (4) | Total return does not reflect sales charges. |
| See accompanying Notes to Financial Statements. | |
| | |
| TortoiseEcofin | 47 |
| |
| |
| |
| |
| Tortoise MLP & Energy Infrastructure Fund |
| Financial Highlights |
| Institutional Class |
| | Year Ended | | Year Ended | | Year Ended | | Year Ended | | Year Ended |
| | November 30, | | November 30, | | November 30, | | November 30, | | November 30, |
| | 2020 | | 2019 | | 2018 | | 2017 | | 2016 |
| Per Common Share Data(1) | | | | | | | | | | | | | | | | | | | | | | | | | |
| Net asset value, beginning of year | | $ | 6.52 | | | | $ | 7.24 | | | | $ | 8.23 | | | | $ | 9.51 | | | | $ | 9.31 | | |
| Investment operations: | | | | | | | | | | | | | | | | | | | | | | | | | |
| Net investment income (loss) | | | 0.11 | (2) | | | (0.97 | ) | | | | 0.11 | (2) | | | 0.13 | (2) | | | 0.25 | (2) |
| Net realized and unrealized gain (loss) on | | | | | | | | | | | | | | | | | | | | | | | | | |
| investments and translations of foreign currency | | | (0.98 | ) | | | | 0.92 | | | | | (0.38 | ) | | | | (0.69 | ) | | | | 0.68 | | |
| Total from investment operations | | | (0.87 | ) | | | | (0.05 | ) | | | | (0.27 | ) | | | | (0.56 | ) | | | | 0.93 | | |
| Less distributions from: | | | | | | | | | | | | | | | | | | | | | | | | | |
| Net investment income | | | (0.20 | ) | | | | (0.41 | ) | | | | (0.48 | ) | | | | (0.27 | ) | | | | (0.25 | ) | |
| Net realized gains | | | — | | | | | — | | | | | — | | | | | — | | | | | — | | |
| Return of capital | | | (0.29 | ) | | | | (0.26 | ) | | | | (0.24 | ) | | | | (0.45 | ) | | | | (0.48 | ) | |
| Total distributions | | | (0.49 | ) | | | | (0.67 | ) | | | | (0.72 | ) | | | | (0.72 | ) | | | | (0.73 | ) | |
| Redemption fee proceeds | | | — | | | | | — | (3) | | | — | (2)(3) | | | — | (2)(3) | | | — | (2)(3) |
| Net asset value, end of year | | $ | 5.16 | | | | $ | 6.52 | | | | $ | 7.24 | | | | $ | 8.23 | | | | $ | 9.51 | | |
| Total Return | | | (13.48 | ) | % | | | (0.83 | ) | % | | | (3.71 | ) | % | | | (6.13 | ) | % | | | 11.45 | | % |
| Supplemental Data and Ratios | | | | | | | | | | | | | | | | | | | | | | | | | |
| Net assets, end of year (in 000’s) | | $ | 16,574 | | | | $ | 75,910 | | | | $ | 265,892 | | | | $ | 328,540 | | | | $ | 432,631 | | |
| Ratio of expenses to average net assets: | | | | | | | | | | | | | | | | | | | | | | | | | |
| Before expense waiver/recoupment | | | 1.06 | | % | | | 0.95 | | % | | | 0.93 | | % | | | 0.90 | | % | | | 0.90 | | % |
| After expense waiver/recoupment | | | 1.01 | | % | | | 0.94 | | % | | | 0.93 | | % | | | 0.90 | | % | | | 0.94 | | % |
| Ratio of expenses excluding interest expense | | | | | | | | | | | | | | | | | | | | | | | | | |
| to average net assets: | | | | | | | | | | | | | | | | | | | | | | | | | |
| Before expense waiver/recoupment | | | 1.05 | | % | | | 0.95 | | % | | | 0.93 | | % | | | 0.90 | | % | | | 0.90 | | % |
| After expense waiver/recoupment | | | 1.00 | | % | | | 0.94 | | % | | | 0.93 | | % | | | 0.90 | | % | | | 0.94 | | % |
| Ratio of net investment income to average net assets: | | | | | | | | | | | | | | | | | | | | | | | | | |
| Before expense waiver/recoupment | | | 1.95 | | % | | | 1.79 | | % | | | 1.32 | | % | | | 1.42 | | % | | | 3.01 | | % |
| After expense waiver/recoupment | | | 2.00 | | % | | | 1.80 | | % | | | 1.32 | | % | | | 1.42 | | % | | | 2.97 | | % |
| Portfolio turnover rate | | | 78 | | % | | | 75 | | % | | | 73 | | % | | | 28 | | % | | | 71 | | % |
| (1) | For an Institutional Class Share outstanding for the entire period. |
| (2) | Per share amounts calculated using average shares method. |
| (3) | Amount per share is less than $0.01. |
| See accompanying Notes to Financial Statements. | |
| 48 | TortoiseEcofin |
| |
| |
| 2020 Annual Report | November 30, 2020 |
| |
| Tortoise Energy Evolution Fund |
| Financial Highlights |
| Institutional Class |
| | Year Ended | | Year Ended | | Year Ended | | Year Ended | | Year Ended |
| | November 30, | | November 30, | | November 30, | | November 30, | | November 30, |
| | 2020 | | 2019 | | 2018 | | 2017 | | 2016 |
| Per Common Share Data(1) | | | | | | | | | | | | | | | | | | | | | | | | | |
| Net asset value, beginning of year | | $ | 7.53 | | | | $ | 8.17 | | | | $ | 9.00 | | | | $ | 10.22 | | | | $ | 8.83 | | |
| Investment operations: | | | | | | | | | | | | | | | | | | | | | | | | | |
| Net investment income (loss)(2) | | | 0.33 | | | | | 0.09 | | | | | (0.03 | ) | | | | (0.02 | ) | | | | 0.03 | | |
| Net realized and unrealized gain (loss) on | | | | | | | | | | | | | | | | | | | | | | | | | |
| investments and translations of foreign currency(2) | | | (0.78 | ) | | | | (0.73 | ) | | | | (0.80 | ) | | | | (1.16 | ) | | | | 1.41 | | |
| Total from investment operations | | | (0.45 | ) | | | | (0.64 | ) | | | | (0.83 | ) | | | | (1.18 | ) | | | | 1.44 | | |
| Less distributions from: | | | | | | | | | | | | | | | | | | | | | | | | | |
| Net investment income | | | (0.16 | ) | | | | — | | | | | — | | | | | (0.04 | ) | | | | (0.05 | ) | |
| Net realized gains | | | — | | | | | — | | | | | — | | | | | — | | | | | — | | |
| Total distributions | | | (0.16 | ) | | | | — | | | | | — | | | | | (0.04 | ) | | | | (0.05 | ) | |
| Net asset value, end of year | | $ | 6.92 | | | | $ | 7.53 | | | | $ | 8.17 | | | | $ | 9.00 | | | | $ | 10.22 | | |
| Total Return | | | (6.19 | ) | % | | | (7.83 | ) | % | | | (9.22 | ) | % | | | (11.57 | ) | % | | | 16.52 | | % |
| Supplemental Data and Ratios | | | | | | | | | | | | | | | | | | | | | | | | | |
| Net assets, end of year (in 000’s) | | $ | 5,550 | | | | $ | 21,748 | | | | $ | 32,984 | | | | $ | 57,431 | | | | $ | 38,363 | | |
| Ratio of expenses to average net assets: | | | | | | | | | | | | | | | | | | | | | | | | | |
| Before expense waiver | | | 3.47 | | % | | | 2.16 | | % | | | 1.40 | | % | | | 1.42 | | % | | | 1.70 | | % |
| After expense waiver | | | 1.11 | | % | | | 1.10 | | % | | | 1.10 | | % | | | 1.10 | | % | | | 1.10 | | % |
| Ratio of expenses excluding interest expense | | | | | | | | | | | | | | | | | | | | | | | | | |
| to average net assets: | | | | | | | | | | | | | | | | | | | | | | | | | |
| Before expense waiver | | | 3.46 | | % | | | 2.16 | | % | | | 1.40 | | % | | | 1.42 | | % | | | 1.70 | | % |
| After expense waiver | | | 1.10 | | % | | | 1.10 | | % | | | 1.10 | | % | | | 1.10 | | % | | | 1.10 | | % |
| Ratio of net investment income (loss) | | | | | | | | | | | | | | | | | | | | | | | | | |
| to average net assets: | | | | | | | | | | | | | | | | | | | | | | | | | |
| Before expense waiver | | | 0.13 | | % | | | 0.13 | | % | | | (0.49 | ) | % | | | (0.52 | ) | % | | | 0.06 | | % |
| After expense waiver | | | 2.49 | | % | | | 1.19 | | % | | | (0.19 | ) | % | | | (0.20 | ) | | | | 0.66 | | % |
| Portfolio turnover rate | | | 110 | | % | | | 124 | | % | | | 100 | | % | | | 105 | | %(3) | | | 168 | | % |
| (1) | For an Institutional Class Share outstanding for the entire period. |
| (2) | The per common share data for the years ended November 30, 2019, 2018, 2017, and 2016 does not reflect the change in estimate of investment income and return of capital. See Note 2 to the financial statements for further disclosure. |
| (3) | Portfolio turnover excludes the purchases and sales of the Tortoise North American Energy Independence Fund (TNPTX) prior to the merger on June 16, 2017. If these transactions were included portfolio turnover would have been higher. |
| See accompanying Notes to Financial Statements. | |
| | |
| TortoiseEcofin | 49 |
| |
| |
| |
| |
| Tortoise Energy Evolution Fund |
| Financial Highlights (continued) |
| A Class |
| | Year Ended | | Year Ended | | Year Ended | | Year Ended | | Year Ended |
| | November 30, | | November 30, | | November 30, | | November 30, | | November 30, |
| | 2020 | | 2019 | | 2018 | | 2017 | | 2016 |
| Per Common Share Data(1) | | | | | | | | | | | | | | | | | | | | | | | | | |
| Net asset value, beginning of year | | $ | 7.47 | | | | $ | 8.12 | | | | $ | 8.98 | | | | $ | 10.19 | | | | $ | 8.80 | | |
| Investment operations: | | | | | | | | | | | | | | | | | | | | | | | | | |
| Net investment income (loss)(2) | | | 0.14 | | | | | 0.09 | | | | | (0.04 | ) | | | | (0.05 | ) | | | | 0.03 | | |
| Net realized and unrealized gain (loss) on | | | | | | | | | | | | | | | | | | | | | | | | | |
| investments and translations of foreign currency(2) | | | (0.60 | ) | | | | (0.74 | ) | | | | (0.82 | ) | | | | (1.14 | ) | | | | 1.38 | | |
| Total from investment operations | | | (0.46 | ) | | | | (0.65 | ) | | | | (0.86 | ) | | | | (1.19 | ) | | | | 1.41 | | |
| Less distributions from: | | | | | | | | | | | | | | | | | | | | | | | | | |
| Net investment income | | | (0.13 | ) | | | | — | | | | | — | | | | | (0.02 | ) | | | | (0.02 | ) | |
| Net realized gains | | | — | | | | | — | | | | | — | | | | | — | | | | | — | | |
| Total distributions | | | (0.13 | ) | | | | — | | | | | — | | | | | (0.02 | ) | | | | (0.02 | ) | |
| Net asset value, end of year | | $ | 6.88 | | | | $ | 7.47 | | | | $ | 8.12 | | | | $ | 8.98 | | | | $ | 10.19 | | |
| Total Return(3) | | | (6.30 | ) | % | | | (8.00 | ) | % | | | (9.58 | ) | % | | | (11.67 | ) | % | | | 16.06 | | % |
| Supplemental Data and Ratios | | | | | | | | | | | | | | | | | | | | | | | | | |
| Net assets, end of year (in 000’s) | | $ | 1,948 | | | | $ | 2,349 | | | | $ | 3,740 | | | | $ | 4,371 | | | | $ | 3,068 | | |
| Ratio of expenses to average net assets: | | | | | | | | | | | | | | | | | | | | | | | | | |
| Before expense waiver | | | 4.08 | | % | | | 2.41 | | % | | | 1.70 | | % | | | 1.67 | | % | | | 1.95 | | % |
| After expense waiver | | | 1.36 | | % | | | 1.35 | | % | | | 1.35 | | % | | | 1.35 | | % | | | 1.35 | | % |
| Ratio of expenses excluding interest expense | | | | | | | | | | | | | | | | | | | | | | | | | |
| to average net assets: | | | | | | | | | | | | | | | | | | | | | | | | | |
| Before expense waiver | | | 4.07 | | % | | | 2.41 | | % | | | 1.70 | | % | | | 1.67 | | % | | | 1.95 | | % |
| After expense waiver | | | 1.35 | | % | | | 1.35 | | % | | | 1.35 | | % | | | 1.35 | | % | | | 1.35 | | % |
| Ratio of net investment income (loss) | | | | | | | | | | | | | | | | | | | | | | | | | |
| to average net assets: | | | | | | | | | | | | | | | | | | | | | | | | | |
| Before expense waiver | | | (0.49 | ) | % | | | (0.12 | ) | % | | | (0.79 | ) | % | | | (0.77 | ) | % | | | (0.19 | ) | % |
| After expense waiver | | | 2.23 | | % | | | 0.94 | | % | | | (0.44 | ) | % | | | (0.45 | ) | % | | | 0.41 | | % |
| Portfolio turnover rate | | | 110 | | % | | | 124 | | % | | | 100 | | % | | | 105 | | %(4) | | | 168 | | % |
| (1) | For an A Class Share outstanding for the entire period. Prior to March 30, 2019, A Class Shares were known as Investor Class Shares. |
| (2) | The per common share data for the years ended November 30, 2019, 2018, 2017, and 2016 does not reflect the change in estimate of investment income and return of capital. See Note 2 to the financial statements for further disclosure. |
| (3) | Total return does not reflect sales charges. |
| (4) | Portfolio turnover excludes the purchases and sales of the Tortoise North American Energy Independence Fund (TNPTX) prior to the merger on June 16, 2017. If these transactions were included portfolio turnover would have been higher. |
| See accompanying Notes to Financial Statements. | |
| | |
| 50 | TortoiseEcofin |
| |
| |
| 2020 Annual Report | November 30, 2020 |
| |
| Tortoise Energy Evolution Fund |
| Financial Highlights (continued) |
| C Class |
| |
| | Year Ended | | Year Ended | | Year Ended | | Year Ended | | Year Ended |
| | November 30, | | November 30, | | November 30, | | November 30, | | November 30, |
| | 2020 | | 2019 | | 2018 | | 2017 | | 2016 |
| Per Common Share Data(1) | | | | | | | | | | | | | | | | | | | | | | | | | |
| Net asset value, beginning of year | | $ | 7.17 | | | | $ | 7.85 | | | | $ | 8.74 | | | | $ | 9.98 | | | | $ | 8.67 | | |
| Investment operations: | | | | | | | | | | | | | | | | | | | | | | | | | |
| Net investment loss(2) | | | (0.02 | ) | | | | (0.01 | ) | | | | (0.15 | ) | | | | (0.04 | ) | | | | (0.03 | ) | |
| Net realized and unrealized gain (loss) on | | | | | | | | | | | | | | | | | | | | | | | | | |
| investments and translations of foreign currency(2) | | | (0.49 | ) | | | | (0.67 | ) | | | | (0.74 | ) | | | | (1.20 | ) | | | | 1.36 | | |
| Total from investment operations | | | (0.51 | ) | | | | (0.68 | ) | | | | (0.89 | ) | | | | (1.24 | ) | | | | 1.33 | | |
| Less distributions from: | | | | | | | | | | | | | | | | | | | | | | | | | |
| Net investment income | | | (0.02 | ) | | | | — | | | | | — | | | | | — | | | | | (0.02 | ) | |
| Net realized gains | | | — | | | | | — | | | | | — | | | | | — | | | | | — | | |
| Total distributions | | | (0.02 | ) | | | | — | | | | | — | | | | | — | | | | | (0.02 | ) | |
| Net asset value, end of year | | $ | 6.64 | | | | $ | 7.17 | | | | $ | 7.85 | | | | $ | 8.74 | | | | $ | 9.98 | | |
| Total Return(3) | | | (7.10 | ) | % | | | (8.66 | ) | % | | | (10.18 | ) | % | | | (12.42 | ) | % | | | 15.41 | | % |
| Supplemental Data and Ratios | | | | | | | | | | | | | | | | | | | | | | | | | |
| Net assets, end of year (in 000’s) | | $ | 751 | | | | $ | 1,332 | | | | $ | 1,679 | | | | $ | 2,056 | | | | $ | 1,379 | | |
| Ratio of expenses to average net assets: | | | | | | | | | | | | | | | | | | | | | | | | | |
| Before expense waiver | | | 4.78 | | % | | | 3.15 | | % | | | 2.44 | | % | | | 2.42 | | % | | | 2.70 | | % |
| After expense waiver | | | 2.11 | | % | | | 2.10 | | % | | | 2.10 | | % | | | 2.10 | | % | | | 2.10 | | % |
| Ratio of expenses excluding interest expense | | | | | | | | | | | | | | | | | | | | | | | | | |
| to average net assets: | | | | | | | | | | | | | | | | | | | | | | | | | |
| Before expense waiver | | | 4.77 | | % | | | 3.15 | | % | | | 2.44 | | % | | | 2.42 | | % | | | 2.70 | | % |
| After expense waiver | | | 2.10 | | % | | | 2.10 | | % | | | 2.10 | | % | | | 2.10 | | % | | | 2.10 | | % |
| Ratio of net investment income (loss) | | | | | | | | | | | | | | | | | | | | | | | | | |
| to average net assets: | | | | | | | | | | | | | | | | | | | | | | | | | |
| Before expense waiver | | | (1.18 | ) | % | | | (0.87 | ) | % | | | (1.53 | ) | % | | | (1.52 | ) | % | | | (0.94 | ) | % |
| After expense waiver | | | 1.49 | | % | | | 0.19 | | % | | | (1.19 | ) | % | | | (1.20 | ) | % | | | (0.34 | ) | % |
| Portfolio turnover rate | | | 110 | | % | | | 124 | | % | | | 100 | | % | | | 105 | | %(4) | | | 168 | | % |
| (1) | For a C Class Share outstanding for the entire period. |
| (2) | The per common share data for the years ended November 30, 2019, 2018, 2017, and 2016 does not reflect the change in estimate of investment income and return of capital. See Note 2 to the financial statements for further disclosure. |
| (3) | Total return does not reflect sales charges. |
| (4) | Portfolio turnover excludes the purchases and sales of the Tortoise North American Energy Independence Fund (TNPTX) prior to the merger on June 16, 2017. If these transactions were included portfolio turnover would have been higher. |
| See accompanying Notes to Financial Statements. | |
| TortoiseEcofin | 51 |
| |
| |
| |
| |
| Ecofin Global Renewables Infrastructure Fund |
| Financial Highlights (continued) |
| Institutional Class |
| | Period |
| | from Inception(1) |
| | to November 30, |
| | 2020 |
| Per Common Share Data(2) | | | | | |
| Net asset value, beginning of period | | $ | 10.00 | | |
| Investment operations: | | | | | |
| Net investment income(2) | | | 0.04 | | |
| Net realized and unrealized gain (loss) on investments and translations of foreign currency(2) | | | 1.40 | | |
| Total from investment operations | | | 1.44 | | |
| Less distributions from: | | | | | |
| Net investment income | | | (0.02 | ) | |
| Net realized gains | | | — | | |
| Total distributions | | | (0.02 | ) | |
| Net asset value, end of period | | $ | 11.42 | | |
| Total Return(3) | | | 14.43 | | % |
| Supplemental Data and Ratios | | | | | |
| Net assets, end of period (in 000’s) | | $ | 108,048 | | |
| Ratio of expenses to average net assets: | | | | | |
| Before expense waiver(4) | | | 1.46 | | % |
| After expense waiver(4) | | | 1.00 | | % |
| Ratio of net investment income to average net assets: | | | | | |
| Before expense waiver(4) | | | 1.05 | | % |
| After expense waiver(4) | | | 1.51 | | % |
| Portfolio turnover rate(3) | | | 20 | | % |
| (1) | August 7, 2020. |
| (2) | For an Institutional Class Share outstanding for the entire period. |
| (3) | Not annualized. |
| (4) | Annualized. |
| See accompanying Notes to Financial Statements. | |
| 52 | TortoiseEcofin |
| |
| |
| 2020 Annual Report | November 30, 2020 |
| |
| Ecofin Global Renewables Infrastructure Fund |
| Financial Highlights (continued) |
| A Class |
| | Period |
| | from Inception(1) |
| | to November 30, |
| | 2020 |
| Per Common Share Data(2) | | | | | |
| Net asset value, beginning of period | | $ | 9.72 | | |
| Investment operations: | | | | | |
| Net investment income(2) | | | 0.03 | | |
| Net realized and unrealized gain on investments and translations of foreign currency(2) | | | 1.70 | | |
| Total from investment operations | | | 1.73 | | |
| Less distributions from: | | | | | |
| Net investment income | | | (0.01 | ) | |
| Net realized gains | | | — | | |
| Total distributions | | | (0.01 | ) | |
| Net asset value, end of period | | $ | 11.44 | | |
| Total Return(3)(4) | | | 17.82 | | % |
| Supplemental Data and Ratios | | | | | |
| Net assets, end of period (in 000's) | | $ | 1,338 | | |
| Ratio of expenses to average net assets: | | | | | |
| Before expense waiver(5) | | | 2.08 | | % |
| After expense waiver(5) | | | 1.25 | | % |
| Ratio of net investment income to average net assets: | | | | | |
| Before expense waiver(5) | | | 2.43 | | % |
| After expense waiver(5) | | | 3.26 | | % |
| Portfolio turnover rate(4) | | | 20 | | % |
| (1) | September 25, 2020. |
| (2) | For an A Class Share outstanding for the entire period. |
| (3) | Total return does not reflect sales charges. |
| (4) | Not annualized. |
| (5) | Annualized. |
| See accompanying Notes to Financial Statements. | |
| TortoiseEcofin | 53 |
| |
| |
| |
| |
| Notes to Financial Statements |
| November 30, 2020 |
| |
1. Organization
Managed Portfolio Series (the “Trust”) was organized as a Delaware statutory trust on January 27, 2011. The Trust is registered under the Investment Company Act of 1940, as amended (the “1940 Act”), as an open-end management investment company. The Tortoise MLP & Pipeline Fund (“MLP & Pipeline Fund”), the Tortoise Energy Evolution Fund (“Energy Evolution Fund”), the Tortoise MLP & Energy Income Fund (“MLP & Energy Income Fund”), the Tortoise MLP & Energy Infrastructure Fund (“MLP & Energy Infrastructure Fund”) and the Ecofin Global Renewables Infrastructure Fund (“Global Renewables Infrastructure Fund”) (or collectively, “the Funds”) are each a non-diversified series with their own investment objectives and policies within the Trust. The Trust has evaluated the structure, objective and activities of the Funds and determined that they meet the characteristics of an investment company. As such, these financial statements have applied the guidance as set forth in the Accounting Standards Codifications (“ASC”) 946, Financial Services Investment Companies.
The investment objective of the MLP & Pipeline Fund is total return. The MLP & Pipeline Fund seeks to achieve its objective by investing primarily in equity securities of master limited partnerships (“MLPs”) and pipeline companies that own and operate a network of energy infrastructure asset systems that transport, store, distribute, gather and/or process crude oil, refined petroleum products (including biodiesel and ethanol), natural gas or natural gas liquids. The MLP & Pipeline Fund commenced operations on May 31, 2011.
The investment objective of the MLP & Energy Income Fund is primarily to seek current income and secondarily to seek long-term capital appreciation. The MLP & Energy Income Fund primarily invests in equity and debt securities of MLPs focused in the energy infrastructure sector and in equity and debt securities of other companies focused in the energy infrastructure sector. The MLP & Energy Income Fund commenced operations on December 27, 2010.
The investment objective of the MLP & Energy Infrastructure Fund is primarily to seek current income and secondarily to seek long-term capital appreciation. The MLP & Energy Infrastructure Fund primarily invests in equity and debt securities of MLPs focused in the energy infrastructure sector and in equity and debt securities of other companies focused in the energy infrastructure sector. The MLP & Energy Infrastructure Fund commenced operations on September 9, 2010.
The investment objective of the Energy Evolution Fund is total return. The Energy Evolution Fund seeks to invest in securities benefiting from the long-term growth associated with the changes in energy supply relating to the energy transition that is currently underway. Energy transition (the “Transition”) is the transformation of the global energy sector to low cost and/or lower and zero-carbon energy sourced enabled by new technologies, policy framework and other market catalysts. The Energy Evolution Fund commenced operations on September 30, 2013. Prior to December 31, 2019, the Energy Evolution Fund was named the Tortoise Select Opportunity Fund and the Fund invested primarily in the securities of North American Energy companies or other companies that benefit from the operations of such North American energy companies.
The investment objective of the Global Renewables Infrastructure Fund is to generate long-term total return derived principally from a combination of capital appreciation and income over time. the Fund will principally focus its investment activities in equity securities of companies who are developers, owners and operators, in full or in part, of renewable electricity technology plants and systems, and related infrastructure investments. The Fund will typically emphasize those companies achieving measurable improvements in overall emissions, as defined as those gases and particles that are exhausted into the air as a result of fuel combustion-related activities, relative to their market peers. The Fund’s investments in equity securities may include investments in other investment companies, real estate investment trusts, foreign investment funds, preferred stocks, rights, warrants, convertible securities, and initial public offerings. The Fund will be invested in a range of both developed and non-developed markets, commensurate with its investment criteria. The Fund considers non-developed market countries to be those countries defined as such by the MSCI Market Classification Framework. The Global Renewables Infrastructure Fund commenced operations on August 7, 2020.
The MLP & Pipeline Fund, MLP & Energy Income Fund and the Energy Evolution Fund offer three classes of shares: the Institutional Class, the A Class and the C Class. The MLP & Energy Infrastructure Fund offers one class of shares: the Institutional Class. The Global Renewables Infrastructure Fund offers two classes of shares: The Institutional Class and the A Class. Institutional Class shares have no sales charge and are offered only to qualifying institutional investors and certain other qualifying accounts. A Class shares may be subject to a front-end sales charge of up to 5.50%. Prior to November 15, 2019, the MLP & Pipeline Fund and the Energy Evolution Fund A class shares were subject to a front-end sales charge of up to 5.75%. C Class shares may be subject to a deferred sales charge of up to 1.00%.
| |
| |
| 2020 Annual Report | November 30, 2020 |
| |
| Notes to Financial Statements (continued) |
| |
| |
2. Significant Accounting Policies
The following is a summary of significant accounting policies followed by the Funds in the preparation of its financial statements. These policies are in conformity with generally accepted accounting principles in the United States of America (“GAAP”).
Securities Valuation — All investments in securities are recorded at their estimated fair value, as described in Note 3.
Foreign Currency Translation — The books and records relating to the Funds’ non-U.S. dollar denominated investments are maintained in U.S. dollars on the following bases: (1) market value of investment securities, assets, and liabilities are translated at the current rate of exchange; and (2) purchases and sales of investment securities, income, and expenses are translated at the relevant rates of exchange prevailing on the respective dates of such transactions. The Funds do not isolate the portion of gains and losses on investments in equity securities that is due to changes in the foreign exchange rates from that which is due to changes in market prices of equity securities. The Funds report certain foreign currency-related transactions as components of realized gains for financial reporting purposes, whereas such components are treated as ordinary income for federal income tax purposes.
Federal Income Taxes — The Funds intend to meet the requirements of subchapter M of the Internal Revenue Code applicable to regulated investment companies and to distribute substantially all net taxable investment income and net realized gains to shareholders in a manner which results in no tax cost to the Funds. Therefore, no federal income or excise tax provision is required. As of November 30, 2020, the Funds did not have any tax positions that did not meet the “more-likely-than-not” threshold of being sustained by the applicable tax authority. The Funds recognize interest and penalties, if any, related to unrecognized tax benefits on uncertain tax positions as income tax expense in the Statements of Operations. During the period ended November 30, 2020, the Funds did not incur any interest or penalties. The Global Renewables Infrastructure Fund is subject to examination by U.S. taxing authorities for the year ended November 30, 2020. The MLP & Pipeline Fund, MLP & Energy Income Fund, MLP & Energy Infrastructure Fund and Energy Evolution Fund are subject to examination by U.S. taxing authorities for the tax years ended November 30, 2017 through 2020.
Securities Transactions, Income and Distributions — Securities transactions are accounted for on the date the securities are purchased or sold (trade date). Realized gains and losses are reported on a specific identified cost basis. Interest income is recognized on an accrual basis, including amortization of premiums and accretion of discounts. Dividend income and distributions are recorded on the ex-dividend date. Withholding taxes on foreign dividends have been provided for in accordance with the Funds’ understanding of the applicable country’s tax rules and regulations. Distributions received from the Funds’ investments generally are comprised of ordinary income and return of capital. The Funds allocate distributions between investment income and return of capital based on estimates made at the time such distributions are received. Such estimates are based on information provided by each portfolio company and other industry sources. These estimates may subsequently be revised based on actual allocations received from the portfolio companies after their tax reporting periods are concluded, as the actual character of these distributions is not known until after the fiscal year end of the Funds.
During the year ended November 30, 2020, the MLP & Pipeline Fund reallocated the amount of return of capital recognized based on the 2019 tax reporting information received. The impact of this adjustment is a decrease to return of capital by approximately $15,420,335 or $0.08 per share.
During the year ended November 30, 2020, the MLP & Energy Income Fund reallocated the amount of return of capital recognized based on the 2019 tax reporting information received. The impact of this adjustment is a decrease to return of capital by approximately $1,830,860 or $0.03 per share.
During the year ended November 30, 2020, the MLP & Energy Infrastructure Fund reallocated the amount of return of capital recognized based on the 2019 tax reporting information received. The impact of this adjustment is a decrease to return of capital by approximately $386,543 or $0.12 per share.
During the year ended November 30, 2020, the Energy Evolution Fund reallocated the amount of return of capital recognized based on the 2019 tax reporting information received. The impact of this adjustment is a decrease to return of capital by approximately $75,575 or $0.06 per share.
The Energy Evolution Fund distributes all net investment income, if any, and net realized capital gains, if any, annually in December. The MLP & Pipeline Fund and Global Renewables Infrastructure Fund will make distributions of net investment income, if any, semi-annually and net realized capital gains, if any, annually. The MLP & Energy Income Fund and the MLP & Energy Infrastructure Fund will make distributions of net investment income, if any, quarterly and net realized capital gains, if any, annually. Distributions to shareholders are recorded on the ex-dividend date. The treatment for financial reporting purposes of distributions made to shareholders during the year from net investment income or net realized capital gains may differ from their ultimate treatment for federal income tax purposes. These differences are caused primarily by differences in the timing of the recognition of certain components of income, expense or realized capital gain for federal income tax purposes. Where such differences are permanent in nature, GAAP requires that they be reclassified in the components of the net assets based on their ultimate characterization for federal income tax purposes. Any such reclassifications will have no effect on net assets, results of operations or net asset values per share of the Funds.
| |
| |
| |
| |
| Notes to Financial Statements (continued) |
| |
| |
Reclassification of Capital Accounts — GAAP requires that certain components of net assets relating to permanent differences be reclassified between financial and tax reporting. These differences are caused primarily by differences in the timing of the recognition of certain components of income, expense or realized capital gain for federal income tax purposes. These reclassifications have no effect on net assets, results of operations or net asset value per share. For the year ended November 30, 2020, the following reclassifications were made:
| | Distributable | | | | |
| Fund | | Earnings | | Paid-in Capital |
| MLP & Pipeline Fund | | $ | (3,047,024 | ) | | $ | 3,047,024 | |
| MLP & Energy Income Fund | | | (14 | ) | | | 14 | |
| MLP & Energy Infrastructure Fund | | | 1,117,951 | | | | (1,117,951 | ) |
Use of Estimates — The preparation of financial statements in conformity with GAAP requires management to make estimates and assumptions that affect the reported amounts of assets and liabilities and disclosure of contingent assets and liabilities at the date of the financial statements and the reported amounts of revenues and expenses during the reporting period. Actual results could differ from those estimates.
Allocation of Income, Expenses and Gains/Losses — Income, expenses (other than those deemed attributable to a specific share class), and gains and losses of the Funds are allocated daily to each class of shares based upon the ratio of net assets represented by each class as a percentage of the net assets of each Fund. Expenses deemed directly attributable to a class of shares are recorded by the specific class. Most Fund expenses are allocated by class based on relative net assets. 12b-1 fees are expensed at 0.25% and 1.00% of average daily net assets of A Class shares and C Class shares, respectively. Trust expenses associated with a specific fund in the Trust are charged to that fund. Common Trust expenses are typically allocated evenly between the funds of the Trust, or by other equitable means.
Illiquid or Restricted Securities — A security may be considered illiquid if it lacks a readily available market. Securities are generally considered liquid if they can be sold or disposed of in the ordinary course of business within seven days at approximately the price at which the security is valued by the Funds. Illiquid securities may be valued under methods approved by the Board of Trustees as reflecting fair value. Each Fund will not hold more than 15% of the value of its net assets in illiquid securities. Certain restricted securities may be considered illiquid. Restricted securities are often purchased in private placement transactions, are not registered under the Securities Act of 1933, may have contractual restrictions on resale, and may be valued under methods approved by the Board of Trustees as reflecting fair value. At November 30, 2020, the Funds did not hold any illiquid securities.
Indemnifications — Under the Trust’s organizational documents, its officers and trustees are indemnified against certain liabilities arising out of the performance of their duties to the Trust. In addition, in the normal course of business, the Trust may enter into contracts that provide general indemnification to other parties. The Trust’s maximum exposure under these arrangements is unknown, as this would involve future claims that may be made against the Trust that have not yet occurred and may not occur. However, the Trust has not had prior claims or losses pursuant to these contracts and expects the risk of loss to be remote.
Cash and Cash Equivalents — Cash and cash equivalents include short-term, liquid investments with an original maturity of three months or less and include money market fund accounts.
3. Securities Valuation
The Funds have adopted fair value accounting standards, which establish an authoritative definition of fair value and set out a hierarchy for measuring fair value. These standards require additional disclosures about the various inputs and valuation techniques used to develop the measurements of fair value, a discussion of changes in valuation techniques and related inputs during the period and expanded disclosure of valuation levels for major security types. These inputs are summarized in the three broad levels listed below:
| Level 1 — | Quoted prices in active markets for identical assets or liabilities. |
| | |
| Level 2 — | Observable inputs other than quoted prices included in Level 1. These inputs may include quoted prices for similar instruments, interest rates, prepayment speeds, credit risk, yield curves, default rates and similar data. |
| | |
| Level 3 — | Significant unobservable inputs for the asset or liability, representing the Fund’s view of assumptions a market participant would use in valuing the asset or liability. |
Following is a description of the valuation techniques applied to each Fund’s major categories of assets and liabilities measured at fair value on a recurring basis. Each Fund’s investments are carried at fair value.
Common stock (including MLPs) — Securities that are primarily traded on a national securities exchange are valued at the last sale price on the exchange on which they are primarily traded on the day of valuation or, if there has been no sale on such day, at the mean between the bid and ask prices. Securities traded primarily on the Nasdaq Global Market System for which market quotations are readily available are valued using the Nasdaq Official Closing Price (“NOCP”). If the NOCP is not available, such securities are valued at the last sale price on the day of valuation, or if there has been no sale on such day, at the mean between the bid and ask prices. To the extent these securities are actively traded and valuation adjustments are not applied, they are categorized in Level 1 of the fair value hierarchy.
| |
| |
| 2020 Annual Report | November 30, 2020 |
| |
| Notes to Financial Statements (continued) |
| |
| |
Corporate and Municipal Bonds — Corporate and municipal bonds, including listed issues, are valued at fair value on the basis of valuation furnished by an independent pricing service which utilized both dealer-supplied valuations and formula-based techniques. The pricing service may consider recently executed transactions in securities of the issuer or comparable issuers, market price quotations (where observable), bond spreads, and fundamental data relating to the issuer. Most corporate and municipal bonds are categorized in Level 2 of the fair value hierarchy.
Investment Companies — Investments in other mutual funds, including money market funds, are valued at their net asset value per share. To the extent these securities are actively traded and valuation adjustments are not applied, they are categorized in Level 1 of the fair value hierarchy.
Restricted Securities — Restricted securities are subject to statutory or contractual restrictions on their public resale, which may make it more difficult to obtain a valuation and may limit a Fund’s ability to dispose of them. Investments in private placement securities and other securities for which market quotations are not readily available are valued in good faith by using fair value procedures. Such fair value procedures may consider factors such as discounts to publicly traded issues and time until conversion date.
Derivative Instruments — Listed derivatives, including options, rights, swaps, warrants and futures that are actively traded are valued based on quoted prices from the exchange and categorized in Level 1 of the fair value hierarchy.
Securities for which market quotations are not readily available, or if the closing price does not represent fair value, are valued following procedures approved by the Board of Trustees. These procedures consider many factors, including the type of security, size of holding, trading volume and news events. There can be no assurance that the Funds could obtain the fair value assigned to a security if they were to sell the security at approximately the time at which the Funds determine their net asset value per share. The Board of Trustees has established a Valuation Committee to administer, implement, and oversee the fair valuation process, and to make fair value decisions when necessary. The Board of Trustees regularly reviews reports that describe any fair value determinations and methods.
The inputs or methodology used for valuing securities are not an indication of the risk associated with investing in those securities.
The following table is a summary of the inputs used to value each Fund’s securities by level within the fair value hierarchy as of November 30, 2020:
| MLP & Pipeline Fund | | Level 1 | | Level 2 | | Level 3 | | Total |
| Common stock | | $ | 1,209,072,834 | | $ | — | | $ | — | | $ | 1,209,072,834 |
| Master limited partnerships | | | 405,690,625 | | | — | | | — | | | 405,690,625 |
| Short-term investment | | | 1,641,409 | | | — | | | — | | | 1,641,409 |
| Total investments in securities | | $ | 1,616,404,868 | | $ | — | | $ | — | | $ | 1,616,404,868 |
| |
| MLP & Energy Income Fund | | Level 1 | | Level 2 | | Level 3 | | Total |
| Common stock | | $ | 157,036,779 | | $ | — | | $ | — | | $ | 157,036,779 |
| Corporate bonds | | | — | | | 94,267,886 | | | — | | | 94,267,886 |
| Master limited partnerships | | | 83,087,489 | | | — | | | — | | | 83,087,489 |
| Short-term investment | | | 8,383,287 | | | — | | | — | | | 8,383,287 |
| Convertible preferred stock | | | 3,802,316 | | | — | | | — | | | 3,802,316 |
| Total investments in securities | | $ | 252,309,871 | | $ | 94,267,886 | | $ | — | | $ | 346,577,757 |
| |
| MLP & Energy Infrastructure Fund | | Level 1 | | Level 2 | | Level 3 | | Total |
| Common stock | | $ | 7,456,754 | | $ | — | | $ | — | | $ | 7,456,754 |
| Master limited partnerships | | | 3,945,363 | | | — | | | — | | | 3,945,363 |
| Corporate bonds | | | — | | | 3,775,535 | | | — | | | 3,775,535 |
| Short-term investment | | | 1,167,638 | | | — | | | — | | | 1,167,638 |
| Convertible preferred stock | | | 180,531 | | | — | | | — | | | 180,531 |
| Total investments in securities | | $ | 12,750,286 | | $ | 3,775,535 | | $ | — | | $ | 16,525,821 |
| |
| Energy Evolution Fund | | Level 1 | | Level 2 | | Level 3 | | Total |
| Common stock | | $ | 5,359,384 | | $ | 3,703,927 | | $ | — | | $ | 9,063,311 |
| Master limited partnerships | | | 282,445 | | | — | | | — | | | 282,445 |
| Short-term investment | | | 74,472 | | | — | | | — | | | 74,472 |
| Total investments in securities | | $ | 5,716,301 | | $ | 3,703,927 | | $ | — | | $ | 9,420,228 |
| | | | | | | | | | | | |
| Global Renewables Infrastructure Fund | | Level 1 | | Level 2 | | Level 3 | | Total |
| Common stock | | $ | 47,846,733 | | $ | 47,642,319 | | $ | — | | $ | 95,489,052 |
| Short-term investment | | | 4,504,049 | | | — | | | — | | | 4,504,049 |
| Total investments in securities | | $ | 52,350,782 | | $ | 47,642,319 | | $ | — | | $ | 99,993,101 |
| |
| |
| |
| |
| Notes to Financial Statements (continued) |
| |
| |
As of November 30, 2020, the Fund’s investments in other financial instruments* were classified as follows:
| Global Renewables Infrastructure Fund | | Level 1 | | Level 2 | | Level 3 | | Total |
| Swap Contracts | | $ | — | | $ | (2,719 | ) | | $ | — | | $ | (2,719 | ) |
| Total Other Financial Instruments | | $ | — | | $ | (2,719 | ) | | $ | — | | $ | (2,719 | ) |
| * | Other financial instruments are derivative instruments not reflected in the Schedule of Investments, such as futures, swap contracts and written options. Swap contracts are presented at the unrealized appreciation (depreciation) on the instruments. |
Refer to each Fund’s Schedule of Investments for additional industry information.
4. Derivatives Transactions
The Funds may use derivatives for different purposes, such as a substitute for taking a position in the underlying asset and/or as part of a strategy designed to reduce exposure to other risks, such as interest rate or currency risk. The various derivative instruments that the Funds may use are options, futures contracts and options on futures contracts and other derivative securities. The Funds may also use derivatives for leverage, in which case their use would involve leveraging risk. A Fund investing in a derivative instrument could lose more than the principal amount invested.
FASB Accounting Standards Codification 815, Derivatives and Hedging (“ASC 815”) requires enhanced disclosures about each Fund’s use of, and accounting for, derivative instruments and the effect of derivative instruments on each Fund’s results of operations and financial position. Tabular disclosure regarding derivative fair value and gain/loss by contract type (e.g., interest rate contracts, foreign exchange contracts, credit contracts, etc.) is required and derivatives accounted for as hedging instruments under ASC 815 must be disclosed separately from those that do not qualify for hedge accounting. Even though the Funds may use derivatives in an attempt to achieve an economic hedge, the Funds’ derivatives are not accounted for as hedging instruments under ASC 815 because investment companies account for their derivatives at fair value and record any changes in fair value in current period earnings.
For the year ended November 30, 2020, the Funds’ average quarterly notional values are as follows:
| | Purchased Option | | Written Option | | Long Total Return |
| Fund | | Contracts | | Contracts | | Swap Contracts |
| MLP & Energy Income Fund | | $ | — | | | $ | (32,392,996 | ) | | | $ | — |
| MLP & Energy Infrastructure Fund | | $ | — | | | $ | (3,384,675 | ) | | | $ | — |
| Global Renewables Infrastructure Fund | | $ | — | | | $ | — | | | | $ | 7,520,397 |
The locations on the Statements of Assets and Liabilities of the Funds’ derivative positions by type of exposure, all of which are not accounted for as hedging instruments under ASC 815, are as follows:
Values of Derivative Instruments as of November 30, 2020, on the Statements of Assets and Liabilities:
| MLP & Energy Income Fund | | | | | | | | | | | |
| | | Assets | | Liabilities |
| Derivatives not accounted for as | | | | | | | | | | | |
| hedging instruments under ASC 815 | | Location | | Fair Value | | Location | | Fair Value |
| Equity Contracts – Written | | Written option contracts, | | | | | Written option contracts, | | | | |
| Options | | at fair value | | $ | — | | at fair value | | $ | — | |
| |
| MLP & Energy Infrastructure Fund | | | | | | | | | | | |
| | | Assets | | Liabilities |
| Derivatives not accounted for as | | | | | | | | | | | |
| hedging instruments under ASC 815 | | Location | | Fair Value | | Location | | Fair Value |
| Equity Contracts – Written | | Written option contracts, | | | | | Written option contracts, | | | | |
| Options | | at fair value | | $ | — | | at fair value | | $ | — | |
| |
| Global Renewables Infrastructure Fund | | | | | | | | | | | |
| | | Assets | | Liabilities |
| Derivatives not accounted for as | | | | | | | | | | | |
| hedging instruments under ASC 815 | | Location | | Fair Value | | Location | | Fair Value |
| Equity Contracts – Swap | | Net Assets – unrealized | | | | | Net Assets – unrealized | | | | |
| Contracts | | appreciation on swap contracts** | | $ | — | | depreciation on swap contracts** | | $ | (2,719 | ) |
**Includes cumulative appreciation/depreciation on swap contracts as reported in the Schedule of Open Swap Contracts.
| |
| |
| 2020 Annual Report | November 30, 2020 |
| |
| Notes to Financial Statements (continued) |
| |
| |
The effect of Derivative Instruments on the Statements of Operations for the year ended November 30, 2020:
Amount of Realized Gain (Loss) on Derivatives
| | MLP & Energy Income Fund | | MLP & Energy Infrastructure Fund | | Global Renewables Infrastructure Fund |
| Derivatives not accounted for as | | | | | | |
| hedging instruments under ASC 815 | | Written Options | | Written Options | | Swap Contracts |
| Equity Contracts | | | $ | (2,188,386 | ) | | | | $ | (607,940 | ) | | | | $ | 585,777 | | |
| | | | | | | |
| Change in Unrealized Appreciation or (Depreciation) on Derivatives |
| | | | | | | |
| | MLP & Energy Income Fund | | MLP & Energy Infrastructure Fund | | Global Renewables Infrastructure Fund |
| Derivatives not accounted for as | | | | | | |
| hedging instruments under ASC 815 | | Written Options | | Written Options | | Swap Contracts |
| Equity Contracts | | | $ | 1,758,724 | | | | | $ | 177,446 | | | | | $ | (2,719 | ) | |
Balance Sheet Offsetting Information
The following table provides a summary of offsetting financial liabilities and derivatives and the effect of derivative instruments on the Statements of Assets and Liabilities as of November 30, 2020.
| MLP & Energy Income Fund | | | | | | | | | | | | | | | | | | | | | | | | | | | | | | |
| | | | | | | | | | | | | | | | | Gross Amounts Not Offset in |
| | | | | | | | | | | | | | | | | Statements of Assets and Liabilities |
| | | | | | | Gross Amounts | | Net Amounts | | | | | | | | | | | | | | | |
| | | | | | | Offset in | | of Assets Presented | | | | | | | | | | | | | | | |
| | Gross Amounts | | Statements of | | in Statements of | | Financial | | Cash Collateral | | | | | |
| Liabilities: | | Recognized | | Assets and Liabilities | | Assets and Liabilities | | Instruments | | Pledged | | Net Amount |
| Written Option Contracts | | | $ | — | | | | $ | — | | | | $ | — | | | | $ | — | | | | $ | — | | | | $ | — | |
| | | | | | | | | | | | | | | | | | | | | | | | | | | | | | | |
| MLP & Energy Infrastructure Fund |
| | | | | | | | | | | | | | | | | Gross Amounts Not Offset in |
| | | | | | | | | | | | | | | | | Statements of Assets and Liabilities |
| | | | | | | Gross Amounts | | Net Amounts | | | | | | | | | | | | | | | |
| | | | | | | Offset in | | of Assets Presented | | | | | | | | | | | | | | | |
| | Gross Amounts | | Statements of | | in Statements of | | Financial | | Cash Collateral | | | | | |
| Liabilities: | | Recognized | | Assets and Liabilities | | Assets and Liabilities | | Instruments | | Pledged | | Net Amount |
| Written Option Contracts | | | $ | — | | | | $ | — | | | | $ | — | | | | $ | — | | | | $ | — | | | | $ | — | |
| | | | | | | | | | | | | | | | | | | | | | | | | | | | | | | |
| Global Renewables Infrastructure Fund | | | | | | | | | | | | | | | | | | | | | | | |
| | | | | | | | | | | | | | | | | Gross Amounts Not Offset in |
| | | | | | | | | | | | | | | | | Statements of Assets and Liabilities |
| | | | | | | Gross Amounts | | Net Amounts | | | | | | | | | | | | | | | |
| | | | | | | Offset in | | of Assets Presented | | | | | | | | | | | | | | | |
| | Gross Amounts | | Statements of | | in Statements of | | Financial | | Cash Collateral | | | | | |
| Assets: | | Recognized | | Assets and Liabilities | | Assets and Liabilities | | Instruments | | Pledged | | Net Amount |
| Swap Contracts | | | $ | 188,792 | | | | $ | (188,792 | ) | | | $ | — | | | | $ | — | | | | $ | — | | | | $ | — | |
| | | | | | | | | | | | | | | | | | | | | | | | | | | | | | |
| Liabilities: | | | | | | | | | | | | | | | | | | | | | | | | | | | | | | |
| Swap Contracts | | | $ | 191,511 | | | | $ | (188,792 | ) | | | $ | 2,719 | | | | $ | — | | | | $ | 2,719 | | | | $ | — | |
During the ordinary course of business, the Funds may enter into transactions subject to enforceable netting agreements or other similar arrangements (“netting agreements”). Generally, the right to offset in netting agreements allows the Funds to offset any exposure to a specific counterparty with any collateral received or delivered to that counterparty based on the terms of the agreement. Generally, each fund manages its cash collateral and securities collateral on a counterparty basis. As of November 30, 2020, the Funds did not enter into any netting agreements which would require any portfolio securities to be netted.
5. Concentration Risk & General Risk
The MLP & Pipeline Fund seeks to achieve its investment objective by investing, under normal market conditions, at least 80% of its net assets in securities of MLP and pipeline companies. Funds that primarily invest in a particular sector may experience greater volatility than funds investing in a broad range of industry sectors.
The MLP & Energy Income Fund and the MLP & Energy Infrastructure Fund seeks to achieve their investment objective by investing, under normal market conditions, at least 80% of its net assets in securities of companies focused in the energy infrastructure sector. Funds that primarily invest in a particular sector may experience greater volatility than funds investing in a broad range of industry sectors.
The Energy Evolution Fund seeks to achieve its investment objective by investing, under normal market conditions, at least 80% of its net assets in securities of North American energy companies. Funds that primarily invest in a particular sector may experience greater volatility than funds investing in a broad range of industry sectors.
| |
| |
| |
| |
| Notes to Financial Statements (continued) |
| |
| |
The Global Renewables Infrastructure Fund seeks to achieve its investment objective by investing, under normal market conditions, at least 80% of its net assets in securities of renewable infrastructure companies. Funds that primarily invest in a particular sector may experience greater volatility than funds investing in a broad range of industry sectors.
The global outbreak of COVID-19 (commonly referred to as “coronavirus”) has disrupted economic markets and the prolonged economic impact is uncertain. The ultimate economic fallout from the pandemic, and the long-term impact on economies, markets, industries and individual issuers, are not known. The operational and financial performance of the issuers of securities in which the Funds invest depends on future developments, including the duration and spread of the outbreak, and such uncertainty may in turn adversely affect the value and liquidity of the Funds’ investments, impair the Funds’ ability to satisfy redemption requests, and negatively impact the Funds’ performance.
6. Investment Advisory Fee and Other Transactions with Affiliates
The Trust has an agreement with Tortoise Capital Advisors, L.L.C. (the “Adviser”) to furnish investment advisory services to the Funds. Pursuant to an Investment Advisory Agreement between the Trust and the Adviser, the Adviser is entitled to receive, on a monthly basis, an annual advisory fee equal to 0.75% for the MLP & Energy Infrastructure Fund and Global Renewables Infrastructure Fund, 0.85% for the MLP & Pipeline Fund and the Energy Evolution Fund, and 1.00% for the MLP & Energy Income Fund of each Fund’s average daily net assets.
The Funds’ Adviser has contractually agreed to reimburse the Fund for its expenses to ensure that total annual operating expenses (excluding acquired fund fees and expenses, interest, taxes, brokerage commissions and extraordinary expenses) for each Fund do not exceed 1.00% for the Global Renewables Infrastructure Fund and MLP & Energy Infrastructure Fund, 1.10% for the MLP & Pipeline Fund and the Energy Evolution Fund and 1.25% for the MLP & Energy Income Fund of the average daily net assets of each Fund. Expenses reimbursed by the Adviser may be recouped by the Adviser for a period of thirty-six months following the date on which such reimbursement was made if such recoupment can be achieved without exceeding the expense limit in effect at the time the expense reimbursement occurred and at the time of recoupment. The Operating Expense Limitation Agreement is intended to be continual in nature and cannot be terminated within a year after the effective date of the Fund’s prospectus. During the year ended November 30, 2020, the Adviser recouped expenses of $26,884 and $4,166 relating to fees waived in prior years for the MLP & Energy Income Fund and MLP & Energy Infrastructure Fund, respectively. Reimbursed expenses subject to potential recovery by month of expiration are as follows:
| MLP & Energy Infrastructure Fund | | | | | Energy Evolution Fund | | | |
| December 2020 – November 2021 | | $ | — | | December 2020 – November 2021 | | $ | 180,617 |
| December 2021 – November 2022 | | | 7,597 | | December 2021 – November 2022 | | | 264,958 |
| December 2022 – November 2023 | | | 34,322 | | December 2022 – November 2023 | | | 273,530 |
| | | | | | | | | |
| Ecofin Global Renewables Infrastructure Fund | | | | | | | | |
| December 2020 – November 2021 | | $ | — | | | | | |
| December 2021 – November 2022 | | | — | | | | | |
| December 2022 – November 2023 | | | 127,414 | | | | | |
U.S. Bancorp Fund Services, LLC, doing business as U.S. Bank Global Fund Services (“Fund Services” or the “Administrator”) acts as the Funds’ Administrator, Transfer Agent and fund accountant. U.S. Bank, N.A. (the “Custodian”) serves as the custodian to the Funds. The Custodian is an affiliate of the Administrator. The Administrator performs various administrative and accounting services for the Funds. The Administrator prepares various federal and state regulatory filings, reports and returns for the Funds; prepares reports and materials to be supplied to the Trustees; monitors the activities of the Funds’ custodian; coordinates the payment of the Funds’ expenses and reviews the Funds’ expense accruals. The officers of the Trust including the Chief Compliance Officer are employees of the Administrator. As compensation for its services, the Administrator is entitled to a monthly fee at an annual rate of 0.07% of the first $125 million of the average daily net assets of each fund, 0.05% on the next $250 million of the average daily net assets and 0.0325% of the daily average net assets in excess of $375 million, subject to an annual minimum of $60,000 per fund. Fees paid by the Funds for administration and accounting, transfer agency, custody and compliance services for the year ended November 30, 2020 are disclosed in the Statements of Operations.
Quasar Distributors, LLC (the “Distributor”) acts as the Funds’ principal underwriter in a continuous public offering of the Funds’ shares. Effective March 31, 2020 Foreside Financial Group, LLC (“Foreside”) acquired Quasar from U.S. Bancorp. As a result of the acquisition, Quasar became a wholly-owned broker-dealer subsidiary of Foreside and is no longer affiliated with U.S. Bancorp. The Board of Trustees of the Funds has approved a new Distribution Agreement to enable Quasar to continue serving as the Fund’s distributor.
| |
| |
| 2020 Annual Report | November 30, 2020 |
| |
| Notes to Financial Statements (continued) |
| |
| |
7. Distribution Costs
The MLP & Pipeline Fund, MLP & Energy Income Fund and the Energy Evolution Fund have adopted a Distribution Plan pursuant to Rule 12b-1 (the “Plan”) in the A Class and the C Class. The Global Renewables Infrastructure Fund has adopted a Distribution Plan pursuant to Rule 12b-1 in the A Class. The Plan permits each Fund to pay for distribution and related expenses at an annual rate of 0.25% of the A Class and 1.00% of the C Class average daily net assets. The expenses covered by the Plan may include the cost of preparing and distributing prospectuses and other sales material, advertising and public relations expenses, payments to financial intermediaries and compensation of personnel involved in selling shares of the Funds. For the year ended November 30, 2020, expenses incurred by the A Class and C Class pursuant to the Plan were as follows:
| Fund | | A Class | | C Class |
| MLP & Pipeline Fund | | $ | 579,147 | | $ | 253,188 |
| MLP & Energy Income | | | 89,504 | | | 323,192 |
| Energy Evolution Fund | | | 4,479 | | | 8,238 |
| Global Renewables Infrastructure Fund | | | 249 | | | N/A |
8. Investment Transactions
The aggregate purchases and sales, excluding U.S. government securities and short-term investments, by the Funds for the year ended November 30, 2020, were as follows:
| Fund | | Purchases | | Sales |
| MLP & Pipeline Fund | | $ | 933,808,304 | | $ | 1,818,129,516 |
| MLP & Energy Income Fund | | | 200,540,485 | | | 409,570,815 |
| MLP & Energy Infrastructure Fund | | | 45,675,806 | | | 92,895,581 |
| Energy Evolution Fund | | | 12,599,507 | | | 26,528,835 |
| Global Renewables Infrastructure Fund | | | 25,577,160 | | | 12,462,614 |
9. Federal Tax Information
As of November 30, 2020, cost basis of investments for federal income tax purposes and the components of accumulated losses on a tax basis were as follows:
| | MLP & Pipeline | | MLP & Energy | | MLP & Energy | | Energy Evolution | | Global Renewables |
| | Fund | | Income Fund | | Infrastructure Fund | | Fund | | Infrastructure Fund |
| Cost of investments | | $ | 2,039,687,312 | | | $ | 336,081,667 | | | $ | 499,935 | | | $ | 8,395,911 | | | $ | 81,358,972 | |
| Gross unrealized appreciation | | $ | 212,950,505 | | | $ | 111,450,618 | | | $ | 30,718,485 | | | $ | 1,400,940 | | | $ | 19,968,955 | |
| Gross unrealized depreciation | | | (887,103,210 | ) | | | (160,006,886 | ) | | | (30,489,190 | ) | | | (581,935 | ) | | | (1,304,838 | ) |
| Net unrealized appreciation | | | | | | | | | | | | | | | | | | | | |
| (depreciation) | | | (674,152,705 | ) | | | (48,556,268 | ) | | | 229,295 | | | | 819,005 | | | | 18,664,117 | |
| Undistributed ordinary income | | | — | | | | — | | | | — | | | | 143,850 | | | | 2,012,849 | |
| Undistributed long-term | | | | | | | | | | | | | | | | | | | | |
| capital gain | | | — | | | | — | | | | — | | | | — | | | | — | |
| Total distributable earnings | | | — | | | | — | | | | — | | | | 143,850 | | | | 2,012,849 | |
| Other accumulated losses | | | (919,625,646 | ) | | | (315,691,318 | ) | | | (133,788,080 | ) | | | (32,769,935 | ) | | | — | |
| Total accumulated gain (loss) | | $ | (1,593,778,351 | ) | | $ | (364,247,585 | ) | | $ | (133,558,785 | ) | | $ | (31,807,080 | ) | | $ | 20,676,966 | |
The difference between book and tax-basis cost is attributable primarily to wash sales and MLP adjustments, if any.
As of November 30, 2020, the MLP & Pipeline Fund, the MLP & Energy Income Fund, the MLP & Energy Infrastructure Fund and the Energy Evolution Fund had short-term capital loss carryforwards of $80,650,151, $151,495,500, $60,973,677 and $19,223,811, respectively, and long-term capital loss carryforwards of $838,975,495, $164,195,818, $72,813,912 and $13,546,124, respectively, which may be carried forward for an unlimited period under the Regulated Investment Company Modernization Act of 2010. Included in the total capital loss carryforward, the Energy Evolution Fund has a short-term carryforward of $1,741,778 and a long-term carryforward of $5,470,474 that it inherited as the result of the merger with North American Energy Independence Fund. These capital loss carryforwards are further subject to an annual limitation of $105,999 pursuant to Section 382. To the extent the Funds realize future net capital gains, those gains will be offset by any unused capital loss carryforwards. Capital loss carryforwards will retain their character as either short-term or long-term capital losses. Thus, such losses must be used first to offset gains of the same character; for example, long-term loss carryforwards will first offset long-term gains, before they can be used to offset short-term gains. For the MLP & Pipeline Fund, MLP & Energy Income Fund, the MLP & Energy Infrastructure Fund and the Energy Evolution Fund, the capital gains and losses have been estimated based on information currently available and are subject to revision upon receipt of the 2020 tax reporting information from the individual MLPs.
| |
| |
| |
| |
| Notes to Financial Statements (continued) |
| |
| |
In order to meet certain excise tax distribution requirements, the Funds are required to measure and distribute annually net capital gains realized during a twelve month period ending November 30 and net investment income earned during a twelve month period ending December 31. In connection with this, the Funds are permitted for tax purposes to defer into their next fiscal year qualified late year losses. Qualified late year ordinary losses are any net ordinary capital losses incurred between January 1 and the end of their fiscal year, November 30, 2020. For the taxable year ended November 30, 2020, The MLP & Pipeline Fund, the MLP & Energy Income Fund, the MLP & Energy Infrastructure Fund, the Energy Evolution Fund and the Global Renewables Infrastructure Fund do not plan to defer any late year losses.
During the year ended November 30, 2020, the Funds paid the following distributions to shareholders:
| | | | | | | | MLP & Energy | | | | | Global Renewables |
| | MLP & Pipeline | | MLP & Energy | | Infrastructure | | Energy Evolution | | Infrastructure |
| | Fund | | Income Fund | | Fund | | Fund | | Fund |
| Ordinary income* | | $ | 37,375,521 | | $ | 6,019,139 | | $ | 1,874,368 | | $ | 359,523 | | $ | 213,295 |
| Long-term capital gains** | | | — | | | — | | | — | | | — | | | — |
| Return of capital | | | 68,887,041 | | | 33,960,830 | | | 2,901,876 | | | — | | | — |
| Total distributions | | $ | 106,262,562 | | $ | 39,979,969 | | $ | 4,776,244 | | $ | 359,523 | | $ | 213,295 |
| |
| During the year ended November 30, 2019, the Funds paid the following distributions to shareholders: |
| |
| | | | | | MLP & Energy | | | | Global Renewables |
| | MLP & Pipeline | | MLP & Energy | | Infrastructure | | Energy Evolution | | Infrastructure |
| | Fund | | Income Fund | | Fund | | Fund | | Fund |
| Ordinary income* | | $ | 61,120,453 | | $ | 1,231,712 | | $ | 8,869,767 | | $ | — | | $ | — |
| Long-term capital gains** | | | — | | | — | | | — | | | — | | | — |
| Return of capital | | | 114,297,923 | | | 72,423,404 | | | 5,582,876 | | | — | | | — |
| Total distributions | | $ | 175,418,376 | | $ | 73,655,116 | | $ | 14,452,643 | | $ | — | | $ | — |
*For federal income tax purposes, distributions of short-term capital gains are treated as ordinary income distributions.
**The Funds designate as long-term capital gain distributions, pursuant to Internal Revenue Code Section 852(b)(3)(C).
10. Transactions with Affiliates
If the Fund’s holding represents ownership of 5% or more of the voting securities of a company, the company is deemed to be an affiliate as defined by the 1940 Act. The MLP & Pipeline Fund conducted transactions during the year ended November 30, 2020 with affiliated companies as so defined:
| | Beginning shares | | Additions | | Reductions | | Ending shares | | |
| Plains GP Holdings L.P. | | 8,603,956 | | 6,880,660 | | 3,422,771 | | 12,061,845 | | |
| |
| | Value as of | | | | | | | | Change in |
| | November 30, | | | | | | Realized | | Unrealized |
| | 2020 | | Dividend Income | | Return of Capital | | Gain (Loss) | | Depreciation |
| Plains GP Holdings L.P. | | $ 95,650,431 | | $ — | | $ 10,413,327 | | $ (50,625,613) | | $(39,596,967) |
11. Line of Credit
The Funds have established a line of credit (“LOC”) in the amount of $150,000,000. Borrowings under the loan agreement are charged an interest rate equal to prime, 3.25% as of November 30, 2020. This LOC is intended to provide short-term financing, if necessary, subject to certain restrictions, in connection with shareholder redemptions. The credit facility is with the Funds custodian, U.S. Bank, N.A. During the year ended November 30, 2020, the Global Renewables Infrastructure Fund did not have any borrowings under the LOC. During the year ended November 30, 2020, the MLP & Pipeline Fund, MLP & Energy Income Fund, the MLP & Energy Infrastructure Fund and the Energy Evolution Fund LOC activity was as follows:
| | | | | | Amount |
| | | | | | Outstanding as |
| | Average | | Weighted-Average | | of November 30, |
| Fund | | Borrowings | | Interest Rate | | 2020 |
| MLP & Pipeline Fund | | $ 2,413,956 | | 3.28% | | $ | — |
| MLP & Energy Income Fund | | 737,044 | | 3.33% | | | — |
| MLP & Energy Infrastructure Fund | | 217,934 | | 3.25% | | | — |
| Energy Evolution Fund | | 23,587 | | 3.62% | | | — |
| |
| |
| 2020 Annual Report | November 30, 2020 |
| |
| Notes to Financial Statements (continued) |
| |
| |
12. Control Ownership
The beneficial ownership, either directly or indirectly, of more than 25% of the voting securities of a fund creates a presumption of control of the fund, under Section 2(a)(9) of the Investment Company Act of 1940. As of November 30, 2020, each Fund’s percentage of control ownership positions greater than 25% are as follows:
| Fund | Shareholder | | Percent of Shares Held |
| MLP & Energy Income Fund | Merrill Lynch, Pierce, Fenner & Smith Inc. | | 36.50% |
| MLP & Energy Infrastructure Fund | Charles Schwab & Co. Inc. | | 38.80% |
| MLP & Energy Infrastructure Fund | JP Morgan Securities, LLC | | 29.45% |
| Energy Evolution Fund | Charles Schwab & Co. Inc. | | 25.52% |
| Global Renewables Infrastructure Fund | Sequoia Holdings, LLC | | 41.71% |
13. Reorganization of Global Renewables Infrastructure Fund
On August 7, 2020, as the result of a reorganization, the Ecofin Global Renewables Infrastructure Fund Limited, established in November 2015 (which later changed its name to the Tortoise Global Renewables Infrastructure Fund Limited in May of 2019), (the “Predecessor Fund”), an unregistered Cayman limited liability company, was reorganized into the Trust by transferring a majority of the Predecessor Fund’s assets to the Global Renewables Infrastructure Fund in exchange for Institutional Class shares of the Global Renewables Infrastructure Fund. Effective on that date, the Predecessor Fund was renamed the Ecofin Global Renewables Infrastructure Fund (“ECOIX”). The Global Renewables Infrastructure Fund was deemed to be the accounting survivor for financial reporting purposes.
Given the structure of the Predecessor Fund, the reorganization was 54.12% tax-free and 45.88% taxable. For the tax-free portion of the reorganization, 54.12% of the historical cost of each tax lot of each security was brought into ECOIX along with the original purchase date of the lot. For the taxable portion, any unrealized appreciation or depreciation on the securities on the date of reorganization was treated as a taxable event, thus the cost basis of 45.88% of the tax lots of each security held reflect the fair value as of the date of the reorganization. Immediately prior to the reorganization, the net assets, fair value of investments, and net unrealized appreciation of the Predecessor Fund was $78,252,177, $72,261,618 and $16,230,501, respectively.
14. Subsequent Events
On December 30, 2020, the MLP & Pipeline Fund paid an income distribution to the Institutional Class in the amount of $17,948,724 or $0.10847923 per share, the A Class in the amount of $1,721,367 or $0.10663693 per share and the C Class in the amount of $230,945 or $0.10099572 per share.
On December 30, 2020, the MLP & Energy Income Fund paid an income distribution to the Institutional Class in the amount of $94,670 or $0.00182327 per share and the A Class in the amount of $2,776 or $0.00050682 per share.
On December 23, 2020, the Energy Evolution Fund paid an income distribution to the Institutional Class in the amount of $109,563 or $0.18269337 per share, the A Class in the amount of $40,120 or $0.16477534 per share, and the C Class in the amount of $10,778 or $0.10602222 per share.
On December 30, 2020, the Global Renewables Infrastructure Fund paid an income distribution to the Institutional Class in the amount of $887,434 or $0.08995055 per share and the A Class in the amount of $12,476 or $0.08726633 per share. The Global Renewables Infrastructure Fund paid a short-term capital gain distribution to the Institutional Class in the amount of $487,568 or $0.04942 per share and the A Class in the amount of $7,065 or $0.04942 per share.
Based upon a recommendation by the Adviser, the Board of Trustees of the Trust approved a plan of liquidation for the Energy Evolution Fund as a series of the Trust, pursuant to which the Energy Evolution Fund liquidated (the “Liquidation”) on December 30, 2020. The Adviser had determined that the Energy Evolution Fund had limited prospects for meaningful growth. As a result, the Adviser and the Board believed that the Liquidation of the Energy Evolution Fund was in the best interests of shareholders.
Management has performed an evaluation of subsequent events through the date the financial statements were issued and has determined that no additional items require recognition or disclosure.
| |
| |
| |
| |
| Report of Independent Registered Public Accounting Firm |
| |
| |
To the Shareholders and the Board of Trustees
Tortoise MLP & Pipeline Fund
Tortoise MLP & Energy Income Fund
Tortoise MLP & Energy Infrastructure Fund
Tortoise Energy Evolution Fund
Ecofin Global Renewables Infrastructure Fund
Opinion on the Financial Statements
We have audited the accompanying statements of assets and liabilities of Tortoise MLP & Pipeline Fund, Tortoise MLP & Energy Income Fund, Tortoise MLP & Energy Infrastructure Fund, Tortoise Energy Evolution Fund and Ecofin Global Renewables Infrastructure Fund, (collectively referred to as the “Funds”) (five of the funds constituting the Managed Portfolio Series (the “Trust”)), including the schedules of investments, as of November 30, 2020, and the related statements of operations, changes in net assets, and the financial highlights for each of periods indicated in the table below and the related notes (collectively referred to as the “financial statements”). In our opinion, the financial statements present fairly, in all material respects, the financial position of each of the Funds (five of the funds constituting the Managed Portfolio Series) at November 30, 2020, the results of their operations, the changes in their net assets and their financial highlights for each of the for each of the periods indicated in the table below, in conformity with U.S. generally accepted accounting principles.
| Funds constituting | Statement | Statement of | |
| Managed Portfolio Series | of operations | changes in net assets | Financial highlights |
| Tortoise MLP & Pipeline Fund | For the year ended
November 30, 2020 | For each of the two years
in the period ended
November 30, 2020 | For each of the five years
in the period ended
November 30, 2020 |
| Tortoise MLP & Energy Income Fund |
| Tortoise MLP & Energy Infrastructure Fund |
| Tortoise Energy Evolution Fund |
| Ecofin Global Renewables Infrastructure Fund | For the period August 7, 2020 (commencement of operations) to November 30, 2020 |
Basis for Opinion
These financial statements are the responsibility of the Trust’s management. Our responsibility is to express an opinion on each of the Funds’ financial statements based on our audits. We are a public accounting firm registered with the Public Company Accounting Oversight Board (United States) (“PCAOB”) and are required to be independent with respect to the Trust in accordance with the U.S. federal securities laws and the applicable rules and regulations of the Securities and Exchange Commission and the PCAOB.
We conducted our audits in accordance with the standards of the PCAOB. Those standards require that we plan and perform the audit to obtain reasonable assurance about whether the financial statements are free of material misstatement, whether due to error or fraud. The Trust is not required to have, nor were we engaged to perform, an audit of the Trust’s internal control over financial reporting. As part of our audits we are required to obtain an understanding of internal control over financial reporting but not for the purpose of expressing an opinion on the effectiveness of the Trust’s internal control over financial reporting. Accordingly, we express no such opinion.
Our audits included performing procedures to assess the risks of material misstatement of the financial statements, whether due to error or fraud, and performing procedures that respond to those risks. Such procedures included examining, on a test basis, evidence regarding the amounts and disclosures in the financial statements. Our procedures included confirmation of securities owned as of November 30, 2020, by correspondence with the custodian and brokers or by other appropriate auditing procedures where replies from brokers were not received. Our audits also included evaluating the accounting principles used and significant estimates made by management, as well as evaluating the overall presentation of the financial statements. We believe that our audits provide a reasonable basis for our opinion.

We have served as the auditor for one or more of the portfolios that comprise the Managed Portfolio Series since 2011.
Minneapolis, Minnesota
January 29, 2021
| |
| |
| 2020 Annual Report | November 30, 2020 |
| |
| Investment Advisory Agreement (unaudited) |
| |
| |
Approval Of Investment Advisory Agreement — Tortoise Capital Advisors, L.L.C.
Approval Of Investment Sub-Advisory Agreement — Ecofin Advisors Limited
At the regular meeting of the Board of Trustees of Managed Portfolio Series (“Trust”) on May 19-20, 2020, the Trust’s Board of Trustees (“Board”), each of whom were present in person, including all of the Trustees who are not “interested persons” of the Trust, as that term is defined in Section 2(a)(19) of the Investment Company Act of 1940, as amended, (“Independent Trustees”) considered and approved the Investment Advisory Agreement between the Trust and Tortoise Capital Advisors, L.L.C. (“Tortoise” or “Adviser”) regarding the Ecofin Global Renewables Infrastructure Fund (the “Fund”) (the “Advisory Agreement”) and the Investment Sub-Advisory Agreement between Tortoise and Ecofin Advisors Limited (“Ecofin” or “Sub-Adviser”) regarding the Fund (the “Sub-Advisory Agreement”) for an initial two-year term.
Prior to the meeting and at the meeting, the Trustees received and considered information from Tortoise, Ecofin, and the Trust’s administrator designed to provide the Trustees with the information necessary to evaluate the approval of the Advisory Agreement and the Sub-Advisory Agreement (“Support Materials”). The Independent Trustees then reviewed the Support Materials with regard to Tortoise, Ecofin and the Fund. They discussed initial SEC filings for the Fund. They reviewed and considered Tortoise and Ecofin’s responses to the due diligence questionnaire regarding the Fund’s investment strategy, services that Tortoise and Ecofin propose to provide to the Fund, proposed Fund management fees and the profitability that Tortoise expects to realize from its management of the Fund, any additional benefits that Tortoise or Ecofin expect to realize from their management of the Fund, and other matters that the Trustees deemed relevant. The Trustees also reviewed Tortoise’s and Ecofin’s financial statements and considered the financial condition of the firms. They also reviewed analyses which were prepared by the administrator of the Fund’s proposed and projected expenses relative to other funds in the same Morningstar category. Before voting to approve the Advisory Agreement and Sub-Advisory Agreement, the Trustees reviewed the Support Materials with Trust management and with counsel to the Independent Trustees, and received a memorandum from such counsel discussing the legal standards for the Trustees’ consideration of the approval of the Advisory Agreement and Sub-Advisory Agreement. This information, together with the information provided to the Board throughout the course of the year, formed the primary (but not exclusive) basis for the Board’s determinations.
In determining whether to approve the Advisory Agreement and the Sub-Advisory Agreement, the Trustees considered all factors they believed relevant, including the following with respect to the Fund: 1) the nature, extent, and quality of the services to be provided by Tortoise and Ecofin with respect to the Fund; (2) the cost of the services to be provided and the profits to be realized by Tortoise, from services rendered to the Fund; (3) comparative fee and expense data for the Fund and other investment companies with similar investment objectives; (4) the extent to which economies of scale may be realized as the Fund grows, and whether the proposed advisory fee for the Fund reflects such economies of scale for the Fund’s benefit; and (5) other benefits to Tortoise or Ecofin resulting from services rendered to the Fund. In their deliberations, the Trustees weighed to varying degrees the importance of the information provided to them and did not identify any particular information that was all-important or controlling.
Based upon the information provided to the Board throughout the course of the year, including at a presentation by representatives from Tortoise and Ecofin, and the Support Materials, the Board concluded that the overall arrangements between the Trust and Tortoise as set forth in the Advisory Agreement, and between Tortoise and Ecofin as set forth in the Sub-Advisory Agreement, as each agreement relates to the Fund, continue to be fair and reasonable in light of the services that Tortoise and Ecofin perform, the investment advisory fees that each receives for such services, and such other matters as the Trustees considered relevant in the exercise of their reasonable business judgment. The material factors and conclusions that formed the basis of the Trustees’ determination to approve the Advisory Agreement and the Sub-Advisory Agreement are summarized below.
Nature, Extent and Quality of Services Provided. The Trustees considered the scope of services that Tortoise and Ecofin will collectively provide under the Advisory Agreement and Sub-Advisory Agreement with respect to the Fund, noting that such services include but are not limited to the following: (1) investing the Fund’s assets consistent with the Fund’s investment objective and investment policies; (2) determining the portfolio securities to be purchased, sold, or otherwise disposed of and the timing of such transactions; (3) voting all proxies with respect to the Fund’s portfolio securities; (4) maintaining the required books and records for transactions effected by Tortoise or Ecofin on behalf of the Fund; and (5) selecting broker-dealers to execute orders on behalf of the Fund. The Trustees noted that Tortoise is well capitalized. The Trustees also considered Tortoise’s assets under management. The Trustees considered the experience of the proposed portfolio managers from Ecofin in managing an unregistered private fund that would be converted into the Fund, as well as a composite of separately managed accounts managed in a strategy similar to the Fund. The Trustees noted that Tortoise would be responsible for oversight of Ecofin, providing back office support to Ecofin with respect to shareholder servicing, compliance and Board reporting. The Trustees further noted that Ecofin would be responsible for portfolio management and trading for the Fund. The Trustees concluded that they were satisfied with the nature, extent, and quality of services that Tortoise and Ecofin propose to provide to the Fund under the Advisory Agreement and Sub-Advisory Agreement.
| |
| |
| |
| |
| Investment Advisory Agreement (unaudited) (continued) |
| |
| |
Cost of Advisory Services and Profitability. The Trustees considered the proposed management fee that the Fund will pay to Tortoise under the Advisory Agreement in the amount of 0.75% of the Fund’s average annual daily net assets. They also considered Tortoise’s profitability analysis (12-month pro-forma) for services that Tortoise will render to the Fund. The Trustees considered that Ecofin is 100% owned by Tortoise and that the sub-advisory fees would be paid to Ecofin out of the gross advisory fees paid to Tortoise from the Fund. In that regard, the Trustees noted that Tortoise expects to waive a portion of its management fees during the first 12 months of the Fund’s operations under the proposed operating expenses limitation agreement. The Trustees also noted that the proposed management fee would be less than the management fee payable to Ecofin by four of the share classes of the unregistered private fund that will convert into the Fund, although there were two share classes of the private fund with management fees below the proposed management fee under the Advisory Agreement. The Trustees noted that Tortoise manages separately managed accounts with investment strategies that are substantially similar to the Fund. The Trustees considered that Ecofin serves as sub-adviser to a sleeve of an Irish UCITS for which it receives a sub-advisory fee that is below the proposed management fee payable to Tortoise under the Advisory Agreement. The Trustees also noted that Tortoise believes the services provided to the Fund will be more frequent and intensive in nature than those provided by Ecofin to the UCITS for which it serves as sub-adviser. The Trustees expected that Tortoise’s service relationship with the Fund would not be profitable during the first 12 months of operations.
The Trustees also considered the proposed annual sub-advisory fee that Tortoise will pay to Ecofin under the Sub-Advisory Agreement. The Trustees noted that because the sub-advisory fees are paid by Tortoise, the overall advisory fee paid by the Fund is not directly affected by the sub-advisory fees paid to Ecofin. Consequently, the Trustees did not consider the costs of services provided by Ecofin or the profitability of its relationship with the Fund to be material factors for consideration.
Comparative Fee and Expense Data. The Trustees considered an analysis that the Trust’s administrator had prepared, comparing the contractual expenses that the Fund will bear to those of funds in the same Morningstar category. The Trustees noted that the Fund’s proposed management fee of 0.75% was below the peer group median and average and in the first quartile of the peer group. The Trustees also noted that the projected total contractual expenses of the Fund’s Institutional Class were equal to the peer group average and above the median. While recognizing that it is difficult to compare advisory fees because the scope of advisory services provided may vary from one investment adviser to another, the Trustees concluded that Tortoise’s proposed management fee is reasonable.
Economies of Scale. The Trustees considered whether the Fund would benefit from any economies of scale, noting that the proposed investment advisory fee for the Fund does not contain breakpoints. The Trustees took into account the fact that Tortoise had agreed to consider breakpoints in the future in response to asset growth in the Fund. The Trustees concluded that it is not necessary to consider the implementation of fee breakpoints at this time, but committed to revisit this issue in the future as circumstances change and asset levels increase.
Other Benefits. The Trustees considered the direct and indirect benefits that could be realized by Tortoise from its relationships with the Fund. The Trustees noted that Tortoise will not use affiliated brokers to execute the Fund’s portfolio transactions. The Trustees considered that Tortoise may receive some form of reputational benefit from services rendered to the Fund, but that such benefits are immaterial and cannot otherwise be quantified. The Trustees concluded that Tortoise does not receive additional material benefits from its relationship with the Fund.
| |
| |
| 2020 Annual Report | November 30, 2020 |
| |
| Trustees & Officers (unaudited) |
| November 30, 2020 |
| |
Name, Address
and Year of Birth | | Position(s) Held
with the Trust | | Term of Office
and Length of
Time Served | | Number of
Portfolios
in Trust
Overseen
by Trustee | | Principal Occupation(s)
During the Past Five Years | | Other Directorships
Held by Trustee During
the Past Five Years |
| Independent Trustees | | | | | | | | | | |
Leonard M. Rush, CPA
615 E. Michigan St.
Milwaukee, WI 53202
Year of Birth: 1946 | | Lead Independent
Trustee and Audit
Committee Chairman | | Indefinite Term;
Since April 2011 | | 37 | | Retired, Chief Financial Officer, Robert W. Baird & Co. Incorporated (2000-2011). | | Independent Trustee, ETF Series Solutions (49 Portfolios) (2012-Present); Director, Anchor Bancorp Wisconsin, Inc. (2011-2013). |
David A. Massart
615 E. Michigan St.
Milwaukee, WI 53202
Year of Birth: 1967 | | Trustee and Valuation
Committee Chairman | | Indefinite Term;
Since April 2011 | | 37 | | Co-Founder and Chief Investment Strategist, Next Generation Wealth Management, Inc. (2005-present). | | Independent Trustee, ETF Series Solutions (49 Portfolios) (2012-Present). |
David M. Swanson
615 E. Michigan St.
Milwaukee, WI 53202
Year of Birth: 1957 | | Trustee and Nominating
& Governance
Committee Chairman | | Indefinite Term;
Since April 2011 | | 37 | | Founder and Managing Principal, SwanDog Strategic Marketing, LLC (2006-present). | | Independent Trustee, ALPS Variable Investment Trust (7 Portfolios) (2006-Present); Independent Trustee, RiverNorth Funds (3 Portfolios) (2018-Present); RiverNorth Managed Duration Municipal Income Fund Inc. (1 Portfolio) (2019-Present); RiverNorth Marketplace Leading Corporation (1 Portfolio) (2018-Present); RiverNorth/ DoubleLine Strategic Opportunity Fund, Inc. (1 Portfolio) (2018-Present); RiverNorth Opportunities Fund, Inc. (1 Portfolio) (2018-Present); RiverNorth Opportunistic Municipal Income Fund, Inc. (1 Portfolio) (2018-Present). |
Robert J. Kern*
615 E. Michigan St.
Milwaukee, WI 53202
Year of Birth: 1958 | | Chairman, and Trustee | | Indefinite Term;
Since January
2011 | | 37 | | Retired Executive Vice President, U.S. Bancorp Fund Services, LLC (1994-2018). | | None |
| * | Mr. Kern became an independent Trustee on July 6, 2020. Previously he was an Interested Trustee. |
| |
| |
| |
| |
| Trustees & Officers (unaudited) (continued) |
| November 30, 2020 |
| |
Name, Address
and Year of Birth | | Position(s) Held
with the Trust | | Term of Office
and Length of
Time Served | | Number of
Portfolios
in Trust
Overseen
by Trustee | | Principal Occupation(s)
During the Past Five Years | | Other Directorships
Held by Trustee During
the Past Five Years |
| Officers | | | | | | | | | | |
Brian R. Wiedmeyer
615 E. Michigan St.
Milwaukee, WI 53202
Year of Birth: 1973 | | President and Principal
Executive Officer | | Indefinite Term;
Since November 2018 | | N/A | | Vice President, U.S. Bancorp Fund Services, LLC (2005-present). | | N/A |
Deborah Ward
615 E. Michigan St.
Milwaukee, WI 53202
Year of Birth: 1966 | | Vice President,
Chief Compliance
Officer and Anti-Money
Laundering Officer | | Indefinite Term;
Since April 2013 | | N/A | | Senior Vice President, U.S. Bancorp Fund Services, LLC (2004-present). | | N/A |
Benjamin Eirich
615 E. Michigan St.
Milwaukee, WI 53202
Year of Birth: 1981 | | Vice President,
Treasurer and Principal
Financial Officer | | Indefinite Term;
Since August 2019
(Treasurer);
Since November 2018
(Vice President) | | N/A | | Assistant Vice President, U.S. Bancorp Fund Services, LLC (2008-present). | | N/A |
Thomas A. Bausch, Esq.
615 E. Michigan St.
Milwaukee, WI 53202
Year of Birth: 1979 | | Secretary | | Indefinite Term;
Since November 2017 | | N/A | | Assistant Vice President, U.S. Bancorp Fund Services, LLC (2016-Present); Associate, Godfrey & Kahn S.C. (2012-2016). | | N/A |
Douglas Schafer
615 E. Michigan St.
Milwaukee, WI 53202
Year of Birth: 1970 | | Vice President and
Assistant Treasurer | | Indefinite Term;
Since May 2016
(Assistant Treasurer);
Since November 2018
(Vice President) | | N/A | | Assistant Vice President, U.S. Bancorp Fund Services, LLC (2002-present). | | N/A |
Michael Cyr II, CPA
615 E. Michigan St.
Milwaukee, WI 53202
Year of Birth: 1992 | | Vice President and
Assistant Treasurer | | Indefinite Term;
Since August 2019 | | N/A | | Assistant Vice President, U.S. Bancorp Fund Services, LLC (2013-present). | | N/A |
| |
| |
| 2020 Annual Report | November 30, 2020 |
| |
| Additional Information (unaudited) (continued) |
| |
| |
Availability of Fund Portfolio Information
The Fund files complete schedules of portfolio holdings with the SEC for the first and third quarters of each fiscal year on Part F of Form N-PORT. The Funds’ Part F of Form N-PORT is available on the SEC’s website at www.sec.gov and may be reviewed and copied at the SEC’s Public Reference Room in Washington, D.C. Information on the operation of the Public Reference Room may be obtained by calling 1-800-732-0330. The Funds’ Part F of Form N-PORT may also be obtained by calling toll-free 1-855-TCA-Fund or 1-855-822-3863.
Availability of Proxy Voting Information
A description of the Funds’ Proxy Voting Policies and Procedures is available without charge, upon request, by calling 1-855-TCA-Fund or 1-855-822-3863. Information regarding how the Funds voted proxies relating to portfolio securities during the most recent 12 month period ended June 30, is available (1) without charge, upon request, by calling 1-855-TCA-Fund or 1-855-822-3863, or (2) on the SEC’s website at www.sec.gov.
Qualified Dividend Income/Dividends Received Deduction
For the fiscal year ended November 30, 2020, certain dividends paid by the Funds may be reported as qualified dividend income and may be eligible for taxation at capital gain rates. The Percentage of dividends declared from ordinary income designated as qualified dividend income was 100.00%, 95.34%, 38.33%, 100.00% and 32.89% for the MLP & Pipeline Fund, MLP & Energy Income Fund, MLP & Energy Infrastructure Fund, Energy Evolution Fund and Global Renewables Infrastructure Fund, respectively.
For corporate shareholders, the percent of ordinary income distributions qualifying for the corporate dividends received deduction for the fiscal year ended November 30, 2020, was 68.18%, 53.02%, 21.81%, 97.23% and 8.49% for the MLP & Pipeline Fund, MLP & Energy Income Fund, MLP & Energy Infrastructure Fund, Energy Evolution Fund and Global Renewables Infrastructure Fund, respectively.
The percentage of taxable ordinary income distributions that are designated as short-term capital gain distributions under Internal Revenue Section 871 (k)(2)(C) was 0.00%, 0.00%, 0.00%, 0.00% and 0.00% for the MLP & Pipeline Fund, MLP & Energy Income Fund, MLP & Energy Infrastructure Fund, Energy Evolution Fund and Global Renewables Infrastructure Fund, respectively.
PRIVACY NOTICE
The Funds collect only relevant information about you that the law allows or requires it to have in order to conduct its business and properly service you. The Funds collect financial and personal information about you (“Personal Information”) directly (e.g., information on account applications and other forms, such as your name, address, and social security number, and information provided to access account information or conduct account transactions online, such as password, account number, e-mail address, and alternate telephone number), and indirectly (e.g., information about your transactions with us, such as transaction amounts, account balance and account holdings).
The Funds do not disclose any non-public personal information about its shareholders or former shareholders other than for everyday business purposes such as to process a transaction, service an account, respond to court orders and legal investigations or as otherwise permitted by law. Third parties that may receive this information include companies that provide transfer agency, technology and administrative services to the Funds, as well as the Funds’ investment adviser who is an affiliate of the Funds. If you maintain a retirement/ educational custodial account directly with the Funds, we may also disclose your Personal Information to the custodian for that account for shareholder servicing purposes. The Funds limit access to your Personal Information provided to unaffiliated third parties to information necessary to carry out their assigned responsibilities to the Fund. All shareholder records will be disposed of in accordance with applicable law. The Funds maintain physical, electronic and procedural safeguards to protect your Personal Information and requires its third party service providers with access to such information to treat your Personal Information with the same high degree of confidentiality.
In the event that you hold shares of the Funds through a financial intermediary, including, but not limited to, a broker-dealer, credit union, bank or trust company, the privacy policy of your financial intermediary governs how your non-public personal information is shared with unaffiliated third parties.
Contacts
Board of Trustees
David Massart
Leonard Rush, CPA
David Swanson
Robert Kern Investment Adviser
Tortoise Capital Advisors, L.L.C.
5100 W. 115th Place
Leawood, KS 66211 Independent Registered Public
Accounting Firm
Ernst & Young, LLP
220 South Sixth Street, Suite 1400
Minneapolis, MN 55402 Transfer Agent, Fund Accountant
And Fund Administrator
U.S. Bancorp Fund Services, LLC
777 East Wisconsin Avenue
Milwaukee, WI 53202 Distributor
Quasar Distributors, LLC
111 E Kilbourn Avenue, Suite 2200
Milwaukee, WI 53202 | Custodian
U.S. Bank, N.A.
1555 North Rivercenter Drive
Milwaukee, WI 53212 Fund Counsel
Stradley Ronon Stevens & Young, LLP
2005 Market Street, Suite 2600
Philadelphia, PA 19103-7096 855-TCA-FUND
(855-822-3863) This report must be accompanied or preceded by a prospectus. The Fund’s Statement of Additional Information contains additional information about the Fund’s trustees and is available without charge upon request by calling 1-855-TCA-Fund or 1-855-822-3863. |

5100 W. 115th Place
Leawood, KS 66211
www.TortoiseEcofin.com
The registrant has adopted a code of ethics that applies to the registrant’s principal executive officer and principal financial officer. The registrant has not made any substantive amendments to its code of ethics during the period covered by this period.
The registrant has not granted any waivers from any provisions of the code of ethics during the period covered by this report.
The registrant’s Board of Trustees has determined that there is at least one audit committee financial expert serving on its audit committee. Leonard M. Rush is the “audit committee financial expert” and is considered to be “independent” as each term is defined in Item 3 of Form N-CSR.
The registrant has engaged its principal accountant to perform audit services, audit-related services, tax services and other services during the past fiscal year. “Audit services” refer to performing an audit of the registrant's annual financial statements or services that are normally provided by the accountant in connection with statutory and regulatory filings or engagements for the past fiscal year. “Audit-related services” refer to the assurance and related services by the principal accountant that are reasonably related to the performance of the audit. “Tax services” refer to professional services rendered by the principal accountant for tax compliance, tax advice, and tax planning, including reviewing the Fund’s tax returns and distribution calculations. There were no “other services” provided by the principal accountant. For the fiscal years ended November 30, 2020 and November 30, 2019, the Fund’s principal accountant was Ernst & Young. The following table details the aggregate fees billed or expected to be billed for each of the last fiscal year for audit fees, audit-related fees, tax fees and other fees by the principal accountant.
The audit committee has adopted pre-approval policies and procedures that require the audit committee to pre-approve all audit and non-audit services of the registrant, including services provided to any entity affiliated with the registrant.
The percentage of fees billed by Ernst & Young applicable to non-audit services pursuant to waiver of pre-approval requirement was as follows:
All of the principal accountant’s hours spent on auditing the registrant’s financial statements were attributed to work performed by full-time permanent employees of the principal accountant.
The following table indicates the non-audit fees, other than the tax services as noted above, billed or expected to be billed by the registrant’s accountant for services to the registrant and to the registrant’s investment adviser (and any other controlling entity, etc.—not sub-adviser) for the last two years. The audit committee of the board of trustees/directors has considered whether the provision of non-audit services that were rendered to the registrant's investment adviser is compatible with maintaining the principal accountant's independence and has concluded that the provision of such non-audit services by the accountant has not compromised the accountant’s independence.
Not applicable to registrants who are not listed issuers (as defined in Rule 10A-3 under the Securities Exchange Act of 1934).
(a) Schedule of Investments is included as part of the report to shareholders filed under Item 1 of this Form.
(b) Not applicable.
Not applicable to open-end investment companies.
Not applicable to open-end investment companies.
Not applicable to open-end investment companies.
There have been no material changes to the procedures by which shareholders may recommend nominees to the registrant’s board of trustees.
Not applicable to open-end investment companies.
Pursuant to the requirements of the Securities Exchange Act of 1934 and the Investment Company Act of 1940, the registrant has duly caused this report to be signed on its behalf by the undersigned, thereunto duly authorized.
Pursuant to the requirements of the Securities Exchange Act of 1934 and the Investment Company Act of 1940, this report has been signed below by the following persons on behalf of the registrant and in the capacities and on the dates indicated.